0000823535fmr:C000048814Memberfmr:TH6Member2024-12-310000823535fmr:C000048817Memberfmr:AAPurchasedOptionsMember2024-12-310000823535fmr:C000048819Memberfmr:QDAAMember2024-12-310000823535fmr:C000048801_NoLoadClassMember_5YRMember2019-12-312024-12-31
UNITED STATES
SECURITIES AND EXCHANGE COMMISSION
Washington, D.C. 20549
FORM N-CSR
CERTIFIED SHAREHOLDER REPORT OF REGISTERED
MANAGEMENT INVESTMENT COMPANIES
Investment Company Act file number 811-05361
Variable Insurance Products Fund V
(Exact name of registrant as specified in charter)
245 Summer St., Boston, Massachusetts 02210
(Address of principal executive offices) (Zip code)
Nicole Macarchuk, Secretary
245 Summer St.
Boston, Massachusetts 02210
(Name and address of agent for service)
Registrant's telephone number, including area code:
617-563-7000
| |
Date of fiscal year end: | December 31 |
|
|
Date of reporting period: | December 31, 2024 |
Item 1.
Reports to Stockholders
| |
| | ANNUAL SHAREHOLDER REPORT | AS OF DECEMBER 31, 2024 | |
| | VIP Freedom 2040 Portfolio℠ VIP Freedom 2040 Portfolio℠ Initial Class true |
| | | |
This annual shareholder report contains information about VIP Freedom 2040 Portfolio℠ for the period January 1, 2024 to December 31, 2024. You can find additional information about the Fund at fundresearch.fidelity.com/prospectus/sec. You can also request this information by contacting us at 1-877-208-0098 or by sending an e-mail to funddocuments@fmr.com.
What were your Fund costs for the last year?(based on hypothetical $10,000 investment)
FUND COST (PREVIOUS YEAR)
| | Costs of a $10,000 investment | Costs paid as a percentage of a $10,000 investment | |
| Initial Class | $ 0 A | 0.00%B | |
AAmount represents less than $.50
BAmount represents less than 0.005%
What affected the Fund's performance this period?
•Risk assets largely produced positive results in 2024, influenced by an expanding global economy and a slowing in the pace of inflation in certain markets, as well as a pivot by some central banks toward monetary easing, despite ongoing geopolitical risk.
•Against this backdrop, active asset allocation positioning detracted from the fund's performance relative to the Composite index, whereas the performance of the underlying investment portfolios contributed.
•In terms of active asset allocation, an underweight in outperforming U.S. equities hurt the fund's relative result the past 12 months, as did an overweight in lagging long-term U.S. Treasurys and outsized exposure to non-U.S. equities. Conversely, an underweight in relatively weaker-performing investment-grade bonds added relative value for the fund.
•Looking at the performance of the underlying portfolios, investments in non-U.S. equities contributed to the fund's relative result. Investments in U.S. investment-grade bonds and U.S. equities also helped to a lesser extent. Within U.S. equities, VIP Contrafund Portfolio (+33.79%) notably outperformed its benchmark, the S&P 500® index (+25.02%). Elsewhere among non-U.S. equities, VIP Overseas Portfolio (+5%) topped the MSCI EAFE index (+4.07%) and VIP Emerging Markets Portfolio (+10.04%) outpaced the MSCI EM Index (+7.50%).
•At the other end of the performance spectrum of underlying funds, within equities, VIP Growth Portfolio (+30.39%) lagged its benchmark, the Russell 3000® Index (+32.46%), and VIP Growth & Income Portfolio (+22.21%) trailed the S&P 500® index.
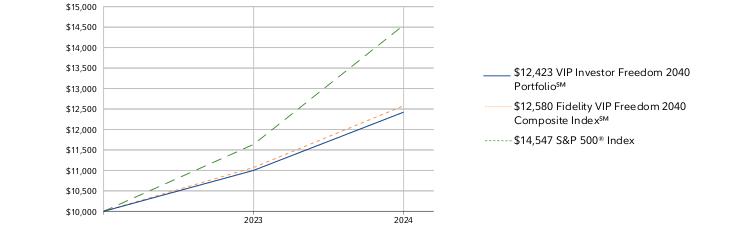
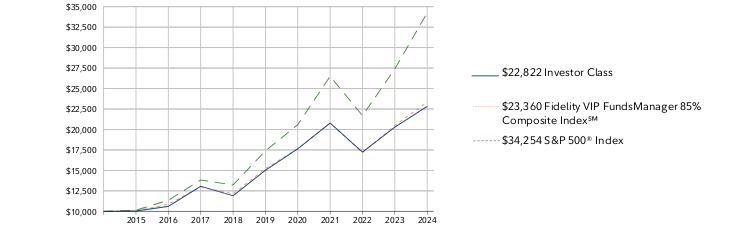
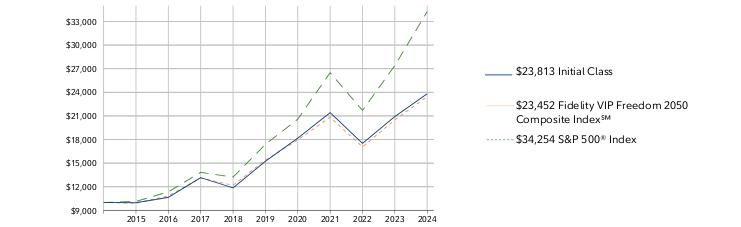
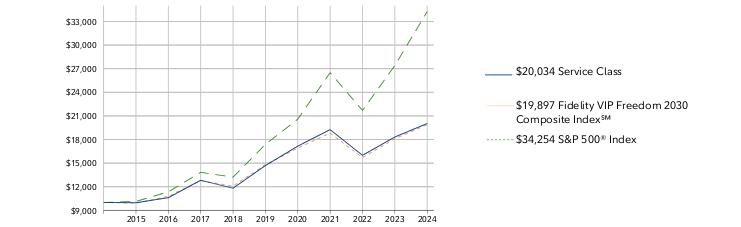
How did the Fund perform over the past 10 years?
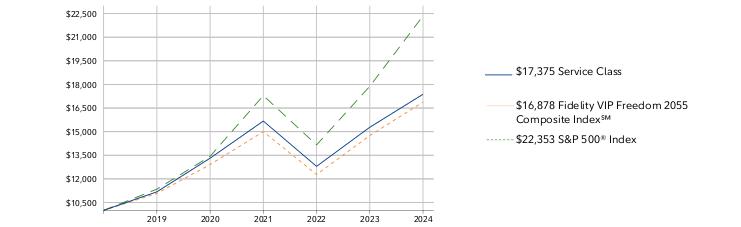
CUMULATIVE PERFORMANCE
December 31, 2014 through December 31, 2024.
Initial investment of $10,000.
Initial Class | $10,000 | $9,974 | $10,655 | $13,170 | $11,868 | $15,253 | $18,194 | $21,438 | $17,533 | $20,842 | $23,572 |
Fidelity VIP Freedom 2040 Composite Index℠ | $10,000 | $9,894 | $10,838 | $13,109 | $12,185 | $15,394 | $17,940 | $20,841 | $17,068 | $20,411 | $23,193 |
S&P 500® Index | $10,000 | $10,138 | $11,351 | $13,829 | $13,223 | $17,386 | $20,585 | $26,494 | $21,696 | $27,399 | $34,254 |
| | 2014 | 2015 | 2016 | 2017 | 2018 | 2019 | 2020 | 2021 | 2022 | 2023 | 2024 |
AVERAGE ANNUAL TOTAL RETURNS:| | 1 Year | 5 Year | 10 Year |
| Initial Class | 13.10% | 9.10% | 8.95% |
| Fidelity VIP Freedom 2040 Composite Index℠ | 13.63% | 8.54% | 8.78% |
| S&P 500® Index | 25.02% | 14.53% | 13.10% |
Visit institutional.fidelity.com for more recent performance information. |
The Fund's past performance is not a good predictor of the Fund's future performance. The graph and table do not reflect the deduction of taxes that a shareholder would pay on fund distributions or redemption of fund shares. |
Key Fund Statistics(as of December 31, 2024)
KEY FACTS | | |
| Fund Size | $349,922,751 | |
| Number of Holdings | 14 | |
| Total Advisory Fee | $0 | |
| Portfolio Turnover | 34% | |
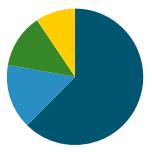
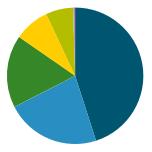
What did the Fund invest in?
(as of December 31, 2024)
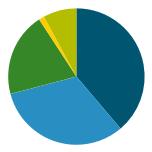
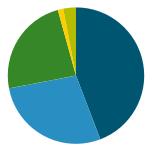
| Domestic Equity Funds | 47.8 |
| International Equity Funds | 38.5 |
| Bond Funds | 13.7 |
| Short-Term Investments and Net Other Assets (Liabilities) | 0.0 |
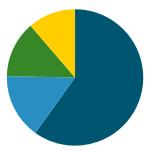
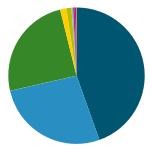
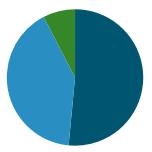
ASSET ALLOCATION (% of Fund's net assets) |
|
| | Domestic Equity Funds - 47.8 |
| | International Equity Funds - 38.5 |
| | Bond Funds - 13.7 |
| | Short-Term Investments and Net Other Assets (Liabilities) - 0.0 |
| |
TOP HOLDINGS(% of Fund's net assets) | | |
| VIP Overseas Portfolio - Initial Class | 25.6 | |
| VIP Growth Portfolio - Initial Class | 13.9 | |
| VIP Emerging Markets Portfolio - Initial Class | 12.9 | |
| VIP Growth & Income Portfolio - Initial Class | 9.4 | |
| VIP Contrafund Portfolio - Initial Class | 8.4 | |
| Fidelity Long-Term Treasury Bond Index Fund | 8.0 | |
| VIP Equity-Income Portfolio - Initial Class | 6.8 | |
| VIP Value Portfolio - Initial Class | 4.8 | |
| VIP Value Strategies Portfolio - Initial Class | 2.4 | |
| Fidelity International Bond Index Fund | 2.3 | |
| | 94.5 | |
| Fidelity, the Fidelity Investments Logo and all other Fidelity trademarks or service marks used herein are trademarks or service marks of FMR LLC. Any third-party marks that are used herein are trademarks or service marks of their respective owners. © 2025 FMR LLC. All rights reserved. |
| | For additional information about the Fund; including its prospectus, financial information, holdings and proxy information, scan the QR code or visit fundresearch.fidelity.com/prospectus/sec 1.9914333.100 2162-TSRA-0325 |
| |
| | ANNUAL SHAREHOLDER REPORT | AS OF DECEMBER 31, 2024 | |
| | VIP Investor Freedom 2035 Portfolio℠ VIP Investor Freedom 2035 Portfolio℠ true |
| | | |
This annual shareholder report contains information about VIP Investor Freedom 2035 Portfolio℠ for the period January 1, 2024 to December 31, 2024. You can find additional information about the Fund at fundresearch.fidelity.com/prospectus/sec. You can also request this information by contacting us at 1-877-208-0098 or by sending an e-mail to funddocuments@fmr.com.
What were your Fund costs for the last year?(based on hypothetical $10,000 investment)
FUND COST (PREVIOUS YEAR)
| | Costs of a $10,000 investment | Costs paid as a percentage of a $10,000 investment | |
| VIP Investor Freedom 2035 Portfolio℠ | $ 0 A | 0.00%B | |
A Amount represents less than $.50
B Amount represents less than 0.005%
What affected the Fund's performance this period?
•Risk assets largely produced positive results in 2024, influenced by an expanding global economy and a slowing in the pace of inflation in certain markets, as well as a pivot by some central banks toward monetary easing, despite ongoing geopolitical risk.
•Against this backdrop, active asset allocation positioning detracted from the fund's performance relative to the Composite index, whereas the performance of the underlying investment portfolios contributed.
•In terms of active asset allocation, an underweight in outperforming U.S. equities hurt the fund's relative result the past 12 months, as did an overweight in lagging long-term U.S. Treasurys and outsized exposure to non-U.S. equities. Conversely, underweighting relatively weaker-performing investment-grade bonds added relative value for the fund.
•Looking at the performance of the underlying portfolios, investments in non-U.S. equities contributed to the fund's relative result. Investments in U.S. investment-grade bonds and U.S. equities also helped to a lesser extent. Within U.S. equities, VIP Contrafund Portfolio (+33.70%) notably outperformed its benchmark, the S&P 500® index (+25.02%). Elsewhere in non-U.S. equities, VIP Overseas Portfolio (+4.97%) topped the MSCI EAFE index (+4.07%) and VIP Emerging Markets Portfolio (+9.90%) outpaced the MSCI EM Index (+7.50%).
•At the other end of the performance spectrum of underlying funds, in terms of equities, VIP Growth Portfolio (+30.30%) lagged its benchmark, the Russell 3000® Index (+32.46%), and VIP Growth & Income Portfolio (+22.18%) trailed the S&P 500® index.
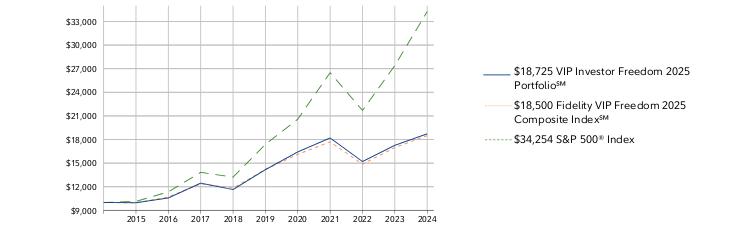
How did the Fund perform over the life of Fund?
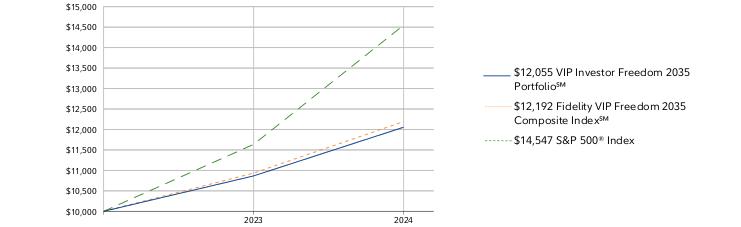
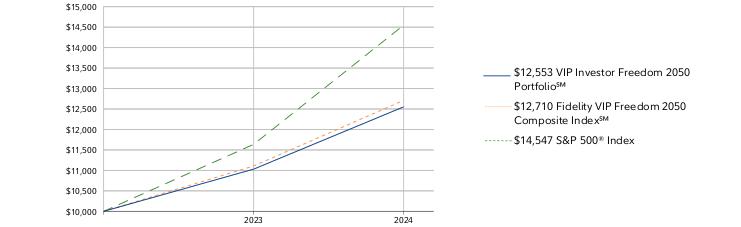
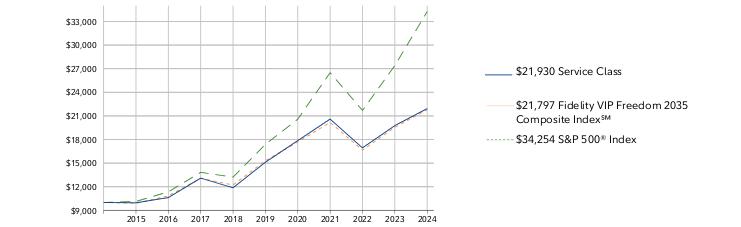
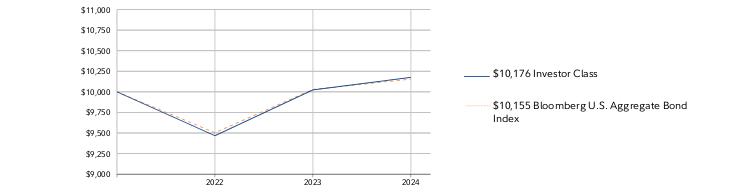
CUMULATIVE PERFORMANCE
April 13, 2023 through December 31, 2024.
Initial investment of $10,000.
VIP Investor Freedom 2035 Portfolio℠ | $10,000 | $10,866 |
Fidelity VIP Freedom 2035 Composite Index℠ | $10,000 | $10,935 |
S&P 500® Index | $10,000 | $11,636 |
| | 2023 | 2024 |
AVERAGE ANNUAL TOTAL RETURNS:| | 1 Year | Life of Fund A |
| VIP Investor Freedom 2035 Portfolio℠ | 10.94% | 11.47% |
| Fidelity VIP Freedom 2035 Composite Index℠ | 11.50% | 12.21% |
| S&P 500® Index | 25.02% | 24.34% |
A From April 13, 2023
Visit institutional.fidelity.com for more recent performance information. |
The Fund's past performance is not a good predictor of the Fund's future performance. The graph and table do not reflect the deduction of taxes that a shareholder would pay on fund distributions or redemption of fund shares. |
Key Fund Statistics(as of December 31, 2024)
KEY FACTS | | |
| Fund Size | $21,341,796 | |
| Number of Holdings | 14 | |
| Total Advisory Fee | $0 | |
| Portfolio Turnover | 37% | |
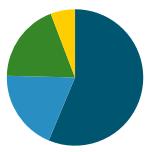
What did the Fund invest in?
(as of December 31, 2024)
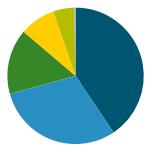
| Domestic Equity Funds | 39.1 |
| International Equity Funds | 32.7 |
| Bond Funds | 28.2 |
| Short-Term Investments and Net Other Assets (Liabilities) | 0.0 |
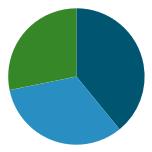
ASSET ALLOCATION (% of Fund's net assets) |
|
| | Domestic Equity Funds - 39.1 |
| | International Equity Funds - 32.7 |
| | Bond Funds - 28.2 |
| | Short-Term Investments and Net Other Assets (Liabilities) - 0.0 |
| |
TOP HOLDINGS(% of Fund's net assets) | | |
| VIP Overseas Portfolio - Investor Class | 21.5 | |
| VIP Investment Grade Bond II Portfolio - Investor Class | 12.1 | |
| VIP Growth Portfolio - Investor Class | 11.4 | |
| VIP Emerging Markets Portfolio - Investor Class | 11.2 | |
| Fidelity Long-Term Treasury Bond Index Fund | 7.9 | |
| VIP Growth & Income Portfolio - Investor Class | 7.7 | |
| VIP Contrafund Portfolio - Investor Class | 6.8 | |
| VIP Equity Income Portfolio - Investor Class | 5.6 | |
| Fidelity Inflation-Protected Bond Index Fund | 4.1 | |
| VIP Value Portfolio - Investor Class | 3.9 | |
| | 92.2 | |
| Fidelity, the Fidelity Investments Logo and all other Fidelity trademarks or service marks used herein are trademarks or service marks of FMR LLC. Any third-party marks that are used herein are trademarks or service marks of their respective owners. © 2025 FMR LLC. All rights reserved. |
| | For additional information about the Fund; including its prospectus, financial information, holdings and proxy information, scan the QR code or visit fundresearch.fidelity.com/prospectus/sec 1.9914405.100 6574-TSRA-0325 |
| |
| | ANNUAL SHAREHOLDER REPORT | AS OF DECEMBER 31, 2024 | |
| | VIP Freedom 2010 Portfolio℠ VIP Freedom 2010 Portfolio℠ Service Class 2 true |
| | | |
This annual shareholder report contains information about VIP Freedom 2010 Portfolio℠ for the period January 1, 2024 to December 31, 2024. You can find additional information about the Fund at fundresearch.fidelity.com/prospectus/sec. You can also request this information by contacting us at 1-877-208-0098 or by sending an e-mail to funddocuments@fmr.com.
What were your Fund costs for the last year?(based on hypothetical $10,000 investment)
FUND COST (PREVIOUS YEAR)
| | Costs of a $10,000 investment | Costs paid as a percentage of a $10,000 investment | |
| Service Class 2 | $ 26 | 0.25% | |
What affected the Fund's performance this period?
•Risk assets largely produced positive results in 2024, influenced by an expanding global economy and a slowing in the pace of inflation in certain markets, as well as a pivot by some central banks toward monetary easing, despite ongoing geopolitical risk.
•Against this backdrop, active asset allocation positioning detracted from the fund's performance relative to the Composite index, whereas the performance of the underlying investment portfolios contributed.
•In terms of active asset allocation, an underweight in outperforming U.S. equities hurt the fund's relative result the past 12 months, as did an overweight in lagging long-term U.S. Treasurys and outsized exposure to non-U.S. equities. Conversely, an underweight in relatively weaker-performing investment-grade bonds added relative value for the fund.
•Looking at the performance of the underlying portfolios, investments in non-U.S. equities contributed to the fund's relative result. Investments in U.S. investment-grade bonds and U.S. equities also helped to a lesser extent. Within U.S. equities, VIP Contrafund Portfolio (+33.79%) notably outperformed its benchmark, the S&P 500® index (+25.02%). Elsewhere among non-U.S. equities, VIP Overseas Portfolio (+5%) topped the MSCI EAFE index (+4.07%) and VIP Emerging Markets Portfolio (+10.04%) outpaced the MSCI EM Index (+7.50%).
•At the other end of the performance spectrum of underlying funds, within equities, VIP Growth Portfolio (+30.39%) lagged its benchmark, the Russell 3000® Index (+32.46%), and VIP Growth & Income Portfolio (+22.21%) trailed the S&P 500® index.
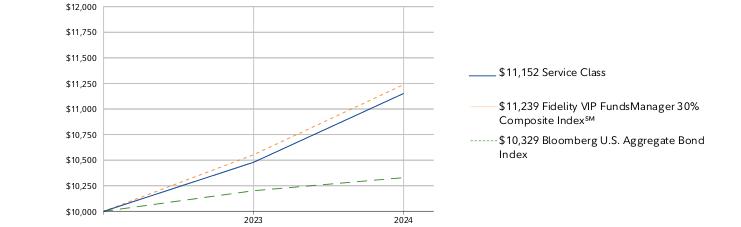
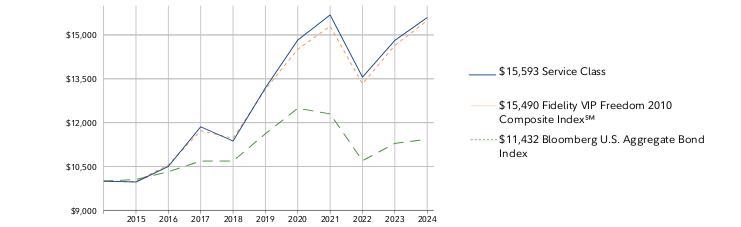
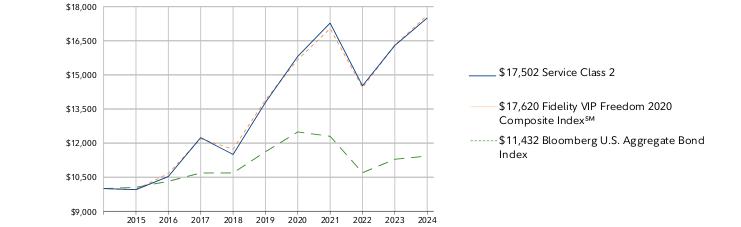
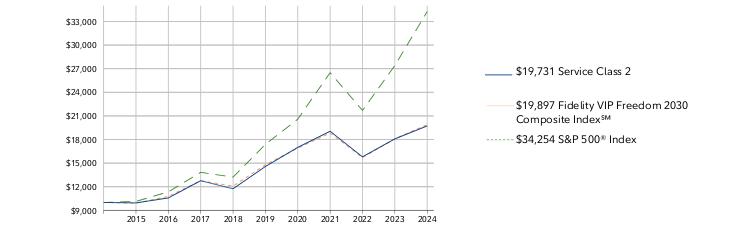
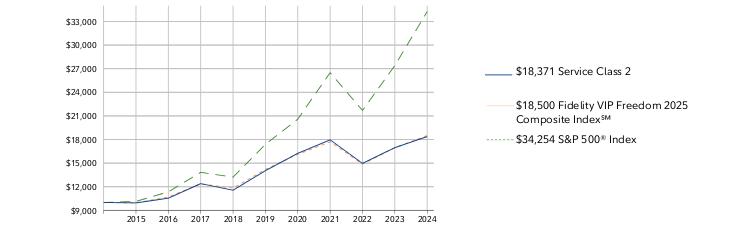
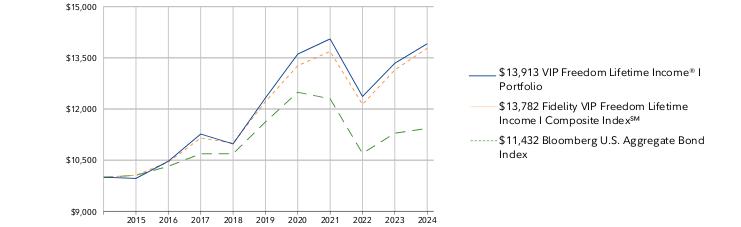
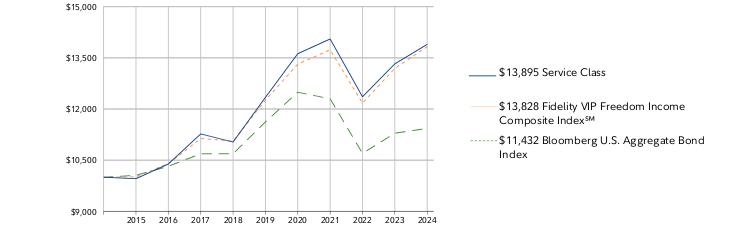
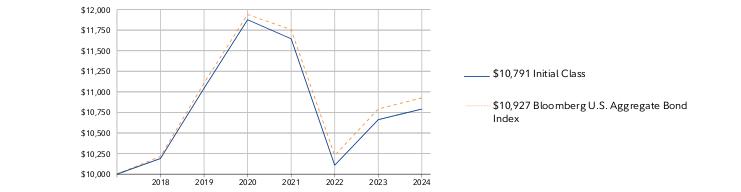
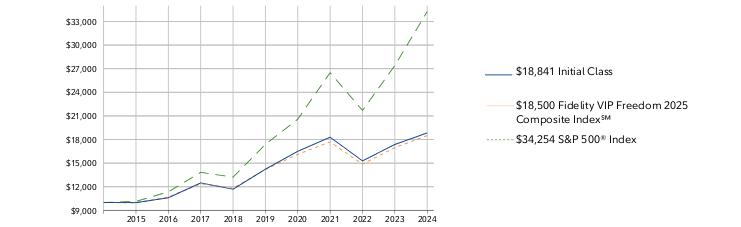
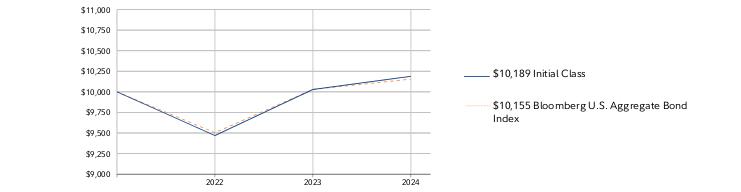
How did the Fund perform over the past 10 years?
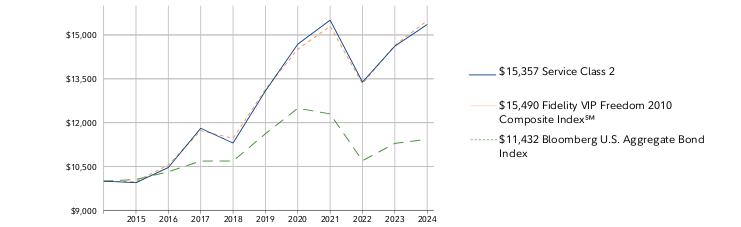
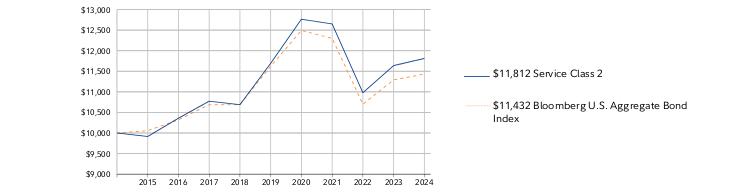
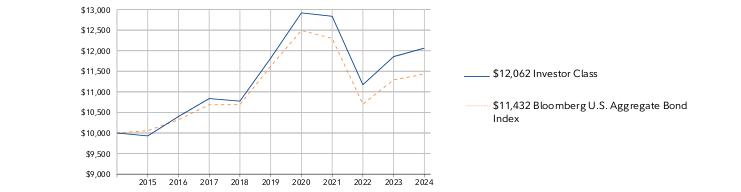
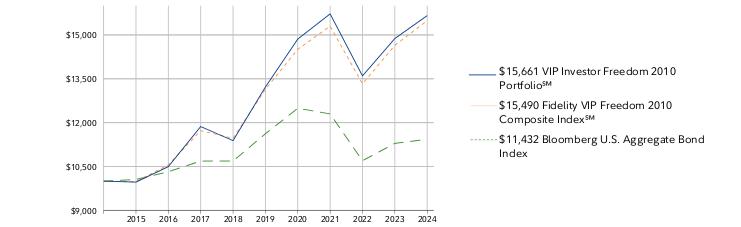
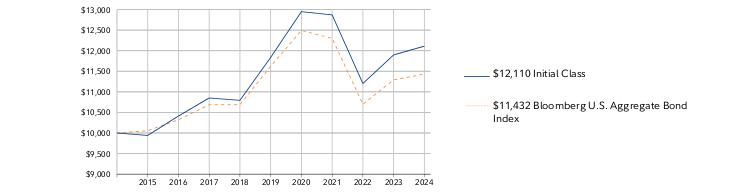
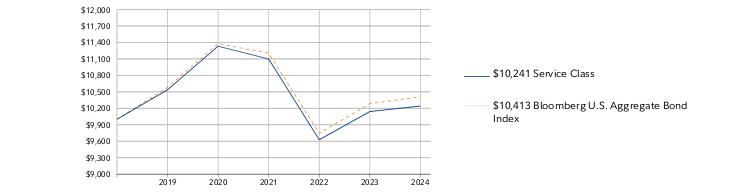
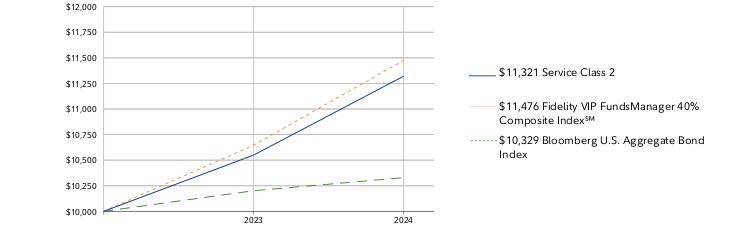
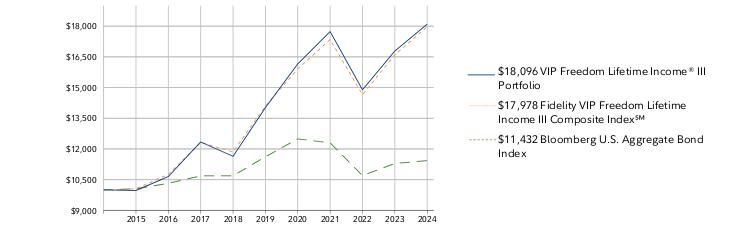
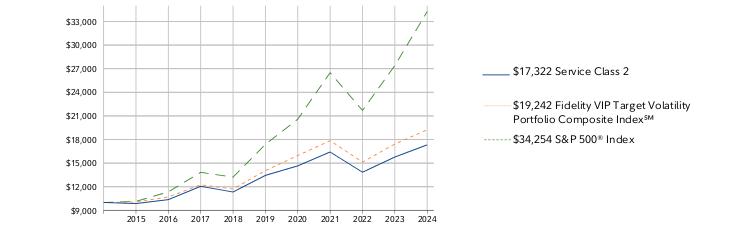
CUMULATIVE PERFORMANCE
December 31, 2014 through December 31, 2024.
Initial investment of $10,000.
Service Class 2 | $10,000 | $9,947 | $10,467 | $11,807 | $11,303 | $13,084 | $14,685 | $15,507 | $13,388 | $14,618 | $15,357 |
Fidelity VIP Freedom 2010 Composite Index℠ | $10,000 | $9,984 | $10,555 | $11,726 | $11,465 | $13,141 | $14,510 | $15,300 | $13,328 | $14,643 | $15,490 |
Bloomberg U.S. Aggregate Bond Index | $10,000 | $10,055 | $10,321 | $10,687 | $10,688 | $11,620 | $12,492 | $12,299 | $10,699 | $11,291 | $11,432 |
| | 2014 | 2015 | 2016 | 2017 | 2018 | 2019 | 2020 | 2021 | 2022 | 2023 | 2024 |
AVERAGE ANNUAL TOTAL RETURNS:| | 1 Year | 5 Year | 10 Year |
| Service Class 2 | 5.06% | 3.26% | 4.38% |
| Fidelity VIP Freedom 2010 Composite Index℠ | 5.78% | 3.34% | 4.47% |
| Bloomberg U.S. Aggregate Bond Index | 1.25% | -0.33% | 1.35% |
Visit institutional.fidelity.com for more recent performance information. |
The Fund's past performance is not a good predictor of the Fund's future performance. The graph and table do not reflect the deduction of taxes that a shareholder would pay on fund distributions or redemption of fund shares. |
Key Fund Statistics(as of December 31, 2024)
KEY FACTS | | |
| Fund Size | $249,525,780 | |
| Number of Holdings | 15 | |
| Total Advisory Fee | $0 | |
| Portfolio Turnover | 25% | |
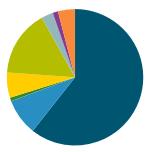
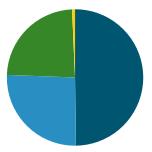
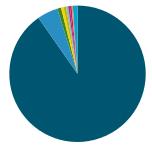
What did the Fund invest in?
(as of December 31, 2024)
| Bond Funds | 60.0 |
| International Equity Funds | 15.4 |
| Domestic Equity Funds | 13.4 |
| Short-Term Funds | 11.2 |
| Short-Term Investments and Net Other Assets (Liabilities) | 0.0 |
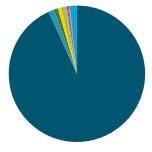
ASSET ALLOCATION (% of Fund's net assets) |
|
| | Bond Funds - 60.0 |
| | International Equity Funds - 15.4 |
| | Domestic Equity Funds - 13.4 |
| | Short-Term Funds - 11.2 |
| | Short-Term Investments and Net Other Assets (Liabilities) - 0.0 |
| |
TOP HOLDINGS(% of Fund's net assets) | | |
| VIP Investment Grade Bond II Portfolio - Initial Class | 37.3 | |
| Fidelity Inflation-Protected Bond Index Fund | 15.2 | |
| VIP Government Money Market Portfolio - Initial Class | 11.2 | |
| VIP Overseas Portfolio - Initial Class | 9.2 | |
| VIP Emerging Markets Portfolio - Initial Class | 6.2 | |
| VIP Growth Portfolio - Initial Class | 4.0 | |
| Fidelity International Bond Index Fund | 3.4 | |
| Fidelity Long-Term Treasury Bond Index Fund | 2.9 | |
| VIP Growth & Income Portfolio - Initial Class | 2.6 | |
| VIP Contrafund Portfolio - Initial Class | 2.3 | |
| | 94.3 | |
| Fidelity, the Fidelity Investments Logo and all other Fidelity trademarks or service marks used herein are trademarks or service marks of FMR LLC. Any third-party marks that are used herein are trademarks or service marks of their respective owners. © 2025 FMR LLC. All rights reserved. |
| | For additional information about the Fund; including its prospectus, financial information, holdings and proxy information, scan the QR code or visit fundresearch.fidelity.com/prospectus/sec 1.9914276.100 1425-TSRA-0325 |
| |
| | ANNUAL SHAREHOLDER REPORT | AS OF DECEMBER 31, 2024 | |
| | VIP Freedom 2020 Portfolio℠ VIP Freedom 2020 Portfolio℠ Initial Class true |
| | | |
This annual shareholder report contains information about VIP Freedom 2020 Portfolio℠ for the period January 1, 2024 to December 31, 2024. You can find additional information about the Fund at fundresearch.fidelity.com/prospectus/sec. You can also request this information by contacting us at 1-877-208-0098 or by sending an e-mail to funddocuments@fmr.com.
What were your Fund costs for the last year?(based on hypothetical $10,000 investment)
FUND COST (PREVIOUS YEAR)
| | Costs of a $10,000 investment | Costs paid as a percentage of a $10,000 investment | |
| Initial Class | $ 0 A | 0.00%B | |
AAmount represents less than $.50
BAmount represents less than 0.005%
What affected the Fund's performance this period?
•Risk assets largely produced positive results in 2024, influenced by an expanding global economy and a slowing in the pace of inflation in certain markets, as well as a pivot by some central banks toward monetary easing, despite ongoing geopolitical risk.
•Against this backdrop, active asset allocation positioning detracted from the fund's performance relative to the Composite index, whereas the performance of the underlying investment portfolios contributed.
•In terms of active asset allocation, an underweight in outperforming U.S. equities hurt the fund's relative result the past 12 months, as did an overweight in lagging long-term U.S. Treasurys and outsized exposure to non-U.S. equities. Conversely, an underweight in relatively weaker-performing investment-grade bonds added relative value for the fund.
•Looking at the performance of the underlying portfolios, investments in non-U.S. equities contributed to the fund's relative result. Investments in U.S. investment-grade bonds and U.S. equities also helped to a lesser extent. Within U.S. equities, VIP Contrafund Portfolio (+33.79%) notably outperformed its benchmark, the S&P 500® index (+25.02%). Elsewhere among non-U.S. equities, VIP Overseas Portfolio (+5%) topped the MSCI EAFE index (+4.07%) and VIP Emerging Markets Portfolio (+10.04%) outpaced the MSCI EM Index (+7.50%).
•At the other end of the performance spectrum of underlying funds, within equities, VIP Growth Portfolio (+30.39%) lagged its benchmark, the Russell 3000® Index (+32.46%), and VIP Growth & Income Portfolio (+22.21%) trailed the S&P 500® index.
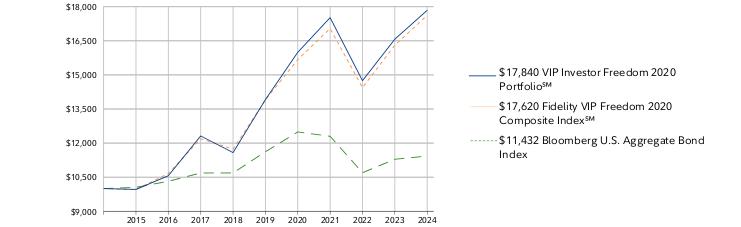
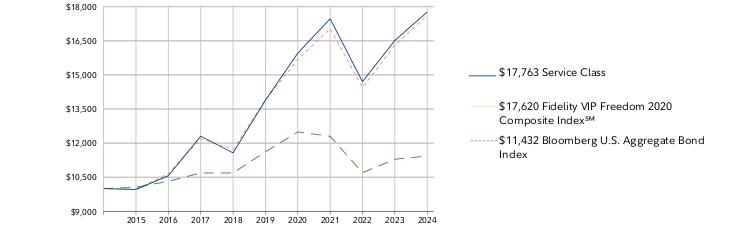
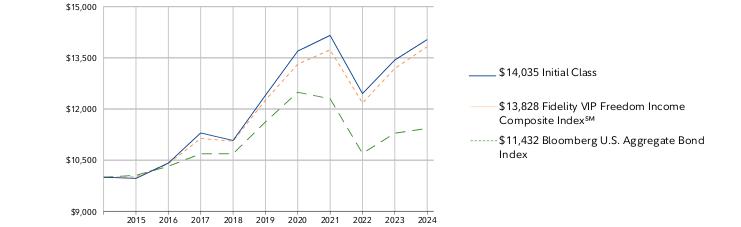
How did the Fund perform over the past 10 years?
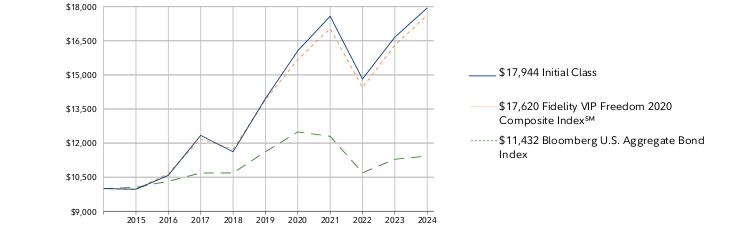
CUMULATIVE PERFORMANCE
December 31, 2014 through December 31, 2024.
Initial investment of $10,000.
Initial Class | $10,000 | $9,973 | $10,583 | $12,342 | $11,618 | $13,957 | $16,058 | $17,579 | $14,821 | $16,659 | $17,944 |
Fidelity VIP Freedom 2020 Composite Index℠ | $10,000 | $9,960 | $10,663 | $12,190 | $11,734 | $13,901 | $15,674 | $17,037 | $14,442 | $16,306 | $17,620 |
Bloomberg U.S. Aggregate Bond Index | $10,000 | $10,055 | $10,321 | $10,687 | $10,688 | $11,620 | $12,492 | $12,299 | $10,699 | $11,291 | $11,432 |
| | 2014 | 2015 | 2016 | 2017 | 2018 | 2019 | 2020 | 2021 | 2022 | 2023 | 2024 |
AVERAGE ANNUAL TOTAL RETURNS:| | 1 Year | 5 Year | 10 Year |
| Initial Class | 7.71% | 5.15% | 6.02% |
| Fidelity VIP Freedom 2020 Composite Index℠ | 8.05% | 4.85% | 5.83% |
| Bloomberg U.S. Aggregate Bond Index | 1.25% | -0.33% | 1.35% |
Visit institutional.fidelity.com for more recent performance information. |
The Fund's past performance is not a good predictor of the Fund's future performance. The graph and table do not reflect the deduction of taxes that a shareholder would pay on fund distributions or redemption of fund shares. |
Key Fund Statistics(as of December 31, 2024)
KEY FACTS | | |
| Fund Size | $536,951,422 | |
| Number of Holdings | 15 | |
| Total Advisory Fee | $0 | |
| Portfolio Turnover | 29% | |
What did the Fund invest in?
(as of December 31, 2024)
| Bond Funds | 52.2 |
| Domestic Equity Funds | 24.4 |
| International Equity Funds | 22.7 |
| Short-Term Funds | 0.7 |
| Short-Term Investments and Net Other Assets (Liabilities) | 0.0 |
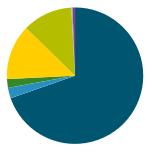
ASSET ALLOCATION (% of Fund's net assets) |
|
| | Bond Funds - 52.2 |
| | Domestic Equity Funds - 24.4 |
| | International Equity Funds - 22.7 |
| | Short-Term Funds - 0.7 |
| | Short-Term Investments and Net Other Assets (Liabilities) - 0.0 |
| |
TOP HOLDINGS(% of Fund's net assets) | | |
| VIP Investment Grade Bond II Portfolio - Initial Class | 30.3 | |
| VIP Overseas Portfolio - Initial Class | 14.4 | |
| Fidelity Inflation-Protected Bond Index Fund | 13.3 | |
| VIP Emerging Markets Portfolio - Initial Class | 8.3 | |
| VIP Growth Portfolio - Initial Class | 7.1 | |
| VIP Growth & Income Portfolio - Initial Class | 4.8 | |
| VIP Contrafund Portfolio - Initial Class | 4.3 | |
| Fidelity International Bond Index Fund | 4.0 | |
| VIP Equity-Income Portfolio - Initial Class | 3.5 | |
| Fidelity Long-Term Treasury Bond Index Fund | 3.4 | |
| | 93.4 | |
| Fidelity, the Fidelity Investments Logo and all other Fidelity trademarks or service marks used herein are trademarks or service marks of FMR LLC. Any third-party marks that are used herein are trademarks or service marks of their respective owners. © 2025 FMR LLC. All rights reserved. |
| | For additional information about the Fund; including its prospectus, financial information, holdings and proxy information, scan the QR code or visit fundresearch.fidelity.com/prospectus/sec 1.9914280.100 1429-TSRA-0325 |
| |
| | ANNUAL SHAREHOLDER REPORT | AS OF DECEMBER 31, 2024 | |
| | VIP Freedom 2070 Portfolio℠ VIP Freedom 2070 Portfolio℠ Service Class true |
| | | |
This annual shareholder report contains information about VIP Freedom 2070 Portfolio℠ for the period July 1, 2024 to December 31, 2024. You can find additional information about the Fund at fundresearch.fidelity.com/prospectus/sec. You can also request this information by contacting us at 1-877-208-0098 or by sending an e-mail to funddocuments@fmr.com.
What were your Fund costs for the last year?(based on hypothetical $10,000 investment)
FUND COST (PREVIOUS YEAR)
| | Costs of a $10,000 investment | Costs paid as a percentage of a $10,000 investment | |
Service Class A | $ 5 | 0.10% | |
AExpenses for the full reporting period would be higher.
Key Fund Statistics(as of December 31, 2024)
KEY FACTS | | |
| Fund Size | $504,235 | |
| Number of Holdings | 11 | |
| Total Advisory Fee | $0 | |
Portfolio TurnoverA | 26% | |
A Amount not annualized
What did the Fund invest in?
(as of December 31, 2024)
| Domestic Equity Funds | 51.5 |
| International Equity Funds | 40.9 |
| Fixed-Income Funds | 7.6 |
| Short-Term Investments and Net Other Assets (Liabilities) | 0.0 |
ASSET ALLOCATION (% of Fund's net assets) |
|
| | Domestic Equity Funds - 51.5 |
| | International Equity Funds - 40.9 |
| | Fixed-Income Funds - 7.6 |
| | Short-Term Investments and Net Other Assets (Liabilities) - 0.0 |
| |
TOP HOLDINGS(% of Fund's net assets) | | |
| VIP Overseas Portfolio - Initial Class | 27.8 | |
| VIP Growth Portfolio - Initial Class | 15.0 | |
| VIP Emerging Markets Portfolio - Initial Class | 13.1 | |
| VIP Growth & Income Portfolio - Initial Class | 10.1 | |
| VIP Contrafund Portfolio - Initial Class | 9.0 | |
| VIP Equity-Income Portfolio - Initial Class | 7.4 | |
| Fidelity Long-Term Treasury Bond Index Fund | 6.6 | |
| VIP Value Portfolio - Initial Class | 5.1 | |
| VIP Value Strategies Portfolio - Initial Class | 2.6 | |
| VIP Mid Cap Portfolio - Initial Class | 2.3 | |
| | 99.0 | |
| Fidelity, the Fidelity Investments Logo and all other Fidelity trademarks or service marks used herein are trademarks or service marks of FMR LLC. Any third-party marks that are used herein are trademarks or service marks of their respective owners. © 2025 FMR LLC. All rights reserved. |
| | For additional information about the Fund; including its prospectus, financial information, holdings and proxy information, scan the QR code or visit fundresearch.fidelity.com/prospectus/sec 1.9918310.100 7672-TSRA-0325 |
| |
| | ANNUAL SHAREHOLDER REPORT | AS OF DECEMBER 31, 2024 | This report describes changes to the Fund that occurred during the reporting period. |
| | VIP Freedom 2065 Portfolio℠ VIP Freedom 2065 Portfolio℠ Service Class 2 true |
| | | |
This annual shareholder report contains information about VIP Freedom 2065 Portfolio℠ for the period January 1, 2024 to December 31, 2024. You can find additional information about the Fund at fundresearch.fidelity.com/prospectus/sec. You can also request this information by contacting us at 1-877-208-0098 or by sending an e-mail to funddocuments@fmr.com.
What were your Fund costs for the last year?(based on hypothetical $10,000 investment)
FUND COST (PREVIOUS YEAR)
| | Costs of a $10,000 investment | Costs paid as a percentage of a $10,000 investment | |
| Service Class 2 | $ 27 | 0.25% | |
What affected the Fund's performance this period?
•Risk assets largely produced positive results in 2024, influenced by an expanding global economy and a slowing in the pace of inflation in certain markets, as well as a pivot by some central banks toward monetary easing, despite ongoing geopolitical risk.
•Against this backdrop, active asset allocation positioning detracted from the fund's performance relative to the Composite index, whereas the performance of the underlying investment portfolios contributed.
•In terms of active asset allocation, an underweight in outperforming U.S. equities hurt the fund's relative result the past 12 months, as did an overweight in lagging long-term U.S. Treasurys and outsized exposure to non-U.S. equities. Conversely, an underweight in relatively weaker-performing investment-grade bonds added relative value for the fund.
•Looking at the performance of the underlying portfolios, investments in non-U.S. equities contributed to the fund's relative result. Investments in U.S. investment-grade bonds and U.S. equities also helped to a lesser extent. Within U.S. equities, VIP Contrafund Portfolio (+33.79%) notably outperformed its benchmark, the S&P 500® index (+25.02%). Elsewhere among non-U.S. equities, VIP Overseas Portfolio (+5%) topped the MSCI EAFE index (+4.07%) and VIP Emerging Markets Portfolio (+10.04%) outpaced the MSCI EM Index (+7.50%).
•At the other end of the performance spectrum of underlying funds, within equities, VIP Growth Portfolio (+30.39%) lagged its benchmark, the Russell 3000® Index (+32.46%), and VIP Growth & Income Portfolio (+22.21%) trailed the S&P 500® index.
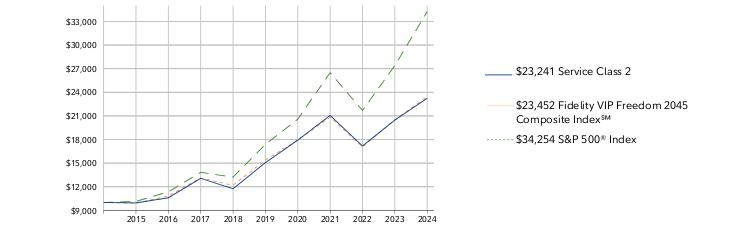
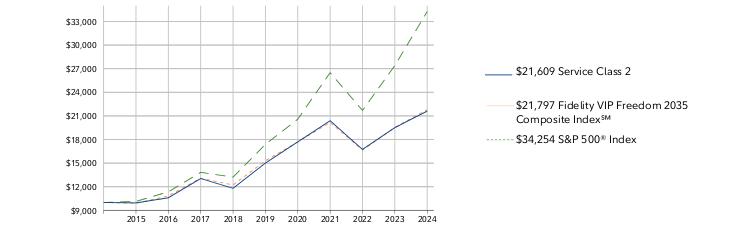
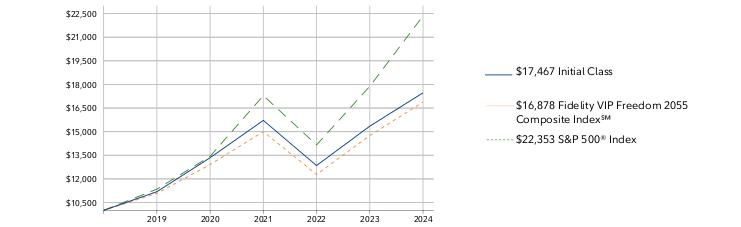
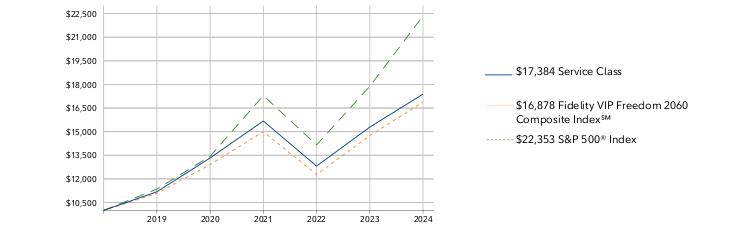
How did the Fund perform over the life of Fund?
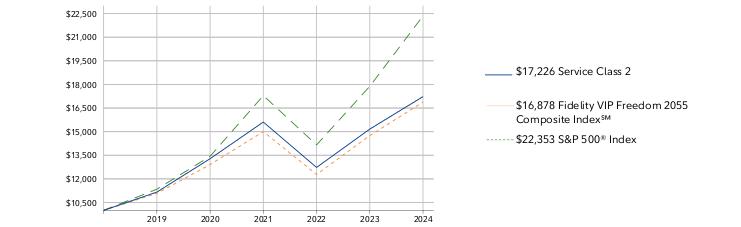
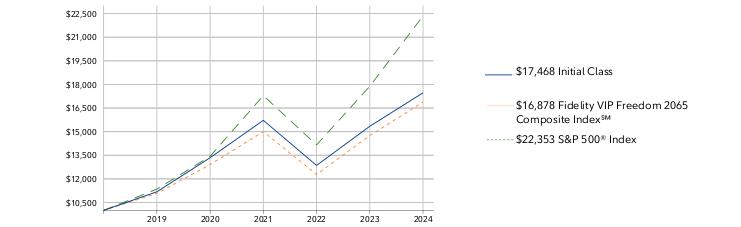
CUMULATIVE PERFORMANCE
April 11, 2019 through December 31, 2024.
Initial investment of $10,000.
Service Class 2 | $10,000 | $11,161 | $13,285 | $15,607 | $12,728 | $15,162 |
Fidelity VIP Freedom 2065 Composite Index℠ | $10,000 | $11,078 | $12,911 | $15,000 | $12,279 | $14,749 |
S&P 500® Index | $10,000 | $11,346 | $13,433 | $17,289 | $14,158 | $17,880 |
| | 2019 | 2020 | 2021 | 2022 | 2023 | 2024 |
AVERAGE ANNUAL TOTAL RETURNS:| | 1 Year | 5 Year | Life of Fund A |
| Service Class 2 | 13.61% | 9.07% | 9.96% |
| Fidelity VIP Freedom 2065 Composite Index℠ | 14.43% | 8.78% | 9.57% |
| S&P 500® Index | 25.02% | 14.53% | 15.07% |
A From April 11, 2019
Visit institutional.fidelity.com for more recent performance information. |
The Fund's past performance is not a good predictor of the Fund's future performance. The graph and table do not reflect the deduction of taxes that a shareholder would pay on fund distributions or redemption of fund shares. |
Key Fund Statistics(as of December 31, 2024)
KEY FACTS | | |
| Fund Size | $7,325,971 | |
| Number of Holdings | 11 | |
| Total Advisory Fee | $0 | |
| Portfolio Turnover | 50% | |
What did the Fund invest in?
(as of December 31, 2024)
| Domestic Equity Funds | 51.5 |
| International Equity Funds | 40.9 |
| Bond Funds | 7.6 |
| Short-Term Investments and Net Other Assets (Liabilities) | 0.0 |
ASSET ALLOCATION (% of Fund's net assets) |
|
| | Domestic Equity Funds - 51.5 |
| | International Equity Funds - 40.9 |
| | Bond Funds - 7.6 |
| | Short-Term Investments and Net Other Assets (Liabilities) - 0.0 |
| |
TOP HOLDINGS(% of Fund's net assets) | | |
| VIP Overseas Portfolio - Initial Class | 27.8 | |
| VIP Growth Portfolio - Initial Class | 15.0 | |
| VIP Emerging Markets Portfolio - Initial Class | 13.1 | |
| VIP Growth & Income Portfolio - Initial Class | 10.1 | |
| VIP Contrafund Portfolio - Initial Class | 9.0 | |
| VIP Equity-Income Portfolio - Initial Class | 7.4 | |
| Fidelity Long-Term Treasury Bond Index Fund | 6.6 | |
| VIP Value Portfolio - Initial Class | 5.1 | |
| VIP Value Strategies Portfolio - Initial Class | 2.6 | |
| VIP Mid Cap Portfolio - Initial Class | 2.3 | |
| | 99.0 | |
How has the Fund changed?
This is a summary of certain changes to the Fund since January 1, 2024. For more complete information, you may review the Fund's next prospectus, which we expect to be available by April 30, 2025 at fundresearch.fidelity.com/prospectus/sec or upon request at 1-877-208-0098 or by sending an e-mail to funddocuments@fmr.com.
The fund added a contractual proxy and shareholder meeting expense cap during the reporting period. | |
| Fidelity, the Fidelity Investments Logo and all other Fidelity trademarks or service marks used herein are trademarks or service marks of FMR LLC. Any third-party marks that are used herein are trademarks or service marks of their respective owners. © 2025 FMR LLC. All rights reserved. |
| | For additional information about the Fund; including its prospectus, financial information, holdings and proxy information, scan the QR code or visit fundresearch.fidelity.com/prospectus/sec 1.9914392.100 3368-TSRA-0325 |
| |
| | ANNUAL SHAREHOLDER REPORT | AS OF DECEMBER 31, 2024 | This report describes changes to the Fund that occurred during the reporting period. |
| | VIP Asset Manager Portfolio VIP Asset Manager Portfolio Service Class 2 true |
| | | |
This annual shareholder report contains information about VIP Asset Manager Portfolio for the period January 1, 2024 to December 31, 2024. You can find additional information about the Fund at fundresearch.fidelity.com/prospectus/sec. You can also request this information by contacting us at 1-877-208-0098 or by sending an e-mail to funddocuments@fmr.com.
What were your Fund costs for the last year?(based on hypothetical $10,000 investment)
FUND COST (PREVIOUS YEAR)
| | Costs of a $10,000 investment | Costs paid as a percentage of a $10,000 investment | |
| Service Class 2 | $ 80 | 0.77% | |
What affected the Fund's performance this period?
•Risk assets largely produced positive results in 2024, influenced by an expanding global economy, a slowing in the pace of inflation in certain markets, and a pivot by some central banks toward monetary easing, despite ongoing geopolitical risk.
•Within this environment, asset class positioning contributed to the fund's performance versus the Composite index, whereas security selection detracted.
•The portfolio's core equity allocation strategy contributed to relative performance, led by an overweight among U.S. stocks. Equal-weight positioning in international developed- and emerging-markets equities also added modest value. Meanwhile, small, out-of-benchmark allocations to real estate investment trusts and commodity-related securities did not have a material impact on the fund's relative result the past year.
•The portfolio's fixed-income positioning also was beneficial from a relative performance standpoint. Specifically, an underweight in investment-grade bonds and cash, in favor of higher-risk segments of the fixed income market was advantageous. That said, a small allocation to long-term U.S. Treasurys hurt.
•In terms of security selection, picks among U.S. equities notably pressured relative performance in 2024. Investment choices in the information technology sector - particularly among software & services and semiconductor companies - detracted the most.
•Stock selection among international developed-market stocks, on the other hand, aided the fund's relative return. Here, picks in Japan, Germany and the U.K., along with favorable positioning in continental European equity markets, helped the most. Conversely, investment choices and an underweight in the strong-performing Canadian stock market detracted.
•Security selection among investment-grade bonds also added value. Corporate debt issued by banks, real estate investment trusts, insurers and consumer staples companies, contributed to the portfolio's relative outcome. Elsewhere, stakes in asset-backed securities, non-government-agency mortgage-backed securities and U.S. Treasurys, helped as well.
•As of December 31, the fund was overweight U.S. stocks and about neutrally weighted in international developed- and emerging-markets equities. Investment-grade bond and cash allocations remained below the fund's target weighting.
How did the Fund perform over the past 10 years?
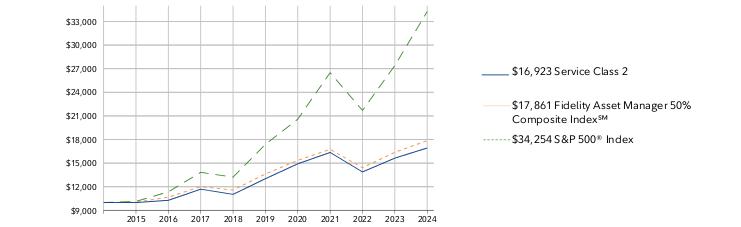
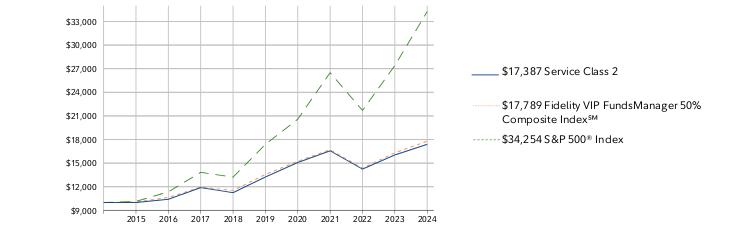
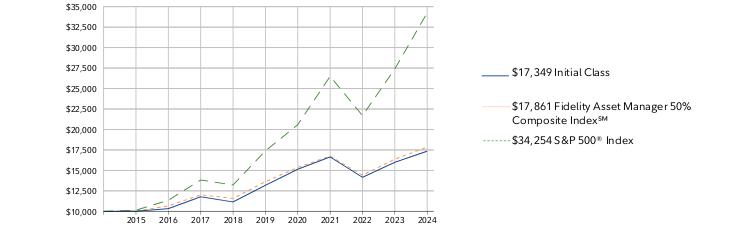
CUMULATIVE PERFORMANCE
December 31, 2014 through December 31, 2024.
Initial investment of $10,000.
Service Class 2 | $10,000 | $9,994 | $10,278 | $11,690 | $11,034 | $13,021 | $14,914 | $16,358 | $13,879 | $15,636 | $16,923 |
Fidelity Asset Manager 50% Composite Index℠ | $10,000 | $10,032 | $10,667 | $12,015 | $11,583 | $13,624 | $15,355 | $16,754 | $14,416 | $16,374 | $17,861 |
S&P 500® Index | $10,000 | $10,138 | $11,351 | $13,829 | $13,223 | $17,386 | $20,585 | $26,494 | $21,696 | $27,399 | $34,254 |
| | 2014 | 2015 | 2016 | 2017 | 2018 | 2019 | 2020 | 2021 | 2022 | 2023 | 2024 |
AVERAGE ANNUAL TOTAL RETURNS:| | 1 Year | 5 Year | 10 Year |
| Service Class 2 | 8.23% | 5.38% | 5.40% |
| Fidelity Asset Manager 50% Composite Index℠ | 9.08% | 5.56% | 5.97% |
| S&P 500® Index | 25.02% | 14.53% | 13.10% |
Visit institutional.fidelity.com for more recent performance information. |
The Fund's past performance is not a good predictor of the Fund's future performance. The graph and table do not reflect the deduction of taxes that a shareholder would pay on fund distributions or redemption of fund shares. |
Key Fund Statistics(as of December 31, 2024)
KEY FACTS | | |
| Fund Size | $904,415,380 | |
| Number of Holdings | 32 | |
| Total Advisory Fee | $4,688,967 | |
| Portfolio Turnover | 16% | |
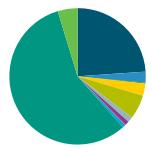
What did the Fund invest in?
(as of December 31, 2024)
The information in the following tables is based on the combined Investments of the Fund and it's pro-rata share of investments in Fidelity's Central Funds, other than the Commodity Strategy and Money Market Central Funds as applicable.
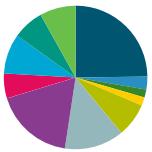
| U.S. Government and U.S. Government Agency Obligations | 23.9 |
| AAA | 2.6 |
| AA | 0.2 |
| A | 2.9 |
| BBB | 5.7 |
| BB | 1.3 |
| B | 0.9 |
| CCC,CC,C | 0.2 |
| D | 0.0 |
| Not Rated | 0.7 |
| Equities | 56.9 |
| Short-Term Investments and Net Other Assets (Liabilities) | 4.7 |
QUALITY DIVERSIFICATION (% of Fund's net assets) |
| |
| | U.S. Government and U.S. Government Agency Obligations - 23.9 |
| | AAA - 2.6 |
| | AA - 0.2 |
| | A - 2.9 |
| | BBB - 5.7 |
| | BB - 1.3 |
| | B - 0.9 |
| | CCC,CC,C - 0.2 |
| | D - 0.0 |
| | Not Rated - 0.7 |
| | Equities - 56.9 |
| | Short-Term Investments and Net Other Assets (Liabilities) - 4.7 |
| |
| We have used ratings from Moody's Investors Service, Inc. Where Moody's® ratings are not available, we have used S&P® ratings. All ratings are as of the date indicated and do not reflect subsequent changes. |
MARKET SECTORS (% of Fund's net assets) | | |
| Financials | 13.7 | |
| Information Technology | 13.4 | |
| Industrials | 6.6 | |
| Consumer Discretionary | 6.1 | |
| Health Care | 5.3 | |
| Communication Services | 4.5 | |
| Consumer Staples | 2.6 | |
| Energy | 2.4 | |
| Real Estate | 2.0 | |
| Materials | 2.0 | |
| Utilities | 1.2 | |
| |
| Equities | 55.9 |
| Bonds | 39.4 |
| Short-Term Investments and Net Other Assets (Liabilities) | 4.7 |
ASSET ALLOCATION (% of Fund's net assets) |
|
| | Equities - 55.9 |
| | Bonds - 39.4 |
| | Short-Term Investments and Net Other Assets (Liabilities) - 4.7 |
| |
TOP HOLDINGS(% of Fund's net assets) | | |
| US Treasury Notes | 14.0 | |
| US Treasury Bonds | 3.9 | |
| Microsoft Corp | 2.3 | |
| Fannie Mae Mortgage pass-thru certificates | 2.2 | |
| NVIDIA Corp | 2.2 | |
| Apple Inc | 2.1 | |
| Fidelity Blue Chip Growth ETF | 2.1 | |
| Ginnie Mae II Pool | 1.7 | |
| Freddie Mac Gold Pool | 1.5 | |
| Alphabet Inc Class A | 1.5 | |
| | 33.5 | |
How has the Fund changed?
This is a summary of certain changes to the Fund since January 1, 2024. For more complete information, you may review the Fund's next prospectus, which we expect to be available by April 30, 2025 at fundresearch.fidelity.com/prospectus/sec or upon request at 1-877-208-0098 or by sending an e-mail to funddocuments@fmr.com.
The fees associated with this class changed during the reporting year. The variations in class fees are primarily the result of the following changes: The fund's transfer agent and pricing & bookkeeping fees were changed to a fixed rate effective December 1, 2023. Effective March 1, 2024, the fund's management contract was amended to incorporate administrative services previously covered under separate services agreements (transfer agent and pricing & bookkeeping). The amended contract incorporates a management fee rate that may vary by class. The Adviser or an affiliate pays certain expenses of managing and operating the fund out of each class's management fee. | The fund modified its principal investment strategies during the reporting period.
|
The fund modified its principal investment risks during the reporting period. | |
| Fidelity, the Fidelity Investments Logo and all other Fidelity trademarks or service marks used herein are trademarks or service marks of FMR LLC. Any third-party marks that are used herein are trademarks or service marks of their respective owners. © 2025 FMR LLC. All rights reserved. |
| | For additional information about the Fund; including its prospectus, financial information, holdings and proxy information, scan the QR code or visit fundresearch.fidelity.com/prospectus/sec 1.9914197.100 363-TSRA-0325 |
| |
| | ANNUAL SHAREHOLDER REPORT | AS OF DECEMBER 31, 2024 | This report describes changes to the Fund that occurred during the reporting period. |
| | VIP Asset Manager: Growth Portfolio VIP Asset Manager: Growth Portfolio Investor Class true |
| | | |
This annual shareholder report contains information about VIP Asset Manager: Growth Portfolio for the period January 1, 2024 to December 31, 2024. You can find additional information about the Fund at fundresearch.fidelity.com/prospectus/sec. You can also request this information by contacting us at 1-877-208-0098 or by sending an e-mail to funddocuments@fmr.com.
What were your Fund costs for the last year?(based on hypothetical $10,000 investment)
FUND COST (PREVIOUS YEAR)
| | Costs of a $10,000 investment | Costs paid as a percentage of a $10,000 investment | |
| Investor Class | $ 73 | 0.69% | |
What affected the Fund's performance this period?
•Risk assets largely produced positive results in 2024, influenced by an expanding global economy, a slowing in the pace of inflation in certain markets, and a pivot by some central banks toward monetary easing, despite ongoing geopolitical risk.
•Within this environment, asset class positioning contributed to the fund's performance versus the Composite index, whereas security selection detracted.
•The portfolio's core equity allocation strategy contributed to relative performance, led by an overweight among U.S. stocks. Equal-weight positioning in international developed- and emerging-markets equities also added modest value. Meanwhile, small, out-of-benchmark allocations to real estate investment trusts and commodity-related securities slightly detracted.
•The portfolio's fixed-income positioning was beneficial from a relative performance standpoint. Specifically, an underweight in investment-grade bonds and cash, in favor of higher-risk segments of the fixed income market was advantageous. That said, a small allocation to long-term U.S. Treasurys hurt.
•In terms of security selection, picks among U.S. equities pressured relative performance in 2024. Investment choices in the information technology sector - particularly among software & services and semiconductor companies - detracted the most.
•Stock selection among international developed-market stocks, on the other hand, aided the fund's relative return. Here, picks in Japan, Germany and the U.K., along with favorable positioning in continental European equity markets, helped the most. Conversely, investment choices and an underweight in the strong-performing Canadian stock market detracted.
•Security selection among investment-grade bonds also added value. Corporate debt issued by banks, real estate investment trusts, insurers and consumer staples companies, contributed to the portfolio's relative outcome. Elsewhere, stakes in asset-backed securities, non-government-agency mortgage-backed securities and U.S. Treasurys, helped as well.
•As of December 31, the fund was overweight U.S. stocks and about neutrally weighted in international developed- and emerging-markets equities. Investment-grade bond and cash allocations remained below the fund's target weighting.
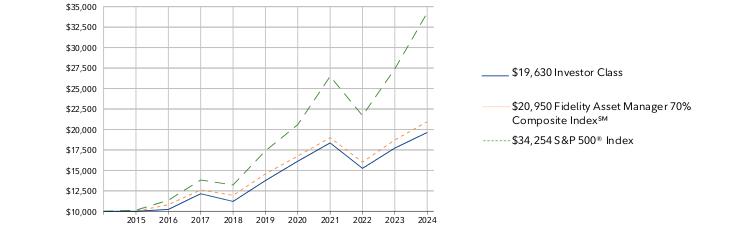
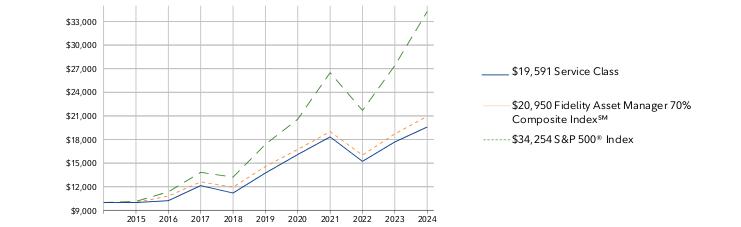
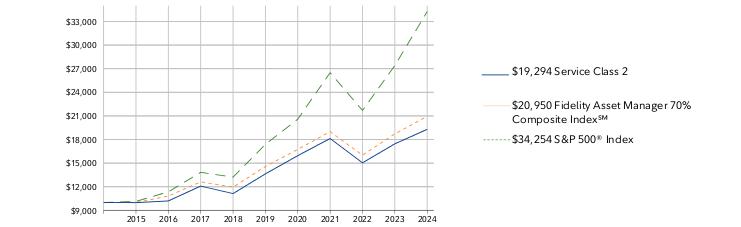
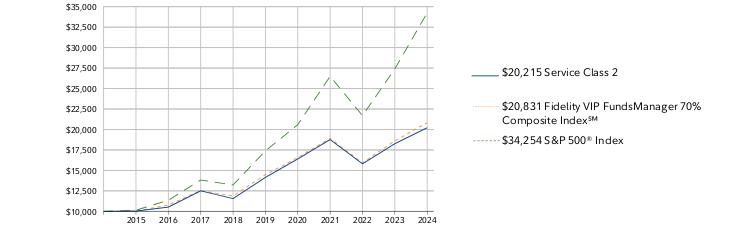
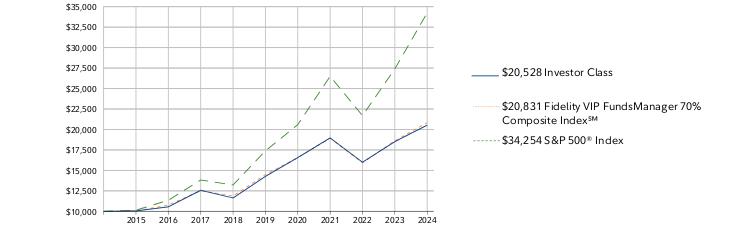
How did the Fund perform over the past 10 years?
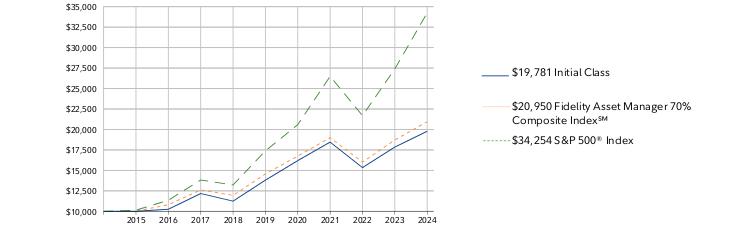
CUMULATIVE PERFORMANCE
December 31, 2014 through December 31, 2024.
Initial investment of $10,000.
Investor Class | $10,000 | $10,001 | $10,236 | $12,149 | $11,211 | $13,755 | $16,120 | $18,359 | $15,250 | $17,728 | $19,630 |
Fidelity Asset Manager 70% Composite Index℠ | $10,000 | $10,015 | $10,811 | $12,619 | $11,951 | $14,563 | $16,749 | $18,997 | $16,013 | $18,717 | $20,950 |
S&P 500® Index | $10,000 | $10,138 | $11,351 | $13,829 | $13,223 | $17,386 | $20,585 | $26,494 | $21,696 | $27,399 | $34,254 |
| | 2014 | 2015 | 2016 | 2017 | 2018 | 2019 | 2020 | 2021 | 2022 | 2023 | 2024 |
AVERAGE ANNUAL TOTAL RETURNS:| | 1 Year | 5 Year | 10 Year |
| Investor Class | 10.73% | 7.37% | 6.98% |
| Fidelity Asset Manager 70% Composite Index℠ | 11.93% | 7.54% | 7.68% |
| S&P 500® Index | 25.02% | 14.53% | 13.10% |
Visit institutional.fidelity.com for more recent performance information. |
The Fund's past performance is not a good predictor of the Fund's future performance. The graph and table do not reflect the deduction of taxes that a shareholder would pay on fund distributions or redemption of fund shares. |
Key Fund Statistics(as of December 31, 2024)
KEY FACTS | | |
| Fund Size | $277,549,788 | |
| Number of Holdings | 27 | |
| Total Advisory Fee | $1,610,000 | |
| Portfolio Turnover | 21% | |
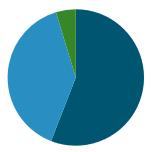
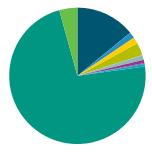
What did the Fund invest in?
(as of December 31, 2024)
The information in the following tables is based on the combined Investments of the Fund and it's pro-rata share of investments in Fidelity's Central Funds, other than the Commodity Strategy and Money Market Central Funds as applicable.
| U.S. Government and U.S. Government Agency Obligations | 14.1 |
| AAA | 1.4 |
| AA | 0.1 |
| A | 1.5 |
| BBB | 3.0 |
| BB | 1.1 |
| B | 0.8 |
| CCC,CC,C | 0.2 |
| D | 0.0 |
| Not Rated | 0.6 |
| Equities | 72.9 |
| Short-Term Investments and Net Other Assets (Liabilities) | 4.3 |
QUALITY DIVERSIFICATION (% of Fund's net assets) |
| |
| | U.S. Government and U.S. Government Agency Obligations - 14.1 |
| | AAA - 1.4 |
| | AA - 0.1 |
| | A - 1.5 |
| | BBB - 3.0 |
| | BB - 1.1 |
| | B - 0.8 |
| | CCC,CC,C - 0.2 |
| | D - 0.0 |
| | Not Rated - 0.6 |
| | Equities - 72.9 |
| | Short-Term Investments and Net Other Assets (Liabilities) - 4.3 |
| |
| We have used ratings from Moody's Investors Service, Inc. Where Moody's® ratings are not available, we have used S&P® ratings. All ratings are as of the date indicated and do not reflect subsequent changes. |
MARKET SECTORS (% of Fund's net assets) | | |
| Information Technology | 16.9 | |
| Financials | 14.6 | |
| Industrials | 8.2 | |
| Consumer Discretionary | 7.8 | |
| Health Care | 6.5 | |
| Communication Services | 5.5 | |
| Consumer Staples | 3.1 | |
| Energy | 2.9 | |
| Materials | 2.4 | |
| Real Estate | 1.8 | |
| Utilities | 1.4 | |
| |
| Equities | 72.0 |
| Bonds | 23.7 |
| Short-Term Investments and Net Other Assets (Liabilities) | 4.3 |
ASSET ALLOCATION (% of Fund's net assets) |
|
| | Equities - 72.0 |
| | Bonds - 23.7 |
| | Short-Term Investments and Net Other Assets (Liabilities) - 4.3 |
| |
TOP HOLDINGS(% of Fund's net assets) | | |
| US Treasury Notes | 8.4 | |
| Microsoft Corp | 2.9 | |
| NVIDIA Corp | 2.8 | |
| Apple Inc | 2.7 | |
| Fidelity Blue Chip Growth ETF | 2.6 | |
| US Treasury Bonds | 2.2 | |
| Alphabet Inc Class A | 1.8 | |
| Amazon.com Inc | 1.8 | |
| Fidelity Hedged Equity ETF | 1.3 | |
| Fannie Mae Mortgage pass-thru certificates | 1.2 | |
| | 27.7 | |
How has the Fund changed?
This is a summary of certain changes to the Fund since January 1, 2024. For more complete information, you may review the Fund's next prospectus, which we expect to be available by April 30, 2025 at fundresearch.fidelity.com/prospectus/sec or upon request at 1-877-208-0098 or by sending an e-mail to funddocuments@fmr.com.
The fees associated with this class changed during the reporting year. The variations in class fees are primarily the result of the following changes:- Management fee
- Operating expenses
The fund's transfer agent and pricing & bookkeeping fees were changed to a fixed rate effective December 1, 2023. Effective March 1, 2024, the fund's management contract was amended to incorporate administrative services previously covered under separate services agreements (transfer agent and pricing & bookkeeping). The amended contract incorporates a management fee rate that may vary by class. The Adviser or an affiliate pays certain expenses of managing and operating the fund out of each class's management fee. | The fund modified its principal investment strategies during the reporting period.
|
The fund modified its principal investment risks during the reporting period. | |
| Fidelity, the Fidelity Investments Logo and all other Fidelity trademarks or service marks used herein are trademarks or service marks of FMR LLC. Any third-party marks that are used herein are trademarks or service marks of their respective owners. © 2025 FMR LLC. All rights reserved. |
| | For additional information about the Fund; including its prospectus, financial information, holdings and proxy information, scan the QR code or visit fundresearch.fidelity.com/prospectus/sec 1.9914170.100 1458-TSRA-0325 |
| |
| | ANNUAL SHAREHOLDER REPORT | AS OF DECEMBER 31, 2024 | This report describes changes to the Fund that occurred during the reporting period. |
| | VIP FundsManager® 20% Portfolio VIP FundsManager® 20% Portfolio Service Class 2 true |
| | | |
This annual shareholder report contains information about VIP FundsManager® 20% Portfolio for the period January 1, 2024 to December 31, 2024. You can find additional information about the Fund at fundresearch.fidelity.com/prospectus/sec. You can also request this information by contacting us at 1-877-208-0098 or by sending an e-mail to funddocuments@fmr.com.
What were your Fund costs for the last year?(based on hypothetical $10,000 investment)
FUND COST (PREVIOUS YEAR)
| | Costs of a $10,000 investment | Costs paid as a percentage of a $10,000 investment | |
| Service Class 2 | $ 26 | 0.25% | |
What affected the Fund's performance this period?
•Risk assets largely produced positive results in 2024, influenced by an expanding global economy, a slowing in the pace of inflation in certain markets, and a pivot by some central banks toward monetary easing, despite ongoing geopolitical risk.
•Within this environment, asset class positioning contributed to the Portfolios' performance versus the Composite indexes, whereas security selection detracted.
•The Portfolios' core equity allocation strategy contributed to relative performance, led by an overweight among U.S. stocks. Equal-weight positioning in international developed- and emerging-markets equities added modest value. Meanwhile, small, out-of-benchmark allocations to real estate investment trusts and commodity-related securities slightly detracted.
•The portfolio's fixed-income allocation strategy also was beneficial from a relative performance standpoint. Specifically, an underweight in investment-grade bonds and cash, in favor of higher-risks segments of the fixed market was advantageous. That said, a small allocation to long-term U.S. Treasurys hurt.
•In terms of security selection, picks among U.S. equities notably pressured relative performance in 2024 due to disappointing results from Fidelity® VIP Stock Selector All Cap Portfolio, the largest equity holding this period. Investment choices in the information technology sector - particularly among software & services and semiconductor companies - detracted the most.
•Conversely, stock selection in developed international markets was a plus, propelled by Fidelity® International Discovery Fund and Fidelity® Overseas Fund. Picks in continental Europe fueled the former, while investment choices in the U.K. helped the latter.
•Security selection among investment-grade bonds also added value, driven by the efforts of our active bond fund managers. In contrast, stocks picks in emerging-markets equities modestly detracted.
•As of December 31, the Portfolios were overweight U.S. stocks and about neutrally weighted in international developed- and emerging-markets equities. Investment-grade bond and cash allocations remained below the Portfolios' target weightings.
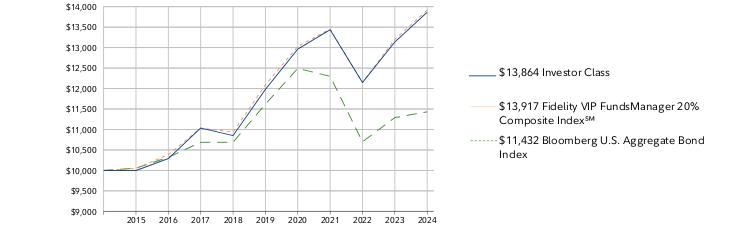
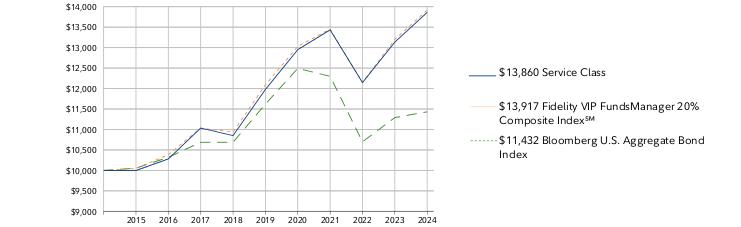
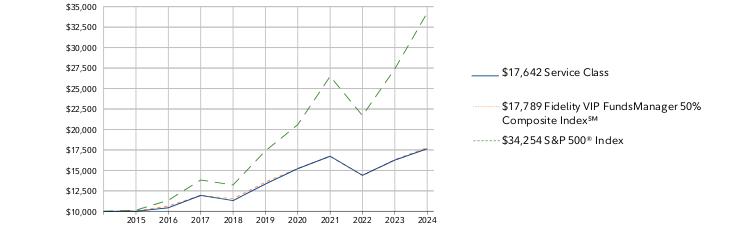
How did the Fund perform over the past 10 years?
CUMULATIVE PERFORMANCE
December 31, 2014 through December 31, 2024.
Initial investment of $10,000.
Service Class 2 | $10,000 | $9,983 | $10,249 | $10,986 | $10,785 | $11,892 | $12,840 | $13,291 | $12,006 | $12,956 | $13,655 |
Fidelity VIP FundsManager 20% Composite Index℠ | $10,000 | $10,048 | $10,383 | $11,033 | $10,937 | $12,089 | $13,029 | $13,453 | $12,145 | $13,201 | $13,917 |
Bloomberg U.S. Aggregate Bond Index | $10,000 | $10,055 | $10,321 | $10,687 | $10,688 | $11,620 | $12,492 | $12,299 | $10,699 | $11,291 | $11,432 |
| | 2014 | 2015 | 2016 | 2017 | 2018 | 2019 | 2020 | 2021 | 2022 | 2023 | 2024 |
AVERAGE ANNUAL TOTAL RETURNS:| | 1 Year | 5 Year | 10 Year |
| Service Class 2 | 5.39% | 2.80% | 3.16% |
| Fidelity VIP FundsManager 20% Composite Index℠ | 5.43% | 2.86% | 3.36% |
| Bloomberg U.S. Aggregate Bond Index | 1.25% | -0.33% | 1.35% |
Visit institutional.fidelity.com for more recent performance information. |
The Fund's past performance is not a good predictor of the Fund's future performance. The graph and table do not reflect the deduction of taxes that a shareholder would pay on fund distributions or redemption of fund shares. |
Key Fund Statistics(as of December 31, 2024)
KEY FACTS | | |
| Fund Size | $677,977,229 | |
| Number of Holdings | 35 | |
| Total Advisory Fee | $709,392 | |
| Portfolio Turnover | 19% | |
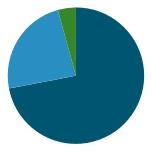
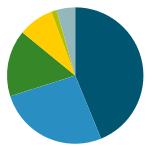
What did the Fund invest in?
(as of December 31, 2024)
| Bond Funds | 48.6 |
| Short-Term Funds | 19.6 |
| Domestic Equity Funds | 14.4 |
| International Equity Funds | 7.8 |
| Alternative Funds | 1.3 |
| Short-Term Investments and Net Other Assets (Liabilities) | 8.3 |
ASSET ALLOCATION (% of Fund's net assets) |
|
| | Bond Funds - 48.6 |
| | Short-Term Funds - 19.6 |
| | Domestic Equity Funds - 14.4 |
| | International Equity Funds - 7.8 |
| | Alternative Funds - 1.3 |
| | Short-Term Investments and Net Other Assets (Liabilities) - 8.3 |
| |
TOP HOLDINGS(% of Fund's net assets) | | |
| Fidelity Total Bond Fund | 22.3 | |
| VIP Investment Grade Bond II Portfolio - Investor Class | 22.3 | |
| Fidelity Investments Money Market Government Portfolio - Institutional Class | 19.6 | |
| VIP Stock Selector All Cap Portfolio - Investor Class | 10.1 | |
| Fidelity Overseas Fund | 2.3 | |
| Fidelity Emerging Markets Fund | 1.8 | |
| Fidelity Inflation-Protected Bond Index Fund | 1.5 | |
| Fidelity Hedged Equity Fund | 1.3 | |
| Fidelity Long-Term Treasury Bond Index Fund | 1.0 | |
| Fidelity High Income Fund | 0.8 | |
| | 83.0 | |
How has the Fund changed?
This is a summary of certain changes to the Fund since January 1, 2024. For more complete information, you may review the Fund's next prospectus, which we expect to be available by April 30, 2025 at fundresearch.fidelity.com/prospectus/sec or upon request at 1-877-208-0098 or by sending an e-mail to funddocuments@fmr.com.
The fund modified its principal investment strategies during the reporting period. | The fund modified its principal investment risks during the reporting period.
|
| Fidelity, the Fidelity Investments Logo and all other Fidelity trademarks or service marks used herein are trademarks or service marks of FMR LLC. Any third-party marks that are used herein are trademarks or service marks of their respective owners. © 2025 FMR LLC. All rights reserved. |
| | For additional information about the Fund; including its prospectus, financial information, holdings and proxy information, scan the QR code or visit fundresearch.fidelity.com/prospectus/sec 1.9914305.100 1586-TSRA-0325 |
| |
| | ANNUAL SHAREHOLDER REPORT | AS OF DECEMBER 31, 2024 | This report describes changes to the Fund that occurred during the reporting period. |
| | VIP FundsManager® 30% Portfolio VIP FundsManager® 30% Portfolio Service Class true |
| | | |
This annual shareholder report contains information about VIP FundsManager® 30% Portfolio for the period January 1, 2024 to December 31, 2024. You can find additional information about the Fund at fundresearch.fidelity.com/prospectus/sec. You can also request this information by contacting us at 1-877-208-0098 or by sending an e-mail to funddocuments@fmr.com.
What were your Fund costs for the last year?(based on hypothetical $10,000 investment)
FUND COST (PREVIOUS YEAR)
| | Costs of a $10,000 investment | Costs paid as a percentage of a $10,000 investment | |
| Service Class | $ 10 | 0.10% | |
What affected the Fund's performance this period?
•Risk assets largely produced positive results in 2024, influenced by an expanding global economy, a slowing in the pace of inflation in certain markets, and a pivot by some central banks toward monetary easing, despite ongoing geopolitical risk.
•Within this environment, asset class positioning contributed to the Portfolios' performance versus the Composite indexes, whereas security selection detracted.
•The Portfolios' core equity allocation strategy contributed to relative performance, led by an overweight among U.S. stocks. Equal-weight positioning in international developed- and emerging-markets equities added modest value. Meanwhile, small, out-of-benchmark allocations to real estate investment trusts and commodity-related securities slightly detracted.
•The portfolio's fixed-income allocation strategy also was beneficial from a relative performance standpoint. Specifically, an underweight in investment-grade bonds and cash, in favor of higher-risks segments of the fixed market was advantageous. That said, a small allocation to long-term U.S. Treasurys hurt.
•In terms of security selection, picks among U.S. equities notably pressured relative performance in 2024 due to disappointing results from Fidelity® VIP Stock Selector All Cap Portfolio, the largest equity holding this period. Investment choices in the information technology sector - particularly among software & services and semiconductor companies - detracted the most.
•Conversely, stock selection in developed international markets was a plus, propelled by Fidelity® International Discovery Fund and Fidelity® Overseas Fund. Picks in continental Europe fueled the former, while investment choices in the U.K. helped the latter.
•Security selection among investment-grade bonds also added value, driven by the efforts of our active bond fund managers. In contrast, stocks picks in emerging-markets equities modestly detracted.
•As of December 31, the Portfolios were overweight U.S. stocks and about neutrally weighted in international developed- and emerging-markets equities. Investment-grade bond and cash allocations remained below the Portfolios' target weightings.
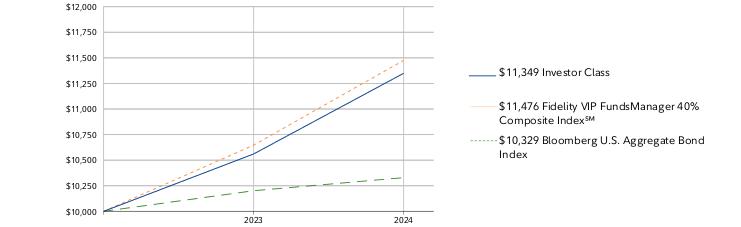
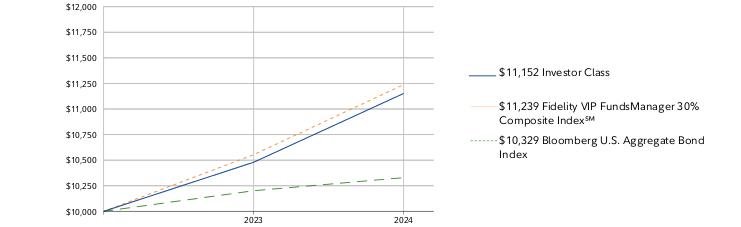
How did the Fund perform over the life of Fund?
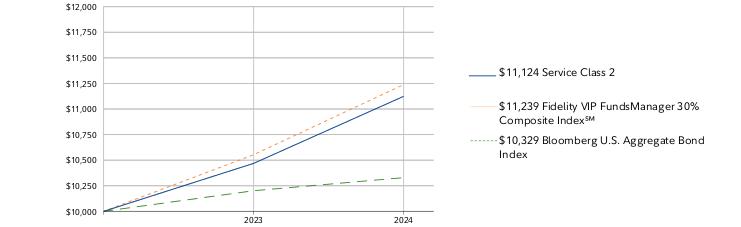
CUMULATIVE PERFORMANCE
April 13, 2023 through December 31, 2024.
Initial investment of $10,000.
Service Class | $10,000 | $10,480 |
Fidelity VIP FundsManager 30% Composite Index℠ | $10,000 | $10,553 |
Bloomberg U.S. Aggregate Bond Index | $10,000 | $10,202 |
| | 2023 | 2024 |
AVERAGE ANNUAL TOTAL RETURNS:| | 1 Year | Life of Fund A |
| Service Class | 6.42% | 6.54% |
| Fidelity VIP FundsManager 30% Composite Index℠ | 6.50% | 7.02% |
| Bloomberg U.S. Aggregate Bond Index | 1.25% | 1.90% |
A From April 13, 2023
Visit institutional.fidelity.com for more recent performance information. |
The Fund's past performance is not a good predictor of the Fund's future performance. The graph and table do not reflect the deduction of taxes that a shareholder would pay on fund distributions or redemption of fund shares. |
Key Fund Statistics(as of December 31, 2024)
KEY FACTS | | |
| Fund Size | $14,740,183 | |
| Number of Holdings | 33 | |
| Total Advisory Fee | $10,778 | |
| Portfolio Turnover | 33% | |
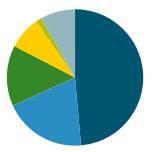
What did the Fund invest in?
(as of December 31, 2024)
| Bond Funds | 48.7 |
| Domestic Equity Funds | 20.4 |
| Short-Term Funds | 12.9 |
| International Equity Funds | 11.8 |
| Alternative Funds | 1.3 |
| Short-Term Investments and Net Other Assets (Liabilities) | 4.9 |
ASSET ALLOCATION (% of Fund's net assets) |
|
| | Bond Funds - 48.7 |
| | Domestic Equity Funds - 20.4 |
| | Short-Term Funds - 12.9 |
| | International Equity Funds - 11.8 |
| | Alternative Funds - 1.3 |
| | Short-Term Investments and Net Other Assets (Liabilities) - 4.9 |
| |
TOP HOLDINGS(% of Fund's net assets) | | |
| Fidelity Total Bond Fund | 22.4 | |
| VIP Investment Grade Bond II Portfolio - Investor Class | 22.3 | |
| VIP Stock Selector All Cap Portfolio - Investor Class | 14.3 | |
| Fidelity Investments Money Market Government Portfolio - Institutional Class | 12.9 | |
| Fidelity Overseas Fund | 3.8 | |
| Fidelity Emerging Markets Fund | 3.3 | |
| Fidelity Inflation-Protected Bond Index Fund | 1.5 | |
| Fidelity Hedged Equity Fund | 1.3 | |
| Fidelity Stock Selector Small Cap Fund | 1.3 | |
| Fidelity International Discovery Fund | 1.1 | |
| | 84.2 | |
How has the Fund changed?
This is a summary of certain changes to the Fund since January 1, 2024. For more complete information, you may review the Fund's next prospectus, which we expect to be available by April 30, 2025 at fundresearch.fidelity.com/prospectus/sec or upon request at 1-877-208-0098 or by sending an e-mail to funddocuments@fmr.com.
The fund modified its principal investment strategies during the reporting period. | The fund modified its principal investment risks during the reporting period.
|
| Fidelity, the Fidelity Investments Logo and all other Fidelity trademarks or service marks used herein are trademarks or service marks of FMR LLC. Any third-party marks that are used herein are trademarks or service marks of their respective owners. © 2025 FMR LLC. All rights reserved. |
| | For additional information about the Fund; including its prospectus, financial information, holdings and proxy information, scan the QR code or visit fundresearch.fidelity.com/prospectus/sec 1.9914411.100 6991-TSRA-0325 |
| |
| | ANNUAL SHAREHOLDER REPORT | AS OF DECEMBER 31, 2024 | This report describes changes to the Fund that occurred during the reporting period. |
| | VIP Freedom Income Portfolio℠ VIP Freedom Income Portfolio℠ Service Class 2 true |
| | | |
This annual shareholder report contains information about VIP Freedom Income Portfolio℠ for the period January 1, 2024 to December 31, 2024. You can find additional information about the Fund at fundresearch.fidelity.com/prospectus/sec. You can also request this information by contacting us at 1-877-208-0098 or by sending an e-mail to funddocuments@fmr.com.
What were your Fund costs for the last year?(based on hypothetical $10,000 investment)
FUND COST (PREVIOUS YEAR)
| | Costs of a $10,000 investment | Costs paid as a percentage of a $10,000 investment | |
| Service Class 2 | $ 26 | 0.25% | |
What affected the Fund's performance this period?
•Risk assets largely produced positive results in 2024, influenced by an expanding global economy and a slowing in the pace of inflation in certain markets, as well as a pivot by some central banks toward monetary easing, despite ongoing geopolitical risk.
•Against this backdrop, active asset allocation positioning detracted from the fund's performance relative to the Composite index, whereas the performance of the underlying investment portfolios contributed.
•In terms of active asset allocation, an underweight in outperforming U.S. equities hurt the fund's relative result the past 12 months, as did an overweight in lagging long-term U.S. Treasurys and outsized exposure to non-U.S. equities. Conversely, an underweight in relatively weaker-performing investment-grade bonds added relative value for the fund.
•Looking at the performance of the underlying portfolios, investments in non-U.S. equities contributed to the fund's relative result. Investments in U.S. investment-grade bonds and U.S. equities also helped to a lesser extent. Within U.S. equities, VIP Contrafund Portfolio (+33.79%) notably outperformed its benchmark, the S&P 500® index (+25.02%). Elsewhere among non-U.S. equities, VIP Overseas Portfolio (+5%) topped the MSCI EAFE index (+4.07%) and VIP Emerging Markets Portfolio (+10.04%) outpaced the MSCI EM Index (+7.50%).
•At the other end of the performance spectrum of underlying funds, within equities, VIP Growth Portfolio (+30.39%) lagged its benchmark, the Russell 3000® Index (+32.46%), and VIP Growth & Income Portfolio (+22.21%) trailed the S&P 500® index.
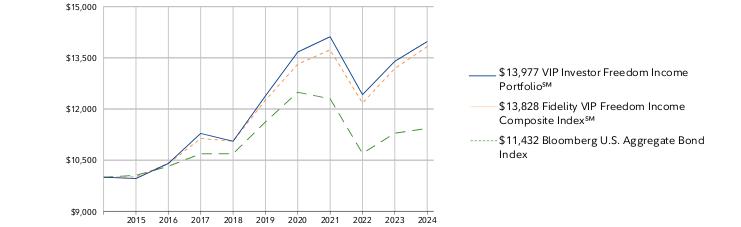
How did the Fund perform over the past 10 years?
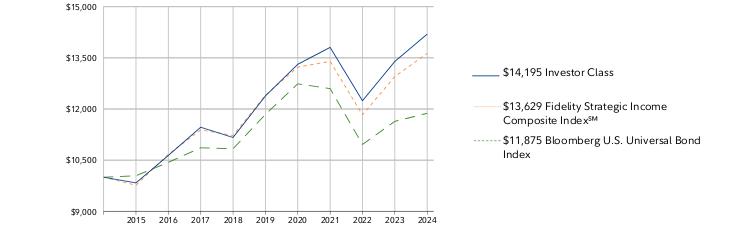
CUMULATIVE PERFORMANCE
December 31, 2014 through December 31, 2024.
Initial investment of $10,000.
Service Class 2 | $10,000 | $9,943 | $10,358 | $11,224 | $10,968 | $12,244 | $13,504 | $13,912 | $12,207 | $13,140 | $13,693 |
Fidelity VIP Freedom Income Composite Index℠ | $10,000 | $10,012 | $10,397 | $11,135 | $11,058 | $12,258 | $13,314 | $13,734 | $12,175 | $13,190 | $13,828 |
Bloomberg U.S. Aggregate Bond Index | $10,000 | $10,055 | $10,321 | $10,687 | $10,688 | $11,620 | $12,492 | $12,299 | $10,699 | $11,291 | $11,432 |
| | 2014 | 2015 | 2016 | 2017 | 2018 | 2019 | 2020 | 2021 | 2022 | 2023 | 2024 |
AVERAGE ANNUAL TOTAL RETURNS:| | 1 Year | 5 Year | 10 Year |
| Service Class 2 | 4.20% | 2.26% | 3.19% |
| Fidelity VIP Freedom Income Composite Index℠ | 4.84% | 2.44% | 3.29% |
| Bloomberg U.S. Aggregate Bond Index | 1.25% | -0.33% | 1.35% |
Visit institutional.fidelity.com for more recent performance information. |
The Fund's past performance is not a good predictor of the Fund's future performance. The graph and table do not reflect the deduction of taxes that a shareholder would pay on fund distributions or redemption of fund shares. |
Key Fund Statistics(as of December 31, 2024)
KEY FACTS | | |
| Fund Size | $88,636,009 | |
| Number of Holdings | 15 | |
| Total Advisory Fee | $0 | |
| Portfolio Turnover | 40% | |
What did the Fund invest in?
(as of December 31, 2024)
| Bond Funds | 62.4 |
| Short-Term Funds | 15.4 |
| International Equity Funds | 12.8 |
| Domestic Equity Funds | 9.4 |
| Short-Term Investments and Net Other Assets (Liabilities) | 0.0 |
ASSET ALLOCATION (% of Fund's net assets) |
|
| | Bond Funds - 62.4 |
| | Short-Term Funds - 15.4 |
| | International Equity Funds - 12.8 |
| | Domestic Equity Funds - 9.4 |
| | Short-Term Investments and Net Other Assets (Liabilities) - 0.0 |
| |
TOP HOLDINGS(% of Fund's net assets) | | |
| VIP Investment Grade Bond II Portfolio - Initial Class | 39.3 | |
| Fidelity Inflation-Protected Bond Index Fund | 16.0 | |
| VIP Government Money Market Portfolio - Initial Class | 15.4 | |
| VIP Overseas Portfolio - Initial Class | 7.4 | |
| VIP Emerging Markets Portfolio - Initial Class | 5.4 | |
| Fidelity International Bond Index Fund | 3.2 | |
| VIP Growth Portfolio - Initial Class | 2.8 | |
| Fidelity Long-Term Treasury Bond Index Fund | 2.7 | |
| VIP Growth & Income Portfolio - Initial Class | 1.9 | |
| VIP Contrafund Portfolio - Initial Class | 1.7 | |
| | 95.8 | |
How has the Fund changed?
This is a summary of certain changes to the Fund since January 1, 2024. For more complete information, you may review the Fund's next prospectus, which we expect to be available by April 30, 2025 at fundresearch.fidelity.com/prospectus/sec or upon request at 1-877-208-0098 or by sending an e-mail to funddocuments@fmr.com.
VIP Freedom 2005 Portfolio℠ merged into VIP Freedom Income Portfolio℠ on June 7, 2024. | |
| Fidelity, the Fidelity Investments Logo and all other Fidelity trademarks or service marks used herein are trademarks or service marks of FMR LLC. Any third-party marks that are used herein are trademarks or service marks of their respective owners. © 2025 FMR LLC. All rights reserved. |
| | For additional information about the Fund; including its prospectus, financial information, holdings and proxy information, scan the QR code or visit fundresearch.fidelity.com/prospectus/sec 1.9914270.100 1419-TSRA-0325 |
| |
| | ANNUAL SHAREHOLDER REPORT | AS OF DECEMBER 31, 2024 | |
| | VIP Freedom 2015 Portfolio℠ VIP Freedom 2015 Portfolio℠ Service Class 2 true |
| | | |
This annual shareholder report contains information about VIP Freedom 2015 Portfolio℠ for the period January 1, 2024 to December 31, 2024. You can find additional information about the Fund at fundresearch.fidelity.com/prospectus/sec. You can also request this information by contacting us at 1-877-208-0098 or by sending an e-mail to funddocuments@fmr.com.
What were your Fund costs for the last year?(based on hypothetical $10,000 investment)
FUND COST (PREVIOUS YEAR)
| | Costs of a $10,000 investment | Costs paid as a percentage of a $10,000 investment | |
| Service Class 2 | $ 26 | 0.25% | |
What affected the Fund's performance this period?
•Risk assets largely produced positive results in 2024, influenced by an expanding global economy and a slowing in the pace of inflation in certain markets, as well as a pivot by some central banks toward monetary easing, despite ongoing geopolitical risk.
•Against this backdrop, active asset allocation positioning detracted from the fund's performance relative to the Composite index, whereas the performance of the underlying investment portfolios contributed.
•In terms of active asset allocation, an underweight in outperforming U.S. equities hurt the fund's relative result the past 12 months, as did an overweight in lagging long-term U.S. Treasurys and outsized exposure to non-U.S. equities. Conversely, an underweight in relatively weaker-performing investment-grade bonds added relative value for the fund.
•Looking at the performance of the underlying portfolios, investments in non-U.S. equities contributed to the fund's relative result. Investments in U.S. investment-grade bonds and U.S. equities also helped to a lesser extent. Within U.S. equities, VIP Contrafund Portfolio (+33.79%) notably outperformed its benchmark, the S&P 500® index (+25.02%). Elsewhere among non-U.S. equities, VIP Overseas Portfolio (+5%) topped the MSCI EAFE index (+4.07%) and VIP Emerging Markets Portfolio (+10.04%) outpaced the MSCI EM Index (+7.50%).
•At the other end of the performance spectrum of underlying funds, within equities, VIP Growth Portfolio (+30.39%) lagged its benchmark, the Russell 3000® Index (+32.46%), and VIP Growth & Income Portfolio (+22.21%) trailed the S&P 500® index.
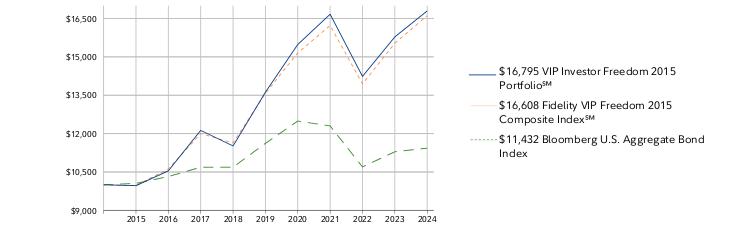
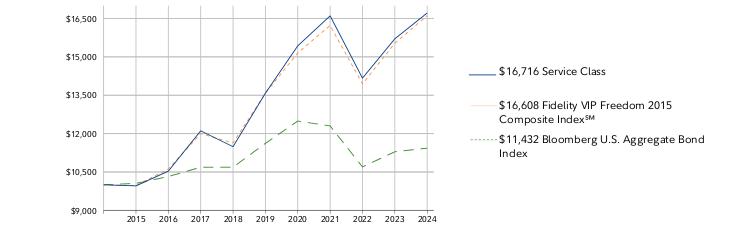
How did the Fund perform over the past 10 years?
CUMULATIVE PERFORMANCE
December 31, 2014 through December 31, 2024.
Initial investment of $10,000.
Service Class 2 | $10,000 | $9,949 | $10,504 | $12,059 | $11,422 | $13,475 | $15,303 | $16,434 | $14,004 | $15,494 | $16,456 |
Fidelity VIP Freedom 2015 Composite Index℠ | $10,000 | $9,970 | $10,622 | $12,001 | $11,636 | $13,578 | $15,155 | $16,227 | $13,946 | $15,534 | $16,608 |
Bloomberg U.S. Aggregate Bond Index | $10,000 | $10,055 | $10,321 | $10,687 | $10,688 | $11,620 | $12,492 | $12,299 | $10,699 | $11,291 | $11,432 |
| | 2014 | 2015 | 2016 | 2017 | 2018 | 2019 | 2020 | 2021 | 2022 | 2023 | 2024 |
AVERAGE ANNUAL TOTAL RETURNS:| | 1 Year | 5 Year | 10 Year |
| Service Class 2 | 6.21% | 4.08% | 5.11% |
| Fidelity VIP Freedom 2015 Composite Index℠ | 6.91% | 4.11% | 5.20% |
| Bloomberg U.S. Aggregate Bond Index | 1.25% | -0.33% | 1.35% |
Visit institutional.fidelity.com for more recent performance information. |
The Fund's past performance is not a good predictor of the Fund's future performance. The graph and table do not reflect the deduction of taxes that a shareholder would pay on fund distributions or redemption of fund shares. |
Key Fund Statistics(as of December 31, 2024)
KEY FACTS | | |
| Fund Size | $58,148,499 | |
| Number of Holdings | 15 | |
| Total Advisory Fee | $0 | |
| Portfolio Turnover | 35% | |
What did the Fund invest in?
(as of December 31, 2024)
| Bond Funds | 56.3 |
| International Equity Funds | 19.1 |
| Domestic Equity Funds | 18.8 |
| Short-Term Funds | 5.8 |
| Short-Term Investments and Net Other Assets (Liabilities) | 0.0 |
ASSET ALLOCATION (% of Fund's net assets) |
|
| | Bond Funds - 56.3 |
| | International Equity Funds - 19.1 |
| | Domestic Equity Funds - 18.8 |
| | Short-Term Funds - 5.8 |
| | Short-Term Investments and Net Other Assets (Liabilities) - 0.0 |
| |
TOP HOLDINGS(% of Fund's net assets) | | |
| VIP Investment Grade Bond II Portfolio - Initial Class | 34.3 | |
| Fidelity Inflation-Protected Bond Index Fund | 14.1 | |
| VIP Overseas Portfolio - Initial Class | 11.9 | |
| VIP Emerging Markets Portfolio - Initial Class | 7.2 | |
| VIP Government Money Market Portfolio - Initial Class | 5.8 | |
| VIP Growth Portfolio - Initial Class | 5.5 | |
| VIP Growth & Income Portfolio - Initial Class | 3.7 | |
| Fidelity International Bond Index Fund | 3.7 | |
| VIP Contrafund Portfolio - Initial Class | 3.3 | |
| Fidelity Long-Term Treasury Bond Index Fund | 3.0 | |
| | 92.5 | |
| Fidelity, the Fidelity Investments Logo and all other Fidelity trademarks or service marks used herein are trademarks or service marks of FMR LLC. Any third-party marks that are used herein are trademarks or service marks of their respective owners. © 2025 FMR LLC. All rights reserved. |
| | For additional information about the Fund; including its prospectus, financial information, holdings and proxy information, scan the QR code or visit fundresearch.fidelity.com/prospectus/sec 1.9914279.100 1428-TSRA-0325 |
| |
| | ANNUAL SHAREHOLDER REPORT | AS OF DECEMBER 31, 2024 | |
| | VIP Freedom 2035 Portfolio℠ VIP Freedom 2035 Portfolio℠ Initial Class true |
| | | |
This annual shareholder report contains information about VIP Freedom 2035 Portfolio℠ for the period January 1, 2024 to December 31, 2024. You can find additional information about the Fund at fundresearch.fidelity.com/prospectus/sec. You can also request this information by contacting us at 1-877-208-0098 or by sending an e-mail to funddocuments@fmr.com.
What were your Fund costs for the last year?(based on hypothetical $10,000 investment)
FUND COST (PREVIOUS YEAR)
| | Costs of a $10,000 investment | Costs paid as a percentage of a $10,000 investment | |
| Initial Class | $ 0 A | 0.00%B | |
AAmount represents less than $.50
BAmount represents less than 0.005%
What affected the Fund's performance this period?
•Risk assets largely produced positive results in 2024, influenced by an expanding global economy and a slowing in the pace of inflation in certain markets, as well as a pivot by some central banks toward monetary easing, despite ongoing geopolitical risk.
•Against this backdrop, active asset allocation positioning detracted from the fund's performance relative to the Composite index, whereas the performance of the underlying investment portfolios contributed.
•In terms of active asset allocation, an underweight in outperforming U.S. equities hurt the fund's relative result the past 12 months, as did an overweight in lagging long-term U.S. Treasurys and outsized exposure to non-U.S. equities. Conversely, an underweight in relatively weaker-performing investment-grade bonds added relative value for the fund.
•Looking at the performance of the underlying portfolios, investments in non-U.S. equities contributed to the fund's relative result. Investments in U.S. investment-grade bonds and U.S. equities also helped to a lesser extent. Within U.S. equities, VIP Contrafund Portfolio (+33.79%) notably outperformed its benchmark, the S&P 500® index (+25.02%). Elsewhere among non-U.S. equities, VIP Overseas Portfolio (+5%) topped the MSCI EAFE index (+4.07%) and VIP Emerging Markets Portfolio (+10.04%) outpaced the MSCI EM Index (+7.50%).
•At the other end of the performance spectrum of underlying funds, within equities, VIP Growth Portfolio (+30.39%) lagged its benchmark, the Russell 3000® Index (+32.46%), and VIP Growth & Income Portfolio (+22.21%) trailed the S&P 500® index.
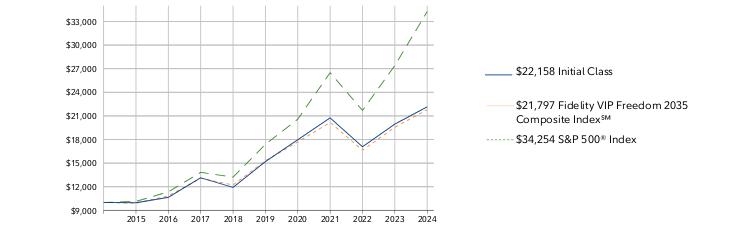
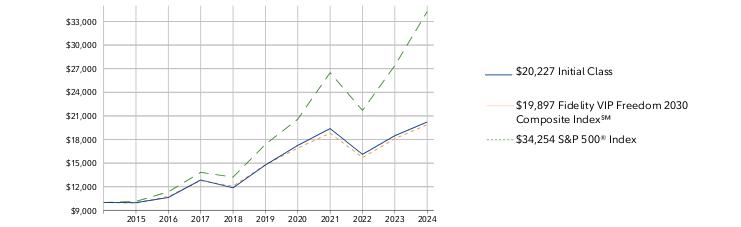
How did the Fund perform over the past 10 years?
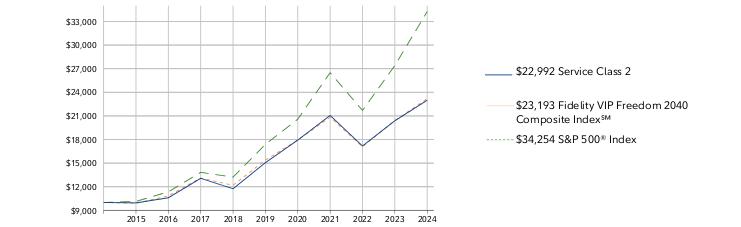
CUMULATIVE PERFORMANCE
December 31, 2014 through December 31, 2024.
Initial investment of $10,000.
Initial Class | $10,000 | $9,969 | $10,654 | $13,142 | $11,919 | $15,196 | $17,973 | $20,751 | $17,079 | $19,957 | $22,158 |
Fidelity VIP Freedom 2035 Composite Index℠ | $10,000 | $9,894 | $10,836 | $13,083 | $12,223 | $15,304 | $17,691 | $20,172 | $16,654 | $19,549 | $21,797 |
S&P 500® Index | $10,000 | $10,138 | $11,351 | $13,829 | $13,223 | $17,386 | $20,585 | $26,494 | $21,696 | $27,399 | $34,254 |
| | 2014 | 2015 | 2016 | 2017 | 2018 | 2019 | 2020 | 2021 | 2022 | 2023 | 2024 |
AVERAGE ANNUAL TOTAL RETURNS:| | 1 Year | 5 Year | 10 Year |
| Initial Class | 11.03% | 7.84% | 8.28% |
| Fidelity VIP Freedom 2035 Composite Index℠ | 11.50% | 7.33% | 8.10% |
| S&P 500® Index | 25.02% | 14.53% | 13.10% |
Visit institutional.fidelity.com for more recent performance information. |
The Fund's past performance is not a good predictor of the Fund's future performance. The graph and table do not reflect the deduction of taxes that a shareholder would pay on fund distributions or redemption of fund shares. |
Key Fund Statistics(as of December 31, 2024)
KEY FACTS | | |
| Fund Size | $372,945,696 | |
| Number of Holdings | 14 | |
| Total Advisory Fee | $0 | |
| Portfolio Turnover | 34% | |
What did the Fund invest in?
(as of December 31, 2024)
| Domestic Equity Funds | 39.1 |
| International Equity Funds | 32.7 |
| Bond Funds | 28.2 |
| Short-Term Investments and Net Other Assets (Liabilities) | 0.0 |
ASSET ALLOCATION (% of Fund's net assets) |
|
| | Domestic Equity Funds - 39.1 |
| | International Equity Funds - 32.7 |
| | Bond Funds - 28.2 |
| | Short-Term Investments and Net Other Assets (Liabilities) - 0.0 |
| |
TOP HOLDINGS(% of Fund's net assets) | | |
| VIP Overseas Portfolio - Initial Class | 21.5 | |
| VIP Investment Grade Bond II Portfolio - Initial Class | 12.2 | |
| VIP Growth Portfolio - Initial Class | 11.4 | |
| VIP Emerging Markets Portfolio - Initial Class | 11.2 | |
| Fidelity Long-Term Treasury Bond Index Fund | 7.9 | |
| VIP Growth & Income Portfolio - Initial Class | 7.7 | |
| VIP Contrafund Portfolio - Initial Class | 6.9 | |
| VIP Equity-Income Portfolio - Initial Class | 5.6 | |
| Fidelity Inflation-Protected Bond Index Fund | 4.1 | |
| VIP Value Portfolio - Initial Class | 3.9 | |
| | 92.4 | |
| Fidelity, the Fidelity Investments Logo and all other Fidelity trademarks or service marks used herein are trademarks or service marks of FMR LLC. Any third-party marks that are used herein are trademarks or service marks of their respective owners. © 2025 FMR LLC. All rights reserved. |
| | For additional information about the Fund; including its prospectus, financial information, holdings and proxy information, scan the QR code or visit fundresearch.fidelity.com/prospectus/sec 1.9914330.100 2159-TSRA-0325 |
| |
| | ANNUAL SHAREHOLDER REPORT | AS OF DECEMBER 31, 2024 | |
| | VIP Freedom 2050 Portfolio℠ VIP Freedom 2050 Portfolio℠ Service Class 2 true |
| | | |
This annual shareholder report contains information about VIP Freedom 2050 Portfolio℠ for the period January 1, 2024 to December 31, 2024. You can find additional information about the Fund at fundresearch.fidelity.com/prospectus/sec. You can also request this information by contacting us at 1-877-208-0098 or by sending an e-mail to funddocuments@fmr.com.
What were your Fund costs for the last year?(based on hypothetical $10,000 investment)
FUND COST (PREVIOUS YEAR)
| | Costs of a $10,000 investment | Costs paid as a percentage of a $10,000 investment | |
| Service Class 2 | $ 27 | 0.25% | |
What affected the Fund's performance this period?
•Risk assets largely produced positive results in 2024, influenced by an expanding global economy and a slowing in the pace of inflation in certain markets, as well as a pivot by some central banks toward monetary easing, despite ongoing geopolitical risk.
•Against this backdrop, active asset allocation positioning detracted from the fund's performance relative to the Composite index, whereas the performance of the underlying investment portfolios contributed.
•In terms of active asset allocation, an underweight in outperforming U.S. equities hurt the fund's relative result the past 12 months, as did an overweight in lagging long-term U.S. Treasurys and outsized exposure to non-U.S. equities. Conversely, an underweight in relatively weaker-performing investment-grade bonds added relative value for the fund.
•Looking at the performance of the underlying portfolios, investments in non-U.S. equities contributed to the fund's relative result. Investments in U.S. investment-grade bonds and U.S. equities also helped to a lesser extent. Within U.S. equities, VIP Contrafund Portfolio (+33.79%) notably outperformed its benchmark, the S&P 500® index (+25.02%). Elsewhere among non-U.S. equities, VIP Overseas Portfolio (+5%) topped the MSCI EAFE index (+4.07%) and VIP Emerging Markets Portfolio (+10.04%) outpaced the MSCI EM Index (+7.50%).
•At the other end of the performance spectrum of underlying funds, within equities, VIP Growth Portfolio (+30.39%) lagged its benchmark, the Russell 3000® Index (+32.46%), and VIP Growth & Income Portfolio (+22.21%) trailed the S&P 500® index.
How did the Fund perform over the past 10 years?
CUMULATIVE PERFORMANCE
December 31, 2014 through December 31, 2024.
Initial investment of $10,000.
Service Class 2 | $10,000 | $9,942 | $10,594 | $13,063 | $11,740 | $15,053 | $17,912 | $21,049 | $17,162 | $20,455 | $23,227 |
Fidelity VIP Freedom 2050 Composite Index℠ | $10,000 | $9,894 | $10,838 | $13,109 | $12,185 | $15,394 | $17,940 | $20,843 | $17,062 | $20,494 | $23,452 |
S&P 500® Index | $10,000 | $10,138 | $11,351 | $13,829 | $13,223 | $17,386 | $20,585 | $26,494 | $21,696 | $27,399 | $34,254 |
| | 2014 | 2015 | 2016 | 2017 | 2018 | 2019 | 2020 | 2021 | 2022 | 2023 | 2024 |
AVERAGE ANNUAL TOTAL RETURNS:| | 1 Year | 5 Year | 10 Year |
| Service Class 2 | 13.55% | 9.06% | 8.79% |
| Fidelity VIP Freedom 2050 Composite Index℠ | 14.43% | 8.78% | 8.90% |
| S&P 500® Index | 25.02% | 14.53% | 13.10% |
Visit institutional.fidelity.com for more recent performance information. |
The Fund's past performance is not a good predictor of the Fund's future performance. The graph and table do not reflect the deduction of taxes that a shareholder would pay on fund distributions or redemption of fund shares. |
Key Fund Statistics(as of December 31, 2024)
KEY FACTS | | |
| Fund Size | $168,362,171 | |
| Number of Holdings | 11 | |
| Total Advisory Fee | $0 | |
| Portfolio Turnover | 34% | |
What did the Fund invest in?
(as of December 31, 2024)
| Domestic Equity Funds | 51.5 |
| International Equity Funds | 40.9 |
| Bond Funds | 7.6 |
| Short-Term Investments and Net Other Assets (Liabilities) | 0.0 |
ASSET ALLOCATION (% of Fund's net assets) |
|
| | Domestic Equity Funds - 51.5 |
| | International Equity Funds - 40.9 |
| | Bond Funds - 7.6 |
| | Short-Term Investments and Net Other Assets (Liabilities) - 0.0 |
| |
TOP HOLDINGS(% of Fund's net assets) | | |
| VIP Overseas Portfolio - Initial Class | 27.8 | |
| VIP Growth Portfolio - Initial Class | 15.0 | |
| VIP Emerging Markets Portfolio - Initial Class | 13.1 | |
| VIP Growth & Income Portfolio - Initial Class | 10.1 | |
| VIP Contrafund Portfolio - Initial Class | 9.0 | |
| VIP Equity-Income Portfolio - Initial Class | 7.4 | |
| Fidelity Long-Term Treasury Bond Index Fund | 6.6 | |
| VIP Value Portfolio - Initial Class | 5.1 | |
| VIP Value Strategies Portfolio - Initial Class | 2.6 | |
| VIP Mid Cap Portfolio - Initial Class | 2.3 | |
| | 99.0 | |
| Fidelity, the Fidelity Investments Logo and all other Fidelity trademarks or service marks used herein are trademarks or service marks of FMR LLC. Any third-party marks that are used herein are trademarks or service marks of their respective owners. © 2025 FMR LLC. All rights reserved. |
| | For additional information about the Fund; including its prospectus, financial information, holdings and proxy information, scan the QR code or visit fundresearch.fidelity.com/prospectus/sec 1.9914341.100 2170-TSRA-0325 |
| |
| | ANNUAL SHAREHOLDER REPORT | AS OF DECEMBER 31, 2024 | This report describes changes to the Fund that occurred during the reporting period. |
| | VIP FundsManager® 20% Portfolio VIP FundsManager® 20% Portfolio Investor Class true |
| | | |
This annual shareholder report contains information about VIP FundsManager® 20% Portfolio for the period January 1, 2024 to December 31, 2024. You can find additional information about the Fund at fundresearch.fidelity.com/prospectus/sec. You can also request this information by contacting us at 1-877-208-0098 or by sending an e-mail to funddocuments@fmr.com.
What were your Fund costs for the last year?(based on hypothetical $10,000 investment)
FUND COST (PREVIOUS YEAR)
| | Costs of a $10,000 investment | Costs paid as a percentage of a $10,000 investment | |
| Investor Class | $ 10 | 0.10% | |
What affected the Fund's performance this period?
•Risk assets largely produced positive results in 2024, influenced by an expanding global economy, a slowing in the pace of inflation in certain markets, and a pivot by some central banks toward monetary easing, despite ongoing geopolitical risk.
•Within this environment, asset class positioning contributed to the Portfolios' performance versus the Composite indexes, whereas security selection detracted.
•The Portfolios' core equity allocation strategy contributed to relative performance, led by an overweight among U.S. stocks. Equal-weight positioning in international developed- and emerging-markets equities added modest value. Meanwhile, small, out-of-benchmark allocations to real estate investment trusts and commodity-related securities slightly detracted.
•The portfolio's fixed-income allocation strategy also was beneficial from a relative performance standpoint. Specifically, an underweight in investment-grade bonds and cash, in favor of higher-risks segments of the fixed market was advantageous. That said, a small allocation to long-term U.S. Treasurys hurt.
•In terms of security selection, picks among U.S. equities notably pressured relative performance in 2024 due to disappointing results from Fidelity® VIP Stock Selector All Cap Portfolio, the largest equity holding this period. Investment choices in the information technology sector - particularly among software & services and semiconductor companies - detracted the most.
•Conversely, stock selection in developed international markets was a plus, propelled by Fidelity® International Discovery Fund and Fidelity® Overseas Fund. Picks in continental Europe fueled the former, while investment choices in the U.K. helped the latter.
•Security selection among investment-grade bonds also added value, driven by the efforts of our active bond fund managers. In contrast, stocks picks in emerging-markets equities modestly detracted.
•As of December 31, the Portfolios were overweight U.S. stocks and about neutrally weighted in international developed- and emerging-markets equities. Investment-grade bond and cash allocations remained below the Portfolios' target weightings.
How did the Fund perform over the past 10 years?
CUMULATIVE PERFORMANCE
December 31, 2014 through December 31, 2024.
Initial investment of $10,000.
Investor Class | $10,000 | $9,997 | $10,290 | $11,035 | $10,851 | $11,980 | $12,963 | $13,437 | $12,147 | $13,138 | $13,864 |
Fidelity VIP FundsManager 20% Composite Index℠ | $10,000 | $10,048 | $10,383 | $11,033 | $10,937 | $12,089 | $13,029 | $13,453 | $12,145 | $13,201 | $13,917 |
Bloomberg U.S. Aggregate Bond Index | $10,000 | $10,055 | $10,321 | $10,687 | $10,688 | $11,620 | $12,492 | $12,299 | $10,699 | $11,291 | $11,432 |
| | 2014 | 2015 | 2016 | 2017 | 2018 | 2019 | 2020 | 2021 | 2022 | 2023 | 2024 |
AVERAGE ANNUAL TOTAL RETURNS:| | 1 Year | 5 Year | 10 Year |
| Investor Class | 5.53% | 2.96% | 3.32% |
| Fidelity VIP FundsManager 20% Composite Index℠ | 5.43% | 2.86% | 3.36% |
| Bloomberg U.S. Aggregate Bond Index | 1.25% | -0.33% | 1.35% |
Visit institutional.fidelity.com for more recent performance information. |
The Fund's past performance is not a good predictor of the Fund's future performance. The graph and table do not reflect the deduction of taxes that a shareholder would pay on fund distributions or redemption of fund shares. |
Key Fund Statistics(as of December 31, 2024)
KEY FACTS | | |
| Fund Size | $677,977,229 | |
| Number of Holdings | 35 | |
| Total Advisory Fee | $709,392 | |
| Portfolio Turnover | 19% | |
What did the Fund invest in?
(as of December 31, 2024)
| Bond Funds | 48.6 |
| Short-Term Funds | 19.6 |
| Domestic Equity Funds | 14.4 |
| International Equity Funds | 7.8 |
| Alternative Funds | 1.3 |
| Short-Term Investments and Net Other Assets (Liabilities) | 8.3 |
ASSET ALLOCATION (% of Fund's net assets) |
|
| | Bond Funds - 48.6 |
| | Short-Term Funds - 19.6 |
| | Domestic Equity Funds - 14.4 |
| | International Equity Funds - 7.8 |
| | Alternative Funds - 1.3 |
| | Short-Term Investments and Net Other Assets (Liabilities) - 8.3 |
| |
TOP HOLDINGS(% of Fund's net assets) | | |
| Fidelity Total Bond Fund | 22.3 | |
| VIP Investment Grade Bond II Portfolio - Investor Class | 22.3 | |
| Fidelity Investments Money Market Government Portfolio - Institutional Class | 19.6 | |
| VIP Stock Selector All Cap Portfolio - Investor Class | 10.1 | |
| Fidelity Overseas Fund | 2.3 | |
| Fidelity Emerging Markets Fund | 1.8 | |
| Fidelity Inflation-Protected Bond Index Fund | 1.5 | |
| Fidelity Hedged Equity Fund | 1.3 | |
| Fidelity Long-Term Treasury Bond Index Fund | 1.0 | |
| Fidelity High Income Fund | 0.8 | |
| | 83.0 | |
How has the Fund changed?
This is a summary of certain changes to the Fund since January 1, 2024. For more complete information, you may review the Fund's next prospectus, which we expect to be available by April 30, 2025 at fundresearch.fidelity.com/prospectus/sec or upon request at 1-877-208-0098 or by sending an e-mail to funddocuments@fmr.com.
The fund modified its principal investment strategies during the reporting period. | The fund modified its principal investment risks during the reporting period.
|
| Fidelity, the Fidelity Investments Logo and all other Fidelity trademarks or service marks used herein are trademarks or service marks of FMR LLC. Any third-party marks that are used herein are trademarks or service marks of their respective owners. © 2025 FMR LLC. All rights reserved. |
| | For additional information about the Fund; including its prospectus, financial information, holdings and proxy information, scan the QR code or visit fundresearch.fidelity.com/prospectus/sec 1.9914303.100 1584-TSRA-0325 |
| |
| | ANNUAL SHAREHOLDER REPORT | AS OF DECEMBER 31, 2024 | This report describes changes to the Fund that occurred during the reporting period. |
| | VIP FundsManager® 20% Portfolio VIP FundsManager® 20% Portfolio Service Class true |
| | | |
This annual shareholder report contains information about VIP FundsManager® 20% Portfolio for the period January 1, 2024 to December 31, 2024. You can find additional information about the Fund at fundresearch.fidelity.com/prospectus/sec. You can also request this information by contacting us at 1-877-208-0098 or by sending an e-mail to funddocuments@fmr.com.
What were your Fund costs for the last year?(based on hypothetical $10,000 investment)
FUND COST (PREVIOUS YEAR)
| | Costs of a $10,000 investment | Costs paid as a percentage of a $10,000 investment | |
| Service Class | $ 10 | 0.10% | |
What affected the Fund's performance this period?
•Risk assets largely produced positive results in 2024, influenced by an expanding global economy, a slowing in the pace of inflation in certain markets, and a pivot by some central banks toward monetary easing, despite ongoing geopolitical risk.
•Within this environment, asset class positioning contributed to the Portfolios' performance versus the Composite indexes, whereas security selection detracted.
•The Portfolios' core equity allocation strategy contributed to relative performance, led by an overweight among U.S. stocks. Equal-weight positioning in international developed- and emerging-markets equities added modest value. Meanwhile, small, out-of-benchmark allocations to real estate investment trusts and commodity-related securities slightly detracted.
•The portfolio's fixed-income allocation strategy also was beneficial from a relative performance standpoint. Specifically, an underweight in investment-grade bonds and cash, in favor of higher-risks segments of the fixed market was advantageous. That said, a small allocation to long-term U.S. Treasurys hurt.
•In terms of security selection, picks among U.S. equities notably pressured relative performance in 2024 due to disappointing results from Fidelity® VIP Stock Selector All Cap Portfolio, the largest equity holding this period. Investment choices in the information technology sector - particularly among software & services and semiconductor companies - detracted the most.
•Conversely, stock selection in developed international markets was a plus, propelled by Fidelity® International Discovery Fund and Fidelity® Overseas Fund. Picks in continental Europe fueled the former, while investment choices in the U.K. helped the latter.
•Security selection among investment-grade bonds also added value, driven by the efforts of our active bond fund managers. In contrast, stocks picks in emerging-markets equities modestly detracted.
•As of December 31, the Portfolios were overweight U.S. stocks and about neutrally weighted in international developed- and emerging-markets equities. Investment-grade bond and cash allocations remained below the Portfolios' target weightings.
How did the Fund perform over the past 10 years?
CUMULATIVE PERFORMANCE
December 31, 2014 through December 31, 2024.
Initial investment of $10,000.
Service Class | $10,000 | $9,997 | $10,281 | $11,034 | $10,850 | $11,978 | $12,950 | $13,434 | $12,145 | $13,135 | $13,860 |
Fidelity VIP FundsManager 20% Composite Index℠ | $10,000 | $10,048 | $10,383 | $11,033 | $10,937 | $12,089 | $13,029 | $13,453 | $12,145 | $13,201 | $13,917 |
Bloomberg U.S. Aggregate Bond Index | $10,000 | $10,055 | $10,321 | $10,687 | $10,688 | $11,620 | $12,492 | $12,299 | $10,699 | $11,291 | $11,432 |
| | 2014 | 2015 | 2016 | 2017 | 2018 | 2019 | 2020 | 2021 | 2022 | 2023 | 2024 |
AVERAGE ANNUAL TOTAL RETURNS:| | 1 Year | 5 Year | 10 Year |
| Service Class | 5.52% | 2.96% | 3.32% |
| Fidelity VIP FundsManager 20% Composite Index℠ | 5.43% | 2.86% | 3.36% |
| Bloomberg U.S. Aggregate Bond Index | 1.25% | -0.33% | 1.35% |
Visit institutional.fidelity.com for more recent performance information. |
The Fund's past performance is not a good predictor of the Fund's future performance. The graph and table do not reflect the deduction of taxes that a shareholder would pay on fund distributions or redemption of fund shares. |
Key Fund Statistics(as of December 31, 2024)
KEY FACTS | | |
| Fund Size | $677,977,229 | |
| Number of Holdings | 35 | |
| Total Advisory Fee | $709,392 | |
| Portfolio Turnover | 19% | |
What did the Fund invest in?
(as of December 31, 2024)
| Bond Funds | 48.6 |
| Short-Term Funds | 19.6 |
| Domestic Equity Funds | 14.4 |
| International Equity Funds | 7.8 |
| Alternative Funds | 1.3 |
| Short-Term Investments and Net Other Assets (Liabilities) | 8.3 |
ASSET ALLOCATION (% of Fund's net assets) |
|
| | Bond Funds - 48.6 |
| | Short-Term Funds - 19.6 |
| | Domestic Equity Funds - 14.4 |
| | International Equity Funds - 7.8 |
| | Alternative Funds - 1.3 |
| | Short-Term Investments and Net Other Assets (Liabilities) - 8.3 |
| |
TOP HOLDINGS(% of Fund's net assets) | | |
| Fidelity Total Bond Fund | 22.3 | |
| VIP Investment Grade Bond II Portfolio - Investor Class | 22.3 | |
| Fidelity Investments Money Market Government Portfolio - Institutional Class | 19.6 | |
| VIP Stock Selector All Cap Portfolio - Investor Class | 10.1 | |
| Fidelity Overseas Fund | 2.3 | |
| Fidelity Emerging Markets Fund | 1.8 | |
| Fidelity Inflation-Protected Bond Index Fund | 1.5 | |
| Fidelity Hedged Equity Fund | 1.3 | |
| Fidelity Long-Term Treasury Bond Index Fund | 1.0 | |
| Fidelity High Income Fund | 0.8 | |
| | 83.0 | |
How has the Fund changed?
This is a summary of certain changes to the Fund since January 1, 2024. For more complete information, you may review the Fund's next prospectus, which we expect to be available by April 30, 2025 at fundresearch.fidelity.com/prospectus/sec or upon request at 1-877-208-0098 or by sending an e-mail to funddocuments@fmr.com.
The fund modified its principal investment strategies during the reporting period. | The fund modified its principal investment risks during the reporting period.
|
| Fidelity, the Fidelity Investments Logo and all other Fidelity trademarks or service marks used herein are trademarks or service marks of FMR LLC. Any third-party marks that are used herein are trademarks or service marks of their respective owners. © 2025 FMR LLC. All rights reserved. |
| | For additional information about the Fund; including its prospectus, financial information, holdings and proxy information, scan the QR code or visit fundresearch.fidelity.com/prospectus/sec 1.9914304.100 1585-TSRA-0325 |
| |
| | ANNUAL SHAREHOLDER REPORT | AS OF DECEMBER 31, 2024 | This report describes changes to the Fund that occurred during the reporting period. |
| | VIP FundsManager® 40% Portfolio VIP FundsManager® 40% Portfolio Investor Class true |
| | | |
This annual shareholder report contains information about VIP FundsManager® 40% Portfolio for the period January 1, 2024 to December 31, 2024. You can find additional information about the Fund at fundresearch.fidelity.com/prospectus/sec. You can also request this information by contacting us at 1-877-208-0098 or by sending an e-mail to funddocuments@fmr.com.
What were your Fund costs for the last year?(based on hypothetical $10,000 investment)
FUND COST (PREVIOUS YEAR)
| | Costs of a $10,000 investment | Costs paid as a percentage of a $10,000 investment | |
| Investor Class | $ 10 | 0.10% | |
What affected the Fund's performance this period?
•Risk assets largely produced positive results in 2024, influenced by an expanding global economy, a slowing in the pace of inflation in certain markets, and a pivot by some central banks toward monetary easing, despite ongoing geopolitical risk.
•Within this environment, asset class positioning contributed to the Portfolios' performance versus the Composite indexes, whereas security selection detracted.
•The Portfolios' core equity allocation strategy contributed to relative performance, led by an overweight among U.S. stocks. Equal-weight positioning in international developed- and emerging-markets equities added modest value. Meanwhile, small, out-of-benchmark allocations to real estate investment trusts and commodity-related securities slightly detracted.
•The portfolio's fixed-income allocation strategy also was beneficial from a relative performance standpoint. Specifically, an underweight in investment-grade bonds and cash, in favor of higher-risks segments of the fixed market was advantageous. That said, a small allocation to long-term U.S. Treasurys hurt.
•In terms of security selection, picks among U.S. equities notably pressured relative performance in 2024 due to disappointing results from Fidelity® VIP Stock Selector All Cap Portfolio, the largest equity holding this period. Investment choices in the information technology sector - particularly among software & services and semiconductor companies - detracted the most.
•Conversely, stock selection in developed international markets was a plus, propelled by Fidelity® International Discovery Fund and Fidelity® Overseas Fund. Picks in continental Europe fueled the former, while investment choices in the U.K. helped the latter.
•Security selection among investment-grade bonds also added value, driven by the efforts of our active bond fund managers. In contrast, stocks picks in emerging-markets equities modestly detracted.
•As of December 31, the Portfolios were overweight U.S. stocks and about neutrally weighted in international developed- and emerging-markets equities. Investment-grade bond and cash allocations remained below the Portfolios' target weightings.
How did the Fund perform over the life of Fund?
CUMULATIVE PERFORMANCE
April 13, 2023 through December 31, 2024.
Initial investment of $10,000.
Investor Class | $10,000 | $10,561 |
Fidelity VIP FundsManager 40% Composite Index℠ | $10,000 | $10,647 |
Bloomberg U.S. Aggregate Bond Index | $10,000 | $10,202 |
| | 2023 | 2024 |
AVERAGE ANNUAL TOTAL RETURNS:| | 1 Year | Life of Fund A |
| Investor Class | 7.46% | 7.63% |
| Fidelity VIP FundsManager 40% Composite Index℠ | 7.78% | 8.33% |
| Bloomberg U.S. Aggregate Bond Index | 1.25% | 1.90% |
A From April 13, 2023
Visit institutional.fidelity.com for more recent performance information. |
The Fund's past performance is not a good predictor of the Fund's future performance. The graph and table do not reflect the deduction of taxes that a shareholder would pay on fund distributions or redemption of fund shares. |
Key Fund Statistics(as of December 31, 2024)
KEY FACTS | | |
| Fund Size | $24,604,924 | |
| Number of Holdings | 33 | |
| Total Advisory Fee | $18,586 | |
| Portfolio Turnover | 34% | |
What did the Fund invest in?
(as of December 31, 2024)
| Bond Funds | 43.8 |
| Domestic Equity Funds | 26.3 |
| International Equity Funds | 15.8 |
| Short-Term Funds | 8.4 |
| Alternative Funds | 1.3 |
| Short-Term Investments and Net Other Assets (Liabilities) | 4.4 |
ASSET ALLOCATION (% of Fund's net assets) |
|
| | Bond Funds - 43.8 |
| | Domestic Equity Funds - 26.3 |
| | International Equity Funds - 15.8 |
| | Short-Term Funds - 8.4 |
| | Alternative Funds - 1.3 |
| | Short-Term Investments and Net Other Assets (Liabilities) - 4.4 |
| |
TOP HOLDINGS(% of Fund's net assets) | | |
| Fidelity Total Bond Fund | 19.9 | |
| VIP Investment Grade Bond II Portfolio - Investor Class | 19.8 | |
| VIP Stock Selector All Cap Portfolio - Investor Class | 19.0 | |
| Fidelity Investments Money Market Government Portfolio - Institutional Class | 8.4 | |
| Fidelity Overseas Fund | 5.2 | |
| Fidelity Emerging Markets Fund | 4.3 | |
| Fidelity Stock Selector Small Cap Fund | 1.7 | |
| Fidelity Inflation-Protected Bond Index Fund | 1.5 | |
| Fidelity International Discovery Fund | 1.4 | |
| Fidelity Hedged Equity Fund | 1.3 | |
| | 82.5 | |
How has the Fund changed?
This is a summary of certain changes to the Fund since January 1, 2024. For more complete information, you may review the Fund's next prospectus, which we expect to be available by April 30, 2025 at fundresearch.fidelity.com/prospectus/sec or upon request at 1-877-208-0098 or by sending an e-mail to funddocuments@fmr.com.
The fund modified its principal investment strategies during the reporting period. | The fund modified its principal investment risks during the reporting period.
|
| Fidelity, the Fidelity Investments Logo and all other Fidelity trademarks or service marks used herein are trademarks or service marks of FMR LLC. Any third-party marks that are used herein are trademarks or service marks of their respective owners. © 2025 FMR LLC. All rights reserved. |
| | For additional information about the Fund; including its prospectus, financial information, holdings and proxy information, scan the QR code or visit fundresearch.fidelity.com/prospectus/sec 1.9914412.100 6992-TSRA-0325 |
| |
| | ANNUAL SHAREHOLDER REPORT | AS OF DECEMBER 31, 2024 | This report describes changes to the Fund that occurred during the reporting period. |
| | VIP FundsManager® 60% Portfolio VIP FundsManager® 60% Portfolio Investor Class true |
| | | |
This annual shareholder report contains information about VIP FundsManager® 60% Portfolio for the period January 1, 2024 to December 31, 2024. You can find additional information about the Fund at fundresearch.fidelity.com/prospectus/sec. You can also request this information by contacting us at 1-877-208-0098 or by sending an e-mail to funddocuments@fmr.com.
What were your Fund costs for the last year?(based on hypothetical $10,000 investment)
FUND COST (PREVIOUS YEAR)
| | Costs of a $10,000 investment | Costs paid as a percentage of a $10,000 investment | |
| Investor Class | $ 10 | 0.10% | |
What affected the Fund's performance this period?
•Risk assets largely produced positive results in 2024, influenced by an expanding global economy, a slowing in the pace of inflation in certain markets, and a pivot by some central banks toward monetary easing, despite ongoing geopolitical risk.
•Within this environment, asset class positioning contributed to the Portfolios' performance versus the Composite indexes, whereas security selection detracted.
•The Portfolios' core equity allocation strategy contributed to relative performance, led by an overweight among U.S. stocks. Equal-weight positioning in international developed- and emerging-markets equities added modest value. Meanwhile, small, out-of-benchmark allocations to real estate investment trusts and commodity-related securities slightly detracted.
•The portfolio's fixed-income allocation strategy also was beneficial from a relative performance standpoint. Specifically, an underweight in investment-grade bonds and cash, in favor of higher-risks segments of the fixed market was advantageous. That said, a small allocation to long-term U.S. Treasurys hurt.
•In terms of security selection, picks among U.S. equities notably pressured relative performance in 2024 due to disappointing results from Fidelity® VIP Stock Selector All Cap Portfolio, the largest equity holding this period. Investment choices in the information technology sector - particularly among software & services and semiconductor companies - detracted the most.
•Conversely, stock selection in developed international markets was a plus, propelled by Fidelity® International Discovery Fund and Fidelity® Overseas Fund. Picks in continental Europe fueled the former, while investment choices in the U.K. helped the latter.
•Security selection among investment-grade bonds also added value, driven by the efforts of our active bond fund managers. In contrast, stocks picks in emerging-markets equities modestly detracted.
•As of December 31, the Portfolios were overweight U.S. stocks and about neutrally weighted in international developed- and emerging-markets equities. Investment-grade bond and cash allocations remained below the Portfolios' target weightings.
How did the Fund perform over the past 10 years?
CUMULATIVE PERFORMANCE
December 31, 2014 through December 31, 2024.
Initial investment of $10,000.
Investor Class | $10,000 | $10,041 | $10,522 | $12,309 | $11,517 | $13,876 | $15,975 | $17,947 | $15,244 | $17,404 | $19,071 |
Fidelity VIP FundsManager 60% Composite Index℠ | $10,000 | $10,051 | $10,711 | $12,252 | $11,714 | $14,057 | $15,964 | $17,855 | $15,128 | $17,431 | $19,242 |
S&P 500® Index | $10,000 | $10,138 | $11,351 | $13,829 | $13,223 | $17,386 | $20,585 | $26,494 | $21,696 | $27,399 | $34,254 |
| | 2014 | 2015 | 2016 | 2017 | 2018 | 2019 | 2020 | 2021 | 2022 | 2023 | 2024 |
AVERAGE ANNUAL TOTAL RETURNS:| | 1 Year | 5 Year | 10 Year |
| Investor Class | 9.58% | 6.57% | 6.67% |
| Fidelity VIP FundsManager 60% Composite Index℠ | 10.39% | 6.48% | 6.76% |
| S&P 500® Index | 25.02% | 14.53% | 13.10% |
Visit institutional.fidelity.com for more recent performance information. |
The Fund's past performance is not a good predictor of the Fund's future performance. The graph and table do not reflect the deduction of taxes that a shareholder would pay on fund distributions or redemption of fund shares. |
Key Fund Statistics(as of December 31, 2024)
KEY FACTS | | |
| Fund Size | $6,873,861,179 | |
| Number of Holdings | 39 | |
| Total Advisory Fee | $6,697,647 | |
| Portfolio Turnover | 28% | |
What did the Fund invest in?
(as of December 31, 2024)
| Domestic Equity Funds | 38.2 |
| Bond Funds | 33.8 |
| International Equity Funds | 23.7 |
| Alternative Funds | 1.3 |
| Short-Term Investments and Net Other Assets (Liabilities) | 3.0 |
ASSET ALLOCATION (% of Fund's net assets) |
|
| | Domestic Equity Funds - 38.2 |
| | Bond Funds - 33.8 |
| | International Equity Funds - 23.7 |
| | Alternative Funds - 1.3 |
| | Short-Term Investments and Net Other Assets (Liabilities) - 3.0 |
| |
TOP HOLDINGS(% of Fund's net assets) | | |
| VIP Stock Selector All Cap Portfolio - Investor Class | 30.1 | |
| Fidelity Total Bond Fund | 15.0 | |
| VIP Investment Grade Bond II Portfolio - Investor Class | 14.9 | |
| Fidelity Overseas Fund | 7.0 | |
| Fidelity Emerging Markets Fund | 6.4 | |
| Fidelity Enhanced International ETF | 1.8 | |
| Fidelity International Discovery Fund | 1.7 | |
| Fidelity Stock Selector Small Cap Fund | 1.6 | |
| Fidelity Inflation-Protected Bond Index Fund | 1.4 | |
| Fidelity International Capital Appreciation Fund | 1.4 | |
| | 81.3 | |
How has the Fund changed?
This is a summary of certain changes to the Fund since January 1, 2024. For more complete information, you may review the Fund's next prospectus, which we expect to be available by April 30, 2025 at fundresearch.fidelity.com/prospectus/sec or upon request at 1-877-208-0098 or by sending an e-mail to funddocuments@fmr.com.
The fund modified its principal investment strategies during the reporting period. | The fund modified its principal investment risks during the reporting period.
|
| Fidelity, the Fidelity Investments Logo and all other Fidelity trademarks or service marks used herein are trademarks or service marks of FMR LLC. Any third-party marks that are used herein are trademarks or service marks of their respective owners. © 2025 FMR LLC. All rights reserved. |
| | For additional information about the Fund; including its prospectus, financial information, holdings and proxy information, scan the QR code or visit fundresearch.fidelity.com/prospectus/sec 1.9914323.100 1880-TSRA-0325 |
| |
| | ANNUAL SHAREHOLDER REPORT | AS OF DECEMBER 31, 2024 | |
| | VIP Freedom 2010 Portfolio℠ VIP Freedom 2010 Portfolio℠ Service Class true |
| | | |
This annual shareholder report contains information about VIP Freedom 2010 Portfolio℠ for the period January 1, 2024 to December 31, 2024. You can find additional information about the Fund at fundresearch.fidelity.com/prospectus/sec. You can also request this information by contacting us at 1-877-208-0098 or by sending an e-mail to funddocuments@fmr.com.
What were your Fund costs for the last year?(based on hypothetical $10,000 investment)
FUND COST (PREVIOUS YEAR)
| | Costs of a $10,000 investment | Costs paid as a percentage of a $10,000 investment | |
| Service Class | $ 10 | 0.10% | |
What affected the Fund's performance this period?
•Risk assets largely produced positive results in 2024, influenced by an expanding global economy and a slowing in the pace of inflation in certain markets, as well as a pivot by some central banks toward monetary easing, despite ongoing geopolitical risk.
•Against this backdrop, active asset allocation positioning detracted from the fund's performance relative to the Composite index, whereas the performance of the underlying investment portfolios contributed.
•In terms of active asset allocation, an underweight in outperforming U.S. equities hurt the fund's relative result the past 12 months, as did an overweight in lagging long-term U.S. Treasurys and outsized exposure to non-U.S. equities. Conversely, an underweight in relatively weaker-performing investment-grade bonds added relative value for the fund.
•Looking at the performance of the underlying portfolios, investments in non-U.S. equities contributed to the fund's relative result. Investments in U.S. investment-grade bonds and U.S. equities also helped to a lesser extent. Within U.S. equities, VIP Contrafund Portfolio (+33.79%) notably outperformed its benchmark, the S&P 500® index (+25.02%). Elsewhere among non-U.S. equities, VIP Overseas Portfolio (+5%) topped the MSCI EAFE index (+4.07%) and VIP Emerging Markets Portfolio (+10.04%) outpaced the MSCI EM Index (+7.50%).
•At the other end of the performance spectrum of underlying funds, within equities, VIP Growth Portfolio (+30.39%) lagged its benchmark, the Russell 3000® Index (+32.46%), and VIP Growth & Income Portfolio (+22.21%) trailed the S&P 500® index.
How did the Fund perform over the past 10 years?
CUMULATIVE PERFORMANCE
December 31, 2014 through December 31, 2024.
Initial investment of $10,000.
Service Class | $10,000 | $9,969 | $10,503 | $11,858 | $11,372 | $13,191 | $14,826 | $15,684 | $13,556 | $14,814 | $15,593 |
Fidelity VIP Freedom 2010 Composite Index℠ | $10,000 | $9,984 | $10,555 | $11,726 | $11,465 | $13,141 | $14,510 | $15,300 | $13,328 | $14,643 | $15,490 |
Bloomberg U.S. Aggregate Bond Index | $10,000 | $10,055 | $10,321 | $10,687 | $10,688 | $11,620 | $12,492 | $12,299 | $10,699 | $11,291 | $11,432 |
| | 2014 | 2015 | 2016 | 2017 | 2018 | 2019 | 2020 | 2021 | 2022 | 2023 | 2024 |
AVERAGE ANNUAL TOTAL RETURNS:| | 1 Year | 5 Year | 10 Year |
| Service Class | 5.26% | 3.40% | 4.54% |
| Fidelity VIP Freedom 2010 Composite Index℠ | 5.78% | 3.34% | 4.47% |
| Bloomberg U.S. Aggregate Bond Index | 1.25% | -0.33% | 1.35% |
Visit institutional.fidelity.com for more recent performance information. |
The Fund's past performance is not a good predictor of the Fund's future performance. The graph and table do not reflect the deduction of taxes that a shareholder would pay on fund distributions or redemption of fund shares. |
Key Fund Statistics(as of December 31, 2024)
KEY FACTS | | |
| Fund Size | $249,525,780 | |
| Number of Holdings | 15 | |
| Total Advisory Fee | $0 | |
| Portfolio Turnover | 25% | |
What did the Fund invest in?
(as of December 31, 2024)
| Bond Funds | 60.0 |
| International Equity Funds | 15.4 |
| Domestic Equity Funds | 13.4 |
| Short-Term Funds | 11.2 |
| Short-Term Investments and Net Other Assets (Liabilities) | 0.0 |
ASSET ALLOCATION (% of Fund's net assets) |
|
| | Bond Funds - 60.0 |
| | International Equity Funds - 15.4 |
| | Domestic Equity Funds - 13.4 |
| | Short-Term Funds - 11.2 |
| | Short-Term Investments and Net Other Assets (Liabilities) - 0.0 |
| |
TOP HOLDINGS(% of Fund's net assets) | | |
| VIP Investment Grade Bond II Portfolio - Initial Class | 37.3 | |
| Fidelity Inflation-Protected Bond Index Fund | 15.2 | |
| VIP Government Money Market Portfolio - Initial Class | 11.2 | |
| VIP Overseas Portfolio - Initial Class | 9.2 | |
| VIP Emerging Markets Portfolio - Initial Class | 6.2 | |
| VIP Growth Portfolio - Initial Class | 4.0 | |
| Fidelity International Bond Index Fund | 3.4 | |
| Fidelity Long-Term Treasury Bond Index Fund | 2.9 | |
| VIP Growth & Income Portfolio - Initial Class | 2.6 | |
| VIP Contrafund Portfolio - Initial Class | 2.3 | |
| | 94.3 | |
| Fidelity, the Fidelity Investments Logo and all other Fidelity trademarks or service marks used herein are trademarks or service marks of FMR LLC. Any third-party marks that are used herein are trademarks or service marks of their respective owners. © 2025 FMR LLC. All rights reserved. |
| | For additional information about the Fund; including its prospectus, financial information, holdings and proxy information, scan the QR code or visit fundresearch.fidelity.com/prospectus/sec 1.9914275.100 1424-TSRA-0325 |
| |
| | ANNUAL SHAREHOLDER REPORT | AS OF DECEMBER 31, 2024 | This report describes changes to the Fund that occurred during the reporting period. |
| | VIP FundsManager® 40% Portfolio VIP FundsManager® 40% Portfolio Service Class true |
| | | |
This annual shareholder report contains information about VIP FundsManager® 40% Portfolio for the period January 1, 2024 to December 31, 2024. You can find additional information about the Fund at fundresearch.fidelity.com/prospectus/sec. You can also request this information by contacting us at 1-877-208-0098 or by sending an e-mail to funddocuments@fmr.com.
What were your Fund costs for the last year?(based on hypothetical $10,000 investment)
FUND COST (PREVIOUS YEAR)
| | Costs of a $10,000 investment | Costs paid as a percentage of a $10,000 investment | |
| Service Class | $ 10 | 0.10% | |
What affected the Fund's performance this period?
•Risk assets largely produced positive results in 2024, influenced by an expanding global economy, a slowing in the pace of inflation in certain markets, and a pivot by some central banks toward monetary easing, despite ongoing geopolitical risk.
•Within this environment, asset class positioning contributed to the Portfolios' performance versus the Composite indexes, whereas security selection detracted.
•The Portfolios' core equity allocation strategy contributed to relative performance, led by an overweight among U.S. stocks. Equal-weight positioning in international developed- and emerging-markets equities added modest value. Meanwhile, small, out-of-benchmark allocations to real estate investment trusts and commodity-related securities slightly detracted.
•The portfolio's fixed-income allocation strategy also was beneficial from a relative performance standpoint. Specifically, an underweight in investment-grade bonds and cash, in favor of higher-risks segments of the fixed market was advantageous. That said, a small allocation to long-term U.S. Treasurys hurt.
•In terms of security selection, picks among U.S. equities notably pressured relative performance in 2024 due to disappointing results from Fidelity® VIP Stock Selector All Cap Portfolio, the largest equity holding this period. Investment choices in the information technology sector - particularly among software & services and semiconductor companies - detracted the most.
•Conversely, stock selection in developed international markets was a plus, propelled by Fidelity® International Discovery Fund and Fidelity® Overseas Fund. Picks in continental Europe fueled the former, while investment choices in the U.K. helped the latter.
•Security selection among investment-grade bonds also added value, driven by the efforts of our active bond fund managers. In contrast, stocks picks in emerging-markets equities modestly detracted.
•As of December 31, the Portfolios were overweight U.S. stocks and about neutrally weighted in international developed- and emerging-markets equities. Investment-grade bond and cash allocations remained below the Portfolios' target weightings.
How did the Fund perform over the life of Fund?
CUMULATIVE PERFORMANCE
April 13, 2023 through December 31, 2024.
Initial investment of $10,000.
Service Class | $10,000 | $10,561 |
Fidelity VIP FundsManager 40% Composite Index℠ | $10,000 | $10,647 |
Bloomberg U.S. Aggregate Bond Index | $10,000 | $10,202 |
| | 2023 | 2024 |
AVERAGE ANNUAL TOTAL RETURNS:| | 1 Year | Life of Fund A |
| Service Class | 7.56% | 7.69% |
| Fidelity VIP FundsManager 40% Composite Index℠ | 7.78% | 8.33% |
| Bloomberg U.S. Aggregate Bond Index | 1.25% | 1.90% |
A From April 13, 2023
Visit institutional.fidelity.com for more recent performance information. |
The Fund's past performance is not a good predictor of the Fund's future performance. The graph and table do not reflect the deduction of taxes that a shareholder would pay on fund distributions or redemption of fund shares. |
Key Fund Statistics(as of December 31, 2024)
KEY FACTS | | |
| Fund Size | $24,604,924 | |
| Number of Holdings | 33 | |
| Total Advisory Fee | $18,586 | |
| Portfolio Turnover | 34% | |
What did the Fund invest in?
(as of December 31, 2024)
| Bond Funds | 43.8 |
| Domestic Equity Funds | 26.3 |
| International Equity Funds | 15.8 |
| Short-Term Funds | 8.4 |
| Alternative Funds | 1.3 |
| Short-Term Investments and Net Other Assets (Liabilities) | 4.4 |
ASSET ALLOCATION (% of Fund's net assets) |
|
| | Bond Funds - 43.8 |
| | Domestic Equity Funds - 26.3 |
| | International Equity Funds - 15.8 |
| | Short-Term Funds - 8.4 |
| | Alternative Funds - 1.3 |
| | Short-Term Investments and Net Other Assets (Liabilities) - 4.4 |
| |
TOP HOLDINGS(% of Fund's net assets) | | |
| Fidelity Total Bond Fund | 19.9 | |
| VIP Investment Grade Bond II Portfolio - Investor Class | 19.8 | |
| VIP Stock Selector All Cap Portfolio - Investor Class | 19.0 | |
| Fidelity Investments Money Market Government Portfolio - Institutional Class | 8.4 | |
| Fidelity Overseas Fund | 5.2 | |
| Fidelity Emerging Markets Fund | 4.3 | |
| Fidelity Stock Selector Small Cap Fund | 1.7 | |
| Fidelity Inflation-Protected Bond Index Fund | 1.5 | |
| Fidelity International Discovery Fund | 1.4 | |
| Fidelity Hedged Equity Fund | 1.3 | |
| | 82.5 | |
How has the Fund changed?
This is a summary of certain changes to the Fund since January 1, 2024. For more complete information, you may review the Fund's next prospectus, which we expect to be available by April 30, 2025 at fundresearch.fidelity.com/prospectus/sec or upon request at 1-877-208-0098 or by sending an e-mail to funddocuments@fmr.com.
The fund modified its principal investment strategies during the reporting period. | The fund modified its principal investment risks during the reporting period.
|
| Fidelity, the Fidelity Investments Logo and all other Fidelity trademarks or service marks used herein are trademarks or service marks of FMR LLC. Any third-party marks that are used herein are trademarks or service marks of their respective owners. © 2025 FMR LLC. All rights reserved. |
| | For additional information about the Fund; including its prospectus, financial information, holdings and proxy information, scan the QR code or visit fundresearch.fidelity.com/prospectus/sec 1.9914413.100 6993-TSRA-0325 |
| |
| | ANNUAL SHAREHOLDER REPORT | AS OF DECEMBER 31, 2024 | This report describes changes to the Fund that occurred during the reporting period. |
| | VIP Asset Manager: Growth Portfolio VIP Asset Manager: Growth Portfolio Service Class true |
| | | |
This annual shareholder report contains information about VIP Asset Manager: Growth Portfolio for the period January 1, 2024 to December 31, 2024. You can find additional information about the Fund at fundresearch.fidelity.com/prospectus/sec. You can also request this information by contacting us at 1-877-208-0098 or by sending an e-mail to funddocuments@fmr.com.
What were your Fund costs for the last year?(based on hypothetical $10,000 investment)
FUND COST (PREVIOUS YEAR)
| | Costs of a $10,000 investment | Costs paid as a percentage of a $10,000 investment | |
| Service Class | $ 75 | 0.71% | |
What affected the Fund's performance this period?
•Risk assets largely produced positive results in 2024, influenced by an expanding global economy, a slowing in the pace of inflation in certain markets, and a pivot by some central banks toward monetary easing, despite ongoing geopolitical risk.
•Within this environment, asset class positioning contributed to the fund's performance versus the Composite index, whereas security selection detracted.
•The portfolio's core equity allocation strategy contributed to relative performance, led by an overweight among U.S. stocks. Equal-weight positioning in international developed- and emerging-markets equities also added modest value. Meanwhile, small, out-of-benchmark allocations to real estate investment trusts and commodity-related securities slightly detracted.
•The portfolio's fixed-income positioning was beneficial from a relative performance standpoint. Specifically, an underweight in investment-grade bonds and cash, in favor of higher-risk segments of the fixed income market was advantageous. That said, a small allocation to long-term U.S. Treasurys hurt.
•In terms of security selection, picks among U.S. equities pressured relative performance in 2024. Investment choices in the information technology sector - particularly among software & services and semiconductor companies - detracted the most.
•Stock selection among international developed-market stocks, on the other hand, aided the fund's relative return. Here, picks in Japan, Germany and the U.K., along with favorable positioning in continental European equity markets, helped the most. Conversely, investment choices and an underweight in the strong-performing Canadian stock market detracted.
•Security selection among investment-grade bonds also added value. Corporate debt issued by banks, real estate investment trusts, insurers and consumer staples companies, contributed to the portfolio's relative outcome. Elsewhere, stakes in asset-backed securities, non-government-agency mortgage-backed securities and U.S. Treasurys, helped as well.
•As of December 31, the fund was overweight U.S. stocks and about neutrally weighted in international developed- and emerging-markets equities. Investment-grade bond and cash allocations remained below the fund's target weighting.
How did the Fund perform over the past 10 years?
CUMULATIVE PERFORMANCE
December 31, 2014 through December 31, 2024.
Initial investment of $10,000.
Service Class | $10,000 | $9,997 | $10,231 | $12,144 | $11,202 | $13,748 | $16,098 | $18,333 | $15,225 | $17,693 | $19,591 |
Fidelity Asset Manager 70% Composite Index℠ | $10,000 | $10,015 | $10,811 | $12,619 | $11,951 | $14,563 | $16,749 | $18,997 | $16,013 | $18,717 | $20,950 |
S&P 500® Index | $10,000 | $10,138 | $11,351 | $13,829 | $13,223 | $17,386 | $20,585 | $26,494 | $21,696 | $27,399 | $34,254 |
| | 2014 | 2015 | 2016 | 2017 | 2018 | 2019 | 2020 | 2021 | 2022 | 2023 | 2024 |
AVERAGE ANNUAL TOTAL RETURNS:| | 1 Year | 5 Year | 10 Year |
| Service Class | 10.73% | 7.34% | 6.96% |
| Fidelity Asset Manager 70% Composite Index℠ | 11.93% | 7.54% | 7.68% |
| S&P 500® Index | 25.02% | 14.53% | 13.10% |
Visit institutional.fidelity.com for more recent performance information. |
The Fund's past performance is not a good predictor of the Fund's future performance. The graph and table do not reflect the deduction of taxes that a shareholder would pay on fund distributions or redemption of fund shares. |
Key Fund Statistics(as of December 31, 2024)
KEY FACTS | | |
| Fund Size | $277,549,788 | |
| Number of Holdings | 27 | |
| Total Advisory Fee | $1,610,000 | |
| Portfolio Turnover | 21% | |
What did the Fund invest in?
(as of December 31, 2024)
The information in the following tables is based on the combined Investments of the Fund and it's pro-rata share of investments in Fidelity's Central Funds, other than the Commodity Strategy and Money Market Central Funds as applicable.
| U.S. Government and U.S. Government Agency Obligations | 14.1 |
| AAA | 1.4 |
| AA | 0.1 |
| A | 1.5 |
| BBB | 3.0 |
| BB | 1.1 |
| B | 0.8 |
| CCC,CC,C | 0.2 |
| D | 0.0 |
| Not Rated | 0.6 |
| Equities | 72.9 |
| Short-Term Investments and Net Other Assets (Liabilities) | 4.3 |
QUALITY DIVERSIFICATION (% of Fund's net assets) |
| |
| | U.S. Government and U.S. Government Agency Obligations - 14.1 |
| | AAA - 1.4 |
| | AA - 0.1 |
| | A - 1.5 |
| | BBB - 3.0 |
| | BB - 1.1 |
| | B - 0.8 |
| | CCC,CC,C - 0.2 |
| | D - 0.0 |
| | Not Rated - 0.6 |
| | Equities - 72.9 |
| | Short-Term Investments and Net Other Assets (Liabilities) - 4.3 |
| |
| We have used ratings from Moody's Investors Service, Inc. Where Moody's® ratings are not available, we have used S&P® ratings. All ratings are as of the date indicated and do not reflect subsequent changes. |
MARKET SECTORS (% of Fund's net assets) | | |
| Information Technology | 16.9 | |
| Financials | 14.6 | |
| Industrials | 8.2 | |
| Consumer Discretionary | 7.8 | |
| Health Care | 6.5 | |
| Communication Services | 5.5 | |
| Consumer Staples | 3.1 | |
| Energy | 2.9 | |
| Materials | 2.4 | |
| Real Estate | 1.8 | |
| Utilities | 1.4 | |
| |
| Equities | 72.0 |
| Bonds | 23.7 |
| Short-Term Investments and Net Other Assets (Liabilities) | 4.3 |
ASSET ALLOCATION (% of Fund's net assets) |
|
| | Equities - 72.0 |
| | Bonds - 23.7 |
| | Short-Term Investments and Net Other Assets (Liabilities) - 4.3 |
| |
TOP HOLDINGS(% of Fund's net assets) | | |
| US Treasury Notes | 8.4 | |
| Microsoft Corp | 2.9 | |
| NVIDIA Corp | 2.8 | |
| Apple Inc | 2.7 | |
| Fidelity Blue Chip Growth ETF | 2.6 | |
| US Treasury Bonds | 2.2 | |
| Alphabet Inc Class A | 1.8 | |
| Amazon.com Inc | 1.8 | |
| Fidelity Hedged Equity ETF | 1.3 | |
| Fannie Mae Mortgage pass-thru certificates | 1.2 | |
| | 27.7 | |
How has the Fund changed?
This is a summary of certain changes to the Fund since January 1, 2024. For more complete information, you may review the Fund's next prospectus, which we expect to be available by April 30, 2025 at fundresearch.fidelity.com/prospectus/sec or upon request at 1-877-208-0098 or by sending an e-mail to funddocuments@fmr.com.
The fees associated with this class changed during the reporting year. The variations in class fees are primarily the result of the following changes:- Management fee
- Operating expenses
The fund's transfer agent and pricing & bookkeeping fees were changed to a fixed rate effective December 1, 2023. Effective March 1, 2024, the fund's management contract was amended to incorporate administrative services previously covered under separate services agreements (transfer agent and pricing & bookkeeping). The amended contract incorporates a management fee rate that may vary by class. The Adviser or an affiliate pays certain expenses of managing and operating the fund out of each class's management fee. | The fund modified its principal investment strategies during the reporting period.
|
The fund modified its principal investment risks during the reporting period. | |
| Fidelity, the Fidelity Investments Logo and all other Fidelity trademarks or service marks used herein are trademarks or service marks of FMR LLC. Any third-party marks that are used herein are trademarks or service marks of their respective owners. © 2025 FMR LLC. All rights reserved. |
| | For additional information about the Fund; including its prospectus, financial information, holdings and proxy information, scan the QR code or visit fundresearch.fidelity.com/prospectus/sec 1.9914173.100 468-TSRA-0325 |
| |
| | ANNUAL SHAREHOLDER REPORT | AS OF DECEMBER 31, 2024 | This report describes changes to the Fund that occurred during the reporting period. |
| | VIP FundsManager® 50% Portfolio VIP FundsManager® 50% Portfolio Service Class true |
| | | |
This annual shareholder report contains information about VIP FundsManager® 50% Portfolio for the period January 1, 2024 to December 31, 2024. You can find additional information about the Fund at fundresearch.fidelity.com/prospectus/sec. You can also request this information by contacting us at 1-877-208-0098 or by sending an e-mail to funddocuments@fmr.com.
What were your Fund costs for the last year?(based on hypothetical $10,000 investment)
FUND COST (PREVIOUS YEAR)
| | Costs of a $10,000 investment | Costs paid as a percentage of a $10,000 investment | |
| Service Class | $ 10 | 0.10% | |
What affected the Fund's performance this period?
•Risk assets largely produced positive results in 2024, influenced by an expanding global economy, a slowing in the pace of inflation in certain markets, and a pivot by some central banks toward monetary easing, despite ongoing geopolitical risk.
•Within this environment, asset class positioning contributed to the Portfolios' performance versus the Composite indexes, whereas security selection detracted.
•The Portfolios' core equity allocation strategy contributed to relative performance, led by an overweight among U.S. stocks. Equal-weight positioning in international developed- and emerging-markets equities added modest value. Meanwhile, small, out-of-benchmark allocations to real estate investment trusts and commodity-related securities slightly detracted.
•The portfolio's fixed-income allocation strategy also was beneficial from a relative performance standpoint. Specifically, an underweight in investment-grade bonds and cash, in favor of higher-risks segments of the fixed market was advantageous. That said, a small allocation to long-term U.S. Treasurys hurt.
•In terms of security selection, picks among U.S. equities notably pressured relative performance in 2024 due to disappointing results from Fidelity® VIP Stock Selector All Cap Portfolio, the largest equity holding this period. Investment choices in the information technology sector - particularly among software & services and semiconductor companies - detracted the most.
•Conversely, stock selection in developed international markets was a plus, propelled by Fidelity® International Discovery Fund and Fidelity® Overseas Fund. Picks in continental Europe fueled the former, while investment choices in the U.K. helped the latter.
•Security selection among investment-grade bonds also added value, driven by the efforts of our active bond fund managers. In contrast, stocks picks in emerging-markets equities modestly detracted.
•As of December 31, the Portfolios were overweight U.S. stocks and about neutrally weighted in international developed- and emerging-markets equities. Investment-grade bond and cash allocations remained below the Portfolios' target weightings.
How did the Fund perform over the past 10 years?
CUMULATIVE PERFORMANCE
December 31, 2014 through December 31, 2024.
Initial investment of $10,000.
Service Class | $10,000 | $10,006 | $10,436 | $11,944 | $11,314 | $13,338 | $15,213 | $16,736 | $14,408 | $16,259 | $17,642 |
Fidelity VIP FundsManager 50% Composite Index℠ | $10,000 | $10,053 | $10,637 | $11,950 | $11,529 | $13,568 | $15,236 | $16,704 | $14,358 | $16,308 | $17,789 |
S&P 500® Index | $10,000 | $10,138 | $11,351 | $13,829 | $13,223 | $17,386 | $20,585 | $26,494 | $21,696 | $27,399 | $34,254 |
| | 2014 | 2015 | 2016 | 2017 | 2018 | 2019 | 2020 | 2021 | 2022 | 2023 | 2024 |
AVERAGE ANNUAL TOTAL RETURNS:| | 1 Year | 5 Year | 10 Year |
| Service Class | 8.50% | 5.75% | 5.84% |
| Fidelity VIP FundsManager 50% Composite Index℠ | 9.08% | 5.57% | 5.93% |
| S&P 500® Index | 25.02% | 14.53% | 13.10% |
Visit institutional.fidelity.com for more recent performance information. |
The Fund's past performance is not a good predictor of the Fund's future performance. The graph and table do not reflect the deduction of taxes that a shareholder would pay on fund distributions or redemption of fund shares. |
Key Fund Statistics(as of December 31, 2024)
KEY FACTS | | |
| Fund Size | $3,953,645,477 | |
| Number of Holdings | 39 | |
| Total Advisory Fee | $4,172,041 | |
| Portfolio Turnover | 20% | |
What did the Fund invest in?
(as of December 31, 2024)
| Bond Funds | 38.8 |
| Domestic Equity Funds | 32.1 |
| International Equity Funds | 19.9 |
| Alternative Funds | 1.3 |
| Short-Term Investments and Net Other Assets (Liabilities) | 7.9 |
ASSET ALLOCATION (% of Fund's net assets) |
|
| | Bond Funds - 38.8 |
| | Domestic Equity Funds - 32.1 |
| | International Equity Funds - 19.9 |
| | Alternative Funds - 1.3 |
| | Short-Term Investments and Net Other Assets (Liabilities) - 7.9 |
| |
TOP HOLDINGS(% of Fund's net assets) | | |
| VIP Stock Selector All Cap Portfolio - Investor Class | 24.9 | |
| Fidelity Total Bond Fund | 17.4 | |
| VIP Investment Grade Bond II Portfolio - Investor Class | 17.3 | |
| Fidelity Emerging Markets Fund | 5.2 | |
| Fidelity Overseas Fund | 4.5 | |
| Fidelity Enhanced International ETF | 2.1 | |
| Fidelity International Discovery Fund | 1.6 | |
| Fidelity Inflation-Protected Bond Index Fund | 1.5 | |
| Fidelity International Capital Appreciation Fund | 1.3 | |
| Fidelity Stock Selector Small Cap Fund | 1.3 | |
| | 77.1 | |
How has the Fund changed?
This is a summary of certain changes to the Fund since January 1, 2024. For more complete information, you may review the Fund's next prospectus, which we expect to be available by April 30, 2025 at fundresearch.fidelity.com/prospectus/sec or upon request at 1-877-208-0098 or by sending an e-mail to funddocuments@fmr.com.
The fund modified its principal investment strategies during the reporting period. | The fund modified its principal investment risks during the reporting period.
|
| Fidelity, the Fidelity Investments Logo and all other Fidelity trademarks or service marks used herein are trademarks or service marks of FMR LLC. Any third-party marks that are used herein are trademarks or service marks of their respective owners. © 2025 FMR LLC. All rights reserved. |
| | For additional information about the Fund; including its prospectus, financial information, holdings and proxy information, scan the QR code or visit fundresearch.fidelity.com/prospectus/sec 1.9914307.100 1588-TSRA-0325 |
| |
| | ANNUAL SHAREHOLDER REPORT | AS OF DECEMBER 31, 2024 | This report describes changes to the Fund that occurred during the reporting period. |
| | VIP Strategic Income Portfolio VIP Strategic Income Portfolio Initial Class true |
| | | |
This annual shareholder report contains information about VIP Strategic Income Portfolio for the period January 1, 2024 to December 31, 2024. You can find additional information about the Fund at fundresearch.fidelity.com/prospectus/sec. You can also request this information by contacting us at 1-877-208-0098 or by sending an e-mail to funddocuments@fmr.com.
What were your Fund costs for the last year?(based on hypothetical $10,000 investment)
FUND COST (PREVIOUS YEAR)
| | Costs of a $10,000 investment | Costs paid as a percentage of a $10,000 investment | |
| Initial Class | $ 66 | 0.64% | |
What affected the Fund's performance this period?
•Risk assets fared well in 2024, driven by a sturdy economy, the U.S. Federal Reserve's long-anticipated pivot to cutting interest rates and the potential for artificial intelligence to drive transformative change.
•Against this backdrop, compared with the Fidelity Strategic Income Composite IndexSM, security selection among high-yield bonds meaningfully contributed to the fund's result, especially picks in the energy, technology & electronics and financial services categories.
•Investment choices in emerging-markets debt also added value relative to the Composite index, with bond picks in Chile and Peru as standouts.
•On the negative side, an allocation to U.S. Treasury futures, a position we established to help offset the portfolio's overall lower duration, underperformed in a generally rising interest-rate environment.
•Changes to the portfolio this period, which were modest, included adding exposure to emerging-markets debt and developed-markets international debt, while reducing the fund's allocation to floating-rate loans and high-yield bonds.
How did the Fund perform over the past 10 years?
CUMULATIVE PERFORMANCE
December 31, 2014 through December 31, 2024.
Initial investment of $10,000.
Initial Class | $10,000 | $9,837 | $10,651 | $11,481 | $11,185 | $12,404 | $13,336 | $13,834 | $12,277 | $13,432 | $14,248 |
Fidelity Strategic Income Composite Index℠ | $10,000 | $9,764 | $10,671 | $11,388 | $11,224 | $12,406 | $13,229 | $13,394 | $11,829 | $12,952 | $13,629 |
Bloomberg U.S. Universal Bond Index | $10,000 | $10,043 | $10,436 | $10,863 | $10,835 | $11,842 | $12,739 | $12,598 | $10,961 | $11,638 | $11,875 |
| | 2014 | 2015 | 2016 | 2017 | 2018 | 2019 | 2020 | 2021 | 2022 | 2023 | 2024 |
AVERAGE ANNUAL TOTAL RETURNS:| | 1 Year | 5 Year | 10 Year |
| Initial Class | 6.08% | 2.81% | 3.60% |
| Fidelity Strategic Income Composite Index℠ | 5.23% | 1.90% | 3.14% |
| Bloomberg U.S. Universal Bond Index | 2.04% | 0.06% | 1.73% |
Visit institutional.fidelity.com for more recent performance information. |
The Fund's past performance is not a good predictor of the Fund's future performance. The graph and table do not reflect the deduction of taxes that a shareholder would pay on fund distributions or redemption of fund shares. |
Key Fund Statistics(as of December 31, 2024)
KEY FACTS | | |
| Fund Size | $1,508,793,887 | |
| Number of Holdings | 1,470 | |
| Total Advisory Fee | $9,132,751 | |
| Portfolio Turnover | 77% | |
What did the Fund invest in?
(as of December 31, 2024)
The information in the following tables is based on the combined Investments of the Fund and it's pro-rata share of investments in Fidelity's Central Funds, other than the Commodity Strategy and Money Market Central Funds as applicable.
| U.S. Government and U.S. Government Agency Obligations | 24.8 |
| AAA | 2.9 |
| AA | 1.8 |
| A | 1.9 |
| BBB | 7.6 |
| BB | 13.4 |
| B | 17.9 |
| CCC,CC,C | 5.6 |
| D | 0.0 |
| Not Rated | 9.0 |
| Equities | 7.0 |
| Short-Term Investments and Net Other Assets (Liabilities) | 8.1 |
QUALITY DIVERSIFICATION (% of Fund's net assets) |
| |
| | U.S. Government and U.S. Government Agency Obligations - 24.8 |
| | AAA - 2.9 |
| | AA - 1.8 |
| | A - 1.9 |
| | BBB - 7.6 |
| | BB - 13.4 |
| | B - 17.9 |
| | CCC,CC,C - 5.6 |
| | D - 0.0 |
| | Not Rated - 9.0 |
| | Equities - 7.0 |
| | Short-Term Investments and Net Other Assets (Liabilities) - 8.1 |
| |
| We have used ratings from Moody's Investors Service, Inc. Where Moody's® ratings are not available, we have used S&P® ratings. All ratings are as of the date indicated and do not reflect subsequent changes. |
| High-Yield Debt | 40.6 |
| U.S. Government & Investment Grade-Debt | 30.1 |
| Emerging-Markets Debt | 15.5 |
| Foreign Developed-Markets Debt | 8.5 |
| Floating-Rate debt | 5.0 |
| Short-Term Investments and Net Other Assets (Liabilities) | 0.3 |
ASSET ALLOCATION (% of Fund's net assets) |
|
| | High-Yield Debt - 40.6 |
| | U.S. Government & Investment Grade-Debt - 30.1 |
| | Emerging-Markets Debt - 15.5 |
| | Foreign Developed-Markets Debt - 8.5 |
| | Floating-Rate debt - 5.0 |
| | Short-Term Investments and Net Other Assets (Liabilities) - 0.3 |
| |
| United States | 74.6 |
| Germany | 6.1 |
| Mexico | 1.3 |
| Brazil | 1.1 |
| United Kingdom | 1.1 |
| Canada | 1.0 |
| France | 1.0 |
| Saudi Arabia | 0.8 |
| Turkey | 0.8 |
| Others | 12.2 |
GEOGRAPHIC DIVERSIFICATION (% of Fund's net assets) |
|
| | United States - 74.6 |
| | Germany - 6.1 |
| | Mexico - 1.3 |
| | Brazil - 1.1 |
| | United Kingdom - 1.1 |
| | Canada - 1.0 |
| | France - 1.0 |
| | Saudi Arabia - 0.8 |
| | Turkey - 0.8 |
| | Others - 12.2 |
| |
TOP HOLDINGS(% of Fund's net assets) | | |
| US Treasury Notes | 18.8 | |
| US Treasury Bonds | 5.7 | |
| German Federal Republic | 5.7 | |
| Freddie Mac Multifamily Structured pass-thru certificates | 3.9 | |
| TransDigm Inc | 1.3 | |
| EchoStar Corp | 0.8 | |
| Energy Transfer LP | 0.8 | |
| Argentine Republic | 0.7 | |
| Turkish Republic | 0.7 | |
| NVIDIA Corp | 0.7 | |
| | 39.1 | |
How has the Fund changed?
This is a summary of certain changes to the Fund since January 1, 2024. For more complete information, you may review the Fund's next prospectus, which we expect to be available by April 30, 2025 at fundresearch.fidelity.com/prospectus/sec or upon request at 1-877-208-0098 or by sending an e-mail to funddocuments@fmr.com.
The fund's transfer agent and pricing & bookkeeping fees were changed to a fixed rate effective December 1, 2023. Effective March 1, 2024, the fund's management contract was amended to incorporate administrative services previously covered under separate services agreements (transfer agent and pricing & bookkeeping). The amended contract incorporates a management fee rate that may vary by class. The Adviser or an affiliate pays certain expenses of managing and operating the fund out of each class's management fee. | |
| Fidelity, the Fidelity Investments Logo and all other Fidelity trademarks or service marks used herein are trademarks or service marks of FMR LLC. Any third-party marks that are used herein are trademarks or service marks of their respective owners. © 2025 FMR LLC. All rights reserved. |
| | For additional information about the Fund; including its prospectus, financial information, holdings and proxy information, scan the QR code or visit fundresearch.fidelity.com/prospectus/sec 1.9914255.100 1326-TSRA-0325 |
| |
| | ANNUAL SHAREHOLDER REPORT | AS OF DECEMBER 31, 2024 | This report describes changes to the Fund that occurred during the reporting period. |
| | VIP FundsManager® 85% Portfolio VIP FundsManager® 85% Portfolio Service Class true |
| | | |
This annual shareholder report contains information about VIP FundsManager® 85% Portfolio for the period January 1, 2024 to December 31, 2024. You can find additional information about the Fund at fundresearch.fidelity.com/prospectus/sec. You can also request this information by contacting us at 1-877-208-0098 or by sending an e-mail to funddocuments@fmr.com.
What were your Fund costs for the last year?(based on hypothetical $10,000 investment)
FUND COST (PREVIOUS YEAR)
| | Costs of a $10,000 investment | Costs paid as a percentage of a $10,000 investment | |
| Service Class | $ 11 | 0.10% | |
What affected the Fund's performance this period?
•Risk assets largely produced positive results in 2024, influenced by an expanding global economy, a slowing in the pace of inflation in certain markets, and a pivot by some central banks toward monetary easing, despite ongoing geopolitical risk.
•Within this environment, asset class positioning contributed to the Portfolios' performance versus the Composite indexes, whereas security selection detracted.
•The Portfolios' core equity allocation strategy contributed to relative performance, led by an overweight among U.S. stocks. Equal-weight positioning in international developed- and emerging-markets equities added modest value. Meanwhile, small, out-of-benchmark allocations to real estate investment trusts and commodity-related securities slightly detracted.
•The portfolio's fixed-income allocation strategy also was beneficial from a relative performance standpoint. Specifically, an underweight in investment-grade bonds and cash, in favor of higher-risks segments of the fixed market was advantageous. That said, a small allocation to long-term U.S. Treasurys hurt.
•In terms of security selection, picks among U.S. equities notably pressured relative performance in 2024 due to disappointing results from Fidelity® VIP Stock Selector All Cap Portfolio, the largest equity holding this period. Investment choices in the information technology sector - particularly among software & services and semiconductor companies - detracted the most.
•Conversely, stock selection in developed international markets was a plus, propelled by Fidelity® International Discovery Fund and Fidelity® Overseas Fund. Picks in continental Europe fueled the former, while investment choices in the U.K. helped the latter.
•Security selection among investment-grade bonds also added value, driven by the efforts of our active bond fund managers. In contrast, stocks picks in emerging-markets equities modestly detracted.
•As of December 31, the Portfolios were overweight U.S. stocks and about neutrally weighted in international developed- and emerging-markets equities. Investment-grade bond and cash allocations remained below the Portfolios' target weightings.
How did the Fund perform over the past 10 years?
CUMULATIVE PERFORMANCE
December 31, 2014 through December 31, 2024.
Initial investment of $10,000.
Service Class | $10,000 | $10,040 | $10,608 | $13,053 | $11,891 | $14,988 | $17,676 | $20,861 | $17,313 | $20,375 | $22,928 |
Fidelity VIP FundsManager 85% Composite Index℠ | $10,000 | $10,033 | $10,867 | $12,975 | $12,135 | $15,212 | $17,643 | $20,771 | $17,159 | $20,484 | $23,360 |
S&P 500® Index | $10,000 | $10,138 | $11,351 | $13,829 | $13,223 | $17,386 | $20,585 | $26,494 | $21,696 | $27,399 | $34,254 |
| | 2014 | 2015 | 2016 | 2017 | 2018 | 2019 | 2020 | 2021 | 2022 | 2023 | 2024 |
AVERAGE ANNUAL TOTAL RETURNS:| | 1 Year | 5 Year | 10 Year |
| Service Class | 12.53% | 8.87% | 8.65% |
| Fidelity VIP FundsManager 85% Composite Index℠ | 14.04% | 8.96% | 8.85% |
| S&P 500® Index | 25.02% | 14.53% | 13.10% |
Visit institutional.fidelity.com for more recent performance information. |
The Fund's past performance is not a good predictor of the Fund's future performance. The graph and table do not reflect the deduction of taxes that a shareholder would pay on fund distributions or redemption of fund shares. |
Key Fund Statistics(as of December 31, 2024)
KEY FACTS | | |
| Fund Size | $959,355,337 | |
| Number of Holdings | 42 | |
| Total Advisory Fee | $896,733 | |
| Portfolio Turnover | 34% | |
What did the Fund invest in?
(as of December 31, 2024)
| Domestic Equity Funds | 53.5 |
| International Equity Funds | 31.8 |
| Bond Funds | 13.1 |
| Alternative Funds | 1.3 |
| Short-Term Investments and Net Other Assets (Liabilities) | 0.3 |
ASSET ALLOCATION (% of Fund's net assets) |
|
| | Domestic Equity Funds - 53.5 |
| | International Equity Funds - 31.8 |
| | Bond Funds - 13.1 |
| | Alternative Funds - 1.3 |
| | Short-Term Investments and Net Other Assets (Liabilities) - 0.3 |
| |
TOP HOLDINGS(% of Fund's net assets) | | |
| VIP Stock Selector All Cap Portfolio - Investor Class | 43.2 | |
| Fidelity Overseas Fund | 9.7 | |
| Fidelity Emerging Markets Fund | 8.9 | |
| Fidelity Total Bond Fund | 4.8 | |
| VIP Investment Grade Bond II Portfolio - Investor Class | 4.8 | |
| Fidelity International Discovery Fund | 2.5 | |
| Fidelity Stock Selector Small Cap Fund | 2.3 | |
| Fidelity Enhanced International ETF | 2.2 | |
| Fidelity International Capital Appreciation Fund | 2.1 | |
| VIP Value Strategies Portfolio - Investor Class | 2.0 | |
| | 82.5 | |
How has the Fund changed?
This is a summary of certain changes to the Fund since January 1, 2024. For more complete information, you may review the Fund's next prospectus, which we expect to be available by April 30, 2025 at fundresearch.fidelity.com/prospectus/sec or upon request at 1-877-208-0098 or by sending an e-mail to funddocuments@fmr.com.
The fund modified its principal investment strategies during the reporting period. | The fund modified its principal investment risks during the reporting period.
|
| Fidelity, the Fidelity Investments Logo and all other Fidelity trademarks or service marks used herein are trademarks or service marks of FMR LLC. Any third-party marks that are used herein are trademarks or service marks of their respective owners. © 2025 FMR LLC. All rights reserved. |
| | For additional information about the Fund; including its prospectus, financial information, holdings and proxy information, scan the QR code or visit fundresearch.fidelity.com/prospectus/sec 1.9914313.100 1594-TSRA-0325 |
| |
| | ANNUAL SHAREHOLDER REPORT | AS OF DECEMBER 31, 2024 | This report describes changes to the Fund that occurred during the reporting period. |
| | VIP Investment Grade Bond Portfolio VIP Investment Grade Bond Portfolio Service Class 2 true |
| | | |
This annual shareholder report contains information about VIP Investment Grade Bond Portfolio for the period January 1, 2024 to December 31, 2024. You can find additional information about the Fund at fundresearch.fidelity.com/prospectus/sec. You can also request this information by contacting us at 1-877-208-0098 or by sending an e-mail to funddocuments@fmr.com.
What were your Fund costs for the last year?(based on hypothetical $10,000 investment)
FUND COST (PREVIOUS YEAR)
| | Costs of a $10,000 investment | Costs paid as a percentage of a $10,000 investment | |
| Service Class 2 | $ 63 | 0.63% | |
What affected the Fund's performance this period?
•U.S. taxable investment-grade bonds posted a modest advance in 2024, rallying during the summer months, as the bond market reflected anticipated interest-rate reductions by the U.S. Federal Reserve, but falling back in the fourth quarter when the Fed tempered rate-cut expectations for 2025.
•Against this backdrop, the fund's exposure to asset-backed securities, including collateralized loan obligations, was a key contributor to performance versus the Bloomberg U.S. Aggregate Bond Index for the fiscal year.
•An overweight to commercial mortgage-backed securities provided another performance advantage, as did an underweight to agency mortgage-backed securities.
•Among corporate bonds, industry allocation lifted relative performance as well, led by security selection among financials and an overweight in the segment. Specifically, positioning among banks and REITS was beneficial versus the index.
•Exposure to certain "plus" sectors, namely high yield bonds and emerging markets debt, also were modest contributors.
•In contrast, the fund's yield-curve positioning modestly detracted for the year.
How did the Fund perform over the past 10 years?
CUMULATIVE PERFORMANCE
December 31, 2014 through December 31, 2024.
Initial investment of $10,000.
Service Class 2 | $10,000 | $9,915 | $10,359 | $10,773 | $10,688 | $11,693 | $12,764 | $12,650 | $10,979 | $11,637 | $11,812 |
Bloomberg U.S. Aggregate Bond Index | $10,000 | $10,055 | $10,321 | $10,687 | $10,688 | $11,620 | $12,492 | $12,299 | $10,699 | $11,291 | $11,432 |
| | 2014 | 2015 | 2016 | 2017 | 2018 | 2019 | 2020 | 2021 | 2022 | 2023 | 2024 |
AVERAGE ANNUAL TOTAL RETURNS:| | 1 Year | 5 Year | 10 Year |
| Service Class 2 | 1.50% | 0.20% | 1.68% |
| Bloomberg U.S. Aggregate Bond Index | 1.25% | -0.33% | 1.35% |
Visit institutional.fidelity.com for more recent performance information. |
The Fund's past performance is not a good predictor of the Fund's future performance. The graph and table do not reflect the deduction of taxes that a shareholder would pay on fund distributions or redemption of fund shares. |
Key Fund Statistics(as of December 31, 2024)
KEY FACTS | | |
| Fund Size | $4,430,972,983 | |
| Number of Holdings | 2,224 | |
| Total Advisory Fee | $15,386,008 | |
| Portfolio Turnover | 205% | |
What did the Fund invest in?
(as of December 31, 2024)
The information in the following tables is based on the combined Investments of the Fund and it's pro-rata share of investments in Fidelity's Central Funds, other than the Commodity Strategy and Money Market Central Funds as applicable.
| U.S. Government and U.S. Government Agency Obligations | 63.0 |
| AAA | 9.0 |
| AA | 0.9 |
| A | 6.2 |
| BBB | 16.4 |
| BB | 2.9 |
| B | 1.3 |
| CCC,CC,C | 0.0 |
| Not Rated | 4.2 |
| Equities | 0.0 |
QUALITY DIVERSIFICATION (% of Fund's net assets) |
| |
| | U.S. Government and U.S. Government Agency Obligations - 63.0 |
| | AAA - 9.0 |
| | AA - 0.9 |
| | A - 6.2 |
| | BBB - 16.4 |
| | BB - 2.9 |
| | B - 1.3 |
| | CCC,CC,C - 0.0 |
| | Not Rated - 4.2 |
| | Equities - 0.0 |
| Short-Term Investments and Net Other Assets (Liabilities) - (3.9)% |
| |
| We have used ratings from Moody's Investors Service, Inc. Where Moody's® ratings are not available, we have used S&P® ratings. All ratings are as of the date indicated and do not reflect subsequent changes. |
| U.S. Treasury Obligations | 45.2 |
| Corporate Bonds | 24.9 |
| U.S. Government Agency - Mortgage Securities | 17.8 |
| Asset-Backed Securities | 8.6 |
| CMOs and Other Mortgage Related Securities | 7.0 |
| Other Investments | 0.2 |
| Purchased Options | 0.1 |
| Foreign Government and Government Agency Obligations | 0.1 |
| Preferred Securities | 0.0 |
| Bank Loan Obligations | 0.0 |
| Common Stocks | 0.0 |
ASSET ALLOCATION (% of Fund's net assets) |
|
| | U.S. Treasury Obligations - 45.2 |
| | Corporate Bonds - 24.9 |
| | U.S. Government Agency - Mortgage Securities - 17.8 |
| | Asset-Backed Securities - 8.6 |
| | CMOs and Other Mortgage Related Securities - 7.0 |
| | Other Investments - 0.2 |
| | Purchased Options - 0.1 |
| | Foreign Government and Government Agency Obligations - 0.1 |
| | Preferred Securities - 0.0 |
| | Bank Loan Obligations - 0.0 |
| | Common Stocks - 0.0 |
| Short-Term Investments and Net Other Assets (Liabilities) - (3.9)% |
| |
| United States | 90.8 |
| Grand Cayman (UK Overseas Ter) | 4.7 |
| Mexico | 1.0 |
| Ireland | 0.7 |
| United Kingdom | 0.6 |
| Netherlands | 0.4 |
| Switzerland | 0.4 |
| Bailiwick Of Jersey | 0.3 |
| Germany | 0.3 |
| Others | 0.8 |
GEOGRAPHIC DIVERSIFICATION (% of Fund's net assets) |
|
| | United States - 90.8 |
| | Grand Cayman (UK Overseas Ter) - 4.7 |
| | Mexico - 1.0 |
| | Ireland - 0.7 |
| | United Kingdom - 0.6 |
| | Netherlands - 0.4 |
| | Switzerland - 0.4 |
| | Bailiwick Of Jersey - 0.3 |
| | Germany - 0.3 |
| | Others - 0.8 |
| |
TOP HOLDINGS(% of Fund's net assets) | | |
| US Treasury Notes | 33.8 | |
| US Treasury Bonds | 11.4 | |
| Fannie Mae Mortgage pass-thru certificates | 6.4 | |
| Ginnie Mae II Pool | 5.2 | |
| Freddie Mac Gold Pool | 3.4 | |
| Uniform Mortgage Backed Securities | 2.1 | |
| Freddie Mac Multifamily Structured pass-thru certificates | 1.4 | |
| Bank of America Corp | 1.1 | |
| Petroleos Mexicanos | 1.0 | |
| Morgan Stanley | 1.0 | |
| | 66.8 | |
How has the Fund changed?
This is a summary of certain changes to the Fund since January 1, 2024. For more complete information, you may review the Fund's next prospectus, which we expect to be available by April 30, 2025 at fundresearch.fidelity.com/prospectus/sec or upon request at 1-877-208-0098 or by sending an e-mail to funddocuments@fmr.com.
The fund's transfer agent and pricing & bookkeeping fees were changed to a fixed rate effective December 1, 2023. Effective March 1, 2024, the fund's management contract was amended to incorporate administrative services previously covered under separate services agreements (transfer agent and pricing & bookkeeping). The amended contract incorporates a management fee rate that may vary by class. The Adviser or an affiliate pays certain expenses of managing and operating the fund out of each class's management fee. | |
| Fidelity, the Fidelity Investments Logo and all other Fidelity trademarks or service marks used herein are trademarks or service marks of FMR LLC. Any third-party marks that are used herein are trademarks or service marks of their respective owners. © 2025 FMR LLC. All rights reserved. |
| | For additional information about the Fund; including its prospectus, financial information, holdings and proxy information, scan the QR code or visit fundresearch.fidelity.com/prospectus/sec 1.9914193.100 367-TSRA-0325 |
| |
| | ANNUAL SHAREHOLDER REPORT | AS OF DECEMBER 31, 2024 | |
| | VIP Freedom 2020 Portfolio℠ VIP Freedom 2020 Portfolio℠ Service Class 2 true |
| | | |
This annual shareholder report contains information about VIP Freedom 2020 Portfolio℠ for the period January 1, 2024 to December 31, 2024. You can find additional information about the Fund at fundresearch.fidelity.com/prospectus/sec. You can also request this information by contacting us at 1-877-208-0098 or by sending an e-mail to funddocuments@fmr.com.
What were your Fund costs for the last year?(based on hypothetical $10,000 investment)
FUND COST (PREVIOUS YEAR)
| | Costs of a $10,000 investment | Costs paid as a percentage of a $10,000 investment | |
| Service Class 2 | $ 26 | 0.25% | |
What affected the Fund's performance this period?
•Risk assets largely produced positive results in 2024, influenced by an expanding global economy and a slowing in the pace of inflation in certain markets, as well as a pivot by some central banks toward monetary easing, despite ongoing geopolitical risk.
•Against this backdrop, active asset allocation positioning detracted from the fund's performance relative to the Composite index, whereas the performance of the underlying investment portfolios contributed.
•In terms of active asset allocation, an underweight in outperforming U.S. equities hurt the fund's relative result the past 12 months, as did an overweight in lagging long-term U.S. Treasurys and outsized exposure to non-U.S. equities. Conversely, an underweight in relatively weaker-performing investment-grade bonds added relative value for the fund.
•Looking at the performance of the underlying portfolios, investments in non-U.S. equities contributed to the fund's relative result. Investments in U.S. investment-grade bonds and U.S. equities also helped to a lesser extent. Within U.S. equities, VIP Contrafund Portfolio (+33.79%) notably outperformed its benchmark, the S&P 500® index (+25.02%). Elsewhere among non-U.S. equities, VIP Overseas Portfolio (+5%) topped the MSCI EAFE index (+4.07%) and VIP Emerging Markets Portfolio (+10.04%) outpaced the MSCI EM Index (+7.50%).
•At the other end of the performance spectrum of underlying funds, within equities, VIP Growth Portfolio (+30.39%) lagged its benchmark, the Russell 3000® Index (+32.46%), and VIP Growth & Income Portfolio (+22.21%) trailed the S&P 500® index.
How did the Fund perform over the past 10 years?
CUMULATIVE PERFORMANCE
December 31, 2014 through December 31, 2024.
Initial investment of $10,000.
Service Class 2 | $10,000 | $9,954 | $10,532 | $12,244 | $11,500 | $13,786 | $15,815 | $17,280 | $14,521 | $16,296 | $17,502 |
Fidelity VIP Freedom 2020 Composite Index℠ | $10,000 | $9,960 | $10,663 | $12,190 | $11,734 | $13,901 | $15,674 | $17,037 | $14,442 | $16,306 | $17,620 |
Bloomberg U.S. Aggregate Bond Index | $10,000 | $10,055 | $10,321 | $10,687 | $10,688 | $11,620 | $12,492 | $12,299 | $10,699 | $11,291 | $11,432 |
| | 2014 | 2015 | 2016 | 2017 | 2018 | 2019 | 2020 | 2021 | 2022 | 2023 | 2024 |
AVERAGE ANNUAL TOTAL RETURNS:| | 1 Year | 5 Year | 10 Year |
| Service Class 2 | 7.40% | 4.89% | 5.76% |
| Fidelity VIP Freedom 2020 Composite Index℠ | 8.05% | 4.85% | 5.83% |
| Bloomberg U.S. Aggregate Bond Index | 1.25% | -0.33% | 1.35% |
Visit institutional.fidelity.com for more recent performance information. |
The Fund's past performance is not a good predictor of the Fund's future performance. The graph and table do not reflect the deduction of taxes that a shareholder would pay on fund distributions or redemption of fund shares. |
Key Fund Statistics(as of December 31, 2024)
KEY FACTS | | |
| Fund Size | $536,951,422 | |
| Number of Holdings | 15 | |
| Total Advisory Fee | $0 | |
| Portfolio Turnover | 29% | |
What did the Fund invest in?
(as of December 31, 2024)
| Bond Funds | 52.2 |
| Domestic Equity Funds | 24.4 |
| International Equity Funds | 22.7 |
| Short-Term Funds | 0.7 |
| Short-Term Investments and Net Other Assets (Liabilities) | 0.0 |
ASSET ALLOCATION (% of Fund's net assets) |
|
| | Bond Funds - 52.2 |
| | Domestic Equity Funds - 24.4 |
| | International Equity Funds - 22.7 |
| | Short-Term Funds - 0.7 |
| | Short-Term Investments and Net Other Assets (Liabilities) - 0.0 |
| |
TOP HOLDINGS(% of Fund's net assets) | | |
| VIP Investment Grade Bond II Portfolio - Initial Class | 30.3 | |
| VIP Overseas Portfolio - Initial Class | 14.4 | |
| Fidelity Inflation-Protected Bond Index Fund | 13.3 | |
| VIP Emerging Markets Portfolio - Initial Class | 8.3 | |
| VIP Growth Portfolio - Initial Class | 7.1 | |
| VIP Growth & Income Portfolio - Initial Class | 4.8 | |
| VIP Contrafund Portfolio - Initial Class | 4.3 | |
| Fidelity International Bond Index Fund | 4.0 | |
| VIP Equity-Income Portfolio - Initial Class | 3.5 | |
| Fidelity Long-Term Treasury Bond Index Fund | 3.4 | |
| | 93.4 | |
| Fidelity, the Fidelity Investments Logo and all other Fidelity trademarks or service marks used herein are trademarks or service marks of FMR LLC. Any third-party marks that are used herein are trademarks or service marks of their respective owners. © 2025 FMR LLC. All rights reserved. |
| | For additional information about the Fund; including its prospectus, financial information, holdings and proxy information, scan the QR code or visit fundresearch.fidelity.com/prospectus/sec 1.9914282.100 1431-TSRA-0325 |
| |
| | ANNUAL SHAREHOLDER REPORT | AS OF DECEMBER 31, 2024 | This report describes changes to the Fund that occurred during the reporting period. |
| | VIP Asset Manager: Growth Portfolio VIP Asset Manager: Growth Portfolio Service Class 2 true |
| | | |
This annual shareholder report contains information about VIP Asset Manager: Growth Portfolio for the period January 1, 2024 to December 31, 2024. You can find additional information about the Fund at fundresearch.fidelity.com/prospectus/sec. You can also request this information by contacting us at 1-877-208-0098 or by sending an e-mail to funddocuments@fmr.com.
What were your Fund costs for the last year?(based on hypothetical $10,000 investment)
FUND COST (PREVIOUS YEAR)
| | Costs of a $10,000 investment | Costs paid as a percentage of a $10,000 investment | |
| Service Class 2 | $ 93 | 0.89% | |
What affected the Fund's performance this period?
•Risk assets largely produced positive results in 2024, influenced by an expanding global economy, a slowing in the pace of inflation in certain markets, and a pivot by some central banks toward monetary easing, despite ongoing geopolitical risk.
•Within this environment, asset class positioning contributed to the fund's performance versus the Composite index, whereas security selection detracted.
•The portfolio's core equity allocation strategy contributed to relative performance, led by an overweight among U.S. stocks. Equal-weight positioning in international developed- and emerging-markets equities also added modest value. Meanwhile, small, out-of-benchmark allocations to real estate investment trusts and commodity-related securities slightly detracted.
•The portfolio's fixed-income positioning was beneficial from a relative performance standpoint. Specifically, an underweight in investment-grade bonds and cash, in favor of higher-risk segments of the fixed income market was advantageous. That said, a small allocation to long-term U.S. Treasurys hurt.
•In terms of security selection, picks among U.S. equities pressured relative performance in 2024. Investment choices in the information technology sector - particularly among software & services and semiconductor companies - detracted the most.
•Stock selection among international developed-market stocks, on the other hand, aided the fund's relative return. Here, picks in Japan, Germany and the U.K., along with favorable positioning in continental European equity markets, helped the most. Conversely, investment choices and an underweight in the strong-performing Canadian stock market detracted.
•Security selection among investment-grade bonds also added value. Corporate debt issued by banks, real estate investment trusts, insurers and consumer staples companies, contributed to the portfolio's relative outcome. Elsewhere, stakes in asset-backed securities, non-government-agency mortgage-backed securities and U.S. Treasurys, helped as well.
•As of December 31, the fund was overweight U.S. stocks and about neutrally weighted in international developed- and emerging-markets equities. Investment-grade bond and cash allocations remained below the fund's target weighting.
How did the Fund perform over the past 10 years?
CUMULATIVE PERFORMANCE
December 31, 2014 through December 31, 2024.
Initial investment of $10,000.
Service Class 2 | $10,000 | $9,982 | $10,199 | $12,085 | $11,132 | $13,636 | $15,948 | $18,130 | $15,039 | $17,453 | $19,294 |
Fidelity Asset Manager 70% Composite Index℠ | $10,000 | $10,015 | $10,811 | $12,619 | $11,951 | $14,563 | $16,749 | $18,997 | $16,013 | $18,717 | $20,950 |
S&P 500® Index | $10,000 | $10,138 | $11,351 | $13,829 | $13,223 | $17,386 | $20,585 | $26,494 | $21,696 | $27,399 | $34,254 |
| | 2014 | 2015 | 2016 | 2017 | 2018 | 2019 | 2020 | 2021 | 2022 | 2023 | 2024 |
AVERAGE ANNUAL TOTAL RETURNS:| | 1 Year | 5 Year | 10 Year |
| Service Class 2 | 10.55% | 7.19% | 6.79% |
| Fidelity Asset Manager 70% Composite Index℠ | 11.93% | 7.54% | 7.68% |
| S&P 500® Index | 25.02% | 14.53% | 13.10% |
Visit institutional.fidelity.com for more recent performance information. |
The Fund's past performance is not a good predictor of the Fund's future performance. The graph and table do not reflect the deduction of taxes that a shareholder would pay on fund distributions or redemption of fund shares. |
Key Fund Statistics(as of December 31, 2024)
KEY FACTS | | |
| Fund Size | $277,549,788 | |
| Number of Holdings | 27 | |
| Total Advisory Fee | $1,610,000 | |
| Portfolio Turnover | 21% | |
What did the Fund invest in?
(as of December 31, 2024)
The information in the following tables is based on the combined Investments of the Fund and it's pro-rata share of investments in Fidelity's Central Funds, other than the Commodity Strategy and Money Market Central Funds as applicable.
| U.S. Government and U.S. Government Agency Obligations | 14.1 |
| AAA | 1.4 |
| AA | 0.1 |
| A | 1.5 |
| BBB | 3.0 |
| BB | 1.1 |
| B | 0.8 |
| CCC,CC,C | 0.2 |
| D | 0.0 |
| Not Rated | 0.6 |
| Equities | 72.9 |
| Short-Term Investments and Net Other Assets (Liabilities) | 4.3 |
QUALITY DIVERSIFICATION (% of Fund's net assets) |
| |
| | U.S. Government and U.S. Government Agency Obligations - 14.1 |
| | AAA - 1.4 |
| | AA - 0.1 |
| | A - 1.5 |
| | BBB - 3.0 |
| | BB - 1.1 |
| | B - 0.8 |
| | CCC,CC,C - 0.2 |
| | D - 0.0 |
| | Not Rated - 0.6 |
| | Equities - 72.9 |
| | Short-Term Investments and Net Other Assets (Liabilities) - 4.3 |
| |
| We have used ratings from Moody's Investors Service, Inc. Where Moody's® ratings are not available, we have used S&P® ratings. All ratings are as of the date indicated and do not reflect subsequent changes. |
MARKET SECTORS (% of Fund's net assets) | | |
| Information Technology | 16.9 | |
| Financials | 14.6 | |
| Industrials | 8.2 | |
| Consumer Discretionary | 7.8 | |
| Health Care | 6.5 | |
| Communication Services | 5.5 | |
| Consumer Staples | 3.1 | |
| Energy | 2.9 | |
| Materials | 2.4 | |
| Real Estate | 1.8 | |
| Utilities | 1.4 | |
| |
| Equities | 72.0 |
| Bonds | 23.7 |
| Short-Term Investments and Net Other Assets (Liabilities) | 4.3 |
ASSET ALLOCATION (% of Fund's net assets) |
|
| | Equities - 72.0 |
| | Bonds - 23.7 |
| | Short-Term Investments and Net Other Assets (Liabilities) - 4.3 |
| |
TOP HOLDINGS(% of Fund's net assets) | | |
| US Treasury Notes | 8.4 | |
| Microsoft Corp | 2.9 | |
| NVIDIA Corp | 2.8 | |
| Apple Inc | 2.7 | |
| Fidelity Blue Chip Growth ETF | 2.6 | |
| US Treasury Bonds | 2.2 | |
| Alphabet Inc Class A | 1.8 | |
| Amazon.com Inc | 1.8 | |
| Fidelity Hedged Equity ETF | 1.3 | |
| Fannie Mae Mortgage pass-thru certificates | 1.2 | |
| | 27.7 | |
How has the Fund changed?
This is a summary of certain changes to the Fund since January 1, 2024. For more complete information, you may review the Fund's next prospectus, which we expect to be available by April 30, 2025 at fundresearch.fidelity.com/prospectus/sec or upon request at 1-877-208-0098 or by sending an e-mail to funddocuments@fmr.com.
The fund's transfer agent and pricing & bookkeeping fees were changed to a fixed rate effective December 1, 2023. Effective March 1, 2024, the fund's management contract was amended to incorporate administrative services previously covered under separate services agreements (transfer agent and pricing & bookkeeping). The amended contract incorporates a management fee rate that may vary by class. The Adviser or an affiliate pays certain expenses of managing and operating the fund out of each class's management fee. | The fund modified its principal investment strategies during the reporting period.
|
The fund modified its principal investment risks during the reporting period. | |
| Fidelity, the Fidelity Investments Logo and all other Fidelity trademarks or service marks used herein are trademarks or service marks of FMR LLC. Any third-party marks that are used herein are trademarks or service marks of their respective owners. © 2025 FMR LLC. All rights reserved. |
| | For additional information about the Fund; including its prospectus, financial information, holdings and proxy information, scan the QR code or visit fundresearch.fidelity.com/prospectus/sec 1.9914172.100 364-TSRA-0325 |
| |
| | ANNUAL SHAREHOLDER REPORT | AS OF DECEMBER 31, 2024 | |
| | VIP Investor Freedom 2040 Portfolio℠ VIP Investor Freedom 2040 Portfolio℠ true |
| | | |
This annual shareholder report contains information about VIP Investor Freedom 2040 Portfolio℠ for the period January 1, 2024 to December 31, 2024. You can find additional information about the Fund at fundresearch.fidelity.com/prospectus/sec. You can also request this information by contacting us at 1-877-208-0098 or by sending an e-mail to funddocuments@fmr.com.
What were your Fund costs for the last year?(based on hypothetical $10,000 investment)
FUND COST (PREVIOUS YEAR)
| | Costs of a $10,000 investment | Costs paid as a percentage of a $10,000 investment | |
| VIP Investor Freedom 2040 Portfolio℠ | $ 0 A | 0.00%B | |
A Amount represents less than $.50
B Amount represents less than 0.005%
What affected the Fund's performance this period?
•Risk assets largely produced positive results in 2024, influenced by an expanding global economy and a slowing in the pace of inflation in certain markets, as well as a pivot by some central banks toward monetary easing, despite ongoing geopolitical risk.
•Against this backdrop, active asset allocation positioning detracted from the fund's performance relative to the Composite index, whereas the performance of the underlying investment portfolios contributed.
•In terms of active asset allocation, an underweight in outperforming U.S. equities hurt the fund's relative result the past 12 months, as did an overweight in lagging long-term U.S. Treasurys and outsized exposure to non-U.S. equities. Conversely, underweighting relatively weaker-performing investment-grade bonds added relative value for the fund.
•Looking at the performance of the underlying portfolios, investments in non-U.S. equities contributed to the fund's relative result. Investments in U.S. investment-grade bonds and U.S. equities also helped to a lesser extent. Within U.S. equities, VIP Contrafund Portfolio (+33.70%) notably outperformed its benchmark, the S&P 500® index (+25.02%). Elsewhere in non-U.S. equities, VIP Overseas Portfolio (+4.97%) topped the MSCI EAFE index (+4.07%) and VIP Emerging Markets Portfolio (+9.90%) outpaced the MSCI EM Index (+7.50%).
•At the other end of the performance spectrum of underlying funds, in terms of equities, VIP Growth Portfolio (+30.30%) lagged its benchmark, the Russell 3000® Index (+32.46%), and VIP Growth & Income Portfolio (+22.18%) trailed the S&P 500® index.
How did the Fund perform over the life of Fund?
CUMULATIVE PERFORMANCE
April 13, 2023 through December 31, 2024.
Initial investment of $10,000.
VIP Investor Freedom 2040 Portfolio℠ | $10,000 | $11,001 |
Fidelity VIP Freedom 2040 Composite Index℠ | $10,000 | $11,072 |
S&P 500® Index | $10,000 | $11,636 |
| | 2023 | 2024 |
AVERAGE ANNUAL TOTAL RETURNS:| | 1 Year | Life of Fund A |
| VIP Investor Freedom 2040 Portfolio℠ | 12.93% | 13.44% |
| Fidelity VIP Freedom 2040 Composite Index℠ | 13.63% | 14.27% |
| S&P 500® Index | 25.02% | 24.34% |
A From April 13, 2023
Visit institutional.fidelity.com for more recent performance information. |
The Fund's past performance is not a good predictor of the Fund's future performance. The graph and table do not reflect the deduction of taxes that a shareholder would pay on fund distributions or redemption of fund shares. |
Key Fund Statistics(as of December 31, 2024)
KEY FACTS | | |
| Fund Size | $13,516,384 | |
| Number of Holdings | 14 | |
| Total Advisory Fee | $0 | |
| Portfolio Turnover | 27% | |
What did the Fund invest in?
(as of December 31, 2024)
| Domestic Equity Funds | 47.8 |
| International Equity Funds | 38.5 |
| Bond Funds | 13.7 |
| Short-Term Investments and Net Other Assets (Liabilities) | 0.0 |
ASSET ALLOCATION (% of Fund's net assets) |
|
| | Domestic Equity Funds - 47.8 |
| | International Equity Funds - 38.5 |
| | Bond Funds - 13.7 |
| | Short-Term Investments and Net Other Assets (Liabilities) - 0.0 |
| |
TOP HOLDINGS(% of Fund's net assets) | | |
| VIP Overseas Portfolio - Investor Class | 25.6 | |
| VIP Growth Portfolio - Investor Class | 13.9 | |
| VIP Emerging Markets Portfolio - Investor Class | 12.9 | |
| VIP Growth & Income Portfolio - Investor Class | 9.4 | |
| VIP Contrafund Portfolio - Investor Class | 8.4 | |
| Fidelity Long-Term Treasury Bond Index Fund | 8.0 | |
| VIP Equity Income Portfolio - Investor Class | 6.8 | |
| VIP Value Portfolio - Investor Class | 4.8 | |
| VIP Value Strategies Portfolio - Investor Class | 2.4 | |
| Fidelity International Bond Index Fund | 2.3 | |
| | 94.5 | |
| Fidelity, the Fidelity Investments Logo and all other Fidelity trademarks or service marks used herein are trademarks or service marks of FMR LLC. Any third-party marks that are used herein are trademarks or service marks of their respective owners. © 2025 FMR LLC. All rights reserved. |
| | For additional information about the Fund; including its prospectus, financial information, holdings and proxy information, scan the QR code or visit fundresearch.fidelity.com/prospectus/sec 1.9914406.100 6575-TSRA-0325 |
| |
| | ANNUAL SHAREHOLDER REPORT | AS OF DECEMBER 31, 2024 | |
| | VIP Freedom 2015 Portfolio℠ VIP Freedom 2015 Portfolio℠ Initial Class true |
| | | |
This annual shareholder report contains information about VIP Freedom 2015 Portfolio℠ for the period January 1, 2024 to December 31, 2024. You can find additional information about the Fund at fundresearch.fidelity.com/prospectus/sec. You can also request this information by contacting us at 1-877-208-0098 or by sending an e-mail to funddocuments@fmr.com.
What were your Fund costs for the last year?(based on hypothetical $10,000 investment)
FUND COST (PREVIOUS YEAR)
| | Costs of a $10,000 investment | Costs paid as a percentage of a $10,000 investment | |
| Initial Class | $ 0 A | 0.00%B | |
AAmount represents less than $.50
BAmount represents less than 0.005%
What affected the Fund's performance this period?
•Risk assets largely produced positive results in 2024, influenced by an expanding global economy and a slowing in the pace of inflation in certain markets, as well as a pivot by some central banks toward monetary easing, despite ongoing geopolitical risk.
•Against this backdrop, active asset allocation positioning detracted from the fund's performance relative to the Composite index, whereas the performance of the underlying investment portfolios contributed.
•In terms of active asset allocation, an underweight in outperforming U.S. equities hurt the fund's relative result the past 12 months, as did an overweight in lagging long-term U.S. Treasurys and outsized exposure to non-U.S. equities. Conversely, an underweight in relatively weaker-performing investment-grade bonds added relative value for the fund.
•Looking at the performance of the underlying portfolios, investments in non-U.S. equities contributed to the fund's relative result. Investments in U.S. investment-grade bonds and U.S. equities also helped to a lesser extent. Within U.S. equities, VIP Contrafund Portfolio (+33.79%) notably outperformed its benchmark, the S&P 500® index (+25.02%). Elsewhere among non-U.S. equities, VIP Overseas Portfolio (+5%) topped the MSCI EAFE index (+4.07%) and VIP Emerging Markets Portfolio (+10.04%) outpaced the MSCI EM Index (+7.50%).
•At the other end of the performance spectrum of underlying funds, within equities, VIP Growth Portfolio (+30.39%) lagged its benchmark, the Russell 3000® Index (+32.46%), and VIP Growth & Income Portfolio (+22.21%) trailed the S&P 500® index.
How did the Fund perform over the past 10 years?
CUMULATIVE PERFORMANCE
December 31, 2014 through December 31, 2024.
Initial investment of $10,000.
Initial Class | $10,000 | $9,967 | $10,556 | $12,150 | $11,534 | $13,651 | $15,529 | $16,724 | $14,283 | $15,847 | $16,880 |
Fidelity VIP Freedom 2015 Composite Index℠ | $10,000 | $9,970 | $10,622 | $12,001 | $11,636 | $13,578 | $15,155 | $16,227 | $13,946 | $15,534 | $16,608 |
Bloomberg U.S. Aggregate Bond Index | $10,000 | $10,055 | $10,321 | $10,687 | $10,688 | $11,620 | $12,492 | $12,299 | $10,699 | $11,291 | $11,432 |
| | 2014 | 2015 | 2016 | 2017 | 2018 | 2019 | 2020 | 2021 | 2022 | 2023 | 2024 |
AVERAGE ANNUAL TOTAL RETURNS:| | 1 Year | 5 Year | 10 Year |
| Initial Class | 6.52% | 4.34% | 5.37% |
| Fidelity VIP Freedom 2015 Composite Index℠ | 6.91% | 4.11% | 5.20% |
| Bloomberg U.S. Aggregate Bond Index | 1.25% | -0.33% | 1.35% |
Visit institutional.fidelity.com for more recent performance information. |
The Fund's past performance is not a good predictor of the Fund's future performance. The graph and table do not reflect the deduction of taxes that a shareholder would pay on fund distributions or redemption of fund shares. |
Key Fund Statistics(as of December 31, 2024)
KEY FACTS | | |
| Fund Size | $58,148,499 | |
| Number of Holdings | 15 | |
| Total Advisory Fee | $0 | |
| Portfolio Turnover | 35% | |
What did the Fund invest in?
(as of December 31, 2024)
| Bond Funds | 56.3 |
| International Equity Funds | 19.1 |
| Domestic Equity Funds | 18.8 |
| Short-Term Funds | 5.8 |
| Short-Term Investments and Net Other Assets (Liabilities) | 0.0 |
ASSET ALLOCATION (% of Fund's net assets) |
|
| | Bond Funds - 56.3 |
| | International Equity Funds - 19.1 |
| | Domestic Equity Funds - 18.8 |
| | Short-Term Funds - 5.8 |
| | Short-Term Investments and Net Other Assets (Liabilities) - 0.0 |
| |
TOP HOLDINGS(% of Fund's net assets) | | |
| VIP Investment Grade Bond II Portfolio - Initial Class | 34.3 | |
| Fidelity Inflation-Protected Bond Index Fund | 14.1 | |
| VIP Overseas Portfolio - Initial Class | 11.9 | |
| VIP Emerging Markets Portfolio - Initial Class | 7.2 | |
| VIP Government Money Market Portfolio - Initial Class | 5.8 | |
| VIP Growth Portfolio - Initial Class | 5.5 | |
| VIP Growth & Income Portfolio - Initial Class | 3.7 | |
| Fidelity International Bond Index Fund | 3.7 | |
| VIP Contrafund Portfolio - Initial Class | 3.3 | |
| Fidelity Long-Term Treasury Bond Index Fund | 3.0 | |
| | 92.5 | |
| Fidelity, the Fidelity Investments Logo and all other Fidelity trademarks or service marks used herein are trademarks or service marks of FMR LLC. Any third-party marks that are used herein are trademarks or service marks of their respective owners. © 2025 FMR LLC. All rights reserved. |
| | For additional information about the Fund; including its prospectus, financial information, holdings and proxy information, scan the QR code or visit fundresearch.fidelity.com/prospectus/sec 1.9914277.100 1426-TSRA-0325 |
| |
| | ANNUAL SHAREHOLDER REPORT | AS OF DECEMBER 31, 2024 | |
| | VIP Freedom 2030 Portfolio℠ VIP Freedom 2030 Portfolio℠ Service Class 2 true |
| | | |
This annual shareholder report contains information about VIP Freedom 2030 Portfolio℠ for the period January 1, 2024 to December 31, 2024. You can find additional information about the Fund at fundresearch.fidelity.com/prospectus/sec. You can also request this information by contacting us at 1-877-208-0098 or by sending an e-mail to funddocuments@fmr.com.
What were your Fund costs for the last year?(based on hypothetical $10,000 investment)
FUND COST (PREVIOUS YEAR)
| | Costs of a $10,000 investment | Costs paid as a percentage of a $10,000 investment | |
| Service Class 2 | $ 26 | 0.25% | |
What affected the Fund's performance this period?
•Risk assets largely produced positive results in 2024, influenced by an expanding global economy and a slowing in the pace of inflation in certain markets, as well as a pivot by some central banks toward monetary easing, despite ongoing geopolitical risk.
•Against this backdrop, active asset allocation positioning detracted from the fund's performance relative to the Composite index, whereas the performance of the underlying investment portfolios contributed.
•In terms of active asset allocation, an underweight in outperforming U.S. equities hurt the fund's relative result the past 12 months, as did an overweight in lagging long-term U.S. Treasurys and outsized exposure to non-U.S. equities. Conversely, an underweight in relatively weaker-performing investment-grade bonds added relative value for the fund.
•Looking at the performance of the underlying portfolios, investments in non-U.S. equities contributed to the fund's relative result. Investments in U.S. investment-grade bonds and U.S. equities also helped to a lesser extent. Within U.S. equities, VIP Contrafund Portfolio (+33.79%) notably outperformed its benchmark, the S&P 500® index (+25.02%). Elsewhere among non-U.S. equities, VIP Overseas Portfolio (+5%) topped the MSCI EAFE index (+4.07%) and VIP Emerging Markets Portfolio (+10.04%) outpaced the MSCI EM Index (+7.50%).
•At the other end of the performance spectrum of underlying funds, within equities, VIP Growth Portfolio (+30.39%) lagged its benchmark, the Russell 3000® Index (+32.46%), and VIP Growth & Income Portfolio (+22.21%) trailed the S&P 500® index.
How did the Fund perform over the past 10 years?
CUMULATIVE PERFORMANCE
December 31, 2014 through December 31, 2024.
Initial investment of $10,000.
Service Class 2 | $10,000 | $9,947 | $10,581 | $12,771 | $11,742 | $14,573 | $16,999 | $19,050 | $15,795 | $18,079 | $19,731 |
Fidelity VIP Freedom 2030 Composite Index℠ | $10,000 | $9,914 | $10,780 | $12,767 | $12,083 | $14,793 | $16,919 | $18,813 | $15,710 | $18,104 | $19,897 |
S&P 500® Index | $10,000 | $10,138 | $11,351 | $13,829 | $13,223 | $17,386 | $20,585 | $26,494 | $21,696 | $27,399 | $34,254 |
| | 2014 | 2015 | 2016 | 2017 | 2018 | 2019 | 2020 | 2021 | 2022 | 2023 | 2024 |
AVERAGE ANNUAL TOTAL RETURNS:| | 1 Year | 5 Year | 10 Year |
| Service Class 2 | 9.14% | 6.25% | 7.03% |
| Fidelity VIP Freedom 2030 Composite Index℠ | 9.90% | 6.11% | 7.12% |
| S&P 500® Index | 25.02% | 14.53% | 13.10% |
Visit institutional.fidelity.com for more recent performance information. |
The Fund's past performance is not a good predictor of the Fund's future performance. The graph and table do not reflect the deduction of taxes that a shareholder would pay on fund distributions or redemption of fund shares. |
Key Fund Statistics(as of December 31, 2024)
KEY FACTS | | |
| Fund Size | $784,775,482 | |
| Number of Holdings | 14 | |
| Total Advisory Fee | $0 | |
| Portfolio Turnover | 31% | |
What did the Fund invest in?
(as of December 31, 2024)
| Bond Funds | 37.9 |
| Domestic Equity Funds | 33.3 |
| International Equity Funds | 28.8 |
| Short-Term Investments and Net Other Assets (Liabilities) | 0.0 |
ASSET ALLOCATION (% of Fund's net assets) |
|
| | Bond Funds - 37.9 |
| | Domestic Equity Funds - 33.3 |
| | International Equity Funds - 28.8 |
| | Short-Term Investments and Net Other Assets (Liabilities) - 0.0 |
| |
TOP HOLDINGS(% of Fund's net assets) | | |
| VIP Overseas Portfolio - Initial Class | 18.7 | |
| VIP Investment Grade Bond II Portfolio - Initial Class | 17.5 | |
| VIP Emerging Markets Portfolio - Initial Class | 10.1 | |
| VIP Growth Portfolio - Initial Class | 9.7 | |
| Fidelity Inflation-Protected Bond Index Fund | 8.4 | |
| Fidelity Long-Term Treasury Bond Index Fund | 7.4 | |
| VIP Growth & Income Portfolio - Initial Class | 6.5 | |
| VIP Contrafund Portfolio - Initial Class | 5.8 | |
| VIP Equity-Income Portfolio - Initial Class | 4.8 | |
| Fidelity International Bond Index Fund | 3.4 | |
| | 92.3 | |
| Fidelity, the Fidelity Investments Logo and all other Fidelity trademarks or service marks used herein are trademarks or service marks of FMR LLC. Any third-party marks that are used herein are trademarks or service marks of their respective owners. © 2025 FMR LLC. All rights reserved. |
| | For additional information about the Fund; including its prospectus, financial information, holdings and proxy information, scan the QR code or visit fundresearch.fidelity.com/prospectus/sec 1.9914288.100 1437-TSRA-0325 |
| |
| | ANNUAL SHAREHOLDER REPORT | AS OF DECEMBER 31, 2024 | |
| | VIP Freedom 2025 Portfolio℠ VIP Freedom 2025 Portfolio℠ Service Class 2 true |
| | | |
This annual shareholder report contains information about VIP Freedom 2025 Portfolio℠ for the period January 1, 2024 to December 31, 2024. You can find additional information about the Fund at fundresearch.fidelity.com/prospectus/sec. You can also request this information by contacting us at 1-877-208-0098 or by sending an e-mail to funddocuments@fmr.com.
What were your Fund costs for the last year?(based on hypothetical $10,000 investment)
FUND COST (PREVIOUS YEAR)
| | Costs of a $10,000 investment | Costs paid as a percentage of a $10,000 investment | |
| Service Class 2 | $ 26 | 0.25% | |
What affected the Fund's performance this period?
•Risk assets largely produced positive results in 2024, influenced by an expanding global economy and a slowing in the pace of inflation in certain markets, as well as a pivot by some central banks toward monetary easing, despite ongoing geopolitical risk.
•Against this backdrop, active asset allocation positioning detracted from the fund's performance relative to the Composite index, whereas the performance of the underlying investment portfolios contributed.
•In terms of active asset allocation, an underweight in outperforming U.S. equities hurt the fund's relative result the past 12 months, as did an overweight in lagging long-term U.S. Treasurys and outsized exposure to non-U.S. equities. Conversely, an underweight in relatively weaker-performing investment-grade bonds added relative value for the fund.
•Looking at the performance of the underlying portfolios, investments in non-U.S. equities contributed to the fund's relative result. Investments in U.S. investment-grade bonds and U.S. equities also helped to a lesser extent. Within U.S. equities, VIP Contrafund Portfolio (+33.79%) notably outperformed its benchmark, the S&P 500® index (+25.02%). Elsewhere among non-U.S. equities, VIP Overseas Portfolio (+5%) topped the MSCI EAFE index (+4.07%) and VIP Emerging Markets Portfolio (+10.04%) outpaced the MSCI EM Index (+7.50%).
•At the other end of the performance spectrum of underlying funds, within equities, VIP Growth Portfolio (+30.39%) lagged its benchmark, the Russell 3000® Index (+32.46%), and VIP Growth & Income Portfolio (+22.21%) trailed the S&P 500® index.
How did the Fund perform over the past 10 years?
CUMULATIVE PERFORMANCE
December 31, 2014 through December 31, 2024.
Initial investment of $10,000.
Service Class 2 | $10,000 | $9,950 | $10,545 | $12,397 | $11,557 | $14,044 | $16,245 | $17,959 | $14,971 | $16,965 | $18,371 |
Fidelity VIP Freedom 2025 Composite Index℠ | $10,000 | $9,947 | $10,701 | $12,368 | $11,828 | $14,193 | $16,117 | $17,707 | $14,874 | $16,975 | $18,500 |
S&P 500® Index | $10,000 | $10,138 | $11,351 | $13,829 | $13,223 | $17,386 | $20,585 | $26,494 | $21,696 | $27,399 | $34,254 |
| | 2014 | 2015 | 2016 | 2017 | 2018 | 2019 | 2020 | 2021 | 2022 | 2023 | 2024 |
AVERAGE ANNUAL TOTAL RETURNS:| | 1 Year | 5 Year | 10 Year |
| Service Class 2 | 8.28% | 5.52% | 6.27% |
| Fidelity VIP Freedom 2025 Composite Index℠ | 8.98% | 5.44% | 6.35% |
| S&P 500® Index | 25.02% | 14.53% | 13.10% |
Visit institutional.fidelity.com for more recent performance information. |
The Fund's past performance is not a good predictor of the Fund's future performance. The graph and table do not reflect the deduction of taxes that a shareholder would pay on fund distributions or redemption of fund shares. |
Key Fund Statistics(as of December 31, 2024)
KEY FACTS | | |
| Fund Size | $391,334,231 | |
| Number of Holdings | 14 | |
| Total Advisory Fee | $0 | |
| Portfolio Turnover | 41% | |
What did the Fund invest in?
(as of December 31, 2024)
| Bond Funds | 44.5 |
| Domestic Equity Funds | 29.4 |
| International Equity Funds | 26.1 |
| Short-Term Investments and Net Other Assets (Liabilities) | 0.0 |
ASSET ALLOCATION (% of Fund's net assets) |
|
| | Bond Funds - 44.5 |
| | Domestic Equity Funds - 29.4 |
| | International Equity Funds - 26.1 |
| | Short-Term Investments and Net Other Assets (Liabilities) - 0.0 |
| |
TOP HOLDINGS(% of Fund's net assets) | | |
| VIP Investment Grade Bond II Portfolio - Initial Class | 20.3 | |
| VIP Overseas Portfolio - Initial Class | 16.9 | |
| Fidelity Inflation-Protected Bond Index Fund | 12.0 | |
| VIP Emerging Markets Portfolio - Initial Class | 9.2 | |
| VIP Growth Portfolio - Initial Class | 8.5 | |
| Fidelity Long-Term Treasury Bond Index Fund | 7.0 | |
| VIP Growth & Income Portfolio - Initial Class | 5.8 | |
| VIP Contrafund Portfolio - Initial Class | 5.1 | |
| VIP Equity-Income Portfolio - Initial Class | 4.2 | |
| Fidelity International Bond Index Fund | 4.0 | |
| | 93.0 | |
| Fidelity, the Fidelity Investments Logo and all other Fidelity trademarks or service marks used herein are trademarks or service marks of FMR LLC. Any third-party marks that are used herein are trademarks or service marks of their respective owners. © 2025 FMR LLC. All rights reserved. |
| | For additional information about the Fund; including its prospectus, financial information, holdings and proxy information, scan the QR code or visit fundresearch.fidelity.com/prospectus/sec 1.9914285.100 1434-TSRA-0325 |
| |
| | ANNUAL SHAREHOLDER REPORT | AS OF DECEMBER 31, 2024 | |
| | VIP Freedom Lifetime Income® I Portfolio VIP Freedom Lifetime Income® I Portfolio true |
| | | |
This annual shareholder report contains information about VIP Freedom Lifetime Income® I Portfolio for the period January 1, 2024 to December 31, 2024. You can find additional information about the Fund at fundresearch.fidelity.com/prospectus/sec. You can also request this information by contacting us at 1-877-208-0098 or by sending an e-mail to funddocuments@fmr.com.
What were your Fund costs for the last year?(based on hypothetical $10,000 investment)
FUND COST (PREVIOUS YEAR)
| | Costs of a $10,000 investment | Costs paid as a percentage of a $10,000 investment | |
| VIP Freedom Lifetime Income® I Portfolio | $ 0 A | 0.00%B | |
A Amount represents less than $.50
B Amount represents less than 0.005%
What affected the Fund's performance this period?
•Risk assets largely produced positive results in 2024, influenced by an expanding global economy and a slowing in the pace of inflation in certain markets, as well as a pivot by some central banks toward monetary easing, despite ongoing geopolitical risk.
•Against this backdrop, active asset allocation positioning detracted from the fund's performance relative to the Composite index, whereas the performance of the underlying investment portfolios contributed.
•In terms of active asset allocation, an underweight in outperforming U.S. equities hurt the fund's relative result most the past 12 months. Conversely, an overweight in emerging-markets equities added relative value for the fund.
•Looking at the performance of the underlying portfolios, investments in non-U.S. equities contributed to the fund's relative result. Investments in U.S. investment-grade bonds also helped. Within U.S. equities, VIP Contrafund Portfolio (+33.70%) notably outperformed its benchmark, the S&P 500® index (+25.02%). Elsewhere among non-U.S. equities, VIP Overseas Portfolio (+4.97%) topped the MSCI EAFE index (+4.07%) and VIP Emerging Markets Portfolio (+9.90%) outpaced the MSCI EM Index (+7.50%).
•At the other end of the performance spectrum of underlying funds, in terms of U.S. equities, VIP Growth Portfolio (+30.30%) lagged its benchmark, the Russell 3000® Index (+32.46%), and VIP Growth & Income Portfolio (+22.18%) trailed the S&P 500® index.
How did the Fund perform over the past 10 years?
CUMULATIVE PERFORMANCE
December 31, 2014 through December 31, 2024.
Initial investment of $10,000.
VIP Freedom Lifetime Income® I Portfolio | $10,000 | $9,965 | $10,469 | $11,266 | $10,976 | $12,324 | $13,610 | $14,054 | $12,367 | $13,342 | $13,913 |
Fidelity VIP Freedom Lifetime Income I Composite Index℠ | $10,000 | $10,060 | $10,446 | $11,151 | $10,998 | $12,218 | $13,270 | $13,688 | $12,135 | $13,146 | $13,782 |
Bloomberg U.S. Aggregate Bond Index | $10,000 | $10,055 | $10,321 | $10,687 | $10,688 | $11,620 | $12,492 | $12,299 | $10,699 | $11,291 | $11,432 |
| | 2014 | 2015 | 2016 | 2017 | 2018 | 2019 | 2020 | 2021 | 2022 | 2023 | 2024 |
AVERAGE ANNUAL TOTAL RETURNS:| | 1 Year | 5 Year | 10 Year |
| VIP Freedom Lifetime Income® I Portfolio | 4.28% | 2.46% | 3.36% |
| Fidelity VIP Freedom Lifetime Income I Composite Index℠ | 4.84% | 2.44% | 3.26% |
| Bloomberg U.S. Aggregate Bond Index | 1.25% | -0.33% | 1.35% |
Visit institutional.fidelity.com for more recent performance information. |
The Fund's past performance is not a good predictor of the Fund's future performance. The graph and table do not reflect the deduction of taxes that a shareholder would pay on fund distributions or redemption of fund shares. |
Key Fund Statistics(as of December 31, 2024)
KEY FACTS | | |
| Fund Size | $8,404,913 | |
| Number of Holdings | 15 | |
| Total Advisory Fee | $0 | |
| Portfolio Turnover | 20% | |
What did the Fund invest in?
(as of December 31, 2024)
| Bond Funds | 62.4 |
| Short-Term Funds | 15.4 |
| International Equity Funds | 12.8 |
| Domestic Equity Funds | 9.4 |
| Short-Term Investments and Net Other Assets (Liabilities) | 0.0 |
ASSET ALLOCATION (% of Fund's net assets) |
|
| | Bond Funds - 62.4 |
| | Short-Term Funds - 15.4 |
| | International Equity Funds - 12.8 |
| | Domestic Equity Funds - 9.4 |
| | Short-Term Investments and Net Other Assets (Liabilities) - 0.0 |
| |
TOP HOLDINGS(% of Fund's net assets) | | |
| VIP Investment Grade Bond II Portfolio - Investor Class | 39.3 | |
| Fidelity Inflation-Protected Bond Index Fund | 15.7 | |
| VIP Government Money Market Portfolio - Investor Class | 15.4 | |
| VIP Overseas Portfolio - Investor Class | 7.4 | |
| VIP Emerging Markets Portfolio - Investor Class | 5.4 | |
| Fidelity International Bond Index Fund | 3.2 | |
| Fidelity Long-Term Treasury Bond Index Fund | 3.0 | |
| VIP Growth Portfolio - Investor Class | 2.8 | |
| VIP Growth & Income Portfolio - Investor Class | 1.9 | |
| VIP Contrafund Portfolio - Investor Class | 1.7 | |
| | 95.8 | |
| Fidelity, the Fidelity Investments Logo and all other Fidelity trademarks or service marks used herein are trademarks or service marks of FMR LLC. Any third-party marks that are used herein are trademarks or service marks of their respective owners. © 2025 FMR LLC. All rights reserved. |
| | For additional information about the Fund; including its prospectus, financial information, holdings and proxy information, scan the QR code or visit fundresearch.fidelity.com/prospectus/sec 1.9914289.100 1492-TSRA-0325 |
| |
| | ANNUAL SHAREHOLDER REPORT | AS OF DECEMBER 31, 2024 | This report describes changes to the Fund that occurred during the reporting period. |
| | VIP FundsManager® 70% Portfolio VIP FundsManager® 70% Portfolio Service Class 2 true |
| | | |
This annual shareholder report contains information about VIP FundsManager® 70% Portfolio for the period January 1, 2024 to December 31, 2024. You can find additional information about the Fund at fundresearch.fidelity.com/prospectus/sec. You can also request this information by contacting us at 1-877-208-0098 or by sending an e-mail to funddocuments@fmr.com.
What were your Fund costs for the last year?(based on hypothetical $10,000 investment)
FUND COST (PREVIOUS YEAR)
| | Costs of a $10,000 investment | Costs paid as a percentage of a $10,000 investment | |
| Service Class 2 | $ 26 | 0.25% | |
What affected the Fund's performance this period?
•Risk assets largely produced positive results in 2024, influenced by an expanding global economy, a slowing in the pace of inflation in certain markets, and a pivot by some central banks toward monetary easing, despite ongoing geopolitical risk.
•Within this environment, asset class positioning contributed to the Portfolios' performance versus the Composite indexes, whereas security selection detracted.
•The Portfolios' core equity allocation strategy contributed to relative performance, led by an overweight among U.S. stocks. Equal-weight positioning in international developed- and emerging-markets equities added modest value. Meanwhile, small, out-of-benchmark allocations to real estate investment trusts and commodity-related securities slightly detracted.
•The portfolio's fixed-income allocation strategy also was beneficial from a relative performance standpoint. Specifically, an underweight in investment-grade bonds and cash, in favor of higher-risks segments of the fixed market was advantageous. That said, a small allocation to long-term U.S. Treasurys hurt.
•In terms of security selection, picks among U.S. equities notably pressured relative performance in 2024 due to disappointing results from Fidelity® VIP Stock Selector All Cap Portfolio, the largest equity holding this period. Investment choices in the information technology sector - particularly among software & services and semiconductor companies - detracted the most.
•Conversely, stock selection in developed international markets was a plus, propelled by Fidelity® International Discovery Fund and Fidelity® Overseas Fund. Picks in continental Europe fueled the former, while investment choices in the U.K. helped the latter.
•Security selection among investment-grade bonds also added value, driven by the efforts of our active bond fund managers. In contrast, stocks picks in emerging-markets equities modestly detracted.
•As of December 31, the Portfolios were overweight U.S. stocks and about neutrally weighted in international developed- and emerging-markets equities. Investment-grade bond and cash allocations remained below the Portfolios' target weightings.
How did the Fund perform over the past 10 years?
CUMULATIVE PERFORMANCE
December 31, 2014 through December 31, 2024.
Initial investment of $10,000.
Service Class 2 | $10,000 | $10,029 | $10,516 | $12,507 | $11,557 | $14,145 | $16,400 | $18,767 | $15,803 | $18,263 | $20,215 |
Fidelity VIP FundsManager 70% Composite Index℠ | $10,000 | $10,044 | $10,767 | $12,524 | $11,872 | $14,481 | $16,568 | $18,918 | $15,923 | $18,611 | $20,831 |
S&P 500® Index | $10,000 | $10,138 | $11,351 | $13,829 | $13,223 | $17,386 | $20,585 | $26,494 | $21,696 | $27,399 | $34,254 |
| | 2014 | 2015 | 2016 | 2017 | 2018 | 2019 | 2020 | 2021 | 2022 | 2023 | 2024 |
AVERAGE ANNUAL TOTAL RETURNS:| | 1 Year | 5 Year | 10 Year |
| Service Class 2 | 10.68% | 7.40% | 7.29% |
| Fidelity VIP FundsManager 70% Composite Index℠ | 11.93% | 7.54% | 7.61% |
| S&P 500® Index | 25.02% | 14.53% | 13.10% |
Visit institutional.fidelity.com for more recent performance information. |
The Fund's past performance is not a good predictor of the Fund's future performance. The graph and table do not reflect the deduction of taxes that a shareholder would pay on fund distributions or redemption of fund shares. |
Key Fund Statistics(as of December 31, 2024)
KEY FACTS | | |
| Fund Size | $2,289,288,181 | |
| Number of Holdings | 39 | |
| Total Advisory Fee | $2,203,855 | |
| Portfolio Turnover | 29% | |
What did the Fund invest in?
(as of December 31, 2024)
| Domestic Equity Funds | 44.2 |
| International Equity Funds | 27.8 |
| Bond Funds | 23.7 |
| Alternative Funds | 1.3 |
| Short-Term Investments and Net Other Assets (Liabilities) | 3.0 |
ASSET ALLOCATION (% of Fund's net assets) |
|
| | Domestic Equity Funds - 44.2 |
| | International Equity Funds - 27.8 |
| | Bond Funds - 23.7 |
| | Alternative Funds - 1.3 |
| | Short-Term Investments and Net Other Assets (Liabilities) - 3.0 |
| |
TOP HOLDINGS(% of Fund's net assets) | | |
| VIP Stock Selector All Cap Portfolio - Investor Class | 35.2 | |
| Fidelity Total Bond Fund | 9.9 | |
| VIP Investment Grade Bond II Portfolio - Investor Class | 9.9 | |
| Fidelity Overseas Fund | 8.5 | |
| Fidelity Emerging Markets Fund | 7.6 | |
| Fidelity Enhanced International ETF | 2.1 | |
| Fidelity International Discovery Fund | 2.1 | |
| Fidelity Stock Selector Small Cap Fund | 1.9 | |
| Fidelity International Capital Appreciation Fund | 1.7 | |
| VIP Value Strategies Portfolio - Investor Class | 1.7 | |
| | 80.6 | |
How has the Fund changed?
This is a summary of certain changes to the Fund since January 1, 2024. For more complete information, you may review the Fund's next prospectus, which we expect to be available by April 30, 2025 at fundresearch.fidelity.com/prospectus/sec or upon request at 1-877-208-0098 or by sending an e-mail to funddocuments@fmr.com.
The fund modified its principal investment strategies during the reporting period. | The fund modified its principal investment risks during the reporting period.
|
| Fidelity, the Fidelity Investments Logo and all other Fidelity trademarks or service marks used herein are trademarks or service marks of FMR LLC. Any third-party marks that are used herein are trademarks or service marks of their respective owners. © 2025 FMR LLC. All rights reserved. |
| | For additional information about the Fund; including its prospectus, financial information, holdings and proxy information, scan the QR code or visit fundresearch.fidelity.com/prospectus/sec 1.9914311.100 1592-TSRA-0325 |
| |
| | ANNUAL SHAREHOLDER REPORT | AS OF DECEMBER 31, 2024 | |
| | VIP Freedom 2030 Portfolio℠ VIP Freedom 2030 Portfolio℠ Initial Class true |
| | | |
This annual shareholder report contains information about VIP Freedom 2030 Portfolio℠ for the period January 1, 2024 to December 31, 2024. You can find additional information about the Fund at fundresearch.fidelity.com/prospectus/sec. You can also request this information by contacting us at 1-877-208-0098 or by sending an e-mail to funddocuments@fmr.com.
What were your Fund costs for the last year?(based on hypothetical $10,000 investment)
FUND COST (PREVIOUS YEAR)
| | Costs of a $10,000 investment | Costs paid as a percentage of a $10,000 investment | |
| Initial Class | $ 0 A | 0.00%B | |
AAmount represents less than $.50
BAmount represents less than 0.005%
What affected the Fund's performance this period?
•Risk assets largely produced positive results in 2024, influenced by an expanding global economy and a slowing in the pace of inflation in certain markets, as well as a pivot by some central banks toward monetary easing, despite ongoing geopolitical risk.
•Against this backdrop, active asset allocation positioning detracted from the fund's performance relative to the Composite index, whereas the performance of the underlying investment portfolios contributed.
•In terms of active asset allocation, an underweight in outperforming U.S. equities hurt the fund's relative result the past 12 months, as did an overweight in lagging long-term U.S. Treasurys and outsized exposure to non-U.S. equities. Conversely, an underweight in relatively weaker-performing investment-grade bonds added relative value for the fund.
•Looking at the performance of the underlying portfolios, investments in non-U.S. equities contributed to the fund's relative result. Investments in U.S. investment-grade bonds and U.S. equities also helped to a lesser extent. Within U.S. equities, VIP Contrafund Portfolio (+33.79%) notably outperformed its benchmark, the S&P 500® index (+25.02%). Elsewhere among non-U.S. equities, VIP Overseas Portfolio (+5%) topped the MSCI EAFE index (+4.07%) and VIP Emerging Markets Portfolio (+10.04%) outpaced the MSCI EM Index (+7.50%).
•At the other end of the performance spectrum of underlying funds, within equities, VIP Growth Portfolio (+30.39%) lagged its benchmark, the Russell 3000® Index (+32.46%), and VIP Growth & Income Portfolio (+22.21%) trailed the S&P 500® index.
How did the Fund perform over the past 10 years?
CUMULATIVE PERFORMANCE
December 31, 2014 through December 31, 2024.
Initial investment of $10,000.
Initial Class | $10,000 | $9,976 | $10,636 | $12,865 | $11,864 | $14,762 | $17,255 | $19,390 | $16,118 | $18,488 | $20,227 |
Fidelity VIP Freedom 2030 Composite Index℠ | $10,000 | $9,914 | $10,780 | $12,767 | $12,083 | $14,793 | $16,919 | $18,813 | $15,710 | $18,104 | $19,897 |
S&P 500® Index | $10,000 | $10,138 | $11,351 | $13,829 | $13,223 | $17,386 | $20,585 | $26,494 | $21,696 | $27,399 | $34,254 |
| | 2014 | 2015 | 2016 | 2017 | 2018 | 2019 | 2020 | 2021 | 2022 | 2023 | 2024 |
AVERAGE ANNUAL TOTAL RETURNS:| | 1 Year | 5 Year | 10 Year |
| Initial Class | 9.41% | 6.50% | 7.30% |
| Fidelity VIP Freedom 2030 Composite Index℠ | 9.90% | 6.11% | 7.12% |
| S&P 500® Index | 25.02% | 14.53% | 13.10% |
Visit institutional.fidelity.com for more recent performance information. |
The Fund's past performance is not a good predictor of the Fund's future performance. The graph and table do not reflect the deduction of taxes that a shareholder would pay on fund distributions or redemption of fund shares. |
Key Fund Statistics(as of December 31, 2024)
KEY FACTS | | |
| Fund Size | $784,775,482 | |
| Number of Holdings | 14 | |
| Total Advisory Fee | $0 | |
| Portfolio Turnover | 31% | |
What did the Fund invest in?
(as of December 31, 2024)
| Bond Funds | 37.9 |
| Domestic Equity Funds | 33.3 |
| International Equity Funds | 28.8 |
| Short-Term Investments and Net Other Assets (Liabilities) | 0.0 |
ASSET ALLOCATION (% of Fund's net assets) |
|
| | Bond Funds - 37.9 |
| | Domestic Equity Funds - 33.3 |
| | International Equity Funds - 28.8 |
| | Short-Term Investments and Net Other Assets (Liabilities) - 0.0 |
| |
TOP HOLDINGS(% of Fund's net assets) | | |
| VIP Overseas Portfolio - Initial Class | 18.7 | |
| VIP Investment Grade Bond II Portfolio - Initial Class | 17.5 | |
| VIP Emerging Markets Portfolio - Initial Class | 10.1 | |
| VIP Growth Portfolio - Initial Class | 9.7 | |
| Fidelity Inflation-Protected Bond Index Fund | 8.4 | |
| Fidelity Long-Term Treasury Bond Index Fund | 7.4 | |
| VIP Growth & Income Portfolio - Initial Class | 6.5 | |
| VIP Contrafund Portfolio - Initial Class | 5.8 | |
| VIP Equity-Income Portfolio - Initial Class | 4.8 | |
| Fidelity International Bond Index Fund | 3.4 | |
| | 92.3 | |
| Fidelity, the Fidelity Investments Logo and all other Fidelity trademarks or service marks used herein are trademarks or service marks of FMR LLC. Any third-party marks that are used herein are trademarks or service marks of their respective owners. © 2025 FMR LLC. All rights reserved. |
| | For additional information about the Fund; including its prospectus, financial information, holdings and proxy information, scan the QR code or visit fundresearch.fidelity.com/prospectus/sec 1.9914286.100 1435-TSRA-0325 |
| |
| | ANNUAL SHAREHOLDER REPORT | AS OF DECEMBER 31, 2024 | This report describes changes to the Fund that occurred during the reporting period. |
| | VIP Government Money Market Portfolio VIP Government Money Market Portfolio Service Class true |
| | | |
This annual shareholder report contains information about VIP Government Money Market Portfolio for the period January 1, 2024 to December 31, 2024. You can find additional information about the Fund at fundresearch.fidelity.com/prospectus/sec. You can also request this information by contacting us at 1-877-208-0098 or by sending an e-mail to funddocuments@fmr.com.
What were your Fund costs for the last year?(based on hypothetical $10,000 investment)
FUND COST (PREVIOUS YEAR)
| | Costs of a $10,000 investment | Costs paid as a percentage of a $10,000 investment | |
| Service Class | $ 38 | 0.37% | |
Key Fund Statistics(as of December 31, 2024)
KEY FACTS | | |
| Fund Size | $8,497,434,407 | |
| Number of Holdings | 552 | |
| Total Advisory Fee | $22,031,036 | |
What did the Fund invest in?
(as of December 31, 2024)
EFFECTIVE MATURITY DIVERSIFICATION (% of Fund's net assets) |
| Days |
| 1-7 | 59.4 | |
| 8-30 | 9.4 | |
| 31-60 | 13.8 | |
| 61-90 | 7.4 | |
| 91-180 | 7.4 | |
| >180 | 3.4 | |
| |
| Repurchase Agreements | 37.1 |
| U.S. Treasury Obligations | 32.4 |
| U.S. Government Agency - Debt | 31.3 |
ASSET ALLOCATION (% of Fund's net assets) |
|
| | Repurchase Agreements - 37.1 |
| | U.S. Treasury Obligations - 32.4 |
| | U.S. Government Agency - Debt - 31.3 |
| Net Other Assets (Liabilities) - (0.8)% |
| |
How has the Fund changed?
This is a summary of certain changes to the Fund since January 1, 2024. For more complete information, you may review the Fund's next prospectus, which we expect to be available by April 30, 2025 at fundresearch.fidelity.com/prospectus/sec or upon request at 1-877-208-0098 or by sending an e-mail to funddocuments@fmr.com.
The fees associated with this class changed during the reporting year. The variations in class fees are primarily the result of the following changes: The fund's transfer agent and pricing & bookkeeping fees were changed to a fixed rate effective December 1, 2023. Effective March 1, 2024, the fund's management contract was amended to incorporate administrative services previously covered under separate services agreements (transfer agent and pricing & bookkeeping). The amended contract incorporates a management fee rate that may vary by class. The Adviser or an affiliate pays certain expenses of managing and operating the fund out of each class's management fee. | The fund's principal investment risks were updated in connection with the implementation of recent rule amendments related to money market funds adopted by the SEC.
|
| Fidelity, the Fidelity Investments Logo and all other Fidelity trademarks or service marks used herein are trademarks or service marks of FMR LLC. Any third-party marks that are used herein are trademarks or service marks of their respective owners. © 2025 FMR LLC. All rights reserved. |
| | For additional information about the Fund; including its prospectus, financial information, holdings and proxy information, scan the QR code or visit fundresearch.fidelity.com/prospectus/sec 1.9914127.100 713-TSRA-0325 |
| |
| | ANNUAL SHAREHOLDER REPORT | AS OF DECEMBER 31, 2024 | |
| | VIP Investor Freedom 2050 Portfolio℠ VIP Investor Freedom 2050 Portfolio℠ true |
| | | |
This annual shareholder report contains information about VIP Investor Freedom 2050 Portfolio℠ for the period January 1, 2024 to December 31, 2024. You can find additional information about the Fund at fundresearch.fidelity.com/prospectus/sec. You can also request this information by contacting us at 1-877-208-0098 or by sending an e-mail to funddocuments@fmr.com.
What were your Fund costs for the last year?(based on hypothetical $10,000 investment)
FUND COST (PREVIOUS YEAR)
| | Costs of a $10,000 investment | Costs paid as a percentage of a $10,000 investment | |
| VIP Investor Freedom 2050 Portfolio℠ | $ 0 A | 0.00%B | |
A Amount represents less than $.50
B Amount represents less than 0.005%
What affected the Fund's performance this period?
•Risk assets largely produced positive results in 2024, influenced by an expanding global economy and a slowing in the pace of inflation in certain markets, as well as a pivot by some central banks toward monetary easing, despite ongoing geopolitical risk.
•Against this backdrop, active asset allocation positioning detracted from the fund's performance relative to the Composite index, whereas the performance of the underlying investment portfolios contributed.
•In terms of active asset allocation, an underweight in outperforming U.S. equities hurt the fund's relative result the past 12 months, as did an overweight in lagging long-term U.S. Treasurys and outsized exposure to non-U.S. equities. Conversely, underweighting relatively weaker-performing investment-grade bonds added relative value for the fund.
•Looking at the performance of the underlying portfolios, investments in non-U.S. equities contributed to the fund's relative result. Investments in U.S. investment-grade bonds and U.S. equities also helped to a lesser extent. Within U.S. equities, VIP Contrafund Portfolio (+33.70%) notably outperformed its benchmark, the S&P 500® index (+25.02%). Elsewhere in non-U.S. equities, VIP Overseas Portfolio (+4.97%) topped the MSCI EAFE index (+4.07%) and VIP Emerging Markets Portfolio (+9.90%) outpaced the MSCI EM Index (+7.50%).
•At the other end of the performance spectrum of underlying funds, in terms of equities, VIP Growth Portfolio (+30.30%) lagged its benchmark, the Russell 3000® Index (+32.46%), and VIP Growth & Income Portfolio (+22.18%) trailed the S&P 500® index.
How did the Fund perform over the life of Fund?
CUMULATIVE PERFORMANCE
April 13, 2023 through December 31, 2024.
Initial investment of $10,000.
VIP Investor Freedom 2050 Portfolio℠ | $10,000 | $11,031 |
Fidelity VIP Freedom 2050 Composite Index℠ | $10,000 | $11,108 |
S&P 500® Index | $10,000 | $11,636 |
| | 2023 | 2024 |
AVERAGE ANNUAL TOTAL RETURNS:| | 1 Year | Life of Fund A |
| VIP Investor Freedom 2050 Portfolio℠ | 13.80% | 14.13% |
| Fidelity VIP Freedom 2050 Composite Index℠ | 14.43% | 14.96% |
| S&P 500® Index | 25.02% | 24.34% |
A From April 13, 2023
Visit institutional.fidelity.com for more recent performance information. |
The Fund's past performance is not a good predictor of the Fund's future performance. The graph and table do not reflect the deduction of taxes that a shareholder would pay on fund distributions or redemption of fund shares. |
Key Fund Statistics(as of December 31, 2024)
KEY FACTS | | |
| Fund Size | $7,232,306 | |
| Number of Holdings | 11 | |
| Total Advisory Fee | $0 | |
| Portfolio Turnover | 44% | |
What did the Fund invest in?
(as of December 31, 2024)
| Domestic Equity Funds | 51.5 |
| International Equity Funds | 40.9 |
| Bond Funds | 7.6 |
| Short-Term Investments and Net Other Assets (Liabilities) | 0.0 |
ASSET ALLOCATION (% of Fund's net assets) |
|
| | Domestic Equity Funds - 51.5 |
| | International Equity Funds - 40.9 |
| | Bond Funds - 7.6 |
| | Short-Term Investments and Net Other Assets (Liabilities) - 0.0 |
| |
TOP HOLDINGS(% of Fund's net assets) | | |
| VIP Overseas Portfolio - Investor Class | 27.8 | |
| VIP Growth Portfolio - Investor Class | 15.0 | |
| VIP Emerging Markets Portfolio - Investor Class | 13.1 | |
| VIP Growth & Income Portfolio - Investor Class | 10.1 | |
| VIP Contrafund Portfolio - Investor Class | 9.0 | |
| VIP Equity Income Portfolio - Investor Class | 7.4 | |
| Fidelity Long-Term Treasury Bond Index Fund | 6.6 | |
| VIP Value Portfolio - Investor Class | 5.1 | |
| VIP Value Strategies Portfolio - Investor Class | 2.6 | |
| VIP Mid Cap Portfolio - Investor Class | 2.3 | |
| | 99.0 | |
| Fidelity, the Fidelity Investments Logo and all other Fidelity trademarks or service marks used herein are trademarks or service marks of FMR LLC. Any third-party marks that are used herein are trademarks or service marks of their respective owners. © 2025 FMR LLC. All rights reserved. |
| | For additional information about the Fund; including its prospectus, financial information, holdings and proxy information, scan the QR code or visit fundresearch.fidelity.com/prospectus/sec 1.9914408.100 6577-TSRA-0325 |
| |
| | ANNUAL SHAREHOLDER REPORT | AS OF DECEMBER 31, 2024 | This report describes changes to the Fund that occurred during the reporting period. |
| | VIP Freedom 2065 Portfolio℠ VIP Freedom 2065 Portfolio℠ Service Class true |
| | | |
This annual shareholder report contains information about VIP Freedom 2065 Portfolio℠ for the period January 1, 2024 to December 31, 2024. You can find additional information about the Fund at fundresearch.fidelity.com/prospectus/sec. You can also request this information by contacting us at 1-877-208-0098 or by sending an e-mail to funddocuments@fmr.com.
What were your Fund costs for the last year?(based on hypothetical $10,000 investment)
FUND COST (PREVIOUS YEAR)
| | Costs of a $10,000 investment | Costs paid as a percentage of a $10,000 investment | |
| Service Class | $ 11 | 0.10% | |
What affected the Fund's performance this period?
•Risk assets largely produced positive results in 2024, influenced by an expanding global economy and a slowing in the pace of inflation in certain markets, as well as a pivot by some central banks toward monetary easing, despite ongoing geopolitical risk.
•Against this backdrop, active asset allocation positioning detracted from the fund's performance relative to the Composite index, whereas the performance of the underlying investment portfolios contributed.
•In terms of active asset allocation, an underweight in outperforming U.S. equities hurt the fund's relative result the past 12 months, as did an overweight in lagging long-term U.S. Treasurys and outsized exposure to non-U.S. equities. Conversely, an underweight in relatively weaker-performing investment-grade bonds added relative value for the fund.
•Looking at the performance of the underlying portfolios, investments in non-U.S. equities contributed to the fund's relative result. Investments in U.S. investment-grade bonds and U.S. equities also helped to a lesser extent. Within U.S. equities, VIP Contrafund Portfolio (+33.79%) notably outperformed its benchmark, the S&P 500® index (+25.02%). Elsewhere among non-U.S. equities, VIP Overseas Portfolio (+5%) topped the MSCI EAFE index (+4.07%) and VIP Emerging Markets Portfolio (+10.04%) outpaced the MSCI EM Index (+7.50%).
•At the other end of the performance spectrum of underlying funds, within equities, VIP Growth Portfolio (+30.39%) lagged its benchmark, the Russell 3000® Index (+32.46%), and VIP Growth & Income Portfolio (+22.21%) trailed the S&P 500® index.
How did the Fund perform over the life of Fund?
CUMULATIVE PERFORMANCE
April 11, 2019 through December 31, 2024.
Initial investment of $10,000.
Service Class | $10,000 | $11,172 | $13,313 | $15,678 | $12,806 | $15,276 |
Fidelity VIP Freedom 2065 Composite Index℠ | $10,000 | $11,078 | $12,911 | $15,000 | $12,279 | $14,749 |
S&P 500® Index | $10,000 | $11,346 | $13,433 | $17,289 | $14,158 | $17,880 |
| | 2019 | 2020 | 2021 | 2022 | 2023 | 2024 |
AVERAGE ANNUAL TOTAL RETURNS:| | 1 Year | 5 Year | Life of Fund A |
| Service Class | 13.70% | 9.23% | 10.12% |
| Fidelity VIP Freedom 2065 Composite Index℠ | 14.43% | 8.78% | 9.57% |
| S&P 500® Index | 25.02% | 14.53% | 15.07% |
A From April 11, 2019
Visit institutional.fidelity.com for more recent performance information. |
The Fund's past performance is not a good predictor of the Fund's future performance. The graph and table do not reflect the deduction of taxes that a shareholder would pay on fund distributions or redemption of fund shares. |
Key Fund Statistics(as of December 31, 2024)
KEY FACTS | | |
| Fund Size | $7,325,971 | |
| Number of Holdings | 11 | |
| Total Advisory Fee | $0 | |
| Portfolio Turnover | 50% | |
What did the Fund invest in?
(as of December 31, 2024)
| Domestic Equity Funds | 51.5 |
| International Equity Funds | 40.9 |
| Bond Funds | 7.6 |
| Short-Term Investments and Net Other Assets (Liabilities) | 0.0 |
ASSET ALLOCATION (% of Fund's net assets) |
|
| | Domestic Equity Funds - 51.5 |
| | International Equity Funds - 40.9 |
| | Bond Funds - 7.6 |
| | Short-Term Investments and Net Other Assets (Liabilities) - 0.0 |
| |
TOP HOLDINGS(% of Fund's net assets) | | |
| VIP Overseas Portfolio - Initial Class | 27.8 | |
| VIP Growth Portfolio - Initial Class | 15.0 | |
| VIP Emerging Markets Portfolio - Initial Class | 13.1 | |
| VIP Growth & Income Portfolio - Initial Class | 10.1 | |
| VIP Contrafund Portfolio - Initial Class | 9.0 | |
| VIP Equity-Income Portfolio - Initial Class | 7.4 | |
| Fidelity Long-Term Treasury Bond Index Fund | 6.6 | |
| VIP Value Portfolio - Initial Class | 5.1 | |
| VIP Value Strategies Portfolio - Initial Class | 2.6 | |
| VIP Mid Cap Portfolio - Initial Class | 2.3 | |
| | 99.0 | |
How has the Fund changed?
This is a summary of certain changes to the Fund since January 1, 2024. For more complete information, you may review the Fund's next prospectus, which we expect to be available by April 30, 2025 at fundresearch.fidelity.com/prospectus/sec or upon request at 1-877-208-0098 or by sending an e-mail to funddocuments@fmr.com.
The fund added a contractual proxy and shareholder meeting expense cap during the reporting period. | |
| Fidelity, the Fidelity Investments Logo and all other Fidelity trademarks or service marks used herein are trademarks or service marks of FMR LLC. Any third-party marks that are used herein are trademarks or service marks of their respective owners. © 2025 FMR LLC. All rights reserved. |
| | For additional information about the Fund; including its prospectus, financial information, holdings and proxy information, scan the QR code or visit fundresearch.fidelity.com/prospectus/sec 1.9914391.100 3367-TSRA-0325 |
| |
| | ANNUAL SHAREHOLDER REPORT | AS OF DECEMBER 31, 2024 | This report describes changes to the Fund that occurred during the reporting period. |
| | VIP Government Money Market Portfolio VIP Government Money Market Portfolio Initial Class true |
| | | |
This annual shareholder report contains information about VIP Government Money Market Portfolio for the period January 1, 2024 to December 31, 2024. You can find additional information about the Fund at fundresearch.fidelity.com/prospectus/sec. You can also request this information by contacting us at 1-877-208-0098 or by sending an e-mail to funddocuments@fmr.com.
What were your Fund costs for the last year?(based on hypothetical $10,000 investment)
FUND COST (PREVIOUS YEAR)
| | Costs of a $10,000 investment | Costs paid as a percentage of a $10,000 investment | |
| Initial Class | $ 27 | 0.27% | |
Key Fund Statistics(as of December 31, 2024)
KEY FACTS | | |
| Fund Size | $8,497,434,407 | |
| Number of Holdings | 552 | |
| Total Advisory Fee | $22,031,036 | |
What did the Fund invest in?
(as of December 31, 2024)
EFFECTIVE MATURITY DIVERSIFICATION (% of Fund's net assets) |
| Days |
| 1-7 | 59.4 | |
| 8-30 | 9.4 | |
| 31-60 | 13.8 | |
| 61-90 | 7.4 | |
| 91-180 | 7.4 | |
| >180 | 3.4 | |
| |
| Repurchase Agreements | 37.1 |
| U.S. Treasury Obligations | 32.4 |
| U.S. Government Agency - Debt | 31.3 |
ASSET ALLOCATION (% of Fund's net assets) |
|
| | Repurchase Agreements - 37.1 |
| | U.S. Treasury Obligations - 32.4 |
| | U.S. Government Agency - Debt - 31.3 |
| Net Other Assets (Liabilities) - (0.8)% |
| |
How has the Fund changed?
This is a summary of certain changes to the Fund since January 1, 2024. For more complete information, you may review the Fund's next prospectus, which we expect to be available by April 30, 2025 at fundresearch.fidelity.com/prospectus/sec or upon request at 1-877-208-0098 or by sending an e-mail to funddocuments@fmr.com.
The fees associated with this class changed during the reporting year. The variations in class fees are primarily the result of the following changes: The fund's transfer agent and pricing & bookkeeping fees were changed to a fixed rate effective December 1, 2023. Effective March 1, 2024, the fund's management contract was amended to incorporate administrative services previously covered under separate services agreements (transfer agent and pricing & bookkeeping). The amended contract incorporates a management fee rate that may vary by class. The Adviser or an affiliate pays certain expenses of managing and operating the fund out of each class's management fee. | The fund's principal investment risks were updated in connection with the implementation of recent rule amendments related to money market funds adopted by the SEC.
|
| Fidelity, the Fidelity Investments Logo and all other Fidelity trademarks or service marks used herein are trademarks or service marks of FMR LLC. Any third-party marks that are used herein are trademarks or service marks of their respective owners. © 2025 FMR LLC. All rights reserved. |
| | For additional information about the Fund; including its prospectus, financial information, holdings and proxy information, scan the QR code or visit fundresearch.fidelity.com/prospectus/sec 1.9914125.100 153-TSRA-0325 |
| |
| | ANNUAL SHAREHOLDER REPORT | AS OF DECEMBER 31, 2024 | This report describes changes to the Fund that occurred during the reporting period. |
| | VIP Investment Grade Bond Portfolio VIP Investment Grade Bond Portfolio Investor Class true |
| | | |
This annual shareholder report contains information about VIP Investment Grade Bond Portfolio for the period January 1, 2024 to December 31, 2024. You can find additional information about the Fund at fundresearch.fidelity.com/prospectus/sec. You can also request this information by contacting us at 1-877-208-0098 or by sending an e-mail to funddocuments@fmr.com.
What were your Fund costs for the last year?(based on hypothetical $10,000 investment)
FUND COST (PREVIOUS YEAR)
| | Costs of a $10,000 investment | Costs paid as a percentage of a $10,000 investment | |
| Investor Class | $ 42 | 0.42% | |
What affected the Fund's performance this period?
•U.S. taxable investment-grade bonds posted a modest advance in 2024, rallying during the summer months, as the bond market reflected anticipated interest-rate reductions by the U.S. Federal Reserve, but falling back in the fourth quarter when the Fed tempered rate-cut expectations for 2025.
•Against this backdrop, the fund's exposure to asset-backed securities, including collateralized loan obligations, was a key contributor to performance versus the Bloomberg U.S. Aggregate Bond Index for the fiscal year.
•An overweight to commercial mortgage-backed securities provided another performance advantage, as did an underweight to agency mortgage-backed securities.
•Among corporate bonds, industry allocation lifted relative performance as well, led by security selection among financials and an overweight in the segment. Specifically, positioning among banks and REITS was beneficial versus the index.
•Exposure to certain "plus" sectors, namely high yield bonds and emerging markets debt, also were modest contributors.
•In contrast, the fund's yield-curve positioning modestly detracted for the year.
How did the Fund perform over the past 10 years?
CUMULATIVE PERFORMANCE
December 31, 2014 through December 31, 2024.
Initial investment of $10,000.
Investor Class | $10,000 | $9,929 | $10,399 | $10,836 | $10,774 | $11,817 | $12,919 | $12,836 | $11,173 | $11,855 | $12,062 |
Bloomberg U.S. Aggregate Bond Index | $10,000 | $10,055 | $10,321 | $10,687 | $10,688 | $11,620 | $12,492 | $12,299 | $10,699 | $11,291 | $11,432 |
| | 2014 | 2015 | 2016 | 2017 | 2018 | 2019 | 2020 | 2021 | 2022 | 2023 | 2024 |
AVERAGE ANNUAL TOTAL RETURNS:| | 1 Year | 5 Year | 10 Year |
| Investor Class | 1.75% | 0.41% | 1.89% |
| Bloomberg U.S. Aggregate Bond Index | 1.25% | -0.33% | 1.35% |
Visit institutional.fidelity.com for more recent performance information. |
The Fund's past performance is not a good predictor of the Fund's future performance. The graph and table do not reflect the deduction of taxes that a shareholder would pay on fund distributions or redemption of fund shares. |
Key Fund Statistics(as of December 31, 2024)
KEY FACTS | | |
| Fund Size | $4,430,972,983 | |
| Number of Holdings | 2,224 | |
| Total Advisory Fee | $15,386,008 | |
| Portfolio Turnover | 205% | |
What did the Fund invest in?
(as of December 31, 2024)
The information in the following tables is based on the combined Investments of the Fund and it's pro-rata share of investments in Fidelity's Central Funds, other than the Commodity Strategy and Money Market Central Funds as applicable.
| U.S. Government and U.S. Government Agency Obligations | 63.0 |
| AAA | 9.0 |
| AA | 0.9 |
| A | 6.2 |
| BBB | 16.4 |
| BB | 2.9 |
| B | 1.3 |
| CCC,CC,C | 0.0 |
| Not Rated | 4.2 |
| Equities | 0.0 |
QUALITY DIVERSIFICATION (% of Fund's net assets) |
| |
| | U.S. Government and U.S. Government Agency Obligations - 63.0 |
| | AAA - 9.0 |
| | AA - 0.9 |
| | A - 6.2 |
| | BBB - 16.4 |
| | BB - 2.9 |
| | B - 1.3 |
| | CCC,CC,C - 0.0 |
| | Not Rated - 4.2 |
| | Equities - 0.0 |
| Short-Term Investments and Net Other Assets (Liabilities) - (3.9)% |
| |
| We have used ratings from Moody's Investors Service, Inc. Where Moody's® ratings are not available, we have used S&P® ratings. All ratings are as of the date indicated and do not reflect subsequent changes. |
| U.S. Treasury Obligations | 45.2 |
| Corporate Bonds | 24.9 |
| U.S. Government Agency - Mortgage Securities | 17.8 |
| Asset-Backed Securities | 8.6 |
| CMOs and Other Mortgage Related Securities | 7.0 |
| Other Investments | 0.2 |
| Purchased Options | 0.1 |
| Foreign Government and Government Agency Obligations | 0.1 |
| Preferred Securities | 0.0 |
| Bank Loan Obligations | 0.0 |
| Common Stocks | 0.0 |
ASSET ALLOCATION (% of Fund's net assets) |
|
| | U.S. Treasury Obligations - 45.2 |
| | Corporate Bonds - 24.9 |
| | U.S. Government Agency - Mortgage Securities - 17.8 |
| | Asset-Backed Securities - 8.6 |
| | CMOs and Other Mortgage Related Securities - 7.0 |
| | Other Investments - 0.2 |
| | Purchased Options - 0.1 |
| | Foreign Government and Government Agency Obligations - 0.1 |
| | Preferred Securities - 0.0 |
| | Bank Loan Obligations - 0.0 |
| | Common Stocks - 0.0 |
| Short-Term Investments and Net Other Assets (Liabilities) - (3.9)% |
| |
| United States | 90.8 |
| Grand Cayman (UK Overseas Ter) | 4.7 |
| Mexico | 1.0 |
| Ireland | 0.7 |
| United Kingdom | 0.6 |
| Netherlands | 0.4 |
| Switzerland | 0.4 |
| Bailiwick Of Jersey | 0.3 |
| Germany | 0.3 |
| Others | 0.8 |
GEOGRAPHIC DIVERSIFICATION (% of Fund's net assets) |
|
| | United States - 90.8 |
| | Grand Cayman (UK Overseas Ter) - 4.7 |
| | Mexico - 1.0 |
| | Ireland - 0.7 |
| | United Kingdom - 0.6 |
| | Netherlands - 0.4 |
| | Switzerland - 0.4 |
| | Bailiwick Of Jersey - 0.3 |
| | Germany - 0.3 |
| | Others - 0.8 |
| |
TOP HOLDINGS(% of Fund's net assets) | | |
| US Treasury Notes | 33.8 | |
| US Treasury Bonds | 11.4 | |
| Fannie Mae Mortgage pass-thru certificates | 6.4 | |
| Ginnie Mae II Pool | 5.2 | |
| Freddie Mac Gold Pool | 3.4 | |
| Uniform Mortgage Backed Securities | 2.1 | |
| Freddie Mac Multifamily Structured pass-thru certificates | 1.4 | |
| Bank of America Corp | 1.1 | |
| Petroleos Mexicanos | 1.0 | |
| Morgan Stanley | 1.0 | |
| | 66.8 | |
How has the Fund changed?
This is a summary of certain changes to the Fund since January 1, 2024. For more complete information, you may review the Fund's next prospectus, which we expect to be available by April 30, 2025 at fundresearch.fidelity.com/prospectus/sec or upon request at 1-877-208-0098 or by sending an e-mail to funddocuments@fmr.com.
The fees associated with this class changed during the reporting year. The variations in class fees are primarily the result of the following changes:- Management fee
- Operating expenses
The fund's transfer agent and pricing & bookkeeping fees were changed to a fixed rate effective December 1, 2023. Effective March 1, 2024, the fund's management contract was amended to incorporate administrative services previously covered under separate services agreements (transfer agent and pricing & bookkeeping). The amended contract incorporates a management fee rate that may vary by class. The Adviser or an affiliate pays certain expenses of managing and operating the fund out of each class's management fee. | |
| Fidelity, the Fidelity Investments Logo and all other Fidelity trademarks or service marks used herein are trademarks or service marks of FMR LLC. Any third-party marks that are used herein are trademarks or service marks of their respective owners. © 2025 FMR LLC. All rights reserved. |
| | For additional information about the Fund; including its prospectus, financial information, holdings and proxy information, scan the QR code or visit fundresearch.fidelity.com/prospectus/sec 1.9914191.100 1460-TSRA-0325 |
| |
| | ANNUAL SHAREHOLDER REPORT | AS OF DECEMBER 31, 2024 | This report describes changes to the Fund that occurred during the reporting period. |
| | VIP FundsManager® 50% Portfolio VIP FundsManager® 50% Portfolio Investor Class true |
| | | |
This annual shareholder report contains information about VIP FundsManager® 50% Portfolio for the period January 1, 2024 to December 31, 2024. You can find additional information about the Fund at fundresearch.fidelity.com/prospectus/sec. You can also request this information by contacting us at 1-877-208-0098 or by sending an e-mail to funddocuments@fmr.com.
What were your Fund costs for the last year?(based on hypothetical $10,000 investment)
FUND COST (PREVIOUS YEAR)
| | Costs of a $10,000 investment | Costs paid as a percentage of a $10,000 investment | |
| Investor Class | $ 10 | 0.10% | |
What affected the Fund's performance this period?
•Risk assets largely produced positive results in 2024, influenced by an expanding global economy, a slowing in the pace of inflation in certain markets, and a pivot by some central banks toward monetary easing, despite ongoing geopolitical risk.
•Within this environment, asset class positioning contributed to the Portfolios' performance versus the Composite indexes, whereas security selection detracted.
•The Portfolios' core equity allocation strategy contributed to relative performance, led by an overweight among U.S. stocks. Equal-weight positioning in international developed- and emerging-markets equities added modest value. Meanwhile, small, out-of-benchmark allocations to real estate investment trusts and commodity-related securities slightly detracted.
•The portfolio's fixed-income allocation strategy also was beneficial from a relative performance standpoint. Specifically, an underweight in investment-grade bonds and cash, in favor of higher-risks segments of the fixed market was advantageous. That said, a small allocation to long-term U.S. Treasurys hurt.
•In terms of security selection, picks among U.S. equities notably pressured relative performance in 2024 due to disappointing results from Fidelity® VIP Stock Selector All Cap Portfolio, the largest equity holding this period. Investment choices in the information technology sector - particularly among software & services and semiconductor companies - detracted the most.
•Conversely, stock selection in developed international markets was a plus, propelled by Fidelity® International Discovery Fund and Fidelity® Overseas Fund. Picks in continental Europe fueled the former, while investment choices in the U.K. helped the latter.
•Security selection among investment-grade bonds also added value, driven by the efforts of our active bond fund managers. In contrast, stocks picks in emerging-markets equities modestly detracted.
•As of December 31, the Portfolios were overweight U.S. stocks and about neutrally weighted in international developed- and emerging-markets equities. Investment-grade bond and cash allocations remained below the Portfolios' target weightings.
How did the Fund perform over the past 10 years?
CUMULATIVE PERFORMANCE
December 31, 2014 through December 31, 2024.
Initial investment of $10,000.
Investor Class | $10,000 | $10,014 | $10,437 | $11,946 | $11,324 | $13,350 | $15,216 | $16,741 | $14,408 | $16,275 | $17,659 |
Fidelity VIP FundsManager 50% Composite Index℠ | $10,000 | $10,053 | $10,637 | $11,950 | $11,529 | $13,568 | $15,236 | $16,704 | $14,358 | $16,308 | $17,789 |
S&P 500® Index | $10,000 | $10,138 | $11,351 | $13,829 | $13,223 | $17,386 | $20,585 | $26,494 | $21,696 | $27,399 | $34,254 |
| | 2014 | 2015 | 2016 | 2017 | 2018 | 2019 | 2020 | 2021 | 2022 | 2023 | 2024 |
AVERAGE ANNUAL TOTAL RETURNS:| | 1 Year | 5 Year | 10 Year |
| Investor Class | 8.51% | 5.75% | 5.85% |
| Fidelity VIP FundsManager 50% Composite Index℠ | 9.08% | 5.57% | 5.93% |
| S&P 500® Index | 25.02% | 14.53% | 13.10% |
Visit institutional.fidelity.com for more recent performance information. |
The Fund's past performance is not a good predictor of the Fund's future performance. The graph and table do not reflect the deduction of taxes that a shareholder would pay on fund distributions or redemption of fund shares. |
Key Fund Statistics(as of December 31, 2024)
KEY FACTS | | |
| Fund Size | $3,953,645,477 | |
| Number of Holdings | 39 | |
| Total Advisory Fee | $4,172,041 | |
| Portfolio Turnover | 20% | |
What did the Fund invest in?
(as of December 31, 2024)
| Bond Funds | 38.8 |
| Domestic Equity Funds | 32.1 |
| International Equity Funds | 19.9 |
| Alternative Funds | 1.3 |
| Short-Term Investments and Net Other Assets (Liabilities) | 7.9 |
ASSET ALLOCATION (% of Fund's net assets) |
|
| | Bond Funds - 38.8 |
| | Domestic Equity Funds - 32.1 |
| | International Equity Funds - 19.9 |
| | Alternative Funds - 1.3 |
| | Short-Term Investments and Net Other Assets (Liabilities) - 7.9 |
| |
TOP HOLDINGS(% of Fund's net assets) | | |
| VIP Stock Selector All Cap Portfolio - Investor Class | 24.9 | |
| Fidelity Total Bond Fund | 17.4 | |
| VIP Investment Grade Bond II Portfolio - Investor Class | 17.3 | |
| Fidelity Emerging Markets Fund | 5.2 | |
| Fidelity Overseas Fund | 4.5 | |
| Fidelity Enhanced International ETF | 2.1 | |
| Fidelity International Discovery Fund | 1.6 | |
| Fidelity Inflation-Protected Bond Index Fund | 1.5 | |
| Fidelity International Capital Appreciation Fund | 1.3 | |
| Fidelity Stock Selector Small Cap Fund | 1.3 | |
| | 77.1 | |
How has the Fund changed?
This is a summary of certain changes to the Fund since January 1, 2024. For more complete information, you may review the Fund's next prospectus, which we expect to be available by April 30, 2025 at fundresearch.fidelity.com/prospectus/sec or upon request at 1-877-208-0098 or by sending an e-mail to funddocuments@fmr.com.
The fund modified its principal investment strategies during the reporting period. | The fund modified its principal investment risks during the reporting period.
|
| Fidelity, the Fidelity Investments Logo and all other Fidelity trademarks or service marks used herein are trademarks or service marks of FMR LLC. Any third-party marks that are used herein are trademarks or service marks of their respective owners. © 2025 FMR LLC. All rights reserved. |
| | For additional information about the Fund; including its prospectus, financial information, holdings and proxy information, scan the QR code or visit fundresearch.fidelity.com/prospectus/sec 1.9914306.100 1587-TSRA-0325 |
| |
| | ANNUAL SHAREHOLDER REPORT | AS OF DECEMBER 31, 2024 | This report describes changes to the Fund that occurred during the reporting period. |
| | VIP Government Money Market Portfolio VIP Government Money Market Portfolio Service Class 2 true |
| | | |
This annual shareholder report contains information about VIP Government Money Market Portfolio for the period January 1, 2024 to December 31, 2024. You can find additional information about the Fund at fundresearch.fidelity.com/prospectus/sec. You can also request this information by contacting us at 1-877-208-0098 or by sending an e-mail to funddocuments@fmr.com.
What were your Fund costs for the last year?(based on hypothetical $10,000 investment)
FUND COST (PREVIOUS YEAR)
| | Costs of a $10,000 investment | Costs paid as a percentage of a $10,000 investment | |
| Service Class 2 | $ 53 | 0.52% | |
Key Fund Statistics(as of December 31, 2024)
KEY FACTS | | |
| Fund Size | $8,497,434,407 | |
| Number of Holdings | 552 | |
| Total Advisory Fee | $22,031,036 | |
What did the Fund invest in?
(as of December 31, 2024)
EFFECTIVE MATURITY DIVERSIFICATION (% of Fund's net assets) |
| Days |
| 1-7 | 59.4 | |
| 8-30 | 9.4 | |
| 31-60 | 13.8 | |
| 61-90 | 7.4 | |
| 91-180 | 7.4 | |
| >180 | 3.4 | |
| |
| Repurchase Agreements | 37.1 |
| U.S. Treasury Obligations | 32.4 |
| U.S. Government Agency - Debt | 31.3 |
ASSET ALLOCATION (% of Fund's net assets) |
|
| | Repurchase Agreements - 37.1 |
| | U.S. Treasury Obligations - 32.4 |
| | U.S. Government Agency - Debt - 31.3 |
| Net Other Assets (Liabilities) - (0.8)% |
| |
How has the Fund changed?
This is a summary of certain changes to the Fund since January 1, 2024. For more complete information, you may review the Fund's next prospectus, which we expect to be available by April 30, 2025 at fundresearch.fidelity.com/prospectus/sec or upon request at 1-877-208-0098 or by sending an e-mail to funddocuments@fmr.com.
The fund's transfer agent and pricing & bookkeeping fees were changed to a fixed rate effective December 1, 2023. Effective March 1, 2024, the fund's management contract was amended to incorporate administrative services previously covered under separate services agreements (transfer agent and pricing & bookkeeping). The amended contract incorporates a management fee rate that may vary by class. The Adviser or an affiliate pays certain expenses of managing and operating the fund out of each class's management fee. | The fund's principal investment risks were updated in connection with the implementation of recent rule amendments related to money market funds adopted by the SEC.
|
| Fidelity, the Fidelity Investments Logo and all other Fidelity trademarks or service marks used herein are trademarks or service marks of FMR LLC. Any third-party marks that are used herein are trademarks or service marks of their respective owners. © 2025 FMR LLC. All rights reserved. |
| | For additional information about the Fund; including its prospectus, financial information, holdings and proxy information, scan the QR code or visit fundresearch.fidelity.com/prospectus/sec 1.9914126.100 359-TSRA-0325 |
| |
| | ANNUAL SHAREHOLDER REPORT | AS OF DECEMBER 31, 2024 | |
| | VIP Investor Freedom 2010 Portfolio℠ VIP Investor Freedom 2010 Portfolio℠ true |
| | | |
This annual shareholder report contains information about VIP Investor Freedom 2010 Portfolio℠ for the period January 1, 2024 to December 31, 2024. You can find additional information about the Fund at fundresearch.fidelity.com/prospectus/sec. You can also request this information by contacting us at 1-877-208-0098 or by sending an e-mail to funddocuments@fmr.com.
What were your Fund costs for the last year?(based on hypothetical $10,000 investment)
FUND COST (PREVIOUS YEAR)
| | Costs of a $10,000 investment | Costs paid as a percentage of a $10,000 investment | |
| VIP Investor Freedom 2010 Portfolio℠ | $ 0 A | 0.00%B | |
A Amount represents less than $.50
B Amount represents less than 0.005%
What affected the Fund's performance this period?
•Risk assets largely produced positive results in 2024, influenced by an expanding global economy and a slowing in the pace of inflation in certain markets, as well as a pivot by some central banks toward monetary easing, despite ongoing geopolitical risk.
•Against this backdrop, active asset allocation positioning detracted from the fund's performance relative to the Composite index, whereas the performance of the underlying investment portfolios contributed.
•In terms of active asset allocation, an underweight in outperforming U.S. equities hurt the fund's relative result the past 12 months, as did an overweight in lagging long-term U.S. Treasurys and outsized exposure to non-U.S. equities. Conversely, underweighting relatively weaker-performing investment-grade bonds added relative value for the fund.
•Looking at the performance of the underlying portfolios, investments in non-U.S. equities contributed to the fund's relative result. Investments in U.S. investment-grade bonds and U.S. equities also helped to a lesser extent. Within U.S. equities, VIP Contrafund Portfolio (+33.70%) notably outperformed its benchmark, the S&P 500® index (+25.02%). Elsewhere in non-U.S. equities, VIP Overseas Portfolio (+4.97%) topped the MSCI EAFE index (+4.07%) and VIP Emerging Markets Portfolio (+9.90%) outpaced the MSCI EM Index (+7.50%).
•At the other end of the performance spectrum of underlying funds, in terms of equities, VIP Growth Portfolio (+30.30%) lagged its benchmark, the Russell 3000® Index (+32.46%), and VIP Growth & Income Portfolio (+22.18%) trailed the S&P 500® index.
How did the Fund perform over the past 10 years?
CUMULATIVE PERFORMANCE
December 31, 2014 through December 31, 2024.
Initial investment of $10,000.
VIP Investor Freedom 2010 Portfolio℠ | $10,000 | $9,966 | $10,497 | $11,867 | $11,385 | $13,219 | $14,858 | $15,721 | $13,599 | $14,877 | $15,661 |
Fidelity VIP Freedom 2010 Composite Index℠ | $10,000 | $9,984 | $10,555 | $11,726 | $11,465 | $13,141 | $14,510 | $15,300 | $13,328 | $14,643 | $15,490 |
Bloomberg U.S. Aggregate Bond Index | $10,000 | $10,055 | $10,321 | $10,687 | $10,688 | $11,620 | $12,492 | $12,299 | $10,699 | $11,291 | $11,432 |
| | 2014 | 2015 | 2016 | 2017 | 2018 | 2019 | 2020 | 2021 | 2022 | 2023 | 2024 |
AVERAGE ANNUAL TOTAL RETURNS:| | 1 Year | 5 Year | 10 Year |
| VIP Investor Freedom 2010 Portfolio℠ | 5.27% | 3.45% | 4.59% |
| Fidelity VIP Freedom 2010 Composite Index℠ | 5.78% | 3.34% | 4.47% |
| Bloomberg U.S. Aggregate Bond Index | 1.25% | -0.33% | 1.35% |
Visit institutional.fidelity.com for more recent performance information. |
The Fund's past performance is not a good predictor of the Fund's future performance. The graph and table do not reflect the deduction of taxes that a shareholder would pay on fund distributions or redemption of fund shares. |
Key Fund Statistics(as of December 31, 2024)
KEY FACTS | | |
| Fund Size | $52,609,584 | |
| Number of Holdings | 15 | |
| Total Advisory Fee | $0 | |
| Portfolio Turnover | 22% | |
What did the Fund invest in?
(as of December 31, 2024)
| Bond Funds | 59.9 |
| International Equity Funds | 15.4 |
| Domestic Equity Funds | 13.4 |
| Short-Term Funds | 11.3 |
| Short-Term Investments and Net Other Assets (Liabilities) | 0.0 |
ASSET ALLOCATION (% of Fund's net assets) |
|
| | Bond Funds - 59.9 |
| | International Equity Funds - 15.4 |
| | Domestic Equity Funds - 13.4 |
| | Short-Term Funds - 11.3 |
| | Short-Term Investments and Net Other Assets (Liabilities) - 0.0 |
| |
TOP HOLDINGS(% of Fund's net assets) | | |
| VIP Investment Grade Bond II Portfolio - Investor Class | 37.2 | |
| Fidelity Inflation-Protected Bond Index Fund | 14.9 | |
| VIP Government Money Market Portfolio - Investor Class | 11.3 | |
| VIP Overseas Portfolio - Investor Class | 9.2 | |
| VIP Emerging Markets Portfolio - Investor Class | 6.2 | |
| VIP Growth Portfolio - Investor Class | 4.0 | |
| Fidelity International Bond Index Fund | 3.4 | |
| Fidelity Long-Term Treasury Bond Index Fund | 3.2 | |
| VIP Growth & Income Portfolio - Investor Class | 2.6 | |
| VIP Contrafund Portfolio - Investor Class | 2.3 | |
| | 94.3 | |
| Fidelity, the Fidelity Investments Logo and all other Fidelity trademarks or service marks used herein are trademarks or service marks of FMR LLC. Any third-party marks that are used herein are trademarks or service marks of their respective owners. © 2025 FMR LLC. All rights reserved. |
| | For additional information about the Fund; including its prospectus, financial information, holdings and proxy information, scan the QR code or visit fundresearch.fidelity.com/prospectus/sec 1.9914293.100 1496-TSRA-0325 |
| |
| | ANNUAL SHAREHOLDER REPORT | AS OF DECEMBER 31, 2024 | This report describes changes to the Fund that occurred during the reporting period. |
| | VIP Investment Grade Bond Portfolio VIP Investment Grade Bond Portfolio Initial Class true |
| | | |
This annual shareholder report contains information about VIP Investment Grade Bond Portfolio for the period January 1, 2024 to December 31, 2024. You can find additional information about the Fund at fundresearch.fidelity.com/prospectus/sec. You can also request this information by contacting us at 1-877-208-0098 or by sending an e-mail to funddocuments@fmr.com.
What were your Fund costs for the last year?(based on hypothetical $10,000 investment)
FUND COST (PREVIOUS YEAR)
| | Costs of a $10,000 investment | Costs paid as a percentage of a $10,000 investment | |
| Initial Class | $ 38 | 0.38% | |
What affected the Fund's performance this period?
•U.S. taxable investment-grade bonds posted a modest advance in 2024, rallying during the summer months, as the bond market reflected anticipated interest-rate reductions by the U.S. Federal Reserve, but falling back in the fourth quarter when the Fed tempered rate-cut expectations for 2025.
•Against this backdrop, the fund's exposure to asset-backed securities, including collateralized loan obligations, was a key contributor to performance versus the Bloomberg U.S. Aggregate Bond Index for the fiscal year.
•An overweight to commercial mortgage-backed securities provided another performance advantage, as did an underweight to agency mortgage-backed securities.
•Among corporate bonds, industry allocation lifted relative performance as well, led by security selection among financials and an overweight in the segment. Specifically, positioning among banks and REITS was beneficial versus the index.
•Exposure to certain "plus" sectors, namely high yield bonds and emerging markets debt, also were modest contributors.
•In contrast, the fund's yield-curve positioning modestly detracted for the year.
How did the Fund perform over the past 10 years?
CUMULATIVE PERFORMANCE
December 31, 2014 through December 31, 2024.
Initial investment of $10,000.
Initial Class | $10,000 | $9,940 | $10,412 | $10,851 | $10,793 | $11,837 | $12,948 | $12,870 | $11,202 | $11,897 | $12,110 |
Bloomberg U.S. Aggregate Bond Index | $10,000 | $10,055 | $10,321 | $10,687 | $10,688 | $11,620 | $12,492 | $12,299 | $10,699 | $11,291 | $11,432 |
| | 2014 | 2015 | 2016 | 2017 | 2018 | 2019 | 2020 | 2021 | 2022 | 2023 | 2024 |
AVERAGE ANNUAL TOTAL RETURNS:| | 1 Year | 5 Year | 10 Year |
| Initial Class | 1.79% | 0.46% | 1.93% |
| Bloomberg U.S. Aggregate Bond Index | 1.25% | -0.33% | 1.35% |
Visit institutional.fidelity.com for more recent performance information. |
The Fund's past performance is not a good predictor of the Fund's future performance. The graph and table do not reflect the deduction of taxes that a shareholder would pay on fund distributions or redemption of fund shares. |
Key Fund Statistics(as of December 31, 2024)
KEY FACTS | | |
| Fund Size | $4,430,972,983 | |
| Number of Holdings | 2,224 | |
| Total Advisory Fee | $15,386,008 | |
| Portfolio Turnover | 205% | |
What did the Fund invest in?
(as of December 31, 2024)
The information in the following tables is based on the combined Investments of the Fund and it's pro-rata share of investments in Fidelity's Central Funds, other than the Commodity Strategy and Money Market Central Funds as applicable.
| U.S. Government and U.S. Government Agency Obligations | 63.0 |
| AAA | 9.0 |
| AA | 0.9 |
| A | 6.2 |
| BBB | 16.4 |
| BB | 2.9 |
| B | 1.3 |
| CCC,CC,C | 0.0 |
| Not Rated | 4.2 |
| Equities | 0.0 |
QUALITY DIVERSIFICATION (% of Fund's net assets) |
| |
| | U.S. Government and U.S. Government Agency Obligations - 63.0 |
| | AAA - 9.0 |
| | AA - 0.9 |
| | A - 6.2 |
| | BBB - 16.4 |
| | BB - 2.9 |
| | B - 1.3 |
| | CCC,CC,C - 0.0 |
| | Not Rated - 4.2 |
| | Equities - 0.0 |
| Short-Term Investments and Net Other Assets (Liabilities) - (3.9)% |
| |
| We have used ratings from Moody's Investors Service, Inc. Where Moody's® ratings are not available, we have used S&P® ratings. All ratings are as of the date indicated and do not reflect subsequent changes. |
| U.S. Treasury Obligations | 45.2 |
| Corporate Bonds | 24.9 |
| U.S. Government Agency - Mortgage Securities | 17.8 |
| Asset-Backed Securities | 8.6 |
| CMOs and Other Mortgage Related Securities | 7.0 |
| Other Investments | 0.2 |
| Purchased Options | 0.1 |
| Foreign Government and Government Agency Obligations | 0.1 |
| Preferred Securities | 0.0 |
| Bank Loan Obligations | 0.0 |
| Common Stocks | 0.0 |
ASSET ALLOCATION (% of Fund's net assets) |
|
| | U.S. Treasury Obligations - 45.2 |
| | Corporate Bonds - 24.9 |
| | U.S. Government Agency - Mortgage Securities - 17.8 |
| | Asset-Backed Securities - 8.6 |
| | CMOs and Other Mortgage Related Securities - 7.0 |
| | Other Investments - 0.2 |
| | Purchased Options - 0.1 |
| | Foreign Government and Government Agency Obligations - 0.1 |
| | Preferred Securities - 0.0 |
| | Bank Loan Obligations - 0.0 |
| | Common Stocks - 0.0 |
| Short-Term Investments and Net Other Assets (Liabilities) - (3.9)% |
| |
| United States | 90.8 |
| Grand Cayman (UK Overseas Ter) | 4.7 |
| Mexico | 1.0 |
| Ireland | 0.7 |
| United Kingdom | 0.6 |
| Netherlands | 0.4 |
| Switzerland | 0.4 |
| Bailiwick Of Jersey | 0.3 |
| Germany | 0.3 |
| Others | 0.8 |
GEOGRAPHIC DIVERSIFICATION (% of Fund's net assets) |
|
| | United States - 90.8 |
| | Grand Cayman (UK Overseas Ter) - 4.7 |
| | Mexico - 1.0 |
| | Ireland - 0.7 |
| | United Kingdom - 0.6 |
| | Netherlands - 0.4 |
| | Switzerland - 0.4 |
| | Bailiwick Of Jersey - 0.3 |
| | Germany - 0.3 |
| | Others - 0.8 |
| |
TOP HOLDINGS(% of Fund's net assets) | | |
| US Treasury Notes | 33.8 | |
| US Treasury Bonds | 11.4 | |
| Fannie Mae Mortgage pass-thru certificates | 6.4 | |
| Ginnie Mae II Pool | 5.2 | |
| Freddie Mac Gold Pool | 3.4 | |
| Uniform Mortgage Backed Securities | 2.1 | |
| Freddie Mac Multifamily Structured pass-thru certificates | 1.4 | |
| Bank of America Corp | 1.1 | |
| Petroleos Mexicanos | 1.0 | |
| Morgan Stanley | 1.0 | |
| | 66.8 | |
How has the Fund changed?
This is a summary of certain changes to the Fund since January 1, 2024. For more complete information, you may review the Fund's next prospectus, which we expect to be available by April 30, 2025 at fundresearch.fidelity.com/prospectus/sec or upon request at 1-877-208-0098 or by sending an e-mail to funddocuments@fmr.com.
The fees associated with this class changed during the reporting year. The variations in class fees are primarily the result of the following changes:- Management fee
- Operating expenses
The fund's transfer agent and pricing & bookkeeping fees were changed to a fixed rate effective December 1, 2023. Effective March 1, 2024, the fund's management contract was amended to incorporate administrative services previously covered under separate services agreements (transfer agent and pricing & bookkeeping). The amended contract incorporates a management fee rate that may vary by class. The Adviser or an affiliate pays certain expenses of managing and operating the fund out of each class's management fee. | |
| Fidelity, the Fidelity Investments Logo and all other Fidelity trademarks or service marks used herein are trademarks or service marks of FMR LLC. Any third-party marks that are used herein are trademarks or service marks of their respective owners. © 2025 FMR LLC. All rights reserved. |
| | For additional information about the Fund; including its prospectus, financial information, holdings and proxy information, scan the QR code or visit fundresearch.fidelity.com/prospectus/sec 1.9914192.100 155-TSRA-0325 |
| |
| | ANNUAL SHAREHOLDER REPORT | AS OF DECEMBER 31, 2024 | This report describes changes to the Fund that occurred during the reporting period. |
| | VIP FundsManager® 50% Portfolio VIP FundsManager® 50% Portfolio Service Class 2 true |
| | | |
This annual shareholder report contains information about VIP FundsManager® 50% Portfolio for the period January 1, 2024 to December 31, 2024. You can find additional information about the Fund at fundresearch.fidelity.com/prospectus/sec. You can also request this information by contacting us at 1-877-208-0098 or by sending an e-mail to funddocuments@fmr.com.
What were your Fund costs for the last year?(based on hypothetical $10,000 investment)
FUND COST (PREVIOUS YEAR)
| | Costs of a $10,000 investment | Costs paid as a percentage of a $10,000 investment | |
| Service Class 2 | $ 26 | 0.25% | |
What affected the Fund's performance this period?
•Risk assets largely produced positive results in 2024, influenced by an expanding global economy, a slowing in the pace of inflation in certain markets, and a pivot by some central banks toward monetary easing, despite ongoing geopolitical risk.
•Within this environment, asset class positioning contributed to the Portfolios' performance versus the Composite indexes, whereas security selection detracted.
•The Portfolios' core equity allocation strategy contributed to relative performance, led by an overweight among U.S. stocks. Equal-weight positioning in international developed- and emerging-markets equities added modest value. Meanwhile, small, out-of-benchmark allocations to real estate investment trusts and commodity-related securities slightly detracted.
•The portfolio's fixed-income allocation strategy also was beneficial from a relative performance standpoint. Specifically, an underweight in investment-grade bonds and cash, in favor of higher-risks segments of the fixed market was advantageous. That said, a small allocation to long-term U.S. Treasurys hurt.
•In terms of security selection, picks among U.S. equities notably pressured relative performance in 2024 due to disappointing results from Fidelity® VIP Stock Selector All Cap Portfolio, the largest equity holding this period. Investment choices in the information technology sector - particularly among software & services and semiconductor companies - detracted the most.
•Conversely, stock selection in developed international markets was a plus, propelled by Fidelity® International Discovery Fund and Fidelity® Overseas Fund. Picks in continental Europe fueled the former, while investment choices in the U.K. helped the latter.
•Security selection among investment-grade bonds also added value, driven by the efforts of our active bond fund managers. In contrast, stocks picks in emerging-markets equities modestly detracted.
•As of December 31, the Portfolios were overweight U.S. stocks and about neutrally weighted in international developed- and emerging-markets equities. Investment-grade bond and cash allocations remained below the Portfolios' target weightings.
How did the Fund perform over the past 10 years?
CUMULATIVE PERFORMANCE
December 31, 2014 through December 31, 2024.
Initial investment of $10,000.
Service Class 2 | $10,000 | $9,998 | $10,406 | $11,888 | $11,249 | $13,239 | $15,078 | $16,567 | $14,241 | $16,043 | $17,387 |
Fidelity VIP FundsManager 50% Composite Index℠ | $10,000 | $10,053 | $10,637 | $11,950 | $11,529 | $13,568 | $15,236 | $16,704 | $14,358 | $16,308 | $17,789 |
S&P 500® Index | $10,000 | $10,138 | $11,351 | $13,829 | $13,223 | $17,386 | $20,585 | $26,494 | $21,696 | $27,399 | $34,254 |
| | 2014 | 2015 | 2016 | 2017 | 2018 | 2019 | 2020 | 2021 | 2022 | 2023 | 2024 |
AVERAGE ANNUAL TOTAL RETURNS:| | 1 Year | 5 Year | 10 Year |
| Service Class 2 | 8.38% | 5.60% | 5.69% |
| Fidelity VIP FundsManager 50% Composite Index℠ | 9.08% | 5.57% | 5.93% |
| S&P 500® Index | 25.02% | 14.53% | 13.10% |
Visit institutional.fidelity.com for more recent performance information. |
The Fund's past performance is not a good predictor of the Fund's future performance. The graph and table do not reflect the deduction of taxes that a shareholder would pay on fund distributions or redemption of fund shares. |
Key Fund Statistics(as of December 31, 2024)
KEY FACTS | | |
| Fund Size | $3,953,645,477 | |
| Number of Holdings | 39 | |
| Total Advisory Fee | $4,172,041 | |
| Portfolio Turnover | 20% | |
What did the Fund invest in?
(as of December 31, 2024)
| Bond Funds | 38.8 |
| Domestic Equity Funds | 32.1 |
| International Equity Funds | 19.9 |
| Alternative Funds | 1.3 |
| Short-Term Investments and Net Other Assets (Liabilities) | 7.9 |
ASSET ALLOCATION (% of Fund's net assets) |
|
| | Bond Funds - 38.8 |
| | Domestic Equity Funds - 32.1 |
| | International Equity Funds - 19.9 |
| | Alternative Funds - 1.3 |
| | Short-Term Investments and Net Other Assets (Liabilities) - 7.9 |
| |
TOP HOLDINGS(% of Fund's net assets) | | |
| VIP Stock Selector All Cap Portfolio - Investor Class | 24.9 | |
| Fidelity Total Bond Fund | 17.4 | |
| VIP Investment Grade Bond II Portfolio - Investor Class | 17.3 | |
| Fidelity Emerging Markets Fund | 5.2 | |
| Fidelity Overseas Fund | 4.5 | |
| Fidelity Enhanced International ETF | 2.1 | |
| Fidelity International Discovery Fund | 1.6 | |
| Fidelity Inflation-Protected Bond Index Fund | 1.5 | |
| Fidelity International Capital Appreciation Fund | 1.3 | |
| Fidelity Stock Selector Small Cap Fund | 1.3 | |
| | 77.1 | |
How has the Fund changed?
This is a summary of certain changes to the Fund since January 1, 2024. For more complete information, you may review the Fund's next prospectus, which we expect to be available by April 30, 2025 at fundresearch.fidelity.com/prospectus/sec or upon request at 1-877-208-0098 or by sending an e-mail to funddocuments@fmr.com.
The fund modified its principal investment strategies during the reporting period. | The fund modified its principal investment risks during the reporting period.
|
| Fidelity, the Fidelity Investments Logo and all other Fidelity trademarks or service marks used herein are trademarks or service marks of FMR LLC. Any third-party marks that are used herein are trademarks or service marks of their respective owners. © 2025 FMR LLC. All rights reserved. |
| | For additional information about the Fund; including its prospectus, financial information, holdings and proxy information, scan the QR code or visit fundresearch.fidelity.com/prospectus/sec 1.9914308.100 1589-TSRA-0325 |
| |
| | ANNUAL SHAREHOLDER REPORT | AS OF DECEMBER 31, 2024 | This report describes changes to the Fund that occurred during the reporting period. |
| | VIP Freedom 2060 Portfolio℠ VIP Freedom 2060 Portfolio℠ Service Class 2 true |
| | | |
This annual shareholder report contains information about VIP Freedom 2060 Portfolio℠ for the period January 1, 2024 to December 31, 2024. You can find additional information about the Fund at fundresearch.fidelity.com/prospectus/sec. You can also request this information by contacting us at 1-877-208-0098 or by sending an e-mail to funddocuments@fmr.com.
What were your Fund costs for the last year?(based on hypothetical $10,000 investment)
FUND COST (PREVIOUS YEAR)
| | Costs of a $10,000 investment | Costs paid as a percentage of a $10,000 investment | |
| Service Class 2 | $ 27 | 0.25% | |
What affected the Fund's performance this period?
•Risk assets largely produced positive results in 2024, influenced by an expanding global economy and a slowing in the pace of inflation in certain markets, as well as a pivot by some central banks toward monetary easing, despite ongoing geopolitical risk.
•Against this backdrop, active asset allocation positioning detracted from the fund's performance relative to the Composite index, whereas the performance of the underlying investment portfolios contributed.
•In terms of active asset allocation, an underweight in outperforming U.S. equities hurt the fund's relative result the past 12 months, as did an overweight in lagging long-term U.S. Treasurys and outsized exposure to non-U.S. equities. Conversely, an underweight in relatively weaker-performing investment-grade bonds added relative value for the fund.
•Looking at the performance of the underlying portfolios, investments in non-U.S. equities contributed to the fund's relative result. Investments in U.S. investment-grade bonds and U.S. equities also helped to a lesser extent. Within U.S. equities, VIP Contrafund Portfolio (+33.79%) notably outperformed its benchmark, the S&P 500® index (+25.02%). Elsewhere among non-U.S. equities, VIP Overseas Portfolio (+5%) topped the MSCI EAFE index (+4.07%) and VIP Emerging Markets Portfolio (+10.04%) outpaced the MSCI EM Index (+7.50%).
•At the other end of the performance spectrum of underlying funds, within equities, VIP Growth Portfolio (+30.39%) lagged its benchmark, the Russell 3000® Index (+32.46%), and VIP Growth & Income Portfolio (+22.21%) trailed the S&P 500® index.
How did the Fund perform over the life of Fund?
CUMULATIVE PERFORMANCE
April 11, 2019 through December 31, 2024.
Initial investment of $10,000.
Service Class 2 | $10,000 | $11,161 | $13,286 | $15,614 | $12,743 | $15,180 |
Fidelity VIP Freedom 2060 Composite Index℠ | $10,000 | $11,078 | $12,911 | $15,000 | $12,279 | $14,749 |
S&P 500® Index | $10,000 | $11,346 | $13,433 | $17,289 | $14,158 | $17,880 |
| | 2019 | 2020 | 2021 | 2022 | 2023 | 2024 |
AVERAGE ANNUAL TOTAL RETURNS:| | 1 Year | 5 Year | Life of Fund A |
| Service Class 2 | 13.53% | 9.08% | 9.97% |
| Fidelity VIP Freedom 2060 Composite Index℠ | 14.43% | 8.78% | 9.57% |
| S&P 500® Index | 25.02% | 14.53% | 15.07% |
A From April 11, 2019
Visit institutional.fidelity.com for more recent performance information. |
The Fund's past performance is not a good predictor of the Fund's future performance. The graph and table do not reflect the deduction of taxes that a shareholder would pay on fund distributions or redemption of fund shares. |
Key Fund Statistics(as of December 31, 2024)
KEY FACTS | | |
| Fund Size | $26,164,071 | |
| Number of Holdings | 11 | |
| Total Advisory Fee | $0 | |
| Portfolio Turnover | 54% | |
What did the Fund invest in?
(as of December 31, 2024)
| Domestic Equity Funds | 51.5 |
| International Equity Funds | 40.9 |
| Bond Funds | 7.6 |
| Short-Term Investments and Net Other Assets (Liabilities) | 0.0 |
ASSET ALLOCATION (% of Fund's net assets) |
|
| | Domestic Equity Funds - 51.5 |
| | International Equity Funds - 40.9 |
| | Bond Funds - 7.6 |
| | Short-Term Investments and Net Other Assets (Liabilities) - 0.0 |
| |
TOP HOLDINGS(% of Fund's net assets) | | |
| VIP Overseas Portfolio - Initial Class | 27.8 | |
| VIP Growth Portfolio - Initial Class | 15.0 | |
| VIP Emerging Markets Portfolio - Initial Class | 13.1 | |
| VIP Growth & Income Portfolio - Initial Class | 10.1 | |
| VIP Contrafund Portfolio - Initial Class | 9.0 | |
| VIP Equity-Income Portfolio - Initial Class | 7.4 | |
| Fidelity Long-Term Treasury Bond Index Fund | 6.6 | |
| VIP Value Portfolio - Initial Class | 5.1 | |
| VIP Value Strategies Portfolio - Initial Class | 2.6 | |
| VIP Mid Cap Portfolio - Initial Class | 2.3 | |
| | 99.0 | |
How has the Fund changed?
This is a summary of certain changes to the Fund since January 1, 2024. For more complete information, you may review the Fund's next prospectus, which we expect to be available by April 30, 2025 at fundresearch.fidelity.com/prospectus/sec or upon request at 1-877-208-0098 or by sending an e-mail to funddocuments@fmr.com.
The fund added a contractual proxy and shareholder meeting expense cap during the reporting period. | |
| Fidelity, the Fidelity Investments Logo and all other Fidelity trademarks or service marks used herein are trademarks or service marks of FMR LLC. Any third-party marks that are used herein are trademarks or service marks of their respective owners. © 2025 FMR LLC. All rights reserved. |
| | For additional information about the Fund; including its prospectus, financial information, holdings and proxy information, scan the QR code or visit fundresearch.fidelity.com/prospectus/sec 1.9914389.100 3366-TSRA-0325 |
| |
| | ANNUAL SHAREHOLDER REPORT | AS OF DECEMBER 31, 2024 | This report describes changes to the Fund that occurred during the reporting period. |
| | VIP Freedom 2055 Portfolio℠ VIP Freedom 2055 Portfolio℠ Service Class 2 true |
| | | |
This annual shareholder report contains information about VIP Freedom 2055 Portfolio℠ for the period January 1, 2024 to December 31, 2024. You can find additional information about the Fund at fundresearch.fidelity.com/prospectus/sec. You can also request this information by contacting us at 1-877-208-0098 or by sending an e-mail to funddocuments@fmr.com.
What were your Fund costs for the last year?(based on hypothetical $10,000 investment)
FUND COST (PREVIOUS YEAR)
| | Costs of a $10,000 investment | Costs paid as a percentage of a $10,000 investment | |
| Service Class 2 | $ 27 | 0.25% | |
What affected the Fund's performance this period?
•Risk assets largely produced positive results in 2024, influenced by an expanding global economy and a slowing in the pace of inflation in certain markets, as well as a pivot by some central banks toward monetary easing, despite ongoing geopolitical risk.
•Against this backdrop, active asset allocation positioning detracted from the fund's performance relative to the Composite index, whereas the performance of the underlying investment portfolios contributed.
•In terms of active asset allocation, an underweight in outperforming U.S. equities hurt the fund's relative result the past 12 months, as did an overweight in lagging long-term U.S. Treasurys and outsized exposure to non-U.S. equities. Conversely, an underweight in relatively weaker-performing investment-grade bonds added relative value for the fund.
•Looking at the performance of the underlying portfolios, investments in non-U.S. equities contributed to the fund's relative result. Investments in U.S. investment-grade bonds and U.S. equities also helped to a lesser extent. Within U.S. equities, VIP Contrafund Portfolio (+33.79%) notably outperformed its benchmark, the S&P 500® index (+25.02%). Elsewhere among non-U.S. equities, VIP Overseas Portfolio (+5%) topped the MSCI EAFE index (+4.07%) and VIP Emerging Markets Portfolio (+10.04%) outpaced the MSCI EM Index (+7.50%).
•At the other end of the performance spectrum of underlying funds, within equities, VIP Growth Portfolio (+30.39%) lagged its benchmark, the Russell 3000® Index (+32.46%), and VIP Growth & Income Portfolio (+22.21%) trailed the S&P 500® index.
How did the Fund perform over the life of Fund?
CUMULATIVE PERFORMANCE
April 11, 2019 through December 31, 2024.
Initial investment of $10,000.
Service Class 2 | $10,000 | $11,160 | $13,282 | $15,609 | $12,728 | $15,162 |
Fidelity VIP Freedom 2055 Composite Index℠ | $10,000 | $11,078 | $12,911 | $15,000 | $12,279 | $14,749 |
S&P 500® Index | $10,000 | $11,346 | $13,433 | $17,289 | $14,158 | $17,880 |
| | 2019 | 2020 | 2021 | 2022 | 2023 | 2024 |
AVERAGE ANNUAL TOTAL RETURNS:| | 1 Year | 5 Year | Life of Fund A |
| Service Class 2 | 13.61% | 9.07% | 9.96% |
| Fidelity VIP Freedom 2055 Composite Index℠ | 14.43% | 8.78% | 9.57% |
| S&P 500® Index | 25.02% | 14.53% | 15.07% |
A From April 11, 2019
Visit institutional.fidelity.com for more recent performance information. |
The Fund's past performance is not a good predictor of the Fund's future performance. The graph and table do not reflect the deduction of taxes that a shareholder would pay on fund distributions or redemption of fund shares. |
Key Fund Statistics(as of December 31, 2024)
KEY FACTS | | |
| Fund Size | $21,543,729 | |
| Number of Holdings | 11 | |
| Total Advisory Fee | $0 | |
| Portfolio Turnover | 43% | |
What did the Fund invest in?
(as of December 31, 2024)
| Domestic Equity Funds | 51.5 |
| International Equity Funds | 40.9 |
| Bond Funds | 7.6 |
| Short-Term Investments and Net Other Assets (Liabilities) | 0.0 |
ASSET ALLOCATION (% of Fund's net assets) |
|
| | Domestic Equity Funds - 51.5 |
| | International Equity Funds - 40.9 |
| | Bond Funds - 7.6 |
| | Short-Term Investments and Net Other Assets (Liabilities) - 0.0 |
| |
TOP HOLDINGS(% of Fund's net assets) | | |
| VIP Overseas Portfolio - Initial Class | 27.8 | |
| VIP Growth Portfolio - Initial Class | 15.0 | |
| VIP Emerging Markets Portfolio - Initial Class | 13.1 | |
| VIP Growth & Income Portfolio - Initial Class | 10.1 | |
| VIP Contrafund Portfolio - Initial Class | 9.0 | |
| VIP Equity-Income Portfolio - Initial Class | 7.4 | |
| Fidelity Long-Term Treasury Bond Index Fund | 6.6 | |
| VIP Value Portfolio - Initial Class | 5.1 | |
| VIP Value Strategies Portfolio - Initial Class | 2.6 | |
| VIP Mid Cap Portfolio - Initial Class | 2.3 | |
| | 99.0 | |
How has the Fund changed?
This is a summary of certain changes to the Fund since January 1, 2024. For more complete information, you may review the Fund's next prospectus, which we expect to be available by April 30, 2025 at fundresearch.fidelity.com/prospectus/sec or upon request at 1-877-208-0098 or by sending an e-mail to funddocuments@fmr.com.
The fund added a contractual proxy and shareholder meeting expense cap during the reporting period. | |
| Fidelity, the Fidelity Investments Logo and all other Fidelity trademarks or service marks used herein are trademarks or service marks of FMR LLC. Any third-party marks that are used herein are trademarks or service marks of their respective owners. © 2025 FMR LLC. All rights reserved. |
| | For additional information about the Fund; including its prospectus, financial information, holdings and proxy information, scan the QR code or visit fundresearch.fidelity.com/prospectus/sec 1.9914386.100 3364-TSRA-0325 |
| |
| | ANNUAL SHAREHOLDER REPORT | AS OF DECEMBER 31, 2024 | |
| | VIP Freedom 2070 Portfolio℠ VIP Freedom 2070 Portfolio℠ Service Class 2 true |
| | | |
This annual shareholder report contains information about VIP Freedom 2070 Portfolio℠ for the period July 1, 2024 to December 31, 2024. You can find additional information about the Fund at fundresearch.fidelity.com/prospectus/sec. You can also request this information by contacting us at 1-877-208-0098 or by sending an e-mail to funddocuments@fmr.com.
What were your Fund costs for the last year?(based on hypothetical $10,000 investment)
FUND COST (PREVIOUS YEAR)
| | Costs of a $10,000 investment | Costs paid as a percentage of a $10,000 investment | |
Service Class 2 A | $ 13 | 0.25% | |
AExpenses for the full reporting period would be higher.
Key Fund Statistics(as of December 31, 2024)
KEY FACTS | | |
| Fund Size | $504,235 | |
| Number of Holdings | 11 | |
| Total Advisory Fee | $0 | |
Portfolio TurnoverA | 26% | |
A Amount not annualized
What did the Fund invest in?
(as of December 31, 2024)
| Domestic Equity Funds | 51.5 |
| International Equity Funds | 40.9 |
| Fixed-Income Funds | 7.6 |
| Short-Term Investments and Net Other Assets (Liabilities) | 0.0 |
ASSET ALLOCATION (% of Fund's net assets) |
|
| | Domestic Equity Funds - 51.5 |
| | International Equity Funds - 40.9 |
| | Fixed-Income Funds - 7.6 |
| | Short-Term Investments and Net Other Assets (Liabilities) - 0.0 |
| |
TOP HOLDINGS(% of Fund's net assets) | | |
| VIP Overseas Portfolio - Initial Class | 27.8 | |
| VIP Growth Portfolio - Initial Class | 15.0 | |
| VIP Emerging Markets Portfolio - Initial Class | 13.1 | |
| VIP Growth & Income Portfolio - Initial Class | 10.1 | |
| VIP Contrafund Portfolio - Initial Class | 9.0 | |
| VIP Equity-Income Portfolio - Initial Class | 7.4 | |
| Fidelity Long-Term Treasury Bond Index Fund | 6.6 | |
| VIP Value Portfolio - Initial Class | 5.1 | |
| VIP Value Strategies Portfolio - Initial Class | 2.6 | |
| VIP Mid Cap Portfolio - Initial Class | 2.3 | |
| | 99.0 | |
| Fidelity, the Fidelity Investments Logo and all other Fidelity trademarks or service marks used herein are trademarks or service marks of FMR LLC. Any third-party marks that are used herein are trademarks or service marks of their respective owners. © 2025 FMR LLC. All rights reserved. |
| | For additional information about the Fund; including its prospectus, financial information, holdings and proxy information, scan the QR code or visit fundresearch.fidelity.com/prospectus/sec 1.9918312.100 7673-TSRA-0325 |
| |
| | ANNUAL SHAREHOLDER REPORT | AS OF DECEMBER 31, 2024 | |
| | VIP Freedom 2050 Portfolio℠ VIP Freedom 2050 Portfolio℠ Service Class true |
| | | |
This annual shareholder report contains information about VIP Freedom 2050 Portfolio℠ for the period January 1, 2024 to December 31, 2024. You can find additional information about the Fund at fundresearch.fidelity.com/prospectus/sec. You can also request this information by contacting us at 1-877-208-0098 or by sending an e-mail to funddocuments@fmr.com.
What were your Fund costs for the last year?(based on hypothetical $10,000 investment)
FUND COST (PREVIOUS YEAR)
| | Costs of a $10,000 investment | Costs paid as a percentage of a $10,000 investment | |
| Service Class | $ 11 | 0.10% | |
What affected the Fund's performance this period?
•Risk assets largely produced positive results in 2024, influenced by an expanding global economy and a slowing in the pace of inflation in certain markets, as well as a pivot by some central banks toward monetary easing, despite ongoing geopolitical risk.
•Against this backdrop, active asset allocation positioning detracted from the fund's performance relative to the Composite index, whereas the performance of the underlying investment portfolios contributed.
•In terms of active asset allocation, an underweight in outperforming U.S. equities hurt the fund's relative result the past 12 months, as did an overweight in lagging long-term U.S. Treasurys and outsized exposure to non-U.S. equities. Conversely, an underweight in relatively weaker-performing investment-grade bonds added relative value for the fund.
•Looking at the performance of the underlying portfolios, investments in non-U.S. equities contributed to the fund's relative result. Investments in U.S. investment-grade bonds and U.S. equities also helped to a lesser extent. Within U.S. equities, VIP Contrafund Portfolio (+33.79%) notably outperformed its benchmark, the S&P 500® index (+25.02%). Elsewhere among non-U.S. equities, VIP Overseas Portfolio (+5%) topped the MSCI EAFE index (+4.07%) and VIP Emerging Markets Portfolio (+10.04%) outpaced the MSCI EM Index (+7.50%).
•At the other end of the performance spectrum of underlying funds, within equities, VIP Growth Portfolio (+30.39%) lagged its benchmark, the Russell 3000® Index (+32.46%), and VIP Growth & Income Portfolio (+22.21%) trailed the S&P 500® index.
How did the Fund perform over the past 10 years?
CUMULATIVE PERFORMANCE
December 31, 2014 through December 31, 2024.
Initial investment of $10,000.
Service Class | $10,000 | $9,962 | $10,634 | $13,130 | $11,812 | $15,166 | $18,074 | $21,280 | $17,383 | $20,738 | $23,587 |
Fidelity VIP Freedom 2050 Composite Index℠ | $10,000 | $9,894 | $10,838 | $13,109 | $12,185 | $15,394 | $17,940 | $20,843 | $17,062 | $20,494 | $23,452 |
S&P 500® Index | $10,000 | $10,138 | $11,351 | $13,829 | $13,223 | $17,386 | $20,585 | $26,494 | $21,696 | $27,399 | $34,254 |
| | 2014 | 2015 | 2016 | 2017 | 2018 | 2019 | 2020 | 2021 | 2022 | 2023 | 2024 |
AVERAGE ANNUAL TOTAL RETURNS:| | 1 Year | 5 Year | 10 Year |
| Service Class | 13.74% | 9.23% | 8.96% |
| Fidelity VIP Freedom 2050 Composite Index℠ | 14.43% | 8.78% | 8.90% |
| S&P 500® Index | 25.02% | 14.53% | 13.10% |
Visit institutional.fidelity.com for more recent performance information. |
The Fund's past performance is not a good predictor of the Fund's future performance. The graph and table do not reflect the deduction of taxes that a shareholder would pay on fund distributions or redemption of fund shares. |
Key Fund Statistics(as of December 31, 2024)
KEY FACTS | | |
| Fund Size | $168,362,171 | |
| Number of Holdings | 11 | |
| Total Advisory Fee | $0 | |
| Portfolio Turnover | 34% | |
What did the Fund invest in?
(as of December 31, 2024)
| Domestic Equity Funds | 51.5 |
| International Equity Funds | 40.9 |
| Bond Funds | 7.6 |
| Short-Term Investments and Net Other Assets (Liabilities) | 0.0 |
ASSET ALLOCATION (% of Fund's net assets) |
|
| | Domestic Equity Funds - 51.5 |
| | International Equity Funds - 40.9 |
| | Bond Funds - 7.6 |
| | Short-Term Investments and Net Other Assets (Liabilities) - 0.0 |
| |
TOP HOLDINGS(% of Fund's net assets) | | |
| VIP Overseas Portfolio - Initial Class | 27.8 | |
| VIP Growth Portfolio - Initial Class | 15.0 | |
| VIP Emerging Markets Portfolio - Initial Class | 13.1 | |
| VIP Growth & Income Portfolio - Initial Class | 10.1 | |
| VIP Contrafund Portfolio - Initial Class | 9.0 | |
| VIP Equity-Income Portfolio - Initial Class | 7.4 | |
| Fidelity Long-Term Treasury Bond Index Fund | 6.6 | |
| VIP Value Portfolio - Initial Class | 5.1 | |
| VIP Value Strategies Portfolio - Initial Class | 2.6 | |
| VIP Mid Cap Portfolio - Initial Class | 2.3 | |
| | 99.0 | |
| Fidelity, the Fidelity Investments Logo and all other Fidelity trademarks or service marks used herein are trademarks or service marks of FMR LLC. Any third-party marks that are used herein are trademarks or service marks of their respective owners. © 2025 FMR LLC. All rights reserved. |
| | For additional information about the Fund; including its prospectus, financial information, holdings and proxy information, scan the QR code or visit fundresearch.fidelity.com/prospectus/sec 1.9914340.100 2169-TSRA-0325 |
| |
| | ANNUAL SHAREHOLDER REPORT | AS OF DECEMBER 31, 2024 | This report describes changes to the Fund that occurred during the reporting period. |
| | VIP FundsManager® 85% Portfolio VIP FundsManager® 85% Portfolio Investor Class true |
| | | |
This annual shareholder report contains information about VIP FundsManager® 85% Portfolio for the period January 1, 2024 to December 31, 2024. You can find additional information about the Fund at fundresearch.fidelity.com/prospectus/sec. You can also request this information by contacting us at 1-877-208-0098 or by sending an e-mail to funddocuments@fmr.com.
What were your Fund costs for the last year?(based on hypothetical $10,000 investment)
FUND COST (PREVIOUS YEAR)
| | Costs of a $10,000 investment | Costs paid as a percentage of a $10,000 investment | |
| Investor Class | $ 11 | 0.10% | |
What affected the Fund's performance this period?
•Risk assets largely produced positive results in 2024, influenced by an expanding global economy, a slowing in the pace of inflation in certain markets, and a pivot by some central banks toward monetary easing, despite ongoing geopolitical risk.
•Within this environment, asset class positioning contributed to the Portfolios' performance versus the Composite indexes, whereas security selection detracted.
•The Portfolios' core equity allocation strategy contributed to relative performance, led by an overweight among U.S. stocks. Equal-weight positioning in international developed- and emerging-markets equities added modest value. Meanwhile, small, out-of-benchmark allocations to real estate investment trusts and commodity-related securities slightly detracted.
•The portfolio's fixed-income allocation strategy also was beneficial from a relative performance standpoint. Specifically, an underweight in investment-grade bonds and cash, in favor of higher-risks segments of the fixed market was advantageous. That said, a small allocation to long-term U.S. Treasurys hurt.
•In terms of security selection, picks among U.S. equities notably pressured relative performance in 2024 due to disappointing results from Fidelity® VIP Stock Selector All Cap Portfolio, the largest equity holding this period. Investment choices in the information technology sector - particularly among software & services and semiconductor companies - detracted the most.
•Conversely, stock selection in developed international markets was a plus, propelled by Fidelity® International Discovery Fund and Fidelity® Overseas Fund. Picks in continental Europe fueled the former, while investment choices in the U.K. helped the latter.
•Security selection among investment-grade bonds also added value, driven by the efforts of our active bond fund managers. In contrast, stocks picks in emerging-markets equities modestly detracted.
•As of December 31, the Portfolios were overweight U.S. stocks and about neutrally weighted in international developed- and emerging-markets equities. Investment-grade bond and cash allocations remained below the Portfolios' target weightings.
How did the Fund perform over the past 10 years?
CUMULATIVE PERFORMANCE
December 31, 2014 through December 31, 2024.
Initial investment of $10,000.
Investor Class | $10,000 | $10,039 | $10,607 | $13,061 | $11,900 | $15,019 | $17,641 | $20,786 | $17,238 | $20,285 | $22,822 |
Fidelity VIP FundsManager 85% Composite Index℠ | $10,000 | $10,033 | $10,867 | $12,975 | $12,135 | $15,212 | $17,643 | $20,771 | $17,159 | $20,484 | $23,360 |
S&P 500® Index | $10,000 | $10,138 | $11,351 | $13,829 | $13,223 | $17,386 | $20,585 | $26,494 | $21,696 | $27,399 | $34,254 |
| | 2014 | 2015 | 2016 | 2017 | 2018 | 2019 | 2020 | 2021 | 2022 | 2023 | 2024 |
AVERAGE ANNUAL TOTAL RETURNS:| | 1 Year | 5 Year | 10 Year |
| Investor Class | 12.51% | 8.73% | 8.60% |
| Fidelity VIP FundsManager 85% Composite Index℠ | 14.04% | 8.96% | 8.85% |
| S&P 500® Index | 25.02% | 14.53% | 13.10% |
Visit institutional.fidelity.com for more recent performance information. |
The Fund's past performance is not a good predictor of the Fund's future performance. The graph and table do not reflect the deduction of taxes that a shareholder would pay on fund distributions or redemption of fund shares. |
Key Fund Statistics(as of December 31, 2024)
KEY FACTS | | |
| Fund Size | $959,355,337 | |
| Number of Holdings | 42 | |
| Total Advisory Fee | $896,733 | |
| Portfolio Turnover | 34% | |
What did the Fund invest in?
(as of December 31, 2024)
| Domestic Equity Funds | 53.5 |
| International Equity Funds | 31.8 |
| Bond Funds | 13.1 |
| Alternative Funds | 1.3 |
| Short-Term Investments and Net Other Assets (Liabilities) | 0.3 |
ASSET ALLOCATION (% of Fund's net assets) |
|
| | Domestic Equity Funds - 53.5 |
| | International Equity Funds - 31.8 |
| | Bond Funds - 13.1 |
| | Alternative Funds - 1.3 |
| | Short-Term Investments and Net Other Assets (Liabilities) - 0.3 |
| |
TOP HOLDINGS(% of Fund's net assets) | | |
| VIP Stock Selector All Cap Portfolio - Investor Class | 43.2 | |
| Fidelity Overseas Fund | 9.7 | |
| Fidelity Emerging Markets Fund | 8.9 | |
| Fidelity Total Bond Fund | 4.8 | |
| VIP Investment Grade Bond II Portfolio - Investor Class | 4.8 | |
| Fidelity International Discovery Fund | 2.5 | |
| Fidelity Stock Selector Small Cap Fund | 2.3 | |
| Fidelity Enhanced International ETF | 2.2 | |
| Fidelity International Capital Appreciation Fund | 2.1 | |
| VIP Value Strategies Portfolio - Investor Class | 2.0 | |
| | 82.5 | |
How has the Fund changed?
This is a summary of certain changes to the Fund since January 1, 2024. For more complete information, you may review the Fund's next prospectus, which we expect to be available by April 30, 2025 at fundresearch.fidelity.com/prospectus/sec or upon request at 1-877-208-0098 or by sending an e-mail to funddocuments@fmr.com.
The fund modified its principal investment strategies during the reporting period. | The fund modified its principal investment risks during the reporting period.
|
| Fidelity, the Fidelity Investments Logo and all other Fidelity trademarks or service marks used herein are trademarks or service marks of FMR LLC. Any third-party marks that are used herein are trademarks or service marks of their respective owners. © 2025 FMR LLC. All rights reserved. |
| | For additional information about the Fund; including its prospectus, financial information, holdings and proxy information, scan the QR code or visit fundresearch.fidelity.com/prospectus/sec 1.9914312.100 1593-TSRA-0325 |
| |
| | ANNUAL SHAREHOLDER REPORT | AS OF DECEMBER 31, 2024 | |
| | VIP Investor Freedom 2020 Portfolio℠ VIP Investor Freedom 2020 Portfolio℠ true |
| | | |
This annual shareholder report contains information about VIP Investor Freedom 2020 Portfolio℠ for the period January 1, 2024 to December 31, 2024. You can find additional information about the Fund at fundresearch.fidelity.com/prospectus/sec. You can also request this information by contacting us at 1-877-208-0098 or by sending an e-mail to funddocuments@fmr.com.
What were your Fund costs for the last year?(based on hypothetical $10,000 investment)
FUND COST (PREVIOUS YEAR)
| | Costs of a $10,000 investment | Costs paid as a percentage of a $10,000 investment | |
| VIP Investor Freedom 2020 Portfolio℠ | $ 0 A | 0.00%B | |
A Amount represents less than $.50
B Amount represents less than 0.005%
What affected the Fund's performance this period?
•Risk assets largely produced positive results in 2024, influenced by an expanding global economy and a slowing in the pace of inflation in certain markets, as well as a pivot by some central banks toward monetary easing, despite ongoing geopolitical risk.
•Against this backdrop, active asset allocation positioning detracted from the fund's performance relative to the Composite index, whereas the performance of the underlying investment portfolios contributed.
•In terms of active asset allocation, an underweight in outperforming U.S. equities hurt the fund's relative result the past 12 months, as did an overweight in lagging long-term U.S. Treasurys and outsized exposure to non-U.S. equities. Conversely, underweighting relatively weaker-performing investment-grade bonds added relative value for the fund.
•Looking at the performance of the underlying portfolios, investments in non-U.S. equities contributed to the fund's relative result. Investments in U.S. investment-grade bonds and U.S. equities also helped to a lesser extent. Within U.S. equities, VIP Contrafund Portfolio (+33.70%) notably outperformed its benchmark, the S&P 500® index (+25.02%). Elsewhere in non-U.S. equities, VIP Overseas Portfolio (+4.97%) topped the MSCI EAFE index (+4.07%) and VIP Emerging Markets Portfolio (+9.90%) outpaced the MSCI EM Index (+7.50%).
•At the other end of the performance spectrum of underlying funds, in terms of equities, VIP Growth Portfolio (+30.30%) lagged its benchmark, the Russell 3000® Index (+32.46%), and VIP Growth & Income Portfolio (+22.18%) trailed the S&P 500® index.
How did the Fund perform over the past 10 years?
CUMULATIVE PERFORMANCE
December 31, 2014 through December 31, 2024.
Initial investment of $10,000.
VIP Investor Freedom 2020 Portfolio℠ | $10,000 | $9,965 | $10,566 | $12,315 | $11,583 | $13,913 | $15,993 | $17,518 | $14,746 | $16,573 | $17,840 |
Fidelity VIP Freedom 2020 Composite Index℠ | $10,000 | $9,960 | $10,663 | $12,190 | $11,734 | $13,901 | $15,674 | $17,037 | $14,442 | $16,306 | $17,620 |
Bloomberg U.S. Aggregate Bond Index | $10,000 | $10,055 | $10,321 | $10,687 | $10,688 | $11,620 | $12,492 | $12,299 | $10,699 | $11,291 | $11,432 |
| | 2014 | 2015 | 2016 | 2017 | 2018 | 2019 | 2020 | 2021 | 2022 | 2023 | 2024 |
AVERAGE ANNUAL TOTAL RETURNS:| | 1 Year | 5 Year | 10 Year |
| VIP Investor Freedom 2020 Portfolio℠ | 7.65% | 5.10% | 5.96% |
| Fidelity VIP Freedom 2020 Composite Index℠ | 8.05% | 4.85% | 5.83% |
| Bloomberg U.S. Aggregate Bond Index | 1.25% | -0.33% | 1.35% |
Visit institutional.fidelity.com for more recent performance information. |
The Fund's past performance is not a good predictor of the Fund's future performance. The graph and table do not reflect the deduction of taxes that a shareholder would pay on fund distributions or redemption of fund shares. |
Key Fund Statistics(as of December 31, 2024)
KEY FACTS | | |
| Fund Size | $171,434,399 | |
| Number of Holdings | 15 | |
| Total Advisory Fee | $0 | |
| Portfolio Turnover | 25% | |
What did the Fund invest in?
(as of December 31, 2024)
| Bond Funds | 52.2 |
| Domestic Equity Funds | 24.4 |
| International Equity Funds | 22.7 |
| Short-Term Funds | 0.7 |
| Short-Term Investments and Net Other Assets (Liabilities) | 0.0 |
ASSET ALLOCATION (% of Fund's net assets) |
|
| | Bond Funds - 52.2 |
| | Domestic Equity Funds - 24.4 |
| | International Equity Funds - 22.7 |
| | Short-Term Funds - 0.7 |
| | Short-Term Investments and Net Other Assets (Liabilities) - 0.0 |
| |
TOP HOLDINGS(% of Fund's net assets) | | |
| VIP Investment Grade Bond II Portfolio - Investor Class | 30.3 | |
| VIP Overseas Portfolio - Investor Class | 14.4 | |
| Fidelity Inflation-Protected Bond Index Fund | 12.9 | |
| VIP Emerging Markets Portfolio - Investor Class | 8.3 | |
| VIP Growth Portfolio - Investor Class | 7.1 | |
| VIP Growth & Income Portfolio - Investor Class | 4.8 | |
| VIP Contrafund Portfolio - Investor Class | 4.3 | |
| Fidelity International Bond Index Fund | 4.0 | |
| Fidelity Long-Term Treasury Bond Index Fund | 3.8 | |
| VIP Equity Income Portfolio - Investor Class | 3.5 | |
| | 93.4 | |
| Fidelity, the Fidelity Investments Logo and all other Fidelity trademarks or service marks used herein are trademarks or service marks of FMR LLC. Any third-party marks that are used herein are trademarks or service marks of their respective owners. © 2025 FMR LLC. All rights reserved. |
| | For additional information about the Fund; including its prospectus, financial information, holdings and proxy information, scan the QR code or visit fundresearch.fidelity.com/prospectus/sec 1.9914295.100 1498-TSRA-0325 |
| |
| | ANNUAL SHAREHOLDER REPORT | AS OF DECEMBER 31, 2024 | |
| | VIP Freedom Lifetime Income® II Portfolio VIP Freedom Lifetime Income® II Portfolio true |
| | | |
This annual shareholder report contains information about VIP Freedom Lifetime Income® II Portfolio for the period January 1, 2024 to December 31, 2024. You can find additional information about the Fund at fundresearch.fidelity.com/prospectus/sec. You can also request this information by contacting us at 1-877-208-0098 or by sending an e-mail to funddocuments@fmr.com.
What were your Fund costs for the last year?(based on hypothetical $10,000 investment)
FUND COST (PREVIOUS YEAR)
| | Costs of a $10,000 investment | Costs paid as a percentage of a $10,000 investment | |
| VIP Freedom Lifetime Income® II Portfolio | $ 0 A | 0.00%B | |
A Amount represents less than $.50
B Amount represents less than 0.005%
What affected the Fund's performance this period?
•Risk assets largely produced positive results in 2024, influenced by an expanding global economy and a slowing in the pace of inflation in certain markets, as well as a pivot by some central banks toward monetary easing, despite ongoing geopolitical risk.
•Against this backdrop, active asset allocation positioning detracted from the fund's performance relative to the Composite index, whereas the performance of the underlying investment portfolios contributed.
•In terms of active asset allocation, an underweight in outperforming U.S. equities hurt the fund's relative result most the past 12 months. Conversely, an overweight in emerging-markets equities added relative value for the fund.
•Looking at the performance of the underlying portfolios, investments in non-U.S. equities contributed to the fund's relative result. Investments in U.S. investment-grade bonds also helped. Within U.S. equities, VIP Contrafund Portfolio (+33.70%) notably outperformed its benchmark, the S&P 500® index (+25.02%). Elsewhere among non-U.S. equities, VIP Overseas Portfolio (+4.97%) topped the MSCI EAFE index (+4.07%) and VIP Emerging Markets Portfolio (+9.90%) outpaced the MSCI EM Index (+7.50%).
•At the other end of the performance spectrum of underlying funds, in terms of U.S. equities, VIP Growth Portfolio (+30.30%) lagged its benchmark, the Russell 3000® Index (+32.46%), and VIP Growth & Income Portfolio (+22.18%) trailed the S&P 500® index.
How did the Fund perform over the past 10 years?
CUMULATIVE PERFORMANCE
December 31, 2014 through December 31, 2024.
Initial investment of $10,000.
VIP Freedom Lifetime Income® II Portfolio | $10,000 | $9,977 | $10,566 | $11,865 | $11,395 | $13,285 | $14,982 | $15,921 | $13,719 | $15,063 | $15,903 |
Fidelity VIP Freedom Lifetime Income II Composite Index℠ | $10,000 | $10,057 | $10,625 | $11,824 | $11,560 | $13,309 | $14,736 | $15,598 | $13,543 | $14,931 | $15,837 |
Bloomberg U.S. Aggregate Bond Index | $10,000 | $10,055 | $10,321 | $10,687 | $10,688 | $11,620 | $12,492 | $12,299 | $10,699 | $11,291 | $11,432 |
| | 2014 | 2015 | 2016 | 2017 | 2018 | 2019 | 2020 | 2021 | 2022 | 2023 | 2024 |
AVERAGE ANNUAL TOTAL RETURNS:| | 1 Year | 5 Year | 10 Year |
| VIP Freedom Lifetime Income® II Portfolio | 5.57% | 3.66% | 4.75% |
| Fidelity VIP Freedom Lifetime Income II Composite Index℠ | 6.07% | 3.54% | 4.70% |
| Bloomberg U.S. Aggregate Bond Index | 1.25% | -0.33% | 1.35% |
Visit institutional.fidelity.com for more recent performance information. |
The Fund's past performance is not a good predictor of the Fund's future performance. The graph and table do not reflect the deduction of taxes that a shareholder would pay on fund distributions or redemption of fund shares. |
Key Fund Statistics(as of December 31, 2024)
KEY FACTS | | |
| Fund Size | $25,315,378 | |
| Number of Holdings | 15 | |
| Total Advisory Fee | $0 | |
| Portfolio Turnover | 23% | |
What did the Fund invest in?
(as of December 31, 2024)
| Bond Funds | 58.8 |
| International Equity Funds | 16.3 |
| Domestic Equity Funds | 14.7 |
| Short-Term Funds | 10.2 |
| Short-Term Investments and Net Other Assets (Liabilities) | 0.0 |
ASSET ALLOCATION (% of Fund's net assets) |
|
| | Bond Funds - 58.8 |
| | International Equity Funds - 16.3 |
| | Domestic Equity Funds - 14.7 |
| | Short-Term Funds - 10.2 |
| | Short-Term Investments and Net Other Assets (Liabilities) - 0.0 |
| |
TOP HOLDINGS(% of Fund's net assets) | | |
| VIP Investment Grade Bond II Portfolio - Investor Class | 36.4 | |
| Fidelity Inflation-Protected Bond Index Fund | 14.5 | |
| VIP Government Money Market Portfolio - Investor Class | 10.2 | |
| VIP Overseas Portfolio - Investor Class | 9.9 | |
| VIP Emerging Markets Portfolio - Investor Class | 6.4 | |
| VIP Growth Portfolio - Investor Class | 4.3 | |
| Fidelity International Bond Index Fund | 3.4 | |
| Fidelity Long-Term Treasury Bond Index Fund | 3.3 | |
| VIP Growth & Income Portfolio - Investor Class | 2.9 | |
| VIP Contrafund Portfolio - Investor Class | 2.5 | |
| | 93.8 | |
| Fidelity, the Fidelity Investments Logo and all other Fidelity trademarks or service marks used herein are trademarks or service marks of FMR LLC. Any third-party marks that are used herein are trademarks or service marks of their respective owners. © 2025 FMR LLC. All rights reserved. |
| | For additional information about the Fund; including its prospectus, financial information, holdings and proxy information, scan the QR code or visit fundresearch.fidelity.com/prospectus/sec 1.9914290.100 1493-TSRA-0325 |
| |
| | ANNUAL SHAREHOLDER REPORT | AS OF DECEMBER 31, 2024 | |
| | VIP Bond Index Portfolio VIP Bond Index Portfolio Service Class true |
| | | |
This annual shareholder report contains information about VIP Bond Index Portfolio for the period January 1, 2024 to December 31, 2024. You can find additional information about the Fund at fundresearch.fidelity.com/prospectus/sec. You can also request this information by contacting us at 1-877-208-0098 or by sending an e-mail to funddocuments@fmr.com.
What were your Fund costs for the last year?(based on hypothetical $10,000 investment)
FUND COST (PREVIOUS YEAR)
| | Costs of a $10,000 investment | Costs paid as a percentage of a $10,000 investment | |
| Service Class | $ 24 | 0.24% | |
What affected the Fund's performance this period?
•U.S. taxable investment-grade bonds posted a modest advance in 2024, rallying during the summer months, as the bond market reflected anticipated interest-rate reductions by the U.S. Federal Reserve, but falling back in the fourth quarter when the Fed tempered rate-cut expectations for 2025.
•We construct the portfolio using optimization. This approach minimizes the differences between risk exposures of the fund relative to the index. We attempt to hold all positions held by the index in the same relative proportions.
•Exposures include duration, key rate durations, credit quality, sector and issuer allocation, and other factors.
How did the Fund perform over the life of Fund?
CUMULATIVE PERFORMANCE
April 11, 2019 through December 31, 2024.
Initial investment of $10,000.
Service Class | $10,000 | $10,538 | $11,331 | $11,099 | $9,626 | $10,141 |
Bloomberg U.S. Aggregate Bond Index | $10,000 | $10,584 | $11,378 | $11,203 | $9,745 | $10,284 |
| | 2019 | 2020 | 2021 | 2022 | 2023 | 2024 |
AVERAGE ANNUAL TOTAL RETURNS:| | 1 Year | 5 Year | Life of Fund A |
| Service Class | 0.99% | -0.57% | 0.42% |
| Bloomberg U.S. Aggregate Bond Index | 1.25% | -0.33% | 0.71% |
A From April 11, 2019
Visit institutional.fidelity.com for more recent performance information. |
The Fund's past performance is not a good predictor of the Fund's future performance. The graph and table do not reflect the deduction of taxes that a shareholder would pay on fund distributions or redemption of fund shares. |
Key Fund Statistics(as of December 31, 2024)
KEY FACTS | | |
| Fund Size | $969,508,026 | |
| Number of Holdings | 3,106 | |
| Total Advisory Fee | $784,003 | |
| Portfolio Turnover | 62% | |
What did the Fund invest in?
(as of December 31, 2024)
| U.S. Government and U.S. Government Agency Obligations | 70.2 |
| AAA | 2.5 |
| AA | 2.1 |
| A | 13.2 |
| BBB | 11.9 |
| BB | 0.3 |
| Not Rated | 0.6 |
QUALITY DIVERSIFICATION (% of Fund's net assets) |
| |
| | U.S. Government and U.S. Government Agency Obligations - 70.2 |
| | AAA - 2.5 |
| | AA - 2.1 |
| | A - 13.2 |
| | BBB - 11.9 |
| | BB - 0.3 |
| | Not Rated - 0.6 |
| Short-Term Investments and Net Other Assets (Liabilities) - (0.8)% |
| |
| We have used ratings from Moody's Investors Service, Inc. Where Moody's® ratings are not available, we have used S&P® ratings. All ratings are as of the date indicated and do not reflect subsequent changes. |
| U.S. Treasury Obligations | 44.9 |
| Corporate Bonds | 27.1 |
| U.S. Government Agency - Mortgage Securities | 24.9 |
| Foreign Government and Government Agency Obligations | 1.5 |
| CMOs and Other Mortgage Related Securities | 1.2 |
| U.S. Government Agency Obligations | 0.4 |
| Municipal Securities | 0.4 |
| Asset-Backed Securities | 0.3 |
| Other Investments | 0.1 |
ASSET ALLOCATION (% of Fund's net assets) |
|
| | U.S. Treasury Obligations - 44.9 |
| | Corporate Bonds - 27.1 |
| | U.S. Government Agency - Mortgage Securities - 24.9 |
| | Foreign Government and Government Agency Obligations - 1.5 |
| | CMOs and Other Mortgage Related Securities - 1.2 |
| | U.S. Government Agency Obligations - 0.4 |
| | Municipal Securities - 0.4 |
| | Asset-Backed Securities - 0.3 |
| | Other Investments - 0.1 |
| Short-Term Investments and Net Other Assets (Liabilities) - (0.8)% |
| |
| United States | 93.2 |
| United Kingdom | 1.3 |
| Canada | 1.0 |
| Japan | 0.8 |
| Multi-national | 0.8 |
| Mexico | 0.5 |
| Germany | 0.3 |
| Spain | 0.2 |
| Australia | 0.2 |
| Others | 1.7 |
GEOGRAPHIC DIVERSIFICATION (% of Fund's net assets) |
|
| | United States - 93.2 |
| | United Kingdom - 1.3 |
| | Canada - 1.0 |
| | Japan - 0.8 |
| | Multi-national - 0.8 |
| | Mexico - 0.5 |
| | Germany - 0.3 |
| | Spain - 0.2 |
| | Australia - 0.2 |
| | Others - 1.7 |
| |
TOP HOLDINGS(% of Fund's net assets) | | |
| US Treasury Notes | 35.6 | |
| Fannie Mae Mortgage pass-thru certificates | 10.3 | |
| US Treasury Bonds | 9.3 | |
| Freddie Mac Gold Pool | 7.6 | |
| Ginnie Mae II Pool | 4.8 | |
| Uniform Mortgage Backed Securities | 1.2 | |
| Ginnie Mae I Pool | 0.9 | |
| Bank of America Corp | 0.7 | |
| JPMorgan Chase & Co | 0.7 | |
| Freddie Mac Multifamily Structured pass-thru certificates | 0.7 | |
| | 71.8 | |
| Fidelity, the Fidelity Investments Logo and all other Fidelity trademarks or service marks used herein are trademarks or service marks of FMR LLC. Any third-party marks that are used herein are trademarks or service marks of their respective owners. © 2025 FMR LLC. All rights reserved. |
| | For additional information about the Fund; including its prospectus, financial information, holdings and proxy information, scan the QR code or visit fundresearch.fidelity.com/prospectus/sec 1.9914380.100 1019-TSRA-0325 |
| |
| | ANNUAL SHAREHOLDER REPORT | AS OF DECEMBER 31, 2024 | This report describes changes to the Fund that occurred during the reporting period. |
| | VIP FundsManager® 40% Portfolio VIP FundsManager® 40% Portfolio Service Class 2 true |
| | | |
This annual shareholder report contains information about VIP FundsManager® 40% Portfolio for the period January 1, 2024 to December 31, 2024. You can find additional information about the Fund at fundresearch.fidelity.com/prospectus/sec. You can also request this information by contacting us at 1-877-208-0098 or by sending an e-mail to funddocuments@fmr.com.
What were your Fund costs for the last year?(based on hypothetical $10,000 investment)
FUND COST (PREVIOUS YEAR)
| | Costs of a $10,000 investment | Costs paid as a percentage of a $10,000 investment | |
| Service Class 2 | $ 26 | 0.25% | |
What affected the Fund's performance this period?
•Risk assets largely produced positive results in 2024, influenced by an expanding global economy, a slowing in the pace of inflation in certain markets, and a pivot by some central banks toward monetary easing, despite ongoing geopolitical risk.
•Within this environment, asset class positioning contributed to the Portfolios' performance versus the Composite indexes, whereas security selection detracted.
•The Portfolios' core equity allocation strategy contributed to relative performance, led by an overweight among U.S. stocks. Equal-weight positioning in international developed- and emerging-markets equities added modest value. Meanwhile, small, out-of-benchmark allocations to real estate investment trusts and commodity-related securities slightly detracted.
•The portfolio's fixed-income allocation strategy also was beneficial from a relative performance standpoint. Specifically, an underweight in investment-grade bonds and cash, in favor of higher-risks segments of the fixed market was advantageous. That said, a small allocation to long-term U.S. Treasurys hurt.
•In terms of security selection, picks among U.S. equities notably pressured relative performance in 2024 due to disappointing results from Fidelity® VIP Stock Selector All Cap Portfolio, the largest equity holding this period. Investment choices in the information technology sector - particularly among software & services and semiconductor companies - detracted the most.
•Conversely, stock selection in developed international markets was a plus, propelled by Fidelity® International Discovery Fund and Fidelity® Overseas Fund. Picks in continental Europe fueled the former, while investment choices in the U.K. helped the latter.
•Security selection among investment-grade bonds also added value, driven by the efforts of our active bond fund managers. In contrast, stocks picks in emerging-markets equities modestly detracted.
•As of December 31, the Portfolios were overweight U.S. stocks and about neutrally weighted in international developed- and emerging-markets equities. Investment-grade bond and cash allocations remained below the Portfolios' target weightings.
How did the Fund perform over the life of Fund?
CUMULATIVE PERFORMANCE
April 13, 2023 through December 31, 2024.
Initial investment of $10,000.
Service Class 2 | $10,000 | $10,550 |
Fidelity VIP FundsManager 40% Composite Index℠ | $10,000 | $10,647 |
Bloomberg U.S. Aggregate Bond Index | $10,000 | $10,202 |
| | 2023 | 2024 |
AVERAGE ANNUAL TOTAL RETURNS:| | 1 Year | Life of Fund A |
| Service Class 2 | 7.31% | 7.48% |
| Fidelity VIP FundsManager 40% Composite Index℠ | 7.78% | 8.33% |
| Bloomberg U.S. Aggregate Bond Index | 1.25% | 1.90% |
A From April 13, 2023
Visit institutional.fidelity.com for more recent performance information. |
The Fund's past performance is not a good predictor of the Fund's future performance. The graph and table do not reflect the deduction of taxes that a shareholder would pay on fund distributions or redemption of fund shares. |
Key Fund Statistics(as of December 31, 2024)
KEY FACTS | | |
| Fund Size | $24,604,924 | |
| Number of Holdings | 33 | |
| Total Advisory Fee | $18,586 | |
| Portfolio Turnover | 34% | |
What did the Fund invest in?
(as of December 31, 2024)
| Bond Funds | 43.8 |
| Domestic Equity Funds | 26.3 |
| International Equity Funds | 15.8 |
| Short-Term Funds | 8.4 |
| Alternative Funds | 1.3 |
| Short-Term Investments and Net Other Assets (Liabilities) | 4.4 |
ASSET ALLOCATION (% of Fund's net assets) |
|
| | Bond Funds - 43.8 |
| | Domestic Equity Funds - 26.3 |
| | International Equity Funds - 15.8 |
| | Short-Term Funds - 8.4 |
| | Alternative Funds - 1.3 |
| | Short-Term Investments and Net Other Assets (Liabilities) - 4.4 |
| |
TOP HOLDINGS(% of Fund's net assets) | | |
| Fidelity Total Bond Fund | 19.9 | |
| VIP Investment Grade Bond II Portfolio - Investor Class | 19.8 | |
| VIP Stock Selector All Cap Portfolio - Investor Class | 19.0 | |
| Fidelity Investments Money Market Government Portfolio - Institutional Class | 8.4 | |
| Fidelity Overseas Fund | 5.2 | |
| Fidelity Emerging Markets Fund | 4.3 | |
| Fidelity Stock Selector Small Cap Fund | 1.7 | |
| Fidelity Inflation-Protected Bond Index Fund | 1.5 | |
| Fidelity International Discovery Fund | 1.4 | |
| Fidelity Hedged Equity Fund | 1.3 | |
| | 82.5 | |
How has the Fund changed?
This is a summary of certain changes to the Fund since January 1, 2024. For more complete information, you may review the Fund's next prospectus, which we expect to be available by April 30, 2025 at fundresearch.fidelity.com/prospectus/sec or upon request at 1-877-208-0098 or by sending an e-mail to funddocuments@fmr.com.
The fund modified its principal investment strategies during the reporting period. | The fund modified its principal investment risks during the reporting period.
|
| Fidelity, the Fidelity Investments Logo and all other Fidelity trademarks or service marks used herein are trademarks or service marks of FMR LLC. Any third-party marks that are used herein are trademarks or service marks of their respective owners. © 2025 FMR LLC. All rights reserved. |
| | For additional information about the Fund; including its prospectus, financial information, holdings and proxy information, scan the QR code or visit fundresearch.fidelity.com/prospectus/sec 1.9914414.100 6994-TSRA-0325 |
| |
| | ANNUAL SHAREHOLDER REPORT | AS OF DECEMBER 31, 2024 | |
| | VIP Freedom 2070 Portfolio℠ VIP Freedom 2070 Portfolio℠ Initial Class true |
| | | |
This annual shareholder report contains information about VIP Freedom 2070 Portfolio℠ for the period July 1, 2024 to December 31, 2024. You can find additional information about the Fund at fundresearch.fidelity.com/prospectus/sec. You can also request this information by contacting us at 1-877-208-0098 or by sending an e-mail to funddocuments@fmr.com.
What were your Fund costs for the last year?(based on hypothetical $10,000 investment)
FUND COST (PREVIOUS YEAR)
| | Costs of a $10,000 investment | Costs paid as a percentage of a $10,000 investment | |
Initial Class A | $ 0 B | 0.00%C | |
AExpenses for the full reporting period would be higher.
BAmount represents less than $.50
CAmount represents less than 0.005%
Key Fund Statistics(as of December 31, 2024)
KEY FACTS | | |
| Fund Size | $504,235 | |
| Number of Holdings | 11 | |
| Total Advisory Fee | $0 | |
Portfolio TurnoverA | 26% | |
A Amount not annualized
What did the Fund invest in?
(as of December 31, 2024)
| Domestic Equity Funds | 51.5 |
| International Equity Funds | 40.9 |
| Fixed-Income Funds | 7.6 |
| Short-Term Investments and Net Other Assets (Liabilities) | 0.0 |
ASSET ALLOCATION (% of Fund's net assets) |
|
| | Domestic Equity Funds - 51.5 |
| | International Equity Funds - 40.9 |
| | Fixed-Income Funds - 7.6 |
| | Short-Term Investments and Net Other Assets (Liabilities) - 0.0 |
| |
TOP HOLDINGS(% of Fund's net assets) | | |
| VIP Overseas Portfolio - Initial Class | 27.8 | |
| VIP Growth Portfolio - Initial Class | 15.0 | |
| VIP Emerging Markets Portfolio - Initial Class | 13.1 | |
| VIP Growth & Income Portfolio - Initial Class | 10.1 | |
| VIP Contrafund Portfolio - Initial Class | 9.0 | |
| VIP Equity-Income Portfolio - Initial Class | 7.4 | |
| Fidelity Long-Term Treasury Bond Index Fund | 6.6 | |
| VIP Value Portfolio - Initial Class | 5.1 | |
| VIP Value Strategies Portfolio - Initial Class | 2.6 | |
| VIP Mid Cap Portfolio - Initial Class | 2.3 | |
| | 99.0 | |
| Fidelity, the Fidelity Investments Logo and all other Fidelity trademarks or service marks used herein are trademarks or service marks of FMR LLC. Any third-party marks that are used herein are trademarks or service marks of their respective owners. © 2025 FMR LLC. All rights reserved. |
| | For additional information about the Fund; including its prospectus, financial information, holdings and proxy information, scan the QR code or visit fundresearch.fidelity.com/prospectus/sec 1.9918308.100 7671-TSRA-0325 |
| |
| | ANNUAL SHAREHOLDER REPORT | AS OF DECEMBER 31, 2024 | |
| | VIP Freedom 2035 Portfolio℠ VIP Freedom 2035 Portfolio℠ Service Class true |
| | | |
This annual shareholder report contains information about VIP Freedom 2035 Portfolio℠ for the period January 1, 2024 to December 31, 2024. You can find additional information about the Fund at fundresearch.fidelity.com/prospectus/sec. You can also request this information by contacting us at 1-877-208-0098 or by sending an e-mail to funddocuments@fmr.com.
What were your Fund costs for the last year?(based on hypothetical $10,000 investment)
FUND COST (PREVIOUS YEAR)
| | Costs of a $10,000 investment | Costs paid as a percentage of a $10,000 investment | |
| Service Class | $ 11 | 0.10% | |
What affected the Fund's performance this period?
•Risk assets largely produced positive results in 2024, influenced by an expanding global economy and a slowing in the pace of inflation in certain markets, as well as a pivot by some central banks toward monetary easing, despite ongoing geopolitical risk.
•Against this backdrop, active asset allocation positioning detracted from the fund's performance relative to the Composite index, whereas the performance of the underlying investment portfolios contributed.
•In terms of active asset allocation, an underweight in outperforming U.S. equities hurt the fund's relative result the past 12 months, as did an overweight in lagging long-term U.S. Treasurys and outsized exposure to non-U.S. equities. Conversely, an underweight in relatively weaker-performing investment-grade bonds added relative value for the fund.
•Looking at the performance of the underlying portfolios, investments in non-U.S. equities contributed to the fund's relative result. Investments in U.S. investment-grade bonds and U.S. equities also helped to a lesser extent. Within U.S. equities, VIP Contrafund Portfolio (+33.79%) notably outperformed its benchmark, the S&P 500® index (+25.02%). Elsewhere among non-U.S. equities, VIP Overseas Portfolio (+5%) topped the MSCI EAFE index (+4.07%) and VIP Emerging Markets Portfolio (+10.04%) outpaced the MSCI EM Index (+7.50%).
•At the other end of the performance spectrum of underlying funds, within equities, VIP Growth Portfolio (+30.39%) lagged its benchmark, the Russell 3000® Index (+32.46%), and VIP Growth & Income Portfolio (+22.21%) trailed the S&P 500® index.
How did the Fund perform over the past 10 years?
CUMULATIVE PERFORMANCE
December 31, 2014 through December 31, 2024.
Initial investment of $10,000.
Service Class | $10,000 | $9,960 | $10,628 | $13,097 | $11,872 | $15,116 | $17,859 | $20,595 | $16,939 | $19,769 | $21,930 |
Fidelity VIP Freedom 2035 Composite Index℠ | $10,000 | $9,894 | $10,836 | $13,083 | $12,223 | $15,304 | $17,691 | $20,172 | $16,654 | $19,549 | $21,797 |
S&P 500® Index | $10,000 | $10,138 | $11,351 | $13,829 | $13,223 | $17,386 | $20,585 | $26,494 | $21,696 | $27,399 | $34,254 |
| | 2014 | 2015 | 2016 | 2017 | 2018 | 2019 | 2020 | 2021 | 2022 | 2023 | 2024 |
AVERAGE ANNUAL TOTAL RETURNS:| | 1 Year | 5 Year | 10 Year |
| Service Class | 10.93% | 7.73% | 8.17% |
| Fidelity VIP Freedom 2035 Composite Index℠ | 11.50% | 7.33% | 8.10% |
| S&P 500® Index | 25.02% | 14.53% | 13.10% |
Visit institutional.fidelity.com for more recent performance information. |
The Fund's past performance is not a good predictor of the Fund's future performance. The graph and table do not reflect the deduction of taxes that a shareholder would pay on fund distributions or redemption of fund shares. |
Key Fund Statistics(as of December 31, 2024)
KEY FACTS | | |
| Fund Size | $372,945,696 | |
| Number of Holdings | 14 | |
| Total Advisory Fee | $0 | |
| Portfolio Turnover | 34% | |
What did the Fund invest in?
(as of December 31, 2024)
| Domestic Equity Funds | 39.1 |
| International Equity Funds | 32.7 |
| Bond Funds | 28.2 |
| Short-Term Investments and Net Other Assets (Liabilities) | 0.0 |
ASSET ALLOCATION (% of Fund's net assets) |
|
| | Domestic Equity Funds - 39.1 |
| | International Equity Funds - 32.7 |
| | Bond Funds - 28.2 |
| | Short-Term Investments and Net Other Assets (Liabilities) - 0.0 |
| |
TOP HOLDINGS(% of Fund's net assets) | | |
| VIP Overseas Portfolio - Initial Class | 21.5 | |
| VIP Investment Grade Bond II Portfolio - Initial Class | 12.2 | |
| VIP Growth Portfolio - Initial Class | 11.4 | |
| VIP Emerging Markets Portfolio - Initial Class | 11.2 | |
| Fidelity Long-Term Treasury Bond Index Fund | 7.9 | |
| VIP Growth & Income Portfolio - Initial Class | 7.7 | |
| VIP Contrafund Portfolio - Initial Class | 6.9 | |
| VIP Equity-Income Portfolio - Initial Class | 5.6 | |
| Fidelity Inflation-Protected Bond Index Fund | 4.1 | |
| VIP Value Portfolio - Initial Class | 3.9 | |
| | 92.4 | |
| Fidelity, the Fidelity Investments Logo and all other Fidelity trademarks or service marks used herein are trademarks or service marks of FMR LLC. Any third-party marks that are used herein are trademarks or service marks of their respective owners. © 2025 FMR LLC. All rights reserved. |
| | For additional information about the Fund; including its prospectus, financial information, holdings and proxy information, scan the QR code or visit fundresearch.fidelity.com/prospectus/sec 1.9914331.100 2160-TSRA-0325 |
| |
| | ANNUAL SHAREHOLDER REPORT | AS OF DECEMBER 31, 2024 | This report describes changes to the Fund that occurred during the reporting period. |
| | VIP Strategic Income Portfolio VIP Strategic Income Portfolio Investor Class true |
| | | |
This annual shareholder report contains information about VIP Strategic Income Portfolio for the period January 1, 2024 to December 31, 2024. You can find additional information about the Fund at fundresearch.fidelity.com/prospectus/sec. You can also request this information by contacting us at 1-877-208-0098 or by sending an e-mail to funddocuments@fmr.com.
What were your Fund costs for the last year?(based on hypothetical $10,000 investment)
FUND COST (PREVIOUS YEAR)
| | Costs of a $10,000 investment | Costs paid as a percentage of a $10,000 investment | |
| Investor Class | $ 69 | 0.67% | |
What affected the Fund's performance this period?
•Risk assets fared well in 2024, driven by a sturdy economy, the U.S. Federal Reserve's long-anticipated pivot to cutting interest rates and the potential for artificial intelligence to drive transformative change.
•Against this backdrop, compared with the Fidelity Strategic Income Composite IndexSM, security selection among high-yield bonds meaningfully contributed to the fund's result, especially picks in the energy, technology & electronics and financial services categories.
•Investment choices in emerging-markets debt also added value relative to the Composite index, with bond picks in Chile and Peru as standouts.
•On the negative side, an allocation to U.S. Treasury futures, a position we established to help offset the portfolio's overall lower duration, underperformed in a generally rising interest-rate environment.
•Changes to the portfolio this period, which were modest, included adding exposure to emerging-markets debt and developed-markets international debt, while reducing the fund's allocation to floating-rate loans and high-yield bonds.
How did the Fund perform over the past 10 years?
CUMULATIVE PERFORMANCE
December 31, 2014 through December 31, 2024.
Initial investment of $10,000.
Investor Class | $10,000 | $9,834 | $10,637 | $11,465 | $11,165 | $12,382 | $13,311 | $13,806 | $12,242 | $13,395 | $14,195 |
Fidelity Strategic Income Composite Index℠ | $10,000 | $9,764 | $10,671 | $11,388 | $11,224 | $12,406 | $13,229 | $13,394 | $11,829 | $12,952 | $13,629 |
Bloomberg U.S. Universal Bond Index | $10,000 | $10,043 | $10,436 | $10,863 | $10,835 | $11,842 | $12,739 | $12,598 | $10,961 | $11,638 | $11,875 |
| | 2014 | 2015 | 2016 | 2017 | 2018 | 2019 | 2020 | 2021 | 2022 | 2023 | 2024 |
AVERAGE ANNUAL TOTAL RETURNS:| | 1 Year | 5 Year | 10 Year |
| Investor Class | 5.97% | 2.77% | 3.56% |
| Fidelity Strategic Income Composite Index℠ | 5.23% | 1.90% | 3.14% |
| Bloomberg U.S. Universal Bond Index | 2.04% | 0.06% | 1.73% |
Visit institutional.fidelity.com for more recent performance information. |
The Fund's past performance is not a good predictor of the Fund's future performance. The graph and table do not reflect the deduction of taxes that a shareholder would pay on fund distributions or redemption of fund shares. |
Key Fund Statistics(as of December 31, 2024)
KEY FACTS | | |
| Fund Size | $1,508,793,887 | |
| Number of Holdings | 1,470 | |
| Total Advisory Fee | $9,132,751 | |
| Portfolio Turnover | 77% | |
What did the Fund invest in?
(as of December 31, 2024)
The information in the following tables is based on the combined Investments of the Fund and it's pro-rata share of investments in Fidelity's Central Funds, other than the Commodity Strategy and Money Market Central Funds as applicable.
| U.S. Government and U.S. Government Agency Obligations | 24.8 |
| AAA | 2.9 |
| AA | 1.8 |
| A | 1.9 |
| BBB | 7.6 |
| BB | 13.4 |
| B | 17.9 |
| CCC,CC,C | 5.6 |
| D | 0.0 |
| Not Rated | 9.0 |
| Equities | 7.0 |
| Short-Term Investments and Net Other Assets (Liabilities) | 8.1 |
QUALITY DIVERSIFICATION (% of Fund's net assets) |
| |
| | U.S. Government and U.S. Government Agency Obligations - 24.8 |
| | AAA - 2.9 |
| | AA - 1.8 |
| | A - 1.9 |
| | BBB - 7.6 |
| | BB - 13.4 |
| | B - 17.9 |
| | CCC,CC,C - 5.6 |
| | D - 0.0 |
| | Not Rated - 9.0 |
| | Equities - 7.0 |
| | Short-Term Investments and Net Other Assets (Liabilities) - 8.1 |
| |
| We have used ratings from Moody's Investors Service, Inc. Where Moody's® ratings are not available, we have used S&P® ratings. All ratings are as of the date indicated and do not reflect subsequent changes. |
| High-Yield Debt | 40.6 |
| U.S. Government & Investment Grade-Debt | 30.1 |
| Emerging-Markets Debt | 15.5 |
| Foreign Developed-Markets Debt | 8.5 |
| Floating-Rate debt | 5.0 |
| Short-Term Investments and Net Other Assets (Liabilities) | 0.3 |
ASSET ALLOCATION (% of Fund's net assets) |
|
| | High-Yield Debt - 40.6 |
| | U.S. Government & Investment Grade-Debt - 30.1 |
| | Emerging-Markets Debt - 15.5 |
| | Foreign Developed-Markets Debt - 8.5 |
| | Floating-Rate debt - 5.0 |
| | Short-Term Investments and Net Other Assets (Liabilities) - 0.3 |
| |
| United States | 74.6 |
| Germany | 6.1 |
| Mexico | 1.3 |
| Brazil | 1.1 |
| United Kingdom | 1.1 |
| Canada | 1.0 |
| France | 1.0 |
| Saudi Arabia | 0.8 |
| Turkey | 0.8 |
| Others | 12.2 |
GEOGRAPHIC DIVERSIFICATION (% of Fund's net assets) |
|
| | United States - 74.6 |
| | Germany - 6.1 |
| | Mexico - 1.3 |
| | Brazil - 1.1 |
| | United Kingdom - 1.1 |
| | Canada - 1.0 |
| | France - 1.0 |
| | Saudi Arabia - 0.8 |
| | Turkey - 0.8 |
| | Others - 12.2 |
| |
TOP HOLDINGS(% of Fund's net assets) | | |
| US Treasury Notes | 18.8 | |
| US Treasury Bonds | 5.7 | |
| German Federal Republic | 5.7 | |
| Freddie Mac Multifamily Structured pass-thru certificates | 3.9 | |
| TransDigm Inc | 1.3 | |
| EchoStar Corp | 0.8 | |
| Energy Transfer LP | 0.8 | |
| Argentine Republic | 0.7 | |
| Turkish Republic | 0.7 | |
| NVIDIA Corp | 0.7 | |
| | 39.1 | |
How has the Fund changed?
This is a summary of certain changes to the Fund since January 1, 2024. For more complete information, you may review the Fund's next prospectus, which we expect to be available by April 30, 2025 at fundresearch.fidelity.com/prospectus/sec or upon request at 1-877-208-0098 or by sending an e-mail to funddocuments@fmr.com.
The fund's transfer agent and pricing & bookkeeping fees were changed to a fixed rate effective December 1, 2023. Effective March 1, 2024, the fund's management contract was amended to incorporate administrative services previously covered under separate services agreements (transfer agent and pricing & bookkeeping). The amended contract incorporates a management fee rate that may vary by class. The Adviser or an affiliate pays certain expenses of managing and operating the fund out of each class's management fee. | |
| Fidelity, the Fidelity Investments Logo and all other Fidelity trademarks or service marks used herein are trademarks or service marks of FMR LLC. Any third-party marks that are used herein are trademarks or service marks of their respective owners. © 2025 FMR LLC. All rights reserved. |
| | For additional information about the Fund; including its prospectus, financial information, holdings and proxy information, scan the QR code or visit fundresearch.fidelity.com/prospectus/sec 1.9914258.100 1470-TSRA-0325 |
| |
| | ANNUAL SHAREHOLDER REPORT | AS OF DECEMBER 31, 2024 | This report describes changes to the Fund that occurred during the reporting period. |
| | VIP Asset Manager Portfolio VIP Asset Manager Portfolio Initial Class true |
| | | |
This annual shareholder report contains information about VIP Asset Manager Portfolio for the period January 1, 2024 to December 31, 2024. You can find additional information about the Fund at fundresearch.fidelity.com/prospectus/sec. You can also request this information by contacting us at 1-877-208-0098 or by sending an e-mail to funddocuments@fmr.com.
What were your Fund costs for the last year?(based on hypothetical $10,000 investment)
FUND COST (PREVIOUS YEAR)
| | Costs of a $10,000 investment | Costs paid as a percentage of a $10,000 investment | |
| Initial Class | $ 54 | 0.51% | |
What affected the Fund's performance this period?
•Risk assets largely produced positive results in 2024, influenced by an expanding global economy, a slowing in the pace of inflation in certain markets, and a pivot by some central banks toward monetary easing, despite ongoing geopolitical risk.
•Within this environment, asset class positioning contributed to the fund's performance versus the Composite index, whereas security selection detracted.
•The portfolio's core equity allocation strategy contributed to relative performance, led by an overweight among U.S. stocks. Equal-weight positioning in international developed- and emerging-markets equities also added modest value. Meanwhile, small, out-of-benchmark allocations to real estate investment trusts and commodity-related securities did not have a material impact on the fund's relative result the past year.
•The portfolio's fixed-income positioning also was beneficial from a relative performance standpoint. Specifically, an underweight in investment-grade bonds and cash, in favor of higher-risk segments of the fixed income market was advantageous. That said, a small allocation to long-term U.S. Treasurys hurt.
•In terms of security selection, picks among U.S. equities notably pressured relative performance in 2024. Investment choices in the information technology sector - particularly among software & services and semiconductor companies - detracted the most.
•Stock selection among international developed-market stocks, on the other hand, aided the fund's relative return. Here, picks in Japan, Germany and the U.K., along with favorable positioning in continental European equity markets, helped the most. Conversely, investment choices and an underweight in the strong-performing Canadian stock market detracted.
•Security selection among investment-grade bonds also added value. Corporate debt issued by banks, real estate investment trusts, insurers and consumer staples companies, contributed to the portfolio's relative outcome. Elsewhere, stakes in asset-backed securities, non-government-agency mortgage-backed securities and U.S. Treasurys, helped as well.
•As of December 31, the fund was overweight U.S. stocks and about neutrally weighted in international developed- and emerging-markets equities. Investment-grade bond and cash allocations remained below the fund's target weighting.
How did the Fund perform over the past 10 years?
CUMULATIVE PERFORMANCE
December 31, 2014 through December 31, 2024.
Initial investment of $10,000.
Initial Class | $10,000 | $10,014 | $10,328 | $11,778 | $11,147 | $13,182 | $15,142 | $16,644 | $14,158 | $15,991 | $17,349 |
Fidelity Asset Manager 50% Composite Index℠ | $10,000 | $10,032 | $10,667 | $12,015 | $11,583 | $13,624 | $15,355 | $16,754 | $14,416 | $16,374 | $17,861 |
S&P 500® Index | $10,000 | $10,138 | $11,351 | $13,829 | $13,223 | $17,386 | $20,585 | $26,494 | $21,696 | $27,399 | $34,254 |
| | 2014 | 2015 | 2016 | 2017 | 2018 | 2019 | 2020 | 2021 | 2022 | 2023 | 2024 |
AVERAGE ANNUAL TOTAL RETURNS:| | 1 Year | 5 Year | 10 Year |
| Initial Class | 8.50% | 5.65% | 5.66% |
| Fidelity Asset Manager 50% Composite Index℠ | 9.08% | 5.56% | 5.97% |
| S&P 500® Index | 25.02% | 14.53% | 13.10% |
Visit institutional.fidelity.com for more recent performance information. |
The Fund's past performance is not a good predictor of the Fund's future performance. The graph and table do not reflect the deduction of taxes that a shareholder would pay on fund distributions or redemption of fund shares. |
Key Fund Statistics(as of December 31, 2024)
KEY FACTS | | |
| Fund Size | $904,415,380 | |
| Number of Holdings | 32 | |
| Total Advisory Fee | $4,688,967 | |
| Portfolio Turnover | 16% | |
What did the Fund invest in?
(as of December 31, 2024)
The information in the following tables is based on the combined Investments of the Fund and it's pro-rata share of investments in Fidelity's Central Funds, other than the Commodity Strategy and Money Market Central Funds as applicable.
| U.S. Government and U.S. Government Agency Obligations | 23.9 |
| AAA | 2.6 |
| AA | 0.2 |
| A | 2.9 |
| BBB | 5.7 |
| BB | 1.3 |
| B | 0.9 |
| CCC,CC,C | 0.2 |
| D | 0.0 |
| Not Rated | 0.7 |
| Equities | 56.9 |
| Short-Term Investments and Net Other Assets (Liabilities) | 4.7 |
QUALITY DIVERSIFICATION (% of Fund's net assets) |
| |
| | U.S. Government and U.S. Government Agency Obligations - 23.9 |
| | AAA - 2.6 |
| | AA - 0.2 |
| | A - 2.9 |
| | BBB - 5.7 |
| | BB - 1.3 |
| | B - 0.9 |
| | CCC,CC,C - 0.2 |
| | D - 0.0 |
| | Not Rated - 0.7 |
| | Equities - 56.9 |
| | Short-Term Investments and Net Other Assets (Liabilities) - 4.7 |
| |
| We have used ratings from Moody's Investors Service, Inc. Where Moody's® ratings are not available, we have used S&P® ratings. All ratings are as of the date indicated and do not reflect subsequent changes. |
MARKET SECTORS (% of Fund's net assets) | | |
| Financials | 13.7 | |
| Information Technology | 13.4 | |
| Industrials | 6.6 | |
| Consumer Discretionary | 6.1 | |
| Health Care | 5.3 | |
| Communication Services | 4.5 | |
| Consumer Staples | 2.6 | |
| Energy | 2.4 | |
| Real Estate | 2.0 | |
| Materials | 2.0 | |
| Utilities | 1.2 | |
| |
| Equities | 55.9 |
| Bonds | 39.4 |
| Short-Term Investments and Net Other Assets (Liabilities) | 4.7 |
ASSET ALLOCATION (% of Fund's net assets) |
|
| | Equities - 55.9 |
| | Bonds - 39.4 |
| | Short-Term Investments and Net Other Assets (Liabilities) - 4.7 |
| |
TOP HOLDINGS(% of Fund's net assets) | | |
| US Treasury Notes | 14.0 | |
| US Treasury Bonds | 3.9 | |
| Microsoft Corp | 2.3 | |
| Fannie Mae Mortgage pass-thru certificates | 2.2 | |
| NVIDIA Corp | 2.2 | |
| Apple Inc | 2.1 | |
| Fidelity Blue Chip Growth ETF | 2.1 | |
| Ginnie Mae II Pool | 1.7 | |
| Freddie Mac Gold Pool | 1.5 | |
| Alphabet Inc Class A | 1.5 | |
| | 33.5 | |
How has the Fund changed?
This is a summary of certain changes to the Fund since January 1, 2024. For more complete information, you may review the Fund's next prospectus, which we expect to be available by April 30, 2025 at fundresearch.fidelity.com/prospectus/sec or upon request at 1-877-208-0098 or by sending an e-mail to funddocuments@fmr.com.
The fees associated with this class changed during the reporting year. The variations in class fees are primarily the result of the following changes: The fund's transfer agent and pricing & bookkeeping fees were changed to a fixed rate effective December 1, 2023. Effective March 1, 2024, the fund's management contract was amended to incorporate administrative services previously covered under separate services agreements (transfer agent and pricing & bookkeeping). The amended contract incorporates a management fee rate that may vary by class. The Adviser or an affiliate pays certain expenses of managing and operating the fund out of each class's management fee. | The fund modified its principal investment strategies during the reporting period.
|
The fund modified its principal investment risks during the reporting period. | |
| Fidelity, the Fidelity Investments Logo and all other Fidelity trademarks or service marks used herein are trademarks or service marks of FMR LLC. Any third-party marks that are used herein are trademarks or service marks of their respective owners. © 2025 FMR LLC. All rights reserved. |
| | For additional information about the Fund; including its prospectus, financial information, holdings and proxy information, scan the QR code or visit fundresearch.fidelity.com/prospectus/sec 1.9914196.100 156-TSRA-0325 |
| |
| | ANNUAL SHAREHOLDER REPORT | AS OF DECEMBER 31, 2024 | |
| | VIP Investor Freedom 2025 Portfolio℠ VIP Investor Freedom 2025 Portfolio℠ true |
| | | |
This annual shareholder report contains information about VIP Investor Freedom 2025 Portfolio℠ for the period January 1, 2024 to December 31, 2024. You can find additional information about the Fund at fundresearch.fidelity.com/prospectus/sec. You can also request this information by contacting us at 1-877-208-0098 or by sending an e-mail to funddocuments@fmr.com.
What were your Fund costs for the last year?(based on hypothetical $10,000 investment)
FUND COST (PREVIOUS YEAR)
| | Costs of a $10,000 investment | Costs paid as a percentage of a $10,000 investment | |
| VIP Investor Freedom 2025 Portfolio℠ | $ 0 A | 0.00%B | |
A Amount represents less than $.50
B Amount represents less than 0.005%
What affected the Fund's performance this period?
•Risk assets largely produced positive results in 2024, influenced by an expanding global economy and a slowing in the pace of inflation in certain markets, as well as a pivot by some central banks toward monetary easing, despite ongoing geopolitical risk.
•Against this backdrop, active asset allocation positioning detracted from the fund's performance relative to the Composite index, whereas the performance of the underlying investment portfolios contributed.
•In terms of active asset allocation, an underweight in outperforming U.S. equities hurt the fund's relative result the past 12 months, as did an overweight in lagging long-term U.S. Treasurys and outsized exposure to non-U.S. equities. Conversely, underweighting relatively weaker-performing investment-grade bonds added relative value for the fund.
•Looking at the performance of the underlying portfolios, investments in non-U.S. equities contributed to the fund's relative result. Investments in U.S. investment-grade bonds and U.S. equities also helped to a lesser extent. Within U.S. equities, VIP Contrafund Portfolio (+33.70%) notably outperformed its benchmark, the S&P 500® index (+25.02%). Elsewhere in non-U.S. equities, VIP Overseas Portfolio (+4.97%) topped the MSCI EAFE index (+4.07%) and VIP Emerging Markets Portfolio (+9.90%) outpaced the MSCI EM Index (+7.50%).
•At the other end of the performance spectrum of underlying funds, in terms of equities, VIP Growth Portfolio (+30.30%) lagged its benchmark, the Russell 3000® Index (+32.46%), and VIP Growth & Income Portfolio (+22.18%) trailed the S&P 500® index.
How did the Fund perform over the past 10 years?
CUMULATIVE PERFORMANCE
December 31, 2014 through December 31, 2024.
Initial investment of $10,000.
VIP Investor Freedom 2025 Portfolio℠ | $10,000 | $9,968 | $10,576 | $12,462 | $11,645 | $14,176 | $16,426 | $18,198 | $15,204 | $17,265 | $18,725 |
Fidelity VIP Freedom 2025 Composite Index℠ | $10,000 | $9,947 | $10,701 | $12,368 | $11,828 | $14,193 | $16,117 | $17,707 | $14,874 | $16,975 | $18,500 |
S&P 500® Index | $10,000 | $10,138 | $11,351 | $13,829 | $13,223 | $17,386 | $20,585 | $26,494 | $21,696 | $27,399 | $34,254 |
| | 2014 | 2015 | 2016 | 2017 | 2018 | 2019 | 2020 | 2021 | 2022 | 2023 | 2024 |
AVERAGE ANNUAL TOTAL RETURNS:| | 1 Year | 5 Year | 10 Year |
| VIP Investor Freedom 2025 Portfolio℠ | 8.46% | 5.72% | 6.47% |
| Fidelity VIP Freedom 2025 Composite Index℠ | 8.98% | 5.44% | 6.35% |
| S&P 500® Index | 25.02% | 14.53% | 13.10% |
Visit institutional.fidelity.com for more recent performance information. |
The Fund's past performance is not a good predictor of the Fund's future performance. The graph and table do not reflect the deduction of taxes that a shareholder would pay on fund distributions or redemption of fund shares. |
Key Fund Statistics(as of December 31, 2024)
KEY FACTS | | |
| Fund Size | $203,438,892 | |
| Number of Holdings | 14 | |
| Total Advisory Fee | $0 | |
| Portfolio Turnover | 26% | |
What did the Fund invest in?
(as of December 31, 2024)
| Bond Funds | 44.5 |
| Domestic Equity Funds | 29.4 |
| International Equity Funds | 26.1 |
| Short-Term Investments and Net Other Assets (Liabilities) | 0.0 |
ASSET ALLOCATION (% of Fund's net assets) |
|
| | Bond Funds - 44.5 |
| | Domestic Equity Funds - 29.4 |
| | International Equity Funds - 26.1 |
| | Short-Term Investments and Net Other Assets (Liabilities) - 0.0 |
| |
TOP HOLDINGS(% of Fund's net assets) | | |
| VIP Investment Grade Bond II Portfolio - Investor Class | 20.3 | |
| VIP Overseas Portfolio - Investor Class | 16.9 | |
| Fidelity Inflation-Protected Bond Index Fund | 12.0 | |
| VIP Emerging Markets Portfolio - Investor Class | 9.2 | |
| VIP Growth Portfolio - Investor Class | 8.5 | |
| Fidelity Long-Term Treasury Bond Index Fund | 7.0 | |
| VIP Growth & Income Portfolio - Investor Class | 5.8 | |
| VIP Contrafund Portfolio - Investor Class | 5.1 | |
| VIP Equity Income Portfolio - Investor Class | 4.2 | |
| Fidelity International Bond Index Fund | 4.0 | |
| | 93.0 | |
| Fidelity, the Fidelity Investments Logo and all other Fidelity trademarks or service marks used herein are trademarks or service marks of FMR LLC. Any third-party marks that are used herein are trademarks or service marks of their respective owners. © 2025 FMR LLC. All rights reserved. |
| | For additional information about the Fund; including its prospectus, financial information, holdings and proxy information, scan the QR code or visit fundresearch.fidelity.com/prospectus/sec 1.9914296.100 1499-TSRA-0325 |
| |
| | ANNUAL SHAREHOLDER REPORT | AS OF DECEMBER 31, 2024 | |
| | VIP Freedom 2020 Portfolio℠ VIP Freedom 2020 Portfolio℠ Service Class true |
| | | |
This annual shareholder report contains information about VIP Freedom 2020 Portfolio℠ for the period January 1, 2024 to December 31, 2024. You can find additional information about the Fund at fundresearch.fidelity.com/prospectus/sec. You can also request this information by contacting us at 1-877-208-0098 or by sending an e-mail to funddocuments@fmr.com.
What were your Fund costs for the last year?(based on hypothetical $10,000 investment)
FUND COST (PREVIOUS YEAR)
| | Costs of a $10,000 investment | Costs paid as a percentage of a $10,000 investment | |
| Service Class | $ 10 | 0.10% | |
What affected the Fund's performance this period?
•Risk assets largely produced positive results in 2024, influenced by an expanding global economy and a slowing in the pace of inflation in certain markets, as well as a pivot by some central banks toward monetary easing, despite ongoing geopolitical risk.
•Against this backdrop, active asset allocation positioning detracted from the fund's performance relative to the Composite index, whereas the performance of the underlying investment portfolios contributed.
•In terms of active asset allocation, an underweight in outperforming U.S. equities hurt the fund's relative result the past 12 months, as did an overweight in lagging long-term U.S. Treasurys and outsized exposure to non-U.S. equities. Conversely, an underweight in relatively weaker-performing investment-grade bonds added relative value for the fund.
•Looking at the performance of the underlying portfolios, investments in non-U.S. equities contributed to the fund's relative result. Investments in U.S. investment-grade bonds and U.S. equities also helped to a lesser extent. Within U.S. equities, VIP Contrafund Portfolio (+33.79%) notably outperformed its benchmark, the S&P 500® index (+25.02%). Elsewhere among non-U.S. equities, VIP Overseas Portfolio (+5%) topped the MSCI EAFE index (+4.07%) and VIP Emerging Markets Portfolio (+10.04%) outpaced the MSCI EM Index (+7.50%).
•At the other end of the performance spectrum of underlying funds, within equities, VIP Growth Portfolio (+30.39%) lagged its benchmark, the Russell 3000® Index (+32.46%), and VIP Growth & Income Portfolio (+22.21%) trailed the S&P 500® index.
How did the Fund perform over the past 10 years?
CUMULATIVE PERFORMANCE
December 31, 2014 through December 31, 2024.
Initial investment of $10,000.
Service Class | $10,000 | $9,963 | $10,565 | $12,306 | $11,570 | $13,885 | $15,956 | $17,467 | $14,702 | $16,516 | $17,763 |
Fidelity VIP Freedom 2020 Composite Index℠ | $10,000 | $9,960 | $10,663 | $12,190 | $11,734 | $13,901 | $15,674 | $17,037 | $14,442 | $16,306 | $17,620 |
Bloomberg U.S. Aggregate Bond Index | $10,000 | $10,055 | $10,321 | $10,687 | $10,688 | $11,620 | $12,492 | $12,299 | $10,699 | $11,291 | $11,432 |
| | 2014 | 2015 | 2016 | 2017 | 2018 | 2019 | 2020 | 2021 | 2022 | 2023 | 2024 |
AVERAGE ANNUAL TOTAL RETURNS:| | 1 Year | 5 Year | 10 Year |
| Service Class | 7.55% | 5.05% | 5.91% |
| Fidelity VIP Freedom 2020 Composite Index℠ | 8.05% | 4.85% | 5.83% |
| Bloomberg U.S. Aggregate Bond Index | 1.25% | -0.33% | 1.35% |
Visit institutional.fidelity.com for more recent performance information. |
The Fund's past performance is not a good predictor of the Fund's future performance. The graph and table do not reflect the deduction of taxes that a shareholder would pay on fund distributions or redemption of fund shares. |
Key Fund Statistics(as of December 31, 2024)
KEY FACTS | | |
| Fund Size | $536,951,422 | |
| Number of Holdings | 15 | |
| Total Advisory Fee | $0 | |
| Portfolio Turnover | 29% | |
What did the Fund invest in?
(as of December 31, 2024)
| Bond Funds | 52.2 |
| Domestic Equity Funds | 24.4 |
| International Equity Funds | 22.7 |
| Short-Term Funds | 0.7 |
| Short-Term Investments and Net Other Assets (Liabilities) | 0.0 |
ASSET ALLOCATION (% of Fund's net assets) |
|
| | Bond Funds - 52.2 |
| | Domestic Equity Funds - 24.4 |
| | International Equity Funds - 22.7 |
| | Short-Term Funds - 0.7 |
| | Short-Term Investments and Net Other Assets (Liabilities) - 0.0 |
| |
TOP HOLDINGS(% of Fund's net assets) | | |
| VIP Investment Grade Bond II Portfolio - Initial Class | 30.3 | |
| VIP Overseas Portfolio - Initial Class | 14.4 | |
| Fidelity Inflation-Protected Bond Index Fund | 13.3 | |
| VIP Emerging Markets Portfolio - Initial Class | 8.3 | |
| VIP Growth Portfolio - Initial Class | 7.1 | |
| VIP Growth & Income Portfolio - Initial Class | 4.8 | |
| VIP Contrafund Portfolio - Initial Class | 4.3 | |
| Fidelity International Bond Index Fund | 4.0 | |
| VIP Equity-Income Portfolio - Initial Class | 3.5 | |
| Fidelity Long-Term Treasury Bond Index Fund | 3.4 | |
| | 93.4 | |
| Fidelity, the Fidelity Investments Logo and all other Fidelity trademarks or service marks used herein are trademarks or service marks of FMR LLC. Any third-party marks that are used herein are trademarks or service marks of their respective owners. © 2025 FMR LLC. All rights reserved. |
| | For additional information about the Fund; including its prospectus, financial information, holdings and proxy information, scan the QR code or visit fundresearch.fidelity.com/prospectus/sec 1.9914281.100 1430-TSRA-0325 |
| |
| | ANNUAL SHAREHOLDER REPORT | AS OF DECEMBER 31, 2024 | |
| | VIP Freedom 2045 Portfolio℠ VIP Freedom 2045 Portfolio℠ Service Class 2 true |
| | | |
This annual shareholder report contains information about VIP Freedom 2045 Portfolio℠ for the period January 1, 2024 to December 31, 2024. You can find additional information about the Fund at fundresearch.fidelity.com/prospectus/sec. You can also request this information by contacting us at 1-877-208-0098 or by sending an e-mail to funddocuments@fmr.com.
What were your Fund costs for the last year?(based on hypothetical $10,000 investment)
FUND COST (PREVIOUS YEAR)
| | Costs of a $10,000 investment | Costs paid as a percentage of a $10,000 investment | |
| Service Class 2 | $ 27 | 0.25% | |
What affected the Fund's performance this period?
•Risk assets largely produced positive results in 2024, influenced by an expanding global economy and a slowing in the pace of inflation in certain markets, as well as a pivot by some central banks toward monetary easing, despite ongoing geopolitical risk.
•Against this backdrop, active asset allocation positioning detracted from the fund's performance relative to the Composite index, whereas the performance of the underlying investment portfolios contributed.
•In terms of active asset allocation, an underweight in outperforming U.S. equities hurt the fund's relative result the past 12 months, as did an overweight in lagging long-term U.S. Treasurys and outsized exposure to non-U.S. equities. Conversely, an underweight in relatively weaker-performing investment-grade bonds added relative value for the fund.
•Looking at the performance of the underlying portfolios, investments in non-U.S. equities contributed to the fund's relative result. Investments in U.S. investment-grade bonds and U.S. equities also helped to a lesser extent. Within U.S. equities, VIP Contrafund Portfolio (+33.79%) notably outperformed its benchmark, the S&P 500® index (+25.02%). Elsewhere among non-U.S. equities, VIP Overseas Portfolio (+5%) topped the MSCI EAFE index (+4.07%) and VIP Emerging Markets Portfolio (+10.04%) outpaced the MSCI EM Index (+7.50%).
•At the other end of the performance spectrum of underlying funds, within equities, VIP Growth Portfolio (+30.39%) lagged its benchmark, the Russell 3000® Index (+32.46%), and VIP Growth & Income Portfolio (+22.21%) trailed the S&P 500® index.
How did the Fund perform over the past 10 years?
CUMULATIVE PERFORMANCE
December 31, 2014 through December 31, 2024.
Initial investment of $10,000.
Service Class 2 | $10,000 | $9,947 | $10,599 | $13,069 | $11,745 | $15,063 | $17,920 | $21,062 | $17,183 | $20,470 | $23,241 |
Fidelity VIP Freedom 2045 Composite Index℠ | $10,000 | $9,894 | $10,838 | $13,109 | $12,185 | $15,394 | $17,940 | $20,843 | $17,062 | $20,494 | $23,452 |
S&P 500® Index | $10,000 | $10,138 | $11,351 | $13,829 | $13,223 | $17,386 | $20,585 | $26,494 | $21,696 | $27,399 | $34,254 |
| | 2014 | 2015 | 2016 | 2017 | 2018 | 2019 | 2020 | 2021 | 2022 | 2023 | 2024 |
AVERAGE ANNUAL TOTAL RETURNS:| | 1 Year | 5 Year | 10 Year |
| Service Class 2 | 13.54% | 9.06% | 8.80% |
| Fidelity VIP Freedom 2045 Composite Index℠ | 14.43% | 8.78% | 8.90% |
| S&P 500® Index | 25.02% | 14.53% | 13.10% |
Visit institutional.fidelity.com for more recent performance information. |
The Fund's past performance is not a good predictor of the Fund's future performance. The graph and table do not reflect the deduction of taxes that a shareholder would pay on fund distributions or redemption of fund shares. |
Key Fund Statistics(as of December 31, 2024)
KEY FACTS | | |
| Fund Size | $193,295,202 | |
| Number of Holdings | 11 | |
| Total Advisory Fee | $0 | |
| Portfolio Turnover | 31% | |
What did the Fund invest in?
(as of December 31, 2024)
| Domestic Equity Funds | 51.5 |
| International Equity Funds | 40.9 |
| Bond Funds | 7.6 |
| Short-Term Investments and Net Other Assets (Liabilities) | 0.0 |
ASSET ALLOCATION (% of Fund's net assets) |
|
| | Domestic Equity Funds - 51.5 |
| | International Equity Funds - 40.9 |
| | Bond Funds - 7.6 |
| | Short-Term Investments and Net Other Assets (Liabilities) - 0.0 |
| |
TOP HOLDINGS(% of Fund's net assets) | | |
| VIP Overseas Portfolio - Initial Class | 27.8 | |
| VIP Growth Portfolio - Initial Class | 15.0 | |
| VIP Emerging Markets Portfolio - Initial Class | 13.1 | |
| VIP Growth & Income Portfolio - Initial Class | 10.1 | |
| VIP Contrafund Portfolio - Initial Class | 9.0 | |
| VIP Equity-Income Portfolio - Initial Class | 7.4 | |
| Fidelity Long-Term Treasury Bond Index Fund | 6.6 | |
| VIP Value Portfolio - Initial Class | 5.1 | |
| VIP Value Strategies Portfolio - Initial Class | 2.6 | |
| VIP Mid Cap Portfolio - Initial Class | 2.3 | |
| | 99.0 | |
| Fidelity, the Fidelity Investments Logo and all other Fidelity trademarks or service marks used herein are trademarks or service marks of FMR LLC. Any third-party marks that are used herein are trademarks or service marks of their respective owners. © 2025 FMR LLC. All rights reserved. |
| | For additional information about the Fund; including its prospectus, financial information, holdings and proxy information, scan the QR code or visit fundresearch.fidelity.com/prospectus/sec 1.9914338.100 2167-TSRA-0325 |
| |
| | ANNUAL SHAREHOLDER REPORT | AS OF DECEMBER 31, 2024 | This report describes changes to the Fund that occurred during the reporting period. |
| | VIP Freedom 2055 Portfolio℠ VIP Freedom 2055 Portfolio℠ Service Class true |
| | | |
This annual shareholder report contains information about VIP Freedom 2055 Portfolio℠ for the period January 1, 2024 to December 31, 2024. You can find additional information about the Fund at fundresearch.fidelity.com/prospectus/sec. You can also request this information by contacting us at 1-877-208-0098 or by sending an e-mail to funddocuments@fmr.com.
What were your Fund costs for the last year?(based on hypothetical $10,000 investment)
FUND COST (PREVIOUS YEAR)
| | Costs of a $10,000 investment | Costs paid as a percentage of a $10,000 investment | |
| Service Class | $ 11 | 0.10% | |
What affected the Fund's performance this period?
•Risk assets largely produced positive results in 2024, influenced by an expanding global economy and a slowing in the pace of inflation in certain markets, as well as a pivot by some central banks toward monetary easing, despite ongoing geopolitical risk.
•Against this backdrop, active asset allocation positioning detracted from the fund's performance relative to the Composite index, whereas the performance of the underlying investment portfolios contributed.
•In terms of active asset allocation, an underweight in outperforming U.S. equities hurt the fund's relative result the past 12 months, as did an overweight in lagging long-term U.S. Treasurys and outsized exposure to non-U.S. equities. Conversely, an underweight in relatively weaker-performing investment-grade bonds added relative value for the fund.
•Looking at the performance of the underlying portfolios, investments in non-U.S. equities contributed to the fund's relative result. Investments in U.S. investment-grade bonds and U.S. equities also helped to a lesser extent. Within U.S. equities, VIP Contrafund Portfolio (+33.79%) notably outperformed its benchmark, the S&P 500® index (+25.02%). Elsewhere among non-U.S. equities, VIP Overseas Portfolio (+5%) topped the MSCI EAFE index (+4.07%) and VIP Emerging Markets Portfolio (+10.04%) outpaced the MSCI EM Index (+7.50%).
•At the other end of the performance spectrum of underlying funds, within equities, VIP Growth Portfolio (+30.39%) lagged its benchmark, the Russell 3000® Index (+32.46%), and VIP Growth & Income Portfolio (+22.21%) trailed the S&P 500® index.
How did the Fund perform over the life of Fund?
CUMULATIVE PERFORMANCE
April 11, 2019 through December 31, 2024.
Initial investment of $10,000.
Service Class | $10,000 | $11,178 | $13,314 | $15,673 | $12,796 | $15,279 |
Fidelity VIP Freedom 2055 Composite Index℠ | $10,000 | $11,078 | $12,911 | $15,000 | $12,279 | $14,749 |
S&P 500® Index | $10,000 | $11,346 | $13,433 | $17,289 | $14,158 | $17,880 |
| | 2019 | 2020 | 2021 | 2022 | 2023 | 2024 |
AVERAGE ANNUAL TOTAL RETURNS:| | 1 Year | 5 Year | Life of Fund A |
| Service Class | 13.72% | 9.22% | 10.12% |
| Fidelity VIP Freedom 2055 Composite Index℠ | 14.43% | 8.78% | 9.57% |
| S&P 500® Index | 25.02% | 14.53% | 15.07% |
A From April 11, 2019
Visit institutional.fidelity.com for more recent performance information. |
The Fund's past performance is not a good predictor of the Fund's future performance. The graph and table do not reflect the deduction of taxes that a shareholder would pay on fund distributions or redemption of fund shares. |
Key Fund Statistics(as of December 31, 2024)
KEY FACTS | | |
| Fund Size | $21,543,729 | |
| Number of Holdings | 11 | |
| Total Advisory Fee | $0 | |
| Portfolio Turnover | 43% | |
What did the Fund invest in?
(as of December 31, 2024)
| Domestic Equity Funds | 51.5 |
| International Equity Funds | 40.9 |
| Bond Funds | 7.6 |
| Short-Term Investments and Net Other Assets (Liabilities) | 0.0 |
ASSET ALLOCATION (% of Fund's net assets) |
|
| | Domestic Equity Funds - 51.5 |
| | International Equity Funds - 40.9 |
| | Bond Funds - 7.6 |
| | Short-Term Investments and Net Other Assets (Liabilities) - 0.0 |
| |
TOP HOLDINGS(% of Fund's net assets) | | |
| VIP Overseas Portfolio - Initial Class | 27.8 | |
| VIP Growth Portfolio - Initial Class | 15.0 | |
| VIP Emerging Markets Portfolio - Initial Class | 13.1 | |
| VIP Growth & Income Portfolio - Initial Class | 10.1 | |
| VIP Contrafund Portfolio - Initial Class | 9.0 | |
| VIP Equity-Income Portfolio - Initial Class | 7.4 | |
| Fidelity Long-Term Treasury Bond Index Fund | 6.6 | |
| VIP Value Portfolio - Initial Class | 5.1 | |
| VIP Value Strategies Portfolio - Initial Class | 2.6 | |
| VIP Mid Cap Portfolio - Initial Class | 2.3 | |
| | 99.0 | |
How has the Fund changed?
This is a summary of certain changes to the Fund since January 1, 2024. For more complete information, you may review the Fund's next prospectus, which we expect to be available by April 30, 2025 at fundresearch.fidelity.com/prospectus/sec or upon request at 1-877-208-0098 or by sending an e-mail to funddocuments@fmr.com.
The fund added a contractual proxy and shareholder meeting expense cap during the reporting period. | |
| Fidelity, the Fidelity Investments Logo and all other Fidelity trademarks or service marks used herein are trademarks or service marks of FMR LLC. Any third-party marks that are used herein are trademarks or service marks of their respective owners. © 2025 FMR LLC. All rights reserved. |
| | For additional information about the Fund; including its prospectus, financial information, holdings and proxy information, scan the QR code or visit fundresearch.fidelity.com/prospectus/sec 1.9914385.100 3363-TSRA-0325 |
| |
| | ANNUAL SHAREHOLDER REPORT | AS OF DECEMBER 31, 2024 | |
| | VIP Freedom 2040 Portfolio℠ VIP Freedom 2040 Portfolio℠ Service Class true |
| | | |
This annual shareholder report contains information about VIP Freedom 2040 Portfolio℠ for the period January 1, 2024 to December 31, 2024. You can find additional information about the Fund at fundresearch.fidelity.com/prospectus/sec. You can also request this information by contacting us at 1-877-208-0098 or by sending an e-mail to funddocuments@fmr.com.
What were your Fund costs for the last year?(based on hypothetical $10,000 investment)
FUND COST (PREVIOUS YEAR)
| | Costs of a $10,000 investment | Costs paid as a percentage of a $10,000 investment | |
| Service Class | $ 11 | 0.10% | |
What affected the Fund's performance this period?
•Risk assets largely produced positive results in 2024, influenced by an expanding global economy and a slowing in the pace of inflation in certain markets, as well as a pivot by some central banks toward monetary easing, despite ongoing geopolitical risk.
•Against this backdrop, active asset allocation positioning detracted from the fund's performance relative to the Composite index, whereas the performance of the underlying investment portfolios contributed.
•In terms of active asset allocation, an underweight in outperforming U.S. equities hurt the fund's relative result the past 12 months, as did an overweight in lagging long-term U.S. Treasurys and outsized exposure to non-U.S. equities. Conversely, an underweight in relatively weaker-performing investment-grade bonds added relative value for the fund.
•Looking at the performance of the underlying portfolios, investments in non-U.S. equities contributed to the fund's relative result. Investments in U.S. investment-grade bonds and U.S. equities also helped to a lesser extent. Within U.S. equities, VIP Contrafund Portfolio (+33.79%) notably outperformed its benchmark, the S&P 500® index (+25.02%). Elsewhere among non-U.S. equities, VIP Overseas Portfolio (+5%) topped the MSCI EAFE index (+4.07%) and VIP Emerging Markets Portfolio (+10.04%) outpaced the MSCI EM Index (+7.50%).
•At the other end of the performance spectrum of underlying funds, within equities, VIP Growth Portfolio (+30.39%) lagged its benchmark, the Russell 3000® Index (+32.46%), and VIP Growth & Income Portfolio (+22.21%) trailed the S&P 500® index.
How did the Fund perform over the past 10 years?
CUMULATIVE PERFORMANCE
December 31, 2014 through December 31, 2024.
Initial investment of $10,000.
Service Class | $10,000 | $9,965 | $10,637 | $13,128 | $11,823 | $15,180 | $18,089 | $21,287 | $17,391 | $20,664 | $23,338 |
Fidelity VIP Freedom 2040 Composite Index℠ | $10,000 | $9,894 | $10,838 | $13,109 | $12,185 | $15,394 | $17,940 | $20,841 | $17,068 | $20,411 | $23,193 |
S&P 500® Index | $10,000 | $10,138 | $11,351 | $13,829 | $13,223 | $17,386 | $20,585 | $26,494 | $21,696 | $27,399 | $34,254 |
| | 2014 | 2015 | 2016 | 2017 | 2018 | 2019 | 2020 | 2021 | 2022 | 2023 | 2024 |
AVERAGE ANNUAL TOTAL RETURNS:| | 1 Year | 5 Year | 10 Year |
| Service Class | 12.94% | 8.98% | 8.84% |
| Fidelity VIP Freedom 2040 Composite Index℠ | 13.63% | 8.54% | 8.78% |
| S&P 500® Index | 25.02% | 14.53% | 13.10% |
Visit institutional.fidelity.com for more recent performance information. |
The Fund's past performance is not a good predictor of the Fund's future performance. The graph and table do not reflect the deduction of taxes that a shareholder would pay on fund distributions or redemption of fund shares. |
Key Fund Statistics(as of December 31, 2024)
KEY FACTS | | |
| Fund Size | $349,922,751 | |
| Number of Holdings | 14 | |
| Total Advisory Fee | $0 | |
| Portfolio Turnover | 34% | |
What did the Fund invest in?
(as of December 31, 2024)
| Domestic Equity Funds | 47.8 |
| International Equity Funds | 38.5 |
| Bond Funds | 13.7 |
| Short-Term Investments and Net Other Assets (Liabilities) | 0.0 |
ASSET ALLOCATION (% of Fund's net assets) |
|
| | Domestic Equity Funds - 47.8 |
| | International Equity Funds - 38.5 |
| | Bond Funds - 13.7 |
| | Short-Term Investments and Net Other Assets (Liabilities) - 0.0 |
| |
TOP HOLDINGS(% of Fund's net assets) | | |
| VIP Overseas Portfolio - Initial Class | 25.6 | |
| VIP Growth Portfolio - Initial Class | 13.9 | |
| VIP Emerging Markets Portfolio - Initial Class | 12.9 | |
| VIP Growth & Income Portfolio - Initial Class | 9.4 | |
| VIP Contrafund Portfolio - Initial Class | 8.4 | |
| Fidelity Long-Term Treasury Bond Index Fund | 8.0 | |
| VIP Equity-Income Portfolio - Initial Class | 6.8 | |
| VIP Value Portfolio - Initial Class | 4.8 | |
| VIP Value Strategies Portfolio - Initial Class | 2.4 | |
| Fidelity International Bond Index Fund | 2.3 | |
| | 94.5 | |
| Fidelity, the Fidelity Investments Logo and all other Fidelity trademarks or service marks used herein are trademarks or service marks of FMR LLC. Any third-party marks that are used herein are trademarks or service marks of their respective owners. © 2025 FMR LLC. All rights reserved. |
| | For additional information about the Fund; including its prospectus, financial information, holdings and proxy information, scan the QR code or visit fundresearch.fidelity.com/prospectus/sec 1.9914334.100 2163-TSRA-0325 |
| |
| | ANNUAL SHAREHOLDER REPORT | AS OF DECEMBER 31, 2024 | This report describes changes to the Fund that occurred during the reporting period. |
| | VIP Asset Manager: Growth Portfolio VIP Asset Manager: Growth Portfolio Initial Class true |
| | | |
This annual shareholder report contains information about VIP Asset Manager: Growth Portfolio for the period January 1, 2024 to December 31, 2024. You can find additional information about the Fund at fundresearch.fidelity.com/prospectus/sec. You can also request this information by contacting us at 1-877-208-0098 or by sending an e-mail to funddocuments@fmr.com.
What were your Fund costs for the last year?(based on hypothetical $10,000 investment)
FUND COST (PREVIOUS YEAR)
| | Costs of a $10,000 investment | Costs paid as a percentage of a $10,000 investment | |
| Initial Class | $ 65 | 0.61% | |
What affected the Fund's performance this period?
•Risk assets largely produced positive results in 2024, influenced by an expanding global economy, a slowing in the pace of inflation in certain markets, and a pivot by some central banks toward monetary easing, despite ongoing geopolitical risk.
•Within this environment, asset class positioning contributed to the fund's performance versus the Composite index, whereas security selection detracted.
•The portfolio's core equity allocation strategy contributed to relative performance, led by an overweight among U.S. stocks. Equal-weight positioning in international developed- and emerging-markets equities also added modest value. Meanwhile, small, out-of-benchmark allocations to real estate investment trusts and commodity-related securities slightly detracted.
•The portfolio's fixed-income positioning was beneficial from a relative performance standpoint. Specifically, an underweight in investment-grade bonds and cash, in favor of higher-risk segments of the fixed income market was advantageous. That said, a small allocation to long-term U.S. Treasurys hurt.
•In terms of security selection, picks among U.S. equities pressured relative performance in 2024. Investment choices in the information technology sector - particularly among software & services and semiconductor companies - detracted the most.
•Stock selection among international developed-market stocks, on the other hand, aided the fund's relative return. Here, picks in Japan, Germany and the U.K., along with favorable positioning in continental European equity markets, helped the most. Conversely, investment choices and an underweight in the strong-performing Canadian stock market detracted.
•Security selection among investment-grade bonds also added value. Corporate debt issued by banks, real estate investment trusts, insurers and consumer staples companies, contributed to the portfolio's relative outcome. Elsewhere, stakes in asset-backed securities, non-government-agency mortgage-backed securities and U.S. Treasurys, helped as well.
•As of December 31, the fund was overweight U.S. stocks and about neutrally weighted in international developed- and emerging-markets equities. Investment-grade bond and cash allocations remained below the fund's target weighting.
How did the Fund perform over the past 10 years?
CUMULATIVE PERFORMANCE
December 31, 2014 through December 31, 2024.
Initial investment of $10,000.
Initial Class | $10,000 | $10,003 | $10,255 | $12,175 | $11,244 | $13,810 | $16,195 | $18,456 | $15,341 | $17,852 | $19,781 |
Fidelity Asset Manager 70% Composite Index℠ | $10,000 | $10,015 | $10,811 | $12,619 | $11,951 | $14,563 | $16,749 | $18,997 | $16,013 | $18,717 | $20,950 |
S&P 500® Index | $10,000 | $10,138 | $11,351 | $13,829 | $13,223 | $17,386 | $20,585 | $26,494 | $21,696 | $27,399 | $34,254 |
| | 2014 | 2015 | 2016 | 2017 | 2018 | 2019 | 2020 | 2021 | 2022 | 2023 | 2024 |
AVERAGE ANNUAL TOTAL RETURNS:| | 1 Year | 5 Year | 10 Year |
| Initial Class | 10.81% | 7.45% | 7.06% |
| Fidelity Asset Manager 70% Composite Index℠ | 11.93% | 7.54% | 7.68% |
| S&P 500® Index | 25.02% | 14.53% | 13.10% |
Visit institutional.fidelity.com for more recent performance information. |
The Fund's past performance is not a good predictor of the Fund's future performance. The graph and table do not reflect the deduction of taxes that a shareholder would pay on fund distributions or redemption of fund shares. |
Key Fund Statistics(as of December 31, 2024)
KEY FACTS | | |
| Fund Size | $277,549,788 | |
| Number of Holdings | 27 | |
| Total Advisory Fee | $1,610,000 | |
| Portfolio Turnover | 21% | |
What did the Fund invest in?
(as of December 31, 2024)
The information in the following tables is based on the combined Investments of the Fund and it's pro-rata share of investments in Fidelity's Central Funds, other than the Commodity Strategy and Money Market Central Funds as applicable.
| U.S. Government and U.S. Government Agency Obligations | 14.1 |
| AAA | 1.4 |
| AA | 0.1 |
| A | 1.5 |
| BBB | 3.0 |
| BB | 1.1 |
| B | 0.8 |
| CCC,CC,C | 0.2 |
| D | 0.0 |
| Not Rated | 0.6 |
| Equities | 72.9 |
| Short-Term Investments and Net Other Assets (Liabilities) | 4.3 |
QUALITY DIVERSIFICATION (% of Fund's net assets) |
| |
| | U.S. Government and U.S. Government Agency Obligations - 14.1 |
| | AAA - 1.4 |
| | AA - 0.1 |
| | A - 1.5 |
| | BBB - 3.0 |
| | BB - 1.1 |
| | B - 0.8 |
| | CCC,CC,C - 0.2 |
| | D - 0.0 |
| | Not Rated - 0.6 |
| | Equities - 72.9 |
| | Short-Term Investments and Net Other Assets (Liabilities) - 4.3 |
| |
| We have used ratings from Moody's Investors Service, Inc. Where Moody's® ratings are not available, we have used S&P® ratings. All ratings are as of the date indicated and do not reflect subsequent changes. |
MARKET SECTORS (% of Fund's net assets) | | |
| Information Technology | 16.9 | |
| Financials | 14.6 | |
| Industrials | 8.2 | |
| Consumer Discretionary | 7.8 | |
| Health Care | 6.5 | |
| Communication Services | 5.5 | |
| Consumer Staples | 3.1 | |
| Energy | 2.9 | |
| Materials | 2.4 | |
| Real Estate | 1.8 | |
| Utilities | 1.4 | |
| |
| Equities | 72.0 |
| Bonds | 23.7 |
| Short-Term Investments and Net Other Assets (Liabilities) | 4.3 |
ASSET ALLOCATION (% of Fund's net assets) |
|
| | Equities - 72.0 |
| | Bonds - 23.7 |
| | Short-Term Investments and Net Other Assets (Liabilities) - 4.3 |
| |
TOP HOLDINGS(% of Fund's net assets) | | |
| US Treasury Notes | 8.4 | |
| Microsoft Corp | 2.9 | |
| NVIDIA Corp | 2.8 | |
| Apple Inc | 2.7 | |
| Fidelity Blue Chip Growth ETF | 2.6 | |
| US Treasury Bonds | 2.2 | |
| Alphabet Inc Class A | 1.8 | |
| Amazon.com Inc | 1.8 | |
| Fidelity Hedged Equity ETF | 1.3 | |
| Fannie Mae Mortgage pass-thru certificates | 1.2 | |
| | 27.7 | |
How has the Fund changed?
This is a summary of certain changes to the Fund since January 1, 2024. For more complete information, you may review the Fund's next prospectus, which we expect to be available by April 30, 2025 at fundresearch.fidelity.com/prospectus/sec or upon request at 1-877-208-0098 or by sending an e-mail to funddocuments@fmr.com.
The fees associated with this class changed during the reporting year. The variations in class fees are primarily the result of the following changes:- Management fee
- Operating expenses
The fund's transfer agent and pricing & bookkeeping fees were changed to a fixed rate effective December 1, 2023. Effective March 1, 2024, the fund's management contract was amended to incorporate administrative services previously covered under separate services agreements (transfer agent and pricing & bookkeeping). The amended contract incorporates a management fee rate that may vary by class. The Adviser or an affiliate pays certain expenses of managing and operating the fund out of each class's management fee. | The fund modified its principal investment strategies during the reporting period.
|
The fund modified its principal investment risks during the reporting period. | |
| Fidelity, the Fidelity Investments Logo and all other Fidelity trademarks or service marks used herein are trademarks or service marks of FMR LLC. Any third-party marks that are used herein are trademarks or service marks of their respective owners. © 2025 FMR LLC. All rights reserved. |
| | For additional information about the Fund; including its prospectus, financial information, holdings and proxy information, scan the QR code or visit fundresearch.fidelity.com/prospectus/sec 1.9914171.100 159-TSRA-0325 |
| |
| | ANNUAL SHAREHOLDER REPORT | AS OF DECEMBER 31, 2024 | This report describes changes to the Fund that occurred during the reporting period. |
| | VIP Investment Grade Bond Portfolio VIP Investment Grade Bond Portfolio Service Class true |
| | | |
This annual shareholder report contains information about VIP Investment Grade Bond Portfolio for the period January 1, 2024 to December 31, 2024. You can find additional information about the Fund at fundresearch.fidelity.com/prospectus/sec. You can also request this information by contacting us at 1-877-208-0098 or by sending an e-mail to funddocuments@fmr.com.
What were your Fund costs for the last year?(based on hypothetical $10,000 investment)
FUND COST (PREVIOUS YEAR)
| | Costs of a $10,000 investment | Costs paid as a percentage of a $10,000 investment | |
| Service Class | $ 48 | 0.48% | |
What affected the Fund's performance this period?
•U.S. taxable investment-grade bonds posted a modest advance in 2024, rallying during the summer months, as the bond market reflected anticipated interest-rate reductions by the U.S. Federal Reserve, but falling back in the fourth quarter when the Fed tempered rate-cut expectations for 2025.
•Against this backdrop, the fund's exposure to asset-backed securities, including collateralized loan obligations, was a key contributor to performance versus the Bloomberg U.S. Aggregate Bond Index for the fiscal year.
•An overweight to commercial mortgage-backed securities provided another performance advantage, as did an underweight to agency mortgage-backed securities.
•Among corporate bonds, industry allocation lifted relative performance as well, led by security selection among financials and an overweight in the segment. Specifically, positioning among banks and REITS was beneficial versus the index.
•Exposure to certain "plus" sectors, namely high yield bonds and emerging markets debt, also were modest contributors.
•In contrast, the fund's yield-curve positioning modestly detracted for the year.
How did the Fund perform over the past 10 years?
CUMULATIVE PERFORMANCE
December 31, 2014 through December 31, 2024.
Initial investment of $10,000.
Service Class | $10,000 | $9,929 | $10,389 | $10,821 | $10,753 | $11,783 | $12,882 | $12,780 | $11,115 | $11,796 | $11,987 |
Bloomberg U.S. Aggregate Bond Index | $10,000 | $10,055 | $10,321 | $10,687 | $10,688 | $11,620 | $12,492 | $12,299 | $10,699 | $11,291 | $11,432 |
| | 2014 | 2015 | 2016 | 2017 | 2018 | 2019 | 2020 | 2021 | 2022 | 2023 | 2024 |
AVERAGE ANNUAL TOTAL RETURNS:| | 1 Year | 5 Year | 10 Year |
| Service Class | 1.62% | 0.34% | 1.83% |
| Bloomberg U.S. Aggregate Bond Index | 1.25% | -0.33% | 1.35% |
Visit institutional.fidelity.com for more recent performance information. |
The Fund's past performance is not a good predictor of the Fund's future performance. The graph and table do not reflect the deduction of taxes that a shareholder would pay on fund distributions or redemption of fund shares. |
Key Fund Statistics(as of December 31, 2024)
KEY FACTS | | |
| Fund Size | $4,430,972,983 | |
| Number of Holdings | 2,224 | |
| Total Advisory Fee | $15,386,008 | |
| Portfolio Turnover | 205% | |
What did the Fund invest in?
(as of December 31, 2024)
The information in the following tables is based on the combined Investments of the Fund and it's pro-rata share of investments in Fidelity's Central Funds, other than the Commodity Strategy and Money Market Central Funds as applicable.
| U.S. Government and U.S. Government Agency Obligations | 63.0 |
| AAA | 9.0 |
| AA | 0.9 |
| A | 6.2 |
| BBB | 16.4 |
| BB | 2.9 |
| B | 1.3 |
| CCC,CC,C | 0.0 |
| Not Rated | 4.2 |
| Equities | 0.0 |
QUALITY DIVERSIFICATION (% of Fund's net assets) |
| |
| | U.S. Government and U.S. Government Agency Obligations - 63.0 |
| | AAA - 9.0 |
| | AA - 0.9 |
| | A - 6.2 |
| | BBB - 16.4 |
| | BB - 2.9 |
| | B - 1.3 |
| | CCC,CC,C - 0.0 |
| | Not Rated - 4.2 |
| | Equities - 0.0 |
| Short-Term Investments and Net Other Assets (Liabilities) - (3.9)% |
| |
| We have used ratings from Moody's Investors Service, Inc. Where Moody's® ratings are not available, we have used S&P® ratings. All ratings are as of the date indicated and do not reflect subsequent changes. |
| U.S. Treasury Obligations | 45.2 |
| Corporate Bonds | 24.9 |
| U.S. Government Agency - Mortgage Securities | 17.8 |
| Asset-Backed Securities | 8.6 |
| CMOs and Other Mortgage Related Securities | 7.0 |
| Other Investments | 0.2 |
| Purchased Options | 0.1 |
| Foreign Government and Government Agency Obligations | 0.1 |
| Preferred Securities | 0.0 |
| Bank Loan Obligations | 0.0 |
| Common Stocks | 0.0 |
ASSET ALLOCATION (% of Fund's net assets) |
|
| | U.S. Treasury Obligations - 45.2 |
| | Corporate Bonds - 24.9 |
| | U.S. Government Agency - Mortgage Securities - 17.8 |
| | Asset-Backed Securities - 8.6 |
| | CMOs and Other Mortgage Related Securities - 7.0 |
| | Other Investments - 0.2 |
| | Purchased Options - 0.1 |
| | Foreign Government and Government Agency Obligations - 0.1 |
| | Preferred Securities - 0.0 |
| | Bank Loan Obligations - 0.0 |
| | Common Stocks - 0.0 |
| Short-Term Investments and Net Other Assets (Liabilities) - (3.9)% |
| |
| United States | 90.8 |
| Grand Cayman (UK Overseas Ter) | 4.7 |
| Mexico | 1.0 |
| Ireland | 0.7 |
| United Kingdom | 0.6 |
| Netherlands | 0.4 |
| Switzerland | 0.4 |
| Bailiwick Of Jersey | 0.3 |
| Germany | 0.3 |
| Others | 0.8 |
GEOGRAPHIC DIVERSIFICATION (% of Fund's net assets) |
|
| | United States - 90.8 |
| | Grand Cayman (UK Overseas Ter) - 4.7 |
| | Mexico - 1.0 |
| | Ireland - 0.7 |
| | United Kingdom - 0.6 |
| | Netherlands - 0.4 |
| | Switzerland - 0.4 |
| | Bailiwick Of Jersey - 0.3 |
| | Germany - 0.3 |
| | Others - 0.8 |
| |
TOP HOLDINGS(% of Fund's net assets) | | |
| US Treasury Notes | 33.8 | |
| US Treasury Bonds | 11.4 | |
| Fannie Mae Mortgage pass-thru certificates | 6.4 | |
| Ginnie Mae II Pool | 5.2 | |
| Freddie Mac Gold Pool | 3.4 | |
| Uniform Mortgage Backed Securities | 2.1 | |
| Freddie Mac Multifamily Structured pass-thru certificates | 1.4 | |
| Bank of America Corp | 1.1 | |
| Petroleos Mexicanos | 1.0 | |
| Morgan Stanley | 1.0 | |
| | 66.8 | |
How has the Fund changed?
This is a summary of certain changes to the Fund since January 1, 2024. For more complete information, you may review the Fund's next prospectus, which we expect to be available by April 30, 2025 at fundresearch.fidelity.com/prospectus/sec or upon request at 1-877-208-0098 or by sending an e-mail to funddocuments@fmr.com.
The fund's transfer agent and pricing & bookkeeping fees were changed to a fixed rate effective December 1, 2023. Effective March 1, 2024, the fund's management contract was amended to incorporate administrative services previously covered under separate services agreements (transfer agent and pricing & bookkeeping). The amended contract incorporates a management fee rate that may vary by class. The Adviser or an affiliate pays certain expenses of managing and operating the fund out of each class's management fee. | |
| Fidelity, the Fidelity Investments Logo and all other Fidelity trademarks or service marks used herein are trademarks or service marks of FMR LLC. Any third-party marks that are used herein are trademarks or service marks of their respective owners. © 2025 FMR LLC. All rights reserved. |
| | For additional information about the Fund; including its prospectus, financial information, holdings and proxy information, scan the QR code or visit fundresearch.fidelity.com/prospectus/sec 1.9914194.100 827-TSRA-0325 |
| |
| | ANNUAL SHAREHOLDER REPORT | AS OF DECEMBER 31, 2024 | |
| | VIP Freedom 2040 Portfolio℠ VIP Freedom 2040 Portfolio℠ Service Class 2 true |
| | | |
This annual shareholder report contains information about VIP Freedom 2040 Portfolio℠ for the period January 1, 2024 to December 31, 2024. You can find additional information about the Fund at fundresearch.fidelity.com/prospectus/sec. You can also request this information by contacting us at 1-877-208-0098 or by sending an e-mail to funddocuments@fmr.com.
What were your Fund costs for the last year?(based on hypothetical $10,000 investment)
FUND COST (PREVIOUS YEAR)
| | Costs of a $10,000 investment | Costs paid as a percentage of a $10,000 investment | |
| Service Class 2 | $ 27 | 0.25% | |
What affected the Fund's performance this period?
•Risk assets largely produced positive results in 2024, influenced by an expanding global economy and a slowing in the pace of inflation in certain markets, as well as a pivot by some central banks toward monetary easing, despite ongoing geopolitical risk.
•Against this backdrop, active asset allocation positioning detracted from the fund's performance relative to the Composite index, whereas the performance of the underlying investment portfolios contributed.
•In terms of active asset allocation, an underweight in outperforming U.S. equities hurt the fund's relative result the past 12 months, as did an overweight in lagging long-term U.S. Treasurys and outsized exposure to non-U.S. equities. Conversely, an underweight in relatively weaker-performing investment-grade bonds added relative value for the fund.
•Looking at the performance of the underlying portfolios, investments in non-U.S. equities contributed to the fund's relative result. Investments in U.S. investment-grade bonds and U.S. equities also helped to a lesser extent. Within U.S. equities, VIP Contrafund Portfolio (+33.79%) notably outperformed its benchmark, the S&P 500® index (+25.02%). Elsewhere among non-U.S. equities, VIP Overseas Portfolio (+5%) topped the MSCI EAFE index (+4.07%) and VIP Emerging Markets Portfolio (+10.04%) outpaced the MSCI EM Index (+7.50%).
•At the other end of the performance spectrum of underlying funds, within equities, VIP Growth Portfolio (+30.39%) lagged its benchmark, the Russell 3000® Index (+32.46%), and VIP Growth & Income Portfolio (+22.21%) trailed the S&P 500® index.
How did the Fund perform over the past 10 years?
CUMULATIVE PERFORMANCE
December 31, 2014 through December 31, 2024.
Initial investment of $10,000.
Service Class 2 | $10,000 | $9,951 | $10,600 | $13,070 | $11,747 | $15,063 | $17,924 | $21,060 | $17,183 | $20,381 | $22,992 |
Fidelity VIP Freedom 2040 Composite Index℠ | $10,000 | $9,894 | $10,838 | $13,109 | $12,185 | $15,394 | $17,940 | $20,841 | $17,068 | $20,411 | $23,193 |
S&P 500® Index | $10,000 | $10,138 | $11,351 | $13,829 | $13,223 | $17,386 | $20,585 | $26,494 | $21,696 | $27,399 | $34,254 |
| | 2014 | 2015 | 2016 | 2017 | 2018 | 2019 | 2020 | 2021 | 2022 | 2023 | 2024 |
AVERAGE ANNUAL TOTAL RETURNS:| | 1 Year | 5 Year | 10 Year |
| Service Class 2 | 12.81% | 8.83% | 8.68% |
| Fidelity VIP Freedom 2040 Composite Index℠ | 13.63% | 8.54% | 8.78% |
| S&P 500® Index | 25.02% | 14.53% | 13.10% |
Visit institutional.fidelity.com for more recent performance information. |
The Fund's past performance is not a good predictor of the Fund's future performance. The graph and table do not reflect the deduction of taxes that a shareholder would pay on fund distributions or redemption of fund shares. |
Key Fund Statistics(as of December 31, 2024)
KEY FACTS | | |
| Fund Size | $349,922,751 | |
| Number of Holdings | 14 | |
| Total Advisory Fee | $0 | |
| Portfolio Turnover | 34% | |
What did the Fund invest in?
(as of December 31, 2024)
| Domestic Equity Funds | 47.8 |
| International Equity Funds | 38.5 |
| Bond Funds | 13.7 |
| Short-Term Investments and Net Other Assets (Liabilities) | 0.0 |
ASSET ALLOCATION (% of Fund's net assets) |
|
| | Domestic Equity Funds - 47.8 |
| | International Equity Funds - 38.5 |
| | Bond Funds - 13.7 |
| | Short-Term Investments and Net Other Assets (Liabilities) - 0.0 |
| |
TOP HOLDINGS(% of Fund's net assets) | | |
| VIP Overseas Portfolio - Initial Class | 25.6 | |
| VIP Growth Portfolio - Initial Class | 13.9 | |
| VIP Emerging Markets Portfolio - Initial Class | 12.9 | |
| VIP Growth & Income Portfolio - Initial Class | 9.4 | |
| VIP Contrafund Portfolio - Initial Class | 8.4 | |
| Fidelity Long-Term Treasury Bond Index Fund | 8.0 | |
| VIP Equity-Income Portfolio - Initial Class | 6.8 | |
| VIP Value Portfolio - Initial Class | 4.8 | |
| VIP Value Strategies Portfolio - Initial Class | 2.4 | |
| Fidelity International Bond Index Fund | 2.3 | |
| | 94.5 | |
| Fidelity, the Fidelity Investments Logo and all other Fidelity trademarks or service marks used herein are trademarks or service marks of FMR LLC. Any third-party marks that are used herein are trademarks or service marks of their respective owners. © 2025 FMR LLC. All rights reserved. |
| | For additional information about the Fund; including its prospectus, financial information, holdings and proxy information, scan the QR code or visit fundresearch.fidelity.com/prospectus/sec 1.9914335.100 2164-TSRA-0325 |
| |
| | ANNUAL SHAREHOLDER REPORT | AS OF DECEMBER 31, 2024 | This report describes changes to the Fund that occurred during the reporting period. |
| | VIP Freedom 2060 Portfolio℠ VIP Freedom 2060 Portfolio℠ Initial Class true |
| | | |
This annual shareholder report contains information about VIP Freedom 2060 Portfolio℠ for the period January 1, 2024 to December 31, 2024. You can find additional information about the Fund at fundresearch.fidelity.com/prospectus/sec. You can also request this information by contacting us at 1-877-208-0098 or by sending an e-mail to funddocuments@fmr.com.
What were your Fund costs for the last year?(based on hypothetical $10,000 investment)
FUND COST (PREVIOUS YEAR)
| | Costs of a $10,000 investment | Costs paid as a percentage of a $10,000 investment | |
| Initial Class | $ 1 | 0.01% | |
What affected the Fund's performance this period?
•Risk assets largely produced positive results in 2024, influenced by an expanding global economy and a slowing in the pace of inflation in certain markets, as well as a pivot by some central banks toward monetary easing, despite ongoing geopolitical risk.
•Against this backdrop, active asset allocation positioning detracted from the fund's performance relative to the Composite index, whereas the performance of the underlying investment portfolios contributed.
•In terms of active asset allocation, an underweight in outperforming U.S. equities hurt the fund's relative result the past 12 months, as did an overweight in lagging long-term U.S. Treasurys and outsized exposure to non-U.S. equities. Conversely, an underweight in relatively weaker-performing investment-grade bonds added relative value for the fund.
•Looking at the performance of the underlying portfolios, investments in non-U.S. equities contributed to the fund's relative result. Investments in U.S. investment-grade bonds and U.S. equities also helped to a lesser extent. Within U.S. equities, VIP Contrafund Portfolio (+33.79%) notably outperformed its benchmark, the S&P 500® index (+25.02%). Elsewhere among non-U.S. equities, VIP Overseas Portfolio (+5%) topped the MSCI EAFE index (+4.07%) and VIP Emerging Markets Portfolio (+10.04%) outpaced the MSCI EM Index (+7.50%).
•At the other end of the performance spectrum of underlying funds, within equities, VIP Growth Portfolio (+30.39%) lagged its benchmark, the Russell 3000® Index (+32.46%), and VIP Growth & Income Portfolio (+22.21%) trailed the S&P 500® index.
How did the Fund perform over the life of Fund?
CUMULATIVE PERFORMANCE
April 11, 2019 through December 31, 2024.
Initial investment of $10,000.
Initial Class | $10,000 | $11,186 | $13,345 | $15,719 | $12,860 | $15,353 |
Fidelity VIP Freedom 2060 Composite Index℠ | $10,000 | $11,078 | $12,911 | $15,000 | $12,279 | $14,749 |
S&P 500® Index | $10,000 | $11,346 | $13,433 | $17,289 | $14,158 | $17,880 |
| | 2019 | 2020 | 2021 | 2022 | 2023 | 2024 |
AVERAGE ANNUAL TOTAL RETURNS:| | 1 Year | 5 Year | Life of Fund A |
| Initial Class | 13.89% | 9.35% | 10.25% |
| Fidelity VIP Freedom 2060 Composite Index℠ | 14.43% | 8.78% | 9.57% |
| S&P 500® Index | 25.02% | 14.53% | 15.07% |
A From April 11, 2019
Visit institutional.fidelity.com for more recent performance information. |
The Fund's past performance is not a good predictor of the Fund's future performance. The graph and table do not reflect the deduction of taxes that a shareholder would pay on fund distributions or redemption of fund shares. |
Key Fund Statistics(as of December 31, 2024)
KEY FACTS | | |
| Fund Size | $26,164,071 | |
| Number of Holdings | 11 | |
| Total Advisory Fee | $0 | |
| Portfolio Turnover | 54% | |
What did the Fund invest in?
(as of December 31, 2024)
| Domestic Equity Funds | 51.5 |
| International Equity Funds | 40.9 |
| Bond Funds | 7.6 |
| Short-Term Investments and Net Other Assets (Liabilities) | 0.0 |
ASSET ALLOCATION (% of Fund's net assets) |
|
| | Domestic Equity Funds - 51.5 |
| | International Equity Funds - 40.9 |
| | Bond Funds - 7.6 |
| | Short-Term Investments and Net Other Assets (Liabilities) - 0.0 |
| |
TOP HOLDINGS(% of Fund's net assets) | | |
| VIP Overseas Portfolio - Initial Class | 27.8 | |
| VIP Growth Portfolio - Initial Class | 15.0 | |
| VIP Emerging Markets Portfolio - Initial Class | 13.1 | |
| VIP Growth & Income Portfolio - Initial Class | 10.1 | |
| VIP Contrafund Portfolio - Initial Class | 9.0 | |
| VIP Equity-Income Portfolio - Initial Class | 7.4 | |
| Fidelity Long-Term Treasury Bond Index Fund | 6.6 | |
| VIP Value Portfolio - Initial Class | 5.1 | |
| VIP Value Strategies Portfolio - Initial Class | 2.6 | |
| VIP Mid Cap Portfolio - Initial Class | 2.3 | |
| | 99.0 | |
How has the Fund changed?
This is a summary of certain changes to the Fund since January 1, 2024. For more complete information, you may review the Fund's next prospectus, which we expect to be available by April 30, 2025 at fundresearch.fidelity.com/prospectus/sec or upon request at 1-877-208-0098 or by sending an e-mail to funddocuments@fmr.com.
The fund added a contractual proxy and shareholder meeting expense cap during the reporting period. | |
| Fidelity, the Fidelity Investments Logo and all other Fidelity trademarks or service marks used herein are trademarks or service marks of FMR LLC. Any third-party marks that are used herein are trademarks or service marks of their respective owners. © 2025 FMR LLC. All rights reserved. |
| | For additional information about the Fund; including its prospectus, financial information, holdings and proxy information, scan the QR code or visit fundresearch.fidelity.com/prospectus/sec 1.9914387.100 3361-TSRA-0325 |
| |
| | ANNUAL SHAREHOLDER REPORT | AS OF DECEMBER 31, 2024 | This report describes changes to the Fund that occurred during the reporting period. |
| | VIP FundsManager® 30% Portfolio VIP FundsManager® 30% Portfolio Service Class 2 true |
| | | |
This annual shareholder report contains information about VIP FundsManager® 30% Portfolio for the period January 1, 2024 to December 31, 2024. You can find additional information about the Fund at fundresearch.fidelity.com/prospectus/sec. You can also request this information by contacting us at 1-877-208-0098 or by sending an e-mail to funddocuments@fmr.com.
What were your Fund costs for the last year?(based on hypothetical $10,000 investment)
FUND COST (PREVIOUS YEAR)
| | Costs of a $10,000 investment | Costs paid as a percentage of a $10,000 investment | |
| Service Class 2 | $ 26 | 0.25% | |
What affected the Fund's performance this period?
•Risk assets largely produced positive results in 2024, influenced by an expanding global economy, a slowing in the pace of inflation in certain markets, and a pivot by some central banks toward monetary easing, despite ongoing geopolitical risk.
•Within this environment, asset class positioning contributed to the Portfolios' performance versus the Composite indexes, whereas security selection detracted.
•The Portfolios' core equity allocation strategy contributed to relative performance, led by an overweight among U.S. stocks. Equal-weight positioning in international developed- and emerging-markets equities added modest value. Meanwhile, small, out-of-benchmark allocations to real estate investment trusts and commodity-related securities slightly detracted.
•The portfolio's fixed-income allocation strategy also was beneficial from a relative performance standpoint. Specifically, an underweight in investment-grade bonds and cash, in favor of higher-risks segments of the fixed market was advantageous. That said, a small allocation to long-term U.S. Treasurys hurt.
•In terms of security selection, picks among U.S. equities notably pressured relative performance in 2024 due to disappointing results from Fidelity® VIP Stock Selector All Cap Portfolio, the largest equity holding this period. Investment choices in the information technology sector - particularly among software & services and semiconductor companies - detracted the most.
•Conversely, stock selection in developed international markets was a plus, propelled by Fidelity® International Discovery Fund and Fidelity® Overseas Fund. Picks in continental Europe fueled the former, while investment choices in the U.K. helped the latter.
•Security selection among investment-grade bonds also added value, driven by the efforts of our active bond fund managers. In contrast, stocks picks in emerging-markets equities modestly detracted.
•As of December 31, the Portfolios were overweight U.S. stocks and about neutrally weighted in international developed- and emerging-markets equities. Investment-grade bond and cash allocations remained below the Portfolios' target weightings.
How did the Fund perform over the life of Fund?
CUMULATIVE PERFORMANCE
April 13, 2023 through December 31, 2024.
Initial investment of $10,000.
Service Class 2 | $10,000 | $10,469 |
Fidelity VIP FundsManager 30% Composite Index℠ | $10,000 | $10,553 |
Bloomberg U.S. Aggregate Bond Index | $10,000 | $10,202 |
| | 2023 | 2024 |
AVERAGE ANNUAL TOTAL RETURNS:| | 1 Year | Life of Fund A |
| Service Class 2 | 6.26% | 6.39% |
| Fidelity VIP FundsManager 30% Composite Index℠ | 6.50% | 7.02% |
| Bloomberg U.S. Aggregate Bond Index | 1.25% | 1.90% |
A From April 13, 2023
Visit institutional.fidelity.com for more recent performance information. |
The Fund's past performance is not a good predictor of the Fund's future performance. The graph and table do not reflect the deduction of taxes that a shareholder would pay on fund distributions or redemption of fund shares. |
Key Fund Statistics(as of December 31, 2024)
KEY FACTS | | |
| Fund Size | $14,740,183 | |
| Number of Holdings | 33 | |
| Total Advisory Fee | $10,778 | |
| Portfolio Turnover | 33% | |
What did the Fund invest in?
(as of December 31, 2024)
| Bond Funds | 48.7 |
| Domestic Equity Funds | 20.4 |
| Short-Term Funds | 12.9 |
| International Equity Funds | 11.8 |
| Alternative Funds | 1.3 |
| Short-Term Investments and Net Other Assets (Liabilities) | 4.9 |
ASSET ALLOCATION (% of Fund's net assets) |
|
| | Bond Funds - 48.7 |
| | Domestic Equity Funds - 20.4 |
| | Short-Term Funds - 12.9 |
| | International Equity Funds - 11.8 |
| | Alternative Funds - 1.3 |
| | Short-Term Investments and Net Other Assets (Liabilities) - 4.9 |
| |
TOP HOLDINGS(% of Fund's net assets) | | |
| Fidelity Total Bond Fund | 22.4 | |
| VIP Investment Grade Bond II Portfolio - Investor Class | 22.3 | |
| VIP Stock Selector All Cap Portfolio - Investor Class | 14.3 | |
| Fidelity Investments Money Market Government Portfolio - Institutional Class | 12.9 | |
| Fidelity Overseas Fund | 3.8 | |
| Fidelity Emerging Markets Fund | 3.3 | |
| Fidelity Inflation-Protected Bond Index Fund | 1.5 | |
| Fidelity Hedged Equity Fund | 1.3 | |
| Fidelity Stock Selector Small Cap Fund | 1.3 | |
| Fidelity International Discovery Fund | 1.1 | |
| | 84.2 | |
How has the Fund changed?
This is a summary of certain changes to the Fund since January 1, 2024. For more complete information, you may review the Fund's next prospectus, which we expect to be available by April 30, 2025 at fundresearch.fidelity.com/prospectus/sec or upon request at 1-877-208-0098 or by sending an e-mail to funddocuments@fmr.com.
The fund modified its principal investment strategies during the reporting period. | The fund modified its principal investment risks during the reporting period.
|
| Fidelity, the Fidelity Investments Logo and all other Fidelity trademarks or service marks used herein are trademarks or service marks of FMR LLC. Any third-party marks that are used herein are trademarks or service marks of their respective owners. © 2025 FMR LLC. All rights reserved. |
| | For additional information about the Fund; including its prospectus, financial information, holdings and proxy information, scan the QR code or visit fundresearch.fidelity.com/prospectus/sec 1.9914410.100 6988-TSRA-0325 |
| |
| | ANNUAL SHAREHOLDER REPORT | AS OF DECEMBER 31, 2024 | This report describes changes to the Fund that occurred during the reporting period. |
| | VIP Strategic Income Portfolio VIP Strategic Income Portfolio Service Class 2 true |
| | | |
This annual shareholder report contains information about VIP Strategic Income Portfolio for the period January 1, 2024 to December 31, 2024. You can find additional information about the Fund at fundresearch.fidelity.com/prospectus/sec. You can also request this information by contacting us at 1-877-208-0098 or by sending an e-mail to funddocuments@fmr.com.
What were your Fund costs for the last year?(based on hypothetical $10,000 investment)
FUND COST (PREVIOUS YEAR)
| | Costs of a $10,000 investment | Costs paid as a percentage of a $10,000 investment | |
| Service Class 2 | $ 92 | 0.89% | |
What affected the Fund's performance this period?
•Risk assets fared well in 2024, driven by a sturdy economy, the U.S. Federal Reserve's long-anticipated pivot to cutting interest rates and the potential for artificial intelligence to drive transformative change.
•Against this backdrop, compared with the Fidelity Strategic Income Composite IndexSM, security selection among high-yield bonds meaningfully contributed to the fund's result, especially picks in the energy, technology & electronics and financial services categories.
•Investment choices in emerging-markets debt also added value relative to the Composite index, with bond picks in Chile and Peru as standouts.
•On the negative side, an allocation to U.S. Treasury futures, a position we established to help offset the portfolio's overall lower duration, underperformed in a generally rising interest-rate environment.
•Changes to the portfolio this period, which were modest, included adding exposure to emerging-markets debt and developed-markets international debt, while reducing the fund's allocation to floating-rate loans and high-yield bonds.
How did the Fund perform over the past 10 years?
CUMULATIVE PERFORMANCE
December 31, 2014 through December 31, 2024.
Initial investment of $10,000.
Service Class 2 | $10,000 | $9,806 | $10,593 | $11,392 | $11,070 | $12,250 | $13,138 | $13,591 | $12,025 | $13,129 | $13,887 |
Fidelity Strategic Income Composite Index℠ | $10,000 | $9,764 | $10,671 | $11,388 | $11,224 | $12,406 | $13,229 | $13,394 | $11,829 | $12,952 | $13,629 |
Bloomberg U.S. Universal Bond Index | $10,000 | $10,043 | $10,436 | $10,863 | $10,835 | $11,842 | $12,739 | $12,598 | $10,961 | $11,638 | $11,875 |
| | 2014 | 2015 | 2016 | 2017 | 2018 | 2019 | 2020 | 2021 | 2022 | 2023 | 2024 |
AVERAGE ANNUAL TOTAL RETURNS:| | 1 Year | 5 Year | 10 Year |
| Service Class 2 | 5.78% | 2.54% | 3.34% |
| Fidelity Strategic Income Composite Index℠ | 5.23% | 1.90% | 3.14% |
| Bloomberg U.S. Universal Bond Index | 2.04% | 0.06% | 1.73% |
Visit institutional.fidelity.com for more recent performance information. |
The Fund's past performance is not a good predictor of the Fund's future performance. The graph and table do not reflect the deduction of taxes that a shareholder would pay on fund distributions or redemption of fund shares. |
Key Fund Statistics(as of December 31, 2024)
KEY FACTS | | |
| Fund Size | $1,508,793,887 | |
| Number of Holdings | 1,470 | |
| Total Advisory Fee | $9,132,751 | |
| Portfolio Turnover | 77% | |
What did the Fund invest in?
(as of December 31, 2024)
The information in the following tables is based on the combined Investments of the Fund and it's pro-rata share of investments in Fidelity's Central Funds, other than the Commodity Strategy and Money Market Central Funds as applicable.
| U.S. Government and U.S. Government Agency Obligations | 24.8 |
| AAA | 2.9 |
| AA | 1.8 |
| A | 1.9 |
| BBB | 7.6 |
| BB | 13.4 |
| B | 17.9 |
| CCC,CC,C | 5.6 |
| D | 0.0 |
| Not Rated | 9.0 |
| Equities | 7.0 |
| Short-Term Investments and Net Other Assets (Liabilities) | 8.1 |
QUALITY DIVERSIFICATION (% of Fund's net assets) |
| |
| | U.S. Government and U.S. Government Agency Obligations - 24.8 |
| | AAA - 2.9 |
| | AA - 1.8 |
| | A - 1.9 |
| | BBB - 7.6 |
| | BB - 13.4 |
| | B - 17.9 |
| | CCC,CC,C - 5.6 |
| | D - 0.0 |
| | Not Rated - 9.0 |
| | Equities - 7.0 |
| | Short-Term Investments and Net Other Assets (Liabilities) - 8.1 |
| |
| We have used ratings from Moody's Investors Service, Inc. Where Moody's® ratings are not available, we have used S&P® ratings. All ratings are as of the date indicated and do not reflect subsequent changes. |
| High-Yield Debt | 40.6 |
| U.S. Government & Investment Grade-Debt | 30.1 |
| Emerging-Markets Debt | 15.5 |
| Foreign Developed-Markets Debt | 8.5 |
| Floating-Rate debt | 5.0 |
| Short-Term Investments and Net Other Assets (Liabilities) | 0.3 |
ASSET ALLOCATION (% of Fund's net assets) |
|
| | High-Yield Debt - 40.6 |
| | U.S. Government & Investment Grade-Debt - 30.1 |
| | Emerging-Markets Debt - 15.5 |
| | Foreign Developed-Markets Debt - 8.5 |
| | Floating-Rate debt - 5.0 |
| | Short-Term Investments and Net Other Assets (Liabilities) - 0.3 |
| |
| United States | 74.6 |
| Germany | 6.1 |
| Mexico | 1.3 |
| Brazil | 1.1 |
| United Kingdom | 1.1 |
| Canada | 1.0 |
| France | 1.0 |
| Saudi Arabia | 0.8 |
| Turkey | 0.8 |
| Others | 12.2 |
GEOGRAPHIC DIVERSIFICATION (% of Fund's net assets) |
|
| | United States - 74.6 |
| | Germany - 6.1 |
| | Mexico - 1.3 |
| | Brazil - 1.1 |
| | United Kingdom - 1.1 |
| | Canada - 1.0 |
| | France - 1.0 |
| | Saudi Arabia - 0.8 |
| | Turkey - 0.8 |
| | Others - 12.2 |
| |
TOP HOLDINGS(% of Fund's net assets) | | |
| US Treasury Notes | 18.8 | |
| US Treasury Bonds | 5.7 | |
| German Federal Republic | 5.7 | |
| Freddie Mac Multifamily Structured pass-thru certificates | 3.9 | |
| TransDigm Inc | 1.3 | |
| EchoStar Corp | 0.8 | |
| Energy Transfer LP | 0.8 | |
| Argentine Republic | 0.7 | |
| Turkish Republic | 0.7 | |
| NVIDIA Corp | 0.7 | |
| | 39.1 | |
How has the Fund changed?
This is a summary of certain changes to the Fund since January 1, 2024. For more complete information, you may review the Fund's next prospectus, which we expect to be available by April 30, 2025 at fundresearch.fidelity.com/prospectus/sec or upon request at 1-877-208-0098 or by sending an e-mail to funddocuments@fmr.com.
The fund's transfer agent and pricing & bookkeeping fees were changed to a fixed rate effective December 1, 2023. Effective March 1, 2024, the fund's management contract was amended to incorporate administrative services previously covered under separate services agreements (transfer agent and pricing & bookkeeping). The amended contract incorporates a management fee rate that may vary by class. The Adviser or an affiliate pays certain expenses of managing and operating the fund out of each class's management fee. | |
| Fidelity, the Fidelity Investments Logo and all other Fidelity trademarks or service marks used herein are trademarks or service marks of FMR LLC. Any third-party marks that are used herein are trademarks or service marks of their respective owners. © 2025 FMR LLC. All rights reserved. |
| | For additional information about the Fund; including its prospectus, financial information, holdings and proxy information, scan the QR code or visit fundresearch.fidelity.com/prospectus/sec 1.9914257.100 1328-TSRA-0325 |
| |
| | ANNUAL SHAREHOLDER REPORT | AS OF DECEMBER 31, 2024 | |
| | VIP Freedom 2050 Portfolio℠ VIP Freedom 2050 Portfolio℠ Initial Class true |
| | | |
This annual shareholder report contains information about VIP Freedom 2050 Portfolio℠ for the period January 1, 2024 to December 31, 2024. You can find additional information about the Fund at fundresearch.fidelity.com/prospectus/sec. You can also request this information by contacting us at 1-877-208-0098 or by sending an e-mail to funddocuments@fmr.com.
What were your Fund costs for the last year?(based on hypothetical $10,000 investment)
FUND COST (PREVIOUS YEAR)
| | Costs of a $10,000 investment | Costs paid as a percentage of a $10,000 investment | |
| Initial Class | $ 0 A | 0.00%B | |
AAmount represents less than $.50
BAmount represents less than 0.005%
What affected the Fund's performance this period?
•Risk assets largely produced positive results in 2024, influenced by an expanding global economy and a slowing in the pace of inflation in certain markets, as well as a pivot by some central banks toward monetary easing, despite ongoing geopolitical risk.
•Against this backdrop, active asset allocation positioning detracted from the fund's performance relative to the Composite index, whereas the performance of the underlying investment portfolios contributed.
•In terms of active asset allocation, an underweight in outperforming U.S. equities hurt the fund's relative result the past 12 months, as did an overweight in lagging long-term U.S. Treasurys and outsized exposure to non-U.S. equities. Conversely, an underweight in relatively weaker-performing investment-grade bonds added relative value for the fund.
•Looking at the performance of the underlying portfolios, investments in non-U.S. equities contributed to the fund's relative result. Investments in U.S. investment-grade bonds and U.S. equities also helped to a lesser extent. Within U.S. equities, VIP Contrafund Portfolio (+33.79%) notably outperformed its benchmark, the S&P 500® index (+25.02%). Elsewhere among non-U.S. equities, VIP Overseas Portfolio (+5%) topped the MSCI EAFE index (+4.07%) and VIP Emerging Markets Portfolio (+10.04%) outpaced the MSCI EM Index (+7.50%).
•At the other end of the performance spectrum of underlying funds, within equities, VIP Growth Portfolio (+30.39%) lagged its benchmark, the Russell 3000® Index (+32.46%), and VIP Growth & Income Portfolio (+22.21%) trailed the S&P 500® index.
How did the Fund perform over the past 10 years?
CUMULATIVE PERFORMANCE
December 31, 2014 through December 31, 2024.
Initial investment of $10,000.
Initial Class | $10,000 | $9,971 | $10,652 | $13,158 | $11,857 | $15,237 | $18,175 | $21,416 | $17,513 | $20,919 | $23,813 |
Fidelity VIP Freedom 2050 Composite Index℠ | $10,000 | $9,894 | $10,838 | $13,109 | $12,185 | $15,394 | $17,940 | $20,843 | $17,062 | $20,494 | $23,452 |
S&P 500® Index | $10,000 | $10,138 | $11,351 | $13,829 | $13,223 | $17,386 | $20,585 | $26,494 | $21,696 | $27,399 | $34,254 |
| | 2014 | 2015 | 2016 | 2017 | 2018 | 2019 | 2020 | 2021 | 2022 | 2023 | 2024 |
AVERAGE ANNUAL TOTAL RETURNS:| | 1 Year | 5 Year | 10 Year |
| Initial Class | 13.83% | 9.34% | 9.06% |
| Fidelity VIP Freedom 2050 Composite Index℠ | 14.43% | 8.78% | 8.90% |
| S&P 500® Index | 25.02% | 14.53% | 13.10% |
Visit institutional.fidelity.com for more recent performance information. |
The Fund's past performance is not a good predictor of the Fund's future performance. The graph and table do not reflect the deduction of taxes that a shareholder would pay on fund distributions or redemption of fund shares. |
Key Fund Statistics(as of December 31, 2024)
KEY FACTS | | |
| Fund Size | $168,362,171 | |
| Number of Holdings | 11 | |
| Total Advisory Fee | $0 | |
| Portfolio Turnover | 34% | |
What did the Fund invest in?
(as of December 31, 2024)
| Domestic Equity Funds | 51.5 |
| International Equity Funds | 40.9 |
| Bond Funds | 7.6 |
| Short-Term Investments and Net Other Assets (Liabilities) | 0.0 |
ASSET ALLOCATION (% of Fund's net assets) |
|
| | Domestic Equity Funds - 51.5 |
| | International Equity Funds - 40.9 |
| | Bond Funds - 7.6 |
| | Short-Term Investments and Net Other Assets (Liabilities) - 0.0 |
| |
TOP HOLDINGS(% of Fund's net assets) | | |
| VIP Overseas Portfolio - Initial Class | 27.8 | |
| VIP Growth Portfolio - Initial Class | 15.0 | |
| VIP Emerging Markets Portfolio - Initial Class | 13.1 | |
| VIP Growth & Income Portfolio - Initial Class | 10.1 | |
| VIP Contrafund Portfolio - Initial Class | 9.0 | |
| VIP Equity-Income Portfolio - Initial Class | 7.4 | |
| Fidelity Long-Term Treasury Bond Index Fund | 6.6 | |
| VIP Value Portfolio - Initial Class | 5.1 | |
| VIP Value Strategies Portfolio - Initial Class | 2.6 | |
| VIP Mid Cap Portfolio - Initial Class | 2.3 | |
| | 99.0 | |
| Fidelity, the Fidelity Investments Logo and all other Fidelity trademarks or service marks used herein are trademarks or service marks of FMR LLC. Any third-party marks that are used herein are trademarks or service marks of their respective owners. © 2025 FMR LLC. All rights reserved. |
| | For additional information about the Fund; including its prospectus, financial information, holdings and proxy information, scan the QR code or visit fundresearch.fidelity.com/prospectus/sec 1.9914339.100 2168-TSRA-0325 |
| |
| | ANNUAL SHAREHOLDER REPORT | AS OF DECEMBER 31, 2024 | This report describes changes to the Fund that occurred during the reporting period. |
| | VIP Freedom Income Portfolio℠ VIP Freedom Income Portfolio℠ Service Class true |
| | | |
This annual shareholder report contains information about VIP Freedom Income Portfolio℠ for the period January 1, 2024 to December 31, 2024. You can find additional information about the Fund at fundresearch.fidelity.com/prospectus/sec. You can also request this information by contacting us at 1-877-208-0098 or by sending an e-mail to funddocuments@fmr.com.
What were your Fund costs for the last year?(based on hypothetical $10,000 investment)
FUND COST (PREVIOUS YEAR)
| | Costs of a $10,000 investment | Costs paid as a percentage of a $10,000 investment | |
| Service Class | $ 10 | 0.10% | |
What affected the Fund's performance this period?
•Risk assets largely produced positive results in 2024, influenced by an expanding global economy and a slowing in the pace of inflation in certain markets, as well as a pivot by some central banks toward monetary easing, despite ongoing geopolitical risk.
•Against this backdrop, active asset allocation positioning detracted from the fund's performance relative to the Composite index, whereas the performance of the underlying investment portfolios contributed.
•In terms of active asset allocation, an underweight in outperforming U.S. equities hurt the fund's relative result the past 12 months, as did an overweight in lagging long-term U.S. Treasurys and outsized exposure to non-U.S. equities. Conversely, an underweight in relatively weaker-performing investment-grade bonds added relative value for the fund.
•Looking at the performance of the underlying portfolios, investments in non-U.S. equities contributed to the fund's relative result. Investments in U.S. investment-grade bonds and U.S. equities also helped to a lesser extent. Within U.S. equities, VIP Contrafund Portfolio (+33.79%) notably outperformed its benchmark, the S&P 500® index (+25.02%). Elsewhere among non-U.S. equities, VIP Overseas Portfolio (+5%) topped the MSCI EAFE index (+4.07%) and VIP Emerging Markets Portfolio (+10.04%) outpaced the MSCI EM Index (+7.50%).
•At the other end of the performance spectrum of underlying funds, within equities, VIP Growth Portfolio (+30.39%) lagged its benchmark, the Russell 3000® Index (+32.46%), and VIP Growth & Income Portfolio (+22.21%) trailed the S&P 500® index.
How did the Fund perform over the past 10 years?
CUMULATIVE PERFORMANCE
December 31, 2014 through December 31, 2024.
Initial investment of $10,000.
Service Class | $10,000 | $9,958 | $10,387 | $11,270 | $11,031 | $12,340 | $13,622 | $14,053 | $12,359 | $13,324 | $13,895 |
Fidelity VIP Freedom Income Composite Index℠ | $10,000 | $10,012 | $10,397 | $11,135 | $11,058 | $12,258 | $13,314 | $13,734 | $12,175 | $13,190 | $13,828 |
Bloomberg U.S. Aggregate Bond Index | $10,000 | $10,055 | $10,321 | $10,687 | $10,688 | $11,620 | $12,492 | $12,299 | $10,699 | $11,291 | $11,432 |
| | 2014 | 2015 | 2016 | 2017 | 2018 | 2019 | 2020 | 2021 | 2022 | 2023 | 2024 |
AVERAGE ANNUAL TOTAL RETURNS:| | 1 Year | 5 Year | 10 Year |
| Service Class | 4.28% | 2.40% | 3.34% |
| Fidelity VIP Freedom Income Composite Index℠ | 4.84% | 2.44% | 3.29% |
| Bloomberg U.S. Aggregate Bond Index | 1.25% | -0.33% | 1.35% |
Visit institutional.fidelity.com for more recent performance information. |
The Fund's past performance is not a good predictor of the Fund's future performance. The graph and table do not reflect the deduction of taxes that a shareholder would pay on fund distributions or redemption of fund shares. |
Key Fund Statistics(as of December 31, 2024)
KEY FACTS | | |
| Fund Size | $88,636,009 | |
| Number of Holdings | 15 | |
| Total Advisory Fee | $0 | |
| Portfolio Turnover | 40% | |
What did the Fund invest in?
(as of December 31, 2024)
| Bond Funds | 62.4 |
| Short-Term Funds | 15.4 |
| International Equity Funds | 12.8 |
| Domestic Equity Funds | 9.4 |
| Short-Term Investments and Net Other Assets (Liabilities) | 0.0 |
ASSET ALLOCATION (% of Fund's net assets) |
|
| | Bond Funds - 62.4 |
| | Short-Term Funds - 15.4 |
| | International Equity Funds - 12.8 |
| | Domestic Equity Funds - 9.4 |
| | Short-Term Investments and Net Other Assets (Liabilities) - 0.0 |
| |
TOP HOLDINGS(% of Fund's net assets) | | |
| VIP Investment Grade Bond II Portfolio - Initial Class | 39.3 | |
| Fidelity Inflation-Protected Bond Index Fund | 16.0 | |
| VIP Government Money Market Portfolio - Initial Class | 15.4 | |
| VIP Overseas Portfolio - Initial Class | 7.4 | |
| VIP Emerging Markets Portfolio - Initial Class | 5.4 | |
| Fidelity International Bond Index Fund | 3.2 | |
| VIP Growth Portfolio - Initial Class | 2.8 | |
| Fidelity Long-Term Treasury Bond Index Fund | 2.7 | |
| VIP Growth & Income Portfolio - Initial Class | 1.9 | |
| VIP Contrafund Portfolio - Initial Class | 1.7 | |
| | 95.8 | |
How has the Fund changed?
This is a summary of certain changes to the Fund since January 1, 2024. For more complete information, you may review the Fund's next prospectus, which we expect to be available by April 30, 2025 at fundresearch.fidelity.com/prospectus/sec or upon request at 1-877-208-0098 or by sending an e-mail to funddocuments@fmr.com.
VIP Freedom 2005 Portfolio℠ merged into VIP Freedom Income Portfolio℠ on June 7, 2024. | |
| Fidelity, the Fidelity Investments Logo and all other Fidelity trademarks or service marks used herein are trademarks or service marks of FMR LLC. Any third-party marks that are used herein are trademarks or service marks of their respective owners. © 2025 FMR LLC. All rights reserved. |
| | For additional information about the Fund; including its prospectus, financial information, holdings and proxy information, scan the QR code or visit fundresearch.fidelity.com/prospectus/sec 1.9914269.100 1418-TSRA-0325 |
| |
| | ANNUAL SHAREHOLDER REPORT | AS OF DECEMBER 31, 2024 | This report describes changes to the Fund that occurred during the reporting period. |
| | VIP Freedom Income Portfolio℠ VIP Freedom Income Portfolio℠ Initial Class true |
| | | |
This annual shareholder report contains information about VIP Freedom Income Portfolio℠ for the period January 1, 2024 to December 31, 2024. You can find additional information about the Fund at fundresearch.fidelity.com/prospectus/sec. You can also request this information by contacting us at 1-877-208-0098 or by sending an e-mail to funddocuments@fmr.com.
What were your Fund costs for the last year?(based on hypothetical $10,000 investment)
FUND COST (PREVIOUS YEAR)
| | Costs of a $10,000 investment | Costs paid as a percentage of a $10,000 investment | |
| Initial Class | $ 0 A | 0.00%B | |
AAmount represents less than $.50
BAmount represents less than 0.005%
What affected the Fund's performance this period?
•Risk assets largely produced positive results in 2024, influenced by an expanding global economy and a slowing in the pace of inflation in certain markets, as well as a pivot by some central banks toward monetary easing, despite ongoing geopolitical risk.
•Against this backdrop, active asset allocation positioning detracted from the fund's performance relative to the Composite index, whereas the performance of the underlying investment portfolios contributed.
•In terms of active asset allocation, an underweight in outperforming U.S. equities hurt the fund's relative result the past 12 months, as did an overweight in lagging long-term U.S. Treasurys and outsized exposure to non-U.S. equities. Conversely, an underweight in relatively weaker-performing investment-grade bonds added relative value for the fund.
•Looking at the performance of the underlying portfolios, investments in non-U.S. equities contributed to the fund's relative result. Investments in U.S. investment-grade bonds and U.S. equities also helped to a lesser extent. Within U.S. equities, VIP Contrafund Portfolio (+33.79%) notably outperformed its benchmark, the S&P 500® index (+25.02%). Elsewhere among non-U.S. equities, VIP Overseas Portfolio (+5%) topped the MSCI EAFE index (+4.07%) and VIP Emerging Markets Portfolio (+10.04%) outpaced the MSCI EM Index (+7.50%).
•At the other end of the performance spectrum of underlying funds, within equities, VIP Growth Portfolio (+30.39%) lagged its benchmark, the Russell 3000® Index (+32.46%), and VIP Growth & Income Portfolio (+22.21%) trailed the S&P 500® index.
How did the Fund perform over the past 10 years?
CUMULATIVE PERFORMANCE
December 31, 2014 through December 31, 2024.
Initial investment of $10,000.
Initial Class | $10,000 | $9,966 | $10,415 | $11,298 | $11,077 | $12,400 | $13,699 | $14,157 | $12,452 | $13,437 | $14,035 |
Fidelity VIP Freedom Income Composite Index℠ | $10,000 | $10,012 | $10,397 | $11,135 | $11,058 | $12,258 | $13,314 | $13,734 | $12,175 | $13,190 | $13,828 |
Bloomberg U.S. Aggregate Bond Index | $10,000 | $10,055 | $10,321 | $10,687 | $10,688 | $11,620 | $12,492 | $12,299 | $10,699 | $11,291 | $11,432 |
| | 2014 | 2015 | 2016 | 2017 | 2018 | 2019 | 2020 | 2021 | 2022 | 2023 | 2024 |
AVERAGE ANNUAL TOTAL RETURNS:| | 1 Year | 5 Year | 10 Year |
| Initial Class | 4.45% | 2.51% | 3.45% |
| Fidelity VIP Freedom Income Composite Index℠ | 4.84% | 2.44% | 3.29% |
| Bloomberg U.S. Aggregate Bond Index | 1.25% | -0.33% | 1.35% |
Visit institutional.fidelity.com for more recent performance information. |
The Fund's past performance is not a good predictor of the Fund's future performance. The graph and table do not reflect the deduction of taxes that a shareholder would pay on fund distributions or redemption of fund shares. |
Key Fund Statistics(as of December 31, 2024)
KEY FACTS | | |
| Fund Size | $88,636,009 | |
| Number of Holdings | 15 | |
| Total Advisory Fee | $0 | |
| Portfolio Turnover | 40% | |
What did the Fund invest in?
(as of December 31, 2024)
| Bond Funds | 62.4 |
| Short-Term Funds | 15.4 |
| International Equity Funds | 12.8 |
| Domestic Equity Funds | 9.4 |
| Short-Term Investments and Net Other Assets (Liabilities) | 0.0 |
ASSET ALLOCATION (% of Fund's net assets) |
|
| | Bond Funds - 62.4 |
| | Short-Term Funds - 15.4 |
| | International Equity Funds - 12.8 |
| | Domestic Equity Funds - 9.4 |
| | Short-Term Investments and Net Other Assets (Liabilities) - 0.0 |
| |
TOP HOLDINGS(% of Fund's net assets) | | |
| VIP Investment Grade Bond II Portfolio - Initial Class | 39.3 | |
| Fidelity Inflation-Protected Bond Index Fund | 16.0 | |
| VIP Government Money Market Portfolio - Initial Class | 15.4 | |
| VIP Overseas Portfolio - Initial Class | 7.4 | |
| VIP Emerging Markets Portfolio - Initial Class | 5.4 | |
| Fidelity International Bond Index Fund | 3.2 | |
| VIP Growth Portfolio - Initial Class | 2.8 | |
| Fidelity Long-Term Treasury Bond Index Fund | 2.7 | |
| VIP Growth & Income Portfolio - Initial Class | 1.9 | |
| VIP Contrafund Portfolio - Initial Class | 1.7 | |
| | 95.8 | |
How has the Fund changed?
This is a summary of certain changes to the Fund since January 1, 2024. For more complete information, you may review the Fund's next prospectus, which we expect to be available by April 30, 2025 at fundresearch.fidelity.com/prospectus/sec or upon request at 1-877-208-0098 or by sending an e-mail to funddocuments@fmr.com.
VIP Freedom 2005 Portfolio℠ merged into VIP Freedom Income Portfolio℠ on June 7, 2024. | |
| Fidelity, the Fidelity Investments Logo and all other Fidelity trademarks or service marks used herein are trademarks or service marks of FMR LLC. Any third-party marks that are used herein are trademarks or service marks of their respective owners. © 2025 FMR LLC. All rights reserved. |
| | For additional information about the Fund; including its prospectus, financial information, holdings and proxy information, scan the QR code or visit fundresearch.fidelity.com/prospectus/sec 1.9914268.100 1417-TSRA-0325 |
| |
| | ANNUAL SHAREHOLDER REPORT | AS OF DECEMBER 31, 2024 | This report describes changes to the Fund that occurred during the reporting period. |
| | VIP FundsManager® 70% Portfolio VIP FundsManager® 70% Portfolio Investor Class true |
| | | |
This annual shareholder report contains information about VIP FundsManager® 70% Portfolio for the period January 1, 2024 to December 31, 2024. You can find additional information about the Fund at fundresearch.fidelity.com/prospectus/sec. You can also request this information by contacting us at 1-877-208-0098 or by sending an e-mail to funddocuments@fmr.com.
What were your Fund costs for the last year?(based on hypothetical $10,000 investment)
FUND COST (PREVIOUS YEAR)
| | Costs of a $10,000 investment | Costs paid as a percentage of a $10,000 investment | |
| Investor Class | $ 11 | 0.10% | |
What affected the Fund's performance this period?
•Risk assets largely produced positive results in 2024, influenced by an expanding global economy, a slowing in the pace of inflation in certain markets, and a pivot by some central banks toward monetary easing, despite ongoing geopolitical risk.
•Within this environment, asset class positioning contributed to the Portfolios' performance versus the Composite indexes, whereas security selection detracted.
•The Portfolios' core equity allocation strategy contributed to relative performance, led by an overweight among U.S. stocks. Equal-weight positioning in international developed- and emerging-markets equities added modest value. Meanwhile, small, out-of-benchmark allocations to real estate investment trusts and commodity-related securities slightly detracted.
•The portfolio's fixed-income allocation strategy also was beneficial from a relative performance standpoint. Specifically, an underweight in investment-grade bonds and cash, in favor of higher-risks segments of the fixed market was advantageous. That said, a small allocation to long-term U.S. Treasurys hurt.
•In terms of security selection, picks among U.S. equities notably pressured relative performance in 2024 due to disappointing results from Fidelity® VIP Stock Selector All Cap Portfolio, the largest equity holding this period. Investment choices in the information technology sector - particularly among software & services and semiconductor companies - detracted the most.
•Conversely, stock selection in developed international markets was a plus, propelled by Fidelity® International Discovery Fund and Fidelity® Overseas Fund. Picks in continental Europe fueled the former, while investment choices in the U.K. helped the latter.
•Security selection among investment-grade bonds also added value, driven by the efforts of our active bond fund managers. In contrast, stocks picks in emerging-markets equities modestly detracted.
•As of December 31, the Portfolios were overweight U.S. stocks and about neutrally weighted in international developed- and emerging-markets equities. Investment-grade bond and cash allocations remained below the Portfolios' target weightings.
How did the Fund perform over the past 10 years?
CUMULATIVE PERFORMANCE
December 31, 2014 through December 31, 2024.
Initial investment of $10,000.
Investor Class | $10,000 | $10,049 | $10,547 | $12,574 | $11,632 | $14,268 | $16,564 | $18,970 | $15,997 | $18,514 | $20,528 |
Fidelity VIP FundsManager 70% Composite Index℠ | $10,000 | $10,044 | $10,767 | $12,524 | $11,872 | $14,481 | $16,568 | $18,918 | $15,923 | $18,611 | $20,831 |
S&P 500® Index | $10,000 | $10,138 | $11,351 | $13,829 | $13,223 | $17,386 | $20,585 | $26,494 | $21,696 | $27,399 | $34,254 |
| | 2014 | 2015 | 2016 | 2017 | 2018 | 2019 | 2020 | 2021 | 2022 | 2023 | 2024 |
AVERAGE ANNUAL TOTAL RETURNS:| | 1 Year | 5 Year | 10 Year |
| Investor Class | 10.88% | 7.55% | 7.46% |
| Fidelity VIP FundsManager 70% Composite Index℠ | 11.93% | 7.54% | 7.61% |
| S&P 500® Index | 25.02% | 14.53% | 13.10% |
Visit institutional.fidelity.com for more recent performance information. |
The Fund's past performance is not a good predictor of the Fund's future performance. The graph and table do not reflect the deduction of taxes that a shareholder would pay on fund distributions or redemption of fund shares. |
Key Fund Statistics(as of December 31, 2024)
KEY FACTS | | |
| Fund Size | $2,289,288,181 | |
| Number of Holdings | 39 | |
| Total Advisory Fee | $2,203,855 | |
| Portfolio Turnover | 29% | |
What did the Fund invest in?
(as of December 31, 2024)
| Domestic Equity Funds | 44.2 |
| International Equity Funds | 27.8 |
| Bond Funds | 23.7 |
| Alternative Funds | 1.3 |
| Short-Term Investments and Net Other Assets (Liabilities) | 3.0 |
ASSET ALLOCATION (% of Fund's net assets) |
|
| | Domestic Equity Funds - 44.2 |
| | International Equity Funds - 27.8 |
| | Bond Funds - 23.7 |
| | Alternative Funds - 1.3 |
| | Short-Term Investments and Net Other Assets (Liabilities) - 3.0 |
| |
TOP HOLDINGS(% of Fund's net assets) | | |
| VIP Stock Selector All Cap Portfolio - Investor Class | 35.2 | |
| Fidelity Total Bond Fund | 9.9 | |
| VIP Investment Grade Bond II Portfolio - Investor Class | 9.9 | |
| Fidelity Overseas Fund | 8.5 | |
| Fidelity Emerging Markets Fund | 7.6 | |
| Fidelity Enhanced International ETF | 2.1 | |
| Fidelity International Discovery Fund | 2.1 | |
| Fidelity Stock Selector Small Cap Fund | 1.9 | |
| Fidelity International Capital Appreciation Fund | 1.7 | |
| VIP Value Strategies Portfolio - Investor Class | 1.7 | |
| | 80.6 | |
How has the Fund changed?
This is a summary of certain changes to the Fund since January 1, 2024. For more complete information, you may review the Fund's next prospectus, which we expect to be available by April 30, 2025 at fundresearch.fidelity.com/prospectus/sec or upon request at 1-877-208-0098 or by sending an e-mail to funddocuments@fmr.com.
The fund modified its principal investment strategies during the reporting period. | The fund modified its principal investment risks during the reporting period.
|
| Fidelity, the Fidelity Investments Logo and all other Fidelity trademarks or service marks used herein are trademarks or service marks of FMR LLC. Any third-party marks that are used herein are trademarks or service marks of their respective owners. © 2025 FMR LLC. All rights reserved. |
| | For additional information about the Fund; including its prospectus, financial information, holdings and proxy information, scan the QR code or visit fundresearch.fidelity.com/prospectus/sec 1.9914309.100 1590-TSRA-0325 |
| |
| | ANNUAL SHAREHOLDER REPORT | AS OF DECEMBER 31, 2024 | |
| | VIP Freedom Lifetime Income® III Portfolio VIP Freedom Lifetime Income® III Portfolio true |
| | | |
This annual shareholder report contains information about VIP Freedom Lifetime Income® III Portfolio for the period January 1, 2024 to December 31, 2024. You can find additional information about the Fund at fundresearch.fidelity.com/prospectus/sec. You can also request this information by contacting us at 1-877-208-0098 or by sending an e-mail to funddocuments@fmr.com.
What were your Fund costs for the last year?(based on hypothetical $10,000 investment)
FUND COST (PREVIOUS YEAR)
| | Costs of a $10,000 investment | Costs paid as a percentage of a $10,000 investment | |
| VIP Freedom Lifetime Income® III Portfolio | $ 0 A | 0.00%B | |
A Amount represents less than $.50
B Amount represents less than 0.005%
What affected the Fund's performance this period?
•Risk assets largely produced positive results in 2024, influenced by an expanding global economy and a slowing in the pace of inflation in certain markets, as well as a pivot by some central banks toward monetary easing, despite ongoing geopolitical risk.
•Against this backdrop, active asset allocation positioning detracted from the fund's performance relative to the Composite index, whereas the performance of the underlying investment portfolios contributed.
•In terms of active asset allocation, an underweight in outperforming U.S. equities hurt the fund's relative result most the past 12 months. Conversely, an overweight in emerging-markets equities added relative value for the fund.
•Looking at the performance of the underlying portfolios, investments in non-U.S. equities contributed to the fund's relative result. Investments in U.S. investment-grade bonds also helped. Within U.S. equities, VIP Contrafund Portfolio (+33.70%) notably outperformed its benchmark, the S&P 500® index (+25.02%). Elsewhere among non-U.S. equities, VIP Overseas Portfolio (+4.97%) topped the MSCI EAFE index (+4.07%) and VIP Emerging Markets Portfolio (+9.90%) outpaced the MSCI EM Index (+7.50%).
•At the other end of the performance spectrum of underlying funds, in terms of U.S. equities, VIP Growth Portfolio (+30.30%) lagged its benchmark, the Russell 3000® Index (+32.46%), and VIP Growth & Income Portfolio (+22.18%) trailed the S&P 500® index.
How did the Fund perform over the past 10 years?
CUMULATIVE PERFORMANCE
December 31, 2014 through December 31, 2024.
Initial investment of $10,000.
VIP Freedom Lifetime Income® III Portfolio | $10,000 | $9,973 | $10,654 | $12,342 | $11,641 | $14,021 | $16,156 | $17,736 | $14,891 | $16,786 | $18,096 |
Fidelity VIP Freedom Lifetime Income III Composite Index℠ | $10,000 | $10,053 | $10,758 | $12,317 | $11,858 | $14,093 | $15,918 | $17,346 | $14,653 | $16,600 | $17,978 |
Bloomberg U.S. Aggregate Bond Index | $10,000 | $10,055 | $10,321 | $10,687 | $10,688 | $11,620 | $12,492 | $12,299 | $10,699 | $11,291 | $11,432 |
| | 2014 | 2015 | 2016 | 2017 | 2018 | 2019 | 2020 | 2021 | 2022 | 2023 | 2024 |
AVERAGE ANNUAL TOTAL RETURNS:| | 1 Year | 5 Year | 10 Year |
| VIP Freedom Lifetime Income® III Portfolio | 7.80% | 5.24% | 6.11% |
| Fidelity VIP Freedom Lifetime Income III Composite Index℠ | 8.30% | 4.99% | 6.04% |
| Bloomberg U.S. Aggregate Bond Index | 1.25% | -0.33% | 1.35% |
Visit institutional.fidelity.com for more recent performance information. |
The Fund's past performance is not a good predictor of the Fund's future performance. The graph and table do not reflect the deduction of taxes that a shareholder would pay on fund distributions or redemption of fund shares. |
Key Fund Statistics(as of December 31, 2024)
KEY FACTS | | |
| Fund Size | $28,829,359 | |
| Number of Holdings | 15 | |
| Total Advisory Fee | $0 | |
| Portfolio Turnover | 25% | |
What did the Fund invest in?
(as of December 31, 2024)
| Bond Funds | 49.8 |
| Domestic Equity Funds | 25.8 |
| International Equity Funds | 23.7 |
| Short-Term Funds | 0.7 |
| Short-Term Investments and Net Other Assets (Liabilities) | 0.0 |
ASSET ALLOCATION (% of Fund's net assets) |
|
| | Bond Funds - 49.8 |
| | Domestic Equity Funds - 25.8 |
| | International Equity Funds - 23.7 |
| | Short-Term Funds - 0.7 |
| | Short-Term Investments and Net Other Assets (Liabilities) - 0.0 |
| |
TOP HOLDINGS(% of Fund's net assets) | | |
| VIP Investment Grade Bond II Portfolio - Investor Class | 27.5 | |
| VIP Overseas Portfolio - Investor Class | 15.1 | |
| Fidelity Inflation-Protected Bond Index Fund | 12.1 | |
| VIP Emerging Markets Portfolio - Investor Class | 8.6 | |
| VIP Growth Portfolio - Investor Class | 7.5 | |
| Fidelity Long-Term Treasury Bond Index Fund | 5.1 | |
| VIP Growth & Income Portfolio - Investor Class | 5.1 | |
| VIP Contrafund Portfolio - Investor Class | 4.5 | |
| Fidelity International Bond Index Fund | 3.9 | |
| VIP Equity Income Portfolio - Investor Class | 3.7 | |
| | 93.1 | |
| Fidelity, the Fidelity Investments Logo and all other Fidelity trademarks or service marks used herein are trademarks or service marks of FMR LLC. Any third-party marks that are used herein are trademarks or service marks of their respective owners. © 2025 FMR LLC. All rights reserved. |
| | For additional information about the Fund; including its prospectus, financial information, holdings and proxy information, scan the QR code or visit fundresearch.fidelity.com/prospectus/sec 1.9914291.100 1494-TSRA-0325 |
| |
| | ANNUAL SHAREHOLDER REPORT | AS OF DECEMBER 31, 2024 | This report describes changes to the Fund that occurred during the reporting period. |
| | VIP FundsManager® 30% Portfolio VIP FundsManager® 30% Portfolio Investor Class true |
| | | |
This annual shareholder report contains information about VIP FundsManager® 30% Portfolio for the period January 1, 2024 to December 31, 2024. You can find additional information about the Fund at fundresearch.fidelity.com/prospectus/sec. You can also request this information by contacting us at 1-877-208-0098 or by sending an e-mail to funddocuments@fmr.com.
What were your Fund costs for the last year?(based on hypothetical $10,000 investment)
FUND COST (PREVIOUS YEAR)
| | Costs of a $10,000 investment | Costs paid as a percentage of a $10,000 investment | |
| Investor Class | $ 10 | 0.10% | |
What affected the Fund's performance this period?
•Risk assets largely produced positive results in 2024, influenced by an expanding global economy, a slowing in the pace of inflation in certain markets, and a pivot by some central banks toward monetary easing, despite ongoing geopolitical risk.
•Within this environment, asset class positioning contributed to the Portfolios' performance versus the Composite indexes, whereas security selection detracted.
•The Portfolios' core equity allocation strategy contributed to relative performance, led by an overweight among U.S. stocks. Equal-weight positioning in international developed- and emerging-markets equities added modest value. Meanwhile, small, out-of-benchmark allocations to real estate investment trusts and commodity-related securities slightly detracted.
•The portfolio's fixed-income allocation strategy also was beneficial from a relative performance standpoint. Specifically, an underweight in investment-grade bonds and cash, in favor of higher-risks segments of the fixed market was advantageous. That said, a small allocation to long-term U.S. Treasurys hurt.
•In terms of security selection, picks among U.S. equities notably pressured relative performance in 2024 due to disappointing results from Fidelity® VIP Stock Selector All Cap Portfolio, the largest equity holding this period. Investment choices in the information technology sector - particularly among software & services and semiconductor companies - detracted the most.
•Conversely, stock selection in developed international markets was a plus, propelled by Fidelity® International Discovery Fund and Fidelity® Overseas Fund. Picks in continental Europe fueled the former, while investment choices in the U.K. helped the latter.
•Security selection among investment-grade bonds also added value, driven by the efforts of our active bond fund managers. In contrast, stocks picks in emerging-markets equities modestly detracted.
•As of December 31, the Portfolios were overweight U.S. stocks and about neutrally weighted in international developed- and emerging-markets equities. Investment-grade bond and cash allocations remained below the Portfolios' target weightings.
How did the Fund perform over the life of Fund?
CUMULATIVE PERFORMANCE
April 13, 2023 through December 31, 2024.
Initial investment of $10,000.
Investor Class | $10,000 | $10,480 |
Fidelity VIP FundsManager 30% Composite Index℠ | $10,000 | $10,553 |
Bloomberg U.S. Aggregate Bond Index | $10,000 | $10,202 |
| | 2023 | 2024 |
AVERAGE ANNUAL TOTAL RETURNS:| | 1 Year | Life of Fund A |
| Investor Class | 6.42% | 6.54% |
| Fidelity VIP FundsManager 30% Composite Index℠ | 6.50% | 7.02% |
| Bloomberg U.S. Aggregate Bond Index | 1.25% | 1.90% |
A From April 13, 2023
Visit institutional.fidelity.com for more recent performance information. |
The Fund's past performance is not a good predictor of the Fund's future performance. The graph and table do not reflect the deduction of taxes that a shareholder would pay on fund distributions or redemption of fund shares. |
Key Fund Statistics(as of December 31, 2024)
KEY FACTS | | |
| Fund Size | $14,740,183 | |
| Number of Holdings | 33 | |
| Total Advisory Fee | $10,778 | |
| Portfolio Turnover | 33% | |
What did the Fund invest in?
(as of December 31, 2024)
| Bond Funds | 48.7 |
| Domestic Equity Funds | 20.4 |
| Short-Term Funds | 12.9 |
| International Equity Funds | 11.8 |
| Alternative Funds | 1.3 |
| Short-Term Investments and Net Other Assets (Liabilities) | 4.9 |
ASSET ALLOCATION (% of Fund's net assets) |
|
| | Bond Funds - 48.7 |
| | Domestic Equity Funds - 20.4 |
| | Short-Term Funds - 12.9 |
| | International Equity Funds - 11.8 |
| | Alternative Funds - 1.3 |
| | Short-Term Investments and Net Other Assets (Liabilities) - 4.9 |
| |
TOP HOLDINGS(% of Fund's net assets) | | |
| Fidelity Total Bond Fund | 22.4 | |
| VIP Investment Grade Bond II Portfolio - Investor Class | 22.3 | |
| VIP Stock Selector All Cap Portfolio - Investor Class | 14.3 | |
| Fidelity Investments Money Market Government Portfolio - Institutional Class | 12.9 | |
| Fidelity Overseas Fund | 3.8 | |
| Fidelity Emerging Markets Fund | 3.3 | |
| Fidelity Inflation-Protected Bond Index Fund | 1.5 | |
| Fidelity Hedged Equity Fund | 1.3 | |
| Fidelity Stock Selector Small Cap Fund | 1.3 | |
| Fidelity International Discovery Fund | 1.1 | |
| | 84.2 | |
How has the Fund changed?
This is a summary of certain changes to the Fund since January 1, 2024. For more complete information, you may review the Fund's next prospectus, which we expect to be available by April 30, 2025 at fundresearch.fidelity.com/prospectus/sec or upon request at 1-877-208-0098 or by sending an e-mail to funddocuments@fmr.com.
The fund modified its principal investment strategies during the reporting period. | The fund modified its principal investment risks during the reporting period.
|
| Fidelity, the Fidelity Investments Logo and all other Fidelity trademarks or service marks used herein are trademarks or service marks of FMR LLC. Any third-party marks that are used herein are trademarks or service marks of their respective owners. © 2025 FMR LLC. All rights reserved. |
| | For additional information about the Fund; including its prospectus, financial information, holdings and proxy information, scan the QR code or visit fundresearch.fidelity.com/prospectus/sec 1.9914409.100 6986-TSRA-0325 |
| |
| | ANNUAL SHAREHOLDER REPORT | AS OF DECEMBER 31, 2024 | This report describes changes to the Fund that occurred during the reporting period. |
| | VIP Asset Manager Portfolio VIP Asset Manager Portfolio Investor Class true |
| | | |
This annual shareholder report contains information about VIP Asset Manager Portfolio for the period January 1, 2024 to December 31, 2024. You can find additional information about the Fund at fundresearch.fidelity.com/prospectus/sec. You can also request this information by contacting us at 1-877-208-0098 or by sending an e-mail to funddocuments@fmr.com.
What were your Fund costs for the last year?(based on hypothetical $10,000 investment)
FUND COST (PREVIOUS YEAR)
| | Costs of a $10,000 investment | Costs paid as a percentage of a $10,000 investment | |
| Investor Class | $ 62 | 0.59% | |
What affected the Fund's performance this period?
•Risk assets largely produced positive results in 2024, influenced by an expanding global economy, a slowing in the pace of inflation in certain markets, and a pivot by some central banks toward monetary easing, despite ongoing geopolitical risk.
•Within this environment, asset class positioning contributed to the fund's performance versus the Composite index, whereas security selection detracted.
•The portfolio's core equity allocation strategy contributed to relative performance, led by an overweight among U.S. stocks. Equal-weight positioning in international developed- and emerging-markets equities also added modest value. Meanwhile, small, out-of-benchmark allocations to real estate investment trusts and commodity-related securities did not have a material impact on the fund's relative result the past year.
•The portfolio's fixed-income positioning also was beneficial from a relative performance standpoint. Specifically, an underweight in investment-grade bonds and cash, in favor of higher-risk segments of the fixed income market was advantageous. That said, a small allocation to long-term U.S. Treasurys hurt.
•In terms of security selection, picks among U.S. equities notably pressured relative performance in 2024. Investment choices in the information technology sector - particularly among software & services and semiconductor companies - detracted the most.
•Stock selection among international developed-market stocks, on the other hand, aided the fund's relative return. Here, picks in Japan, Germany and the U.K., along with favorable positioning in continental European equity markets, helped the most. Conversely, investment choices and an underweight in the strong-performing Canadian stock market detracted.
•Security selection among investment-grade bonds also added value. Corporate debt issued by banks, real estate investment trusts, insurers and consumer staples companies, contributed to the portfolio's relative outcome. Elsewhere, stakes in asset-backed securities, non-government-agency mortgage-backed securities and U.S. Treasurys, helped as well.
•As of December 31, the fund was overweight U.S. stocks and about neutrally weighted in international developed- and emerging-markets equities. Investment-grade bond and cash allocations remained below the fund's target weighting.
How did the Fund perform over the past 10 years?
CUMULATIVE PERFORMANCE
December 31, 2014 through December 31, 2024.
Initial investment of $10,000.
Investor Class | $10,000 | $10,007 | $10,309 | $11,747 | $11,113 | $13,129 | $15,067 | $16,552 | $14,068 | $15,883 | $17,210 |
Fidelity Asset Manager 50% Composite Index℠ | $10,000 | $10,032 | $10,667 | $12,015 | $11,583 | $13,624 | $15,355 | $16,754 | $14,416 | $16,374 | $17,861 |
S&P 500® Index | $10,000 | $10,138 | $11,351 | $13,829 | $13,223 | $17,386 | $20,585 | $26,494 | $21,696 | $27,399 | $34,254 |
| | 2014 | 2015 | 2016 | 2017 | 2018 | 2019 | 2020 | 2021 | 2022 | 2023 | 2024 |
AVERAGE ANNUAL TOTAL RETURNS:| | 1 Year | 5 Year | 10 Year |
| Investor Class | 8.36% | 5.56% | 5.58% |
| Fidelity Asset Manager 50% Composite Index℠ | 9.08% | 5.56% | 5.97% |
| S&P 500® Index | 25.02% | 14.53% | 13.10% |
Visit institutional.fidelity.com for more recent performance information. |
The Fund's past performance is not a good predictor of the Fund's future performance. The graph and table do not reflect the deduction of taxes that a shareholder would pay on fund distributions or redemption of fund shares. |
Key Fund Statistics(as of December 31, 2024)
KEY FACTS | | |
| Fund Size | $904,415,380 | |
| Number of Holdings | 32 | |
| Total Advisory Fee | $4,688,967 | |
| Portfolio Turnover | 16% | |
What did the Fund invest in?
(as of December 31, 2024)
The information in the following tables is based on the combined Investments of the Fund and it's pro-rata share of investments in Fidelity's Central Funds, other than the Commodity Strategy and Money Market Central Funds as applicable.
| U.S. Government and U.S. Government Agency Obligations | 23.9 |
| AAA | 2.6 |
| AA | 0.2 |
| A | 2.9 |
| BBB | 5.7 |
| BB | 1.3 |
| B | 0.9 |
| CCC,CC,C | 0.2 |
| D | 0.0 |
| Not Rated | 0.7 |
| Equities | 56.9 |
| Short-Term Investments and Net Other Assets (Liabilities) | 4.7 |
QUALITY DIVERSIFICATION (% of Fund's net assets) |
| |
| | U.S. Government and U.S. Government Agency Obligations - 23.9 |
| | AAA - 2.6 |
| | AA - 0.2 |
| | A - 2.9 |
| | BBB - 5.7 |
| | BB - 1.3 |
| | B - 0.9 |
| | CCC,CC,C - 0.2 |
| | D - 0.0 |
| | Not Rated - 0.7 |
| | Equities - 56.9 |
| | Short-Term Investments and Net Other Assets (Liabilities) - 4.7 |
| |
| We have used ratings from Moody's Investors Service, Inc. Where Moody's® ratings are not available, we have used S&P® ratings. All ratings are as of the date indicated and do not reflect subsequent changes. |
MARKET SECTORS (% of Fund's net assets) | | |
| Financials | 13.7 | |
| Information Technology | 13.4 | |
| Industrials | 6.6 | |
| Consumer Discretionary | 6.1 | |
| Health Care | 5.3 | |
| Communication Services | 4.5 | |
| Consumer Staples | 2.6 | |
| Energy | 2.4 | |
| Real Estate | 2.0 | |
| Materials | 2.0 | |
| Utilities | 1.2 | |
| |
| Equities | 55.9 |
| Bonds | 39.4 |
| Short-Term Investments and Net Other Assets (Liabilities) | 4.7 |
ASSET ALLOCATION (% of Fund's net assets) |
|
| | Equities - 55.9 |
| | Bonds - 39.4 |
| | Short-Term Investments and Net Other Assets (Liabilities) - 4.7 |
| |
TOP HOLDINGS(% of Fund's net assets) | | |
| US Treasury Notes | 14.0 | |
| US Treasury Bonds | 3.9 | |
| Microsoft Corp | 2.3 | |
| Fannie Mae Mortgage pass-thru certificates | 2.2 | |
| NVIDIA Corp | 2.2 | |
| Apple Inc | 2.1 | |
| Fidelity Blue Chip Growth ETF | 2.1 | |
| Ginnie Mae II Pool | 1.7 | |
| Freddie Mac Gold Pool | 1.5 | |
| Alphabet Inc Class A | 1.5 | |
| | 33.5 | |
How has the Fund changed?
This is a summary of certain changes to the Fund since January 1, 2024. For more complete information, you may review the Fund's next prospectus, which we expect to be available by April 30, 2025 at fundresearch.fidelity.com/prospectus/sec or upon request at 1-877-208-0098 or by sending an e-mail to funddocuments@fmr.com.
The fees associated with this class changed during the reporting year. The variations in class fees are primarily the result of the following changes: The fund's transfer agent and pricing & bookkeeping fees were changed to a fixed rate effective December 1, 2023. Effective March 1, 2024, the fund's management contract was amended to incorporate administrative services previously covered under separate services agreements (transfer agent and pricing & bookkeeping). The amended contract incorporates a management fee rate that may vary by class. The Adviser or an affiliate pays certain expenses of managing and operating the fund out of each class's management fee. | The fund modified its principal investment strategies during the reporting period.
|
The fund modified its principal investment risks during the reporting period. | |
| Fidelity, the Fidelity Investments Logo and all other Fidelity trademarks or service marks used herein are trademarks or service marks of FMR LLC. Any third-party marks that are used herein are trademarks or service marks of their respective owners. © 2025 FMR LLC. All rights reserved. |
| | For additional information about the Fund; including its prospectus, financial information, holdings and proxy information, scan the QR code or visit fundresearch.fidelity.com/prospectus/sec 1.9914195.100 1457-TSRA-0325 |
| |
| | ANNUAL SHAREHOLDER REPORT | AS OF DECEMBER 31, 2024 | |
| | VIP Freedom 2035 Portfolio℠ VIP Freedom 2035 Portfolio℠ Service Class 2 true |
| | | |
This annual shareholder report contains information about VIP Freedom 2035 Portfolio℠ for the period January 1, 2024 to December 31, 2024. You can find additional information about the Fund at fundresearch.fidelity.com/prospectus/sec. You can also request this information by contacting us at 1-877-208-0098 or by sending an e-mail to funddocuments@fmr.com.
What were your Fund costs for the last year?(based on hypothetical $10,000 investment)
FUND COST (PREVIOUS YEAR)
| | Costs of a $10,000 investment | Costs paid as a percentage of a $10,000 investment | |
| Service Class 2 | $ 26 | 0.25% | |
What affected the Fund's performance this period?
•Risk assets largely produced positive results in 2024, influenced by an expanding global economy and a slowing in the pace of inflation in certain markets, as well as a pivot by some central banks toward monetary easing, despite ongoing geopolitical risk.
•Against this backdrop, active asset allocation positioning detracted from the fund's performance relative to the Composite index, whereas the performance of the underlying investment portfolios contributed.
•In terms of active asset allocation, an underweight in outperforming U.S. equities hurt the fund's relative result the past 12 months, as did an overweight in lagging long-term U.S. Treasurys and outsized exposure to non-U.S. equities. Conversely, an underweight in relatively weaker-performing investment-grade bonds added relative value for the fund.
•Looking at the performance of the underlying portfolios, investments in non-U.S. equities contributed to the fund's relative result. Investments in U.S. investment-grade bonds and U.S. equities also helped to a lesser extent. Within U.S. equities, VIP Contrafund Portfolio (+33.79%) notably outperformed its benchmark, the S&P 500® index (+25.02%). Elsewhere among non-U.S. equities, VIP Overseas Portfolio (+5%) topped the MSCI EAFE index (+4.07%) and VIP Emerging Markets Portfolio (+10.04%) outpaced the MSCI EM Index (+7.50%).
•At the other end of the performance spectrum of underlying funds, within equities, VIP Growth Portfolio (+30.39%) lagged its benchmark, the Russell 3000® Index (+32.46%), and VIP Growth & Income Portfolio (+22.21%) trailed the S&P 500® index.
How did the Fund perform over the past 10 years?
CUMULATIVE PERFORMANCE
December 31, 2014 through December 31, 2024.
Initial investment of $10,000.
Service Class 2 | $10,000 | $9,949 | $10,598 | $13,043 | $11,805 | $15,007 | $17,702 | $20,388 | $16,741 | $19,508 | $21,609 |
Fidelity VIP Freedom 2035 Composite Index℠ | $10,000 | $9,894 | $10,836 | $13,083 | $12,223 | $15,304 | $17,691 | $20,172 | $16,654 | $19,549 | $21,797 |
S&P 500® Index | $10,000 | $10,138 | $11,351 | $13,829 | $13,223 | $17,386 | $20,585 | $26,494 | $21,696 | $27,399 | $34,254 |
| | 2014 | 2015 | 2016 | 2017 | 2018 | 2019 | 2020 | 2021 | 2022 | 2023 | 2024 |
AVERAGE ANNUAL TOTAL RETURNS:| | 1 Year | 5 Year | 10 Year |
| Service Class 2 | 10.77% | 7.56% | 8.01% |
| Fidelity VIP Freedom 2035 Composite Index℠ | 11.50% | 7.33% | 8.10% |
| S&P 500® Index | 25.02% | 14.53% | 13.10% |
Visit institutional.fidelity.com for more recent performance information. |
The Fund's past performance is not a good predictor of the Fund's future performance. The graph and table do not reflect the deduction of taxes that a shareholder would pay on fund distributions or redemption of fund shares. |
Key Fund Statistics(as of December 31, 2024)
KEY FACTS | | |
| Fund Size | $372,945,696 | |
| Number of Holdings | 14 | |
| Total Advisory Fee | $0 | |
| Portfolio Turnover | 34% | |
What did the Fund invest in?
(as of December 31, 2024)
| Domestic Equity Funds | 39.1 |
| International Equity Funds | 32.7 |
| Bond Funds | 28.2 |
| Short-Term Investments and Net Other Assets (Liabilities) | 0.0 |
ASSET ALLOCATION (% of Fund's net assets) |
|
| | Domestic Equity Funds - 39.1 |
| | International Equity Funds - 32.7 |
| | Bond Funds - 28.2 |
| | Short-Term Investments and Net Other Assets (Liabilities) - 0.0 |
| |
TOP HOLDINGS(% of Fund's net assets) | | |
| VIP Overseas Portfolio - Initial Class | 21.5 | |
| VIP Investment Grade Bond II Portfolio - Initial Class | 12.2 | |
| VIP Growth Portfolio - Initial Class | 11.4 | |
| VIP Emerging Markets Portfolio - Initial Class | 11.2 | |
| Fidelity Long-Term Treasury Bond Index Fund | 7.9 | |
| VIP Growth & Income Portfolio - Initial Class | 7.7 | |
| VIP Contrafund Portfolio - Initial Class | 6.9 | |
| VIP Equity-Income Portfolio - Initial Class | 5.6 | |
| Fidelity Inflation-Protected Bond Index Fund | 4.1 | |
| VIP Value Portfolio - Initial Class | 3.9 | |
| | 92.4 | |
| Fidelity, the Fidelity Investments Logo and all other Fidelity trademarks or service marks used herein are trademarks or service marks of FMR LLC. Any third-party marks that are used herein are trademarks or service marks of their respective owners. © 2025 FMR LLC. All rights reserved. |
| | For additional information about the Fund; including its prospectus, financial information, holdings and proxy information, scan the QR code or visit fundresearch.fidelity.com/prospectus/sec 1.9914332.100 2161-TSRA-0325 |
| |
| | ANNUAL SHAREHOLDER REPORT | AS OF DECEMBER 31, 2024 | This report describes changes to the Fund that occurred during the reporting period. |
| | VIP Target Volatility Portfolio VIP Target Volatility Portfolio Service Class true |
| | | |
This annual shareholder report contains information about VIP Target Volatility Portfolio for the period January 1, 2024 to December 31, 2024. You can find additional information about the Fund at fundresearch.fidelity.com/prospectus/sec. You can also request this information by contacting us at 1-877-208-0098 or by sending an e-mail to funddocuments@fmr.com.
What were your Fund costs for the last year?(based on hypothetical $10,000 investment)
FUND COST (PREVIOUS YEAR)
| | Costs of a $10,000 investment | Costs paid as a percentage of a $10,000 investment | |
| Service Class | $ 18 | 0.18% | |
What affected the Fund's performance this period?
•Risk assets largely produced positive results in 2024, influenced by an expanding global economy, a slowing in the pace of inflation in certain markets, and a pivot by some central banks toward monetary easing, despite ongoing geopolitical risk.
•Asset class positioning, which is primarily driven by volatility management, contributed to the fund's performance versus the Composite benchmark, whereas security selection detracted.
•The portfolio's core equity allocation strategy pressured the fund's relative return. Specifically, a favorable overweight in U.S. stocks added value but outsized exposure to international developed- and emerging markets equities notably detracted as returns in the latter two asset classes substantially lagged their U.S. counterparts in 2024.
•The fund's fixed-income positioning was quite beneficial from a relative performance standpoint, especially a sizable underweight in investment-grade bonds. In contrast, adjustments made to the fund's cash position during the year slightly hurt.
•In terms of security selection, picks among U.S. equities weighed on relative performance due to disappointing results from Fidelity® VIP Stock Selector All Cap Portfolio, the largest holding this period. Investment choices in the information technology sector - particularly among software & services and semiconductor companies - detracted the most. Conversely, a stake in Fidelity® Contrafund, which handily outperformed the broader fund's equity benchmark, was a plus.
•Stock picks in international developed-markets modestly boosted the fund's relative outcome, led by positions in Fidelity® Enhanced International Equity Fund and Fidelity® Overseas Fund. On the other hand, investment choices among emerging-markets equities slightly detracted.
•Turning to fixed-income, an investment in Fidelity® Total Bond Fund outperformed and contributed from a security selection standpoint.
•As of December 31, the fund maintained outsized exposure to U.S. stocks, as well as international developed- and emerging-markets equities. We increased the portfolio's U.S. overweight this period. Investment-grade bond and cash allocations remained well below the fund's target weightings.
How did the Fund perform over the past 10 years?
CUMULATIVE PERFORMANCE
December 31, 2014 through December 31, 2024.
Initial investment of $10,000.
Service Class | $10,000 | $9,878 | $10,401 | $12,106 | $11,402 | $13,547 | $14,784 | $16,581 | $14,006 | $15,987 | $17,576 |
Fidelity VIP Target Volatility Portfolio Composite Index℠ | $10,000 | $10,051 | $10,711 | $12,252 | $11,714 | $14,057 | $15,964 | $17,855 | $15,128 | $17,431 | $19,242 |
S&P 500® Index | $10,000 | $10,138 | $11,351 | $13,829 | $13,223 | $17,386 | $20,585 | $26,494 | $21,696 | $27,399 | $34,254 |
| | 2014 | 2015 | 2016 | 2017 | 2018 | 2019 | 2020 | 2021 | 2022 | 2023 | 2024 |
AVERAGE ANNUAL TOTAL RETURNS:| | 1 Year | 5 Year | 10 Year |
| Service Class | 9.94% | 5.35% | 5.80% |
| Fidelity VIP Target Volatility Portfolio Composite Index℠ | 10.39% | 6.48% | 6.76% |
| S&P 500® Index | 25.02% | 14.53% | 13.10% |
Visit institutional.fidelity.com for more recent performance information. |
The Fund's past performance is not a good predictor of the Fund's future performance. The graph and table do not reflect the deduction of taxes that a shareholder would pay on fund distributions or redemption of fund shares. |
Key Fund Statistics(as of December 31, 2024)
KEY FACTS | | |
| Fund Size | $175,503,555 | |
| Number of Holdings | 25 | |
| Total Advisory Fee | $283,336 | |
| Portfolio Turnover | 56% | |
What did the Fund invest in?
(as of December 31, 2024)
| Domestic Equity Funds | 45.1 |
| International Equity Funds | 32.6 |
| Bond Funds | 20.0 |
| Alternative Funds | 2.0 |
| Short-Term Funds | 0.0 |
| Short-Term Investments and Net Other Assets (Liabilities) | 0.3 |
ASSET ALLOCATION (% of Fund's net assets) |
|
| | Domestic Equity Funds - 45.1 |
| | International Equity Funds - 32.6 |
| | Bond Funds - 20.0 |
| | Alternative Funds - 2.0 |
| | Short-Term Funds - 0.0 |
| | Short-Term Investments and Net Other Assets (Liabilities) - 0.3 |
| |
TOP HOLDINGS(% of Fund's net assets) | | |
| VIP Stock Selector All Cap Portfolio - Investor Class | 30.6 | |
| Fidelity Total Bond Fund | 19.2 | |
| Fidelity Enhanced International ETF | 10.9 | |
| Fidelity Enhanced Large Cap Core ETF | 9.8 | |
| Fidelity Emerging Markets Fund | 8.3 | |
| Fidelity Overseas Fund | 6.6 | |
| Fidelity International Value Fund | 3.2 | |
| Fidelity Contrafund | 2.9 | |
| Fidelity Hedged Equity Fund | 2.0 | |
| iShares Core MSCI Emerging Markets ETF | 1.7 | |
| | 95.2 | |
How has the Fund changed?
This is a summary of certain changes to the Fund since January 1, 2024. For more complete information, you may review the Fund's next prospectus, which we expect to be available by March 1, 2025 at fundresearch.fidelity.com/prospectus/sec or upon request at 1-877-208-0098 or by sending an e-mail to funddocuments@fmr.com.
The fees associated with this class changed during the reporting year. The variations in class fees are primarily the result of the following changes: | |
| Fidelity, the Fidelity Investments Logo and all other Fidelity trademarks or service marks used herein are trademarks or service marks of FMR LLC. Any third-party marks that are used herein are trademarks or service marks of their respective owners. © 2025 FMR LLC. All rights reserved. |
| | For additional information about the Fund; including its prospectus, financial information, holdings and proxy information, scan the QR code or visit fundresearch.fidelity.com/prospectus/sec 1.9914352.100 2520-TSRA-0325 |
| |
| | ANNUAL SHAREHOLDER REPORT | AS OF DECEMBER 31, 2024 | This report describes changes to the Fund that occurred during the reporting period. |
| | VIP FundsManager® 70% Portfolio VIP FundsManager® 70% Portfolio Service Class true |
| | | |
This annual shareholder report contains information about VIP FundsManager® 70% Portfolio for the period January 1, 2024 to December 31, 2024. You can find additional information about the Fund at fundresearch.fidelity.com/prospectus/sec. You can also request this information by contacting us at 1-877-208-0098 or by sending an e-mail to funddocuments@fmr.com.
What were your Fund costs for the last year?(based on hypothetical $10,000 investment)
FUND COST (PREVIOUS YEAR)
| | Costs of a $10,000 investment | Costs paid as a percentage of a $10,000 investment | |
| Service Class | $ 11 | 0.10% | |
What affected the Fund's performance this period?
•Risk assets largely produced positive results in 2024, influenced by an expanding global economy, a slowing in the pace of inflation in certain markets, and a pivot by some central banks toward monetary easing, despite ongoing geopolitical risk.
•Within this environment, asset class positioning contributed to the Portfolios' performance versus the Composite indexes, whereas security selection detracted.
•The Portfolios' core equity allocation strategy contributed to relative performance, led by an overweight among U.S. stocks. Equal-weight positioning in international developed- and emerging-markets equities added modest value. Meanwhile, small, out-of-benchmark allocations to real estate investment trusts and commodity-related securities slightly detracted.
•The portfolio's fixed-income allocation strategy also was beneficial from a relative performance standpoint. Specifically, an underweight in investment-grade bonds and cash, in favor of higher-risks segments of the fixed market was advantageous. That said, a small allocation to long-term U.S. Treasurys hurt.
•In terms of security selection, picks among U.S. equities notably pressured relative performance in 2024 due to disappointing results from Fidelity® VIP Stock Selector All Cap Portfolio, the largest equity holding this period. Investment choices in the information technology sector - particularly among software & services and semiconductor companies - detracted the most.
•Conversely, stock selection in developed international markets was a plus, propelled by Fidelity® International Discovery Fund and Fidelity® Overseas Fund. Picks in continental Europe fueled the former, while investment choices in the U.K. helped the latter.
•Security selection among investment-grade bonds also added value, driven by the efforts of our active bond fund managers. In contrast, stocks picks in emerging-markets equities modestly detracted.
•As of December 31, the Portfolios were overweight U.S. stocks and about neutrally weighted in international developed- and emerging-markets equities. Investment-grade bond and cash allocations remained below the Portfolios' target weightings.
How did the Fund perform over the past 10 years?
CUMULATIVE PERFORMANCE
December 31, 2014 through December 31, 2024.
Initial investment of $10,000.
Service Class | $10,000 | $10,041 | $10,547 | $12,563 | $11,621 | $14,253 | $16,547 | $18,963 | $15,996 | $18,509 | $20,521 |
Fidelity VIP FundsManager 70% Composite Index℠ | $10,000 | $10,044 | $10,767 | $12,524 | $11,872 | $14,481 | $16,568 | $18,918 | $15,923 | $18,611 | $20,831 |
S&P 500® Index | $10,000 | $10,138 | $11,351 | $13,829 | $13,223 | $17,386 | $20,585 | $26,494 | $21,696 | $27,399 | $34,254 |
| | 2014 | 2015 | 2016 | 2017 | 2018 | 2019 | 2020 | 2021 | 2022 | 2023 | 2024 |
AVERAGE ANNUAL TOTAL RETURNS:| | 1 Year | 5 Year | 10 Year |
| Service Class | 10.87% | 7.56% | 7.45% |
| Fidelity VIP FundsManager 70% Composite Index℠ | 11.93% | 7.54% | 7.61% |
| S&P 500® Index | 25.02% | 14.53% | 13.10% |
Visit institutional.fidelity.com for more recent performance information. |
The Fund's past performance is not a good predictor of the Fund's future performance. The graph and table do not reflect the deduction of taxes that a shareholder would pay on fund distributions or redemption of fund shares. |
Key Fund Statistics(as of December 31, 2024)
KEY FACTS | | |
| Fund Size | $2,289,288,181 | |
| Number of Holdings | 39 | |
| Total Advisory Fee | $2,203,855 | |
| Portfolio Turnover | 29% | |
What did the Fund invest in?
(as of December 31, 2024)
| Domestic Equity Funds | 44.2 |
| International Equity Funds | 27.8 |
| Bond Funds | 23.7 |
| Alternative Funds | 1.3 |
| Short-Term Investments and Net Other Assets (Liabilities) | 3.0 |
ASSET ALLOCATION (% of Fund's net assets) |
|
| | Domestic Equity Funds - 44.2 |
| | International Equity Funds - 27.8 |
| | Bond Funds - 23.7 |
| | Alternative Funds - 1.3 |
| | Short-Term Investments and Net Other Assets (Liabilities) - 3.0 |
| |
TOP HOLDINGS(% of Fund's net assets) | | |
| VIP Stock Selector All Cap Portfolio - Investor Class | 35.2 | |
| Fidelity Total Bond Fund | 9.9 | |
| VIP Investment Grade Bond II Portfolio - Investor Class | 9.9 | |
| Fidelity Overseas Fund | 8.5 | |
| Fidelity Emerging Markets Fund | 7.6 | |
| Fidelity Enhanced International ETF | 2.1 | |
| Fidelity International Discovery Fund | 2.1 | |
| Fidelity Stock Selector Small Cap Fund | 1.9 | |
| Fidelity International Capital Appreciation Fund | 1.7 | |
| VIP Value Strategies Portfolio - Investor Class | 1.7 | |
| | 80.6 | |
How has the Fund changed?
This is a summary of certain changes to the Fund since January 1, 2024. For more complete information, you may review the Fund's next prospectus, which we expect to be available by April 30, 2025 at fundresearch.fidelity.com/prospectus/sec or upon request at 1-877-208-0098 or by sending an e-mail to funddocuments@fmr.com.
The fund modified its principal investment strategies during the reporting period. | The fund modified its principal investment risks during the reporting period.
|
| Fidelity, the Fidelity Investments Logo and all other Fidelity trademarks or service marks used herein are trademarks or service marks of FMR LLC. Any third-party marks that are used herein are trademarks or service marks of their respective owners. © 2025 FMR LLC. All rights reserved. |
| | For additional information about the Fund; including its prospectus, financial information, holdings and proxy information, scan the QR code or visit fundresearch.fidelity.com/prospectus/sec 1.9914310.100 1591-TSRA-0325 |
| |
| | ANNUAL SHAREHOLDER REPORT | AS OF DECEMBER 31, 2024 | This report describes changes to the Fund that occurred during the reporting period. |
| | VIP Freedom 2055 Portfolio℠ VIP Freedom 2055 Portfolio℠ Initial Class true |
| | | |
This annual shareholder report contains information about VIP Freedom 2055 Portfolio℠ for the period January 1, 2024 to December 31, 2024. You can find additional information about the Fund at fundresearch.fidelity.com/prospectus/sec. You can also request this information by contacting us at 1-877-208-0098 or by sending an e-mail to funddocuments@fmr.com.
What were your Fund costs for the last year?(based on hypothetical $10,000 investment)
FUND COST (PREVIOUS YEAR)
| | Costs of a $10,000 investment | Costs paid as a percentage of a $10,000 investment | |
| Initial Class | $ 1 | 0.01% | |
What affected the Fund's performance this period?
•Risk assets largely produced positive results in 2024, influenced by an expanding global economy and a slowing in the pace of inflation in certain markets, as well as a pivot by some central banks toward monetary easing, despite ongoing geopolitical risk.
•Against this backdrop, active asset allocation positioning detracted from the fund's performance relative to the Composite index, whereas the performance of the underlying investment portfolios contributed.
•In terms of active asset allocation, an underweight in outperforming U.S. equities hurt the fund's relative result the past 12 months, as did an overweight in lagging long-term U.S. Treasurys and outsized exposure to non-U.S. equities. Conversely, an underweight in relatively weaker-performing investment-grade bonds added relative value for the fund.
•Looking at the performance of the underlying portfolios, investments in non-U.S. equities contributed to the fund's relative result. Investments in U.S. investment-grade bonds and U.S. equities also helped to a lesser extent. Within U.S. equities, VIP Contrafund Portfolio (+33.79%) notably outperformed its benchmark, the S&P 500® index (+25.02%). Elsewhere among non-U.S. equities, VIP Overseas Portfolio (+5%) topped the MSCI EAFE index (+4.07%) and VIP Emerging Markets Portfolio (+10.04%) outpaced the MSCI EM Index (+7.50%).
•At the other end of the performance spectrum of underlying funds, within equities, VIP Growth Portfolio (+30.39%) lagged its benchmark, the Russell 3000® Index (+32.46%), and VIP Growth & Income Portfolio (+22.21%) trailed the S&P 500® index.
How did the Fund perform over the life of Fund?
CUMULATIVE PERFORMANCE
April 11, 2019 through December 31, 2024.
Initial investment of $10,000.
Initial Class | $10,000 | $11,185 | $13,342 | $15,715 | $12,846 | $15,348 |
Fidelity VIP Freedom 2055 Composite Index℠ | $10,000 | $11,078 | $12,911 | $15,000 | $12,279 | $14,749 |
S&P 500® Index | $10,000 | $11,346 | $13,433 | $17,289 | $14,158 | $17,880 |
| | 2019 | 2020 | 2021 | 2022 | 2023 | 2024 |
AVERAGE ANNUAL TOTAL RETURNS:| | 1 Year | 5 Year | Life of Fund A |
| Initial Class | 13.80% | 9.32% | 10.22% |
| Fidelity VIP Freedom 2055 Composite Index℠ | 14.43% | 8.78% | 9.57% |
| S&P 500® Index | 25.02% | 14.53% | 15.07% |
A From April 11, 2019
Visit institutional.fidelity.com for more recent performance information. |
The Fund's past performance is not a good predictor of the Fund's future performance. The graph and table do not reflect the deduction of taxes that a shareholder would pay on fund distributions or redemption of fund shares. |
Key Fund Statistics(as of December 31, 2024)
KEY FACTS | | |
| Fund Size | $21,543,729 | |
| Number of Holdings | 11 | |
| Total Advisory Fee | $0 | |
| Portfolio Turnover | 43% | |
What did the Fund invest in?
(as of December 31, 2024)
| Domestic Equity Funds | 51.5 |
| International Equity Funds | 40.9 |
| Bond Funds | 7.6 |
| Short-Term Investments and Net Other Assets (Liabilities) | 0.0 |
ASSET ALLOCATION (% of Fund's net assets) |
|
| | Domestic Equity Funds - 51.5 |
| | International Equity Funds - 40.9 |
| | Bond Funds - 7.6 |
| | Short-Term Investments and Net Other Assets (Liabilities) - 0.0 |
| |
TOP HOLDINGS(% of Fund's net assets) | | |
| VIP Overseas Portfolio - Initial Class | 27.8 | |
| VIP Growth Portfolio - Initial Class | 15.0 | |
| VIP Emerging Markets Portfolio - Initial Class | 13.1 | |
| VIP Growth & Income Portfolio - Initial Class | 10.1 | |
| VIP Contrafund Portfolio - Initial Class | 9.0 | |
| VIP Equity-Income Portfolio - Initial Class | 7.4 | |
| Fidelity Long-Term Treasury Bond Index Fund | 6.6 | |
| VIP Value Portfolio - Initial Class | 5.1 | |
| VIP Value Strategies Portfolio - Initial Class | 2.6 | |
| VIP Mid Cap Portfolio - Initial Class | 2.3 | |
| | 99.0 | |
How has the Fund changed?
This is a summary of certain changes to the Fund since January 1, 2024. For more complete information, you may review the Fund's next prospectus, which we expect to be available by April 30, 2025 at fundresearch.fidelity.com/prospectus/sec or upon request at 1-877-208-0098 or by sending an e-mail to funddocuments@fmr.com.
The fund added a contractual proxy and shareholder meeting expense cap during the reporting period. | |
| Fidelity, the Fidelity Investments Logo and all other Fidelity trademarks or service marks used herein are trademarks or service marks of FMR LLC. Any third-party marks that are used herein are trademarks or service marks of their respective owners. © 2025 FMR LLC. All rights reserved. |
| | For additional information about the Fund; including its prospectus, financial information, holdings and proxy information, scan the QR code or visit fundresearch.fidelity.com/prospectus/sec 1.9914384.100 3360-TSRA-0325 |
| |
| | ANNUAL SHAREHOLDER REPORT | AS OF DECEMBER 31, 2024 | This report describes changes to the Fund that occurred during the reporting period. |
| | VIP Freedom 2060 Portfolio℠ VIP Freedom 2060 Portfolio℠ Service Class true |
| | | |
This annual shareholder report contains information about VIP Freedom 2060 Portfolio℠ for the period January 1, 2024 to December 31, 2024. You can find additional information about the Fund at fundresearch.fidelity.com/prospectus/sec. You can also request this information by contacting us at 1-877-208-0098 or by sending an e-mail to funddocuments@fmr.com.
What were your Fund costs for the last year?(based on hypothetical $10,000 investment)
FUND COST (PREVIOUS YEAR)
| | Costs of a $10,000 investment | Costs paid as a percentage of a $10,000 investment | |
| Service Class | $ 11 | 0.10% | |
What affected the Fund's performance this period?
•Risk assets largely produced positive results in 2024, influenced by an expanding global economy and a slowing in the pace of inflation in certain markets, as well as a pivot by some central banks toward monetary easing, despite ongoing geopolitical risk.
•Against this backdrop, active asset allocation positioning detracted from the fund's performance relative to the Composite index, whereas the performance of the underlying investment portfolios contributed.
•In terms of active asset allocation, an underweight in outperforming U.S. equities hurt the fund's relative result the past 12 months, as did an overweight in lagging long-term U.S. Treasurys and outsized exposure to non-U.S. equities. Conversely, an underweight in relatively weaker-performing investment-grade bonds added relative value for the fund.
•Looking at the performance of the underlying portfolios, investments in non-U.S. equities contributed to the fund's relative result. Investments in U.S. investment-grade bonds and U.S. equities also helped to a lesser extent. Within U.S. equities, VIP Contrafund Portfolio (+33.79%) notably outperformed its benchmark, the S&P 500® index (+25.02%). Elsewhere among non-U.S. equities, VIP Overseas Portfolio (+5%) topped the MSCI EAFE index (+4.07%) and VIP Emerging Markets Portfolio (+10.04%) outpaced the MSCI EM Index (+7.50%).
•At the other end of the performance spectrum of underlying funds, within equities, VIP Growth Portfolio (+30.39%) lagged its benchmark, the Russell 3000® Index (+32.46%), and VIP Growth & Income Portfolio (+22.21%) trailed the S&P 500® index.
How did the Fund perform over the life of Fund?
CUMULATIVE PERFORMANCE
April 11, 2019 through December 31, 2024.
Initial investment of $10,000.
Service Class | $10,000 | $11,180 | $13,329 | $15,677 | $12,813 | $15,287 |
Fidelity VIP Freedom 2060 Composite Index℠ | $10,000 | $11,078 | $12,911 | $15,000 | $12,279 | $14,749 |
S&P 500® Index | $10,000 | $11,346 | $13,433 | $17,289 | $14,158 | $17,880 |
| | 2019 | 2020 | 2021 | 2022 | 2023 | 2024 |
AVERAGE ANNUAL TOTAL RETURNS:| | 1 Year | 5 Year | Life of Fund A |
| Service Class | 13.72% | 9.23% | 10.13% |
| Fidelity VIP Freedom 2060 Composite Index℠ | 14.43% | 8.78% | 9.57% |
| S&P 500® Index | 25.02% | 14.53% | 15.07% |
A From April 11, 2019
Visit institutional.fidelity.com for more recent performance information. |
The Fund's past performance is not a good predictor of the Fund's future performance. The graph and table do not reflect the deduction of taxes that a shareholder would pay on fund distributions or redemption of fund shares. |
Key Fund Statistics(as of December 31, 2024)
KEY FACTS | | |
| Fund Size | $26,164,071 | |
| Number of Holdings | 11 | |
| Total Advisory Fee | $0 | |
| Portfolio Turnover | 54% | |
What did the Fund invest in?
(as of December 31, 2024)
| Domestic Equity Funds | 51.5 |
| International Equity Funds | 40.9 |
| Bond Funds | 7.6 |
| Short-Term Investments and Net Other Assets (Liabilities) | 0.0 |
ASSET ALLOCATION (% of Fund's net assets) |
|
| | Domestic Equity Funds - 51.5 |
| | International Equity Funds - 40.9 |
| | Bond Funds - 7.6 |
| | Short-Term Investments and Net Other Assets (Liabilities) - 0.0 |
| |
TOP HOLDINGS(% of Fund's net assets) | | |
| VIP Overseas Portfolio - Initial Class | 27.8 | |
| VIP Growth Portfolio - Initial Class | 15.0 | |
| VIP Emerging Markets Portfolio - Initial Class | 13.1 | |
| VIP Growth & Income Portfolio - Initial Class | 10.1 | |
| VIP Contrafund Portfolio - Initial Class | 9.0 | |
| VIP Equity-Income Portfolio - Initial Class | 7.4 | |
| Fidelity Long-Term Treasury Bond Index Fund | 6.6 | |
| VIP Value Portfolio - Initial Class | 5.1 | |
| VIP Value Strategies Portfolio - Initial Class | 2.6 | |
| VIP Mid Cap Portfolio - Initial Class | 2.3 | |
| | 99.0 | |
How has the Fund changed?
This is a summary of certain changes to the Fund since January 1, 2024. For more complete information, you may review the Fund's next prospectus, which we expect to be available by April 30, 2025 at fundresearch.fidelity.com/prospectus/sec or upon request at 1-877-208-0098 or by sending an e-mail to funddocuments@fmr.com.
The fund added a contractual proxy and shareholder meeting expense cap during the reporting period. | |
| Fidelity, the Fidelity Investments Logo and all other Fidelity trademarks or service marks used herein are trademarks or service marks of FMR LLC. Any third-party marks that are used herein are trademarks or service marks of their respective owners. © 2025 FMR LLC. All rights reserved. |
| | For additional information about the Fund; including its prospectus, financial information, holdings and proxy information, scan the QR code or visit fundresearch.fidelity.com/prospectus/sec 1.9914388.100 3365-TSRA-0325 |
| |
| | ANNUAL SHAREHOLDER REPORT | AS OF DECEMBER 31, 2024 | |
| | VIP Bond Index Portfolio VIP Bond Index Portfolio Initial Class true |
| | | |
This annual shareholder report contains information about VIP Bond Index Portfolio for the period January 1, 2024 to December 31, 2024. You can find additional information about the Fund at fundresearch.fidelity.com/prospectus/sec. You can also request this information by contacting us at 1-877-208-0098 or by sending an e-mail to funddocuments@fmr.com.
What were your Fund costs for the last year?(based on hypothetical $10,000 investment)
FUND COST (PREVIOUS YEAR)
| | Costs of a $10,000 investment | Costs paid as a percentage of a $10,000 investment | |
| Initial Class | $ 14 | 0.14% | |
What affected the Fund's performance this period?
•U.S. taxable investment-grade bonds posted a modest advance in 2024, rallying during the summer months, as the bond market reflected anticipated interest-rate reductions by the U.S. Federal Reserve, but falling back in the fourth quarter when the Fed tempered rate-cut expectations for 2025.
•We construct the portfolio using optimization. This approach minimizes the differences between risk exposures of the fund relative to the index. We attempt to hold all positions held by the index in the same relative proportions.
•Exposures include duration, key rate durations, credit quality, sector and issuer allocation, and other factors.
How did the Fund perform over the life of Fund?
CUMULATIVE PERFORMANCE
April 19, 2018 through December 31, 2024.
Initial investment of $10,000.
Initial Class | $10,000 | $10,190 | $11,044 | $11,876 | $11,644 | $10,108 | $10,662 |
Bloomberg U.S. Aggregate Bond Index | $10,000 | $10,216 | $11,106 | $11,940 | $11,756 | $10,226 | $10,792 |
| | 2018 | 2019 | 2020 | 2021 | 2022 | 2023 | 2024 |
AVERAGE ANNUAL TOTAL RETURNS:| | 1 Year | 5 Year | Life of Fund A |
| Initial Class | 1.21% | -0.46% | 1.14% |
| Bloomberg U.S. Aggregate Bond Index | 1.25% | -0.33% | 1.33% |
A From April 19, 2018
Visit institutional.fidelity.com for more recent performance information. |
The Fund's past performance is not a good predictor of the Fund's future performance. The graph and table do not reflect the deduction of taxes that a shareholder would pay on fund distributions or redemption of fund shares. |
Key Fund Statistics(as of December 31, 2024)
KEY FACTS | | |
| Fund Size | $969,508,026 | |
| Number of Holdings | 3,106 | |
| Total Advisory Fee | $784,003 | |
| Portfolio Turnover | 62% | |
What did the Fund invest in?
(as of December 31, 2024)
| U.S. Government and U.S. Government Agency Obligations | 70.2 |
| AAA | 2.5 |
| AA | 2.1 |
| A | 13.2 |
| BBB | 11.9 |
| BB | 0.3 |
| Not Rated | 0.6 |
QUALITY DIVERSIFICATION (% of Fund's net assets) |
| |
| | U.S. Government and U.S. Government Agency Obligations - 70.2 |
| | AAA - 2.5 |
| | AA - 2.1 |
| | A - 13.2 |
| | BBB - 11.9 |
| | BB - 0.3 |
| | Not Rated - 0.6 |
| Short-Term Investments and Net Other Assets (Liabilities) - (0.8)% |
| |
| We have used ratings from Moody's Investors Service, Inc. Where Moody's® ratings are not available, we have used S&P® ratings. All ratings are as of the date indicated and do not reflect subsequent changes. |
| U.S. Treasury Obligations | 44.9 |
| Corporate Bonds | 27.1 |
| U.S. Government Agency - Mortgage Securities | 24.9 |
| Foreign Government and Government Agency Obligations | 1.5 |
| CMOs and Other Mortgage Related Securities | 1.2 |
| U.S. Government Agency Obligations | 0.4 |
| Municipal Securities | 0.4 |
| Asset-Backed Securities | 0.3 |
| Other Investments | 0.1 |
ASSET ALLOCATION (% of Fund's net assets) |
|
| | U.S. Treasury Obligations - 44.9 |
| | Corporate Bonds - 27.1 |
| | U.S. Government Agency - Mortgage Securities - 24.9 |
| | Foreign Government and Government Agency Obligations - 1.5 |
| | CMOs and Other Mortgage Related Securities - 1.2 |
| | U.S. Government Agency Obligations - 0.4 |
| | Municipal Securities - 0.4 |
| | Asset-Backed Securities - 0.3 |
| | Other Investments - 0.1 |
| Short-Term Investments and Net Other Assets (Liabilities) - (0.8)% |
| |
| United States | 93.2 |
| United Kingdom | 1.3 |
| Canada | 1.0 |
| Japan | 0.8 |
| Multi-national | 0.8 |
| Mexico | 0.5 |
| Germany | 0.3 |
| Spain | 0.2 |
| Australia | 0.2 |
| Others | 1.7 |
GEOGRAPHIC DIVERSIFICATION (% of Fund's net assets) |
|
| | United States - 93.2 |
| | United Kingdom - 1.3 |
| | Canada - 1.0 |
| | Japan - 0.8 |
| | Multi-national - 0.8 |
| | Mexico - 0.5 |
| | Germany - 0.3 |
| | Spain - 0.2 |
| | Australia - 0.2 |
| | Others - 1.7 |
| |
TOP HOLDINGS(% of Fund's net assets) | | |
| US Treasury Notes | 35.6 | |
| Fannie Mae Mortgage pass-thru certificates | 10.3 | |
| US Treasury Bonds | 9.3 | |
| Freddie Mac Gold Pool | 7.6 | |
| Ginnie Mae II Pool | 4.8 | |
| Uniform Mortgage Backed Securities | 1.2 | |
| Ginnie Mae I Pool | 0.9 | |
| Bank of America Corp | 0.7 | |
| JPMorgan Chase & Co | 0.7 | |
| Freddie Mac Multifamily Structured pass-thru certificates | 0.7 | |
| | 71.8 | |
| Fidelity, the Fidelity Investments Logo and all other Fidelity trademarks or service marks used herein are trademarks or service marks of FMR LLC. Any third-party marks that are used herein are trademarks or service marks of their respective owners. © 2025 FMR LLC. All rights reserved. |
| | For additional information about the Fund; including its prospectus, financial information, holdings and proxy information, scan the QR code or visit fundresearch.fidelity.com/prospectus/sec 1.9914381.100 3078-TSRA-0325 |
| |
| | ANNUAL SHAREHOLDER REPORT | AS OF DECEMBER 31, 2024 | |
| | VIP Investor Freedom 2030 Portfolio℠ VIP Investor Freedom 2030 Portfolio℠ true |
| | | |
This annual shareholder report contains information about VIP Investor Freedom 2030 Portfolio℠ for the period January 1, 2024 to December 31, 2024. You can find additional information about the Fund at fundresearch.fidelity.com/prospectus/sec. You can also request this information by contacting us at 1-877-208-0098 or by sending an e-mail to funddocuments@fmr.com.
What were your Fund costs for the last year?(based on hypothetical $10,000 investment)
FUND COST (PREVIOUS YEAR)
| | Costs of a $10,000 investment | Costs paid as a percentage of a $10,000 investment | |
| VIP Investor Freedom 2030 Portfolio℠ | $ 0 A | 0.00%B | |
A Amount represents less than $.50
B Amount represents less than 0.005%
What affected the Fund's performance this period?
•Risk assets largely produced positive results in 2024, influenced by an expanding global economy and a slowing in the pace of inflation in certain markets, as well as a pivot by some central banks toward monetary easing, despite ongoing geopolitical risk.
•Against this backdrop, active asset allocation positioning detracted from the fund's performance relative to the Composite index, whereas the performance of the underlying investment portfolios contributed.
•In terms of active asset allocation, an underweight in outperforming U.S. equities hurt the fund's relative result the past 12 months, as did an overweight in lagging long-term U.S. Treasurys and outsized exposure to non-U.S. equities. Conversely, underweighting relatively weaker-performing investment-grade bonds added relative value for the fund.
•Looking at the performance of the underlying portfolios, investments in non-U.S. equities contributed to the fund's relative result. Investments in U.S. investment-grade bonds and U.S. equities also helped to a lesser extent. Within U.S. equities, VIP Contrafund Portfolio (+33.70%) notably outperformed its benchmark, the S&P 500® index (+25.02%). Elsewhere in non-U.S. equities, VIP Overseas Portfolio (+4.97%) topped the MSCI EAFE index (+4.07%) and VIP Emerging Markets Portfolio (+9.90%) outpaced the MSCI EM Index (+7.50%).
•At the other end of the performance spectrum of underlying funds, in terms of equities, VIP Growth Portfolio (+30.30%) lagged its benchmark, the Russell 3000® Index (+32.46%), and VIP Growth & Income Portfolio (+22.18%) trailed the S&P 500® index.
How did the Fund perform over the past 10 years?
CUMULATIVE PERFORMANCE
December 31, 2014 through December 31, 2024.
Initial investment of $10,000.
VIP Investor Freedom 2030 Portfolio℠ | $10,000 | $9,968 | $10,616 | $12,838 | $11,827 | $14,715 | $17,190 | $19,296 | $16,034 | $18,380 | $20,108 |
Fidelity VIP Freedom 2030 Composite Index℠ | $10,000 | $9,914 | $10,780 | $12,767 | $12,083 | $14,793 | $16,919 | $18,813 | $15,710 | $18,104 | $19,897 |
S&P 500® Index | $10,000 | $10,138 | $11,351 | $13,829 | $13,223 | $17,386 | $20,585 | $26,494 | $21,696 | $27,399 | $34,254 |
| | 2014 | 2015 | 2016 | 2017 | 2018 | 2019 | 2020 | 2021 | 2022 | 2023 | 2024 |
AVERAGE ANNUAL TOTAL RETURNS:| | 1 Year | 5 Year | 10 Year |
| VIP Investor Freedom 2030 Portfolio℠ | 9.40% | 6.44% | 7.23% |
| Fidelity VIP Freedom 2030 Composite Index℠ | 9.90% | 6.11% | 7.12% |
| S&P 500® Index | 25.02% | 14.53% | 13.10% |
Visit institutional.fidelity.com for more recent performance information. |
The Fund's past performance is not a good predictor of the Fund's future performance. The graph and table do not reflect the deduction of taxes that a shareholder would pay on fund distributions or redemption of fund shares. |
Key Fund Statistics(as of December 31, 2024)
KEY FACTS | | |
| Fund Size | $357,585,814 | |
| Number of Holdings | 14 | |
| Total Advisory Fee | $0 | |
| Portfolio Turnover | 29% | |
What did the Fund invest in?
(as of December 31, 2024)
| Bond Funds | 37.9 |
| Domestic Equity Funds | 33.3 |
| International Equity Funds | 28.8 |
| Short-Term Investments and Net Other Assets (Liabilities) | 0.0 |
ASSET ALLOCATION (% of Fund's net assets) |
|
| | Bond Funds - 37.9 |
| | Domestic Equity Funds - 33.3 |
| | International Equity Funds - 28.8 |
| | Short-Term Investments and Net Other Assets (Liabilities) - 0.0 |
| |
TOP HOLDINGS(% of Fund's net assets) | | |
| VIP Overseas Portfolio - Investor Class | 18.7 | |
| VIP Investment Grade Bond II Portfolio - Investor Class | 17.5 | |
| VIP Emerging Markets Portfolio - Investor Class | 10.1 | |
| VIP Growth Portfolio - Investor Class | 9.7 | |
| Fidelity Inflation-Protected Bond Index Fund | 8.4 | |
| Fidelity Long-Term Treasury Bond Index Fund | 7.4 | |
| VIP Growth & Income Portfolio - Investor Class | 6.5 | |
| VIP Contrafund Portfolio - Investor Class | 5.8 | |
| VIP Equity Income Portfolio - Investor Class | 4.8 | |
| Fidelity International Bond Index Fund | 3.4 | |
| | 92.3 | |
| Fidelity, the Fidelity Investments Logo and all other Fidelity trademarks or service marks used herein are trademarks or service marks of FMR LLC. Any third-party marks that are used herein are trademarks or service marks of their respective owners. © 2025 FMR LLC. All rights reserved. |
| | For additional information about the Fund; including its prospectus, financial information, holdings and proxy information, scan the QR code or visit fundresearch.fidelity.com/prospectus/sec 1.9914297.100 1501-TSRA-0325 |
| |
| | ANNUAL SHAREHOLDER REPORT | AS OF DECEMBER 31, 2024 | |
| | VIP Freedom 2025 Portfolio℠ VIP Freedom 2025 Portfolio℠ Initial Class true |
| | | |
This annual shareholder report contains information about VIP Freedom 2025 Portfolio℠ for the period January 1, 2024 to December 31, 2024. You can find additional information about the Fund at fundresearch.fidelity.com/prospectus/sec. You can also request this information by contacting us at 1-877-208-0098 or by sending an e-mail to funddocuments@fmr.com.
What were your Fund costs for the last year?(based on hypothetical $10,000 investment)
FUND COST (PREVIOUS YEAR)
| | Costs of a $10,000 investment | Costs paid as a percentage of a $10,000 investment | |
| Initial Class | $ 0 A | 0.00%B | |
AAmount represents less than $.50
BAmount represents less than 0.005%
What affected the Fund's performance this period?
•Risk assets largely produced positive results in 2024, influenced by an expanding global economy and a slowing in the pace of inflation in certain markets, as well as a pivot by some central banks toward monetary easing, despite ongoing geopolitical risk.
•Against this backdrop, active asset allocation positioning detracted from the fund's performance relative to the Composite index, whereas the performance of the underlying investment portfolios contributed.
•In terms of active asset allocation, an underweight in outperforming U.S. equities hurt the fund's relative result the past 12 months, as did an overweight in lagging long-term U.S. Treasurys and outsized exposure to non-U.S. equities. Conversely, an underweight in relatively weaker-performing investment-grade bonds added relative value for the fund.
•Looking at the performance of the underlying portfolios, investments in non-U.S. equities contributed to the fund's relative result. Investments in U.S. investment-grade bonds and U.S. equities also helped to a lesser extent. Within U.S. equities, VIP Contrafund Portfolio (+33.79%) notably outperformed its benchmark, the S&P 500® index (+25.02%). Elsewhere among non-U.S. equities, VIP Overseas Portfolio (+5%) topped the MSCI EAFE index (+4.07%) and VIP Emerging Markets Portfolio (+10.04%) outpaced the MSCI EM Index (+7.50%).
•At the other end of the performance spectrum of underlying funds, within equities, VIP Growth Portfolio (+30.39%) lagged its benchmark, the Russell 3000® Index (+32.46%), and VIP Growth & Income Portfolio (+22.21%) trailed the S&P 500® index.
How did the Fund perform over the past 10 years?
CUMULATIVE PERFORMANCE
December 31, 2014 through December 31, 2024.
Initial investment of $10,000.
Initial Class | $10,000 | $9,982 | $10,599 | $12,496 | $11,681 | $14,235 | $16,505 | $18,293 | $15,288 | $17,370 | $18,841 |
Fidelity VIP Freedom 2025 Composite Index℠ | $10,000 | $9,947 | $10,701 | $12,368 | $11,828 | $14,193 | $16,117 | $17,707 | $14,874 | $16,975 | $18,500 |
S&P 500® Index | $10,000 | $10,138 | $11,351 | $13,829 | $13,223 | $17,386 | $20,585 | $26,494 | $21,696 | $27,399 | $34,254 |
| | 2014 | 2015 | 2016 | 2017 | 2018 | 2019 | 2020 | 2021 | 2022 | 2023 | 2024 |
AVERAGE ANNUAL TOTAL RETURNS:| | 1 Year | 5 Year | 10 Year |
| Initial Class | 8.47% | 5.77% | 6.54% |
| Fidelity VIP Freedom 2025 Composite Index℠ | 8.98% | 5.44% | 6.35% |
| S&P 500® Index | 25.02% | 14.53% | 13.10% |
Visit institutional.fidelity.com for more recent performance information. |
The Fund's past performance is not a good predictor of the Fund's future performance. The graph and table do not reflect the deduction of taxes that a shareholder would pay on fund distributions or redemption of fund shares. |
Key Fund Statistics(as of December 31, 2024)
KEY FACTS | | |
| Fund Size | $391,334,231 | |
| Number of Holdings | 14 | |
| Total Advisory Fee | $0 | |
| Portfolio Turnover | 41% | |
What did the Fund invest in?
(as of December 31, 2024)
| Bond Funds | 44.5 |
| Domestic Equity Funds | 29.4 |
| International Equity Funds | 26.1 |
| Short-Term Investments and Net Other Assets (Liabilities) | 0.0 |
ASSET ALLOCATION (% of Fund's net assets) |
|
| | Bond Funds - 44.5 |
| | Domestic Equity Funds - 29.4 |
| | International Equity Funds - 26.1 |
| | Short-Term Investments and Net Other Assets (Liabilities) - 0.0 |
| |
TOP HOLDINGS(% of Fund's net assets) | | |
| VIP Investment Grade Bond II Portfolio - Initial Class | 20.3 | |
| VIP Overseas Portfolio - Initial Class | 16.9 | |
| Fidelity Inflation-Protected Bond Index Fund | 12.0 | |
| VIP Emerging Markets Portfolio - Initial Class | 9.2 | |
| VIP Growth Portfolio - Initial Class | 8.5 | |
| Fidelity Long-Term Treasury Bond Index Fund | 7.0 | |
| VIP Growth & Income Portfolio - Initial Class | 5.8 | |
| VIP Contrafund Portfolio - Initial Class | 5.1 | |
| VIP Equity-Income Portfolio - Initial Class | 4.2 | |
| Fidelity International Bond Index Fund | 4.0 | |
| | 93.0 | |
| Fidelity, the Fidelity Investments Logo and all other Fidelity trademarks or service marks used herein are trademarks or service marks of FMR LLC. Any third-party marks that are used herein are trademarks or service marks of their respective owners. © 2025 FMR LLC. All rights reserved. |
| | For additional information about the Fund; including its prospectus, financial information, holdings and proxy information, scan the QR code or visit fundresearch.fidelity.com/prospectus/sec 1.9914283.100 1432-TSRA-0325 |
| |
| | ANNUAL SHAREHOLDER REPORT | AS OF DECEMBER 31, 2024 | This report describes changes to the Fund that occurred during the reporting period. |
| | VIP Asset Manager Portfolio VIP Asset Manager Portfolio Service Class true |
| | | |
This annual shareholder report contains information about VIP Asset Manager Portfolio for the period January 1, 2024 to December 31, 2024. You can find additional information about the Fund at fundresearch.fidelity.com/prospectus/sec. You can also request this information by contacting us at 1-877-208-0098 or by sending an e-mail to funddocuments@fmr.com.
What were your Fund costs for the last year?(based on hypothetical $10,000 investment)
FUND COST (PREVIOUS YEAR)
| | Costs of a $10,000 investment | Costs paid as a percentage of a $10,000 investment | |
| Service Class | $ 64 | 0.62% | |
What affected the Fund's performance this period?
•Risk assets largely produced positive results in 2024, influenced by an expanding global economy, a slowing in the pace of inflation in certain markets, and a pivot by some central banks toward monetary easing, despite ongoing geopolitical risk.
•Within this environment, asset class positioning contributed to the fund's performance versus the Composite index, whereas security selection detracted.
•The portfolio's core equity allocation strategy contributed to relative performance, led by an overweight among U.S. stocks. Equal-weight positioning in international developed- and emerging-markets equities also added modest value. Meanwhile, small, out-of-benchmark allocations to real estate investment trusts and commodity-related securities did not have a material impact on the fund's relative result the past year.
•The portfolio's fixed-income positioning also was beneficial from a relative performance standpoint. Specifically, an underweight in investment-grade bonds and cash, in favor of higher-risk segments of the fixed income market was advantageous. That said, a small allocation to long-term U.S. Treasurys hurt.
•In terms of security selection, picks among U.S. equities notably pressured relative performance in 2024. Investment choices in the information technology sector - particularly among software & services and semiconductor companies - detracted the most.
•Stock selection among international developed-market stocks, on the other hand, aided the fund's relative return. Here, picks in Japan, Germany and the U.K., along with favorable positioning in continental European equity markets, helped the most. Conversely, investment choices and an underweight in the strong-performing Canadian stock market detracted.
•Security selection among investment-grade bonds also added value. Corporate debt issued by banks, real estate investment trusts, insurers and consumer staples companies, contributed to the portfolio's relative outcome. Elsewhere, stakes in asset-backed securities, non-government-agency mortgage-backed securities and U.S. Treasurys, helped as well.
•As of December 31, the fund was overweight U.S. stocks and about neutrally weighted in international developed- and emerging-markets equities. Investment-grade bond and cash allocations remained below the fund's target weighting.
How did the Fund perform over the past 10 years?
CUMULATIVE PERFORMANCE
December 31, 2014 through December 31, 2024.
Initial investment of $10,000.
Service Class | $10,000 | $10,003 | $10,304 | $11,740 | $11,101 | $13,117 | $15,051 | $16,525 | $14,041 | $15,852 | $17,174 |
Fidelity Asset Manager 50% Composite Index℠ | $10,000 | $10,032 | $10,667 | $12,015 | $11,583 | $13,624 | $15,355 | $16,754 | $14,416 | $16,374 | $17,861 |
S&P 500® Index | $10,000 | $10,138 | $11,351 | $13,829 | $13,223 | $17,386 | $20,585 | $26,494 | $21,696 | $27,399 | $34,254 |
| | 2014 | 2015 | 2016 | 2017 | 2018 | 2019 | 2020 | 2021 | 2022 | 2023 | 2024 |
AVERAGE ANNUAL TOTAL RETURNS:| | 1 Year | 5 Year | 10 Year |
| Service Class | 8.34% | 5.54% | 5.56% |
| Fidelity Asset Manager 50% Composite Index℠ | 9.08% | 5.56% | 5.97% |
| S&P 500® Index | 25.02% | 14.53% | 13.10% |
Visit institutional.fidelity.com for more recent performance information. |
The Fund's past performance is not a good predictor of the Fund's future performance. The graph and table do not reflect the deduction of taxes that a shareholder would pay on fund distributions or redemption of fund shares. |
Key Fund Statistics(as of December 31, 2024)
KEY FACTS | | |
| Fund Size | $904,415,380 | |
| Number of Holdings | 32 | |
| Total Advisory Fee | $4,688,967 | |
| Portfolio Turnover | 16% | |
What did the Fund invest in?
(as of December 31, 2024)
The information in the following tables is based on the combined Investments of the Fund and it's pro-rata share of investments in Fidelity's Central Funds, other than the Commodity Strategy and Money Market Central Funds as applicable.
| U.S. Government and U.S. Government Agency Obligations | 23.9 |
| AAA | 2.6 |
| AA | 0.2 |
| A | 2.9 |
| BBB | 5.7 |
| BB | 1.3 |
| B | 0.9 |
| CCC,CC,C | 0.2 |
| D | 0.0 |
| Not Rated | 0.7 |
| Equities | 56.9 |
| Short-Term Investments and Net Other Assets (Liabilities) | 4.7 |
QUALITY DIVERSIFICATION (% of Fund's net assets) |
| |
| | U.S. Government and U.S. Government Agency Obligations - 23.9 |
| | AAA - 2.6 |
| | AA - 0.2 |
| | A - 2.9 |
| | BBB - 5.7 |
| | BB - 1.3 |
| | B - 0.9 |
| | CCC,CC,C - 0.2 |
| | D - 0.0 |
| | Not Rated - 0.7 |
| | Equities - 56.9 |
| | Short-Term Investments and Net Other Assets (Liabilities) - 4.7 |
| |
| We have used ratings from Moody's Investors Service, Inc. Where Moody's® ratings are not available, we have used S&P® ratings. All ratings are as of the date indicated and do not reflect subsequent changes. |
MARKET SECTORS (% of Fund's net assets) | | |
| Financials | 13.7 | |
| Information Technology | 13.4 | |
| Industrials | 6.6 | |
| Consumer Discretionary | 6.1 | |
| Health Care | 5.3 | |
| Communication Services | 4.5 | |
| Consumer Staples | 2.6 | |
| Energy | 2.4 | |
| Real Estate | 2.0 | |
| Materials | 2.0 | |
| Utilities | 1.2 | |
| |
| Equities | 55.9 |
| Bonds | 39.4 |
| Short-Term Investments and Net Other Assets (Liabilities) | 4.7 |
ASSET ALLOCATION (% of Fund's net assets) |
|
| | Equities - 55.9 |
| | Bonds - 39.4 |
| | Short-Term Investments and Net Other Assets (Liabilities) - 4.7 |
| |
TOP HOLDINGS(% of Fund's net assets) | | |
| US Treasury Notes | 14.0 | |
| US Treasury Bonds | 3.9 | |
| Microsoft Corp | 2.3 | |
| Fannie Mae Mortgage pass-thru certificates | 2.2 | |
| NVIDIA Corp | 2.2 | |
| Apple Inc | 2.1 | |
| Fidelity Blue Chip Growth ETF | 2.1 | |
| Ginnie Mae II Pool | 1.7 | |
| Freddie Mac Gold Pool | 1.5 | |
| Alphabet Inc Class A | 1.5 | |
| | 33.5 | |
How has the Fund changed?
This is a summary of certain changes to the Fund since January 1, 2024. For more complete information, you may review the Fund's next prospectus, which we expect to be available by April 30, 2025 at fundresearch.fidelity.com/prospectus/sec or upon request at 1-877-208-0098 or by sending an e-mail to funddocuments@fmr.com.
The fees associated with this class changed during the reporting year. The variations in class fees are primarily the result of the following changes: The fund's transfer agent and pricing & bookkeeping fees were changed to a fixed rate effective December 1, 2023. Effective March 1, 2024, the fund's management contract was amended to incorporate administrative services previously covered under separate services agreements (transfer agent and pricing & bookkeeping). The amended contract incorporates a management fee rate that may vary by class. The Adviser or an affiliate pays certain expenses of managing and operating the fund out of each class's management fee. | The fund modified its principal investment strategies during the reporting period.
|
The fund modified its principal investment risks during the reporting period. | |
| Fidelity, the Fidelity Investments Logo and all other Fidelity trademarks or service marks used herein are trademarks or service marks of FMR LLC. Any third-party marks that are used herein are trademarks or service marks of their respective owners. © 2025 FMR LLC. All rights reserved. |
| | For additional information about the Fund; including its prospectus, financial information, holdings and proxy information, scan the QR code or visit fundresearch.fidelity.com/prospectus/sec 1.9914198.100 467-TSRA-0325 |
| |
| | ANNUAL SHAREHOLDER REPORT | AS OF DECEMBER 31, 2024 | |
| | VIP Freedom 2010 Portfolio℠ VIP Freedom 2010 Portfolio℠ Initial Class true |
| | | |
This annual shareholder report contains information about VIP Freedom 2010 Portfolio℠ for the period January 1, 2024 to December 31, 2024. You can find additional information about the Fund at fundresearch.fidelity.com/prospectus/sec. You can also request this information by contacting us at 1-877-208-0098 or by sending an e-mail to funddocuments@fmr.com.
What were your Fund costs for the last year?(based on hypothetical $10,000 investment)
FUND COST (PREVIOUS YEAR)
| | Costs of a $10,000 investment | Costs paid as a percentage of a $10,000 investment | |
| Initial Class | $ 0 A | 0.00%B | |
AAmount represents less than $.50
BAmount represents less than 0.005%
What affected the Fund's performance this period?
•Risk assets largely produced positive results in 2024, influenced by an expanding global economy and a slowing in the pace of inflation in certain markets, as well as a pivot by some central banks toward monetary easing, despite ongoing geopolitical risk.
•Against this backdrop, active asset allocation positioning detracted from the fund's performance relative to the Composite index, whereas the performance of the underlying investment portfolios contributed.
•In terms of active asset allocation, an underweight in outperforming U.S. equities hurt the fund's relative result the past 12 months, as did an overweight in lagging long-term U.S. Treasurys and outsized exposure to non-U.S. equities. Conversely, an underweight in relatively weaker-performing investment-grade bonds added relative value for the fund.
•Looking at the performance of the underlying portfolios, investments in non-U.S. equities contributed to the fund's relative result. Investments in U.S. investment-grade bonds and U.S. equities also helped to a lesser extent. Within U.S. equities, VIP Contrafund Portfolio (+33.79%) notably outperformed its benchmark, the S&P 500® index (+25.02%). Elsewhere among non-U.S. equities, VIP Overseas Portfolio (+5%) topped the MSCI EAFE index (+4.07%) and VIP Emerging Markets Portfolio (+10.04%) outpaced the MSCI EM Index (+7.50%).
•At the other end of the performance spectrum of underlying funds, within equities, VIP Growth Portfolio (+30.39%) lagged its benchmark, the Russell 3000® Index (+32.46%), and VIP Growth & Income Portfolio (+22.21%) trailed the S&P 500® index.
How did the Fund perform over the past 10 years?
CUMULATIVE PERFORMANCE
December 31, 2014 through December 31, 2024.
Initial investment of $10,000.
Initial Class | $10,000 | $9,971 | $10,515 | $11,890 | $11,414 | $13,250 | $14,905 | $15,783 | $13,648 | $14,942 | $15,745 |
Fidelity VIP Freedom 2010 Composite Index℠ | $10,000 | $9,984 | $10,555 | $11,726 | $11,465 | $13,141 | $14,510 | $15,300 | $13,328 | $14,643 | $15,490 |
Bloomberg U.S. Aggregate Bond Index | $10,000 | $10,055 | $10,321 | $10,687 | $10,688 | $11,620 | $12,492 | $12,299 | $10,699 | $11,291 | $11,432 |
| | 2014 | 2015 | 2016 | 2017 | 2018 | 2019 | 2020 | 2021 | 2022 | 2023 | 2024 |
AVERAGE ANNUAL TOTAL RETURNS:| | 1 Year | 5 Year | 10 Year |
| Initial Class | 5.38% | 3.51% | 4.64% |
| Fidelity VIP Freedom 2010 Composite Index℠ | 5.78% | 3.34% | 4.47% |
| Bloomberg U.S. Aggregate Bond Index | 1.25% | -0.33% | 1.35% |
Visit institutional.fidelity.com for more recent performance information. |
The Fund's past performance is not a good predictor of the Fund's future performance. The graph and table do not reflect the deduction of taxes that a shareholder would pay on fund distributions or redemption of fund shares. |
Key Fund Statistics(as of December 31, 2024)
KEY FACTS | | |
| Fund Size | $249,525,780 | |
| Number of Holdings | 15 | |
| Total Advisory Fee | $0 | |
| Portfolio Turnover | 25% | |
What did the Fund invest in?
(as of December 31, 2024)
| Bond Funds | 60.0 |
| International Equity Funds | 15.4 |
| Domestic Equity Funds | 13.4 |
| Short-Term Funds | 11.2 |
| Short-Term Investments and Net Other Assets (Liabilities) | 0.0 |
ASSET ALLOCATION (% of Fund's net assets) |
|
| | Bond Funds - 60.0 |
| | International Equity Funds - 15.4 |
| | Domestic Equity Funds - 13.4 |
| | Short-Term Funds - 11.2 |
| | Short-Term Investments and Net Other Assets (Liabilities) - 0.0 |
| |
TOP HOLDINGS(% of Fund's net assets) | | |
| VIP Investment Grade Bond II Portfolio - Initial Class | 37.3 | |
| Fidelity Inflation-Protected Bond Index Fund | 15.2 | |
| VIP Government Money Market Portfolio - Initial Class | 11.2 | |
| VIP Overseas Portfolio - Initial Class | 9.2 | |
| VIP Emerging Markets Portfolio - Initial Class | 6.2 | |
| VIP Growth Portfolio - Initial Class | 4.0 | |
| Fidelity International Bond Index Fund | 3.4 | |
| Fidelity Long-Term Treasury Bond Index Fund | 2.9 | |
| VIP Growth & Income Portfolio - Initial Class | 2.6 | |
| VIP Contrafund Portfolio - Initial Class | 2.3 | |
| | 94.3 | |
| Fidelity, the Fidelity Investments Logo and all other Fidelity trademarks or service marks used herein are trademarks or service marks of FMR LLC. Any third-party marks that are used herein are trademarks or service marks of their respective owners. © 2025 FMR LLC. All rights reserved. |
| | For additional information about the Fund; including its prospectus, financial information, holdings and proxy information, scan the QR code or visit fundresearch.fidelity.com/prospectus/sec 1.9914274.100 1423-TSRA-0325 |
| |
| | ANNUAL SHAREHOLDER REPORT | AS OF DECEMBER 31, 2024 | |
| | VIP Target Volatility Portfolio VIP Target Volatility Portfolio Service Class 2 true |
| | | |
This annual shareholder report contains information about VIP Target Volatility Portfolio for the period January 1, 2024 to December 31, 2024. You can find additional information about the Fund at fundresearch.fidelity.com/prospectus/sec. You can also request this information by contacting us at 1-877-208-0098 or by sending an e-mail to funddocuments@fmr.com.
What were your Fund costs for the last year?(based on hypothetical $10,000 investment)
FUND COST (PREVIOUS YEAR)
| | Costs of a $10,000 investment | Costs paid as a percentage of a $10,000 investment | |
| Service Class 2 | $ 34 | 0.33% | |
What affected the Fund's performance this period?
•Risk assets largely produced positive results in 2024, influenced by an expanding global economy, a slowing in the pace of inflation in certain markets, and a pivot by some central banks toward monetary easing, despite ongoing geopolitical risk.
•Asset class positioning, which is primarily driven by volatility management, contributed to the fund's performance versus the Composite benchmark, whereas security selection detracted.
•The portfolio's core equity allocation strategy pressured the fund's relative return. Specifically, a favorable overweight in U.S. stocks added value but outsized exposure to international developed- and emerging markets equities notably detracted as returns in the latter two asset classes substantially lagged their U.S. counterparts in 2024.
•The fund's fixed-income positioning was quite beneficial from a relative performance standpoint, especially a sizable underweight in investment-grade bonds. In contrast, adjustments made to the fund's cash position during the year slightly hurt.
•In terms of security selection, picks among U.S. equities weighed on relative performance due to disappointing results from Fidelity® VIP Stock Selector All Cap Portfolio, the largest holding this period. Investment choices in the information technology sector - particularly among software & services and semiconductor companies - detracted the most. Conversely, a stake in Fidelity® Contrafund, which handily outperformed the broader fund's equity benchmark, was a plus.
•Stock picks in international developed-markets modestly boosted the fund's relative outcome, led by positions in Fidelity® Enhanced International Equity Fund and Fidelity® Overseas Fund. On the other hand, investment choices among emerging-markets equities slightly detracted.
•Turning to fixed-income, an investment in Fidelity® Total Bond Fund outperformed and contributed from a security selection standpoint.
•As of December 31, the fund maintained outsized exposure to U.S. stocks, as well as international developed- and emerging-markets equities. We increased the portfolio's U.S. overweight this period. Investment-grade bond and cash allocations remained well below the fund's target weightings.
How did the Fund perform over the past 10 years?
CUMULATIVE PERFORMANCE
December 31, 2014 through December 31, 2024.
Initial investment of $10,000.
Service Class 2 | $10,000 | $9,866 | $10,365 | $12,054 | $11,332 | $13,444 | $14,653 | $16,417 | $13,847 | $15,775 | $17,322 |
Fidelity VIP Target Volatility Portfolio Composite Index℠ | $10,000 | $10,051 | $10,711 | $12,252 | $11,714 | $14,057 | $15,964 | $17,855 | $15,128 | $17,431 | $19,242 |
S&P 500® Index | $10,000 | $10,138 | $11,351 | $13,829 | $13,223 | $17,386 | $20,585 | $26,494 | $21,696 | $27,399 | $34,254 |
| | 2014 | 2015 | 2016 | 2017 | 2018 | 2019 | 2020 | 2021 | 2022 | 2023 | 2024 |
AVERAGE ANNUAL TOTAL RETURNS:| | 1 Year | 5 Year | 10 Year |
| Service Class 2 | 9.80% | 5.20% | 5.65% |
| Fidelity VIP Target Volatility Portfolio Composite Index℠ | 10.39% | 6.48% | 6.76% |
| S&P 500® Index | 25.02% | 14.53% | 13.10% |
Visit institutional.fidelity.com for more recent performance information. |
The Fund's past performance is not a good predictor of the Fund's future performance. The graph and table do not reflect the deduction of taxes that a shareholder would pay on fund distributions or redemption of fund shares. |
Key Fund Statistics(as of December 31, 2024)
KEY FACTS | | |
| Fund Size | $175,503,555 | |
| Number of Holdings | 25 | |
| Total Advisory Fee | $283,336 | |
| Portfolio Turnover | 56% | |
What did the Fund invest in?
(as of December 31, 2024)
| Domestic Equity Funds | 45.1 |
| International Equity Funds | 32.6 |
| Bond Funds | 20.0 |
| Alternative Funds | 2.0 |
| Short-Term Funds | 0.0 |
| Short-Term Investments and Net Other Assets (Liabilities) | 0.3 |
ASSET ALLOCATION (% of Fund's net assets) |
|
| | Domestic Equity Funds - 45.1 |
| | International Equity Funds - 32.6 |
| | Bond Funds - 20.0 |
| | Alternative Funds - 2.0 |
| | Short-Term Funds - 0.0 |
| | Short-Term Investments and Net Other Assets (Liabilities) - 0.3 |
| |
TOP HOLDINGS(% of Fund's net assets) | | |
| VIP Stock Selector All Cap Portfolio - Investor Class | 30.6 | |
| Fidelity Total Bond Fund | 19.2 | |
| Fidelity Enhanced International ETF | 10.9 | |
| Fidelity Enhanced Large Cap Core ETF | 9.8 | |
| Fidelity Emerging Markets Fund | 8.3 | |
| Fidelity Overseas Fund | 6.6 | |
| Fidelity International Value Fund | 3.2 | |
| Fidelity Contrafund | 2.9 | |
| Fidelity Hedged Equity Fund | 2.0 | |
| iShares Core MSCI Emerging Markets ETF | 1.7 | |
| | 95.2 | |
| Fidelity, the Fidelity Investments Logo and all other Fidelity trademarks or service marks used herein are trademarks or service marks of FMR LLC. Any third-party marks that are used herein are trademarks or service marks of their respective owners. © 2025 FMR LLC. All rights reserved. |
| | For additional information about the Fund; including its prospectus, financial information, holdings and proxy information, scan the QR code or visit fundresearch.fidelity.com/prospectus/sec 1.9914353.100 2521-TSRA-0325 |
| |
| | ANNUAL SHAREHOLDER REPORT | AS OF DECEMBER 31, 2024 | This report describes changes to the Fund that occurred during the reporting period. |
| | VIP Investment Grade Bond II Portfolio VIP Investment Grade Bond II Portfolio Investor Class true |
| | | |
This annual shareholder report contains information about VIP Investment Grade Bond II Portfolio for the period January 1, 2024 to December 31, 2024. You can find additional information about the Fund at fundresearch.fidelity.com/prospectus/sec. You can also request this information by contacting us at 1-877-208-0098 or by sending an e-mail to funddocuments@fmr.com.
What were your Fund costs for the last year?(based on hypothetical $10,000 investment)
FUND COST (PREVIOUS YEAR)
| | Costs of a $10,000 investment | Costs paid as a percentage of a $10,000 investment | |
| Investor Class | $ 42 | 0.42% | |
What affected the Fund's performance this period?
•U.S. taxable investment-grade bonds posted a modest advance in 2024, rallying during the summer months, as the bond market reflected anticipated interest-rate reductions by the U.S. Federal Reserve, but falling back in the fourth quarter when the Fed tempered rate-cut expectations for 2025.
•Against this backdrop, the fund's exposure to asset-backed securities, including collateralized loan obligations, was a key contributor to performance versus the Bloomberg U.S. Aggregate Bond Index for the fiscal year.
•An overweight to commercial mortgage-backed securities provided another performance advantage, as did an underweight to agency mortgage-backed securities.
•Among corporate bonds, industry allocation lifted relative performance as well, led by security selection among financials and an overweight in the segment. Specifically, positioning among banks and REITS was beneficial versus the index.
•Exposure to certain "plus" sectors, namely high yield bonds and emerging markets debt, also were modest contributors.
•In contrast, the fund's yield-curve positioning modestly detracted for the year.
How did the Fund perform over the life of Fund?
CUMULATIVE PERFORMANCE
May 27, 2022 through December 31, 2024.
Initial investment of $10,000.
Investor Class | $10,000 | $9,467 | $10,024 |
Bloomberg U.S. Aggregate Bond Index | $10,000 | $9,504 | $10,029 |
| | 2022 | 2023 | 2024 |
AVERAGE ANNUAL TOTAL RETURNS:| | 1 Year | Life of Fund A |
| Investor Class | 1.52% | 0.67% |
| Bloomberg U.S. Aggregate Bond Index | 1.25% | 0.59% |
A From May 27, 2022
Visit institutional.fidelity.com for more recent performance information. |
The Fund's past performance is not a good predictor of the Fund's future performance. The graph and table do not reflect the deduction of taxes that a shareholder would pay on fund distributions or redemption of fund shares. |
Key Fund Statistics(as of December 31, 2024)
KEY FACTS | | |
| Fund Size | $3,249,669,268 | |
| Number of Holdings | 4,841 | |
| Total Advisory Fee | $12,203,892 | |
| Portfolio Turnover | 217% | |
What did the Fund invest in?
(as of December 31, 2024)
The information in the following tables is based on the combined Investments of the Fund and it's pro-rata share of investments in Fidelity's Central Funds, other than the Commodity Strategy and Money Market Central Funds as applicable.
| U.S. Government and U.S. Government Agency Obligations | 65.2 |
| AAA | 8.6 |
| AA | 0.7 |
| A | 8.9 |
| BBB | 13.4 |
| BB | 1.7 |
| B | 0.9 |
| CCC,CC,C | 0.0 |
| Not Rated | 5.4 |
| Equities | 0.0 |
QUALITY DIVERSIFICATION (% of Fund's net assets) |
| |
| | U.S. Government and U.S. Government Agency Obligations - 65.2 |
| | AAA - 8.6 |
| | AA - 0.7 |
| | A - 8.9 |
| | BBB - 13.4 |
| | BB - 1.7 |
| | B - 0.9 |
| | CCC,CC,C - 0.0 |
| | Not Rated - 5.4 |
| | Equities - 0.0 |
| Short-Term Investments and Net Other Assets (Liabilities) - (4.8)% |
| |
| We have used ratings from Moody's Investors Service, Inc. Where Moody's® ratings are not available, we have used S&P® ratings. All ratings are as of the date indicated and do not reflect subsequent changes. |
| U.S. Treasury Obligations | 47.2 |
| Corporate Bonds | 23.5 |
| U.S. Government Agency - Mortgage Securities | 18.0 |
| Asset-Backed Securities | 8.8 |
| CMOs and Other Mortgage Related Securities | 6.8 |
| Foreign Government and Government Agency Obligations | 0.3 |
| Purchased Options | 0.1 |
| Other Investments | 0.1 |
| Municipal Securities | 0.0 |
| Preferred Securities | 0.0 |
| Bank Loan Obligations | 0.0 |
| Common Stocks | 0.0 |
ASSET ALLOCATION (% of Fund's net assets) |
|
| | U.S. Treasury Obligations - 47.2 |
| | Corporate Bonds - 23.5 |
| | U.S. Government Agency - Mortgage Securities - 18.0 |
| | Asset-Backed Securities - 8.8 |
| | CMOs and Other Mortgage Related Securities - 6.8 |
| | Foreign Government and Government Agency Obligations - 0.3 |
| | Purchased Options - 0.1 |
| | Other Investments - 0.1 |
| | Municipal Securities - 0.0 |
| | Preferred Securities - 0.0 |
| | Bank Loan Obligations - 0.0 |
| | Common Stocks - 0.0 |
| Short-Term Investments and Net Other Assets (Liabilities) - (4.8)% |
| |
| United States | 90.3 |
| Grand Cayman (UK Overseas Ter) | 4.9 |
| Mexico | 0.9 |
| Ireland | 0.6 |
| Multi-national | 0.6 |
| United Kingdom | 0.5 |
| Switzerland | 0.4 |
| Netherlands | 0.4 |
| Bailiwick Of Jersey | 0.3 |
| Others | 1.1 |
GEOGRAPHIC DIVERSIFICATION (% of Fund's net assets) |
|
| | United States - 90.3 |
| | Grand Cayman (UK Overseas Ter) - 4.9 |
| | Mexico - 0.9 |
| | Ireland - 0.6 |
| | Multi-national - 0.6 |
| | United Kingdom - 0.5 |
| | Switzerland - 0.4 |
| | Netherlands - 0.4 |
| | Bailiwick Of Jersey - 0.3 |
| | Others - 1.1 |
| |
TOP HOLDINGS(% of Fund's net assets) | | |
| US Treasury Notes | 36.3 | |
| US Treasury Bonds | 10.9 | |
| Fannie Mae Mortgage pass-thru certificates | 6.3 | |
| Ginnie Mae II Pool | 5.3 | |
| Freddie Mac Gold Pool | 3.0 | |
| Uniform Mortgage Backed Securities | 2.8 | |
| Freddie Mac Multifamily Structured pass-thru certificates | 1.9 | |
| Bank of America Corp | 1.2 | |
| Morgan Stanley | 1.2 | |
| JPMorgan Chase & Co | 1.2 | |
| | 70.1 | |
How has the Fund changed?
This is a summary of certain changes to the Fund since January 1, 2024. For more complete information, you may review the Fund's next prospectus, which we expect to be available by April 30, 2025 at fundresearch.fidelity.com/prospectus/sec or upon request at 1-877-208-0098 or by sending an e-mail to funddocuments@fmr.com.
The fund's transfer agent and pricing & bookkeeping fees were changed to a fixed rate effective December 1, 2023. Effective March 1, 2024, the fund's management contract was amended to incorporate administrative services previously covered under separate services agreements (transfer agent and pricing & bookkeeping). The amended contract incorporates a management fee rate that may vary by class. The Adviser or an affiliate pays certain expenses of managing and operating the fund out of each class's management fee. | |
| Fidelity, the Fidelity Investments Logo and all other Fidelity trademarks or service marks used herein are trademarks or service marks of FMR LLC. Any third-party marks that are used herein are trademarks or service marks of their respective owners. © 2025 FMR LLC. All rights reserved. |
| | For additional information about the Fund; including its prospectus, financial information, holdings and proxy information, scan the QR code or visit fundresearch.fidelity.com/prospectus/sec 1.9914404.100 6572-TSRA-0325 |
| |
| | ANNUAL SHAREHOLDER REPORT | AS OF DECEMBER 31, 2024 | |
| | VIP Investor Freedom 2015 Portfolio℠ VIP Investor Freedom 2015 Portfolio℠ true |
| | | |
This annual shareholder report contains information about VIP Investor Freedom 2015 Portfolio℠ for the period January 1, 2024 to December 31, 2024. You can find additional information about the Fund at fundresearch.fidelity.com/prospectus/sec. You can also request this information by contacting us at 1-877-208-0098 or by sending an e-mail to funddocuments@fmr.com.
What were your Fund costs for the last year?(based on hypothetical $10,000 investment)
FUND COST (PREVIOUS YEAR)
| | Costs of a $10,000 investment | Costs paid as a percentage of a $10,000 investment | |
| VIP Investor Freedom 2015 Portfolio℠ | $ 0 A | 0.00%B | |
A Amount represents less than $.50
B Amount represents less than 0.005%
What affected the Fund's performance this period?
•Risk assets largely produced positive results in 2024, influenced by an expanding global economy and a slowing in the pace of inflation in certain markets, as well as a pivot by some central banks toward monetary easing, despite ongoing geopolitical risk.
•Against this backdrop, active asset allocation positioning detracted from the fund's performance relative to the Composite index, whereas the performance of the underlying investment portfolios contributed.
•In terms of active asset allocation, an underweight in outperforming U.S. equities hurt the fund's relative result the past 12 months, as did an overweight in lagging long-term U.S. Treasurys and outsized exposure to non-U.S. equities. Conversely, underweighting relatively weaker-performing investment-grade bonds added relative value for the fund.
•Looking at the performance of the underlying portfolios, investments in non-U.S. equities contributed to the fund's relative result. Investments in U.S. investment-grade bonds and U.S. equities also helped to a lesser extent. Within U.S. equities, VIP Contrafund Portfolio (+33.70%) notably outperformed its benchmark, the S&P 500® index (+25.02%). Elsewhere in non-U.S. equities, VIP Overseas Portfolio (+4.97%) topped the MSCI EAFE index (+4.07%) and VIP Emerging Markets Portfolio (+9.90%) outpaced the MSCI EM Index (+7.50%).
•At the other end of the performance spectrum of underlying funds, in terms of equities, VIP Growth Portfolio (+30.30%) lagged its benchmark, the Russell 3000® Index (+32.46%), and VIP Growth & Income Portfolio (+22.18%) trailed the S&P 500® index.
How did the Fund perform over the past 10 years?
CUMULATIVE PERFORMANCE
December 31, 2014 through December 31, 2024.
Initial investment of $10,000.
VIP Investor Freedom 2015 Portfolio℠ | $10,000 | $9,966 | $10,546 | $12,126 | $11,518 | $13,618 | $15,484 | $16,667 | $14,237 | $15,781 | $16,795 |
Fidelity VIP Freedom 2015 Composite Index℠ | $10,000 | $9,970 | $10,622 | $12,001 | $11,636 | $13,578 | $15,155 | $16,227 | $13,946 | $15,534 | $16,608 |
Bloomberg U.S. Aggregate Bond Index | $10,000 | $10,055 | $10,321 | $10,687 | $10,688 | $11,620 | $12,492 | $12,299 | $10,699 | $11,291 | $11,432 |
| | 2014 | 2015 | 2016 | 2017 | 2018 | 2019 | 2020 | 2021 | 2022 | 2023 | 2024 |
AVERAGE ANNUAL TOTAL RETURNS:| | 1 Year | 5 Year | 10 Year |
| VIP Investor Freedom 2015 Portfolio℠ | 6.43% | 4.28% | 5.32% |
| Fidelity VIP Freedom 2015 Composite Index℠ | 6.91% | 4.11% | 5.20% |
| Bloomberg U.S. Aggregate Bond Index | 1.25% | -0.33% | 1.35% |
Visit institutional.fidelity.com for more recent performance information. |
The Fund's past performance is not a good predictor of the Fund's future performance. The graph and table do not reflect the deduction of taxes that a shareholder would pay on fund distributions or redemption of fund shares. |
Key Fund Statistics(as of December 31, 2024)
KEY FACTS | | |
| Fund Size | $88,975,451 | |
| Number of Holdings | 15 | |
| Total Advisory Fee | $0 | |
| Portfolio Turnover | 25% | |
What did the Fund invest in?
(as of December 31, 2024)
| Bond Funds | 56.3 |
| International Equity Funds | 19.1 |
| Domestic Equity Funds | 18.9 |
| Short-Term Funds | 5.7 |
| Short-Term Investments and Net Other Assets (Liabilities) | 0.0 |
ASSET ALLOCATION (% of Fund's net assets) |
|
| | Bond Funds - 56.3 |
| | International Equity Funds - 19.1 |
| | Domestic Equity Funds - 18.9 |
| | Short-Term Funds - 5.7 |
| | Short-Term Investments and Net Other Assets (Liabilities) - 0.0 |
| |
TOP HOLDINGS(% of Fund's net assets) | | |
| VIP Investment Grade Bond II Portfolio - Investor Class | 34.3 | |
| Fidelity Inflation-Protected Bond Index Fund | 13.8 | |
| VIP Overseas Portfolio - Investor Class | 11.9 | |
| VIP Emerging Markets Portfolio - Investor Class | 7.2 | |
| VIP Government Money Market Portfolio - Investor Class | 5.7 | |
| VIP Growth Portfolio - Investor Class | 5.5 | |
| VIP Growth & Income Portfolio - Investor Class | 3.8 | |
| Fidelity International Bond Index Fund | 3.7 | |
| Fidelity Long-Term Treasury Bond Index Fund | 3.3 | |
| VIP Contrafund Portfolio - Investor Class | 3.3 | |
| | 92.5 | |
| Fidelity, the Fidelity Investments Logo and all other Fidelity trademarks or service marks used herein are trademarks or service marks of FMR LLC. Any third-party marks that are used herein are trademarks or service marks of their respective owners. © 2025 FMR LLC. All rights reserved. |
| | For additional information about the Fund; including its prospectus, financial information, holdings and proxy information, scan the QR code or visit fundresearch.fidelity.com/prospectus/sec 1.9914294.100 1497-TSRA-0325 |
| |
| | ANNUAL SHAREHOLDER REPORT | AS OF DECEMBER 31, 2024 | |
| | VIP Freedom 2015 Portfolio℠ VIP Freedom 2015 Portfolio℠ Service Class true |
| | | |
This annual shareholder report contains information about VIP Freedom 2015 Portfolio℠ for the period January 1, 2024 to December 31, 2024. You can find additional information about the Fund at fundresearch.fidelity.com/prospectus/sec. You can also request this information by contacting us at 1-877-208-0098 or by sending an e-mail to funddocuments@fmr.com.
What were your Fund costs for the last year?(based on hypothetical $10,000 investment)
FUND COST (PREVIOUS YEAR)
| | Costs of a $10,000 investment | Costs paid as a percentage of a $10,000 investment | |
| Service Class | $ 10 | 0.10% | |
What affected the Fund's performance this period?
•Risk assets largely produced positive results in 2024, influenced by an expanding global economy and a slowing in the pace of inflation in certain markets, as well as a pivot by some central banks toward monetary easing, despite ongoing geopolitical risk.
•Against this backdrop, active asset allocation positioning detracted from the fund's performance relative to the Composite index, whereas the performance of the underlying investment portfolios contributed.
•In terms of active asset allocation, an underweight in outperforming U.S. equities hurt the fund's relative result the past 12 months, as did an overweight in lagging long-term U.S. Treasurys and outsized exposure to non-U.S. equities. Conversely, an underweight in relatively weaker-performing investment-grade bonds added relative value for the fund.
•Looking at the performance of the underlying portfolios, investments in non-U.S. equities contributed to the fund's relative result. Investments in U.S. investment-grade bonds and U.S. equities also helped to a lesser extent. Within U.S. equities, VIP Contrafund Portfolio (+33.79%) notably outperformed its benchmark, the S&P 500® index (+25.02%). Elsewhere among non-U.S. equities, VIP Overseas Portfolio (+5%) topped the MSCI EAFE index (+4.07%) and VIP Emerging Markets Portfolio (+10.04%) outpaced the MSCI EM Index (+7.50%).
•At the other end of the performance spectrum of underlying funds, within equities, VIP Growth Portfolio (+30.39%) lagged its benchmark, the Russell 3000® Index (+32.46%), and VIP Growth & Income Portfolio (+22.21%) trailed the S&P 500® index.
How did the Fund perform over the past 10 years?
CUMULATIVE PERFORMANCE
December 31, 2014 through December 31, 2024.
Initial investment of $10,000.
Service Class | $10,000 | $9,956 | $10,535 | $12,109 | $11,489 | $13,582 | $15,431 | $16,603 | $14,168 | $15,706 | $16,716 |
Fidelity VIP Freedom 2015 Composite Index℠ | $10,000 | $9,970 | $10,622 | $12,001 | $11,636 | $13,578 | $15,155 | $16,227 | $13,946 | $15,534 | $16,608 |
Bloomberg U.S. Aggregate Bond Index | $10,000 | $10,055 | $10,321 | $10,687 | $10,688 | $11,620 | $12,492 | $12,299 | $10,699 | $11,291 | $11,432 |
| | 2014 | 2015 | 2016 | 2017 | 2018 | 2019 | 2020 | 2021 | 2022 | 2023 | 2024 |
AVERAGE ANNUAL TOTAL RETURNS:| | 1 Year | 5 Year | 10 Year |
| Service Class | 6.43% | 4.24% | 5.27% |
| Fidelity VIP Freedom 2015 Composite Index℠ | 6.91% | 4.11% | 5.20% |
| Bloomberg U.S. Aggregate Bond Index | 1.25% | -0.33% | 1.35% |
Visit institutional.fidelity.com for more recent performance information. |
The Fund's past performance is not a good predictor of the Fund's future performance. The graph and table do not reflect the deduction of taxes that a shareholder would pay on fund distributions or redemption of fund shares. |
Key Fund Statistics(as of December 31, 2024)
KEY FACTS | | |
| Fund Size | $58,148,499 | |
| Number of Holdings | 15 | |
| Total Advisory Fee | $0 | |
| Portfolio Turnover | 35% | |
What did the Fund invest in?
(as of December 31, 2024)
| Bond Funds | 56.3 |
| International Equity Funds | 19.1 |
| Domestic Equity Funds | 18.8 |
| Short-Term Funds | 5.8 |
| Short-Term Investments and Net Other Assets (Liabilities) | 0.0 |
ASSET ALLOCATION (% of Fund's net assets) |
|
| | Bond Funds - 56.3 |
| | International Equity Funds - 19.1 |
| | Domestic Equity Funds - 18.8 |
| | Short-Term Funds - 5.8 |
| | Short-Term Investments and Net Other Assets (Liabilities) - 0.0 |
| |
TOP HOLDINGS(% of Fund's net assets) | | |
| VIP Investment Grade Bond II Portfolio - Initial Class | 34.3 | |
| Fidelity Inflation-Protected Bond Index Fund | 14.1 | |
| VIP Overseas Portfolio - Initial Class | 11.9 | |
| VIP Emerging Markets Portfolio - Initial Class | 7.2 | |
| VIP Government Money Market Portfolio - Initial Class | 5.8 | |
| VIP Growth Portfolio - Initial Class | 5.5 | |
| VIP Growth & Income Portfolio - Initial Class | 3.7 | |
| Fidelity International Bond Index Fund | 3.7 | |
| VIP Contrafund Portfolio - Initial Class | 3.3 | |
| Fidelity Long-Term Treasury Bond Index Fund | 3.0 | |
| | 92.5 | |
| Fidelity, the Fidelity Investments Logo and all other Fidelity trademarks or service marks used herein are trademarks or service marks of FMR LLC. Any third-party marks that are used herein are trademarks or service marks of their respective owners. © 2025 FMR LLC. All rights reserved. |
| | For additional information about the Fund; including its prospectus, financial information, holdings and proxy information, scan the QR code or visit fundresearch.fidelity.com/prospectus/sec 1.9914278.100 1427-TSRA-0325 |
| |
| | ANNUAL SHAREHOLDER REPORT | AS OF DECEMBER 31, 2024 | This report describes changes to the Fund that occurred during the reporting period. |
| | VIP Investor Freedom Income Portfolio℠ VIP Investor Freedom Income Portfolio℠ true |
| | | |
This annual shareholder report contains information about VIP Investor Freedom Income Portfolio℠ for the period January 1, 2024 to December 31, 2024. You can find additional information about the Fund at fundresearch.fidelity.com/prospectus/sec. You can also request this information by contacting us at 1-877-208-0098 or by sending an e-mail to funddocuments@fmr.com.
What were your Fund costs for the last year?(based on hypothetical $10,000 investment)
FUND COST (PREVIOUS YEAR)
| | Costs of a $10,000 investment | Costs paid as a percentage of a $10,000 investment | |
| VIP Investor Freedom Income Portfolio℠ | $ 0 A | 0.00%B | |
A Amount represents less than $.50
B Amount represents less than 0.005%
What affected the Fund's performance this period?
•Risk assets largely produced positive results in 2024, influenced by an expanding global economy and a slowing in the pace of inflation in certain markets, as well as a pivot by some central banks toward monetary easing, despite ongoing geopolitical risk.
•Against this backdrop, active asset allocation positioning detracted from the fund's performance relative to the Composite index, whereas the performance of the underlying investment portfolios contributed.
•In terms of active asset allocation, an underweight in outperforming U.S. equities hurt the fund's relative result the past 12 months, as did an overweight in lagging long-term U.S. Treasurys and outsized exposure to non-U.S. equities. Conversely, underweighting relatively weaker-performing investment-grade bonds added relative value for the fund.
•Looking at the performance of the underlying portfolios, investments in non-U.S. equities contributed to the fund's relative result. Investments in U.S. investment-grade bonds and U.S. equities also helped to a lesser extent. Within U.S. equities, VIP Contrafund Portfolio (+33.70%) notably outperformed its benchmark, the S&P 500® index (+25.02%). Elsewhere in non-U.S. equities, VIP Overseas Portfolio (+4.97%) topped the MSCI EAFE index (+4.07%) and VIP Emerging Markets Portfolio (+9.90%) outpaced the MSCI EM Index (+7.50%).
•At the other end of the performance spectrum of underlying funds, in terms of equities, VIP Growth Portfolio (+30.30%) lagged its benchmark, the Russell 3000® Index (+32.46%), and VIP Growth & Income Portfolio (+22.18%) trailed the S&P 500® index.
How did the Fund perform over the past 10 years?
CUMULATIVE PERFORMANCE
December 31, 2014 through December 31, 2024.
Initial investment of $10,000.
VIP Investor Freedom Income Portfolio℠ | $10,000 | $9,963 | $10,404 | $11,284 | $11,054 | $12,383 | $13,671 | $14,119 | $12,421 | $13,400 | $13,977 |
Fidelity VIP Freedom Income Composite Index℠ | $10,000 | $10,012 | $10,397 | $11,135 | $11,058 | $12,258 | $13,314 | $13,734 | $12,175 | $13,190 | $13,828 |
Bloomberg U.S. Aggregate Bond Index | $10,000 | $10,055 | $10,321 | $10,687 | $10,688 | $11,620 | $12,492 | $12,299 | $10,699 | $11,291 | $11,432 |
| | 2014 | 2015 | 2016 | 2017 | 2018 | 2019 | 2020 | 2021 | 2022 | 2023 | 2024 |
AVERAGE ANNUAL TOTAL RETURNS:| | 1 Year | 5 Year | 10 Year |
| VIP Investor Freedom Income Portfolio℠ | 4.31% | 2.45% | 3.41% |
| Fidelity VIP Freedom Income Composite Index℠ | 4.84% | 2.44% | 3.29% |
| Bloomberg U.S. Aggregate Bond Index | 1.25% | -0.33% | 1.35% |
Visit institutional.fidelity.com for more recent performance information. |
The Fund's past performance is not a good predictor of the Fund's future performance. The graph and table do not reflect the deduction of taxes that a shareholder would pay on fund distributions or redemption of fund shares. |
Key Fund Statistics(as of December 31, 2024)
KEY FACTS | | |
| Fund Size | $76,504,375 | |
| Number of Holdings | 15 | |
| Total Advisory Fee | $0 | |
| Portfolio Turnover | 25% | |
What did the Fund invest in?
(as of December 31, 2024)
| Bond Funds | 62.4 |
| Short-Term Funds | 15.4 |
| International Equity Funds | 12.8 |
| Domestic Equity Funds | 9.4 |
| Short-Term Investments and Net Other Assets (Liabilities) | 0.0 |
ASSET ALLOCATION (% of Fund's net assets) |
|
| | Bond Funds - 62.4 |
| | Short-Term Funds - 15.4 |
| | International Equity Funds - 12.8 |
| | Domestic Equity Funds - 9.4 |
| | Short-Term Investments and Net Other Assets (Liabilities) - 0.0 |
| |
TOP HOLDINGS(% of Fund's net assets) | | |
| VIP Investment Grade Bond II Portfolio - Investor Class | 39.3 | |
| Fidelity Inflation-Protected Bond Index Fund | 15.7 | |
| VIP Government Money Market Portfolio - Investor Class | 15.4 | |
| VIP Overseas Portfolio - Investor Class | 7.4 | |
| VIP Emerging Markets Portfolio - Investor Class | 5.4 | |
| Fidelity International Bond Index Fund | 3.2 | |
| Fidelity Long-Term Treasury Bond Index Fund | 3.0 | |
| VIP Growth Portfolio - Investor Class | 2.8 | |
| VIP Growth & Income Portfolio - Investor Class | 1.9 | |
| VIP Contrafund Portfolio - Investor Class | 1.7 | |
| | 95.8 | |
How has the Fund changed?
This is a summary of certain changes to the Fund since January 1, 2024. For more complete information, you may review the Fund's next prospectus, which we expect to be available by April 30, 2025 at fundresearch.fidelity.com/prospectus/sec or upon request at 1-877-208-0098 or by sending an e-mail to funddocuments@fmr.com.
VIP Investor Freedom 2005 Portfolio℠ merged into VIP Investor Freedom Income Portfolio℠ on June 7, 2024. | |
| Fidelity, the Fidelity Investments Logo and all other Fidelity trademarks or service marks used herein are trademarks or service marks of FMR LLC. Any third-party marks that are used herein are trademarks or service marks of their respective owners. © 2025 FMR LLC. All rights reserved. |
| | For additional information about the Fund; including its prospectus, financial information, holdings and proxy information, scan the QR code or visit fundresearch.fidelity.com/prospectus/sec 1.9914298.100 1502-TSRA-0325 |
| |
| | ANNUAL SHAREHOLDER REPORT | AS OF DECEMBER 31, 2024 | This report describes changes to the Fund that occurred during the reporting period. |
| | VIP FundsManager® 85% Portfolio VIP FundsManager® 85% Portfolio Service Class 2 true |
| | | |
This annual shareholder report contains information about VIP FundsManager® 85% Portfolio for the period January 1, 2024 to December 31, 2024. You can find additional information about the Fund at fundresearch.fidelity.com/prospectus/sec. You can also request this information by contacting us at 1-877-208-0098 or by sending an e-mail to funddocuments@fmr.com.
What were your Fund costs for the last year?(based on hypothetical $10,000 investment)
FUND COST (PREVIOUS YEAR)
| | Costs of a $10,000 investment | Costs paid as a percentage of a $10,000 investment | |
| Service Class 2 | $ 27 | 0.25% | |
What affected the Fund's performance this period?
•Risk assets largely produced positive results in 2024, influenced by an expanding global economy, a slowing in the pace of inflation in certain markets, and a pivot by some central banks toward monetary easing, despite ongoing geopolitical risk.
•Within this environment, asset class positioning contributed to the Portfolios' performance versus the Composite indexes, whereas security selection detracted.
•The Portfolios' core equity allocation strategy contributed to relative performance, led by an overweight among U.S. stocks. Equal-weight positioning in international developed- and emerging-markets equities added modest value. Meanwhile, small, out-of-benchmark allocations to real estate investment trusts and commodity-related securities slightly detracted.
•The portfolio's fixed-income allocation strategy also was beneficial from a relative performance standpoint. Specifically, an underweight in investment-grade bonds and cash, in favor of higher-risks segments of the fixed market was advantageous. That said, a small allocation to long-term U.S. Treasurys hurt.
•In terms of security selection, picks among U.S. equities notably pressured relative performance in 2024 due to disappointing results from Fidelity® VIP Stock Selector All Cap Portfolio, the largest equity holding this period. Investment choices in the information technology sector - particularly among software & services and semiconductor companies - detracted the most.
•Conversely, stock selection in developed international markets was a plus, propelled by Fidelity® International Discovery Fund and Fidelity® Overseas Fund. Picks in continental Europe fueled the former, while investment choices in the U.K. helped the latter.
•Security selection among investment-grade bonds also added value, driven by the efforts of our active bond fund managers. In contrast, stocks picks in emerging-markets equities modestly detracted.
•As of December 31, the Portfolios were overweight U.S. stocks and about neutrally weighted in international developed- and emerging-markets equities. Investment-grade bond and cash allocations remained below the Portfolios' target weightings.
How did the Fund perform over the past 10 years?
CUMULATIVE PERFORMANCE
December 31, 2014 through December 31, 2024.
Initial investment of $10,000.
Service Class 2 | $10,000 | $10,035 | $10,584 | $13,007 | $11,826 | $14,917 | $17,493 | $20,579 | $17,041 | $20,020 | $22,499 |
Fidelity VIP FundsManager 85% Composite Index℠ | $10,000 | $10,033 | $10,867 | $12,975 | $12,135 | $15,212 | $17,643 | $20,771 | $17,159 | $20,484 | $23,360 |
S&P 500® Index | $10,000 | $10,138 | $11,351 | $13,829 | $13,223 | $17,386 | $20,585 | $26,494 | $21,696 | $27,399 | $34,254 |
| | 2014 | 2015 | 2016 | 2017 | 2018 | 2019 | 2020 | 2021 | 2022 | 2023 | 2024 |
AVERAGE ANNUAL TOTAL RETURNS:| | 1 Year | 5 Year | 10 Year |
| Service Class 2 | 12.38% | 8.57% | 8.45% |
| Fidelity VIP FundsManager 85% Composite Index℠ | 14.04% | 8.96% | 8.85% |
| S&P 500® Index | 25.02% | 14.53% | 13.10% |
Visit institutional.fidelity.com for more recent performance information. |
The Fund's past performance is not a good predictor of the Fund's future performance. The graph and table do not reflect the deduction of taxes that a shareholder would pay on fund distributions or redemption of fund shares. |
Key Fund Statistics(as of December 31, 2024)
KEY FACTS | | |
| Fund Size | $959,355,337 | |
| Number of Holdings | 42 | |
| Total Advisory Fee | $896,733 | |
| Portfolio Turnover | 34% | |
What did the Fund invest in?
(as of December 31, 2024)
| Domestic Equity Funds | 53.5 |
| International Equity Funds | 31.8 |
| Bond Funds | 13.1 |
| Alternative Funds | 1.3 |
| Short-Term Investments and Net Other Assets (Liabilities) | 0.3 |
ASSET ALLOCATION (% of Fund's net assets) |
|
| | Domestic Equity Funds - 53.5 |
| | International Equity Funds - 31.8 |
| | Bond Funds - 13.1 |
| | Alternative Funds - 1.3 |
| | Short-Term Investments and Net Other Assets (Liabilities) - 0.3 |
| |
TOP HOLDINGS(% of Fund's net assets) | | |
| VIP Stock Selector All Cap Portfolio - Investor Class | 43.2 | |
| Fidelity Overseas Fund | 9.7 | |
| Fidelity Emerging Markets Fund | 8.9 | |
| Fidelity Total Bond Fund | 4.8 | |
| VIP Investment Grade Bond II Portfolio - Investor Class | 4.8 | |
| Fidelity International Discovery Fund | 2.5 | |
| Fidelity Stock Selector Small Cap Fund | 2.3 | |
| Fidelity Enhanced International ETF | 2.2 | |
| Fidelity International Capital Appreciation Fund | 2.1 | |
| VIP Value Strategies Portfolio - Investor Class | 2.0 | |
| | 82.5 | |
How has the Fund changed?
This is a summary of certain changes to the Fund since January 1, 2024. For more complete information, you may review the Fund's next prospectus, which we expect to be available by April 30, 2025 at fundresearch.fidelity.com/prospectus/sec or upon request at 1-877-208-0098 or by sending an e-mail to funddocuments@fmr.com.
The fund modified its principal investment strategies during the reporting period. | The fund modified its principal investment risks during the reporting period.
|
| Fidelity, the Fidelity Investments Logo and all other Fidelity trademarks or service marks used herein are trademarks or service marks of FMR LLC. Any third-party marks that are used herein are trademarks or service marks of their respective owners. © 2025 FMR LLC. All rights reserved. |
| | For additional information about the Fund; including its prospectus, financial information, holdings and proxy information, scan the QR code or visit fundresearch.fidelity.com/prospectus/sec 1.9914314.100 1595-TSRA-0325 |
| |
| | ANNUAL SHAREHOLDER REPORT | AS OF DECEMBER 31, 2024 | This report describes changes to the Fund that occurred during the reporting period. |
| | VIP Freedom 2065 Portfolio℠ VIP Freedom 2065 Portfolio℠ Initial Class true |
| | | |
This annual shareholder report contains information about VIP Freedom 2065 Portfolio℠ for the period January 1, 2024 to December 31, 2024. You can find additional information about the Fund at fundresearch.fidelity.com/prospectus/sec. You can also request this information by contacting us at 1-877-208-0098 or by sending an e-mail to funddocuments@fmr.com.
What were your Fund costs for the last year?(based on hypothetical $10,000 investment)
FUND COST (PREVIOUS YEAR)
| | Costs of a $10,000 investment | Costs paid as a percentage of a $10,000 investment | |
| Initial Class | $ 0 A | 0.00%B | |
AAmount represents less than $.50
BAmount represents less than 0.005%
What affected the Fund's performance this period?
•Risk assets largely produced positive results in 2024, influenced by an expanding global economy and a slowing in the pace of inflation in certain markets, as well as a pivot by some central banks toward monetary easing, despite ongoing geopolitical risk.
•Against this backdrop, active asset allocation positioning detracted from the fund's performance relative to the Composite index, whereas the performance of the underlying investment portfolios contributed.
•In terms of active asset allocation, an underweight in outperforming U.S. equities hurt the fund's relative result the past 12 months, as did an overweight in lagging long-term U.S. Treasurys and outsized exposure to non-U.S. equities. Conversely, an underweight in relatively weaker-performing investment-grade bonds added relative value for the fund.
•Looking at the performance of the underlying portfolios, investments in non-U.S. equities contributed to the fund's relative result. Investments in U.S. investment-grade bonds and U.S. equities also helped to a lesser extent. Within U.S. equities, VIP Contrafund Portfolio (+33.79%) notably outperformed its benchmark, the S&P 500® index (+25.02%). Elsewhere among non-U.S. equities, VIP Overseas Portfolio (+5%) topped the MSCI EAFE index (+4.07%) and VIP Emerging Markets Portfolio (+10.04%) outpaced the MSCI EM Index (+7.50%).
•At the other end of the performance spectrum of underlying funds, within equities, VIP Growth Portfolio (+30.39%) lagged its benchmark, the Russell 3000® Index (+32.46%), and VIP Growth & Income Portfolio (+22.21%) trailed the S&P 500® index.
How did the Fund perform over the life of Fund?
CUMULATIVE PERFORMANCE
April 11, 2019 through December 31, 2024.
Initial investment of $10,000.
Initial Class | $10,000 | $11,179 | $13,343 | $15,719 | $12,855 | $15,342 |
Fidelity VIP Freedom 2065 Composite Index℠ | $10,000 | $11,078 | $12,911 | $15,000 | $12,279 | $14,749 |
S&P 500® Index | $10,000 | $11,346 | $13,433 | $17,289 | $14,158 | $17,880 |
| | 2019 | 2020 | 2021 | 2022 | 2023 | 2024 |
AVERAGE ANNUAL TOTAL RETURNS:| | 1 Year | 5 Year | Life of Fund A |
| Initial Class | 13.85% | 9.34% | 10.23% |
| Fidelity VIP Freedom 2065 Composite Index℠ | 14.43% | 8.78% | 9.57% |
| S&P 500® Index | 25.02% | 14.53% | 15.07% |
A From April 11, 2019
Visit institutional.fidelity.com for more recent performance information. |
The Fund's past performance is not a good predictor of the Fund's future performance. The graph and table do not reflect the deduction of taxes that a shareholder would pay on fund distributions or redemption of fund shares. |
Key Fund Statistics(as of December 31, 2024)
KEY FACTS | | |
| Fund Size | $7,325,971 | |
| Number of Holdings | 11 | |
| Total Advisory Fee | $0 | |
| Portfolio Turnover | 50% | |
What did the Fund invest in?
(as of December 31, 2024)
| Domestic Equity Funds | 51.5 |
| International Equity Funds | 40.9 |
| Bond Funds | 7.6 |
| Short-Term Investments and Net Other Assets (Liabilities) | 0.0 |
ASSET ALLOCATION (% of Fund's net assets) |
|
| | Domestic Equity Funds - 51.5 |
| | International Equity Funds - 40.9 |
| | Bond Funds - 7.6 |
| | Short-Term Investments and Net Other Assets (Liabilities) - 0.0 |
| |
TOP HOLDINGS(% of Fund's net assets) | | |
| VIP Overseas Portfolio - Initial Class | 27.8 | |
| VIP Growth Portfolio - Initial Class | 15.0 | |
| VIP Emerging Markets Portfolio - Initial Class | 13.1 | |
| VIP Growth & Income Portfolio - Initial Class | 10.1 | |
| VIP Contrafund Portfolio - Initial Class | 9.0 | |
| VIP Equity-Income Portfolio - Initial Class | 7.4 | |
| Fidelity Long-Term Treasury Bond Index Fund | 6.6 | |
| VIP Value Portfolio - Initial Class | 5.1 | |
| VIP Value Strategies Portfolio - Initial Class | 2.6 | |
| VIP Mid Cap Portfolio - Initial Class | 2.3 | |
| | 99.0 | |
How has the Fund changed?
This is a summary of certain changes to the Fund since January 1, 2024. For more complete information, you may review the Fund's next prospectus, which we expect to be available by April 30, 2025 at fundresearch.fidelity.com/prospectus/sec or upon request at 1-877-208-0098 or by sending an e-mail to funddocuments@fmr.com.
The fund added a contractual proxy and shareholder meeting expense cap during the reporting period. | |
| Fidelity, the Fidelity Investments Logo and all other Fidelity trademarks or service marks used herein are trademarks or service marks of FMR LLC. Any third-party marks that are used herein are trademarks or service marks of their respective owners. © 2025 FMR LLC. All rights reserved. |
| | For additional information about the Fund; including its prospectus, financial information, holdings and proxy information, scan the QR code or visit fundresearch.fidelity.com/prospectus/sec 1.9914390.100 3362-TSRA-0325 |
| |
| | ANNUAL SHAREHOLDER REPORT | AS OF DECEMBER 31, 2024 | |
| | VIP Freedom 2045 Portfolio℠ VIP Freedom 2045 Portfolio℠ Service Class true |
| | | |
This annual shareholder report contains information about VIP Freedom 2045 Portfolio℠ for the period January 1, 2024 to December 31, 2024. You can find additional information about the Fund at fundresearch.fidelity.com/prospectus/sec. You can also request this information by contacting us at 1-877-208-0098 or by sending an e-mail to funddocuments@fmr.com.
What were your Fund costs for the last year?(based on hypothetical $10,000 investment)
FUND COST (PREVIOUS YEAR)
| | Costs of a $10,000 investment | Costs paid as a percentage of a $10,000 investment | |
| Service Class | $ 11 | 0.10% | |
What affected the Fund's performance this period?
•Risk assets largely produced positive results in 2024, influenced by an expanding global economy and a slowing in the pace of inflation in certain markets, as well as a pivot by some central banks toward monetary easing, despite ongoing geopolitical risk.
•Against this backdrop, active asset allocation positioning detracted from the fund's performance relative to the Composite index, whereas the performance of the underlying investment portfolios contributed.
•In terms of active asset allocation, an underweight in outperforming U.S. equities hurt the fund's relative result the past 12 months, as did an overweight in lagging long-term U.S. Treasurys and outsized exposure to non-U.S. equities. Conversely, an underweight in relatively weaker-performing investment-grade bonds added relative value for the fund.
•Looking at the performance of the underlying portfolios, investments in non-U.S. equities contributed to the fund's relative result. Investments in U.S. investment-grade bonds and U.S. equities also helped to a lesser extent. Within U.S. equities, VIP Contrafund Portfolio (+33.79%) notably outperformed its benchmark, the S&P 500® index (+25.02%). Elsewhere among non-U.S. equities, VIP Overseas Portfolio (+5%) topped the MSCI EAFE index (+4.07%) and VIP Emerging Markets Portfolio (+10.04%) outpaced the MSCI EM Index (+7.50%).
•At the other end of the performance spectrum of underlying funds, within equities, VIP Growth Portfolio (+30.39%) lagged its benchmark, the Russell 3000® Index (+32.46%), and VIP Growth & Income Portfolio (+22.21%) trailed the S&P 500® index.
How did the Fund perform over the past 10 years?
CUMULATIVE PERFORMANCE
December 31, 2014 through December 31, 2024.
Initial investment of $10,000.
Service Class | $10,000 | $9,963 | $10,634 | $13,125 | $11,817 | $15,173 | $18,083 | $21,282 | $17,386 | $20,747 | $23,590 |
Fidelity VIP Freedom 2045 Composite Index℠ | $10,000 | $9,894 | $10,838 | $13,109 | $12,185 | $15,394 | $17,940 | $20,843 | $17,062 | $20,494 | $23,452 |
S&P 500® Index | $10,000 | $10,138 | $11,351 | $13,829 | $13,223 | $17,386 | $20,585 | $26,494 | $21,696 | $27,399 | $34,254 |
| | 2014 | 2015 | 2016 | 2017 | 2018 | 2019 | 2020 | 2021 | 2022 | 2023 | 2024 |
AVERAGE ANNUAL TOTAL RETURNS:| | 1 Year | 5 Year | 10 Year |
| Service Class | 13.70% | 9.23% | 8.96% |
| Fidelity VIP Freedom 2045 Composite Index℠ | 14.43% | 8.78% | 8.90% |
| S&P 500® Index | 25.02% | 14.53% | 13.10% |
Visit institutional.fidelity.com for more recent performance information. |
The Fund's past performance is not a good predictor of the Fund's future performance. The graph and table do not reflect the deduction of taxes that a shareholder would pay on fund distributions or redemption of fund shares. |
Key Fund Statistics(as of December 31, 2024)
KEY FACTS | | |
| Fund Size | $193,295,202 | |
| Number of Holdings | 11 | |
| Total Advisory Fee | $0 | |
| Portfolio Turnover | 31% | |
What did the Fund invest in?
(as of December 31, 2024)
| Domestic Equity Funds | 51.5 |
| International Equity Funds | 40.9 |
| Bond Funds | 7.6 |
| Short-Term Investments and Net Other Assets (Liabilities) | 0.0 |
ASSET ALLOCATION (% of Fund's net assets) |
|
| | Domestic Equity Funds - 51.5 |
| | International Equity Funds - 40.9 |
| | Bond Funds - 7.6 |
| | Short-Term Investments and Net Other Assets (Liabilities) - 0.0 |
| |
TOP HOLDINGS(% of Fund's net assets) | | |
| VIP Overseas Portfolio - Initial Class | 27.8 | |
| VIP Growth Portfolio - Initial Class | 15.0 | |
| VIP Emerging Markets Portfolio - Initial Class | 13.1 | |
| VIP Growth & Income Portfolio - Initial Class | 10.1 | |
| VIP Contrafund Portfolio - Initial Class | 9.0 | |
| VIP Equity-Income Portfolio - Initial Class | 7.4 | |
| Fidelity Long-Term Treasury Bond Index Fund | 6.6 | |
| VIP Value Portfolio - Initial Class | 5.1 | |
| VIP Value Strategies Portfolio - Initial Class | 2.6 | |
| VIP Mid Cap Portfolio - Initial Class | 2.3 | |
| | 99.0 | |
| Fidelity, the Fidelity Investments Logo and all other Fidelity trademarks or service marks used herein are trademarks or service marks of FMR LLC. Any third-party marks that are used herein are trademarks or service marks of their respective owners. © 2025 FMR LLC. All rights reserved. |
| | For additional information about the Fund; including its prospectus, financial information, holdings and proxy information, scan the QR code or visit fundresearch.fidelity.com/prospectus/sec 1.9914337.100 2166-TSRA-0325 |
| |
| | ANNUAL SHAREHOLDER REPORT | AS OF DECEMBER 31, 2024 | This report describes changes to the Fund that occurred during the reporting period. |
| | VIP FundsManager® 60% Portfolio VIP FundsManager® 60% Portfolio Service Class true |
| | | |
This annual shareholder report contains information about VIP FundsManager® 60% Portfolio for the period January 1, 2024 to December 31, 2024. You can find additional information about the Fund at fundresearch.fidelity.com/prospectus/sec. You can also request this information by contacting us at 1-877-208-0098 or by sending an e-mail to funddocuments@fmr.com.
What were your Fund costs for the last year?(based on hypothetical $10,000 investment)
FUND COST (PREVIOUS YEAR)
| | Costs of a $10,000 investment | Costs paid as a percentage of a $10,000 investment | |
| Service Class | $ 10 | 0.10% | |
What affected the Fund's performance this period?
•Risk assets largely produced positive results in 2024, influenced by an expanding global economy, a slowing in the pace of inflation in certain markets, and a pivot by some central banks toward monetary easing, despite ongoing geopolitical risk.
•Within this environment, asset class positioning contributed to the Portfolios' performance versus the Composite indexes, whereas security selection detracted.
•The Portfolios' core equity allocation strategy contributed to relative performance, led by an overweight among U.S. stocks. Equal-weight positioning in international developed- and emerging-markets equities added modest value. Meanwhile, small, out-of-benchmark allocations to real estate investment trusts and commodity-related securities slightly detracted.
•The portfolio's fixed-income allocation strategy also was beneficial from a relative performance standpoint. Specifically, an underweight in investment-grade bonds and cash, in favor of higher-risks segments of the fixed market was advantageous. That said, a small allocation to long-term U.S. Treasurys hurt.
•In terms of security selection, picks among U.S. equities notably pressured relative performance in 2024 due to disappointing results from Fidelity® VIP Stock Selector All Cap Portfolio, the largest equity holding this period. Investment choices in the information technology sector - particularly among software & services and semiconductor companies - detracted the most.
•Conversely, stock selection in developed international markets was a plus, propelled by Fidelity® International Discovery Fund and Fidelity® Overseas Fund. Picks in continental Europe fueled the former, while investment choices in the U.K. helped the latter.
•Security selection among investment-grade bonds also added value, driven by the efforts of our active bond fund managers. In contrast, stocks picks in emerging-markets equities modestly detracted.
•As of December 31, the Portfolios were overweight U.S. stocks and about neutrally weighted in international developed- and emerging-markets equities. Investment-grade bond and cash allocations remained below the Portfolios' target weightings.
How did the Fund perform over the past 10 years?
CUMULATIVE PERFORMANCE
December 31, 2014 through December 31, 2024.
Initial investment of $10,000.
Service Class | $10,000 | $10,041 | $10,522 | $12,309 | $11,517 | $13,876 | $15,975 | $17,947 | $15,244 | $17,404 | $19,071 |
Fidelity VIP FundsManager 60% Composite Index℠ | $10,000 | $10,051 | $10,711 | $12,252 | $11,714 | $14,057 | $15,964 | $17,855 | $15,128 | $17,431 | $19,242 |
S&P 500® Index | $10,000 | $10,138 | $11,351 | $13,829 | $13,223 | $17,386 | $20,585 | $26,494 | $21,696 | $27,399 | $34,254 |
| | 2014 | 2015 | 2016 | 2017 | 2018 | 2019 | 2020 | 2021 | 2022 | 2023 | 2024 |
AVERAGE ANNUAL TOTAL RETURNS:| | 1 Year | 5 Year | 10 Year |
| Service Class | 9.58% | 6.57% | 6.67% |
| Fidelity VIP FundsManager 60% Composite Index℠ | 10.39% | 6.48% | 6.76% |
| S&P 500® Index | 25.02% | 14.53% | 13.10% |
Visit institutional.fidelity.com for more recent performance information. |
The Fund's past performance is not a good predictor of the Fund's future performance. The graph and table do not reflect the deduction of taxes that a shareholder would pay on fund distributions or redemption of fund shares. |
Key Fund Statistics(as of December 31, 2024)
KEY FACTS | | |
| Fund Size | $6,873,861,179 | |
| Number of Holdings | 39 | |
| Total Advisory Fee | $6,697,647 | |
| Portfolio Turnover | 28% | |
What did the Fund invest in?
(as of December 31, 2024)
| Domestic Equity Funds | 38.2 |
| Bond Funds | 33.8 |
| International Equity Funds | 23.7 |
| Alternative Funds | 1.3 |
| Short-Term Investments and Net Other Assets (Liabilities) | 3.0 |
ASSET ALLOCATION (% of Fund's net assets) |
|
| | Domestic Equity Funds - 38.2 |
| | Bond Funds - 33.8 |
| | International Equity Funds - 23.7 |
| | Alternative Funds - 1.3 |
| | Short-Term Investments and Net Other Assets (Liabilities) - 3.0 |
| |
TOP HOLDINGS(% of Fund's net assets) | | |
| VIP Stock Selector All Cap Portfolio - Investor Class | 30.1 | |
| Fidelity Total Bond Fund | 15.0 | |
| VIP Investment Grade Bond II Portfolio - Investor Class | 14.9 | |
| Fidelity Overseas Fund | 7.0 | |
| Fidelity Emerging Markets Fund | 6.4 | |
| Fidelity Enhanced International ETF | 1.8 | |
| Fidelity International Discovery Fund | 1.7 | |
| Fidelity Stock Selector Small Cap Fund | 1.6 | |
| Fidelity Inflation-Protected Bond Index Fund | 1.4 | |
| Fidelity International Capital Appreciation Fund | 1.4 | |
| | 81.3 | |
How has the Fund changed?
This is a summary of certain changes to the Fund since January 1, 2024. For more complete information, you may review the Fund's next prospectus, which we expect to be available by April 30, 2025 at fundresearch.fidelity.com/prospectus/sec or upon request at 1-877-208-0098 or by sending an e-mail to funddocuments@fmr.com.
The fund modified its principal investment strategies during the reporting period. | The fund modified its principal investment risks during the reporting period.
|
| Fidelity, the Fidelity Investments Logo and all other Fidelity trademarks or service marks used herein are trademarks or service marks of FMR LLC. Any third-party marks that are used herein are trademarks or service marks of their respective owners. © 2025 FMR LLC. All rights reserved. |
| | For additional information about the Fund; including its prospectus, financial information, holdings and proxy information, scan the QR code or visit fundresearch.fidelity.com/prospectus/sec 1.9914324.100 1881-TSRA-0325 |
| |
| | ANNUAL SHAREHOLDER REPORT | AS OF DECEMBER 31, 2024 | This report describes changes to the Fund that occurred during the reporting period. |
| | VIP Strategic Income Portfolio VIP Strategic Income Portfolio Service Class true |
| | | |
This annual shareholder report contains information about VIP Strategic Income Portfolio for the period January 1, 2024 to December 31, 2024. You can find additional information about the Fund at fundresearch.fidelity.com/prospectus/sec. You can also request this information by contacting us at 1-877-208-0098 or by sending an e-mail to funddocuments@fmr.com.
What were your Fund costs for the last year?(based on hypothetical $10,000 investment)
FUND COST (PREVIOUS YEAR)
| | Costs of a $10,000 investment | Costs paid as a percentage of a $10,000 investment | |
| Service Class | $ 77 | 0.75% | |
What affected the Fund's performance this period?
•Risk assets fared well in 2024, driven by a sturdy economy, the U.S. Federal Reserve's long-anticipated pivot to cutting interest rates and the potential for artificial intelligence to drive transformative change.
•Against this backdrop, compared with the Fidelity Strategic Income Composite IndexSM, security selection among high-yield bonds meaningfully contributed to the fund's result, especially picks in the energy, technology & electronics and financial services categories.
•Investment choices in emerging-markets debt also added value relative to the Composite index, with bond picks in Chile and Peru as standouts.
•On the negative side, an allocation to U.S. Treasury futures, a position we established to help offset the portfolio's overall lower duration, underperformed in a generally rising interest-rate environment.
•Changes to the portfolio this period, which were modest, included adding exposure to emerging-markets debt and developed-markets international debt, while reducing the fund's allocation to floating-rate loans and high-yield bonds.
How did the Fund perform over the past 10 years?
CUMULATIVE PERFORMANCE
December 31, 2014 through December 31, 2024.
Initial investment of $10,000.
Service Class | $10,000 | $9,827 | $10,628 | $11,447 | $11,140 | $12,345 | $13,279 | $13,753 | $12,187 | $13,336 | $14,117 |
Fidelity Strategic Income Composite Index℠ | $10,000 | $9,764 | $10,671 | $11,388 | $11,224 | $12,406 | $13,229 | $13,394 | $11,829 | $12,952 | $13,629 |
Bloomberg U.S. Universal Bond Index | $10,000 | $10,043 | $10,436 | $10,863 | $10,835 | $11,842 | $12,739 | $12,598 | $10,961 | $11,638 | $11,875 |
| | 2014 | 2015 | 2016 | 2017 | 2018 | 2019 | 2020 | 2021 | 2022 | 2023 | 2024 |
AVERAGE ANNUAL TOTAL RETURNS:| | 1 Year | 5 Year | 10 Year |
| Service Class | 5.86% | 2.72% | 3.51% |
| Fidelity Strategic Income Composite Index℠ | 5.23% | 1.90% | 3.14% |
| Bloomberg U.S. Universal Bond Index | 2.04% | 0.06% | 1.73% |
Visit institutional.fidelity.com for more recent performance information. |
The Fund's past performance is not a good predictor of the Fund's future performance. The graph and table do not reflect the deduction of taxes that a shareholder would pay on fund distributions or redemption of fund shares. |
Key Fund Statistics(as of December 31, 2024)
KEY FACTS | | |
| Fund Size | $1,508,793,887 | |
| Number of Holdings | 1,470 | |
| Total Advisory Fee | $9,132,751 | |
| Portfolio Turnover | 77% | |
What did the Fund invest in?
(as of December 31, 2024)
The information in the following tables is based on the combined Investments of the Fund and it's pro-rata share of investments in Fidelity's Central Funds, other than the Commodity Strategy and Money Market Central Funds as applicable.
| U.S. Government and U.S. Government Agency Obligations | 24.8 |
| AAA | 2.9 |
| AA | 1.8 |
| A | 1.9 |
| BBB | 7.6 |
| BB | 13.4 |
| B | 17.9 |
| CCC,CC,C | 5.6 |
| D | 0.0 |
| Not Rated | 9.0 |
| Equities | 7.0 |
| Short-Term Investments and Net Other Assets (Liabilities) | 8.1 |
QUALITY DIVERSIFICATION (% of Fund's net assets) |
| |
| | U.S. Government and U.S. Government Agency Obligations - 24.8 |
| | AAA - 2.9 |
| | AA - 1.8 |
| | A - 1.9 |
| | BBB - 7.6 |
| | BB - 13.4 |
| | B - 17.9 |
| | CCC,CC,C - 5.6 |
| | D - 0.0 |
| | Not Rated - 9.0 |
| | Equities - 7.0 |
| | Short-Term Investments and Net Other Assets (Liabilities) - 8.1 |
| |
| We have used ratings from Moody's Investors Service, Inc. Where Moody's® ratings are not available, we have used S&P® ratings. All ratings are as of the date indicated and do not reflect subsequent changes. |
| High-Yield Debt | 40.6 |
| U.S. Government & Investment Grade-Debt | 30.1 |
| Emerging-Markets Debt | 15.5 |
| Foreign Developed-Markets Debt | 8.5 |
| Floating-Rate debt | 5.0 |
| Short-Term Investments and Net Other Assets (Liabilities) | 0.3 |
ASSET ALLOCATION (% of Fund's net assets) |
|
| | High-Yield Debt - 40.6 |
| | U.S. Government & Investment Grade-Debt - 30.1 |
| | Emerging-Markets Debt - 15.5 |
| | Foreign Developed-Markets Debt - 8.5 |
| | Floating-Rate debt - 5.0 |
| | Short-Term Investments and Net Other Assets (Liabilities) - 0.3 |
| |
| United States | 74.6 |
| Germany | 6.1 |
| Mexico | 1.3 |
| Brazil | 1.1 |
| United Kingdom | 1.1 |
| Canada | 1.0 |
| France | 1.0 |
| Saudi Arabia | 0.8 |
| Turkey | 0.8 |
| Others | 12.2 |
GEOGRAPHIC DIVERSIFICATION (% of Fund's net assets) |
|
| | United States - 74.6 |
| | Germany - 6.1 |
| | Mexico - 1.3 |
| | Brazil - 1.1 |
| | United Kingdom - 1.1 |
| | Canada - 1.0 |
| | France - 1.0 |
| | Saudi Arabia - 0.8 |
| | Turkey - 0.8 |
| | Others - 12.2 |
| |
TOP HOLDINGS(% of Fund's net assets) | | |
| US Treasury Notes | 18.8 | |
| US Treasury Bonds | 5.7 | |
| German Federal Republic | 5.7 | |
| Freddie Mac Multifamily Structured pass-thru certificates | 3.9 | |
| TransDigm Inc | 1.3 | |
| EchoStar Corp | 0.8 | |
| Energy Transfer LP | 0.8 | |
| Argentine Republic | 0.7 | |
| Turkish Republic | 0.7 | |
| NVIDIA Corp | 0.7 | |
| | 39.1 | |
How has the Fund changed?
This is a summary of certain changes to the Fund since January 1, 2024. For more complete information, you may review the Fund's next prospectus, which we expect to be available by April 30, 2025 at fundresearch.fidelity.com/prospectus/sec or upon request at 1-877-208-0098 or by sending an e-mail to funddocuments@fmr.com.
The fund's transfer agent and pricing & bookkeeping fees were changed to a fixed rate effective December 1, 2023. Effective March 1, 2024, the fund's management contract was amended to incorporate administrative services previously covered under separate services agreements (transfer agent and pricing & bookkeeping). The amended contract incorporates a management fee rate that may vary by class. The Adviser or an affiliate pays certain expenses of managing and operating the fund out of each class's management fee. | |
| Fidelity, the Fidelity Investments Logo and all other Fidelity trademarks or service marks used herein are trademarks or service marks of FMR LLC. Any third-party marks that are used herein are trademarks or service marks of their respective owners. © 2025 FMR LLC. All rights reserved. |
| | For additional information about the Fund; including its prospectus, financial information, holdings and proxy information, scan the QR code or visit fundresearch.fidelity.com/prospectus/sec 1.9914256.100 1327-TSRA-0325 |
| |
| | ANNUAL SHAREHOLDER REPORT | AS OF DECEMBER 31, 2024 | |
| | VIP Freedom 2045 Portfolio℠ VIP Freedom 2045 Portfolio℠ Initial Class true |
| | | |
This annual shareholder report contains information about VIP Freedom 2045 Portfolio℠ for the period January 1, 2024 to December 31, 2024. You can find additional information about the Fund at fundresearch.fidelity.com/prospectus/sec. You can also request this information by contacting us at 1-877-208-0098 or by sending an e-mail to funddocuments@fmr.com.
What were your Fund costs for the last year?(based on hypothetical $10,000 investment)
FUND COST (PREVIOUS YEAR)
| | Costs of a $10,000 investment | Costs paid as a percentage of a $10,000 investment | |
| Initial Class | $ 0 A | 0.00%B | |
AAmount represents less than $.50
BAmount represents less than 0.005%
What affected the Fund's performance this period?
•Risk assets largely produced positive results in 2024, influenced by an expanding global economy and a slowing in the pace of inflation in certain markets, as well as a pivot by some central banks toward monetary easing, despite ongoing geopolitical risk.
•Against this backdrop, active asset allocation positioning detracted from the fund's performance relative to the Composite index, whereas the performance of the underlying investment portfolios contributed.
•In terms of active asset allocation, an underweight in outperforming U.S. equities hurt the fund's relative result the past 12 months, as did an overweight in lagging long-term U.S. Treasurys and outsized exposure to non-U.S. equities. Conversely, an underweight in relatively weaker-performing investment-grade bonds added relative value for the fund.
•Looking at the performance of the underlying portfolios, investments in non-U.S. equities contributed to the fund's relative result. Investments in U.S. investment-grade bonds and U.S. equities also helped to a lesser extent. Within U.S. equities, VIP Contrafund Portfolio (+33.79%) notably outperformed its benchmark, the S&P 500® index (+25.02%). Elsewhere among non-U.S. equities, VIP Overseas Portfolio (+5%) topped the MSCI EAFE index (+4.07%) and VIP Emerging Markets Portfolio (+10.04%) outpaced the MSCI EM Index (+7.50%).
•At the other end of the performance spectrum of underlying funds, within equities, VIP Growth Portfolio (+30.39%) lagged its benchmark, the Russell 3000® Index (+32.46%), and VIP Growth & Income Portfolio (+22.21%) trailed the S&P 500® index.
How did the Fund perform over the past 10 years?
CUMULATIVE PERFORMANCE
December 31, 2014 through December 31, 2024.
Initial investment of $10,000.
Initial Class | $10,000 | $9,974 | $10,653 | $13,165 | $11,863 | $15,253 | $18,191 | $21,434 | $17,530 | $20,933 | $23,830 |
Fidelity VIP Freedom 2045 Composite Index℠ | $10,000 | $9,894 | $10,838 | $13,109 | $12,185 | $15,394 | $17,940 | $20,843 | $17,062 | $20,494 | $23,452 |
S&P 500® Index | $10,000 | $10,138 | $11,351 | $13,829 | $13,223 | $17,386 | $20,585 | $26,494 | $21,696 | $27,399 | $34,254 |
| | 2014 | 2015 | 2016 | 2017 | 2018 | 2019 | 2020 | 2021 | 2022 | 2023 | 2024 |
AVERAGE ANNUAL TOTAL RETURNS:| | 1 Year | 5 Year | 10 Year |
| Initial Class | 13.84% | 9.33% | 9.07% |
| Fidelity VIP Freedom 2045 Composite Index℠ | 14.43% | 8.78% | 8.90% |
| S&P 500® Index | 25.02% | 14.53% | 13.10% |
Visit institutional.fidelity.com for more recent performance information. |
The Fund's past performance is not a good predictor of the Fund's future performance. The graph and table do not reflect the deduction of taxes that a shareholder would pay on fund distributions or redemption of fund shares. |
Key Fund Statistics(as of December 31, 2024)
KEY FACTS | | |
| Fund Size | $193,295,202 | |
| Number of Holdings | 11 | |
| Total Advisory Fee | $0 | |
| Portfolio Turnover | 31% | |
What did the Fund invest in?
(as of December 31, 2024)
| Domestic Equity Funds | 51.5 |
| International Equity Funds | 40.9 |
| Bond Funds | 7.6 |
| Short-Term Investments and Net Other Assets (Liabilities) | 0.0 |
ASSET ALLOCATION (% of Fund's net assets) |
|
| | Domestic Equity Funds - 51.5 |
| | International Equity Funds - 40.9 |
| | Bond Funds - 7.6 |
| | Short-Term Investments and Net Other Assets (Liabilities) - 0.0 |
| |
TOP HOLDINGS(% of Fund's net assets) | | |
| VIP Overseas Portfolio - Initial Class | 27.8 | |
| VIP Growth Portfolio - Initial Class | 15.0 | |
| VIP Emerging Markets Portfolio - Initial Class | 13.1 | |
| VIP Growth & Income Portfolio - Initial Class | 10.1 | |
| VIP Contrafund Portfolio - Initial Class | 9.0 | |
| VIP Equity-Income Portfolio - Initial Class | 7.4 | |
| Fidelity Long-Term Treasury Bond Index Fund | 6.6 | |
| VIP Value Portfolio - Initial Class | 5.1 | |
| VIP Value Strategies Portfolio - Initial Class | 2.6 | |
| VIP Mid Cap Portfolio - Initial Class | 2.3 | |
| | 99.0 | |
| Fidelity, the Fidelity Investments Logo and all other Fidelity trademarks or service marks used herein are trademarks or service marks of FMR LLC. Any third-party marks that are used herein are trademarks or service marks of their respective owners. © 2025 FMR LLC. All rights reserved. |
| | For additional information about the Fund; including its prospectus, financial information, holdings and proxy information, scan the QR code or visit fundresearch.fidelity.com/prospectus/sec 1.9914336.100 2165-TSRA-0325 |
| |
| | ANNUAL SHAREHOLDER REPORT | AS OF DECEMBER 31, 2024 | This report describes changes to the Fund that occurred during the reporting period. |
| | VIP Government Money Market Portfolio VIP Government Money Market Portfolio Investor Class true |
| | | |
This annual shareholder report contains information about VIP Government Money Market Portfolio for the period January 1, 2024 to December 31, 2024. You can find additional information about the Fund at fundresearch.fidelity.com/prospectus/sec. You can also request this information by contacting us at 1-877-208-0098 or by sending an e-mail to funddocuments@fmr.com.
What were your Fund costs for the last year?(based on hypothetical $10,000 investment)
FUND COST (PREVIOUS YEAR)
| | Costs of a $10,000 investment | Costs paid as a percentage of a $10,000 investment | |
| Investor Class | $ 31 | 0.30% | |
Key Fund Statistics(as of December 31, 2024)
KEY FACTS | | |
| Fund Size | $8,497,434,407 | |
| Number of Holdings | 552 | |
| Total Advisory Fee | $22,031,036 | |
What did the Fund invest in?
(as of December 31, 2024)
EFFECTIVE MATURITY DIVERSIFICATION (% of Fund's net assets) |
| Days |
| 1-7 | 59.4 | |
| 8-30 | 9.4 | |
| 31-60 | 13.8 | |
| 61-90 | 7.4 | |
| 91-180 | 7.4 | |
| >180 | 3.4 | |
| |
| Repurchase Agreements | 37.1 |
| U.S. Treasury Obligations | 32.4 |
| U.S. Government Agency - Debt | 31.3 |
ASSET ALLOCATION (% of Fund's net assets) |
|
| | Repurchase Agreements - 37.1 |
| | U.S. Treasury Obligations - 32.4 |
| | U.S. Government Agency - Debt - 31.3 |
| Net Other Assets (Liabilities) - (0.8)% |
| |
How has the Fund changed?
This is a summary of certain changes to the Fund since January 1, 2024. For more complete information, you may review the Fund's next prospectus, which we expect to be available by April 30, 2025 at fundresearch.fidelity.com/prospectus/sec or upon request at 1-877-208-0098 or by sending an e-mail to funddocuments@fmr.com.
The fund's transfer agent and pricing & bookkeeping fees were changed to a fixed rate effective December 1, 2023. Effective March 1, 2024, the fund's management contract was amended to incorporate administrative services previously covered under separate services agreements (transfer agent and pricing & bookkeeping). The amended contract incorporates a management fee rate that may vary by class. The Adviser or an affiliate pays certain expenses of managing and operating the fund out of each class's management fee. | The fund's principal investment risks were updated in connection with the implementation of recent rule amendments related to money market funds adopted by the SEC.
|
| Fidelity, the Fidelity Investments Logo and all other Fidelity trademarks or service marks used herein are trademarks or service marks of FMR LLC. Any third-party marks that are used herein are trademarks or service marks of their respective owners. © 2025 FMR LLC. All rights reserved. |
| | For additional information about the Fund; including its prospectus, financial information, holdings and proxy information, scan the QR code or visit fundresearch.fidelity.com/prospectus/sec 1.9914124.100 1455-TSRA-0325 |
| |
| | ANNUAL SHAREHOLDER REPORT | AS OF DECEMBER 31, 2024 | |
| | VIP Investor Freedom 2045 Portfolio℠ VIP Investor Freedom 2045 Portfolio℠ true |
| | | |
This annual shareholder report contains information about VIP Investor Freedom 2045 Portfolio℠ for the period January 1, 2024 to December 31, 2024. You can find additional information about the Fund at fundresearch.fidelity.com/prospectus/sec. You can also request this information by contacting us at 1-877-208-0098 or by sending an e-mail to funddocuments@fmr.com.
What were your Fund costs for the last year?(based on hypothetical $10,000 investment)
FUND COST (PREVIOUS YEAR)
| | Costs of a $10,000 investment | Costs paid as a percentage of a $10,000 investment | |
| VIP Investor Freedom 2045 Portfolio℠ | $ 0 A | 0.00%B | |
A Amount represents less than $.50
B Amount represents less than 0.005%
What affected the Fund's performance this period?
•Risk assets largely produced positive results in 2024, influenced by an expanding global economy and a slowing in the pace of inflation in certain markets, as well as a pivot by some central banks toward monetary easing, despite ongoing geopolitical risk.
•Against this backdrop, active asset allocation positioning detracted from the fund's performance relative to the Composite index, whereas the performance of the underlying investment portfolios contributed.
•In terms of active asset allocation, an underweight in outperforming U.S. equities hurt the fund's relative result the past 12 months, as did an overweight in lagging long-term U.S. Treasurys and outsized exposure to non-U.S. equities. Conversely, underweighting relatively weaker-performing investment-grade bonds added relative value for the fund.
•Looking at the performance of the underlying portfolios, investments in non-U.S. equities contributed to the fund's relative result. Investments in U.S. investment-grade bonds and U.S. equities also helped to a lesser extent. Within U.S. equities, VIP Contrafund Portfolio (+33.70%) notably outperformed its benchmark, the S&P 500® index (+25.02%). Elsewhere in non-U.S. equities, VIP Overseas Portfolio (+4.97%) topped the MSCI EAFE index (+4.07%) and VIP Emerging Markets Portfolio (+9.90%) outpaced the MSCI EM Index (+7.50%).
•At the other end of the performance spectrum of underlying funds, in terms of equities, VIP Growth Portfolio (+30.30%) lagged its benchmark, the Russell 3000® Index (+32.46%), and VIP Growth & Income Portfolio (+22.18%) trailed the S&P 500® index.
How did the Fund perform over the life of Fund?
CUMULATIVE PERFORMANCE
April 13, 2023 through December 31, 2024.
Initial investment of $10,000.
VIP Investor Freedom 2045 Portfolio℠ | $10,000 | $11,039 |
Fidelity VIP Freedom 2045 Composite Index℠ | $10,000 | $11,108 |
S&P 500® Index | $10,000 | $11,636 |
| | 2023 | 2024 |
AVERAGE ANNUAL TOTAL RETURNS:| | 1 Year | Life of Fund A |
| VIP Investor Freedom 2045 Portfolio℠ | 13.74% | 14.14% |
| Fidelity VIP Freedom 2045 Composite Index℠ | 14.43% | 14.96% |
| S&P 500® Index | 25.02% | 24.34% |
A From April 13, 2023
Visit institutional.fidelity.com for more recent performance information. |
The Fund's past performance is not a good predictor of the Fund's future performance. The graph and table do not reflect the deduction of taxes that a shareholder would pay on fund distributions or redemption of fund shares. |
Key Fund Statistics(as of December 31, 2024)
KEY FACTS | | |
| Fund Size | $4,660,285 | |
| Number of Holdings | 11 | |
| Total Advisory Fee | $0 | |
| Portfolio Turnover | 36% | |
What did the Fund invest in?
(as of December 31, 2024)
| Domestic Equity Funds | 51.5 |
| International Equity Funds | 40.9 |
| Bond Funds | 7.6 |
| Short-Term Investments and Net Other Assets (Liabilities) | 0.0 |
ASSET ALLOCATION (% of Fund's net assets) |
|
| | Domestic Equity Funds - 51.5 |
| | International Equity Funds - 40.9 |
| | Bond Funds - 7.6 |
| | Short-Term Investments and Net Other Assets (Liabilities) - 0.0 |
| |
TOP HOLDINGS(% of Fund's net assets) | | |
| VIP Overseas Portfolio - Investor Class | 27.8 | |
| VIP Growth Portfolio - Investor Class | 15.0 | |
| VIP Emerging Markets Portfolio - Investor Class | 13.1 | |
| VIP Growth & Income Portfolio - Investor Class | 10.1 | |
| VIP Contrafund Portfolio - Investor Class | 9.0 | |
| VIP Equity Income Portfolio - Investor Class | 7.4 | |
| Fidelity Long-Term Treasury Bond Index Fund | 6.6 | |
| VIP Value Portfolio - Investor Class | 5.1 | |
| VIP Value Strategies Portfolio - Investor Class | 2.6 | |
| VIP Mid Cap Portfolio - Investor Class | 2.3 | |
| | 99.0 | |
| Fidelity, the Fidelity Investments Logo and all other Fidelity trademarks or service marks used herein are trademarks or service marks of FMR LLC. Any third-party marks that are used herein are trademarks or service marks of their respective owners. © 2025 FMR LLC. All rights reserved. |
| | For additional information about the Fund; including its prospectus, financial information, holdings and proxy information, scan the QR code or visit fundresearch.fidelity.com/prospectus/sec 1.9914407.100 6576-TSRA-0325 |
| |
| | ANNUAL SHAREHOLDER REPORT | AS OF DECEMBER 31, 2024 | This report describes changes to the Fund that occurred during the reporting period. |
| | VIP FundsManager® 60% Portfolio VIP FundsManager® 60% Portfolio Service Class 2 true |
| | | |
This annual shareholder report contains information about VIP FundsManager® 60% Portfolio for the period January 1, 2024 to December 31, 2024. You can find additional information about the Fund at fundresearch.fidelity.com/prospectus/sec. You can also request this information by contacting us at 1-877-208-0098 or by sending an e-mail to funddocuments@fmr.com.
What were your Fund costs for the last year?(based on hypothetical $10,000 investment)
FUND COST (PREVIOUS YEAR)
| | Costs of a $10,000 investment | Costs paid as a percentage of a $10,000 investment | |
| Service Class 2 | $ 26 | 0.25% | |
What affected the Fund's performance this period?
•Risk assets largely produced positive results in 2024, influenced by an expanding global economy, a slowing in the pace of inflation in certain markets, and a pivot by some central banks toward monetary easing, despite ongoing geopolitical risk.
•Within this environment, asset class positioning contributed to the Portfolios' performance versus the Composite indexes, whereas security selection detracted.
•The Portfolios' core equity allocation strategy contributed to relative performance, led by an overweight among U.S. stocks. Equal-weight positioning in international developed- and emerging-markets equities added modest value. Meanwhile, small, out-of-benchmark allocations to real estate investment trusts and commodity-related securities slightly detracted.
•The portfolio's fixed-income allocation strategy also was beneficial from a relative performance standpoint. Specifically, an underweight in investment-grade bonds and cash, in favor of higher-risks segments of the fixed market was advantageous. That said, a small allocation to long-term U.S. Treasurys hurt.
•In terms of security selection, picks among U.S. equities notably pressured relative performance in 2024 due to disappointing results from Fidelity® VIP Stock Selector All Cap Portfolio, the largest equity holding this period. Investment choices in the information technology sector - particularly among software & services and semiconductor companies - detracted the most.
•Conversely, stock selection in developed international markets was a plus, propelled by Fidelity® International Discovery Fund and Fidelity® Overseas Fund. Picks in continental Europe fueled the former, while investment choices in the U.K. helped the latter.
•Security selection among investment-grade bonds also added value, driven by the efforts of our active bond fund managers. In contrast, stocks picks in emerging-markets equities modestly detracted.
•As of December 31, the Portfolios were overweight U.S. stocks and about neutrally weighted in international developed- and emerging-markets equities. Investment-grade bond and cash allocations remained below the Portfolios' target weightings.
How did the Fund perform over the past 10 years?
CUMULATIVE PERFORMANCE
December 31, 2014 through December 31, 2024.
Initial investment of $10,000.
Service Class 2 | $10,000 | $10,027 | $10,493 | $12,252 | $11,454 | $13,773 | $15,828 | $17,760 | $15,052 | $17,170 | $18,793 |
Fidelity VIP FundsManager 60% Composite Index℠ | $10,000 | $10,051 | $10,711 | $12,252 | $11,714 | $14,057 | $15,964 | $17,855 | $15,128 | $17,431 | $19,242 |
S&P 500® Index | $10,000 | $10,138 | $11,351 | $13,829 | $13,223 | $17,386 | $20,585 | $26,494 | $21,696 | $27,399 | $34,254 |
| | 2014 | 2015 | 2016 | 2017 | 2018 | 2019 | 2020 | 2021 | 2022 | 2023 | 2024 |
AVERAGE ANNUAL TOTAL RETURNS:| | 1 Year | 5 Year | 10 Year |
| Service Class 2 | 9.45% | 6.41% | 6.51% |
| Fidelity VIP FundsManager 60% Composite Index℠ | 10.39% | 6.48% | 6.76% |
| S&P 500® Index | 25.02% | 14.53% | 13.10% |
Visit institutional.fidelity.com for more recent performance information. |
The Fund's past performance is not a good predictor of the Fund's future performance. The graph and table do not reflect the deduction of taxes that a shareholder would pay on fund distributions or redemption of fund shares. |
Key Fund Statistics(as of December 31, 2024)
KEY FACTS | | |
| Fund Size | $6,873,861,179 | |
| Number of Holdings | 39 | |
| Total Advisory Fee | $6,697,647 | |
| Portfolio Turnover | 28% | |
What did the Fund invest in?
(as of December 31, 2024)
| Domestic Equity Funds | 38.2 |
| Bond Funds | 33.8 |
| International Equity Funds | 23.7 |
| Alternative Funds | 1.3 |
| Short-Term Investments and Net Other Assets (Liabilities) | 3.0 |
ASSET ALLOCATION (% of Fund's net assets) |
|
| | Domestic Equity Funds - 38.2 |
| | Bond Funds - 33.8 |
| | International Equity Funds - 23.7 |
| | Alternative Funds - 1.3 |
| | Short-Term Investments and Net Other Assets (Liabilities) - 3.0 |
| |
TOP HOLDINGS(% of Fund's net assets) | | |
| VIP Stock Selector All Cap Portfolio - Investor Class | 30.1 | |
| Fidelity Total Bond Fund | 15.0 | |
| VIP Investment Grade Bond II Portfolio - Investor Class | 14.9 | |
| Fidelity Overseas Fund | 7.0 | |
| Fidelity Emerging Markets Fund | 6.4 | |
| Fidelity Enhanced International ETF | 1.8 | |
| Fidelity International Discovery Fund | 1.7 | |
| Fidelity Stock Selector Small Cap Fund | 1.6 | |
| Fidelity Inflation-Protected Bond Index Fund | 1.4 | |
| Fidelity International Capital Appreciation Fund | 1.4 | |
| | 81.3 | |
How has the Fund changed?
This is a summary of certain changes to the Fund since January 1, 2024. For more complete information, you may review the Fund's next prospectus, which we expect to be available by April 30, 2025 at fundresearch.fidelity.com/prospectus/sec or upon request at 1-877-208-0098 or by sending an e-mail to funddocuments@fmr.com.
The fund modified its principal investment strategies during the reporting period. | The fund modified its principal investment risks during the reporting period.
|
| Fidelity, the Fidelity Investments Logo and all other Fidelity trademarks or service marks used herein are trademarks or service marks of FMR LLC. Any third-party marks that are used herein are trademarks or service marks of their respective owners. © 2025 FMR LLC. All rights reserved. |
| | For additional information about the Fund; including its prospectus, financial information, holdings and proxy information, scan the QR code or visit fundresearch.fidelity.com/prospectus/sec 1.9914325.100 1882-TSRA-0325 |
| |
| | ANNUAL SHAREHOLDER REPORT | AS OF DECEMBER 31, 2024 | |
| | VIP Freedom 2025 Portfolio℠ VIP Freedom 2025 Portfolio℠ Service Class true |
| | | |
This annual shareholder report contains information about VIP Freedom 2025 Portfolio℠ for the period January 1, 2024 to December 31, 2024. You can find additional information about the Fund at fundresearch.fidelity.com/prospectus/sec. You can also request this information by contacting us at 1-877-208-0098 or by sending an e-mail to funddocuments@fmr.com.
What were your Fund costs for the last year?(based on hypothetical $10,000 investment)
FUND COST (PREVIOUS YEAR)
| | Costs of a $10,000 investment | Costs paid as a percentage of a $10,000 investment | |
| Service Class | $ 10 | 0.10% | |
What affected the Fund's performance this period?
•Risk assets largely produced positive results in 2024, influenced by an expanding global economy and a slowing in the pace of inflation in certain markets, as well as a pivot by some central banks toward monetary easing, despite ongoing geopolitical risk.
•Against this backdrop, active asset allocation positioning detracted from the fund's performance relative to the Composite index, whereas the performance of the underlying investment portfolios contributed.
•In terms of active asset allocation, an underweight in outperforming U.S. equities hurt the fund's relative result the past 12 months, as did an overweight in lagging long-term U.S. Treasurys and outsized exposure to non-U.S. equities. Conversely, an underweight in relatively weaker-performing investment-grade bonds added relative value for the fund.
•Looking at the performance of the underlying portfolios, investments in non-U.S. equities contributed to the fund's relative result. Investments in U.S. investment-grade bonds and U.S. equities also helped to a lesser extent. Within U.S. equities, VIP Contrafund Portfolio (+33.79%) notably outperformed its benchmark, the S&P 500® index (+25.02%). Elsewhere among non-U.S. equities, VIP Overseas Portfolio (+5%) topped the MSCI EAFE index (+4.07%) and VIP Emerging Markets Portfolio (+10.04%) outpaced the MSCI EM Index (+7.50%).
•At the other end of the performance spectrum of underlying funds, within equities, VIP Growth Portfolio (+30.39%) lagged its benchmark, the Russell 3000® Index (+32.46%), and VIP Growth & Income Portfolio (+22.21%) trailed the S&P 500® index.
How did the Fund perform over the past 10 years?
CUMULATIVE PERFORMANCE
December 31, 2014 through December 31, 2024.
Initial investment of $10,000.
Service Class | $10,000 | $9,964 | $10,573 | $12,459 | $11,635 | $14,159 | $16,401 | $18,156 | $15,159 | $17,203 | $18,648 |
Fidelity VIP Freedom 2025 Composite Index℠ | $10,000 | $9,947 | $10,701 | $12,368 | $11,828 | $14,193 | $16,117 | $17,707 | $14,874 | $16,975 | $18,500 |
S&P 500® Index | $10,000 | $10,138 | $11,351 | $13,829 | $13,223 | $17,386 | $20,585 | $26,494 | $21,696 | $27,399 | $34,254 |
| | 2014 | 2015 | 2016 | 2017 | 2018 | 2019 | 2020 | 2021 | 2022 | 2023 | 2024 |
AVERAGE ANNUAL TOTAL RETURNS:| | 1 Year | 5 Year | 10 Year |
| Service Class | 8.40% | 5.66% | 6.43% |
| Fidelity VIP Freedom 2025 Composite Index℠ | 8.98% | 5.44% | 6.35% |
| S&P 500® Index | 25.02% | 14.53% | 13.10% |
Visit institutional.fidelity.com for more recent performance information. |
The Fund's past performance is not a good predictor of the Fund's future performance. The graph and table do not reflect the deduction of taxes that a shareholder would pay on fund distributions or redemption of fund shares. |
Key Fund Statistics(as of December 31, 2024)
KEY FACTS | | |
| Fund Size | $391,334,231 | |
| Number of Holdings | 14 | |
| Total Advisory Fee | $0 | |
| Portfolio Turnover | 41% | |
What did the Fund invest in?
(as of December 31, 2024)
| Bond Funds | 44.5 |
| Domestic Equity Funds | 29.4 |
| International Equity Funds | 26.1 |
| Short-Term Investments and Net Other Assets (Liabilities) | 0.0 |
ASSET ALLOCATION (% of Fund's net assets) |
|
| | Bond Funds - 44.5 |
| | Domestic Equity Funds - 29.4 |
| | International Equity Funds - 26.1 |
| | Short-Term Investments and Net Other Assets (Liabilities) - 0.0 |
| |
TOP HOLDINGS(% of Fund's net assets) | | |
| VIP Investment Grade Bond II Portfolio - Initial Class | 20.3 | |
| VIP Overseas Portfolio - Initial Class | 16.9 | |
| Fidelity Inflation-Protected Bond Index Fund | 12.0 | |
| VIP Emerging Markets Portfolio - Initial Class | 9.2 | |
| VIP Growth Portfolio - Initial Class | 8.5 | |
| Fidelity Long-Term Treasury Bond Index Fund | 7.0 | |
| VIP Growth & Income Portfolio - Initial Class | 5.8 | |
| VIP Contrafund Portfolio - Initial Class | 5.1 | |
| VIP Equity-Income Portfolio - Initial Class | 4.2 | |
| Fidelity International Bond Index Fund | 4.0 | |
| | 93.0 | |
| Fidelity, the Fidelity Investments Logo and all other Fidelity trademarks or service marks used herein are trademarks or service marks of FMR LLC. Any third-party marks that are used herein are trademarks or service marks of their respective owners. © 2025 FMR LLC. All rights reserved. |
| | For additional information about the Fund; including its prospectus, financial information, holdings and proxy information, scan the QR code or visit fundresearch.fidelity.com/prospectus/sec 1.9914284.100 1433-TSRA-0325 |
| |
| | ANNUAL SHAREHOLDER REPORT | AS OF DECEMBER 31, 2024 | |
| | VIP Freedom 2030 Portfolio℠ VIP Freedom 2030 Portfolio℠ Service Class true |
| | | |
This annual shareholder report contains information about VIP Freedom 2030 Portfolio℠ for the period January 1, 2024 to December 31, 2024. You can find additional information about the Fund at fundresearch.fidelity.com/prospectus/sec. You can also request this information by contacting us at 1-877-208-0098 or by sending an e-mail to funddocuments@fmr.com.
What were your Fund costs for the last year?(based on hypothetical $10,000 investment)
FUND COST (PREVIOUS YEAR)
| | Costs of a $10,000 investment | Costs paid as a percentage of a $10,000 investment | |
| Service Class | $ 10 | 0.10% | |
What affected the Fund's performance this period?
•Risk assets largely produced positive results in 2024, influenced by an expanding global economy and a slowing in the pace of inflation in certain markets, as well as a pivot by some central banks toward monetary easing, despite ongoing geopolitical risk.
•Against this backdrop, active asset allocation positioning detracted from the fund's performance relative to the Composite index, whereas the performance of the underlying investment portfolios contributed.
•In terms of active asset allocation, an underweight in outperforming U.S. equities hurt the fund's relative result the past 12 months, as did an overweight in lagging long-term U.S. Treasurys and outsized exposure to non-U.S. equities. Conversely, an underweight in relatively weaker-performing investment-grade bonds added relative value for the fund.
•Looking at the performance of the underlying portfolios, investments in non-U.S. equities contributed to the fund's relative result. Investments in U.S. investment-grade bonds and U.S. equities also helped to a lesser extent. Within U.S. equities, VIP Contrafund Portfolio (+33.79%) notably outperformed its benchmark, the S&P 500® index (+25.02%). Elsewhere among non-U.S. equities, VIP Overseas Portfolio (+5%) topped the MSCI EAFE index (+4.07%) and VIP Emerging Markets Portfolio (+10.04%) outpaced the MSCI EM Index (+7.50%).
•At the other end of the performance spectrum of underlying funds, within equities, VIP Growth Portfolio (+30.39%) lagged its benchmark, the Russell 3000® Index (+32.46%), and VIP Growth & Income Portfolio (+22.21%) trailed the S&P 500® index.
How did the Fund perform over the past 10 years?
CUMULATIVE PERFORMANCE
December 31, 2014 through December 31, 2024.
Initial investment of $10,000.
Service Class | $10,000 | $9,966 | $10,616 | $12,826 | $11,815 | $14,695 | $17,157 | $19,257 | $15,994 | $18,322 | $20,034 |
Fidelity VIP Freedom 2030 Composite Index℠ | $10,000 | $9,914 | $10,780 | $12,767 | $12,083 | $14,793 | $16,919 | $18,813 | $15,710 | $18,104 | $19,897 |
S&P 500® Index | $10,000 | $10,138 | $11,351 | $13,829 | $13,223 | $17,386 | $20,585 | $26,494 | $21,696 | $27,399 | $34,254 |
| | 2014 | 2015 | 2016 | 2017 | 2018 | 2019 | 2020 | 2021 | 2022 | 2023 | 2024 |
AVERAGE ANNUAL TOTAL RETURNS:| | 1 Year | 5 Year | 10 Year |
| Service Class | 9.34% | 6.40% | 7.20% |
| Fidelity VIP Freedom 2030 Composite Index℠ | 9.90% | 6.11% | 7.12% |
| S&P 500® Index | 25.02% | 14.53% | 13.10% |
Visit institutional.fidelity.com for more recent performance information. |
The Fund's past performance is not a good predictor of the Fund's future performance. The graph and table do not reflect the deduction of taxes that a shareholder would pay on fund distributions or redemption of fund shares. |
Key Fund Statistics(as of December 31, 2024)
KEY FACTS | | |
| Fund Size | $784,775,482 | |
| Number of Holdings | 14 | |
| Total Advisory Fee | $0 | |
| Portfolio Turnover | 31% | |
What did the Fund invest in?
(as of December 31, 2024)
| Bond Funds | 37.9 |
| Domestic Equity Funds | 33.3 |
| International Equity Funds | 28.8 |
| Short-Term Investments and Net Other Assets (Liabilities) | 0.0 |
ASSET ALLOCATION (% of Fund's net assets) |
|
| | Bond Funds - 37.9 |
| | Domestic Equity Funds - 33.3 |
| | International Equity Funds - 28.8 |
| | Short-Term Investments and Net Other Assets (Liabilities) - 0.0 |
| |
TOP HOLDINGS(% of Fund's net assets) | | |
| VIP Overseas Portfolio - Initial Class | 18.7 | |
| VIP Investment Grade Bond II Portfolio - Initial Class | 17.5 | |
| VIP Emerging Markets Portfolio - Initial Class | 10.1 | |
| VIP Growth Portfolio - Initial Class | 9.7 | |
| Fidelity Inflation-Protected Bond Index Fund | 8.4 | |
| Fidelity Long-Term Treasury Bond Index Fund | 7.4 | |
| VIP Growth & Income Portfolio - Initial Class | 6.5 | |
| VIP Contrafund Portfolio - Initial Class | 5.8 | |
| VIP Equity-Income Portfolio - Initial Class | 4.8 | |
| Fidelity International Bond Index Fund | 3.4 | |
| | 92.3 | |
| Fidelity, the Fidelity Investments Logo and all other Fidelity trademarks or service marks used herein are trademarks or service marks of FMR LLC. Any third-party marks that are used herein are trademarks or service marks of their respective owners. © 2025 FMR LLC. All rights reserved. |
| | For additional information about the Fund; including its prospectus, financial information, holdings and proxy information, scan the QR code or visit fundresearch.fidelity.com/prospectus/sec 1.9914287.100 1436-TSRA-0325 |
| |
| | ANNUAL SHAREHOLDER REPORT | AS OF DECEMBER 31, 2024 | This report describes changes to the Fund that occurred during the reporting period. |
| | VIP Investment Grade Bond II Portfolio VIP Investment Grade Bond II Portfolio Initial Class true |
| | | |
This annual shareholder report contains information about VIP Investment Grade Bond II Portfolio for the period January 1, 2024 to December 31, 2024. You can find additional information about the Fund at fundresearch.fidelity.com/prospectus/sec. You can also request this information by contacting us at 1-877-208-0098 or by sending an e-mail to funddocuments@fmr.com.
What were your Fund costs for the last year?(based on hypothetical $10,000 investment)
FUND COST (PREVIOUS YEAR)
| | Costs of a $10,000 investment | Costs paid as a percentage of a $10,000 investment | |
| Initial Class | $ 40 | 0.40% | |
What affected the Fund's performance this period?
•U.S. taxable investment-grade bonds posted a modest advance in 2024, rallying during the summer months, as the bond market reflected anticipated interest-rate reductions by the U.S. Federal Reserve, but falling back in the fourth quarter when the Fed tempered rate-cut expectations for 2025.
•Against this backdrop, the fund's exposure to asset-backed securities, including collateralized loan obligations, was a key contributor to performance versus the Bloomberg U.S. Aggregate Bond Index for the fiscal year.
•An overweight to commercial mortgage-backed securities provided another performance advantage, as did an underweight to agency mortgage-backed securities.
•Among corporate bonds, industry allocation lifted relative performance as well, led by security selection among financials and an overweight in the segment. Specifically, positioning among banks and REITS was beneficial versus the index.
•Exposure to certain "plus" sectors, namely high yield bonds and emerging markets debt, also were modest contributors.
•In contrast, the fund's yield-curve positioning modestly detracted for the year.
How did the Fund perform over the life of Fund?
CUMULATIVE PERFORMANCE
May 27, 2022 through December 31, 2024.
Initial investment of $10,000.
Initial Class | $10,000 | $9,469 | $10,029 |
Bloomberg U.S. Aggregate Bond Index | $10,000 | $9,504 | $10,029 |
| | 2022 | 2023 | 2024 |
AVERAGE ANNUAL TOTAL RETURNS:| | 1 Year | Life of Fund A |
| Initial Class | 1.59% | 0.72% |
| Bloomberg U.S. Aggregate Bond Index | 1.25% | 0.59% |
A From May 27, 2022
Visit institutional.fidelity.com for more recent performance information. |
The Fund's past performance is not a good predictor of the Fund's future performance. The graph and table do not reflect the deduction of taxes that a shareholder would pay on fund distributions or redemption of fund shares. |
Key Fund Statistics(as of December 31, 2024)
KEY FACTS | | |
| Fund Size | $3,249,669,268 | |
| Number of Holdings | 4,841 | |
| Total Advisory Fee | $12,203,892 | |
| Portfolio Turnover | 217% | |
What did the Fund invest in?
(as of December 31, 2024)
The information in the following tables is based on the combined Investments of the Fund and it's pro-rata share of investments in Fidelity's Central Funds, other than the Commodity Strategy and Money Market Central Funds as applicable.
| U.S. Government and U.S. Government Agency Obligations | 65.2 |
| AAA | 8.6 |
| AA | 0.7 |
| A | 8.9 |
| BBB | 13.4 |
| BB | 1.7 |
| B | 0.9 |
| CCC,CC,C | 0.0 |
| Not Rated | 5.4 |
| Equities | 0.0 |
QUALITY DIVERSIFICATION (% of Fund's net assets) |
| |
| | U.S. Government and U.S. Government Agency Obligations - 65.2 |
| | AAA - 8.6 |
| | AA - 0.7 |
| | A - 8.9 |
| | BBB - 13.4 |
| | BB - 1.7 |
| | B - 0.9 |
| | CCC,CC,C - 0.0 |
| | Not Rated - 5.4 |
| | Equities - 0.0 |
| Short-Term Investments and Net Other Assets (Liabilities) - (4.8)% |
| |
| We have used ratings from Moody's Investors Service, Inc. Where Moody's® ratings are not available, we have used S&P® ratings. All ratings are as of the date indicated and do not reflect subsequent changes. |
| U.S. Treasury Obligations | 47.2 |
| Corporate Bonds | 23.5 |
| U.S. Government Agency - Mortgage Securities | 18.0 |
| Asset-Backed Securities | 8.8 |
| CMOs and Other Mortgage Related Securities | 6.8 |
| Foreign Government and Government Agency Obligations | 0.3 |
| Purchased Options | 0.1 |
| Other Investments | 0.1 |
| Municipal Securities | 0.0 |
| Preferred Securities | 0.0 |
| Bank Loan Obligations | 0.0 |
| Common Stocks | 0.0 |
ASSET ALLOCATION (% of Fund's net assets) |
|
| | U.S. Treasury Obligations - 47.2 |
| | Corporate Bonds - 23.5 |
| | U.S. Government Agency - Mortgage Securities - 18.0 |
| | Asset-Backed Securities - 8.8 |
| | CMOs and Other Mortgage Related Securities - 6.8 |
| | Foreign Government and Government Agency Obligations - 0.3 |
| | Purchased Options - 0.1 |
| | Other Investments - 0.1 |
| | Municipal Securities - 0.0 |
| | Preferred Securities - 0.0 |
| | Bank Loan Obligations - 0.0 |
| | Common Stocks - 0.0 |
| Short-Term Investments and Net Other Assets (Liabilities) - (4.8)% |
| |
| United States | 90.3 |
| Grand Cayman (UK Overseas Ter) | 4.9 |
| Mexico | 0.9 |
| Ireland | 0.6 |
| Multi-national | 0.6 |
| United Kingdom | 0.5 |
| Switzerland | 0.4 |
| Netherlands | 0.4 |
| Bailiwick Of Jersey | 0.3 |
| Others | 1.1 |
GEOGRAPHIC DIVERSIFICATION (% of Fund's net assets) |
|
| | United States - 90.3 |
| | Grand Cayman (UK Overseas Ter) - 4.9 |
| | Mexico - 0.9 |
| | Ireland - 0.6 |
| | Multi-national - 0.6 |
| | United Kingdom - 0.5 |
| | Switzerland - 0.4 |
| | Netherlands - 0.4 |
| | Bailiwick Of Jersey - 0.3 |
| | Others - 1.1 |
| |
TOP HOLDINGS(% of Fund's net assets) | | |
| US Treasury Notes | 36.3 | |
| US Treasury Bonds | 10.9 | |
| Fannie Mae Mortgage pass-thru certificates | 6.3 | |
| Ginnie Mae II Pool | 5.3 | |
| Freddie Mac Gold Pool | 3.0 | |
| Uniform Mortgage Backed Securities | 2.8 | |
| Freddie Mac Multifamily Structured pass-thru certificates | 1.9 | |
| Bank of America Corp | 1.2 | |
| Morgan Stanley | 1.2 | |
| JPMorgan Chase & Co | 1.2 | |
| | 70.1 | |
How has the Fund changed?
This is a summary of certain changes to the Fund since January 1, 2024. For more complete information, you may review the Fund's next prospectus, which we expect to be available by April 30, 2025 at fundresearch.fidelity.com/prospectus/sec or upon request at 1-877-208-0098 or by sending an e-mail to funddocuments@fmr.com.
The fund's transfer agent and pricing & bookkeeping fees were changed to a fixed rate effective December 1, 2023. Effective March 1, 2024, the fund's management contract was amended to incorporate administrative services previously covered under separate services agreements (transfer agent and pricing & bookkeeping). The amended contract incorporates a management fee rate that may vary by class. The Adviser or an affiliate pays certain expenses of managing and operating the fund out of each class's management fee. | |
| Fidelity, the Fidelity Investments Logo and all other Fidelity trademarks or service marks used herein are trademarks or service marks of FMR LLC. Any third-party marks that are used herein are trademarks or service marks of their respective owners. © 2025 FMR LLC. All rights reserved. |
| | For additional information about the Fund; including its prospectus, financial information, holdings and proxy information, scan the QR code or visit fundresearch.fidelity.com/prospectus/sec 1.9914403.100 6571-TSRA-0325 |
| |
| | ANNUAL SHAREHOLDER REPORT | AS OF DECEMBER 31, 2024 | |
| | VIP Bond Index Portfolio VIP Bond Index Portfolio Service Class 2 true |
| | | |
This annual shareholder report contains information about VIP Bond Index Portfolio for the period January 1, 2024 to December 31, 2024. You can find additional information about the Fund at fundresearch.fidelity.com/prospectus/sec. You can also request this information by contacting us at 1-877-208-0098 or by sending an e-mail to funddocuments@fmr.com.
What were your Fund costs for the last year?(based on hypothetical $10,000 investment)
FUND COST (PREVIOUS YEAR)
| | Costs of a $10,000 investment | Costs paid as a percentage of a $10,000 investment | |
| Service Class 2 | $ 39 | 0.39% | |
What affected the Fund's performance this period?
•U.S. taxable investment-grade bonds posted a modest advance in 2024, rallying during the summer months, as the bond market reflected anticipated interest-rate reductions by the U.S. Federal Reserve, but falling back in the fourth quarter when the Fed tempered rate-cut expectations for 2025.
•We construct the portfolio using optimization. This approach minimizes the differences between risk exposures of the fund relative to the index. We attempt to hold all positions held by the index in the same relative proportions.
•Exposures include duration, key rate durations, credit quality, sector and issuer allocation, and other factors.
How did the Fund perform over the life of Fund?
CUMULATIVE PERFORMANCE
April 19, 2018 through December 31, 2024.
Initial investment of $10,000.
Service Class 2 | $10,000 | $10,172 | $10,999 | $11,798 | $11,534 | $9,991 | $10,503 |
Bloomberg U.S. Aggregate Bond Index | $10,000 | $10,216 | $11,106 | $11,940 | $11,756 | $10,226 | $10,792 |
| | 2018 | 2019 | 2020 | 2021 | 2022 | 2023 | 2024 |
AVERAGE ANNUAL TOTAL RETURNS:| | 1 Year | 5 Year | Life of Fund A |
| Service Class 2 | 1.00% | -0.72% | 0.88% |
| Bloomberg U.S. Aggregate Bond Index | 1.25% | -0.33% | 1.33% |
A From April 19, 2018
Visit institutional.fidelity.com for more recent performance information. |
The Fund's past performance is not a good predictor of the Fund's future performance. The graph and table do not reflect the deduction of taxes that a shareholder would pay on fund distributions or redemption of fund shares. |
Key Fund Statistics(as of December 31, 2024)
KEY FACTS | | |
| Fund Size | $969,508,026 | |
| Number of Holdings | 3,106 | |
| Total Advisory Fee | $784,003 | |
| Portfolio Turnover | 62% | |
What did the Fund invest in?
(as of December 31, 2024)
| U.S. Government and U.S. Government Agency Obligations | 70.2 |
| AAA | 2.5 |
| AA | 2.1 |
| A | 13.2 |
| BBB | 11.9 |
| BB | 0.3 |
| Not Rated | 0.6 |
QUALITY DIVERSIFICATION (% of Fund's net assets) |
| |
| | U.S. Government and U.S. Government Agency Obligations - 70.2 |
| | AAA - 2.5 |
| | AA - 2.1 |
| | A - 13.2 |
| | BBB - 11.9 |
| | BB - 0.3 |
| | Not Rated - 0.6 |
| Short-Term Investments and Net Other Assets (Liabilities) - (0.8)% |
| |
| We have used ratings from Moody's Investors Service, Inc. Where Moody's® ratings are not available, we have used S&P® ratings. All ratings are as of the date indicated and do not reflect subsequent changes. |
| U.S. Treasury Obligations | 44.9 |
| Corporate Bonds | 27.1 |
| U.S. Government Agency - Mortgage Securities | 24.9 |
| Foreign Government and Government Agency Obligations | 1.5 |
| CMOs and Other Mortgage Related Securities | 1.2 |
| U.S. Government Agency Obligations | 0.4 |
| Municipal Securities | 0.4 |
| Asset-Backed Securities | 0.3 |
| Other Investments | 0.1 |
ASSET ALLOCATION (% of Fund's net assets) |
|
| | U.S. Treasury Obligations - 44.9 |
| | Corporate Bonds - 27.1 |
| | U.S. Government Agency - Mortgage Securities - 24.9 |
| | Foreign Government and Government Agency Obligations - 1.5 |
| | CMOs and Other Mortgage Related Securities - 1.2 |
| | U.S. Government Agency Obligations - 0.4 |
| | Municipal Securities - 0.4 |
| | Asset-Backed Securities - 0.3 |
| | Other Investments - 0.1 |
| Short-Term Investments and Net Other Assets (Liabilities) - (0.8)% |
| |
| United States | 93.2 |
| United Kingdom | 1.3 |
| Canada | 1.0 |
| Japan | 0.8 |
| Multi-national | 0.8 |
| Mexico | 0.5 |
| Germany | 0.3 |
| Spain | 0.2 |
| Australia | 0.2 |
| Others | 1.7 |
GEOGRAPHIC DIVERSIFICATION (% of Fund's net assets) |
|
| | United States - 93.2 |
| | United Kingdom - 1.3 |
| | Canada - 1.0 |
| | Japan - 0.8 |
| | Multi-national - 0.8 |
| | Mexico - 0.5 |
| | Germany - 0.3 |
| | Spain - 0.2 |
| | Australia - 0.2 |
| | Others - 1.7 |
| |
TOP HOLDINGS(% of Fund's net assets) | | |
| US Treasury Notes | 35.6 | |
| Fannie Mae Mortgage pass-thru certificates | 10.3 | |
| US Treasury Bonds | 9.3 | |
| Freddie Mac Gold Pool | 7.6 | |
| Ginnie Mae II Pool | 4.8 | |
| Uniform Mortgage Backed Securities | 1.2 | |
| Ginnie Mae I Pool | 0.9 | |
| Bank of America Corp | 0.7 | |
| JPMorgan Chase & Co | 0.7 | |
| Freddie Mac Multifamily Structured pass-thru certificates | 0.7 | |
| | 71.8 | |
| Fidelity, the Fidelity Investments Logo and all other Fidelity trademarks or service marks used herein are trademarks or service marks of FMR LLC. Any third-party marks that are used herein are trademarks or service marks of their respective owners. © 2025 FMR LLC. All rights reserved. |
| | For additional information about the Fund; including its prospectus, financial information, holdings and proxy information, scan the QR code or visit fundresearch.fidelity.com/prospectus/sec 1.9914382.100 3079-TSRA-0325 |
Item 2.
Code of Ethics
As of the end of the period, December 31, 2024, Variable Insurance Products Fund V (the trust) has adopted a code of ethics, as defined in Item 2 of Form N-CSR, that applies to its President and Treasurer and its Chief Financial Officer. A copy of the code of ethics is filed as an exhibit to this Form N-CSR.
Item 3.
Audit Committee Financial Expert
The Board of Trustees of the trust has determined that Laura M. Bishop is an audit committee financial expert, as defined in Item 3 of Form N-CSR. Ms. Bishop is independent for purposes of Item 3 of Form N-CSR.
Item 4.
Principal Accountant Fees and Services
Fees and Services
The following table presents fees billed by Deloitte & Touche LLP, the member firms of Deloitte Touche Tohmatsu, and their respective affiliates (collectively, “Deloitte Entities”) in each of the last two fiscal years for services rendered to VIP Asset Manager Growth Portfolio, VIP Asset Manager Portfolio, VIP Bond Index Portfolio, VIP Freedom 2010 Portfolio, VIP Freedom 2015 Portfolio, VIP Freedom 2020 Portfolio, VIP Freedom 2025 Portfolio, VIP Freedom 2030 Portfolio, VIP Freedom 2035 Portfolio, VIP Freedom 2040 Portfolio, VIP Freedom 2045 Portfolio, VIP Freedom 2050 Portfolio, VIP Freedom 2055 Portfolio, VIP Freedom 2060 Portfolio, VIP Freedom 2065 Portfolio, VIP Freedom 2070 Portfolio, VIP Freedom Income Portfolio, VIP Freedom Lifetime Income I Portfolio, VIP Freedom Lifetime Income II Portfolio, VIP Freedom Lifetime Income III Portfolio, VIP Investment Grade Bond Portfolio, and VIP Investment Grade Bond II Portfolio (the “Funds”):
Services Billed by Deloitte Entities
December 31, 2024 FeesA,C
|
| Audit Fees | Audit-Related Fees | Tax Fees | All Other Fees |
VIP Asset Manager Growth Portfolio | $33,100 | $- | $8,000 | $700 |
VIP Asset Manager Portfolio | $33,900 | $- | $12,700 | $800 |
VIP Bond Index Portfolio | $69,300 | $- | $10,400 | $1,500 |
VIP Freedom 2010 Portfolio | $17,800 | $- | $7,400 | $400 |
VIP Freedom 2015 Portfolio | $17,800 | $- | $7,400 | $400 |
VIP Freedom 2020 Portfolio | $17,800 | $- | $7,400 | $400 |
VIP Freedom 2025 Portfolio | $17,800 | $- | $7,400 | $400 |
VIP Freedom 2030 Portfolio | $17,800 | $- | $7,400 | $400 |
VIP Freedom 2035 Portfolio | $17,800 | $- | $7,400 | $400 |
VIP Freedom 2040 Portfolio | $17,800 | $- | $7,200 | $400 |
VIP Freedom 2045 Portfolio | $17,800 | $- | $7,400 | $400 |
VIP Freedom 2050 Portfolio | $17,800 | $- | $7,400 | $400 |
VIP Freedom 2055 Portfolio | $17,800 | $- | $7,600 | $500 |
VIP Freedom 2060 Portfolio | $18,300 | $- | $7,600 | $500 |
VIP Freedom 2065 Portfolio | $17,800 | $- | $7,600 | $500 |
VIP Freedom 2070 Portfolio | $15,100 | $- | $7,700 | $200 |
VIP Freedom Income Portfolio | $17,800 | $- | $7,400 | $400 |
VIP Freedom Lifetime Income I Portfolio | $15,700 | $- | $7,700 | $400 |
VIP Freedom Lifetime Income II Portfolio | $15,700 | $- | $7,700 | $400 |
VIP Freedom Lifetime Income III Portfolio | $15,700 | $- | $7,700 | $400 |
VIP Investment Grade Bond II Portfolio | $37,800 | $- | $10,500 | $900 |
VIP Investment Grade Bond Portfolio | $34,900 | $- | $10,000 | $800 |
|
|
|
|
|
December 31, 2023 FeesA,C
|
| Audit Fees | Audit-Related Fees | Tax Fees | All Other Fees |
VIP Asset Manager Growth Portfolio | $33,200 | $- | $8,700 | $900 |
VIP Asset Manager Portfolio | $34,000 | $- | $13,400 | $1,000 |
VIP Bond Index Portfolio | $69,600 | $- | $11,100 | $1,700 |
VIP Freedom 2010 Portfolio | $17,900 | $- | $7,400 | $500 |
VIP Freedom 2015 Portfolio | $17,900 | $- | $7,400 | $500 |
VIP Freedom 2020 Portfolio | $17,900 | $- | $7,400 | $500 |
VIP Freedom 2025 Portfolio | $17,900 | $- | $7,400 | $500 |
VIP Freedom 2030 Portfolio | $17,900 | $- | $7,400 | $500 |
VIP Freedom 2035 Portfolio | $17,900 | $- | $7,400 | $500 |
VIP Freedom 2040 Portfolio | $17,900 | $- | $7,400 | $500 |
VIP Freedom 2045 Portfolio | $17,900 | $- | $7,400 | $500 |
VIP Freedom 2050 Portfolio | $17,900 | $- | $7,400 | $500 |
VIP Freedom 2055 Portfolio | $17,900 | $- | $7,600 | $500 |
VIP Freedom 2060 Portfolio | $18,400 | $- | $7,600 | $500 |
VIP Freedom 2065 Portfolio | $17,900 | $- | $7,900 | $500 |
VIP Freedom 2070 Portfolio | $- | $- | $- | $- |
VIP Freedom Income Portfolio | $17,900 | $- | $7,400 | $500 |
VIP Freedom Lifetime Income I Portfolio | $15,800 | $- | $7,900 | $500 |
VIP Freedom Lifetime Income II Portfolio | $15,800 | $- | $7,900 | $500 |
VIP Freedom Lifetime Income III Portfolio | $15,800 | $- | $7,900 | $500 |
VIP Investment Grade Bond II Portfolio | $38,000 | $- | $10,500 | $1,000 |
VIP Investment Grade Bond Portfolio | $35,500 | $- | $12,300 | $1,000 |
|
|
|
|
|
A Amounts may reflect rounding.
CVIP Freedom 2070 Portfolio commenced operations on July 1, 2024.
The following table presents fees billed by PricewaterhouseCoopers LLP (“PwC”) in each of the last two fiscal years for services rendered to VIP FundsManager 20% Portfolio, VIP FundsManager 30% Portfolio, VIP FundsManager 40% Portfolio, VIP FundsManager 50% Portfolio, VIP FundsManager 60% Portfolio, VIP FundsManager 70% Portfolio, VIP FundsManager 85% Portfolio, VIP Government Money Market Portfolio, VIP Investor Freedom 2010 Portfolio, VIP Investor Freedom 2015 Portfolio, VIP Investor Freedom 2020 Portfolio, VIP Investor Freedom 2025 Portfolio, VIP Investor Freedom 2030 Portfolio, VIP Investor Freedom 2035 Portfolio, VIP Investor Freedom 2040 Portfolio, VIP Investor Freedom 2045 Portfolio, VIP Investor Freedom 2050 Portfolio, VIP Investor Freedom Income Portfolio, VIP Strategic Income Portfolio, and VIP Target Volatility Portfolio (the “Funds”):
Services Billed by PwC
December 31, 2024 FeesA
|
| Audit Fees | Audit-Related Fees | Tax Fees | All Other Fees |
VIP FundsManager 20% Portfolio | $24,100 | $2,000 | $5,400 | $900 |
VIP FundsManager 30% Portfolio | $24,300 | $2,100 | $5,400 | $900 |
VIP FundsManager 40% Portfolio | $24,300 | $2,100 | $5,400 | $900 |
VIP FundsManager 50% Portfolio | $24,200 | $2,000 | $5,400 | $900 |
VIP FundsManager 60% Portfolio | $24,300 | $2,000 | $5,400 | $900 |
VIP FundsManager 70% Portfolio | $24,200 | $2,000 | $5,400 | $900 |
VIP FundsManager 85% Portfolio | $24,100 | $2,000 | $5,400 | $900 |
VIP Government Money Market Portfolio | $42,800 | $3,300 | $2,100 | $1,400 |
VIP Investor Freedom 2010 Portfolio | $16,000 | $1,500 | $6,200 | $600 |
VIP Investor Freedom 2015 Portfolio | $16,000 | $1,500 | $6,200 | $600 |
VIP Investor Freedom 2020 Portfolio | $16,000 | $1,500 | $6,200 | $600 |
VIP Investor Freedom 2025 Portfolio | $16,000 | $1,500 | $6,200 | $600 |
VIP Investor Freedom 2030 Portfolio | $16,000 | $1,500 | $6,200 | $600 |
VIP Investor Freedom 2035 Portfolio | $17,400 | $1,700 | $6,200 | $700 |
VIP Investor Freedom 2040 Portfolio | $17,400 | $1,700 | $6,200 | $700 |
VIP Investor Freedom 2045 Portfolio | $17,400 | $1,700 | $6,200 | $700 |
VIP Investor Freedom 2050 Portfolio | $17,400 | $1,700 | $6,200 | $700 |
VIP Investor Freedom Income Portfolio | $16,000 | $1,500 | $6,200 | $600 |
VIP Strategic Income Portfolio | $91,400 | $7,500 | $12,800 | $3,200 |
VIP Target Volatility Portfolio | $27,200 | $2,400 | $5,900 | $1,100 |
December 31, 2023 FeesA,B
|
| Audit Fees | Audit-Related Fees | Tax Fees | All Other Fees |
VIP FundsManager 20% Portfolio | $26,700 | $2,200 | $5,400 | $900 |
VIP FundsManager 30% Portfolio | $21,300 | $1,300 | $5,400 | $500 |
VIP FundsManager 40% Portfolio | $21,300 | $1,300 | $5,400 | $500 |
VIP FundsManager 50% Portfolio | $26,900 | $2,200 | $5,400 | $900 |
VIP FundsManager 60% Portfolio | $27,000 | $2,200 | $5,400 | $900 |
VIP FundsManager 70% Portfolio | $26,800 | $2,200 | $5,400 | $900 |
VIP FundsManager 85% Portfolio | $26,700 | $2,200 | $5,400 | $900 |
VIP Government Money Market Portfolio | $42,900 | $3,300 | $2,100 | $1,400 |
VIP Investor Freedom 2010 Portfolio | $18,500 | $1,600 | $7,200 | $700 |
VIP Investor Freedom 2015 Portfolio | $18,500 | $1,600 | $7,200 | $700 |
VIP Investor Freedom 2020 Portfolio | $18,500 | $1,600 | $7,200 | $700 |
VIP Investor Freedom 2025 Portfolio | $18,500 | $1,600 | $7,200 | $700 |
VIP Investor Freedom 2030 Portfolio | $18,500 | $1,600 | $7,200 | $700 |
VIP Investor Freedom 2035 Portfolio | $15,000 | $1,000 | $6,200 | $400 |
VIP Investor Freedom 2040 Portfolio | $15,000 | $1,000 | $6,200 | $400 |
VIP Investor Freedom 2045 Portfolio | $15,000 | $1,000 | $6,200 | $400 |
VIP Investor Freedom 2050 Portfolio | $15,000 | $1,000 | $6,200 | $400 |
VIP Investor Freedom Income Portfolio | $18,500 | $1,600 | $7,200 | $700 |
VIP Strategic Income Portfolio | $92,800 | $7,600 | $10,600 | $3,200 |
VIP Target Volatility Portfolio | $27,300 | $2,400 | $5,900 | $1,000 |
A Amounts may reflect rounding.
BVIP FundsManager 30% Portfolio, VIP FundsManager 40% Portfolio, VIP Investor Freedom 2035 Portfolio, VIP Investor Freedom 2040 Portfolio, VIP Investor Freedom 2045 Portfolio, and VIP Investor Freedom 2050 Portfolio commenced operations on April 13, 2023.
The following table(s) present(s) fees billed by Deloitte Entities and PwC that were required to be approved by the Audit Committee for services that relate directly to the operations and financial reporting of the Fund(s) and that are rendered on behalf of Fidelity Management & Research Company LLC ("FMR") and entities controlling, controlled by, or under common control with FMR (not including any sub-adviser whose role is primarily portfolio management and is subcontracted with or overseen by another investment adviser) that provide ongoing services to the Fund(s) (“Fund Service Providers”):
Services Billed by Deloitte Entities
|
| December 31, 2024A,C | December 31, 2023A,C |
Audit-Related Fees | $125,000 | $75,000 |
Tax Fees | $- | $- |
All Other Fees | $2,929,500 | $- |
A Amounts may reflect rounding.
C May include amounts billed prior to the VIP Freedom 2070 Portfolio’s commencement of operations.
Services Billed by PwC
|
| December 31, 2024A | December 31, 2023A,B |
Audit-Related Fees | $9,701,800 | $8,881,200 |
Tax Fees | $61,000 | $1,000 |
All Other Fees | $35,000 | $- |
A Amounts may reflect rounding.
B May include amounts billed prior to the VIP FundsManager 30% Portfolio, VIP FundsManager 40% Portfolio, VIP Investor Freedom 2035 Portfolio, VIP Investor
Freedom 2040 Portfolio, VIP Investor Freedom 2045 Portfolio, and VIP Investor Freedom 2050 Portfolio’s commencement of operations.
“Audit-Related Fees” represent fees billed for assurance and related services that are reasonably related to the performance of the fund audit or the review of the fund's financial statements and that are not reported under Audit Fees.
“Tax Fees” represent fees billed for tax compliance, tax advice or tax planning that relate directly to the operations and financial reporting of the fund.
“All Other Fees” represent fees billed for services provided to the fund or Fund Service Provider, a significant portion of which are assurance related, that relate directly to the operations and financial reporting of the fund, excluding those services that are reported under Audit Fees, Audit-Related Fees or Tax Fees.
Assurance services must be performed by an independent public accountant.
* * *
The aggregate non-audit fees billed by Deloitte Entities and PwC for services rendered to the Fund(s), FMR (not including any sub-adviser whose role is primarily portfolio management and is subcontracted with or overseen by another investment adviser), and any Fund Service Provider for each of the last two fiscal years of the Fund(s) are as follows:
|
Billed By | December 31, 2024A,C | December 31, 2023A,B,C |
Deloitte Entities | $3,545,500 | $5,555,900 |
PwC | $15,477,300 | $14,527,600 |
A Amounts may reflect rounding.
B May include amounts billed prior to the Amounts may reflect rounding since and VIP Freedom 2070 Portfolio, VIP FundsManager 30% Portfolio, VIP FundsManager 40% Portfolio, VIP Investment Grade Bond II Portfolio, VIP Investor Freedom 2035 Portfolio, VIP Investor Freedom 2040 Portfolio, VIP Investor Freedom 2045 Portfolio, and VIP Investor Freedom 2050 Portfolio’s commencement of operations.
The trust's Audit Committee has considered non-audit services that were not pre-approved that were provided by Deloitte Entities and PwC to Fund Service Providers to be compatible with maintaining the independence of Deloitte Entities and PwC in its(their) audit of the Fund(s), taking into account representations from Deloitte Entities and PwC, in accordance with Public Company Accounting Oversight Board rules, regarding its independence from the Fund(s) and its(their) related entities and FMR’s review of the appropriateness and permissibility under applicable law of such non-audit services prior to their provision to the Fund(s) Service Providers.
Audit Committee Pre-Approval Policies and Procedures
The trust’s Audit Committee must pre-approve all audit and non-audit services provided by a fund’s independent registered public accounting firm relating to the operations or financial reporting of the fund. Prior to the commencement of any audit or non-audit services to a fund, the Audit Committee reviews the services to determine whether they are appropriate and permissible under applicable law.
The Audit Committee has adopted policies and procedures to, among other purposes, provide a framework for the Committee’s consideration of non-audit services by the audit firms that audit the Fidelity funds. The policies and procedures require that any non-audit service provided by a fund audit firm to a Fidelity fund and any non-audit service provided by a fund auditor to a Fund Service Provider that relates directly to the operations and financial reporting of a Fidelity fund (“Covered Service”) are subject to approval by the Audit Committee before such service is provided.
All Covered Services must be approved in advance of provision of the service either: (i) by formal resolution of the Audit Committee, or (ii) by oral or written approval of the service by the Chair of the Audit Committee (or if the Chair is unavailable, such other member of the Audit Committee as may be designated by the Chair to act in the Chair’s absence). The approval contemplated by (ii) above is permitted where the Treasurer determines that action on such an engagement is necessary before the next meeting of the Audit Committee.
Non-audit services provided by a fund audit firm to a Fund Service Provider that do not relate directly to the operations and financial reporting of a Fidelity fund are reported to the Audit Committee periodically.
Non-Audit Services Approved Pursuant to Rule 2-01(c)(7)(i)(C) and (ii) of Regulation S-X (“De Minimis Exception”)
There were no non-audit services approved or required to be approved by the Audit Committee pursuant to the De Minimis Exception during the Fund’s(s’) last two fiscal years relating to services provided to (i) the Fund(s) or (ii) any Fund Service Provider that relate directly to the operations and financial reporting of the Fund(s).
The Registrant has not retained, for the preparation of the audit report on the financial statements included in the Form N-CSR, a registered public accounting firm that has a branch or office that is located in a foreign jurisdiction and that the Public Company Accounting Oversight Board (the “PCAOB”) has determined that the PCAOB is unable to inspect or investigate completely because of a position taken by an authority in the foreign jurisdiction.
The Registrant is not a “foreign issuer,” as defined in 17 CFR 240.3b-4.
Item 5.
Audit Committee of Listed Registrants
Not applicable.
Item 6.
Investments
(a)
Not applicable.
(b)
Not applicable.
Item 7.
Financial Statements and Financial Highlights for Open-End Management Investment Companies
Fidelity® Variable Insurance Products:
VIP Strategic Income Portfolio
Annual Report
December 31, 2024
Contents
To view a fund's proxy voting guidelines and proxy voting record for the 12-month period ended June 30, visit http://www.fidelity.com/proxyvotingresults or visit the Securities and Exchange Commission's (SEC) web site at http://www.sec.gov.
You may also call 1-877-208-0098 to request a free copy of the proxy voting guidelines.
Fidelity® Variable Insurance Products are separate account options which are purchased through a variable insurance contract.
Standard & Poor's, S&P and S&P 500 are registered service marks of The McGraw-Hill Companies, Inc. and have been licensed for use by Fidelity Distributors Corporation.
Other third-party marks appearing herein are the property of their respective owners.
All other marks appearing herein are registered or unregistered trademarks or service marks of FMR LLC or an affiliated company. © 2025 FMR LLC. All rights reserved.
This report and the financial statements contained herein are submitted for the general information of the shareholders of the Fund. This report is not authorized for distribution to prospective investors in the Fund unless preceded or accompanied by an effective prospectus.
A fund files its complete schedule of portfolio holdings with the SEC for the first and third quarters of each fiscal year on Form N-PORT. Forms N-PORT are available on the SEC's web site at http://www.sec.gov. A fund's Forms N-PORT may be reviewed and copied at the SEC's Public Reference Room in Washington, DC. Information regarding the operation of the SEC's Public Reference Room may be obtained by calling 1-800-SEC-0330.
For a complete list of a fund's portfolio holdings, view the most recent holdings listing, semiannual report, or annual report on Fidelity's web site at http://www.fidelity.com, http://www.institutional.fidelity.com, or http://www.401k.com, as applicable.
NOT FDIC INSURED •MAY LOSE VALUE •NO BANK GUARANTEE
Neither the Fund nor Fidelity Distributors Corporation is a bank.
Item 7: Financial Statements and Financial Highlights for Open-End Management Investment Companies (Annual Report)
VIP Strategic Income Portfolio
Schedule of Investments December 31, 2024
Showing Percentage of Net Assets
| Asset-Backed Securities - 0.1% |
| | | Principal Amount (a) | Value ($) |
| BAILIWICK OF JERSEY - 0.0% | | | |
| Golub Cap Partners Clo 76 B Ltd Series 2024-76A Class E, CME Term SOFR 3 month Index + 5.75%, 10.4919% 10/25/2037 (b)(c)(d) | | 175,000 | 177,581 |
| GRAND CAYMAN (UK OVERSEAS TER) - 0.1% | | | |
| Agl Clo 5 Ltd Series 2024-5A Class ERR, CME Term SOFR 3 month Index + 6.0884%, 10.9674% 7/20/2034 (b)(c)(d) | | 100,000 | 100,799 |
| Ares Loan Funding VII Ltd Series 2024-ALF7A Class E, CME Term SOFR 3 month Index + 6.25%, 10.7901% 10/22/2037 (b)(c)(d) | | 100,000 | 100,743 |
| Birch Grove Clo 5 LLC Series 2024-5A Class ER, CME Term SOFR 3 month Index + 6.75%, 11.3674% 10/20/2037 (b)(c)(d) | | 100,000 | 102,339 |
| Carlyle US Clo Ltd Series 2024-6A Class E, CME Term SOFR 3 month Index + 5.75%, 10.2067% 10/25/2037 (b)(c)(d) | | 150,000 | 151,054 |
| OCP CLO Ltd Series 2024-14A Class ER, CME Term SOFR 3 month Index + 6.55%, 11.2908% 7/20/2037 (b)(c)(d) | | 200,000 | 204,736 |
| Orchard Park Clo Ltd Series 2024-1A Class E, CME Term SOFR 3 month Index + 5.6%, 10.2529% 10/20/2037 (b)(c)(d) | | 100,000 | 101,652 |
| Palmer Square Loan Funding Ltd Series 2024-2A Class D, CME Term SOFR 3 month Index + 4.7%, 9.15% 1/15/2033 (b)(c)(d) | | 250,000 | 250,014 |
| Rr 31 Ltd Series 2024-31A Class D, CME Term SOFR 3 month Index + 6%, 10.5928% 10/15/2039 (b)(c)(d) | | 125,000 | 126,554 |
TOTAL GRAND CAYMAN (UK OVERSEAS TER) | | | 1,137,891 |
| UNITED STATES - 0.0% | | | |
| Croton Pk Clo Ltd Series 2024-1A Class E, CME Term SOFR 3 month Index + 5.55%, 10.1997% 10/15/2036 (b)(c)(d) | | 239,000 | 244,277 |
| TOTAL ASSET-BACKED SECURITIES (Cost $1,539,000) | | | 1,559,749 |
| | | | |
| Bank Loan Obligations - 3.7% |
| | | Principal Amount (a) | Value ($) |
| CANADA - 0.0% | | | |
| Consumer Discretionary - 0.0% | | | |
| Hotels, Restaurants & Leisure - 0.0% | | | |
| Ontario Gaming GTA LP Tranche B 1LN, term loan CME Term SOFR 3 month Index + 4.25%, 8.5788% 8/1/2030 (c)(d)(e) | | 287,100 | 287,511 |
| LUXEMBOURG - 0.0% | | | |
| Materials - 0.0% | | | |
| Containers & Packaging - 0.0% | | | |
| Kloeckner Pentaplast GmbH Tranche B 1LN, term loan CME Term SOFR 6 month Index + 4.725%, 9.7229% 2/9/2026 (c)(d)(e) | | 77,000 | 69,822 |
| NETHERLANDS - 0.1% | | | |
| Industrials - 0.1% | | | |
| Building Products - 0.1% | | | |
| Hunter Douglas Inc Tranche B 1LN, term loan CME Term SOFR 3 month Index + 3.5%, 8.0208% 2/25/2029 (c)(d)(e) | | 1,018,875 | 1,016,328 |
| SWITZERLAND - 0.0% | | | |
| Materials - 0.0% | | | |
| Chemicals - 0.0% | | | |
| Consolidated Energy Finance SA Tranche B 1LN, term loan CME Term SOFR 3 month Index + 4.5%, 9.0139% 11/15/2030 (c)(d)(e) | | 560,763 | 543,940 |
| UNITED KINGDOM - 0.2% | | | |
| Communication Services - 0.0% | | | |
| Diversified Telecommunication Services - 0.0% | | | |
| Connect US FinCo LLC Tranche B 1LN, term loan CME Term SOFR 1 month Index + 4.5%, 8.857% 9/13/2029 (c)(d)(e) | | 463,311 | 404,433 |
| Energy - 0.2% | | | |
| Oil, Gas & Consumable Fuels - 0.2% | | | |
| EG America LLC Tranche BC 1LN, term loan CME Term SOFR 1 month Index + 5.5%, 10.3312% 2/7/2028 (c)(d)(e) | | 1,891,849 | 1,906,379 |
| TOTAL UNITED KINGDOM | | | 2,310,812 |
| UNITED STATES - 3.4% | | | |
| Communication Services - 0.0% | | | |
| Diversified Telecommunication Services - 0.0% | | | |
| Aventiv Technologies LLC 1LN, term loan CME Term SOFR 3 month Index + 5.09%, 9.6804% 7/31/2025 (c)(d)(e) | | 419,833 | 304,589 |
| Aventiv Technologies LLC Tranche DEC FLSO, term loan CME Term SOFR 3 month Index + 0%, 0% 1/31/2025 (c)(d)(e)(f)(g) | | 10,998 | 10,998 |
| Aventiv Technologies LLC Tranche FLSO 1LN, term loan CME Term SOFR 3 month Index + 7.5%, 12.0904% 7/31/2025 (c)(d)(e) | | 11,188 | 10,853 |
| GTT RemainCo LLC Tranche OPCO 1LN, term loan CME Term SOFR 1 month Index + 7%, 11.6726% 12/30/2027 (c)(d)(e) | | 278,358 | 265,367 |
| | | | 591,807 |
| Media - 0.0% | | | |
| Diamond Sports Group LLC 1LN, term loan CME Term SOFR 1 month Index + 8%, 14.6527% 5/25/2026 (c)(d)(e) | | 36,618 | 31,148 |
| Univision Communications Inc 1LN, term loan CME Term SOFR 3 month Index + 4.25%, 8.5788% 6/24/2029 (c)(d)(e) | | 34,125 | 34,232 |
| Univision Communications Inc Tranche B 1LN, term loan CME Term SOFR 1 month Index + 3.25%, 7.7215% 1/31/2029 (c)(d)(e) | | 345,238 | 341,785 |
| | | | 407,165 |
TOTAL COMMUNICATION SERVICES | | | 998,972 |
| | | | |
| Consumer Discretionary - 0.8% | | | |
| Automobile Components - 0.0% | | | |
| Clarios Global LP Tranche B 1LN, term loan CME Term SOFR 1 month Index + 2.5%, 6.857% 5/6/2030 (c)(d)(e) | | 134,663 | 135,066 |
| Broadline Retail - 0.0% | | | |
| Great Outdoors Group LLC Tranche B2 1LN, term loan CME Term SOFR 1 month Index + 3.75%, 8.2215% 3/5/2028 (c)(d)(e) | | 138,568 | 139,053 |
| Diversified Consumer Services - 0.1% | | | |
| Spin Holdco Inc Tranche B 1LN, term loan CME Term SOFR 3 month Index + 4%, 8.7058% 3/4/2028 (c)(d)(e) | | 816,667 | 685,812 |
| TKC Holdings Inc 1LN, term loan CME Term SOFR 1 month Index + 5%, 9.356% 5/15/2028 (c)(d)(e) | | 1,210,761 | 1,223,631 |
| | | | 1,909,443 |
| Hotels, Restaurants & Leisure - 0.2% | | | |
| Carnival Corp Tranche B 1LN, term loan CME Term SOFR 1 month Index + 2.75%, 7.107% 10/18/2028 (c)(d)(e) | | 690,036 | 693,631 |
| Carnival Corp Tranche B 1LN, term loan CME Term SOFR 1 month Index + 2.75%, 7.107% 8/9/2027 (c)(d)(e) | | 899,801 | 904,580 |
| Fertitta Entertainment LLC/NV 1LN, term loan CME Term SOFR 1 month Index + 3.5%, 7.857% 1/27/2029 (c)(d)(e) | | 1,375,165 | 1,379,126 |
| United PF Holdings LLC 1LN, term loan CME Term SOFR 3 month Index + 4%, 8.847% 12/30/2026 (c)(d)(e) | | 423,888 | 406,931 |
| | | | 3,384,268 |
| Specialty Retail - 0.5% | | | |
| Belron Finance 2019 LLC Tranche B 1LN, term loan CME Term SOFR 1 month Index + 2.75%, 7.2727% 10/2/2031 (c)(d)(e) | | 214,463 | 216,206 |
| Kodiak BP LLC Tranche B 1LN, term loan CME Term SOFR 1 month Index + 3.75%, 8.274% 11/26/2031 (c)(d)(e) | | 140,000 | 139,950 |
| LBM Acquisition LLC Tranche B 1LN, term loan CME Term SOFR 1 month Index + 3.75%, 8.2965% 6/6/2031 (c)(d)(e) | | 5,500,569 | 5,446,170 |
| Wand NewCo 3 Inc Tranche B 1LN, term loan CME Term SOFR 1 month Index + 3.25%, 7.607% 1/30/2031 (c)(d)(e) | | 102,548 | 102,863 |
| | | | 5,905,189 |
TOTAL CONSUMER DISCRETIONARY | | | 11,473,019 |
| | | | |
| Consumer Staples - 0.0% | | | |
| Beverages - 0.0% | | | |
| Naked Juice LLC 1LN, term loan CME Term SOFR 3 month Index + 3.25%, 7.4288% 1/24/2029 (c)(d)(e) | | 102,375 | 67,038 |
| Food Products - 0.0% | | | |
| Fiesta Purchaser Inc Tranche B 1LN, term loan CME Term SOFR 1 month Index + 4%, 8.5726% 2/12/2031 (c)(d)(e) | | 99,750 | 99,734 |
TOTAL CONSUMER STAPLES | | | 166,772 |
| | | | |
| Energy - 0.0% | | | |
| Energy Equipment & Services - 0.0% | | | |
| Forbes Energy Services LLC Tranche PIK, term loan 0% (c)(e)(f)(g)(h) | | 61,482 | 0 |
| Oil, Gas & Consumable Fuels - 0.0% | | | |
| CVR CHC LP Tranche B 1LN, term loan CME Term SOFR 1 month Index + 4%, 0% 12/30/2027 (c)(d)(e)(f) | | 125,000 | 125,000 |
| EPIC Crude Services LP Tranche B 1LN, term loan CME Term SOFR 3 month Index + 3%, 7.6559% 10/9/2031 (c)(d)(e) | | 85,000 | 85,668 |
| Mesquite Energy Inc 1LN, term loan 0% (c)(e)(f)(g)(h) | | 122,000 | 0 |
| Mesquite Energy Inc 1LN, term loan 3 month U.S. LIBOR + 8%, 0% (c)(d)(e)(f)(g)(h) | | 283,417 | 0 |
| | | | 210,668 |
TOTAL ENERGY | | | 210,668 |
| | | | |
| Financials - 0.4% | | | |
| Capital Markets - 0.1% | | | |
| Citadel Securities Global Holdings LLC Tranche B 1LN, term loan CME Term SOFR 1 month Index + 2%, 6.3288% 10/24/2031 (c)(d)(e) | | 521,304 | 522,487 |
| Focus Financial Partners LLC Tranche B8 1LN, term loan CME Term SOFR 1 month Index + 3.25%, 7.607% 9/17/2031 (c)(d)(e) | | 1,015,891 | 1,024,395 |
| Focus Financial Partners LLC Tranche DD 1LN, term loan CME Term SOFR 1 month Index + 3.25%, 1.625% 9/10/2031 (c)(d)(e)(f)(i) | | 109,109 | 110,022 |
| PEX Holdings LLC 1LN, term loan CME Term SOFR 1 month Index + 2.75%, 7.0788% 11/19/2031 (c)(d)(e) | | 80,000 | 80,300 |
| | | | 1,737,204 |
| Insurance - 0.3% | | | |
| Acrisure LLC Tranche B1 1LN, term loan CME Term SOFR 1 month Index + 3%, 7.5992% 2/16/2027 (c)(d)(e) | | 793,473 | 793,719 |
| Acrisure LLC Tranche B6 1LN, term loan CME Term SOFR 1 month Index + 3.25%, 7.8492% 11/6/2030 (c)(d)(e) | | 541,805 | 541,637 |
| Alliant Hldgs Intermediate LLC Tranche B6 1LN, term loan CME Term SOFR 1 month Index + 2.75%, 7.106% 9/19/2031 (c)(d)(e) | | 1,614,722 | 1,617,241 |
| HUB International Ltd Tranche B 1LN, term loan CME Term SOFR 3 month Index + 2.75%, 7.3674% 6/20/2030 (c)(d)(e) | | 222,757 | 223,871 |
| TIH Insurance Holdings LLC 2LN, term loan CME Term SOFR 3 month Index + 4.75%, 9.0788% 5/6/2032 (c)(d)(e) | | 618,421 | 631,692 |
| TIH Insurance Holdings LLC Tranche B 1LN, term loan CME Term SOFR 1 month Index + 2.75%, 7.0788% 5/6/2031 (c)(d)(e) | | 103,427 | 103,589 |
| | | | 3,911,749 |
TOTAL FINANCIALS | | | 5,648,953 |
| | | | |
| Health Care - 0.4% | | | |
| Health Care Equipment & Supplies - 0.1% | | | |
| Medline Borrower LP 1LN, term loan CME Term SOFR 1 month Index + 2.25%, 6.607% 10/21/2028 (c)(d)(e) | | 1,054,854 | 1,057,692 |
| Health Care Providers & Services - 0.1% | | | |
| Gainwell Acquisition Corp Tranche B 1LN, term loan CME Term SOFR 3 month Index + 4%, 8.4288% 10/1/2027 (c)(d)(e) | | 947,080 | 915,248 |
| Phoenix Newco Inc Tranche B 1LN, term loan CME Term SOFR 1 month Index + 3%, 7.357% 11/15/2028 (c)(d)(e) | | 308,502 | 310,301 |
| | | | 1,225,549 |
| Health Care Technology - 0.2% | | | |
| AthenaHealth Group Inc Tranche B 1LN, term loan CME Term SOFR 1 month Index + 3.25%, 7.607% 2/15/2029 (c)(d)(e) | | 1,329,875 | 1,331,298 |
| Cotiviti Inc Tranche B 1LN, term loan CME Term SOFR 1 month Index + 2.75%, 7.3027% 4/30/2031 (c)(d)(e) | | 1,905,425 | 1,913,771 |
| | | | 3,245,069 |
TOTAL HEALTH CARE | | | 5,528,310 |
| | | | |
| Industrials - 0.3% | | | |
| Aerospace & Defense - 0.0% | | | |
| TransDigm Inc Tranche L 1LN, term loan CME Term SOFR 3 month Index + 2.5%, 6.8288% 1/20/2032 (c)(d)(e) | | 473,813 | 474,552 |
| Building Products - 0.0% | | | |
| MIWD Holdco II LLC Tranche B2 1LN, term loan CME Term SOFR 1 month Index + 3.5%, 7.357% 3/28/2031 (c)(d)(e) | | 34,825 | 35,124 |
| Commercial Services & Supplies - 0.3% | | | |
| ABG Intermediate Holdings 2 LLC Tranche B1 1LN, term loan CME Term SOFR 1 month Index + 2.25%, 6.5946% 12/21/2028 (c)(d)(e) | | 866,308 | 868,743 |
| Artera Services LLC 1LN, term loan CME Term SOFR 3 month Index + 4.5%, 8.8288% 2/10/2031 (c)(d)(e) | | 292,788 | 289,778 |
| Brand Industrial Services Inc Tranche B 1LN, term loan CME Term SOFR 3 month Index + 4.5%, 9.0711% 8/1/2030 (c)(d)(e) | | 1,488,459 | 1,444,238 |
| GEO Group Inc/The Tranche B 1LN, term loan CME Term SOFR 1 month Index + 5.25%, 9.5946% 4/14/2029 (c)(d)(e) | | 153,282 | 155,708 |
| Madison IAQ LLC Tranche B 1LN, term loan CME Term SOFR 6 month Index + 2.75%, 7.8892% 6/21/2028 (c)(d)(e) | | 135,100 | 135,459 |
| Neptune Bidco US Inc Tranche B 1LN, term loan CME Term SOFR 3 month Index + 5%, 9.7583% 4/11/2029 (c)(d)(e) | | 778,150 | 696,584 |
| Sabert Corp Tranche B 1LN, term loan CME Term SOFR 1 month Index + 3%, 7.4532% 12/10/2026 (c)(d)(e) | | 264,311 | 265,632 |
| | | | 3,856,142 |
| Machinery - 0.0% | | | |
| STS Operating Inc 1LN, term loan CME Term SOFR 1 month Index + 4%, 8.457% 3/25/2031 (c)(d)(e) | | 277,900 | 278,456 |
| Passenger Airlines - 0.0% | | | |
| SkyMiles IP Ltd Tranche B 1LN, term loan CME Term SOFR 3 month Index + 3.75%, 8.3674% 10/20/2027 (c)(d)(e) | | 75,430 | 76,691 |
| Spirit Airlines Inc Tranche DIP 1LN, term loan CME Term SOFR 3 month Index + 7%, 0% 11/30/2025 (c)(d)(e)(f)(g) | | 184,793 | 184,331 |
| United Airlines Inc Tranche B 1LN, term loan CME Term SOFR 3 month Index + 2%, 6.6348% 2/24/2031 (c)(d)(e) | | 104,113 | 104,299 |
| | | | 365,321 |
| Professional Services - 0.0% | | | |
| Amentum Holdings Inc 1LN, term loan CME Term SOFR 1 month Index + 2.25%, 6.607% 9/29/2031 (c)(d)(e) | | 270,000 | 268,874 |
TOTAL INDUSTRIALS | | | 5,278,469 |
| | | | |
| Information Technology - 1.1% | | | |
| Electronic Equipment, Instruments & Components - 0.0% | | | |
| DG Investment Intermediate Holdings Inc Tranche B 1LN, term loan CME Term SOFR 1 month Index + 3.75%, 8.2215% 3/31/2028 (c)(d)(e) | | 96,504 | 97,268 |
| Lightning Power LLC Tranche B 1LN, term loan CME Term SOFR 3 month Index + 3.25%, 7.5788% 8/18/2031 (c)(d)(e) | | 135,000 | 136,350 |
| | | | 233,618 |
| IT Services - 0.0% | | | |
| Acuris Finance US Inc 1LN, term loan CME Term SOFR 1 month Index + 3.75%, 8.0788% 2/16/2028 (c)(d)(e) | | 37,744 | 37,922 |
| GTT Communications Inc Tranche HOLDCO 1LN, term loan CME Term SOFR 1 month Index + 9%, 13.4288% 6/30/2028 (c)(d)(e) | | 247,775 | 186,141 |
| | | | 224,063 |
| Software - 1.1% | | | |
| Applied Systems Inc 2LN, term loan CME Term SOFR 3 month Index + 5.25%, 9.5788% 2/23/2032 (c)(d)(e) | | 10,000 | 10,275 |
| Applied Systems Inc Tranche B 1LN, term loan CME Term SOFR 3 month Index + 3%, 7.3288% 2/24/2031 (c)(d)(e) | | 547,250 | 552,164 |
| ConnectWise LLC Tranche B 1LN, term loan CME Term SOFR 3 month Index + 3.5%, 8.0904% 9/30/2028 (c)(d)(e) | | 850,960 | 855,394 |
| McAfee Corp Tranche B 1LN, term loan CME Term SOFR 1 month Index + 3.25%, 7.8027% 3/1/2029 (c)(d)(e) | | 1,506,167 | 1,505,791 |
| MH Sub I LLC Tranche B 1LN, term loan CME Term SOFR 1 month Index + 4.25%, 8.8226% 5/3/2028 (c)(d)(e) | | 888,750 | 888,590 |
| Modena Buyer LLC 1LN, term loan CME Term SOFR 3 month Index + 4.5%, 8.857% 7/1/2031 (c)(d)(e) | | 1,355,000 | 1,308,537 |
| Polaris Newco LLC Tranche B 1LN, term loan CME Term SOFR 3 month Index + 4%, 8.847% 6/2/2028 (c)(d)(e) | | 309,600 | 309,916 |
| Project Alpha Intermediate Holding Inc Tranche B 1LN, term loan CME Term SOFR 1 month Index + 3.25%, 0% 10/28/2030 (c)(d)(e)(f) | | 70,000 | 70,404 |
| Project Alpha Intermediate Holding Inc Tranche B 1LN, term loan CME Term SOFR 1 month Index + 3.25%, 7.5788% 10/28/2030 (c)(d)(e) | | 575,657 | 578,985 |
| Proofpoint Inc Tranche B 1LN, term loan CME Term SOFR 1 month Index + 3%, 7.357% 8/31/2028 (c)(d)(e) | | 3,697,445 | 3,712,715 |
| RealPage Inc Tranche B 1LN, term loan CME Term SOFR 1 month Index + 3%, 7.5904% 4/22/2028 (c)(d)(e) | | 299,925 | 299,040 |
| UKG Inc Tranche B 1LN, term loan CME Term SOFR 3 month Index + 3%, 7.6172% 2/10/2031 (c)(d)(e) | | 3,843,248 | 3,867,615 |
| VS Buyer LLC Tranche B 1LN, term loan CME Term SOFR 1 month Index + 2.75%, 7.1203% 4/14/2031 (c)(d)(e) | | 1,692,502 | 1,703,080 |
| | | | 15,662,506 |
TOTAL INFORMATION TECHNOLOGY | | | 16,120,187 |
| | | | |
| Materials - 0.4% | | | |
| Chemicals - 0.2% | | | |
| Discovery Purchaser Corp 1LN, term loan CME Term SOFR 3 month Index + 4.375%, 8.9461% 10/4/2029 (c)(d)(e) | | 2,053,189 | 2,062,428 |
| Olympus Water US Holding Corp Tranche B 1LN, term loan CME Term SOFR 3 month Index + 3.5%, 8.1037% 6/23/2031 (c)(d)(e) | | 153,328 | 153,663 |
| WR Grace Holdings LLC Tranche B 1LN, term loan CME Term SOFR 3 month Index + 3.75%, 7.5788% 9/22/2028 (c)(d)(e) | | 698,721 | 704,311 |
| | | | 2,920,402 |
| Containers & Packaging - 0.2% | | | |
| Clydesdale Acquisition Holdings Inc 1LN, term loan CME Term SOFR 1 month Index + 3.175%, 7.532% 4/13/2029 (c)(d)(e) | | 2,959,305 | 2,962,442 |
| Metals & Mining - 0.0% | | | |
| Arsenal AIC Parent LLC Tranche B 1LN, term loan CME Term SOFR 1 month Index + 3.25%, 7.607% 8/19/2030 (c)(d)(e) | | 79,004 | 79,576 |
TOTAL MATERIALS | | | 5,962,420 |
| | | | |
| Utilities - 0.0% | | | |
| Independent Power and Renewable Electricity Producers - 0.0% | | | |
| Talen Energy Supply LLC Tranche TLB-EXIT 1LN, term loan CME Term SOFR 1 month Index + 3.5%, 7.0235% 5/17/2030 (c)(d)(e) | | 23,972 | 24,038 |
| TOTAL UNITED STATES | | | 51,411,808 |
| TOTAL BANK LOAN OBLIGATIONS (Cost $55,891,748) | | | 55,640,221 |
| | | | |
| Collateralized Mortgage Obligations - 0.6% |
| | | Principal Amount (a) | Value ($) |
| UNITED STATES - 0.6% | | | |
| Fannie Mae Guaranteed REMICS Series 2020-51 Class BA, 2% 6/25/2046 | | 432,803 | 375,471 |
| Fannie Mae Guaranteed REMICS Series 2021-59 Class H, 2% 6/25/2048 | | 133,417 | 107,564 |
| Fannie Mae Guaranteed REMICS Series 2021-66 Class DA, 2% 1/25/2048 | | 141,225 | 114,731 |
| Fannie Mae Guaranteed REMICS Series 2021-66 Class DM, 2% 1/25/2048 | | 150,082 | 121,926 |
| Fannie Mae Guaranteed REMICS Series 2021-85 Class L, 2.5% 8/25/2048 | | 123,659 | 106,101 |
| Fannie Mae Guaranteed REMICS Series 2021-96 Class HA, 2.5% 2/25/2050 | | 202,136 | 171,498 |
| Fannie Mae Guaranteed REMICS Series 2022-1 Class KA, 3% 5/25/2048 | | 203,743 | 182,821 |
| Fannie Mae Guaranteed REMICS Series 2022-13 Class MA, 3% 5/25/2044 | | 784,367 | 734,868 |
| Fannie Mae Guaranteed REMICS Series 2022-3 Class N, 2% 10/25/2047 | | 1,573,739 | 1,349,681 |
| Fannie Mae Guaranteed REMICS Series 2022-4 Class B, 2.5% 5/25/2049 | | 146,809 | 125,567 |
| Fannie Mae Guaranteed REMICS Series 2022-5 Class BA, 2.5% 12/25/2049 | | 227,639 | 189,553 |
| Fannie Mae Guaranteed REMICS Series 2022-66 Class KA, 5% 10/25/2052 | | 282,116 | 280,910 |
| Fannie Mae Guaranteed REMICS Series 2022-7 Class A, 3% 5/25/2048 | | 289,640 | 259,939 |
| Freddie Mac Multiclass Mortgage participation certificates Series 2021-5159 Class GC, 2% 11/25/2047 | | 116,187 | 99,347 |
| Freddie Mac Multifamily Structured pass-thru certificates Series 2020-5018 Class LC, 3% 10/25/2040 | | 222,308 | 197,211 |
| Freddie Mac Multifamily Structured pass-thru certificates Series 2021-5122 Class TE, 1.5% 6/25/2051 | | 476,245 | 382,081 |
| Freddie Mac Multifamily Structured pass-thru certificates Series 2021-5175 Class CB, 2.5% 4/25/2050 | | 725,947 | 613,928 |
| Freddie Mac Multifamily Structured pass-thru certificates Series 2021-5180 Class KA, 2.5% 10/25/2047 | | 145,235 | 127,198 |
| Freddie Mac Multifamily Structured pass-thru certificates Series 2022-5189 Class DA, 2.5% 5/25/2049 | | 157,832 | 134,789 |
| Freddie Mac Multifamily Structured pass-thru certificates Series 2022-5190 Class BA, 2.5% 11/25/2047 | | 151,142 | 132,276 |
| Freddie Mac Multifamily Structured pass-thru certificates Series 2022-5191 Class CA, 2.5% 4/25/2050 | | 170,730 | 143,587 |
| Freddie Mac Multifamily Structured pass-thru certificates Series 2022-5197 Class DA, 2.5% 11/25/2047 | | 114,707 | 100,484 |
| Freddie Mac Multifamily Structured pass-thru certificates Series 2022-5198 Class BA, 2.5% 11/25/2047 | | 569,761 | 501,781 |
| Freddie Mac Multifamily Structured pass-thru certificates Series 2022-5200 Class LA, 3% 10/25/2048 | | 270,167 | 241,931 |
| Freddie Mac Multifamily Structured pass-thru certificates Series 2022-5213 Class JM, 3.5% 9/25/2051 | | 676,879 | 642,476 |
| Freddie Mac Multifamily Structured pass-thru certificates Series 2022-5214 Class CG, 3.5% 4/25/2052 | | 262,774 | 243,824 |
| Freddie Mac Multifamily Structured pass-thru certificates Series 2022-5220 Class PK, 3.5% 1/25/2051 | | 339,540 | 315,381 |
| Freddie Mac Multifamily Structured pass-thru certificates Series 2022-5224 Class DQ, 3.75% 8/25/2044 | | 383,802 | 364,013 |
TOTAL UNITED STATES | | | 8,360,937 |
| TOTAL COLLATERALIZED MORTGAGE OBLIGATIONS (Cost $8,411,710) | | | 8,360,937 |
| | | | |
| Commercial Mortgage Securities - 4.0% |
| | | Principal Amount (a) | Value ($) |
| UNITED STATES - 4.0% | | | |
| Freddie Mac Multiclass Mortgage participation certificates Series 2015-K044 Class A2, 2.811% 1/25/2025 | | 459,920 | 458,499 |
| Freddie Mac Multiclass Mortgage participation certificates Series 2015-K045 Class A2, 3.023% 1/25/2025 | | 1,430,596 | 1,426,175 |
| Freddie Mac Multifamily Structured pass-thru certificates Series 2015-K048 Class A2, 3.284% 6/25/2025 (c) | | 8,056,789 | 8,004,316 |
| Freddie Mac Multifamily Structured pass-thru certificates Series 2015-K049 Class A2, 3.01% 7/25/2025 | | 1,048,500 | 1,039,205 |
| Freddie Mac Multifamily Structured pass-thru certificates Series 2015-K050 Class A2, 3.334% 8/25/2025 (c) | | 1,397,405 | 1,385,884 |
| Freddie Mac Multifamily Structured pass-thru certificates Series 2015-K051 Class A2, 3.308% 9/25/2025 | | 2,127,448 | 2,107,709 |
| Freddie Mac Multifamily Structured pass-thru certificates Series 2015-KPLB Class A, 2.77% 5/25/2025 | | 1,180,000 | 1,169,729 |
| Freddie Mac Multifamily Structured pass-thru certificates Series 2016-K052 Class A2, 3.151% 11/25/2025 | | 4,851,926 | 4,796,971 |
| Freddie Mac Multifamily Structured pass-thru certificates Series 2016-K053 Class A2, 2.995% 12/25/2025 | | 2,300,000 | 2,268,904 |
| Freddie Mac Multifamily Structured pass-thru certificates Series 2016-K055 Class A2, 2.673% 3/25/2026 | | 2,085,541 | 2,042,215 |
| Freddie Mac Multifamily Structured pass-thru certificates Series 2016-K056 Class A2, 2.525% 5/25/2026 | | 200,000 | 195,029 |
| Freddie Mac Multifamily Structured pass-thru certificates Series 2016-K057 Class A2, 2.57% 7/25/2026 | | 1,900,000 | 1,849,902 |
| Freddie Mac Multifamily Structured pass-thru certificates Series 2016-K058 Class A2, 2.653% 8/25/2026 | | 2,300,000 | 2,232,278 |
| Freddie Mac Multifamily Structured pass-thru certificates Series 2016-K059 Class A2, 3.12% 9/25/2026 (c) | | 500,000 | 488,383 |
| Freddie Mac Multifamily Structured pass-thru certificates Series 2017-K063 Class A2, 3.43% 1/25/2027 | | 600,000 | 586,964 |
| Freddie Mac Multifamily Structured pass-thru certificates Series 2017-K065 Class A2, 3.243% 4/25/2027 | | 2,100,000 | 2,038,680 |
| Freddie Mac Multifamily Structured pass-thru certificates Series 2017-K066 Class A2, 3.117% 6/25/2027 | | 3,090,000 | 2,988,058 |
| Freddie Mac Multifamily Structured pass-thru certificates Series 2018-K073 Class A2, 3.35% 1/25/2028 | | 300,000 | 289,296 |
| Freddie Mac Multifamily Structured pass-thru certificates Series 2018-K077 Class A2, 3.85% 5/25/2028 | | 600,000 | 584,846 |
| Freddie Mac Multifamily Structured pass-thru certificates Series 2018-K084 Class A2, 3.78% 10/25/2028 | | 1,200,000 | 1,161,013 |
| Freddie Mac Multifamily Structured pass-thru certificates Series 2018-K731 Class A2, 3.6% 2/25/2025 | | 188,037 | 187,454 |
| Freddie Mac Multifamily Structured pass-thru certificates Series 2018-K732 Class A2, 3.7% 5/25/2025 | | 1,416,128 | 1,409,047 |
| Freddie Mac Multifamily Structured pass-thru certificates Series 2018-K733 Class A2, 3.75% 8/25/2025 | | 1,762,919 | 1,751,336 |
| Freddie Mac Multifamily Structured pass-thru certificates Series 2019-K734 Class A2, 3.208% 2/25/2026 | | 1,882,352 | 1,858,977 |
| Freddie Mac Multifamily Structured pass-thru certificates Series 2019-K735 Class A2, 2.862% 5/25/2026 | | 1,060,583 | 1,039,310 |
| Freddie Mac Multifamily Structured pass-thru certificates Series 2019-K736 Class A2, 2.282% 7/25/2026 | | 896,917 | 870,586 |
| Freddie Mac Multifamily Structured pass-thru certificates Series 2020-K739 Class A2, 1.336% 9/25/2027 | | 10,700,000 | 9,894,235 |
| Freddie Mac Multifamily Structured pass-thru certificates Series 2022-K747 Class A2, 2.05% 11/25/2028 | | 500,000 | 453,839 |
| Freddie Mac Multifamily Structured pass-thru certificates Series 2024-K523 Class AS, U.S. 30-Day Avg. SOFR Index + 0.55%, 5.2158% 4/25/2029 (c)(d) | | 2,199,601 | 2,205,531 |
| FREMF Mortgage Trust Series 2015-KPLB Class B, 2.5% 5/25/2025 (b) | | 4,200,000 | 4,149,785 |
TOTAL UNITED STATES | | | 60,934,156 |
| TOTAL COMMERCIAL MORTGAGE SECURITIES (Cost $60,867,212) | | | 60,934,156 |
| | | | |
| Common Stocks - 6.9% |
| | | Shares | Value ($) |
| CANADA - 0.0% | | | |
| Energy - 0.0% | | | |
| Oil, Gas & Consumable Fuels - 0.0% | | | |
| South Bow Corp | | 28,700 | 677,244 |
| CHINA - 0.2% | | | |
| Consumer Discretionary - 0.2% | | | |
| Automobiles - 0.2% | | | |
| BYD Co Ltd H Shares | | 55,500 | 1,887,729 |
| Information Technology - 0.0% | | | |
| Semiconductors & Semiconductor Equipment - 0.0% | | | |
| NXP Semiconductors NV | | 2,300 | 478,055 |
| TOTAL CHINA | | | 2,365,784 |
| FRANCE - 0.0% | | | |
| Consumer Discretionary - 0.0% | | | |
| Textiles, Apparel & Luxury Goods - 0.0% | | | |
| LVMH Moet Hennessy Louis Vuitton SE | | 500 | 328,897 |
| HONG KONG - 0.0% | | | |
| Consumer Discretionary - 0.0% | | | |
| Hotels, Restaurants & Leisure - 0.0% | | | |
| Studio City International Holdings Ltd ADR (j) | | 11,100 | 62,715 |
| Studio City International Holdings Ltd ADR (b)(j) | | 10,083 | 56,969 |
| | | | |
| TOTAL HONG KONG | | | 119,684 |
| LUXEMBOURG - 0.0% | | | |
| Industrials - 0.0% | | | |
| Transportation Infrastructure - 0.0% | | | |
| Tricer Holdco S.C.A. Class A1 (g)(j)(k) | | 16,755 | 0 |
| Tricer Holdco S.C.A. Class A2 (g)(j)(k) | | 16,755 | 0 |
| Tricer Holdco S.C.A. Class A3 (g)(j)(k) | | 16,755 | 0 |
| Tricer Holdco S.C.A. Class A4 (g)(j)(k) | | 16,755 | 0 |
| Tricer Holdco S.C.A. Class A5 (g)(j)(k) | | 16,755 | 0 |
| Tricer Holdco S.C.A. Class A6 (g)(j)(k) | | 16,755 | 0 |
| Tricer Holdco S.C.A. Class A7 (g)(j)(k) | | 16,755 | 0 |
| Tricer Holdco S.C.A. Class A8 (g)(j)(k) | | 16,755 | 0 |
| Tricer Holdco S.C.A. Class A9 (g)(j)(k) | | 16,755 | 0 |
| | | | 0 |
| Materials - 0.0% | | | |
| Metals & Mining - 0.0% | | | |
| Algoma Steel Sca (g)(j) | | 10,220 | 0 |
| TOTAL LUXEMBOURG | | | 0 |
| NETHERLANDS - 0.0% | | | |
| Information Technology - 0.0% | | | |
| Semiconductors & Semiconductor Equipment - 0.0% | | | |
| ASML Holding NV depository receipt | | 900 | 623,772 |
| TAIWAN - 0.1% | | | |
| Information Technology - 0.1% | | | |
| Semiconductors & Semiconductor Equipment - 0.1% | | | |
| Taiwan Semiconductor Manufacturing Co Ltd ADR | | 5,200 | 1,026,948 |
| UNITED STATES - 6.6% | | | |
| Communication Services - 0.6% | | | |
| Interactive Media & Services - 0.5% | | | |
| Alphabet Inc Class A | | 7,000 | 1,325,100 |
| Meta Platforms Inc Class A | | 8,800 | 5,152,488 |
| Pinterest Inc Class A (j) | | 32,200 | 933,800 |
| | | | 7,411,388 |
| Media - 0.1% | | | |
| EchoStar Corp (k) | | 22,127 | 506,708 |
| EchoStar Corp Class A (j)(l) | | 36,100 | 826,690 |
| iHeartMedia Inc Class A (j)(l) | | 5,655 | 11,197 |
| | | | 1,344,595 |
| Consumer Discretionary - 0.7% | | | |
| Automobile Components - 0.0% | | | |
| UC Holdings Inc (g)(j) | | 33,750 | 11,813 |
| Broadline Retail - 0.1% | | | |
| Amazon.com Inc (j) | | 10,200 | 2,237,778 |
| Hotels, Restaurants & Leisure - 0.3% | | | |
| Airbnb Inc Class A (j) | | 6,400 | 841,024 |
| Booking Holdings Inc | | 200 | 993,684 |
| Boyd Gaming Corp | | 12,300 | 892,242 |
| Domino's Pizza Inc | | 1,100 | 461,736 |
| New Cotai LLC / New Cotai Capital Corp (j)(k) | | 247,076 | 170,482 |
| | | | 3,359,168 |
| Household Durables - 0.1% | | | |
| TopBuild Corp (j) | | 4,300 | 1,338,762 |
| Specialty Retail - 0.1% | | | |
| Dick's Sporting Goods Inc | | 5,700 | 1,304,388 |
| Williams-Sonoma Inc | | 4,600 | 851,828 |
| | | | 2,156,216 |
| Textiles, Apparel & Luxury Goods - 0.1% | | | |
| Crocs Inc (j) | | 11,600 | 1,270,548 |
TOTAL CONSUMER DISCRETIONARY | | | 10,374,285 |
| | | | |
| Consumer Staples - 0.1% | | | |
| Beverages - 0.0% | | | |
| Celsius Holdings Inc (j) | | 11,200 | 295,008 |
| Consumer Staples Distribution & Retail - 0.1% | | | |
| Southeastern Grocers Inc rights (g)(j) | | 40,826 | 10,008 |
| US Foods Holding Corp (j) | | 12,800 | 863,488 |
| | | | 873,496 |
| Personal Care Products - 0.0% | | | |
| elf Beauty Inc (j)(l) | | 3,200 | 401,760 |
TOTAL CONSUMER STAPLES | | | 1,570,264 |
| | | | |
| Energy - 0.3% | | | |
| Energy Equipment & Services - 0.0% | | | |
| Forbes Energy Services Ltd (g)(j) | | 6,562 | 1 |
| Superior Energy Services Inc Class A (g) | | 5,560 | 338,715 |
| | | | 338,716 |
| Oil, Gas & Consumable Fuels - 0.3% | | | |
| California Resources Corp | | 865 | 44,885 |
| Canvas Energy Inc Series B warrants 10/1/2025 (g)(j) | | 13 | 0 |
| Cheniere Energy Inc | | 7,900 | 1,697,473 |
| Energy Transfer LP | | 38,700 | 758,133 |
| EP Energy Corp (g)(j) | | 52,316 | 68,011 |
| Expand Energy Corp | | 48 | 4,778 |
| Expand Energy Corp warrants 2/9/2026 (j) | | 93 | 7,953 |
| Mesquite Energy Inc (g)(j) | | 15,322 | 1,323,783 |
| Permian Resources Corp Class A | | 41,000 | 589,580 |
| Unit Corp | | 2,069 | 62,484 |
| | | | 4,557,080 |
TOTAL ENERGY | | | 4,895,796 |
| | | | |
| Financials - 1.1% | | | |
| Capital Markets - 0.2% | | | |
| Ares Management Corp Class A | | 4,400 | 778,932 |
| Blue Owl Capital Inc Class A | | 33,300 | 774,558 |
| Coinbase Global Inc Class A (j) | | 4,400 | 1,092,520 |
| Moody's Corp | | 1,600 | 757,392 |
| | | | 3,403,402 |
| Consumer Finance - 0.1% | | | |
| OneMain Holdings Inc | | 29,100 | 1,516,983 |
| Financial Services - 0.6% | | | |
| Apollo Global Management Inc | | 20,300 | 3,352,748 |
| Block Inc Class A (j) | | 9,800 | 832,902 |
| Carnelian Point Holdings LP warrants (g)(j) | | 54 | 158 |
| Fiserv Inc (j) | | 5,800 | 1,191,436 |
| Mastercard Inc Class A | | 3,000 | 1,579,710 |
| Visa Inc Class A | | 8,800 | 2,781,152 |
| | | | 9,738,106 |
| Insurance - 0.2% | | | |
| Arthur J Gallagher & Co | | 8,600 | 2,441,110 |
TOTAL FINANCIALS | | | 17,099,601 |
| | | | |
| Health Care - 0.1% | | | |
| Health Care Providers & Services - 0.1% | | | |
| Cano Health LLC warrants (g)(j) | | 493 | 1,888 |
| DaVita Inc (j) | | 2,800 | 418,740 |
| Tenet Healthcare Corp (j) | | 3,700 | 467,051 |
| | | | 887,679 |
| Industrials - 1.2% | | | |
| Aerospace & Defense - 0.0% | | | |
| TransDigm Group Inc | | 500 | 633,640 |
| Building Products - 0.2% | | | |
| Builders FirstSource Inc (j) | | 3,200 | 457,376 |
| Carlisle Cos Inc | | 2,800 | 1,032,752 |
| Fortune Brands Innovations Inc | | 11,300 | 772,129 |
| Trane Technologies PLC | | 3,600 | 1,329,660 |
| | | | 3,591,917 |
| Construction & Engineering - 0.3% | | | |
| Comfort Systems USA Inc | | 6,000 | 2,544,360 |
| EMCOR Group Inc | | 2,700 | 1,225,530 |
| WillScot Holdings Corp (j) | | 28,500 | 953,325 |
| | | | 4,723,215 |
| Electrical Equipment - 0.5% | | | |
| Eaton Corp PLC | | 6,500 | 2,157,155 |
| NEXTracker Inc Class A (j) | | 19,000 | 694,070 |
| nVent Electric PLC | | 12,100 | 824,736 |
| Vertiv Holdings Co Class A | | 20,100 | 2,283,561 |
| | | | 5,959,522 |
| Machinery - 0.2% | | | |
| Allison Transmission Holdings Inc | | 4,900 | 529,494 |
| Deere & Co | | 700 | 296,590 |
| Parker-Hannifin Corp | | 2,600 | 1,653,678 |
| | | | 2,479,762 |
| Trading Companies & Distributors - 0.0% | | | |
| Core & Main Inc Class A (j) | | 10,800 | 549,828 |
| Penhall Acquisition Company (g) | | 428 | 0 |
| | | | 549,828 |
TOTAL INDUSTRIALS | | | 17,937,884 |
| | | | |
| Information Technology - 1.8% | | | |
| Communications Equipment - 0.1% | | | |
| Arista Networks Inc | | 14,400 | 1,591,632 |
| IT Services - 0.0% | | | |
| GTT Communications Inc (g)(j) | | 4,921 | 235,322 |
| Semiconductors & Semiconductor Equipment - 1.1% | | | |
| KLA Corp | | 2,000 | 1,260,240 |
| Lam Research Corp | | 17,000 | 1,227,910 |
| Marvell Technology Inc | | 9,500 | 1,049,275 |
| Micron Technology Inc | | 5,200 | 437,632 |
| NVIDIA Corp | | 66,000 | 8,863,140 |
| ON Semiconductor Corp (j) | | 25,965 | 1,637,093 |
| | | | 14,475,290 |
| Software - 0.6% | | | |
| Adobe Inc (j) | | 3,000 | 1,334,040 |
| Autodesk Inc (j) | | 2,300 | 679,811 |
| Gen Digital Inc | | 21,100 | 577,718 |
| Microsoft Corp | | 6,500 | 2,739,750 |
| Monday.com Ltd (j) | | 2,600 | 612,144 |
| Oracle Corp | | 7,800 | 1,299,792 |
| Salesforce Inc | | 5,300 | 1,771,949 |
| | | | 9,015,204 |
| Technology Hardware, Storage & Peripherals - 0.0% | | | |
| Dell Technologies Inc Class C | | 5,800 | 668,392 |
TOTAL INFORMATION TECHNOLOGY | | | 25,985,840 |
| | | | |
| Materials - 0.2% | | | |
| Chemicals - 0.0% | | | |
| Chemours Co/The | | 30,845 | 521,281 |
| Construction Materials - 0.1% | | | |
| Eagle Materials Inc | | 5,100 | 1,258,476 |
| Martin Marietta Materials Inc | | 1,100 | 568,150 |
| | | | 1,826,626 |
| Containers & Packaging - 0.1% | | | |
| Graphic Packaging Holding CO | | 34,200 | 928,872 |
| Metals & Mining - 0.0% | | | |
| Elah Holdings Inc (j) | | 14 | 275 |
TOTAL MATERIALS | | | 3,277,054 |
| | | | |
| Utilities - 0.5% | | | |
| Electric Utilities - 0.2% | | | |
| Constellation Energy Corp | | 12,900 | 2,885,859 |
| PG&E Corp | | 53,066 | 1,070,872 |
| Portland General Electric Co | | 140 | 6,106 |
| | | | 3,962,837 |
| Independent Power and Renewable Electricity Producers - 0.3% | | | |
| PureWest Energy LLC (g)(j) | | 901 | 203 |
| Vistra Corp | | 30,600 | 4,218,822 |
| | | | 4,219,025 |
TOTAL UTILITIES | | | 8,181,862 |
| | | | |
| TOTAL UNITED STATES | | | 98,966,248 |
| TOTAL COMMON STOCKS (Cost $71,003,248) | | | 104,108,577 |
| | | | |
| Convertible Corporate Bonds - 0.4% |
| | | Principal Amount (a) | Value ($) |
| UNITED STATES - 0.4% | | | |
| Communication Services - 0.1% | | | |
| Media - 0.1% | | | |
| EchoStar Corp 3.875% 11/30/2030 pay-in-kind | | 1,776,702 | 1,864,265 |
| Consumer Discretionary - 0.1% | | | |
| Automobiles - 0.1% | | | |
| Rivian Automotive Inc 3.625% 10/15/2030 | | 1,240,000 | 1,152,932 |
| Hotels, Restaurants & Leisure - 0.0% | | | |
| New Cotai LLC 5% 2/24/2027 | | 326,057 | 563,134 |
TOTAL CONSUMER DISCRETIONARY | | | 1,716,066 |
| | | | |
| Financials - 0.0% | | | |
| Capital Markets - 0.0% | | | |
| Coinbase Global Inc 0.25% 4/1/2030 (b) | | 390,000 | 415,376 |
| Information Technology - 0.2% | | | |
| Semiconductors & Semiconductor Equipment - 0.2% | | | |
| Wolfspeed Inc 1.875% 12/1/2029 | | 5,455,000 | 2,260,552 |
| TOTAL UNITED STATES | | | 6,256,259 |
| TOTAL CONVERTIBLE CORPORATE BONDS (Cost $6,894,966) | | | 6,256,259 |
| | | | |
| Fixed-Income Funds - 5.1% |
| | | Shares | Value ($) |
Fidelity Floating Rate Central Fund (m) (Cost $76,686,933) | | 775,710 | 76,205,739 |
| | | | |
| Foreign Government and Government Agency Obligations - 12.7% |
| | | Principal Amount (a) | Value ($) |
| ANGOLA - 0.1% | | | |
| Angola Republic 8.25% 5/9/2028 (b) | | 650,000 | 611,202 |
| Angola Republic 8.75% 4/14/2032 (b) | | 325,000 | 286,322 |
| Angola Republic 9.375% 5/8/2048 (b) | | 310,000 | 254,035 |
| Angola Republic 9.5% 11/12/2025 (b) | | 795,000 | 796,630 |
TOTAL ANGOLA | | | 1,948,189 |
| ARGENTINA - 0.8% | | | |
| Argentine Republic 0.75% 7/9/2030 (n) | | 5,496,296 | 4,234,896 |
| Argentine Republic 1% 7/9/2029 | | 738,798 | 598,796 |
| Argentine Republic 3.5% 7/9/2041 (n) | | 1,140,000 | 711,930 |
| Argentine Republic 4.125% 7/9/2035 (n) | | 3,492,241 | 2,317,102 |
| Argentine Republic 5% 1/9/2038 (n) | | 2,032,304 | 1,419,564 |
| Bonos Para La Reconstruccion De Una Argentina Libre 0% 6/30/2025 (o) | | 215,895 | 107,881 |
| Provincia de Cordoba 6.875% 12/10/2025 (b)(n) | | 130,615 | 128,419 |
| Provincia de Cordoba 6.99% 6/1/2027 (b)(n) | | 515,562 | 481,607 |
TOTAL ARGENTINA | | | 10,000,195 |
| ARMENIA - 0.0% | | | |
| Republic of Armenia 3.6% 2/2/2031 (b) | | 280,000 | 230,331 |
| BAHAMAS (NASSAU) - 0.0% | | | |
| Bahamas Government International Bond 6% 11/21/2028 (b) | | 310,000 | 294,633 |
| BAHRAIN - 0.0% | | | |
| Central Bank of Bahrain Ijara Sukuk 5.625% 5/18/2034 (b) | | 155,000 | 140,261 |
| Central Bank of Bahrain Ijara Sukuk 7.5% 2/12/2036 (b) | | 200,000 | 204,822 |
TOTAL BAHRAIN | | | 345,083 |
| BARBADOS - 0.0% | | | |
| Barbados Government 6.5% 10/1/2029 (b) | | 354,000 | 345,426 |
| BENIN - 0.0% | | | |
| Republic of Benin 4.875% 1/19/2032 (b) | EUR | 275,000 | 257,264 |
| Republic of Benin 7.96% 2/13/2038 (b) | | 290,000 | 273,235 |
TOTAL BENIN | | | 530,499 |
| BERMUDA - 0.1% | | | |
| Bermuda 2.375% 8/20/2030 (b) | | 55,000 | 46,661 |
| Bermuda 3.375% 8/20/2050 (b) | | 165,000 | 109,210 |
| Bermuda 3.717% 1/25/2027 (b) | | 645,000 | 625,449 |
| Bermuda 4.75% 2/15/2029 (b) | | 360,000 | 350,845 |
| Bermuda 5% 7/15/2032 (b) | | 260,000 | 250,900 |
TOTAL BERMUDA | | | 1,383,065 |
| BRAZIL - 0.2% | | | |
| Federative Republic of Brazil 3.875% 6/12/2030 | | 830,000 | 730,400 |
| Federative Republic of Brazil 6% 10/20/2033 | | 335,000 | 312,555 |
| Federative Republic of Brazil 7.125% 1/20/2037 | | 565,000 | 567,825 |
| Federative Republic of Brazil 7.125% 5/13/2054 | | 215,000 | 199,843 |
| Federative Republic of Brazil 8.25% 1/20/2034 | | 1,045,000 | 1,140,095 |
TOTAL BRAZIL | | | 2,950,718 |
| CHILE - 0.2% | | | |
| Chilean Republic 2.45% 1/31/2031 | | 1,355,000 | 1,162,336 |
| Chilean Republic 2.75% 1/31/2027 | | 310,000 | 295,120 |
| Chilean Republic 3.1% 1/22/2061 | | 700,000 | 414,092 |
| Chilean Republic 3.5% 1/31/2034 | | 200,000 | 172,688 |
| Chilean Republic 4% 1/31/2052 | | 200,000 | 149,874 |
| Chilean Republic 4.34% 3/7/2042 | | 260,000 | 218,806 |
| Chilean Republic 5.33% 1/5/2054 | | 505,000 | 467,600 |
TOTAL CHILE | | | 2,880,516 |
| COLOMBIA - 0.4% | | | |
| Colombian Republic 3% 1/30/2030 | | 1,025,000 | 853,313 |
| Colombian Republic 3.125% 4/15/2031 | | 535,000 | 424,266 |
| Colombian Republic 3.25% 4/22/2032 | | 290,000 | 222,001 |
| Colombian Republic 4.125% 5/15/2051 | | 220,000 | 126,169 |
| Colombian Republic 5% 6/15/2045 | | 855,000 | 573,030 |
| Colombian Republic 5.2% 5/15/2049 | | 650,000 | 437,775 |
| Colombian Republic 6.125% 1/18/2041 | | 40,000 | 32,619 |
| Colombian Republic 7.375% 9/18/2037 | | 140,000 | 133,490 |
| Colombian Republic 7.5% 2/2/2034 | | 250,000 | 246,500 |
| Colombian Republic 8% 11/14/2035 | | 310,000 | 311,860 |
| Colombian Republic 8% 4/20/2033 | | 280,000 | 285,606 |
| Colombian Republic 8.75% 11/14/2053 | | 290,000 | 292,900 |
TOTAL COLOMBIA | | | 3,939,529 |
| COSTA RICA - 0.0% | | | |
| Costa Rica Government International Bond 5.625% 4/30/2043 (b) | | 285,000 | 255,075 |
| Costa Rica Government International Bond 6.125% 2/19/2031 (b) | | 130,000 | 130,325 |
| Costa Rica Government International Bond 7.3% 11/13/2054 (b) | | 305,000 | 315,370 |
TOTAL COSTA RICA | | | 700,770 |
| COTE D'IVOIRE - 0.1% | | | |
| Cote d'Ivoire Treasury Bill 5.875% 10/17/2031 (b) | EUR | 460,000 | 446,115 |
| Cote d'Ivoire Treasury Bill 6.125% 6/15/2033 (b) | | 620,000 | 552,769 |
| Cote d'Ivoire Treasury Bill 6.375% 3/3/2028 (b) | | 490,000 | 485,575 |
| Cote d'Ivoire Treasury Bill 8.25% 1/30/2037 (b) | | 300,000 | 291,375 |
TOTAL COTE D'IVOIRE | | | 1,775,834 |
| DOMINICAN REPUBLIC - 0.4% | | | |
| Dominican Republic International Bond 4.5% 1/30/2030 (b) | | 735,000 | 672,893 |
| Dominican Republic International Bond 4.875% 9/23/2032 (b) | | 860,000 | 766,260 |
| Dominican Republic International Bond 5.95% 1/25/2027 (b) | | 445,000 | 442,108 |
| Dominican Republic International Bond 6% 7/19/2028 (b) | | 360,000 | 356,220 |
| Dominican Republic International Bond 6.5% 2/15/2048 (b) | | 215,000 | 204,584 |
| Dominican Republic International Bond 6.6% 6/1/2036 (b) | | 224,000 | 222,432 |
| Dominican Republic International Bond 6.85% 1/27/2045 (b) | | 300,000 | 294,741 |
| Dominican Republic International Bond 6.875% 1/29/2026 (b) | | 790,000 | 795,925 |
| Dominican Republic International Bond 7.05% 2/3/2031 (b) | | 375,000 | 383,745 |
| Dominican Republic International Bond 7.45% 4/30/2044 (b) | | 335,000 | 350,913 |
TOTAL DOMINICAN REPUBLIC | | | 4,489,821 |
| ECUADOR - 0.1% | | | |
| Ecuador Government International Bond 5.5% 7/31/2035 (b)(n) | | 705,000 | 398,678 |
| Ecuador Government International Bond 6.9% 7/31/2030 (b)(n) | | 1,089,190 | 756,987 |
TOTAL ECUADOR | | | 1,155,665 |
| EGYPT - 0.2% | | | |
| Arab Republic of Egypt 7.0529% 1/15/2032 (b) | | 30,000 | 25,719 |
| Arab Republic of Egypt 7.5% 1/31/2027 (b) | | 830,000 | 818,795 |
| Arab Republic of Egypt 7.5% 2/16/2061 (b) | | 480,000 | 327,845 |
| Arab Republic of Egypt 7.6003% 3/1/2029 (b) | | 370,000 | 357,550 |
| Arab Republic of Egypt 7.903% 2/21/2048 (b) | | 460,000 | 338,652 |
| Arab Republic of Egypt 8.5% 1/31/2047 (b) | | 580,000 | 449,680 |
| Arab Republic of Egypt 8.7002% 3/1/2049 (b) | | 460,000 | 360,976 |
| Arab Republic of Egypt Treasury Bills 0% 1/14/2025 (o) | EGP | 8,900,000 | 172,678 |
| Arab Republic of Egypt Treasury Bills 0% 3/18/2025 (o) | EGP | 21,075,000 | 392,557 |
TOTAL EGYPT | | | 3,244,452 |
| EL SALVADOR - 0.1% | | | |
| El Salvador Republic 0.25% 4/17/2030 (b) | | 290,000 | 5,045 |
| El Salvador Republic 7.1246% 1/20/2050 (b) | | 290,000 | 243,600 |
| El Salvador Republic 7.625% 2/1/2041 (b) | | 90,000 | 83,475 |
| El Salvador Republic 7.65% 6/15/2035 (b) | | 135,000 | 130,613 |
| El Salvador Republic 9.25% 4/17/2030 (b) | | 290,000 | 306,313 |
| El Salvador Republic 9.65% 11/21/2054 (b) | | 175,000 | 183,148 |
TOTAL EL SALVADOR | | | 952,194 |
| GABON - 0.0% | | | |
| Gabonese Republic 6.625% 2/6/2031 (b) | | 425,000 | 314,500 |
| Gabonese Republic 7% 11/24/2031 (b) | | 455,000 | 338,122 |
TOTAL GABON | | | 652,622 |
| GEORGIA - 0.0% | | | |
| Georgia Republic 2.75% 4/22/2026 (b) | | 290,000 | 272,781 |
| GERMANY - 5.7% | | | |
| German Federal Republic 2.1% 4/12/2029 (p) | EUR | 10,330,000 | 10,692,536 |
| German Federal Republic 2.4% 10/19/2028 (p) | EUR | 2,570,000 | 2,693,562 |
| German Federal Republic 2.5% 3/13/2025 (p) | EUR | 6,350,000 | 6,576,700 |
| German Federal Republic 2.6% 8/15/2033 (p) | EUR | 32,810,000 | 34,763,708 |
| German Federal Republic 2.6% 8/15/2034 (p) | EUR | 28,230,000 | 29,832,048 |
TOTAL GERMANY | | | 84,558,554 |
| GHANA - 0.0% | | | |
| Ghana Republic 0% 1/3/2030 (b)(o) | | 28,965 | 22,231 |
| Ghana Republic 0% 7/3/2026 (b)(o) | | 33,920 | 31,486 |
| Ghana Republic 5% 7/3/2029 (b)(n) | | 291,520 | 250,707 |
| Ghana Republic 5% 7/3/2035 (b)(n) | | 333,880 | 233,616 |
TOTAL GHANA | | | 538,040 |
| GUATEMALA - 0.0% | | | |
| Guatemala Government Bond 4.9% 6/1/2030 (b) | | 230,000 | 216,632 |
| Guatemala Government Bond 5.375% 4/24/2032 (b) | | 120,000 | 113,100 |
| Guatemala Government Bond 6.125% 6/1/2050 (b) | | 225,000 | 199,062 |
| Guatemala Government Bond 6.6% 6/13/2036 (b) | | 190,000 | 187,981 |
TOTAL GUATEMALA | | | 716,775 |
| HUNGARY - 0.1% | | | |
| Hungary Government 2.125% 9/22/2031 (b) | | 205,000 | 162,340 |
| Hungary Government 3.125% 9/21/2051 (b) | | 340,000 | 198,193 |
| Hungary Government 5.25% 6/16/2029 (b) | | 295,000 | 290,206 |
| Hungary Government 5.5% 6/16/2034 (b) | | 695,000 | 662,639 |
| Hungary Government 6.125% 5/22/2028 (b) | | 225,000 | 228,996 |
| Hungary Government 6.75% 9/25/2052 (b) | | 145,000 | 147,265 |
TOTAL HUNGARY | | | 1,689,639 |
| INDONESIA - 0.4% | | | |
| Indonesia Government 3.2% 9/23/2061 | | 400,000 | 246,055 |
| Indonesia Government 4.35% 1/11/2048 | | 300,000 | 251,625 |
| Indonesia Government 5.125% 1/15/2045 (b) | | 1,160,000 | 1,090,064 |
| Indonesia Government 5.25% 1/17/2042 (b) | | 305,000 | 293,563 |
| Indonesia Government 5.95% 1/8/2046 (b) | | 350,000 | 360,938 |
| Indonesia Government 6.625% 2/17/2037 (b) | | 220,000 | 240,349 |
| Indonesia Government 6.75% 1/15/2044 (b) | | 330,000 | 372,488 |
| Indonesia Government 7.75% 1/17/2038 (b) | | 930,000 | 1,117,163 |
| Indonesia Government 8.5% 10/12/2035 (b) | | 875,000 | 1,083,906 |
TOTAL INDONESIA | | | 5,056,151 |
| ISRAEL - 0.0% | | | |
| Israel Government 3.375% 1/15/2050 | | 595,000 | 385,841 |
| Israel Government 5.75% 3/12/2054 | | 315,000 | 288,048 |
TOTAL ISRAEL | | | 673,889 |
| JAMAICA - 0.0% | | | |
| Jamaican Government 6.75% 4/28/2028 | | 255,000 | 262,650 |
| Jamaican Government 7.875% 7/28/2045 | | 160,000 | 185,110 |
TOTAL JAMAICA | | | 447,760 |
| JAPAN - 0.5% | | | |
| Japan Government 0.7% 12/20/2048 | JPY | 1,270,000,000 | 6,021,694 |
| JORDAN - 0.0% | | | |
| Jordan Government 7.375% 10/10/2047 (b) | | 110,000 | 97,372 |
| Jordan Government 7.5% 1/13/2029 (b) | | 270,000 | 268,059 |
| Jordan Government 7.75% 1/15/2028 (b) | | 320,000 | 320,800 |
TOTAL JORDAN | | | 686,231 |
| KENYA - 0.0% | | | |
| Republic of Kenya Government Bond 6.3% 1/23/2034 (b) | | 195,000 | 153,502 |
| Republic of Kenya Government Bond 7.25% 2/28/2028 (b) | | 100,000 | 95,000 |
| Republic of Kenya Government Bond 9.75% 2/16/2031 (b) | | 410,000 | 405,003 |
TOTAL KENYA | | | 653,505 |
| LEBANON - 0.0% | | | |
| Lebanon Republic 5.8% (h)(p) | | 625,000 | 80,624 |
| Lebanon Republic 6.375% (h)(p) | | 810,000 | 104,490 |
TOTAL LEBANON | | | 185,114 |
| MEXICO - 0.3% | | | |
| United Mexican States 3.5% 2/12/2034 | | 610,000 | 485,522 |
| United Mexican States 3.75% 4/19/2071 | | 1,000,000 | 552,400 |
| United Mexican States 4.875% 5/19/2033 | | 345,000 | 309,206 |
| United Mexican States 5.75% 10/12/2110 | | 840,000 | 645,488 |
| United Mexican States 6% 5/7/2036 | | 600,000 | 564,563 |
| United Mexican States 6.05% 1/11/2040 | | 670,000 | 621,844 |
| United Mexican States 6.338% 5/4/2053 | | 305,000 | 271,544 |
| United Mexican States 6.35% 2/9/2035 | | 465,000 | 454,538 |
TOTAL MEXICO | | | 3,905,105 |
| MONGOLIA - 0.0% | | | |
| Mongolia Government 7.875% 6/5/2029 (b) | | 200,000 | 207,499 |
| MONTENEGRO - 0.0% | | | |
| Republic of Montenegro 7.25% 3/12/2031 (b) | | 515,000 | 528,678 |
| MOROCCO - 0.0% | | | |
| Moroccan Kingdom 6.5% 9/8/2033 (b) | | 495,000 | 510,622 |
| NETHERLANDS - 0.0% | | | |
| Dutch Government 0.5% 7/15/2032 (b)(p) | EUR | 10,000 | 8,974 |
| NIGERIA - 0.2% | | | |
| Republic of Nigeria 6.125% 9/28/2028 (b) | | 1,150,000 | 1,041,831 |
| Republic of Nigeria 6.5% 11/28/2027 (b) | | 445,000 | 421,749 |
| Republic of Nigeria 7.143% 2/23/2030 (b) | | 360,000 | 324,742 |
| Republic of Nigeria 7.625% 11/21/2025 (b) | | 345,000 | 342,820 |
| Republic of Nigeria 7.696% 2/23/2038 (b) | | 280,000 | 227,685 |
| Republic of Nigeria 7.875% 2/16/2032 (b) | | 160,000 | 143,850 |
| Republic of Nigeria Treasury Bills 0% 3/6/2025 (o) | NGN | 601,565,000 | 372,059 |
| Republic of Nigeria Treasury Bills 0% 4/10/2025 (o) | NGN | 192,090,000 | 115,971 |
| Republic of Nigeria Treasury Bills 0% 5/20/2025 (o) | NGN | 207,005,000 | 120,974 |
| Republic of Nigeria Treasury Bills 0% 5/27/2025 (o) | NGN | 222,745,000 | 129,453 |
TOTAL NIGERIA | | | 3,241,134 |
| OMAN - 0.2% | | | |
| Oman Sultanate 5.375% 3/8/2027 (b) | | 120,000 | 119,096 |
| Oman Sultanate 5.625% 1/17/2028 (b) | | 930,000 | 927,384 |
| Oman Sultanate 6% 8/1/2029 (b) | | 450,000 | 455,486 |
| Oman Sultanate 6.25% 1/25/2031 (b) | | 425,000 | 435,540 |
| Oman Sultanate 6.5% 3/8/2047 (b) | | 195,000 | 192,875 |
| Oman Sultanate 6.75% 1/17/2048 (b) | | 920,000 | 933,230 |
| Oman Sultanate 7% 1/25/2051 (b) | | 105,000 | 109,954 |
TOTAL OMAN | | | 3,173,565 |
| PAKISTAN - 0.1% | | | |
| Islamic Republic of Pakistan 6% 4/8/2026 (b) | | 730,000 | 686,083 |
| Islamic Republic of Pakistan 6.875% 12/5/2027 (b) | | 430,000 | 387,271 |
| Islamic Republic of Pakistan 7.375% 4/8/2031 (b) | | 480,000 | 399,600 |
TOTAL PAKISTAN | | | 1,472,954 |
| PANAMA - 0.2% | | | |
| Panamanian Republic 2.252% 9/29/2032 | | 400,000 | 279,904 |
| Panamanian Republic 3.298% 1/19/2033 | | 445,000 | 335,141 |
| Panamanian Republic 3.87% 7/23/2060 | | 715,000 | 372,565 |
| Panamanian Republic 4.5% 4/16/2050 | | 780,000 | 480,659 |
| Panamanian Republic 4.5% 5/15/2047 | | 250,000 | 160,703 |
| Panamanian Republic 6.853% 3/28/2054 | | 200,000 | 170,625 |
| Panamanian Republic 7.875% 3/1/2057 | | 290,000 | 279,760 |
| Panamanian Republic 8% 3/1/2038 | | 305,000 | 305,857 |
TOTAL PANAMA | | | 2,385,214 |
| PARAGUAY - 0.1% | | | |
| Republic of Paraguay 2.739% 1/29/2033 (b) | | 225,000 | 182,461 |
| Republic of Paraguay 4.95% 4/28/2031 (b) | | 480,000 | 459,150 |
| Republic of Paraguay 5.4% 3/30/2050 (b) | | 265,000 | 224,839 |
| Republic of Paraguay 6% 2/9/2036 (b) | | 260,000 | 257,400 |
TOTAL PARAGUAY | | | 1,123,850 |
| PERU - 0.1% | | | |
| Peruvian Republic 2.783% 1/23/2031 | | 740,000 | 632,238 |
| Peruvian Republic 3% 1/15/2034 | | 440,000 | 354,338 |
| Peruvian Republic 3.3% 3/11/2041 | | 360,000 | 259,987 |
TOTAL PERU | | | 1,246,563 |
| PHILIPPINES - 0.1% | | | |
| Philippine Republic 2.65% 12/10/2045 | | 390,000 | 246,188 |
| Philippine Republic 2.95% 5/5/2045 | | 160,000 | 106,799 |
| Philippine Republic 5% 7/17/2033 | | 210,000 | 205,800 |
| Philippine Republic 5.5% 1/17/2048 | | 200,000 | 195,000 |
| Philippine Republic 5.6% 5/14/2049 | | 295,000 | 290,575 |
| Philippine Republic 5.609% 4/13/2033 | | 305,000 | 310,719 |
| Philippine Republic 5.95% 10/13/2047 | | 490,000 | 506,538 |
TOTAL PHILIPPINES | | | 1,861,619 |
| POLAND - 0.1% | | | |
| Bank Gospodarstwa Krajowego 5.375% 5/22/2033 (b) | | 200,000 | 194,626 |
| Bank Gospodarstwa Krajowego 6.25% 10/31/2028 (b) | | 200,000 | 207,536 |
| Bank Gospodarstwa Krajowego 6.25% 7/9/2054 (b) | | 495,000 | 483,991 |
| Republic of Poland 5.5% 3/18/2054 | | 285,000 | 262,203 |
| Republic of Poland 5.5% 4/4/2053 | | 210,000 | 194,191 |
| Republic of Poland 5.75% 11/16/2032 | | 425,000 | 432,735 |
TOTAL POLAND | | | 1,775,282 |
| QATAR - 0.2% | | | |
| State of Qatar 4.4% 4/16/2050 (b) | | 1,045,000 | 884,331 |
| State of Qatar 4.625% 6/2/2046 (b) | | 575,000 | 513,216 |
| State of Qatar 4.817% 3/14/2049 (b) | | 1,060,000 | 954,732 |
| State of Qatar 5.103% 4/23/2048 (b) | | 975,000 | 922,289 |
| State of Qatar 9.75% 6/15/2030 (b) | | 295,000 | 365,741 |
TOTAL QATAR | | | 3,640,309 |
| ROMANIA - 0.1% | | | |
| Romanian Republic 3% 2/27/2027 (b) | | 265,000 | 249,650 |
| Romanian Republic 3.625% 3/27/2032 (b) | | 470,000 | 383,197 |
| Romanian Republic 4% 2/14/2051 (b) | | 280,000 | 176,561 |
| Romanian Republic 6.625% 2/17/2028 (b) | | 225,000 | 227,250 |
| Romanian Republic 7.125% 1/17/2033 (b) | | 290,000 | 293,451 |
TOTAL ROMANIA | | | 1,330,109 |
| RWANDA - 0.0% | | | |
| Rwanda Republic 5.5% 8/9/2031 (b) | | 560,000 | 470,753 |
| SAUDI ARABIA - 0.2% | | | |
| Kingdom of Saudi Arabia 2.25% 2/2/2033 (b) | | 665,000 | 528,883 |
| Kingdom of Saudi Arabia 3.45% 2/2/2061 (b) | | 1,120,000 | 680,050 |
| Kingdom of Saudi Arabia 3.625% 3/4/2028 (b) | | 315,000 | 302,299 |
| Kingdom of Saudi Arabia 3.75% 1/21/2055 (b) | | 655,000 | 434,347 |
| Kingdom of Saudi Arabia 4.5% 10/26/2046 (b) | | 640,000 | 516,800 |
| Kingdom of Saudi Arabia 4.5% 4/22/2060 (b) | | 225,000 | 172,255 |
| Kingdom of Saudi Arabia 4.625% 10/4/2047 (b) | | 330,000 | 269,771 |
| Kingdom of Saudi Arabia 5% 1/18/2053 (b) | | 375,000 | 317,209 |
| Kingdom of Saudi Arabia 5.75% 1/16/2054 (b) | | 315,000 | 293,738 |
TOTAL SAUDI ARABIA | | | 3,515,352 |
| SENEGAL - 0.0% | | | |
| Republic of Senegal 6.25% 5/23/2033 (b) | | 395,000 | 314,519 |
| SERBIA - 0.1% | | | |
| Republic of Serbia 2.125% 12/1/2030 (b) | | 840,000 | 682,760 |
| Republic of Serbia 6% 6/12/2034 (b) | | 335,000 | 329,556 |
| Republic of Serbia 6.5% 9/26/2033 (b) | | 405,000 | 416,138 |
TOTAL SERBIA | | | 1,428,454 |
| SOUTH AFRICA - 0.1% | | | |
| South African Republic 4.85% 9/27/2027 | | 285,000 | 277,530 |
| South African Republic 4.85% 9/30/2029 | | 235,000 | 218,615 |
| South African Republic 5% 10/12/2046 | | 395,000 | 271,578 |
| South African Republic 5.65% 9/27/2047 | | 190,000 | 141,795 |
| South African Republic 5.75% 9/30/2049 | | 620,000 | 462,334 |
| South African Republic 5.875% 4/20/2032 | | 280,000 | 262,861 |
| South African Republic 7.1% 11/19/2036 (b) | | 475,000 | 461,957 |
TOTAL SOUTH AFRICA | | | 2,096,670 |
| SRI LANKA - 0.1% | | | |
| Democratic Socialist Republic of Sri Lanka 3.1% 1/15/2030 (b)(n) | | 170,921 | 140,174 |
| Democratic Socialist Republic of Sri Lanka 3.35% 3/15/2033 (b)(n) | | 335,261 | 248,130 |
| Democratic Socialist Republic of Sri Lanka 3.6% 2/15/2038 (b)(n) | | 314,356 | 235,767 |
| Democratic Socialist Republic of Sri Lanka 3.6% 5/15/2036 (b)(n) | | 157,111 | 117,850 |
| Democratic Socialist Republic of Sri Lanka 3.6% 6/15/2035 (b)(n) | | 226,380 | 162,994 |
| Democratic Socialist Republic of Sri Lanka 4% 4/15/2028 (b) | | 227,140 | 211,265 |
TOTAL SRI LANKA | | | 1,116,180 |
| TURKEY - 0.7% | | | |
| Turkish Republic 26.2% 10/5/2033 | TRY | 8,645,000 | 237,593 |
| Turkish Republic 31.08% 11/8/2028 | TRY | 13,415,000 | 374,970 |
| Turkish Republic 37% 2/18/2026 | TRY | 4,065,000 | 113,199 |
| Turkish Republic 4.25% 4/14/2026 | | 830,000 | 815,475 |
| Turkish Republic 4.75% 1/26/2026 | | 980,000 | 971,670 |
| Turkish Republic 4.875% 10/9/2026 | | 650,000 | 641,264 |
| Turkish Republic 4.875% 4/16/2043 | | 815,000 | 566,947 |
| Turkish Republic 5.125% 2/17/2028 | | 255,000 | 247,470 |
| Turkish Republic 5.25% 3/13/2030 | | 185,000 | 172,917 |
| Turkish Republic 5.75% 5/11/2047 | | 520,000 | 386,729 |
| Turkish Republic 6% 1/14/2041 | | 770,000 | 631,747 |
| Turkish Republic 6% 3/25/2027 | | 170,000 | 170,319 |
| Turkish Republic 6.625% 2/17/2045 | | 310,000 | 261,141 |
| Turkish Republic 7.625% 5/15/2034 | | 325,000 | 330,281 |
| Turkish Republic 9.125% 7/13/2030 | | 350,000 | 387,188 |
| Turkish Republic 9.375% 1/19/2033 | | 840,000 | 945,260 |
| Turkish Republic 9.375% 3/14/2029 | | 490,000 | 540,684 |
| Turkish Republic 9.875% 1/15/2028 | | 1,165,000 | 1,288,053 |
TOTAL TURKEY | | | 9,082,907 |
| UKRAINE - 0.1% | | | |
| Ukraine Government 0% 2/1/2030 (b)(n) | | 109,055 | 59,053 |
| Ukraine Government 0% 2/1/2034 (b)(n) | | 407,526 | 168,104 |
| Ukraine Government 0% 2/1/2035 (b)(n) | | 629,387 | 371,339 |
| Ukraine Government 0% 2/1/2036 (b)(n) | | 286,989 | 167,889 |
| Ukraine Government 0% 8/1/2041 (b)(c) | | 370,000 | 283,975 |
| Ukraine Government 1.75% 2/1/2029 (b)(n) | | 457,501 | 314,223 |
| Ukraine Government 1.75% 2/1/2034 (b)(n) | | 626,091 | 351,081 |
| Ukraine Government 1.75% 2/1/2035 (b)(n) | | 428,419 | 235,630 |
| Ukraine Government 1.75% 2/1/2036 (b)(n) | | 284,447 | 153,601 |
TOTAL UKRAINE | | | 2,104,895 |
| UNITED ARAB EMIRATES - 0.2% | | | |
| Emirate of Abu Dhabi 3% 9/15/2051 (b) | | 645,000 | 417,225 |
| Emirate of Abu Dhabi 3.125% 9/30/2049 (b) | | 1,915,000 | 1,270,488 |
| Emirate of Abu Dhabi 3.875% 4/16/2050 (b) | | 620,000 | 473,525 |
| Emirate of Abu Dhabi 5.5% 4/30/2054 (b) | | 395,000 | 386,112 |
| Emirate of Dubai 3.9% 9/9/2050 (p) | | 920,000 | 667,000 |
| Emirate of Dubai 5.25% 1/30/2043 (p) | | 330,000 | 312,846 |
TOTAL UNITED ARAB EMIRATES | | | 3,527,196 |
| URUGUAY - 0.1% | | | |
| Uruguay Republic 5.1% 6/18/2050 | | 675,000 | 619,945 |
| Uruguay Republic 5.75% 10/28/2034 | | 300,000 | 308,344 |
TOTAL URUGUAY | | | 928,289 |
| UZBEKISTAN - 0.0% | | | |
| Republic of Uzbekistan 3.7% 11/25/2030 (b) | | 115,000 | 95,548 |
| Republic of Uzbekistan 3.9% 10/19/2031 (b) | | 205,000 | 168,484 |
TOTAL UZBEKISTAN | | | 264,032 |
| VENEZUELA - 0.0% | | | |
| Venezuela Republic 11.95% (h)(p) | | 1,090,000 | 169,495 |
| Venezuela Republic 12.75% (h)(p) | | 190,000 | 29,336 |
| Venezuela Republic 9.25% (h) | | 2,395,000 | 370,028 |
TOTAL VENEZUELA | | | 568,859 |
| ZAMBIA - 0.0% | | | |
| Republic of Zambia 0.5% 12/31/2053 (b) | | 532,254 | 304,551 |
| Republic of Zambia 5.75% 6/30/2033 (b)(n) | | 62,669 | 54,894 |
TOTAL ZAMBIA | | | 359,445 |
| TOTAL FOREIGN GOVERNMENT AND GOVERNMENT AGENCY OBLIGATIONS (Cost $201,848,480) | | | 191,508,703 |
| | | | |
| Non-Convertible Corporate Bonds - 31.5% |
| | | Principal Amount (a) | Value ($) |
| AUSTRALIA - 0.2% | | | |
| Materials - 0.2% | | | |
| Metals & Mining - 0.2% | | | |
| FMG Resources August 2006 Pty Ltd 4.375% 4/1/2031 (b) | | 445,000 | 400,555 |
| FMG Resources August 2006 Pty Ltd 4.5% 9/15/2027 (b) | | 485,000 | 469,006 |
| Mineral Resources Ltd 8% 11/1/2027 (b) | | 280,000 | 286,249 |
| Mineral Resources Ltd 8.125% 5/1/2027 (b) | | 960,000 | 963,819 |
| Mineral Resources Ltd 8.5% 5/1/2030 (b) | | 210,000 | 214,212 |
| Mineral Resources Ltd 9.25% 10/1/2028 (b) | | 515,000 | 540,323 |
| | | | |
| TOTAL AUSTRALIA | | | 2,874,164 |
| AZERBAIJAN - 0.1% | | | |
| Energy - 0.1% | | | |
| Energy Equipment & Services - 0.1% | | | |
| Southern Gas Corridor CJSC 6.875% 3/24/2026 (b) | | 1,075,000 | 1,087,212 |
| BAHRAIN - 0.1% | | | |
| Energy - 0.1% | | | |
| Energy Equipment & Services - 0.1% | | | |
| Bapco Energies BSC Closed 7.5% 10/25/2027 (b) | | 665,000 | 684,119 |
| Bapco Energies BSC Closed 8.375% 11/7/2028 (b) | | 180,000 | 191,932 |
| | | | |
| TOTAL BAHRAIN | | | 876,051 |
| BELGIUM - 0.0% | | | |
| Communication Services - 0.0% | | | |
| Diversified Telecommunication Services - 0.0% | | | |
| Telenet Finance Luxembourg Notes Sarl 5.5% 3/1/2028 (b) | | 600,000 | 581,736 |
| BRAZIL - 0.8% | | | |
| Consumer Staples - 0.1% | | | |
| Consumer Staples Distribution & Retail - 0.1% | | | |
| Minerva Luxembourg SA 8.875% 9/13/2033 (b) | | 320,000 | 332,013 |
| NBM US Holdings Inc 6.625% 8/6/2029 (b) | | 615,000 | 615,387 |
| | | | 947,400 |
| Food Products - 0.0% | | | |
| Adecoagro SA 6% 9/21/2027 (b) | | 270,000 | 263,334 |
| Marb Bondco PLC 3.95% 1/29/2031 (b) | | 345,000 | 287,913 |
| | | | 551,247 |
| Energy - 0.1% | | | |
| Energy Equipment & Services - 0.1% | | | |
| Guara Norte Sarl 5.198% 6/15/2034 (b) | | 399,325 | 363,321 |
| Yinson Boronia Production BV 8.947% 7/31/2042 (b) | | 650,000 | 678,568 |
| | | | 1,041,889 |
| Oil, Gas & Consumable Fuels - 0.0% | | | |
| MC Brazil Downstream Trading SARL 7.25% 6/30/2031 (b) | | 962,077 | 802,132 |
| Petrorio Luxembourg Holding Sarl 6.125% 6/9/2026 (b) | | 230,000 | 228,347 |
| | | | 1,030,479 |
TOTAL ENERGY | | | 2,072,368 |
| | | | |
| Financials - 0.0% | | | |
| Financial Services - 0.0% | | | |
| Azul Secured Finance II LLP ICE Term SOFR 3M + 8.25%, 12.8203% 1/28/2025 pay-in-kind (b)(c)(d) | | 74,140 | 74,881 |
| Cosan Luxembourg SA 7.25% 6/27/2031 (b) | | 300,000 | 295,218 |
| | | | 370,099 |
| Industrials - 0.1% | | | |
| Aerospace & Defense - 0.1% | | | |
| Embraer Netherlands Finance BV 5.4% 2/1/2027 | | 325,000 | 324,694 |
| Embraer Netherlands Finance BV 6.95% 1/17/2028 (b) | | 390,000 | 400,116 |
| Embraer Netherlands Finance BV 7% 7/28/2030 (b) | | 320,000 | 331,568 |
| | | | 1,056,378 |
| Passenger Airlines - 0.0% | | | |
| Azul Secured Finance LLP 11.5% 5/28/2029 pay-in-kind (b) | | 641,704 | 359,354 |
| Azul Secured Finance LLP 11.93% 8/28/2028 pay-in-kind (b) | | 308,947 | 310,588 |
| | | | 669,942 |
TOTAL INDUSTRIALS | | | 1,726,320 |
| | | | |
| Materials - 0.5% | | | |
| Chemicals - 0.1% | | | |
| Braskem Netherlands Finance BV 5.875% 1/31/2050 (b) | | 300,000 | 205,314 |
| Braskem Netherlands Finance BV 7.25% 2/13/2033 (b) | | 375,000 | 346,875 |
| Braskem Netherlands Finance BV 8% 10/15/2034 (b) | | 225,000 | 214,148 |
| Braskem Netherlands Finance BV 8.5% 1/12/2031 (b) | | 595,000 | 594,108 |
| | | | 1,360,445 |
| Metals & Mining - 0.3% | | | |
| CSN Inova Ventures 6.75% 1/28/2028 (b) | | 485,000 | 453,625 |
| CSN Resources SA 5.875% 4/8/2032 (b) | | 420,000 | 340,070 |
| CSN Resources SA 8.875% 12/5/2030 (b) | | 200,000 | 198,688 |
| ERO Copper Corp 6.5% 2/15/2030 (b) | | 415,000 | 399,956 |
| Nexa Resources SA 6.5% 1/18/2028 (b) | | 356,000 | 359,339 |
| Nexa Resources SA 6.75% 4/9/2034 (b) | | 200,000 | 202,000 |
| Samarco Mineracao SA 9% 6/30/2031 pay-in-kind (b)(c) | | 1,244,468 | 1,200,912 |
| Vale Overseas Ltd 6.4% 6/28/2054 | | 515,000 | 503,413 |
| | | | 3,658,003 |
| Paper & Forest Products - 0.1% | | | |
| LD Celulose International GmbH 7.95% 1/26/2032 (b) | | 325,000 | 325,101 |
| Suzano Austria GmbH 3.75% 1/15/2031 | | 245,000 | 215,811 |
| Suzano Austria GmbH 5% 1/15/2030 | | 490,000 | 470,830 |
| | | | 1,011,742 |
TOTAL MATERIALS | | | 6,030,190 |
| | | | |
| Utilities - 0.0% | | | |
| Water Utilities - 0.0% | | | |
| Aegea Finance Sarl 9% 1/20/2031 (b) | | 200,000 | 203,750 |
| TOTAL BRAZIL | | | 11,901,374 |
| BURKINA FASO - 0.0% | | | |
| Materials - 0.0% | | | |
| Metals & Mining - 0.0% | | | |
| Endeavour Mining PLC 5% 10/14/2026 (b) | | 580,000 | 561,330 |
| CANADA - 0.9% | | | |
| Communication Services - 0.0% | | | |
| Media - 0.0% | | | |
| Videotron Ltd 5.125% 4/15/2027 (b) | | 615,000 | 611,985 |
| Consumer Discretionary - 0.4% | | | |
| Hotels, Restaurants & Leisure - 0.3% | | | |
| 1011778 BC ULC / New Red Finance Inc 3.875% 1/15/2028 (b) | | 570,000 | 539,032 |
| 1011778 BC ULC / New Red Finance Inc 4% 10/15/2030 (b) | | 2,320,000 | 2,074,864 |
| 1011778 BC ULC / New Red Finance Inc 4.375% 1/15/2028 (b) | | 560,000 | 534,920 |
| Ontario Gaming GTA LP/OTG Co-Issuer Inc 8% 8/1/2030 (b) | | 600,000 | 616,794 |
| | | | 3,765,610 |
| Household Durables - 0.1% | | | |
| Brookfield Residential Properties Inc / Brookfield Residential US LLC 4.875% 2/15/2030 (b) | | 405,000 | 365,742 |
TOTAL CONSUMER DISCRETIONARY | | | 4,131,352 |
| | | | |
| Consumer Staples - 0.0% | | | |
| Household Products - 0.0% | | | |
| Kronos Acquisition Holdings Inc 8.25% 6/30/2031 (b) | | 550,000 | 523,888 |
| Energy - 0.1% | | | |
| Oil, Gas & Consumable Fuels - 0.1% | | | |
| Parkland Corp 4.5% 10/1/2029 (b) | | 440,000 | 408,095 |
| Parkland Corp 4.625% 5/1/2030 (b) | | 550,000 | 504,849 |
| Parkland Corp 6.625% 8/15/2032 (b) | | 280,000 | 277,088 |
| Teine Energy Ltd 6.875% 4/15/2029 (b) | | 445,000 | 432,106 |
| | | | 1,622,138 |
| Financials - 0.0% | | | |
| Insurance - 0.0% | | | |
| Jones Deslauriers Insurance Management Inc 10.5% 12/15/2030 (b) | | 175,000 | 189,197 |
| Sagicor Financial Co Ltd 5.3% 5/13/2028 (b) | | 480,000 | 470,400 |
| | | | 659,597 |
| Industrials - 0.2% | | | |
| Aerospace & Defense - 0.2% | | | |
| Bombardier Inc 6% 2/15/2028 (b) | | 280,000 | 278,866 |
| Bombardier Inc 7.125% 6/15/2026 (b) | | 146,000 | 146,536 |
| Bombardier Inc 7.25% 7/1/2031 (b) | | 280,000 | 288,757 |
| Bombardier Inc 7.875% 4/15/2027 (b) | | 658,000 | 658,997 |
| Bombardier Inc 8.75% 11/15/2030 (b) | | 430,000 | 462,222 |
| | | | 1,835,378 |
| Machinery - 0.0% | | | |
| ATS Corp 4.125% 12/15/2028 (b) | | 460,000 | 426,383 |
| Passenger Airlines - 0.0% | | | |
| Air Canada 3.875% 8/15/2026 (b) | | 425,000 | 412,933 |
TOTAL INDUSTRIALS | | | 2,674,694 |
| | | | |
| Information Technology - 0.1% | | | |
| Software - 0.1% | | | |
| Open Text Corp 6.9% 12/1/2027 (b) | | 530,000 | 547,664 |
| Open Text Holdings Inc 4.125% 12/1/2031 (b) | | 245,000 | 217,242 |
| Open Text Holdings Inc 4.125% 2/15/2030 (b) | | 300,000 | 272,063 |
| | | | 1,036,969 |
| Materials - 0.1% | | | |
| Chemicals - 0.0% | | | |
| NOVA Chemicals Corp 8.5% 11/15/2028 (b) | | 385,000 | 407,815 |
| Containers & Packaging - 0.1% | | | |
| Cascades Inc/Cascades USA Inc 5.125% 1/15/2026 (b) | | 300,000 | 296,974 |
| Cascades Inc/Cascades USA Inc 5.375% 1/15/2028 (b) | | 300,000 | 291,103 |
| Intelligent Packaging Ltd Finco Inc / Intelligent Packaging Ltd Co-Issuer LLC 6% 9/15/2028 (b) | | 255,000 | 250,990 |
| | | | 839,067 |
| Metals & Mining - 0.0% | | | |
| Hudbay Minerals Inc 4.5% 4/1/2026 (b) | | 360,000 | 354,857 |
TOTAL MATERIALS | | | 1,601,739 |
| | | | |
| TOTAL CANADA | | | 12,862,362 |
| CHILE - 0.3% | | | |
| Communication Services - 0.1% | | | |
| Media - 0.0% | | | |
| VTR Finance NV 6.375% 7/15/2028 (b) | | 320,000 | 302,400 |
| Wireless Telecommunication Services - 0.1% | | | |
| VTR Comunicaciones SpA 4.375% 4/15/2029 (b) | | 210,000 | 185,823 |
| VTR Comunicaciones SpA 5.125% 1/15/2028 (b) | | 620,000 | 579,892 |
| | | | 765,715 |
TOTAL COMMUNICATION SERVICES | | | 1,068,115 |
| | | | |
| Energy - 0.0% | | | |
| Oil, Gas & Consumable Fuels - 0.0% | | | |
| Empresa Nacional del Petroleo 5.95% 7/30/2034 (b) | | 200,000 | 199,438 |
| Empresa Nacional del Petroleo 6.15% 5/10/2033 (b) | | 305,000 | 307,574 |
| | | | 507,012 |
| Materials - 0.2% | | | |
| Metals & Mining - 0.2% | | | |
| Antofagasta PLC 2.375% 10/14/2030 (b) | | 685,000 | 572,167 |
| Antofagasta PLC 5.625% 5/13/2032 (b) | | 260,000 | 254,230 |
| Corp Nacional del Cobre de Chile 3% 9/30/2029 (b) | | 105,000 | 93,364 |
| Corp Nacional del Cobre de Chile 3.15% 1/14/2030 (b) | | 280,000 | 248,850 |
| Corp Nacional del Cobre de Chile 3.7% 1/30/2050 (b) | | 870,000 | 582,900 |
| Corp Nacional del Cobre de Chile 5.125% 2/2/2033 (b) | | 290,000 | 275,228 |
| Corp Nacional del Cobre de Chile 5.95% 1/8/2034 (b) | | 205,000 | 203,783 |
| Corp Nacional del Cobre de Chile 6.3% 9/8/2053 (b) | | 290,000 | 282,396 |
| Corp Nacional del Cobre de Chile 6.44% 1/26/2036 (b) | | 205,000 | 208,780 |
| | | | 2,721,698 |
| Paper & Forest Products - 0.0% | | | |
| Inversiones CMPC SA 3% 4/6/2031 (b) | | 245,000 | 208,632 |
TOTAL MATERIALS | | | 2,930,330 |
| | | | |
| Utilities - 0.0% | | | |
| Electric Utilities - 0.0% | | | |
| Chile Electricity Lux Mpc II Sarl 5.58% 10/20/2035 (b) | | 200,000 | 194,300 |
| Chile Electricity Lux MPC Sarl 6.01% 1/20/2033 (b) | | 193,000 | 194,768 |
| | | | 389,068 |
| TOTAL CHILE | | | 4,894,525 |
| CHINA - 0.4% | | | |
| Communication Services - 0.1% | | | |
| Interactive Media & Services - 0.1% | | | |
| Tencent Holdings Ltd 1.81% 1/26/2026 (b) | | 240,000 | 232,414 |
| Tencent Holdings Ltd 2.39% 6/3/2030 (b) | | 495,000 | 432,650 |
| Tencent Holdings Ltd 3.975% 4/11/2029 (b) | | 180,000 | 173,185 |
| | | | 838,249 |
| Consumer Discretionary - 0.3% | | | |
| Broadline Retail - 0.2% | | | |
| Alibaba Group Holding Ltd 2.125% 2/9/2031 | | 300,000 | 252,711 |
| JD.com Inc 3.375% 1/14/2030 | | 850,000 | 784,873 |
| Prosus NV 2.031% 8/3/2032 (p) | EUR | 210,000 | 189,328 |
| Prosus NV 3.061% 7/13/2031 (b) | | 385,000 | 323,643 |
| Prosus NV 3.68% 1/21/2030 (b) | | 370,000 | 332,075 |
| Prosus NV 4.027% 8/3/2050 (b) | | 595,000 | 399,394 |
| Prosus NV 4.193% 1/19/2032 (b) | | 205,000 | 183,091 |
| | | | 2,465,115 |
| Hotels, Restaurants & Leisure - 0.1% | | | |
| Meituan 2.125% 10/28/2025 (b) | | 275,000 | 268,064 |
| Meituan 3.05% 10/28/2030 (b) | | 335,000 | 295,524 |
| Meituan 4.625% 10/2/2029 (b) | | 280,000 | 270,786 |
| | | | 834,374 |
TOTAL CONSUMER DISCRETIONARY | | | 3,299,489 |
| | | | |
| Information Technology - 0.0% | | | |
| Technology Hardware, Storage & Peripherals - 0.0% | | | |
| Lenovo Group Ltd 3.421% 11/2/2030 (b) | | 485,000 | 434,948 |
| Lenovo Group Ltd 5.875% 4/24/2025 (p) | | 200,000 | 200,382 |
| | | | 635,330 |
| Materials - 0.0% | | | |
| Chemicals - 0.0% | | | |
| ENN Clean Energy International Investment Ltd 3.375% 5/12/2026 (b) | | 420,000 | 407,916 |
| Utilities - 0.0% | | | |
| Gas Utilities - 0.0% | | | |
| ENN Energy Holdings Ltd 4.625% 5/17/2027 (b) | | 640,000 | 633,306 |
| TOTAL CHINA | | | 5,814,290 |
| COLOMBIA - 0.4% | | | |
| Communication Services - 0.0% | | | |
| Diversified Telecommunication Services - 0.0% | | | |
| Colombia Telecomunicaciones SA ESP 4.95% 7/17/2030 (b) | | 210,000 | 174,090 |
| Energy - 0.3% | | | |
| Energy Equipment & Services - 0.0% | | | |
| Oleoducto Central SA 4% 7/14/2027 (b) | | 454,000 | 429,171 |
| Oil, Gas & Consumable Fuels - 0.3% | | | |
| Canacol Energy Ltd 5.75% 11/24/2028 (b) | | 265,000 | 146,948 |
| Ecopetrol SA 4.625% 11/2/2031 | | 335,000 | 276,898 |
| Ecopetrol SA 8.375% 1/19/2036 | | 290,000 | 279,415 |
| Ecopetrol SA 8.875% 1/13/2033 | | 1,420,000 | 1,441,598 |
| Geopark Ltd 5.5% 1/17/2027 (b) | | 505,000 | 484,957 |
| Gran Tierra Energy Inc 9.5% 10/15/2029 (b) | | 940,000 | 870,026 |
| | | | 3,499,842 |
TOTAL ENERGY | | | 3,929,013 |
| | | | |
| Financials - 0.0% | | | |
| Banks - 0.0% | | | |
| Bancolombia SA 8.625% 12/24/2034 (c) | | 295,000 | 308,552 |
| Materials - 0.0% | | | |
| Metals & Mining - 0.0% | | | |
| Aris Mining Corp 8% 10/31/2029 (b) | | 470,000 | 465,314 |
| Utilities - 0.1% | | | |
| Independent Power and Renewable Electricity Producers - 0.1% | | | |
| Enfragen Energia Sur SA 5.375% 12/30/2030 (b) | | 1,020,000 | 867,959 |
| Termocandelaria Power SA 7.75% 9/17/2031 (b) | | 440,000 | 443,071 |
| | | | 1,311,030 |
| TOTAL COLOMBIA | | | 6,187,999 |
| COSTA RICA - 0.0% | | | |
| Financials - 0.0% | | | |
| Financial Services - 0.0% | | | |
| Liberty Costa Rica Senior Secured Finance 10.875% 1/15/2031 (b) | | 425,000 | 454,351 |
| CZECH REPUBLIC - 0.0% | | | |
| Utilities - 0.0% | | | |
| Independent Power and Renewable Electricity Producers - 0.0% | | | |
| Energo-Pro AS 8.5% 2/4/2027 (b) | | 465,000 | 472,120 |
| DENMARK - 0.2% | | | |
| Industrials - 0.2% | | | |
| Transportation Infrastructure - 0.2% | | | |
| DSV Finance BV 3.25% 11/6/2030 (p) | EUR | 730,000 | 763,926 |
| DSV Finance BV 3.375% 11/6/2032 (p) | EUR | 727,000 | 762,459 |
| DSV Finance BV 3.375% 11/6/2034 (p) | EUR | 822,000 | 852,351 |
| | | | |
| TOTAL DENMARK | | | 2,378,736 |
| DOMINICAN REPUBLIC - 0.0% | | | |
| Industrials - 0.0% | | | |
| Transportation Infrastructure - 0.0% | | | |
| Aeropuertos Dominicanos Siglo XXI SA 7% 6/30/2034 (b) | | 300,000 | 307,689 |
| FRANCE - 1.0% | | | |
| Communication Services - 0.5% | | | |
| Diversified Telecommunication Services - 0.5% | | | |
| Altice France SA 5.125% 1/15/2029 (b) | | 135,000 | 101,650 |
| Altice France SA 5.125% 7/15/2029 (b) | | 4,495,000 | 3,366,139 |
| Altice France SA 5.5% 1/15/2028 (b) | | 1,355,000 | 998,845 |
| Altice France SA 5.5% 10/15/2029 (b) | | 2,950,000 | 2,209,630 |
| | | | 6,676,264 |
| Energy - 0.1% | | | |
| Energy Equipment & Services - 0.1% | | | |
| Vallourec SACA 7.5% 4/15/2032 (b) | | 565,000 | 585,426 |
| Viridien 8.75% 4/1/2027 (b) | | 590,000 | 579,566 |
| | | | 1,164,992 |
| Financials - 0.0% | | | |
| Banks - 0.0% | | | |
| Banque Federative du Credit Mutuel SA 3.75% 2/3/2034 (p) | EUR | 400,000 | 420,291 |
| Industrials - 0.1% | | | |
| Construction & Engineering - 0.1% | | | |
| Bouygues SA 5.375% 6/30/2042 (p) | EUR | 1,800,000 | 2,174,307 |
| Utilities - 0.3% | | | |
| Multi-Utilities - 0.1% | | | |
| Engie SA 4.25% 3/6/2044 (p) | EUR | 1,000,000 | 1,056,237 |
| Water Utilities - 0.2% | | | |
| Suez SACA 2.375% 5/24/2030 (p) | EUR | 1,800,000 | 1,784,650 |
| TOTAL FRANCE | | | 13,276,741 |
| GEORGIA - 0.0% | | | |
| Industrials - 0.0% | | | |
| Ground Transportation - 0.0% | | | |
| Georgian Railway JSC 4% 6/17/2028 (b) | | 191,000 | 166,764 |
| GERMANY - 0.4% | | | |
| Financials - 0.0% | | | |
| Banks - 0.0% | | | |
| Commerzbank AG 4.625% 1/17/2031 (c)(p) | EUR | 600,000 | 652,758 |
| Health Care - 0.1% | | | |
| Pharmaceuticals - 0.1% | | | |
| Bayer AG 5.375% 3/25/2082 (c)(p) | EUR | 300,000 | 303,857 |
| Bayer AG 6.625% 9/25/2083 (c)(p) | EUR | 200,000 | 214,595 |
| Bayer AG 7% 9/25/2083 (c)(p) | EUR | 1,100,000 | 1,203,186 |
| | | | 1,721,638 |
| Utilities - 0.3% | | | |
| Electric Utilities - 0.1% | | | |
| EnBW International Finance BV 4.3% 5/23/2034 (p) | EUR | 1,119,000 | 1,226,663 |
| Independent Power and Renewable Electricity Producers - 0.1% | | | |
| RWE AG 4.125% 2/13/2035 (p) | EUR | 971,000 | 1,041,129 |
| Multi-Utilities - 0.1% | | | |
| E.ON SE 4.125% 3/25/2044 (p) | EUR | 747,000 | 784,350 |
TOTAL UTILITIES | | | 3,052,142 |
| | | | |
| TOTAL GERMANY | | | 5,426,538 |
| GHANA - 0.1% | | | |
| Energy - 0.1% | | | |
| Oil, Gas & Consumable Fuels - 0.1% | | | |
| Kosmos Energy Ltd 7.5% 3/1/2028 (b) | | 145,000 | 136,449 |
| Kosmos Energy Ltd 8.75% 10/1/2031 (b) | | 1,170,000 | 1,099,800 |
| Tullow Oil PLC 10.25% 5/15/2026 (b) | | 845,000 | 722,475 |
| Tullow Oil PLC 7% 3/1/2025 (b) | | 125,000 | 105,000 |
| | | | |
| TOTAL GHANA | | | 2,063,724 |
| GUATEMALA - 0.2% | | | |
| Communication Services - 0.2% | | | |
| Wireless Telecommunication Services - 0.2% | | | |
| CT Trust 5.125% 2/3/2032 (b) | | 720,000 | 640,577 |
| Millicom International Cellular SA 4.5% 4/27/2031 (b) | | 530,000 | 465,738 |
| Millicom International Cellular SA 7.375% 4/2/2032 (b) | | 265,000 | 262,723 |
| | | | 1,369,038 |
| Consumer Staples - 0.0% | | | |
| Beverages - 0.0% | | | |
| Cntl Amr Bottling Corp 5.25% 4/27/2029 (b) | | 600,000 | 569,628 |
| Utilities - 0.0% | | | |
| Independent Power and Renewable Electricity Producers - 0.0% | | | |
| Investment Energy Resources Ltd 6.25% 4/26/2029 (b) | | 485,000 | 466,357 |
| TOTAL GUATEMALA | | | 2,405,023 |
| HONG KONG - 0.0% | | | |
| Industrials - 0.0% | | | |
| Marine Transportation - 0.0% | | | |
| Seaspan Corp 5.5% 8/1/2029 (b) | | 425,000 | 396,860 |
| HUNGARY - 0.0% | | | |
| Financials - 0.0% | | | |
| Banks - 0.0% | | | |
| Magyar Export-Import Bank Zrt 6.125% 12/4/2027 (b) | | 200,000 | 201,626 |
| OTP Bank Nyrt 8.75% 5/15/2033 (c)(p) | | 215,000 | 225,952 |
| | | | |
| TOTAL HUNGARY | | | 427,578 |
| INDIA - 0.1% | | | |
| Financials - 0.0% | | | |
| Consumer Finance - 0.0% | | | |
| Shriram Finance Ltd 4.15% 7/18/2025 (b) | | 545,000 | 538,188 |
| Shriram Finance Ltd 6.625% 4/22/2027 (b) | | 230,000 | 231,437 |
| | | | 769,625 |
| Health Care - 0.0% | | | |
| Biotechnology - 0.0% | | | |
| Biocon Biologics Global PLC 6.67% 10/9/2029 (b) | | 485,000 | 464,961 |
| Information Technology - 0.1% | | | |
| IT Services - 0.1% | | | |
| CA Magnum Holdings 5.375% 10/31/2026 (b) | | 955,000 | 932,319 |
| TOTAL INDIA | | | 2,166,905 |
| INDONESIA - 0.2% | | | |
| Energy - 0.1% | | | |
| Oil, Gas & Consumable Fuels - 0.1% | | | |
| Medco Laurel Tree Pte Ltd 6.95% 11/12/2028 (b) | | 640,000 | 636,717 |
| Medco Maple Tree Pte Ltd 8.96% 4/27/2029 (b) | | 550,000 | 578,358 |
| Pertamina Persero PT 4.175% 1/21/2050 (b) | | 240,000 | 181,166 |
| | | | 1,396,241 |
| Materials - 0.1% | | | |
| Metals & Mining - 0.1% | | | |
| Freeport Indonesia PT 4.763% 4/14/2027 (b) | | 225,000 | 222,750 |
| Freeport Indonesia PT 5.315% 4/14/2032 (b) | | 450,000 | 438,750 |
| Freeport Indonesia PT 6.2% 4/14/2052 (b) | | 265,000 | 261,330 |
| Indonesia Asahan Aluminium PT / Mineral Industri Indonesia Persero PT 5.45% 5/15/2030 (b) | | 880,000 | 873,400 |
| | | | 1,796,230 |
| Utilities - 0.0% | | | |
| Independent Power and Renewable Electricity Producers - 0.0% | | | |
| Pertamina Geothermal Energy PT 5.15% 4/27/2028 (b) | | 205,000 | 203,719 |
| TOTAL INDONESIA | | | 3,396,190 |
| IRELAND - 0.0% | | | |
| Financials - 0.0% | | | |
| Banks - 0.0% | | | |
| Bank of Ireland Group PLC 6.75% 3/1/2033 (c)(p) | EUR | 400,000 | 447,472 |
| ISRAEL - 0.3% | | | |
| Energy - 0.2% | | | |
| Oil, Gas & Consumable Fuels - 0.2% | | | |
| Energean Israel Finance Ltd 4.875% 3/30/2026 (b)(p) | | 615,000 | 600,978 |
| Energean Israel Finance Ltd 8.5% 9/30/2033 (b)(p) | | 200,000 | 196,260 |
| Energean PLC 6.5% 4/30/2027 (b) | | 550,000 | 546,759 |
| Leviathan Bond Ltd 6.125% 6/30/2025 (b)(p) | | 495,000 | 491,288 |
| | | | 1,835,285 |
| Health Care - 0.1% | | | |
| Pharmaceuticals - 0.1% | | | |
| Teva Pharmaceutical Finance Netherlands III BV 4.75% 5/9/2027 | | 555,000 | 541,581 |
| Teva Pharmaceutical Finance Netherlands III BV 5.125% 5/9/2029 | | 275,000 | 268,543 |
| Teva Pharmaceutical Finance Netherlands III BV 7.875% 9/15/2029 | | 850,000 | 916,082 |
| | | | 1,726,206 |
| Utilities - 0.0% | | | |
| Electric Utilities - 0.0% | | | |
| Israel Electric Corp Ltd 3.75% 2/22/2032 (b)(p) | | 295,000 | 256,386 |
| TOTAL ISRAEL | | | 3,817,877 |
| JAMAICA - 0.0% | | | |
| Industrials - 0.0% | | | |
| Transportation Infrastructure - 0.0% | | | |
| Kingston Airport Revenue Finance Ltd 6.75% 12/15/2036 (b) | | 215,000 | 215,968 |
| KAZAKHSTAN - 0.1% | | | |
| Energy - 0.1% | | | |
| Oil, Gas & Consumable Fuels - 0.1% | | | |
| KazMunayGas National Co JSC 3.5% 4/14/2033 (b) | | 335,000 | 276,546 |
| KazMunayGas National Co JSC 5.375% 4/24/2030 (b) | | 165,000 | 160,373 |
| KazMunayGas National Co JSC 5.75% 4/19/2047 (b) | | 170,000 | 146,678 |
| Tengizchevroil Finance Co International Ltd 3.25% 8/15/2030 (b) | | 650,000 | 552,701 |
| | | | |
| TOTAL KAZAKHSTAN | | | 1,136,298 |
| KOREA (SOUTH) - 0.0% | | | |
| Materials - 0.0% | | | |
| Metals & Mining - 0.0% | | | |
| POSCO 5.75% 1/17/2028 (b) | | 420,000 | 427,431 |
| POSCO 5.875% 1/17/2033 (b) | | 200,000 | 204,924 |
| | | | |
| TOTAL KOREA (SOUTH) | | | 632,355 |
| KUWAIT - 0.1% | | | |
| Materials - 0.1% | | | |
| Chemicals - 0.1% | | | |
| MEGlobal BV 2.625% 4/28/2028 (b) | | 275,000 | 249,219 |
| MEGlobal BV 4.25% 11/3/2026 (b) | | 235,000 | 229,859 |
| MEGlobal Canada ULC 5% 5/18/2025 (b) | | 445,000 | 444,706 |
| | | | |
| TOTAL KUWAIT | | | 923,784 |
| LUXEMBOURG - 0.4% | | | |
| Communication Services - 0.1% | | | |
| Media - 0.1% | | | |
| Altice Financing SA 5% 1/15/2028 (b) | | 990,000 | 774,901 |
| Altice Financing SA 5.75% 8/15/2029 (b) | | 1,190,000 | 871,130 |
| | | | 1,646,031 |
| Information Technology - 0.1% | | | |
| Software - 0.1% | | | |
| ION Trading Technologies Sarl 5.75% 5/15/2028 (b) | | 575,000 | 543,555 |
| ION Trading Technologies Sarl 9.5% 5/30/2029 (b) | | 415,000 | 435,196 |
| | | | 978,751 |
| Materials - 0.0% | | | |
| Metals & Mining - 0.0% | | | |
| Algoma Steel Sca 0% 12/31/2049 (g) | | 102,200 | 0 |
| Real Estate - 0.2% | | | |
| Industrial REITs - 0.1% | | | |
| Prologis International Funding II SA 3.125% 6/1/2031 (p) | EUR | 1,200,000 | 1,228,936 |
| Real Estate Management & Development - 0.1% | | | |
| SELP Finance Sarl 0.875% 5/27/2029 (p) | EUR | 588,000 | 544,643 |
| SELP Finance Sarl 3.75% 8/10/2027 (p) | EUR | 1,069,000 | 1,124,672 |
| | | | 1,669,315 |
| TOTAL LUXEMBOURG | | | 5,523,033 |
| MACAU - 0.0% | | | |
| Consumer Discretionary - 0.0% | | | |
| Hotels, Restaurants & Leisure - 0.0% | | | |
| Studio City Finance Ltd 5% 1/15/2029 (b) | | 320,000 | 290,301 |
| MALAYSIA - 0.1% | | | |
| Consumer Discretionary - 0.0% | | | |
| Hotels, Restaurants & Leisure - 0.0% | | | |
| GENM Capital Labuan Ltd 3.882% 4/19/2031 (b) | | 595,000 | 524,343 |
| Energy - 0.0% | | | |
| Oil, Gas & Consumable Fuels - 0.0% | | | |
| Petronas Capital Ltd 3.404% 4/28/2061 (b) | | 500,000 | 325,800 |
| Petronas Capital Ltd 3.5% 4/21/2030 (b) | | 230,000 | 212,801 |
| | | | 538,601 |
| Industrials - 0.1% | | | |
| Marine Transportation - 0.1% | | | |
| MISC Capital Two Labuan Ltd 3.625% 4/6/2025 (b) | | 360,000 | 358,128 |
| MISC Capital Two Labuan Ltd 3.75% 4/6/2027 (b) | | 570,000 | 554,485 |
| | | | 912,613 |
| TOTAL MALAYSIA | | | 1,975,557 |
| MAURITIUS - 0.0% | | | |
| Communication Services - 0.0% | | | |
| Wireless Telecommunication Services - 0.0% | | | |
| Axian Telecom 7.375% 2/16/2027 (b) | | 525,000 | 521,997 |
| MEXICO - 0.8% | | | |
| Communication Services - 0.0% | | | |
| Media - 0.0% | | | |
| TV Azteca SAB de CV 8.25% (h)(p) | | 1,500,000 | 555,000 |
| Consumer Discretionary - 0.1% | | | |
| Automobile Components - 0.0% | | | |
| Metalsa Sapi De Cv 3.75% 5/4/2031 (b) | | 455,000 | 362,721 |
| Hotels, Restaurants & Leisure - 0.1% | | | |
| Bimbo Bakeries USA Inc 6.4% 1/15/2034 (b) | | 400,000 | 415,468 |
TOTAL CONSUMER DISCRETIONARY | | | 778,189 |
| | | | |
| Energy - 0.6% | | | |
| Energy Equipment & Services - 0.0% | | | |
| Borr IHC Ltd / Borr Finance LLC 10% 11/15/2028 (b) | | 403,171 | 401,785 |
| Borr IHC Ltd / Borr Finance LLC 10.375% 11/15/2030 (b) | | 137,961 | 137,208 |
| | | | 538,993 |
| Oil, Gas & Consumable Fuels - 0.6% | | | |
| FEL Energy VI SARL 5.75% 12/1/2040 (b) | | 247,172 | 227,245 |
| Petroleos Mexicanos 6.5% 6/2/2041 | | 170,000 | 120,444 |
| Petroleos Mexicanos 6.625% 6/15/2035 | | 1,965,000 | 1,545,473 |
| Petroleos Mexicanos 6.7% 2/16/2032 | | 821,000 | 716,836 |
| Petroleos Mexicanos 6.75% 9/21/2047 | | 798,000 | 548,625 |
| Petroleos Mexicanos 6.875% 8/4/2026 | | 555,000 | 545,288 |
| Petroleos Mexicanos 6.95% 1/28/2060 | | 780,000 | 533,567 |
| Petroleos Mexicanos 7.69% 1/23/2050 | | 4,073,000 | 3,062,896 |
| | | | 7,300,374 |
TOTAL ENERGY | | | 7,839,367 |
| | | | |
| Financials - 0.0% | | | |
| Banks - 0.0% | | | |
| BBVA Bancomer SA/Texas 5.25% 9/10/2029 (b) | | 440,000 | 430,540 |
| Industrials - 0.0% | | | |
| Industrial Conglomerates - 0.0% | | | |
| KUO SAB De CV 5.75% 7/7/2027 (b) | | 585,000 | 569,462 |
| Materials - 0.1% | | | |
| Chemicals - 0.1% | | | |
| Braskem Idesa SAPI 6.99% 2/20/2032 (b) | | 305,000 | 224,175 |
| Braskem Idesa SAPI 7.45% 11/15/2029 (b) | | 600,000 | 477,480 |
| Orbia Advance Corp SAB de CV 1.875% 5/11/2026 (b) | | 630,000 | 594,758 |
| Orbia Advance Corp SAB de CV 2.875% 5/11/2031 (b) | | 340,000 | 278,351 |
| | | | 1,574,764 |
| Metals & Mining - 0.0% | | | |
| Fresnillo PLC 4.25% 10/2/2050 (b) | | 360,000 | 253,933 |
TOTAL MATERIALS | | | 1,828,697 |
| | | | |
| Utilities - 0.0% | | | |
| Independent Power and Renewable Electricity Producers - 0.0% | | | |
| Buffalo Energy Mexico Holdings / Buffalo Energy Infrastructure / Buffalo Energy 7.875% 2/15/2039 (b) | | 490,000 | 505,038 |
| TOTAL MEXICO | | | 12,506,293 |
| MOROCCO - 0.1% | | | |
| Materials - 0.1% | | | |
| Chemicals - 0.1% | | | |
| OCP SA 3.75% 6/23/2031 (b) | | 365,000 | 315,499 |
| OCP SA 5.125% 6/23/2051 (b) | | 305,000 | 229,799 |
| OCP SA 6.75% 5/2/2034 (b) | | 255,000 | 259,718 |
| OCP SA 6.875% 4/25/2044 (b) | | 325,000 | 315,656 |
| OCP SA 7.5% 5/2/2054 (b) | | 200,000 | 202,876 |
| | | | |
| TOTAL MOROCCO | | | 1,323,548 |
| NETHERLANDS - 0.3% | | | |
| Communication Services - 0.1% | | | |
| Media - 0.1% | | | |
| VZ Secured Financing BV 5% 1/15/2032 (b) | | 1,105,000 | 977,326 |
| Ziggo BV 4.875% 1/15/2030 (b) | | 430,000 | 395,103 |
| | | | 1,372,429 |
| Financials - 0.2% | | | |
| Insurance - 0.2% | | | |
| ASR Nederland NV 7% 12/7/2043 (c)(p) | EUR | 1,867,000 | 2,293,264 |
| NN Group NV 6% 11/3/2043 (c)(p) | EUR | 382,000 | 444,783 |
| | | | 2,738,047 |
| TOTAL NETHERLANDS | | | 4,110,476 |
| NIGERIA - 0.1% | | | |
| Communication Services - 0.1% | | | |
| Diversified Telecommunication Services - 0.1% | | | |
| IHS Holding Ltd 7.875% 5/29/2030 (b) | | 465,000 | 458,462 |
| Energy - 0.0% | | | |
| Oil, Gas & Consumable Fuels - 0.0% | | | |
| SEPLAT Energy PLC 7.75% 4/1/2026 (b) | | 115,000 | 114,584 |
| Information Technology - 0.0% | | | |
| Communications Equipment - 0.0% | | | |
| IHS Netherlands Holdco BV 8% 9/18/2027 (b) | | 268,115 | 267,780 |
| TOTAL NIGERIA | | | 840,826 |
| NORWAY - 0.0% | | | |
| Energy - 0.0% | | | |
| Energy Equipment & Services - 0.0% | | | |
| Seadrill Finance Ltd 8.375% 8/1/2030 (b) | | 595,000 | 606,799 |
| PANAMA - 0.2% | | | |
| Communication Services - 0.2% | | | |
| Diversified Telecommunication Services - 0.0% | | | |
| Sable International Finance Ltd 7.125% 10/15/2032 (b) | | 540,000 | 526,900 |
| Media - 0.1% | | | |
| Telecomunicaciones Digitales SA 4.5% 1/30/2030 (b) | | 1,020,000 | 926,609 |
| Wireless Telecommunication Services - 0.1% | | | |
| C&W Senior Finance Ltd 6.875% 9/15/2027 (b) | | 1,494,000 | 1,476,635 |
| Industrials - 0.0% | | | |
| Air Freight & Logistics - 0.0% | | | |
| Aeropuerto Internacional de Tocumen SA 5.125% 8/11/2061 (b) | | 205,000 | 147,631 |
| TOTAL PANAMA | | | 3,077,775 |
| PARAGUAY - 0.0% | | | |
| Communication Services - 0.0% | | | |
| Diversified Telecommunication Services - 0.0% | | | |
| Telefonica Celular del Paraguay SA 5.875% 4/15/2027 (b) | | 365,000 | 362,263 |
| PERU - 0.2% | | | |
| Consumer Staples - 0.0% | | | |
| Food Products - 0.0% | | | |
| Camposol SA 6% 2/3/2027 (b) | | 385,000 | 364,668 |
| Financials - 0.0% | | | |
| Banks - 0.0% | | | |
| Banco de Credito del Peru S.A. 5.8% 3/10/2035 (b)(c) | | 485,000 | 472,633 |
| Health Care - 0.0% | | | |
| Health Care Providers & Services - 0.0% | | | |
| Auna SA 10% 12/15/2029 (b) | | 286,000 | 299,316 |
| Materials - 0.2% | | | |
| Metals & Mining - 0.2% | | | |
| Cia de Minas Buenaventura SAA 5.5% 7/23/2026 (b) | | 400,000 | 397,200 |
| Volcan Cia Minera SAA 8.75% 1/24/2030 (b) | | 494,000 | 470,234 |
| | | | 867,434 |
| Utilities - 0.0% | | | |
| Independent Power and Renewable Electricity Producers - 0.0% | | | |
| Niagara Energy SAC 5.746% 10/3/2034 (b) | | 280,000 | 270,143 |
| TOTAL PERU | | | 2,274,194 |
| PUERTO RICO - 0.0% | | | |
| Communication Services - 0.0% | | | |
| Media - 0.0% | | | |
| Lcpr Senior Secured Financing Dac 5.125% 7/15/2029 (b) | | 720,000 | 577,684 |
| QATAR - 0.3% | | | |
| Communication Services - 0.0% | | | |
| Diversified Telecommunication Services - 0.0% | | | |
| Ooredoo International Finance Ltd 2.625% 4/8/2031 (b) | | 385,000 | 334,349 |
| Energy - 0.3% | | | |
| Oil, Gas & Consumable Fuels - 0.3% | | | |
| QatarEnergy 1.375% 9/12/2026 (b) | | 900,000 | 848,070 |
| QatarEnergy 2.25% 7/12/2031 (b) | | 1,255,000 | 1,053,937 |
| QatarEnergy 3.125% 7/12/2041 (b) | | 1,235,000 | 910,380 |
| QatarEnergy 3.3% 7/12/2051 (b) | | 930,000 | 639,084 |
| | | | 3,451,471 |
| TOTAL QATAR | | | 3,785,820 |
| RUSSIA - 0.0% | | | |
| Materials - 0.0% | | | |
| Metals & Mining - 0.0% | | | |
| TMK OAO Via TMK Capital SA loan participation 4.3% (g)(h)(p) | | 400,000 | 59,999 |
| SAUDI ARABIA - 0.6% | | | |
| Energy - 0.5% | | | |
| Oil, Gas & Consumable Fuels - 0.5% | | | |
| EIG Pearl Holdings Sarl 3.545% 8/31/2036 (b) | | 1,345,000 | 1,152,077 |
| SA Global Sukuk Ltd 1.602% 6/17/2026 (b) | | 775,000 | 737,219 |
| Saudi Arabian Oil Co 2.25% 11/24/2030 (b) | | 1,010,000 | 862,288 |
| Saudi Arabian Oil Co 3.25% 11/24/2050 (b) | | 800,000 | 518,928 |
| Saudi Arabian Oil Co 3.5% 11/24/2070 (b) | | 460,000 | 282,468 |
| Saudi Arabian Oil Co 3.5% 4/16/2029 (b) | | 1,400,000 | 1,315,132 |
| Saudi Arabian Oil Co 4.25% 4/16/2039 (b) | | 1,705,000 | 1,462,890 |
| Saudi Arabian Oil Co 4.375% 4/16/2049 (b) | | 215,000 | 170,924 |
| Saudi Arabian Oil Co 5.875% 7/17/2064 (b) | | 200,000 | 185,850 |
| | | | 6,687,776 |
| Financials - 0.0% | | | |
| Financial Services - 0.0% | | | |
| Gaci First Investment Co 5.25% 10/13/2032 (p) | | 315,000 | 311,015 |
| Industrials - 0.1% | | | |
| Construction & Engineering - 0.1% | | | |
| Greensaif Pipelines Bidco Sarl 5.8528% 2/23/2036 (b) | | 210,000 | 207,310 |
| Greensaif Pipelines Bidco Sarl 6.1027% 8/23/2042 (b) | | 380,000 | 371,119 |
| Greensaif Pipelines Bidco Sarl 6.129% 2/23/2038 (b) | | 1,015,000 | 1,019,446 |
| Greensaif Pipelines Bidco Sarl 6.51% 2/23/2042 (b) | | 305,000 | 308,622 |
| | | | 1,906,497 |
| TOTAL SAUDI ARABIA | | | 8,905,288 |
| SERBIA - 0.0% | | | |
| Consumer Discretionary - 0.0% | | | |
| Distributors - 0.0% | | | |
| Telecommunications co Telekom Srbija AD Belgrade 7% 10/28/2029 (b) | | 465,000 | 464,186 |
| SOUTH AFRICA - 0.3% | | | |
| Communication Services - 0.1% | | | |
| Diversified Telecommunication Services - 0.1% | | | |
| Liquid Telecommunications Financing Plc 5.5% 9/4/2026 (b) | | 830,000 | 647,732 |
| Wireless Telecommunication Services - 0.0% | | | |
| MTN Mauritius Investments Ltd 6.5% 10/13/2026 (b) | | 315,000 | 317,955 |
TOTAL COMMUNICATION SERVICES | | | 965,687 |
| | | | |
| Materials - 0.1% | | | |
| Chemicals - 0.1% | | | |
| Sasol Financing USA LLC 4.375% 9/18/2026 | | 795,000 | 761,459 |
| Sasol Financing USA LLC 5.5% 3/18/2031 | | 200,000 | 168,704 |
| Sasol Financing USA LLC 8.75% 5/3/2029 (b) | | 200,000 | 202,518 |
| | | | 1,132,681 |
| Metals & Mining - 0.0% | | | |
| Stillwater Mining Co 4% 11/16/2026 (b) | | 320,000 | 302,400 |
TOTAL MATERIALS | | | 1,435,081 |
| | | | |
| Utilities - 0.1% | | | |
| Electric Utilities - 0.1% | | | |
| Eskom Holdings SOC Ltd 6.35% 8/10/2028 (b) | | 590,000 | 586,495 |
| Eskom Holdings SOC Ltd 7.125% 2/11/2025 (b) | | 735,000 | 734,082 |
| Eskom Holdings SOC Ltd 8.45% 8/10/2028 (b) | | 240,000 | 251,700 |
| | | | 1,572,277 |
| TOTAL SOUTH AFRICA | | | 3,973,045 |
| SPAIN - 0.2% | | | |
| Financials - 0.2% | | | |
| Banks - 0.1% | | | |
| Banco Santander SA 5.75% 8/23/2033 (c)(p) | EUR | 1,100,000 | 1,211,721 |
| Insurance - 0.1% | | | |
| Mapfre SA 2.875% 4/13/2030 (p) | EUR | 1,400,000 | 1,403,085 |
TOTAL FINANCIALS | | | 2,614,806 |
| | | | |
| Health Care - 0.0% | | | |
| Biotechnology - 0.0% | | | |
| Grifols SA 4.75% 10/15/2028 (b) | | 280,000 | 257,299 |
| Utilities - 0.0% | | | |
| Independent Power and Renewable Electricity Producers - 0.0% | | | |
| Atlantica Sustainable Infrastructure PLC 4.125% 6/15/2028 (b) | | 370,000 | 349,593 |
| TOTAL SPAIN | | | 3,221,698 |
| SWITZERLAND - 0.2% | | | |
| Financials - 0.2% | | | |
| Capital Markets - 0.2% | | | |
| UBS Group AG 4.75% 3/17/2032 (c)(p) | EUR | 1,401,000 | 1,563,850 |
| Industrials - 0.0% | | | |
| Aerospace & Defense - 0.0% | | | |
| VistaJet Malta Finance PLC / Vista Management Holding Inc 9.5% 6/1/2028 (b) | | 450,000 | 452,826 |
| Materials - 0.0% | | | |
| Chemicals - 0.0% | | | |
| Consolidated Energy Finance SA 12% 2/15/2031 (b) | | 450,000 | 431,953 |
| TOTAL SWITZERLAND | | | 2,448,629 |
| THAILAND - 0.0% | | | |
| Financials - 0.0% | | | |
| Financial Services - 0.0% | | | |
| PTT Treasury Center Co Ltd 3.7% 7/16/2070 (b) | | 230,000 | 150,804 |
| TURKEY - 0.1% | | | |
| Financials - 0.0% | | | |
| Banks - 0.0% | | | |
| Turkiye Ihracat Kredi Bankasi AS 9% 1/28/2027 (b) | | 305,000 | 320,917 |
| Industrials - 0.0% | | | |
| Building Products - 0.0% | | | |
| Sisecam UK PLC 8.625% 5/2/2032 (b) | | 375,000 | 372,304 |
| Materials - 0.1% | | | |
| Metals & Mining - 0.1% | | | |
| Eldorado Gold Corp 6.25% 9/1/2029 (b) | | 420,000 | 411,398 |
| Utilities - 0.0% | | | |
| Independent Power and Renewable Electricity Producers - 0.0% | | | |
| Aydem Yenilenebilir Enerji AS 7.75% 2/2/2027 (b) | | 370,000 | 368,265 |
| TOTAL TURKEY | | | 1,472,884 |
| UKRAINE - 0.0% | | | |
| Energy - 0.0% | | | |
| Oil, Gas & Consumable Fuels - 0.0% | | | |
| NAK Naftogaz Ukraine via Kondor Finance PLC loan participation 7.625% 11/8/2028 pay-in-kind (b) | | 268,539 | 198,718 |
| NAK Naftogaz Ukraine via Kondor Finance PLC loan participation 7.65% 7/19/2025 pay-in-kind (p) | | 323,543 | 300,895 |
| | | | |
| TOTAL UKRAINE | | | 499,613 |
| UNITED ARAB EMIRATES - 0.4% | | | |
| Energy - 0.1% | | | |
| Oil, Gas & Consumable Fuels - 0.1% | | | |
| Adnoc Murban Rsc Ltd 5.125% 9/11/2054 (b) | | 375,000 | 338,554 |
| Galaxy Pipeline Assets Bidco Ltd 2.16% 3/31/2034 (b) | | 301,973 | 258,727 |
| Galaxy Pipeline Assets Bidco Ltd 2.625% 3/31/2036 (b) | | 1,210,000 | 982,133 |
| | | | 1,579,414 |
| Financials - 0.1% | | | |
| Financial Services - 0.1% | | | |
| Abu Dhabi Developmental Holding Co PJSC 5.25% 10/2/2054 (b) | | 470,000 | 432,547 |
| Abu Dhabi Developmental Holding Co PJSC 5.5% 5/8/2034 (b) | | 230,000 | 233,450 |
| MDGH GMTN RSC Ltd 2.875% 11/7/2029 (b) | | 530,000 | 480,191 |
| MDGH GMTN RSC Ltd 4.375% 11/22/2033 (b) | | 305,000 | 285,830 |
| MDGH GMTN RSC Ltd 5.084% 5/22/2053 (b) | | 345,000 | 316,324 |
| MDGH GMTN RSC Ltd Series 1, 5.5% 4/28/2033 (b) | | 300,000 | 305,388 |
| | | | 2,053,730 |
| Industrials - 0.1% | | | |
| Transportation Infrastructure - 0.1% | | | |
| DP World Crescent Ltd 3.7495% 1/30/2030 (b) | | 425,000 | 397,242 |
| DP World Ltd/United Arab Emirates 5.625% 9/25/2048 (b) | | 400,000 | 376,464 |
| | | | 773,706 |
| Real Estate - 0.0% | | | |
| Real Estate Management & Development - 0.0% | | | |
| Alpha Star Holding VIII Ltd 8.375% 4/12/2027 (p) | | 245,000 | 253,881 |
| Utilities - 0.1% | | | |
| Multi-Utilities - 0.1% | | | |
| Abu Dhabi National Energy Co PJSC 4% 10/3/2049 (b) | | 448,000 | 348,571 |
| Abu Dhabi National Energy Co PJSC 4.375% 1/24/2029 (b) | | 315,000 | 307,736 |
| Abu Dhabi National Energy Co PJSC 4.696% 4/24/2033 (b) | | 350,000 | 336,865 |
| Abu Dhabi National Energy Co PJSC 4.75% 3/9/2037 (b) | | 470,000 | 440,331 |
| Abu Dhabi National Energy Co PJSC 4.875% 4/23/2030 (b) | | 195,000 | 193,001 |
| | | | 1,626,504 |
| TOTAL UNITED ARAB EMIRATES | | | 6,287,235 |
| UNITED KINGDOM - 0.8% | | | |
| Communication Services - 0.1% | | | |
| Wireless Telecommunication Services - 0.1% | | | |
| Vmed O2 UK Financing I PLC 4.75% 7/15/2031 (b) | | 995,000 | 855,380 |
| Consumer Discretionary - 0.1% | | | |
| Automobile Components - 0.1% | | | |
| Macquarie Airfinance Holdings Ltd 6.4% 3/26/2029 (b) | | 195,000 | 200,642 |
| Macquarie Airfinance Holdings Ltd 6.5% 3/26/2031 (b) | | 295,000 | 304,759 |
| Macquarie Airfinance Holdings Ltd 8.125% 3/30/2029 (b) | | 435,000 | 460,060 |
| | | | 965,461 |
| Automobiles - 0.0% | | | |
| Mclaren Finance PLC 7.5% 8/1/2026 (b) | | 390,000 | 387,823 |
| Hotels, Restaurants & Leisure - 0.0% | | | |
| Merlin Entertainments Ltd 5.75% 6/15/2026 (b) | | 395,000 | 391,742 |
| Energy - 0.4% | | | |
| Oil, Gas & Consumable Fuels - 0.4% | | | |
| eG Global Finance PLC 12% 11/30/2028 (b) | | 4,410,000 | 4,931,682 |
| Financials - 0.1% | | | |
| Banks - 0.1% | | | |
| Barclays PLC 4.506% 1/31/2033 (c)(p) | EUR | 1,881,000 | 2,061,624 |
| Health Care - 0.0% | | | |
| Health Care Providers & Services - 0.0% | | | |
| 180 Medical Inc 3.875% 10/15/2029 (b) | | 300,000 | 273,971 |
| Industrials - 0.0% | | | |
| Aerospace & Defense - 0.0% | | | |
| Rolls-Royce PLC 5.75% 10/15/2027 (b) | | 650,000 | 660,006 |
| Materials - 0.0% | | | |
| Metals & Mining - 0.0% | | | |
| Celtic Resources Holdings DAC 4.125% (b)(g)(h) | | 445,000 | 63,795 |
| Utilities - 0.1% | | | |
| Multi-Utilities - 0.1% | | | |
| National Grid PLC 4.275% 1/16/2035 (p) | EUR | 1,088,000 | 1,181,805 |
| TOTAL UNITED KINGDOM | | | 11,773,289 |
| UNITED STATES - 20.4% | | | |
| Communication Services - 1.4% | | | |
| Diversified Telecommunication Services - 0.1% | | | |
| Frontier Communications Holdings LLC 5% 5/1/2028 (b) | | 1,165,000 | 1,138,921 |
| Frontier Communications Holdings LLC 5.875% 10/15/2027 (b) | | 620,000 | 618,035 |
| Qwest Corp 7.25% 9/15/2025 | | 35,000 | 34,878 |
| | | | 1,791,834 |
| Entertainment - 0.1% | | | |
| ROBLOX Corp 3.875% 5/1/2030 (b) | | 1,160,000 | 1,045,330 |
| Media - 1.2% | | | |
| DISH Network Corp 11.75% 11/15/2027 (b) | | 2,920,000 | 3,092,841 |
| EchoStar Corp 10.75% 11/30/2029 | | 7,472,195 | 8,034,742 |
| EchoStar Corp 6.75% 11/30/2030 pay-in-kind (c) | | 2,168,993 | 1,967,166 |
| Scripps Escrow II Inc 3.875% 1/15/2029 (b) | | 165,000 | 121,280 |
| Sirius XM Radio LLC 3.875% 9/1/2031 (b) | | 570,000 | 476,964 |
| Sirius XM Radio LLC 4% 7/15/2028 (b) | | 580,000 | 534,387 |
| Sirius XM Radio LLC 5% 8/1/2027 (b) | | 485,000 | 471,676 |
| Univision Communications Inc 4.5% 5/1/2029 (b) | | 570,000 | 510,193 |
| Univision Communications Inc 7.375% 6/30/2030 (b) | | 2,520,000 | 2,410,760 |
| Univision Communications Inc 8.5% 7/31/2031 (b) | | 980,000 | 960,890 |
| | | | 18,580,899 |
TOTAL COMMUNICATION SERVICES | | | 21,418,063 |
| | | | |
| Consumer Discretionary - 2.4% | | | |
| Automobile Components - 0.2% | | | |
| Adient Global Holdings Ltd 7% 4/15/2028 (b) | | 300,000 | 303,564 |
| Clarios Global LP / Clarios US Finance Co 6.75% 5/15/2028 (b) | | 600,000 | 610,973 |
| Dana Inc 4.5% 2/15/2032 | | 410,000 | 376,044 |
| Hertz Corp/The 12.625% 7/15/2029 (b) | | 130,000 | 138,504 |
| Hertz Corp/The 5.5% (b)(g)(h) | | 650,000 | 39,000 |
| Hertz Corp/The 6% (b)(g)(h) | | 575,000 | 112,125 |
| Hertz Corp/The 6.25% (g)(h) | | 670,000 | 48,575 |
| Hertz Corp/The 7.125% (b)(g)(h) | | 620,000 | 130,200 |
| Nesco Holdings II Inc 5.5% 4/15/2029 (b) | | 715,000 | 663,448 |
| | | | 2,422,433 |
| Broadline Retail - 0.1% | | | |
| ANGI Group LLC 3.875% 8/15/2028 (b) | | 335,000 | 299,144 |
| Saks Global Enterprises LLC 11% 12/15/2029 (b) | | 825,000 | 793,481 |
| Wayfair LLC 7.25% 10/31/2029 (b) | | 610,000 | 609,695 |
| | | | 1,702,320 |
| Distributors - 0.0% | | | |
| Windsor Holdings III LLC 8.5% 6/15/2030 (b) | | 295,000 | 310,402 |
| Diversified Consumer Services - 0.2% | | | |
| Adtalem Global Education Inc 5.5% 3/1/2028 (b) | | 420,000 | 410,304 |
| Service Corp International/US 4% 5/15/2031 | | 570,000 | 507,930 |
| TKC Holdings Inc 6.875% 5/15/2028 (b) | | 950,000 | 939,249 |
| WASH Multifamily Acquisition Inc 5.75% 4/15/2026 (b) | | 475,000 | 471,327 |
| | | | 2,328,810 |
| Hotels, Restaurants & Leisure - 1.2% | | | |
| Bloomin' Brands Inc / OSI Restaurant Partners LLC 5.125% 4/15/2029 (b) | | 270,000 | 243,700 |
| Boyd Gaming Corp 4.75% 6/15/2031 (b) | | 715,000 | 661,503 |
| Carnival Corp 4% 8/1/2028 (b) | | 3,420,000 | 3,241,428 |
| Carnival Corp 7% 8/15/2029 (b) | | 300,000 | 312,061 |
| Carnival Corp 7.625% 3/1/2026 (b) | | 1,070,000 | 1,071,564 |
| Carnival Holdings Bermuda Ltd 10.375% 5/1/2028 (b) | | 885,000 | 942,867 |
| Churchill Downs Inc 5.75% 4/1/2030 (b) | | 725,000 | 711,553 |
| Churchill Downs Inc 6.75% 5/1/2031 (b) | | 600,000 | 606,490 |
| Fertitta Entertainment LLC / Fertitta Entertainment Finance Co Inc 4.625% 1/15/2029 (b) | | 1,175,000 | 1,088,849 |
| Fertitta Entertainment LLC / Fertitta Entertainment Finance Co Inc 6.75% 1/15/2030 (b) | | 1,600,000 | 1,476,038 |
| Hilton Domestic Operating Co Inc 3.75% 5/1/2029 (b) | | 330,000 | 304,089 |
| Hilton Domestic Operating Co Inc 4% 5/1/2031 (b) | | 500,000 | 449,671 |
| Hilton Domestic Operating Co Inc 4.875% 1/15/2030 | | 975,000 | 935,228 |
| Hilton Worldwide Finance LLC / Hilton Worldwide Finance Corp 4.875% 4/1/2027 | | 435,000 | 429,070 |
| Jacobs Entertainment Inc 6.75% 2/15/2029 (b) | | 395,000 | 381,194 |
| Light & Wonder International Inc 7.5% 9/1/2031 (b) | | 295,000 | 303,738 |
| MGM Resorts International 4.75% 10/15/2028 | | 665,000 | 636,779 |
| NCL Corp Ltd 5.875% 2/15/2027 (b) | | 550,000 | 548,280 |
| Neogen Food Safety Corp 8.625% 7/20/2030 (b) | | 260,000 | 278,862 |
| Papa John's International Inc 3.875% 9/15/2029 (b) | | 255,000 | 228,445 |
| Premier Entertainment Sub LLC / Premier Entertainment Finance Corp 5.625% 9/1/2029 (b) | | 510,000 | 400,350 |
| Premier Entertainment Sub LLC / Premier Entertainment Finance Corp 5.875% 9/1/2031 (b) | | 110,000 | 80,025 |
| Royal Caribbean Cruises Ltd 5.375% 7/15/2027 (b) | | 415,000 | 412,414 |
| Royal Caribbean Cruises Ltd 6.25% 3/15/2032 (b) | | 565,000 | 571,769 |
| SeaWorld Parks & Entertainment Inc 5.25% 8/15/2029 (b) | | 560,000 | 534,515 |
| Station Casinos LLC 4.625% 12/1/2031 (b) | | 410,000 | 367,275 |
| VOC Escrow Ltd 5% 2/15/2028 (b) | | 990,000 | 963,407 |
| Yum! Brands Inc 4.625% 1/31/2032 | | 590,000 | 545,179 |
| | | | 18,726,343 |
| Household Durables - 0.2% | | | |
| Ashton Woods USA LLC / Ashton Woods Finance Co 4.625% 4/1/2030 (b) | | 410,000 | 372,024 |
| Century Communities Inc 3.875% 8/15/2029 (b) | | 420,000 | 376,244 |
| LGI Homes Inc 8.75% 12/15/2028 (b) | | 285,000 | 298,950 |
| Tempur Sealy International Inc 3.875% 10/15/2031 (b) | | 735,000 | 641,240 |
| Tempur Sealy International Inc 4% 4/15/2029 (b) | | 790,000 | 727,941 |
| TopBuild Corp 3.625% 3/15/2029 (b) | | 305,000 | 279,219 |
| Tri Pointe Homes Inc 5.7% 6/15/2028 | | 865,000 | 859,390 |
| | | | 3,555,008 |
| Specialty Retail - 0.4% | | | |
| Asbury Automotive Group Inc 4.5% 3/1/2028 | | 184,000 | 176,364 |
| Asbury Automotive Group Inc 4.625% 11/15/2029 (b) | | 450,000 | 418,803 |
| Asbury Automotive Group Inc 4.75% 3/1/2030 | | 184,000 | 172,085 |
| Asbury Automotive Group Inc 5% 2/15/2032 (b) | | 485,000 | 442,424 |
| Bath & Body Works Inc 6.625% 10/1/2030 (b) | | 925,000 | 931,650 |
| Bath & Body Works Inc 6.75% 7/1/2036 | | 870,000 | 884,135 |
| Bath & Body Works Inc 7.5% 6/15/2029 | | 500,000 | 515,258 |
| LBM Acquisition LLC 6.25% 1/15/2029 (b) | | 900,000 | 827,839 |
| LCM Investments Holdings II LLC 8.25% 8/1/2031 (b) | | 355,000 | 368,265 |
| Petsmart Inc / Petsmart Finance Corp 4.75% 2/15/2028 (b) | | 610,000 | 575,532 |
| Petsmart Inc / Petsmart Finance Corp 7.75% 2/15/2029 (b) | | 445,000 | 430,164 |
| Wand NewCo 3 Inc 7.625% 1/30/2032 (b) | | 565,000 | 580,325 |
| | | | 6,322,844 |
| Textiles, Apparel & Luxury Goods - 0.1% | | | |
| Crocs Inc 4.125% 8/15/2031 (b) | | 280,000 | 243,605 |
| Crocs Inc 4.25% 3/15/2029 (b) | | 435,000 | 402,116 |
| Kontoor Brands Inc 4.125% 11/15/2029 (b) | | 240,000 | 220,989 |
| | | | 866,710 |
TOTAL CONSUMER DISCRETIONARY | | | 36,234,870 |
| | | | |
| Consumer Staples - 1.3% | | | |
| Beverages - 0.0% | | | |
| Triton Water Holdings 6.25% 4/1/2029 (b) | | 315,000 | 312,705 |
| Consumer Staples Distribution & Retail - 0.7% | | | |
| Albertsons Cos Inc / Safeway Inc / New Albertsons LP / Albertsons LLC 3.5% 3/15/2029 (b) | | 525,000 | 477,834 |
| Albertsons Cos Inc / Safeway Inc / New Albertsons LP / Albertsons LLC 4.625% 1/15/2027 (b) | | 1,310,000 | 1,282,508 |
| Albertsons Cos Inc / Safeway Inc / New Albertsons LP / Albertsons LLC 4.875% 2/15/2030 (b) | | 5,365,000 | 5,111,935 |
| C&S Group Enterprises LLC 5% 12/15/2028 (b) | | 510,000 | 431,874 |
| KeHE Distributors LLC / KeHE Finance Corp / NextWave Distribution Inc 9% 2/15/2029 (b) | | 1,595,000 | 1,654,776 |
| Performance Food Group Inc 4.25% 8/1/2029 (b) | | 400,000 | 371,133 |
| Performance Food Group Inc 5.5% 10/15/2027 (b) | | 475,000 | 470,985 |
| US Foods Inc 7.25% 1/15/2032 (b) | | 290,000 | 300,124 |
| | | | 10,101,169 |
| Food Products - 0.6% | | | |
| Chobani LLC / Chobani Finance Corp Inc 4.625% 11/15/2028 (b) | | 375,000 | 360,985 |
| Darling Ingredients Inc 6% 6/15/2030 (b) | | 675,000 | 665,874 |
| Fiesta Purchaser Inc 7.875% 3/1/2031 (b) | | 535,000 | 558,403 |
| Fiesta Purchaser Inc 9.625% 9/15/2032 (b) | | 340,000 | 356,178 |
| Lamb Weston Holdings Inc 4.125% 1/31/2030 (b) | | 555,000 | 507,454 |
| Lamb Weston Holdings Inc 4.375% 1/31/2032 (b) | | 275,000 | 248,832 |
| Post Holdings Inc 4.5% 9/15/2031 (b) | | 1,215,000 | 1,088,449 |
| Post Holdings Inc 4.625% 4/15/2030 (b) | | 3,850,000 | 3,550,655 |
| Post Holdings Inc 5.5% 12/15/2029 (b) | | 1,085,000 | 1,049,856 |
| Simmons Foods Inc/Simmons Prepared Foods Inc/Simmons Pet Food Inc/Simmons Feed 4.625% 3/1/2029 (b) | | 430,000 | 397,360 |
| | | | 8,784,046 |
| Household Products - 0.0% | | | |
| Spectrum Brands Inc 3.875% 3/15/2031 (b) | | 103,000 | 88,636 |
| Personal Care Products - 0.0% | | | |
| BellRing Brands Inc 7% 3/15/2030 (b) | | 685,000 | 701,559 |
TOTAL CONSUMER STAPLES | | | 19,988,115 |
| | | | |
| Energy - 3.3% | | | |
| Energy Equipment & Services - 0.4% | | | |
| Diamond Foreign Asset Co / Diamond Finance LLC 8.5% 10/1/2030 (b) | | 290,000 | 300,940 |
| Nabors Industries Inc 9.125% 1/31/2030 (b) | | 575,000 | 584,754 |
| Nabors Industries Ltd 7.5% 1/15/2028 (b) | | 510,000 | 472,241 |
| Noble Finance II LLC 8% 4/15/2030 (b) | | 300,000 | 302,990 |
| Nustar Logistics LP 6% 6/1/2026 | | 640,000 | 640,857 |
| Transocean Inc 8% 2/1/2027 (b) | | 381,000 | 380,281 |
| Transocean Inc 8.25% 5/15/2029 (b) | | 205,000 | 200,812 |
| Transocean Inc 8.5% 5/15/2031 (b) | | 205,000 | 200,977 |
| Transocean Inc 8.75% 2/15/2030 (b) | | 1,253,750 | 1,293,024 |
| Transocean Titan Financing Ltd 8.375% 2/1/2028 (b) | | 621,000 | 633,654 |
| Valaris Ltd 8.375% 4/30/2030 (b) | | 295,000 | 298,105 |
| | | | 5,308,635 |
| Oil, Gas & Consumable Fuels - 2.9% | | | |
| Antero Midstream Partners LP / Antero Midstream Finance Corp 5.375% 6/15/2029 (b) | | 430,000 | 418,744 |
| Antero Midstream Partners LP / Antero Midstream Finance Corp 5.75% 1/15/2028 (b) | | 955,000 | 947,480 |
| BP Capital Markets BV 4.323% 5/12/2035 (p) | EUR | 2,243,000 | 2,445,019 |
| California Resources Corp 8.25% 6/15/2029 (b) | | 275,000 | 278,863 |
| Chesapeake Energy Corp 7% (g)(h) | | 360,000 | 0 |
| Chesapeake Energy Corp 8% (g)(h) | | 180,000 | 0 |
| Chesapeake Energy Corp 8% (g)(h) | | 115,000 | 0 |
| CITGO Petroleum Corp 6.375% 6/15/2026 (b) | | 470,000 | 470,480 |
| CITGO Petroleum Corp 7% 6/15/2025 (b) | | 1,340,000 | 1,341,382 |
| CITGO Petroleum Corp 8.375% 1/15/2029 (b) | | 1,280,000 | 1,318,766 |
| Civitas Resources Inc 8.625% 11/1/2030 (b) | | 580,000 | 607,402 |
| CNX Midstream Partners LP 4.75% 4/15/2030 (b) | | 295,000 | 269,027 |
| CNX Resources Corp 6% 1/15/2029 (b) | | 315,000 | 308,880 |
| CNX Resources Corp 7.375% 1/15/2031 (b) | | 295,000 | 303,046 |
| Comstock Resources Inc 5.875% 1/15/2030 (b) | | 1,525,000 | 1,422,245 |
| Comstock Resources Inc 6.75% 3/1/2029 (b) | | 1,030,000 | 1,004,078 |
| CQP Holdco LP / BIP-V Chinook Holdco LLC 5.5% 6/15/2031 (b) | | 1,265,000 | 1,208,237 |
| CQP Holdco LP / BIP-V Chinook Holdco LLC 7.5% 12/15/2033 (b) | | 760,000 | 799,014 |
| CrownRock LP / CrownRock Finance Inc 5% 5/1/2029 (b) | | 245,000 | 248,068 |
| CVR CHC LP 5.75% 2/15/2028 (b) | | 2,320,000 | 2,137,816 |
| CVR CHC LP 8.5% 1/15/2029 (b) | | 2,000,000 | 1,918,379 |
| DT Midstream Inc 4.125% 6/15/2029 (b) | | 430,000 | 401,568 |
| DT Midstream Inc 4.375% 6/15/2031 (b) | | 430,000 | 392,341 |
| Energy Transfer LP 5.5% 6/1/2027 | | 860,000 | 870,696 |
| Energy Transfer LP 5.625% 5/1/2027 (b) | | 2,960,000 | 2,960,764 |
| Energy Transfer LP 6% 2/1/2029 (b) | | 2,415,000 | 2,449,549 |
| EnLink Midstream LLC 6.5% 9/1/2030 (b) | | 895,000 | 937,298 |
| Expand Energy Corp 5.375% 3/15/2030 | | 560,000 | 547,589 |
| Expand Energy Corp 5.7% 1/23/2025 (n) | | 14,000 | 13,998 |
| Expand Energy Corp 5.875% 2/1/2029 (b) | | 310,000 | 307,479 |
| Expand Energy Corp 6.75% 4/15/2029 (b) | | 440,000 | 444,554 |
| Global Partners LP / GLP Finance Corp 8.25% 1/15/2032 (b) | | 355,000 | 364,987 |
| Hess Midstream Operations LP 4.25% 2/15/2030 (b) | | 460,000 | 424,084 |
| Hess Midstream Operations LP 5.125% 6/15/2028 (b) | | 595,000 | 578,730 |
| Hess Midstream Operations LP 5.5% 10/15/2030 (b) | | 275,000 | 265,857 |
| Hess Midstream Operations LP 5.625% 2/15/2026 (b) | | 795,000 | 792,395 |
| HF Sinclair Corp 5% 2/1/2028 | | 400,000 | 395,124 |
| HF Sinclair Corp 6.375% 4/15/2027 | | 280,000 | 284,124 |
| Hilcorp Energy I LP / Hilcorp Finance Co 6.25% 11/1/2028 (b) | | 590,000 | 571,359 |
| Howard Midstream Energy Partners LLC 8.875% 7/15/2028 (b) | | 740,000 | 777,189 |
| Kinetik Holdings LP 5.875% 6/15/2030 (b) | | 425,000 | 418,329 |
| Mesquite Energy Inc 7.25% (b)(g)(h) | | 1,063,000 | 0 |
| Moss Creek Resources Holdings Inc 8.25% 9/1/2031 (b) | | 280,000 | 273,793 |
| Murphy Oil USA Inc 4.75% 9/15/2029 | | 370,000 | 351,088 |
| Murphy Oil USA Inc 5.625% 5/1/2027 | | 305,000 | 302,550 |
| NGPL PipeCo LLC 4.875% 8/15/2027 (b) | | 150,000 | 148,838 |
| Northern Oil & Gas Inc 8.125% 3/1/2028 (b) | | 290,000 | 294,444 |
| Northern Oil & Gas Inc 8.75% 6/15/2031 (b) | | 590,000 | 609,000 |
| Occidental Petroleum Corp 7.2% 3/15/2029 | | 240,000 | 256,212 |
| PBF Holding Co LLC / PBF Finance Corp 6% 2/15/2028 | | 1,445,000 | 1,385,747 |
| PBF Holding Co LLC / PBF Finance Corp 7.875% 9/15/2030 (b) | | 870,000 | 853,727 |
| Permian Resources Operating LLC 5.875% 7/1/2029 (b) | | 405,000 | 397,385 |
| Sitio Royalties Operating Partnership LP / Sitio Finance Corp 7.875% 11/1/2028 (b) | | 720,000 | 740,215 |
| SM Energy Co 6.625% 1/15/2027 | | 1,125,000 | 1,123,607 |
| SM Energy Co 6.75% 9/15/2026 | | 250,000 | 249,760 |
| Sunoco LP / Sunoco Finance Corp 4.5% 4/30/2030 | | 555,000 | 514,739 |
| Sunoco LP / Sunoco Finance Corp 4.5% 5/15/2029 | | 605,000 | 568,293 |
| Sunoco LP / Sunoco Finance Corp 7% 9/15/2028 (b) | | 290,000 | 296,696 |
| Tallgrass Energy Partners LP / Tallgrass Energy Finance Corp 5.5% 1/15/2028 (b) | | 30,000 | 28,852 |
| Tallgrass Energy Partners LP / Tallgrass Energy Finance Corp 6% 3/1/2027 (b) | | 300,000 | 297,240 |
| Tallgrass Energy Partners LP / Tallgrass Energy Finance Corp 6% 9/1/2031 (b) | | 540,000 | 509,670 |
| Talos Production Inc 9% 2/1/2029 (b) | | 250,000 | 256,490 |
| Talos Production Inc 9.375% 2/1/2031 (b) | | 285,000 | 290,525 |
| Targa Resources Partners LP / Targa Resources Partners Finance Corp 4.875% 2/1/2031 | | 625,000 | 603,463 |
| Unit Corp 0% 12/1/2029 (Escrow) (g) | | 120,000 | 0 |
| Venture Global Calcasieu 3.875% 8/15/2029 (b) | | 355,000 | 326,145 |
| Venture Global Calcasieu 4.125% 8/15/2031 (b) | | 355,000 | 317,912 |
| Venture Global Calcasieu 6.25% 1/15/2030 (b) | | 1,195,000 | 1,206,152 |
| | | | 43,847,483 |
TOTAL ENERGY | | | 49,156,118 |
| | | | |
| Financials - 2.5% | | | |
| Capital Markets - 0.3% | | | |
| AssuredPartners Inc 5.625% 1/15/2029 (b) | | 475,000 | 479,981 |
| AssuredPartners Inc 7.5% 2/15/2032 (b) | | 280,000 | 301,360 |
| BroadStreet Partners Inc 5.875% 4/15/2029 (b) | | 725,000 | 701,424 |
| Coinbase Global Inc 3.375% 10/1/2028 (b) | | 1,445,000 | 1,300,356 |
| Coinbase Global Inc 3.625% 10/1/2031 (b) | | 865,000 | 730,973 |
| Hightower Holding LLC 6.75% 4/15/2029 (b) | | 285,000 | 283,760 |
| Jane Street Group / JSG Finance Inc 4.5% 11/15/2029 (b) | | 395,000 | 369,894 |
| MSCI Inc 3.25% 8/15/2033 (b) | | 420,000 | 354,840 |
| MSCI Inc 4% 11/15/2029 (b) | | 340,000 | 320,562 |
| | | | 4,843,150 |
| Consumer Finance - 0.8% | | | |
| Ally Financial Inc 8% 11/1/2031 | | 5,045,000 | 5,577,896 |
| Ally Financial Inc 8% 11/1/2031 | | 823,000 | 908,874 |
| OneMain Finance Corp 4% 9/15/2030 | | 330,000 | 293,292 |
| OneMain Finance Corp 5.375% 11/15/2029 | | 500,000 | 480,718 |
| OneMain Finance Corp 6.625% 1/15/2028 | | 385,000 | 389,766 |
| OneMain Finance Corp 7.125% 3/15/2026 | | 3,310,000 | 3,369,454 |
| OneMain Finance Corp 7.875% 3/15/2030 | | 285,000 | 297,300 |
| | | | 11,317,300 |
| Financial Services - 0.5% | | | |
| Block Inc 3.5% 6/1/2031 | | 570,000 | 501,874 |
| Compass Group Diversified Holdings LLC 5% 1/15/2032 (b) | | 275,000 | 251,594 |
| CRH SMW Finance DAC 4.25% 7/11/2035 (p) | EUR | 1,791,000 | 1,974,237 |
| Icahn Enterprises LP / Icahn Enterprises Finance Corp 10% 11/15/2029 (b) | | 360,000 | 360,850 |
| Icahn Enterprises LP / Icahn Enterprises Finance Corp 4.375% 2/1/2029 | | 630,000 | 526,227 |
| Icahn Enterprises LP / Icahn Enterprises Finance Corp 5.25% 5/15/2027 | | 1,730,000 | 1,637,922 |
| Icahn Enterprises LP / Icahn Enterprises Finance Corp 6.25% 5/15/2026 | | 783,000 | 776,333 |
| James Hardie International Finance DAC 5% 1/15/2028 (b) | | 455,000 | 442,686 |
| MGIC Investment Corp 5.25% 8/15/2028 | | 465,000 | 454,929 |
| NCR Atleos Corp 9.5% 4/1/2029 (b) | | 435,000 | 471,238 |
| | | | 7,397,890 |
| Insurance - 0.9% | | | |
| Acrisure LLC / Acrisure Finance Inc 6% 8/1/2029 (b) | | 425,000 | 407,619 |
| Acrisure LLC / Acrisure Finance Inc 7.5% 11/6/2030 (b) | | 275,000 | 283,171 |
| Acrisure LLC / Acrisure Finance Inc 8.25% 2/1/2029 (b) | | 1,335,000 | 1,382,394 |
| Alliant Holdings Intermediate LLC / Alliant Holdings Co-Issuer 4.25% 10/15/2027 (b) | | 665,000 | 634,754 |
| Alliant Holdings Intermediate LLC / Alliant Holdings Co-Issuer 5.875% 11/1/2029 (b) | | 415,000 | 398,683 |
| Alliant Holdings Intermediate LLC / Alliant Holdings Co-Issuer 6.75% 10/15/2027 (b) | | 1,985,000 | 1,968,584 |
| Alliant Holdings Intermediate LLC / Alliant Holdings Co-Issuer 6.75% 4/15/2028 (b) | | 1,760,000 | 1,764,138 |
| Alliant Holdings Intermediate LLC / Alliant Holdings Co-Issuer 7% 1/15/2031 (b) | | 490,000 | 491,914 |
| AmWINS Group Inc 4.875% 6/30/2029 (b) | | 415,000 | 389,683 |
| HUB International Ltd 5.625% 12/1/2029 (b) | | 1,705,000 | 1,653,768 |
| HUB International Ltd 7.25% 6/15/2030 (b) | | 1,915,000 | 1,962,397 |
| HUB International Ltd 7.375% 1/31/2032 (b) | | 710,000 | 721,113 |
| Panther Escrow Issuer LLC 7.125% 6/1/2031 (b) | | 970,000 | 979,695 |
| USI Inc/NY 7.5% 1/15/2032 (b) | | 380,000 | 392,999 |
| | | | 13,430,912 |
TOTAL FINANCIALS | | | 36,989,252 |
| | | | |
| Health Care - 1.4% | | | |
| Health Care Equipment & Supplies - 0.1% | | | |
| Avantor Funding Inc 3.875% 11/1/2029 (b) | | 275,000 | 251,406 |
| Bausch + Lomb Corp 8.375% 10/1/2028 (b) | | 580,000 | 600,300 |
| Hologic Inc 4.625% 2/1/2028 (b) | | 215,000 | 208,462 |
| | | | 1,060,168 |
| Health Care Providers & Services - 0.9% | | | |
| CHS/Community Health Systems Inc 10.875% 1/15/2032 (b) | | 915,000 | 944,032 |
| CHS/Community Health Systems Inc 4.75% 2/15/2031 (b) | | 1,150,000 | 892,350 |
| CHS/Community Health Systems Inc 5.25% 5/15/2030 (b) | | 825,000 | 677,595 |
| CHS/Community Health Systems Inc 6% 1/15/2029 (b) | | 485,000 | 434,272 |
| CHS/Community Health Systems Inc 6.125% 4/1/2030 (b) | | 1,035,000 | 710,227 |
| DaVita Inc 3.75% 2/15/2031 (b) | | 210,000 | 181,705 |
| DaVita Inc 4.625% 6/1/2030 (b) | | 1,590,000 | 1,461,727 |
| HAH Group Holding Co LLC 9.75% 10/1/2031 (b) | | 420,000 | 420,334 |
| HealthEquity Inc 4.5% 10/1/2029 (b) | | 295,000 | 276,519 |
| Molina Healthcare Inc 3.875% 11/15/2030 (b) | | 640,000 | 569,748 |
| Molina Healthcare Inc 3.875% 5/15/2032 (b) | | 550,000 | 474,959 |
| Molina Healthcare Inc 4.375% 6/15/2028 (b) | | 465,000 | 440,682 |
| Tenet Healthcare Corp 5.125% 11/1/2027 | | 975,000 | 954,888 |
| Tenet Healthcare Corp 6.125% 6/15/2030 | | 1,430,000 | 1,418,729 |
| Tenet Healthcare Corp 6.25% 2/1/2027 | | 1,850,000 | 1,848,495 |
| Tenet Healthcare Corp 6.75% 5/15/2031 | | 2,040,000 | 2,060,892 |
| | | | 13,767,154 |
| Health Care Technology - 0.0% | | | |
| IQVIA Inc 5% 5/15/2027 (b) | | 640,000 | 627,981 |
| Life Sciences Tools & Services - 0.1% | | | |
| Charles River Laboratories International Inc 3.75% 3/15/2029 (b) | | 525,000 | 481,466 |
| Charles River Laboratories International Inc 4% 3/15/2031 (b) | | 605,000 | 538,194 |
| Charles River Laboratories International Inc 4.25% 5/1/2028 (b) | | 185,000 | 175,518 |
| | | | 1,195,178 |
| Pharmaceuticals - 0.3% | | | |
| Bausch Health Cos Inc 11% 9/30/2028 (b) | | 240,000 | 228,000 |
| Bausch Health Cos Inc 4.875% 6/1/2028 (b) | | 810,000 | 648,000 |
| Bausch Health Cos Inc 5.75% 8/15/2027 (b) | | 870,000 | 756,900 |
| Bausch Health Cos Inc 6.125% 2/1/2027 (b) | | 1,495,000 | 1,356,713 |
| Organon & Co / Organon Foreign Debt Co-Issuer BV 4.125% 4/30/2028 (b) | | 1,015,000 | 953,577 |
| Organon & Co / Organon Foreign Debt Co-Issuer BV 5.125% 4/30/2031 (b) | | 885,000 | 795,446 |
| | | | 4,738,636 |
TOTAL HEALTH CARE | | | 21,389,117 |
| | | | |
| Industrials - 3.6% | | | |
| Aerospace & Defense - 1.2% | | | |
| BWX Technologies Inc 4.125% 6/30/2028 (b) | | 630,000 | 589,851 |
| Moog Inc 4.25% 12/15/2027 (b) | | 185,000 | 176,575 |
| TransDigm Inc 4.625% 1/15/2029 | | 930,000 | 870,589 |
| TransDigm Inc 5.5% 11/15/2027 | | 7,825,000 | 7,689,113 |
| TransDigm Inc 6.375% 3/1/2029 (b) | | 780,000 | 781,733 |
| TransDigm Inc 6.625% 3/1/2032 (b) | | 280,000 | 282,527 |
| TransDigm Inc 6.75% 8/15/2028 (b) | | 3,560,000 | 3,591,150 |
| TransDigm Inc 6.875% 12/15/2030 (b) | | 2,350,000 | 2,384,956 |
| TransDigm Inc 7.125% 12/1/2031 (b) | | 575,000 | 588,779 |
| Triumph Group Inc 9% 3/15/2028 (b) | | 360,000 | 374,844 |
| | | | 17,330,117 |
| Air Freight & Logistics - 0.0% | | | |
| Rand Parent LLC 8.5% 2/15/2030 (b) | | 745,000 | 749,085 |
| Building Products - 0.2% | | | |
| Advanced Drainage Systems Inc 5% 9/30/2027 (b) | | 125,000 | 122,667 |
| Advanced Drainage Systems Inc 6.375% 6/15/2030 (b) | | 280,000 | 280,025 |
| Carrier Global Corp 4.5% 11/29/2032 | EUR | 1,087,000 | 1,206,555 |
| Miter Brands Acquisition Holdco Inc / MIWD Borrower LLC 6.75% 4/1/2032 (b) | | 420,000 | 421,968 |
| MIWD Holdco II LLC / MIWD Finance Corp 5.5% 2/1/2030 (b) | | 185,000 | 174,746 |
| Shea Homes LP / Shea Homes Funding Corp 4.75% 4/1/2029 | | 475,000 | 447,429 |
| | | | 2,653,390 |
| Commercial Services & Supplies - 1.1% | | | |
| Allied Universal Holdco LLC/Allied Universal Finance Corp/Atlas Luxco 4 Sarl 4.625% 6/1/2028 (b) | | 348,000 | 327,734 |
| Artera Services LLC 8.5% 2/15/2031 (b) | | 1,175,000 | 1,132,549 |
| Brand Industrial Services Inc 10.375% 8/1/2030 (b) | | 2,225,000 | 2,264,610 |
| Brink's Co/The 4.625% 10/15/2027 (b) | | 620,000 | 601,552 |
| Clean Harbors Inc 6.375% 2/1/2031 (b) | | 250,000 | 251,694 |
| CoreCivic Inc 8.25% 4/15/2029 | | 1,575,000 | 1,665,724 |
| GEO Group Inc/The 10.25% 4/15/2031 | | 695,000 | 757,730 |
| GEO Group Inc/The 8.625% 4/15/2029 | | 970,000 | 1,024,494 |
| GFL Environmental Inc 4% 8/1/2028 (b) | | 420,000 | 397,695 |
| GFL Environmental Inc 4.75% 6/15/2029 (b) | | 575,000 | 552,200 |
| GFL Environmental Inc 6.75% 1/15/2031 (b) | | 425,000 | 436,414 |
| Madison IAQ LLC 4.125% 6/30/2028 (b) | | 535,000 | 506,457 |
| Madison IAQ LLC 5.875% 6/30/2029 (b) | | 425,000 | 401,300 |
| Neptune Bidco US Inc 9.29% 4/15/2029 (b) | | 2,380,000 | 2,213,694 |
| OPENLANE Inc 5.125% 6/1/2025 (b) | | 525,000 | 522,446 |
| Reworld Holding Corp 4.875% 12/1/2029 (b) | | 995,000 | 920,195 |
| Reworld Holding Corp 5% 9/1/2030 | | 800,000 | 737,758 |
| Williams Scotsman Inc 7.375% 10/1/2031 (b) | | 290,000 | 298,400 |
| | | | 15,012,646 |
| Construction & Engineering - 0.2% | | | |
| AECOM 5.125% 3/15/2027 | | 625,000 | 619,001 |
| Arcosa Inc 4.375% 4/15/2029 (b) | | 415,000 | 386,688 |
| Pike Corp 5.5% 9/1/2028 (b) | | 1,850,000 | 1,778,704 |
| Pike Corp 8.625% 1/31/2031 (b) | | 715,000 | 754,293 |
| | | | 3,538,686 |
| Electrical Equipment - 0.0% | | | |
| Sensata Technologies BV 4% 4/15/2029 (b) | | 590,000 | 541,412 |
| Ground Transportation - 0.3% | | | |
| Uber Technologies Inc 4.5% 8/15/2029 (b) | | 1,260,000 | 1,218,531 |
| Uber Technologies Inc 6.25% 1/15/2028 (b) | | 545,000 | 549,688 |
| Uber Technologies Inc 7.5% 9/15/2027 (b) | | 1,606,000 | 1,634,601 |
| XPO Inc 6.25% 6/1/2028 (b) | | 300,000 | 301,832 |
| XPO Inc 7.125% 2/1/2032 (b) | | 430,000 | 440,025 |
| | | | 4,144,677 |
| Machinery - 0.1% | | | |
| Allison Transmission Inc 5.875% 6/1/2029 (b) | | 420,000 | 417,239 |
| Chart Industries Inc 7.5% 1/1/2030 (b) | | 790,000 | 821,345 |
| | | | 1,238,584 |
| Passenger Airlines - 0.4% | | | |
| Allegiant Travel Co 7.25% 8/15/2027 (b) | | 445,000 | 447,249 |
| American Airlines 2016-3 Class A Pass Through Trust 7.25% 2/15/2028 (b) | | 990,000 | 1,014,778 |
| American Airlines 2016-3 Class A Pass Through Trust 8.5% 5/15/2029 (b) | | 945,000 | 992,187 |
| American Airlines Inc/AAdvantage Loyalty IP Ltd 5.75% 4/20/2029 (b) | | 1,485,000 | 1,472,656 |
| Spirit Loyalty Cayman Ltd / Spirit IP Cayman Ltd 8% 9/20/2025 (b) | | 150,000 | 116,250 |
| Spirit Loyalty Cayman Ltd / Spirit IP Cayman Ltd 8% 9/20/2025 (b) | | 462,000 | 358,050 |
| United Airlines Inc 4.375% 4/15/2026 (b) | | 1,450,000 | 1,425,725 |
| United Airlines Inc 4.625% 4/15/2029 (b) | | 870,000 | 827,184 |
| | | | 6,654,079 |
| Professional Services - 0.0% | | | |
| TriNet Group Inc 3.5% 3/1/2029 (b) | | 455,000 | 411,773 |
| Trading Companies & Distributors - 0.1% | | | |
| Fortress Transportation and Infrastructure Investors LLC 7.875% 12/1/2030 (b) | | 430,000 | 452,582 |
| Foundation Building Materials Inc 6% 3/1/2029 (b) | | 310,000 | 271,671 |
| H&E Equipment Services Inc 3.875% 12/15/2028 (b) | | 995,000 | 909,368 |
| | | | 1,633,621 |
TOTAL INDUSTRIALS | | | 53,908,070 |
| | | | |
| Information Technology - 1.2% | | | |
| Electronic Equipment, Instruments & Components - 0.1% | | | |
| Coherent Corp 5% 12/15/2029 (b) | | 435,000 | 415,117 |
| CPI CG Inc 10% 7/15/2029 (b) | | 275,000 | 293,815 |
| Lightning Power LLC 7.25% 8/15/2032 (b) | | 545,000 | 560,332 |
| TTM Technologies Inc 4% 3/1/2029 (b) | | 455,000 | 422,217 |
| | | | 1,691,481 |
| IT Services - 0.2% | | | |
| Acuris Finance US Inc / Acuris Finance SARL 5% 5/1/2028 (b) | | 430,000 | 388,843 |
| ASGN Inc 4.625% 5/15/2028 (b) | | 510,000 | 484,398 |
| Camelot Finance SA 4.5% 11/1/2026 (b) | | 570,000 | 553,898 |
| Go Daddy Operating Co LLC / GD Finance Co Inc 3.5% 3/1/2029 (b) | | 610,000 | 557,275 |
| Go Daddy Operating Co LLC / GD Finance Co Inc 5.25% 12/1/2027 (b) | | 500,000 | 491,137 |
| Unisys Corp 6.875% 11/1/2027 (b) | | 365,000 | 354,151 |
| | | | 2,829,702 |
| Semiconductors & Semiconductor Equipment - 0.1% | | | |
| ON Semiconductor Corp 3.875% 9/1/2028 (b) | | 690,000 | 647,097 |
| Synaptics Inc 4% 6/15/2029 (b) | | 350,000 | 318,981 |
| Wolfspeed Inc 7.9583% 6/23/2030 pay-in-kind (b)(c)(g)(i) | | 1,095,000 | 1,053,938 |
| | | | 2,020,016 |
| Software - 0.7% | | | |
| Clarivate Science Holdings Corp 3.875% 7/1/2028 (b) | | 500,000 | 465,776 |
| Clarivate Science Holdings Corp 4.875% 7/1/2029 (b) | | 475,000 | 442,800 |
| Cloud Software Group Inc 6.5% 3/31/2029 (b) | | 4,985,000 | 4,892,992 |
| Elastic NV 4.125% 7/15/2029 (b) | | 1,165,000 | 1,080,033 |
| Fair Isaac Corp 4% 6/15/2028 (b) | | 580,000 | 547,306 |
| Gen Digital Inc 5% 4/15/2025 (b) | | 530,000 | 528,790 |
| NCR Voyix Corp 5% 10/1/2028 (b) | | 335,000 | 322,216 |
| PTC Inc 3.625% 2/15/2025 (b) | | 350,000 | 349,057 |
| PTC Inc 4% 2/15/2028 (b) | | 345,000 | 326,700 |
| UKG Inc 6.875% 2/1/2031 (b) | | 425,000 | 431,176 |
| | | | 9,386,846 |
| Technology Hardware, Storage & Peripherals - 0.1% | | | |
| Seagate HDD Cayman 8.25% 12/15/2029 | | 985,000 | 1,049,510 |
| Seagate HDD Cayman 8.5% 7/15/2031 | | 640,000 | 684,390 |
| | | | 1,733,900 |
TOTAL INFORMATION TECHNOLOGY | | | 17,661,945 |
| | | | |
| Materials - 1.5% | | | |
| Chemicals - 0.4% | | | |
| Ingevity Corp 3.875% 11/1/2028 (b) | | 665,000 | 607,979 |
| LSB Industries Inc 6.25% 10/15/2028 (b) | | 960,000 | 930,737 |
| Olympus Water US Holding Corp 4.25% 10/1/2028 (b) | | 720,000 | 672,825 |
| Olympus Water US Holding Corp 7.125% 10/1/2027 (b) | | 355,000 | 359,959 |
| Olympus Water US Holding Corp 9.75% 11/15/2028 (b) | | 1,485,000 | 1,575,609 |
| Scih Salt Hldgs Inc 4.875% 5/1/2028 (b) | | 375,000 | 352,773 |
| SCIL IV LLC / SCIL USA Holdings LLC 5.375% 11/1/2026 (b) | | 640,000 | 626,821 |
| Scotts Miracle-Gro Co/The 4% 4/1/2031 | | 595,000 | 518,794 |
| WR Grace Holdings LLC 7.375% 3/1/2031 (b) | | 300,000 | 306,365 |
| | | | 5,951,862 |
| Construction Materials - 0.2% | | | |
| Smyrna Ready Mix Concrete LLC 8.875% 11/15/2031 (b) | | 1,150,000 | 1,205,723 |
| Summit Materials LLC / Summit Materials Finance Corp 5.25% 1/15/2029 (b) | | 645,000 | 649,522 |
| Summit Materials LLC / Summit Materials Finance Corp 7.25% 1/15/2031 (b) | | 435,000 | 461,572 |
| | | | 2,316,817 |
| Containers & Packaging - 0.5% | | | |
| Ardagh Metal Packaging Finance USA LLC / Ardagh Metal Packaging Finance PLC 3.25% 9/1/2028 (b) | | 300,000 | 268,402 |
| Ardagh Metal Packaging Finance USA LLC / Ardagh Metal Packaging Finance PLC 4% 9/1/2029 (b) | | 605,000 | 519,691 |
| Ardagh Metal Packaging Finance USA LLC / Ardagh Metal Packaging Finance PLC 6% 6/15/2027 (b) | | 280,000 | 277,811 |
| Clydesdale Acquisition Holdings Inc 6.625% 4/15/2029 (b) | | 915,000 | 921,065 |
| Clydesdale Acquisition Holdings Inc 8.75% 4/15/2030 (b) | | 2,175,000 | 2,198,641 |
| Crown Cork & Seal Co Inc 7.375% 12/15/2026 | | 1,210,000 | 1,241,398 |
| Crown Cork & Seal Co Inc 7.5% 12/15/2096 | | 160,000 | 164,800 |
| Graham Packaging Co Inc 7.125% 8/15/2028 (b) | | 365,000 | 359,674 |
| Graphic Packaging International LLC 3.75% 2/1/2030 (b) | | 355,000 | 320,642 |
| Mauser Packaging Solutions Holding Co 7.875% 4/15/2027 (b) | | 605,000 | 617,227 |
| Sealed Air Corp/Sealed Air Corp US 6.125% 2/1/2028 (b) | | 300,000 | 300,998 |
| Trident TPI Holdings Inc 12.75% 12/31/2028 (b) | | 295,000 | 325,412 |
| | | | 7,515,761 |
| Metals & Mining - 0.4% | | | |
| Alcoa Nederland Holding BV 4.125% 3/31/2029 (b) | | 775,000 | 722,950 |
| Alcoa Nederland Holding BV 6.125% 5/15/2028 (b) | | 200,000 | 199,825 |
| Alcoa Nederland Holding BV 7.125% 3/15/2031 (b) | | 230,000 | 237,678 |
| Arsenal AIC Parent LLC 8% 10/1/2030 (b) | | 350,000 | 362,179 |
| ATI Inc 4.875% 10/1/2029 | | 280,000 | 266,709 |
| ATI Inc 5.125% 10/1/2031 | | 245,000 | 230,355 |
| ATI Inc 7.25% 8/15/2030 | | 295,000 | 303,350 |
| Cleveland-Cliffs Inc 4.625% 3/1/2029 (b) | | 465,000 | 431,767 |
| Cleveland-Cliffs Inc 4.875% 3/1/2031 (b) | | 465,000 | 415,082 |
| Cleveland-Cliffs Inc 6.75% 4/15/2030 (b) | | 965,000 | 943,620 |
| Compass Minerals International Inc 6.75% 12/1/2027 (b) | | 1,305,000 | 1,285,292 |
| Kaiser Aluminum Corp 4.625% 3/1/2028 (b) | | 595,000 | 559,436 |
| Murray Energy Corp 11.25% (b)(g)(h) | | 490,000 | 0 |
| Murray Energy Corp 12% pay-in-kind (b)(c)(g)(h) | | 548,100 | 0 |
| Roller Bearing Co of America Inc 4.375% 10/15/2029 (b) | | 200,000 | 186,875 |
| | | | 6,145,118 |
TOTAL MATERIALS | | | 21,929,558 |
| | | | |
| Real Estate - 0.9% | | | |
| Diversified REITs - 0.3% | | | |
| Iron Mountain Information Management Services Inc 5% 7/15/2032 (b) | | 415,000 | 381,954 |
| Uniti Group LP / Uniti Fiber Holdings Inc / CSL Capital LLC 6% 1/15/2030 (b) | | 335,000 | 294,130 |
| Uniti Group LP / Uniti Group Finance 2019 Inc / CSL Capital LLC 10.5% 2/15/2028 (b) | | 635,000 | 677,088 |
| Uniti Group LP / Uniti Group Finance 2019 Inc / CSL Capital LLC 4.75% 4/15/2028 (b) | | 940,000 | 881,003 |
| Uniti Group LP / Uniti Group Finance 2019 Inc / CSL Capital LLC 6.5% 2/15/2029 (b) | | 655,000 | 594,323 |
| Vici Properties LP / Vici Note Co Inc 3.875% 2/15/2029 (b) | | 665,000 | 626,624 |
| Vici Properties LP / Vici Note Co Inc 4.25% 12/1/2026 (b) | | 1,140,000 | 1,121,084 |
| Vici Properties LP / Vici Note Co Inc 4.625% 12/1/2029 (b) | | 650,000 | 622,593 |
| | | | 5,198,799 |
| Health Care REITs - 0.2% | | | |
| MPT Operating Partnership LP / MPT Finance Corp 3.5% 3/15/2031 | | 665,000 | 419,021 |
| MPT Operating Partnership LP / MPT Finance Corp 4.625% 8/1/2029 | | 970,000 | 695,053 |
| MPT Operating Partnership LP / MPT Finance Corp 5% 10/15/2027 | | 2,850,000 | 2,402,782 |
| | | | 3,516,856 |
| Real Estate Management & Development - 0.1% | | | |
| Greystar Real Estate Partners LLC 7.75% 9/1/2030 (b) | | 260,000 | 274,729 |
| Taylor Morrison Communities Inc 5.125% 8/1/2030 (b) | | 635,000 | 607,648 |
| Taylor Morrison Communities Inc 5.875% 6/15/2027 (b) | | 495,000 | 496,785 |
| Weekley Homes LLC / Weekley Finance Corp 4.875% 9/15/2028 (b) | | 300,000 | 286,247 |
| | | | 1,665,409 |
| Specialized REITs - 0.3% | | | |
| Iron Mountain Inc 4.875% 9/15/2029 (b) | | 1,300,000 | 1,235,496 |
| Iron Mountain Inc 5% 7/15/2028 (b) | | 630,000 | 608,970 |
| Iron Mountain Inc 5.25% 7/15/2030 (b) | | 585,000 | 558,416 |
| Iron Mountain Inc 5.625% 7/15/2032 (b) | | 585,000 | 558,830 |
| SBA Communications Corp 3.875% 2/15/2027 | | 890,000 | 852,019 |
| | | | 3,813,731 |
TOTAL REAL ESTATE | | | 14,194,795 |
| | | | |
| Utilities - 0.9% | | | |
| Electric Utilities - 0.8% | | | |
| Clearway Energy Operating LLC 3.75% 1/15/2032 (b) | | 280,000 | 239,005 |
| Clearway Energy Operating LLC 4.75% 3/15/2028 (b) | | 365,000 | 349,062 |
| Nextera Energy Operating Partners LP 7.25% 1/15/2029 (b) | | 285,000 | 291,511 |
| NRG Energy Inc 3.375% 2/15/2029 (b) | | 305,000 | 276,720 |
| NRG Energy Inc 3.625% 2/15/2031 (b) | | 605,000 | 529,049 |
| NRG Energy Inc 3.875% 2/15/2032 (b) | | 58,000 | 50,655 |
| NRG Energy Inc 5.75% 1/15/2028 | | 1,665,000 | 1,659,038 |
| Pacific Gas and Electric Co 3.95% 12/1/2047 | | 578,000 | 431,548 |
| Pacific Gas and Electric Co 4% 12/1/2046 | | 743,000 | 559,866 |
| Pacific Gas and Electric Co 4.3% 3/15/2045 | | 315,000 | 251,359 |
| PG&E Corp 5% 7/1/2028 | | 1,345,000 | 1,313,990 |
| PG&E Corp 5.25% 7/1/2030 | | 510,000 | 499,201 |
| Vistra Operations Co LLC 4.375% 5/1/2029 (b) | | 1,105,000 | 1,040,371 |
| Vistra Operations Co LLC 5% 7/31/2027 (b) | | 1,220,000 | 1,197,057 |
| Vistra Operations Co LLC 5.5% 9/1/2026 (b) | | 820,000 | 817,413 |
| Vistra Operations Co LLC 5.625% 2/15/2027 (b) | | 1,495,000 | 1,489,012 |
| Vistra Operations Co LLC 7.75% 10/15/2031 (b) | | 580,000 | 608,458 |
| | | | 11,603,315 |
| Gas Utilities - 0.1% | | | |
| Southern Natural Gas Co LLC 7.35% 2/15/2031 | | 175,000 | 192,117 |
| Southern Natural Gas Co LLC 8% 3/1/2032 | | 335,000 | 376,625 |
| Suburban Propane Partners LP/Suburban Energy Finance Corp 5% 6/1/2031 (b) | | 570,000 | 508,138 |
| | | | 1,076,880 |
| Independent Power and Renewable Electricity Producers - 0.0% | | | |
| Sunnova Energy Corp 11.75% 10/1/2028 (b) | | 860,000 | 614,900 |
| Sunnova Energy Corp 5.875% 9/1/2026 (b) | | 145,000 | 120,506 |
| | | | 735,406 |
TOTAL UTILITIES | | | 13,415,601 |
| | | | |
| TOTAL UNITED STATES | | | 306,285,504 |
| UZBEKISTAN - 0.0% | | | |
| Materials - 0.0% | | | |
| Metals & Mining - 0.0% | | | |
| Navoi Mining & Metallurgical Combinat 6.7% 10/17/2028 (b) | | 200,000 | 199,250 |
| Navoi Mining & Metallurgical Combinat 6.95% 10/17/2031 (b) | | 235,000 | 232,504 |
| | | | |
| TOTAL UZBEKISTAN | | | 431,754 |
| VENEZUELA - 0.0% | | | |
| Energy - 0.0% | | | |
| Oil, Gas & Consumable Fuels - 0.0% | | | |
| Petroleos de Venezuela SA 12.75% (b)(h) | | 110,000 | 12,210 |
| Petroleos de Venezuela SA 5.375% (h)(p) | | 480,000 | 51,619 |
| Petroleos de Venezuela SA 6% (b)(h) | | 585,000 | 60,243 |
| Petroleos de Venezuela SA 6% (b)(h) | | 930,000 | 97,186 |
| | | | |
| TOTAL VENEZUELA | | | 221,258 |
| VIETNAM - 0.0% | | | |
| Utilities - 0.0% | | | |
| Electric Utilities - 0.0% | | | |
| Mong Duong Finance Holdings BV 5.125% 5/7/2029 (b) | | 499,405 | 478,859 |
| ZAMBIA - 0.1% | | | |
| Materials - 0.1% | | | |
| Metals & Mining - 0.1% | | | |
| First Quantum Minerals Ltd 8.625% 6/1/2031 (b) | | 1,120,000 | 1,147,653 |
| First Quantum Minerals Ltd 9.375% 3/1/2029 (b) | | 665,000 | 703,656 |
| | | | |
| TOTAL ZAMBIA | | | 1,851,309 |
| TOTAL NON-CONVERTIBLE CORPORATE BONDS (Cost $489,420,229) | | | 474,455,936 |
| | | | |
| Non-Convertible Preferred Stocks - 0.0% |
| | | Shares | Value ($) |
| LUXEMBOURG - 0.0% | | | |
| Industrials - 0.0% | | | |
| Transportation Infrastructure - 0.0% | | | |
Tricer Holdco S.C.A. (g)(k) (Cost $286,754) | | 8,042,141 | 80 |
| | | | |
| Preferred Securities - 2.2% |
| | | Principal Amount (a) | Value ($) |
| BRAZIL - 0.1% | | | |
| Consumer Staples - 0.0% | | | |
| Food Products - 0.0% | | | |
| Cosan Overseas Ltd 8.25% (p)(q) | | 710,000 | 715,288 |
| Financials - 0.1% | | | |
| Banks - 0.1% | | | |
| Banco do Brasil SA/Cayman 10 year U.S. Treasury Note + 4.398%, 8.748% (b)(c)(d)(q) | | 815,000 | 833,848 |
| Financial Services - 0.0% | | | |
| Oec Fin Ltd 7.5% pay-in-kind (b)(h)(q) | | 2,178 | 37 |
| Materials - 0.0% | | | |
| Metals & Mining - 0.0% | | | |
| Vale SA 0% (c)(q) | BRL | 1,115,000 | 64,072 |
| TOTAL BRAZIL | | | 1,613,245 |
| CHILE - 0.1% | | | |
| Financials - 0.1% | | | |
| Banks - 0.1% | | | |
| Banco de Credito e Inversiones SA 7.5% (b)(c)(q) | | 295,000 | 296,327 |
| Banco de Credito e Inversiones SA 8.75% (b)(c)(q) | | 290,000 | 313,390 |
| Banco del Estado de Chile 7.95% (b)(c)(q) | | 260,000 | 270,966 |
| | | | |
| TOTAL CHILE | | | 880,683 |
| HONG KONG - 0.1% | | | |
| Communication Services - 0.1% | | | |
| Diversified Telecommunication Services - 0.1% | | | |
| CAS Capital No 1 Ltd 4% (c)(p)(q) | | 800,000 | 780,493 |
| INDIA - 0.1% | | | |
| Information Technology - 0.1% | | | |
| IT Services - 0.1% | | | |
| Network i2i Ltd 3.975% (b)(c)(q) | | 315,000 | 306,941 |
| Network i2i Ltd 5.65% (b)(c)(q) | | 570,000 | 576,011 |
| | | | |
| TOTAL INDIA | | | 882,952 |
| ITALY - 0.0% | | | |
| Utilities - 0.0% | | | |
| Electric Utilities - 0.0% | | | |
| Enel SpA 6.625% (c)(p)(q) | EUR | 564,000 | 670,492 |
| KUWAIT - 0.0% | | | |
| Financials - 0.0% | | | |
| Banks - 0.0% | | | |
| NBK Tier 1 Ltd 3.625% (b)(c)(q) | | 230,000 | 221,183 |
| MEXICO - 0.2% | | | |
| Financials - 0.1% | | | |
| Banks - 0.1% | | | |
| Banco Mercantil del Norte SA/Grand Cayman 7.625% (b)(c)(q) | | 610,000 | 610,522 |
| Banco Mercantil del Norte SA/Grand Cayman 8.375% (b)(c)(q) | | 200,000 | 200,503 |
| BBVA Bancomer SA/Texas 5.125% 1/18/2033 (b)(c) | | 340,000 | 323,367 |
| BBVA Bancomer SA/Texas 8.45% 6/29/2038 (b)(c) | | 310,000 | 321,267 |
| | | | 1,455,659 |
| Materials - 0.1% | | | |
| Construction Materials - 0.1% | | | |
| Cemex SAB de CV 5.125% (b)(c)(q) | | 965,000 | 961,275 |
| Cemex SAB de CV 9.125% (b)(c)(q) | | 475,000 | 490,948 |
| | | | 1,452,223 |
| TOTAL MEXICO | | | 2,907,882 |
| RUSSIA - 0.0% | | | |
| Financials - 0.0% | | | |
| Banks - 0.0% | | | |
| Tinkoff Bank JSC Via TCS Finance Ltd loan participation 6% (b)(c)(g)(h)(q) | | 275,000 | 13,749 |
| UNITED ARAB EMIRATES - 0.0% | | | |
| Industrials - 0.0% | | | |
| Marine Transportation - 0.0% | | | |
| DP World Salaam 6% (c)(p)(q) | | 600,000 | 615,000 |
| UNITED STATES - 1.6% | | | |
| Energy - 0.3% | | | |
| Oil, Gas & Consumable Fuels - 0.3% | | | |
| Energy Transfer LP 6.5% (c)(q) | | 505,000 | 509,470 |
| Energy Transfer LP 6.625% (c)(q) | | 1,730,000 | 1,744,720 |
| Energy Transfer LP Series G, 7.125% (c)(q) | | 2,460,000 | 2,491,615 |
| Summit Midstream Corp 3 month U.S. LIBOR + 7.43%, 12.2837% (c)(d)(h)(q) | | 148,000 | 227,881 |
| | | | 4,973,686 |
| Financials - 1.3% | | | |
| Banks - 1.2% | | | |
| Bank of America Corp 5.875% (c)(q) | | 5,125,000 | 5,226,466 |
| Citigroup Inc 4.7% (c)(q) | | 3,805,000 | 3,856,379 |
| JPMorgan Chase & Co 4% (c)(q) | | 4,005,000 | 4,006,970 |
| JPMorgan Chase & Co 4.6% (c)(q) | | 2,025,000 | 2,054,698 |
| Wells Fargo & Co 5.875% (c)(q) | | 2,600,000 | 2,602,007 |
| | | | 17,746,520 |
| Insurance - 0.1% | | | |
| Alliant Holdings LP 10.5% (c)(g)(q) | | 2,166,000 | 2,123,239 |
| TOTAL UNITED STATES | | | 24,843,445 |
| TOTAL PREFERRED SECURITIES (Cost $33,007,457) | | | 33,429,124 |
| | | | |
| U.S. Government Agency - Mortgage Securities - 2.3% |
| | | Principal Amount (a) | Value ($) |
| UNITED STATES - 2.3% | | | |
| Fannie Mae Mortgage pass-thru certificates 2% 11/1/2041 | | 444,910 | 370,506 |
| Fannie Mae Mortgage pass-thru certificates 2% 2/1/2028 | | 75,227 | 72,964 |
| Fannie Mae Mortgage pass-thru certificates 2% 5/1/2051 (r) | | 999,901 | 777,377 |
| Fannie Mae Mortgage pass-thru certificates 2% 6/1/2051 | | 124,988 | 97,172 |
| Fannie Mae Mortgage pass-thru certificates 2.5% 5/1/2042 | | 18,166 | 15,637 |
| Fannie Mae Mortgage pass-thru certificates 2.5% 5/1/2042 | | 43,614 | 37,678 |
| Fannie Mae Mortgage pass-thru certificates 3% 10/1/2040 | | 382,448 | 346,133 |
| Fannie Mae Mortgage pass-thru certificates 3% 9/1/2041 | | 138,500 | 123,661 |
| Fannie Mae Mortgage pass-thru certificates 3.5% 3/1/2052 (s) | | 450,635 | 400,059 |
| Fannie Mae Mortgage pass-thru certificates 3.5% 3/1/2052 | | 347,733 | 308,068 |
| Fannie Mae Mortgage pass-thru certificates 5% 11/1/2052 (s) | | 175,612 | 170,959 |
| Fannie Mae Mortgage pass-thru certificates 6% 6/1/2053 | | 315,024 | 319,981 |
| Fannie Mae Mortgage pass-thru certificates 6% 6/1/2053 (s) | | 477,395 | 485,056 |
| Fannie Mae Mortgage pass-thru certificates 6.5% 3/1/2054 (s) | | 139,214 | 142,364 |
| Freddie Mac Gold Pool 2.5% 11/1/2041 | | 1,338,921 | 1,156,290 |
| Freddie Mac Gold Pool 2.5% 2/1/2042 | | 250,094 | 216,762 |
| Freddie Mac Gold Pool 2.5% 5/1/2041 | | 541,698 | 471,071 |
| Freddie Mac Gold Pool 3% 9/1/2034 | | 284,227 | 267,889 |
| Freddie Mac Gold Pool 3.5% 3/1/2050 (r)(s) | | 390,676 | 345,999 |
| Freddie Mac Gold Pool 5.5% 9/1/2052 | | 314,080 | 312,608 |
| Freddie Mac Gold Pool 6.5% 10/1/2053 (r) | | 360,701 | 373,343 |
| Freddie Mac Gold Pool 6.5% 10/1/2053 (s) | | 370,972 | 383,278 |
| Ginnie Mae I Pool 2.5% 12/20/2051 | | 497,988 | 411,278 |
| Ginnie Mae I Pool 2.5% 8/20/2051 | | 419,630 | 346,563 |
| Ginnie Mae I Pool 2.5% 9/20/2051 | | 369,256 | 304,961 |
| Ginnie Mae II Pool 2% 1/1/2055 (t) | | 4,700,000 | 3,753,688 |
| Ginnie Mae II Pool 2% 2/1/2055 (t) | | 1,000,000 | 798,930 |
| Ginnie Mae II Pool 2% 3/20/2052 | | 49,999 | 39,949 |
| Ginnie Mae II Pool 2% 4/20/2052 | | 49,997 | 39,947 |
| Ginnie Mae II Pool 2% 5/20/2052 | | 99,991 | 79,876 |
| Uniform Mortgage Backed Securities 2% 1/1/2055 (t) | | 8,150,000 | 6,331,530 |
| Uniform Mortgage Backed Securities 2.5% 1/1/2055 (t) | | 5,000,000 | 4,066,406 |
| Uniform Mortgage Backed Securities 3% 1/1/2055 (t) | | 3,650,000 | 3,096,226 |
| Uniform Mortgage Backed Securities 3.5% 1/1/2055 (t) | | 675,000 | 596,426 |
| Uniform Mortgage Backed Securities 5% 1/1/2055 (t) | | 4,800,000 | 4,629,187 |
| Uniform Mortgage Backed Securities 6.5% 1/1/2055 (t) | | 3,600,000 | 3,675,656 |
TOTAL UNITED STATES | | | 35,365,478 |
| TOTAL U.S. GOVERNMENT AGENCY - MORTGAGE SECURITIES (Cost $35,790,924) | | | 35,365,478 |
| | | | |
| U.S. Government Agency Obligations - 0.0% |
| | | Principal Amount (a) | Value ($) |
| UNITED STATES - 0.0% | | | |
| Utilities - 0.0% | | | |
| Independent Power and Renewable Electricity Producers - 0.0% | | | |
| Tennessee Valley Authority 5.25% 9/15/2039 | | 126,000 | 128,470 |
| Tennessee Valley Authority 5.375% 4/1/2056 | | 302,000 | 304,465 |
| | | | |
| TOTAL U.S. GOVERNMENT AGENCY OBLIGATIONS (Cost $440,546) | | | 432,935 |
| | | | |
| U.S. Treasury Obligations - 24.6% |
| | | Yield (%) (u) | Principal Amount (a) | Value ($) |
| US Treasury Bills 0% 1/30/2025 (s) | | 4.45 to 4.51 | 1,060,000 | 1,056,512 |
| US Treasury Bills 0% 2/6/2025 (s) | | 4.47 | 1,110,000 | 1,105,443 |
| US Treasury Bonds 2% 8/15/2051 | | 1.93 to 2.09 | 13,066,000 | 7,466,040 |
| US Treasury Bonds 2.25% 2/15/2052 | | 2.15 to 2.99 | 12,700,000 | 7,699,251 |
| US Treasury Bonds 2.5% 2/15/2045 | | 2.98 to 3.04 | 17,524,000 | 12,158,558 |
| US Treasury Bonds 2.875% 5/15/2052 | | 2.99 to 3.12 | 2,520,000 | 1,762,316 |
| US Treasury Bonds 3% 2/15/2049 | | 2.99 to 3.10 | 13,991,000 | 10,179,035 |
| US Treasury Bonds 3% 5/15/2045 | | 1.80 | 1,800,000 | 1,360,026 |
| US Treasury Bonds 3.25% 5/15/2042 | | 3.37 to 5.18 | 1,428,000 | 1,161,521 |
| US Treasury Bonds 3.625% 2/15/2053 | | 3.70 to 4.32 | 17,313,000 | 14,066,650 |
| US Treasury Bonds 4.125% 8/15/2044 | | 4.58 to 4.66 | 5,050,000 | 4,570,097 |
| US Treasury Bonds 4.375% 8/15/2043 | | 5.10 to 5.28 | 10,015,000 | 9,423,338 |
| US Treasury Bonds 4.5% 11/15/2054 | | 4.35 to 4.77 | 5,510,000 | 5,253,388 |
| US Treasury Bonds 4.5% 2/15/2044 | | 4.58 | 1,010,000 | 964,014 |
| US Treasury Bonds 4.625% 5/15/2054 | | 4.02 to 4.31 | 1,460,000 | 1,418,533 |
| US Treasury Bonds 4.75% 2/15/2037 | | 2.56 to 5.00 | 8,126,000 | 8,241,303 |
| US Treasury Notes 0.375% 1/31/2026 | | 0.47 | 2,100,000 | 2,014,973 |
| US Treasury Notes 0.375% 12/31/2025 | | 0.40 to 0.44 | 8,019,000 | 7,721,698 |
| US Treasury Notes 0.625% 7/31/2026 | | 0.77 | 2,400,000 | 2,268,112 |
| US Treasury Notes 0.75% 3/31/2026 | | 0.83 to 0.92 | 4,704,000 | 4,505,675 |
| US Treasury Notes 0.75% 8/31/2026 | | 4.64 | 15,467,000 | 14,606,249 |
| US Treasury Notes 1% 7/31/2028 | | 0.96 to 1.13 | 4,418,000 | 3,933,076 |
| US Treasury Notes 1.125% 10/31/2026 | | 1.23 | 1,700,000 | 1,607,076 |
| US Treasury Notes 1.125% 8/31/2028 | | 1.13 to 1.14 | 40,242,000 | 35,892,608 |
| US Treasury Notes 1.25% 12/31/2026 | | 1.26 | 698,000 | 658,329 |
| US Treasury Notes 1.25% 9/30/2028 | | 1.37 to 1.45 | 2,930,000 | 2,618,589 |
| US Treasury Notes 1.375% 10/31/2028 | | 1.45 to 1.52 | 3,514,000 | 3,147,384 |
| US Treasury Notes 1.5% 1/31/2027 | | 1.50 to 1.57 | 4,595,000 | 4,345,527 |
| US Treasury Notes 1.5% 11/30/2028 | | 1.37 to 1.46 | 860,000 | 772,393 |
| US Treasury Notes 1.625% 9/30/2026 | | 1.63 to 1.68 | 4,153,000 | 3,971,551 |
| US Treasury Notes 1.75% 1/31/2029 | | 1.74 to 1.81 | 2,583,000 | 2,332,486 |
| US Treasury Notes 1.875% 2/28/2027 | | 1.71 to 2.55 | 27,200,000 | 25,875,284 |
| US Treasury Notes 2.5% 2/28/2026 | | 2.28 to 2.62 | 7,215,000 | 7,073,400 |
| US Treasury Notes 2.5% 3/31/2027 | | 2.72 | 900,000 | 866,613 |
| US Treasury Notes 2.625% 7/31/2029 | | 2.83 | 1,210,000 | 1,122,565 |
| US Treasury Notes 2.75% 5/31/2029 | | 3.03 | 155,000 | 144,920 |
| US Treasury Notes 2.75% 7/31/2027 | | 2.71 | 1,240,000 | 1,194,211 |
| US Treasury Notes 2.75% 8/15/2032 | | 2.79 to 3.99 | 6,935,000 | 6,150,160 |
| US Treasury Notes 2.875% 4/30/2029 | | 2.97 to 3.14 | 3,300,000 | 3,106,153 |
| US Treasury Notes 2.875% 5/15/2032 | | 2.84 to 2.95 | 4,068,000 | 3,653,480 |
| US Treasury Notes 3.125% 11/15/2028 | | 2.69 | 1,180,000 | 1,129,125 |
| US Treasury Notes 3.375% 5/15/2033 | | 3.83 | 250,000 | 229,744 |
| US Treasury Notes 3.5% 1/31/2028 | | 3.60 to 3.83 | 4,190,000 | 4,093,952 |
| US Treasury Notes 3.5% 2/15/2033 | | 3.91 | 3,800,000 | 3,535,114 |
| US Treasury Notes 3.5% 9/30/2029 | | 3.56 to 3.58 | 3,020,000 | 2,905,825 |
| US Treasury Notes 3.625% 3/31/2030 | | 3.31 to 3.55 | 7,767,000 | 7,485,449 |
| US Treasury Notes 3.625% 5/15/2026 | | 4.05 to 4.16 | 1,050,000 | 1,041,447 |
| US Treasury Notes 3.75% 5/31/2030 | | 3.84 | 189,000 | 182,931 |
| US Treasury Notes 3.75% 8/31/2031 | | 3.65 to 4.10 | 3,170,000 | 3,037,108 |
| US Treasury Notes 3.875% 1/15/2026 | | 3.92 | 50,000 | 49,832 |
| US Treasury Notes 3.875% 11/30/2027 | | 3.74 | 850,000 | 840,407 |
| US Treasury Notes 3.875% 12/31/2027 | | 3.56 to 4.01 | 6,700,000 | 6,624,845 |
| US Treasury Notes 3.875% 8/15/2033 | | 4.02 to 4.57 | 1,810,000 | 1,722,612 |
| US Treasury Notes 3.875% 8/15/2034 | | 3.63 to 3.80 | 7,210,000 | 6,822,687 |
| US Treasury Notes 4% 1/15/2027 | | 4.14 to 4.15 | 4,470,000 | 4,448,024 |
| US Treasury Notes 4% 1/31/2031 | | 3.89 to 3.96 | 680,000 | 663,441 |
| US Treasury Notes 4% 10/31/2029 | | 4.15 | 1,300,000 | 1,278,122 |
| US Treasury Notes 4% 7/31/2029 | | 3.83 | 260,000 | 255,985 |
| US Treasury Notes 4% 7/31/2030 | | 4.08 | 2,500,000 | 2,447,551 |
| US Treasury Notes 4.125% 10/31/2026 | | 4.29 | 3,000,000 | 2,993,171 |
| US Treasury Notes 4.125% 10/31/2027 | | 4.24 | 900,000 | 896,449 |
| US Treasury Notes 4.125% 10/31/2031 | | 4.39 | 4,390,000 | 4,296,981 |
| US Treasury Notes 4.125% 11/15/2027 | | 4.09 to 4.20 | 2,110,000 | 2,100,689 |
| US Treasury Notes 4.125% 11/15/2032 | | 3.46 to 3.48 | 4,064,000 | 3,963,696 |
| US Treasury Notes 4.125% 11/30/2031 | | 4.13 | 2,280,000 | 2,231,322 |
| US Treasury Notes 4.125% 2/15/2027 | | 4.40 to 4.49 | 12,610,000 | 12,575,635 |
| US Treasury Notes 4.125% 3/31/2031 | | 4.36 to 4.71 | 3,858,000 | 3,787,082 |
| US Treasury Notes 4.125% 7/31/2028 | | 4.19 | 850,000 | 844,134 |
| US Treasury Notes 4.125% 8/31/2030 | | 4.19 to 4.61 | 3,320,000 | 3,268,889 |
| US Treasury Notes 4.25% 11/30/2026 | | 4.17 | 9,580,000 | 9,578,095 |
| US Treasury Notes 4.25% 2/28/2031 | | 4.25 to 4.36 | 3,660,000 | 3,618,473 |
| US Treasury Notes 4.25% 3/15/2027 | | 4.36 to 4.42 | 4,070,000 | 4,068,939 |
| US Treasury Notes 4.25% 6/30/2029 | | 4.11 to 4.12 | 4,440,000 | 4,417,308 |
| US Treasury Notes 4.25% 6/30/2031 | | 3.99 to 4.45 | 3,080,000 | 3,041,270 |
| US Treasury Notes 4.375% 11/30/2028 | | 4.15 | 3,230,000 | 3,231,307 |
| US Treasury Notes 4.375% 11/30/2030 | | 4.16 to 4.36 | 2,591,000 | 2,581,567 |
| US Treasury Notes 4.375% 5/15/2034 | | 3.84 | 810,000 | 797,549 |
| US Treasury Notes 4.375% 7/31/2026 | | 4.10 | 4,300,000 | 4,307,095 |
| US Treasury Notes 4.5% 3/31/2026 | | 5.00 | 3,241,000 | 3,249,824 |
| US Treasury Notes 4.625% 11/15/2026 | | 4.59 to 4.68 | 9,400,000 | 9,461,257 |
| US Treasury Notes 4.625% 3/15/2026 | | 4.06 to 4.07 | 2,250,000 | 2,259,725 |
| US Treasury Notes 4.625% 9/30/2030 | | 5.00 | 399,000 | 402,708 |
| US Treasury Notes 4.875% 10/31/2030 | | 4.31 to 4.92 | 4,520,000 | 4,619,737 |
| US Treasury Notes 5% 10/31/2025 | | 5.07 | 1,990,000 | 2,001,485 |
| TOTAL U.S. TREASURY OBLIGATIONS (Cost $406,968,943) | | | | 370,857,125 |
| | | | | |
| Money Market Funds - 6.5% |
| | | Yield (%) | Shares | Value ($) |
| Fidelity Cash Central Fund (v) | | 4.36 | 97,523,232 | 97,542,736 |
| Fidelity Securities Lending Cash Central Fund (v)(w) | | 4.35 | 960,879 | 960,975 |
| TOTAL MONEY MARKET FUNDS (Cost $98,498,766) | | | | 98,503,711 |
| | | | | |
| Purchased Swaptions - 0.1% |
| | Expiration Date | Notional Amount | Value ($) |
| Put Swaptions - 0.1% | | | | |
| Option on an interest rate swap with JPMorgan Chase Bank NA to pay annually a fixed rate of 3.92% and receive annually a floating rate based on US SOFR Index, expiring November 2034 | 11/20/29 | | 7,300,000 | 309,963 |
| Option on an interest rate swap with Citibank NA to pay annually a fixed rate of 3.658% and receive annually a floating rate based on US SOFR Index, expiring December 2035 | 12/09/25 | | 3,490,000 | 177,605 |
| | | | | |
| TOTAL PUT SWAPTIONS | | | | 487,568 |
| Call Swaptions - 0.0% | | | | |
| Option on an interest rate swap with JPMorgan Chase Bank NA to receive annually a fixed rate of 3.92% and pay annually a floating rate based on US SOFR Index, expiring November 2034 | 11/20/29 | | 7,300,000 | 260,107 |
| Option on an interest rate swap with Citibank NA to receive annually a fixed rate of 3.658% and pay annually a floating rate based on US SOFR Index, expiring December 2035 | 12/09/25 | | 3,490,000 | 64,595 |
| | | | | |
| TOTAL CALL SWAPTIONS | | | | 324,702 |
TOTAL PURCHASED SWAPTIONS (Cost $810,777) | | | | 812,270 |
| TOTAL INVESTMENT IN SECURITIES - 100.7% (Cost $1,548,367,693) | 1,518,431,000 |
NET OTHER ASSETS (LIABILITIES) - (0.7)% | (9,637,113) |
| NET ASSETS - 100.0% | 1,508,793,887 |
| | |
| TBA Sale Commitments |
| | Principal Amount (a) | Value ($) |
| U.S. Government Agency - Mortgage Securities | | |
| Ginnie Mae II Pool 2% 1/1/2055 | (1,875,000) | (1,497,482) |
| Ginnie Mae II Pool 2.5% 1/1/2055 | (1,400,000) | (1,167,460) |
| Uniform Mortgage Backed Securities 2% 1/1/2055 | (4,650,000) | (3,612,468) |
| Uniform Mortgage Backed Securities 2.5% 1/1/2055 | (8,850,000) | (7,197,538) |
| Uniform Mortgage Backed Securities 3% 1/1/2055 | (4,625,000) | (3,923,300) |
| Uniform Mortgage Backed Securities 4% 1/1/2055 | (3,700,000) | (3,378,562) |
| Uniform Mortgage Backed Securities 4.5% 1/1/2055 | (6,100,000) | (5,733,046) |
| Uniform Mortgage Backed Securities 5% 1/1/2055 | (4,800,000) | (4,629,187) |
| | | |
| TOTAL U.S. GOVERNMENT AGENCY - MORTGAGE SECURITIES | | (31,139,043) |
| | | |
TOTAL TBA SALE COMMITMENTS (Proceeds $31,699,150) | | (31,139,043) |
| Futures Contracts |
| | Number of contracts | Expiration Date | Notional Amount ($) | Value ($) | Unrealized Appreciation/ (Depreciation) ($) |
| Purchased | | | | | |
| | | | | | |
| Interest Rate Contracts | | | | | |
| CBOT 10-Year U.S. Treasury Note Contracts (United States) | 1,542 | Mar 2025 | 167,692,500 | (1,471,848) | (1,471,848) |
| CBOT 2-Year U.S. Treasury Note Contracts (United States) | 83 | Mar 2025 | 17,065,578 | 7,638 | 7,638 |
| CBOT 5-Year U.S. Treasury Note Contracts (United States) | 66 | Mar 2025 | 7,016,109 | (32,066) | (32,066) |
| CBOT Long Term U.S. Treasury Bond Contracts (United States) | 101 | Mar 2025 | 11,498,219 | (327,643) | (327,643) |
| Eurex Euro-Bund Contracts (Germany) | 12 | Mar 2025 | 1,658,686 | (41,827) | (41,827) |
| | | | | | |
| TOTAL FUTURES CONTRACTS | | | | | (1,865,746) |
| The notional amount of futures purchased as a percentage of Net Assets is 13.6% |
| Forward Foreign Currency Contracts |
Currency Purchased
| Currency Sold | Counterparty | Settlement Date | Unrealized Appreciation/ (Depreciation) ($) |
| | | | | | | |
| GBP | 4,793,000 | USD | 5,998,116 | BNP Paribas SA | 1/14/25 | 1,662 |
| USD | 9,961,841 | GBP | 7,809,000 | Barclays Bank PLC | 1/14/25 | 186,696 |
| EUR | 1,051,000 | USD | 1,114,410 | Canadian Imperial Bank of Commerce | 1/14/25 | (25,241) |
| USD | 3,414,573 | EUR | 3,279,000 | BNP Paribas SA | 1/14/25 | 16,490 |
| USD | 97,855,528 | EUR | 92,371,000 | Bank of America NA | 1/14/25 | 2,129,929 |
| USD | 6,383,586 | JPY | 956,814,000 | Bank of America NA | 1/14/25 | 294,377 |
| GBP | 3,017,000 | USD | 3,789,464 | BNP Paribas SA | 1/14/25 | (12,846) |
| EUR | 357,000 | USD | 375,809 | JPMorgan Chase Bank NA | 1/14/25 | (5,844) |
| USD | 366,907 | EUR | 350,000 | Royal Bank of Canada | 1/14/25 | 4,196 |
| USD | 405,448 | EUR | 383,000 | Bank of America NA | 1/14/25 | 8,538 |
| CAD | 1,000 | USD | 713 | Canadian Imperial Bank of Commerce | 1/14/25 | (17) |
| EUR | 677,000 | USD | 706,774 | Bank of America NA | 1/14/25 | (5,188) |
| AUD | 5,932,000 | USD | 3,783,043 | Canadian Imperial Bank of Commerce | 1/14/25 | (111,399) |
| USD | 7,850,374 | EUR | 7,461,000 | HSBC Bank PLC | 1/14/25 | 118,416 |
| USD | 463,447 | EUR | 441,000 | HSBC Bank PLC | 1/14/25 | 6,431 |
| USD | 7,860,524 | EUR | 7,574,000 | Citibank NA | 1/14/25 | 11,463 |
| EUR | 567,000 | USD | 589,203 | HSBC Bank PLC | 1/14/25 | (1,611) |
| USD | 3,797,262 | AUD | 5,907,000 | Bank of America NA | 1/14/25 | 141,092 |
| USD | 6,156,359 | EUR | 5,849,000 | Brown Brothers Harriman & Co | 1/14/25 | 94,943 |
| | | | | | | |
| TOTAL FORWARD FOREIGN CURRENCY CONTRACTS | | 2,852,087 |
| Unrealized Appreciation | | | 3,014,233 |
| Unrealized Depreciation | | | (162,146) |
| Interest Rate Swaps |
| Payment Received | Payment Frequency | Payment Paid | Payment Frequency | Clearinghouse / Counterparty(1) | Maturity Date | Notional Amount(3) | Value ($) | Upfront Premium Received/ (Paid) ($)(2) | Unrealized Appreciation/ (Depreciation) ($) |
UNITED STATES SOFR SECURED OVERNIGHT FINL RATE INDX(4) | Annual | 3% | Annual | LCH | Mar 2027 | | 48,000 | 180 | 0 | 180 |
UNITED STATES SOFR SECURED OVERNIGHT FINL RATE INDX(4) | Annual | 3% | Annual | LCH | Mar 2028 | | 38,807,000 | 263,502 | 0 | 263,502 |
UNITED STATES SOFR SECURED OVERNIGHT FINL RATE INDX(4) | Annual | 3% | Annual | LCH | Mar 2030 | | 33,000 | 460 | 0 | 460 |
UNITED STATES SOFR SECURED OVERNIGHT FINL RATE INDX(4) | Annual | 3.25% | Annual | LCH | Mar 2032 | | 4,590,000 | 91,929 | 0 | 91,929 |
| 3.25% | Annual | UNITED STATES SOFR SECURED OVERNIGHT FINL RATE INDX(4) | Annual | LCH | Mar 2035 | | 2,867,000 | (54,331) | 0 | (54,331) |
UNITED STATES SOFR SECURED OVERNIGHT FINL RATE INDX(4) | Annual | 3.25% | Annual | LCH | Mar 2045 | | 1,144,000 | 46,871 | 0 | 46,871 |
| TOTAL INTEREST RATE SWAPS | | | | | | | | 348,611 | 0 | 348,611 |
| | | | | | | | | | | |
(1)Swaps with LCH Clearnet Group (LCH) are centrally cleared swaps.
(2)Any premiums for centrally cleared swaps are recorded periodically throughout the term of the swap to variation margin and included in unrealized appreciation (depreciation).
(3)Notional amount is stated in U.S. Dollars unless otherwise noted.
(4)Represents floating rate.
Currency Abbreviations
| AUD | - | Australian Dollar |
| BRL | - | Brazilian Real |
| CAD | - | Canadian Dollar |
| EGP | - | Egyptian Pound |
| EUR | - | European Monetary Unit (Euro) |
| GBP | - | United Kingdom Pound |
| JPY | - | Japanese Yen |
| NGN | - | Nigerian Naira |
| TRY | - | New Turkish Lira |
| USD | - | United States Dollar |
Legend
| (a) | Amount is stated in United States dollars unless otherwise noted. |
| (b) | Security exempt from registration under Rule 144A of the Securities Act of 1933. These securities may be resold in transactions exempt from registration, normally to qualified institutional buyers. At the end of the period, the value of these securities amounted to $418,794,482 or 27.8% of net assets. |
| (c) | Coupon rates for floating and adjustable rate securities reflect the rates in effect at period end. |
| (d) | Coupon is indexed to a floating interest rate which may be multiplied by a specified factor and/or subject to caps or floors. |
| (e) | Remaining maturities of bank loan obligations may be less than the stated maturities shown as a result of contractual or optional prepayments by the borrower. Such prepayments cannot be predicted with certainty. |
| (f) | A coupon rate of 0% signifies an unsettled loan. The coupon rate will be determined upon settlement of the loan after period end. |
| (h) | Non-income producing - Security is in default. |
| (i) | Position or a portion of the position represents an unfunded loan commitment. At period end, the total principal amount and market value of unfunded commitments totaled $839,109 and $812,647, respectively. |
| (k) | Restricted securities (including private placements) - Investment in securities not registered under the Securities Act of 1933 (excluding 144A issues). At the end of the period, the value of restricted securities (excluding 144A issues) amounted to $677,270 or 0.0% of net assets. |
| (l) | Security or a portion of the security is on loan at period end. |
| (m) | Affiliated fund that is generally available only to investment companies and other accounts managed by Fidelity Investments. A complete unaudited schedule of portfolio holdings for each Fidelity Central Fund is filed with the SEC for the first and third quarters of each fiscal year on Form N-PORT and is available upon request or at the SEC's website at www.sec.gov. An unaudited holdings listing for the Fund, which presents direct holdings as well as the pro-rata share of securities and other investments held indirectly through its investment in underlying non-money market Fidelity Central Funds, is available at fidelity.com and/or institutional.fidelity.com, as applicable. In addition, each Fidelity Central Fund's financial statements,which are not covered by the Fund's Report of Independent Registered Public Accounting Firm, are available on the SEC's website or upon request. |
| (n) | Security initially issued at one coupon which converts to a higher coupon at a specified date. The rate shown is the rate at period end. |
| (o) | Security initially issued in zero coupon form which converts to coupon form at a specified rate and date. The rate shown is the rate at period end. |
| (p) | Security is exempt from registration under Regulation S of the Securities Act of 1933 and may be resold to qualified foreign investors outside of the United States. At the end of the period, the value of securities amounted to $123,571,445 or 8.2% of net assets. |
| (q) | Security is perpetual in nature with no stated maturity date. |
| (r) | Security or a portion of the security was pledged to cover margin requirements for centrally cleared swaps. At period end, the value of securities pledged amounted to $1,093,557. |
| (s) | Security or a portion of the security was pledged to cover margin requirements for futures contracts. At period end, the value of securities pledged amounted to $3,746,383. |
| (t) | Security or a portion of the security purchased on a delayed delivery or when-issued basis. |
| (u) | Yield represents either the annualized yield at the date of purchase, or the stated coupon rate, or, for floating and adjustable rate securities, the rate at period end. |
| (v) | Affiliated fund that is generally available only to investment companies and other accounts managed by Fidelity Investments. The rate quoted is the annualized seven-day yield of the fund at period end. A complete unaudited listing of the fund's holdings as of its most recent quarter end is available upon request. In addition, each Fidelity Central Fund's financial statements, which are not covered by the Fund's Report of Independent Registered Public Accounting Firm, are available on the SEC's website or upon request. |
| (w) | Investment made with cash collateral received from securities on loan. |
| Additional information on each restricted holding is as follows: |
| Security | Acquisition Date | Acquisition Cost ($) |
| EchoStar Corp | 9/30/24 | 620,441 |
| | | |
| New Cotai LLC / New Cotai Capital Corp | 9/11/20 | 1,223,948 |
| | | |
| Tricer Holdco S.C.A. | 10/16/09 - 12/30/17 | 286,754 |
| | | |
| Tricer Holdco S.C.A. Class A1 | 10/16/09 - 10/29/09 | 45,666 |
| | | |
| Tricer Holdco S.C.A. Class A2 | 10/16/09 - 10/29/09 | 45,666 |
| | | |
| Tricer Holdco S.C.A. Class A3 | 10/16/09 - 10/29/09 | 45,666 |
| | | |
| Tricer Holdco S.C.A. Class A4 | 10/16/09 - 10/29/09 | 45,666 |
| | | |
| Tricer Holdco S.C.A. Class A5 | 10/16/09 - 10/29/09 | 45,666 |
| | | |
| Tricer Holdco S.C.A. Class A6 | 10/16/09 - 10/29/09 | 45,666 |
| | | |
| Tricer Holdco S.C.A. Class A7 | 10/16/09 - 10/29/09 | 45,666 |
| | | |
| Tricer Holdco S.C.A. Class A8 | 10/16/09 - 10/29/09 | 45,666 |
| | | |
| Tricer Holdco S.C.A. Class A9 | 10/16/09 - 10/29/09 | 45,707 |
| | | |
Affiliated Central Funds
Fiscal year to date information regarding the Fund's investments in Fidelity Central Funds, including the ownership percentage, is presented below.
| Affiliate | Value, beginning of period ($) | Purchases ($) | Sales Proceeds ($) | Dividend Income ($) | Realized Gain (loss) ($) | Change in Unrealized appreciation (depreciation) ($) | Value, end of period ($) | Shares, end of period | % ownership, end of period |
| Fidelity Cash Central Fund | 45,433,517 | 384,677,288 | 332,568,232 | 3,544,646 | 2,323 | (2,160) | 97,542,736 | 97,523,232 | 0.2% |
| Fidelity Floating Rate Central Fund | 74,970,126 | 10,599,300 | 9,114,273 | 7,250,446 | (238,808) | (10,606) | 76,205,739 | 775,710 | 4.8% |
| Fidelity Securities Lending Cash Central Fund | - | 53,456,813 | 52,495,838 | 1,710 | - | - | 960,975 | 960,879 | 0.0% |
| Total | 120,403,643 | 448,733,401 | 394,178,343 | 10,796,802 | (236,485) | (12,766) | 174,709,450 | 99,259,821 | |
| | | | | | | | | | |
Amounts in the dividend income column in the above table include any capital gain distributions from underlying funds, which are presented in the corresponding line item in the Statement of Operations, if applicable.
Amounts in the dividend income column for Fidelity Securities Lending Cash Central Fund represents the income earned on investing cash collateral, less rebates paid to borrowers and any lending agent fees associated with the loan, plus any premium payments received for lending certain types of securities.
Amounts included in the purchases and sales proceeds columns may include in-kind transactions, if applicable.
Investment Valuation
The following is a summary of the inputs used, as of December 31, 2024, involving the Fund's assets and liabilities carried at fair value. The inputs or methodology used for valuing securities may not be an indication of the risk associated with investing in those securities. For more information on valuation inputs, and their aggregation into the levels used below, please refer to the Investment Valuation section in the accompanying Notes to Financial Statements.
| Valuation Inputs at Reporting Date: |
| Description | Total ($) | Level 1 ($) | Level 2 ($) | Level 3 ($) |
Investments in Securities: | | | | |
|
| Asset-Backed Securities | 1,559,749 | - | 1,559,749 | - |
|
| Bank Loan Obligations | | | | |
Communication Services | 1,403,405 | - | 1,392,407 | 10,998 |
Consumer Discretionary | 11,760,530 | - | 11,760,530 | - |
Consumer Staples | 166,772 | - | 166,772 | - |
Energy | 2,117,047 | - | 2,117,047 | - |
Financials | 5,648,953 | - | 5,648,953 | - |
Health Care | 5,528,310 | - | 5,528,310 | - |
Industrials | 6,294,797 | - | 6,110,466 | 184,331 |
Information Technology | 16,120,187 | - | 16,120,187 | - |
Materials | 6,576,182 | - | 6,576,182 | - |
Utilities | 24,038 | - | 24,038 | - |
|
| Collateralized Mortgage Obligations | 8,360,937 | - | 8,360,937 | - |
|
| Commercial Mortgage Securities | 60,934,156 | - | 60,934,156 | - |
|
| Common Stocks | | | | |
Communication Services | 8,755,983 | 8,755,983 | - | - |
Consumer Discretionary | 12,710,595 | 10,311,674 | 2,387,108 | 11,813 |
Consumer Staples | 1,570,264 | 1,560,256 | - | 10,008 |
Energy | 5,573,040 | 3,842,530 | - | 1,730,510 |
Financials | 17,099,601 | 17,099,443 | - | 158 |
Health Care | 887,679 | 885,791 | - | 1,888 |
Industrials | 17,937,884 | 17,937,884 | - | - |
Information Technology | 28,114,615 | 27,879,293 | - | 235,322 |
Materials | 3,277,054 | 3,277,054 | - | - |
Utilities | 8,181,862 | 8,181,659 | - | 203 |
|
| Convertible Corporate Bonds | | | | |
Communication Services | 1,864,265 | - | 1,864,265 | - |
Consumer Discretionary | 1,716,066 | - | 1,716,066 | - |
Financials | 415,376 | - | 415,376 | - |
Information Technology | 2,260,552 | - | 2,260,552 | - |
|
| Fixed-Income Funds | 76,205,739 | 76,205,739 | - | - |
|
| Foreign Government and Government Agency Obligations | 191,508,703 | - | 191,508,703 | - |
|
| Non-Convertible Corporate Bonds | | | | |
Communication Services | 43,316,966 | - | 43,316,966 | - |
Consumer Discretionary | 47,467,756 | - | 47,137,856 | 329,900 |
Consumer Staples | 22,944,946 | - | 22,944,946 | - |
Energy | 93,317,017 | - | 93,317,017 | - |
Financials | 54,217,541 | - | 54,217,541 | - |
Health Care | 26,132,508 | - | 26,132,508 | - |
Industrials | 69,744,453 | - | 69,744,453 | - |
Information Technology | 21,513,094 | - | 20,459,156 | 1,053,938 |
Materials | 48,857,878 | - | 48,734,084 | 123,794 |
Real Estate | 17,346,927 | - | 17,346,927 | - |
Utilities | 29,596,850 | - | 29,596,850 | - |
|
| Non-Convertible Preferred Stocks | | | | |
Industrials | 80 | - | - | 80 |
|
| Preferred Securities | | | | |
Communication Services | 780,493 | - | 780,493 | - |
Consumer Staples | 715,288 | - | 715,288 | - |
Energy | 4,973,686 | - | 4,973,686 | - |
Financials | 23,274,918 | - | 21,137,930 | 2,136,988 |
Industrials | 615,000 | - | 615,000 | - |
Information Technology | 882,952 | - | 882,952 | - |
Materials | 1,516,295 | - | 1,516,295 | - |
Utilities | 670,492 | - | 670,492 | - |
|
| U.S. Government Agency - Mortgage Securities | 35,365,478 | - | 35,365,478 | - |
|
| U.S. Government Agency Obligations | | | | |
Utilities | 432,935 | - | 432,935 | - |
|
| U.S. Treasury Obligations | 370,857,125 | - | 370,857,125 | - |
|
| Money Market Funds | 98,503,711 | 98,503,711 | - | - |
|
| Purchased Swaptions | 812,270 | - | 812,270 | - |
| Total Investments in Securities: | 1,518,431,000 | 274,441,017 | 1,238,160,052 | 5,829,931 |
Derivative Instruments: Assets | | | | |
Futures Contracts | 7,638 | 7,638 | - | - |
Forward Foreign Currency Contracts | 3,014,233 | - | 3,014,233 | - |
Swaps | 402,942 | - | 402,942 | - |
| Total Assets | 3,424,813 | 7,638 | 3,417,175 | - |
| Liabilities | | | | |
Futures Contracts | (1,873,384) | (1,873,384) | - | - |
Forward Foreign Currency Contracts | (162,146) | - | (162,146) | - |
Swaps | (54,331) | - | (54,331) | - |
| Total Liabilities | (2,089,861) | (1,873,384) | (216,477) | - |
| Total Derivative Instruments: | 1,334,952 | (1,865,746) | 3,200,698 | - |
Other Financial Instruments: | | | | |
| TBA Sale Commitments | (31,139,043) | - | (31,139,043) | - |
| Total Other Financial Instruments: | (31,139,043) | - | (31,139,043) | - |
Value of Derivative Instruments
The following table is a summary of the Fund's value of derivative instruments by primary risk exposure as of December 31, 2024. For additional information on derivative instruments, please refer to the Derivative Instruments section in the accompanying Notes to Financial Statements.
Primary Risk Exposure / Derivative Type | Value |
| Asset ($) | Liability ($) |
| Foreign Exchange Risk | | |
Forward Foreign Currency Contracts (a) | 3,014,233 | (162,146) |
| Total Foreign Exchange Risk | 3,014,233 | (162,146) |
| Interest Rate Risk | | |
Futures Contracts (d) | 7,638 | (1,873,384) |
Purchased Swaptions (b) | 812,270 | 0 |
Swaps (c) | 402,942 | (54,331) |
| Total Interest Rate Risk | 1,222,850 | (1,927,715) |
| Total Value of Derivatives | 4,237,083 | (2,089,861) |
(a)Gross value is presented in the Statement of Assets and Liabilities in the unrealized appreciation/depreciation on forward foreign currency contracts line-items.
(b)Gross value is included in the Statement of Assets and Liabilities in the investments in securities, at value line-item.
(c)For centrally cleared swaps, reflects gross cumulative appreciation (depreciation) as presented in the Schedule of Investments. In the Statement of Assets and Liabilities, the period end daily variation margin for centrally cleared swaps is included in receivable or payable for daily variation margin on centrally cleared swaps, and the net cumulative appreciation (depreciation) for centrally cleared swaps is included in Total accumulated earnings (loss).
(d)Reflects gross cumulative appreciation (depreciation) on futures contracts as presented in the Schedule of Investments. In the Statement of Assets and Liabilities, the period end daily variation margin is included in receivable or payable for daily variation margin on futures contracts, and the net cumulative appreciation (depreciation) is included in Total accumulated earnings (loss).
Financial Statements
| Statement of Assets and Liabilities |
As of December 31, 2024 |
| Assets | | | | |
| Investment in securities, at value (including securities loaned of $933,863) - See accompanying schedule: | | | | |
Unaffiliated issuers (cost $1,373,181,994) | $ | 1,343,721,550 | | |
Fidelity Central Funds (cost $175,185,699) | | 174,709,450 | | |
| | | | | |
| | | | | |
| Total Investment in Securities (cost $1,548,367,693) | | | $ | 1,518,431,000 |
| Segregated cash with brokers for derivative instruments | | | | 250,545 |
| Cash | | | | 167,110 |
| Foreign currency held at value (cost $21,036) | | | | 20,317 |
| Receivable for investments sold | | | | |
Regular delivery | | | | 115,798 |
Delayed delivery | | | | 3,273,834 |
| Receivable for TBA sale commitments | | | | 31,699,150 |
| Unrealized appreciation on forward foreign currency contracts | | | | 3,014,233 |
| Receivable for fund shares sold | | | | 731,841 |
| Dividends receivable | | | | 63,585 |
| Interest receivable | | | | 15,089,970 |
| Distributions receivable from Fidelity Central Funds | | | | 357,236 |
| Receivable for daily variation margin on centrally cleared swaps | | | | 14,741 |
| Prepaid expenses | | | | 1,250 |
Total assets | | | | 1,573,230,610 |
| Liabilities | | | | |
| Payable for investments purchased | | | | |
Regular delivery | $ | 2,695,381 | | |
Delayed delivery | | 27,151,200 | | |
| TBA sale commitments, at value | | 31,139,043 | | |
| Unrealized depreciation on forward foreign currency contracts | | 162,146 | | |
| Payable for fund shares redeemed | | 891,596 | | |
| Accrued management fee | | 812,782 | | |
| Distribution and service plan fees payable | | 133,788 | | |
| Payable for daily variation margin on futures contracts | | 370,047 | | |
| Other payables and accrued expenses | | 119,765 | | |
| Collateral on securities loaned | | 960,975 | | |
| Total liabilities | | | | 64,436,723 |
| Net Assets | | | $ | 1,508,793,887 |
| Net Assets consist of: | | | | |
| Paid in capital | | | $ | 1,584,997,089 |
| Total accumulated earnings (loss) | | | | (76,203,202) |
| Net Assets | | | $ | 1,508,793,887 |
| | | | | |
| Net Asset Value and Maximum Offering Price | | | | |
| Initial Class : | | | | |
Net Asset Value, offering price and redemption price per share ($83,380,999 ÷ 7,780,079 shares) | | | $ | 10.72 |
| Service Class : | | | | |
Net Asset Value, offering price and redemption price per share ($896,103 ÷ 83,814 shares) | | | $ | 10.69 |
| Service Class 2 : | | | | |
Net Asset Value, offering price and redemption price per share ($639,058,040 ÷ 60,471,998 shares) | | | $ | 10.57 |
| Investor Class : | | | | |
Net Asset Value, offering price and redemption price per share ($785,458,745 ÷ 73,613,481 shares) | | | $ | 10.67 |
| Statement of Operations |
| Year ended December 31, 2024 |
| Investment Income | | | | |
| Dividends | | | $ | 4,208,383 |
| Interest | | | | 61,773,313 |
| Income from Fidelity Central Funds (including $1,710 from security lending) | | | | 10,796,802 |
| Total income | | | | 76,778,498 |
| Expenses | | | | |
| Management fee | $ | 9,165,941 | | |
| Transfer agent fees | | 201,758 | | |
| Distribution and service plan fees | | 1,496,622 | | |
| Accounting fees | | 79,461 | | |
| Custodian fees and expenses | | 42,272 | | |
| Independent trustees' fees and expenses | | 3,757 | | |
| Registration fees | | 63 | | |
| Audit fees | | 119,662 | | |
| Legal | | 29,954 | | |
| Miscellaneous | | 43,734 | | |
| Total expenses before reductions | | 11,183,224 | | |
| Expense reductions | | (79,526) | | |
| Total expenses after reductions | | | | 11,103,698 |
| Net Investment income (loss) | | | | 65,674,800 |
| Realized and Unrealized Gain (Loss) | | | | |
| Net realized gain (loss) on: | | | | |
| Investment Securities: | | | | |
| Unaffiliated issuers | | (1,793,937) | | |
| Fidelity Central Funds | | (236,485) | | |
| Forward foreign currency contracts | | 5,015,109 | | |
| Foreign currency transactions | | (115,905) | | |
| Futures contracts | | (1,265,921) | | |
| Swaps | | 693,483 | | |
| Total net realized gain (loss) | | | | 2,296,344 |
| Change in net unrealized appreciation (depreciation) on: | | | | |
| Investment Securities: | | | | |
| Unaffiliated issuers | | 14,854,724 | | |
| Fidelity Central Funds | | (12,766) | | |
| Forward foreign currency contracts | | 4,179,116 | | |
| Assets and liabilities in foreign currencies | | (101,902) | | |
| Futures contracts | | (5,798,094) | | |
| Swaps | | 1,011,032 | | |
| TBA Sale commitments | | 959,875 | | |
| Total change in net unrealized appreciation (depreciation) | | | | 15,091,985 |
| Net gain (loss) | | | | 17,388,329 |
| Net increase (decrease) in net assets resulting from operations | | | $ | 83,063,129 |
| Statement of Changes in Net Assets |
| |
| | Year ended December 31, 2024 | | Year ended December 31, 2023 |
| Increase (Decrease) in Net Assets | | | | |
| Operations | | | | |
| Net investment income (loss) | $ | 65,674,800 | $ | 61,894,301 |
| Net realized gain (loss) | | 2,296,344 | | (41,475,449) |
| Change in net unrealized appreciation (depreciation) | | 15,091,985 | | 102,411,161 |
| Net increase (decrease) in net assets resulting from operations | | 83,063,129 | | 122,830,013 |
| Distributions to shareholders | | (53,920,932) | | (60,369,827) |
| | | | | |
| Share transactions - net increase (decrease) | | 62,177,599 | | (22,362,620) |
| Total increase (decrease) in net assets | | 91,319,796 | | 40,097,566 |
| | | | | |
| Net Assets | | | | |
| Beginning of period | | 1,417,474,091 | | 1,377,376,525 |
| End of period | $ | 1,508,793,887 | $ | 1,417,474,091 |
| | | | | |
| | | | | |
Financial Highlights
VIP Strategic Income Portfolio Initial Class |
| |
| Years ended December 31, | | 2024 | | 2023 | | 2022 | | 2021 | | 2020 |
Selected Per-Share Data | | | | | | | | | | |
| Net asset value, beginning of period | $ | 10.48 | $ | 10.02 | $ | 11.74 | $ | 11.81 | $ | 11.45 |
| Income from Investment Operations | | | | | | | | | | |
Net investment income (loss) A,B | | .498 | | .475 | | .377 | | .327 | | .380 |
| Net realized and unrealized gain (loss) | | .146 | | .460 | | (1.690) | | .113 | | .477 |
| Total from investment operations | | .644 | | .935 | | (1.313) | | .440 | | .857 |
| Distributions from net investment income | | (.404) | | (.475) | | (.380) | | (.320) | | (.385) |
| Distributions from net realized gain | | - | | - | | (.011) | | (.190) | | (.112) |
| Distributions from tax return of capital | | - | | - | | (.016) | | - | | - |
| Total distributions | | (.404) | | (.475) | | (.407) | | (.510) | | (.497) |
| Net asset value, end of period | $ | 10.72 | $ | 10.48 | $ | 10.02 | $ | 11.74 | $ | 11.81 |
Total Return C,D | | | | 9.41% | | (11.26)% | | 3.74% | | 7.52% |
Ratios to Average Net Assets B,E,F | | | | | | | | | | |
| Expenses before reductions | | .64% | | .67% | | .67% | | .66% | | .67% |
| Expenses net of fee waivers, if any | | | | .67% | | .66% | | .66% | | .67% |
| Expenses net of all reductions | | .64% | | .66% | | .66% | | .66% | | .66% |
| Net investment income (loss) | | 4.61% | | 4.59% | | 3.52% | | 2.72% | | 3.32% |
| Supplemental Data | | | | | | | | | | |
| Net assets, end of period (000 omitted) | $ | 83,381 | $ | 76,209 | $ | 71,244 | $ | 84,605 | $ | 79,320 |
Portfolio turnover rate G | | | | 78% | | 75% | | 103% | | 116% |
ACalculated based on average shares outstanding during the period.
BNet investment income (loss) is affected by the timing of the declaration of dividends by any underlying mutual funds or exchange-traded funds (ETFs). Net investment income (loss) of any mutual funds or ETFs is not included in the Fund's net investment income (loss) ratio.
CTotal returns do not reflect charges attributable to your insurance company's separate account. Inclusion of these charges would reduce the total returns shown.
DTotal returns would have been lower if certain expenses had not been reduced during the applicable periods shown.
EFees and expenses of any underlying mutual funds or exchange-traded funds (ETFs) are not included in the Fund's expense ratio. The Fund indirectly bears its proportionate share of these expenses. For additional expense information related to investments in Fidelity Central Funds, please refer to the "Investments in Fidelity Central Funds" note found in the Notes to Financial Statements section of the most recent Annual or Semi-Annual report.
FExpense ratios reflect operating expenses of the class. Expenses before reductions do not reflect amounts reimbursed, waived, or reduced through arrangements with the investment adviser, brokerage services, or other offset arrangements, if applicable, and do not represent the amount paid by the class during periods when reimbursements, waivers or reductions occur.
GAmount does not include the portfolio activity of any underlying mutual funds or exchange-traded funds (ETFs), derivatives or securities that mature within one year from acquisition.
VIP Strategic Income Portfolio Service Class |
| |
| Years ended December 31, | | 2024 | | 2023 | | 2022 | | 2021 | | 2020 |
Selected Per-Share Data | | | | | | | | | | |
| Net asset value, beginning of period | $ | 10.47 | $ | 10.00 | $ | 11.73 | $ | 11.81 | $ | 11.42 |
| Income from Investment Operations | | | | | | | | | | |
Net investment income (loss) A,B | | .486 | | .464 | | .356 | | .315 | | .371 |
| Net realized and unrealized gain (loss) | | .135 | | .470 | | (1.682) | | .105 | | .489 |
| Total from investment operations | | .621 | | .934 | | (1.326) | | .420 | | .860 |
| Distributions from net investment income | | (.401) | | (.464) | | (.377) | | (.310) | | (.358) |
| Distributions from net realized gain | | - | | - | | (.011) | | (.190) | | (.112) |
| Distributions from tax return of capital | | - | | - | | (.016) | | - | | - |
| Total distributions | | (.401) | | (.464) | | (.404) | | (.500) | | (.470) |
| Net asset value, end of period | $ | 10.69 | $ | 10.47 | $ | 10.00 | $ | 11.73 | $ | 11.81 |
Total Return C,D | | | | 9.42% | | (11.38)% | | 3.57% | | 7.56% |
Ratios to Average Net Assets B,E,F | | | | | | | | | | |
| Expenses before reductions | | .75% | | .77% | | .77% | | .76% | | .77% |
| Expenses net of fee waivers, if any | | | | .77% | | .76% | | .76% | | .77% |
| Expenses net of all reductions | | .75% | | .76% | | .76% | | .76% | | .77% |
| Net investment income (loss) | | 4.50% | | 4.49% | | 3.42% | | 2.62% | | 3.21% |
| Supplemental Data | | | | | | | | | | |
| Net assets, end of period (000 omitted) | $ | 896 | $ | 1,356 | $ | 1,446 | $ | 502 | $ | 426 |
Portfolio turnover rate G | | | | 78% | | 75% | | 103% | | 116% |
ACalculated based on average shares outstanding during the period.
BNet investment income (loss) is affected by the timing of the declaration of dividends by any underlying mutual funds or exchange-traded funds (ETFs). Net investment income (loss) of any mutual funds or ETFs is not included in the Fund's net investment income (loss) ratio.
CTotal returns do not reflect charges attributable to your insurance company's separate account. Inclusion of these charges would reduce the total returns shown.
DTotal returns would have been lower if certain expenses had not been reduced during the applicable periods shown.
EFees and expenses of any underlying mutual funds or exchange-traded funds (ETFs) are not included in the Fund's expense ratio. The Fund indirectly bears its proportionate share of these expenses. For additional expense information related to investments in Fidelity Central Funds, please refer to the "Investments in Fidelity Central Funds" note found in the Notes to Financial Statements section of the most recent Annual or Semi-Annual report.
FExpense ratios reflect operating expenses of the class. Expenses before reductions do not reflect amounts reimbursed, waived, or reduced through arrangements with the investment adviser, brokerage services, or other offset arrangements, if applicable, and do not represent the amount paid by the class during periods when reimbursements, waivers or reductions occur.
GAmount does not include the portfolio activity of any underlying mutual funds or exchange-traded funds (ETFs), derivatives or securities that mature within one year from acquisition.
VIP Strategic Income Portfolio Service Class 2 |
| |
| Years ended December 31, | | 2024 | | 2023 | | 2022 | | 2021 | | 2020 |
Selected Per-Share Data | | | | | | | | | | |
| Net asset value, beginning of period | $ | 10.35 | $ | 9.90 | $ | 11.61 | $ | 11.69 | $ | 11.34 |
| Income from Investment Operations | | | | | | | | | | |
Net investment income (loss) A,B | | .464 | | .443 | | .346 | | .293 | | .348 |
| Net realized and unrealized gain (loss) | | .141 | | .458 | | (1.675) | | .108 | | .471 |
| Total from investment operations | | .605 | | .901 | | (1.329) | | .401 | | .819 |
| Distributions from net investment income | | (.385) | | (.451) | | (.355) | | (.292) | | (.357) |
| Distributions from net realized gain | | - | | - | | (.011) | | (.189) | | (.112) |
| Distributions from tax return of capital | | - | | - | | (.015) | | - | | - |
| Total distributions | | (.385) | | (.451) | | (.381) | | (.481) | | (.469) |
| Net asset value, end of period | $ | 10.57 | $ | 10.35 | $ | 9.90 | $ | 11.61 | $ | 11.69 |
Total Return C,D | | | | 9.18% | | (11.52)% | | 3.44% | | 7.25% |
Ratios to Average Net Assets B,E,F | | | | | | | | | | |
| Expenses before reductions | | .90% | | .92% | | .92% | | .91% | | .92% |
| Expenses net of fee waivers, if any | | | | .92% | | .91% | | .91% | | .92% |
| Expenses net of all reductions | | .89% | | .91% | | .91% | | .91% | | .91% |
| Net investment income (loss) | | 4.36% | | 4.34% | | 3.27% | | 2.47% | | 3.07% |
| Supplemental Data | | | | | | | | | | |
| Net assets, end of period (000 omitted) | $ | 639,058 | $ | 562,099 | $ | 507,410 | $ | 619,208 | $ | 534,029 |
Portfolio turnover rate G | | | | 78% | | 75% | | 103% | | 116% |
ACalculated based on average shares outstanding during the period.
BNet investment income (loss) is affected by the timing of the declaration of dividends by any underlying mutual funds or exchange-traded funds (ETFs). Net investment income (loss) of any mutual funds or ETFs is not included in the Fund's net investment income (loss) ratio.
CTotal returns do not reflect charges attributable to your insurance company's separate account. Inclusion of these charges would reduce the total returns shown.
DTotal returns would have been lower if certain expenses had not been reduced during the applicable periods shown.
EFees and expenses of any underlying mutual funds or exchange-traded funds (ETFs) are not included in the Fund's expense ratio. The Fund indirectly bears its proportionate share of these expenses. For additional expense information related to investments in Fidelity Central Funds, please refer to the "Investments in Fidelity Central Funds" note found in the Notes to Financial Statements section of the most recent Annual or Semi-Annual report.
FExpense ratios reflect operating expenses of the class. Expenses before reductions do not reflect amounts reimbursed, waived, or reduced through arrangements with the investment adviser, brokerage services, or other offset arrangements, if applicable, and do not represent the amount paid by the class during periods when reimbursements, waivers or reductions occur.
GAmount does not include the portfolio activity of any underlying mutual funds or exchange-traded funds (ETFs), derivatives or securities that mature within one year from acquisition.
VIP Strategic Income Portfolio Investor Class |
| |
| Years ended December 31, | | 2024 | | 2023 | | 2022 | | 2021 | | 2020 |
Selected Per-Share Data | | | | | | | | | | |
| Net asset value, beginning of period | $ | 10.44 | $ | 9.98 | $ | 11.70 | $ | 11.77 | $ | 11.41 |
| Income from Investment Operations | | | | | | | | | | |
Net investment income (loss) A,B | | .492 | | .470 | | .372 | | .322 | | .375 |
| Net realized and unrealized gain (loss) | | .138 | | .462 | | (1.689) | | .114 | | .478 |
| Total from investment operations | | .630 | | .932 | | (1.317) | | .436 | | .853 |
| Distributions from net investment income | | (.400) | | (.472) | | (.376) | | (.316) | | (.381) |
| Distributions from net realized gain | | - | | - | | (.011) | | (.190) | | (.112) |
| Distributions from tax return of capital | | - | | - | | (.016) | | - | | - |
| Total distributions | | (.400) | | (.472) | | (.403) | | (.506) | | (.493) |
| Net asset value, end of period | $ | 10.67 | $ | 10.44 | $ | 9.98 | $ | 11.70 | $ | 11.77 |
Total Return C,D | | | | 9.42% | | (11.33)% | | 3.72% | | 7.51% |
Ratios to Average Net Assets B,E,F | | | | | | | | | | |
| Expenses before reductions | | .68% | | .70% | | .70% | | .69% | | .70% |
| Expenses net of fee waivers, if any | | | | .70% | | .70% | | .69% | | .70% |
| Expenses net of all reductions | | .67% | | .70% | | .70% | | .69% | | .70% |
| Net investment income (loss) | | 4.58% | | 4.56% | | 3.49% | | 2.69% | | 3.28% |
| Supplemental Data | | | | | | | | | | |
| Net assets, end of period (000 omitted) | $ | 785,459 | $ | 777,810 | $ | 797,276 | $ | 986,699 | $ | 944,625 |
Portfolio turnover rate G | | | | 78% | | 75% | | 103% | | 116% |
ACalculated based on average shares outstanding during the period.
BNet investment income (loss) is affected by the timing of the declaration of dividends by any underlying mutual funds or exchange-traded funds (ETFs). Net investment income (loss) of any mutual funds or ETFs is not included in the Fund's net investment income (loss) ratio.
CTotal returns would have been lower if certain expenses had not been reduced during the applicable periods shown.
DTotal returns do not reflect charges attributable to your insurance company's separate account. Inclusion of these charges would reduce the total returns shown.
EFees and expenses of any underlying mutual funds or exchange-traded funds (ETFs) are not included in the Fund's expense ratio. The Fund indirectly bears its proportionate share of these expenses. For additional expense information related to investments in Fidelity Central Funds, please refer to the "Investments in Fidelity Central Funds" note found in the Notes to Financial Statements section of the most recent Annual or Semi-Annual report.
FExpense ratios reflect operating expenses of the class. Expenses before reductions do not reflect amounts reimbursed, waived, or reduced through arrangements with the investment adviser, brokerage services, or other offset arrangements, if applicable, and do not represent the amount paid by the class during periods when reimbursements, waivers or reductions occur.
GAmount does not include the portfolio activity of any underlying mutual funds or exchange-traded funds (ETFs), derivatives or securities that mature within one year from acquisition.
Notes to Financial Statements
For the period ended December 31, 2024
1. Organization.
VIP Strategic Income Portfolio (the Fund) is a fund of Variable Insurance Products Fund V (the Trust) and is authorized to issue an unlimited number of shares. The Trust is registered under the Investment Company Act of 1940, as amended (the 1940 Act), as an open-end management investment company organized as a Massachusetts business trust. Shares of the Fund may only be purchased by insurance companies for the purpose of funding variable annuity or variable life insurance contracts. The Fund offers the following classes of shares: Initial Class shares, Service Class shares, Service Class 2 shares and Investor Class shares. All classes have equal rights and voting privileges, except for matters affecting a single class.
2. Investments in Fidelity Central Funds.
Funds may invest in Fidelity Central Funds, which are open-end investment companies generally available only to other investment companies and accounts managed by the investment adviser and its affiliates. The Schedule of Investments lists any Fidelity Central Funds held as an investment as of period end, but does not include the underlying holdings of each Fidelity Central Fund. An investing fund indirectly bears its proportionate share of the expenses of the underlying Fidelity Central Funds.
Based on its investment objective, each Fidelity Central Fund may invest or participate in various investment vehicles or strategies that are similar to those of the investing fund. These strategies are consistent with the investment objectives of the investing fund and may involve certain economic risks which may cause a decline in value of each of the Fidelity Central Funds and thus a decline in the value of the investing fund.
| Fidelity Central Fund+ | Investment Manager | Investment Objective | Investment Practices | Expense RatioA |
| Fidelity Floating Rate Central Fund | Fidelity Management & Research Company LLC (FMR) | Seeks a high level of income by normally investing in floating rate loans and other floating rate securities. | Loans & Direct Debt Instruments Restricted Securities | .005% |
| Fidelity Money Market Central Funds | Fidelity Management & Research Company LLC (FMR) | Each fund seeks to obtain a high level of current income consistent with the preservation of capital and liquidity. | Short-term Investments | Less than .005% |
A Expenses expressed as a percentage of average net assets and are as of each underlying Central Fund's most recent annual or semi-annual shareholder report.
An unaudited holdings listing for the investing fund, which presents direct holdings as well as the pro-rata share of any securities and other investments held indirectly through its investment in underlying non-money market Fidelity Central Funds, is available at fidelity.com and/or institutional.fidelity.com, as applicable. A complete unaudited list of holdings for each Fidelity Central Fund is available upon request or at the Securities and Exchange Commission website at www.sec.gov. In addition, the financial statements of the Fidelity Central Funds which contain the significant accounting policies (including investment valuation policies) of those funds, and are not covered by the Report of Independent Registered Public Accounting Firm, are available on the Securities and Exchange Commission website or upon request.
3. Significant Accounting Policies.
The Fund is an investment company and applies the accounting and reporting guidance of the Financial Accounting Standards Board (FASB) Accounting Standards Codification Topic 946 Financial Services - Investment Companies. The financial statements have been prepared in conformity with accounting principles generally accepted in the United States of America (GAAP), which require management to make certain estimates and assumptions at the date of the financial statements. Actual results could differ from those estimates. The Fund operates as a single operating segment. The Fund's income, expenses, assets, and performance are regularly monitored and assessed as a whole by the investment adviser and other individuals responsible for oversight functions of the Trust, using the information presented in the financial statements and financial highlights. Subsequent events, if any, through the date that the financial statements were issued have been evaluated in the preparation of the financial statements. The Fund's Schedule of Investments lists any underlying mutual funds or exchange-traded funds (ETFs) but does not include the underlying holdings of these funds. The following summarizes the significant accounting policies of the Fund:
Investment Valuation. Investments are valued as of 4:00 p.m. Eastern time on the last calendar day of the period. The Board of Trustees (the Board) has designated the Fund's investment adviser as the valuation designee responsible for the fair valuation function and performing fair value determinations as needed. The investment adviser has established a Fair Value Committee (the Committee) to carry out the day-to-day fair valuation responsibilities and has adopted policies and procedures to govern the fair valuation process and the activities of the Committee. In accordance with these fair valuation policies and procedures, which have been approved by the Board, the Fund attempts to obtain prices from one or more third party pricing services or brokers to value its investments. When current market prices, quotations or currency exchange rates are not readily available or reliable, investments will be fair valued in good faith by the Committee, in accordance with the policies and procedures. Factors used in determining fair value vary by investment type and may include market or investment specific events, transaction data, estimated cash flows, and market observations of comparable investments. The frequency that the fair valuation procedures are used cannot be predicted and they may be utilized to a significant extent. The Committee manages the Fund's fair valuation practices and maintains the fair valuation policies and procedures. The Fund's investment adviser reports to the Board information regarding the fair valuation process and related material matters.
The Fund categorizes the inputs to valuation techniques used to value its investments into a disclosure hierarchy consisting of three levels as shown below:
Level 1 - unadjusted quoted prices in active markets for identical investments
Level 2 - other significant observable inputs (including quoted prices for similar investments, interest rates, prepayment speeds, etc.)
Level 3 - unobservable inputs (including the Fund's own assumptions based on the best information available)
Valuation techniques used to value the Fund's investments by major category are as follows:
Debt securities, including restricted securities, are valued based on evaluated prices received from third party pricing services or from brokers who make markets in such securities. Corporate bonds, bank loan obligations, foreign government and government agency obligations, preferred securities and U.S. government and government agency obligations are valued by pricing services who utilize matrix pricing which considers yield or price of bonds of comparable quality, coupon, maturity and type or by broker-supplied prices. Asset backed securities, collateralized mortgage obligations, commercial mortgage securities and U.S. government agency mortgage securities are valued by pricing services who utilize matrix pricing which considers prepayment speed assumptions, attributes of the collateral, yield or price of bonds of comparable quality, coupon, maturity and type or by broker-supplied prices. Swaps are marked-to-market daily based on valuations from third party pricing services, registered derivatives clearing organizations (clearinghouses) or broker-supplied valuations. These pricing sources may utilize inputs such as interest rate curves, credit spread curves, default possibilities and recovery rates. When independent prices are unavailable or unreliable, debt securities and swaps may be valued utilizing pricing methodologies which consider similar factors that would be used by third party pricing services. For foreign debt securities, when significant market or security specific events arise, valuations may be determined in good faith in accordance with procedures adopted by the Board. Debt securities and swaps are generally categorized as Level 2 in the hierarchy but may be Level 3 depending on the circumstances. The Fund invests a significant portion of its assets in below investment grade securities. The value of these securities can be more volatile due to changes in the credit quality of the issuer and is sensitive to changes in economic, market and regulatory conditions.
Equity securities, including restricted securities, for which market quotations are readily available, are valued at the last reported sale price or official closing price as reported by a third party pricing service on the primary market or exchange on which they are traded and are categorized as Level 1 in the hierarchy. In the event there were no sales during the day or closing prices are not available, securities are valued at the last quoted bid price or may be valued using the last available price and are generally categorized as Level 2 in the hierarchy. For foreign equity securities, when market or security specific events arise, comparisons to the valuation of American Depositary Receipts (ADRs), futures contracts, ETFs and certain indexes as well as quoted prices for similar securities may be used and would be categorized as Level 2 in the hierarchy. For equity securities, including restricted securities, where observable inputs are limited, assumptions about market activity and risk are used and these securities may be categorized as Level 3 in the hierarchy.
The U.S. dollar value of forward foreign currency contracts is determined using currency exchange rates supplied by a pricing service and are categorized as Level 2 in the hierarchy. Futures contracts are valued at the settlement price established each day by the board of trade or exchange on which they are traded and are categorized as Level 1 in the hierarchy. Options traded over-the-counter are valued using service or broker-supplied valuations and are categorized as Level 2 in the hierarchy. Investments in open-end mutual funds, including the Fidelity Central Funds, are valued at their closing net asset value (NAV) each business day and are categorized as Level 1 in the hierarchy.
Changes in valuation techniques may result in transfers in or out of an assigned level within the disclosure hierarchy. The aggregate value of investments by input level as of December 31, 2024 is included at the end of the Fund's Schedule of Investments.
Foreign Currency. Foreign-denominated assets, including investment securities, and liabilities are translated into U.S. dollars at the exchange rates at period end. Purchases and sales of investment securities, income and dividends received, and expenses denominated in foreign currencies are translated into U.S. dollars at the exchange rate in effect on the transaction date.
The effects of exchange rate fluctuations on investments are included with the net realized and unrealized gain (loss) on investment securities. Other foreign currency transactions resulting in realized and unrealized gain (loss) are disclosed separately.
Realized gains and losses on foreign currency transactions arise from the disposition of foreign currency, realized changes in the value of foreign currency between the trade and settlement dates on security transactions, and the difference between the amounts of dividends, interest and foreign withholding taxes recorded on transaction date and the U.S. dollar equivalent of the amounts actually received or paid. Unrealized gains and losses on assets and liabilities in foreign currencies arise from changes in the value of foreign currency, and from assets and liabilities denominated in foreign currencies, other than investments, which are held at period end.
Investment Transactions and Income. For financial reporting purposes, the Fund's investment holdings and NAV include trades executed through the end of the last business day of the period. The NAV per share for processing shareholder transactions is calculated as of the close of business of the New York Stock Exchange (NYSE), normally 4:00 p.m. Eastern time and includes trades executed through the end of the prior business day. Gains and losses on securities sold are determined on the basis of identified cost and include proceeds received from litigation. Commissions paid to certain brokers with whom the investment adviser, or its affiliates, places trades on behalf of a fund include an amount in addition to trade execution, which may be rebated back to a fund. Any such rebates are included in net realized gain (loss) on investments in the Statement of Operations. Dividend income is recorded on the ex-dividend date, except for certain dividends from foreign securities where the ex-dividend date may have passed, which are recorded as soon as the Fund is informed of the ex-dividend date. Non-cash dividends included in dividend income, if any, are recorded at the fair market value of the securities received. Income and capital gain distributions from Fidelity Central Funds, if any, are recorded on the ex-dividend date. Certain distributions received by the Fund represent a return of capital or capital gain. The Fund determines the components of these distributions subsequent to the ex-dividend date, based upon receipt of tax filings or other correspondence relating to the underlying investment. These distributions are recorded as a reduction of cost of investments and/or as a realized gain. Interest income is accrued as earned and includes coupon interest and amortization of premium and accretion of discount on debt securities as applicable. Paid in Kind (PIK) income is recorded at the fair market value of the securities received. Investment income is recorded net of foreign taxes withheld where recovery of such taxes is uncertain. Debt obligations may be placed on non-accrual status and related interest income may be reduced by ceasing current accruals and writing off interest receivables when the collection of all or a portion of interest has become doubtful based on consistently applied procedures. A debt obligation is removed from non-accrual status when the issuer resumes interest payments or when collectability of interest is reasonably assured. Funds may file withholding tax reclaims in certain jurisdictions to recover a portion of amounts previously withheld. Any withholding tax reclaims income is included in the Statement of Operations in dividends and interest. Any receivables for withholding tax reclaims are included in the Statement of Assets and Liabilities in dividends receivable.
Class Allocations and Expenses. Investment income, realized and unrealized capital gains and losses, common expenses of a fund, and certain fund-level expense reductions, if any, are allocated daily on a pro-rata basis to each class based on the relative net assets of each class to the total net assets of a fund. Each class differs with respect to transfer agent and distribution and service plan fees incurred, as applicable. Certain expense reductions may also differ by class, if applicable. For the reporting period, the allocated portion of income and expenses to each class as a percent of its average net assets may vary due to the timing of recording these transactions in relation to fluctuating net assets of the classes. Expenses directly attributable to a fund are charged to that fund. Expenses attributable to more than one fund are allocated among the respective funds on the basis of relative net assets or other appropriate methods. Expenses included in the accompanying financial statements reflect the expenses of that fund and do not include any expenses associated with any underlying mutual funds or exchange-traded funds (ETFs). Although not included in a fund's expenses, a fund indirectly bears its proportionate share of these expenses through the net asset value of each underlying mutual fund or exchange-traded fund (ETF). Expense estimates are accrued in the period to which they relate and adjustments are made when actual amounts are known.
Income Tax Information and Distributions to Shareholders. Each year, the Fund intends to qualify as a regulated investment company under Subchapter M of the Internal Revenue Code, including distributing substantially all of its taxable income and realized gains. As a result, no provision for U.S. Federal income taxes is required. As of December 31, 2024, the Fund did not have any unrecognized tax benefits in the financial statements; nor is the Fund aware of any tax positions for which it is reasonably possible that the total amounts of unrecognized tax benefits will significantly change in the next twelve months. The Fund files a U.S. federal tax return, in addition to state and local tax returns as required. The Fund's federal income tax returns are subject to examination by the Internal Revenue Service (IRS) for a period of three fiscal years after they are filed. State and local tax returns may be subject to examination for an additional fiscal year depending on the jurisdiction. Foreign taxes are provided for based on the Fund's understanding of the tax rules and rates that exist in the foreign markets in which it invests.
Distributions are declared and recorded on the ex-dividend date. Income and capital gain distributions are declared separately for each class. Income and capital gain distributions are determined in accordance with income tax regulations, which may differ from GAAP.
Capital accounts within the financial statements are adjusted for permanent book-tax differences. These adjustments have no impact on net assets or the results of operations. Capital accounts are not adjusted for temporary book-tax differences which will reverse in a subsequent period.
Book-tax differences are primarily due to futures contracts, swaps, foreign currency transactions, market discount, partnerships, capital loss carryforwards and losses deferred due to wash sales and futures transactions.
As of period end, the cost and unrealized appreciation (depreciation) in securities, and derivatives if applicable, for federal income tax purposes were as follows:
| Gross unrealized appreciation | $67,231,368 |
| Gross unrealized depreciation | (83,817,911) |
| Net unrealized appreciation (depreciation) | $(16,586,543) |
| Tax Cost | $1,540,191,897 |
The tax-based components of distributable earnings as of period end were as follows:
| Undistributed ordinary income | $11,803,043 |
| Capital loss carryforward | $(71,015,707) |
| Net unrealized appreciation (depreciation) on securities and other investments | $(16,990,537) |
Capital loss carryforwards are only available to offset future capital gains of the Fund to the extent provided by regulations and may be limited. The capital loss carryforward information presented below, including any applicable limitation, is estimated as of fiscal period end and is subject to adjustment.
Short-term | $(33,304,604) |
Long-term | (37,711,103) |
| Total capital loss carryforward | $(71,015,707) |
The tax character of distributions paid was as follows:
| | December 31, 2024 | December 31, 2023 |
| Ordinary Income | $53,920,932 | $ 60,369,827 |
| Total | $53,920,932 | $ 60,369,827 |
Delayed Delivery Transactions and When-Issued Securities. During the period, certain Funds transacted in securities on a delayed delivery or when-issued basis. Payment and delivery may take place after the customary settlement period for that security. The price of the underlying securities and the date when the securities will be delivered and paid for are fixed at the time the transaction is negotiated. Securities purchased on a delayed delivery or when-issued basis are identified as such in the Schedule of Investments. Compensation for interest forgone in the purchase of a delayed delivery or when-issued debt security may be received. With respect to purchase commitments, each applicable Fund identifies securities as segregated in its records with a value at least equal to the amount of the commitment. Payables and receivables associated with the purchases and sales of delayed delivery securities having the same coupon, settlement date and broker are offset. Delayed delivery or when-issued securities that have been purchased from and sold to different brokers are reflected as both payables and receivables in the Statement of Assets and Liabilities under the caption "Delayed delivery", as applicable. Losses may arise due to changes in the value of the underlying securities or if the counterparty does not perform under the contract's terms, or if the issuer does not issue the securities due to political, economic, or other factors.
To-Be-Announced (TBA) Securities and Mortgage Dollar Rolls. TBA securities involve buying or selling mortgage-backed securities (MBS) on a forward commitment basis. A TBA transaction typically does not designate the actual security to be delivered and only includes an approximate principal amount; however delivered securities must meet specified terms defined by industry guidelines, including issuer, rate and current principal amount outstanding on underlying mortgage pools. Funds may enter into a TBA transaction with the intent to take possession of or deliver the underlying MBS, or a fund may elect to extend the settlement by entering into either a mortgage or reverse mortgage dollar roll. Mortgage dollar rolls are transactions where a fund sells TBA securities and simultaneously agrees to repurchase MBS on a later date at a lower price and with the same counterparty. Reverse mortgage dollar rolls involve the purchase and simultaneous agreement to sell TBA securities on a later date at a lower price. Transactions in mortgage dollar rolls and reverse mortgage dollar rolls are accounted for as purchases and sales and may result in an increase to a fund's portfolio turnover rate.
Purchases and sales of TBA securities involve risks similar to those discussed above for delayed delivery and when-issued securities. Also, if the counterparty in a mortgage dollar roll or a reverse mortgage dollar roll transaction files for bankruptcy or becomes insolvent, a fund's right to repurchase or sell securities may be limited. Additionally, when a fund sells TBA securities without already owning or having the right to obtain the deliverable securities (an uncovered forward commitment to sell), it incurs a risk of loss because it could have to purchase the securities at a price that is higher than the price at which it sold them. A fund may be unable to purchase the deliverable securities if the corresponding market is illiquid.
TBA securities subject to a forward commitment to sell at period end are included at the end of the Schedule of Investments under the caption "TBA Sale Commitments." The value of these commitments and proceeds to be received at contractual settlement date are reflected in the Statement of Assets and Liabilities as "TBA sale commitments, at value" and "Receivable for TBA sale commitments," respectively. If the TBA sale commitment is closed through the acquisition of an offsetting TBA purchase commitment, a fund realizes a gain or loss. If a fund delivers securities under the commitment, a fund realizes a gain or loss from the sale of the securities based upon the price established at the date the commitment was entered into.
Restricted Securities (including Private Placements). Funds may invest in securities that are subject to legal or contractual restrictions on resale. These securities generally may be resold in transactions exempt from registration or to the public if the securities are registered. Disposal of these securities may involve time-consuming negotiations and expense, and prompt sale at an acceptable price may be difficult. Information regarding restricted securities held at period end is included at the end of the Schedule of Investments, if applicable.
Loans and Other Direct Debt Instruments. Direct debt instruments are interests in amounts owed to lenders by corporate or other borrowers. These instruments may be in the form of loans, trade claims or other receivables and may include standby financing commitments such as revolving credit facilities that obligate a fund to supply additional cash to the borrower on demand. Loans may be acquired through assignment, participation, or may be made directly to a borrower. Such instruments are presented in the Bank Loan Obligations section in the Schedule of Investments. Certain funds may also invest in unfunded loan commitments, which are contractual obligations for future funding. Information regarding unfunded commitments is included at the end of the Schedule of Investments, if applicable.
New Accounting Pronouncement. FASB Accounting Standards Update (ASU) 2023-07 Segment Reporting (Topic 280): Improvements to Reportable Segment Disclosures became effective in this reporting period. ASU 2023-07 enhances segment information disclosure in the notes to financial statements.
4. Derivative Instruments.
Risk Exposures and the Use of Derivative Instruments. The Fund's investment objectives allow for various types of derivative instruments, including futures contracts, forward foreign currency contracts, options and swaps. Derivatives are investments whose value is primarily derived from underlying assets, indices or reference rates and may be transacted on an exchange or over-the-counter (OTC). Derivatives may involve a future commitment to buy or sell a specified asset based on specified terms, to exchange future cash flows at periodic intervals based on a notional principal amount, or for one party to make one or more payments upon the occurrence of specified events in exchange for periodic payments from the other party.
Derivatives were used to increase returns, to gain exposure to certain types of assets, to facilitate transactions in foreign-denominated securities and to manage exposure to certain risks as defined below. The success of any strategy involving derivatives depends on analysis of numerous economic factors, and if the strategies for investment do not work as intended, the objectives may not be achieved.
Derivatives were used to increase or decrease exposure to the following risk(s):
| | |
| Foreign Exchange Risk | Foreign exchange rate risk relates to fluctuations in the value of an asset or liability due to changes in currency exchange rates. |
| Interest Rate Risk | Interest rate risk relates to the fluctuations in the value of interest-bearing securities due to changes in the prevailing levels of market interest rates. |
Funds are also exposed to additional risks from investing in derivatives, such as liquidity risk and counterparty credit risk. Liquidity risk is the risk that a fund will be unable to close out the derivative in the open market in a timely manner. Counterparty credit risk is the risk that the counterparty will not be able to fulfill its obligation to a fund. Derivative counterparty credit risk is managed through formal evaluation of the creditworthiness of all potential counterparties. On certain OTC derivatives such as forward foreign currency contracts and options, a fund attempts to reduce its exposure to counterparty credit risk by entering into an International Swaps and Derivatives Association, Inc. (ISDA) Master Agreement with each of its counterparties. The ISDA Master Agreement gives a fund the right to terminate all transactions traded under such agreement upon the deterioration in the credit quality of the counterparty beyond specified levels. The ISDA Master Agreement gives each party the right, upon an event of default by the other party or a termination of the agreement, to close out all transactions traded under such agreement and to net amounts owed under each transaction to one net payable by one party to the other. To mitigate counterparty credit risk on bi-lateral OTC derivatives, a fund receives collateral in the form of cash or securities once net unrealized appreciation on outstanding derivative contracts under an ISDA Master Agreement exceeds certain applicable thresholds, subject to certain minimum transfer provisions. The collateral received is held in segregated accounts with the custodian bank in accordance with the collateral agreements entered into between a fund, the counterparty and the custodian bank. A fund could experience delays and costs in gaining access to the collateral even though it is held by the custodian bank. The maximum risk of loss to a fund from counterparty credit risk related to bi-lateral OTC derivatives is generally the aggregate unrealized appreciation and unpaid counterparty payments in excess of any collateral pledged by the counterparty to a fund. A fund may be required to pledge collateral for the benefit of the counterparties on bi-lateral OTC derivatives in an amount not less than each counterparty's unrealized appreciation on outstanding derivative contracts, subject to certain minimum transfer provisions, and any such pledged collateral is identified in the Schedule of Investments. Exchange-traded contracts are not covered by the ISDA Master Agreement; however counterparty credit risk related to these contracts may be mitigated by the protection provided by the exchange on which they trade. Counterparty credit risk related to centrally cleared swaps may be mitigated by the protection provided by the clearinghouse.
Investing in derivatives may involve greater risks than investing in the underlying assets directly and, to varying degrees, may involve risk of loss in excess of any initial investment and collateral received and amounts recognized in the Statement of Assets and Liabilities. In addition, there may be the risk that the change in value of the derivative contract does not correspond to the change in value of the underlying instrument.
Net Realized Gain (Loss) and Change in Net Unrealized Appreciation (Depreciation) on Derivatives. The table below, which reflects the impacts of derivatives on the financial performance, summarizes the net realized gain (loss) and change in net unrealized appreciation (depreciation) for derivatives during the period as presented in the Statement of Operations.
| Primary Risk Exposure / Derivative Type | Net Realized Gain (Loss)($) | Change in Net Unrealized Appreciation (Depreciation)($) |
| VIP Strategic Income Portfolio | | |
| Foreign Exchange Risk | | |
| Forward Foreign Currency Contracts | 5,015,109 | 4,179,116 |
| Total Foreign Exchange Risk | 5,015,109 | 4,179,116 |
| Interest Rate Risk | | |
| Futures Contracts | (1,265,921) | (5,798,094) |
| Purchased Options | (7,329) | (11,573) |
| Swaps | 693,483 | 1,011,032 |
| Total Interest Rate Risk | (579,767) | (4,798,635) |
| Totals | 4,435,342 | (619,519) |
If there are any open positions at period end, a summary of the value of derivatives by primary risk exposure is included at the end of the Schedule of Investments.
Forward Foreign Currency Contracts. Forward foreign currency contracts represent obligations to purchase or sell foreign currency on a specified future date at a price fixed at the time the contracts are entered into. Forward foreign currency contracts were used to facilitate transactions in foreign-denominated securities and to manage exposure to certain foreign currencies.
Forward foreign currency contracts are valued daily and fluctuations in exchange rates on open contracts are recorded as unrealized appreciation or (depreciation) and reflected in total accumulated earnings (loss) in the Statement of Assets and Liabilities. When the contract is closed, a gain or loss is realized equal to the difference between the closing value and the value at the time it was opened. Non-deliverable forward foreign currency exchange contracts are settled with the counterparty in cash without the delivery of foreign currency. The net realized gain (loss) and change in net unrealized appreciation (depreciation) on forward foreign currency contracts during the period is presented in the Statement of Operations.
Any open forward foreign currency contracts at period end are presented in the Schedule of Investments under the caption "Forward Foreign Currency Contracts." The contract amount and unrealized appreciation (depreciation) reflects each contract's exposure to the underlying currency at period end, and is representative of volume of activity during the period, unless an average contract value is presented in the table below.
| | Average Contracts Amount ($) |
| VIP Strategic Income Portfolio | 125,652,885 |
Futures Contracts. A futures contract is an agreement between two parties to buy or sell a specified underlying instrument for a fixed price at a specified future date. Futures contracts were used to manage exposure to the bond market and fluctuations in interest rates.
Upon entering into a futures contract, a fund is required to deposit either cash or securities (initial margin) with a clearing broker in an amount equal to a certain percentage of the face value of the contract. Futures contracts are marked-to-market daily and subsequent daily payments are made or received by a fund depending on the daily fluctuations in the value of the futures contracts and are recorded as unrealized appreciation or (depreciation). This receivable and/or payable, if any, is included in daily variation margin on futures contracts in the Statement of Assets and Liabilities. Realized gain or (loss) is recorded upon the expiration or closing of a futures contract. The net realized gain (loss) and change in net unrealized appreciation (depreciation) on futures contracts during the period is presented in the Statement of Operations.
Any open futures contracts at period end are presented in the Schedule of Investments under the caption "Futures Contracts". The notional amount at value reflects each contract's exposure to the underlying instrument or index at period end, and is representative of volume of activity during the period, unless an average notional amount is presented in the table below.
| | Average Notional Amount ($) |
| VIP Strategic Income Portfolio | 203,046,697 |
Any securities deposited to meet initial margin requirements are identified in the Schedule of Investments. Any cash deposited to meet initial margin requirements is presented as segregated cash with brokers for derivative instruments in the Statement of Assets and Liabilities.
Options. Options give the purchaser the right, but not the obligation, to buy (call) or sell (put) an underlying security or financial instrument at an agreed exercise or strike price between or on certain dates. Options obligate the seller (writer) to buy (put) or sell (call) an underlying instrument at the exercise or strike price or cash settle an underlying derivative instrument if the holder exercises the option on or before the expiration date. OTC options, such as swaptions, which are options where the underlying instrument is a swap, were used to manage exposure to fluctuations in interest rates.
Upon entering into an options contract, a fund will pay or receive a premium. Premiums paid on purchased options are reflected as cost of investments and premiums received on written options are reflected as a liability on the Statement of Assets and Liabilities. Certain options may be purchased or written with premiums to be paid or received on a future date. Options are valued daily and any unrealized appreciation (depreciation) is reflected in total accumulated earnings (loss) in the Statement of Assets and Liabilities. When an option is exercised, the cost or proceeds of the underlying instrument purchased or sold is adjusted by the amount of the premium. When an option is closed, a gain or loss is realized depending on whether the proceeds or amount paid for the closing sale transaction is greater or less than the premium received or paid. When an option expires, gains and losses are realized to the extent of premiums received and paid, respectively. The net realized and unrealized gains (losses) on purchased options are included in the Statement of Operations in net realized gain (loss) and change in net unrealized appreciation (depreciation) on investment securities. The net realized gain (loss) and change in net unrealized appreciation (depreciation) on written options are presented in the Statement of Operations.
Any open options at period end are presented in the Schedule of Investments under the captions "Purchased Options," "Purchased Swaptions," "Written Options" and "Written Swaptions," as applicable, and are representative of volume of activity during the period.
Writing puts and buying calls tend to increase exposure to the underlying instrument while buying puts and writing calls tend to decrease exposure to the underlying instrument. For purchased options, risk of loss is limited to the premium paid, and for written options, risk of loss is the change in value in excess of the premium received.
Swaps. A swap is a contract between two parties to exchange future cash flows at periodic intervals based on a notional principal amount. A centrally cleared swap is a transaction executed between a fund and a dealer counterparty, then cleared by a futures commission merchant (FCM) through a clearinghouse. Once cleared, the clearinghouse serves as a central counterparty, with whom a fund exchanges cash flows for the life of the transaction, similar to transactions in futures contracts.
Centrally cleared swaps require a fund to deposit either cash or securities (initial margin) with the FCM, at the instruction of and for the benefit of the clearinghouse. Any securities deposited to meet initial margin requirements are identified in the Schedule of Investments. Any cash deposited to meet initial margin requirements is presented in segregated cash with brokers for derivative instruments in the Statement of Assets and Liabilities. Centrally cleared swaps are marked-to-market daily and subsequent payments (variation margin) are made or received depending on the daily fluctuations in the value of the swaps and are recorded as unrealized appreciation or (depreciation). These daily payments, if any, are included in receivable or payable for daily variation margin on centrally cleared swaps in the Statement of Assets and Liabilities. Any premiums for centrally cleared swaps are recorded periodically throughout the term of the swap to variation margin and included in total accumulated earnings (loss) in the Statement of Assets and Liabilities. Any premiums are recognized as realized gain (loss) upon termination or maturity of the swap.
Payments are exchanged at specified intervals, accrued daily commencing with the effective date of the contract and recorded as realized gain or (loss). Some swaps may be terminated prior to the effective date and realize a gain or loss upon termination. The net realized gain (loss) and change in net unrealized appreciation (depreciation) on swaps during the period is presented in the Statement of Operations.
Any open swaps at period end are included in the Schedule of Investments under the caption "Swaps", and are representative of volume of activity during the period.
Interest Rate Swaps. Interest rate swaps are agreements between counterparties to exchange cash flows, one based on a fixed rate, and the other on a floating rate. A fund enters into interest rate swaps to manage its exposure to interest rate changes. Changes in interest rates can have an effect on both the value of bond holdings as well as the amount of interest income earned. In general, the value of bonds can fall when interest rates rise and can rise when interest rates fall.
5. Purchases and Sales of Investments.
Purchases and sales of securities, other than short-term securities, U.S. government securities and in-kind transactions, as applicable, are noted in the table below.
| | Purchases ($) | Sales ($) |
| VIP Strategic Income Portfolio | 740,617,601 | 763,251,658 |
6. Fees and Other Transactions with Affiliates.
Management Fee. Fidelity Management & Research Company LLC (the investment adviser) and its affiliates provide the Fund with investment management related services for which the Fund pays a monthly management fee.
Effective March 1, 2024, the Fund's management contract was amended to incorporate administrative services previously covered under separate services agreements (Transfer Agent and Accounting agreements). The amended contract incorporates a management fee rate that may vary by class. The investment adviser or an affiliate pays certain expenses of managing and operating the Fund out of each class's management fee. Each class of the Fund pays a management fee to the investment adviser. The management fee is calculated and paid to the investment adviser every month. When determining a class's management fee, a mandate rate is calculated based on the monthly average net assets of a group of funds advised by FMR within a designated asset class. A discount rate is subtracted from the mandate rate once the Fund's monthly average net assets reach a certain level. The mandate rate and discount rate may vary by class. The annual management fee rate for a class of shares of the Fund is the lesser of (1) the class's mandate rate reduced by the class's discount rate (if applicable) or (2) the amount set forth in the following table.
| | Maximum Management Fee Rate % |
| Initial Class | .63 |
| Service Class | .63 |
| Service Class 2 | .63 |
| Investor Class | .66 |
One-twelfth of the management fee rate for a class is applied to the average net assets of the class for the month, giving a dollar amount which is the management fee for the class for that month. A different management fee rate may be applicable to each class of the Fund. The difference between classes is the result of separate arrangements for class-level services and/or waivers of certain expenses. It is not the result of any difference in advisory or custodial fees or other expenses related to the management of the Fund's assets, which do not vary by class. For the portion of the reporting period on or after March 1, 2024, the total annualized management fee rates were as follows:
| | Total Management Fee Rate % |
| Initial Class | .63 |
| Service Class | .63 |
| Service Class 2 | .63 |
| Investor Class | .66 |
Prior to March 1, 2024, the management fee was the sum of an individual fund fee rate that was based on an annual rate of .45% of the Fund's average net assets and an annualized group fee rate that averaged .10% during the period. The group fee rate was based upon the monthly average net assets of a group of registered investment companies with which the investment adviser has management contracts. The group fee rate decreased as assets under management increased and increased as assets under management decreased. For the portion of the reporting period prior to March 1, 2024, the total annualized management fee rate was .55%.
Effective March 1, 2024, the Fund's sub-advisory agreements with FMR Investment Management (UK) Limited, Fidelity Management & Research (Hong Kong) Limited, and Fidelity Management & Research (Japan) Limited were amended to provide that the investment adviser pays each sub-adviser monthly fees equal to 110% of the sub-adviser's costs for providing sub-advisory services.
Effective March 1, 2024, the Fund's sub-advisory agreement with FIL Investment Advisors (FIA) was amended to provide that the investment adviser pays FIA monthly fees at an annual rate of 0.30% with respect to the average daily net assets of the Fund managed by FIA. FIA in turn pays FIA(UK).
Distribution and Service Plan Fees. In accordance with Rule 12b-1 of the 1940 Act, the Fund has adopted separate 12b-1 Plans for each Service Class of shares. Each Service Class pays Fidelity Distributors Company LLC (FDC), an affiliate of the investment adviser, a service fee. For the period, the service fee is based on an annual rate of .10% of Service Class' average net assets and .25% of Service Class 2's average net assets.
For the period, total fees, all of which were re-allowed to insurance companies for the distribution of shares and providing shareholder support services, were as follows:
| Service Class | $1,568 |
| Service Class 2 | 1,495,054 |
| | $1,496,622 |
Transfer Agent Fees. Fidelity Investments Institutional Operations Company LLC (FIIOC), an affiliate of the investment adviser, is the Fund's transfer, dividend disbursing, and shareholder servicing agent. Effective March 1, 2024, the Fund's management contract was amended to incorporate transfer agent services and associated fees previously covered under a separate services agreement.
During the period January 1, 2024 through February 29, 2024, the transfer agent fees for each class were a fixed annual rate of class-level average net assets as follows:
| | Amount ($) | % of Class-Level Average Net Assets |
| Initial Class | 8,550 | .0680 |
| Service Class | 151 | .0680 |
| Service Class 2 | 63,152 | .0680 |
| Investor Class | 129,905 | .1020 |
| | 201,758 | |
Accounting Fees. Fidelity Service Company, Inc. (FSC), an affiliate of the investment adviser, maintains the Fund's accounting records. Effective March 1, 2024, the Fund's management contract was amended to incorporate accounting services and associated fees previously covered under a separate services agreement.
During the period January 1, 2024 through February 29, 2024, the accounting fees were a fixed annual rate of average net assets as follows:
| | % of Average Net Assets |
| VIP Strategic Income Portfolio | .0341 |
Brokerage Commissions. A portion of portfolio transactions were placed with brokerage firms which are affiliates of the investment adviser. Brokerage commissions are included in net realized gain (loss) and change in net unrealized appreciation (depreciation) in the Statement of Operations. The commissions paid to these affiliated firms were as follows:
| | Amount ($) |
| VIP Strategic Income Portfolio | 263 |
Interfund Trades. Funds may purchase from or sell securities to other Fidelity Funds under procedures adopted by the Board. The procedures have been designed to ensure these interfund trades are executed in accordance with Rule 17a-7 of the 1940 Act. Any interfund trades are included within the respective purchases and sales amounts shown in the Purchases and Sales of Investments note. Interfund trades during the period are noted in the table below.
| | Purchases ($) | Sales ($) | Realized Gain (Loss) ($) |
| VIP Strategic Income Portfolio | 2,526,367 | 1,350,527 | 146,554 |
7. Committed Line of Credit.
Certain Funds participate with other funds managed by the investment adviser or an affiliate in a $4.25 billion credit facility (the "line of credit") to be utilized for temporary or emergency purposes to fund shareholder redemptions or for other short-term liquidity purposes.
Commitment fees are charged based on the unused amount of the line of credit at an annual rate of .10%, and then allocated to each participating fund based on its pro-rata portion of the line of credit. The commitment fees are reflected in Miscellaneous expenses on the Statement of Operations, and are listed below.
Interest is charged to a participating fund based on its borrowings at an annual rate of .75% plus the highest of (i) daily SOFR plus a .10% spread adjustment, (ii) Federal Funds Effective Rate, or (iii) Overnight Bank Funding Rate. During the period, there were no borrowings on this line of credit.
The line of credit agreement will expire in March 2025 unless extended or renewed.| | Amount ($) |
| VIP Strategic Income Portfolio | 2,280 |
8. Security Lending.
Funds lend portfolio securities from time to time in order to earn additional income. Lending agents are used, including National Financial Services (NFS), an affiliate of the investment adviser. Pursuant to a securities lending agreement, NFS will receive a fee, which is capped at 9.9% of a fund's daily lending revenue, for its services as lending agent. A fund may lend securities to certain qualified borrowers, including NFS. On the settlement date of the loan, a fund receives collateral (in the form of U.S. Treasury obligations, letters of credit and/or cash) against the loaned securities and maintains collateral in an amount not less than 100% of the market value of the loaned securities during the period of the loan. The market value of the loaned securities is determined at the close of business of a fund and any additional required collateral is delivered to a fund on the next business day. A fund or borrower may terminate the loan at any time, and if the borrower defaults on its obligation to return the securities loaned because of insolvency or other reasons, a fund may apply collateral received from the borrower against the obligation. A fund may experience delays and costs in recovering the securities loaned. Any cash collateral received is invested in the Fidelity Securities Lending Cash Central Fund. Any loaned securities are identified as such in the Schedule of Investments, and the value of loaned securities and cash collateral at period end, as applicable, are presented in the Statement of Assets and Liabilities. Security lending income represents the income earned on investing cash collateral, less rebates paid to borrowers and any lending agent fees associated with the loan, plus any premium payments received for lending certain types of securities. Security lending income is presented in the Statement of Operations as a component of income from Fidelity Central Funds. Affiliated security lending activity, if any, was as follows:
| | Total Security Lending Fees Paid to NFS ($) | Security Lending Income From Securities Loaned to NFS ($) | Value of Securities Loaned to NFS at Period End ($) |
| VIP Strategic Income Portfolio | 186 | - | - |
9. Expense Reductions.
Through arrangements with the Fund's custodian, credits realized as a result of certain uninvested cash balances were used to reduce the Fund's expenses. During the period, custodian credits reduced the Fund's expenses by $46,336.
In addition, during the period the investment adviser or an affiliate reimbursed and/or waived a portion of fund-level operating expenses in the amount of $33,190.
10. Distributions to Shareholders.
Distributions to shareholders of each class were as follows:
| | Year ended December 31, 2024 | Year ended December 31, 2023 |
| VIP Strategic Income Portfolio | | |
| Distributions to shareholders | | |
| Initial Class | $2,983,430 | $3,335,055 |
| Service Class | 66,822 | 57,420 |
| Service Class 2 | 22,343,547 | 23,409,961 |
| Investor Class | 28,527,133 | 33,567,391 |
Total | $53,920,932 | $60,369,827 |
11. Share Transactions.
Transactions for each class of shares were as follows and may contain in-kind transactions:
| | Shares | Shares | Dollars | Dollars |
| | Year ended December 31, 2024 | Year ended December 31, 2023 | Year ended December 31, 2024 | Year ended December 31, 2023 |
| VIP Strategic Income Portfolio | | | | |
| Initial Class | | | | |
| Shares sold | 1,308,611 | 1,126,735 | $14,205,903 | $11,661,824 |
| Reinvestment of distributions | 273,327 | 323,478 | 2,983,430 | 3,335,055 |
| Shares redeemed | (1,070,922) | (1,291,573) | (11,567,367) | (13,368,273) |
| Net increase (decrease) | 511,016 | 158,640 | $5,621,966 | $1,628,606 |
| Service Class | | | | |
| Shares sold | 62,881 | 22,215 | $678,622 | $228,491 |
| Reinvestment of distributions | 5,340 | 4,609 | 58,185 | 47,426 |
| Shares redeemed | (113,929) | (41,831) | (1,230,866) | (428,837) |
| Net increase (decrease) | (45,708) | (15,007) | $(494,059) | $(152,920) |
| Service Class 2 | | | | |
| Shares sold | 10,246,349 | 6,808,643 | $109,333,726 | $69,518,676 |
| Reinvestment of distributions | 2,075,515 | 2,299,603 | 22,343,547 | 23,409,961 |
| Shares redeemed | (6,153,550) | (6,054,876) | (65,529,570) | (61,741,063) |
| Net increase (decrease) | 6,168,314 | 3,053,370 | $66,147,703 | $31,187,574 |
| Investor Class | | | | |
| Shares sold | 3,527,642 | 2,067,578 | $38,182,302 | $21,381,691 |
| Reinvestment of distributions | 2,625,617 | 3,271,676 | 28,527,133 | 33,567,391 |
| Shares redeemed | (7,048,736) | (10,723,998) | (75,807,446) | (109,974,962) |
| Net increase (decrease) | (895,477) | (5,384,744) | $(9,098,011) | $(55,025,880) |
12. Other.
A fund's organizational documents provide former and current trustees and officers with a limited indemnification against liabilities arising in connection with the performance of their duties to the fund. In the normal course of business, a fund may also enter into contracts that provide general indemnifications. A fund's maximum exposure under these arrangements is unknown as this would be dependent on future claims that may be made against a fund. The risk of material loss from such claims is considered remote.
At the end of the period, the investment adviser or its affiliates were owners of record of more than 10% and certain otherwise unaffiliated shareholders were owners of record of more than 10% of the outstanding shares as follows:
| Fund | Affiliated % | Number ofUnaffiliated Shareholders | Unaffiliated Shareholders % |
| VIP Strategic Income Portfolio | 55% | 1 | 13% |
13. Credit Risk.
The Fund's relatively large investment in countries with limited or developing capital markets may involve greater risks than investments in more developed markets and the prices of such investments may be volatile. The yields of emerging market debt obligations reflect, among other things, perceived credit risk. The consequences of political, social or economic changes in these markets may have disruptive effects on the market prices of the Fund's investments and the income they generate, as well as the Fund's ability to repatriate such amounts.
14. Risk and Uncertainties.
Many factors affect a fund's performance. Developments that disrupt global economies and financial markets, such as pandemics, epidemics, outbreaks of infectious diseases, war, terrorism, and environmental disasters, may significantly affect a fund's investment performance. The effects of these developments to a fund will be impacted by the types of securities in which a fund invests, the financial condition, industry, economic sector, and geographic location of an issuer, and a fund's level of investment in the securities of that issuer. Significant concentrations in security types, issuers, industries, sectors, and geographic locations may magnify the factors that affect a fund's performance.
Report of Independent Registered Public Accounting Firm
To the Board of Trustees of Variable Insurance Products Fund V and Shareholders of VIP Strategic Income Portfolio
Opinion on the Financial Statements
We have audited the accompanying statement of assets and liabilities, including the schedule of investments, of VIP Strategic Income Portfolio (one of the funds constituting Variable Insurance Products Fund V, referred to hereafter as the "Fund") as of December 31, 2024, the related statement of operations for the year ended December 31, 2024, the statement of changes in net assets for each of the two years in the period ended December 31, 2024, including the related notes, and the financial highlights for each of the five years in the period ended December 31, 2024 (collectively referred to as the "financial statements"). In our opinion, the financial statements present fairly, in all material respects, the financial position of the Fund as of December 31, 2024, the results of its operations for the year then ended, the changes in its net assets for each of the two years in the period ended December 31, 2024 and the financial highlights for each of the five years in the period ended December 31, 2024 in conformity with accounting principles generally accepted in the United States of America.
Basis for Opinion
These financial statements are the responsibility of the Fund's management. Our responsibility is to express an opinion on the Fund's financial statements based on our audits. We are a public accounting firm registered with the Public Company Accounting Oversight Board (United States) (PCAOB) and are required to be independent with respect to the Fund in accordance with the U.S. federal securities laws and the applicable rules and regulations of the Securities and Exchange Commission and the PCAOB.
We conducted our audits of these financial statements in accordance with the standards of the PCAOB. Those standards require that we plan and perform the audit to obtain reasonable assurance about whether the financial statements are free of material misstatement, whether due to error or fraud.
Our audits included performing procedures to assess the risks of material misstatement of the financial statements, whether due to error or fraud, and performing procedures that respond to those risks. Such procedures included examining, on a test basis, evidence regarding the amounts and disclosures in the financial statements. Our audits also included evaluating the accounting principles used and significant estimates made by management, as well as evaluating the overall presentation of the financial statements. Our procedures included confirmation of securities owned as of December 31, 2024 by correspondence with the custodian, issuers of privately offered securities, agent banks and brokers; when replies were not received from brokers, we performed other auditing procedures. We believe that our audits provide a reasonable basis for our opinion.
/s/ PricewaterhouseCoopers LLP
Boston, Massachusetts
February 13, 2025
We have served as the auditor of one or more investment companies in the Fidelity group of funds since 1932.
Distributions
(Unaudited)The dividend and capital gains distributions for the fund(s) are available on Fidelity.com or Institutional.Fidelity.com.
A total of 15.51% of the dividend distributed during the fiscal year was derived from interest on U.S. Government securities which is generally exempt from state income tax.
The fund designates $53,462,256 of distributions paid during the fiscal year ended 2024 as qualifying to be taxed as section 163(j) interest dividends.
Initial Class designates 1%; Service Class designates 1%; Service Class 2 designates 1%; and Investor Class designates 1% of the dividend distributed during the fiscal year as qualifying for the dividends-received deduction for corporate shareholders.
Item 8: Changes in and Disagreements with Accountants for Open-End Management Investment Companies
(Unaudited)
Note: This is not applicable for any fund included in this document.
Item 9: Proxy Disclosures for Open-End Management Investment Companies
(Unaudited)
Note: This is not applicable for any fund included in this document.
Item 10: Remuneration Paid to Directors, Officers, and others of Open-End Management Investment Companies
(Unaudited)
Note: This information is disclosed as part of the financial statements for each Fund as part of Item 7: Financial Statements and Financial Highlights for Open-End Management Investment companies.
Item 11: Statement Regarding Basis for Approval of Investment Advisory Contract
(Unaudited)
Board Approval of Investment Advisory Contracts and Management Fees
VIP Strategic Income Portfolio
Each year, the Board of Trustees, including the Independent Trustees (together, the Board), considers the renewal of the fund's management contract with Fidelity Management & Research Company LLC (FMR) and the sub-advisory agreements (together, the Advisory Contracts) for the fund. FMR and the sub-advisers are referred to herein as the Investment Advisers. The Board, assisted by the advice of fund counsel and Independent Trustees' counsel, requests and considers a broad range of information relevant to the renewal of the Advisory Contracts throughout the year.
The Board meets regularly and, at each of its meetings, covers an extensive agenda of topics and materials and considers factors that are relevant to its annual consideration of the renewal of the fund's Advisory Contracts, including the services and support provided to the fund and its shareholders. The Board's Operations Committee, of which all the Independent Trustees are members, meets regularly throughout the year and requests, receives and considers, among other matters, information related to the annual consideration of the renewal of the fund's Advisory Contracts before making its recommendation to the Board. The Board also meets as needed to review matters specifically related to the Board's annual consideration of the renewal of the Advisory Contracts. Members of the Board may also meet from time to time with trustees of other Fidelity funds through joint ad hoc committees to discuss certain matters relevant to all of the Fidelity funds.
At its September 2024 meeting, the Board unanimously determined to renew the fund's Advisory Contracts. In reaching its determination, the Board considered all factors it believed relevant, including (i) the nature, extent, and quality of the services provided to the fund and its shareholders (including the investment performance of the fund); (ii) the competitiveness relative to peer funds of the fund's management fee and the total expense ratio of a representative class (Investor Class, which was selected because it was the largest class without 12b-1 fees); (iii) the total costs of the services provided by and the profits realized by FMR and its affiliates (Fidelity) from its relationships with the fund; and (iv) the extent to which, if any, economies of scale exist and are realized as the fund grows, and whether any economies of scale are appropriately shared with fund shareholders. The Board also considered the broad range of investment choices available to shareholders from FMR's competitors and that the fund's shareholders have chosen to invest in the fund, which is part of the Fidelity family of funds. The Board's decision to renew the Advisory Contracts was not based on any single factor and the factors may have been weighed differently by different Trustees.
The Board reached a determination, with the assistance of fund counsel and Independent Trustees' counsel and through the exercise of its business judgment, that the renewal of the Advisory Contracts was in the best interests of the fund and its shareholders and that the compensation payable under the Advisory Contracts was fair and reasonable in light of all of the surrounding circumstances.
Nature, Extent, and Quality of Services Provided. The Board considered the Investment Advisers' staffing as it relates to the fund, including the backgrounds and experience of investment personnel, and also considered the Investment Advisers' implementation of the fund's investment program. The Independent Trustees also had discussions with senior management of Fidelity's investment operations and investment groups. The Board considered the structure of the investment personnel compensation program and whether this structure provides appropriate incentives to act in the best interests of the fund. Additionally, the Board considered the portfolio managers' investments, if any, in the funds that they manage.
Resources Dedicated to Investment Management and Support Services. The Board reviewed the general qualifications and capabilities of Fidelity's investment staff, including its size, education, experience, and resources, as well as Fidelity's approach to recruiting, managing, training, and compensating investment personnel. The Board noted the resources devoted to Fidelity's global investment organization, and that Fidelity's analysts have extensive resources, tools and capabilities that allow them to conduct quantitative and fundamental analysis, as well as credit analysis of issuers, counterparties and guarantors. Further, the Board considered that Fidelity's investment professionals have sufficient access to global information and data so as to provide competitive investment results over time, and that those professionals also have access to sophisticated tools that permit them to assess portfolio construction and risk and performance attribution characteristics continuously, as well as to transmit new information and research conclusions rapidly around the world. Additionally, in its deliberations, the Board considered Fidelity's trading, risk management, compliance, cybersecurity, and technology and operations capabilities and resources, which are integral parts of the investment management process.
Shareholder and Administrative Services. The Board considered (i) the nature, extent, quality, and cost of advisory, administrative, shareholder, transfer agency, and pricing and bookkeeping services performed by the Investment Advisers and their affiliates under the Advisory Contracts; (ii) the nature and extent of Fidelity's supervision of third party service providers, principally custodians, subcustodians, and pricing vendors; and (iii) the resources devoted by Fidelity to, and the record of compliance with, the fund's compliance policies and procedures, including with respect to liquidity and derivatives risk management. The Board also reviewed the allocation of fund brokerage, including allocations to brokers affiliated with the Investment Advisers, the use of brokerage commissions to pay fund expenses, and the use of "soft" commission dollars to pay for research services. The Board also considered the fund's securities lending activities and any payments made to Fidelity relating to securities lending under a separate agreement.
The Board noted that the growth of fund assets over time across the complex allows Fidelity to reinvest in the development of services designed to enhance the value and convenience of the Fidelity funds as investment vehicles. These services include 24-hour access to account information and market information over the Internet and through telephone representatives, investor education materials and asset allocation tools. The Board also considered that it reviews customer service metrics such as telephone response times, continuity of services on the website and metrics addressing services at Fidelity Investor Centers.
Investment in a Large Fund Family. The Board considered the benefits to shareholders of investing in a fund that is part of a large family of funds offering a variety of investment disciplines and providing a large variety of fund investor services. The Board noted that Fidelity had taken, or had made recommendations to the Board that resulted in the Fidelity funds taking, a number of actions over the previous year that benefited particular funds and/or the Fidelity funds in general.
Investment Performance. The Board took into account discussions that occur with representatives of the Investment Advisers, and reports that it receives, at Board meetings throughout the year relating to fund investment performance. In this regard the Board noted that as part of regularly scheduled fund reviews and other reports to the Board on fund performance, the Board considered annualized return information for the fund for different time periods, measured against one or more appropriate securities market indices, including a customized blended index that reflects the respective weights of the fund's asset classes (each a benchmark index) and an appropriate peer group of funds with similar objectives (peer group). The Board also considered information about performance attribution. In its evaluation of fund investment performance at meetings throughout the year, the Board gave particular attention to information indicating underperformance of certain Fidelity funds over different time periods and discussed with the Investment Advisers the reasons for such underperformance.
In addition to reviewing absolute and relative fund performance, the Independent Trustees periodically consider the appropriateness of fund performance metrics in evaluating the results achieved. The Independent Trustees generally give greater weight to fund performance over longer time periods than over shorter time periods. Depending on the circumstances, the Independent Trustees may be satisfied with a fund's performance notwithstanding that it lags its benchmark index or peer group for certain periods.
Based on its review, the Board concluded that the nature, extent, and quality of services provided to the fund under the Advisory Contracts should continue to benefit the shareholders of the fund.
Competitiveness of Management Fee and Total Expense Ratio. The Board was provided with information regarding industry trends in management fees and expenses. The Board considered that, effective March 1, 2024, an amended Advisory Contract with FMR went into effect with class-level management fees based on tiered schedules and subject to a maximum class-level rate (the management fee). The Board also considered that in exchange for the variable management fee, each class of the fund receives investment advisory, management, administrative, transfer agent, and pricing and bookkeeping services. In its review of the management fee and total expense ratio of Investor Class, the Board considered a pro forma management fee rate for Investor Class as if the new management fee structure had been in effect for the 12-month period ended December 31, 2023, as well as other third-party fund expenses, as applicable, such as custodial, legal, and audit fees and any fund-paid 12b-1 fees. The Board noted that Fidelity may agree to waive fees or reimburse expenses from time to time, and the extent to which, if any, it has done so for the fund.
Comparisons of Management Fees and Total Expense Ratios. Among other things, the Board reviewed data for selected groups of competitive funds and classes (referred to as "mapped groups") that were compiled by Fidelity based on combining similar investment objective categories (as classified by Morningstar) that have comparable investment mandates. The data reviewed by the Board included (i) gross management fee comparisons (before taking into account expense reimbursements or caps) relative to the total universe of funds within the mapped group; (ii) gross management fee comparisons relative to a subset of non-Fidelity funds in the mapped group that are similar in size and management fee structure to the fund (referred to as the "asset size peer group"); (iii) total expense comparisons of Investor Class of the fund relative to funds and classes in the mapped group that have a similar sales load structure to Investor Class of the fund (referred to as the "similar sales load structure group"); and (iv) total expense comparisons of Investor Class of the fund relative to funds and classes in the similar sales load structure group that are similar in size and management fee structure to the fund (referred to as the "total expense asset size peer group").
The information provided to the Board indicated that the fund's management fee rate ranked above the competitive median of the mapped group for 2023 and above the competitive median of the asset size peer group for 2023. Further, the information provided to the Board indicated that the total expense ratio of the fund's Investor Class ranked below the competitive median of the similar sales load structure group for 2023 and above the competitive median of the total expense asset size peer group for 2023.
The information provided to the Board indicated that the level of servicing for both Fidelity's and competitors' classes ranges across classes from those that provide all servicing at the class level, like Investor Classes, to those that split servicing between the class level and the annuity level. When servicing is provided at the annuity level, it is not reflected in the total expense ratio of the class and, for that reason, the fees of funds that provide service at the class level are not directly comparable to the fees of funds that provide service at the annuity level. The Board considered that, although total expenses ranked above the competitive medians, Fidelity believes the fees for Investor Class of these funds are reasonable given both the value proposition Fidelity offers and the disparity in servicing models within the competitive environment. The Board also considered that the fund has a variable unified management fee that covers expenses beyond portfolio management, unlike the majority of funds within the mapped group. The Board further considered that, when compared to the total expenses of its competitors, the fund ranked below its load-type group median.
The Board noted that a different variable management fee rate is applicable to each class of the fund. The Board considered that the difference in management fee rates between classes is the result of separate arrangements for class-level services and/or waivers of certain expenses and not the result of any difference in advisory or custodial fees or other expenses related to the management of the fund's assets, which do not vary by class.
Fees Charged to Other Fidelity Clients. The Board also considered Fidelity fee structures and other information with respect to clients of Fidelity, such as other funds advised or subadvised by Fidelity, pension plan clients, and other institutional clients with similar mandates. The Board noted that a joint ad hoc committee created by it and the boards of other Fidelity funds periodically reviews and compares Fidelity's institutional investment advisory business with its business of providing services to the Fidelity funds and also noted the most recent findings of the committee. The Board noted that the committee's review included a consideration of the differences in services provided, fees charged, and costs incurred, as well as competition in the markets serving the different categories of clients.
Based on its review, the Board concluded that the fund's management fee is fair and reasonable in light of the services that the fund receives and the other factors considered. Further, based on its review of total expense ratios and fees charged to other Fidelity clients, the Board concluded that the total expense ratio of each class of the fund was reasonable in light of the services that the fund and its shareholders receive and the other factors considered.
Costs of the Services and Profitability. The Board considered the revenues earned and the expenses incurred by Fidelity in conducting the business of developing, marketing, distributing, managing, administering and servicing the fund and servicing the fund's shareholders. The Board also considered the level of Fidelity's profits in respect of all the Fidelity funds.
On an annual basis, Fidelity presents to the Board information about the profitability of its relationships with the fund. Fidelity calculates profitability information for each Fidelity fund, as well as aggregate profitability information for groups of Fidelity funds and all Fidelity funds, using a series of detailed revenue and cost allocation methodologies which originate with the books and records of Fidelity on which Fidelity's audited financial statements are based. The Audit Committee of the Board reviews any significant changes from the prior year's methodologies.
A public accounting firm has been engaged annually by the Board as part of the Board's assessment of Fidelity's profitability analysis. The engagement includes the review and assessment of the methodologies used by Fidelity in determining the revenues and expenses attributable to Fidelity's fund business. After considering the reports issued under the engagement and information provided by Fidelity, the Board concluded that while other allocation methods may also be reasonable, Fidelity's profitability methodologies are reasonable in all material respects.
The Board also reviewed Fidelity's non-fund businesses and potential indirect benefits such businesses may have received as a result of their association with Fidelity's fund business (i.e., fall-out benefits) as well as cases where Fidelity's affiliates may benefit from the funds' business. The Board considered areas where potential indirect benefits to the Fidelity funds from their relationships with Fidelity may exist. The Board's consideration of these matters was informed by the findings of a joint ad hoc committee created by it and the boards of other Fidelity funds to evaluate potential fall-out benefits.
The Board considered the costs of the services provided by and the profits realized by Fidelity in connection with the operation of the fund and was satisfied that the profitability was not excessive.
Economies of Scale. The Board considered whether there have been economies of scale in respect of the management of the Fidelity funds, whether the Fidelity funds (including the fund) have appropriately benefited from any such economies of scale, and whether there is potential for realization of any further economies of scale. The Board considered the extent to which the fund will benefit from economies of scale as assets grow through increased services to the fund, through waivers or reimbursements, or through fee or expense ratio reductions. The Board also noted that a committee created by it and the boards of other Fidelity funds periodically analyzes whether Fidelity attains economies of scale in respect of the management and servicing of the Fidelity funds, whether the Fidelity funds have appropriately benefited from such economies of scale, and whether there is potential for realization of any further economies of scale.
The Board recognized that the fund's management contract incorporates a variable management fee structure, which provides breakpoints as a way to share, in part, any potential economies of scale that may exist at the asset class level determined based on the total net assets of specified Fidelity funds in the same asset class as the fund and through a discount determined based on both fund size and total assets of a broader group of specified Fidelity funds. The Board considered that the variable management fee is designed to deliver the benefits of economies of scale to fund shareholders even if assets of any particular fund are unchanged or have declined, because some portion of Fidelity's costs are attributable to services provided to all funds subject to the variable management fee, and all such funds benefit if those costs can be allocated among more assets. The Board concluded that, given the variable management fee structure, fund shareholders will benefit from lower management fees due to the application of the breakpoints and discount, regardless of whether Fidelity achieves any such economies of scale.
The Board concluded, taking into account the analysis of the committee, that economies of scale, if any, are being appropriately shared between fund shareholders and Fidelity.
Additional Information Requested by the Board. In order to develop fully the factual basis for consideration of the Fidelity funds' advisory contracts, the Board requested and received additional information on certain topics, including: (i) portfolio manager changes that have occurred during the past year; (ii) hiring, training, compensating, and retaining adviser and sub-adviser personnel; (iii) the terms of the funds' various management fee structures and arrangements for transfer agent and pricing and bookkeeping services; (iv) Fidelity's fund profitability methodology, profitability trends for certain funds, the allocation of various costs to different funds, and the impact of certain factors on fund profitability results; (v) the impact on fund profitability of recent industry trends, such as the growth in passively managed funds and the changes in flows for different types of funds; (vi) the types of management fee and total expense comparisons provided, and the challenges and limitations associated with such information; (vii) explanations regarding the relative total expense ratios and management fees of certain funds and classes, total expense and management fee competitive trends, and methodologies for total expense and management fee competitive comparisons; (viii) matters related to money market funds, exchange-traded funds, and target date funds; (ix) the arrangements with and compensation paid to certain fund sub-advisers and the treatment of such compensation within Fidelity's fund profitability methodology; and (x) the terms of management contracts between Fidelity and other funds and products not overseen by the Board.
Conclusion. Based on its evaluation of all of the conclusions noted above, and after considering all factors it believed relevant, the Board, including the Independent Trustees, concluded that the advisory and sub-advisory fee arrangements are fair and reasonable in light of all of the surrounding circumstances and that the fund's Advisory Contracts should be renewed through September 30, 2025.
1.796350.122
VIPSI-ANN-0325
Fidelity® Variable Insurance Products:
VIP FundsManager® 20% Portfolio
VIP FundsManager® 30% Portfolio
VIP FundsManager® 40% Portfolio
VIP FundsManager® 50% Portfolio
VIP FundsManager® 60% Portfolio
VIP FundsManager® 70% Portfolio
VIP FundsManager® 85% Portfolio
Annual Report
December 31, 2024
Contents
To view a fund's proxy voting guidelines and proxy voting record for the 12-month period ended June 30, visit http://www.fidelity.com/proxyvotingresults or visit the Securities and Exchange Commission's (SEC) web site at http://www.sec.gov.
You may also call 1-877-208-0098 to request a free copy of the proxy voting guidelines.
Fidelity® Variable Insurance Products are separate account options which are purchased through a variable insurance contract.
Standard & Poor's, S&P and S&P 500 are registered service marks of The McGraw-Hill Companies, Inc. and have been licensed for use by Fidelity Distributors Corporation.
Other third-party marks appearing herein are the property of their respective owners.
All other marks appearing herein are registered or unregistered trademarks or service marks of FMR LLC or an affiliated company. © 2025 FMR LLC. All rights reserved.
This report and the financial statements contained herein are submitted for the general information of the shareholders of the Funds. This report is not authorized for distribution to prospective investors in the Funds unless preceded or accompanied by an effective prospectus.
A fund files its complete schedule of portfolio holdings with the SEC for the first and third quarters of each fiscal year on Form N-PORT. Forms N-PORT are available on the SEC's web site at http://www.sec.gov. A fund's Forms N-PORT may be reviewed and copied at the SEC's Public Reference Room in Washington, DC. Information regarding the operation of the SEC's Public Reference Room may be obtained by calling 1-800-SEC-0330.
For a complete list of a fund's portfolio holdings, view the most recent holdings listing, semiannual report, or annual report on Fidelity's web site at http://www.fidelity.com, http://www.institutional.fidelity.com, or http://www.401k.com, as applicable.
NOT FDIC INSURED •MAY LOSE VALUE •NO BANK GUARANTEE
Neither the Funds nor Fidelity Distributors Corporation is a bank.
Item 7: Financial Statements and Financial Highlights for Open-End Management Investment Companies (Annual Report)
VIP FundsManager® 20% Portfolio
Schedule of Investments December 31, 2024
Showing Percentage of Net Assets
| Alternative Funds - 1.3% |
| | | Shares | Value ($) |
Fidelity Hedged Equity Fund (b) (Cost $6,831,475) | | 667,688 | 8,800,132 |
| | | | |
| Bond Funds - 48.6% |
| | | Shares | Value ($) |
| Fidelity Floating Rate High Income Fund (b) | | 566,603 | 5,263,738 |
| Fidelity High Income Fund (b) | | 671,921 | 5,288,021 |
| Fidelity Inflation-Protected Bond Index Fund (b) | | 1,139,965 | 10,134,289 |
| Fidelity Long-Term Treasury Bond Index Fund (b) | | 719,855 | 6,601,069 |
| Fidelity Total Bond Fund (b) | | 16,090,760 | 151,253,142 |
| VIP Investment Grade Bond II Portfolio - Investor Class (b) | | 16,349,328 | 150,577,316 |
| TOTAL BOND FUNDS (Cost $343,947,866) | | | 329,117,575 |
| | | | |
| Domestic Equity Funds - 14.4% |
| | | Shares | Value ($) |
| Fidelity Blue Chip Growth ETF (b) | | 51,513 | 2,382,991 |
| Fidelity Commodity Strategy Fund (b) | | 35,207 | 3,219,295 |
| Fidelity Contrafund (b) | | 112,681 | 2,369,685 |
| Fidelity Enhanced Large Cap Core ETF (b) | | 154,574 | 5,090,123 |
| Fidelity Enhanced Mid Cap ETF (b) | | 81,711 | 2,684,206 |
| Fidelity Enhanced Small Cap ETF (b) | | 120,096 | 3,885,106 |
| Fidelity Fundamental Small-Mid Cap ETF (b) | | 18,476 | 496,635 |
| Fidelity Real Estate Investment Portfolio (b) | | 83,458 | 3,220,650 |
| Fidelity Stock Selector Small Cap Fund (b) | | 96,127 | 3,583,601 |
| VIP Stock Selector All Cap Portfolio - Investor Class (b) | | 5,556,258 | 67,786,352 |
| VIP Value Strategies Portfolio - Investor Class (b) | | 209,502 | 3,211,670 |
| TOTAL DOMESTIC EQUITY FUNDS (Cost $84,161,977) | | | 97,930,314 |
| | | | |
| International Equity Funds - 7.8% |
| | | Shares | Value ($) |
| Fidelity Canada Fund (b) | | 18,337 | 1,204,364 |
| Fidelity Emerging Markets Discovery Fund (b) | | 246,096 | 3,750,510 |
| Fidelity Emerging Markets Fund (b) | | 318,513 | 12,128,990 |
| Fidelity Enhanced International ETF (b) | | 186,277 | 5,128,206 |
| Fidelity Infrastructure Fund (b) | | 56,658 | 777,350 |
| Fidelity International Capital Appreciation Fund (b) | | 120,314 | 3,313,442 |
| Fidelity International Discovery Fund (b) | | 78,403 | 3,756,295 |
| Fidelity International Small Cap Fund (b) | | 52,048 | 1,592,145 |
| Fidelity International Small Cap Opportunities Fund (b) | | 148,689 | 2,909,847 |
| Fidelity International Value Fund (b) | | 274,502 | 2,761,492 |
| Fidelity Overseas Fund (b) | | 247,217 | 15,475,791 |
| TOTAL INTERNATIONAL EQUITY FUNDS (Cost $40,625,911) | | | 52,798,432 |
| | | | |
| U.S. Treasury Obligations - 0.1% |
| | | Yield (%) (c) | Principal Amount (a) | Value ($) |
US Treasury Bills 0% 1/23/2025 (Cost $349,038) | | 4.55 | 350,000 | 349,133 |
| | | | | |
| Money Market Funds - 27.8% |
| | | Yield (%) | Shares | Value ($) |
| Fidelity Cash Central Fund (d) | | 4.36 | 56,061,491 | 56,072,703 |
| Fidelity Investments Money Market Government Portfolio - Institutional Class (b)(e) | | 4.42 | 132,720,953 | 132,720,953 |
| TOTAL MONEY MARKET FUNDS (Cost $188,793,656) | | | | 188,793,656 |
| | | | | |
| TOTAL INVESTMENT IN SECURITIES - 100.0% (Cost $664,709,923) | 677,789,242 |
NET OTHER ASSETS (LIABILITIES) - 0.0% | 187,987 |
| NET ASSETS - 100.0% | 677,977,229 |
| | |
| Futures Contracts |
| | Number of contracts | Expiration Date | Notional Amount ($) | Value ($) | Unrealized Appreciation/ (Depreciation) ($) |
| Purchased | | | | | |
| | | | | | |
| Equity Contracts | | | | | |
| CME E-mini Russell 2000 Index Contracts (United States) | 26 | Mar 2025 | 2,924,740 | (2,230) | (2,230) |
| CME E-mini S&P MidCap 400 Index Contracts (United States) | 3 | Mar 2025 | 944,010 | 329 | 329 |
| | | | | | |
| TOTAL PURCHASED | | | | | (1,901) |
| | | | | | |
| Sold | | | | | |
| | | | | | |
| Equity Contracts | | | | | |
| CME E-mini S&P 500 Index Contracts (United States) | 13 | Mar 2025 | 3,858,238 | 2,641 | 2,641 |
| | | | | | |
| TOTAL FUTURES CONTRACTS | | | | | 740 |
| The notional amount of futures purchased as a percentage of Net Assets is 0.5% |
| The notional amount of futures sold as a percentage of Net Assets is 0.6% |
Security Type Abbreviations
Legend
| (a) | Amount is stated in United States dollars unless otherwise noted. |
| (c) | Yield represents either the annualized yield at the date of purchase, or the stated coupon rate, or, for floating and adjustable rate securities, the rate at period end. |
| (d) | Affiliated fund that is generally available only to investment companies and other accounts managed by Fidelity Investments. The rate quoted is the annualized seven-day yield of the fund at period end. A complete unaudited listing of the fund's holdings as of its most recent quarter end is available upon request. In addition, each Fidelity Central Fund's financial statements, which are not covered by the Fund's Report of Independent Registered Public Accounting Firm, are available on the SEC's website or upon request. |
| (e) | The rate quoted is the annualized seven-day yield of the fund at period end. |
Affiliated Central Funds
Fiscal year to date information regarding the Fund's investments in Fidelity Central Funds, including the ownership percentage, is presented below.
| Affiliate | Value, beginning of period ($) | Purchases ($) | Sales Proceeds ($) | Dividend Income ($) | Realized Gain (loss) ($) | Change in Unrealized appreciation (depreciation) ($) | Value, end of period ($) | Shares, end of period | % ownership, end of period |
| Fidelity Cash Central Fund | 24,884,346 | 48,009,087 | 16,820,736 | 1,926,448 | 6 | - | 56,072,703 | 56,061,491 | 0.1% |
| Total | 24,884,346 | 48,009,087 | 16,820,736 | 1,926,448 | 6 | - | 56,072,703 | 56,061,491 | |
| | | | | | | | | | |
Amounts in the dividend income column in the above table include any capital gain distributions from underlying funds, which are presented in the corresponding line item in the Statement of Operations, if applicable.
Amounts included in the purchases and sales proceeds columns may include in-kind transactions, if applicable.
Affiliated Underlying Funds
Fiscal year to date information regarding the Fund's investments in affiliated Underlying Funds is presented below. Exchanges between classes of the same affiliated Underlying Funds may occur. If an Underlying Funds changes its name, the name presented below is the name in effect at period end.
| Affiliate | Value, beginning of period ($) | Purchases ($) | Sales Proceeds ($) | Dividend Income ($) | Realized Gain (loss) ($) | Change in Unrealized appreciation (depreciation) ($) | Value, end of period ($) | Shares, end of period |
| Fidelity Blue Chip Growth ETF | - | 2,383,717 | - | - | - | (726) | 2,382,991 | 51,513 |
| Fidelity Canada Fund | 1,461,838 | 131,563 | 424,678 | 85,266 | 27,575 | 8,066 | 1,204,364 | 18,337 |
| Fidelity Commodity Strategy Fund | 1,975,189 | 1,733,369 | 458,394 | 121,894 | (66,763) | 35,894 | 3,219,295 | 35,207 |
| Fidelity Contrafund | 1,502,791 | 4,799,528 | 4,620,407 | 248,140 | 213,590 | 474,183 | 2,369,685 | 112,681 |
| Fidelity Emerging Markets Discovery Fund | 7,788,655 | 172,309 | 3,832,291 | 144,642 | 405,814 | (783,977) | 3,750,510 | 246,096 |
| Fidelity Emerging Markets Fund | 13,333,819 | 328,365 | 2,409,576 | 79,048 | 385,669 | 490,713 | 12,128,990 | 318,513 |
| Fidelity Enhanced International ETF | 4,900,274 | 38,680 | - | 153,882 | - | 189,252 | 5,128,206 | 186,277 |
| Fidelity Enhanced Large Cap Core ETF | - | 12,075,817 | 7,303,686 | 23,470 | 75,705 | 242,287 | 5,090,123 | 154,574 |
| Fidelity Enhanced Large Cap Value ETF | 684,004 | - | 736,258 | 6,649 | 204,429 | (152,175) | - | - |
| Fidelity Enhanced Mid Cap ETF | - | 2,952,095 | 520,242 | 21,564 | 35,533 | 216,820 | 2,684,206 | 81,711 |
| Fidelity Enhanced Small Cap ETF | - | 3,777,330 | 187,544 | 31,506 | 10,543 | 284,777 | 3,885,106 | 120,096 |
| Fidelity Equity-Income Fund | 2,439,882 | 18,201 | 2,643,438 | 8,584 | 660,485 | (475,130) | - | - |
| Fidelity Floating Rate High Income Fund | 9,516,426 | 763,942 | 4,978,665 | 655,667 | (80,706) | 42,741 | 5,263,738 | 566,603 |
| Fidelity Fundamental Small-Mid Cap ETF | - | 497,113 | - | - | - | (478) | 496,635 | 18,476 |
| Fidelity Hedged Equity Fund | 9,407,664 | 53,658 | 2,255,216 | 53,659 | 426,560 | 1,167,466 | 8,800,132 | 667,688 |
| Fidelity High Income Fund | 3,775,562 | 2,163,675 | 810,774 | 323,538 | 5,378 | 154,180 | 5,288,021 | 671,921 |
| Fidelity Inflation-Protected Bond Index Fund | 8,969,720 | 5,771,746 | 4,318,791 | 292,557 | (264,476) | (23,910) | 10,134,289 | 1,139,965 |
| Fidelity Infrastructure Fund | 759,224 | 22,060 | 93,162 | 12,669 | 3,297 | 85,931 | 777,350 | 56,658 |
| Fidelity International Capital Appreciation Fund | 3,614,793 | 219,557 | 673,159 | 135,100 | 123,460 | 28,791 | 3,313,442 | 120,314 |
| Fidelity International Discovery Fund | 4,086,066 | 212,803 | 878,956 | 106,576 | 30,153 | 306,229 | 3,756,295 | 78,403 |
| Fidelity International Small Cap Fund | 1,886,543 | 84,065 | 345,478 | 41,459 | 41,313 | (74,298) | 1,592,145 | 52,048 |
| Fidelity International Small Cap Opportunities Fund | 2,751,296 | 220,758 | - | 175,500 | - | (62,207) | 2,909,847 | 148,689 |
| Fidelity International Value Fund | 2,994,051 | 140,520 | 458,813 | 78,922 | 47,737 | 37,997 | 2,761,492 | 274,502 |
| Fidelity Investments Money Market Government Portfolio - Institutional Class | 135,697,223 | 25,479,230 | 28,455,500 | 6,854,200 | - | - | 132,720,953 | 132,720,953 |
| Fidelity Long-Term Treasury Bond Index Fund | 4,455,102 | 3,971,110 | 1,308,011 | 146,268 | (59,980) | (457,152) | 6,601,069 | 719,855 |
| Fidelity Low-Priced Stock Fund | 2,697,945 | 1,883,518 | 4,478,479 | 307,142 | (20,757) | (82,227) | - | - |
| Fidelity Overseas Fund | 17,434,856 | 624,882 | 3,323,856 | 213,832 | 493,347 | 246,562 | 15,475,791 | 247,217 |
| Fidelity Real Estate Investment Portfolio | 3,857,144 | 241,584 | 910,518 | 182,847 | (10,781) | 43,221 | 3,220,650 | 83,458 |
| Fidelity Stock Selector Small Cap Fund | - | 3,583,601 | - | - | - | - | 3,583,601 | 96,127 |
| Fidelity Total Bond Fund | 179,493,756 | 13,901,783 | 38,956,233 | 7,409,116 | (1,259,180) | (1,926,984) | 151,253,142 | 16,090,760 |
| Fidelity U.S. Low Volatility Equity Fund | 7,244,007 | 2,872 | 7,399,884 | - | 963,359 | (810,354) | - | - |
| Fidelity Value Discovery Fund | 1,194,898 | 5,333 | 1,264,307 | - | 338,997 | (274,921) | - | - |
| VIP Investment Grade Bond II Portfolio - Investor Class | 177,997,412 | 13,957,948 | 37,684,368 | 6,352,631 | (1,439,421) | (2,254,255) | 150,577,316 | 16,349,328 |
| VIP Stock Selector Portfolio - Investor Class | 101,760,217 | 2,071,711 | 51,307,378 | 490,789 | 5,616,760 | 9,645,042 | 67,786,352 | 5,556,258 |
| VIP Value Strategies Portfolio - Investor Class | - | 3,211,670 | - | - | - | - | 3,211,670 | 209,502 |
| | 713,680,357 | 107,496,113 | 213,038,062 | 24,757,117 | 6,907,640 | 6,321,358 | 621,367,406 | 177,193,730 |
Amounts in the dividend income column in the above table include any capital gain distributions from underlying funds, which are presented in the corresponding line item in the Statement of Operations, if applicable.
Amounts included in the purchases and sales proceeds columns may include in-kind transactions, if applicable.
Investment Valuation
The following is a summary of the inputs used, as of December 31, 2024, involving the Fund's assets and liabilities carried at fair value. The inputs or methodology used for valuing securities may not be an indication of the risk associated with investing in those securities. For more information on valuation inputs, and their aggregation into the levels used below, please refer to the Investment Valuation section in the accompanying Notes to Financial Statements.
| Valuation Inputs at Reporting Date: |
| Description | Total ($) | Level 1 ($) | Level 2 ($) | Level 3 ($) |
Investments in Securities: | | | | |
|
| Alternative Funds | 8,800,132 | 8,800,132 | - | - |
|
| Bond Funds | 329,117,575 | 329,117,575 | - | - |
|
| Domestic Equity Funds | 97,930,314 | 97,930,314 | - | - |
|
| International Equity Funds | 52,798,432 | 52,798,432 | - | - |
|
| U.S. Treasury Obligations | 349,133 | - | 349,133 | - |
|
| Money Market Funds | 188,793,656 | 188,793,656 | - | - |
| Total Investments in Securities: | 677,789,242 | 677,440,109 | 349,133 | - |
Derivative Instruments: Assets | | | | |
Futures Contracts | 2,970 | 2,970 | - | - |
| Total Assets | 2,970 | 2,970 | - | - |
| Liabilities | | | | |
Futures Contracts | (2,230) | (2,230) | - | - |
| Total Liabilities | (2,230) | (2,230) | - | - |
| Total Derivative Instruments: | 740 | 740 | - | - |
Value of Derivative Instruments
The following table is a summary of the Fund's value of derivative instruments by primary risk exposure as of December 31, 2024. For additional information on derivative instruments, please refer to the Derivative Instruments section in the accompanying Notes to Financial Statements.
Primary Risk Exposure / Derivative Type | Value |
| Asset ($) | Liability ($) |
| Equity Risk | | |
Futures Contracts (a) | 2,970 | (2,230) |
| Total Equity Risk | 2,970 | (2,230) |
| Total Value of Derivatives | 2,970 | (2,230) |
(a)Reflects gross cumulative appreciation (depreciation) on futures contracts as presented in the Schedule of Investments. In the Statement of Assets and Liabilities, the period end daily variation margin is included in receivable or payable for daily variation margin on futures contracts, and the net cumulative appreciation (depreciation) is included in Total accumulated earnings (loss).
VIP FundsManager® 20% Portfolio
Financial Statements
| Statement of Assets and Liabilities |
As of December 31, 2024 |
| Assets | | | | |
| Investment in securities, at value - See accompanying schedule: | | | | |
Unaffiliated issuers (cost $349,038) | $ | 349,133 | | |
Fidelity Central Funds (cost $56,072,703) | | 56,072,703 | | |
Other affiliated issuers (cost $608,288,182) | | 621,367,406 | | |
| | | | | |
| | | | | |
| Total Investment in Securities (cost $664,709,923) | | | $ | 677,789,242 |
| Cash | | | | 237 |
| Receivable for investments sold | | | | 10,002,047 |
| Receivable for fund shares sold | | | | 1,291 |
| Distributions receivable from Fidelity Central Funds | | | | 214,427 |
| Receivable for daily variation margin on futures contracts | | | | 741 |
Total assets | | | | 688,007,985 |
| Liabilities | | | | |
| Payable for investments purchased | $ | 9,676,106 | | |
| Payable for fund shares redeemed | | 295,614 | | |
| Accrued management fee | | 57,434 | | |
| Distribution and service plan fees payable | | 1,602 | | |
| Total liabilities | | | | 10,030,756 |
| Net Assets | | | $ | 677,977,229 |
| Net Assets consist of: | | | | |
| Paid in capital | | | $ | 694,497,123 |
| Total accumulated earnings (loss) | | | | (16,519,894) |
| Net Assets | | | $ | 677,977,229 |
| | | | | |
| Net Asset Value and Maximum Offering Price | | | | |
| Service Class : | | | | |
Net Asset Value, offering price and redemption price per share ($59,123 ÷ 5,553 shares) | | | $ | 10.65 |
| Service Class 2 : | | | | |
Net Asset Value, offering price and redemption price per share ($12,302,326 ÷ 1,159,846 shares) | | | $ | 10.61 |
| Investor Class : | | | | |
Net Asset Value, offering price and redemption price per share ($665,615,780 ÷ 62,572,076 shares) | | | $ | 10.64 |
| Statement of Operations |
| Year ended December 31, 2024 |
| Investment Income | | | | |
| Dividends: | | | | |
| Unaffiliated issuers | | | $ | 27,154 |
| Affiliated issuers | | | | 23,812,293 |
| Interest | | | | 37,786 |
| Income from Fidelity Central Funds | | | | 1,926,448 |
| Total income | | | | 25,803,681 |
| Expenses | | | | |
| Management fee | $ | 1,065,017 | | |
| Distribution and service plan fees | | 30,150 | | |
| Independent trustees' fees and expenses | | 1,858 | | |
| Total expenses before reductions | | 1,097,025 | | |
| Expense reductions | | (368,113) | | |
| Total expenses after reductions | | | | 728,912 |
| Net Investment income (loss) | | | | 25,074,769 |
| Realized and Unrealized Gain (Loss) | | | | |
| Net realized gain (loss) on: | | | | |
| Investment Securities: | | | | |
| Unaffiliated issuers | | 434,971 | | |
| Fidelity Central Funds | | 6 | | |
| Other affiliated issuers | | 6,907,640 | | |
| Foreign currency transactions | | 54 | | |
| Futures contracts | | (2,488,156) | | |
| Capital gain distributions from underlying funds: | | | | |
| Affiliated issuers | | 944,824 | | |
| Total net realized gain (loss) | | | | 5,799,339 |
| Change in net unrealized appreciation (depreciation) on: | | | | |
| Investment Securities: | | | | |
| Unaffiliated issuers | | (117) | | |
| Affiliated issuers | | 6,321,358 | | |
| Futures contracts | | 810,249 | | |
| Total change in net unrealized appreciation (depreciation) | | | | 7,131,490 |
| Net gain (loss) | | | | 12,930,829 |
| Net increase (decrease) in net assets resulting from operations | | | $ | 38,005,598 |
| Statement of Changes in Net Assets |
| |
| | Year ended December 31, 2024 | | Year ended December 31, 2023 |
| Increase (Decrease) in Net Assets | | | | |
| Operations | | | | |
| Net investment income (loss) | $ | 25,074,769 | $ | 26,133,887 |
| Net realized gain (loss) | | 5,799,339 | | (15,499,603) |
| Change in net unrealized appreciation (depreciation) | | 7,131,490 | | 49,379,650 |
| Net increase (decrease) in net assets resulting from operations | | 38,005,598 | | 60,013,934 |
| Distributions to shareholders | | (24,562,137) | | (27,487,975) |
| | | | | |
| Share transactions - net increase (decrease) | | (75,215,003) | | (105,051,134) |
| Total increase (decrease) in net assets | | (61,771,542) | | (72,525,175) |
| | | | | |
| Net Assets | | | | |
| Beginning of period | | 739,748,771 | | 812,273,946 |
| End of period | $ | 677,977,229 | $ | 739,748,771 |
| | | | | |
| | | | | |
Financial Highlights
VIP FundsManager® 20% Portfolio Service Class |
| |
| Years ended December 31, | | 2024 | | 2023 | | 2022 | | 2021 | | 2020 |
Selected Per-Share Data | | | | | | | | | | |
| Net asset value, beginning of period | $ | 10.47 | $ | 10.05 | $ | 12.18 | $ | 11.89 | $ | 11.19 |
| Income from Investment Operations | | | | | | | | | | |
Net investment income (loss) A,B | | .38 | | .35 | | .24 | | .14 | | .13 |
| Net realized and unrealized gain (loss) | | .20 | | .47 | | (1.35) | | .30 | | .77 |
| Total from investment operations | | .58 | | .82 | | (1.11) | | .44 | | .90 |
| Distributions from net investment income | | (.40) | | (.40) | | (.25) | | (.13) | | (.13) |
| Distributions from net realized gain | | - | | - | | (.77) | | (.03) | | (.07) |
| Total distributions | | (.40) | | (.40) | | (1.02) | | (.15) C | | (.20) |
| Net asset value, end of period | $ | 10.65 | $ | 10.47 | $ | 10.05 | $ | 12.18 | $ | 11.89 |
Total Return D,E | | | | 8.15% | | (9.59)% | | 3.74% | | 8.11% |
Ratios to Average Net Assets B,F,G | | | | | | | | | | |
| Expenses before reductions | | .25% | | .25% | | .30% | | .35% | | .35% |
| Expenses net of fee waivers, if any | | | | .10% | | .15% | | .20% | | .20% |
| Expenses net of all reductions | | .10% | | .10% | | .15% | | .20% | | .20% |
| Net investment income (loss) | | 3.53% | | 3.37% | | 2.24% | | 1.12% | | 1.17% |
| Supplemental Data | | | | | | | | | | |
| Net assets, end of period (000 omitted) | $ | 59 | $ | 59 | $ | 54 | $ | 63 | $ | 61 |
Portfolio turnover rate H | | | | 14% | | 70% I | | 45% I | | 32% I |
ACalculated based on average shares outstanding during the period.
BNet investment income (loss) is affected by the timing of the declaration of dividends by any underlying mutual funds or exchange-traded funds (ETFs). Net investment income (loss) of any mutual funds or ETFs is not included in the Fund's net investment income (loss) ratio.
CTotal distributions per share do not sum due to rounding.
DTotal returns do not reflect charges attributable to your insurance company's separate account. Inclusion of these charges would reduce the total returns shown.
ETotal returns would have been lower if certain expenses had not been reduced during the applicable periods shown.
FExpense ratios reflect operating expenses of the class. Expenses before reductions do not reflect amounts reimbursed, waived, or reduced through arrangements with the investment adviser, brokerage services, or other offset arrangements, if applicable, and do not represent the amount paid by the class during periods when reimbursements, waivers or reductions occur.
GFees and expenses of any underlying mutual funds or exchange-traded funds (ETFs) are not included in the Fund's expense ratio. The Fund indirectly bears its proportionate share of these expenses. For additional expense information related to investments in Fidelity Central Funds, please refer to the "Investments in Fidelity Central Funds" note found in the Notes to Financial Statements section of the most recent Annual or Semi-Annual report.
HAmount does not include the portfolio activity of any underlying mutual funds or exchange-traded funds (ETFs), derivatives or securities that mature within one year from acquisition.
IPortfolio turnover rate excludes securities received or delivered in-kind.
VIP FundsManager® 20% Portfolio Service Class 2 |
| |
| Years ended December 31, | | 2024 | | 2023 | | 2022 | | 2021 | | 2020 |
Selected Per-Share Data | | | | | | | | | | |
| Net asset value, beginning of period | $ | 10.43 | $ | 10.02 | $ | 12.14 | $ | 11.86 | $ | 11.16 |
| Income from Investment Operations | | | | | | | | | | |
Net investment income (loss) A,B | | .36 | | .33 | | .22 | | .12 | | .12 |
| Net realized and unrealized gain (loss) | | .20 | | .46 | | (1.34) | | .30 | | .77 |
| Total from investment operations | | .56 | | .79 | | (1.12) | | .42 | | .89 |
| Distributions from net investment income | | (.38) | | (.38) | | (.23) | | (.11) | | (.11) |
| Distributions from net realized gain | | - | | - | | (.77) | | (.03) | | (.07) |
| Total distributions | | (.38) | | (.38) | | (1.00) | | (.14) | | (.19) C |
| Net asset value, end of period | $ | 10.61 | $ | 10.43 | $ | 10.02 | $ | 12.14 | $ | 11.86 |
Total Return D,E | | | | 7.91% | | (9.67)% | | 3.52% | | 7.97% |
Ratios to Average Net Assets B,F,G | | | | | | | | | | |
| Expenses before reductions | | .40% | | .40% | | .44% | | .50% | | .50% |
| Expenses net of fee waivers, if any | | | | .25% | | .29% | | .35% | | .35% |
| Expenses net of all reductions | | .25% | | .25% | | .29% | | .35% | | .35% |
| Net investment income (loss) | | 3.38% | | 3.22% | | 2.09% | | .97% | | 1.02% |
| Supplemental Data | | | | | | | | | | |
| Net assets, end of period (000 omitted) | $ | 12,302 | $ | 11,585 | $ | 11,376 | $ | 10,257 | $ | 9,323 |
Portfolio turnover rate H | | | | 14% | | 70% I | | 45% I | | 32% I |
ACalculated based on average shares outstanding during the period.
BNet investment income (loss) is affected by the timing of the declaration of dividends by any underlying mutual funds or exchange-traded funds (ETFs). Net investment income (loss) of any mutual funds or ETFs is not included in the Fund's net investment income (loss) ratio.
CTotal distributions per share do not sum due to rounding.
DTotal returns do not reflect charges attributable to your insurance company's separate account. Inclusion of these charges would reduce the total returns shown.
ETotal returns would have been lower if certain expenses had not been reduced during the applicable periods shown.
FExpense ratios reflect operating expenses of the class. Expenses before reductions do not reflect amounts reimbursed, waived, or reduced through arrangements with the investment adviser, brokerage services, or other offset arrangements, if applicable, and do not represent the amount paid by the class during periods when reimbursements, waivers or reductions occur.
GFees and expenses of any underlying mutual funds or exchange-traded funds (ETFs) are not included in the Fund's expense ratio. The Fund indirectly bears its proportionate share of these expenses. For additional expense information related to investments in Fidelity Central Funds, please refer to the "Investments in Fidelity Central Funds" note found in the Notes to Financial Statements section of the most recent Annual or Semi-Annual report.
HAmount does not include the portfolio activity of any underlying mutual funds or exchange-traded funds (ETFs), derivatives or securities that mature within one year from acquisition.
IPortfolio turnover rate excludes securities received or delivered in-kind.
VIP FundsManager® 20% Portfolio Investor Class |
| |
| Years ended December 31, | | 2024 | | 2023 | | 2022 | | 2021 | | 2020 |
Selected Per-Share Data | | | | | | | | | | |
| Net asset value, beginning of period | $ | 10.46 | $ | 10.04 | $ | 12.17 | $ | 11.89 | $ | 11.18 |
| Income from Investment Operations | | | | | | | | | | |
Net investment income (loss) A,B | | .38 | | .35 | | .24 | | .14 | | .13 |
| Net realized and unrealized gain (loss) | | .20 | | .47 | | (1.35) | | .29 | | .78 |
| Total from investment operations | | .58 | | .82 | | (1.11) | | .43 | | .91 |
| Distributions from net investment income | | (.40) | | (.40) | | (.25) | | (.13) | | (.13) |
| Distributions from net realized gain | | - | | - | | (.77) | | (.03) | | (.07) |
| Total distributions | | (.40) | | (.40) | | (1.02) | | (.15) C | | (.20) |
| Net asset value, end of period | $ | 10.64 | $ | 10.46 | $ | 10.04 | $ | 12.17 | $ | 11.89 |
Total Return D,E | | | | 8.15% | | (9.60)% | | 3.65% | | 8.21% |
Ratios to Average Net Assets B,F,G | | | | | | | | | | |
| Expenses before reductions | | .15% | | .15% | | .19% | | .25% | | .25% |
| Expenses net of fee waivers, if any | | | | .10% | | .14% | | .20% | | .20% |
| Expenses net of all reductions | | .10% | | .10% | | .14% | | .20% | | .20% |
| Net investment income (loss) | | 3.53% | | 3.37% | | 2.24% | | 1.12% | | 1.17% |
| Supplemental Data | | | | | | | | | | |
| Net assets, end of period (000 omitted) | $ | 665,616 | $ | 728,105 | $ | 800,844 | $ | 986,076 | $ | 925,096 |
Portfolio turnover rate H | | | | 14% | | 70% I | | 45% I | | 32% I |
ACalculated based on average shares outstanding during the period.
BNet investment income (loss) is affected by the timing of the declaration of dividends by any underlying mutual funds or exchange-traded funds (ETFs). Net investment income (loss) of any mutual funds or ETFs is not included in the Fund's net investment income (loss) ratio.
CTotal distributions per share do not sum due to rounding.
DTotal returns do not reflect charges attributable to your insurance company's separate account. Inclusion of these charges would reduce the total returns shown.
ETotal returns would have been lower if certain expenses had not been reduced during the applicable periods shown.
FExpense ratios reflect operating expenses of the class. Expenses before reductions do not reflect amounts reimbursed, waived, or reduced through arrangements with the investment adviser, brokerage services, or other offset arrangements, if applicable, and do not represent the amount paid by the class during periods when reimbursements, waivers or reductions occur.
GFees and expenses of any underlying mutual funds or exchange-traded funds (ETFs) are not included in the Fund's expense ratio. The Fund indirectly bears its proportionate share of these expenses. For additional expense information related to investments in Fidelity Central Funds, please refer to the "Investments in Fidelity Central Funds" note found in the Notes to Financial Statements section of the most recent Annual or Semi-Annual report.
HAmount does not include the portfolio activity of any underlying mutual funds or exchange-traded funds (ETFs), derivatives or securities that mature within one year from acquisition.
IPortfolio turnover rate excludes securities received or delivered in-kind.
VIP FundsManager® 30% Portfolio
Schedule of Investments December 31, 2024
Showing Percentage of Net Assets
| Alternative Funds - 1.3% |
| | | Shares | Value ($) |
Fidelity Hedged Equity Fund (b) (Cost $160,932) | | 14,171 | 186,769 |
| | | | |
| Bond Funds - 48.7% |
| | | Shares | Value ($) |
| Fidelity Floating Rate High Income Fund (b) | | 12,275 | 114,037 |
| Fidelity High Income Fund (b) | | 14,410 | 113,408 |
| Fidelity Inflation-Protected Bond Index Fund (b) | | 24,892 | 221,287 |
| Fidelity Long-Term Treasury Bond Index Fund (b) | | 15,729 | 144,233 |
| Fidelity Total Bond Fund (b) | | 350,989 | 3,299,294 |
| VIP Investment Grade Bond II Portfolio - Investor Class (b) | | 356,754 | 3,285,706 |
| TOTAL BOND FUNDS (Cost $7,244,714) | | | 7,177,965 |
| | | | |
| Domestic Equity Funds - 20.4% |
| | | Shares | Value ($) |
| Fidelity Blue Chip Growth ETF (b) | | 1,689 | 78,133 |
| Fidelity Commodity Strategy Fund (b) | | 774 | 70,789 |
| Fidelity Contrafund (b) | | 3,697 | 77,747 |
| Fidelity Enhanced Large Cap Core ETF (b) | | 3,323 | 109,426 |
| Fidelity Enhanced Mid Cap ETF (b) | | 1,640 | 53,874 |
| Fidelity Enhanced Small Cap ETF (b) | | 2,410 | 77,964 |
| Fidelity Fundamental Small-Mid Cap ETF (b) | | 2,943 | 79,108 |
| Fidelity Real Estate Investment Portfolio (b) | | 1,824 | 70,403 |
| Fidelity Stock Selector Small Cap Fund (b) | | 4,945 | 184,341 |
| VIP Stock Selector All Cap Portfolio - Investor Class (b) | | 171,743 | 2,095,268 |
| VIP Value Strategies Portfolio - Investor Class (b) | | 6,871 | 105,338 |
| TOTAL DOMESTIC EQUITY FUNDS (Cost $2,615,207) | | | 3,002,391 |
| | | | |
| International Equity Funds - 11.8% |
| | | Shares | Value ($) |
| Fidelity Canada Fund (b) | | 1,118 | 73,435 |
| Fidelity Emerging Markets Discovery Fund (b) | | 3,203 | 48,817 |
| Fidelity Emerging Markets Fund (b) | | 12,363 | 470,781 |
| Fidelity Enhanced International ETF (b) | | 1,845 | 50,793 |
| Fidelity Infrastructure Fund (b) | | 1,290 | 17,694 |
| Fidelity International Capital Appreciation Fund (b) | | 4,248 | 116,977 |
| Fidelity International Discovery Fund (b) | | 3,191 | 152,901 |
| Fidelity International Small Cap Fund (b) | | 1,860 | 56,902 |
| Fidelity International Small Cap Opportunities Fund (b) | | 4,009 | 78,450 |
| Fidelity International Value Fund (b) | | 7,592 | 76,381 |
| Fidelity Japan Smaller Companies Fund (b) | | 2,362 | 36,845 |
| Fidelity Overseas Fund (b) | | 8,948 | 560,145 |
| TOTAL INTERNATIONAL EQUITY FUNDS (Cost $1,697,307) | | | 1,740,121 |
| | | | |
| U.S. Treasury Obligations - 0.1% |
| | | Yield (%) (c) | Principal Amount (a) | Value ($) |
US Treasury Bills 0% 1/9/2025 (Cost $19,980) | | 4.58 | 20,000 | 19,984 |
| | | | | |
| Money Market Funds - 17.4% |
| | | Yield (%) | Shares | Value ($) |
| Fidelity Cash Central Fund (d) | | 4.36 | 660,593 | 660,725 |
| Fidelity Investments Money Market Government Portfolio - Institutional Class (b)(e) | | 4.42 | 1,907,759 | 1,907,759 |
| TOTAL MONEY MARKET FUNDS (Cost $2,568,484) | | | | 2,568,484 |
| | | | | |
| TOTAL INVESTMENT IN SECURITIES - 99.7% (Cost $14,306,624) | 14,695,714 |
NET OTHER ASSETS (LIABILITIES) - 0.3% | 44,469 |
| NET ASSETS - 100.0% | 14,740,183 |
| | |
Security Type Abbreviations
Legend
| (a) | Amount is stated in United States dollars unless otherwise noted. |
| (c) | Yield represents either the annualized yield at the date of purchase, or the stated coupon rate, or, for floating and adjustable rate securities, the rate at period end. |
| (d) | Affiliated fund that is generally available only to investment companies and other accounts managed by Fidelity Investments. The rate quoted is the annualized seven-day yield of the fund at period end. A complete unaudited listing of the fund's holdings as of its most recent quarter end is available upon request. In addition, each Fidelity Central Fund's financial statements, which are not covered by the Fund's Report of Independent Registered Public Accounting Firm, are available on the SEC's website or upon request. |
| (e) | The rate quoted is the annualized seven-day yield of the fund at period end. |
Affiliated Central Funds
Fiscal year to date information regarding the Fund's investments in Fidelity Central Funds, including the ownership percentage, is presented below.
| Affiliate | Value, beginning of period ($) | Purchases ($) | Sales Proceeds ($) | Dividend Income ($) | Realized Gain (loss) ($) | Change in Unrealized appreciation (depreciation) ($) | Value, end of period ($) | Shares, end of period | % ownership, end of period |
| Fidelity Cash Central Fund | 116,577 | 826,957 | 282,804 | 17,872 | (5) | - | 660,725 | 660,593 | 0.0% |
| Total | 116,577 | 826,957 | 282,804 | 17,872 | (5) | - | 660,725 | 660,593 | |
| | | | | | | | | | |
Amounts in the dividend income column in the above table include any capital gain distributions from underlying funds, which are presented in the corresponding line item in the Statement of Operations, if applicable.
Amounts included in the purchases and sales proceeds columns may include in-kind transactions, if applicable.
Affiliated Underlying Funds
Fiscal year to date information regarding the Fund's investments in affiliated Underlying Funds is presented below. Exchanges between classes of the same affiliated Underlying Funds may occur. If an Underlying Funds changes its name, the name presented below is the name in effect at period end.
| Affiliate | Value, beginning of period ($) | Purchases ($) | Sales Proceeds ($) | Dividend Income ($) | Realized Gain (loss) ($) | Change in Unrealized appreciation (depreciation) ($) | Value, end of period ($) | Shares, end of period |
| Fidelity Blue Chip Growth ETF | - | 78,157 | - | - | - | (24) | 78,133 | 1,689 |
| Fidelity Canada Fund | 28,857 | 56,337 | 10,751 | 4,819 | 103 | (1,111) | 73,435 | 1,118 |
| Fidelity Commodity Strategy Fund | 14,255 | 65,469 | 7,767 | 2,166 | (273) | (895) | 70,789 | 774 |
| Fidelity Contrafund | 18,309 | 196,903 | 149,766 | 7,623 | 1,811 | 10,490 | 77,747 | 3,697 |
| Fidelity Emerging Markets Discovery Fund | 19,869 | 42,287 | 9,561 | 1,768 | (100) | (3,678) | 48,817 | 3,203 |
| Fidelity Emerging Markets Fund | 174,641 | 374,291 | 86,428 | 2,875 | (907) | 9,184 | 470,781 | 12,363 |
| Fidelity Enhanced International ETF | 49,847 | 2,259 | 3,231 | 1,505 | 236 | 1,682 | 50,793 | 1,845 |
| Fidelity Enhanced Large Cap Core ETF | - | 219,675 | 115,281 | 450 | 956 | 4,076 | 109,426 | 3,323 |
| Fidelity Enhanced Large Cap Value ETF | 20,621 | 654 | 22,854 | 202 | 2,776 | (1,197) | - | - |
| Fidelity Enhanced Mid Cap ETF | - | 49,433 | - | 364 | - | 4,441 | 53,874 | 1,640 |
| Fidelity Enhanced Small Cap ETF | - | 73,278 | - | 567 | - | 4,686 | 77,964 | 2,410 |
| Fidelity Equity-Income Fund | 45,419 | 22,800 | 72,511 | 205 | 6,105 | (1,813) | - | - |
| Fidelity Floating Rate High Income Fund | 77,140 | 98,605 | 61,220 | 9,006 | (429) | (59) | 114,037 | 12,275 |
| Fidelity Fundamental Small-Mid Cap ETF | - | 79,184 | - | - | - | (76) | 79,108 | 2,943 |
| Fidelity Hedged Equity Fund | 77,811 | 119,415 | 31,215 | 1,078 | 35 | 20,723 | 186,769 | 14,171 |
| Fidelity High Income Fund | 31,212 | 91,627 | 11,796 | 5,062 | 52 | 2,313 | 113,408 | 14,410 |
| Fidelity Inflation-Protected Bond Index Fund | 89,094 | 200,830 | 64,039 | 5,750 | (729) | (3,869) | 221,287 | 24,892 |
| Fidelity Infrastructure Fund | 7,649 | 10,219 | 1,810 | 233 | 38 | 1,598 | 17,694 | 1,290 |
| Fidelity International Capital Appreciation Fund | 48,390 | 86,734 | 17,348 | 4,461 | 48 | (847) | 116,977 | 4,248 |
| Fidelity International Discovery Fund | 60,950 | 111,847 | 22,636 | 4,047 | 241 | 2,499 | 152,901 | 3,191 |
| Fidelity International Small Cap Fund | 24,068 | 43,791 | 8,824 | 1,379 | 27 | (2,160) | 56,902 | 1,860 |
| Fidelity International Small Cap Opportunities Fund | 33,126 | 59,660 | 11,725 | 4,471 | 136 | (2,747) | 78,450 | 4,009 |
| Fidelity International Value Fund | 31,159 | 57,982 | 11,651 | 2,066 | 40 | (1,149) | 76,381 | 7,592 |
| Fidelity Investments Money Market Government Portfolio - Institutional Class | 823,275 | 1,277,119 | 192,635 | 71,221 | - | - | 1,907,759 | 1,907,759 |
| Fidelity Japan Smaller Companies Fund | 15,522 | 25,212 | 3,936 | 1,516 | 37 | 10 | 36,845 | 2,362 |
| Fidelity Long-Term Treasury Bond Index Fund | 54,522 | 130,672 | 32,489 | 2,338 | 466 | (8,938) | 144,233 | 15,729 |
| Fidelity Low-Priced Stock Fund | 56,431 | 83,610 | 137,879 | 8,041 | (1,725) | (437) | - | - |
| Fidelity Overseas Fund | 233,785 | 413,354 | 85,223 | 7,220 | 666 | (2,437) | 560,145 | 8,948 |
| Fidelity Real Estate Investment Portfolio | 32,574 | 50,886 | 13,920 | 3,492 | 252 | 611 | 70,403 | 1,824 |
| Fidelity Stock Selector Small Cap Fund | - | 184,341 | - | - | - | - | 184,341 | 4,945 |
| Fidelity Total Bond Fund | 1,464,648 | 2,452,770 | 580,921 | 111,628 | 1,517 | (38,720) | 3,299,294 | 350,989 |
| Fidelity U.S. Low Volatility Equity Fund | 61,462 | 4,673 | 67,818 | - | 3,836 | (2,153) | - | - |
| Fidelity Value Discovery Fund | 24,438 | 12,435 | 38,560 | - | 2,266 | (579) | - | - |
| VIP Investment Grade Bond II Portfolio - Investor Class | 1,459,945 | 2,463,214 | 560,745 | 128,753 | 1,658 | (78,366) | 3,285,706 | 356,754 |
| VIP Stock Selector Portfolio - Investor Class | 978,885 | 1,708,022 | 863,619 | 14,970 | 1,994 | 269,986 | 2,095,268 | 171,743 |
| VIP Value Strategies Portfolio - Investor Class | - | 105,338 | - | - | - | - | 105,338 | 6,871 |
| | 6,057,904 | 11,053,083 | 3,298,159 | 409,276 | 21,133 | 181,044 | 14,015,005 | 2,950,867 |
Amounts in the dividend income column in the above table include any capital gain distributions from underlying funds, which are presented in the corresponding line item in the Statement of Operations, if applicable.
Amounts included in the purchases and sales proceeds columns may include in-kind transactions, if applicable.
Investment Valuation
The following is a summary of the inputs used, as of December 31, 2024, involving the Fund's assets and liabilities carried at fair value. The inputs or methodology used for valuing securities may not be an indication of the risk associated with investing in those securities. For more information on valuation inputs, and their aggregation into the levels used below, please refer to the Investment Valuation section in the accompanying Notes to Financial Statements.
| Valuation Inputs at Reporting Date: |
| Description | Total ($) | Level 1 ($) | Level 2 ($) | Level 3 ($) |
Investments in Securities: | | | | |
|
| Alternative Funds | 186,769 | 186,769 | - | - |
|
| Bond Funds | 7,177,965 | 7,177,965 | - | - |
|
| Domestic Equity Funds | 3,002,391 | 3,002,391 | - | - |
|
| International Equity Funds | 1,740,121 | 1,740,121 | - | - |
|
| U.S. Treasury Obligations | 19,984 | - | 19,984 | - |
|
| Money Market Funds | 2,568,484 | 2,568,484 | - | - |
| Total Investments in Securities: | 14,695,714 | 14,675,730 | 19,984 | - |
VIP FundsManager® 30% Portfolio
Financial Statements
| Statement of Assets and Liabilities |
As of December 31, 2024 |
| Assets | | | | |
| Investment in securities, at value - See accompanying schedule: | | | | |
Unaffiliated issuers (cost $19,980) | $ | 19,984 | | |
Fidelity Central Funds (cost $660,725) | | 660,725 | | |
Other affiliated issuers (cost $13,625,919) | | 14,015,005 | | |
| | | | | |
| | | | | |
| Total Investment in Securities (cost $14,306,624) | | | $ | 14,695,714 |
| Cash | | | | 42,177 |
| Receivable for investments sold | | | | 447,518 |
| Receivable for fund shares sold | | | | 1,913 |
| Distributions receivable from Fidelity Central Funds | | | | 2,539 |
Total assets | | | | 15,189,861 |
| Liabilities | | | | |
| Payable for investments purchased | $ | 448,431 | | |
| Payable for fund shares redeemed | | 3 | | |
| Accrued management fee | | 1,198 | | |
| Distribution and service plan fees payable | | 46 | | |
| Total liabilities | | | | 449,678 |
| Net Assets | | | $ | 14,740,183 |
| Net Assets consist of: | | | | |
| Paid in capital | | | $ | 14,353,889 |
| Total accumulated earnings (loss) | | | | 386,294 |
| Net Assets | | | $ | 14,740,183 |
| | | | | |
| Net Asset Value and Maximum Offering Price | | | | |
| Service Class : | | | | |
Net Asset Value, offering price and redemption price per share ($353,456 ÷ 33,300 shares) | | | $ | 10.61 |
| Service Class 2 : | | | | |
Net Asset Value, offering price and redemption price per share ($353,432 ÷ 33,300 shares) | | | $ | 10.61 |
| Investor Class : | | | | |
Net Asset Value, offering price and redemption price per share ($14,033,295 ÷ 1,322,208 shares) | | | $ | 10.61 |
| Statement of Operations |
| Year ended December 31, 2024 |
| Investment Income | | | | |
| Dividends: | | | | |
| Unaffiliated issuers | | | $ | 397 |
| Affiliated issuers | | | | 380,701 |
| Interest | | | | 476 |
| Income from Fidelity Central Funds | | | | 17,872 |
| Total income | | | | 399,446 |
| Expenses | | | | |
| Management fee | $ | 16,167 | | |
| Distribution and service plan fees | | 1,244 | | |
| Independent trustees' fees and expenses | | 25 | | |
| Miscellaneous | | 11 | | |
| Total expenses before reductions | | 17,447 | | |
| Expense reductions | | (6,970) | | |
| Total expenses after reductions | | | | 10,477 |
| Net Investment income (loss) | | | | 388,969 |
| Realized and Unrealized Gain (Loss) | | | | |
| Net realized gain (loss) on: | | | | |
| Investment Securities: | | | | |
| Unaffiliated issuers | | 6,998 | | |
| Fidelity Central Funds | | (5) | | |
| Other affiliated issuers | | 21,133 | | |
| Futures contracts | | (7,573) | | |
| Capital gain distributions from underlying funds: | | | | |
| Affiliated issuers | | 28,575 | | |
| Total net realized gain (loss) | | | | 49,128 |
| Change in net unrealized appreciation (depreciation) on: | | | | |
| Investment Securities: | | | | |
| Unaffiliated issuers | | 4 | | |
| Affiliated issuers | | 181,044 | | |
| Total change in net unrealized appreciation (depreciation) | | | | 181,048 |
| Net gain (loss) | | | | 230,176 |
| Net increase (decrease) in net assets resulting from operations | | | $ | 619,145 |
| Statement of Changes in Net Assets |
| |
| | Year ended December 31, 2024 | | For the period April 13, 2023 (commencement of operations) through December 31, 2023 |
| Increase (Decrease) in Net Assets | | | | |
| Operations | | | | |
| Net investment income (loss) | $ | 388,969 | $ | 123,789 |
| Net realized gain (loss) | | 49,128 | | (15,573) |
| Change in net unrealized appreciation (depreciation) | | 181,048 | | 208,042 |
| Net increase (decrease) in net assets resulting from operations | | 619,145 | | 316,258 |
| Distributions to shareholders | | (424,674) | | (124,436) |
| | | | | |
| Share transactions - net increase (decrease) | | 8,339,096 | | 6,014,794 |
| Total increase (decrease) in net assets | | 8,533,567 | | 6,206,616 |
| | | | | |
| Net Assets | | | | |
| Beginning of period | | 6,206,616 | | - |
| End of period | $ | 14,740,183 | $ | 6,206,616 |
| | | | | |
| | | | | |
Financial Highlights
VIP FundsManager® 30% Portfolio Service Class |
| |
| Years ended December 31, | | 2024 | | 2023 A |
Selected Per-Share Data | | | | |
| Net asset value, beginning of period | $ | 10.27 | $ | 10.00 |
| Income from Investment Operations | | | | |
Net investment income (loss) B,C | | .38 | | .36 |
| Net realized and unrealized gain (loss) | | .28 | | .12 |
| Total from investment operations | | .66 | | .48 |
| Distributions from net investment income | | (.29) | | (.21) |
| Distributions from net realized gain | | (.03) | | - |
| Total distributions | | (.32) | | (.21) |
| Net asset value, end of period | $ | 10.61 | $ | 10.27 |
Total Return D,E,F | | | | 4.80% |
Ratios to Average Net Assets C,G,H | | | | |
| Expenses before reductions | | .25% | | .25% I |
| Expenses net of fee waivers, if any | | | | .10% I |
| Expenses net of all reductions | | .09% | | .09% I |
| Net investment income (loss) | | 3.60% | | 5.05% I |
| Supplemental Data | | | | |
| Net assets, end of period (000 omitted) | $ | 353 | $ | 342 |
Portfolio turnover rate J | | | | 29% I |
AFor the period April 13, 2023 (commencement of operations) through December 31, 2023.
BCalculated based on average shares outstanding during the period.
CNet investment income (loss) is affected by the timing of the declaration of dividends by any underlying mutual funds or exchange-traded funds (ETFs). Net investment income (loss) of any mutual funds or ETFs is not included in the Fund's net investment income (loss) ratio.
DTotal returns for periods of less than one year are not annualized.
ETotal returns do not reflect charges attributable to your insurance company's separate account. Inclusion of these charges would reduce the total returns shown.
FTotal returns would have been lower if certain expenses had not been reduced during the applicable periods shown.
GFees and expenses of any underlying mutual funds or exchange-traded funds (ETFs) are not included in the Fund's expense ratio. The Fund indirectly bears its proportionate share of these expenses. For additional expense information related to investments in Fidelity Central Funds, please refer to the "Investments in Fidelity Central Funds" note found in the Notes to Financial Statements section of the most recent Annual or Semi-Annual report.
HExpense ratios reflect operating expenses of the class. Expenses before reductions do not reflect amounts reimbursed, waived, or reduced through arrangements with the investment adviser, brokerage services, or other offset arrangements, if applicable, and do not represent the amount paid by the class during periods when reimbursements, waivers or reductions occur.
IAnnualized.
JAmount does not include the portfolio activity of any underlying mutual funds or exchange-traded funds (ETFs), derivatives or securities that mature within one year from acquisition.
VIP FundsManager® 30% Portfolio Service Class 2 |
| |
| Years ended December 31, | | 2024 | | 2023 A |
Selected Per-Share Data | | | | |
| Net asset value, beginning of period | $ | 10.27 | $ | 10.00 |
| Income from Investment Operations | | | | |
Net investment income (loss) B,C | | .37 | | .35 |
| Net realized and unrealized gain (loss) | | .27 | | .12 |
| Total from investment operations | | .64 | | .47 |
| Distributions from net investment income | | (.27) | | (.20) |
| Distributions from net realized gain | | (.03) | | - |
| Total distributions | | (.30) | | (.20) |
| Net asset value, end of period | $ | 10.61 | $ | 10.27 |
Total Return D,E,F | | | | 4.69% |
Ratios to Average Net Assets C,G,H | | | | |
| Expenses before reductions | | .40% | | .40% I |
| Expenses net of fee waivers, if any | | | | .25% I |
| Expenses net of all reductions | | .24% | | .24% I |
| Net investment income (loss) | | 3.45% | | 4.90% I |
| Supplemental Data | | | | |
| Net assets, end of period (000 omitted) | $ | 353 | $ | 342 |
Portfolio turnover rate J | | | | 29% I |
AFor the period April 13, 2023 (commencement of operations) through December 31, 2023.
BCalculated based on average shares outstanding during the period.
CNet investment income (loss) is affected by the timing of the declaration of dividends by any underlying mutual funds or exchange-traded funds (ETFs). Net investment income (loss) of any mutual funds or ETFs is not included in the Fund's net investment income (loss) ratio.
DTotal returns for periods of less than one year are not annualized.
ETotal returns do not reflect charges attributable to your insurance company's separate account. Inclusion of these charges would reduce the total returns shown.
FTotal returns would have been lower if certain expenses had not been reduced during the applicable periods shown.
GFees and expenses of any underlying mutual funds or exchange-traded funds (ETFs) are not included in the Fund's expense ratio. The Fund indirectly bears its proportionate share of these expenses. For additional expense information related to investments in Fidelity Central Funds, please refer to the "Investments in Fidelity Central Funds" note found in the Notes to Financial Statements section of the most recent Annual or Semi-Annual report.
HExpense ratios reflect operating expenses of the class. Expenses before reductions do not reflect amounts reimbursed, waived, or reduced through arrangements with the investment adviser, brokerage services, or other offset arrangements, if applicable, and do not represent the amount paid by the class during periods when reimbursements, waivers or reductions occur.
IAnnualized.
JAmount does not include the portfolio activity of any underlying mutual funds or exchange-traded funds (ETFs), derivatives or securities that mature within one year from acquisition.
VIP FundsManager® 30% Portfolio Investor Class |
| |
| Years ended December 31, | | 2024 | | 2023 A |
Selected Per-Share Data | | | | |
| Net asset value, beginning of period | $ | 10.27 | $ | 10.00 |
| Income from Investment Operations | | | | |
Net investment income (loss) B,C | | .39 | | .36 |
| Net realized and unrealized gain (loss) | | .27 | | .12 |
| Total from investment operations | | .66 | | .48 |
| Distributions from net investment income | | (.29) | | (.21) |
| Distributions from net realized gain | | (.03) | | - |
| Total distributions | | (.32) | | (.21) |
| Net asset value, end of period | $ | 10.61 | $ | 10.27 |
Total Return D,E,F | | | | 4.80% |
Ratios to Average Net Assets C,G,H | | | | |
| Expenses before reductions | | .15% | | .15% I |
| Expenses net of fee waivers, if any | | | | .10% I |
| Expenses net of all reductions | | .09% | | .09% I |
| Net investment income (loss) | | 3.60% | | 5.05% I |
| Supplemental Data | | | | |
| Net assets, end of period (000 omitted) | $ | 14,033 | $ | 5,523 |
Portfolio turnover rate J | | | | 29% I |
AFor the period April 13, 2023 (commencement of operations) through December 31, 2023.
BCalculated based on average shares outstanding during the period.
CNet investment income (loss) is affected by the timing of the declaration of dividends by any underlying mutual funds or exchange-traded funds (ETFs). Net investment income (loss) of any mutual funds or ETFs is not included in the Fund's net investment income (loss) ratio.
DTotal returns for periods of less than one year are not annualized.
ETotal returns do not reflect charges attributable to your insurance company's separate account. Inclusion of these charges would reduce the total returns shown.
FTotal returns would have been lower if certain expenses had not been reduced during the applicable periods shown.
GFees and expenses of any underlying mutual funds or exchange-traded funds (ETFs) are not included in the Fund's expense ratio. The Fund indirectly bears its proportionate share of these expenses. For additional expense information related to investments in Fidelity Central Funds, please refer to the "Investments in Fidelity Central Funds" note found in the Notes to Financial Statements section of the most recent Annual or Semi-Annual report.
HExpense ratios reflect operating expenses of the class. Expenses before reductions do not reflect amounts reimbursed, waived, or reduced through arrangements with the investment adviser, brokerage services, or other offset arrangements, if applicable, and do not represent the amount paid by the class during periods when reimbursements, waivers or reductions occur.
IAnnualized.
JAmount does not include the portfolio activity of any underlying mutual funds or exchange-traded funds (ETFs), derivatives or securities that mature within one year from acquisition.
VIP FundsManager® 40% Portfolio
Schedule of Investments December 31, 2024
Showing Percentage of Net Assets
| Alternative Funds - 1.3% |
| | | Shares | Value ($) |
Fidelity Hedged Equity Fund (b) (Cost $265,291) | | 23,666 | 311,917 |
| | | | |
| Bond Funds - 43.8% |
| | | Shares | Value ($) |
| Fidelity Floating Rate High Income Fund (b) | | 20,478 | 190,243 |
| Fidelity High Income Fund (b) | | 23,898 | 188,079 |
| Fidelity Inflation-Protected Bond Index Fund (b) | | 41,685 | 370,582 |
| Fidelity Long-Term Treasury Bond Index Fund (b) | | 26,292 | 241,097 |
| Fidelity Total Bond Fund (b) | | 521,224 | 4,899,510 |
| VIP Investment Grade Bond II Portfolio - Investor Class (b) | | 529,868 | 4,880,088 |
| TOTAL BOND FUNDS (Cost $10,875,838) | | | 10,769,599 |
| | | | |
| Domestic Equity Funds - 26.3% |
| | | Shares | Value ($) |
| Fidelity Blue Chip Growth ETF (b) | | 3,768 | 174,308 |
| Fidelity Commodity Strategy Fund (b) | | 1,298 | 118,716 |
| Fidelity Contrafund (b) | | 8,245 | 173,389 |
| Fidelity Enhanced Large Cap Core ETF (b) | | 5,672 | 186,779 |
| Fidelity Enhanced Mid Cap ETF (b) | | 2,534 | 83,242 |
| Fidelity Enhanced Small Cap ETF (b) | | 3,725 | 120,504 |
| Fidelity Fundamental Small-Mid Cap ETF (b) | | 6,565 | 176,467 |
| Fidelity Real Estate Investment Portfolio (b) | | 3,050 | 117,683 |
| Fidelity Stock Selector Small Cap Fund (b) | | 11,028 | 411,122 |
| VIP Stock Selector All Cap Portfolio - Investor Class (b) | | 383,009 | 4,672,710 |
| VIP Value Strategies Portfolio - Investor Class (b) | | 15,325 | 234,927 |
| TOTAL DOMESTIC EQUITY FUNDS (Cost $5,552,608) | | | 6,469,847 |
| | | | |
| International Equity Funds - 15.8% |
| | | Shares | Value ($) |
| Fidelity Canada Fund (b) | | 2,535 | 166,514 |
| Fidelity Emerging Markets Discovery Fund (b) | | 7,122 | 108,535 |
| Fidelity Emerging Markets Fund (b) | | 27,642 | 1,052,621 |
| Fidelity Enhanced International ETF (b) | | 3,783 | 104,146 |
| Fidelity Infrastructure Fund (b) | | 2,059 | 28,255 |
| Fidelity International Capital Appreciation Fund (b) | | 9,686 | 266,754 |
| Fidelity International Discovery Fund (b) | | 7,289 | 349,229 |
| Fidelity International Small Cap Fund (b) | | 4,213 | 128,880 |
| Fidelity International Small Cap Opportunities Fund (b) | | 9,101 | 178,109 |
| Fidelity International Value Fund (b) | | 17,258 | 173,620 |
| Fidelity Japan Smaller Companies Fund (b) | | 3,969 | 61,917 |
| Fidelity Overseas Fund (b) | | 20,403 | 1,277,242 |
| TOTAL INTERNATIONAL EQUITY FUNDS (Cost $3,727,829) | | | 3,895,822 |
| | | | |
| U.S. Treasury Obligations - 0.1% |
| | | Yield (%) (c) | Principal Amount (a) | Value ($) |
US Treasury Bills 0% 1/9/2025 (Cost $29,970) | | 4.58 | 30,000 | 29,975 |
| | | | | |
| Money Market Funds - 12.7% |
| | | Yield (%) | Shares | Value ($) |
| Fidelity Cash Central Fund (d) | | 4.36 | 1,052,709 | 1,052,919 |
| Fidelity Investments Money Market Government Portfolio - Institutional Class (b)(e) | | 4.42 | 2,071,016 | 2,071,016 |
| TOTAL MONEY MARKET FUNDS (Cost $3,123,935) | | | | 3,123,935 |
| | | | | |
| TOTAL INVESTMENT IN SECURITIES - 100.0% (Cost $23,575,471) | 24,601,095 |
NET OTHER ASSETS (LIABILITIES) - 0.0% | 3,829 |
| NET ASSETS - 100.0% | 24,604,924 |
| | |
Security Type Abbreviations
Legend
| (a) | Amount is stated in United States dollars unless otherwise noted. |
| (c) | Yield represents either the annualized yield at the date of purchase, or the stated coupon rate, or, for floating and adjustable rate securities, the rate at period end. |
| (d) | Affiliated fund that is generally available only to investment companies and other accounts managed by Fidelity Investments. The rate quoted is the annualized seven-day yield of the fund at period end. A complete unaudited listing of the fund's holdings as of its most recent quarter end is available upon request. In addition, each Fidelity Central Fund's financial statements, which are not covered by the Fund's Report of Independent Registered Public Accounting Firm, are available on the SEC's website or upon request. |
| (e) | The rate quoted is the annualized seven-day yield of the fund at period end. |
Affiliated Central Funds
Fiscal year to date information regarding the Fund's investments in Fidelity Central Funds, including the ownership percentage, is presented below.
| Affiliate | Value, beginning of period ($) | Purchases ($) | Sales Proceeds ($) | Dividend Income ($) | Realized Gain (loss) ($) | Change in Unrealized appreciation (depreciation) ($) | Value, end of period ($) | Shares, end of period | % ownership, end of period |
| Fidelity Cash Central Fund | 361,973 | 1,414,184 | 723,238 | 30,108 | - | - | 1,052,919 | 1,052,709 | 0.0% |
| Total | 361,973 | 1,414,184 | 723,238 | 30,108 | - | - | 1,052,919 | 1,052,709 | |
| | | | | | | | | | |
Amounts in the dividend income column in the above table include any capital gain distributions from underlying funds, which are presented in the corresponding line item in the Statement of Operations, if applicable.
Amounts included in the purchases and sales proceeds columns may include in-kind transactions, if applicable.
Affiliated Underlying Funds
Fiscal year to date information regarding the Fund's investments in affiliated Underlying Funds is presented below. Exchanges between classes of the same affiliated Underlying Funds may occur. If an Underlying Funds changes its name, the name presented below is the name in effect at period end.
| Affiliate | Value, beginning of period ($) | Purchases ($) | Sales Proceeds ($) | Dividend Income ($) | Realized Gain (loss) ($) | Change in Unrealized appreciation (depreciation) ($) | Value, end of period ($) | Shares, end of period |
| Fidelity Blue Chip Growth ETF | - | 174,361 | - | - | - | (53) | 174,308 | 3,768 |
| Fidelity Canada Fund | 92,774 | 96,924 | 21,102 | 11,201 | (338) | (1,744) | 166,514 | 2,535 |
| Fidelity Commodity Strategy Fund | 34,179 | 97,358 | 11,697 | 3,881 | (281) | (843) | 118,716 | 1,298 |
| Fidelity Contrafund | 67,494 | 412,220 | 340,934 | 16,971 | 6,779 | 27,830 | 173,389 | 8,245 |
| Fidelity Emerging Markets Discovery Fund | 61,146 | 72,425 | 17,135 | 4,036 | (400) | (7,501) | 108,535 | 7,122 |
| Fidelity Emerging Markets Fund | 538,540 | 638,133 | 155,801 | 6,584 | (2,712) | 34,461 | 1,052,621 | 27,642 |
| Fidelity Enhanced International ETF | 101,972 | 4,123 | 5,903 | 3,087 | 393 | 3,561 | 104,146 | 3,783 |
| Fidelity Enhanced Large Cap Core ETF | - | 435,169 | 252,621 | 571 | 2,230 | 2,001 | 186,779 | 5,672 |
| Fidelity Enhanced Large Cap Value ETF | 50,532 | 1,418 | 55,668 | 452 | 6,612 | (2,894) | - | - |
| Fidelity Enhanced Mid Cap ETF | - | 76,256 | - | 584 | - | 6,986 | 83,242 | 2,534 |
| Fidelity Enhanced Small Cap ETF | - | 112,830 | - | 896 | - | 7,674 | 120,504 | 3,725 |
| Fidelity Equity-Income Fund | 171,765 | 29,652 | 215,287 | 611 | 20,250 | (6,380) | - | - |
| Fidelity Floating Rate High Income Fund | 173,552 | 122,442 | 104,956 | 15,737 | (513) | (282) | 190,243 | 20,478 |
| Fidelity Fundamental Small-Mid Cap ETF | - | 176,637 | - | - | - | (170) | 176,467 | 6,565 |
| Fidelity Hedged Equity Fund | 176,581 | 147,503 | 49,994 | 1,866 | 131 | 37,696 | 311,917 | 23,666 |
| Fidelity High Income Fund | 70,573 | 132,304 | 18,508 | 8,587 | (30) | 3,740 | 188,079 | 23,898 |
| Fidelity Inflation-Protected Bond Index Fund | 197,736 | 271,937 | 90,289 | 9,771 | (1,678) | (7,124) | 370,582 | 41,685 |
| Fidelity Infrastructure Fund | 15,849 | 15,007 | 4,806 | 351 | (32) | 2,237 | 28,255 | 2,059 |
| Fidelity International Capital Appreciation Fund | 152,413 | 147,092 | 34,105 | 10,426 | (218) | 1,572 | 266,754 | 9,686 |
| Fidelity International Discovery Fund | 194,653 | 188,326 | 44,686 | 9,480 | (268) | 11,204 | 349,229 | 7,289 |
| Fidelity International Small Cap Fund | 77,370 | 73,271 | 17,332 | 3,205 | (275) | (4,154) | 128,880 | 4,213 |
| Fidelity International Small Cap Opportunities Fund | 105,280 | 101,983 | 23,105 | 10,410 | (400) | (5,649) | 178,109 | 9,101 |
| Fidelity International Value Fund | 100,119 | 97,485 | 22,992 | 4,795 | (301) | (691) | 173,620 | 17,258 |
| Fidelity Investments Money Market Government Portfolio - Institutional Class | 1,184,335 | 1,069,698 | 183,017 | 78,061 | - | - | 2,071,016 | 2,071,016 |
| Fidelity Japan Smaller Companies Fund | 35,527 | 31,921 | 6,180 | 2,610 | (99) | 748 | 61,917 | 3,969 |
| Fidelity Long-Term Treasury Bond Index Fund | 102,252 | 202,519 | 47,656 | 3,981 | 596 | (16,614) | 241,097 | 26,292 |
| Fidelity Low-Priced Stock Fund | 212,603 | 138,329 | 349,511 | 19,375 | 759 | (2,180) | - | - |
| Fidelity Overseas Fund | 744,759 | 690,651 | 167,964 | 16,890 | (1,501) | 11,297 | 1,277,242 | 20,403 |
| Fidelity Real Estate Investment Portfolio | 73,537 | 64,762 | 19,998 | 6,080 | (475) | (143) | 117,683 | 3,050 |
| Fidelity Stock Selector Small Cap Fund | - | 411,122 | - | - | - | - | 411,122 | 11,028 |
| Fidelity Total Bond Fund | 2,970,224 | 2,774,395 | 761,164 | 170,761 | (5,867) | (78,078) | 4,899,510 | 521,224 |
| Fidelity U.S. Low Volatility Equity Fund | 139,787 | 5,912 | 149,517 | - | 8,081 | (4,263) | - | - |
| Fidelity Value Discovery Fund | 93,104 | 15,939 | 114,395 | - | 7,688 | (2,336) | - | - |
| VIP Investment Grade Bond II Portfolio - Investor Class | 2,963,153 | 2,811,203 | 749,147 | 196,367 | (7,405) | (137,716) | 4,880,088 | 529,868 |
| VIP Stock Selector Portfolio - Investor Class | 2,858,677 | 2,814,615 | 1,647,162 | 34,266 | (14,881) | 661,461 | 4,672,710 | 383,009 |
| VIP Value Strategies Portfolio - Investor Class | - | 234,927 | - | - | - | - | 234,927 | 15,325 |
| | 13,760,486 | 14,890,849 | 5,682,632 | 651,893 | 15,845 | 533,653 | 23,518,201 | 3,817,406 |
Amounts in the dividend income column in the above table include any capital gain distributions from underlying funds, which are presented in the corresponding line item in the Statement of Operations, if applicable.
Amounts included in the purchases and sales proceeds columns may include in-kind transactions, if applicable.
Investment Valuation
The following is a summary of the inputs used, as of December 31, 2024, involving the Fund's assets and liabilities carried at fair value. The inputs or methodology used for valuing securities may not be an indication of the risk associated with investing in those securities. For more information on valuation inputs, and their aggregation into the levels used below, please refer to the Investment Valuation section in the accompanying Notes to Financial Statements.
| Valuation Inputs at Reporting Date: |
| Description | Total ($) | Level 1 ($) | Level 2 ($) | Level 3 ($) |
Investments in Securities: | | | | |
|
| Alternative Funds | 311,917 | 311,917 | - | - |
|
| Bond Funds | 10,769,599 | 10,769,599 | - | - |
|
| Domestic Equity Funds | 6,469,847 | 6,469,847 | - | - |
|
| International Equity Funds | 3,895,822 | 3,895,822 | - | - |
|
| U.S. Treasury Obligations | 29,975 | - | 29,975 | - |
|
| Money Market Funds | 3,123,935 | 3,123,935 | - | - |
| Total Investments in Securities: | 24,601,095 | 24,571,120 | 29,975 | - |
VIP FundsManager® 40% Portfolio
Financial Statements
| Statement of Assets and Liabilities |
As of December 31, 2024 |
| Assets | | | | |
| Investment in securities, at value - See accompanying schedule: | | | | |
Unaffiliated issuers (cost $29,970) | $ | 29,975 | | |
Fidelity Central Funds (cost $1,052,919) | | 1,052,919 | | |
Other affiliated issuers (cost $22,492,582) | | 23,518,201 | | |
| | | | | |
| | | | | |
| Total Investment in Securities (cost $23,575,471) | | | $ | 24,601,095 |
| Cash | | | | 54 |
| Receivable for investments sold | | | | 999,162 |
| Distributions receivable from Fidelity Central Funds | | | | 3,866 |
Total assets | | | | 25,604,177 |
| Liabilities | | | | |
| Payable for investments purchased | $ | 997,050 | | |
| Payable for fund shares redeemed | | 150 | | |
| Accrued management fee | | 2,006 | | |
| Distribution and service plan fees payable | | 47 | | |
| Total liabilities | | | | 999,253 |
| Net Assets | | | $ | 24,604,924 |
| Net Assets consist of: | | | | |
| Paid in capital | | | $ | 23,592,784 |
| Total accumulated earnings (loss) | | | | 1,012,140 |
| Net Assets | | | $ | 24,604,924 |
| | | | | |
| Net Asset Value and Maximum Offering Price | | | | |
| Service Class : | | | | |
Net Asset Value, offering price and redemption price per share ($362,140 ÷ 33,300 shares) | | | $ | 10.88 |
| Service Class 2 : | | | | |
Net Asset Value, offering price and redemption price per share ($362,099 ÷ 33,300 shares) | | | $ | 10.87 |
| Investor Class : | | | | |
Net Asset Value, offering price and redemption price per share ($23,880,685 ÷ 2,196,238 shares) | | | $ | 10.87 |
| Statement of Operations |
| Year ended December 31, 2024 |
| Investment Income | | | | |
| Dividends: | | | | |
| Unaffiliated issuers | | | $ | 676 |
| Affiliated issuers | | | | 587,128 |
| Interest | | | | 580 |
| Income from Fidelity Central Funds | | | | 30,108 |
| Total income | | | | 618,492 |
| Expenses | | | | |
| Management fee | $ | 27,880 | | |
| Distribution and service plan fees | | 1,270 | | |
| Independent trustees' fees and expenses | | 45 | | |
| Miscellaneous | | 13 | | |
| Total expenses before reductions | | 29,208 | | |
| Expense reductions | | (10,945) | | |
| Total expenses after reductions | | | | 18,263 |
| Net Investment income (loss) | | | | 600,229 |
| Realized and Unrealized Gain (Loss) | | | | |
| Net realized gain (loss) on: | | | | |
| Investment Securities: | | | | |
| Unaffiliated issuers | | 12,711 | | |
| Affiliated issuers | | 15,845 | | |
| Futures contracts | | (14,506) | | |
| Capital gain distributions from underlying funds: | | | | |
| Affiliated issuers | | 64,765 | | |
| Total net realized gain (loss) | | | | 78,815 |
| Change in net unrealized appreciation (depreciation) on: | | | | |
| Investment Securities: | | | | |
| Unaffiliated issuers | | 5 | | |
| Affiliated issuers | | 533,653 | | |
| Total change in net unrealized appreciation (depreciation) | | | | 533,658 |
| Net gain (loss) | | | | 612,473 |
| Net increase (decrease) in net assets resulting from operations | | | $ | 1,212,702 |
| Statement of Changes in Net Assets |
| |
| | Year ended December 31, 2024 | | For the period April 13, 2023 (commencement of operations) through December 31, 2023 |
| Increase (Decrease) in Net Assets | | | | |
| Operations | | | | |
| Net investment income (loss) | $ | 600,229 | $ | 197,508 |
| Net realized gain (loss) | | 78,815 | | 438 |
| Change in net unrealized appreciation (depreciation) | | 533,658 | | 491,966 |
| Net increase (decrease) in net assets resulting from operations | | 1,212,702 | | 689,912 |
| Distributions to shareholders | | (688,686) | | (201,791) |
| | | | | |
| Share transactions - net increase (decrease) | | 9,957,972 | | 13,634,815 |
| Total increase (decrease) in net assets | | 10,481,988 | | 14,122,936 |
| | | | | |
| Net Assets | | | | |
| Beginning of period | | 14,122,936 | | - |
| End of period | $ | 24,604,924 | $ | 14,122,936 |
| | | | | |
| | | | | |
Financial Highlights
VIP FundsManager® 40% Portfolio Service Class |
| |
| Years ended December 31, | | 2024 | | 2023 A |
Selected Per-Share Data | | | | |
| Net asset value, beginning of period | $ | 10.41 | $ | 10.00 |
| Income from Investment Operations | | | | |
Net investment income (loss) B,C | | .35 | | .39 |
| Net realized and unrealized gain (loss) | | .44 | | .17 |
| Total from investment operations | | .79 | | .56 |
| Distributions from net investment income | | (.27) | | (.15) |
| Distributions from net realized gain | | (.04) | | - D |
| Total distributions | | (.32) E | | (.15) |
| Net asset value, end of period | $ | 10.88 | $ | 10.41 |
Total Return F,G,H | | | | 5.61% |
Ratios to Average Net Assets B,I,J | | | | |
| Expenses before reductions | | .25% | | .25% K |
| Expenses net of fee waivers, if any | | | | .10% K |
| Expenses net of all reductions | | .10% | | .10% K |
| Net investment income (loss) | | 3.23% | | 5.41% K |
| Supplemental Data | | | | |
| Net assets, end of period (000 omitted) | $ | 362 | $ | 347 |
Portfolio turnover rate L | | | | 26% K |
AFor the period April 13, 2023 (commencement of operations) through December 31, 2023.
BNet investment income (loss) is affected by the timing of the declaration of dividends by any underlying mutual funds or exchange-traded funds (ETFs). Net investment income (loss) of any mutual funds or ETFs is not included in the Fund's net investment income (loss) ratio.
CCalculated based on average shares outstanding during the period.
DAmount represents less than $.005 per share.
ETotal distributions per share do not sum due to rounding.
FTotal returns for periods of less than one year are not annualized.
GTotal returns do not reflect charges attributable to your insurance company's separate account. Inclusion of these charges would reduce the total returns shown.
HTotal returns would have been lower if certain expenses had not been reduced during the applicable periods shown.
IExpense ratios reflect operating expenses of the class. Expenses before reductions do not reflect amounts reimbursed, waived, or reduced through arrangements with the investment adviser, brokerage services, or other offset arrangements, if applicable, and do not represent the amount paid by the class during periods when reimbursements, waivers or reductions occur.
JFees and expenses of any underlying mutual funds or exchange-traded funds (ETFs) are not included in the Fund's expense ratio. The Fund indirectly bears its proportionate share of these expenses. For additional expense information related to investments in Fidelity Central Funds, please refer to the "Investments in Fidelity Central Funds" note found in the Notes to Financial Statements section of the most recent Annual or Semi-Annual report.
KAnnualized.
LAmount does not include the portfolio activity of any underlying mutual funds or exchange-traded funds (ETFs), derivatives or securities that mature within one year from acquisition.
VIP FundsManager® 40% Portfolio Service Class 2 |
| |
| Years ended December 31, | | 2024 | | 2023 A |
Selected Per-Share Data | | | | |
| Net asset value, beginning of period | $ | 10.41 | $ | 10.00 |
| Income from Investment Operations | | | | |
Net investment income (loss) B,C | | .34 | | .38 |
| Net realized and unrealized gain (loss) | | .42 | | .17 |
| Total from investment operations | | .76 | | .55 |
| Distributions from net investment income | | (.26) | | (.14) |
| Distributions from net realized gain | | (.04) | | - D |
| Total distributions | | (.30) | | (.14) |
| Net asset value, end of period | $ | 10.87 | $ | 10.41 |
Total Return E,F,G | | | | 5.50% |
Ratios to Average Net Assets C,H,I | | | | |
| Expenses before reductions | | .40% | | .40% J |
| Expenses net of fee waivers, if any | | | | .25% J |
| Expenses net of all reductions | | .25% | | .25% J |
| Net investment income (loss) | | 3.08% | | 5.26% J |
| Supplemental Data | | | | |
| Net assets, end of period (000 omitted) | $ | 362 | $ | 347 |
Portfolio turnover rate K | | | | 26% J |
AFor the period April 13, 2023 (commencement of operations) through December 31, 2023.
BCalculated based on average shares outstanding during the period.
CNet investment income (loss) is affected by the timing of the declaration of dividends by any underlying mutual funds or exchange-traded funds (ETFs). Net investment income (loss) of any mutual funds or ETFs is not included in the Fund's net investment income (loss) ratio.
DAmount represents less than $.005 per share.
ETotal returns for periods of less than one year are not annualized.
FTotal returns do not reflect charges attributable to your insurance company's separate account. Inclusion of these charges would reduce the total returns shown.
GTotal returns would have been lower if certain expenses had not been reduced during the applicable periods shown.
HExpense ratios reflect operating expenses of the class. Expenses before reductions do not reflect amounts reimbursed, waived, or reduced through arrangements with the investment adviser, brokerage services, or other offset arrangements, if applicable, and do not represent the amount paid by the class during periods when reimbursements, waivers or reductions occur.
IFees and expenses of any underlying mutual funds or exchange-traded funds (ETFs) are not included in the Fund's expense ratio. The Fund indirectly bears its proportionate share of these expenses. For additional expense information related to investments in Fidelity Central Funds, please refer to the "Investments in Fidelity Central Funds" note found in the Notes to Financial Statements section of the most recent Annual or Semi-Annual report.
JAnnualized.
KAmount does not include the portfolio activity of any underlying mutual funds or exchange-traded funds (ETFs), derivatives or securities that mature within one year from acquisition.
VIP FundsManager® 40% Portfolio Investor Class |
| |
| Years ended December 31, | | 2024 | | 2023 A |
Selected Per-Share Data | | | | |
| Net asset value, beginning of period | $ | 10.41 | $ | 10.00 |
| Income from Investment Operations | | | | |
Net investment income (loss) B,C | | .35 | | .39 |
| Net realized and unrealized gain (loss) | | .43 | | .17 |
| Total from investment operations | | .78 | | .56 |
| Distributions from net investment income | | (.27) | | (.15) |
| Distributions from net realized gain | | (.04) | | - D |
| Total distributions | | (.32) E | | (.15) |
| Net asset value, end of period | $ | 10.87 | $ | 10.41 |
Total Return F,G,H | | | | 5.61% |
Ratios to Average Net Assets C,I,J | | | | |
| Expenses before reductions | | .15% | | .15% K |
| Expenses net of fee waivers, if any | | | | .10% K |
| Expenses net of all reductions | | .10% | | .10% K |
| Net investment income (loss) | | 3.23% | | 5.41% K |
| Supplemental Data | | | | |
| Net assets, end of period (000 omitted) | $ | 23,881 | $ | 13,430 |
Portfolio turnover rate L | | | | 26% K |
AFor the period April 13, 2023 (commencement of operations) through December 31, 2023.
BCalculated based on average shares outstanding during the period.
CNet investment income (loss) is affected by the timing of the declaration of dividends by any underlying mutual funds or exchange-traded funds (ETFs). Net investment income (loss) of any mutual funds or ETFs is not included in the Fund's net investment income (loss) ratio.
DAmount represents less than $.005 per share.
ETotal distributions per share do not sum due to rounding.
FTotal returns for periods of less than one year are not annualized.
GTotal returns do not reflect charges attributable to your insurance company's separate account. Inclusion of these charges would reduce the total returns shown.
HTotal returns would have been lower if certain expenses had not been reduced during the applicable periods shown.
IExpense ratios reflect operating expenses of the class. Expenses before reductions do not reflect amounts reimbursed, waived, or reduced through arrangements with the investment adviser, brokerage services, or other offset arrangements, if applicable, and do not represent the amount paid by the class during periods when reimbursements, waivers or reductions occur.
JFees and expenses of any underlying mutual funds or exchange-traded funds (ETFs) are not included in the Fund's expense ratio. The Fund indirectly bears its proportionate share of these expenses. For additional expense information related to investments in Fidelity Central Funds, please refer to the "Investments in Fidelity Central Funds" note found in the Notes to Financial Statements section of the most recent Annual or Semi-Annual report.
KAnnualized.
LAmount does not include the portfolio activity of any underlying mutual funds or exchange-traded funds (ETFs), derivatives or securities that mature within one year from acquisition.
VIP FundsManager® 50% Portfolio
Schedule of Investments December 31, 2024
Showing Percentage of Net Assets
| Alternative Funds - 1.3% |
| | | Shares | Value ($) |
Fidelity Hedged Equity Fund (b) (Cost $40,145,941) | | 3,921,835 | 51,689,783 |
| | | | |
| Bond Funds - 38.8% |
| | | Shares | Value ($) |
| Fidelity Floating Rate High Income Fund (b) | | 3,279,315 | 30,464,838 |
| Fidelity High Income Fund (b) | | 3,807,910 | 29,968,250 |
| Fidelity Inflation-Protected Bond Index Fund (b) | | 6,717,791 | 59,721,163 |
| Fidelity Long-Term Treasury Bond Index Fund (b) | | 4,204,843 | 38,558,414 |
| Fidelity New Markets Income Fund (b) | | 176,737 | 2,235,726 |
| Fidelity Total Bond Fund (b) | | 73,133,414 | 687,454,095 |
| VIP Investment Grade Bond II Portfolio - Investor Class (b) | | 74,311,706 | 684,410,809 |
| TOTAL BOND FUNDS (Cost $1,597,823,511) | | | 1,532,813,295 |
| | | | |
| Domestic Equity Funds - 32.1% |
| | | Shares | Value ($) |
| Fidelity Blue Chip Growth ETF (b) | | 750,296 | 34,708,693 |
| Fidelity Commodity Strategy Fund (b) | | 120,644 | 11,031,689 |
| Fidelity Contrafund (b) | | 1,637,592 | 34,438,561 |
| Fidelity Enhanced Large Cap Core ETF (b) | | 1,166,088 | 38,399,278 |
| Fidelity Enhanced Mid Cap ETF (b) | | 484,096 | 15,902,553 |
| Fidelity Enhanced Small Cap ETF (b) | | 711,513 | 23,017,446 |
| Fidelity Fundamental Small-Mid Cap ETF (b) | | 269,106 | 7,233,569 |
| Fidelity Real Estate Investment Portfolio (b) | | 502,638 | 19,396,790 |
| Fidelity Stock Selector Small Cap Fund (b) | | 1,400,098 | 52,195,665 |
| VIP Stock Selector All Cap Portfolio - Investor Class (b) | | 80,848,246 | 986,348,601 |
| VIP Value Strategies Portfolio - Investor Class (b) | | 3,051,431 | 46,778,430 |
| TOTAL DOMESTIC EQUITY FUNDS (Cost $1,082,611,189) | | | 1,269,451,275 |
| | | | |
| International Equity Funds - 19.9% |
| | | Shares | Value ($) |
| Fidelity Canada Fund (b) | | 356,613 | 23,422,321 |
| Fidelity Emerging Markets Discovery Fund (b) | | 2,092,112 | 31,883,781 |
| Fidelity Emerging Markets Fund (b) | | 5,301,866 | 201,895,040 |
| Fidelity Enhanced International ETF (b) | | 3,044,240 | 83,807,927 |
| Fidelity Global Commodity Stock Fund (b) | | 301,028 | 5,403,457 |
| Fidelity Infrastructure Fund (b) | | 266,977 | 3,662,919 |
| Fidelity International Capital Appreciation Fund (b) | | 1,898,228 | 52,277,195 |
| Fidelity International Discovery Fund (b) | | 1,229,858 | 58,922,483 |
| Fidelity International Small Cap Fund (b) | | 827,275 | 25,306,344 |
| Fidelity International Small Cap Opportunities Fund (b) | | 2,248,755 | 44,008,139 |
| Fidelity International Value Fund (b) | | 4,393,988 | 44,203,520 |
| Fidelity Japan Smaller Companies Fund (b) | | 2,061,688 | 32,162,325 |
| Fidelity Overseas Fund (b) | | 2,844,742 | 178,080,869 |
| TOTAL INTERNATIONAL EQUITY FUNDS (Cost $596,563,908) | | | 785,036,320 |
| | | | |
| U.S. Treasury Obligations - 0.0% |
| | | Yield (%) (c) | Principal Amount (a) | Value ($) |
| US Treasury Bills 0% 1/23/2025 | | 4.55 | 1,130,000 | 1,127,202 |
| US Treasury Bills 0% 1/30/2025 (d) | | 4.51 | 750,000 | 747,532 |
| TOTAL U.S. TREASURY OBLIGATIONS (Cost $1,874,198) | | | | 1,874,734 |
| | | | | |
| Money Market Funds - 7.9% |
| | | Yield (%) | Shares | Value ($) |
Fidelity Cash Central Fund (e) (Cost $311,491,038) | | 4.36 | 311,428,752 | 311,491,038 |
| | | | | |
| TOTAL INVESTMENT IN SECURITIES - 100.0% (Cost $3,630,509,785) | 3,952,356,445 |
NET OTHER ASSETS (LIABILITIES) - 0.0% | 1,289,032 |
| NET ASSETS - 100.0% | 3,953,645,477 |
| | |
| Futures Contracts |
| | Number of contracts | Expiration Date | Notional Amount ($) | Value ($) | Unrealized Appreciation/ (Depreciation) ($) |
| Purchased | | | | | |
| | | | | | |
| Equity Contracts | | | | | |
| CME E-mini Russell 2000 Index Contracts (United States) | 385 | Mar 2025 | 43,308,650 | (32,472) | (32,472) |
| CME E-mini S&P MidCap 400 Index Contracts (United States) | 44 | Mar 2025 | 13,845,480 | 4,793 | 4,793 |
| ICE MSCI EAFE Index Contracts (United States) | 64 | Mar 2025 | 7,256,000 | (240,453) | (240,453) |
| | | | | | |
| TOTAL PURCHASED | | | | | (268,132) |
| | | | | | |
| Sold | | | | | |
| | | | | | |
| Equity Contracts | | | | | |
| CME E-mini S&P 500 Index Contracts (United States) | 192 | Mar 2025 | 56,983,200 | 41,452 | 41,452 |
| | | | | | |
| TOTAL FUTURES CONTRACTS | | | | | (226,680) |
| The notional amount of futures purchased as a percentage of Net Assets is 1.7% |
| The notional amount of futures sold as a percentage of Net Assets is 1.4% |
Security Type Abbreviations
Legend
| (a) | Amount is stated in United States dollars unless otherwise noted. |
| (c) | Yield represents either the annualized yield at the date of purchase, or the stated coupon rate, or, for floating and adjustable rate securities, the rate at period end. |
| (d) | Security or a portion of the security was pledged to cover margin requirements for futures contracts. At period end, the value of securities pledged amounted to $251,171. |
| (e) | Affiliated fund that is generally available only to investment companies and other accounts managed by Fidelity Investments. The rate quoted is the annualized seven-day yield of the fund at period end. A complete unaudited listing of the fund's holdings as of its most recent quarter end is available upon request. In addition, each Fidelity Central Fund's financial statements, which are not covered by the Fund's Report of Independent Registered Public Accounting Firm, are available on the SEC's website or upon request. |
Affiliated Central Funds
Fiscal year to date information regarding the Fund's investments in Fidelity Central Funds, including the ownership percentage, is presented below.
| Affiliate | Value, beginning of period ($) | Purchases ($) | Sales Proceeds ($) | Dividend Income ($) | Realized Gain (loss) ($) | Change in Unrealized appreciation (depreciation) ($) | Value, end of period ($) | Shares, end of period | % ownership, end of period |
| Fidelity Cash Central Fund | 44,968,450 | 473,363,453 | 206,840,974 | 9,468,337 | 110 | (1) | 311,491,038 | 311,428,752 | 0.6% |
| Total | 44,968,450 | 473,363,453 | 206,840,974 | 9,468,337 | 110 | (1) | 311,491,038 | 311,428,752 | |
| | | | | | | | | | |
Amounts in the dividend income column in the above table include any capital gain distributions from underlying funds, which are presented in the corresponding line item in the Statement of Operations, if applicable.
Amounts included in the purchases and sales proceeds columns may include in-kind transactions, if applicable.
Affiliated Underlying Funds
Fiscal year to date information regarding the Fund's investments in affiliated Underlying Funds is presented below. Exchanges between classes of the same affiliated Underlying Funds may occur. If an Underlying Funds changes its name, the name presented below is the name in effect at period end.
| Affiliate | Value, beginning of period ($) | Purchases ($) | Sales Proceeds ($) | Dividend Income ($) | Realized Gain (loss) ($) | Change in Unrealized appreciation (depreciation) ($) | Value, end of period ($) | Shares, end of period |
| Fidelity Blue Chip Growth ETF | - | 34,719,272 | - | - | - | (10,579) | 34,708,693 | 750,296 |
| Fidelity Canada Fund | 27,692,105 | 2,609,832 | 7,497,590 | 1,641,916 | 309,389 | 308,585 | 23,422,321 | 356,613 |
| Fidelity Commodity Strategy Fund | 12,941,471 | 498,136 | 2,542,984 | 420,850 | (858,204) | 993,270 | 11,031,689 | 120,644 |
| Fidelity Contrafund | 13,207,708 | 81,847,490 | 68,838,026 | 3,627,815 | 3,650,935 | 4,570,454 | 34,438,561 | 1,637,592 |
| Fidelity Emerging Markets Discovery Fund | 47,220,532 | 1,365,744 | 14,147,937 | 1,230,089 | 1,253,599 | (3,808,157) | 31,883,781 | 2,092,112 |
| Fidelity Emerging Markets Fund | 236,045,565 | 2,524,247 | 52,873,496 | 1,309,298 | 5,919,932 | 10,278,792 | 201,895,040 | 5,301,866 |
| Fidelity Enhanced International ETF | 78,219,043 | 2,621,771 | - | 2,467,551 | - | 2,967,113 | 83,807,927 | 3,044,240 |
| Fidelity Enhanced Large Cap Core ETF | - | 79,678,933 | 42,933,823 | 160,927 | 403,960 | 1,250,208 | 38,399,278 | 1,166,088 |
| Fidelity Enhanced Large Cap Value ETF | 22,919,966 | - | 24,670,905 | 222,797 | 7,020,127 | (5,269,188) | - | - |
| Fidelity Enhanced Mid Cap ETF | - | 17,577,368 | 3,157,613 | 127,637 | 215,667 | 1,267,131 | 15,902,553 | 484,096 |
| Fidelity Enhanced Small Cap ETF | - | 22,535,768 | 1,249,329 | 186,597 | 70,375 | 1,660,632 | 23,017,446 | 711,513 |
| Fidelity Equity-Income Fund | 41,261,275 | 222,657 | 44,513,449 | 138,955 | 10,905,346 | (7,875,829) | - | - |
| Fidelity Floating Rate High Income Fund | 55,502,687 | 3,994,827 | 28,821,030 | 3,781,280 | (543,615) | 331,969 | 30,464,838 | 3,279,315 |
| Fidelity Fundamental Small-Mid Cap ETF | - | 7,240,539 | - | - | - | (6,970) | 7,233,569 | 269,106 |
| Fidelity Global Commodity Stock Fund | 6,466,383 | 178,761 | 1,309,970 | 138,999 | 541,230 | (472,947) | 5,403,457 | 301,028 |
| Fidelity Hedged Equity Fund | 54,975,688 | 315,103 | 12,938,019 | 315,103 | 2,442,325 | 6,894,686 | 51,689,783 | 3,921,835 |
| Fidelity High Income Fund | 21,961,088 | 12,687,110 | 5,603,974 | 1,859,895 | 49,204 | 874,822 | 29,968,250 | 3,807,910 |
| Fidelity Inflation-Protected Bond Index Fund | 72,138,790 | 24,360,449 | 35,357,273 | 1,837,025 | (2,358,990) | 938,187 | 59,721,163 | 6,717,791 |
| Fidelity Infrastructure Fund | 4,146,102 | 97,568 | 1,042,133 | 63,815 | 62,794 | 398,588 | 3,662,919 | 266,977 |
| Fidelity International Capital Appreciation Fund | 57,661,205 | 4,112,519 | 11,924,841 | 2,121,706 | 2,775,545 | (347,233) | 52,277,195 | 1,898,228 |
| Fidelity International Discovery Fund | 65,215,973 | 3,970,861 | 15,623,062 | 1,663,117 | 1,029,950 | 4,328,761 | 58,922,483 | 1,229,858 |
| Fidelity International Small Cap Fund | 30,326,894 | 1,621,082 | 6,137,190 | 655,634 | 1,286,766 | (1,791,208) | 25,306,344 | 827,275 |
| Fidelity International Small Cap Opportunities Fund | 42,049,904 | 2,881,376 | - | 2,652,413 | - | (923,141) | 44,008,139 | 2,248,755 |
| Fidelity International Value Fund | 48,065,402 | 2,892,494 | 8,120,669 | 1,259,080 | 842,979 | 523,314 | 44,203,520 | 4,393,988 |
| Fidelity Japan Smaller Companies Fund | 33,245,260 | 1,397,858 | 3,704,560 | 1,397,858 | 479,468 | 744,299 | 32,162,325 | 2,061,688 |
| Fidelity Long-Term Treasury Bond Index Fund | 43,599,007 | 23,781,234 | 23,693,400 | 1,123,723 | (1,725,061) | (3,403,366) | 38,558,414 | 4,204,843 |
| Fidelity Low-Priced Stock Fund | 63,561,353 | 5,613,466 | 69,550,136 | 4,495,603 | 2,813,954 | (2,438,637) | - | - |
| Fidelity New Markets Income Fund | 10,153,254 | 250,922 | 8,231,524 | 241,734 | (1,407,954) | 1,471,028 | 2,235,726 | 176,737 |
| Fidelity Overseas Fund | 278,927,160 | 9,814,011 | 126,299,444 | 2,455,306 | 41,901,900 | (26,262,758) | 178,080,869 | 2,844,742 |
| Fidelity Real Estate Investment Portfolio | 22,028,627 | 1,180,345 | 3,853,245 | 1,063,007 | (157,315) | 198,378 | 19,396,790 | 502,638 |
| Fidelity Stock Selector Small Cap Fund | - | 52,195,665 | - | - | - | - | 52,195,665 | 1,400,098 |
| Fidelity Total Bond Fund | 776,763,038 | 114,188,550 | 189,481,913 | 32,649,525 | (4,319,946) | (9,695,634) | 687,454,095 | 73,133,414 |
| Fidelity U.S. Low Volatility Equity Fund | 42,070,487 | 11,929 | 42,940,404 | - | 6,018,319 | (5,160,331) | - | - |
| Fidelity Value Discovery Fund | 24,469,106 | 46,155 | 25,786,957 | - | 8,190,312 | (6,918,616) | - | - |
| VIP Investment Grade Bond II Portfolio - Investor Class | 770,369,855 | 117,853,654 | 186,747,652 | 28,817,808 | (5,155,464) | (11,909,584) | 684,410,809 | 74,311,706 |
| VIP Stock Selector Portfolio - Investor Class | 1,294,325,367 | 13,864,659 | 531,746,651 | 7,100,499 | 64,834,402 | 145,070,824 | 986,348,601 | 80,848,246 |
| VIP Value Strategies Portfolio - Investor Class | - | 46,778,430 | - | - | - | - | 46,778,430 | 3,051,431 |
| | 4,297,530,295 | 697,530,785 | 1,601,339,199 | 107,227,562 | 146,491,929 | 98,776,863 | 3,638,990,673 | 287,362,669 |
Amounts in the dividend income column in the above table include any capital gain distributions from underlying funds, which are presented in the corresponding line item in the Statement of Operations, if applicable.
Amounts included in the purchases and sales proceeds columns may include in-kind transactions, if applicable.
Investment Valuation
The following is a summary of the inputs used, as of December 31, 2024, involving the Fund's assets and liabilities carried at fair value. The inputs or methodology used for valuing securities may not be an indication of the risk associated with investing in those securities. For more information on valuation inputs, and their aggregation into the levels used below, please refer to the Investment Valuation section in the accompanying Notes to Financial Statements.
| Valuation Inputs at Reporting Date: |
| Description | Total ($) | Level 1 ($) | Level 2 ($) | Level 3 ($) |
Investments in Securities: | | | | |
|
| Alternative Funds | 51,689,783 | 51,689,783 | - | - |
|
| Bond Funds | 1,532,813,295 | 1,532,813,295 | - | - |
|
| Domestic Equity Funds | 1,269,451,275 | 1,269,451,275 | - | - |
|
| International Equity Funds | 785,036,320 | 785,036,320 | - | - |
|
| U.S. Treasury Obligations | 1,874,734 | - | 1,874,734 | - |
|
| Money Market Funds | 311,491,038 | 311,491,038 | - | - |
| Total Investments in Securities: | 3,952,356,445 | 3,950,481,711 | 1,874,734 | - |
Derivative Instruments: Assets | | | | |
Futures Contracts | 46,245 | 46,245 | - | - |
| Total Assets | 46,245 | 46,245 | - | - |
| Liabilities | | | | |
Futures Contracts | (272,925) | (272,925) | - | - |
| Total Liabilities | (272,925) | (272,925) | - | - |
| Total Derivative Instruments: | (226,680) | (226,680) | - | - |
Value of Derivative Instruments
The following table is a summary of the Fund's value of derivative instruments by primary risk exposure as of December 31, 2024. For additional information on derivative instruments, please refer to the Derivative Instruments section in the accompanying Notes to Financial Statements.
Primary Risk Exposure / Derivative Type | Value |
| Asset ($) | Liability ($) |
| Equity Risk | | |
Futures Contracts (a) | 46,245 | (272,925) |
| Total Equity Risk | 46,245 | (272,925) |
| Total Value of Derivatives | 46,245 | (272,925) |
(a)Reflects gross cumulative appreciation (depreciation) on futures contracts as presented in the Schedule of Investments. In the Statement of Assets and Liabilities, the period end daily variation margin is included in receivable or payable for daily variation margin on futures contracts, and the net cumulative appreciation (depreciation) is included in Total accumulated earnings (loss).
VIP FundsManager® 50% Portfolio
Financial Statements
| Statement of Assets and Liabilities |
As of December 31, 2024 |
| Assets | | | | |
| Investment in securities, at value - See accompanying schedule: | | | | |
Unaffiliated issuers (cost $1,874,198) | $ | 1,874,734 | | |
Fidelity Central Funds (cost $311,491,038) | | 311,491,038 | | |
Other affiliated issuers (cost $3,317,144,549) | | 3,638,990,673 | | |
| | | | | |
| | | | | |
| Total Investment in Securities (cost $3,630,509,785) | | | $ | 3,952,356,445 |
| Cash | | | | 1 |
| Receivable for investments sold | | | | 144,038,136 |
| Receivable for fund shares sold | | | | 12,395 |
| Distributions receivable from Fidelity Central Funds | | | | 1,191,540 |
| Receivable for daily variation margin on futures contracts | | | | 6,413 |
Total assets | | | | 4,097,604,930 |
| Liabilities | | | | |
| Payable for investments purchased | $ | 140,935,924 | | |
| Payable for fund shares redeemed | | 2,676,237 | | |
| Accrued management fee | | 337,309 | | |
| Distribution and service plan fees payable | | 9,983 | | |
| Total liabilities | | | | 143,959,453 |
| Net Assets | | | $ | 3,953,645,477 |
| Net Assets consist of: | | | | |
| Paid in capital | | | $ | 3,660,861,399 |
| Total accumulated earnings (loss) | | | | 292,784,078 |
| Net Assets | | | $ | 3,953,645,477 |
| | | | | |
| Net Asset Value and Maximum Offering Price | | | | |
| Service Class : | | | | |
Net Asset Value, offering price and redemption price per share ($56,277 ÷ 4,673 shares) | | | $ | 12.04 |
| Service Class 2 : | | | | |
Net Asset Value, offering price and redemption price per share ($77,812,119 ÷ 6,496,193 shares) | | | $ | 11.98 |
| Investor Class : | | | | |
Net Asset Value, offering price and redemption price per share ($3,875,777,081 ÷ 322,000,471 shares) | | | $ | 12.04 |
| Statement of Operations |
| Year ended December 31, 2024 |
| Investment Income | | | | |
| Dividends: | | | | |
| Unaffiliated issuers | | | $ | 160,068 |
| Affiliated issuers | | | | 93,196,444 |
| Interest | | | | 304,588 |
| Income from Fidelity Central Funds | | | | 9,468,337 |
| Total income | | | | 103,129,437 |
| Expenses | | | | |
| Management fee | $ | 6,263,521 | | |
| Distribution and service plan fees | | 199,394 | | |
| Independent trustees' fees and expenses | | 10,919 | | |
| Total expenses before reductions | | 6,473,834 | | |
| Expense reductions | | (2,171,277) | | |
| Total expenses after reductions | | | | 4,302,557 |
| Net Investment income (loss) | | | | 98,826,880 |
| Realized and Unrealized Gain (Loss) | | | | |
| Net realized gain (loss) on: | | | | |
| Investment Securities: | | | | |
| Unaffiliated issuers | | 2,544,835 | | |
| Fidelity Central Funds | | 110 | | |
| Other affiliated issuers | | 146,491,929 | | |
| Foreign currency transactions | | 320 | | |
| Futures contracts | | (23,813,676) | | |
| Capital gain distributions from underlying funds: | | | | |
| Affiliated issuers | | 14,031,118 | | |
| Total net realized gain (loss) | | | | 139,254,636 |
| Change in net unrealized appreciation (depreciation) on: | | | | |
| Investment Securities: | | | | |
| Unaffiliated issuers | | (1,078) | | |
| Fidelity Central Funds | | (1) | | |
| Other affiliated issuers | | 98,776,863 | | |
| Futures contracts | | 7,890,388 | | |
| Total change in net unrealized appreciation (depreciation) | | | | 106,666,172 |
| Net gain (loss) | | | | 245,920,808 |
| Net increase (decrease) in net assets resulting from operations | | | $ | 344,747,688 |
| Statement of Changes in Net Assets |
| |
| | Year ended December 31, 2024 | | Year ended December 31, 2023 |
| Increase (Decrease) in Net Assets | | | | |
| Operations | | | | |
| Net investment income (loss) | $ | 98,826,880 | $ | 99,332,774 |
| Net realized gain (loss) | | 139,254,636 | | (59,183,170) |
| Change in net unrealized appreciation (depreciation) | | 106,666,172 | | 492,084,095 |
| Net increase (decrease) in net assets resulting from operations | | 344,747,688 | | 532,233,699 |
| Distributions to shareholders | | (95,669,676) | | (108,450,832) |
| | | | | |
| Share transactions - net increase (decrease) | | (647,189,348) | | (567,547,837) |
| Total increase (decrease) in net assets | | (398,111,336) | | (143,764,970) |
| | | | | |
| Net Assets | | | | |
| Beginning of period | | 4,351,756,813 | | 4,495,521,783 |
| End of period | $ | 3,953,645,477 | $ | 4,351,756,813 |
| | | | | |
| | | | | |
Financial Highlights
VIP FundsManager® 50% Portfolio Service Class |
| |
| Years ended December 31, | | 2024 | | 2023 | | 2022 | | 2021 | | 2020 |
Selected Per-Share Data | | | | | | | | | | |
| Net asset value, beginning of period | $ | 11.37 | $ | 10.33 | $ | 14.51 | $ | 13.57 | $ | 12.28 |
| Income from Investment Operations | | | | | | | | | | |
Net investment income (loss) A,B | | .28 | | .25 | | .21 | | .15 | | .14 |
| Net realized and unrealized gain (loss) | | .69 | | 1.08 | | (2.00) | | 1.19 | | 1.55 |
| Total from investment operations | | .97 | | 1.33 | | (1.79) | | 1.34 | | 1.69 |
| Distributions from net investment income | | (.30) | | (.29) | | (.23) | | (.16) | | (.14) |
| Distributions from net realized gain | | - | | - | | (2.16) | | (.24) | | (.26) |
| Total distributions | | (.30) | | (.29) | | (2.39) | | (.40) | | (.40) |
| Net asset value, end of period | $ | 12.04 | $ | 11.37 | $ | 10.33 | $ | 14.51 | $ | 13.57 |
Total Return C,D | | | | 12.85% | | (13.91)% | | 10.01% | | 14.06% |
Ratios to Average Net Assets B,E,F | | | | | | | | | | |
| Expenses before reductions | | .25% | | .25% | | .30% | | .35% | | .35% |
| Expenses net of fee waivers, if any | | | | .10% | | .15% | | .20% | | .20% |
| Expenses net of all reductions | | .10% | | .10% | | .15% | | .20% | | .20% |
| Net investment income (loss) | | 2.37% | | 2.26% | | 1.86% | | 1.10% | | 1.12% |
| Supplemental Data | | | | | | | | | | |
| Net assets, end of period (000 omitted) | $ | 56 | $ | 53 | $ | 49 | $ | 69 | $ | 64 |
Portfolio turnover rate G | | | | 14% | | 51% H | | 51% H | | 24% H |
ACalculated based on average shares outstanding during the period.
BNet investment income (loss) is affected by the timing of the declaration of dividends by any underlying mutual funds or exchange-traded funds (ETFs). Net investment income (loss) of any mutual funds or ETFs is not included in the Fund's net investment income (loss) ratio.
CTotal returns do not reflect charges attributable to your insurance company's separate account. Inclusion of these charges would reduce the total returns shown.
DTotal returns would have been lower if certain expenses had not been reduced during the applicable periods shown.
EExpense ratios reflect operating expenses of the class. Expenses before reductions do not reflect amounts reimbursed, waived, or reduced through arrangements with the investment adviser, brokerage services, or other offset arrangements, if applicable, and do not represent the amount paid by the class during periods when reimbursements, waivers or reductions occur.
FFees and expenses of any underlying mutual funds or exchange-traded funds (ETFs) are not included in the Fund's expense ratio. The Fund indirectly bears its proportionate share of these expenses. For additional expense information related to investments in Fidelity Central Funds, please refer to the "Investments in Fidelity Central Funds" note found in the Notes to Financial Statements section of the most recent Annual or Semi-Annual report.
GAmount does not include the portfolio activity of any underlying mutual funds or exchange-traded funds (ETFs), derivatives or securities that mature within one year from acquisition.
HPortfolio turnover rate excludes securities received or delivered in-kind.
VIP FundsManager® 50% Portfolio Service Class 2 |
| |
| Years ended December 31, | | 2024 | | 2023 | | 2022 | | 2021 | | 2020 |
Selected Per-Share Data | | | | | | | | | | |
| Net asset value, beginning of period | $ | 11.31 | $ | 10.28 | $ | 14.45 | $ | 13.51 | $ | 12.23 |
| Income from Investment Operations | | | | | | | | | | |
Net investment income (loss) A,B | | .26 | | .23 | | .19 | | .13 | | .12 |
| Net realized and unrealized gain (loss) | | .69 | | 1.07 | | (1.99) | | 1.18 | | 1.55 |
| Total from investment operations | | .95 | | 1.30 | | (1.80) | | 1.31 | | 1.67 |
| Distributions from net investment income | | (.28) | | (.27) | | (.21) | | (.14) | | (.13) |
| Distributions from net realized gain | | - | | - | | (2.16) | | (.24) | | (.26) |
| Total distributions | | (.28) | | (.27) | | (2.37) | | (.37) C | | (.39) |
| Net asset value, end of period | $ | 11.98 | $ | 11.31 | $ | 10.28 | $ | 14.45 | $ | 13.51 |
Total Return D,E | | | | 12.65% | | (14.04)% | | 9.88% | | 13.89% |
Ratios to Average Net Assets B,F,G | | | | | | | | | | |
| Expenses before reductions | | .40% | | .40% | | .45% | | .50% | | .50% |
| Expenses net of fee waivers, if any | | | | .25% | | .30% | | .35% | | .35% |
| Expenses net of all reductions | | .25% | | .25% | | .30% | | .35% | | .35% |
| Net investment income (loss) | | 2.22% | | 2.11% | | 1.71% | | .95% | | .97% |
| Supplemental Data | | | | | | | | | | |
| Net assets, end of period (000 omitted) | $ | 77,812 | $ | 77,398 | $ | 75,580 | $ | 94,708 | $ | 114,211 |
Portfolio turnover rate H | | | | 14% | | 51% I | | 51% I | | 24% I |
ACalculated based on average shares outstanding during the period.
BNet investment income (loss) is affected by the timing of the declaration of dividends by any underlying mutual funds or exchange-traded funds (ETFs). Net investment income (loss) of any mutual funds or ETFs is not included in the Fund's net investment income (loss) ratio.
CTotal distributions per share do not sum due to rounding.
DTotal returns do not reflect charges attributable to your insurance company's separate account. Inclusion of these charges would reduce the total returns shown.
ETotal returns would have been lower if certain expenses had not been reduced during the applicable periods shown.
FExpense ratios reflect operating expenses of the class. Expenses before reductions do not reflect amounts reimbursed, waived, or reduced through arrangements with the investment adviser, brokerage services, or other offset arrangements, if applicable, and do not represent the amount paid by the class during periods when reimbursements, waivers or reductions occur.
GFees and expenses of any underlying mutual funds or exchange-traded funds (ETFs) are not included in the Fund's expense ratio. The Fund indirectly bears its proportionate share of these expenses. For additional expense information related to investments in Fidelity Central Funds, please refer to the "Investments in Fidelity Central Funds" note found in the Notes to Financial Statements section of the most recent Annual or Semi-Annual report.
HAmount does not include the portfolio activity of any underlying mutual funds or exchange-traded funds (ETFs), derivatives or securities that mature within one year from acquisition.
IPortfolio turnover rate excludes securities received or delivered in-kind.
VIP FundsManager® 50% Portfolio Investor Class |
| |
| Years ended December 31, | | 2024 | | 2023 | | 2022 | | 2021 | | 2020 |
Selected Per-Share Data | | | | | | | | | | |
| Net asset value, beginning of period | $ | 11.37 | $ | 10.32 | $ | 14.50 | $ | 13.56 | $ | 12.28 |
| Income from Investment Operations | | | | | | | | | | |
Net investment income (loss) A,B | | .28 | | .25 | | .21 | | .15 | | .14 |
| Net realized and unrealized gain (loss) | | .69 | | 1.09 | | (2.00) | | 1.19 | | 1.54 |
| Total from investment operations | | .97 | | 1.34 | | (1.79) | | 1.34 | | 1.68 |
| Distributions from net investment income | | (.30) | | (.29) | | (.23) | | (.16) | | (.14) |
| Distributions from net realized gain | | - | | - | | (2.16) | | (.24) | | (.26) |
| Total distributions | | (.30) | | (.29) | | (2.39) | | (.40) | | (.40) |
| Net asset value, end of period | $ | 12.04 | $ | 11.37 | $ | 10.32 | $ | 14.50 | $ | 13.56 |
Total Return C,D | | | | 12.96% | | (13.94)% | | 10.02% | | 13.98% |
Ratios to Average Net Assets A,E,F | | | | | | | | | | |
| Expenses before reductions | | .15% | | .15% | | .20% | | .25% | | .25% |
| Expenses net of fee waivers, if any | | | | .10% | | .15% | | .20% | | .20% |
| Expenses net of all reductions | | .10% | | .10% | | .15% | | .20% | | .20% |
| Net investment income (loss) | | 2.37% | | 2.26% | | 1.86% | | 1.10% | | 1.12% |
| Supplemental Data | | | | | | | | | | |
| Net assets, end of period (000 omitted) | $ | 3,875,777 | $ | 4,274,306 | $ | 4,419,893 | $ | 5,887,190 | $ | 5,731,732 |
Portfolio turnover rate G | | | | 14% | | 51% H | | 51% H | | 24% H |
ANet investment income (loss) is affected by the timing of the declaration of dividends by any underlying mutual funds or exchange-traded funds (ETFs). Net investment income (loss) of any mutual funds or ETFs is not included in the Fund's net investment income (loss) ratio.
BCalculated based on average shares outstanding during the period.
CTotal returns do not reflect charges attributable to your insurance company's separate account. Inclusion of these charges would reduce the total returns shown.
DTotal returns would have been lower if certain expenses had not been reduced during the applicable periods shown.
EExpense ratios reflect operating expenses of the class. Expenses before reductions do not reflect amounts reimbursed, waived, or reduced through arrangements with the investment adviser, brokerage services, or other offset arrangements, if applicable, and do not represent the amount paid by the class during periods when reimbursements, waivers or reductions occur.
FFees and expenses of any underlying mutual funds or exchange-traded funds (ETFs) are not included in the Fund's expense ratio. The Fund indirectly bears its proportionate share of these expenses. For additional expense information related to investments in Fidelity Central Funds, please refer to the "Investments in Fidelity Central Funds" note found in the Notes to Financial Statements section of the most recent Annual or Semi-Annual report.
GAmount does not include the portfolio activity of any underlying mutual funds or exchange-traded funds (ETFs), derivatives or securities that mature within one year from acquisition.
HPortfolio turnover rate excludes securities received or delivered in-kind.
VIP FundsManager® 60% Portfolio
Schedule of Investments December 31, 2024
Showing Percentage of Net Assets
| Alternative Funds - 1.3% |
| | | Shares | Value ($) |
Fidelity Hedged Equity Fund (b) (Cost $67,951,021) | | 6,645,046 | 87,581,711 |
| | | | |
| Bond Funds - 33.8% |
| | | Shares | Value ($) |
| Fidelity Floating Rate High Income Fund (b) | | 5,507,354 | 51,163,318 |
| Fidelity High Income Fund (b) | | 6,562,692 | 51,648,384 |
| Fidelity Inflation-Protected Bond Index Fund (b) | | 11,165,715 | 99,263,205 |
| Fidelity Long-Term Treasury Bond Index Fund (b) | | 7,322,246 | 67,144,997 |
| Fidelity New Markets Income Fund (b) | | 279,152 | 3,531,269 |
| Fidelity Total Bond Fund (b) | | 109,365,620 | 1,028,036,827 |
| VIP Investment Grade Bond II Portfolio - Investor Class (b) | | 111,139,060 | 1,023,590,740 |
| TOTAL BOND FUNDS (Cost $2,422,333,859) | | | 2,324,378,740 |
| | | | |
| Domestic Equity Funds - 38.2% |
| | | Shares | Value ($) |
| Fidelity Blue Chip Growth ETF (b) | | 1,570,488 | 72,650,776 |
| Fidelity Commodity Strategy Fund (b) | | 205,924 | 18,829,687 |
| Fidelity Contrafund (b) | | 3,434,419 | 72,225,823 |
| Fidelity Enhanced Large Cap Core ETF (b) | | 2,016,959 | 66,418,460 |
| Fidelity Enhanced Mid Cap ETF (b) | | 827,803 | 27,193,328 |
| Fidelity Enhanced Small Cap ETF (b) | | 1,216,685 | 39,359,760 |
| Fidelity Fundamental Small-Mid Cap ETF (b) | | 563,281 | 15,140,993 |
| Fidelity Real Estate Investment Portfolio (b) | | 862,617 | 33,288,385 |
| Fidelity Stock Selector Small Cap Fund (b) | | 2,930,749 | 109,258,326 |
| VIP Stock Selector All Cap Portfolio - Investor Class (b) | | 169,461,899 | 2,067,435,170 |
| VIP Value Strategies Portfolio - Investor Class (b) | | 6,387,297 | 97,917,265 |
| TOTAL DOMESTIC EQUITY FUNDS (Cost $2,211,883,149) | | | 2,619,717,973 |
| | | | |
| International Equity Funds - 23.7% |
| | | Shares | Value ($) |
| Fidelity Canada Fund (b) | | 805,079 | 52,877,619 |
| Fidelity Emerging Markets Discovery Fund (b) | | 3,330,573 | 50,757,926 |
| Fidelity Emerging Markets Fund (b) | | 11,508,435 | 438,241,212 |
| Fidelity Enhanced International ETF (b) | | 4,491,183 | 123,642,268 |
| Fidelity Global Commodity Stock Fund (b) | | 575,975 | 10,338,744 |
| Fidelity Infrastructure Fund (b) | | 476,038 | 6,531,236 |
| Fidelity International Capital Appreciation Fund (b) | | 3,587,164 | 98,790,491 |
| Fidelity International Discovery Fund (b) | | 2,479,797 | 118,807,090 |
| Fidelity International Small Cap Fund (b) | | 1,647,397 | 50,393,862 |
| Fidelity International Small Cap Opportunities Fund (b) | | 3,449,678 | 67,510,200 |
| Fidelity International Value Fund (b) | | 7,667,863 | 77,138,698 |
| Fidelity Japan Smaller Companies Fund (b) | | 3,312,153 | 51,669,588 |
| Fidelity Overseas Fund (b) | | 7,713,803 | 482,884,065 |
| TOTAL INTERNATIONAL EQUITY FUNDS (Cost $1,276,002,788) | | | 1,629,582,999 |
| | | | |
| U.S. Treasury Obligations - 0.0% |
| | | Yield (%) (c) | Principal Amount (a) | Value ($) |
| US Treasury Bills 0% 1/30/2025 (d) | | 4.51 | 800,000 | 797,368 |
| US Treasury Bills 0% 1/9/2025 (d) | | 4.58 | 1,940,000 | 1,938,412 |
| TOTAL U.S. TREASURY OBLIGATIONS (Cost $2,735,170) | | | | 2,735,780 |
| | | | | |
| Money Market Funds - 3.0% |
| | | Yield (%) | Shares | Value ($) |
Fidelity Cash Central Fund (e) (Cost $208,767,658) | | 4.36 | 208,725,912 | 208,767,658 |
| | | | | |
| TOTAL INVESTMENT IN SECURITIES - 100.0% (Cost $6,189,673,645) | 6,872,764,861 |
NET OTHER ASSETS (LIABILITIES) - 0.0% | 1,096,318 |
| NET ASSETS - 100.0% | 6,873,861,179 |
| | |
| Futures Contracts |
| | Number of contracts | Expiration Date | Notional Amount ($) | Value ($) | Unrealized Appreciation/ (Depreciation) ($) |
| Purchased | | | | | |
| | | | | | |
| Equity Contracts | | | | | |
| CME E-mini Russell 2000 Index Contracts (United States) | 806 | Mar 2025 | 90,666,940 | (68,026) | (68,026) |
| CME E-mini S&P MidCap 400 Index Contracts (United States) | 92 | Mar 2025 | 28,949,640 | 10,036 | 10,036 |
| ICE MSCI EAFE Index Contracts (United States) | 218 | Mar 2025 | 24,715,750 | (819,220) | (819,220) |
| | | | | | |
| TOTAL PURCHASED | | | | | (877,210) |
| | | | | | |
| Sold | | | | | |
| | | | | | |
| Equity Contracts | | | | | |
| CME E-mini S&P 500 Index Contracts (United States) | 403 | Mar 2025 | 119,605,363 | 86,983 | 86,983 |
| | | | | | |
| TOTAL FUTURES CONTRACTS | | | | | (790,227) |
| The notional amount of futures purchased as a percentage of Net Assets is 2.1% |
| The notional amount of futures sold as a percentage of Net Assets is 1.7% |
Security Type Abbreviations
Legend
| (a) | Amount is stated in United States dollars unless otherwise noted. |
| (c) | Yield represents either the annualized yield at the date of purchase, or the stated coupon rate, or, for floating and adjustable rate securities, the rate at period end. |
| (d) | Security or a portion of the security was pledged to cover margin requirements for futures contracts. At period end, the value of securities pledged amounted to $839,334. |
| (e) | Affiliated fund that is generally available only to investment companies and other accounts managed by Fidelity Investments. The rate quoted is the annualized seven-day yield of the fund at period end. A complete unaudited listing of the fund's holdings as of its most recent quarter end is available upon request. In addition, each Fidelity Central Fund's financial statements, which are not covered by the Fund's Report of Independent Registered Public Accounting Firm, are available on the SEC's website or upon request. |
Affiliated Central Funds
Fiscal year to date information regarding the Fund's investments in Fidelity Central Funds, including the ownership percentage, is presented below.
| Affiliate | Value, beginning of period ($) | Purchases ($) | Sales Proceeds ($) | Dividend Income ($) | Realized Gain (loss) ($) | Change in Unrealized appreciation (depreciation) ($) | Value, end of period ($) | Shares, end of period | % ownership, end of period |
| Fidelity Cash Central Fund | 70,860,946 | 577,056,565 | 439,149,866 | 7,531,360 | 13 | - | 208,767,658 | 208,725,912 | 0.4% |
| Total | 70,860,946 | 577,056,565 | 439,149,866 | 7,531,360 | 13 | - | 208,767,658 | 208,725,912 | |
| | | | | | | | | | |
Amounts in the dividend income column in the above table include any capital gain distributions from underlying funds, which are presented in the corresponding line item in the Statement of Operations, if applicable.
Amounts included in the purchases and sales proceeds columns may include in-kind transactions, if applicable.
Affiliated Underlying Funds
Fiscal year to date information regarding the Fund's investments in affiliated Underlying Funds is presented below. Exchanges between classes of the same affiliated Underlying Funds may occur. If an Underlying Funds changes its name, the name presented below is the name in effect at period end.
| Affiliate | Value, beginning of period ($) | Purchases ($) | Sales Proceeds ($) | Dividend Income ($) | Realized Gain (loss) ($) | Change in Unrealized appreciation (depreciation) ($) | Value, end of period ($) | Shares, end of period |
| Fidelity Blue Chip Growth ETF | - | 72,672,920 | - | - | - | (22,144) | 72,650,776 | 1,570,488 |
| Fidelity Canada Fund | 48,951,193 | 10,084,565 | 6,737,932 | 3,672,552 | (13,613) | 593,406 | 52,877,619 | 805,079 |
| Fidelity Commodity Strategy Fund | 18,532,277 | 2,020,728 | 1,897,127 | 689,147 | (388,098) | 561,907 | 18,829,687 | 205,924 |
| Fidelity Contrafund | 65,614,917 | 112,888,202 | 130,462,683 | 7,553,509 | 9,060,212 | 15,125,175 | 72,225,823 | 3,434,419 |
| Fidelity Emerging Markets Discovery Fund | 53,057,223 | 5,564,376 | 3,990,820 | 1,949,913 | 119,830 | (3,992,683) | 50,757,926 | 3,330,573 |
| Fidelity Emerging Markets Fund | 412,943,178 | 35,001,616 | 35,861,720 | 2,825,017 | 849,509 | 25,308,629 | 438,241,212 | 11,508,435 |
| Fidelity Enhanced International ETF | 114,678,883 | 4,633,866 | - | 3,622,181 | - | 4,329,519 | 123,642,268 | 4,491,183 |
| Fidelity Enhanced Large Cap Core ETF | - | 137,964,464 | 73,849,785 | 253,990 | 589,459 | 1,714,322 | 66,418,460 | 2,016,959 |
| Fidelity Enhanced Large Cap Value ETF | 55,696,110 | - | 59,950,938 | 541,404 | 15,678,232 | (11,423,404) | - | - |
| Fidelity Enhanced Mid Cap ETF | - | 28,106,264 | 3,259,677 | 206,664 | 222,637 | 2,124,104 | 27,193,328 | 827,803 |
| Fidelity Enhanced Small Cap ETF | - | 36,735,517 | - | 308,030 | - | 2,624,243 | 39,359,760 | 1,216,685 |
| Fidelity Equity-Income Fund | 132,961,011 | 2,497,885 | 145,695,235 | 474,787 | 30,951,817 | (20,715,478) | - | - |
| Fidelity Floating Rate High Income Fund | 64,998,244 | 8,098,048 | 21,735,455 | 4,951,712 | (357,837) | 160,318 | 51,163,318 | 5,507,354 |
| Fidelity Fundamental Small-Mid Cap ETF | - | 15,155,582 | - | - | - | (14,589) | 15,140,993 | 563,281 |
| Fidelity Global Commodity Stock Fund | 10,317,289 | 949,995 | 977,327 | 264,010 | 81,333 | (32,546) | 10,338,744 | 575,975 |
| Fidelity Hedged Equity Fund | 80,398,853 | 530,456 | 7,809,024 | 530,455 | 1,414,590 | 13,046,836 | 87,581,711 | 6,645,046 |
| Fidelity High Income Fund | 32,325,105 | 22,052,489 | 4,179,056 | 2,986,153 | 19,829 | 1,430,017 | 51,648,384 | 6,562,692 |
| Fidelity Inflation-Protected Bond Index Fund | 121,283,345 | 10,311,218 | 30,507,593 | 3,667,519 | (1,810,226) | (13,539) | 99,263,205 | 11,165,715 |
| Fidelity Infrastructure Fund | 5,928,055 | 762,462 | 881,458 | 103,036 | 6,775 | 715,402 | 6,531,236 | 476,038 |
| Fidelity International Capital Appreciation Fund | 91,622,204 | 14,701,833 | 10,731,505 | 3,983,480 | 790,620 | 2,407,339 | 98,790,491 | 3,587,164 |
| Fidelity International Discovery Fund | 107,661,865 | 16,960,939 | 14,052,086 | 3,327,822 | (387,629) | 8,624,001 | 118,807,090 | 2,479,797 |
| Fidelity International Small Cap Fund | 50,410,321 | 6,779,989 | 5,526,779 | 1,296,446 | 182,708 | (1,452,377) | 50,393,862 | 1,647,397 |
| Fidelity International Small Cap Opportunities Fund | 60,236,982 | 8,834,169 | - | 4,057,717 | - | (1,560,951) | 67,510,200 | 3,449,678 |
| Fidelity International Value Fund | 72,956,733 | 9,869,641 | 7,288,519 | 2,186,994 | 296,839 | 1,304,004 | 77,138,698 | 7,667,863 |
| Fidelity Japan Smaller Companies Fund | 45,177,646 | 5,028,462 | - | 2,245,694 | - | 1,463,480 | 51,669,588 | 3,312,153 |
| Fidelity Long-Term Treasury Bond Index Fund | 73,850,609 | 42,301,407 | 40,457,924 | 1,835,242 | (2,830,403) | (5,718,692) | 67,144,997 | 7,322,246 |
| Fidelity Low-Priced Stock Fund | 148,840,987 | 15,802,729 | 167,706,945 | 9,039,294 | 2,438,792 | 624,437 | - | - |
| Fidelity New Markets Income Fund | 15,895,249 | 571,717 | 13,038,507 | 381,609 | (2,190,085) | 2,292,895 | 3,531,269 | 279,152 |
| Fidelity Overseas Fund | 446,263,974 | 74,083,188 | 52,896,536 | 6,594,127 | 2,254,201 | 13,179,238 | 482,884,065 | 7,713,803 |
| Fidelity Real Estate Investment Portfolio | 32,364,428 | 3,799,099 | 2,875,018 | 1,780,969 | (69,110) | 68,986 | 33,288,385 | 862,617 |
| Fidelity Stock Selector Small Cap Fund | - | 109,258,326 | - | - | - | - | 109,258,326 | 2,930,749 |
| Fidelity Total Bond Fund | 978,836,650 | 197,295,539 | 128,497,598 | 44,631,243 | (757,344) | (18,840,420) | 1,028,036,827 | 109,365,620 |
| Fidelity U.S. Low Volatility Equity Fund | 62,736,299 | 151,445 | 64,209,801 | - | 8,968,487 | (7,646,430) | - | - |
| Fidelity Value Discovery Fund | 63,921,110 | 1,113,705 | 68,520,772 | - | 17,043,659 | (13,557,702) | - | - |
| VIP Investment Grade Bond II Portfolio - Investor Class | 971,144,091 | 205,158,242 | 125,720,496 | 42,661,766 | (610,716) | (26,380,381) | 1,023,590,740 | 111,139,060 |
| VIP Stock Selector Portfolio - Investor Class | 1,915,137,612 | 261,556,809 | 476,191,425 | 14,774,890 | 42,858,319 | 324,073,855 | 2,067,435,170 | 169,461,899 |
| VIP Value Strategies Portfolio - Investor Class | - | 97,917,265 | - | - | - | - | 97,917,265 | 6,387,297 |
| | 6,354,742,443 | 1,577,215,157 | 1,705,509,741 | 173,397,372 | 124,412,787 | 310,400,777 | 6,661,261,423 | 498,510,144 |
Amounts in the dividend income column in the above table include any capital gain distributions from underlying funds, which are presented in the corresponding line item in the Statement of Operations, if applicable.
Amounts included in the purchases and sales proceeds columns may include in-kind transactions, if applicable.
Investment Valuation
The following is a summary of the inputs used, as of December 31, 2024, involving the Fund's assets and liabilities carried at fair value. The inputs or methodology used for valuing securities may not be an indication of the risk associated with investing in those securities. For more information on valuation inputs, and their aggregation into the levels used below, please refer to the Investment Valuation section in the accompanying Notes to Financial Statements.
| Valuation Inputs at Reporting Date: |
| Description | Total ($) | Level 1 ($) | Level 2 ($) | Level 3 ($) |
Investments in Securities: | | | | |
|
| Alternative Funds | 87,581,711 | 87,581,711 | - | - |
|
| Bond Funds | 2,324,378,740 | 2,324,378,740 | - | - |
|
| Domestic Equity Funds | 2,619,717,973 | 2,619,717,973 | - | - |
|
| International Equity Funds | 1,629,582,999 | 1,629,582,999 | - | - |
|
| U.S. Treasury Obligations | 2,735,780 | - | 2,735,780 | - |
|
| Money Market Funds | 208,767,658 | 208,767,658 | - | - |
| Total Investments in Securities: | 6,872,764,861 | 6,870,029,081 | 2,735,780 | - |
Derivative Instruments: Assets | | | | |
Futures Contracts | 97,019 | 97,019 | - | - |
| Total Assets | 97,019 | 97,019 | - | - |
| Liabilities | | | | |
Futures Contracts | (887,246) | (887,246) | - | - |
| Total Liabilities | (887,246) | (887,246) | - | - |
| Total Derivative Instruments: | (790,227) | (790,227) | - | - |
Value of Derivative Instruments
The following table is a summary of the Fund's value of derivative instruments by primary risk exposure as of December 31, 2024. For additional information on derivative instruments, please refer to the Derivative Instruments section in the accompanying Notes to Financial Statements.
Primary Risk Exposure / Derivative Type | Value |
| Asset ($) | Liability ($) |
| Equity Risk | | |
Futures Contracts (a) | 97,019 | (887,246) |
| Total Equity Risk | 97,019 | (887,246) |
| Total Value of Derivatives | 97,019 | (887,246) |
(a)Reflects gross cumulative appreciation (depreciation) on futures contracts as presented in the Schedule of Investments. In the Statement of Assets and Liabilities, the period end daily variation margin is included in receivable or payable for daily variation margin on futures contracts, and the net cumulative appreciation (depreciation) is included in Total accumulated earnings (loss).
VIP FundsManager® 60% Portfolio
Financial Statements
| Statement of Assets and Liabilities |
As of December 31, 2024 |
| Assets | | | | |
| Investment in securities, at value - See accompanying schedule: | | | | |
Unaffiliated issuers (cost $2,735,170) | $ | 2,735,780 | | |
Fidelity Central Funds (cost $208,767,658) | | 208,767,658 | | |
Other affiliated issuers (cost $5,978,170,817) | | 6,661,261,423 | | |
| | | | | |
| | | | | |
| Total Investment in Securities (cost $6,189,673,645) | | | $ | 6,872,764,861 |
| Receivable for investments sold | | | | 296,124,883 |
| Receivable for fund shares sold | | | | 2,325,424 |
| Distributions receivable from Fidelity Central Funds | | | | 797,905 |
| Receivable for daily variation margin on futures contracts | | | | 3,922 |
Total assets | | | | 7,172,016,995 |
| Liabilities | | | | |
| Payable for investments purchased | $ | 295,111,145 | | |
| Payable for fund shares redeemed | | 2,385,840 | | |
| Accrued management fee | | 584,549 | | |
| Distribution and service plan fees payable | | 74,282 | | |
| Total liabilities | | | | 298,155,816 |
| Net Assets | | | $ | 6,873,861,179 |
| Net Assets consist of: | | | | |
| Paid in capital | | | $ | 6,169,724,453 |
| Total accumulated earnings (loss) | | | | 704,136,726 |
| Net Assets | | | $ | 6,873,861,179 |
| | | | | |
| Net Asset Value and Maximum Offering Price | | | | |
| Service Class : | | | | |
Net Asset Value, offering price and redemption price per share ($117,197,566 ÷ 11,254,247 shares) | | | $ | 10.41 |
| Service Class 2 : | | | | |
Net Asset Value, offering price and redemption price per share ($580,498,652 ÷ 55,966,265 shares) | | | $ | 10.37 |
| Investor Class : | | | | |
Net Asset Value, offering price and redemption price per share ($6,176,164,961 ÷ 593,094,275 shares) | | | $ | 10.41 |
| Statement of Operations |
| Year ended December 31, 2024 |
| Investment Income | | | | |
| Dividends: | | | | |
| Unaffiliated issuers | | | $ | 253,908 |
| Affiliated issuers | | | | 146,126,839 |
| Interest | | | | 180,518 |
| Income from Fidelity Central Funds | | | | 7,531,360 |
| Total income | | | | 154,092,625 |
| Expenses | | | | |
| Management fee | $ | 10,055,081 | | |
| Distribution and service plan fees | | 1,580,627 | | |
| Independent trustees' fees and expenses | | 17,221 | | |
| Total expenses before reductions | | 11,652,929 | | |
| Expense reductions | | (4,054,508) | | |
| Total expenses after reductions | | | | 7,598,421 |
| Net Investment income (loss) | | | | 146,494,204 |
| Realized and Unrealized Gain (Loss) | | | | |
| Net realized gain (loss) on: | | | | |
| Investment Securities: | | | | |
| Unaffiliated issuers | | 4,977,959 | | |
| Fidelity Central Funds | | 13 | | |
| Other affiliated issuers | | 124,412,787 | | |
| Foreign currency transactions | | 467 | | |
| Futures contracts | | (7,147,047) | | |
| Capital gain distributions from underlying funds: | | | | |
| Affiliated issuers | | 27,270,533 | | |
| Total net realized gain (loss) | | | | 149,514,712 |
| Change in net unrealized appreciation (depreciation) on: | | | | |
| Investment Securities: | | | | |
| Unaffiliated issuers | | (319) | | |
| Affiliated issuers | | 310,400,777 | | |
| Futures contracts | | 466,943 | | |
| Total change in net unrealized appreciation (depreciation) | | | | 310,867,401 |
| Net gain (loss) | | | | 460,382,113 |
| Net increase (decrease) in net assets resulting from operations | | | $ | 606,876,317 |
| Statement of Changes in Net Assets |
| |
| | Year ended December 31, 2024 | | Year ended December 31, 2023 |
| Increase (Decrease) in Net Assets | | | | |
| Operations | | | | |
| Net investment income (loss) | $ | 146,494,204 | $ | 130,906,624 |
| Net realized gain (loss) | | 149,514,712 | | (33,423,554) |
| Change in net unrealized appreciation (depreciation) | | 310,867,401 | | 706,352,348 |
| Net increase (decrease) in net assets resulting from operations | | 606,876,317 | | 803,835,418 |
| Distributions to shareholders | | (140,926,408) | | (142,216,963) |
| | | | | |
| Share transactions - net increase (decrease) | | (22,914,353) | | 72,699,093 |
| Total increase (decrease) in net assets | | 443,035,556 | | 734,317,548 |
| | | | | |
| Net Assets | | | | |
| Beginning of period | | 6,430,825,623 | | 5,696,508,075 |
| End of period | $ | 6,873,861,179 | $ | 6,430,825,623 |
| | | | | |
| | | | | |
Financial Highlights
VIP FundsManager® 60% Portfolio Service Class |
| |
| Years ended December 31, | | 2024 | | 2023 | | 2022 | | 2021 | | 2020 |
Selected Per-Share Data | | | | | | | | | | |
| Net asset value, beginning of period | $ | 9.70 | $ | 8.69 | $ | 12.40 | $ | 11.35 | $ | 10.20 |
| Income from Investment Operations | | | | | | | | | | |
Net investment income (loss) A,B | | .23 | | .20 | | .16 | | .13 | | .11 |
| Net realized and unrealized gain (loss) | | .70 | | 1.03 | | (1.82) | | 1.25 | | 1.40 |
| Total from investment operations | | .93 | | 1.23 | | (1.66) | | 1.38 | | 1.51 |
| Distributions from net investment income | | (.22) | | (.22) | | (.17) | | (.14) | | (.11) |
| Distributions from net realized gain | | - | | - | | (1.88) | | (.20) | | (.25) |
| Total distributions | | (.22) | | (.22) | | (2.05) | | (.33) C | | (.36) |
| Net asset value, end of period | $ | 10.41 | $ | 9.70 | $ | 8.69 | $ | 12.40 | $ | 11.35 |
Total Return D,E | | | | 14.17% | | (15.06)% | | 12.34% | | 15.12% |
Ratios to Average Net Assets B,F,G | | | | | | | | | | |
| Expenses before reductions | | .25% | | .25% | | .29% | | .35% | | .35% |
| Expenses net of fee waivers, if any | | | | .10% | | .14% | | .20% | | .20% |
| Expenses net of all reductions | | .10% | | .10% | | .14% | | .20% | | .20% |
| Net investment income (loss) | | 2.19% | | 2.18% | | 1.73% | | 1.08% | | 1.06% |
| Supplemental Data | | | | | | | | | | |
| Net assets, end of period (000 omitted) | $ | 117,198 | $ | 96,947 | $ | 68,120 | $ | 58,353 | $ | 28,621 |
Portfolio turnover rate H | | | | 18% | | 43% I | | 54% I | | 22% I |
ACalculated based on average shares outstanding during the period.
BNet investment income (loss) is affected by the timing of the declaration of dividends by any underlying mutual funds or exchange-traded funds (ETFs). Net investment income (loss) of any mutual funds or ETFs is not included in the Fund's net investment income (loss) ratio.
CTotal distributions per share do not sum due to rounding.
DTotal returns do not reflect charges attributable to your insurance company's separate account. Inclusion of these charges would reduce the total returns shown.
ETotal returns would have been lower if certain expenses had not been reduced during the applicable periods shown.
FExpense ratios reflect operating expenses of the class. Expenses before reductions do not reflect amounts reimbursed, waived, or reduced through arrangements with the investment adviser, brokerage services, or other offset arrangements, if applicable, and do not represent the amount paid by the class during periods when reimbursements, waivers or reductions occur.
GFees and expenses of any underlying mutual funds or exchange-traded funds (ETFs) are not included in the Fund's expense ratio. The Fund indirectly bears its proportionate share of these expenses. For additional expense information related to investments in Fidelity Central Funds, please refer to the "Investments in Fidelity Central Funds" note found in the Notes to Financial Statements section of the most recent Annual or Semi-Annual report.
HAmount does not include the portfolio activity of any underlying mutual funds or exchange-traded funds (ETFs), derivatives or securities that mature within one year from acquisition.
IPortfolio turnover rate excludes securities received or delivered in-kind.
VIP FundsManager® 60% Portfolio Service Class 2 |
| |
| Years ended December 31, | | 2024 | | 2023 | | 2022 | | 2021 | | 2020 |
Selected Per-Share Data | | | | | | | | | | |
| Net asset value, beginning of period | $ | 9.66 | $ | 8.65 | $ | 12.36 | $ | 11.31 | $ | 10.17 |
| Income from Investment Operations | | | | | | | | | | |
Net investment income (loss) A,B | | .21 | | .19 | | .15 | | .11 | | .09 |
| Net realized and unrealized gain (loss) | | .70 | | 1.03 | | (1.82) | | 1.25 | | 1.39 |
| Total from investment operations | | .91 | | 1.22 | | (1.67) | | 1.36 | | 1.48 |
| Distributions from net investment income | | (.20) | | (.21) | | (.16) | | (.12) | | (.09) |
| Distributions from net realized gain | | - | | - | | (1.88) | | (.20) | | (.25) |
| Total distributions | | (.20) | | (.21) | | (2.04) | | (.31) C | | (.34) |
| Net asset value, end of period | $ | 10.37 | $ | 9.66 | $ | 8.65 | $ | 12.36 | $ | 11.31 |
Total Return D,E | | | | 14.08% | | (15.25)% | | 12.21% | | 14.92% |
Ratios to Average Net Assets B,F,G | | | | | | | | | | |
| Expenses before reductions | | .40% | | .40% | | .45% | | .50% | | .50% |
| Expenses net of fee waivers, if any | | | | .25% | | .29% | | .35% | | .35% |
| Expenses net of all reductions | | .25% | | .25% | | .29% | | .35% | | .35% |
| Net investment income (loss) | | 2.04% | | 2.03% | | 1.58% | | .93% | | .91% |
| Supplemental Data | | | | | | | | | | |
| Net assets, end of period (000 omitted) | $ | 580,499 | $ | 582,339 | $ | 534,692 | $ | 640,658 | $ | 656,402 |
Portfolio turnover rate H | | | | 18% | | 43% I | | 54% I | | 22% I |
ACalculated based on average shares outstanding during the period.
BNet investment income (loss) is affected by the timing of the declaration of dividends by any underlying mutual funds or exchange-traded funds (ETFs). Net investment income (loss) of any mutual funds or ETFs is not included in the Fund's net investment income (loss) ratio.
CTotal distributions per share do not sum due to rounding.
DTotal returns do not reflect charges attributable to your insurance company's separate account. Inclusion of these charges would reduce the total returns shown.
ETotal returns would have been lower if certain expenses had not been reduced during the applicable periods shown.
FExpense ratios reflect operating expenses of the class. Expenses before reductions do not reflect amounts reimbursed, waived, or reduced through arrangements with the investment adviser, brokerage services, or other offset arrangements, if applicable, and do not represent the amount paid by the class during periods when reimbursements, waivers or reductions occur.
GFees and expenses of any underlying mutual funds or exchange-traded funds (ETFs) are not included in the Fund's expense ratio. The Fund indirectly bears its proportionate share of these expenses. For additional expense information related to investments in Fidelity Central Funds, please refer to the "Investments in Fidelity Central Funds" note found in the Notes to Financial Statements section of the most recent Annual or Semi-Annual report.
HAmount does not include the portfolio activity of any underlying mutual funds or exchange-traded funds (ETFs), derivatives or securities that mature within one year from acquisition.
IPortfolio turnover rate excludes securities received or delivered in-kind.
VIP FundsManager® 60% Portfolio Investor Class |
| |
| Years ended December 31, | | 2024 | | 2023 | | 2022 | | 2021 | | 2020 |
Selected Per-Share Data | | | | | | | | | | |
| Net asset value, beginning of period | $ | 9.70 | $ | 8.69 | $ | 12.40 | $ | 11.35 | $ | 10.20 |
| Income from Investment Operations | | | | | | | | | | |
Net investment income (loss) A,B | | .23 | | .20 | | .16 | | .13 | | .11 |
| Net realized and unrealized gain (loss) | | .70 | | 1.03 | | (1.82) | | 1.25 | | 1.40 |
| Total from investment operations | | .93 | | 1.23 | | (1.66) | | 1.38 | | 1.51 |
| Distributions from net investment income | | (.22) | | (.22) | | (.17) | | (.14) | | (.11) |
| Distributions from net realized gain | | - | | - | | (1.88) | | (.20) | | (.25) |
| Total distributions | | (.22) | | (.22) | | (2.05) | | (.33) C | | (.36) |
| Net asset value, end of period | $ | 10.41 | $ | 9.70 | $ | 8.69 | $ | 12.40 | $ | 11.35 |
Total Return D,E | | | | 14.17% | | (15.06)% | | 12.34% | | 15.12% |
Ratios to Average Net Assets B,F,G | | | | | | | | | | |
| Expenses before reductions | | .15% | | .15% | | .19% | | .25% | | .25% |
| Expenses net of fee waivers, if any | | | | .10% | | .14% | | .20% | | .20% |
| Expenses net of all reductions | | .10% | | .10% | | .14% | | .20% | | .20% |
| Net investment income (loss) | | 2.19% | | 2.18% | | 1.73% | | 1.08% | | 1.06% |
| Supplemental Data | | | | | | | | | | |
| Net assets, end of period (000 omitted) | $ | 6,176,165 | $ | 5,751,540 | $ | 5,093,696 | $ | 6,493,070 | $ | 5,919,107 |
Portfolio turnover rate H | | | | 18% | | 43% I | | 54% I | | 22% I |
ACalculated based on average shares outstanding during the period.
BNet investment income (loss) is affected by the timing of the declaration of dividends by any underlying mutual funds or exchange-traded funds (ETFs). Net investment income (loss) of any mutual funds or ETFs is not included in the Fund's net investment income (loss) ratio.
CTotal distributions per share do not sum due to rounding.
DTotal returns do not reflect charges attributable to your insurance company's separate account. Inclusion of these charges would reduce the total returns shown.
ETotal returns would have been lower if certain expenses had not been reduced during the applicable periods shown.
FExpense ratios reflect operating expenses of the class. Expenses before reductions do not reflect amounts reimbursed, waived, or reduced through arrangements with the investment adviser, brokerage services, or other offset arrangements, if applicable, and do not represent the amount paid by the class during periods when reimbursements, waivers or reductions occur.
GFees and expenses of any underlying mutual funds or exchange-traded funds (ETFs) are not included in the Fund's expense ratio. The Fund indirectly bears its proportionate share of these expenses. For additional expense information related to investments in Fidelity Central Funds, please refer to the "Investments in Fidelity Central Funds" note found in the Notes to Financial Statements section of the most recent Annual or Semi-Annual report.
HAmount does not include the portfolio activity of any underlying mutual funds or exchange-traded funds (ETFs), derivatives or securities that mature within one year from acquisition.
IPortfolio turnover rate excludes securities received or delivered in-kind.
VIP FundsManager® 70% Portfolio
Schedule of Investments December 31, 2024
Showing Percentage of Net Assets
| Alternative Funds - 1.3% |
| | | Shares | Value ($) |
Fidelity Hedged Equity Fund (b) (Cost $22,852,793) | | 2,236,732 | 29,480,124 |
| | | | |
| Bond Funds - 23.7% |
| | | Shares | Value ($) |
| Fidelity Floating Rate High Income Fund (b) | | 1,819,124 | 16,899,666 |
| Fidelity High Income Fund (b) | | 2,163,555 | 17,027,174 |
| Fidelity Inflation-Protected Bond Index Fund (b) | | 3,703,787 | 32,926,664 |
| Fidelity Long-Term Treasury Bond Index Fund (b) | | 2,439,277 | 22,368,169 |
| Fidelity New Markets Income Fund (b) | | 91,584 | 1,158,535 |
| Fidelity Total Bond Fund (b) | | 24,125,345 | 226,778,243 |
| VIP Investment Grade Bond II Portfolio - Investor Class (b) | | 24,517,210 | 225,803,503 |
| TOTAL BOND FUNDS (Cost $562,490,912) | | | 542,961,954 |
| | | | |
| Domestic Equity Funds - 44.2% |
| | | Shares | Value ($) |
| Fidelity Blue Chip Growth ETF (b) | | 611,333 | 28,280,265 |
| Fidelity Commodity Strategy Fund (b) | | 81,471 | 7,449,729 |
| Fidelity Contrafund (b) | | 1,337,334 | 28,124,144 |
| Fidelity Enhanced Large Cap Core ETF (b) | | 688,960 | 22,687,453 |
| Fidelity Enhanced Mid Cap ETF (b) | | 275,577 | 9,052,704 |
| Fidelity Enhanced Small Cap ETF (b) | | 405,036 | 13,102,915 |
| Fidelity Fundamental Small-Mid Cap ETF (b) | | 219,264 | 5,893,816 |
| Fidelity Real Estate Investment Portfolio (b) | | 281,618 | 10,867,633 |
| Fidelity Stock Selector Small Cap Fund (b) | | 1,140,786 | 42,528,499 |
| VIP Stock Selector All Cap Portfolio - Investor Class (b) | | 65,960,799 | 804,721,746 |
| VIP Value Strategies Portfolio - Investor Class (b) | | 2,486,275 | 38,114,591 |
| TOTAL DOMESTIC EQUITY FUNDS (Cost $853,825,331) | | | 1,010,823,495 |
| | | | |
| International Equity Funds - 27.8% |
| | | Shares | Value ($) |
| Fidelity Canada Fund (b) | | 312,220 | 20,506,597 |
| Fidelity Emerging Markets Discovery Fund (b) | | 1,156,471 | 17,624,623 |
| Fidelity Emerging Markets Fund (b) | | 4,540,865 | 172,916,140 |
| Fidelity Enhanced International ETF (b) | | 1,742,427 | 47,969,015 |
| Fidelity Global Commodity Stock Fund (b) | | 109,044 | 1,957,343 |
| Fidelity Infrastructure Fund (b) | | 157,202 | 2,156,818 |
| Fidelity International Capital Appreciation Fund (b) | | 1,446,070 | 39,824,759 |
| Fidelity International Discovery Fund (b) | | 996,293 | 47,732,397 |
| Fidelity International Small Cap Fund (b) | | 656,588 | 20,085,018 |
| Fidelity International Small Cap Opportunities Fund (b) | | 1,159,431 | 22,690,066 |
| Fidelity International Value Fund (b) | | 3,051,366 | 30,696,740 |
| Fidelity Japan Smaller Companies Fund (b) | | 1,096,518 | 17,105,676 |
| Fidelity Overseas Fund (b) | | 3,105,688 | 194,416,096 |
| TOTAL INTERNATIONAL EQUITY FUNDS (Cost $522,754,408) | | | 635,681,288 |
| | | | |
| U.S. Treasury Obligations - 0.0% |
| | | Yield (%) (c) | Principal Amount (a) | Value ($) |
| US Treasury Bills 0% 1/30/2025 (d) | | 4.51 | 310,000 | 308,979 |
| US Treasury Bills 0% 1/9/2025 | | 4.58 | 610,000 | 609,501 |
| TOTAL U.S. TREASURY OBLIGATIONS (Cost $918,271) | | | | 918,480 |
| | | | | |
| Money Market Funds - 3.0% |
| | | Yield (%) | Shares | Value ($) |
Fidelity Cash Central Fund (e) (Cost $68,983,699) | | 4.36 | 68,969,905 | 68,983,699 |
| | | | | |
| TOTAL INVESTMENT IN SECURITIES - 100.0% (Cost $2,031,825,414) | 2,288,849,040 |
NET OTHER ASSETS (LIABILITIES) - 0.0% | 439,141 |
| NET ASSETS - 100.0% | 2,289,288,181 |
| | |
| Futures Contracts |
| | Number of contracts | Expiration Date | Notional Amount ($) | Value ($) | Unrealized Appreciation/ (Depreciation) ($) |
| Purchased | | | | | |
| | | | | | |
| Equity Contracts | | | | | |
| CME E-mini Russell 2000 Index Contracts (United States) | 314 | Mar 2025 | 35,321,860 | (26,489) | (26,489) |
| CME E-mini S&P MidCap 400 Index Contracts (United States) | 36 | Mar 2025 | 11,328,120 | 3,925 | 3,925 |
| ICE MSCI EAFE Index Contracts (United States) | 59 | Mar 2025 | 6,689,125 | (221,721) | (221,721) |
| | | | | | |
| TOTAL PURCHASED | | | | | (244,285) |
| | | | | | |
| Sold | | | | | |
| | | | | | |
| Equity Contracts | | | | | |
| CME E-mini S&P 500 Index Contracts (United States) | 157 | Mar 2025 | 46,595,638 | 33,730 | 33,730 |
| | | | | | |
| TOTAL FUTURES CONTRACTS | | | | | (210,555) |
| The notional amount of futures purchased as a percentage of Net Assets is 2.3% |
| The notional amount of futures sold as a percentage of Net Assets is 2.0% |
Security Type Abbreviations
Legend
| (a) | Amount is stated in United States dollars unless otherwise noted. |
| (c) | Yield represents either the annualized yield at the date of purchase, or the stated coupon rate, or, for floating and adjustable rate securities, the rate at period end. |
| (d) | Security or a portion of the security was pledged to cover margin requirements for futures contracts. At period end, the value of securities pledged amounted to $231,236. |
| (e) | Affiliated fund that is generally available only to investment companies and other accounts managed by Fidelity Investments. The rate quoted is the annualized seven-day yield of the fund at period end. A complete unaudited listing of the fund's holdings as of its most recent quarter end is available upon request. In addition, each Fidelity Central Fund's financial statements, which are not covered by the Fund's Report of Independent Registered Public Accounting Firm, are available on the SEC's website or upon request. |
Affiliated Central Funds
Fiscal year to date information regarding the Fund's investments in Fidelity Central Funds, including the ownership percentage, is presented below.
| Affiliate | Value, beginning of period ($) | Purchases ($) | Sales Proceeds ($) | Dividend Income ($) | Realized Gain (loss) ($) | Change in Unrealized appreciation (depreciation) ($) | Value, end of period ($) | Shares, end of period | % ownership, end of period |
| Fidelity Cash Central Fund | 25,719,081 | 129,921,859 | 86,657,241 | 2,783,113 | - | - | 68,983,699 | 68,969,905 | 0.1% |
| Total | 25,719,081 | 129,921,859 | 86,657,241 | 2,783,113 | - | - | 68,983,699 | 68,969,905 | |
| | | | | | | | | | |
Amounts in the dividend income column in the above table include any capital gain distributions from underlying funds, which are presented in the corresponding line item in the Statement of Operations, if applicable.
Amounts included in the purchases and sales proceeds columns may include in-kind transactions, if applicable.
Affiliated Underlying Funds
Fiscal year to date information regarding the Fund's investments in affiliated Underlying Funds is presented below. Exchanges between classes of the same affiliated Underlying Funds may occur. If an Underlying Funds changes its name, the name presented below is the name in effect at period end.
| Affiliate | Value, beginning of period ($) | Purchases ($) | Sales Proceeds ($) | Dividend Income ($) | Realized Gain (loss) ($) | Change in Unrealized appreciation (depreciation) ($) | Value, end of period ($) | Shares, end of period |
| Fidelity Blue Chip Growth ETF | - | 28,288,885 | - | - | - | (8,620) | 28,280,265 | 611,333 |
| Fidelity Canada Fund | 18,190,478 | 3,823,895 | 1,687,827 | 1,420,366 | (7,063) | 187,114 | 20,506,597 | 312,220 |
| Fidelity Commodity Strategy Fund | 7,148,072 | 647,798 | 407,176 | 272,656 | (43,500) | 104,535 | 7,449,729 | 81,471 |
| Fidelity Contrafund | 26,403,063 | 41,138,566 | 48,998,480 | 2,933,312 | 3,856,445 | 5,724,550 | 28,124,144 | 1,337,334 |
| Fidelity Emerging Markets Discovery Fund | 17,405,241 | 2,547,066 | 986,745 | 675,782 | (3,398) | (1,337,541) | 17,624,623 | 1,156,471 |
| Fidelity Emerging Markets Fund | 153,104,055 | 19,196,661 | 8,871,523 | 1,112,738 | 70,454 | 9,416,493 | 172,916,140 | 4,540,865 |
| Fidelity Enhanced International ETF | 44,104,427 | 2,211,481 | - | 1,395,468 | - | 1,653,107 | 47,969,015 | 1,742,427 |
| Fidelity Enhanced Large Cap Core ETF | - | 48,352,732 | 26,325,131 | 81,255 | 213,185 | 446,667 | 22,687,453 | 688,960 |
| Fidelity Enhanced Large Cap Value ETF | 26,746,144 | - | 28,789,379 | 259,990 | 7,127,309 | (5,084,074) | - | - |
| Fidelity Enhanced Mid Cap ETF | - | 9,201,626 | 917,463 | 67,915 | 62,664 | 705,877 | 9,052,704 | 275,577 |
| Fidelity Enhanced Small Cap ETF | - | 12,229,179 | - | 101,681 | - | 873,736 | 13,102,915 | 405,036 |
| Fidelity Equity-Income Fund | 45,778,814 | 760,735 | 50,066,203 | 162,985 | 10,369,058 | (6,842,404) | - | - |
| Fidelity Floating Rate High Income Fund | 15,644,981 | 2,195,265 | 925,062 | 1,342,972 | 2,141 | (17,659) | 16,899,666 | 1,819,124 |
| Fidelity Fundamental Small-Mid Cap ETF | - | 5,899,495 | - | - | - | (5,679) | 5,893,816 | 219,264 |
| Fidelity Global Commodity Stock Fund | 1,919,924 | 242,980 | 209,681 | 49,802 | 7,711 | (3,591) | 1,957,343 | 109,044 |
| Fidelity Hedged Equity Fund | 25,857,327 | 178,226 | 1,286,140 | 178,226 | 215,652 | 4,515,059 | 29,480,124 | 2,236,732 |
| Fidelity High Income Fund | 10,382,945 | 7,052,420 | 884,010 | 976,092 | 5,590 | 470,229 | 17,027,174 | 2,163,555 |
| Fidelity Inflation-Protected Bond Index Fund | 38,885,960 | 3,070,366 | 8,431,086 | 1,211,834 | (602,550) | 3,974 | 32,926,664 | 3,703,787 |
| Fidelity Infrastructure Fund | 1,891,412 | 235,603 | 205,166 | 33,608 | 280 | 234,689 | 2,156,818 | 157,202 |
| Fidelity International Capital Appreciation Fund | 35,573,485 | 5,737,461 | 2,685,680 | 1,602,252 | 19,225 | 1,180,268 | 39,824,759 | 1,446,070 |
| Fidelity International Discovery Fund | 41,572,529 | 6,544,695 | 3,517,419 | 1,333,711 | (67,918) | 3,200,510 | 47,732,397 | 996,293 |
| Fidelity International Small Cap Fund | 19,376,827 | 2,616,555 | 1,383,035 | 515,521 | 755 | (526,084) | 20,085,018 | 656,588 |
| Fidelity International Small Cap Opportunities Fund | 20,266,795 | 2,932,278 | - | 1,362,969 | - | (509,007) | 22,690,066 | 1,159,431 |
| Fidelity International Value Fund | 28,101,130 | 3,855,800 | 1,825,754 | 868,928 | 37,876 | 527,688 | 30,696,740 | 3,051,366 |
| Fidelity Japan Smaller Companies Fund | 14,955,959 | 1,665,250 | - | 743,457 | - | 484,467 | 17,105,676 | 1,096,518 |
| Fidelity Long-Term Treasury Bond Index Fund | 23,670,343 | 13,927,956 | 12,428,307 | 602,235 | (1,094,524) | (1,707,299) | 22,368,169 | 2,439,277 |
| Fidelity Low-Priced Stock Fund | 54,932,364 | 5,982,555 | 61,876,899 | 3,507,960 | 124,434 | 837,546 | - | - |
| Fidelity New Markets Income Fund | 5,363,159 | 183,770 | 4,422,719 | 127,866 | 302,033 | (267,708) | 1,158,535 | 91,584 |
| Fidelity Overseas Fund | 173,051,933 | 28,789,201 | 13,201,782 | 2,648,904 | 212,442 | 5,564,302 | 194,416,096 | 3,105,688 |
| Fidelity Real Estate Investment Portfolio | 10,324,914 | 1,149,213 | 616,731 | 581,017 | (15,160) | 25,397 | 10,867,633 | 281,618 |
| Fidelity Stock Selector Small Cap Fund | - | 42,528,499 | - | - | - | - | 42,528,499 | 1,140,786 |
| Fidelity Total Bond Fund | 211,869,923 | 42,637,839 | 23,496,906 | 9,780,751 | (285,846) | (3,946,767) | 226,778,243 | 24,125,345 |
| Fidelity U.S. Low Volatility Equity Fund | 20,227,098 | 70,231 | 20,729,275 | - | 2,896,040 | (2,464,094) | - | - |
| Fidelity Value Discovery Fund | 22,335,424 | 329,260 | 23,882,196 | - | 6,167,877 | (4,950,365) | - | - |
| VIP Investment Grade Bond II Portfolio - Investor Class | 210,213,338 | 44,368,578 | 22,885,736 | 9,392,004 | (433,268) | (5,459,409) | 225,803,503 | 24,517,210 |
| VIP Stock Selector Portfolio - Investor Class | 719,984,357 | 99,148,587 | 154,850,592 | 5,740,617 | 14,007,815 | 126,431,579 | 804,721,746 | 65,960,799 |
| VIP Value Strategies Portfolio - Investor Class | - | 38,114,591 | - | - | - | - | 38,114,591 | 2,486,275 |
| | 2,045,282,421 | 527,855,298 | 526,794,103 | 51,084,874 | 43,145,759 | 129,457,486 | 2,218,946,861 | 154,115,250 |
Amounts in the dividend income column in the above table include any capital gain distributions from underlying funds, which are presented in the corresponding line item in the Statement of Operations, if applicable.
Amounts included in the purchases and sales proceeds columns may include in-kind transactions, if applicable.
Investment Valuation
The following is a summary of the inputs used, as of December 31, 2024, involving the Fund's assets and liabilities carried at fair value. The inputs or methodology used for valuing securities may not be an indication of the risk associated with investing in those securities. For more information on valuation inputs, and their aggregation into the levels used below, please refer to the Investment Valuation section in the accompanying Notes to Financial Statements.
| Valuation Inputs at Reporting Date: |
| Description | Total ($) | Level 1 ($) | Level 2 ($) | Level 3 ($) |
Investments in Securities: | | | | |
|
| Alternative Funds | 29,480,124 | 29,480,124 | - | - |
|
| Bond Funds | 542,961,954 | 542,961,954 | - | - |
|
| Domestic Equity Funds | 1,010,823,495 | 1,010,823,495 | - | - |
|
| International Equity Funds | 635,681,288 | 635,681,288 | - | - |
|
| U.S. Treasury Obligations | 918,480 | - | 918,480 | - |
|
| Money Market Funds | 68,983,699 | 68,983,699 | - | - |
| Total Investments in Securities: | 2,288,849,040 | 2,287,930,560 | 918,480 | - |
Derivative Instruments: Assets | | | | |
Futures Contracts | 37,655 | 37,655 | - | - |
| Total Assets | 37,655 | 37,655 | - | - |
| Liabilities | | | | |
Futures Contracts | (248,210) | (248,210) | - | - |
| Total Liabilities | (248,210) | (248,210) | - | - |
| Total Derivative Instruments: | (210,555) | (210,555) | - | - |
Value of Derivative Instruments
The following table is a summary of the Fund's value of derivative instruments by primary risk exposure as of December 31, 2024. For additional information on derivative instruments, please refer to the Derivative Instruments section in the accompanying Notes to Financial Statements.
Primary Risk Exposure / Derivative Type | Value |
| Asset ($) | Liability ($) |
| Equity Risk | | |
Futures Contracts (a) | 37,655 | (248,210) |
| Total Equity Risk | 37,655 | (248,210) |
| Total Value of Derivatives | 37,655 | (248,210) |
(a)Reflects gross cumulative appreciation (depreciation) on futures contracts as presented in the Schedule of Investments. In the Statement of Assets and Liabilities, the period end daily variation margin is included in receivable or payable for daily variation margin on futures contracts, and the net cumulative appreciation (depreciation) is included in Total accumulated earnings (loss).
VIP FundsManager® 70% Portfolio
Financial Statements
| Statement of Assets and Liabilities |
As of December 31, 2024 |
| Assets | | | | |
| Investment in securities, at value - See accompanying schedule: | | | | |
Unaffiliated issuers (cost $918,271) | $ | 918,480 | | |
Fidelity Central Funds (cost $68,983,699) | | 68,983,699 | | |
Other affiliated issuers (cost $1,961,923,444) | | 2,218,946,861 | | |
| | | | | |
| | | | | |
| Total Investment in Securities (cost $2,031,825,414) | | | $ | 2,288,849,040 |
| Receivable for investments sold | | | | 115,783,048 |
| Receivable for fund shares sold | | | | 121,274 |
| Distributions receivable from Fidelity Central Funds | | | | 263,905 |
| Receivable for daily variation margin on futures contracts | | | | 4,381 |
Total assets | | | | 2,405,021,648 |
| Liabilities | | | | |
| Payable for investments purchased | $ | 114,832,474 | | |
| Payable for fund shares redeemed | | 697,126 | | |
| Accrued management fee | | 194,916 | | |
| Distribution and service plan fees payable | | 8,951 | | |
| Total liabilities | | | | 115,733,467 |
| Net Assets | | | $ | 2,289,288,181 |
| Net Assets consist of: | | | | |
| Paid in capital | | | $ | 2,011,718,222 |
| Total accumulated earnings (loss) | | | | 277,569,959 |
| Net Assets | | | $ | 2,289,288,181 |
| | | | | |
| Net Asset Value and Maximum Offering Price | | | | |
| Service Class : | | | | |
Net Asset Value, offering price and redemption price per share ($71,890 ÷ 5,414 shares) | | | $ | 13.28 |
| Service Class 2 : | | | | |
Net Asset Value, offering price and redemption price per share ($69,646,687 ÷ 5,280,292 shares) | | | $ | 13.19 |
| Investor Class : | | | | |
Net Asset Value, offering price and redemption price per share ($2,219,569,604 ÷ 167,233,086 shares) | | | $ | 13.27 |
| Statement of Operations |
| Year ended December 31, 2024 |
| Investment Income | | | | |
| Dividends: | | | | |
| Unaffiliated issuers | | | $ | 83,458 |
| Affiliated issuers | | | | 40,770,522 |
| Interest | | | | 64,339 |
| Income from Fidelity Central Funds | | | | 2,783,113 |
| Total income | | | | 43,701,432 |
| Expenses | | | | |
| Management fee | $ | 3,308,605 | | |
| Distribution and service plan fees | | 176,615 | | |
| Independent trustees' fees and expenses | | 5,645 | | |
| Total expenses before reductions | | 3,490,865 | | |
| Expense reductions | | (1,175,480) | | |
| Total expenses after reductions | | | | 2,315,385 |
| Net Investment income (loss) | | | | 41,386,047 |
| Realized and Unrealized Gain (Loss) | | | | |
| Net realized gain (loss) on: | | | | |
| Investment Securities: | | | | |
| Unaffiliated issuers | | 1,674,529 | | |
| Affiliated issuers | | 43,145,759 | | |
| Foreign currency transactions | | 150 | | |
| Futures contracts | | (2,506,024) | | |
| Capital gain distributions from underlying funds: | | | | |
| Affiliated issuers | | 10,314,352 | | |
| Total net realized gain (loss) | | | | 52,628,766 |
| Change in net unrealized appreciation (depreciation) on: | | | | |
| Investment Securities: | | | | |
| Unaffiliated issuers | | (134) | | |
| Affiliated issuers | | 129,457,486 | | |
| Futures contracts | | 273,367 | | |
| Total change in net unrealized appreciation (depreciation) | | | | 129,730,719 |
| Net gain (loss) | | | | 182,359,485 |
| Net increase (decrease) in net assets resulting from operations | | | $ | 223,745,532 |
| Statement of Changes in Net Assets |
| |
| | Year ended December 31, 2024 | | Year ended December 31, 2023 |
| Increase (Decrease) in Net Assets | | | | |
| Operations | | | | |
| Net investment income (loss) | $ | 41,386,047 | $ | 36,163,060 |
| Net realized gain (loss) | | 52,628,766 | | (10,886,233) |
| Change in net unrealized appreciation (depreciation) | | 129,730,719 | | 261,094,283 |
| Net increase (decrease) in net assets resulting from operations | | 223,745,532 | | 286,371,110 |
| Distributions to shareholders | | (39,755,123) | | (39,485,458) |
| | | | | |
| Share transactions - net increase (decrease) | | 32,337,091 | | (21,696,786) |
| Total increase (decrease) in net assets | | 216,327,500 | | 225,188,866 |
| | | | | |
| Net Assets | | | | |
| Beginning of period | | 2,072,960,681 | | 1,847,771,815 |
| End of period | $ | 2,289,288,181 | $ | 2,072,960,681 |
| | | | | |
| | | | | |
Financial Highlights
VIP FundsManager® 70% Portfolio Service Class |
| |
| Years ended December 31, | | 2024 | | 2023 | | 2022 | | 2021 | | 2020 |
Selected Per-Share Data | | | | | | | | | | |
| Net asset value, beginning of period | $ | 12.19 | $ | 10.74 | $ | 15.55 | $ | 13.90 | $ | 12.37 |
| Income from Investment Operations | | | | | | | | | | |
Net investment income (loss) A,B | | .25 | | .21 | | .18 | | .15 | | .12 |
| Net realized and unrealized gain (loss) | | 1.08 | | 1.48 | | (2.33) | | 1.86 | | 1.82 |
| Total from investment operations | | 1.33 | | 1.69 | | (2.15) | | 2.01 | | 1.94 |
| Distributions from net investment income | | (.24) | | (.24) | | (.19) | | (.16) | | (.12) |
| Distributions from net realized gain | | - | | - | | (2.47) | | (.20) | | (.30) |
| Total distributions | | (.24) | | (.24) | | (2.66) | | (.36) | | (.41) C |
| Net asset value, end of period | $ | 13.28 | $ | 12.19 | $ | 10.74 | $ | 15.55 | $ | 13.90 |
Total Return D,E | | | | 15.72% | | (15.65)% | | 14.60% | | 16.10% |
Ratios to Average Net Assets B,F,G | | | | | | | | | | |
| Expenses before reductions | | .25% | | .25% | | .29% | | .35% | | .35% |
| Expenses net of fee waivers, if any | | | | .10% | | .14% | | .20% | | .20% |
| Expenses net of all reductions | | .10% | | .10% | | .14% | | .20% | | .20% |
| Net investment income (loss) | | 1.88% | | 1.87% | | 1.58% | | .99% | | .95% |
| Supplemental Data | | | | | | | | | | |
| Net assets, end of period (000 omitted) | $ | 72 | $ | 66 | $ | 58 | $ | 84 | $ | 75 |
Portfolio turnover rate H | | | | 15% | | 33% I | | 60% I | | 24% I |
ACalculated based on average shares outstanding during the period.
BNet investment income (loss) is affected by the timing of the declaration of dividends by any underlying mutual funds or exchange-traded funds (ETFs). Net investment income (loss) of any mutual funds or ETFs is not included in the Fund's net investment income (loss) ratio.
CTotal distributions per share do not sum due to rounding.
DTotal returns do not reflect charges attributable to your insurance company's separate account. Inclusion of these charges would reduce the total returns shown.
ETotal returns would have been lower if certain expenses had not been reduced during the applicable periods shown.
FExpense ratios reflect operating expenses of the class. Expenses before reductions do not reflect amounts reimbursed, waived, or reduced through arrangements with the investment adviser, brokerage services, or other offset arrangements, if applicable, and do not represent the amount paid by the class during periods when reimbursements, waivers or reductions occur.
GFees and expenses of any underlying mutual funds or exchange-traded funds (ETFs) are not included in the Fund's expense ratio. The Fund indirectly bears its proportionate share of these expenses. For additional expense information related to investments in Fidelity Central Funds, please refer to the "Investments in Fidelity Central Funds" note found in the Notes to Financial Statements section of the most recent Annual or Semi-Annual report.
HAmount does not include the portfolio activity of any underlying mutual funds or exchange-traded funds (ETFs), derivatives or securities that mature within one year from acquisition.
IPortfolio turnover rate excludes securities received or delivered in-kind.
VIP FundsManager® 70% Portfolio Service Class 2 |
| |
| Years ended December 31, | | 2024 | | 2023 | | 2022 | | 2021 | | 2020 |
Selected Per-Share Data | | | | | | | | | | |
| Net asset value, beginning of period | $ | 12.11 | $ | 10.67 | $ | 15.47 | $ | 13.83 | $ | 12.31 |
| Income from Investment Operations | | | | | | | | | | |
Net investment income (loss) A,B | | .22 | | .20 | | .16 | | .12 | | .10 |
| Net realized and unrealized gain (loss) | | 1.07 | | 1.46 | | (2.31) | | 1.85 | | 1.82 |
| Total from investment operations | | 1.29 | | 1.66 | | (2.15) | | 1.97 | | 1.92 |
| Distributions from net investment income | | (.21) | | (.22) | | (.17) | | (.13) | | (.10) |
| Distributions from net realized gain | | - | | - | | (2.47) | | (.20) | | (.30) |
| Total distributions | | (.21) | | (.22) | | (2.65) C | | (.33) | | (.40) |
| Net asset value, end of period | $ | 13.19 | $ | 12.11 | $ | 10.67 | $ | 15.47 | $ | 13.83 |
Total Return D,E | | | | 15.57% | | (15.79)% | | 14.44% | | 15.94% |
Ratios to Average Net Assets B,F,G | | | | | | | | | | |
| Expenses before reductions | | .40% | | .40% | | .44% | | .50% | | .50% |
| Expenses net of fee waivers, if any | | | | .25% | | .29% | | .35% | | .35% |
| Expenses net of all reductions | | .25% | | .25% | | .29% | | .35% | | .35% |
| Net investment income (loss) | | 1.73% | | 1.72% | | 1.43% | | .84% | | .80% |
| Supplemental Data | | | | | | | | | | |
| Net assets, end of period (000 omitted) | $ | 69,647 | $ | 68,638 | $ | 61,541 | $ | 74,699 | $ | 66,433 |
Portfolio turnover rate H | | | | 15% | | 33% I | | 60% I | | 24% I |
ACalculated based on average shares outstanding during the period.
BNet investment income (loss) is affected by the timing of the declaration of dividends by any underlying mutual funds or exchange-traded funds (ETFs). Net investment income (loss) of any mutual funds or ETFs is not included in the Fund's net investment income (loss) ratio.
CTotal distributions per share do not sum due to rounding.
DTotal returns do not reflect charges attributable to your insurance company's separate account. Inclusion of these charges would reduce the total returns shown.
ETotal returns would have been lower if certain expenses had not been reduced during the applicable periods shown.
FExpense ratios reflect operating expenses of the class. Expenses before reductions do not reflect amounts reimbursed, waived, or reduced through arrangements with the investment adviser, brokerage services, or other offset arrangements, if applicable, and do not represent the amount paid by the class during periods when reimbursements, waivers or reductions occur.
GFees and expenses of any underlying mutual funds or exchange-traded funds (ETFs) are not included in the Fund's expense ratio. The Fund indirectly bears its proportionate share of these expenses. For additional expense information related to investments in Fidelity Central Funds, please refer to the "Investments in Fidelity Central Funds" note found in the Notes to Financial Statements section of the most recent Annual or Semi-Annual report.
HAmount does not include the portfolio activity of any underlying mutual funds or exchange-traded funds (ETFs), derivatives or securities that mature within one year from acquisition.
IPortfolio turnover rate excludes securities received or delivered in-kind.
VIP FundsManager® 70% Portfolio Investor Class |
| |
| Years ended December 31, | | 2024 | | 2023 | | 2022 | | 2021 | | 2020 |
Selected Per-Share Data | | | | | | | | | | |
| Net asset value, beginning of period | $ | 12.18 | $ | 10.73 | $ | 15.54 | $ | 13.90 | $ | 12.37 |
| Income from Investment Operations | | | | | | | | | | |
Net investment income (loss) A,B | | .25 | | .21 | | .18 | | .15 | | .12 |
| Net realized and unrealized gain (loss) | | 1.08 | | 1.48 | | (2.33) | | 1.85 | | 1.82 |
| Total from investment operations | | 1.33 | | 1.69 | | (2.15) | | 2.00 | | 1.94 |
| Distributions from net investment income | | (.24) | | (.24) | | (.19) | | (.16) | | (.12) |
| Distributions from net realized gain | | - | | - | | (2.47) | | (.20) | | (.30) |
| Total distributions | | (.24) | | (.24) | | (2.66) | | (.36) | | (.41) C |
| Net asset value, end of period | $ | 13.27 | $ | 12.18 | $ | 10.73 | $ | 15.54 | $ | 13.90 |
Total Return D,E | | | | 15.73% | | (15.67)% | | 14.52% | | 16.10% |
Ratios to Average Net Assets B,F,G | | | | | | | | | | |
| Expenses before reductions | | .15% | | .15% | | .19% | | .25% | | .25% |
| Expenses net of fee waivers, if any | | | | .10% | | .14% | | .20% | | .20% |
| Expenses net of all reductions | | .10% | | .10% | | .14% | | .20% | | .20% |
| Net investment income (loss) | | 1.88% | | 1.87% | | 1.58% | | .99% | | .95% |
| Supplemental Data | | | | | | | | | | |
| Net assets, end of period (000 omitted) | $ | 2,219,570 | $ | 2,004,256 | $ | 1,786,172 | $ | 2,136,227 | $ | 1,769,102 |
Portfolio turnover rate H | | | | 15% | | 33% I | | 60% I | | 24% I |
ACalculated based on average shares outstanding during the period.
BNet investment income (loss) is affected by the timing of the declaration of dividends by any underlying mutual funds or exchange-traded funds (ETFs). Net investment income (loss) of any mutual funds or ETFs is not included in the Fund's net investment income (loss) ratio.
CTotal distributions per share do not sum due to rounding.
DTotal returns do not reflect charges attributable to your insurance company's separate account. Inclusion of these charges would reduce the total returns shown.
ETotal returns would have been lower if certain expenses had not been reduced during the applicable periods shown.
FExpense ratios reflect operating expenses of the class. Expenses before reductions do not reflect amounts reimbursed, waived, or reduced through arrangements with the investment adviser, brokerage services, or other offset arrangements, if applicable, and do not represent the amount paid by the class during periods when reimbursements, waivers or reductions occur.
GFees and expenses of any underlying mutual funds or exchange-traded funds (ETFs) are not included in the Fund's expense ratio. The Fund indirectly bears its proportionate share of these expenses. For additional expense information related to investments in Fidelity Central Funds, please refer to the "Investments in Fidelity Central Funds" note found in the Notes to Financial Statements section of the most recent Annual or Semi-Annual report.
HAmount does not include the portfolio activity of any underlying mutual funds or exchange-traded funds (ETFs), derivatives or securities that mature within one year from acquisition.
IPortfolio turnover rate excludes securities received or delivered in-kind.
VIP FundsManager® 85% Portfolio
Schedule of Investments December 31, 2024
Showing Percentage of Net Assets
| Alternative Funds - 1.3% |
| | | Shares | Value ($) |
Fidelity Hedged Equity Fund (b) (Cost $9,432,671) | | 920,155 | 12,127,648 |
| | | | |
| Bond Funds - 13.1% |
| | | Shares | Value ($) |
| Fidelity Floating Rate High Income Fund (b) | | 529,963 | 4,923,357 |
| Fidelity High Income Fund (b) | | 621,793 | 4,893,512 |
| Fidelity Inflation-Protected Bond Index Fund (b) | | 1,543,919 | 13,725,438 |
| Fidelity Long-Term Treasury Bond Index Fund (b) | | 1,023,833 | 9,388,546 |
| Fidelity New Markets Income Fund (b) | | 37,051 | 468,695 |
| Fidelity Total Bond Fund (b) | | 4,941,246 | 46,447,709 |
| VIP Investment Grade Bond II Portfolio - Investor Class (b) | | 5,021,824 | 46,251,001 |
| TOTAL BOND FUNDS (Cost $129,467,657) | | | 126,098,258 |
| | | | |
| Domestic Equity Funds - 53.5% |
| | | Shares | Value ($) |
| Fidelity Blue Chip Growth ETF (b) | | 313,986 | 14,524,992 |
| Fidelity Commodity Strategy Fund (b) | | 28,535 | 2,609,210 |
| Fidelity Contrafund (b) | | 687,112 | 14,449,975 |
| Fidelity Enhanced Large Cap Core ETF (b) | | 284,932 | 9,382,811 |
| Fidelity Enhanced Mid Cap ETF (b) | | 114,674 | 3,767,041 |
| Fidelity Enhanced Small Cap ETF (b) | | 168,545 | 5,452,431 |
| Fidelity Fundamental Small-Mid Cap ETF (b) | | 112,616 | 3,027,118 |
| Fidelity Real Estate Investment Portfolio (b) | | 119,552 | 4,613,495 |
| Fidelity Stock Selector Small Cap Fund (b) | | 585,917 | 21,842,967 |
| VIP Stock Selector All Cap Portfolio - Investor Class (b) | | 33,887,449 | 413,426,873 |
| VIP Value Strategies Portfolio - Investor Class (b) | | 1,276,970 | 19,575,950 |
| TOTAL DOMESTIC EQUITY FUNDS (Cost $436,297,934) | | | 512,672,863 |
| | | | |
| International Equity Funds - 31.8% |
| | | Shares | Value ($) |
| Fidelity Canada Fund (b) | | 153,033 | 10,051,210 |
| Fidelity Emerging Markets Discovery Fund (b) | | 395,284 | 6,024,131 |
| Fidelity Emerging Markets Fund (b) | | 2,215,563 | 84,368,625 |
| Fidelity Enhanced International ETF (b) | | 786,406 | 21,649,757 |
| Fidelity Global Commodity Stock Fund (b) | | 108,404 | 1,945,858 |
| Fidelity Infrastructure Fund (b) | | 67,892 | 931,485 |
| Fidelity International Capital Appreciation Fund (b) | | 715,803 | 19,713,204 |
| Fidelity International Discovery Fund (b) | | 495,651 | 23,746,660 |
| Fidelity International Small Cap Fund (b) | | 323,320 | 9,890,353 |
| Fidelity International Small Cap Opportunities Fund (b) | | 605,584 | 11,851,284 |
| Fidelity International Value Fund (b) | | 1,477,171 | 14,860,335 |
| Fidelity Japan Fund (b) | | 32,045 | 528,424 |
| Fidelity Japan Smaller Companies Fund (b) | | 443,168 | 6,913,423 |
| Fidelity Overseas Fund (b) | | 1,482,122 | 92,780,850 |
| TOTAL INTERNATIONAL EQUITY FUNDS (Cost $258,279,701) | | | 305,255,599 |
| | | | |
| U.S. Treasury Obligations - 0.1% |
| | | Yield (%) (c) | Principal Amount (a) | Value ($) |
| US Treasury Bills 0% 1/2/2025 (d) | | 4.55 | 460,000 | 460,000 |
| US Treasury Bills 0% 1/30/2025 (d) | | 4.51 | 90,000 | 89,704 |
| US Treasury Bills 0% 1/9/2025 (d) | | 4.58 | 320,000 | 319,738 |
| TOTAL U.S. TREASURY OBLIGATIONS (Cost $869,296) | | | | 869,442 |
| | | | | |
| Money Market Funds - 0.2% |
| | | Yield (%) | Shares | Value ($) |
Fidelity Cash Central Fund (e) (Cost $2,251,222) | | 4.36 | 2,250,773 | 2,251,223 |
| | | | | |
| TOTAL INVESTMENT IN SECURITIES - 100.0% (Cost $836,598,481) | 959,275,033 |
NET OTHER ASSETS (LIABILITIES) - 0.0% | 80,304 |
| NET ASSETS - 100.0% | 959,355,337 |
| | |
| Futures Contracts |
| | Number of contracts | Expiration Date | Notional Amount ($) | Value ($) | Unrealized Appreciation/ (Depreciation) ($) |
| Purchased | | | | | |
| | | | | | |
| Equity Contracts | | | | | |
| CME E-mini Russell 2000 Index Contracts (United States) | 161 | Mar 2025 | 18,110,890 | (13,569) | (13,569) |
| CME E-mini S&P MidCap 400 Index Contracts (United States) | 18 | Mar 2025 | 5,664,060 | 1,977 | 1,977 |
| ICE MSCI EAFE Index Contracts (United States) | 156 | Mar 2025 | 17,686,500 | (586,222) | (586,222) |
| ICE MSCI Emerging Markets Index Contracts (United States) | 130 | Mar 2025 | 6,979,700 | (241,796) | (241,796) |
| | | | | | |
| TOTAL PURCHASED | | | | | (839,610) |
| | | | | | |
| Sold | | | | | |
| | | | | | |
| Equity Contracts | | | | | |
| CME E-mini S&P 500 Index Contracts (United States) | 81 | Mar 2025 | 24,039,788 | 17,417 | 17,417 |
| | | | | | |
| TOTAL FUTURES CONTRACTS | | | | | (822,193) |
| The notional amount of futures purchased as a percentage of Net Assets is 5.0% |
| The notional amount of futures sold as a percentage of Net Assets is 2.5% |
Security Type Abbreviations
Legend
| (a) | Amount is stated in United States dollars unless otherwise noted. |
| (c) | Yield represents either the annualized yield at the date of purchase, or the stated coupon rate, or, for floating and adjustable rate securities, the rate at period end. |
| (d) | Security or a portion of the security was pledged to cover margin requirements for futures contracts. At period end, the value of securities pledged amounted to $808,442. |
| (e) | Affiliated fund that is generally available only to investment companies and other accounts managed by Fidelity Investments. The rate quoted is the annualized seven-day yield of the fund at period end. A complete unaudited listing of the fund's holdings as of its most recent quarter end is available upon request. In addition, each Fidelity Central Fund's financial statements, which are not covered by the Fund's Report of Independent Registered Public Accounting Firm, are available on the SEC's website or upon request. |
Affiliated Central Funds
Fiscal year to date information regarding the Fund's investments in Fidelity Central Funds, including the ownership percentage, is presented below.
| Affiliate | Value, beginning of period ($) | Purchases ($) | Sales Proceeds ($) | Dividend Income ($) | Realized Gain (loss) ($) | Change in Unrealized appreciation (depreciation) ($) | Value, end of period ($) | Shares, end of period | % ownership, end of period |
| Fidelity Cash Central Fund | 6,688,473 | 89,313,285 | 93,750,524 | 775,829 | (12) | 1 | 2,251,223 | 2,250,773 | 0.0% |
| Total | 6,688,473 | 89,313,285 | 93,750,524 | 775,829 | (12) | 1 | 2,251,223 | 2,250,773 | |
| | | | | | | | | | |
Amounts in the dividend income column in the above table include any capital gain distributions from underlying funds, which are presented in the corresponding line item in the Statement of Operations, if applicable.
Amounts included in the purchases and sales proceeds columns may include in-kind transactions, if applicable.
Affiliated Underlying Funds
Fiscal year to date information regarding the Fund's investments in affiliated Underlying Funds is presented below. Exchanges between classes of the same affiliated Underlying Funds may occur. If an Underlying Funds changes its name, the name presented below is the name in effect at period end.
| Affiliate | Value, beginning of period ($) | Purchases ($) | Sales Proceeds ($) | Dividend Income ($) | Realized Gain (loss) ($) | Change in Unrealized appreciation (depreciation) ($) | Value, end of period ($) | Shares, end of period |
| Fidelity Blue Chip Growth ETF | - | 14,529,419 | - | - | - | (4,427) | 14,524,992 | 313,986 |
| Fidelity Canada Fund | 7,915,360 | 2,977,867 | 858,903 | 696,910 | 100 | 16,786 | 10,051,210 | 153,033 |
| Fidelity Commodity Strategy Fund | 2,363,650 | 362,096 | 134,941 | 94,716 | (20) | 18,425 | 2,609,210 | 28,535 |
| Fidelity Contrafund | 11,357,603 | 23,486,566 | 24,796,233 | 1,492,426 | 1,039,468 | 3,362,571 | 14,449,975 | 687,112 |
| Fidelity Emerging Markets Discovery Fund | 5,635,512 | 1,416,811 | 563,764 | 231,019 | 2,162 | (466,590) | 6,024,131 | 395,284 |
| Fidelity Emerging Markets Fund | 73,626,545 | 11,687,180 | 5,582,827 | 543,253 | 281,458 | 4,356,269 | 84,368,625 | 2,215,563 |
| Fidelity Enhanced International ETF | 19,543,936 | 1,492,498 | 109,468 | 620,643 | 14,903 | 707,888 | 21,649,757 | 786,406 |
| Fidelity Enhanced Large Cap Core ETF | - | 18,070,924 | 8,907,017 | 32,554 | 57,929 | 160,975 | 9,382,811 | 284,932 |
| Fidelity Enhanced Large Cap Value ETF | 15,548,164 | - | 16,735,945 | 151,139 | 3,577,117 | (2,389,336) | - | - |
| Fidelity Enhanced Mid Cap ETF | - | 3,762,318 | 307,199 | 27,790 | 20,982 | 290,940 | 3,767,041 | 114,674 |
| Fidelity Enhanced Small Cap ETF | - | 5,101,389 | - | 41,855 | - | 351,042 | 5,452,431 | 168,545 |
| Fidelity Equity-Income Fund | 23,295,038 | 1,101,750 | 26,209,477 | 84,711 | 5,024,994 | (3,212,305) | - | - |
| Fidelity Floating Rate High Income Fund | 2,018,095 | 4,628,612 | 1,712,881 | 180,987 | 53,219 | (63,688) | 4,923,357 | 529,963 |
| Fidelity Fundamental Small-Mid Cap ETF | - | 3,030,035 | - | - | - | (2,917) | 3,027,118 | 112,616 |
| Fidelity Global Commodity Stock Fund | 3,149,967 | 313,303 | 1,438,829 | 49,620 | 405,350 | (483,933) | 1,945,858 | 108,404 |
| Fidelity Hedged Equity Fund | 9,971,753 | 352,390 | 86,320 | 73,140 | 2,244 | 1,887,581 | 12,127,648 | 920,155 |
| Fidelity High Income Fund | - | 4,962,945 | 117,309 | 159,123 | (212) | 48,088 | 4,893,512 | 621,793 |
| Fidelity Inflation-Protected Bond Index Fund | 14,904,513 | 2,296,177 | 3,229,872 | 499,483 | (311,074) | 65,694 | 13,725,438 | 1,543,919 |
| Fidelity Infrastructure Fund | 720,315 | 214,434 | 98,616 | 13,975 | (219) | 95,571 | 931,485 | 67,892 |
| Fidelity International Capital Appreciation Fund | 15,982,839 | 4,663,158 | 1,386,734 | 793,772 | 12,242 | 441,699 | 19,713,204 | 715,803 |
| Fidelity International Discovery Fund | 18,630,495 | 5,588,893 | 1,805,590 | 664,124 | 55,784 | 1,277,078 | 23,746,660 | 495,651 |
| Fidelity International Small Cap Fund | 8,656,697 | 2,220,254 | 713,199 | 254,064 | 1,385 | (274,784) | 9,890,353 | 323,320 |
| Fidelity International Small Cap Opportunities Fund | 9,671,322 | 2,467,376 | - | 711,718 | - | (287,414) | 11,851,284 | 605,584 |
| Fidelity International Value Fund | 12,459,531 | 3,158,264 | 951,852 | 420,998 | (1,807) | 196,199 | 14,860,335 | 1,477,171 |
| Fidelity Japan Fund | 1,820,067 | 24,482 | 1,472,949 | 24,481 | 209,071 | (52,247) | 528,424 | 32,045 |
| Fidelity Japan Smaller Companies Fund | 6,837,976 | 300,476 | 490,983 | 300,475 | 10,159 | 255,795 | 6,913,423 | 443,168 |
| Fidelity Long-Term Treasury Bond Index Fund | 10,199,317 | 6,203,213 | 5,859,130 | 247,197 | (567,963) | (586,891) | 9,388,546 | 1,023,833 |
| Fidelity Low-Priced Stock Fund | 29,032,604 | 4,908,632 | 34,596,533 | 1,765,757 | (719,368) | 1,374,665 | - | - |
| Fidelity New Markets Income Fund | 2,059,321 | 143,379 | 1,747,613 | 50,176 | 47,320 | (33,712) | 468,695 | 37,051 |
| Fidelity Overseas Fund | 75,065,263 | 22,315,730 | 6,828,567 | 1,265,136 | 72,847 | 2,155,577 | 92,780,850 | 1,482,122 |
| Fidelity Real Estate Investment Portfolio | 3,959,349 | 2,291,829 | 1,612,160 | 220,906 | 23,645 | (49,168) | 4,613,495 | 119,552 |
| Fidelity Stock Selector Small Cap Fund | - | 21,842,967 | - | - | - | - | 21,842,967 | 585,917 |
| Fidelity Total Bond Fund | 41,847,328 | 12,866,397 | 7,475,249 | 1,948,982 | (109,476) | (681,291) | 46,447,709 | 4,941,246 |
| Fidelity U.S. Low Volatility Equity Fund | 7,807,593 | 37,919 | 8,010,867 | - | 1,114,944 | (949,589) | - | - |
| Fidelity Value Discovery Fund | 14,701,329 | 560,555 | 16,073,494 | - | 4,042,840 | (3,231,230) | - | - |
| VIP Investment Grade Bond II Portfolio - Investor Class | 41,702,201 | 12,856,374 | 7,141,148 | 1,920,302 | (119,288) | (1,047,138) | 46,251,001 | 5,021,824 |
| VIP Stock Selector Portfolio - Investor Class | 303,814,232 | 116,063,493 | 72,095,344 | 2,948,803 | 3,876,118 | 61,768,374 | 413,426,873 | 33,887,449 |
| VIP Value Strategies Portfolio - Investor Class | - | 19,575,950 | - | - | - | - | 19,575,950 | 1,276,970 |
| | 794,297,915 | 337,876,055 | 259,151,013 | 18,530,235 | 18,116,854 | 65,014,557 | 956,154,368 | 61,521,518 |
Amounts in the dividend income column in the above table include any capital gain distributions from underlying funds, which are presented in the corresponding line item in the Statement of Operations, if applicable.
Amounts included in the purchases and sales proceeds columns may include in-kind transactions, if applicable.
Investment Valuation
The following is a summary of the inputs used, as of December 31, 2024, involving the Fund's assets and liabilities carried at fair value. The inputs or methodology used for valuing securities may not be an indication of the risk associated with investing in those securities. For more information on valuation inputs, and their aggregation into the levels used below, please refer to the Investment Valuation section in the accompanying Notes to Financial Statements.
| Valuation Inputs at Reporting Date: |
| Description | Total ($) | Level 1 ($) | Level 2 ($) | Level 3 ($) |
Investments in Securities: | | | | |
|
| Alternative Funds | 12,127,648 | 12,127,648 | - | - |
|
| Bond Funds | 126,098,258 | 126,098,258 | - | - |
|
| Domestic Equity Funds | 512,672,863 | 512,672,863 | - | - |
|
| International Equity Funds | 305,255,599 | 305,255,599 | - | - |
|
| U.S. Treasury Obligations | 869,442 | - | 869,442 | - |
|
| Money Market Funds | 2,251,223 | 2,251,223 | - | - |
| Total Investments in Securities: | 959,275,033 | 958,405,591 | 869,442 | - |
Derivative Instruments: Assets | | | | |
Futures Contracts | 19,394 | 19,394 | - | - |
| Total Assets | 19,394 | 19,394 | - | - |
| Liabilities | | | | |
Futures Contracts | (841,587) | (841,587) | - | - |
| Total Liabilities | (841,587) | (841,587) | - | - |
| Total Derivative Instruments: | (822,193) | (822,193) | - | - |
Value of Derivative Instruments
The following table is a summary of the Fund's value of derivative instruments by primary risk exposure as of December 31, 2024. For additional information on derivative instruments, please refer to the Derivative Instruments section in the accompanying Notes to Financial Statements.
Primary Risk Exposure / Derivative Type | Value |
| Asset ($) | Liability ($) |
| Equity Risk | | |
Futures Contracts (a) | 19,394 | (841,587) |
| Total Equity Risk | 19,394 | (841,587) |
| Total Value of Derivatives | 19,394 | (841,587) |
(a)Reflects gross cumulative appreciation (depreciation) on futures contracts as presented in the Schedule of Investments. In the Statement of Assets and Liabilities, the period end daily variation margin is included in receivable or payable for daily variation margin on futures contracts, and the net cumulative appreciation (depreciation) is included in Total accumulated earnings (loss).
VIP FundsManager® 85% Portfolio
Financial Statements
| Statement of Assets and Liabilities |
As of December 31, 2024 |
| Assets | | | | |
| Investment in securities, at value - See accompanying schedule: | | | | |
Unaffiliated issuers (cost $869,296) | $ | 869,442 | | |
Fidelity Central Funds (cost $2,251,222) | | 2,251,223 | | |
Other affiliated issuers (cost $833,477,963) | | 956,154,368 | | |
| | | | | |
| | | | | |
| Total Investment in Securities (cost $836,598,481) | | | $ | 959,275,033 |
| Cash | | | | 61 |
| Receivable for investments sold | | | | 59,200,913 |
| Receivable for fund shares sold | | | | 24,841 |
| Distributions receivable from Fidelity Central Funds | | | | 10,334 |
Total assets | | | | 1,018,511,182 |
| Liabilities | | | | |
| Payable for investments purchased | $ | 58,978,778 | | |
| Payable for fund shares redeemed | | 54,710 | | |
| Accrued management fee | | 81,943 | | |
| Distribution and service plan fees payable | | 7,442 | | |
| Payable for daily variation margin on futures contracts | | 32,916 | | |
| Other payables and accrued expenses | | 56 | | |
| Total liabilities | | | | 59,155,845 |
| Net Assets | | | $ | 959,355,337 |
| Net Assets consist of: | | | | |
| Paid in capital | | | $ | 825,924,344 |
| Total accumulated earnings (loss) | | | | 133,430,993 |
| Net Assets | | | $ | 959,355,337 |
| | | | | |
| Net Asset Value and Maximum Offering Price | | | | |
| Service Class : | | | | |
Net Asset Value, offering price and redemption price per share ($112,851 ÷ 8,311 shares) | | | $ | 13.58 |
| Service Class 2 : | | | | |
Net Asset Value, offering price and redemption price per share ($58,215,473 ÷ 4,351,324 shares) | | | $ | 13.38 |
| Investor Class : | | | | |
Net Asset Value, offering price and redemption price per share ($901,027,013 ÷ 66,682,204 shares) | | | $ | 13.51 |
| Statement of Operations |
| Year ended December 31, 2024 |
| Investment Income | | | | |
| Dividends: | | | | |
| Unaffiliated issuers | | | $ | 33,905 |
| Affiliated issuers | | | | 13,393,615 |
| Interest | | | | 70,943 |
| Income from Fidelity Central Funds | | | | 775,829 |
| Total income | | | | 14,274,292 |
| Expenses | | | | |
| Management fee | $ | 1,346,238 | | |
| Distribution and service plan fees | | 143,094 | | |
| Independent trustees' fees and expenses | | 2,276 | | |
| Total expenses before reductions | | 1,491,608 | | |
| Expense reductions | | (506,965) | | |
| Total expenses after reductions | | | | 984,643 |
| Net Investment income (loss) | | | | 13,289,649 |
| Realized and Unrealized Gain (Loss) | | | | |
| Net realized gain (loss) on: | | | | |
| Investment Securities: | | | | |
| Unaffiliated issuers | | 561,793 | | |
| Fidelity Central Funds | | (12) | | |
| Other affiliated issuers | | 18,116,854 | | |
| Foreign currency transactions | | 58 | | |
| Futures contracts | | 1,795,523 | | |
| Capital gain distributions from underlying funds: | | | | |
| Affiliated issuers | | 5,136,620 | | |
| Total net realized gain (loss) | | | | 25,610,836 |
| Change in net unrealized appreciation (depreciation) on: | | | | |
| Investment Securities: | | | | |
| Unaffiliated issuers | | (97) | | |
| Fidelity Central Funds | | 1 | | |
| Other affiliated issuers | | 65,014,557 | | |
| Futures contracts | | (1,727,061) | | |
| Total change in net unrealized appreciation (depreciation) | | | | 63,287,400 |
| Net gain (loss) | | | | 88,898,236 |
| Net increase (decrease) in net assets resulting from operations | | | $ | 102,187,885 |
| Statement of Changes in Net Assets |
| |
| | Year ended December 31, 2024 | | Year ended December 31, 2023 |
| Increase (Decrease) in Net Assets | | | | |
| Operations | | | | |
| Net investment income (loss) | $ | 13,289,649 | $ | 10,788,033 |
| Net realized gain (loss) | | 25,610,836 | | (2,632,268) |
| Change in net unrealized appreciation (depreciation) | | 63,287,400 | | 112,771,154 |
| Net increase (decrease) in net assets resulting from operations | | 102,187,885 | | 120,926,919 |
| Distributions to shareholders | | (12,653,461) | | (11,901,106) |
| | | | | |
| Share transactions - net increase (decrease) | | 67,748,056 | | 8,282,094 |
| Total increase (decrease) in net assets | | 157,282,480 | | 117,307,907 |
| | | | | |
| Net Assets | | | | |
| Beginning of period | | 802,072,857 | | 684,764,950 |
| End of period | $ | 959,355,337 | $ | 802,072,857 |
| | | | | |
| | | | | |
Financial Highlights
VIP FundsManager® 85% Portfolio Service Class |
| |
| Years ended December 31, | | 2024 | | 2023 | | 2022 | | 2021 | | 2020 |
Selected Per-Share Data | | | | | | | | | | |
| Net asset value, beginning of period | $ | 12.23 | $ | 10.55 | $ | 15.82 | $ | 13.88 | $ | 12.25 |
| Income from Investment Operations | | | | | | | | | | |
Net investment income (loss) A,B | | .20 | | .17 | | .12 | | .12 | | .09 |
| Net realized and unrealized gain (loss) | | 1.33 | | 1.69 | | (2.46) | | 2.34 | | 2.04 |
| Total from investment operations | | 1.53 | | 1.86 | | (2.34) | | 2.46 | | 2.13 |
| Distributions from net investment income | | (.18) | | (.18) | | (.13) | | (.15) | | (.10) |
| Distributions from net realized gain | | - | | - | | (2.80) | | (.37) | | (.39) |
| Total distributions | | (.18) | | (.18) | | (2.93) | | (.52) | | (.50) C |
| Net asset value, end of period | $ | 13.58 | $ | 12.23 | $ | 10.55 | $ | 15.82 | $ | 13.88 |
Total Return D,E | | | | 17.69% | | (17.01)% | | 18.02% | | 17.93% |
Ratios to Average Net Assets B,F,G | | | | | | | | | | |
| Expenses before reductions | | .25% | | .25% | | .29% | | .25% | | .25% |
| Expenses net of fee waivers, if any | | | | .10% | | .14% | | .20% | | .20% |
| Expenses net of all reductions | | .10% | | .10% | | .14% | | .20% | | .20% |
| Net investment income (loss) | | 1.49% | | 1.48% | | 1.18% | | .78% | | .82% |
| Supplemental Data | | | | | | | | | | |
| Net assets, end of period (000 omitted) | $ | 113 | $ | 111 | $ | 100 | $ | - | $ | - |
Portfolio turnover rate H | | | | 19% | | 28% I | | 68% I | | 37% I |
ACalculated based on average shares outstanding during the period.
BNet investment income (loss) is affected by the timing of the declaration of dividends by any underlying mutual funds or exchange-traded funds (ETFs). Net investment income (loss) of any mutual funds or ETFs is not included in the Fund's net investment income (loss) ratio.
CTotal distributions per share do not sum due to rounding.
DTotal returns do not reflect charges attributable to your insurance company's separate account. Inclusion of these charges would reduce the total returns shown.
ETotal returns would have been lower if certain expenses had not been reduced during the applicable periods shown.
FExpense ratios reflect operating expenses of the class. Expenses before reductions do not reflect amounts reimbursed, waived, or reduced through arrangements with the investment adviser, brokerage services, or other offset arrangements, if applicable, and do not represent the amount paid by the class during periods when reimbursements, waivers or reductions occur.
GFees and expenses of any underlying mutual funds or exchange-traded funds (ETFs) are not included in the Fund's expense ratio. The Fund indirectly bears its proportionate share of these expenses. For additional expense information related to investments in Fidelity Central Funds, please refer to the "Investments in Fidelity Central Funds" note found in the Notes to Financial Statements section of the most recent Annual or Semi-Annual report.
HAmount does not include the portfolio activity of any underlying mutual funds or exchange-traded funds (ETFs), derivatives or securities that mature within one year from acquisition.
IPortfolio turnover rate excludes securities received or delivered in-kind.
VIP FundsManager® 85% Portfolio Service Class 2 |
| |
| Years ended December 31, | | 2024 | | 2023 | | 2022 | | 2021 | | 2020 |
Selected Per-Share Data | | | | | | | | | | |
| Net asset value, beginning of period | $ | 12.05 | $ | 10.40 | $ | 15.65 | $ | 13.76 | $ | 12.20 |
| Income from Investment Operations | | | | | | | | | | |
Net investment income (loss) A,B | | .17 | | .15 | | .11 | | .10 | | .08 |
| Net realized and unrealized gain (loss) | | 1.32 | | 1.67 | | (2.45) | | 2.29 | | 1.96 |
| Total from investment operations | | 1.49 | | 1.82 | | (2.34) | | 2.39 | | 2.04 |
| Distributions from net investment income | | (.16) | | (.17) | | (.11) | | (.13) | | (.09) |
| Distributions from net realized gain | | - | | - | | (2.80) | | (.37) | | (.39) |
| Total distributions | | (.16) | | (.17) | | (2.91) | | (.50) | | (.48) |
| Net asset value, end of period | $ | 13.38 | $ | 12.05 | $ | 10.40 | $ | 15.65 | $ | 13.76 |
Total Return C,D | | | | 17.48% | | (17.19)% | | 17.64% | | 17.27% |
Ratios to Average Net Assets B,E,F | | | | | | | | | | |
| Expenses before reductions | | .40% | | .40% | | .44% | | .50% | | .50% |
| Expenses net of fee waivers, if any | | | | .25% | | .29% | | .35% | | .35% |
| Expenses net of all reductions | | .25% | | .25% | | .29% | | .35% | | .35% |
| Net investment income (loss) | | 1.34% | | 1.33% | | 1.03% | | .68% | | .68% |
| Supplemental Data | | | | | | | | | | |
| Net assets, end of period (000 omitted) | $ | 58,215 | $ | 53,871 | $ | 48,826 | $ | 58,047 | $ | 48,373 |
Portfolio turnover rate G | | | | 19% | | 28% H | | 68% H | | 37% H |
ACalculated based on average shares outstanding during the period.
BNet investment income (loss) is affected by the timing of the declaration of dividends by any underlying mutual funds or exchange-traded funds (ETFs). Net investment income (loss) of any mutual funds or ETFs is not included in the Fund's net investment income (loss) ratio.
CTotal returns do not reflect charges attributable to your insurance company's separate account. Inclusion of these charges would reduce the total returns shown.
DTotal returns would have been lower if certain expenses had not been reduced during the applicable periods shown.
EExpense ratios reflect operating expenses of the class. Expenses before reductions do not reflect amounts reimbursed, waived, or reduced through arrangements with the investment adviser, brokerage services, or other offset arrangements, if applicable, and do not represent the amount paid by the class during periods when reimbursements, waivers or reductions occur.
FFees and expenses of any underlying mutual funds or exchange-traded funds (ETFs) are not included in the Fund's expense ratio. The Fund indirectly bears its proportionate share of these expenses. For additional expense information related to investments in Fidelity Central Funds, please refer to the "Investments in Fidelity Central Funds" note found in the Notes to Financial Statements section of the most recent Annual or Semi-Annual report.
GAmount does not include the portfolio activity of any underlying mutual funds or exchange-traded funds (ETFs), derivatives or securities that mature within one year from acquisition.
HPortfolio turnover rate excludes securities received or delivered in-kind.
VIP FundsManager® 85% Portfolio Investor Class |
| |
| Years ended December 31, | | 2024 | | 2023 | | 2022 | | 2021 | | 2020 |
Selected Per-Share Data | | | | | | | | | | |
| Net asset value, beginning of period | $ | 12.17 | $ | 10.50 | $ | 15.77 | $ | 13.86 | $ | 12.28 |
| Income from Investment Operations | | | | | | | | | | |
Net investment income (loss) A,B | | .20 | | .17 | | .13 | | .12 | | .10 |
| Net realized and unrealized gain (loss) | | 1.32 | | 1.68 | | (2.47) | | 2.31 | | 1.98 |
| Total from investment operations | | 1.52 | | 1.85 | | (2.34) | | 2.43 | | 2.08 |
| Distributions from net investment income | | (.18) | | (.18) | | (.13) | | (.15) | | (.10) |
| Distributions from net realized gain | | - | | - | | (2.80) | | (.37) | | (.39) |
| Total distributions | | (.18) | | (.18) | | (2.93) | | (.52) | | (.50) C |
| Net asset value, end of period | $ | 13.51 | $ | 12.17 | $ | 10.50 | $ | 15.77 | $ | 13.86 |
Total Return D,E | | | | 17.68% | | (17.07)% | | 17.83% | | 17.46% |
Ratios to Average Net Assets B,F,G | | | | | | | | | | |
| Expenses before reductions | | .15% | | .15% | | .19% | | .25% | | .25% |
| Expenses net of fee waivers, if any | | | | .10% | | .14% | | .20% | | .20% |
| Expenses net of all reductions | | .10% | | .10% | | .14% | | .20% | | .20% |
| Net investment income (loss) | | 1.49% | | 1.48% | | 1.18% | | .83% | | .83% |
| Supplemental Data | | | | | | | | | | |
| Net assets, end of period (000 omitted) | $ | 901,027 | $ | 748,091 | $ | 635,839 | $ | 755,243 | $ | 615,808 |
Portfolio turnover rate H | | | | 19% | | 28% I | | 68% I | | 37% I |
ACalculated based on average shares outstanding during the period.
BNet investment income (loss) is affected by the timing of the declaration of dividends by any underlying mutual funds or exchange-traded funds (ETFs). Net investment income (loss) of any mutual funds or ETFs is not included in the Fund's net investment income (loss) ratio.
CTotal distributions per share do not sum due to rounding.
DTotal returns do not reflect charges attributable to your insurance company's separate account. Inclusion of these charges would reduce the total returns shown.
ETotal returns would have been lower if certain expenses had not been reduced during the applicable periods shown.
FExpense ratios reflect operating expenses of the class. Expenses before reductions do not reflect amounts reimbursed, waived, or reduced through arrangements with the investment adviser, brokerage services, or other offset arrangements, if applicable, and do not represent the amount paid by the class during periods when reimbursements, waivers or reductions occur.
GFees and expenses of any underlying mutual funds or exchange-traded funds (ETFs) are not included in the Fund's expense ratio. The Fund indirectly bears its proportionate share of these expenses. For additional expense information related to investments in Fidelity Central Funds, please refer to the "Investments in Fidelity Central Funds" note found in the Notes to Financial Statements section of the most recent Annual or Semi-Annual report.
HAmount does not include the portfolio activity of any underlying mutual funds or exchange-traded funds (ETFs), derivatives or securities that mature within one year from acquisition.
IPortfolio turnover rate excludes securities received or delivered in-kind.
Notes to Financial Statements
For the period ended December 31, 2024
1. Organization.
VIP FundsManager 20% Portfolio, VIP FundsManager 30% Portfolio, VIP FundsManager 40% Portfolio, VIP FundsManager 50% Portfolio, VIP FundsManager 60% Portfolio, VIP FundsManager 70% Portfolio, and VIP FundsManager 85% Portfolio (the Funds) are funds of Variable Insurance Products Fund V (the Trust). The Trust is registered under the Investment Company Act of 1940, as amended (the 1940 Act), as an open-end management investment company organized as a Massachusetts business trust. Each Fund is authorized to issue an unlimited number of shares. Shares of each Fund may only be purchased by insurance companies for the purpose of funding variable annuity or variable life insurance contracts. Each Fund offers three classes of shares: Service Class, Service Class 2 and Investor Class. All classes have equal rights and voting privileges, except for matters affecting a single class.
2. Investments in Fidelity Central Funds.
Funds may invest in Fidelity Central Funds, which are open-end investment companies generally available only to other investment companies and accounts managed by the investment adviser and its affiliates. The Schedule of Investments lists any Fidelity Central Funds held as an investment as of period end, but does not include the underlying holdings of each Fidelity Central Fund. An investing fund indirectly bears its proportionate share of the expenses of the underlying Fidelity Central Funds.
Based on its investment objective, each Fidelity Central Fund may invest or participate in various investment vehicles or strategies that are similar to those of the investing fund. These strategies are consistent with the investment objectives of the investing fund and may involve certain economic risks which may cause a decline in value of each of the Fidelity Central Funds and thus a decline in the value of the investing fund.
| Fidelity Central Fund | Investment Manager | Investment Objective | Investment Practices | Expense RatioA |
| Fidelity Money Market Central Funds | Fidelity Management & Research Company LLC (FMR) | Each fund seeks to obtain a high level of current income consistent with the preservation of capital and liquidity. | Short-term Investments | Less than .005% |
A Expenses expressed as a percentage of average net assets and are as of each underlying Central Fund's most recent annual or semi-annual shareholder report.
A complete unaudited list of holdings for each Fidelity Central Fund is available upon request or at the Securities and Exchange Commission website at www.sec.gov. In addition, the financial statements of the Fidelity Central Funds which contain the significant accounting policies (including investment valuation policies) of those funds, and are not covered by the Report of Independent Registered Public Accounting Firm, are available on the Securities and Exchange Commission website or upon request.
3. Significant Accounting Policies.
Each Fund is an investment company and applies the accounting and reporting guidance of the Financial Accounting Standards Board (FASB) Accounting Standards Codification Topic 946 Financial Services - Investment Companies. The financial statements have been prepared in conformity with accounting principles generally accepted in the United States of America (GAAP), which require management to make certain estimates and assumptions at the date of the financial statements. Actual results could differ from those estimates. Each Fund operates as a single operating segment. Each Fund's income, expenses, assets, and performance are regularly monitored and assessed as a whole by the investment adviser and other individuals responsible for oversight functions of the Trust, using the information presented in the financial statements and financial highlights. Subsequent events, if any, through the date that the financial statements were issued have been evaluated in the preparation of the financial statements. Each Fund's Schedule of Investments lists any underlying mutual funds or exchange-traded funds (ETFs) but does not include the underlying holdings of these funds. The following summarizes the significant accounting policies of each Fund:
Investment Valuation. Investments are valued as of 4:00 p.m. Eastern time on the last calendar day of the period. Each Fund uses a third party pricing service approved by the Board of Trustees (the Board) to value its investments. The Board of Trustees (the Board) has designated each Fund's investment adviser as the valuation designee responsible for the fair valuation function and performing fair value determinations as needed. The investment adviser has established a Fair Value Committee (the Committee) to carry out the day-to-day fair valuation responsibilities and has adopted policies and procedures to govern the fair valuation process and the activities of the Committee. In accordance with these fair valuation policies and procedures, which have been approved by the Board, each Fund attempts to obtain prices from one or more third party pricing services or brokers to value its investments. When current market prices, quotations or currency exchange rates are not readily available or reliable, investments will be fair valued in good faith by the Committee, in accordance with the policies and procedures. Factors used in determining fair value vary by investment type and may include market or investment specific events, transaction data, estimated cash flows, and market observations of comparable investments. The frequency that the fair valuation procedures are used cannot be predicted and they may be utilized to a significant extent. The Committee manages each Fund's fair valuation practices and maintains the fair valuation policies and procedures. Each Fund's investment adviser reports to the Board information regarding the fair valuation process and related material matters. Each Fund categorizes the inputs to valuation techniques used to value its investments into a disclosure hierarchy consisting of three levels as shown below:
Level 1 - unadjusted quoted prices in active markets for identical investments
Level 2 - other significant observable inputs (including quoted prices for similar investments, interest rates, prepayment speeds, etc.)
Level 3 - unobservable inputs (including the Fund's own assumptions based on the best information available)
Valuation techniques used to value each Fund's investments by major category are as follows:
Investments in open-end mutual funds, including the Fidelity Central Funds, are valued at their closing net asset value (NAV) each business day and are categorized as Level 1 in the hierarchy.
Debt securities, including restricted securities, are valued based on evaluated prices received from third party pricing services or from brokers who make markets in such securities. U.S. government and government agency obligations are valued by pricing services who utilize matrix pricing which considers yield or price of bonds of comparable quality, coupon, maturity and type or by broker-supplied prices. When independent prices are unavailable or unreliable, debt securities may be valued utilizing pricing methodologies which consider similar factors that would be used by third party pricing services. Debt securities are generally categorized as Level 2 in the hierarchy but may be Level 3 depending on the circumstances.
Exchange-Traded Funds (ETFs) are valued at their last sale price or official closing price as reported by a third party pricing service on the primary market or exchange on which they are traded and are categorized as Level 1 in the hierarchy. In the event there were no sales during the day but the exchange reports a closing bid level, ETFs are valued at the closing bid and would be categorized as Level 1 in the hierarchy. In the event there was no closing bid, ETFs may be valued by another method that the Board believes reflects fair value in accordance with the Board's fair value pricing policies and may be categorized as Level 2 in the hierarchy.
Futures contracts are valued at the settlement price established each day by the board of trade or exchange on which they are traded and are categorized as Level 1 in the hierarchy.
Changes in valuation techniques may result in transfers in or out of an assigned level within the disclosure hierarchy. The aggregate value of investments by input level as of December 31, 2024 is included at the end of each Fund's Schedule of Investments.
Foreign Currency. Certain Funds may use foreign currency contracts to facilitate transactions in foreign-denominated securities. Gains and losses from these transactions may arise from changes in the value of the foreign currency or if the counterparties do not perform under the contracts' terms.
Foreign-denominated assets, including investment securities, and liabilities are translated into U.S. dollars at the exchange rates at period end. Purchases and sales of investment securities, income and dividends received, and expenses denominated in foreign currencies are translated into U.S. dollars at the exchange rate in effect on the transaction date.
The effects of exchange rate fluctuations on investments are included with the net realized and unrealized gain (loss) on investment securities. Other foreign currency transactions resulting in realized and unrealized gain (loss) are disclosed separately.
Investment Transactions and Income. For financial reporting purposes, the Funds' investment holdings and NAV include trades executed through the end of the last business day of the period. The NAV per share for processing shareholder transactions is calculated as of the close of business of the New York Stock Exchange (NYSE), normally 4:00 p.m. Eastern time and includes trades executed through the end of the prior business day. Gains and losses on securities sold are determined on the basis of identified cost. Income and capital gain distributions from any underlying mutual funds or exchange-traded funds (ETFs) are recorded on the ex-dividend date. Interest income is accrued as earned. Interest income includes coupon interest and amortization of premium and accretion of discount on debt securities as applicable.
Class Allocations and Expenses. Investment income, realized and unrealized capital gains and losses, common expenses of a fund, and certain fund-level expense reductions, if any, are allocated daily on a pro-rata basis to each class based on the relative net assets of each class to the total net assets of a fund. Each class differs with respect to transfer agent and distribution and service plan fees incurred, as applicable. Certain expense reductions may also differ by class, if applicable. For the reporting period, the allocated portion of income and expenses to each class as a percent of its average net assets may vary due to the timing of recording these transactions in relation to fluctuating net assets of the classes. Expenses directly attributable to a fund are charged to that fund. Expenses attributable to more than one fund are allocated among the respective funds on the basis of relative net assets or other appropriate methods. Expenses included in the accompanying financial statements reflect the expenses of that fund and do not include any expenses associated with any underlying mutual funds or exchange-traded funds (ETFs). Although not included in a fund's expenses, a fund indirectly bears its proportionate share of these expenses through the net asset value of each underlying mutual fund or exchange-traded fund (ETF). Expense estimates are accrued in the period to which they relate and adjustments are made when actual amounts are known.
Income Tax Information and Distributions to Shareholders. Each year, each Fund intends to qualify as a regulated investment company under Subchapter M of the Internal Revenue Code, including distributing substantially all of its taxable income and realized gains. As a result, no provision for U.S. Federal income taxes is required. As of December 31, 2024, each Fund did not have any unrecognized tax benefits in the financial statements; nor is each Fund aware of any tax positions for which it is reasonably possible that the total amounts of unrecognized tax benefits will significantly change in the next twelve months. Each Fund files a U.S. federal tax return, in addition to state and local tax returns as required. Each Fund's federal income tax returns are subject to examination by the Internal Revenue Service (IRS) for a period of three fiscal years after they are filed. State and local tax returns may be subject to examination for an additional fiscal year depending on the jurisdiction. Foreign taxes are provided for based on each Fund's understanding of the tax rules and rates that exist in the foreign markets in which it invests.
Distributions are declared and recorded on the ex-dividend date. Income and capital gain distributions are declared separately for each class. Income and capital gain distributions are determined in accordance with income tax regulations, which may differ from GAAP.
Capital accounts within the financial statements are adjusted for permanent book-tax differences. These adjustments have no impact on net assets or the results of operations. Capital accounts are not adjusted for temporary book-tax differences which will reverse in a subsequent period.
Book-tax differences are primarily due to the short-term gain distributions from the underlying mutual funds or exchange-traded funds (ETFs), futures contracts, foreign currency transactions, capital loss carryforwards and losses deferred due to wash sales and excise tax regulations.
As of period end, the cost and unrealized appreciation (depreciation) in securities, and derivatives if applicable, for federal income tax purposes were as follows for each Fund:
| | Tax cost ($) | Gross unrealized appreciation ($) | Gross unrealized depreciation ($) | Net unrealized appreciation (depreciation)($) |
| VIP FundsManager 20% Portfolio | 666,403,852 | 30,599,337 | (19,213,947) | 11,385,390 |
| VIP FundsManager 30% Portfolio | 14,330,435 | 629,140 | (263,861) | 365,279 |
| VIP FundsManager 40% Portfolio | 23,624,577 | 1,497,090 | (520,572) | 976,518 |
| VIP FundsManager 50% Portfolio | 3,643,314,496 | 431,578,661 | (122,536,712) | 309,041,949 |
| VIP FundsManager 60% Portfolio | 6,204,120,292 | 875,627,100 | (206,982,531) | 668,644,569 |
| VIP FundsManager 70% Portfolio | 2,035,558,641 | 317,413,205 | (64,122,806) | 253,290,399 |
| VIP FundsManager 85% Portfolio | 839,644,532 | 146,250,851 | (26,620,350) | 119,630,501 |
The tax-based components of distributable earnings as of period end were as follows for each Fund:
| | Undistributed ordinary income ($) | Undistributed long-term capital gain ($) | Capital loss carryforward ($) | Net unrealized appreciation (depreciation) on securities and other investments ($) |
| VIP FundsManager 20% Portfolio | 1,152,466 | - | (29,057,749) | (11,385,389) |
| VIP FundsManager 30% Portfolio | 823 | 20,192 | - | 365,279 |
| VIP FundsManager 40% Portfolio | - | 41,225 | - | 976,518 |
| VIP FundsManager 50% Portfolio | 5,206,742 | - | (21,464,613) | 309,041,950 |
| VIP FundsManager 60% Portfolio | 8,046,122 | 27,446,036 | - | 668,644,570 |
| VIP FundsManager 70% Portfolio | 2,339,714 | 21,939,848 | - | 253,290,399 |
| VIP FundsManager 85% Portfolio | 850,781 | 12,949,708 | - | 119,630,501 |
Capital loss carryforwards are only available to offset future capital gains of the Funds to the extent provided by regulations and may be limited. The capital loss carryforward information presented below, including any applicable limitation, is estimated as of fiscal period end and is subject to adjustment.
| | Short-term ($) | Long-term ($) | Total capital loss carryforward ($) |
| VIP FundsManager 20% Portfolio | (10,832,096) | (18,225,653) | (29,057,749) |
| VIP FundsManager 50% Portfolio | (21,464,613) | - | (21,464,613) |
Certain of the Funds intend to elect to defer to the next fiscal year capital losses recognized during the period November 1, 2024 to December 31, 2024. Loss deferrals were as follows:
| | Capital losses ($) |
| | |
| VIP FundsManager 40% Portfolio | (5,604) |
The tax character of distributions paid was as follows:
| December 31, 2024 | | | |
| | Ordinary Income ($) | Long-term Capital Gains ($) | Total ($) |
| VIP FundsManager 20% Portfolio | 24,562,137 | - | 24,562,137 |
| VIP FundsManager 30% Portfolio | 414,627 | 10,047 | 424,674 |
| VIP FundsManager 40% Portfolio | 666,858 | 21,828 | 688,686 |
| VIP FundsManager 50% Portfolio | 95,669,676 | - | 95,669,676 |
| VIP FundsManager 60% Portfolio | 140,926,408 | - | 140,926,408 |
| VIP FundsManager 70% Portfolio | 39,755,123 | - | 39,755,123 |
| VIP FundsManager 85% Portfolio | 12,653,461 | - | 12,653,461 |
| December 31, 2023 | | | |
| | Ordinary Income ($) | Long-term Capital Gains ($) | Total ($) |
| VIP FundsManager 20% Portfolio | 27,487,975 | - | 27,487,975 |
VIP FundsManager 30% PortfolioA | 124,436 | - | 124,436 |
VIP FundsManager 40% PortfolioA | 196,436 | 5,355 | 201,791 |
VIP FundsManager 50% Portfolio | 108,450,832 | - | 108,450,832 |
| VIP FundsManager 60% Portfolio | 142,216,963 | - | 142,216,963 |
| VIP FundsManager 70% Portfolio | 39,485,458 | - | 39,485,458 |
| VIP FundsManager 85% Portfolio | 11,901,106 | - | 11,901,106 |
A For the period April 13, 2023 (commencement of operations) through December 31, 2023.
New Accounting Pronouncement. FASB Accounting Standards Update (ASU) 2023-07 Segment Reporting (Topic 280): Improvements to Reportable Segment Disclosures became effective in this reporting period. ASU 2023-07 enhances segment information disclosure in the notes to financial statements.
4. Derivative Instruments.
Risk Exposures and the Use of Derivative Instruments. Each Fund's investment objectives allow for various types of derivative instruments, including futures contracts. Derivatives are investments whose value is primarily derived from underlying assets, indices or reference rates and may be transacted on an exchange or over-the-counter (OTC). Derivatives may involve a future commitment to buy or sell a specified asset based on specified terms, to exchange future cash flows at periodic intervals based on a notional principal amount, or for one party to make one or more payments upon the occurrence of specified events in exchange for periodic payments from the other party.
Derivatives were used to increase returns and to manage exposure to certain risks as defined below. The success of any strategy involving derivatives depends on analysis of numerous economic factors, and if the strategies for investment do not work as intended, the objectives may not be achieved.
Derivatives were used to increase or decrease exposure to the following risk(s):
| | |
| Equity Risk | Equity risk relates to the fluctuations in the value of financial instruments as a result of changes in market prices (other than those arising from interest rate risk or foreign exchange risk), whether caused by factors specific to an individual investment, its issuer, or all factors affecting all instruments traded in a market or market segment. |
| Interest Rate Risk | Interest rate risk relates to the fluctuations in the value of interest-bearing securities due to changes in the prevailing levels of market interest rates. |
Funds are also exposed to additional risks from investing in derivatives, such as liquidity risk and counterparty credit risk. Liquidity risk is the risk that a fund will be unable to close out the derivative in the open market in a timely manner. Counterparty credit risk is the risk that the counterparty will not be able to fulfill its obligation to a fund. Counterparty credit risk related to exchange-traded contracts may be mitigated by the protection provided by the exchange on which they trade.
Investing in derivatives may involve greater risks than investing in the underlying assets directly and, to varying degrees, may involve risk of loss in excess of any initial investment and collateral received and amounts recognized in the Statement of Assets and Liabilities. In addition, there may be the risk that the change in value of the derivative contract does not correspond to the change in value of the underlying instrument.
Net Realized Gain (Loss) and Change in Net Unrealized Appreciation (Depreciation) on Derivatives. The table below, which reflects the impacts of derivatives on the financial performance, summarizes the net realized gain (loss) and change in net unrealized appreciation (depreciation) for derivatives during the period as presented in the Statement of Operations.
| Primary Risk Exposure / Derivative Type | Net Realized Gain (Loss)($) | Change in Net Unrealized Appreciation (Depreciation)($) |
| VIP FundsManager 20% Portfolio | | |
| Equity Risk | | |
| Futures Contracts | (2,158,639) | 810,249 |
| Total Equity Risk | (2,158,639) | 810,249 |
| Interest Rate Risk | | |
| Futures Contracts | (329,517) | - |
| Total Interest Rate Risk | (329,517) | - |
| Totals | (2,488,156) | 810,249 |
| VIP FundsManager 30% Portfolio | | |
| Interest Rate Risk | | |
| Futures Contracts | (7,573) | - |
| Total Interest Rate Risk | (7,573) | - |
| Totals | (7,573) | - |
| VIP FundsManager 40% Portfolio | | |
| Interest Rate Risk | | |
| Futures Contracts | (14,506) | - |
| Total Interest Rate Risk | (14,506) | - |
| Totals | (14,506) | - |
VIP FundsManager 50% Portfolio | | |
| Equity Risk | | |
| Futures Contracts | (21,930,055) | 7,890,388 |
| Total Equity Risk | (21,930,055) | 7,890,388 |
| Interest Rate Risk | | |
| Futures Contracts | (1,883,621) | - |
| Total Interest Rate Risk | (1,883,621) | - |
| Totals | (23,813,676) | 7,890,388 |
| VIP FundsManager 60% Portfolio | | |
| Equity Risk | | |
| Futures Contracts | (3,963,377) | 466,943 |
| Total Equity Risk | (3,963,377) | 466,943 |
| Interest Rate Risk | | |
| Futures Contracts | (3,183,670) | - |
| Total Interest Rate Risk | (3,183,670) | - |
| Totals | (7,147,047) | 466,943 |
| VIP FundsManager 70% Portfolio | | |
| Equity Risk | | |
| Futures Contracts | (1,446,896) | 273,367 |
| Total Equity Risk | (1,446,896) | 273,367 |
| Interest Rate Risk | | |
| Futures Contracts | (1,059,128) | - |
| Total Interest Rate Risk | (1,059,128) | - |
| Totals | (2,506,024) | 273,367 |
| VIP FundsManager 85% Portfolio | | |
| Equity Risk | | |
| Futures Contracts | 2,230,448 | (1,727,061) |
| Total Equity Risk | 2,230,448 | (1,727,061) |
| Interest Rate Risk | | |
| Futures Contracts | (434,925) | - |
| Total Interest Rate Risk | (434,925) | - |
| Totals | 1,795,523 | (1,727,061) |
If there are any open positions at period end, a summary of the value of derivatives by primary risk exposure is included at the end of the Schedule of Investments.
Futures Contracts. A futures contract is an agreement between two parties to buy or sell a specified underlying instrument for a fixed price at a specified future date. Futures contracts were used to manage exposure to the stock market, bond market and fluctuations in interest rates.
Upon entering into a futures contract, a fund is required to deposit either cash or securities (initial margin) with a clearing broker in an amount equal to a certain percentage of the face value of the contract. Futures contracts are marked-to-market daily and subsequent daily payments are made or received by a fund depending on the daily fluctuations in the value of the futures contracts and are recorded as unrealized appreciation or (depreciation). This receivable and/or payable, if any, is included in daily variation margin on futures contracts in the Statement of Assets and Liabilities. Realized gain or (loss) is recorded upon the expiration or closing of a futures contract. The net realized gain (loss) and change in net unrealized appreciation (depreciation) on futures contracts during the period is presented in the Statement of Operations.
Any open futures contracts at period end are presented in the Schedule of Investments under the caption "Futures Contracts". The notional amount at value reflects each contract's exposure to the underlying instrument or index at period end, and is representative of volume of activity during the period, unless an average notional amount is presented in the table below.
| | Average Notional Amount ($) |
| VIP FundsManager 20% Portfolio | 14,576,279 |
| VIP FundsManager 50% Portfolio | 135,816,946 |
Any securities deposited to meet initial margin requirements are identified in the Schedule of Investments. Any cash deposited to meet initial margin requirements is presented as segregated cash with brokers for derivative instruments in the Statement of Assets and Liabilities.
5. Purchases and Sales of Investments.
Purchases and sales of securities, other than short-term securities and U.S. government securities, as applicable, are noted in the table below.
| | Purchases ($) | Sales ($) |
| VIP FundsManager 20% Portfolio | 125,329,324 | 231,306,247 |
| VIP FundsManager 30% Portfolio | 11,216,126 | 3,468,205 |
| VIP FundsManager 40% Portfolio | 15,225,346 | 6,029,844 |
| VIP FundsManager 50% Portfolio | 801,315,424 | 1,707,668,694 |
| VIP FundsManager 60% Portfolio | 1,867,475,675 | 2,000,748,223 |
| VIP FundsManager 70% Portfolio | 632,013,641 | 632,626,977 |
| VIP FundsManager 85% Portfolio | 375,108,545 | 296,945,327 |
6. Fees and Other Transactions with Affiliates.
Management Fee. Fidelity Management & Research Company LLC (the investment adviser) provides the Funds with investment management related services. For these services each Fund pays a monthly management fee to the investment adviser. The management fee is based on an annual rate of .15% of each fund's average net assets. Under the management contract, the investment adviser pays all other fund-level operating expenses, except the compensation of the independent Trustees and certain other expenses such as interest expense. The management fee is reduced by an amount equal to the fees and expenses paid by the Funds to the independent Trustees.
During the period, the investment adviser waived a portion of its management fee as described in the Expense Reductions note.
Distribution and Service Plan Fees. In accordance with Rule 12b-1 of the 1940 Act, the Funds have adopted separate 12b-1 Plans for each Service Class of shares. Each Service Class pays Fidelity Distributors Company LLC (FDC), an affiliate of the investment adviser, a service fee. For the period, the service fee is based on an annual rate of .10% of Service Class' average net assets and .25% of Service Class 2's average net assets.
For the period, total fees, all of which were reallowed to insurance companies for the distribution of shares and providing shareholder support services were as follows:
| | Service Class ($) | Service Class 2 ($) | Total ($) |
VIP FundsManager 20% Portfolio | 60 | 30,090 | 30,150 |
VIP FundsManager 30% Portfolio | 356 | 888 | 1,244 |
VIP FundsManager 40% Portfolio | 363 | 907 | 1,270 |
VIP FundsManager 50% Portfolio | 56 | 199,338 | 199,394 |
VIP FundsManager 60% Portfolio | 107,984 | 1,472,643 | 1,580,627 |
VIP FundsManager 70% Portfolio | 71 | 176,544 | 176,615 |
VIP FundsManager 85% Portfolio | 114 | 142,980 | 143,094 |
Brokerage Commissions. A portion of portfolio transactions were placed with brokerage firms which are affiliates of the investment adviser. Brokerage commissions are included in net realized gain (loss) and change in net unrealized appreciation (depreciation) in the Statement of Operations. The commissions paid to these affiliated firms were as follows:
| | Amount ($) |
| VIP FundsManager 20% Portfolio | 29 |
| VIP FundsManager 50% Portfolio | 172 |
| VIP FundsManager 60% Portfolio | 247 |
| VIP FundsManager 70% Portfolio | 79 |
| VIP FundsManager 85% Portfolio | 30 |
Interfund Trades. Funds may purchase from or sell securities to other Fidelity Funds under procedures adopted by the Board. The procedures have been designed to ensure these interfund trades are executed in accordance with Rule 17a-7 of the 1940 Act. Any interfund trades are included within the respective purchases and sales amounts shown in the Purchases and Sales of Investments note. Interfund trades during the period are noted in the table below.
| | Purchases ($) | Sales ($) | Realized Gain (Loss) ($) |
| VIP FundsManager 20% Portfolio | 8,775,304 | 427,385 | 22,119 |
| VIP FundsManager 30% Portfolio | 39,827 | 141 | (2) |
| VIP FundsManager 40% Portfolio | 18,231 | 52,343 | 153 |
| VIP FundsManager 50% Portfolio | 51,529,590 | 2,178,032 | 110,845 |
| VIP FundsManager 60% Portfolio | 1,168,581 | 40,125,707 | 112,772 |
| VIP FundsManager 70% Portfolio | 813,308 | 14,884,874 | 41,574 |
| VIP FundsManager 85% Portfolio | 434,636 | 5,571,727 | 14,850 |
Reallocation of Underlying Fund Investments. During the period, the investment adviser reallocated investments of the Funds. This involved taxable redemptions of each Fund's interest in Fidelity U.S. Low Volatility Equity Fund ("Underlying Fund") for investments. Net realized gain (loss) on the redemptions of the Underlying Fund in connection with the reallocation is included in the accompanying Statements of Operations as "Net realized gain (loss) on Affiliated issuers."
Details of these transactions with the net realized gain (loss) for the Funds are presented in the accompanying table:
| | Value of Investments and Cash reallocated ($) | Net realized gain (loss) on redemptions of Underlying Fund ($) |
| VIP FundsManager 20% Portfolio | 7,324,821 | 953,928 |
| VIP FundsManager 50% Portfolio | 42,189,458 | 5,917,244 |
| VIP FundsManager 60% Portfolio | 63,616,477 | 8,938,799 |
| VIP FundsManager 70% Portfolio | 20,635,443 | 2,889,874 |
| VIP FundsManager 85% Portfolio | 7,972,170 | 1,111,792 |
7. Expense Reductions.
The investment adviser contractually agreed to waive each Fund's management fee in an amount equal to .05% of each Fund's average net assets until April 30, 2026. During the period, each Fund's management fees were reduced by the following amounts:
| | Management Fee Waiver ($) |
| VIP FundsManager 20% Portfolio | 355,625 |
| VIP FundsManager 30% Portfolio | 5,390 |
| VIP FundsManager 40% Portfolio | 9,294 |
| VIP FundsManager 50% Portfolio | 2,091,480 |
| VIP FundsManager 60% Portfolio | 3,357,434 |
| VIP FundsManager 70% Portfolio | 1,104,750 |
| VIP FundsManager 85% Portfolio | 449,505 |
In addition, FMR has contractually agreed to reimburse 0.10% of class-level expenses for each Fund's Service Class and Service Class 2. During the period, this reimbursement reduced each Fund's Service Class and Service Class 2's expenses by the following amounts:
| | Reimbursement ($) |
| VIP FundsManager 20% Portfolio | |
| Service Class | 60 |
| Service Class 2 | 12,036 |
| VIP FundsManager 30% Portfolio | |
| Service Class | 356 |
| Service Class 2 | 355 |
| VIP FundsManager 40% Portfolio | |
| Service Class | 363 |
| Service Class 2 | 363 |
| VIP FundsManager 50% Portfolio | |
| Service Class | 56 |
| Service Class 2 | 79,735 |
| VIP FundsManager 60% Portfolio | |
| Service Class | 107,983 |
| Service Class 2 | 589,057 |
| VIP FundsManager 70% Portfolio | |
| Service Class | 71 |
| Service Class 2 | 70,618 |
| VIP FundsManager 85% Portfolio | |
| Service Class | 114 |
| Service Class 2 | 57,192 |
Through arrangements with each applicable Fund's custodian, credits realized as a result of certain uninvested cash balances were used to reduce each applicable Fund's or class' expenses. All of the applicable expense reductions are noted in the table below.
| | Custodian credits ($) |
| VIP FundsManager 20% Portfolio | 392 |
| VIP FundsManager 30% Portfolio | 869 |
| VIP FundsManager 40% Portfolio | 925 |
| VIP FundsManager 50% Portfolio | 6 |
| VIP FundsManager 60% Portfolio | 34 |
| VIP FundsManager 70% Portfolio | 41 |
| VIP FundsManager 85% Portfolio | 154 |
8. Distributions to Shareholders.
Distributions to shareholders of each class were as follows:
| | Year ended December 31, 2024 | Year ended December 31, 2023 |
| VIP FundsManager 20% Portfolio | | |
| Distributions to shareholders | | |
| Service Class | $2,204 | $2,225 |
| Service Class 2 | 428,565 | 411,354 |
| Investor Class | 24,131,368 | 27,074,396 |
Total | $24,562,137 | $27,487,975 |
| VIP FundsManager 30% Portfolio | | |
| Distributions to shareholders | | |
| Service Class | $10,622 | $6,993 |
| Service Class 2 | 10,090 | 6,627 |
| Investor Class | 403,962 | 110,816 |
Total | $424,674 | $124,436 |
| VIP FundsManager 40% Portfolio | | |
| Distributions to shareholders | | |
| Service Class | $10,556 | $ 5,028 |
| Service Class 2 | 10,023 | 4,662 |
| Investor Class | 668,107 | 192,101 |
Total | $688,686 | $201,791 |
| VIP FundsManager 50% Portfolio | | |
| Distributions to shareholders | | |
| Service Class | $1,388 | $1,338 |
| Service Class 2 | 1,769,713 | 1,817,121 |
| Investor Class | 93,898,575 | 106,632,373 |
Total | $95,669,676 | $108,450,832 |
| VIP FundsManager 60% Portfolio | | |
| Distributions to shareholders | | |
| Service Class | $2,407,728 | $2,118,631 |
| Service Class 2 | 11,178,443 | 12,240,216 |
| Investor Class | 127,340,237 | 127,858,116 |
Total | $140,926,408 | $142,216,963 |
| VIP FundsManager 70% Portfolio | | |
| Distributions to shareholders | | |
| Service Class | $1,272 | $1,277 |
| Service Class 2 | 1,116,348 | 1,226,654 |
| Investor Class | 38,637,503 | 38,257,527 |
Total | $39,755,123 | $39,485,458 |
| VIP FundsManager 85% Portfolio | | |
| Distributions to shareholders | | |
| Service Class | $1,497 | $1,658 |
| Service Class 2 | 697,777 | 739,759 |
| Investor Class | 11,954,187 | 11,159,689 |
Total | $12,653,461 | $11,901,106 |
9. Share Transactions.
Transactions for each class of shares were as follows and may contain in-kind transactions:
| | Shares | Shares | Dollars | Dollars |
| | Year ended December 31, 2024 | Year ended December 31, 2023A | Year ended December 31, 2024 | Year ended December 31, 2023A |
| VIP FundsManager 20% Portfolio | | | | |
| Service Class | | | | |
| Shares sold | 602 | 712 | $6,446 | $7,372 |
| Reinvestment of distributions | 21 | 23 | 219 | 240 |
| Shares redeemed | (694) | (522) | (7,500) | (5,385) |
| Net increase (decrease) | (71) | 213 | $(835) | $2,227 |
| Service Class 2 | | | | |
| Shares sold | 239,233 | 151,146 | $2,584,163 | $1,554,620 |
| Reinvestment of distributions | 40,374 | 39,418 | 428,565 | 411,354 |
| Shares redeemed | (229,927) | (216,261) | (2,474,285) | (2,240,355) |
| Net increase (decrease) | 49,680 | (25,697) | $538,443 | $(274,381) |
| Investor Class | | | | |
| Shares sold | 1,217,947 | 1,103,803 | $13,199,944 | $11,382,293 |
| Reinvestment of distributions | 2,267,071 | 2,587,222 | 24,131,368 | 27,074,396 |
| Shares redeemed | (10,497,596) | (13,861,772) | (113,083,923) | (143,235,669) |
| Net increase (decrease) | (7,012,578) | (10,170,747) | $(75,752,611) | $(104,778,980) |
| VIP FundsManager 30% Portfolio | | | | |
| Service Class | | | | |
| Shares sold | - | 33,300 | $ - | $333,000 |
| Net increase (decrease) | - | 33,300 | $- | $333,000 |
| Service Class 2 | | | | |
| Shares sold | - | 33,300 | $ - | $333,000 |
| Net increase (decrease) | - | 33,300 | $- | $333,000 |
| Investor Class | | | | |
| Shares sold | 890,942 | 566,712 | $9,490,756 | $5,625,882 |
| Reinvestment of distributions | 37,015 | 10,088 | 393,307 | 103,802 |
| Shares redeemed | (143,530) | (39,019) | (1,544,967) | (380,890) |
| Net increase (decrease) | 784,427 | 537,781 | $8,339,096 | $5,348,794 |
| VIP FundsManager 40% Portfolio | | | | |
| Service Class | | | | |
| Shares sold | - | 33,300 | $ - | $333,000 |
| Net increase (decrease) | - | 33,300 | $- | $333,000 |
| Service Class 2 | | | | |
| Shares sold | - | 33,300 | $ - | $333,000 |
| Net increase (decrease) | - | 33,300 | $- | $333,000 |
| Investor Class | | | | |
| Shares sold | 1,066,790 | 1,313,289 | $11,740,344 | $13,203,311 |
| Reinvestment of distributions | 60,388 | 17,935 | 657,520 | 187,057 |
| Shares redeemed | (221,049) | (41,115) | (2,439,892) | (421,553) |
| Net increase (decrease) | 906,129 | 1,290,109 | $9,957,972 | $12,968,815 |
| VIP FundsManager 50% Portfolio | | | | |
| Service Class | | | | |
| Shares sold | 26 | 80 | $315 | $870 |
| Reinvestment of distributions | - | - | - | 2 |
| Shares redeemed | (26) | (154) | (313) | (1,683) |
| Net increase (decrease) | - | (74) | $2 | $(811) |
| Service Class 2 | | | | |
| Shares sold | 683,358 | 508,472 | $8,078,532 | $5,493,861 |
| Reinvestment of distributions | 147,556 | 161,277 | 1,769,713 | 1,817,121 |
| Shares redeemed | (1,175,311) | (1,183,544) | (14,053,154) | (12,765,469) |
| Net increase (decrease) | (344,397) | (513,795) | $(4,204,909) | $(5,454,487) |
| Investor Class | | | | |
| Shares sold | 2,266,957 | 1,973,837 | $27,355,707 | $21,448,148 |
| Reinvestment of distributions | 7,796,561 | 9,421,207 | 93,898,575 | 106,632,373 |
| Shares redeemed | (64,028,367) | (63,521,430) | (764,238,723) | (690,173,060) |
| Net increase (decrease) | (53,964,849) | (52,126,386) | $(642,984,441) | $(562,092,539) |
| VIP FundsManager 60% Portfolio | | | | |
| Service Class | | | | |
| Shares sold | 2,653,727 | 3,237,282 | $27,426,524 | $29,895,512 |
| Reinvestment of distributions | 230,821 | 219,119 | 2,406,684 | 2,117,582 |
| Shares redeemed | (1,625,705) | (1,302,569) | (16,755,404) | (12,065,112) |
| Net increase (decrease) | 1,258,843 | 2,153,832 | $13,077,804 | $19,947,982 |
| Service Class 2 | | | | |
| Shares sold | 1,889,185 | 3,424,085 | $19,461,905 | $31,360,733 |
| Reinvestment of distributions | 1,076,634 | 1,273,863 | 11,178,443 | 12,240,216 |
| Shares redeemed | (7,274,295) | (6,203,615) | (74,460,234) | (56,845,626) |
| Net increase (decrease) | (4,308,476) | (1,505,667) | $(43,819,886) | $(13,244,677) |
| Investor Class | | | | |
| Shares sold | 60,737,620 | 62,951,717 | $628,300,050 | $577,922,893 |
| Reinvestment of distributions | 12,214,883 | 13,243,928 | 127,340,237 | 127,858,116 |
| Shares redeemed | (72,857,954) | (69,556,604) | (747,812,558) | (639,785,221) |
| Net increase (decrease) | 94,549 | 6,639,041 | $7,827,729 | $65,995,788 |
| VIP FundsManager 70% Portfolio | | | | |
| Service Class | | | | |
| Shares sold | 257 | 290 | $3,307 | $3,307 |
| Reinvestment of distributions | 1 | 1 | 17 | 16 |
| Shares redeemed | (255) | (290) | (3,304) | (3,305) |
| Net increase (decrease) | 3 | 1 | $20 | $18 |
| Service Class 2 | | | | |
| Shares sold | 241,852 | 293,434 | $3,129,428 | $3,342,027 |
| Reinvestment of distributions | 84,569 | 102,062 | 1,116,348 | 1,226,654 |
| Shares redeemed | (715,086) | (495,196) | (9,298,374) | (5,621,284) |
| Net increase (decrease) | (388,665) | (99,700) | $(5,052,598) | $(1,052,603) |
| Investor Class | | | | |
| Shares sold | 9,344,829 | 5,488,147 | $122,005,457 | $62,399,529 |
| Reinvestment of distributions | 2,908,326 | 3,160,203 | 38,637,503 | 38,257,527 |
| Shares redeemed | (9,534,789) | (10,570,255) | (123,253,291) | (121,301,257) |
| Net increase (decrease) | 2,718,366 | (1,921,905) | $37,389,669 | $(20,644,201) |
| VIP FundsManager 85% Portfolio | | | | |
| Service Class | | | | |
| Shares sold | 284 | 1,156 | $3,755 | $12,667 |
| Reinvestment of distributions | 110 | 137 | 1,497 | 1,658 |
| Shares redeemed | (1,171) | (1,684) | (15,384) | (18,741) |
| Net increase (decrease) | (777) | (391) | $(10,132) | $(4,416) |
| Service Class 2 | | | | |
| Shares sold | 322,858 | 604,456 | $4,206,733 | $6,768,233 |
| Reinvestment of distributions | 52,143 | 62,010 | 697,777 | 739,759 |
| Shares redeemed | (493,276) | (892,306) | (6,417,266) | (9,967,296) |
| Net increase (decrease) | (118,275) | (225,840) | $(1,512,756) | $(2,459,304) |
| Investor Class | | | | |
| Shares sold | 7,939,691 | 4,659,068 | $104,431,714 | $52,385,474 |
| Reinvestment of distributions | 884,245 | 924,934 | 11,954,187 | 11,159,689 |
| Shares redeemed | (3,606,258) | (4,681,238) | (47,114,957) | (52,799,349) |
| Net increase (decrease) | 5,217,678 | 902,764 | $69,270,944 | $10,745,814 |
A VIP FundsManager 30% Portfolio and VIP FundsManager 40% Portfolio are for the period April 13, 2023 (commencement of operations) through December 31, 2023.
10. Other.
A fund's organizational documents provide former and current trustees and officers with a limited indemnification against liabilities arising in connection with the performance of their duties to the fund. In the normal course of business, a fund may also enter into contracts that provide general indemnifications. A fund's maximum exposure under these arrangements is unknown as this would be dependent on future claims that may be made against a fund. The risk of material loss from such claims is considered remote.
Funds do not invest in underlying mutual funds for the purpose of exercising management or control; however, investments by funds within their principal investment strategies may represent a significant portion of the underlying mutual fund's net assets. At the end of the period, certain Funds were the owners of record of 10% or more of the total outstanding shares of the following underlying mutual funds as shown below.
| Fund | VIP FundsManager 50% Portfolio | VIP FundsManager 60% Portfolio | VIP FundsManager 70% Portfolio |
| Fidelity Commodity Strategy Fund | 23% | 39% | 15% |
| Fidelity Hedged Equity Fund | 16% | 27% | - |
| Fidelity Infrastructure Fund | - | 13% | - |
| Fidelity Japan Smaller Companies Fund | - | 13% | - |
| VIP Investment Grade Bond II Portfolio | 21% | 32% | - |
| VIP Stock Selector Portfolio | 22% | 47% | 18% |
| VIP Value Strategies Portfolio | - | 11% | - |
The Funds, in aggregate, were the owners of record of more than 20% of the total outstanding shares of the following underlying mutual funds.
| Fund | % of shares held |
| Fidelity Commodity Strategy Fund | 90% |
| Fidelity Hedged Equity Fund | 59% |
| Fidelity Infrastructure Fund | 29% |
| Fidelity Japan Smaller Companies Fund | 27% |
| VIP Investment Grade Bond II Portfolio | 66% |
| VIP Stock Selector Portfolio | 99% |
| VIP Value Strategies Portfolio | 22% |
In addition, at the end of the period the investment adviser or its affiliates were owners of record of more than 10% and certain otherwise unaffiliated shareholders were owners of record of more than 10%, respectively, of the outstanding shares of the following Funds:
| | Affiliated % | Number of Unaffiliated Shareholders | Unaffiliated Shareholders |
| | | | |
| VIP FundsManager 20% Portfolio | 98% | - | - |
| VIP FundsManager 30% Portfolio | 100% | - | - |
| VIP FundsManager 40% Portfolio | 100% | - | - |
| VIP FundsManager 50% Portfolio | 45% | - | - |
| VIP FundsManager 60% Portfolio | 32% | 3 | 39% |
| VIP FundsManager 70% Portfolio | 97% | - | - |
| VIP FundsManager 85% Portfolio | 94% | - | - |
11. Risk and Uncertainties.
Many factors affect a fund's performance. Developments that disrupt global economies and financial markets, such as pandemics, epidemics, outbreaks of infectious diseases, war, terrorism, and environmental disasters, may significantly affect a fund's investment performance. The effects of these developments to a fund will be impacted by the types of securities in which a fund invests, the financial condition, industry, economic sector, and geographic location of an issuer, and a fund's level of investment in the securities of that issuer. Significant concentrations in security types, issuers, industries, sectors, and geographic locations may magnify the factors that affect a fund's performance.
Report of Independent Registered Public Accounting Firm
To the Board of Trustees of Variable Insurance Products Fund V and Shareholders of each of the seven funds listed in the table below
Opinions on the Financial Statements
We have audited the accompanying statements of assets and liabilities, including the schedules of investments, of each of the funds listed in the table below (seven of the funds constituting Variable Insurance Products Fund V, hereafter collectively referred to as the "Funds") as of December 31, 2024, the related statements of operations and of changes in net assets for each of the periods indicated in the table below, including the related notes, and the financial highlights for each of the periods indicated in the table below (collectively referred to as the "financial statements"). In our opinion, the financial statements present fairly, in all material respects, the financial position of each of the Funds listed in the table below as of December 31, 2024, the results of each of their operations, the changes in each of their net assets and each of the financial highlights for each of the periods indicated in the table below, in conformity with accounting principles generally accepted in the United States of America.| Fund | Statement of Operations | Statement of Changes in Net Assets | Financial Highlights |
VIP FundsManager 20% Portfolio VIP FundsManager 50% Portfolio VIP FundsManager 60% Portfolio VIP FundsManager 70% Portfolio VIP FundsManager 85% Portfolio | For the year ended December 31, 2024 | For the years ended December 31, 2024 and 2023 | For the years ended December 31, 2024, 2023, 2022, 2021 and 2020 |
VIP FundsManager 30% Portfolio VIP FundsManager 40% Portfolio | For the year ended December 31, 2024 | For the year ended December 31, 2024 and for the period April 13, 2023 (commencement of operations) through December 31, 2023 | For the year ended December 31, 2024 and for the period April 13, 2023 (commencement of operations) through December 31, 2023 |
Basis for Opinions
These financial statements are the responsibility of the Funds' management. Our responsibility is to express an opinion on the Funds' financial statements based on our audits. We are a public accounting firm registered with the Public Company Accounting Oversight Board (United States) (PCAOB) and are required to be independent with respect to the Funds in accordance with the U.S. federal securities laws and the applicable rules and regulations of the Securities and Exchange Commission and the PCAOB.
We conducted our audits of these financial statements in accordance with the standards of the PCAOB. Those standards require that we plan and perform the audit to obtain reasonable assurance about whether the financial statements are free of material misstatement, whether due to error or fraud.
Our audits included performing procedures to assess the risks of material misstatement of the financial statements, whether due to error or fraud, and performing procedures that respond to those risks. Such procedures included examining, on a test basis, evidence regarding the amounts and disclosures in the financial statements. Our audits also included evaluating the accounting principles used and significant estimates made by management, as well as evaluating the overall presentation of the financial statements. Our procedures included confirmation of securities owned as of December 31, 2024 by correspondence with the custodian and brokers; when replies were not received from brokers, we performed other auditing procedures. We believe that our audits provide a reasonable basis for our opinions.
/s/ PricewaterhouseCoopers LLP
Boston, Massachusetts
February 13, 2025
We have served as the auditor of one or more investment companies in the Fidelity group of funds since 1932.
Distributions
(Unaudited)The dividend and capital gains distributions for the fund(s) are available on Fidelity.com or Institutional.Fidelity.com.
The funds hereby designate as capital gain dividend the amounts noted below for the taxable year ended December 31, 2024, or, if subsequently determined to be different, the net capital gain of such year.
| VIP FundsManager 30% Portfolio | $25,490 |
| VIP FundsManager 40% Portfolio | $47,623 |
| VIP FundsManager 60% Portfolio | $27,446,036 |
| VIP FundsManager 70% Portfolio | $21,939,848 |
| VIP FundsManager 85% Portfolio | $12,949,707 |
A percentage of the dividends distributed during the fiscal year for the following funds were derived from interest on U.S. Government securities which is generally exempt from state income tax.
| VIP FundsManager 20% Portfolio | 33.98% |
| VIP FundsManager 30% Portfolio | 29.03% |
| VIP FundsManager 40% Portfolio | 24.88% |
| VIP FundsManager 50% Portfolio | 21.45% |
| VIP FundsManager 60% Portfolio | 19.89% |
| VIP FundsManager 70% Portfolio | 16.30% |
| VIP FundsManager 85% Portfolio | 11.46% |
The funds hereby designate the amounts noted below as distributions paid during the fiscal year ended 2024 as qualifying to be taxed as section 163(j) interest dividends:
| VIP FundsManager 20% Portfolio | $23,337,423 |
| VIP FundsManager 30% Portfolio | $343,929 |
| VIP FundsManager 40% Portfolio | $501,176 |
| VIP FundsManager 50% Portfolio | $76,695,051 |
| VIP FundsManager 60% Portfolio | $103,334,784 |
| VIP FundsManager 70% Portfolio | $24,877,341 |
| VIP FundsManager 85% Portfolio | $5,440,715 |
A percentage of the dividends distributed during the fiscal year for the following funds qualify for the dividends-received deduction for corporate shareholders:
| | Service Class | Service Class 2 | Investor Class |
| VIP FundsManager 20% Portfolio | | | |
| December, 2024 | 3% | 3% | 3% |
| VIP FundsManager 30% Portfolio | | | |
| December, 2024 | 4% | 5% | 4% |
| VIP FundsManager 40% Portfolio | | | |
| February, 2024 | 1% | 1% | 1% |
| December, 2024 | 6% | 6% | 6% |
| VIP FundsManager 50% Portfolio | | | |
| February, 2024 | 2% | 2% | 2% |
| December, 2024 | 9% | 9% | 9% |
| VIP FundsManager 60% Portfolio | | | |
| February, 2024 | 3% | 3% | 3% |
| December, 2024 | 12% | 13% | 12% |
| VIP FundsManager 70% Portfolio | | | |
| February, 2024 | 5% | 5% | 5% |
| December, 2024 | 16% | 18% | 16% |
| VIP FundsManager 85% Portfolio | | | |
| February, 2024 | 10% | 10% | 10% |
| December, 2024 | 25% | 28% | 25% |
The amounts per share which represent income derived from sources within, and taxes paid to, foreign countries or possessions of the United States are as follows:
| | Pay Date | Income | Taxes |
| VIP FundsManager 20% Portfolio | | | |
| Service Class | 12/30/2024 | $0.0150 | $0.0028 |
| Service Class 2 | 12/30/2024 | $0.0143 | $0.0028 |
| Investor Class | 12/30/2024 | $0.0150 | $0.0028 |
| VIP FundsManager 30% Portfolio | | | |
| Service Class | 12/30/2024 | $0.0200 | $0.0038 |
| Service Class 2 | 12/30/2024 | $0.0190 | $0.0038 |
| Investor Class | 12/30/2024 | $0.0200 | $0.0038 |
| VIP FundsManager 40% Portfolio | | | |
| Service Class | 12/30/2024 | $0.0281 | $0.0053 |
| Service Class 2 | 12/30/2024 | $0.0267 | $0.0053 |
| Investor Class | 12/30/2024 | $0.0281 | $0.0053 |
| VIP FundsManager 50% Portfolio | | | |
| Service Class | 12/30/2024 | $0.0420 | $0.0077 |
| Service Class 2 | 12/30/2024 | $0.0393 | $0.0077 |
| Investor Class | 12/30/2024 | $0.0420 | $0.0077 |
| VIP FundsManager 60% Portfolio | | | |
| Service Class | 12/30/2024 | $0.0409 | $0.0078 |
| Service Class 2 | 12/30/2024 | $0.0379 | $0.0078 |
| Investor Class | 12/30/2024 | $0.0409 | $0.0078 |
| VIP FundsManager 70% Portfolio | | | |
| Service Class | 12/30/2024 | $0.0604 | $0.0116 |
| Service Class 2 | 12/30/2024 | $0.0552 | $0.0116 |
| Investor Class | 12/30/2024 | $0.0604 | $0.0116 |
| VIP FundsManager 85% Portfolio | | | |
| Service Class | 12/30/2024 | $0.0691 | $0.0133 |
| Service Class 2 | 12/30/2024 | $0.0618 | $0.0133 |
| Investor Class | 12/30/2024 | $0.0691 | $0.0133 |
Item 8: Changes in and Disagreements with Accountants for Open-End Management Investment Companies
(Unaudited)
Note: This is not applicable for any fund included in this document.
Item 9: Proxy Disclosures for Open-End Management Investment Companies
(Unaudited)
Note: This is not applicable for any fund included in this document.
Item 10: Remuneration Paid to Directors, Officers, and others of Open-End Management Investment Companies
(Unaudited)
Note: This information is disclosed as part of the financial statements for each Fund as part of Item 7: Financial Statements and Financial Highlights for Open-End Management Investment companies.
Item 11: Statement Regarding Basis for Approval of Investment Advisory Contract
(Unaudited)
Board Approval of Investment Advisory Contracts and Management Fees
VIP FundsManager 20% Portfolio
VIP FundsManager 30% Portfolio
VIP FundsManager 40% Portfolio
VIP FundsManager 50% Portfolio
VIP FundsManager 60% Portfolio
VIP FundsManager 70% Portfolio
VIP FundsManager 85% Portfolio
Each year, the Board of Trustees, including the Independent Trustees (together, the Board), considers the renewal of the management contract with Fidelity Management & Research Company LLC (FMR) for each fund (the Advisory Contract). The Board, assisted by the advice of fund counsel and Independent Trustees' counsel, requests and considers a broad range of information relevant to the renewal of the Advisory Contracts throughout the year.
The Board meets regularly and, at each of its meetings, covers an extensive agenda of topics and materials and considers factors that are relevant to its annual consideration of the renewal of each fund's Advisory Contract, including the services and support provided to each fund and its shareholders. The Board's Operations Committee, of which all the Independent Trustees are members, meets regularly throughout the year and requests, receives and considers, among other matters, information related to the annual consideration of the renewal of each fund's Advisory Contract before making its recommendation to the Board. The Board also meets as needed to review matters specifically related to the Board's annual consideration of the renewal of the Advisory Contracts. Members of the Board may also meet from time to time with trustees of other Fidelity funds through joint ad hoc committees to discuss certain matters relevant to all of the Fidelity funds.
At its September 2024 meeting, the Board unanimously determined to renew each fund's Advisory Contract. In reaching its determination, the Board considered all factors it believed relevant, including (i) the nature, extent, and quality of the services provided to each fund and its shareholders (including the investment performance of each fund); (ii) the competitiveness relative to peer funds of each fund's management fee and the total expense ratio of a representative class (Investor Class, which was selected because it was the largest class without 12b-1 fees); (iii) the total costs of the services provided by and the profits realized by Fidelity from its relationships with each fund; and (iv) the extent to which, if any, economies of scale exist and are realized as each fund grows, and whether any economies of scale are appropriately shared with fund shareholders. The Board also considered the broad range of investment choices available to shareholders from FMR's competitors and that each fund's shareholders have chosen to invest in that fund, which is part of the Fidelity family of funds. The Board's decision to renew the Advisory Contracts was not based on any single factor and the factors may have been weighed differently by different Trustees.
The Board reached a determination, with the assistance of fund counsel and Independent Trustees' counsel and through the exercise of its business judgment, that the renewal of the Advisory Contracts was in the best interests of each fund and its shareholders and that the compensation payable under the Advisory Contract was fair and reasonable in light of all of the surrounding circumstances.
Nature, Extent, and Quality of Services Provided. The Board considered Fidelity's staffing as it relates to the funds, including the backgrounds and experience of investment personnel of FMR, and also considered FMR's implementation of each fund's investment program. The Independent Trustees also had discussions with senior management of Fidelity's investment operations and investment groups with responsibility for the underlying Fidelity funds in which each fund invests. The Board considered the structure of the investment personnel compensation program and whether this structure provides appropriate incentives to act in the best interests of each fund. Additionally, the Board considered the portfolio managers' investments, if any, in the funds that they manage.
Resources Dedicated to Investment Management and Support Services. The Board reviewed the general qualifications and capabilities of Fidelity's investment staff, including its size, education, experience, and resources, as well as Fidelity's approach to recruiting, training, managing, and compensating investment personnel. The Board noted the resources devoted to Fidelity's global investment organization, and that Fidelity's analysts have extensive resources, tools, and capabilities that allow them to conduct quantitative and fundamental analysis, as well as credit analysis of issuers, counterparties, and guarantors. Further, the Board considered that Fidelity's investment professionals have sufficient access to global information and data so as to provide competitive investment results over time, and that those professionals also have access to sophisticated tools that permit them to assess portfolio construction and risk and performance attribution characteristics continuously, as well as to transmit new information and research conclusions rapidly around the world. Additionally, in its deliberations, the Board considered Fidelity's risk management, compliance, cybersecurity, and technology and operations capabilities and resources, which are integral parts of the investment management process.
Shareholder and Administrative Services. The Board considered (i) the nature, extent, quality, and cost of advisory, administrative, and shareholder services performed by Fidelity under the Advisory Contract and under separate agreements covering transfer agency and pricing and bookkeeping services for each fund; (ii) the nature and extent of Fidelity's supervision of third party service providers, principally custodians, subcustodians, and pricing vendors; and (iii) the resources devoted by Fidelity to, and the record of compliance with, each fund's compliance policies and procedures, including with respect to liquidity risk management.
The Board noted that the growth of fund assets over time across the complex allows Fidelity to reinvest in the development of services designed to enhance the value and convenience of the Fidelity funds as investment vehicles. These services include 24-hour access to account information and market information over the Internet and through telephone representatives, investor education materials and asset allocation tools. The Board also considered that it reviews customer service metrics such as telephone response times, continuity of services on the website and metrics addressing services at Fidelity Investor Centers.
Investment in a Large Fund Family. The Board considered the benefits to shareholders of investing in a fund that is part of a large family of funds offering a variety of investment disciplines and providing a large variety of fund investor services. The Board noted that Fidelity had taken, or had made recommendations to the Board that resulted in the Fidelity funds taking, a number of actions over the previous year that benefited particular funds and/or the Fidelity funds in general.
Investment Performance. The Board took into account discussions that occur with representatives of the investment adviser, or reports it receives, at Board meetings throughout the year relating to fund investment performance. In this regard the Board noted that as part of regularly scheduled fund reviews and other reports to the Board on fund performance, the Board considered annualized return information for each fund for different time periods, measured against one or more appropriate securities market indices, including a customized blended index that reflects the respective weights of the fund's asset classes (each a benchmark index) and an appropriate peer group of funds with similar investment objectives (peer group). The Board also considered information about performance attribution. In its evaluation of fund investment performance at meetings throughout the year, the Board gave particular attention to information indicating underperformance of certain Fidelity funds over different time periods and discussed with the Investment Advisers the reasons for such underperformance.
In addition to reviewing absolute and relative fund performance, the Independent Trustees periodically consider the appropriateness of fund performance metrics in evaluating the results achieved. The Independent Trustees generally give greater weight to fund performance over longer time periods than over shorter time periods. Depending on the circumstances, the Independent Trustees may be satisfied with a fund's performance notwithstanding that it lags its benchmark index or peer group for certain periods.
Based on its review, the Board concluded that the nature, extent, and quality of services provided to each fund under the Advisory Contracts should continue to benefit the shareholders of each fund.
Competitiveness of Management Fee and Total Expense Ratio. The Board was provided with information regarding industry trends in management fees and expenses. In its review of each fund's management fee and the total expense ratio of Investor Class, the Board considered each fund's all-inclusive (subject to certain limited exceptions) fee rate. The Board also considered other expenses, such as pricing and bookkeeping fees and custodial, legal, and audit fees, paid by FMR under the all-inclusive arrangement. The Board also considered fund-paid 12b-1 fees. The Board noted that Fidelity may agree to waive fees or reimburse expenses from time to time, and the extent to which, if any, it has done so for the fund.
Comparisons of Management Fees and Total Expense Ratios. Among other things, the Board reviewed data for selected groups of competitive funds and classes (referred to as "mapped groups") that were compiled by Fidelity based on combining similar investment objective categories (as classified by Morningstar) that have comparable investment mandates. The data reviewed by the Board included (i) gross management fee comparisons (before taking into account expense reimbursements or caps) relative to the total universe of funds within the mapped group; (ii) gross management fee comparisons relative to a subset of non-Fidelity funds in the mapped group that are similar in size and management fee structure to each fund (referred to as the "asset size peer group"); (iii) total expense comparisons of Investor Class of each fund relative to funds and classes in the mapped group that have a similar sales load structure to Investor Class of each fund (referred to as the "similar sales load structure group"); and (iv) total expense comparisons of Investor Class of each fund relative to funds and classes in the similar sales load structure group that are similar in size and management fee structure to each fund (referred to as the "total expense asset size peer group"). The total expense asset size peer group comparison excludes performance adjustments and fund-paid 12b-1 fees to eliminate variability in fee structures.
The information provided to the Board indicated that each fund's management fee rate ranked below the competitive median of the mapped group for 2023 and, except for VIP FundsManager 70% Portfolio, below the competitive median of the asset size peer group for 2023. Further, the information provided to the Board indicated that the total expense ratio of Investor Class of each fund ranked below the competitive median of the similar sales load structure group for 2023. VIP FundsManager 20% Portfolio, VIP FundsManager 30% Portfolio, VIP FundsManager 40% Portfolio, and VIP FundsManager 70% Portfolio ranked below the competitive median of the total expense asset size peer group for 2023, while VIP FundsManager 50% Portfolio, VIP FundsManager 60% Portfolio, and VIP FundsManager 85% Portfolio ranked above the competitive median of the total expense asset size peer group for 2023.
The Board considered that VIP FundsManager 70% Portfolio has an all-inclusive management fee that covers expenses beyond portfolio management, unlike the majority of funds within the mapped group. The Board further considered that, when compared to the total expenses of its competitors, the fund ranked below its load-type group median.
The information provided to the Board indicated that the level of servicing for both Fidelity's and competitors' classes ranges across classes from those that provide all servicing at the class level, like Investor Classes, to those that split servicing between the class level and the annuity level. When servicing is provided at the annuity level, it is not reflected in the total expense ratio of the class and, for that reason, the fees of funds that provide service at the class level are not directly comparable to the fees of funds that provide service at the annuity level. The Board considered that, although total expenses for VIP FundsManager 50% Portfolio, VIP FundsManager 60% Portfolio, and VIP FundsManager 85% Portfolio ranked above the asset size peer group median, Fidelity believes the fees for Investor Class of these funds are reasonable given both the value proposition Fidelity offers and the disparity in servicing models within the competitive environment.
Other Contractual Arrangements. The Board considered that FMR has contractually agreed to waive 0.05% of each fund's management fee through April 30, 2025.
The Board further considered that FMR contractually agreed to reimburse 0.10% of "class-level" expenses for Service Class and Service Class 2 as long as these classes continue to be sold to unaffiliated insurance companies.
Fees Charged to Other Fidelity Clients. The Board also considered Fidelity fee structures and other information with respect to clients of Fidelity, such as other funds advised or subadvised by Fidelity, pension plan clients, and other institutional clients with similar mandates. The Board noted that a joint ad hoc committee created by it and the boards of other Fidelity funds periodically reviews and compares Fidelity's institutional investment advisory business with its business of providing services to the Fidelity funds and also noted the most recent findings of the committee. The Board noted that the committee's review included a consideration of the differences in services provided, fees charged, and costs incurred, as well as competition in the markets serving the different categories of clients.
Based on its review, the Board concluded that each fund's management fee is fair and reasonable in light of the services that each fund receives and the other factors considered. Further, based on its review of total expense ratios and fees charged to other Fidelity clients, the Board concluded that the total expense ratio of each class of each fund was reasonable in light of the services that the fund and its shareholders receive and the other factors considered.
Costs of the Services and Profitability. The Board considered the revenues earned and the expenses incurred by Fidelity in conducting the business of developing, marketing, distributing, managing, administering and servicing each fund and servicing each fund's shareholders. The Board also considered the level of Fidelity's profits in respect of all the Fidelity funds, including the Fidelity funds in which the funds invest.
On an annual basis, Fidelity presents to the Board information about the profitability of its relationships with each fund. Fidelity calculates profitability information for each Fidelity fund, as well as aggregate profitability information for groups of Fidelity funds and all Fidelity funds, using a series of detailed revenue and cost allocation methodologies which originate with the books and records of Fidelity on which Fidelity's audited financial statements are based. The Audit Committee of the Board reviews any significant changes from the prior year's methodologies.
A public accounting firm has been engaged annually by the Board as part of the Board's assessment of Fidelity's profitability analysis. The engagement includes the review and assessment of the methodologies used by Fidelity in determining the revenues and expenses attributable to Fidelity's fund business. After considering the reports issued under the engagement and information provided by Fidelity, the Board concluded that while other allocation methods may also be reasonable, Fidelity's profitability methodologies are reasonable in all material respects.
The Board also reviewed Fidelity's non-fund businesses and potential indirect benefits such businesses may have received as a result of their association with Fidelity's fund business (i.e., fall-out benefits) as well as cases where Fidelity's affiliates may benefit from the funds' business. The Board considered areas where potential indirect benefits to the Fidelity funds from their relationships with Fidelity may exist. The Board's consideration of these matters was informed by the findings of a joint ad hoc committee created by it and the boards of other Fidelity funds to evaluate potential fall-out benefits.
The Board considered the costs of the services provided by and the profits realized by Fidelity in connection with the operation of each fund and was satisfied that the profitability was not excessive.
Economies of Scale. The Board considered whether there have been economies of scale in respect of the management of the Fidelity funds, whether the Fidelity funds (including each fund) have appropriately benefited from any such economies of scale, and whether there is potential for realization of any further economies of scale. The Board considered the extent to which each fund will benefit from economies of scale as assets grow through increased services to the fund, through waivers or reimbursements, or through fee or expense ratio reductions. The Board recognized that, due to each fund's current contractual arrangements, its expense ratio will not decline if the fund's operating costs decrease as assets grow, or rise as assets decrease. The Board also noted that a committee created by it and the boards of other Fidelity funds periodically analyzes whether Fidelity attains economies of scale in respect of the management and servicing of the Fidelity funds, whether the Fidelity funds have appropriately benefited from such economies of scale, and whether there is potential for realization of any further economies of scale.
The Board concluded, taking into account the analysis of the committee, that economies of scale, if any, are being appropriately shared between fund shareholders and Fidelity.
Additional Information Requested by the Board. In order to develop fully the factual basis for consideration of the Fidelity funds' advisory contracts, the Board requested and received additional information on certain topics, including: (i) portfolio manager changes that have occurred during the past year; (ii) hiring, training, compensating, and retaining adviser and sub-adviser personnel; (iii) the terms of the funds' various management fee structures and arrangements for transfer agent and pricing and bookkeeping services; (iv) Fidelity's fund profitability methodology, profitability trends for certain funds, the allocation of various costs to different funds, and the impact of certain factors on fund profitability results; (v) the impact on fund profitability of recent industry trends, such as the growth in passively managed funds and the changes in flows for different types of funds; (vi) the types of management fee and total expense comparisons provided, and the challenges and limitations associated with such information; (vii) explanations regarding the relative total expense ratios and management fees of certain funds and classes, total expense and management fee competitive trends, and methodologies for total expense and management fee competitive comparisons; (viii) matters related to money market funds, exchange-traded funds, and target date funds; (ix) the arrangements with and compensation paid to certain fund sub-advisers and the treatment of such compensation within Fidelity's fund profitability methodology; and (x) the terms of management contracts between Fidelity and other funds and products not overseen by the Board.
Conclusion. Based on its evaluation of all of the conclusions noted above, and after considering all factors it believed relevant, the Board, including the Independent Trustees, concluded that the advisory fee arrangements are fair and reasonable in light of all of the surrounding circumstances and that each fund's Advisory Contract should be renewed through September 30, 2025.
1.843208.118
VIPFM-ANN-0325
Fidelity® Variable Insurance Products:
VIP Investment Grade Bond II Portfolio
Annual Report
December 31, 2024
Contents
To view a fund's proxy voting guidelines and proxy voting record for the 12-month period ended June 30, visit http://www.fidelity.com/proxyvotingresults or visit the Securities and Exchange Commission's (SEC) web site at http://www.sec.gov.
You may also call 1-877-208-0098 to request a free copy of the proxy voting guidelines.
Fidelity® Variable Insurance Products are separate account options which are purchased through a variable insurance contract.
Standard & Poor's, S&P and S&P 500 are registered service marks of The McGraw-Hill Companies, Inc. and have been licensed for use by Fidelity Distributors Corporation.
Other third-party marks appearing herein are the property of their respective owners.
All other marks appearing herein are registered or unregistered trademarks or service marks of FMR LLC or an affiliated company. © 2025 FMR LLC. All rights reserved.
This report and the financial statements contained herein are submitted for the general information of the shareholders of the Fund. This report is not authorized for distribution to prospective investors in the Fund unless preceded or accompanied by an effective prospectus.
A fund files its complete schedule of portfolio holdings with the SEC for the first and third quarters of each fiscal year on Form N-PORT. Forms N-PORT are available on the SEC's web site at http://www.sec.gov. A fund's Forms N-PORT may be reviewed and copied at the SEC's Public Reference Room in Washington, DC. Information regarding the operation of the SEC's Public Reference Room may be obtained by calling 1-800-SEC-0330.
For a complete list of a fund's portfolio holdings, view the most recent holdings listing, semiannual report, or annual report on Fidelity's web site at http://www.fidelity.com, http://www.institutional.fidelity.com, or http://www.401k.com, as applicable.
NOT FDIC INSURED •MAY LOSE VALUE •NO BANK GUARANTEE
Neither the Fund nor Fidelity Distributors Corporation is a bank.
Item 7: Financial Statements and Financial Highlights for Open-End Management Investment Companies (Annual Report)
VIP Investment Grade Bond II Portfolio
Schedule of Investments December 31, 2024
Showing Percentage of Net Assets
| Asset-Backed Securities - 8.8% |
| | | Principal Amount (a) | Value ($) |
| BAILIWICK OF JERSEY - 0.3% | | | |
| Aimco Clo 22 Ltd / Aimco Clo 22 LLC Series 2024-22A Class A, CME Term SOFR 3 month Index + 1.5%, 6.1174% 4/19/2037 (b)(c)(d) | | 1,960,000 | 1,975,435 |
| Blueberry Park Clo Ltd Series 2024-1A Class A, CME Term SOFR 3 month Index + 1.35%, 6.4761% 10/20/2037 (b)(c)(d) | | 2,642,000 | 2,660,787 |
| Dryden 108 Clo Ltd / Dryden 108 Clo LLC Series 2024-108A Class A1R, CME Term SOFR 3 month Index + 1.36%, 5.9924% 7/18/2037 (b)(c)(d) | | 4,174,000 | 4,196,627 |
| Invesco US CLO Ltd Series 2024-3A Class A, CME Term SOFR 3 month Index + 1.51%, 6.8292% 7/20/2037 (b)(c)(d) | | 1,884,000 | 1,895,798 |
TOTAL BAILIWICK OF JERSEY | | | 10,728,647 |
| BERMUDA - 0.2% | | | |
| RRAM Series 2024-24A Class A1A2, CME Term SOFR 3 month Index + 1.31%, 5.6511% 1/15/2037 (b)(c)(d) | | 6,000,000 | 6,001,026 |
| CANADA - 0.0% | | | |
| Chesapeake Funding II LLC Series 2023-2A Class A1, 6.16% 10/15/2035 (d) | | 616,514 | 625,495 |
| GRAND CAYMAN (UK OVERSEAS TER) - 4.9% | | | |
| Aimco CDO Series 2024-10A Class ARR, CME Term SOFR 3 month Index + 1.41%, 6.0416% 7/22/2037 (b)(c)(d) | | 1,348,000 | 1,357,168 |
| Aimco CLO 11 Ltd Series 2024-11A Class A1R2, CME Term SOFR 3 month Index + 1.34%, 5.9875% 7/17/2037 (b)(c)(d) | | 1,526,000 | 1,537,579 |
| Aimco Clo 14 Ltd / Aimco Clo 14 LLC Series 2021-14A Class A, CME Term SOFR 3 month Index + 1.2516%, 5.869% 4/20/2034 (b)(c)(d) | | 2,044,526 | 2,047,482 |
| AIMCO CLO Series 2024-BA Class ARR, CME Term SOFR 3 month Index + 1.5%, 6.1473% 4/16/2037 (b)(c)(d) | | 2,766,000 | 2,783,221 |
| Allegro Clo Ltd Series 2021-1A Class A, CME Term SOFR 3 month Index + 1.4016%, 6.019% 7/20/2034 (b)(c)(d) | | 627,261 | 627,257 |
| Allegro Clo Xii Ltd Series 2024-1A Class A1R, CME Term SOFR 3 month Index + 1.44%, 6.7236% 7/21/2037 (b)(c)(d) | | 3,577,000 | 3,580,788 |
| Ares LIV CLO Ltd Series 2024-54A Class AR, CME Term SOFR 3 month Index + 1.27%, 5.9259% 10/15/2032 (b)(c)(d) | | 2,723,000 | 2,725,826 |
| Ares Lix Clo Ltd Series 2021-59A Class A, CME Term SOFR 3 month Index + 1.2916%, 5.9175% 4/25/2034 (b)(c)(d) | | 425,583 | 426,107 |
| Ares Lv Clo Ltd Series 2024-55A Class A1R2, CME Term SOFR 3 month Index + 1.37%, 6.0259% 10/15/2037 (b)(c)(d) | | 813,000 | 817,258 |
| Ares Lviii Clo Ltd / Ares Lviii Clo LLC Series 2022-58A Class AR, CME Term SOFR 3 month Index + 1.33%, 5.9859% 1/15/2035 (b)(c)(d) | | 1,304,759 | 1,306,222 |
| Ares XLI Clo Ltd Series 2021-41A Class AR2, CME Term SOFR 3 month Index + 1.3316%, 5.9875% 4/15/2034 (b)(c)(d) | | 3,561,718 | 3,565,728 |
| Babson CLO Ltd/Cayman Islands Series 2021-1A Class AR, CME Term SOFR 3 month Index + 1.4116%, 6.0675% 10/15/2036 (b)(c)(d) | | 14,190,185 | 14,210,251 |
| Babson CLO Ltd/Cayman Islands Series 2025-1A Class A1R2, CME Term SOFR 3 month Index + 1.26%, 1.26% 1/15/2038 (b)(c)(d) | | 14,191,000 | 14,191,000 |
| Barings Clo Ltd Series 2024-4A Class A, CME Term SOFR 3 month Index + 1.75%, 6.3674% 1/20/2037 (b)(c)(d) | | 3,356,000 | 3,377,049 |
| Barings Clo Ltd Series 2024-4A Class AR, 6.4518% 10/20/2037 (b)(d) | | 1,352,000 | 1,357,730 |
| Barings Clo Ltd Series 2021-1A Class A, CME Term SOFR 3 month Index + 1.2816%, 5.9075% 4/25/2034 (b)(c)(d) | | 934,550 | 936,626 |
| Beechwood Park Clo Ltd Series 2022-1A Class A1R, CME Term SOFR 3 month Index + 1.3%, 5.9475% 1/17/2035 (b)(c)(d) | | 17,227,148 | 17,261,500 |
| Bristol Park CLO LTD Series 2020-1A Class AR, CME Term SOFR 3 month Index + 1.2516%, 5.9075% 4/15/2029 (b)(c)(d) | | 190,350 | 190,476 |
| Carlyle US CLO Ltd Series 2024-10A Class A1R, CME Term SOFR 3 month Index + 1.31%, 5.6852% 1/20/2038 (b)(c)(d) | | 1,826,000 | 1,826,754 |
| Carlyle US CLO Ltd Series 2024-11A Class A1R, CME Term SOFR 3 month Index + 1.41%, 6.0359% 7/25/2037 (b)(c)(d) | | 3,068,000 | 3,079,892 |
| Cedar Fdg Xii Clo Ltd / Cedar Fdg Xii Clo LLC Series 2021-12A Class A1R, CME Term SOFR 3 month Index + 1.3916%, 6.0175% 10/25/2034 (b)(c)(d) | | 490,758 | 491,424 |
| Cedar Fdg Xvii Clo Ltd Series 2023-17A Class A, CME Term SOFR 3 month Index + 1.85%, 6.4674% 7/20/2036 (b)(c)(d) | | 2,065,000 | 2,072,228 |
| Cedar Funding Ltd Series 2024-10A Class AR2, CME Term SOFR 3 month Index + 1.36%, 5.9069% 10/20/2037 (b)(c)(d) | | 799,000 | 800,389 |
| CEDF Series 2021-6A Class ARR, CME Term SOFR 3 month Index + 1.3116%, 5.929% 4/20/2034 (b)(c)(d) | | 772,931 | 774,305 |
| Columbia Cent Clo 29 Ltd / Columbia Cent Clo 29 Corp Series 2021-29A Class AR, CME Term SOFR 3 month Index + 1.4316%, 6.049% 10/20/2034 (b)(c)(d) | | 795,912 | 796,628 |
| Columbia Cent Clo 31 Ltd Series 2021-31A Class A1, CME Term SOFR 3 month Index + 1.4616%, 6.079% 4/20/2034 (b)(c)(d) | | 853,929 | 855,290 |
| Dryden 58 Clo Ltd / Dryden 58 Clo LLC Series 2018-58A Class A1, CME Term SOFR 3 month Index + 1.2616%, 5.9091% 7/17/2031 (b)(c)(d) | | 695,601 | 695,916 |
| Dryden CLO Ltd Series 2022-98A Class A, CME Term SOFR 3 month Index + 1.3%, 5.9174% 4/20/2035 (b)(c)(d) | | 2,345,807 | 2,351,085 |
| Dryden CLO Ltd Series 2024-83A Class AR, CME Term SOFR 3 month Index + 1.53%, 6.1624% 4/18/2037 (b)(c)(d) | | 2,387,000 | 2,401,503 |
| Dryden CLO Ltd Series 2024-85A Class A1R2, CME Term SOFR 3 month Index + 1.38%, 6.0359% 7/15/2037 (b)(c)(d) | | 2,435,000 | 2,444,553 |
| Dryden Senior Loan Fund Series 2021-90A Class A1A, CME Term SOFR 3 month Index + 1.3916%, 5.9126% 2/20/2035 (b)(c)(d) | | 1,574,048 | 1,574,339 |
| Dryden Senior Loan Fund Series 2024-78A Class A1R, CME Term SOFR 3 month Index + 1.53%, 6.1775% 4/17/2037 (b)(c)(d) | | 600,000 | 602,842 |
| Eaton Vance CLO Ltd Series 2024-1A Class ARR, CME Term SOFR 3 month Index + 1.39%, 6.0459% 10/15/2037 (b)(c)(d) | | 2,398,000 | 2,402,192 |
| Eaton Vance CLO Ltd Series 2024-2A Class AR2, CME Term SOFR 3 month Index + 1.38%, 6.0359% 10/15/2037 (b)(c)(d) | | 1,958,000 | 1,961,299 |
| Flatiron Clo Ltd Series 2024-1A Class A1R, CME Term SOFR 3 month Index + 1.36%, 5.9774% 10/19/2037 (b)(c)(d) | | 2,033,000 | 2,044,053 |
| Flatiron Clo Ltd Series 2021-1A Class AR, CME Term SOFR 3 month Index + 1.3416%, 5.827% 11/16/2034 (b)(c)(d) | | 521,255 | 522,351 |
| Horizon Aircraft Finance Ltd Series 2019-1 Class A, 3.721% 7/15/2039 (d) | | 199,514 | 189,536 |
| Invesco Clo Ltd Series 2021-3A Class A, CME Term SOFR 3 month Index + 1.3916%, 6.0232% 10/22/2034 (b)(c)(d) | | 560,077 | 561,266 |
| Invesco US CLO Series 2024-1RA Class AR, CME Term SOFR 3 month Index + 1.55%, 6.2059% 4/15/2037 (b)(c)(d) | | 1,500,000 | 1,511,751 |
| Kkr Clo 41 Ltd Series 2022-41A Class A1, CME Term SOFR 3 month Index + 1.33%, 5.9773% 4/15/2035 (b)(c)(d) | | 1,298,569 | 1,299,988 |
| Madison Park Funding 2015 Series 2024-19A Class AR3, CME Term SOFR 3 month Index + 1.6%, 6.2316% 1/22/2037 (b)(c)(d) | | 410,000 | 412,566 |
| Madison Pk Fdg L Ltd / Madison Pk Fdg L LLC Series 2021-50A Class A, CME Term SOFR 3 month Index + 1.4016%, 6.019% 4/19/2034 (b)(c)(d) | | 1,795,369 | 1,798,529 |
| Madison Pk Fdg Lii Ltd / Madison Pk Fdg Lii LLC Series 2021-52A Class A, CME Term SOFR 3 month Index + 1.3616%, 5.9932% 1/22/2035 (b)(c)(d) | | 910,439 | 912,338 |
| Madison Pk Fdg Lxvii Ltd / Madison Pk Fdg Lxvii LLC Series 2024-67A Class A1, CME Term SOFR 3 month Index + 1.51%, 6.1359% 4/25/2037 (b)(c)(d) | | 2,755,000 | 2,775,412 |
| Madison Pk Fdg Xlv Ltd / Madison Pk Fdg Xlv LLC Series 2024-45A Class ARR, CME Term SOFR 3 month Index + 1.08%, 5.4618% 7/15/2034 (b)(c)(d) | | 1,248,118 | 1,248,333 |
| Magnetite CLO LTD Series 2023-36A Class A, CME Term SOFR 3 month Index + 1.8%, 6.4316% 4/22/2036 (b)(c)(d) | | 1,441,000 | 1,446,425 |
| Magnetite CLO Ltd Series 2024-30A Class AR, CME Term SOFR 3 month Index + 1.35%, 6.1433% 10/25/2037 (b)(c)(d) | | 965,191 | 969,972 |
| Magnetite Xli Ltd Series 2024-41A Class A, CME Term SOFR 3 month Index + 1.29%, 5.603% 1/25/2038 (b)(c)(d) | | 1,475,000 | 1,475,252 |
| Magnetite XXI Ltd Series 2021-21A Class AR, CME Term SOFR 3 month Index + 1.2816%, 5.899% 4/20/2034 (b)(c)(d) | | 746,434 | 748,305 |
| Magnetite Xxix Ltd / Magnetite Xxix LLC Series 2024-29A Class AR, CME Term SOFR 3 month Index + 1.35%, 6.5917% 7/15/2037 (b)(c)(d) | | 1,119,000 | 1,120,966 |
| Magnetite Xxviii Ltd Series 2025-28A Class A1RR, CME Term SOFR 3 month Index + 1.24%, 1.24% 1/15/2038 (b)(c)(d) | | 2,414,000 | 2,414,000 |
| Milos CLO Ltd Series 2020-1A Class AR, CME Term SOFR 3 month Index + 1.3316%, 5.949% 10/20/2030 (b)(c)(d) | | 1,125,733 | 1,126,992 |
| Neuberger Berman Loan Advisers Clo 25 Ltd Series 2024-25A Class AR2, CME Term SOFR 3 month Index + 1.4%, 6.0324% 7/18/2038 (b)(c)(d) | | 2,320,000 | 2,332,296 |
| Oak Hill Credit Partners Series 2024-13A Class AR, CME Term SOFR 3 month Index + 1.35%, 5.9674% 7/20/2037 (b)(c)(d) | | 3,898,000 | 3,920,125 |
| Oha Cr Fdg 4 Ltd / Oha Cr Fdg 4 LLC Series 2024-4A Class AR2, CME Term SOFR 3 month Index + 1.29%, 6.3132% 1/22/2038 (b)(c)(d) | | 2,694,000 | 2,694,458 |
| OHA Credit Funding 6 Ltd Series 2024-6A Class AR2, CME Term SOFR 3 month Index + 1.33%, 5.9218% 10/20/2037 (b)(c)(d) | | 2,146,000 | 2,150,129 |
| OHA Credit Partners Ltd Series 2024-18A Class A1, CME Term SOFR 3 month Index + 1.5%, 6.1174% 4/20/2037 (b)(c)(d) | | 1,960,000 | 1,962,844 |
| OHA Credit Partners XVII Ltd Series 2024-17A Class A, CME Term SOFR 3 month Index + 1.32%, 5.7215% 1/18/2038 (b)(c)(d) | | 920,000 | 920,235 |
| Palmer Square Loan Funding Ltd Series 2024-2A Class A1N, CME Term SOFR 3 month Index + 1%, 5.45% 1/15/2033 (b)(c)(d) | | 1,431,000 | 1,432,933 |
| Peace Park Clo Ltd Series 2021-1A Class A, CME Term SOFR 3 month Index + 1.3916%, 6.009% 10/20/2034 (b)(c)(d) | | 1,605,558 | 1,607,775 |
| Project Silver Series 2019-1 Class A, 3.967% 7/15/2044 (d) | | 434,198 | 407,200 |
| Rockland Park Clo Ltd Series 2021-1A Class A, CME Term SOFR 3 month Index + 1.3816%, 5.999% 4/20/2034 (b)(c)(d) | | 4,536,406 | 4,542,821 |
| Rr 34 Ltd Series 2024-34RA Class A1R, CME Term SOFR 3 month Index + 1.35%, 5.9123% 10/15/2039 (b)(c)(d) | | 1,175,000 | 1,177,036 |
| Rr 7 Ltd Series 2022-7A Class A1AB, CME Term SOFR 3 month Index + 1.34%, 5.9959% 1/15/2037 (b)(c)(d) | | 1,078,307 | 1,080,606 |
| SYMP Series 2022-32A Class A1, CME Term SOFR 3 month Index + 1.32%, 5.9463% 4/23/2035 (b)(c)(d) | | 4,851,802 | 4,858,217 |
| Symphony Clo 43 Ltd Series 2024-43A Class A1, CME Term SOFR 3 month Index + 1.52%, 6.1759% 4/15/2037 (b)(c)(d) | | 1,901,000 | 1,909,695 |
| Symphony Clo Xxvi Ltd / Symphony Clo Xxvi LLC Series 2021-26A Class AR, CME Term SOFR 3 month Index + 1.3416%, 5.959% 4/20/2033 (b)(c)(d) | | 784,771 | 785,613 |
| Thunderbolt Aircraft Lease Series 2018-A Class A, 4.147% 9/15/2038 (b)(d) | | 421,374 | 405,229 |
| Thunderbolt III Aircraft Lease Ltd Series 2019-1 Class A, 3.671% 11/15/2039 (d) | | 529,528 | 503,072 |
| Voya CLO Ltd Series 2023-1A Class A1, CME Term SOFR 3 month Index + 1.8%, 6.4174% 1/20/2037 (b)(c)(d) | | 2,577,000 | 2,598,376 |
| Voya Clo Ltd Series 2024-1A Class A1, CME Term SOFR 3 month Index + 1.52%, 6.1759% 4/15/2037 (b)(c)(d) | | 900,000 | 904,499 |
| Voya CLO Ltd/Voya CLO LLC Series 2021-2A Class A1R, CME Term SOFR 3 month Index + 1.4216%, 6.039% 7/19/2034 (b)(c)(d) | | 265,906 | 265,906 |
| Voya CLO Ltd/Voya CLO LLC Series 2021-3A Class AR, CME Term SOFR 3 month Index + 1.4116%, 6.029% 10/20/2034 (b)(c)(d) | | 1,070,174 | 1,071,492 |
| Voya CLO Ltd/Voya CLO LLC Series 2025-2A Class A1RR, CME Term SOFR 3 month Index + 1.31%, 1.31% 1/20/2038 (b)(c)(d) | | 266,000 | 266,047 |
TOTAL GRAND CAYMAN (UK OVERSEAS TER) | | | 157,804,546 |
| IRELAND - 0.0% | | | |
| Volofin Finance Designated Activity Co Series 2024-1A Class A, 5.935% 6/15/2037 (d) | | 1,249,936 | 1,252,235 |
| MULTI-NATIONAL - 0.2% | | | |
| Aimco Clo 21 Ltd / Aimco Clo 21 LLC Series 2024-21A Class A1, CME Term SOFR 3 month Index + 1.5%, 6.1324% 4/18/2037 (b)(c)(d) | | 1,864,000 | 1,878,405 |
| Allegro Clo Xv Ltd / Allegro Clo Vx LLC Series 2022-1A Class A, CME Term SOFR 3 month Index + 1.5%, 6.1174% 7/20/2035 (b)(c)(d) | | 667,851 | 668,427 |
| Ares Ln Fdg V Ltd / Ares Ln Fdg V LLC Series 2024-ALF5A Class A1, CME Term SOFR 3 month Index + 1.5%, 6.8235% 7/27/2037 (b)(c)(d) | | 2,450,000 | 2,459,499 |
TOTAL MULTI-NATIONAL | | | 5,006,331 |
| UNITED STATES - 3.2% | | | |
| Aaset 2024-1 US Ltd / Aaset 2024-1 Intl Ltd Series 2024-1A Class A1, 6.261% 5/16/2049 (d) | | 1,752,684 | 1,765,071 |
| Aaset 2024-1 US Ltd / Aaset 2024-1 Intl Ltd Series 2024-1A Class A2, 6.261% 5/16/2049 (d) | | 1,595,554 | 1,606,829 |
| AASET Trust Series 2018-1A Class A, 3.844% 1/16/2038 (d) | | 246,670 | 186,851 |
| AASET Trust Series 2019-1 Class A, 3.844% 5/15/2039 (d) | | 22,369 | 21,700 |
| AASET Trust Series 2019-2 Class A, 3.376% 10/16/2039 (d) | | 398,139 | 382,242 |
| AASET Trust Series 2021-1A Class A, 2.95% 11/16/2041 (d) | | 439,603 | 410,088 |
| AASET Trust Series 2021-2A Class A, 2.798% 1/15/2047 (d) | | 1,039,709 | 946,152 |
| AASET Trust Series 2022-1A Class A, 6% 5/16/2047 (d) | | 9,506,621 | 9,486,648 |
| Achv Abs Trust Series 2024-3AL Class A, 5.01% 12/26/2031 (d) | | 311,397 | 311,364 |
| Affirm Asset Securitization Trust Series 2024-A Class 1A, 5.61% 2/15/2029 (d) | | 500,000 | 503,601 |
| Affirm Asset Securitization Trust Series 2024-X1 Class A, 6.27% 5/15/2029 (d) | | 484,512 | 486,161 |
| Aimco Clo 17 Ltd / Aimco Clo 17 LLC Series 2024-17A Class A1R, CME Term SOFR 3 month Index + 1.35%, 5.9816% 7/20/2037 (b)(c)(d) | | 2,320,000 | 2,340,875 |
| Aimco Clo 19 Ltd / Aimco Clo 19 LLC Series 2024-19A Class A, CME Term SOFR 3 month Index + 1.35%, 5.9123% 10/20/2037 (b)(c)(d) | | 828,000 | 832,048 |
| Ally Auto Receivables Trust Series 2024-1 Class A3, 5.08% 12/15/2028 | | 1,420,000 | 1,430,019 |
| Apollo Aviation Securitization Equity Trust Series 2020-1A Class A, 3.351% 1/16/2040 (d) | | 128,179 | 123,056 |
| BETHP Series 2021-1A Class A, CME Term SOFR 3 month Index + 1.3916%, 6.0475% 1/15/2035 (b)(c)(d) | | 799,679 | 801,249 |
| Blackbird Cap II Aircraft Lease Ltd / Blackbird Cap II Aircraft Lease Us L Series 2021-1A Class A, 2.443% 7/15/2046 (d) | | 804,584 | 734,201 |
| Blackbird Capital Aircraft Lease Securitization Ltd Series 2016-1A Class A, 6.5% 12/16/2041 (d)(e) | | 400,644 | 399,826 |
| Bofa Auto Trust Series 2024-1A Class A3, 5.35% 11/15/2028 (d) | | 562,000 | 568,918 |
| Capital One Multi-Asset Execution Trust Series 2019-A3 Class A3, 2.06% 8/15/2028 | | 283,000 | 272,263 |
| CarMax Auto Owner Trust Series 2023-4 Class A3, 6% 7/17/2028 | | 1,353,000 | 1,377,270 |
| CarMax Auto Owner Trust Series 2024-2 Class A3, 5.5% 1/16/2029 | | 1,011,000 | 1,027,112 |
| Castlelake Aircraft Securitization Series 2018-1 Class A, 4.125% 6/15/2043 (d) | | 128,358 | 121,940 |
| Castlelake Aircraft Securitization Trust Series 2019-1A Class A, 3.967% 4/15/2039 (d) | | 418,201 | 384,772 |
| Castlelake Aircraft Securitization Trust Series 2019-1A Class B, 5.095% 4/15/2039 (d) | | 272,765 | 193,696 |
| Castlelake Aircraft Structured Trust Series 2021-1A Class A, 3.474% 1/15/2046 (d) | | 95,330 | 91,602 |
| Cedar Funding Ltd Series 2022-15A Class A, CME Term SOFR 3 month Index + 1.32%, 5.9374% 4/20/2035 (b)(c)(d) | | 3,994,984 | 3,996,390 |
| CFMT LLC Series 2023-HB12 Class A, 4.25% 4/25/2033 (d) | | 541,151 | 535,841 |
| Chase Auto Owner Trust Series 2024-1A Class A3, 5.13% 5/25/2029 (d) | | 900,000 | 906,825 |
| Citibank Credit Card Issuance Trust Series 2018-A7 Class A7, 3.96% 10/13/2030 | | 442,000 | 431,028 |
| Citizens Auto Receivables Trust Series 2024-2 Class A3, 5.33% 8/15/2028 (d) | | 700,000 | 707,598 |
| Cnh Equipment Trust Series 2023-A Class A2, 5.34% 9/15/2026 | | 203,415 | 203,584 |
| DB Master Finance LLC Series 2017-1A Class A2II, 4.03% 11/20/2047 (d) | | 705,903 | 684,660 |
| DLLAA Series 2023-1A Class A2, 5.93% 7/20/2026 (d) | | 230,096 | 230,991 |
| DLLAA Series 2023-1A Class A3, 5.64% 2/22/2028 (d) | | 597,000 | 605,930 |
| DLLAD Series 2023-1A Class A3, 4.79% 1/20/2028 (d) | | 600,000 | 601,314 |
| DLLAD Series 2024-1A Class A3, 5.3% 7/20/2029 (d) | | 444,000 | 449,851 |
| Dllmt 2024-1 LLC Series 2024-1A Class A3, 4.84% 8/21/2028 (d) | | 1,700,000 | 1,704,159 |
| Domino's Pizza Master Issuer LLC Series 2018-1A Class A2II, 4.328% 7/25/2048 (d) | | 1,895,000 | 1,851,723 |
| Eaton Vance CLO Ltd Series 2024-1A Class AR2, CME Term SOFR 3 month Index + 1.51%, 6.1659% 7/15/2037 (b)(c)(d) | | 2,449,000 | 2,452,887 |
| Enterprise Fleet Financing LLC Series 2023-3 Class A2, 6.4% 3/20/2030 (d) | | 1,756,097 | 1,789,202 |
| Enterprise Fleet Financing Series 2024-2 Class A2, 5.74% 12/20/2026 (d) | | 800,000 | 806,749 |
| Enterprise Fleet Financing Series 2024-2 Class A3, 5.61% 4/20/2028 (d) | | 800,000 | 813,773 |
| Flatiron Clo 26 Ltd / Flatiron Clo 26 LLC Series 2024-4A Class A, CME Term SOFR 3 month Index + 1.33%, 5.7719% 1/15/2038 (b)(c)(d) | | 2,270,000 | 2,273,005 |
| Ford Credit Floorplan Master Owner Trust A Series 2023-1 Class A1, 4.92% 5/15/2028 (d) | | 1,700,000 | 1,708,098 |
| GM Financial Consumer Automobile Receivables Trust Series 2023-3 Class A3, 5.45% 6/16/2028 | | 1,245,000 | 1,258,436 |
| Gm Financial Leasing Trust Series 2023-3 Class A3, 5.38% 11/20/2026 | | 620,000 | 623,245 |
| GMF Floorplan Owner Revolving Trust Series 2023-1 Class A1, 5.34% 6/15/2028 (d) | | 1,600,000 | 1,617,978 |
| GMF Floorplan Owner Revolving Trust Series 2024-4A Class A1, 4.73% 11/15/2029 (d) | | 1,860,000 | 1,860,870 |
| Hamlin Pk Clo Ltd / Hamlin Pk Clo LLC Series 2024-1A Class A, CME Term SOFR 3 month Index + 1.34%, 5.9013% 10/20/2037 (b)(c)(d) | | 2,323,000 | 2,338,973 |
| Honda Auto Receivables 2023-3 Owner Tr Series 2023-3 Class A3, 5.41% 2/18/2028 | | 700,000 | 706,975 |
| Horizon Aircraft Finance I Limited Series 2018-1 Class A, 4.458% 12/15/2038 (d) | | 231,972 | 222,692 |
| Jersey Mike's Funding Series 2024-1A Class A2, 5.636% 2/15/2055 (d) | | 1,995,000 | 1,970,099 |
| Kubota Credit Owner Trust Series 2024-2A Class A3, 5.26% 11/15/2028 (d) | | 1,000,000 | 1,013,464 |
| Marlette Funding Trust Series 2024-1A Class A, 5.95% 7/17/2034 (d) | | 284,621 | 285,905 |
| Mercedes-Benz Auto Lease Trust Series 2024-A Class A3, 5.32% 1/18/2028 | | 1,600,000 | 1,618,931 |
| Mercedes-Benz Auto Lease Trust Series 2024-B Class A3, 4.23% 2/15/2028 | | 1,000,000 | 995,411 |
| Merchants Fleet Funding LLC Series 2023-1A Class A, 7.21% 5/20/2036 (d) | | 833,945 | 844,039 |
| Merchants Fleet Funding LLC Series 2024-1A Class A, 5.82% 4/20/2037 (d) | | 1,200,000 | 1,211,702 |
| OWN Equipment Fund I LLC Series 2024-2M Class A, 5.7% 12/20/2032 (d) | | 800,000 | 800,641 |
| Park Place Securities Inc Asset-Backed Pass-Through Certificates Series 2005-WCH1 Class M4, CME Term SOFR 1 month Index + 1.3595%, 5.6982% 1/25/2036 (b)(c) | | 3,869 | 3,843 |
| Pk Alift Loan Funding 3 LP Series 2024-1 Class A1, 5.842% 9/15/2039 (d) | | 498,840 | 501,370 |
| Planet Fitness Master Issuer LLC Series 2019-1A Class A2, 3.858% 12/5/2049 (d) | | 578,550 | 532,072 |
| Planet Fitness Master Issuer LLC Series 2022-1A Class A2I, 3.251% 12/5/2051 (d) | | 634,070 | 609,267 |
| Planet Fitness Master Issuer LLC Series 2022-1A Class A2II, 4.008% 12/5/2051 (d) | | 566,968 | 513,596 |
| SAPPHIRE AVIATION FINANCE Series 2020-1A Class A, 3.228% 3/15/2040 (d) | | 446,563 | 419,783 |
| SBA Tower Trust Series 2019, 2.836% 1/15/2050 (d) | | 779,000 | 778,202 |
| SBA Tower Trust Series 2020, 1.884% 7/15/2050 (d) | | 300,000 | 290,680 |
| SBA Tower Trust Series 2020, 2.328% 7/15/2052 (d) | | 229,000 | 208,863 |
| Sbna Auto Lease Trust Series 2024-B Class A3, 5.56% 11/22/2027 (d) | | 1,200,000 | 1,214,915 |
| SBNA Auto Lease Trust Series 2024-C Class A3, 4.56% 2/22/2028 (d) | | 1,100,000 | 1,099,525 |
| SFS Auto Receivables Securitization Trust Series 2023-1A Class A2A, 5.89% 3/22/2027 (d) | | 236,919 | 237,456 |
| Sfs Auto Receivables Securitization Trust Series 2024-2A Class A3, 5.33% 11/20/2029 (d) | | 840,000 | 848,235 |
| Subway Funding LLC 2024-1X Series 2024-1A Class A23, 6.505% 7/30/2054 (d) | | 2,103,000 | 2,158,461 |
| Subway Funding LLC 2024-1X Series 2024-3A Class A2I, 5.246% 7/30/2054 (d) | | 3,026,000 | 2,946,251 |
| Subway Funding LLC Series 2024-1A Class A2I, 6.028% 7/30/2054 (d) | | 4,033,000 | 4,081,689 |
| Subway Funding LLC Series 2024-1A Class A2II, 6.268% 7/30/2054 (d) | | 2,398,000 | 2,439,314 |
| Subway Funding LLC Series 2024-3A Class A23, 5.914% 7/30/2054 (d) | | 2,902,000 | 2,833,891 |
| Subway Funding LLC Series 2024-3A Class A2II, 5.566% 7/30/2054 (d) | | 1,431,000 | 1,390,405 |
| Terwin Mortgage Trust Series 2003-4HE Class A1, CME Term SOFR 1 month Index + 0.9745%, 5.3132% 9/25/2034 (b)(c) | | 836 | 856 |
| Tesla Auto Lease Trust 23-A Series 2023-A Class A3, 5.89% 6/22/2026 (d) | | 1,388,276 | 1,393,149 |
| Tesla Auto Lease Trust Series 2023-B Class A3, 6.13% 9/21/2026 (d) | | 1,200,000 | 1,208,214 |
| Tesla Series 2024-A Class A2A, 5.37% 6/22/2026 (d) | | 371,365 | 372,130 |
| Toyota Auto Receivables 2022-C Owner Tr Series 2022-C Class A3, 3.76% 4/15/2027 | | 2,305,139 | 2,297,198 |
| Toyota Lease Owner Trust Series 2023-A Class A3, 4.93% 4/20/2026 (d) | | 1,070,411 | 1,071,493 |
| Upgrade Receivables Trust Series 2024-1A Class A, 5.37% 2/18/2031 (d) | | 300,000 | 300,363 |
| USAA Auto Owner Trust Series 2024-A Class A3, 5.03% 3/15/2029 (d) | | 900,000 | 906,981 |
| Wheels Fleet Lease Funding 1 LLC Series 2024-2A Class A1, 4.87% 6/21/2039 (d) | | 2,261,000 | 2,263,788 |
| Willis Engine Structured Tr VII Series 2023-A Class A, 8% 10/15/2048 (d) | | 1,042,990 | 1,078,307 |
| World Omni Auto Receivables Trust 2023-B Series 2023-B Class A3, 4.66% 5/15/2028 | | 1,572,000 | 1,573,741 |
| World Omni Auto Receivables Trust 2023-C Series 2023-C Class A3, 5.15% 11/15/2028 | | 762,000 | 767,420 |
| World Omni Automobile Lease Securitization Trst Series 2023-A Class A2A, 5.47% 11/17/2025 | | 5,690 | 5,690 |
TOTAL UNITED STATES | | | 103,275,671 |
| TOTAL ASSET-BACKED SECURITIES (Cost $281,557,504) | | | 284,693,951 |
| | | | |
| Bank Notes - 0.1% |
| | | Principal Amount (a) | Value ($) |
| UNITED STATES - 0.1% | | | |
| Financials - 0.1% | | | |
| Banks - 0.1% | | | |
| Citizens Bank NA/Providence RI 2.25% 4/28/2025 | | 359,000 | 356,036 |
| Citizens Bank NA/Providence RI 3.75% 2/18/2026 | | 370,000 | 365,317 |
| Discover Bank 3.45% 7/27/2026 | | 350,000 | 342,141 |
| Discover Bank USD SOFR Spread-Adj ICE Swap Rate 5Y + 1.73%, 5.974% 8/9/2028 (b)(c) | | 347,000 | 353,369 |
| Regions Bank/Birmingham AL 6.45% 6/26/2037 | | 969,000 | 987,830 |
| | | | |
| TOTAL BANK NOTES (Cost $2,540,059) | | | 2,404,693 |
| | | | |
| Collateralized Mortgage Obligations - 1.2% |
| | | Principal Amount (a) | Value ($) |
| UNITED STATES - 1.2% | | | |
| Binom Securitization Trust Series 2022-RPL1 Class A1, 3% 2/25/2061 (d) | | 531,652 | 483,412 |
| Bravo Residential Funding Trust Series 2022-RPL1 Class A1, 2.75% 9/25/2061 (d) | | 870,636 | 782,246 |
| Bravo Residential Funding Trust Series 2023-RPL1 Class A1, 5% 5/25/2063 (d) | | 1,385,938 | 1,361,515 |
| CFMT LLC Series 2022-HB10 Class A, 3.25% 11/25/2035 (d) | | 253,654 | 251,077 |
| CFMT LLC Series 2022-HB8 Class A, 3.75% 4/25/2025 (d) | | 1,147,146 | 1,140,149 |
| CFMT LLC Series 2024-HB13 Class A, 3% 5/25/2034 (b)(d) | | 719,615 | 702,440 |
| CFMT LLC Series 2024-HB15 Class A, 4% 8/25/2034 (b)(d) | | 543,260 | 535,372 |
| Fannie Mae Guaranteed REMICS Series 2020-51 Class BA, 2% 6/25/2046 | | 721,338 | 625,785 |
| Fannie Mae Guaranteed REMICS Series 2021-21 Class HG, 2% 11/25/2047 | | 285,132 | 249,525 |
| Fannie Mae Guaranteed REMICS Series 2021-45 Class DA, 3% 7/25/2051 | | 459,198 | 393,763 |
| Fannie Mae Guaranteed REMICS Series 2021-59 Class H, 2% 6/25/2048 | | 83,387 | 67,228 |
| Fannie Mae Guaranteed REMICS Series 2021-66 Class DA, 2% 1/25/2048 | | 88,266 | 71,707 |
| Fannie Mae Guaranteed REMICS Series 2021-66 Class DM, 2% 1/25/2048 | | 93,802 | 76,205 |
| Fannie Mae Guaranteed REMICS Series 2021-85 Class L, 2.5% 8/25/2048 | | 77,287 | 66,313 |
| Fannie Mae Guaranteed REMICS Series 2021-95 Class BA, 2.5% 6/25/2049 | | 895,091 | 763,996 |
| Fannie Mae Guaranteed REMICS Series 2021-95, 2.5% 9/25/2048 | | 586,163 | 504,100 |
| Fannie Mae Guaranteed REMICS Series 2021-96 Class AH, 2.5% 3/25/2049 | | 1,279,025 | 1,100,635 |
| Fannie Mae Guaranteed REMICS Series 2021-96 Class HA, 2.5% 2/25/2050 | | 126,335 | 107,186 |
| Fannie Mae Guaranteed REMICS Series 2022-1 Class KA, 3% 5/25/2048 | | 298,338 | 267,702 |
| Fannie Mae Guaranteed REMICS Series 2022-11 Class B, 3% 6/25/2049 | | 359,543 | 322,535 |
| Fannie Mae Guaranteed REMICS Series 2022-13 Class HA, 3% 8/25/2046 | | 473,029 | 434,591 |
| Fannie Mae Guaranteed REMICS Series 2022-13 Class MA, 3% 5/25/2044 | | 1,176,214 | 1,101,988 |
| Fannie Mae Guaranteed REMICS Series 2022-2 Class TH, 2.5% 2/25/2052 | | 143,308 | 127,866 |
| Fannie Mae Guaranteed REMICS Series 2022-20 Class HC, 2.5% 4/25/2052 | | 1,744,214 | 1,539,930 |
| Fannie Mae Guaranteed REMICS Series 2022-25 Class AB, 4% 9/25/2047 | | 442,610 | 424,236 |
| Fannie Mae Guaranteed REMICS Series 2022-3 Class D, 2% 2/25/2048 | | 820,007 | 711,416 |
| Fannie Mae Guaranteed REMICS Series 2022-3 Class N, 2% 10/25/2047 | | 2,402,023 | 2,060,040 |
| Fannie Mae Guaranteed REMICS Series 2022-4 Class B, 2.5% 5/25/2049 | | 91,756 | 78,480 |
| Fannie Mae Guaranteed REMICS Series 2022-42 Class BA, 4% 6/25/2050 | | 940,353 | 887,765 |
| Fannie Mae Guaranteed REMICS Series 2022-49 Class TC, 4% 12/25/2048 | | 264,680 | 252,998 |
| Fannie Mae Guaranteed REMICS Series 2022-5 Class BA, 2.5% 12/25/2049 | | 342,249 | 284,988 |
| Fannie Mae Guaranteed REMICS Series 2022-5 Class DA, 2.25% 11/25/2047 | | 985,811 | 856,306 |
| Fannie Mae Guaranteed REMICS Series 2022-7 Class A, 3% 5/25/2048 | | 424,116 | 380,624 |
| Fannie Mae Guaranteed REMICS Series 2022-7 Class E, 2.5% 11/25/2047 | | 861,628 | 757,164 |
| Fannie Mae Mortgage pass-thru certificates Series 1999-57 Class PH, 6.5% 12/25/2029 | | 4,579 | 4,675 |
| Fannie Mae Series 2022-30 Class E, 4.5% 7/25/2048 | | 848,524 | 821,095 |
| Freddie Mac Multiclass Mortgage participation certificates Series 2021-5159 Class EA, 2.5% 8/25/2048 | | 252,587 | 216,729 |
| Freddie Mac Multiclass Mortgage participation certificates Series 2021-5159 Class GC, 2% 11/25/2047 | | 72,617 | 62,092 |
| Freddie Mac Multiclass Mortgage participation certificates Series 2021-5164 Class M, 2.5% 7/25/2048 | | 257,938 | 221,587 |
| Freddie Mac Multifamily Structured pass-thru certificates Series 2020-5018 Class LC, 3% 10/25/2040 | | 197,609 | 175,300 |
| Freddie Mac Multifamily Structured pass-thru certificates Series 2021-5083 Class VA, 1% 8/15/2038 | | 716,287 | 677,014 |
| Freddie Mac Multifamily Structured pass-thru certificates Series 2021-5169 Class TP, 2.5% 6/25/2049 | | 256,037 | 218,165 |
| Freddie Mac Multifamily Structured pass-thru certificates Series 2021-5175 Class CB, 2.5% 4/25/2050 | | 453,717 | 383,705 |
| Freddie Mac Multifamily Structured pass-thru certificates Series 2021-5180 Class KA, 2.5% 10/25/2047 | | 90,772 | 79,499 |
| Freddie Mac Multifamily Structured pass-thru certificates Series 2021-5182 Class A, 2.5% 10/25/2048 | | 602,329 | 517,824 |
| Freddie Mac Multifamily Structured pass-thru certificates Series 2022-5189 Class DA, 2.5% 5/25/2049 | | 236,747 | 202,184 |
| Freddie Mac Multifamily Structured pass-thru certificates Series 2022-5189 Class TP, 2.5% 5/25/2049 | | 214,137 | 182,874 |
| Freddie Mac Multifamily Structured pass-thru certificates Series 2022-5190 Class BA, 2.5% 11/25/2047 | | 221,315 | 193,689 |
| Freddie Mac Multifamily Structured pass-thru certificates Series 2022-5190 Class CA, 2.5% 5/25/2049 | | 179,025 | 152,825 |
| Freddie Mac Multifamily Structured pass-thru certificates Series 2022-5191 Class CA, 2.5% 4/25/2050 | | 106,707 | 89,742 |
| Freddie Mac Multifamily Structured pass-thru certificates Series 2022-5197 Class A, 2.5% 6/25/2049 | | 179,025 | 152,825 |
| Freddie Mac Multifamily Structured pass-thru certificates Series 2022-5197 Class DA, 2.5% 11/25/2047 | | 167,964 | 147,138 |
| Freddie Mac Multifamily Structured pass-thru certificates Series 2022-5198 Class BA, 2.5% 11/25/2047 | | 814,248 | 717,097 |
| Freddie Mac Multifamily Structured pass-thru certificates Series 2022-5202 Class AG, 3% 1/25/2049 | | 129,558 | 115,774 |
| Freddie Mac Multifamily Structured pass-thru certificates Series 2022-5202 Class LB, 2.5% 10/25/2047 | | 180,328 | 158,207 |
| Freddie Mac Multifamily Structured pass-thru certificates Series 2022-5202 Class UA, 3% 4/25/2050 | | 297,745 | 261,848 |
| Freddie Mac Multifamily Structured pass-thru certificates Series 2022-5207 Class PA, 3% 6/25/2051 | | 3,317,340 | 2,893,190 |
| Freddie Mac Multifamily Structured pass-thru certificates Series 2022-5210 Class AB, 3% 1/25/2042 | | 461,522 | 421,011 |
| GS Mortgage-Backed Securities Trust Series 2024-RPL2 Class A1, 3.75% 7/25/2061 (d) | | 368,236 | 353,310 |
| MFA Trust Series 2022-RPL1 Class A1, 3.3% 8/25/2061 (d) | | 2,635,841 | 2,428,712 |
| MFRA Trust Series 2024-RPL1 Class A1, 4.25% 2/25/2066 (b)(d) | | 385,044 | 354,399 |
| NYMT Loan Trust Series 2021-CP1 Class A1, 2.0424% 7/25/2061 (d) | | 277,467 | 252,980 |
| NYMT Loan Trust Series 2024-CP1 Class A1, 3.75% 2/25/2068 (d) | | 457,777 | 418,712 |
| Ocwen Loan Investment Trust Series 2023-HB1 Class A, 3% 6/25/2036 (d) | | 161,468 | 158,912 |
| Ocwen Loan Investment Trust Series 2024-HB1 Class A, 3% 2/25/2037 (d) | | 155,497 | 150,602 |
| PRPM LLC Series 2024-RCF3 Class A1, 4% 5/25/2054 (d) | | 863,721 | 837,843 |
| PRPM LLC Series 2024-RCF4 Class A1, 4% 7/25/2054 (d) | | 264,186 | 255,909 |
| PRPM LLC Series 2024-RPL2 Class A1, 3.5% 5/25/2054 (b)(d) | | 931,492 | 890,307 |
| Towd Point Mortgage Trust Series 2020-1 Class A1, 2.71% 1/25/2060 (d) | | 1,276,751 | 1,205,986 |
| Towd Point Mortgage Trust Series 2022-1 Class A1, 3.75% 7/25/2062 (d) | | 2,800,405 | 2,591,785 |
TOTAL UNITED STATES | | | 38,736,829 |
| TOTAL COLLATERALIZED MORTGAGE OBLIGATIONS (Cost $39,133,787) | | | 38,736,829 |
| | | | |
| Commercial Mortgage Securities - 5.6% |
| | | Principal Amount (a) | Value ($) |
| UNITED STATES - 5.6% | | | |
| Arbor Multifamily Mortgage Securities Trust Series 2021-MF2 Class ASB, 2.2446% 6/15/2054 (d) | | 600,000 | 542,075 |
| BAMLL Commercial Mortgage Securities Trust Series 2019-BPR Class ANM, 3.112% 11/5/2032 (d) | | 484,000 | 445,328 |
| BAMLL Commercial Mortgage Securities Trust Series 2019-BPR Class BNM, 3.465% 11/5/2032 (d) | | 109,000 | 92,936 |
| BAMLL Commercial Mortgage Securities Trust Series 2022-DKLX Class A, CME Term SOFR 1 month Index + 1.15%, 5.548% 1/15/2039 (b)(c)(d) | | 450,768 | 449,226 |
| BANK Series 2017-BNK4 Class ASB, 3.419% 5/15/2050 | | 270,581 | 267,182 |
| BANK Series 2018-BN10 Class A5, 3.688% 2/15/2061 | | 48,347 | 46,507 |
| BANK Series 2018-BN14 Class ASB, 4.185% 9/15/2060 | | 264,332 | 261,260 |
| BANK Series 2019-BN19 Class ASB, 3.071% 8/15/2061 | | 607,639 | 582,505 |
| BANK Series 2019-BN21 Class A5, 2.851% 10/17/2052 | | 82,630 | 74,127 |
| BANK Series 2020-BN25 Class A5, 2.649% 1/15/2063 | | 462,410 | 408,648 |
| BANK Series 2020-BN26 Class ASB, 2.313% 3/15/2063 | | 1,100,000 | 1,031,923 |
| BANK Series 2020-BN28 Class A4, 1.844% 3/15/2063 | | 1,148,351 | 961,719 |
| BANK Series 2021-BN33 Class XA, 1.0471% 5/15/2064 (b)(f) | | 11,982,152 | 542,440 |
| BANK Series 2021-BN35 Class A5, 2.285% 6/15/2064 | | 567,169 | 474,901 |
| BANK5 Series 2023-5YR1 Class A2, 5.779% 4/15/2056 | | 800,000 | 813,241 |
| BBCMS Mortgage Trust Series 2021-C11 Class A5, 2.322% 9/15/2054 | | 722,307 | 607,748 |
| BBCMS Mortgage Trust Series 2022-C14 Class ASB, 2.901% 2/15/2055 | | 600,000 | 549,809 |
| BBCMS Mortgage Trust Series 2023-C21 Class A3, 6.2967% 9/15/2056 (b) | | 1,422,000 | 1,487,004 |
| Benchmark Mortgage Trust Series 2018-B4 Class A5, 4.121% 7/15/2051 | | 172,167 | 166,568 |
| Benchmark Mortgage Trust Series 2018-B7 Class A4, 4.51% 5/15/2053 | | 200,000 | 193,965 |
| Benchmark Mortgage Trust Series 2018-B8 Class A5, 4.2317% 1/15/2052 | | 1,180,306 | 1,129,821 |
| Benchmark Mortgage Trust Series 2019-B10 Class A4, 3.717% 3/15/2062 | | 159,609 | 150,940 |
| Benchmark Mortgage Trust Series 2019-B10 Class ASB, 3.615% 3/15/2062 | | 428,454 | 418,770 |
| Benchmark Mortgage Trust Series 2019-B12 Class A5, 3.1156% 8/15/2052 | | 726,144 | 661,560 |
| Benchmark Mortgage Trust Series 2019-B9 Class A5, 4.0156% 3/15/2052 | | 642,936 | 610,899 |
| Benchmark Mortgage Trust Series 2019-B9 Class AAB, 3.9325% 3/15/2052 | | 804,340 | 792,220 |
| Benchmark Mortgage Trust Series 2020-B19 Class A5, 1.85% 9/15/2053 | | 468,749 | 390,202 |
| Benchmark Mortgage Trust Series 2021-B24 Class A5, 2.5843% 3/15/2054 | | 700,621 | 591,962 |
| Benchmark Mortgage Trust Series 2021-B28 Class ASB, 1.9804% 8/15/2054 | | 1,600,000 | 1,422,275 |
| Benchmark Mortgage Trust Series 2023-V3 Class XA, 0.814% 7/15/2056 (b)(f) | | 31,980,870 | 805,611 |
| BLP Commercial Mortgage Trust Series 2024-IND2 Class A, CME Term SOFR 1 month Index + 1.3422%, 5.7392% 3/15/2041 (b)(c)(d) | | 1,256,302 | 1,256,695 |
| BMO Mortgage Trust Series 2023-C6 Class XA, 0.786% 9/15/2056 (b)(f) | | 13,458,058 | 726,977 |
| BMO Mortgage Trust Series 2024-5C5 Class A3, 5.8574% 2/15/2057 | | 300,000 | 307,213 |
| BMP Series 2024-MF23 Class A, CME Term SOFR 1 month Index + 1.3719%, 5.769% 6/15/2041 (b)(c)(d) | | 1,792,000 | 1,798,661 |
| BMP Series 2024-MF23 Class B, CME Term SOFR 1 month Index + 1.6416%, 6.0387% 6/15/2041 (b)(c)(d) | | 885,000 | 886,383 |
| BMP Series 2024-MF23 Class C, CME Term SOFR 1 month Index + 1.8413%, 6.2384% 6/15/2041 (b)(c)(d) | | 626,000 | 626,391 |
| BPR Trust Series 2022-OANA Class A, CME Term SOFR 1 month Index + 1.898%, 6.2951% 4/15/2037 (b)(c)(d) | | 2,835,445 | 2,846,078 |
| BPR Trust Series 2022-OANA Class B, CME Term SOFR 1 month Index + 2.447%, 6.8441% 4/15/2037 (b)(c)(d) | | 841,247 | 844,927 |
| BX Commercial Mortgage Trust Series 2019-IMC Class A, CME Term SOFR 1 month Index + 1.0463%, 5.4433% 4/15/2034 (b)(c)(d) | | 562,789 | 558,662 |
| BX Commercial Mortgage Trust Series 2019-IMC Class B, CME Term SOFR 1 month Index + 1.3463%, 5.7433% 4/15/2034 (b)(c)(d) | | 412,398 | 408,532 |
| BX Commercial Mortgage Trust Series 2019-IMC Class C, CME Term SOFR 1 month Index + 1.6463%, 6.0433% 4/15/2034 (b)(c)(d) | | 272,629 | 269,391 |
| BX Commercial Mortgage Trust Series 2019-IMC Class D, CME Term SOFR 1 month Index + 1.9463%, 6.3433% 4/15/2034 (b)(c)(d) | | 286,192 | 282,436 |
| BX Commercial Mortgage Trust Series 2021-PAC Class A, CME Term SOFR 1 month Index + 0.8036%, 5.2006% 10/15/2036 (b)(c)(d) | | 1,109,960 | 1,104,411 |
| BX Commercial Mortgage Trust Series 2021-PAC Class B, CME Term SOFR 1 month Index + 1.0133%, 5.4103% 10/15/2036 (b)(c)(d) | | 162,246 | 161,029 |
| BX Commercial Mortgage Trust Series 2021-PAC Class C, CME Term SOFR 1 month Index + 1.2131%, 5.6101% 10/15/2036 (b)(c)(d) | | 217,124 | 215,224 |
| BX Commercial Mortgage Trust Series 2021-PAC Class D, CME Term SOFR 1 month Index + 1.4128%, 5.8098% 10/15/2036 (b)(c)(d) | | 210,720 | 208,613 |
| BX Commercial Mortgage Trust Series 2021-PAC Class E, CME Term SOFR 1 month Index + 2.062%, 6.459% 10/15/2036 (b)(c)(d) | | 732,746 | 729,998 |
| BX Commercial Mortgage Trust Series 2022-IND Class A, CME Term SOFR 1 month Index + 1.491%, 5.8881% 4/15/2037 (b)(c)(d) | | 751,917 | 752,857 |
| BX Commercial Mortgage Trust Series 2022-LP2 Class A, CME Term SOFR 1 month Index + 1.0129%, 5.41% 2/15/2039 (b)(c)(d) | | 859,124 | 859,392 |
| BX Commercial Mortgage Trust Series 2022-LP2 Class B, CME Term SOFR 1 month Index + 1.3123%, 5.7094% 2/15/2039 (b)(c)(d) | | 310,649 | 309,485 |
| BX Commercial Mortgage Trust Series 2022-LP2 Class C, CME Term SOFR 1 month Index + 1.5617%, 5.9588% 2/15/2039 (b)(c)(d) | | 310,649 | 309,485 |
| BX Commercial Mortgage Trust Series 2022-LP2 Class D, CME Term SOFR 1 month Index + 1.9608%, 6.3579% 2/15/2039 (b)(c)(d) | | 310,649 | 309,484 |
| BX Commercial Mortgage Trust Series 2023-XL3 Class A, CME Term SOFR 1 month Index + 1.7614%, 6.1585% 12/9/2040 (b)(c)(d) | | 1,471,055 | 1,477,032 |
| BX Commercial Mortgage Trust Series 2023-XL3 Class B, CME Term SOFR 1 month Index + 2.1908%, 6.5879% 12/9/2040 (b)(c)(d) | | 398,153 | 398,526 |
| BX Commercial Mortgage Trust Series 2023-XL3 Class C, CME Term SOFR 1 month Index + 2.6402%, 7.0373% 12/9/2040 (b)(c)(d) | | 176,148 | 176,257 |
| BX Commercial Mortgage Trust Series 2024-GPA3 Class A, CME Term SOFR 1 month Index + 1.2928%, 5.7998% 12/15/2039 (b)(c)(d) | | 893,000 | 893,274 |
| BX Commercial Mortgage Trust Series 2024-MDHS Class A, 6.0384% 5/15/2041 (b)(d) | | 3,147,444 | 3,162,198 |
| BX Commercial Mortgage Trust Series 2024-XL5 Class A, CME Term SOFR 1 month Index + 1.3917%, 5.7887% 3/15/2041 (b)(c)(d) | | 6,375,894 | 6,401,798 |
| BX Trust Series 2021-BXMF Class A, CME Term SOFR 1 month Index + 0.7504%, 5.1474% 10/15/2026 (b)(c)(d) | | 1,939,262 | 1,930,778 |
| BX Trust Series 2021-LBA Class AJV, CME Term SOFR 1 month Index + 0.9145%, 5.3125% 2/15/2036 (b)(c)(d) | | 200,000 | 200,000 |
| BX Trust Series 2021-SOAR Class A, CME Term SOFR 1 month Index + 0.7845%, 5.1825% 6/15/2038 (b)(c)(d) | | 230,582 | 230,294 |
| BX Trust Series 2022-IND Class B, CME Term SOFR 1 month Index + 1.94%, 6.3371% 4/15/2037 (b)(c)(d) | | 383,323 | 383,802 |
| BX Trust Series 2022-IND Class C, CME Term SOFR 1 month Index + 2.29%, 6.6871% 4/15/2037 (b)(c)(d) | | 86,544 | 86,707 |
| BX Trust Series 2022-IND Class D, CME Term SOFR 1 month Index + 2.839%, 7.2361% 4/15/2037 (b)(c)(d) | | 72,468 | 72,603 |
| BX Trust Series 2024-CNYN Class A, CME Term SOFR 1 month Index + 1.4419%, 5.839% 4/15/2041 (b)(c)(d) | | 3,905,421 | 3,915,185 |
| BX Trust Series 2024-CNYN Class B, CME Term SOFR 1 month Index + 1.6915%, 6.0886% 4/15/2041 (b)(c)(d) | | 622,364 | 624,075 |
| BX Trust Series 2024-CNYN Class C, CME Term SOFR 1 month Index + 1.9412%, 6.3383% 4/15/2041 (b)(c)(d) | | 516,319 | 517,286 |
| BX Trust Series 2024-XL4 Class A, CME Term SOFR 1 month Index + 1.442%, 5.8391% 2/15/2039 (b)(c)(d) | | 2,981,153 | 2,993,264 |
| BX Trust Series 2024-XL4 Class B, CME Term SOFR 1 month Index + 1.7915%, 6.1886% 2/15/2039 (b)(c)(d) | | 378,112 | 378,112 |
| BX Trust Series 2024-XL5 Class B, CME Term SOFR 1 month Index + 1.6912%, 6.0883% 3/15/2041 (b)(c)(d) | | 1,089,185 | 1,088,845 |
| BX Trust Series 2024-XL5 Class C, CME Term SOFR 1 month Index + 1.9409%, 6.338% 3/15/2041 (b)(c)(d) | | 1,446,517 | 1,446,065 |
| CAMB Commercial Mortgage Trust Series 2019-LIFE Class A, CME Term SOFR 1 month Index + 1.367%, 5.765% 12/15/2037 (b)(c)(d) | | 2,145,000 | 2,146,074 |
| CAMB Commercial Mortgage Trust Series 2019-LIFE Class E, CME Term SOFR 1 month Index + 2.447%, 6.845% 12/15/2037 (b)(c)(d) | | 520,000 | 520,000 |
| CF Hippolyta Issuer LLC Series 2021-1A Class A1, 1.53% 3/15/2061 (d) | | 1,194,866 | 1,132,773 |
| CFCRE Commercial Mortgage Trust Series 2016-C7 Class A2, 3.5853% 12/10/2054 | | 527,861 | 512,288 |
| CFCRE Commercial Mortgage Trust Series 2017-C8 Class A3, 3.3048% 6/15/2050 | | 1,960,100 | 1,877,299 |
| Citigroup Commercial Mortgage Trust Series 2015-GC29 Class A4, 3.192% 4/10/2048 | | 274,233 | 272,950 |
| Citigroup Commercial Mortgage Trust Series 2015-P1 Class A5, 3.717% 9/15/2048 | | 160,809 | 159,466 |
| Citigroup Commercial Mortgage Trust Series 2016-C1 Class A4, 3.209% 5/10/2049 | | 508,851 | 496,953 |
| Citigroup Commercial Mortgage Trust Series 2016-P4 Class A4, 2.902% 7/10/2049 | | 589,456 | 571,853 |
| Citigroup Commercial Mortgage Trust Series 2020-GC46 Class AAB, 2.614% 2/15/2053 | | 500,000 | 472,788 |
| COMM Mortgage Trust Series 2015-CR22 Class A5, 3.309% 3/10/2048 | | 532,572 | 529,324 |
| Computershare Corporate Trust Series 2018-C48 Class A5, 4.302% 1/15/2052 | | 1,284,202 | 1,248,538 |
| CSAIL Commercial Mortgage Trust Series 2015-C3 Class A4, 3.7182% 8/15/2048 | | 344,472 | 341,685 |
| CSAIL Commercial Mortgage Trust Series 2019-C17 Class A4, 2.7628% 9/15/2052 | | 516,958 | 469,227 |
| CSAIL Commercial Mortgage Trust Series 2019-C17 Class A5, 3.0161% 9/15/2052 | | 516,958 | 464,368 |
| CSMC Trust Series 2020-NET Class A, 2.2569% 8/15/2037 (d) | | 123,106 | 119,978 |
| DTP Coml Mtg Trust Series 2023-STE2 Class A, 5.8433% 1/15/2041 (b)(d) | | 605,000 | 611,452 |
| ELP Commercial Mortgage Trust Series 2021-ELP Class A, CME Term SOFR 1 month Index + 0.8155%, 5.2135% 11/15/2038 (b)(c)(d) | | 2,964,315 | 2,962,462 |
| Extended Stay America Trust Series 2021-ESH Class A, CME Term SOFR 1 month Index + 1.1945%, 5.5915% 7/15/2038 (b)(c)(d) | | 594,534 | 594,905 |
| Extended Stay America Trust Series 2021-ESH Class B, CME Term SOFR 1 month Index + 1.4945%, 5.8915% 7/15/2038 (b)(c)(d) | | 1,420,716 | 1,421,603 |
| Extended Stay America Trust Series 2021-ESH Class C, CME Term SOFR 1 month Index + 1.8145%, 6.2115% 7/15/2038 (b)(c)(d) | | 183,205 | 183,434 |
| Extended Stay America Trust Series 2021-ESH Class D, CME Term SOFR 1 month Index + 2.3645%, 6.7615% 7/15/2038 (b)(c)(d) | | 10,193,392 | 10,218,876 |
| Freddie Mac Multiclass Mortgage participation certificates Series 2015-K044 Class A2, 2.811% 1/25/2025 | | 744,633 | 742,332 |
| Freddie Mac Multiclass Mortgage participation certificates Series 2015-K045 Class A2, 3.023% 1/25/2025 | | 730,081 | 727,824 |
| Freddie Mac Multifamily Structured pass-thru certificates Series 2015-K046 Class A2, 3.205% 3/25/2025 | | 813,013 | 809,330 |
| Freddie Mac Multifamily Structured pass-thru certificates Series 2015-K047 Class A2, 3.329% 5/25/2025 | | 2,048,771 | 2,036,301 |
| Freddie Mac Multifamily Structured pass-thru certificates Series 2015-K049 Class A2, 3.01% 7/25/2025 | | 258,683 | 256,389 |
| Freddie Mac Multifamily Structured pass-thru certificates Series 2016-K053 Class A2, 2.995% 12/25/2025 | | 194,973 | 192,337 |
| Freddie Mac Multifamily Structured pass-thru certificates Series 2016-K054 Class A2, 2.745% 1/25/2026 | | 1,255,566 | 1,234,117 |
| Freddie Mac Multifamily Structured pass-thru certificates Series 2016-K055 Class A2, 2.673% 3/25/2026 | | 2,681,410 | 2,625,706 |
| Freddie Mac Multifamily Structured pass-thru certificates Series 2016-K056 Class A2, 2.525% 5/25/2026 | | 568,904 | 554,764 |
| Freddie Mac Multifamily Structured pass-thru certificates Series 2016-K057 Class A2, 2.57% 7/25/2026 | | 437,441 | 425,907 |
| Freddie Mac Multifamily Structured pass-thru certificates Series 2016-K058 Class A2, 2.653% 8/25/2026 | | 2,100,000 | 2,038,167 |
| Freddie Mac Multifamily Structured pass-thru certificates Series 2017-K062 Class A1, 3.032% 9/25/2026 | | 85,009 | 84,313 |
| Freddie Mac Multifamily Structured pass-thru certificates Series 2017-K063 Class A2, 3.43% 1/25/2027 | | 2,600,000 | 2,543,513 |
| Freddie Mac Multifamily Structured pass-thru certificates Series 2017-K064 Class A2, 3.224% 3/25/2027 | | 472,919 | 459,958 |
| Freddie Mac Multifamily Structured pass-thru certificates Series 2017-K066 Class A2, 3.117% 6/25/2027 | | 300,000 | 290,103 |
| Freddie Mac Multifamily Structured pass-thru certificates Series 2017-K068 Class A2, 3.244% 8/25/2027 | | 1,152,712 | 1,114,152 |
| Freddie Mac Multifamily Structured pass-thru certificates Series 2017-K069 Class A2, 3.187% 9/25/2027 | | 396,599 | 382,513 |
| Freddie Mac Multifamily Structured pass-thru certificates Series 2017-K070 Class A2, 3.303% 11/25/2027 | | 1,100,000 | 1,061,885 |
| Freddie Mac Multifamily Structured pass-thru certificates Series 2017-K071 Class A2, 3.286% 11/25/2027 | | 600,000 | 578,415 |
| Freddie Mac Multifamily Structured pass-thru certificates Series 2018-K072 Class A2, 3.444% 12/25/2027 | | 500,000 | 483,664 |
| Freddie Mac Multifamily Structured pass-thru certificates Series 2018-K073 Class A2, 3.35% 1/25/2028 | | 900,000 | 867,889 |
| Freddie Mac Multifamily Structured pass-thru certificates Series 2018-K074 Class A2, 3.6% 1/25/2028 | | 2,600,000 | 2,523,810 |
| Freddie Mac Multifamily Structured pass-thru certificates Series 2018-K075 Class A2, 3.65% 2/25/2028 | | 3,400,000 | 3,300,999 |
| Freddie Mac Multifamily Structured pass-thru certificates Series 2018-K076 Class A2, 3.9% 4/25/2028 | | 600,000 | 586,149 |
| Freddie Mac Multifamily Structured pass-thru certificates Series 2018-K077 Class A2, 3.85% 5/25/2028 | | 1,800,000 | 1,754,537 |
| Freddie Mac Multifamily Structured pass-thru certificates Series 2018-K079 Class A2, 3.926% 6/25/2028 | | 213,322 | 208,187 |
| Freddie Mac Multifamily Structured pass-thru certificates Series 2018-K080 Class A2, 3.926% 7/25/2028 | | 454,836 | 443,891 |
| Freddie Mac Multifamily Structured pass-thru certificates Series 2018-K081 Class A2, 3.9% 8/25/2028 | | 400,000 | 389,582 |
| Freddie Mac Multifamily Structured pass-thru certificates Series 2018-K083 Class A2, 4.05% 9/25/2028 | | 400,000 | 391,287 |
| Freddie Mac Multifamily Structured pass-thru certificates Series 2018-K084 Class A2, 3.78% 10/25/2028 | | 400,000 | 387,004 |
| Freddie Mac Multifamily Structured pass-thru certificates Series 2018-K730 Class A2, 3.59% 1/25/2025 | | 6,528 | 6,507 |
| Freddie Mac Multifamily Structured pass-thru certificates Series 2019-1510 Class A2, 3.718% 1/25/2031 | | 407,161 | 382,628 |
| Freddie Mac Multifamily Structured pass-thru certificates Series 2019-K091 Class A2, 3.505% 3/25/2029 | | 900,000 | 859,674 |
| Freddie Mac Multifamily Structured pass-thru certificates Series 2019-K094 Class A2, 2.903% 6/25/2029 | | 1,410,116 | 1,308,682 |
| Freddie Mac Multifamily Structured pass-thru certificates Series 2019-K098 Class A2, 2.425% 8/25/2029 | | 300,000 | 271,816 |
| Freddie Mac Multifamily Structured pass-thru certificates Series 2020-K104 Class A2, 2.253% 1/25/2030 | | 2,053,820 | 1,828,741 |
| Freddie Mac Multifamily Structured pass-thru certificates Series 2020-K116 Class A2, 1.378% 7/25/2030 | | 1,745,881 | 1,461,735 |
| Freddie Mac Multifamily Structured pass-thru certificates Series 2020-K117 Class A2, 1.406% 8/25/2030 | | 890,789 | 744,469 |
| Freddie Mac Multifamily Structured pass-thru certificates Series 2020-K118 Class A2, 1.493% 9/25/2030 | | 423,042 | 354,491 |
| Freddie Mac Multifamily Structured pass-thru certificates Series 2020-K121 Class A2, 1.547% 10/25/2030 | | 593,860 | 496,696 |
| Freddie Mac Multifamily Structured pass-thru certificates Series 2020-K740 Class A2, 1.47% 9/25/2027 | | 1,100,000 | 1,012,777 |
| Freddie Mac Multifamily Structured pass-thru certificates Series 2021-K123 Class A2, 1.621% 12/25/2030 | | 781,693 | 655,002 |
| Freddie Mac Multifamily Structured pass-thru certificates Series 2021-K125 Class A2, 1.846% 1/25/2031 | | 230,204 | 194,807 |
| Freddie Mac Multifamily Structured pass-thru certificates Series 2021-K126 Class A2, 2.074% 1/25/2031 | | 327,624 | 281,338 |
| Freddie Mac Multifamily Structured pass-thru certificates Series 2021-K130 Class A2, 1.723% 6/25/2031 | | 281,917 | 234,332 |
| Freddie Mac Multifamily Structured pass-thru certificates Series 2021-K136 Class A2, 2.127% 11/25/2031 | | 771,017 | 648,919 |
| Freddie Mac Multifamily Structured pass-thru certificates Series 2021-K744 Class A2, 1.712% 7/25/2028 | | 483,227 | 438,997 |
| Freddie Mac Multifamily Structured pass-thru certificates Series 2021-K745 Class A2, 1.657% 8/25/2028 | | 500,000 | 450,681 |
| Freddie Mac Multifamily Structured pass-thru certificates Series 2022-151 Class A2, 3.8% 10/25/2032 | | 300,000 | 278,574 |
| Freddie Mac Multifamily Structured pass-thru certificates Series 2022-K139 Class A2, 2.59% 1/25/2032 | | 400,000 | 346,039 |
| Freddie Mac Multifamily Structured pass-thru certificates Series 2022-K140 Class A2, 2.25% 1/25/2032 | | 400,000 | 337,810 |
| Freddie Mac Multifamily Structured pass-thru certificates Series 2022-K748 Class A2, 2.26% 1/25/2029 | | 4,300,000 | 3,919,103 |
| Freddie Mac Multifamily Structured pass-thru certificates Series 2023-K751 Class A2, 4.412% 3/25/2030 | | 800,000 | 786,991 |
| Freddie Mac Multifamily Structured pass-thru certificates Series 2024-164 Class A2, 5% 5/25/2034 | | 100,000 | 100,214 |
| Freddie Mac Multifamily Structured pass-thru certificates Series 2024-165 Class A2, 4.489% 9/25/2034 | | 200,000 | 192,655 |
| Freddie Mac Multifamily Structured pass-thru certificates Series 2024-K517 Class A2, 5.355% 1/25/2029 | | 1,200,000 | 1,226,050 |
| Freddie Mac Multifamily Structured pass-thru certificates Series 2024-K758 Class A2, 4.68% 10/25/2031 | | 300,000 | 296,544 |
| GS Mortgage Securities Trust Series 2018-3PCK Class A, CME Term SOFR 1 month Index + 2.0645%, 6.4625% 9/15/2031 (b)(c)(d) | | 243,148 | 241,025 |
| GS Mortgage Securities Trust Series 2018-GS10 Class A4, 3.89% 7/10/2051 | | 3,800,000 | 3,620,372 |
| GS Mortgage Securities Trust Series 2018-GS9 Class A4, 3.992% 3/10/2051 | | 400,000 | 385,786 |
| GS Mortgage Securities Trust Series 2020-GC45 Class A5, 2.9106% 2/13/2053 | | 1,245,771 | 1,117,457 |
| GS Mortgage Securities Trust Series 2021-IP Class A, CME Term SOFR 1 month Index + 1.0645%, 5.4625% 10/15/2036 (b)(c)(d) | | 1,961,563 | 1,948,352 |
| GS Mortgage Securities Trust Series 2021-IP Class B, CME Term SOFR 1 month Index + 1.2645%, 5.6625% 10/15/2036 (b)(c)(d) | | 450,000 | 442,288 |
| GS Mortgage Securities Trust Series 2021-IP Class C, CME Term SOFR 1 month Index + 1.6645%, 6.0625% 10/15/2036 (b)(c)(d) | | 2,451,000 | 2,420,906 |
| Intown Mortgage Trust Series 2022-STAY Class A, CME Term SOFR 1 month Index + 2.4886%, 6.8856% 8/15/2039 (b)(c)(d) | | 4,070,000 | 4,072,544 |
| JPMBB Commercial Mortgage Securities Trust Series 2014-C23 Class A5, 3.9342% 9/15/2047 | | 5,261 | 5,249 |
| JPMBB Commercial Mortgage Securities Trust Series 2014-C24 Class A5, 3.6385% 11/15/2047 | | 61,637 | 61,464 |
| JPMBB Commercial Mortgage Securities Trust Series 2015-C29 Class A4, 3.6108% 5/15/2048 | | 246,754 | 245,591 |
| JPMCC Commercial Mortgage Securities Trust Series 2016-JP4 Class ASB, 3.4743% 12/15/2049 | | 312,836 | 309,083 |
| JPMCC Commercial Mortgage Securities Trust Series 2017-JP6 Class ASB, 3.2829% 7/15/2050 | | 143,842 | 141,802 |
| JPMorgan Chase Commercial Mortgage Securities Trust Series 2018-WPT Class DFX, 5.3503% 7/5/2033 (d) | | 158,353 | 100,843 |
| JPMorgan Chase Commercial Mortgage Securities Trust Series 2022-NLP Class A, CME Term SOFR 1 month Index + 0.5965%, 4.9936% 4/15/2037 (b)(c)(d) | | 318,267 | 311,206 |
| Life Financial Services Trust Series 2022-BMR2 Class A1, CME Term SOFR 1 month Index + 1.2952%, 5.6923% 5/15/2039 (b)(c)(d) | | 2,976,439 | 2,909,470 |
| Life Financial Services Trust Series 2022-BMR2 Class B, CME Term SOFR 1 month Index + 1.7939%, 6.191% 5/15/2039 (b)(c)(d) | | 899,162 | 864,019 |
| Life Financial Services Trust Series 2022-BMR2 Class C, CME Term SOFR 1 month Index + 2.0931%, 6.4902% 5/15/2039 (b)(c)(d) | | 511,349 | 484,503 |
| Life Financial Services Trust Series 2022-BMR2 Class D, CME Term SOFR 1 month Index + 2.5419%, 6.939% 5/15/2039 (b)(c)(d) | | 454,472 | 421,070 |
| LIFE Mortgage Trust Series 2021-BMR Class A, CME Term SOFR 1 month Index + 0.8145%, 5.2115% 3/15/2038 (b)(c)(d) | | 544,889 | 538,078 |
| LIFE Mortgage Trust Series 2021-BMR Class B, CME Term SOFR 1 month Index + 0.9945%, 5.3915% 3/15/2038 (b)(c)(d) | | 175,296 | 172,995 |
| LIFE Mortgage Trust Series 2021-BMR Class C, CME Term SOFR 1 month Index + 1.2145%, 5.6115% 3/15/2038 (b)(c)(d) | | 110,258 | 108,673 |
| LIFE Mortgage Trust Series 2021-BMR Class D, CME Term SOFR 1 month Index + 1.5145%, 5.9115% 3/15/2038 (b)(c)(d) | | 153,384 | 151,083 |
| LIFE Mortgage Trust Series 2021-BMR Class E, CME Term SOFR 1 month Index + 1.8645%, 6.2615% 3/15/2038 (b)(c)(d) | | 134,062 | 130,710 |
| Morgan Stanley Capital I Trust Series 2016-UB11 Class A4, 2.782% 8/15/2049 | | 1,200,000 | 1,154,979 |
| Morgan Stanley Capital I Trust Series 2017-H1 Class A4, 3.259% 6/15/2050 | | 1,500,000 | 1,460,693 |
| Morgan Stanley Capital I Trust Series 2018-H4 Class A4, 4.31% 12/15/2051 | | 1,275,945 | 1,236,372 |
| Morgan Stanley Capital I Trust Series 2019-L2 Class A3, 3.806% 3/15/2052 | | 979,282 | 939,022 |
| Morgan Stanley Capital I Trust Series 2020-L4 Class A3, 2.698% 2/15/2053 | | 487,766 | 435,061 |
| Morgan Stanley Capital I Trust Series 2024-NSTB Class A, 3.9% 9/24/2057 (b)(d) | | 992,994 | 958,162 |
| Natixis Commercial Mortgage Securities Trust Series 2020-2PAC Class A, 2.966% 12/15/2038 (d) | | 531,500 | 498,127 |
| OPEN Trust Series 2023-AIR Class A, CME Term SOFR 1 month Index + 3.0891%, 7.4862% 11/15/2040 (b)(c)(d) | | 792,480 | 798,429 |
| OPEN Trust Series 2023-AIR Class B, CME Term SOFR 1 month Index + 3.838%, 8.2351% 11/15/2040 (b)(c)(d) | | 871,200 | 877,659 |
| OPG Trust Series 2021-PORT Class A, CME Term SOFR 1 month Index + 0.5985%, 4.9965% 10/15/2036 (b)(c)(d) | | 1,321,794 | 1,316,837 |
| Providence Place Group LP Series 2000-C1 Class A2, 7.75% 7/20/2028 (d) | | 209,512 | 213,518 |
| SPGN Mortgage Trust Series 2022-TFLM Class B, CME Term SOFR 1 month Index + 2%, 6.3971% 2/15/2039 (b)(c)(d) | | 263,000 | 258,476 |
| SPGN Mortgage Trust Series 2022-TFLM Class C, CME Term SOFR 1 month Index + 2.65%, 7.0471% 2/15/2039 (b)(c)(d) | | 137,000 | 134,306 |
| SREIT Trust Series 2021-FLWR Class A, CME Term SOFR 1 month Index + 0.691%, 5.088% 7/15/2036 (b)(c)(d) | | 813,932 | 812,915 |
| SREIT Trust Series 2021-MFP Class A, CME Term SOFR 1 month Index + 0.8453%, 5.2424% 11/15/2038 (b)(c)(d) | | 2,240,402 | 2,238,301 |
| SREIT Trust Series 2021-MFP Class B, CME Term SOFR 1 month Index + 1.1943%, 5.5914% 11/15/2038 (b)(c)(d) | | 1,694,882 | 1,691,704 |
| SREIT Trust Series 2021-MFP Class C, CME Term SOFR 1 month Index + 1.4435%, 5.8406% 11/15/2038 (b)(c)(d) | | 344,260 | 343,399 |
| SREIT Trust Series 2021-MFP Class D, CME Term SOFR 1 month Index + 1.6927%, 6.0898% 11/15/2038 (b)(c)(d) | | 226,263 | 225,980 |
| Taubman Centers Commercial Mortgage Trust Series 2024-DPM Class A, CME Term SOFR 1 month Index + 1.2429%, 5.7429% 12/15/2039 (b)(c)(d) | | 2,790,000 | 2,788,253 |
| Taubman Centers Commercial Mortgage Trust Series 2024-DPM Class B, CME Term SOFR 1 month Index + 1.5924%, 6.0924% 12/15/2039 (b)(c)(d) | | 680,000 | 679,575 |
| Taubman Centers Commercial Mortgage Trust Series 2024-DPM Class C, CME Term SOFR 1 month Index + 1.9919%, 6.4919% 12/15/2039 (b)(c)(d) | | 501,000 | 500,998 |
| VLS Commercial Mortgage Trust Series 2020-LAB Class A, 2.13% 10/10/2042 (d) | | 1,123,328 | 899,873 |
| Wells Fargo Commercial Mortgage Trust Series 2016-C37 Class A4, 3.525% 12/15/2049 | | 450,823 | 440,789 |
| Wells Fargo Commercial Mortgage Trust Series 2019-C52 Class A5, 2.892% 8/15/2052 | | 887,720 | 802,811 |
| Wells Fargo Commercial Mortgage Trust Series 2019-C54 Class A4, 3.146% 12/15/2052 | | 63,390 | 57,701 |
| Wells Fargo Commercial Mortgage Trust Series 2020-C55 Class A5, 2.725% 2/15/2053 | | 438,989 | 390,779 |
| Wells Fargo Commercial Mortgage Trust Series 2020-C55 Class ASB, 2.651% 2/15/2053 | | 400,000 | 378,955 |
| Wells Fargo Commercial Mortgage Trust Series 2021-FCMT Class A, CME Term SOFR 1 month Index + 1.3145%, 5.7125% 5/15/2031 (b)(c)(d) | | 552,000 | 542,547 |
| Wells Fargo Commercial Mortgage Trust Series 2024-MGP Class A11, CME Term SOFR 1 month Index + 1.9907%, 6.3878% 8/15/2041 (b)(c)(d) | | 500,000 | 502,261 |
| Wells Fargo Commercial Mortgage Trust Series 2024-MGP Class A12, CME Term SOFR 1 month Index + 1.6912%, 6.0882% 8/15/2041 (b)(c)(d) | | 1,100,000 | 1,105,029 |
TOTAL UNITED STATES | | | 180,949,470 |
| TOTAL COMMERCIAL MORTGAGE SECURITIES (Cost $180,649,594) | | | 180,949,470 |
| | | | |
| Fixed-Income Funds - 0.5% |
| | | Shares | Value ($) |
Fidelity Specialized High Income Central Fund (g) (Cost $16,752,628) | | 191,383 | 16,667,551 |
| | | | |
| Foreign Government and Government Agency Obligations - 0.3% |
| | | Principal Amount (a) | Value ($) |
| CANADA - 0.2% | | | |
| Province of Alberta 1% 5/20/2025 | | 968,000 | 955,503 |
| Province of Alberta 3.3% 3/15/2028 | | 274,000 | 264,243 |
| Province of British Columbia 2.25% 6/2/2026 | | 654,000 | 634,687 |
| Province of Ontario 0.625% 1/21/2026 | | 70,000 | 67,191 |
| Province of Ontario 1.125% 10/7/2030 | | 658,000 | 540,251 |
| Province of Ontario 2.3% 6/15/2026 | | 391,000 | 379,325 |
| Province of Ontario 2.5% 4/27/2026 | | 137,000 | 133,589 |
| Province of Quebec 1.5% 2/11/2025 | | 791,000 | 788,595 |
| Province of Quebec 2.5% 4/20/2026 | | 322,000 | 314,063 |
| Province of Quebec 2.75% 4/12/2027 | | 350,000 | 337,033 |
TOTAL CANADA | | | 4,414,480 |
| JAPAN - 0.0% | | | |
| Japan International Cooperation Agency 1.75% 4/28/2031 | | 274,000 | 228,098 |
| MEXICO - 0.1% | | | |
| United Mexican States 3.25% 4/16/2030 | | 366,000 | 318,603 |
| United Mexican States 3.5% 2/12/2034 | | 1,114,000 | 886,674 |
| United Mexican States 4.28% 8/14/2041 | | 1,201,000 | 887,614 |
| United Mexican States 4.35% 1/15/2047 | | 395,000 | 276,006 |
| United Mexican States 4.5% 1/31/2050 | | 254,000 | 178,562 |
| United Mexican States 4.6% 2/10/2048 | | 481,000 | 345,869 |
| United Mexican States 4.75% 3/8/2044 | | 266,000 | 202,409 |
| United Mexican States 5.55% 1/21/2045 | | 107,000 | 92,856 |
| United Mexican States 6.05% 1/11/2040 | | 132,000 | 122,513 |
TOTAL MEXICO | | | 3,311,106 |
| PANAMA - 0.0% | | | |
| Panamanian Republic 3.16% 1/23/2030 | | 517,000 | 432,186 |
| Panamanian Republic 4.5% 4/1/2056 | | 547,000 | 323,447 |
| Panamanian Republic 4.5% 4/16/2050 | | 353,000 | 217,529 |
TOTAL PANAMA | | | 973,162 |
| SAUDI ARABIA - 0.0% | | | |
| Kingdom of Saudi Arabia 3.25% 10/22/2030 (d) | | 396,000 | 356,648 |
| Kingdom of Saudi Arabia 4.5% 4/22/2060 (d) | | 301,000 | 230,439 |
TOTAL SAUDI ARABIA | | | 587,087 |
| URUGUAY - 0.0% | | | |
| Uruguay Republic 4.125% 11/20/2045 | | 130,228 | 108,680 |
| TOTAL FOREIGN GOVERNMENT AND GOVERNMENT AGENCY OBLIGATIONS (Cost $10,732,756) | | | 9,622,613 |
| | | | |
| Municipal Securities - 0.0% |
| | | Principal Amount (a) | Value ($) |
| Texas - 0.0% | | | |
| Transportation - 0.0% | | | |
| Dallas Fort Worth International Airport 4.507% 11/1/2051 | | 155,000 | 134,336 |
| Dallas Fort Worth International Airport Series 2019A, 3.144% 11/1/2045 | | 65,000 | 48,536 |
| Dallas Fort Worth International Airport Series 2021 C, 2.843% 11/1/2046 | | 400,000 | 281,101 |
| | | | 463,973 |
| TOTAL MUNICIPAL SECURITIES (Cost $532,618) | | | 463,973 |
| | | | |
| Non-Convertible Corporate Bonds - 23.0% |
| | | Principal Amount (a) | Value ($) |
| AUSTRALIA - 0.1% | | | |
| Financials - 0.1% | | | |
| Banks - 0.1% | | | |
| Commonwealth Bank of Australia 3.61% 9/12/2034 (b)(d) | | 328,000 | 301,786 |
| Westpac Banking Corp 1.953% 11/20/2028 | | 200,000 | 180,096 |
| Westpac Banking Corp 2.85% 5/13/2026 | | 130,000 | 127,112 |
| Westpac Banking Corp 4.11% 7/24/2034 (b) | | 800,000 | 753,387 |
| Westpac Banking Corp 4.421% 7/24/2039 | | 160,000 | 141,577 |
| | | | 1,503,958 |
| Materials - 0.0% | | | |
| Metals & Mining - 0.0% | | | |
| Rio Tinto Finance USA Ltd 5.2% 11/2/2040 | | 357,000 | 343,594 |
| Rio Tinto Finance USA Ltd 7.125% 7/15/2028 | | 55,000 | 59,040 |
| | | | 402,634 |
| TOTAL AUSTRALIA | | | 1,906,592 |
| AUSTRIA - 0.0% | | | |
| Financials - 0.0% | | | |
| Banks - 0.0% | | | |
| Oesterreichische Kontrollbank AG 0.375% 9/17/2025 | | 299,000 | 290,531 |
| BELGIUM - 0.0% | | | |
| Consumer Staples - 0.0% | | | |
| Beverages - 0.0% | | | |
| Anheuser-Busch InBev Worldwide Inc 3.5% 6/1/2030 | | 465,000 | 435,962 |
| BRAZIL - 0.0% | | | |
| Materials - 0.0% | | | |
| Metals & Mining - 0.0% | | | |
| Vale Overseas Ltd 3.75% 7/8/2030 | | 667,000 | 610,352 |
| Vale SA 5.625% 9/11/2042 | | 181,000 | 172,288 |
| | | | 782,640 |
| Paper & Forest Products - 0.0% | | | |
| Suzano Austria GmbH 2.5% 9/15/2028 | | 412,000 | 367,839 |
| Suzano Austria GmbH 6% 1/15/2029 | | 330,000 | 330,495 |
| | | | 698,334 |
| TOTAL BRAZIL | | | 1,480,974 |
| CANADA - 0.1% | | | |
| Energy - 0.1% | | | |
| Oil, Gas & Consumable Fuels - 0.1% | | | |
| Canadian Natural Resources Ltd 3.9% 2/1/2025 | | 51,000 | 50,936 |
| Canadian Natural Resources Ltd 4.95% 6/1/2047 | | 175,000 | 150,077 |
| Canadian Natural Resources Ltd 5.85% 2/1/2035 | | 644,000 | 646,456 |
| Canadian Natural Resources Ltd 6.25% 3/15/2038 | | 188,000 | 192,065 |
| Cenovus Energy Inc 2.65% 1/15/2032 | | 196,000 | 163,036 |
| Cenovus Energy Inc 5.4% 6/15/2047 | | 154,000 | 137,044 |
| Cenovus Energy Inc 6.75% 11/15/2039 | | 8,000 | 8,576 |
| Enbridge Inc 4.25% 12/1/2026 | | 223,000 | 220,872 |
| Enbridge Inc 5.5% 12/1/2046 | | 397,000 | 378,068 |
| TransCanada PipeLines Ltd 4.875% 1/15/2026 | | 137,000 | 136,960 |
| TransCanada PipeLines Ltd 6.1% 6/1/2040 | | 184,000 | 186,957 |
| | | | 2,271,047 |
| Utilities - 0.0% | | | |
| Independent Power and Renewable Electricity Producers - 0.0% | | | |
| Emera US Finance LP 3.55% 6/15/2026 | | 237,000 | 232,127 |
| Emera US Finance LP 4.75% 6/15/2046 | | 143,000 | 118,413 |
| | | | 350,540 |
| TOTAL CANADA | | | 2,621,587 |
| FRANCE - 0.1% | | | |
| Financials - 0.1% | | | |
| Banks - 0.1% | | | |
| BNP Paribas SA 2.219% 6/9/2026 (b)(d) | | 947,000 | 934,757 |
| Societe Generale SA 1.488% 12/14/2026 (b)(d) | | 1,222,000 | 1,179,303 |
| | | | |
| TOTAL FRANCE | | | 2,114,060 |
| GERMANY - 0.3% | | | |
| Financials - 0.3% | | | |
| Capital Markets - 0.2% | | | |
| Deutsche Bank AG 4.1% 1/13/2026 | | 330,000 | 327,603 |
| Deutsche Bank AG 4.5% 4/1/2025 | | 1,502,000 | 1,499,731 |
| Deutsche Bank AG/New York NY 2.311% 11/16/2027 (b) | | 171,000 | 162,532 |
| Deutsche Bank AG/New York NY 4.1% 1/13/2026 | | 598,000 | 594,464 |
| Deutsche Bank AG/New York NY 4.999% 9/11/2030 (b) | | 2,100,000 | 2,052,696 |
| Deutsche Bank AG/New York NY 6.72% 1/18/2029 (b) | | 1,810,000 | 1,879,380 |
| | | | 6,516,406 |
| Financial Services - 0.1% | | | |
| KfW 0.375% 7/18/2025 | | 472,000 | 461,865 |
| KfW 0.625% 1/22/2026 | | 1,471,000 | 1,415,051 |
| KfW 2% 5/2/2025 | | 105,000 | 104,183 |
| KfW 2.875% 4/3/2028 | | 421,000 | 401,966 |
| Landwirtschaftliche Rentenbank 1.75% 7/27/2026 | | 233,000 | 223,773 |
| Landwirtschaftliche Rentenbank 2.5% 11/15/2027 | | 242,000 | 229,835 |
| | | | 2,836,673 |
| Health Care - 0.0% | | | |
| Pharmaceuticals - 0.0% | | | |
| Bayer US Finance II LLC 2.85% 4/15/2025 (d) | | 105,000 | 104,109 |
| Bayer US Finance II LLC 3.95% 4/15/2045 (d) | | 38,000 | 26,189 |
| Bayer US Finance II LLC 4.25% 12/15/2025 (d) | | 548,000 | 544,306 |
| | | | 674,604 |
| TOTAL GERMANY | | | 10,027,683 |
| IRELAND - 0.6% | | | |
| Financials - 0.4% | | | |
| Consumer Finance - 0.4% | | | |
| AerCap Ireland Capital DAC / AerCap Global Aviation Trust 2.45% 10/29/2026 | | 878,000 | 840,503 |
| AerCap Ireland Capital DAC / AerCap Global Aviation Trust 3% 10/29/2028 | | 730,000 | 675,951 |
| AerCap Ireland Capital DAC / AerCap Global Aviation Trust 3.3% 1/30/2032 | | 567,000 | 494,038 |
| AerCap Ireland Capital DAC / AerCap Global Aviation Trust 3.4% 10/29/2033 | | 204,000 | 173,731 |
| AerCap Ireland Capital DAC / AerCap Global Aviation Trust 3.5% 1/15/2025 | | 1,042,000 | 1,041,414 |
| AerCap Ireland Capital DAC / AerCap Global Aviation Trust 3.85% 10/29/2041 | | 204,000 | 159,661 |
| AerCap Ireland Capital DAC / AerCap Global Aviation Trust 3.875% 1/23/2028 | | 430,000 | 416,448 |
| AerCap Ireland Capital DAC / AerCap Global Aviation Trust 4.45% 10/1/2025 | | 270,000 | 269,360 |
| AerCap Ireland Capital DAC / AerCap Global Aviation Trust 4.45% 4/3/2026 | | 393,000 | 390,957 |
| AerCap Ireland Capital DAC / AerCap Global Aviation Trust 5.75% 6/6/2028 | | 4,500,000 | 4,585,114 |
| AerCap Ireland Capital DAC / AerCap Global Aviation Trust 6.45% 4/15/2027 | | 2,464,000 | 2,540,677 |
| AerCap Ireland Capital DAC / AerCap Global Aviation Trust 6.5% 7/15/2025 | | 455,000 | 457,934 |
| | | | 12,045,788 |
| Industrials - 0.2% | | | |
| Transportation Infrastructure - 0.2% | | | |
| Avolon Holdings Funding Ltd 4.25% 4/15/2026 (d) | | 198,000 | 195,616 |
| Avolon Holdings Funding Ltd 4.375% 5/1/2026 (d) | | 587,000 | 580,565 |
| Avolon Holdings Funding Ltd 6.375% 5/4/2028 (d) | | 7,268,000 | 7,470,366 |
| | | | 8,246,547 |
| TOTAL IRELAND | | | 20,292,335 |
| ITALY - 0.0% | | | |
| Financials - 0.0% | | | |
| Banks - 0.0% | | | |
| Intesa Sanpaolo SpA 5.71% 1/15/2026 (d) | | 1,614,000 | 1,614,228 |
| JAPAN - 0.1% | | | |
| Financials - 0.1% | | | |
| Banks - 0.1% | | | |
| Japan Bank for International Cooperation 1.25% 1/21/2031 | | 1,072,000 | 877,684 |
| Japan Bank for International Cooperation 2.375% 4/20/2026 | | 358,000 | 348,133 |
| Japan Bank for International Cooperation 2.875% 6/1/2027 | | 208,000 | 200,031 |
| Japan Bank for International Cooperation 3.25% 7/20/2028 | | 246,000 | 235,639 |
| | | | |
| TOTAL JAPAN | | | 1,661,487 |
| KOREA (SOUTH) - 0.0% | | | |
| Financials - 0.0% | | | |
| Banks - 0.0% | | | |
| Export-Import Bank of Korea 0.625% 2/9/2026 | | 719,000 | 687,991 |
| Export-Import Bank of Korea 2.875% 1/21/2025 | | 208,000 | 207,744 |
| Korea Development Bank/The 1.625% 1/19/2031 | | 367,000 | 301,696 |
| | | | |
| TOTAL KOREA (SOUTH) | | | 1,197,431 |
| MEXICO - 0.8% | | | |
| Energy - 0.8% | | | |
| Oil, Gas & Consumable Fuels - 0.8% | | | |
| Petroleos Mexicanos 4.5% 1/23/2026 | | 668,000 | 643,284 |
| Petroleos Mexicanos 5.95% 1/28/2031 | | 807,000 | 678,824 |
| Petroleos Mexicanos 6.35% 2/12/2048 | | 1,658,000 | 1,089,107 |
| Petroleos Mexicanos 6.49% 1/23/2027 | | 481,000 | 465,818 |
| Petroleos Mexicanos 6.5% 1/23/2029 | | 698,000 | 649,636 |
| Petroleos Mexicanos 6.5% 3/13/2027 | | 607,000 | 584,905 |
| Petroleos Mexicanos 6.7% 2/16/2032 | | 2,314,000 | 2,020,411 |
| Petroleos Mexicanos 6.75% 9/21/2047 | | 1,520,000 | 1,045,000 |
| Petroleos Mexicanos 6.84% 1/23/2030 | | 289,000 | 263,279 |
| Petroleos Mexicanos 6.95% 1/28/2060 | | 989,000 | 676,535 |
| Petroleos Mexicanos 7.69% 1/23/2050 | | 2,036,000 | 1,531,072 |
| Petroleos Mexicanos 8.75% 6/2/2029 | | 15,000,000 | 15,009,376 |
| | | | 24,657,247 |
| Materials - 0.0% | | | |
| Metals & Mining - 0.0% | | | |
| Southern Copper Corp 3.875% 4/23/2025 | | 101,000 | 100,195 |
| Southern Copper Corp 5.25% 11/8/2042 | | 158,000 | 143,109 |
| Southern Copper Corp 7.5% 7/27/2035 | | 167,000 | 189,335 |
| | | | 432,639 |
| TOTAL MEXICO | | | 25,089,886 |
| MULTI-NATIONAL - 0.4% | | | |
| Financials - 0.4% | | | |
| Banks - 0.3% | | | |
| African Development Bank 0.875% 7/22/2026 | | 419,000 | 397,072 |
| Asian Development Bank 0.375% 9/3/2025 | | 1,103,000 | 1,072,557 |
| Asian Development Bank 0.5% 2/4/2026 | | 611,000 | 585,773 |
| Asian Development Bank 0.75% 10/8/2030 | | 534,000 | 433,075 |
| Asian Development Bank 2% 4/24/2026 | | 173,000 | 167,801 |
| Asian Development Bank 2.5% 11/2/2027 | | 184,000 | 174,866 |
| Asian Development Bank 2.625% 1/12/2027 | | 178,000 | 171,947 |
| Asian Development Bank 2.75% 1/19/2028 | | 1,032,000 | 984,374 |
| European Investment Bank 0.75% 9/23/2030 | | 762,000 | 619,847 |
| European Investment Bank 0.875% 5/17/2030 | | 183,000 | 151,911 |
| European Investment Bank 1.25% 2/14/2031 | | 331,000 | 273,085 |
| European Investment Bank 1.875% 2/10/2025 | | 82,000 | 81,778 |
| European Investment Bank 2.375% 5/24/2027 | | 110,000 | 104,960 |
| Inter-American Development Bank 0.625% 7/15/2025 | | 607,000 | 595,027 |
| Inter-American Development Bank 0.875% 4/20/2026 | | 1,388,000 | 1,327,228 |
| Inter-American Development Bank 1.75% 3/14/2025 | | 505,000 | 502,330 |
| Inter-American Development Bank 2% 6/2/2026 | | 110,000 | 106,410 |
| Inter-American Development Bank 2.125% 1/15/2025 (h) | | 50,000 | 49,961 |
| Inter-American Development Bank 2.25% 6/18/2029 | | 524,000 | 477,482 |
| Inter-American Development Bank 2.375% 7/7/2027 | | 184,000 | 175,279 |
| Inter-American Development Bank 4.375% 1/24/2044 | | 239,000 | 218,449 |
| | | | 8,671,212 |
| Financial Services - 0.1% | | | |
| International Bank for Reconstruction & Development 0.375% 7/28/2025 | | 717,000 | 700,849 |
| International Bank for Reconstruction & Development 0.5% 10/28/2025 | | 905,000 | 877,135 |
| International Bank for Reconstruction & Development 0.75% 8/26/2030 | | 454,000 | 369,638 |
| International Bank for Reconstruction & Development 0.875% 5/14/2030 | | 555,000 | 459,800 |
| International Bank for Reconstruction & Development 1.25% 2/10/2031 | | 497,000 | 408,897 |
| International Bank for Reconstruction & Development 1.625% 1/15/2025 | | 488,000 | 487,345 |
| International Bank for Reconstruction & Development 1.875% 10/27/2026 | | 130,000 | 124,371 |
| International Bank for Reconstruction & Development 2.5% 3/29/2032 | | 1,000,000 | 871,162 |
| International Bank for Reconstruction & Development 2.5% 7/29/2025 | | 104,000 | 102,916 |
| International Finance Corp 0.75% 8/27/2030 | | 303,000 | 246,945 |
| | | | 4,649,058 |
| TOTAL MULTI-NATIONAL | | | 13,320,270 |
| NETHERLANDS - 0.4% | | | |
| Financials - 0.4% | | | |
| Banks - 0.4% | | | |
| ABN AMRO Bank NV 4.988% 12/3/2028 (b)(d) | | 10,000,000 | 9,978,507 |
| Cooperatieve Rabobank UA 3.75% 7/21/2026 | | 528,000 | 517,367 |
| Cooperatieve Rabobank UA 4.375% 8/4/2025 | | 936,000 | 932,226 |
| Cooperatieve Rabobank UA 5.25% 5/24/2041 | | 82,000 | 79,544 |
| | | | |
| TOTAL NETHERLANDS | | | 11,507,644 |
| NORWAY - 0.0% | | | |
| Energy - 0.0% | | | |
| Oil, Gas & Consumable Fuels - 0.0% | | | |
| Equinor ASA 2.375% 5/22/2030 | | 316,000 | 280,280 |
| Equinor ASA 3.125% 4/6/2030 | | 274,000 | 252,469 |
| Equinor ASA 3.625% 9/10/2028 | | 331,000 | 320,289 |
| Equinor ASA 3.7% 4/6/2050 | | 438,000 | 324,303 |
| Equinor ASA 5.1% 8/17/2040 | | 55,000 | 52,962 |
| | | | |
| TOTAL NORWAY | | | 1,230,303 |
| QATAR - 0.0% | | | |
| Utilities - 0.0% | | | |
| Gas Utilities - 0.0% | | | |
| Nakilat Inc 6.067% 12/31/2033 (d) | | 174,775 | 181,439 |
| SWITZERLAND - 0.4% | | | |
| Financials - 0.4% | | | |
| Capital Markets - 0.4% | | | |
| UBS Group AG 1.494% 8/10/2027 (b)(d) | | 732,000 | 692,599 |
| UBS Group AG 3.75% 3/26/2025 | | 585,000 | 583,249 |
| UBS Group AG 3.869% 1/12/2029 (b)(d) | | 505,000 | 486,272 |
| UBS Group AG 4.125% 9/24/2025 (d) | | 661,000 | 657,905 |
| UBS Group AG 4.194% 4/1/2031 (b)(d) | | 1,208,000 | 1,141,414 |
| UBS Group AG 4.55% 4/17/2026 | | 323,000 | 321,868 |
| UBS Group AG 4.875% 5/15/2045 | | 310,000 | 277,687 |
| UBS Group AG 6.537% 8/12/2033 (b)(d) | | 7,000,000 | 7,421,703 |
| | | | 11,582,697 |
| Insurance - 0.0% | | | |
| Swiss Re Finance Luxembourg SA 5% 4/2/2049 (b)(d) | | 200,000 | 198,343 |
| TOTAL SWITZERLAND | | | 11,781,040 |
| UNITED KINGDOM - 0.5% | | | |
| Consumer Staples - 0.1% | | | |
| Tobacco - 0.1% | | | |
| BAT Capital Corp 3.557% 8/15/2027 | | 153,000 | 148,043 |
| BAT Capital Corp 4.39% 8/15/2037 | | 298,000 | 257,073 |
| BAT Capital Corp 4.54% 8/15/2047 | | 306,000 | 241,320 |
| BAT Capital Corp 4.758% 9/6/2049 | | 334,000 | 270,365 |
| BAT Capital Corp 6.421% 8/2/2033 | | 422,000 | 446,027 |
| Imperial Brands Finance PLC 4.25% 7/21/2025 (d) | | 201,000 | 199,960 |
| Imperial Brands Finance PLC 6.125% 7/27/2027 (d) | | 1,309,000 | 1,344,040 |
| Reynolds American Inc 4.45% 6/12/2025 | | 303,000 | 302,155 |
| Reynolds American Inc 5.7% 8/15/2035 | | 153,000 | 153,438 |
| Reynolds American Inc 5.85% 8/15/2045 | | 116,000 | 110,450 |
| Reynolds American Inc 6.15% 9/15/2043 | | 502,000 | 496,523 |
| Reynolds American Inc 7.25% 6/15/2037 | | 570,000 | 626,547 |
| | | | 4,595,941 |
| Financials - 0.4% | | | |
| Banks - 0.4% | | | |
| Barclays PLC 2.279% 11/24/2027 (b) | | 500,000 | 475,587 |
| Barclays PLC 2.894% 11/24/2032 (b) | | 520,000 | 439,109 |
| Barclays PLC 4.836% 5/9/2028 | | 263,000 | 258,377 |
| Barclays PLC 4.95% 1/10/2047 | | 443,000 | 393,650 |
| Barclays PLC 5.088% 6/20/2030 (b) | | 923,000 | 899,074 |
| Barclays PLC 5.2% 5/12/2026 | | 781,000 | 781,890 |
| Barclays PLC 5.829% 5/9/2027 (b) | | 4,830,000 | 4,882,013 |
| Barclays PLC 6.224% 5/9/2034 (b) | | 2,572,000 | 2,641,932 |
| NatWest Group PLC 3.073% 5/22/2028 (b) | | 584,000 | 558,542 |
| NatWest Group PLC 4.8% 4/5/2026 | | 358,000 | 357,882 |
| NatWest Group PLC 4.892% 5/18/2029 (b) | | 234,000 | 231,624 |
| | | | 11,919,680 |
| Industrials - 0.0% | | | |
| Aerospace & Defense - 0.0% | | | |
| BAE Systems PLC 3.4% 4/15/2030 (d) | | 285,000 | 262,881 |
| TOTAL UNITED KINGDOM | | | 16,778,502 |
| UNITED STATES - 19.2% | | | |
| Communication Services - 2.1% | | | |
| Diversified Telecommunication Services - 0.5% | | | |
| AT&T Inc 1.65% 2/1/2028 | | 284,000 | 258,248 |
| AT&T Inc 2.25% 2/1/2032 | | 467,000 | 386,076 |
| AT&T Inc 2.55% 12/1/2033 | | 1,877,000 | 1,511,987 |
| AT&T Inc 2.75% 6/1/2031 | | 509,000 | 442,764 |
| AT&T Inc 2.95% 7/15/2026 | | 219,000 | 213,437 |
| AT&T Inc 3.3% 2/1/2052 | | 484,000 | 321,338 |
| AT&T Inc 3.5% 6/1/2041 | | 261,000 | 199,995 |
| AT&T Inc 3.5% 9/15/2053 | | 864,000 | 581,766 |
| AT&T Inc 3.55% 9/15/2055 | | 1,880,000 | 1,264,460 |
| AT&T Inc 3.65% 6/1/2051 | | 400,000 | 282,491 |
| AT&T Inc 3.65% 9/15/2059 | | 1,701,000 | 1,126,684 |
| AT&T Inc 3.8% 12/1/2057 | | 1,915,000 | 1,321,166 |
| AT&T Inc 3.8% 2/15/2027 | | 247,000 | 242,323 |
| AT&T Inc 4.35% 6/15/2045 | | 175,000 | 143,427 |
| AT&T Inc 4.5% 3/9/2048 | | 224,000 | 184,981 |
| AT&T Inc 4.65% 6/1/2044 | | 216,000 | 183,375 |
| Verizon Communications Inc 1.5% 9/18/2030 | | 110,000 | 91,246 |
| Verizon Communications Inc 1.68% 10/30/2030 | | 92,000 | 76,509 |
| Verizon Communications Inc 2.355% 3/15/2032 | | 1,607,000 | 1,332,690 |
| Verizon Communications Inc 2.55% 3/21/2031 | | 2,142,000 | 1,844,625 |
| Verizon Communications Inc 3.55% 3/22/2051 | | 299,000 | 211,288 |
| Verizon Communications Inc 4.272% 1/15/2036 | | 666,000 | 598,969 |
| Verizon Communications Inc 4.4% 11/1/2034 | | 103,000 | 95,426 |
| Verizon Communications Inc 4.75% 11/1/2041 | | 27,000 | 24,257 |
| Verizon Communications Inc 4.78% 2/15/2035 (d) | | 1,473,000 | 1,402,194 |
| Verizon Communications Inc 5.012% 4/15/2049 | | 67,000 | 61,964 |
| Verizon Communications Inc 5.012% 8/21/2054 | | 344,000 | 303,767 |
| | | | 14,707,453 |
| Entertainment - 0.1% | | | |
| Walt Disney Co/The 2% 9/1/2029 | | 286,000 | 254,320 |
| Walt Disney Co/The 2.65% 1/13/2031 | | 435,000 | 385,077 |
| Walt Disney Co/The 2.75% 9/1/2049 | | 286,000 | 178,367 |
| Walt Disney Co/The 3.5% 5/13/2040 | | 187,000 | 149,954 |
| Walt Disney Co/The 3.6% 1/13/2051 | | 186,000 | 136,703 |
| Walt Disney Co/The 3.7% 10/15/2025 | | 192,000 | 190,863 |
| Walt Disney Co/The 3.8% 3/22/2030 | | 2,891,000 | 2,767,056 |
| Walt Disney Co/The 4.7% 3/23/2050 | | 1,046,000 | 928,169 |
| Walt Disney Co/The 5.4% 10/1/2043 | | 106,000 | 104,084 |
| Walt Disney Co/The 6.15% 2/15/2041 | | 288,000 | 304,897 |
| Walt Disney Co/The 6.15% 3/1/2037 | | 108,000 | 114,980 |
| | | | 5,514,470 |
| Media - 1.3% | | | |
| Charter Communications Operating LLC / Charter Communications Operating Capital 2.3% 2/1/2032 | | 408,000 | 323,109 |
| Charter Communications Operating LLC / Charter Communications Operating Capital 2.8% 4/1/2031 | | 701,000 | 591,154 |
| Charter Communications Operating LLC / Charter Communications Operating Capital 3.5% 6/1/2041 | | 924,000 | 633,172 |
| Charter Communications Operating LLC / Charter Communications Operating Capital 3.7% 4/1/2051 | | 243,000 | 151,792 |
| Charter Communications Operating LLC / Charter Communications Operating Capital 3.9% 6/1/2052 | | 4,000,000 | 2,573,241 |
| Charter Communications Operating LLC / Charter Communications Operating Capital 4.2% 3/15/2028 | | 302,000 | 291,934 |
| Charter Communications Operating LLC / Charter Communications Operating Capital 4.4% 4/1/2033 | | 318,000 | 284,098 |
| Charter Communications Operating LLC / Charter Communications Operating Capital 4.8% 3/1/2050 | | 8,242,000 | 6,191,037 |
| Charter Communications Operating LLC / Charter Communications Operating Capital 4.908% 7/23/2025 | | 163,000 | 162,806 |
| Charter Communications Operating LLC / Charter Communications Operating Capital 5.05% 3/30/2029 | | 1,087,000 | 1,063,619 |
| Charter Communications Operating LLC / Charter Communications Operating Capital 5.125% 7/1/2049 | | 339,000 | 265,358 |
| Charter Communications Operating LLC / Charter Communications Operating Capital 5.375% 5/1/2047 | | 2,518,000 | 2,066,703 |
| Charter Communications Operating LLC / Charter Communications Operating Capital 5.5% 4/1/2063 | | 318,000 | 253,013 |
| Charter Communications Operating LLC / Charter Communications Operating Capital 5.75% 4/1/2048 | | 143,000 | 122,241 |
| Charter Communications Operating LLC / Charter Communications Operating Capital 6.1% 6/1/2029 | | 1,665,000 | 1,697,179 |
| Charter Communications Operating LLC / Charter Communications Operating Capital 6.384% 10/23/2035 | | 369,000 | 368,315 |
| Charter Communications Operating LLC / Charter Communications Operating Capital 6.484% 10/23/2045 | | 474,000 | 447,891 |
| Charter Communications Operating LLC / Charter Communications Operating Capital 6.55% 6/1/2034 | | 1,149,000 | 1,175,320 |
| Charter Communications Operating LLC / Charter Communications Operating Capital 6.834% 10/23/2055 | | 3,000,000 | 2,918,746 |
| Comcast Corp 1.5% 2/15/2031 | | 390,000 | 317,428 |
| Comcast Corp 1.95% 1/15/2031 | | 70,000 | 58,550 |
| Comcast Corp 2.35% 1/15/2027 | | 653,000 | 624,256 |
| Comcast Corp 2.45% 8/15/2052 | | 390,000 | 211,823 |
| Comcast Corp 2.65% 2/1/2030 | | 216,000 | 193,504 |
| Comcast Corp 2.8% 1/15/2051 | | 224,000 | 133,134 |
| Comcast Corp 3.15% 3/1/2026 | | 137,000 | 134,901 |
| Comcast Corp 3.3% 2/1/2027 | | 327,000 | 318,299 |
| Comcast Corp 3.375% 8/15/2025 | | 376,000 | 372,778 |
| Comcast Corp 3.4% 4/1/2030 | | 200,000 | 185,579 |
| Comcast Corp 3.45% 2/1/2050 | | 204,000 | 139,669 |
| Comcast Corp 3.75% 4/1/2040 | | 160,000 | 128,693 |
| Comcast Corp 3.969% 11/1/2047 | | 143,000 | 108,363 |
| Comcast Corp 4% 3/1/2048 | | 329,000 | 249,848 |
| Comcast Corp 4.15% 10/15/2028 | | 517,000 | 504,196 |
| Discovery Communications LLC 3.625% 5/15/2030 | | 765,000 | 680,543 |
| Discovery Communications LLC 4.125% 5/15/2029 | | 26,000 | 24,224 |
| Time Warner Cable LLC 4.5% 9/15/2042 | | 418,000 | 312,705 |
| Time Warner Cable LLC 5.5% 9/1/2041 | | 214,000 | 181,600 |
| Time Warner Cable LLC 5.875% 11/15/2040 | | 188,000 | 168,221 |
| Time Warner Cable LLC 6.55% 5/1/2037 | | 2,538,000 | 2,453,932 |
| Time Warner Cable LLC 7.3% 7/1/2038 | | 585,000 | 595,136 |
| TWDC Enterprises 18 Corp 1.85% 7/30/2026 | | 140,000 | 134,410 |
| TWDC Enterprises 18 Corp 3% 7/30/2046 | | 123,000 | 82,502 |
| TWDC Enterprises 18 Corp 3.15% 9/17/2025 | | 260,000 | 257,402 |
| TWDC Enterprises 18 Corp 4.125% 6/1/2044 | | 156,000 | 128,265 |
| Warnermedia Holdings Inc 3.638% 3/15/2025 | | 281,000 | 280,096 |
| Warnermedia Holdings Inc 3.755% 3/15/2027 | | 853,000 | 821,807 |
| Warnermedia Holdings Inc 4.054% 3/15/2029 | | 164,000 | 152,594 |
| Warnermedia Holdings Inc 4.279% 3/15/2032 | | 4,437,000 | 3,909,916 |
| Warnermedia Holdings Inc 5.05% 3/15/2042 | | 692,000 | 555,594 |
| Warnermedia Holdings Inc 5.141% 3/15/2052 | | 8,192,000 | 6,086,691 |
| | | | 42,087,387 |
| Wireless Telecommunication Services - 0.2% | | | |
| T-Mobile USA Inc 2.05% 2/15/2028 | | 412,000 | 378,355 |
| T-Mobile USA Inc 2.25% 11/15/2031 | | 5,000,000 | 4,153,522 |
| T-Mobile USA Inc 3.3% 2/15/2051 | | 412,000 | 271,731 |
| T-Mobile USA Inc 3.5% 4/15/2025 | | 241,000 | 239,910 |
| T-Mobile USA Inc 3.75% 4/15/2027 | | 997,000 | 974,028 |
| T-Mobile USA Inc 3.875% 4/15/2030 | | 1,339,000 | 1,259,982 |
| | | | 7,277,528 |
TOTAL COMMUNICATION SERVICES | | | 69,586,838 |
| | | | |
| Consumer Discretionary - 0.4% | | | |
| Automobiles - 0.1% | | | |
| General Motors Co 5% 10/1/2028 | | 189,000 | 188,162 |
| General Motors Co 5.2% 4/1/2045 | | 117,000 | 101,447 |
| General Motors Co 5.95% 4/1/2049 | | 173,000 | 163,425 |
| General Motors Co 6.6% 4/1/2036 | | 160,000 | 167,947 |
| General Motors Co 6.75% 4/1/2046 | | 196,000 | 204,554 |
| General Motors Co 6.8% 10/1/2027 | | 364,000 | 380,157 |
| General Motors Financial Co Inc 3.85% 1/5/2028 | | 192,000 | 185,433 |
| General Motors Financial Co Inc 4% 1/15/2025 | | 169,000 | 168,929 |
| General Motors Financial Co Inc 4% 10/6/2026 | | 101,000 | 99,562 |
| General Motors Financial Co Inc 4.3% 7/13/2025 | | 340,000 | 338,990 |
| General Motors Financial Co Inc 4.35% 1/17/2027 | | 219,000 | 216,466 |
| General Motors Financial Co Inc 5.65% 1/17/2029 | | 587,000 | 595,720 |
| General Motors Financial Co Inc 5.85% 4/6/2030 | | 1,080,000 | 1,103,035 |
| | | | 3,913,827 |
| Broadline Retail - 0.0% | | | |
| Kohl's Corp 4.25% 7/17/2025 | | 100,000 | 98,735 |
| Diversified Consumer Services - 0.0% | | | |
| American University/The 3.672% 4/1/2049 | | 66,000 | 50,141 |
| Duke University 2.832% 10/1/2055 | | 128,000 | 79,502 |
| George Washington University/The 4.126% 9/15/2048 | | 192,000 | 156,140 |
| George Washington University/The 4.3% 9/15/2044 | | 55,000 | 47,146 |
| Massachusetts Institute of Technology 2.989% 7/1/2050 | | 128,000 | 86,042 |
| Massachusetts Institute of Technology 3.885% 7/1/2116 | | 78,000 | 54,582 |
| Massachusetts Institute of Technology 3.959% 7/1/2038 | | 130,000 | 115,431 |
| Northwestern University 3.662% 12/1/2057 | | 152,000 | 111,472 |
| Northwestern University 4.643% 12/1/2044 | | 92,000 | 84,143 |
| President and Fellows of Harvard College 3.3% 7/15/2056 | | 133,000 | 91,191 |
| President and Fellows of Harvard College 3.619% 10/1/2037 | | 27,000 | 22,998 |
| Princeton Univ 5.7% 3/1/2039 | | 27,000 | 28,344 |
| Trane Technologies Global Holding Co Ltd 3.75% 8/21/2028 | | 127,000 | 122,554 |
| Trane Technologies Global Holding Co Ltd 4.3% 2/21/2048 | | 136,000 | 112,689 |
| University of Notre Dame du Lac 3.438% 2/15/2045 | | 91,000 | 69,150 |
| University of Southern California 2.945% 10/1/2051 | | 314,000 | 205,136 |
| University of Southern California 5.25% 10/1/2111 | | 55,000 | 50,627 |
| William Marsh Rice University 3.774% 5/15/2055 | | 50,000 | 37,990 |
| | | | 1,525,278 |
| Hotels, Restaurants & Leisure - 0.0% | | | |
| McDonald's Corp 3.3% 7/1/2025 | | 165,000 | 163,821 |
| McDonald's Corp 3.5% 7/1/2027 | | 475,000 | 462,654 |
| McDonald's Corp 3.6% 7/1/2030 | | 448,000 | 420,238 |
| McDonald's Corp 3.7% 1/30/2026 | | 463,000 | 459,410 |
| Metropolitan Museum of Art/The 3.4% 7/1/2045 | | 82,000 | 60,528 |
| | | | 1,566,651 |
| Specialty Retail - 0.3% | | | |
| AutoNation Inc 3.85% 3/1/2032 | | 2,004,000 | 1,796,171 |
| AutoNation Inc 4.75% 6/1/2030 | | 96,000 | 92,685 |
| AutoZone Inc 3.25% 4/15/2025 | | 110,000 | 109,477 |
| AutoZone Inc 3.625% 4/15/2025 | | 461,000 | 459,438 |
| AutoZone Inc 3.75% 6/1/2027 | | 159,000 | 155,363 |
| AutoZone Inc 4% 4/15/2030 | | 996,000 | 948,198 |
| Lowe's Cos Inc 1.3% 4/15/2028 | | 220,000 | 196,673 |
| Lowe's Cos Inc 1.7% 10/15/2030 | | 334,000 | 279,447 |
| Lowe's Cos Inc 3.35% 4/1/2027 | | 85,000 | 82,557 |
| Lowe's Cos Inc 3.65% 4/5/2029 | | 294,000 | 279,963 |
| Lowe's Cos Inc 3.7% 4/15/2046 | | 96,000 | 71,029 |
| Lowe's Cos Inc 3.75% 4/1/2032 | | 899,000 | 823,285 |
| Lowe's Cos Inc 4.05% 5/3/2047 | | 315,000 | 244,576 |
| Lowe's Cos Inc 4.45% 4/1/2062 | | 1,098,000 | 850,445 |
| Lowe's Cos Inc 4.5% 4/15/2030 | | 811,000 | 795,669 |
| O'Reilly Automotive Inc 4.2% 4/1/2030 | | 148,000 | 142,287 |
| | | | 7,327,263 |
TOTAL CONSUMER DISCRETIONARY | | | 14,431,754 |
| | | | |
| Consumer Staples - 0.3% | | | |
| Beverages - 0.2% | | | |
| Coca-Cola Co/The 1.375% 3/15/2031 | | 334,000 | 273,369 |
| Coca-Cola Co/The 1.45% 6/1/2027 | | 230,000 | 214,728 |
| Coca-Cola Co/The 1.65% 6/1/2030 | | 230,000 | 196,142 |
| Coca-Cola Co/The 2.5% 3/15/2051 | | 167,000 | 97,898 |
| Coca-Cola Co/The 2.5% 6/1/2040 | | 230,000 | 161,065 |
| Coca-Cola Co/The 2.6% 6/1/2050 | | 230,000 | 138,621 |
| Coca-Cola Co/The 2.75% 6/1/2060 | | 230,000 | 134,081 |
| Coca-Cola Co/The 3.375% 3/25/2027 | | 713,000 | 698,192 |
| Coca-Cola Co/The 3.45% 3/25/2030 | | 436,000 | 411,322 |
| Molson Coors Beverage Co 3% 7/15/2026 | | 1,419,000 | 1,382,253 |
| Molson Coors Beverage Co 4.2% 7/15/2046 | | 363,000 | 289,769 |
| Molson Coors Beverage Co 5% 5/1/2042 | | 1,644,000 | 1,511,026 |
| | | | 5,508,466 |
| Consumer Staples Distribution & Retail - 0.0% | | | |
| Dollar Tree Inc 4% 5/15/2025 | | 219,000 | 218,184 |
| Food Products - 0.0% | | | |
| General Mills Inc 2.875% 4/15/2030 | | 289,000 | 259,934 |
| General Mills Inc 3% 2/1/2051 | | 168,000 | 106,296 |
| General Mills Inc 4.2% 4/17/2028 | | 472,000 | 462,178 |
| | | | 828,408 |
| Tobacco - 0.1% | | | |
| Altria Group Inc 3.875% 9/16/2046 | | 274,000 | 198,590 |
| Altria Group Inc 4.25% 8/9/2042 | | 963,000 | 767,942 |
| Altria Group Inc 4.5% 5/2/2043 | | 466,000 | 380,304 |
| Altria Group Inc 4.8% 2/14/2029 | | 491,000 | 485,146 |
| Altria Group Inc 5.8% 2/14/2039 | | 256,000 | 252,906 |
| Altria Group Inc 5.95% 2/14/2049 | | 452,000 | 442,242 |
| Philip Morris International Inc 2.75% 2/25/2026 | | 103,000 | 100,786 |
| Philip Morris International Inc 3.875% 8/21/2042 | | 132,000 | 104,368 |
| Philip Morris International Inc 4.125% 3/4/2043 | | 274,000 | 222,517 |
| Philip Morris International Inc 4.875% 11/15/2043 | | 165,000 | 147,587 |
| Philip Morris International Inc 6.375% 5/16/2038 | | 40,000 | 42,953 |
| | | | 3,145,341 |
TOTAL CONSUMER STAPLES | | | 9,700,399 |
| | | | |
| Energy - 1.3% | | | |
| Energy Equipment & Services - 0.0% | | | |
| Halliburton Co 2.92% 3/1/2030 | | 264,000 | 237,575 |
| Halliburton Co 3.8% 11/15/2025 | | 14,000 | 13,882 |
| Halliburton Co 4.85% 11/15/2035 | | 270,000 | 256,554 |
| Halliburton Co 5% 11/15/2045 | | 207,000 | 184,805 |
| Halliburton Co 7.45% 9/15/2039 | | 41,000 | 47,926 |
| | | | 740,742 |
| Oil, Gas & Consumable Fuels - 1.3% | | | |
| Columbia Pipeline Group Inc 4.5% 6/1/2025 | | 259,000 | 258,315 |
| Columbia Pipelines Operating Co LLC 5.927% 8/15/2030 (d) | | 432,000 | 444,663 |
| Columbia Pipelines Operating Co LLC 6.036% 11/15/2033 (d) | | 1,163,000 | 1,193,008 |
| Columbia Pipelines Operating Co LLC 6.497% 8/15/2043 (d) | | 348,000 | 361,098 |
| Columbia Pipelines Operating Co LLC 6.544% 11/15/2053 (d) | | 626,000 | 656,031 |
| Columbia Pipelines Operating Co LLC 6.714% 8/15/2063 (d) | | 375,000 | 398,109 |
| DCP Midstream Operating LP 5.125% 5/15/2029 | | 1,257,000 | 1,258,980 |
| DCP Midstream Operating LP 5.6% 4/1/2044 | | 154,000 | 143,939 |
| DCP Midstream Operating LP 6.45% 11/3/2036 (d) | | 311,000 | 319,963 |
| DCP Midstream Operating LP 6.75% 9/15/2037 (d) | | 1,205,000 | 1,294,581 |
| Energy Transfer LP 3.75% 5/15/2030 | | 750,000 | 699,731 |
| Energy Transfer LP 3.9% 7/15/2026 | | 206,000 | 203,291 |
| Energy Transfer LP 4.95% 6/15/2028 | | 767,000 | 765,646 |
| Energy Transfer LP 5% 5/15/2050 | | 3,892,000 | 3,301,801 |
| Energy Transfer LP 5.15% 3/15/2045 | | 219,000 | 191,654 |
| Energy Transfer LP 5.25% 4/15/2029 | | 258,000 | 258,919 |
| Energy Transfer LP 5.3% 4/1/2044 | | 159,000 | 142,213 |
| Energy Transfer LP 5.4% 10/1/2047 | | 420,000 | 377,339 |
| Energy Transfer LP 5.8% 6/15/2038 | | 523,000 | 514,040 |
| Energy Transfer LP 6% 6/15/2048 | | 923,000 | 891,536 |
| Energy Transfer LP 6.125% 12/15/2045 | | 120,000 | 118,439 |
| Energy Transfer LP 6.25% 4/15/2049 | | 257,000 | 257,215 |
| Enterprise Products Operating LLC 3.7% 2/15/2026 | | 652,000 | 645,745 |
| Hess Corp 4.3% 4/1/2027 | | 614,000 | 607,735 |
| Hess Corp 5.6% 2/15/2041 | | 2,043,000 | 2,017,620 |
| Hess Corp 5.8% 4/1/2047 | | 117,000 | 117,073 |
| Hess Corp 7.125% 3/15/2033 | | 126,000 | 139,643 |
| Hess Corp 7.3% 8/15/2031 | | 168,000 | 186,577 |
| Hess Corp 7.875% 10/1/2029 | | 551,000 | 613,770 |
| Kinder Morgan Energy Partners LP 4.7% 11/1/2042 | | 104,000 | 87,403 |
| Kinder Morgan Energy Partners LP 5% 3/1/2043 | | 27,000 | 23,512 |
| Kinder Morgan Energy Partners LP 5.5% 3/1/2044 | | 192,000 | 177,947 |
| Kinder Morgan Energy Partners LP 5.625% 9/1/2041 | | 27,000 | 25,456 |
| Kinder Morgan Energy Partners LP 6.55% 9/15/2040 | | 140,000 | 145,461 |
| Kinder Morgan Inc 4.3% 3/1/2028 | | 273,000 | 267,912 |
| Kinder Morgan Inc 5.2% 3/1/2048 | | 241,000 | 212,558 |
| Kinder Morgan Inc 5.3% 12/1/2034 | | 234,000 | 227,909 |
| Kinder Morgan Inc 5.55% 6/1/2045 | | 573,000 | 535,523 |
| Marathon Petroleum Corp 4.5% 4/1/2048 | | 160,000 | 124,922 |
| Marathon Petroleum Corp 4.7% 5/1/2025 | | 601,000 | 600,310 |
| Marathon Petroleum Corp 6.5% 3/1/2041 | | 27,000 | 27,974 |
| MPLX LP 4.125% 3/1/2027 | | 259,000 | 255,155 |
| MPLX LP 4.7% 4/15/2048 | | 535,000 | 438,375 |
| MPLX LP 4.8% 2/15/2029 | | 393,000 | 389,567 |
| MPLX LP 4.95% 9/1/2032 | | 2,488,000 | 2,398,718 |
| MPLX LP 5.2% 3/1/2047 | | 168,000 | 149,150 |
| MPLX LP 5.5% 2/15/2049 | | 662,000 | 607,821 |
| Occidental Petroleum Corp 6.2% 3/15/2040 | | 214,000 | 210,833 |
| Occidental Petroleum Corp 6.45% 9/15/2036 | | 578,000 | 591,715 |
| Occidental Petroleum Corp 6.6% 3/15/2046 | | 717,000 | 723,858 |
| Occidental Petroleum Corp 7.5% 5/1/2031 | | 964,000 | 1,053,902 |
| ONEOK Inc 4.25% 9/15/2046 | | 151,000 | 116,010 |
| ONEOK Inc 4.25% 9/24/2027 | | 820,000 | 808,092 |
| ONEOK Inc 4.4% 10/15/2029 | | 858,000 | 831,833 |
| ONEOK Inc 4.45% 9/1/2049 | | 160,000 | 124,791 |
| ONEOK Inc 4.75% 10/15/2031 | | 1,669,000 | 1,614,438 |
| ONEOK Inc 4.95% 7/13/2047 | | 160,000 | 135,379 |
| ONEOK Inc 5% 3/1/2026 | | 82,000 | 82,126 |
| ONEOK Inc 5.2% 7/15/2048 | | 83,000 | 73,095 |
| Ovintiv Inc 6.5% 2/1/2038 | | 244,000 | 248,432 |
| Phillips 66 3.85% 4/9/2025 | | 77,000 | 76,782 |
| Phillips 66 4.875% 11/15/2044 | | 27,000 | 23,296 |
| Phillips 66 5.875% 5/1/2042 | | 260,000 | 258,421 |
| Plains All American Pipeline LP / PAA Finance Corp 3.55% 12/15/2029 | | 166,000 | 154,399 |
| Plains All American Pipeline LP / PAA Finance Corp 4.65% 10/15/2025 | | 336,000 | 335,504 |
| Plains All American Pipeline LP / PAA Finance Corp 4.9% 2/15/2045 | | 52,000 | 44,101 |
| Plains All American Pipeline LP / PAA Finance Corp 6.65% 1/15/2037 | | 77,000 | 80,692 |
| Sabine Pass Liquefaction LLC 4.5% 5/15/2030 | | 1,002,000 | 970,612 |
| Spectra Energy Partners LP 3.375% 10/15/2026 | | 447,000 | 436,430 |
| Transcontinental Gas Pipe Line Co LLC 3.25% 5/15/2030 | | 288,000 | 262,368 |
| Transcontinental Gas Pipe Line Co LLC 4.45% 8/1/2042 | | 212,000 | 178,958 |
| Transcontinental Gas Pipe Line Co LLC 4.6% 3/15/2048 | | 110,000 | 91,385 |
| Western Gas Partners LP 3.95% 6/1/2025 | | 109,000 | 108,448 |
| Western Gas Partners LP 4.5% 3/1/2028 | | 251,000 | 245,719 |
| Western Gas Partners LP 4.65% 7/1/2026 | | 1,137,000 | 1,131,076 |
| Western Gas Partners LP 4.75% 8/15/2028 | | 145,000 | 142,419 |
| Williams Cos Inc/The 3.5% 11/15/2030 | | 1,068,000 | 981,308 |
| Williams Cos Inc/The 3.75% 6/15/2027 | | 640,000 | 623,821 |
| Williams Cos Inc/The 3.9% 1/15/2025 | | 250,000 | 249,897 |
| Williams Cos Inc/The 4.65% 8/15/2032 | | 2,571,000 | 2,446,950 |
| Williams Cos Inc/The 4.85% 3/1/2048 | | 231,000 | 196,743 |
| Williams Cos Inc/The 5.3% 8/15/2052 | | 581,000 | 531,134 |
| Williams Cos Inc/The 5.75% 6/24/2044 | | 52,000 | 50,380 |
| | | | 41,309,694 |
TOTAL ENERGY | | | 42,050,436 |
| | | | |
| Financials - 10.3% | | | |
| Banks - 4.8% | | | |
| Bank of America Corp 1.658% 3/11/2027 (b) | | 532,000 | 512,628 |
| Bank of America Corp 1.734% 7/22/2027 (b) | | 690,000 | 657,795 |
| Bank of America Corp 2.015% 2/13/2026 (b) | | 692,000 | 689,686 |
| Bank of America Corp 2.087% 6/14/2029 (b) | | 157,000 | 142,488 |
| Bank of America Corp 2.299% 7/21/2032 (b) | | 2,174,000 | 1,812,360 |
| Bank of America Corp 2.651% 3/11/2032 (b) | | 506,000 | 436,197 |
| Bank of America Corp 2.676% 6/19/2041 (b) | | 340,000 | 236,038 |
| Bank of America Corp 2.687% 4/22/2032 (b) | | 246,000 | 211,459 |
| Bank of America Corp 2.831% 10/24/2051 (b) | | 276,000 | 169,834 |
| Bank of America Corp 2.972% 7/21/2052 (b) | | 268,000 | 170,362 |
| Bank of America Corp 3.194% 7/23/2030 (b) | | 1,318,000 | 1,214,145 |
| Bank of America Corp 3.248% 10/21/2027 | | 103,000 | 99,267 |
| Bank of America Corp 3.366% 1/23/2026 (b) | | 724,000 | 723,318 |
| Bank of America Corp 3.419% 12/20/2028 (b) | | 3,213,000 | 3,080,517 |
| Bank of America Corp 3.593% 7/21/2028 (b) | | 304,000 | 294,349 |
| Bank of America Corp 3.705% 4/24/2028 (b) | | 241,000 | 234,721 |
| Bank of America Corp 3.846% 3/8/2037 (b) | | 197,000 | 174,502 |
| Bank of America Corp 3.95% 4/21/2025 | | 518,000 | 516,577 |
| Bank of America Corp 3.97% 3/5/2029 (b) | | 601,000 | 582,866 |
| Bank of America Corp 3.974% 2/7/2030 (b) | | 388,000 | 371,832 |
| Bank of America Corp 4% 1/22/2025 | | 165,000 | 164,917 |
| Bank of America Corp 4.083% 3/20/2051 (b) | | 173,000 | 135,429 |
| Bank of America Corp 4.183% 11/25/2027 | | 425,000 | 417,177 |
| Bank of America Corp 4.25% 10/22/2026 | | 645,000 | 639,465 |
| Bank of America Corp 4.271% 7/23/2029 (b) | | 494,000 | 481,292 |
| Bank of America Corp 4.33% 3/15/2050 (b) | | 359,000 | 293,885 |
| Bank of America Corp 4.443% 1/20/2048 (b) | | 418,000 | 352,047 |
| Bank of America Corp 4.45% 3/3/2026 | | 547,000 | 544,733 |
| Bank of America Corp 4.571% 4/27/2033 (b) | | 10,000,000 | 9,503,167 |
| Bank of America Corp 5% 1/21/2044 | | 147,000 | 137,265 |
| Bank of America Corp 5.015% 7/22/2033 (b) | | 14,951,000 | 14,664,217 |
| Bank of America Corp 5.875% 2/7/2042 | | 90,000 | 93,894 |
| Bank of America Corp 6.11% 1/29/2037 | | 194,000 | 200,961 |
| Bank of America Corp 7.75% 5/14/2038 | | 114,000 | 133,167 |
| Citigroup Inc 1.122% 1/28/2027 (b) | | 487,000 | 467,685 |
| Citigroup Inc 2.561% 5/1/2032 (b) | | 414,000 | 350,411 |
| Citigroup Inc 3.106% 4/8/2026 (b) | | 854,000 | 849,885 |
| Citigroup Inc 3.52% 10/27/2028 (b) | | 632,000 | 608,254 |
| Citigroup Inc 3.668% 7/24/2028 (b) | | 1,119,000 | 1,083,934 |
| Citigroup Inc 3.7% 1/12/2026 | | 305,000 | 301,952 |
| Citigroup Inc 3.875% 3/26/2025 | | 1,193,000 | 1,189,829 |
| Citigroup Inc 3.887% 1/10/2028 (b) | | 123,000 | 120,570 |
| Citigroup Inc 3.98% 3/20/2030 (b) | | 976,000 | 931,824 |
| Citigroup Inc 4.125% 7/25/2028 | | 423,000 | 411,258 |
| Citigroup Inc 4.3% 11/20/2026 | | 218,000 | 216,028 |
| Citigroup Inc 4.4% 6/10/2025 | | 110,000 | 109,668 |
| Citigroup Inc 4.412% 3/31/2031 (b) | | 1,601,000 | 1,538,826 |
| Citigroup Inc 4.45% 9/29/2027 | | 3,118,000 | 3,075,758 |
| Citigroup Inc 4.6% 3/9/2026 | | 441,000 | 439,800 |
| Citigroup Inc 4.65% 7/23/2048 | | 389,000 | 332,853 |
| Citigroup Inc 4.75% 5/18/2046 | | 216,000 | 189,803 |
| Citigroup Inc 4.91% 5/24/2033 (b) | | 11,248,000 | 10,871,130 |
| Citigroup Inc 5.3% 5/6/2044 | | 55,000 | 51,768 |
| Citigroup Inc 5.5% 9/13/2025 | | 831,000 | 834,667 |
| Citigroup Inc 5.875% 1/30/2042 | | 149,000 | 152,286 |
| Citigroup Inc 6.27% 11/17/2033 (b) | | 5,000,000 | 5,243,007 |
| Citigroup Inc 8.125% 7/15/2039 | | 219,000 | 270,280 |
| Citizens Financial Group Inc 2.638% 9/30/2032 | | 662,000 | 531,999 |
| Citizens Financial Group Inc 5.718% 7/23/2032 (b) | | 4,546,000 | 4,561,832 |
| Fifth Third Bancorp 2.55% 5/5/2027 | | 407,000 | 386,471 |
| Fifth Third Bancorp 4.895% 9/6/2030 (b) | | 3,500,000 | 3,452,142 |
| Fifth Third Bancorp 8.25% 3/1/2038 | | 57,000 | 68,339 |
| JPMorgan Chase & Co 1.47% 9/22/2027 (b) | | 821,000 | 776,633 |
| JPMorgan Chase & Co 1.953% 2/4/2032 (b) | | 440,000 | 364,704 |
| JPMorgan Chase & Co 2.083% 4/22/2026 (b) | | 1,010,000 | 1,001,324 |
| JPMorgan Chase & Co 2.522% 4/22/2031 (b) | | 329,000 | 289,837 |
| JPMorgan Chase & Co 2.545% 11/8/2032 (b) | | 642,000 | 541,538 |
| JPMorgan Chase & Co 2.95% 10/1/2026 | | 692,000 | 674,216 |
| JPMorgan Chase & Co 2.956% 5/13/2031 (b) | | 884,000 | 790,746 |
| JPMorgan Chase & Co 3.109% 4/22/2051 (b) | | 409,000 | 270,703 |
| JPMorgan Chase & Co 3.3% 4/1/2026 | | 247,000 | 243,227 |
| JPMorgan Chase & Co 3.509% 1/23/2029 (b) | | 867,000 | 831,783 |
| JPMorgan Chase & Co 3.54% 5/1/2028 (b) | | 466,000 | 452,796 |
| JPMorgan Chase & Co 3.882% 7/24/2038 (b) | | 123,000 | 104,942 |
| JPMorgan Chase & Co 3.9% 7/15/2025 | | 592,000 | 589,887 |
| JPMorgan Chase & Co 3.96% 1/29/2027 (b) | | 334,000 | 331,405 |
| JPMorgan Chase & Co 3.964% 11/15/2048 (b) | | 258,000 | 201,734 |
| JPMorgan Chase & Co 4.005% 4/23/2029 (b) | | 563,000 | 545,853 |
| JPMorgan Chase & Co 4.125% 12/15/2026 | | 1,929,000 | 1,908,598 |
| JPMorgan Chase & Co 4.203% 7/23/2029 (b) | | 1,198,000 | 1,165,771 |
| JPMorgan Chase & Co 4.323% 4/26/2028 (b) | | 326,000 | 322,101 |
| JPMorgan Chase & Co 4.452% 12/5/2029 (b) | | 335,000 | 328,298 |
| JPMorgan Chase & Co 4.493% 3/24/2031 (b) | | 1,607,000 | 1,565,829 |
| JPMorgan Chase & Co 4.586% 4/26/2033 (b) | | 8,275,000 | 7,935,971 |
| JPMorgan Chase & Co 4.85% 2/1/2044 | | 137,000 | 126,082 |
| JPMorgan Chase & Co 4.912% 7/25/2033 (b) | | 15,028,000 | 14,693,129 |
| JPMorgan Chase & Co 4.95% 6/1/2045 | | 262,000 | 237,884 |
| JPMorgan Chase & Co 5.5% 10/15/2040 | | 156,000 | 155,220 |
| JPMorgan Chase & Co 5.6% 7/15/2041 | | 41,000 | 41,392 |
| JPMorgan Chase & Co 5.625% 8/16/2043 | | 137,000 | 136,545 |
| JPMorgan Chase & Co 5.717% 9/14/2033 (b) | | 2,300,000 | 2,349,193 |
| PNC Financial Services Group Inc/The 1.15% 8/13/2026 | | 345,000 | 325,989 |
| PNC Financial Services Group Inc/The 2.6% 7/23/2026 | | 667,000 | 646,121 |
| PNC Financial Services Group Inc/The 4.626% 6/6/2033 (b) | | 15,000,000 | 14,124,300 |
| Santander Holdings USA Inc 2.49% 1/6/2028 (b) | | 717,000 | 679,982 |
| Wells Fargo & Co 2.164% 2/11/2026 (b) | | 1,018,000 | 1,014,895 |
| Wells Fargo & Co 2.188% 4/30/2026 (b) | | 806,000 | 798,703 |
| Wells Fargo & Co 2.572% 2/11/2031 (b) | | 644,000 | 567,932 |
| Wells Fargo & Co 3% 10/23/2026 | | 557,000 | 540,078 |
| Wells Fargo & Co 3.068% 4/30/2041 (b) | | 487,000 | 354,320 |
| Wells Fargo & Co 3.35% 3/2/2033 (b) | | 157,000 | 137,634 |
| Wells Fargo & Co 3.526% 3/24/2028 (b) | | 1,167,000 | 1,131,907 |
| Wells Fargo & Co 3.584% 5/22/2028 (b) | | 287,000 | 278,116 |
| Wells Fargo & Co 3.9% 5/1/2045 | | 130,000 | 101,109 |
| Wells Fargo & Co 4.1% 6/3/2026 | | 88,000 | 87,046 |
| Wells Fargo & Co 4.4% 6/14/2046 | | 196,000 | 157,382 |
| Wells Fargo & Co 4.478% 4/4/2031 (b) | | 1,796,000 | 1,738,485 |
| Wells Fargo & Co 4.75% 12/7/2046 | | 439,000 | 370,073 |
| Wells Fargo & Co 4.897% 7/25/2033 (b) | | 13,435,000 | 12,975,057 |
| Wells Fargo & Co 4.9% 11/17/2045 | | 265,000 | 229,666 |
| Wells Fargo & Co 5.013% 4/4/2051 (b) | | 2,145,000 | 1,904,007 |
| Wells Fargo & Co 5.375% 11/2/2043 | | 184,000 | 171,808 |
| Wells Fargo & Co 5.499% 1/23/2035 (b) | | 670,000 | 667,153 |
| Wells Fargo & Co 5.606% 1/15/2044 | | 312,000 | 298,540 |
| | | | 157,012,460 |
| Capital Markets - 2.7% | | | |
| Ares Capital Corp 2.15% 7/15/2026 | | 705,000 | 674,066 |
| Ares Capital Corp 3.25% 7/15/2025 | | 173,000 | 171,321 |
| Ares Capital Corp 3.875% 1/15/2026 | | 1,565,000 | 1,547,102 |
| Athene Global Funding 5.339% 1/15/2027 (d) | | 4,421,000 | 4,447,975 |
| Athene Global Funding 5.583% 1/9/2029 (d) | | 2,226,000 | 2,251,344 |
| Blackstone Private Credit Fund 2.7% 1/15/2025 | | 437,000 | 436,547 |
| Blackstone Private Credit Fund 4.7% 3/24/2025 | | 2,482,000 | 2,478,261 |
| Blackstone Private Credit Fund 7.05% 9/29/2025 | | 3,077,000 | 3,122,012 |
| Goldman Sachs Group Inc/The 0.855% 2/12/2026 (b) | | 471,000 | 468,678 |
| Goldman Sachs Group Inc/The 1.093% 12/9/2026 (b) | | 1,144,000 | 1,104,336 |
| Goldman Sachs Group Inc/The 2.383% 7/21/2032 (b) | | 1,960,000 | 1,633,467 |
| Goldman Sachs Group Inc/The 2.6% 2/7/2030 | | 334,000 | 295,855 |
| Goldman Sachs Group Inc/The 2.615% 4/22/2032 (b) | | 848,000 | 722,602 |
| Goldman Sachs Group Inc/The 2.65% 10/21/2032 (b) | | 434,000 | 366,829 |
| Goldman Sachs Group Inc/The 3.102% 2/24/2033 (b) | | 16,994,000 | 14,646,600 |
| Goldman Sachs Group Inc/The 3.436% 2/24/2043 (b) | | 137,000 | 101,984 |
| Goldman Sachs Group Inc/The 3.5% 1/23/2025 | | 1,432,000 | 1,431,176 |
| Goldman Sachs Group Inc/The 3.691% 6/5/2028 (b) | | 5,717,000 | 5,552,706 |
| Goldman Sachs Group Inc/The 3.8% 3/15/2030 | | 1,945,000 | 1,823,983 |
| Goldman Sachs Group Inc/The 3.85% 1/26/2027 | | 829,000 | 813,516 |
| Goldman Sachs Group Inc/The 4.25% 10/21/2025 | | 422,000 | 419,672 |
| Goldman Sachs Group Inc/The 4.411% 4/23/2039 (b) | | 130,000 | 114,570 |
| Goldman Sachs Group Inc/The 4.75% 10/21/2045 | | 433,000 | 383,167 |
| Goldman Sachs Group Inc/The 5.95% 1/15/2027 | | 411,000 | 421,180 |
| Goldman Sachs Group Inc/The 6.75% 10/1/2037 | | 843,000 | 902,482 |
| Moody's Corp 3.25% 1/15/2028 | | 737,000 | 706,083 |
| Moody's Corp 3.75% 3/24/2025 | | 637,000 | 635,395 |
| Moody's Corp 4.875% 12/17/2048 | | 284,000 | 252,604 |
| Morgan Stanley 1.512% 7/20/2027 (b) | | 270,000 | 256,593 |
| Morgan Stanley 1.593% 5/4/2027 (b) | | 393,000 | 376,703 |
| Morgan Stanley 2.188% 4/28/2026 (b) | | 672,000 | 666,007 |
| Morgan Stanley 2.239% 7/21/2032 (b) | | 255,000 | 211,144 |
| Morgan Stanley 2.511% 10/20/2032 (b) | | 137,000 | 114,793 |
| Morgan Stanley 3.125% 7/27/2026 | | 2,912,000 | 2,844,568 |
| Morgan Stanley 3.217% 4/22/2042 (b) | | 498,000 | 368,185 |
| Morgan Stanley 3.591% 7/22/2028 (b) | | 984,000 | 948,876 |
| Morgan Stanley 3.622% 4/1/2031 (b) | | 1,260,000 | 1,170,324 |
| Morgan Stanley 3.625% 1/20/2027 | | 1,381,000 | 1,355,827 |
| Morgan Stanley 3.772% 1/24/2029 (b) | | 337,000 | 324,990 |
| Morgan Stanley 3.875% 1/27/2026 | | 144,000 | 142,886 |
| Morgan Stanley 3.95% 4/23/2027 | | 937,000 | 918,267 |
| Morgan Stanley 3.971% 7/22/2038 (b) | | 171,000 | 145,440 |
| Morgan Stanley 4.3% 1/27/2045 | | 55,000 | 45,335 |
| Morgan Stanley 4.375% 1/22/2047 | | 304,000 | 253,867 |
| Morgan Stanley 4.431% 1/23/2030 (b) | | 552,000 | 537,239 |
| Morgan Stanley 4.457% 4/22/2039 (b) | | 207,000 | 185,297 |
| Morgan Stanley 4.889% 7/20/2033 (b) | | 10,161,000 | 9,843,968 |
| Morgan Stanley 5% 11/24/2025 | | 1,838,000 | 1,841,005 |
| Morgan Stanley 5.597% 3/24/2051 (b) | | 355,000 | 351,094 |
| Morgan Stanley 6.342% 10/18/2033 (b) | | 15,700,000 | 16,607,561 |
| Morgan Stanley 6.375% 7/24/2042 | | 80,000 | 86,430 |
| Morgan Stanley 7.25% 4/1/2032 | | 27,000 | 30,336 |
| Peachtree Corners Funding Trust 3.976% 2/15/2025 (d) | | 628,000 | 626,665 |
| | | | 88,178,913 |
| Consumer Finance - 1.6% | | | |
| Ally Financial Inc 2.2% 11/2/2028 | | 330,000 | 293,597 |
| Ally Financial Inc 5.8% 5/1/2025 | | 1,168,000 | 1,169,335 |
| Ally Financial Inc 6.7% 2/14/2033 | | 6,000,000 | 6,048,404 |
| Ally Financial Inc 7.1% 11/15/2027 | | 2,990,000 | 3,155,774 |
| Ally Financial Inc 8% 11/1/2031 | | 5,339,000 | 5,902,950 |
| Capital One Financial Corp 2.636% 3/3/2026 (b) | | 612,000 | 609,400 |
| Capital One Financial Corp 3.273% 3/1/2030 (b) | | 783,000 | 723,914 |
| Capital One Financial Corp 3.65% 5/11/2027 | | 1,693,000 | 1,648,125 |
| Capital One Financial Corp 3.75% 3/9/2027 | | 970,000 | 947,043 |
| Capital One Financial Corp 3.75% 7/28/2026 | | 267,000 | 262,037 |
| Capital One Financial Corp 3.8% 1/31/2028 | | 1,242,000 | 1,198,814 |
| Capital One Financial Corp 4.985% 7/24/2026 (b) | | 2,477,000 | 2,475,046 |
| Capital One Financial Corp 5.247% 7/26/2030 (b) | | 3,190,000 | 3,180,201 |
| Capital One Financial Corp 5.468% 2/1/2029 (b) | | 2,078,000 | 2,092,428 |
| Capital One Financial Corp 5.817% 2/1/2034 (b) | | 8,003,000 | 8,037,611 |
| Capital One Financial Corp 6.377% 6/8/2034 (b) | | 2,857,000 | 2,966,367 |
| Discover Financial Services 4.1% 2/9/2027 | | 358,000 | 351,535 |
| Discover Financial Services 4.5% 1/30/2026 | | 1,105,000 | 1,100,356 |
| Ford Motor Credit Co LLC 5.303% 9/6/2029 | | 6,610,000 | 6,477,689 |
| Synchrony Financial 3.7% 8/4/2026 | | 129,000 | 126,180 |
| Synchrony Financial 3.95% 12/1/2027 | | 965,000 | 933,036 |
| Synchrony Financial 5.15% 3/19/2029 | | 721,000 | 710,172 |
| | | | 50,410,014 |
| Financial Services - 0.9% | | | |
| Aon Corp / Aon Global Holdings PLC 2.6% 12/2/2031 | | 547,000 | 463,743 |
| Corebridge Financial Inc 3.5% 4/4/2025 | | 254,000 | 253,091 |
| Corebridge Financial Inc 3.65% 4/5/2027 | | 4,362,000 | 4,241,137 |
| Corebridge Financial Inc 3.85% 4/5/2029 | | 355,000 | 338,992 |
| Corebridge Financial Inc 3.9% 4/5/2032 | | 423,000 | 384,996 |
| Corebridge Financial Inc 4.35% 4/5/2042 | | 96,000 | 79,917 |
| Corebridge Financial Inc 4.4% 4/5/2052 | | 285,000 | 228,953 |
| Corebridge Global Funding 4.9% 12/3/2029 (d) | | 4,000,000 | 3,971,007 |
| Corebridge Global Funding 5.9% 9/19/2028 (d) | | 1,806,000 | 1,856,840 |
| Equitable Holdings Inc 4.35% 4/20/2028 | | 759,000 | 743,639 |
| Equitable Holdings Inc 4.572% 2/15/2029 (d) | | 185,000 | 180,278 |
| Jackson Financial Inc 3.125% 11/23/2031 | | 304,000 | 259,128 |
| Jackson Financial Inc 5.17% 6/8/2027 | | 1,172,000 | 1,177,044 |
| Jackson Financial Inc 5.67% 6/8/2032 | | 1,260,000 | 1,268,338 |
| JBS USA Holding Lux Sarl/ JBS USA Food Co/ JBS Lux Co Sarl 2.5% 1/15/2027 | | 1,107,000 | 1,051,333 |
| JBS USA Holding Lux Sarl/ JBS USA Food Co/ JBS Lux Co Sarl 3% 5/15/2032 | | 991,000 | 824,968 |
| JBS USA Holding Lux Sarl/ JBS USA Food Co/ JBS Lux Co Sarl 3.625% 1/15/2032 | | 381,000 | 336,213 |
| JBS USA Holding Lux Sarl/ JBS USA Food Co/ JBS Lux Co Sarl 5.125% 2/1/2028 | | 1,205,000 | 1,196,560 |
| JBS USA Holding Lux Sarl/ JBS USA Food Co/ JBS Lux Co Sarl 5.5% 1/15/2030 | | 159,000 | 158,707 |
| JBS USA Holding Lux Sarl/ JBS USA Food Co/ JBS Lux Co Sarl 5.75% 4/1/2033 | | 1,805,000 | 1,796,728 |
| JBS USA Holding Lux Sarl/ JBS USA Food Co/ JBS Lux Co Sarl 6.75% 3/15/2034 | | 5,571,000 | 5,890,016 |
| Pine Street Trust II 5.568% 2/15/2049 (d) | | 716,000 | 659,517 |
| Voya Financial Inc 3.65% 6/15/2026 | | 433,000 | 425,768 |
| Voya Financial Inc 5.7% 7/15/2043 | | 103,000 | 98,339 |
| Western Union Co/The 2.85% 1/10/2025 | | 300,000 | 299,850 |
| | | | 28,185,102 |
| Insurance - 0.3% | | | |
| Aon Global Ltd 4.6% 6/14/2044 | | 44,000 | 37,219 |
| Aon Global Ltd 4.75% 5/15/2045 | | 161,000 | 138,689 |
| Athene Holding Ltd 3.5% 1/15/2031 | | 187,000 | 168,561 |
| Five Corners Funding Trust II 2.85% 5/15/2030 (d) | | 1,385,000 | 1,238,063 |
| Liberty Mutual Group Inc 4.569% 2/1/2029 (d) | | 514,000 | 503,413 |
| Lincoln National Corp 3.625% 12/12/2026 | | 165,000 | 161,713 |
| Lincoln National Corp 4.35% 3/1/2048 | | 83,000 | 64,425 |
| Lincoln National Corp 4.375% 6/15/2050 | | 167,000 | 128,634 |
| Marsh & McLennan Cos Inc 4.2% 3/1/2048 | | 134,000 | 108,553 |
| Marsh & McLennan Cos Inc 4.35% 1/30/2047 | | 77,000 | 64,312 |
| Marsh & McLennan Cos Inc 4.375% 3/15/2029 | | 711,000 | 698,232 |
| Marsh & McLennan Cos Inc 4.9% 3/15/2049 | | 255,000 | 228,317 |
| Massachusetts Mutual Life Insurance Co 3.729% 10/15/2070 (d) | | 730,000 | 471,273 |
| MetLife Inc 3.6% 11/13/2025 | | 334,000 | 331,212 |
| MetLife Inc 4.125% 8/13/2042 | | 171,000 | 141,869 |
| MetLife Inc 4.6% 5/13/2046 | | 55,000 | 47,774 |
| MetLife Inc 4.721% 12/15/2044 (b) | | 137,000 | 120,954 |
| MetLife Inc 5.375% 7/15/2033 | | 1,754,000 | 1,772,586 |
| Pacific LifeCorp 5.125% 1/30/2043 (d) | | 660,000 | 608,258 |
| Prudential Financial Inc 3.878% 3/27/2028 | | 114,000 | 110,974 |
| Prudential Financial Inc 3.905% 12/7/2047 | | 15,000 | 11,432 |
| Prudential Financial Inc 3.935% 12/7/2049 | | 294,000 | 221,618 |
| Prudential Financial Inc 4.35% 2/25/2050 | | 343,000 | 279,508 |
| Prudential Financial Inc 4.418% 3/27/2048 | | 174,000 | 143,627 |
| Prudential Financial Inc 5.125% 3/1/2052 (b) | | 115,000 | 109,437 |
| Prudential Financial Inc 5.7% 12/14/2036 | | 10,000 | 10,266 |
| Unum Group 3.875% 11/5/2025 | | 610,000 | 604,976 |
| Unum Group 4% 6/15/2029 | | 554,000 | 530,527 |
| Unum Group 5.75% 8/15/2042 | | 914,000 | 892,296 |
| | | | 9,948,718 |
TOTAL FINANCIALS | | | 333,735,207 |
| | | | |
| Health Care - 1.2% | | | |
| Biotechnology - 0.3% | | | |
| Amgen Inc 1.65% 8/15/2028 | | 532,000 | 475,492 |
| Amgen Inc 1.9% 2/21/2025 | | 224,000 | 223,106 |
| Amgen Inc 2.6% 8/19/2026 | | 288,000 | 278,553 |
| Amgen Inc 2.8% 8/15/2041 | | 544,000 | 378,828 |
| Amgen Inc 3.125% 5/1/2025 | | 55,000 | 54,694 |
| Amgen Inc 4.4% 5/1/2045 | | 272,000 | 225,592 |
| Amgen Inc 4.663% 6/15/2051 | | 342,000 | 286,346 |
| Amgen Inc 5.15% 3/2/2028 | | 1,562,000 | 1,573,363 |
| Amgen Inc 5.25% 3/2/2030 | | 1,426,000 | 1,439,306 |
| Amgen Inc 5.25% 3/2/2033 | | 1,610,000 | 1,598,116 |
| Amgen Inc 5.6% 3/2/2043 | | 1,529,000 | 1,486,381 |
| Amgen Inc 5.65% 3/2/2053 | | 135,000 | 129,974 |
| Amgen Inc 5.75% 3/2/2063 | | 1,385,000 | 1,328,295 |
| | | | 9,478,046 |
| Health Care Providers & Services - 0.9% | | | |
| Allina Health System 3.887% 4/15/2049 | | 182,000 | 139,002 |
| Banner Health 2.913% 1/1/2051 | | 377,000 | 239,390 |
| Centene Corp 2.45% 7/15/2028 | | 1,232,000 | 1,108,688 |
| Centene Corp 2.625% 8/1/2031 | | 575,000 | 473,498 |
| Centene Corp 3.375% 2/15/2030 | | 640,000 | 570,035 |
| Centene Corp 4.25% 12/15/2027 | | 721,000 | 698,435 |
| Centene Corp 4.625% 12/15/2029 | | 1,121,000 | 1,060,197 |
| Children's Hospital of Philadelphia/The 2.704% 7/1/2050 | | 277,000 | 171,221 |
| Cigna Group/The 3.05% 10/15/2027 | | 402,000 | 384,842 |
| Cigna Group/The 4.375% 10/15/2028 | | 1,489,000 | 1,459,641 |
| Cigna Group/The 4.5% 2/25/2026 | | 209,000 | 208,440 |
| Cigna Group/The 4.8% 8/15/2038 | | 1,120,000 | 1,015,335 |
| Cigna Group/The 6.125% 11/15/2041 | | 82,000 | 83,235 |
| CVS Health Corp 2.875% 6/1/2026 | | 206,000 | 200,043 |
| CVS Health Corp 3% 8/15/2026 | | 532,000 | 515,331 |
| CVS Health Corp 3.25% 8/15/2029 | | 482,000 | 438,812 |
| CVS Health Corp 3.625% 4/1/2027 | | 225,000 | 218,310 |
| CVS Health Corp 3.875% 7/20/2025 | | 128,000 | 127,177 |
| CVS Health Corp 4.3% 3/25/2028 | | 655,000 | 634,634 |
| CVS Health Corp 4.78% 3/25/2038 | | 749,000 | 647,639 |
| CVS Health Corp 4.875% 7/20/2035 | | 85,000 | 77,215 |
| CVS Health Corp 5% 1/30/2029 | | 1,255,000 | 1,238,144 |
| CVS Health Corp 5.05% 3/25/2048 | | 751,000 | 619,234 |
| CVS Health Corp 5.125% 7/20/2045 | | 242,000 | 203,319 |
| CVS Health Corp 5.25% 1/30/2031 | | 515,000 | 502,970 |
| CVS Health Corp 5.3% 12/5/2043 | | 120,000 | 104,688 |
| Franciscan Missionaries of Our Lady Health System Inc 3.914% 7/1/2049 | | 292,000 | 222,027 |
| HCA Inc 3.5% 9/1/2030 | | 6,450,000 | 5,857,893 |
| HCA Inc 3.625% 3/15/2032 | | 333,000 | 293,496 |
| HCA Inc 5.25% 6/15/2049 | | 475,000 | 410,965 |
| HCA Inc 5.625% 9/1/2028 | | 1,513,000 | 1,533,038 |
| HCA Inc 5.875% 2/1/2029 | | 1,674,000 | 1,708,552 |
| Humana Inc 1.35% 2/3/2027 | | 346,000 | 321,685 |
| Humana Inc 2.15% 2/3/2032 | | 347,000 | 276,399 |
| Humana Inc 3.125% 8/15/2029 | | 223,000 | 203,491 |
| Humana Inc 3.7% 3/23/2029 | | 333,000 | 314,324 |
| Humana Inc 4.95% 10/1/2044 | | 69,000 | 58,613 |
| Integris Baptist Medical Center Inc 3.875% 8/15/2050 | | 313,000 | 226,681 |
| Kaiser Foundation Hospitals 3.266% 11/1/2049 | | 251,000 | 174,045 |
| Kaiser Foundation Hospitals 4.15% 5/1/2047 | | 180,000 | 146,826 |
| Kaiser Foundation Hospitals 4.875% 4/1/2042 | | 49,000 | 45,318 |
| Mass General Brigham Inc 4.117% 7/1/2055 | | 96,000 | 75,453 |
| Memorial Sloan-Kettering Cancer Center 4.2% 7/1/2055 | | 82,000 | 65,791 |
| MyMichigan Health 3.409% 6/1/2050 | | 129,000 | 89,746 |
| New York and Presbyterian Hospital/The 4.024% 8/1/2045 | | 96,000 | 78,450 |
| New York and Presbyterian Hospital/The 4.063% 8/1/2056 | | 72,000 | 56,317 |
| Novant Health Inc 3.168% 11/1/2051 | | 227,000 | 149,942 |
| NYU Langone Hospitals 4.784% 7/1/2044 | | 208,000 | 187,556 |
| Orlando Health Obligated Grp 3.327% 10/1/2050 | | 208,000 | 144,935 |
| Piedmont Healthcare Inc 2.719% 1/1/2042 | | 42,000 | 28,870 |
| Providence St Joseph Health Obligated Group 2.7% 10/1/2051 | | 74,000 | 42,660 |
| Sabra Health Care LP 3.2% 12/1/2031 | | 1,175,000 | 1,008,098 |
| Sutter Health 3.361% 8/15/2050 | | 504,000 | 354,216 |
| Toledo Hospital/The Series 2018 B, 5.325% 11/15/2028 | | 265,000 | 260,288 |
| Trinity Health Corp 2.632% 12/1/2040 | | 121,000 | 84,296 |
| West Virginia United Health System Obligated Group 3.129% 6/1/2050 | | 170,000 | 107,977 |
| | | | 27,667,423 |
| Pharmaceuticals - 0.0% | | | |
| Elanco Animal Health Inc 6.65% 8/28/2028 (b) | | 168,000 | 170,325 |
| Mylan Inc 4.55% 4/15/2028 | | 502,000 | 491,819 |
| Utah Acquisition Sub Inc 3.95% 6/15/2026 | | 240,000 | 236,188 |
| | | | 898,332 |
TOTAL HEALTH CARE | | | 38,043,801 |
| | | | |
| Industrials - 0.4% | | | |
| Aerospace & Defense - 0.3% | | | |
| Boeing Co 2.5% 3/1/2025 | | 126,000 | 125,344 |
| Boeing Co 2.7% 2/1/2027 | | 217,000 | 206,925 |
| Boeing Co 2.95% 2/1/2030 | | 278,000 | 248,288 |
| Boeing Co 3.625% 3/1/2048 | | 110,000 | 73,202 |
| Boeing Co 3.65% 3/1/2047 | | 76,000 | 51,303 |
| Boeing Co 3.75% 2/1/2050 | | 424,000 | 289,184 |
| Boeing Co 5.04% 5/1/2027 | | 372,000 | 372,959 |
| Boeing Co 5.15% 5/1/2030 | | 706,000 | 696,104 |
| Boeing Co 5.705% 5/1/2040 | | 1,466,000 | 1,394,723 |
| Boeing Co 5.805% 5/1/2050 | | 869,000 | 808,303 |
| Boeing Co 5.93% 5/1/2060 | | 372,000 | 344,215 |
| Boeing Co 6.259% 5/1/2027 | | 654,000 | 669,555 |
| Boeing Co 6.298% 5/1/2029 | | 838,000 | 868,643 |
| Boeing Co 6.388% 5/1/2031 | | 635,000 | 663,906 |
| Boeing Co 6.528% 5/1/2034 | | 679,000 | 711,326 |
| Boeing Co 6.858% 5/1/2054 | | 1,023,000 | 1,087,293 |
| Boeing Co 6.875% 3/15/2039 | | 90,000 | 94,835 |
| Boeing Co 7.008% 5/1/2064 | | 965,000 | 1,023,987 |
| | | | 9,730,095 |
| Building Products - 0.1% | | | |
| Carrier Global Corp 2.242% 2/15/2025 | | 347,000 | 345,612 |
| Carrier Global Corp 2.493% 2/15/2027 | | 245,000 | 234,265 |
| Carrier Global Corp 2.722% 2/15/2030 | | 427,000 | 381,971 |
| Carrier Global Corp 3.377% 4/5/2040 | | 171,000 | 132,057 |
| Carrier Global Corp 3.577% 4/5/2050 | | 131,000 | 93,881 |
| Carrier Global Corp 5.9% 3/15/2034 | | 284,000 | 294,064 |
| Carrier Global Corp 6.2% 3/15/2054 | | 176,000 | 186,070 |
| | | | 1,667,920 |
| Industrial Conglomerates - 0.0% | | | |
| Trane Technologies Financing Ltd 3.8% 3/21/2029 | | 393,000 | 376,901 |
| Trane Technologies Financing Ltd 4.65% 11/1/2044 | | 165,000 | 145,178 |
| | | | 522,079 |
| Trading Companies & Distributors - 0.0% | | | |
| Air Lease Corp 3.375% 7/1/2025 | | 809,000 | 802,707 |
TOTAL INDUSTRIALS | | | 12,722,801 |
| | | | |
| Information Technology - 0.5% | | | |
| Electronic Equipment, Instruments & Components - 0.1% | | | |
| Dell International LLC / EMC Corp 4.9% 10/1/2026 | | 259,000 | 259,723 |
| Dell International LLC / EMC Corp 5.3% 10/1/2029 | | 690,000 | 696,626 |
| Dell International LLC / EMC Corp 6.02% 6/15/2026 | | 454,000 | 460,508 |
| Dell International LLC / EMC Corp 6.1% 7/15/2027 | | 298,000 | 306,720 |
| Dell International LLC / EMC Corp 6.2% 7/15/2030 | | 258,000 | 270,390 |
| Dell International LLC / EMC Corp 8.1% 7/15/2036 | | 287,000 | 340,187 |
| Dell International LLC / EMC Corp 8.35% 7/15/2046 | | 141,000 | 179,342 |
| | | | 2,513,496 |
| Semiconductors & Semiconductor Equipment - 0.2% | | | |
| Broadcom Corp / Broadcom Cayman Finance Ltd 3.5% 1/15/2028 | | 192,000 | 184,861 |
| Broadcom Corp / Broadcom Cayman Finance Ltd 3.875% 1/15/2027 | | 105,000 | 103,360 |
| Broadcom Inc 1.95% 2/15/2028 (d) | | 209,000 | 191,340 |
| Broadcom Inc 2.45% 2/15/2031 (d) | | 2,705,000 | 2,332,696 |
| Broadcom Inc 2.6% 2/15/2033 (d) | | 1,777,000 | 1,468,862 |
| Broadcom Inc 3.459% 9/15/2026 | | 346,000 | 339,194 |
| Broadcom Inc 3.469% 4/15/2034 (d) | | 117,000 | 101,398 |
| Broadcom Inc 3.5% 2/15/2041 (d) | | 1,435,000 | 1,120,629 |
| Broadcom Inc 4.3% 11/15/2032 | | 344,000 | 324,441 |
| Broadcom Inc 4.75% 4/15/2029 | | 469,000 | 465,849 |
| | | | 6,632,630 |
| Software - 0.2% | | | |
| Oracle Corp 1.65% 3/25/2026 | | 1,129,000 | 1,088,349 |
| Oracle Corp 2.3% 3/25/2028 | | 1,288,000 | 1,190,739 |
| Oracle Corp 2.5% 4/1/2025 | | 296,000 | 294,295 |
| Oracle Corp 2.65% 7/15/2026 | | 247,000 | 239,465 |
| Oracle Corp 2.8% 4/1/2027 | | 736,000 | 706,692 |
| Oracle Corp 2.95% 5/15/2025 | | 137,000 | 136,043 |
| Oracle Corp 3.25% 11/15/2027 | | 469,000 | 450,924 |
| Oracle Corp 3.6% 4/1/2040 | | 736,000 | 575,444 |
| Oracle Corp 3.6% 4/1/2050 | | 427,000 | 299,160 |
| Oracle Corp 3.85% 4/1/2060 | | 497,000 | 340,949 |
| Oracle Corp 3.85% 7/15/2036 | | 278,000 | 238,174 |
| Oracle Corp 3.95% 3/25/2051 | | 365,000 | 270,358 |
| Oracle Corp 4% 11/15/2047 | | 480,000 | 365,837 |
| Oracle Corp 4% 7/15/2046 | | 269,000 | 207,015 |
| Oracle Corp 4.125% 5/15/2045 | | 82,000 | 64,797 |
| Oracle Corp 4.3% 7/8/2034 | | 106,000 | 97,441 |
| Oracle Corp 5.375% 7/15/2040 | | 343,000 | 330,250 |
| | | | 6,895,932 |
TOTAL INFORMATION TECHNOLOGY | | | 16,042,058 |
| | | | |
| Materials - 0.1% | | | |
| Chemicals - 0.1% | | | |
| Celanese US Holdings LLC 6.6% 11/15/2028 | | 1,512,000 | 1,548,819 |
| Celanese US Holdings LLC 6.8% 11/15/2030 | | 1,533,000 | 1,586,923 |
| Celanese US Holdings LLC 6.95% 11/15/2033 | | 895,000 | 928,809 |
| | | | 4,064,551 |
| Real Estate - 1.3% | | | |
| Diversified REITs - 0.2% | | | |
| Piedmont Operating Partnership LP 2.75% 4/1/2032 | | 184,000 | 146,138 |
| Store Capital LLC 2.75% 11/18/2030 | | 1,096,000 | 945,871 |
| Store Capital LLC 4.625% 3/15/2029 | | 225,000 | 216,734 |
| VICI Properties LP 4.375% 5/15/2025 | | 99,000 | 98,719 |
| VICI Properties LP 4.75% 2/15/2028 | | 964,000 | 955,897 |
| VICI Properties LP 4.95% 2/15/2030 | | 1,228,000 | 1,203,689 |
| VICI Properties LP 5.125% 5/15/2032 | | 823,000 | 801,337 |
| VICI Properties LP 5.75% 4/1/2034 | | 377,000 | 380,420 |
| Vornado Realty LP 2.15% 6/1/2026 | | 237,000 | 225,680 |
| WP Carey Inc 2.4% 2/1/2031 | | 477,000 | 405,377 |
| WP Carey Inc 3.85% 7/15/2029 | | 160,000 | 152,089 |
| WP Carey Inc 4% 2/1/2025 | | 673,000 | 672,133 |
| | | | 6,204,084 |
| Health Care REITs - 0.4% | | | |
| Alexandria Real Estate Equities Inc 2% 5/18/2032 | | 254,000 | 202,466 |
| Alexandria Real Estate Equities Inc 3% 5/18/2051 | | 193,000 | 118,107 |
| Alexandria Real Estate Equities Inc 4.85% 4/15/2049 | | 316,000 | 271,256 |
| Alexandria Real Estate Equities Inc 4.9% 12/15/2030 | | 523,000 | 514,843 |
| Healthcare Realty Holdings LP 3.1% 2/15/2030 | | 165,000 | 148,281 |
| Healthcare Realty Holdings LP 3.5% 8/1/2026 | | 172,000 | 168,091 |
| Healthpeak OP LLC 3% 1/15/2030 | | 343,000 | 310,404 |
| Healthpeak OP LLC 3.25% 7/15/2026 | | 72,000 | 70,376 |
| Healthpeak OP LLC 3.4% 2/1/2025 | | 13,000 | 12,981 |
| Healthpeak OP LLC 3.5% 7/15/2029 | | 82,000 | 76,724 |
| Omega Healthcare Investors Inc 3.25% 4/15/2033 | | 2,781,000 | 2,325,661 |
| Omega Healthcare Investors Inc 3.375% 2/1/2031 | | 527,000 | 467,380 |
| Omega Healthcare Investors Inc 3.625% 10/1/2029 | | 742,000 | 684,391 |
| Omega Healthcare Investors Inc 4.5% 1/15/2025 | | 556,000 | 555,799 |
| Omega Healthcare Investors Inc 4.5% 4/1/2027 | | 2,294,000 | 2,264,632 |
| Omega Healthcare Investors Inc 4.75% 1/15/2028 | | 801,000 | 790,156 |
| Omega Healthcare Investors Inc 5.25% 1/15/2026 | | 714,000 | 714,851 |
| Ventas Realty LP 3% 1/15/2030 | | 958,000 | 865,402 |
| Ventas Realty LP 3.25% 10/15/2026 | | 96,000 | 93,376 |
| Ventas Realty LP 3.5% 2/1/2025 | | 919,000 | 917,398 |
| Ventas Realty LP 3.85% 4/1/2027 | | 260,000 | 253,903 |
| Ventas Realty LP 4% 3/1/2028 | | 876,000 | 852,417 |
| Ventas Realty LP 4.125% 1/15/2026 | | 235,000 | 233,119 |
| Ventas Realty LP 4.375% 2/1/2045 | | 178,000 | 145,196 |
| Ventas Realty LP 4.75% 11/15/2030 | | 1,258,000 | 1,230,178 |
| Ventas Realty LP 4.875% 4/15/2049 | | 78,000 | 67,126 |
| | | | 14,354,514 |
| Industrial REITs - 0.0% | | | |
| LXP Industrial Trust 2.375% 10/1/2031 | | 83,000 | 67,479 |
| LXP Industrial Trust 2.7% 9/15/2030 | | 230,000 | 198,909 |
| | | | 266,388 |
| Office REITs - 0.2% | | | |
| Boston Properties LP 2.75% 10/1/2026 | | 192,000 | 184,795 |
| Boston Properties LP 3.25% 1/30/2031 | | 1,011,000 | 889,043 |
| Boston Properties LP 4.5% 12/1/2028 | | 489,000 | 475,821 |
| Boston Properties LP 6.75% 12/1/2027 | | 1,962,000 | 2,045,906 |
| COPT Defense Properties LP 2% 1/15/2029 | | 228,000 | 200,595 |
| COPT Defense Properties LP 2.25% 3/15/2026 | | 209,000 | 202,259 |
| COPT Defense Properties LP 2.75% 4/15/2031 | | 310,000 | 264,631 |
| Hudson Pacific Properties LP 4.65% 4/1/2029 | | 972,000 | 732,518 |
| | | | 4,995,568 |
| Real Estate Management & Development - 0.2% | | | |
| Brandywine Operating Partnership LP 3.95% 11/15/2027 | | 579,000 | 549,061 |
| Brandywine Operating Partnership LP 4.55% 10/1/2029 | | 734,000 | 662,555 |
| Brandywine Operating Partnership LP 8.3% 3/15/2028 | | 2,672,000 | 2,823,058 |
| CBRE Services Inc 2.5% 4/1/2031 | | 699,000 | 594,936 |
| CBRE Services Inc 4.875% 3/1/2026 | | 156,000 | 155,768 |
| Digital Realty Trust LP 3.7% 8/15/2027 | | 219,000 | 212,886 |
| Essex Portfolio LP 3% 1/15/2030 | | 51,000 | 46,135 |
| Essex Portfolio LP 4% 3/1/2029 | | 167,000 | 160,572 |
| Tanger Properties LP 2.75% 9/1/2031 | | 551,000 | 464,749 |
| Tanger Properties LP 3.125% 9/1/2026 | | 767,000 | 742,443 |
| Tanger Properties LP 3.875% 7/15/2027 | | 170,000 | 165,028 |
| | | | 6,577,191 |
| Residential REITs - 0.1% | | | |
| American Homes 4 Rent LP 2.375% 7/15/2031 | | 95,000 | 79,483 |
| American Homes 4 Rent LP 3.625% 4/15/2032 | | 389,000 | 347,743 |
| American Homes 4 Rent LP 4.25% 2/15/2028 | | 264,000 | 257,571 |
| Invitation Homes Operating Partnership LP 4.15% 4/15/2032 | | 799,000 | 736,915 |
| Sun Communities Operating LP 2.3% 11/1/2028 | | 210,000 | 189,313 |
| Sun Communities Operating LP 2.7% 7/15/2031 | | 542,000 | 455,720 |
| UDR Inc 2.1% 6/15/2033 | | 446,000 | 343,575 |
| | | | 2,410,320 |
| Retail REITs - 0.2% | | | |
| Brixmor Operating Partnership LP 3.9% 3/15/2027 | | 155,000 | 151,825 |
| Brixmor Operating Partnership LP 4.05% 7/1/2030 | | 804,000 | 760,102 |
| Brixmor Operating Partnership LP 4.125% 5/15/2029 | | 819,000 | 785,941 |
| Brixmor Operating Partnership LP 4.125% 6/15/2026 | | 791,000 | 782,581 |
| Kite Realty Group Trust 4% 3/15/2025 | | 783,000 | 780,741 |
| Kite Realty Group Trust 4.75% 9/15/2030 | | 1,220,000 | 1,191,115 |
| Phillips Edison Grocery Center Operating Partnership I LP 5.75% 7/15/2034 | | 482,000 | 482,552 |
| Realty Income Corp 2.2% 6/15/2028 | | 100,000 | 91,509 |
| Realty Income Corp 2.85% 12/15/2032 | | 123,000 | 103,898 |
| Realty Income Corp 3.25% 1/15/2031 | | 128,000 | 115,574 |
| Realty Income Corp 3.4% 1/15/2028 | | 200,000 | 191,919 |
| Simon Property Group LP 2.2% 2/1/2031 | | 731,000 | 621,768 |
| Simon Property Group LP 2.45% 9/13/2029 | | 205,000 | 184,337 |
| Simon Property Group LP 3.25% 9/13/2049 | | 320,000 | 214,942 |
| Simon Property Group LP 3.375% 12/1/2027 | | 547,000 | 529,770 |
| | | | 6,988,574 |
TOTAL REAL ESTATE | | | 41,796,639 |
| | | | |
| Utilities - 1.3% | | | |
| Electric Utilities - 0.8% | | | |
| Alabama Power Co 1.45% 9/15/2030 | | 500,000 | 413,769 |
| Alabama Power Co 3.05% 3/15/2032 | | 828,000 | 726,632 |
| Alabama Power Co 3.7% 12/1/2047 | | 162,000 | 120,945 |
| Alabama Power Co 3.75% 3/1/2045 | | 27,000 | 20,671 |
| Alabama Power Co 4.15% 8/15/2044 | | 127,000 | 104,381 |
| Alabama Power Co 4.3% 7/15/2048 | | 161,000 | 132,081 |
| Alabama Power Co 5.2% 6/1/2041 | | 106,000 | 100,531 |
| Appalachian Power Co 4.45% 6/1/2045 | | 165,000 | 133,264 |
| Appalachian Power Co 4.5% 3/1/2049 | | 251,000 | 200,978 |
| Baltimore Gas and Electric Co 2.9% 6/15/2050 | | 220,000 | 137,366 |
| Baltimore Gas and Electric Co 3.5% 8/15/2046 | | 69,000 | 49,864 |
| Cleco Corporate Holdings LLC 3.375% 9/15/2029 | | 433,000 | 389,307 |
| Cleco Corporate Holdings LLC 3.743% 5/1/2026 | | 1,810,000 | 1,772,898 |
| Commonwealth Edison Co 3.2% 11/15/2049 | | 467,000 | 309,878 |
| Commonwealth Edison Co 3.65% 6/15/2046 | | 78,000 | 58,248 |
| Commonwealth Edison Co 3.7% 3/1/2045 | | 85,000 | 64,854 |
| Commonwealth Edison Co 3.75% 8/15/2047 | | 169,000 | 126,154 |
| Commonwealth Edison Co 4% 3/1/2048 | | 187,000 | 145,814 |
| Commonwealth Edison Co 4% 3/1/2049 | | 164,000 | 126,258 |
| Consolidated Edison Co of New York Inc 3.35% 4/1/2030 | | 99,000 | 92,127 |
| Consolidated Edison Co of New York Inc 3.875% 6/15/2047 | | 78,000 | 59,402 |
| Consolidated Edison Co of New York Inc 4.45% 3/15/2044 | | 219,000 | 187,044 |
| Consolidated Edison Co of New York Inc 4.5% 5/15/2058 | | 260,000 | 208,863 |
| Consolidated Edison Co of New York Inc 4.65% 12/1/2048 | | 287,000 | 245,207 |
| Consolidated Edison Co of New York Inc 5.5% 12/1/2039 | | 69,000 | 68,202 |
| Duke Energy Carolinas LLC 2.85% 3/15/2032 | | 83,000 | 71,755 |
| Duke Energy Carolinas LLC 2.95% 12/1/2026 | | 165,000 | 160,219 |
| Duke Energy Carolinas LLC 3.2% 8/15/2049 | | 219,000 | 145,929 |
| Duke Energy Carolinas LLC 3.75% 6/1/2045 | | 55,000 | 42,087 |
| Duke Energy Carolinas LLC 3.875% 3/15/2046 | | 107,000 | 82,940 |
| Duke Energy Carolinas LLC 4% 9/30/2042 | | 103,000 | 83,652 |
| Duke Energy Corp 2.45% 6/1/2030 | | 529,000 | 463,677 |
| Duke Energy Corp 2.65% 9/1/2026 | | 366,000 | 354,275 |
| Duke Energy Corp 3.75% 9/1/2046 | | 250,000 | 184,063 |
| Duke Energy Corp 4.2% 6/15/2049 | | 260,000 | 200,873 |
| Duke Energy Corp 4.8% 12/15/2045 | | 76,000 | 65,589 |
| Duke Energy Florida LLC 3.4% 10/1/2046 | | 69,000 | 48,870 |
| Duke Energy Ohio Inc 4.3% 2/1/2049 | | 744,000 | 597,561 |
| Duke Energy Progress LLC 3.4% 4/1/2032 | | 334,000 | 299,057 |
| Duke Energy Progress LLC 4.15% 12/1/2044 | | 49,000 | 39,871 |
| Duke Energy Progress LLC 4.375% 3/30/2044 | | 55,000 | 46,281 |
| Duquesne Light Holdings Inc 2.532% 10/1/2030 (d) | | 166,000 | 143,452 |
| Duquesne Light Holdings Inc 2.775% 1/7/2032 (d) | | 574,000 | 477,917 |
| Entergy Corp 0.9% 9/15/2025 | | 464,000 | 451,229 |
| Entergy Corp 2.8% 6/15/2030 | | 359,000 | 319,782 |
| Entergy Corp 2.95% 9/1/2026 | | 129,000 | 125,196 |
| Entergy Corp 3.75% 6/15/2050 | | 113,000 | 80,109 |
| Entergy Louisiana LLC 4.2% 9/1/2048 | | 87,000 | 69,094 |
| Entergy Tex Inc 3.55% 9/30/2049 | | 111,000 | 78,054 |
| Entergy Tex Inc 4% 3/30/2029 | | 485,000 | 469,295 |
| Exelon Corp 2.75% 3/15/2027 | | 183,000 | 175,230 |
| Exelon Corp 3.35% 3/15/2032 | | 222,000 | 196,542 |
| Exelon Corp 3.95% 6/15/2025 | | 539,000 | 536,637 |
| Exelon Corp 4.05% 4/15/2030 | | 218,000 | 207,747 |
| Exelon Corp 5.1% 6/15/2045 | | 30,000 | 27,165 |
| FirstEnergy Corp 1.6% 1/15/2026 | | 344,000 | 331,635 |
| FirstEnergy Corp 2.25% 9/1/2030 | | 370,000 | 317,315 |
| FirstEnergy Corp 3.4% 3/1/2050 | | 100,000 | 67,903 |
| FirstEnergy Corp 3.9% 7/15/2027 (e) | | 233,000 | 226,894 |
| FirstEnergy Corp 4.85% 7/15/2047 (e) | | 129,000 | 110,028 |
| Interstate Power and Light Co 2.3% 6/1/2030 | | 381,000 | 329,822 |
| IPALCO Enterprises Inc 4.25% 5/1/2030 | | 1,025,000 | 965,205 |
| Pacific Gas and Electric Co 3.15% 1/1/2026 | | 400,355 | 393,377 |
| Pacific Gas and Electric Co 3.25% 6/1/2031 | | 167,000 | 148,069 |
| Pacific Gas and Electric Co 3.45% 7/1/2025 | | 166,815 | 165,510 |
| Pacific Gas and Electric Co 3.5% 6/15/2025 | | 334,000 | 331,626 |
| Pacific Gas and Electric Co 4.2% 6/1/2041 | | 834,000 | 679,837 |
| Pacific Gas and Electric Co 4.55% 7/1/2030 | | 1,037,586 | 1,004,178 |
| Pacific Gas and Electric Co 4.75% 2/15/2044 | | 33,000 | 28,160 |
| Potomac Electric Power Co 6.5% 11/15/2037 | | 104,000 | 113,923 |
| Progress Energy Inc 6% 12/1/2039 | | 143,000 | 144,541 |
| Puget Sound Energy Inc 4.3% 5/20/2045 | | 176,000 | 143,755 |
| Southern California Edison Co 2.25% 6/1/2030 | | 248,000 | 215,484 |
| Southern Co/The 3.25% 7/1/2026 | | 302,000 | 295,774 |
| Southern Co/The 4.4% 7/1/2046 | | 201,000 | 166,245 |
| Southern Co/The 4.85% 3/15/2035 | | 4,500,000 | 4,293,133 |
| Tampa Electric Co 4.45% 6/15/2049 | | 321,000 | 264,379 |
| Tampa Electric Co 6.15% 5/15/2037 | | 172,000 | 175,711 |
| Virginia Electric and Power Co 3.1% 5/15/2025 | | 110,000 | 109,329 |
| Virginia Electric and Power Co 3.8% 4/1/2028 | | 409,000 | 396,436 |
| Wisconsin Electric Power Co 4.25% 6/1/2044 | | 129,000 | 104,617 |
| | | | 23,761,772 |
| Gas Utilities - 0.0% | | | |
| Southern Co Gas Capital Corp 3.95% 10/1/2046 | | 371,000 | 287,142 |
| Independent Power and Renewable Electricity Producers - 0.2% | | | |
| AES Corp/The 1.375% 1/15/2026 | | 4,000,000 | 3,852,617 |
| AES Corp/The 2.45% 1/15/2031 | | 807,000 | 672,479 |
| AES Corp/The 3.3% 7/15/2025 (d) | | 1,079,000 | 1,068,626 |
| AES Corp/The 3.95% 7/15/2030 (d) | | 941,000 | 867,417 |
| | | | 6,461,139 |
| Multi-Utilities - 0.3% | | | |
| Berkshire Hathaway Energy Co 3.25% 4/15/2028 | | 274,000 | 260,829 |
| Berkshire Hathaway Energy Co 3.7% 7/15/2030 | | 275,000 | 258,745 |
| Berkshire Hathaway Energy Co 3.8% 7/15/2048 | | 274,000 | 203,247 |
| Berkshire Hathaway Energy Co 4.05% 4/15/2025 | | 1,561,000 | 1,558,311 |
| Berkshire Hathaway Energy Co 4.25% 10/15/2050 | | 237,000 | 187,093 |
| Berkshire Hathaway Energy Co 4.5% 2/1/2045 | | 182,000 | 157,664 |
| Berkshire Hathaway Energy Co 5.15% 11/15/2043 | | 212,000 | 201,187 |
| Delmarva Power & Light Co 4% 6/1/2042 | | 110,000 | 86,149 |
| Dominion Energy Inc 3.9% 10/1/2025 | | 354,000 | 351,607 |
| NiSource Inc 0.95% 8/15/2025 | | 374,000 | 364,781 |
| NiSource Inc 1.7% 2/15/2031 | | 444,000 | 363,048 |
| NiSource Inc 2.95% 9/1/2029 | | 1,074,000 | 983,067 |
| NiSource Inc 3.49% 5/15/2027 | | 210,000 | 204,412 |
| NiSource Inc 3.6% 5/1/2030 | | 1,800,000 | 1,679,018 |
| NiSource Inc 3.95% 3/30/2048 | | 274,000 | 208,504 |
| NiSource Inc 4.375% 5/15/2047 | | 131,000 | 107,074 |
| NiSource Inc 4.8% 2/15/2044 | | 151,000 | 133,353 |
| Puget Energy Inc 3.65% 5/15/2025 | | 221,000 | 219,646 |
| Puget Energy Inc 4.1% 6/15/2030 | | 1,710,000 | 1,612,222 |
| Puget Energy Inc 4.224% 3/15/2032 | | 756,000 | 691,004 |
| | | | 9,830,961 |
| Water Utilities - 0.0% | | | |
| American Water Capital Corp 2.95% 9/1/2027 | | 167,000 | 159,639 |
| American Water Capital Corp 3.45% 6/1/2029 | | 167,000 | 157,242 |
| American Water Capital Corp 6.593% 10/15/2037 | | 179,000 | 196,957 |
| | | | 513,838 |
TOTAL UTILITIES | | | 40,854,852 |
| | | | |
| TOTAL UNITED STATES | | | 623,029,336 |
| TOTAL NON-CONVERTIBLE CORPORATE BONDS (Cost $766,999,005) | | | 746,561,290 |
| | | | |
| U.S. Government Agency - Mortgage Securities - 21.5% |
| | | Principal Amount (a) | Value ($) |
| UNITED STATES - 21.5% | | | |
| Fannie Mae 3% 10/1/2031 | | 63,568 | 60,955 |
| Fannie Mae 3% 11/1/2047 | | 11,120 | 9,612 |
| Fannie Mae 3.5% 2/1/2045 | | 405,681 | 371,633 |
| Fannie Mae 4% 4/1/2050 | | 15,673 | 14,460 |
| Fannie Mae Mortgage pass-thru certificates 1 year FTSE USD IBOR Consumer Fallbacks + 1.48%, 7.48% 7/1/2034 (b)(c) | | 307 | 312 |
| Fannie Mae Mortgage pass-thru certificates 1 year FTSE USD IBOR Consumer Fallbacks + 1.54%, 7.19% 11/1/2034 (b)(c) | | 38,886 | 39,555 |
| Fannie Mae Mortgage pass-thru certificates 1 year FTSE USD IBOR Consumer Fallbacks + 1.553%, 7.428% 6/1/2036 (b)(c) | | 763 | 777 |
| Fannie Mae Mortgage pass-thru certificates 1 year FTSE USD IBOR Consumer Fallbacks + 1.638%, 6.938% 11/1/2036 (b)(c) | | 6,695 | 6,814 |
| Fannie Mae Mortgage pass-thru certificates 1 year FTSE USD IBOR Consumer Fallbacks + 1.644%, 7.394% 5/1/2036 (b)(c) | | 4,306 | 4,384 |
| Fannie Mae Mortgage pass-thru certificates 1 year FTSE USD IBOR Consumer Fallbacks + 1.645%, 7.02% 4/1/2041 (b)(c) | | 2,408 | 2,455 |
| Fannie Mae Mortgage pass-thru certificates 1 year FTSE USD IBOR Consumer Fallbacks + 1.7%, 7.178% 6/1/2042 (b)(c) | | 4,449 | 4,545 |
| Fannie Mae Mortgage pass-thru certificates 1 year FTSE USD IBOR Consumer Fallbacks + 1.75%, 6.58% 7/1/2035 (b)(c) | | 452 | 462 |
| Fannie Mae Mortgage pass-thru certificates 1 year FTSE USD IBOR Consumer Fallbacks + 1.788%, 6.163% 2/1/2036 (b)(c) | | 2,382 | 2,447 |
| Fannie Mae Mortgage pass-thru certificates 1 year FTSE USD IBOR Consumer Fallbacks + 1.8%, 7.635% 7/1/2041 (b)(c) | | 1,037 | 1,061 |
| Fannie Mae Mortgage pass-thru certificates 1 year FTSE USD IBOR Consumer Fallbacks + 1.818%, 7.318% 9/1/2041 (b)(c) | | 1,984 | 2,034 |
| Fannie Mae Mortgage pass-thru certificates 1 year FTSE USD IBOR Consumer Fallbacks + 1.818%, 7.639% 7/1/2041 (b)(c) | | 2,648 | 2,712 |
| Fannie Mae Mortgage pass-thru certificates 1 year FTSE USD IBOR Consumer Fallbacks + 1.82%, 6.195% 12/1/2035 (b)(c) | | 2,511 | 2,566 |
| Fannie Mae Mortgage pass-thru certificates 1 year FTSE USD IBOR Consumer Fallbacks + 1.83%, 7.004% 10/1/2041 (b)(c) | | 1,778 | 1,825 |
| Fannie Mae Mortgage pass-thru certificates 1 year FTSE USD IBOR Consumer Fallbacks + 1.88%, 7.059% 11/1/2034 (b)(c) | | 2,785 | 2,838 |
| Fannie Mae Mortgage pass-thru certificates 1 year FTSE USD IBOR Consumer Fallbacks + 1.95%, 7.285% 9/1/2036 (b)(c) | | 4,546 | 4,656 |
| Fannie Mae Mortgage pass-thru certificates 1 year FTSE USD IBOR Consumer Fallbacks + 1.953%, 7.703% 7/1/2037 (b)(c) | | 1,706 | 1,749 |
| Fannie Mae Mortgage pass-thru certificates 1 year U.S. Treasury Index + 1.945%, 6.995% 10/1/2033 (b)(c) | | 6,321 | 6,399 |
| Fannie Mae Mortgage pass-thru certificates 1 year U.S. Treasury Index + 2.208%, 6.583% 3/1/2035 (b)(c) | | 541 | 550 |
| Fannie Mae Mortgage pass-thru certificates 1 year U.S. Treasury Index + 2.224%, 6.391% 8/1/2036 (b)(c) | | 7,616 | 7,750 |
| Fannie Mae Mortgage pass-thru certificates 1 year U.S. Treasury Index + 2.281%, 7.242% 10/1/2033 (b)(c) | | 824 | 838 |
| Fannie Mae Mortgage pass-thru certificates 1 year U.S. Treasury Index + 2.462%, 6.967% 5/1/2035 (b)(c) | | 922 | 939 |
| Fannie Mae Mortgage pass-thru certificates 1.5% 1/1/2036 | | 874,430 | 755,675 |
| Fannie Mae Mortgage pass-thru certificates 1.5% 1/1/2041 | | 41,861 | 33,952 |
| Fannie Mae Mortgage pass-thru certificates 1.5% 10/1/2036 | | 66,906 | 58,008 |
| Fannie Mae Mortgage pass-thru certificates 1.5% 11/1/2035 | | 600,053 | 518,561 |
| Fannie Mae Mortgage pass-thru certificates 1.5% 11/1/2035 | | 570,670 | 493,168 |
| Fannie Mae Mortgage pass-thru certificates 1.5% 11/1/2035 | | 13,566 | 11,724 |
| Fannie Mae Mortgage pass-thru certificates 1.5% 11/1/2035 | | 312,005 | 270,412 |
| Fannie Mae Mortgage pass-thru certificates 1.5% 11/1/2035 | | 13,892 | 12,006 |
| Fannie Mae Mortgage pass-thru certificates 1.5% 11/1/2036 | | 670,515 | 580,920 |
| Fannie Mae Mortgage pass-thru certificates 1.5% 11/1/2036 | | 37,433 | 32,478 |
| Fannie Mae Mortgage pass-thru certificates 1.5% 11/1/2036 | | 123,362 | 107,032 |
| Fannie Mae Mortgage pass-thru certificates 1.5% 11/1/2036 | | 120,714 | 104,735 |
| Fannie Mae Mortgage pass-thru certificates 1.5% 11/1/2036 | | 129,684 | 112,518 |
| Fannie Mae Mortgage pass-thru certificates 1.5% 11/1/2036 | | 106,921 | 92,701 |
| Fannie Mae Mortgage pass-thru certificates 1.5% 11/1/2040 | | 40,804 | 33,147 |
| Fannie Mae Mortgage pass-thru certificates 1.5% 11/1/2041 (k) | | 732,860 | 589,349 |
| Fannie Mae Mortgage pass-thru certificates 1.5% 11/1/2050 | | 877,540 | 648,374 |
| Fannie Mae Mortgage pass-thru certificates 1.5% 11/1/2050 | | 1,284,363 | 948,958 |
| Fannie Mae Mortgage pass-thru certificates 1.5% 12/1/2035 | | 607,470 | 524,971 |
| Fannie Mae Mortgage pass-thru certificates 1.5% 12/1/2040 | | 41,333 | 33,550 |
| Fannie Mae Mortgage pass-thru certificates 1.5% 12/1/2050 | | 1,233,442 | 911,334 |
| Fannie Mae Mortgage pass-thru certificates 1.5% 12/1/2050 | | 530,200 | 391,741 |
| Fannie Mae Mortgage pass-thru certificates 1.5% 2/1/2036 | | 130,222 | 112,537 |
| Fannie Mae Mortgage pass-thru certificates 1.5% 2/1/2041 | | 42,680 | 34,589 |
| Fannie Mae Mortgage pass-thru certificates 1.5% 3/1/2041 | | 43,497 | 35,227 |
| Fannie Mae Mortgage pass-thru certificates 1.5% 6/1/2051 | | 20,913 | 15,451 |
| Fannie Mae Mortgage pass-thru certificates 1.5% 9/1/2035 | | 788,661 | 682,540 |
| Fannie Mae Mortgage pass-thru certificates 2% 1/1/2052 | | 67,547 | 52,831 |
| Fannie Mae Mortgage pass-thru certificates 2% 10/1/2030 | | 9,343 | 8,809 |
| Fannie Mae Mortgage pass-thru certificates 2% 10/1/2035 | | 12,128 | 10,796 |
| Fannie Mae Mortgage pass-thru certificates 2% 10/1/2035 | | 336,321 | 299,375 |
| Fannie Mae Mortgage pass-thru certificates 2% 10/1/2035 | | 13,685 | 12,182 |
| Fannie Mae Mortgage pass-thru certificates 2% 10/1/2035 | | 20,166 | 17,950 |
| Fannie Mae Mortgage pass-thru certificates 2% 10/1/2040 | | 62,148 | 52,249 |
| Fannie Mae Mortgage pass-thru certificates 2% 10/1/2050 | | 78,449 | 62,192 |
| Fannie Mae Mortgage pass-thru certificates 2% 10/1/2051 | | 424,014 | 335,747 |
| Fannie Mae Mortgage pass-thru certificates 2% 10/1/2051 | | 482,701 | 381,764 |
| Fannie Mae Mortgage pass-thru certificates 2% 11/1/2050 | | 57,161 | 44,976 |
| Fannie Mae Mortgage pass-thru certificates 2% 11/1/2051 | | 231,702 | 181,224 |
| Fannie Mae Mortgage pass-thru certificates 2% 12/1/2035 | | 63,950 | 56,485 |
| Fannie Mae Mortgage pass-thru certificates 2% 12/1/2036 | | 37,299 | 33,097 |
| Fannie Mae Mortgage pass-thru certificates 2% 12/1/2040 | | 167,786 | 141,815 |
| Fannie Mae Mortgage pass-thru certificates 2% 12/1/2051 | | 585,796 | 463,484 |
| Fannie Mae Mortgage pass-thru certificates 2% 12/1/2051 | | 2,915,636 | 2,291,375 |
| Fannie Mae Mortgage pass-thru certificates 2% 12/1/2051 | | 742,737 | 577,444 |
| Fannie Mae Mortgage pass-thru certificates 2% 2/1/2028 | | 551,666 | 535,067 |
| Fannie Mae Mortgage pass-thru certificates 2% 2/1/2036 | | 41,144 | 36,599 |
| Fannie Mae Mortgage pass-thru certificates 2% 2/1/2036 | | 40,922 | 36,427 |
| Fannie Mae Mortgage pass-thru certificates 2% 2/1/2036 | | 58,120 | 51,663 |
| Fannie Mae Mortgage pass-thru certificates 2% 2/1/2036 | | 21,416 | 19,110 |
| Fannie Mae Mortgage pass-thru certificates 2% 2/1/2052 | | 5,357,471 | 4,165,190 |
| Fannie Mae Mortgage pass-thru certificates 2% 2/1/2052 | | 1,514,901 | 1,178,713 |
| Fannie Mae Mortgage pass-thru certificates 2% 3/1/2051 | | 18,496 | 14,512 |
| Fannie Mae Mortgage pass-thru certificates 2% 3/1/2052 | | 2,642,533 | 2,056,100 |
| Fannie Mae Mortgage pass-thru certificates 2% 4/1/2035 | | 7,578 | 6,759 |
| Fannie Mae Mortgage pass-thru certificates 2% 4/1/2041 | | 76,057 | 64,048 |
| Fannie Mae Mortgage pass-thru certificates 2% 4/1/2051 | | 570,041 | 450,307 |
| Fannie Mae Mortgage pass-thru certificates 2% 4/1/2052 | | 7,924,995 | 6,161,323 |
| Fannie Mae Mortgage pass-thru certificates 2% 4/1/2052 | | 204,935 | 159,327 |
| Fannie Mae Mortgage pass-thru certificates 2% 5/1/2036 | | 61,411 | 54,626 |
| Fannie Mae Mortgage pass-thru certificates 2% 5/1/2042 | | 2,759,103 | 2,313,181 |
| Fannie Mae Mortgage pass-thru certificates 2% 5/1/2051 | | 7,999,206 | 6,219,018 |
| Fannie Mae Mortgage pass-thru certificates 2% 6/1/2036 | | 68,922 | 61,308 |
| Fannie Mae Mortgage pass-thru certificates 2% 6/1/2041 | | 724,689 | 605,443 |
| Fannie Mae Mortgage pass-thru certificates 2% 6/1/2041 | | 55,416 | 46,656 |
| Fannie Mae Mortgage pass-thru certificates 2% 6/1/2051 | | 999,900 | 777,377 |
| Fannie Mae Mortgage pass-thru certificates 2% 7/1/2035 | | 173,533 | 154,470 |
| Fannie Mae Mortgage pass-thru certificates 2% 7/1/2035 | | 276,750 | 246,349 |
| Fannie Mae Mortgage pass-thru certificates 2% 7/1/2041 | | 535,660 | 449,506 |
| Fannie Mae Mortgage pass-thru certificates 2% 7/1/2050 | | 74,529 | 58,968 |
| Fannie Mae Mortgage pass-thru certificates 2% 7/1/2051 | | 19,137 | 14,998 |
| Fannie Mae Mortgage pass-thru certificates 2% 7/1/2051 | | 34,283 | 26,868 |
| Fannie Mae Mortgage pass-thru certificates 2% 7/1/2051 | | 1,036,612 | 812,074 |
| Fannie Mae Mortgage pass-thru certificates 2% 8/1/2028 | | 7,603 | 7,323 |
| Fannie Mae Mortgage pass-thru certificates 2% 8/1/2035 | | 180,945 | 161,067 |
| Fannie Mae Mortgage pass-thru certificates 2% 8/1/2035 | | 53,409 | 47,542 |
| Fannie Mae Mortgage pass-thru certificates 2% 8/1/2035 | | 679,452 | 604,812 |
| Fannie Mae Mortgage pass-thru certificates 2% 8/1/2035 | | 14,255 | 12,707 |
| Fannie Mae Mortgage pass-thru certificates 2% 9/1/2035 | | 27,272 | 24,276 |
| Fannie Mae Mortgage pass-thru certificates 2% 9/1/2035 | | 30,824 | 27,438 |
| Fannie Mae Mortgage pass-thru certificates 2.5% 1/1/2031 | | 7,172 | 6,815 |
| Fannie Mae Mortgage pass-thru certificates 2.5% 1/1/2031 | | 767 | 739 |
| Fannie Mae Mortgage pass-thru certificates 2.5% 1/1/2031 | | 3,952 | 3,756 |
| Fannie Mae Mortgage pass-thru certificates 2.5% 1/1/2031 | | 11,139 | 10,599 |
| Fannie Mae Mortgage pass-thru certificates 2.5% 1/1/2032 | | 216,528 | 204,819 |
| Fannie Mae Mortgage pass-thru certificates 2.5% 1/1/2032 | | 14,263 | 13,483 |
| Fannie Mae Mortgage pass-thru certificates 2.5% 1/1/2032 | | 75,648 | 72,023 |
| Fannie Mae Mortgage pass-thru certificates 2.5% 1/1/2032 | | 72,194 | 68,904 |
| Fannie Mae Mortgage pass-thru certificates 2.5% 1/1/2033 | | 18,221 | 17,073 |
| Fannie Mae Mortgage pass-thru certificates 2.5% 1/1/2033 | | 10,836 | 10,172 |
| Fannie Mae Mortgage pass-thru certificates 2.5% 1/1/2035 | | 86,109 | 78,949 |
| Fannie Mae Mortgage pass-thru certificates 2.5% 1/1/2043 | | 222,020 | 191,192 |
| Fannie Mae Mortgage pass-thru certificates 2.5% 1/1/2047 | | 9,903 | 8,280 |
| Fannie Mae Mortgage pass-thru certificates 2.5% 1/1/2047 | | 30,861 | 25,880 |
| Fannie Mae Mortgage pass-thru certificates 2.5% 1/1/2050 | | 54,697 | 44,946 |
| Fannie Mae Mortgage pass-thru certificates 2.5% 1/1/2051 | | 283,892 | 233,280 |
| Fannie Mae Mortgage pass-thru certificates 2.5% 1/1/2051 | | 4,102,814 | 3,403,429 |
| Fannie Mae Mortgage pass-thru certificates 2.5% 1/1/2052 | | 438,143 | 357,567 |
| Fannie Mae Mortgage pass-thru certificates 2.5% 1/1/2052 | | 113,629 | 93,230 |
| Fannie Mae Mortgage pass-thru certificates 2.5% 10/1/2031 | | 210,979 | 199,688 |
| Fannie Mae Mortgage pass-thru certificates 2.5% 10/1/2032 | | 37,315 | 35,069 |
| Fannie Mae Mortgage pass-thru certificates 2.5% 10/1/2034 | | 30,053 | 27,592 |
| Fannie Mae Mortgage pass-thru certificates 2.5% 10/1/2039 | | 40,907 | 35,823 |
| Fannie Mae Mortgage pass-thru certificates 2.5% 10/1/2039 | | 5,704 | 4,983 |
| Fannie Mae Mortgage pass-thru certificates 2.5% 10/1/2043 | | 8,643 | 7,429 |
| Fannie Mae Mortgage pass-thru certificates 2.5% 10/1/2050 | | 1,147,834 | 950,375 |
| Fannie Mae Mortgage pass-thru certificates 2.5% 10/1/2051 | | 7,934,138 | 6,507,266 |
| Fannie Mae Mortgage pass-thru certificates 2.5% 10/1/2051 | | 156,256 | 128,204 |
| Fannie Mae Mortgage pass-thru certificates 2.5% 11/1/2029 | | 4,532 | 4,354 |
| Fannie Mae Mortgage pass-thru certificates 2.5% 11/1/2029 | | 2,783 | 2,679 |
| Fannie Mae Mortgage pass-thru certificates 2.5% 11/1/2030 | | 1,567 | 1,496 |
| Fannie Mae Mortgage pass-thru certificates 2.5% 11/1/2031 | | 146,550 | 138,784 |
| Fannie Mae Mortgage pass-thru certificates 2.5% 11/1/2031 | | 14,861 | 14,149 |
| Fannie Mae Mortgage pass-thru certificates 2.5% 11/1/2034 | | 120,863 | 110,965 |
| Fannie Mae Mortgage pass-thru certificates 2.5% 11/1/2035 | | 71,826 | 65,540 |
| Fannie Mae Mortgage pass-thru certificates 2.5% 11/1/2039 | | 10,351 | 9,051 |
| Fannie Mae Mortgage pass-thru certificates 2.5% 11/1/2041 | | 1,259,070 | 1,083,002 |
| Fannie Mae Mortgage pass-thru certificates 2.5% 11/1/2041 | | 508,422 | 437,324 |
| Fannie Mae Mortgage pass-thru certificates 2.5% 11/1/2041 | | 329,595 | 283,504 |
| Fannie Mae Mortgage pass-thru certificates 2.5% 11/1/2041 | | 413,213 | 355,429 |
| Fannie Mae Mortgage pass-thru certificates 2.5% 11/1/2041 | | 376,655 | 323,984 |
| Fannie Mae Mortgage pass-thru certificates 2.5% 11/1/2041 | | 118,113 | 101,891 |
| Fannie Mae Mortgage pass-thru certificates 2.5% 11/1/2049 | | 76,568 | 62,918 |
| Fannie Mae Mortgage pass-thru certificates 2.5% 11/1/2051 | | 1,517,063 | 1,246,132 |
| Fannie Mae Mortgage pass-thru certificates 2.5% 11/1/2051 | | 1,177,120 | 967,267 |
| Fannie Mae Mortgage pass-thru certificates 2.5% 12/1/2026 | | 2,097 | 2,061 |
| Fannie Mae Mortgage pass-thru certificates 2.5% 12/1/2029 | | 4,239 | 4,076 |
| Fannie Mae Mortgage pass-thru certificates 2.5% 12/1/2029 | | 3,071 | 2,948 |
| Fannie Mae Mortgage pass-thru certificates 2.5% 12/1/2030 | | 3,705 | 3,534 |
| Fannie Mae Mortgage pass-thru certificates 2.5% 12/1/2030 | | 16,810 | 16,044 |
| Fannie Mae Mortgage pass-thru certificates 2.5% 12/1/2031 | | 368,882 | 348,935 |
| Fannie Mae Mortgage pass-thru certificates 2.5% 12/1/2031 | | 6,121 | 5,780 |
| Fannie Mae Mortgage pass-thru certificates 2.5% 12/1/2033 | | 11,305 | 10,456 |
| Fannie Mae Mortgage pass-thru certificates 2.5% 12/1/2051 | | 546,290 | 448,728 |
| Fannie Mae Mortgage pass-thru certificates 2.5% 12/1/2051 (i) | | 3,072,545 | 2,531,502 |
| Fannie Mae Mortgage pass-thru certificates 2.5% 2/1/2031 | | 44,026 | 43,019 |
| Fannie Mae Mortgage pass-thru certificates 2.5% 2/1/2032 | | 2,275 | 2,150 |
| Fannie Mae Mortgage pass-thru certificates 2.5% 2/1/2035 | | 20,088 | 18,417 |
| Fannie Mae Mortgage pass-thru certificates 2.5% 2/1/2035 | | 23,096 | 21,176 |
| Fannie Mae Mortgage pass-thru certificates 2.5% 2/1/2035 | | 68,782 | 63,063 |
| Fannie Mae Mortgage pass-thru certificates 2.5% 2/1/2035 | | 116,095 | 109,942 |
| Fannie Mae Mortgage pass-thru certificates 2.5% 2/1/2041 | | 331,570 | 286,974 |
| Fannie Mae Mortgage pass-thru certificates 2.5% 2/1/2042 | | 1,028,299 | 886,108 |
| Fannie Mae Mortgage pass-thru certificates 2.5% 2/1/2050 | | 33,241 | 27,315 |
| Fannie Mae Mortgage pass-thru certificates 2.5% 2/1/2051 | | 37,185 | 30,486 |
| Fannie Mae Mortgage pass-thru certificates 2.5% 3/1/2032 | | 134,157 | 126,749 |
| Fannie Mae Mortgage pass-thru certificates 2.5% 3/1/2035 | | 18,016 | 16,518 |
| Fannie Mae Mortgage pass-thru certificates 2.5% 3/1/2040 | | 103,655 | 90,271 |
| Fannie Mae Mortgage pass-thru certificates 2.5% 3/1/2041 | | 149,847 | 130,441 |
| Fannie Mae Mortgage pass-thru certificates 2.5% 3/1/2047 | | 90,431 | 74,422 |
| Fannie Mae Mortgage pass-thru certificates 2.5% 4/1/2030 | | 2,953 | 2,828 |
| Fannie Mae Mortgage pass-thru certificates 2.5% 4/1/2030 | | 16,351 | 15,845 |
| Fannie Mae Mortgage pass-thru certificates 2.5% 4/1/2031 | | 15,473 | 14,705 |
| Fannie Mae Mortgage pass-thru certificates 2.5% 4/1/2036 | | 414,142 | 381,908 |
| Fannie Mae Mortgage pass-thru certificates 2.5% 4/1/2036 | | 206,503 | 195,554 |
| Fannie Mae Mortgage pass-thru certificates 2.5% 4/1/2040 | | 70,242 | 61,185 |
| Fannie Mae Mortgage pass-thru certificates 2.5% 4/1/2041 | | 309,496 | 266,700 |
| Fannie Mae Mortgage pass-thru certificates 2.5% 4/1/2042 | | 396,114 | 339,236 |
| Fannie Mae Mortgage pass-thru certificates 2.5% 4/1/2043 | | 17,481 | 15,029 |
| Fannie Mae Mortgage pass-thru certificates 2.5% 4/1/2043 | | 58,011 | 50,031 |
| Fannie Mae Mortgage pass-thru certificates 2.5% 4/1/2046 | | 676 | 568 |
| Fannie Mae Mortgage pass-thru certificates 2.5% 4/1/2051 | | 459,783 | 382,268 |
| Fannie Mae Mortgage pass-thru certificates 2.5% 5/1/2029 | | 1,302 | 1,256 |
| Fannie Mae Mortgage pass-thru certificates 2.5% 5/1/2029 | | 2,835 | 2,735 |
| Fannie Mae Mortgage pass-thru certificates 2.5% 5/1/2035 | | 40,343 | 36,938 |
| Fannie Mae Mortgage pass-thru certificates 2.5% 5/1/2035 | | 23,197 | 21,240 |
| Fannie Mae Mortgage pass-thru certificates 2.5% 5/1/2040 | | 244,275 | 212,716 |
| Fannie Mae Mortgage pass-thru certificates 2.5% 5/1/2041 | | 132,219 | 114,845 |
| Fannie Mae Mortgage pass-thru certificates 2.5% 5/1/2041 | | 169,312 | 146,535 |
| Fannie Mae Mortgage pass-thru certificates 2.5% 5/1/2042 | | 24,902 | 21,435 |
| Fannie Mae Mortgage pass-thru certificates 2.5% 5/1/2042 | | 67,032 | 57,910 |
| Fannie Mae Mortgage pass-thru certificates 2.5% 5/1/2046 | | 9,102 | 7,650 |
| Fannie Mae Mortgage pass-thru certificates 2.5% 5/1/2046 | | 3,149 | 2,647 |
| Fannie Mae Mortgage pass-thru certificates 2.5% 5/1/2051 | | 625,259 | 513,008 |
| Fannie Mae Mortgage pass-thru certificates 2.5% 5/1/2051 | | 1,769,771 | 1,452,049 |
| Fannie Mae Mortgage pass-thru certificates 2.5% 5/1/2051 | | 170,103 | 139,565 |
| Fannie Mae Mortgage pass-thru certificates 2.5% 6/1/2031 | | 111,183 | 105,539 |
| Fannie Mae Mortgage pass-thru certificates 2.5% 6/1/2033 | | 8,955 | 8,294 |
| Fannie Mae Mortgage pass-thru certificates 2.5% 6/1/2035 | | 525,116 | 480,799 |
| Fannie Mae Mortgage pass-thru certificates 2.5% 6/1/2035 | | 27,528 | 25,205 |
| Fannie Mae Mortgage pass-thru certificates 2.5% 6/1/2040 | | 260,174 | 226,324 |
| Fannie Mae Mortgage pass-thru certificates 2.5% 6/1/2046 | | 12,422 | 10,440 |
| Fannie Mae Mortgage pass-thru certificates 2.5% 6/1/2046 | | 13,680 | 11,476 |
| Fannie Mae Mortgage pass-thru certificates 2.5% 6/1/2050 | | 161,512 | 133,728 |
| Fannie Mae Mortgage pass-thru certificates 2.5% 6/1/2050 | | 43,916 | 36,128 |
| Fannie Mae Mortgage pass-thru certificates 2.5% 7/1/2026 | | 1,531 | 1,509 |
| Fannie Mae Mortgage pass-thru certificates 2.5% 7/1/2029 | | 2,910 | 2,790 |
| Fannie Mae Mortgage pass-thru certificates 2.5% 7/1/2031 | | 866,771 | 822,254 |
| Fannie Mae Mortgage pass-thru certificates 2.5% 7/1/2035 | | 288,170 | 263,850 |
| Fannie Mae Mortgage pass-thru certificates 2.5% 7/1/2035 | | 16,295 | 14,920 |
| Fannie Mae Mortgage pass-thru certificates 2.5% 7/1/2035 | | 18,297 | 16,724 |
| Fannie Mae Mortgage pass-thru certificates 2.5% 7/1/2040 | | 20,149 | 17,508 |
| Fannie Mae Mortgage pass-thru certificates 2.5% 7/1/2041 | | 213,385 | 183,879 |
| Fannie Mae Mortgage pass-thru certificates 2.5% 7/1/2041 | | 137,979 | 119,417 |
| Fannie Mae Mortgage pass-thru certificates 2.5% 7/1/2045 | | 90,864 | 75,176 |
| Fannie Mae Mortgage pass-thru certificates 2.5% 7/1/2046 | | 41,371 | 34,771 |
| Fannie Mae Mortgage pass-thru certificates 2.5% 7/1/2046 | | 87,660 | 73,676 |
| Fannie Mae Mortgage pass-thru certificates 2.5% 7/1/2046 | | 11,072 | 9,306 |
| Fannie Mae Mortgage pass-thru certificates 2.5% 7/1/2050 | | 1,508,787 | 1,247,820 |
| Fannie Mae Mortgage pass-thru certificates 2.5% 8/1/2029 | | 7,844 | 7,531 |
| Fannie Mae Mortgage pass-thru certificates 2.5% 8/1/2029 | | 17,125 | 16,487 |
| Fannie Mae Mortgage pass-thru certificates 2.5% 8/1/2029 | | 4,917 | 4,727 |
| Fannie Mae Mortgage pass-thru certificates 2.5% 8/1/2029 | | 9,694 | 9,308 |
| Fannie Mae Mortgage pass-thru certificates 2.5% 8/1/2029 | | 6,270 | 6,020 |
| Fannie Mae Mortgage pass-thru certificates 2.5% 8/1/2029 | | 1,185 | 1,140 |
| Fannie Mae Mortgage pass-thru certificates 2.5% 8/1/2031 | | 9,284 | 8,808 |
| Fannie Mae Mortgage pass-thru certificates 2.5% 8/1/2032 | | 12,018 | 11,314 |
| Fannie Mae Mortgage pass-thru certificates 2.5% 8/1/2033 | | 8,601 | 7,966 |
| Fannie Mae Mortgage pass-thru certificates 2.5% 8/1/2035 | | 225,613 | 206,220 |
| Fannie Mae Mortgage pass-thru certificates 2.5% 8/1/2035 | | 514,584 | 470,352 |
| Fannie Mae Mortgage pass-thru certificates 2.5% 8/1/2035 | | 66,919 | 61,272 |
| Fannie Mae Mortgage pass-thru certificates 2.5% 8/1/2039 | | 8,626 | 7,553 |
| Fannie Mae Mortgage pass-thru certificates 2.5% 8/1/2050 | | 15,828 | 13,021 |
| Fannie Mae Mortgage pass-thru certificates 2.5% 8/1/2051 | | 173,983 | 142,422 |
| Fannie Mae Mortgage pass-thru certificates 2.5% 8/1/2051 | | 585,071 | 480,035 |
| Fannie Mae Mortgage pass-thru certificates 2.5% 8/1/2051 | | 565,793 | 464,218 |
| Fannie Mae Mortgage pass-thru certificates 2.5% 8/1/2051 | | 726,262 | 595,878 |
| Fannie Mae Mortgage pass-thru certificates 2.5% 9/1/2029 | | 4,631 | 4,452 |
| Fannie Mae Mortgage pass-thru certificates 2.5% 9/1/2029 | | 9,029 | 8,687 |
| Fannie Mae Mortgage pass-thru certificates 2.5% 9/1/2029 | | 2,914 | 2,799 |
| Fannie Mae Mortgage pass-thru certificates 2.5% 9/1/2029 | | 24,243 | 23,260 |
| Fannie Mae Mortgage pass-thru certificates 2.5% 9/1/2029 | | 9,432 | 9,049 |
| Fannie Mae Mortgage pass-thru certificates 2.5% 9/1/2029 | | 43,011 | 41,295 |
| Fannie Mae Mortgage pass-thru certificates 2.5% 9/1/2029 | | 3,243 | 3,127 |
| Fannie Mae Mortgage pass-thru certificates 2.5% 9/1/2029 | | 4,713 | 4,527 |
| Fannie Mae Mortgage pass-thru certificates 2.5% 9/1/2029 | | 5,057 | 4,858 |
| Fannie Mae Mortgage pass-thru certificates 2.5% 9/1/2029 | | 4,303 | 4,123 |
| Fannie Mae Mortgage pass-thru certificates 2.5% 9/1/2029 | | 10,919 | 10,504 |
| Fannie Mae Mortgage pass-thru certificates 2.5% 9/1/2034 | | 19,044 | 17,508 |
| Fannie Mae Mortgage pass-thru certificates 2.5% 9/1/2041 | | 423,889 | 364,877 |
| Fannie Mae Mortgage pass-thru certificates 2.5% 9/1/2046 | | 5,829 | 4,888 |
| Fannie Mae Mortgage pass-thru certificates 3% 1/1/2027 | | 3,616 | 3,560 |
| Fannie Mae Mortgage pass-thru certificates 3% 1/1/2027 | | 942 | 927 |
| Fannie Mae Mortgage pass-thru certificates 3% 1/1/2027 | | 3,762 | 3,705 |
| Fannie Mae Mortgage pass-thru certificates 3% 1/1/2030 | | 12,375 | 11,965 |
| Fannie Mae Mortgage pass-thru certificates 3% 1/1/2030 | | 2,132 | 2,067 |
| Fannie Mae Mortgage pass-thru certificates 3% 1/1/2030 | | 1,110 | 1,083 |
| Fannie Mae Mortgage pass-thru certificates 3% 1/1/2030 | | 3,437 | 3,323 |
| Fannie Mae Mortgage pass-thru certificates 3% 1/1/2030 | | 2,988 | 2,921 |
| Fannie Mae Mortgage pass-thru certificates 3% 1/1/2031 | | 28,059 | 27,003 |
| Fannie Mae Mortgage pass-thru certificates 3% 1/1/2031 | | 21,644 | 20,849 |
| Fannie Mae Mortgage pass-thru certificates 3% 1/1/2032 | | 3,047 | 2,915 |
| Fannie Mae Mortgage pass-thru certificates 3% 1/1/2032 | | 25,800 | 24,708 |
| Fannie Mae Mortgage pass-thru certificates 3% 1/1/2033 | | 35,652 | 33,997 |
| Fannie Mae Mortgage pass-thru certificates 3% 1/1/2035 | | 160,101 | 150,598 |
| Fannie Mae Mortgage pass-thru certificates 3% 1/1/2035 | | 507,533 | 477,406 |
| Fannie Mae Mortgage pass-thru certificates 3% 1/1/2040 | | 23,590 | 21,137 |
| Fannie Mae Mortgage pass-thru certificates 3% 1/1/2043 | | 8,234 | 7,353 |
| Fannie Mae Mortgage pass-thru certificates 3% 1/1/2043 | | 22,634 | 20,263 |
| Fannie Mae Mortgage pass-thru certificates 3% 1/1/2043 | | 11,201 | 9,938 |
| Fannie Mae Mortgage pass-thru certificates 3% 1/1/2043 | | 47,313 | 42,007 |
| Fannie Mae Mortgage pass-thru certificates 3% 1/1/2043 | | 13,623 | 12,084 |
| Fannie Mae Mortgage pass-thru certificates 3% 1/1/2043 | | 17,079 | 15,140 |
| Fannie Mae Mortgage pass-thru certificates 3% 1/1/2043 | | 24,775 | 22,001 |
| Fannie Mae Mortgage pass-thru certificates 3% 1/1/2043 | | 28,286 | 25,073 |
| Fannie Mae Mortgage pass-thru certificates 3% 1/1/2043 | | 20,249 | 17,917 |
| Fannie Mae Mortgage pass-thru certificates 3% 1/1/2043 | | 10,028 | 8,966 |
| Fannie Mae Mortgage pass-thru certificates 3% 1/1/2043 | | 6,006 | 5,324 |
| Fannie Mae Mortgage pass-thru certificates 3% 1/1/2043 | | 4,316 | 3,813 |
| Fannie Mae Mortgage pass-thru certificates 3% 1/1/2043 | | 6,109 | 5,452 |
| Fannie Mae Mortgage pass-thru certificates 3% 1/1/2045 | | 3,508 | 3,052 |
| Fannie Mae Mortgage pass-thru certificates 3% 1/1/2046 | | 15,850 | 13,766 |
| Fannie Mae Mortgage pass-thru certificates 3% 1/1/2046 | | 25,777 | 22,387 |
| Fannie Mae Mortgage pass-thru certificates 3% 1/1/2046 | | 2,458 | 2,135 |
| Fannie Mae Mortgage pass-thru certificates 3% 1/1/2047 | | 62,930 | 54,536 |
| Fannie Mae Mortgage pass-thru certificates 3% 1/1/2047 | | 118,544 | 102,731 |
| Fannie Mae Mortgage pass-thru certificates 3% 1/1/2047 | | 8,999 | 7,799 |
| Fannie Mae Mortgage pass-thru certificates 3% 1/1/2047 | | 39,621 | 34,336 |
| Fannie Mae Mortgage pass-thru certificates 3% 1/1/2047 | | 34,501 | 29,899 |
| Fannie Mae Mortgage pass-thru certificates 3% 1/1/2047 | | 47,939 | 41,544 |
| Fannie Mae Mortgage pass-thru certificates 3% 1/1/2047 | | 89,715 | 77,748 |
| Fannie Mae Mortgage pass-thru certificates 3% 1/1/2047 | | 4,656 | 4,032 |
| Fannie Mae Mortgage pass-thru certificates 3% 1/1/2047 | | 56,906 | 49,315 |
| Fannie Mae Mortgage pass-thru certificates 3% 1/1/2047 | | 5,388 | 4,666 |
| Fannie Mae Mortgage pass-thru certificates 3% 1/1/2048 | | 11,257 | 9,731 |
| Fannie Mae Mortgage pass-thru certificates 3% 1/1/2051 | | 617,752 | 528,786 |
| Fannie Mae Mortgage pass-thru certificates 3% 1/1/2052 | | 47,794 | 40,806 |
| Fannie Mae Mortgage pass-thru certificates 3% 1/1/2052 | | 43,005 | 36,718 |
| Fannie Mae Mortgage pass-thru certificates 3% 1/1/2052 | | 31,428 | 26,833 |
| Fannie Mae Mortgage pass-thru certificates 3% 1/1/2052 | | 37,491 | 32,010 |
| Fannie Mae Mortgage pass-thru certificates 3% 1/1/2052 | | 730,191 | 623,435 |
| Fannie Mae Mortgage pass-thru certificates 3% 1/1/2052 | | 149,040 | 127,250 |
| Fannie Mae Mortgage pass-thru certificates 3% 10/1/2027 | | 2,525 | 2,477 |
| Fannie Mae Mortgage pass-thru certificates 3% 10/1/2027 | | 13,583 | 13,344 |
| Fannie Mae Mortgage pass-thru certificates 3% 10/1/2029 | | 11,514 | 11,138 |
| Fannie Mae Mortgage pass-thru certificates 3% 10/1/2030 | | 3,168 | 3,052 |
| Fannie Mae Mortgage pass-thru certificates 3% 10/1/2030 | | 3,180 | 3,066 |
| Fannie Mae Mortgage pass-thru certificates 3% 10/1/2030 | | 17,571 | 16,940 |
| Fannie Mae Mortgage pass-thru certificates 3% 10/1/2030 | | 4,208 | 4,052 |
| Fannie Mae Mortgage pass-thru certificates 3% 10/1/2030 | | 6,022 | 5,806 |
| Fannie Mae Mortgage pass-thru certificates 3% 10/1/2031 | | 17,021 | 16,314 |
| Fannie Mae Mortgage pass-thru certificates 3% 10/1/2031 | | 5,054 | 4,842 |
| Fannie Mae Mortgage pass-thru certificates 3% 10/1/2032 | | 49,323 | 47,096 |
| Fannie Mae Mortgage pass-thru certificates 3% 10/1/2043 | | 13,732 | 12,121 |
| Fannie Mae Mortgage pass-thru certificates 3% 10/1/2043 | | 14,050 | 12,360 |
| Fannie Mae Mortgage pass-thru certificates 3% 10/1/2043 | | 18,810 | 16,550 |
| Fannie Mae Mortgage pass-thru certificates 3% 10/1/2043 | | 36,926 | 32,634 |
| Fannie Mae Mortgage pass-thru certificates 3% 10/1/2043 | | 15,549 | 13,737 |
| Fannie Mae Mortgage pass-thru certificates 3% 10/1/2044 | | 518,548 | 458,853 |
| Fannie Mae Mortgage pass-thru certificates 3% 10/1/2046 | | 33,622 | 29,137 |
| Fannie Mae Mortgage pass-thru certificates 3% 10/1/2046 | | 7,185 | 6,227 |
| Fannie Mae Mortgage pass-thru certificates 3% 10/1/2046 | | 44,261 | 38,357 |
| Fannie Mae Mortgage pass-thru certificates 3% 10/1/2046 | | 49,166 | 42,607 |
| Fannie Mae Mortgage pass-thru certificates 3% 10/1/2046 | | 11,743 | 10,176 |
| Fannie Mae Mortgage pass-thru certificates 3% 10/1/2046 | | 5,687 | 4,928 |
| Fannie Mae Mortgage pass-thru certificates 3% 10/1/2046 | | 11,640 | 10,087 |
| Fannie Mae Mortgage pass-thru certificates 3% 10/1/2046 | | 34,547 | 29,939 |
| Fannie Mae Mortgage pass-thru certificates 3% 10/1/2046 | | 37,410 | 32,420 |
| Fannie Mae Mortgage pass-thru certificates 3% 10/1/2046 | | 23,604 | 20,456 |
| Fannie Mae Mortgage pass-thru certificates 3% 10/1/2046 | | 531,198 | 463,495 |
| Fannie Mae Mortgage pass-thru certificates 3% 10/1/2047 | | 14,244 | 12,322 |
| Fannie Mae Mortgage pass-thru certificates 3% 10/1/2049 | | 824,572 | 709,428 |
| Fannie Mae Mortgage pass-thru certificates 3% 10/1/2051 (j) | | 1,426,900 | 1,227,200 |
| Fannie Mae Mortgage pass-thru certificates 3% 10/1/2051 | | 244,326 | 208,604 |
| Fannie Mae Mortgage pass-thru certificates 3% 10/1/2051 | | 476,489 | 407,569 |
| Fannie Mae Mortgage pass-thru certificates 3% 11/1/2026 | | 2,344 | 2,310 |
| Fannie Mae Mortgage pass-thru certificates 3% 11/1/2026 | | 6,770 | 6,675 |
| Fannie Mae Mortgage pass-thru certificates 3% 11/1/2026 | | 2,008 | 1,977 |
| Fannie Mae Mortgage pass-thru certificates 3% 11/1/2027 | | 16,046 | 15,731 |
| Fannie Mae Mortgage pass-thru certificates 3% 11/1/2027 | | 1,036 | 1,017 |
| Fannie Mae Mortgage pass-thru certificates 3% 11/1/2027 | | 4,555 | 4,472 |
| Fannie Mae Mortgage pass-thru certificates 3% 11/1/2030 | | 6,986 | 6,717 |
| Fannie Mae Mortgage pass-thru certificates 3% 11/1/2030 | | 5,116 | 4,926 |
| Fannie Mae Mortgage pass-thru certificates 3% 11/1/2030 | | 5,821 | 5,612 |
| Fannie Mae Mortgage pass-thru certificates 3% 11/1/2032 | | 53,160 | 50,715 |
| Fannie Mae Mortgage pass-thru certificates 3% 11/1/2032 | | 4,871 | 4,649 |
| Fannie Mae Mortgage pass-thru certificates 3% 11/1/2033 | | 36,644 | 34,973 |
| Fannie Mae Mortgage pass-thru certificates 3% 11/1/2034 | | 72,290 | 69,665 |
| Fannie Mae Mortgage pass-thru certificates 3% 11/1/2042 | | 36,701 | 32,577 |
| Fannie Mae Mortgage pass-thru certificates 3% 11/1/2042 | | 7,848 | 6,937 |
| Fannie Mae Mortgage pass-thru certificates 3% 11/1/2042 | | 20,319 | 18,035 |
| Fannie Mae Mortgage pass-thru certificates 3% 11/1/2042 | | 8,267 | 7,349 |
| Fannie Mae Mortgage pass-thru certificates 3% 11/1/2042 | | 3,893 | 3,460 |
| Fannie Mae Mortgage pass-thru certificates 3% 11/1/2042 | | 2,972 | 2,619 |
| Fannie Mae Mortgage pass-thru certificates 3% 11/1/2045 | | 3,542 | 3,077 |
| Fannie Mae Mortgage pass-thru certificates 3% 11/1/2046 | | 264,696 | 229,388 |
| Fannie Mae Mortgage pass-thru certificates 3% 11/1/2046 | | 439,448 | 380,830 |
| Fannie Mae Mortgage pass-thru certificates 3% 11/1/2046 | | 246,217 | 213,374 |
| Fannie Mae Mortgage pass-thru certificates 3% 11/1/2046 | | 6,901 | 5,981 |
| Fannie Mae Mortgage pass-thru certificates 3% 11/1/2046 | | 6,646 | 5,759 |
| Fannie Mae Mortgage pass-thru certificates 3% 11/1/2046 | | 4,826 | 4,182 |
| Fannie Mae Mortgage pass-thru certificates 3% 11/1/2046 | | 127,919 | 110,856 |
| Fannie Mae Mortgage pass-thru certificates 3% 11/1/2046 | | 38,826 | 33,647 |
| Fannie Mae Mortgage pass-thru certificates 3% 11/1/2046 | | 397,343 | 351,767 |
| Fannie Mae Mortgage pass-thru certificates 3% 11/1/2046 | | 684,788 | 597,509 |
| Fannie Mae Mortgage pass-thru certificates 3% 11/1/2046 | | 662,064 | 577,682 |
| Fannie Mae Mortgage pass-thru certificates 3% 11/1/2047 | | 20,166 | 17,444 |
| Fannie Mae Mortgage pass-thru certificates 3% 11/1/2047 | | 8,311 | 7,189 |
| Fannie Mae Mortgage pass-thru certificates 3% 11/1/2048 | | 184,342 | 159,349 |
| Fannie Mae Mortgage pass-thru certificates 3% 11/1/2050 | | 121,693 | 104,167 |
| Fannie Mae Mortgage pass-thru certificates 3% 11/1/2050 | | 14,757 | 12,673 |
| Fannie Mae Mortgage pass-thru certificates 3% 11/1/2051 | | 78,174 | 66,793 |
| Fannie Mae Mortgage pass-thru certificates 3% 12/1/2026 | | 686 | 676 |
| Fannie Mae Mortgage pass-thru certificates 3% 12/1/2026 | | 877 | 863 |
| Fannie Mae Mortgage pass-thru certificates 3% 12/1/2026 | | 1,868 | 1,840 |
| Fannie Mae Mortgage pass-thru certificates 3% 12/1/2026 | | 466 | 459 |
| Fannie Mae Mortgage pass-thru certificates 3% 12/1/2029 | | 20,339 | 19,703 |
| Fannie Mae Mortgage pass-thru certificates 3% 12/1/2030 | | 8,224 | 7,930 |
| Fannie Mae Mortgage pass-thru certificates 3% 12/1/2030 | | 2,950 | 2,844 |
| Fannie Mae Mortgage pass-thru certificates 3% 12/1/2031 | | 6,567 | 6,289 |
| Fannie Mae Mortgage pass-thru certificates 3% 12/1/2032 | | 68,158 | 64,995 |
| Fannie Mae Mortgage pass-thru certificates 3% 12/1/2032 | | 186,877 | 179,358 |
| Fannie Mae Mortgage pass-thru certificates 3% 12/1/2034 | | 62,742 | 59,017 |
| Fannie Mae Mortgage pass-thru certificates 3% 12/1/2034 | | 217,873 | 204,940 |
| Fannie Mae Mortgage pass-thru certificates 3% 12/1/2034 | | 558,439 | 525,989 |
| Fannie Mae Mortgage pass-thru certificates 3% 12/1/2042 | | 27,796 | 24,730 |
| Fannie Mae Mortgage pass-thru certificates 3% 12/1/2042 | | 14,553 | 12,902 |
| Fannie Mae Mortgage pass-thru certificates 3% 12/1/2042 | | 8,366 | 7,415 |
| Fannie Mae Mortgage pass-thru certificates 3% 12/1/2042 | | 490,181 | 434,297 |
| Fannie Mae Mortgage pass-thru certificates 3% 12/1/2042 | | 11,093 | 9,844 |
| Fannie Mae Mortgage pass-thru certificates 3% 12/1/2042 | | 10,369 | 9,205 |
| Fannie Mae Mortgage pass-thru certificates 3% 12/1/2042 | | 27,292 | 24,229 |
| Fannie Mae Mortgage pass-thru certificates 3% 12/1/2042 | | 15,000 | 13,312 |
| Fannie Mae Mortgage pass-thru certificates 3% 12/1/2042 | | 10,753 | 9,505 |
| Fannie Mae Mortgage pass-thru certificates 3% 12/1/2042 | | 11,142 | 9,849 |
| Fannie Mae Mortgage pass-thru certificates 3% 12/1/2042 | | 10,744 | 9,525 |
| Fannie Mae Mortgage pass-thru certificates 3% 12/1/2042 | | 4,522 | 4,046 |
| Fannie Mae Mortgage pass-thru certificates 3% 12/1/2042 | | 2,150 | 1,894 |
| Fannie Mae Mortgage pass-thru certificates 3% 12/1/2042 | | 195,228 | 173,110 |
| Fannie Mae Mortgage pass-thru certificates 3% 12/1/2042 | | 38,048 | 33,632 |
| Fannie Mae Mortgage pass-thru certificates 3% 12/1/2045 | | 32,159 | 27,929 |
| Fannie Mae Mortgage pass-thru certificates 3% 12/1/2045 | | 19,502 | 16,937 |
| Fannie Mae Mortgage pass-thru certificates 3% 12/1/2045 | | 22,906 | 19,894 |
| Fannie Mae Mortgage pass-thru certificates 3% 12/1/2046 | | 26,452 | 22,923 |
| Fannie Mae Mortgage pass-thru certificates 3% 12/1/2046 | | 310,391 | 268,988 |
| Fannie Mae Mortgage pass-thru certificates 3% 12/1/2046 | | 28,481 | 24,682 |
| Fannie Mae Mortgage pass-thru certificates 3% 12/1/2046 | | 87,338 | 75,688 |
| Fannie Mae Mortgage pass-thru certificates 3% 12/1/2046 | | 6,857 | 5,942 |
| Fannie Mae Mortgage pass-thru certificates 3% 12/1/2046 | | 46,426 | 40,233 |
| Fannie Mae Mortgage pass-thru certificates 3% 12/1/2046 | | 6,561 | 5,686 |
| Fannie Mae Mortgage pass-thru certificates 3% 12/1/2046 | | 13,000 | 11,266 |
| Fannie Mae Mortgage pass-thru certificates 3% 12/1/2047 | | 8,765 | 7,582 |
| Fannie Mae Mortgage pass-thru certificates 3% 12/1/2047 | | 14,366 | 12,418 |
| Fannie Mae Mortgage pass-thru certificates 3% 12/1/2050 | | 1,122,387 | 960,745 |
| Fannie Mae Mortgage pass-thru certificates 3% 12/1/2051 | | 857,287 | 734,627 |
| Fannie Mae Mortgage pass-thru certificates 3% 12/1/2051 | | 25,852 | 22,048 |
| Fannie Mae Mortgage pass-thru certificates 3% 12/1/2051 | | 49,875 | 42,614 |
| Fannie Mae Mortgage pass-thru certificates 3% 12/1/2051 | | 526,776 | 450,582 |
| Fannie Mae Mortgage pass-thru certificates 3% 12/1/2051 | | 434,756 | 372,687 |
| Fannie Mae Mortgage pass-thru certificates 3% 2/1/2027 | | 2,871 | 2,827 |
| Fannie Mae Mortgage pass-thru certificates 3% 2/1/2027 | | 1,567 | 1,543 |
| Fannie Mae Mortgage pass-thru certificates 3% 2/1/2027 | | 3,376 | 3,324 |
| Fannie Mae Mortgage pass-thru certificates 3% 2/1/2027 | | 776 | 763 |
| Fannie Mae Mortgage pass-thru certificates 3% 2/1/2029 | | 23,748 | 23,117 |
| Fannie Mae Mortgage pass-thru certificates 3% 2/1/2029 | | 42,344 | 41,219 |
| Fannie Mae Mortgage pass-thru certificates 3% 2/1/2030 | | 11,966 | 11,581 |
| Fannie Mae Mortgage pass-thru certificates 3% 2/1/2030 | | 24,191 | 23,400 |
| Fannie Mae Mortgage pass-thru certificates 3% 2/1/2030 | | 2,186 | 2,116 |
| Fannie Mae Mortgage pass-thru certificates 3% 2/1/2030 | | 1,238 | 1,197 |
| Fannie Mae Mortgage pass-thru certificates 3% 2/1/2031 | | 4,118 | 3,963 |
| Fannie Mae Mortgage pass-thru certificates 3% 2/1/2031 | | 24,820 | 23,875 |
| Fannie Mae Mortgage pass-thru certificates 3% 2/1/2031 | | 7,503 | 7,236 |
| Fannie Mae Mortgage pass-thru certificates 3% 2/1/2031 | | 127,696 | 123,582 |
| Fannie Mae Mortgage pass-thru certificates 3% 2/1/2032 | | 15,793 | 15,150 |
| Fannie Mae Mortgage pass-thru certificates 3% 2/1/2033 | | 26,894 | 25,668 |
| Fannie Mae Mortgage pass-thru certificates 3% 2/1/2034 | | 16,991 | 16,236 |
| Fannie Mae Mortgage pass-thru certificates 3% 2/1/2035 | | 49,731 | 47,947 |
| Fannie Mae Mortgage pass-thru certificates 3% 2/1/2040 | | 161,537 | 144,735 |
| Fannie Mae Mortgage pass-thru certificates 3% 2/1/2043 | | 14,267 | 12,626 |
| Fannie Mae Mortgage pass-thru certificates 3% 2/1/2043 | | 66,899 | 59,381 |
| Fannie Mae Mortgage pass-thru certificates 3% 2/1/2043 | | 6,365 | 5,620 |
| Fannie Mae Mortgage pass-thru certificates 3% 2/1/2043 | | 171,308 | 151,763 |
| Fannie Mae Mortgage pass-thru certificates 3% 2/1/2043 | | 61,523 | 54,549 |
| Fannie Mae Mortgage pass-thru certificates 3% 2/1/2043 | | 130,280 | 115,418 |
| Fannie Mae Mortgage pass-thru certificates 3% 2/1/2043 | | 14,968 | 13,285 |
| Fannie Mae Mortgage pass-thru certificates 3% 2/1/2043 | | 9,012 | 7,967 |
| Fannie Mae Mortgage pass-thru certificates 3% 2/1/2043 | | 12,963 | 11,430 |
| Fannie Mae Mortgage pass-thru certificates 3% 2/1/2043 | | 1,012 | 925 |
| Fannie Mae Mortgage pass-thru certificates 3% 2/1/2045 | | 12,116 | 10,542 |
| Fannie Mae Mortgage pass-thru certificates 3% 2/1/2046 | | 11,463 | 9,955 |
| Fannie Mae Mortgage pass-thru certificates 3% 2/1/2046 | | 4,775 | 4,147 |
| Fannie Mae Mortgage pass-thru certificates 3% 2/1/2046 | | 46,163 | 40,092 |
| Fannie Mae Mortgage pass-thru certificates 3% 2/1/2046 | | 15,030 | 13,053 |
| Fannie Mae Mortgage pass-thru certificates 3% 2/1/2047 | | 7,014 | 6,078 |
| Fannie Mae Mortgage pass-thru certificates 3% 2/1/2047 | | 220,038 | 190,687 |
| Fannie Mae Mortgage pass-thru certificates 3% 2/1/2047 | | 93,700 | 81,201 |
| Fannie Mae Mortgage pass-thru certificates 3% 2/1/2047 | | 65,814 | 56,994 |
| Fannie Mae Mortgage pass-thru certificates 3% 2/1/2048 | | 9,891 | 8,550 |
| Fannie Mae Mortgage pass-thru certificates 3% 2/1/2052 | | 46,034 | 39,304 |
| Fannie Mae Mortgage pass-thru certificates 3% 2/1/2052 | | 238,851 | 204,602 |
| Fannie Mae Mortgage pass-thru certificates 3% 2/1/2052 | | 2,722,306 | 2,324,295 |
| Fannie Mae Mortgage pass-thru certificates 3% 2/1/2052 | | 97,879 | 83,568 |
| Fannie Mae Mortgage pass-thru certificates 3% 3/1/2027 | | 2,799 | 2,753 |
| Fannie Mae Mortgage pass-thru certificates 3% 3/1/2027 | | 7,367 | 7,250 |
| Fannie Mae Mortgage pass-thru certificates 3% 3/1/2029 | | 1,583 | 1,540 |
| Fannie Mae Mortgage pass-thru certificates 3% 3/1/2029 | | 29,374 | 28,547 |
| Fannie Mae Mortgage pass-thru certificates 3% 3/1/2030 | | 2,832 | 2,736 |
| Fannie Mae Mortgage pass-thru certificates 3% 3/1/2030 | | 9,180 | 9,039 |
| Fannie Mae Mortgage pass-thru certificates 3% 3/1/2031 | | 1,225 | 1,184 |
| Fannie Mae Mortgage pass-thru certificates 3% 3/1/2032 | | 4,998 | 4,784 |
| Fannie Mae Mortgage pass-thru certificates 3% 3/1/2032 | | 23,232 | 22,231 |
| Fannie Mae Mortgage pass-thru certificates 3% 3/1/2032 | | 9,637 | 9,228 |
| Fannie Mae Mortgage pass-thru certificates 3% 3/1/2032 | | 39,056 | 37,355 |
| Fannie Mae Mortgage pass-thru certificates 3% 3/1/2033 | | 27,533 | 26,379 |
| Fannie Mae Mortgage pass-thru certificates 3% 3/1/2033 | | 10,452 | 9,942 |
| Fannie Mae Mortgage pass-thru certificates 3% 3/1/2033 | | 8,799 | 8,409 |
| Fannie Mae Mortgage pass-thru certificates 3% 3/1/2038 | | 15,300 | 13,962 |
| Fannie Mae Mortgage pass-thru certificates 3% 3/1/2043 | | 13,800 | 12,241 |
| Fannie Mae Mortgage pass-thru certificates 3% 3/1/2043 | | 6,473 | 5,735 |
| Fannie Mae Mortgage pass-thru certificates 3% 3/1/2044 | | 15,389 | 13,509 |
| Fannie Mae Mortgage pass-thru certificates 3% 3/1/2046 | | 13,057 | 11,323 |
| Fannie Mae Mortgage pass-thru certificates 3% 3/1/2046 | | 10,602 | 9,194 |
| Fannie Mae Mortgage pass-thru certificates 3% 3/1/2046 | | 10,578 | 9,187 |
| Fannie Mae Mortgage pass-thru certificates 3% 3/1/2047 | | 14,734 | 12,759 |
| Fannie Mae Mortgage pass-thru certificates 3% 3/1/2047 | | 7,587 | 6,570 |
| Fannie Mae Mortgage pass-thru certificates 3% 3/1/2047 | | 10,621 | 9,198 |
| Fannie Mae Mortgage pass-thru certificates 3% 3/1/2047 | | 243,356 | 212,340 |
| Fannie Mae Mortgage pass-thru certificates 3% 3/1/2048 | | 20,749 | 17,936 |
| Fannie Mae Mortgage pass-thru certificates 3% 3/1/2048 | | 27,807 | 24,037 |
| Fannie Mae Mortgage pass-thru certificates 3% 3/1/2048 | | 14,008 | 12,109 |
| Fannie Mae Mortgage pass-thru certificates 3% 3/1/2048 | | 290,411 | 252,671 |
| Fannie Mae Mortgage pass-thru certificates 3% 3/1/2052 | | 711,883 | 607,803 |
| Fannie Mae Mortgage pass-thru certificates 3% 4/1/2027 | | 2,167 | 2,132 |
| Fannie Mae Mortgage pass-thru certificates 3% 4/1/2027 | | 2,165 | 2,130 |
| Fannie Mae Mortgage pass-thru certificates 3% 4/1/2027 | | 8,896 | 8,751 |
| Fannie Mae Mortgage pass-thru certificates 3% 4/1/2027 | | 4,062 | 3,997 |
| Fannie Mae Mortgage pass-thru certificates 3% 4/1/2029 | | 2,144 | 2,084 |
| Fannie Mae Mortgage pass-thru certificates 3% 4/1/2029 | | 2,403 | 2,337 |
| Fannie Mae Mortgage pass-thru certificates 3% 4/1/2030 | | 10,601 | 10,245 |
| Fannie Mae Mortgage pass-thru certificates 3% 4/1/2031 | | 6,179 | 5,941 |
| Fannie Mae Mortgage pass-thru certificates 3% 4/1/2031 | | 6,113 | 5,862 |
| Fannie Mae Mortgage pass-thru certificates 3% 4/1/2031 | | 10,777 | 10,361 |
| Fannie Mae Mortgage pass-thru certificates 3% 4/1/2032 | | 7,482 | 7,156 |
| Fannie Mae Mortgage pass-thru certificates 3% 4/1/2032 | | 7,515 | 7,190 |
| Fannie Mae Mortgage pass-thru certificates 3% 4/1/2039 | | 4,174 | 3,757 |
| Fannie Mae Mortgage pass-thru certificates 3% 4/1/2042 | | 160,925 | 143,288 |
| Fannie Mae Mortgage pass-thru certificates 3% 4/1/2043 | | 34,424 | 30,519 |
| Fannie Mae Mortgage pass-thru certificates 3% 4/1/2043 | | 27,686 | 24,401 |
| Fannie Mae Mortgage pass-thru certificates 3% 4/1/2043 | | 19,913 | 17,623 |
| Fannie Mae Mortgage pass-thru certificates 3% 4/1/2043 | | 14,607 | 12,927 |
| Fannie Mae Mortgage pass-thru certificates 3% 4/1/2045 | | 5,299 | 4,610 |
| Fannie Mae Mortgage pass-thru certificates 3% 4/1/2045 | | 2,243 | 1,952 |
| Fannie Mae Mortgage pass-thru certificates 3% 4/1/2045 | | 3,677 | 3,199 |
| Fannie Mae Mortgage pass-thru certificates 3% 4/1/2045 | | 101,654 | 88,698 |
| Fannie Mae Mortgage pass-thru certificates 3% 4/1/2046 | | 10,621 | 9,211 |
| Fannie Mae Mortgage pass-thru certificates 3% 4/1/2046 | | 3,345 | 2,901 |
| Fannie Mae Mortgage pass-thru certificates 3% 4/1/2046 | | 7,712 | 6,688 |
| Fannie Mae Mortgage pass-thru certificates 3% 4/1/2046 | | 2,965 | 2,571 |
| Fannie Mae Mortgage pass-thru certificates 3% 4/1/2046 | | 2,306 | 1,999 |
| Fannie Mae Mortgage pass-thru certificates 3% 4/1/2046 | | 4,498 | 3,901 |
| Fannie Mae Mortgage pass-thru certificates 3% 4/1/2046 | | 3,124 | 2,709 |
| Fannie Mae Mortgage pass-thru certificates 3% 4/1/2048 | | 43,495 | 37,598 |
| Fannie Mae Mortgage pass-thru certificates 3% 4/1/2048 | | 41,937 | 36,251 |
| Fannie Mae Mortgage pass-thru certificates 3% 4/1/2052 | | 1,899,999 | 1,612,712 |
| Fannie Mae Mortgage pass-thru certificates 3% 5/1/2027 | | 813 | 800 |
| Fannie Mae Mortgage pass-thru certificates 3% 5/1/2027 | | 1,031 | 1,014 |
| Fannie Mae Mortgage pass-thru certificates 3% 5/1/2027 | | 1,125 | 1,106 |
| Fannie Mae Mortgage pass-thru certificates 3% 5/1/2027 | | 1,747 | 1,719 |
| Fannie Mae Mortgage pass-thru certificates 3% 5/1/2031 | | 13,101 | 12,602 |
| Fannie Mae Mortgage pass-thru certificates 3% 5/1/2031 | | 3,208 | 3,080 |
| Fannie Mae Mortgage pass-thru certificates 3% 5/1/2031 | | 28,259 | 27,157 |
| Fannie Mae Mortgage pass-thru certificates 3% 5/1/2032 | | 4,458 | 4,263 |
| Fannie Mae Mortgage pass-thru certificates 3% 5/1/2032 | | 6,022 | 5,760 |
| Fannie Mae Mortgage pass-thru certificates 3% 5/1/2032 | | 11,267 | 10,768 |
| Fannie Mae Mortgage pass-thru certificates 3% 5/1/2032 | | 4,593 | 4,389 |
| Fannie Mae Mortgage pass-thru certificates 3% 5/1/2043 | | 12,664 | 11,217 |
| Fannie Mae Mortgage pass-thru certificates 3% 5/1/2043 | | 4,521 | 3,998 |
| Fannie Mae Mortgage pass-thru certificates 3% 5/1/2043 | | 64,176 | 56,868 |
| Fannie Mae Mortgage pass-thru certificates 3% 5/1/2043 | | 12,801 | 11,325 |
| Fannie Mae Mortgage pass-thru certificates 3% 5/1/2043 | | 10,135 | 8,969 |
| Fannie Mae Mortgage pass-thru certificates 3% 5/1/2043 | | 43,333 | 38,272 |
| Fannie Mae Mortgage pass-thru certificates 3% 5/1/2043 | | 64,830 | 57,232 |
| Fannie Mae Mortgage pass-thru certificates 3% 5/1/2043 | | 41,284 | 36,551 |
| Fannie Mae Mortgage pass-thru certificates 3% 5/1/2043 | | 369,264 | 326,688 |
| Fannie Mae Mortgage pass-thru certificates 3% 5/1/2043 | | 130,917 | 115,621 |
| Fannie Mae Mortgage pass-thru certificates 3% 5/1/2043 | | 9,249 | 8,185 |
| Fannie Mae Mortgage pass-thru certificates 3% 5/1/2045 | | 18,056 | 15,755 |
| Fannie Mae Mortgage pass-thru certificates 3% 5/1/2045 | | 31,080 | 27,041 |
| Fannie Mae Mortgage pass-thru certificates 3% 5/1/2046 | | 4,219 | 3,659 |
| Fannie Mae Mortgage pass-thru certificates 3% 5/1/2046 | | 23,003 | 19,949 |
| Fannie Mae Mortgage pass-thru certificates 3% 5/1/2046 | | 22,276 | 19,318 |
| Fannie Mae Mortgage pass-thru certificates 3% 5/1/2046 | | 9,293 | 8,060 |
| Fannie Mae Mortgage pass-thru certificates 3% 5/1/2046 | | 217,646 | 190,042 |
| Fannie Mae Mortgage pass-thru certificates 3% 5/1/2046 | | 4,975 | 4,315 |
| Fannie Mae Mortgage pass-thru certificates 3% 5/1/2050 | | 50,276 | 43,192 |
| Fannie Mae Mortgage pass-thru certificates 3% 5/1/2051 | | 76,278 | 65,292 |
| Fannie Mae Mortgage pass-thru certificates 3% 5/1/2052 | | 2,025,094 | 1,733,448 |
| Fannie Mae Mortgage pass-thru certificates 3% 6/1/2027 | | 6,443 | 6,335 |
| Fannie Mae Mortgage pass-thru certificates 3% 6/1/2027 | | 8,217 | 8,074 |
| Fannie Mae Mortgage pass-thru certificates 3% 6/1/2028 | | 3,148 | 3,096 |
| Fannie Mae Mortgage pass-thru certificates 3% 6/1/2029 | | 6,372 | 6,182 |
| Fannie Mae Mortgage pass-thru certificates 3% 6/1/2029 | | 14,563 | 14,161 |
| Fannie Mae Mortgage pass-thru certificates 3% 6/1/2029 | | 2,538 | 2,465 |
| Fannie Mae Mortgage pass-thru certificates 3% 6/1/2029 | | 5,999 | 5,838 |
| Fannie Mae Mortgage pass-thru certificates 3% 6/1/2030 | | 18,024 | 17,419 |
| Fannie Mae Mortgage pass-thru certificates 3% 6/1/2030 | | 19,250 | 18,595 |
| Fannie Mae Mortgage pass-thru certificates 3% 6/1/2031 | | 22,415 | 21,550 |
| Fannie Mae Mortgage pass-thru certificates 3% 6/1/2042 | | 72,125 | 64,038 |
| Fannie Mae Mortgage pass-thru certificates 3% 6/1/2043 | | 27,016 | 23,876 |
| Fannie Mae Mortgage pass-thru certificates 3% 6/1/2043 | | 51,845 | 45,807 |
| Fannie Mae Mortgage pass-thru certificates 3% 6/1/2043 | | 8,263 | 7,303 |
| Fannie Mae Mortgage pass-thru certificates 3% 6/1/2043 | | 7,576 | 6,699 |
| Fannie Mae Mortgage pass-thru certificates 3% 6/1/2043 | | 9,924 | 8,776 |
| Fannie Mae Mortgage pass-thru certificates 3% 6/1/2043 | | 12,269 | 10,850 |
| Fannie Mae Mortgage pass-thru certificates 3% 6/1/2043 | | 5,673 | 5,014 |
| Fannie Mae Mortgage pass-thru certificates 3% 6/1/2043 | | 269,720 | 238,774 |
| Fannie Mae Mortgage pass-thru certificates 3% 6/1/2043 | | 59,904 | 53,016 |
| Fannie Mae Mortgage pass-thru certificates 3% 6/1/2043 | | 10,006 | 8,919 |
| Fannie Mae Mortgage pass-thru certificates 3% 6/1/2043 | | 15,791 | 13,959 |
| Fannie Mae Mortgage pass-thru certificates 3% 6/1/2043 | | 11,894 | 10,547 |
| Fannie Mae Mortgage pass-thru certificates 3% 6/1/2045 | | 24,101 | 20,946 |
| Fannie Mae Mortgage pass-thru certificates 3% 6/1/2045 | | 6,825 | 5,951 |
| Fannie Mae Mortgage pass-thru certificates 3% 6/1/2045 | | 14,366 | 12,486 |
| Fannie Mae Mortgage pass-thru certificates 3% 6/1/2046 | | 44,663 | 38,733 |
| Fannie Mae Mortgage pass-thru certificates 3% 6/1/2047 | | 7,997 | 6,925 |
| Fannie Mae Mortgage pass-thru certificates 3% 6/1/2048 | | 138,921 | 120,087 |
| Fannie Mae Mortgage pass-thru certificates 3% 6/1/2051 | | 840,247 | 720,813 |
| Fannie Mae Mortgage pass-thru certificates 3% 7/1/2027 | | 5,178 | 5,096 |
| Fannie Mae Mortgage pass-thru certificates 3% 7/1/2027 | | 4,558 | 4,483 |
| Fannie Mae Mortgage pass-thru certificates 3% 7/1/2029 | | 9,571 | 9,292 |
| Fannie Mae Mortgage pass-thru certificates 3% 7/1/2029 | | 5,028 | 4,876 |
| Fannie Mae Mortgage pass-thru certificates 3% 7/1/2029 | | 13,420 | 13,042 |
| Fannie Mae Mortgage pass-thru certificates 3% 7/1/2029 | | 5,334 | 5,181 |
| Fannie Mae Mortgage pass-thru certificates 3% 7/1/2030 | | 5,016 | 4,843 |
| Fannie Mae Mortgage pass-thru certificates 3% 7/1/2030 | | 4,261 | 4,117 |
| Fannie Mae Mortgage pass-thru certificates 3% 7/1/2030 | | 5,239 | 5,060 |
| Fannie Mae Mortgage pass-thru certificates 3% 7/1/2032 | | 49,593 | 47,393 |
| Fannie Mae Mortgage pass-thru certificates 3% 7/1/2032 | | 7,106 | 6,796 |
| Fannie Mae Mortgage pass-thru certificates 3% 7/1/2033 | | 66,159 | 63,170 |
| Fannie Mae Mortgage pass-thru certificates 3% 7/1/2034 | | 146,232 | 141,118 |
| Fannie Mae Mortgage pass-thru certificates 3% 7/1/2039 | | 90,075 | 81,071 |
| Fannie Mae Mortgage pass-thru certificates 3% 7/1/2043 | | 2,476 | 2,177 |
| Fannie Mae Mortgage pass-thru certificates 3% 7/1/2043 | | 7,976 | 7,045 |
| Fannie Mae Mortgage pass-thru certificates 3% 7/1/2043 | | 26,201 | 23,167 |
| Fannie Mae Mortgage pass-thru certificates 3% 7/1/2043 | | 26,913 | 23,807 |
| Fannie Mae Mortgage pass-thru certificates 3% 7/1/2043 | | 34,260 | 30,307 |
| Fannie Mae Mortgage pass-thru certificates 3% 7/1/2043 | | 38,147 | 33,729 |
| Fannie Mae Mortgage pass-thru certificates 3% 7/1/2043 | | 12,184 | 10,789 |
| Fannie Mae Mortgage pass-thru certificates 3% 7/1/2043 | | 16,031 | 14,164 |
| Fannie Mae Mortgage pass-thru certificates 3% 7/1/2043 | | 27,417 | 24,202 |
| Fannie Mae Mortgage pass-thru certificates 3% 7/1/2043 | | 38,114 | 33,743 |
| Fannie Mae Mortgage pass-thru certificates 3% 7/1/2043 | | 7,428 | 6,560 |
| Fannie Mae Mortgage pass-thru certificates 3% 7/1/2043 | | 3,660 | 3,242 |
| Fannie Mae Mortgage pass-thru certificates 3% 7/1/2043 | | 7,973 | 7,067 |
| Fannie Mae Mortgage pass-thru certificates 3% 7/1/2043 | | 4,113 | 3,634 |
| Fannie Mae Mortgage pass-thru certificates 3% 7/1/2043 | | 22,596 | 19,980 |
| Fannie Mae Mortgage pass-thru certificates 3% 7/1/2043 | | 8,920 | 7,897 |
| Fannie Mae Mortgage pass-thru certificates 3% 7/1/2043 | | 255,828 | 226,202 |
| Fannie Mae Mortgage pass-thru certificates 3% 7/1/2045 | | 7,706 | 6,738 |
| Fannie Mae Mortgage pass-thru certificates 3% 7/1/2045 | | 8,635 | 7,551 |
| Fannie Mae Mortgage pass-thru certificates 3% 7/1/2046 | | 5,286 | 4,584 |
| Fannie Mae Mortgage pass-thru certificates 3% 7/1/2046 | | 7,909 | 6,859 |
| Fannie Mae Mortgage pass-thru certificates 3% 7/1/2047 | | 17,627 | 15,265 |
| Fannie Mae Mortgage pass-thru certificates 3% 7/1/2047 | | 32,411 | 28,087 |
| Fannie Mae Mortgage pass-thru certificates 3% 7/1/2047 | | 26,786 | 23,213 |
| Fannie Mae Mortgage pass-thru certificates 3% 7/1/2050 | | 43,169 | 37,087 |
| Fannie Mae Mortgage pass-thru certificates 3% 7/1/2051 | | 23,174 | 19,808 |
| Fannie Mae Mortgage pass-thru certificates 3% 8/1/2026 | | 2,165 | 2,139 |
| Fannie Mae Mortgage pass-thru certificates 3% 8/1/2027 | | 1,407 | 1,382 |
| Fannie Mae Mortgage pass-thru certificates 3% 8/1/2029 | | 4,346 | 4,217 |
| Fannie Mae Mortgage pass-thru certificates 3% 8/1/2029 | | 518 | 503 |
| Fannie Mae Mortgage pass-thru certificates 3% 8/1/2029 | | 3,752 | 3,637 |
| Fannie Mae Mortgage pass-thru certificates 3% 8/1/2029 | | 14,278 | 13,860 |
| Fannie Mae Mortgage pass-thru certificates 3% 8/1/2029 | | 3,858 | 3,734 |
| Fannie Mae Mortgage pass-thru certificates 3% 8/1/2029 | | 3,960 | 3,836 |
| Fannie Mae Mortgage pass-thru certificates 3% 8/1/2029 | | 13,329 | 12,919 |
| Fannie Mae Mortgage pass-thru certificates 3% 8/1/2029 | | 4,512 | 4,373 |
| Fannie Mae Mortgage pass-thru certificates 3% 8/1/2030 | | 2,547 | 2,457 |
| Fannie Mae Mortgage pass-thru certificates 3% 8/1/2031 | | 7,027 | 6,750 |
| Fannie Mae Mortgage pass-thru certificates 3% 8/1/2032 | | 284,948 | 272,195 |
| Fannie Mae Mortgage pass-thru certificates 3% 8/1/2032 | | 7,537 | 7,193 |
| Fannie Mae Mortgage pass-thru certificates 3% 8/1/2032 | | 11,924 | 11,424 |
| Fannie Mae Mortgage pass-thru certificates 3% 8/1/2039 | | 10,809 | 9,709 |
| Fannie Mae Mortgage pass-thru certificates 3% 8/1/2043 | | 9,061 | 8,003 |
| Fannie Mae Mortgage pass-thru certificates 3% 8/1/2043 | | 16,390 | 14,492 |
| Fannie Mae Mortgage pass-thru certificates 3% 8/1/2043 | | 10,272 | 9,072 |
| Fannie Mae Mortgage pass-thru certificates 3% 8/1/2043 | | 9,093 | 8,040 |
| Fannie Mae Mortgage pass-thru certificates 3% 8/1/2043 | | 32,981 | 29,117 |
| Fannie Mae Mortgage pass-thru certificates 3% 8/1/2043 | | 8,713 | 7,690 |
| Fannie Mae Mortgage pass-thru certificates 3% 8/1/2043 | | 13,778 | 12,173 |
| Fannie Mae Mortgage pass-thru certificates 3% 8/1/2043 | | 14,969 | 13,253 |
| Fannie Mae Mortgage pass-thru certificates 3% 8/1/2043 | | 80,791 | 71,408 |
| Fannie Mae Mortgage pass-thru certificates 3% 8/1/2045 | | 39,089 | 34,082 |
| Fannie Mae Mortgage pass-thru certificates 3% 8/1/2045 | | 5,365 | 4,678 |
| Fannie Mae Mortgage pass-thru certificates 3% 8/1/2045 | | 16,482 | 14,371 |
| Fannie Mae Mortgage pass-thru certificates 3% 8/1/2045 | | 367,383 | 319,296 |
| Fannie Mae Mortgage pass-thru certificates 3% 8/1/2046 | | 9,418 | 8,168 |
| Fannie Mae Mortgage pass-thru certificates 3% 8/1/2046 | | 8,542 | 7,402 |
| Fannie Mae Mortgage pass-thru certificates 3% 8/1/2046 | | 5,413 | 4,691 |
| Fannie Mae Mortgage pass-thru certificates 3% 8/1/2046 | | 11,120 | 9,682 |
| Fannie Mae Mortgage pass-thru certificates 3% 8/1/2050 | | 140,857 | 120,791 |
| Fannie Mae Mortgage pass-thru certificates 3% 8/1/2050 | | 105,245 | 90,253 |
| Fannie Mae Mortgage pass-thru certificates 3% 8/1/2051 | | 71,304 | 60,879 |
| Fannie Mae Mortgage pass-thru certificates 3% 9/1/2027 | | 705 | 693 |
| Fannie Mae Mortgage pass-thru certificates 3% 9/1/2027 | | 1,237 | 1,214 |
| Fannie Mae Mortgage pass-thru certificates 3% 9/1/2027 | | 638 | 625 |
| Fannie Mae Mortgage pass-thru certificates 3% 9/1/2027 | | 1,007 | 989 |
| Fannie Mae Mortgage pass-thru certificates 3% 9/1/2027 | | 908 | 893 |
| Fannie Mae Mortgage pass-thru certificates 3% 9/1/2030 | | 2,676 | 2,580 |
| Fannie Mae Mortgage pass-thru certificates 3% 9/1/2030 | | 2,657 | 2,562 |
| Fannie Mae Mortgage pass-thru certificates 3% 9/1/2030 | | 14,902 | 14,367 |
| Fannie Mae Mortgage pass-thru certificates 3% 9/1/2030 | | 1,568 | 1,516 |
| Fannie Mae Mortgage pass-thru certificates 3% 9/1/2032 | | 42,425 | 40,526 |
| Fannie Mae Mortgage pass-thru certificates 3% 9/1/2032 | | 3,219 | 3,066 |
| Fannie Mae Mortgage pass-thru certificates 3% 9/1/2032 | | 6,192 | 5,892 |
| Fannie Mae Mortgage pass-thru certificates 3% 9/1/2032 | | 3,792 | 3,611 |
| Fannie Mae Mortgage pass-thru certificates 3% 9/1/2032 | | 3,860 | 3,684 |
| Fannie Mae Mortgage pass-thru certificates 3% 9/1/2032 | | 7,757 | 7,381 |
| Fannie Mae Mortgage pass-thru certificates 3% 9/1/2032 | | 29,554 | 28,480 |
| Fannie Mae Mortgage pass-thru certificates 3% 9/1/2032 | | 18,243 | 17,440 |
| Fannie Mae Mortgage pass-thru certificates 3% 9/1/2035 | | 304,343 | 292,224 |
| Fannie Mae Mortgage pass-thru certificates 3% 9/1/2043 | | 109,998 | 97,214 |
| Fannie Mae Mortgage pass-thru certificates 3% 9/1/2043 | | 11,017 | 9,744 |
| Fannie Mae Mortgage pass-thru certificates 3% 9/1/2043 | | 17,538 | 15,517 |
| Fannie Mae Mortgage pass-thru certificates 3% 9/1/2043 | | 140,625 | 124,433 |
| Fannie Mae Mortgage pass-thru certificates 3% 9/1/2046 | | 696,701 | 603,985 |
| Fannie Mae Mortgage pass-thru certificates 3% 9/1/2046 | | 12,687 | 10,994 |
| Fannie Mae Mortgage pass-thru certificates 3% 9/1/2046 | | 9,706 | 8,411 |
| Fannie Mae Mortgage pass-thru certificates 3% 9/1/2046 | | 129,037 | 111,824 |
| Fannie Mae Mortgage pass-thru certificates 3% 9/1/2046 | | 6,729 | 5,831 |
| Fannie Mae Mortgage pass-thru certificates 3% 9/1/2046 | | 5,381 | 4,663 |
| Fannie Mae Mortgage pass-thru certificates 3% 9/1/2047 | | 13,242 | 11,455 |
| Fannie Mae Mortgage pass-thru certificates 3% 9/1/2047 | | 64,410 | 55,717 |
| Fannie Mae Mortgage pass-thru certificates 3% 9/1/2048 | | 20,930 | 18,138 |
| Fannie Mae Mortgage pass-thru certificates 3% 9/1/2050 | | 78,542 | 67,378 |
| Fannie Mae Mortgage pass-thru certificates 3% 9/1/2051 | | 52,718 | 45,093 |
| Fannie Mae Mortgage pass-thru certificates 3% 9/1/2051 | | 47,044 | 40,166 |
| Fannie Mae Mortgage pass-thru certificates 3.5% 1/1/2034 | | 20,267 | 19,425 |
| Fannie Mae Mortgage pass-thru certificates 3.5% 1/1/2035 | | 66,456 | 63,446 |
| Fannie Mae Mortgage pass-thru certificates 3.5% 1/1/2042 | | 1,530 | 1,397 |
| Fannie Mae Mortgage pass-thru certificates 3.5% 1/1/2043 | | 26,350 | 24,057 |
| Fannie Mae Mortgage pass-thru certificates 3.5% 1/1/2043 | | 10,374 | 9,484 |
| Fannie Mae Mortgage pass-thru certificates 3.5% 1/1/2043 | | 3,594 | 3,282 |
| Fannie Mae Mortgage pass-thru certificates 3.5% 1/1/2043 | | 3,576 | 3,253 |
| Fannie Mae Mortgage pass-thru certificates 3.5% 1/1/2043 | | 11,620 | 10,620 |
| Fannie Mae Mortgage pass-thru certificates 3.5% 1/1/2043 | | 31,926 | 29,228 |
| Fannie Mae Mortgage pass-thru certificates 3.5% 1/1/2043 | | 169,841 | 155,563 |
| Fannie Mae Mortgage pass-thru certificates 3.5% 1/1/2044 | | 12,954 | 11,871 |
| Fannie Mae Mortgage pass-thru certificates 3.5% 1/1/2045 | | 160,433 | 144,997 |
| Fannie Mae Mortgage pass-thru certificates 3.5% 1/1/2045 | | 135,339 | 122,317 |
| Fannie Mae Mortgage pass-thru certificates 3.5% 1/1/2045 | | 7,960 | 7,194 |
| Fannie Mae Mortgage pass-thru certificates 3.5% 1/1/2045 | | 3,985 | 3,601 |
| Fannie Mae Mortgage pass-thru certificates 3.5% 1/1/2045 | | 4,681 | 4,231 |
| Fannie Mae Mortgage pass-thru certificates 3.5% 1/1/2045 | | 6,044 | 5,462 |
| Fannie Mae Mortgage pass-thru certificates 3.5% 1/1/2045 | | 6,006 | 5,428 |
| Fannie Mae Mortgage pass-thru certificates 3.5% 1/1/2046 | | 38,506 | 34,741 |
| Fannie Mae Mortgage pass-thru certificates 3.5% 1/1/2046 | | 7,832 | 7,067 |
| Fannie Mae Mortgage pass-thru certificates 3.5% 1/1/2046 | | 17,034 | 15,369 |
| Fannie Mae Mortgage pass-thru certificates 3.5% 1/1/2046 | | 13,685 | 12,347 |
| Fannie Mae Mortgage pass-thru certificates 3.5% 1/1/2047 | | 43,733 | 39,388 |
| Fannie Mae Mortgage pass-thru certificates 3.5% 1/1/2047 | | 28,664 | 25,817 |
| Fannie Mae Mortgage pass-thru certificates 3.5% 1/1/2047 | | 79,821 | 71,892 |
| Fannie Mae Mortgage pass-thru certificates 3.5% 1/1/2047 | | 26,600 | 23,957 |
| Fannie Mae Mortgage pass-thru certificates 3.5% 1/1/2047 | | 6,496 | 5,851 |
| Fannie Mae Mortgage pass-thru certificates 3.5% 1/1/2047 | | 213,971 | 192,982 |
| Fannie Mae Mortgage pass-thru certificates 3.5% 1/1/2047 | | 228,586 | 206,235 |
| Fannie Mae Mortgage pass-thru certificates 3.5% 1/1/2047 | | 29,071 | 26,146 |
| Fannie Mae Mortgage pass-thru certificates 3.5% 1/1/2048 | | 308,927 | 279,686 |
| Fannie Mae Mortgage pass-thru certificates 3.5% 1/1/2052 | | 85,053 | 75,620 |
| Fannie Mae Mortgage pass-thru certificates 3.5% 1/1/2052 | | 79,608 | 71,003 |
| Fannie Mae Mortgage pass-thru certificates 3.5% 10/1/2033 | | 2,592 | 2,481 |
| Fannie Mae Mortgage pass-thru certificates 3.5% 10/1/2042 | | 2,986 | 2,720 |
| Fannie Mae Mortgage pass-thru certificates 3.5% 10/1/2042 | | 22,903 | 20,962 |
| Fannie Mae Mortgage pass-thru certificates 3.5% 10/1/2042 | | 3,984 | 3,648 |
| Fannie Mae Mortgage pass-thru certificates 3.5% 10/1/2042 | | 81,919 | 75,001 |
| Fannie Mae Mortgage pass-thru certificates 3.5% 10/1/2042 | | 21,758 | 19,886 |
| Fannie Mae Mortgage pass-thru certificates 3.5% 10/1/2042 | | 39,948 | 36,670 |
| Fannie Mae Mortgage pass-thru certificates 3.5% 10/1/2042 | | 15,444 | 14,068 |
| Fannie Mae Mortgage pass-thru certificates 3.5% 10/1/2043 | | 5,298 | 4,820 |
| Fannie Mae Mortgage pass-thru certificates 3.5% 10/1/2045 | | 8,644 | 7,853 |
| Fannie Mae Mortgage pass-thru certificates 3.5% 10/1/2045 | | 75,861 | 68,514 |
| Fannie Mae Mortgage pass-thru certificates 3.5% 10/1/2045 | | 135,609 | 121,184 |
| Fannie Mae Mortgage pass-thru certificates 3.5% 10/1/2045 | | 19,559 | 17,665 |
| Fannie Mae Mortgage pass-thru certificates 3.5% 10/1/2046 | | 272,054 | 245,453 |
| Fannie Mae Mortgage pass-thru certificates 3.5% 10/1/2046 | | 28,333 | 25,554 |
| Fannie Mae Mortgage pass-thru certificates 3.5% 10/1/2047 | | 297,797 | 269,702 |
| Fannie Mae Mortgage pass-thru certificates 3.5% 10/1/2048 | | 13,517 | 12,158 |
| Fannie Mae Mortgage pass-thru certificates 3.5% 10/1/2049 | | 414,292 | 373,524 |
| Fannie Mae Mortgage pass-thru certificates 3.5% 10/1/2050 | | 2,476,890 | 2,209,157 |
| Fannie Mae Mortgage pass-thru certificates 3.5% 11/1/2041 | | 33,336 | 30,556 |
| Fannie Mae Mortgage pass-thru certificates 3.5% 11/1/2042 | | 12,852 | 11,719 |
| Fannie Mae Mortgage pass-thru certificates 3.5% 11/1/2042 | | 8,855 | 8,099 |
| Fannie Mae Mortgage pass-thru certificates 3.5% 11/1/2042 | | 5,934 | 5,431 |
| Fannie Mae Mortgage pass-thru certificates 3.5% 11/1/2042 | | 2,327 | 2,128 |
| Fannie Mae Mortgage pass-thru certificates 3.5% 11/1/2042 | | 7,288 | 6,671 |
| Fannie Mae Mortgage pass-thru certificates 3.5% 11/1/2043 | | 26,081 | 23,860 |
| Fannie Mae Mortgage pass-thru certificates 3.5% 11/1/2043 | | 22,024 | 20,175 |
| Fannie Mae Mortgage pass-thru certificates 3.5% 11/1/2045 | | 4,117 | 3,715 |
| Fannie Mae Mortgage pass-thru certificates 3.5% 11/1/2045 | | 118,735 | 107,125 |
| Fannie Mae Mortgage pass-thru certificates 3.5% 11/1/2045 | | 542,545 | 490,003 |
| Fannie Mae Mortgage pass-thru certificates 3.5% 11/1/2046 | | 11,273 | 10,167 |
| Fannie Mae Mortgage pass-thru certificates 3.5% 11/1/2051 | | 210,510 | 187,295 |
| Fannie Mae Mortgage pass-thru certificates 3.5% 11/1/2051 | | 350,776 | 312,092 |
| Fannie Mae Mortgage pass-thru certificates 3.5% 12/1/2034 | | 13,802 | 13,194 |
| Fannie Mae Mortgage pass-thru certificates 3.5% 12/1/2035 | | 1,837,421 | 1,761,076 |
| Fannie Mae Mortgage pass-thru certificates 3.5% 12/1/2041 | | 247,588 | 227,403 |
| Fannie Mae Mortgage pass-thru certificates 3.5% 12/1/2041 | | 97,659 | 89,606 |
| Fannie Mae Mortgage pass-thru certificates 3.5% 12/1/2042 | | 2,112 | 1,947 |
| Fannie Mae Mortgage pass-thru certificates 3.5% 12/1/2042 | | 40,617 | 37,225 |
| Fannie Mae Mortgage pass-thru certificates 3.5% 12/1/2042 | | 4,393 | 4,009 |
| Fannie Mae Mortgage pass-thru certificates 3.5% 12/1/2042 | | 10,361 | 9,488 |
| Fannie Mae Mortgage pass-thru certificates 3.5% 12/1/2042 | | 22,088 | 20,113 |
| Fannie Mae Mortgage pass-thru certificates 3.5% 12/1/2042 | | 10,605 | 9,716 |
| Fannie Mae Mortgage pass-thru certificates 3.5% 12/1/2042 | | 9,094 | 8,284 |
| Fannie Mae Mortgage pass-thru certificates 3.5% 12/1/2042 | | 9,977 | 9,096 |
| Fannie Mae Mortgage pass-thru certificates 3.5% 12/1/2042 | | 866 | 801 |
| Fannie Mae Mortgage pass-thru certificates 3.5% 12/1/2042 | | 2,796 | 2,547 |
| Fannie Mae Mortgage pass-thru certificates 3.5% 12/1/2045 | | 12,894 | 11,633 |
| Fannie Mae Mortgage pass-thru certificates 3.5% 12/1/2045 | | 71,662 | 64,722 |
| Fannie Mae Mortgage pass-thru certificates 3.5% 12/1/2045 | | 7,485 | 6,753 |
| Fannie Mae Mortgage pass-thru certificates 3.5% 12/1/2046 | | 79,243 | 72,458 |
| Fannie Mae Mortgage pass-thru certificates 3.5% 2/1/2034 | | 10,062 | 9,644 |
| Fannie Mae Mortgage pass-thru certificates 3.5% 2/1/2035 | | 81,070 | 77,575 |
| Fannie Mae Mortgage pass-thru certificates 3.5% 2/1/2042 | | 16,283 | 14,911 |
| Fannie Mae Mortgage pass-thru certificates 3.5% 2/1/2043 | | 16,921 | 15,462 |
| Fannie Mae Mortgage pass-thru certificates 3.5% 2/1/2043 | | 29,413 | 26,924 |
| Fannie Mae Mortgage pass-thru certificates 3.5% 2/1/2043 | | 10,397 | 9,457 |
| Fannie Mae Mortgage pass-thru certificates 3.5% 2/1/2043 | | 30,832 | 28,134 |
| Fannie Mae Mortgage pass-thru certificates 3.5% 2/1/2045 | | 66,679 | 60,264 |
| Fannie Mae Mortgage pass-thru certificates 3.5% 2/1/2045 | | 6,724 | 6,077 |
| Fannie Mae Mortgage pass-thru certificates 3.5% 2/1/2045 | | 6,614 | 5,978 |
| Fannie Mae Mortgage pass-thru certificates 3.5% 2/1/2045 | | 7,913 | 7,151 |
| Fannie Mae Mortgage pass-thru certificates 3.5% 2/1/2046 | | 41,476 | 37,420 |
| Fannie Mae Mortgage pass-thru certificates 3.5% 2/1/2047 | | 18,451 | 16,618 |
| Fannie Mae Mortgage pass-thru certificates 3.5% 2/1/2052 | | 170,379 | 151,855 |
| Fannie Mae Mortgage pass-thru certificates 3.5% 2/1/2052 | | 85,887 | 76,576 |
| Fannie Mae Mortgage pass-thru certificates 3.5% 3/1/2031 | | 2,798 | 2,705 |
| Fannie Mae Mortgage pass-thru certificates 3.5% 3/1/2034 | | 6,227 | 5,959 |
| Fannie Mae Mortgage pass-thru certificates 3.5% 3/1/2043 | | 32,944 | 30,193 |
| Fannie Mae Mortgage pass-thru certificates 3.5% 3/1/2045 | | 13,659 | 12,345 |
| Fannie Mae Mortgage pass-thru certificates 3.5% 3/1/2046 | | 121,625 | 111,283 |
| Fannie Mae Mortgage pass-thru certificates 3.5% 3/1/2046 | | 934,840 | 854,547 |
| Fannie Mae Mortgage pass-thru certificates 3.5% 3/1/2052 | | 233,929 | 207,675 |
| Fannie Mae Mortgage pass-thru certificates 3.5% 4/1/2034 | | 11,315 | 10,827 |
| Fannie Mae Mortgage pass-thru certificates 3.5% 4/1/2034 | | 5,494 | 5,261 |
| Fannie Mae Mortgage pass-thru certificates 3.5% 4/1/2039 | | 11,270 | 10,425 |
| Fannie Mae Mortgage pass-thru certificates 3.5% 4/1/2042 | | 7,049 | 6,476 |
| Fannie Mae Mortgage pass-thru certificates 3.5% 4/1/2042 | | 103,957 | 95,233 |
| Fannie Mae Mortgage pass-thru certificates 3.5% 4/1/2042 | | 24,103 | 22,030 |
| Fannie Mae Mortgage pass-thru certificates 3.5% 4/1/2042 | | 36,946 | 33,857 |
| Fannie Mae Mortgage pass-thru certificates 3.5% 4/1/2042 | | 9,213 | 8,455 |
| Fannie Mae Mortgage pass-thru certificates 3.5% 4/1/2046 | | 136,704 | 123,423 |
| Fannie Mae Mortgage pass-thru certificates 3.5% 4/1/2046 | | 92,097 | 83,092 |
| Fannie Mae Mortgage pass-thru certificates 3.5% 4/1/2046 | | 162,910 | 147,082 |
| Fannie Mae Mortgage pass-thru certificates 3.5% 5/1/2028 | | 2,575 | 2,535 |
| Fannie Mae Mortgage pass-thru certificates 3.5% 5/1/2039 | | 15,351 | 14,200 |
| Fannie Mae Mortgage pass-thru certificates 3.5% 5/1/2042 | | 86,594 | 79,565 |
| Fannie Mae Mortgage pass-thru certificates 3.5% 5/1/2042 | | 13,960 | 12,817 |
| Fannie Mae Mortgage pass-thru certificates 3.5% 5/1/2042 | | 67,752 | 62,125 |
| Fannie Mae Mortgage pass-thru certificates 3.5% 5/1/2042 | | 2,852 | 2,628 |
| Fannie Mae Mortgage pass-thru certificates 3.5% 5/1/2042 | | 8,634 | 7,881 |
| Fannie Mae Mortgage pass-thru certificates 3.5% 5/1/2046 | | 51,798 | 46,733 |
| Fannie Mae Mortgage pass-thru certificates 3.5% 5/1/2046 | | 19,721 | 17,792 |
| Fannie Mae Mortgage pass-thru certificates 3.5% 6/1/2034 | | 3,433 | 3,285 |
| Fannie Mae Mortgage pass-thru certificates 3.5% 6/1/2035 | | 78,949 | 75,545 |
| Fannie Mae Mortgage pass-thru certificates 3.5% 6/1/2041 | | 50,036 | 45,191 |
| Fannie Mae Mortgage pass-thru certificates 3.5% 6/1/2042 | | 7,175 | 6,571 |
| Fannie Mae Mortgage pass-thru certificates 3.5% 6/1/2043 | | 48,749 | 44,406 |
| Fannie Mae Mortgage pass-thru certificates 3.5% 6/1/2044 | | 5,372 | 4,940 |
| Fannie Mae Mortgage pass-thru certificates 3.5% 6/1/2045 | | 3,325 | 3,003 |
| Fannie Mae Mortgage pass-thru certificates 3.5% 6/1/2045 | | 11,954 | 10,796 |
| Fannie Mae Mortgage pass-thru certificates 3.5% 6/1/2045 | | 90,155 | 81,424 |
| Fannie Mae Mortgage pass-thru certificates 3.5% 6/1/2045 | | 15,492 | 13,992 |
| Fannie Mae Mortgage pass-thru certificates 3.5% 6/1/2049 | | 239,628 | 215,898 |
| Fannie Mae Mortgage pass-thru certificates 3.5% 6/1/2051 | | 943,539 | 840,075 |
| Fannie Mae Mortgage pass-thru certificates 3.5% 7/1/2039 | | 13,280 | 12,285 |
| Fannie Mae Mortgage pass-thru certificates 3.5% 7/1/2042 | | 7,698 | 7,037 |
| Fannie Mae Mortgage pass-thru certificates 3.5% 7/1/2042 | | 36,087 | 33,141 |
| Fannie Mae Mortgage pass-thru certificates 3.5% 7/1/2042 | | 18,983 | 17,421 |
| Fannie Mae Mortgage pass-thru certificates 3.5% 7/1/2042 | | 7,890 | 7,200 |
| Fannie Mae Mortgage pass-thru certificates 3.5% 7/1/2042 | | 11,004 | 10,103 |
| Fannie Mae Mortgage pass-thru certificates 3.5% 7/1/2042 | | 7,826 | 7,240 |
| Fannie Mae Mortgage pass-thru certificates 3.5% 7/1/2042 | | 6,630 | 6,075 |
| Fannie Mae Mortgage pass-thru certificates 3.5% 7/1/2042 | | 10,851 | 9,939 |
| Fannie Mae Mortgage pass-thru certificates 3.5% 7/1/2042 | | 10,130 | 9,275 |
| Fannie Mae Mortgage pass-thru certificates 3.5% 7/1/2042 | | 2,276 | 2,087 |
| Fannie Mae Mortgage pass-thru certificates 3.5% 7/1/2042 | | 8,063 | 7,433 |
| Fannie Mae Mortgage pass-thru certificates 3.5% 7/1/2046 | | 38,854 | 35,055 |
| Fannie Mae Mortgage pass-thru certificates 3.5% 7/1/2046 | | 24,812 | 22,386 |
| Fannie Mae Mortgage pass-thru certificates 3.5% 7/1/2046 | | 26,242 | 23,676 |
| Fannie Mae Mortgage pass-thru certificates 3.5% 7/1/2046 | | 37,301 | 33,642 |
| Fannie Mae Mortgage pass-thru certificates 3.5% 7/1/2047 | | 1,519,086 | 1,388,978 |
| Fannie Mae Mortgage pass-thru certificates 3.5% 7/1/2047 | | 805,865 | 734,122 |
| Fannie Mae Mortgage pass-thru certificates 3.5% 7/1/2052 | | 1,065,236 | 942,019 |
| Fannie Mae Mortgage pass-thru certificates 3.5% 7/1/2052 | | 441,885 | 395,363 |
| Fannie Mae Mortgage pass-thru certificates 3.5% 8/1/2033 | | 12,370 | 11,860 |
| Fannie Mae Mortgage pass-thru certificates 3.5% 8/1/2034 | | 13,810 | 13,214 |
| Fannie Mae Mortgage pass-thru certificates 3.5% 8/1/2037 | | 9,629 | 8,988 |
| Fannie Mae Mortgage pass-thru certificates 3.5% 8/1/2039 | | 5,980 | 5,531 |
| Fannie Mae Mortgage pass-thru certificates 3.5% 8/1/2042 | | 14,853 | 13,587 |
| Fannie Mae Mortgage pass-thru certificates 3.5% 8/1/2042 | | 2,128 | 1,965 |
| Fannie Mae Mortgage pass-thru certificates 3.5% 8/1/2042 | | 4,266 | 3,897 |
| Fannie Mae Mortgage pass-thru certificates 3.5% 8/1/2042 | | 1,527 | 1,395 |
| Fannie Mae Mortgage pass-thru certificates 3.5% 8/1/2042 | | 5,256 | 4,820 |
| Fannie Mae Mortgage pass-thru certificates 3.5% 8/1/2042 | | 86,576 | 79,320 |
| Fannie Mae Mortgage pass-thru certificates 3.5% 8/1/2042 | | 156,253 | 143,158 |
| Fannie Mae Mortgage pass-thru certificates 3.5% 8/1/2043 | | 38,161 | 34,979 |
| Fannie Mae Mortgage pass-thru certificates 3.5% 8/1/2043 | | 453,387 | 414,845 |
| Fannie Mae Mortgage pass-thru certificates 3.5% 8/1/2045 | | 33,090 | 29,885 |
| Fannie Mae Mortgage pass-thru certificates 3.5% 8/1/2046 | | 39,958 | 36,038 |
| Fannie Mae Mortgage pass-thru certificates 3.5% 8/1/2046 | | 38,223 | 34,474 |
| Fannie Mae Mortgage pass-thru certificates 3.5% 9/1/2039 | | 32,609 | 30,123 |
| Fannie Mae Mortgage pass-thru certificates 3.5% 9/1/2042 | | 14,828 | 13,584 |
| Fannie Mae Mortgage pass-thru certificates 3.5% 9/1/2042 | | 63,413 | 58,028 |
| Fannie Mae Mortgage pass-thru certificates 3.5% 9/1/2042 | | 10,735 | 9,853 |
| Fannie Mae Mortgage pass-thru certificates 3.5% 9/1/2042 | | 71,156 | 65,279 |
| Fannie Mae Mortgage pass-thru certificates 3.5% 9/1/2042 | | 7,963 | 7,265 |
| Fannie Mae Mortgage pass-thru certificates 3.5% 9/1/2042 | | 2,916 | 2,655 |
| Fannie Mae Mortgage pass-thru certificates 3.5% 9/1/2042 | | 10,110 | 9,250 |
| Fannie Mae Mortgage pass-thru certificates 3.5% 9/1/2042 | | 21,909 | 20,209 |
| Fannie Mae Mortgage pass-thru certificates 3.5% 9/1/2042 | | 15,908 | 14,567 |
| Fannie Mae Mortgage pass-thru certificates 3.5% 9/1/2042 | | 9,707 | 8,860 |
| Fannie Mae Mortgage pass-thru certificates 3.5% 9/1/2042 | | 1,502 | 1,394 |
| Fannie Mae Mortgage pass-thru certificates 3.5% 9/1/2042 | | 2,694 | 2,475 |
| Fannie Mae Mortgage pass-thru certificates 3.5% 9/1/2042 | | 7,990 | 7,304 |
| Fannie Mae Mortgage pass-thru certificates 3.5% 9/1/2045 | | 3,458 | 3,123 |
| Fannie Mae Mortgage pass-thru certificates 3.5% 9/1/2046 | | 22,519 | 20,310 |
| Fannie Mae Mortgage pass-thru certificates 3.5% 9/1/2047 | | 187,307 | 169,636 |
| Fannie Mae Mortgage pass-thru certificates 4% 1/1/2033 | | 12,486 | 12,095 |
| Fannie Mae Mortgage pass-thru certificates 4% 1/1/2041 | | 3,569 | 3,378 |
| Fannie Mae Mortgage pass-thru certificates 4% 1/1/2042 | | 22,807 | 21,450 |
| Fannie Mae Mortgage pass-thru certificates 4% 1/1/2049 | | 20,094 | 18,583 |
| Fannie Mae Mortgage pass-thru certificates 4% 1/1/2049 | | 28,490 | 26,347 |
| Fannie Mae Mortgage pass-thru certificates 4% 1/1/2049 | | 3,098 | 2,865 |
| Fannie Mae Mortgage pass-thru certificates 4% 1/1/2050 | | 8,375 | 7,732 |
| Fannie Mae Mortgage pass-thru certificates 4% 1/1/2050 | | 18,768 | 17,327 |
| Fannie Mae Mortgage pass-thru certificates 4% 1/1/2051 | | 17,701 | 16,212 |
| Fannie Mae Mortgage pass-thru certificates 4% 1/1/2052 | | 59,583 | 54,766 |
| Fannie Mae Mortgage pass-thru certificates 4% 10/1/2033 | | 8,715 | 8,434 |
| Fannie Mae Mortgage pass-thru certificates 4% 10/1/2034 | | 29,580 | 28,617 |
| Fannie Mae Mortgage pass-thru certificates 4% 10/1/2038 | | 51,314 | 48,577 |
| Fannie Mae Mortgage pass-thru certificates 4% 10/1/2040 | | 3,962 | 3,752 |
| Fannie Mae Mortgage pass-thru certificates 4% 10/1/2040 | | 4,699 | 4,460 |
| Fannie Mae Mortgage pass-thru certificates 4% 10/1/2041 | | 18,471 | 17,451 |
| Fannie Mae Mortgage pass-thru certificates 4% 10/1/2041 | | 69,307 | 65,374 |
| Fannie Mae Mortgage pass-thru certificates 4% 10/1/2041 | | 3,128 | 2,940 |
| Fannie Mae Mortgage pass-thru certificates 4% 10/1/2043 | | 38,953 | 36,721 |
| Fannie Mae Mortgage pass-thru certificates 4% 10/1/2046 | | 134,159 | 125,158 |
| Fannie Mae Mortgage pass-thru certificates 4% 10/1/2047 | | 28,729 | 26,639 |
| Fannie Mae Mortgage pass-thru certificates 4% 10/1/2047 | | 316,688 | 293,659 |
| Fannie Mae Mortgage pass-thru certificates 4% 10/1/2048 | | 204,644 | 189,251 |
| Fannie Mae Mortgage pass-thru certificates 4% 10/1/2049 | | 36,481 | 33,714 |
| Fannie Mae Mortgage pass-thru certificates 4% 11/1/2033 | | 14,143 | 13,695 |
| Fannie Mae Mortgage pass-thru certificates 4% 11/1/2039 | | 2,591 | 2,472 |
| Fannie Mae Mortgage pass-thru certificates 4% 11/1/2040 | | 465,162 | 439,874 |
| Fannie Mae Mortgage pass-thru certificates 4% 11/1/2041 | | 7,763 | 7,318 |
| Fannie Mae Mortgage pass-thru certificates 4% 11/1/2041 | | 68,851 | 64,947 |
| Fannie Mae Mortgage pass-thru certificates 4% 11/1/2049 | | 17,614 | 16,268 |
| Fannie Mae Mortgage pass-thru certificates 4% 12/1/2041 | | 4,006 | 3,776 |
| Fannie Mae Mortgage pass-thru certificates 4% 12/1/2041 | | 8,506 | 8,005 |
| Fannie Mae Mortgage pass-thru certificates 4% 12/1/2044 | | 13,589 | 12,717 |
| Fannie Mae Mortgage pass-thru certificates 4% 12/1/2049 | | 21,512 | 19,860 |
| Fannie Mae Mortgage pass-thru certificates 4% 12/1/2049 | | 28,559 | 26,429 |
| Fannie Mae Mortgage pass-thru certificates 4% 12/1/2049 | | 10,674 | 9,855 |
| Fannie Mae Mortgage pass-thru certificates 4% 12/1/2050 | | 28,620 | 26,371 |
| Fannie Mae Mortgage pass-thru certificates 4% 2/1/2033 | | 35,510 | 34,398 |
| Fannie Mae Mortgage pass-thru certificates 4% 2/1/2042 | | 3,696 | 3,506 |
| Fannie Mae Mortgage pass-thru certificates 4% 2/1/2042 | | 2,388 | 2,251 |
| Fannie Mae Mortgage pass-thru certificates 4% 2/1/2042 | | 36,325 | 34,250 |
| Fannie Mae Mortgage pass-thru certificates 4% 2/1/2046 | | 21,341 | 19,850 |
| Fannie Mae Mortgage pass-thru certificates 4% 2/1/2046 | | 5,103 | 4,769 |
| Fannie Mae Mortgage pass-thru certificates 4% 2/1/2047 | | 345,331 | 321,947 |
| Fannie Mae Mortgage pass-thru certificates 4% 2/1/2047 | | 13,152 | 12,204 |
| Fannie Mae Mortgage pass-thru certificates 4% 2/1/2049 | | 4,952 | 4,580 |
| Fannie Mae Mortgage pass-thru certificates 4% 2/1/2049 | | 493,410 | 456,297 |
| Fannie Mae Mortgage pass-thru certificates 4% 2/1/2049 | | 33,412 | 30,899 |
| Fannie Mae Mortgage pass-thru certificates 4% 2/1/2049 | | 65,584 | 60,651 |
| Fannie Mae Mortgage pass-thru certificates 4% 2/1/2050 | | 7,536 | 6,955 |
| Fannie Mae Mortgage pass-thru certificates 4% 2/1/2050 | | 11,518 | 10,633 |
| Fannie Mae Mortgage pass-thru certificates 4% 2/1/2050 | | 12,027 | 11,104 |
| Fannie Mae Mortgage pass-thru certificates 4% 2/1/2050 | | 123,883 | 114,952 |
| Fannie Mae Mortgage pass-thru certificates 4% 2/1/2051 | | 14,626 | 13,490 |
| Fannie Mae Mortgage pass-thru certificates 4% 3/1/2032 | | 20,389 | 20,032 |
| Fannie Mae Mortgage pass-thru certificates 4% 3/1/2042 | | 6,655 | 6,276 |
| Fannie Mae Mortgage pass-thru certificates 4% 3/1/2042 | | 7,113 | 6,695 |
| Fannie Mae Mortgage pass-thru certificates 4% 3/1/2042 | | 11,076 | 10,426 |
| Fannie Mae Mortgage pass-thru certificates 4% 3/1/2045 | | 214,409 | 200,493 |
| Fannie Mae Mortgage pass-thru certificates 4% 3/1/2047 | | 35,658 | 33,087 |
| Fannie Mae Mortgage pass-thru certificates 4% 3/1/2049 | | 4,651 | 4,300 |
| Fannie Mae Mortgage pass-thru certificates 4% 3/1/2049 | | 26,067 | 24,098 |
| Fannie Mae Mortgage pass-thru certificates 4% 3/1/2049 | | 548,760 | 507,484 |
| Fannie Mae Mortgage pass-thru certificates 4% 3/1/2050 | | 6,327 | 5,839 |
| Fannie Mae Mortgage pass-thru certificates 4% 3/1/2050 | | 8,602 | 7,955 |
| Fannie Mae Mortgage pass-thru certificates 4% 3/1/2050 | | 134,200 | 124,022 |
| Fannie Mae Mortgage pass-thru certificates 4% 3/1/2050 | | 101,726 | 93,852 |
| Fannie Mae Mortgage pass-thru certificates 4% 3/1/2051 | | 17,951 | 16,589 |
| Fannie Mae Mortgage pass-thru certificates 4% 4/1/2042 | | 6,314 | 5,939 |
| Fannie Mae Mortgage pass-thru certificates 4% 4/1/2042 | | 8,340 | 7,863 |
| Fannie Mae Mortgage pass-thru certificates 4% 4/1/2042 | | 55,577 | 52,370 |
| Fannie Mae Mortgage pass-thru certificates 4% 4/1/2042 | | 15,418 | 14,536 |
| Fannie Mae Mortgage pass-thru certificates 4% 4/1/2044 | | 33,841 | 31,743 |
| Fannie Mae Mortgage pass-thru certificates 4% 4/1/2047 | | 21,392 | 19,850 |
| Fannie Mae Mortgage pass-thru certificates 4% 4/1/2047 | | 46,604 | 43,245 |
| Fannie Mae Mortgage pass-thru certificates 4% 4/1/2047 | | 62,172 | 57,690 |
| Fannie Mae Mortgage pass-thru certificates 4% 4/1/2048 | | 19,120 | 17,760 |
| Fannie Mae Mortgage pass-thru certificates 4% 4/1/2048 | | 29,259 | 27,113 |
| Fannie Mae Mortgage pass-thru certificates 4% 4/1/2048 | | 19,474 | 18,088 |
| Fannie Mae Mortgage pass-thru certificates 4% 4/1/2048 | | 82,899 | 77,078 |
| Fannie Mae Mortgage pass-thru certificates 4% 4/1/2049 | | 428,492 | 396,128 |
| Fannie Mae Mortgage pass-thru certificates 4% 4/1/2049 | | 133,458 | 123,044 |
| Fannie Mae Mortgage pass-thru certificates 4% 4/1/2049 | | 47,824 | 44,212 |
| Fannie Mae Mortgage pass-thru certificates 4% 4/1/2050 | | 9,994 | 9,221 |
| Fannie Mae Mortgage pass-thru certificates 4% 5/1/2046 | | 36,700 | 34,260 |
| Fannie Mae Mortgage pass-thru certificates 4% 5/1/2047 | | 28,822 | 26,724 |
| Fannie Mae Mortgage pass-thru certificates 4% 5/1/2047 | | 89,803 | 83,498 |
| Fannie Mae Mortgage pass-thru certificates 4% 5/1/2048 | | 34,497 | 32,010 |
| Fannie Mae Mortgage pass-thru certificates 4% 5/1/2048 | | 210,065 | 194,921 |
| Fannie Mae Mortgage pass-thru certificates 4% 5/1/2048 | | 16,860 | 15,603 |
| Fannie Mae Mortgage pass-thru certificates 4% 5/1/2048 | | 121,208 | 112,432 |
| Fannie Mae Mortgage pass-thru certificates 4% 5/1/2048 | | 20,683 | 19,186 |
| Fannie Mae Mortgage pass-thru certificates 4% 5/1/2048 | | 12,069 | 11,169 |
| Fannie Mae Mortgage pass-thru certificates 4% 5/1/2049 | | 5,664 | 5,221 |
| Fannie Mae Mortgage pass-thru certificates 4% 5/1/2049 | | 5,946 | 5,496 |
| Fannie Mae Mortgage pass-thru certificates 4% 5/1/2049 | | 2,815 | 2,602 |
| Fannie Mae Mortgage pass-thru certificates 4% 5/1/2049 | | 11,517 | 10,651 |
| Fannie Mae Mortgage pass-thru certificates 4% 5/1/2050 | | 19,158 | 17,681 |
| Fannie Mae Mortgage pass-thru certificates 4% 5/1/2050 | | 58,380 | 53,989 |
| Fannie Mae Mortgage pass-thru certificates 4% 5/1/2050 | | 18,126 | 16,718 |
| Fannie Mae Mortgage pass-thru certificates 4% 6/1/2034 | | 19,751 | 19,114 |
| Fannie Mae Mortgage pass-thru certificates 4% 6/1/2041 | | 11,618 | 10,989 |
| Fannie Mae Mortgage pass-thru certificates 4% 6/1/2047 | | 23,776 | 22,055 |
| Fannie Mae Mortgage pass-thru certificates 4% 6/1/2048 | | 8,276 | 7,595 |
| Fannie Mae Mortgage pass-thru certificates 4% 6/1/2048 | | 4,950 | 4,543 |
| Fannie Mae Mortgage pass-thru certificates 4% 6/1/2048 | | 41,946 | 38,818 |
| Fannie Mae Mortgage pass-thru certificates 4% 6/1/2048 | | 11,983 | 11,115 |
| Fannie Mae Mortgage pass-thru certificates 4% 6/1/2048 | | 107,123 | 99,132 |
| Fannie Mae Mortgage pass-thru certificates 4% 6/1/2049 | | 7,304 | 6,752 |
| Fannie Mae Mortgage pass-thru certificates 4% 6/1/2049 | | 90,554 | 83,714 |
| Fannie Mae Mortgage pass-thru certificates 4% 6/1/2050 | | 43,151 | 39,798 |
| Fannie Mae Mortgage pass-thru certificates 4% 7/1/2030 | | 3,785 | 3,717 |
| Fannie Mae Mortgage pass-thru certificates 4% 7/1/2046 | | 8,425 | 7,860 |
| Fannie Mae Mortgage pass-thru certificates 4% 7/1/2046 | | 122,179 | 114,058 |
| Fannie Mae Mortgage pass-thru certificates 4% 7/1/2047 | | 46,848 | 43,559 |
| Fannie Mae Mortgage pass-thru certificates 4% 7/1/2048 | | 45,816 | 42,398 |
| Fannie Mae Mortgage pass-thru certificates 4% 7/1/2048 | | 69,362 | 64,188 |
| Fannie Mae Mortgage pass-thru certificates 4% 7/1/2049 | | 62,702 | 57,966 |
| Fannie Mae Mortgage pass-thru certificates 4% 7/1/2049 | | 14,154 | 13,089 |
| Fannie Mae Mortgage pass-thru certificates 4% 7/1/2049 | | 6,943 | 6,418 |
| Fannie Mae Mortgage pass-thru certificates 4% 8/1/2041 | | 1,048 | 987 |
| Fannie Mae Mortgage pass-thru certificates 4% 8/1/2041 | | 526 | 496 |
| Fannie Mae Mortgage pass-thru certificates 4% 8/1/2044 | | 10,159 | 9,516 |
| Fannie Mae Mortgage pass-thru certificates 4% 8/1/2046 | | 38,778 | 36,201 |
| Fannie Mae Mortgage pass-thru certificates 4% 8/1/2047 | | 104,906 | 97,277 |
| Fannie Mae Mortgage pass-thru certificates 4% 8/1/2048 | | 21,737 | 20,115 |
| Fannie Mae Mortgage pass-thru certificates 4% 8/1/2049 | | 31,538 | 29,146 |
| Fannie Mae Mortgage pass-thru certificates 4% 8/1/2049 | | 64,211 | 59,361 |
| Fannie Mae Mortgage pass-thru certificates 4% 8/1/2049 | | 17,490 | 16,164 |
| Fannie Mae Mortgage pass-thru certificates 4% 8/1/2050 | | 49,862 | 46,018 |
| Fannie Mae Mortgage pass-thru certificates 4% 8/1/2051 | | 22,921 | 21,134 |
| Fannie Mae Mortgage pass-thru certificates 4% 9/1/2039 | | 2,137 | 2,032 |
| Fannie Mae Mortgage pass-thru certificates 4% 9/1/2041 | | 38,925 | 36,735 |
| Fannie Mae Mortgage pass-thru certificates 4% 9/1/2041 | | 1,278 | 1,207 |
| Fannie Mae Mortgage pass-thru certificates 4% 9/1/2041 | | 1,435 | 1,351 |
| Fannie Mae Mortgage pass-thru certificates 4% 9/1/2041 | | 5,880 | 5,528 |
| Fannie Mae Mortgage pass-thru certificates 4% 9/1/2044 | | 65,365 | 61,156 |
| Fannie Mae Mortgage pass-thru certificates 4% 9/1/2046 | | 4,420 | 4,121 |
| Fannie Mae Mortgage pass-thru certificates 4% 9/1/2046 | | 143,546 | 133,915 |
| Fannie Mae Mortgage pass-thru certificates 4% 9/1/2048 | | 801,991 | 742,169 |
| Fannie Mae Mortgage pass-thru certificates 4% 9/1/2049 | | 37,146 | 34,329 |
| Fannie Mae Mortgage pass-thru certificates 4% 9/1/2049 | | 503,175 | 465,170 |
| Fannie Mae Mortgage pass-thru certificates 4% 9/1/2049 | | 4,109 | 3,799 |
| Fannie Mae Mortgage pass-thru certificates 4% 9/1/2050 | | 105,914 | 97,914 |
| Fannie Mae Mortgage pass-thru certificates 4.5% 1/1/2025 | | 5 | 4 |
| Fannie Mae Mortgage pass-thru certificates 4.5% 1/1/2041 | | 5,589 | 5,432 |
| Fannie Mae Mortgage pass-thru certificates 4.5% 1/1/2041 | | 1,758 | 1,707 |
| Fannie Mae Mortgage pass-thru certificates 4.5% 1/1/2042 | | 1,414 | 1,371 |
| Fannie Mae Mortgage pass-thru certificates 4.5% 1/1/2043 | | 135,515 | 131,587 |
| Fannie Mae Mortgage pass-thru certificates 4.5% 1/1/2044 | | 5,962 | 5,756 |
| Fannie Mae Mortgage pass-thru certificates 4.5% 1/1/2044 | | 5,872 | 5,670 |
| Fannie Mae Mortgage pass-thru certificates 4.5% 1/1/2044 | | 3,150 | 3,041 |
| Fannie Mae Mortgage pass-thru certificates 4.5% 1/1/2044 | | 6,692 | 6,461 |
| Fannie Mae Mortgage pass-thru certificates 4.5% 1/1/2045 | | 12,254 | 11,797 |
| Fannie Mae Mortgage pass-thru certificates 4.5% 1/1/2047 | | 47,674 | 45,732 |
| Fannie Mae Mortgage pass-thru certificates 4.5% 1/1/2047 | | 4,188 | 4,021 |
| Fannie Mae Mortgage pass-thru certificates 4.5% 1/1/2048 | | 12,040 | 11,497 |
| Fannie Mae Mortgage pass-thru certificates 4.5% 1/1/2048 | | 526 | 502 |
| Fannie Mae Mortgage pass-thru certificates 4.5% 1/1/2049 | | 22,943 | 21,865 |
| Fannie Mae Mortgage pass-thru certificates 4.5% 1/1/2050 | | 4,520 | 4,304 |
| Fannie Mae Mortgage pass-thru certificates 4.5% 1/1/2050 | | 223,273 | 212,852 |
| Fannie Mae Mortgage pass-thru certificates 4.5% 1/1/2050 | | 12,384 | 11,795 |
| Fannie Mae Mortgage pass-thru certificates 4.5% 10/1/2039 | | 7,629 | 7,452 |
| Fannie Mae Mortgage pass-thru certificates 4.5% 10/1/2039 | | 60,021 | 58,436 |
| Fannie Mae Mortgage pass-thru certificates 4.5% 10/1/2040 | | 2,827 | 2,752 |
| Fannie Mae Mortgage pass-thru certificates 4.5% 10/1/2043 | | 7,751 | 7,484 |
| Fannie Mae Mortgage pass-thru certificates 4.5% 10/1/2044 | | 3,557 | 3,429 |
| Fannie Mae Mortgage pass-thru certificates 4.5% 10/1/2044 | | 10,467 | 10,090 |
| Fannie Mae Mortgage pass-thru certificates 4.5% 10/1/2044 | | 2,857 | 2,754 |
| Fannie Mae Mortgage pass-thru certificates 4.5% 10/1/2044 | | 2,925 | 2,820 |
| Fannie Mae Mortgage pass-thru certificates 4.5% 10/1/2044 | | 3,849 | 3,710 |
| Fannie Mae Mortgage pass-thru certificates 4.5% 10/1/2045 | | 71,886 | 69,841 |
| Fannie Mae Mortgage pass-thru certificates 4.5% 10/1/2046 | | 3,440 | 3,303 |
| Fannie Mae Mortgage pass-thru certificates 4.5% 10/1/2046 | | 6,356 | 6,097 |
| Fannie Mae Mortgage pass-thru certificates 4.5% 10/1/2047 | | 7,868 | 7,523 |
| Fannie Mae Mortgage pass-thru certificates 4.5% 10/1/2047 | | 6,020 | 5,756 |
| Fannie Mae Mortgage pass-thru certificates 4.5% 10/1/2047 | | 1,731 | 1,656 |
| Fannie Mae Mortgage pass-thru certificates 4.5% 10/1/2047 | | 14,375 | 13,745 |
| Fannie Mae Mortgage pass-thru certificates 4.5% 10/1/2048 | | 116,251 | 110,825 |
| Fannie Mae Mortgage pass-thru certificates 4.5% 10/1/2048 | | 54,963 | 52,398 |
| Fannie Mae Mortgage pass-thru certificates 4.5% 10/1/2048 | | 22,148 | 21,114 |
| Fannie Mae Mortgage pass-thru certificates 4.5% 10/1/2049 | | 23,376 | 22,263 |
| Fannie Mae Mortgage pass-thru certificates 4.5% 10/1/2050 | | 10,961 | 10,422 |
| Fannie Mae Mortgage pass-thru certificates 4.5% 11/1/2040 | | 15,751 | 15,307 |
| Fannie Mae Mortgage pass-thru certificates 4.5% 11/1/2040 | | 40,591 | 39,436 |
| Fannie Mae Mortgage pass-thru certificates 4.5% 11/1/2041 | | 4,219 | 4,103 |
| Fannie Mae Mortgage pass-thru certificates 4.5% 11/1/2042 | | 28,039 | 27,239 |
| Fannie Mae Mortgage pass-thru certificates 4.5% 11/1/2043 | | 12,041 | 11,626 |
| Fannie Mae Mortgage pass-thru certificates 4.5% 11/1/2043 | | 1,913 | 1,847 |
| Fannie Mae Mortgage pass-thru certificates 4.5% 11/1/2044 | | 25,862 | 24,930 |
| Fannie Mae Mortgage pass-thru certificates 4.5% 11/1/2044 | | 1,848 | 1,781 |
| Fannie Mae Mortgage pass-thru certificates 4.5% 11/1/2044 | | 2,485 | 2,396 |
| Fannie Mae Mortgage pass-thru certificates 4.5% 11/1/2044 | | 3,435 | 3,311 |
| Fannie Mae Mortgage pass-thru certificates 4.5% 11/1/2044 | | 3,356 | 3,235 |
| Fannie Mae Mortgage pass-thru certificates 4.5% 11/1/2045 | | 7,168 | 6,889 |
| Fannie Mae Mortgage pass-thru certificates 4.5% 11/1/2046 | | 30,895 | 29,636 |
| Fannie Mae Mortgage pass-thru certificates 4.5% 11/1/2047 | | 20,031 | 19,153 |
| Fannie Mae Mortgage pass-thru certificates 4.5% 11/1/2048 | | 2,033 | 1,938 |
| Fannie Mae Mortgage pass-thru certificates 4.5% 11/1/2048 | | 48,503 | 46,239 |
| Fannie Mae Mortgage pass-thru certificates 4.5% 11/1/2048 | | 6,145 | 5,858 |
| Fannie Mae Mortgage pass-thru certificates 4.5% 11/1/2048 | | 17,387 | 16,603 |
| Fannie Mae Mortgage pass-thru certificates 4.5% 11/1/2048 | | 45,082 | 42,978 |
| Fannie Mae Mortgage pass-thru certificates 4.5% 11/1/2049 | | 37,550 | 35,762 |
| Fannie Mae Mortgage pass-thru certificates 4.5% 12/1/2038 | | 3,333 | 3,280 |
| Fannie Mae Mortgage pass-thru certificates 4.5% 12/1/2039 | | 26,014 | 25,327 |
| Fannie Mae Mortgage pass-thru certificates 4.5% 12/1/2040 | | 87,321 | 84,793 |
| Fannie Mae Mortgage pass-thru certificates 4.5% 12/1/2043 | | 29,922 | 28,891 |
| Fannie Mae Mortgage pass-thru certificates 4.5% 12/1/2043 | | 1,395 | 1,347 |
| Fannie Mae Mortgage pass-thru certificates 4.5% 12/1/2044 | | 12,881 | 12,417 |
| Fannie Mae Mortgage pass-thru certificates 4.5% 12/1/2044 | | 9,572 | 9,215 |
| Fannie Mae Mortgage pass-thru certificates 4.5% 12/1/2044 | | 2,980 | 2,871 |
| Fannie Mae Mortgage pass-thru certificates 4.5% 12/1/2044 | | 12,785 | 12,308 |
| Fannie Mae Mortgage pass-thru certificates 4.5% 12/1/2044 | | 670 | 646 |
| Fannie Mae Mortgage pass-thru certificates 4.5% 12/1/2044 | | 2,799 | 2,695 |
| Fannie Mae Mortgage pass-thru certificates 4.5% 12/1/2044 | | 3,382 | 3,260 |
| Fannie Mae Mortgage pass-thru certificates 4.5% 12/1/2045 | | 6,265 | 6,022 |
| Fannie Mae Mortgage pass-thru certificates 4.5% 12/1/2046 | | 5,882 | 5,642 |
| Fannie Mae Mortgage pass-thru certificates 4.5% 12/1/2046 | | 6,904 | 6,623 |
| Fannie Mae Mortgage pass-thru certificates 4.5% 12/1/2048 | | 38,660 | 36,856 |
| Fannie Mae Mortgage pass-thru certificates 4.5% 12/1/2048 | | 198,037 | 189,722 |
| Fannie Mae Mortgage pass-thru certificates 4.5% 12/1/2048 | | 15,209 | 14,499 |
| Fannie Mae Mortgage pass-thru certificates 4.5% 12/1/2048 | | 1,488 | 1,419 |
| Fannie Mae Mortgage pass-thru certificates 4.5% 12/1/2048 | | 1,849 | 1,771 |
| Fannie Mae Mortgage pass-thru certificates 4.5% 12/1/2048 | | 9,256 | 8,824 |
| Fannie Mae Mortgage pass-thru certificates 4.5% 12/1/2048 | | 11,059 | 10,542 |
| Fannie Mae Mortgage pass-thru certificates 4.5% 12/1/2050 | | 12,796 | 12,187 |
| Fannie Mae Mortgage pass-thru certificates 4.5% 2/1/2025 | | 6 | 5 |
| Fannie Mae Mortgage pass-thru certificates 4.5% 2/1/2040 | | 2,145 | 2,085 |
| Fannie Mae Mortgage pass-thru certificates 4.5% 2/1/2041 | | 9,960 | 9,688 |
| Fannie Mae Mortgage pass-thru certificates 4.5% 2/1/2041 | | 1,551 | 1,504 |
| Fannie Mae Mortgage pass-thru certificates 4.5% 2/1/2044 | | 5,463 | 5,274 |
| Fannie Mae Mortgage pass-thru certificates 4.5% 2/1/2044 | | 6,997 | 6,749 |
| Fannie Mae Mortgage pass-thru certificates 4.5% 2/1/2044 | | 3,384 | 3,264 |
| Fannie Mae Mortgage pass-thru certificates 4.5% 2/1/2044 | | 18,033 | 17,411 |
| Fannie Mae Mortgage pass-thru certificates 4.5% 2/1/2045 | | 993 | 960 |
| Fannie Mae Mortgage pass-thru certificates 4.5% 2/1/2045 | | 3,321 | 3,197 |
| Fannie Mae Mortgage pass-thru certificates 4.5% 2/1/2047 | | 14,633 | 14,028 |
| Fannie Mae Mortgage pass-thru certificates 4.5% 2/1/2047 | | 6,330 | 6,068 |
| Fannie Mae Mortgage pass-thru certificates 4.5% 2/1/2047 | | 18,177 | 17,425 |
| Fannie Mae Mortgage pass-thru certificates 4.5% 2/1/2047 | | 2,104 | 2,017 |
| Fannie Mae Mortgage pass-thru certificates 4.5% 2/1/2047 | | 254,534 | 245,359 |
| Fannie Mae Mortgage pass-thru certificates 4.5% 2/1/2048 | | 10,568 | 10,091 |
| Fannie Mae Mortgage pass-thru certificates 4.5% 2/1/2049 | | 3,633 | 3,463 |
| Fannie Mae Mortgage pass-thru certificates 4.5% 2/1/2049 | | 192,163 | 183,135 |
| Fannie Mae Mortgage pass-thru certificates 4.5% 2/1/2049 | | 9,565 | 9,113 |
| Fannie Mae Mortgage pass-thru certificates 4.5% 2/1/2049 | | 5,405 | 5,151 |
| Fannie Mae Mortgage pass-thru certificates 4.5% 2/1/2049 | | 3,406 | 3,246 |
| Fannie Mae Mortgage pass-thru certificates 4.5% 2/1/2049 | | 16,035 | 15,281 |
| Fannie Mae Mortgage pass-thru certificates 4.5% 2/1/2049 | | 3,209 | 3,047 |
| Fannie Mae Mortgage pass-thru certificates 4.5% 2/1/2050 | | 126,456 | 120,396 |
| Fannie Mae Mortgage pass-thru certificates 4.5% 3/1/2025 | | 46 | 46 |
| Fannie Mae Mortgage pass-thru certificates 4.5% 3/1/2025 | | 348 | 348 |
| Fannie Mae Mortgage pass-thru certificates 4.5% 3/1/2041 | | 1,465 | 1,430 |
| Fannie Mae Mortgage pass-thru certificates 4.5% 3/1/2041 | | 13,279 | 12,893 |
| Fannie Mae Mortgage pass-thru certificates 4.5% 3/1/2041 | | 2,321 | 2,255 |
| Fannie Mae Mortgage pass-thru certificates 4.5% 3/1/2041 | | 1,662 | 1,613 |
| Fannie Mae Mortgage pass-thru certificates 4.5% 3/1/2041 | | 1,680 | 1,631 |
| Fannie Mae Mortgage pass-thru certificates 4.5% 3/1/2044 | | 5,586 | 5,388 |
| Fannie Mae Mortgage pass-thru certificates 4.5% 3/1/2044 | | 3,626 | 3,498 |
| Fannie Mae Mortgage pass-thru certificates 4.5% 3/1/2044 | | 3,233 | 3,114 |
| Fannie Mae Mortgage pass-thru certificates 4.5% 3/1/2044 | | 4,294 | 4,142 |
| Fannie Mae Mortgage pass-thru certificates 4.5% 3/1/2044 | | 1,298 | 1,252 |
| Fannie Mae Mortgage pass-thru certificates 4.5% 3/1/2044 | | 6,335 | 6,111 |
| Fannie Mae Mortgage pass-thru certificates 4.5% 3/1/2046 | | 40,386 | 38,994 |
| Fannie Mae Mortgage pass-thru certificates 4.5% 3/1/2046 | | 4,403 | 4,232 |
| Fannie Mae Mortgage pass-thru certificates 4.5% 3/1/2047 | | 19,390 | 18,588 |
| Fannie Mae Mortgage pass-thru certificates 4.5% 3/1/2048 | | 20,115 | 19,207 |
| Fannie Mae Mortgage pass-thru certificates 4.5% 3/1/2049 | | 6,026 | 5,741 |
| Fannie Mae Mortgage pass-thru certificates 4.5% 3/1/2049 | | 29,731 | 28,334 |
| Fannie Mae Mortgage pass-thru certificates 4.5% 3/1/2049 | | 13,749 | 13,098 |
| Fannie Mae Mortgage pass-thru certificates 4.5% 3/1/2050 | | 8,008 | 7,621 |
| Fannie Mae Mortgage pass-thru certificates 4.5% 4/1/2025 | | 27 | 27 |
| Fannie Mae Mortgage pass-thru certificates 4.5% 4/1/2025 | | 12 | 11 |
| Fannie Mae Mortgage pass-thru certificates 4.5% 4/1/2035 | | 96 | 94 |
| Fannie Mae Mortgage pass-thru certificates 4.5% 4/1/2039 | | 320,896 | 314,870 |
| Fannie Mae Mortgage pass-thru certificates 4.5% 4/1/2039 | | 55,832 | 54,841 |
| Fannie Mae Mortgage pass-thru certificates 4.5% 4/1/2041 | | 53,105 | 51,551 |
| Fannie Mae Mortgage pass-thru certificates 4.5% 4/1/2041 | | 2,586 | 2,514 |
| Fannie Mae Mortgage pass-thru certificates 4.5% 4/1/2041 | | 11,197 | 10,858 |
| Fannie Mae Mortgage pass-thru certificates 4.5% 4/1/2044 | | 5,444 | 5,251 |
| Fannie Mae Mortgage pass-thru certificates 4.5% 4/1/2044 | | 21,908 | 21,132 |
| Fannie Mae Mortgage pass-thru certificates 4.5% 4/1/2044 | | 10,214 | 9,852 |
| Fannie Mae Mortgage pass-thru certificates 4.5% 4/1/2044 | | 8,900 | 8,585 |
| Fannie Mae Mortgage pass-thru certificates 4.5% 4/1/2044 | | 3,115 | 3,005 |
| Fannie Mae Mortgage pass-thru certificates 4.5% 4/1/2044 | | 2,203 | 2,125 |
| Fannie Mae Mortgage pass-thru certificates 4.5% 4/1/2045 | | 6,723 | 6,473 |
| Fannie Mae Mortgage pass-thru certificates 4.5% 4/1/2047 | | 11,377 | 10,907 |
| Fannie Mae Mortgage pass-thru certificates 4.5% 4/1/2048 | | 11,424 | 10,919 |
| Fannie Mae Mortgage pass-thru certificates 4.5% 4/1/2049 | | 11,568 | 11,025 |
| Fannie Mae Mortgage pass-thru certificates 4.5% 4/1/2049 | | 7,067 | 6,732 |
| Fannie Mae Mortgage pass-thru certificates 4.5% 4/1/2050 | | 59,556 | 56,684 |
| Fannie Mae Mortgage pass-thru certificates 4.5% 4/1/2050 | | 5,016 | 4,775 |
| Fannie Mae Mortgage pass-thru certificates 4.5% 5/1/2025 | | 123 | 122 |
| Fannie Mae Mortgage pass-thru certificates 4.5% 5/1/2025 | | 273 | 272 |
| Fannie Mae Mortgage pass-thru certificates 4.5% 5/1/2035 | | 140 | 137 |
| Fannie Mae Mortgage pass-thru certificates 4.5% 5/1/2039 | | 2,368 | 2,308 |
| Fannie Mae Mortgage pass-thru certificates 4.5% 5/1/2040 | | 4,096 | 3,984 |
| Fannie Mae Mortgage pass-thru certificates 4.5% 5/1/2044 | | 4,776 | 4,607 |
| Fannie Mae Mortgage pass-thru certificates 4.5% 5/1/2044 | | 2,426 | 2,340 |
| Fannie Mae Mortgage pass-thru certificates 4.5% 5/1/2044 | | 18,917 | 18,246 |
| Fannie Mae Mortgage pass-thru certificates 4.5% 5/1/2044 | | 1,390 | 1,345 |
| Fannie Mae Mortgage pass-thru certificates 4.5% 5/1/2044 | | 5,913 | 5,703 |
| Fannie Mae Mortgage pass-thru certificates 4.5% 5/1/2044 | | 2,783 | 2,684 |
| Fannie Mae Mortgage pass-thru certificates 4.5% 5/1/2045 | | 3,519 | 3,386 |
| Fannie Mae Mortgage pass-thru certificates 4.5% 5/1/2046 | | 2,167 | 2,081 |
| Fannie Mae Mortgage pass-thru certificates 4.5% 5/1/2047 | | 5,954 | 5,703 |
| Fannie Mae Mortgage pass-thru certificates 4.5% 5/1/2049 | | 11,256 | 10,724 |
| Fannie Mae Mortgage pass-thru certificates 4.5% 5/1/2049 | | 14,247 | 13,573 |
| Fannie Mae Mortgage pass-thru certificates 4.5% 6/1/2025 | | 172 | 172 |
| Fannie Mae Mortgage pass-thru certificates 4.5% 6/1/2025 | | 34 | 34 |
| Fannie Mae Mortgage pass-thru certificates 4.5% 6/1/2042 | | 2,449 | 2,371 |
| Fannie Mae Mortgage pass-thru certificates 4.5% 6/1/2044 | | 13,066 | 12,603 |
| Fannie Mae Mortgage pass-thru certificates 4.5% 6/1/2045 | | 4,404 | 4,248 |
| Fannie Mae Mortgage pass-thru certificates 4.5% 6/1/2047 | | 6,001 | 5,747 |
| Fannie Mae Mortgage pass-thru certificates 4.5% 6/1/2047 | | 13,633 | 13,048 |
| Fannie Mae Mortgage pass-thru certificates 4.5% 6/1/2047 | | 79,237 | 75,910 |
| Fannie Mae Mortgage pass-thru certificates 4.5% 6/1/2047 | | 3,190 | 3,055 |
| Fannie Mae Mortgage pass-thru certificates 4.5% 6/1/2048 | | 1,456 | 1,382 |
| Fannie Mae Mortgage pass-thru certificates 4.5% 6/1/2048 | | 2,642 | 2,519 |
| Fannie Mae Mortgage pass-thru certificates 4.5% 6/1/2049 | | 7,157 | 6,819 |
| Fannie Mae Mortgage pass-thru certificates 4.5% 6/1/2049 | | 164,580 | 156,847 |
| Fannie Mae Mortgage pass-thru certificates 4.5% 6/1/2049 | | 3,302 | 3,146 |
| Fannie Mae Mortgage pass-thru certificates 4.5% 6/1/2050 | | 40,786 | 38,819 |
| Fannie Mae Mortgage pass-thru certificates 4.5% 7/1/2025 | | 87 | 87 |
| Fannie Mae Mortgage pass-thru certificates 4.5% 7/1/2038 | | 11,704 | 11,381 |
| Fannie Mae Mortgage pass-thru certificates 4.5% 7/1/2039 | | 68,408 | 66,611 |
| Fannie Mae Mortgage pass-thru certificates 4.5% 7/1/2039 | | 1,806 | 1,759 |
| Fannie Mae Mortgage pass-thru certificates 4.5% 7/1/2039 | | 25,200 | 24,522 |
| Fannie Mae Mortgage pass-thru certificates 4.5% 7/1/2041 | | 3,718 | 3,615 |
| Fannie Mae Mortgage pass-thru certificates 4.5% 7/1/2045 | | 3,425 | 3,295 |
| Fannie Mae Mortgage pass-thru certificates 4.5% 7/1/2047 | | 8,535 | 8,174 |
| Fannie Mae Mortgage pass-thru certificates 4.5% 7/1/2047 | | 14,677 | 14,047 |
| Fannie Mae Mortgage pass-thru certificates 4.5% 7/1/2047 | | 3,678 | 3,520 |
| Fannie Mae Mortgage pass-thru certificates 4.5% 7/1/2047 | | 66,734 | 63,932 |
| Fannie Mae Mortgage pass-thru certificates 4.5% 7/1/2048 | | 12,801 | 12,204 |
| Fannie Mae Mortgage pass-thru certificates 4.5% 7/1/2049 | | 24,472 | 23,314 |
| Fannie Mae Mortgage pass-thru certificates 4.5% 8/1/2027 | | 167 | 167 |
| Fannie Mae Mortgage pass-thru certificates 4.5% 8/1/2033 | | 2,827 | 2,781 |
| Fannie Mae Mortgage pass-thru certificates 4.5% 8/1/2033 | | 5,793 | 5,696 |
| Fannie Mae Mortgage pass-thru certificates 4.5% 8/1/2033 | | 15,060 | 14,803 |
| Fannie Mae Mortgage pass-thru certificates 4.5% 8/1/2037 | | 1,951 | 1,924 |
| Fannie Mae Mortgage pass-thru certificates 4.5% 8/1/2039 | | 2,551 | 2,486 |
| Fannie Mae Mortgage pass-thru certificates 4.5% 8/1/2039 | | 2,260 | 2,199 |
| Fannie Mae Mortgage pass-thru certificates 4.5% 8/1/2039 | | 28,074 | 27,320 |
| Fannie Mae Mortgage pass-thru certificates 4.5% 8/1/2039 | | 24,414 | 23,756 |
| Fannie Mae Mortgage pass-thru certificates 4.5% 8/1/2039 | | 1,840 | 1,791 |
| Fannie Mae Mortgage pass-thru certificates 4.5% 8/1/2039 | | 838 | 817 |
| Fannie Mae Mortgage pass-thru certificates 4.5% 8/1/2040 | | 3,917 | 3,810 |
| Fannie Mae Mortgage pass-thru certificates 4.5% 8/1/2041 | | 5,708 | 5,543 |
| Fannie Mae Mortgage pass-thru certificates 4.5% 8/1/2041 | | 12,075 | 11,733 |
| Fannie Mae Mortgage pass-thru certificates 4.5% 8/1/2041 | | 2,843 | 2,759 |
| Fannie Mae Mortgage pass-thru certificates 4.5% 8/1/2041 | | 2,283 | 2,217 |
| Fannie Mae Mortgage pass-thru certificates 4.5% 8/1/2041 | | 1,518 | 1,474 |
| Fannie Mae Mortgage pass-thru certificates 4.5% 8/1/2041 | | 1,645 | 1,597 |
| Fannie Mae Mortgage pass-thru certificates 4.5% 8/1/2044 | | 4,810 | 4,637 |
| Fannie Mae Mortgage pass-thru certificates 4.5% 8/1/2044 | | 2,544 | 2,452 |
| Fannie Mae Mortgage pass-thru certificates 4.5% 8/1/2044 | | 9,287 | 8,952 |
| Fannie Mae Mortgage pass-thru certificates 4.5% 8/1/2044 | | 13,358 | 12,876 |
| Fannie Mae Mortgage pass-thru certificates 4.5% 8/1/2044 | | 4,729 | 4,562 |
| Fannie Mae Mortgage pass-thru certificates 4.5% 8/1/2044 | | 4,886 | 4,710 |
| Fannie Mae Mortgage pass-thru certificates 4.5% 8/1/2046 | | 98,836 | 95,335 |
| Fannie Mae Mortgage pass-thru certificates 4.5% 8/1/2046 | | 41,033 | 39,400 |
| Fannie Mae Mortgage pass-thru certificates 4.5% 8/1/2048 | | 27,639 | 26,349 |
| Fannie Mae Mortgage pass-thru certificates 4.5% 8/1/2049 | | 144,564 | 137,727 |
| Fannie Mae Mortgage pass-thru certificates 4.5% 8/1/2049 | | 223,724 | 213,212 |
| Fannie Mae Mortgage pass-thru certificates 4.5% 8/1/2049 | | 5,276 | 5,026 |
| Fannie Mae Mortgage pass-thru certificates 4.5% 8/1/2050 | | 12,542 | 11,933 |
| Fannie Mae Mortgage pass-thru certificates 4.5% 9/1/2029 | | 426 | 423 |
| Fannie Mae Mortgage pass-thru certificates 4.5% 9/1/2033 | | 14,803 | 14,546 |
| Fannie Mae Mortgage pass-thru certificates 4.5% 9/1/2033 | | 6,761 | 6,644 |
| Fannie Mae Mortgage pass-thru certificates 4.5% 9/1/2033 | | 5,432 | 5,338 |
| Fannie Mae Mortgage pass-thru certificates 4.5% 9/1/2033 | | 3,088 | 3,035 |
| Fannie Mae Mortgage pass-thru certificates 4.5% 9/1/2035 | | 29,975 | 29,375 |
| Fannie Mae Mortgage pass-thru certificates 4.5% 9/1/2039 | | 43,300 | 42,163 |
| Fannie Mae Mortgage pass-thru certificates 4.5% 9/1/2040 | | 22,256 | 21,628 |
| Fannie Mae Mortgage pass-thru certificates 4.5% 9/1/2041 | | 33,780 | 32,776 |
| Fannie Mae Mortgage pass-thru certificates 4.5% 9/1/2043 | | 5,323 | 5,139 |
| Fannie Mae Mortgage pass-thru certificates 4.5% 9/1/2043 | | 2,832 | 2,741 |
| Fannie Mae Mortgage pass-thru certificates 4.5% 9/1/2044 | | 19,839 | 19,123 |
| Fannie Mae Mortgage pass-thru certificates 4.5% 9/1/2046 | | 3,430 | 3,290 |
| Fannie Mae Mortgage pass-thru certificates 4.5% 9/1/2047 | | 4,163 | 3,984 |
| Fannie Mae Mortgage pass-thru certificates 4.5% 9/1/2047 | | 1,831 | 1,752 |
| Fannie Mae Mortgage pass-thru certificates 4.5% 9/1/2048 | | 52,274 | 49,834 |
| Fannie Mae Mortgage pass-thru certificates 5% 1/1/2037 | | 1,783 | 1,784 |
| Fannie Mae Mortgage pass-thru certificates 5% 1/1/2038 | | 1,526 | 1,526 |
| Fannie Mae Mortgage pass-thru certificates 5% 1/1/2040 | | 1,744 | 1,740 |
| Fannie Mae Mortgage pass-thru certificates 5% 1/1/2041 | | 2,501 | 2,494 |
| Fannie Mae Mortgage pass-thru certificates 5% 1/1/2044 | | 2,410 | 2,395 |
| Fannie Mae Mortgage pass-thru certificates 5% 1/1/2044 | | 4,265 | 4,240 |
| Fannie Mae Mortgage pass-thru certificates 5% 1/1/2044 | | 3,822 | 3,799 |
| Fannie Mae Mortgage pass-thru certificates 5% 1/1/2049 | | 7,481 | 7,346 |
| Fannie Mae Mortgage pass-thru certificates 5% 1/1/2049 | | 19,591 | 19,237 |
| Fannie Mae Mortgage pass-thru certificates 5% 1/1/2051 | | 241,000 | 236,195 |
| Fannie Mae Mortgage pass-thru certificates 5% 10/1/2035 | | 20,126 | 20,141 |
| Fannie Mae Mortgage pass-thru certificates 5% 10/1/2041 | | 11,559 | 11,525 |
| Fannie Mae Mortgage pass-thru certificates 5% 10/1/2041 | | 71,676 | 71,477 |
| Fannie Mae Mortgage pass-thru certificates 5% 10/1/2043 | | 4,969 | 4,940 |
| Fannie Mae Mortgage pass-thru certificates 5% 10/1/2043 | | 2,644 | 2,628 |
| Fannie Mae Mortgage pass-thru certificates 5% 10/1/2044 | | 4,005 | 3,976 |
| Fannie Mae Mortgage pass-thru certificates 5% 10/1/2045 | | 14,495 | 14,457 |
| Fannie Mae Mortgage pass-thru certificates 5% 10/1/2048 | | 13,446 | 12,995 |
| Fannie Mae Mortgage pass-thru certificates 5% 10/1/2048 | | 135,408 | 135,627 |
| Fannie Mae Mortgage pass-thru certificates 5% 10/1/2049 | | 50,395 | 49,374 |
| Fannie Mae Mortgage pass-thru certificates 5% 10/1/2050 | | 23,867 | 23,391 |
| Fannie Mae Mortgage pass-thru certificates 5% 10/1/2052 | | 985,112 | 959,624 |
| Fannie Mae Mortgage pass-thru certificates 5% 10/1/2052 | | 974,868 | 949,035 |
| Fannie Mae Mortgage pass-thru certificates 5% 11/1/2033 | | 32,001 | 32,029 |
| Fannie Mae Mortgage pass-thru certificates 5% 11/1/2034 | | 9,351 | 9,358 |
| Fannie Mae Mortgage pass-thru certificates 5% 11/1/2035 | | 3,336 | 3,338 |
| Fannie Mae Mortgage pass-thru certificates 5% 11/1/2039 | | 437 | 436 |
| Fannie Mae Mortgage pass-thru certificates 5% 11/1/2039 | | 9,510 | 9,501 |
| Fannie Mae Mortgage pass-thru certificates 5% 11/1/2040 | | 4,682 | 4,671 |
| Fannie Mae Mortgage pass-thru certificates 5% 11/1/2043 | | 12,484 | 12,410 |
| Fannie Mae Mortgage pass-thru certificates 5% 11/1/2044 | | 10,442 | 10,411 |
| Fannie Mae Mortgage pass-thru certificates 5% 11/1/2044 | | 1,257 | 1,248 |
| Fannie Mae Mortgage pass-thru certificates 5% 11/1/2048 | | 9,976 | 9,796 |
| Fannie Mae Mortgage pass-thru certificates 5% 11/1/2049 | | 26,198 | 25,668 |
| Fannie Mae Mortgage pass-thru certificates 5% 11/1/2052 | | 572,932 | 558,108 |
| Fannie Mae Mortgage pass-thru certificates 5% 11/1/2052 | | 351,224 | 341,917 |
| Fannie Mae Mortgage pass-thru certificates 5% 12/1/2029 | | 2,020 | 2,026 |
| Fannie Mae Mortgage pass-thru certificates 5% 12/1/2039 | | 1,090 | 1,087 |
| Fannie Mae Mortgage pass-thru certificates 5% 12/1/2039 | | 2,463 | 2,457 |
| Fannie Mae Mortgage pass-thru certificates 5% 12/1/2043 | | 4,633 | 4,606 |
| Fannie Mae Mortgage pass-thru certificates 5% 12/1/2043 | | 7,813 | 7,805 |
| Fannie Mae Mortgage pass-thru certificates 5% 12/1/2048 | | 43,383 | 42,600 |
| Fannie Mae Mortgage pass-thru certificates 5% 12/1/2048 | | 33,845 | 33,233 |
| Fannie Mae Mortgage pass-thru certificates 5% 12/1/2048 | | 10,244 | 10,059 |
| Fannie Mae Mortgage pass-thru certificates 5% 12/1/2048 | | 10,143 | 9,803 |
| Fannie Mae Mortgage pass-thru certificates 5% 12/1/2048 | | 8,254 | 8,105 |
| Fannie Mae Mortgage pass-thru certificates 5% 12/1/2049 | | 61,457 | 60,212 |
| Fannie Mae Mortgage pass-thru certificates 5% 12/1/2049 | | 18,292 | 17,921 |
| Fannie Mae Mortgage pass-thru certificates 5% 12/1/2049 | | 14,502 | 14,240 |
| Fannie Mae Mortgage pass-thru certificates 5% 12/1/2050 | | 10,767 | 10,402 |
| Fannie Mae Mortgage pass-thru certificates 5% 12/1/2052 | | 402,736 | 392,190 |
| Fannie Mae Mortgage pass-thru certificates 5% 2/1/2035 | | 5,940 | 5,945 |
| Fannie Mae Mortgage pass-thru certificates 5% 2/1/2037 | | 29,065 | 29,086 |
| Fannie Mae Mortgage pass-thru certificates 5% 2/1/2041 | | 160 | 160 |
| Fannie Mae Mortgage pass-thru certificates 5% 2/1/2047 | | 2,181 | 2,155 |
| Fannie Mae Mortgage pass-thru certificates 5% 2/1/2049 | | 81,236 | 79,769 |
| Fannie Mae Mortgage pass-thru certificates 5% 2/1/2049 | | 22,216 | 21,815 |
| Fannie Mae Mortgage pass-thru certificates 5% 3/1/2030 | | 4,150 | 4,162 |
| Fannie Mae Mortgage pass-thru certificates 5% 3/1/2033 | | 2,747 | 2,749 |
| Fannie Mae Mortgage pass-thru certificates 5% 3/1/2038 | | 946 | 945 |
| Fannie Mae Mortgage pass-thru certificates 5% 3/1/2038 | | 1,661 | 1,660 |
| Fannie Mae Mortgage pass-thru certificates 5% 3/1/2040 | | 1,676 | 1,672 |
| Fannie Mae Mortgage pass-thru certificates 5% 3/1/2041 | | 4,023 | 4,008 |
| Fannie Mae Mortgage pass-thru certificates 5% 3/1/2042 | | 2,834 | 2,822 |
| Fannie Mae Mortgage pass-thru certificates 5% 3/1/2044 | | 2,431 | 2,416 |
| Fannie Mae Mortgage pass-thru certificates 5% 3/1/2044 | | 4,099 | 4,073 |
| Fannie Mae Mortgage pass-thru certificates 5% 3/1/2044 | | 2,507 | 2,491 |
| Fannie Mae Mortgage pass-thru certificates 5% 3/1/2049 | | 35,486 | 34,845 |
| Fannie Mae Mortgage pass-thru certificates 5% 3/1/2049 | | 3,349 | 3,283 |
| Fannie Mae Mortgage pass-thru certificates 5% 3/1/2050 | | 8,632 | 8,457 |
| Fannie Mae Mortgage pass-thru certificates 5% 4/1/2035 | | 5,690 | 5,693 |
| Fannie Mae Mortgage pass-thru certificates 5% 4/1/2035 | | 19,666 | 19,677 |
| Fannie Mae Mortgage pass-thru certificates 5% 4/1/2035 | | 2,800 | 2,801 |
| Fannie Mae Mortgage pass-thru certificates 5% 4/1/2038 | | 1,928 | 1,926 |
| Fannie Mae Mortgage pass-thru certificates 5% 4/1/2040 | | 17,131 | 17,088 |
| Fannie Mae Mortgage pass-thru certificates 5% 4/1/2040 | | 4,762 | 4,755 |
| Fannie Mae Mortgage pass-thru certificates 5% 4/1/2040 | | 442 | 441 |
| Fannie Mae Mortgage pass-thru certificates 5% 4/1/2041 | | 10,502 | 10,477 |
| Fannie Mae Mortgage pass-thru certificates 5% 4/1/2041 | | 5,761 | 5,743 |
| Fannie Mae Mortgage pass-thru certificates 5% 4/1/2041 | | 5,199 | 5,184 |
| Fannie Mae Mortgage pass-thru certificates 5% 4/1/2041 | | 9,493 | 9,469 |
| Fannie Mae Mortgage pass-thru certificates 5% 4/1/2041 | | 1,531 | 1,527 |
| Fannie Mae Mortgage pass-thru certificates 5% 4/1/2041 | | 5,196 | 5,181 |
| Fannie Mae Mortgage pass-thru certificates 5% 4/1/2041 | | 18,599 | 18,544 |
| Fannie Mae Mortgage pass-thru certificates 5% 4/1/2042 | | 78,421 | 78,183 |
| Fannie Mae Mortgage pass-thru certificates 5% 4/1/2047 | | 9,235 | 9,126 |
| Fannie Mae Mortgage pass-thru certificates 5% 4/1/2048 | | 29,076 | 28,488 |
| Fannie Mae Mortgage pass-thru certificates 5% 4/1/2049 | | 3,004 | 2,944 |
| Fannie Mae Mortgage pass-thru certificates 5% 4/1/2049 | | 4,864 | 4,768 |
| Fannie Mae Mortgage pass-thru certificates 5% 5/1/2030 | | 509 | 510 |
| Fannie Mae Mortgage pass-thru certificates 5% 5/1/2036 | | 1,348 | 1,348 |
| Fannie Mae Mortgage pass-thru certificates 5% 5/1/2038 | | 510 | 509 |
| Fannie Mae Mortgage pass-thru certificates 5% 5/1/2039 | | 478 | 478 |
| Fannie Mae Mortgage pass-thru certificates 5% 5/1/2040 | | 1,317 | 1,314 |
| Fannie Mae Mortgage pass-thru certificates 5% 5/1/2041 | | 2,526 | 2,519 |
| Fannie Mae Mortgage pass-thru certificates 5% 5/1/2041 | | 9,607 | 9,579 |
| Fannie Mae Mortgage pass-thru certificates 5% 5/1/2044 | | 4,225 | 4,225 |
| Fannie Mae Mortgage pass-thru certificates 5% 5/1/2047 | | 2,330 | 2,303 |
| Fannie Mae Mortgage pass-thru certificates 5% 5/1/2048 | | 11,559 | 11,423 |
| Fannie Mae Mortgage pass-thru certificates 5% 5/1/2048 | | 10,581 | 10,407 |
| Fannie Mae Mortgage pass-thru certificates 5% 5/1/2048 | | 28,181 | 27,452 |
| Fannie Mae Mortgage pass-thru certificates 5% 5/1/2049 | | 68,486 | 67,249 |
| Fannie Mae Mortgage pass-thru certificates 5% 5/1/2050 | | 19,738 | 19,333 |
| Fannie Mae Mortgage pass-thru certificates 5% 6/1/2035 | | 491 | 492 |
| Fannie Mae Mortgage pass-thru certificates 5% 6/1/2035 | | 1,578 | 1,579 |
| Fannie Mae Mortgage pass-thru certificates 5% 6/1/2036 | | 607 | 608 |
| Fannie Mae Mortgage pass-thru certificates 5% 6/1/2038 | | 355 | 355 |
| Fannie Mae Mortgage pass-thru certificates 5% 6/1/2039 | | 1,689 | 1,688 |
| Fannie Mae Mortgage pass-thru certificates 5% 6/1/2039 | | 36,787 | 36,817 |
| Fannie Mae Mortgage pass-thru certificates 5% 6/1/2040 | | 2,977 | 2,969 |
| Fannie Mae Mortgage pass-thru certificates 5% 6/1/2041 | | 6,480 | 6,469 |
| Fannie Mae Mortgage pass-thru certificates 5% 6/1/2041 | | 16,959 | 16,897 |
| Fannie Mae Mortgage pass-thru certificates 5% 6/1/2041 | | 5,253 | 5,237 |
| Fannie Mae Mortgage pass-thru certificates 5% 6/1/2048 | | 14,624 | 14,382 |
| Fannie Mae Mortgage pass-thru certificates 5% 6/1/2048 | | 2,537 | 2,496 |
| Fannie Mae Mortgage pass-thru certificates 5% 6/1/2048 | | 31,480 | 30,430 |
| Fannie Mae Mortgage pass-thru certificates 5% 6/1/2049 | | 13,931 | 13,653 |
| Fannie Mae Mortgage pass-thru certificates 5% 6/1/2053 | | 397,488 | 383,850 |
| Fannie Mae Mortgage pass-thru certificates 5% 7/1/2030 | | 2,976 | 2,986 |
| Fannie Mae Mortgage pass-thru certificates 5% 7/1/2034 | | 58,944 | 58,988 |
| Fannie Mae Mortgage pass-thru certificates 5% 7/1/2034 | | 2,092 | 2,093 |
| Fannie Mae Mortgage pass-thru certificates 5% 7/1/2035 | | 23,404 | 23,421 |
| Fannie Mae Mortgage pass-thru certificates 5% 7/1/2035 | | 40,211 | 40,243 |
| Fannie Mae Mortgage pass-thru certificates 5% 7/1/2037 | | 1,916 | 1,918 |
| Fannie Mae Mortgage pass-thru certificates 5% 7/1/2039 | | 1,703 | 1,699 |
| Fannie Mae Mortgage pass-thru certificates 5% 7/1/2041 | | 3,346 | 3,337 |
| Fannie Mae Mortgage pass-thru certificates 5% 7/1/2041 | | 5,891 | 5,875 |
| Fannie Mae Mortgage pass-thru certificates 5% 7/1/2044 | | 3,451 | 3,427 |
| Fannie Mae Mortgage pass-thru certificates 5% 7/1/2047 | | 2,714 | 2,679 |
| Fannie Mae Mortgage pass-thru certificates 5% 7/1/2047 | | 4,686 | 4,626 |
| Fannie Mae Mortgage pass-thru certificates 5% 7/1/2048 | | 30,049 | 29,553 |
| Fannie Mae Mortgage pass-thru certificates 5% 7/1/2048 | | 5,140 | 5,055 |
| Fannie Mae Mortgage pass-thru certificates 5% 8/1/2030 | | 949 | 953 |
| Fannie Mae Mortgage pass-thru certificates 5% 8/1/2033 | | 5,588 | 5,593 |
| Fannie Mae Mortgage pass-thru certificates 5% 8/1/2039 | | 1,959 | 1,957 |
| Fannie Mae Mortgage pass-thru certificates 5% 8/1/2041 | | 2,685 | 2,678 |
| Fannie Mae Mortgage pass-thru certificates 5% 8/1/2041 | | 3,612 | 3,607 |
| Fannie Mae Mortgage pass-thru certificates 5% 8/1/2043 | | 5,066 | 5,046 |
| Fannie Mae Mortgage pass-thru certificates 5% 8/1/2044 | | 4,506 | 4,474 |
| Fannie Mae Mortgage pass-thru certificates 5% 8/1/2047 | | 15,715 | 15,515 |
| Fannie Mae Mortgage pass-thru certificates 5% 8/1/2048 | | 158,396 | 155,782 |
| Fannie Mae Mortgage pass-thru certificates 5% 8/1/2048 | | 6,108 | 6,007 |
| Fannie Mae Mortgage pass-thru certificates 5% 8/1/2048 | | 19,686 | 19,361 |
| Fannie Mae Mortgage pass-thru certificates 5% 8/1/2049 | | 38,605 | 37,908 |
| Fannie Mae Mortgage pass-thru certificates 5% 9/1/2025 | | 53 | 53 |
| Fannie Mae Mortgage pass-thru certificates 5% 9/1/2035 | | 3,640 | 3,643 |
| Fannie Mae Mortgage pass-thru certificates 5% 9/1/2041 | | 2,643 | 2,636 |
| Fannie Mae Mortgage pass-thru certificates 5% 9/1/2041 | | 2,227 | 2,221 |
| Fannie Mae Mortgage pass-thru certificates 5% 9/1/2043 | | 30,364 | 30,236 |
| Fannie Mae Mortgage pass-thru certificates 5% 9/1/2048 | | 2,998 | 2,949 |
| Fannie Mae Mortgage pass-thru certificates 5% 9/1/2048 | | 18,215 | 17,914 |
| Fannie Mae Mortgage pass-thru certificates 5% 9/1/2048 | | 15,755 | 15,495 |
| Fannie Mae Mortgage pass-thru certificates 5% 9/1/2049 | | 16,785 | 16,482 |
| Fannie Mae Mortgage pass-thru certificates 5.5% 1/1/2034 | | 126 | 129 |
| Fannie Mae Mortgage pass-thru certificates 5.5% 1/1/2037 | | 1,203 | 1,230 |
| Fannie Mae Mortgage pass-thru certificates 5.5% 1/1/2037 | | 651 | 666 |
| Fannie Mae Mortgage pass-thru certificates 5.5% 1/1/2037 | | 651 | 667 |
| Fannie Mae Mortgage pass-thru certificates 5.5% 1/1/2038 | | 841 | 859 |
| Fannie Mae Mortgage pass-thru certificates 5.5% 1/1/2038 | | 1,206 | 1,232 |
| Fannie Mae Mortgage pass-thru certificates 5.5% 1/1/2038 | | 593 | 606 |
| Fannie Mae Mortgage pass-thru certificates 5.5% 1/1/2038 | | 1,306 | 1,334 |
| Fannie Mae Mortgage pass-thru certificates 5.5% 1/1/2039 | | 432 | 442 |
| Fannie Mae Mortgage pass-thru certificates 5.5% 1/1/2039 | | 604 | 618 |
| Fannie Mae Mortgage pass-thru certificates 5.5% 1/1/2040 | | 8,095 | 8,274 |
| Fannie Mae Mortgage pass-thru certificates 5.5% 1/1/2041 | | 11,822 | 12,062 |
| Fannie Mae Mortgage pass-thru certificates 5.5% 1/1/2049 | | 13,524 | 13,621 |
| Fannie Mae Mortgage pass-thru certificates 5.5% 1/1/2049 | | 30,857 | 31,079 |
| Fannie Mae Mortgage pass-thru certificates 5.5% 1/1/2049 | | 21,086 | 21,237 |
| Fannie Mae Mortgage pass-thru certificates 5.5% 10/1/2035 | | 468 | 478 |
| Fannie Mae Mortgage pass-thru certificates 5.5% 10/1/2035 | | 709 | 725 |
| Fannie Mae Mortgage pass-thru certificates 5.5% 10/1/2036 | | 361 | 370 |
| Fannie Mae Mortgage pass-thru certificates 5.5% 10/1/2037 | | 2,570 | 2,624 |
| Fannie Mae Mortgage pass-thru certificates 5.5% 10/1/2054 | | 593,702 | 586,467 |
| Fannie Mae Mortgage pass-thru certificates 5.5% 11/1/2033 | | 1,529 | 1,560 |
| Fannie Mae Mortgage pass-thru certificates 5.5% 11/1/2033 | | 387 | 394 |
| Fannie Mae Mortgage pass-thru certificates 5.5% 11/1/2035 | | 191 | 195 |
| Fannie Mae Mortgage pass-thru certificates 5.5% 11/1/2036 | | 940 | 961 |
| Fannie Mae Mortgage pass-thru certificates 5.5% 11/1/2036 | | 354 | 362 |
| Fannie Mae Mortgage pass-thru certificates 5.5% 11/1/2036 | | 17,011 | 17,407 |
| Fannie Mae Mortgage pass-thru certificates 5.5% 11/1/2036 | | 28,315 | 28,944 |
| Fannie Mae Mortgage pass-thru certificates 5.5% 11/1/2036 | | 7,915 | 8,098 |
| Fannie Mae Mortgage pass-thru certificates 5.5% 11/1/2038 | | 22,071 | 22,559 |
| Fannie Mae Mortgage pass-thru certificates 5.5% 11/1/2039 | | 1,579 | 1,613 |
| Fannie Mae Mortgage pass-thru certificates 5.5% 11/1/2052 | | 1,588,775 | 1,573,882 |
| Fannie Mae Mortgage pass-thru certificates 5.5% 12/1/2034 | | 347 | 355 |
| Fannie Mae Mortgage pass-thru certificates 5.5% 12/1/2035 | | 6,248 | 6,392 |
| Fannie Mae Mortgage pass-thru certificates 5.5% 12/1/2035 | | 376 | 385 |
| Fannie Mae Mortgage pass-thru certificates 5.5% 12/1/2035 | | 1,995 | 2,041 |
| Fannie Mae Mortgage pass-thru certificates 5.5% 12/1/2035 | | 9,668 | 9,893 |
| Fannie Mae Mortgage pass-thru certificates 5.5% 12/1/2036 | | 13,981 | 14,305 |
| Fannie Mae Mortgage pass-thru certificates 5.5% 12/1/2037 | | 777 | 795 |
| Fannie Mae Mortgage pass-thru certificates 5.5% 12/1/2037 | | 2,617 | 2,673 |
| Fannie Mae Mortgage pass-thru certificates 5.5% 12/1/2038 | | 820 | 837 |
| Fannie Mae Mortgage pass-thru certificates 5.5% 12/1/2038 | | 296 | 303 |
| Fannie Mae Mortgage pass-thru certificates 5.5% 12/1/2039 | | 6,066 | 6,188 |
| Fannie Mae Mortgage pass-thru certificates 5.5% 12/1/2039 | | 6,677 | 6,811 |
| Fannie Mae Mortgage pass-thru certificates 5.5% 12/1/2039 | | 5,744 | 5,860 |
| Fannie Mae Mortgage pass-thru certificates 5.5% 12/1/2041 | | 2,534 | 2,586 |
| Fannie Mae Mortgage pass-thru certificates 5.5% 12/1/2048 | | 3,642 | 3,679 |
| Fannie Mae Mortgage pass-thru certificates 5.5% 12/1/2048 | | 12,744 | 12,876 |
| Fannie Mae Mortgage pass-thru certificates 5.5% 12/1/2054 | | 1,326,165 | 1,310,003 |
| Fannie Mae Mortgage pass-thru certificates 5.5% 2/1/2033 | | 549 | 560 |
| Fannie Mae Mortgage pass-thru certificates 5.5% 2/1/2034 | | 20,576 | 20,999 |
| Fannie Mae Mortgage pass-thru certificates 5.5% 2/1/2034 | | 802 | 819 |
| Fannie Mae Mortgage pass-thru certificates 5.5% 2/1/2035 | | 2,714 | 2,774 |
| Fannie Mae Mortgage pass-thru certificates 5.5% 2/1/2035 | | 8,068 | 8,248 |
| Fannie Mae Mortgage pass-thru certificates 5.5% 2/1/2035 | | 4,796 | 4,903 |
| Fannie Mae Mortgage pass-thru certificates 5.5% 2/1/2035 | | 1,980 | 2,026 |
| Fannie Mae Mortgage pass-thru certificates 5.5% 2/1/2037 | | 6,705 | 6,860 |
| Fannie Mae Mortgage pass-thru certificates 5.5% 2/1/2037 | | 1,153 | 1,180 |
| Fannie Mae Mortgage pass-thru certificates 5.5% 2/1/2037 | | 1,347 | 1,379 |
| Fannie Mae Mortgage pass-thru certificates 5.5% 2/1/2038 | | 4,833 | 4,935 |
| Fannie Mae Mortgage pass-thru certificates 5.5% 2/1/2038 | | 911 | 932 |
| Fannie Mae Mortgage pass-thru certificates 5.5% 2/1/2038 | | 4,302 | 4,402 |
| Fannie Mae Mortgage pass-thru certificates 5.5% 2/1/2038 | | 1,135 | 1,160 |
| Fannie Mae Mortgage pass-thru certificates 5.5% 2/1/2039 | | 24,867 | 25,439 |
| Fannie Mae Mortgage pass-thru certificates 5.5% 2/1/2041 | | 1,619 | 1,652 |
| Fannie Mae Mortgage pass-thru certificates 5.5% 2/1/2042 | | 11,328 | 11,558 |
| Fannie Mae Mortgage pass-thru certificates 5.5% 2/1/2042 | | 12,402 | 12,696 |
| Fannie Mae Mortgage pass-thru certificates 5.5% 2/1/2042 | | 3,541 | 3,625 |
| Fannie Mae Mortgage pass-thru certificates 5.5% 2/1/2049 | | 29,495 | 29,634 |
| Fannie Mae Mortgage pass-thru certificates 5.5% 3/1/2035 | | 842 | 861 |
| Fannie Mae Mortgage pass-thru certificates 5.5% 3/1/2036 | | 862 | 881 |
| Fannie Mae Mortgage pass-thru certificates 5.5% 3/1/2038 | | 957 | 977 |
| Fannie Mae Mortgage pass-thru certificates 5.5% 3/1/2038 | | 775 | 791 |
| Fannie Mae Mortgage pass-thru certificates 5.5% 3/1/2038 | | 29,758 | 30,455 |
| Fannie Mae Mortgage pass-thru certificates 5.5% 3/1/2039 | | 3,319 | 3,398 |
| Fannie Mae Mortgage pass-thru certificates 5.5% 3/1/2040 | | 8,952 | 9,143 |
| Fannie Mae Mortgage pass-thru certificates 5.5% 4/1/2033 | | 165 | 169 |
| Fannie Mae Mortgage pass-thru certificates 5.5% 4/1/2034 | | 710 | 725 |
| Fannie Mae Mortgage pass-thru certificates 5.5% 4/1/2034 | | 14,779 | 15,094 |
| Fannie Mae Mortgage pass-thru certificates 5.5% 4/1/2036 | | 1,870 | 1,912 |
| Fannie Mae Mortgage pass-thru certificates 5.5% 4/1/2038 | | 776 | 793 |
| Fannie Mae Mortgage pass-thru certificates 5.5% 4/1/2039 | | 10,442 | 10,664 |
| Fannie Mae Mortgage pass-thru certificates 5.5% 4/1/2040 | | 4,015 | 4,096 |
| Fannie Mae Mortgage pass-thru certificates 5.5% 4/1/2054 | | 4,649,878 | 4,593,213 |
| Fannie Mae Mortgage pass-thru certificates 5.5% 5/1/2033 | | 5,147 | 5,249 |
| Fannie Mae Mortgage pass-thru certificates 5.5% 5/1/2033 | | 2,337 | 2,383 |
| Fannie Mae Mortgage pass-thru certificates 5.5% 5/1/2034 | | 4,116 | 4,201 |
| Fannie Mae Mortgage pass-thru certificates 5.5% 5/1/2034 | | 1,202 | 1,229 |
| Fannie Mae Mortgage pass-thru certificates 5.5% 5/1/2035 | | 39,488 | 40,377 |
| Fannie Mae Mortgage pass-thru certificates 5.5% 5/1/2036 | | 2,224 | 2,273 |
| Fannie Mae Mortgage pass-thru certificates 5.5% 5/1/2037 | | 3,193 | 3,267 |
| Fannie Mae Mortgage pass-thru certificates 5.5% 5/1/2038 | | 300 | 307 |
| Fannie Mae Mortgage pass-thru certificates 5.5% 5/1/2038 | | 921 | 943 |
| Fannie Mae Mortgage pass-thru certificates 5.5% 5/1/2038 | | 3,132 | 3,198 |
| Fannie Mae Mortgage pass-thru certificates 5.5% 5/1/2038 | | 1,070 | 1,093 |
| Fannie Mae Mortgage pass-thru certificates 5.5% 5/1/2038 | | 721 | 737 |
| Fannie Mae Mortgage pass-thru certificates 5.5% 5/1/2038 | | 6,058 | 6,186 |
| Fannie Mae Mortgage pass-thru certificates 5.5% 5/1/2039 | | 5,417 | 5,547 |
| Fannie Mae Mortgage pass-thru certificates 5.5% 5/1/2040 | | 29,520 | 30,151 |
| Fannie Mae Mortgage pass-thru certificates 5.5% 5/1/2040 | | 11,640 | 11,876 |
| Fannie Mae Mortgage pass-thru certificates 5.5% 5/1/2044 | | 63,224 | 64,655 |
| Fannie Mae Mortgage pass-thru certificates 5.5% 5/1/2049 | | 11,876 | 11,932 |
| Fannie Mae Mortgage pass-thru certificates 5.5% 5/1/2053 | | 1,069,779 | 1,063,763 |
| Fannie Mae Mortgage pass-thru certificates 5.5% 6/1/2027 | | 1,855 | 1,868 |
| Fannie Mae Mortgage pass-thru certificates 5.5% 6/1/2033 | | 5,318 | 5,425 |
| Fannie Mae Mortgage pass-thru certificates 5.5% 6/1/2033 | | 2,277 | 2,317 |
| Fannie Mae Mortgage pass-thru certificates 5.5% 6/1/2033 | | 5,794 | 5,909 |
| Fannie Mae Mortgage pass-thru certificates 5.5% 6/1/2036 | | 147 | 150 |
| Fannie Mae Mortgage pass-thru certificates 5.5% 6/1/2037 | | 2,214 | 2,267 |
| Fannie Mae Mortgage pass-thru certificates 5.5% 6/1/2038 | | 1,904 | 1,945 |
| Fannie Mae Mortgage pass-thru certificates 5.5% 6/1/2038 | | 7,831 | 8,016 |
| Fannie Mae Mortgage pass-thru certificates 5.5% 6/1/2038 | | 338 | 345 |
| Fannie Mae Mortgage pass-thru certificates 5.5% 6/1/2038 | | 2,069 | 2,118 |
| Fannie Mae Mortgage pass-thru certificates 5.5% 6/1/2040 | | 1,185 | 1,210 |
| Fannie Mae Mortgage pass-thru certificates 5.5% 6/1/2040 | | 4,507 | 4,598 |
| Fannie Mae Mortgage pass-thru certificates 5.5% 6/1/2041 | | 2,557 | 2,610 |
| Fannie Mae Mortgage pass-thru certificates 5.5% 6/1/2041 | | 2,343 | 2,391 |
| Fannie Mae Mortgage pass-thru certificates 5.5% 6/1/2049 | | 3,098 | 3,113 |
| Fannie Mae Mortgage pass-thru certificates 5.5% 6/1/2053 | | 166,110 | 165,695 |
| Fannie Mae Mortgage pass-thru certificates 5.5% 6/1/2054 | | 1,220,521 | 1,205,647 |
| Fannie Mae Mortgage pass-thru certificates 5.5% 7/1/2033 | | 718 | 733 |
| Fannie Mae Mortgage pass-thru certificates 5.5% 7/1/2033 | | 2,578 | 2,631 |
| Fannie Mae Mortgage pass-thru certificates 5.5% 7/1/2033 | | 975 | 995 |
| Fannie Mae Mortgage pass-thru certificates 5.5% 7/1/2033 | | 1,278 | 1,303 |
| Fannie Mae Mortgage pass-thru certificates 5.5% 7/1/2034 | | 40,088 | 40,953 |
| Fannie Mae Mortgage pass-thru certificates 5.5% 7/1/2035 | | 13,565 | 13,877 |
| Fannie Mae Mortgage pass-thru certificates 5.5% 7/1/2036 | | 3,712 | 3,795 |
| Fannie Mae Mortgage pass-thru certificates 5.5% 7/1/2037 | | 785 | 802 |
| Fannie Mae Mortgage pass-thru certificates 5.5% 7/1/2037 | | 565 | 578 |
| Fannie Mae Mortgage pass-thru certificates 5.5% 7/1/2038 | | 440 | 450 |
| Fannie Mae Mortgage pass-thru certificates 5.5% 7/1/2039 | | 1,981 | 2,026 |
| Fannie Mae Mortgage pass-thru certificates 5.5% 7/1/2039 | | 1,176 | 1,200 |
| Fannie Mae Mortgage pass-thru certificates 5.5% 7/1/2041 | | 2,678 | 2,732 |
| Fannie Mae Mortgage pass-thru certificates 5.5% 7/1/2054 | | 782,065 | 777,178 |
| Fannie Mae Mortgage pass-thru certificates 5.5% 8/1/2029 | | 2,596 | 2,631 |
| Fannie Mae Mortgage pass-thru certificates 5.5% 8/1/2037 | | 671 | 686 |
| Fannie Mae Mortgage pass-thru certificates 5.5% 8/1/2037 | | 586 | 599 |
| Fannie Mae Mortgage pass-thru certificates 5.5% 8/1/2037 | | 685 | 700 |
| Fannie Mae Mortgage pass-thru certificates 5.5% 8/1/2037 | | 3,736 | 3,820 |
| Fannie Mae Mortgage pass-thru certificates 5.5% 8/1/2039 | | 4,745 | 4,849 |
| Fannie Mae Mortgage pass-thru certificates 5.5% 8/1/2039 | | 394 | 402 |
| Fannie Mae Mortgage pass-thru certificates 5.5% 8/1/2040 | | 2,276 | 2,323 |
| Fannie Mae Mortgage pass-thru certificates 5.5% 8/1/2053 | | 554,766 | 553,380 |
| Fannie Mae Mortgage pass-thru certificates 5.5% 8/1/2054 | | 295,559 | 291,958 |
| Fannie Mae Mortgage pass-thru certificates 5.5% 9/1/2034 | | 1,031 | 1,054 |
| Fannie Mae Mortgage pass-thru certificates 5.5% 9/1/2036 | | 10,827 | 11,047 |
| Fannie Mae Mortgage pass-thru certificates 5.5% 9/1/2037 | | 831 | 851 |
| Fannie Mae Mortgage pass-thru certificates 5.5% 9/1/2037 | | 5,550 | 5,680 |
| Fannie Mae Mortgage pass-thru certificates 5.5% 9/1/2037 | | 1,772 | 1,810 |
| Fannie Mae Mortgage pass-thru certificates 5.5% 9/1/2038 | | 880 | 898 |
| Fannie Mae Mortgage pass-thru certificates 5.5% 9/1/2039 | | 21,475 | 21,947 |
| Fannie Mae Mortgage pass-thru certificates 5.5% 9/1/2040 | | 6,948 | 7,096 |
| Fannie Mae Mortgage pass-thru certificates 5.5% 9/1/2041 | | 2,977 | 3,048 |
| Fannie Mae Mortgage pass-thru certificates 5.5% 9/1/2041 | | 15,515 | 15,886 |
| Fannie Mae Mortgage pass-thru certificates 5.5% 9/1/2041 | | 47,665 | 48,706 |
| Fannie Mae Mortgage pass-thru certificates 5.5% 9/1/2054 (k) | | 2,374,821 | 2,345,881 |
| Fannie Mae Mortgage pass-thru certificates 6 month FTSE USD IBOR Consumer Fallbacks + 1.313%, 5.938% 5/1/2034 (b)(c) | | 2,466 | 2,478 |
| Fannie Mae Mortgage pass-thru certificates 6 month FTSE USD IBOR Consumer Fallbacks + 1.42%, 6.572% 9/1/2033 (b)(c) | | 6,317 | 6,325 |
| Fannie Mae Mortgage pass-thru certificates 6 month FTSE USD IBOR Consumer Fallbacks + 1.55%, 7.08% 10/1/2033 (b)(c) | | 299 | 302 |
| Fannie Mae Mortgage pass-thru certificates 6 month FTSE USD IBOR Consumer Fallbacks + 1.565%, 7.315% 7/1/2035 (b)(c) | | 340 | 343 |
| Fannie Mae Mortgage pass-thru certificates 6% 1/1/2038 | | 15,951 | 16,549 |
| Fannie Mae Mortgage pass-thru certificates 6% 1/1/2040 | | 1,373 | 1,426 |
| Fannie Mae Mortgage pass-thru certificates 6% 1/1/2040 | | 15,517 | 16,097 |
| Fannie Mae Mortgage pass-thru certificates 6% 1/1/2042 | | 1,535 | 1,595 |
| Fannie Mae Mortgage pass-thru certificates 6% 10/1/2033 | | 20,391 | 20,976 |
| Fannie Mae Mortgage pass-thru certificates 6% 10/1/2034 | | 6,043 | 6,233 |
| Fannie Mae Mortgage pass-thru certificates 6% 10/1/2037 | | 16,082 | 16,674 |
| Fannie Mae Mortgage pass-thru certificates 6% 10/1/2038 | | 11,045 | 11,463 |
| Fannie Mae Mortgage pass-thru certificates 6% 10/1/2038 | | 256 | 265 |
| Fannie Mae Mortgage pass-thru certificates 6% 11/1/2032 | | 3,486 | 3,580 |
| Fannie Mae Mortgage pass-thru certificates 6% 11/1/2032 | | 20,858 | 21,420 |
| Fannie Mae Mortgage pass-thru certificates 6% 11/1/2035 | | 7,526 | 7,760 |
| Fannie Mae Mortgage pass-thru certificates 6% 11/1/2035 | | 9,272 | 9,558 |
| Fannie Mae Mortgage pass-thru certificates 6% 11/1/2036 | | 4,033 | 4,182 |
| Fannie Mae Mortgage pass-thru certificates 6% 11/1/2037 | | 149 | 155 |
| Fannie Mae Mortgage pass-thru certificates 6% 11/1/2038 | | 7,452 | 7,734 |
| Fannie Mae Mortgage pass-thru certificates 6% 11/1/2038 | | 4,945 | 5,130 |
| Fannie Mae Mortgage pass-thru certificates 6% 11/1/2052 | | 1,083,307 | 1,093,244 |
| Fannie Mae Mortgage pass-thru certificates 6% 11/1/2053 | | 1,464,919 | 1,479,528 |
| Fannie Mae Mortgage pass-thru certificates 6% 11/1/2054 | | 199,217 | 203,783 |
| Fannie Mae Mortgage pass-thru certificates 6% 11/1/2054 | | 1,332,889 | 1,359,277 |
| Fannie Mae Mortgage pass-thru certificates 6% 11/1/2054 | | 499,099 | 509,760 |
| Fannie Mae Mortgage pass-thru certificates 6% 12/1/2038 | | 6,260 | 6,498 |
| Fannie Mae Mortgage pass-thru certificates 6% 12/1/2052 | | 489,756 | 493,024 |
| Fannie Mae Mortgage pass-thru certificates 6% 2/1/2034 | | 9,939 | 10,235 |
| Fannie Mae Mortgage pass-thru certificates 6% 2/1/2037 | | 5,979 | 6,200 |
| Fannie Mae Mortgage pass-thru certificates 6% 2/1/2037 | | 8,755 | 9,074 |
| Fannie Mae Mortgage pass-thru certificates 6% 2/1/2037 | | 370 | 383 |
| Fannie Mae Mortgage pass-thru certificates 6% 2/1/2038 | | 2,785 | 2,890 |
| Fannie Mae Mortgage pass-thru certificates 6% 2/1/2039 | | 454 | 472 |
| Fannie Mae Mortgage pass-thru certificates 6% 3/1/2034 | | 3,728 | 3,838 |
| Fannie Mae Mortgage pass-thru certificates 6% 3/1/2037 | | 738 | 764 |
| Fannie Mae Mortgage pass-thru certificates 6% 3/1/2038 | | 2,113 | 2,194 |
| Fannie Mae Mortgage pass-thru certificates 6% 3/1/2038 | | 5,871 | 6,092 |
| Fannie Mae Mortgage pass-thru certificates 6% 3/1/2054 | | 539,578 | 542,841 |
| Fannie Mae Mortgage pass-thru certificates 6% 4/1/2035 | | 22,330 | 23,061 |
| Fannie Mae Mortgage pass-thru certificates 6% 4/1/2035 | | 22,558 | 23,267 |
| Fannie Mae Mortgage pass-thru certificates 6% 4/1/2036 | | 5,484 | 5,680 |
| Fannie Mae Mortgage pass-thru certificates 6% 4/1/2039 | | 581 | 603 |
| Fannie Mae Mortgage pass-thru certificates 6% 4/1/2040 | | 9,030 | 9,367 |
| Fannie Mae Mortgage pass-thru certificates 6% 4/1/2040 | | 4,072 | 4,227 |
| Fannie Mae Mortgage pass-thru certificates 6% 5/1/2036 | | 117,232 | 121,198 |
| Fannie Mae Mortgage pass-thru certificates 6% 5/1/2040 | | 22,265 | 23,110 |
| Fannie Mae Mortgage pass-thru certificates 6% 5/1/2041 | | 2,743 | 2,847 |
| Fannie Mae Mortgage pass-thru certificates 6% 5/1/2054 | | 1,914,644 | 1,926,223 |
| Fannie Mae Mortgage pass-thru certificates 6% 6/1/2035 | | 10,204 | 10,481 |
| Fannie Mae Mortgage pass-thru certificates 6% 6/1/2037 | | 2,458 | 2,550 |
| Fannie Mae Mortgage pass-thru certificates 6% 6/1/2040 | | 5,130 | 5,323 |
| Fannie Mae Mortgage pass-thru certificates 6% 6/1/2040 | | 4,955 | 5,141 |
| Fannie Mae Mortgage pass-thru certificates 6% 6/1/2053 | | 810,061 | 822,807 |
| Fannie Mae Mortgage pass-thru certificates 6% 6/1/2053 | | 1,128,389 | 1,146,497 |
| Fannie Mae Mortgage pass-thru certificates 6% 6/1/2054 | | 3,675,002 | 3,692,633 |
| Fannie Mae Mortgage pass-thru certificates 6% 6/1/2054 | | 2,234,996 | 2,248,512 |
| Fannie Mae Mortgage pass-thru certificates 6% 7/1/2037 | | 957 | 993 |
| Fannie Mae Mortgage pass-thru certificates 6% 7/1/2038 | | 371 | 385 |
| Fannie Mae Mortgage pass-thru certificates 6% 7/1/2038 | | 3,384 | 3,510 |
| Fannie Mae Mortgage pass-thru certificates 6% 7/1/2038 | | 2,498 | 2,591 |
| Fannie Mae Mortgage pass-thru certificates 6% 7/1/2041 | | 58,631 | 60,816 |
| Fannie Mae Mortgage pass-thru certificates 6% 7/1/2054 (k) | | 4,848,486 | 4,871,747 |
| Fannie Mae Mortgage pass-thru certificates 6% 7/1/2054 | | 1,459,061 | 1,487,491 |
| Fannie Mae Mortgage pass-thru certificates 6% 7/1/2054 | | 1,353,873 | 1,362,061 |
| Fannie Mae Mortgage pass-thru certificates 6% 7/1/2054 | | 1,709,975 | 1,728,332 |
| Fannie Mae Mortgage pass-thru certificates 6% 8/1/2037 | | 25,946 | 26,719 |
| Fannie Mae Mortgage pass-thru certificates 6% 8/1/2039 | | 671 | 697 |
| Fannie Mae Mortgage pass-thru certificates 6% 8/1/2054 | | 2,349,678 | 2,364,255 |
| Fannie Mae Mortgage pass-thru certificates 6% 9/1/2036 | | 11,446 | 11,857 |
| Fannie Mae Mortgage pass-thru certificates 6% 9/1/2037 | | 2,636 | 2,735 |
| Fannie Mae Mortgage pass-thru certificates 6% 9/1/2037 | | 5,743 | 5,950 |
| Fannie Mae Mortgage pass-thru certificates 6% 9/1/2037 | | 1,436 | 1,490 |
| Fannie Mae Mortgage pass-thru certificates 6% 9/1/2038 | | 5,155 | 5,350 |
| Fannie Mae Mortgage pass-thru certificates 6% 9/1/2039 | | 8,592 | 8,916 |
| Fannie Mae Mortgage pass-thru certificates 6% 9/1/2039 | | 2,702 | 2,804 |
| Fannie Mae Mortgage pass-thru certificates 6% 9/1/2039 | | 3,179 | 3,301 |
| Fannie Mae Mortgage pass-thru certificates 6% 9/1/2052 | | 1,009,844 | 1,021,632 |
| Fannie Mae Mortgage pass-thru certificates 6% 9/1/2053 | | 405,158 | 410,014 |
| Fannie Mae Mortgage pass-thru certificates 6% 9/1/2054 | | 2,667,380 | 2,683,928 |
| Fannie Mae Mortgage pass-thru certificates 6% 9/1/2054 | | 789,844 | 807,702 |
| Fannie Mae Mortgage pass-thru certificates 6.5% 1/1/2033 | | 840 | 872 |
| Fannie Mae Mortgage pass-thru certificates 6.5% 1/1/2036 | | 2,898 | 2,997 |
| Fannie Mae Mortgage pass-thru certificates 6.5% 1/1/2037 | | 660 | 692 |
| Fannie Mae Mortgage pass-thru certificates 6.5% 10/1/2032 | | 651 | 675 |
| Fannie Mae Mortgage pass-thru certificates 6.5% 10/1/2036 | | 2,140 | 2,241 |
| Fannie Mae Mortgage pass-thru certificates 6.5% 10/1/2037 | | 20,274 | 21,230 |
| Fannie Mae Mortgage pass-thru certificates 6.5% 10/1/2037 | | 290 | 304 |
| Fannie Mae Mortgage pass-thru certificates 6.5% 10/1/2037 | | 331 | 348 |
| Fannie Mae Mortgage pass-thru certificates 6.5% 10/1/2038 | | 365 | 384 |
| Fannie Mae Mortgage pass-thru certificates 6.5% 10/1/2039 | | 7,173 | 7,529 |
| Fannie Mae Mortgage pass-thru certificates 6.5% 11/1/2036 | | 343 | 360 |
| Fannie Mae Mortgage pass-thru certificates 6.5% 11/1/2037 | | 4,286 | 4,501 |
| Fannie Mae Mortgage pass-thru certificates 6.5% 11/1/2053 | | 961,168 | 993,053 |
| Fannie Mae Mortgage pass-thru certificates 6.5% 12/1/2032 | | 174 | 180 |
| Fannie Mae Mortgage pass-thru certificates 6.5% 12/1/2032 | | 4,203 | 4,348 |
| Fannie Mae Mortgage pass-thru certificates 6.5% 12/1/2034 | | 3,403 | 3,548 |
| Fannie Mae Mortgage pass-thru certificates 6.5% 12/1/2035 | | 14,735 | 15,271 |
| Fannie Mae Mortgage pass-thru certificates 6.5% 12/1/2036 | | 684 | 714 |
| Fannie Mae Mortgage pass-thru certificates 6.5% 12/1/2037 | | 1,929 | 2,021 |
| Fannie Mae Mortgage pass-thru certificates 6.5% 12/1/2037 | | 1,190 | 1,250 |
| Fannie Mae Mortgage pass-thru certificates 6.5% 2/1/2036 | | 600 | 627 |
| Fannie Mae Mortgage pass-thru certificates 6.5% 2/1/2037 | | 178 | 187 |
| Fannie Mae Mortgage pass-thru certificates 6.5% 3/1/2054 | | 417,642 | 427,092 |
| Fannie Mae Mortgage pass-thru certificates 6.5% 4/1/2035 | | 938 | 979 |
| Fannie Mae Mortgage pass-thru certificates 6.5% 5/1/2031 | | 173 | 179 |
| Fannie Mae Mortgage pass-thru certificates 6.5% 5/1/2038 | | 548 | 575 |
| Fannie Mae Mortgage pass-thru certificates 6.5% 5/1/2039 | | 624 | 654 |
| Fannie Mae Mortgage pass-thru certificates 6.5% 5/1/2053 | | 3,341,811 | 3,439,875 |
| Fannie Mae Mortgage pass-thru certificates 6.5% 5/1/2053 | | 1,041,437 | 1,078,913 |
| Fannie Mae Mortgage pass-thru certificates 6.5% 5/1/2053 | | 1,566,513 | 1,614,439 |
| Fannie Mae Mortgage pass-thru certificates 6.5% 6/1/2035 | | 3,274 | 3,404 |
| Fannie Mae Mortgage pass-thru certificates 6.5% 6/1/2035 | | 4,067 | 4,237 |
| Fannie Mae Mortgage pass-thru certificates 6.5% 6/1/2036 | | 374 | 392 |
| Fannie Mae Mortgage pass-thru certificates 6.5% 6/1/2054 | | 764,762 | 782,065 |
| Fannie Mae Mortgage pass-thru certificates 6.5% 7/1/2032 | | 1,474 | 1,527 |
| Fannie Mae Mortgage pass-thru certificates 6.5% 7/1/2032 | | 4,130 | 4,272 |
| Fannie Mae Mortgage pass-thru certificates 6.5% 7/1/2032 | | 3,074 | 3,179 |
| Fannie Mae Mortgage pass-thru certificates 6.5% 7/1/2035 | | 1,375 | 1,435 |
| Fannie Mae Mortgage pass-thru certificates 6.5% 7/1/2035 | | 4,555 | 4,738 |
| Fannie Mae Mortgage pass-thru certificates 6.5% 7/1/2035 | | 5,940 | 6,165 |
| Fannie Mae Mortgage pass-thru certificates 6.5% 7/1/2036 | | 642 | 673 |
| Fannie Mae Mortgage pass-thru certificates 6.5% 7/1/2054 | | 4,700,003 | 4,800,102 |
| Fannie Mae Mortgage pass-thru certificates 6.5% 7/1/2054 | | 1,042,317 | 1,065,900 |
| Fannie Mae Mortgage pass-thru certificates 6.5% 8/1/2031 | | 255 | 262 |
| Fannie Mae Mortgage pass-thru certificates 6.5% 8/1/2032 | | 187 | 194 |
| Fannie Mae Mortgage pass-thru certificates 6.5% 8/1/2032 | | 214 | 222 |
| Fannie Mae Mortgage pass-thru certificates 6.5% 8/1/2036 | | 12,661 | 13,109 |
| Fannie Mae Mortgage pass-thru certificates 6.5% 8/1/2036 | | 12,583 | 13,040 |
| Fannie Mae Mortgage pass-thru certificates 6.5% 8/1/2036 | | 9,851 | 10,206 |
| Fannie Mae Mortgage pass-thru certificates 6.5% 8/1/2036 | | 2,340 | 2,425 |
| Fannie Mae Mortgage pass-thru certificates 6.5% 8/1/2037 | | 764 | 802 |
| Fannie Mae Mortgage pass-thru certificates 6.5% 9/1/2032 | | 280 | 290 |
| Fannie Mae Mortgage pass-thru certificates 6.5% 9/1/2032 | | 2,429 | 2,514 |
| Fannie Mae Mortgage pass-thru certificates 6.5% 9/1/2036 | | 2,292 | 2,399 |
| Fannie Mae Mortgage pass-thru certificates 6.5% 9/1/2036 | | 271 | 281 |
| Fannie Mae Mortgage pass-thru certificates 7% 1/1/2027 | | 148 | 153 |
| Fannie Mae Mortgage pass-thru certificates 7% 1/1/2028 | | 41 | 42 |
| Fannie Mae Mortgage pass-thru certificates 7% 1/1/2028 | | 31 | 32 |
| Fannie Mae Mortgage pass-thru certificates 7% 1/1/2028 | | 117 | 121 |
| Fannie Mae Mortgage pass-thru certificates 7% 1/1/2029 | | 18 | 18 |
| Fannie Mae Mortgage pass-thru certificates 7% 10/1/2028 | | 94 | 97 |
| Fannie Mae Mortgage pass-thru certificates 7% 10/1/2028 | | 7 | 6 |
| Fannie Mae Mortgage pass-thru certificates 7% 11/1/2025 | | 24 | 24 |
| Fannie Mae Mortgage pass-thru certificates 7% 11/1/2025 | | 31 | 31 |
| Fannie Mae Mortgage pass-thru certificates 7% 11/1/2027 | | 169 | 175 |
| Fannie Mae Mortgage pass-thru certificates 7% 12/1/2026 | | 3 | 1 |
| Fannie Mae Mortgage pass-thru certificates 7% 12/1/2027 | | 37 | 38 |
| Fannie Mae Mortgage pass-thru certificates 7% 2/1/2028 | | 22 | 23 |
| Fannie Mae Mortgage pass-thru certificates 7% 2/1/2029 | | 1,988 | 2,060 |
| Fannie Mae Mortgage pass-thru certificates 7% 3/1/2026 | | 13 | 12 |
| Fannie Mae Mortgage pass-thru certificates 7% 4/1/2026 | | 194 | 195 |
| Fannie Mae Mortgage pass-thru certificates 7% 4/1/2026 | | 83 | 86 |
| Fannie Mae Mortgage pass-thru certificates 7% 4/1/2026 | | 24 | 25 |
| Fannie Mae Mortgage pass-thru certificates 7% 5/1/2026 | | 70 | 73 |
| Fannie Mae Mortgage pass-thru certificates 7% 5/1/2026 | | 22 | 23 |
| Fannie Mae Mortgage pass-thru certificates 7% 5/1/2026 | | 70 | 72 |
| Fannie Mae Mortgage pass-thru certificates 7% 5/1/2026 | | 18 | 17 |
| Fannie Mae Mortgage pass-thru certificates 7% 5/1/2027 | | 46 | 48 |
| Fannie Mae Mortgage pass-thru certificates 7% 6/1/2026 | | 288 | 298 |
| Fannie Mae Mortgage pass-thru certificates 7% 8/1/2025 | | 21 | 21 |
| Fannie Mae Mortgage pass-thru certificates 7% 8/1/2025 | | 4 | 3 |
| Fannie Mae Mortgage pass-thru certificates 7% 8/1/2025 | | 34 | 34 |
| Fannie Mae Mortgage pass-thru certificates 7% 8/1/2027 | | 19 | 19 |
| Fannie Mae Mortgage pass-thru certificates 7% 9/1/2025 | | 19 | 19 |
| Fannie Mae Mortgage pass-thru certificates 7% 9/1/2026 | | 10 | 10 |
| Fannie Mae Mortgage pass-thru certificates 7.5% 1/1/2028 | | 144 | 148 |
| Fannie Mae Mortgage pass-thru certificates 7.5% 10/1/2026 | | 155 | 158 |
| Fannie Mae Mortgage pass-thru certificates 7.5% 10/1/2027 | | 25 | 26 |
| Fannie Mae Mortgage pass-thru certificates 7.5% 10/1/2029 | | 19 | 19 |
| Fannie Mae Mortgage pass-thru certificates 7.5% 11/1/2027 | | 126 | 129 |
| Fannie Mae Mortgage pass-thru certificates 7.5% 11/1/2028 | | 57 | 58 |
| Fannie Mae Mortgage pass-thru certificates 7.5% 11/1/2029 | | 61 | 64 |
| Fannie Mae Mortgage pass-thru certificates 7.5% 11/1/2029 | | 20 | 20 |
| Fannie Mae Mortgage pass-thru certificates 7.5% 11/1/2031 | | 1,092 | 1,144 |
| Fannie Mae Mortgage pass-thru certificates 7.5% 12/1/2027 | | 42 | 43 |
| Fannie Mae Mortgage pass-thru certificates 7.5% 12/1/2029 | | 38 | 39 |
| Fannie Mae Mortgage pass-thru certificates 7.5% 2/1/2026 | | 14 | 13 |
| Fannie Mae Mortgage pass-thru certificates 7.5% 2/1/2027 | | 87 | 88 |
| Fannie Mae Mortgage pass-thru certificates 7.5% 2/1/2028 | | 26 | 26 |
| Fannie Mae Mortgage pass-thru certificates 7.5% 3/1/2028 | | 74 | 76 |
| Fannie Mae Mortgage pass-thru certificates 7.5% 3/1/2029 | | 30 | 31 |
| Fannie Mae Mortgage pass-thru certificates 7.5% 4/1/2029 | | 11 | 11 |
| Fannie Mae Mortgage pass-thru certificates 7.5% 5/1/2027 | | 23 | 24 |
| Fannie Mae Mortgage pass-thru certificates 7.5% 5/1/2028 | | 284 | 293 |
| Fannie Mae Mortgage pass-thru certificates 7.5% 5/1/2029 | | 25 | 26 |
| Fannie Mae Mortgage pass-thru certificates 7.5% 6/1/2027 | | 628 | 644 |
| Fannie Mae Mortgage pass-thru certificates 7.5% 6/1/2028 | | 111 | 115 |
| Fannie Mae Mortgage pass-thru certificates 7.5% 7/1/2027 | | 19 | 19 |
| Fannie Mae Mortgage pass-thru certificates 7.5% 7/1/2028 | | 735 | 749 |
| Fannie Mae Mortgage pass-thru certificates 7.5% 7/1/2029 | | 66 | 67 |
| Fannie Mae Mortgage pass-thru certificates 7.5% 8/1/2028 | | 184 | 185 |
| Fannie Mae Mortgage pass-thru certificates 7.5% 8/1/2029 | | 51 | 53 |
| Fannie Mae Mortgage pass-thru certificates 7.5% 8/1/2029 | | 14 | 13 |
| Fannie Mae Mortgage pass-thru certificates 7.5% 8/1/2029 | | 242 | 252 |
| Fannie Mae Mortgage pass-thru certificates 7.5% 8/1/2029 | | 53 | 55 |
| Fannie Mae Mortgage pass-thru certificates 7.5% 8/1/2029 | | 20 | 20 |
| Fannie Mae Mortgage pass-thru certificates 7.5% 8/1/2029 | | 187 | 194 |
| Fannie Mae Mortgage pass-thru certificates 7.5% 9/1/2025 | | 12 | 11 |
| Fannie Mae Mortgage pass-thru certificates 7.5% 9/1/2029 | | 121 | 126 |
| Fannie Mae Mortgage pass-thru certificates 7.5% 9/1/2029 | | 1,774 | 1,849 |
| Freddie Mac Gold Pool 1.5% 1/1/2036 | | 677,203 | 585,234 |
| Freddie Mac Gold Pool 1.5% 1/1/2037 | | 31,059 | 26,929 |
| Freddie Mac Gold Pool 1.5% 10/1/2035 | | 1,141,579 | 987,970 |
| Freddie Mac Gold Pool 1.5% 10/1/2036 | | 36,179 | 31,390 |
| Freddie Mac Gold Pool 1.5% 10/1/2036 | | 29,589 | 25,654 |
| Freddie Mac Gold Pool 1.5% 11/1/2035 | | 2,899,080 | 2,505,361 |
| Freddie Mac Gold Pool 1.5% 11/1/2035 | | 29,416 | 25,421 |
| Freddie Mac Gold Pool 1.5% 11/1/2036 | | 26,070 | 22,603 |
| Freddie Mac Gold Pool 1.5% 11/1/2036 | | 25,812 | 22,395 |
| Freddie Mac Gold Pool 1.5% 11/1/2036 | | 21,738 | 18,881 |
| Freddie Mac Gold Pool 1.5% 11/1/2036 | | 96,047 | 83,333 |
| Freddie Mac Gold Pool 1.5% 12/1/2035 | | 600,576 | 519,013 |
| Freddie Mac Gold Pool 1.5% 12/1/2036 | | 94,816 | 82,265 |
| Freddie Mac Gold Pool 1.5% 12/1/2040 | | 25,118 | 20,387 |
| Freddie Mac Gold Pool 1.5% 12/1/2050 | | 499,734 | 369,231 |
| Freddie Mac Gold Pool 1.5% 2/1/2036 | | 661,314 | 571,502 |
| Freddie Mac Gold Pool 1.5% 2/1/2041 | | 42,935 | 34,792 |
| Freddie Mac Gold Pool 1.5% 3/1/2036 | | 265,547 | 229,484 |
| Freddie Mac Gold Pool 1.5% 3/1/2041 | | 43,589 | 35,295 |
| Freddie Mac Gold Pool 1.5% 4/1/2041 | | 44,273 | 35,823 |
| Freddie Mac Gold Pool 1.5% 5/1/2036 | | 25,022 | 21,561 |
| Freddie Mac Gold Pool 1.5% 7/1/2035 | | 83,065 | 71,888 |
| Freddie Mac Gold Pool 1.5% 8/1/2035 | | 2,462,428 | 2,131,088 |
| Freddie Mac Gold Pool 1.5% 9/1/2050 | | 1,086,038 | 804,800 |
| Freddie Mac Gold Pool 2% 1/1/2036 | | 18,413 | 16,350 |
| Freddie Mac Gold Pool 2% 1/1/2052 | | 602,327 | 468,282 |
| Freddie Mac Gold Pool 2% 10/1/2035 | | 13,837 | 12,317 |
| Freddie Mac Gold Pool 2% 10/1/2051 | | 562,307 | 442,264 |
| Freddie Mac Gold Pool 2% 10/1/2051 | | 216,757 | 171,432 |
| Freddie Mac Gold Pool 2% 11/1/2041 | | 101,765 | 84,556 |
| Freddie Mac Gold Pool 2% 11/1/2051 | | 326,224 | 255,969 |
| Freddie Mac Gold Pool 2% 11/1/2051 | | 416,253 | 325,569 |
| Freddie Mac Gold Pool 2% 11/1/2051 | | 24,497 | 19,092 |
| Freddie Mac Gold Pool 2% 12/1/2035 | | 71,873 | 63,820 |
| Freddie Mac Gold Pool 2% 12/1/2035 | | 511,796 | 454,454 |
| Freddie Mac Gold Pool 2% 12/1/2035 | | 56,129 | 49,963 |
| Freddie Mac Gold Pool 2% 12/1/2051 | | 54,441 | 42,581 |
| Freddie Mac Gold Pool 2% 12/1/2051 | | 41,047 | 31,938 |
| Freddie Mac Gold Pool 2% 12/1/2051 | | 499,999 | 389,039 |
| Freddie Mac Gold Pool 2% 2/1/2035 | | 12,558 | 11,226 |
| Freddie Mac Gold Pool 2% 2/1/2036 | | 74,772 | 66,558 |
| Freddie Mac Gold Pool 2% 2/1/2036 | | 19,688 | 17,501 |
| Freddie Mac Gold Pool 2% 2/1/2036 | | 55,673 | 49,522 |
| Freddie Mac Gold Pool 2% 2/1/2042 | | 112,804 | 93,587 |
| Freddie Mac Gold Pool 2% 2/1/2052 | | 2,084,741 | 1,622,094 |
| Freddie Mac Gold Pool 2% 2/1/2052 | | 24,999 | 19,436 |
| Freddie Mac Gold Pool 2% 3/1/2041 | | 177,728 | 149,689 |
| Freddie Mac Gold Pool 2% 3/1/2052 | | 974,903 | 757,943 |
| Freddie Mac Gold Pool 2% 4/1/2042 | | 1,520,997 | 1,275,278 |
| Freddie Mac Gold Pool 2% 4/1/2052 | | 192,735 | 151,409 |
| Freddie Mac Gold Pool 2% 4/1/2052 | | 1,027,063 | 806,518 |
| Freddie Mac Gold Pool 2% 5/1/2051 | | 45,130 | 35,651 |
| Freddie Mac Gold Pool 2% 5/1/2051 | | 83,199 | 65,204 |
| Freddie Mac Gold Pool 2% 5/1/2051 | | 197,958 | 155,141 |
| Freddie Mac Gold Pool 2% 6/1/2035 | | 39,919 | 35,534 |
| Freddie Mac Gold Pool 2% 6/1/2040 | | 28,984 | 24,407 |
| Freddie Mac Gold Pool 2% 7/1/2041 | | 1,956,768 | 1,643,589 |
| Freddie Mac Gold Pool 2% 7/1/2051 | | 25,328 | 20,008 |
| Freddie Mac Gold Pool 2% 8/1/2036 | | 43,598 | 38,727 |
| Freddie Mac Gold Pool 2% 9/1/2051 | | 399,255 | 315,767 |
| Freddie Mac Gold Pool 2.5% 1/1/2031 | | 23,011 | 21,936 |
| Freddie Mac Gold Pool 2.5% 1/1/2035 | | 24,322 | 22,300 |
| Freddie Mac Gold Pool 2.5% 1/1/2040 | | 64,257 | 56,103 |
| Freddie Mac Gold Pool 2.5% 1/1/2042 | | 492,920 | 423,220 |
| Freddie Mac Gold Pool 2.5% 1/1/2051 | | 24,456 | 20,287 |
| Freddie Mac Gold Pool 2.5% 1/1/2052 | | 1,354,134 | 1,112,299 |
| Freddie Mac Gold Pool 2.5% 10/1/2029 | | 15,777 | 15,167 |
| Freddie Mac Gold Pool 2.5% 10/1/2029 | | 8,983 | 8,653 |
| Freddie Mac Gold Pool 2.5% 10/1/2032 | | 66,536 | 62,682 |
| Freddie Mac Gold Pool 2.5% 10/1/2034 | | 20,313 | 18,649 |
| Freddie Mac Gold Pool 2.5% 10/1/2041 | | 243,477 | 209,429 |
| Freddie Mac Gold Pool 2.5% 10/1/2049 | | 34,990 | 28,861 |
| Freddie Mac Gold Pool 2.5% 10/1/2050 | | 3,087,966 | 2,556,752 |
| Freddie Mac Gold Pool 2.5% 11/1/2031 | | 174,522 | 165,171 |
| Freddie Mac Gold Pool 2.5% 11/1/2034 | | 10,578 | 9,712 |
| Freddie Mac Gold Pool 2.5% 11/1/2041 | | 162,341 | 140,045 |
| Freddie Mac Gold Pool 2.5% 11/1/2041 | | 113,659 | 98,155 |
| Freddie Mac Gold Pool 2.5% 11/1/2041 | | 2,036,138 | 1,758,404 |
| Freddie Mac Gold Pool 2.5% 11/1/2049 | | 18,089 | 14,920 |
| Freddie Mac Gold Pool 2.5% 11/1/2050 | | 2,502,589 | 2,069,730 |
| Freddie Mac Gold Pool 2.5% 12/1/2029 | | 20,923 | 20,114 |
| Freddie Mac Gold Pool 2.5% 12/1/2032 | | 51,204 | 48,122 |
| Freddie Mac Gold Pool 2.5% 12/1/2034 | | 5,974 | 5,485 |
| Freddie Mac Gold Pool 2.5% 12/1/2049 | | 760,459 | 624,887 |
| Freddie Mac Gold Pool 2.5% 12/1/2049 | | 71,504 | 58,756 |
| Freddie Mac Gold Pool 2.5% 12/1/2051 | | 392,766 | 320,536 |
| Freddie Mac Gold Pool 2.5% 12/1/2051 | | 412,683 | 338,982 |
| Freddie Mac Gold Pool 2.5% 2/1/2030 | | 31,757 | 30,512 |
| Freddie Mac Gold Pool 2.5% 2/1/2032 | | 10,273 | 9,729 |
| Freddie Mac Gold Pool 2.5% 2/1/2033 | | 68,034 | 63,982 |
| Freddie Mac Gold Pool 2.5% 2/1/2035 | | 55,080 | 50,501 |
| Freddie Mac Gold Pool 2.5% 2/1/2042 | | 380,876 | 330,114 |
| Freddie Mac Gold Pool 2.5% 2/1/2051 | | 230,256 | 190,718 |
| Freddie Mac Gold Pool 2.5% 2/1/2051 | | 482,159 | 396,201 |
| Freddie Mac Gold Pool 2.5% 3/1/2028 | | 31,818 | 30,999 |
| Freddie Mac Gold Pool 2.5% 3/1/2032 | | 343,001 | 324,481 |
| Freddie Mac Gold Pool 2.5% 3/1/2033 | | 89,873 | 84,515 |
| Freddie Mac Gold Pool 2.5% 3/1/2033 | | 8,081 | 7,609 |
| Freddie Mac Gold Pool 2.5% 3/1/2035 | | 21,198 | 19,435 |
| Freddie Mac Gold Pool 2.5% 3/1/2051 | | 464,084 | 381,348 |
| Freddie Mac Gold Pool 2.5% 3/1/2052 | | 28,715 | 23,533 |
| Freddie Mac Gold Pool 2.5% 4/1/2031 | | 85,267 | 81,088 |
| Freddie Mac Gold Pool 2.5% 4/1/2033 | | 30,401 | 28,539 |
| Freddie Mac Gold Pool 2.5% 4/1/2035 | | 20,820 | 19,089 |
| Freddie Mac Gold Pool 2.5% 4/1/2040 | | 106,190 | 92,497 |
| Freddie Mac Gold Pool 2.5% 4/1/2042 | | 105,223 | 90,575 |
| Freddie Mac Gold Pool 2.5% 4/1/2047 | | 914,262 | 752,412 |
| Freddie Mac Gold Pool 2.5% 5/1/2035 | | 170,873 | 156,452 |
| Freddie Mac Gold Pool 2.5% 5/1/2041 | | 823,817 | 716,407 |
| Freddie Mac Gold Pool 2.5% 5/1/2051 | | 221,144 | 182,825 |
| Freddie Mac Gold Pool 2.5% 6/1/2030 | | 13,542 | 12,958 |
| Freddie Mac Gold Pool 2.5% 6/1/2040 | | 190,427 | 165,649 |
| Freddie Mac Gold Pool 2.5% 6/1/2041 | | 124,848 | 107,936 |
| Freddie Mac Gold Pool 2.5% 6/1/2050 | | 183,859 | 151,253 |
| Freddie Mac Gold Pool 2.5% 6/1/2050 | | 87,795 | 72,226 |
| Freddie Mac Gold Pool 2.5% 6/1/2050 | | 107,383 | 88,340 |
| Freddie Mac Gold Pool 2.5% 7/1/2030 | | 245,042 | 234,322 |
| Freddie Mac Gold Pool 2.5% 7/1/2031 | | 5,377 | 5,111 |
| Freddie Mac Gold Pool 2.5% 7/1/2035 | | 60,395 | 55,298 |
| Freddie Mac Gold Pool 2.5% 7/1/2040 | | 28,037 | 24,361 |
| Freddie Mac Gold Pool 2.5% 8/1/2031 | | 71,966 | 68,315 |
| Freddie Mac Gold Pool 2.5% 8/1/2031 | | 8,982 | 8,532 |
| Freddie Mac Gold Pool 2.5% 8/1/2035 | | 698,363 | 638,333 |
| Freddie Mac Gold Pool 2.5% 8/1/2041 | | 97,686 | 84,453 |
| Freddie Mac Gold Pool 2.5% 8/1/2050 | | 945,150 | 779,014 |
| Freddie Mac Gold Pool 2.5% 8/1/2050 | | 235,663 | 195,123 |
| Freddie Mac Gold Pool 2.5% 9/1/2031 | | 49,546 | 47,006 |
| Freddie Mac Gold Pool 2.5% 9/1/2035 | | 694,119 | 634,454 |
| Freddie Mac Gold Pool 2.5% 9/1/2041 | | 208,644 | 180,771 |
| Freddie Mac Gold Pool 3% 1/1/2027 | | 3,252 | 3,203 |
| Freddie Mac Gold Pool 3% 1/1/2028 | | 2,161 | 2,122 |
| Freddie Mac Gold Pool 3% 1/1/2031 | | 1,497 | 1,443 |
| Freddie Mac Gold Pool 3% 1/1/2033 | | 12,406 | 11,803 |
| Freddie Mac Gold Pool 3% 1/1/2033 | | 33,339 | 31,777 |
| Freddie Mac Gold Pool 3% 1/1/2034 | | 19,956 | 18,870 |
| Freddie Mac Gold Pool 3% 1/1/2040 | | 29,828 | 26,791 |
| Freddie Mac Gold Pool 3% 1/1/2043 | | 24,741 | 21,965 |
| Freddie Mac Gold Pool 3% 1/1/2043 | | 5,480 | 4,857 |
| Freddie Mac Gold Pool 3% 1/1/2043 | | 46,090 | 40,929 |
| Freddie Mac Gold Pool 3% 1/1/2044 | | 76,576 | 67,886 |
| Freddie Mac Gold Pool 3% 1/1/2045 | | 37,535 | 32,702 |
| Freddie Mac Gold Pool 3% 1/1/2047 | | 1,609,843 | 1,397,021 |
| Freddie Mac Gold Pool 3% 1/1/2048 | | 33,531 | 29,025 |
| Freddie Mac Gold Pool 3% 1/1/2051 | | 65,699 | 56,258 |
| Freddie Mac Gold Pool 3% 1/1/2052 | | 374,250 | 319,534 |
| Freddie Mac Gold Pool 3% 1/1/2052 | | 38,358 | 32,750 |
| Freddie Mac Gold Pool 3% 1/1/2052 | | 140,407 | 119,879 |
| Freddie Mac Gold Pool 3% 1/1/2052 | | 308,602 | 263,484 |
| Freddie Mac Gold Pool 3% 10/1/2026 | | 1,354 | 1,334 |
| Freddie Mac Gold Pool 3% 10/1/2027 | | 1,474 | 1,446 |
| Freddie Mac Gold Pool 3% 10/1/2028 | | 38,722 | 37,802 |
| Freddie Mac Gold Pool 3% 10/1/2028 | | 678 | 668 |
| Freddie Mac Gold Pool 3% 10/1/2028 | | 29,552 | 28,834 |
| Freddie Mac Gold Pool 3% 10/1/2028 | | 4,840 | 4,716 |
| Freddie Mac Gold Pool 3% 10/1/2028 | | 4,552 | 4,475 |
| Freddie Mac Gold Pool 3% 10/1/2029 | | 3,693 | 3,586 |
| Freddie Mac Gold Pool 3% 10/1/2029 | | 5,147 | 4,995 |
| Freddie Mac Gold Pool 3% 10/1/2030 | | 19,587 | 18,905 |
| Freddie Mac Gold Pool 3% 10/1/2030 | | 8,556 | 8,240 |
| Freddie Mac Gold Pool 3% 10/1/2030 | | 5,572 | 5,368 |
| Freddie Mac Gold Pool 3% 10/1/2032 | | 4,286 | 4,096 |
| Freddie Mac Gold Pool 3% 10/1/2039 | | 9,732 | 8,741 |
| Freddie Mac Gold Pool 3% 10/1/2039 | | 9,990 | 9,076 |
| Freddie Mac Gold Pool 3% 10/1/2042 | | 21,738 | 19,288 |
| Freddie Mac Gold Pool 3% 10/1/2042 | | 3,953 | 3,514 |
| Freddie Mac Gold Pool 3% 10/1/2042 | | 37,297 | 33,114 |
| Freddie Mac Gold Pool 3% 10/1/2043 | | 37,576 | 33,369 |
| Freddie Mac Gold Pool 3% 10/1/2047 | | 43,273 | 37,485 |
| Freddie Mac Gold Pool 3% 10/1/2048 | | 20,936 | 18,091 |
| Freddie Mac Gold Pool 3% 10/1/2050 | | 324,830 | 278,659 |
| Freddie Mac Gold Pool 3% 10/1/2051 | | 67,190 | 57,430 |
| Freddie Mac Gold Pool 3% 11/1/2030 | | 56,492 | 55,031 |
| Freddie Mac Gold Pool 3% 11/1/2032 | | 4,553 | 4,349 |
| Freddie Mac Gold Pool 3% 11/1/2032 | | 12,447 | 11,909 |
| Freddie Mac Gold Pool 3% 11/1/2042 | | 30,348 | 27,314 |
| Freddie Mac Gold Pool 3% 11/1/2042 | | 7,820 | 6,960 |
| Freddie Mac Gold Pool 3% 11/1/2042 | | 7,665 | 6,762 |
| Freddie Mac Gold Pool 3% 11/1/2042 | | 5,212 | 4,639 |
| Freddie Mac Gold Pool 3% 11/1/2048 | | 73,947 | 63,806 |
| Freddie Mac Gold Pool 3% 11/1/2050 | | 80,628 | 69,016 |
| Freddie Mac Gold Pool 3% 11/1/2051 | | 64,747 | 55,281 |
| Freddie Mac Gold Pool 3% 11/1/2051 | | 20,947 | 17,905 |
| Freddie Mac Gold Pool 3% 11/1/2051 | | 291,786 | 249,400 |
| Freddie Mac Gold Pool 3% 12/1/2029 | | 55,808 | 54,106 |
| Freddie Mac Gold Pool 3% 12/1/2030 | | 36,908 | 35,535 |
| Freddie Mac Gold Pool 3% 12/1/2032 | | 24,826 | 23,704 |
| Freddie Mac Gold Pool 3% 12/1/2032 | | 6,059 | 5,786 |
| Freddie Mac Gold Pool 3% 12/1/2032 | | 30,388 | 29,000 |
| Freddie Mac Gold Pool 3% 12/1/2032 | | 25,788 | 24,634 |
| Freddie Mac Gold Pool 3% 12/1/2042 | | 777,869 | 691,760 |
| Freddie Mac Gold Pool 3% 12/1/2042 | | 5,406 | 4,802 |
| Freddie Mac Gold Pool 3% 12/1/2044 | | 5,734 | 4,999 |
| Freddie Mac Gold Pool 3% 12/1/2046 | | 505,950 | 439,222 |
| Freddie Mac Gold Pool 3% 12/1/2047 | | 9,405 | 8,147 |
| Freddie Mac Gold Pool 3% 12/1/2050 | | 671,004 | 574,369 |
| Freddie Mac Gold Pool 3% 2/1/2027 | | 2,174 | 2,140 |
| Freddie Mac Gold Pool 3% 2/1/2030 | | 3,219 | 3,129 |
| Freddie Mac Gold Pool 3% 2/1/2030 | | 4,790 | 4,644 |
| Freddie Mac Gold Pool 3% 2/1/2030 | | 3,971 | 3,849 |
| Freddie Mac Gold Pool 3% 2/1/2033 | | 69,705 | 66,554 |
| Freddie Mac Gold Pool 3% 2/1/2033 | | 35,569 | 34,294 |
| Freddie Mac Gold Pool 3% 2/1/2038 | | 22,628 | 20,649 |
| Freddie Mac Gold Pool 3% 2/1/2040 | | 189,575 | 169,856 |
| Freddie Mac Gold Pool 3% 2/1/2043 | | 16,117 | 14,370 |
| Freddie Mac Gold Pool 3% 2/1/2043 | | 70,776 | 63,181 |
| Freddie Mac Gold Pool 3% 2/1/2043 | | 7,040 | 6,257 |
| Freddie Mac Gold Pool 3% 2/1/2043 | | 11,792 | 10,472 |
| Freddie Mac Gold Pool 3% 2/1/2043 | | 31,096 | 27,688 |
| Freddie Mac Gold Pool 3% 2/1/2043 | | 21,530 | 19,095 |
| Freddie Mac Gold Pool 3% 2/1/2043 | | 39,847 | 35,315 |
| Freddie Mac Gold Pool 3% 2/1/2043 | | 5,734 | 5,099 |
| Freddie Mac Gold Pool 3% 2/1/2047 | | 148,264 | 128,663 |
| Freddie Mac Gold Pool 3% 2/1/2047 | | 142,364 | 123,454 |
| Freddie Mac Gold Pool 3% 2/1/2049 | | 10,946 | 9,438 |
| Freddie Mac Gold Pool 3% 3/1/2027 | | 7,486 | 7,372 |
| Freddie Mac Gold Pool 3% 3/1/2027 | | 2,045 | 2,013 |
| Freddie Mac Gold Pool 3% 3/1/2032 | | 107,080 | 102,633 |
| Freddie Mac Gold Pool 3% 3/1/2033 | | 5,538 | 5,285 |
| Freddie Mac Gold Pool 3% 3/1/2033 | | 20,909 | 19,946 |
| Freddie Mac Gold Pool 3% 3/1/2040 | | 109,905 | 98,473 |
| Freddie Mac Gold Pool 3% 3/1/2040 | | 11,609 | 10,402 |
| Freddie Mac Gold Pool 3% 3/1/2043 | | 11,950 | 10,592 |
| Freddie Mac Gold Pool 3% 3/1/2043 | | 3,599 | 3,192 |
| Freddie Mac Gold Pool 3% 3/1/2043 | | 20,016 | 17,887 |
| Freddie Mac Gold Pool 3% 3/1/2043 | | 19,124 | 17,001 |
| Freddie Mac Gold Pool 3% 3/1/2045 | | 18,208 | 15,864 |
| Freddie Mac Gold Pool 3% 3/1/2045 | | 31,045 | 27,047 |
| Freddie Mac Gold Pool 3% 3/1/2045 | | 30,153 | 26,271 |
| Freddie Mac Gold Pool 3% 3/1/2047 | | 328,647 | 284,994 |
| Freddie Mac Gold Pool 3% 3/1/2048 | | 7,357 | 6,360 |
| Freddie Mac Gold Pool 3% 3/1/2052 | | 999,900 | 848,712 |
| Freddie Mac Gold Pool 3% 3/1/2052 | | 187,708 | 160,030 |
| Freddie Mac Gold Pool 3% 4/1/2027 | | 2,322 | 2,284 |
| Freddie Mac Gold Pool 3% 4/1/2027 | | 768 | 755 |
| Freddie Mac Gold Pool 3% 4/1/2028 | | 4,859 | 4,756 |
| Freddie Mac Gold Pool 3% 4/1/2030 | | 5,016 | 4,854 |
| Freddie Mac Gold Pool 3% 4/1/2033 | | 9,838 | 9,381 |
| Freddie Mac Gold Pool 3% 4/1/2034 | | 51,646 | 48,804 |
| Freddie Mac Gold Pool 3% 4/1/2039 | | 14,889 | 13,448 |
| Freddie Mac Gold Pool 3% 4/1/2040 | | 20,312 | 18,199 |
| Freddie Mac Gold Pool 3% 4/1/2043 | | 67,113 | 59,572 |
| Freddie Mac Gold Pool 3% 4/1/2045 | | 23,080 | 20,209 |
| Freddie Mac Gold Pool 3% 4/1/2046 | | 7,135 | 6,221 |
| Freddie Mac Gold Pool 3% 4/1/2046 | | 8,675 | 7,563 |
| Freddie Mac Gold Pool 3% 4/1/2047 | | 9,541 | 8,274 |
| Freddie Mac Gold Pool 3% 4/1/2051 | | 124,893 | 106,399 |
| Freddie Mac Gold Pool 3% 5/1/2028 | | 1,762 | 1,723 |
| Freddie Mac Gold Pool 3% 5/1/2029 | | 1,300 | 1,276 |
| Freddie Mac Gold Pool 3% 5/1/2032 | | 116,392 | 111,461 |
| Freddie Mac Gold Pool 3% 5/1/2043 | | 167,585 | 148,370 |
| Freddie Mac Gold Pool 3% 5/1/2043 | | 7,328 | 6,518 |
| Freddie Mac Gold Pool 3% 5/1/2043 | | 25,353 | 22,467 |
| Freddie Mac Gold Pool 3% 5/1/2043 | | 13,926 | 12,344 |
| Freddie Mac Gold Pool 3% 5/1/2043 | | 24,164 | 21,403 |
| Freddie Mac Gold Pool 3% 5/1/2043 | | 8,104 | 7,148 |
| Freddie Mac Gold Pool 3% 5/1/2045 | | 55,874 | 48,679 |
| Freddie Mac Gold Pool 3% 5/1/2045 | | 5,634 | 4,923 |
| Freddie Mac Gold Pool 3% 5/1/2046 | | 21,459 | 18,709 |
| Freddie Mac Gold Pool 3% 5/1/2046 | | 134,618 | 117,368 |
| Freddie Mac Gold Pool 3% 5/1/2048 | | 22,805 | 19,713 |
| Freddie Mac Gold Pool 3% 5/1/2051 | | 280,305 | 239,937 |
| Freddie Mac Gold Pool 3% 5/1/2051 | | 25,875 | 22,140 |
| Freddie Mac Gold Pool 3% 5/1/2052 | | 1,031,210 | 878,510 |
| Freddie Mac Gold Pool 3% 6/1/2027 | | 1,507 | 1,481 |
| Freddie Mac Gold Pool 3% 6/1/2028 | | 4,275 | 4,185 |
| Freddie Mac Gold Pool 3% 6/1/2028 | | 2,270 | 2,217 |
| Freddie Mac Gold Pool 3% 6/1/2030 | | 26,295 | 25,421 |
| Freddie Mac Gold Pool 3% 6/1/2031 | | 9,757 | 9,388 |
| Freddie Mac Gold Pool 3% 6/1/2043 | | 89,899 | 79,754 |
| Freddie Mac Gold Pool 3% 6/1/2043 | | 14,545 | 12,987 |
| Freddie Mac Gold Pool 3% 6/1/2043 | | 10,420 | 9,254 |
| Freddie Mac Gold Pool 3% 6/1/2043 | | 10,117 | 8,962 |
| Freddie Mac Gold Pool 3% 6/1/2043 | | 14,504 | 12,871 |
| Freddie Mac Gold Pool 3% 6/1/2043 | | 6,901 | 6,110 |
| Freddie Mac Gold Pool 3% 6/1/2045 | | 148,656 | 129,375 |
| Freddie Mac Gold Pool 3% 6/1/2045 | | 6,431 | 5,647 |
| Freddie Mac Gold Pool 3% 6/1/2045 | | 15,474 | 13,617 |
| Freddie Mac Gold Pool 3% 6/1/2046 | | 133,076 | 116,024 |
| Freddie Mac Gold Pool 3% 6/1/2052 | | 300,000 | 254,733 |
| Freddie Mac Gold Pool 3% 6/1/2052 | | 619,488 | 528,142 |
| Freddie Mac Gold Pool 3% 7/1/2029 | | 17,568 | 17,087 |
| Freddie Mac Gold Pool 3% 7/1/2032 | | 21,714 | 20,749 |
| Freddie Mac Gold Pool 3% 7/1/2032 | | 52,445 | 50,421 |
| Freddie Mac Gold Pool 3% 7/1/2042 | | 46,106 | 41,043 |
| Freddie Mac Gold Pool 3% 7/1/2043 | | 334,976 | 296,628 |
| Freddie Mac Gold Pool 3% 7/1/2043 | | 17,157 | 15,206 |
| Freddie Mac Gold Pool 3% 7/1/2043 | | 19,090 | 16,919 |
| Freddie Mac Gold Pool 3% 7/1/2043 | | 19,781 | 17,527 |
| Freddie Mac Gold Pool 3% 7/1/2043 | | 8,901 | 7,851 |
| Freddie Mac Gold Pool 3% 7/1/2043 | | 6,323 | 5,603 |
| Freddie Mac Gold Pool 3% 7/1/2045 | | 4,879 | 4,260 |
| Freddie Mac Gold Pool 3% 7/1/2045 | | 237,244 | 206,473 |
| Freddie Mac Gold Pool 3% 7/1/2045 | | 11,379 | 9,964 |
| Freddie Mac Gold Pool 3% 7/1/2048 | | 17,045 | 14,729 |
| Freddie Mac Gold Pool 3% 8/1/2028 | | 2,707 | 2,644 |
| Freddie Mac Gold Pool 3% 8/1/2030 | | 43,558 | 42,107 |
| Freddie Mac Gold Pool 3% 8/1/2032 | | 85,051 | 81,341 |
| Freddie Mac Gold Pool 3% 8/1/2042 | | 3,128 | 2,776 |
| Freddie Mac Gold Pool 3% 8/1/2043 | | 10,087 | 8,919 |
| Freddie Mac Gold Pool 3% 8/1/2045 | | 7,608 | 6,681 |
| Freddie Mac Gold Pool 3% 8/1/2047 | | 5,175 | 4,483 |
| Freddie Mac Gold Pool 3% 9/1/2028 | | 3,534 | 3,452 |
| Freddie Mac Gold Pool 3% 9/1/2028 | | 1,735 | 1,693 |
| Freddie Mac Gold Pool 3% 9/1/2029 | | 2,704 | 2,618 |
| Freddie Mac Gold Pool 3% 9/1/2030 | | 24,916 | 24,053 |
| Freddie Mac Gold Pool 3% 9/1/2032 | | 12,563 | 11,980 |
| Freddie Mac Gold Pool 3% 9/1/2042 | | 6,370 | 5,665 |
| Freddie Mac Gold Pool 3% 9/1/2043 | | 9,807 | 8,649 |
| Freddie Mac Gold Pool 3% 9/1/2043 | | 34,718 | 30,716 |
| Freddie Mac Gold Pool 3% 9/1/2043 | | 8,080 | 7,147 |
| Freddie Mac Gold Pool 3% 9/1/2043 | | 6,189 | 5,488 |
| Freddie Mac Gold Pool 3% 9/1/2043 | | 3,837 | 3,386 |
| Freddie Mac Gold Pool 3% 9/1/2046 | | 118,995 | 105,115 |
| Freddie Mac Gold Pool 3% 9/1/2050 | | 72,724 | 62,364 |
| Freddie Mac Gold Pool 3% 9/1/2051 | | 21,525 | 18,412 |
| Freddie Mac Gold Pool 3% 9/1/2051 | | 252,840 | 216,269 |
| Freddie Mac Gold Pool 3.5% 1/1/2029 | | 2,944 | 2,896 |
| Freddie Mac Gold Pool 3.5% 1/1/2031 | | 3,893 | 3,773 |
| Freddie Mac Gold Pool 3.5% 1/1/2044 | | 280,472 | 256,742 |
| Freddie Mac Gold Pool 3.5% 1/1/2044 | | 49,403 | 45,280 |
| Freddie Mac Gold Pool 3.5% 1/1/2045 | | 15,922 | 14,409 |
| Freddie Mac Gold Pool 3.5% 1/1/2046 | | 7,883 | 7,121 |
| Freddie Mac Gold Pool 3.5% 1/1/2052 | | 45,501 | 40,454 |
| Freddie Mac Gold Pool 3.5% 10/1/2033 | | 63,658 | 61,092 |
| Freddie Mac Gold Pool 3.5% 10/1/2040 | | 4,519 | 4,115 |
| Freddie Mac Gold Pool 3.5% 10/1/2042 | | 28,010 | 25,666 |
| Freddie Mac Gold Pool 3.5% 10/1/2042 | | 5,013 | 4,600 |
| Freddie Mac Gold Pool 3.5% 10/1/2042 | | 9,268 | 8,481 |
| Freddie Mac Gold Pool 3.5% 10/1/2045 | | 150,870 | 136,301 |
| Freddie Mac Gold Pool 3.5% 10/1/2047 | | 9,726 | 8,750 |
| Freddie Mac Gold Pool 3.5% 10/1/2047 | | 9,154 | 8,291 |
| Freddie Mac Gold Pool 3.5% 10/1/2049 | | 439,695 | 395,328 |
| Freddie Mac Gold Pool 3.5% 10/1/2049 | | 89,936 | 80,355 |
| Freddie Mac Gold Pool 3.5% 11/1/2033 | | 5,218 | 4,999 |
| Freddie Mac Gold Pool 3.5% 11/1/2040 | | 9,480 | 8,624 |
| Freddie Mac Gold Pool 3.5% 11/1/2042 | | 209,498 | 191,505 |
| Freddie Mac Gold Pool 3.5% 11/1/2044 | | 10,712 | 9,738 |
| Freddie Mac Gold Pool 3.5% 11/1/2045 | | 234,869 | 212,408 |
| Freddie Mac Gold Pool 3.5% 11/1/2047 | | 6,339 | 5,703 |
| Freddie Mac Gold Pool 3.5% 11/1/2047 | | 62,588 | 56,683 |
| Freddie Mac Gold Pool 3.5% 11/1/2048 | | 6,027 | 5,407 |
| Freddie Mac Gold Pool 3.5% 12/1/2033 | | 43,413 | 41,135 |
| Freddie Mac Gold Pool 3.5% 12/1/2040 | | 9,336 | 8,493 |
| Freddie Mac Gold Pool 3.5% 12/1/2042 | | 6,687 | 6,119 |
| Freddie Mac Gold Pool 3.5% 12/1/2042 | | 4,233 | 3,879 |
| Freddie Mac Gold Pool 3.5% 12/1/2044 | | 53,712 | 49,259 |
| Freddie Mac Gold Pool 3.5% 12/1/2045 | | 74,122 | 66,964 |
| Freddie Mac Gold Pool 3.5% 12/1/2046 | | 17,576 | 15,835 |
| Freddie Mac Gold Pool 3.5% 12/1/2047 | | 94,239 | 84,697 |
| Freddie Mac Gold Pool 3.5% 12/1/2047 | | 35,590 | 31,986 |
| Freddie Mac Gold Pool 3.5% 12/1/2047 | | 15,928 | 14,420 |
| Freddie Mac Gold Pool 3.5% 2/1/2034 | | 1,160,017 | 1,106,362 |
| Freddie Mac Gold Pool 3.5% 2/1/2034 | | 58,491 | 55,813 |
| Freddie Mac Gold Pool 3.5% 2/1/2042 | | 102,900 | 94,483 |
| Freddie Mac Gold Pool 3.5% 2/1/2043 | | 9,789 | 9,048 |
| Freddie Mac Gold Pool 3.5% 2/1/2043 | | 24,392 | 22,394 |
| Freddie Mac Gold Pool 3.5% 2/1/2043 | | 46,696 | 42,526 |
| Freddie Mac Gold Pool 3.5% 2/1/2043 | | 5,176 | 4,757 |
| Freddie Mac Gold Pool 3.5% 2/1/2043 | | 416,351 | 381,388 |
| Freddie Mac Gold Pool 3.5% 2/1/2044 | | 35,164 | 32,149 |
| Freddie Mac Gold Pool 3.5% 2/1/2044 | | 22,543 | 20,650 |
| Freddie Mac Gold Pool 3.5% 2/1/2045 | | 195,501 | 176,927 |
| Freddie Mac Gold Pool 3.5% 2/1/2045 | | 35,035 | 31,706 |
| Freddie Mac Gold Pool 3.5% 2/1/2052 | | 150,080 | 133,810 |
| Freddie Mac Gold Pool 3.5% 2/1/2052 | | 94,499 | 84,225 |
| Freddie Mac Gold Pool 3.5% 3/1/2032 | | 113,847 | 109,403 |
| Freddie Mac Gold Pool 3.5% 3/1/2032 | | 3,170 | 3,051 |
| Freddie Mac Gold Pool 3.5% 3/1/2045 | | 40,121 | 36,309 |
| Freddie Mac Gold Pool 3.5% 3/1/2045 | | 14,393 | 13,026 |
| Freddie Mac Gold Pool 3.5% 3/1/2045 | | 3,816 | 3,454 |
| Freddie Mac Gold Pool 3.5% 3/1/2046 | | 259,005 | 233,993 |
| Freddie Mac Gold Pool 3.5% 3/1/2050 | | 15,664 | 13,980 |
| Freddie Mac Gold Pool 3.5% 3/1/2050 | | 1,528,456 | 1,378,526 |
| Freddie Mac Gold Pool 3.5% 3/1/2052 | | 197,041 | 175,542 |
| Freddie Mac Gold Pool 3.5% 3/1/2052 | | 987,944 | 873,668 |
| Freddie Mac Gold Pool 3.5% 4/1/2028 | | 4,567 | 4,497 |
| Freddie Mac Gold Pool 3.5% 4/1/2033 | | 6,206 | 5,965 |
| Freddie Mac Gold Pool 3.5% 4/1/2034 | | 4,063 | 3,888 |
| Freddie Mac Gold Pool 3.5% 4/1/2040 | | 11,227 | 10,230 |
| Freddie Mac Gold Pool 3.5% 4/1/2042 | | 189,765 | 174,219 |
| Freddie Mac Gold Pool 3.5% 4/1/2042 | | 10,499 | 9,653 |
| Freddie Mac Gold Pool 3.5% 4/1/2042 | | 4,194 | 3,851 |
| Freddie Mac Gold Pool 3.5% 4/1/2043 | | 39,660 | 36,293 |
| Freddie Mac Gold Pool 3.5% 4/1/2043 | | 19,466 | 17,833 |
| Freddie Mac Gold Pool 3.5% 4/1/2043 | | 183,178 | 167,616 |
| Freddie Mac Gold Pool 3.5% 4/1/2046 | | 172,605 | 155,721 |
| Freddie Mac Gold Pool 3.5% 4/1/2046 | | 61,171 | 55,264 |
| Freddie Mac Gold Pool 3.5% 4/1/2046 | | 111,695 | 100,978 |
| Freddie Mac Gold Pool 3.5% 4/1/2052 | | 422,034 | 378,921 |
| Freddie Mac Gold Pool 3.5% 4/1/2052 | | 1,029,045 | 909,693 |
| Freddie Mac Gold Pool 3.5% 5/1/2032 | | 21,470 | 20,759 |
| Freddie Mac Gold Pool 3.5% 5/1/2034 | | 51,617 | 48,812 |
| Freddie Mac Gold Pool 3.5% 5/1/2039 | | 7,352 | 6,801 |
| Freddie Mac Gold Pool 3.5% 5/1/2040 | | 23,289 | 21,222 |
| Freddie Mac Gold Pool 3.5% 5/1/2042 | | 6,893 | 6,322 |
| Freddie Mac Gold Pool 3.5% 5/1/2043 | | 7,666 | 7,008 |
| Freddie Mac Gold Pool 3.5% 5/1/2043 | | 7,333 | 6,699 |
| Freddie Mac Gold Pool 3.5% 5/1/2043 | | 76,714 | 69,977 |
| Freddie Mac Gold Pool 3.5% 5/1/2043 | | 72,345 | 66,042 |
| Freddie Mac Gold Pool 3.5% 5/1/2045 | | 151,179 | 136,817 |
| Freddie Mac Gold Pool 3.5% 5/1/2045 | | 93,704 | 84,743 |
| Freddie Mac Gold Pool 3.5% 5/1/2046 | | 100,326 | 90,826 |
| Freddie Mac Gold Pool 3.5% 5/1/2046 | | 9,106 | 8,215 |
| Freddie Mac Gold Pool 3.5% 5/1/2046 | | 70,426 | 63,669 |
| Freddie Mac Gold Pool 3.5% 5/1/2048 | | 3,602 | 3,237 |
| Freddie Mac Gold Pool 3.5% 6/1/2032 | | 539,397 | 517,692 |
| Freddie Mac Gold Pool 3.5% 6/1/2038 | | 3,898 | 3,621 |
| Freddie Mac Gold Pool 3.5% 6/1/2039 | | 65,319 | 60,422 |
| Freddie Mac Gold Pool 3.5% 6/1/2040 | | 20,152 | 18,350 |
| Freddie Mac Gold Pool 3.5% 6/1/2045 | | 183,343 | 165,810 |
| Freddie Mac Gold Pool 3.5% 6/1/2045 | | 28,711 | 25,983 |
| Freddie Mac Gold Pool 3.5% 6/1/2048 | | 3,777 | 3,390 |
| Freddie Mac Gold Pool 3.5% 7/1/2029 | | 31,706 | 31,198 |
| Freddie Mac Gold Pool 3.5% 7/1/2032 | | 26,066 | 25,072 |
| Freddie Mac Gold Pool 3.5% 7/1/2034 | | 5,433 | 5,199 |
| Freddie Mac Gold Pool 3.5% 7/1/2039 | | 11,741 | 10,861 |
| Freddie Mac Gold Pool 3.5% 7/1/2040 | | 2,891 | 2,632 |
| Freddie Mac Gold Pool 3.5% 7/1/2042 | | 14,049 | 12,911 |
| Freddie Mac Gold Pool 3.5% 7/1/2042 | | 520,529 | 476,735 |
| Freddie Mac Gold Pool 3.5% 7/1/2042 | | 237,341 | 217,603 |
| Freddie Mac Gold Pool 3.5% 7/1/2045 | | 273,416 | 247,269 |
| Freddie Mac Gold Pool 3.5% 7/1/2046 | | 961,132 | 871,358 |
| Freddie Mac Gold Pool 3.5% 7/1/2047 | | 154,989 | 140,415 |
| Freddie Mac Gold Pool 3.5% 7/1/2051 | | 341,206 | 303,791 |
| Freddie Mac Gold Pool 3.5% 7/1/2052 | | 73,703 | 65,431 |
| Freddie Mac Gold Pool 3.5% 8/1/2032 | | 53,706 | 51,658 |
| Freddie Mac Gold Pool 3.5% 8/1/2034 | | 84,965 | 80,267 |
| Freddie Mac Gold Pool 3.5% 8/1/2034 | | 39,976 | 38,252 |
| Freddie Mac Gold Pool 3.5% 8/1/2039 | | 20,433 | 18,902 |
| Freddie Mac Gold Pool 3.5% 8/1/2040 | | 13,148 | 11,973 |
| Freddie Mac Gold Pool 3.5% 8/1/2042 | | 2,139 | 1,962 |
| Freddie Mac Gold Pool 3.5% 8/1/2042 | | 82,204 | 75,342 |
| Freddie Mac Gold Pool 3.5% 8/1/2042 | | 7,375 | 6,745 |
| Freddie Mac Gold Pool 3.5% 8/1/2043 | | 9,865 | 9,010 |
| Freddie Mac Gold Pool 3.5% 8/1/2043 | | 28,300 | 25,852 |
| Freddie Mac Gold Pool 3.5% 8/1/2043 | | 3,100 | 2,821 |
| Freddie Mac Gold Pool 3.5% 8/1/2045 | | 3,249 | 2,939 |
| Freddie Mac Gold Pool 3.5% 8/1/2045 | | 139,879 | 126,502 |
| Freddie Mac Gold Pool 3.5% 8/1/2046 | | 294,931 | 265,713 |
| Freddie Mac Gold Pool 3.5% 8/1/2047 | | 5,027 | 4,523 |
| Freddie Mac Gold Pool 3.5% 8/1/2047 | | 27,874 | 25,244 |
| Freddie Mac Gold Pool 3.5% 8/1/2047 | | 235,592 | 213,365 |
| Freddie Mac Gold Pool 3.5% 8/1/2047 | | 18,646 | 16,887 |
| Freddie Mac Gold Pool 3.5% 9/1/2033 | | 15,045 | 14,443 |
| Freddie Mac Gold Pool 3.5% 9/1/2040 | | 9,938 | 9,050 |
| Freddie Mac Gold Pool 3.5% 9/1/2042 | | 600,631 | 549,921 |
| Freddie Mac Gold Pool 3.5% 9/1/2042 | | 678,003 | 620,403 |
| Freddie Mac Gold Pool 3.5% 9/1/2043 | | 30,168 | 27,574 |
| Freddie Mac Gold Pool 3.5% 9/1/2043 | | 8,602 | 7,834 |
| Freddie Mac Gold Pool 3.5% 9/1/2043 | | 12,832 | 11,690 |
| Freddie Mac Gold Pool 3.5% 9/1/2045 | | 64,297 | 58,148 |
| Freddie Mac Gold Pool 3.5% 9/1/2045 | | 2,813 | 2,544 |
| Freddie Mac Gold Pool 3.5% 9/1/2046 | | 59,789 | 53,866 |
| Freddie Mac Gold Pool 3.5% 9/1/2046 | | 41,987 | 37,971 |
| Freddie Mac Gold Pool 3.5% 9/1/2047 | | 220,309 | 199,240 |
| Freddie Mac Gold Pool 3.5% 9/1/2047 | | 6,581 | 5,960 |
| Freddie Mac Gold Pool 3.5% 9/1/2047 | | 6,165 | 5,583 |
| Freddie Mac Gold Pool 4% 1/1/2039 | | 6,954 | 6,583 |
| Freddie Mac Gold Pool 4% 1/1/2049 | | 27,761 | 25,673 |
| Freddie Mac Gold Pool 4% 1/1/2049 | | 20,437 | 18,900 |
| Freddie Mac Gold Pool 4% 1/1/2052 | | 25,718 | 23,639 |
| Freddie Mac Gold Pool 4% 10/1/2033 | | 2,750 | 2,661 |
| Freddie Mac Gold Pool 4% 10/1/2034 | | 9,687 | 9,374 |
| Freddie Mac Gold Pool 4% 10/1/2041 | | 85,884 | 81,100 |
| Freddie Mac Gold Pool 4% 10/1/2048 | | 13,069 | 12,086 |
| Freddie Mac Gold Pool 4% 10/1/2051 | | 14,255 | 13,102 |
| Freddie Mac Gold Pool 4% 11/1/2043 | | 50,313 | 47,341 |
| Freddie Mac Gold Pool 4% 12/1/2038 | | 46,464 | 43,986 |
| Freddie Mac Gold Pool 4% 12/1/2049 | | 5,341 | 4,933 |
| Freddie Mac Gold Pool 4% 12/1/2049 | | 6,232 | 5,736 |
| Freddie Mac Gold Pool 4% 2/1/2043 | | 2,372 | 2,227 |
| Freddie Mac Gold Pool 4% 2/1/2045 | | 77,055 | 72,258 |
| Freddie Mac Gold Pool 4% 2/1/2049 | | 23,757 | 21,970 |
| Freddie Mac Gold Pool 4% 3/1/2049 | | 3,461 | 3,200 |
| Freddie Mac Gold Pool 4% 3/1/2049 | | 81,235 | 75,125 |
| Freddie Mac Gold Pool 4% 3/1/2049 | | 6,647 | 6,145 |
| Freddie Mac Gold Pool 4% 4/1/2035 | | 43,042 | 41,600 |
| Freddie Mac Gold Pool 4% 4/1/2043 | | 3,862 | 3,636 |
| Freddie Mac Gold Pool 4% 4/1/2046 | | 25,470 | 23,721 |
| Freddie Mac Gold Pool 4% 4/1/2049 | | 11,432 | 10,568 |
| Freddie Mac Gold Pool 4% 4/1/2050 | | 10,888 | 10,052 |
| Freddie Mac Gold Pool 4% 5/1/2037 | | 323,468 | 307,625 |
| Freddie Mac Gold Pool 4% 5/1/2048 | | 120,910 | 112,344 |
| Freddie Mac Gold Pool 4% 5/1/2048 | | 178,544 | 165,616 |
| Freddie Mac Gold Pool 4% 5/1/2049 | | 5,549 | 5,130 |
| Freddie Mac Gold Pool 4% 5/1/2049 | | 4,313 | 3,988 |
| Freddie Mac Gold Pool 4% 5/1/2050 | | 65,761 | 60,671 |
| Freddie Mac Gold Pool 4% 5/1/2051 | | 9,199 | 8,424 |
| Freddie Mac Gold Pool 4% 6/1/2044 | | 3,441 | 3,296 |
| Freddie Mac Gold Pool 4% 6/1/2049 | | 6,170 | 5,704 |
| Freddie Mac Gold Pool 4% 7/1/2048 | | 11,445 | 10,592 |
| Freddie Mac Gold Pool 4% 7/1/2049 | | 12,084 | 11,171 |
| Freddie Mac Gold Pool 4% 7/1/2049 | | 7,562 | 6,991 |
| Freddie Mac Gold Pool 4% 8/1/2033 | | 3,937 | 3,811 |
| Freddie Mac Gold Pool 4% 8/1/2048 | | 13,621 | 12,605 |
| Freddie Mac Gold Pool 4% 8/1/2049 | | 324,986 | 300,440 |
| Freddie Mac Gold Pool 4% 8/1/2049 | | 85,406 | 78,928 |
| Freddie Mac Gold Pool 4% 9/1/2041 | | 9,244 | 8,735 |
| Freddie Mac Gold Pool 4% 9/1/2048 | | 20,797 | 19,304 |
| Freddie Mac Gold Pool 4% 9/1/2049 | | 41,090 | 37,974 |
| Freddie Mac Gold Pool 4.5% 1/1/2041 | | 17,214 | 16,759 |
| Freddie Mac Gold Pool 4.5% 1/1/2041 | | 3,550 | 3,463 |
| Freddie Mac Gold Pool 4.5% 1/1/2042 | | 155,112 | 150,907 |
| Freddie Mac Gold Pool 4.5% 1/1/2044 | | 41,435 | 40,059 |
| Freddie Mac Gold Pool 4.5% 1/1/2049 | | 31,582 | 30,139 |
| Freddie Mac Gold Pool 4.5% 1/1/2049 | | 2,616 | 2,497 |
| Freddie Mac Gold Pool 4.5% 1/1/2049 | | 104,177 | 99,282 |
| Freddie Mac Gold Pool 4.5% 1/1/2049 | | 5,491 | 5,233 |
| Freddie Mac Gold Pool 4.5% 10/1/2039 | | 3,966 | 3,872 |
| Freddie Mac Gold Pool 4.5% 10/1/2040 | | 9,522 | 9,258 |
| Freddie Mac Gold Pool 4.5% 10/1/2041 | | 79,542 | 77,285 |
| Freddie Mac Gold Pool 4.5% 10/1/2041 | | 1,936 | 1,888 |
| Freddie Mac Gold Pool 4.5% 10/1/2043 | | 12,634 | 12,215 |
| Freddie Mac Gold Pool 4.5% 10/1/2048 | | 4,877 | 4,655 |
| Freddie Mac Gold Pool 4.5% 10/1/2048 | | 12,619 | 12,046 |
| Freddie Mac Gold Pool 4.5% 10/1/2048 | | 8,867 | 8,453 |
| Freddie Mac Gold Pool 4.5% 10/1/2048 | | 266,874 | 256,012 |
| Freddie Mac Gold Pool 4.5% 10/1/2049 | | 29,374 | 27,975 |
| Freddie Mac Gold Pool 4.5% 11/1/2039 | | 68,858 | 67,102 |
| Freddie Mac Gold Pool 4.5% 11/1/2041 | | 44,349 | 43,116 |
| Freddie Mac Gold Pool 4.5% 11/1/2044 | | 1,106 | 1,068 |
| Freddie Mac Gold Pool 4.5% 11/1/2047 | | 21,637 | 20,716 |
| Freddie Mac Gold Pool 4.5% 11/1/2047 | | 19,004 | 18,195 |
| Freddie Mac Gold Pool 4.5% 11/1/2048 | | 2,528 | 2,413 |
| Freddie Mac Gold Pool 4.5% 11/1/2049 | | 30,052 | 28,621 |
| Freddie Mac Gold Pool 4.5% 11/1/2049 | | 3,062 | 2,917 |
| Freddie Mac Gold Pool 4.5% 12/1/2040 | | 10,564 | 10,287 |
| Freddie Mac Gold Pool 4.5% 12/1/2043 | | 43,621 | 42,172 |
| Freddie Mac Gold Pool 4.5% 12/1/2044 | | 2,402 | 2,319 |
| Freddie Mac Gold Pool 4.5% 12/1/2045 | | 10,914 | 10,642 |
| Freddie Mac Gold Pool 4.5% 12/1/2046 | | 4,563 | 4,383 |
| Freddie Mac Gold Pool 4.5% 12/1/2047 | | 73,637 | 70,502 |
| Freddie Mac Gold Pool 4.5% 12/1/2048 | | 16,490 | 15,720 |
| Freddie Mac Gold Pool 4.5% 12/1/2048 | | 26,290 | 25,163 |
| Freddie Mac Gold Pool 4.5% 12/1/2048 | | 4,770 | 4,546 |
| Freddie Mac Gold Pool 4.5% 2/1/2041 | | 6,476 | 6,301 |
| Freddie Mac Gold Pool 4.5% 2/1/2041 | | 2,744 | 2,666 |
| Freddie Mac Gold Pool 4.5% 2/1/2041 | | 4,769 | 4,644 |
| Freddie Mac Gold Pool 4.5% 2/1/2041 | | 4,030 | 3,927 |
| Freddie Mac Gold Pool 4.5% 2/1/2041 | | 6,523 | 6,344 |
| Freddie Mac Gold Pool 4.5% 2/1/2041 | | 8,214 | 7,979 |
| Freddie Mac Gold Pool 4.5% 2/1/2044 | | 24,357 | 23,526 |
| Freddie Mac Gold Pool 4.5% 2/1/2047 | | 4,848 | 4,653 |
| Freddie Mac Gold Pool 4.5% 2/1/2047 | | 16,923 | 16,245 |
| Freddie Mac Gold Pool 4.5% 2/1/2048 | | 4,803 | 4,592 |
| Freddie Mac Gold Pool 4.5% 2/1/2049 | | 1,868 | 1,783 |
| Freddie Mac Gold Pool 4.5% 2/1/2049 | | 105,353 | 100,403 |
| Freddie Mac Gold Pool 4.5% 2/1/2049 | | 5,152 | 4,921 |
| Freddie Mac Gold Pool 4.5% 2/1/2050 | | 7,021 | 6,685 |
| Freddie Mac Gold Pool 4.5% 3/1/2041 | | 27,001 | 26,272 |
| Freddie Mac Gold Pool 4.5% 3/1/2041 | | 4,466 | 4,343 |
| Freddie Mac Gold Pool 4.5% 3/1/2041 | | 6,219 | 6,051 |
| Freddie Mac Gold Pool 4.5% 3/1/2044 | | 18,165 | 17,545 |
| Freddie Mac Gold Pool 4.5% 3/1/2044 | | 21,644 | 20,905 |
| Freddie Mac Gold Pool 4.5% 3/1/2044 | | 24,931 | 24,080 |
| Freddie Mac Gold Pool 4.5% 3/1/2044 | | 8,811 | 8,510 |
| Freddie Mac Gold Pool 4.5% 3/1/2049 | | 89,132 | 84,944 |
| Freddie Mac Gold Pool 4.5% 3/1/2049 | | 1,040 | 992 |
| Freddie Mac Gold Pool 4.5% 3/1/2050 | | 22,442 | 21,367 |
| Freddie Mac Gold Pool 4.5% 4/1/2041 | | 44,279 | 43,069 |
| Freddie Mac Gold Pool 4.5% 4/1/2041 | | 11,169 | 10,847 |
| Freddie Mac Gold Pool 4.5% 4/1/2041 | | 10,999 | 10,694 |
| Freddie Mac Gold Pool 4.5% 4/1/2044 | | 17,064 | 16,482 |
| Freddie Mac Gold Pool 4.5% 4/1/2044 | | 1,913 | 1,848 |
| Freddie Mac Gold Pool 4.5% 4/1/2047 | | 12,313 | 11,797 |
| Freddie Mac Gold Pool 4.5% 4/1/2048 | | 13,438 | 12,866 |
| Freddie Mac Gold Pool 4.5% 4/1/2048 | | 13,157 | 12,593 |
| Freddie Mac Gold Pool 4.5% 4/1/2048 | | 41,123 | 39,359 |
| Freddie Mac Gold Pool 4.5% 4/1/2048 | | 14,817 | 14,158 |
| Freddie Mac Gold Pool 4.5% 4/1/2048 | | 3,968 | 3,793 |
| Freddie Mac Gold Pool 4.5% 4/1/2049 | | 27,303 | 26,012 |
| Freddie Mac Gold Pool 4.5% 4/1/2049 | | 2,198 | 2,098 |
| Freddie Mac Gold Pool 4.5% 4/1/2049 | | 15,522 | 14,788 |
| Freddie Mac Gold Pool 4.5% 4/1/2050 | | 52,590 | 50,070 |
| Freddie Mac Gold Pool 4.5% 5/1/2039 | | 43,101 | 42,061 |
| Freddie Mac Gold Pool 4.5% 5/1/2041 | | 11,659 | 11,323 |
| Freddie Mac Gold Pool 4.5% 5/1/2041 | | 11,910 | 11,575 |
| Freddie Mac Gold Pool 4.5% 5/1/2044 | | 6,324 | 6,108 |
| Freddie Mac Gold Pool 4.5% 5/1/2047 | | 42,642 | 40,907 |
| Freddie Mac Gold Pool 4.5% 5/1/2047 | | 13,786 | 13,233 |
| Freddie Mac Gold Pool 4.5% 5/1/2047 | | 31,795 | 30,521 |
| Freddie Mac Gold Pool 4.5% 5/1/2048 | | 26,871 | 25,719 |
| Freddie Mac Gold Pool 4.5% 5/1/2048 | | 126,856 | 121,098 |
| Freddie Mac Gold Pool 4.5% 5/1/2049 | | 51,795 | 49,345 |
| Freddie Mac Gold Pool 4.5% 6/1/2025 | | 91 | 90 |
| Freddie Mac Gold Pool 4.5% 6/1/2041 | | 12,592 | 12,268 |
| Freddie Mac Gold Pool 4.5% 6/1/2041 | | 7,896 | 7,695 |
| Freddie Mac Gold Pool 4.5% 6/1/2041 | | 9,190 | 8,926 |
| Freddie Mac Gold Pool 4.5% 6/1/2041 | | 3,869 | 3,777 |
| Freddie Mac Gold Pool 4.5% 6/1/2047 | | 20,212 | 19,421 |
| Freddie Mac Gold Pool 4.5% 6/1/2047 | | 10,070 | 9,657 |
| Freddie Mac Gold Pool 4.5% 6/1/2047 | | 61,001 | 58,518 |
| Freddie Mac Gold Pool 4.5% 6/1/2048 | | 6,157 | 5,878 |
| Freddie Mac Gold Pool 4.5% 6/1/2048 | | 20,312 | 19,390 |
| Freddie Mac Gold Pool 4.5% 6/1/2049 | | 9,250 | 8,812 |
| Freddie Mac Gold Pool 4.5% 6/1/2049 | | 10,792 | 10,281 |
| Freddie Mac Gold Pool 4.5% 7/1/2025 | | 1,234 | 1,232 |
| Freddie Mac Gold Pool 4.5% 7/1/2030 | | 705 | 700 |
| Freddie Mac Gold Pool 4.5% 7/1/2039 | | 26,836 | 26,169 |
| Freddie Mac Gold Pool 4.5% 7/1/2041 | | 18,927 | 18,389 |
| Freddie Mac Gold Pool 4.5% 7/1/2041 | | 160,859 | 156,170 |
| Freddie Mac Gold Pool 4.5% 7/1/2047 | | 12,768 | 12,188 |
| Freddie Mac Gold Pool 4.5% 7/1/2047 | | 40,326 | 38,646 |
| Freddie Mac Gold Pool 4.5% 7/1/2047 | | 25,606 | 24,563 |
| Freddie Mac Gold Pool 4.5% 7/1/2047 | | 15,165 | 14,567 |
| Freddie Mac Gold Pool 4.5% 7/1/2047 | | 34,301 | 32,959 |
| Freddie Mac Gold Pool 4.5% 7/1/2048 | | 4,150 | 3,956 |
| Freddie Mac Gold Pool 4.5% 7/1/2049 | | 6,058 | 5,772 |
| Freddie Mac Gold Pool 4.5% 7/1/2050 | | 9,436 | 8,978 |
| Freddie Mac Gold Pool 4.5% 8/1/2039 | | 5,498 | 5,361 |
| Freddie Mac Gold Pool 4.5% 8/1/2040 | | 1,121 | 1,092 |
| Freddie Mac Gold Pool 4.5% 8/1/2041 | | 986 | 960 |
| Freddie Mac Gold Pool 4.5% 8/1/2041 | | 13,733 | 13,356 |
| Freddie Mac Gold Pool 4.5% 8/1/2047 | | 112,055 | 107,389 |
| Freddie Mac Gold Pool 4.5% 8/1/2048 | | 72,794 | 69,490 |
| Freddie Mac Gold Pool 4.5% 8/1/2049 | | 6,072 | 5,785 |
| Freddie Mac Gold Pool 4.5% 9/1/2025 | | 12 | 11 |
| Freddie Mac Gold Pool 4.5% 9/1/2041 | | 103,667 | 100,813 |
| Freddie Mac Gold Pool 4.5% 9/1/2041 | | 18,726 | 18,216 |
| Freddie Mac Gold Pool 4.5% 9/1/2046 | | 4,295 | 4,129 |
| Freddie Mac Gold Pool 4.5% 9/1/2047 | | 10,428 | 9,994 |
| Freddie Mac Gold Pool 4.5% 9/1/2047 | | 14,251 | 13,658 |
| Freddie Mac Gold Pool 4.5% 9/1/2048 | | 67,733 | 64,658 |
| Freddie Mac Gold Pool 4.5% 9/1/2048 | | 40,166 | 38,343 |
| Freddie Mac Gold Pool 4.5% 9/1/2049 | | 7,012 | 6,678 |
| Freddie Mac Gold Pool 4.5% 9/1/2050 | | 11,377 | 10,824 |
| Freddie Mac Gold Pool 5% 1/1/2039 | | 315 | 315 |
| Freddie Mac Gold Pool 5% 1/1/2040 | | 17,614 | 17,613 |
| Freddie Mac Gold Pool 5% 1/1/2049 | | 15,693 | 15,410 |
| Freddie Mac Gold Pool 5% 1/1/2049 | | 3,565 | 3,501 |
| Freddie Mac Gold Pool 5% 1/1/2053 | | 654,025 | 634,650 |
| Freddie Mac Gold Pool 5% 10/1/2038 | | 593 | 593 |
| Freddie Mac Gold Pool 5% 10/1/2048 | | 3,777 | 3,708 |
| Freddie Mac Gold Pool 5% 10/1/2048 | | 12,929 | 12,696 |
| Freddie Mac Gold Pool 5% 11/1/2038 | | 1,426 | 1,426 |
| Freddie Mac Gold Pool 5% 11/1/2038 | | 1,150 | 1,150 |
| Freddie Mac Gold Pool 5% 11/1/2048 | | 14,099 | 13,844 |
| Freddie Mac Gold Pool 5% 11/1/2052 | | 1,475,524 | 1,437,346 |
| Freddie Mac Gold Pool 5% 11/1/2052 | | 443,653 | 433,006 |
| Freddie Mac Gold Pool 5% 12/1/2036 | | 1,725 | 1,727 |
| Freddie Mac Gold Pool 5% 12/1/2038 | | 13,503 | 13,511 |
| Freddie Mac Gold Pool 5% 12/1/2038 | | 419 | 420 |
| Freddie Mac Gold Pool 5% 12/1/2048 | | 19,679 | 19,324 |
| Freddie Mac Gold Pool 5% 12/1/2048 | | 40,138 | 39,413 |
| Freddie Mac Gold Pool 5% 12/1/2052 | | 2,027,115 | 1,974,032 |
| Freddie Mac Gold Pool 5% 12/1/2052 | | 1,846,354 | 1,796,851 |
| Freddie Mac Gold Pool 5% 12/1/2052 | | 192,158 | 187,006 |
| Freddie Mac Gold Pool 5% 2/1/2037 | | 1,004 | 1,005 |
| Freddie Mac Gold Pool 5% 2/1/2038 | | 3,416 | 3,418 |
| Freddie Mac Gold Pool 5% 2/1/2038 | | 365 | 365 |
| Freddie Mac Gold Pool 5% 2/1/2038 | | 19,425 | 19,466 |
| Freddie Mac Gold Pool 5% 2/1/2039 | | 378 | 378 |
| Freddie Mac Gold Pool 5% 2/1/2039 | | 13,297 | 13,300 |
| Freddie Mac Gold Pool 5% 2/1/2049 | | 68,673 | 67,523 |
| Freddie Mac Gold Pool 5% 2/1/2049 | | 9,670 | 9,496 |
| Freddie Mac Gold Pool 5% 2/1/2049 | | 6,579 | 6,460 |
| Freddie Mac Gold Pool 5% 2/1/2050 | | 13,639 | 13,363 |
| Freddie Mac Gold Pool 5% 3/1/2038 | | 1,280 | 1,282 |
| Freddie Mac Gold Pool 5% 3/1/2039 | | 495 | 496 |
| Freddie Mac Gold Pool 5% 4/1/2038 | | 7,161 | 7,165 |
| Freddie Mac Gold Pool 5% 4/1/2038 | | 425 | 425 |
| Freddie Mac Gold Pool 5% 4/1/2038 | | 5,333 | 5,334 |
| Freddie Mac Gold Pool 5% 4/1/2040 | | 24,693 | 24,663 |
| Freddie Mac Gold Pool 5% 4/1/2049 | | 9,898 | 9,701 |
| Freddie Mac Gold Pool 5% 5/1/2028 | | 598 | 600 |
| Freddie Mac Gold Pool 5% 5/1/2035 | | 15,531 | 15,561 |
| Freddie Mac Gold Pool 5% 5/1/2040 | | 2,367 | 2,367 |
| Freddie Mac Gold Pool 5% 5/1/2050 | | 62,248 | 60,968 |
| Freddie Mac Gold Pool 5% 5/1/2054 | | 571,499 | 551,310 |
| Freddie Mac Gold Pool 5% 6/1/2037 | | 306 | 306 |
| Freddie Mac Gold Pool 5% 6/1/2038 | | 706 | 706 |
| Freddie Mac Gold Pool 5% 6/1/2038 | | 8,874 | 8,877 |
| Freddie Mac Gold Pool 5% 6/1/2038 | | 2,144 | 2,146 |
| Freddie Mac Gold Pool 5% 6/1/2040 | | 8,476 | 8,466 |
| Freddie Mac Gold Pool 5% 6/1/2041 | | 43,585 | 43,521 |
| Freddie Mac Gold Pool 5% 6/1/2052 | | 187,013 | 182,642 |
| Freddie Mac Gold Pool 5% 7/1/2040 | | 6,108 | 6,110 |
| Freddie Mac Gold Pool 5% 7/1/2048 | | 16,819 | 16,258 |
| Freddie Mac Gold Pool 5% 7/1/2048 | | 14,337 | 13,858 |
| Freddie Mac Gold Pool 5% 8/1/2037 | | 692 | 693 |
| Freddie Mac Gold Pool 5% 8/1/2038 | | 1,766 | 1,766 |
| Freddie Mac Gold Pool 5% 8/1/2038 | | 1,664 | 1,666 |
| Freddie Mac Gold Pool 5% 8/1/2040 | | 1,556 | 1,554 |
| Freddie Mac Gold Pool 5% 8/1/2040 | | 42,535 | 42,484 |
| Freddie Mac Gold Pool 5% 8/1/2040 | | 28,305 | 28,310 |
| Freddie Mac Gold Pool 5% 8/1/2048 | | 30,070 | 29,574 |
| Freddie Mac Gold Pool 5% 8/1/2049 | | 3,853 | 3,776 |
| Freddie Mac Gold Pool 5% 9/1/2038 | | 28,363 | 28,374 |
| Freddie Mac Gold Pool 5% 9/1/2039 | | 19,244 | 19,249 |
| Freddie Mac Gold Pool 5% 9/1/2039 | | 561 | 560 |
| Freddie Mac Gold Pool 5% 9/1/2039 | | 25,122 | 25,132 |
| Freddie Mac Gold Pool 5% 9/1/2049 | | 11,346 | 11,116 |
| Freddie Mac Gold Pool 5.5% 1/1/2036 | | 4,563 | 4,671 |
| Freddie Mac Gold Pool 5.5% 1/1/2037 | | 588 | 602 |
| Freddie Mac Gold Pool 5.5% 1/1/2037 | | 469 | 480 |
| Freddie Mac Gold Pool 5.5% 1/1/2038 | | 752 | 771 |
| Freddie Mac Gold Pool 5.5% 1/1/2038 | | 1,874 | 1,917 |
| Freddie Mac Gold Pool 5.5% 1/1/2039 | | 889 | 912 |
| Freddie Mac Gold Pool 5.5% 1/1/2039 | | 9,630 | 9,856 |
| Freddie Mac Gold Pool 5.5% 1/1/2041 | | 1,737 | 1,776 |
| Freddie Mac Gold Pool 5.5% 10/1/2033 | | 342 | 350 |
| Freddie Mac Gold Pool 5.5% 10/1/2035 | | 2,092 | 2,142 |
| Freddie Mac Gold Pool 5.5% 11/1/2028 | | 406 | 411 |
| Freddie Mac Gold Pool 5.5% 11/1/2037 | | 1,615 | 1,653 |
| Freddie Mac Gold Pool 5.5% 11/1/2038 | | 347 | 355 |
| Freddie Mac Gold Pool 5.5% 12/1/2037 | | 132 | 135 |
| Freddie Mac Gold Pool 5.5% 12/1/2039 | | 4,334 | 4,432 |
| Freddie Mac Gold Pool 5.5% 2/1/2038 | | 353 | 361 |
| Freddie Mac Gold Pool 5.5% 2/1/2039 | | 484 | 495 |
| Freddie Mac Gold Pool 5.5% 2/1/2054 | | 446,503 | 441,062 |
| Freddie Mac Gold Pool 5.5% 3/1/2034 | | 21,091 | 21,559 |
| Freddie Mac Gold Pool 5.5% 3/1/2037 | | 181 | 186 |
| Freddie Mac Gold Pool 5.5% 3/1/2038 | | 643 | 658 |
| Freddie Mac Gold Pool 5.5% 3/1/2039 | | 42,362 | 43,317 |
| Freddie Mac Gold Pool 5.5% 3/1/2039 | | 1,190 | 1,217 |
| Freddie Mac Gold Pool 5.5% 3/1/2053 (k)(m) | | 1,732,494 | 1,733,578 |
| Freddie Mac Gold Pool 5.5% 4/1/2027 | | 23 | 22 |
| Freddie Mac Gold Pool 5.5% 4/1/2038 | | 332 | 339 |
| Freddie Mac Gold Pool 5.5% 4/1/2038 | | 279 | 286 |
| Freddie Mac Gold Pool 5.5% 4/1/2038 | | 3,973 | 4,063 |
| Freddie Mac Gold Pool 5.5% 4/1/2038 | | 638 | 653 |
| Freddie Mac Gold Pool 5.5% 4/1/2039 | | 3,164 | 3,235 |
| Freddie Mac Gold Pool 5.5% 4/1/2040 | | 9,744 | 9,957 |
| Freddie Mac Gold Pool 5.5% 5/1/2028 | | 196 | 198 |
| Freddie Mac Gold Pool 5.5% 5/1/2036 | | 349 | 357 |
| Freddie Mac Gold Pool 5.5% 5/1/2037 | | 97 | 99 |
| Freddie Mac Gold Pool 5.5% 5/1/2037 | | 343 | 352 |
| Freddie Mac Gold Pool 5.5% 5/1/2037 | | 12,391 | 12,694 |
| Freddie Mac Gold Pool 5.5% 5/1/2038 | | 291 | 297 |
| Freddie Mac Gold Pool 5.5% 5/1/2038 | | 6,760 | 6,914 |
| Freddie Mac Gold Pool 5.5% 5/1/2038 | | 260 | 265 |
| Freddie Mac Gold Pool 5.5% 5/1/2038 | | 259 | 265 |
| Freddie Mac Gold Pool 5.5% 5/1/2053 | | 989,232 | 983,668 |
| Freddie Mac Gold Pool 5.5% 6/1/2027 | | 502 | 506 |
| Freddie Mac Gold Pool 5.5% 6/1/2038 | | 400 | 410 |
| Freddie Mac Gold Pool 5.5% 6/1/2038 | | 834 | 853 |
| Freddie Mac Gold Pool 5.5% 6/1/2038 | | 474 | 485 |
| Freddie Mac Gold Pool 5.5% 6/1/2038 | | 3,095 | 3,165 |
| Freddie Mac Gold Pool 5.5% 6/1/2041 | | 14,559 | 14,925 |
| Freddie Mac Gold Pool 5.5% 6/1/2041 | | 7,454 | 7,635 |
| Freddie Mac Gold Pool 5.5% 6/1/2041 | | 23,744 | 24,280 |
| Freddie Mac Gold Pool 5.5% 6/1/2049 | | 113,616 | 114,433 |
| Freddie Mac Gold Pool 5.5% 7/1/2028 | | 220 | 222 |
| Freddie Mac Gold Pool 5.5% 7/1/2035 | | 13,353 | 13,648 |
| Freddie Mac Gold Pool 5.5% 7/1/2036 | | 6,335 | 6,488 |
| Freddie Mac Gold Pool 5.5% 7/1/2038 | | 323 | 331 |
| Freddie Mac Gold Pool 5.5% 7/1/2038 | | 212 | 217 |
| Freddie Mac Gold Pool 5.5% 8/1/2038 | | 321 | 329 |
| Freddie Mac Gold Pool 5.5% 8/1/2038 | | 541 | 554 |
| Freddie Mac Gold Pool 5.5% 8/1/2038 | | 763 | 782 |
| Freddie Mac Gold Pool 5.5% 8/1/2039 | | 5,822 | 5,958 |
| Freddie Mac Gold Pool 5.5% 8/1/2040 | | 1,282 | 1,311 |
| Freddie Mac Gold Pool 5.5% 9/1/2038 | | 385 | 394 |
| Freddie Mac Gold Pool 5.5% 9/1/2038 | | 4,590 | 4,694 |
| Freddie Mac Gold Pool 5.5% 9/1/2038 | | 619 | 633 |
| Freddie Mac Gold Pool 5.5% 9/1/2040 | | 19,831 | 20,259 |
| Freddie Mac Gold Pool 6% 11/1/2053 | | 268,846 | 272,068 |
| Freddie Mac Gold Pool 6% 4/1/2032 | | 21,299 | 21,891 |
| Freddie Mac Gold Pool 6% 4/1/2054 | | 1,290,199 | 1,314,532 |
| Freddie Mac Gold Pool 6% 5/1/2033 | | 4,885 | 5,008 |
| Freddie Mac Gold Pool 6% 7/1/2037 | | 758 | 788 |
| Freddie Mac Gold Pool 6% 7/1/2054 | | 7,151,520 | 7,185,830 |
| Freddie Mac Gold Pool 6% 8/1/2037 | | 8,543 | 8,866 |
| Freddie Mac Gold Pool 6.5% 1/1/2054 | | 1,552,541 | 1,607,439 |
| Freddie Mac Gold Pool 6.5% 10/1/2037 | | 390 | 410 |
| Freddie Mac Gold Pool 6.5% 10/1/2053 | | 445,167 | 459,934 |
| Freddie Mac Gold Pool 6.5% 10/1/2053 | | 432,841 | 448,011 |
| Freddie Mac Gold Pool 6.5% 11/1/2036 | | 199 | 209 |
| Freddie Mac Gold Pool 6.5% 12/1/2037 | | 326 | 343 |
| Freddie Mac Gold Pool 6.5% 6/1/2054 | | 286,800 | 299,003 |
| Freddie Mac Gold Pool 6.5% 7/1/2054 | | 3,950,000 | 4,034,126 |
| Freddie Mac Gold Pool 6.5% 9/1/2037 | | 240 | 250 |
| Freddie Mac Gold Pool 6.5% 9/1/2053 | | 327,838 | 338,713 |
| Freddie Mac Gold Pool 6.5% 9/1/2053 | | 342,480 | 355,018 |
| Freddie Mac Gold Pool 6.5% 9/1/2054 | | 332,105 | 346,365 |
| Freddie Mac Gold Pool 7.5% 1/1/2027 | | 35 | 34 |
| Freddie Mac Gold Pool 7.5% 10/1/2027 | | 7 | 6 |
| Freddie Mac Gold Pool 7.5% 11/1/2029 | | 308 | 321 |
| Freddie Mac Gold Pool 7.5% 2/1/2028 | | 17 | 16 |
| Freddie Mac Gold Pool 7.5% 8/1/2026 | | 5 | 4 |
| Freddie Mac Gold Pool 7.5% 9/1/2031 | | 557 | 587 |
| Freddie Mac Gold Pool 8% 5/1/2027 | | 12 | 11 |
| Freddie Mac Gold Pool 8.5% 1/1/2028 | | 35 | 35 |
| Freddie Mac Gold Pool 8.5% 5/1/2027 | | 10 | 9 |
| Freddie Mac Non Gold Pool 1 year FTSE USD IBOR Consumer Fallbacks + 1.375%, 6.382% 3/1/2036 (b)(c) | | 3,880 | 3,914 |
| Freddie Mac Non Gold Pool 1 year FTSE USD IBOR Consumer Fallbacks + 1.88%, 7.255% 4/1/2041 (b)(c) | | 653 | 666 |
| Freddie Mac Non Gold Pool 1 year FTSE USD IBOR Consumer Fallbacks + 1.88%, 7.601% 9/1/2041 (b)(c) | | 2,796 | 2,858 |
| Freddie Mac Non Gold Pool 1 year FTSE USD IBOR Consumer Fallbacks + 1.902%, 7.343% 9/1/2037 (b)(c) | | 1,913 | 1,954 |
| Freddie Mac Non Gold Pool 1 year FTSE USD IBOR Consumer Fallbacks + 1.91%, 7.156% 5/1/2041 (b)(c) | | 5,295 | 5,416 |
| Freddie Mac Non Gold Pool 1 year FTSE USD IBOR Consumer Fallbacks + 1.91%, 7.485% 5/1/2041 (b)(c) | | 3,622 | 3,702 |
| Freddie Mac Non Gold Pool 1 year FTSE USD IBOR Consumer Fallbacks + 1.91%, 7.628% 6/1/2041 (b)(c) | | 5,081 | 5,191 |
| Freddie Mac Non Gold Pool 1 year FTSE USD IBOR Consumer Fallbacks + 1.91%, 7.785% 6/1/2041 (b)(c) | | 1,447 | 1,478 |
| Freddie Mac Non Gold Pool 1 year FTSE USD IBOR Consumer Fallbacks + 2.031%, 7.658% 3/1/2033 (b)(c) | | 56 | 56 |
| Freddie Mac Non Gold Pool 1 year FTSE USD IBOR Consumer Fallbacks + 2.16%, 6.785% 11/1/2035 (b)(c) | | 279 | 285 |
| Freddie Mac Non Gold Pool 1 year U.S. Treasury Index + 1.7%, 6.014% 3/1/2036 (b)(c) | | 29,952 | 30,081 |
| Freddie Mac Non Gold Pool 1 year U.S. Treasury Index + 2.231%, 6.597% 12/1/2035 (b)(c) | | 12,991 | 13,179 |
| Freddie Mac Non Gold Pool 1 year U.S. Treasury Index + 2.247%, 6.371% 1/1/2035 (b)(c) | | 427 | 433 |
| Freddie Mac Non Gold Pool 1 year U.S. Treasury Index + 2.25%, 6.452% 3/1/2035 (b)(c) | | 7,053 | 7,147 |
| Freddie Mac Non Gold Pool 4.5% 9/1/2040 | | 24,548 | 23,865 |
| Freddie Mac Non Gold Pool 5% 8/1/2053 | | 456,996 | 442,744 |
| Freddie Mac Non Gold Pool 5% 9/1/2040 | | 4,133 | 4,127 |
| Freddie Mac Non Gold Pool 5.5% 8/1/2053 | | 568,772 | 566,640 |
| Freddie Mac Non Gold Pool 5.5% 8/1/2053 | | 901,300 | 897,921 |
| Freddie Mac Non Gold Pool 6 month FTSE USD IBOR Consumer Fallbacks + 1.655%, 7.071% 4/1/2035 (b)(c) | | 3,910 | 3,942 |
| Freddie Mac Non Gold Pool 6 month FTSE USD IBOR Consumer Fallbacks + 2.96%, 8.46% 10/1/2035 (b)(c) | | 179 | 183 |
| Freddie Mac Non Gold Pool 6% 6/1/2053 | | 632,913 | 643,070 |
| Freddie Mac Non Gold Pool 6% 6/1/2053 | | 536,519 | 544,961 |
| Freddie Mac Non Gold Pool 6% 6/1/2053 | | 624,605 | 633,457 |
| Freddie Mac Non Gold Pool 6% 7/1/2053 | | 482,859 | 490,457 |
| Freddie Mac Non Gold Pool 6% 7/1/2053 | | 548,433 | 557,234 |
| Freddie Mac Non Gold Pool 6% 9/1/2053 | | 503,304 | 509,336 |
| Ginnie Mae I Pool 2.5% 1/20/2052 | | 722,429 | 596,639 |
| Ginnie Mae I Pool 2.5% 12/20/2051 | | 1,118,244 | 923,535 |
| Ginnie Mae I Pool 2.5% 12/20/2051 | | 580,999 | 479,835 |
| Ginnie Mae I Pool 2.5% 8/20/2051 | | 4,144,862 | 3,423,156 |
| Ginnie Mae I Pool 2.5% 8/20/2051 | | 1,081,660 | 894,335 |
| Ginnie Mae I Pool 2.5% 9/20/2051 | | 1,295,120 | 1,069,614 |
| Ginnie Mae I Pool 2.5% 9/20/2051 | | 1,074,605 | 887,494 |
| Ginnie Mae I Pool 3% 1/15/2043 | | 6,419 | 5,667 |
| Ginnie Mae I Pool 3% 10/20/2042 | | 377,779 | 337,288 |
| Ginnie Mae I Pool 3% 12/20/2042 | | 263,431 | 235,402 |
| Ginnie Mae I Pool 3% 2/15/2045 | | 8,171 | 7,166 |
| Ginnie Mae I Pool 3% 2/15/2045 | | 3,733 | 3,274 |
| Ginnie Mae I Pool 3% 2/20/2046 | | 6,414 | 5,635 |
| Ginnie Mae I Pool 3% 3/15/2045 | | 3,005 | 2,636 |
| Ginnie Mae I Pool 3% 3/15/2045 | | 3,297 | 2,892 |
| Ginnie Mae I Pool 3% 3/15/2045 | | 20,318 | 17,821 |
| Ginnie Mae I Pool 3% 3/15/2045 | | 9,944 | 8,721 |
| Ginnie Mae I Pool 3% 3/15/2045 | | 4,728 | 4,147 |
| Ginnie Mae I Pool 3% 3/15/2045 | | 9,489 | 8,323 |
| Ginnie Mae I Pool 3% 3/15/2045 | | 1,847 | 1,620 |
| Ginnie Mae I Pool 3% 3/15/2045 | | 7,693 | 6,747 |
| Ginnie Mae I Pool 3% 3/15/2045 | | 7,094 | 6,222 |
| Ginnie Mae I Pool 3% 3/20/2043 | | 176,538 | 157,775 |
| Ginnie Mae I Pool 3% 3/20/2043 | | 74,666 | 66,782 |
| Ginnie Mae I Pool 3% 5/15/2045 | | 5,143 | 4,511 |
| Ginnie Mae I Pool 3% 6/15/2043 | | 9,520 | 8,384 |
| Ginnie Mae I Pool 3% 6/15/2043 | | 8,458 | 7,496 |
| Ginnie Mae I Pool 3% 6/15/2043 | | 52,576 | 46,473 |
| Ginnie Mae I Pool 3% 6/15/2045 | | 5,280 | 4,631 |
| Ginnie Mae I Pool 3% 7/15/2042 | | 2,446 | 2,194 |
| Ginnie Mae I Pool 3% 7/15/2043 | | 15,354 | 13,577 |
| Ginnie Mae I Pool 3% 7/15/2045 | | 6,115 | 5,363 |
| Ginnie Mae I Pool 3% 7/15/2045 | | 2,553 | 2,239 |
| Ginnie Mae I Pool 3% 7/15/2045 | | 2,212 | 1,940 |
| Ginnie Mae I Pool 3% 7/15/2045 | | 12,552 | 11,009 |
| Ginnie Mae I Pool 3% 7/15/2045 | | 5,762 | 5,054 |
| Ginnie Mae I Pool 3.5% 1/15/2041 | | 2,191 | 2,010 |
| Ginnie Mae I Pool 3.5% 1/15/2041 | | 2,018 | 1,861 |
| Ginnie Mae I Pool 3.5% 1/15/2041 | | 14,819 | 13,645 |
| Ginnie Mae I Pool 3.5% 1/15/2042 | | 5,081 | 4,636 |
| Ginnie Mae I Pool 3.5% 1/20/2050 | | 22,019 | 19,706 |
| Ginnie Mae I Pool 3.5% 1/20/2050 | | 77,844 | 69,400 |
| Ginnie Mae I Pool 3.5% 1/20/2050 | | 39,727 | 35,666 |
| Ginnie Mae I Pool 3.5% 1/20/2050 | | 38,783 | 34,710 |
| Ginnie Mae I Pool 3.5% 11/15/2041 | | 14,997 | 13,724 |
| Ginnie Mae I Pool 3.5% 11/15/2042 | | 45,320 | 41,381 |
| Ginnie Mae I Pool 3.5% 12/15/2040 | | 2,314 | 2,126 |
| Ginnie Mae I Pool 3.5% 12/20/2049 | | 4,511 | 4,022 |
| Ginnie Mae I Pool 3.5% 12/20/2049 | | 1,043 | 930 |
| Ginnie Mae I Pool 3.5% 12/20/2049 | | 3,494 | 3,137 |
| Ginnie Mae I Pool 3.5% 12/20/2049 | | 9,912 | 8,871 |
| Ginnie Mae I Pool 3.5% 2/15/2041 | | 21,598 | 19,792 |
| Ginnie Mae I Pool 3.5% 2/15/2042 | | 9,759 | 8,921 |
| Ginnie Mae I Pool 3.5% 2/15/2042 | | 2,608 | 2,380 |
| Ginnie Mae I Pool 3.5% 2/15/2042 | | 12,033 | 11,017 |
| Ginnie Mae I Pool 3.5% 2/15/2042 | | 19,919 | 18,208 |
| Ginnie Mae I Pool 3.5% 2/15/2043 | | 7,252 | 6,613 |
| Ginnie Mae I Pool 3.5% 2/15/2043 | | 4,369 | 3,974 |
| Ginnie Mae I Pool 3.5% 3/15/2042 | | 3,738 | 3,427 |
| Ginnie Mae I Pool 3.5% 3/15/2042 | | 1,507 | 1,379 |
| Ginnie Mae I Pool 3.5% 3/15/2043 | | 21,257 | 19,314 |
| Ginnie Mae I Pool 3.5% 4/15/2042 | | 3,379 | 3,093 |
| Ginnie Mae I Pool 3.5% 5/15/2042 | | 35,777 | 32,758 |
| Ginnie Mae I Pool 3.5% 5/15/2042 | | 55,558 | 50,913 |
| Ginnie Mae I Pool 3.5% 5/15/2042 | | 8,445 | 7,722 |
| Ginnie Mae I Pool 3.5% 5/15/2042 | | 1,900 | 1,739 |
| Ginnie Mae I Pool 3.5% 5/15/2042 | | 15,036 | 13,722 |
| Ginnie Mae I Pool 3.5% 5/15/2043 | | 4,057 | 3,695 |
| Ginnie Mae I Pool 3.5% 5/15/2043 | | 3,006 | 2,738 |
| Ginnie Mae I Pool 3.5% 5/15/2043 | | 11,525 | 10,523 |
| Ginnie Mae I Pool 3.5% 5/15/2043 | | 8,049 | 7,330 |
| Ginnie Mae I Pool 3.5% 6/15/2042 | | 13,804 | 12,635 |
| Ginnie Mae I Pool 3.5% 6/15/2043 | | 4,290 | 3,917 |
| Ginnie Mae I Pool 3.5% 6/15/2043 | | 13,051 | 11,880 |
| Ginnie Mae I Pool 3.5% 6/20/2042 | | 67,770 | 62,296 |
| Ginnie Mae I Pool 3.5% 7/15/2042 | | 28,073 | 25,654 |
| Ginnie Mae I Pool 3.5% 7/15/2043 | | 31,275 | 28,389 |
| Ginnie Mae I Pool 3.5% 8/15/2042 | | 24,895 | 22,763 |
| Ginnie Mae I Pool 3.5% 8/15/2042 | | 1,173 | 1,071 |
| Ginnie Mae I Pool 3.5% 8/15/2042 | | 90,465 | 82,602 |
| Ginnie Mae I Pool 3.5% 9/15/2041 | | 3,518 | 3,231 |
| Ginnie Mae I Pool 3.5% 9/15/2043 | | 812 | 749 |
| Ginnie Mae I Pool 4% 1/15/2025 | | 4 | 4 |
| Ginnie Mae I Pool 4% 1/15/2025 | | 5 | 5 |
| Ginnie Mae I Pool 4% 1/15/2041 | | 31,767 | 30,105 |
| Ginnie Mae I Pool 4% 1/15/2041 | | 15,508 | 14,702 |
| Ginnie Mae I Pool 4% 10/15/2040 | | 5,186 | 4,923 |
| Ginnie Mae I Pool 4% 10/15/2040 | | 21,166 | 20,080 |
| Ginnie Mae I Pool 4% 10/15/2041 | | 43,728 | 41,365 |
| Ginnie Mae I Pool 4% 10/15/2041 | | 58,036 | 54,972 |
| Ginnie Mae I Pool 4% 10/15/2041 | | 31,264 | 29,628 |
| Ginnie Mae I Pool 4% 10/15/2041 | | 9,819 | 9,319 |
| Ginnie Mae I Pool 4% 10/15/2041 | | 6,953 | 6,583 |
| Ginnie Mae I Pool 4% 10/15/2041 | | 5,157 | 4,885 |
| Ginnie Mae I Pool 4% 10/15/2041 | | 5,190 | 4,919 |
| Ginnie Mae I Pool 4% 10/15/2041 | | 33,853 | 32,018 |
| Ginnie Mae I Pool 4% 11/15/2040 | | 2,481 | 2,352 |
| Ginnie Mae I Pool 4% 11/15/2040 | | 12,203 | 11,551 |
| Ginnie Mae I Pool 4% 11/15/2040 | | 7,899 | 7,486 |
| Ginnie Mae I Pool 4% 11/15/2041 | | 13,695 | 12,970 |
| Ginnie Mae I Pool 4% 12/15/2040 | | 1,049 | 996 |
| Ginnie Mae I Pool 4% 12/15/2040 | | 2,168 | 2,056 |
| Ginnie Mae I Pool 4% 12/15/2041 | | 7,701 | 7,292 |
| Ginnie Mae I Pool 4% 12/15/2041 | | 29,785 | 28,189 |
| Ginnie Mae I Pool 4% 12/15/2041 | | 16,455 | 15,570 |
| Ginnie Mae I Pool 4% 12/15/2041 | | 4,222 | 3,993 |
| Ginnie Mae I Pool 4% 2/15/2041 | | 5,512 | 5,231 |
| Ginnie Mae I Pool 4% 3/15/2040 | | 16,361 | 15,572 |
| Ginnie Mae I Pool 4% 3/15/2041 | | 6,402 | 6,074 |
| Ginnie Mae I Pool 4% 3/15/2042 | | 7,202 | 6,813 |
| Ginnie Mae I Pool 4% 3/15/2044 | | 2,063 | 1,952 |
| Ginnie Mae I Pool 4% 3/20/2047 | | 245,085 | 228,239 |
| Ginnie Mae I Pool 4% 4/15/2040 | | 8,666 | 8,235 |
| Ginnie Mae I Pool 4% 4/15/2045 | | 5,387 | 5,043 |
| Ginnie Mae I Pool 4% 4/15/2046 | | 184,157 | 172,423 |
| Ginnie Mae I Pool 4% 4/20/2047 | | 69,656 | 64,781 |
| Ginnie Mae I Pool 4% 4/20/2047 | | 71,709 | 66,691 |
| Ginnie Mae I Pool 4% 4/20/2048 | | 52,425 | 48,576 |
| Ginnie Mae I Pool 4% 4/20/2048 | | 57,259 | 53,055 |
| Ginnie Mae I Pool 4% 5/15/2040 | | 10,505 | 9,957 |
| Ginnie Mae I Pool 4% 6/15/2039 | | 25,133 | 23,901 |
| Ginnie Mae I Pool 4% 6/15/2045 | | 44,460 | 41,847 |
| Ginnie Mae I Pool 4% 7/15/2040 | | 6,152 | 5,848 |
| Ginnie Mae I Pool 4% 7/15/2041 | | 18,093 | 17,104 |
| Ginnie Mae I Pool 4% 7/15/2041 | | 3,795 | 3,594 |
| Ginnie Mae I Pool 4% 8/15/2041 | | 58,757 | 55,635 |
| Ginnie Mae I Pool 4% 8/15/2041 | | 5,760 | 5,458 |
| Ginnie Mae I Pool 4% 9/15/2025 | | 283 | 282 |
| Ginnie Mae I Pool 4% 9/15/2040 | | 2,706 | 2,567 |
| Ginnie Mae I Pool 4% 9/15/2041 | | 6,656 | 6,301 |
| Ginnie Mae I Pool 4% 9/15/2041 | | 5,300 | 5,022 |
| Ginnie Mae I Pool 4% 9/15/2041 | | 5,131 | 4,866 |
| Ginnie Mae I Pool 4.5% 2/15/2039 | | 3,304 | 3,212 |
| Ginnie Mae I Pool 4.5% 2/15/2040 | | 5,126 | 4,976 |
| Ginnie Mae I Pool 4.5% 3/15/2041 | | 1,136 | 1,102 |
| Ginnie Mae I Pool 4.5% 3/15/2041 | | 100,536 | 97,253 |
| Ginnie Mae I Pool 4.5% 3/15/2041 | | 75,942 | 73,661 |
| Ginnie Mae I Pool 4.5% 3/15/2041 | | 51,640 | 50,106 |
| Ginnie Mae I Pool 4.5% 4/15/2041 | | 10,378 | 10,051 |
| Ginnie Mae I Pool 4.5% 4/20/2053 | | 746,243 | 706,071 |
| Ginnie Mae I Pool 4.5% 5/15/2039 | | 1,672 | 1,625 |
| Ginnie Mae I Pool 4.5% 5/15/2040 | | 9,607 | 9,286 |
| Ginnie Mae I Pool 4.5% 6/15/2040 | | 2,316 | 2,250 |
| Ginnie Mae I Pool 4.5% 6/15/2040 | | 9,544 | 9,265 |
| Ginnie Mae I Pool 4.5% 6/15/2040 | | 31,659 | 30,718 |
| Ginnie Mae I Pool 4.5% 6/15/2040 | | 13,706 | 13,304 |
| Ginnie Mae I Pool 4.5% 7/15/2040 | | 1,092 | 1,057 |
| Ginnie Mae I Pool 4.5% 7/15/2040 | | 21,367 | 20,735 |
| Ginnie Mae I Pool 4.5% 7/15/2040 | | 8,445 | 8,190 |
| Ginnie Mae I Pool 4.5% 7/15/2040 | | 2,619 | 2,540 |
| Ginnie Mae I Pool 4.5% 7/15/2040 | | 11,572 | 11,228 |
| Ginnie Mae I Pool 4.5% 7/20/2041 | | 116,634 | 113,553 |
| Ginnie Mae I Pool 4.5% 8/15/2039 | | 17,362 | 16,868 |
| Ginnie Mae I Pool 4.5% 8/15/2040 | | 6,674 | 6,473 |
| Ginnie Mae I Pool 4.5% 8/15/2040 | | 1,325 | 1,290 |
| Ginnie Mae I Pool 4.5% 9/15/2040 | | 1,197 | 1,160 |
| Ginnie Mae I Pool 5% 10/15/2039 | | 2,206 | 2,190 |
| Ginnie Mae I Pool 5% 10/15/2039 | | 5,124 | 5,084 |
| Ginnie Mae I Pool 5% 11/15/2039 | | 9,065 | 8,988 |
| Ginnie Mae I Pool 5% 11/15/2040 | | 4,439 | 4,404 |
| Ginnie Mae I Pool 5% 11/15/2040 | | 1,751 | 1,734 |
| Ginnie Mae I Pool 5% 12/15/2039 | | 6,026 | 5,978 |
| Ginnie Mae I Pool 5% 2/20/2041 | | 2,550 | 2,548 |
| Ginnie Mae I Pool 5% 3/15/2039 | | 3,006 | 2,985 |
| Ginnie Mae I Pool 5% 3/15/2044 | | 13,954 | 13,847 |
| Ginnie Mae I Pool 5% 4/15/2039 | | 10,226 | 10,151 |
| Ginnie Mae I Pool 5% 4/15/2039 | | 2,693 | 2,675 |
| Ginnie Mae I Pool 5% 4/15/2040 | | 4,558 | 4,521 |
| Ginnie Mae I Pool 5% 4/15/2041 | | 841 | 833 |
| Ginnie Mae I Pool 5% 4/20/2048 | | 154,776 | 153,959 |
| Ginnie Mae I Pool 5% 5/15/2039 | | 11,799 | 11,703 |
| Ginnie Mae I Pool 5% 5/15/2039 | | 4,597 | 4,560 |
| Ginnie Mae I Pool 5% 5/15/2040 | | 5,069 | 5,028 |
| Ginnie Mae I Pool 5% 5/15/2040 | | 2,167 | 2,150 |
| Ginnie Mae I Pool 5% 6/15/2040 | | 6,754 | 6,701 |
| Ginnie Mae I Pool 5% 6/15/2040 | | 3,808 | 3,777 |
| Ginnie Mae I Pool 5% 7/15/2040 | | 22,923 | 22,719 |
| Ginnie Mae I Pool 5% 7/15/2040 | | 5,575 | 5,525 |
| Ginnie Mae I Pool 5% 7/15/2040 | | 4,086 | 4,050 |
| Ginnie Mae I Pool 5% 7/15/2040 | | 12,993 | 12,883 |
| Ginnie Mae I Pool 5% 7/15/2040 | | 24,763 | 24,568 |
| Ginnie Mae I Pool 5% 7/15/2040 | | 18,466 | 18,319 |
| Ginnie Mae I Pool 5% 7/15/2040 | | 14,058 | 13,946 |
| Ginnie Mae I Pool 5% 7/15/2040 | | 13,650 | 13,541 |
| Ginnie Mae I Pool 5% 7/15/2040 | | 12,906 | 12,809 |
| Ginnie Mae I Pool 5% 7/15/2040 | | 3,931 | 3,899 |
| Ginnie Mae I Pool 5% 7/15/2040 | | 5,383 | 5,339 |
| Ginnie Mae I Pool 5% 7/15/2040 | | 3,329 | 3,302 |
| Ginnie Mae I Pool 5% 7/20/2041 | | 2,035 | 2,033 |
| Ginnie Mae I Pool 5% 8/15/2039 | | 6,000 | 5,953 |
| Ginnie Mae I Pool 5% 8/15/2039 | | 8,038 | 7,978 |
| Ginnie Mae I Pool 5% 8/15/2039 | | 13,062 | 12,963 |
| Ginnie Mae I Pool 5% 8/15/2039 | | 4,954 | 4,916 |
| Ginnie Mae I Pool 5% 8/15/2039 | | 1,441 | 1,431 |
| Ginnie Mae I Pool 5% 8/15/2040 | | 9,516 | 9,440 |
| Ginnie Mae I Pool 5% 8/15/2040 | | 7,855 | 7,790 |
| Ginnie Mae I Pool 5% 9/15/2039 | | 18,813 | 18,674 |
| Ginnie Mae I Pool 5% 9/15/2039 | | 6,348 | 6,295 |
| Ginnie Mae I Pool 5% 9/15/2039 | | 6,650 | 6,595 |
| Ginnie Mae I Pool 5% 9/15/2039 | | 18,023 | 17,892 |
| Ginnie Mae I Pool 5% 9/15/2039 | | 3,879 | 3,849 |
| Ginnie Mae I Pool 5% 9/15/2040 | | 3,487 | 3,459 |
| Ginnie Mae I Pool 5% 9/15/2040 | | 5,819 | 5,773 |
| Ginnie Mae I Pool 5% 9/15/2041 | | 72,594 | 72,037 |
| Ginnie Mae I Pool 5.5% 1/15/2038 | | 1,146 | 1,153 |
| Ginnie Mae I Pool 5.5% 10/15/2035 | | 12,917 | 12,995 |
| Ginnie Mae I Pool 5.5% 10/15/2038 | | 405 | 407 |
| Ginnie Mae I Pool 5.5% 11/15/2038 | | 1,839 | 1,850 |
| Ginnie Mae I Pool 5.5% 11/15/2038 | | 4,355 | 4,381 |
| Ginnie Mae I Pool 5.5% 11/15/2038 | | 247 | 249 |
| Ginnie Mae I Pool 5.5% 12/15/2038 | | 11,058 | 11,126 |
| Ginnie Mae I Pool 5.5% 12/20/2041 | | 4,358 | 4,424 |
| Ginnie Mae I Pool 5.5% 2/15/2038 | | 917 | 922 |
| Ginnie Mae I Pool 5.5% 2/15/2039 | | 7,671 | 7,717 |
| Ginnie Mae I Pool 5.5% 2/15/2039 | | 1,864 | 1,875 |
| Ginnie Mae I Pool 5.5% 3/15/2039 | | 25,682 | 25,837 |
| Ginnie Mae I Pool 5.5% 3/15/2039 | | 5,582 | 5,615 |
| Ginnie Mae I Pool 5.5% 4/15/2039 | | 8,102 | 8,150 |
| Ginnie Mae I Pool 5.5% 4/15/2041 | | 906 | 911 |
| Ginnie Mae I Pool 5.5% 5/15/2039 | | 4,132 | 4,156 |
| Ginnie Mae I Pool 5.5% 5/15/2039 | | 10,869 | 10,934 |
| Ginnie Mae I Pool 5.5% 5/20/2045 | | 12,091 | 12,285 |
| Ginnie Mae I Pool 5.5% 6/15/2038 | | 212 | 213 |
| Ginnie Mae I Pool 5.5% 6/15/2038 | | 1,317 | 1,325 |
| Ginnie Mae I Pool 5.5% 8/15/2039 | | 3,525 | 3,546 |
| Ginnie Mae I Pool 5.5% 9/15/2034 | | 440 | 442 |
| Ginnie Mae I Pool 5.5% 9/15/2038 | | 687 | 691 |
| Ginnie Mae I Pool 5.5% 9/15/2039 | | 15,721 | 15,813 |
| Ginnie Mae I Pool 6% 1/15/2038 | | 2,354 | 2,408 |
| Ginnie Mae I Pool 6% 1/15/2038 | | 522 | 535 |
| Ginnie Mae I Pool 6% 10/15/2039 | | 943 | 967 |
| Ginnie Mae I Pool 6% 11/15/2034 | | 9,045 | 9,228 |
| Ginnie Mae I Pool 6% 11/15/2039 | | 2,691 | 2,761 |
| Ginnie Mae I Pool 6% 11/15/2039 | | 1,026 | 1,052 |
| Ginnie Mae I Pool 6% 11/15/2039 | | 2,718 | 2,785 |
| Ginnie Mae I Pool 6% 12/15/2040 | | 2,550 | 2,613 |
| Ginnie Mae I Pool 6% 6/15/2036 | | 17,546 | 17,934 |
| Ginnie Mae I Pool 6% 8/15/2037 | | 529 | 542 |
| Ginnie Mae I Pool 6.5% 1/15/2039 | | 7,334 | 7,549 |
| Ginnie Mae I Pool 6.5% 11/15/2035 | | 1,035 | 1,061 |
| Ginnie Mae I Pool 6.5% 2/15/2038 | | 1,627 | 1,674 |
| Ginnie Mae I Pool 6.5% 4/15/2035 | | 1,348 | 1,381 |
| Ginnie Mae I Pool 6.5% 9/15/2035 | | 3,068 | 3,139 |
| Ginnie Mae I Pool 7% 1/15/2028 | | 227 | 230 |
| Ginnie Mae I Pool 7% 10/15/2031 | | 860 | 879 |
| Ginnie Mae I Pool 7% 12/15/2028 | | 64 | 65 |
| Ginnie Mae I Pool 7% 12/15/2030 | | 1,332 | 1,360 |
| Ginnie Mae I Pool 7% 2/15/2028 | | 1,247 | 1,258 |
| Ginnie Mae I Pool 7% 2/15/2032 | | 89 | 91 |
| Ginnie Mae I Pool 7% 2/15/2032 | | 2,901 | 2,966 |
| Ginnie Mae I Pool 7% 3/15/2028 | | 68 | 69 |
| Ginnie Mae I Pool 7% 3/15/2029 | | 407 | 414 |
| Ginnie Mae I Pool 7% 3/15/2032 | | 1,566 | 1,597 |
| Ginnie Mae I Pool 7% 3/15/2032 | | 1,508 | 1,537 |
| Ginnie Mae I Pool 7% 4/15/2028 | | 138 | 140 |
| Ginnie Mae I Pool 7% 4/15/2029 | | 196 | 199 |
| Ginnie Mae I Pool 7% 4/15/2029 | | 486 | 494 |
| Ginnie Mae I Pool 7% 4/15/2031 | | 257 | 262 |
| Ginnie Mae I Pool 7% 4/15/2032 | | 301 | 307 |
| Ginnie Mae I Pool 7% 4/15/2032 | | 440 | 450 |
| Ginnie Mae I Pool 7% 4/15/2032 | | 3,889 | 3,983 |
| Ginnie Mae I Pool 7% 5/15/2029 | | 420 | 427 |
| Ginnie Mae I Pool 7% 6/15/2028 | | 164 | 167 |
| Ginnie Mae I Pool 7% 6/15/2028 | | 735 | 740 |
| Ginnie Mae I Pool 7% 6/15/2032 | | 34 | 35 |
| Ginnie Mae I Pool 7% 6/15/2032 | | 1,140 | 1,167 |
| Ginnie Mae I Pool 7% 6/15/2032 | | 31 | 32 |
| Ginnie Mae I Pool 7% 6/15/2032 | | 425 | 434 |
| Ginnie Mae I Pool 7% 7/15/2028 | | 264 | 266 |
| Ginnie Mae I Pool 7% 7/15/2031 | | 163 | 167 |
| Ginnie Mae I Pool 7% 7/15/2031 | | 632 | 646 |
| Ginnie Mae I Pool 7% 7/15/2031 | | 284 | 290 |
| Ginnie Mae I Pool 7% 7/15/2032 | | 147 | 151 |
| Ginnie Mae I Pool 7% 7/15/2032 | | 451 | 459 |
| Ginnie Mae I Pool 7% 8/15/2031 | | 46 | 47 |
| Ginnie Mae I Pool 7% 8/15/2031 | | 390 | 399 |
| Ginnie Mae I Pool 7% 8/15/2031 | | 657 | 666 |
| Ginnie Mae I Pool 7% 9/15/2031 | | 584 | 595 |
| Ginnie Mae I Pool 7.5% 10/15/2027 | | 50 | 51 |
| Ginnie Mae I Pool 7.5% 10/15/2027 | | 82 | 83 |
| Ginnie Mae I Pool 7.5% 10/15/2028 | | 842 | 862 |
| Ginnie Mae I Pool 7.5% 12/15/2025 | | 5 | 5 |
| Ginnie Mae I Pool 7.5% 12/15/2027 | | 174 | 178 |
| Ginnie Mae I Pool 7.5% 2/15/2027 | | 56 | 56 |
| Ginnie Mae I Pool 7.5% 3/15/2028 | | 568 | 580 |
| Ginnie Mae I Pool 7.5% 4/15/2027 | | 249 | 252 |
| Ginnie Mae I Pool 7.5% 4/15/2027 | | 192 | 196 |
| Ginnie Mae I Pool 7.5% 4/15/2027 | | 40 | 41 |
| Ginnie Mae I Pool 7.5% 4/15/2027 | | 21 | 21 |
| Ginnie Mae I Pool 7.5% 4/15/2027 | | 20 | 20 |
| Ginnie Mae I Pool 7.5% 4/15/2027 | | 88 | 89 |
| Ginnie Mae I Pool 7.5% 4/15/2027 | | 26 | 26 |
| Ginnie Mae I Pool 7.5% 5/15/2027 | | 28 | 28 |
| Ginnie Mae I Pool 7.5% 6/15/2027 | | 22 | 23 |
| Ginnie Mae I Pool 7.5% 6/15/2027 | | 80 | 81 |
| Ginnie Mae I Pool 7.5% 7/15/2027 | | 172 | 173 |
| Ginnie Mae I Pool 7.5% 8/15/2028 | | 114 | 116 |
| Ginnie Mae I Pool 8% 3/15/2030 | | 270 | 277 |
| Ginnie Mae I Pool 8% 5/15/2030 | | 138 | 142 |
| Ginnie Mae I Pool 8% 9/15/2030 | | 276 | 283 |
| Ginnie Mae II Pool 1.5% 12/20/2051 | | 47,616 | 36,372 |
| Ginnie Mae II Pool 1.5% 3/20/2051 | | 22,127 | 16,930 |
| Ginnie Mae II Pool 1.5% 4/20/2051 | | 66,933 | 51,211 |
| Ginnie Mae II Pool 1.5% 5/20/2051 | | 129,330 | 98,951 |
| Ginnie Mae II Pool 2% 1/1/2055 (l) | | 51,350,000 | 41,011,027 |
| Ginnie Mae II Pool 2% 1/20/2051 | | 518,161 | 414,169 |
| Ginnie Mae II Pool 2% 11/20/2050 | | 1,330,435 | 1,063,840 |
| Ginnie Mae II Pool 2% 2/1/2055 (l) | | 12,400,000 | 9,906,734 |
| Ginnie Mae II Pool 2% 2/20/2051 | | 658,537 | 526,578 |
| Ginnie Mae II Pool 2% 2/20/2052 | | 2,949,999 | 2,357,029 |
| Ginnie Mae II Pool 2% 4/20/2052 | | 874,933 | 699,066 |
| Ginnie Mae II Pool 2% 5/20/2052 | | 7,374,265 | 5,890,837 |
| Ginnie Mae II Pool 2% 9/20/2051 | | 503,726 | 402,789 |
| Ginnie Mae II Pool 2.5% 1/1/2055 (l) | | 4,475,000 | 3,731,706 |
| Ginnie Mae II Pool 2.5% 1/20/2047 | | 34,184 | 28,895 |
| Ginnie Mae II Pool 2.5% 1/20/2051 | | 663,150 | 554,521 |
| Ginnie Mae II Pool 2.5% 10/20/2043 | | 6,261 | 5,433 |
| Ginnie Mae II Pool 2.5% 10/20/2050 | | 1,610,841 | 1,348,482 |
| Ginnie Mae II Pool 2.5% 10/20/2051 | | 204,728 | 170,872 |
| Ginnie Mae II Pool 2.5% 11/20/2046 | | 20,083 | 16,975 |
| Ginnie Mae II Pool 2.5% 11/20/2050 | | 52,406 | 43,838 |
| Ginnie Mae II Pool 2.5% 11/20/2051 | | 442,319 | 369,035 |
| Ginnie Mae II Pool 2.5% 12/20/2046 | | 14,348 | 12,127 |
| Ginnie Mae II Pool 2.5% 12/20/2047 | | 8,388 | 7,082 |
| Ginnie Mae II Pool 2.5% 12/20/2049 | | 6,775 | 5,674 |
| Ginnie Mae II Pool 2.5% 12/20/2050 | | 901,504 | 754,111 |
| Ginnie Mae II Pool 2.5% 12/20/2051 | | 1,546,788 | 1,290,995 |
| Ginnie Mae II Pool 2.5% 2/20/2047 | | 15,773 | 13,332 |
| Ginnie Mae II Pool 2.5% 2/20/2050 | | 599,751 | 502,069 |
| Ginnie Mae II Pool 2.5% 2/20/2051 | | 123,717 | 103,335 |
| Ginnie Mae II Pool 2.5% 3/20/2050 | | 504,314 | 422,176 |
| Ginnie Mae II Pool 2.5% 3/20/2051 | | 214,918 | 179,511 |
| Ginnie Mae II Pool 2.5% 4/20/2045 | | 5,107 | 4,381 |
| Ginnie Mae II Pool 2.5% 4/20/2050 | | 406,465 | 340,264 |
| Ginnie Mae II Pool 2.5% 5/20/2050 | | 2,184,716 | 1,828,890 |
| Ginnie Mae II Pool 2.5% 6/20/2050 | | 257,033 | 215,170 |
| Ginnie Mae II Pool 2.5% 7/20/2043 | | 24,257 | 21,021 |
| Ginnie Mae II Pool 2.5% 7/20/2046 | | 9,752 | 8,338 |
| Ginnie Mae II Pool 2.5% 7/20/2050 | | 776,906 | 650,370 |
| Ginnie Mae II Pool 2.5% 8/20/2050 | | 412,769 | 345,541 |
| Ginnie Mae II Pool 2.5% 9/20/2046 | | 14,693 | 12,419 |
| Ginnie Mae II Pool 2.5% 9/20/2049 | | 138,527 | 116,008 |
| Ginnie Mae II Pool 2.5% 9/20/2050 | | 1,408,832 | 1,179,374 |
| Ginnie Mae II Pool 3% 1/1/2055 (l) | | 20,750,000 | 17,974,571 |
| Ginnie Mae II Pool 3% 1/20/2044 | | 14,962 | 13,318 |
| Ginnie Mae II Pool 3% 1/20/2045 | | 25,609 | 22,626 |
| Ginnie Mae II Pool 3% 1/20/2047 | | 208,684 | 183,259 |
| Ginnie Mae II Pool 3% 1/20/2048 | | 125,724 | 110,013 |
| Ginnie Mae II Pool 3% 1/20/2051 | | 16,898 | 14,719 |
| Ginnie Mae II Pool 3% 10/20/2045 | | 23,687 | 20,816 |
| Ginnie Mae II Pool 3% 10/20/2046 | | 77,525 | 68,080 |
| Ginnie Mae II Pool 3% 10/20/2047 | | 91,449 | 80,079 |
| Ginnie Mae II Pool 3% 10/20/2049 | | 145,269 | 126,526 |
| Ginnie Mae II Pool 3% 11/20/2046 | | 719,313 | 631,675 |
| Ginnie Mae II Pool 3% 11/20/2047 | | 66,899 | 58,581 |
| Ginnie Mae II Pool 3% 12/20/2044 | | 8,132 | 7,191 |
| Ginnie Mae II Pool 3% 12/20/2045 | | 141,567 | 124,364 |
| Ginnie Mae II Pool 3% 12/20/2046 | | 169,851 | 149,157 |
| Ginnie Mae II Pool 3% 12/20/2047 | | 262,634 | 229,815 |
| Ginnie Mae II Pool 3% 2/1/2055 (l) | | 7,350,000 | 6,367,183 |
| Ginnie Mae II Pool 3% 2/20/2044 | | 23,007 | 20,456 |
| Ginnie Mae II Pool 3% 2/20/2045 | | 189,373 | 166,419 |
| Ginnie Mae II Pool 3% 2/20/2046 | | 833,231 | 731,974 |
| Ginnie Mae II Pool 3% 2/20/2047 | | 188,783 | 165,546 |
| Ginnie Mae II Pool 3% 2/20/2048 | | 27,802 | 24,328 |
| Ginnie Mae II Pool 3% 2/20/2051 | | 955,159 | 831,698 |
| Ginnie Mae II Pool 3% 3/20/2043 | | 15,715 | 14,013 |
| Ginnie Mae II Pool 3% 3/20/2045 | | 2,848 | 2,503 |
| Ginnie Mae II Pool 3% 3/20/2046 | | 22,906 | 20,122 |
| Ginnie Mae II Pool 3% 3/20/2047 | | 9,727 | 8,530 |
| Ginnie Mae II Pool 3% 3/20/2048 | | 30,849 | 26,994 |
| Ginnie Mae II Pool 3% 3/20/2051 | | 164,996 | 143,669 |
| Ginnie Mae II Pool 3% 4/20/2043 | | 92,915 | 82,795 |
| Ginnie Mae II Pool 3% 4/20/2047 | | 62,344 | 54,671 |
| Ginnie Mae II Pool 3% 4/20/2048 | | 25,445 | 22,265 |
| Ginnie Mae II Pool 3% 4/20/2049 | | 33,567 | 29,393 |
| Ginnie Mae II Pool 3% 4/20/2051 | | 248,850 | 216,374 |
| Ginnie Mae II Pool 3% 5/20/2045 | | 80,224 | 70,500 |
| Ginnie Mae II Pool 3% 5/20/2047 | | 30,719 | 26,938 |
| Ginnie Mae II Pool 3% 5/20/2051 | | 304,444 | 264,712 |
| Ginnie Mae II Pool 3% 6/20/2045 | | 114,067 | 100,241 |
| Ginnie Mae II Pool 3% 6/20/2046 | | 86,554 | 76,035 |
| Ginnie Mae II Pool 3% 6/20/2051 | | 792,441 | 688,526 |
| Ginnie Mae II Pool 3% 7/20/2042 | | 52,743 | 47,107 |
| Ginnie Mae II Pool 3% 7/20/2044 | | 19,042 | 16,878 |
| Ginnie Mae II Pool 3% 7/20/2045 | | 108,326 | 95,196 |
| Ginnie Mae II Pool 3% 7/20/2046 | | 374,017 | 328,566 |
| Ginnie Mae II Pool 3% 7/20/2049 | | 315,608 | 275,084 |
| Ginnie Mae II Pool 3% 8/20/2042 | | 636,964 | 568,967 |
| Ginnie Mae II Pool 3% 8/20/2043 | | 5,605 | 4,988 |
| Ginnie Mae II Pool 3% 8/20/2044 | | 11,219 | 9,966 |
| Ginnie Mae II Pool 3% 8/20/2045 | | 24,607 | 21,624 |
| Ginnie Mae II Pool 3% 8/20/2046 | | 912,992 | 802,042 |
| Ginnie Mae II Pool 3% 8/20/2047 | | 28,642 | 25,080 |
| Ginnie Mae II Pool 3% 8/20/2049 | | 6,230 | 5,430 |
| Ginnie Mae II Pool 3% 9/20/2043 | | 110,203 | 97,985 |
| Ginnie Mae II Pool 3% 9/20/2046 | | 225,204 | 197,766 |
| Ginnie Mae II Pool 3% 9/20/2047 | | 189,394 | 165,845 |
| Ginnie Mae II Pool 3% 9/20/2049 | | 163,093 | 142,051 |
| Ginnie Mae II Pool 3.5% 1/1/2055 (l) | | 11,550,000 | 10,313,725 |
| Ginnie Mae II Pool 3.5% 1/20/2045 | | 104,585 | 95,342 |
| Ginnie Mae II Pool 3.5% 1/20/2046 | | 120,518 | 109,253 |
| Ginnie Mae II Pool 3.5% 1/20/2048 | | 242,778 | 219,328 |
| Ginnie Mae II Pool 3.5% 1/20/2050 | | 868,578 | 781,154 |
| Ginnie Mae II Pool 3.5% 10/20/2045 | | 105,506 | 95,678 |
| Ginnie Mae II Pool 3.5% 10/20/2046 | | 48,430 | 43,874 |
| Ginnie Mae II Pool 3.5% 10/20/2047 | | 62,852 | 56,820 |
| Ginnie Mae II Pool 3.5% 10/20/2048 | | 83,879 | 75,646 |
| Ginnie Mae II Pool 3.5% 11/20/2042 | | 249,233 | 228,810 |
| Ginnie Mae II Pool 3.5% 11/20/2045 | | 82,310 | 74,617 |
| Ginnie Mae II Pool 3.5% 11/20/2047 | | 218,881 | 197,876 |
| Ginnie Mae II Pool 3.5% 12/20/2040 | | 22,187 | 20,490 |
| Ginnie Mae II Pool 3.5% 12/20/2041 | | 84,728 | 78,023 |
| Ginnie Mae II Pool 3.5% 12/20/2042 | | 123,615 | 113,485 |
| Ginnie Mae II Pool 3.5% 12/20/2043 | | 9,941 | 9,093 |
| Ginnie Mae II Pool 3.5% 12/20/2045 | | 30,851 | 27,967 |
| Ginnie Mae II Pool 3.5% 12/20/2047 | | 45,500 | 41,105 |
| Ginnie Mae II Pool 3.5% 12/20/2048 | | 3,591 | 3,240 |
| Ginnie Mae II Pool 3.5% 12/20/2049 | | 353,160 | 317,614 |
| Ginnie Mae II Pool 3.5% 12/20/2050 | | 11,101 | 9,981 |
| Ginnie Mae II Pool 3.5% 2/1/2055 (l) | | 5,675,000 | 5,068,453 |
| Ginnie Mae II Pool 3.5% 2/20/2043 | | 155,016 | 142,202 |
| Ginnie Mae II Pool 3.5% 2/20/2044 | | 9,595 | 8,774 |
| Ginnie Mae II Pool 3.5% 2/20/2045 | | 67,116 | 60,864 |
| Ginnie Mae II Pool 3.5% 2/20/2046 | | 559,841 | 507,515 |
| Ginnie Mae II Pool 3.5% 2/20/2051 | | 248,141 | 223,087 |
| Ginnie Mae II Pool 3.5% 3/20/2043 | | 127,840 | 117,275 |
| Ginnie Mae II Pool 3.5% 3/20/2046 | | 148,141 | 134,295 |
| Ginnie Mae II Pool 3.5% 3/20/2048 | | 13,301 | 12,017 |
| Ginnie Mae II Pool 3.5% 3/20/2049 | | 776,689 | 699,727 |
| Ginnie Mae II Pool 3.5% 3/20/2050 | | 410,191 | 368,905 |
| Ginnie Mae II Pool 3.5% 4/20/2042 | | 82,681 | 76,061 |
| Ginnie Mae II Pool 3.5% 4/20/2043 | | 236,916 | 217,286 |
| Ginnie Mae II Pool 3.5% 4/20/2045 | | 71,612 | 64,941 |
| Ginnie Mae II Pool 3.5% 4/20/2046 | | 485,159 | 439,662 |
| Ginnie Mae II Pool 3.5% 4/20/2047 | | 11,137 | 10,079 |
| Ginnie Mae II Pool 3.5% 4/20/2049 | | 158,896 | 143,151 |
| Ginnie Mae II Pool 3.5% 5/20/2042 | | 240,164 | 220,823 |
| Ginnie Mae II Pool 3.5% 5/20/2043 | | 198,267 | 181,010 |
| Ginnie Mae II Pool 3.5% 5/20/2045 | | 17,113 | 15,519 |
| Ginnie Mae II Pool 3.5% 5/20/2046 | | 106,524 | 96,534 |
| Ginnie Mae II Pool 3.5% 5/20/2047 | | 871,969 | 788,835 |
| Ginnie Mae II Pool 3.5% 5/20/2048 | | 141,165 | 127,530 |
| Ginnie Mae II Pool 3.5% 5/20/2051 | | 187,981 | 169,002 |
| Ginnie Mae II Pool 3.5% 6/20/2043 | | 9,659 | 8,854 |
| Ginnie Mae II Pool 3.5% 6/20/2045 | | 93,947 | 85,195 |
| Ginnie Mae II Pool 3.5% 6/20/2046 | | 272,139 | 246,618 |
| Ginnie Mae II Pool 3.5% 6/20/2047 | | 66,983 | 60,597 |
| Ginnie Mae II Pool 3.5% 6/20/2051 | | 16,882 | 15,178 |
| Ginnie Mae II Pool 3.5% 7/20/2042 | | 88,336 | 81,182 |
| Ginnie Mae II Pool 3.5% 7/20/2043 | | 56,105 | 51,394 |
| Ginnie Mae II Pool 3.5% 7/20/2045 | | 236,576 | 214,538 |
| Ginnie Mae II Pool 3.5% 7/20/2046 | | 175,511 | 159,052 |
| Ginnie Mae II Pool 3.5% 7/20/2047 | | 190,455 | 172,178 |
| Ginnie Mae II Pool 3.5% 8/20/2042 | | 30,332 | 27,869 |
| Ginnie Mae II Pool 3.5% 8/20/2043 | | 11,986 | 10,978 |
| Ginnie Mae II Pool 3.5% 8/20/2045 | | 145,768 | 132,190 |
| Ginnie Mae II Pool 3.5% 8/20/2046 | | 96,288 | 87,258 |
| Ginnie Mae II Pool 3.5% 8/20/2047 | | 311,554 | 281,656 |
| Ginnie Mae II Pool 3.5% 8/20/2048 | | 124,070 | 111,970 |
| Ginnie Mae II Pool 3.5% 8/20/2049 | | 22,460 | 20,214 |
| Ginnie Mae II Pool 3.5% 9/20/2043 | | 276,037 | 252,756 |
| Ginnie Mae II Pool 3.5% 9/20/2045 | | 8,193 | 7,429 |
| Ginnie Mae II Pool 3.5% 9/20/2046 | | 66,325 | 60,105 |
| Ginnie Mae II Pool 3.5% 9/20/2047 | | 24,062 | 21,753 |
| Ginnie Mae II Pool 3.5% 9/20/2048 | | 22,375 | 20,214 |
| Ginnie Mae II Pool 4% 1/20/2041 | | 154,038 | 145,619 |
| Ginnie Mae II Pool 4% 1/20/2042 | | 248,508 | 234,429 |
| Ginnie Mae II Pool 4% 1/20/2046 | | 31,598 | 29,455 |
| Ginnie Mae II Pool 4% 10/20/2040 | | 83,719 | 79,167 |
| Ginnie Mae II Pool 4% 10/20/2044 | | 26,523 | 24,886 |
| Ginnie Mae II Pool 4% 10/20/2045 | | 72,358 | 67,566 |
| Ginnie Mae II Pool 4% 10/20/2048 | | 274,775 | 255,460 |
| Ginnie Mae II Pool 4% 11/20/2039 | | 3,152 | 2,985 |
| Ginnie Mae II Pool 4% 11/20/2040 | | 208,213 | 196,861 |
| Ginnie Mae II Pool 4% 11/20/2044 | | 55,252 | 51,835 |
| Ginnie Mae II Pool 4% 11/20/2045 | | 30,817 | 28,776 |
| Ginnie Mae II Pool 4% 12/20/2041 | | 18,721 | 17,664 |
| Ginnie Mae II Pool 4% 12/20/2045 | | 60,651 | 56,539 |
| Ginnie Mae II Pool 4% 12/20/2054 | | 4,900,000 | 4,509,621 |
| Ginnie Mae II Pool 4% 2/20/2041 | | 11,239 | 10,622 |
| Ginnie Mae II Pool 4% 2/20/2044 | | 2,751 | 2,584 |
| Ginnie Mae II Pool 4% 2/20/2046 | | 58,438 | 54,477 |
| Ginnie Mae II Pool 4% 3/20/2045 | | 188,162 | 176,550 |
| Ginnie Mae II Pool 4% 3/20/2046 | | 54,937 | 51,213 |
| Ginnie Mae II Pool 4% 3/20/2047 | | 37,274 | 34,712 |
| Ginnie Mae II Pool 4% 4/20/2045 | | 144,867 | 135,868 |
| Ginnie Mae II Pool 4% 4/20/2046 | | 79,399 | 74,016 |
| Ginnie Mae II Pool 4% 4/20/2047 | | 368,743 | 343,398 |
| Ginnie Mae II Pool 4% 5/20/2046 | | 208,266 | 194,147 |
| Ginnie Mae II Pool 4% 6/20/2045 | | 23,708 | 22,138 |
| Ginnie Mae II Pool 4% 7/20/2043 | | 33,219 | 31,288 |
| Ginnie Mae II Pool 4% 7/20/2045 | | 99,141 | 92,575 |
| Ginnie Mae II Pool 4% 8/20/2040 | | 3,694 | 3,495 |
| Ginnie Mae II Pool 4% 8/20/2041 | | 62,900 | 59,370 |
| Ginnie Mae II Pool 4% 8/20/2043 | | 8,803 | 8,277 |
| Ginnie Mae II Pool 4% 8/20/2044 | | 3,576 | 3,357 |
| Ginnie Mae II Pool 4% 8/20/2045 | | 186,432 | 174,085 |
| Ginnie Mae II Pool 4% 9/20/2040 | | 60,484 | 57,191 |
| Ginnie Mae II Pool 4% 9/20/2041 | | 202,085 | 190,714 |
| Ginnie Mae II Pool 4% 9/20/2044 | | 23,449 | 22,008 |
| Ginnie Mae II Pool 4% 9/20/2045 | | 35,248 | 32,913 |
| Ginnie Mae II Pool 4% 9/20/2046 | | 14,111 | 13,154 |
| Ginnie Mae II Pool 4.5% 1/20/2041 | | 11,391 | 11,097 |
| Ginnie Mae II Pool 4.5% 1/20/2042 | | 2,209 | 2,151 |
| Ginnie Mae II Pool 4.5% 1/20/2045 | | 5,446 | 5,262 |
| Ginnie Mae II Pool 4.5% 1/20/2046 | | 14,162 | 13,683 |
| Ginnie Mae II Pool 4.5% 1/20/2047 | | 60,964 | 58,844 |
| Ginnie Mae II Pool 4.5% 1/20/2050 | | 21,938 | 20,928 |
| Ginnie Mae II Pool 4.5% 10/20/2047 | | 45,012 | 43,236 |
| Ginnie Mae II Pool 4.5% 10/20/2048 | | 82,746 | 79,016 |
| Ginnie Mae II Pool 4.5% 10/20/2049 | | 39,915 | 38,116 |
| Ginnie Mae II Pool 4.5% 11/20/2033 | | 748 | 735 |
| Ginnie Mae II Pool 4.5% 11/20/2040 | | 35,765 | 34,844 |
| Ginnie Mae II Pool 4.5% 11/20/2044 | | 5,651 | 5,460 |
| Ginnie Mae II Pool 4.5% 11/20/2048 | | 72,466 | 69,154 |
| Ginnie Mae II Pool 4.5% 11/20/2054 | | 4,299,761 | 4,063,595 |
| Ginnie Mae II Pool 4.5% 12/20/2050 | | 26,569 | 25,346 |
| Ginnie Mae II Pool 4.5% 2/20/2041 | | 14,624 | 14,244 |
| Ginnie Mae II Pool 4.5% 2/20/2046 | | 33,738 | 32,597 |
| Ginnie Mae II Pool 4.5% 2/20/2050 | | 45,942 | 43,842 |
| Ginnie Mae II Pool 4.5% 3/20/2034 | | 832 | 818 |
| Ginnie Mae II Pool 4.5% 3/20/2041 | | 36,747 | 35,793 |
| Ginnie Mae II Pool 4.5% 3/20/2045 | | 14,985 | 14,478 |
| Ginnie Mae II Pool 4.5% 3/20/2046 | | 2,963 | 2,862 |
| Ginnie Mae II Pool 4.5% 3/20/2047 | | 77,817 | 75,038 |
| Ginnie Mae II Pool 4.5% 3/20/2050 | | 64,013 | 61,067 |
| Ginnie Mae II Pool 4.5% 4/20/2041 | | 3,223 | 3,139 |
| Ginnie Mae II Pool 4.5% 4/20/2045 | | 19,319 | 18,765 |
| Ginnie Mae II Pool 4.5% 4/20/2046 | | 7,154 | 6,912 |
| Ginnie Mae II Pool 4.5% 4/20/2047 | | 36,339 | 34,996 |
| Ginnie Mae II Pool 4.5% 4/20/2050 | | 44,340 | 42,285 |
| Ginnie Mae II Pool 4.5% 5/20/2034 | | 1,001 | 985 |
| Ginnie Mae II Pool 4.5% 5/20/2040 | | 37,105 | 36,171 |
| Ginnie Mae II Pool 4.5% 5/20/2041 | | 323,077 | 314,629 |
| Ginnie Mae II Pool 4.5% 5/20/2044 | | 2,887 | 2,789 |
| Ginnie Mae II Pool 4.5% 5/20/2045 | | 10,039 | 9,700 |
| Ginnie Mae II Pool 4.5% 5/20/2046 | | 5,115 | 4,942 |
| Ginnie Mae II Pool 4.5% 5/20/2049 | | 77,076 | 73,529 |
| Ginnie Mae II Pool 4.5% 5/20/2051 | | 91,802 | 87,721 |
| Ginnie Mae II Pool 4.5% 6/20/2045 | | 66,423 | 64,176 |
| Ginnie Mae II Pool 4.5% 6/20/2046 | | 24,034 | 23,221 |
| Ginnie Mae II Pool 4.5% 7/20/2040 | | 16,439 | 16,021 |
| Ginnie Mae II Pool 4.5% 7/20/2042 | | 1,753 | 1,707 |
| Ginnie Mae II Pool 4.5% 7/20/2045 | | 2,216 | 2,141 |
| Ginnie Mae II Pool 4.5% 7/20/2046 | | 13,763 | 13,297 |
| Ginnie Mae II Pool 4.5% 7/20/2049 | | 10,839 | 10,340 |
| Ginnie Mae II Pool 4.5% 8/20/2041 | | 5,091 | 4,956 |
| Ginnie Mae II Pool 4.5% 8/20/2046 | | 37,375 | 36,111 |
| Ginnie Mae II Pool 4.5% 8/20/2048 | | 567,684 | 542,092 |
| Ginnie Mae II Pool 4.5% 9/20/2040 | | 74,951 | 73,033 |
| Ginnie Mae II Pool 4.5% 9/20/2042 | | 1,998 | 1,944 |
| Ginnie Mae II Pool 4.5% 9/20/2046 | | 20,769 | 20,191 |
| Ginnie Mae II Pool 4.5% 9/20/2047 | | 56,122 | 53,908 |
| Ginnie Mae II Pool 4.5% 9/20/2049 | | 21,690 | 20,699 |
| Ginnie Mae II Pool 5% 1/1/2055 (l) | | 10,700,000 | 10,377,704 |
| Ginnie Mae II Pool 5% 1/20/2039 | | 1,042 | 1,042 |
| Ginnie Mae II Pool 5% 1/20/2047 | | 12,746 | 12,738 |
| Ginnie Mae II Pool 5% 1/20/2049 | | 15,833 | 15,556 |
| Ginnie Mae II Pool 5% 10/20/2039 | | 23,981 | 23,968 |
| Ginnie Mae II Pool 5% 10/20/2046 | | 2,566 | 2,564 |
| Ginnie Mae II Pool 5% 10/20/2047 | | 4,196 | 4,174 |
| Ginnie Mae II Pool 5% 11/20/2044 | | 9,956 | 9,944 |
| Ginnie Mae II Pool 5% 11/20/2047 | | 14,445 | 14,369 |
| Ginnie Mae II Pool 5% 11/20/2048 | | 25,047 | 24,617 |
| Ginnie Mae II Pool 5% 12/20/2044 | | 4,077 | 4,073 |
| Ginnie Mae II Pool 5% 12/20/2047 | | 15,477 | 15,381 |
| Ginnie Mae II Pool 5% 12/20/2054 | | 875,000 | 848,984 |
| Ginnie Mae II Pool 5% 2/20/2045 | | 7,378 | 7,370 |
| Ginnie Mae II Pool 5% 2/20/2048 | | 3,296 | 3,268 |
| Ginnie Mae II Pool 5% 2/20/2049 | | 16,795 | 16,507 |
| Ginnie Mae II Pool 5% 3/20/2044 | | 9,441 | 9,432 |
| Ginnie Mae II Pool 5% 3/20/2046 | | 4,828 | 4,822 |
| Ginnie Mae II Pool 5% 3/20/2048 | | 32,413 | 32,160 |
| Ginnie Mae II Pool 5% 3/20/2049 | | 11,951 | 11,746 |
| Ginnie Mae II Pool 5% 4/20/2040 | | 2,192 | 2,190 |
| Ginnie Mae II Pool 5% 4/20/2044 | | 7,285 | 7,277 |
| Ginnie Mae II Pool 5% 4/20/2046 | | 2,651 | 2,649 |
| Ginnie Mae II Pool 5% 4/20/2047 | | 10,248 | 10,231 |
| Ginnie Mae II Pool 5% 4/20/2048 | | 45,221 | 44,756 |
| Ginnie Mae II Pool 5% 4/20/2049 | | 5,939 | 5,837 |
| Ginnie Mae II Pool 5% 5/20/2044 | | 17,909 | 17,893 |
| Ginnie Mae II Pool 5% 5/20/2046 | | 3,947 | 3,943 |
| Ginnie Mae II Pool 5% 5/20/2047 | | 5,312 | 5,284 |
| Ginnie Mae II Pool 5% 5/20/2048 | | 8,799 | 8,687 |
| Ginnie Mae II Pool 5% 6/20/2040 | | 8,100 | 8,093 |
| Ginnie Mae II Pool 5% 6/20/2045 | | 3,718 | 3,713 |
| Ginnie Mae II Pool 5% 6/20/2048 | | 46,599 | 45,945 |
| Ginnie Mae II Pool 5% 7/20/2040 | | 4,254 | 4,251 |
| Ginnie Mae II Pool 5% 7/20/2045 | | 4,449 | 4,443 |
| Ginnie Mae II Pool 5% 7/20/2048 | | 87,771 | 86,375 |
| Ginnie Mae II Pool 5% 8/20/2040 | | 6,572 | 6,567 |
| Ginnie Mae II Pool 5% 8/20/2046 | | 10,278 | 10,267 |
| Ginnie Mae II Pool 5% 9/20/2045 | | 3,501 | 3,496 |
| Ginnie Mae II Pool 5% 9/20/2048 | | 48,587 | 47,814 |
| Ginnie Mae II Pool 5.5% 1/1/2055 (l) | | 14,400,000 | 14,271,103 |
| Ginnie Mae II Pool 5.5% 1/20/2033 | | 6,788 | 6,874 |
| Ginnie Mae II Pool 5.5% 11/20/2033 | | 708 | 717 |
| Ginnie Mae II Pool 5.5% 11/20/2046 | | 5,705 | 5,795 |
| Ginnie Mae II Pool 5.5% 12/20/2032 | | 932 | 944 |
| Ginnie Mae II Pool 5.5% 12/20/2043 | | 1,684 | 1,710 |
| Ginnie Mae II Pool 5.5% 12/20/2048 | | 4,618 | 4,687 |
| Ginnie Mae II Pool 5.5% 2/20/2033 | | 3,672 | 3,718 |
| Ginnie Mae II Pool 5.5% 3/20/2045 | | 2,129 | 2,163 |
| Ginnie Mae II Pool 5.5% 4/20/2045 | | 9,329 | 9,477 |
| Ginnie Mae II Pool 5.5% 5/20/2044 | | 2,238 | 2,273 |
| Ginnie Mae II Pool 5.5% 5/20/2046 | | 3,107 | 3,154 |
| Ginnie Mae II Pool 5.5% 6/20/2033 | | 800 | 809 |
| Ginnie Mae II Pool 5.5% 6/20/2045 | | 4,100 | 4,166 |
| Ginnie Mae II Pool 5.5% 7/20/2038 | | 4,751 | 4,824 |
| Ginnie Mae II Pool 5.5% 7/20/2048 | | 9,774 | 9,952 |
| Ginnie Mae II Pool 5.5% 8/20/2044 | | 2,920 | 2,967 |
| Ginnie Mae II Pool 5.5% 9/20/2048 | | 9,481 | 9,653 |
| Ginnie Mae II Pool 6% 1/1/2055 (l) | | 34,500,000 | 34,712,931 |
| Ginnie Mae II Pool 6% 1/20/2037 | | 528 | 541 |
| Ginnie Mae II Pool 6% 10/20/2035 | | 2,195 | 2,251 |
| Ginnie Mae II Pool 6% 10/20/2037 | | 3,721 | 3,824 |
| Ginnie Mae II Pool 6% 11/20/2037 | | 13,352 | 13,723 |
| Ginnie Mae II Pool 6% 12/20/2036 | | 1,676 | 1,721 |
| Ginnie Mae II Pool 6% 12/20/2037 | | 4,417 | 4,541 |
| Ginnie Mae II Pool 6% 12/20/2054 (l) | | 1,000,000 | 1,007,581 |
| Ginnie Mae II Pool 6% 2/1/2055 (l) | | 15,525,000 | 15,597,773 |
| Ginnie Mae II Pool 6% 4/20/2037 | | 886 | 910 |
| Ginnie Mae II Pool 6% 5/20/2034 | | 1,162 | 1,190 |
| Ginnie Mae II Pool 6% 7/20/2036 | | 2,615 | 2,684 |
| Ginnie Mae II Pool 6% 9/20/2037 | | 3,746 | 3,850 |
| Ginnie Mae II Pool 6% 9/20/2038 | | 605 | 621 |
| Ginnie Mae II Pool 6.5% 1/1/2055 (l) | | 6,700,000 | 6,811,492 |
| Ginnie Mae II Pool 6.5% 2/1/2055 (l) | | 1,950,000 | 1,980,012 |
| Ginnie Mae II Pool 6.5% 3/20/2038 | | 4,073 | 4,224 |
| Ginnie Mae II Pool 6.5% 8/20/2036 | | 1,628 | 1,685 |
| Uniform Mortgage Backed Securities 2% 1/1/2055 (l) | | 105,600,000 | 82,037,989 |
| Uniform Mortgage Backed Securities 2% 2/1/2055 (l) | | 18,375,000 | 14,282,972 |
| Uniform Mortgage Backed Securities 3% 1/1/2040 (l) | | 1,600,000 | 1,489,250 |
| Uniform Mortgage Backed Securities 3% 1/1/2055 (l) | | 6,050,000 | 5,132,101 |
| Uniform Mortgage Backed Securities 3.5% 1/1/2055 (l) | | 10,000,000 | 8,835,936 |
| Uniform Mortgage Backed Securities 4.5% 1/1/2055 (l) | | 850,000 | 798,867 |
| Uniform Mortgage Backed Securities 5% 1/1/2040 (l) | | 1,900,000 | 1,889,906 |
| Uniform Mortgage Backed Securities 5% 1/1/2055 (l) | | 5,200,000 | 5,014,953 |
| Uniform Mortgage Backed Securities 5.5% 1/1/2055 (l) | | 9,200,000 | 9,073,140 |
| Uniform Mortgage Backed Securities 6% 1/1/2055 (l) | | 3,200,000 | 3,214,250 |
| Uniform Mortgage Backed Securities 6.5% 1/1/2055 (l) | | 10,900,000 | 11,129,070 |
TOTAL UNITED STATES | | | 700,097,136 |
| TOTAL U.S. GOVERNMENT AGENCY - MORTGAGE SECURITIES (Cost $722,278,494) | | | 700,097,136 |
| | | | |
| U.S. Treasury Obligations - 47.2% |
| | | Yield (%) (n) | Principal Amount (a) | Value ($) |
| US Treasury Bonds 1.125% 5/15/2040 | | 3.16 | 15,985,600 | 9,614,227 |
| US Treasury Bonds 1.75% 8/15/2041 | | 3.21 | 23,171,800 | 15,004,511 |
| US Treasury Bonds 1.875% 11/15/2051 | | 3.02 | 14,846,000 | 8,188,190 |
| US Treasury Bonds 2% 8/15/2051 | | 3.03 | 27,127,600 | 15,500,976 |
| US Treasury Bonds 2.25% 2/15/2052 | | 3.00 | 11,359,700 | 6,886,707 |
| US Treasury Bonds 2.375% 11/15/2049 | | 3.05 | 848,000 | 538,846 |
| US Treasury Bonds 2.375% 5/15/2051 | | 3.02 | 8,558,600 | 5,381,777 |
| US Treasury Bonds 2.875% 5/15/2052 | | 2.95 to 3.37 | 15,000,000 | 10,489,976 |
| US Treasury Bonds 3% 8/15/2052 | | 3.23 | 57,000,000 | 40,895,585 |
| US Treasury Bonds 3.375% 8/15/2042 | | 3.49 to 4.52 | 78,200,000 | 64,550,355 |
| US Treasury Bonds 3.625% 2/15/2053 | | 3.72 to 3.88 | 31,000,000 | 25,187,207 |
| US Treasury Bonds 3.625% 5/15/2053 | | 3.90 to 4.31 | 7,500,000 | 6,096,767 |
| US Treasury Bonds 4% 11/15/2042 | | 3.77 | 14,000,000 | 12,596,857 |
| US Treasury Bonds 4.125% 8/15/2044 | | 4.58 to 4.63 | 7,670,000 | 6,941,118 |
| US Treasury Bonds 4.125% 8/15/2053 | | 4.18 to 5.00 | 41,293,000 | 36,777,352 |
| US Treasury Bonds 4.25% 2/15/2054 | | 4.11 to 4.78 | 78,700,000 | 71,794,095 |
| US Treasury Bonds 4.25% 8/15/2054 | | 4.04 to 4.65 | 10,450,000 | 9,542,949 |
| US Treasury Bonds 4.5% 11/15/2054 | | 4.35 to 4.82 | 1,510,000 | 1,439,676 |
| US Treasury Bonds 4.625% 5/15/2044 | | 4.09 to 4.73 | 990,000 | 959,762 |
| US Treasury Bonds 4.625% 5/15/2054 | | 4.02 to 4.65 | 7,200,000 | 6,995,504 |
| US Treasury Notes 1.125% 2/29/2028 | | 2.77 | 9,043,800 | 8,203,383 |
| US Treasury Notes 1.125% 8/31/2028 | | 2.79 | 17,817,900 | 15,892,125 |
| US Treasury Notes 1.25% 5/31/2028 | | 2.78 | 19,521,400 | 17,630,352 |
| US Treasury Notes 1.25% 6/30/2028 | | 2.79 | 12,849,100 | 11,577,304 |
| US Treasury Notes 2.25% 11/15/2027 | | 2.76 | 8,316,200 | 7,862,689 |
| US Treasury Notes 2.625% 7/31/2029 | | 2.69 | 30,000,000 | 27,832,198 |
| US Treasury Notes 3.375% 5/15/2033 | | 3.64 to 4.04 | 39,286,000 | 36,102,947 |
| US Treasury Notes 3.5% 2/15/2033 | | 3.49 to 3.92 | 86,600,000 | 80,563,386 |
| US Treasury Notes 3.625% 9/30/2031 | | 3.63 | 28,700,000 | 27,272,478 |
| US Treasury Notes 3.75% 5/31/2030 | | 3.98 to 3.99 | 47,700,000 | 46,168,313 |
| US Treasury Notes 3.75% 6/30/2030 | | 3.91 | 10,000,000 | 9,673,802 |
| US Treasury Notes 3.75% 8/31/2031 | | 3.52 to 3.63 | 100,600,000 | 96,382,663 |
| US Treasury Notes 3.875% 11/30/2027 | | 3.72 | 4,000,000 | 3,954,855 |
| US Treasury Notes 3.875% 11/30/2029 | | 3.65 to 3.73 | 55,000,000 | 53,764,932 |
| US Treasury Notes 3.875% 8/15/2034 | | 3.72 to 4.27 | 145,800,000 | 137,967,800 |
| US Treasury Notes 4% 1/31/2031 | | 4.01 | 30,000,000 | 29,269,471 |
| US Treasury Notes 4% 10/31/2029 | | 4.14 to 4.26 | 53,000,000 | 52,108,050 |
| US Treasury Notes 4% 2/15/2034 | | 4.28 to 4.46 | 44,100,000 | 42,219,538 |
| US Treasury Notes 4% 2/28/2030 | | 4.07 to 4.18 | 52,000,000 | 51,037,323 |
| US Treasury Notes 4% 2/29/2028 | | 3.59 | 30,000,000 | 29,727,214 |
| US Treasury Notes 4% 6/30/2028 | | 4.02 | 7,000,000 | 6,927,622 |
| US Treasury Notes 4% 7/31/2030 | | 4.07 | 25,000,000 | 24,475,509 |
| US Treasury Notes 4.125% 10/31/2027 | | 4.08 to 4.18 | 25,000,000 | 24,901,362 |
| US Treasury Notes 4.125% 11/15/2032 | | 3.52 | 35,000,000 | 34,136,158 |
| US Treasury Notes 4.125% 11/30/2029 | | 4.08 | 45,000,000 | 44,488,746 |
| US Treasury Notes 4.125% 7/31/2028 | | 4.18 to 4.30 | 75,000,000 | 74,482,398 |
| US Treasury Notes 4.125% 8/31/2030 | | 4.61 | 14,100,000 | 13,882,933 |
| US Treasury Notes 4.375% 11/30/2030 | | 4.35 | 24,600,000 | 24,510,439 |
| US Treasury Notes 4.375% 12/31/2031 | | 4.43 to 4.44 | 57,000,000 | 57,047,451 |
| US Treasury Notes 4.625% 4/30/2031 | | 4.46 to 4.49 | 45,200,000 | 45,581,987 |
| US Treasury Notes 4.625% 5/31/2031 | | 4.50 | 42,900,000 | 43,252,295 |
| TOTAL U.S. TREASURY OBLIGATIONS (Cost $1,630,042,311) | | | | 1,534,280,160 |
| | | | | |
| Money Market Funds - 1.6% |
| | | Yield (%) | Shares | Value ($) |
Fidelity Cash Central Fund (o) (Cost $53,378,703) | | 4.36 | 53,368,029 | 53,378,703 |
| | | | | |
| Purchased Swaptions - 0.1% |
| | Expiration Date | Notional Amount | Value ($) |
| Put Swaptions - 0.1% | | | | |
| Option on an interest rate swap with Bank of America NA to pay annually a fixed rate of 3.7375% and receive annually a floating rate based on the US SOFR Index, expiring February 2035 | 2/26/25 | | 5,500,000 | 169,159 |
| Option on an interest rate swap with Bank of America NA to pay annually a fixed rate of 4.05% and receive annually a floating rate based on the US SOFR Index, expiring April 2034 | 4/23/29 | | 4,800,000 | 184,935 |
| Option on an interest rate swap with Bank of America NA to pay annually a fixed rate of 3.845% and receive annually a floating rate based on US SOFR Index, expiring October 2034 | 10/29/29 | | 8,000,000 | 348,541 |
| Option on an interest rate swap with Bank of America NA to pay annually a fixed rate of 4.07% and receive annually a floating rate based on US SOFR Index, expiring December 2034 | 12/19/29 | | 6,810,000 | 273,126 |
| Option on an interest rate swap with Citibank NA to pay annually a fixed rate of 3.795% and receive annually a floating rate based on US SOFR Index, expiring November 2034 | 10/30/29 | | 8,200,000 | 365,220 |
| Option on an interest rate swap with Citibank NA to pay annually a fixed rate of 4.01% and receive annually a floating rate based on US SOFR Index, expiring December 2034 | 12/20/29 | | 2,000,000 | 82,275 |
| Option on an interest rate swap with JPMorgan Chase Bank NA to pay annually a fixed rate of 3.8225% and receive annually a floating rate based on the US SOFR Index, expiring February 2035 | 2/24/25 | | 4,600,000 | 115,984 |
| Option on an interest rate swap with JPMorgan Chase Bank NA to pay annually a fixed rate of 3.92% and receive annually a floating rate based on US SOFR Index, expiring November 2034 | 11/20/29 | | 2,700,000 | 114,644 |
| Option on an interest rate swap with Goldman Sachs Bank USA to pay annually a fixed rate of 3.53% and receive annually a floating rate based on US SOFR Index, expiring August 2034 | 8/01/29 | | 4,100,000 | 201,350 |
| Option on an interest rate swap with Goldman Sachs Bank USA to pay annually a fixed rate of 3.386% and receive annually a floating rate based on US SOFR Index, expiring August 2035 | 8/18/25 | | 7,000,000 | 436,467 |
| Option on an interest rate swap with Morgan Stanley Capital Services LLC to pay annually a fixed rate of 3.17% and receive annually a floating rate based on US SOFR Index, expiring September 2035 | 9/18/25 | | 1,900,000 | 147,720 |
| | | | | |
| TOTAL PUT SWAPTIONS | | | | 2,439,421 |
| Call Swaptions - 0.0% | | | | |
| Option on an interest rate swap with Bank of America NA to receive annually a fixed rate of 3.7375% and pay annually a floating rate based on the US SOFR Index, expiring February 2035 | 2/26/25 | | 5,500,000 | 21,721 |
| Option on an interest rate swap with Bank of America NA to receive annually a fixed rate of 4.05% and pay annually a floating rate based on the US SOFR Index, expiring April 2034 | 4/23/29 | | 4,800,000 | 178,112 |
| Option on an interest rate swap with Bank of America NA to receive annually a fixed rate of 3.845% and pay annually a floating rate based on US SOFR Index, expiring October 2034 | 10/29/29 | | 8,000,000 | 272,089 |
| Option on an interest rate swap with Bank of America NA to receive annually a fixed rate of 4.07% and pay annually a floating rate based on US SOFR Index, expiring December 2034 | 12/19/29 | | 6,810,000 | 263,953 |
| Option on an interest rate swap with Citibank NA to receive annually a fixed rate of 3.795% and pay annually a floating rate based on US SOFR Index, expiring November 2034 | 10/30/29 | | 8,200,000 | 271,625 |
| Option on an interest rate swap with Citibank NA to receive annually a fixed rate of 4.01% and pay annually a floating rate based on the US SOFR Index, expiring December 2034 | 12/20/29 | | 2,000,000 | 75,119 |
| Option on an interest rate swap with JPMorgan Chase Bank NA to receive annually a fixed rate of 3.8225% and pay annually a floating rate based on the US SOFR Index, expiring February 2035 | 2/24/25 | | 4,600,000 | 24,368 |
| Option on an interest rate swap with JPMorgan Chase Bank NA to receive annually a fixed rate of 3.92% and pay annually a floating rate based on US SOFR Index, expiring November 2034 | 11/20/29 | | 2,700,000 | 96,204 |
| Option on an interest rate swap with Goldman Sachs Bank USA to receive annually a fixed rate of 3.53% and pay annually a floating rate based on US SOFR Index, expiring August 2034 | 8/01/29 | | 4,100,000 | 114,481 |
| Option on an interest rate swap with Goldman Sachs Bank USA to receive annually a fixed rate of 3.386% and pay annually a floating rate based on US SOFR Index, expiring August 2035 | 8/18/25 | | 7,000,000 | 57,807 |
| Option on an interest rate swap with Morgan Stanley Capital Services LLC to receive annually a fixed rate of 3.17% and pay annually a floating rate based on US SOFR Index, expiring September 2035 | 9/18/25 | | 1,900,000 | 12,483 |
| | | | | |
| TOTAL CALL SWAPTIONS | | | | 1,387,962 |
TOTAL PURCHASED SWAPTIONS (Cost $4,276,413) | | | | 3,827,383 |
| TOTAL INVESTMENT IN SECURITIES - 109.9% (Cost $3,708,873,872) | 3,571,683,752 |
NET OTHER ASSETS (LIABILITIES) - (9.9)% | (322,014,484) |
| NET ASSETS - 100.0% | 3,249,669,268 |
| | |
| TBA Sale Commitments |
| | Principal Amount (a) | Value ($) |
| U.S. Government Agency - Mortgage Securities | | |
| Ginnie Mae II Pool 2% 1/1/2055 | (17,550,000) | (14,016,427) |
| Ginnie Mae II Pool 3% 1/1/2055 | (14,700,000) | (12,733,793) |
| Ginnie Mae II Pool 3.5% 1/1/2055 | (5,675,000) | (5,067,566) |
| Ginnie Mae II Pool 5.5% 1/1/2055 | (8,000,000) | (7,928,390) |
| Ginnie Mae II Pool 6% 1/1/2055 | (18,925,000) | (19,041,803) |
| Ginnie Mae II Pool 6.5% 1/1/2055 | (1,950,000) | (1,982,449) |
| Uniform Mortgage Backed Securities 2% 1/1/2055 | (32,075,000) | (24,918,262) |
| Uniform Mortgage Backed Securities 3.5% 1/1/2055 | (10,000,000) | (8,835,936) |
| Uniform Mortgage Backed Securities 4% 1/1/2055 | (2,000,000) | (1,826,250) |
| Uniform Mortgage Backed Securities 4.5% 1/1/2055 | (850,000) | (798,866) |
| Uniform Mortgage Backed Securities 5% 1/1/2055 | (5,200,000) | (5,014,953) |
| Uniform Mortgage Backed Securities 5.5% 1/1/2055 | (3,450,000) | (3,402,428) |
| Uniform Mortgage Backed Securities 6% 1/1/2055 | (6,700,000) | (6,729,836) |
| Uniform Mortgage Backed Securities 6.5% 1/1/2055 | (1,600,000) | (1,633,625) |
| | | |
| TOTAL U.S. GOVERNMENT AGENCY - MORTGAGE SECURITIES | | (113,930,584) |
| | | |
TOTAL TBA SALE COMMITMENTS (Proceeds $114,462,235) | | (113,930,584) |
| Futures Contracts |
| | Number of contracts | Expiration Date | Notional Amount ($) | Value ($) | Unrealized Appreciation/ (Depreciation) ($) |
| Purchased | | | | | |
| | | | | | |
| Interest Rate Contracts | | | | | |
| CBOT 10-Year U.S. Treasury Note Contracts (United States) | 153 | Mar 2025 | 16,638,750 | (92,878) | (92,878) |
| CBOT 2-Year U.S. Treasury Note Contracts (United States) | 86 | Mar 2025 | 17,682,406 | 10,867 | 10,867 |
| CBOT Long Term U.S. Treasury Bond Contracts (United States) | 41 | Mar 2025 | 4,667,594 | (157,110) | (157,110) |
| | | | | | |
| TOTAL PURCHASED | | | | | (239,121) |
| | | | | | |
| Sold | | | | | |
| | | | | | |
| Interest Rate Contracts | | | | | |
| CBOT 5-Year U.S. Treasury Note Contracts (United States) | 60 | Mar 2025 | 6,378,281 | 19,539 | 19,539 |
| CBOT Ultra Long Term U.S. Treasury Bond Contracts (United States) | 7 | Mar 2025 | 832,344 | 23,695 | 23,695 |
| | | | | | |
| TOTAL SOLD | | | | | 43,234 |
| | | | | | |
| TOTAL FUTURES CONTRACTS | | | | | (195,887) |
| The notional amount of futures purchased as a percentage of Net Assets is 1.1% |
| The notional amount of futures sold as a percentage of Net Assets is 0.2% |
| Credit Default Swaps |
| Underlying Reference | Rating(2) | Maturity Date | Clearinghouse / Counterparty | Fixed Payment Received/ (Paid) | Payment Frequency | Notional Amount(3)(1) | Value ($)(2) | Upfront Premium Received/ (Paid) ($) | Unrealized Appreciation/ (Depreciation) ($) |
| Buy Protection | | | | | | | | | | |
| CMBX BBB- Series 16 Index | | Apr 2065 | Goldman Sachs & Co LLC | (3%) | Monthly | | 60,000 | 9,031 | (15,557) | (6,526) |
| CMBX BBB- Series 16 Index | | Apr 2065 | Goldman Sachs & Co LLC | (3%) | Monthly | | 260,000 | 39,133 | (73,267) | (34,134) |
| CMBX BBB- Series 16 Index | | Apr 2065 | Goldman Sachs & Co LLC | (3%) | Monthly | | 400,000 | 60,204 | (94,667) | (34,463) |
| CMBX BBB- Series 16 Index | | Apr 2065 | Goldman Sachs & Co LLC | (3%) | Monthly | | 90,000 | 13,546 | (20,703) | (7,157) |
| CMBX BBB- Series 16 Index | | Apr 2065 | Goldman Sachs & Co LLC | (3%) | Monthly | | 380,000 | 57,194 | (95,938) | (38,744) |
| CMBX BBB- Series 16 Index | | Apr 2065 | JP Morgan Securities LLC | (3%) | Monthly | | 300,000 | 45,153 | (84,571) | (39,418) |
| CMBX BBB- Series 16 Index | | Apr 2065 | JP Morgan Securities LLC | (3%) | Monthly | | 130,000 | 19,566 | (33,871) | (14,305) |
| CMBX AAA Series 13 Index | | Dec 2072 | Morgan Stanley Capital Services LLC | (0.5%) | Monthly | | 990,000 | 403 | (15,643) | (15,240) |
| CMBX AAA Series 13 Index | | Dec 2072 | Morgan Stanley Capital Services LLC | (0.5%) | Monthly | | 620,000 | 252 | (4,083) | (3,831) |
| CMBX BBB- Series 16 Index | | Apr 2065 | Morgan Stanley Capital Services LLC | (3%) | Monthly | | 20,000 | 3,010 | (4,988) | (1,978) |
| CMBX BBB- Series 16 Index | | Apr 2065 | Morgan Stanley Capital Services LLC | (3%) | Monthly | | 180,000 | 27,092 | (42,539) | (15,447) |
| CMBX AAA Series 13 Index | | Dec 2072 | Citigroup Global Markets Ltd | (0.5%) | Monthly | | 760,000 | 309 | (8,063) | (7,754) |
| CMBX BBB- Series 16 Index | | Apr 2065 | Citigroup Global Markets Ltd | (3%) | Monthly | | 200,000 | 30,102 | (51,881) | (21,779) |
| CMBX BBB- Series 16 Index | | Apr 2065 | Citigroup Global Markets Ltd | (3%) | Monthly | | 720,000 | 108,368 | (213,969) | (105,601) |
| CMBX BBB- Series 16 Index | | Apr 2065 | Citigroup Global Markets Ltd | (3%) | Monthly | | 90,000 | 13,546 | (19,808) | (6,262) |
| CMBX BBB- Series 16 Index | | Apr 2065 | Citigroup Global Markets Ltd | (3%) | Monthly | | 390,000 | 58,699 | (105,720) | (47,021) |
| | | | | | | | | | | |
| TOTAL BUY PROTECTION | | | | | | | | 485,608 | (885,268) | (399,660) |
| Sell Protection | | | | | | | | | | |
| CMBX AAA Series 16 Index | NR | Apr 2065 | Goldman Sachs & Co LLC | 0.5% | Monthly | | 900,000 | (11,639) | 11,756 | 117 |
| CMBX AAA Series 16 Index | NR | Apr 2065 | Goldman Sachs & Co LLC | 0.5% | Monthly | | 1,300,000 | (16,813) | 25,865 | 9,052 |
| CMBX AAA Series 15 Index | NR | Nov 2064 | Goldman Sachs & Co LLC | 0.5% | Monthly | | 500,000 | (4,091) | 3,822 | (269) |
| CMBX BBB- Series 17 Index | NR | Dec 2056 | Goldman Sachs & Co LLC | 3% | Monthly | | 150,000 | (16,082) | 16,003 | (79) |
| CMBX AAA Series 13 Index | NR | Dec 2072 | Morgan Stanley Capital Services LLC | 0.5% | Monthly | | 1,490,000 | (607) | 33,359 | 32,752 |
| CMBX AAA Series 13 Index | NR | Dec 2072 | Morgan Stanley Capital Services LLC | 0.5% | Monthly | | 880,000 | (358) | 20,261 | 19,903 |
| CMBX AAA Series 17 Index | NR | Dec 2056 | Morgan Stanley Capital Services LLC | 0.5% | Monthly | | 700,000 | (12,210) | 11,398 | (812) |
| CMBX AAA Series 16 Index | NR | Apr 2065 | Citigroup Global Markets Ltd | 0.5% | Monthly | | 1,100,000 | (14,226) | 21,808 | 7,582 |
| CMBX AAA Series 17 Index | NR | Dec 2056 | Citigroup Global Markets Ltd | 0.5% | Monthly | | 700,000 | (12,210) | 17,403 | 5,193 |
| CMBX AAA Series 16 Index | NR | Apr 2065 | Citigroup Global Markets Ltd | 0.5% | Monthly | | 850,000 | (10,993) | 16,974 | 5,981 |
| CMBX AAA Series 16 Index | NR | Apr 2065 | Citigroup Global Markets Ltd | 0.5% | Monthly | | 1,000,000 | (12,933) | 15,685 | 2,752 |
| CMBX AAA Series 17 Index | NR | Dec 2056 | Citigroup Global Markets Ltd | 0.5% | Monthly | | 400,000 | (6,977) | 6,388 | (589) |
| | | | | | | | | | | |
| TOTAL SELL PROTECTION | | | | | | | | (119,139) | 200,722 | 81,583 |
| TOTAL CREDIT DEFAULT SWAPS | | | | | | | | 366,469 | (684,546) | (318,077) |
(1)Notional amount is stated in U.S. Dollars unless otherwise noted.
(2)Ratings are presented for credit default swaps in which the Fund has sold protection on the underlying referenced debt. Ratings for an underlying index represent a weighted average of the ratings of all securities included in the index. The credit rating or value can be measures of the current payment/performance risk. Ratings are from Moody's Investors Service, Inc. Where Moody's® ratings are not available, S&P® ratings are disclosed and are indicated as such. All ratings are as of the report date and do not reflect subsequent changes.
(3)The notional amount of each credit default swap where the Fund has sold protection approximates the maximum potential amount of future payments that the Fund could be required to make if a credit event were to occur.
| Interest Rate Swaps |
| Payment Received | Payment Frequency | Payment Paid | Payment Frequency | Clearinghouse / Counterparty(1) | Maturity Date | Notional Amount(3) | Value ($) | Upfront Premium Received/ (Paid) ($)(2) | Unrealized Appreciation/ (Depreciation) ($) |
UNITED STATES SOFR SECURED OVERNIGHT FINL RATE INDX(4) | Annual | 3% | Annual | LCH | Mar 2027 | | 12,647,000 | 47,418 | 0 | 47,418 |
UNITED STATES SOFR SECURED OVERNIGHT FINL RATE INDX(4) | Annual | 3% | Annual | LCH | Mar 2028 | | 42,132,000 | 286,079 | 0 | 286,079 |
UNITED STATES SOFR SECURED OVERNIGHT FINL RATE INDX(4) | Annual | 3% | Annual | LCH | Mar 2029 | | 377,000 | 3,926 | 0 | 3,926 |
| 3% | Annual | UNITED STATES SOFR SECURED OVERNIGHT FINL RATE INDX(4) | Annual | LCH | Mar 2030 | | 81,000 | 107 | 0 | 107 |
UNITED STATES SOFR SECURED OVERNIGHT FINL RATE INDX(4) | Annual | 3.25% | Annual | LCH | Mar 2032 | | 9,888,000 | 198,038 | 0 | 198,038 |
| 3.25% | Annual | UNITED STATES SOFR SECURED OVERNIGHT FINL RATE INDX(4) | Annual | LCH | Mar 2035 | | 3,445,000 | (91,248) | 0 | (91,248) |
UNITED STATES SOFR SECURED OVERNIGHT FINL RATE INDX(4) | Annual | 3.25% | Annual | LCH | Mar 2045 | | 10,359,000 | 424,424 | 0 | 424,424 |
| 3.25% | Annual | UNITED STATES SOFR SECURED OVERNIGHT FINL RATE INDX(4) | Annual | LCH | Mar 2055 | | 3,998,000 | (170,494) | 0 | (170,494) |
| TOTAL INTEREST RATE SWAPS | | | | | | | | 698,250 | 0 | 698,250 |
| | | | | | | | | | | |
(1)Swaps with LCH Clearnet Group (LCH) are centrally cleared swaps.
(2)Any premiums for centrally cleared swaps are recorded periodically throughout the term of the swap to variation margin and included in unrealized appreciation (depreciation).
(3)Notional amount is stated in U.S. Dollars unless otherwise noted.
(4)Represents floating rate.
Legend
| (a) | Amount is stated in United States dollars unless otherwise noted. |
| (b) | Coupon rates for floating and adjustable rate securities reflect the rates in effect at period end. |
| (c) | Coupon is indexed to a floating interest rate which may be multiplied by a specified factor and/or subject to caps or floors. |
| (d) | Security exempt from registration under Rule 144A of the Securities Act of 1933. These securities may be resold in transactions exempt from registration, normally to qualified institutional buyers. At the end of the period, the value of these securities amounted to $447,276,060 or 13.8% of net assets. |
| (e) | Security initially issued at one coupon which converts to a higher coupon at a specified date. The rate shown is the rate at period end. |
| (f) | Interest Only (IO) security represents the right to receive only monthly interest payments on an underlying pool of mortgages or assets. Principal shown is the outstanding par amount of the pool as of the end of the period. |
| (g) | Affiliated fund that is generally available only to investment companies and other accounts managed by Fidelity Investments. A complete unaudited schedule of portfolio holdings for each Fidelity Central Fund is filed with the SEC for the first and third quarters of each fiscal year on Form N-PORT and is available upon request or at the SEC's website at www.sec.gov. An unaudited holdings listing for the Fund, which presents direct holdings as well as the pro-rata share of securities and other investments held indirectly through its investment in underlying non-money market Fidelity Central Funds, is available at fidelity.com and/or institutional.fidelity.com, as applicable. In addition, each Fidelity Central Fund's financial statements,which are not covered by the Fund's Report of Independent Registered Public Accounting Firm, are available on the SEC's website or upon request. |
| (h) | Security is exempt from registration under Regulation S of the Securities Act of 1933 and may be resold to qualified foreign investors outside of the United States. At the end of the period, the value of securities amounted to $49,961 or 0.0% of net assets. |
| (i) | Security or a portion of the security was pledged to cover margin requirements for centrally cleared swaps. At period end, the value of securities pledged amounted to $1,854,808. |
| (j) | Security or a portion of the security was pledged to cover margin requirements for futures contracts. At period end, the value of securities pledged amounted to $603,870. |
| (k) | Security or a portion of the security has been segregated as collateral for mortgage-backed or asset-backed securities purchased on a delayed delivery or when-issued basis. At period end, the value of securities pledged amounted to $2,113,663. |
| (l) | Security or a portion of the security purchased on a delayed delivery or when-issued basis. |
| (m) | Security or a portion of the security has been segregated as collateral for open options. At period end, the value of securities pledged amounted to $157,676. |
| (n) | Yield represents either the annualized yield at the date of purchase, or the stated coupon rate, or, for floating and adjustable rate securities, the rate at period end. |
| (o) | Affiliated fund that is generally available only to investment companies and other accounts managed by Fidelity Investments. The rate quoted is the annualized seven-day yield of the fund at period end. A complete unaudited listing of the fund's holdings as of its most recent quarter end is available upon request. In addition, each Fidelity Central Fund's financial statements, which are not covered by the Fund's Report of Independent Registered Public Accounting Firm, are available on the SEC's website or upon request. |
Affiliated Central Funds
Fiscal year to date information regarding the Fund's investments in Fidelity Central Funds, including the ownership percentage, is presented below.
| Affiliate | Value, beginning of period ($) | Purchases ($) | Sales Proceeds ($) | Dividend Income ($) | Realized Gain (loss) ($) | Change in Unrealized appreciation (depreciation) ($) | Value, end of period ($) | Shares, end of period | % ownership, end of period |
| Fidelity Cash Central Fund | 57,300,436 | 809,866,713 | 813,789,313 | 3,088,389 | 867 | - | 53,378,703 | 53,368,029 | 0.1% |
| Fidelity Specialized High Income Central Fund | 15,645,506 | 924,172 | - | 924,160 | - | 97,873 | 16,667,551 | 191,383 | 6.9% |
| Total | 72,945,942 | 810,790,885 | 813,789,313 | 4,012,549 | 867 | 97,873 | 70,046,254 | 53,559,412 | |
| | | | | | | | | | |
Amounts in the dividend income column in the above table include any capital gain distributions from underlying funds, which are presented in the corresponding line item in the Statement of Operations, if applicable.
Amounts included in the purchases and sales proceeds columns may include in-kind transactions, if applicable.
Investment Valuation
The following is a summary of the inputs used, as of December 31, 2024, involving the Fund's assets and liabilities carried at fair value. The inputs or methodology used for valuing securities may not be an indication of the risk associated with investing in those securities. For more information on valuation inputs, and their aggregation into the levels used below, please refer to the Investment Valuation section in the accompanying Notes to Financial Statements.
| Valuation Inputs at Reporting Date: |
| Description | Total ($) | Level 1 ($) | Level 2 ($) | Level 3 ($) |
Investments in Securities: | | | | |
|
| Asset-Backed Securities | 284,693,951 | - | 284,693,951 | - |
|
| Bank Notes | | | | |
Financials | 2,404,693 | - | 2,404,693 | - |
|
| Collateralized Mortgage Obligations | 38,736,829 | - | 38,736,829 | - |
|
| Commercial Mortgage Securities | 180,949,470 | - | 180,949,470 | - |
|
| Fixed-Income Funds | 16,667,551 | 16,667,551 | - | - |
|
| Foreign Government and Government Agency Obligations | 9,622,613 | - | 9,622,613 | - |
|
| Municipal Securities | | | | |
Transportation | 463,973 | - | 463,973 | - |
|
| Non-Convertible Corporate Bonds | | | | |
Communication Services | 69,586,838 | - | 69,586,838 | - |
Consumer Discretionary | 14,431,754 | - | 14,431,754 | - |
Consumer Staples | 14,732,302 | - | 14,732,302 | - |
Energy | 70,209,033 | - | 70,209,033 | - |
Financials | 412,044,403 | - | 412,044,403 | - |
Health Care | 38,718,405 | - | 38,718,405 | - |
Industrials | 21,232,229 | - | 21,232,229 | - |
Information Technology | 16,042,058 | - | 16,042,058 | - |
Materials | 6,380,798 | - | 6,380,798 | - |
Real Estate | 41,796,639 | - | 41,796,639 | - |
Utilities | 41,386,831 | - | 41,386,831 | - |
|
| U.S. Government Agency - Mortgage Securities | 700,097,136 | - | 700,097,136 | - |
|
| U.S. Treasury Obligations | 1,534,280,160 | - | 1,534,280,160 | - |
|
| Money Market Funds | 53,378,703 | 53,378,703 | - | - |
|
| Purchased Swaptions | 3,827,383 | - | 3,827,383 | - |
| Total Investments in Securities: | 3,571,683,752 | 70,046,254 | 3,501,637,498 | - |
Derivative Instruments: Assets | | | | |
Futures Contracts | 54,101 | 54,101 | - | - |
Swaps | 1,445,600 | - | 1,445,600 | - |
| Total Assets | 1,499,701 | 54,101 | 1,445,600 | - |
| Liabilities | | | | |
Futures Contracts | (249,988) | (249,988) | - | - |
Swaps | (380,881) | - | (380,881) | - |
| Total Liabilities | (630,869) | (249,988) | (380,881) | - |
| Total Derivative Instruments: | 868,832 | (195,887) | 1,064,719 | - |
Other Financial Instruments: | | | | |
| TBA Sale Commitments | (113,930,584) | - | (113,930,584) | - |
| Total Other Financial Instruments: | (113,930,584) | - | (113,930,584) | - |
Value of Derivative Instruments
The following table is a summary of the Fund's value of derivative instruments by primary risk exposure as of December 31, 2024. For additional information on derivative instruments, please refer to the Derivative Instruments section in the accompanying Notes to Financial Statements.
Primary Risk Exposure / Derivative Type | Value |
| Asset ($) | Liability ($) |
| Credit Risk | | |
Swaps (a) | 485,608 | (119,139) |
| Total Credit Risk | 485,608 | (119,139) |
| Interest Rate Risk | | |
Futures Contracts (c) | 54,101 | (249,988) |
Purchased Swaptions (b) | 3,827,383 | 0 |
Swaps (a)(d) | 959,992 | (261,742) |
| Total Interest Rate Risk | 4,841,476 | (511,730) |
| Total Value of Derivatives | 5,327,084 | (630,869) |
(a)For bi-lateral over-the-counter (OTC) swaps, reflects gross value which is presented in the Statement of Assets and Liabilities in the bi-lateral OTC swaps, at value line-items.
(b)Gross value is included in the Statement of Assets and Liabilities in the investments in securities, at value line-item.
(c)Reflects gross cumulative appreciation (depreciation) on futures contracts as presented in the Schedule of Investments. In the Statement of Assets and Liabilities, the period end daily variation margin is included in receivable or payable for daily variation margin on futures contracts, and the net cumulative appreciation (depreciation) is included in Total accumulated earnings (loss).
(d)For centrally cleared swaps, reflects gross cumulative appreciation (depreciation) as presented in the Schedule of Investments. In the Statement of Assets and Liabilities, the period end daily variation margin for centrally cleared swaps is included in receivable or payable for daily variation margin on centrally cleared swaps, and the net cumulative appreciation (depreciation) for centrally cleared swaps is included in Total accumulated earnings (loss).
Financial Statements
| Statement of Assets and Liabilities |
As of December 31, 2024 |
| Assets | | | | |
| Investment in securities, at value - See accompanying schedule: | | | | |
Unaffiliated issuers (cost $3,638,742,541) | $ | 3,501,637,498 | | |
Fidelity Central Funds (cost $70,131,331) | | 70,046,254 | | |
| | | | | |
| | | | | |
| Total Investment in Securities (cost $3,708,873,872) | | | $ | 3,571,683,752 |
| Receivable for investments sold | | | | |
Regular delivery | | | | 51,245,476 |
Delayed delivery | | | | 408,054 |
| Receivable for TBA sale commitments | | | | 114,462,235 |
| Receivable for fund shares sold | | | | 1,701,140 |
| Interest receivable | | | | 31,143,647 |
| Distributions receivable from Fidelity Central Funds | | | | 222,814 |
| Receivable for daily variation margin on centrally cleared swaps | | | | 29,690 |
| Bi-lateral OTC swaps, at value | | | | 485,608 |
| Prepaid expenses | | | | 2,801 |
Total assets | | | | 3,771,385,217 |
| Liabilities | | | | |
| Payable for investments purchased | | | | |
Regular delivery | $ | 78,362,990 | | |
Delayed delivery | | 324,881,748 | | |
| TBA sale commitments, at value | | 113,930,584 | | |
| Payable for fund shares redeemed | | 3,185,353 | | |
| Bi-lateral OTC swaps, at value | | 119,139 | | |
| Accrued management fee | | 1,096,771 | | |
| Payable for daily variation margin on futures contracts | | 34,979 | | |
| Other payables and accrued expenses | | 104,385 | | |
| Total liabilities | | | | 521,715,949 |
| Net Assets | | | $ | 3,249,669,268 |
| Net Assets consist of: | | | | |
| Paid in capital | | | $ | 3,475,975,897 |
| Total accumulated earnings (loss) | | | | (226,306,629) |
| Net Assets | | | $ | 3,249,669,268 |
| | | | | |
| Net Asset Value and Maximum Offering Price | | | | |
| Initial Class : | | | | |
Net Asset Value, offering price and redemption price per share ($851,073,996 ÷ 92,415,137 shares) | | | $ | 9.21 |
| Investor Class : | | | | |
Net Asset Value, offering price and redemption price per share ($2,398,595,272 ÷ 260,343,992 shares) | | | $ | 9.21 |
| Statement of Operations |
| Year ended December 31, 2024 |
| Investment Income | | | | |
| Interest | | | $ | 143,111,822 |
| Income from Fidelity Central Funds | | | | 4,012,549 |
| Total income | | | | 147,124,371 |
| Expenses | | | | |
| Management fee | $ | 12,276,599 | | |
| Transfer agent fees | | 486,486 | | |
| Accounting fees and expenses | | 163,188 | | |
| Custodian fees and expenses | | 177,746 | | |
| Independent trustees' fees and expenses | | 8,211 | | |
| Registration fees | | 30,381 | | |
| Audit fees | | 54,377 | | |
| Legal | | 2,991 | | |
| Miscellaneous | | 17,834 | | |
| Total expenses before reductions | | 13,217,813 | | |
| Expense reductions | | (85,952) | | |
| Total expenses after reductions | | | | 13,131,861 |
| Net Investment income (loss) | | | | 133,992,510 |
| Realized and Unrealized Gain (Loss) | | | | |
| Net realized gain (loss) on: | | | | |
| Investment Securities: | | | | |
| Unaffiliated issuers | | (11,580,612) | | |
| Fidelity Central Funds | | 867 | | |
| Futures contracts | | (3,064,129) | | |
| Swaps | | 1,450,349 | | |
| Written options | | 18,474 | | |
| Total net realized gain (loss) | | | | (13,175,051) |
| Change in net unrealized appreciation (depreciation) on: | | | | |
| Investment Securities: | | | | |
| Unaffiliated issuers | | (73,813,181) | | |
| Fidelity Central Funds | | 97,873 | | |
| Futures contracts | | 79,568 | | |
| Swaps | | 1,742,203 | | |
| Written options | | (1,092) | | |
| TBA Sale commitments | | 1,724,570 | | |
| Total change in net unrealized appreciation (depreciation) | | | | (70,170,059) |
| Net gain (loss) | | | | (83,345,110) |
| Net increase (decrease) in net assets resulting from operations | | | $ | 50,647,400 |
| Statement of Changes in Net Assets |
| |
| | Year ended December 31, 2024 | | Year ended December 31, 2023 |
| Increase (Decrease) in Net Assets | | | | |
| Operations | | | | |
| Net investment income (loss) | $ | 133,992,510 | $ | 115,968,988 |
| Net realized gain (loss) | | (13,175,051) | | (47,179,598) |
| Change in net unrealized appreciation (depreciation) | | (70,170,059) | | 102,413,361 |
| Net increase (decrease) in net assets resulting from operations | | 50,647,400 | | 171,202,751 |
| Distributions to shareholders | | (136,335,721) | | (115,213,666) |
| | | | | |
| Share transactions - net increase (decrease) | | 213,328,559 | | 257,729,252 |
| Total increase (decrease) in net assets | | 127,640,238 | | 313,718,337 |
| | | | | |
| Net Assets | | | | |
| Beginning of period | | 3,122,029,030 | | 2,808,310,693 |
| End of period | $ | 3,249,669,268 | $ | 3,122,029,030 |
| | | | | |
| | | | | |
Financial Highlights
VIP Investment Grade Bond II Portfolio Initial Class |
| |
| Years ended December 31, | | 2024 | | 2023 | | 2022 A |
Selected Per-Share Data | | | | | | |
| Net asset value, beginning of period | $ | 9.46 | $ | 9.29 | $ | 10.00 |
| Income from Investment Operations | | | | | | |
Net investment income (loss) B,C | | .402 | | .370 | | .191 |
| Net realized and unrealized gain (loss) | | (.245) | | .167 | | (.721) D |
| Total from investment operations | | .157 | | .537 | | (.530) |
| Distributions from net investment income | | (.407) | | (.367) | | (.180) |
| Total distributions | | (.407) | | (.367) | | (.180) |
| Net asset value, end of period | $ | 9.21 | $ | 9.46 | $ | 9.29 |
Total Return E,F,G | | | | 5.91% | | (5.31)% |
Ratios to Average Net Assets C,H,I | | | | | | |
| Expenses before reductions | | .40% | | .41% | | .40% J |
| Expenses net of fee waivers, if any | | | | .40% | | .40% J |
| Expenses net of all reductions | | .39% | | .40% | | .40% J |
| Net investment income (loss) | | 4.22% | | 3.93% | | 3.32% J |
| Supplemental Data | | | | | | |
| Net assets, end of period (000 omitted) | $ | 851,074 | $ | 647,893 | $ | 528,508 |
Portfolio turnover rate K | | | | 190% | | 225% J,L |
AFor the period May 27, 2022 (commencement of operations) through December 31, 2022
BCalculated based on average shares outstanding during the period.
CNet investment income (loss) is affected by the timing of the declaration of dividends by any underlying mutual funds or exchange-traded funds (ETFs). Net investment income (loss) of any mutual funds or ETFs is not included in the Fund's net investment income (loss) ratio.
DThe amount shown for a share outstanding does not correspond with the aggregate net gain (loss) on investments for the period due to the timing of sales and repurchases of shares in relation to fluctuating market values of the investments of the Fund.
ETotal returns for periods of less than one year are not annualized.
FTotal returns do not reflect charges attributable to your insurance company's separate account. Inclusion of these charges would reduce the total returns shown.
GTotal returns would have been lower if certain expenses had not been reduced during the applicable periods shown.
HFees and expenses of any underlying mutual funds or exchange-traded funds (ETFs) are not included in the Fund's expense ratio. The Fund indirectly bears its proportionate share of these expenses. For additional expense information related to investments in Fidelity Central Funds, please refer to the "Investments in Fidelity Central Funds" note found in the Notes to Financial Statements section of the most recent Annual or Semi-Annual report.
IExpense ratios reflect operating expenses of the class. Expenses before reductions do not reflect amounts reimbursed, waived, or reduced through arrangements with the investment adviser, brokerage services, or other offset arrangements, if applicable, and do not represent the amount paid by the class during periods when reimbursements, waivers or reductions occur.
JAnnualized.
KAmount does not include the portfolio activity of any underlying mutual funds or exchange-traded funds (ETFs), derivatives or securities that mature within one year from acquisition.
LPortfolio turnover rate excludes securities received or delivered in-kind.
VIP Investment Grade Bond II Portfolio Investor Class |
| |
| Years ended December 31, | | 2024 | | 2023 | | 2022 A |
Selected Per-Share Data | | | | | | |
| Net asset value, beginning of period | $ | 9.46 | $ | 9.29 | $ | 10.00 |
| Income from Investment Operations | | | | | | |
Net investment income (loss) B,C | | .399 | | .367 | | .189 |
| Net realized and unrealized gain (loss) | | (.249) | | .167 | | (.721) D |
| Total from investment operations | | .150 | | .534 | | (.532) |
| Distributions from net investment income | | (.400) | | (.364) | | (.178) |
| Total distributions | | (.400) | | (.364) | | (.178) |
| Net asset value, end of period | $ | 9.21 | $ | 9.46 | $ | 9.29 |
Total Return E,F,G | | | | 5.88% | | (5.33)% |
Ratios to Average Net Assets C,H,I | | | | | | |
| Expenses before reductions | | .42% | | .44% | | .44% J |
| Expenses net of fee waivers, if any | | | | .44% | | .43% J |
| Expenses net of all reductions | | .42% | | .44% | | .43% J |
| Net investment income (loss) | | 4.20% | | 3.89% | | 3.29% J |
| Supplemental Data | | | | | | |
| Net assets, end of period (000 omitted) | $ | 2,398,595 | $ | 2,474,136 | $ | 2,279,803 |
Portfolio turnover rate K | | | | 190% | | 225% J,L |
AFor the period May 27, 2022 (commencement of operations) through December 31, 2022
BCalculated based on average shares outstanding during the period.
CNet investment income (loss) is affected by the timing of the declaration of dividends by any underlying mutual funds or exchange-traded funds (ETFs). Net investment income (loss) of any mutual funds or ETFs is not included in the Fund's net investment income (loss) ratio.
DThe amount shown for a share outstanding does not correspond with the aggregate net gain (loss) on investments for the period due to the timing of sales and repurchases of shares in relation to fluctuating market values of the investments of the Fund.
ETotal returns for periods of less than one year are not annualized.
FTotal returns do not reflect charges attributable to your insurance company's separate account. Inclusion of these charges would reduce the total returns shown.
GTotal returns would have been lower if certain expenses had not been reduced during the applicable periods shown.
HFees and expenses of any underlying mutual funds or exchange-traded funds (ETFs) are not included in the Fund's expense ratio. The Fund indirectly bears its proportionate share of these expenses. For additional expense information related to investments in Fidelity Central Funds, please refer to the "Investments in Fidelity Central Funds" note found in the Notes to Financial Statements section of the most recent Annual or Semi-Annual report.
IExpense ratios reflect operating expenses of the class. Expenses before reductions do not reflect amounts reimbursed, waived, or reduced through arrangements with the investment adviser, brokerage services, or other offset arrangements, if applicable, and do not represent the amount paid by the class during periods when reimbursements, waivers or reductions occur.
JAnnualized.
KAmount does not include the portfolio activity of any underlying mutual funds or exchange-traded funds (ETFs), derivatives or securities that mature within one year from acquisition.
LPortfolio turnover rate excludes securities received or delivered in-kind.
Notes to Financial Statements
For the period ended December 31, 2024
1. Organization.
VIP Investment Grade Bond II Portfolio (the Fund) is a fund of Variable Insurance Products Fund V (the Trust) and is authorized to issue an unlimited number of shares. The Trust is registered under the Investment Company Act of 1940, as amended (the 1940 Act), as an open-end management investment company organized as a Massachusetts business trust. Shares of the Fund may only be purchased by insurance companies for the purpose of funding variable annuity or variable life insurance contracts. The Fund offers the following classes of shares: Initial Class shares and Investor Class shares. All classes have equal rights and voting privileges, except for matters affecting a single class.
2. Investments in Fidelity Central Funds.
Funds may invest in Fidelity Central Funds, which are open-end investment companies generally available only to other investment companies and accounts managed by the investment adviser and its affiliates. The Schedule of Investments lists any Fidelity Central Funds held as an investment as of period end, but does not include the underlying holdings of each Fidelity Central Fund. An investing fund indirectly bears its proportionate share of the expenses of the underlying Fidelity Central Funds.
Based on its investment objective, each Fidelity Central Fund may invest or participate in various investment vehicles or strategies that are similar to those of the investing fund. These strategies are consistent with the investment objectives of the investing fund and may involve certain economic risks which may cause a decline in value of each of the Fidelity Central Funds and thus a decline in the value of the investing fund.
| Fidelity Central Fund | Investment Manager | Investment Objective | Investment Practices | Expense RatioA |
| Fidelity Specialized High Income Central Fund | Fidelity Management & Research Company LLC (FMR) | Seeks a high level of current income by normally investing in income-producing debt securities, with an emphasis on lower-quality debt securities. | Loans & Direct Debt Instruments Restricted Securities | Less than .005% |
| Fidelity Money Market Central Funds | Fidelity Management & Research Company LLC (FMR) | Each fund seeks to obtain a high level of current income consistent with the preservation of capital and liquidity. | Short-term Investments | Less than .005% |
A Expenses expressed as a percentage of average net assets and are as of each underlying Central Fund's most recent annual or semi-annual shareholder report.
A complete unaudited list of holdings for each Fidelity Central Fund is available upon request or at the Securities and Exchange Commission website at www.sec.gov. In addition, the financial statements of the Fidelity Central Funds which contain the significant accounting policies (including investment valuation policies) of those funds, and are not covered by the Report of Independent Registered Public Accounting Firm, are available on the Securities and Exchange Commission website or upon request.
3. Significant Accounting Policies.
The Fund is an investment company and applies the accounting and reporting guidance of the Financial Accounting Standards Board (FASB) Accounting Standards Codification Topic 946 Financial Services - Investment Companies. The financial statements have been prepared in conformity with accounting principles generally accepted in the United States of America (GAAP), which require management to make certain estimates and assumptions at the date of the financial statements. Actual results could differ from those estimates. The Fund operates as a single operating segment. The Fund's income, expenses, assets, and performance are regularly monitored and assessed as a whole by the investment adviser and other individuals responsible for oversight functions of the Trust, using the information presented in the financial statements and financial highlights. Subsequent events, if any, through the date that the financial statements were issued have been evaluated in the preparation of the financial statements. The Fund's Schedule of Investments lists any underlying mutual funds or exchange-traded funds (ETFs) but does not include the underlying holdings of these funds. The following summarizes the significant accounting policies of the Fund:
Investment Valuation. Investments are valued as of 4:00 p.m. Eastern time on the last calendar day of the period. The Board of Trustees (the Board) has designated the Fund's investment adviser as the valuation designee responsible for the fair valuation function and performing fair value determinations as needed. The investment adviser has established a Fair Value Committee (the Committee) to carry out the day-to-day fair valuation responsibilities and has adopted policies and procedures to govern the fair valuation process and the activities of the Committee. In accordance with these fair valuation policies and procedures, which have been approved by the Board, the Fund attempts to obtain prices from one or more third party pricing services or brokers to value its investments. When current market prices, quotations or currency exchange rates are not readily available or reliable, investments will be fair valued in good faith by the Committee, in accordance with the policies and procedures. Factors used in determining fair value vary by investment type and may include market or investment specific events, transaction data, estimated cash flows, and market observations of comparable investments. The frequency that the fair valuation procedures are used cannot be predicted and they may be utilized to a significant extent. The Committee manages the Fund's fair valuation practices and maintains the fair valuation policies and procedures. The Fund's investment adviser reports to the Board information regarding the fair valuation process and related material matters.
The Fund categorizes the inputs to valuation techniques used to value its investments into a disclosure hierarchy consisting of three levels as shown below:
Level 1 - unadjusted quoted prices in active markets for identical investments
Level 2 - other significant observable inputs (including quoted prices for similar investments, interest rates, prepayment speeds, etc.)
Level 3 - unobservable inputs (including the Fund's own assumptions based on the best information available)
Valuation techniques used to value the Fund's investments by major category are as follows:
Debt securities, including restricted securities, are valued based on evaluated prices received from third party pricing services or from brokers who make markets in such securities. Corporate bonds, bank notes, foreign government and government agency obligations, municipal securities, supranational obligations and U.S. government and government agency obligations are valued by pricing services who utilize matrix pricing which considers yield or price of bonds of comparable quality, coupon, maturity and type or by broker-supplied prices. Asset backed securities, collateralized mortgage obligations, commercial mortgage securities and U.S. government agency mortgage securities are valued by pricing services who utilize matrix pricing which considers prepayment speed assumptions, attributes of the collateral, yield or price of bonds of comparable quality, coupon, maturity and type or by broker-supplied prices. Brokers which make markets in asset backed securities, collateralized mortgage obligations and commercial mortgage securities may also consider such factors as the structure of the issue, cash flow assumptions, the value of underlying assets as well as any guarantees. Swaps are marked-to-market daily based on valuations from third party pricing services, registered derivatives clearing organizations (clearinghouses) or broker-supplied valuations. These pricing sources may utilize inputs such as interest rate curves, credit spread curves, default possibilities and recovery rates. When independent prices are unavailable or unreliable, debt securities and swaps may be valued utilizing pricing methodologies which consider similar factors that would be used by third party pricing services. Debt securities and swaps are generally categorized as Level 2 in the hierarchy but may be Level 3 depending on the circumstances.
Futures contracts are valued at the settlement price established each day by the board of trade or exchange on which they are traded and are categorized as Level 1 in the hierarchy. Options traded over-the-counter are valued using service or broker-supplied valuations and are categorized as Level 2 in the hierarchy. Investments in open-end mutual funds, including the Fidelity Central Funds, are valued at their closing net asset value (NAV) each business day and are categorized as Level 1 in the hierarchy.
Changes in valuation techniques may result in transfers in or out of an assigned level within the disclosure hierarchy. The aggregate value of investments by input level as of December 31, 2024 is included at the end of the Fund's Schedule of Investments.
Investment Transactions and Income. For financial reporting purposes, the Fund's investment holdings and NAV include trades executed through the end of the last business day of the period. The NAV per share for processing shareholder transactions is calculated as of the close of business of the New York Stock Exchange (NYSE), normally 4:00 p.m. Eastern time and includes trades executed through the end of the prior business day. Gains and losses on securities sold are determined on the basis of identified cost. Income and capital gain distributions from Fidelity Central Funds, if any, are recorded on the ex-dividend date. Interest income is accrued as earned and includes coupon interest and amortization of premium and accretion of discount on debt securities as applicable. Debt obligations may be placed on non-accrual status and related interest income may be reduced by ceasing current accruals and writing off interest receivables when the collection of all or a portion of interest has become doubtful based on consistently applied procedures. A debt obligation is removed from non-accrual status when the issuer resumes interest payments or when collectability of interest is reasonably assured.
Class Allocations and Expenses. Investment income, realized and unrealized capital gains and losses, common expenses of a fund, and certain fund-level expense reductions, if any, are allocated daily on a pro-rata basis to each class based on the relative net assets of each class to the total net assets of a fund. Each class differs with respect to transfer agent and distribution and service plan fees incurred, as applicable. Certain expense reductions may also differ by class, if applicable. For the reporting period, the allocated portion of income and expenses to each class as a percent of its average net assets may vary due to the timing of recording these transactions in relation to fluctuating net assets of the classes. Expenses directly attributable to a fund are charged to that fund. Expenses attributable to more than one fund are allocated among the respective funds on the basis of relative net assets or other appropriate methods. Expenses included in the accompanying financial statements reflect the expenses of that fund and do not include any expenses associated with any underlying mutual funds or exchange-traded funds (ETFs). Although not included in a fund's expenses, a fund indirectly bears its proportionate share of these expenses through the net asset value of each underlying mutual fund or exchange-traded fund (ETF). Expense estimates are accrued in the period to which they relate and adjustments are made when actual amounts are known.
Income Tax Information and Distributions to Shareholders. Each year, the Fund intends to qualify as a regulated investment company under Subchapter M of the Internal Revenue Code, including distributing substantially all of its taxable income and realized gains. As a result, no provision for U.S. Federal income taxes is required. As of December 31, 2024, the Fund did not have any unrecognized tax benefits in the financial statements; nor is the Fund aware of any tax positions for which it is reasonably possible that the total amounts of unrecognized tax benefits will significantly change in the next twelve months. The Fund files a U.S. federal tax return, in addition to state and local tax returns as required. The Fund's federal income tax returns are subject to examination by the Internal Revenue Service (IRS) for a period of three fiscal years after they are filed. State and local tax returns may be subject to examination for an additional fiscal year depending on the jurisdiction.
Distributions are declared and recorded on the ex-dividend date. Income and capital gain distributions are declared separately for each class. Income and capital gain distributions are determined in accordance with income tax regulations, which may differ from GAAP.
Capital accounts within the financial statements are adjusted for permanent book-tax differences. These adjustments have no impact on net assets or the results of operations. Capital accounts are not adjusted for temporary book-tax differences which will reverse in a subsequent period.
Book-tax differences are primarily due to futures contracts, swaps, capital loss carryforwards, losses deferred due to wash sales and futures transactions.
As of period end, the cost and unrealized appreciation (depreciation) in securities, and derivatives if applicable, for federal income tax purposes were as follows:
| Gross unrealized appreciation | $11,848,658 |
| Gross unrealized depreciation | (148,438,682) |
| Net unrealized appreciation (depreciation) | $(136,590,024) |
| Tax Cost | $3,709,946,386 |
The tax-based components of distributable earnings as of period end were as follows:
| Undistributed ordinary income | $278,744 |
| Capital loss carryforward | $(89,871,772) |
| Net unrealized appreciation (depreciation) on securities and other investments | $(136,713,601) |
Capital loss carryforwards are only available to offset future capital gains of the Fund to the extent provided by regulations and may be limited. The capital loss carryforward information presented below, including any applicable limitation, is estimated as of fiscal period end and is subject to adjustment.
Short-term | $(48,166,762) |
Long-term | (41,705,010) |
| Total capital loss carryforward | $(89,871,772) |
The tax character of distributions paid was as follows:
| | December 31, 2024 | December 31, 2023 |
| Ordinary Income | $136,335,721 | $ 115,213,666 |
Delayed Delivery Transactions and When-Issued Securities. During the period, certain Funds transacted in securities on a delayed delivery or when-issued basis. Payment and delivery may take place after the customary settlement period for that security. The price of the underlying securities and the date when the securities will be delivered and paid for are fixed at the time the transaction is negotiated. Securities purchased on a delayed delivery or when-issued basis are identified as such in the Schedule of Investments. Compensation for interest forgone in the purchase of a delayed delivery or when-issued debt security may be received. With respect to purchase commitments, each applicable Fund identifies securities as segregated in its records with a value at least equal to the amount of the commitment. Payables and receivables associated with the purchases and sales of delayed delivery securities having the same coupon, settlement date and broker are offset. Delayed delivery or when-issued securities that have been purchased from and sold to different brokers are reflected as both payables and receivables in the Statement of Assets and Liabilities under the caption "Delayed delivery", as applicable. Losses may arise due to changes in the value of the underlying securities or if the counterparty does not perform under the contract's terms, or if the issuer does not issue the securities due to political, economic, or other factors.
To-Be-Announced (TBA) Securities and Mortgage Dollar Rolls. TBA securities involve buying or selling mortgage-backed securities (MBS) on a forward commitment basis. A TBA transaction typically does not designate the actual security to be delivered and only includes an approximate principal amount; however delivered securities must meet specified terms defined by industry guidelines, including issuer, rate and current principal amount outstanding on underlying mortgage pools. Funds may enter into a TBA transaction with the intent to take possession of or deliver the underlying MBS, or a fund may elect to extend the settlement by entering into either a mortgage or reverse mortgage dollar roll. Mortgage dollar rolls are transactions where a fund sells TBA securities and simultaneously agrees to repurchase MBS on a later date at a lower price and with the same counterparty. Reverse mortgage dollar rolls involve the purchase and simultaneous agreement to sell TBA securities on a later date at a lower price. Transactions in mortgage dollar rolls and reverse mortgage dollar rolls are accounted for as purchases and sales and may result in an increase to a fund's portfolio turnover rate.
Purchases and sales of TBA securities involve risks similar to those discussed above for delayed delivery and when-issued securities. Also, if the counterparty in a mortgage dollar roll or a reverse mortgage dollar roll transaction files for bankruptcy or becomes insolvent, a fund's right to repurchase or sell securities may be limited. Additionally, when a fund sells TBA securities without already owning or having the right to obtain the deliverable securities (an uncovered forward commitment to sell), it incurs a risk of loss because it could have to purchase the securities at a price that is higher than the price at which it sold them. A fund may be unable to purchase the deliverable securities if the corresponding market is illiquid.
TBA securities subject to a forward commitment to sell at period end are included at the end of the Schedule of Investments under the caption "TBA Sale Commitments." The value of these commitments and proceeds to be received at contractual settlement date are reflected in the Statement of Assets and Liabilities as "TBA sale commitments, at value" and "Receivable for TBA sale commitments," respectively. If the TBA sale commitment is closed through the acquisition of an offsetting TBA purchase commitment, a fund realizes a gain or loss. If a fund delivers securities under the commitment, a fund realizes a gain or loss from the sale of the securities based upon the price established at the date the commitment was entered into.
Restricted Securities (including Private Placements). Funds may invest in securities that are subject to legal or contractual restrictions on resale. These securities generally may be resold in transactions exempt from registration or to the public if the securities are registered. Disposal of these securities may involve time-consuming negotiations and expense, and prompt sale at an acceptable price may be difficult. Information regarding restricted securities held at period end is included at the end of the Schedule of Investments, if applicable.
New Accounting Pronouncement. FASB Accounting Standards Update (ASU) 2023-07 Segment Reporting (Topic 280): Improvements to Reportable Segment Disclosures became effective in this reporting period. ASU 2023-07 enhances segment information disclosure in the notes to financial statements.
4. Derivative Instruments.
Risk Exposures and the Use of Derivative Instruments. The Fund's investment objectives allow for various types of derivative instruments, including futures contracts, swaps and options. Derivatives are investments whose value is primarily derived from underlying assets, indices or reference rates and may be transacted on an exchange or over-the-counter (OTC). Derivatives may involve a future commitment to buy or sell a specified asset based on specified terms, to exchange future cash flows at periodic intervals based on a notional principal amount, or for one party to make one or more payments upon the occurrence of specified events in exchange for periodic payments from the other party.
Derivatives were used to increase returns, to gain exposure to certain types of assets and to manage exposure to certain risks as defined below. The success of any strategy involving derivatives depends on analysis of numerous economic factors, and if the strategies for investment do not work as intended, the objectives may not be achieved.
Derivatives were used to increase or decrease exposure to the following risk(s):
| | |
| Credit Risk | Credit risk relates to the ability of the issuer of a financial instrument to make further principal or interest payments on an obligation or commitment that it has to a fund. |
| Interest Rate Risk | Interest rate risk relates to the fluctuations in the value of interest-bearing securities due to changes in the prevailing levels of market interest rates. |
Funds are also exposed to additional risks from investing in derivatives, such as liquidity risk and counterparty credit risk. Liquidity risk is the risk that a fund will be unable to close out the derivative in the open market in a timely manner. Counterparty credit risk is the risk that the counterparty will not be able to fulfill its obligation to a fund. Derivative counterparty credit risk is managed through formal evaluation of the creditworthiness of all potential counterparties. On certain OTC derivatives such as options and bi-lateral swaps, a fund attempts to reduce its exposure to counterparty credit risk by entering into an International Swaps and Derivatives Association, Inc. (ISDA) Master Agreement with each of its counterparties. The ISDA Master Agreement gives a fund the right to terminate all transactions traded under such agreement upon the deterioration in the credit quality of the counterparty beyond specified levels. The ISDA Master Agreement gives each party the right, upon an event of default by the other party or a termination of the agreement, to close out all transactions traded under such agreement and to net amounts owed under each transaction to one net payable by one party to the other. To mitigate counterparty credit risk on bi-lateral OTC derivatives, a fund receives collateral in the form of cash or securities once net unrealized appreciation on outstanding derivative contracts under an ISDA Master Agreement exceeds certain applicable thresholds, subject to certain minimum transfer provisions. The collateral received is held in segregated accounts with the custodian bank in accordance with the collateral agreements entered into between a fund, the counterparty and the custodian bank. A fund could experience delays and costs in gaining access to the collateral even though it is held by the custodian bank. The maximum risk of loss to a fund from counterparty credit risk related to bi-lateral OTC derivatives is generally the aggregate unrealized appreciation and unpaid counterparty payments in excess of any collateral pledged by the counterparty to a fund. For OTC written options with upfront premiums received, a fund is obligated to perform and therefore does not have counterparty risk. For OTC written options with premiums to be received at a future date, the maximum risk of loss from counterparty credit risk is the amount of the premium in excess of any collateral pledged by the counterparty. A fund may be required to pledge collateral for the benefit of the counterparties on bi-lateral OTC derivatives in an amount not less than each counterparty's unrealized appreciation on outstanding derivative contracts, subject to certain minimum transfer provisions, and any such pledged collateral is identified in the Schedule of Investments. Exchange-traded contracts are not covered by the ISDA Master Agreement; however counterparty credit risk related to these contracts may be mitigated by the protection provided by the exchange on which they trade. Counterparty credit risk related to centrally cleared swaps may be mitigated by the protection provided by the clearinghouse.
Investing in derivatives may involve greater risks than investing in the underlying assets directly and, to varying degrees, may involve risk of loss in excess of any initial investment and collateral received and amounts recognized in the Statement of Assets and Liabilities. In addition, there may be the risk that the change in value of the derivative contract does not correspond to the change in value of the underlying instrument.
Net Realized Gain (Loss) and Change in Net Unrealized Appreciation (Depreciation) on Derivatives. The table below, which reflects the impacts of derivatives on the financial performance, summarizes the net realized gain (loss) and change in net unrealized appreciation (depreciation) for derivatives during the period as presented in the Statement of Operations.
| Primary Risk Exposure / Derivative Type | Net Realized Gain (Loss)($) | Change in Net Unrealized Appreciation (Depreciation)($) |
| VIP Investment Grade Bond II Portfolio | | |
| Credit Risk | | |
| Swaps | (175,514) | 2,422 |
| Total Credit Risk | (175,514) | 2,422 |
| Interest Rate Risk | | |
| Futures Contracts | (3,064,129) | 79,568 |
| Purchased Options | (53,666) | (449,031) |
| Written Options | 18,474 | (1,092) |
| Swaps | 1,625,863 | 1,739,781 |
| Total Interest Rate Risk | (1,473,458) | 1,369,226 |
| Totals | (1,648,972) | 1,371,648 |
If there are any open positions at period end, a summary of the value of derivatives by primary risk exposure is included at the end of the Schedule of Investments.
Futures Contracts. A futures contract is an agreement between two parties to buy or sell a specified underlying instrument for a fixed price at a specified future date. Futures contracts were used to manage exposure to the bond market and fluctuations in interest rates.
Upon entering into a futures contract, a fund is required to deposit either cash or securities (initial margin) with a clearing broker in an amount equal to a certain percentage of the face value of the contract. Futures contracts are marked-to-market daily and subsequent daily payments are made or received by a fund depending on the daily fluctuations in the value of the futures contracts and are recorded as unrealized appreciation or (depreciation). This receivable and/or payable, if any, is included in daily variation margin on futures contracts in the Statement of Assets and Liabilities. Realized gain or (loss) is recorded upon the expiration or closing of a futures contract. The net realized gain (loss) and change in net unrealized appreciation (depreciation) on futures contracts during the period is presented in the Statement of Operations.
Any open futures contracts at period end are presented in the Schedule of Investments under the caption "Futures Contracts". The notional amount at value reflects each contract's exposure to the underlying instrument or index at period end, and is representative of volume of activity during the period, unless an average notional amount is presented in the table below.
| | Average Notional Amount ($) |
| VIP Investment Grade Bond II Portfolio | 51,456,859 |
Any securities deposited to meet initial margin requirements are identified in the Schedule of Investments. Any cash deposited to meet initial margin requirements is presented as segregated cash with brokers for derivative instruments in the Statement of Assets and Liabilities.
Options. Options give the purchaser the right, but not the obligation, to buy (call) or sell (put) an underlying security or financial instrument at an agreed exercise or strike price between or on certain dates. Options obligate the seller (writer) to buy (put) or sell (call) an underlying instrument at the exercise or strike price or cash settle an underlying derivative instrument if the holder exercises the option on or before the expiration date. OTC options, such as swaptions, which are options where the underlying instrument is a swap, were used to manage exposure to fluctuations in interest rates.
Upon entering into an options contract, a fund will pay or receive a premium. Premiums paid on purchased options are reflected as cost of investments and premiums received on written options are reflected as a liability on the Statement of Assets and Liabilities. Certain options may be purchased or written with premiums to be paid or received on a future date. Options are valued daily and any unrealized appreciation (depreciation) is reflected in total accumulated earnings (loss) in the Statement of Assets and Liabilities. When an option is exercised, the cost or proceeds of the underlying instrument purchased or sold is adjusted by the amount of the premium. When an option is closed, a gain or loss is realized depending on whether the proceeds or amount paid for the closing sale transaction is greater or less than the premium received or paid. When an option expires, gains and losses are realized to the extent of premiums received and paid, respectively. The net realized and unrealized gains (losses) on purchased options are included in the Statement of Operations in net realized gain (loss) and change in net unrealized appreciation (depreciation) on investment securities. The net realized gain (loss) and change in net unrealized appreciation (depreciation) on written options are presented in the Statement of Operations.
Any open options at period end are presented in the Schedule of Investments under the captions "Purchased Options," "Purchased Swaptions," "Written Options" and "Written Swaptions," as applicable, and are representative of volume of activity during the period.
Writing puts and buying calls tend to increase exposure to the underlying instrument while buying puts and writing calls tend to decrease exposure to the underlying instrument. For purchased options, risk of loss is limited to the premium paid, and for written options, risk of loss is the change in value in excess of the premium received.
Swaps. A swap is a contract between two parties to exchange future cash flows at periodic intervals based on a notional principal amount. A bi-lateral OTC swap is a transaction between a fund and a dealer counterparty where cash flows are exchanged between the two parties for the life of the swap. A centrally cleared swap is a transaction executed between a fund and a dealer counterparty, then cleared by a futures commission merchant (FCM) through a clearinghouse. Once cleared, the clearinghouse serves as a central counterparty, with whom a fund exchanges cash flows for the life of the transaction, similar to transactions in futures contracts.
Bi-lateral OTC swaps are marked-to-market daily and changes in value are reflected in the Statement of Assets and Liabilities in the bi-lateral OTC swaps at value line items. Any upfront premiums paid or received upon entering a bi-lateral OTC swap to compensate for differences between stated terms of the swap and prevailing market conditions (e.g. credit spreads, interest rates or other factors) are recorded in total accumulated earnings (loss) in the Statement of Assets and Liabilities and amortized to realized gain or (loss) ratably over the term of the swap. Any unamortized upfront premiums are presented in the Schedule of Investments.
Centrally cleared swaps require a fund to deposit either cash or securities (initial margin) with the FCM, at the instruction of and for the benefit of the clearinghouse. Any securities deposited to meet initial margin requirements are identified in the Schedule of Investments. Any cash deposited to meet initial margin requirements is presented in segregated cash with brokers for derivative instruments in the Statement of Assets and Liabilities. Centrally cleared swaps are marked-to-market daily and subsequent payments (variation margin) are made or received depending on the daily fluctuations in the value of the swaps and are recorded as unrealized appreciation or (depreciation). These daily payments, if any, are included in receivable or payable for daily variation margin on centrally cleared swaps in the Statement of Assets and Liabilities. Any premiums for centrally cleared swaps are recorded periodically throughout the term of the swap to variation margin and included in total accumulated earnings (loss) in the Statement of Assets and Liabilities. Any premiums are recognized as realized gain (loss) upon termination or maturity of the swap.
For both bi-lateral and centrally cleared swaps, payments are exchanged at specified intervals, accrued daily commencing with the effective date of the contract and recorded as realized gain or (loss). Some swaps may be terminated prior to the effective date and realize a gain or loss upon termination. The net realized gain (loss) and change in net unrealized appreciation (depreciation) on swaps during the period is presented in the Statement of Operations.
Any open swaps at period end are included in the Schedule of Investments under the caption "Swaps", and are representative of volume of activity during the period.
Credit Default Swaps. Credit default swaps enable a fund to buy or sell protection against specified credit events on a single-name issuer or a traded credit index. Under the terms of a credit default swap the buyer of protection (buyer) receives credit protection in exchange for making periodic payments to the seller of protection (seller) based on a fixed percentage applied to a notional principal amount. In return for these payments, the seller will be required to make a payment upon the occurrence of one or more specified credit events. A fund enters into credit default swaps as a seller to gain credit exposure to an issuer and/or as a buyer to obtain a measure of protection against defaults of an issuer. Periodic payments are made over the life of the contract by the buyer provided that no credit event occurs.
For credit default swaps on most corporate and sovereign issuers, credit events include bankruptcy, failure to pay or repudiation/moratorium. For credit default swaps on corporate or sovereign issuers, the obligation that may be put to the seller is not limited to the specific reference obligation described in the Schedule of Investments. For credit default swaps on asset-backed securities, a credit event may be triggered by events such as failure to pay principal, maturity extension, rating downgrade or write-down. For credit default swaps on asset-backed securities, the reference obligation described represents the security that may be put to the seller. For credit default swaps on a traded credit index, a specified credit event may affect all or individual underlying securities included in the index.
As a seller, if an underlying credit event occurs, a fund will pay a net settlement amount of cash equal to the notional amount of the swap less the recovery value of the reference obligation or underlying securities comprising an index. Only in the event of the industry's inability to value the underlying asset will a fund be required to take delivery of the reference obligation or underlying securities comprising an index and pay an amount equal to the notional amount of the swap.
As a buyer, if an underlying credit event occurs, a fund will receive a net settlement amount of cash equal to the notional amount of the swap less the recovery value of the reference obligation or underlying securities comprising an index. Only in the event of the industry's inability to value the underlying asset will a fund be required to deliver the reference obligation or underlying securities comprising an index in exchange for payment of an amount equal to the notional amount of the swap.
Typically, the value of each credit default swap and credit rating disclosed for each reference obligation in the Schedule of Investments, where a fund is the seller, can be used as measures of the current payment/performance risk of the swap. As the value of the swap changes as a positive or negative percentage of the total notional amount, the payment/performance risk may decrease or increase, respectively. In addition to these measures, the investment adviser monitors a variety of factors including cash flow assumptions, market activity and market sentiment as part of its ongoing process of assessing payment/performance risk.
Interest Rate Swaps. Interest rate swaps are agreements between counterparties to exchange cash flows, one based on a fixed rate, and the other on a floating rate. A fund enters into interest rate swaps to manage its exposure to interest rate changes. Changes in interest rates can have an effect on both the value of bond holdings as well as the amount of interest income earned. In general, the value of bonds can fall when interest rates rise and can rise when interest rates fall.
5. Purchases and Sales of Investments.
Purchases and sales of securities, other than short-term securities, U.S. government securities and in-kind transactions, as applicable, are noted in the table below.
| | Purchases ($) | Sales ($) |
| VIP Investment Grade Bond II Portfolio | 4,263,761,056 | 4,352,998,746 |
6. Fees and Other Transactions with Affiliates.
Management Fee. Fidelity Management & Research Company LLC (the investment adviser) and its affiliates provide the Fund with investment management related services for which the Fund pays a monthly management fee.
Effective March 1, 2024, the Fund's management contract was amended to incorporate administrative services previously covered under separate services agreements (Transfer Agent and Accounting agreements). The amended contract incorporates a management fee rate that may vary by class. The investment adviser or an affiliate pays certain expenses of managing and operating the Fund out of each class's management fee. Each class of the Fund pays a management fee to the investment adviser. The management fee is calculated and paid to the investment adviser every month. When determining a class's management fee, a mandate rate is calculated based on the monthly average net assets of a group of funds advised by FMR within a designated asset class. A discount rate is subtracted from the mandate rate once the Fund's monthly average net assets reach a certain level. The mandate rate and discount rate may vary by class. The annual management fee rate for a class of shares of the Fund is the lesser of (1) the class's mandate rate reduced by the class's discount rate (if applicable) or (2) the amount set forth in the following table.
| | Maximum Management Fee Rate % |
| Initial Class | .38 |
| Investor Class | .41 |
One-twelfth of the management fee rate for a class is applied to the average net assets of the class for the month, giving a dollar amount which is the management fee for the class for that month. A different management fee rate may be applicable to each class of the Fund. The difference between classes is the result of separate arrangements for class-level services and/or waivers of certain expenses. It is not the result of any difference in advisory or custodial fees or other expenses related to the management of the Fund's assets, which do not vary by class. For the portion of the reporting period on or after March 1, 2024, the total annualized management fee rates were as follows:
| | Total Management Fee Rate % |
| Initial Class | .38 |
| Investor Class | .41 |
Prior to March 1, 2024, the management fee was the sum of an individual fund fee rate that was based on an annual rate of .20% of the Fund's average net assets and an annualized group fee rate that averaged .10% during the period. The group fee rate was based upon the monthly average net assets of a group of registered investment companies with which the investment adviser has management contracts. The group fee rate decreased as assets under management increased and increased as assets under management decreased. For the portion of the reporting period prior to March 1, 2024, the total annualized management fee rate was .30%.
Effective March 1, 2024, the Fund's sub-advisory agreements with FMR Investment Management (UK) Limited, Fidelity Management & Research (Hong Kong) Limited, and Fidelity Management & Research (Japan) Limited were amended to provide that the investment adviser pays each sub-adviser monthly fees equal to 110% of the sub-adviser's costs for providing sub-advisory services.
Transfer Agent Fees. Fidelity Investments Institutional Operations Company LLC (FIIOC), an affiliate of the investment adviser, is the Fund's transfer, dividend disbursing, and shareholder servicing agent. Effective March 1, 2024, the Fund's management contract was amended to incorporate transfer agent services and associated fees previously covered under a separate services agreement.
During the period January 1, 2024 through February 29, 2024, the transfer agent fees for each class were a fixed annual rate of class-level average net assets as follows:
| | Amount ($) | % of Class-Level Average Net Assets |
| Initial Class | 70,617 | .0680 |
| Investor Class | 415,869 | .1020 |
| | 486,486 | |
Accounting Fees. Fidelity Service Company, Inc. (FSC), an affiliate of the investment adviser, maintains the Fund's accounting records. Effective March 1, 2024, the Fund's management contract was amended to incorporate accounting services and associated fees previously covered under a separate services agreement.
During the period January 1, 2024 through February 29, 2024, the accounting fees were a fixed annual rate of average net assets as follows:
| | % of Average Net Assets |
| VIP Investment Grade Bond II Portfolio | .0319 |
Interfund Trades. Funds may purchase from or sell securities to other Fidelity Funds under procedures adopted by the Board. The procedures have been designed to ensure these interfund trades are executed in accordance with Rule 17a-7 of the 1940 Act. Any interfund trades are included within the respective purchases and sales amounts shown in the Purchases and Sales of Investments note. During the period, there were no interfund trades.
7. Committed Line of Credit.
Certain Funds participate with other funds managed by the investment adviser or an affiliate in a $4.25 billion credit facility (the "line of credit") to be utilized for temporary or emergency purposes to fund shareholder redemptions or for other short-term liquidity purposes.
Commitment fees are charged based on the unused amount of the line of credit at an annual rate of .10%, and then allocated to each participating fund based on its pro-rata portion of the line of credit. The commitment fees are reflected in Miscellaneous expenses on the Statement of Operations, and are listed below.
Interest is charged to a participating fund based on its borrowings at an annual rate of .75% plus the highest of (i) daily SOFR plus a .10% spread adjustment, (ii) Federal Funds Effective Rate, or (iii) Overnight Bank Funding Rate. During the period, there were no borrowings on this line of credit.
The line of credit agreement will expire in March 2025 unless extended or renewed.
| | Amount ($) |
| VIP Investment Grade Bond II Portfolio | 4,969 |
8. Expense Reductions.
Through arrangements with the Fund's custodian, credits realized as a result of certain uninvested cash balances were used to reduce the Fund's expenses. During the period, custodian credits reduced the Fund's expenses by $13,245.
In addition, during the period the investment adviser or an affiliate reimbursed and/or waived a portion of fund-level operating expenses in the amount of $72,707.
9. Distributions to Shareholders.
Distributions to shareholders of each class were as follows:
| | Year ended December 31, 2024 | Year ended December 31, 2023 |
| VIP Investment Grade Bond II Portfolio | | |
| Distributions to shareholders | | |
| Initial Class | $35,926,042 | $23,447,707 |
| Investor Class | 100,409,679 | 91,765,959 |
Total | $136,335,721 | $115,213,666 |
10. Share Transactions.
Transactions for each class of shares were as follows and may contain in-kind transactions:
| | Shares | Shares | Dollars | Dollars |
| | Year ended December 31, 2024 | Year ended December 31, 2023 | Year ended December 31, 2024 | Year ended December 31, 2023 |
| VIP Investment Grade Bond II Portfolio | | | | |
| Initial Class | | | | |
| Shares sold | 46,148,217 | 21,072,688 | $442,561,844 | $198,853,080 |
| Reinvestment of distributions | 3,839,335 | 2,561,711 | 35,926,042 | 23,447,707 |
| Shares redeemed | (26,043,642) | (12,058,072) | (251,204,675) | (113,550,841) |
| Net increase (decrease) | 23,943,910 | 11,576,327 | $227,283,211 | $108,749,946 |
| Investor Class | | | | |
| Shares sold | 36,918,102 | 41,309,206 | $358,152,134 | $389,397,660 |
| Reinvestment of distributions | 10,728,024 | 10,024,101 | 100,402,433 | 91,765,959 |
| Shares redeemed | (48,772,088) | (35,286,498) | (472,509,219) | (332,184,313) |
| Net increase (decrease) | (1,125,962) | 16,046,809 | $(13,954,652) | $148,979,306 |
11. Other.
A fund's organizational documents provide former and current trustees and officers with a limited indemnification against liabilities arising in connection with the performance of their duties to the fund. In the normal course of business, a fund may also enter into contracts that provide general indemnifications. A fund's maximum exposure under these arrangements is unknown as this would be dependent on future claims that may be made against a fund. The risk of material loss from such claims is considered remote.
At the end of the period, the following mutual funds managed by the investment adviser or its affiliates were the owners of record of 10% or more of the total outstanding shares.
| | VIP FundsManager 50% Portfolio | VIP FundsManager 60% Portfolio |
| VIP Investment Grade Bond II Portfolio | 21% | 32% |
Mutual funds managed by the investment adviser or its affiliates, in aggregate, were the owners of record of more than 20% of the total outstanding shares.
| Fund | % of shares held |
| VIP Investment Grade Bond II Portfolio | 92% |
12. Risk and Uncertainties.
Many factors affect a fund's performance. Developments that disrupt global economies and financial markets, such as pandemics, epidemics, outbreaks of infectious diseases, war, terrorism, and environmental disasters, may significantly affect a fund's investment performance. The effects of these developments to a fund will be impacted by the types of securities in which a fund invests, the financial condition, industry, economic sector, and geographic location of an issuer, and a fund's level of investment in the securities of that issuer. Significant concentrations in security types, issuers, industries, sectors, and geographic locations may magnify the factors that affect a fund's performance.
Report of Independent Registered Public Accounting Firm
To the Board of Trustees of Variable Insurance Products Fund V and the Shareholders of VIP Investment Grade Bond II Portfolio:
Opinion on the Financial Statements and Financial Highlights
We have audited the accompanying statement of assets and liabilities of VIP Investment Grade Bond II Portfolio (the "Fund"), a fund of Variable Insurance Products Fund V, including the schedule of investments, as of December 31, 2024, the related statement of operations for the year then ended, the statement of changes in net assets for each of the two years in the period then ended, the financial highlights for each of the two years in the period then ended and for the period from May 27, 2022 (commencement of operations) through December 31, 2022, and the related notes. In our opinion, the financial statements and financial highlights present fairly, in all material respects, the financial position of the Fund as of December 31, 2024, and the results of its operations for the year then ended, the changes in its net assets for each of the two years in the period then ended, and the financial highlights for each of the two years in the period then ended and for the period from May 27, 2022 (commencement of operations) through December 31, 2022, in conformity with accounting principles generally accepted in the United States of America.
Basis for Opinion
These financial statements and financial highlights are the responsibility of the Fund's management. Our responsibility is to express an opinion on the Fund's financial statements and financial highlights based on our audits. We are a public accounting firm registered with the Public Company Accounting Oversight Board (United States) (PCAOB) and are required to be independent with respect to the Fund in accordance with the U.S. federal securities laws and the applicable rules and regulations of the Securities and Exchange Commission and the PCAOB.
We conducted our audits in accordance with the standards of the PCAOB. Those standards require that we plan and perform the audit to obtain reasonable assurance about whether the financial statements and financial highlights are free of material misstatement, whether due to error or fraud. The Fund is not required to have, nor were we engaged to perform, an audit of its internal control over financial reporting. As part of our audits, we are required to obtain an understanding of internal control over financial reporting but not for the purpose of expressing an opinion on the effectiveness of the Fund's internal control over financial reporting. Accordingly, we express no such opinion.
Our audits included performing procedures to assess the risks of material misstatement of the financial statements and financial highlights, whether due to error or fraud, and performing procedures that respond to those risks. Such procedures included examining, on a test basis, evidence regarding the amounts and disclosures in the financial statements and financial highlights. Our audits also included evaluating the accounting principles used and significant estimates made by management, as well as evaluating the overall presentation of the financial statements and financial highlights. Our procedures included confirmation of securities owned as of December 31, 2024, by correspondence with the custodian and brokers; when replies were not received from brokers, we performed other auditing procedures. We believe that our audits provide a reasonable basis for our opinion.
/s/ Deloitte & Touche LLP
Boston, Massachusetts
February 13, 2025
We have served as the auditor of one or more of the Fidelity investment companies since 1999.
Distributions
(Unaudited)
The dividend and capital gains distributions for the fund(s) are available on Fidelity.com or Institutional.Fidelity.com.
A total of 38.55% of the dividends distributed during the fiscal year was derived from interest on U.S. Government securities which is generally exempt from state income tax.
The fund designates $135,471,219 of distributions paid during the fiscal year ended 2024 as qualifying to be taxed as section 163(j) interest dividends.
Item 8: Changes in and Disagreements with Accountants for Open-End Management Investment Companies
(Unaudited)
Note: This is not applicable for any fund included in this document.
Item 9: Proxy Disclosures for Open-End Management Investment Companies
(Unaudited)
Note: This is not applicable for any fund included in this document.
Item 10: Remuneration Paid to Directors, Officers, and others of Open-End Management Investment Companies
(Unaudited)
Note: This information is disclosed as part of the financial statements for each Fund as part of Item 7: Financial Statements and Financial Highlights for Open-End Management Investment companies.
Item 11: Statement Regarding Basis for Approval of Investment Advisory Contract
(Unaudited)
Board Approval of Investment Advisory Contracts and Management Fees
VIP Investment Grade Bond II Portfolio
Each year, the Board of Trustees, including the Independent Trustees (together, the Board), considers the renewal of the fund's management contract with Fidelity Management & Research Company LLC (FMR) and the sub-advisory agreements (together, the Advisory Contracts) for the fund. FMR and the sub-advisers are referred to herein as the Investment Advisers. The Board, assisted by the advice of fund counsel and Independent Trustees' counsel, requests and considers a broad range of information relevant to the renewal of the Advisory Contracts throughout the year.
The Board meets regularly and, at each of its meetings, covers an extensive agenda of topics and materials and considers factors that are relevant to its annual consideration of the renewal of the fund's Advisory Contracts, including the services and support provided to the fund and its shareholders. The Board's Operations Committee, of which all the Independent Trustees are members, meets regularly throughout the year and requests, receives and considers, among other matters, information related to the annual consideration of the renewal of the fund's Advisory Contracts before making its recommendation to the Board. The Board also meets as needed to review matters specifically related to the Board's annual consideration of the renewal of the Advisory Contracts. Members of the Board may also meet from time to time with trustees of other Fidelity funds through joint ad hoc committees to discuss certain matters relevant to all of the Fidelity funds.
At its September 2024 meeting, the Board unanimously determined to renew the fund's Advisory Contracts. In reaching its determination, the Board considered all factors it believed relevant, including (i) the nature, extent, and quality of the services provided to the fund and its shareholders (including the investment performance of the fund); (ii) the competitiveness relative to peer funds of the fund's management fee and the total expense ratio of a representative class (Investor Class, which was selected because it was the largest class without 12b-1 fees); (iii) the total costs of the services provided by and the profits realized by FMR and its affiliates (Fidelity) from its relationships with the fund; and (iv) the extent to which, if any, economies of scale exist and are realized as the fund grows, and whether any economies of scale are appropriately shared with fund shareholders. The Board also considered the broad range of investment choices available to shareholders from FMR's competitors and that the fund's shareholders have chosen to invest in the fund, which is part of the Fidelity family of funds. The Board's decision to renew the Advisory Contracts was not based on any single factor and the factors may have been weighed differently by different Trustees.
The Board reached a determination, with the assistance of fund counsel and Independent Trustees' counsel and through the exercise of its business judgment, that the renewal of the Advisory Contracts was in the best interests of the fund and its shareholders and that the compensation payable under the Advisory Contracts was fair and reasonable in light of all of the surrounding circumstances.
Nature, Extent, and Quality of Services Provided. The Board considered Fidelity's staffing as it relates to the fund, including the backgrounds and experience of investment personnel, and also considered the Investment Advisers' implementation of the fund's investment program. The Independent Trustees also had discussions with senior management of Fidelity's investment operations and investment groups. The Board considered the structure of the investment personnel compensation program and whether this structure provides appropriate incentives to act in the best interests of the fund. Additionally, the Board considered the portfolio managers' investments, if any, in the funds that they manage.
Resources Dedicated to Investment Management and Support Services. The Board reviewed the general qualifications and capabilities of Fidelity's investment staff, including its size, education, experience, and resources, as well as Fidelity's approach to recruiting, training, managing, and compensating investment personnel. The Board noted the resources devoted to Fidelity's global investment organization, and that Fidelity's analysts have extensive resources, tools and capabilities that allow them to conduct quantitative and fundamental analysis, as well as credit analysis of issuers, counterparties and guarantors. Further, the Board considered that Fidelity's investment professionals have sufficient access to global information and data so as to provide competitive investment results over time, and that those professionals also have access to sophisticated tools that permit them to assess portfolio construction and risk and performance attribution characteristics continuously, as well as to transmit new information and research conclusions rapidly around the world. Additionally, in its deliberations, the Board considered Fidelity's trading, risk management, compliance, cybersecurity, and technology and operations capabilities and resources, which are integral parts of the investment management process.
Shareholder and Administrative Services. The Board considered (i) the nature, extent, quality, and cost of advisory, administrative, shareholder, transfer agency, and pricing and bookkeeping services performed by the Investment Advisers and their affiliates under the Advisory Contracts; (ii) the nature and extent of Fidelity's supervision of third party service providers, principally custodians, subcustodians, and pricing vendors; and (iii) the resources devoted by Fidelity to, and the record of compliance with, the fund's compliance policies and procedures, including with respect to liquidity and derivatives risk management. The Board also considered the fund's securities lending activities and any payments made to Fidelity relating to securities lending under a separate agreement.
The Board noted that the growth of fund assets over time across the complex allows Fidelity to reinvest in the development of services designed to enhance the value and convenience of the Fidelity funds as investment vehicles. These services include 24-hour access to account information and market information over the Internet and through telephone representatives, investor education materials and asset allocation tools. The Board also considered that it reviews customer service metrics such as telephone response times, continuity of services on the website and metrics addressing services at Fidelity Investor Centers.
Investment in a Large Fund Family. The Board considered the benefits to shareholders of investing in a fund that is part of a large family of funds offering a variety of investment disciplines and providing a large variety of fund investor services. The Board noted that Fidelity had taken, or had made recommendations to the Board that resulted in the Fidelity funds taking, a number of actions over the previous year that benefited particular funds and/or the Fidelity funds in general.
Investment Performance. The Board took into account discussions that occur with representatives of the Investment Advisers, and reports that it receives, at Board meetings throughout the year relating to fund investment performance. In this regard the Board noted that as part of regularly scheduled fund reviews and other reports to the Board on fund performance, the Board considered annualized return information for the fund for different time periods, measured against an appropriate securities market index (benchmark index) and an appropriate peer group of funds with similar objectives (peer group). The Board also considered information about performance attribution. In its evaluation of fund investment performance at meetings throughout the year, the Board gave particular attention to information indicating underperformance of certain Fidelity funds over different time periods and discussed with the Investment Advisers the reasons for such underperformance.
In addition to reviewing absolute and relative fund performance, the Independent Trustees periodically consider the appropriateness of fund performance metrics in evaluating the results achieved. The Independent Trustees generally give greater weight to fund performance over longer time periods than over shorter time periods. Depending on the circumstances, the Independent Trustees may be satisfied with a fund's performance notwithstanding that it lags its benchmark index or peer group for certain periods.
Based on its review, the Board concluded that the nature, extent, and quality of services provided to the fund under the Advisory Contracts should continue to benefit the shareholders of the fund.
Competitiveness of Management Fee and Total Expense Ratio. The Board was provided with information regarding industry trends in management fees and expenses. The Board considered that, effective March 1, 2024, an amended Advisory Contract with FMR went into effect with class-level management fees based on tiered schedules and subject to a maximum class-level rate (the management fee). The Board also considered that in exchange for the variable management fee, each class of the fund receives investment advisory, management, administrative, transfer agent, and pricing and bookkeeping services. In its review of the management fee and total expense ratio of Investor Class, the Board considered a pro forma management fee rate for Investor Class as if the new management fee structure had been in effect for the 12-month period ended December 31, 2023, as well as other third-party fund expenses, as applicable, such as custodial, legal, and audit fees and any fund-paid 12b-1 fees. The Board noted that Fidelity may agree to waive fees or reimburse expenses from time to time, and the extent to which, if any, it has done so for the fund.
Comparisons of Management Fees and Total Expense Ratios. Among other things, the Board reviewed data for selected groups of competitive funds and classes (referred to as "mapped groups") that were compiled by Fidelity based on combining similar investment objective categories (as classified by Morningstar) that have comparable investment mandates. The data reviewed by the Board included (i) gross management fee comparisons (before taking into account expense reimbursements or caps) relative to the total universe of funds within the mapped group; (ii) gross management fee comparisons relative to a subset of non-Fidelity funds in the mapped group that are similar in size and management fee structure to the fund (referred to as the "asset size peer group"); (iii) total expense comparisons of Investor Class of the fund relative to funds and classes in the mapped group that have a similar sales load structure to Investor Class of the fund (referred to as the "similar sales load structure group"); and (iv) total expense comparisons of Investor Class of the fund relative to funds and classes in the similar sales load structure group that are similar in size and management fee structure to the fund (referred to as the "total expense asset size peer group"). The total expense asset size peer group comparison excludes performance adjustments and fund-paid 12b-1 fees to eliminate variability in fee structures.
The information provided to the Board indicated that the fund's management fee rate ranked below the competitive median of the mapped group for 2023 and below the competitive median of the asset size peer group for 2023. Further, the information provided to the Board indicated that the total expense ratio of Investor Class of the fund ranked below the competitive median of the similar sales load structure group for 202 and below the competitive median of the total expense asset size peer group for 2023.
The Board noted that a different variable management fee rate is applicable to each class of the fund. The Board considered that the difference in management fee rates between classes is the result of separate arrangements for class-level services and/or waivers of certain expenses and not the result of any difference in advisory or custodial fees or other expenses related to the management of the fund's assets, which do not vary by class.
Fees Charged to Other Fidelity Clients. The Board also considered Fidelity fee structures and other information with respect to clients of Fidelity, such as other funds advised or subadvised by Fidelity, pension plan clients, and other institutional clients with similar mandates. The Board noted that a joint ad hoc committee created by it and the boards of other Fidelity funds periodically reviews and compares Fidelity's institutional investment advisory business with its business of providing services to the Fidelity funds and also noted the most recent findings of the committee. The Board noted that the committee's review included a consideration of the differences in services provided, fees charged, and costs incurred, as well as competition in the markets serving the different categories of clients.
Based on its review, the Board concluded that the fund's management fee is fair and reasonable in light of the services that the fund receives and the other factors considered. Further, based on its review of total expense ratios and fees charged to other Fidelity clients, the Board concluded that the total expense ratio of each class of the fund was reasonable in light of the services that the fund and its shareholders receive and the other factors considered.
Costs of the Services and Profitability. The Board considered the revenues earned and the expenses incurred by Fidelity in conducting the business of developing, marketing, distributing, managing, administering and servicing the fund and servicing the fund's shareholders. The Board also considered the level of Fidelity's profits in respect of all the Fidelity funds.
On an annual basis, Fidelity presents to the Board information about the profitability of its relationships with the fund. Fidelity calculates profitability information for each Fidelity fund, as well as aggregate profitability information for groups of Fidelity funds and all Fidelity funds, using a series of detailed revenue and cost allocation methodologies which originate with the books and records of Fidelity on which Fidelity's audited financial statements are based. The Audit Committee of the Board reviews any significant changes from the prior year's methodologies.
A public accounting firm has been engaged annually by the Board as part of the Board's assessment of Fidelity's profitability analysis. The engagement includes the review and assessment of the methodologies used by Fidelity in determining the revenues and expenses attributable to Fidelity's fund business. After considering the reports issued under the engagement and information provided by Fidelity, the Board concluded that while other allocation methods may also be reasonable, Fidelity's profitability methodologies are reasonable in all material respects.
The Board also reviewed Fidelity's non-fund businesses and potential indirect benefits such businesses may have received as a result of their association with Fidelity's fund business (i.e., fall-out benefits) as well as cases where Fidelity's affiliates may benefit from the funds' business. The Board considered areas where potential indirect benefits to the Fidelity funds from their relationships with Fidelity may exist. The Board's consideration of these matters was informed by the findings of a joint ad hoc committee created by it and the boards of other Fidelity funds to evaluate potential fall-out benefits.
The Board considered the costs of the services provided by and the profits realized by Fidelity in connection with the operation of the fund and was satisfied that the profitability was not excessive.
Economies of Scale. The Board considered whether there have been economies of scale in respect of the management of the Fidelity funds, whether the Fidelity funds (including the fund) have appropriately benefited from any such economies of scale, and whether there is potential for realization of any further economies of scale. The Board considered the extent to which the fund will benefit from economies of scale as assets grow through increased services to the fund, through waivers or reimbursements, or through fee or expense ratio reductions. The Board also noted that a committee created by it and the boards of other Fidelity funds periodically analyzes whether Fidelity attains economies of scale in respect of the management and servicing of the Fidelity funds, whether the Fidelity funds have appropriately benefited from such economies of scale, and whether there is potential for realization of any further economies of scale.
The Board recognized that the fund's management contract incorporates a variable management fee structure, which provides breakpoints as a way to share, in part, any potential economies of scale that may exist at the asset class level determined based on the total net assets of specified Fidelity funds in the same asset class as the fund and through a discount determined based on both fund size and total assets of a broader group of specified Fidelity funds. The Board considered that the variable management fee is designed to deliver the benefits of economies of scale to fund shareholders even if assets of any particular fund are unchanged or have declined, because some portion of Fidelity's costs are attributable to services provided to all funds subject to the variable management fee, and all such funds benefit if those costs can be allocated among more assets. The Board concluded that, given the variable management fee structure, fund shareholders will benefit from lower management fees due to the application of the breakpoints and discount, regardless of whether Fidelity achieves any such economies of scale.
The Board concluded, taking into account the analysis of the committee, that economies of scale, if any, are being appropriately shared between fund shareholders and Fidelity.
Additional Information Requested by the Board. In order to develop fully the factual basis for consideration of the Fidelity funds' advisory contracts, the Board requested and received additional information on certain topics, including: (i) portfolio manager changes that have occurred during the past year; (ii) hiring, training, compensating, and retaining adviser and sub-adviser personnel; (iii) the terms of the funds' various management fee structures and arrangements for transfer agent and pricing and bookkeeping services; (iv) Fidelity's fund profitability methodology, profitability trends for certain funds, the allocation of various costs to different funds, and the impact of certain factors on fund profitability results; (v) the impact on fund profitability of recent industry trends, such as the growth in passively managed funds and the changes in flows for different types of funds; (vi) the types of management fee and total expense comparisons provided, and the challenges and limitations associated with such information; (vii) explanations regarding the relative total expense ratios and management fees of certain funds and classes, total expense and management fee competitive trends, and methodologies for total expense and management fee competitive comparisons; (viii) matters related to money market funds, exchange-traded funds, and target date funds; (ix) the arrangements with and compensation paid to certain fund sub-advisers and the treatment of such compensation within Fidelity's fund profitability methodology; and (x) the terms of management contracts between Fidelity and other funds and products not overseen by the Board.
Conclusion. Based on its evaluation of all of the conclusions noted above, and after considering all factors it believed relevant, the Board, including the Independent Trustees, concluded that the advisory and sub-advisory fee arrangements are fair and reasonable in light of all of the surrounding circumstances and that the fund's Advisory Contracts should be renewed through September 30, 2025.
1.9905666.102
VIGBI-ANN-0325
Fidelity® Variable Insurance Products:
VIP Freedom Lifetime Income® I Portfolio
VIP Freedom Lifetime Income® II Portfolio
VIP Freedom Lifetime Income® III Portfolio
Annual Report
December 31, 2024
Contents
To view a fund's proxy voting guidelines and proxy voting record for the 12-month period ended June 30, visit http://www.fidelity.com/proxyvotingresults or visit the Securities and Exchange Commission's (SEC) web site at http://www.sec.gov.
You may also call 1-877-208-0098 to request a free copy of the proxy voting guidelines.
Fidelity® Variable Insurance Products are separate account options which are purchased through a variable insurance contract.
Standard & Poor's, S&P and S&P 500 are registered service marks of The McGraw-Hill Companies, Inc. and have been licensed for use by Fidelity Distributors Corporation.
Other third-party marks appearing herein are the property of their respective owners.
All other marks appearing herein are registered or unregistered trademarks or service marks of FMR LLC or an affiliated company. © 2025 FMR LLC. All rights reserved.
This report and the financial statements contained herein are submitted for the general information of the shareholders of the Funds. This report is not authorized for distribution to prospective investors in the Funds unless preceded or accompanied by an effective prospectus.
A fund files its complete schedule of portfolio holdings with the SEC for the first and third quarters of each fiscal year on Form N-PORT. Forms N-PORT are available on the SEC's web site at http://www.sec.gov. A fund's Forms N-PORT may be reviewed and copied at the SEC's Public Reference Room in Washington, DC. Information regarding the operation of the SEC's Public Reference Room may be obtained by calling 1-800-SEC-0330.
For a complete list of a fund's portfolio holdings, view the most recent holdings listing, semiannual report, or annual report on Fidelity's web site at http://www.fidelity.com, http://www.institutional.fidelity.com, or http://www.401k.com, as applicable.
NOT FDIC INSURED •MAY LOSE VALUE •NO BANK GUARANTEE
Neither the Funds nor Fidelity Distributors Corporation is a bank.
Item 7: Financial Statements and Financial Highlights for Open-End Management Investment Companies (Annual Report)
VIP Freedom Lifetime Income® I Portfolio
Schedule of Investments December 31, 2024
Showing Percentage of Net Assets
| Bond Funds - 62.4% |
| | | Shares | Value ($) |
| Fidelity Inflation-Protected Bond Index Fund (a) | | 148,508 | 1,320,236 |
| Fidelity International Bond Index Fund (a) | | 28,695 | 266,860 |
| Fidelity Long-Term Treasury Bond Index Fund (a) | | 27,694 | 253,951 |
| VIP High Income Portfolio - Investor Class (a) | | 21,788 | 101,970 |
| VIP Investment Grade Bond II Portfolio - Investor Class (a) | | 358,140 | 3,298,468 |
| TOTAL BOND FUNDS (Cost $5,626,995) | | | 5,241,485 |
| | | | |
| Domestic Equity Funds - 9.4% |
| | | Shares | Value ($) |
| VIP Contrafund Portfolio - Investor Class (a) | | 2,425 | 139,049 |
| VIP Equity Income Portfolio - Investor Class (a) | | 4,305 | 113,450 |
| VIP Growth & Income Portfolio - Investor Class (a) | | 5,129 | 155,658 |
| VIP Growth Portfolio - Investor Class (a) | | 2,404 | 230,446 |
| VIP Mid Cap Portfolio - Investor Class (a) | | 961 | 35,718 |
| VIP Value Portfolio - Investor Class (a) | | 4,209 | 79,717 |
| VIP Value Strategies Portfolio - Investor Class (a) | | 2,585 | 39,622 |
| TOTAL DOMESTIC EQUITY FUNDS (Cost $535,028) | | | 793,660 |
| | | | |
| International Equity Funds - 12.8% |
| | | Shares | Value ($) |
| VIP Emerging Markets Portfolio - Investor Class (a) | | 39,542 | 451,571 |
| VIP Overseas Portfolio - Investor Class (a) | | 24,542 | 622,390 |
| TOTAL INTERNATIONAL EQUITY FUNDS (Cost $815,398) | | | 1,073,961 |
| | | | |
| Money Market Funds - 15.4% |
| | | Yield (%) | Shares | Value ($) |
VIP Government Money Market Portfolio - Investor Class (a)(b) (Cost $1,295,809) | | 4.29 | 1,295,809 | 1,295,809 |
| | | | | |
| TOTAL INVESTMENT IN SECURITIES - 100.0% (Cost $8,273,230) | 8,404,915 |
NET OTHER ASSETS (LIABILITIES) - 0.0% | (2) |
| NET ASSETS - 100.0% | 8,404,913 |
| | |
Legend
| (b) | The rate quoted is the annualized seven-day yield of the fund at period end. |
Affiliated Underlying Funds
Fiscal year to date information regarding the Fund's investments in affiliated Underlying Funds is presented below. Exchanges between classes of the same affiliated Underlying Funds may occur. If an Underlying Funds changes its name, the name presented below is the name in effect at period end.
| Affiliate | Value, beginning of period ($) | Purchases ($) | Sales Proceeds ($) | Dividend Income ($) | Realized Gain (loss) ($) | Change in Unrealized appreciation (depreciation) ($) | Value, end of period ($) | Shares, end of period |
| Fidelity Inflation-Protected Bond Index Fund | 1,534,190 | 84,658 | 277,996 | 50,632 | (22,913) | 2,297 | 1,320,236 | 148,508 |
| Fidelity International Bond Index Fund | 228,203 | 99,378 | 61,345 | 8,026 | (3,325) | 3,949 | 266,860 | 28,695 |
| Fidelity Long-Term Treasury Bond Index Fund | 299,772 | 103,144 | 121,827 | 7,792 | (24,478) | (2,660) | 253,951 | 27,694 |
| VIP Contrafund Portfolio - Investor Class | 92,117 | 73,735 | 44,372 | 16,103 | 1,053 | 16,516 | 139,049 | 2,425 |
| VIP Emerging Markets Portfolio - Investor Class | 448,404 | 151,054 | 186,285 | 6,230 | 4,466 | 33,932 | 451,571 | 39,542 |
| VIP Equity Income Portfolio - Investor Class | 74,699 | 69,329 | 36,345 | 8,030 | 1,302 | 4,465 | 113,450 | 4,305 |
| VIP Government Money Market Portfolio - Investor Class | 1,637,802 | 238,956 | 580,949 | 68,675 | - | - | 1,295,809 | 1,295,809 |
| VIP Growth & Income Portfolio - Investor Class | 102,645 | 86,656 | 48,469 | 11,785 | 1,529 | 13,297 | 155,658 | 5,129 |
| VIP Growth Portfolio - Investor Class | 152,552 | 147,950 | 71,051 | 49,114 | 393 | 602 | 230,446 | 2,404 |
| VIP High Income Portfolio - Investor Class | 148,141 | 8,372 | 61,132 | 6,133 | (2,169) | 8,758 | 101,970 | 21,788 |
| VIP Investment Grade Bond II Portfolio - Investor Class | 3,503,069 | 447,267 | 572,462 | 138,239 | (21,051) | (58,355) | 3,298,468 | 358,140 |
| VIP Mid Cap Portfolio - Investor Class | 23,385 | 20,900 | 9,291 | 4,325 | 397 | 327 | 35,718 | 961 |
| VIP Overseas Portfolio - Investor Class | 648,231 | 171,505 | 191,018 | 39,437 | 13,606 | (19,934) | 622,390 | 24,542 |
| VIP Value Portfolio - Investor Class | 52,128 | 50,970 | 23,014 | 8,175 | 819 | (1,186) | 79,717 | 4,209 |
| VIP Value Strategies Portfolio - Investor Class | 25,779 | 26,771 | 10,804 | 5,550 | 495 | (2,619) | 39,622 | 2,585 |
| | 8,971,117 | 1,780,645 | 2,296,360 | 428,246 | (49,876) | (611) | 8,404,915 | 1,966,736 |
Amounts in the dividend income column in the above table include any capital gain distributions from underlying funds, which are presented in the corresponding line item in the Statement of Operations, if applicable.
Amounts included in the purchases and sales proceeds columns may include in-kind transactions, if applicable.
Investment Valuation
The following is a summary of the inputs used, as of December 31, 2024, involving the Fund's assets and liabilities carried at fair value. The inputs or methodology used for valuing securities may not be an indication of the risk associated with investing in those securities. For more information on valuation inputs, and their aggregation into the levels used below, please refer to the Investment Valuation section in the accompanying Notes to Financial Statements.
| Valuation Inputs at Reporting Date: |
| Description | Total ($) | Level 1 ($) | Level 2 ($) | Level 3 ($) |
Investments in Securities: | | | | |
|
| Bond Funds | 5,241,485 | 5,241,485 | - | - |
|
| Domestic Equity Funds | 793,660 | 793,660 | - | - |
|
| International Equity Funds | 1,073,961 | 1,073,961 | - | - |
|
| Money Market Funds | 1,295,809 | 1,295,809 | - | - |
| Total Investments in Securities: | 8,404,915 | 8,404,915 | - | - |
VIP Freedom Lifetime Income® I Portfolio
Financial Statements
| Statement of Assets and Liabilities |
As of December 31, 2024 |
| Assets | | | | |
| Investment in securities, at value - See accompanying schedule: | | | | |
Affiliated issuers (cost $8,273,230) | $ | 8,404,915 | | |
| | | | | |
| | | | | |
| Total Investment in Securities (cost $8,273,230) | | | $ | 8,404,915 |
| Receivable for investments sold | | | | 29,473 |
Total assets | | | | 8,434,388 |
| Liabilities | | | | |
| Payable for investments purchased | $ | 29,335 | | |
| Payable for fund shares redeemed | | 138 | | |
| Other payables and accrued expenses | | 2 | | |
| Total liabilities | | | | 29,475 |
| Net Assets | | | $ | 8,404,913 |
| Net Assets consist of: | | | | |
| Paid in capital | | | $ | 8,360,772 |
| Total accumulated earnings (loss) | | | | 44,141 |
| Net Assets | | | $ | 8,404,913 |
Net Asset Value, offering price and redemption price per share ($8,404,913 ÷ 817,443 shares) | | | $ | 10.28 |
| Statement of Operations |
| Year ended December 31, 2024 |
| Investment Income | | | | |
| Dividends: | | | | |
| Affiliated issuers | | | $ | 301,278 |
| Expenses | | | | |
| Independent trustees' fees and expenses | $ | 23 | | |
| Total expenses | | | | 23 |
| Net Investment income (loss) | | | | 301,255 |
| Realized and Unrealized Gain (Loss) | | | | |
| Net realized gain (loss) on: | | | | |
| Investment Securities: | | | | |
| Affiliated issuers | | (49,876) | | |
| Capital gain distributions from underlying funds: | | | | |
| Affiliated issuers | | 126,968 | | |
| Total net realized gain (loss) | | | | 77,092 |
| Change in net unrealized appreciation (depreciation) on: | | | | |
| Investment Securities: | | | | |
| Affiliated issuers | | (611) | | |
| Total change in net unrealized appreciation (depreciation) | | | | (611) |
| Net gain (loss) | | | | 76,481 |
| Net increase (decrease) in net assets resulting from operations | | | $ | 377,736 |
| Statement of Changes in Net Assets |
| |
| | Year ended December 31, 2024 | | Year ended December 31, 2023 |
| Increase (Decrease) in Net Assets | | | | |
| Operations | | | | |
| Net investment income (loss) | $ | 301,255 | $ | 312,205 |
| Net realized gain (loss) | | 77,092 | | (27,863) |
| Change in net unrealized appreciation (depreciation) | | (611) | | 405,756 |
| Net increase (decrease) in net assets resulting from operations | | 377,736 | | 690,098 |
| Distributions to shareholders | | (334,854) | | (389,059) |
| | | | | |
| Share transactions | | | | |
| Proceeds from sales of shares | | 42,879 | | 104,164 |
| Reinvestment of distributions | | 334,854 | | 389,059 |
| Cost of shares redeemed | | (987,272) | | (1,177,520) |
| | | | | |
Net increase (decrease) in net assets resulting from share transactions | | (609,539) | | (684,297) |
| Total increase (decrease) in net assets | | (566,657) | | (383,258) |
| | | | | |
| Net Assets | | | | |
| Beginning of period | | 8,971,570 | | 9,354,828 |
| End of period | $ | 8,404,913 | $ | 8,971,570 |
| | | | | |
| Other Information | | | | |
| Shares | | | | |
| Sold | | 4,007 | | 10,652 |
| Issued in reinvestment of distributions | | 32,590 | | 38,331 |
| Redeemed | | (93,901) | | (116,500) |
| Net increase (decrease) | | (57,304) | | (67,517) |
| | | | | |
Financial Highlights
VIP Freedom Lifetime Income® I Portfolio |
| |
| Years ended December 31, | | 2024 | | 2023 | | 2022 | | 2021 | | 2020 |
Selected Per-Share Data | | | | | | | | | | |
| Net asset value, beginning of period | $ | 10.26 | $ | 9.93 | $ | 12.01 | $ | 12.11 | $ | 11.49 |
| Income from Investment Operations | | | | | | | | | | |
Net investment income (loss) A,B | | .36 | | .35 | | .27 | | .22 | | .15 |
| Net realized and unrealized gain (loss) | | .08 | | .42 | | (1.66) | | .17 | | 1.02 |
| Total from investment operations | | .44 | | .77 | | (1.39) | | .39 | | 1.17 |
| Distributions from net investment income | | (.41) | | (.44) | | (.24) | | (.13) | | (.16) |
| Distributions from net realized gain | | (.01) | | - | | (.45) | | (.36) | | (.39) |
| Total distributions | | (.42) | | (.44) | | (.69) | | (.49) | | (.55) |
| Net asset value, end of period | $ | 10.28 | $ | 10.26 | $ | 9.93 | $ | 12.01 | $ | 12.11 |
Total Return C,D | | | | 7.89% | | (12.01)% | | 3.26% | | 10.44% |
Ratios to Average Net Assets B,E,F | | | | | | | | | | |
Expenses before reductions G | | -% | | -% | | -% | | -% | | -% |
Expenses net of fee waivers, if any G | | | | -% | | -% | | -% | | -% |
Expenses net of all reductions G | | -% | | -% | | -% | | -% | | -% |
| Net investment income (loss) | | 3.44% | | 3.43% | | 2.59% | | 1.83% | | 1.29% |
| Supplemental Data | | | | | | | | | | |
| Net assets, end of period (000 omitted) | $ | 8,405 | $ | 8,972 | $ | 9,355 | $ | 11,934 | $ | 12,553 |
Portfolio turnover rate H | | | | 17% | | 63% | | 18% | | 26% |
ACalculated based on average shares outstanding during the period.
BNet investment income (loss) is affected by the timing of the declaration of dividends by any underlying mutual funds or exchange-traded funds (ETFs). Net investment income (loss) of any mutual funds or ETFs is not included in the Fund's net investment income (loss) ratio.
CTotal returns do not reflect charges attributable to your insurance company's separate account. Inclusion of these charges would reduce the total returns shown.
DTotal returns would have been lower if certain expenses had not been reduced during the applicable periods shown.
EFees and expenses of any underlying mutual funds or exchange-traded funds (ETFs) are not included in the Fund's expense ratio. The Fund indirectly bears its proportionate share of these expenses.
FExpense ratios reflect operating expenses of the class. Expenses before reductions do not reflect amounts reimbursed, waived, or reduced through arrangements with the investment adviser, brokerage services, or other offset arrangements, if applicable, and do not represent the amount paid by the class during periods when reimbursements, waivers or reductions occur.
GAmount represents less than .005%.
HAmount does not include the portfolio activity of any underlying mutual funds or exchange-traded funds (ETFs), derivatives or securities that mature within one year from acquisition.
VIP Freedom Lifetime Income® II Portfolio
Schedule of Investments December 31, 2024
Showing Percentage of Net Assets
| Bond Funds - 58.8% |
| | | Shares | Value ($) |
| Fidelity Inflation-Protected Bond Index Fund (a) | | 410,955 | 3,653,389 |
| Fidelity International Bond Index Fund (a) | | 93,271 | 867,424 |
| Fidelity Long-Term Treasury Bond Index Fund (a) | | 91,173 | 836,058 |
| VIP High Income Portfolio - Investor Class (a) | | 65,646 | 307,222 |
| VIP Investment Grade Bond II Portfolio - Investor Class (a) | | 1,000,796 | 9,217,327 |
| TOTAL BOND FUNDS (Cost $16,015,793) | | | 14,881,420 |
| | | | |
| Domestic Equity Funds - 14.7% |
| | | Shares | Value ($) |
| VIP Contrafund Portfolio - Investor Class (a) | | 11,381 | 652,726 |
| VIP Equity Income Portfolio - Investor Class (a) | | 20,212 | 532,591 |
| VIP Growth & Income Portfolio - Investor Class (a) | | 24,077 | 730,727 |
| VIP Growth Portfolio - Investor Class (a) | | 11,284 | 1,081,755 |
| VIP Mid Cap Portfolio - Investor Class (a) | | 4,514 | 167,677 |
| VIP Value Portfolio - Investor Class (a) | | 19,760 | 374,248 |
| VIP Value Strategies Portfolio - Investor Class (a) | | 12,134 | 186,018 |
| TOTAL DOMESTIC EQUITY FUNDS (Cost $2,172,951) | | | 3,725,742 |
| | | | |
| International Equity Funds - 16.3% |
| | | Shares | Value ($) |
| VIP Emerging Markets Portfolio - Investor Class (a) | | 142,208 | 1,624,010 |
| VIP Overseas Portfolio - Investor Class (a) | | 98,689 | 2,502,752 |
| TOTAL INTERNATIONAL EQUITY FUNDS (Cost $3,061,276) | | | 4,126,762 |
| | | | |
| Money Market Funds - 10.2% |
| | | Yield (%) | Shares | Value ($) |
VIP Government Money Market Portfolio - Investor Class (a)(b) (Cost $2,581,462) | | 4.29 | 2,581,462 | 2,581,462 |
| | | | | |
| TOTAL INVESTMENT IN SECURITIES - 100.0% (Cost $23,831,482) | 25,315,386 |
NET OTHER ASSETS (LIABILITIES) - 0.0% | (8) |
| NET ASSETS - 100.0% | 25,315,378 |
| | |
Legend
| (b) | The rate quoted is the annualized seven-day yield of the fund at period end. |
Affiliated Underlying Funds
Fiscal year to date information regarding the Fund's investments in affiliated Underlying Funds is presented below. Exchanges between classes of the same affiliated Underlying Funds may occur. If an Underlying Funds changes its name, the name presented below is the name in effect at period end.
| Affiliate | Value, beginning of period ($) | Purchases ($) | Sales Proceeds ($) | Dividend Income ($) | Realized Gain (loss) ($) | Change in Unrealized appreciation (depreciation) ($) | Value, end of period ($) | Shares, end of period |
| Fidelity Inflation-Protected Bond Index Fund | 4,098,444 | 357,329 | 745,063 | 138,778 | (71,929) | 14,608 | 3,653,389 | 410,955 |
| Fidelity International Bond Index Fund | 748,692 | 307,380 | 191,193 | 26,358 | (9,291) | 11,836 | 867,424 | 93,271 |
| Fidelity Long-Term Treasury Bond Index Fund | 969,030 | 329,318 | 374,363 | 25,993 | (87,142) | (785) | 836,058 | 91,173 |
| VIP Contrafund Portfolio - Investor Class | 564,839 | 218,016 | 234,754 | 76,461 | 48,520 | 56,105 | 652,726 | 11,381 |
| VIP Emerging Markets Portfolio - Investor Class | 1,630,777 | 475,934 | 619,918 | 22,523 | 16,048 | 121,169 | 1,624,010 | 142,208 |
| VIP Equity Income Portfolio - Investor Class | 458,039 | 229,054 | 189,194 | 38,694 | 12,695 | 21,997 | 532,591 | 20,212 |
| VIP Government Money Market Portfolio - Investor Class | 3,140,564 | 753,791 | 1,312,893 | 128,917 | - | - | 2,581,462 | 2,581,462 |
| VIP Growth & Income Portfolio - Investor Class | 629,391 | 255,493 | 238,390 | 56,204 | 30,478 | 53,755 | 730,727 | 24,077 |
| VIP Growth Portfolio - Investor Class | 935,401 | 481,784 | 372,955 | 234,359 | 38,074 | (549) | 1,081,755 | 11,284 |
| VIP High Income Portfolio - Investor Class | 434,858 | 34,602 | 181,466 | 18,501 | (12,245) | 31,473 | 307,222 | 65,646 |
| VIP Investment Grade Bond II Portfolio - Investor Class | 9,383,686 | 1,558,022 | 1,501,540 | 386,396 | (42,664) | (180,177) | 9,217,327 | 1,000,796 |
| VIP Mid Cap Portfolio - Investor Class | 143,385 | 70,928 | 52,496 | 20,908 | 3,651 | 2,209 | 167,677 | 4,514 |
| VIP Overseas Portfolio - Investor Class | 2,709,299 | 552,317 | 742,215 | 158,874 | 100,881 | (117,530) | 2,502,752 | 98,689 |
| VIP Value Portfolio - Investor Class | 319,630 | 174,346 | 120,463 | 39,859 | 5,033 | (4,298) | 374,248 | 19,760 |
| VIP Value Strategies Portfolio - Investor Class | 158,070 | 95,548 | 58,609 | 26,619 | 2,836 | (11,827) | 186,018 | 12,134 |
| | 26,324,105 | 5,893,862 | 6,935,512 | 1,399,444 | 34,945 | (2,014) | 25,315,386 | 4,587,562 |
Amounts in the dividend income column in the above table include any capital gain distributions from underlying funds, which are presented in the corresponding line item in the Statement of Operations, if applicable.
Amounts included in the purchases and sales proceeds columns may include in-kind transactions, if applicable.
Investment Valuation
The following is a summary of the inputs used, as of December 31, 2024, involving the Fund's assets and liabilities carried at fair value. The inputs or methodology used for valuing securities may not be an indication of the risk associated with investing in those securities. For more information on valuation inputs, and their aggregation into the levels used below, please refer to the Investment Valuation section in the accompanying Notes to Financial Statements.
| Valuation Inputs at Reporting Date: |
| Description | Total ($) | Level 1 ($) | Level 2 ($) | Level 3 ($) |
Investments in Securities: | | | | |
|
| Bond Funds | 14,881,420 | 14,881,420 | - | - |
|
| Domestic Equity Funds | 3,725,742 | 3,725,742 | - | - |
|
| International Equity Funds | 4,126,762 | 4,126,762 | - | - |
|
| Money Market Funds | 2,581,462 | 2,581,462 | - | - |
| Total Investments in Securities: | 25,315,386 | 25,315,386 | - | - |
VIP Freedom Lifetime Income® II Portfolio
Financial Statements
| Statement of Assets and Liabilities |
As of December 31, 2024 |
| Assets | | | | |
| Investment in securities, at value - See accompanying schedule: | | | | |
Affiliated issuers (cost $23,831,482) | $ | 25,315,386 | | |
| | | | | |
| | | | | |
| Total Investment in Securities (cost $23,831,482) | | | $ | 25,315,386 |
| Receivable for investments sold | | | | 75,500 |
Total assets | | | | 25,390,886 |
| Liabilities | | | | |
| Payable for investments purchased | $ | 75,083 | | |
| Payable for fund shares redeemed | | 417 | | |
| Other payables and accrued expenses | | 8 | | |
| Total liabilities | | | | 75,508 |
| Net Assets | | | $ | 25,315,378 |
| Net Assets consist of: | | | | |
| Paid in capital | | | $ | 23,336,857 |
| Total accumulated earnings (loss) | | | | 1,978,521 |
| Net Assets | | | $ | 25,315,378 |
Net Asset Value, offering price and redemption price per share ($25,315,378 ÷ 2,132,176 shares) | | | $ | 11.87 |
| Statement of Operations |
| Year ended December 31, 2024 |
| Investment Income | | | | |
| Dividends: | | | | |
| Affiliated issuers | | | $ | 814,202 |
| Expenses | | | | |
| Independent trustees' fees and expenses | $ | 68 | | |
| Total expenses | | | | 68 |
| Net Investment income (loss) | | | | 814,134 |
| Realized and Unrealized Gain (Loss) | | | | |
| Net realized gain (loss) on: | | | | |
| Investment Securities: | | | | |
| Affiliated issuers | | 34,945 | | |
| Capital gain distributions from underlying funds: | | | | |
| Affiliated issuers | | 585,242 | | |
| Total net realized gain (loss) | | | | 620,187 |
| Change in net unrealized appreciation (depreciation) on: | | | | |
| Investment Securities: | | | | |
| Affiliated issuers | | (2,014) | | |
| Total change in net unrealized appreciation (depreciation) | | | | (2,014) |
| Net gain (loss) | | | | 618,173 |
| Net increase (decrease) in net assets resulting from operations | | | $ | 1,432,307 |
| Statement of Changes in Net Assets |
| |
| | Year ended December 31, 2024 | | Year ended December 31, 2023 |
| Increase (Decrease) in Net Assets | | | | |
| Operations | | | | |
| Net investment income (loss) | $ | 814,134 | $ | 804,590 |
| Net realized gain (loss) | | 620,187 | | 199,540 |
| Change in net unrealized appreciation (depreciation) | | (2,014) | | 1,422,936 |
| Net increase (decrease) in net assets resulting from operations | | 1,432,307 | | 2,427,066 |
| Distributions to shareholders | | (935,406) | | (992,391) |
| | | | | |
| Share transactions | | | | |
| Proceeds from sales of shares | | 207,598 | | 18,065 |
| Reinvestment of distributions | | 935,406 | | 992,391 |
| Cost of shares redeemed | | (2,649,501) | | (2,406,984) |
| | | | | |
Net increase (decrease) in net assets resulting from share transactions | | (1,506,497) | | (1,396,528) |
| Total increase (decrease) in net assets | | (1,009,596) | | 38,147 |
| | | | | |
| Net Assets | | | | |
| Beginning of period | | 26,324,974 | | 26,286,827 |
| End of period | $ | 25,315,378 | $ | 26,324,974 |
| | | | | |
| Other Information | | | | |
| Shares | | | | |
| Sold | | 16,796 | | 1,650 |
| Issued in reinvestment of distributions | | 78,988 | | 86,461 |
| Redeemed | | (219,447) | | (212,331) |
| Net increase (decrease) | | (123,663) | | (124,220) |
| | | | | |
Financial Highlights
VIP Freedom Lifetime Income® II Portfolio |
| |
| Years ended December 31, | | 2024 | | 2023 | | 2022 | | 2021 | | 2020 |
Selected Per-Share Data | | | | | | | | | | |
| Net asset value, beginning of period | $ | 11.67 | $ | 11.04 | $ | 13.96 | $ | 13.83 | $ | 12.98 |
| Income from Investment Operations | | | | | | | | | | |
Net investment income (loss) A,B | | .38 | | .35 | | .29 | | .25 | | .16 |
| Net realized and unrealized gain (loss) | | .27 | | .72 | | (2.12) | | .60 | | 1.44 |
| Total from investment operations | | .65 | | 1.07 | | (1.83) | | .85 | | 1.60 |
| Distributions from net investment income | | (.42) | | (.44) | | (.26) | | (.15) | | (.17) |
| Distributions from net realized gain | | (.02) | | - | | (.83) | | (.57) | | (.58) |
| Total distributions | | (.45) C | | (.44) | | (1.09) | | (.72) | | (.75) |
| Net asset value, end of period | $ | 11.87 | $ | 11.67 | $ | 11.04 | $ | 13.96 | $ | 13.83 |
Total Return D,E | | | | 9.80% | | (13.83)% | | 6.27% | | 12.78% |
Ratios to Average Net Assets B,F,G | | | | | | | | | | |
Expenses before reductions H | | -% | | -% | | -% | | -% | | -% |
Expenses net of fee waivers, if any H | | | | -% | | -% | | -% | | -% |
Expenses net of all reductions H | | -% | | -% | | -% | | -% | | -% |
| Net investment income (loss) | | 3.13% | | 3.07% | | 2.43% | | 1.78% | | 1.29% |
| Supplemental Data | | | | | | | | | | |
| Net assets, end of period (000 omitted) | $ | 25,315 | $ | 26,325 | $ | 26,287 | $ | 33,250 | $ | 34,232 |
Portfolio turnover rate I | | | | 18% | | 63% | | 23% | | 33% |
ACalculated based on average shares outstanding during the period.
BNet investment income (loss) is affected by the timing of the declaration of dividends by any underlying mutual funds or exchange-traded funds (ETFs). Net investment income (loss) of any mutual funds or ETFs is not included in the Fund's net investment income (loss) ratio.
CTotal distributions per share do not sum due to rounding.
DTotal returns do not reflect charges attributable to your insurance company's separate account. Inclusion of these charges would reduce the total returns shown.
ETotal returns would have been lower if certain expenses had not been reduced during the applicable periods shown.
FFees and expenses of any underlying mutual funds or exchange-traded funds (ETFs) are not included in the Fund's expense ratio. The Fund indirectly bears its proportionate share of these expenses.
GExpense ratios reflect operating expenses of the class. Expenses before reductions do not reflect amounts reimbursed, waived, or reduced through arrangements with the investment adviser, brokerage services, or other offset arrangements, if applicable, and do not represent the amount paid by the class during periods when reimbursements, waivers or reductions occur.
HAmount represents less than .005%.
IAmount does not include the portfolio activity of any underlying mutual funds or exchange-traded funds (ETFs), derivatives or securities that mature within one year from acquisition.
VIP Freedom Lifetime Income® III Portfolio
Schedule of Investments December 31, 2024
Showing Percentage of Net Assets
| Bond Funds - 49.8% |
| | | Shares | Value ($) |
| Fidelity Inflation-Protected Bond Index Fund (a) | | 391,596 | 3,481,287 |
| Fidelity International Bond Index Fund (a) | | 121,496 | 1,129,914 |
| Fidelity Long-Term Treasury Bond Index Fund (a) | | 160,542 | 1,472,172 |
| VIP High Income Portfolio - Investor Class (a) | | 74,795 | 350,041 |
| VIP Investment Grade Bond II Portfolio - Investor Class (a) | | 859,729 | 7,918,105 |
| TOTAL BOND FUNDS (Cost $15,585,035) | | | 14,351,519 |
| | | | |
| Domestic Equity Funds - 25.8% |
| | | Shares | Value ($) |
| VIP Contrafund Portfolio - Investor Class (a) | | 22,680 | 1,300,683 |
| VIP Equity Income Portfolio - Investor Class (a) | | 40,277 | 1,061,311 |
| VIP Growth & Income Portfolio - Investor Class (a) | | 47,978 | 1,456,136 |
| VIP Growth Portfolio - Investor Class (a) | | 22,485 | 2,155,604 |
| VIP Mid Cap Portfolio - Investor Class (a) | | 8,994 | 334,134 |
| VIP Value Portfolio - Investor Class (a) | | 39,376 | 745,778 |
| VIP Value Strategies Portfolio - Investor Class (a) | | 24,181 | 370,691 |
| TOTAL DOMESTIC EQUITY FUNDS (Cost $4,436,924) | | | 7,424,337 |
| | | | |
| International Equity Funds - 23.7% |
| | | Shares | Value ($) |
| VIP Emerging Markets Portfolio - Investor Class (a) | | 217,130 | 2,479,623 |
| VIP Overseas Portfolio - Investor Class (a) | | 171,335 | 4,345,058 |
| TOTAL INTERNATIONAL EQUITY FUNDS (Cost $5,239,759) | | | 6,824,681 |
| | | | |
| Money Market Funds - 0.7% |
| | | Yield (%) | Shares | Value ($) |
VIP Government Money Market Portfolio - Investor Class (a)(b) (Cost $228,821) | | 4.29 | 228,821 | 228,821 |
| | | | | |
| TOTAL INVESTMENT IN SECURITIES - 100.0% (Cost $25,490,539) | 28,829,358 |
NET OTHER ASSETS (LIABILITIES) - 0.0% | 1 |
| NET ASSETS - 100.0% | 28,829,359 |
| | |
Legend
| (b) | The rate quoted is the annualized seven-day yield of the fund at period end. |
Affiliated Underlying Funds
Fiscal year to date information regarding the Fund's investments in affiliated Underlying Funds is presented below. Exchanges between classes of the same affiliated Underlying Funds may occur. If an Underlying Funds changes its name, the name presented below is the name in effect at period end.
| Affiliate | Value, beginning of period ($) | Purchases ($) | Sales Proceeds ($) | Dividend Income ($) | Realized Gain (loss) ($) | Change in Unrealized appreciation (depreciation) ($) | Value, end of period ($) | Shares, end of period |
| Fidelity Inflation-Protected Bond Index Fund | 3,734,763 | 476,024 | 672,863 | 132,685 | (34,613) | (22,024) | 3,481,287 | 391,596 |
| Fidelity International Bond Index Fund | 954,574 | 397,752 | 226,912 | 34,749 | (5,299) | 9,799 | 1,129,914 | 121,496 |
| Fidelity Long-Term Treasury Bond Index Fund | 1,430,397 | 650,226 | 466,182 | 47,275 | (74,548) | (67,721) | 1,472,172 | 160,542 |
| VIP Contrafund Portfolio - Investor Class | 1,170,699 | 348,700 | 433,878 | 152,476 | 95,401 | 119,761 | 1,300,683 | 22,680 |
| VIP Emerging Markets Portfolio - Investor Class | 2,366,432 | 649,525 | 738,514 | 34,153 | 12,042 | 190,138 | 2,479,623 | 217,130 |
| VIP Equity Income Portfolio - Investor Class | 949,324 | 353,780 | 311,910 | 77,427 | 19,698 | 50,419 | 1,061,311 | 40,277 |
| VIP Government Money Market Portfolio - Investor Class | 569,826 | 351,781 | 692,786 | 8,853 | - | - | 228,821 | 228,821 |
| VIP Growth & Income Portfolio - Investor Class | 1,304,477 | 368,851 | 388,651 | 112,217 | 61,229 | 110,230 | 1,456,136 | 47,978 |
| VIP Growth Portfolio - Investor Class | 1,938,763 | 790,288 | 660,170 | 467,072 | 73,159 | 13,564 | 2,155,604 | 22,485 |
| VIP High Income Portfolio - Investor Class | 473,088 | 53,381 | 197,646 | 21,144 | (7,801) | 29,019 | 350,041 | 74,795 |
| VIP Investment Grade Bond II Portfolio - Investor Class | 7,971,340 | 1,460,701 | 1,313,340 | 333,080 | (33,414) | (167,182) | 7,918,105 | 859,729 |
| VIP Mid Cap Portfolio - Investor Class | 297,202 | 116,788 | 92,203 | 41,824 | 11,851 | 496 | 334,134 | 8,994 |
| VIP Overseas Portfolio - Investor Class | 4,469,968 | 830,568 | 907,512 | 275,705 | 85,029 | (132,995) | 4,345,058 | 171,335 |
| VIP Value Portfolio - Investor Class | 662,492 | 285,054 | 203,282 | 79,828 | 12,144 | (10,630) | 745,778 | 39,376 |
| VIP Value Strategies Portfolio - Investor Class | 327,639 | 164,591 | 103,701 | 53,163 | 6,207 | (24,045) | 370,691 | 24,181 |
| | 28,620,984 | 7,298,010 | 7,409,550 | 1,871,651 | 221,085 | 98,829 | 28,829,358 | 2,431,415 |
Amounts in the dividend income column in the above table include any capital gain distributions from underlying funds, which are presented in the corresponding line item in the Statement of Operations, if applicable.
Amounts included in the purchases and sales proceeds columns may include in-kind transactions, if applicable.
Investment Valuation
The following is a summary of the inputs used, as of December 31, 2024, involving the Fund's assets and liabilities carried at fair value. The inputs or methodology used for valuing securities may not be an indication of the risk associated with investing in those securities. For more information on valuation inputs, and their aggregation into the levels used below, please refer to the Investment Valuation section in the accompanying Notes to Financial Statements.
| Valuation Inputs at Reporting Date: |
| Description | Total ($) | Level 1 ($) | Level 2 ($) | Level 3 ($) |
Investments in Securities: | | | | |
|
| Bond Funds | 14,351,519 | 14,351,519 | - | - |
|
| Domestic Equity Funds | 7,424,337 | 7,424,337 | - | - |
|
| International Equity Funds | 6,824,681 | 6,824,681 | - | - |
|
| Money Market Funds | 228,821 | 228,821 | - | - |
| Total Investments in Securities: | 28,829,358 | 28,829,358 | - | - |
VIP Freedom Lifetime Income® III Portfolio
Financial Statements
| Statement of Assets and Liabilities |
As of December 31, 2024 |
| Assets | | | | |
| Investment in securities, at value - See accompanying schedule: | | | | |
Affiliated issuers (cost $25,490,539) | $ | 28,829,358 | | |
| | | | | |
| | | | | |
| Total Investment in Securities (cost $25,490,539) | | | $ | 28,829,358 |
| Receivable for investments sold | | | | 144,401 |
Total assets | | | | 28,973,759 |
| Liabilities | | | | |
| Payable for investments purchased | $ | 143,925 | | |
| Payable for fund shares redeemed | | 475 | | |
| Total liabilities | | | | 144,400 |
| Net Assets | | | $ | 28,829,359 |
| Net Assets consist of: | | | | |
| Paid in capital | | | $ | 24,318,316 |
| Total accumulated earnings (loss) | | | | 4,511,043 |
| Net Assets | | | $ | 28,829,359 |
Net Asset Value, offering price and redemption price per share ($28,829,359 ÷ 2,185,081 shares) | | | $ | 13.19 |
| Statement of Operations |
| Year ended December 31, 2024 |
| Investment Income | | | | |
| Dividends: | | | | |
| Affiliated issuers | | | $ | 734,358 |
| Expenses | | | | |
| Independent trustees' fees and expenses | $ | 76 | | |
| Total expenses | | | | 76 |
| Net Investment income (loss) | | | | 734,282 |
| Realized and Unrealized Gain (Loss) | | | | |
| Net realized gain (loss) on: | | | | |
| Investment Securities: | | | | |
| Affiliated issuers | | 221,085 | | |
| Capital gain distributions from underlying funds: | | | | |
| Affiliated issuers | | 1,137,293 | | |
| Total net realized gain (loss) | | | | 1,358,378 |
| Change in net unrealized appreciation (depreciation) on: | | | | |
| Investment Securities: | | | | |
| Affiliated issuers | | 98,829 | | |
| Total change in net unrealized appreciation (depreciation) | | | | 98,829 |
| Net gain (loss) | | | | 1,457,207 |
| Net increase (decrease) in net assets resulting from operations | | | $ | 2,191,489 |
| Statement of Changes in Net Assets |
| |
| | Year ended December 31, 2024 | | Year ended December 31, 2023 |
| Increase (Decrease) in Net Assets | | | | |
| Operations | | | | |
| Net investment income (loss) | $ | 734,282 | $ | 692,926 |
| Net realized gain (loss) | | 1,358,378 | | 352,098 |
| Change in net unrealized appreciation (depreciation) | | 98,829 | | 2,330,943 |
| Net increase (decrease) in net assets resulting from operations | | 2,191,489 | | 3,375,967 |
| Distributions to shareholders | | (1,106,077) | | (855,343) |
| | | | | |
| Share transactions | | | | |
| Proceeds from sales of shares | | 313,980 | | 91,608 |
| Reinvestment of distributions | | 1,106,077 | | 855,343 |
| Cost of shares redeemed | | (2,297,248) | | (2,614,932) |
| | | | | |
Net increase (decrease) in net assets resulting from share transactions | | (877,191) | | (1,667,981) |
| Total increase (decrease) in net assets | | 208,221 | | 852,643 |
| | | | | |
| Net Assets | | | | |
| Beginning of period | | 28,621,138 | | 27,768,495 |
| End of period | $ | 28,829,359 | $ | 28,621,138 |
| | | | | |
| Other Information | | | | |
| Shares | | | | |
| Sold | | 23,085 | | 7,857 |
| Issued in reinvestment of distributions | | 84,874 | | 69,067 |
| Redeemed | | (172,774) | | (214,663) |
| Net increase (decrease) | | (64,815) | | (137,739) |
| | | | | |
Financial Highlights
VIP Freedom Lifetime Income® III Portfolio |
| |
| Years ended December 31, | | 2024 | | 2023 | | 2022 | | 2021 | | 2020 |
Selected Per-Share Data | | | | | | | | | | |
| Net asset value, beginning of period | $ | 12.72 | $ | 11.63 | $ | 15.29 | $ | 14.72 | $ | 13.53 |
| Income from Investment Operations | | | | | | | | | | |
Net investment income (loss) A,B | | .33 | | .30 | | .27 | | .26 | | .16 |
| Net realized and unrealized gain (loss) | | .65 | | 1.17 | | (2.58) | | 1.15 | | 1.83 |
| Total from investment operations | | .98 | | 1.47 | | (2.31) | | 1.41 | | 1.99 |
| Distributions from net investment income | | (.37) | | (.38) | | (.26) | | (.16) | | (.17) |
| Distributions from net realized gain | | (.14) | | - | | (1.10) | | (.67) | | (.62) |
| Total distributions | | (.51) | | (.38) | | (1.35) C | | (.84) C | | (.80) C |
| Net asset value, end of period | $ | 13.19 | $ | 12.72 | $ | 11.63 | $ | 15.29 | $ | 14.72 |
Total Return D,E | | | | 12.73% | | (16.04)% | | 9.78% | | 15.23% |
Ratios to Average Net Assets B,F,G | | | | | | | | | | |
Expenses before reductions H | | -% | | -% | | -% | | -% | | -% |
Expenses net of fee waivers, if any H | | | | -% | | -% | | -% | | -% |
Expenses net of all reductions H | | -% | | -% | | -% | | -% | | -% |
| Net investment income (loss) | | 2.51% | | 2.47% | | 2.18% | | 1.73% | | 1.24% |
| Supplemental Data | | | | | | | | | | |
| Net assets, end of period (000 omitted) | $ | 28,829 | $ | 28,621 | $ | 27,768 | $ | 36,135 | $ | 35,275 |
Portfolio turnover rate I | | | | 19% | | 61% | | 28% | | 35% |
ACalculated based on average shares outstanding during the period.
BNet investment income (loss) is affected by the timing of the declaration of dividends by any underlying mutual funds or exchange-traded funds (ETFs). Net investment income (loss) of any mutual funds or ETFs is not included in the Fund's net investment income (loss) ratio.
CTotal distributions per share do not sum due to rounding.
DTotal returns do not reflect charges attributable to your insurance company's separate account. Inclusion of these charges would reduce the total returns shown.
ETotal returns would have been lower if certain expenses had not been reduced during the applicable periods shown.
FFees and expenses of any underlying mutual funds or exchange-traded funds (ETFs) are not included in the Fund's expense ratio. The Fund indirectly bears its proportionate share of these expenses.
GExpense ratios reflect operating expenses of the class. Expenses before reductions do not reflect amounts reimbursed, waived, or reduced through arrangements with the investment adviser, brokerage services, or other offset arrangements, if applicable, and do not represent the amount paid by the class during periods when reimbursements, waivers or reductions occur.
HAmount represents less than .005%.
IAmount does not include the portfolio activity of any underlying mutual funds or exchange-traded funds (ETFs), derivatives or securities that mature within one year from acquisition.
Notes to Financial Statements
For the period ended December 31, 2024
1. Organization.
VIP Freedom Lifetime Income I Portfolio, VIP Freedom Lifetime Income II Portfolio, and VIP Freedom Lifetime Income III Portfolio (the Funds) are funds of Variable Insurance Products Fund V (the Trust). The Trust is registered under the Investment Company Act of 1940, as amended (the 1940 Act), as an open-end management investment company organized as a Massachusetts business trust. Each Fund is authorized to issue an unlimited number of shares. Shares of each Fund may only be purchased by insurance companies for the purpose of funding variable annuity or variable life insurance contracts.
2. Significant Accounting Policies.
Each Fund is an investment company and applies the accounting and reporting guidance of the Financial Accounting Standards Board (FASB) Accounting Standards Codification Topic 946 Financial Services - Investment Companies. The financial statements have been prepared in conformity with accounting principles generally accepted in the United States of America (GAAP), which require management to make certain estimates and assumptions at the date of the financial statements. Actual results could differ from those estimates. Each Fund operates as a single operating segment. Each Fund's income, expenses, assets, and performance are regularly monitored and assessed as a whole by the investment adviser and other individuals responsible for oversight functions of the Trust, using the information presented in the financial statements and financial highlights. Subsequent events, if any, through the date that the financial statements were issued have been evaluated in the preparation of the financial statements. Each Fund's Schedule of Investments lists any underlying mutual funds or exchange-traded funds (ETFs) but does not include the underlying holdings of these funds. The following summarizes the significant accounting policies of each Fund:
Investment Valuation. Investments are valued as of 4:00 p.m. Eastern time on the last calendar day of the period. Each Fund categorizes the inputs to valuation techniques used to value its investments into a disclosure hierarchy consisting of three levels as shown below:
Level 1 - unadjusted quoted prices in active markets for identical investments
Level 2 - other significant observable inputs (including quoted prices for similar investments, interest rates, prepayment speeds, etc.)
Level 3 - unobservable inputs (including the Fund's own assumptions based on the best information available)
Valuation techniques used to value each Fund's investments by major category are as follows:
Investments in open-end mutual funds are valued at their closing net asset value (NAV) each business day and are categorized as Level 1 in the hierarchy. The aggregate value of investments by input level as of December 31, 2024 is included at the end of each Fund's Schedule of Investments.
Investment Transactions and Income. For financial reporting purposes, the Funds' investment holdings and NAV include trades executed through the end of the last business day of the period. The NAV per share for processing shareholder transactions is calculated as of the close of business of the New York Stock Exchange (NYSE), normally 4:00 p.m. Eastern time and includes trades executed through the end of the prior business day. Gains and losses on securities sold are determined on the basis of identified cost. Income and capital gain distributions from any underlying mutual funds or exchange-traded funds (ETFs) are recorded on the ex-dividend date.
Expenses. Expenses directly attributable to a fund are charged to that fund. Expenses attributable to more than one fund are allocated among the respective funds on the basis of relative net assets or other appropriate methods. Expenses included in the accompanying financial statements reflect the expenses of that fund and do not include any expenses associated with any underlying mutual funds or exchange-traded funds. Although not included in a fund's expenses, a fund indirectly bears its proportionate share of these expenses through the net asset value of each underlying mutual fund or exchange-traded fund. Expense estimates are accrued in the period to which they relate and adjustments are made when actual amounts are known.
Income Tax Information and Distributions to Shareholders. Each year, each Fund intends to qualify as a regulated investment company under Subchapter M of the Internal Revenue Code, including distributing substantially all of its taxable income and realized gains. As a result, no provision for U.S. Federal income taxes is required. As of December 31, 2024, each Fund did not have any unrecognized tax benefits in the financial statements; nor is each Fund aware of any tax positions for which it is reasonably possible that the total amounts of unrecognized tax benefits will significantly change in the next twelve months. Each Fund files a U.S. federal tax return, in addition to state and local tax returns as required. Each Fund's federal income tax returns are subject to examination by the Internal Revenue Service (IRS) for a period of three fiscal years after they are filed. State and local tax returns may be subject to examination for an additional fiscal year depending on the jurisdiction.
Distributions are declared and recorded on the ex-dividend date. Income and capital gain distributions are determined in accordance with income tax regulations, which may differ from GAAP.
Capital accounts within the financial statements are adjusted for permanent book-tax differences. These adjustments have no impact on net assets or the results of operations. Capital accounts are not adjusted for temporary book-tax differences which will reverse in a subsequent period.
Book-tax differences are primarily due to short-term gain distributions from the Underlying Funds, capital loss carryforwards and losses deferred due to wash sales.
As of period end, the cost and unrealized appreciation (depreciation) in securities, and derivatives if applicable, for federal income tax purposes were as follows for each Fund:
| | Tax cost ($) | Gross unrealized appreciation ($) | Gross unrealized depreciation ($) | Net unrealized appreciation (depreciation)($) |
| VIP Freedom Lifetime Income I Portfolio. | 8,318,236 | 472,518 | (385,839) | 86,679 |
VIP Freedom Lifetime Income II Portfolio | 23,983,613 | 2,626,947 | (1,295,174) | 1,331,773 |
VIP Freedom Lifetime Income III Portfolio | 25,672,905 | 4,569,773 | (1,413,320) | 3,156,453 |
The tax-based components of distributable earnings as of period end were as follows for each Fund:
| | Undistributed ordinary income ($) | Undistributed long-term capital gain ($) | Capital loss carryforward ($) | Net unrealized appreciation (depreciation) on securities and other investments ($) |
| VIP Freedom Lifetime Income I Portfolio. | 29,686 | - | (72,225) | 86,679 |
VIP Freedom Lifetime Income II Portfolio | 86,865 | 559,883 | - | 1,331,773 |
VIP Freedom Lifetime Income III Portfolio | 97,345 | 1,257,244 | - | 3,156,453 |
Capital loss carryforwards are only available to offset future capital gains of the Funds to the extent provided by regulations and may be limited. The capital loss carryforward information presented below, including any applicable limitation, is estimated as of fiscal period end and is subject to adjustment.
| | Short-term ($) | Long-term ($) | Total capital loss carryforward ($) |
| VIP Freedom Lifetime Income I Portfolio. | (48,966) | (23,259) | (72,225) |
The tax character of distributions paid was as follows:
| December 31, 2024 | | | |
| | Ordinary Income ($) | Long-term Capital Gains ($) | Total ($) |
| VIP Freedom Lifetime Income I Portfolio. | 334,854 | - | 334,854 |
VIP Freedom Lifetime Income II Portfolio | 935,406 | - | 935,406 |
VIP Freedom Lifetime Income III Portfolio | 883,329 | 222,748 | 1,106,077 |
| December 31, 2023 | | |
| | Ordinary Income ($) | Total ($) |
| VIP Freedom Lifetime Income I Portfolio. | 389,059 | 389,059 |
VIP Freedom Lifetime Income II Portfolio | 992,391 | 992,391 |
VIP Freedom Lifetime Income III Portfolio | 855,343 | 855,343 |
New Accounting Pronouncement. FASB Accounting Standards Update (ASU) 2023-07 Segment Reporting (Topic 280): Improvements to Reportable Segment Disclosures became effective in this reporting period. ASU 2023-07 enhances segment information disclosure in the notes to financial statements.
3. Purchases and Sales of Investments.
Purchases and sales of securities, other than short-term securities and in-kind transactions, as applicable, are noted in the table below.
| | Purchases ($) | Sales ($) |
| VIP Freedom Lifetime Income I Portfolio | 1,780,645 | 2,296,360 |
| VIP Freedom Lifetime Income II Portfolio | 5,893,862 | 6,935,512 |
| VIP Freedom Lifetime Income III Portfolio | 7,298,010 | 7,409,550 |
4. Fees and Other Transactions with Affiliates.
Management Fee. Fidelity Management & Research Company LLC (the investment adviser) provides the Funds with investment management related services. The Funds do not pay any fees for these services.
Interfund Trades. Funds may purchase from or sell securities to other Fidelity Funds under procedures adopted by the Board. The procedures have been designed to ensure these interfund trades are executed in accordance with Rule 17a-7 of the 1940 Act. Any interfund trades are included within the respective purchases and sales amounts shown in the Purchases and Sales of Investments note. During the period, there were no interfund trades.
5. Other.
A fund's organizational documents provide former and current trustees and officers with a limited indemnification against liabilities arising in connection with the performance of their duties to the fund. In the normal course of business, a fund may also enter into contracts that provide general indemnifications. A fund's maximum exposure under these arrangements is unknown as this would be dependent on future claims that may be made against a fund. The risk of material loss from such claims is considered remote.
At the end of the period, the investment adviser or its affiliates were owners of record of more than 10% of the outstanding shares as follows:
| Fund | Affiliated % |
VIP Freedom Lifetime Income I Portfolio | 100% |
VIP Freedom Lifetime Income II Portfolio | 100% |
VIP Freedom Lifetime Income III Portfolio | 100% |
6. Risk and Uncertainties.
Many factors affect a fund's performance. Developments that disrupt global economies and financial markets, such as pandemics, epidemics, outbreaks of infectious diseases, war, terrorism, and environmental disasters, may significantly affect a fund's investment performance. The effects of these developments to a fund will be impacted by the types of securities in which a fund invests, the financial condition, industry, economic sector, and geographic location of an issuer, and a fund's level of investment in the securities of that issuer. Significant concentrations in security types, issuers, industries, sectors, and geographic locations may magnify the factors that affect a fund's performance.
Report of Independent Registered Public Accounting Firm
To the Board of Trustees of Variable Insurance Products Fund V and the Shareholders of VIP Freedom Lifetime Income I Portfolio, VIP Freedom Lifetime Income II Portfolio and VIP Freedom Lifetime Income III Portfolio:
Opinion on the Financial Statements and Financial Highlights
We have audited the accompanying statements of assets and liabilities of VIP Freedom Lifetime Income I Portfolio, VIP Freedom Lifetime Income II Portfolio and VIP Freedom Lifetime Income III Portfolio (the "Funds"), each a fund of Variable Insurance Products Fund V, including the schedules of investments, as of December 31, 2024, the related statements of operations for the year then ended, the statements of changes in net assets for each of the two years in the period then ended, the financial highlights for each of the five years in the period then ended, and the related notes. In our opinion, the financial statements and financial highlights present fairly, in all material respects, the financial position of each of the Funds as of December 31, 2024, and the results of their operations for the year then ended, the changes in their net assets for each of the two years in the period then ended, and the financial highlights for each of the five years in the period then ended in conformity with accounting principles generally accepted in the United States of America.
Basis for Opinion
These financial statements and financial highlights are the responsibility of the Funds' management. Our responsibility is to express an opinion on the Funds' financial statements and financial highlights based on our audits. We are a public accounting firm registered with the Public Company Accounting Oversight Board (United States) (PCAOB) and are required to be independent with respect to the Funds in accordance with the U.S. federal securities laws and the applicable rules and regulations of the Securities and Exchange Commission and the PCAOB.
We conducted our audits in accordance with the standards of the PCAOB. Those standards require that we plan and perform the audit to obtain reasonable assurance about whether the financial statements and financial highlights are free of material misstatement, whether due to error or fraud. The Funds are not required to have, nor were we engaged to perform, an audit of their internal control over financial reporting. As part of our audits, we are required to obtain an understanding of internal control over financial reporting but not for the purpose of expressing an opinion on the effectiveness of the Funds' internal control over financial reporting. Accordingly, we express no such opinion.
Our audits included performing procedures to assess the risks of material misstatement of the financial statements and financial highlights, whether due to error or fraud, and performing procedures that respond to those risks. Such procedures included examining, on a test basis, evidence regarding the amounts and disclosures in the financial statements and financial highlights. Our audits also included evaluating the accounting principles used and significant estimates made by management, as well as evaluating the overall presentation of the financial statements and financial highlights. Our procedures included confirmation of securities owned as of December 31, 2024, by correspondence with the custodian and brokers; when replies were not received from brokers, we performed other auditing procedures. We believe that our audits provide a reasonable basis for our opinion.
/s/ Deloitte & Touche LLP
Boston, Massachusetts
February 11, 2025
We have served as the auditor of one or more of the Fidelity investment companies since 1999.
Distributions
(Unaudited)The dividend and capital gains distributions for the fund(s) are available on Fidelity.com or Institutional.Fidelity.com.
The funds hereby designate as capital gain dividend the amounts noted below for the taxable year ended December 31, 2024, or, if subsequently determined to be different, the net capital gain of such year.
| VIP Freedom Lifetime Income II Portfolio | $559,883 |
| VIP Freedom Lifetime Income III Portfolio | $ 1,259,106 |
A percentage of the dividends distributed during the fiscal year for the following funds were derived from interest on U.S. Government securities which is generally exempt from state income tax:
| VIP Freedom Lifetime Income I Portfolio | 34.52% |
| VIP Freedom Lifetime Income II Portfolio | 26.54% |
| VIP Freedom Lifetime Income III Portfolio | 15.96% |
A percentage of the dividends distributed during the fiscal year for the following funds qualify for the dividends-received deduction for corporate shareholders:
| VIP Freedom Lifetime Income I Portfolio | |
| December 2024 | 2% |
| VIP Freedom Lifetime Income II Portfolio | |
| December 2024 | 4% |
| VIP Freedom Lifetime Income III Portfolio | |
| December 2024 | 8% |
The funds hereby designate the amounts noted below as distributions paid during the fiscal year ended 2024 as qualifying to be taxed as section 163(j) interest dividends:
| VIP Freedom Lifetime Income I Portfolio | $294,735 |
| VIP Freedom Lifetime Income II Portfolio | $737,116 |
| VIP Freedom Lifetime Income III Portfolio | $544,319 |
The amounts per share which represent income derived from sources within, and taxes paid to, foreign countries or possessions of the United States are as follows:
| | Pay Date | Income | Taxes |
| VIP Freedom Lifetime Income I Portfolio | 12/18/24 | $0.0212 | $0.0064 |
| VIP Freedom Lifetime Income II Portfolio | 12/18/24 | $0.0306 | $0.0091 |
| VIP Freedom Lifetime Income III Portfolio | 12/18/24 | $0.0473 | $0.0140 |
Item 8: Changes in and Disagreements with Accountants for Open-End Management Investment Companies
(Unaudited)
Note: This is not applicable for any fund included in this document.
Item 9: Proxy Disclosures for Open-End Management Investment Companies
(Unaudited)
Note: This is not applicable for any fund included in this document.
Item 10: Remuneration Paid to Directors, Officers, and others of Open-End Management Investment Companies
(Unaudited)
Note: This information is disclosed as part of the financial statements for each Fund as part of Item 7: Financial Statements and Financial Highlights for Open-End Management Investment companies.
Item 11: Statement Regarding Basis for Approval of Investment Advisory Contract
(Unaudited)
Board Approval of Investment Advisory Contracts and Management Fees
VIP Freedom Lifetime Income I Portfolio
VIP Freedom Lifetime Income II Portfolio
VIP Freedom Lifetime Income III Portfolio
Each year, the Board of Trustees, including the Independent Trustees (together, the Board), considers the renewal of the management contract with Fidelity Management & Research Company LLC (FMR) for each fund (the Advisory Contract). The Board, assisted by the advice of fund counsel and Independent Trustees' counsel, requests and considers a broad range of information relevant to the renewal of the Advisory Contracts throughout the year.
The Board meets regularly and, at each of its meetings, covers an extensive agenda of topics and materials and considers factors that are relevant to its annual consideration of the renewal of each fund's Advisory Contract, including the services and support provided to each fund and its shareholders. The Board's Operations Committee, of which all the Independent Trustees are members, meets regularly throughout the year and requests, receives and considers, among other matters, information related to the annual consideration of the renewal of each fund's Advisory Contract before making its recommendation to the Board. The Board also meets as needed to review matters specifically related to the Board's annual consideration of the renewal of the Advisory Contracts. Members of the Board may also meet from time to time with trustees of other Fidelity funds through joint ad hoc committees to discuss certain matters relevant to all of the Fidelity funds.
At its September 2024 meeting, the Board unanimously determined to renew each fund's Advisory Contract. The Board also considered the broad range of investment choices available to shareholders from FMR's competitors and that each fund's shareholders have chosen to invest in that fund, which is part of the Fidelity family of funds. The Board's decision to renew the Advisory Contracts was not based on any single factor and the factors may have been weighed differently by different Trustees. The Board considered all factors it believed relevant and reached a determination, with the assistance of fund counsel and Independent Trustees' counsel and through the exercise of its business judgment, that the renewal of the Advisory Contract was in the best interests of each fund and its shareholders and that the fact that no fees are payable under the Advisory Contracts was fair and reasonable in light of all of the surrounding circumstances.
Nature, Extent, and Quality of Services Provided. The Board considered Fidelity's staffing as it relates to the funds, including the backgrounds and experience of investment personnel, and also considered FMR's implementation of each fund's investment program. The Independent Trustees also had discussions with senior management of Fidelity's investment operations and investment groups with responsibility for the underlying Fidelity funds in which each fund invests. The Board considered the structure of the investment personnel compensation program and whether this structure provides appropriate incentives to act in the best interests of each fund. Additionally, the Board considered the portfolio managers' investments, if any, in the funds that they manage.
Resources Dedicated to Investment Management and Support Services. The Board reviewed the general qualifications and capabilities of Fidelity's investment staff, including its size, education, experience, and resources, as well as Fidelity's approach to recruiting, training, managing, and compensating investment personnel. The Board noted the resources devoted to Fidelity's global investment organization, and that Fidelity's analysts have extensive resources, tools, and capabilities that allow them to conduct quantitative and fundamental analysis, as well as credit analysis of issuers, counterparties, and guarantors. Further, the Board considered that Fidelity's investment professionals have sufficient access to global information and data so as to provide competitive investment results over time, and that those professionals also have access to sophisticated tools that permit them to assess portfolio construction and risk and performance attribution characteristics continuously, as well as to transmit new information and research conclusions rapidly around the world. Additionally, in its deliberations, the Board considered Fidelity's risk management, compliance, cybersecurity, and technology and operations capabilities and resources, which are integral parts of the investment management process.
Shareholder and Administrative Services. The Board considered (i) the nature, extent, quality, and cost of advisory, administrative, and shareholder services performed by Fidelity under the Advisory Contract and under separate agreements covering transfer agency and pricing and bookkeeping services for each fund; (ii) the nature and extent of Fidelity's supervision of third party service providers, principally custodians, subcustodians, and pricing vendors; and (iii) the resources devoted by Fidelity to, and the record of compliance with, each fund's compliance policies and procedures, including with respect to liquidity risk management.
The Board noted that the growth of fund assets over time across the complex allows Fidelity to reinvest in the development of services designed to enhance the value and convenience of the Fidelity funds as investment vehicles. These services include 24-hour access to account information and market information over the Internet and through telephone representatives, investor education materials and asset allocation tools. The Board also considered that it reviews customer service metrics such as telephone response times, continuity of services on the website and metrics addressing services at Fidelity Investor Centers.
Investment in a Large Fund Family. The Board considered the benefits to shareholders of investing in a fund that is part of a large family of funds offering a variety of investment disciplines and providing a large variety of fund investor services. The Board noted that Fidelity had taken, or had made recommendations to the Board that resulted in the Fidelity funds taking, a number of actions over the previous year that benefited particular funds and/or the Fidelity funds in general.
Investment Performance. The Board took into account discussions that occur with representatives of the investment adviser, or reports it receives, at Board meetings throughout the year relating to fund investment performance. In this regard the Board noted that as part of regularly scheduled fund reviews and other reports to the Board on fund performance, the Board considered annualized return information for each fund for different time periods, measured against one or more appropriate securities market indices, including a customized blended index that reflects the respective weights of the fund's asset classes (each a benchmark index). The Board also considered information about performance attribution. In its evaluation of fund investment performance at meetings throughout the year, the Board gave particular attention to information indicating underperformance of certain Fidelity funds over different time periods and discussed with the Investment Advisers the reasons for such underperformance. VIP Freedom Lifetime Income I Portfolio underperformed its benchmark and peers for the one- and three-year periods ended January 31, 2024, and as a result, the Board continues to engage in discussions with FMR regarding the steps it is taking to address the fund's performance.
In addition to reviewing absolute and relative fund performance, the Independent Trustees periodically consider the appropriateness of fund performance metrics in evaluating the results achieved. The Independent Trustees generally give greater weight to fund performance over longer time periods than over shorter time periods. Depending on the circumstances, the Independent Trustees may be satisfied with a fund's performance notwithstanding that it lags its benchmark index for certain periods.
Based on its review, the Board concluded that the nature, extent, and quality of services provided to each fund under the Advisory Contracts should continue to benefit the shareholders of each fund.
Competitiveness of Management Fee and Total Expense Ratio. The Board was provided with information regarding industry trends in management fees and expenses. The Board noted that the funds do not pay FMR a management fee for investment advisory services, and that each fund bears indirectly the fees and expenses, including the management fees, paid by the underlying Fidelity funds in which it invests. In its review of each fund's total expense ratio, the Board considered each fund's all-inclusive (subject to certain limited exceptions) fee rate. the Board noted that each fund invests in a class of shares of the underlying Fidelity funds that does not charge a 12b-1 fee. The Board considered that the funds do not pay transfer agent fees. Instead, the applicable class of each underlying Fidelity fund bears its pro rata portion of each fund's transfer agent fee according to the percentage of each fund's assets invested in that underlying fund. The Board further noted that FMR pays all other expenses of each fund, with limited exceptions. The Board noted that Fidelity may agree to waive fees or reimburse expenses from time to time, and the extent to which, if any, it has done so for the fund.
Comparisons of Management Fees and Total Expense Ratios. Among other things, the Board reviewed data for selected groups of competitive funds and classes (referred to as "mapped groups") that were compiled by Fidelity based on combining similar investment objective categories (as classified by Morningstar) that have comparable investment mandates. The data reviewed by the Board included (i) gross management fee comparisons (before taking into account expense reimbursements or caps) relative to the total universe of funds within the mapped group; (ii) gross management fee comparisons relative to a subset of non-Fidelity funds in the mapped group that are similar in size and management fee structure to each fund (referred to as the "asset size peer group"); (iii) total expense comparisons of each fund relative to funds and classes in the mapped group that have a similar sales load structure to each fund (referred to as the "similar sales load structure group"); and (iv) total expense comparisons of each fund relative to funds and classes in the similar sales load structure group that are similar in size and management fee structure to each fund (referred to as the "total expense asset size peer group"). The total expense asset size peer group comparison excludes performance adjustments and fund-paid 12b-1 fees to eliminate variability in fee structures.
The information provided to the Board indicated that each fund's management fee rate ranked equal to the competitive median of the mapped group for 2023 and below the competitive median of the asset size peer group for 2023. Further, the information provided to the Board indicated that the total expense ratio of each fund ranked below the competitive median of the similar sales load structure group for 2023 and below the competitive median of the total expense asset size peer group for 2023.
Fees Charged to Other Fidelity Clients. The Board also considered Fidelity fee structures and other information with respect to clients of Fidelity, such as other funds advised or subadvised by Fidelity, pension plan clients, and other institutional clients with similar mandates. The Board noted that a joint ad hoc committee created by it and the boards of other Fidelity funds periodically reviews and compares Fidelity's institutional investment advisory business with its business of providing services to the Fidelity funds and also noted the most recent findings of the committee. The Board noted that the committee's review included a consideration of the differences in services provided, fees charged, and costs incurred, as well as competition in the markets serving the different categories of clients.
Based on its review, the Board concluded that each fund's management fee is fair and reasonable in light of the services that each fund receives and the other factors considered. Further, based on its review of total expense ratios and fees charged to other Fidelity clients, the Board concluded that each fund's total expense ratio was reasonable in light of the services that the fund and its shareholders receive and the other factors considered.
Costs of the Services and Profitability. The Board considered the level of Fidelity's profits in respect of all the Fidelity funds, including the Fidelity funds in which the funds invest.
A public accounting firm has been engaged annually by the Board as part of the Board's assessment of Fidelity's profitability analysis. The engagement includes the review and assessment of the methodologies used by Fidelity in determining the revenues and expenses attributable to Fidelity's fund. After considering the reports issued under the engagement and information provided by Fidelity, the Board concluded that while other allocation methods may also be reasonable, Fidelity's profitability methodologies are reasonable in all material respects.
The Board also reviewed Fidelity's non-fund businesses and potential indirect benefits such businesses may have received as a result of their association with Fidelity's fund business (i.e., fall-out benefits) as well as cases where Fidelity's affiliates may benefit from the funds' business. The Board considered areas where potential indirect benefits to the Fidelity funds from their relationships with Fidelity may exist. The Board's consideration of these matters was informed by the findings of a joint ad hoc committee created by it and the boards of other Fidelity funds to evaluate potential fall-out benefits.
The Board concluded that the costs of the services provided by and the profits realized by Fidelity in connection with the operation of each fund were not relevant to the renewal of each fund's Advisory Contract because the funds do not pay management fees and FMR pays all other expenses of each fund, with limited exceptions.
Economies of Scale. The Board concluded that because the funds do not pay management fees and FMR pays all other expenses of each fund, with limited exceptions, economies of scale cannot be realized by the funds, but may be realized by the other Fidelity funds in which each fund invests, many of which may benefit from breakpoints under the group fee arrangement.
Additional Information Requested by the Board. In order to develop fully the factual basis for consideration of the Fidelity funds' advisory contracts, the Board requested and received additional information on certain topics, including: (i) portfolio manager changes that have occurred during the past year; (ii) hiring, training, compensating, and retaining adviser and sub-adviser personnel; (iii) the terms of the funds' various management fee structures and arrangements for transfer agent and pricing and bookkeeping services; (iv) Fidelity's fund profitability methodology, profitability trends for certain funds, the allocation of various costs to different funds, and the impact of certain factors on fund profitability results; (v) the impact on fund profitability of recent industry trends, such as the growth in passively managed funds and the changes in flows for different types of funds; (vi) the types of management fee and total expense comparisons provided, and the challenges and limitations associated with such information; (vii) explanations regarding the relative total expense ratios and management fees of certain funds and classes, total expense and management fee competitive trends, and methodologies for total expense and management fee competitive comparisons; (viii) matters related to money market funds, exchange-traded funds, and target date funds; (ix) the arrangements with and compensation paid to certain fund sub-advisers and the treatment of such compensation within Fidelity's fund profitability methodology; and (x) the terms of management contracts between Fidelity and other funds and products not overseen by the Board.
Conclusion. Based on its evaluation of all of the conclusions noted above, and after considering all factors it believed relevant, the Board, including the Independent Trustees, concluded that the advisory fee arrangements are fair and reasonable in light of all of the surrounding circumstances and that each fund's Advisory Contract should be renewed through September 30, 2025.
1.816199.119
VIPFLI-ANN-0325
Fidelity® Variable Insurance Products:
VIP Freedom Income Portfolio℠
VIP Freedom 2010 Portfolio℠
VIP Freedom 2015 Portfolio℠
VIP Freedom 2020 Portfolio℠
VIP Freedom 2025 Portfolio℠
VIP Freedom 2030 Portfolio℠
VIP Freedom 2035 Portfolio℠
VIP Freedom 2040 Portfolio℠
VIP Freedom 2045 Portfolio℠
VIP Freedom 2050 Portfolio℠
VIP Freedom 2055 Portfolio℠
VIP Freedom 2060 Portfolio℠
VIP Freedom 2065 Portfolio℠
VIP Freedom 2070 Portfolio℠
Annual Report
December 31, 2024
Contents
To view a fund's proxy voting guidelines and proxy voting record for the 12-month period ended June 30, visit http://www.fidelity.com/proxyvotingresults or visit the Securities and Exchange Commission's (SEC) web site at http://www.sec.gov.
You may also call 1-877-208-0098 to request a free copy of the proxy voting guidelines.
Fidelity® Variable Insurance Products are separate account options which are purchased through a variable insurance contract.
Standard & Poor's, S&P and S&P 500 are registered service marks of The McGraw-Hill Companies, Inc. and have been licensed for use by Fidelity Distributors Corporation.
Other third-party marks appearing herein are the property of their respective owners.
All other marks appearing herein are registered or unregistered trademarks or service marks of FMR LLC or an affiliated company. © 2025 FMR LLC. All rights reserved.
This report and the financial statements contained herein are submitted for the general information of the shareholders of the Funds. This report is not authorized for distribution to prospective investors in the Funds unless preceded or accompanied by an effective prospectus.
A fund files its complete schedule of portfolio holdings with the SEC for the first and third quarters of each fiscal year on Form N-PORT. Forms N-PORT are available on the SEC's web site at http://www.sec.gov. A fund's Forms N-PORT may be reviewed and copied at the SEC's Public Reference Room in Washington, DC. Information regarding the operation of the SEC's Public Reference Room may be obtained by calling 1-800-SEC-0330.
For a complete list of a fund's portfolio holdings, view the most recent holdings listing, semiannual report, or annual report on Fidelity's web site at http://www.fidelity.com, http://www.institutional.fidelity.com, or http://www.401k.com, as applicable.
NOT FDIC INSURED •MAY LOSE VALUE •NO BANK GUARANTEE
Neither the Funds nor Fidelity Distributors Corporation is a bank.
Item 7: Financial Statements and Financial Highlights for Open-End Management Investment Companies (Annual Report)
VIP Freedom Income Portfolio℠
Schedule of Investments December 31, 2024
Showing Percentage of Net Assets
| Bond Funds - 62.4% |
| | | Shares | Value ($) |
| Fidelity Inflation-Protected Bond Index Fund (a) | | 1,592,515 | 14,157,460 |
| Fidelity International Bond Index Fund (a) | | 302,502 | 2,813,265 |
| Fidelity Long-Term Treasury Bond Index Fund (a) | | 265,846 | 2,437,808 |
| VIP High Income Portfolio - Initial Class (a) | | 227,745 | 1,074,957 |
| VIP Investment Grade Bond II Portfolio - Initial Class (a) | | 3,779,677 | 34,810,823 |
| TOTAL BOND FUNDS (Cost $59,453,258) | | | 55,294,313 |
| | | | |
| Domestic Equity Funds - 9.4% |
| | | Shares | Value ($) |
| VIP Contrafund Portfolio - Initial Class (a) | | 25,302 | 1,465,989 |
| VIP Equity-Income Portfolio - Initial Class (a) | | 44,979 | 1,195,991 |
| VIP Growth & Income Portfolio - Initial Class (a) | | 53,697 | 1,640,442 |
| VIP Growth Portfolio - Initial Class (a) | | 25,063 | 2,429,643 |
| VIP Mid Cap Portfolio - Initial Class (a) | | 10,025 | 376,525 |
| VIP Value Portfolio - Initial Class (a) | | 44,229 | 840,358 |
| VIP Value Strategies Portfolio - Initial Class (a) | | 26,913 | 417,414 |
| TOTAL DOMESTIC EQUITY FUNDS (Cost $6,418,026) | | | 8,366,362 |
| | | | |
| International Equity Funds - 12.8% |
| | | Shares | Value ($) |
| VIP Emerging Markets Portfolio - Initial Class (a) | | 414,679 | 4,760,511 |
| VIP Overseas Portfolio - Initial Class (a) | | 257,613 | 6,561,403 |
| TOTAL INTERNATIONAL EQUITY FUNDS (Cost $9,005,888) | | | 11,321,914 |
| | | | |
| Money Market Funds - 15.4% |
| | | Yield (%) | Shares | Value ($) |
VIP Government Money Market Portfolio - Initial Class (a)(b) (Cost $13,660,362) | | 4.33 | 13,660,362 | 13,660,362 |
| | | | | |
| TOTAL INVESTMENT IN SECURITIES - 100.0% (Cost $88,537,534) | 88,642,951 |
NET OTHER ASSETS (LIABILITIES) - 0.0% | (6,942) |
| NET ASSETS - 100.0% | 88,636,009 |
| | |
Legend
| (b) | The rate quoted is the annualized seven-day yield of the fund at period end. |
Affiliated Underlying Funds
Fiscal year to date information regarding the Fund's investments in affiliated Underlying Funds is presented below. Exchanges between classes of the same affiliated Underlying Funds may occur. If an Underlying Funds changes its name, the name presented below is the name in effect at period end.
| Affiliate | Value, beginning of period ($) | Purchases ($) | Sales Proceeds ($) | Dividend Income ($) | Realized Gain (loss) ($) | Change in Unrealized appreciation (depreciation) ($) | Value, end of period ($) | Shares, end of period |
| Fidelity Inflation-Protected Bond Index Fund | 11,952,508 | 5,123,381 | 4,126,731 | 495,518 | (41,114) | (207,994) | 14,157,460 | 1,592,515 |
| Fidelity International Bond Index Fund | 1,775,787 | 1,609,554 | 771,298 | 76,204 | (17,201) | 23,721 | 2,813,265 | 302,502 |
| Fidelity Long-Term Treasury Bond Index Fund | 2,332,824 | 1,410,495 | 1,279,656 | 68,188 | (141,305) | (88,708) | 2,437,808 | 265,846 |
| VIP Contrafund Portfolio - Initial Class | 716,844 | 1,043,535 | 539,027 | 165,842 | 8,549 | 108,217 | 1,465,989 | 25,302 |
| VIP Emerging Markets Portfolio - Initial Class | 3,485,948 | 2,800,082 | 2,289,196 | 67,630 | (2,616) | 268,648 | 4,760,511 | 414,679 |
| VIP Equity-Income Portfolio - Initial Class | 581,292 | 922,525 | 439,763 | 82,813 | 8,810 | 21,324 | 1,195,991 | 44,979 |
| VIP Government Money Market Portfolio - Initial Class | 12,731,894 | 6,074,091 | 6,531,076 | 607,942 | - | - | 13,660,362 | 13,660,362 |
| VIP Growth & Income Portfolio - Initial Class | 799,053 | 1,186,182 | 588,752 | 120,877 | 7,882 | 95,344 | 1,640,442 | 53,697 |
| VIP Growth Portfolio - Initial Class | 1,187,146 | 1,992,076 | 878,480 | 501,801 | 715 | (83,186) | 2,429,643 | 25,063 |
| VIP High Income Portfolio - Initial Class | 1,152,783 | 501,602 | 776,123 | 63,434 | (13,169) | 63,209 | 1,074,957 | 227,745 |
| VIP Investment Grade Bond II Portfolio - Initial Class | 27,259,612 | 14,208,085 | 9,352,854 | 1,462,577 | 3,200 | (916,017) | 34,810,823 | 3,779,677 |
| VIP Mid Cap Portfolio - Initial Class | 181,931 | 283,676 | 119,560 | 43,508 | 2,203 | (3,217) | 376,525 | 10,025 |
| VIP Overseas Portfolio - Initial Class | 5,044,303 | 3,593,646 | 2,553,247 | 406,794 | 13,720 | (227,905) | 6,561,403 | 257,613 |
| VIP Value Portfolio - Initial Class | 405,418 | 669,858 | 289,682 | 82,167 | 4,259 | (19,706) | 840,358 | 44,229 |
| VIP Value Strategies Portfolio - Initial Class | 200,620 | 346,178 | 136,318 | 56,388 | 2,381 | (30,029) | 417,414 | 26,913 |
| | 69,807,963 | 41,764,966 | 30,671,763 | 4,301,683 | (163,686) | (996,299) | 88,642,951 | 20,731,147 |
Amounts in the dividend income column in the above table include any capital gain distributions from underlying funds, which are presented in the corresponding line item in the Statement of Operations, if applicable.
Amounts included in the purchases and sales proceeds columns may include in-kind transactions, if applicable.
Purchases and sales proceeds exclude the value of securities received and delivered through reorganization transactions, if applicable.
Investment Valuation
The following is a summary of the inputs used, as of December 31, 2024, involving the Fund's assets and liabilities carried at fair value. The inputs or methodology used for valuing securities may not be an indication of the risk associated with investing in those securities. For more information on valuation inputs, and their aggregation into the levels used below, please refer to the Investment Valuation section in the accompanying Notes to Financial Statements.
| Valuation Inputs at Reporting Date: |
| Description | Total ($) | Level 1 ($) | Level 2 ($) | Level 3 ($) |
Investments in Securities: | | | | |
|
| Bond Funds | 55,294,313 | 55,294,313 | - | - |
|
| Domestic Equity Funds | 8,366,362 | 8,366,362 | - | - |
|
| International Equity Funds | 11,321,914 | 11,321,914 | - | - |
|
| Money Market Funds | 13,660,362 | 13,660,362 | - | - |
| Total Investments in Securities: | 88,642,951 | 88,642,951 | - | - |
VIP Freedom Income Portfolio℠
Financial Statements
| Statement of Assets and Liabilities |
As of December 31, 2024 |
| Assets | | | | |
| Investment in securities, at value - See accompanying schedule: | | | | |
Affiliated issuers (cost $88,537,534) | $ | 88,642,951 | | |
| | | | | |
| | | | | |
| Total Investment in Securities (cost $88,537,534) | | | $ | 88,642,951 |
| Receivable for investments sold | | | | 390,997 |
| Receivable for fund shares sold | | | | 415,663 |
Total assets | | | | 89,449,611 |
| Liabilities | | | | |
| Payable for investments purchased | $ | 686,959 | | |
| Payable for fund shares redeemed | | 119,709 | | |
| Distribution and service plan fees payable | | 6,934 | | |
| Total liabilities | | | | 813,602 |
| Net Assets | | | $ | 88,636,009 |
| Net Assets consist of: | | | | |
| Paid in capital | | | $ | 89,676,558 |
| Total accumulated earnings (loss) | | | | (1,040,549) |
| Net Assets | | | $ | 88,636,009 |
| | | | | |
| Net Asset Value and Maximum Offering Price | | | | |
| Initial Class : | | | | |
Net Asset Value, offering price and redemption price per share ($26,044,260 ÷ 2,362,109 shares) | | | $ | 11.03 |
| Service Class : | | | | |
Net Asset Value, offering price and redemption price per share ($49,066,769 ÷ 4,456,768 shares) | | | $ | 11.01 |
| Service Class 2 : | | | | |
Net Asset Value, offering price and redemption price per share ($13,524,980 ÷ 1,232,184 shares) | | | $ | 10.98 |
| Statement of Operations |
| Year ended December 31, 2024 |
| Investment Income | | | | |
| Dividends: | | | | |
| Affiliated issuers | | | $ | 3,007,965 |
| Expenses | | | | |
| Distribution and service plan fees | $ | 74,007 | | |
| Independent trustees' fees and expenses | | 200 | | |
| Total expenses before reductions | | 74,207 | | |
| Expense reductions | | (2) | | |
| Total expenses after reductions | | | | 74,205 |
| Net Investment income (loss) | | | | 2,933,760 |
| Realized and Unrealized Gain (Loss) | | | | |
| Net realized gain (loss) on: | | | | |
| Investment Securities: | | | | |
| Affiliated issuers | | (163,686) | | |
| Capital gain distributions from underlying funds: | | | | |
| Affiliated issuers | | 1,293,718 | | |
| Total net realized gain (loss) | | | | 1,130,032 |
| Change in net unrealized appreciation (depreciation) on: | | | | |
| Investment Securities: | | | | |
| Affiliated issuers | | (996,299) | | |
| Total change in net unrealized appreciation (depreciation) | | | | (996,299) |
| Net gain (loss) | | | | 133,733 |
| Net increase (decrease) in net assets resulting from operations | | | $ | 3,067,493 |
| Statement of Changes in Net Assets |
| |
| | Year ended December 31, 2024 | | Year ended December 31, 2023 |
| Increase (Decrease) in Net Assets | | | | |
| Operations | | | | |
| Net investment income (loss) | $ | 2,933,760 | $ | 2,347,521 |
| Net realized gain (loss) | | 1,130,032 | | (72,462) |
| Change in net unrealized appreciation (depreciation) | | (996,299) | | 2,839,039 |
| Net increase (decrease) in net assets resulting from operations | | 3,067,493 | | 5,114,098 |
| Distributions to shareholders | | (3,128,768) | | (2,815,603) |
| | | | | |
| Share transactions - net increase (decrease) | | 18,891,667 | | 3,699,301 |
| Total increase (decrease) in net assets | | 18,830,392 | | 5,997,796 |
| | | | | |
| Net Assets | | | | |
| Beginning of period | | 69,805,617 | | 63,807,821 |
| End of period | $ | 88,636,009 | $ | 69,805,617 |
| | | | | |
| | | | | |
Financial Highlights
VIP Freedom Income Portfolio℠ Initial Class |
| |
| Years ended December 31, | | 2024 | | 2023 | | 2022 | | 2021 | | 2020 |
Selected Per-Share Data | | | | | | | | | | |
| Net asset value, beginning of period | $ | 10.97 | $ | 10.61 | $ | 12.76 | $ | 12.74 | $ | 11.89 |
| Income from Investment Operations | | | | | | | | | | |
Net investment income (loss) A,B | | .43 | | .41 | | .30 | | .24 | | .17 |
| Net realized and unrealized gain (loss) | | .06 | | .42 | | (1.79) | | .18 | | 1.06 |
| Total from investment operations | | .49 | | .83 | | (1.49) | | .42 | | 1.23 |
| Distributions from net investment income | | (.42) | | (.47) | | (.26) | | (.13) | | (.16) |
| Distributions from net realized gain | | (.01) | | - | | (.40) | | (.27) | | (.22) |
| Total distributions | | (.43) | | (.47) | | (.66) | | (.40) | | (.38) |
| Net asset value, end of period | $ | 11.03 | $ | 10.97 | $ | 10.61 | $ | 12.76 | $ | 12.74 |
Total Return C,D | | | | 7.91% | | (12.05)% | | 3.35% | | 10.47% |
Ratios to Average Net Assets B,E,F | | | | | | | | | | |
Expenses before reductions G | | -% | | -% | | -% | | -% | | -% |
Expenses net of fee waivers, if any G | | | | -% | | -% | | -% | | -% |
Expenses net of all reductions G | | -% | | -% | | -% | | -% | | -% |
| Net investment income (loss) | | 3.86% | | 3.75% | | 2.71% | | 1.85% | | 1.40% |
| Supplemental Data | | | | | | | | | | |
| Net assets, end of period (000 omitted) | $ | 26,044 | $ | 22,698 | $ | 15,085 | $ | 17,011 | $ | 16,854 |
Portfolio turnover rate H | | | | 40% | | 91% | | 52% | | 66% |
ACalculated based on average shares outstanding during the period.
BNet investment income (loss) is affected by the timing of the declaration of dividends by any underlying mutual funds or exchange-traded funds (ETFs). Net investment income (loss) of any mutual funds or ETFs is not included in the Fund's net investment income (loss) ratio.
CTotal returns do not reflect charges attributable to your insurance company's separate account. Inclusion of these charges would reduce the total returns shown.
DTotal returns would have been lower if certain expenses had not been reduced during the applicable periods shown.
EFees and expenses of any underlying mutual funds or exchange-traded funds (ETFs) are not included in the Fund's expense ratio. The Fund indirectly bears its proportionate share of these expenses.
FExpense ratios reflect operating expenses of the class. Expenses before reductions do not reflect amounts reimbursed, waived, or reduced through arrangements with the investment adviser, brokerage services, or other offset arrangements, if applicable, and do not represent the amount paid by the class during periods when reimbursements, waivers or reductions occur.
GAmount represents less than .005%.
HAmount does not include the portfolio activity of any underlying mutual funds or exchange-traded funds (ETFs), derivatives or securities that mature within one year from acquisition.
IThe portfolio turnover rate does not include the assets acquired in the reorganization.
VIP Freedom Income Portfolio℠ Service Class |
| |
| Years ended December 31, | | 2024 | | 2023 | | 2022 | | 2021 | | 2020 |
Selected Per-Share Data | | | | | | | | | | |
| Net asset value, beginning of period | $ | 10.96 | $ | 10.60 | $ | 12.74 | $ | 12.73 | $ | 11.88 |
| Income from Investment Operations | | | | | | | | | | |
Net investment income (loss) A,B | | .42 | | .39 | | .29 | | .22 | | .16 |
| Net realized and unrealized gain (loss) | | .05 | | .43 | | (1.77) | | .18 | | 1.06 |
| Total from investment operations | | .47 | | .82 | | (1.48) | | .40 | | 1.22 |
| Distributions from net investment income | | (.41) | | (.46) | | (.25) | | (.12) | | (.15) |
| Distributions from net realized gain | | (.01) | | - | | (.40) | | (.27) | | (.22) |
| Total distributions | | (.42) | | (.46) | | (.66) C | | (.39) | | (.37) |
| Net asset value, end of period | $ | 11.01 | $ | 10.96 | $ | 10.60 | $ | 12.74 | $ | 12.73 |
Total Return D,E | | | | 7.81% | | (12.06)% | | 3.17% | | 10.38% |
Ratios to Average Net Assets B,F,G | | | | | | | | | | |
| Expenses before reductions | | .10% | | .10% | | .10% | | .10% | | .10% |
| Expenses net of fee waivers, if any | | | | .10% | | .10% | | .10% | | .10% |
| Expenses net of all reductions | | .10% | | .10% | | .10% | | .10% | | .10% |
| Net investment income (loss) | | 3.76% | | 3.65% | | 2.61% | | 1.75% | | 1.30% |
| Supplemental Data | | | | | | | | | | |
| Net assets, end of period (000 omitted) | $ | 49,067 | $ | 32,753 | $ | 31,739 | $ | 32,637 | $ | 32,810 |
Portfolio turnover rate H | | | | 40% | | 91% | | 52% | | 66% |
ACalculated based on average shares outstanding during the period.
BNet investment income (loss) is affected by the timing of the declaration of dividends by any underlying mutual funds or exchange-traded funds (ETFs). Net investment income (loss) of any mutual funds or ETFs is not included in the Fund's net investment income (loss) ratio.
CTotal distributions per share do not sum due to rounding.
DTotal returns do not reflect charges attributable to your insurance company's separate account. Inclusion of these charges would reduce the total returns shown.
ETotal returns would have been lower if certain expenses had not been reduced during the applicable periods shown.
FFees and expenses of any underlying mutual funds or exchange-traded funds (ETFs) are not included in the Fund's expense ratio. The Fund indirectly bears its proportionate share of these expenses.
GExpense ratios reflect operating expenses of the class. Expenses before reductions do not reflect amounts reimbursed, waived, or reduced through arrangements with the investment adviser, brokerage services, or other offset arrangements, if applicable, and do not represent the amount paid by the class during periods when reimbursements, waivers or reductions occur.
HAmount does not include the portfolio activity of any underlying mutual funds or exchange-traded funds (ETFs), derivatives or securities that mature within one year from acquisition.
IThe portfolio turnover rate does not include the assets acquired in the reorganization.
VIP Freedom Income Portfolio℠ Service Class 2 |
| |
| Years ended December 31, | | 2024 | | 2023 | | 2022 | | 2021 | | 2020 |
Selected Per-Share Data | | | | | | | | | | |
| Net asset value, beginning of period | $ | 10.92 | $ | 10.56 | $ | 12.69 | $ | 12.68 | $ | 11.83 |
| Income from Investment Operations | | | | | | | | | | |
Net investment income (loss) A,B | | .40 | | .38 | | .27 | | .20 | | .14 |
| Net realized and unrealized gain (loss) | | .06 | | .42 | | (1.77) | | .18 | | 1.06 |
| Total from investment operations | | .46 | | .80 | | (1.50) | | .38 | | 1.20 |
| Distributions from net investment income | | (.39) | | (.44) | | (.22) | | (.10) | | (.13) |
| Distributions from net realized gain | | (.01) | | - | | (.40) | | (.27) | | (.22) |
| Total distributions | | (.40) | | (.44) | | (.63) C | | (.37) | | (.35) |
| Net asset value, end of period | $ | 10.98 | $ | 10.92 | $ | 10.56 | $ | 12.69 | $ | 12.68 |
Total Return D,E | | | | 7.65% | | (12.26)% | | 3.03% | | 10.29% |
Ratios to Average Net Assets B,F,G | | | | | | | | | | |
| Expenses before reductions | | .25% | | .25% | | .25% | | .25% | | .25% |
| Expenses net of fee waivers, if any | | | | .25% | | .25% | | .25% | | .25% |
| Expenses net of all reductions | | .25% | | .25% | | .25% | | .25% | | .25% |
| Net investment income (loss) | | 3.61% | | 3.50% | | 2.46% | | 1.60% | | 1.15% |
| Supplemental Data | | | | | | | | | | |
| Net assets, end of period (000 omitted) | $ | 13,525 | $ | 14,354 | $ | 16,984 | $ | 28,521 | $ | 27,518 |
Portfolio turnover rate H | | | | 40% | | 91% | | 52% | | 66% |
ACalculated based on average shares outstanding during the period.
BNet investment income (loss) is affected by the timing of the declaration of dividends by any underlying mutual funds or exchange-traded funds (ETFs). Net investment income (loss) of any mutual funds or ETFs is not included in the Fund's net investment income (loss) ratio.
CTotal distributions per share do not sum due to rounding.
DTotal returns do not reflect charges attributable to your insurance company's separate account. Inclusion of these charges would reduce the total returns shown.
ETotal returns would have been lower if certain expenses had not been reduced during the applicable periods shown.
FFees and expenses of any underlying mutual funds or exchange-traded funds (ETFs) are not included in the Fund's expense ratio. The Fund indirectly bears its proportionate share of these expenses.
GExpense ratios reflect operating expenses of the class. Expenses before reductions do not reflect amounts reimbursed, waived, or reduced through arrangements with the investment adviser, brokerage services, or other offset arrangements, if applicable, and do not represent the amount paid by the class during periods when reimbursements, waivers or reductions occur.
HAmount does not include the portfolio activity of any underlying mutual funds or exchange-traded funds (ETFs), derivatives or securities that mature within one year from acquisition.
IThe portfolio turnover rate does not include the assets acquired in the reorganization.
VIP Freedom 2010 Portfolio℠
Schedule of Investments December 31, 2024
Showing Percentage of Net Assets
| Bond Funds - 60.0% |
| | | Shares | Value ($) |
| Fidelity Inflation-Protected Bond Index Fund (a) | | 4,254,556 | 37,823,003 |
| Fidelity International Bond Index Fund (a) | | 908,347 | 8,447,623 |
| Fidelity Long-Term Treasury Bond Index Fund (a) | | 811,319 | 7,439,795 |
| VIP High Income Portfolio - Initial Class (a) | | 641,379 | 3,027,309 |
| VIP Investment Grade Bond II Portfolio - Initial Class (a) | | 10,089,165 | 92,921,207 |
| TOTAL BOND FUNDS (Cost $162,242,488) | | | 149,658,937 |
| | | | |
| Domestic Equity Funds - 13.4% |
| | | Shares | Value ($) |
| VIP Contrafund Portfolio - Initial Class (a) | | 100,774 | 5,838,873 |
| VIP Equity-Income Portfolio - Initial Class (a) | | 179,160 | 4,763,862 |
| VIP Growth & Income Portfolio - Initial Class (a) | | 213,882 | 6,534,105 |
| VIP Growth Portfolio - Initial Class (a) | | 99,823 | 9,676,806 |
| VIP Mid Cap Portfolio - Initial Class (a) | | 39,932 | 1,499,844 |
| VIP Value Portfolio - Initial Class (a) | | 176,186 | 3,347,529 |
| VIP Value Strategies Portfolio - Initial Class (a) | | 107,204 | 1,662,740 |
| TOTAL DOMESTIC EQUITY FUNDS (Cost $24,385,508) | | | 33,323,759 |
| | | | |
| International Equity Funds - 15.4% |
| | | Shares | Value ($) |
| VIP Emerging Markets Portfolio - Initial Class (a) | | 1,337,447 | 15,353,892 |
| VIP Overseas Portfolio - Initial Class (a) | | 905,626 | 23,066,286 |
| TOTAL INTERNATIONAL EQUITY FUNDS (Cost $31,423,511) | | | 38,420,178 |
| | | | |
| Money Market Funds - 11.2% |
| | | Yield (%) | Shares | Value ($) |
VIP Government Money Market Portfolio - Initial Class (a)(b) (Cost $28,170,443) | | 4.33 | 28,170,443 | 28,170,443 |
| | | | | |
| TOTAL INVESTMENT IN SECURITIES - 100.0% (Cost $246,221,950) | 249,573,317 |
NET OTHER ASSETS (LIABILITIES) - 0.0% | (47,537) |
| NET ASSETS - 100.0% | 249,525,780 |
| | |
Legend
| (b) | The rate quoted is the annualized seven-day yield of the fund at period end. |
Affiliated Underlying Funds
Fiscal year to date information regarding the Fund's investments in affiliated Underlying Funds is presented below. Exchanges between classes of the same affiliated Underlying Funds may occur. If an Underlying Funds changes its name, the name presented below is the name in effect at period end.
| Affiliate | Value, beginning of period ($) | Purchases ($) | Sales Proceeds ($) | Dividend Income ($) | Realized Gain (loss) ($) | Change in Unrealized appreciation (depreciation) ($) | Value, end of period ($) | Shares, end of period |
| Fidelity Inflation-Protected Bond Index Fund | 43,902,853 | 4,894,092 | 10,365,462 | 1,447,076 | (687,782) | 79,302 | 37,823,003 | 4,254,556 |
| Fidelity International Bond Index Fund | 7,652,075 | 3,264,559 | 2,492,130 | 261,249 | (17,673) | 40,792 | 8,447,623 | 908,347 |
| Fidelity Long-Term Treasury Bond Index Fund | 9,827,697 | 2,751,019 | 4,295,995 | 256,009 | (718,340) | (124,586) | 7,439,795 | 811,319 |
| VIP Contrafund Portfolio - Initial Class | 5,203,651 | 2,289,966 | 2,642,618 | 684,419 | 247,794 | 740,080 | 5,838,873 | 100,774 |
| VIP Emerging Markets Portfolio - Initial Class | 16,176,839 | 5,119,593 | 7,347,412 | 226,236 | 180,370 | 1,224,502 | 15,353,892 | 1,337,447 |
| VIP Equity-Income Portfolio - Initial Class | 4,219,682 | 2,364,479 | 2,157,703 | 347,711 | 69,592 | 267,812 | 4,763,862 | 179,160 |
| VIP Government Money Market Portfolio - Initial Class | 35,491,219 | 8,690,406 | 16,011,182 | 1,457,354 | - | - | 28,170,443 | 28,170,443 |
| VIP Growth & Income Portfolio - Initial Class | 5,800,472 | 2,745,982 | 2,805,820 | 506,897 | 175,308 | 618,163 | 6,534,105 | 213,882 |
| VIP Growth Portfolio - Initial Class | 8,617,574 | 4,906,481 | 4,261,316 | 2,097,005 | 306,673 | 107,394 | 9,676,806 | 99,823 |
| VIP High Income Portfolio - Initial Class | 4,507,789 | 468,335 | 2,146,147 | 181,762 | 41,439 | 155,893 | 3,027,309 | 641,379 |
| VIP Investment Grade Bond II Portfolio - Initial Class | 99,453,184 | 19,222,124 | 23,498,505 | 3,980,094 | (763,831) | (1,491,765) | 92,921,207 | 10,089,165 |
| VIP Mid Cap Portfolio - Initial Class | 1,320,626 | 719,036 | 601,964 | 187,434 | 36,245 | 25,901 | 1,499,844 | 39,932 |
| VIP Overseas Portfolio - Initial Class | 26,309,096 | 6,135,134 | 9,320,820 | 1,492,279 | 689,026 | (746,150) | 23,066,286 | 905,626 |
| VIP Value Portfolio - Initial Class | 2,942,935 | 1,772,092 | 1,388,011 | 361,556 | 65,415 | (44,902) | 3,347,529 | 176,186 |
| VIP Value Strategies Portfolio - Initial Class | 1,456,302 | 952,172 | 673,077 | 238,339 | 30,988 | (103,645) | 1,662,740 | 107,204 |
| | 272,881,994 | 66,295,470 | 90,008,162 | 13,725,420 | (344,776) | 748,791 | 249,573,317 | 48,035,243 |
Amounts in the dividend income column in the above table include any capital gain distributions from underlying funds, which are presented in the corresponding line item in the Statement of Operations, if applicable.
Amounts included in the purchases and sales proceeds columns may include in-kind transactions, if applicable.
Investment Valuation
The following is a summary of the inputs used, as of December 31, 2024, involving the Fund's assets and liabilities carried at fair value. The inputs or methodology used for valuing securities may not be an indication of the risk associated with investing in those securities. For more information on valuation inputs, and their aggregation into the levels used below, please refer to the Investment Valuation section in the accompanying Notes to Financial Statements.
| Valuation Inputs at Reporting Date: |
| Description | Total ($) | Level 1 ($) | Level 2 ($) | Level 3 ($) |
Investments in Securities: | | | | |
|
| Bond Funds | 149,658,937 | 149,658,937 | - | - |
|
| Domestic Equity Funds | 33,323,759 | 33,323,759 | - | - |
|
| International Equity Funds | 38,420,178 | 38,420,178 | - | - |
|
| Money Market Funds | 28,170,443 | 28,170,443 | - | - |
| Total Investments in Securities: | 249,573,317 | 249,573,317 | - | - |
VIP Freedom 2010 Portfolio℠
Financial Statements
| Statement of Assets and Liabilities |
As of December 31, 2024 |
| Assets | | | | |
| Investment in securities, at value - See accompanying schedule: | | | | |
Affiliated issuers (cost $246,221,950) | $ | 249,573,317 | | |
| | | | | |
| | | | | |
| Total Investment in Securities (cost $246,221,950) | | | $ | 249,573,317 |
| Receivable for investments sold | | | | 766,726 |
| Receivable for fund shares sold | | | | 10,282 |
Total assets | | | | 250,350,325 |
| Liabilities | | | | |
| Payable for investments purchased | $ | 676,389 | | |
| Payable for fund shares redeemed | | 100,622 | | |
| Distribution and service plan fees payable | | 47,534 | | |
| Total liabilities | | | | 824,545 |
| Net Assets | | | $ | 249,525,780 |
| Net Assets consist of: | | | | |
| Paid in capital | | | $ | 244,680,693 |
| Total accumulated earnings (loss) | | | | 4,845,087 |
| Net Assets | | | $ | 249,525,780 |
| | | | | |
| Net Asset Value and Maximum Offering Price | | | | |
| Initial Class : | | | | |
Net Asset Value, offering price and redemption price per share ($15,567,951 ÷ 1,353,686 shares) | | | $ | 11.50 |
| Service Class : | | | | |
Net Asset Value, offering price and redemption price per share ($16,163,005 ÷ 1,407,616 shares) | | | $ | 11.48 |
| Service Class 2 : | | | | |
Net Asset Value, offering price and redemption price per share ($217,794,824 ÷ 19,117,289 shares) | | | $ | 11.39 |
| Statement of Operations |
| Year ended December 31, 2024 |
| Investment Income | | | | |
| Dividends: | | | | |
| Affiliated issuers | | | $ | 8,457,286 |
| Expenses | | | | |
| Distribution and service plan fees | $ | 590,641 | | |
| Independent trustees' fees and expenses | | 689 | | |
| Total expenses before reductions | | 591,330 | | |
| Expense reductions | | (1) | | |
| Total expenses after reductions | | | | 591,329 |
| Net Investment income (loss) | | | | 7,865,957 |
| Realized and Unrealized Gain (Loss) | | | | |
| Net realized gain (loss) on: | | | | |
| Investment Securities: | | | | |
| Affiliated issuers | | (344,776) | | |
| Capital gain distributions from underlying funds: | | | | |
| Affiliated issuers | | 5,268,134 | | |
| Total net realized gain (loss) | | | | 4,923,358 |
| Change in net unrealized appreciation (depreciation) on: | | | | |
| Investment Securities: | | | | |
| Affiliated issuers | | 748,791 | | |
| Total change in net unrealized appreciation (depreciation) | | | | 748,791 |
| Net gain (loss) | | | | 5,672,149 |
| Net increase (decrease) in net assets resulting from operations | | | $ | 13,538,106 |
| Statement of Changes in Net Assets |
| |
| | Year ended December 31, 2024 | | Year ended December 31, 2023 |
| Increase (Decrease) in Net Assets | | | | |
| Operations | | | | |
| Net investment income (loss) | $ | 7,865,957 | $ | 8,116,821 |
| Net realized gain (loss) | | 4,923,358 | | (48,144) |
| Change in net unrealized appreciation (depreciation) | | 748,791 | | 16,466,483 |
| Net increase (decrease) in net assets resulting from operations | | 13,538,106 | | 24,535,160 |
| Distributions to shareholders | | (8,877,417) | | (29,955,899) |
| | | | | |
| Share transactions - net increase (decrease) | | (27,976,626) | | (6,836,301) |
| Total increase (decrease) in net assets | | (23,315,937) | | (12,257,040) |
| | | | | |
| Net Assets | | | | |
| Beginning of period | | 272,841,717 | | 285,098,757 |
| End of period | $ | 249,525,780 | $ | 272,841,717 |
| | | | | |
| | | | | |
Financial Highlights
VIP Freedom 2010 Portfolio℠ Initial Class |
| |
| Years ended December 31, | | 2024 | | 2023 | | 2022 | | 2021 | | 2020 |
Selected Per-Share Data | | | | | | | | | | |
| Net asset value, beginning of period | $ | 11.33 | $ | 11.55 | $ | 14.45 | $ | 14.28 | $ | 13.42 |
| Income from Investment Operations | | | | | | | | | | |
Net investment income (loss) A,B | | .37 | | .34 | | .30 | | .26 | | .18 |
| Net realized and unrealized gain (loss) | | .24 | | .70 | | (2.16) | | .56 | | 1.44 |
| Total from investment operations | | .61 | | 1.04 | | (1.86) | | .82 | | 1.62 |
| Distributions from net investment income | | (.43) | | (.46) | | (.27) | | (.15) | | (.18) |
| Distributions from net realized gain | | (.01) | | (.80) | | (.77) | | (.50) | | (.58) |
| Total distributions | | (.44) | | (1.26) | | (1.04) | | (.65) | | (.76) |
| Net asset value, end of period | $ | 11.50 | $ | 11.33 | $ | 11.55 | $ | 14.45 | $ | 14.28 |
Total Return C,D | | | | 9.48% | | (13.53)% | | 5.89% | | 12.49% |
Ratios to Average Net Assets B,E,F | | | | | | | | | | |
Expenses before reductions G | | -% | | -% | | -% | | -% | | -% |
Expenses net of fee waivers, if any G | | | | -% | | -% | | -% | | -% |
Expenses net of all reductions G | | -% | | -% | | -% | | -% | | -% |
| Net investment income (loss) | | 3.21% | | 3.10% | | 2.47% | | 1.82% | | 1.34% |
| Supplemental Data | | | | | | | | | | |
| Net assets, end of period (000 omitted) | $ | 15,568 | $ | 17,668 | $ | 12,298 | $ | 16,685 | $ | 19,195 |
Portfolio turnover rate H | | | | 21% | | 231% | | 29% | | 40% |
ACalculated based on average shares outstanding during the period.
BNet investment income (loss) is affected by the timing of the declaration of dividends by any underlying mutual funds or exchange-traded funds (ETFs). Net investment income (loss) of any mutual funds or ETFs is not included in the Fund's net investment income (loss) ratio.
CTotal returns do not reflect charges attributable to your insurance company's separate account. Inclusion of these charges would reduce the total returns shown.
DTotal returns would have been lower if certain expenses had not been reduced during the applicable periods shown.
EFees and expenses of any underlying mutual funds or exchange-traded funds (ETFs) are not included in the Fund's expense ratio. The Fund indirectly bears its proportionate share of these expenses.
FExpense ratios reflect operating expenses of the class. Expenses before reductions do not reflect amounts reimbursed, waived, or reduced through arrangements with the investment adviser, brokerage services, or other offset arrangements, if applicable, and do not represent the amount paid by the class during periods when reimbursements, waivers or reductions occur.
GAmount represents less than .005%.
HAmount does not include the portfolio activity of any underlying mutual funds or exchange-traded funds (ETFs), derivatives or securities that mature within one year from acquisition.
VIP Freedom 2010 Portfolio℠ Service Class |
| |
| Years ended December 31, | | 2024 | | 2023 | | 2022 | | 2021 | | 2020 |
Selected Per-Share Data | | | | | | | | | | |
| Net asset value, beginning of period | $ | 11.31 | $ | 11.54 | $ | 14.43 | $ | 14.26 | $ | 13.40 |
| Income from Investment Operations | | | | | | | | | | |
Net investment income (loss) A,B | | .36 | | .33 | | .29 | | .25 | | .16 |
| Net realized and unrealized gain (loss) | | .23 | | .68 | | (2.15) | | .56 | | 1.44 |
| Total from investment operations | | .59 | | 1.01 | | (1.86) | | .81 | | 1.60 |
| Distributions from net investment income | | (.41) | | (.44) | | (.26) | | (.14) | | (.16) |
| Distributions from net realized gain | | (.01) | | (.80) | | (.77) | | (.50) | | (.58) |
| Total distributions | | (.42) | | (1.24) | | (1.03) | | (.64) | | (.74) |
| Net asset value, end of period | $ | 11.48 | $ | 11.31 | $ | 11.54 | $ | 14.43 | $ | 14.26 |
Total Return C,D | | | | 9.28% | | (13.57)% | | 5.79% | | 12.39% |
Ratios to Average Net Assets B,E,F | | | | | | | | | | |
| Expenses before reductions | | .10% | | .10% | | .10% | | .10% | | .10% |
| Expenses net of fee waivers, if any | | | | .10% | | .10% | | .10% | | .10% |
| Expenses net of all reductions | | .10% | | .10% | | .10% | | .10% | | .10% |
| Net investment income (loss) | | 3.11% | | 3.00% | | 2.37% | | 1.72% | | 1.24% |
| Supplemental Data | | | | | | | | | | |
| Net assets, end of period (000 omitted) | $ | 16,163 | $ | 19,596 | $ | 21,518 | $ | 27,360 | $ | 26,484 |
Portfolio turnover rate G | | | | 21% | | 231% | | 29% | | 40% |
ACalculated based on average shares outstanding during the period.
BNet investment income (loss) is affected by the timing of the declaration of dividends by any underlying mutual funds or exchange-traded funds (ETFs). Net investment income (loss) of any mutual funds or ETFs is not included in the Fund's net investment income (loss) ratio.
CTotal returns do not reflect charges attributable to your insurance company's separate account. Inclusion of these charges would reduce the total returns shown.
DTotal returns would have been lower if certain expenses had not been reduced during the applicable periods shown.
EFees and expenses of any underlying mutual funds or exchange-traded funds (ETFs) are not included in the Fund's expense ratio. The Fund indirectly bears its proportionate share of these expenses.
FExpense ratios reflect operating expenses of the class. Expenses before reductions do not reflect amounts reimbursed, waived, or reduced through arrangements with the investment adviser, brokerage services, or other offset arrangements, if applicable, and do not represent the amount paid by the class during periods when reimbursements, waivers or reductions occur.
GAmount does not include the portfolio activity of any underlying mutual funds or exchange-traded funds (ETFs), derivatives or securities that mature within one year from acquisition.
VIP Freedom 2010 Portfolio℠ Service Class 2 |
| |
| Years ended December 31, | | 2024 | | 2023 | | 2022 | | 2021 | | 2020 |
Selected Per-Share Data | | | | | | | | | | |
| Net asset value, beginning of period | $ | 11.23 | $ | 11.46 | $ | 14.33 | $ | 14.17 | $ | 13.32 |
| Income from Investment Operations | | | | | | | | | | |
Net investment income (loss) A,B | | .34 | | .31 | | .27 | | .22 | | .14 |
| Net realized and unrealized gain (loss) | | .23 | | .69 | | (2.13) | | .56 | | 1.43 |
| Total from investment operations | | .57 | | 1.00 | | (1.86) | | .78 | | 1.57 |
| Distributions from net investment income | | (.40) | | (.43) | | (.24) | | (.12) | | (.14) |
| Distributions from net realized gain | | (.01) | | (.80) | | (.77) | | (.50) | | (.58) |
| Total distributions | | (.41) | | (1.23) | | (1.01) | | (.62) | | (.72) |
| Net asset value, end of period | $ | 11.39 | $ | 11.23 | $ | 11.46 | $ | 14.33 | $ | 14.17 |
Total Return C,D | | | | 9.18% | | (13.66)% | | 5.60% | | 12.24% |
Ratios to Average Net Assets B,E,F | | | | | | | | | | |
| Expenses before reductions | | .25% | | .25% | | .25% | | .25% | | .25% |
| Expenses net of fee waivers, if any | | | | .25% | | .25% | | .25% | | .25% |
| Expenses net of all reductions | | .25% | | .25% | | .25% | | .25% | | .25% |
| Net investment income (loss) | | 2.96% | | 2.85% | | 2.22% | | 1.57% | | 1.09% |
| Supplemental Data | | | | | | | | | | |
| Net assets, end of period (000 omitted) | $ | 217,795 | $ | 235,579 | $ | 251,283 | $ | 327,526 | $ | 317,773 |
Portfolio turnover rate G | | | | 21% | | 231% | | 29% | | 40% |
ACalculated based on average shares outstanding during the period.
BNet investment income (loss) is affected by the timing of the declaration of dividends by any underlying mutual funds or exchange-traded funds (ETFs). Net investment income (loss) of any mutual funds or ETFs is not included in the Fund's net investment income (loss) ratio.
CTotal returns do not reflect charges attributable to your insurance company's separate account. Inclusion of these charges would reduce the total returns shown.
DTotal returns would have been lower if certain expenses had not been reduced during the applicable periods shown.
EFees and expenses of any underlying mutual funds or exchange-traded funds (ETFs) are not included in the Fund's expense ratio. The Fund indirectly bears its proportionate share of these expenses.
FExpense ratios reflect operating expenses of the class. Expenses before reductions do not reflect amounts reimbursed, waived, or reduced through arrangements with the investment adviser, brokerage services, or other offset arrangements, if applicable, and do not represent the amount paid by the class during periods when reimbursements, waivers or reductions occur.
GAmount does not include the portfolio activity of any underlying mutual funds or exchange-traded funds (ETFs), derivatives or securities that mature within one year from acquisition.
VIP Freedom 2015 Portfolio℠
Schedule of Investments December 31, 2024
Showing Percentage of Net Assets
| Bond Funds - 56.3% |
| | | Shares | Value ($) |
| Fidelity Inflation-Protected Bond Index Fund (a) | | 919,710 | 8,176,222 |
| Fidelity International Bond Index Fund (a) | | 228,643 | 2,126,381 |
| Fidelity Long-Term Treasury Bond Index Fund (a) | | 195,467 | 1,792,433 |
| VIP High Income Portfolio - Initial Class (a) | | 149,503 | 705,653 |
| VIP Investment Grade Bond II Portfolio - Initial Class (a) | | 2,165,536 | 19,944,584 |
| TOTAL BOND FUNDS (Cost $35,062,510) | | | 32,745,273 |
| | | | |
| Domestic Equity Funds - 18.8% |
| | | Shares | Value ($) |
| VIP Contrafund Portfolio - Initial Class (a) | | 33,146 | 1,920,459 |
| VIP Equity-Income Portfolio - Initial Class (a) | | 58,928 | 1,566,884 |
| VIP Growth & Income Portfolio - Initial Class (a) | | 70,348 | 2,149,133 |
| VIP Growth Portfolio - Initial Class (a) | | 32,833 | 3,182,794 |
| VIP Mid Cap Portfolio - Initial Class (a) | | 13,134 | 493,313 |
| VIP Value Portfolio - Initial Class (a) | | 57,950 | 1,101,042 |
| VIP Value Strategies Portfolio - Initial Class (a) | | 35,261 | 546,899 |
| TOTAL DOMESTIC EQUITY FUNDS (Cost $4,174,564) | | | 10,960,524 |
| | | | |
| International Equity Funds - 19.1% |
| | | Shares | Value ($) |
| VIP Emerging Markets Portfolio - Initial Class (a) | | 367,005 | 4,213,215 |
| VIP Overseas Portfolio - Initial Class (a) | | 269,746 | 6,870,432 |
| TOTAL INTERNATIONAL EQUITY FUNDS (Cost $6,434,905) | | | 11,083,647 |
| | | | |
| Money Market Funds - 5.8% |
| | | Yield (%) | Shares | Value ($) |
VIP Government Money Market Portfolio - Initial Class (a)(b) (Cost $3,364,905) | | 4.33 | 3,364,905 | 3,364,905 |
| | | | | |
| TOTAL INVESTMENT IN SECURITIES - 100.0% (Cost $49,036,884) | 58,154,349 |
NET OTHER ASSETS (LIABILITIES) - 0.0% | (5,850) |
| NET ASSETS - 100.0% | 58,148,499 |
| | |
Legend
| (b) | The rate quoted is the annualized seven-day yield of the fund at period end. |
Affiliated Underlying Funds
Fiscal year to date information regarding the Fund's investments in affiliated Underlying Funds is presented below. Exchanges between classes of the same affiliated Underlying Funds may occur. If an Underlying Funds changes its name, the name presented below is the name in effect at period end.
| Affiliate | Value, beginning of period ($) | Purchases ($) | Sales Proceeds ($) | Dividend Income ($) | Realized Gain (loss) ($) | Change in Unrealized appreciation (depreciation) ($) | Value, end of period ($) | Shares, end of period |
| Fidelity Inflation-Protected Bond Index Fund | 9,341,789 | 1,855,511 | 2,879,414 | 306,891 | (125,016) | (16,648) | 8,176,222 | 919,710 |
| Fidelity International Bond Index Fund | 1,915,549 | 940,468 | 735,665 | 65,534 | (28,415) | 34,444 | 2,126,381 | 228,643 |
| Fidelity Long-Term Treasury Bond Index Fund | 2,300,409 | 830,103 | 1,136,492 | 59,778 | (226,841) | 25,254 | 1,792,433 | 195,467 |
| VIP Contrafund Portfolio - Initial Class | 1,791,452 | 775,463 | 968,514 | 226,597 | 254,333 | 67,725 | 1,920,459 | 33,146 |
| VIP Emerging Markets Portfolio - Initial Class | 4,338,412 | 1,666,243 | 2,143,884 | 62,496 | 112,570 | 239,874 | 4,213,215 | 367,005 |
| VIP Equity-Income Portfolio - Initial Class | 1,452,686 | 758,065 | 749,563 | 115,359 | 90,540 | 15,156 | 1,566,884 | 58,928 |
| VIP Government Money Market Portfolio - Initial Class | 4,679,020 | 1,782,723 | 3,096,838 | 167,529 | - | - | 3,364,905 | 3,364,905 |
| VIP Growth & Income Portfolio - Initial Class | 1,996,900 | 859,528 | 962,534 | 167,762 | 171,263 | 83,976 | 2,149,133 | 70,348 |
| VIP Growth Portfolio - Initial Class | 2,966,784 | 1,614,354 | 1,530,747 | 693,729 | 223,434 | (91,031) | 3,182,794 | 32,833 |
| VIP High Income Portfolio - Initial Class | 1,029,515 | 198,228 | 564,570 | 42,751 | 5,472 | 37,008 | 705,653 | 149,503 |
| VIP Investment Grade Bond II Portfolio - Initial Class | 20,864,630 | 6,140,938 | 6,526,436 | 861,872 | (176,342) | (358,206) | 19,944,584 | - |
| VIP Mid Cap Portfolio - Initial Class | 454,667 | 241,268 | 222,078 | 62,178 | 25,665 | (6,209) | 493,313 | 13,134 |
| VIP Overseas Portfolio - Initial Class | 7,655,851 | 2,190,679 | 2,914,640 | 446,951 | 385,001 | (446,459) | 6,870,432 | 269,746 |
| VIP Value Portfolio - Initial Class | 1,013,180 | 578,864 | 494,414 | 119,935 | 45,483 | (42,071) | 1,101,042 | 57,950 |
| VIP Value Strategies Portfolio - Initial Class | 501,376 | 318,588 | 247,355 | 78,962 | 24,125 | (49,835) | 546,899 | 35,261 |
| | 62,302,220 | 20,751,023 | 25,173,144 | 3,478,324 | 781,272 | (507,022) | 58,154,349 | 5,796,579 |
Amounts in the dividend income column in the above table include any capital gain distributions from underlying funds, which are presented in the corresponding line item in the Statement of Operations, if applicable.
Amounts included in the purchases and sales proceeds columns may include in-kind transactions, if applicable.
Investment Valuation
The following is a summary of the inputs used, as of December 31, 2024, involving the Fund's assets and liabilities carried at fair value. The inputs or methodology used for valuing securities may not be an indication of the risk associated with investing in those securities. For more information on valuation inputs, and their aggregation into the levels used below, please refer to the Investment Valuation section in the accompanying Notes to Financial Statements.
| Valuation Inputs at Reporting Date: |
| Description | Total ($) | Level 1 ($) | Level 2 ($) | Level 3 ($) |
Investments in Securities: | | | | |
|
| Bond Funds | 32,745,273 | 32,745,273 | - | - |
|
| Domestic Equity Funds | 10,960,524 | 10,960,524 | - | - |
|
| International Equity Funds | 11,083,647 | 11,083,647 | - | - |
|
| Money Market Funds | 3,364,905 | 3,364,905 | - | - |
| Total Investments in Securities: | 58,154,349 | 58,154,349 | - | - |
VIP Freedom 2015 Portfolio℠
Financial Statements
| Statement of Assets and Liabilities |
As of December 31, 2024 |
| Assets | | | | |
| Investment in securities, at value - See accompanying schedule: | | | | |
Affiliated issuers (cost $49,036,884) | $ | 58,154,349 | | |
| | | | | |
| | | | | |
| Total Investment in Securities (cost $49,036,884) | | | $ | 58,154,349 |
| Receivable for investments sold | | | | 215,757 |
| Receivable for fund shares sold | | | | 17,600 |
Total assets | | | | 58,387,706 |
| Liabilities | | | | |
| Payable to custodian bank | $ | 31 | | |
| Payable for investments purchased | | 192,631 | | |
| Payable for fund shares redeemed | | 40,687 | | |
| Distribution and service plan fees payable | | 5,858 | | |
| Total liabilities | | | | 239,207 |
| Net Assets | | | $ | 58,148,499 |
| Net Assets consist of: | | | | |
| Paid in capital | | | $ | 47,016,460 |
| Total accumulated earnings (loss) | | | | 11,132,039 |
| Net Assets | | | $ | 58,148,499 |
| | | | | |
| Net Asset Value and Maximum Offering Price | | | | |
| Initial Class : | | | | |
Net Asset Value, offering price and redemption price per share ($23,392,345 ÷ 2,038,030 shares) | | | $ | 11.48 |
| Service Class : | | | | |
Net Asset Value, offering price and redemption price per share ($12,187,387 ÷ 1,064,858 shares) | | | $ | 11.45 |
| Service Class 2 : | | | | |
Net Asset Value, offering price and redemption price per share ($22,568,767 ÷ 1,980,762 shares) | | | $ | 11.39 |
| Statement of Operations |
| Year ended December 31, 2024 |
| Investment Income | | | | |
| Dividends: | | | | |
| Affiliated issuers | | | $ | 1,768,277 |
| Expenses | | | | |
| Distribution and service plan fees | $ | 70,249 | | |
| Independent trustees' fees and expenses | | 156 | | |
| Total expenses before reductions | | 70,405 | | |
| Expense reductions | | (10) | | |
| Total expenses after reductions | | | | 70,395 |
| Net Investment income (loss) | | | | 1,697,882 |
| Realized and Unrealized Gain (Loss) | | | | |
| Net realized gain (loss) on: | | | | |
| Investment Securities: | | | | |
| Affiliated issuers | | 781,272 | | |
| Capital gain distributions from underlying funds: | | | | |
| Affiliated issuers | | 1,710,047 | | |
| Total net realized gain (loss) | | | | 2,491,319 |
| Change in net unrealized appreciation (depreciation) on: | | | | |
| Investment Securities: | | | | |
| Affiliated issuers | | (507,022) | | |
| Total change in net unrealized appreciation (depreciation) | | | | (507,022) |
| Net gain (loss) | | | | 1,984,297 |
| Net increase (decrease) in net assets resulting from operations | | | $ | 3,682,179 |
| Statement of Changes in Net Assets |
| |
| | Year ended December 31, 2024 | | Year ended December 31, 2023 |
| Increase (Decrease) in Net Assets | | | | |
| Operations | | | | |
| Net investment income (loss) | $ | 1,697,882 | $ | 1,707,988 |
| Net realized gain (loss) | | 2,491,319 | | 1,664,907 |
| Change in net unrealized appreciation (depreciation) | | (507,022) | | 2,980,827 |
| Net increase (decrease) in net assets resulting from operations | | 3,682,179 | | 6,353,722 |
| Distributions to shareholders | | (3,687,246) | | (3,369,075) |
| | | | | |
| Share transactions - net increase (decrease) | | (4,144,040) | | (3,755,098) |
| Total increase (decrease) in net assets | | (4,149,107) | | (770,451) |
| | | | | |
| Net Assets | | | | |
| Beginning of period | | 62,297,606 | | 63,068,057 |
| End of period | $ | 58,148,499 | $ | 62,297,606 |
| | | | | |
| | | | | |
Financial Highlights
VIP Freedom 2015 Portfolio℠ Initial Class |
| |
| Years ended December 31, | | 2024 | | 2023 | | 2022 | | 2021 | | 2020 |
Selected Per-Share Data | | | | | | | | | | |
| Net asset value, beginning of period | $ | 11.49 | $ | 10.95 | $ | 14.42 | $ | 14.12 | $ | 13.20 |
| Income from Investment Operations | | | | | | | | | | |
Net investment income (loss) A,B | | .35 | | .32 | | .27 | | .25 | | .17 |
| Net realized and unrealized gain (loss) | | .38 | | .85 | | (2.21) | | .81 | | 1.57 |
| Total from investment operations | | .73 | | 1.17 | | (1.94) | | 1.06 | | 1.74 |
| Distributions from net investment income | | (.39) | | (.41) | | (.26) | | (.16) | | (.17) |
| Distributions from net realized gain | | (.35) | | (.22) | | (1.26) | | (.60) | | (.65) |
| Total distributions | | (.74) | | (.63) | | (1.53) C | | (.76) | | (.82) |
| Net asset value, end of period | $ | 11.48 | $ | 11.49 | $ | 10.95 | $ | 14.42 | $ | 14.12 |
Total Return D,E | | | | 10.95% | | (14.60)% | | 7.69% | | 13.76% |
Ratios to Average Net Assets B,F,G | | | | | | | | | | |
Expenses before reductions H | | -% | | -% | | -% | | -% | | -% |
Expenses net of fee waivers, if any H | | | | -% | | -% | | -% | | -% |
Expenses net of all reductions H | | -% | | -% | | -% | | -% | | -% |
| Net investment income (loss) | | 2.96% | | 2.90% | | 2.26% | | 1.75% | | 1.33% |
| Supplemental Data | | | | | | | | | | |
| Net assets, end of period (000 omitted) | $ | 23,392 | $ | 24,978 | $ | 21,474 | $ | 33,325 | $ | 35,010 |
Portfolio turnover rate I | | | | 32% | | 73% | | 43% | | 58% |
ACalculated based on average shares outstanding during the period.
BNet investment income (loss) is affected by the timing of the declaration of dividends by any underlying mutual funds or exchange-traded funds (ETFs). Net investment income (loss) of any mutual funds or ETFs is not included in the Fund's net investment income (loss) ratio.
CTotal distributions per share do not sum due to rounding.
DTotal returns do not reflect charges attributable to your insurance company's separate account. Inclusion of these charges would reduce the total returns shown.
ETotal returns would have been lower if certain expenses had not been reduced during the applicable periods shown.
FFees and expenses of any underlying mutual funds or exchange-traded funds (ETFs) are not included in the Fund's expense ratio. The Fund indirectly bears its proportionate share of these expenses.
GExpense ratios reflect operating expenses of the class. Expenses before reductions do not reflect amounts reimbursed, waived, or reduced through arrangements with the investment adviser, brokerage services, or other offset arrangements, if applicable, and do not represent the amount paid by the class during periods when reimbursements, waivers or reductions occur.
HAmount represents less than .005%.
IAmount does not include the portfolio activity of any underlying mutual funds or exchange-traded funds (ETFs), derivatives or securities that mature within one year from acquisition.
VIP Freedom 2015 Portfolio℠ Service Class |
| |
| Years ended December 31, | | 2024 | | 2023 | | 2022 | | 2021 | | 2020 |
Selected Per-Share Data | | | | | | | | | | |
| Net asset value, beginning of period | $ | 11.46 | $ | 10.92 | $ | 14.38 | $ | 14.08 | $ | 13.17 |
| Income from Investment Operations | | | | | | | | | | |
Net investment income (loss) A,B | | .33 | | .31 | | .25 | | .24 | | .16 |
| Net realized and unrealized gain (loss) | | .39 | | .85 | | (2.20) | | .80 | | 1.56 |
| Total from investment operations | | .72 | | 1.16 | | (1.95) | | 1.04 | | 1.72 |
| Distributions from net investment income | | (.37) | | (.40) | | (.25) | | (.14) | | (.16) |
| Distributions from net realized gain | | (.35) | | (.22) | | (1.26) | | (.60) | | (.65) |
| Total distributions | | (.73) C | | (.62) | | (1.51) | | (.74) | | (.81) |
| Net asset value, end of period | $ | 11.45 | $ | 11.46 | $ | 10.92 | $ | 14.38 | $ | 14.08 |
Total Return D,E | | | | 10.86% | | (14.66)% | | 7.59% | | 13.62% |
Ratios to Average Net Assets B,F,G | | | | | | | | | | |
| Expenses before reductions | | .10% | | .10% | | .10% | | .10% | | .10% |
| Expenses net of fee waivers, if any | | | | .10% | | .10% | | .10% | | .10% |
| Expenses net of all reductions | | .10% | | .10% | | .10% | | .10% | | .10% |
| Net investment income (loss) | | 2.86% | | 2.80% | | 2.16% | | 1.65% | | 1.23% |
| Supplemental Data | | | | | | | | | | |
| Net assets, end of period (000 omitted) | $ | 12,187 | $ | 12,904 | $ | 16,217 | $ | 20,808 | $ | 27,209 |
Portfolio turnover rate H | | | | 32% | | 73% | | 43% | | 58% |
ACalculated based on average shares outstanding during the period.
BNet investment income (loss) is affected by the timing of the declaration of dividends by any underlying mutual funds or exchange-traded funds (ETFs). Net investment income (loss) of any mutual funds or ETFs is not included in the Fund's net investment income (loss) ratio.
CTotal distributions per share do not sum due to rounding.
DTotal returns do not reflect charges attributable to your insurance company's separate account. Inclusion of these charges would reduce the total returns shown.
ETotal returns would have been lower if certain expenses had not been reduced during the applicable periods shown.
FFees and expenses of any underlying mutual funds or exchange-traded funds (ETFs) are not included in the Fund's expense ratio. The Fund indirectly bears its proportionate share of these expenses.
GExpense ratios reflect operating expenses of the class. Expenses before reductions do not reflect amounts reimbursed, waived, or reduced through arrangements with the investment adviser, brokerage services, or other offset arrangements, if applicable, and do not represent the amount paid by the class during periods when reimbursements, waivers or reductions occur.
HAmount does not include the portfolio activity of any underlying mutual funds or exchange-traded funds (ETFs), derivatives or securities that mature within one year from acquisition.
VIP Freedom 2015 Portfolio℠ Service Class 2 |
| |
| Years ended December 31, | | 2024 | | 2023 | | 2022 | | 2021 | | 2020 |
Selected Per-Share Data | | | | | | | | | | |
| Net asset value, beginning of period | $ | 11.41 | $ | 10.88 | $ | 14.33 | $ | 14.04 | $ | 13.12 |
| Income from Investment Operations | | | | | | | | | | |
Net investment income (loss) A,B | | .31 | | .29 | | .23 | | .21 | | .14 |
| Net realized and unrealized gain (loss) | | .38 | | .84 | | (2.19) | | .80 | | 1.57 |
| Total from investment operations | | .69 | | 1.13 | | (1.96) | | 1.01 | | 1.71 |
| Distributions from net investment income | | (.36) | | (.38) | | (.23) | | (.12) | | (.14) |
| Distributions from net realized gain | | (.35) | | (.22) | | (1.26) | | (.60) | | (.65) |
| Total distributions | | (.71) | | (.60) | | (1.49) | | (.72) | | (.79) |
| Net asset value, end of period | $ | 11.39 | $ | 11.41 | $ | 10.88 | $ | 14.33 | $ | 14.04 |
Total Return C,D | | | | 10.64% | | (14.79)% | | 7.39% | | 13.56% |
Ratios to Average Net Assets B,E,F | | | | | | | | | | |
| Expenses before reductions | | .25% | | .25% | | .25% | | .25% | | .25% |
| Expenses net of fee waivers, if any | | | | .25% | | .25% | | .25% | | .25% |
| Expenses net of all reductions | | .25% | | .25% | | .25% | | .25% | | .25% |
| Net investment income (loss) | | 2.71% | | 2.65% | | 2.01% | | 1.50% | | 1.08% |
| Supplemental Data | | | | | | | | | | |
| Net assets, end of period (000 omitted) | $ | 22,569 | $ | 24,415 | $ | 25,377 | $ | 37,143 | $ | 36,840 |
Portfolio turnover rate G | | | | 32% | | 73% | | 43% | | 58% |
ACalculated based on average shares outstanding during the period.
BNet investment income (loss) is affected by the timing of the declaration of dividends by any underlying mutual funds or exchange-traded funds (ETFs). Net investment income (loss) of any mutual funds or ETFs is not included in the Fund's net investment income (loss) ratio.
CTotal returns do not reflect charges attributable to your insurance company's separate account. Inclusion of these charges would reduce the total returns shown.
DTotal returns would have been lower if certain expenses had not been reduced during the applicable periods shown.
EFees and expenses of any underlying mutual funds or exchange-traded funds (ETFs) are not included in the Fund's expense ratio. The Fund indirectly bears its proportionate share of these expenses.
FExpense ratios reflect operating expenses of the class. Expenses before reductions do not reflect amounts reimbursed, waived, or reduced through arrangements with the investment adviser, brokerage services, or other offset arrangements, if applicable, and do not represent the amount paid by the class during periods when reimbursements, waivers or reductions occur.
GAmount does not include the portfolio activity of any underlying mutual funds or exchange-traded funds (ETFs), derivatives or securities that mature within one year from acquisition.
VIP Freedom 2020 Portfolio℠
Schedule of Investments December 31, 2024
Showing Percentage of Net Assets
| Bond Funds - 52.2% |
| | | Shares | Value ($) |
| Fidelity Inflation-Protected Bond Index Fund (a) | | 8,006,036 | 71,173,664 |
| Fidelity International Bond Index Fund (a) | | 2,291,509 | 21,311,031 |
| Fidelity Long-Term Treasury Bond Index Fund (a) | | 2,028,337 | 18,599,851 |
| VIP High Income Portfolio - Initial Class (a) | | 1,381,044 | 6,518,530 |
| VIP Investment Grade Bond II Portfolio - Initial Class (a) | | 17,642,805 | 162,490,234 |
| TOTAL BOND FUNDS (Cost $301,206,744) | | | 280,093,310 |
| | | | |
| Domestic Equity Funds - 24.4% |
| | | Shares | Value ($) |
| VIP Contrafund Portfolio - Initial Class (a) | | 395,699 | 22,926,822 |
| VIP Equity-Income Portfolio - Initial Class (a) | | 703,502 | 18,706,116 |
| VIP Growth & Income Portfolio - Initial Class (a) | | 839,838 | 25,657,037 |
| VIP Growth Portfolio - Initial Class (a) | | 391,961 | 37,996,681 |
| VIP Mid Cap Portfolio - Initial Class (a) | | 156,797 | 5,889,310 |
| VIP Value Portfolio - Initial Class (a) | | 691,826 | 13,144,687 |
| VIP Value Strategies Portfolio - Initial Class (a) | | 420,964 | 6,529,148 |
| TOTAL DOMESTIC EQUITY FUNDS (Cost $57,336,119) | | | 130,849,801 |
| | | | |
| International Equity Funds - 22.7% |
| | | Shares | Value ($) |
| VIP Emerging Markets Portfolio - Initial Class (a) | | 3,895,944 | 44,725,435 |
| VIP Overseas Portfolio - Initial Class (a) | | 3,037,788 | 77,372,468 |
| TOTAL INTERNATIONAL EQUITY FUNDS (Cost $76,956,586) | | | 122,097,903 |
| | | | |
| Money Market Funds - 0.7% |
| | | Yield (%) | Shares | Value ($) |
VIP Government Money Market Portfolio - Initial Class (a)(b) (Cost $3,991,714) | | 4.33 | 3,991,714 | 3,991,713 |
| | | | | |
| TOTAL INVESTMENT IN SECURITIES - 100.0% (Cost $439,491,163) | 537,032,727 |
NET OTHER ASSETS (LIABILITIES) - 0.0% | (81,305) |
| NET ASSETS - 100.0% | 536,951,422 |
| | |
Legend
| (b) | The rate quoted is the annualized seven-day yield of the fund at period end. |
Affiliated Central Funds
Fiscal year to date information regarding the Fund's investments in Fidelity Central Funds, including the ownership percentage, is presented below.
| Affiliate | Value, beginning of period ($) | Purchases ($) | Sales Proceeds ($) | Dividend Income ($) | Realized Gain (loss) ($) | Change in Unrealized appreciation (depreciation) ($) | Value, end of period ($) | Shares, end of period | % ownership, end of period |
| Fidelity Cash Central Fund | - | 493,474 | 493,474 | 73 | - | - | - | - | 0.0% |
| Total | - | 493,474 | 493,474 | 73 | - | - | - | - | |
| | | | | | | | | | |
Amounts in the dividend income column in the above table include any capital gain distributions from underlying funds, which are presented in the corresponding line item in the Statement of Operations, if applicable.
Amounts included in the purchases and sales proceeds columns may include in-kind transactions, if applicable.
Affiliated Underlying Funds
Fiscal year to date information regarding the Fund's investments in affiliated Underlying Funds is presented below. Exchanges between classes of the same affiliated Underlying Funds may occur. If an Underlying Funds changes its name, the name presented below is the name in effect at period end.
| Affiliate | Value, beginning of period ($) | Purchases ($) | Sales Proceeds ($) | Dividend Income ($) | Realized Gain (loss) ($) | Change in Unrealized appreciation (depreciation) ($) | Value, end of period ($) | Shares, end of period |
| Fidelity Inflation-Protected Bond Index Fund | 80,294,782 | 13,297,398 | 21,291,257 | 2,701,501 | (886,080) | (241,179) | 71,173,664 | 8,006,036 |
| Fidelity International Bond Index Fund | 19,369,102 | 8,398,379 | 6,554,796 | 668,525 | 4,059 | 94,287 | 21,311,031 | 2,291,509 |
| Fidelity Long-Term Treasury Bond Index Fund | 21,724,310 | 10,236,109 | 11,443,550 | 644,086 | (1,028,893) | (888,125) | 18,599,851 | 2,028,337 |
| VIP Contrafund Portfolio - Initial Class | 22,203,724 | 7,614,195 | 10,945,875 | 2,682,500 | 3,033,719 | 1,021,059 | 22,926,822 | 395,699 |
| VIP Emerging Markets Portfolio - Initial Class | 46,179,241 | 14,604,051 | 19,813,232 | 657,884 | 814,945 | 2,940,430 | 44,725,435 | 3,895,944 |
| VIP Equity-Income Portfolio - Initial Class | 18,004,849 | 7,505,369 | 8,184,291 | 1,369,247 | 796,684 | 583,505 | 18,706,116 | 703,502 |
| VIP Government Money Market Portfolio - Initial Class | 11,551,535 | 6,847,000 | 14,406,822 | 167,044 | - | - | 3,991,713 | 3,991,714 |
| VIP Growth & Income Portfolio - Initial Class | 24,749,954 | 8,265,927 | 10,577,531 | 1,990,210 | 2,327,686 | 891,001 | 25,657,037 | 839,838 |
| VIP Growth Portfolio - Initial Class | 36,771,285 | 16,346,397 | 17,049,307 | 8,218,512 | 2,025,342 | (97,036) | 37,996,681 | 391,961 |
| VIP High Income Portfolio - Initial Class | 9,542,272 | 1,488,141 | 4,931,488 | 391,599 | 107,000 | 312,605 | 6,518,530 | 1,381,044 |
| VIP Investment Grade Bond II Portfolio - Initial Class | 176,191,286 | 38,867,137 | 48,630,694 | 6,965,290 | (1,009,232) | (2,928,263) | 162,490,234 | 17,642,805 |
| VIP Mid Cap Portfolio - Initial Class | 5,635,427 | 2,444,980 | 2,459,146 | 739,261 | 351,157 | (83,108) | 5,889,310 | 156,797 |
| VIP Overseas Portfolio - Initial Class | 86,285,319 | 19,803,955 | 28,153,259 | 4,994,225 | 4,153,841 | (4,717,388) | 77,372,468 | 3,037,788 |
| VIP Value Portfolio - Initial Class | 12,557,849 | 5,926,648 | 5,433,393 | 1,428,925 | 759,670 | (666,087) | 13,144,687 | 691,826 |
| VIP Value Strategies Portfolio - Initial Class | 6,214,377 | 3,336,786 | 2,743,625 | 937,050 | 377,951 | (656,341) | 6,529,148 | 420,964 |
| | 577,275,312 | 164,982,472 | 212,618,266 | 34,555,859 | 11,827,849 | (4,434,640) | 537,032,727 | 45,875,764 |
Amounts in the dividend income column in the above table include any capital gain distributions from underlying funds, which are presented in the corresponding line item in the Statement of Operations, if applicable.
Amounts included in the purchases and sales proceeds columns may include in-kind transactions, if applicable.
Investment Valuation
The following is a summary of the inputs used, as of December 31, 2024, involving the Fund's assets and liabilities carried at fair value. The inputs or methodology used for valuing securities may not be an indication of the risk associated with investing in those securities. For more information on valuation inputs, and their aggregation into the levels used below, please refer to the Investment Valuation section in the accompanying Notes to Financial Statements.
| Valuation Inputs at Reporting Date: |
| Description | Total ($) | Level 1 ($) | Level 2 ($) | Level 3 ($) |
Investments in Securities: | | | | |
|
| Bond Funds | 280,093,310 | 280,093,310 | - | - |
|
| Domestic Equity Funds | 130,849,801 | 130,849,801 | - | - |
|
| International Equity Funds | 122,097,903 | 122,097,903 | - | - |
|
| Money Market Funds | 3,991,713 | 3,991,713 | - | - |
| Total Investments in Securities: | 537,032,727 | 537,032,727 | - | - |
VIP Freedom 2020 Portfolio℠
Financial Statements
| Statement of Assets and Liabilities |
As of December 31, 2024 |
| Assets | | | | |
| Investment in securities, at value - See accompanying schedule: | | | | |
Affiliated issuers (cost $439,491,163) | $ | 537,032,727 | | |
| | | | | |
| | | | | |
| Total Investment in Securities (cost $439,491,163) | | | $ | 537,032,727 |
| Receivable for investments sold | | | | 3,111,583 |
| Receivable for fund shares sold | | | | 42,894 |
Total assets | | | | 540,187,204 |
| Liabilities | | | | |
| Payable to custodian bank | $ | 68 | | |
| Payable for investments purchased | | 2,210,718 | | |
| Payable for fund shares redeemed | | 943,695 | | |
| Distribution and service plan fees payable | | 81,301 | | |
| Total liabilities | | | | 3,235,782 |
| Net Assets | | | $ | 536,951,422 |
| Net Assets consist of: | | | | |
| Paid in capital | | | $ | 414,207,402 |
| Total accumulated earnings (loss) | | | | 122,744,020 |
| Net Assets | | | $ | 536,951,422 |
| | | | | |
| Net Asset Value and Maximum Offering Price | | | | |
| Initial Class : | | | | |
Net Asset Value, offering price and redemption price per share ($80,739,755 ÷ 6,359,042 shares) | | | $ | 12.70 |
| Service Class : | | | | |
Net Asset Value, offering price and redemption price per share ($124,110,861 ÷ 9,818,647 shares) | | | $ | 12.64 |
| Service Class 2 : | | | | |
Net Asset Value, offering price and redemption price per share ($332,100,806 ÷ 26,388,053 shares) | | | $ | 12.59 |
| Statement of Operations |
| Year ended December 31, 2024 |
| Investment Income | | | | |
| Dividends: | | | | |
| Affiliated issuers | | | $ | 14,502,958 |
| Income from Fidelity Central Funds | | | | 73 |
| Total income | | | | 14,503,031 |
| Expenses | | | | |
| Distribution and service plan fees | $ | 1,011,644 | | |
| Independent trustees' fees and expenses | | 1,466 | | |
| Total expenses before reductions | | 1,013,110 | | |
| Expense reductions | | (4) | | |
| Total expenses after reductions | | | | 1,013,106 |
| Net Investment income (loss) | | | | 13,489,925 |
| Realized and Unrealized Gain (Loss) | | | | |
| Net realized gain (loss) on: | | | | |
| Investment Securities: | | | | |
| Affiliated issuers | | 11,827,849 | | |
| Capital gain distributions from underlying funds: | | | | |
| Affiliated issuers | | 20,052,901 | | |
| Total net realized gain (loss) | | | | 31,880,750 |
| Change in net unrealized appreciation (depreciation) on: | | | | |
| Investment Securities: | | | | |
| Affiliated issuers | | (4,434,640) | | |
| Total change in net unrealized appreciation (depreciation) | | | | (4,434,640) |
| Net gain (loss) | | | | 27,446,110 |
| Net increase (decrease) in net assets resulting from operations | | | $ | 40,936,035 |
| Statement of Changes in Net Assets |
| |
| | Year ended December 31, 2024 | | Year ended December 31, 2023 |
| Increase (Decrease) in Net Assets | | | | |
| Operations | | | | |
| Net investment income (loss) | $ | 13,489,925 | $ | 13,510,865 |
| Net realized gain (loss) | | 31,880,750 | | 16,128,265 |
| Change in net unrealized appreciation (depreciation) | | (4,434,640) | | 35,813,659 |
| Net increase (decrease) in net assets resulting from operations | | 40,936,035 | | 65,452,789 |
| Distributions to shareholders | | (30,855,896) | | (21,127,196) |
| | | | | |
| Share transactions - net increase (decrease) | | (50,321,719) | | (32,060,845) |
| Total increase (decrease) in net assets | | (40,241,580) | | 12,264,748 |
| | | | | |
| Net Assets | | | | |
| Beginning of period | | 577,193,002 | | 564,928,254 |
| End of period | $ | 536,951,422 | $ | 577,193,002 |
| | | | | |
| | | | | |
Financial Highlights
VIP Freedom 2020 Portfolio℠ Initial Class |
| |
| Years ended December 31, | | 2024 | | 2023 | | 2022 | | 2021 | | 2020 |
Selected Per-Share Data | | | | | | | | | | |
| Net asset value, beginning of period | $ | 12.50 | $ | 11.56 | $ | 15.42 | $ | 15.03 | $ | 14.01 |
| Income from Investment Operations | | | | | | | | | | |
Net investment income (loss) A,B | | .33 | | .31 | | .28 | | .27 | | .17 |
| Net realized and unrealized gain (loss) | | .61 | | 1.10 | | (2.51) | | 1.11 | | 1.84 |
| Total from investment operations | | .94 | | 1.41 | | (2.23) | | 1.38 | | 2.01 |
| Distributions from net investment income | | (.38) | | (.39) | | (.27) | | (.17) | | (.18) |
| Distributions from net realized gain | | (.36) | | (.08) | | (1.36) | | (.81) | | (.80) |
| Total distributions | | (.74) | | (.47) | | (1.63) | | (.99) C | | (.99) C |
| Net asset value, end of period | $ | 12.70 | $ | 12.50 | $ | 11.56 | $ | 15.42 | $ | 15.03 |
Total Return D,E | | | | 12.40% | | (15.69)% | | 9.47% | | 15.06% |
Ratios to Average Net Assets B,F,G | | | | | | | | | | |
Expenses before reductions H | | -% | | -% | | -% | | -% | | -% |
Expenses net of fee waivers, if any H | | | | -% | | -% | | -% | | -% |
Expenses net of all reductions H | | -% | | -% | | -% | | -% | | -% |
| Net investment income (loss) | | 2.57% | | 2.60% | | 2.26% | | 1.77% | | 1.27% |
| Supplemental Data | | | | | | | | | | |
| Net assets, end of period (000 omitted) | $ | 80,740 | $ | 85,393 | $ | 63,227 | $ | 82,875 | $ | 80,503 |
Portfolio turnover rate I | | | | 27% | | 121% | | 34% | | 40% |
ACalculated based on average shares outstanding during the period.
BNet investment income (loss) is affected by the timing of the declaration of dividends by any underlying mutual funds or exchange-traded funds (ETFs). Net investment income (loss) of any mutual funds or ETFs is not included in the Fund's net investment income (loss) ratio.
CTotal distributions per share do not sum due to rounding.
DTotal returns do not reflect charges attributable to your insurance company's separate account. Inclusion of these charges would reduce the total returns shown.
ETotal returns would have been lower if certain expenses had not been reduced during the applicable periods shown.
FFees and expenses of any underlying mutual funds or exchange-traded funds (ETFs) are not included in the Fund's expense ratio. The Fund indirectly bears its proportionate share of these expenses.
GExpense ratios reflect operating expenses of the class. Expenses before reductions do not reflect amounts reimbursed, waived, or reduced through arrangements with the investment adviser, brokerage services, or other offset arrangements, if applicable, and do not represent the amount paid by the class during periods when reimbursements, waivers or reductions occur.
HAmount represents less than .005%.
IAmount does not include the portfolio activity of any underlying mutual funds or exchange-traded funds (ETFs), derivatives or securities that mature within one year from acquisition.
VIP Freedom 2020 Portfolio℠ Service Class |
| |
| Years ended December 31, | | 2024 | | 2023 | | 2022 | | 2021 | | 2020 |
Selected Per-Share Data | | | | | | | | | | |
| Net asset value, beginning of period | $ | 12.45 | $ | 11.51 | $ | 15.37 | $ | 14.97 | $ | 13.96 |
| Income from Investment Operations | | | | | | | | | | |
Net investment income (loss) A,B | | .32 | | .30 | | .27 | | .25 | | .16 |
| Net realized and unrealized gain (loss) | | .60 | | 1.10 | | (2.52) | | 1.12 | | 1.82 |
| Total from investment operations | | .92 | | 1.40 | | (2.25) | | 1.37 | | 1.98 |
| Distributions from net investment income | | (.36) | | (.38) | | (.26) | | (.16) | | (.17) |
| Distributions from net realized gain | | (.36) | | (.08) | | (1.36) | | (.81) | | (.80) |
| Total distributions | | (.73) C | | (.46) | | (1.61) C | | (.97) | | (.97) |
| Net asset value, end of period | $ | 12.64 | $ | 12.45 | $ | 11.51 | $ | 15.37 | $ | 14.97 |
Total Return D,E | | | | 12.34% | | (15.83)% | | 9.47% | | 14.92% |
Ratios to Average Net Assets B,F,G | | | | | | | | | | |
| Expenses before reductions | | .10% | | .10% | | .10% | | .10% | | .10% |
| Expenses net of fee waivers, if any | | | | .10% | | .10% | | .10% | | .10% |
| Expenses net of all reductions | | .10% | | .10% | | .10% | | .10% | | .10% |
| Net investment income (loss) | | 2.47% | | 2.50% | | 2.16% | | 1.67% | | 1.17% |
| Supplemental Data | | | | | | | | | | |
| Net assets, end of period (000 omitted) | $ | 124,111 | $ | 125,938 | $ | 129,176 | $ | 167,097 | $ | 178,229 |
Portfolio turnover rate H | | | | 27% | | 121% | | 34% | | 40% |
ACalculated based on average shares outstanding during the period.
BNet investment income (loss) is affected by the timing of the declaration of dividends by any underlying mutual funds or exchange-traded funds (ETFs). Net investment income (loss) of any mutual funds or ETFs is not included in the Fund's net investment income (loss) ratio.
CTotal distributions per share do not sum due to rounding.
DTotal returns do not reflect charges attributable to your insurance company's separate account. Inclusion of these charges would reduce the total returns shown.
ETotal returns would have been lower if certain expenses had not been reduced during the applicable periods shown.
FFees and expenses of any underlying mutual funds or exchange-traded funds (ETFs) are not included in the Fund's expense ratio. The Fund indirectly bears its proportionate share of these expenses.
GExpense ratios reflect operating expenses of the class. Expenses before reductions do not reflect amounts reimbursed, waived, or reduced through arrangements with the investment adviser, brokerage services, or other offset arrangements, if applicable, and do not represent the amount paid by the class during periods when reimbursements, waivers or reductions occur.
HAmount does not include the portfolio activity of any underlying mutual funds or exchange-traded funds (ETFs), derivatives or securities that mature within one year from acquisition.
VIP Freedom 2020 Portfolio℠ Service Class 2 |
| |
| Years ended December 31, | | 2024 | | 2023 | | 2022 | | 2021 | | 2020 |
Selected Per-Share Data | | | | | | | | | | |
| Net asset value, beginning of period | $ | 12.40 | $ | 11.46 | $ | 15.31 | $ | 14.92 | $ | 13.92 |
| Income from Investment Operations | | | | | | | | | | |
Net investment income (loss) A,B | | .30 | | .28 | | .25 | | .23 | | .14 |
| Net realized and unrealized gain (loss) | | .59 | | 1.10 | | (2.51) | | 1.11 | | 1.81 |
| Total from investment operations | | .89 | | 1.38 | | (2.26) | | 1.34 | | 1.95 |
| Distributions from net investment income | | (.34) | | (.36) | | (.24) | | (.13) | | (.14) |
| Distributions from net realized gain | | (.36) | | (.08) | | (1.36) | | (.81) | | (.80) |
| Total distributions | | (.70) | | (.44) | | (1.59) C | | (.95) C | | (.95) C |
| Net asset value, end of period | $ | 12.59 | $ | 12.40 | $ | 11.46 | $ | 15.31 | $ | 14.92 |
Total Return D,E | | | | 12.22% | | (15.97)% | | 9.26% | | 14.72% |
Ratios to Average Net Assets B,F,G | | | | | | | | | | |
| Expenses before reductions | | .25% | | .25% | | .25% | | .25% | | .25% |
| Expenses net of fee waivers, if any | | | | .25% | | .25% | | .25% | | .25% |
| Expenses net of all reductions | | .25% | | .25% | | .25% | | .25% | | .25% |
| Net investment income (loss) | | 2.32% | | 2.35% | | 2.01% | | 1.51% | | 1.02% |
| Supplemental Data | | | | | | | | | | |
| Net assets, end of period (000 omitted) | $ | 332,101 | $ | 365,862 | $ | 372,526 | $ | 508,713 | $ | 522,637 |
Portfolio turnover rate H | | | | 27% | | 121% | | 34% | | 40% |
ACalculated based on average shares outstanding during the period.
BNet investment income (loss) is affected by the timing of the declaration of dividends by any underlying mutual funds or exchange-traded funds (ETFs). Net investment income (loss) of any mutual funds or ETFs is not included in the Fund's net investment income (loss) ratio.
CTotal distributions per share do not sum due to rounding.
DTotal returns do not reflect charges attributable to your insurance company's separate account. Inclusion of these charges would reduce the total returns shown.
ETotal returns would have been lower if certain expenses had not been reduced during the applicable periods shown.
FFees and expenses of any underlying mutual funds or exchange-traded funds (ETFs) are not included in the Fund's expense ratio. The Fund indirectly bears its proportionate share of these expenses.
GExpense ratios reflect operating expenses of the class. Expenses before reductions do not reflect amounts reimbursed, waived, or reduced through arrangements with the investment adviser, brokerage services, or other offset arrangements, if applicable, and do not represent the amount paid by the class during periods when reimbursements, waivers or reductions occur.
HAmount does not include the portfolio activity of any underlying mutual funds or exchange-traded funds (ETFs), derivatives or securities that mature within one year from acquisition.
VIP Freedom 2025 Portfolio℠
Schedule of Investments December 31, 2024
Showing Percentage of Net Assets
| Bond Funds - 44.5% |
| | | Shares | Value ($) |
| Fidelity Inflation-Protected Bond Index Fund (a) | | 5,288,486 | 47,014,642 |
| Fidelity International Bond Index Fund (a) | | 1,665,877 | 15,492,655 |
| Fidelity Long-Term Treasury Bond Index Fund (a) | | 2,977,970 | 27,307,986 |
| VIP High Income Portfolio - Initial Class (a) | | 1,006,537 | 4,750,857 |
| VIP Investment Grade Bond II Portfolio - Initial Class (a) | | 8,630,338 | 79,485,409 |
| TOTAL BOND FUNDS (Cost $188,502,719) | | | 174,051,549 |
| | | | |
| Domestic Equity Funds - 29.4% |
| | | Shares | Value ($) |
| VIP Contrafund Portfolio - Initial Class (a) | | 347,723 | 20,147,098 |
| VIP Equity-Income Portfolio - Initial Class (a) | | 618,214 | 16,438,299 |
| VIP Growth & Income Portfolio - Initial Class (a) | | 738,021 | 22,546,540 |
| VIP Growth Portfolio - Initial Class (a) | | 344,437 | 33,389,766 |
| VIP Mid Cap Portfolio - Initial Class (a) | | 137,790 | 5,175,374 |
| VIP Value Portfolio - Initial Class (a) | | 607,956 | 11,551,167 |
| VIP Value Strategies Portfolio - Initial Class (a) | | 369,930 | 5,737,612 |
| TOTAL DOMESTIC EQUITY FUNDS (Cost $72,614,168) | | | 114,985,856 |
| | | | |
| International Equity Funds - 26.1% |
| | | Shares | Value ($) |
| VIP Emerging Markets Portfolio - Initial Class (a) | | 3,163,659 | 36,318,807 |
| VIP Overseas Portfolio - Initial Class (a) | | 2,591,962 | 66,017,272 |
| TOTAL INTERNATIONAL EQUITY FUNDS (Cost $83,891,738) | | | 102,336,079 |
| | | | |
| TOTAL INVESTMENT IN SECURITIES - 100.0% (Cost $345,008,625) | 391,373,484 |
NET OTHER ASSETS (LIABILITIES) - 0.0% | (39,253) |
| NET ASSETS - 100.0% | 391,334,231 |
| | |
Legend
Affiliated Underlying Funds
Fiscal year to date information regarding the Fund's investments in affiliated Underlying Funds is presented below. Exchanges between classes of the same affiliated Underlying Funds may occur. If an Underlying Funds changes its name, the name presented below is the name in effect at period end.
| Affiliate | Value, beginning of period ($) | Purchases ($) | Sales Proceeds ($) | Dividend Income ($) | Realized Gain (loss) ($) | Change in Unrealized appreciation (depreciation) ($) | Value, end of period ($) | Shares, end of period |
| Fidelity Inflation-Protected Bond Index Fund | 45,960,157 | 15,829,524 | 13,993,162 | 1,756,053 | (542,789) | (239,088) | 47,014,642 | 5,288,486 |
| Fidelity International Bond Index Fund | 13,026,169 | 7,751,717 | 5,348,912 | 467,347 | (174,547) | 238,228 | 15,492,655 | 1,665,877 |
| Fidelity Long-Term Treasury Bond Index Fund | 21,236,859 | 18,178,501 | 9,761,318 | 860,995 | (834,372) | (1,511,684) | 27,307,986 | 2,977,970 |
| VIP Contrafund Portfolio - Initial Class | 17,851,037 | 8,028,212 | 8,866,032 | 2,363,189 | 606,176 | 2,527,705 | 20,147,098 | 347,723 |
| VIP Emerging Markets Portfolio - Initial Class | 34,002,026 | 14,873,608 | 15,266,727 | 531,811 | 246,859 | 2,463,041 | 36,318,807 | 3,163,659 |
| VIP Equity-Income Portfolio - Initial Class | 14,475,187 | 7,428,026 | 6,491,331 | 1,202,413 | 122,778 | 903,639 | 16,438,299 | 618,214 |
| VIP Government Money Market Portfolio - Initial Class | - | 1,076,462 | 1,076,462 | 4,357 | - | - | - | - |
| VIP Growth & Income Portfolio - Initial Class | 19,898,021 | 8,614,268 | 8,472,965 | 1,746,477 | 195,321 | 2,311,895 | 22,546,540 | 738,021 |
| VIP Growth Portfolio - Initial Class | 29,563,106 | 16,566,828 | 13,792,863 | 7,213,332 | 608,517 | 444,178 | 33,389,766 | 344,437 |
| VIP High Income Portfolio - Initial Class | 6,341,779 | 1,751,294 | 3,617,686 | 287,935 | (151,197) | 426,667 | 4,750,857 | 1,006,537 |
| VIP Investment Grade Bond II Portfolio - Initial Class | 95,810,293 | 26,969,440 | 41,091,013 | 3,433,702 | (1,084,528) | (1,118,783) | 79,485,409 | 8,630,338 |
| VIP Mid Cap Portfolio - Initial Class | 4,530,824 | 2,506,469 | 2,040,858 | 643,435 | 104,222 | 74,717 | 5,175,374 | 137,790 |
| VIP Overseas Portfolio - Initial Class | 65,800,781 | 23,351,382 | 21,981,089 | 4,253,957 | 149,790 | (1,303,592) | 66,017,272 | 2,591,962 |
| VIP Value Portfolio - Initial Class | 10,096,260 | 5,876,929 | 4,431,995 | 1,238,350 | 146,375 | (136,402) | 11,551,167 | 607,956 |
| VIP Value Strategies Portfolio - Initial Class | 4,996,294 | 3,296,890 | 2,274,772 | 820,047 | 91,629 | (372,429) | 5,737,612 | 369,930 |
| | 383,588,793 | 162,099,550 | 158,507,185 | 26,823,400 | (515,766) | 4,708,092 | 391,373,484 | 28,488,900 |
Amounts in the dividend income column in the above table include any capital gain distributions from underlying funds, which are presented in the corresponding line item in the Statement of Operations, if applicable.
Amounts included in the purchases and sales proceeds columns may include in-kind transactions, if applicable.
Investment Valuation
The following is a summary of the inputs used, as of December 31, 2024, involving the Fund's assets and liabilities carried at fair value. The inputs or methodology used for valuing securities may not be an indication of the risk associated with investing in those securities. For more information on valuation inputs, and their aggregation into the levels used below, please refer to the Investment Valuation section in the accompanying Notes to Financial Statements.
| Valuation Inputs at Reporting Date: |
| Description | Total ($) | Level 1 ($) | Level 2 ($) | Level 3 ($) |
Investments in Securities: | | | | |
|
| Bond Funds | 174,051,549 | 174,051,549 | - | - |
|
| Domestic Equity Funds | 114,985,856 | 114,985,856 | - | - |
|
| International Equity Funds | 102,336,079 | 102,336,079 | - | - |
| Total Investments in Securities: | 391,373,484 | 391,373,484 | - | - |
VIP Freedom 2025 Portfolio℠
Financial Statements
| Statement of Assets and Liabilities |
As of December 31, 2024 |
| Assets | | | | |
| Investment in securities, at value - See accompanying schedule: | | | | |
Affiliated issuers (cost $345,008,625) | $ | 391,373,484 | | |
| | | | | |
| | | | | |
| Total Investment in Securities (cost $345,008,625) | | | $ | 391,373,484 |
| Receivable for investments sold | | | | 2,639,098 |
| Receivable for fund shares sold | | | | 43,078 |
Total assets | | | | 394,055,660 |
| Liabilities | | | | |
| Payable to custodian bank | $ | 37 | | |
| Payable for investments purchased | | 1,519,300 | | |
| Payable for fund shares redeemed | | 1,162,838 | | |
| Distribution and service plan fees payable | | 39,254 | | |
| Total liabilities | | | | 2,721,429 |
| Net Assets | | | $ | 391,334,231 |
| Net Assets consist of: | | | | |
| Paid in capital | | | $ | 333,996,250 |
| Total accumulated earnings (loss) | | | | 57,337,981 |
| Net Assets | | | $ | 391,334,231 |
| | | | | |
| Net Asset Value and Maximum Offering Price | | | | |
| Initial Class : | | | | |
Net Asset Value, offering price and redemption price per share ($94,275,364 ÷ 5,887,082 shares) | | | $ | 16.01 |
| Service Class : | | | | |
Net Asset Value, offering price and redemption price per share ($190,259,498 ÷ 11,925,885 shares) | | | $ | 15.95 |
| Service Class 2 : | | | | |
Net Asset Value, offering price and redemption price per share ($106,799,369 ÷ 6,739,060 shares) | | | $ | 15.85 |
| Statement of Operations |
| Year ended December 31, 2024 |
| Investment Income | | | | |
| Dividends: | | | | |
| Affiliated issuers | | | $ | 9,326,422 |
| Expenses | | | | |
| Distribution and service plan fees | $ | 460,650 | | |
| Independent trustees' fees and expenses | | 1,002 | | |
| Total expenses before reductions | | 461,652 | | |
| Expense reductions | | (169) | | |
| Total expenses after reductions | | | | 461,483 |
| Net Investment income (loss) | | | | 8,864,939 |
| Realized and Unrealized Gain (Loss) | | | | |
| Net realized gain (loss) on: | | | | |
| Investment Securities: | | | | |
| Affiliated issuers | | (515,766) | | |
| Capital gain distributions from underlying funds: | | | | |
| Affiliated issuers | | 17,496,978 | | |
| Total net realized gain (loss) | | | | 16,981,212 |
| Change in net unrealized appreciation (depreciation) on: | | | | |
| Investment Securities: | | | | |
| Affiliated issuers | | 4,708,092 | | |
| Total change in net unrealized appreciation (depreciation) | | | | 4,708,092 |
| Net gain (loss) | | | | 21,689,304 |
| Net increase (decrease) in net assets resulting from operations | | | $ | 30,554,243 |
| Statement of Changes in Net Assets |
| |
| | Year ended December 31, 2024 | | Year ended December 31, 2023 |
| Increase (Decrease) in Net Assets | | | | |
| Operations | | | | |
| Net investment income (loss) | $ | 8,864,939 | $ | 8,168,556 |
| Net realized gain (loss) | | 16,981,212 | | 1,913,349 |
| Change in net unrealized appreciation (depreciation) | | 4,708,092 | | 34,621,437 |
| Net increase (decrease) in net assets resulting from operations | | 30,554,243 | | 44,703,342 |
| Distributions to shareholders | | (10,214,778) | | (9,580,605) |
| | | | | |
| Share transactions - net increase (decrease) | | (12,560,504) | | 24,596,927 |
| Total increase (decrease) in net assets | | 7,778,961 | | 59,719,664 |
| | | | | |
| Net Assets | | | | |
| Beginning of period | | 383,555,270 | | 323,835,606 |
| End of period | $ | 391,334,231 | $ | 383,555,270 |
| | | | | |
| | | | | |
Financial Highlights
VIP Freedom 2025 Portfolio℠ Initial Class |
| |
| Years ended December 31, | | 2024 | | 2023 | | 2022 | | 2021 | | 2020 |
Selected Per-Share Data | | | | | | | | | | |
| Net asset value, beginning of period | $ | 15.17 | $ | 13.73 | $ | 17.82 | $ | 16.84 | $ | 15.34 |
| Income from Investment Operations | | | | | | | | | | |
Net investment income (loss) A,B | | .38 | | .37 | | .32 | | .32 | | .20 |
| Net realized and unrealized gain (loss) | | .90 | | 1.49 | | (3.10) | | 1.47 | | 2.16 |
| Total from investment operations | | 1.28 | | 1.86 | | (2.78) | | 1.79 | | 2.36 |
| Distributions from net investment income | | (.41) | | (.42) | | (.31) | | (.19) | | (.19) |
| Distributions from net realized gain | | (.03) | | - | | (1.00) | | (.62) | | (.67) |
| Total distributions | | (.44) | | (.42) | | (1.31) | | (.81) | | (.86) |
| Net asset value, end of period | $ | 16.01 | $ | 15.17 | $ | 13.73 | $ | 17.82 | $ | 16.84 |
Total Return C,D | | | | 13.62% | | (16.43)% | | 10.83% | | 15.95% |
Ratios to Average Net Assets B,E,F | | | | | | | | | | |
Expenses before reductions G | | -% | | -% | | -% | | -% | | -% |
Expenses net of fee waivers, if any G | | | | -% | | -% | | -% | | -% |
Expenses net of all reductions G | | -% | | -% | | -% | | -% | | -% |
| Net investment income (loss) | | 2.39% | | 2.53% | | 2.19% | | 1.82% | | 1.33% |
| Supplemental Data | | | | | | | | | | |
| Net assets, end of period (000 omitted) | $ | 94,275 | $ | 92,164 | $ | 45,943 | $ | 59,715 | $ | 55,624 |
Portfolio turnover rate H | | | | 34% | | 73% | | 32% | | 61% |
ACalculated based on average shares outstanding during the period.
BNet investment income (loss) is affected by the timing of the declaration of dividends by any underlying mutual funds or exchange-traded funds (ETFs). Net investment income (loss) of any mutual funds or ETFs is not included in the Fund's net investment income (loss) ratio.
CTotal returns do not reflect charges attributable to your insurance company's separate account. Inclusion of these charges would reduce the total returns shown.
DTotal returns would have been lower if certain expenses had not been reduced during the applicable periods shown.
EFees and expenses of any underlying mutual funds or exchange-traded funds (ETFs) are not included in the Fund's expense ratio. The Fund indirectly bears its proportionate share of these expenses.
FExpense ratios reflect operating expenses of the class. Expenses before reductions do not reflect amounts reimbursed, waived, or reduced through arrangements with the investment adviser, brokerage services, or other offset arrangements, if applicable, and do not represent the amount paid by the class during periods when reimbursements, waivers or reductions occur.
GAmount represents less than .005%.
HAmount does not include the portfolio activity of any underlying mutual funds or exchange-traded funds (ETFs), derivatives or securities that mature within one year from acquisition.
VIP Freedom 2025 Portfolio℠ Service Class |
| |
| Years ended December 31, | | 2024 | | 2023 | | 2022 | | 2021 | | 2020 |
Selected Per-Share Data | | | | | | | | | | |
| Net asset value, beginning of period | $ | 15.11 | $ | 13.68 | $ | 17.76 | $ | 16.79 | $ | 15.30 |
| Income from Investment Operations | | | | | | | | | | |
Net investment income (loss) A,B | | .37 | | .35 | | .30 | | .30 | | .18 |
| Net realized and unrealized gain (loss) | | .90 | | 1.48 | | (3.08) | | 1.46 | | 2.15 |
| Total from investment operations | | 1.27 | | 1.83 | | (2.78) | | 1.76 | | 2.33 |
| Distributions from net investment income | | (.39) | | (.40) | | (.29) | | (.17) | | (.18) |
| Distributions from net realized gain | | (.03) | | - | | (1.00) | | (.62) | | (.67) |
| Total distributions | | (.43) C | | (.40) | | (1.30) C | | (.79) | | (.84) C |
| Net asset value, end of period | $ | 15.95 | $ | 15.11 | $ | 13.68 | $ | 17.76 | $ | 16.79 |
Total Return D,E | | | | 13.48% | | (16.51)% | | 10.71% | | 15.83% |
Ratios to Average Net Assets B,F,G | | | | | | | | | | |
| Expenses before reductions | | .10% | | .10% | | .10% | | .10% | | .10% |
| Expenses net of fee waivers, if any | | | | .10% | | .10% | | .10% | | .10% |
| Expenses net of all reductions | | .10% | | .10% | | .10% | | .10% | | .10% |
| Net investment income (loss) | | 2.29% | | 2.43% | | 2.09% | | 1.72% | | 1.23% |
| Supplemental Data | | | | | | | | | | |
| Net assets, end of period (000 omitted) | $ | 190,259 | $ | 183,294 | $ | 174,000 | $ | 199,248 | $ | 147,904 |
Portfolio turnover rate H | | | | 34% | | 73% | | 32% | | 61% |
ACalculated based on average shares outstanding during the period.
BNet investment income (loss) is affected by the timing of the declaration of dividends by any underlying mutual funds or exchange-traded funds (ETFs). Net investment income (loss) of any mutual funds or ETFs is not included in the Fund's net investment income (loss) ratio.
CTotal distributions per share do not sum due to rounding.
DTotal returns do not reflect charges attributable to your insurance company's separate account. Inclusion of these charges would reduce the total returns shown.
ETotal returns would have been lower if certain expenses had not been reduced during the applicable periods shown.
FFees and expenses of any underlying mutual funds or exchange-traded funds (ETFs) are not included in the Fund's expense ratio. The Fund indirectly bears its proportionate share of these expenses.
GExpense ratios reflect operating expenses of the class. Expenses before reductions do not reflect amounts reimbursed, waived, or reduced through arrangements with the investment adviser, brokerage services, or other offset arrangements, if applicable, and do not represent the amount paid by the class during periods when reimbursements, waivers or reductions occur.
HAmount does not include the portfolio activity of any underlying mutual funds or exchange-traded funds (ETFs), derivatives or securities that mature within one year from acquisition.
VIP Freedom 2025 Portfolio℠ Service Class 2 |
| |
| Years ended December 31, | | 2024 | | 2023 | | 2022 | | 2021 | | 2020 |
Selected Per-Share Data | | | | | | | | | | |
| Net asset value, beginning of period | $ | 15.01 | $ | 13.59 | $ | 17.65 | $ | 16.69 | $ | 15.21 |
| Income from Investment Operations | | | | | | | | | | |
Net investment income (loss) A,B | | .34 | | .33 | | .28 | | .27 | | .16 |
| Net realized and unrealized gain (loss) | | .90 | | 1.47 | | (3.07) | | 1.46 | | 2.14 |
| Total from investment operations | | 1.24 | | 1.80 | | (2.79) | | 1.73 | | 2.30 |
| Distributions from net investment income | | (.37) | | (.38) | | (.27) | | (.15) | | (.15) |
| Distributions from net realized gain | | (.03) | | - | | (1.00) | | (.62) | | (.67) |
| Total distributions | | (.40) | | (.38) | | (1.27) | | (.77) | | (.82) |
| Net asset value, end of period | $ | 15.85 | $ | 15.01 | $ | 13.59 | $ | 17.65 | $ | 16.69 |
Total Return C,D | | | | 13.32% | | (16.64)% | | 10.55% | | 15.68% |
Ratios to Average Net Assets B,E,F | | | | | | | | | | |
| Expenses before reductions | | .25% | | .25% | | .25% | | .25% | | .25% |
| Expenses net of fee waivers, if any | | | | .25% | | .25% | | .25% | | .25% |
| Expenses net of all reductions | | .25% | | .25% | | .25% | | .25% | | .25% |
| Net investment income (loss) | | 2.14% | | 2.28% | | 1.94% | | 1.57% | | 1.08% |
| Supplemental Data | | | | | | | | | | |
| Net assets, end of period (000 omitted) | $ | 106,799 | $ | 108,097 | $ | 103,892 | $ | 130,746 | $ | 112,114 |
Portfolio turnover rate G | | | | 34% | | 73% | | 32% | | 61% |
ACalculated based on average shares outstanding during the period.
BNet investment income (loss) is affected by the timing of the declaration of dividends by any underlying mutual funds or exchange-traded funds (ETFs). Net investment income (loss) of any mutual funds or ETFs is not included in the Fund's net investment income (loss) ratio.
CTotal returns do not reflect charges attributable to your insurance company's separate account. Inclusion of these charges would reduce the total returns shown.
DTotal returns would have been lower if certain expenses had not been reduced during the applicable periods shown.
EFees and expenses of any underlying mutual funds or exchange-traded funds (ETFs) are not included in the Fund's expense ratio. The Fund indirectly bears its proportionate share of these expenses.
FExpense ratios reflect operating expenses of the class. Expenses before reductions do not reflect amounts reimbursed, waived, or reduced through arrangements with the investment adviser, brokerage services, or other offset arrangements, if applicable, and do not represent the amount paid by the class during periods when reimbursements, waivers or reductions occur.
GAmount does not include the portfolio activity of any underlying mutual funds or exchange-traded funds (ETFs), derivatives or securities that mature within one year from acquisition.
VIP Freedom 2030 Portfolio℠
Schedule of Investments December 31, 2024
Showing Percentage of Net Assets
| Bond Funds - 37.9% |
| | | Shares | Value ($) |
| Fidelity Inflation-Protected Bond Index Fund (a) | | 7,353,787 | 65,375,169 |
| Fidelity International Bond Index Fund (a) | | 2,909,650 | 27,059,742 |
| Fidelity Long-Term Treasury Bond Index Fund (a) | | 6,332,265 | 58,066,871 |
| VIP High Income Portfolio - Initial Class (a) | | 2,018,674 | 9,528,143 |
| VIP Investment Grade Bond II Portfolio - Initial Class (a) | | 14,939,602 | 137,593,733 |
| TOTAL BOND FUNDS (Cost $321,622,405) | | | 297,623,658 |
| | | | |
| Domestic Equity Funds - 33.3% |
| | | Shares | Value ($) |
| VIP Contrafund Portfolio - Initial Class (a) | | 790,551 | 45,804,499 |
| VIP Equity-Income Portfolio - Initial Class (a) | | 1,405,491 | 37,371,996 |
| VIP Growth & Income Portfolio - Initial Class (a) | | 1,677,878 | 51,259,178 |
| VIP Growth Portfolio - Initial Class (a) | | 783,082 | 75,912,005 |
| VIP Mid Cap Portfolio - Initial Class (a) | | 313,261 | 11,766,086 |
| VIP Value Portfolio - Initial Class (a) | | 1,382,167 | 26,261,181 |
| VIP Value Strategies Portfolio - Initial Class (a) | | 841,023 | 13,044,270 |
| TOTAL DOMESTIC EQUITY FUNDS (Cost $169,379,831) | | | 261,419,215 |
| | | | |
| International Equity Funds - 28.8% |
| | | Shares | Value ($) |
| VIP Emerging Markets Portfolio - Initial Class (a) | | 6,878,812 | 78,968,760 |
| VIP Overseas Portfolio - Initial Class (a) | | 5,765,348 | 146,843,425 |
| TOTAL INTERNATIONAL EQUITY FUNDS (Cost $188,286,747) | | | 225,812,185 |
| | | | |
| TOTAL INVESTMENT IN SECURITIES - 100.0% (Cost $679,288,983) | 784,855,058 |
NET OTHER ASSETS (LIABILITIES) - 0.0% | (79,576) |
| NET ASSETS - 100.0% | 784,775,482 |
| | |
Legend
Affiliated Underlying Funds
Fiscal year to date information regarding the Fund's investments in affiliated Underlying Funds is presented below. Exchanges between classes of the same affiliated Underlying Funds may occur. If an Underlying Funds changes its name, the name presented below is the name in effect at period end.
| Affiliate | Value, beginning of period ($) | Purchases ($) | Sales Proceeds ($) | Dividend Income ($) | Realized Gain (loss) ($) | Change in Unrealized appreciation (depreciation) ($) | Value, end of period ($) | Shares, end of period |
| Fidelity Inflation-Protected Bond Index Fund | 58,286,708 | 21,894,240 | 13,733,466 | 2,414,010 | (444,787) | (627,526) | 65,375,169 | 7,353,787 |
| Fidelity International Bond Index Fund | 20,292,078 | 13,884,647 | 7,199,530 | 780,028 | (123,273) | 205,820 | 27,059,742 | 2,909,650 |
| Fidelity Long-Term Treasury Bond Index Fund | 41,790,891 | 35,789,557 | 14,686,623 | 1,778,975 | (1,321,627) | (3,505,327) | 58,066,871 | 6,332,265 |
| VIP Contrafund Portfolio - Initial Class | 37,570,860 | 16,507,056 | 14,958,995 | 5,304,260 | 811,466 | 5,874,112 | 45,804,499 | 790,551 |
| VIP Emerging Markets Portfolio - Initial Class | 67,536,911 | 29,264,523 | 23,445,617 | 1,139,611 | 503,403 | 5,109,540 | 78,968,760 | 6,878,812 |
| VIP Equity-Income Portfolio - Initial Class | 30,465,655 | 15,401,630 | 10,636,079 | 2,697,773 | 164,534 | 1,976,256 | 37,371,996 | 1,405,491 |
| VIP Government Money Market Portfolio - Initial Class | - | 2,087,556 | 2,087,556 | 8,500 | - | - | - | - |
| VIP Growth & Income Portfolio - Initial Class | 41,879,004 | 17,616,957 | 13,612,993 | 3,914,935 | 148,645 | 5,227,565 | 51,259,178 | 1,677,878 |
| VIP Growth Portfolio - Initial Class | 62,221,215 | 34,705,061 | 22,870,780 | 16,167,946 | 580,123 | 1,276,386 | 75,912,005 | 783,082 |
| VIP High Income Portfolio - Initial Class | 11,622,459 | 3,192,877 | 5,807,776 | 571,315 | (128,451) | 649,034 | 9,528,143 | 2,018,674 |
| VIP Investment Grade Bond II Portfolio - Initial Class | 156,120,087 | 44,470,495 | 59,228,526 | 5,868,163 | (1,431,339) | (2,336,984) | 137,593,733 | 14,939,602 |
| VIP Mid Cap Portfolio - Initial Class | 9,536,049 | 5,214,394 | 3,331,184 | 1,438,657 | 195,127 | 151,700 | 11,766,086 | 313,261 |
| VIP Overseas Portfolio - Initial Class | 133,904,853 | 46,083,169 | 30,009,773 | 9,338,494 | 576,317 | (3,711,141) | 146,843,425 | 5,765,348 |
| VIP Value Portfolio - Initial Class | 21,249,584 | 12,399,823 | 7,336,272 | 2,766,290 | 245,754 | (297,708) | 26,261,181 | 1,382,167 |
| VIP Value Strategies Portfolio - Initial Class | 10,515,711 | 6,916,624 | 3,722,667 | 1,836,921 | 145,947 | (811,345) | 13,044,270 | 841,023 |
| | 702,992,065 | 305,428,609 | 232,667,837 | 56,025,878 | (78,161) | 9,180,382 | 784,855,058 | 53,391,591 |
Amounts in the dividend income column in the above table include any capital gain distributions from underlying funds, which are presented in the corresponding line item in the Statement of Operations, if applicable.
Amounts included in the purchases and sales proceeds columns may include in-kind transactions, if applicable.
Investment Valuation
The following is a summary of the inputs used, as of December 31, 2024, involving the Fund's assets and liabilities carried at fair value. The inputs or methodology used for valuing securities may not be an indication of the risk associated with investing in those securities. For more information on valuation inputs, and their aggregation into the levels used below, please refer to the Investment Valuation section in the accompanying Notes to Financial Statements.
| Valuation Inputs at Reporting Date: |
| Description | Total ($) | Level 1 ($) | Level 2 ($) | Level 3 ($) |
Investments in Securities: | | | | |
|
| Bond Funds | 297,623,658 | 297,623,658 | - | - |
|
| Domestic Equity Funds | 261,419,215 | 261,419,215 | - | - |
|
| International Equity Funds | 225,812,185 | 225,812,185 | - | - |
| Total Investments in Securities: | 784,855,058 | 784,855,058 | - | - |
VIP Freedom 2030 Portfolio℠
Financial Statements
| Statement of Assets and Liabilities |
As of December 31, 2024 |
| Assets | | | | |
| Investment in securities, at value - See accompanying schedule: | | | | |
Affiliated issuers (cost $679,288,983) | $ | 784,855,058 | | |
| | | | | |
| | | | | |
| Total Investment in Securities (cost $679,288,983) | | | $ | 784,855,058 |
| Receivable for investments sold | | | | 4,313,385 |
| Receivable for fund shares sold | | | | 1,204,860 |
Total assets | | | | 790,373,303 |
| Liabilities | | | | |
| Payable to custodian bank | $ | 177 | | |
| Payable for investments purchased | | 4,238,374 | | |
| Payable for fund shares redeemed | | 1,279,698 | | |
| Distribution and service plan fees payable | | 79,572 | | |
| Total liabilities | | | | 5,597,821 |
| Net Assets | | | $ | 784,775,482 |
| Net Assets consist of: | | | | |
| Paid in capital | | | $ | 652,355,686 |
| Total accumulated earnings (loss) | | | | 132,419,796 |
| Net Assets | | | $ | 784,775,482 |
| | | | | |
| Net Asset Value and Maximum Offering Price | | | | |
| Initial Class : | | | | |
Net Asset Value, offering price and redemption price per share ($189,257,692 ÷ 11,544,257 shares) | | | $ | 16.39 |
| Service Class : | | | | |
Net Asset Value, offering price and redemption price per share ($369,233,467 ÷ 22,597,402 shares) | | | $ | 16.34 |
| Service Class 2 : | | | | |
Net Asset Value, offering price and redemption price per share ($226,284,323 ÷ 13,910,161 shares) | | | $ | 16.27 |
| Statement of Operations |
| Year ended December 31, 2024 |
| Investment Income | | | | |
| Dividends: | | | | |
| Affiliated issuers | | | $ | 16,952,857 |
| Expenses | | | | |
| Distribution and service plan fees | $ | 919,573 | | |
| Independent trustees' fees and expenses | | 1,923 | | |
| Total expenses before reductions | | 921,496 | | |
| Expense reductions | | (150) | | |
| Total expenses after reductions | | | | 921,346 |
| Net Investment income (loss) | | | | 16,031,511 |
| Realized and Unrealized Gain (Loss) | | | | |
| Net realized gain (loss) on: | | | | |
| Investment Securities: | | | | |
| Affiliated issuers | | (78,161) | | |
| Capital gain distributions from underlying funds: | | | | |
| Affiliated issuers | | 39,073,021 | | |
| Total net realized gain (loss) | | | | 38,994,860 |
| Change in net unrealized appreciation (depreciation) on: | | | | |
| Investment Securities: | | | | |
| Affiliated issuers | | 9,180,382 | | |
| Total change in net unrealized appreciation (depreciation) | | | | 9,180,382 |
| Net gain (loss) | | | | 48,175,242 |
| Net increase (decrease) in net assets resulting from operations | | | $ | 64,206,753 |
| Statement of Changes in Net Assets |
| |
| | Year ended December 31, 2024 | | Year ended December 31, 2023 |
| Increase (Decrease) in Net Assets | | | | |
| Operations | | | | |
| Net investment income (loss) | $ | 16,031,511 | $ | 13,839,719 |
| Net realized gain (loss) | | 38,994,860 | | 9,900,140 |
| Change in net unrealized appreciation (depreciation) | | 9,180,382 | | 63,539,585 |
| Net increase (decrease) in net assets resulting from operations | | 64,206,753 | | 87,279,444 |
| Distributions to shareholders | | (18,336,552) | | (15,442,922) |
| | | | | |
| Share transactions - net increase (decrease) | | 35,981,736 | | 44,480,083 |
| Total increase (decrease) in net assets | | 81,851,937 | | 116,316,605 |
| | | | | |
| Net Assets | | | | |
| Beginning of period | | 702,923,545 | | 586,606,940 |
| End of period | $ | 784,775,482 | $ | 702,923,545 |
| | | | | |
| | | | | |
Financial Highlights
VIP Freedom 2030 Portfolio℠ Initial Class |
| |
| Years ended December 31, | | 2024 | | 2023 | | 2022 | | 2021 | | 2020 |
Selected Per-Share Data | | | | | | | | | | |
| Net asset value, beginning of period | $ | 15.36 | $ | 13.72 | $ | 17.93 | $ | 16.83 | $ | 15.28 |
| Income from Investment Operations | | | | | | | | | | |
Net investment income (loss) A,B | | .37 | | .34 | | .29 | | .31 | | .19 |
| Net realized and unrealized gain (loss) | | 1.07 | | 1.67 | | (3.16) | | 1.72 | | 2.28 |
| Total from investment operations | | 1.44 | | 2.01 | | (2.87) | | 2.03 | | 2.47 |
| Distributions from net investment income | | (.38) | | (.37) | | (.29) | | (.19) | | (.19) |
| Distributions from net realized gain | | (.04) | | - | | (1.05) | | (.74) | | (.74) |
| Total distributions | | (.41) C | | (.37) | | (1.34) | | (.93) | | (.92) C |
| Net asset value, end of period | $ | 16.39 | $ | 15.36 | $ | 13.72 | $ | 17.93 | $ | 16.83 |
Total Return D,E | | | | 14.70% | | (16.87)% | | 12.37% | | 16.89% |
Ratios to Average Net Assets B,F,G | | | | | | | | | | |
Expenses before reductions H | | -% | | -% | | -% | | -% | | -% |
Expenses net of fee waivers, if any H | | | | -% | | -% | | -% | | -% |
Expenses net of all reductions H | | -% | | -% | | -% | | -% | | -% |
| Net investment income (loss) | | 2.25% | | 2.33% | | 1.96% | | 1.77% | | 1.31% |
| Supplemental Data | | | | | | | | | | |
| Net assets, end of period (000 omitted) | $ | 189,258 | $ | 162,784 | $ | 116,986 | $ | 138,193 | $ | 113,727 |
Portfolio turnover rate I | | | | 26% | | 76% | | 28% | | 46% |
ACalculated based on average shares outstanding during the period.
BNet investment income (loss) is affected by the timing of the declaration of dividends by any underlying mutual funds or exchange-traded funds (ETFs). Net investment income (loss) of any mutual funds or ETFs is not included in the Fund's net investment income (loss) ratio.
CTotal distributions per share do not sum due to rounding.
DTotal returns do not reflect charges attributable to your insurance company's separate account. Inclusion of these charges would reduce the total returns shown.
ETotal returns would have been lower if certain expenses had not been reduced during the applicable periods shown.
FFees and expenses of any underlying mutual funds or exchange-traded funds (ETFs) are not included in the Fund's expense ratio. The Fund indirectly bears its proportionate share of these expenses.
GExpense ratios reflect operating expenses of the class. Expenses before reductions do not reflect amounts reimbursed, waived, or reduced through arrangements with the investment adviser, brokerage services, or other offset arrangements, if applicable, and do not represent the amount paid by the class during periods when reimbursements, waivers or reductions occur.
HAmount represents less than .005%.
IAmount does not include the portfolio activity of any underlying mutual funds or exchange-traded funds (ETFs), derivatives or securities that mature within one year from acquisition.
VIP Freedom 2030 Portfolio℠ Service Class |
| |
| Years ended December 31, | | 2024 | | 2023 | | 2022 | | 2021 | | 2020 |
Selected Per-Share Data | | | | | | | | | | |
| Net asset value, beginning of period | $ | 15.31 | $ | 13.68 | $ | 17.88 | $ | 16.79 | $ | 15.25 |
| Income from Investment Operations | | | | | | | | | | |
Net investment income (loss) A,B | | .35 | | .32 | | .27 | | .29 | | .18 |
| Net realized and unrealized gain (loss) | | 1.08 | | 1.66 | | (3.14) | | 1.72 | | 2.27 |
| Total from investment operations | | 1.43 | | 1.98 | | (2.87) | | 2.01 | | 2.45 |
| Distributions from net investment income | | (.36) | | (.35) | | (.28) | | (.18) | | (.17) |
| Distributions from net realized gain | | (.04) | | - | | (1.05) | | (.74) | | (.74) |
| Total distributions | | (.40) | | (.35) | | (1.33) | | (.92) | | (.91) |
| Net asset value, end of period | $ | 16.34 | $ | 15.31 | $ | 13.68 | $ | 17.88 | $ | 16.79 |
Total Return C,D | | | | 14.56% | | (16.94)% | | 12.24% | | 16.76% |
Ratios to Average Net Assets B,E,F | | | | | | | | | | |
| Expenses before reductions | | .10% | | .10% | | .10% | | .10% | | .10% |
| Expenses net of fee waivers, if any | | | | .10% | | .10% | | .10% | | .10% |
| Expenses net of all reductions | | .10% | | .10% | | .10% | | .10% | | .10% |
| Net investment income (loss) | | 2.15% | | 2.23% | | 1.86% | | 1.67% | | 1.21% |
| Supplemental Data | | | | | | | | | | |
| Net assets, end of period (000 omitted) | $ | 369,233 | $ | 319,543 | $ | 271,187 | $ | 294,595 | $ | 225,149 |
Portfolio turnover rate G | | | | 26% | | 76% | | 28% | | 46% |
ACalculated based on average shares outstanding during the period.
BNet investment income (loss) is affected by the timing of the declaration of dividends by any underlying mutual funds or exchange-traded funds (ETFs). Net investment income (loss) of any mutual funds or ETFs is not included in the Fund's net investment income (loss) ratio.
CTotal returns do not reflect charges attributable to your insurance company's separate account. Inclusion of these charges would reduce the total returns shown.
DTotal returns would have been lower if certain expenses had not been reduced during the applicable periods shown.
EFees and expenses of any underlying mutual funds or exchange-traded funds (ETFs) are not included in the Fund's expense ratio. The Fund indirectly bears its proportionate share of these expenses.
FExpense ratios reflect operating expenses of the class. Expenses before reductions do not reflect amounts reimbursed, waived, or reduced through arrangements with the investment adviser, brokerage services, or other offset arrangements, if applicable, and do not represent the amount paid by the class during periods when reimbursements, waivers or reductions occur.
GAmount does not include the portfolio activity of any underlying mutual funds or exchange-traded funds (ETFs), derivatives or securities that mature within one year from acquisition.
VIP Freedom 2030 Portfolio℠ Service Class 2 |
| |
| Years ended December 31, | | 2024 | | 2023 | | 2022 | | 2021 | | 2020 |
Selected Per-Share Data | | | | | | | | | | |
| Net asset value, beginning of period | $ | 15.25 | $ | 13.62 | $ | 17.81 | $ | 16.73 | $ | 15.19 |
| Income from Investment Operations | | | | | | | | | | |
Net investment income (loss) A,B | | .33 | | .30 | | .25 | | .27 | | .16 |
| Net realized and unrealized gain (loss) | | 1.06 | | 1.66 | | (3.14) | | 1.70 | | 2.26 |
| Total from investment operations | | 1.39 | | 1.96 | | (2.89) | | 1.97 | | 2.42 |
| Distributions from net investment income | | (.33) | | (.33) | | (.26) | | (.15) | | (.15) |
| Distributions from net realized gain | | (.04) | | - | | (1.05) | | (.74) | | (.74) |
| Total distributions | | (.37) | | (.33) | | (1.30) C | | (.89) | | (.88) C |
| Net asset value, end of period | $ | 16.27 | $ | 15.25 | $ | 13.62 | $ | 17.81 | $ | 16.73 |
Total Return D,E | | | | 14.46% | | (17.09)% | | 12.07% | | 16.64% |
Ratios to Average Net Assets B,F,G | | | | | | | | | | |
| Expenses before reductions | | .25% | | .25% | | .25% | | .25% | | .25% |
| Expenses net of fee waivers, if any | | | | .25% | | .25% | | .25% | | .25% |
| Expenses net of all reductions | | .25% | | .25% | | .25% | | .25% | | .25% |
| Net investment income (loss) | | 2.00% | | 2.08% | | 1.71% | | 1.52% | | 1.06% |
| Supplemental Data | | | | | | | | | | |
| Net assets, end of period (000 omitted) | $ | 226,284 | $ | 220,596 | $ | 198,433 | $ | 243,043 | $ | 193,997 |
Portfolio turnover rate H | | | | 26% | | 76% | | 28% | | 46% |
ACalculated based on average shares outstanding during the period.
BNet investment income (loss) is affected by the timing of the declaration of dividends by any underlying mutual funds or exchange-traded funds (ETFs). Net investment income (loss) of any mutual funds or ETFs is not included in the Fund's net investment income (loss) ratio.
CTotal distributions per share do not sum due to rounding.
DTotal returns do not reflect charges attributable to your insurance company's separate account. Inclusion of these charges would reduce the total returns shown.
ETotal returns would have been lower if certain expenses had not been reduced during the applicable periods shown.
FFees and expenses of any underlying mutual funds or exchange-traded funds (ETFs) are not included in the Fund's expense ratio. The Fund indirectly bears its proportionate share of these expenses.
GExpense ratios reflect operating expenses of the class. Expenses before reductions do not reflect amounts reimbursed, waived, or reduced through arrangements with the investment adviser, brokerage services, or other offset arrangements, if applicable, and do not represent the amount paid by the class during periods when reimbursements, waivers or reductions occur.
HAmount does not include the portfolio activity of any underlying mutual funds or exchange-traded funds (ETFs), derivatives or securities that mature within one year from acquisition.
VIP Freedom 2035 Portfolio℠
Schedule of Investments December 31, 2024
Showing Percentage of Net Assets
| Bond Funds - 28.2% |
| | | Shares | Value ($) |
| Fidelity Inflation-Protected Bond Index Fund (a) | | 1,722,398 | 15,312,116 |
| Fidelity International Bond Index Fund (a) | | 1,177,909 | 10,954,552 |
| Fidelity Long-Term Treasury Bond Index Fund (a) | | 3,180,668 | 29,166,730 |
| VIP High Income Portfolio - Initial Class (a) | | 959,466 | 4,528,679 |
| VIP Investment Grade Bond II Portfolio - Initial Class (a) | | 4,921,543 | 45,327,408 |
| TOTAL BOND FUNDS (Cost $112,157,635) | | | 105,289,485 |
| | | | |
| Domestic Equity Funds - 39.1% |
| | | Shares | Value ($) |
| VIP Contrafund Portfolio - Initial Class (a) | | 441,195 | 25,562,817 |
| VIP Equity-Income Portfolio - Initial Class (a) | | 784,402 | 20,857,239 |
| VIP Growth & Income Portfolio - Initial Class (a) | | 936,415 | 28,607,468 |
| VIP Growth Portfolio - Initial Class (a) | | 437,026 | 42,365,299 |
| VIP Mid Cap Portfolio - Initial Class (a) | | 174,830 | 6,566,603 |
| VIP Value Portfolio - Initial Class (a) | | 771,390 | 14,656,408 |
| VIP Value Strategies Portfolio - Initial Class (a) | | 469,379 | 7,280,062 |
| TOTAL DOMESTIC EQUITY FUNDS (Cost $115,996,717) | | | 145,895,896 |
| | | | |
| International Equity Funds - 32.7% |
| | | Shares | Value ($) |
| VIP Emerging Markets Portfolio - Initial Class (a) | | 3,643,572 | 41,828,206 |
| VIP Overseas Portfolio - Initial Class (a) | | 3,140,052 | 79,977,130 |
| TOTAL INTERNATIONAL EQUITY FUNDS (Cost $113,170,977) | | | 121,805,336 |
| | | | |
| TOTAL INVESTMENT IN SECURITIES - 100.0% (Cost $341,325,329) | 372,990,717 |
NET OTHER ASSETS (LIABILITIES) - 0.0% | (45,021) |
| NET ASSETS - 100.0% | 372,945,696 |
| | |
Legend
Affiliated Underlying Funds
Fiscal year to date information regarding the Fund's investments in affiliated Underlying Funds is presented below. Exchanges between classes of the same affiliated Underlying Funds may occur. If an Underlying Funds changes its name, the name presented below is the name in effect at period end.
| Affiliate | Value, beginning of period ($) | Purchases ($) | Sales Proceeds ($) | Dividend Income ($) | Realized Gain (loss) ($) | Change in Unrealized appreciation (depreciation) ($) | Value, end of period ($) | Shares, end of period |
| Fidelity Inflation-Protected Bond Index Fund | 11,336,840 | 8,809,902 | 4,587,174 | 550,059 | (367,202) | 119,750 | 15,312,116 | 1,722,398 |
| Fidelity International Bond Index Fund | 7,204,463 | 6,763,887 | 3,030,256 | 296,672 | (84,713) | 101,171 | 10,954,552 | 1,177,909 |
| Fidelity Long-Term Treasury Bond Index Fund | 19,284,316 | 19,261,368 | 7,068,595 | 853,511 | (311,163) | (1,999,196) | 29,166,730 | 3,180,668 |
| VIP Contrafund Portfolio - Initial Class | 19,888,473 | 10,968,860 | 8,722,516 | 2,940,342 | 202,545 | 3,225,455 | 25,562,817 | 441,195 |
| VIP Emerging Markets Portfolio - Initial Class | 33,040,517 | 18,316,266 | 12,203,684 | 598,087 | 412,078 | 2,263,029 | 41,828,206 | 3,643,572 |
| VIP Equity-Income Portfolio - Initial Class | 16,127,207 | 9,849,724 | 6,203,293 | 1,494,728 | 109,700 | 973,901 | 20,857,239 | 784,402 |
| VIP Government Money Market Portfolio - Initial Class | - | 940,064 | 940,064 | 3,814 | - | - | - | - |
| VIP Growth & Income Portfolio - Initial Class | 22,168,948 | 11,636,264 | 7,980,627 | 2,166,906 | 67,134 | 2,715,749 | 28,607,468 | 936,415 |
| VIP Growth Portfolio - Initial Class | 32,937,468 | 22,302,722 | 13,483,222 | 8,948,274 | 114,201 | 494,130 | 42,365,299 | 437,026 |
| VIP High Income Portfolio - Initial Class | 5,010,573 | 2,107,651 | 2,815,361 | 268,547 | (91,375) | 317,191 | 4,528,679 | 959,466 |
| VIP Investment Grade Bond II Portfolio - Initial Class | 46,396,638 | 23,781,740 | 23,564,302 | 1,896,322 | (587,812) | (698,856) | 45,327,408 | 4,921,543 |
| VIP Mid Cap Portfolio - Initial Class | 5,048,090 | 3,276,473 | 1,916,164 | 793,364 | 76,899 | 81,305 | 6,566,603 | 174,830 |
| VIP Overseas Portfolio - Initial Class | 67,809,730 | 30,597,052 | 16,365,161 | 5,037,084 | 88,978 | (2,153,469) | 79,977,130 | 3,140,052 |
| VIP Value Portfolio - Initial Class | 11,248,764 | 7,685,779 | 4,206,693 | 1,523,807 | 130,376 | (201,818) | 14,656,408 | 771,390 |
| VIP Value Strategies Portfolio - Initial Class | 5,566,689 | 4,246,035 | 2,142,575 | 1,015,534 | 74,683 | (464,770) | 7,280,062 | 469,379 |
| | 303,068,716 | 180,543,787 | 115,229,687 | 28,387,051 | (165,671) | 4,773,572 | 372,990,717 | 22,760,245 |
Amounts in the dividend income column in the above table include any capital gain distributions from underlying funds, which are presented in the corresponding line item in the Statement of Operations, if applicable.
Amounts included in the purchases and sales proceeds columns may include in-kind transactions, if applicable.
Investment Valuation
The following is a summary of the inputs used, as of December 31, 2024, involving the Fund's assets and liabilities carried at fair value. The inputs or methodology used for valuing securities may not be an indication of the risk associated with investing in those securities. For more information on valuation inputs, and their aggregation into the levels used below, please refer to the Investment Valuation section in the accompanying Notes to Financial Statements.
| Valuation Inputs at Reporting Date: |
| Description | Total ($) | Level 1 ($) | Level 2 ($) | Level 3 ($) |
Investments in Securities: | | | | |
|
| Bond Funds | 105,289,485 | 105,289,485 | - | - |
|
| Domestic Equity Funds | 145,895,896 | 145,895,896 | - | - |
|
| International Equity Funds | 121,805,336 | 121,805,336 | - | - |
| Total Investments in Securities: | 372,990,717 | 372,990,717 | - | - |
VIP Freedom 2035 Portfolio℠
Financial Statements
| Statement of Assets and Liabilities |
As of December 31, 2024 |
| Assets | | | | |
| Investment in securities, at value - See accompanying schedule: | | | | |
Affiliated issuers (cost $341,325,329) | $ | 372,990,717 | | |
| | | | | |
| | | | | |
| Total Investment in Securities (cost $341,325,329) | | | $ | 372,990,717 |
| Receivable for investments sold | | | | 2,188,539 |
| Receivable for fund shares sold | | | | 377,306 |
Total assets | | | | 375,556,562 |
| Liabilities | | | | |
| Payable for investments purchased | $ | 2,364,688 | | |
| Payable for fund shares redeemed | | 201,150 | | |
| Distribution and service plan fees payable | | 45,028 | | |
| Total liabilities | | | | 2,610,866 |
| Net Assets | | | $ | 372,945,696 |
| Net Assets consist of: | | | | |
| Paid in capital | | | $ | 325,402,925 |
| Total accumulated earnings (loss) | | | | 47,542,771 |
| Net Assets | | | $ | 372,945,696 |
| | | | | |
| Net Asset Value and Maximum Offering Price | | | | |
| Initial Class : | | | | |
Net Asset Value, offering price and redemption price per share ($51,996,361 ÷ 1,863,734 shares) | | | $ | 27.90 |
| Service Class : | | | | |
Net Asset Value, offering price and redemption price per share ($180,271,357 ÷ 6,484,473 shares) | | | $ | 27.80 |
| Service Class 2 : | | | | |
Net Asset Value, offering price and redemption price per share ($140,677,978 ÷ 5,096,240 shares) | | | $ | 27.60 |
| Statement of Operations |
| Year ended December 31, 2024 |
| Investment Income | | | | |
| Dividends: | | | | |
| Affiliated issuers | | | $ | 6,860,858 |
| Expenses | | | | |
| Distribution and service plan fees | $ | 494,624 | | |
| Independent trustees' fees and expenses | | 857 | | |
| Total expenses before reductions | | 495,481 | | |
| Expense reductions | | (18) | | |
| Total expenses after reductions | | | | 495,463 |
| Net Investment income (loss) | | | | 6,365,395 |
| Realized and Unrealized Gain (Loss) | | | | |
| Net realized gain (loss) on: | | | | |
| Investment Securities: | | | | |
| Affiliated issuers | | (165,671) | | |
| Capital gain distributions from underlying funds: | | | | |
| Affiliated issuers | | 21,526,193 | | |
| Total net realized gain (loss) | | | | 21,360,522 |
| Change in net unrealized appreciation (depreciation) on: | | | | |
| Investment Securities: | | | | |
| Affiliated issuers | | 4,773,572 | | |
| Total change in net unrealized appreciation (depreciation) | | | | 4,773,572 |
| Net gain (loss) | | | | 26,134,094 |
| Net increase (decrease) in net assets resulting from operations | | | $ | 32,499,489 |
| Statement of Changes in Net Assets |
| |
| | Year ended December 31, 2024 | | Year ended December 31, 2023 |
| Increase (Decrease) in Net Assets | | | | |
| Operations | | | | |
| Net investment income (loss) | $ | 6,365,395 | $ | 4,927,105 |
| Net realized gain (loss) | | 21,360,522 | | 3,653,251 |
| Change in net unrealized appreciation (depreciation) | | 4,773,572 | | 31,369,275 |
| Net increase (decrease) in net assets resulting from operations | | 32,499,489 | | 39,949,631 |
| Distributions to shareholders | | (11,041,046) | | (5,500,228) |
| | | | | |
| Share transactions - net increase (decrease) | | 48,454,817 | | 52,953,517 |
| Total increase (decrease) in net assets | | 69,913,260 | | 87,402,920 |
| | | | | |
| Net Assets | | | | |
| Beginning of period | | 303,032,436 | | 215,629,516 |
| End of period | $ | 372,945,696 | $ | 303,032,436 |
| | | | | |
| | | | | |
Financial Highlights
VIP Freedom 2035 Portfolio℠ Initial Class |
| |
| Years ended December 31, | | 2024 | | 2023 | | 2022 | | 2021 | | 2020 |
Selected Per-Share Data | | | | | | | | | | |
| Net asset value, beginning of period | $ | 25.99 | $ | 22.71 | $ | 30.05 | $ | 27.34 | $ | 24.35 |
| Income from Investment Operations | | | | | | | | | | |
Net investment income (loss) A,B | | .56 | | .51 | | .40 | | .45 | | .28 |
| Net realized and unrealized gain (loss) | | 2.28 | | 3.30 | | (5.43) | | 3.69 | | 4.01 |
| Total from investment operations | | 2.84 | | 3.81 | | (5.03) | | 4.14 | | 4.29 |
| Distributions from net investment income | | (.53) | | (.48) | | (.42) | | (.30) | | (.27) |
| Distributions from net realized gain | | (.40) | | (.05) | | (1.89) | | (1.13) | | (1.04) |
| Total distributions | | (.93) | | (.53) | | (2.31) | | (1.43) | | (1.30) C |
| Net asset value, end of period | $ | 27.90 | $ | 25.99 | $ | 22.71 | $ | 30.05 | $ | 27.34 |
Total Return D,E | | | | 16.85% | | (17.69)% | | 15.46% | | 18.28% |
Ratios to Average Net Assets B,F,G | | | | | | | | | | |
Expenses before reductions H | | -% | | -% | | -% | | -% | | -% |
Expenses net of fee waivers, if any H | | | | -% | | -% | | -% | | -% |
Expenses net of all reductions H | | -% | | -% | | -% | | -% | | -% |
| Net investment income (loss) | | 2.02% | | 2.10% | | 1.68% | | 1.53% | | 1.20% |
| Supplemental Data | | | | | | | | | | |
| Net assets, end of period (000 omitted) | $ | 51,996 | $ | 39,129 | $ | 18,619 | $ | 17,426 | $ | 17,852 |
Portfolio turnover rate I | | | | 26% | | 49% | | 34% | | 55% |
ACalculated based on average shares outstanding during the period.
BNet investment income (loss) is affected by the timing of the declaration of dividends by any underlying mutual funds or exchange-traded funds (ETFs). Net investment income (loss) of any mutual funds or ETFs is not included in the Fund's net investment income (loss) ratio.
CTotal distributions per share do not sum due to rounding.
DTotal returns do not reflect charges attributable to your insurance company's separate account. Inclusion of these charges would reduce the total returns shown.
ETotal returns would have been lower if certain expenses had not been reduced during the applicable periods shown.
FFees and expenses of any underlying mutual funds or exchange-traded funds (ETFs) are not included in the Fund's expense ratio. The Fund indirectly bears its proportionate share of these expenses.
GExpense ratios reflect operating expenses of the class. Expenses before reductions do not reflect amounts reimbursed, waived, or reduced through arrangements with the investment adviser, brokerage services, or other offset arrangements, if applicable, and do not represent the amount paid by the class during periods when reimbursements, waivers or reductions occur.
HAmount represents less than .005%.
IAmount does not include the portfolio activity of any underlying mutual funds or exchange-traded funds (ETFs), derivatives or securities that mature within one year from acquisition.
VIP Freedom 2035 Portfolio℠ Service Class |
| |
| Years ended December 31, | | 2024 | | 2023 | | 2022 | | 2021 | | 2020 |
Selected Per-Share Data | | | | | | | | | | |
| Net asset value, beginning of period | $ | 25.90 | $ | 22.64 | $ | 29.96 | $ | 27.27 | $ | 24.30 |
| Income from Investment Operations | | | | | | | | | | |
Net investment income (loss) A,B | | .53 | | .49 | | .38 | | .42 | | .26 |
| Net realized and unrealized gain (loss) | | 2.27 | | 3.28 | | (5.42) | | 3.67 | | 3.99 |
| Total from investment operations | | 2.80 | | 3.77 | | (5.04) | | 4.09 | | 4.25 |
| Distributions from net investment income | | (.50) | | (.46) | | (.40) | | (.27) | | (.25) |
| Distributions from net realized gain | | (.40) | | (.05) | | (1.89) | | (1.13) | | (1.04) |
| Total distributions | | (.90) | | (.51) | | (2.28) C | | (1.40) | | (1.28) C |
| Net asset value, end of period | $ | 27.80 | $ | 25.90 | $ | 22.64 | $ | 29.96 | $ | 27.27 |
Total Return D,E | | | | 16.71% | | (17.75)% | | 15.32% | | 18.15% |
Ratios to Average Net Assets B,F,G | | | | | | | | | | |
| Expenses before reductions | | .10% | | .10% | | .10% | | .10% | | .10% |
| Expenses net of fee waivers, if any | | | | .10% | | .10% | | .10% | | .10% |
| Expenses net of all reductions | | .10% | | .10% | | .10% | | .10% | | .10% |
| Net investment income (loss) | | 1.92% | | 2.00% | | 1.58% | | 1.43% | | 1.10% |
| Supplemental Data | | | | | | | | | | |
| Net assets, end of period (000 omitted) | $ | 180,271 | $ | 141,514 | $ | 98,376 | $ | 82,275 | $ | 51,598 |
Portfolio turnover rate H | | | | 26% | | 49% | | 34% | | 55% |
ACalculated based on average shares outstanding during the period.
BNet investment income (loss) is affected by the timing of the declaration of dividends by any underlying mutual funds or exchange-traded funds (ETFs). Net investment income (loss) of any mutual funds or ETFs is not included in the Fund's net investment income (loss) ratio.
CTotal distributions per share do not sum due to rounding.
DTotal returns do not reflect charges attributable to your insurance company's separate account. Inclusion of these charges would reduce the total returns shown.
ETotal returns would have been lower if certain expenses had not been reduced during the applicable periods shown.
FFees and expenses of any underlying mutual funds or exchange-traded funds (ETFs) are not included in the Fund's expense ratio. The Fund indirectly bears its proportionate share of these expenses.
GExpense ratios reflect operating expenses of the class. Expenses before reductions do not reflect amounts reimbursed, waived, or reduced through arrangements with the investment adviser, brokerage services, or other offset arrangements, if applicable, and do not represent the amount paid by the class during periods when reimbursements, waivers or reductions occur.
HAmount does not include the portfolio activity of any underlying mutual funds or exchange-traded funds (ETFs), derivatives or securities that mature within one year from acquisition.
VIP Freedom 2035 Portfolio℠ Service Class 2 |
| |
| Years ended December 31, | | 2024 | | 2023 | | 2022 | | 2021 | | 2020 |
Selected Per-Share Data | | | | | | | | | | |
| Net asset value, beginning of period | $ | 25.72 | $ | 22.49 | $ | 29.78 | $ | 27.11 | $ | 24.17 |
| Income from Investment Operations | | | | | | | | | | |
Net investment income (loss) A,B | | .49 | | .45 | | .34 | | .37 | | .22 |
| Net realized and unrealized gain (loss) | | 2.25 | | 3.25 | | (5.38) | | 3.66 | | 3.97 |
| Total from investment operations | | 2.74 | | 3.70 | | (5.04) | | 4.03 | | 4.19 |
| Distributions from net investment income | | (.46) | | (.42) | | (.36) | | (.23) | | (.21) |
| Distributions from net realized gain | | (.40) | | (.05) | | (1.89) | | (1.13) | | (1.04) |
| Total distributions | | (.86) | | (.47) | | (2.25) | | (1.36) | | (1.25) |
| Net asset value, end of period | $ | 27.60 | $ | 25.72 | $ | 22.49 | $ | 29.78 | $ | 27.11 |
Total Return C,D | | | | 16.53% | | (17.89)% | | 15.18% | | 17.96% |
Ratios to Average Net Assets B,E,F | | | | | | | | | | |
| Expenses before reductions | | .25% | | .25% | | .25% | | .25% | | .25% |
| Expenses net of fee waivers, if any | | | | .25% | | .25% | | .25% | | .25% |
| Expenses net of all reductions | | .25% | | .25% | | .25% | | .25% | | .25% |
| Net investment income (loss) | | 1.77% | | 1.85% | | 1.43% | | 1.28% | | .95% |
| Supplemental Data | | | | | | | | | | |
| Net assets, end of period (000 omitted) | $ | 140,678 | $ | 122,389 | $ | 98,634 | $ | 113,228 | $ | 87,124 |
Portfolio turnover rate G | | | | 26% | | 49% | | 34% | | 55% |
ACalculated based on average shares outstanding during the period.
BNet investment income (loss) is affected by the timing of the declaration of dividends by any underlying mutual funds or exchange-traded funds (ETFs). Net investment income (loss) of any mutual funds or ETFs is not included in the Fund's net investment income (loss) ratio.
CTotal returns do not reflect charges attributable to your insurance company's separate account. Inclusion of these charges would reduce the total returns shown.
DTotal returns would have been lower if certain expenses had not been reduced during the applicable periods shown.
EFees and expenses of any underlying mutual funds or exchange-traded funds (ETFs) are not included in the Fund's expense ratio. The Fund indirectly bears its proportionate share of these expenses.
FExpense ratios reflect operating expenses of the class. Expenses before reductions do not reflect amounts reimbursed, waived, or reduced through arrangements with the investment adviser, brokerage services, or other offset arrangements, if applicable, and do not represent the amount paid by the class during periods when reimbursements, waivers or reductions occur.
GAmount does not include the portfolio activity of any underlying mutual funds or exchange-traded funds (ETFs), derivatives or securities that mature within one year from acquisition.
VIP Freedom 2040 Portfolio℠
Schedule of Investments December 31, 2024
Showing Percentage of Net Assets
| Bond Funds - 13.7% |
| | | Shares | Value ($) |
| Fidelity Inflation-Protected Bond Index Fund (a) | | 563,716 | 5,011,433 |
| Fidelity International Bond Index Fund (a) | | 856,330 | 7,963,874 |
| Fidelity Long-Term Treasury Bond Index Fund (a) | | 3,030,541 | 27,790,061 |
| VIP High Income Portfolio - Initial Class (a) | | 900,345 | 4,249,628 |
| VIP Investment Grade Bond II Portfolio - Initial Class (a) | | 311,785 | 2,871,539 |
| TOTAL BOND FUNDS (Cost $52,439,870) | | | 47,886,535 |
| | | | |
| Domestic Equity Funds - 47.8% |
| | | Shares | Value ($) |
| VIP Contrafund Portfolio - Initial Class (a) | | 506,183 | 29,328,261 |
| VIP Equity-Income Portfolio - Initial Class (a) | | 899,963 | 23,930,024 |
| VIP Growth & Income Portfolio - Initial Class (a) | | 1,074,370 | 32,821,997 |
| VIP Growth Portfolio - Initial Class (a) | | 501,400 | 48,605,670 |
| VIP Mid Cap Portfolio - Initial Class (a) | | 200,586 | 7,534,013 |
| VIP Value Portfolio - Initial Class (a) | | 885,036 | 16,815,680 |
| VIP Value Strategies Portfolio - Initial Class (a) | | 538,527 | 8,352,561 |
| TOTAL DOMESTIC EQUITY FUNDS (Cost $130,940,481) | | | 167,388,206 |
| | | | |
| International Equity Funds - 38.5% |
| | | Shares | Value ($) |
| VIP Emerging Markets Portfolio - Initial Class (a) | | 3,947,136 | 45,313,121 |
| VIP Overseas Portfolio - Initial Class (a) | | 3,508,618 | 89,364,488 |
| TOTAL INTERNATIONAL EQUITY FUNDS (Cost $124,416,049) | | | 134,677,609 |
| | | | |
| TOTAL INVESTMENT IN SECURITIES - 100.0% (Cost $307,796,400) | 349,952,350 |
NET OTHER ASSETS (LIABILITIES) - 0.0% | (29,599) |
| NET ASSETS - 100.0% | 349,922,751 |
| | |
Legend
Affiliated Underlying Funds
Fiscal year to date information regarding the Fund's investments in affiliated Underlying Funds is presented below. Exchanges between classes of the same affiliated Underlying Funds may occur. If an Underlying Funds changes its name, the name presented below is the name in effect at period end.
| Affiliate | Value, beginning of period ($) | Purchases ($) | Sales Proceeds ($) | Dividend Income ($) | Realized Gain (loss) ($) | Change in Unrealized appreciation (depreciation) ($) | Value, end of period ($) | Shares, end of period |
| Fidelity Inflation-Protected Bond Index Fund | 6,013,100 | 3,029,696 | 3,979,919 | 227,992 | (264,049) | 212,605 | 5,011,433 | 563,716 |
| Fidelity International Bond Index Fund | 3,956,871 | 6,282,477 | 2,260,192 | 194,766 | (73,681) | 58,399 | 7,963,874 | 856,330 |
| Fidelity Long-Term Treasury Bond Index Fund | 17,177,919 | 18,985,529 | 6,139,306 | 777,459 | (293,633) | (1,940,448) | 27,790,061 | 3,030,541 |
| VIP Contrafund Portfolio - Initial Class | 22,520,261 | 11,557,980 | 8,799,134 | 3,410,856 | 159,577 | 3,889,577 | 29,328,261 | 506,183 |
| VIP Emerging Markets Portfolio - Initial Class | 34,971,639 | 19,448,494 | 12,125,949 | 654,771 | 361,860 | 2,657,077 | 45,313,121 | 3,947,136 |
| VIP Equity-Income Portfolio - Initial Class | 18,261,110 | 10,663,237 | 6,258,276 | 1,736,045 | 99,219 | 1,164,734 | 23,930,024 | 899,963 |
| VIP Government Money Market Portfolio - Initial Class | - | 902,909 | 902,909 | 3,654 | - | - | - | - |
| VIP Growth & Income Portfolio - Initial Class | 25,102,332 | 12,308,336 | 7,868,072 | 2,515,537 | 51,259 | 3,228,142 | 32,821,997 | 1,074,370 |
| VIP Growth Portfolio - Initial Class | 37,296,237 | 24,198,962 | 13,719,340 | 10,380,742 | (77,017) | 906,828 | 48,605,670 | 501,400 |
| VIP High Income Portfolio - Initial Class | 760,059 | 3,955,676 | 275,253 | 254,021 | (5,626) | (185,228) | 4,249,628 | 900,345 |
| VIP Investment Grade Bond II Portfolio - Initial Class | 16,097,687 | 9,673,055 | 22,942,410 | 97,549 | (11,144) | 54,351 | 2,871,539 | 311,785 |
| VIP Mid Cap Portfolio - Initial Class | 5,716,239 | 3,582,109 | 1,953,239 | 920,013 | 81,960 | 106,944 | 7,534,013 | 200,586 |
| VIP Overseas Portfolio - Initial Class | 74,035,341 | 34,288,594 | 16,553,690 | 5,695,842 | 120,165 | (2,525,922) | 89,364,488 | 3,508,618 |
| VIP Value Portfolio - Initial Class | 12,737,446 | 8,482,992 | 4,326,035 | 1,769,329 | 99,627 | (178,350) | 16,815,680 | 885,036 |
| VIP Value Strategies Portfolio - Initial Class | 6,303,467 | 4,634,271 | 2,134,909 | 1,178,487 | 63,163 | (513,431) | 8,352,561 | 538,527 |
| | 280,949,708 | 171,994,317 | 110,238,633 | 29,817,063 | 311,680 | 6,935,278 | 349,952,350 | 17,724,536 |
Amounts in the dividend income column in the above table include any capital gain distributions from underlying funds, which are presented in the corresponding line item in the Statement of Operations, if applicable.
Amounts included in the purchases and sales proceeds columns may include in-kind transactions, if applicable.
Investment Valuation
The following is a summary of the inputs used, as of December 31, 2024, involving the Fund's assets and liabilities carried at fair value. The inputs or methodology used for valuing securities may not be an indication of the risk associated with investing in those securities. For more information on valuation inputs, and their aggregation into the levels used below, please refer to the Investment Valuation section in the accompanying Notes to Financial Statements.
| Valuation Inputs at Reporting Date: |
| Description | Total ($) | Level 1 ($) | Level 2 ($) | Level 3 ($) |
Investments in Securities: | | | | |
|
| Bond Funds | 47,886,535 | 47,886,535 | - | - |
|
| Domestic Equity Funds | 167,388,206 | 167,388,206 | - | - |
|
| International Equity Funds | 134,677,609 | 134,677,609 | - | - |
| Total Investments in Securities: | 349,952,350 | 349,952,350 | - | - |
VIP Freedom 2040 Portfolio℠
Financial Statements
| Statement of Assets and Liabilities |
As of December 31, 2024 |
| Assets | | | | |
| Investment in securities, at value - See accompanying schedule: | | | | |
Affiliated issuers (cost $307,796,400) | $ | 349,952,350 | | |
| | | | | |
| | | | | |
| Total Investment in Securities (cost $307,796,400) | | | $ | 349,952,350 |
| Receivable for investments sold | | | | 3,019,614 |
| Receivable for fund shares sold | | | | 177,810 |
Total assets | | | | 353,149,774 |
| Liabilities | | | | |
| Payable for investments purchased | $ | 2,427,043 | | |
| Payable for fund shares redeemed | | 770,382 | | |
| Distribution and service plan fees payable | | 29,598 | | |
| Total liabilities | | | | 3,227,023 |
| Net Assets | | | $ | 349,922,751 |
| Net Assets consist of: | | | | |
| Paid in capital | | | $ | 288,738,104 |
| Total accumulated earnings (loss) | | | | 61,184,647 |
| Net Assets | | | $ | 349,922,751 |
| | | | | |
| Net Asset Value and Maximum Offering Price | | | | |
| Initial Class : | | | | |
Net Asset Value, offering price and redemption price per share ($86,500,673 ÷ 3,168,414 shares) | | | $ | 27.30 |
| Service Class : | | | | |
Net Asset Value, offering price and redemption price per share ($208,187,262 ÷ 7,648,121 shares) | | | $ | 27.22 |
| Service Class 2 : | | | | |
Net Asset Value, offering price and redemption price per share ($55,234,816 ÷ 2,040,723 shares) | | | $ | 27.07 |
| Statement of Operations |
| Year ended December 31, 2024 |
| Investment Income | | | | |
| Dividends: | | | | |
| Affiliated issuers | | | $ | 4,948,920 |
| Expenses | | | | |
| Distribution and service plan fees | $ | 324,629 | | |
| Independent trustees' fees and expenses | | 818 | | |
| Total expenses before reductions | | 325,447 | | |
| Expense reductions | | (71) | | |
| Total expenses after reductions | | | | 325,376 |
| Net Investment income (loss) | | | | 4,623,544 |
| Realized and Unrealized Gain (Loss) | | | | |
| Net realized gain (loss) on: | | | | |
| Investment Securities: | | | | |
| Affiliated issuers | | 311,680 | | |
| Capital gain distributions from underlying funds: | | | | |
| Affiliated issuers | | 24,868,143 | | |
| Total net realized gain (loss) | | | | 25,179,823 |
| Change in net unrealized appreciation (depreciation) on: | | | | |
| Investment Securities: | | | | |
| Affiliated issuers | | 6,935,278 | | |
| Total change in net unrealized appreciation (depreciation) | | | | 6,935,278 |
| Net gain (loss) | | | | 32,115,101 |
| Net increase (decrease) in net assets resulting from operations | | | $ | 36,738,645 |
| Statement of Changes in Net Assets |
| |
| | Year ended December 31, 2024 | | Year ended December 31, 2023 |
| Increase (Decrease) in Net Assets | | | | |
| Operations | | | | |
| Net investment income (loss) | $ | 4,623,544 | $ | 3,728,100 |
| Net realized gain (loss) | | 25,179,823 | | 4,204,597 |
| Change in net unrealized appreciation (depreciation) | | 6,935,278 | | 34,145,294 |
| Net increase (decrease) in net assets resulting from operations | | 36,738,645 | | 42,077,991 |
| Distributions to shareholders | | (9,691,579) | | (6,990,227) |
| | | | | |
| Share transactions - net increase (decrease) | | 41,947,663 | | 43,995,084 |
| Total increase (decrease) in net assets | | 68,994,729 | | 79,082,848 |
| | | | | |
| Net Assets | | | | |
| Beginning of period | | 280,928,022 | | 201,845,174 |
| End of period | $ | 349,922,751 | $ | 280,928,022 |
| | | | | |
| | | | | |
Financial Highlights
VIP Freedom 2040 Portfolio℠ Initial Class |
| |
| Years ended December 31, | | 2024 | | 2023 | | 2022 | | 2021 | | 2020 |
Selected Per-Share Data | | | | | | | | | | |
| Net asset value, beginning of period | $ | 24.91 | $ | 21.58 | $ | 29.04 | $ | 25.96 | $ | 23.08 |
| Income from Investment Operations | | | | | | | | | | |
Net investment income (loss) A,B | | .41 | | .38 | | .34 | | .41 | | .24 |
| Net realized and unrealized gain (loss) | | 2.82 | | 3.65 | | (5.31) | | 4.11 | | 4.02 |
| Total from investment operations | | 3.23 | | 4.03 | | (4.97) | | 4.52 | | 4.26 |
| Distributions from net investment income | | (.39) | | (.37) | | (.39) | | (.26) | | (.23) |
| Distributions from net realized gain | | (.44) | | (.32) | | (2.10) | | (1.18) | | (1.16) |
| Total distributions | | (.84) C | | (.70) C | | (2.49) | | (1.44) | | (1.38) C |
| Net asset value, end of period | $ | 27.30 | $ | 24.91 | $ | 21.58 | $ | 29.04 | $ | 25.96 |
Total Return D,E | | | | 18.87% | | (18.22)% | | 17.83% | | 19.28% |
Ratios to Average Net Assets B,F,G | | | | | | | | | | |
Expenses before reductions H | | -% | | -% | | -% | | -% | | -% |
Expenses net of fee waivers, if any H | | | | -% | | -% | | -% | | -% |
Expenses net of all reductions H | | -% | | -% | | -% | | -% | | -% |
| Net investment income (loss) | | 1.52% | | 1.64% | | 1.49% | | 1.45% | | 1.07% |
| Supplemental Data | | | | | | | | | | |
| Net assets, end of period (000 omitted) | $ | 86,501 | $ | 66,167 | $ | 41,856 | $ | 45,822 | $ | 34,365 |
Portfolio turnover rate I | | | | 28% | | 39% | | 32% | | 49% |
ACalculated based on average shares outstanding during the period.
BNet investment income (loss) is affected by the timing of the declaration of dividends by any underlying mutual funds or exchange-traded funds (ETFs). Net investment income (loss) of any mutual funds or ETFs is not included in the Fund's net investment income (loss) ratio.
CTotal distributions per share do not sum due to rounding.
DTotal returns do not reflect charges attributable to your insurance company's separate account. Inclusion of these charges would reduce the total returns shown.
ETotal returns would have been lower if certain expenses had not been reduced during the applicable periods shown.
FFees and expenses of any underlying mutual funds or exchange-traded funds (ETFs) are not included in the Fund's expense ratio. The Fund indirectly bears its proportionate share of these expenses.
GExpense ratios reflect operating expenses of the class. Expenses before reductions do not reflect amounts reimbursed, waived, or reduced through arrangements with the investment adviser, brokerage services, or other offset arrangements, if applicable, and do not represent the amount paid by the class during periods when reimbursements, waivers or reductions occur.
HAmount represents less than .005%.
IAmount does not include the portfolio activity of any underlying mutual funds or exchange-traded funds (ETFs), derivatives or securities that mature within one year from acquisition.
VIP Freedom 2040 Portfolio℠ Service Class |
| |
| Years ended December 31, | | 2024 | | 2023 | | 2022 | | 2021 | | 2020 |
Selected Per-Share Data | | | | | | | | | | |
| Net asset value, beginning of period | $ | 24.85 | $ | 21.52 | $ | 28.97 | $ | 25.91 | $ | 23.04 |
| Income from Investment Operations | | | | | | | | | | |
Net investment income (loss) A,B | | .38 | | .36 | | .32 | | .38 | | .21 |
| Net realized and unrealized gain (loss) | | 2.80 | | 3.64 | | (5.30) | | 4.10 | | 4.02 |
| Total from investment operations | | 3.18 | | 4.00 | | (4.98) | | 4.48 | | 4.23 |
| Distributions from net investment income | | (.37) | | (.35) | | (.37) | | (.24) | | (.21) |
| Distributions from net realized gain | | (.44) | | (.32) | | (2.10) | | (1.18) | | (1.16) |
| Total distributions | | (.81) | | (.67) | | (2.47) | | (1.42) | | (1.36) C |
| Net asset value, end of period | $ | 27.22 | $ | 24.85 | $ | 21.52 | $ | 28.97 | $ | 25.91 |
Total Return D,E | | | | 18.82% | | (18.30)% | | 17.68% | | 19.16% |
Ratios to Average Net Assets B,F,G | | | | | | | | | | |
| Expenses before reductions | | .10% | | .10% | | .10% | | .10% | | .10% |
| Expenses net of fee waivers, if any | | | | .10% | | .10% | | .10% | | .10% |
| Expenses net of all reductions | | .10% | | .10% | | .10% | | .10% | | .10% |
| Net investment income (loss) | | 1.42% | | 1.54% | | 1.39% | | 1.35% | | .97% |
| Supplemental Data | | | | | | | | | | |
| Net assets, end of period (000 omitted) | $ | 208,187 | $ | 169,888 | $ | 124,508 | $ | 119,062 | $ | 85,197 |
Portfolio turnover rate H | | | | 28% | | 39% | | 32% | | 49% |
ACalculated based on average shares outstanding during the period.
BNet investment income (loss) is affected by the timing of the declaration of dividends by any underlying mutual funds or exchange-traded funds (ETFs). Net investment income (loss) of any mutual funds or ETFs is not included in the Fund's net investment income (loss) ratio.
CTotal distributions per share do not sum due to rounding.
DTotal returns do not reflect charges attributable to your insurance company's separate account. Inclusion of these charges would reduce the total returns shown.
ETotal returns would have been lower if certain expenses had not been reduced during the applicable periods shown.
FFees and expenses of any underlying mutual funds or exchange-traded funds (ETFs) are not included in the Fund's expense ratio. The Fund indirectly bears its proportionate share of these expenses.
GExpense ratios reflect operating expenses of the class. Expenses before reductions do not reflect amounts reimbursed, waived, or reduced through arrangements with the investment adviser, brokerage services, or other offset arrangements, if applicable, and do not represent the amount paid by the class during periods when reimbursements, waivers or reductions occur.
HAmount does not include the portfolio activity of any underlying mutual funds or exchange-traded funds (ETFs), derivatives or securities that mature within one year from acquisition.
VIP Freedom 2040 Portfolio℠ Service Class 2 |
| |
| Years ended December 31, | | 2024 | | 2023 | | 2022 | | 2021 | | 2020 |
Selected Per-Share Data | | | | | | | | | | |
| Net asset value, beginning of period | $ | 24.71 | $ | 21.41 | $ | 28.83 | $ | 25.80 | $ | 22.95 |
| Income from Investment Operations | | | | | | | | | | |
Net investment income (loss) A,B | | .34 | | .32 | | .28 | | .33 | | .18 |
| Net realized and unrealized gain (loss) | | 2.79 | | 3.62 | | (5.26) | | 4.08 | | 4.00 |
| Total from investment operations | | 3.13 | | 3.94 | | (4.98) | | 4.41 | | 4.18 |
| Distributions from net investment income | | (.33) | | (.32) | | (.33) | | (.20) | | (.17) |
| Distributions from net realized gain | | (.44) | | (.32) | | (2.10) | | (1.18) | | (1.15) |
| Total distributions | | (.77) | | (.64) | | (2.44) C | | (1.38) | | (1.33) C |
| Net asset value, end of period | $ | 27.07 | $ | 24.71 | $ | 21.41 | $ | 28.83 | $ | 25.80 |
Total Return D,E | | | | 18.61% | | (18.41)% | | 17.50% | | 18.99% |
Ratios to Average Net Assets B,F,G | | | | | | | | | | |
| Expenses before reductions | | .25% | | .25% | | .25% | | .25% | | .25% |
| Expenses net of fee waivers, if any | | | | .25% | | .25% | | .25% | | .25% |
| Expenses net of all reductions | | .25% | | .25% | | .25% | | .25% | | .25% |
| Net investment income (loss) | | 1.27% | | 1.39% | | 1.24% | | 1.20% | | .82% |
| Supplemental Data | | | | | | | | | | |
| Net assets, end of period (000 omitted) | $ | 55,235 | $ | 44,872 | $ | 35,481 | $ | 41,525 | $ | 30,980 |
Portfolio turnover rate H | | | | 28% | | 39% | | 32% | | 49% |
ACalculated based on average shares outstanding during the period.
BNet investment income (loss) is affected by the timing of the declaration of dividends by any underlying mutual funds or exchange-traded funds (ETFs). Net investment income (loss) of any mutual funds or ETFs is not included in the Fund's net investment income (loss) ratio.
CTotal distributions per share do not sum due to rounding.
DTotal returns do not reflect charges attributable to your insurance company's separate account. Inclusion of these charges would reduce the total returns shown.
ETotal returns would have been lower if certain expenses had not been reduced during the applicable periods shown.
FFees and expenses of any underlying mutual funds or exchange-traded funds (ETFs) are not included in the Fund's expense ratio. The Fund indirectly bears its proportionate share of these expenses.
GExpense ratios reflect operating expenses of the class. Expenses before reductions do not reflect amounts reimbursed, waived, or reduced through arrangements with the investment adviser, brokerage services, or other offset arrangements, if applicable, and do not represent the amount paid by the class during periods when reimbursements, waivers or reductions occur.
HAmount does not include the portfolio activity of any underlying mutual funds or exchange-traded funds (ETFs), derivatives or securities that mature within one year from acquisition.
VIP Freedom 2045 Portfolio℠
Schedule of Investments December 31, 2024
Showing Percentage of Net Assets
| Bond Funds - 7.6% |
| | | Shares | Value ($) |
| Fidelity International Bond Index Fund (a) | | 208,431 | 1,938,409 |
| Fidelity Long-Term Treasury Bond Index Fund (a) | | 1,393,540 | 12,778,766 |
| TOTAL BOND FUNDS (Cost $16,176,962) | | | 14,717,175 |
| | | | |
| Domestic Equity Funds - 51.5% |
| | | Shares | Value ($) |
| VIP Contrafund Portfolio - Initial Class (a) | | 301,057 | 17,443,253 |
| VIP Equity-Income Portfolio - Initial Class (a) | | 535,246 | 14,232,197 |
| VIP Growth & Income Portfolio - Initial Class (a) | | 638,980 | 19,520,824 |
| VIP Growth Portfolio - Initial Class (a) | | 298,213 | 28,908,730 |
| VIP Mid Cap Portfolio - Initial Class (a) | | 119,298 | 4,480,819 |
| VIP Value Portfolio - Initial Class (a) | | 526,361 | 10,000,865 |
| VIP Value Strategies Portfolio - Initial Class (a) | | 320,278 | 4,967,506 |
| TOTAL DOMESTIC EQUITY FUNDS (Cost $80,964,433) | | | 99,554,194 |
| | | | |
| International Equity Funds - 40.9% |
| | | Shares | Value ($) |
| VIP Emerging Markets Portfolio - Initial Class (a) | | 2,202,765 | 25,287,739 |
| VIP Overseas Portfolio - Initial Class (a) | | 2,110,930 | 53,765,396 |
| TOTAL INTERNATIONAL EQUITY FUNDS (Cost $73,840,616) | | | 79,053,135 |
| | | | |
| TOTAL INVESTMENT IN SECURITIES - 100.0% (Cost $170,982,011) | 193,324,504 |
NET OTHER ASSETS (LIABILITIES) - 0.0% | (29,302) |
| NET ASSETS - 100.0% | 193,295,202 |
| | |
Legend
Affiliated Central Funds
Fiscal year to date information regarding the Fund's investments in Fidelity Central Funds, including the ownership percentage, is presented below.
| Affiliate | Value, beginning of period ($) | Purchases ($) | Sales Proceeds ($) | Dividend Income ($) | Realized Gain (loss) ($) | Change in Unrealized appreciation (depreciation) ($) | Value, end of period ($) | Shares, end of period | % ownership, end of period |
| Fidelity Cash Central Fund | - | 89,078 | 89,078 | 14 | - | - | - | - | 0.0% |
| Total | - | 89,078 | 89,078 | 14 | - | - | - | - | |
| | | | | | | | | | |
Amounts in the dividend income column in the above table include any capital gain distributions from underlying funds, which are presented in the corresponding line item in the Statement of Operations, if applicable.
Amounts included in the purchases and sales proceeds columns may include in-kind transactions, if applicable.
Affiliated Underlying Funds
Fiscal year to date information regarding the Fund's investments in affiliated Underlying Funds is presented below. Exchanges between classes of the same affiliated Underlying Funds may occur. If an Underlying Funds changes its name, the name presented below is the name in effect at period end.
| Affiliate | Value, beginning of period ($) | Purchases ($) | Sales Proceeds ($) | Dividend Income ($) | Realized Gain (loss) ($) | Change in Unrealized appreciation (depreciation) ($) | Value, end of period ($) | Shares, end of period |
| Fidelity Inflation-Protected Bond Index Fund | 3,290,282 | 942,915 | 4,264,646 | 44,431 | (198,631) | 230,080 | - | - |
| Fidelity International Bond Index Fund | 844,505 | 2,276,155 | 1,148,583 | 36,637 | (24,234) | (9,434) | 1,938,409 | 208,431 |
| Fidelity Long-Term Treasury Bond Index Fund | 9,398,932 | 10,280,383 | 5,766,104 | 354,681 | (821,789) | (312,656) | 12,778,766 | 1,393,540 |
| VIP Contrafund Portfolio - Initial Class | 13,090,234 | 6,642,324 | 4,659,344 | 2,011,729 | 125,435 | 2,244,604 | 17,443,253 | 301,057 |
| VIP Emerging Markets Portfolio - Initial Class | 19,954,035 | 10,183,020 | 6,627,399 | 362,608 | 176,445 | 1,601,638 | 25,287,739 | 2,202,765 |
| VIP Equity-Income Portfolio - Initial Class | 10,614,544 | 6,303,458 | 3,413,404 | 1,024,314 | 67,311 | 660,288 | 14,232,197 | 535,246 |
| VIP Government Money Market Portfolio - Initial Class | - | 496,259 | 496,259 | 2,015 | - | - | - | - |
| VIP Growth & Income Portfolio - Initial Class | 14,591,079 | 7,134,242 | 4,118,097 | 1,483,430 | 33,685 | 1,879,915 | 19,520,824 | 638,980 |
| VIP Growth Portfolio - Initial Class | 21,678,993 | 14,155,230 | 7,383,760 | 6,119,200 | 33,737 | 424,530 | 28,908,730 | 298,213 |
| VIP High Income Portfolio - Initial Class | 415,899 | 150,151 | 609,506 | 180 | 30,078 | 13,378 | - | - |
| VIP Investment Grade Bond II Portfolio - Initial Class | 2,843,761 | 668,782 | 3,480,646 | 566 | (25,287) | (6,610) | - | - |
| VIP Mid Cap Portfolio - Initial Class | 3,322,636 | 2,101,420 | 1,048,978 | 542,683 | 55,450 | 50,291 | 4,480,819 | 119,298 |
| VIP Overseas Portfolio - Initial Class | 42,622,148 | 20,600,121 | 7,947,582 | 3,392,696 | 98,740 | (1,608,031) | 53,765,396 | 2,110,930 |
| VIP Value Portfolio - Initial Class | 7,403,843 | 4,950,576 | 2,295,542 | 1,045,138 | 59,981 | (117,993) | 10,000,865 | 526,361 |
| VIP Value Strategies Portfolio - Initial Class | 3,664,004 | 2,733,857 | 1,159,662 | 695,114 | 35,859 | (306,552) | 4,967,506 | 320,278 |
| | 153,734,895 | 89,618,893 | 54,419,512 | 17,115,422 | (353,220) | 4,743,448 | 193,324,504 | 8,655,099 |
Amounts in the dividend income column in the above table include any capital gain distributions from underlying funds, which are presented in the corresponding line item in the Statement of Operations, if applicable.
Amounts included in the purchases and sales proceeds columns may include in-kind transactions, if applicable.
Investment Valuation
The following is a summary of the inputs used, as of December 31, 2024, involving the Fund's assets and liabilities carried at fair value. The inputs or methodology used for valuing securities may not be an indication of the risk associated with investing in those securities. For more information on valuation inputs, and their aggregation into the levels used below, please refer to the Investment Valuation section in the accompanying Notes to Financial Statements.
| Valuation Inputs at Reporting Date: |
| Description | Total ($) | Level 1 ($) | Level 2 ($) | Level 3 ($) |
Investments in Securities: | | | | |
|
| Bond Funds | 14,717,175 | 14,717,175 | - | - |
|
| Domestic Equity Funds | 99,554,194 | 99,554,194 | - | - |
|
| International Equity Funds | 79,053,135 | 79,053,135 | - | - |
| Total Investments in Securities: | 193,324,504 | 193,324,504 | - | - |
VIP Freedom 2045 Portfolio℠
Financial Statements
| Statement of Assets and Liabilities |
As of December 31, 2024 |
| Assets | | | | |
| Investment in securities, at value - See accompanying schedule: | | | | |
Affiliated issuers (cost $170,982,011) | $ | 193,324,504 | | |
| | | | | |
| | | | | |
| Total Investment in Securities (cost $170,982,011) | | | $ | 193,324,504 |
| Receivable for investments sold | | | | 1,190,812 |
| Receivable for fund shares sold | | | | 145,581 |
Total assets | | | | 194,660,897 |
| Liabilities | | | | |
| Payable for investments purchased | $ | 1,207,182 | | |
| Payable for fund shares redeemed | | 129,205 | | |
| Distribution and service plan fees payable | | 29,308 | | |
| Total liabilities | | | | 1,365,695 |
| Net Assets | | | $ | 193,295,202 |
| Net Assets consist of: | | | | |
| Paid in capital | | | $ | 160,480,824 |
| Total accumulated earnings (loss) | | | | 32,814,378 |
| Net Assets | | | $ | 193,295,202 |
| | | | | |
| Net Asset Value and Maximum Offering Price | | | | |
| Initial Class : | | | | |
Net Asset Value, offering price and redemption price per share ($23,336,079 ÷ 839,128 shares) | | | $ | 27.81 |
| Service Class : | | | | |
Net Asset Value, offering price and redemption price per share ($53,830,107 ÷ 1,942,360 shares) | | | $ | 27.71 |
| Service Class 2 : | | | | |
Net Asset Value, offering price and redemption price per share ($116,129,016 ÷ 4,216,487 shares) | | | $ | 27.54 |
| Statement of Operations |
| Year ended December 31, 2024 |
| Investment Income | | | | |
| Dividends: | | | | |
| Affiliated issuers | | | $ | 2,423,911 |
| Income from Fidelity Central Funds | | | | 14 |
| Total income | | | | 2,423,925 |
| Expenses | | | | |
| Distribution and service plan fees | $ | 321,146 | | |
| Independent trustees' fees and expenses | | 448 | | |
| Total expenses before reductions | | 321,594 | | |
| Expense reductions | | (52) | | |
| Total expenses after reductions | | | | 321,542 |
| Net Investment income (loss) | | | | 2,102,383 |
| Realized and Unrealized Gain (Loss) | | | | |
| Net realized gain (loss) on: | | | | |
| Investment Securities: | | | | |
| Affiliated issuers | | (353,220) | | |
| Capital gain distributions from underlying funds: | | | | |
| Affiliated issuers | | 14,691,511 | | |
| Total net realized gain (loss) | | | | 14,338,291 |
| Change in net unrealized appreciation (depreciation) on: | | | | |
| Investment Securities: | | | | |
| Affiliated issuers | | 4,743,448 | | |
| Total change in net unrealized appreciation (depreciation) | | | | 4,743,448 |
| Net gain (loss) | | | | 19,081,739 |
| Net increase (decrease) in net assets resulting from operations | | | $ | 21,184,122 |
| Statement of Changes in Net Assets |
| |
| | Year ended December 31, 2024 | | Year ended December 31, 2023 |
| Increase (Decrease) in Net Assets | | | | |
| Operations | | | | |
| Net investment income (loss) | $ | 2,102,383 | $ | 1,735,494 |
| Net realized gain (loss) | | 14,338,291 | | 2,560,863 |
| Change in net unrealized appreciation (depreciation) | | 4,743,448 | | 18,054,403 |
| Net increase (decrease) in net assets resulting from operations | | 21,184,122 | | 22,350,760 |
| Distributions to shareholders | | (5,192,516) | | (3,608,373) |
| | | | | |
| Share transactions - net increase (decrease) | | 23,590,217 | | 30,569,201 |
| Total increase (decrease) in net assets | | 39,581,823 | | 49,311,588 |
| | | | | |
| Net Assets | | | | |
| Beginning of period | | 153,713,379 | | 104,401,791 |
| End of period | $ | 193,295,202 | $ | 153,713,379 |
| | | | | |
| | | | | |
Financial Highlights
VIP Freedom 2045 Portfolio℠ Initial Class |
| |
| Years ended December 31, | | 2024 | | 2023 | | 2022 | | 2021 | | 2020 |
Selected Per-Share Data | | | | | | | | | | |
| Net asset value, beginning of period | $ | 25.21 | $ | 21.76 | $ | 29.30 | $ | 26.09 | $ | 23.08 |
| Income from Investment Operations | | | | | | | | | | |
Net investment income (loss) A,B | | .37 | | .37 | | .34 | | .40 | | .25 |
| Net realized and unrealized gain (loss) | | 3.08 | | 3.80 | | (5.35) | | 4.16 | | 4.03 |
| Total from investment operations | | 3.45 | | 4.17 | | (5.01) | | 4.56 | | 4.28 |
| Distributions from net investment income | | (.36) | | (.35) | | (.38) | | (.27) | | (.22) |
| Distributions from net realized gain | | (.48) | | (.37) | | (2.15) | | (1.08) | | (1.05) |
| Total distributions | | (.85) C | | (.72) | | (2.53) | | (1.35) | | (1.27) |
| Net asset value, end of period | $ | 27.81 | $ | 25.21 | $ | 21.76 | $ | 29.30 | $ | 26.09 |
Total Return D,E | | | | 19.41% | | (18.21)% | | 17.83% | | 19.27% |
Ratios to Average Net Assets B,F,G | | | | | | | | | | |
Expenses before reductions H | | -% | | -% | | -% | | -% | | -% |
Expenses net of fee waivers, if any H | | | | -% | | -% | | -% | | -% |
Expenses net of all reductions H | | -% | | -% | | -% | | -% | | -% |
| Net investment income (loss) | | 1.36% | | 1.59% | | 1.50% | | 1.42% | | 1.12% |
| Supplemental Data | | | | | | | | | | |
| Net assets, end of period (000 omitted) | $ | 23,336 | $ | 17,029 | $ | 7,366 | $ | 6,866 | $ | 5,282 |
Portfolio turnover rate I | | | | 24% | | 39% | | 29% | | 38% |
ACalculated based on average shares outstanding during the period.
BNet investment income (loss) is affected by the timing of the declaration of dividends by any underlying mutual funds or exchange-traded funds (ETFs). Net investment income (loss) of any mutual funds or ETFs is not included in the Fund's net investment income (loss) ratio.
CTotal distributions per share do not sum due to rounding.
DTotal returns do not reflect charges attributable to your insurance company's separate account. Inclusion of these charges would reduce the total returns shown.
ETotal returns would have been lower if certain expenses had not been reduced during the applicable periods shown.
FFees and expenses of any underlying mutual funds or exchange-traded funds (ETFs) are not included in the Fund's expense ratio. The Fund indirectly bears its proportionate share of these expenses.
GExpense ratios reflect operating expenses of the class. Expenses before reductions do not reflect amounts reimbursed, waived, or reduced through arrangements with the investment adviser, brokerage services, or other offset arrangements, if applicable, and do not represent the amount paid by the class during periods when reimbursements, waivers or reductions occur.
HAmount represents less than .005%.
IAmount does not include the portfolio activity of any underlying mutual funds or exchange-traded funds (ETFs), derivatives or securities that mature within one year from acquisition.
VIP Freedom 2045 Portfolio℠ Service Class |
| |
| Years ended December 31, | | 2024 | | 2023 | | 2022 | | 2021 | | 2020 |
Selected Per-Share Data | | | | | | | | | | |
| Net asset value, beginning of period | $ | 25.13 | $ | 21.69 | $ | 29.22 | $ | 26.03 | $ | 23.03 |
| Income from Investment Operations | | | | | | | | | | |
Net investment income (loss) A,B | | .35 | | .35 | | .32 | | .37 | | .23 |
| Net realized and unrealized gain (loss) | | 3.05 | | 3.79 | | (5.34) | | 4.14 | | 4.02 |
| Total from investment operations | | 3.40 | | 4.14 | | (5.02) | | 4.51 | | 4.25 |
| Distributions from net investment income | | (.34) | | (.33) | | (.36) | | (.24) | | (.21) |
| Distributions from net realized gain | | (.48) | | (.37) | | (2.15) | | (1.08) | | (1.05) |
| Total distributions | | (.82) | | (.70) | | (2.51) | | (1.32) | | (1.25) C |
| Net asset value, end of period | $ | 27.71 | $ | 25.13 | $ | 21.69 | $ | 29.22 | $ | 26.03 |
Total Return D,E | | | | 19.33% | | (18.30)% | | 17.69% | | 19.18% |
Ratios to Average Net Assets B,F,G | | | | | | | | | | |
| Expenses before reductions | | .10% | | .10% | | .10% | | .10% | | .10% |
| Expenses net of fee waivers, if any | | | | .10% | | .10% | | .10% | | .10% |
| Expenses net of all reductions | | .10% | | .10% | | .10% | | .10% | | .10% |
| Net investment income (loss) | | 1.26% | | 1.49% | | 1.40% | | 1.32% | | 1.02% |
| Supplemental Data | | | | | | | | | | |
| Net assets, end of period (000 omitted) | $ | 53,830 | $ | 41,877 | $ | 23,628 | $ | 22,218 | $ | 13,322 |
Portfolio turnover rate H | | | | 24% | | 39% | | 29% | | 38% |
ACalculated based on average shares outstanding during the period.
BNet investment income (loss) is affected by the timing of the declaration of dividends by any underlying mutual funds or exchange-traded funds (ETFs). Net investment income (loss) of any mutual funds or ETFs is not included in the Fund's net investment income (loss) ratio.
CTotal distributions per share do not sum due to rounding.
DTotal returns do not reflect charges attributable to your insurance company's separate account. Inclusion of these charges would reduce the total returns shown.
ETotal returns would have been lower if certain expenses had not been reduced during the applicable periods shown.
FFees and expenses of any underlying mutual funds or exchange-traded funds (ETFs) are not included in the Fund's expense ratio. The Fund indirectly bears its proportionate share of these expenses.
GExpense ratios reflect operating expenses of the class. Expenses before reductions do not reflect amounts reimbursed, waived, or reduced through arrangements with the investment adviser, brokerage services, or other offset arrangements, if applicable, and do not represent the amount paid by the class during periods when reimbursements, waivers or reductions occur.
HAmount does not include the portfolio activity of any underlying mutual funds or exchange-traded funds (ETFs), derivatives or securities that mature within one year from acquisition.
VIP Freedom 2045 Portfolio℠ Service Class 2 |
| |
| Years ended December 31, | | 2024 | | 2023 | | 2022 | | 2021 | | 2020 |
Selected Per-Share Data | | | | | | | | | | |
| Net asset value, beginning of period | $ | 24.98 | $ | 21.57 | $ | 29.07 | $ | 25.90 | $ | 22.93 |
| Income from Investment Operations | | | | | | | | | | |
Net investment income (loss) A,B | | .30 | | .31 | | .28 | | .33 | | .19 |
| Net realized and unrealized gain (loss) | | 3.04 | | 3.76 | | (5.30) | | 4.12 | | 4.00 |
| Total from investment operations | | 3.34 | | 4.07 | | (5.02) | | 4.45 | | 4.19 |
| Distributions from net investment income | | (.30) | | (.30) | | (.33) | | (.20) | | (.17) |
| Distributions from net realized gain | | (.48) | | (.37) | | (2.15) | | (1.08) | | (1.05) |
| Total distributions | | (.78) | | (.66) C | | (2.48) | | (1.28) | | (1.22) |
| Net asset value, end of period | $ | 27.54 | $ | 24.98 | $ | 21.57 | $ | 29.07 | $ | 25.90 |
Total Return D,E | | | | 19.13% | | (18.42)% | | 17.53% | | 18.97% |
Ratios to Average Net Assets B,F,G | | | | | | | | | | |
| Expenses before reductions | | .25% | | .25% | | .25% | | .25% | | .25% |
| Expenses net of fee waivers, if any | | | | .25% | | .25% | | .25% | | .25% |
| Expenses net of all reductions | | .25% | | .25% | | .25% | | .25% | | .25% |
| Net investment income (loss) | | 1.11% | | 1.34% | | 1.25% | | 1.17% | | .87% |
| Supplemental Data | | | | | | | | | | |
| Net assets, end of period (000 omitted) | $ | 116,129 | $ | 94,807 | $ | 73,408 | $ | 78,396 | $ | 63,126 |
Portfolio turnover rate H | | | | 24% | | 39% | | 29% | | 38% |
ACalculated based on average shares outstanding during the period.
BNet investment income (loss) is affected by the timing of the declaration of dividends by any underlying mutual funds or exchange-traded funds (ETFs). Net investment income (loss) of any mutual funds or ETFs is not included in the Fund's net investment income (loss) ratio.
CTotal distributions per share do not sum due to rounding.
DTotal returns do not reflect charges attributable to your insurance company's separate account. Inclusion of these charges would reduce the total returns shown.
ETotal returns would have been lower if certain expenses had not been reduced during the applicable periods shown.
FFees and expenses of any underlying mutual funds or exchange-traded funds (ETFs) are not included in the Fund's expense ratio. The Fund indirectly bears its proportionate share of these expenses.
GExpense ratios reflect operating expenses of the class. Expenses before reductions do not reflect amounts reimbursed, waived, or reduced through arrangements with the investment adviser, brokerage services, or other offset arrangements, if applicable, and do not represent the amount paid by the class during periods when reimbursements, waivers or reductions occur.
HAmount does not include the portfolio activity of any underlying mutual funds or exchange-traded funds (ETFs), derivatives or securities that mature within one year from acquisition.
VIP Freedom 2050 Portfolio℠
Schedule of Investments December 31, 2024
Showing Percentage of Net Assets
| Bond Funds - 7.6% |
| | | Shares | Value ($) |
| Fidelity International Bond Index Fund (a) | | 181,541 | 1,688,328 |
| Fidelity Long-Term Treasury Bond Index Fund (a) | | 1,213,758 | 11,130,165 |
| TOTAL BOND FUNDS (Cost $14,014,440) | | | 12,818,493 |
| | | | |
| Domestic Equity Funds - 51.5% |
| | | Shares | Value ($) |
| VIP Contrafund Portfolio - Initial Class (a) | | 262,219 | 15,192,965 |
| VIP Equity-Income Portfolio - Initial Class (a) | | 466,192 | 12,396,049 |
| VIP Growth & Income Portfolio - Initial Class (a) | | 556,544 | 17,002,407 |
| VIP Growth Portfolio - Initial Class (a) | | 259,741 | 25,179,315 |
| VIP Mid Cap Portfolio - Initial Class (a) | | 103,907 | 3,902,729 |
| VIP Value Portfolio - Initial Class (a) | | 458,452 | 8,710,588 |
| VIP Value Strategies Portfolio - Initial Class (a) | | 278,956 | 4,326,612 |
| TOTAL DOMESTIC EQUITY FUNDS (Cost $70,098,634) | | | 86,710,665 |
| | | | |
| International Equity Funds - 40.9% |
| | | Shares | Value ($) |
| VIP Emerging Markets Portfolio - Initial Class (a) | | 1,918,580 | 22,025,297 |
| VIP Overseas Portfolio - Initial Class (a) | | 1,838,597 | 46,829,077 |
| TOTAL INTERNATIONAL EQUITY FUNDS (Cost $64,413,727) | | | 68,854,374 |
| | | | |
| TOTAL INVESTMENT IN SECURITIES - 100.0% (Cost $148,526,801) | 168,383,532 |
NET OTHER ASSETS (LIABILITIES) - 0.0% | (21,361) |
| NET ASSETS - 100.0% | 168,362,171 |
| | |
Legend
Affiliated Underlying Funds
Fiscal year to date information regarding the Fund's investments in affiliated Underlying Funds is presented below. Exchanges between classes of the same affiliated Underlying Funds may occur. If an Underlying Funds changes its name, the name presented below is the name in effect at period end.
| Affiliate | Value, beginning of period ($) | Purchases ($) | Sales Proceeds ($) | Dividend Income ($) | Realized Gain (loss) ($) | Change in Unrealized appreciation (depreciation) ($) | Value, end of period ($) | Shares, end of period |
| Fidelity Inflation-Protected Bond Index Fund | 2,917,638 | 855,486 | 3,801,324 | 39,373 | (182,484) | 210,684 | - | - |
| Fidelity International Bond Index Fund | 748,858 | 2,001,712 | 1,032,946 | 31,999 | (21,577) | (7,719) | 1,688,328 | 181,541 |
| Fidelity Long-Term Treasury Bond Index Fund | 8,334,937 | 9,187,106 | 5,400,686 | 314,194 | (811,726) | (179,466) | 11,130,165 | 1,213,758 |
| VIP Contrafund Portfolio - Initial Class | 11,607,631 | 6,228,492 | 4,777,978 | 1,750,562 | 115,060 | 2,019,760 | 15,192,965 | 262,219 |
| VIP Emerging Markets Portfolio - Initial Class | 17,693,952 | 9,385,340 | 6,634,902 | 315,602 | 36,486 | 1,544,421 | 22,025,297 | 1,918,580 |
| VIP Equity-Income Portfolio - Initial Class | 9,412,299 | 5,706,163 | 3,385,463 | 891,984 | 54,886 | 608,164 | 12,396,049 | 466,192 |
| VIP Government Money Market Portfolio - Initial Class | - | 441,592 | 441,592 | 1,784 | - | - | - | - |
| VIP Growth & Income Portfolio - Initial Class | 12,938,462 | 6,539,331 | 4,193,627 | 1,292,088 | 39,146 | 1,679,095 | 17,002,407 | 556,544 |
| VIP Growth Portfolio - Initial Class | 19,223,689 | 13,048,115 | 7,593,634 | 5,328,002 | 37,589 | 463,556 | 25,179,315 | 259,741 |
| VIP High Income Portfolio - Initial Class | 368,791 | 136,169 | 543,395 | 160 | 25,291 | 13,144 | - | - |
| VIP Investment Grade Bond II Portfolio - Initial Class | 2,521,673 | 602,912 | 3,096,092 | 504 | (22,247) | (6,246) | - | - |
| VIP Mid Cap Portfolio - Initial Class | 2,946,366 | 1,948,350 | 1,091,675 | 473,077 | 41,741 | 57,947 | 3,902,729 | 103,907 |
| VIP Overseas Portfolio - Initial Class | 37,794,234 | 18,970,930 | 8,638,959 | 2,953,322 | (20,755) | (1,276,373) | 46,829,077 | 1,838,597 |
| VIP Value Portfolio - Initial Class | 6,565,327 | 4,525,908 | 2,339,721 | 912,006 | 49,918 | (90,844) | 8,710,588 | 458,452 |
| VIP Value Strategies Portfolio - Initial Class | 3,249,042 | 2,511,210 | 1,201,698 | 605,572 | 30,563 | (262,505) | 4,326,612 | 278,956 |
| | 136,322,899 | 82,088,816 | 54,173,692 | 14,910,229 | (628,109) | 4,773,618 | 168,383,532 | 7,538,487 |
Amounts in the dividend income column in the above table include any capital gain distributions from underlying funds, which are presented in the corresponding line item in the Statement of Operations, if applicable.
Amounts included in the purchases and sales proceeds columns may include in-kind transactions, if applicable.
Investment Valuation
The following is a summary of the inputs used, as of December 31, 2024, involving the Fund's assets and liabilities carried at fair value. The inputs or methodology used for valuing securities may not be an indication of the risk associated with investing in those securities. For more information on valuation inputs, and their aggregation into the levels used below, please refer to the Investment Valuation section in the accompanying Notes to Financial Statements.
| Valuation Inputs at Reporting Date: |
| Description | Total ($) | Level 1 ($) | Level 2 ($) | Level 3 ($) |
Investments in Securities: | | | | |
|
| Bond Funds | 12,818,493 | 12,818,493 | - | - |
|
| Domestic Equity Funds | 86,710,665 | 86,710,665 | - | - |
|
| International Equity Funds | 68,854,374 | 68,854,374 | - | - |
| Total Investments in Securities: | 168,383,532 | 168,383,532 | - | - |
VIP Freedom 2050 Portfolio℠
Financial Statements
| Statement of Assets and Liabilities |
As of December 31, 2024 |
| Assets | | | | |
| Investment in securities, at value - See accompanying schedule: | | | | |
Affiliated issuers (cost $148,526,801) | $ | 168,383,532 | | |
| | | | | |
| | | | | |
| Total Investment in Securities (cost $148,526,801) | | | $ | 168,383,532 |
| Receivable for investments sold | | | | 1,073,823 |
| Receivable for fund shares sold | | | | 400,275 |
Total assets | | | | 169,857,630 |
| Liabilities | | | | |
| Payable for investments purchased | $ | 1,254,730 | | |
| Payable for fund shares redeemed | | 219,370 | | |
| Distribution and service plan fees payable | | 21,359 | | |
| Total liabilities | | | | 1,495,459 |
| Net Assets | | | $ | 168,362,171 |
| Net Assets consist of: | | | | |
| Paid in capital | | | $ | 139,997,514 |
| Total accumulated earnings (loss) | | | | 28,364,657 |
| Net Assets | | | $ | 168,362,171 |
| | | | | |
| Net Asset Value and Maximum Offering Price | | | | |
| Initial Class : | | | | |
Net Asset Value, offering price and redemption price per share ($33,292,565 ÷ 1,327,131 shares) | | | $ | 25.09 |
| Service Class : | | | | |
Net Asset Value, offering price and redemption price per share ($57,267,223 ÷ 2,291,139 shares) | | | $ | 25.00 |
| Service Class 2 : | | | | |
Net Asset Value, offering price and redemption price per share ($77,802,383 ÷ 3,128,882 shares) | | | $ | 24.87 |
| Statement of Operations |
| Year ended December 31, 2024 |
| Investment Income | | | | |
| Dividends: | | | | |
| Affiliated issuers | | | $ | 2,116,899 |
| Expenses | | | | |
| Distribution and service plan fees | $ | 236,612 | | |
| Independent trustees' fees and expenses | | 398 | | |
| Total expenses before reductions | | 237,010 | | |
| Expense reductions | | (37) | | |
| Total expenses after reductions | | | | 236,973 |
| Net Investment income (loss) | | | | 1,879,926 |
| Realized and Unrealized Gain (Loss) | | | | |
| Net realized gain (loss) on: | | | | |
| Investment Securities: | | | | |
| Affiliated issuers | | (628,109) | | |
| Capital gain distributions from underlying funds: | | | | |
| Affiliated issuers | | 12,793,330 | | |
| Total net realized gain (loss) | | | | 12,165,221 |
| Change in net unrealized appreciation (depreciation) on: | | | | |
| Investment Securities: | | | | |
| Affiliated issuers | | 4,773,618 | | |
| Total change in net unrealized appreciation (depreciation) | | | | 4,773,618 |
| Net gain (loss) | | | | 16,938,839 |
| Net increase (decrease) in net assets resulting from operations | | | $ | 18,818,765 |
| Statement of Changes in Net Assets |
| |
| | Year ended December 31, 2024 | | Year ended December 31, 2023 |
| Increase (Decrease) in Net Assets | | | | |
| Operations | | | | |
| Net investment income (loss) | $ | 1,879,926 | $ | 1,610,051 |
| Net realized gain (loss) | | 12,165,221 | | 2,210,842 |
| Change in net unrealized appreciation (depreciation) | | 4,773,618 | | 16,693,640 |
| Net increase (decrease) in net assets resulting from operations | | 18,818,765 | | 20,514,533 |
| Distributions to shareholders | | (4,759,754) | | (3,285,601) |
| | | | | |
| Share transactions - net increase (decrease) | | 17,996,348 | | 23,658,219 |
| Total increase (decrease) in net assets | | 32,055,359 | | 40,887,151 |
| | | | | |
| Net Assets | | | | |
| Beginning of period | | 136,306,812 | | 95,419,661 |
| End of period | $ | 168,362,171 | $ | 136,306,812 |
| | | | | |
| | | | | |
Financial Highlights
VIP Freedom 2050 Portfolio℠ Initial Class |
| |
| Years ended December 31, | | 2024 | | 2023 | | 2022 | | 2021 | | 2020 |
Selected Per-Share Data | | | | | | | | | | |
| Net asset value, beginning of period | $ | 22.77 | $ | 19.64 | $ | 26.36 | $ | 23.45 | $ | 20.68 |
| Income from Investment Operations | | | | | | | | | | |
Net investment income (loss) A,B | | .33 | | .33 | | .31 | | .38 | | .22 |
| Net realized and unrealized gain (loss) | | 2.78 | | 3.44 | | (4.83) | | 3.72 | | 3.63 |
| Total from investment operations | | 3.11 | | 3.77 | | (4.52) | | 4.10 | | 3.85 |
| Distributions from net investment income | | (.33) | | (.32) | | (.35) | | (.24) | | (.20) |
| Distributions from net realized gain | | (.46) | | (.32) | | (1.85) | | (.95) | | (.88) |
| Total distributions | | (.79) | | (.64) | | (2.20) | | (1.19) | | (1.08) |
| Net asset value, end of period | $ | 25.09 | $ | 22.77 | $ | 19.64 | $ | 26.36 | $ | 23.45 |
Total Return C,D | | | | 19.45% | | (18.22)% | | 17.83% | | 19.28% |
Ratios to Average Net Assets B,E,F | | | | | | | | | | |
Expenses before reductions G | | -% | | -% | | -% | | -% | | -% |
Expenses net of fee waivers, if any G | | | | -% | | -% | | -% | | -% |
Expenses net of all reductions G | | -% | | -% | | -% | | -% | | -% |
| Net investment income (loss) | | 1.34% | | 1.57% | | 1.50% | | 1.48% | | 1.08% |
| Supplemental Data | | | | | | | | | | |
| Net assets, end of period (000 omitted) | $ | 33,293 | $ | 27,394 | $ | 17,775 | $ | 19,102 | $ | 13,644 |
Portfolio turnover rate H | | | | 24% | | 38% | | 30% | | 43% |
ACalculated based on average shares outstanding during the period.
BNet investment income (loss) is affected by the timing of the declaration of dividends by any underlying mutual funds or exchange-traded funds (ETFs). Net investment income (loss) of any mutual funds or ETFs is not included in the Fund's net investment income (loss) ratio.
CTotal returns do not reflect charges attributable to your insurance company's separate account. Inclusion of these charges would reduce the total returns shown.
DTotal returns would have been lower if certain expenses had not been reduced during the applicable periods shown.
EFees and expenses of any underlying mutual funds or exchange-traded funds (ETFs) are not included in the Fund's expense ratio. The Fund indirectly bears its proportionate share of these expenses.
FExpense ratios reflect operating expenses of the class. Expenses before reductions do not reflect amounts reimbursed, waived, or reduced through arrangements with the investment adviser, brokerage services, or other offset arrangements, if applicable, and do not represent the amount paid by the class during periods when reimbursements, waivers or reductions occur.
GAmount represents less than .005%.
HAmount does not include the portfolio activity of any underlying mutual funds or exchange-traded funds (ETFs), derivatives or securities that mature within one year from acquisition.
VIP Freedom 2050 Portfolio℠ Service Class |
| |
| Years ended December 31, | | 2024 | | 2023 | | 2022 | | 2021 | | 2020 |
Selected Per-Share Data | | | | | | | | | | |
| Net asset value, beginning of period | $ | 22.69 | $ | 19.58 | $ | 26.29 | $ | 23.39 | $ | 20.63 |
| Income from Investment Operations | | | | | | | | | | |
Net investment income (loss) A,B | | .31 | | .31 | | .29 | | .35 | | .20 |
| Net realized and unrealized gain (loss) | | 2.77 | | 3.42 | | (4.82) | | 3.72 | | 3.62 |
| Total from investment operations | | 3.08 | | 3.73 | | (4.53) | | 4.07 | | 3.82 |
| Distributions from net investment income | | (.31) | | (.30) | | (.33) | | (.22) | | (.18) |
| Distributions from net realized gain | | (.46) | | (.32) | | (1.85) | | (.95) | | (.88) |
| Total distributions | | (.77) | | (.62) | | (2.18) | | (1.17) | | (1.06) |
| Net asset value, end of period | $ | 25.00 | $ | 22.69 | $ | 19.58 | $ | 26.29 | $ | 23.39 |
Total Return C,D | | | | 19.30% | | (18.31)% | | 17.73% | | 19.17% |
Ratios to Average Net Assets B,E,F | | | | | | | | | | |
| Expenses before reductions | | .10% | | .10% | | .10% | | .10% | | .10% |
| Expenses net of fee waivers, if any | | | | .10% | | .10% | | .10% | | .10% |
| Expenses net of all reductions | | .10% | | .10% | | .10% | | .10% | | .10% |
| Net investment income (loss) | | 1.24% | | 1.47% | | 1.40% | | 1.38% | | .98% |
| Supplemental Data | | | | | | | | | | |
| Net assets, end of period (000 omitted) | $ | 57,267 | $ | 44,557 | $ | 31,042 | $ | 30,244 | $ | 21,593 |
Portfolio turnover rate G | | | | 24% | | 38% | | 30% | | 43% |
ACalculated based on average shares outstanding during the period.
BNet investment income (loss) is affected by the timing of the declaration of dividends by any underlying mutual funds or exchange-traded funds (ETFs). Net investment income (loss) of any mutual funds or ETFs is not included in the Fund's net investment income (loss) ratio.
CTotal returns do not reflect charges attributable to your insurance company's separate account. Inclusion of these charges would reduce the total returns shown.
DTotal returns would have been lower if certain expenses had not been reduced during the applicable periods shown.
EFees and expenses of any underlying mutual funds or exchange-traded funds (ETFs) are not included in the Fund's expense ratio. The Fund indirectly bears its proportionate share of these expenses.
FExpense ratios reflect operating expenses of the class. Expenses before reductions do not reflect amounts reimbursed, waived, or reduced through arrangements with the investment adviser, brokerage services, or other offset arrangements, if applicable, and do not represent the amount paid by the class during periods when reimbursements, waivers or reductions occur.
GAmount does not include the portfolio activity of any underlying mutual funds or exchange-traded funds (ETFs), derivatives or securities that mature within one year from acquisition.
VIP Freedom 2050 Portfolio℠ Service Class 2 |
| |
| Years ended December 31, | | 2024 | | 2023 | | 2022 | | 2021 | | 2020 |
Selected Per-Share Data | | | | | | | | | | |
| Net asset value, beginning of period | $ | 22.58 | $ | 19.48 | $ | 26.18 | $ | 23.31 | $ | 20.57 |
| Income from Investment Operations | | | | | | | | | | |
Net investment income (loss) A,B | | .27 | | .28 | | .26 | | .31 | | .17 |
| Net realized and unrealized gain (loss) | | 2.75 | | 3.41 | | (4.81) | | 3.69 | | 3.60 |
| Total from investment operations | | 3.02 | | 3.69 | | (4.55) | | 4.00 | | 3.77 |
| Distributions from net investment income | | (.27) | | (.27) | | (.30) | | (.18) | | (.15) |
| Distributions from net realized gain | | (.46) | | (.32) | | (1.85) | | (.95) | | (.88) |
| Total distributions | | (.73) | | (.59) | | (2.15) | | (1.13) | | (1.03) |
| Net asset value, end of period | $ | 24.87 | $ | 22.58 | $ | 19.48 | $ | 26.18 | $ | 23.31 |
Total Return C,D | | | | 19.19% | | (18.47)% | | 17.51% | | 18.99% |
Ratios to Average Net Assets B,E,F | | | | | | | | | | |
| Expenses before reductions | | .25% | | .25% | | .25% | | .25% | | .25% |
| Expenses net of fee waivers, if any | | | | .25% | | .25% | | .25% | | .25% |
| Expenses net of all reductions | | .25% | | .25% | | .25% | | .25% | | .25% |
| Net investment income (loss) | | 1.09% | | 1.32% | | 1.25% | | 1.23% | | .83% |
| Supplemental Data | | | | | | | | | | |
| Net assets, end of period (000 omitted) | $ | 77,802 | $ | 64,355 | $ | 46,602 | $ | 47,661 | $ | 33,256 |
Portfolio turnover rate G | | | | 24% | | 38% | | 30% | | 43% |
ACalculated based on average shares outstanding during the period.
BNet investment income (loss) is affected by the timing of the declaration of dividends by any underlying mutual funds or exchange-traded funds (ETFs). Net investment income (loss) of any mutual funds or ETFs is not included in the Fund's net investment income (loss) ratio.
CTotal returns do not reflect charges attributable to your insurance company's separate account. Inclusion of these charges would reduce the total returns shown.
DTotal returns would have been lower if certain expenses had not been reduced during the applicable periods shown.
EFees and expenses of any underlying mutual funds or exchange-traded funds (ETFs) are not included in the Fund's expense ratio. The Fund indirectly bears its proportionate share of these expenses.
FExpense ratios reflect operating expenses of the class. Expenses before reductions do not reflect amounts reimbursed, waived, or reduced through arrangements with the investment adviser, brokerage services, or other offset arrangements, if applicable, and do not represent the amount paid by the class during periods when reimbursements, waivers or reductions occur.
GAmount does not include the portfolio activity of any underlying mutual funds or exchange-traded funds (ETFs), derivatives or securities that mature within one year from acquisition.
VIP Freedom 2055 Portfolio℠
Schedule of Investments December 31, 2024
Showing Percentage of Net Assets
| Bond Funds - 7.6% |
| | | Shares | Value ($) |
| Fidelity International Bond Index Fund (a) | | 23,230 | 216,040 |
| Fidelity Long-Term Treasury Bond Index Fund (a) | | 155,316 | 1,424,250 |
| TOTAL BOND FUNDS (Cost $1,745,872) | | | 1,640,290 |
| | | | |
| Domestic Equity Funds - 51.5% |
| | | Shares | Value ($) |
| VIP Contrafund Portfolio - Initial Class (a) | | 33,554 | 1,944,113 |
| VIP Equity-Income Portfolio - Initial Class (a) | | 59,655 | 1,586,224 |
| VIP Growth & Income Portfolio - Initial Class (a) | | 71,216 | 2,175,652 |
| VIP Growth Portfolio - Initial Class (a) | | 33,237 | 3,221,982 |
| VIP Mid Cap Portfolio - Initial Class (a) | | 13,296 | 499,397 |
| VIP Value Portfolio - Initial Class (a) | | 58,663 | 1,114,600 |
| VIP Value Strategies Portfolio - Initial Class (a) | | 35,694 | 553,618 |
| TOTAL DOMESTIC EQUITY FUNDS (Cost $9,986,285) | | | 11,095,586 |
| | | | |
| International Equity Funds - 40.9% |
| | | Shares | Value ($) |
| VIP Emerging Markets Portfolio - Initial Class (a) | | 245,504 | 2,818,382 |
| VIP Overseas Portfolio - Initial Class (a) | | 235,269 | 5,992,309 |
| TOTAL INTERNATIONAL EQUITY FUNDS (Cost $8,638,772) | | | 8,810,691 |
| | | | |
| TOTAL INVESTMENT IN SECURITIES - 100.0% (Cost $20,370,929) | 21,546,567 |
NET OTHER ASSETS (LIABILITIES) - 0.0% | (2,838) |
| NET ASSETS - 100.0% | 21,543,729 |
| | |
Legend
Affiliated Underlying Funds
Fiscal year to date information regarding the Fund's investments in affiliated Underlying Funds is presented below. Exchanges between classes of the same affiliated Underlying Funds may occur. If an Underlying Funds changes its name, the name presented below is the name in effect at period end.
| Affiliate | Value, beginning of period ($) | Purchases ($) | Sales Proceeds ($) | Dividend Income ($) | Realized Gain (loss) ($) | Change in Unrealized appreciation (depreciation) ($) | Value, end of period ($) | Shares, end of period |
| Fidelity Inflation-Protected Bond Index Fund | 296,475 | 171,726 | 471,896 | 4,782 | (14,610) | 18,305 | - | - |
| Fidelity International Bond Index Fund | 76,096 | 266,062 | 122,490 | 3,961 | (234) | (3,394) | 216,040 | 23,230 |
| Fidelity Long-Term Treasury Bond Index Fund | 846,916 | 1,417,619 | 727,169 | 37,124 | (54,930) | (58,186) | 1,424,250 | 155,316 |
| VIP Contrafund Portfolio - Initial Class | 1,179,505 | 1,229,861 | 678,890 | 225,333 | 5,097 | 208,540 | 1,944,113 | 33,554 |
| VIP Emerging Markets Portfolio - Initial Class | 1,797,982 | 1,838,114 | 984,878 | 40,431 | (6,206) | 173,370 | 2,818,382 | 245,504 |
| VIP Equity-Income Portfolio - Initial Class | 956,429 | 1,097,425 | 530,999 | 113,997 | 3,670 | 59,699 | 1,586,224 | 59,655 |
| VIP Government Money Market Portfolio - Initial Class | - | 51,811 | 51,811 | 208 | - | - | - | - |
| VIP Growth & Income Portfolio - Initial Class | 1,314,738 | 1,356,742 | 676,607 | 165,047 | (1,878) | 182,657 | 2,175,652 | 71,216 |
| VIP Growth Portfolio - Initial Class | 1,953,406 | 2,380,188 | 1,084,963 | 682,486 | (14,628) | (12,021) | 3,221,982 | 33,237 |
| VIP High Income Portfolio - Initial Class | 37,475 | 30,451 | 72,588 | 17 | 3,958 | 704 | - | - |
| VIP Investment Grade Bond II Portfolio - Initial Class | 256,242 | 84,798 | 338,208 | 53 | (1,781) | (1,051) | - | - |
| VIP Mid Cap Portfolio - Initial Class | 299,393 | 356,449 | 163,191 | 59,779 | 4,702 | 2,044 | 499,397 | 13,296 |
| VIP Overseas Portfolio - Initial Class | 3,840,476 | 3,859,975 | 1,473,499 | 378,272 | 32,578 | (267,221) | 5,992,309 | 235,269 |
| VIP Value Portfolio - Initial Class | 667,133 | 827,102 | 368,659 | 114,296 | 3,805 | (14,781) | 1,114,600 | 58,663 |
| VIP Value Strategies Portfolio - Initial Class | 330,150 | 440,830 | 184,782 | 77,119 | 3,145 | (35,725) | 553,618 | 35,694 |
| | 13,852,416 | 15,409,153 | 7,930,630 | 1,902,905 | (37,312) | 252,940 | 21,546,567 | 964,634 |
Amounts in the dividend income column in the above table include any capital gain distributions from underlying funds, which are presented in the corresponding line item in the Statement of Operations, if applicable.
Amounts included in the purchases and sales proceeds columns may include in-kind transactions, if applicable.
Investment Valuation
The following is a summary of the inputs used, as of December 31, 2024, involving the Fund's assets and liabilities carried at fair value. The inputs or methodology used for valuing securities may not be an indication of the risk associated with investing in those securities. For more information on valuation inputs, and their aggregation into the levels used below, please refer to the Investment Valuation section in the accompanying Notes to Financial Statements.
| Valuation Inputs at Reporting Date: |
| Description | Total ($) | Level 1 ($) | Level 2 ($) | Level 3 ($) |
Investments in Securities: | | | | |
|
| Bond Funds | 1,640,290 | 1,640,290 | - | - |
|
| Domestic Equity Funds | 11,095,586 | 11,095,586 | - | - |
|
| International Equity Funds | 8,810,691 | 8,810,691 | - | - |
| Total Investments in Securities: | 21,546,567 | 21,546,567 | - | - |
VIP Freedom 2055 Portfolio℠
Financial Statements
| Statement of Assets and Liabilities |
As of December 31, 2024 |
| Assets | | | | |
| Investment in securities, at value - See accompanying schedule: | | | | |
Affiliated issuers (cost $20,370,929) | $ | 21,546,567 | | |
| | | | | |
| | | | | |
| Total Investment in Securities (cost $20,370,929) | | | $ | 21,546,567 |
| Receivable for investments sold | | | | 121,004 |
| Receivable for fund shares sold | | | | 38,752 |
Total assets | | | | 21,706,323 |
| Liabilities | | | | |
| Payable for investments purchased | $ | 157,572 | | |
| Payable for fund shares redeemed | | 2,181 | | |
| Distribution and service plan fees payable | | 2,786 | | |
| Payable to investment adviser | | 55 | | |
| Total liabilities | | | | 162,594 |
| Net Assets | | | $ | 21,543,729 |
| Net Assets consist of: | | | | |
| Paid in capital | | | $ | 19,156,134 |
| Total accumulated earnings (loss) | | | | 2,387,595 |
| Net Assets | | | $ | 21,543,729 |
| | | | | |
| Net Asset Value and Maximum Offering Price | | | | |
| Initial Class : | | | | |
Net Asset Value, offering price and redemption price per share ($4,477,107 ÷ 318,363 shares) | | | $ | 14.06 |
| Service Class : | | | | |
Net Asset Value, offering price and redemption price per share ($6,653,226 ÷ 473,661 shares) | | | $ | 14.05 |
| Service Class 2 : | | | | |
Net Asset Value, offering price and redemption price per share ($10,413,396 ÷ 743,449 shares) | | | $ | 14.01 |
| Statement of Operations |
| Year ended December 31, 2024 |
| Investment Income | | | | |
| Dividends: | | | | |
| Affiliated issuers | | | $ | 266,934 |
| Expenses | | | | |
| Distribution and service plan fees | $ | 28,252 | | |
| Independent trustees' fees and expenses | | 46 | | |
| Proxy fee | | 2,749 | | |
| Total expenses before reductions | | 31,047 | | |
| Expense reductions | | (2,189) | | |
| Total expenses after reductions | | | | 28,858 |
| Net Investment income (loss) | | | | 238,076 |
| Realized and Unrealized Gain (Loss) | | | | |
| Net realized gain (loss) on: | | | | |
| Investment Securities: | | | | |
| Affiliated issuers | | (37,312) | | |
| Capital gain distributions from underlying funds: | | | | |
| Affiliated issuers | | 1,635,971 | | |
| Total net realized gain (loss) | | | | 1,598,659 |
| Change in net unrealized appreciation (depreciation) on: | | | | |
| Investment Securities: | | | | |
| Affiliated issuers | | 252,940 | | |
| Total change in net unrealized appreciation (depreciation) | | | | 252,940 |
| Net gain (loss) | | | | 1,851,599 |
| Net increase (decrease) in net assets resulting from operations | | | $ | 2,089,675 |
| Statement of Changes in Net Assets |
| |
| | Year ended December 31, 2024 | | Year ended December 31, 2023 |
| Increase (Decrease) in Net Assets | | | | |
| Operations | | | | |
| Net investment income (loss) | $ | 238,076 | $ | 158,680 |
| Net realized gain (loss) | | 1,598,659 | | 251,529 |
| Change in net unrealized appreciation (depreciation) | | 252,940 | | 1,451,746 |
| Net increase (decrease) in net assets resulting from operations | | 2,089,675 | | 1,861,955 |
| Distributions to shareholders | | (534,199) | | (264,888) |
| | | | | |
| Share transactions - net increase (decrease) | | 6,137,574 | | 5,542,714 |
| Total increase (decrease) in net assets | | 7,693,050 | | 7,139,781 |
| | | | | |
| Net Assets | | | | |
| Beginning of period | | 13,850,679 | | 6,710,898 |
| End of period | $ | 21,543,729 | $ | 13,850,679 |
| | | | | |
| | | | | |
Financial Highlights
VIP Freedom 2055 Portfolio℠ Initial Class |
| |
| Years ended December 31, | | 2024 | | 2023 | | 2022 | | 2021 | | 2020 |
Selected Per-Share Data | | | | | | | | | | |
| Net asset value, beginning of period | $ | 12.74 | $ | 10.94 | $ | 14.28 | $ | 12.67 | $ | 10.98 |
| Income from Investment Operations | | | | | | | | | | |
Net investment income (loss) A,B | | .20 | | .21 | | .18 | | .23 | | .12 |
| Net realized and unrealized gain (loss) | | 1.54 | | 1.91 | | (2.69) | | 2.02 | | 1.99 |
| Total from investment operations | | 1.74 | | 2.12 | | (2.51) | | 2.25 | | 2.11 |
| Distributions from net investment income | | (.18) | | (.17) | | (.16) | | (.17) | | (.10) |
| Distributions from net realized gain | | (.24) | | (.15) | | (.67) | | (.46) | | (.32) |
| Total distributions | | (.42) | | (.32) | | (.83) | | (.64) C | | (.42) |
| Net asset value, end of period | $ | 14.06 | $ | 12.74 | $ | 10.94 | $ | 14.28 | $ | 12.67 |
Total Return D,E | | | | 19.48% | | (18.26)% | | 17.79% | | 19.28% |
Ratios to Average Net Assets B,F,G | | | | | | | | | | |
| Expenses before reductions | | .01% | | -% H | | -% H | | -% H | | -% H |
| Expenses net of fee waivers, if any | | | | -% H | | -% H | | -% H | | -% H |
| Expenses net of all reductions | | .01% | | -% H | | -% H | | -% H | | -% H |
| Net investment income (loss) | | 1.42% | | 1.80% | | 1.57% | | 1.64% | | 1.09% |
| Supplemental Data | | | | | | | | | | |
| Net assets, end of period (000 omitted) | $ | 4,477 | $ | 2,508 | $ | 746 | $ | 501 | $ | 423 |
Portfolio turnover rate I | | | | 30% | | 58% | | 35% | | 64% |
ACalculated based on average shares outstanding during the period.
BNet investment income (loss) is affected by the timing of the declaration of dividends by any underlying mutual funds or exchange-traded funds (ETFs). Net investment income (loss) of any mutual funds or ETFs is not included in the Fund's net investment income (loss) ratio.
CTotal distributions per share do not sum due to rounding.
DTotal returns do not reflect charges attributable to your insurance company's separate account. Inclusion of these charges would reduce the total returns shown.
ETotal returns would have been lower if certain expenses had not been reduced during the applicable periods shown.
FFees and expenses of any underlying mutual funds or exchange-traded funds (ETFs) are not included in the Fund's expense ratio. The Fund indirectly bears its proportionate share of these expenses.
GExpense ratios reflect operating expenses of the class. Expenses before reductions do not reflect amounts reimbursed, waived, or reduced through arrangements with the investment adviser, brokerage services, or other offset arrangements, if applicable, and do not represent the amount paid by the class during periods when reimbursements, waivers or reductions occur.
HAmount represents less than .005%.
IAmount does not include the portfolio activity of any underlying mutual funds or exchange-traded funds (ETFs), derivatives or securities that mature within one year from acquisition.
VIP Freedom 2055 Portfolio℠ Service Class |
| |
| Years ended December 31, | | 2024 | | 2023 | | 2022 | | 2021 | | 2020 |
Selected Per-Share Data | | | | | | | | | | |
| Net asset value, beginning of period | $ | 12.73 | $ | 10.93 | $ | 14.27 | $ | 12.66 | $ | 10.98 |
| Income from Investment Operations | | | | | | | | | | |
Net investment income (loss) A,B | | .18 | | .20 | | .17 | | .22 | | .11 |
| Net realized and unrealized gain (loss) | | 1.55 | | 1.91 | | (2.69) | | 2.02 | | 1.99 |
| Total from investment operations | | 1.73 | | 2.11 | | (2.52) | | 2.24 | | 2.10 |
| Distributions from net investment income | | (.17) | | (.16) | | (.14) | | (.16) | | (.09) |
| Distributions from net realized gain | | (.24) | | (.15) | | (.67) | | (.46) | | (.32) |
| Total distributions | | (.41) | | (.31) | | (.82) C | | (.63) C | | (.42) C |
| Net asset value, end of period | $ | 14.05 | $ | 12.73 | $ | 10.93 | $ | 14.27 | $ | 12.66 |
Total Return D,E | | | | 19.40% | | (18.36)% | | 17.72% | | 19.11% |
Ratios to Average Net Assets B,F,G | | | | | | | | | | |
| Expenses before reductions | | .11% | | .10% | | .10% | | .10% | | .10% |
| Expenses net of fee waivers, if any | | | | .10% | | .10% | | .10% | | .10% |
| Expenses net of all reductions | | .10% | | .10% | | .10% | | .10% | | .10% |
| Net investment income (loss) | | 1.32% | | 1.70% | | 1.47% | | 1.54% | | .99% |
| Supplemental Data | | | | | | | | | | |
| Net assets, end of period (000 omitted) | $ | 6,653 | $ | 4,647 | $ | 2,306 | $ | 2,549 | $ | 814 |
Portfolio turnover rate H | | | | 30% | | 58% | | 35% | | 64% |
ACalculated based on average shares outstanding during the period.
BNet investment income (loss) is affected by the timing of the declaration of dividends by any underlying mutual funds or exchange-traded funds (ETFs). Net investment income (loss) of any mutual funds or ETFs is not included in the Fund's net investment income (loss) ratio.
CTotal distributions per share do not sum due to rounding.
DTotal returns do not reflect charges attributable to your insurance company's separate account. Inclusion of these charges would reduce the total returns shown.
ETotal returns would have been lower if certain expenses had not been reduced during the applicable periods shown.
FFees and expenses of any underlying mutual funds or exchange-traded funds (ETFs) are not included in the Fund's expense ratio. The Fund indirectly bears its proportionate share of these expenses.
GExpense ratios reflect operating expenses of the class. Expenses before reductions do not reflect amounts reimbursed, waived, or reduced through arrangements with the investment adviser, brokerage services, or other offset arrangements, if applicable, and do not represent the amount paid by the class during periods when reimbursements, waivers or reductions occur.
HAmount does not include the portfolio activity of any underlying mutual funds or exchange-traded funds (ETFs), derivatives or securities that mature within one year from acquisition.
VIP Freedom 2055 Portfolio℠ Service Class 2 |
| |
| Years ended December 31, | | 2024 | | 2023 | | 2022 | | 2021 | | 2020 |
Selected Per-Share Data | | | | | | | | | | |
| Net asset value, beginning of period | $ | 12.69 | $ | 10.91 | $ | 14.25 | $ | 12.65 | $ | 10.97 |
| Income from Investment Operations | | | | | | | | | | |
Net investment income (loss) A,B | | .16 | | .18 | | .15 | | .20 | | .09 |
| Net realized and unrealized gain (loss) | | 1.55 | | 1.89 | | (2.68) | | 2.01 | | 1.99 |
| Total from investment operations | | 1.71 | | 2.07 | | (2.53) | | 2.21 | | 2.08 |
| Distributions from net investment income | | (.15) | | (.14) | | (.13) | | (.15) | | (.08) |
| Distributions from net realized gain | | (.24) | | (.15) | | (.67) | | (.46) | | (.32) |
| Total distributions | | (.39) | | (.29) | | (.81) C | | (.61) | | (.40) |
| Net asset value, end of period | $ | 14.01 | $ | 12.69 | $ | 10.91 | $ | 14.25 | $ | 12.65 |
Total Return D,E | | | | 19.12% | | (18.46)% | | 17.52% | | 19.01% |
Ratios to Average Net Assets B,F,G | | | | | | | | | | |
| Expenses before reductions | | .26% | | .25% | | .25% | | .25% | | .25% |
| Expenses net of fee waivers, if any | | | | .25% | | .25% | | .25% | | .25% |
| Expenses net of all reductions | | .25% | | .25% | | .25% | | .25% | | .25% |
| Net investment income (loss) | | 1.17% | | 1.55% | | 1.32% | | 1.39% | | .84% |
| Supplemental Data | | | | | | | | | | |
| Net assets, end of period (000 omitted) | $ | 10,413 | $ | 6,696 | $ | 3,659 | $ | 2,663 | $ | 1,180 |
Portfolio turnover rate H | | | | 30% | | 58% | | 35% | | 64% |
ACalculated based on average shares outstanding during the period.
BNet investment income (loss) is affected by the timing of the declaration of dividends by any underlying mutual funds or exchange-traded funds (ETFs). Net investment income (loss) of any mutual funds or ETFs is not included in the Fund's net investment income (loss) ratio.
CTotal distributions per share do not sum due to rounding.
DTotal returns do not reflect charges attributable to your insurance company's separate account. Inclusion of these charges would reduce the total returns shown.
ETotal returns would have been lower if certain expenses had not been reduced during the applicable periods shown.
FFees and expenses of any underlying mutual funds or exchange-traded funds (ETFs) are not included in the Fund's expense ratio. The Fund indirectly bears its proportionate share of these expenses.
GExpense ratios reflect operating expenses of the class. Expenses before reductions do not reflect amounts reimbursed, waived, or reduced through arrangements with the investment adviser, brokerage services, or other offset arrangements, if applicable, and do not represent the amount paid by the class during periods when reimbursements, waivers or reductions occur.
HAmount does not include the portfolio activity of any underlying mutual funds or exchange-traded funds (ETFs), derivatives or securities that mature within one year from acquisition.
VIP Freedom 2060 Portfolio℠
Schedule of Investments December 31, 2024
Showing Percentage of Net Assets
| Bond Funds - 7.6% |
| | | Shares | Value ($) |
| Fidelity International Bond Index Fund (a) | | 28,212 | 262,371 |
| Fidelity Long-Term Treasury Bond Index Fund (a) | | 188,611 | 1,729,561 |
| TOTAL BOND FUNDS (Cost $2,152,450) | | | 1,991,932 |
| | | | |
| Domestic Equity Funds - 51.5% |
| | | Shares | Value ($) |
| VIP Contrafund Portfolio - Initial Class (a) | | 40,750 | 2,361,039 |
| VIP Equity-Income Portfolio - Initial Class (a) | | 72,448 | 1,926,385 |
| VIP Growth & Income Portfolio - Initial Class (a) | | 86,489 | 2,642,224 |
| VIP Growth Portfolio - Initial Class (a) | | 40,365 | 3,912,956 |
| VIP Mid Cap Portfolio - Initial Class (a) | | 16,147 | 606,495 |
| VIP Value Portfolio - Initial Class (a) | | 71,245 | 1,353,656 |
| VIP Value Strategies Portfolio - Initial Class (a) | | 43,351 | 672,374 |
| TOTAL DOMESTIC EQUITY FUNDS (Cost $11,787,405) | | | 13,475,129 |
| | | | |
| International Equity Funds - 40.9% |
| | | Shares | Value ($) |
| VIP Emerging Markets Portfolio - Initial Class (a) | | 298,153 | 3,422,794 |
| VIP Overseas Portfolio - Initial Class (a) | | 285,724 | 7,277,382 |
| TOTAL INTERNATIONAL EQUITY FUNDS (Cost $10,321,224) | | | 10,700,176 |
| | | | |
| TOTAL INVESTMENT IN SECURITIES - 100.0% (Cost $24,261,079) | 26,167,237 |
NET OTHER ASSETS (LIABILITIES) - 0.0% | (3,166) |
| NET ASSETS - 100.0% | 26,164,071 |
| | |
Legend
Affiliated Underlying Funds
Fiscal year to date information regarding the Fund's investments in affiliated Underlying Funds is presented below. Exchanges between classes of the same affiliated Underlying Funds may occur. If an Underlying Funds changes its name, the name presented below is the name in effect at period end.
| Affiliate | Value, beginning of period ($) | Purchases ($) | Sales Proceeds ($) | Dividend Income ($) | Realized Gain (loss) ($) | Change in Unrealized appreciation (depreciation) ($) | Value, end of period ($) | Shares, end of period |
| Fidelity Inflation-Protected Bond Index Fund | 444,604 | 183,777 | 632,323 | 5,526 | (23,646) | 27,588 | - | - |
| Fidelity International Bond Index Fund | 114,115 | 314,804 | 162,028 | 4,793 | (1,242) | (3,278) | 262,371 | 28,212 |
| Fidelity Long-Term Treasury Bond Index Fund | 1,270,104 | 1,628,900 | 1,022,565 | 44,328 | (93,092) | (53,786) | 1,729,561 | 188,611 |
| VIP Contrafund Portfolio - Initial Class | 1,768,828 | 1,385,084 | 1,074,380 | 266,688 | 11,931 | 269,576 | 2,361,039 | 40,750 |
| VIP Emerging Markets Portfolio - Initial Class | 2,696,297 | 2,078,231 | 1,525,073 | 48,003 | (36,534) | 209,873 | 3,422,794 | 298,153 |
| VIP Equity-Income Portfolio - Initial Class | 1,434,294 | 1,204,670 | 787,290 | 135,496 | 7,555 | 67,156 | 1,926,385 | 72,448 |
| VIP Government Money Market Portfolio - Initial Class | - | 62,037 | 62,037 | 248 | - | - | - | - |
| VIP Growth & Income Portfolio - Initial Class | 1,971,628 | 1,478,675 | 1,029,366 | 196,001 | 9,822 | 211,465 | 2,642,224 | 86,489 |
| VIP Growth Portfolio - Initial Class | 2,929,397 | 2,655,244 | 1,687,693 | 809,189 | (4,413) | 20,421 | 3,912,956 | 40,365 |
| VIP High Income Portfolio - Initial Class | 56,198 | 31,671 | 93,254 | 22 | 3,682 | 1,703 | - | - |
| VIP Investment Grade Bond II Portfolio - Initial Class | 384,265 | 96,490 | 476,920 | 68 | (2,874) | (961) | - | - |
| VIP Mid Cap Portfolio - Initial Class | 448,980 | 408,732 | 258,573 | 71,462 | 2,347 | 5,009 | 606,495 | 16,147 |
| VIP Overseas Portfolio - Initial Class | 5,759,288 | 4,269,601 | 2,511,578 | 449,120 | 7,041 | (246,970) | 7,277,382 | 285,724 |
| VIP Value Portfolio - Initial Class | 1,000,456 | 929,065 | 556,025 | 137,138 | 6,023 | (25,863) | 1,353,656 | 71,245 |
| VIP Value Strategies Portfolio - Initial Class | 495,105 | 506,256 | 287,021 | 91,847 | 3,872 | (45,838) | 672,374 | 43,351 |
| | 20,773,559 | 17,233,237 | 12,166,126 | 2,259,929 | (109,528) | 436,095 | 26,167,237 | 1,171,495 |
Amounts in the dividend income column in the above table include any capital gain distributions from underlying funds, which are presented in the corresponding line item in the Statement of Operations, if applicable.
Amounts included in the purchases and sales proceeds columns may include in-kind transactions, if applicable.
Investment Valuation
The following is a summary of the inputs used, as of December 31, 2024, involving the Fund's assets and liabilities carried at fair value. The inputs or methodology used for valuing securities may not be an indication of the risk associated with investing in those securities. For more information on valuation inputs, and their aggregation into the levels used below, please refer to the Investment Valuation section in the accompanying Notes to Financial Statements.
| Valuation Inputs at Reporting Date: |
| Description | Total ($) | Level 1 ($) | Level 2 ($) | Level 3 ($) |
Investments in Securities: | | | | |
|
| Bond Funds | 1,991,932 | 1,991,932 | - | - |
|
| Domestic Equity Funds | 13,475,129 | 13,475,129 | - | - |
|
| International Equity Funds | 10,700,176 | 10,700,176 | - | - |
| Total Investments in Securities: | 26,167,237 | 26,167,237 | - | - |
VIP Freedom 2060 Portfolio℠
Financial Statements
| Statement of Assets and Liabilities |
As of December 31, 2024 |
| Assets | | | | |
| Investment in securities, at value - See accompanying schedule: | | | | |
Affiliated issuers (cost $24,261,079) | $ | 26,167,237 | | |
| | | | | |
| | | | | |
| Total Investment in Securities (cost $24,261,079) | | | $ | 26,167,237 |
| Receivable for investments sold | | | | 147,821 |
| Receivable for fund shares sold | | | | 25,869 |
Total assets | | | | 26,340,927 |
| Liabilities | | | | |
| Payable for investments purchased | $ | 172,537 | | |
| Payable for fund shares redeemed | | 1,153 | | |
| Distribution and service plan fees payable | | 3,101 | | |
| Payable to investment adviser | | 65 | | |
| Total liabilities | | | | 176,856 |
| Net Assets | | | $ | 26,164,071 |
| Net Assets consist of: | | | | |
| Paid in capital | | | $ | 22,883,697 |
| Total accumulated earnings (loss) | | | | 3,280,374 |
| Net Assets | | | $ | 26,164,071 |
| | | | | |
| Net Asset Value and Maximum Offering Price | | | | |
| Initial Class : | | | | |
Net Asset Value, offering price and redemption price per share ($2,925,471 ÷ 210,815 shares) | | | $ | 13.88 |
| Service Class : | | | | |
Net Asset Value, offering price and redemption price per share ($13,987,266 ÷ 1,009,284 shares) | | | $ | 13.86 |
| Service Class 2 : | | | | |
Net Asset Value, offering price and redemption price per share ($9,251,334 ÷ 669,443 shares) | | | $ | 13.82 |
| Statement of Operations |
| Year ended December 31, 2024 |
| Investment Income | | | | |
| Dividends: | | | | |
| Affiliated issuers | | | $ | 317,494 |
| Expenses | | | | |
| Distribution and service plan fees | $ | 31,461 | | |
| Independent trustees' fees and expenses | | 56 | | |
| Proxy fee | | 2,719 | | |
| Total expenses before reductions | | 34,236 | | |
| Expense reductions | | (2,050) | | |
| Total expenses after reductions | | | | 32,186 |
| Net Investment income (loss) | | | | 285,308 |
| Realized and Unrealized Gain (Loss) | | | | |
| Net realized gain (loss) on: | | | | |
| Investment Securities: | | | | |
| Affiliated issuers | | (109,528) | | |
| Capital gain distributions from underlying funds: | | | | |
| Affiliated issuers | | 1,942,435 | | |
| Total net realized gain (loss) | | | | 1,832,907 |
| Change in net unrealized appreciation (depreciation) on: | | | | |
| Investment Securities: | | | | |
| Affiliated issuers | | 436,095 | | |
| Total change in net unrealized appreciation (depreciation) | | | | 436,095 |
| Net gain (loss) | | | | 2,269,002 |
| Net increase (decrease) in net assets resulting from operations | | | $ | 2,554,310 |
| Statement of Changes in Net Assets |
| |
| | Year ended December 31, 2024 | | Year ended December 31, 2023 |
| Increase (Decrease) in Net Assets | | | | |
| Operations | | | | |
| Net investment income (loss) | $ | 285,308 | $ | 246,362 |
| Net realized gain (loss) | | 1,832,907 | | 363,812 |
| Change in net unrealized appreciation (depreciation) | | 436,095 | | 2,240,585 |
| Net increase (decrease) in net assets resulting from operations | | 2,554,310 | | 2,850,759 |
| Distributions to shareholders | | (694,907) | | (422,332) |
| | | | | |
| Share transactions - net increase (decrease) | | 3,533,385 | | 6,446,479 |
| Total increase (decrease) in net assets | | 5,392,788 | | 8,874,906 |
| | | | | |
| Net Assets | | | | |
| Beginning of period | | 20,771,283 | | 11,896,377 |
| End of period | $ | 26,164,071 | $ | 20,771,283 |
| | | | | |
| | | | | |
Financial Highlights
VIP Freedom 2060 Portfolio℠ Initial Class |
| |
| Years ended December 31, | | 2024 | | 2023 | | 2022 | | 2021 | | 2020 |
Selected Per-Share Data | | | | | | | | | | |
| Net asset value, beginning of period | $ | 12.59 | $ | 10.82 | $ | 14.18 | $ | 12.65 | $ | 10.99 |
| Income from Investment Operations | | | | | | | | | | |
Net investment income (loss) A,B | | .20 | | .20 | | .19 | | .21 | | .13 |
| Net realized and unrealized gain (loss) | | 1.53 | | 1.88 | | (2.67) | | 2.04 | | 1.99 |
| Total from investment operations | | 1.73 | | 2.08 | | (2.48) | | 2.25 | | 2.12 |
| Distributions from net investment income | | (.17) | | (.17) | | (.16) | | (.18) | | (.11) |
| Distributions from net realized gain | | (.27) | | (.15) | | (.72) | | (.54) | | (.35) |
| Total distributions | | (.44) | | (.31) C | | (.88) | | (.72) | | (.46) |
| Net asset value, end of period | $ | 13.88 | $ | 12.59 | $ | 10.82 | $ | 14.18 | $ | 12.65 |
Total Return D,E | | | | 19.39% | | (18.19)% | | 17.79% | | 19.30% |
Ratios to Average Net Assets B,F,G | | | | | | | | | | |
| Expenses before reductions | | .01% | | -% H | | -% H | | -% H | | -% H |
| Expenses net of fee waivers, if any | | | | -% H | | -% H | | -% H | | -% H |
| Expenses net of all reductions | | .01% | | -% H | | -% H | | -% H | | -% H |
| Net investment income (loss) | | 1.42% | | 1.70% | | 1.69% | | 1.51% | | 1.18% |
| Supplemental Data | | | | | | | | | | |
| Net assets, end of period (000 omitted) | $ | 2,925 | $ | 1,690 | $ | 471 | $ | 523 | $ | 422 |
Portfolio turnover rate I | | | | 25% | | 45% | | 60% | | 68% |
ACalculated based on average shares outstanding during the period.
BNet investment income (loss) is affected by the timing of the declaration of dividends by any underlying mutual funds or exchange-traded funds (ETFs). Net investment income (loss) of any mutual funds or ETFs is not included in the Fund's net investment income (loss) ratio.
CTotal distributions per share do not sum due to rounding.
DTotal returns do not reflect charges attributable to your insurance company's separate account. Inclusion of these charges would reduce the total returns shown.
ETotal returns would have been lower if certain expenses had not been reduced during the applicable periods shown.
FFees and expenses of any underlying mutual funds or exchange-traded funds (ETFs) are not included in the Fund's expense ratio. The Fund indirectly bears its proportionate share of these expenses.
GExpense ratios reflect operating expenses of the class. Expenses before reductions do not reflect amounts reimbursed, waived, or reduced through arrangements with the investment adviser, brokerage services, or other offset arrangements, if applicable, and do not represent the amount paid by the class during periods when reimbursements, waivers or reductions occur.
HAmount represents less than .005%.
IAmount does not include the portfolio activity of any underlying mutual funds or exchange-traded funds (ETFs), derivatives or securities that mature within one year from acquisition.
VIP Freedom 2060 Portfolio℠ Service Class |
| |
| Years ended December 31, | | 2024 | | 2023 | | 2022 | | 2021 | | 2020 |
Selected Per-Share Data | | | | | | | | | | |
| Net asset value, beginning of period | $ | 12.58 | $ | 10.81 | $ | 14.17 | $ | 12.65 | $ | 10.99 |
| Income from Investment Operations | | | | | | | | | | |
Net investment income (loss) A,B | | .18 | | .19 | | .18 | | .20 | | .12 |
| Net realized and unrealized gain (loss) | | 1.53 | | 1.88 | | (2.67) | | 2.03 | | 1.99 |
| Total from investment operations | | 1.71 | | 2.07 | | (2.49) | | 2.23 | | 2.11 |
| Distributions from net investment income | | (.16) | | (.16) | | (.15) | | (.17) | | (.10) |
| Distributions from net realized gain | | (.27) | | (.15) | | (.72) | | (.54) | | (.35) |
| Total distributions | | (.43) | | (.30) C | | (.87) | | (.71) | | (.45) |
| Net asset value, end of period | $ | 13.86 | $ | 12.58 | $ | 10.81 | $ | 14.17 | $ | 12.65 |
Total Return D,E | | | | 19.30% | | (18.27)% | | 17.62% | | 19.22% |
Ratios to Average Net Assets B,F,G | | | | | | | | | | |
| Expenses before reductions | | .11% | | .10% | | .10% | | .10% | | .10% |
| Expenses net of fee waivers, if any | | | | .10% | | .10% | | .10% | | .10% |
| Expenses net of all reductions | | .10% | | .10% | | .10% | | .10% | | .10% |
| Net investment income (loss) | | 1.32% | | 1.60% | | 1.59% | | 1.41% | | 1.08% |
| Supplemental Data | | | | | | | | | | |
| Net assets, end of period (000 omitted) | $ | 13,987 | $ | 13,329 | $ | 8,331 | $ | 6,124 | $ | 3,530 |
Portfolio turnover rate H | | | | 25% | | 45% | | 60% | | 68% |
ACalculated based on average shares outstanding during the period.
BNet investment income (loss) is affected by the timing of the declaration of dividends by any underlying mutual funds or exchange-traded funds (ETFs). Net investment income (loss) of any mutual funds or ETFs is not included in the Fund's net investment income (loss) ratio.
CTotal distributions per share do not sum due to rounding.
DTotal returns do not reflect charges attributable to your insurance company's separate account. Inclusion of these charges would reduce the total returns shown.
ETotal returns would have been lower if certain expenses had not been reduced during the applicable periods shown.
FFees and expenses of any underlying mutual funds or exchange-traded funds (ETFs) are not included in the Fund's expense ratio. The Fund indirectly bears its proportionate share of these expenses.
GExpense ratios reflect operating expenses of the class. Expenses before reductions do not reflect amounts reimbursed, waived, or reduced through arrangements with the investment adviser, brokerage services, or other offset arrangements, if applicable, and do not represent the amount paid by the class during periods when reimbursements, waivers or reductions occur.
HAmount does not include the portfolio activity of any underlying mutual funds or exchange-traded funds (ETFs), derivatives or securities that mature within one year from acquisition.
VIP Freedom 2060 Portfolio℠ Service Class 2 |
| |
| Years ended December 31, | | 2024 | | 2023 | | 2022 | | 2021 | | 2020 |
Selected Per-Share Data | | | | | | | | | | |
| Net asset value, beginning of period | $ | 12.55 | $ | 10.79 | $ | 14.15 | $ | 12.63 | $ | 10.98 |
| Income from Investment Operations | | | | | | | | | | |
Net investment income (loss) A,B | | .16 | | .17 | | .16 | | .18 | | .10 |
| Net realized and unrealized gain (loss) | | 1.52 | | 1.88 | | (2.66) | | 2.03 | | 1.99 |
| Total from investment operations | | 1.68 | | 2.05 | | (2.50) | | 2.21 | | 2.09 |
| Distributions from net investment income | | (.14) | | (.14) | | (.14) | | (.15) | | (.09) |
| Distributions from net realized gain | | (.27) | | (.15) | | (.72) | | (.54) | | (.35) |
| Total distributions | | (.41) | | (.29) | | (.86) | | (.69) | | (.44) |
| Net asset value, end of period | $ | 13.82 | $ | 12.55 | $ | 10.79 | $ | 14.15 | $ | 12.63 |
Total Return C,D | | | | 19.12% | | (18.38)% | | 17.52% | | 19.04% |
Ratios to Average Net Assets B,E,F | | | | | | | | | | |
| Expenses before reductions | | .26% | | .25% | | .25% | | .25% | | .25% |
| Expenses net of fee waivers, if any | | | | .25% | | .25% | | .25% | | .25% |
| Expenses net of all reductions | | .25% | | .25% | | .25% | | .25% | | .25% |
| Net investment income (loss) | | 1.17% | | 1.45% | | 1.44% | | 1.26% | | .93% |
| Supplemental Data | | | | | | | | | | |
| Net assets, end of period (000 omitted) | $ | 9,251 | $ | 5,752 | $ | 3,094 | $ | 2,254 | $ | 1,161 |
Portfolio turnover rate G | | | | 25% | | 45% | | 60% | | 68% |
ACalculated based on average shares outstanding during the period.
BNet investment income (loss) is affected by the timing of the declaration of dividends by any underlying mutual funds or exchange-traded funds (ETFs). Net investment income (loss) of any mutual funds or ETFs is not included in the Fund's net investment income (loss) ratio.
CTotal returns do not reflect charges attributable to your insurance company's separate account. Inclusion of these charges would reduce the total returns shown.
DTotal returns would have been lower if certain expenses had not been reduced during the applicable periods shown.
EFees and expenses of any underlying mutual funds or exchange-traded funds (ETFs) are not included in the Fund's expense ratio. The Fund indirectly bears its proportionate share of these expenses.
FExpense ratios reflect operating expenses of the class. Expenses before reductions do not reflect amounts reimbursed, waived, or reduced through arrangements with the investment adviser, brokerage services, or other offset arrangements, if applicable, and do not represent the amount paid by the class during periods when reimbursements, waivers or reductions occur.
GAmount does not include the portfolio activity of any underlying mutual funds or exchange-traded funds (ETFs), derivatives or securities that mature within one year from acquisition.
VIP Freedom 2065 Portfolio℠
Schedule of Investments December 31, 2024
Showing Percentage of Net Assets
| Bond Funds - 7.6% |
| | | Shares | Value ($) |
| Fidelity International Bond Index Fund (a) | | 7,899 | 73,462 |
| Fidelity Long-Term Treasury Bond Index Fund (a) | | 52,805 | 484,223 |
| TOTAL BOND FUNDS (Cost $592,083) | | | 557,685 |
| | | | |
| Domestic Equity Funds - 51.5% |
| | | Shares | Value ($) |
| VIP Contrafund Portfolio - Initial Class (a) | | 11,410 | 661,072 |
| VIP Equity-Income Portfolio - Initial Class (a) | | 20,285 | 539,372 |
| VIP Growth & Income Portfolio - Initial Class (a) | | 24,216 | 739,800 |
| VIP Growth Portfolio - Initial Class (a) | | 11,302 | 1,095,598 |
| VIP Mid Cap Portfolio - Initial Class (a) | | 4,521 | 169,814 |
| VIP Value Portfolio - Initial Class (a) | | 19,948 | 379,015 |
| VIP Value Strategies Portfolio - Initial Class (a) | | 12,138 | 188,262 |
| TOTAL DOMESTIC EQUITY FUNDS (Cost $3,574,615) | | | 3,772,933 |
| | | | |
| International Equity Funds - 40.9% |
| | | Shares | Value ($) |
| VIP Emerging Markets Portfolio - Initial Class (a) | | 83,480 | 958,356 |
| VIP Overseas Portfolio - Initial Class (a) | | 80,000 | 2,037,598 |
| TOTAL INTERNATIONAL EQUITY FUNDS (Cost $3,013,938) | | | 2,995,954 |
| | | | |
| TOTAL INVESTMENT IN SECURITIES - 100.0% (Cost $7,180,636) | 7,326,572 |
NET OTHER ASSETS (LIABILITIES) - 0.0% | (601) |
| NET ASSETS - 100.0% | 7,325,971 |
| | |
Legend
Affiliated Underlying Funds
Fiscal year to date information regarding the Fund's investments in affiliated Underlying Funds is presented below. Exchanges between classes of the same affiliated Underlying Funds may occur. If an Underlying Funds changes its name, the name presented below is the name in effect at period end.
| Affiliate | Value, beginning of period ($) | Purchases ($) | Sales Proceeds ($) | Dividend Income ($) | Realized Gain (loss) ($) | Change in Unrealized appreciation (depreciation) ($) | Value, end of period ($) | Shares, end of period |
| Fidelity Inflation-Protected Bond Index Fund | 72,290 | 64,600 | 137,711 | 1,498 | (2,862) | 3,683 | - | - |
| Fidelity International Bond Index Fund | 18,554 | 85,055 | 28,956 | 1,246 | (403) | (788) | 73,462 | 7,899 |
| Fidelity Long-Term Treasury Bond Index Fund | 206,494 | 533,301 | 220,413 | 10,202 | (19,811) | (15,348) | 484,223 | 52,805 |
| VIP Contrafund Portfolio - Initial Class | 287,608 | 559,947 | 223,101 | 71,278 | 9,528 | 27,090 | 661,072 | 11,410 |
| VIP Emerging Markets Portfolio - Initial Class | 438,412 | 817,780 | 334,342 | 12,724 | 10,539 | 25,967 | 958,356 | 83,480 |
| VIP Equity-Income Portfolio - Initial Class | 233,214 | 471,926 | 176,338 | 35,878 | 7,305 | 3,265 | 539,372 | 20,285 |
| VIP Government Money Market Portfolio - Initial Class | - | 13,145 | 13,145 | 52 | - | - | - | - |
| VIP Growth & Income Portfolio - Initial Class | 320,583 | 605,541 | 224,782 | 51,842 | 10,877 | 27,581 | 739,800 | 24,216 |
| VIP Growth Portfolio - Initial Class | 476,316 | 1,031,669 | 359,416 | 214,677 | 10,834 | (63,805) | 1,095,598 | 11,302 |
| VIP High Income Portfolio - Initial Class | 9,138 | 12,707 | 23,169 | 4 | 968 | 356 | - | - |
| VIP Investment Grade Bond II Portfolio - Initial Class | 62,480 | 24,110 | 85,927 | 13 | (282) | (381) | - | - |
| VIP Mid Cap Portfolio - Initial Class | 73,005 | 152,372 | 54,743 | 18,606 | 3,147 | (3,967) | 169,814 | 4,521 |
| VIP Overseas Portfolio - Initial Class | 936,443 | 1,729,826 | 521,275 | 119,178 | 26,721 | (134,117) | 2,037,598 | 80,000 |
| VIP Value Portfolio - Initial Class | 162,674 | 345,700 | 123,688 | 35,247 | 5,713 | (11,384) | 379,015 | 19,948 |
| VIP Value Strategies Portfolio - Initial Class | 80,505 | 180,847 | 61,859 | 24,210 | 3,190 | (14,421) | 188,262 | 12,138 |
| | 3,377,716 | 6,628,526 | 2,588,865 | 596,655 | 65,464 | (156,269) | 7,326,572 | 328,004 |
Amounts in the dividend income column in the above table include any capital gain distributions from underlying funds, which are presented in the corresponding line item in the Statement of Operations, if applicable.
Amounts included in the purchases and sales proceeds columns may include in-kind transactions, if applicable.
Investment Valuation
The following is a summary of the inputs used, as of December 31, 2024, involving the Fund's assets and liabilities carried at fair value. The inputs or methodology used for valuing securities may not be an indication of the risk associated with investing in those securities. For more information on valuation inputs, and their aggregation into the levels used below, please refer to the Investment Valuation section in the accompanying Notes to Financial Statements.
| Valuation Inputs at Reporting Date: |
| Description | Total ($) | Level 1 ($) | Level 2 ($) | Level 3 ($) |
Investments in Securities: | | | | |
|
| Bond Funds | 557,685 | 557,685 | - | - |
|
| Domestic Equity Funds | 3,772,933 | 3,772,933 | - | - |
|
| International Equity Funds | 2,995,954 | 2,995,954 | - | - |
| Total Investments in Securities: | 7,326,572 | 7,326,572 | - | - |
VIP Freedom 2065 Portfolio℠
Financial Statements
| Statement of Assets and Liabilities |
As of December 31, 2024 |
| Assets | | | | |
| Investment in securities, at value - See accompanying schedule: | | | | |
Affiliated issuers (cost $7,180,636) | $ | 7,326,572 | | |
| | | | | |
| | | | | |
| Total Investment in Securities (cost $7,180,636) | | | $ | 7,326,572 |
| Receivable for investments sold | | | | 41,172 |
| Receivable for fund shares sold | | | | 1,579 |
Total assets | | | | 7,369,323 |
| Liabilities | | | | |
| Payable for investments purchased | $ | 41,842 | | |
| Payable for fund shares redeemed | | 906 | | |
| Distribution and service plan fees payable | | 587 | | |
| Payable to investment adviser | | 17 | | |
| Total liabilities | | | | 43,352 |
| Net Assets | | | $ | 7,325,971 |
| Net Assets consist of: | | | | |
| Paid in capital | | | $ | 6,790,267 |
| Total accumulated earnings (loss) | | | | 535,704 |
| Net Assets | | | $ | 7,325,971 |
| | | | | |
| Net Asset Value and Maximum Offering Price | | | | |
| Initial Class : | | | | |
Net Asset Value, offering price and redemption price per share ($1,984,567 ÷ 143,995 shares) | | | $ | 13.78 |
| Service Class : | | | | |
Net Asset Value, offering price and redemption price per share ($3,951,013 ÷ 287,100 shares) | | | $ | 13.76 |
| Service Class 2 : | | | | |
Net Asset Value, offering price and redemption price per share ($1,390,391 ÷ 101,135 shares) | | | $ | 13.75 |
| Statement of Operations |
| Year ended December 31, 2024 |
| Investment Income | | | | |
| Dividends: | | | | |
| Affiliated issuers | | | $ | 82,379 |
| Expenses | | | | |
| Distribution and service plan fees | $ | 5,001 | | |
| Independent trustees' fees and expenses | | 12 | | |
| Miscellaneous | | 185 | | |
| Total expenses before reductions | | 5,198 | | |
| Expense reductions | | (31) | | |
| Total expenses after reductions | | | | 5,167 |
| Net Investment income (loss) | | | | 77,212 |
| Realized and Unrealized Gain (Loss) | | | | |
| Net realized gain (loss) on: | | | | |
| Investment Securities: | | | | |
| Affiliated issuers | | 65,464 | | |
| Capital gain distributions from underlying funds: | | | | |
| Affiliated issuers | | 514,276 | | |
| Total net realized gain (loss) | | | | 579,740 |
| Change in net unrealized appreciation (depreciation) on: | | | | |
| Investment Securities: | | | | |
| Affiliated issuers | | (156,269) | | |
| Total change in net unrealized appreciation (depreciation) | | | | (156,269) |
| Net gain (loss) | | | | 423,471 |
| Net increase (decrease) in net assets resulting from operations | | | $ | 500,683 |
| Statement of Changes in Net Assets |
| |
| | Year ended December 31, 2024 | | Year ended December 31, 2023 |
| Increase (Decrease) in Net Assets | | | | |
| Operations | | | | |
| Net investment income (loss) | $ | 77,212 | $ | 40,663 |
| Net realized gain (loss) | | 579,740 | | (30,154) |
| Change in net unrealized appreciation (depreciation) | | (156,269) | | 455,960 |
| Net increase (decrease) in net assets resulting from operations | | 500,683 | | 466,469 |
| Distributions to shareholders | | (135,733) | | (70,234) |
| | | | | |
| Share transactions - net increase (decrease) | | 3,583,577 | | 728,596 |
| Total increase (decrease) in net assets | | 3,948,527 | | 1,124,831 |
| | | | | |
| Net Assets | | | | |
| Beginning of period | | 3,377,444 | | 2,252,613 |
| End of period | $ | 7,325,971 | $ | 3,377,444 |
| | | | | |
| | | | | |
Financial Highlights
VIP Freedom 2065 Portfolio℠ Initial Class |
| |
| Years ended December 31, | | 2024 | | 2023 | | 2022 | | 2021 | | 2020 |
Selected Per-Share Data | | | | | | | | | | |
| Net asset value, beginning of period | $ | 12.40 | $ | 10.65 | $ | 13.92 | $ | 12.47 | $ | 10.96 |
| Income from Investment Operations | | | | | | | | | | |
Net investment income (loss) A,B | | .22 | | .20 | | .17 | | .25 | | .12 |
| Net realized and unrealized gain (loss) | | 1.49 | | 1.85 | | (2.61) | | 1.96 | | 1.99 |
| Total from investment operations | | 1.71 | | 2.05 | | (2.44) | | 2.21 | | 2.11 |
| Distributions from net investment income | | (.16) | | (.17) | | (.15) | | (.18) | | (.11) |
| Distributions from net realized gain | | (.17) | | (.13) | | (.67) | | (.58) | | (.49) |
| Total distributions | | (.33) | | (.30) | | (.83) C | | (.76) | | (.60) |
| Net asset value, end of period | $ | 13.78 | $ | 12.40 | $ | 10.65 | $ | 13.92 | $ | 12.47 |
Total Return D,E | | | | 19.35% | | (18.22)% | | 17.81% | | 19.35% |
Ratios to Average Net Assets B,F,G | | | | | | | | | | |
Expenses before reductions H | | -% | | -% | | -% | | -% | | -% |
Expenses net of fee waivers, if any H | | | | -% | | -% | | -% | | -% |
Expenses net of all reductions H | | -% | | -% | | -% | | -% | | -% |
| Net investment income (loss) | | 1.59% | | 1.70% | | 1.50% | | 1.82% | | 1.07% |
| Supplemental Data | | | | | | | | | | |
| Net assets, end of period (000 omitted) | $ | 1,985 | $ | 844 | $ | 537 | $ | 482 | $ | 416 |
Portfolio turnover rate I | | | | 74% | | 48% | | 24% | | 34% |
ACalculated based on average shares outstanding during the period.
BNet investment income (loss) is affected by the timing of the declaration of dividends by any underlying mutual funds or exchange-traded funds (ETFs). Net investment income (loss) of any mutual funds or ETFs is not included in the Fund's net investment income (loss) ratio.
CTotal distributions per share do not sum due to rounding.
DTotal returns do not reflect charges attributable to your insurance company's separate account. Inclusion of these charges would reduce the total returns shown.
ETotal returns would have been lower if certain expenses had not been reduced during the applicable periods shown.
FFees and expenses of any underlying mutual funds or exchange-traded funds (ETFs) are not included in the Fund's expense ratio. The Fund indirectly bears its proportionate share of these expenses.
GExpense ratios reflect operating expenses of the class. Expenses before reductions do not reflect amounts reimbursed, waived, or reduced through arrangements with the investment adviser, brokerage services, or other offset arrangements, if applicable, and do not represent the amount paid by the class during periods when reimbursements, waivers or reductions occur.
HAmount represents less than .005%.
IAmount does not include the portfolio activity of any underlying mutual funds or exchange-traded funds (ETFs), derivatives or securities that mature within one year from acquisition.
VIP Freedom 2065 Portfolio℠ Service Class |
| |
| Years ended December 31, | | 2024 | | 2023 | | 2022 | | 2021 | | 2020 |
Selected Per-Share Data | | | | | | | | | | |
| Net asset value, beginning of period | $ | 12.39 | $ | 10.64 | $ | 13.91 | $ | 12.46 | $ | 10.96 |
| Income from Investment Operations | | | | | | | | | | |
Net investment income (loss) A,B | | .20 | | .18 | | .16 | | .24 | | .11 |
| Net realized and unrealized gain (loss) | | 1.49 | | 1.86 | | (2.61) | | 1.97 | | 1.98 |
| Total from investment operations | | 1.69 | | 2.04 | | (2.45) | | 2.21 | | 2.09 |
| Distributions from net investment income | | (.15) | | (.16) | | (.14) | | (.17) | | (.10) |
| Distributions from net realized gain | | (.17) | | (.13) | | (.67) | | (.58) | | (.49) |
| Total distributions | | (.32) | | (.29) | | (.82) C | | (.76) C | | (.59) |
| Net asset value, end of period | $ | 13.76 | $ | 12.39 | $ | 10.64 | $ | 13.91 | $ | 12.46 |
Total Return D,E | | | | 19.29% | | (18.32)% | | 17.77% | | 19.16% |
Ratios to Average Net Assets B,F,G | | | | | | | | | | |
| Expenses before reductions | | .10% | | .10% | | .10% | | .10% | | .10% |
| Expenses net of fee waivers, if any | | | | .10% | | .10% | | .10% | | .10% |
| Expenses net of all reductions | | .10% | | .10% | | .10% | | .10% | | .10% |
| Net investment income (loss) | | 1.49% | | 1.60% | | 1.40% | | 1.72% | | .97% |
| Supplemental Data | | | | | | | | | | |
| Net assets, end of period (000 omitted) | $ | 3,951 | $ | 1,816 | $ | 1,181 | $ | 1,224 | $ | 416 |
Portfolio turnover rate H | | | | 74% | | 48% | | 24% | | 34% |
ACalculated based on average shares outstanding during the period.
BNet investment income (loss) is affected by the timing of the declaration of dividends by any underlying mutual funds or exchange-traded funds (ETFs). Net investment income (loss) of any mutual funds or ETFs is not included in the Fund's net investment income (loss) ratio.
CTotal distributions per share do not sum due to rounding.
DTotal returns do not reflect charges attributable to your insurance company's separate account. Inclusion of these charges would reduce the total returns shown.
ETotal returns would have been lower if certain expenses had not been reduced during the applicable periods shown.
FFees and expenses of any underlying mutual funds or exchange-traded funds (ETFs) are not included in the Fund's expense ratio. The Fund indirectly bears its proportionate share of these expenses.
GExpense ratios reflect operating expenses of the class. Expenses before reductions do not reflect amounts reimbursed, waived, or reduced through arrangements with the investment adviser, brokerage services, or other offset arrangements, if applicable, and do not represent the amount paid by the class during periods when reimbursements, waivers or reductions occur.
HAmount does not include the portfolio activity of any underlying mutual funds or exchange-traded funds (ETFs), derivatives or securities that mature within one year from acquisition.
VIP Freedom 2065 Portfolio℠ Service Class 2 |
| |
| Years ended December 31, | | 2024 | | 2023 | | 2022 | | 2021 | | 2020 |
Selected Per-Share Data | | | | | | | | | | |
| Net asset value, beginning of period | $ | 12.38 | $ | 10.63 | $ | 13.90 | $ | 12.46 | $ | 10.96 |
| Income from Investment Operations | | | | | | | | | | |
Net investment income (loss) A,B | | .18 | | .17 | | .14 | | .22 | | .09 |
| Net realized and unrealized gain (loss) | | 1.49 | | 1.85 | | (2.61) | | 1.95 | | 1.99 |
| Total from investment operations | | 1.67 | | 2.02 | | (2.47) | | 2.17 | | 2.08 |
| Distributions from net investment income | | (.14) | | (.14) | | (.13) | | (.15) | | (.09) |
| Distributions from net realized gain | | (.17) | | (.13) | | (.67) | | (.58) | | (.49) |
| Total distributions | | (.30) C | | (.27) | | (.80) | | (.73) | | (.58) |
| Net asset value, end of period | $ | 13.75 | $ | 12.38 | $ | 10.63 | $ | 13.90 | $ | 12.46 |
Total Return D,E | | | | 19.12% | | (18.44)% | | 17.47% | | 19.03% |
Ratios to Average Net Assets B,F,G | | | | | | | | | | |
| Expenses before reductions | | .25% | | .25% | | .25% | | .25% | | .25% |
| Expenses net of fee waivers, if any | | | | .25% | | .25% | | .25% | | .25% |
| Expenses net of all reductions | | .25% | | .25% | | .25% | | .25% | | .25% |
| Net investment income (loss) | | 1.34% | | 1.45% | | 1.25% | | 1.57% | | .82% |
| Supplemental Data | | | | | | | | | | |
| Net assets, end of period (000 omitted) | $ | 1,390 | $ | 718 | $ | 534 | $ | 559 | $ | 459 |
Portfolio turnover rate H | | | | 74% | | 48% | | 24% | | 34% |
ACalculated based on average shares outstanding during the period.
BNet investment income (loss) is affected by the timing of the declaration of dividends by any underlying mutual funds or exchange-traded funds (ETFs). Net investment income (loss) of any mutual funds or ETFs is not included in the Fund's net investment income (loss) ratio.
CTotal distributions per share do not sum due to rounding.
DTotal returns do not reflect charges attributable to your insurance company's separate account. Inclusion of these charges would reduce the total returns shown.
ETotal returns would have been lower if certain expenses had not been reduced during the applicable periods shown.
FFees and expenses of any underlying mutual funds or exchange-traded funds (ETFs) are not included in the Fund's expense ratio. The Fund indirectly bears its proportionate share of these expenses.
GExpense ratios reflect operating expenses of the class. Expenses before reductions do not reflect amounts reimbursed, waived, or reduced through arrangements with the investment adviser, brokerage services, or other offset arrangements, if applicable, and do not represent the amount paid by the class during periods when reimbursements, waivers or reductions occur.
HAmount does not include the portfolio activity of any underlying mutual funds or exchange-traded funds (ETFs), derivatives or securities that mature within one year from acquisition.
VIP Freedom 2070 Portfolio℠
Schedule of Investments December 31, 2024
Showing Percentage of Net Assets
| Domestic Equity Funds - 51.5% |
| | | Shares | Value ($) |
| VIP Contrafund Portfolio - Initial Class (a) | | 785 | 45,498 |
| VIP Equity-Income Portfolio - Initial Class (a) | | 1,396 | 37,123 |
| VIP Growth & Income Portfolio - Initial Class (a) | | 1,667 | 50,918 |
| VIP Growth Portfolio - Initial Class (a) | | 778 | 75,405 |
| VIP Mid Cap Portfolio - Initial Class (a) | | 311 | 11,688 |
| VIP Value Portfolio - Initial Class (a) | | 1,373 | 26,086 |
| VIP Value Strategies Portfolio - Initial Class (a) | | 835 | 12,957 |
| TOTAL DOMESTIC EQUITY FUNDS (Cost $275,631) | | | 259,675 |
| | | | |
| Fixed-Income Funds - 7.6% |
| | | Shares | Value ($) |
| Fidelity International Bond Index Fund (a) | | 544 | 5,056 |
| Fidelity Long-Term Treasury Bond Index Fund (a) | | 3,635 | 33,334 |
| TOTAL FIXED-INCOME FUNDS (Cost $39,574) | | | 38,390 |
| | | | |
| International Equity Funds - 40.9% |
| | | Shares | Value ($) |
| VIP Emerging Markets Portfolio - Initial Class (a) | | 5,746 | 65,960 |
| VIP Overseas Portfolio - Initial Class (a) | | 5,506 | 140,241 |
| TOTAL INTERNATIONAL EQUITY FUNDS (Cost $219,107) | | | 206,201 |
| | | | |
| TOTAL INVESTMENT IN SECURITIES - 100.0% (Cost $534,312) | 504,266 |
NET OTHER ASSETS (LIABILITIES) - 0.0% | (31) |
| NET ASSETS - 100.0% | 504,235 |
| | |
Legend
Affiliated Central Funds
Fiscal year to date information regarding the Fund's investments in Fidelity Central Funds, including the ownership percentage, is presented below.
| Affiliate | Value, beginning of period ($) | Purchases ($) | Sales Proceeds ($) | Dividend Income ($) | Realized Gain (loss) ($) | Change in Unrealized appreciation (depreciation) ($) | Value, end of period ($) | Shares, end of period | % ownership, end of period |
| Fidelity Cash Central Fund | - | 499,970 | 499,970 | 74 | - | - | - | - | 0.0% |
| Total | - | 499,970 | 499,970 | 74 | - | - | - | - | |
| | | | | | | | | | |
Amounts in the dividend income column in the above table include any capital gain distributions from underlying funds, which are presented in the corresponding line item in the Statement of Operations, if applicable.
Amounts included in the purchases and sales proceeds columns may include in-kind transactions, if applicable.
Affiliated Underlying Funds
Fiscal year to date information regarding the Fund's investments in affiliated Underlying Funds is presented below. Exchanges between classes of the same affiliated Underlying Funds may occur. If an Underlying Funds changes its name, the name presented below is the name in effect at period end.
| Affiliate | Value, beginning of period ($) | Purchases ($) | Sales Proceeds ($) | Dividend Income ($) | Realized Gain (loss) ($) | Change in Unrealized appreciation (depreciation) ($) | Value, end of period ($) | Shares, end of period |
| Fidelity Inflation-Protected Bond Index Fund | - | 6,466 | 6,534 | 113 | 68 | - | - | - |
| Fidelity International Bond Index Fund | - | 5,757 | 618 | 83 | (3) | (80) | 5,056 | 544 |
| Fidelity Long-Term Treasury Bond Index Fund | - | 42,222 | 8,008 | 498 | 224 | (1,104) | 33,334 | 3,635 |
| VIP Contrafund Portfolio - Initial Class | - | 52,941 | 5,186 | 5,227 | (43) | (2,214) | 45,498 | 785 |
| VIP Emerging Markets Portfolio - Initial Class | - | 75,913 | 9,456 | 920 | 14 | (511) | 65,960 | 5,746 |
| VIP Equity-Income Portfolio - Initial Class | - | 42,762 | 5,155 | 2,572 | 43 | (527) | 37,123 | 1,396 |
| VIP Government Money Market Portfolio - Initial Class | - | 420 | 420 | 2 | - | - | - | - |
| VIP Growth & Income Portfolio - Initial Class | - | 56,808 | 5,591 | 3,697 | 79 | (378) | 50,918 | 1,667 |
| VIP Growth Portfolio - Initial Class | - | 95,130 | 8,169 | 15,471 | (538) | (11,018) | 75,405 | 778 |
| VIP High Income Portfolio - Initial Class | - | 1,400 | 1,485 | - | 85 | - | - | - |
| VIP Investment Grade Bond II Portfolio - Initial Class | - | 1,536 | 1,543 | - | 7 | - | - | - |
| VIP Mid Cap Portfolio - Initial Class | - | 13,597 | 1,597 | 1,281 | 100 | (412) | 11,688 | 311 |
| VIP Overseas Portfolio - Initial Class | - | 159,845 | 6,949 | 8,608 | (260) | (12,395) | 140,241 | 5,506 |
| VIP Value Portfolio - Initial Class | - | 30,372 | 3,885 | 2,356 | 146 | (547) | 26,086 | 1,373 |
| VIP Value Strategies Portfolio - Initial Class | - | 15,604 | 1,882 | 1,715 | 95 | (860) | 12,957 | 835 |
| | - | 600,773 | 66,478 | 42,543 | 17 | (30,046) | 504,266 | 22,576 |
Amounts in the dividend income column in the above table include any capital gain distributions from underlying funds, which are presented in the corresponding line item in the Statement of Operations, if applicable.
Amounts included in the purchases and sales proceeds columns may include in-kind transactions, if applicable.
Investment Valuation
The following is a summary of the inputs used, as of December 31, 2024, involving the Fund's assets and liabilities carried at fair value. The inputs or methodology used for valuing securities may not be an indication of the risk associated with investing in those securities. For more information on valuation inputs, and their aggregation into the levels used below, please refer to the Investment Valuation section in the accompanying Notes to Financial Statements.
| Valuation Inputs at Reporting Date: |
| Description | Total ($) | Level 1 ($) | Level 2 ($) | Level 3 ($) |
Investments in Securities: | | | | |
|
| Domestic Equity Funds | 259,675 | 259,675 | - | - |
|
| Fixed-Income Funds | 38,390 | 38,390 | - | - |
|
| International Equity Funds | 206,201 | 206,201 | - | - |
| Total Investments in Securities: | 504,266 | 504,266 | - | - |
VIP Freedom 2070 Portfolio℠
Financial Statements
| Statement of Assets and Liabilities |
As of December 31, 2024 |
| Assets | | | | |
| Investment in securities, at value - See accompanying schedule: | | | | |
Affiliated issuers (cost $534,312) | $ | 504,266 | | |
| | | | | |
| | | | | |
| Total Investment in Securities (cost $534,312) | | | $ | 504,266 |
| Receivable for investments sold | | | | 3,133 |
Total assets | | | | 507,399 |
| Liabilities | | | | |
| Payable for investments purchased | $ | 3,133 | | |
| Distribution and service plan fees payable | | 31 | | |
| Total liabilities | | | | 3,164 |
| Net Assets | | | $ | 504,235 |
| Net Assets consist of: | | | | |
| Paid in capital | | | $ | 500,000 |
| Total accumulated earnings (loss) | | | | 4,235 |
| Net Assets | | | $ | 504,235 |
| | | | | |
| Net Asset Value and Maximum Offering Price | | | | |
| Initial Class : | | | | |
Net Asset Value, offering price and redemption price per share ($302,540 ÷ 30,000 shares) | | | $ | 10.08 |
| Service Class : | | | | |
Net Asset Value, offering price and redemption price per share ($100,846 ÷ 10,000 shares) | | | $ | 10.08 |
| Service Class 2 : | | | | |
Net Asset Value, offering price and redemption price per share ($100,849 ÷ 10,000 shares) | | | $ | 10.08 |
| Statement of Operations |
| For the period July 1, 2024 (commencement of operations) through December 31, 2024 |
| Investment Income | | | | |
| Dividends: | | | | |
| Affiliated issuers | | | $ | 5,655 |
| Income from Fidelity Central Funds | | | | 74 |
| Total income | | | | 5,729 |
| Expenses | | | | |
| Distribution and service plan fees | $ | 182 | | |
| Independent trustees' fees and expenses | | 1 | | |
| Total expenses | | | | 183 |
| Net Investment income (loss) | | | | 5,546 |
| Realized and Unrealized Gain (Loss) | | | | |
| Net realized gain (loss) on: | | | | |
| Investment Securities: | | | | |
| Affiliated issuers | | 17 | | |
| Capital gain distributions from underlying funds: | | | | |
| Affiliated issuers | | 36,888 | | |
| Total net realized gain (loss) | | | | 36,905 |
| Change in net unrealized appreciation (depreciation) on: | | | | |
| Investment Securities: | | | | |
| Affiliated issuers | | (30,046) | | |
| Total change in net unrealized appreciation (depreciation) | | | | (30,046) |
| Net gain (loss) | | | | 6,859 |
| Net increase (decrease) in net assets resulting from operations | | | $ | 12,405 |
| Statement of Changes in Net Assets |
| |
| | For the period July 1, 2024 (commencement of operations) through December 31, 2024 |
| Increase (Decrease) in Net Assets | | |
| Operations | | |
| Net investment income (loss) | $ | 5,546 |
| Net realized gain (loss) | | 36,905 |
| Change in net unrealized appreciation (depreciation) | | (30,046) |
| Net increase (decrease) in net assets resulting from operations | | 12,405 |
| Distributions to shareholders | | (8,170) |
| | | |
| Share transactions - net increase (decrease) | | 500,000 |
| Total increase (decrease) in net assets | | 504,235 |
| | | |
| Net Assets | | |
| Beginning of period | | - |
| End of period | $ | 504,235 |
| | | |
| | | |
Financial Highlights
VIP Freedom 2070 Portfolio℠ Initial Class |
| |
| Years ended December 31, | | 2024 A |
Selected Per-Share Data | | |
| Net asset value, beginning of period | $ | 10.00 |
| Income from Investment Operations | | |
Net investment income (loss) B,C | | .11 |
| Net realized and unrealized gain (loss) | | .14 |
| Total from investment operations | | .25 |
| Distributions from net investment income | | (.12) |
| Distributions from net realized gain | | (.05) |
| Total distributions | | (.17) |
| Net asset value, end of period | $ | 10.08 |
Total Return D,E | | |
Ratios to Average Net Assets C,F,G | | |
Expenses before reductions H | | -% I |
Expenses net of fee waivers, if any H | | |
Expenses net of all reductions H | | -% I |
| Net investment income (loss) | | 2.21% I |
| Supplemental Data | | |
| Net assets, end of period (000 omitted) | $ | 303 |
Portfolio turnover rate J | | |
AFor the period July 1, 2024 (commencement of operations) through December 31, 2024.
BCalculated based on average shares outstanding during the period.
CNet investment income (loss) is affected by the timing of the declaration of dividends by any underlying mutual funds or exchange-traded funds (ETFs). Net investment income (loss) of any mutual funds or ETFs is not included in the Fund's net investment income (loss) ratio.
DTotal returns for periods of less than one year are not annualized.
ETotal returns do not reflect charges attributable to your insurance company's separate account. Inclusion of these charges would reduce the total returns shown.
FFees and expenses of any underlying mutual funds or exchange-traded funds (ETFs) are not included in the Fund's expense ratio. The Fund indirectly bears its proportionate share of these expenses.
GExpense ratios reflect operating expenses of the class. Expenses before reductions do not reflect amounts reimbursed, waived, or reduced through arrangements with the investment adviser, brokerage services, or other offset arrangements, if applicable, and do not represent the amount paid by the class during periods when reimbursements, waivers or reductions occur.
HAmount represents less than .005%.
IAnnualized.
JAmount does not include the portfolio activity of any underlying mutual funds or exchange-traded funds (ETFs), derivatives or securities that mature within one year from acquisition.
VIP Freedom 2070 Portfolio℠ Service Class |
| |
| Years ended December 31, | | 2024 A |
Selected Per-Share Data | | |
| Net asset value, beginning of period | $ | 10.00 |
| Income from Investment Operations | | |
Net investment income (loss) B,C | | .11 |
| Net realized and unrealized gain (loss) | | .13 |
| Total from investment operations | | .24 |
| Distributions from net investment income | | (.11) |
| Distributions from net realized gain | | (.05) |
| Total distributions | | (.16) |
| Net asset value, end of period | $ | 10.08 |
Total Return D,E | | |
Ratios to Average Net Assets C,F,G | | |
| Expenses before reductions | | .10% H |
| Expenses net of fee waivers, if any | | |
| Expenses net of all reductions | | .10% H |
| Net investment income (loss) | | 2.11% H |
| Supplemental Data | | |
| Net assets, end of period (000 omitted) | $ | 101 |
Portfolio turnover rate I | | |
AFor the period July 1, 2024 (commencement of operations) through December 31, 2024.
BCalculated based on average shares outstanding during the period.
CNet investment income (loss) is affected by the timing of the declaration of dividends by any underlying mutual funds or exchange-traded funds (ETFs). Net investment income (loss) of any mutual funds or ETFs is not included in the Fund's net investment income (loss) ratio.
DTotal returns for periods of less than one year are not annualized.
ETotal returns do not reflect charges attributable to your insurance company's separate account. Inclusion of these charges would reduce the total returns shown.
FFees and expenses of any underlying mutual funds or exchange-traded funds (ETFs) are not included in the Fund's expense ratio. The Fund indirectly bears its proportionate share of these expenses.
GExpense ratios reflect operating expenses of the class. Expenses before reductions do not reflect amounts reimbursed, waived, or reduced through arrangements with the investment adviser, brokerage services, or other offset arrangements, if applicable, and do not represent the amount paid by the class during periods when reimbursements, waivers or reductions occur.
HAnnualized.
IAmount does not include the portfolio activity of any underlying mutual funds or exchange-traded funds (ETFs), derivatives or securities that mature within one year from acquisition.
VIP Freedom 2070 Portfolio℠ Service Class 2 |
| |
| Years ended December 31, | | 2024 A |
Selected Per-Share Data | | |
| Net asset value, beginning of period | $ | 10.00 |
| Income from Investment Operations | | |
Net investment income (loss) B,C | | .10 |
| Net realized and unrealized gain (loss) | | .13 |
| Total from investment operations | | .23 |
| Distributions from net investment income | | (.10) |
| Distributions from net realized gain | | (.05) |
| Total distributions | | (.15) |
| Net asset value, end of period | $ | 10.08 |
Total Return D,E | | |
Ratios to Average Net Assets C,F,G | | |
| Expenses before reductions | | .25% H |
| Expenses net of fee waivers, if any | | |
| Expenses net of all reductions | | .25% H |
| Net investment income (loss) | | 1.96% H |
| Supplemental Data | | |
| Net assets, end of period (000 omitted) | $ | 101 |
Portfolio turnover rate I | | |
AFor the period July 1, 2024 (commencement of operations) through December 31, 2024.
BCalculated based on average shares outstanding during the period.
CNet investment income (loss) is affected by the timing of the declaration of dividends by any underlying mutual funds or exchange-traded funds (ETFs). Net investment income (loss) of any mutual funds or ETFs is not included in the Fund's net investment income (loss) ratio.
DTotal returns for periods of less than one year are not annualized.
ETotal returns do not reflect charges attributable to your insurance company's separate account. Inclusion of these charges would reduce the total returns shown.
FFees and expenses of any underlying mutual funds or exchange-traded funds (ETFs) are not included in the Fund's expense ratio. The Fund indirectly bears its proportionate share of these expenses.
GExpense ratios reflect operating expenses of the class. Expenses before reductions do not reflect amounts reimbursed, waived, or reduced through arrangements with the investment adviser, brokerage services, or other offset arrangements, if applicable, and do not represent the amount paid by the class during periods when reimbursements, waivers or reductions occur.
HAnnualized.
IAmount does not include the portfolio activity of any underlying mutual funds or exchange-traded funds (ETFs), derivatives or securities that mature within one year from acquisition.
Notes to Financial Statements
For the period ended December 31, 2024
1. Organization.
VIP Freedom Income Portfolio, VIP Freedom 2010 Portfolio, VIP Freedom 2015 Portfolio, VIP Freedom 2020 Portfolio, VIP Freedom 2025 Portfolio, VIP Freedom 2030 Portfolio, VIP Freedom 2035 Portfolio, VIP Freedom 2040 Portfolio, VIP Freedom 2045 Portfolio, VIP Freedom 2050 Portfolio, VIP Freedom 2055 Portfolio, VIP Freedom 2060 Portfolio, VIP Freedom 2065 Portfolio and VIP Freedom 2070 Portfolio (the Funds) are funds of Variable Insurance Products Fund V (the Trust). The Trust is registered under the Investment Company Act of 1940, as amended (the 1940 Act), as an open-end management investment company organized as a Massachusetts business trust. Each Fund is authorized to issue an unlimited number of shares. Shares of each Fund may only be purchased by insurance companies for the purpose of funding variable annuity or variable life insurance contracts. Each Fund offers three classes of shares: Initial Class, Service Class and Service Class 2. All classes have equal rights and voting privileges, except for matters affecting a single class.
2. Investments in Fidelity Central Funds.
Funds may invest in Fidelity Central Funds, which are open-end investment companies generally available only to other investment companies and accounts managed by the investment adviser and its affiliates. The Schedule of Investments lists any Fidelity Central Funds held as an investment as of period end, but does not include the underlying holdings of each Fidelity Central Fund. An investing fund indirectly bears its proportionate share of the expenses of the underlying Fidelity Central Funds.
Based on its investment objective, each Fidelity Central Fund may invest or participate in various investment vehicles or strategies that are similar to those of the investing fund. These strategies are consistent with the investment objectives of the investing fund and may involve certain economic risks which may cause a decline in value of each of the Fidelity Central Funds and thus a decline in the value of the investing fund.
| Fidelity Central Fund | Investment Manager | Investment Objective | Investment Practices | Expense RatioA |
| Fidelity Money Market Central Funds | Fidelity Management & Research Company LLC (FMR) | Each fund seeks to obtain a high level of current income consistent with the preservation of capital and liquidity. | Short-term Investments | Less than .005% |
A Expenses expressed as a percentage of average net assets and are as of each underlying Central Fund's most recent annual or semi-annual shareholder report.
A complete unaudited list of holdings for each Fidelity Central Fund is available upon request or at the Securities and Exchange Commission website at www.sec.gov. In addition, the financial statements of the Fidelity Central Funds which contain the significant accounting policies (including investment valuation policies) of those funds, and are not covered by the Report of Independent Registered Public Accounting Firm, are available on the Securities and Exchange Commission website or upon request.
3. Significant Accounting Policies.
Each Fund is an investment company and applies the accounting and reporting guidance of the Financial Accounting Standards Board (FASB) Accounting Standards Codification Topic 946 Financial Services - Investment Companies. The financial statements have been prepared in conformity with accounting principles generally accepted in the United States of America (GAAP), which require management to make certain estimates and assumptions at the date of the financial statements. Actual results could differ from those estimates. Each Fund operates as a single operating segment. Each Fund's income, expenses, assets, and performance are regularly monitored and assessed as a whole by the investment adviser and other individuals responsible for oversight functions of the Trust, using the information presented in the financial statements and financial highlights. Subsequent events, if any, through the date that the financial statements were issued have been evaluated in the preparation of the financial statements. Each Fund's Schedule of Investments lists any underlying mutual funds or exchange-traded funds (ETFs) but does not include the underlying holdings of these funds. The following summarizes the significant accounting policies of each Fund:
Investment Valuation. Investments are valued as of 4:00 p.m. Eastern time on the last calendar day of the period. Each Fund categorizes the inputs to valuation techniques used to value its investments into a disclosure hierarchy consisting of three levels as shown below:
Level 1 - unadjusted quoted prices in active markets for identical investments
Level 2 - other significant observable inputs (including quoted prices for similar investments, interest rates, prepayment speeds, etc.)
Level 3 - unobservable inputs (including the Fund's own assumptions based on the best information available)
Valuation techniques used to value each Fund's investments by major category are as follows:
Investments in open-end mutual funds are valued at their closing net asset value (NAV) each business day and are categorized as Level 1 in the hierarchy. The aggregate value of investments by input level as of December 31, 2024 is included at the end of each Fund's Schedule of investments.
Investment Transactions and Income. For financial reporting purposes, the Funds' investment holdings and NAV include trades executed through the end of the last business day of the period. The NAV per share for processing shareholder transactions is calculated as of the close of business of the New York Stock Exchange (NYSE), normally 4:00 p.m. Eastern time and includes trades executed through the end of the prior business day. Gains and losses on securities sold are determined on the basis of identified cost. Income and capital gain distributions from any underlying mutual funds or exchange-traded funds (ETFs) are recorded on the ex-dividend date.
Class Allocations and Expenses. Investment income, realized and unrealized capital gains and losses, common expenses of a fund, and certain fund-level expense reductions, if any, are allocated daily on a pro-rata basis to each class based on the relative net assets of each class to the total net assets of a fund. Each class differs with respect to transfer agent and distribution and service plan fees incurred, as applicable. Certain expense reductions may also differ by class, if applicable. For the reporting period, the allocated portion of income and expenses to each class as a percent of its average net assets may vary due to the timing of recording these transactions in relation to fluctuating net assets of the classes. Expenses directly attributable to a fund are charged to that fund. Expenses attributable to more than one fund are allocated among the respective funds on the basis of relative net assets or other appropriate methods. Expenses included in the accompanying financial statements reflect the expenses of that fund and do not include any expenses associated with any underlying mutual funds or exchange-traded funds (ETFs). Although not included in a fund's expenses, a fund indirectly bears its proportionate share of these expenses through the net asset value of each underlying mutual fund or exchange-traded fund (ETF). Expense estimates are accrued in the period to which they relate and adjustments are made when actual amounts are known.
Income Tax Information and Distributions to Shareholders. Each year, each Fund intends to qualify as a regulated investment company under Subchapter M of the Internal Revenue Code, including distributing substantially all of its taxable income and realized gains. As a result, no provision for U.S. Federal income taxes is required. As of December 31, 2024, each Fund did not have any unrecognized tax benefits in the financial statements; nor is each Fund aware of any tax positions for which it is reasonably possible that the total amounts of unrecognized tax benefits will significantly change in the next twelve months. Each Fund files a U.S. federal tax return, in addition to state and local tax returns as required. Each Fund's federal income tax returns are subject to examination by the Internal Revenue Service (IRS) for a period of three fiscal years after they are filed. State and local tax returns may be subject to examination for an additional fiscal year depending on the jurisdiction.
Distributions are declared and recorded on the ex-dividend date. Income and capital gain distributions are declared separately for each class. Income and capital gain distributions are determined in accordance with income tax regulations, which may differ from GAAP.
Capital accounts within the financial statements are adjusted for permanent book-tax differences. These adjustments have no impact on net assets or the results of operations. Capital accounts are not adjusted for temporary book-tax differences which will reverse in a subsequent period.
Book-tax differences are primarily due to the short-term gain distributions from the underlying mutual funds or exchange-traded funds (ETFs), capital loss carryforwards and losses deferred due to wash sales.
As of period end, the cost and unrealized appreciation (depreciation) in securities, and derivatives if applicable, for federal income tax purposes were as follows for each Fund:
| | Tax cost ($) | Gross unrealized appreciation ($) | Gross unrealized depreciation ($) | Net unrealized appreciation (depreciation)($) |
| VIP Freedom Income Portfolio | 89,050,298 | 4,505,808 | (4,913,155) | (407,347) |
| VIP Freedom 2010 Portfolio | 248,617,594 | 15,875,461 | (14,919,738) | 955,723 |
| VIP Freedom 2015 Portfolio | 49,539,066 | 11,485,244 | (2,869,961) | 8,615,283 |
| VIP Freedom 2020 Portfolio | 444,353,705 | 118,874,554 | (26,195,532) | 92,679,022 |
| VIP Freedom 2025 Portfolio | 348,484,800 | 60,796,278 | (17,907,594) | 42,888,684 |
| VIP Freedom 2030 Portfolio | 688,236,140 | 129,165,211 | (32,546,293) | 96,618,918 |
| VIP Freedom 2035 Portfolio | 346,169,532 | 40,766,053 | (13,944,868) | 26,821,185 |
| VIP Freedom 2040 Portfolio | 312,882,121 | 48,759,236 | (11,689,007) | 37,070,229 |
| VIP Freedom 2045 Portfolio | 173,655,462 | 24,896,276 | (5,227,234) | 19,669,042 |
| VIP Freedom 2050 Portfolio | 151,358,118 | 21,816,057 | (4,790,643) | 17,025,414 |
| VIP Freedom 2055 Portfolio | 20,645,828 | 1,650,179 | (749,440) | 900,739 |
| VIP Freedom 2060 Portfolio | 24,622,670 | 2,396,263 | (851,696) | 1,544,567 |
| VIP Freedom 2065 Portfolio | 7,263,117 | 413,806 | (350,351) | 63,455 |
| VIP Freedom 2070 Portfolio | 535,543 | 4 | (31,281) | (31,277) |
The tax-based components of distributable earnings as of period end were as follows for each Fund:
| | Undistributed ordinary income ($) | Undistributed long-term capital gain ($) | Capital loss carryforward ($) | Net unrealized appreciation (depreciation) on securities and other investments ($) |
| VIP Freedom Income Portfolio | 315,536 | - | (948,735) | (407,347) |
| VIP Freedom 2010 Portfolio | 903,328 | 2,986,038 | - | 955,723 |
| VIP Freedom 2015 Portfolio | 200,394 | 2,316,362 | - | 8,615,283 |
| VIP Freedom 2020 Portfolio | 1,539,480 | 28,525,520 | - | 92,679,022 |
| VIP Freedom 2025 Portfolio | 1,093,219 | 13,356,085 | - | 42,888,684 |
| VIP Freedom 2030 Portfolio | 1,629,091 | 34,171,791 | - | 96,618,918 |
| VIP Freedom 2035 Portfolio | 847,630 | 19,873,957 | - | 26,821,185 |
| VIP Freedom 2040 Portfolio | 764,353 | 23,350,068 | - | 37,070,229 |
| VIP Freedom 2045 Portfolio | 371,349 | 12,773,986 | - | 19,669,042 |
| VIP Freedom 2050 Portfolio | 293,620 | 11,045,622 | - | 17,025,414 |
| VIP Freedom 2055 Portfolio | 38,129 | 1,448,727 | - | 900,739 |
| VIP Freedom 2060 Portfolio | 80,626 | 1,655,181 | - | 1,544,567 |
| VIP Freedom 2065 Portfolio | 13,056 | 459,191 | - | 63,455 |
| VIP Freedom 2070 Portfolio | 778 | 34,733 | - | (31,277) |
Capital loss carryforwards are only available to offset future capital gains of the Funds to the extent provided by regulations and may be limited. The capital loss carryforward information presented below, including any applicable limitation, is estimated as of fiscal period end and is subject to adjustment.
| | Short-term ($) | Long-term ($) | Total capital loss carryforward ($) |
| VIP Freedom Income Portfolio | (41,179) | (907,556) | (948,735) |
Due to large subscriptions in a prior period, VIP Freedom 2060 Portfolio is subject to an annual limit on its use of some of its unrealized capital losses to offset capital gains in future periods. If those capital losses are realized and the limitation prevents the Fund from using any of those capital losses in a future period, those capital losses will be available to offset capital gains in subsequent periods.
The tax character of distributions paid was as follows:
| December 31, 2024 | | | |
| | Ordinary Income ($) | Long-term Capital Gains ($) | Total ($) |
| VIP Freedom Income Portfolio | 3,128,768 | - | 3,128,768 |
| VIP Freedom 2010 Portfolio | 8,877,417 | - | 8,877,417 |
| VIP Freedom 2015 Portfolio | 2,107,005 | 1,580,241 | 3,687,246 |
| VIP Freedom 2020 Portfolio | 17,148,254 | 13,707,642 | 30,855,896 |
| VIP Freedom 2025 Portfolio | 10,214,778 | - | 10,214,778 |
| VIP Freedom 2030 Portfolio | 18,336,552 | - | 18,336,552 |
| VIP Freedom 2035 Portfolio | 7,604,689 | 3,436,357 | 11,041,046 |
| VIP Freedom 2040 Portfolio | 5,851,627 | 3,839,952 | 9,691,579 |
| VIP Freedom 2045 Portfolio | 2,815,603 | 2,376,913 | 5,192,516 |
| VIP Freedom 2050 Portfolio | 2,506,084 | 2,253,670 | 4,759,754 |
| VIP Freedom 2055 Portfolio | 320,226 | 213,973 | 534,199 |
| VIP Freedom 2060 Portfolio | 371,501 | 323,406 | 694,907 |
| VIP Freedom 2065 Portfolio | 101,110 | 34,623 | 135,733 |
VIP Freedom 2070 PortfolioA | 8,170 | - | 8,170 |
| December 31, 2023 | | | |
| | Ordinary Income ($) | Long-term Capital Gains ($) | Total ($) |
| VIP Freedom Income Portfolio | 2,815,603 | - | 2,815,603 |
| VIP Freedom 2010 Portfolio | 10,294,615 | 19,661,284 | 29,955,899 |
| VIP Freedom 2015 Portfolio | 2,153,433 | 1,215,642 | 3,369,075 |
| VIP Freedom 2020 Portfolio | 17,133,976 | 3,993,220 | 21,127,196 |
| VIP Freedom 2025 Portfolio | 9,580,605 | - | 9,580,605 |
| VIP Freedom 2030 Portfolio | 15,442,922 | - | 15,442,922 |
| VIP Freedom 2035 Portfolio | 5,074,359 | 425,869 | 5,500,228 |
| VIP Freedom 2040 Portfolio | 3,902,896 | 3,087,331 | 6,990,227 |
| VIP Freedom 2045 Portfolio | 1,848,980 | 1,759,393 | 3,608,373 |
| VIP Freedom 2050 Portfolio | 1,710,876 | 1,574,725 | 3,285,601 |
| VIP Freedom 2055 Portfolio | 163,936 | 100,952 | 264,888 |
| VIP Freedom 2060 Portfolio | 252,959 | 169,373 | 422,332 |
| VIP Freedom 2065 Portfolio | 42,522 | 27,712 | 70,234 |
A For the period July 1, 2024 (commencement of operations) through December 31, 2024.
New Accounting Pronouncement. FASB Accounting Standards Update (ASU) 2023-07 Segment Reporting (Topic 280): Improvements to Reportable Segment Disclosures became effective in this reporting period. ASU 2023-07 enhances segment information disclosure in the notes to financial statements.
4. Purchases and Sales of Investments.
Purchases and sales of securities, other than short-term securities, securities acquired in the reorganization and in-kind transactions, as applicable, are noted in the table below.
| | Purchases ($) | Sales ($) |
| VIP Freedom Income Portfolio | 41,764,966 | 30,671,763 |
| VIP Freedom 2010 Portfolio | 66,295,470 | 90,008,162 |
| VIP Freedom 2015 Portfolio | 20,751,023 | 25,173,144 |
| VIP Freedom 2020 Portfolio | 164,982,472 | 212,618,266 |
| VIP Freedom 2025 Portfolio | 162,099,550 | 158,507,185 |
| VIP Freedom 2030 Portfolio | 305,428,609 | 232,667,837 |
| VIP Freedom 2035 Portfolio | 180,543,787 | 115,229,687 |
| VIP Freedom 2040 Portfolio | 171,994,317 | 110,238,633 |
| VIP Freedom 2045 Portfolio | 89,618,893 | 54,419,512 |
| VIP Freedom 2050 Portfolio | 82,088,816 | 54,173,692 |
| VIP Freedom 2055 Portfolio | 15,409,153 | 7,930,630 |
| VIP Freedom 2060 Portfolio | 17,233,237 | 12,166,126 |
| VIP Freedom 2065 Portfolio | 6,628,526 | 2,588,865 |
| VIP Freedom 2070 Portfolio | 600,773 | 66,478 |
5. Fees and Other Transactions with Affiliates.
Management Fee. Fidelity Management & Research Company LLC (the investment adviser), provides the Funds with investment management related services. The Funds do not pay any fees for these services.
Distribution and Service Plan Fees. In accordance with Rule 12b-1 of the 1940 Act, the Funds have adopted separate 12b-1 Plans for each Service Class of shares. Each Service Class pays Fidelity Distributors Company LLC (FDC), an affiliate of the investment adviser, a service fee. For the period, the service fee is based on an annual rate of .10% of Service Class' average net assets and .25% of Service Class 2's average net assets.
For the period, total fees, all of which were reallowed to insurance companies for the distribution of shares and providing shareholder support services were as follows:
| | Service Class ($) | Service Class 2 ($) | Total ($) |
VIP Freedom Income Portfolio | 39,524 | 34,483 | 74,007 |
VIP Freedom 2010 Portfolio | 17,986 | 572,655 | 590,641 |
VIP Freedom 2015 Portfolio | 12,661 | 57,588 | 70,249 |
VIP Freedom 2020 Portfolio | 124,429 | 887,215 | 1,011,644 |
VIP Freedom 2025 Portfolio | 184,639 | 276,011 | 460,650 |
VIP Freedom 2030 Portfolio | 341,712 | 577,861 | 919,573 |
VIP Freedom 2035 Portfolio | 159,667 | 334,957 | 494,624 |
VIP Freedom 2040 Portfolio | 193,997 | 130,632 | 324,629 |
VIP Freedom 2045 Portfolio | 48,152 | 272,994 | 321,146 |
VIP Freedom 2050 Portfolio | 52,878 | 183,734 | 236,612 |
VIP Freedom 2055 Portfolio | 5,692 | 22,560 | 28,252 |
VIP Freedom 2060 Portfolio | 11,984 | 19,477 | 31,461 |
VIP Freedom 2065 Portfolio | 2,707 | 2,294 | 5,001 |
VIP Freedom 2070 Portfolio | 52 | 130 | 182 |
Interfund Trades. Funds may purchase from or sell securities to other Fidelity Funds under procedures adopted by the Board. The procedures have been designed to ensure these interfund trades are executed in accordance with Rule 17a-7 of the 1940 Act. Any interfund trades are included within the respective purchases and sales amounts shown in the Purchases and Sales of Investments note. During the period, there were no interfund trades.
6. Expense Reductions.
The investment adviser contractually agreed to reimburse certain Funds to the extent proxy and shareholder meeting expenses exceeded .003% of class-level average net assets on an annual basis. This reimbursement will remain in place through April 30, 2026. During the period this reimbursement reduced each applicable Fund's expenses as follows:
The following classes of each applicable Fund were in reimbursement during the period:
| | Reimbursement ($) |
| VIP Freedom 2055 Portfolio | |
| Initial Class | 391 |
| Service Class | 669 |
| Service Class 2 | 1,128 |
| VIP Freedom 2060 Portfolio | |
| Initial Class | 177 |
| Service Class | 1,185 |
| Service Class 2 | 688 |
| VIP Freedom 2065 Portfolio | |
| Service Class | 17 |
| Service Class 2 | 13 |
Through arrangements with each applicable Fund's custodian, credits realized as a result of certain uninvested cash balances were used to reduce each applicable Fund's or class' expenses. All of the applicable expense reductions are noted in the table below.
| | Custodian credits ($) |
| VIP Freedom Income Portfolio | 2 |
| VIP Freedom 2010 Portfolio | 1 |
| VIP Freedom 2015 Portfolio | 10 |
| VIP Freedom 2020 Portfolio | 4 |
| VIP Freedom 2025 Portfolio | 169 |
| VIP Freedom 2030 Portfolio | 150 |
| VIP Freedom 2035 Portfolio | 18 |
| VIP Freedom 2040 Portfolio | 71 |
| VIP Freedom 2045 Portfolio | 52 |
| VIP Freedom 2050 Portfolio | 37 |
| VIP Freedom 2055 Portfolio | 1 |
| VIP Freedom 2065 Portfolio | 1 |
7. Distributions to Shareholders.
Distributions to shareholders of each class were as follows:
| | Year ended December 31, 2024 | Year ended December 31, 2023 |
| VIP Freedom Income Portfolio | | |
| Distributions to shareholders | | |
| Initial Class | $953,801 | $854,766 |
| Service Class | 1,697,713 | 1,360,128 |
| Service Class 2 | 477,254 | 600,709 |
Total | $3,128,768 | $2,815,603 |
| VIP Freedom 2010 Portfolio | | |
| Distributions to shareholders | | |
| Initial Class | $596,244 | $1,437,928 |
| Service Class | 596,287 | 2,267,100 |
| Service Class 2 | 7,684,886 | 26,250,871 |
Total | $8,877,417 | $29,955,899 |
| VIP Freedom 2015 Portfolio | | |
| Distributions to shareholders | | |
| Initial Class | $1,493,521 | $1,279,047 |
| Service Class | 794,866 | 752,489 |
| Service Class 2 | 1,398,859 | 1,337,539 |
Total | $3,687,246 | $3,369,075 |
| VIP Freedom 2020 Portfolio | | |
| Distributions to shareholders | | |
| Initial Class | $4,714,470 | $2,856,614 |
| Service Class | 6,842,418 | 4,765,965 |
| Service Class 2 | 19,299,008 | 13,504,617 |
Total | $30,855,896 | $21,127,196 |
| VIP Freedom 2025 Portfolio | | |
| Distributions to shareholders | | |
| Initial Class | $2,553,584 | $2,114,386 |
| Service Class | 4,969,981 | 4,741,865 |
| Service Class 2 | 2,691,213 | 2,724,354 |
Total | $10,214,778 | $9,580,605 |
| VIP Freedom 2030 Portfolio | | |
| Distributions to shareholders | | |
| Initial Class | $4,596,693 | $3,630,083 |
| Service Class | 8,654,565 | 7,108,355 |
| Service Class 2 | 5,085,294 | 4,704,484 |
Total | $18,336,552 | $15,442,922 |
| VIP Freedom 2035 Portfolio | | |
| Distributions to shareholders | | |
| Initial Class | $1,559,140 | $708,529 |
| Service Class | 5,270,497 | 2,626,198 |
| Service Class 2 | 4,211,409 | 2,165,501 |
Total | $11,041,046 | $5,500,228 |
| VIP Freedom 2040 Portfolio | | |
| Distributions to shareholders | | |
| Initial Class | $2,445,240 | $1,579,926 |
| Service Class | 5,758,235 | 4,340,621 |
| Service Class 2 | 1,488,104 | 1,069,680 |
Total | $9,691,579 | $6,990,227 |
| VIP Freedom 2045 Portfolio | | |
| Distributions to shareholders | | |
| Initial Class | $644,337 | $350,222 |
| Service Class | 1,431,254 | 910,150 |
| Service Class 2 | 3,116,925 | 2,348,001 |
Total | $5,192,516 | $3,608,373 |
| VIP Freedom 2050 Portfolio | | |
| Distributions to shareholders | | |
| Initial Class | $992,104 | $665,385 |
| Service Class | 1,609,195 | 1,091,054 |
| Service Class 2 | 2,158,455 | 1,529,162 |
Total | $4,759,754 | $3,285,601 |
| VIP Freedom 2055 Portfolio | | |
| Distributions to shareholders | | |
| Initial Class | $111,558 | $44,198 |
| Service Class | 168,172 | 91,852 |
| Service Class 2 | 254,469 | 128,838 |
Total | $534,199 | $264,888 |
| VIP Freedom 2060 Portfolio | | |
| Distributions to shareholders | | |
| Initial Class | $74,260 | $29,565 |
| Service Class | 390,876 | 283,010 |
| Service Class 2 | 229,771 | 109,757 |
Total | $694,907 | $422,332 |
| VIP Freedom 2065 Portfolio | | |
| Distributions to shareholders | | |
| Initial Class | $37,337 | $17,938 |
| Service Class | 72,831 | 37,711 |
| Service Class 2 | 25,565 | 14,585 |
Total | $135,733 | $70,234 |
| VIP Freedom 2070 Portfolio | | |
Distributions to shareholdersA | | |
| Initial Class | $5,010 | $- |
| Service Class | 1,620 | - |
| Service Class 2 | 1,540 | - |
Total | $8,170 | $- |
A For the period July 1, 2024 (commencement of operations) through December 31, 2024.
8. Share Transactions.
Transactions for each class of shares were as follows and may contain in-kind transactions:
| | Shares | Shares | Dollars | Dollars |
| | Year ended December 31, 2024 | Year ended December 31, 2023 | Year ended December 31, 2024 | Year ended December 31, 2023 |
| VIP Freedom Income Portfolio | | | | |
| Initial Class | | | | |
| Shares sold | 284,405 | 886,488 | $3,210,218 | $9,500,247 |
| Issued in exchange for the shares of the Acquired Fund(s) | 446,775 | - | 4,968,120 | - |
| Reinvestment of distributions | 86,614 | 78,642 | 953,801 | 854,766 |
| Shares redeemed | (524,498) | (317,657) | (5,884,868) | (3,428,227) |
| Net increase (decrease) | 293,296 | 647,473 | $3,247,271 | $6,926,786 |
| Service Class | | | | |
| Shares sold | 2,178,367 | 949,188 | $24,571,664 | $10,255,725 |
| Issued in exchange for the shares of the Acquired Fund(s) | 329,353 | - | 3,655,826 | - |
| Reinvestment of distributions | 154,405 | 125,425 | 1,697,713 | 1,360,128 |
| Shares redeemed | (1,194,553) | (1,079,667) | (13,368,019) | (11,651,339) |
| Net increase (decrease) | 1,467,572 | (5,054) | $16,557,184 | $(35,486) |
| Service Class 2 | | | | |
| Shares sold | 295,324 | 223,607 | $3,307,774 | $2,411,512 |
| Issued in exchange for the shares of the Acquired Fund(s) | 25,230 | - | 279,044 | - |
| Reinvestment of distributions | 43,564 | 55,623 | 477,254 | 600,709 |
| Shares redeemed | (446,208) | (572,650) | (4,976,860) | (6,204,220) |
| Net increase (decrease) | (82,090) | (293,420) | $(912,788) | $(3,191,999) |
| VIP Freedom 2010 Portfolio | | | | |
| Initial Class | | | | |
| Shares sold | 225,458 | 734,753 | $2,628,064 | $8,007,538 |
| Reinvestment of distributions | 51,974 | 130,011 | 596,244 | 1,437,928 |
| Shares redeemed | (483,160) | (369,613) | (5,614,292) | (4,138,846) |
| Net increase (decrease) | (205,728) | 495,151 | $(2,389,984) | $5,306,620 |
| Service Class | | | | |
| Shares sold | 284,244 | 189,086 | $3,331,968 | $2,114,536 |
| Reinvestment of distributions | 52,091 | 205,902 | 596,287 | 2,267,100 |
| Shares redeemed | (661,196) | (527,785) | (7,736,504) | (5,863,420) |
| Net increase (decrease) | (324,861) | (132,797) | $(3,808,249) | $(1,481,784) |
| Service Class 2 | | | | |
| Shares sold | 808,374 | 295,703 | $9,324,567 | $3,261,362 |
| Reinvestment of distributions | 676,384 | 2,401,781 | 7,684,886 | 26,250,871 |
| Shares redeemed | (3,352,996) | (3,641,109) | (38,787,846) | (40,173,370) |
| Net increase (decrease) | (1,868,238) | (943,625) | $(21,778,393) | $(10,661,137) |
| VIP Freedom 2015 Portfolio | | | | |
| Initial Class | | | | |
| Shares sold | 91,095 | 452,129 | $1,074,280 | $5,016,230 |
| Reinvestment of distributions | 131,910 | 114,442 | 1,493,521 | 1,279,047 |
| Shares redeemed | (359,400) | (353,327) | (4,179,733) | (3,935,296) |
| Net increase (decrease) | (136,395) | 213,244 | $(1,611,932) | $2,359,981 |
| Service Class | | | | |
| Shares sold | 536,687 | 353,166 | $6,228,387 | $3,916,473 |
| Reinvestment of distributions | 70,442 | 67,691 | 794,866 | 752,489 |
| Shares redeemed | (668,660) | (779,524) | (7,740,561) | (8,677,182) |
| Net increase (decrease) | (61,531) | (358,667) | $(717,308) | $(4,008,220) |
| Service Class 2 | | | | |
| Shares sold | 220,685 | 213,981 | $2,599,097 | $2,362,103 |
| Reinvestment of distributions | 124,505 | 120,772 | 1,398,859 | 1,337,539 |
| Shares redeemed | (504,383) | (527,715) | (5,812,756) | (5,806,501) |
| Net increase (decrease) | (159,193) | (192,962) | $(1,814,800) | $(2,106,859) |
| VIP Freedom 2020 Portfolio | | | | |
| Initial Class | | | | |
| Shares sold | 1,083,159 | 2,685,710 | $13,863,619 | $32,137,000 |
| Reinvestment of distributions | 378,386 | 234,952 | 4,714,470 | 2,856,614 |
| Shares redeemed | (1,932,796) | (1,561,179) | (24,689,059) | (18,657,328) |
| Net increase (decrease) | (471,251) | 1,359,483 | $(6,110,970) | $16,336,286 |
| Service Class | | | | |
| Shares sold | 2,995,047 | 1,884,596 | $38,591,476 | $22,521,084 |
| Reinvestment of distributions | 551,080 | 395,261 | 6,842,418 | 4,765,965 |
| Shares redeemed | (3,843,278) | (3,386,893) | (49,202,209) | (40,288,918) |
| Net increase (decrease) | (297,151) | (1,107,036) | $(3,768,315) | $(13,001,869) |
| Service Class 2 | | | | |
| Shares sold | 648,688 | 830,980 | $8,243,992 | $9,817,447 |
| Reinvestment of distributions | 1,564,994 | 1,125,932 | 19,299,008 | 13,504,617 |
| Shares redeemed | (5,339,980) | (4,942,858) | (67,985,434) | (58,717,326) |
| Net increase (decrease) | (3,126,298) | (2,985,946) | $(40,442,434) | $(35,395,262) |
| VIP Freedom 2025 Portfolio | | | | |
| Initial Class | | | | |
| Shares sold | 802,556 | 3,499,750 | $12,905,572 | $49,982,607 |
| Reinvestment of distributions | 160,505 | 142,515 | 2,553,584 | 2,114,386 |
| Shares redeemed | (1,152,345) | (912,435) | (18,407,342) | (13,203,863) |
| Net increase (decrease) | (189,284) | 2,729,830 | $(2,948,186) | $38,893,130 |
| Service Class | | | | |
| Shares sold | 4,104,611 | 3,171,969 | $66,050,791 | $45,705,083 |
| Reinvestment of distributions | 313,381 | 323,005 | 4,969,981 | 4,741,865 |
| Shares redeemed | (4,620,321) | (4,085,365) | (73,210,407) | (58,562,251) |
| Net increase (decrease) | (202,329) | (590,391) | $(2,189,635) | $(8,115,303) |
| Service Class 2 | | | | |
| Shares sold | 963,283 | 1,001,951 | $15,275,803 | $14,332,648 |
| Reinvestment of distributions | 171,133 | 187,141 | 2,691,213 | 2,724,354 |
| Shares redeemed | (1,595,094) | (1,632,301) | (25,389,699) | (23,237,902) |
| Net increase (decrease) | (460,678) | (443,209) | $(7,422,683) | $(6,180,900) |
| VIP Freedom 2030 Portfolio | | | | |
| Initial Class | | | | |
| Shares sold | 2,429,792 | 3,313,084 | $39,677,916 | $48,202,389 |
| Reinvestment of distributions | 281,761 | 242,309 | 4,596,693 | 3,630,083 |
| Shares redeemed | (1,764,008) | (1,485,965) | (28,938,630) | (21,556,364) |
| Net increase (decrease) | 947,545 | 2,069,428 | $15,335,979 | $30,276,108 |
| Service Class | | | | |
| Shares sold | 6,345,375 | 4,868,737 | $104,407,309 | $70,472,748 |
| Reinvestment of distributions | 532,308 | 476,840 | 8,654,565 | 7,108,355 |
| Shares redeemed | (5,147,020) | (4,306,355) | (83,033,096) | (62,005,332) |
| Net increase (decrease) | 1,730,663 | 1,039,222 | $30,028,778 | $15,575,771 |
| Service Class 2 | | | | |
| Shares sold | 1,699,229 | 1,952,431 | $27,634,128 | $28,097,338 |
| Reinvestment of distributions | 314,611 | 317,545 | 5,085,294 | 4,704,484 |
| Shares redeemed | (2,573,104) | (2,370,936) | (42,102,443) | (34,173,618) |
| Net increase (decrease) | (559,264) | (100,960) | $(9,383,021) | $(1,371,796) |
| VIP Freedom 2035 Portfolio | | | | |
| Initial Class | | | | |
| Shares sold | 539,181 | 816,666 | $14,905,818 | $19,944,052 |
| Reinvestment of distributions | 56,996 | 27,913 | 1,559,140 | 708,529 |
| Shares redeemed | (238,210) | (158,552) | (6,464,325) | (3,859,274) |
| Net increase (decrease) | 357,967 | 686,027 | $10,000,633 | $16,793,307 |
| Service Class | | | | |
| Shares sold | 2,563,366 | 2,222,007 | $71,523,833 | $53,711,627 |
| Reinvestment of distributions | 193,512 | 104,263 | 5,270,497 | 2,626,198 |
| Shares redeemed | (1,736,158) | (1,207,278) | (47,718,477) | (29,346,996) |
| Net increase (decrease) | 1,020,720 | 1,118,992 | $29,075,853 | $26,990,829 |
| Service Class 2 | | | | |
| Shares sold | 861,901 | 897,849 | $23,824,011 | $21,652,655 |
| Reinvestment of distributions | 156,222 | 86,722 | 4,211,409 | 2,165,501 |
| Shares redeemed | (679,676) | (611,604) | (18,657,089) | (14,648,775) |
| Net increase (decrease) | 338,447 | 372,967 | $9,378,331 | $9,169,381 |
| VIP Freedom 2040 Portfolio | | | | |
| Initial Class | | | | |
| Shares sold | 840,567 | 952,651 | $22,592,849 | $21,971,331 |
| Reinvestment of distributions | 92,425 | 66,913 | 2,445,240 | 1,579,926 |
| Shares redeemed | (420,346) | (303,653) | (11,316,844) | (7,025,473) |
| Net increase (decrease) | 512,646 | 715,911 | $13,721,245 | $16,525,784 |
| Service Class | | | | |
| Shares sold | 2,285,320 | 2,441,836 | $61,889,922 | $55,811,760 |
| Reinvestment of distributions | 218,549 | 185,312 | 5,758,235 | 4,340,621 |
| Shares redeemed | (1,693,644) | (1,575,002) | (45,331,621) | (36,358,908) |
| Net increase (decrease) | 810,225 | 1,052,146 | $22,316,536 | $23,793,473 |
| Service Class 2 | | | | |
| Shares sold | 454,054 | 498,289 | $12,115,198 | $11,391,766 |
| Reinvestment of distributions | 56,954 | 45,991 | 1,488,104 | 1,069,680 |
| Shares redeemed | (286,277) | (385,578) | (7,693,420) | (8,785,619) |
| Net increase (decrease) | 224,731 | 158,702 | $5,909,882 | $3,675,827 |
| VIP Freedom 2045 Portfolio | | | | |
| Initial Class | | | | |
| Shares sold | 248,890 | 372,832 | $6,810,083 | $8,687,583 |
| Reinvestment of distributions | 24,011 | 14,637 | 644,337 | 350,222 |
| Shares redeemed | (109,200) | (50,633) | (3,021,983) | (1,198,675) |
| Net increase (decrease) | 163,701 | 336,836 | $4,432,437 | $7,839,130 |
| Service Class | | | | |
| Shares sold | 838,926 | 938,836 | $23,224,944 | $22,105,547 |
| Reinvestment of distributions | 53,561 | 38,486 | 1,431,254 | 910,150 |
| Shares redeemed | (616,539) | (400,189) | (16,822,669) | (9,402,638) |
| Net increase (decrease) | 275,948 | 577,133 | $7,833,529 | $13,613,059 |
| Service Class 2 | | | | |
| Shares sold | 724,114 | 778,851 | $19,629,173 | $18,072,834 |
| Reinvestment of distributions | 117,865 | 100,565 | 3,116,925 | 2,348,001 |
| Shares redeemed | (420,852) | (487,903) | (11,421,847) | (11,303,823) |
| Net increase (decrease) | 421,127 | 391,513 | $11,324,251 | $9,117,012 |
| VIP Freedom 2050 Portfolio | | | | |
| Initial Class | | | | |
| Shares sold | 537,589 | 453,481 | $13,359,347 | $9,533,620 |
| Reinvestment of distributions | 41,100 | 31,041 | 992,104 | 665,385 |
| Shares redeemed | (454,781) | (186,416) | (11,108,842) | (3,994,297) |
| Net increase (decrease) | 123,908 | 298,106 | $3,242,609 | $6,204,708 |
| Service Class | | | | |
| Shares sold | 780,515 | 748,931 | $19,389,175 | $15,721,134 |
| Reinvestment of distributions | 66,891 | 51,197 | 1,609,195 | 1,091,054 |
| Shares redeemed | (520,035) | (422,051) | (12,919,038) | (8,865,929) |
| Net increase (decrease) | 327,371 | 378,077 | $8,079,332 | $7,946,259 |
| Service Class 2 | | | | |
| Shares sold | 654,132 | 733,870 | $15,977,764 | $15,313,791 |
| Reinvestment of distributions | 90,532 | 72,336 | 2,158,455 | 1,529,162 |
| Shares redeemed | (466,286) | (347,415) | (11,461,812) | (7,335,701) |
| Net increase (decrease) | 278,378 | 458,791 | $6,674,407 | $9,507,252 |
| VIP Freedom 2055 Portfolio | | | | |
| Initial Class | | | | |
| Shares sold | 194,369 | 133,801 | $2,667,830 | $1,573,006 |
| Reinvestment of distributions | 7,661 | 2,679 | 105,165 | 33,697 |
| Shares redeemed | (80,542) | (7,740) | (1,135,377) | (91,744) |
| Net increase (decrease) | 121,488 | 128,740 | $1,637,618 | $1,514,959 |
| Service Class | | | | |
| Shares sold | 284,261 | 306,462 | $3,991,814 | $3,595,314 |
| Reinvestment of distributions | 12,346 | 7,422 | 168,172 | 91,423 |
| Shares redeemed | (188,049) | (159,707) | (2,614,190) | (1,892,017) |
| Net increase (decrease) | 108,558 | 154,177 | $1,545,796 | $1,794,720 |
| Service Class 2 | | | | |
| Shares sold | 299,655 | 230,903 | $4,158,264 | $2,693,859 |
| Reinvestment of distributions | 18,368 | 10,187 | 248,909 | 124,679 |
| Shares redeemed | (102,054) | (48,955) | (1,453,013) | (585,503) |
| Net increase (decrease) | 215,969 | 192,135 | $2,954,160 | $2,233,035 |
| VIP Freedom 2060 Portfolio | | | | |
| Initial Class | | | | |
| Shares sold | 131,915 | 101,848 | $1,799,085 | $1,179,175 |
| Reinvestment of distributions | 4,746 | 1,532 | 64,106 | 19,165 |
| Shares redeemed | (60,081) | (12,705) | (825,218) | (152,588) |
| Net increase (decrease) | 76,580 | 90,675 | $1,037,973 | $1,045,752 |
| Service Class | | | | |
| Shares sold | 513,380 | 504,231 | $7,166,128 | $5,910,169 |
| Reinvestment of distributions | 29,300 | 23,370 | 390,876 | 283,010 |
| Shares redeemed | (593,023) | (238,840) | (7,925,941) | (2,796,794) |
| Net increase (decrease) | (50,343) | 288,761 | $(368,937) | $3,396,385 |
| Service Class 2 | | | | |
| Shares sold | 222,528 | 192,925 | $3,031,935 | $2,253,542 |
| Reinvestment of distributions | 16,712 | 8,654 | 222,682 | 104,740 |
| Shares redeemed | (28,199) | (30,061) | (390,268) | (353,940) |
| Net increase (decrease) | 211,041 | 171,518 | $2,864,349 | $2,004,342 |
| VIP Freedom 2065 Portfolio | | | | |
| Initial Class | | | | |
| Shares sold | 97,358 | 36,388 | $1,316,511 | $412,181 |
| Reinvestment of distributions | 1,944 | 670 | 26,469 | 8,071 |
| Shares redeemed | (23,342) | (19,507) | (314,702) | (223,232) |
| Net increase (decrease) | 75,960 | 17,551 | $1,028,278 | $197,020 |
| Service Class | | | | |
| Shares sold | 234,751 | 154,287 | $3,213,478 | $1,772,357 |
| Reinvestment of distributions | 4,861 | 2,618 | 65,687 | 31,223 |
| Shares redeemed | (99,069) | (121,377) | (1,335,547) | (1,359,869) |
| Net increase (decrease) | 140,543 | 35,528 | $1,943,618 | $443,711 |
| Service Class 2 | | | | |
| Shares sold | 45,463 | 8,876 | $643,125 | $100,961 |
| Reinvestment of distributions | 1,145 | 475 | 15,465 | 5,652 |
| Shares redeemed | (3,424) | (1,620) | (46,909) | (18,748) |
| Net increase (decrease) | 43,184 | 7,731 | $611,681 | $87,865 |
VIP Freedom 2070 PortfolioA | | | | |
| Initial Class | | | | |
| Shares sold | 30,000 | - | $300,000 | $- |
| Net increase (decrease) | 30,000 | - | $300,000 | $- |
| Service Class | | | | |
| Shares sold | 10,000 | - | $100,000 | $- |
| Net increase (decrease) | 10,000 | - | $100,000 | $- |
| Service Class 2 | | | | |
| Shares sold | 10,000 | - | $100,000 | $- |
| Net increase (decrease) | 10,000 | - | $100,000 | $- |
A For the period July 1, 2024 (commencement of operations) through December 31, 2024.
9. Other.
A fund's organizational documents provide former and current trustees and officers with a limited indemnification against liabilities arising in connection with the performance of their duties to the fund. In the normal course of business, a fund may also enter into contracts that provide general indemnifications. A fund's maximum exposure under these arrangements is unknown as this would be dependent on future claims that may be made against a fund. The risk of material loss from such claims is considered remote.
Funds do not invest in underlying mutual funds for the purpose of exercising management or control; however, investments by funds within their principal investment strategies may represent a significant portion of the underlying mutual fund's net assets. At the end of the period, certain Funds were the owners of record of 10% or more of the total outstanding shares of the following underlying mutual funds as shown below.
| | Affiliated % | Number of Unaffiliated Shareholders | Unaffiliated Shareholders % |
| VIP Freedom Income Portfolio | 15% | 2 | 41% |
| VIP Freedom 2010 Portfolio | - | 1 | 84% |
| VIP Freedom 2015 Portfolio | 25% | 2 | 26% |
| VIP Freedom 2020 Portfolio | - | 1 | 63% |
| VIP Freedom 2025 Portfolio | - | 3 | 52% |
| VIP Freedom 2030 Portfolio | - | 2 | 51% |
| VIP Freedom 2035 Portfolio | - | 4 | 67% |
| VIP Freedom 2040 Portfolio | - | 3 | 65% |
| VIP Freedom 2045 Portfolio | - | 4 | 68% |
| VIP Freedom 2050 Portfolio | - | 4 | 75% |
| VIP Freedom 2055 Portfolio | - | 2 | 61% |
| VIP Freedom 2060 Portfolio | - | 2 | 76% |
| VIP Freedom 2065 Portfolio | 17% | 3 | 73% |
| VIP Freedom 2070 Portfolio | 100% | - | - |
The Funds, in aggregate, were the owners of record of more than 20% of the total outstanding shares of the following underlying mutual funds.
| Fund | % of shares held |
| VIP Emerging Markets Portfolio | 30% |
| VIP Overseas Portfolio | 33% |
11. Risk and Uncertainties.
Many factors affect a fund's performance. Developments that disrupt global economies and financial markets, such as pandemics, epidemics, outbreaks of infectious diseases, war, terrorism, and environmental disasters, may significantly affect a fund's investment performance. The effects of these developments to a fund will be impacted by the types of securities in which a fund invests, the financial condition, industry, economic sector, and geographic location of an issuer, and a fund's level of investment in the securities of that issuer. Significant concentrations in security types, issuers, industries, sectors, and geographic locations may magnify the factors that affect a fund's performance.
12. Reorganization Information.
On June 7, 2024, VIP Freedom Income Portfolio acquired all of the assets and assumed all of the liabilities of VIP Freedom 2005 Portfolio ("Acquired Fund") pursuant to an Agreement and Plan of Reorganization (Agreements) approved by the Board of Trustees ("The Board"). The securities held by the Acquired Fund were the primary assets acquired by the VIP Freedom Income Portfolio. The acquisition was accomplished by an exchange of each class of VIP Freedom Income Portfolio for corresponding shares then outstanding of the Acquired Fund at its respective net asset value on the acquisition date. The reorganization provides shareholders of the Acquired Fund access to a larger portfolio with a similar investment objective and lower projected expenses. For financial reporting purposes, the assets and liabilities of the Acquired Fund and shares issued by VIP Freedom Income Portfolio were recorded at fair value; however, the cost basis of the investments received from the Acquired Fund were carried forward and will be utilized for purposes of VIP Freedom Income Portfolio's ongoing reporting of realized and unrealized gains and losses to more closely align subsequent reporting of realized gains with amounts distributable to shareholders for tax purposes. The reorganization qualified as a tax-free reorganization for federal income tax purposes with no gain or loss recognized to the funds or their shareholders.
| Acquired Fund and Share Class | Investments $ | Unrealized appreciation (depreciation) $ | Net Assets $ | Shares Exchanged | Shares Exchanged Ratio |
| VIP Freedom 2005 Portfolio | 8,901,778 | 394,296 | | | |
| Initial Class | | | 4,968,120 | 446,775 | 1.0339208633 |
| Service Class | | | 3,655,826 | 329,353 | 1.0437297297 |
| Service Class 2 | | | 279,044 | 25,230 | 1.0365009042 |
| Surviving Fund | Net Assets $ | Total net assets after the acquisition $ |
| VIP Freedom Income Portfolio | 69,407,822 | 78,310,812 |
Pro forma results of operations of the combined entity for the entire period ended December 31, 2024, as though the acquisition had occurred as of the beginning of the year (rather than on the actual acquisition date), are as follows:
| Net investment income (loss) | $2,977,729 |
| Total net realized gain (loss) | 1,095,342 |
| Total change in net unrealized appreciation (depreciation) | (826,367) |
| Net increase (decrease) in net assets resulting from operations | $3,246,704 |
Because the combined investment portfolios have been managed as a single portfolio since the acquisition was completed, it is not practicable to separate the amounts of revenue and earnings of the acquired funds that have been included in the VIP Freedom Income Portfolio's accompanying Statement of Operations since June 7, 2024.
Report of Independent Registered Public Accounting Firm
To the Board of Trustees of Variable Insurance Products Fund V and the Shareholders of VIP Freedom Income Portfolio, VIP Freedom 2010 Portfolio, VIP Freedom 2015 Portfolio, VIP Freedom 2020 Portfolio, VIP Freedom 2025 Portfolio, VIP Freedom 2030 Portfolio, VIP Freedom 2035 Portfolio, VIP Freedom 2040 Portfolio, VIP Freedom 2045 Portfolio, VIP Freedom 2050 Portfolio, VIP Freedom 2055 Portfolio, VIP Freedom 2060 Portfolio, VIP Freedom 2065 Portfolio and VIP Freedom 2070 Portfolio:
Opinion on the Financial Statements and Financial Highlights
We have audited the accompanying statements of assets and liabilities of VIP Freedom Income Portfolio, VIP Freedom 2010 Portfolio, VIP Freedom 2015 Portfolio, VIP Freedom 2020 Portfolio, VIP Freedom 2025 Portfolio, VIP Freedom 2030 Portfolio, VIP Freedom 2035 Portfolio, VIP Freedom 2040 Portfolio, VIP Freedom 2045 Portfolio, VIP Freedom 2050 Portfolio, VIP Freedom 2055 Portfolio, VIP Freedom 2060 Portfolio, VIP Freedom 2065 Portfolio and VIP Freedom 2070 Portfolio (the "Funds"), each a fund of Variable Insurance Products Fund V, including the schedules of investments, as of December 31, 2024, the related statements of operations for the year then ended, the statements of changes in net assets for each of the two years in the period then ended, and the financial highlights for each of the five years in the period then ended, except for the related statements of operations, the statements of changes in net assets and financial highlights for VIP Freedom 2070 Portfolio, which are for the period from July 1, 2024 (commencement of operations) through December 31, 2024, and the related notes. In our opinion, the financial statements and financial highlights present fairly, in all material respects, the financial position of each of the Funds as of December 31, 2024, and the results of their operations for the year then ended, the changes in their net assets for each of the two years in the period then ended, and the financial highlights for each of the five years in the period then ended (or for the period mentioned above), in conformity with accounting principles generally accepted in the United States of America.
Basis for Opinion
These financial statements and financial highlights are the responsibility of the Funds' management. Our responsibility is to express an opinion on the Funds' financial statements and financial highlights based on our audits. We are a public accounting firm registered with the Public Company Accounting Oversight Board (United States) (PCAOB) and are required to be independent with respect to the Funds in accordance with the U.S. federal securities laws and the applicable rules and regulations of the Securities and Exchange Commission and the PCAOB.
We conducted our audits in accordance with the standards of the PCAOB. Those standards require that we plan and perform the audit to obtain reasonable assurance about whether the financial statements and financial highlights are free of material misstatement, whether due to error or fraud. The Funds are not required to have, nor were we engaged to perform, an audit of their internal control over financial reporting. As part of our audits, we are required to obtain an understanding of internal control over financial reporting but not for the purpose of expressing an opinion on the effectiveness of the Funds' internal control over financial reporting. Accordingly, we express no such opinion.
Our audits included performing procedures to assess the risks of material misstatement of the financial statements and financial highlights, whether due to error or fraud, and performing procedures that respond to those risks. Such procedures included examining, on a test basis, evidence regarding the amounts and disclosures in the financial statements and financial highlights. Our audits also included evaluating the accounting principles used and significant estimates made by management, as well as evaluating the overall presentation of the financial statements and financial highlights. Our procedures included confirmation of securities owned as of December 31, 2024, by correspondence with the custodian and brokers; when replies were not received from brokers, we performed other auditing procedures. We believe that our audits provide a reasonable basis for our opinion.
/s/ Deloitte & Touche LLP
Boston, Massachusetts
February 14, 2025
We have served as the auditor of one or more of the Fidelity investment companies since 1999.
Distributions
(Unaudited)The dividend and capital gains distributions for the fund(s) are available on Fidelity.com or Institutional.Fidelity.com.
The funds hereby designate as capital gain dividend the amounts noted below for the taxable year ended December 31, 2024, or, if subsequently determined to be different, the net capital gain of such year.
| VIP Freedom 2010 Portfolio | $2,986,038 |
| VIP Freedom 2015 Portfolio | $2,319,508 |
| VIP Freedom 2020 Portfolio | $28,564,872 |
| VIP Freedom 2025 Portfolio | $13,356,085 |
| VIP Freedom 2030 Portfolio | $34,171,791 |
| VIP Freedom 2035 Portfolio | $19,882,200 |
| VIP Freedom 2040 Portfolio | $23,359,582 |
| VIP Freedom 2045 Portfolio | $12,776,236 |
| VIP Freedom 2050 Portfolio | $11,045,886 |
| VIP Freedom 2055 Portfolio | $1,450,772 |
| VIP Freedom 2060 Portfolio | $1,657,459 |
| VIP Freedom 2065 Portfolio | $459,603 |
| VIP Freedom 2070 Portfolio | $34,733 |
A percentage of the dividends distributed during the fiscal year for the following funds were derived from interest on U.S. Government securities which is generally exempt from state income tax.
| VIP Freedom Income Portfolio | 33.56% |
| VIP Freedom 2005 Portfolio | 47.03% |
| VIP Freedom 2010 Portfolio | 28.97% |
| VIP Freedom 2015 Portfolio | 21.21% |
| VIP Freedom 2020 Portfolio | 16.58% |
| VIP Freedom 2025 Portfolio | 14.29% |
| VIP Freedom 2030 Portfolio | 11.18% |
| VIP Freedom 2035 Portfolio | 7.20% |
| VIP Freedom 2040 Portfolio | 3.36% |
| VIP Freedom 2045 Portfolio | 2.25% |
| VIP Freedom 2050 Portfolio | 2.28% |
| VIP Freedom 2055 Portfolio | 2.11% |
| VIP Freedom 2060 Portfolio | 2.12% |
| VIP Freedom 2065 Portfolio | 1.89% |
| VIP Freedom 2070 Portfolio | 1.38% |
The funds hereby designate the amounts noted below as distributions paid during the fiscal year ended 2024 as qualifying to be taxed as section 163(j) interest dividends:
| VIP Freedom Income Portfolio | $2,845,855 |
| VIP Freedom 2005 Portfolio | $71,164 |
| VIP Freedom 2010 Portfolio | $7,336,333 |
| VIP Freedom 2015 Portfolio | $1,434,731 |
| VIP Freedom 2020 Portfolio | $10,339,366 |
| VIP Freedom 2025 Portfolio | $6,266,321 |
| VIP Freedom 2030 Portfolio | $10,673,544 |
| VIP Freedom 2035 Portfolio | $3,703,354 |
| VIP Freedom 2040 Portfolio | $1,769,571 |
VIP Freedom 2045 Portfolio | $629,048 |
VIP Freedom 2050 Portfolio | $563,305 |
| VIP Freedom 2055 Portfolio | $69,414 |
| VIP Freedom 2060 Portfolio | $83,792 |
| VIP Freedom 2065 Portfolio | $21,537 |
| VIP Freedom 2070 Portfolio | $1,463 |
A percentage of the dividends distributed during the fiscal year for the following funds qualify for the dividends-received deduction for corporate shareholders:
| | Initial Class | Service Class | Service Class 2 |
| VIP Freedom Income Portfolio | | | |
| February, 2024 | 0% | 0% | 0% |
| December, 2024 | 3% | 3% | 3% |
| VIP Freedom 2005 Portfolio | | | |
| February, 2024 | 0% | 0% | 0% |
| December 2024 | 0% | 0% | 0% |
| VIP Freedom 2010 Portfolio | | | |
| February, 2024 | 0% | 0% | 0% |
| December, 2024 | 4% | 4% | 4% |
| VIP Freedom 2015 Portfolio | | | |
| February, 2024 | 0% | 0% | 0% |
| December, 2024 | 5% | 5% | 6% |
| VIP Freedom 2020 Portfolio | | | |
| February, 2024 | 0% | 0% | 0% |
| December, 2024 | 7% | 8% | 8% |
| VIP Freedom 2025 Portfolio | | | |
| February, 2024 | 0% | 0% | 0% |
| December, 2024 | 11% | 11% | 12% |
| VIP Freedom 2030 Portfolio | | | |
| February, 2024 | 0% | 0% | 0% |
| December, 2024 | 13% | 13% | 14% |
| VIP Freedom 2035 Portfolio | | | |
February, 2024 December, 2024 | 0% 16% | 0% 16% | 0% 18% |
| VIP Freedom 2040 Portfolio | | | |
| February, 2024 | 1% | 1% | 1% |
| December, 2024 | 23% | 24% | 27% |
| VIP Freedom 2045 Portfolio | | | |
| February, 2024 | 1% | 1% | 1% |
| December, 2024 | 26% | 28% | 30% |
| VIP Freedom 2050 Portfolio | | | |
| February, 2024 | 2% | 2% | 2% |
| December, 2024 | 26% | 28% | 30% |
| VIP Freedom 2055 Portfolio | | | |
| February, 2024 | 0% | 0% | 0% |
| December, 2024 | 25% | 27% | 29% |
| VIP Freedom 2060 Portfolio | | | |
| February, 2024 | 0% | 0% | 0% |
| December, 2024 | 26% | 27% | 29% |
| VIP Freedom 2065 Portfolio | | | |
| February, 2024 | 0% | 0% | 0% |
| December, 2024 | 26% | 28% | 30% |
| VIP Freedom 2070 Portfolio | | | |
| February, 2024 | 0% | 0% | 0% |
| December, 2024 | 25% | 26% | 27% |
The amounts per share which represent income derived from sources within, and taxes paid to, foreign countries or possessions of the United States are as follows:| | Pay Date | Income | Taxes |
| VIP Freedom Income Portfolio | | | |
| Initial Class | 12/18/24 | $0.0235 | $0.0068 |
| Service Class | 12/18/24 | $0.0229 | $0.0068 |
| Service Class 2 | 12/18/24 | $0.0216 | $0.0068 |
| VIP Freedom 2010 Portfolio | | | |
| Initial Class | 12/18/24 | $0.0188 | $0.0083 |
| Service Class | 12/18/24 | $0.0181 | $0.0083 |
| Service Class 2 | 12/18/24 | $0.0173 | $0.0083 |
| VIP Freedom 2015 Portfolio | | | |
| Initial Class | 12/18/24 | $0.0360 | $0.0101 |
| Service Class | 12/18/24 | $0.0349 | $0.0101 |
| Service Class 2 | 12/18/24 | $0.0332 | $0.0101 |
| VIP Freedom 2020 Portfolio | | | |
| Initial Class | 12/18/24 | $0.0459 | $0.0129 |
| Service Class | 12/18/24 | $0.0443 | $0.0129 |
| Service Class 2 | 12/18/24 | $0.0416 | $0.0129 |
| VIP Freedom 2025 Portfolio | | | |
| Initial Class | 12/18/24 | $0.0641 | $0.0183 |
| Service Class | 12/18/24 | $0.0616 | $0.0183 |
| Service Class 2 | 12/18/24 | $0.0573 | $0.0183 |
| VIP Freedom 2030 Portfolio | | | |
| Initial Class | 12/18/24 | $0.0732 | $0.0204 |
| Service Class | 12/18/24 | $0.0703 | $0.0204 |
| Service Class 2 | 12/18/24 | $0.0651 | $0.0204 |
| VIP Freedom 2035 Portfolio | | | |
| Initial Class | 12/18/24 | $0.1433 | $0.0389 |
| Service Class | 12/18/24 | $0.1375 | $0.0389 |
| Service Class 2 | 12/18/24 | $0.1277 | $0.0389 |
| VIP Freedom 2040 Portfolio | | | |
| Initial Class | 12/18/24 | $0.1616 | $0.0446 |
| Service Class | 12/18/24 | $0.1533 | $0.0446 |
| Service Class 2 | 12/18/24 | $0.1405 | $0.0446 |
| VIP Freedom 2045 Portfolio | | | |
| Initial Class | 12/18/24 | $0.1721 | $0.0464 |
| Service Class | 12/18/24 | $0.1632 | $0.0464 |
| Service Class 2 | 12/18/24 | $0.1486 | $0.0464 |
| VIP Freedom 2050 Portfolio | | | |
| Initial Class | 12/18/24 | $0.1546 | $0.0419 |
| Service Class | 12/18/24 | $0.1465 | $0.0419 |
| Service Class 2 | 12/18/24 | $0.1335 | $0.0419 |
| VIP Freedom 2055 Portfolio | | | |
| Initial Class | 12/30/24 | $0.0935 | $0.0238 |
| Service Class | 12/30/24 | $0.0891 | $0.0238 |
| Service Class 2 | 12/30/24 | $0.0821 | $0.0238 |
| VIP Freedom 2060 Portfolio | | | |
| Initial Class | 12/30/24 | $0.0876 | $0.0228 |
| Service Class | 12/30/24 | $0.0832 | $0.0228 |
| Service Class 2 | 12/30/24 | $0.0766 | $0.0228 |
| VIP Freedom 2065 Portfolio | | | |
| Initial Class | 12/30/24 | $0.0896 | $0.0217 |
| Service Class | 12/30/24 | $0.0856 | $0.0217 |
| Service Class 2 | 12/30/24 | $0.0804 | $0.0217 |
| VIP Freedom 2070 Portfolio | | | |
| Initial Class | 12/30/24 | $0.0824 | $0.0170 |
| Service Class | 12/30/24 | $0.0801 | $0.0170 |
| Service Class 2 | 12/30/24 | $0.0766 | $0.0170 |
| | | | |
Item 8: Changes in and Disagreements with Accountants for Open-End Management Investment Companies
(Unaudited)
Note: This is not applicable for any fund included in this document.
Item 9: Proxy Disclosures for Open-End Management Investment Companies
(Unaudited)
Note: This is not applicable for any fund included in this document.
Item 10: Remuneration Paid to Directors, Officers, and others of Open-End Management Investment Companies
(Unaudited)
Note: This information is disclosed as part of the financial statements for each Fund as part of Item 7: Financial Statements and Financial Highlights for Open-End Management Investment companies.
Item 11: Statement Regarding Basis for Approval of Investment Advisory Contract
(Unaudited)
Board Approval of Investment Advisory Contracts and Management Fees
VIP Freedom 2070 Portfolio
At its March 2024 meeting, the Board of Trustees, including the Independent Trustees (together, the Board), voted to approve the management contract (the Advisory Contract) with Fidelity Management & Research Company LLC (FMR) for the fund. The Board, assisted by the advice of fund counsel and Independent Trustees' counsel, considered a broad range of information.
Nature, Extent, and Quality of Services Provided. The Board considered Fidelity's staffing as it relates to the fund, including the backgrounds of investment personnel of FMR, and also considered the fund's investment objective, strategies, and related investment philosophy. The Board considered the structure of the investment personnel compensation program and whether this structure provides appropriate incentives to act in the best interests of the fund.
Resources Dedicated to Investment Management and Support Services. The Board reviewed the general qualifications and capabilities of Fidelity's investment staff, including its size, education, experience, and resources, as well as Fidelity's approach to recruiting, training, managing, and compensating investment personnel. The Board noted the resources devoted to Fidelity's global investment organization and that Fidelity's analysts have extensive resources, tools and capabilities that allow them to conduct sophisticated quantitative and fundamental analysis, as well as credit analysis of issuers, counterparties and guarantors. Further, the Board considered that Fidelity's investment professionals have sufficient access to global information and data so as to provide competitive investment results over time, and that those professionals also have access to sophisticated tools that permit them to assess portfolio construction and risk and performance attribution characteristics continuously, as well as to transmit new information and research conclusions rapidly around the world. Additionally, in its deliberations, the Board considered Fidelity's risk management, compliance, cybersecurity, and technology and operations capabilities and resources, which are integral parts of the investment management process.
Shareholder and Administrative Services. The Board considered the nature, extent, quality, and cost of advisory, administrative, and shareholder services to be performed by Fidelity under the Advisory Contract and under separate agreements covering transfer agency and pricing and bookkeeping services for the fund. The Board also considered the nature and extent of the supervision of third party service providers, principally custodians, subcustodians, and pricing vendors.
The Board noted that the growth of fund assets over time across the complex allows Fidelity to reinvest in the development of services designed to enhance the value and convenience of the Fidelity funds as investment vehicles. These services include 24-hour access to account information and market information over the Internet and through telephone representatives, investor education materials and asset allocation tools. The Board also considered that it reviews customer service metrics such as telephone response times, continuity of services on the website and metrics addressing services at Fidelity Investor Centers.
Investment Performance. The fund is a new fund and therefore had no historical performance for the Board to review at the time it approved the fund's Advisory Contract. The Board considered FMR's strength in managing asset allocation funds, which the Board is familiar with through its supervision of other target date funds. The Board also considered the fact that it oversees funds managed by FMR that have similar investment objectives and policies as the fund.
Based on its review, the Board concluded that the nature, extent, and quality of services to be provided to the fund under the Advisory Contract should benefit the shareholders of the fund.
Competitiveness of Management Fee and Total Expense Ratio. The Board considered that the fund will not pay FMR a management fee for investment advisory services and that the fund will bear indirectly the fees and expenses, including the management fees, paid by the underlying Fidelity funds in which it invests, and that information about such expenses will be disclosed in the fund's prospectus. In reviewing the Advisory Contract, the Board also considered the projected total expense ratio of each class of the fund. The Board noted that the fund's proposed management fee rate ranks below the median of its competitor funds. The Board also considered that the projected total net expense ratio of Initial Class and Service Class of the fund is below the median of those funds and classes used by the Board for management fee comparisons that have a similar sales load structure. The Board also considered that the projected total net expense ratio of Service Class 2 of the fund is below the competitive median, excluding acquired fund fees and expenses, and above the competitive median when including acquired fund fees and expenses. The Board noted that Service Class 2, unlike most competitor classes in the insurance marketplace, has a 12b-1 fee as it is distributed through the intermediary insurance channel and that intermediaries choose the appropriate class of shares for their clients.
Based on its review, the Board concluded that the fund does not pay a management fee and concluded that the total expense ratio of each class of the fund was reasonable in light of the services that the fund and its shareholders will receive and the other factors considered.
Costs of the Services and Profitability. The fund is a new fund and therefore no revenue, cost, or profitability data were available for the Board to review in respect of the fund at the time it approved the Advisory Contract. In connection with its consideration of future renewals of the fund's Advisory Contract, the Board will consider the level of Fidelity's profits in respect of all the Fidelity funds.
Economies of Scale. The Board concluded that because the fund does not pay a management fee and that FMR or an affiliate will bear all expenses of the fund, with limited exceptions, the realization of economies of scale was not a material factor in the Board's decision to approve the fund's Advisory Contract.
Based on its evaluation of all of the conclusions noted above, and after considering all factors it believed relevant, the Board concluded that the advisory fee arrangements are fair and reasonable, and that the fund's Advisory Contract should be approved.
Board Approval of Investment Advisory Contracts and Management Fees
VIP Freedom Income Portfolio
VIP Freedom 2010 Portfolio
VIP Freedom 2015 Portfolio
VIP Freedom 2020 Portfolio
VIP Freedom 2025 Portfolio
VIP Freedom 2030 Portfolio
VIP Freedom 2035 Portfolio
VIP Freedom 2040 Portfolio
VIP Freedom 2045 Portfolio
VIP Freedom 2050 Portfolio
VIP Freedom 2055 Portfolio
VIP Freedom 2060 Portfolio
VIP Freedom 2065 Portfolio
Each year, the Board of Trustees, including the Independent Trustees (together, the Board), considers the renewal of each fund's management contract with Fidelity Management & Research Company LLC (FMR) (the Advisory Contract). The Board, assisted by the advice of fund counsel and Independent Trustees' counsel, requests and considers a broad range of information relevant to the renewal of the Advisory Contracts throughout the year.
The Board meets regularly and, at each of its meetings, covers an extensive agenda of topics and materials and considers factors that are relevant to its annual consideration of the renewal of each fund's Advisory Contract, including the services and support provided to each fund and its shareholders. The Board's Operations Committee, of which all the Independent Trustees are members, meets regularly throughout the year and requests, receives and considers, among other matters, information related to the annual consideration of the renewal of each fund's Advisory Contract before making its recommendation to the Board. The Board also meets as needed to review matters specifically related to the Board's annual consideration of the renewal of the Advisory Contracts. Members of the Board may also meet from time to time with trustees of other Fidelity funds through joint ad hoc committees to discuss certain matters relevant to all of the Fidelity funds.
At its September 2024 meeting, the Board unanimously determined to renew each fund's Advisory Contract. The Board considered the broad range of investment choices available to shareholders from FMR's competitors and that each fund's shareholders have chosen to invest in that fund, which is part of the Fidelity family of funds. The Board's decision to renew the Advisory Contracts was not based on any single factor and the factors may have been weighed differently by different Trustees. The Board considered all factors it believed relevant and reached a determination, with the assistance of fund counsel and Independent Trustees' counsel and through the exercise of its business judgment, that the renewal of the Advisory Contract was in the best interests of each fund and its shareholders and that the fact that no fees are payable under the Advisory Contracts was fair and reasonable in light of all of the surrounding circumstances.
Nature, Extent, and Quality of Services Provided. The Board considered FMR's staffing as it relates to the funds, including the backgrounds and experience of investment personnel, and also considered FMR's implementation of each fund's investment program. The Independent Trustees also had discussions with senior management of Fidelity's investment operations and investment groups with responsibility for the underlying Fidelity funds in which each fund invests. The Board considered the structure of the investment personnel compensation program and whether this structure provides appropriate incentives to act in the best interests of each fund. Additionally, the Board considered the portfolio managers' investments, if any, in the funds that they manage.
Resources Dedicated to Investment Management and Support Services. The Board reviewed the general qualifications and capabilities of Fidelity's investment staff, including its size, education, experience, and resources, as well as Fidelity's approach to recruiting, training, managing, and compensating investment personnel. The Board noted the resources devoted to Fidelity's global investment organization, and that Fidelity's analysts have extensive resources, tools, and capabilities that allow them to conduct quantitative and fundamental analysis, as well as credit analysis of issuers, counterparties, and guarantors. Further, the Board considered that Fidelity's investment professionals have sufficient access to global information and data so as to provide competitive investment results over time, and that those professionals also have access to sophisticated tools that permit them to assess portfolio construction and risk and performance attribution characteristics continuously, as well as to transmit new information and research conclusions rapidly around the world. Additionally, in its deliberations, the Board considered Fidelity's risk management, compliance, cybersecurity, and technology and operations capabilities and resources, which are integral parts of the investment management process.
Shareholder and Administrative Services. The Board considered (i) the nature, extent, quality, and cost of advisory, administrative, and shareholder services performed by Fidelity under the Advisory Contract and under separate agreements covering transfer agency and pricing and bookkeeping services for each fund; (ii) the nature and extent of Fidelity's supervision of third party service providers, principally custodians, subcustodians, and pricing vendors; and (iii) the resources devoted by Fidelity to, and the record of compliance with, each fund's compliance policies and procedures, including with respect to liquidity risk management.
The Board noted that the growth of fund assets over time across the complex allows Fidelity to reinvest in the development of services designed to enhance the value and convenience of the Fidelity funds as investment vehicles. These services include 24-hour access to account information and market information over the Internet and through telephone representatives, investor education materials and asset allocation tools. The Board also considered that it reviews customer service metrics such as telephone response times, continuity of services on the website and metrics addressing services at Fidelity Investor Centers.
Investment in a Large Fund Family. The Board considered the benefits to shareholders of investing in a fund that is part of a large family of funds offering a variety of investment disciplines and providing a large variety of fund investor services. The Board noted that Fidelity had taken, or had made recommendations to the Board that resulted in the Fidelity funds taking, a number of actions over the previous year that benefited particular funds and/or the Fidelity funds in general.
Investment Performance. The Board took into account discussions that occur with representatives of the investment adviser, or reports it receives, at Board meetings throughout the year relating to fund investment performance. In this regard the Board noted that as part of regularly scheduled fund reviews and other reports to the Board on fund performance, the Board considered annualized return information for each fund for different time periods, measured against one or more appropriate securities market indices, including a customized blended index that reflects the respective weights of the fund's asset classes (each a benchmark index). The Board also considered information about performance attribution. In its evaluation of fund investment performance at meetings throughout the year, the Board gave particular attention to information indicating underperformance of certain Fidelity funds over different time periods and discussed with the Investment Advisers the reasons for such underperformance.
In addition to reviewing absolute and relative fund performance, the Independent Trustees periodically consider the appropriateness of fund performance metrics in evaluating the results achieved. The Independent Trustees generally give greater weight to fund performance over longer time periods than over shorter time periods. Depending on the circumstances, the Independent Trustees may be satisfied with a fund's performance notwithstanding that it lags its benchmark index for certain periods.
Based on its review, the Board concluded that the nature, extent, and quality of services provided to each fund under the Advisory Contracts should continue to benefit the shareholders of each fund.
Competitiveness of Management Fee and Total Expense Ratio. The Board was provided with information regarding industry trends in management fees and expenses. The Board noted that the funds do not pay FMR a management fee for investment advisory services, and that each fund bears indirectly the fees and expenses, including the management fees, paid by the underlying Fidelity funds in which it invests. In its review of the total expense ratio of the representative class (Initial Class, which was selected because it was the largest class without 12b-1 fees) of each fund, the Board noted that each fund invests in a class of shares of the underlying Fidelity funds that does not charge a 12b-1 fee. The Board considered that the funds do not pay transfer agent fees. Instead, the applicable class of each underlying Fidelity fund bears its pro rata portion of each fund's transfer agent fee according to the percentage of each fund's assets invested in that underlying fund. The Board further noted that FMR pays all other expenses of each fund, with limited exceptions. The Board also noted that Fidelity may agree to waive fees or reimburse expenses from time to time, and the extent to which, if any, it has done so for each fund.
Comparisons of Management Fees and Total Expense Ratios. Among other things, the Board reviewed data for selected groups of competitive funds and classes (referred to as "mapped groups") that were compiled by Fidelity based on combining similar investment objective categories (as classified by Morningstar) that have comparable investment mandates. For each fund, data reviewed by the Board included (i) gross management fee comparisons (before taking into account expense reimbursements or caps) relative to the total universe of funds within the mapped group; (ii) gross management fee comparisons relative to a subset of non-Fidelity funds in the mapped group that are similar in size and management fee structure to the fund (referred to as the "asset size peer group"); (iii) total expense comparisons of Initial Class of the fund relative to funds and classes in the mapped group that have a similar sales load structure to Initial Class of the fund (referred to as the "similar sales load structure group"); and (iv) total expense comparisons of Initial Class of the fund relative to funds and classes in the similar sales load structure group that are similar in size and management fee structure to the fund (referred to as the "total expense asset size peer group").
The information provided to the Board indicated that each fund's management fee rate ranked below the competitive median of the mapped group for 2023 and below competitive median of the asset size peer group for 2023. Further, the information provided to the Board indicated that the total expense ratio of Initial Class of each fund ranked below the competitive median of the similar sales load structure group for 2023 and below the competitive median of the total expense asset size peer group for 2023.
The Board considered that the total expense ratio for Service Class 2 of VIP Freedom 2020 Portfolio, VIP Freedom 2025 Portfolio, and VIP Freedom 2040 Portfolio ranked in the 4th quartile of the similar sales load structure group. The Board considered that Service Class 2 has a 0.25% 12b-1 fee, whereas most of the classes in the insurance universe do not have 12b-1 fees. Additionally, the VIP target date mapped groups may contain a combination of active, blend and passive competitors.
The Board noted that each fund offers multiple classes, each of which has a different 12b-1 fee structure than the others, and that the multiple structures are intended to offer a range of pricing options for the intermediary market. The Board also noted that the total expense ratios of the classes of each fund vary primarily by the level of their 12b-1 fees.
Fees Charged to Other Fidelity Clients. The Board also considered Fidelity fee structures and other information with respect to clients of Fidelity, such as other funds advised or subadvised by Fidelity, pension plan clients, and other institutional clients with similar mandates. The Board noted that a joint ad hoc committee created by it and the boards of other Fidelity funds periodically reviews and compares Fidelity's institutional investment advisory business with its business of providing services to the Fidelity funds and also noted the most recent findings of the committee. The Board noted that the committee's review included a consideration of the differences in services provided, fees charged, and costs incurred, as well as competition in the markets serving the different categories of clients.
Based on its review, the Board concluded that each fund's management fee is fair and reasonable in light of the services that the fund receives and the other factors considered. Further, based on its review of total expense ratios and fees charged to other Fidelity clients, the Board concluded that the total expense ratio of each class of each fund was reasonable in light of the services that the fund and its shareholders receive and the other factors considered.
Costs of the Services and Profitability. The Board considered the level of Fidelity's profits in respect of all the Fidelity funds, including the Fidelity funds in which the funds invest.
A public accounting firm has been engaged annually by the Board as part of the Board's assessment of Fidelity's profitability analysis. The engagement includes the review and assessment of the methodologies used by Fidelity in determining the revenues and expenses attributable to Fidelity's fund business. After considering the reports issued under the engagement and information provided by Fidelity, the Board concluded that while other allocation methods may also be reasonable, Fidelity's profitability methodologies are reasonable in all material respects.
The Board also reviewed Fidelity's non-fund businesses and potential indirect benefits such businesses may have received as a result of their association with Fidelity's fund business (i.e., fall-out benefits) as well as cases where Fidelity's affiliates may benefit from the funds' business. The Board considered areas where potential indirect benefits to the Fidelity funds from their relationships with Fidelity may exist. The Board's consideration of these matters was informed by the findings of a joint ad hoc committee created by it and the boards of other Fidelity funds to evaluate potential fall-out benefits.
The Board concluded that the costs of the services provided by and the profits realized by Fidelity in connection with the operation of each fund were not relevant to the renewal of each fund's Advisory Contract because the funds do not pay management fees and FMR pays all other expenses of each fund, with limited exceptions.
Economies of Scale. The Board concluded that because the funds do not pay management fees and FMR pays all other expenses of each fund, with limited exceptions, economies of scale cannot be realized by the funds, but may be realized by the other Fidelity funds in which each fund invests, many of which may benefit from breakpoints under the group fee arrangement.
Additional Information Requested by the Board. In order to develop fully the factual basis for consideration of the Fidelity funds' advisory contracts, the Board requested and received additional information on certain topics, including: (i) portfolio manager changes that have occurred during the past year; (ii) hiring, training, compensating, and retaining adviser and sub-adviser personnel; (iii) the terms of the funds' various management fee structures and arrangements for transfer agent and pricing and bookkeeping services; (iv) Fidelity's fund profitability methodology, profitability trends for certain funds, the allocation of various costs to different funds, and the impact of certain factors on fund profitability results; (v) the impact on fund profitability of recent industry trends, such as the growth in passively managed funds and the changes in flows for different types of funds; (vi) the types of management fee and total expense comparisons provided, and the challenges and limitations associated with such information; (vii) explanations regarding the relative total expense ratios and management fees of certain funds and classes, total expense and management fee competitive trends, and methodologies for total expense and management fee competitive comparisons; (viii) matters related to money market funds, exchange-traded funds, and target date funds; (ix) the arrangements with and compensation paid to certain fund sub-advisers and the treatment of such compensation within Fidelity's fund profitability methodology; and (x) the terms of management contracts between Fidelity and other funds and products not overseen by the Board.
Conclusion. Based on its evaluation of all of the conclusions noted above, and after considering all factors it believed relevant, the Board, including the Independent Trustees, concluded that the advisory fee arrangements are fair and reasonable in light of all of the surrounding circumstances and that each fund's Advisory Contract should be renewed through September 30, 2025.
1.826371.120
VIPFF2K-ANN-0325
Fidelity® Variable Insurance Products:
VIP Investor Freedom Income Portfolio℠
VIP Investor Freedom 2010 Portfolio℠
VIP Investor Freedom 2015 Portfolio℠
VIP Investor Freedom 2020 Portfolio℠
VIP Investor Freedom 2025 Portfolio℠
VIP Investor Freedom 2030 Portfolio℠
VIP Investor Freedom 2035 Portfolio℠
VIP Investor Freedom 2040 Portfolio℠
VIP Investor Freedom 2045 Portfolio℠
VIP Investor Freedom 2050 Portfolio℠
Annual Report
December 31, 2024
Contents
To view a fund's proxy voting guidelines and proxy voting record for the 12-month period ended June 30, visit http://www.fidelity.com/proxyvotingresults or visit the Securities and Exchange Commission's (SEC) web site at http://www.sec.gov.
You may also call 1-877-208-0098 to request a free copy of the proxy voting guidelines.
Fidelity® Variable Insurance Products are separate account options which are purchased through a variable insurance contract.
Standard & Poor's, S&P and S&P 500 are registered service marks of The McGraw-Hill Companies, Inc. and have been licensed for use by Fidelity Distributors Corporation.
Other third-party marks appearing herein are the property of their respective owners.
All other marks appearing herein are registered or unregistered trademarks or service marks of FMR LLC or an affiliated company. © 2025 FMR LLC. All rights reserved.
This report and the financial statements contained herein are submitted for the general information of the shareholders of the Funds. This report is not authorized for distribution to prospective investors in the Funds unless preceded or accompanied by an effective prospectus.
A fund files its complete schedule of portfolio holdings with the SEC for the first and third quarters of each fiscal year on Form N-PORT. Forms N-PORT are available on the SEC's web site at http://www.sec.gov. A fund's Forms N-PORT may be reviewed and copied at the SEC's Public Reference Room in Washington, DC. Information regarding the operation of the SEC's Public Reference Room may be obtained by calling 1-800-SEC-0330.
For a complete list of a fund's portfolio holdings, view the most recent holdings listing, semiannual report, or annual report on Fidelity's web site at http://www.fidelity.com, http://www.institutional.fidelity.com, or http://www.401k.com, as applicable.
NOT FDIC INSURED •MAY LOSE VALUE •NO BANK GUARANTEE
Neither the Funds nor Fidelity Distributors Corporation is a bank.
Item 7: Financial Statements and Financial Highlights for Open-End Management Investment Companies (Annual Report)
VIP Investor Freedom Income Portfolio℠
Schedule of Investments December 31, 2024
Showing Percentage of Net Assets
| Bond Funds - 62.4% |
| | | Shares | Value ($) |
| Fidelity Inflation-Protected Bond Index Fund (a) | | 1,351,769 | 12,017,224 |
| Fidelity International Bond Index Fund (a) | | 261,189 | 2,429,057 |
| Fidelity Long-Term Treasury Bond Index Fund (a) | | 252,077 | 2,311,549 |
| VIP High Income Portfolio - Investor Class (a) | | 198,325 | 928,159 |
| VIP Investment Grade Bond II Portfolio - Investor Class (a) | | 3,259,910 | 30,023,772 |
| TOTAL BOND FUNDS (Cost $51,476,358) | | | 47,709,761 |
| | | | |
| Domestic Equity Funds - 9.4% |
| | | Shares | Value ($) |
| VIP Contrafund Portfolio - Investor Class (a) | | 22,069 | 1,265,673 |
| VIP Equity Income Portfolio - Investor Class (a) | | 39,190 | 1,032,656 |
| VIP Growth & Income Portfolio - Investor Class (a) | | 46,684 | 1,416,853 |
| VIP Growth Portfolio - Investor Class (a) | | 21,880 | 2,097,597 |
| VIP Mid Cap Portfolio - Investor Class (a) | | 8,752 | 325,119 |
| VIP Value Portfolio - Investor Class (a) | | 38,311 | 725,619 |
| VIP Value Strategies Portfolio - Investor Class (a) | | 23,526 | 360,651 |
| TOTAL DOMESTIC EQUITY FUNDS (Cost $4,505,852) | | | 7,224,168 |
| | | | |
| International Equity Funds - 12.8% |
| | | Shares | Value ($) |
| VIP Emerging Markets Portfolio - Investor Class (a) | | 359,926 | 4,110,350 |
| VIP Overseas Portfolio - Investor Class (a) | | 223,391 | 5,665,206 |
| TOTAL INTERNATIONAL EQUITY FUNDS (Cost $6,606,066) | | | 9,775,556 |
| | | | |
| Money Market Funds - 15.4% |
| | | Yield (%) | Shares | Value ($) |
VIP Government Money Market Portfolio - Investor Class (a)(b) (Cost $11,794,889) | | 4.29 | 11,794,889 | 11,794,889 |
| | | | | |
| TOTAL INVESTMENT IN SECURITIES - 100.0% (Cost $74,383,165) | 76,504,374 |
NET OTHER ASSETS (LIABILITIES) - 0.0% | 1 |
| NET ASSETS - 100.0% | 76,504,375 |
| | |
Legend
| (b) | The rate quoted is the annualized seven-day yield of the fund at period end. |
Affiliated Underlying Funds
Fiscal year to date information regarding the Fund's investments in affiliated Underlying Funds is presented below. Exchanges between classes of the same affiliated Underlying Funds may occur. If an Underlying Funds changes its name, the name presented below is the name in effect at period end.
| Affiliate | Value, beginning of period ($) | Purchases ($) | Sales Proceeds ($) | Dividend Income ($) | Realized Gain (loss) ($) | Change in Unrealized appreciation (depreciation) ($) | Value, end of period ($) | Shares, end of period |
| Fidelity Inflation-Protected Bond Index Fund | 10,835,963 | 1,230,840 | 2,814,884 | 450,359 | (240,812) | 39,739 | 12,017,224 | 1,351,769 |
| Fidelity International Bond Index Fund | 1,611,785 | 961,507 | 545,121 | 68,423 | (31,364) | 40,010 | 2,429,057 | 261,189 |
| Fidelity Long-Term Treasury Bond Index Fund | 2,117,312 | 992,142 | 1,000,029 | 65,353 | (209,278) | (4,099) | 2,311,549 | 252,077 |
| VIP Contrafund Portfolio - Investor Class | 650,621 | 647,118 | 403,787 | 145,634 | 12,262 | 99,280 | 1,265,673 | 22,069 |
| VIP Emerging Markets Portfolio - Investor Class | 3,167,082 | 1,383,650 | 1,727,998 | 55,923 | 63,225 | 212,166 | 4,110,350 | 359,926 |
| VIP Equity Income Portfolio - Investor Class | 527,603 | 598,268 | 333,292 | 72,123 | 10,652 | 22,214 | 1,032,656 | 39,190 |
| VIP Government Money Market Portfolio - Investor Class | 11,568,270 | 2,301,238 | 4,894,657 | 548,461 | - | - | 11,794,889 | 11,794,889 |
| VIP Growth & Income Portfolio - Investor Class | 724,972 | 741,017 | 435,852 | 105,536 | 11,269 | 88,982 | 1,416,853 | 46,684 |
| VIP Growth Portfolio - Investor Class | 1,077,461 | 1,296,275 | 647,951 | 441,448 | 6,683 | (65,150) | 2,097,597 | 21,880 |
| VIP High Income Portfolio - Investor Class | 1,046,321 | 124,585 | 591,442 | 55,616 | (28,480) | 78,649 | 928,159 | 198,325 |
| VIP Investment Grade Bond II Portfolio - Investor Class | 24,742,061 | 4,701,722 | 6,059,347 | 1,253,944 | (168,549) | (529,447) | 30,023,772 | 3,259,910 |
| VIP Mid Cap Portfolio - Investor Class | 165,164 | 180,972 | 86,218 | 38,371 | 2,864 | (1,758) | 325,119 | 8,752 |
| VIP Overseas Portfolio - Investor Class | 4,578,447 | 1,685,594 | 1,826,730 | 353,853 | 158,255 | (336,765) | 5,665,206 | 223,391 |
| VIP Value Portfolio - Investor Class | 368,176 | 435,994 | 212,145 | 71,820 | 6,451 | (15,850) | 725,619 | 38,311 |
| VIP Value Strategies Portfolio - Investor Class | 182,076 | 229,372 | 98,707 | 49,676 | 3,554 | (26,032) | 360,651 | 23,526 |
| | 63,363,314 | 17,510,294 | 21,678,160 | 3,776,540 | (403,268) | (398,061) | 76,504,374 | 17,901,888 |
Amounts in the dividend income column in the above table include any capital gain distributions from underlying funds, which are presented in the corresponding line item in the Statement of Operations, if applicable.
Amounts included in the purchases and sales proceeds columns may include in-kind transactions, if applicable.
Purchases and sales proceeds exclude the value of securities received and delivered through reorganization transactions, if applicable.
Investment Valuation
The following is a summary of the inputs used, as of December 31, 2024, involving the Fund's assets and liabilities carried at fair value. The inputs or methodology used for valuing securities may not be an indication of the risk associated with investing in those securities. For more information on valuation inputs, and their aggregation into the levels used below, please refer to the Investment Valuation section in the accompanying Notes to Financial Statements.
| Valuation Inputs at Reporting Date: |
| Description | Total ($) | Level 1 ($) | Level 2 ($) | Level 3 ($) |
Investments in Securities: | | | | |
|
| Bond Funds | 47,709,761 | 47,709,761 | - | - |
|
| Domestic Equity Funds | 7,224,168 | 7,224,168 | - | - |
|
| International Equity Funds | 9,775,556 | 9,775,556 | - | - |
|
| Money Market Funds | 11,794,889 | 11,794,889 | - | - |
| Total Investments in Securities: | 76,504,374 | 76,504,374 | - | - |
VIP Investor Freedom Income Portfolio℠
Financial Statements
| Statement of Assets and Liabilities |
As of December 31, 2024 |
| Assets | | | | |
| Investment in securities, at value - See accompanying schedule: | | | | |
Affiliated issuers (cost $74,383,165) | $ | 76,504,374 | | |
| | | | | |
| | | | | |
| Total Investment in Securities (cost $74,383,165) | | | $ | 76,504,374 |
| Receivable for investments sold | | | | 267,676 |
Total assets | | | | 76,772,050 |
| Liabilities | | | | |
| Payable for investments purchased | $ | 267,302 | | |
| Payable for fund shares redeemed | | 373 | | |
| Total liabilities | | | | 267,675 |
| Net Assets | | | $ | 76,504,375 |
| Net Assets consist of: | | | | |
| Paid in capital | | | $ | 76,903,629 |
| Total accumulated earnings (loss) | | | | (399,254) |
| Net Assets | | | $ | 76,504,375 |
Net Asset Value, offering price and redemption price per share ($76,504,375 ÷ 7,023,723 shares) | | | $ | 10.89 |
| Statement of Operations |
| Year ended December 31, 2024 |
| Investment Income | | | | |
| Dividends: | | | | |
| Affiliated issuers | | | $ | 2,636,349 |
| Expenses | | | | |
| Independent trustees' fees and expenses | $ | 187 | | |
| Total expenses before reductions | | 187 | | |
| Expense reductions | | (2) | | |
| Total expenses after reductions | | | | 185 |
| Net Investment income (loss) | | | | 2,636,164 |
| Realized and Unrealized Gain (Loss) | | | | |
| Net realized gain (loss) on: | | | | |
| Investment Securities: | | | | |
| Affiliated issuers | | (403,268) | | |
| Capital gain distributions from underlying funds: | | | | |
| Affiliated issuers | | 1,140,191 | | |
| Total net realized gain (loss) | | | | 736,923 |
| Change in net unrealized appreciation (depreciation) on: | | | | |
| Investment Securities: | | | | |
| Affiliated issuers | | (398,061) | | |
| Total change in net unrealized appreciation (depreciation) | | | | (398,061) |
| Net gain (loss) | | | | 338,862 |
| Net increase (decrease) in net assets resulting from operations | | | $ | 2,975,026 |
| Statement of Changes in Net Assets |
| |
| | Year ended December 31, 2024 | | Year ended December 31, 2023 |
| Increase (Decrease) in Net Assets | | | | |
| Operations | | | | |
| Net investment income (loss) | $ | 2,636,164 | $ | 2,273,893 |
| Net realized gain (loss) | | 736,923 | | (333,373) |
| Change in net unrealized appreciation (depreciation) | | (398,061) | | 3,112,227 |
| Net increase (decrease) in net assets resulting from operations | | 2,975,026 | | 5,052,747 |
| Distributions to shareholders | | (2,820,718) | | (2,918,126) |
| | | | | |
| Share transactions | | | | |
| Proceeds from sales of shares | | 3,208,805 | | 3,828,335 |
| Net asset value of shares issued in exchange for the net assets of the Acquired Fund(s) (see Reorganization Information note) | | 18,112,866 | | - |
| Reinvestment of distributions | | 2,820,718 | | 2,918,126 |
| Cost of shares redeemed | | (11,158,884) | | (18,462,983) |
| | | | | |
Net increase (decrease) in net assets resulting from share transactions | | 12,983,505 | | (11,716,522) |
| Total increase (decrease) in net assets | | 13,137,813 | | (9,581,901) |
| | | | | |
| Net Assets | | | | |
| Beginning of period | | 63,366,562 | | 72,948,463 |
| End of period | $ | 76,504,375 | $ | 63,366,562 |
| | | | | |
| Other Information | | | | |
| Shares | | | | |
| Sold | | 288,309 | | 356,711 |
| Issued in exchange for the shares of the Acquired Fund(s) (see Reorganization Information note) | | 1,648,130 | | - |
| Issued in reinvestment of distributions | | 259,155 | | 271,775 |
| Redeemed | | (1,012,282) | | (1,721,984) |
| Net increase (decrease) | | 1,183,312 | | (1,093,498) |
| | | | | |
Financial Highlights
VIP Investor Freedom Income Portfolio℠ |
| |
| Years ended December 31, | | 2024 | | 2023 | | 2022 | | 2021 | | 2020 |
Selected Per-Share Data | | | | | | | | | | |
| Net asset value, beginning of period | $ | 10.85 | $ | 10.52 | $ | 12.62 | $ | 12.68 | $ | 11.91 |
| Income from Investment Operations | | | | | | | | | | |
Net investment income (loss) A,B | | .41 | | .36 | | .27 | | .24 | | .16 |
| Net realized and unrealized gain (loss) | | .06 | | .46 | | (1.74) | | .17 | | 1.06 |
| Total from investment operations | | .47 | | .82 | | (1.47) | | .41 | | 1.22 |
| Distributions from net investment income | | (.42) | | (.49) | | (.25) | | (.13) | | (.16) |
| Distributions from net realized gain | | (.01) | | - | | (.38) | | (.34) | | (.29) |
| Total distributions | | (.43) | | (.49) | | (.63) | | (.47) | | (.45) |
| Net asset value, end of period | $ | 10.89 | $ | 10.85 | $ | 10.52 | $ | 12.62 | $ | 12.68 |
Total Return C,D | | | | 7.88% | | (12.03)% | | 3.28% | | 10.40% |
Ratios to Average Net Assets B,E,F | | | | | | | | | | |
Expenses before reductions G | | -% | | -% | | -% | | -% | | -% |
Expenses net of fee waivers, if any G | | | | -% | | -% | | -% | | -% |
Expenses net of all reductions G | | -% | | -% | | -% | | -% | | -% |
| Net investment income (loss) | | 3.72% | | 3.36% | | 2.44% | | 1.88% | | 1.32% |
| Supplemental Data | | | | | | | | | | |
| Net assets, end of period (000 omitted) | $ | 76,504 | $ | 63,367 | $ | 72,948 | $ | 102,427 | $ | 97,889 |
Portfolio turnover rate H | | | | 20% | | 65% | | 27% | | 49% |
ACalculated based on average shares outstanding during the period.
BNet investment income (loss) is affected by the timing of the declaration of dividends by any underlying mutual funds or exchange-traded funds (ETFs). Net investment income (loss) of any mutual funds or ETFs is not included in the Fund's net investment income (loss) ratio.
CTotal returns do not reflect charges attributable to your insurance company's separate account. Inclusion of these charges would reduce the total returns shown.
DTotal returns would have been lower if certain expenses had not been reduced during the applicable periods shown.
EFees and expenses of any underlying mutual funds or exchange-traded funds (ETFs) are not included in the Fund's expense ratio. The Fund indirectly bears its proportionate share of these expenses.
FExpense ratios reflect operating expenses of the class. Expenses before reductions do not reflect amounts reimbursed, waived, or reduced through arrangements with the investment adviser, brokerage services, or other offset arrangements, if applicable, and do not represent the amount paid by the class during periods when reimbursements, waivers or reductions occur.
GAmount represents less than .005%.
HAmount does not include the portfolio activity of any underlying mutual funds or exchange-traded funds (ETFs), derivatives or securities that mature within one year from acquisition.
IThe portfolio turnover rate does not include the assets acquired in the reorganization.
VIP Investor Freedom 2010 Portfolio℠
Schedule of Investments December 31, 2024
Showing Percentage of Net Assets
| Bond Funds - 59.9% |
| | | Shares | Value ($) |
| Fidelity Inflation-Protected Bond Index Fund (a) | | 881,219 | 7,834,035 |
| Fidelity International Bond Index Fund (a) | | 191,554 | 1,781,449 |
| Fidelity Long-Term Treasury Bond Index Fund (a) | | 186,592 | 1,711,047 |
| VIP High Income Portfolio - Investor Class (a) | | 136,414 | 638,416 |
| VIP Investment Grade Bond II Portfolio - Investor Class (a) | | 2,125,318 | 19,574,176 |
| TOTAL BOND FUNDS (Cost $34,054,001) | | | 31,539,123 |
| | | | |
| Domestic Equity Funds - 13.4% |
| | | Shares | Value ($) |
| VIP Contrafund Portfolio - Investor Class (a) | | 21,469 | 1,231,234 |
| VIP Equity Income Portfolio - Investor Class (a) | | 38,126 | 1,004,627 |
| VIP Growth & Income Portfolio - Investor Class (a) | | 45,416 | 1,378,369 |
| VIP Growth Portfolio - Investor Class (a) | | 21,284 | 2,040,511 |
| VIP Mid Cap Portfolio - Investor Class (a) | | 8,514 | 316,290 |
| VIP Value Portfolio - Investor Class (a) | | 37,273 | 705,943 |
| VIP Value Strategies Portfolio - Investor Class (a) | | 22,889 | 350,884 |
| TOTAL DOMESTIC EQUITY FUNDS (Cost $4,027,796) | | | 7,027,858 |
| | | | |
| International Equity Funds - 15.4% |
| | | Shares | Value ($) |
| VIP Emerging Markets Portfolio - Investor Class (a) | | 283,525 | 3,237,857 |
| VIP Overseas Portfolio - Investor Class (a) | | 191,808 | 4,864,240 |
| TOTAL INTERNATIONAL EQUITY FUNDS (Cost $5,748,852) | | | 8,102,097 |
| | | | |
| Money Market Funds - 11.3% |
| | | Yield (%) | Shares | Value ($) |
VIP Government Money Market Portfolio - Investor Class (a)(b) (Cost $5,940,504) | | 4.29 | 5,940,504 | 5,940,504 |
| | | | | |
| TOTAL INVESTMENT IN SECURITIES - 100.0% (Cost $49,771,153) | 52,609,582 |
NET OTHER ASSETS (LIABILITIES) - 0.0% | 2 |
| NET ASSETS - 100.0% | 52,609,584 |
| | |
Legend
| (b) | The rate quoted is the annualized seven-day yield of the fund at period end. |
Affiliated Underlying Funds
Fiscal year to date information regarding the Fund's investments in affiliated Underlying Funds is presented below. Exchanges between classes of the same affiliated Underlying Funds may occur. If an Underlying Funds changes its name, the name presented below is the name in effect at period end.
| Affiliate | Value, beginning of period ($) | Purchases ($) | Sales Proceeds ($) | Dividend Income ($) | Realized Gain (loss) ($) | Change in Unrealized appreciation (depreciation) ($) | Value, end of period ($) | Shares, end of period |
| Fidelity Inflation-Protected Bond Index Fund | 9,058,065 | 710,086 | 1,805,833 | 303,064 | (239,591) | 111,308 | 7,834,035 | 881,219 |
| Fidelity International Bond Index Fund | 1,580,749 | 631,275 | 434,915 | 55,152 | (29,843) | 34,183 | 1,781,449 | 191,554 |
| Fidelity Long-Term Treasury Bond Index Fund | 2,030,133 | 672,230 | 804,744 | 54,143 | (204,924) | 18,352 | 1,711,047 | 186,592 |
| VIP Contrafund Portfolio - Investor Class | 1,074,930 | 439,754 | 486,904 | 144,961 | 92,472 | 110,982 | 1,231,234 | 21,469 |
| VIP Emerging Markets Portfolio - Investor Class | 3,345,014 | 973,480 | 1,369,482 | 45,089 | 86,579 | 202,266 | 3,237,857 | 283,525 |
| VIP Equity Income Portfolio - Investor Class | 871,684 | 465,125 | 400,703 | 73,392 | 28,934 | 39,587 | 1,004,627 | 38,126 |
| VIP Government Money Market Portfolio - Investor Class | 7,342,620 | 1,643,056 | 3,045,172 | 304,266 | - | - | 5,940,504 | 5,940,504 |
| VIP Growth & Income Portfolio - Investor Class | 1,197,780 | 531,852 | 515,896 | 106,685 | 55,633 | 109,000 | 1,378,369 | 45,416 |
| VIP Growth Portfolio - Investor Class | 1,780,132 | 967,649 | 785,729 | 444,728 | 151,816 | (73,357) | 2,040,511 | 21,284 |
| VIP High Income Portfolio - Investor Class | 931,209 | 66,055 | 400,125 | 38,598 | (30,489) | 71,766 | 638,416 | 136,414 |
| VIP Investment Grade Bond II Portfolio - Investor Class | 20,544,834 | 3,190,809 | 3,673,544 | 823,970 | (114,851) | (373,072) | 19,574,176 | 2,125,318 |
| VIP Mid Cap Portfolio - Investor Class | 272,870 | 141,433 | 110,124 | 39,690 | 8,077 | 4,034 | 316,290 | 8,514 |
| VIP Overseas Portfolio - Investor Class | 5,434,877 | 1,125,498 | 1,676,450 | 310,801 | 252,484 | (272,169) | 4,864,240 | 191,808 |
| VIP Value Portfolio - Investor Class | 608,277 | 351,736 | 256,882 | 75,775 | 10,089 | (7,277) | 705,943 | 37,273 |
| VIP Value Strategies Portfolio - Investor Class | 300,815 | 190,719 | 124,497 | 50,513 | 5,755 | (21,908) | 350,884 | 22,889 |
| | 56,373,989 | 12,100,757 | 15,891,000 | 2,870,827 | 72,141 | (46,305) | 52,609,582 | 10,131,905 |
Amounts in the dividend income column in the above table include any capital gain distributions from underlying funds, which are presented in the corresponding line item in the Statement of Operations, if applicable.
Amounts included in the purchases and sales proceeds columns may include in-kind transactions, if applicable.
Investment Valuation
The following is a summary of the inputs used, as of December 31, 2024, involving the Fund's assets and liabilities carried at fair value. The inputs or methodology used for valuing securities may not be an indication of the risk associated with investing in those securities. For more information on valuation inputs, and their aggregation into the levels used below, please refer to the Investment Valuation section in the accompanying Notes to Financial Statements.
| Valuation Inputs at Reporting Date: |
| Description | Total ($) | Level 1 ($) | Level 2 ($) | Level 3 ($) |
Investments in Securities: | | | | |
|
| Bond Funds | 31,539,123 | 31,539,123 | - | - |
|
| Domestic Equity Funds | 7,027,858 | 7,027,858 | - | - |
|
| International Equity Funds | 8,102,097 | 8,102,097 | - | - |
|
| Money Market Funds | 5,940,504 | 5,940,504 | - | - |
| Total Investments in Securities: | 52,609,582 | 52,609,582 | - | - |
VIP Investor Freedom 2010 Portfolio℠
Financial Statements
| Statement of Assets and Liabilities |
As of December 31, 2024 |
| Assets | | | | |
| Investment in securities, at value - See accompanying schedule: | | | | |
Affiliated issuers (cost $49,771,153) | $ | 52,609,582 | | |
| | | | | |
| | | | | |
| Total Investment in Securities (cost $49,771,153) | | | $ | 52,609,582 |
| Receivable for investments sold | | | | 149,161 |
Total assets | | | | 52,758,743 |
| Liabilities | | | | |
| Payable for investments purchased | $ | 148,839 | | |
| Payable for fund shares redeemed | | 320 | | |
| Total liabilities | | | | 149,159 |
| Net Assets | | | $ | 52,609,584 |
| Net Assets consist of: | | | | |
| Paid in capital | | | $ | 49,860,691 |
| Total accumulated earnings (loss) | | | | 2,748,893 |
| Net Assets | | | $ | 52,609,584 |
Net Asset Value, offering price and redemption price per share ($52,609,584 ÷ 4,375,627 shares) | | | $ | 12.02 |
| Statement of Operations |
| Year ended December 31, 2024 |
| Investment Income | | | | |
| Dividends: | | | | |
| Affiliated issuers | | | $ | 1,753,463 |
| Expenses | | | | |
| Independent trustees' fees and expenses | $ | 144 | | |
| Total expenses before reductions | | 144 | | |
| Expense reductions | | (1) | | |
| Total expenses after reductions | | | | 143 |
| Net Investment income (loss) | | | | 1,753,320 |
| Realized and Unrealized Gain (Loss) | | | | |
| Net realized gain (loss) on: | | | | |
| Investment Securities: | | | | |
| Affiliated issuers | | 72,141 | | |
| Capital gain distributions from underlying funds: | | | | |
| Affiliated issuers | | 1,117,364 | | |
| Total net realized gain (loss) | | | | 1,189,505 |
| Change in net unrealized appreciation (depreciation) on: | | | | |
| Investment Securities: | | | | |
| Affiliated issuers | | (46,305) | | |
| Total change in net unrealized appreciation (depreciation) | | | | (46,305) |
| Net gain (loss) | | | | 1,143,200 |
| Net increase (decrease) in net assets resulting from operations | | | $ | 2,896,520 |
| Statement of Changes in Net Assets |
| |
| | Year ended December 31, 2024 | | Year ended December 31, 2023 |
| Increase (Decrease) in Net Assets | | | | |
| Operations | | | | |
| Net investment income (loss) | $ | 1,753,320 | $ | 1,787,859 |
| Net realized gain (loss) | | 1,189,505 | | 347,151 |
| Change in net unrealized appreciation (depreciation) | | (46,305) | | 3,116,971 |
| Net increase (decrease) in net assets resulting from operations | | 2,896,520 | | 5,251,981 |
| Distributions to shareholders | | (1,961,913) | | (2,290,424) |
| | | | | |
| Share transactions | | | | |
| Proceeds from sales of shares | | 216,949 | | 1,062,269 |
| Reinvestment of distributions | | 1,961,913 | | 2,290,424 |
| Cost of shares redeemed | | (6,879,923) | | (12,657,329) |
| | | | | |
Net increase (decrease) in net assets resulting from share transactions | | (4,701,061) | | (9,304,636) |
| Total increase (decrease) in net assets | | (3,766,454) | | (6,343,079) |
| | | | | |
| Net Assets | | | | |
| Beginning of period | | 56,376,038 | | 62,719,117 |
| End of period | $ | 52,609,584 | $ | 56,376,038 |
| | | | | |
| Other Information | | | | |
| Shares | | | | |
| Sold | | 17,708 | | 90,730 |
| Issued in reinvestment of distributions | | 163,592 | | 196,386 |
| Redeemed | | (564,087) | | (1,094,117) |
| Net increase (decrease) | | (382,787) | | (807,001) |
| | | | | |
Financial Highlights
VIP Investor Freedom 2010 Portfolio℠ |
| |
| Years ended December 31, | | 2024 | | 2023 | | 2022 | | 2021 | | 2020 |
Selected Per-Share Data | | | | | | | | | | |
| Net asset value, beginning of period | $ | 11.85 | $ | 11.27 | $ | 13.93 | $ | 13.73 | $ | 12.84 |
| Income from Investment Operations | | | | | | | | | | |
Net investment income (loss) A,B | | .39 | | .35 | | .29 | | .26 | | .17 |
| Net realized and unrealized gain (loss) | | .23 | | .70 | | (2.10) | | .52 | | 1.37 |
| Total from investment operations | | .62 | | 1.05 | | (1.81) | | .78 | | 1.54 |
| Distributions from net investment income | | (.44) | | (.47) | | (.26) | | (.14) | | (.17) |
| Distributions from net realized gain | | (.01) | | - | | (.59) | | (.44) | | (.49) |
| Total distributions | | (.45) | | (.47) | | (.85) | | (.58) | | (.65) C |
| Net asset value, end of period | $ | 12.02 | $ | 11.85 | $ | 11.27 | $ | 13.93 | $ | 13.73 |
Total Return D,E | | | | 9.40% | | (13.50)% | | 5.81% | | 12.40% |
Ratios to Average Net Assets B,F,G | | | | | | | | | | |
Expenses before reductions H | | -% | | -% | | -% | | -% | | -% |
Expenses net of fee waivers, if any H | | | | -% | | -% | | -% | | -% |
Expenses net of all reductions H | | -% | | -% | | -% | | -% | | -% |
| Net investment income (loss) | | 3.17% | | 3.03% | | 2.40% | | 1.87% | | 1.33% |
| Supplemental Data | | | | | | | | | | |
| Net assets, end of period (000 omitted) | $ | 52,610 | $ | 56,376 | $ | 62,719 | $ | 85,277 | $ | 76,008 |
Portfolio turnover rate I | | | | 18% | | 64% | | 23% | | 39% |
ACalculated based on average shares outstanding during the period.
BNet investment income (loss) is affected by the timing of the declaration of dividends by any underlying mutual funds or exchange-traded funds (ETFs). Net investment income (loss) of any mutual funds or ETFs is not included in the Fund's net investment income (loss) ratio.
CTotal distributions per share do not sum due to rounding.
DTotal returns do not reflect charges attributable to your insurance company's separate account. Inclusion of these charges would reduce the total returns shown.
ETotal returns would have been lower if certain expenses had not been reduced during the applicable periods shown.
FFees and expenses of any underlying mutual funds or exchange-traded funds (ETFs) are not included in the Fund's expense ratio. The Fund indirectly bears its proportionate share of these expenses.
GExpense ratios reflect operating expenses of the class. Expenses before reductions do not reflect amounts reimbursed, waived, or reduced through arrangements with the investment adviser, brokerage services, or other offset arrangements, if applicable, and do not represent the amount paid by the class during periods when reimbursements, waivers or reductions occur.
HAmount represents less than .005%.
IAmount does not include the portfolio activity of any underlying mutual funds or exchange-traded funds (ETFs), derivatives or securities that mature within one year from acquisition.
VIP Investor Freedom 2015 Portfolio℠
Schedule of Investments December 31, 2024
Showing Percentage of Net Assets
| Bond Funds - 56.3% |
| | | Shares | Value ($) |
| Fidelity Inflation-Protected Bond Index Fund (a) | | 1,380,602 | 12,273,551 |
| Fidelity International Bond Index Fund (a) | | 349,950 | 3,254,536 |
| Fidelity Long-Term Treasury Bond Index Fund (a) | | 325,381 | 2,983,746 |
| VIP High Income Portfolio - Investor Class (a) | | 230,780 | 1,080,050 |
| VIP Investment Grade Bond II Portfolio - Investor Class (a) | | 3,310,842 | 30,492,859 |
| TOTAL BOND FUNDS (Cost $54,424,852) | | | 50,084,742 |
| | | | |
| Domestic Equity Funds - 18.9% |
| | | Shares | Value ($) |
| VIP Contrafund Portfolio - Investor Class (a) | | 51,250 | 2,939,169 |
| VIP Equity Income Portfolio - Investor Class (a) | | 91,014 | 2,398,220 |
| VIP Growth & Income Portfolio - Investor Class (a) | | 108,415 | 3,290,409 |
| VIP Growth Portfolio - Investor Class (a) | | 50,809 | 4,871,051 |
| VIP Mid Cap Portfolio - Investor Class (a) | | 20,324 | 755,039 |
| VIP Value Portfolio - Investor Class (a) | | 88,976 | 1,685,213 |
| VIP Value Strategies Portfolio - Investor Class (a) | | 54,640 | 837,631 |
| TOTAL DOMESTIC EQUITY FUNDS (Cost $9,478,056) | | | 16,776,732 |
| | | | |
| International Equity Funds - 19.1% |
| | | Shares | Value ($) |
| VIP Emerging Markets Portfolio - Investor Class (a) | | 564,668 | 6,448,513 |
| VIP Overseas Portfolio - Investor Class (a) | | 414,648 | 10,515,475 |
| TOTAL INTERNATIONAL EQUITY FUNDS (Cost $11,790,447) | | | 16,963,988 |
| | | | |
| Money Market Funds - 5.7% |
| | | Yield (%) | Shares | Value ($) |
VIP Government Money Market Portfolio - Investor Class (a)(b) (Cost $5,149,994) | | 4.29 | 5,149,994 | 5,149,993 |
| | | | | |
| TOTAL INVESTMENT IN SECURITIES - 100.0% (Cost $80,843,349) | 88,975,455 |
NET OTHER ASSETS (LIABILITIES) - 0.0% | (4) |
| NET ASSETS - 100.0% | 88,975,451 |
| | |
Legend
| (b) | The rate quoted is the annualized seven-day yield of the fund at period end. |
Affiliated Underlying Funds
Fiscal year to date information regarding the Fund's investments in affiliated Underlying Funds is presented below. Exchanges between classes of the same affiliated Underlying Funds may occur. If an Underlying Funds changes its name, the name presented below is the name in effect at period end.
| Affiliate | Value, beginning of period ($) | Purchases ($) | Sales Proceeds ($) | Dividend Income ($) | Realized Gain (loss) ($) | Change in Unrealized appreciation (depreciation) ($) | Value, end of period ($) | Shares, end of period |
| Fidelity Inflation-Protected Bond Index Fund | 13,627,799 | 1,492,459 | 2,645,921 | 468,778 | (116,652) | (84,134) | 12,273,551 | 1,380,602 |
| Fidelity International Bond Index Fund | 2,798,139 | 1,176,179 | 730,792 | 99,771 | (26,800) | 37,810 | 3,254,536 | 349,950 |
| Fidelity Long-Term Treasury Bond Index Fund | 3,360,256 | 1,236,207 | 1,299,649 | 91,654 | (274,648) | (38,420) | 2,983,746 | 325,381 |
| VIP Contrafund Portfolio - Investor Class | 2,616,792 | 922,252 | 1,078,955 | 344,722 | 211,698 | 267,382 | 2,939,169 | 51,250 |
| VIP Emerging Markets Portfolio - Investor Class | 6,343,446 | 1,861,659 | 2,285,312 | 89,368 | 95,081 | 433,639 | 6,448,513 | 564,668 |
| VIP Equity Income Portfolio - Investor Class | 2,121,988 | 943,060 | 823,931 | 174,660 | 46,279 | 110,824 | 2,398,220 | 91,014 |
| VIP Government Money Market Portfolio - Investor Class | 6,852,888 | 2,185,252 | 3,888,147 | 253,583 | - | - | 5,149,993 | 5,149,994 |
| VIP Growth & Income Portfolio - Investor Class | 2,915,835 | 1,019,689 | 1,029,157 | 253,397 | 116,027 | 268,015 | 3,290,409 | 108,415 |
| VIP Growth Portfolio - Investor Class | 4,333,562 | 2,050,473 | 1,695,133 | 1,056,125 | 164,267 | 17,882 | 4,871,051 | 50,809 |
| VIP High Income Portfolio - Investor Class | 1,503,864 | 154,118 | 644,350 | 65,216 | (37,764) | 104,182 | 1,080,050 | 230,780 |
| VIP Investment Grade Bond II Portfolio - Investor Class | 30,477,999 | 5,765,281 | 4,992,958 | 1,281,802 | (120,265) | (637,198) | 30,492,859 | 3,310,842 |
| VIP Mid Cap Portfolio - Investor Class | 664,295 | 304,045 | 240,602 | 94,337 | 20,098 | 7,203 | 755,039 | 20,324 |
| VIP Overseas Portfolio - Investor Class | 11,183,279 | 2,294,060 | 2,857,176 | 668,079 | 347,265 | (451,953) | 10,515,475 | 414,648 |
| VIP Value Portfolio - Investor Class | 1,480,804 | 740,685 | 539,302 | 179,867 | 32,314 | (29,288) | 1,685,213 | 88,976 |
| VIP Value Strategies Portfolio - Investor Class | 732,325 | 416,272 | 270,229 | 119,995 | 18,219 | (58,956) | 837,631 | 54,640 |
| | 91,013,271 | 22,561,691 | 25,021,614 | 5,241,354 | 475,119 | (53,012) | 88,975,455 | 12,192,293 |
Amounts in the dividend income column in the above table include any capital gain distributions from underlying funds, which are presented in the corresponding line item in the Statement of Operations, if applicable.
Amounts included in the purchases and sales proceeds columns may include in-kind transactions, if applicable.
Investment Valuation
The following is a summary of the inputs used, as of December 31, 2024, involving the Fund's assets and liabilities carried at fair value. The inputs or methodology used for valuing securities may not be an indication of the risk associated with investing in those securities. For more information on valuation inputs, and their aggregation into the levels used below, please refer to the Investment Valuation section in the accompanying Notes to Financial Statements.
| Valuation Inputs at Reporting Date: |
| Description | Total ($) | Level 1 ($) | Level 2 ($) | Level 3 ($) |
Investments in Securities: | | | | |
|
| Bond Funds | 50,084,742 | 50,084,742 | - | - |
|
| Domestic Equity Funds | 16,776,732 | 16,776,732 | - | - |
|
| International Equity Funds | 16,963,988 | 16,963,988 | - | - |
|
| Money Market Funds | 5,149,993 | 5,149,993 | - | - |
| Total Investments in Securities: | 88,975,455 | 88,975,455 | - | - |
VIP Investor Freedom 2015 Portfolio℠
Financial Statements
| Statement of Assets and Liabilities |
As of December 31, 2024 |
| Assets | | | | |
| Investment in securities, at value - See accompanying schedule: | | | | |
Affiliated issuers (cost $80,843,349) | $ | 88,975,455 | | |
| | | | | |
| | | | | |
| Total Investment in Securities (cost $80,843,349) | | | $ | 88,975,455 |
| Receivable for investments sold | | | | 303,537 |
Total assets | | | | 89,278,992 |
| Liabilities | | | | |
| Payable for investments purchased | $ | 303,028 | | |
| Payable for fund shares redeemed | | 509 | | |
| Other payables and accrued expenses | | 4 | | |
| Total liabilities | | | | 303,541 |
| Net Assets | | | $ | 88,975,451 |
| Net Assets consist of: | | | | |
| Paid in capital | | | $ | 78,348,424 |
| Total accumulated earnings (loss) | | | | 10,627,027 |
| Net Assets | | | $ | 88,975,451 |
Net Asset Value, offering price and redemption price per share ($88,975,451 ÷ 7,322,310 shares) | | | $ | 12.15 |
| Statement of Operations |
| Year ended December 31, 2024 |
| Investment Income | | | | |
| Dividends: | | | | |
| Affiliated issuers | | | $ | 2,638,384 |
| Expenses | | | | |
| Independent trustees' fees and expenses | $ | 235 | | |
| Total expenses | | | | 235 |
| Net Investment income (loss) | | | | 2,638,149 |
| Realized and Unrealized Gain (Loss) | | | | |
| Net realized gain (loss) on: | | | | |
| Investment Securities: | | | | |
| Affiliated issuers | | 475,119 | | |
| Capital gain distributions from underlying funds: | | | | |
| Affiliated issuers | | 2,602,970 | | |
| Total net realized gain (loss) | | | | 3,078,089 |
| Change in net unrealized appreciation (depreciation) on: | | | | |
| Investment Securities: | | | | |
| Affiliated issuers | | (53,012) | | |
| Total change in net unrealized appreciation (depreciation) | | | | (53,012) |
| Net gain (loss) | | | | 3,025,077 |
| Net increase (decrease) in net assets resulting from operations | | | $ | 5,663,226 |
| Statement of Changes in Net Assets |
| |
| | Year ended December 31, 2024 | | Year ended December 31, 2023 |
| Increase (Decrease) in Net Assets | | | | |
| Operations | | | | |
| Net investment income (loss) | $ | 2,638,149 | $ | 2,574,669 |
| Net realized gain (loss) | | 3,078,089 | | 1,142,123 |
| Change in net unrealized appreciation (depreciation) | | (53,012) | | 5,945,677 |
| Net increase (decrease) in net assets resulting from operations | | 5,663,226 | | 9,662,469 |
| Distributions to shareholders | | (3,214,348) | | (3,297,264) |
| | | | | |
| Share transactions | | | | |
| Proceeds from sales of shares | | 3,233,859 | | 1,806,390 |
| Reinvestment of distributions | | 3,214,348 | | 3,297,264 |
| Cost of shares redeemed | | (10,936,786) | | (19,521,477) |
| | | | | |
Net increase (decrease) in net assets resulting from share transactions | | (4,488,579) | | (14,417,823) |
| Total increase (decrease) in net assets | | (2,039,701) | | (8,052,618) |
| | | | | |
| Net Assets | | | | |
| Beginning of period | | 91,015,152 | | 99,067,770 |
| End of period | $ | 88,975,451 | $ | 91,015,152 |
| | | | | |
| Other Information | | | | |
| Shares | | | | |
| Sold | | 267,490 | | 154,397 |
| Issued in reinvestment of distributions | | 265,509 | | 284,558 |
| Redeemed | | (899,007) | | (1,703,834) |
| Net increase (decrease) | | (366,008) | | (1,264,879) |
| | | | | |
Financial Highlights
VIP Investor Freedom 2015 Portfolio℠ |
| |
| Years ended December 31, | | 2024 | | 2023 | | 2022 | | 2021 | | 2020 |
Selected Per-Share Data | | | | | | | | | | |
| Net asset value, beginning of period | $ | 11.84 | $ | 11.07 | $ | 14.02 | $ | 13.73 | $ | 12.86 |
| Income from Investment Operations | | | | | | | | | | |
Net investment income (loss) A,B | | .36 | | .31 | | .28 | | .25 | | .16 |
| Net realized and unrealized gain (loss) | | .40 | | .88 | | (2.23) | | .78 | | 1.53 |
| Total from investment operations | | .76 | | 1.19 | | (1.95) | | 1.03 | | 1.69 |
| Distributions from net investment income | | (.40) | | (.42) | | (.25) | | (.15) | | (.17) |
| Distributions from net realized gain | | (.05) | | - | | (.75) | | (.59) | | (.66) |
| Total distributions | | (.45) | | (.42) | | (1.00) | | (.74) | | (.82) C |
| Net asset value, end of period | $ | 12.15 | $ | 11.84 | $ | 11.07 | $ | 14.02 | $ | 13.73 |
Total Return D,E | | | | 10.85% | | (14.58)% | | 7.64% | | 13.70% |
Ratios to Average Net Assets B,F,G | | | | | | | | | | |
Expenses before reductions H | | -% | | -% | | -% | | -% | | -% |
Expenses net of fee waivers, if any H | | | | -% | | -% | | -% | | -% |
Expenses net of all reductions H | | -% | | -% | | -% | | -% | | -% |
| Net investment income (loss) | | 2.90% | | 2.74% | | 2.34% | | 1.78% | | 1.28% |
| Supplemental Data | | | | | | | | | | |
| Net assets, end of period (000 omitted) | $ | 88,975 | $ | 91,015 | $ | 99,068 | $ | 123,323 | $ | 114,226 |
Portfolio turnover rate I | | | | 19% | | 69% | | 31% | | 42% |
ACalculated based on average shares outstanding during the period.
BNet investment income (loss) is affected by the timing of the declaration of dividends by any underlying mutual funds or exchange-traded funds (ETFs). Net investment income (loss) of any mutual funds or ETFs is not included in the Fund's net investment income (loss) ratio.
CTotal distributions per share do not sum due to rounding.
DTotal returns do not reflect charges attributable to your insurance company's separate account. Inclusion of these charges would reduce the total returns shown.
ETotal returns would have been lower if certain expenses had not been reduced during the applicable periods shown.
FFees and expenses of any underlying mutual funds or exchange-traded funds (ETFs) are not included in the Fund's expense ratio. The Fund indirectly bears its proportionate share of these expenses.
GExpense ratios reflect operating expenses of the class. Expenses before reductions do not reflect amounts reimbursed, waived, or reduced through arrangements with the investment adviser, brokerage services, or other offset arrangements, if applicable, and do not represent the amount paid by the class during periods when reimbursements, waivers or reductions occur.
HAmount represents less than .005%.
IAmount does not include the portfolio activity of any underlying mutual funds or exchange-traded funds (ETFs), derivatives or securities that mature within one year from acquisition.
VIP Investor Freedom 2020 Portfolio℠
Schedule of Investments December 31, 2024
Showing Percentage of Net Assets
| Bond Funds - 52.2% |
| | | Shares | Value ($) |
| Fidelity Inflation-Protected Bond Index Fund (a) | | 2,490,874 | 22,143,870 |
| Fidelity International Bond Index Fund (a) | | 731,734 | 6,805,122 |
| Fidelity Long-Term Treasury Bond Index Fund (a) | | 711,351 | 6,523,087 |
| VIP High Income Portfolio - Investor Class (a) | | 444,776 | 2,081,550 |
| VIP Investment Grade Bond II Portfolio - Investor Class (a) | | 5,627,658 | 51,830,730 |
| TOTAL BOND FUNDS (Cost $97,154,160) | | | 89,384,359 |
| | | | |
| Domestic Equity Funds - 24.4% |
| | | Shares | Value ($) |
| VIP Contrafund Portfolio - Investor Class (a) | | 127,649 | 7,320,687 |
| VIP Equity Income Portfolio - Investor Class (a) | | 226,694 | 5,973,379 |
| VIP Growth & Income Portfolio - Investor Class (a) | | 270,036 | 8,195,593 |
| VIP Growth Portfolio - Investor Class (a) | | 126,551 | 12,132,490 |
| VIP Mid Cap Portfolio - Investor Class (a) | | 50,622 | 1,880,616 |
| VIP Value Portfolio - Investor Class (a) | | 221,619 | 4,197,458 |
| VIP Value Strategies Portfolio - Investor Class (a) | | 136,096 | 2,086,345 |
| TOTAL DOMESTIC EQUITY FUNDS (Cost $23,092,147) | | | 41,786,568 |
| | | | |
| International Equity Funds - 22.7% |
| | | Shares | Value ($) |
| VIP Emerging Markets Portfolio - Investor Class (a) | | 1,250,608 | 14,281,938 |
| VIP Overseas Portfolio - Investor Class (a) | | 974,246 | 24,706,883 |
| TOTAL INTERNATIONAL EQUITY FUNDS (Cost $27,399,762) | | | 38,988,821 |
| | | | |
| Money Market Funds - 0.7% |
| | | Yield (%) | Shares | Value ($) |
VIP Government Money Market Portfolio - Investor Class (a)(b) (Cost $1,274,654) | | 4.29 | 1,274,654 | 1,274,653 |
| | | | | |
| TOTAL INVESTMENT IN SECURITIES - 100.0% (Cost $148,920,723) | 171,434,401 |
NET OTHER ASSETS (LIABILITIES) - 0.0% | (2) |
| NET ASSETS - 100.0% | 171,434,399 |
| | |
Legend
| (b) | The rate quoted is the annualized seven-day yield of the fund at period end. |
Affiliated Underlying Funds
Fiscal year to date information regarding the Fund's investments in affiliated Underlying Funds is presented below. Exchanges between classes of the same affiliated Underlying Funds may occur. If an Underlying Funds changes its name, the name presented below is the name in effect at period end.
| Affiliate | Value, beginning of period ($) | Purchases ($) | Sales Proceeds ($) | Dividend Income ($) | Realized Gain (loss) ($) | Change in Unrealized appreciation (depreciation) ($) | Value, end of period ($) | Shares, end of period |
| Fidelity Inflation-Protected Bond Index Fund | 26,220,041 | 3,239,805 | 6,955,665 | 865,146 | (542,901) | 182,590 | 22,143,870 | 2,490,874 |
| Fidelity International Bond Index Fund | 6,334,040 | 2,485,971 | 2,041,952 | 216,641 | (78,489) | 105,552 | 6,805,122 | 731,734 |
| Fidelity Long-Term Treasury Bond Index Fund | 7,104,399 | 3,704,474 | 3,614,772 | 210,570 | (588,256) | (82,758) | 6,523,087 | 711,351 |
| VIP Contrafund Portfolio - Investor Class | 7,260,820 | 2,159,908 | 3,436,357 | 871,738 | 873,657 | 462,659 | 7,320,687 | 127,649 |
| VIP Emerging Markets Portfolio - Investor Class | 15,115,781 | 4,025,105 | 6,113,601 | 201,254 | 275,693 | 978,960 | 14,281,938 | 1,250,608 |
| VIP Equity Income Portfolio - Investor Class | 5,887,833 | 2,177,798 | 2,535,638 | 443,861 | 216,082 | 227,304 | 5,973,379 | 226,694 |
| VIP Government Money Market Portfolio - Investor Class | 3,815,501 | 2,239,958 | 4,780,806 | 54,325 | - | - | 1,274,653 | 1,274,654 |
| VIP Growth & Income Portfolio - Investor Class | 8,090,535 | 2,344,842 | 3,295,754 | 643,732 | 697,050 | 358,920 | 8,195,593 | 270,036 |
| VIP Growth Portfolio - Investor Class | 12,024,459 | 4,834,567 | 5,378,625 | 2,676,602 | 761,463 | (109,374) | 12,132,490 | 126,551 |
| VIP High Income Portfolio - Investor Class | 3,120,471 | 351,462 | 1,526,412 | 127,553 | (90,365) | 226,394 | 2,081,550 | 444,776 |
| VIP Investment Grade Bond II Portfolio - Investor Class | 57,617,540 | 9,747,928 | 14,198,762 | 2,211,418 | (357,634) | (978,342) | 51,830,730 | 5,627,658 |
| VIP Mid Cap Portfolio - Investor Class | 1,843,273 | 713,818 | 762,308 | 240,899 | 100,048 | (14,215) | 1,880,616 | 50,622 |
| VIP Overseas Portfolio - Investor Class | 28,216,596 | 4,918,527 | 8,300,237 | 1,597,288 | 1,246,041 | (1,374,044) | 24,706,883 | 974,246 |
| VIP Value Portfolio - Investor Class | 4,108,837 | 1,756,985 | 1,694,452 | 461,398 | 205,613 | (179,525) | 4,197,458 | 221,619 |
| VIP Value Strategies Portfolio - Investor Class | 2,032,042 | 999,162 | 852,255 | 305,182 | 116,819 | (209,423) | 2,086,345 | 136,096 |
| | 188,792,168 | 45,700,310 | 65,487,596 | 11,127,607 | 2,834,821 | (405,302) | 171,434,401 | 14,665,168 |
Amounts in the dividend income column in the above table include any capital gain distributions from underlying funds, which are presented in the corresponding line item in the Statement of Operations, if applicable.
Amounts included in the purchases and sales proceeds columns may include in-kind transactions, if applicable.
Investment Valuation
The following is a summary of the inputs used, as of December 31, 2024, involving the Fund's assets and liabilities carried at fair value. The inputs or methodology used for valuing securities may not be an indication of the risk associated with investing in those securities. For more information on valuation inputs, and their aggregation into the levels used below, please refer to the Investment Valuation section in the accompanying Notes to Financial Statements.
| Valuation Inputs at Reporting Date: |
| Description | Total ($) | Level 1 ($) | Level 2 ($) | Level 3 ($) |
Investments in Securities: | | | | |
|
| Bond Funds | 89,384,359 | 89,384,359 | - | - |
|
| Domestic Equity Funds | 41,786,568 | 41,786,568 | - | - |
|
| International Equity Funds | 38,988,821 | 38,988,821 | - | - |
|
| Money Market Funds | 1,274,653 | 1,274,653 | - | - |
| Total Investments in Securities: | 171,434,401 | 171,434,401 | - | - |
VIP Investor Freedom 2020 Portfolio℠
Financial Statements
| Statement of Assets and Liabilities |
As of December 31, 2024 |
| Assets | | | | |
| Investment in securities, at value - See accompanying schedule: | | | | |
Affiliated issuers (cost $148,920,723) | $ | 171,434,401 | | |
| | | | | |
| | | | | |
| Total Investment in Securities (cost $148,920,723) | | | $ | 171,434,401 |
| Receivable for investments sold | | | | 793,592 |
| Receivable for fund shares sold | | | | 9,700 |
Total assets | | | | 172,237,693 |
| Liabilities | | | | |
| Payable for investments purchased | $ | 803,202 | | |
| Payable for fund shares redeemed | | 92 | | |
| Total liabilities | | | | 803,294 |
| Net Assets | | | $ | 171,434,399 |
| Net Assets consist of: | | | | |
| Paid in capital | | | $ | 140,747,783 |
| Total accumulated earnings (loss) | | | | 30,686,616 |
| Net Assets | | | $ | 171,434,399 |
Net Asset Value, offering price and redemption price per share ($171,434,399 ÷ 13,374,688 shares) | | | $ | 12.82 |
| Statement of Operations |
| Year ended December 31, 2024 |
| Investment Income | | | | |
| Dividends: | | | | |
| Affiliated issuers | | | $ | 4,594,452 |
| Expenses | | | | |
| Independent trustees' fees and expenses | $ | 476 | | |
| Total expenses before reductions | | 476 | | |
| Expense reductions | | (192) | | |
| Total expenses after reductions | | | | 284 |
| Net Investment income (loss) | | | | 4,594,168 |
| Realized and Unrealized Gain (Loss) | | | | |
| Net realized gain (loss) on: | | | | |
| Investment Securities: | | | | |
| Affiliated issuers | | 2,834,821 | | |
| Capital gain distributions from underlying funds: | | | | |
| Affiliated issuers | | 6,533,155 | | |
| Total net realized gain (loss) | | | | 9,367,976 |
| Change in net unrealized appreciation (depreciation) on: | | | | |
| Investment Securities: | | | | |
| Affiliated issuers | | (405,302) | | |
| Total change in net unrealized appreciation (depreciation) | | | | (405,302) |
| Net gain (loss) | | | | 8,962,674 |
| Net increase (decrease) in net assets resulting from operations | | | $ | 13,556,842 |
| Statement of Changes in Net Assets |
| |
| | Year ended December 31, 2024 | | Year ended December 31, 2023 |
| Increase (Decrease) in Net Assets | | | | |
| Operations | | | | |
| Net investment income (loss) | $ | 4,594,168 | $ | 4,742,091 |
| Net realized gain (loss) | | 9,367,976 | | 3,014,725 |
| Change in net unrealized appreciation (depreciation) | | (405,302) | | 14,254,181 |
| Net increase (decrease) in net assets resulting from operations | | 13,556,842 | | 22,010,997 |
| Distributions to shareholders | | (7,061,848) | | (5,980,890) |
| | | | | |
| Share transactions | | | | |
| Proceeds from sales of shares | | 4,994,584 | | 5,702,745 |
| Reinvestment of distributions | | 7,061,848 | | 5,980,890 |
| Cost of shares redeemed | | (35,913,648) | | (28,888,352) |
| | | | | |
Net increase (decrease) in net assets resulting from share transactions | | (23,857,216) | | (17,204,717) |
| Total increase (decrease) in net assets | | (17,362,222) | | (1,174,610) |
| | | | | |
| Net Assets | | | | |
| Beginning of period | | 188,796,621 | | 189,971,231 |
| End of period | $ | 171,434,399 | $ | 188,796,621 |
| | | | | |
| Other Information | | | | |
| Shares | | | | |
| Sold | | 394,188 | | 473,472 |
| Issued in reinvestment of distributions | | 557,243 | | 495,145 |
| Redeemed | | (2,796,889) | | (2,421,850) |
| Net increase (decrease) | | (1,845,458) | | (1,453,233) |
| | | | | |
Financial Highlights
VIP Investor Freedom 2020 Portfolio℠ |
| |
| Years ended December 31, | | 2024 | | 2023 | | 2022 | | 2021 | | 2020 |
Selected Per-Share Data | | | | | | | | | | |
| Net asset value, beginning of period | $ | 12.40 | $ | 11.39 | $ | 14.83 | $ | 14.36 | $ | 13.29 |
| Income from Investment Operations | | | | | | | | | | |
Net investment income (loss) A,B | | .33 | | .30 | | .27 | | .26 | | .16 |
| Net realized and unrealized gain (loss) | | .61 | | 1.10 | | (2.49) | | 1.07 | | 1.75 |
| Total from investment operations | | .94 | | 1.40 | | (2.22) | | 1.33 | | 1.91 |
| Distributions from net investment income | | (.38) | | (.39) | | (.26) | | (.16) | | (.17) |
| Distributions from net realized gain | | (.14) | | - | | (.97) | | (.71) | | (.67) |
| Total distributions | | (.52) | | (.39) | | (1.22) C | | (.86) C | | (.84) |
| Net asset value, end of period | $ | 12.82 | $ | 12.40 | $ | 11.39 | $ | 14.83 | $ | 14.36 |
Total Return D,E | | | | 12.39% | | (15.83)% | | 9.54% | | 14.95% |
Ratios to Average Net Assets B,F,G | | | | | | | | | | |
Expenses before reductions H | | -% | | -% | | -% | | -% | | -% |
Expenses net of fee waivers, if any H | | | | -% | | -% | | -% | | -% |
Expenses net of all reductions H | | -% | | -% | | -% | | -% | | -% |
| Net investment income (loss) | | 2.52% | | 2.49% | | 2.23% | | 1.78% | | 1.25% |
| Supplemental Data | | | | | | | | | | |
| Net assets, end of period (000 omitted) | $ | 171,434 | $ | 188,797 | $ | 189,971 | $ | 252,026 | $ | 236,662 |
Portfolio turnover rate I | | | | 22% | | 61% | | 32% | | 42% |
ACalculated based on average shares outstanding during the period.
BNet investment income (loss) is affected by the timing of the declaration of dividends by any underlying mutual funds or exchange-traded funds (ETFs). Net investment income (loss) of any mutual funds or ETFs is not included in the Fund's net investment income (loss) ratio.
CTotal distributions per share do not sum due to rounding.
DTotal returns do not reflect charges attributable to your insurance company's separate account. Inclusion of these charges would reduce the total returns shown.
ETotal returns would have been lower if certain expenses had not been reduced during the applicable periods shown.
FFees and expenses of any underlying mutual funds or exchange-traded funds (ETFs) are not included in the Fund's expense ratio. The Fund indirectly bears its proportionate share of these expenses.
GExpense ratios reflect operating expenses of the class. Expenses before reductions do not reflect amounts reimbursed, waived, or reduced through arrangements with the investment adviser, brokerage services, or other offset arrangements, if applicable, and do not represent the amount paid by the class during periods when reimbursements, waivers or reductions occur.
HAmount represents less than .005%.
IAmount does not include the portfolio activity of any underlying mutual funds or exchange-traded funds (ETFs), derivatives or securities that mature within one year from acquisition.
VIP Investor Freedom 2025 Portfolio℠
Schedule of Investments December 31, 2024
Showing Percentage of Net Assets
| Bond Funds - 44.5% |
| | | Shares | Value ($) |
| Fidelity Inflation-Protected Bond Index Fund (a) | | 2,749,543 | 24,443,439 |
| Fidelity International Bond Index Fund (a) | | 866,105 | 8,054,779 |
| Fidelity Long-Term Treasury Bond Index Fund (a) | | 1,548,262 | 14,197,565 |
| VIP High Income Portfolio - Investor Class (a) | | 527,789 | 2,470,053 |
| VIP Investment Grade Bond II Portfolio - Investor Class (a) | | 4,482,144 | 41,280,549 |
| TOTAL BOND FUNDS (Cost $98,809,312) | | | 90,446,385 |
| | | | |
| Domestic Equity Funds - 29.4% |
| | | Shares | Value ($) |
| VIP Contrafund Portfolio - Investor Class (a) | | 182,636 | 10,474,182 |
| VIP Equity Income Portfolio - Investor Class (a) | | 324,347 | 8,546,540 |
| VIP Growth & Income Portfolio - Investor Class (a) | | 386,360 | 11,726,014 |
| VIP Growth Portfolio - Investor Class (a) | | 181,065 | 17,358,720 |
| VIP Mid Cap Portfolio - Investor Class (a) | | 72,429 | 2,690,729 |
| VIP Value Portfolio - Investor Class (a) | | 317,086 | 6,005,609 |
| VIP Value Strategies Portfolio - Investor Class (a) | | 194,722 | 2,985,092 |
| TOTAL DOMESTIC EQUITY FUNDS (Cost $32,181,406) | | | 59,786,886 |
| | | | |
| International Equity Funds - 26.1% |
| | | Shares | Value ($) |
| VIP Emerging Markets Portfolio - Investor Class (a) | | 1,653,464 | 18,882,555 |
| VIP Overseas Portfolio - Investor Class (a) | | 1,353,433 | 34,323,064 |
| TOTAL INTERNATIONAL EQUITY FUNDS (Cost $38,526,267) | | | 53,205,619 |
| | | | |
| TOTAL INVESTMENT IN SECURITIES - 100.0% (Cost $169,516,985) | 203,438,890 |
NET OTHER ASSETS (LIABILITIES) - 0.0% | 2 |
| NET ASSETS - 100.0% | 203,438,892 |
| | |
Legend
Affiliated Central Funds
Fiscal year to date information regarding the Fund's investments in Fidelity Central Funds, including the ownership percentage, is presented below.
| Affiliate | Value, beginning of period ($) | Purchases ($) | Sales Proceeds ($) | Dividend Income ($) | Realized Gain (loss) ($) | Change in Unrealized appreciation (depreciation) ($) | Value, end of period ($) | Shares, end of period | % ownership, end of period |
| Fidelity Cash Central Fund | 920 | - | 920 | 31 | - | - | - | - | 0.0% |
| Total | 920 | - | 920 | 31 | - | - | - | - | |
| | | | | | | | | | |
Amounts in the dividend income column in the above table include any capital gain distributions from underlying funds, which are presented in the corresponding line item in the Statement of Operations, if applicable.
Amounts included in the purchases and sales proceeds columns may include in-kind transactions, if applicable.
Affiliated Underlying Funds
Fiscal year to date information regarding the Fund's investments in affiliated Underlying Funds is presented below. Exchanges between classes of the same affiliated Underlying Funds may occur. If an Underlying Funds changes its name, the name presented below is the name in effect at period end.
| Affiliate | Value, beginning of period ($) | Purchases ($) | Sales Proceeds ($) | Dividend Income ($) | Realized Gain (loss) ($) | Change in Unrealized appreciation (depreciation) ($) | Value, end of period ($) | Shares, end of period |
| Fidelity Inflation-Protected Bond Index Fund | 27,028,466 | 4,632,280 | 6,818,483 | 948,037 | (345,454) | (53,370) | 24,443,439 | 2,749,543 |
| Fidelity International Bond Index Fund | 7,653,948 | 3,184,834 | 2,813,953 | 255,518 | (128,994) | 158,944 | 8,054,779 | 866,105 |
| Fidelity Long-Term Treasury Bond Index Fund | 12,479,234 | 8,237,922 | 5,200,787 | 481,993 | (765,735) | (553,069) | 14,197,565 | 1,548,262 |
| VIP Contrafund Portfolio - Investor Class | 10,488,933 | 2,717,260 | 4,681,259 | 1,232,070 | 1,414,143 | 535,105 | 10,474,182 | 182,636 |
| VIP Emerging Markets Portfolio - Investor Class | 19,998,250 | 5,083,504 | 7,911,102 | 262,002 | 295,460 | 1,416,443 | 18,882,555 | 1,653,464 |
| VIP Equity Income Portfolio - Investor Class | 8,505,454 | 2,793,781 | 3,410,010 | 628,804 | 397,497 | 259,818 | 8,546,540 | 324,347 |
| VIP Government Money Market Portfolio - Investor Class | - | 612,473 | 612,473 | 2,500 | - | - | - | - |
| VIP Growth & Income Portfolio - Investor Class | 11,687,466 | 2,977,745 | 4,482,730 | 911,908 | 1,175,206 | 368,327 | 11,726,014 | 386,360 |
| VIP Growth Portfolio - Investor Class | 17,370,525 | 6,211,356 | 7,236,269 | 3,785,106 | 1,282,506 | (269,398) | 17,358,720 | 181,065 |
| VIP High Income Portfolio - Investor Class | 3,726,207 | 406,254 | 1,827,295 | 149,875 | (129,469) | 294,356 | 2,470,053 | 527,789 |
| VIP Investment Grade Bond II Portfolio - Investor Class | 56,274,990 | 7,492,765 | 21,343,547 | 1,745,521 | (907,047) | (236,612) | 41,280,549 | 4,482,144 |
| VIP Mid Cap Portfolio - Investor Class | 2,662,837 | 935,888 | 1,036,032 | 341,476 | 187,856 | (59,820) | 2,690,729 | 72,429 |
| VIP Overseas Portfolio - Investor Class | 38,664,121 | 6,770,761 | 10,943,376 | 2,192,476 | 1,613,829 | (1,782,271) | 34,323,064 | 1,353,433 |
| VIP Value Portfolio - Investor Class | 5,935,662 | 2,326,189 | 2,302,875 | 655,481 | 366,501 | (319,868) | 6,005,609 | 317,086 |
| VIP Value Strategies Portfolio - Investor Class | 2,935,535 | 1,334,219 | 1,158,395 | 432,043 | 194,539 | (320,806) | 2,985,092 | 194,722 |
| | 225,411,628 | 55,717,231 | 81,778,586 | 14,024,810 | 4,650,838 | (562,221) | 203,438,890 | 14,839,385 |
Amounts in the dividend income column in the above table include any capital gain distributions from underlying funds, which are presented in the corresponding line item in the Statement of Operations, if applicable.
Amounts included in the purchases and sales proceeds columns may include in-kind transactions, if applicable.
Investment Valuation
The following is a summary of the inputs used, as of December 31, 2024, involving the Fund's assets and liabilities carried at fair value. The inputs or methodology used for valuing securities may not be an indication of the risk associated with investing in those securities. For more information on valuation inputs, and their aggregation into the levels used below, please refer to the Investment Valuation section in the accompanying Notes to Financial Statements.
| Valuation Inputs at Reporting Date: |
| Description | Total ($) | Level 1 ($) | Level 2 ($) | Level 3 ($) |
Investments in Securities: | | | | |
|
| Bond Funds | 90,446,385 | 90,446,385 | - | - |
|
| Domestic Equity Funds | 59,786,886 | 59,786,886 | - | - |
|
| International Equity Funds | 53,205,619 | 53,205,619 | - | - |
| Total Investments in Securities: | 203,438,890 | 203,438,890 | - | - |
VIP Investor Freedom 2025 Portfolio℠
Financial Statements
| Statement of Assets and Liabilities |
As of December 31, 2024 |
| Assets | | | | |
| Investment in securities, at value - See accompanying schedule: | | | | |
Affiliated issuers (cost $169,516,985) | $ | 203,438,890 | | |
| | | | | |
| | | | | |
| Total Investment in Securities (cost $169,516,985) | | | $ | 203,438,890 |
| Cash | | | | 1 |
| Receivable for investments sold | | | | 984,936 |
| Receivable for fund shares sold | | | | 2,131 |
Total assets | | | | 204,425,958 |
| Liabilities | | | | |
| Payable for investments purchased | $ | 986,976 | | |
| Payable for fund shares redeemed | | 90 | | |
| Total liabilities | | | | 987,066 |
| Net Assets | | | $ | 203,438,892 |
| Net Assets consist of: | | | | |
| Paid in capital | | | $ | 157,199,552 |
| Total accumulated earnings (loss) | | | | 46,239,340 |
| Net Assets | | | $ | 203,438,892 |
Net Asset Value, offering price and redemption price per share ($203,438,892 ÷ 13,862,070 shares) | | | $ | 14.68 |
| Statement of Operations |
| Year ended December 31, 2024 |
| Investment Income | | | | |
| Dividends: | | | | |
| Affiliated issuers | | | $ | 4,829,502 |
| Income from Fidelity Central Funds | | | | 31 |
| Total income | | | | 4,829,533 |
| Expenses | | | | |
| Independent trustees' fees and expenses | $ | 571 | | |
| Total expenses before reductions | | 571 | | |
| Expense reductions | | (4) | | |
| Total expenses after reductions | | | | 567 |
| Net Investment income (loss) | | | | 4,828,966 |
| Realized and Unrealized Gain (Loss) | | | | |
| Net realized gain (loss) on: | | | | |
| Investment Securities: | | | | |
| Affiliated issuers | | 4,650,838 | | |
| Capital gain distributions from underlying funds: | | | | |
| Affiliated issuers | | 9,195,308 | | |
| Total net realized gain (loss) | | | | 13,846,146 |
| Change in net unrealized appreciation (depreciation) on: | | | | |
| Investment Securities: | | | | |
| Affiliated issuers | | (562,221) | | |
| Total change in net unrealized appreciation (depreciation) | | | | (562,221) |
| Net gain (loss) | | | | 13,283,925 |
| Net increase (decrease) in net assets resulting from operations | | | $ | 18,112,891 |
| Statement of Changes in Net Assets |
| |
| | Year ended December 31, 2024 | | Year ended December 31, 2023 |
| Increase (Decrease) in Net Assets | | | | |
| Operations | | | | |
| Net investment income (loss) | $ | 4,828,966 | $ | 5,169,881 |
| Net realized gain (loss) | | 13,846,146 | | 3,829,145 |
| Change in net unrealized appreciation (depreciation) | | (562,221) | | 20,169,538 |
| Net increase (decrease) in net assets resulting from operations | | 18,112,891 | | 29,168,564 |
| Distributions to shareholders | | (6,840,076) | | (6,397,113) |
| | | | | |
| Share transactions | | | | |
| Proceeds from sales of shares | | 3,063,692 | | 3,335,240 |
| Reinvestment of distributions | | 6,840,076 | | 6,397,113 |
| Cost of shares redeemed | | (43,150,238) | | (40,038,718) |
| | | | | |
Net increase (decrease) in net assets resulting from share transactions | | (33,246,470) | | (30,306,365) |
| Total increase (decrease) in net assets | | (21,973,655) | | (7,534,914) |
| | | | | |
| Net Assets | | | | |
| Beginning of period | | 225,412,547 | | 232,947,461 |
| End of period | $ | 203,438,892 | $ | 225,412,547 |
| | | | | |
| Other Information | | | | |
| Shares | | | | |
| Sold | | 209,349 | | 251,175 |
| Issued in reinvestment of distributions | | 471,308 | | 470,894 |
| Redeemed | | (2,934,100) | | (2,996,065) |
| Net increase (decrease) | | (2,253,443) | | (2,273,996) |
| | | | | |
Financial Highlights
VIP Investor Freedom 2025 Portfolio℠ |
| |
| Years ended December 31, | | 2024 | | 2023 | | 2022 | | 2021 | | 2020 |
Selected Per-Share Data | | | | | | | | | | |
| Net asset value, beginning of period | $ | 13.99 | $ | 12.67 | $ | 16.55 | $ | 15.74 | $ | 14.38 |
| Income from Investment Operations | | | | | | | | | | |
Net investment income (loss) A,B | | .33 | | .30 | | .27 | | .28 | | .18 |
| Net realized and unrealized gain (loss) | | .85 | | 1.40 | | (2.85) | | 1.38 | | 2.02 |
| Total from investment operations | | 1.18 | | 1.70 | | (2.58) | | 1.66 | | 2.20 |
| Distributions from net investment income | | (.38) | | (.38) | | (.28) | | (.18) | | (.18) |
| Distributions from net realized gain | | (.11) | | - | | (1.02) | | (.67) | | (.66) |
| Total distributions | | (.49) | | (.38) | | (1.30) | | (.85) | | (.84) |
| Net asset value, end of period | $ | 14.68 | $ | 13.99 | $ | 12.67 | $ | 16.55 | $ | 15.74 |
Total Return C,D | | | | 13.55% | | (16.45)% | | 10.78% | | 15.88% |
Ratios to Average Net Assets B,E,F | | | | | | | | | | |
Expenses before reductions G | | -% | | -% | | -% | | -% | | -% |
Expenses net of fee waivers, if any G | | | | -% | | -% | | -% | | -% |
Expenses net of all reductions G | | -% | | -% | | -% | | -% | | -% |
| Net investment income (loss) | | 2.21% | | 2.25% | | 2.02% | | 1.74% | | 1.26% |
| Supplemental Data | | | | | | | | | | |
| Net assets, end of period (000 omitted) | $ | 203,439 | $ | 225,413 | $ | 232,947 | $ | 317,596 | $ | 285,539 |
Portfolio turnover rate H | | | | 19% | | 60% | | 30% | | 43% |
ACalculated based on average shares outstanding during the period.
BNet investment income (loss) is affected by the timing of the declaration of dividends by any underlying mutual funds or exchange-traded funds (ETFs). Net investment income (loss) of any mutual funds or ETFs is not included in the Fund's net investment income (loss) ratio.
CTotal returns do not reflect charges attributable to your insurance company's separate account. Inclusion of these charges would reduce the total returns shown.
DTotal returns would have been lower if certain expenses had not been reduced during the applicable periods shown.
EFees and expenses of any underlying mutual funds or exchange-traded funds (ETFs) are not included in the Fund's expense ratio. The Fund indirectly bears its proportionate share of these expenses. For additional expense information related to investments in Fidelity Central Funds, please refer to the "Investments in Fidelity Central Funds" note found in the Notes to Financial Statements section of the most recent Annual or Semi-Annual report.
FExpense ratios reflect operating expenses of the class. Expenses before reductions do not reflect amounts reimbursed, waived, or reduced through arrangements with the investment adviser, brokerage services, or other offset arrangements, if applicable, and do not represent the amount paid by the class during periods when reimbursements, waivers or reductions occur.
GAmount represents less than .005%.
HAmount does not include the portfolio activity of any underlying mutual funds or exchange-traded funds (ETFs), derivatives or securities that mature within one year from acquisition.
VIP Investor Freedom 2030 Portfolio℠
Schedule of Investments December 31, 2024
Showing Percentage of Net Assets
| Bond Funds - 37.9% |
| | | Shares | Value ($) |
| Fidelity Inflation-Protected Bond Index Fund (a) | | 3,351,003 | 29,790,422 |
| Fidelity International Bond Index Fund (a) | | 1,325,881 | 12,330,691 |
| Fidelity Long-Term Treasury Bond Index Fund (a) | | 2,885,539 | 26,460,389 |
| VIP High Income Portfolio - Investor Class (a) | | 927,757 | 4,341,900 |
| VIP Investment Grade Bond II Portfolio - Investor Class (a) | | 6,800,343 | 62,631,158 |
| TOTAL BOND FUNDS (Cost $147,911,186) | | | 135,554,560 |
| | | | |
| Domestic Equity Funds - 33.3% |
| | | Shares | Value ($) |
| VIP Contrafund Portfolio - Investor Class (a) | | 363,923 | 20,871,003 |
| VIP Equity Income Portfolio - Investor Class (a) | | 646,302 | 17,030,054 |
| VIP Growth & Income Portfolio - Investor Class (a) | | 769,869 | 23,365,536 |
| VIP Growth Portfolio - Investor Class (a) | | 360,793 | 34,589,217 |
| VIP Mid Cap Portfolio - Investor Class (a) | | 144,323 | 5,361,613 |
| VIP Value Portfolio - Investor Class (a) | | 631,834 | 11,966,941 |
| VIP Value Strategies Portfolio - Investor Class (a) | | 388,009 | 5,948,182 |
| TOTAL DOMESTIC EQUITY FUNDS (Cost $75,161,821) | | | 119,132,546 |
| | | | |
| International Equity Funds - 28.8% |
| | | Shares | Value ($) |
| VIP Emerging Markets Portfolio - Investor Class (a) | | 3,151,035 | 35,984,823 |
| VIP Overseas Portfolio - Investor Class (a) | | 2,638,560 | 66,913,884 |
| TOTAL INTERNATIONAL EQUITY FUNDS (Cost $82,282,489) | | | 102,898,707 |
| | | | |
| TOTAL INVESTMENT IN SECURITIES - 100.0% (Cost $305,355,496) | 357,585,813 |
NET OTHER ASSETS (LIABILITIES) - 0.0% | 1 |
| NET ASSETS - 100.0% | 357,585,814 |
| | |
Legend
Affiliated Underlying Funds
Fiscal year to date information regarding the Fund's investments in affiliated Underlying Funds is presented below. Exchanges between classes of the same affiliated Underlying Funds may occur. If an Underlying Funds changes its name, the name presented below is the name in effect at period end.
| Affiliate | Value, beginning of period ($) | Purchases ($) | Sales Proceeds ($) | Dividend Income ($) | Realized Gain (loss) ($) | Change in Unrealized appreciation (depreciation) ($) | Value, end of period ($) | Shares, end of period |
| Fidelity Inflation-Protected Bond Index Fund | 29,308,255 | 6,986,759 | 6,041,010 | 1,139,250 | (342,083) | (121,499) | 29,790,422 | 3,351,003 |
| Fidelity International Bond Index Fund | 10,191,161 | 5,452,908 | 3,352,337 | 370,386 | (110,454) | 149,413 | 12,330,691 | 1,325,881 |
| Fidelity Long-Term Treasury Bond Index Fund | 20,988,446 | 14,822,907 | 7,047,307 | 863,537 | (1,149,255) | (1,154,402) | 26,460,389 | 2,885,539 |
| VIP Contrafund Portfolio - Investor Class | 18,868,495 | 5,631,493 | 7,158,906 | 2,446,406 | 1,263,937 | 2,265,984 | 20,871,003 | 363,923 |
| VIP Emerging Markets Portfolio - Investor Class | 33,950,905 | 9,848,581 | 10,838,896 | 495,730 | 92,997 | 2,931,236 | 35,984,823 | 3,151,035 |
| VIP Equity Income Portfolio - Investor Class | 15,300,404 | 5,513,882 | 4,945,705 | 1,245,119 | 302,824 | 858,649 | 17,030,054 | 646,302 |
| VIP Government Money Market Portfolio - Investor Class | - | 1,025,849 | 1,025,849 | 4,176 | - | - | - | - |
| VIP Growth & Income Portfolio - Investor Class | 21,024,526 | 5,862,180 | 6,335,639 | 1,804,055 | 778,589 | 2,035,880 | 23,365,536 | 769,869 |
| VIP Growth Portfolio - Investor Class | 31,247,840 | 12,779,643 | 10,951,030 | 7,493,417 | 1,095,702 | 417,062 | 34,589,217 | 360,793 |
| VIP High Income Portfolio - Investor Class | 5,837,063 | 864,405 | 2,629,284 | 263,225 | (158,930) | 428,646 | 4,341,900 | 927,757 |
| VIP Investment Grade Bond II Portfolio - Investor Class | 78,371,865 | 13,684,161 | 27,757,122 | 2,641,169 | (896,423) | (771,323) | 62,631,158 | 6,800,343 |
| VIP Mid Cap Portfolio - Investor Class | 4,790,238 | 1,924,967 | 1,563,513 | 671,480 | 144,286 | 65,635 | 5,361,613 | 144,323 |
| VIP Overseas Portfolio - Investor Class | 67,250,038 | 13,769,664 | 13,353,352 | 4,249,587 | 300,294 | (1,052,760) | 66,913,884 | 2,638,560 |
| VIP Value Portfolio - Investor Class | 10,677,730 | 4,674,657 | 3,425,340 | 1,284,376 | 200,060 | (160,166) | 11,966,941 | 631,834 |
| VIP Value Strategies Portfolio - Investor Class | 5,280,813 | 2,704,618 | 1,760,498 | 853,299 | 115,196 | (391,947) | 5,948,182 | 388,009 |
| | 353,087,779 | 105,546,674 | 108,185,788 | 25,825,212 | 1,636,740 | 5,500,408 | 357,585,813 | 24,385,171 |
Amounts in the dividend income column in the above table include any capital gain distributions from underlying funds, which are presented in the corresponding line item in the Statement of Operations, if applicable.
Amounts included in the purchases and sales proceeds columns may include in-kind transactions, if applicable.
Investment Valuation
The following is a summary of the inputs used, as of December 31, 2024, involving the Fund's assets and liabilities carried at fair value. The inputs or methodology used for valuing securities may not be an indication of the risk associated with investing in those securities. For more information on valuation inputs, and their aggregation into the levels used below, please refer to the Investment Valuation section in the accompanying Notes to Financial Statements.
| Valuation Inputs at Reporting Date: |
| Description | Total ($) | Level 1 ($) | Level 2 ($) | Level 3 ($) |
Investments in Securities: | | | | |
|
| Bond Funds | 135,554,560 | 135,554,560 | - | - |
|
| Domestic Equity Funds | 119,132,546 | 119,132,546 | - | - |
|
| International Equity Funds | 102,898,707 | 102,898,707 | - | - |
| Total Investments in Securities: | 357,585,813 | 357,585,813 | - | - |
VIP Investor Freedom 2030 Portfolio℠
Financial Statements
| Statement of Assets and Liabilities |
As of December 31, 2024 |
| Assets | | | | |
| Investment in securities, at value - See accompanying schedule: | | | | |
Affiliated issuers (cost $305,355,496) | $ | 357,585,813 | | |
| | | | | |
| | | | | |
| Total Investment in Securities (cost $305,355,496) | | | $ | 357,585,813 |
| Receivable for investments sold | | | | 1,761,669 |
Total assets | | | | 359,347,482 |
| Liabilities | | | | |
| Payable for investments purchased | $ | 1,759,728 | | |
| Payable for fund shares redeemed | | 1,940 | | |
| Total liabilities | | | | 1,761,668 |
| Net Assets | | | $ | 357,585,814 |
| Net Assets consist of: | | | | |
| Paid in capital | | | $ | 291,395,516 |
| Total accumulated earnings (loss) | | | | 66,190,298 |
| Net Assets | | | $ | 357,585,814 |
Net Asset Value, offering price and redemption price per share ($357,585,814 ÷ 23,419,497 shares) | | | $ | 15.27 |
| Statement of Operations |
| Year ended December 31, 2024 |
| Investment Income | | | | |
| Dividends: | | | | |
| Affiliated issuers | | | $ | 7,697,326 |
| Expenses | | | | |
| Independent trustees' fees and expenses | $ | 944 | | |
| Total expenses | | | | 944 |
| Net Investment income (loss) | | | | 7,696,382 |
| Realized and Unrealized Gain (Loss) | | | | |
| Net realized gain (loss) on: | | | | |
| Investment Securities: | | | | |
| Affiliated issuers | | 1,636,740 | | |
| Capital gain distributions from underlying funds: | | | | |
| Affiliated issuers | | 18,127,886 | | |
| Total net realized gain (loss) | | | | 19,764,626 |
| Change in net unrealized appreciation (depreciation) on: | | | | |
| Investment Securities: | | | | |
| Affiliated issuers | | 5,500,408 | | |
| Total change in net unrealized appreciation (depreciation) | | | | 5,500,408 |
| Net gain (loss) | | | | 25,265,034 |
| Net increase (decrease) in net assets resulting from operations | | | $ | 32,961,416 |
| Statement of Changes in Net Assets |
| |
| | Year ended December 31, 2024 | | Year ended December 31, 2023 |
| Increase (Decrease) in Net Assets | | | | |
| Operations | | | | |
| Net investment income (loss) | $ | 7,696,382 | $ | 7,330,788 |
| Net realized gain (loss) | | 19,764,626 | | 2,581,324 |
| Change in net unrealized appreciation (depreciation) | | 5,500,408 | | 37,546,454 |
| Net increase (decrease) in net assets resulting from operations | | 32,961,416 | | 47,458,566 |
| Distributions to shareholders | | (8,820,132) | | (8,449,708) |
| | | | | |
| Share transactions | | | | |
| Proceeds from sales of shares | | 13,033,735 | | 11,192,683 |
| Reinvestment of distributions | | 8,820,132 | | 8,449,708 |
| Cost of shares redeemed | | (41,497,006) | | (46,438,462) |
| | | | | |
Net increase (decrease) in net assets resulting from share transactions | | (19,643,139) | | (26,796,071) |
| Total increase (decrease) in net assets | | 4,498,145 | | 12,212,787 |
| | | | | |
| Net Assets | | | | |
| Beginning of period | | 353,087,669 | | 340,874,882 |
| End of period | $ | 357,585,814 | $ | 353,087,669 |
| | | | | |
| Other Information | | | | |
| Shares | | | | |
| Sold | | 862,678 | | 823,891 |
| Issued in reinvestment of distributions | | 580,911 | | 606,998 |
| Redeemed | | (2,691,085) | | (3,412,909) |
| Net increase (decrease) | | (1,247,496) | | (1,982,020) |
| | | | | |
Financial Highlights
VIP Investor Freedom 2030 Portfolio℠ |
| |
| Years ended December 31, | | 2024 | | 2023 | | 2022 | | 2021 | | 2020 |
Selected Per-Share Data | | | | | | | | | | |
| Net asset value, beginning of period | $ | 14.31 | $ | 12.79 | $ | 16.73 | $ | 15.70 | $ | 14.26 |
| Income from Investment Operations | | | | | | | | | | |
Net investment income (loss) A,B | | .32 | | .29 | | .26 | | .28 | | .17 |
| Net realized and unrealized gain (loss) | | 1.02 | | 1.57 | | (2.95) | | 1.60 | | 2.14 |
| Total from investment operations | | 1.34 | | 1.86 | | (2.69) | | 1.88 | | 2.31 |
| Distributions from net investment income | | (.35) | | (.34) | | (.27) | | (.17) | | (.17) |
| Distributions from net realized gain | | (.03) | | - | | (.99) | | (.68) | | (.69) |
| Total distributions | | (.38) | | (.34) | | (1.25) C | | (.85) | | (.87) C |
| Net asset value, end of period | $ | 15.27 | $ | 14.31 | $ | 12.79 | $ | 16.73 | $ | 15.70 |
Total Return D,E | | | | 14.63% | | (16.91)% | | 12.25% | | 16.82% |
Ratios to Average Net Assets B,F,G | | | | | | | | | | |
Expenses before reductions H | | -% | | -% | | -% | | -% | | -% |
Expenses net of fee waivers, if any H | | | | -% | | -% | | -% | | -% |
Expenses net of all reductions H | | -% | | -% | | -% | | -% | | -% |
| Net investment income (loss) | | 2.10% | | 2.11% | | 1.88% | | 1.71% | | 1.26% |
| Supplemental Data | | | | | | | | | | |
| Net assets, end of period (000 omitted) | $ | 357,586 | $ | 353,088 | $ | 340,875 | $ | 415,184 | $ | 325,667 |
Portfolio turnover rate I | | | | 21% | | 57% | | 23% | | 41% |
ACalculated based on average shares outstanding during the period.
BNet investment income (loss) is affected by the timing of the declaration of dividends by any underlying mutual funds or exchange-traded funds (ETFs). Net investment income (loss) of any mutual funds or ETFs is not included in the Fund's net investment income (loss) ratio.
CTotal distributions per share do not sum due to rounding.
DTotal returns do not reflect charges attributable to your insurance company's separate account. Inclusion of these charges would reduce the total returns shown.
ETotal returns would have been lower if certain expenses had not been reduced during the applicable periods shown.
FFees and expenses of any underlying mutual funds or exchange-traded funds (ETFs) are not included in the Fund's expense ratio. The Fund indirectly bears its proportionate share of these expenses.
GExpense ratios reflect operating expenses of the class. Expenses before reductions do not reflect amounts reimbursed, waived, or reduced through arrangements with the investment adviser, brokerage services, or other offset arrangements, if applicable, and do not represent the amount paid by the class during periods when reimbursements, waivers or reductions occur.
HAmount represents less than .005%.
IAmount does not include the portfolio activity of any underlying mutual funds or exchange-traded funds (ETFs), derivatives or securities that mature within one year from acquisition.
VIP Investor Freedom 2035 Portfolio℠
Schedule of Investments December 31, 2024
Showing Percentage of Net Assets
| Bond Funds - 28.2% |
| | | Shares | Value ($) |
| Fidelity Inflation-Protected Bond Index Fund (a) | | 98,562 | 876,220 |
| Fidelity International Bond Index Fund (a) | | 67,405 | 626,862 |
| Fidelity Long-Term Treasury Bond Index Fund (a) | | 182,018 | 1,669,104 |
| VIP High Income Portfolio - Investor Class (a) | | 55,375 | 259,154 |
| VIP Investment Grade Bond II Portfolio - Investor Class (a) | | 281,328 | 2,591,026 |
| TOTAL BOND FUNDS (Cost $6,202,498) | | | 6,022,366 |
| | | | |
| Domestic Equity Funds - 39.1% |
| | | Shares | Value ($) |
| VIP Contrafund Portfolio - Investor Class (a) | | 25,505 | 1,462,699 |
| VIP Equity Income Portfolio - Investor Class (a) | | 45,296 | 1,193,549 |
| VIP Growth & Income Portfolio - Investor Class (a) | | 53,956 | 1,637,561 |
| VIP Growth Portfolio - Investor Class (a) | | 25,285 | 2,424,110 |
| VIP Mid Cap Portfolio - Investor Class (a) | | 10,115 | 375,767 |
| VIP Value Portfolio - Investor Class (a) | | 44,282 | 838,707 |
| VIP Value Strategies Portfolio - Investor Class (a) | | 27,194 | 416,882 |
| TOTAL DOMESTIC EQUITY FUNDS (Cost $8,253,434) | | | 8,349,275 |
| | | | |
| International Equity Funds - 32.7% |
| | | Shares | Value ($) |
| VIP Emerging Markets Portfolio - Investor Class (a) | | 209,595 | 2,393,575 |
| VIP Overseas Portfolio - Investor Class (a) | | 180,465 | 4,576,582 |
| TOTAL INTERNATIONAL EQUITY FUNDS (Cost $7,106,464) | | | 6,970,157 |
| | | | |
| TOTAL INVESTMENT IN SECURITIES - 100.0% (Cost $21,562,396) | 21,341,798 |
NET OTHER ASSETS (LIABILITIES) - 0.0% | (2) |
| NET ASSETS - 100.0% | 21,341,796 |
| | |
Legend
Affiliated Underlying Funds
Fiscal year to date information regarding the Fund's investments in affiliated Underlying Funds is presented below. Exchanges between classes of the same affiliated Underlying Funds may occur. If an Underlying Funds changes its name, the name presented below is the name in effect at period end.
| Affiliate | Value, beginning of period ($) | Purchases ($) | Sales Proceeds ($) | Dividend Income ($) | Realized Gain (loss) ($) | Change in Unrealized appreciation (depreciation) ($) | Value, end of period ($) | Shares, end of period |
| Fidelity Inflation-Protected Bond Index Fund | 240,670 | 899,914 | 245,372 | 27,499 | (2,111) | (16,881) | 876,220 | 98,562 |
| Fidelity International Bond Index Fund | 152,951 | 598,207 | 125,451 | 14,387 | (70) | 1,225 | 626,862 | 67,405 |
| Fidelity Long-Term Treasury Bond Index Fund | 409,440 | 1,679,203 | 307,647 | 36,638 | (11,236) | (100,656) | 1,669,104 | 182,018 |
| VIP Contrafund Portfolio - Investor Class | 422,221 | 1,384,163 | 403,636 | 172,125 | (9,793) | 69,744 | 1,462,699 | 25,505 |
| VIP Emerging Markets Portfolio - Investor Class | 701,984 | 2,230,838 | 570,248 | 32,501 | (18,044) | 49,045 | 2,393,575 | 209,595 |
| VIP Equity Income Portfolio - Investor Class | 342,362 | 1,156,009 | 305,988 | 85,674 | (4,156) | 5,322 | 1,193,549 | 45,296 |
| VIP Government Money Market Portfolio - Investor Class | - | 38,705 | 38,705 | 147 | - | - | - | - |
| VIP Growth & Income Portfolio - Investor Class | 470,445 | 1,500,881 | 393,905 | 123,388 | (5,490) | 65,630 | 1,637,561 | 53,956 |
| VIP Growth Portfolio - Investor Class | 699,256 | 2,541,645 | 642,601 | 517,175 | (29,440) | (144,750) | 2,424,110 | 25,285 |
| VIP High Income Portfolio - Investor Class | 106,364 | 299,621 | 152,464 | 15,928 | 1,891 | 3,742 | 259,154 | 55,375 |
| VIP Investment Grade Bond II Portfolio - Investor Class | 984,966 | 2,605,010 | 910,014 | 109,176 | (11,915) | (77,021) | 2,591,026 | 281,328 |
| VIP Mid Cap Portfolio - Investor Class | 107,218 | 371,563 | 94,361 | 44,271 | (614) | (8,039) | 375,767 | 10,115 |
| VIP Overseas Portfolio - Investor Class | 1,439,435 | 4,174,643 | 727,818 | 286,173 | (24,709) | (284,969) | 4,576,582 | 180,465 |
| VIP Value Portfolio - Investor Class | 238,963 | 841,109 | 215,346 | 82,208 | (1,720) | (24,299) | 838,707 | 44,282 |
| VIP Value Strategies Portfolio - Investor Class | 118,194 | 438,881 | 106,301 | 57,973 | (1,425) | (32,467) | 416,882 | 27,194 |
| | 6,434,469 | 20,760,392 | 5,239,857 | 1,605,263 | (118,832) | (494,374) | 21,341,798 | 1,306,381 |
Amounts in the dividend income column in the above table include any capital gain distributions from underlying funds, which are presented in the corresponding line item in the Statement of Operations, if applicable.
Amounts included in the purchases and sales proceeds columns may include in-kind transactions, if applicable.
Investment Valuation
The following is a summary of the inputs used, as of December 31, 2024, involving the Fund's assets and liabilities carried at fair value. The inputs or methodology used for valuing securities may not be an indication of the risk associated with investing in those securities. For more information on valuation inputs, and their aggregation into the levels used below, please refer to the Investment Valuation section in the accompanying Notes to Financial Statements.
| Valuation Inputs at Reporting Date: |
| Description | Total ($) | Level 1 ($) | Level 2 ($) | Level 3 ($) |
Investments in Securities: | | | | |
|
| Bond Funds | 6,022,366 | 6,022,366 | - | - |
|
| Domestic Equity Funds | 8,349,275 | 8,349,275 | - | - |
|
| International Equity Funds | 6,970,157 | 6,970,157 | - | - |
| Total Investments in Securities: | 21,341,798 | 21,341,798 | - | - |
VIP Investor Freedom 2035 Portfolio℠
Financial Statements
| Statement of Assets and Liabilities |
As of December 31, 2024 |
| Assets | | | | |
| Investment in securities, at value - See accompanying schedule: | | | | |
Affiliated issuers (cost $21,562,396) | $ | 21,341,798 | | |
| | | | | |
| | | | | |
| Total Investment in Securities (cost $21,562,396) | | | $ | 21,341,798 |
| Receivable for investments sold | | | | 128,474 |
| Receivable for fund shares sold | | | | 99 |
Total assets | | | | 21,470,371 |
| Liabilities | | | | |
| Payable for investments purchased | $ | 128,569 | | |
| Payable for fund shares redeemed | | 6 | | |
| Total liabilities | | | | 128,575 |
| Net Assets | | | $ | 21,341,796 |
| Net Assets consist of: | | | | |
| Paid in capital | | | $ | 20,561,100 |
| Total accumulated earnings (loss) | | | | 780,696 |
| Net Assets | | | $ | 21,341,796 |
Net Asset Value, offering price and redemption price per share ($21,341,796 ÷ 1,855,526 shares) | | | $ | 11.50 |
| Statement of Operations |
| Year ended December 31, 2024 |
| Investment Income | | | | |
| Dividends: | | | | |
| Affiliated issuers | | | $ | 364,930 |
| Expenses | | | | |
| Independent trustees' fees and expenses | $ | 33 | | |
| Proxy fee | | 9 | | |
| Total expenses before reductions | | 42 | | |
| Expense reductions | | (4) | | |
| Total expenses after reductions | | | | 38 |
| Net Investment income (loss) | | | | 364,892 |
| Realized and Unrealized Gain (Loss) | | | | |
| Net realized gain (loss) on: | | | | |
| Investment Securities: | | | | |
| Affiliated issuers | | (118,832) | | |
| Capital gain distributions from underlying funds: | | | | |
| Affiliated issuers | | 1,240,333 | | |
| Total net realized gain (loss) | | | | 1,121,501 |
| Change in net unrealized appreciation (depreciation) on: | | | | |
| Investment Securities: | | | | |
| Affiliated issuers | | (494,374) | | |
| Total change in net unrealized appreciation (depreciation) | | | | (494,374) |
| Net gain (loss) | | | | 627,127 |
| Net increase (decrease) in net assets resulting from operations | | | $ | 992,019 |
| Statement of Changes in Net Assets |
| |
| | Year ended December 31, 2024 | | For the period April 13, 2023 (commencement of operations) through December 31, 2023 |
| Increase (Decrease) in Net Assets | | | | |
| Operations | | | | |
| Net investment income (loss) | $ | 364,892 | $ | 98,408 |
| Net realized gain (loss) | | 1,121,501 | | 55,321 |
| Change in net unrealized appreciation (depreciation) | | (494,374) | | 273,776 |
| Net increase (decrease) in net assets resulting from operations | | 992,019 | | 427,505 |
| Distributions to shareholders | | (537,694) | | (101,135) |
| | | | | |
| Share transactions | | | | |
| Proceeds from sales of shares | | 16,451,210 | | 6,859,975 |
| Reinvestment of distributions | | 502,493 | | 83,535 |
| Cost of shares redeemed | | (2,500,761) | | (835,351) |
| | | | | |
Net increase (decrease) in net assets resulting from share transactions | | 14,452,942 | | 6,108,159 |
| Total increase (decrease) in net assets | | 14,907,267 | | 6,434,529 |
| | | | | |
| Net Assets | | | | |
| Beginning of period | | 6,434,529 | | - |
| End of period | $ | 21,341,796 | $ | 6,434,529 |
| | | | | |
| Other Information | | | | |
| Shares | | | | |
| Sold | | 1,420,788 | | 678,232 |
| Issued in reinvestment of distributions | | 43,979 | | 7,800 |
| Redeemed | | (211,166) | | (84,107) |
| Net increase (decrease) | | 1,253,601 | | 601,925 |
| | | | | |
Financial Highlights
VIP Investor Freedom 2035 Portfolio℠ |
| |
| Years ended December 31, | | 2024 | | 2023 A |
Selected Per-Share Data | | | | |
| Net asset value, beginning of period | $ | 10.69 | $ | 10.00 |
| Income from Investment Operations | | | | |
Net investment income (loss) B,C | | .29 | | .24 |
| Net realized and unrealized gain (loss) | | .87 | | .63 |
| Total from investment operations | | 1.16 | | .87 |
| Distributions from net investment income | | (.20) | | (.17) |
| Distributions from net realized gain | | (.15) | | - D |
| Total distributions | | (.35) | | (.18) E |
| Net asset value, end of period | $ | 11.50 | $ | 10.69 |
Total Return F,G,H | | | | 8.66% |
Ratios to Average Net Assets C,I,J | | | | |
Expenses before reductions K | | -% | | -% L |
Expenses net of fee waivers, if any K | | | | -% L |
Expenses net of all reductions K | | -% | | -% L |
| Net investment income (loss) | | 2.52% | | 3.25% L |
| Supplemental Data | | | | |
| Net assets, end of period (000 omitted) | $ | 21,342 | $ | 6,435 |
Portfolio turnover rate M | | | | 37% L |
AFor the period April 13, 2023 (commencement of operations) through December 31, 2023.
BCalculated based on average shares outstanding during the period.
CNet investment income (loss) is affected by the timing of the declaration of dividends by any underlying mutual funds or exchange-traded funds (ETFs). Net investment income (loss) of any mutual funds or ETFs is not included in the Fund's net investment income (loss) ratio.
DAmount represents less than $.005 per share.
ETotal distributions per share do not sum due to rounding.
FTotal returns for periods of less than one year are not annualized.
GTotal returns do not reflect charges attributable to your insurance company's separate account. Inclusion of these charges would reduce the total returns shown.
HTotal returns would have been lower if certain expenses had not been reduced during the applicable periods shown.
IFees and expenses of any underlying mutual funds or exchange-traded funds (ETFs) are not included in the Fund's expense ratio. The Fund indirectly bears its proportionate share of these expenses.
JExpense ratios reflect operating expenses of the class. Expenses before reductions do not reflect amounts reimbursed, waived, or reduced through arrangements with the investment adviser, brokerage services, or other offset arrangements, if applicable, and do not represent the amount paid by the class during periods when reimbursements, waivers or reductions occur.
KAmount represents less than .005%.
LAnnualized.
MAmount does not include the portfolio activity of any underlying mutual funds or exchange-traded funds (ETFs), derivatives or securities that mature within one year from acquisition.
VIP Investor Freedom 2040 Portfolio℠
Schedule of Investments December 31, 2024
Showing Percentage of Net Assets
| Bond Funds - 13.7% |
| | | Shares | Value ($) |
| Fidelity Inflation-Protected Bond Index Fund (a) | | 21,772 | 193,554 |
| Fidelity International Bond Index Fund (a) | | 33,074 | 307,584 |
| Fidelity Long-Term Treasury Bond Index Fund (a) | | 117,043 | 1,073,284 |
| VIP High Income Portfolio - Investor Class (a) | | 35,071 | 164,134 |
| VIP Investment Grade Bond II Portfolio - Investor Class (a) | | 12,033 | 110,823 |
| TOTAL BOND FUNDS (Cost $1,921,893) | | | 1,849,379 |
| | | | |
| Domestic Equity Funds - 47.8% |
| | | Shares | Value ($) |
| VIP Contrafund Portfolio - Investor Class (a) | | 19,750 | 1,132,672 |
| VIP Equity Income Portfolio - Investor Class (a) | | 35,076 | 924,249 |
| VIP Growth & Income Portfolio - Investor Class (a) | | 41,782 | 1,268,079 |
| VIP Growth Portfolio - Investor Class (a) | | 19,580 | 1,877,156 |
| VIP Mid Cap Portfolio - Investor Class (a) | | 7,833 | 290,983 |
| VIP Value Portfolio - Investor Class (a) | | 34,291 | 649,468 |
| VIP Value Strategies Portfolio - Investor Class (a) | | 21,058 | 322,819 |
| TOTAL DOMESTIC EQUITY FUNDS (Cost $6,175,436) | | | 6,465,426 |
| | | | |
| International Equity Funds - 38.5% |
| | | Shares | Value ($) |
| VIP Emerging Markets Portfolio - Investor Class (a) | | 153,249 | 1,750,108 |
| VIP Overseas Portfolio - Investor Class (a) | | 136,099 | 3,451,469 |
| TOTAL INTERNATIONAL EQUITY FUNDS (Cost $5,179,027) | | | 5,201,577 |
| | | | |
| TOTAL INVESTMENT IN SECURITIES - 100.0% (Cost $13,276,356) | 13,516,382 |
NET OTHER ASSETS (LIABILITIES) - 0.0% | 2 |
| NET ASSETS - 100.0% | 13,516,384 |
| | |
Legend
Affiliated Underlying Funds
Fiscal year to date information regarding the Fund's investments in affiliated Underlying Funds is presented below. Exchanges between classes of the same affiliated Underlying Funds may occur. If an Underlying Funds changes its name, the name presented below is the name in effect at period end.
| Affiliate | Value, beginning of period ($) | Purchases ($) | Sales Proceeds ($) | Dividend Income ($) | Realized Gain (loss) ($) | Change in Unrealized appreciation (depreciation) ($) | Value, end of period ($) | Shares, end of period |
| Fidelity Inflation-Protected Bond Index Fund | 154,354 | 169,306 | 127,150 | 7,829 | (922) | (2,034) | 193,554 | 21,772 |
| Fidelity International Bond Index Fund | 101,571 | 267,072 | 60,110 | 6,896 | 164 | (1,113) | 307,584 | 33,074 |
| Fidelity Long-Term Treasury Bond Index Fund | 440,948 | 849,391 | 137,014 | 25,168 | (5,912) | (74,129) | 1,073,284 | 117,043 |
| VIP Contrafund Portfolio - Investor Class | 578,071 | 691,797 | 232,262 | 129,161 | (2,828) | 97,894 | 1,132,672 | 19,750 |
| VIP Emerging Markets Portfolio - Investor Class | 898,561 | 1,073,759 | 277,372 | 23,151 | (5,597) | 60,757 | 1,750,108 | 153,249 |
| VIP Equity Income Portfolio - Investor Class | 468,751 | 599,497 | 163,070 | 64,928 | 1,371 | 17,700 | 924,249 | 35,076 |
| VIP Government Money Market Portfolio - Investor Class | - | 29,376 | 29,376 | 118 | - | - | - | - |
| VIP Growth & Income Portfolio - Investor Class | 644,121 | 743,935 | 199,857 | 93,610 | (287) | 80,167 | 1,268,079 | 41,782 |
| VIP Growth Portfolio - Investor Class | 957,343 | 1,336,690 | 361,599 | 390,473 | (13,236) | (42,042) | 1,877,156 | 19,580 |
| VIP High Income Portfolio - Investor Class | 19,510 | 159,395 | 6,950 | 9,713 | (258) | (7,563) | 164,134 | 35,071 |
| VIP Investment Grade Bond II Portfolio - Investor Class | 413,221 | 410,278 | 713,756 | 3,553 | 2,457 | (1,377) | 110,823 | 12,033 |
| VIP Mid Cap Portfolio - Investor Class | 146,763 | 195,962 | 49,836 | 33,964 | 917 | (2,823) | 290,983 | 7,833 |
| VIP Overseas Portfolio - Investor Class | 1,900,461 | 2,045,298 | 322,277 | 210,638 | (5,789) | (166,224) | 3,451,469 | 136,099 |
| VIP Value Portfolio - Investor Class | 327,138 | 450,835 | 112,927 | 63,928 | 1,220 | (16,798) | 649,468 | 34,291 |
| VIP Value Strategies Portfolio - Investor Class | 161,793 | 240,451 | 55,940 | 44,055 | 697 | (24,182) | 322,819 | 21,058 |
| | 7,212,606 | 9,263,042 | 2,849,496 | 1,107,185 | (28,003) | (81,767) | 13,516,382 | 687,711 |
Amounts in the dividend income column in the above table include any capital gain distributions from underlying funds, which are presented in the corresponding line item in the Statement of Operations, if applicable.
Amounts included in the purchases and sales proceeds columns may include in-kind transactions, if applicable.
Investment Valuation
The following is a summary of the inputs used, as of December 31, 2024, involving the Fund's assets and liabilities carried at fair value. The inputs or methodology used for valuing securities may not be an indication of the risk associated with investing in those securities. For more information on valuation inputs, and their aggregation into the levels used below, please refer to the Investment Valuation section in the accompanying Notes to Financial Statements.
| Valuation Inputs at Reporting Date: |
| Description | Total ($) | Level 1 ($) | Level 2 ($) | Level 3 ($) |
Investments in Securities: | | | | |
|
| Bond Funds | 1,849,379 | 1,849,379 | - | - |
|
| Domestic Equity Funds | 6,465,426 | 6,465,426 | - | - |
|
| International Equity Funds | 5,201,577 | 5,201,577 | - | - |
| Total Investments in Securities: | 13,516,382 | 13,516,382 | - | - |
VIP Investor Freedom 2040 Portfolio℠
Financial Statements
| Statement of Assets and Liabilities |
As of December 31, 2024 |
| Assets | | | | |
| Investment in securities, at value - See accompanying schedule: | | | | |
Affiliated issuers (cost $13,276,356) | $ | 13,516,382 | | |
| | | | | |
| | | | | |
| Total Investment in Securities (cost $13,276,356) | | | $ | 13,516,382 |
| Receivable for investments sold | | | | 97,300 |
Total assets | | | | 13,613,682 |
| Liabilities | | | | |
| Payable for investments purchased | $ | 97,231 | | |
| Payable for fund shares redeemed | | 67 | | |
| Total liabilities | | | | 97,298 |
| Net Assets | | | $ | 13,516,384 |
| Net Assets consist of: | | | | |
| Paid in capital | | | $ | 12,468,320 |
| Total accumulated earnings (loss) | | | | 1,048,064 |
| Net Assets | | | $ | 13,516,384 |
Net Asset Value, offering price and redemption price per share ($13,516,384 ÷ 1,139,370 shares) | | | $ | 11.86 |
| Statement of Operations |
| Year ended December 31, 2024 |
| Investment Income | | | | |
| Dividends: | | | | |
| Affiliated issuers | | | $ | 172,806 |
| Expenses | | | | |
| Independent trustees' fees and expenses | $ | 25 | | |
| Proxy fee | | 11 | | |
| Total expenses before reductions | | 36 | | |
| Expense reductions | | (4) | | |
| Total expenses after reductions | | | | 32 |
| Net Investment income (loss) | | | | 172,774 |
| Realized and Unrealized Gain (Loss) | | | | |
| Net realized gain (loss) on: | | | | |
| Investment Securities: | | | | |
| Affiliated issuers | | (28,003) | | |
| Capital gain distributions from underlying funds: | | | | |
| Affiliated issuers | | 934,379 | | |
| Total net realized gain (loss) | | | | 906,376 |
| Change in net unrealized appreciation (depreciation) on: | | | | |
| Investment Securities: | | | | |
| Affiliated issuers | | (81,767) | | |
| Total change in net unrealized appreciation (depreciation) | | | | (81,767) |
| Net gain (loss) | | | | 824,609 |
| Net increase (decrease) in net assets resulting from operations | | | $ | 997,383 |
| Statement of Changes in Net Assets |
| |
| | Year ended December 31, 2024 | | For the period April 13, 2023 (commencement of operations) through December 31, 2023 |
| Increase (Decrease) in Net Assets | | | | |
| Operations | | | | |
| Net investment income (loss) | $ | 172,774 | $ | 89,685 |
| Net realized gain (loss) | | 906,376 | | 101,920 |
| Change in net unrealized appreciation (depreciation) | | (81,767) | | 321,793 |
| Net increase (decrease) in net assets resulting from operations | | 997,383 | | 513,398 |
| Distributions to shareholders | | (370,121) | | (92,595) |
| | | | | |
| Share transactions | | | | |
| Proceeds from sales of shares | | 5,887,982 | | 6,769,009 |
| Reinvestment of distributions | | 331,121 | | 78,495 |
| Cost of shares redeemed | | (542,645) | | (55,643) |
| | | | | |
Net increase (decrease) in net assets resulting from share transactions | | 5,676,458 | | 6,791,861 |
| Total increase (decrease) in net assets | | 6,303,720 | | 7,212,664 |
| | | | | |
| Net Assets | | | | |
| Beginning of period | | 7,212,664 | | - |
| End of period | $ | 13,516,384 | $ | 7,212,664 |
| | | | | |
| Other Information | | | | |
| Shares | | | | |
| Sold | | 493,672 | | 662,827 |
| Issued in reinvestment of distributions | | 28,455 | | 7,215 |
| Redeemed | | (47,182) | | (5,617) |
| Net increase (decrease) | | 474,945 | | 664,425 |
| | | | | |
Financial Highlights
VIP Investor Freedom 2040 Portfolio℠ |
| |
| Years ended December 31, | | 2024 | | 2023 A |
Selected Per-Share Data | | | | |
| Net asset value, beginning of period | $ | 10.86 | $ | 10.00 |
| Income from Investment Operations | | | | |
Net investment income (loss) B,C | | .20 | | .21 |
| Net realized and unrealized gain (loss) | | 1.19 | | .79 |
| Total from investment operations | | 1.39 | | 1.00 |
| Distributions from net investment income | | (.15) | | (.14) |
| Distributions from net realized gain | | (.24) | | - D |
| Total distributions | | (.39) | | (.14) |
| Net asset value, end of period | $ | 11.86 | $ | 10.86 |
Total Return E,F,G | | | | 10.01% |
Ratios to Average Net Assets C,H,I | | | | |
Expenses before reductions J | | -% | | -% K |
Expenses net of fee waivers, if any J | | | | -% K |
Expenses net of all reductions J | | -% | | -% K |
| Net investment income (loss) | | 1.65% | | 2.94% K |
| Supplemental Data | | | | |
| Net assets, end of period (000 omitted) | $ | 13,516 | $ | 7,213 |
Portfolio turnover rate L | | | | 14% K |
AFor the period April 13, 2023 (commencement of operations) through December 31, 2023.
BCalculated based on average shares outstanding during the period.
CNet investment income (loss) is affected by the timing of the declaration of dividends by any underlying mutual funds or exchange-traded funds (ETFs). Net investment income (loss) of any mutual funds or ETFs is not included in the Fund's net investment income (loss) ratio.
DAmount represents less than $.005 per share.
ETotal returns for periods of less than one year are not annualized.
FTotal returns do not reflect charges attributable to your insurance company's separate account. Inclusion of these charges would reduce the total returns shown.
GTotal returns would have been lower if certain expenses had not been reduced during the applicable periods shown.
HFees and expenses of any underlying mutual funds or exchange-traded funds (ETFs) are not included in the Fund's expense ratio. The Fund indirectly bears its proportionate share of these expenses.
IExpense ratios reflect operating expenses of the class. Expenses before reductions do not reflect amounts reimbursed, waived, or reduced through arrangements with the investment adviser, brokerage services, or other offset arrangements, if applicable, and do not represent the amount paid by the class during periods when reimbursements, waivers or reductions occur.
JAmount represents less than .005%.
KAnnualized.
LAmount does not include the portfolio activity of any underlying mutual funds or exchange-traded funds (ETFs), derivatives or securities that mature within one year from acquisition.
VIP Investor Freedom 2045 Portfolio℠
Schedule of Investments December 31, 2024
Showing Percentage of Net Assets
| Bond Funds - 7.6% |
| | | Shares | Value ($) |
| Fidelity International Bond Index Fund (a) | | 5,024 | 46,726 |
| Fidelity Long-Term Treasury Bond Index Fund (a) | | 33,592 | 308,037 |
| TOTAL BOND FUNDS (Cost $371,801) | | | 354,763 |
| | | | |
| Domestic Equity Funds - 51.5% |
| | | Shares | Value ($) |
| VIP Contrafund Portfolio - Investor Class (a) | | 7,331 | 420,445 |
| VIP Equity Income Portfolio - Investor Class (a) | | 13,020 | 343,077 |
| VIP Growth & Income Portfolio - Investor Class (a) | | 15,509 | 470,706 |
| VIP Growth Portfolio - Investor Class (a) | | 7,268 | 696,798 |
| VIP Mid Cap Portfolio - Investor Class (a) | | 2,907 | 108,011 |
| VIP Value Portfolio - Investor Class (a) | | 12,728 | 241,074 |
| VIP Value Strategies Portfolio - Investor Class (a) | | 7,816 | 119,822 |
| TOTAL DOMESTIC EQUITY FUNDS (Cost $2,243,736) | | | 2,399,933 |
| | | | |
| International Equity Funds - 40.9% |
| | | Shares | Value ($) |
| VIP Emerging Markets Portfolio - Investor Class (a) | | 53,377 | 609,567 |
| VIP Overseas Portfolio - Investor Class (a) | | 51,105 | 1,296,019 |
| TOTAL INTERNATIONAL EQUITY FUNDS (Cost $1,873,482) | | | 1,905,586 |
| | | | |
| TOTAL INVESTMENT IN SECURITIES - 100.0% (Cost $4,489,019) | 4,660,282 |
NET OTHER ASSETS (LIABILITIES) - 0.0% | 3 |
| NET ASSETS - 100.0% | 4,660,285 |
| | |
Legend
Affiliated Underlying Funds
Fiscal year to date information regarding the Fund's investments in affiliated Underlying Funds is presented below. Exchanges between classes of the same affiliated Underlying Funds may occur. If an Underlying Funds changes its name, the name presented below is the name in effect at period end.
| Affiliate | Value, beginning of period ($) | Purchases ($) | Sales Proceeds ($) | Dividend Income ($) | Realized Gain (loss) ($) | Change in Unrealized appreciation (depreciation) ($) | Value, end of period ($) | Shares, end of period |
| Fidelity Inflation-Protected Bond Index Fund | 58,017 | 37,004 | 95,643 | 1,035 | (470) | 1,092 | - | - |
| Fidelity International Bond Index Fund | 14,892 | 55,615 | 22,986 | 857 | 253 | (1,048) | 46,726 | 5,024 |
| Fidelity Long-Term Treasury Bond Index Fund | 165,756 | 298,965 | 131,057 | 7,713 | (7,611) | (18,016) | 308,037 | 33,592 |
| VIP Contrafund Portfolio - Investor Class | 230,819 | 263,115 | 116,577 | 48,374 | 645 | 42,443 | 420,445 | 7,331 |
| VIP Emerging Markets Portfolio - Investor Class | 352,114 | 396,197 | 174,961 | 8,147 | (530) | 36,747 | 609,567 | 53,377 |
| VIP Equity Income Portfolio - Investor Class | 187,159 | 231,791 | 86,952 | 24,360 | 127 | 10,952 | 343,077 | 13,020 |
| VIP Government Money Market Portfolio - Investor Class | - | 10,609 | 10,609 | 42 | - | - | - | - |
| VIP Growth & Income Portfolio - Investor Class | 257,189 | 286,813 | 109,671 | 35,135 | 375 | 36,000 | 470,706 | 15,509 |
| VIP Growth Portfolio - Investor Class | 382,282 | 511,433 | 187,545 | 146,471 | (2,250) | (7,122) | 696,798 | 7,268 |
| VIP High Income Portfolio - Investor Class | 7,333 | 6,727 | 15,029 | 3 | 971 | (2) | - | - |
| VIP Investment Grade Bond II Portfolio - Investor Class | 50,144 | 17,006 | 66,586 | 11 | (570) | 6 | - | - |
| VIP Mid Cap Portfolio - Investor Class | 58,622 | 76,796 | 28,147 | 12,786 | 687 | 53 | 108,011 | 2,907 |
| VIP Overseas Portfolio - Investor Class | 751,475 | 840,797 | 237,587 | 79,780 | (4,097) | (54,569) | 1,296,019 | 51,105 |
| VIP Value Portfolio - Investor Class | 130,647 | 174,694 | 61,125 | 24,136 | 806 | (3,948) | 241,074 | 12,728 |
| VIP Value Strategies Portfolio - Investor Class | 64,622 | 94,318 | 31,656 | 16,545 | 435 | (7,897) | 119,822 | 7,816 |
| | 2,711,071 | 3,301,880 | 1,376,131 | 405,395 | (11,229) | 34,691 | 4,660,282 | 209,677 |
Amounts in the dividend income column in the above table include any capital gain distributions from underlying funds, which are presented in the corresponding line item in the Statement of Operations, if applicable.
Amounts included in the purchases and sales proceeds columns may include in-kind transactions, if applicable.
Investment Valuation
The following is a summary of the inputs used, as of December 31, 2024, involving the Fund's assets and liabilities carried at fair value. The inputs or methodology used for valuing securities may not be an indication of the risk associated with investing in those securities. For more information on valuation inputs, and their aggregation into the levels used below, please refer to the Investment Valuation section in the accompanying Notes to Financial Statements.
| Valuation Inputs at Reporting Date: |
| Description | Total ($) | Level 1 ($) | Level 2 ($) | Level 3 ($) |
Investments in Securities: | | | | |
|
| Bond Funds | 354,763 | 354,763 | - | - |
|
| Domestic Equity Funds | 2,399,933 | 2,399,933 | - | - |
|
| International Equity Funds | 1,905,586 | 1,905,586 | - | - |
| Total Investments in Securities: | 4,660,282 | 4,660,282 | - | - |
VIP Investor Freedom 2045 Portfolio℠
Financial Statements
| Statement of Assets and Liabilities |
As of December 31, 2024 |
| Assets | | | | |
| Investment in securities, at value - See accompanying schedule: | | | | |
Affiliated issuers (cost $4,489,019) | $ | 4,660,282 | | |
| | | | | |
| | | | | |
| Total Investment in Securities (cost $4,489,019) | | | $ | 4,660,282 |
| Receivable for investments sold | | | | 28,245 |
| Receivable for fund shares sold | | | | 979 |
Total assets | | | | 4,689,506 |
| Liabilities | | | | |
| Payable for investments purchased | $ | 29,221 | | |
| Total liabilities | | | | 29,221 |
| Net Assets | | | $ | 4,660,285 |
| Net Assets consist of: | | | | |
| Paid in capital | | | $ | 4,182,629 |
| Total accumulated earnings (loss) | | | | 477,656 |
| Net Assets | | | $ | 4,660,285 |
Net Asset Value, offering price and redemption price per share ($4,660,285 ÷ 387,809 shares) | | | $ | 12.02 |
| Statement of Operations |
| Year ended December 31, 2024 |
| Investment Income | | | | |
| Dividends: | | | | |
| Affiliated issuers | | | $ | 54,168 |
| Expenses | | | | |
| Independent trustees' fees and expenses | $ | 9 | | |
| Proxy fee | | 8 | | |
| Total expenses before reductions | | 17 | | |
| Expense reductions | | (4) | | |
| Total expenses after reductions | | | | 13 |
| Net Investment income (loss) | | | | 54,155 |
| Realized and Unrealized Gain (Loss) | | | | |
| Net realized gain (loss) on: | | | | |
| Investment Securities: | | | | |
| Affiliated issuers | | (11,229) | | |
| Capital gain distributions from underlying funds: | | | | |
| Affiliated issuers | | 351,227 | | |
| Total net realized gain (loss) | | | | 339,998 |
| Change in net unrealized appreciation (depreciation) on: | | | | |
| Investment Securities: | | | | |
| Affiliated issuers | | 34,691 | | |
| Total change in net unrealized appreciation (depreciation) | | | | 34,691 |
| Net gain (loss) | | | | 374,689 |
| Net increase (decrease) in net assets resulting from operations | | | $ | 428,844 |
| Statement of Changes in Net Assets |
| |
| | Year ended December 31, 2024 | | For the period April 13, 2023 (commencement of operations) through December 31, 2023 |
| Increase (Decrease) in Net Assets | | | | |
| Operations | | | | |
| Net investment income (loss) | $ | 54,155 | $ | 29,300 |
| Net realized gain (loss) | | 339,998 | | 38,012 |
| Change in net unrealized appreciation (depreciation) | | 34,691 | | 136,572 |
| Net increase (decrease) in net assets resulting from operations | | 428,844 | | 203,884 |
| Distributions to shareholders | | (124,508) | | (30,564) |
| | | | | |
| Share transactions | | | | |
| Proceeds from sales of shares | | 2,119,582 | | 2,621,413 |
| Reinvestment of distributions | | 87,108 | | 17,664 |
| Cost of shares redeemed | | (561,881) | | (101,257) |
| | | | | |
Net increase (decrease) in net assets resulting from share transactions | | 1,644,809 | | 2,537,820 |
| Total increase (decrease) in net assets | | 1,949,145 | | 2,711,140 |
| | | | | |
| Net Assets | | | | |
| Beginning of period | | 2,711,140 | | - |
| End of period | $ | 4,660,285 | $ | 2,711,140 |
| | | | | |
| Other Information | | | | |
| Shares | | | | |
| Sold | | 178,590 | | 256,789 |
| Issued in reinvestment of distributions | | 7,402 | | 1,616 |
| Redeemed | | (46,753) | | (9,835) |
| Net increase (decrease) | | 139,239 | | 248,570 |
| | | | | |
Financial Highlights
VIP Investor Freedom 2045 Portfolio℠ |
| |
| Years ended December 31, | | 2024 | | 2023 A |
Selected Per-Share Data | | | | |
| Net asset value, beginning of period | $ | 10.91 | $ | 10.00 |
| Income from Investment Operations | | | | |
Net investment income (loss) B,C | | .17 | | .19 |
| Net realized and unrealized gain (loss) | | 1.31 | | .85 |
| Total from investment operations | | 1.48 | | 1.04 |
| Distributions from net investment income | | (.14) | | (.12) |
| Distributions from net realized gain | | (.23) | | (.01) |
| Total distributions | | (.37) | | (.13) |
| Net asset value, end of period | $ | 12.02 | $ | 10.91 |
Total Return D,E,F | | | | 10.39% |
Ratios to Average Net Assets C,G,H | | | | |
Expenses before reductions I | | -% | | -% J |
Expenses net of fee waivers, if any I | | | | -% J |
Expenses net of all reductions I | | -% | | -% J |
| Net investment income (loss) | | 1.39% | | 2.53% J |
| Supplemental Data | | | | |
| Net assets, end of period (000 omitted) | $ | 4,660 | $ | 2,711 |
Portfolio turnover rate K | | | | 19% J |
AFor the period April 13, 2023 (commencement of operations) through December 31, 2023.
BCalculated based on average shares outstanding during the period.
CNet investment income (loss) is affected by the timing of the declaration of dividends by any underlying mutual funds or exchange-traded funds (ETFs). Net investment income (loss) of any mutual funds or ETFs is not included in the Fund's net investment income (loss) ratio.
DTotal returns for periods of less than one year are not annualized.
ETotal returns do not reflect charges attributable to your insurance company's separate account. Inclusion of these charges would reduce the total returns shown.
FTotal returns would have been lower if certain expenses had not been reduced during the applicable periods shown.
GFees and expenses of any underlying mutual funds or exchange-traded funds (ETFs) are not included in the Fund's expense ratio. The Fund indirectly bears its proportionate share of these expenses.
HExpense ratios reflect operating expenses of the class. Expenses before reductions do not reflect amounts reimbursed, waived, or reduced through arrangements with the investment adviser, brokerage services, or other offset arrangements, if applicable, and do not represent the amount paid by the class during periods when reimbursements, waivers or reductions occur.
IAmount represents less than .005%.
JAnnualized.
KAmount does not include the portfolio activity of any underlying mutual funds or exchange-traded funds (ETFs), derivatives or securities that mature within one year from acquisition.
VIP Investor Freedom 2050 Portfolio℠
Schedule of Investments December 31, 2024
Showing Percentage of Net Assets
| Bond Funds - 7.6% |
| | | Shares | Value ($) |
| Fidelity International Bond Index Fund (a) | | 7,797 | 72,514 |
| Fidelity Long-Term Treasury Bond Index Fund (a) | | 52,127 | 478,001 |
| TOTAL BOND FUNDS (Cost $575,692) | | | 550,515 |
| | | | |
| Domestic Equity Funds - 51.5% |
| | | Shares | Value ($) |
| VIP Contrafund Portfolio - Investor Class (a) | | 11,377 | 652,494 |
| VIP Equity Income Portfolio - Investor Class (a) | | 20,206 | 532,423 |
| VIP Growth & Income Portfolio - Investor Class (a) | | 24,069 | 730,492 |
| VIP Growth Portfolio - Investor Class (a) | | 11,280 | 1,081,368 |
| VIP Mid Cap Portfolio - Investor Class (a) | | 4,512 | 167,624 |
| VIP Value Portfolio - Investor Class (a) | | 19,754 | 374,132 |
| VIP Value Strategies Portfolio - Investor Class (a) | | 12,131 | 185,962 |
| TOTAL DOMESTIC EQUITY FUNDS (Cost $3,633,128) | | | 3,724,495 |
| | | | |
| International Equity Funds - 40.9% |
| | | Shares | Value ($) |
| VIP Emerging Markets Portfolio - Investor Class (a) | | 82,837 | 945,993 |
| VIP Overseas Portfolio - Investor Class (a) | | 79,310 | 2,011,303 |
| TOTAL INTERNATIONAL EQUITY FUNDS (Cost $2,973,622) | | | 2,957,296 |
| | | | |
| TOTAL INVESTMENT IN SECURITIES - 100.0% (Cost $7,182,442) | 7,232,306 |
NET OTHER ASSETS (LIABILITIES) - 0.0% | 0 |
| NET ASSETS - 100.0% | 7,232,306 |
| | |
Legend
Affiliated Underlying Funds
Fiscal year to date information regarding the Fund's investments in affiliated Underlying Funds is presented below. Exchanges between classes of the same affiliated Underlying Funds may occur. If an Underlying Funds changes its name, the name presented below is the name in effect at period end.
| Affiliate | Value, beginning of period ($) | Purchases ($) | Sales Proceeds ($) | Dividend Income ($) | Realized Gain (loss) ($) | Change in Unrealized appreciation (depreciation) ($) | Value, end of period ($) | Shares, end of period |
| Fidelity Inflation-Protected Bond Index Fund | 61,304 | 78,794 | 141,116 | 1,326 | 113 | 905 | - | - |
| Fidelity International Bond Index Fund | 15,735 | 90,874 | 32,900 | 1,270 | 297 | (1,492) | 72,514 | 7,797 |
| Fidelity Long-Term Treasury Bond Index Fund | 175,072 | 541,494 | 204,362 | 10,132 | (6,900) | (27,303) | 478,001 | 52,127 |
| VIP Contrafund Portfolio - Investor Class | 243,897 | 572,363 | 199,342 | 71,801 | (826) | 36,402 | 652,494 | 11,377 |
| VIP Emerging Markets Portfolio - Investor Class | 372,141 | 823,539 | 285,619 | 12,037 | (3,508) | 39,440 | 945,993 | 82,837 |
| VIP Equity Income Portfolio - Investor Class | 197,773 | 473,829 | 145,012 | 35,963 | 397 | 5,436 | 532,423 | 20,206 |
| VIP Government Money Market Portfolio - Investor Class | - | 14,242 | 14,242 | 56 | - | - | - | - |
| VIP Growth & Income Portfolio - Investor Class | 271,765 | 609,465 | 184,814 | 51,547 | (53) | 34,129 | 730,492 | 24,069 |
| VIP Growth Portfolio - Investor Class | 403,921 | 1,051,028 | 317,437 | 215,641 | (5,236) | (50,908) | 1,081,368 | 11,280 |
| VIP High Income Portfolio - Investor Class | 7,749 | 13,621 | 22,656 | 4 | 1,337 | (51) | - | - |
| VIP Investment Grade Bond II Portfolio - Investor Class | 52,987 | 23,149 | 75,547 | 10 | (494) | (95) | - | - |
| VIP Mid Cap Portfolio - Investor Class | 61,927 | 154,515 | 45,660 | 18,625 | 152 | (3,310) | 167,624 | 4,512 |
| VIP Overseas Portfolio - Investor Class | 794,144 | 1,754,657 | 422,405 | 118,005 | (1,269) | (113,824) | 2,011,303 | 79,310 |
| VIP Value Portfolio - Investor Class | 138,033 | 349,608 | 103,073 | 34,769 | (369) | (10,067) | 374,132 | 19,754 |
| VIP Value Strategies Portfolio - Investor Class | 68,270 | 182,429 | 50,710 | 24,336 | (160) | (13,867) | 185,962 | 12,131 |
| | 2,864,718 | 6,733,607 | 2,244,895 | 595,522 | (16,519) | (104,605) | 7,232,306 | 325,400 |
Amounts in the dividend income column in the above table include any capital gain distributions from underlying funds, which are presented in the corresponding line item in the Statement of Operations, if applicable.
Amounts included in the purchases and sales proceeds columns may include in-kind transactions, if applicable.
Investment Valuation
The following is a summary of the inputs used, as of December 31, 2024, involving the Fund's assets and liabilities carried at fair value. The inputs or methodology used for valuing securities may not be an indication of the risk associated with investing in those securities. For more information on valuation inputs, and their aggregation into the levels used below, please refer to the Investment Valuation section in the accompanying Notes to Financial Statements.
| Valuation Inputs at Reporting Date: |
| Description | Total ($) | Level 1 ($) | Level 2 ($) | Level 3 ($) |
Investments in Securities: | | | | |
|
| Bond Funds | 550,515 | 550,515 | - | - |
|
| Domestic Equity Funds | 3,724,495 | 3,724,495 | - | - |
|
| International Equity Funds | 2,957,296 | 2,957,296 | - | - |
| Total Investments in Securities: | 7,232,306 | 7,232,306 | - | - |
VIP Investor Freedom 2050 Portfolio℠
Financial Statements
| Statement of Assets and Liabilities |
As of December 31, 2024 |
| Assets | | | | |
| Investment in securities, at value - See accompanying schedule: | | | | |
Affiliated issuers (cost $7,182,442) | $ | 7,232,306 | | |
| | | | | |
| | | | | |
| Total Investment in Securities (cost $7,182,442) | | | $ | 7,232,306 |
| Receivable for investments sold | | | | 46,082 |
Total assets | | | | 7,278,388 |
| Liabilities | | | | |
| Payable for investments purchased | $ | 40,097 | | |
| Payable for fund shares redeemed | | 5,985 | | |
| Total liabilities | | | | 46,082 |
| Net Assets | | | $ | 7,232,306 |
| Net Assets consist of: | | | | |
| Paid in capital | | | $ | 6,735,449 |
| Total accumulated earnings (loss) | | | | 496,857 |
| Net Assets | | | $ | 7,232,306 |
Net Asset Value, offering price and redemption price per share ($7,232,306 ÷ 600,772 shares) | | | $ | 12.04 |
| Statement of Operations |
| Year ended December 31, 2024 |
| Investment Income | | | | |
| Dividends: | | | | |
| Affiliated issuers | | | $ | 78,334 |
| Expenses | | | | |
| Independent trustees' fees and expenses | $ | 12 | | |
| Proxy fee | | 4 | | |
| Total expenses before reductions | | 16 | | |
| Expense reductions | | (4) | | |
| Total expenses after reductions | | | | 12 |
| Net Investment income (loss) | | | | 78,322 |
| Realized and Unrealized Gain (Loss) | | | | |
| Net realized gain (loss) on: | | | | |
| Investment Securities: | | | | |
| Affiliated issuers | | (16,519) | | |
| Capital gain distributions from underlying funds: | | | | |
| Affiliated issuers | | 517,188 | | |
| Total net realized gain (loss) | | | | 500,669 |
| Change in net unrealized appreciation (depreciation) on: | | | | |
| Investment Securities: | | | | |
| Affiliated issuers | | (104,605) | | |
| Total change in net unrealized appreciation (depreciation) | | | | (104,605) |
| Net gain (loss) | | | | 396,064 |
| Net increase (decrease) in net assets resulting from operations | | | $ | 474,386 |
| Statement of Changes in Net Assets |
| |
| | Year ended December 31, 2024 | | For the period April 13, 2023 (commencement of operations) through December 31, 2023 |
| Increase (Decrease) in Net Assets | | | | |
| Operations | | | | |
| Net investment income (loss) | $ | 78,322 | $ | 27,251 |
| Net realized gain (loss) | | 500,669 | | 36,149 |
| Change in net unrealized appreciation (depreciation) | | (104,605) | | 154,469 |
| Net increase (decrease) in net assets resulting from operations | | 474,386 | | 217,869 |
| Distributions to shareholders | | (166,569) | | (28,830) |
| | | | | |
| Share transactions | | | | |
| Proceeds from sales of shares | | 5,190,105 | | 2,662,800 |
| Reinvestment of distributions | | 129,369 | | 17,730 |
| Cost of shares redeemed | | (1,259,779) | | (4,775) |
| | | | | |
Net increase (decrease) in net assets resulting from share transactions | | 4,059,695 | | 2,675,755 |
| Total increase (decrease) in net assets | | 4,367,512 | | 2,864,794 |
| | | | | |
| Net Assets | | | | |
| Beginning of period | | 2,864,794 | | - |
| End of period | $ | 7,232,306 | $ | 2,864,794 |
| | | | | |
| Other Information | | | | |
| Shares | | | | |
| Sold | | 433,569 | | 261,115 |
| Issued in reinvestment of distributions | | 10,873 | | 1,619 |
| Redeemed | | (105,932) | | (472) |
| Net increase (decrease) | | 338,510 | | 262,262 |
| | | | | |
Financial Highlights
VIP Investor Freedom 2050 Portfolio℠ |
| |
| Years ended December 31, | | 2024 | | 2023 A |
Selected Per-Share Data | | | | |
| Net asset value, beginning of period | $ | 10.92 | $ | 10.00 |
| Income from Investment Operations | | | | |
Net investment income (loss) B,C | | .18 | | .18 |
| Net realized and unrealized gain (loss) | | 1.31 | | .85 |
| Total from investment operations | | 1.49 | | 1.03 |
| Distributions from net investment income | | (.13) | | (.11) |
| Distributions from net realized gain | | (.24) | | (.01) |
| Total distributions | | (.37) | | (.11) D |
| Net asset value, end of period | $ | 12.04 | $ | 10.92 |
Total Return E,F,G | | | | 10.31% |
Ratios to Average Net Assets C,H,I | | | | |
Expenses before reductions J | | -% | | -% K |
Expenses net of fee waivers, if any J | | | | -% K |
Expenses net of all reductions J | | -% | | -% K |
| Net investment income (loss) | | 1.53% | | 2.40% K |
| Supplemental Data | | | | |
| Net assets, end of period (000 omitted) | $ | 7,232 | $ | 2,865 |
Portfolio turnover rate L | | | | 12% K |
AFor the period April 13, 2023 (commencement of operations) through December 31, 2023.
BCalculated based on average shares outstanding during the period.
CNet investment income (loss) is affected by the timing of the declaration of dividends by any underlying mutual funds or exchange-traded funds (ETFs). Net investment income (loss) of any mutual funds or ETFs is not included in the Fund's net investment income (loss) ratio.
DTotal distributions per share do not sum due to rounding.
ETotal returns for periods of less than one year are not annualized.
FTotal returns do not reflect charges attributable to your insurance company's separate account. Inclusion of these charges would reduce the total returns shown.
GTotal returns would have been lower if certain expenses had not been reduced during the applicable periods shown.
HFees and expenses of any underlying mutual funds or exchange-traded funds (ETFs) are not included in the Fund's expense ratio. The Fund indirectly bears its proportionate share of these expenses.
IExpense ratios reflect operating expenses of the class. Expenses before reductions do not reflect amounts reimbursed, waived, or reduced through arrangements with the investment adviser, brokerage services, or other offset arrangements, if applicable, and do not represent the amount paid by the class during periods when reimbursements, waivers or reductions occur.
JAmount represents less than .005%.
KAnnualized.
LAmount does not include the portfolio activity of any underlying mutual funds or exchange-traded funds (ETFs), derivatives or securities that mature within one year from acquisition.
Notes to Financial Statements
For the period ended December 31, 2024
1. Organization.
VIP Investor Freedom Income Portfolio, VIP Investor Freedom 2010 Portfolio, VIP Investor Freedom 2015 Portfolio, VIP Investor Freedom 2020 Portfolio, VIP Investor Freedom 2025 Portfolio, VIP Investor Freedom 2030 Portfolio, VIP Investor Freedom 2035 Portfolio, VIP Investor Freedom 2040 Portfolio, VIP Investor Freedom 2045 Portfolio and VIP Investor Freedom 2050 Portfolio (the Funds) are funds of Variable Insurance Products Fund V (the Trust). The Trust is registered under the Investment Company Act of 1940, as amended (the 1940 Act), as an open-end management investment company organized as a Massachusetts business trust. Each Fund is authorized to issue an unlimited number of shares. Shares of each Fund may only be purchased by insurance companies for the purpose of funding variable annuity or variable life insurance contracts.
2. Investments in Fidelity Central Funds.
Funds may invest in Fidelity Central Funds, which are open-end investment companies generally available only to other investment companies and accounts managed by the investment adviser and its affiliates. The Schedule of Investments lists any Fidelity Central Funds held as an investment as of period end, but does not include the underlying holdings of each Fidelity Central Fund. An investing fund indirectly bears its proportionate share of the expenses of the underlying Fidelity Central Funds.
Based on its investment objective, each Fidelity Central Fund may invest or participate in various investment vehicles or strategies that are similar to those of the investing fund. These strategies are consistent with the investment objectives of the investing fund and may involve certain economic risks which may cause a decline in value of each of the Fidelity Central Funds and thus a decline in the value of the investing fund.
| Fidelity Central Fund | Investment Manager | Investment Objective | Investment Practices | Expense RatioA |
| Fidelity Money Market Central Funds | Fidelity Management & Research Company LLC (FMR) | Each fund seeks to obtain a high level of current income consistent with the preservation of capital and liquidity. | Short-term Investments | Less than .005% |
A Expenses expressed as a percentage of average net assets and are as of each underlying Central Fund's most recent annual or semi-annual shareholder report.
A complete unaudited list of holdings for each Fidelity Central Fund is available upon request or at the Securities and Exchange Commission website at www.sec.gov. In addition, the financial statements of the Fidelity Central Funds which contain the significant accounting policies (including investment valuation policies) of those funds, and are not covered by the Report of Independent Registered Public Accounting Firm, are available on the Securities and Exchange Commission website or upon request.
3. Significant Accounting Policies.
Each Fund is an investment company and applies the accounting and reporting guidance of the Financial Accounting Standards Board (FASB) Accounting Standards Codification Topic 946 Financial Services - Investment Companies. The financial statements have been prepared in conformity with accounting principles generally accepted in the United States of America (GAAP), which require management to make certain estimates and assumptions at the date of the financial statements. Actual results could differ from those estimates. Each Fund operates as a single operating segment. Each Fund's income, expenses, assets, and performance are regularly monitored and assessed as a whole by the investment adviser and other individuals responsible for oversight functions of the Trust, using the information presented in the financial statements and financial highlights. Subsequent events, if any, through the date that the financial statements were issued have been evaluated in the preparation of the financial statements. Each Fund's Schedule of Investments lists any underlying mutual funds or exchange-traded funds (ETFs) but does not include the underlying holdings of these funds. The following summarizes the significant accounting policies of each Fund:
Investment Valuation. Investments are valued as of 4:00 p.m. Eastern time on the last calendar day of the period. Each Fund categorizes the inputs to valuation techniques used to value its investments into a disclosure hierarchy consisting of three levels as shown below:
Level 1 - unadjusted quoted prices in active markets for identical investments
Level 2 - other significant observable inputs (including quoted prices for similar investments, interest rates, prepayment speeds, etc.)
Level 3 - unobservable inputs (including the Fund's own assumptions based on the best information available)
Valuation techniques used to value each Fund's investments by major category are as follows:
Investments in open-end mutual funds are valued at their closing net asset value (NAV) each business day and are categorized as Level 1 in the hierarchy.
The aggregate value of investments by input level as of December 31, 2024 is included at the end of each Fund's Schedule of Investments.
Investment Transactions and Income. For financial reporting purposes, the Funds' investment holdings and NAV include trades executed through the end of the last business day of the period. The NAV per share for processing shareholder transactions is calculated as of the close of business of the New York Stock Exchange (NYSE), normally 4:00 p.m. Eastern time and includes trades executed through the end of the prior business day. Gains and losses on securities sold are determined on the basis of identified cost. Income and capital gain distributions from any underlying mutual funds or exchange-traded funds (ETFs) are recorded on the ex-dividend date.
Expenses. Expenses directly attributable to a fund are charged to that fund. Expenses attributable to more than one fund are allocated among the respective funds on the basis of relative net assets or other appropriate methods. Expenses included in the accompanying financial statements reflect the expenses of that fund and do not include any expenses associated with any underlying mutual funds or exchange-traded funds. Although not included in a fund's expenses, a fund indirectly bears its proportionate share of these expenses through the net asset value of each underlying mutual fund or exchange-traded fund. Expense estimates are accrued in the period to which they relate and adjustments are made when actual amounts are known.
Income Tax Information and Distributions to Shareholders. Each year, each Fund intends to qualify as a regulated investment company under Subchapter M of the Internal Revenue Code, including distributing substantially all of its taxable income and realized gains. As a result, no provision for U.S. Federal income taxes is required. As of December 31, 2024, each Fund did not have any unrecognized tax benefits in the financial statements; nor is each Fund aware of any tax positions for which it is reasonably possible that the total amounts of unrecognized tax benefits will significantly change in the next twelve months. Each Fund files a U.S. federal tax return, in addition to state and local tax returns as required. Each Fund's federal income tax returns are subject to examination by the Internal Revenue Service (IRS) for a period of three fiscal years after they are filed. State and local tax returns may be subject to examination for an additional fiscal year depending on the jurisdiction.
Distributions are declared and recorded on the ex-dividend date. Income and capital gain distributions are determined in accordance with income tax regulations, which may differ from GAAP.
Capital accounts within the financial statements are adjusted for permanent book-tax differences. These adjustments have no impact on net assets or the results of operations. Capital accounts are not adjusted for temporary book-tax differences which will reverse in a subsequent period.
Book-tax differences are primarily due to the short-term gain distributions from the underlying mutual funds or exchange-traded funds (ETFs), capital loss carryforwards and losses deferred due to wash sales.
As of period end, the cost and unrealized appreciation (depreciation) in securities, and derivatives if applicable, for federal income tax purposes were as follows for each Fund:
| | Tax cost ($) | Gross unrealized appreciation ($) | Gross unrealized depreciation ($) | Net unrealized appreciation (depreciation) ($) |
| VIP Investor Freedom Income Portfolio | 74,873,617 | 5,981,412 | (4,350,655) | 1,630,757 |
| VIP Investor Freedom 2010 Portfolio | 50,065,960 | 5,369,654 | (2,826,032) | 2,543,622 |
| VIP Investor Freedom 2015 Portfolio | 81,341,546 | 12,450,152 | (4,816,243) | 7,633,909 |
| VIP Investor Freedom 2020 Portfolio | 149,973,764 | 30,197,657 | (8,737,020) | 21,460,637 |
| VIP Investor Freedom 2025 Portfolio | 170,622,283 | 42,384,065 | (9,567,458) | 32,816,607 |
| VIP Investor Freedom 2030 Portfolio | 307,443,904 | 64,562,380 | (14,420,471) | 50,141,909 |
| VIP Investor Freedom 2035 Portfolio | 21,716,410 | 580,950 | (955,562) | (374,612) |
| VIP Investor Freedom 2040 Portfolio | 13,329,359 | 639,003 | (451,980) | 187,023 |
| VIP Investor Freedom 2045 Portfolio | 4,507,731 | 266,933 | (114,382) | 152,551 |
| VIP Investor Freedom 2050 Portfolio | 7,215,627 | 299,103 | (282,424) | 16,679 |
The tax-based components of distributable earnings as of period end were as follows for each Fund:
| | Undistributed ordinary income ($) | Undistributed long-term capital gain ($) | Capital loss carryforward ($) | Net unrealized appreciation (depreciation) on securities and other investments ($) |
| VIP Investor Freedom Income Portfolio | 277,136 | - | (2,307,146) | 1,630,757 |
| VIP Investor Freedom 2010 Portfolio | 178,858 | 26,413 | - | 2,543,622 |
| VIP Investor Freedom 2015 Portfolio | 297,792 | 2,695,326 | - | 7,633,909 |
| VIP Investor Freedom 2020 Portfolio | 482,097 | 8,743,881 | - | 21,460,637 |
| VIP Investor Freedom 2025 Portfolio | 553,527 | 12,869,207 | - | 32,816,607 |
| VIP Investor Freedom 2030 Portfolio | 755,131 | 15,293,257 | - | 50,141,909 |
| VIP Investor Freedom 2035 Portfolio | 56,714 | 1,098,594 | - | (374,612) |
| VIP Investor Freedom 2040 Portfolio | 22,549 | 838,492 | - | 187,023 |
| VIP Investor Freedom 2045 Portfolio | 8,719 | 316,387 | - | 152,551 |
| VIP Investor Freedom 2050 Portfolio | 12,324 | 467,855 | - | 16,679 |
Capital loss carryforwards are only available to offset future capital gains of the Funds to the extent provided by regulations and may be limited. The capital loss carryforward information presented below, including any applicable limitation, is estimated as of fiscal period end and is subject to adjustment.
| | Short-term ($) | Long-term ($) | Total capital loss carryforward ($) |
| VIP Investor Freedom Income Portfolio | (885,831) | (1,421,315) | (2,307,146) |
The tax character of distributions paid was as follows:
| December 31, 2024 | | | |
| | Ordinary Income ($) | Long-term Capital Gains ($) | Total ($) |
| VIP Investor Freedom Income Portfolio | 2,820,718 | - | 2,820,718 |
| VIP Investor Freedom 2010 Portfolio | 1,961,913 | - | 1,961,913 |
| VIP Investor Freedom 2015 Portfolio | 3,146,754 | 67,594 | 3,214,348 |
| VIP Investor Freedom 2020 Portfolio | 5,625,648 | 1,436,200 | 7,061,848 |
| VIP Investor Freedom 2025 Portfolio | 5,942,407 | 897,669 | 6,840,076 |
| VIP Investor Freedom 2030 Portfolio | 8,820,132 | - | 8,820,132 |
| VIP Investor Freedom 2035 Portfolio | 425,384 | 112,310 | 537,694 |
| VIP Investor Freedom 2040 Portfolio | 222,021 | 148,100 | 370,121 |
| VIP Investor Freedom 2045 Portfolio | 71,158 | 53,350 | 124,508 |
| VIP Investor Freedom 2050 Portfolio | 116,099 | 50,470 | 166,569 |
| December 31, 2023 | | | |
| | Ordinary Income ($) | Long-term Capital Gains ($) | Total ($) |
| VIP Investor Freedom Income Portfolio | 2,918,126 | - | 2,918,126 |
| VIP Investor Freedom 2010 Portfolio | 2,290,424 | - | 2,290,424 |
| VIP Investor Freedom 2015 Portfolio | 3,297,264 | - | 3,297,264 |
| VIP Investor Freedom 2020 Portfolio | 5,980,890 | - | 5,980,890 |
| VIP Investor Freedom 2025 Portfolio | 6,397,113 | - | 6,397,113 |
| VIP Investor Freedom 2030 Portfolio | 8,449,708 | - | 8,449,708 |
VIP Investor Freedom 2035 Portfolio A | 101,135 | - | 101,135 |
VIP Investor Freedom 2040 Portfolio A | 92,595 | - | 92,595 |
VIP Investor Freedom 2045 Portfolio A | 30,564 | - | 30,564 |
VIP Investor Freedom 2050 Portfolio A | 28,830 | - | 28,830 |
A For the period April 13, 2023 (commencement of operations) through December 31, 2023.
New Accounting Pronouncement. FASB Accounting Standards Update (ASU) 2023-07 Segment Reporting (Topic 280): Improvements to Reportable Segment Disclosures became effective in this reporting period. ASU 2023-07 enhances segment information disclosure in the notes to financial statements.
4. Purchases and Sales of Investments.
Purchases and sales of securities, other than short-term securities, securities acquired in the reorganization and in-kind transactions, as applicable, are noted in the table below.
| | Purchases ($) | Sales ($) |
| VIP Investor Freedom Income Portfolio | 17,510,294 | 21,678,160 |
| VIP Investor Freedom 2010 Portfolio | 12,100,757 | 15,891,000 |
| VIP Investor Freedom 2015 Portfolio | 22,561,691 | 25,021,614 |
| VIP Investor Freedom 2020 Portfolio | 45,700,310 | 65,487,596 |
| VIP Investor Freedom 2025 Portfolio | 55,717,231 | 81,778,586 |
| VIP Investor Freedom 2030 Portfolio | 105,546,674 | 108,185,788 |
| VIP Investor Freedom 2035 Portfolio | 20,760,392 | 5,239,857 |
| VIP Investor Freedom 2040 Portfolio | 9,263,042 | 2,849,496 |
| VIP Investor Freedom 2045 Portfolio | 3,301,880 | 1,376,131 |
| VIP Investor Freedom 2050 Portfolio | 6,733,607 | 2,244,895 |
5. Fees and Other Transactions with Affiliates.
Management Fee. Fidelity Management & Research Company LLC (the investment adviser) provides the Funds with investment management related services. The Funds do not pay any fees for these services.
Interfund Trades. Funds may purchase from or sell securities to other Fidelity Funds under procedures adopted by the Board. The procedures have been designed to ensure these interfund trades are executed in accordance with Rule 17a-7 of the 1940 Act. Any interfund trades are included within the respective purchases and sales amounts shown in the Purchases and Sales of Investments note. During the period, there were no interfund trades.
6. Expense Reductions.
Through arrangements with each applicable Fund's custodian, credits realized as a result of certain uninvested cash balances were used to reduce each applicable Fund's expenses. All of the applicable expense reductions are noted in the table below.
| | Custodian credits ($) |
VIP Investor Freedom Income Portfolio | 2 |
| VIP Investor Freedom 2010 Portfolio | 1 |
| VIP Investor Freedom 2020 Portfolio | 192 |
| VIP Investor Freedom 2025 Portfolio | 4 |
| VIP Investor Freedom 2035 Portfolio | 4 |
| VIP Investor Freedom 2040 Portfolio | 4 |
| VIP Investor Freedom 2045 Portfolio | 4 |
| VIP Investor Freedom 2050 Portfolio | 4 |
7. Other.
A fund's organizational documents provide former and current trustees and officers with a limited indemnification against liabilities arising in connection with the performance of their duties to the fund. In the normal course of business, a fund may also enter into contracts that provide general indemnifications. A fund's maximum exposure under these arrangements is unknown as this would be dependent on future claims that may be made against a fund. The risk of material loss from such claims is considered remote.
At the end of the period, the investment adviser or its affiliates were owners of record of more than 10% of the outstanding shares as follows:
| Fund | Affiliated % |
VIP Investor Freedom Income Portfolio | 100% |
| VIP Investor Freedom 2010 Portfolio | 100% |
| VIP Investor Freedom 2015 Portfolio | 100% |
| VIP Investor Freedom 2020 Portfolio | 100% |
| VIP Investor Freedom 2025 Portfolio | 100% |
| VIP Investor Freedom 2030 Portfolio | 100% |
| VIP Investor Freedom 2035 Portfolio | 100% |
| VIP Investor Freedom 2040 Portfolio | 100% |
| VIP Investor Freedom 2045 Portfolio | 100% |
| VIP Investor Freedom 2050 Portfolio | 100% |
8. Risk and Uncertainties.
Many factors affect a fund's performance. Developments that disrupt global economies and financial markets, such as pandemics, epidemics, outbreaks of infectious diseases, war, terrorism, and environmental disasters, may significantly affect a fund's investment performance. The effects of these developments to a fund will be impacted by the types of securities in which a fund invests, the financial condition, industry, economic sector, and geographic location of an issuer, and a fund's level of investment in the securities of that issuer. Significant concentrations in security types, issuers, industries, sectors, and geographic locations may magnify the factors that affect a fund's performance.
9. Reorganization Information.
On June 7, 2024, VIP Investor Freedom Income Portfolio acquired all of the assets and assumed all of the liabilities of VIP Investor Freedom 2005 Portfolio ("Acquired Fund") pursuant to an Agreement and Plan of Reorganization (Agreements) approved by the Board of Trustees ("The Board"). The securities held by the Acquired Fund were the primary assets acquired by VIP Investor Freedom Income Portfolio. The acquisition was accomplished by an exchange of shares of VIP Investor Freedom Income Portfolio for shares then outstanding of the Acquired Fund at its respective net asset value on the acquisition date. The reorganization provides shareholders of the Acquired Fund access to a larger portfolio with a similar investment objective and lower projected expenses. For financial reporting purposes, the assets and liabilities of the Acquired Fund and shares issued by VIP Investor Freedom Income Portfolio were recorded at fair value; however, the cost basis of the investments received from the Acquired Fund were carried forward and will be utilized for purposes of the VIP Investor Freedom Income Portfolio's ongoing reporting of realized and unrealized gains and losses to more closely align subsequent reporting of realized gains with amounts distributable to shareholders for tax purposes. The reorganization qualified as a tax-free reorganization for federal income tax purposes with no gain or loss recognized to the funds or their shareholders.
| Acquired Fund and Share Class | Investments $ | Unrealized appreciation (depreciation) $ | Net Assets $ | Shares Exchanged | Shares Exchanged Ratio |
| VIP Investor Freedom 2005 Portfolio | 18,110,255 | 841,155 | 18,112,866 | 1,648,130 | .9900181984 |
| Surviving Fund | Net Assets $ | Total net assets after the acquisition $ |
| VIP Investor Freedom Income Portfolio | 59,587,991 | 77,700,857 |
Pro forma results of operations of the combined entity for the entire period ended December 31, 2024, as though the acquisition had occurred as of the beginning of the year (rather than on the actual acquisition date), are as follows:
| Net investment income (loss) | $2,728,803 |
| Total net realized gain (loss) | 698,838 |
| Total change in net unrealized appreciation (depreciation) | (92,134) |
| Net increase (decrease) in net assets resulting from operations | $3,335,507 |
Because the combined investment portfolios have been managed as a single portfolio since the acquisition was completed, it is not practicable to separate the amounts of revenue and earnings of the acquired funds that have been included in the VIP Freedom Income Portfolio's accompanying Statement of Operations since June 7, 2024.
Report of Independent Registered Public Accounting Firm
To the Board of Trustees of Variable Insurance Products Fund V and Shareholders of each of the ten funds listed in the table below
Opinions on the Financial Statements
We have audited the accompanying statements of assets and liabilities, including the schedules of investments, of each of the funds listed in the table below (ten of the funds constituting Variable Insurance Products Fund V, hereafter collectively referred to as the "Funds") as of December 31, 2024, the related statements of operations and of changes in net assets for each of the periods indicated in the table below, including the related notes, and the financial highlights for each of the periods indicated in the table below (collectively referred to as the "financial statements"). In our opinion, the financial statements present fairly, in all material respects, the financial position of each of the Funds listed in the table below as of December 31, 2024, the results of each of their operations, the changes in each of their net assets and each of the financial highlights for each of the periods indicated in the table below, in conformity with accounting principles generally accepted in the United States of America.| Fund | Statement of Operations | Statement of Changes in Net Assets | Financial Highlights |
VIP Investor Freedom Income Portfolio VIP Investor Freedom 2010 Portfolio VIP Investor Freedom 2015 Portfolio VIP Investor Freedom 2020 Portfolio VIP Investor Freedom 2025 Portfolio VIP Investor Freedom 2030 Portfolio | For the year ended December 31, 2024 | For each of the two years in the period ended December 31, 2024 | For each of the five years in the period ended December 31, 2024 |
VIP Investor Freedom 2035 Portfolio VIP Investor Freedom 2040 Portfolio VIP Investor Freedom 2045 Portfolio VIP Investor Freedom 2050 Portfolio | For the year ended December 31, 2024 | For the year ended December 31, 2024 and for the period April 13, 2023 (commencement of operations) through December 31, 2023 | For the year ended December 31, 2024 and for the period April 13, 2023 (commencement of operations) through December 31, 2023 |
Basis for Opinions
These financial statements are the responsibility of the Funds' management. Our responsibility is to express an opinion on the Funds' financial statements based on our audits. We are a public accounting firm registered with the Public Company Accounting Oversight Board (United States) (PCAOB) and are required to be independent with respect to the Funds in accordance with the U.S. federal securities laws and the applicable rules and regulations of the Securities and Exchange Commission and the PCAOB.
We conducted our audits of these financial statements in accordance with the standards of the PCAOB. Those standards require that we plan and perform the audit to obtain reasonable assurance about whether the financial statements are free of material misstatement, whether due to error or fraud.
Our audits included performing procedures to assess the risks of material misstatement of the financial statements, whether due to error or fraud, and performing procedures that respond to those risks. Such procedures included examining, on a test basis, evidence regarding the amounts and disclosures in the financial statements. Our audits also included evaluating the accounting principles used and significant estimates made by management, as well as evaluating the overall presentation of the financial statements. Our procedures included confirmation of securities owned as of December 31, 2024 by correspondence with the custodian and brokers; when replies were not received from brokers, we performed other auditing procedures. We believe that our audits provide a reasonable basis for our opinions.
/s/ PricewaterhouseCoopers LLP
Boston, Massachusetts
February 14, 2025
We have served as the auditor of one or more investment companies in the Fidelity group of funds since 1932.
Distributions
(Unaudited)The dividend and capital gains distributions for the fund(s) are available on Fidelity.com or Institutional.Fidelity.com.
The funds hereby designate as a capital gain dividend the amounts noted below for the taxable year ended December 31, 2024, or, if subsequently determined to be different, the net capital gain of such year.
| VIP Investor Freedom 2010 Portfolio | $26,413 |
| VIP Investor Freedom 2015 Portfolio | $2,709,091 |
| VIP Investor Freedom 2020 Portfolio | $8,758,453 |
| VIP Investor Freedom 2025 Portfolio | $12,876,464 |
| VIP Investor Freedom 2030 Portfolio | $15,293,257 |
| VIP Investor Freedom 2035 Portfolio | $1,136,164 |
| VIP Investor Freedom 2040 Portfolio | $879,854 |
| VIP Investor Freedom 2045 Portfolio | $329,844 |
| VIP Investor Freedom 2050 Portfolio | $482,249 |
A percentage of the dividends distributed during the fiscal year for the following funds were derived from interest on U.S. Government securities which is generally exempt from state income tax.
| VIP Investor Freedom Income Portfolio | 34.07% |
| VIP Investor Freedom 2005 Portfolio | 46.94% |
| VIP Investor Freedom 2010 Portfolio | 28.90% |
| VIP Investor Freedom 2015 Portfolio | 21.63% |
| VIP Investor Freedom 2020 Portfolio | 16.74% |
| VIP Investor Freedom 2025 Portfolio | 14.30% |
| VIP Investor Freedom 2030 Portfolio | 11.36% |
| VIP Investor Freedom 2035 Portfolio | 6.38% |
| VIP Investor Freedom 2040 Portfolio | 2.97% |
| VIP Investor Freedom 2045 Portfolio | 2.07% |
| VIP Investor Freedom 2050 Portfolio | 1.81% |
The funds hereby designate the amounts noted below as distributions paid during the fiscal year ended 2024 as qualifying to be taxed as section 163(j) interest dividends:
| VIP Investor Freedom Income Portfolio | $2,304,848 |
| VIP Investor Freedom 2005 Portfolio | $139,637 |
| VIP Investor Freedom 2010 Portfolio | $1,631,285 |
| VIP Investor Freedom 2015 Portfolio | $2,207,650 |
| VIP Investor Freedom 2020 Portfolio | $3,472,811 |
| VIP Investor Freedom 2025 Portfolio | $3,341,344 |
| VIP Investor Freedom 2030 Portfolio | $4,960,857 |
| VIP Investor Freedom 2035 Portfolio | $194,703 |
| VIP Investor Freedom 2040 Portfolio | $50,559 |
| | |
| VIP Investor Freedom 2045 Portfolio | $10,397 |
| VIP Investor Freedom 2050 Portfolio | $13,919 |
A percentage of the dividends distributed during the fiscal year for the following funds qualify for the dividends-received deduction for corporate shareholders:
| VIP Investor Freedom Income Portfolio | | | | | |
| February 2024 | 0% | | | | |
| December 2024 | 3% | | | | |
| VIP Investor Freedom 2005 Portfolio | | | | | |
| February 2024 | 0% | | | | |
| June 2024 | 0% | | | | |
| VIP Investor Freedom 2010 Portfolio | | | | | |
| February 2024 | 0% | | | | |
| December 2024 | 4% | | | | |
| VIP Investor Freedom 2015 Portfolio | | | | | |
| February 2024 | 0% | | | | |
| December 2024 | 5% | | | | |
| VIP Investor Freedom 2020 Portfolio | | | | | |
| February 2024 | 0% | | | | |
| December 2024 | 8% | | | | |
| VIP Investor Freedom 2025 Portfolio | | | | | |
| February 2024 | 0% | | | | |
| December 2024 | 10% | | | | |
| VIP Investor Freedom 2030 Portfolio | | | | | |
| February 2024 | 1% | | | | |
| December 2024 | 13% | | | | |
| VIP Investor Freedom 2035 Portfolio | | | | | |
| December 2024 | 16% | | | | |
| VIP Investor Freedom 2040 Portfolio | | | | | |
| December 2024 | 23% | | | | |
| VIP Investor Freedom 2045 Portfolio | | | | | |
| December 2024 | 27% | | | | |
| VIP Investor Freedom 2050 Portfolio | | | | | |
| December 2024 | 24% | | | | |
The amounts per share which represent income derived from sources within, and taxes paid to, foreign countries or possessions of the United States are as follows:
| | Pay Date | Income | Taxes |
| VIP Investor Freedom Income Portfolio | 12/18/2024 | $0.0225 | $0.0068 |
| VIP Investor Freedom 2010 Portfolio | 12/18/2024 | $0.0291 | $0.0088 |
| VIP Investor Freedom 2015 Portfolio | 12/18/2024 | $0.0363 | $0.0107 |
| VIP Investor Freedom 2020 Portfolio | 12/18/2024 | $0.0446 | $0.0133 |
| VIP Investor Freedom 2025 Portfolio | 12/18/2024 | $0.0561 | $0.0170 |
| VIP Investor Freedom 2030 Portfolio | 12/18/2024 | $0.0643 | $0.0193 |
| VIP Investor Freedom 2035 Portfolio | 12/30/2024 | $0.0663 | $0.0166 |
| VIP Investor Freedom 2040 Portfolio | 12/30/2024 | $0.0726 | $0.0192 |
| VIP Investor Freedom 2045 Portfolio | 12/30/2024 | $0.0759 | $0.0202 |
| VIP Investor Freedom 2050 Portfolio | 12/30/2024 | $0.0787 | $0.0195 |
| | | | |
| | | | |
| | | | |
| | | | |
| | | | |
| | | | |
| | | | |
| | | | |
| | | | |
| | | | |
| | | | |
| | | | |
| | | | |
| | | | |
| | | | |
| | | | |
| | | | |
| | | | |
| | | | |
| | | | |
Item 8: Changes in and Disagreements with Accountants for Open-End Management Investment Companies
(Unaudited)
Note: This is not applicable for any fund included in this document.
Item 9: Proxy Disclosures for Open-End Management Investment Companies
(Unaudited)
Note: This is not applicable for any fund included in this document.
Item 10: Remuneration Paid to Directors, Officers, and others of Open-End Management Investment Companies
(Unaudited)
Note: This information is disclosed as part of the financial statements for each Fund as part of Item 7: Financial Statements and Financial Highlights for Open-End Management Investment companies.
Item 11: Statement Regarding Basis for Approval of Investment Advisory Contract
(Unaudited)
Board Approval of Investment Advisory Contracts and Management Fees
VIP Investor Freedom Income Portfolio
VIP Investor Freedom 2010 Portfolio
VIP Investor Freedom 2015 Portfolio
VIP Investor Freedom 2020 Portfolio
VIP Investor Freedom 2025 Portfolio
VIP Investor Freedom 2030 Portfolio
VIP Investor Freedom 2035 Portfolio
VIP Investor Freedom 2040 Portfolio
VIP Investor Freedom 2045 Portfolio
VIP Investor Freedom 2050 Portfolio
Each year, the Board of Trustees, including the Independent Trustees (together, the Board), considers the renewal of the management contract with Fidelity Management & Research Company LLC (FMR) for each fund (the Advisory Contract). The Board, assisted by the advice of fund counsel and Independent Trustees' counsel, requests and considers a broad range of information relevant to the renewal of the Advisory Contracts throughout the year.
The Board meets regularly and, at each of its meetings, covers an extensive agenda of topics and materials and considers factors that are relevant to its annual consideration of the renewal of each fund's Advisory Contract, including the services and support provided to each fund and its shareholders. The Board's Operations Committee, of which all the Independent Trustees are members, meets regularly throughout the year and requests, receives and considers, among other matters, information related to the annual consideration of the renewal of each fund's Advisory Contract before making its recommendation to the Board. The Board also meets as needed to review matters specifically related to the Board's annual consideration of the renewal of the Advisory Contracts. Members of the Board may also meet from time to time with trustees of other Fidelity funds through joint ad hoc committees to discuss certain matters relevant to all of the Fidelity funds.
At its September 2024 meeting, the Board unanimously determined to renew each fund's Advisory Contract. The Board also considered the broad range of investment choices available to shareholders from FMR's competitors and that each fund's shareholders have chosen to invest in that fund, which is part of the Fidelity family of funds. The Board's decision to renew the Advisory Contracts was not based on any single factor and the factors may have been weighed differently by different Trustees. The Board considered all factors it believed relevant and reached a determination, with the assistance of fund counsel and Independent Trustees' counsel and through the exercise of its business judgment, that the renewal of the Advisory Contract was in the best interests of each fund and its shareholders and that the fact that no fees are payable under the Advisory Contracts was fair and reasonable in light of all of the surrounding circumstances.
Nature, Extent, and Quality of Services Provided. The Board considered Fidelity's staffing as it relates to the funds, including the backgrounds and experience of investment personnel, and also considered FMR's implementation of each fund's investment program. The Independent Trustees also had discussions with senior management of Fidelity's investment operations and investment groups with responsibility for the underlying Fidelity funds in which each fund invests. The Board considered the structure of the investment personnel compensation program and whether this structure provides appropriate incentives to act in the best interests of each fund. Additionally, the Board considered the portfolio managers' investments, if any, in the funds that they manage.
Resources Dedicated to Investment Management and Support Services. The Board reviewed the general qualifications and capabilities of Fidelity's investment staff, including its size, education, experience, and resources, as well as Fidelity's approach to recruiting, training, managing, and compensating investment personnel. The Board noted the resources devoted to Fidelity's global investment organization, and that Fidelity's analysts have extensive resources, tools, and capabilities that allow them to conduct quantitative and fundamental analysis, as well as credit analysis of issuers, counterparties, and guarantors. Further, the Board considered that Fidelity's investment professionals have sufficient access to global information and data so as to provide competitive investment results over time, and that those professionals also have access to sophisticated tools that permit them to assess portfolio construction and risk and performance attribution characteristics continuously, as well as to transmit new information and research conclusions rapidly around the world. Additionally, in its deliberations, the Board considered Fidelity's risk management, compliance, cybersecurity, and technology and operations capabilities and resources, which are integral parts of the investment management process.
Shareholder and Administrative Services. The Board considered (i) the nature, extent, quality, and cost of advisory, administrative, and shareholder services performed by Fidelity under the Advisory Contract and under separate agreements covering transfer agency and pricing and bookkeeping services for each fund; (ii) the nature and extent of Fidelity's supervision of third party service providers, principally custodians, subcustodians, and pricing vendors; and (iii) the resources devoted by Fidelity to, and the record of compliance with, each fund's compliance policies and procedures, including with respect to liquidity risk management.
The Board noted that the growth of fund assets over time across the complex allows Fidelity to reinvest in the development of services designed to enhance the value and convenience of the Fidelity funds as investment vehicles. These services include 24-hour access to account information and market information over the Internet and through telephone representatives, investor education materials and asset allocation tools. The Board also considered that it reviews customer service metrics such as telephone response times, continuity of services on the website and metrics addressing services at Fidelity Investor Centers.
Investment in a Large Fund Family. The Board considered the benefits to shareholders of investing in a fund that is part of a large family of funds offering a variety of investment disciplines and providing a large variety of fund investor services. The Board noted that Fidelity had taken, or had made recommendations to the Board that resulted in the Fidelity funds taking, a number of actions over the previous year that benefited particular funds and/or the Fidelity funds in general.
Investment Performance. The Board took into account discussions that occur with representatives of the investment adviser, or reports it receives, at Board meetings throughout the year relating to fund investment performance. In this regard the Board noted that as part of regularly scheduled fund reviews and other reports to the Board on fund performance, the Board considered annualized return information for each fund for different time periods, measured against one or more appropriate securities market indices, including a customized blended index that reflects the respective weights of the fund's asset classes (each a benchmark index). The Board also considered information about performance attribution. In its evaluation of fund investment performance at meetings throughout the year, the Board gave particular attention to information indicating underperformance of certain Fidelity funds over different time periods and discussed with the Investment Advisers the reasons for such underperformance. VIP Investor Freedom Income Portfolio underperformed its benchmark and peers for the one- and three-year periods ended January 31, 2024, and as a result, the Board continues to engage in discussions with FMR regarding the steps it is taking to address the fund's performance.
In addition to reviewing absolute and relative fund performance, the Independent Trustees periodically consider the appropriateness of fund performance metrics in evaluating the results achieved. The Independent Trustees generally give greater weight to fund performance over longer time periods than over shorter time periods. Depending on the circumstances, the Independent Trustees may be satisfied with a fund's performance notwithstanding that it lags its benchmark index or peer group for certain periods.
Based on its review, the Board concluded that the nature, extent, and quality of services provided to each fund under the Advisory Contracts should continue to benefit the shareholders of each fund.
Competitiveness of Management Fee and Total Expense Ratio. The Board was provided with information regarding industry trends in management fees and expenses. The Board noted that the funds do not pay FMR a management fee for investment advisory services, and that each fund bears indirectly the fees and expenses, including the management fees, paid by the underlying Fidelity funds in which it invests. In its review of each fund's total expense ratio, the Board considered each fund's all-inclusive (subject to certain limited exceptions) fee rate. the Board noted that each fund invests in a class of shares of the underlying Fidelity funds that does not charge a 12b-1 fee. The Board considered that the funds do not pay transfer agent fees. Instead, the applicable class of each underlying Fidelity fund bears its pro rata portion of each fund's transfer agent fee according to the percentage of each fund's assets invested in that underlying fund. The Board further noted that FMR pays all other expenses of each fund, with limited exceptions. The Board noted that Fidelity may agree to waive fees or reimburse expenses from time to time, and the extent to which, if any, it has done so for the fund.
Comparisons of Management Fees and Total Expense Ratios. Among other things, the Board reviewed data for selected groups of competitive funds and classes (referred to as "mapped groups") that were compiled by Fidelity based on combining similar investment objective categories (as classified by Morningstar) that have comparable investment mandates. The data reviewed by the Board included (i) gross management fee comparisons (before taking into account expense reimbursements or caps) relative to the total universe of funds within the mapped group; (ii) gross management fee comparisons relative to a subset of non-Fidelity funds in the mapped group that are similar in size and management fee structure to each fund (referred to as the "asset size peer group"); (iii) total expense comparisons of each fund relative to funds and classes in the mapped group that have a similar sales load structure to each fund (referred to as the "similar sales load structure group"); and (iv) total expense comparisons of each fund relative to funds and classes in the similar sales load structure group that are similar in size and management fee structure to each fund (referred to as the "total expense asset size peer group"). The total expense asset size peer group comparison excludes performance adjustments and fund-paid 12b-1 fees to eliminate variability in fee structures.
The information provided to the Board indicated that each fund's management fee rate ranked equal to the competitive median of the mapped group for 2023 and below the competitive median of the asset size peer group for 2023. Further, the information provided to the Board indicated that, except VIP Investor Freedom 2025 Portfolio and VIP Investor Freedom 2040 Portfolio, the total expense ratio of each fund ranked below the competitive median of the similar sales load structure group for 2023 and below the competitive median of the total expense asset size peer group for 2023. VIP Investor Freedom 2025 Portfolio ranked above the competitive median of the similar sales load structure group for 2023 and below the competitive median of the total expense asset size peer group for 2023. VIP Investor Freedom 2040 Portfolio ranked above the competitive median of the similar sales load structure group for 2023 and above the competitive median of the total expense asset size peer group for 2023.
The Board considered that the VIP target date mapped groups may contain a combination of active, blend and passive competitors. The Board noted that Fidelity believes the competitive discussion has limited value given that each target date fund has a custom benchmark unique to its own strategy, has different objectives and goals, and can have unique asset class exposures and allocations.
Fees Charged to Other Fidelity Clients. The Board also considered Fidelity fee structures and other information with respect to clients of Fidelity, such as other funds advised or subadvised by Fidelity, pension plan clients, and other institutional clients with similar mandates. The Board noted that a joint ad hoc committee created by it and the boards of other Fidelity funds periodically reviews and compares Fidelity's institutional investment advisory business with its business of providing services to the Fidelity funds and also noted the most recent findings of the committee. The Board noted that the committee's review included a consideration of the differences in services provided, fees charged, and costs incurred, as well as competition in the markets serving the different categories of clients.
Based on its review, the Board concluded that each fund's management fee is fair and reasonable in light of the services that each fund receives and the other factors considered. Further, based on its review of total expense ratios and fees charged to other Fidelity clients, the Board concluded that each fund's total expense ratio was reasonable in light of the services that the fund and its shareholders receive and the other factors considered.
Costs of the Services and Profitability. The Board considered the level of Fidelity's profits in respect of all the Fidelity funds, including the Fidelity funds in which the funds invest.
A public accounting firm has been engaged annually by the Board as part of the Board's assessment of Fidelity's profitability analysis. The engagement includes the review and assessment of the methodologies used by Fidelity in determining the revenues and expenses attributable to Fidelity's fund business. After considering the reports issued under the engagement and information provided by Fidelity, the Board concluded that while other allocation methods may also be reasonable, Fidelity's profitability methodologies are reasonable in all material respects.
The Board also reviewed Fidelity's non-fund businesses and potential indirect benefits such businesses may have received as a result of their association with Fidelity's fund business (i.e., fall-out benefits) as well as cases where Fidelity's affiliates may benefit from the funds' business. The Board considered areas where potential indirect benefits to the Fidelity funds from their relationships with Fidelity may exist. The Board's consideration of these matters was informed by the findings of a joint ad hoc committee created by it and the boards of other Fidelity funds to evaluate potential fall-out benefits.
The Board concluded that the costs of the services provided by and the profits realized by Fidelity in connection with the operation of each fund were not relevant to the renewal of each fund's Advisory Contract because the funds do not pay management fees and FMR pays all other expenses of each fund, with limited exceptions.
Economies of Scale. The Board concluded that because the funds do not pay management fees and FMR pays all other expenses of each fund, with limited exceptions, economies of scale cannot be realized by the funds, but may be realized by the other Fidelity funds in which each fund invests, many of which may benefit from breakpoints under the group fee arrangement.
Additional Information Requested by the Board. In order to develop fully the factual basis for consideration of the Fidelity funds' advisory contracts, the Board requested and received additional information on certain topics, including: (i) portfolio manager changes that have occurred during the past year; (ii) hiring, training, compensating, and retaining adviser and sub-adviser personnel; (iii) the terms of the funds' various management fee structures and arrangements for transfer agent and pricing and bookkeeping services; (iv) Fidelity's fund profitability methodology, profitability trends for certain funds, the allocation of various costs to different funds, and the impact of certain factors on fund profitability results; (v) the impact on fund profitability of recent industry trends, such as the growth in passively managed funds and the changes in flows for different types of funds; (vi) the types of management fee and total expense comparisons provided, and the challenges and limitations associated with such information; (vii) explanations regarding the relative total expense ratios and management fees of certain funds and classes, total expense and management fee competitive trends, and methodologies for total expense and management fee competitive comparisons; (viii) matters related to money market funds, exchange-traded funds, and target date funds; (ix) the arrangements with and compensation paid to certain fund sub-advisers and the treatment of such compensation within Fidelity's fund profitability methodology; and (x) the terms of management contracts between Fidelity and other funds and products not overseen by the Board.
Conclusion. Based on its evaluation of all of the conclusions noted above, and after considering all factors it believed relevant, the Board, including the Independent Trustees, concluded that the advisory fee arrangements are fair and reasonable in light of all of the surrounding circumstances and that each fund's Advisory Contract should be renewed through September 30, 2025.
1.814507.119
VIPIFF-ANN-0325
Fidelity® Variable Insurance Products:
VIP Asset Manager Portfolio
(to be renamed VIP Asset Manager 50% Portfolio effective April 30, 2025)
Annual Report
December 31, 2024
Contents
To view a fund's proxy voting guidelines and proxy voting record for the 12-month period ended June 30, visit http://www.fidelity.com/proxyvotingresults or visit the Securities and Exchange Commission's (SEC) web site at http://www.sec.gov.
You may also call 1-877-208-0098 to request a free copy of the proxy voting guidelines.
Fidelity® Variable Insurance Products are separate account options which are purchased through a variable insurance contract.
Standard & Poor's, S&P and S&P 500 are registered service marks of The McGraw-Hill Companies, Inc. and have been licensed for use by Fidelity Distributors Corporation.
Other third-party marks appearing herein are the property of their respective owners.
All other marks appearing herein are registered or unregistered trademarks or service marks of FMR LLC or an affiliated company. © 2025 FMR LLC. All rights reserved.
This report and the financial statements contained herein are submitted for the general information of the shareholders of the Fund. This report is not authorized for distribution to prospective investors in the Fund unless preceded or accompanied by an effective prospectus.
A fund files its complete schedule of portfolio holdings with the SEC for the first and third quarters of each fiscal year on Form N-PORT. Forms N-PORT are available on the SEC's web site at http://www.sec.gov. A fund's Forms N-PORT may be reviewed and copied at the SEC's Public Reference Room in Washington, DC. Information regarding the operation of the SEC's Public Reference Room may be obtained by calling 1-800-SEC-0330.
For a complete list of a fund's portfolio holdings, view the most recent holdings listing, semiannual report, or annual report on Fidelity's web site at http://www.fidelity.com, http://www.institutional.fidelity.com, or http://www.401k.com, as applicable.
NOT FDIC INSURED •MAY LOSE VALUE •NO BANK GUARANTEE
Neither the Fund nor Fidelity Distributors Corporation is a bank.
Item 7: Financial Statements and Financial Highlights for Open-End Management Investment Companies (Annual Report)
VIP Asset Manager Portfolio
Schedule of Investments December 31, 2024
Showing Percentage of Net Assets
| Alternative Funds - 1.3% |
| | | Shares | Value ($) |
Fidelity Hedged Equity ETF (b)(c) (Cost $10,718,468) | | 424,837 | 11,664,877 |
| | | | |
| Bond Funds - 38.9% |
| | | Shares | Value ($) |
| Fidelity Emerging Markets Debt Local Currency Central Fund (d) | | 85,122 | 6,994,470 |
| Fidelity Floating Rate Central Fund (d) | | 71,367 | 7,011,121 |
| Fidelity High Income Central Fund (d) | | 64,190 | 6,879,848 |
| Fidelity Inflation-Protected Bond Index Central Fund (d) | | 157,314 | 13,731,978 |
| Fidelity International Credit Central Fund (d) | | 28,228 | 2,285,623 |
| Fidelity VIP Investment Grade Central Fund (d) | | 3,337,473 | 305,311,985 |
| iShares 20+ Year Treasury Bond ETF | | 101,136 | 8,832,207 |
| TOTAL BOND FUNDS (Cost $385,560,218) | | | 351,047,232 |
| | | | |
| Domestic Equity Funds - 36.3% |
| | | Shares | Value ($) |
| Fidelity Blue Chip Growth ETF (c) | | 401,973 | 18,595,271 |
| Fidelity Commodity Strategy Central Fund (d) | | 42,510 | 3,737,483 |
| Fidelity Enhanced Large Cap Value ETF (c) | | 154,574 | 4,709,870 |
| Fidelity Enhanced Mid Cap ETF (b)(c) | | 190,985 | 6,273,857 |
| Fidelity Enhanced Small Cap ETF (b)(c) | | 238,032 | 7,700,335 |
| Fidelity Fundamental Small-Mid Cap ETF (c) | | 70,633 | 1,898,615 |
| Fidelity Real Estate Equity Central Fund (d) | | 32,353 | 4,390,992 |
| Fidelity U.S. Equity Central Fund (d) | | 2,056,757 | 281,240,984 |
| TOTAL DOMESTIC EQUITY FUNDS (Cost $173,258,793) | | | 328,547,407 |
| | | | |
| International Equity Funds - 20.6% |
| | | Shares | Value ($) |
| Fidelity Emerging Markets Equity Central Fund (d) | | 259,887 | 55,662,557 |
| Fidelity International Equity Central Fund (d) | | 1,279,730 | 130,468,428 |
| TOTAL INTERNATIONAL EQUITY FUNDS (Cost $141,704,066) | | | 186,130,985 |
| | | | |
| U.S. Treasury Obligations - 0.2% |
| | | Yield (%) (e) | Principal Amount (a) | Value ($) |
| US Treasury Bills 0% 1/16/2025 (f) | | 4.58 | 80,000 | 79,868 |
| US Treasury Bills 0% 1/2/2025 (f) | | 4.55 | 40,000 | 40,000 |
| US Treasury Bills 0% 1/23/2025 (f) | | 4.55 | 350,000 | 349,133 |
| US Treasury Bills 0% 1/30/2025 (f) | | 4.51 | 190,000 | 189,375 |
| US Treasury Bills 0% 1/9/2025 (f) | | 4.58 | 100,000 | 99,918 |
| US Treasury Bills 0% 3/20/2025 (f) | | 4.28 | 1,290,000 | 1,278,477 |
| US Treasury Bills 0% 3/27/2025 (f) | | 4.28 | 40,000 | 39,609 |
| TOTAL U.S. TREASURY OBLIGATIONS (Cost $2,075,872) | | | | 2,076,380 |
| | | | | |
| Money Market Funds - 2.9% |
| | | Yield (%) | Shares | Value ($) |
| Fidelity Cash Central Fund (g) | | 4.36 | 24,931,632 | 24,936,619 |
| Fidelity Securities Lending Cash Central Fund (g)(h) | | 4.35 | 1,401,585 | 1,401,725 |
| TOTAL MONEY MARKET FUNDS (Cost $26,338,344) | | | | 26,338,344 |
| | | | | |
| TOTAL INVESTMENT IN SECURITIES - 100.2% (Cost $739,655,761) | 905,805,225 |
NET OTHER ASSETS (LIABILITIES) - (0.2)% | (1,389,845) |
| NET ASSETS - 100.0% | 904,415,380 |
| | |
| Futures Contracts |
| | Number of contracts | Expiration Date | Notional Amount ($) | Value ($) | Unrealized Appreciation/ (Depreciation) ($) |
| Purchased | | | | | |
| | | | | | |
| Equity Contracts | | | | | |
| CME E-mini Russell 2000 Index Contracts (United States) | 106 | Mar 2025 | 11,923,940 | (8,964) | (8,964) |
| CME E-mini S&P MidCap 400 Index Contracts (United States) | 15 | Mar 2025 | 4,720,050 | 1,647 | 1,647 |
| | | | | | |
| TOTAL PURCHASED | | | | | (7,317) |
| | | | | | |
| Sold | | | | | |
| | | | | | |
| Equity Contracts | | | | | |
| CME E-mini S&P 500 Index Contracts (United States) | 181 | Mar 2025 | 53,718,538 | 1,216,288 | 1,216,288 |
| ICE MSCI EAFE Index Contracts (United States) | 42 | Mar 2025 | 4,761,750 | 156,564 | 156,564 |
| ICE MSCI Emerging Markets Index Contracts (United States) | 33 | Mar 2025 | 1,771,770 | 66,273 | 66,273 |
| | | | | | |
| TOTAL SOLD | | | | | 1,439,125 |
| | | | | | |
| TOTAL FUTURES CONTRACTS | | | | | 1,431,808 |
| The notional amount of futures purchased as a percentage of Net Assets is 1.8% |
| The notional amount of futures sold as a percentage of Net Assets is 6.6% |
Security Type Abbreviations
Legend
| (a) | Amount is stated in United States dollars unless otherwise noted. |
| (b) | Security or a portion of the security is on loan at period end. |
| (d) | Affiliated fund that is generally available only to investment companies and other accounts managed by Fidelity Investments. A complete unaudited schedule of portfolio holdings for each Fidelity Central Fund is filed with the SEC for the first and third quarters of each fiscal year on Form N-PORT and is available upon request or at the SEC's website at www.sec.gov. An unaudited holdings listing for the Fund, which presents direct holdings as well as the pro-rata share of securities and other investments held indirectly through its investment in underlying non-money market Fidelity Central Funds, other than the Commodity Strategy Central Fund, is available at fidelity.com and/or institutional.fidelity.com, as applicable. In addition, each Fidelity Central Fund's financial statements,which are not covered by the Fund's Report of Independent Registered Public Accounting Firm, are available on the SEC's website or upon request. |
| (e) | Yield represents either the annualized yield at the date of purchase, or the stated coupon rate, or, for floating and adjustable rate securities, the rate at period end. |
| (f) | Security or a portion of the security was pledged to cover margin requirements for futures contracts. At period end, the value of securities pledged amounted to $2,046,380. |
| (g) | Affiliated fund that is generally available only to investment companies and other accounts managed by Fidelity Investments. The rate quoted is the annualized seven-day yield of the fund at period end. A complete unaudited listing of the fund's holdings as of its most recent quarter end is available upon request. In addition, each Fidelity Central Fund's financial statements, which are not covered by the Fund's Report of Independent Registered Public Accounting Firm, are available on the SEC's website or upon request. |
| (h) | Investment made with cash collateral received from securities on loan. |
Affiliated Central Funds
Fiscal year to date information regarding the Fund's investments in Fidelity Central Funds, including the ownership percentage, is presented below.
| Affiliate | Value, beginning of period ($) | Purchases ($) | Sales Proceeds ($) | Dividend Income ($) | Realized Gain (loss) ($) | Change in Unrealized appreciation (depreciation) ($) | Value, end of period ($) | Shares, end of period | % ownership, end of period |
| Fidelity Cash Central Fund | 3,439,685 | 91,378,634 | 69,881,724 | 617,563 | 24 | - | 24,936,619 | 24,931,632 | 0.0% |
| Fidelity Commodity Strategy Central Fund | 4,124,657 | 239,737 | 625,490 | 211,590 | (139,814) | 138,393 | 3,737,483 | 42,510 | 1.6% |
| Fidelity Emerging Markets Debt Central Fund | 1,050,159 | 41,294 | 1,089,122 | 17,141 | (139,144) | 136,813 | - | - | 0.0% |
| Fidelity Emerging Markets Debt Local Currency Central Fund | 7,984,931 | 518,719 | 796,624 | 518,719 | (127,556) | (585,000) | 6,994,470 | 85,122 | 2.7% |
| Fidelity Emerging Markets Equity Central Fund | 60,315,015 | 1,407,474 | 9,487,083 | 1,084,255 | (2,260,069) | 5,687,220 | 55,662,557 | 259,887 | 2.3% |
| Fidelity Floating Rate Central Fund | 12,136,294 | 886,297 | 5,963,931 | 834,248 | (112,237) | 64,698 | 7,011,121 | 71,367 | 0.4% |
| Fidelity Hedged Equity Central Fund | 11,893,358 | 3,587 | 12,974,737 | 3,586 | 2,008,475 | (930,683) | - | - | 0.0% |
| Fidelity High Income Central Fund | 4,764,215 | 2,819,395 | 885,485 | 469,572 | 7,207 | 174,516 | 6,879,848 | 64,190 | 0.5% |
| Fidelity Inflation-Protected Bond Index Central Fund | 15,853,274 | 5,628,338 | 7,535,990 | 480,679 | (883,314) | 669,670 | 13,731,978 | 157,314 | 2.5% |
| Fidelity International Credit Central Fund | 4,787,509 | 191,846 | 2,744,676 | 170,535 | (667,218) | 718,162 | 2,285,623 | 28,228 | 2.4% |
| Fidelity International Equity Central Fund | 143,796,973 | 4,896,063 | 24,794,918 | 4,117,661 | 3,040,835 | 3,529,475 | 130,468,428 | 1,279,730 | 2.4% |
| Fidelity Real Estate Equity Central Fund | 4,028,946 | 801,497 | 624,168 | 115,665 | 30,386 | 154,331 | 4,390,992 | 32,353 | 0.4% |
| Fidelity Securities Lending Cash Central Fund | 1,042,200 | 116,120,353 | 115,760,828 | 28,118 | - | - | 1,401,725 | 1,401,585 | 0.0% |
| Fidelity U.S. Equity Central Fund | 315,950,019 | 28,972,435 | 96,954,317 | 27,157,269 | 25,250,081 | 8,022,766 | 281,240,984 | 2,056,757 | 1.5% |
| Fidelity VIP Investment Grade Central Fund | 333,042,057 | 44,432,348 | 64,833,162 | 13,570,634 | (2,109,477) | (5,219,781) | 305,311,985 | 3,337,473 | 10.4% |
| Total | 924,209,292 | 298,338,017 | 414,952,255 | 49,397,235 | 23,898,179 | 12,560,580 | 844,053,813 | 33,748,148 | |
| | | | | | | | | | |
Amounts in the dividend income column in the above table include any capital gain distributions from underlying funds, which are presented in the corresponding line item in the Statement of Operations, if applicable.
Amounts in the dividend income column for Fidelity Securities Lending Cash Central Fund represents the income earned on investing cash collateral, less rebates paid to borrowers and any lending agent fees associated with the loan, plus any premium payments received for lending certain types of securities.
Amounts included in the purchases and sales proceeds columns may include in-kind transactions, if applicable.
Affiliated Underlying Funds
Fiscal year to date information regarding the Fund's investments in affiliated Underlying Funds is presented below. Exchanges between classes of the same affiliated Underlying Funds may occur. If an Underlying Funds changes its name, the name presented below is the name in effect at period end.
| Affiliate | Value, beginning of period ($) | Purchases ($) | Sales Proceeds ($) | Dividend Income ($) | Realized Gain (loss) ($) | Change in Unrealized appreciation (depreciation) ($) | Value, end of period ($) | Shares, end of period |
| Fidelity Blue Chip Growth ETF | - | 18,600,939 | - | - | - | (5,668) | 18,595,271 | 401,973 |
| Fidelity Enhanced Large Cap Value ETF | - | 4,706,469 | - | - | - | 3,401 | 4,709,870 | 154,574 |
| Fidelity Enhanced Mid Cap ETF | - | 6,551,006 | 605,767 | 28,441 | 40,675 | 287,943 | 6,273,857 | 190,985 |
| Fidelity Enhanced Small Cap ETF | - | 7,767,724 | 360,057 | 36,465 | 19,789 | 272,879 | 7,700,335 | 238,032 |
| Fidelity Fundamental Small-Mid Cap ETF | - | 1,900,444 | - | - | - | (1,829) | 1,898,615 | 70,633 |
| Fidelity Hedged Equity ETF | - | 12,945,285 | 2,266,269 | 60,568 | 39,455 | 946,406 | 11,664,877 | 424,837 |
| Fidelity Low Volatility Factor ETF | 9,360,489 | - | 9,526,469 | - | 322,160 | (156,180) | - | - |
| | 9,360,489 | 52,471,867 | 12,758,562 | 125,474 | 422,079 | 1,346,952 | 50,842,825 | 1,481,034 |
Amounts in the dividend income column in the above table include any capital gain distributions from underlying funds, which are presented in the corresponding line item in the Statement of Operations, if applicable.
Amounts included in the purchases and sales proceeds columns may include in-kind transactions, if applicable.
Investment Valuation
The following is a summary of the inputs used, as of December 31, 2024, involving the Fund's assets and liabilities carried at fair value. The inputs or methodology used for valuing securities may not be an indication of the risk associated with investing in those securities. For more information on valuation inputs, and their aggregation into the levels used below, please refer to the Investment Valuation section in the accompanying Notes to Financial Statements.
| Valuation Inputs at Reporting Date: |
| Description | Total ($) | Level 1 ($) | Level 2 ($) | Level 3 ($) |
Investments in Securities: | | | | |
|
| Alternative Funds | 11,664,877 | 11,664,877 | - | - |
|
| Bond Funds | 351,047,232 | 351,047,232 | - | - |
|
| Domestic Equity Funds | 328,547,407 | 328,547,407 | - | - |
|
| International Equity Funds | 186,130,985 | 186,130,985 | - | - |
|
| U.S. Treasury Obligations | 2,076,380 | - | 2,076,380 | - |
|
| Money Market Funds | 26,338,344 | 26,338,344 | - | - |
| Total Investments in Securities: | 905,805,225 | 903,728,845 | 2,076,380 | - |
Derivative Instruments: Assets | | | | |
Futures Contracts | 1,440,772 | 1,440,772 | - | - |
| Total Assets | 1,440,772 | 1,440,772 | - | - |
| Liabilities | | | | |
Futures Contracts | (8,964) | (8,964) | - | - |
| Total Liabilities | (8,964) | (8,964) | - | - |
| Total Derivative Instruments: | 1,431,808 | 1,431,808 | - | - |
Value of Derivative Instruments
The following table is a summary of the Fund's value of derivative instruments by primary risk exposure as of December 31, 2024. For additional information on derivative instruments, please refer to the Derivative Instruments section in the accompanying Notes to Financial Statements.
Primary Risk Exposure / Derivative Type | Value |
| Asset ($) | Liability ($) |
| Equity Risk | | |
Futures Contracts (a) | 1,440,772 | (8,964) |
| Total Equity Risk | 1,440,772 | (8,964) |
| Total Value of Derivatives | 1,440,772 | (8,964) |
(a)Reflects gross cumulative appreciation (depreciation) on futures contracts as presented in the Schedule of Investments. In the Statement of Assets and Liabilities, the period end daily variation margin is included in receivable or payable for daily variation margin on futures contracts, and the net cumulative appreciation (depreciation) is included in Total accumulated earnings (loss).
Financial Statements
| Statement of Assets and Liabilities |
As of December 31, 2024 |
| Assets | | | | |
| Investment in securities, at value (including securities loaned of $1,363,840) - See accompanying schedule: | | | | |
Unaffiliated issuers (cost $12,167,838) | $ | 10,908,587 | | |
Fidelity Central Funds (cost $678,148,232) | | 844,053,813 | | |
Other affiliated issuers (cost $49,339,691) | | 50,842,825 | | |
| | | | | |
| | | | | |
| Total Investment in Securities (cost $739,655,761) | | | $ | 905,805,225 |
| Receivable for investments sold | | | | 30,837,435 |
| Receivable for fund shares sold | | | | 185,867 |
| Dividends receivable | | | | 5,830 |
| Distributions receivable from Fidelity Central Funds | | | | 97,911 |
| Receivable for daily variation margin on futures contracts | | | | 158,445 |
| Prepaid expenses | | | | 807 |
| Other receivables | | | | 4,653 |
Total assets | | | | 937,096,173 |
| Liabilities | | | | |
| Payable for investments purchased | $ | 30,329,606 | | |
| Payable for fund shares redeemed | | 505,808 | | |
| Distributions payable | | 12 | | |
| Accrued management fee | | 392,449 | | |
| Distribution and service plan fees payable | | 4,017 | | |
| Other payables and accrued expenses | | 47,176 | | |
| Collateral on securities loaned | | 1,401,725 | | |
| Total liabilities | | | | 32,680,793 |
| Net Assets | | | $ | 904,415,380 |
| Net Assets consist of: | | | | |
| Paid in capital | | | $ | 699,148,325 |
| Total accumulated earnings (loss) | | | | 205,267,055 |
| Net Assets | | | $ | 904,415,380 |
| | | | | |
| Net Asset Value and Maximum Offering Price | | | | |
| Initial Class : | | | | |
Net Asset Value, offering price and redemption price per share ($663,053,417 ÷ 40,308,015 shares) | | | $ | 16.45 |
| Service Class : | | | | |
Net Asset Value, offering price and redemption price per share ($2,435,264 ÷ 149,743 shares) | | | $ | 16.26 |
| Service Class 2 : | | | | |
Net Asset Value, offering price and redemption price per share ($18,078,510 ÷ 1,136,987 shares) | | | $ | 15.90 |
| Investor Class : | | | | |
Net Asset Value, offering price and redemption price per share ($220,848,189 ÷ 13,546,505 shares) | | | $ | 16.30 |
| Statement of Operations |
| Year ended December 31, 2024 |
| Investment Income | | | | |
| Dividends (including $125,474 earned from affiliated issuers) | | | $ | 425,983 |
| Interest | | | | 125,262 |
| Income from Fidelity Central Funds (including $28,118 from security lending) | | | | 26,400,178 |
| Total income | | | | 26,951,423 |
| Expenses | | | | |
| Management fee | $ | 4,779,410 | | |
| Transfer agent fees | | 126,927 | | |
| Distribution and service plan fees | | 45,824 | | |
| Accounting fees | | 63,279 | | |
| Custodian fees and expenses | | 18,318 | | |
| Independent trustees' fees and expenses | | 2,424 | | |
| Audit fees | | 55,661 | | |
| Legal | | 4,104 | | |
| Miscellaneous | | 24,747 | | |
| Total expenses before reductions | | 5,120,694 | | |
| Expense reductions | | (90,647) | | |
| Total expenses after reductions | | | | 5,030,047 |
| Net Investment income (loss) | | | | 21,921,376 |
| Realized and Unrealized Gain (Loss) | | | | |
| Net realized gain (loss) on: | | | | |
| Investment Securities: | | | | |
| Unaffiliated issuers | | 2,344 | | |
| Fidelity Central Funds | | 23,898,179 | | |
| Other affiliated issuers | | 422,079 | | |
| Foreign currency transactions | | 289 | | |
| Futures contracts | | (9,132,552) | | |
| Capital gain distributions from Fidelity Central Funds | | 22,997,057 | | |
| Total net realized gain (loss) | | | | 38,187,396 |
| Change in net unrealized appreciation (depreciation) on: | | | | |
| Investment Securities: | | | | |
| Unaffiliated issuers | | (1,024,798) | | |
| Fidelity Central Funds | | 12,560,580 | | |
| Other affiliated issuers | | 1,346,952 | | |
| Assets and liabilities in foreign currencies | | (501) | | |
| Futures contracts | | 3,145,940 | | |
| Total change in net unrealized appreciation (depreciation) | | | | 16,028,173 |
| Net gain (loss) | | | | 54,215,569 |
| Net increase (decrease) in net assets resulting from operations | | | $ | 76,136,945 |
| Statement of Changes in Net Assets |
| |
| | Year ended December 31, 2024 | | Year ended December 31, 2023 |
| Increase (Decrease) in Net Assets | | | | |
| Operations | | | | |
| Net investment income (loss) | $ | 21,921,376 | $ | 20,868,255 |
| Net realized gain (loss) | | 38,187,396 | | 9,511,712 |
| Change in net unrealized appreciation (depreciation) | | 16,028,173 | | 83,217,057 |
| Net increase (decrease) in net assets resulting from operations | | 76,136,945 | | 113,597,024 |
| Distributions to shareholders | | (27,864,553) | | (31,471,834) |
| | | | | |
| Share transactions - net increase (decrease) | | (86,849,616) | | (69,316,930) |
| Total increase (decrease) in net assets | | (38,577,224) | | 12,808,260 |
| | | | | |
| Net Assets | | | | |
| Beginning of period | | 942,992,604 | | 930,184,344 |
| End of period | $ | 904,415,380 | $ | 942,992,604 |
| | | | | |
| | | | | |
Financial Highlights
VIP Asset Manager Portfolio Initial Class |
| |
| Years ended December 31, | | 2024 | | 2023 | | 2022 | | 2021 | | 2020 |
Selected Per-Share Data | | | | | | | | | | |
| Net asset value, beginning of period | $ | 15.64 | $ | 14.32 | $ | 18.33 | $ | 17.04 | $ | 15.23 |
| Income from Investment Operations | | | | | | | | | | |
Net investment income (loss) A,B | | .39 | | .34 | | .32 | | .29 | | .22 |
| Net realized and unrealized gain (loss) | | .93 | | 1.50 | | (2.94) | | 1.40 | | 2.03 |
| Total from investment operations | | 1.32 | | 1.84 | | (2.62) | | 1.69 | | 2.25 |
| Distributions from net investment income | | (.42) C | | (.36) | | (.32) | | (.30) | | (.24) |
| Distributions from net realized gain | | (.09) C | | (.16) | | (1.07) | | (.10) | | (.21) |
| Total distributions | | (.51) | | (.52) | | (1.39) | | (.40) | | (.44) D |
| Net asset value, end of period | $ | 16.45 | $ | 15.64 | $ | 14.32 | $ | 18.33 | $ | 17.04 |
Total Return E,F | | | | 12.94% | | (14.94)% | | 9.92% | | 14.87% |
Ratios to Average Net Assets B,G,H | | | | | | | | | | |
| Expenses before reductions | | .52% | | .59% | | .59% | | .59% | | .59% |
| Expenses net of fee waivers, if any | | | | .58% | | .59% | | .58% | | .59% |
| Expenses net of all reductions | | .51% | | .58% | | .59% | | .58% | | .59% |
| Net investment income (loss) | | 2.37% | | 2.26% | | 2.08% | | 1.62% | | 1.41% |
| Supplemental Data | | | | | | | | | | |
| Net assets, end of period (000 omitted) | $ | 663,053 | $ | 696,248 | $ | 688,649 | $ | 889,923 | $ | 889,473 |
Portfolio turnover rate I | | | | 19% | | 29% | | 20% | | 20% |
ACalculated based on average shares outstanding during the period.
BNet investment income (loss) is affected by the timing of the declaration of dividends by any underlying mutual funds or exchange-traded funds (ETFs). Net investment income (loss) of any mutual funds or ETFs is not included in the Fund's net investment income (loss) ratio.
CThe amount shown reflects reclassifications related to book to tax differences that were made in the year shown.
DTotal distributions per share do not sum due to rounding.
ETotal returns do not reflect charges attributable to your insurance company's separate account. Inclusion of these charges would reduce the total returns shown.
FTotal returns would have been lower if certain expenses had not been reduced during the applicable periods shown.
GFees and expenses of any underlying mutual funds or exchange-traded funds (ETFs) are not included in the Fund's expense ratio. The Fund indirectly bears its proportionate share of these expenses. For additional expense information related to investments in Fidelity Central Funds, please refer to the "Investments in Fidelity Central Funds" note found in the Notes to Financial Statements section of the most recent Annual or Semi-Annual report.
HExpense ratios reflect operating expenses of the class. Expenses before reductions do not reflect amounts reimbursed, waived, or reduced through arrangements with the investment adviser, brokerage services, or other offset arrangements, if applicable, and do not represent the amount paid by the class during periods when reimbursements, waivers or reductions occur.
IAmount does not include the portfolio activity of any underlying mutual funds or exchange-traded funds (ETFs), derivatives or securities that mature within one year from acquisition.
VIP Asset Manager Portfolio Service Class |
| |
| Years ended December 31, | | 2024 | | 2023 | | 2022 | | 2021 | | 2020 |
Selected Per-Share Data | | | | | | | | | | |
| Net asset value, beginning of period | $ | 15.47 | $ | 14.16 | $ | 18.14 | $ | 16.86 | $ | 15.08 |
| Income from Investment Operations | | | | | | | | | | |
Net investment income (loss) A,B | | .37 | | .32 | | .30 | | .27 | | .20 |
| Net realized and unrealized gain (loss) | | .92 | | 1.49 | | (2.91) | | 1.38 | | 2.01 |
| Total from investment operations | | 1.29 | | 1.81 | | (2.61) | | 1.65 | | 2.21 |
| Distributions from net investment income | | (.40) C | | (.34) | | (.31) | | (.27) | | (.23) |
| Distributions from net realized gain | | (.09) C | | (.16) | | (1.07) | | (.10) | | (.21) |
| Total distributions | | (.50) D | | (.50) | | (1.37) D | | (.37) | | (.43) D |
| Net asset value, end of period | $ | 16.26 | $ | 15.47 | $ | 14.16 | $ | 18.14 | $ | 16.86 |
Total Return E,F | | | | 12.90% | | (15.03)% | | 9.80% | | 14.74% |
Ratios to Average Net Assets B,G,H | | | | | | | | | | |
| Expenses before reductions | | .63% | | .69% | | .69% | | .69% | | .69% |
| Expenses net of fee waivers, if any | | | | .68% | | .69% | | .69% | | .69% |
| Expenses net of all reductions | | .62% | | .68% | | .69% | | .69% | | .69% |
| Net investment income (loss) | | 2.27% | | 2.16% | | 1.98% | | 1.52% | | 1.31% |
| Supplemental Data | | | | | | | | | | |
| Net assets, end of period (000 omitted) | $ | 2,435 | $ | 2,504 | $ | 2,480 | $ | 3,627 | $ | 5,108 |
Portfolio turnover rate I | | | | 19% | | 29% | | 20% | | 20% |
ACalculated based on average shares outstanding during the period.
BNet investment income (loss) is affected by the timing of the declaration of dividends by any underlying mutual funds or exchange-traded funds (ETFs). Net investment income (loss) of any mutual funds or ETFs is not included in the Fund's net investment income (loss) ratio.
CThe amount shown reflects reclassifications related to book to tax differences that were made in the year shown.
DTotal distributions per share do not sum due to rounding.
ETotal returns do not reflect charges attributable to your insurance company's separate account. Inclusion of these charges would reduce the total returns shown.
FTotal returns would have been lower if certain expenses had not been reduced during the applicable periods shown.
GFees and expenses of any underlying mutual funds or exchange-traded funds (ETFs) are not included in the Fund's expense ratio. The Fund indirectly bears its proportionate share of these expenses. For additional expense information related to investments in Fidelity Central Funds, please refer to the "Investments in Fidelity Central Funds" note found in the Notes to Financial Statements section of the most recent Annual or Semi-Annual report.
HExpense ratios reflect operating expenses of the class. Expenses before reductions do not reflect amounts reimbursed, waived, or reduced through arrangements with the investment adviser, brokerage services, or other offset arrangements, if applicable, and do not represent the amount paid by the class during periods when reimbursements, waivers or reductions occur.
IAmount does not include the portfolio activity of any underlying mutual funds or exchange-traded funds (ETFs), derivatives or securities that mature within one year from acquisition.
VIP Asset Manager Portfolio Service Class 2 |
| |
| Years ended December 31, | | 2024 | | 2023 | | 2022 | | 2021 | | 2020 |
Selected Per-Share Data | | | | | | | | | | |
| Net asset value, beginning of period | $ | 15.14 | $ | 13.88 | $ | 17.81 | $ | 16.56 | $ | 14.82 |
| Income from Investment Operations | | | | | | | | | | |
Net investment income (loss) A,B | | .34 | | .29 | | .27 | | .24 | | .17 |
| Net realized and unrealized gain (loss) | | .90 | | 1.45 | | (2.85) | | 1.36 | | 1.97 |
| Total from investment operations | | 1.24 | | 1.74 | | (2.58) | | 1.60 | | 2.14 |
| Distributions from net investment income | | (.39) C | | (.32) | | (.28) | | (.25) | | (.20) |
| Distributions from net realized gain | | (.09) C | | (.16) | | (1.07) | | (.10) | | (.21) |
| Total distributions | | (.48) | | (.48) | | (1.35) | | (.35) | | (.40) D |
| Net asset value, end of period | $ | 15.90 | $ | 15.14 | $ | 13.88 | $ | 17.81 | $ | 16.56 |
Total Return E,F | | | | 12.65% | | (15.15)% | | 9.68% | | 14.54% |
Ratios to Average Net Assets B,G,H | | | | | | | | | | |
| Expenses before reductions | | .78% | | .84% | | .84% | | .84% | | .84% |
| Expenses net of fee waivers, if any | | | | .83% | | .84% | | .83% | | .84% |
| Expenses net of all reductions | | .77% | | .83% | | .84% | | .83% | | .84% |
| Net investment income (loss) | | 2.12% | | 2.01% | | 1.83% | | 1.37% | | 1.16% |
| Supplemental Data | | | | | | | | | | |
| Net assets, end of period (000 omitted) | $ | 18,079 | $ | 16,471 | $ | 14,925 | $ | 20,038 | $ | 19,943 |
Portfolio turnover rate I | | | | 19% | | 29% | | 20% | | 20% |
ACalculated based on average shares outstanding during the period.
BNet investment income (loss) is affected by the timing of the declaration of dividends by any underlying mutual funds or exchange-traded funds (ETFs). Net investment income (loss) of any mutual funds or ETFs is not included in the Fund's net investment income (loss) ratio.
CThe amount shown reflects reclassifications related to book to tax differences that were made in the year shown.
DTotal distributions per share do not sum due to rounding.
ETotal returns do not reflect charges attributable to your insurance company's separate account. Inclusion of these charges would reduce the total returns shown.
FTotal returns would have been lower if certain expenses had not been reduced during the applicable periods shown.
GFees and expenses of any underlying mutual funds or exchange-traded funds (ETFs) are not included in the Fund's expense ratio. The Fund indirectly bears its proportionate share of these expenses. For additional expense information related to investments in Fidelity Central Funds, please refer to the "Investments in Fidelity Central Funds" note found in the Notes to Financial Statements section of the most recent Annual or Semi-Annual report.
HExpense ratios reflect operating expenses of the class. Expenses before reductions do not reflect amounts reimbursed, waived, or reduced through arrangements with the investment adviser, brokerage services, or other offset arrangements, if applicable, and do not represent the amount paid by the class during periods when reimbursements, waivers or reductions occur.
IAmount does not include the portfolio activity of any underlying mutual funds or exchange-traded funds (ETFs), derivatives or securities that mature within one year from acquisition.
VIP Asset Manager Portfolio Investor Class |
| |
| Years ended December 31, | | 2024 | | 2023 | | 2022 | | 2021 | | 2020 |
Selected Per-Share Data | | | | | | | | | | |
| Net asset value, beginning of period | $ | 15.51 | $ | 14.20 | $ | 18.19 | $ | 16.91 | $ | 15.12 |
| Income from Investment Operations | | | | | | | | | | |
Net investment income (loss) A,B | | .37 | | .32 | | .31 | | .28 | | .20 |
| Net realized and unrealized gain (loss) | | .92 | | 1.50 | | (2.92) | | 1.39 | | 2.02 |
| Total from investment operations | | 1.29 | | 1.82 | | (2.61) | | 1.67 | | 2.22 |
| Distributions from net investment income | | (.41) C | | (.35) | | (.31) | | (.28) | | (.23) |
| Distributions from net realized gain | | (.09) C | | (.16) | | (1.07) | | (.10) | | (.21) |
| Total distributions | | (.50) | | (.51) | | (1.38) | | (.39) D | | (.43) D |
| Net asset value, end of period | $ | 16.30 | $ | 15.51 | $ | 14.20 | $ | 18.19 | $ | 16.91 |
Total Return E,F | | | | 12.90% | | (15.00)% | | 9.85% | | 14.77% |
Ratios to Average Net Assets B,G,H | | | | | | | | | | |
| Expenses before reductions | | .60% | | .66% | | .66% | | .66% | | .67% |
| Expenses net of fee waivers, if any | | | | .66% | | .66% | | .66% | | .67% |
| Expenses net of all reductions | | .59% | | .66% | | .66% | | .66% | | .67% |
| Net investment income (loss) | | 2.29% | | 2.18% | | 2.01% | | 1.55% | | 1.33% |
| Supplemental Data | | | | | | | | | | |
| Net assets, end of period (000 omitted) | $ | 220,848 | $ | 227,770 | $ | 224,131 | $ | 285,912 | $ | 254,632 |
Portfolio turnover rate I | | | | 19% | | 29% | | 20% | | 20% |
ACalculated based on average shares outstanding during the period.
BNet investment income (loss) is affected by the timing of the declaration of dividends by any underlying mutual funds or exchange-traded funds (ETFs). Net investment income (loss) of any mutual funds or ETFs is not included in the Fund's net investment income (loss) ratio.
CThe amount shown reflects reclassifications related to book to tax differences that were made in the year shown.
DTotal distributions per share do not sum due to rounding.
ETotal returns do not reflect charges attributable to your insurance company's separate account. Inclusion of these charges would reduce the total returns shown.
FTotal returns would have been lower if certain expenses had not been reduced during the applicable periods shown.
GFees and expenses of any underlying mutual funds or exchange-traded funds (ETFs) are not included in the Fund's expense ratio. The Fund indirectly bears its proportionate share of these expenses. For additional expense information related to investments in Fidelity Central Funds, please refer to the "Investments in Fidelity Central Funds" note found in the Notes to Financial Statements section of the most recent Annual or Semi-Annual report.
HExpense ratios reflect operating expenses of the class. Expenses before reductions do not reflect amounts reimbursed, waived, or reduced through arrangements with the investment adviser, brokerage services, or other offset arrangements, if applicable, and do not represent the amount paid by the class during periods when reimbursements, waivers or reductions occur.
IAmount does not include the portfolio activity of any underlying mutual funds or exchange-traded funds (ETFs), derivatives or securities that mature within one year from acquisition.
Notes to Financial Statements
For the period ended December 31, 2024
1. Organization.
VIP Asset Manager Portfolio (the Fund) is a fund of Variable Insurance Products Fund V (the Trust) and is authorized to issue an unlimited number of shares. The Trust is registered under the Investment Company Act of 1940, as amended (the 1940 Act), as an open-end management investment company organized as a Massachusetts business trust. Shares of the Fund may only be purchased by insurance companies for the purpose of funding variable annuity or variable life insurance contracts. The Fund offers the following classes of shares: Initial Class shares, Service Class shares, Service Class 2 shares and Investor Class shares. All classes have equal rights and voting privileges, except for matters affecting a single class.
During September 2024 the Board approved to change the name of the Fund to VIP Asset Manager 50% Portfolio effective April 30, 2025.
2. Investments in Fidelity Central Funds.
Funds may invest in Fidelity Central Funds, which are open-end investment companies generally available only to other investment companies and accounts managed by the investment adviser and its affiliates. The Schedule of Investments lists any Fidelity Central Funds held as an investment as of period end, but does not include the underlying holdings of each Fidelity Central Fund. An investing fund indirectly bears its proportionate share of the expenses of the underlying Fidelity Central Funds.
Based on its investment objective, each Fidelity Central Fund may invest or participate in various investment vehicles or strategies that are similar to those of the investing fund. These strategies are consistent with the investment objectives of the investing fund and may involve certain economic risks which may cause a decline in value of each of the Fidelity Central Funds and thus a decline in the value of the investing fund.
| Fidelity Central Fund | Investment Manager | Investment Objective | Investment Practices | Expense RatioA |
| Fidelity Commodity Strategy Central Fund | Geode Capital Management, LLC (Geode) | Seeks to provide investment returns that correspond to the performance of the commodities market. | Investment in commodity-related investments through a wholly-owned subsidiary organized under the laws of the Cayman Islands | .01% |
| Fidelity Emerging Markets Debt Central Fund | Fidelity Management & Research Company LLC (FMR) | Seeks high total return by normally investing in debt securities of issuers in emerging markets and other debt investments that are tied economically to emerging markets. | Foreign Securities Restricted Securities Futures | .01% |
| Fidelity Emerging Markets Equity Central Fund | Fidelity Management & Research Company LLC (FMR) | Seeks capital appreciation by investing primarily in equity securities of issuers in emerging markets. | Foreign Securities | .02% |
| Fidelity International Equity Central Fund | Fidelity Management & Research Company LLC (FMR) | Seeks capital appreciation by investing primarily in non-U.S. based common stocks, including securities of issuers located in emerging markets. | Foreign Securities Futures | .01% |
| Fidelity Floating Rate Central Fund | Fidelity Management & Research Company LLC (FMR) | Seeks a high level of income by normally investing in floating rate loans and other floating rate securities. | Restricted Securities Loans & Direct Debt Instruments | Less than .005% |
| Fidelity High Income Central Fund | Fidelity Management & Research Company LLC (FMR) | Seeks a high level of income and may also seek capital appreciation by investing primarily in debt securities, preferred stocks, and convertible securities, with an emphasis on lower-quality debt securities. | Loans & Direct Debt Instruments Restricted Securities | Less than .005% |
| Fidelity Inflation-Protected Bond Index Central Fund | Fidelity Management & Research Company LLC (FMR) | Seeks to provide investment results that correspond to the performance of the inflation-protected United States Treasury market, and may invest in derivatives. | | Less than .005% |
| Fidelity VIP Investment Grade Central Fund | Fidelity Management & Research Company LLC (FMR) | Seeks a high level of current income by normally investing in investment-grade debt securities and repurchase agreements. | Delayed Delivery & When Issued Securities Restricted Securities | Less than .005% |
| Fidelity Real Estate Equity Central Fund | Fidelity Management & Research Company LLC (FMR) | Seeks above-average income and long-term capital growth by investing primarily in equity securities of issuers in the real estate industry. | | Less than .005% |
| Fidelity International Credit Central Fund | Fidelity Management & Research Company LLC (FMR) | Seeks a high level of current income by normally investing in debt securities of foreign issuers, including debt securities of issuers located in emerging markets. Foreign currency exposure is hedged utilizing foreign currency contracts. | Foreign Securities Forward Foreign Currency Contracts Futures Restricted Securities Swaps | Less than .005% |
| Fidelity U.S. Equity Central Fund | Fidelity Management & Research Company LLC (FMR) | Seeks capital appreciation by investing primarily in common stocks, allocated across different market sectors. | Foreign Securities Restricted Securities Futures | Less than .005% |
| Fidelity Emerging Markets Debt Local Currency Central Fund | Fidelity Management & Research Company LLC (FMR) | Seeks high total return by normally investing in debt securities of issuers in emerging markets and other debt investments that are tied economically to emerging markets and denominated in the local currency of the issuer. | Foreign Securities Restricted Securities | .02% |
| Fidelity Money Market Central Funds | Fidelity Management & Research Company LLC (FMR) | Each fund seeks to obtain a high level of current income consistent with the preservation of capital and liquidity. | Short-term Investments | Less than .005% |
A Expenses expressed as a percentage of average net assets and are as of each underlying Central Fund's most recent annual or semi-annual shareholder report.
An unaudited holdings listing for the investing fund, which presents direct holdings as well as the pro-rata share of any securities and other investments held indirectly through its investment in underlying non-money market Fidelity Central Funds, is available at fidelity.com and/or institutional.fidelity.com, as applicable. A complete unaudited list of holdings for each Fidelity Central Fund is available upon request or at the Securities and Exchange Commission website at www.sec.gov. In addition, the financial statements of the Fidelity Central Funds which contain the significant accounting policies (including investment valuation policies) of those funds, and are not covered by the Report of Independent Registered Public Accounting Firm, are available on the Securities and Exchange Commission website or upon request.
3. Significant Accounting Policies.
The Fund is an investment company and applies the accounting and reporting guidance of the Financial Accounting Standards Board (FASB) Accounting Standards Codification Topic 946 Financial Services - Investment Companies. The financial statements have been prepared in conformity with accounting principles generally accepted in the United States of America (GAAP), which require management to make certain estimates and assumptions at the date of the financial statements. Actual results could differ from those estimates. The Fund operates as a single operating segment. The Fund's income, expenses, assets, and performance are regularly monitored and assessed as a whole by the investment adviser and other individuals responsible for oversight functions of the Trust, using the information presented in the financial statements and financial highlights. Subsequent events, if any, through the date that the financial statements were issued have been evaluated in the preparation of the financial statements. The Fund's Schedule of Investments lists any underlying mutual funds or exchange-traded funds (ETFs) but does not include the underlying holdings of these funds. The following summarizes the significant accounting policies of the Fund:
Investment Valuation. Investments are valued as of 4:00 p.m. Eastern time on the last calendar day of the period. The Board of Trustees (the Board) has designated the Fund's investment adviser as the valuation designee responsible for the fair valuation function and performing fair value determinations as needed. The investment adviser has established a Fair Value Committee (the Committee) to carry out the day-to-day fair valuation responsibilities and has adopted policies and procedures to govern the fair valuation process and the activities of the Committee. In accordance with these fair valuation policies and procedures, which have been approved by the Board, the Fund attempts to obtain prices from one or more third party pricing services or brokers to value its investments. When current market prices, quotations or currency exchange rates are not readily available or reliable, investments will be fair valued in good faith by the Committee, in accordance with the policies and procedures. Factors used in determining fair value vary by investment type and may include market or investment specific events, transaction data, estimated cash flows, and market observations of comparable investments. The frequency that the fair valuation procedures are used cannot be predicted and they may be utilized to a significant extent. The Committee manages the Fund's fair valuation practices and maintains the fair valuation policies and procedures. The Fund's investment adviser reports to the Board information regarding the fair valuation process and related material matters.
The Fund categorizes the inputs to valuation techniques used to value its investments into a disclosure hierarchy consisting of three levels as shown below:
Level 1 - unadjusted quoted prices in active markets for identical investments
Level 2 - other significant observable inputs (including quoted prices for similar investments, interest rates, prepayment speeds, etc.)
Level 3 - unobservable inputs (including the Fund's own assumptions based on the best information available)
Valuation techniques used to value the Fund's investments by major category are as follows:
Debt securities, including restricted securities, are valued based on evaluated prices received from third party pricing services or from brokers who make markets in such securities. U.S. government and government agency obligations are valued by pricing services who utilize matrix pricing which considers yield or price of bonds of comparable quality, coupon, maturity and type or by broker-supplied prices. When independent prices are unavailable or unreliable, debt securities may be valued utilizing pricing methodologies which consider similar factors that would be used by third party pricing services. Debt securities are generally categorized as Level 2 in the hierarchy but may be Level 3 depending on the circumstances.
Exchange-Traded Funds (ETFs) are valued at their last sale price or official closing price as reported by a third party pricing service on the primary market or exchange on which they are traded and are categorized as Level 1 in the hierarchy. In the event there were no sales during the day but the exchange reports a closing bid level, ETFs are valued at the closing bid and would be categorized as Level 1 in the hierarchy. In the event there was no closing bid, ETFs may be valued by another method that the Board believes reflects fair value in accordance with the Board's fair value pricing policies and may be categorized as Level 2 in the hierarchy.
Futures contracts are valued at the settlement price established each day by the board of trade or exchange on which they are traded and are categorized as Level 1 in the hierarchy. Investments in open-end mutual funds, including the Fidelity Central Funds, are valued at their closing net asset value (NAV) each business day and are categorized as Level 1 in the hierarchy.
Changes in valuation techniques may result in transfers in or out of an assigned level within the disclosure hierarchy. The aggregate value of investments by input level as of December 31, 2024 is included at the end of the Fund's Schedule of Investments.
Foreign Currency. Certain Funds may use foreign currency contracts to facilitate transactions in foreign-denominated securities. Gains and losses from these transactions may arise from changes in the value of the foreign currency or if the counterparties do not perform under the contracts' terms.
Foreign-denominated assets, including investment securities, and liabilities are translated into U.S. dollars at the exchange rates at period end. Purchases and sales of investment securities, income and dividends received, and expenses denominated in foreign currencies are translated into U.S. dollars at the exchange rate in effect on the transaction date.
The effects of exchange rate fluctuations on investments are included with the net realized and unrealized gain (loss) on investment securities. Other foreign currency transactions resulting in realized and unrealized gain (loss) are disclosed separately.
Investment Transactions and Income. For financial reporting purposes, the Fund's investment holdings and NAV include trades executed through the end of the last business day of the period. The NAV per share for processing shareholder transactions is calculated as of the close of business of the New York Stock Exchange (NYSE), normally 4:00 p.m. Eastern time and includes trades executed through the end of the prior business day. Gains and losses on securities sold are determined on the basis of identified cost and include proceeds received from litigation. Commissions paid to certain brokers with whom the investment adviser, or its affiliates, places trades on behalf of a fund include an amount in addition to trade execution, which may be rebated back to a fund. Any such rebates are included in net realized gain (loss) on investments in the Statement of Operations. Dividend income is recorded on the ex-dividend date, except for certain dividends from foreign securities where the ex-dividend date may have passed, which are recorded as soon as the Fund is informed of the ex-dividend date. Non-cash dividends included in dividend income, if any, are recorded at the fair market value of the securities received. Income and capital gain distributions from Fidelity Central Funds, if any, are recorded on the ex-dividend date. Interest income is accrued as earned and includes coupon interest and amortization of premium and accretion of discount on debt securities as applicable. Investment income is recorded net of foreign taxes withheld where recovery of such taxes is uncertain. Funds may file withholding tax reclaims in certain jurisdictions to recover a portion of amounts previously withheld. Any withholding tax reclaims income is included in the Statement of Operations in dividends. Any receivables for withholding tax reclaims are included in the Statement of Assets and Liabilities in dividends receivable.
Class Allocations and Expenses. Investment income, realized and unrealized capital gains and losses, common expenses of a fund, and certain fund-level expense reductions, if any, are allocated daily on a pro-rata basis to each class based on the relative net assets of each class to the total net assets of a fund. Each class differs with respect to transfer agent and distribution and service plan fees incurred, as applicable. Certain expense reductions may also differ by class, if applicable. For the reporting period, the allocated portion of income and expenses to each class as a percent of its average net assets may vary due to the timing of recording these transactions in relation to fluctuating net assets of the classes. Expenses directly attributable to a fund are charged to that fund. Expenses attributable to more than one fund are allocated among the respective funds on the basis of relative net assets or other appropriate methods. Expenses included in the accompanying financial statements reflect the expenses of that fund and do not include any expenses associated with any underlying mutual funds or exchange-traded funds (ETFs). Although not included in a fund's expenses, a fund indirectly bears its proportionate share of these expenses through the net asset value of each underlying mutual fund or exchange-traded fund (ETF). Expense estimates are accrued in the period to which they relate and adjustments are made when actual amounts are known.
Deferred Trustee Compensation. Under a Deferred Compensation Plan (the Plan) for certain Funds, certain independent Trustees have elected to defer receipt of a portion of their annual compensation. Deferred amounts are invested in affiliated mutual funds, are marked-to-market and remain in a fund until distributed in accordance with the Plan. The investment of deferred amounts and the offsetting payable to the Trustees presented below are included in the accompanying Statement of Assets and Liabilities in other receivables and other payables and accrued expenses, as applicable.
| VIP Asset Manager Portfolio | $3,022 |
Income Tax Information and Distributions to Shareholders. Each year, the Fund intends to qualify as a regulated investment company under Subchapter M of the Internal Revenue Code, including distributing substantially all of its taxable income and realized gains. As a result, no provision for U.S. Federal income taxes is required. As of December 31, 2024, the Fund did not have any unrecognized tax benefits in the financial statements; nor is the Fund aware of any tax positions for which it is reasonably possible that the total amounts of unrecognized tax benefits will significantly change in the next twelve months. The Fund files a U.S. federal tax return, in addition to state and local tax returns as required. The Fund's federal income tax returns are subject to examination by the Internal Revenue Service (IRS) for a period of three fiscal years after they are filed. State and local tax returns may be subject to examination for an additional fiscal year depending on the jurisdiction. Foreign taxes are provided for based on the Fund's understanding of the tax rules and rates that exist in the foreign markets in which it invests.
Distributions are declared and recorded on the ex-dividend date. Income and capital gain distributions are declared separately for each class. Income and capital gain distributions are determined in accordance with income tax regulations, which may differ from GAAP. These differences resulted in distribution reclassifications.
Capital accounts within the financial statements are adjusted for permanent book-tax differences. These adjustments have no impact on net assets or the results of operations. Capital accounts are not adjusted for temporary book-tax differences which will reverse in a subsequent period.
Book-tax differences are primarily due to short-term distributions from the underlying funds, futures contracts and losses deferred due to wash sales.
As of period end, the cost and unrealized appreciation (depreciation) in securities, and derivatives if applicable, for federal income tax purposes were as follows:
| Gross unrealized appreciation | $200,862,920 |
| Gross unrealized depreciation | (28,732,425) |
| Net unrealized appreciation (depreciation) | $172,130,495 |
| Tax Cost | $733,674,730 |
The tax-based components of distributable earnings as of period end were as follows:
| Undistributed long-term capital gain | $41,739,088 |
| Net unrealized appreciation (depreciation) on securities and other investments | $172,129,994 |
The tax character of distributions paid was as follows:
| | December 31, 2024 | December 31, 2023 |
| Ordinary Income | $23,949,854 | $ 21,174,941 |
| Long-term Capital Gains | 3,914,699 | 10,296,893 |
| Total | $27,864,553 | $ 31,471,834 |
New Accounting Pronouncement. FASB Accounting Standards Update (ASU) 2023-07 Segment Reporting (Topic 280): Improvements to Reportable Segment Disclosures became effective in this reporting period. ASU 2023-07 enhances segment information disclosure in the notes to financial statements.
4. Derivative Instruments.
Risk Exposures and the Use of Derivative Instruments. The Fund's investment objectives allow for various types of derivative instruments, including futures contracts. Derivatives are investments whose value is primarily derived from underlying assets, indices or reference rates and may be transacted on an exchange or over-the-counter (OTC). Derivatives may involve a future commitment to buy or sell a specified asset based on specified terms, to exchange future cash flows at periodic intervals based on a notional principal amount, or for one party to make one or more payments upon the occurrence of specified events in exchange for periodic payments from the other party.
Derivatives were used to increase returns and to manage exposure to certain risks as defined below. The success of any strategy involving derivatives depends on analysis of numerous economic factors, and if the strategies for investment do not work as intended, the objectives may not be achieved.
Derivatives were used to increase or decrease exposure to the following risk(s):
| | |
| Equity Risk | Equity risk relates to the fluctuations in the value of financial instruments as a result of changes in market prices (other than those arising from interest rate risk or foreign exchange risk), whether caused by factors specific to an individual investment, its issuer, or all factors affecting all instruments traded in a market or market segment. |
| Interest Rate Risk | Interest rate risk relates to the fluctuations in the value of interest-bearing securities due to changes in the prevailing levels of market interest rates. |
Funds are also exposed to additional risks from investing in derivatives, such as liquidity risk and counterparty credit risk. Liquidity risk is the risk that a fund will be unable to close out the derivative in the open market in a timely manner. Counterparty credit risk is the risk that the counterparty will not be able to fulfill its obligation to a fund. Counterparty credit risk related to exchange-traded contracts may be mitigated by the protection provided by the exchange on which they trade.
Investing in derivatives may involve greater risks than investing in the underlying assets directly and, to varying degrees, may involve risk of loss in excess of any initial investment and collateral received and amounts recognized in the Statement of Assets and Liabilities. In addition, there may be the risk that the change in value of the derivative contract does not correspond to the change in value of the underlying instrument.
Net Realized Gain (Loss) and Change in Net Unrealized Appreciation (Depreciation) on Derivatives. The table below, which reflects the impacts of derivatives on the financial performance, summarizes the net realized gain (loss) and change in net unrealized appreciation (depreciation) for derivatives during the period as presented in the Statement of Operations.
| Primary Risk Exposure / Derivative Type | Net Realized Gain (Loss)($) | Change in Net Unrealized Appreciation (Depreciation)($) |
| VIP Asset Manager Portfolio | | |
| Equity Risk | | |
| Futures Contracts | (8,703,560) | 3,145,940 |
| Total Equity Risk | (8,703,560) | 3,145,940 |
| Interest Rate Risk | | |
| Futures Contracts | (428,992) | - |
| Total Interest Rate Risk | (428,992) | - |
| Totals | (9,132,552) | 3,145,940 |
If there are any open positions at period end, a summary of the value of derivatives by primary risk exposure is included at the end of the Schedule of Investments.
Futures Contracts. A futures contract is an agreement between two parties to buy or sell a specified underlying instrument for a fixed price at a specified future date. Futures contracts were used to manage exposure to the stock market, bond market and fluctuations in interest rates.
Upon entering into a futures contract, a fund is required to deposit either cash or securities (initial margin) with a clearing broker in an amount equal to a certain percentage of the face value of the contract. Futures contracts are marked-to-market daily and subsequent daily payments are made or received by a fund depending on the daily fluctuations in the value of the futures contracts and are recorded as unrealized appreciation or (depreciation). This receivable and/or payable, if any, is included in daily variation margin on futures contracts in the Statement of Assets and Liabilities. Realized gain or (loss) is recorded upon the expiration or closing of a futures contract. The net realized gain (loss) and change in net unrealized appreciation (depreciation) on futures contracts during the period is presented in the Statement of Operations.
Any open futures contracts at period end are presented in the Schedule of Investments under the caption "Futures Contracts". The notional amount at value reflects each contract's exposure to the underlying instrument or index at period end, and is representative of volume of activity during the period, unless an average notional amount is presented in the table below.
| | Average Notional Amount ($) |
| VIP Asset Manager Portfolio | 60,268,545 |
Any securities deposited to meet initial margin requirements are identified in the Schedule of Investments. Any cash deposited to meet initial margin requirements is presented as segregated cash with brokers for derivative instruments in the Statement of Assets and Liabilities.
5. Purchases and Sales of Investments.
Purchases and sales of securities, other than short-term securities, U.S. government securities and in-kind transactions, as applicable, are noted in the table below.
| | Purchases ($) | Sales ($) |
| VIP Asset Manager Portfolio | 151,431,877 | 248,734,042 |
6. Fees and Other Transactions with Affiliates.
Management Fee. Fidelity Management & Research Company LLC (the investment adviser) and its affiliates provide the Fund with investment management related services for which the Fund pays a monthly management fee.
Effective March 1, 2024, the Fund's management contract was amended to incorporate administrative services previously covered under separate services agreements (Transfer Agent and Accounting agreements). The amended contract incorporates a management fee rate that may vary by class. The investment adviser or an affiliate pays certain expenses of managing and operating the Fund out of each class's management fee. Each class of the Fund pays a management fee to the investment adviser. The management fee is calculated and paid to the investment adviser every month. When determining a class's management fee, a mandate rate is calculated based on the monthly average net assets of a group of funds advised by FMR within a designated asset class. A discount rate is subtracted from the mandate rate once the Fund's monthly average net assets reach a certain level. The mandate rate and discount rate may vary by class. The annual management fee rate for a class of shares of the Fund is the lesser of (1) the class's mandate rate reduced by the class's discount rate (if applicable) or (2) the amount set forth in the following table.
| | Maximum Management Fee Rate % |
| Initial Class | .55 |
| Service Class | .55 |
| Service Class 2 | .55 |
| Investor Class | .62 |
One-twelfth of the management fee rate for a class is applied to the average net assets of the class for the month, giving a dollar amount which is the management fee for the class for that month. A different management fee rate may be applicable to each class of the Fund. The difference between classes is the result of separate arrangements for class-level services and/or waivers of certain expenses. It is not the result of any difference in advisory or custodial fees or other expenses related to the management of the Fund's assets, which do not vary by class. For the portion of the reporting period on or after March 1, 2024, the total annualized management fee rates were as follows:
| | Total Management Fee Rate % |
| Initial Class | .50 |
| Service Class | .50 |
| Service Class 2 | .50 |
| Investor Class | .58 |
Prior to March 1, 2024, the management fee was the sum of an individual fund fee rate that was based on an annual rate of .25% of the Fund's average net assets and an annualized group fee rate that averaged .22% during the period. The group fee rate was based upon the monthly average net assets of a group of registered investment companies with which the investment adviser has management contracts. The group fee rate decreased as assets under management increased and increased as assets under management decreased. For the portion of the reporting period prior to March 1, 2024, the total annualized management fee rate was .47%.
Effective March 1, 2024, the Fund's sub-advisory agreements with FMR Investment Management (UK) Limited, Fidelity Management & Research (Hong Kong) Limited, and Fidelity Management & Research (Japan) Limited were amended to provide that the investment adviser pays each sub-adviser monthly fees equal to 110% of the sub-adviser's costs for providing sub-advisory services.
Distribution and Service Plan Fees. In accordance with Rule 12b-1 of the 1940 Act, the Fund has adopted separate 12b-1 Plans for each Service Class of shares. Each Service Class pays Fidelity Distributors Company LLC (FDC), an affiliate of the investment adviser, a service fee. For the period, the service fee is based on an annual rate of .10% of Service Class' average net assets and .25% of Service Class 2's average net assets.
For the period, total fees, all of which were re-allowed to insurance companies for the distribution of shares and providing shareholder support services, were as follows:
| Service Class | $2,567 |
| Service Class 2 | 43,257 |
| | $45,824 |
Transfer Agent Fees. Fidelity Investments Institutional Operations Company LLC (FIIOC), an affiliate of the investment adviser, is the Fund's transfer, dividend disbursing, and shareholder servicing agent. Effective March 1, 2024, the Fund's management contract was amended to incorporate transfer agent services and associated fees previously covered under a separate services agreement.
During the period January 1, 2024 through February 29, 2024, the transfer agent fees for each class were a fixed annual rate of class-level average net assets as follows:
| | Amount ($) | % of Class-Level Average Net Assets |
| Initial Class | 72,382 | .0630 |
| Service Class | 262 | .0630 |
| Service Class 2 | 1,727 | .0630 |
| Investor Class | 52,556 | .1390 |
| | 126,927 | |
Accounting Fees. Fidelity Service Company, Inc. (FSC), an affiliate of the investment adviser, maintains the Fund's accounting records. Effective March 1, 2024, the Fund's management contract was amended to incorporate accounting services and associated fees previously covered under a separate services agreement.
During the period January 1, 2024 through February 29, 2024, the accounting fees were a fixed annual rate of average net assets as follows:
| | % of Average Net Assets |
| VIP Asset Manager Portfolio | .0406 |
Interfund Trades. Funds may purchase from or sell securities to other Fidelity Funds under procedures adopted by the Board. The procedures have been designed to ensure these interfund trades are executed in accordance with Rule 17a-7 of the 1940 Act. Any interfund trades are included within the respective purchases and sales amounts shown in the Purchases and Sales of Investments note. Interfund trades during the period are noted in the table below.
| | Purchases ($) | Sales ($) | Realized Gain (Loss) ($) |
| VIP Asset Manager Portfolio | - | 821,000 | (107,312) |
7. Committed Line of Credit.
Certain Funds participate with other funds managed by the investment adviser or an affiliate in a $4.25 billion credit facility (the "line of credit") to be utilized for temporary or emergency purposes to fund shareholder redemptions or for other short-term liquidity purposes.
Commitment fees are charged based on the unused amount of the line of credit at an annual rate of .10%, and then allocated to each participating fund based on its pro-rata portion of the line of credit. The commitment fees are reflected in Miscellaneous expenses on the Statement of Operations, and are listed below.
Interest is charged to a participating fund based on its borrowings at an annual rate of .75% plus the highest of (i) daily SOFR plus a .10% spread adjustment, (ii) Federal Funds Effective Rate, or (iii) Overnight Bank Funding Rate. During the period, there were no borrowings on this line of credit.
The line of credit agreement will expire in March 2025 unless extended or renewed.
| | Amount ($) |
| VIP Asset Manager Portfolio | 1,491 |
8. Security Lending.
Funds lend portfolio securities from time to time in order to earn additional income. Lending agents are used, including National Financial Services (NFS), an affiliate of the investment adviser. Pursuant to a securities lending agreement, NFS will receive a fee, which is capped at 9.9% of a fund's daily lending revenue, for its services as lending agent. A fund may lend securities to certain qualified borrowers, including NFS. On the settlement date of the loan, a fund receives collateral (in the form of U.S. Treasury obligations, letters of credit and/or cash) against the loaned securities and maintains collateral in an amount not less than 100% of the market value of the loaned securities during the period of the loan. The market value of the loaned securities is determined at the close of business of a fund and any additional required collateral is delivered to a fund on the next business day. A fund or borrower may terminate the loan at any time, and if the borrower defaults on its obligation to return the securities loaned because of insolvency or other reasons, a fund may apply collateral received from the borrower against the obligation. A fund may experience delays and costs in recovering the securities loaned. Any cash collateral received is invested in the Fidelity Securities Lending Cash Central Fund. Any loaned securities are identified as such in the Schedule of Investments, and the value of loaned securities and cash collateral at period end, as applicable, are presented in the Statement of Assets and Liabilities. Security lending income represents the income earned on investing cash collateral, less rebates paid to borrowers and any lending agent fees associated with the loan, plus any premium payments received for lending certain types of securities. Security lending income is presented in the Statement of Operations as a component of income from Fidelity Central Funds. Affiliated security lending activity, if any, was as follows:
| | Total Security Lending Fees Paid to NFS ($) | Security Lending Income From Securities Loaned to NFS ($) | Value of Securities Loaned to NFS at Period End ($) |
| VIP Asset Manager Portfolio | 3,028 | - | - |
9. Expense Reductions.
Effective November 1, 2023, the investment adviser has contractually agreed to waive the Fund's management fee with respect to the portion of the Fund's assets invested in certain affiliated ETFs. This waiver cannot be removed or modified without the approval of the Board. During the period this waiver reduced the Fund's management fee as follows:
| | Waiver ($) |
| VIP Asset Manager Portfolio | 48,684 |
Through arrangements with the Fund's custodian, credits realized as a result of certain uninvested cash balances were used to reduce the Fund's expenses. During the period, custodian credits reduced the Fund's expenses by $204.
In addition, during the period the investment adviser or an affiliate reimbursed and/or waived a portion of fund-level operating expenses in the amount of $41,759.
10. Distributions to Shareholders.
Distributions to shareholders of each class were as follows:
| | Year ended December 31, 2024 | Year ended December 31, 2023 |
| VIP Asset Manager Portfolio | | |
| Distributions to shareholders | | |
| Initial Class | $20,535,652 | $23,344,015 |
| Service Class | 73,407 | 82,405 |
| Service Class 2 | 531,677 | 514,496 |
| Investor Class | 6,723,817 | 7,530,918 |
Total | $27,864,553 | $31,471,834 |
11. Share Transactions.
Transactions for each class of shares were as follows and may contain in-kind transactions:
| | Shares | Shares | Dollars | Dollars |
| | Year ended December 31, 2024 | Year ended December 31, 2023 | Year ended December 31, 2024 | Year ended December 31, 2023 |
| VIP Asset Manager Portfolio | | | | |
| Initial Class | | | | |
| Shares sold | 834,242 | 1,463,280 | $13,689,079 | $21,707,385 |
| Reinvestment of distributions | 1,255,943 | 1,521,440 | 20,535,652 | 23,344,015 |
| Shares redeemed | (6,291,021) | (6,576,680) | (103,200,474) | (98,130,807) |
| Net increase (decrease) | (4,200,836) | (3,591,960) | $(68,975,743) | $(53,079,407) |
| Service Class | | | | |
| Shares sold | 384 | 8,878 | $6,203 | $130,736 |
| Reinvestment of distributions | 4,540 | 5,434 | 73,407 | 82,405 |
| Shares redeemed | (17,041) | (27,578) | (284,773) | (415,524) |
| Net increase (decrease) | (12,117) | (13,266) | $(205,163) | $(202,383) |
| Service Class 2 | | | | |
| Shares sold | 168,778 | 111,815 | $2,699,728 | $1,608,434 |
| Reinvestment of distributions | 33,619 | 34,639 | 531,677 | 514,496 |
| Shares redeemed | (152,975) | (134,360) | (2,425,843) | (1,948,738) |
| Net increase (decrease) | 49,422 | 12,094 | $805,562 | $174,192 |
| Investor Class | | | | |
| Shares sold | 336,480 | 138,956 | $5,458,909 | $2,077,606 |
| Reinvestment of distributions | 414,763 | 495,135 | 6,723,817 | 7,530,918 |
| Shares redeemed | (1,891,165) | (1,733,509) | (30,656,998) | (25,817,856) |
| Net increase (decrease) | (1,139,922) | (1,099,418) | $(18,474,272) | $(16,209,332) |
12. Other.
A fund's organizational documents provide former and current trustees and officers with a limited indemnification against liabilities arising in connection with the performance of their duties to the fund. In the normal course of business, a fund may also enter into contracts that provide general indemnifications. A fund's maximum exposure under these arrangements is unknown as this would be dependent on future claims that may be made against a fund. The risk of material loss from such claims is considered remote.
At the end of the period, the investment adviser or its affiliates were owners of record of more than 10% and certain otherwise unaffiliated shareholders each were owners of record of more than 10% of the outstanding shares as follows:
| Fund | Affiliated % | Number ofUnaffiliated Shareholders | Unaffiliated Shareholders % |
| VIP Asset Manager Portfolio | 44% | 2 | 27% |
13. Risk and Uncertainties.
Many factors affect a fund's performance. Developments that disrupt global economies and financial markets, such as pandemics, epidemics, outbreaks of infectious diseases, war, terrorism, and environmental disasters, may significantly affect a fund's investment performance. The effects of these developments to a fund will be impacted by the types of securities in which a fund invests, the financial condition, industry, economic sector, and geographic location of an issuer, and a fund's level of investment in the securities of that issuer. Significant concentrations in security types, issuers, industries, sectors, and geographic locations may magnify the factors that affect a fund's performance.
Report of Independent Registered Public Accounting Firm
To the Board of Trustees of Variable Insurance Products Fund V and the Shareholders of VIP Asset Manager Portfolio:
Opinion on the Financial Statements and Financial Highlights
We have audited the accompanying statement of assets and liabilities of VIP Asset Manager Portfolio (the "Fund"), a fund of Variable Insurance Products Fund V, including the schedule of investments, as of December 31, 2024, the related statement of operations for the year then ended, the statement of changes in net assets for each of the two years in the period then ended, the financial highlights for each of the five years in the period then ended, and the related notes. In our opinion, the financial statements and financial highlights present fairly, in all material respects, the financial position of the Fund as of December 31, 2024, and the results of its operations for the year then ended, the changes in its net assets for each of the two years in the period then ended, and the financial highlights for each of the five years in the period then ended in conformity with accounting principles generally accepted in the United States of America.
Basis for Opinion
These financial statements and financial highlights are the responsibility of the Fund's management. Our responsibility is to express an opinion on the Fund's financial statements and financial highlights based on our audits. We are a public accounting firm registered with the Public Company Accounting Oversight Board (United States) (PCAOB) and are required to be independent with respect to the Fund in accordance with the U.S. federal securities laws and the applicable rules and regulations of the Securities and Exchange Commission and the PCAOB.
We conducted our audits in accordance with the standards of the PCAOB. Those standards require that we plan and perform the audit to obtain reasonable assurance about whether the financial statements and financial highlights are free of material misstatement, whether due to error or fraud. The Fund is not required to have, nor were we engaged to perform, an audit of its internal control over financial reporting. As part of our audits, we are required to obtain an understanding of internal control over financial reporting but not for the purpose of expressing an opinion on the effectiveness of the Fund's internal control over financial reporting. Accordingly, we express no such opinion.
Our audits included performing procedures to assess the risks of material misstatement of the financial statements and financial highlights, whether due to error or fraud, and performing procedures that respond to those risks. Such procedures included examining, on a test basis, evidence regarding the amounts and disclosures in the financial statements and financial highlights. Our audits also included evaluating the accounting principles used and significant estimates made by management, as well as evaluating the overall presentation of the financial statements and financial highlights. Our procedures included confirmation of securities owned as of December 31, 2024, by correspondence with the custodian and brokers; when replies were not received from brokers, we performed other auditing procedures. We believe that our audits provide a reasonable basis for our opinion.
/s/ Deloitte & Touche LLP
Boston, Massachusetts
February 14, 2025
We have served as the auditor of one or more of the Fidelity investment companies since 1999.
Distributions
(Unaudited)The dividend and capital gains distributions for the fund(s) are available on Fidelity.com or Institutional.Fidelity.com.
The fund hereby designates as a capital gain dividend with respect to the taxable year ended December 31, 2024, $42,005,389, or, if subsequently determined to be different, the net capital gain of such year.
A total of 13.10% of the dividends distributed during the fiscal year was derived from interest on U.S. Government securities which is generally exempt from state income tax.
The fund designates $12,943,220 of distributions paid during the fiscal year ended 2024 as qualifying to be taxed as section 163(j) interest dividends.
Initial Class designates 13%; Service Class designates 13%; Service Class 2 designates 14%; and Investor Class designates 13%; of the dividend distributed respectively during the fiscal year as qualifying for the dividends-received deduction for corporate shareholders.
The amounts per share which represent income derived from sources within, and taxes paid to, foreign countries or possessions of the United States are as follows:
| | Pay Date | Income | Taxes |
| VIP Asset Manager Portfolio | | | |
| Initial Class | 12/30/2024 | $0.0854 | $0.0106 |
| Service Class | 12/30/2024 | $0.0818 | $0.0106 |
| Service Class 2 | 12/30/2024 | $0.0793 | $0.0106 |
| Investor Class | 12/30/2024 | $0.0831 | $0.0106 |
Item 8: Changes in and Disagreements with Accountants for Open-End Management Investment Companies
(Unaudited)
Note: This is not applicable for any fund included in this document.
Item 9: Proxy Disclosures for Open-End Management Investment Companies
(Unaudited)
Note: This is not applicable for any fund included in this document.
Item 10: Remuneration Paid to Directors, Officers, and others of Open-End Management Investment Companies
(Unaudited)
Note: This information is disclosed as part of the financial statements for each Fund as part of Item 7: Financial Statements and Financial Highlights for Open-End Management Investment companies.
Item 11: Statement Regarding Basis for Approval of Investment Advisory Contract
(Unaudited)
Board Approval of Investment Advisory Contracts and Management Fees
VIP Asset Manager Portfolio
Each year, the Board of Trustees, including the Independent Trustees (together, the Board), considers the renewal of the fund's management contract with Fidelity Management & Research Company LLC (FMR) and the sub-advisory agreements (together, the Advisory Contracts) for the fund. FMR and the sub-advisers are referred to herein as the Investment Advisers. The Board, assisted by the advice of fund counsel and Independent Trustees' counsel, requests and considers a broad range of information relevant to the renewal of the Advisory Contracts throughout the year.
The Board meets regularly and, at each of its meetings, covers an extensive agenda of topics and materials and considers factors that are relevant to its annual consideration of the renewal of the fund's Advisory Contracts, including the services and support provided to the fund and its shareholders. The Board's Operations Committee, of which all the Independent Trustees are members, meets regularly throughout the year and requests, receives and considers, among other matters, information related to the annual consideration of the renewal of the fund's Advisory Contracts before making its recommendation to the Board. The Board also meets as needed to review matters specifically related to the Board's annual consideration of the renewal of the Advisory Contracts. Members of the Board may also meet from time to time with trustees of other Fidelity funds through joint ad hoc committees to discuss certain matters relevant to all of the Fidelity funds.
At its September 2024 meeting, the Board unanimously determined to renew the fund's Advisory Contracts. In reaching its determination, the Board considered all factors it believed relevant, including (i) the nature, extent, and quality of the services provided to the fund and its shareholders (including the investment performance of the fund); (ii) the competitiveness relative to peer funds of the fund's management fee and the total expense ratio of a representative class (Investor Class, which was selected because it was the largest class without 12b-1 fees); (iii) the total costs of the services provided by and the profits realized by FMR and its affiliates (Fidelity) from its relationships with the fund; and (iv) the extent to which, if any, economies of scale exist and are realized as the fund grows, and whether any economies of scale are appropriately shared with fund shareholders. The Board also considered the broad range of investment choices available to shareholders from FMR's competitors and that the fund's shareholders have chosen to invest in the fund, which is part of the Fidelity family of funds. The Board's decision to renew the Advisory Contracts was not based on any single factor and the factors may have been weighed differently by different Trustees.
The Board reached a determination, with the assistance of fund counsel and Independent Trustees' counsel and through the exercise of its business judgment, that the renewal of the Advisory Contracts was in the best interests of the fund and its shareholders and that the compensation payable under the Advisory Contracts was fair and reasonable in light of all of the surrounding circumstances.
Nature, Extent, and Quality of Services Provided. The Board considered Fidelity's staffing as it relates to the fund, including the backgrounds and experience of investment personnel, and also considered the Investment Advisers' implementation of the fund's investment program. The Independent Trustees also had discussions with senior management of Fidelity's investment operations and investment groups. The Board considered the structure of the investment personnel compensation program and whether this structure provides appropriate incentives to act in the best interests of the fund. Additionally, the Board considered the portfolio managers' investments, if any, in the funds that they manage.
Resources Dedicated to Investment Management and Support Services. The Board reviewed the general qualifications and capabilities of Fidelity's investment staff, including its size, education, experience, and resources, as well as Fidelity's approach to recruiting, training, managing, and compensating investment personnel. The Board noted the resources devoted to Fidelity's global investment organization, and that Fidelity's analysts have extensive resources, tools and capabilities that allow them to conduct quantitative and fundamental analysis, as well as credit analysis of issuers, counterparties and guarantors. Further, the Board considered that Fidelity's investment professionals have sufficient access to global information and data so as to provide competitive investment results over time, and that those professionals also have access to sophisticated tools that permit them to assess portfolio construction and risk and performance attribution characteristics continuously, as well as to transmit new information and research conclusions rapidly around the world. Additionally, in its deliberations, the Board considered Fidelity's trading, risk management, compliance, cybersecurity, and technology and operations capabilities and resources, which are integral parts of the investment management process.
Shareholder and Administrative Services. The Board considered (i) the nature, extent, quality, and cost of advisory, administrative, shareholder, transfer agency, and pricing and bookkeeping services performed by the Investment Advisers and their affiliates under the Advisory Contracts; (ii) the nature and extent of Fidelity's supervision of third party service providers, principally custodians, subcustodians, and pricing vendors; and (iii) the resources devoted by Fidelity to, and the record of compliance with, the fund's compliance policies and procedures, including with respect to liquidity risk management. The Board also reviewed the allocation of fund brokerage, including allocations to brokers affiliated with the Investment Advisers, the use of brokerage commissions to pay fund expenses, and the use of "soft" commission dollars to pay for research services. The Board also considered the fund's securities lending activities and any payments made to Fidelity relating to securities lending under a separate agreement.
The Board noted that the growth of fund assets over time across the complex allows Fidelity to reinvest in the development of services designed to enhance the value and convenience of the Fidelity funds as investment vehicles. These services include 24-hour access to account information and market information over the Internet and through telephone representatives, investor education materials and asset allocation tools. The Board also considered that it reviews customer service metrics such as telephone response times, continuity of services on the website and metrics addressing services at Fidelity Investor Centers.
Investment in a Large Fund Family. The Board considered the benefits to shareholders of investing in a fund that is part of a large family of funds offering a variety of investment disciplines and providing a large variety of fund investor services. The Board noted that Fidelity had taken, or had made recommendations to the Board that resulted in the Fidelity funds taking, a number of actions over the previous year that benefited particular funds and/or the Fidelity funds in general.
Investment Performance. The Board took into account discussions that occur with representatives of the Investment Advisers, and reports that it receives, at Board meetings throughout the year relating to fund investment performance. In this regard the Board noted that as part of regularly scheduled fund reviews and other reports to the Board on fund performance, the Board considered annualized return information for the fund for different time periods, measured against one or more appropriate securities market indices, including a customized blended index that reflects the respective weights of the fund's asset classes (each a benchmark index) and an appropriate peer group of funds with similar objectives (peer group). The Board also considered information about performance attribution. In its evaluation of fund investment performance at meetings throughout the year, the Board gave particular attention to information indicating underperformance of certain Fidelity funds over different time periods and discussed with the Investment Advisers the reasons for such underperformance.
In addition to reviewing absolute and relative fund performance, the Independent Trustees periodically consider the appropriateness of fund performance metrics in evaluating the results achieved. The Independent Trustees generally give greater weight to fund performance over longer time periods than over shorter time periods. Depending on the circumstances, the Independent Trustees may be satisfied with a fund's performance notwithstanding that it lags its benchmark index or peer group for certain periods.
Based on its review, the Board concluded that the nature, extent, and quality of services provided to the fund under the Advisory Contracts should continue to benefit the shareholders of the fund.
Competitiveness of Management Fee and Total Expense Ratio. The Board was provided with information regarding industry trends in management fees and expenses. The Board considered that, effective March 1, 2024, an amended Advisory Contract with FMR went into effect with class-level management fees based on tiered schedules and subject to a maximum class-level rate (the management fee). The Board also considered that in exchange for the variable management fee, each class of the fund receives investment advisory, management, administrative, transfer agent, and pricing and bookkeeping services. In its review of the management fee and total expense ratio of Investor Class, the Board considered a pro forma management fee rate for Investor Class as if the new management fee structure had been in effect for the 12-month period ended December 31, 2023, as well as other third-party fund expenses, as applicable, such as custodial, legal, and audit fees and any fund-paid 12b-1 fees. The Board noted that Fidelity may agree to waive fees or reimburse expenses from time to time, and the extent to which, if any, it has done so for the fund.
Comparisons of Management Fees and Total Expense Ratios. Among other things, the Board reviewed data for selected groups of competitive funds and classes (referred to as "mapped groups") that were compiled by Fidelity based on combining similar investment objective categories (as classified by Morningstar) that have comparable investment mandates. The data reviewed by the Board included (i) gross management fee comparisons (before taking into account expense reimbursements or caps) relative to the total universe of funds within the mapped group; (ii) gross management fee comparisons relative to a subset of non-Fidelity funds in the mapped group that are similar in size and management fee structure to the fund (referred to as the "asset size peer group"); (iii) total expense comparisons of Investor Class of the fund relative to funds and classes in the mapped group that have a similar sales load structure to Investor Class of the fund (referred to as the "similar sales load structure group"); and (iv) total expense comparisons of Investor Class of the fund relative to funds and classes in the similar sales load structure group that are similar in size and management fee structure to the fund (referred to as the "total expense asset size peer group"). The total expense asset size peer group comparison excludes performance adjustments and fund-paid 12b-1 fees to eliminate variability in fee structures.
The information provided to the Board indicated that the fund's management fee rate ranked below the competitive median of the mapped group for 2023 and below the competitive median of the asset size peer group for 2023. Further, the information provided to the Board indicated that the total expense ratio of Investor Class of the fund ranked below the competitive median of the similar sales load structure group for 2023 and below the competitive median of the total expense asset size peer group for 2023.
The Board noted that a different variable management fee rate is applicable to each class of the fund. The Board considered that the difference in management fee rates between classes is the result of separate arrangements for class-level services and/or waivers of certain expenses and not the result of any difference in advisory or custodial fees or other expenses related to the management of the fund's assets, which do not vary by class.
Fees Charged to Other Fidelity Clients. The Board also considered Fidelity fee structures and other information with respect to clients of Fidelity, such as other funds advised or subadvised by Fidelity, pension plan clients, and other institutional clients with similar mandates. The Board noted that a joint ad hoc committee created by it and the boards of other Fidelity funds periodically reviews and compares Fidelity's institutional investment advisory business with its business of providing services to the Fidelity funds and also noted the most recent findings of the committee. The Board noted that the committee's review included a consideration of the differences in services provided, fees charged, and costs incurred, as well as competition in the markets serving the different categories of clients.
Based on its review, the Board concluded that the fund's management fee is fair and reasonable in light of the services that the fund receives and the other factors considered. Further, based on its review of total expense ratios and fees charged to other Fidelity clients, the Board concluded that the total expense ratio of each class of the fund was reasonable in light of the services that the fund and its shareholders receive and the other factors considered.
Costs of the Services and Profitability. The Board considered the revenues earned and the expenses incurred by Fidelity in conducting the business of developing, marketing, distributing, managing, administering and servicing the fund and servicing the fund's shareholders. The Board also considered the level of Fidelity's profits in respect of all the Fidelity funds.
On an annual basis, Fidelity presents to the Board information about the profitability of its relationships with the fund. Fidelity calculates profitability information for each Fidelity fund, as well as aggregate profitability information for groups of Fidelity funds and all Fidelity funds, using a series of detailed revenue and cost allocation methodologies which originate with the books and records of Fidelity on which Fidelity's audited financial statements are based. The Audit Committee of the Board reviews any significant changes from the prior year's methodologies.
A public accounting firm has been engaged annually by the Board as part of the Board's assessment of Fidelity's profitability analysis. The engagement includes the review and assessment of the methodologies used by Fidelity in determining the revenues and expenses attributable to Fidelity's fund business. After considering the reports issued under the engagement and information provided by Fidelity, the Board concluded that while other allocation methods may also be reasonable, Fidelity's profitability methodologies are reasonable in all material respects.
The Board also reviewed Fidelity's non-fund businesses and potential indirect benefits such businesses may have received as a result of their association with Fidelity's fund business (i.e., fall-out benefits) as well as cases where Fidelity's affiliates may benefit from the funds' business. The Board considered areas where potential indirect benefits to the Fidelity funds from their relationships with Fidelity may exist. The Board's consideration of these matters was informed by the findings of a joint ad hoc committee created by it and the boards of other Fidelity funds to evaluate potential fall-out benefits.
The Board considered the costs of the services provided by and the profits realized by Fidelity in connection with the operation of the fund and was satisfied that the profitability was not excessive.
Economies of Scale. The Board considered whether there have been economies of scale in respect of the management of the Fidelity funds, whether the Fidelity funds (including the fund) have appropriately benefited from any such economies of scale, and whether there is potential for realization of any further economies of scale. The Board considered the extent to which the fund will benefit from economies of scale as assets grow through increased services to the fund, through waivers or reimbursements, or through fee or expense ratio reductions. The Board also noted that a committee created by it and the boards of other Fidelity funds periodically analyzes whether Fidelity attains economies of scale in respect of the management and servicing of the Fidelity funds, whether the Fidelity funds have appropriately benefited from such economies of scale, and whether there is potential for realization of any further economies of scale.
The Board recognized that the fund's management contract incorporates a variable management fee structure, which provides breakpoints as a way to share, in part, any potential economies of scale that may exist at the asset class level determined based on the total net assets of specified Fidelity funds in the same asset class as the fund and through a discount determined based on both fund size and total assets of a broader group of specified Fidelity funds. The Board considered that the variable management fee is designed to deliver the benefits of economies of scale to fund shareholders even if assets of any particular fund are unchanged or have declined, because some portion of Fidelity's costs are attributable to services provided to all funds subject to the variable management fee, and all such funds benefit if those costs can be allocated among more assets. The Board concluded that, given the variable management fee structure, fund shareholders will benefit from lower management fees due to the application of the breakpoints and discount, regardless of whether Fidelity achieves any such economies of scale.
The Board concluded, taking into account the analysis of the committee, that economies of scale, if any, are being appropriately shared between fund shareholders and Fidelity.
Additional Information Requested by the Board. In order to develop fully the factual basis for consideration of the Fidelity funds' advisory contracts, the Board requested and received additional information on certain topics, including: (i) portfolio manager changes that have occurred during the past year; (ii) hiring, training, compensating, and retaining adviser and sub-adviser personnel; (iii) the terms of the funds' various management fee structures and arrangements for transfer agent and pricing and bookkeeping services; (iv) Fidelity's fund profitability methodology, profitability trends for certain funds, the allocation of various costs to different funds, and the impact of certain factors on fund profitability results; (v) the impact on fund profitability of recent industry trends, such as the growth in passively managed funds and the changes in flows for different types of funds; (vi) the types of management fee and total expense comparisons provided, and the challenges and limitations associated with such information; (vii) explanations regarding the relative total expense ratios and management fees of certain funds and classes, total expense and management fee competitive trends, and methodologies for total expense and management fee competitive comparisons; (viii) matters related to money market funds, exchange-traded funds, and target date funds; (ix) the arrangements with and compensation paid to certain fund sub-advisers and the treatment of such compensation within Fidelity's fund profitability methodology; and (x) the terms of management contracts between Fidelity and other funds and products not overseen by the Board.
Conclusion. Based on its evaluation of all of the conclusions noted above, and after considering all factors it believed relevant, the Board, including the Independent Trustees, concluded that the advisory and sub-advisory fee arrangements are fair and reasonable in light of all of the circumstances and that the fund's Advisory Contracts should be renewed through September 30, 2025.
1.540206.127
VIPAM-ANN-0325
Fidelity® Variable Insurance Products:
VIP Bond Index Portfolio
Annual Report
December 31, 2024
Contents
To view a fund's proxy voting guidelines and proxy voting record for the 12-month period ended June 30, visit http://www.fidelity.com/proxyvotingresults or visit the Securities and Exchange Commission's (SEC) web site at http://www.sec.gov.
You may also call 1-877-208-0098 to request a free copy of the proxy voting guidelines.
Fidelity® Variable Insurance Products are separate account options which are purchased through a variable insurance contract.
BLOOMBERG ® is a trademark and service mark of Bloomberg Finance L.P. and its affiliates (collectively "Bloomberg"). Bloomberg or Bloomberg's licensors own all proprietary rights in the Bloomberg Indices. Neither Bloomberg nor Bloomberg's licensors approves or endorses this material, or guarantees the accuracy or completeness of any information herein, or makes any warranty, express or implied, as to the results to be obtained therefrom and, to the maximum extent allowed by law, neither shall have any liability or responsibility for injury or damages arising in connection therewith.
Standard & Poor's, S&P and S&P 500 are registered service marks of The McGraw-Hill Companies, Inc. and have been licensed for use by Fidelity Distributors Corporation.
Other third-party marks appearing herein are the property of their respective owners.
All other marks appearing herein are registered or unregistered trademarks or service marks of FMR LLC or an affiliated company. © 2025 FMR LLC. All rights reserved.
This report and the financial statements contained herein are submitted for the general information of the shareholders of the Fund. This report is not authorized for distribution to prospective investors in the Fund unless preceded or accompanied by an effective prospectus.
A fund files its complete schedule of portfolio holdings with the SEC for the first and third quarters of each fiscal year on Form N-PORT. Forms N-PORT are available on the SEC's web site at http://www.sec.gov. A fund's Forms N-PORT may be reviewed and copied at the SEC's Public Reference Room in Washington, DC. Information regarding the operation of the SEC's Public Reference Room may be obtained by calling 1-800-SEC-0330.
For a complete list of a fund's portfolio holdings, view the most recent holdings listing, semiannual report, or annual report on Fidelity's web site at http://www.fidelity.com, http://www.institutional.fidelity.com, or http://www.401k.com, as applicable.
NOT FDIC INSURED •MAY LOSE VALUE •NO BANK GUARANTEE
Neither the Fund nor Fidelity Distributors Corporation is a bank.
Item 7: Financial Statements and Financial Highlights for Open-End Management Investment Companies (Annual Report)
Schedule of Investments December 31, 2024
Showing Percentage of Net Assets
| Asset-Backed Securities - 0.3% |
| | | Principal Amount (a) | Value ($) |
| UNITED STATES - 0.3% | | | |
| American Express Credit Account Master Trust Series 2023-4 Class A, 5.15% 9/15/2030 | | 100,000 | 101,742 |
| Capital One Multi-Asset Execution Trust Series 2019-A3 Class A3, 2.06% 8/15/2028 | | 116,000 | 111,599 |
| Capital One Multi-Asset Execution Trust Series 2021-A2 Class A2, 1.39% 7/15/2030 | | 150,000 | 134,030 |
| Capital One Prime Auto Receivables Trust 2023-1 Series 2023-1 Class A3, 4.87% 2/15/2028 | | 60,000 | 60,222 |
| CarMax Auto Owner Trust Series 2022-3 Class A3, 3.97% 4/15/2027 | | 201,104 | 200,493 |
| CarMax Auto Owner Trust Series 2023-2 Class A3, 5.05% 1/18/2028 | | 220,000 | 220,991 |
| Carmax Auto Owner Trust Series 2024-4 Class A3, 4.6% 10/15/2029 | | 200,000 | 199,967 |
| Chase Issuance Trust Series 2023-A2 Class A, 5.08% 9/15/2030 | | 400,000 | 406,531 |
| Citibank Credit Card Issuance Trust Series 2018-A7 Class A7, 3.96% 10/13/2030 | | 250,000 | 243,794 |
| Ford Cr Floorplan Mast Own Tr Series 2018-4 Class A, 4.06% 11/15/2030 | | 258,000 | 252,032 |
| Ford Credit Auto Owner Trust Series 2023-A Class A3, 4.65% 2/15/2028 | | 156,000 | 156,195 |
| Ford Credit Auto Owner Trust Series 2024-D Class A3, 4.61% 8/15/2029 | | 250,000 | 250,151 |
| GM Financial Consumer Automobile Receivables Trust Series 2023-2 Class A3, 4.47% 2/16/2028 | | 220,000 | 219,992 |
| Hyundai Auto Receivables Trust Series 2022-B Class A3, 3.72% 11/16/2026 | | 111,440 | 111,069 |
| Hyundai Auto Receivables Trust Series 2022-C Class A3, 5.39% 6/15/2027 | | 117,505 | 118,118 |
| Hyundai Auto Receivables Trust Series 2023-A Class A3, 4.58% 4/15/2027 | | 206,502 | 206,568 |
TOTAL UNITED STATES | | | 2,993,494 |
| TOTAL ASSET-BACKED SECURITIES (Cost $3,040,307) | | | 2,993,494 |
| | | | |
| Bank Notes - 0.1% |
| | | Principal Amount (a) | Value ($) |
| UNITED STATES - 0.1% | | | |
| Financials - 0.1% | | | |
| Banks - 0.1% | | | |
| Bank of America NA 6% 10/15/2036 | | 250,000 | 259,578 |
| Discover Bank 2.7% 2/6/2030 | | 500,000 | 441,198 |
| PNC Bank NA 3.875% 4/10/2025 | | 260,000 | 259,177 |
| Truist Bank 3.3% 5/15/2026 | | 200,000 | 195,833 |
| US Bank NA/Cincinnati OH 2.8% 1/27/2025 | | 1,000,000 | 998,142 |
| | | | |
| TOTAL BANK NOTES (Cost $2,223,334) | | | 2,153,928 |
| | | | |
| Commercial Mortgage Securities - 1.2% |
| | | Principal Amount (a) | Value ($) |
| UNITED STATES - 1.2% | | | |
| BANK Series 2017-BNK4 Class ASB, 3.419% 5/15/2050 | | 82,096 | 81,064 |
| BANK Series 2020-BN28 Class A4, 1.844% 3/15/2063 | | 360,000 | 301,492 |
| BANK Series 2022-BNK39 Class A4, 2.928% 2/15/2055 | | 100,000 | 86,244 |
| BBCMS Mortgage Trust Series 2021-C12 Class A5, 2.689% 11/15/2054 | | 220,000 | 188,266 |
| BBCMS Mortgage Trust Series 2024-C26 Class A5, 5.829% 5/15/2057 (b) | | 281,000 | 293,297 |
| Benchmark Mortgage Trust Series 2019-B12 Class A5, 3.1156% 8/15/2052 | | 36,000 | 32,798 |
| Benchmark Mortgage Trust Series 2019-B9 Class A5, 4.0156% 3/15/2052 | | 130,000 | 123,522 |
| Benchmark Mortgage Trust Series 2020-B19 Class A5, 1.85% 9/15/2053 | | 410,000 | 341,297 |
| Benchmark Mortgage Trust Series 2021-B24 Class A5, 2.5843% 3/15/2054 | | 500,000 | 422,455 |
| BMO Mortgage Trust Series 2022-C1 Class A5, 3.374% 2/15/2055 | | 100,000 | 88,254 |
| BMO Mortgage Trust Series 2024-C9 Class A5, 5.7592% 7/15/2057 | | 225,000 | 232,767 |
| Citigroup Commercial Mortgage Trust Series 2015-GC29 Class A4, 3.192% 4/10/2048 | | 70,329 | 70,000 |
| Citigroup Commercial Mortgage Trust Series 2016-C1 Class A4, 3.209% 5/10/2049 | | 90,000 | 87,896 |
| Citigroup Commercial Mortgage Trust Series 2018-B2 Class A4, 4.009% 3/10/2051 | | 1,000,000 | 970,440 |
| Computershare Corporate Trust Series 2018-C48 Class A5, 4.302% 1/15/2052 | | 123,000 | 119,584 |
| CSAIL Commercial Mortgage Trust Series 2019-C17 Class A4, 2.7628% 9/15/2052 | | 200,000 | 181,534 |
| CSAIL Commercial Mortgage Trust Series 2019-C17 Class A5, 3.0161% 9/15/2052 | | 200,000 | 179,654 |
| Freddie Mac Multifamily Structured pass-thru certificates Series 2016-K057 Class A2, 2.57% 7/25/2026 | | 159,400 | 155,197 |
| Freddie Mac Multifamily Structured pass-thru certificates Series 2017-K068 Class A2, 3.244% 8/25/2027 | | 130,000 | 125,651 |
| Freddie Mac Multifamily Structured pass-thru certificates Series 2018-K079 Class A2, 3.926% 6/25/2028 | | 20,000 | 19,519 |
| Freddie Mac Multifamily Structured pass-thru certificates Series 2018-K080 Class A2, 3.926% 7/25/2028 | | 80,000 | 78,075 |
| Freddie Mac Multifamily Structured pass-thru certificates Series 2019-1510 Class A2, 3.718% 1/25/2031 | | 124,000 | 116,528 |
| Freddie Mac Multifamily Structured pass-thru certificates Series 2019-K094 Class A2, 2.903% 6/25/2029 | | 300,000 | 278,420 |
| Freddie Mac Multifamily Structured pass-thru certificates Series 2020-K104 Class A2, 2.253% 1/25/2030 | | 680,000 | 605,478 |
| Freddie Mac Multifamily Structured pass-thru certificates Series 2020-K116 Class A2, 1.378% 7/25/2030 | | 770,000 | 644,681 |
| Freddie Mac Multifamily Structured pass-thru certificates Series 2020-K117 Class A2, 1.406% 8/25/2030 | | 590,000 | 493,087 |
| Freddie Mac Multifamily Structured pass-thru certificates Series 2020-K118 Class A2, 1.493% 9/25/2030 | | 590,000 | 494,394 |
| Freddie Mac Multifamily Structured pass-thru certificates Series 2020-K121 Class A2, 1.547% 10/25/2030 | | 890,000 | 744,384 |
| Freddie Mac Multifamily Structured pass-thru certificates Series 2021-K123 Class A2, 1.621% 12/25/2030 | | 700,000 | 586,549 |
| Freddie Mac Multifamily Structured pass-thru certificates Series 2021-K125 Class A2, 1.846% 1/25/2031 | | 100,000 | 84,623 |
| Freddie Mac Multifamily Structured pass-thru certificates Series 2021-K126 Class A2, 2.074% 1/25/2031 | | 200,000 | 171,744 |
| Freddie Mac Multifamily Structured pass-thru certificates Series 2021-K128 Class A2, 2.02% 3/25/2031 | | 200,000 | 170,741 |
| Freddie Mac Multifamily Structured pass-thru certificates Series 2022-K140 Class A2, 2.25% 1/25/2032 | | 800,000 | 675,620 |
| Freddie Mac Multifamily Structured pass-thru certificates Series 2023-156 Class A2, 4.43% 2/25/2033 | | 125,000 | 121,082 |
| GS Mortgage Securities Trust Series 2020-GC45 Class A5, 2.9106% 2/13/2053 | | 260,000 | 233,220 |
| JPMBB Commercial Mortgage Securities Trust Series 2014-C24 Class A5, 3.6385% 11/15/2047 | | 12,938 | 12,902 |
| JPMDB Commercial Mortgage Securities Trust Series 2020-COR7 Class A5, 2.1798% 5/13/2053 | | 500,000 | 405,925 |
| Morgan Stanley Capital I Trust Series 2020-L4 Class A3, 2.698% 2/15/2053 | | 100,000 | 89,195 |
| UBS Commercial Mortgage Trust Series 2019-C16 Class A4, 3.6048% 4/15/2052 | | 350,000 | 325,470 |
| Wells Fargo Commercial Mortgage Trust Series 2019-C52 Class A5, 2.892% 8/15/2052 | | 200,000 | 180,870 |
| Wells Fargo Commercial Mortgage Trust Series 2019-C54 Class A4, 3.146% 12/15/2052 | | 538,000 | 489,715 |
| Wells Fargo Commercial Mortgage Trust Series 2020-C55 Class A5, 2.725% 2/15/2053 | | 90,000 | 80,116 |
TOTAL UNITED STATES | | | 11,183,750 |
| TOTAL COMMERCIAL MORTGAGE SECURITIES (Cost $12,842,315) | | | 11,183,750 |
| | | | |
| Foreign Government and Government Agency Obligations - 1.5% |
| | | Principal Amount (a) | Value ($) |
| CANADA - 0.3% | | | |
| Province of Alberta 1.3% 7/22/2030 | | 130,000 | 108,506 |
| Province of Alberta 3.3% 3/15/2028 | | 75,000 | 72,329 |
| Province of British Columbia 4.2% 7/6/2033 | | 140,000 | 133,032 |
| Province of British Columbia 4.9% 4/24/2029 | | 200,000 | 202,194 |
| Province of Ontario 1.05% 5/21/2027 | | 1,413,000 | 1,304,397 |
| Province of Ontario 1.125% 10/7/2030 | | 175,000 | 143,684 |
| Province of Ontario 2.125% 1/21/2032 | | 200,000 | 167,920 |
| Province of Ontario 2.3% 6/15/2026 | | 50,000 | 48,506 |
| Province of Ontario 2.5% 4/27/2026 | | 115,000 | 112,137 |
| Province of Quebec 1.9% 4/21/2031 | | 220,000 | 185,810 |
| Province of Quebec 2.75% 4/12/2027 | | 95,000 | 91,480 |
| Province of Quebec 3.625% 4/13/2028 | | 250,000 | 243,058 |
| Province of Quebec 4.25% 9/5/2034 | | 50,000 | 47,276 |
TOTAL CANADA | | | 2,860,329 |
| CHILE - 0.1% | | | |
| Chilean Republic 2.45% 1/31/2031 | | 220,000 | 188,719 |
| Chilean Republic 3.24% 2/6/2028 | | 200,000 | 189,500 |
| Chilean Republic 3.86% 6/21/2047 | | 325,000 | 243,142 |
| Chilean Republic 4.95% 1/5/2036 | | 270,000 | 256,333 |
TOTAL CHILE | | | 877,694 |
| INDONESIA - 0.1% | | | |
| Indonesia Government 2.85% 2/14/2030 | | 200,000 | 178,750 |
| Indonesia Government 3.5% 2/14/2050 | | 500,000 | 358,125 |
| Indonesia Government 3.85% 10/15/2030 | | 348,000 | 324,510 |
| Indonesia Government 4.1% 4/24/2028 | | 200,000 | 193,500 |
TOTAL INDONESIA | | | 1,054,885 |
| ISRAEL - 0.1% | | | |
| Israel Government 2.75% 7/3/2030 | | 210,000 | 182,585 |
| Israel Government 3.25% 1/17/2028 | | 200,000 | 188,999 |
| Israel Government 3.375% 1/15/2050 | | 225,000 | 145,906 |
| Israel Government 5.5% 3/12/2034 | | 200,000 | 195,122 |
TOTAL ISRAEL | | | 712,612 |
| ITALY - 0.0% | | | |
| Italian Republic 2.875% 10/17/2029 | | 350,000 | 316,791 |
| Italian Republic 4% 10/17/2049 | | 200,000 | 141,969 |
TOTAL ITALY | | | 458,760 |
| JAPAN - 0.0% | | | |
| Japan International Cooperation Agency 1.75% 4/28/2031 | | 200,000 | 166,494 |
| KOREA (SOUTH) - 0.0% | | | |
| Korean Republic 1% 9/16/2030 | | 230,000 | 188,366 |
| Korean Republic 4.5% 7/3/2029 | | 200,000 | 198,888 |
TOTAL KOREA (SOUTH) | | | 387,254 |
| MEXICO - 0.4% | | | |
| United Mexican States 3.25% 4/16/2030 | | 1,971,000 | 1,715,756 |
| United Mexican States 3.5% 2/12/2034 | | 619,000 | 492,685 |
| United Mexican States 4.5% 1/31/2050 | | 480,000 | 337,440 |
| United Mexican States 4.75% 3/8/2044 | | 120,000 | 91,313 |
| United Mexican States 4.75% 4/27/2032 | | 387,000 | 350,622 |
| United Mexican States 6.05% 1/11/2040 | | 170,000 | 157,781 |
TOTAL MEXICO | | | 3,145,597 |
| PANAMA - 0.1% | | | |
| Panamanian Republic 3.16% 1/23/2030 | | 800,000 | 668,760 |
| Panamanian Republic 4.5% 4/16/2050 | | 250,000 | 154,058 |
| Panamanian Republic 6.7% 1/26/2036 | | 100,000 | 92,850 |
TOTAL PANAMA | | | 915,668 |
| PERU - 0.1% | | | |
| Peruvian Republic 1.862% 12/1/2032 | | 340,000 | 257,869 |
| Peruvian Republic 2.78% 12/1/2060 | | 100,000 | 52,781 |
| Peruvian Republic 2.844% 6/20/2030 | | 390,000 | 343,444 |
| Peruvian Republic 3.55% 3/10/2051 | | 170,000 | 113,900 |
| Peruvian Republic 5.875% 8/8/2054 | | 70,000 | 66,653 |
TOTAL PERU | | | 834,647 |
| PHILIPPINES - 0.1% | | | |
| Philippine Republic 2.65% 12/10/2045 | | 600,000 | 378,750 |
| Philippine Republic 3% 2/1/2028 | | 200,000 | 187,750 |
| Philippine Republic 4.75% 3/5/2035 | | 200,000 | 189,750 |
| Philippine Republic 5% 7/17/2033 | | 200,000 | 196,000 |
| Philippine Republic 5.17% 10/13/2027 | | 200,000 | 200,938 |
| Philippine Republic 6.375% 10/23/2034 | | 100,000 | 107,499 |
| Philippine Republic 9.5% 2/2/2030 | | 110,000 | 131,313 |
TOTAL PHILIPPINES | | | 1,392,000 |
| POLAND - 0.1% | | | |
| Republic of Poland 3.25% 4/6/2026 | | 73,000 | 71,803 |
| Republic of Poland 4.625% 3/18/2029 | | 230,000 | 227,767 |
| Republic of Poland 5.125% 9/18/2034 | | 150,000 | 144,470 |
| Republic of Poland 5.5% 3/18/2054 | | 100,000 | 92,001 |
| Republic of Poland 5.5% 4/4/2053 | | 100,000 | 92,472 |
TOTAL POLAND | | | 628,513 |
| URUGUAY - 0.1% | | | |
| Uruguay Republic 7.625% 3/21/2036 | | 678,000 | 790,209 |
| TOTAL FOREIGN GOVERNMENT AND GOVERNMENT AGENCY OBLIGATIONS (Cost $16,473,381) | | | 14,224,662 |
| | | | |
| Municipal Securities - 0.4% |
| | | Principal Amount (a) | Value ($) |
| California - 0.2% | | | |
| Education - 0.0% | | | |
| California St Univ Rev 2.719% 11/1/2052 | | 195,000 | 128,003 |
| General Obligations - 0.2% | | | |
| Golden State Tobacco Securitization Corp. Tobacco Settlement (State of California Proj.) Series 2021 B, 2.746% 6/1/2034 | | 80,000 | 67,328 |
| Golden State Tobacco Securitization Corp. Tobacco Settlement (State of California Proj.) Series 2021 B, 3.293% 6/1/2042 | | 40,000 | 30,076 |
| State of California 7.55% 4/1/2039 | | 145,000 | 171,395 |
| State of California 7.6% 11/1/2040 | | 350,000 | 416,795 |
| | | | 685,594 |
| Health Care - 0.0% | | | |
| Univ CA Regts Med Ctr Pooled Rev (Univ CA Regts Med Ctr Pooled Rev Proj.) Series 2020 N, 3.256% 5/15/2060 | | 150,000 | 96,728 |
| Univ CA Regts Med Ctr Pooled Rev Series 2020 N, 3.006% 5/15/2050 | | 175,000 | 114,392 |
| | | | 211,120 |
| Transportation - 0.0% | | | |
| Bay Area Toll Au CA Bridge Rev 6.263% 4/1/2049 | | 75,000 | 79,267 |
| Bay Area Toll Au CA Bridge Rev 7.043% 4/1/2050 | | 75,000 | 85,968 |
| | | | 165,235 |
TOTAL CALIFORNIA | | | 1,189,952 |
| Idaho - 0.0% | | | |
| Electric Utilities - 0.0% | | | |
| Idaho Energy Res Auth Transmission Facs Rev (Bonneville Power Administration Proj.) Series 2021, 2.861% 9/1/2046 | | 45,000 | 31,101 |
| Illinois - 0.2% | | | |
| General Obligations - 0.1% | | | |
| Illinois St Gen. Oblig. 5.1% 6/1/2033 | | 470,588 | 463,948 |
| Transportation - 0.1% | | | |
| Chicago IL O'Hare Intl Arpt Rev 6.395% 1/1/2040 | | 250,000 | 262,795 |
TOTAL ILLINOIS | | | 726,743 |
| Massachusetts - 0.0% | | | |
| Special Tax - 0.0% | | | |
| Massachusetts St Sch Bldg Auth Dedicated Sales Tax Rev Series 2019 B, 3.395% 10/15/2040 | | 100,000 | 80,956 |
| Water & Sewer - 0.0% | | | |
| Massachusetts St Wtr Res Auth Series 2021C, 2.823% 8/1/2041 | | 100,000 | 77,428 |
TOTAL MASSACHUSETTS | | | 158,384 |
| Michigan - 0.0% | | | |
| Education - 0.0% | | | |
| University MI Univ Revs 4.454% 4/1/2122 | | 80,000 | 62,773 |
| General Obligations - 0.0% | | | |
| Michigan St Strategic Fd Ltd Oblig Rev (State of Michigan Proj.) Series 2021 A, 3.225% 9/1/2047 | | 100,000 | 74,294 |
TOTAL MICHIGAN | | | 137,067 |
| New Jersey - 0.0% | | | |
| Transportation - 0.0% | | | |
| New Jersey Turnpike Authority 7.414% 1/1/2040 | | 160,000 | 183,296 |
| New Jersey,New York - 0.0% | | | |
| Transportation - 0.0% | | | |
| Port Auth NY & NJ Series 225, 3.175% 7/15/2060 | | 400,000 | 256,963 |
| New York - 0.0% | | | |
| General Obligations - 0.0% | | | |
| City of New York NY 6.271% 12/1/2037 | | 100,000 | 104,967 |
| Special Tax - 0.0% | | | |
| New York St Dorm Auth St Pers Income Tax Rev (New York State Pit Proj.) 2.202% 3/15/2034 | | 200,000 | 158,451 |
| Transportation - 0.0% | | | |
| Metropolitan Transn Auth NY Rv 6.668% 11/15/2039 | | 60,000 | 63,974 |
| Water & Sewer - 0.0% | | | |
| New York NY Cty Muni Wtr Fin Auth 6.011% 6/15/2042 | | 100,000 | 101,299 |
TOTAL NEW YORK | | | 428,691 |
| Ohio - 0.0% | | | |
| Electric Utilities - 0.0% | | | |
| American Mun Pwr Rev 7.834% 2/15/2041 | | 55,000 | 64,861 |
| Texas - 0.0% | | | |
| Special Tax - 0.0% | | | |
| Dallas TX Rapid Transit Sales Tax Rev Series 2021 A, 2.613% 12/1/2048 | | 200,000 | 132,717 |
| Transportation - 0.0% | | | |
| Dallas Fort Worth International Airport 4.507% 11/1/2051 | | 65,000 | 56,335 |
| Dallas Fort Worth International Airport Series 2019A, 3.144% 11/1/2045 | | 20,000 | 14,934 |
| Dallas Fort Worth International Airport Series 2021 C, 2.843% 11/1/2046 | | 150,000 | 105,413 |
| | | | 176,682 |
TOTAL TEXAS | | | 309,399 |
| Virginia - 0.0% | | | |
| Education - 0.0% | | | |
| University VA Univ Revs (University VA Univ Revs Proj.) 2.584% 11/1/2051 | | 140,000 | 85,248 |
| TOTAL MUNICIPAL SECURITIES (Cost $4,699,556) | | | 3,571,705 |
| | | | |
| Non-Convertible Corporate Bonds - 27.2% |
| | | Principal Amount (a) | Value ($) |
| AUSTRALIA - 0.2% | | | |
| Financials - 0.2% | | | |
| Banks - 0.2% | | | |
| National Australia Bank Ltd/New York 4.966% 1/12/2026 | | 260,000 | 261,133 |
| Westpac Banking Corp 2.894% 2/4/2030 (b) | | 590,000 | 588,726 |
| Westpac Banking Corp 3.133% 11/18/2041 | | 60,000 | 43,037 |
| Westpac Banking Corp 4.11% 7/24/2034 (b) | | 320,000 | 301,354 |
| | | | 1,194,250 |
| Materials - 0.0% | | | |
| Metals & Mining - 0.0% | | | |
| BHP Billiton Finance USA Ltd 5% 9/30/2043 | | 176,000 | 164,432 |
| BHP Billiton Finance USA Ltd 5.25% 9/8/2033 | | 90,000 | 90,440 |
| Rio Tinto Finance USA Ltd 2.75% 11/2/2051 | | 120,000 | 73,184 |
| Rio Tinto Finance USA Ltd 5.2% 11/2/2040 | | 120,000 | 115,494 |
| | | | 443,550 |
| TOTAL AUSTRALIA | | | 1,637,800 |
| AUSTRIA - 0.0% | | | |
| Financials - 0.0% | | | |
| Banks - 0.0% | | | |
| Oesterreichische Kontrollbank AG 0.375% 9/17/2025 | | 83,000 | 80,649 |
| BELGIUM - 0.1% | | | |
| Consumer Staples - 0.1% | | | |
| Beverages - 0.1% | | | |
| Anheuser-Busch InBev Worldwide Inc 4.5% 6/1/2050 | | 100,000 | 87,822 |
| Anheuser-Busch InBev Worldwide Inc 4.6% 4/15/2048 | | 78,000 | 68,297 |
| Anheuser-Busch InBev Worldwide Inc 4.75% 4/15/2058 | | 140,000 | 122,106 |
| Anheuser-Busch InBev Worldwide Inc 4.95% 1/15/2042 | | 461,000 | 428,411 |
| Anheuser-Busch InBev Worldwide Inc 5.45% 1/23/2039 | | 270,000 | 270,579 |
| Anheuser-Busch InBev Worldwide Inc 5.55% 1/23/2049 | | 130,000 | 127,873 |
| Anheuser-Busch InBev Worldwide Inc 5.8% 1/23/2059 | | 190,000 | 193,472 |
| | | | |
| TOTAL BELGIUM | | | 1,298,560 |
| BRAZIL - 0.1% | | | |
| Materials - 0.1% | | | |
| Metals & Mining - 0.1% | | | |
| Vale Overseas Ltd 3.75% 7/8/2030 | | 300,000 | 274,521 |
| Vale Overseas Ltd 6.4% 6/28/2054 | | 60,000 | 58,650 |
| | | | 333,171 |
| Paper & Forest Products - 0.0% | | | |
| Suzano Austria GmbH 2.5% 9/15/2028 | | 298,000 | 266,058 |
| TOTAL BRAZIL | | | 599,229 |
| CANADA - 0.7% | | | |
| Communication Services - 0.1% | | | |
| Diversified Telecommunication Services - 0.1% | | | |
| Bell Canada 5.1% 5/11/2033 | | 100,000 | 97,177 |
| Bell Canada 5.55% 2/15/2054 | | 130,000 | 121,902 |
| TELUS Corp 3.4% 5/13/2032 | | 130,000 | 114,652 |
| | | | 333,731 |
| Wireless Telecommunication Services - 0.0% | | | |
| Rogers Communications Inc 3.8% 3/15/2032 | | 130,000 | 116,909 |
| Rogers Communications Inc 4.55% 3/15/2052 | | 160,000 | 127,908 |
| Rogers Communications Inc 5% 3/15/2044 | | 20,000 | 17,712 |
| Rogers Communications Inc 7.5% 8/15/2038 | | 50,000 | 56,725 |
| | | | 319,254 |
TOTAL COMMUNICATION SERVICES | | | 652,985 |
| | | | |
| Energy - 0.2% | | | |
| Oil, Gas & Consumable Fuels - 0.2% | | | |
| Canadian Natural Resources Ltd 3.85% 6/1/2027 | | 558,000 | 546,165 |
| Canadian Natural Resources Ltd 4.95% 6/1/2047 | | 19,000 | 16,294 |
| Canadian Natural Resources Ltd 5% 12/15/2029 (c) | | 300,000 | 296,657 |
| Cenovus Energy Inc 5.4% 6/15/2047 | | 74,000 | 65,852 |
| Enbridge Inc 2.5% 8/1/2033 | | 100,000 | 80,266 |
| Enbridge Inc 5.5% 12/1/2046 | | 60,000 | 57,139 |
| Enbridge Inc 5.625% 4/5/2034 | | 140,000 | 140,825 |
| Enbridge Inc 5.7% 3/8/2033 | | 220,000 | 222,285 |
| Enbridge Inc 7.2% 6/27/2054 (b) | | 90,000 | 92,514 |
| Enbridge Inc 8.5% 1/15/2084 (b) | | 40,000 | 44,426 |
| South Bow USA Infrastructure Holdings LLC 5.026% 10/1/2029 (c) | | 40,000 | 39,304 |
| South Bow USA Infrastructure Holdings LLC 5.584% 10/1/2034 (c) | | 40,000 | 38,904 |
| South Bow USA Infrastructure Holdings LLC 6.176% 10/1/2054 (c) | | 40,000 | 38,718 |
| Suncor Energy Inc 4% 11/15/2047 | | 179,000 | 132,751 |
| TransCanada PipeLines Ltd 4.1% 4/15/2030 | | 190,000 | 180,408 |
| TransCanada PipeLines Ltd 7.625% 1/15/2039 | | 231,000 | 267,443 |
| | | | 2,259,951 |
| Financials - 0.3% | | | |
| Banks - 0.3% | | | |
| Bank of Montreal 3.088% 1/10/2037 (b) | | 110,000 | 91,401 |
| Bank of Montreal 5.266% 12/11/2026 | | 300,000 | 303,506 |
| Bank of Montreal 5.717% 9/25/2028 | | 70,000 | 71,779 |
| Bank of Nova Scotia/The 1.95% 2/2/2027 | | 100,000 | 94,511 |
| Bank of Nova Scotia/The 4.588% 5/4/2037 (b) | | 50,000 | 45,969 |
| Bank of Nova Scotia/The 4.85% 2/1/2030 | | 120,000 | 119,148 |
| Bank of Nova Scotia/The 5.25% 6/12/2028 | | 160,000 | 161,667 |
| Canadian Imperial Bank of Commerce 3.6% 4/7/2032 | | 54,000 | 48,452 |
| Canadian Imperial Bank of Commerce 6.092% 10/3/2033 | | 119,000 | 124,372 |
| Royal Bank of Canada 4.65% 1/27/2026 | | 55,000 | 54,929 |
| Royal Bank of Canada 4.65% 10/18/2030 (b) | | 20,000 | 19,588 |
| Royal Bank of Canada 5% 5/2/2033 | | 130,000 | 127,777 |
| Royal Bank of Canada 5.15% 2/1/2034 | | 180,000 | 177,743 |
| Royal Bank of Canada 6% 11/1/2027 | | 100,000 | 103,270 |
| Toronto Dominion Bank 1.95% 1/12/2027 | | 100,000 | 94,582 |
| Toronto Dominion Bank 2.45% 1/12/2032 | | 90,000 | 75,118 |
| Toronto Dominion Bank 4.456% 6/8/2032 | | 200,000 | 189,509 |
| Toronto Dominion Bank 5.156% 1/10/2028 | | 360,000 | 361,803 |
| | | | 2,265,124 |
| Capital Markets - 0.0% | | | |
| Brookfield Finance Inc 2.724% 4/15/2031 | | 312,000 | 271,113 |
| Brookfield Finance Inc 4.85% 3/29/2029 | | 80,000 | 79,439 |
| Brookfield Finance Inc 5.968% 3/4/2054 | | 50,000 | 50,538 |
| Brookfield Finance Inc 6.35% 1/5/2034 | | 30,000 | 31,618 |
| | | | 432,708 |
| Insurance - 0.0% | | | |
| Fairfax Financial Holdings Ltd 5.625% 8/16/2032 | | 90,000 | 91,030 |
| Fairfax Financial Holdings Ltd 6.1% 3/15/2055 (c) | | 70,000 | 69,059 |
| Manulife Financial Corp 5.375% 3/4/2046 | | 40,000 | 38,981 |
| | | | 199,070 |
TOTAL FINANCIALS | | | 2,896,902 |
| | | | |
| Industrials - 0.1% | | | |
| Ground Transportation - 0.1% | | | |
| Canadian National Railway Co 2.45% 5/1/2050 | | 210,000 | 122,000 |
| Canadian Pacific Railway Co 1.75% 12/2/2026 | | 140,000 | 132,573 |
| Canadian Pacific Railway Co 2.45% 12/2/2031 | | 140,000 | 119,373 |
| Canadian Pacific Railway Co 3.1% 12/2/2051 | | 140,000 | 90,968 |
| Canadian Pacific Railway Co 4.2% 11/15/2069 | | 70,000 | 51,306 |
| | | | 516,220 |
| Professional Services - 0.0% | | | |
| Thomson Reuters Corp 3.35% 5/15/2026 | | 76,000 | 74,620 |
| Thomson Reuters Corp 5.85% 4/15/2040 | | 40,000 | 40,527 |
| | | | 115,147 |
TOTAL INDUSTRIALS | | | 631,367 |
| | | | |
| Materials - 0.0% | | | |
| Chemicals - 0.0% | | | |
| Nutrien Ltd 4.125% 3/15/2035 | | 90,000 | 79,666 |
| Nutrien Ltd 4.2% 4/1/2029 | | 13,000 | 12,608 |
| Nutrien Ltd 4.9% 3/27/2028 | | 160,000 | 159,936 |
| Nutrien Ltd 5% 4/1/2049 | | 103,000 | 91,563 |
| | | | 343,773 |
| Metals & Mining - 0.0% | | | |
| Barrick Gold Corp 5.25% 4/1/2042 | | 163,000 | 153,986 |
TOTAL MATERIALS | | | 497,759 |
| | | | |
| Utilities - 0.0% | | | |
| Independent Power and Renewable Electricity Producers - 0.0% | | | |
| Emera US Finance LP 2.639% 6/15/2031 | | 120,000 | 101,462 |
| TOTAL CANADA | | | 7,040,426 |
| CHINA - 0.1% | | | |
| Consumer Discretionary - 0.1% | | | |
| Broadline Retail - 0.1% | | | |
| Alibaba Group Holding Ltd 2.125% 2/9/2031 | | 240,000 | 202,169 |
| Alibaba Group Holding Ltd 3.15% 2/9/2051 | | 245,000 | 157,726 |
| | | | 359,895 |
| Information Technology - 0.0% | | | |
| Semiconductors & Semiconductor Equipment - 0.0% | | | |
| NXP BV / NXP Funding LLC / NXP USA Inc 2.65% 2/15/2032 | | 270,000 | 226,609 |
| NXP BV / NXP Funding LLC / NXP USA Inc 5% 1/15/2033 | | 90,000 | 87,630 |
| | | | 314,239 |
| TOTAL CHINA | | | 674,134 |
| FRANCE - 0.1% | | | |
| Communication Services - 0.0% | | | |
| Diversified Telecommunication Services - 0.0% | | | |
| Orange SA 9% 3/1/2031 (b) | | 180,000 | 214,292 |
| Energy - 0.1% | | | |
| Oil, Gas & Consumable Fuels - 0.1% | | | |
| TotalEnergies Capital International SA 2.829% 1/10/2030 | | 200,000 | 182,005 |
| TotalEnergies Capital International SA 3.127% 5/29/2050 | | 220,000 | 144,124 |
| TotalEnergies Capital SA 5.15% 4/5/2034 | | 40,000 | 39,826 |
| TotalEnergies Capital SA 5.488% 4/5/2054 | | 40,000 | 38,336 |
| TotalEnergies Capital SA 5.638% 4/5/2064 | | 30,000 | 28,675 |
| | | | 432,966 |
| TOTAL FRANCE | | | 647,258 |
| GERMANY - 0.3% | | | |
| Financials - 0.3% | | | |
| Capital Markets - 0.1% | | | |
| Deutsche Bank AG 4.1% 1/13/2026 | | 200,000 | 198,547 |
| Deutsche Bank AG/New York NY 2.311% 11/16/2027 (b)(d) | | 150,000 | 142,572 |
| Deutsche Bank AG/New York NY 3.547% 9/18/2031 (b) | | 170,000 | 152,626 |
| Deutsche Bank AG/New York NY 3.729% 1/14/2032 (b) | | 200,000 | 174,584 |
| Deutsche Bank AG/New York NY 4.1% 1/13/2026 | | 200,000 | 198,817 |
| Deutsche Bank AG/New York NY 4.999% 9/11/2030 (b) | | 170,000 | 166,171 |
| | | | 1,033,317 |
| Financial Services - 0.2% | | | |
| KfW 0% 4/18/2036 (e) | | 200,000 | 117,222 |
| KfW 0.375% 7/18/2025 | | 2,072,000 | 2,027,507 |
| KfW 2.875% 4/3/2028 | | 14,000 | 13,367 |
| KfW 4.75% 10/29/2030 | | 170,000 | 172,286 |
| | | | 2,330,382 |
| TOTAL GERMANY | | | 3,363,699 |
| HONG KONG - 0.0% | | | |
| Financials - 0.0% | | | |
| Insurance - 0.0% | | | |
| Prudential Funding Asia PLC 3.125% 4/14/2030 | | 60,000 | 54,416 |
| IRELAND - 0.1% | | | |
| Financials - 0.1% | | | |
| Consumer Finance - 0.1% | | | |
| AerCap Ireland Capital DAC / AerCap Global Aviation Trust 2.45% 10/29/2026 | | 250,000 | 239,324 |
| AerCap Ireland Capital DAC / AerCap Global Aviation Trust 3.85% 10/29/2041 | | 150,000 | 117,397 |
| AerCap Ireland Capital DAC / AerCap Global Aviation Trust 4.45% 4/3/2026 | | 150,000 | 149,220 |
| AerCap Ireland Capital DAC / AerCap Global Aviation Trust 4.625% 10/15/2027 | | 220,000 | 218,532 |
| AerCap Ireland Capital DAC / AerCap Global Aviation Trust 4.625% 9/10/2029 | | 200,000 | 195,598 |
| AerCap Ireland Capital DAC / AerCap Global Aviation Trust 5.3% 1/19/2034 | | 150,000 | 147,070 |
| | | | 1,067,141 |
| Materials - 0.0% | | | |
| Containers & Packaging - 0.0% | | | |
| Smurfit Kappa Treasury ULC 5.2% 1/15/2030 (c) | | 200,000 | 201,116 |
| TOTAL IRELAND | | | 1,268,257 |
| JAPAN - 0.8% | | | |
| Consumer Discretionary - 0.0% | | | |
| Automobiles - 0.0% | | | |
| Honda Motor Co Ltd 2.271% 3/10/2025 | | 310,000 | 308,554 |
| Financials - 0.8% | | | |
| Banks - 0.7% | | | |
| Japan Bank for International Cooperation 0.625% 7/15/2025 | | 750,000 | 734,751 |
| Japan Bank for International Cooperation 1.25% 1/21/2031 | | 580,000 | 474,865 |
| Mitsubishi UFJ Financial Group Inc 2.193% 2/25/2025 | | 740,000 | 737,163 |
| Mitsubishi UFJ Financial Group Inc 2.341% 1/19/2028 (b) | | 210,000 | 199,799 |
| Mitsubishi UFJ Financial Group Inc 3.287% 7/25/2027 | | 150,000 | 145,348 |
| Mitsubishi UFJ Financial Group Inc 3.751% 7/18/2039 | | 290,000 | 243,263 |
| Mitsubishi UFJ Financial Group Inc 3.777% 3/2/2025 | | 84,000 | 83,824 |
| Mitsubishi UFJ Financial Group Inc 4.286% 7/26/2038 | | 150,000 | 136,825 |
| Mitsubishi UFJ Financial Group Inc 5.242% 4/19/2029 (b) | | 200,000 | 201,503 |
| Mizuho Financial Group Inc 1.554% 7/9/2027 (b) | | 285,000 | 271,263 |
| Mizuho Financial Group Inc 2.226% 5/25/2026 (b) | | 400,000 | 395,616 |
| Mizuho Financial Group Inc 5.382% 7/10/2030 (b) | | 300,000 | 302,844 |
| Mizuho Financial Group Inc 5.778% 7/6/2029 (b) | | 310,000 | 317,200 |
| Sumitomo Mitsui Financial Group Inc 1.474% 7/8/2025 | | 400,000 | 393,296 |
| Sumitomo Mitsui Financial Group Inc 2.142% 9/23/2030 | | 170,000 | 143,946 |
| Sumitomo Mitsui Financial Group Inc 2.174% 1/14/2027 | | 800,000 | 760,287 |
| Sumitomo Mitsui Financial Group Inc 2.348% 1/15/2025 | | 200,000 | 199,822 |
| Sumitomo Mitsui Financial Group Inc 2.75% 1/15/2030 | | 200,000 | 178,501 |
| Sumitomo Mitsui Financial Group Inc 3.352% 10/18/2027 | | 80,000 | 77,148 |
| Sumitomo Mitsui Financial Group Inc 3.364% 7/12/2027 | | 80,000 | 77,510 |
| Sumitomo Mitsui Financial Group Inc 3.784% 3/9/2026 | | 640,000 | 633,458 |
| Sumitomo Mitsui Financial Group Inc 6.184% 7/13/2043 | | 40,000 | 42,869 |
| | | | 6,751,101 |
| Capital Markets - 0.1% | | | |
| Nomura Holdings Inc 3.103% 1/16/2030 | | 623,000 | 561,997 |
TOTAL FINANCIALS | | | 7,313,098 |
| | | | |
| Health Care - 0.0% | | | |
| Pharmaceuticals - 0.0% | | | |
| Takeda Pharmaceutical Co Ltd 2.05% 3/31/2030 | | 200,000 | 172,329 |
| Takeda Pharmaceutical Co Ltd 3.025% 7/9/2040 | | 272,000 | 197,156 |
| | | | 369,485 |
| TOTAL JAPAN | | | 7,991,137 |
| KOREA (SOUTH) - 0.1% | | | |
| Financials - 0.1% | | | |
| Banks - 0.1% | | | |
| Export-Import Bank of Korea 2.875% 1/21/2025 | | 350,000 | 349,570 |
| Export-Import Bank of Korea 4% 9/11/2029 | | 300,000 | 289,782 |
| Export-Import Bank of Korea 5.125% 9/18/2028 | | 380,000 | 383,764 |
| Korea Development Bank/The 1.625% 1/19/2031 | | 200,000 | 164,412 |
| | | | |
| TOTAL KOREA (SOUTH) | | | 1,187,528 |
| LUXEMBOURG - 0.0% | | | |
| Materials - 0.0% | | | |
| Metals & Mining - 0.0% | | | |
| ArcelorMittal SA 6.35% 6/17/2054 | | 40,000 | 39,520 |
| ArcelorMittal SA 6.75% 3/1/2041 (b) | | 20,000 | 20,575 |
| ArcelorMittal SA 6.8% 11/29/2032 | | 80,000 | 85,480 |
| | | | |
| TOTAL LUXEMBOURG | | | 145,575 |
| MEXICO - 0.1% | | | |
| Communication Services - 0.1% | | | |
| Wireless Telecommunication Services - 0.1% | | | |
| America Movil SAB de CV 3.625% 4/22/2029 | | 440,000 | 413,895 |
| Materials - 0.0% | | | |
| Metals & Mining - 0.0% | | | |
| Southern Copper Corp 5.25% 11/8/2042 | | 80,000 | 72,460 |
| Southern Copper Corp 5.875% 4/23/2045 | | 30,000 | 29,192 |
| Southern Copper Corp 6.75% 4/16/2040 | | 50,000 | 53,641 |
| | | | 155,293 |
| TOTAL MEXICO | | | 569,188 |
| MULTI-NATIONAL - 0.8% | | | |
| Financials - 0.8% | | | |
| Banks - 0.5% | | | |
| African Development Bank 0.875% 7/22/2026 | | 160,000 | 151,626 |
| Asian Development Bank 0.75% 10/8/2030 | | 100,000 | 81,100 |
| Asian Development Bank 1.875% 1/24/2030 | | 610,000 | 538,612 |
| Asian Development Bank 4.5% 8/25/2028 | | 220,000 | 221,043 |
| Asian Development Bank 5.82% 6/16/2028 | | 110,000 | 114,456 |
| Corp Andina de Fomento 4.125% 1/7/2028 | | 59,000 | 58,096 |
| Corp Andina de Fomento 5% 1/24/2029 | | 170,000 | 170,563 |
| European Investment Bank 0.75% 9/23/2030 | | 250,000 | 203,362 |
| European Investment Bank 0.875% 5/17/2030 | | 18,000 | 14,942 |
| European Investment Bank 1.75% 3/15/2029 | | 1,350,000 | 1,211,497 |
| European Investment Bank 3.75% 2/14/2033 | | 100,000 | 94,089 |
| European Investment Bank 4.875% 2/15/2036 | | 110,000 | 110,807 |
| Inter-American Development Bank 0.625% 7/15/2025 | | 390,000 | 382,307 |
| Inter-American Development Bank 1.125% 1/13/2031 | | 290,000 | 237,638 |
| Inter-American Development Bank 1.75% 3/14/2025 | | 194,000 | 192,974 |
| Inter-American Development Bank 2.25% 6/18/2029 | | 1,029,000 | 937,651 |
| Inter-American Development Bank 4.375% 1/24/2044 | | 39,000 | 35,647 |
| | | | 4,756,410 |
| Capital Markets - 0.0% | | | |
| Asian Infrastructure Investment Bank/The 4.25% 3/13/2034 | | 110,000 | 106,284 |
| Financial Services - 0.3% | | | |
| International Bank for Reconstruction & Development 0.375% 7/28/2025 | | 270,000 | 263,918 |
| International Bank for Reconstruction & Development 0.5% 10/28/2025 | | 218,000 | 211,288 |
| International Bank for Reconstruction & Development 0.75% 8/26/2030 | | 160,000 | 130,269 |
| International Bank for Reconstruction & Development 0.875% 5/14/2030 | | 176,000 | 145,810 |
| International Bank for Reconstruction & Development 1.25% 2/10/2031 | | 110,000 | 90,500 |
| International Bank for Reconstruction & Development 1.625% 1/15/2025 | | 155,000 | 154,792 |
| International Bank for Reconstruction & Development 2.5% 11/22/2027 | | 92,000 | 87,417 |
| International Bank for Reconstruction & Development 3.625% 9/21/2029 | | 260,000 | 250,775 |
| International Bank for Reconstruction & Development 4% 7/25/2030 | | 500,000 | 487,316 |
| International Bank for Reconstruction & Development 4.75% 11/14/2033 | | 290,000 | 291,118 |
| International Bank for Reconstruction & Development 4.75% 2/15/2035 | | 520,000 | 519,666 |
| International Finance Corp 0.75% 8/27/2030 | | 60,000 | 48,900 |
| | | | 2,681,769 |
| TOTAL MULTI-NATIONAL | | | 7,544,463 |
| NETHERLANDS - 0.1% | | | |
| Financials - 0.1% | | | |
| Banks - 0.1% | | | |
| Cooperatieve Rabobank UA/NY 5.041% 3/5/2027 | | 300,000 | 302,846 |
| ING Groep NV 2.727% 4/1/2032 (b) | | 200,000 | 172,092 |
| ING Groep NV 3.869% 3/28/2026 (b) | | 290,000 | 289,209 |
| | | | |
| TOTAL NETHERLANDS | | | 764,147 |
| NORWAY - 0.1% | | | |
| Energy - 0.1% | | | |
| Oil, Gas & Consumable Fuels - 0.1% | | | |
| Equinor ASA 3.125% 4/6/2030 | | 357,000 | 328,947 |
| Equinor ASA 3.25% 11/18/2049 | | 160,000 | 109,341 |
| Equinor ASA 3.625% 9/10/2028 | | 120,000 | 116,117 |
| | | | |
| TOTAL NORWAY | | | 554,405 |
| SPAIN - 0.2% | | | |
| Communication Services - 0.0% | | | |
| Diversified Telecommunication Services - 0.0% | | | |
| Telefonica Emisiones SA 4.103% 3/8/2027 | | 150,000 | 147,624 |
| Telefonica Emisiones SA 5.213% 3/8/2047 | | 250,000 | 221,463 |
| | | | 369,087 |
| Financials - 0.2% | | | |
| Banks - 0.2% | | | |
| Banco Bilbao Vizcaya Argentaria SA 6.138% 9/14/2028 (b) | | 200,000 | 204,641 |
| Banco Santander SA 1.849% 3/25/2026 | | 200,000 | 192,368 |
| Banco Santander SA 2.749% 12/3/2030 | | 200,000 | 169,370 |
| Banco Santander SA 2.958% 3/25/2031 | | 200,000 | 174,149 |
| Banco Santander SA 5.538% 3/14/2030 (b) | | 400,000 | 401,778 |
| Banco Santander SA 6.607% 11/7/2028 | | 200,000 | 210,327 |
| | | | 1,352,633 |
| TOTAL SPAIN | | | 1,721,720 |
| SWEDEN - 0.0% | | | |
| Financials - 0.0% | | | |
| Financial Services - 0.0% | | | |
| Svensk Exportkredit AB 2.25% 3/22/2027 | | 400,000 | 382,352 |
| SWITZERLAND - 0.1% | | | |
| Financials - 0.1% | | | |
| Capital Markets - 0.1% | | | |
| Credit Suisse USA LLC 7.125% 7/15/2032 | | 130,000 | 144,001 |
| UBS Group AG 4.55% 4/17/2026 | | 580,000 | 577,967 |
| | | | 721,968 |
| Industrials - 0.0% | | | |
| Electrical Equipment - 0.0% | | | |
| ABB Finance USA Inc 4.375% 5/8/2042 | | 30,000 | 26,449 |
| Information Technology - 0.0% | | | |
| Electronic Equipment, Instruments & Components - 0.0% | | | |
| Tyco Electronics Group SA 4.625% 2/1/2030 | | 120,000 | 118,815 |
| TOTAL SWITZERLAND | | | 867,232 |
| UNITED KINGDOM - 1.3% | | | |
| Communication Services - 0.0% | | | |
| Media - 0.0% | | | |
| RELX Capital Inc 4% 3/18/2029 | | 130,000 | 125,483 |
| Wireless Telecommunication Services - 0.0% | | | |
| Vodafone Group PLC 4.375% 5/30/2028 | | 97,000 | 96,173 |
| Vodafone Group PLC 5.25% 5/30/2048 | | 170,000 | 157,352 |
| Vodafone Group PLC 5.875% 6/28/2064 | | 150,000 | 145,134 |
| Vodafone Group PLC 6.15% 2/27/2037 | | 139,000 | 145,940 |
| | | | 544,599 |
| Consumer Staples - 0.2% | | | |
| Beverages - 0.0% | | | |
| Diageo Capital PLC 1.375% 9/29/2025 | | 200,000 | 195,375 |
| Diageo Capital PLC 2% 4/29/2030 | | 200,000 | 172,638 |
| | | | 368,013 |
| Food Products - 0.1% | | | |
| Unilever Capital Corp 1.375% 9/14/2030 | | 135,000 | 112,365 |
| Unilever Capital Corp 2% 7/28/2026 | | 280,000 | 269,865 |
| Unilever Capital Corp 5.9% 11/15/2032 | | 140,000 | 148,683 |
| | | | 530,913 |
| Tobacco - 0.1% | | | |
| BAT Capital Corp 3.557% 8/15/2027 | | 130,000 | 125,788 |
| BAT Capital Corp 4.39% 8/15/2037 | | 621,000 | 535,712 |
| BAT Capital Corp 4.54% 8/15/2047 | | 213,000 | 167,978 |
| BAT Capital Corp 6.343% 8/2/2030 | | 40,000 | 42,060 |
| | | | 871,538 |
TOTAL CONSUMER STAPLES | | | 1,770,464 |
| | | | |
| Financials - 1.0% | | | |
| Banks - 1.0% | | | |
| Barclays PLC 2.279% 11/24/2027 (b) | | 400,000 | 380,469 |
| Barclays PLC 2.852% 5/7/2026 (b) | | 516,000 | 512,025 |
| Barclays PLC 2.894% 11/24/2032 (b) | | 730,000 | 616,441 |
| Barclays PLC 5.088% 6/20/2030 (b) | | 726,000 | 707,181 |
| Barclays PLC 5.501% 8/9/2028 (b) | | 220,000 | 222,377 |
| HSBC Holdings PLC 2.848% 6/4/2031 (b) | | 380,000 | 333,641 |
| HSBC Holdings PLC 2.871% 11/22/2032 (b) | | 200,000 | 168,732 |
| HSBC Holdings PLC 4.292% 9/12/2026 (b) | | 1,260,000 | 1,254,336 |
| HSBC Holdings PLC 5.402% 8/11/2033 (b) | | 250,000 | 247,417 |
| HSBC Holdings PLC 5.597% 5/17/2028 (b) | | 290,000 | 293,108 |
| HSBC Holdings PLC 6.1% 1/14/2042 | | 190,000 | 201,366 |
| HSBC Holdings PLC 6.8% 6/1/2038 | | 449,000 | 469,981 |
| HSBC Holdings PLC 7.39% 11/3/2028 (b) | | 220,000 | 233,169 |
| HSBC Holdings PLC 8.113% 11/3/2033 (b) | | 200,000 | 224,913 |
| Lloyds Banking Group PLC 4.45% 5/8/2025 | | 200,000 | 199,635 |
| Lloyds Banking Group PLC 4.582% 12/10/2025 | | 1,518,000 | 1,510,823 |
| Lloyds Banking Group PLC 5.087% 11/26/2028 (b) | | 200,000 | 200,222 |
| Lloyds Banking Group PLC 5.721% 6/5/2030 (b) | | 500,000 | 508,367 |
| NatWest Group PLC 3.073% 5/22/2028 (b) | | 290,000 | 277,358 |
| NatWest Group PLC 5.583% 3/1/2028 (b) | | 300,000 | 303,565 |
| NatWest Group PLC 5.847% 3/2/2027 (b) | | 200,000 | 201,988 |
| Santander UK Group Holdings PLC 6.534% 1/10/2029 (b) | | 200,000 | 206,113 |
| | | | 9,273,227 |
| Health Care - 0.1% | | | |
| Pharmaceuticals - 0.1% | | | |
| Astrazeneca Finance LLC 1.2% 5/28/2026 | | 290,000 | 277,204 |
| Astrazeneca Finance LLC 2.25% 5/28/2031 | | 440,000 | 374,755 |
| Astrazeneca Finance LLC 4.875% 3/3/2033 | | 110,000 | 108,714 |
| Astrazeneca PLC 4.375% 11/16/2045 | | 45,000 | 38,588 |
| Astrazeneca PLC 4.375% 8/17/2048 | | 50,000 | 42,368 |
| GlaxoSmithKline Capital Inc 3.875% 5/15/2028 (d) | | 130,000 | 126,798 |
| | | | 968,427 |
| Utilities - 0.0% | | | |
| Multi-Utilities - 0.0% | | | |
| National Grid PLC 5.809% 6/12/2033 | | 70,000 | 71,400 |
| TOTAL UNITED KINGDOM | | | 12,753,600 |
| UNITED STATES - 21.9% | | | |
| Communication Services - 1.7% | | | |
| Diversified Telecommunication Services - 0.6% | | | |
| AT&T Inc 1.65% 2/1/2028 | | 200,000 | 181,864 |
| AT&T Inc 2.25% 2/1/2032 | | 50,000 | 41,336 |
| AT&T Inc 2.75% 6/1/2031 | | 300,000 | 260,961 |
| AT&T Inc 3.3% 2/1/2052 | | 50,000 | 33,196 |
| AT&T Inc 3.5% 6/1/2041 | | 1,000,000 | 766,266 |
| AT&T Inc 3.5% 9/15/2053 | | 347,000 | 233,649 |
| AT&T Inc 3.55% 9/15/2055 | | 340,000 | 228,679 |
| AT&T Inc 3.65% 6/1/2051 | | 280,000 | 197,743 |
| AT&T Inc 3.65% 9/15/2059 | | 257,000 | 170,228 |
| AT&T Inc 3.8% 2/15/2027 | | 43,000 | 42,186 |
| AT&T Inc 3.85% 6/1/2060 | | 250,000 | 173,187 |
| AT&T Inc 4.1% 2/15/2028 (d) | | 143,000 | 139,898 |
| AT&T Inc 4.65% 6/1/2044 | | 40,000 | 33,958 |
| Sprint Capital Corp 8.75% 3/15/2032 | | 120,000 | 143,268 |
| Verizon Communications Inc 1.5% 9/18/2030 | | 270,000 | 223,968 |
| Verizon Communications Inc 2.1% 3/22/2028 | | 540,000 | 496,567 |
| Verizon Communications Inc 2.355% 3/15/2032 | | 9,000 | 7,464 |
| Verizon Communications Inc 2.65% 11/20/2040 | | 60,000 | 41,025 |
| Verizon Communications Inc 2.987% 10/30/2056 | | 227,000 | 134,617 |
| Verizon Communications Inc 3% 11/20/2060 | | 230,000 | 133,081 |
| Verizon Communications Inc 3.55% 3/22/2051 | | 500,000 | 353,325 |
| Verizon Communications Inc 3.875% 2/8/2029 | | 210,000 | 202,547 |
| Verizon Communications Inc 4% 3/22/2050 | | 114,000 | 86,521 |
| Verizon Communications Inc 4.016% 12/3/2029 | | 100,000 | 95,981 |
| Verizon Communications Inc 4.125% 8/15/2046 | | 54,000 | 42,770 |
| Verizon Communications Inc 4.272% 1/15/2036 (d) | | 276,000 | 248,221 |
| Verizon Communications Inc 4.329% 9/21/2028 | | 643,000 | 629,783 |
| Verizon Communications Inc 5.012% 8/21/2054 | | 38,000 | 33,556 |
| Verizon Communications Inc 7.75% 12/1/2030 | | 60,000 | 67,964 |
| | | | 5,443,809 |
| Entertainment - 0.1% | | | |
| Netflix Inc 4.9% 8/15/2034 | | 140,000 | 137,102 |
| Walt Disney Co/The 2% 9/1/2029 | | 50,000 | 44,462 |
| Walt Disney Co/The 2.65% 1/13/2031 | | 200,000 | 177,047 |
| Walt Disney Co/The 2.75% 9/1/2049 | | 100,000 | 62,366 |
| Walt Disney Co/The 3.35% 3/24/2025 | | 400,000 | 398,876 |
| Walt Disney Co/The 3.5% 5/13/2040 | | 30,000 | 24,057 |
| Walt Disney Co/The 3.6% 1/13/2051 | | 30,000 | 22,049 |
| Walt Disney Co/The 3.8% 3/22/2030 | | 110,000 | 105,284 |
| Walt Disney Co/The 3.8% 5/13/2060 | | 120,000 | 87,100 |
| Walt Disney Co/The 4.7% 3/23/2050 | | 100,000 | 88,735 |
| | | | 1,147,078 |
| Interactive Media & Services - 0.1% | | | |
| Alphabet Inc 1.1% 8/15/2030 | | 200,000 | 166,309 |
| Alphabet Inc 1.9% 8/15/2040 | | 264,000 | 172,460 |
| Alphabet Inc 2.05% 8/15/2050 | | 170,000 | 94,197 |
| Meta Platforms Inc 3.5% 8/15/2027 | | 60,000 | 58,655 |
| Meta Platforms Inc 3.85% 8/15/2032 | | 60,000 | 55,760 |
| Meta Platforms Inc 4.3% 8/15/2029 | | 100,000 | 98,745 |
| Meta Platforms Inc 4.45% 8/15/2052 | | 150,000 | 126,418 |
| Meta Platforms Inc 4.6% 5/15/2028 | | 70,000 | 70,090 |
| Meta Platforms Inc 4.75% 8/15/2034 | | 70,000 | 68,140 |
| Meta Platforms Inc 4.95% 5/15/2033 | | 100,000 | 100,140 |
| Meta Platforms Inc 5.4% 8/15/2054 | | 150,000 | 145,255 |
| Meta Platforms Inc 5.55% 8/15/2064 | | 140,000 | 136,477 |
| Meta Platforms Inc 5.6% 5/15/2053 | | 60,000 | 59,985 |
| | | | 1,352,631 |
| Media - 0.7% | | | |
| Charter Communications Operating LLC / Charter Communications Operating Capital 2.25% 1/15/2029 | | 50,000 | 44,087 |
| Charter Communications Operating LLC / Charter Communications Operating Capital 3.7% 4/1/2051 | | 80,000 | 49,973 |
| Charter Communications Operating LLC / Charter Communications Operating Capital 3.75% 2/15/2028 | | 100,000 | 95,251 |
| Charter Communications Operating LLC / Charter Communications Operating Capital 3.95% 6/30/2062 | | 260,000 | 158,377 |
| Charter Communications Operating LLC / Charter Communications Operating Capital 4.2% 3/15/2028 | | 48,000 | 46,400 |
| Charter Communications Operating LLC / Charter Communications Operating Capital 4.8% 3/1/2050 | | 100,000 | 75,116 |
| Charter Communications Operating LLC / Charter Communications Operating Capital 5.125% 7/1/2049 | | 60,000 | 46,966 |
| Charter Communications Operating LLC / Charter Communications Operating Capital 5.375% 4/1/2038 | | 42,000 | 37,359 |
| Charter Communications Operating LLC / Charter Communications Operating Capital 5.375% 5/1/2047 | | 190,000 | 155,947 |
| Charter Communications Operating LLC / Charter Communications Operating Capital 6.15% 11/10/2026 | | 150,000 | 152,857 |
| Charter Communications Operating LLC / Charter Communications Operating Capital 6.384% 10/23/2035 | | 621,000 | 619,846 |
| Comcast Corp 2.35% 1/15/2027 | | 260,000 | 248,555 |
| Comcast Corp 2.45% 8/15/2052 | | 135,000 | 73,323 |
| Comcast Corp 2.65% 2/1/2030 | | 80,000 | 71,668 |
| Comcast Corp 2.8% 1/15/2051 | | 180,000 | 106,983 |
| Comcast Corp 2.887% 11/1/2051 | | 179,000 | 107,659 |
| Comcast Corp 2.937% 11/1/2056 | | 385,000 | 224,238 |
| Comcast Corp 2.987% 11/1/2063 | | 305,000 | 172,136 |
| Comcast Corp 3.4% 4/1/2030 | | 87,000 | 80,727 |
| Comcast Corp 3.55% 5/1/2028 | | 76,000 | 72,956 |
| Comcast Corp 3.75% 4/1/2040 | | 31,000 | 24,934 |
| Comcast Corp 3.9% 3/1/2038 | | 50,000 | 42,037 |
| Comcast Corp 3.969% 11/1/2047 | | 350,000 | 265,225 |
| Comcast Corp 4.049% 11/1/2052 | | 146,000 | 109,720 |
| Comcast Corp 4.55% 1/15/2029 | | 110,000 | 108,915 |
| Comcast Corp 5.35% 5/15/2053 | | 110,000 | 101,820 |
| Comcast Corp 5.5% 5/15/2064 | | 20,000 | 18,652 |
| Discovery Communications LLC 3.625% 5/15/2030 | | 220,000 | 195,712 |
| Discovery Communications LLC 5.2% 9/20/2047 | | 18,000 | 13,870 |
| Fox Corp 4.709% 1/25/2029 | | 34,000 | 33,584 |
| Fox Corp 5.476% 1/25/2039 | | 189,000 | 179,609 |
| Fox Corp 5.576% 1/25/2049 | | 23,000 | 21,371 |
| Paramount Global 4.2% 6/1/2029 | | 210,000 | 198,089 |
| Paramount Global 4.95% 1/15/2031 | | 190,000 | 177,365 |
| Paramount Global 5.85% 9/1/2043 | | 363,000 | 315,435 |
| Time Warner Cable LLC 5.5% 9/1/2041 | | 351,000 | 297,858 |
| TWDC Enterprises 18 Corp 2.95% 6/15/2027 | | 98,000 | 94,493 |
| TWDC Enterprises 18 Corp 3% 2/13/2026 | | 210,000 | 206,708 |
| TWDC Enterprises 18 Corp 3% 7/30/2046 | | 100,000 | 67,075 |
| Warnermedia Holdings Inc 3.755% 3/15/2027 | | 100,000 | 96,343 |
| Warnermedia Holdings Inc 4.279% 3/15/2032 | | 629,000 | 554,280 |
| Warnermedia Holdings Inc 5.05% 3/15/2042 | | 100,000 | 80,288 |
| Warnermedia Holdings Inc 5.141% 3/15/2052 | | 175,000 | 130,026 |
| Warnermedia Holdings Inc 5.391% 3/15/2062 | | 160,000 | 117,651 |
| | | | 6,091,484 |
| Wireless Telecommunication Services - 0.2% | | | |
| T-Mobile USA Inc 3% 2/15/2041 | | 529,000 | 377,252 |
| T-Mobile USA Inc 3.5% 4/15/2025 (d) | | 410,000 | 408,146 |
| T-Mobile USA Inc 3.6% 11/15/2060 | | 210,000 | 138,586 |
| T-Mobile USA Inc 3.75% 4/15/2027 | | 80,000 | 78,157 |
| T-Mobile USA Inc 3.875% 4/15/2030 | | 80,000 | 75,279 |
| T-Mobile USA Inc 4.375% 4/15/2040 | | 74,000 | 64,144 |
| T-Mobile USA Inc 4.5% 4/15/2050 | | 80,000 | 65,594 |
| T-Mobile USA Inc 4.8% 7/15/2028 | | 125,000 | 124,323 |
| T-Mobile USA Inc 5.05% 7/15/2033 | | 125,000 | 122,398 |
| T-Mobile USA Inc 5.2% 1/15/2033 | | 605,000 | 598,872 |
| T-Mobile USA Inc 5.65% 1/15/2053 | | 55,000 | 53,219 |
| | | | 2,105,970 |
TOTAL COMMUNICATION SERVICES | | | 16,140,972 |
| | | | |
| Consumer Discretionary - 1.5% | | | |
| Automobile Components - 0.0% | | | |
| Aptiv Swiss Holdings Ltd 4.65% 9/13/2029 | | 400,000 | 388,313 |
| Lear Corp 5.25% 5/15/2049 | | 50,000 | 42,985 |
| | | | 431,298 |
| Automobiles - 0.3% | | | |
| American Honda Finance Corp 1% 9/10/2025 | | 220,000 | 214,321 |
| American Honda Finance Corp 1.2% 7/8/2025 | | 330,000 | 324,335 |
| American Honda Finance Corp 4.9% 1/10/2034 (d) | | 130,000 | 124,976 |
| American Honda Finance Corp 5.125% 7/7/2028 | | 60,000 | 60,409 |
| American Honda Finance Corp 5.65% 11/15/2028 | | 160,000 | 164,329 |
| Ford Motor Co 3.25% 2/12/2032 | | 30,000 | 24,951 |
| Ford Motor Co 4.75% 1/15/2043 | | 30,000 | 23,650 |
| Ford Motor Co 5.291% 12/8/2046 | | 110,000 | 94,209 |
| Ford Motor Co 6.1% 8/19/2032 | | 270,000 | 268,693 |
| General Motors Co 5.4% 10/15/2029 | | 100,000 | 100,685 |
| General Motors Co 5.4% 4/1/2048 | | 40,000 | 35,142 |
| General Motors Co 5.95% 4/1/2049 | | 220,000 | 207,823 |
| General Motors Co 6.125% 10/1/2025 | | 283,000 | 285,179 |
| General Motors Co 6.75% 4/1/2046 | | 69,000 | 72,011 |
| General Motors Financial Co Inc 4.35% 4/9/2025 | | 84,000 | 83,839 |
| General Motors Financial Co Inc 5.6% 6/18/2031 | | 80,000 | 80,400 |
| General Motors Financial Co Inc 5.65% 1/17/2029 | | 250,000 | 253,714 |
| General Motors Financial Co Inc 5.8% 6/23/2028 | | 410,000 | 418,198 |
| General Motors Financial Co Inc 6.1% 1/7/2034 | | 70,000 | 71,013 |
| General Motors Financial Co Inc 6.4% 1/9/2033 | | 100,000 | 103,655 |
| | | | 3,011,532 |
| Broadline Retail - 0.2% | | | |
| Amazon.com Inc 0.8% 6/3/2025 | | 110,000 | 108,390 |
| Amazon.com Inc 1% 5/12/2026 | | 6,000 | 5,740 |
| Amazon.com Inc 2.1% 5/12/2031 | | 105,000 | 89,679 |
| Amazon.com Inc 2.5% 6/3/2050 | | 110,000 | 65,625 |
| Amazon.com Inc 2.7% 6/3/2060 | | 160,000 | 91,785 |
| Amazon.com Inc 2.875% 5/12/2041 | | 220,000 | 161,492 |
| Amazon.com Inc 3.1% 5/12/2051 | | 105,000 | 70,774 |
| Amazon.com Inc 3.15% 8/22/2027 | | 460,000 | 444,139 |
| Amazon.com Inc 3.875% 8/22/2037 | | 440,000 | 388,595 |
| Amazon.com Inc 4.05% 8/22/2047 | | 280,000 | 231,367 |
| eBay Inc 4% 7/15/2042 | | 40,000 | 31,806 |
| eBay Inc 5.95% 11/22/2027 | | 170,000 | 175,645 |
| | | | 1,865,037 |
| Diversified Consumer Services - 0.1% | | | |
| American University/The 3.672% 4/1/2049 | | 130,000 | 98,763 |
| Duke University 2.832% 10/1/2055 | | 30,000 | 18,632 |
| George Washington University/The 4.126% 9/15/2048 | | 100,000 | 81,323 |
| Massachusetts Institute of Technology 2.989% 7/1/2050 | | 250,000 | 168,051 |
| Massachusetts Institute of Technology 3.067% 4/1/2052 | | 200,000 | 134,244 |
| Northwestern University 3.662% 12/1/2057 | | 100,000 | 73,337 |
| President and Fellows of Harvard College 2.517% 10/15/2050 | | 130,000 | 78,516 |
| Trane Technologies Global Holding Co Ltd 3.75% 8/21/2028 (d) | | 210,000 | 202,647 |
| University of Chicago/The 3% 10/1/2052 | | 100,000 | 70,909 |
| University of Southern California 2.945% 10/1/2051 | | 240,000 | 156,792 |
| | | | 1,083,214 |
| Hotels, Restaurants & Leisure - 0.3% | | | |
| Booking Holdings Inc 4.625% 4/13/2030 | | 100,000 | 99,070 |
| Expedia Group Inc 3.8% 2/15/2028 | | 50,000 | 48,296 |
| Expedia Group Inc 4.625% 8/1/2027 | | 130,000 | 129,470 |
| Expedia Group Inc 5% 2/15/2026 | | 160,000 | 160,219 |
| Marriott International Inc/MD 3.125% 6/15/2026 | | 390,000 | 381,220 |
| Marriott International Inc/MD 4.875% 5/15/2029 | | 300,000 | 298,892 |
| Marriott International Inc/MD 5.35% 3/15/2035 | | 100,000 | 98,583 |
| McDonald's Corp 2.125% 3/1/2030 | | 400,000 | 349,639 |
| McDonald's Corp 2.625% 9/1/2029 | | 150,000 | 136,526 |
| McDonald's Corp 3.3% 7/1/2025 | | 32,000 | 31,772 |
| McDonald's Corp 3.5% 7/1/2027 | | 91,000 | 88,635 |
| McDonald's Corp 3.6% 7/1/2030 | | 340,000 | 318,930 |
| McDonald's Corp 3.625% 5/1/2043 | | 20,000 | 15,287 |
| McDonald's Corp 3.8% 4/1/2028 | | 84,000 | 81,750 |
| McDonald's Corp 4.2% 4/1/2050 | | 80,000 | 63,170 |
| McDonald's Corp 4.7% 12/9/2035 | | 109,000 | 103,927 |
| McDonald's Corp 5.15% 9/9/2052 | | 50,000 | 45,720 |
| Starbucks Corp 2.55% 11/15/2030 | | 597,000 | 523,175 |
| Starbucks Corp 4.5% 11/15/2048 | | 50,000 | 41,318 |
| | | | 3,015,599 |
| Household Durables - 0.0% | | | |
| DR Horton Inc 5% 10/15/2034 | | 50,000 | 48,269 |
| PulteGroup Inc 5% 1/15/2027 | | 190,000 | 190,278 |
| Toll Brothers Finance Corp 4.35% 2/15/2028 | | 60,000 | 58,567 |
| Whirlpool Corp 4.75% 2/26/2029 | | 160,000 | 157,673 |
| Whirlpool Corp 5.5% 3/1/2033 | | 20,000 | 19,535 |
| | | | 474,322 |
| Leisure Products - 0.0% | | | |
| Brunswick Corp/DE 4.4% 9/15/2032 (d) | | 70,000 | 64,126 |
| Hasbro Inc 3.55% 11/19/2026 (d) | | 190,000 | 185,776 |
| Hasbro Inc 3.9% 11/19/2029 | | 30,000 | 28,187 |
| | | | 278,089 |
| Specialty Retail - 0.5% | | | |
| AutoNation Inc 1.95% 8/1/2028 | | 100,000 | 89,901 |
| AutoZone Inc 3.625% 4/15/2025 | | 62,000 | 61,790 |
| AutoZone Inc 4% 4/15/2030 | | 150,000 | 142,801 |
| AutoZone Inc 4.75% 2/1/2033 | | 40,000 | 38,377 |
| AutoZone Inc 5.1% 7/15/2029 | | 10,000 | 10,058 |
| AutoZone Inc 5.4% 7/15/2034 | | 10,000 | 9,942 |
| Home Depot Inc/The 2.7% 4/15/2030 | | 146,000 | 131,454 |
| Home Depot Inc/The 2.8% 9/14/2027 | | 84,000 | 80,486 |
| Home Depot Inc/The 2.95% 6/15/2029 | | 686,000 | 636,169 |
| Home Depot Inc/The 3.125% 12/15/2049 | | 20,000 | 13,389 |
| Home Depot Inc/The 3.35% 4/15/2050 | | 100,000 | 69,715 |
| Home Depot Inc/The 3.5% 9/15/2056 | | 50,000 | 34,661 |
| Home Depot Inc/The 3.9% 6/15/2047 | | 29,000 | 22,687 |
| Home Depot Inc/The 4.25% 4/1/2046 | | 104,000 | 86,509 |
| Home Depot Inc/The 4.5% 12/6/2048 | | 90,000 | 76,878 |
| Home Depot Inc/The 4.95% 6/25/2034 | | 200,000 | 197,298 |
| Home Depot Inc/The 5.3% 6/25/2054 | | 250,000 | 239,484 |
| Home Depot Inc/The 5.875% 12/16/2036 | | 110,000 | 115,671 |
| Lowe's Cos Inc 3.5% 4/1/2051 | | 300,000 | 204,588 |
| Lowe's Cos Inc 3.65% 4/5/2029 | | 80,000 | 76,180 |
| Lowe's Cos Inc 4.05% 5/3/2047 | | 53,000 | 41,151 |
| Lowe's Cos Inc 5% 4/15/2033 | | 470,000 | 462,710 |
| Lowe's Cos Inc 5.75% 7/1/2053 | | 30,000 | 29,373 |
| Lowe's Cos Inc 5.85% 4/1/2063 | | 110,000 | 107,605 |
| O'Reilly Automotive Inc 3.6% 9/1/2027 (d) | | 260,000 | 252,288 |
| TJX Cos Inc/The 3.875% 4/15/2030 | | 687,000 | 654,272 |
| | | | 3,885,437 |
| Textiles, Apparel & Luxury Goods - 0.1% | | | |
| NIKE Inc 2.4% 3/27/2025 | | 38,000 | 37,800 |
| NIKE Inc 2.85% 3/27/2030 | | 570,000 | 519,115 |
| NIKE Inc 3.375% 3/27/2050 | | 40,000 | 28,170 |
| Tapestry Inc 5.1% 3/11/2030 | | 50,000 | 49,449 |
| Tapestry Inc 5.5% 3/11/2035 (d) | | 50,000 | 48,633 |
| | | | 683,167 |
TOTAL CONSUMER DISCRETIONARY | | | 14,727,695 |
| | | | |
| Consumer Staples - 1.3% | | | |
| Beverages - 0.2% | | | |
| Coca-Cola Co/The 1.45% 6/1/2027 | | 30,000 | 28,008 |
| Coca-Cola Co/The 1.65% 6/1/2030 | | 30,000 | 25,584 |
| Coca-Cola Co/The 2.5% 6/1/2040 | | 30,000 | 21,009 |
| Coca-Cola Co/The 2.6% 6/1/2050 | | 30,000 | 18,081 |
| Coca-Cola Co/The 2.75% 6/1/2060 | | 30,000 | 17,488 |
| Coca-Cola Co/The 2.875% 5/5/2041 | | 150,000 | 108,980 |
| Coca-Cola Co/The 3.45% 3/25/2030 | | 186,000 | 175,472 |
| Coca-Cola Co/The 4.2% 3/25/2050 | | 150,000 | 123,921 |
| Coca-Cola Co/The 5% 5/13/2034 | | 50,000 | 50,012 |
| Coca-Cola Co/The 5.2% 1/14/2055 | | 120,000 | 113,946 |
| Constellation Brands Inc 3.6% 2/15/2028 | | 63,000 | 60,524 |
| Constellation Brands Inc 3.75% 5/1/2050 | | 90,000 | 65,934 |
| Constellation Brands Inc 5.25% 11/15/2048 | | 50,000 | 45,602 |
| Keurig Dr Pepper Inc 2.55% 9/15/2026 | | 50,000 | 48,310 |
| Keurig Dr Pepper Inc 3.8% 5/1/2050 | | 190,000 | 139,779 |
| Keurig Dr Pepper Inc 5.085% 5/25/2048 | | 20,000 | 17,867 |
| Molson Coors Beverage Co 4.2% 7/15/2046 | | 92,000 | 73,440 |
| PepsiCo Inc 1.4% 2/25/2031 | | 440,000 | 359,243 |
| PepsiCo Inc 1.625% 5/1/2030 | | 267,000 | 227,825 |
| PepsiCo Inc 2.75% 10/21/2051 | | 90,000 | 56,122 |
| PepsiCo Inc 4% 3/5/2042 | | 190,000 | 158,546 |
| PepsiCo Inc 4% 5/2/2047 | | 116,000 | 92,870 |
| Pepsico Singapore Financing I Pte Ltd 4.7% 2/16/2034 | | 50,000 | 48,415 |
| | | | 2,076,978 |
| Consumer Staples Distribution & Retail - 0.5% | | | |
| Costco Wholesale Corp 1.375% 6/20/2027 | | 395,000 | 367,190 |
| Dollar General Corp 3.5% 4/3/2030 | | 40,000 | 36,706 |
| Dollar General Corp 5% 11/1/2032 | | 110,000 | 105,491 |
| Dollar General Corp 5.45% 7/5/2033 (d) | | 40,000 | 39,279 |
| Dollar Tree Inc 4% 5/15/2025 | | 248,000 | 247,077 |
| Kroger Co/The 1.7% 1/15/2031 | | 400,000 | 329,544 |
| Kroger Co/The 2.65% 10/15/2026 | | 230,000 | 221,744 |
| Kroger Co/The 3.7% 8/1/2027 | | 100,000 | 97,632 |
| Kroger Co/The 5.4% 1/15/2049 | | 28,000 | 26,287 |
| Kroger Co/The 5.5% 9/15/2054 | | 80,000 | 75,350 |
| Kroger Co/The 5.65% 9/15/2064 | | 90,000 | 84,462 |
| Sysco Corp 3.3% 2/15/2050 | | 50,000 | 33,628 |
| Sysco Corp 4.45% 3/15/2048 | | 52,000 | 42,454 |
| Sysco Corp 6.6% 4/1/2050 | | 220,000 | 241,153 |
| Target Corp 2.25% 4/15/2025 | | 508,000 | 504,235 |
| Target Corp 2.65% 9/15/2030 | | 77,000 | 68,635 |
| Target Corp 2.95% 1/15/2052 | | 100,000 | 63,735 |
| Target Corp 3.9% 11/15/2047 | | 40,000 | 31,108 |
| Target Corp 4% 7/1/2042 | | 15,000 | 12,540 |
| Walmart Inc 1.8% 9/22/2031 | | 80,000 | 66,775 |
| Walmart Inc 3.05% 7/8/2026 | | 10,000 | 9,801 |
| Walmart Inc 3.625% 12/15/2047 | | 20,000 | 15,312 |
| Walmart Inc 3.7% 6/26/2028 | | 170,000 | 166,102 |
| Walmart Inc 3.9% 4/15/2028 (d) | | 250,000 | 245,446 |
| Walmart Inc 3.95% 6/28/2038 | | 150,000 | 134,414 |
| Walmart Inc 4.05% 6/29/2048 | | 80,000 | 65,714 |
| Walmart Inc 4.1% 4/15/2033 (d) | | 350,000 | 333,479 |
| Walmart Inc 4.5% 4/15/2053 | | 70,000 | 60,906 |
| | | | 3,726,199 |
| Food Products - 0.3% | | | |
| Archer-Daniels-Midland Co 2.5% 8/11/2026 (d) | | 450,000 | 434,977 |
| Archer-Daniels-Midland Co 4.5% 8/15/2033 | | 100,000 | 95,122 |
| Bunge Ltd Fin Corp 4.2% 9/17/2029 | | 60,000 | 58,234 |
| Bunge Ltd Fin Corp 4.65% 9/17/2034 (d) | | 60,000 | 56,638 |
| Conagra Brands Inc 4.85% 11/1/2028 | | 190,000 | 189,013 |
| Conagra Brands Inc 5.3% 11/1/2038 | | 13,000 | 12,214 |
| Conagra Brands Inc 5.4% 11/1/2048 | | 60,000 | 54,426 |
| General Mills Inc 2.875% 4/15/2030 | | 40,000 | 35,977 |
| General Mills Inc 3% 2/1/2051 | | 80,000 | 50,617 |
| General Mills Inc 4.2% 4/17/2028 | | 89,000 | 87,148 |
| General Mills Inc 4.875% 1/30/2030 | | 150,000 | 148,990 |
| JM Smucker Co 6.2% 11/15/2033 (d) | | 270,000 | 284,692 |
| Kellanova 3.25% 4/1/2026 | | 200,000 | 196,714 |
| Kellanova 4.5% 4/1/2046 | | 32,000 | 26,945 |
| Kraft Heinz Foods Co 3.75% 4/1/2030 | | 220,000 | 207,966 |
| Kraft Heinz Foods Co 4.375% 6/1/2046 | | 140,000 | 113,351 |
| Kraft Heinz Foods Co 4.625% 10/1/2039 | | 100,000 | 89,457 |
| Kraft Heinz Foods Co 5% 7/15/2035 | | 150,000 | 145,233 |
| McCormick & Co Inc/MD 2.5% 4/15/2030 | | 110,000 | 97,179 |
| Mondelez International Inc 4.125% 5/7/2028 | | 270,000 | 264,508 |
| Pilgrim's Pride Corp 3.5% 3/1/2032 | | 100,000 | 86,231 |
| The Campbell's Company 4.15% 3/15/2028 | | 80,000 | 78,068 |
| The Campbell's Company 4.8% 3/15/2048 | | 60,000 | 51,704 |
| Tyson Foods Inc 4% 3/1/2026 | | 170,000 | 168,678 |
| Tyson Foods Inc 4.875% 8/15/2034 | | 70,000 | 66,713 |
| Tyson Foods Inc 5.1% 9/28/2048 | | 50,000 | 44,368 |
| | | | 3,145,163 |
| Household Products - 0.1% | | | |
| Church & Dwight Co Inc 5% 6/15/2052 | | 40,000 | 36,173 |
| Colgate-Palmolive Co 3.1% 8/15/2027 (d) | | 430,000 | 416,036 |
| Kimberly-Clark Corp 1.05% 9/15/2027 | | 110,000 | 100,502 |
| Kimberly-Clark Corp 3.05% 8/15/2025 | | 490,000 | 485,090 |
| Kimberly-Clark Corp 3.1% 3/26/2030 | | 22,000 | 20,337 |
| Kimberly-Clark Corp 6.625% 8/1/2037 | | 40,000 | 45,208 |
| Procter & Gamble Co/The 3% 3/25/2030 | | 105,000 | 96,802 |
| Procter & Gamble Co/The 3.55% 3/25/2040 | | 160,000 | 132,515 |
| | | | 1,332,663 |
| Personal Care Products - 0.0% | | | |
| Estee Lauder Cos Inc/The 1.95% 3/15/2031 (d) | | 200,000 | 166,301 |
| Estee Lauder Cos Inc/The 4.375% 6/15/2045 | | 70,000 | 57,248 |
| Kenvue Inc 4.9% 3/22/2033 | | 65,000 | 63,934 |
| Kenvue Inc 5.05% 3/22/2028 | | 65,000 | 65,750 |
| Kenvue Inc 5.05% 3/22/2053 | | 65,000 | 60,243 |
| Kenvue Inc 5.2% 3/22/2063 | | 20,000 | 18,474 |
| | | | 431,950 |
| Tobacco - 0.2% | | | |
| Altria Group Inc 2.625% 9/16/2026 | | 110,000 | 106,229 |
| Altria Group Inc 3.4% 5/6/2030 | | 300,000 | 275,232 |
| Altria Group Inc 3.7% 2/4/2051 | | 110,000 | 74,785 |
| Altria Group Inc 3.875% 9/16/2046 | | 38,000 | 27,542 |
| Altria Group Inc 4.45% 5/6/2050 | | 80,000 | 62,041 |
| Altria Group Inc 4.8% 2/14/2029 | | 120,000 | 118,569 |
| Altria Group Inc 5.8% 2/14/2039 | | 100,000 | 98,792 |
| Altria Group Inc 5.95% 2/14/2049 | | 30,000 | 29,352 |
| Altria Group Inc 6.2% 11/1/2028 | | 70,000 | 72,754 |
| Philip Morris International Inc 3.125% 3/2/2028 | | 54,000 | 51,372 |
| Philip Morris International Inc 4.375% 11/15/2041 | | 265,000 | 225,264 |
| Philip Morris International Inc 4.625% 11/1/2029 | | 30,000 | 29,590 |
| Philip Morris International Inc 4.875% 2/15/2028 | | 30,000 | 30,072 |
| Philip Morris International Inc 4.9% 11/1/2034 | | 30,000 | 28,828 |
| Philip Morris International Inc 5.125% 2/15/2030 | | 190,000 | 191,003 |
| Philip Morris International Inc 5.375% 2/15/2033 | | 100,000 | 100,194 |
| Philip Morris International Inc 6.375% 5/16/2038 | | 100,000 | 107,384 |
| | | | 1,629,003 |
TOTAL CONSUMER STAPLES | | | 12,341,956 |
| | | | |
| Energy - 1.4% | | | |
| Energy Equipment & Services - 0.0% | | | |
| Baker Hughes Holdings LLC / Baker Hughes Co-Obligor Inc 4.08% 12/15/2047 | | 172,000 | 135,330 |
| Halliburton Co 4.5% 11/15/2041 | | 200,000 | 171,944 |
| NOV Inc 3.6% 12/1/2029 | | 110,000 | 102,636 |
| | | | 409,910 |
| Oil, Gas & Consumable Fuels - 1.4% | | | |
| Apache Corp 5.25% 2/1/2042 | | 100,000 | 86,703 |
| Cheniere Corpus Christi Holdings LLC 3.7% 11/15/2029 | | 70,000 | 65,718 |
| Cheniere Energy Partners LP 4.5% 10/1/2029 | | 150,000 | 145,227 |
| Chevron Corp 1.554% 5/11/2025 | | 80,000 | 79,130 |
| Chevron Corp 1.995% 5/11/2027 | | 80,000 | 75,630 |
| Chevron Corp 2.236% 5/11/2030 | | 80,000 | 70,460 |
| Chevron Corp 2.978% 5/11/2040 | | 80,000 | 59,285 |
| Chevron Corp 3.078% 5/11/2050 | | 80,000 | 52,909 |
| Chevron USA Inc 3.85% 1/15/2028 | | 55,000 | 54,252 |
| Chevron USA Inc 4.95% 8/15/2047 | | 30,000 | 27,231 |
| Columbia Pipeline Group Inc 5.8% 6/1/2045 | | 20,000 | 19,271 |
| ConocoPhillips 6.5% 2/1/2039 | | 260,000 | 284,194 |
| ConocoPhillips Co 4.7% 1/15/2030 | | 90,000 | 89,008 |
| ConocoPhillips Co 5% 1/15/2035 | | 110,000 | 106,852 |
| ConocoPhillips Co 5.5% 1/15/2055 | | 60,000 | 57,054 |
| ConocoPhillips Co 5.7% 9/15/2063 | | 50,000 | 47,931 |
| ConocoPhillips Co 5.95% 3/15/2046 (d) | | 86,000 | 87,959 |
| Continental Resources Inc/OK 4.9% 6/1/2044 | | 30,000 | 24,266 |
| Devon Energy Corp 5% 6/15/2045 | | 100,000 | 83,521 |
| Devon Energy Corp 5.75% 9/15/2054 | | 90,000 | 81,648 |
| Diamondback Energy Inc 4.25% 3/15/2052 | | 120,000 | 90,493 |
| Diamondback Energy Inc 6.25% 3/15/2053 | | 120,000 | 119,709 |
| Eastern Gas Transmission & Storage Inc 3.9% 11/15/2049 | | 60,000 | 43,724 |
| Enbridge Energy Partners LP 5.875% 10/15/2025 | | 76,000 | 76,395 |
| Energy Transfer LP 5% 5/15/2050 | | 160,000 | 135,737 |
| Energy Transfer LP 5.75% 2/15/2033 | | 490,000 | 496,717 |
| Energy Transfer LP 5.8% 6/15/2038 | | 70,000 | 68,801 |
| Energy Transfer LP 6% 6/15/2048 | | 356,000 | 343,864 |
| Energy Transfer LP 6.25% 4/15/2049 | | 50,000 | 50,042 |
| Energy Transfer LP 6.55% 12/1/2033 | | 170,000 | 180,969 |
| Enterprise Products Operating LLC 3.125% 7/31/2029 | | 70,000 | 65,136 |
| Enterprise Products Operating LLC 3.95% 2/15/2027 | | 85,000 | 83,812 |
| Enterprise Products Operating LLC 4.2% 1/31/2050 | | 418,000 | 328,788 |
| Enterprise Products Operating LLC 4.25% 2/15/2048 | | 105,000 | 84,238 |
| Enterprise Products Operating LLC 4.95% 2/15/2035 | | 50,000 | 48,391 |
| Enterprise Products Operating LLC 5.25% 8/16/2077 (b) | | 290,000 | 283,364 |
| Enterprise Products Operating LLC 5.35% 1/31/2033 | | 100,000 | 100,793 |
| Enterprise Products Operating LLC 5.55% 2/16/2055 | | 50,000 | 48,098 |
| Enterprise Products Operating LLC 7.55% 4/15/2038 | | 20,000 | 23,416 |
| EOG Resources Inc 4.375% 4/15/2030 | | 510,000 | 495,655 |
| Eqt Corp 7% 2/1/2030 (f) | | 90,000 | 95,588 |
| Exxon Mobil Corp 3.452% 4/15/2051 | | 330,000 | 231,325 |
| Exxon Mobil Corp 4.227% 3/19/2040 | | 421,000 | 369,136 |
| Hess Corp 4.3% 4/1/2027 | | 150,000 | 148,469 |
| Hess Corp 7.125% 3/15/2033 | | 130,000 | 144,076 |
| Kinder Morgan Energy Partners LP 5% 3/1/2043 | | 215,000 | 187,234 |
| Kinder Morgan Energy Partners LP 5% 8/15/2042 | | 100,000 | 87,086 |
| Kinder Morgan Inc 4.3% 3/1/2028 | | 112,000 | 109,913 |
| Kinder Morgan Inc 5.2% 3/1/2048 | | 30,000 | 26,459 |
| Kinder Morgan Inc 5.2% 6/1/2033 | | 250,000 | 244,226 |
| Kinder Morgan Inc 5.55% 6/1/2045 | | 220,000 | 205,611 |
| Kinder Morgan Inc 7.75% 1/15/2032 | | 110,000 | 124,969 |
| Marathon Petroleum Corp 4.75% 9/15/2044 | | 21,000 | 17,428 |
| Marathon Petroleum Corp 5.125% 12/15/2026 | | 410,000 | 412,229 |
| MPLX LP 4.7% 4/15/2048 | | 28,000 | 22,943 |
| MPLX LP 4.8% 2/15/2029 | | 30,000 | 29,738 |
| MPLX LP 5.5% 2/15/2049 | | 310,000 | 284,629 |
| Occidental Petroleum Corp 5.2% 8/1/2029 | | 70,000 | 69,451 |
| Occidental Petroleum Corp 5.55% 10/1/2034 (d) | | 80,000 | 77,814 |
| Occidental Petroleum Corp 6.125% 1/1/2031 | | 200,000 | 204,644 |
| Occidental Petroleum Corp 6.6% 3/15/2046 | | 220,000 | 222,104 |
| ONEOK Inc 3.95% 3/1/2050 | | 75,000 | 54,082 |
| ONEOK Inc 4.25% 9/24/2027 | | 30,000 | 29,564 |
| ONEOK Inc 4.4% 10/15/2029 | | 20,000 | 19,389 |
| ONEOK Inc 4.45% 9/1/2049 | | 40,000 | 31,198 |
| ONEOK Inc 4.55% 7/15/2028 | | 59,000 | 58,142 |
| ONEOK Inc 4.75% 10/15/2031 | | 90,000 | 87,058 |
| ONEOK Inc 5% 3/1/2026 | | 72,000 | 72,111 |
| ONEOK Inc 5.05% 11/1/2034 | | 70,000 | 66,945 |
| ONEOK Inc 5.65% 11/1/2028 | | 50,000 | 51,020 |
| ONEOK Inc 5.7% 11/1/2054 | | 70,000 | 65,821 |
| ONEOK Inc 6.05% 9/1/2033 | | 130,000 | 133,774 |
| ONEOK Inc 6.1% 11/15/2032 | | 220,000 | 227,663 |
| ONEOK Inc 6.625% 9/1/2053 | | 100,000 | 105,142 |
| Ovintiv Inc 6.5% 2/1/2038 | | 50,000 | 50,908 |
| Ovintiv Inc 6.625% 8/15/2037 | | 50,000 | 51,465 |
| Phillips 66 2.15% 12/15/2030 | | 70,000 | 59,378 |
| Phillips 66 3.3% 3/15/2052 | | 140,000 | 90,046 |
| Phillips 66 3.9% 3/15/2028 | | 94,000 | 91,141 |
| Phillips 66 Co 3.15% 12/15/2029 | | 170,000 | 155,987 |
| Phillips 66 Co 4.95% 3/15/2035 | | 120,000 | 113,376 |
| Phillips 66 Co 5.65% 6/15/2054 | | 30,000 | 28,311 |
| Pioneer Natural Resources Co 1.125% 1/15/2026 (d) | | 230,000 | 222,013 |
| Pioneer Natural Resources Co 1.9% 8/15/2030 | | 19,000 | 16,189 |
| Plains All American Pipeline LP / PAA Finance Corp 5.15% 6/1/2042 | | 100,000 | 88,749 |
| Sabine Pass Liquefaction LLC 4.5% 5/15/2030 (d) | | 850,000 | 823,373 |
| Schlumberger Investment SA 4.85% 5/15/2033 | | 60,000 | 58,714 |
| Shell Finance US Inc 3.25% 4/6/2050 | | 100,000 | 67,376 |
| Shell Finance US Inc 3.75% 9/12/2046 | | 70,000 | 52,620 |
| Shell Finance US Inc 4.375% 5/11/2045 | | 293,000 | 244,979 |
| Shell International Finance BV 3.125% 11/7/2049 | | 100,000 | 65,865 |
| Spectra Energy Partners LP 3.375% 10/15/2026 | | 158,000 | 154,264 |
| Targa Resources Corp 6.125% 3/15/2033 | | 250,000 | 257,750 |
| Targa Resources Partners LP / Targa Resources Partners Finance Corp 5.5% 3/1/2030 | | 230,000 | 230,723 |
| Transcontinental Gas Pipe Line Co LLC 3.25% 5/15/2030 | | 66,000 | 60,126 |
| Transcontinental Gas Pipe Line Co LLC 3.95% 5/15/2050 | | 180,000 | 133,045 |
| Valero Energy Corp 2.85% 4/15/2025 | | 190,000 | 188,718 |
| Valero Energy Corp 3.65% 12/1/2051 | | 100,000 | 67,414 |
| Valero Energy Corp 4.35% 6/1/2028 | | 20,000 | 19,602 |
| Valero Energy Corp 6.625% 6/15/2037 | | 30,000 | 31,468 |
| Western Gas Partners LP 5.25% 2/1/2050 (f) | | 20,000 | 17,035 |
| Western Gas Partners LP 5.3% 3/1/2048 | | 100,000 | 84,928 |
| Williams Cos Inc/The 2.6% 3/15/2031 (d) | | 160,000 | 137,780 |
| Williams Cos Inc/The 3.75% 6/15/2027 | | 35,000 | 34,115 |
| Williams Cos Inc/The 4.85% 3/1/2048 | | 83,000 | 70,691 |
| Williams Cos Inc/The 5.4% 3/2/2026 | | 120,000 | 120,809 |
| Williams Cos Inc/The 5.65% 3/15/2033 | | 60,000 | 60,533 |
| | | | 13,032,863 |
TOTAL ENERGY | | | 13,442,773 |
| | | | |
| Financials - 6.1% | | | |
| Banks - 2.7% | | | |
| Bank of America Corp 1.197% 10/24/2026 (b)(d) | | 924,000 | 897,664 |
| Bank of America Corp 2.482% 9/21/2036 (b) | | 280,000 | 228,127 |
| Bank of America Corp 2.651% 3/11/2032 (b) | | 180,000 | 155,169 |
| Bank of America Corp 2.676% 6/19/2041 (b) | | 200,000 | 138,846 |
| Bank of America Corp 2.687% 4/22/2032 (b) | | 356,000 | 306,014 |
| Bank of America Corp 2.972% 2/4/2033 (b) | | 90,000 | 77,358 |
| Bank of America Corp 2.972% 7/21/2052 (b) | | 370,000 | 235,201 |
| Bank of America Corp 3.419% 12/20/2028 (b) | | 220,000 | 210,929 |
| Bank of America Corp 3.946% 1/23/2049 (b) | | 23,000 | 17,729 |
| Bank of America Corp 3.97% 3/5/2029 (b) | | 125,000 | 121,228 |
| Bank of America Corp 3.974% 2/7/2030 (b) | | 60,000 | 57,500 |
| Bank of America Corp 4% 1/22/2025 | | 370,000 | 369,815 |
| Bank of America Corp 4.083% 3/20/2051 (b) | | 320,000 | 250,504 |
| Bank of America Corp 4.271% 7/23/2029 (b) | | 80,000 | 77,942 |
| Bank of America Corp 4.33% 3/15/2050 (b) | | 60,000 | 49,117 |
| Bank of America Corp 5% 1/21/2044 | | 400,000 | 373,511 |
| Bank of America Corp 5.08% 1/20/2027 (b) | | 800,000 | 802,317 |
| Bank of America Corp 5.288% 4/25/2034 (b) | | 500,000 | 495,799 |
| Bank of America Corp 5.425% 8/15/2035 (b) | | 130,000 | 126,531 |
| Bank of America Corp 5.518% 10/25/2035 (b) | | 80,000 | 78,218 |
| Bank of America Corp 5.872% 9/15/2034 (b) | | 260,000 | 267,031 |
| Bank of America Corp 6.204% 11/10/2028 (b) | | 500,000 | 517,656 |
| Citigroup Inc 2.976% 11/5/2030 (b) | | 270,000 | 243,511 |
| Citigroup Inc 3.106% 4/8/2026 (b) | | 500,000 | 497,590 |
| Citigroup Inc 3.29% 3/17/2026 (b) | | 170,000 | 169,372 |
| Citigroup Inc 3.52% 10/27/2028 (b) | | 205,000 | 197,298 |
| Citigroup Inc 3.98% 3/20/2030 (b) | | 160,000 | 152,758 |
| Citigroup Inc 4.412% 3/31/2031 (b) | | 370,000 | 355,631 |
| Citigroup Inc 4.6% 3/9/2026 | | 550,000 | 548,504 |
| Citigroup Inc 4.65% 7/23/2048 | | 78,000 | 66,742 |
| Citigroup Inc 5.3% 5/6/2044 | | 80,000 | 75,300 |
| Citigroup Inc 5.316% 3/26/2041 (b) | | 617,000 | 593,905 |
| Citigroup Inc 5.411% 9/19/2039 (b) | | 180,000 | 171,418 |
| Citigroup Inc 5.875% 2/22/2033 | | 410,000 | 418,234 |
| Citigroup Inc 6.27% 11/17/2033 (b) | | 100,000 | 104,860 |
| Citigroup Inc 8.125% 7/15/2039 | | 220,000 | 271,514 |
| Citizens Financial Group Inc 2.5% 2/6/2030 | | 30,000 | 26,245 |
| Citizens Financial Group Inc 2.638% 9/30/2032 | | 78,000 | 62,683 |
| Citizens Financial Group Inc 2.85% 7/27/2026 | | 100,000 | 96,671 |
| Citizens Financial Group Inc 5.718% 7/23/2032 (b) | | 90,000 | 90,313 |
| Comerica Inc 5.982% 1/30/2030 (b) | | 50,000 | 50,560 |
| Fifth Third Bancorp 2.55% 5/5/2027 | | 200,000 | 189,912 |
| Fifth Third Bancorp 5.631% 1/29/2032 (b) | | 40,000 | 40,445 |
| Fifth Third Bancorp 6.361% 10/27/2028 (b) | | 120,000 | 124,075 |
| Fifth Third Bancorp 8.25% 3/1/2038 | | 40,000 | 47,958 |
| Huntington Bancshares Inc/OH 2.55% 2/4/2030 | | 90,000 | 79,170 |
| Huntington Bancshares Inc/OH 4.443% 8/4/2028 (b) | | 70,000 | 69,283 |
| Huntington Bancshares Inc/OH 5.272% 1/15/2031 (b) | | 130,000 | 130,103 |
| Huntington Bancshares Inc/OH 6.208% 8/21/2029 (b) | | 130,000 | 134,211 |
| JPMorgan Chase & Co 1.47% 9/22/2027 (b) | | 390,000 | 368,924 |
| JPMorgan Chase & Co 1.578% 4/22/2027 (b) | | 188,000 | 180,523 |
| JPMorgan Chase & Co 1.953% 2/4/2032 (b) | | 250,000 | 207,218 |
| JPMorgan Chase & Co 2.083% 4/22/2026 (b) | | 200,000 | 198,282 |
| JPMorgan Chase & Co 2.522% 4/22/2031 (b) | | 150,000 | 132,145 |
| JPMorgan Chase & Co 2.545% 11/8/2032 (b) | | 40,000 | 33,741 |
| JPMorgan Chase & Co 2.58% 4/22/2032 (b) | | 239,000 | 205,018 |
| JPMorgan Chase & Co 2.739% 10/15/2030 (b) | | 720,000 | 648,587 |
| JPMorgan Chase & Co 2.95% 10/1/2026 | | 224,000 | 218,243 |
| JPMorgan Chase & Co 2.956% 5/13/2031 (b) | | 50,000 | 44,725 |
| JPMorgan Chase & Co 3.109% 4/22/2051 (b) | | 100,000 | 66,187 |
| JPMorgan Chase & Co 3.54% 5/1/2028 (b) | | 660,000 | 641,300 |
| JPMorgan Chase & Co 3.882% 7/24/2038 (b) | | 734,000 | 626,242 |
| JPMorgan Chase & Co 4.005% 4/23/2029 (b) | | 43,000 | 41,690 |
| JPMorgan Chase & Co 4.203% 7/23/2029 (b) | | 30,000 | 29,192 |
| JPMorgan Chase & Co 4.452% 12/5/2029 (b) | | 200,000 | 195,999 |
| JPMorgan Chase & Co 4.565% 6/14/2030 (b) | | 470,000 | 460,677 |
| JPMorgan Chase & Co 4.95% 6/1/2045 | | 135,000 | 122,574 |
| JPMorgan Chase & Co 4.995% 7/22/2030 (b) | | 200,000 | 199,135 |
| JPMorgan Chase & Co 5.294% 7/22/2035 (b) | | 150,000 | 148,390 |
| JPMorgan Chase & Co 5.35% 6/1/2034 (b) | | 880,000 | 879,387 |
| JPMorgan Chase & Co 5.717% 9/14/2033 (b) | | 120,000 | 122,567 |
| KeyCorp 2.25% 4/6/2027 (d) | | 350,000 | 330,228 |
| KeyCorp 6.401% 3/6/2035 (b) | | 50,000 | 52,041 |
| M&T Bank Corp 4.553% 8/16/2028 (b) | | 170,000 | 168,193 |
| M&T Bank Corp 5.053% 1/27/2034 (b) | | 40,000 | 38,306 |
| PNC Financial Services Group Inc/The 1.15% 8/13/2026 (d) | | 514,000 | 485,676 |
| PNC Financial Services Group Inc/The 5.354% 12/2/2028 (b) | | 90,000 | 91,277 |
| PNC Financial Services Group Inc/The 5.401% 7/23/2035 (b) | | 90,000 | 89,300 |
| PNC Financial Services Group Inc/The 5.582% 6/12/2029 (b) | | 100,000 | 101,745 |
| PNC Financial Services Group Inc/The 5.676% 1/22/2035 (b) | | 230,000 | 232,656 |
| PNC Financial Services Group Inc/The 5.939% 8/18/2034 (b) | | 100,000 | 102,996 |
| PNC Financial Services Group Inc/The 6.037% 10/28/2033 (b) | | 30,000 | 31,047 |
| Santander Holdings USA Inc 4.5% 7/17/2025 | | 82,000 | 81,751 |
| Santander Holdings USA Inc 6.124% 5/31/2027 (b) | | 350,000 | 355,116 |
| Santander Holdings USA Inc 6.565% 6/12/2029 (b) | | 100,000 | 103,257 |
| Santander Holdings USA Inc 7.66% 11/9/2031 (b) | | 40,000 | 43,741 |
| Truist Financial Corp 1.2% 8/5/2025 | | 700,000 | 685,904 |
| Truist Financial Corp 1.267% 3/2/2027 (b) | | 29,000 | 27,812 |
| Truist Financial Corp 4.916% 7/28/2033 (b) | | 50,000 | 47,240 |
| Truist Financial Corp 5.153% 8/5/2032 (b) | | 10,000 | 9,883 |
| Truist Financial Corp 5.711% 1/24/2035 (b) | | 230,000 | 231,760 |
| Truist Financial Corp 5.867% 6/8/2034 (b) | | 100,000 | 101,810 |
| Truist Financial Corp 6.123% 10/28/2033 (b) | | 30,000 | 31,237 |
| US Bancorp 1.375% 7/22/2030 (d) | | 210,000 | 173,331 |
| US Bancorp 2.491% 11/3/2036 (b) | | 50,000 | 40,498 |
| US Bancorp 3.1% 4/27/2026 | | 240,000 | 234,854 |
| US Bancorp 4.839% 2/1/2034 (b) | | 150,000 | 143,585 |
| US Bancorp 5.775% 6/12/2029 (b) | | 270,000 | 276,098 |
| US Bancorp 5.836% 6/12/2034 (b) | | 60,000 | 61,164 |
| US Bancorp 5.85% 10/21/2033 (b) | | 70,000 | 71,541 |
| Wachovia Corp 5.5% 8/1/2035 | | 140,000 | 139,858 |
| Wells Fargo & Co 2.164% 2/11/2026 (b) | | 310,000 | 309,055 |
| Wells Fargo & Co 2.188% 4/30/2026 (b) | | 340,000 | 336,922 |
| Wells Fargo & Co 2.572% 2/11/2031 (b) | | 690,000 | 608,499 |
| Wells Fargo & Co 3.068% 4/30/2041 (b) | | 100,000 | 72,755 |
| Wells Fargo & Co 3.584% 5/22/2028 (b) | | 82,000 | 79,462 |
| Wells Fargo & Co 4.1% 6/3/2026 | | 1,194,000 | 1,181,064 |
| Wells Fargo & Co 4.75% 12/7/2046 | | 257,000 | 216,649 |
| Wells Fargo & Co 4.897% 7/25/2033 (b) | | 130,000 | 125,549 |
| Wells Fargo & Co 5.013% 4/4/2051 (b) | | 130,000 | 115,394 |
| Wells Fargo & Co 5.375% 2/7/2035 | | 100,000 | 99,236 |
| Wells Fargo & Co 5.389% 4/24/2034 (b) | | 280,000 | 276,885 |
| Wells Fargo & Co 5.557% 7/25/2034 (b) | | 200,000 | 199,733 |
| Wells Fargo & Co 5.574% 7/25/2029 (b) | | 200,000 | 203,059 |
| Wells Fargo & Co 5.606% 1/15/2044 | | 80,000 | 76,548 |
| Wells Fargo & Co 6.491% 10/23/2034 (b) | | 430,000 | 457,080 |
| | | | 25,575,013 |
| Capital Markets - 1.4% | | | |
| Ameriprise Financial Inc 2.875% 9/15/2026 | | 100,000 | 97,282 |
| Ameriprise Financial Inc 5.15% 5/15/2033 | | 40,000 | 39,930 |
| Ares Capital Corp 2.15% 7/15/2026 | | 234,000 | 223,733 |
| Ares Capital Corp 3.2% 11/15/2031 | | 50,000 | 42,979 |
| Ares Capital Corp 5.95% 7/15/2029 | | 70,000 | 70,779 |
| Ares Strategic Income Fund 5.6% 2/15/2030 (c) | | 90,000 | 88,946 |
| Bank of New York Mellon Corp/The 1.8% 7/28/2031 | | 80,000 | 66,285 |
| Bank of New York Mellon Corp/The 3.85% 4/28/2028 | | 27,000 | 26,338 |
| Bank of New York Mellon Corp/The 4.543% 2/1/2029 (b)(d) | | 240,000 | 238,183 |
| Bank of New York Mellon Corp/The 4.967% 4/26/2034 (b) | | 120,000 | 117,603 |
| Bank of New York Mellon Corp/The 4.975% 3/14/2030 (b) | | 150,000 | 150,206 |
| Bank of New York Mellon Corp/The 5.802% 10/25/2028 (b) | | 110,000 | 112,923 |
| Bank of New York Mellon Corp/The 6.474% 10/25/2034 (b) | | 140,000 | 151,170 |
| BlackRock Funding Inc 4.6% 7/26/2027 | | 30,000 | 30,068 |
| BlackRock Funding Inc 5.25% 3/14/2054 | | 100,000 | 94,467 |
| BlackRock Funding Inc 5.35% 1/8/2055 | | 30,000 | 28,638 |
| Blackrock Inc 2.1% 2/25/2032 | | 50,000 | 41,175 |
| Blackrock Inc 4.75% 5/25/2033 | | 160,000 | 156,672 |
| Blackstone Private Credit Fund 2.7% 1/15/2025 | | 160,000 | 159,834 |
| Blackstone Private Credit Fund 4.7% 3/24/2025 | | 180,000 | 179,729 |
| Blackstone Private Credit Fund 5.25% 4/1/2030 (c) | | 70,000 | 68,047 |
| Blackstone Private Credit Fund 5.95% 7/16/2029 | | 50,000 | 50,329 |
| Blackstone Private Credit Fund 6% 11/22/2034 (c) | | 30,000 | 29,271 |
| Blackstone Private Credit Fund 7.3% 11/27/2028 | | 50,000 | 52,586 |
| Blackstone Secured Lending Fund 5.35% 4/13/2028 | | 100,000 | 99,736 |
| Blue Owl Capital Corp 5.95% 3/15/2029 | | 150,000 | 150,596 |
| Charles Schwab Corp/The 1.65% 3/11/2031 | | 70,000 | 57,312 |
| Charles Schwab Corp/The 2% 3/20/2028 | | 215,000 | 196,935 |
| Charles Schwab Corp/The 3.2% 3/2/2027 | | 350,000 | 338,958 |
| Charles Schwab Corp/The 6.136% 8/24/2034 (b) | | 140,000 | 146,989 |
| Charles Schwab Corp/The 6.196% 11/17/2029 (b) | | 60,000 | 62,543 |
| CME Group Inc 3.75% 6/15/2028 | | 110,000 | 107,071 |
| CME Group Inc 5.3% 9/15/2043 | | 40,000 | 40,000 |
| Goldman Sachs Group Inc/The 2.615% 4/22/2032 (b) | | 255,000 | 217,292 |
| Goldman Sachs Group Inc/The 3.691% 6/5/2028 (b)(d) | | 440,000 | 427,355 |
| Goldman Sachs Group Inc/The 4.017% 10/31/2038 (b) | | 887,000 | 751,121 |
| Goldman Sachs Group Inc/The 4.223% 5/1/2029 (b) | | 60,000 | 58,381 |
| Goldman Sachs Group Inc/The 4.411% 4/23/2039 (b) | | 230,000 | 202,701 |
| Goldman Sachs Group Inc/The 4.75% 10/21/2045 | | 28,000 | 24,777 |
| Goldman Sachs Group Inc/The 5.561% 11/19/2045 (b) | | 230,000 | 222,124 |
| Goldman Sachs Group Inc/The 6.75% 10/1/2037 | | 350,000 | 374,696 |
| Golub Capital BDC Inc 6% 7/15/2029 | | 50,000 | 49,959 |
| HPS Corporate Lending Fund 6.25% 9/30/2029 (c) | | 40,000 | 40,685 |
| HPS Corporate Lending Fund 6.75% 1/30/2029 (c) | | 20,000 | 20,538 |
| Intercontinental Exchange Inc 1.85% 9/15/2032 (d) | | 180,000 | 142,428 |
| Intercontinental Exchange Inc 2.65% 9/15/2040 | | 80,000 | 55,637 |
| Intercontinental Exchange Inc 3% 6/15/2050 | | 138,000 | 87,980 |
| Intercontinental Exchange Inc 3% 9/15/2060 | | 40,000 | 23,196 |
| Intercontinental Exchange Inc 3.75% 9/21/2028 | | 50,000 | 48,011 |
| Intercontinental Exchange Inc 4.6% 3/15/2033 | | 240,000 | 229,709 |
| Invesco Finance PLC 3.75% 1/15/2026 | | 110,000 | 108,849 |
| Jefferies Financial Group Inc 2.75% 10/15/2032 | | 100,000 | 81,989 |
| Jefferies Financial Group Inc 4.15% 1/23/2030 | | 40,000 | 38,130 |
| Jefferies Financial Group Inc 4.85% 1/15/2027 | | 100,000 | 100,175 |
| Jefferies Financial Group Inc 5.875% 7/21/2028 | | 140,000 | 143,160 |
| Lazard Group LLC 4.5% 9/19/2028 | | 100,000 | 97,872 |
| Legg Mason Inc 5.625% 1/15/2044 | | 20,000 | 19,567 |
| LPL Holdings Inc 6.75% 11/17/2028 (d) | | 30,000 | 31,508 |
| Moody's Corp 4.875% 12/17/2048 | | 123,000 | 109,403 |
| Moody's Corp 5% 8/5/2034 | | 50,000 | 48,907 |
| Morgan Stanley 2.188% 4/28/2026 (b)(d) | | 940,000 | 931,616 |
| Morgan Stanley 2.699% 1/22/2031 (b) | | 1,340,000 | 1,190,603 |
| Morgan Stanley 3.591% 7/22/2028 (b) | | 210,000 | 202,504 |
| Morgan Stanley 3.625% 1/20/2027 | | 96,000 | 94,250 |
| Morgan Stanley 3.772% 1/24/2029 (b) | | 300,000 | 289,309 |
| Morgan Stanley 3.95% 4/23/2027 | | 200,000 | 196,002 |
| Morgan Stanley 3.971% 7/22/2038 (b) | | 120,000 | 102,063 |
| Morgan Stanley 4.375% 1/22/2047 | | 148,000 | 123,593 |
| Morgan Stanley 4.457% 4/22/2039 (b) | | 295,000 | 264,070 |
| Morgan Stanley 5.042% 7/19/2030 (b) | | 40,000 | 39,862 |
| Morgan Stanley 5.164% 4/20/2029 (b) | | 200,000 | 200,563 |
| Morgan Stanley 5.25% 4/21/2034 (b) | | 420,000 | 413,572 |
| Morgan Stanley 5.297% 4/20/2037 (b) | | 140,000 | 136,020 |
| Morgan Stanley 5.32% 7/19/2035 (b) | | 40,000 | 39,344 |
| Morgan Stanley 5.597% 3/24/2051 (b) | | 90,000 | 89,010 |
| Morgan Stanley 5.948% 1/19/2038 (b) | | 190,000 | 190,196 |
| Morgan Stanley 6.342% 10/18/2033 (b) | | 320,000 | 338,498 |
| Morgan Stanley 6.375% 7/24/2042 | | 190,000 | 205,272 |
| Nasdaq Inc 2.5% 12/21/2040 | | 100,000 | 67,142 |
| Nasdaq Inc 5.35% 6/28/2028 | | 90,000 | 91,263 |
| Nasdaq Inc 5.55% 2/15/2034 | | 40,000 | 40,351 |
| Nasdaq Inc 5.95% 8/15/2053 (d) | | 8,000 | 8,069 |
| Nasdaq Inc 6.1% 6/28/2063 | | 40,000 | 40,696 |
| Northern Trust Corp 1.95% 5/1/2030 | | 220,000 | 189,960 |
| Raymond James Financial Inc 4.95% 7/15/2046 | | 70,000 | 62,830 |
| S&P Global Inc 2.3% 8/15/2060 | | 100,000 | 50,081 |
| S&P Global Inc 2.45% 3/1/2027 | | 590,000 | 564,100 |
| S&P Global Inc 4.75% 8/1/2028 | | 140,000 | 140,202 |
| Sixth Street Specialty Lending Inc 6.125% 3/1/2029 | | 30,000 | 30,367 |
| State Street Corp 1.684% 11/18/2027 (b)(d) | | 204,000 | 193,173 |
| State Street Corp 4.821% 1/26/2034 (b) | | 100,000 | 96,969 |
| State Street Corp 5.684% 11/21/2029 (b) | | 110,000 | 113,063 |
| State Street Corp 6.123% 11/21/2034 (b) | | 30,000 | 31,219 |
| | | | 14,039,295 |
| Consumer Finance - 0.7% | | | |
| Ally Financial Inc 5.8% 5/1/2025 | | 250,000 | 250,286 |
| Ally Financial Inc 6.184% 7/26/2035 (b) | | 50,000 | 49,424 |
| Ally Financial Inc 6.848% 1/3/2030 (b) | | 120,000 | 124,400 |
| Ally Financial Inc 6.992% 6/13/2029 (b) | | 120,000 | 125,014 |
| American Express Co 2.55% 3/4/2027 | | 100,000 | 95,737 |
| American Express Co 3.3% 5/3/2027 | | 30,000 | 29,112 |
| American Express Co 4.05% 12/3/2042 | | 160,000 | 133,957 |
| American Express Co 4.989% 5/26/2033 (b) | | 30,000 | 29,252 |
| American Express Co 5.043% 5/1/2034 (b) | | 90,000 | 88,431 |
| American Express Co 5.532% 4/25/2030 (b) | | 270,000 | 274,916 |
| Capital One Financial Corp 3.75% 7/28/2026 | | 70,000 | 68,699 |
| Capital One Financial Corp 3.8% 1/31/2028 | | 251,000 | 242,272 |
| Capital One Financial Corp 5.817% 2/1/2034 (b) | | 250,000 | 251,081 |
| Capital One Financial Corp 6.377% 6/8/2034 (b) | | 100,000 | 103,828 |
| Capital One Financial Corp 7.624% 10/30/2031 (b) | | 120,000 | 132,493 |
| Ford Motor Credit Co LLC 2.9% 2/16/2028 (d) | | 330,000 | 304,537 |
| Ford Motor Credit Co LLC 6.798% 11/7/2028 | | 280,000 | 290,129 |
| Ford Motor Credit Co LLC 6.8% 5/12/2028 | | 310,000 | 320,340 |
| Ford Motor Credit Co LLC 7.2% 6/10/2030 | | 200,000 | 210,552 |
| John Deere Capital Corp 2.8% 7/18/2029 (d) | | 220,000 | 202,735 |
| John Deere Capital Corp 4.75% 6/8/2026 | | 740,000 | 743,108 |
| John Deere Capital Corp 4.85% 10/11/2029 (d) | | 400,000 | 402,912 |
| John Deere Capital Corp 5.05% 6/12/2034 | | 50,000 | 49,781 |
| PACCAR Financial Corp 4% 9/26/2029 | | 160,000 | 154,752 |
| Synchrony Financial 3.95% 12/1/2027 | | 150,000 | 145,031 |
| Synchrony Financial 5.15% 3/19/2029 | | 159,000 | 156,613 |
| Toyota Motor Credit Corp 2.15% 2/13/2030 | | 100,000 | 87,628 |
| Toyota Motor Credit Corp 3% 4/1/2025 | | 580,000 | 577,761 |
| Toyota Motor Credit Corp 4.55% 8/9/2029 | | 80,000 | 79,021 |
| Toyota Motor Credit Corp 4.6% 10/10/2031 | | 50,000 | 48,674 |
| Toyota Motor Credit Corp 4.7% 1/12/2033 | | 70,000 | 68,085 |
| Toyota Motor Credit Corp 4.8% 1/5/2034 | | 120,000 | 116,585 |
| Toyota Motor Credit Corp 5.45% 11/10/2027 | | 380,000 | 388,912 |
| | | | 6,346,058 |
| Financial Services - 0.6% | | | |
| Aon Corp / Aon Global Holdings PLC 5.35% 2/28/2033 | | 200,000 | 199,113 |
| Berkshire Hathaway Inc 4.5% 2/11/2043 | | 33,000 | 30,489 |
| Blue Owl Credit Income Corp 5.8% 3/15/2030 (c) | | 50,000 | 49,245 |
| Blue Owl Credit Income Corp 6.6% 9/15/2029 (c) | | 30,000 | 30,599 |
| Blue Owl Credit Income Corp 6.65% 3/15/2031 | | 70,000 | 71,247 |
| BP Capital Markets America Inc 3% 2/24/2050 | | 240,000 | 152,580 |
| BP Capital Markets America Inc 3.001% 3/17/2052 | | 100,000 | 62,397 |
| BP Capital Markets America Inc 4.812% 2/13/2033 | | 300,000 | 290,004 |
| BP Capital Markets America Inc 5.017% 11/17/2027 | | 60,000 | 60,658 |
| BP Capital Markets America Inc 5.227% 11/17/2034 | | 180,000 | 177,279 |
| CNH Industrial Capital LLC 5.5% 1/12/2029 | | 120,000 | 121,694 |
| Corebridge Financial Inc 3.5% 4/4/2025 | | 130,000 | 129,536 |
| Corebridge Financial Inc 3.85% 4/5/2029 | | 80,000 | 76,393 |
| Corebridge Financial Inc 3.9% 4/5/2032 | | 80,000 | 72,812 |
| Corebridge Financial Inc 4.35% 4/5/2042 | | 20,000 | 16,649 |
| Corebridge Financial Inc 5.75% 1/15/2034 | | 40,000 | 40,745 |
| Corebridge Financial Inc 6.875% 12/15/2052 (b) | | 100,000 | 102,622 |
| DH Europe Finance II Sarl 2.6% 11/15/2029 | | 80,000 | 72,354 |
| DH Europe Finance II Sarl 3.4% 11/15/2049 | | 50,000 | 35,374 |
| Equitable Holdings Inc 4.35% 4/20/2028 | | 360,000 | 352,714 |
| FedEx Corp 2020-1 Class AA Pass Through Trust equipment trust certificate 1.875% 8/20/2035 | | 30,658 | 25,477 |
| Fidelity National Information Services Inc 1.15% 3/1/2026 | | 246,000 | 235,975 |
| Fidelity National Information Services Inc 2.25% 3/1/2031 | | 200,000 | 169,489 |
| Fiserv Inc 3.5% 7/1/2029 | | 80,000 | 75,061 |
| Fiserv Inc 4.4% 7/1/2049 | | 240,000 | 195,942 |
| Global Payments Inc 1.2% 3/1/2026 | | 346,000 | 331,682 |
| Global Payments Inc 4.15% 8/15/2049 | | 20,000 | 14,902 |
| Global Payments Inc 5.4% 8/15/2032 (d) | | 140,000 | 139,905 |
| Jackson Financial Inc 4% 11/23/2051 | | 40,000 | 27,579 |
| JBS USA Holding Lux Sarl/ JBS USA Food Co/ JBS Lux Co Sarl 3% 5/15/2032 | | 100,000 | 83,246 |
| JBS USA Holding Lux Sarl/ JBS USA Food Co/ JBS Lux Co Sarl 5.75% 4/1/2033 | | 330,000 | 328,488 |
| JBS USA Holding Lux Sarl/ JBS USA Food Co/ JBS Lux Co Sarl 7.25% 11/15/2053 | | 60,000 | 66,109 |
| Mastercard Inc 2% 11/18/2031 | | 240,000 | 199,379 |
| Mastercard Inc 2.95% 6/1/2029 | | 50,000 | 46,653 |
| Mastercard Inc 3.3% 3/26/2027 | | 38,000 | 37,059 |
| Mastercard Inc 3.35% 3/26/2030 | | 53,000 | 49,527 |
| Mastercard Inc 3.85% 3/26/2050 | | 115,000 | 88,985 |
| Mastercard Inc 4.55% 1/15/2035 | | 140,000 | 134,156 |
| National Rural Utilities Cooperative Finance Corp 4.15% 12/15/2032 | | 170,000 | 158,615 |
| National Rural Utilities Cooperative Finance Corp 4.85% 2/7/2029 | | 100,000 | 100,052 |
| National Rural Utilities Cooperative Finance Corp 5.8% 1/15/2033 | | 60,000 | 62,068 |
| PayPal Holdings Inc 1.65% 6/1/2025 | | 70,000 | 69,089 |
| PayPal Holdings Inc 2.3% 6/1/2030 | | 120,000 | 105,166 |
| PayPal Holdings Inc 4.4% 6/1/2032 | | 100,000 | 96,027 |
| PayPal Holdings Inc 5.25% 6/1/2062 | | 30,000 | 27,265 |
| PayPal Holdings Inc 5.5% 6/1/2054 | | 60,000 | 58,596 |
| Sixth Street Lending Partners 6.5% 3/11/2029 (c) | | 50,000 | 50,667 |
| Visa Inc 1.1% 2/15/2031 | | 250,000 | 202,189 |
| Visa Inc 2.05% 4/15/2030 | | 350,000 | 306,071 |
| Visa Inc 2.7% 4/15/2040 | | 150,000 | 109,218 |
| Visa Inc 4.15% 12/14/2035 | | 38,000 | 35,107 |
| Western Union Co/The 2.85% 1/10/2025 | | 70,000 | 69,965 |
| Western Union Co/The 6.2% 11/17/2036 | | 20,000 | 20,251 |
| | | | 5,864,464 |
| Insurance - 0.7% | | | |
| AFLAC Inc 3.6% 4/1/2030 | | 224,000 | 210,427 |
| Allstate Corp/The 1.45% 12/15/2030 | | 110,000 | 89,564 |
| Allstate Corp/The 5.55% 5/9/2035 | | 156,000 | 157,958 |
| American International Group Inc 4.25% 3/15/2029 | | 100,000 | 95,881 |
| American International Group Inc 4.375% 6/30/2050 | | 240,000 | 198,339 |
| American International Group Inc 4.5% 7/16/2044 | | 25,000 | 21,499 |
| American International Group Inc 4.75% 4/1/2048 | | 100,000 | 88,346 |
| Aon Corp 3.75% 5/2/2029 | | 120,000 | 113,942 |
| Aon Global Ltd 4.75% 5/15/2045 | | 50,000 | 43,071 |
| Aon North America Inc 5.45% 3/1/2034 | | 250,000 | 249,564 |
| Arch Capital Group Ltd 7.35% 5/1/2034 | | 20,000 | 22,604 |
| Arch Capital Group US Inc 5.144% 11/1/2043 | | 50,000 | 45,800 |
| Arthur J Gallagher & Co 3.5% 5/20/2051 | | 50,000 | 34,395 |
| Arthur J Gallagher & Co 4.85% 12/15/2029 | | 60,000 | 59,725 |
| Arthur J Gallagher & Co 5.15% 2/15/2035 | | 60,000 | 58,497 |
| Arthur J Gallagher & Co 5.55% 2/15/2055 | | 43,000 | 41,286 |
| Arthur J Gallagher & Co 5.75% 3/2/2053 | | 45,000 | 44,156 |
| Arthur J Gallagher & Co 6.75% 2/15/2054 | | 30,000 | 33,215 |
| Assurant Inc 4.9% 3/27/2028 | | 60,000 | 59,837 |
| Assured Guaranty US Holdings Inc 6.125% 9/15/2028 | | 70,000 | 72,641 |
| Athene Holding Ltd 3.5% 1/15/2031 | | 20,000 | 18,028 |
| Athene Holding Ltd 4.125% 1/12/2028 | | 84,000 | 81,953 |
| Athene Holding Ltd 6.15% 4/3/2030 | | 180,000 | 187,005 |
| Athene Holding Ltd 6.625% 10/15/2054 (b) | | 40,000 | 39,776 |
| Athene Holding Ltd 6.65% 2/1/2033 | | 100,000 | 105,984 |
| Baylor Scott & White Holdings 2.839% 11/15/2050 | | 120,000 | 76,244 |
| Berkshire Hathaway Fin Corp 1.45% 10/15/2030 | | 120,000 | 100,452 |
| Berkshire Hathaway Fin Corp 2.85% 10/15/2050 | | 220,000 | 138,053 |
| Berkshire Hathaway Fin Corp 4.2% 8/15/2048 | | 243,000 | 201,066 |
| Brighthouse Financial Inc 3.85% 12/22/2051 | | 30,000 | 19,504 |
| Brighthouse Financial Inc 5.625% 5/15/2030 | | 80,000 | 81,700 |
| Brown & Brown Inc 4.2% 3/17/2032 | | 110,000 | 101,385 |
| Chubb INA Holdings LLC 1.375% 9/15/2030 | | 350,000 | 290,700 |
| Chubb INA Holdings LLC 4.35% 11/3/2045 | | 128,000 | 109,038 |
| CNA Financial Corp 3.9% 5/1/2029 | | 160,000 | 153,172 |
| First American Financial Corp 2.4% 8/15/2031 | | 60,000 | 49,363 |
| Globe Life Inc 2.15% 8/15/2030 | | 50,000 | 42,330 |
| Hartford Financial Services Group Inc/The 4.4% 3/15/2048 | | 70,000 | 58,328 |
| Hartford Financial Services Group Inc/The 6.1% 10/1/2041 | | 30,000 | 30,633 |
| Lincoln National Corp 4.35% 3/1/2048 | | 160,000 | 124,192 |
| Markel Group Inc 3.35% 9/17/2029 | | 30,000 | 27,888 |
| Markel Group Inc 3.5% 11/1/2027 | | 100,000 | 96,526 |
| Markel Group Inc 4.15% 9/17/2050 | | 40,000 | 30,371 |
| Markel Group Inc 5% 5/20/2049 | | 50,000 | 43,496 |
| Marsh & McLennan Cos Inc 4.2% 3/1/2048 | | 110,000 | 89,110 |
| Marsh & McLennan Cos Inc 4.65% 3/15/2030 | | 70,000 | 69,135 |
| Marsh & McLennan Cos Inc 4.85% 11/15/2031 | | 70,000 | 69,125 |
| Marsh & McLennan Cos Inc 4.9% 3/15/2049 | | 70,000 | 62,675 |
| Marsh & McLennan Cos Inc 5% 3/15/2035 | | 70,000 | 68,326 |
| Marsh & McLennan Cos Inc 5.35% 11/15/2044 | | 40,000 | 38,808 |
| Marsh & McLennan Cos Inc 5.4% 3/15/2055 | | 50,000 | 47,879 |
| Marsh & McLennan Cos Inc 5.45% 3/15/2053 | | 40,000 | 38,621 |
| Marsh & McLennan Cos Inc 5.7% 9/15/2053 | | 40,000 | 40,089 |
| Marsh & McLennan Cos Inc 5.75% 11/1/2032 | | 100,000 | 103,395 |
| MetLife Inc 4.05% 3/1/2045 | | 18,000 | 14,408 |
| MetLife Inc 4.55% 3/23/2030 | | 600,000 | 591,539 |
| MetLife Inc 4.875% 11/13/2043 | | 100,000 | 90,791 |
| MetLife Inc 5.25% 1/15/2054 | | 40,000 | 37,438 |
| MetLife Inc 6.4% 12/15/2066 (b) | | 70,000 | 71,352 |
| Principal Financial Group Inc 5.375% 3/15/2033 | | 120,000 | 120,135 |
| Progressive Corp/The 2.5% 3/15/2027 | | 100,000 | 95,741 |
| Progressive Corp/The 3.2% 3/26/2030 | | 100,000 | 92,345 |
| Progressive Corp/The 4.2% 3/15/2048 | | 135,000 | 110,202 |
| Prudential Financial Inc 3.878% 3/27/2028 | | 23,000 | 22,389 |
| Prudential Financial Inc 3.935% 12/7/2049 | | 38,000 | 28,645 |
| Prudential Financial Inc 4.35% 2/25/2050 | | 285,000 | 232,244 |
| Prudential Financial Inc 5.125% 3/1/2052 (b) | | 50,000 | 47,581 |
| Prudential Financial Inc 6% 9/1/2052 (b) | | 40,000 | 40,052 |
| Prudential Financial Inc 6.5% 3/15/2054 (b) | | 60,000 | 61,708 |
| Reinsurance Group of America Inc 3.95% 9/15/2026 | | 50,000 | 49,301 |
| Reinsurance Group of America Inc 6% 9/15/2033 | | 30,000 | 30,833 |
| The Travelers Companies, Inc. 2.55% 4/27/2050 | | 200,000 | 117,875 |
| The Travelers Companies, Inc. 4% 5/30/2047 | | 32,000 | 25,296 |
| The Travelers Companies, Inc. 4.1% 3/4/2049 | | 50,000 | 39,880 |
| Unum Group 4% 6/15/2029 | | 100,000 | 95,763 |
| Unum Group 4.125% 6/15/2051 | | 20,000 | 14,743 |
| Unum Group 6% 6/15/2054 | | 30,000 | 29,648 |
| Willis North America Inc 2.95% 9/15/2029 | | 250,000 | 227,265 |
| Willis North America Inc 5.35% 5/15/2033 | | 20,000 | 19,859 |
| | | | 6,882,130 |
TOTAL FINANCIALS | | | 58,706,960 |
| | | | |
| Health Care - 2.7% | | | |
| Biotechnology - 0.5% | | | |
| AbbVie Inc 2.95% 11/21/2026 | | 50,000 | 48,573 |
| AbbVie Inc 3.2% 11/21/2029 | | 80,000 | 74,252 |
| AbbVie Inc 3.8% 3/15/2025 | | 61,000 | 60,890 |
| AbbVie Inc 4.05% 11/21/2039 | | 50,000 | 42,715 |
| AbbVie Inc 4.25% 11/21/2049 | | 390,000 | 317,087 |
| AbbVie Inc 4.3% 5/14/2036 | | 140,000 | 127,840 |
| AbbVie Inc 4.5% 5/14/2035 | | 440,000 | 412,051 |
| AbbVie Inc 4.55% 3/15/2035 | | 80,000 | 75,218 |
| AbbVie Inc 4.7% 5/14/2045 | | 120,000 | 105,882 |
| AbbVie Inc 4.8% 3/15/2029 | | 150,000 | 149,887 |
| AbbVie Inc 4.875% 11/14/2048 | | 100,000 | 89,794 |
| AbbVie Inc 5.05% 3/15/2034 | | 220,000 | 217,356 |
| AbbVie Inc 5.4% 3/15/2054 | | 150,000 | 144,383 |
| Amgen Inc 3% 1/15/2052 | | 30,000 | 18,928 |
| Amgen Inc 3.15% 2/21/2040 | | 410,000 | 305,549 |
| Amgen Inc 3.2% 11/2/2027 | | 56,000 | 53,864 |
| Amgen Inc 3.375% 2/21/2050 | | 110,000 | 75,168 |
| Amgen Inc 4.2% 3/1/2033 | | 260,000 | 241,121 |
| Amgen Inc 4.4% 5/1/2045 | | 102,000 | 84,597 |
| Amgen Inc 4.663% 6/15/2051 | | 190,000 | 159,081 |
| Amgen Inc 4.875% 3/1/2053 | | 50,000 | 42,913 |
| Amgen Inc 5.15% 3/2/2028 | | 480,000 | 483,492 |
| Amgen Inc 5.25% 3/2/2033 | | 100,000 | 99,262 |
| Amgen Inc 5.65% 3/2/2053 | | 182,000 | 175,224 |
| Amgen Inc 5.75% 3/2/2063 | | 140,000 | 134,268 |
| Biogen Inc 3.25% 2/15/2051 | | 270,000 | 173,350 |
| Gilead Sciences Inc 2.8% 10/1/2050 | | 180,000 | 110,633 |
| Gilead Sciences Inc 4% 9/1/2036 | | 40,000 | 35,283 |
| Gilead Sciences Inc 4.15% 3/1/2047 | | 60,000 | 47,958 |
| Gilead Sciences Inc 4.5% 2/1/2045 | | 311,000 | 266,568 |
| Gilead Sciences Inc 4.8% 11/15/2029 | | 50,000 | 49,898 |
| Gilead Sciences Inc 5.5% 11/15/2054 | | 50,000 | 48,632 |
| | | | 4,471,717 |
| Health Care Equipment & Supplies - 0.2% | | | |
| Abbott Laboratories 3.875% 9/15/2025 | | 240,000 | 238,932 |
| Abbott Laboratories 4.9% 11/30/2046 | | 150,000 | 140,014 |
| Baxter International Inc 1.915% 2/1/2027 | | 180,000 | 169,675 |
| Baxter International Inc 2.539% 2/1/2032 (d) | | 180,000 | 150,143 |
| Becton Dickinson & Co 2.823% 5/20/2030 | | 150,000 | 134,364 |
| Becton Dickinson & Co 3.7% 6/6/2027 | | 52,000 | 50,770 |
| Becton Dickinson & Co 4.669% 6/6/2047 | | 130,000 | 111,267 |
| Becton Dickinson & Co 5.081% 6/7/2029 | | 100,000 | 100,643 |
| Boston Scientific Corp 3.75% 3/1/2026 | | 120,000 | 118,565 |
| Boston Scientific Corp 4% 3/1/2029 | | 100,000 | 96,491 |
| Boston Scientific Corp 4.7% 3/1/2049 | | 140,000 | 122,931 |
| GE HealthCare Technologies Inc 5.857% 3/15/2030 | | 100,000 | 103,579 |
| GE HealthCare Technologies Inc 5.905% 11/22/2032 | | 140,000 | 145,453 |
| Medtronic Inc 4.625% 3/15/2045 | | 168,000 | 149,132 |
| Solventum Corp 6% 5/15/2064 (c) | | 90,000 | 87,766 |
| Stryker Corp 2.9% 6/15/2050 | | 100,000 | 64,681 |
| Stryker Corp 3.5% 3/15/2026 | | 240,000 | 236,794 |
| Stryker Corp 4.625% 9/11/2034 (d) | | 100,000 | 95,406 |
| | | | 2,316,606 |
| Health Care Providers & Services - 1.1% | | | |
| Aetna Inc 4.75% 3/15/2044 | | 60,000 | 49,654 |
| Aetna Inc 6.625% 6/15/2036 | | 60,000 | 63,190 |
| AHS Hospital Corp 2.78% 7/1/2051 | | 250,000 | 153,439 |
| Allina Health System 3.887% 4/15/2049 | | 20,000 | 15,275 |
| Banner Health 2.913% 1/1/2051 | | 100,000 | 63,499 |
| Baptist Healthcare System Obligated Group 3.54% 8/15/2050 | | 100,000 | 70,442 |
| Bon Secours Mercy Health Inc 2.095% 6/1/2031 | | 71,000 | 59,111 |
| Cardinal Health Inc 3.41% 6/15/2027 | | 67,000 | 64,936 |
| Cardinal Health Inc 5.45% 2/15/2034 | | 110,000 | 109,584 |
| Cencora Inc 4.85% 12/15/2029 | | 30,000 | 29,805 |
| Cencora Inc 5.125% 2/15/2034 | | 110,000 | 107,969 |
| Cencora Inc 5.15% 2/15/2035 | | 30,000 | 29,246 |
| Centene Corp 2.45% 7/15/2028 | | 100,000 | 89,990 |
| Centene Corp 2.625% 8/1/2031 | | 130,000 | 107,052 |
| Centene Corp 3.375% 2/15/2030 | | 260,000 | 231,577 |
| Children's Hospital of Philadelphia/The 2.704% 7/1/2050 | | 79,000 | 48,832 |
| Cigna Group/The 4.125% 11/15/2025 | | 25,000 | 24,873 |
| Cigna Group/The 4.375% 10/15/2028 | | 30,000 | 29,408 |
| Cigna Group/The 4.5% 2/25/2026 | | 74,000 | 73,802 |
| Cigna Group/The 4.8% 7/15/2046 | | 465,000 | 397,326 |
| Cigna Group/The 4.8% 8/15/2038 | | 200,000 | 181,310 |
| Cigna Group/The 4.9% 12/15/2048 | | 30,000 | 25,541 |
| CommonSpirit Health 3.91% 10/1/2050 | | 125,000 | 91,995 |
| CommonSpirit Health 4.35% 11/1/2042 | | 100,000 | 83,545 |
| CommonSpirit Health 5.318% 12/1/2034 | | 100,000 | 98,671 |
| CVS Health Corp 3% 8/15/2026 | | 20,000 | 19,373 |
| CVS Health Corp 3.25% 8/15/2029 | | 195,000 | 177,528 |
| CVS Health Corp 3.625% 4/1/2027 (d) | | 170,000 | 164,945 |
| CVS Health Corp 3.75% 4/1/2030 | | 380,000 | 348,066 |
| CVS Health Corp 4.3% 3/25/2028 | | 264,000 | 255,791 |
| CVS Health Corp 5% 1/30/2029 | | 40,000 | 39,463 |
| CVS Health Corp 5.05% 3/25/2048 | | 131,000 | 108,016 |
| CVS Health Corp 5.25% 2/21/2033 | | 150,000 | 143,798 |
| CVS Health Corp 5.3% 6/1/2033 | | 70,000 | 67,105 |
| CVS Health Corp 5.625% 2/21/2053 | | 130,000 | 115,302 |
| CVS Health Corp 6% 6/1/2063 | | 90,000 | 82,084 |
| CVS Health Corp 6.05% 6/1/2054 | | 50,000 | 46,902 |
| Elevance Health Inc 3.65% 12/1/2027 | | 320,000 | 311,306 |
| Elevance Health Inc 4.101% 3/1/2028 | | 50,000 | 48,862 |
| Elevance Health Inc 4.375% 12/1/2047 | | 175,000 | 141,057 |
| Elevance Health Inc 4.55% 3/1/2048 (d) | | 250,000 | 205,153 |
| Elevance Health Inc 4.625% 5/15/2042 | | 140,000 | 120,881 |
| Elevance Health Inc 5.2% 2/15/2035 | | 140,000 | 136,728 |
| Franciscan Missionaries of Our Lady Health System Inc 3.914% 7/1/2049 | | 120,000 | 91,244 |
| HCA Inc 4.5% 2/15/2027 | | 1,013,000 | 1,003,472 |
| HCA Inc 5.25% 6/15/2049 | | 100,000 | 86,519 |
| HCA Inc 5.6% 4/1/2034 | | 200,000 | 197,018 |
| HCA Inc 6% 4/1/2054 | | 300,000 | 285,784 |
| HCA Inc 6.1% 4/1/2064 | | 70,000 | 66,785 |
| Humana Inc 3.95% 3/15/2027 | | 445,000 | 436,490 |
| Humana Inc 4.625% 12/1/2042 | | 80,000 | 65,762 |
| Humana Inc 5.75% 12/1/2028 | | 70,000 | 71,290 |
| Humana Inc 5.75% 4/15/2054 | | 70,000 | 64,874 |
| Integris Baptist Medical Center Inc 3.875% 8/15/2050 | | 83,000 | 60,110 |
| Kaiser Foundation Hospitals 2.81% 6/1/2041 | | 63,000 | 44,566 |
| Kaiser Foundation Hospitals 3.266% 11/1/2049 | | 80,000 | 55,473 |
| Kaiser Foundation Hospitals 4.15% 5/1/2047 | | 130,000 | 106,041 |
| Mass General Brigham Inc 3.342% 7/1/2060 | | 60,000 | 39,071 |
| MyMichigan Health 3.409% 6/1/2050 | | 33,000 | 22,958 |
| Novant Health Inc 3.168% 11/1/2051 | | 105,000 | 69,356 |
| NYU Langone Hospitals 3.38% 7/1/2055 | | 70,000 | 46,845 |
| Orlando Health Obligated Grp 3.327% 10/1/2050 | | 57,000 | 39,718 |
| Piedmont Healthcare Inc 2.719% 1/1/2042 | | 37,000 | 25,433 |
| Providence St Joseph Health Obligated Group 2.7% 10/1/2051 | | 130,000 | 74,943 |
| Sabra Health Care LP 5.125% 8/15/2026 | | 50,000 | 49,961 |
| Sutter Health 3.361% 8/15/2050 | | 130,000 | 91,365 |
| Trinity Health Corp 2.632% 12/1/2040 | | 50,000 | 34,833 |
| UnitedHealth Group Inc 1.15% 5/15/2026 | | 180,000 | 172,016 |
| UnitedHealth Group Inc 1.25% 1/15/2026 | | 81,000 | 78,358 |
| UnitedHealth Group Inc 2.9% 5/15/2050 | | 120,000 | 74,394 |
| UnitedHealth Group Inc 3.05% 5/15/2041 | | 230,000 | 166,032 |
| UnitedHealth Group Inc 3.5% 8/15/2039 | | 772,000 | 610,558 |
| UnitedHealth Group Inc 3.7% 8/15/2049 | | 40,000 | 29,071 |
| UnitedHealth Group Inc 3.75% 10/15/2047 | | 30,000 | 22,306 |
| UnitedHealth Group Inc 4.25% 1/15/2029 | | 100,000 | 98,008 |
| UnitedHealth Group Inc 4.45% 12/15/2048 | | 102,000 | 84,013 |
| UnitedHealth Group Inc 4.625% 7/15/2035 | | 100,000 | 94,419 |
| UnitedHealth Group Inc 4.7% 4/15/2029 | | 340,000 | 338,539 |
| UnitedHealth Group Inc 4.95% 5/15/2062 | | 90,000 | 77,554 |
| UnitedHealth Group Inc 5% 4/15/2034 | | 40,000 | 39,034 |
| UnitedHealth Group Inc 5.05% 4/15/2053 | | 100,000 | 90,050 |
| UnitedHealth Group Inc 5.15% 7/15/2034 | | 150,000 | 147,998 |
| UnitedHealth Group Inc 5.25% 2/15/2028 | | 90,000 | 91,388 |
| UnitedHealth Group Inc 5.35% 2/15/2033 | | 90,000 | 90,566 |
| UnitedHealth Group Inc 5.5% 4/15/2064 | | 100,000 | 93,422 |
| UnitedHealth Group Inc 5.5% 7/15/2044 | | 210,000 | 203,694 |
| UnitedHealth Group Inc 5.625% 7/15/2054 | | 110,000 | 106,778 |
| UnitedHealth Group Inc 6.05% 2/15/2063 | | 60,000 | 61,265 |
| Universal Health Services Inc 4.625% 10/15/2029 | | 100,000 | 96,452 |
| West Virginia United Health System Obligated Group 3.129% 6/1/2050 | | 70,000 | 44,461 |
| | | | 10,872,719 |
| Life Sciences Tools & Services - 0.1% | | | |
| Agilent Technologies Inc 4.2% 9/9/2027 | | 60,000 | 59,262 |
| Agilent Technologies Inc 4.75% 9/9/2034 | | 60,000 | 56,970 |
| Revvity Inc 2.25% 9/15/2031 | | 90,000 | 74,156 |
| Thermo Fisher Scientific Inc 2.6% 10/1/2029 (d) | | 250,000 | 227,318 |
| Thermo Fisher Scientific Inc 4.95% 11/21/2032 | | 210,000 | 208,601 |
| Thermo Fisher Scientific Inc 5.086% 8/10/2033 | | 20,000 | 19,891 |
| | | | 646,198 |
| Pharmaceuticals - 0.8% | | | |
| Bristol-Myers Squibb Co 3.2% 6/15/2026 | | 650,000 | 638,467 |
| Bristol-Myers Squibb Co 3.7% 3/15/2052 | | 330,000 | 240,282 |
| Bristol-Myers Squibb Co 3.9% 3/15/2062 | | 100,000 | 71,535 |
| Bristol-Myers Squibb Co 4.125% 6/15/2039 | | 100,000 | 86,318 |
| Bristol-Myers Squibb Co 4.55% 2/20/2048 | | 42,000 | 35,676 |
| Bristol-Myers Squibb Co 4.9% 2/22/2029 (d) | | 130,000 | 130,632 |
| Bristol-Myers Squibb Co 5.2% 2/22/2034 | | 190,000 | 189,763 |
| Bristol-Myers Squibb Co 5.55% 2/22/2054 | | 131,000 | 127,080 |
| Bristol-Myers Squibb Co 5.75% 2/1/2031 | | 70,000 | 72,804 |
| Bristol-Myers Squibb Co 6.4% 11/15/2063 | | 190,000 | 203,487 |
| Eli Lilly & Co 2.25% 5/15/2050 | | 200,000 | 112,404 |
| Eli Lilly & Co 4.2% 8/14/2029 | | 100,000 | 97,906 |
| Eli Lilly & Co 4.6% 8/14/2034 | | 100,000 | 96,008 |
| Eli Lilly & Co 4.875% 2/27/2053 | | 50,000 | 45,264 |
| Eli Lilly & Co 5.05% 8/14/2054 | | 100,000 | 92,631 |
| Eli Lilly & Co 5.1% 2/9/2064 | | 100,000 | 91,378 |
| Haleon US Capital LLC 3.625% 3/24/2032 | | 250,000 | 226,376 |
| Johnson & Johnson 2.1% 9/1/2040 | | 220,000 | 146,214 |
| Johnson & Johnson 2.45% 3/1/2026 | | 760,000 | 743,000 |
| Johnson & Johnson 2.45% 9/1/2060 | | 110,000 | 59,652 |
| Johnson & Johnson 3.4% 1/15/2038 | | 116,000 | 97,007 |
| Johnson & Johnson 3.55% 3/1/2036 | | 110,000 | 96,055 |
| Johnson & Johnson 4.9% 6/1/2031 | | 100,000 | 100,631 |
| Merck & Co Inc 1.45% 6/24/2030 | | 100,000 | 83,866 |
| Merck & Co Inc 3.7% 2/10/2045 | | 45,000 | 34,849 |
| Merck & Co Inc 4.05% 5/17/2028 | | 100,000 | 98,531 |
| Merck & Co Inc 4.15% 5/18/2043 | | 266,000 | 222,742 |
| Merck & Co Inc 4.5% 5/17/2033 | | 150,000 | 144,514 |
| Merck & Co Inc 5% 5/17/2053 | | 150,000 | 136,541 |
| Mylan Inc 4.55% 4/15/2028 | | 20,000 | 19,594 |
| Novartis Capital Corp 1.75% 2/14/2025 | | 100,000 | 99,651 |
| Novartis Capital Corp 2% 2/14/2027 (d) | | 320,000 | 304,309 |
| Novartis Capital Corp 2.75% 8/14/2050 | | 50,000 | 31,706 |
| Novartis Capital Corp 3% 11/20/2025 | | 460,000 | 454,166 |
| Novartis Capital Corp 3.1% 5/17/2027 | | 90,000 | 87,266 |
| Novartis Capital Corp 4% 11/20/2045 | | 35,000 | 28,720 |
| Pfizer Inc 2.55% 5/28/2040 | | 125,000 | 86,378 |
| Pfizer Inc 2.7% 5/28/2050 | | 380,000 | 233,791 |
| Pfizer Inc 3.45% 3/15/2029 | | 70,000 | 66,728 |
| Pfizer Inc 4% 12/15/2036 | | 36,000 | 32,093 |
| Pfizer Investment Enterprises Pte Ltd 4.45% 5/19/2026 | | 640,000 | 639,035 |
| Pfizer Investment Enterprises Pte Ltd 4.45% 5/19/2028 | | 270,000 | 267,628 |
| Pfizer Investment Enterprises Pte Ltd 4.65% 5/19/2030 | | 113,000 | 111,807 |
| Pfizer Investment Enterprises Pte Ltd 4.75% 5/19/2033 | | 200,000 | 194,336 |
| Pfizer Investment Enterprises Pte Ltd 5.11% 5/19/2043 | | 150,000 | 140,808 |
| Pfizer Investment Enterprises Pte Ltd 5.3% 5/19/2053 | | 154,000 | 144,194 |
| Pfizer Investment Enterprises Pte Ltd 5.34% 5/19/2063 | | 250,000 | 229,486 |
| Royalty Pharma PLC 3.3% 9/2/2040 | | 100,000 | 72,402 |
| Shire Acquisitions Investments Ireland DAC 3.2% 9/23/2026 | | 3,000 | 2,931 |
| Viatris Inc 2.7% 6/22/2030 | | 100,000 | 86,746 |
| Viatris Inc 3.85% 6/22/2040 | | 120,000 | 89,986 |
| Viatris Inc 4% 6/22/2050 | | 100,000 | 68,132 |
| Zoetis Inc 4.45% 8/20/2048 | | 60,000 | 49,403 |
| | | | 8,062,909 |
TOTAL HEALTH CARE | | | 26,370,149 |
| | | | |
| Industrials - 1.6% | | | |
| Aerospace & Defense - 0.5% | | | |
| Boeing Co 3.2% 3/1/2029 (d) | | 126,000 | 116,104 |
| Boeing Co 3.6% 5/1/2034 (d) | | 170,000 | 142,251 |
| Boeing Co 5.705% 5/1/2040 | | 836,000 | 795,354 |
| Boeing Co 5.805% 5/1/2050 | | 130,000 | 120,920 |
| Boeing Co 6.528% 5/1/2034 | | 150,000 | 157,142 |
| GE Aerospace 4.35% 5/1/2050 | | 489,000 | 407,415 |
| General Dynamics Corp 2.125% 8/15/2026 | | 160,000 | 154,216 |
| General Dynamics Corp 3.625% 4/1/2030 | | 140,000 | 132,189 |
| General Dynamics Corp 4.25% 4/1/2050 | | 50,000 | 41,275 |
| Huntington Ingalls Industries Inc 4.2% 5/1/2030 | | 60,000 | 56,936 |
| L3Harris Technologies Inc 4.854% 4/27/2035 | | 100,000 | 95,098 |
| L3Harris Technologies Inc 5.4% 1/15/2027 | | 270,000 | 273,318 |
| Lockheed Martin Corp 4.07% 12/15/2042 | | 70,000 | 58,339 |
| Lockheed Martin Corp 4.09% 9/15/2052 | | 70,000 | 55,370 |
| Lockheed Martin Corp 4.7% 12/15/2031 | | 210,000 | 206,683 |
| Lockheed Martin Corp 4.7% 5/15/2046 | | 28,000 | 25,019 |
| Lockheed Martin Corp 5.9% 11/15/2063 | | 200,000 | 208,724 |
| Northrop Grumman Corp 3.25% 1/15/2028 | | 80,000 | 76,473 |
| Northrop Grumman Corp 4.03% 10/15/2047 | | 106,000 | 83,214 |
| Northrop Grumman Corp 5.2% 6/1/2054 | | 60,000 | 55,813 |
| Northrop Grumman Corp 5.25% 5/1/2050 | | 120,000 | 112,371 |
| RTX Corp 3.75% 11/1/2046 | | 30,000 | 22,647 |
| RTX Corp 4.05% 5/4/2047 | | 18,000 | 14,135 |
| RTX Corp 4.125% 11/16/2028 | | 260,000 | 253,063 |
| RTX Corp 4.35% 4/15/2047 | | 260,000 | 213,550 |
| RTX Corp 4.45% 11/16/2038 | | 370,000 | 329,184 |
| RTX Corp 5.15% 2/27/2033 | | 240,000 | 237,983 |
| RTX Corp 6.1% 3/15/2034 | | 200,000 | 210,599 |
| | | | 4,655,385 |
| Air Freight & Logistics - 0.1% | | | |
| FedEx Corp 4.05% 2/15/2048 | | 150,000 | 114,812 |
| FedEx Corp 4.25% 5/15/2030 | | 175,000 | 169,508 |
| FedEx Corp 4.9% 1/15/2034 | | 130,000 | 126,513 |
| FedEx Corp 4.95% 10/17/2048 | | 102,000 | 89,018 |
| United Parcel Service Inc 4.875% 3/3/2033 | | 360,000 | 355,732 |
| United Parcel Service Inc 5.05% 3/3/2053 | | 20,000 | 18,329 |
| United Parcel Service Inc 5.5% 5/22/2054 | | 140,000 | 136,429 |
| United Parcel Service Inc 5.6% 5/22/2064 | | 50,000 | 48,482 |
| | | | 1,058,823 |
| Building Products - 0.1% | | | |
| Carrier Global Corp 2.493% 2/15/2027 | | 50,000 | 47,809 |
| Carrier Global Corp 2.722% 2/15/2030 | | 100,000 | 89,455 |
| Carrier Global Corp 3.377% 4/5/2040 | | 195,000 | 150,592 |
| Carrier Global Corp 3.577% 4/5/2050 | | 50,000 | 35,832 |
| Johnson Controls International plc / Tyco Fire & Security Finance SCA 4.9% 12/1/2032 | | 150,000 | 146,145 |
| Johnson Controls International plc 5.125% 9/14/2045 | | 6,000 | 5,359 |
| Masco Corp 2% 2/15/2031 | | 103,000 | 85,959 |
| Masco Corp 3.125% 2/15/2051 | | 52,000 | 32,741 |
| Owens Corning 3.875% 6/1/2030 | | 100,000 | 94,201 |
| Owens Corning 4.4% 1/30/2048 | | 20,000 | 16,063 |
| Owens Corning 5.95% 6/15/2054 | | 40,000 | 39,526 |
| | | | 743,682 |
| Commercial Services & Supplies - 0.1% | | | |
| Republic Services Inc 1.45% 2/15/2031 (d) | | 500,000 | 405,522 |
| Republic Services Inc 3.95% 5/15/2028 | | 28,000 | 27,262 |
| Veralto Corp 5.45% 9/18/2033 | | 40,000 | 40,133 |
| Waste Connections Inc 2.2% 1/15/2032 | | 130,000 | 107,094 |
| Waste Connections Inc 5% 3/1/2034 | | 90,000 | 87,835 |
| Waste Management Inc 4.65% 3/15/2030 | | 60,000 | 59,280 |
| Waste Management Inc 4.875% 2/15/2029 | | 390,000 | 391,871 |
| Waste Management Inc 4.875% 2/15/2034 | | 80,000 | 78,485 |
| Waste Management Inc 4.95% 3/15/2035 | | 60,000 | 58,497 |
| Waste Management Inc 4.95% 7/3/2027 | | 40,000 | 40,427 |
| Waste Management Inc 4.95% 7/3/2031 | | 40,000 | 40,039 |
| Waste Management Inc 5.35% 10/15/2054 | | 60,000 | 57,634 |
| | | | 1,394,079 |
| Electrical Equipment - 0.0% | | | |
| Emerson Electric Co 2% 12/21/2028 | | 290,000 | 261,851 |
| Regal Rexnord Corp 6.05% 4/15/2028 | | 170,000 | 172,910 |
| Regal Rexnord Corp 6.4% 4/15/2033 | | 20,000 | 20,636 |
| Rockwell Automation Inc 4.2% 3/1/2049 | | 50,000 | 41,161 |
| | | | 496,558 |
| Ground Transportation - 0.3% | | | |
| Burlington Northern Santa Fe LLC 3% 4/1/2025 | | 280,000 | 278,880 |
| Burlington Northern Santa Fe LLC 3.05% 2/15/2051 | | 211,000 | 138,526 |
| Burlington Northern Santa Fe LLC 3.25% 6/15/2027 | | 30,000 | 29,146 |
| Burlington Northern Santa Fe LLC 4.05% 6/15/2048 (d) | | 207,000 | 164,793 |
| Burlington Northern Santa Fe LLC 4.45% 3/15/2043 | | 100,000 | 86,937 |
| Burlington Northern Santa Fe LLC 5.2% 4/15/2054 | | 80,000 | 75,287 |
| Burlington Northern Santa Fe LLC 6.15% 5/1/2037 | | 20,000 | 21,371 |
| CSX Corp 2.4% 2/15/2030 | | 80,000 | 70,963 |
| CSX Corp 4.3% 3/1/2048 | | 140,000 | 115,248 |
| CSX Corp 4.5% 3/15/2049 | | 160,000 | 135,731 |
| CSX Corp 4.75% 11/15/2048 | | 70,000 | 61,617 |
| CSX Corp 6.15% 5/1/2037 | | 140,000 | 148,816 |
| Norfolk Southern Corp 2.9% 8/25/2051 | | 110,000 | 67,758 |
| Norfolk Southern Corp 3.8% 8/1/2028 | | 63,000 | 61,028 |
| Norfolk Southern Corp 4.05% 8/15/2052 | | 90,000 | 69,060 |
| Norfolk Southern Corp 4.1% 5/15/2121 | | 60,000 | 41,520 |
| Norfolk Southern Corp 4.15% 2/28/2048 | | 38,000 | 30,218 |
| Norfolk Southern Corp 4.45% 3/1/2033 | | 150,000 | 143,113 |
| Norfolk Southern Corp 5.35% 8/1/2054 | | 50,000 | 47,603 |
| Ryder System Inc 6.6% 12/1/2033 | | 60,000 | 64,931 |
| Uber Technologies Inc 4.3% 1/15/2030 | | 50,000 | 48,385 |
| Uber Technologies Inc 4.8% 9/15/2034 | | 50,000 | 47,853 |
| Uber Technologies Inc 5.35% 9/15/2054 | | 50,000 | 46,495 |
| Union Pacific Corp 2.75% 3/1/2026 | | 160,000 | 156,671 |
| Union Pacific Corp 2.891% 4/6/2036 | | 79,000 | 63,713 |
| Union Pacific Corp 2.973% 9/16/2062 | | 290,000 | 166,857 |
| Union Pacific Corp 3.25% 2/5/2050 | | 50,000 | 34,108 |
| Union Pacific Corp 3.55% 8/15/2039 | | 130,000 | 105,507 |
| Union Pacific Corp 3.6% 9/15/2037 | | 38,000 | 31,887 |
| Union Pacific Corp 3.839% 3/20/2060 | | 70,000 | 50,027 |
| Union Pacific Corp 5.15% 1/20/2063 | | 120,000 | 109,095 |
| | | | 2,713,144 |
| Industrial Conglomerates - 0.1% | | | |
| 3M Co 2.375% 8/26/2029 | | 177,000 | 158,832 |
| 3M Co 2.65% 4/15/2025 | | 24,000 | 23,840 |
| 3M Co 3% 8/7/2025 | | 310,000 | 306,762 |
| 3M Co 3.05% 4/15/2030 | | 19,000 | 17,419 |
| 3M Co 3.625% 10/15/2047 | | 50,000 | 36,353 |
| 3M Co 3.7% 4/15/2050 | | 24,000 | 17,607 |
| 3M Co 3.875% 6/15/2044 | | 70,000 | 54,959 |
| Honeywell International Inc 2.8% 6/1/2050 | | 150,000 | 94,057 |
| Honeywell International Inc 3.812% 11/21/2047 | | 20,000 | 15,321 |
| Honeywell International Inc 4.7% 2/1/2030 | | 40,000 | 39,787 |
| Honeywell International Inc 4.875% 9/1/2029 | | 70,000 | 70,421 |
| Honeywell International Inc 5% 3/1/2035 | | 190,000 | 186,191 |
| Honeywell International Inc 5.25% 3/1/2054 | | 70,000 | 65,554 |
| Honeywell International Inc 5.35% 3/1/2064 | | 20,000 | 18,750 |
| Trane Technologies Financing Ltd 3.8% 3/21/2029 | | 125,000 | 119,879 |
| | | | 1,225,732 |
| Machinery - 0.2% | | | |
| Caterpillar Financial Services Corp 1.1% 9/14/2027 (d) | | 530,000 | 486,385 |
| Caterpillar Inc 3.25% 9/19/2049 | | 110,000 | 76,364 |
| Caterpillar Inc 4.75% 5/15/2064 | | 40,000 | 34,406 |
| Caterpillar Inc 5.2% 5/27/2041 | | 100,000 | 97,775 |
| Cummins Inc 4.875% 10/1/2043 | | 110,000 | 100,815 |
| Cummins Inc 4.9% 2/20/2029 | | 60,000 | 60,374 |
| Deere & Co 2.875% 9/7/2049 | | 130,000 | 84,881 |
| Eaton Corp 4.15% 3/15/2033 | | 150,000 | 141,009 |
| Eaton Corp 4.7% 8/23/2052 | | 20,000 | 17,590 |
| Illinois Tool Works Inc 4.875% 9/15/2041 | | 70,000 | 65,479 |
| Ingersoll Rand Inc 5.7% 8/14/2033 | | 150,000 | 153,490 |
| Otis Worldwide Corp 2.056% 4/5/2025 | | 48,000 | 47,630 |
| Otis Worldwide Corp 2.565% 2/15/2030 | | 70,000 | 62,180 |
| Otis Worldwide Corp 3.362% 2/15/2050 | | 50,000 | 34,395 |
| Parker-Hannifin Corp 3.25% 6/14/2029 | | 60,000 | 56,168 |
| Parker-Hannifin Corp 4% 6/14/2049 | | 110,000 | 85,866 |
| Stanley Black & Decker Inc 2.75% 11/15/2050 | | 150,000 | 86,219 |
| | | | 1,691,026 |
| Passenger Airlines - 0.1% | | | |
| Southwest Airlines Co 5.125% 6/15/2027 | | 595,000 | 597,652 |
| United Airlines 2016-1 Class AA Pass Through Trust equipment trust certificate 3.1% 1/7/2030 | | 173,426 | 164,376 |
| United Airlines 2023-1 Class A Pass Through Trust equipment trust certificate 5.8% 7/15/2037 | | 48,883 | 49,849 |
| | | | 811,877 |
| Professional Services - 0.0% | | | |
| Leidos Inc 2.3% 2/15/2031 | | 110,000 | 92,374 |
| Trading Companies & Distributors - 0.1% | | | |
| Air Lease Corp 2.875% 1/15/2026 | | 120,000 | 117,452 |
| Air Lease Corp 2.875% 1/15/2032 | | 70,000 | 59,653 |
| Air Lease Corp 3.125% 12/1/2030 | | 40,000 | 35,449 |
| Air Lease Corp 3.25% 3/1/2025 | | 88,000 | 87,748 |
| Air Lease Corp 3.75% 6/1/2026 | | 158,000 | 155,547 |
| Air Lease Corp 5.2% 7/15/2031 | | 70,000 | 69,164 |
| GATX Corp 4.55% 11/7/2028 | | 130,000 | 127,834 |
| GATX Corp 4.9% 3/15/2033 | | 80,000 | 77,140 |
| GATX Corp 6.9% 5/1/2034 | | 100,000 | 109,609 |
| WW Grainger Inc 4.45% 9/15/2034 | | 110,000 | 104,674 |
| | | | 944,270 |
TOTAL INDUSTRIALS | | | 15,826,950 |
| | | | |
| Information Technology - 1.9% | | | |
| Communications Equipment - 0.1% | | | |
| Cisco Systems Inc 4.8% 2/26/2027 | | 370,000 | 372,701 |
| Cisco Systems Inc 4.85% 2/26/2029 | | 110,000 | 110,647 |
| Cisco Systems Inc 5.05% 2/26/2034 | | 110,000 | 109,603 |
| Cisco Systems Inc 5.3% 2/26/2054 | | 50,000 | 48,601 |
| Cisco Systems Inc 5.5% 1/15/2040 | | 90,000 | 90,734 |
| Cisco Systems Inc 5.9% 2/15/2039 | | 130,000 | 137,370 |
| Motorola Solutions Inc 5.4% 4/15/2034 | | 160,000 | 160,064 |
| | | | 1,029,720 |
| Electronic Equipment, Instruments & Components - 0.1% | | | |
| Amphenol Corp 5.25% 4/5/2034 | | 130,000 | 130,387 |
| Amphenol Corp 5.375% 11/15/2054 | | 26,000 | 24,715 |
| Corning Inc 5.35% 11/15/2048 | | 140,000 | 130,936 |
| Dell International LLC / EMC Corp 5.3% 10/1/2029 | | 390,000 | 393,745 |
| Dell International LLC / EMC Corp 8.1% 7/15/2036 | | 80,000 | 94,826 |
| Dell International LLC / EMC Corp 8.35% 7/15/2046 | | 187,000 | 237,851 |
| Vontier Corp 2.4% 4/1/2028 | | 60,000 | 54,146 |
| | | | 1,066,606 |
| IT Services - 0.2% | | | |
| CDW LLC / CDW Finance Corp 2.67% 12/1/2026 | | 150,000 | 143,860 |
| CDW LLC / CDW Finance Corp 3.569% 12/1/2031 | | 40,000 | 35,601 |
| CDW LLC / CDW Finance Corp 5.55% 8/22/2034 | | 40,000 | 39,425 |
| IBM Corporation 1.95% 5/15/2030 | | 175,000 | 150,341 |
| IBM Corporation 2.95% 5/15/2050 | | 175,000 | 110,089 |
| IBM Corporation 3.5% 5/15/2029 | | 843,000 | 798,856 |
| IBM Corporation 4% 6/20/2042 | | 90,000 | 73,536 |
| IBM Corporation 4.15% 5/15/2039 | | 100,000 | 86,032 |
| IBM Corporation 5.6% 11/30/2039 | | 50,000 | 50,101 |
| IBM International Capital Pte Ltd 4.6% 2/5/2029 | | 180,000 | 178,390 |
| | | | 1,666,231 |
| Semiconductors & Semiconductor Equipment - 0.7% | | | |
| Advanced Micro Devices Inc 4.393% 6/1/2052 | | 30,000 | 25,069 |
| Analog Devices Inc 2.8% 10/1/2041 | | 130,000 | 91,984 |
| Analog Devices Inc 2.95% 10/1/2051 | | 40,000 | 25,400 |
| Applied Materials Inc 4.35% 4/1/2047 | | 28,000 | 23,716 |
| Applied Materials Inc 5.85% 6/15/2041 | | 70,000 | 72,596 |
| Broadcom Corp / Broadcom Cayman Finance Ltd 3.5% 1/15/2028 | | 1,324,000 | 1,274,770 |
| Broadcom Inc 3.187% 11/15/2036 (c) | | 90,000 | 72,499 |
| Broadcom Inc 3.419% 4/15/2033 (c) | | 82,000 | 71,777 |
| Broadcom Inc 3.5% 2/15/2041 (c) | | 100,000 | 78,093 |
| Broadcom Inc 4% 4/15/2029 (c) | | 70,000 | 67,344 |
| Broadcom Inc 4.3% 11/15/2032 | | 250,000 | 235,786 |
| Broadcom Inc 4.55% 2/15/2032 | | 190,000 | 183,735 |
| Broadcom Inc 4.75% 4/15/2029 | | 50,000 | 49,663 |
| Broadcom Inc 4.8% 10/15/2034 | | 190,000 | 183,347 |
| Broadcom Inc 4.926% 5/15/2037 (c) | | 80,000 | 76,092 |
| Broadcom Inc 5% 4/15/2030 | | 50,000 | 50,013 |
| Broadcom Inc 5.15% 11/15/2031 | | 240,000 | 241,554 |
| Intel Corp 3.25% 11/15/2049 | | 110,000 | 65,666 |
| Intel Corp 3.734% 12/8/2047 | | 617,000 | 406,911 |
| Intel Corp 4.875% 2/10/2028 | | 100,000 | 99,490 |
| Intel Corp 5.15% 2/21/2034 | | 50,000 | 47,970 |
| Intel Corp 5.2% 2/10/2033 (d) | | 710,000 | 686,448 |
| Intel Corp 5.9% 2/10/2063 | | 90,000 | 81,201 |
| KLA Corp 4.65% 7/15/2032 | | 110,000 | 107,632 |
| KLA Corp 4.95% 7/15/2052 | | 110,000 | 99,974 |
| Lam Research Corp 2.875% 6/15/2050 | | 150,000 | 94,746 |
| Marvell Technology Inc 5.95% 9/15/2033 | | 60,000 | 62,293 |
| Micron Technology Inc 3.366% 11/1/2041 | | 30,000 | 21,916 |
| Micron Technology Inc 4.663% 2/15/2030 | | 230,000 | 224,484 |
| Micron Technology Inc 5.327% 2/6/2029 | | 50,000 | 50,236 |
| Micron Technology Inc 5.375% 4/15/2028 | | 60,000 | 60,631 |
| NVIDIA Corp 2% 6/15/2031 | | 216,000 | 183,514 |
| NVIDIA Corp 2.85% 4/1/2030 | | 100,000 | 91,642 |
| NVIDIA Corp 3.5% 4/1/2040 | | 50,000 | 41,349 |
| NVIDIA Corp 3.5% 4/1/2050 | | 50,000 | 37,154 |
| QUALCOMM Inc 1.65% 5/20/2032 | | 54,000 | 43,037 |
| QUALCOMM Inc 5.4% 5/20/2033 (d) | | 250,000 | 257,886 |
| QUALCOMM Inc 6% 5/20/2053 | | 120,000 | 125,431 |
| Texas Instruments Inc 4.15% 5/15/2048 | | 70,000 | 56,871 |
| Texas Instruments Inc 4.85% 2/8/2034 | | 60,000 | 59,008 |
| Texas Instruments Inc 4.9% 3/14/2033 | | 200,000 | 198,621 |
| Texas Instruments Inc 5.05% 5/18/2063 | | 40,000 | 36,044 |
| | | | 6,063,593 |
| Software - 0.5% | | | |
| Adobe Inc 4.95% 4/4/2034 | | 70,000 | 69,427 |
| AppLovin Corp 5.125% 12/1/2029 | | 60,000 | 59,853 |
| AppLovin Corp 5.5% 12/1/2034 | | 120,000 | 119,106 |
| Cadence Design Systems Inc 4.3% 9/10/2029 | | 70,000 | 68,624 |
| Cadence Design Systems Inc 4.7% 9/10/2034 | | 40,000 | 38,349 |
| Intuit Inc 5.5% 9/15/2053 | | 70,000 | 68,542 |
| Microsoft Corp 2.525% 6/1/2050 | | 326,000 | 200,620 |
| Microsoft Corp 2.921% 3/17/2052 | | 534,000 | 352,778 |
| Microsoft Corp 3.3% 2/6/2027 | | 115,000 | 112,592 |
| Microsoft Corp 3.4% 6/15/2027 | | 210,000 | 205,473 |
| Microsoft Corp 3.45% 8/8/2036 | | 31,000 | 27,031 |
| Microsoft Corp 4.2% 11/3/2035 | | 170,000 | 162,491 |
| Oracle Corp 1.65% 3/25/2026 | | 207,000 | 199,547 |
| Oracle Corp 2.5% 4/1/2025 | | 80,000 | 79,539 |
| Oracle Corp 2.95% 4/1/2030 | | 360,000 | 324,976 |
| Oracle Corp 3.25% 11/15/2027 | | 96,000 | 92,300 |
| Oracle Corp 3.6% 4/1/2050 | | 300,000 | 210,183 |
| Oracle Corp 3.8% 11/15/2037 | | 110,000 | 91,832 |
| Oracle Corp 3.85% 4/1/2060 | | 80,000 | 54,881 |
| Oracle Corp 3.9% 5/15/2035 | | 220,000 | 192,754 |
| Oracle Corp 4% 11/15/2047 | | 397,000 | 302,578 |
| Oracle Corp 4.2% 9/27/2029 | | 290,000 | 280,132 |
| Oracle Corp 4.7% 9/27/2034 | | 70,000 | 66,342 |
| Oracle Corp 4.9% 2/6/2033 | | 250,000 | 243,407 |
| Oracle Corp 5.375% 7/15/2040 | | 641,000 | 617,173 |
| Oracle Corp 5.375% 9/27/2054 | | 70,000 | 64,521 |
| Roper Technologies Inc 1% 9/15/2025 | | 50,000 | 48,781 |
| Roper Technologies Inc 1.4% 9/15/2027 | | 50,000 | 45,801 |
| Roper Technologies Inc 1.75% 2/15/2031 | | 50,000 | 41,069 |
| Roper Technologies Inc 2% 6/30/2030 | | 330,000 | 281,296 |
| Salesforce Inc 2.7% 7/15/2041 | | 220,000 | 154,976 |
| Salesforce Inc 2.9% 7/15/2051 | | 20,000 | 12,773 |
| VMware LLC 2.2% 8/15/2031 | | 50,000 | 41,477 |
| VMware LLC 4.7% 5/15/2030 | | 100,000 | 97,838 |
| | | | 5,029,062 |
| Technology Hardware, Storage & Peripherals - 0.3% | | | |
| Apple Inc 1.125% 5/11/2025 (d) | | 772,000 | 762,789 |
| Apple Inc 1.2% 2/8/2028 | | 440,000 | 397,904 |
| Apple Inc 1.25% 8/20/2030 | | 50,000 | 41,783 |
| Apple Inc 2.375% 2/8/2041 | | 330,000 | 226,989 |
| Apple Inc 2.55% 8/20/2060 | | 200,000 | 116,866 |
| Apple Inc 2.8% 2/8/2061 | | 120,000 | 71,080 |
| Apple Inc 2.95% 9/11/2049 | | 240,000 | 159,946 |
| Apple Inc 3% 11/13/2027 | | 96,000 | 92,694 |
| Apple Inc 3.2% 5/11/2027 | | 200,000 | 194,479 |
| Apple Inc 3.75% 11/13/2047 | | 57,000 | 44,795 |
| Apple Inc 3.85% 5/4/2043 | | 369,000 | 305,659 |
| Apple Inc 4.3% 5/10/2033 | | 250,000 | 243,929 |
| Apple Inc 4.5% 2/23/2036 | | 90,000 | 87,840 |
| Hewlett Packard Enterprise Co 4.55% 10/15/2029 | | 130,000 | 126,723 |
| Hewlett Packard Enterprise Co 5% 10/15/2034 | | 130,000 | 124,953 |
| Hewlett Packard Enterprise Co 5.6% 10/15/2054 | | 60,000 | 56,477 |
| HP Inc 2.2% 6/17/2025 (d) | | 160,000 | 158,015 |
| HP Inc 4.2% 4/15/2032 (d) | | 110,000 | 102,999 |
| | | | 3,315,920 |
TOTAL INFORMATION TECHNOLOGY | | | 18,171,132 |
| | | | |
| Materials - 0.5% | | | |
| Chemicals - 0.4% | | | |
| Air Products and Chemicals Inc 1.5% 10/15/2025 | | 100,000 | 97,631 |
| Air Products and Chemicals Inc 2.05% 5/15/2030 | | 60,000 | 52,076 |
| Air Products and Chemicals Inc 2.7% 5/15/2040 | | 60,000 | 42,796 |
| Air Products and Chemicals Inc 2.8% 5/15/2050 | | 100,000 | 62,961 |
| Albemarle Corp 4.65% 6/1/2027 | | 120,000 | 118,997 |
| Albemarle Corp 5.65% 6/1/2052 | | 20,000 | 17,208 |
| Celanese US Holdings LLC 6.8% 11/15/2030 | | 170,000 | 175,980 |
| CF Industries Inc 4.95% 6/1/2043 | | 70,000 | 61,676 |
| Dow Chemical Co/The 2.1% 11/15/2030 (d) | | 250,000 | 212,304 |
| Dow Chemical Co/The 3.6% 11/15/2050 | | 200,000 | 137,326 |
| Dow Chemical Co/The 4.8% 5/15/2049 | | 50,000 | 42,018 |
| Dow Chemical Co/The 7.375% 11/1/2029 | | 46,000 | 50,352 |
| DuPont de Nemours Inc 4.725% 11/15/2028 | | 35,000 | 34,840 |
| DuPont de Nemours Inc 5.319% 11/15/2038 | | 411,000 | 412,217 |
| Eastman Chemical Co 4.5% 12/1/2028 | | 174,000 | 170,686 |
| Eastman Chemical Co 5.75% 3/8/2033 | | 80,000 | 81,485 |
| Ecolab Inc 1.3% 1/30/2031 (d) | | 300,000 | 242,835 |
| Ecolab Inc 2.7% 12/15/2051 | | 20,000 | 12,151 |
| International Flavors & Fragrances Inc 4.375% 6/1/2047 | | 50,000 | 39,103 |
| Linde Inc/CT 2% 8/10/2050 | | 60,000 | 31,235 |
| LYB International Finance II BV 3.5% 3/2/2027 | | 166,000 | 161,390 |
| LYB International Finance III LLC 3.375% 10/1/2040 | | 20,000 | 14,602 |
| LYB International Finance III LLC 3.625% 4/1/2051 | | 120,000 | 80,575 |
| LYB International Finance III LLC 4.2% 10/15/2049 | | 100,000 | 74,891 |
| LYB International Finance III LLC 5.5% 3/1/2034 | | 50,000 | 49,046 |
| Mosaic Co/The 4.05% 11/15/2027 | | 90,000 | 88,189 |
| Mosaic Co/The 5.45% 11/15/2033 (d) | | 50,000 | 49,507 |
| RPM International Inc 5.25% 6/1/2045 | | 30,000 | 28,039 |
| Sherwin-Williams Co/The 3.45% 6/1/2027 | | 290,000 | 282,042 |
| Sherwin-Williams Co/The 3.8% 8/15/2049 | | 80,000 | 58,628 |
| Sherwin-Williams Co/The 4.5% 6/1/2047 | | 50,000 | 42,037 |
| Westlake Corp 3.6% 8/15/2026 | | 625,000 | 612,234 |
| | | | 3,637,057 |
| Construction Materials - 0.0% | | | |
| Martin Marietta Materials Inc 2.4% 7/15/2031 | | 100,000 | 85,050 |
| Martin Marietta Materials Inc 2.5% 3/15/2030 | | 90,000 | 79,623 |
| Martin Marietta Materials Inc 5.15% 12/1/2034 | | 30,000 | 29,458 |
| Martin Marietta Materials Inc 5.5% 12/1/2054 | | 30,000 | 28,298 |
| Vulcan Materials Co 5.35% 12/1/2034 | | 110,000 | 109,667 |
| | | | 332,096 |
| Containers & Packaging - 0.0% | | | |
| Amcor Group Finance PLC 5.45% 5/23/2029 | | 150,000 | 151,240 |
| Avery Dennison Corp 2.65% 4/30/2030 | | 80,000 | 70,973 |
| International Paper Co 4.8% 6/15/2044 | | 155,000 | 136,355 |
| Packaging Corp of America 5.7% 12/1/2033 | | 80,000 | 81,656 |
| Sonoco Products Co 5% 9/1/2034 | | 100,000 | 94,826 |
| WRKCo Inc 4.2% 6/1/2032 | | 50,000 | 46,580 |
| | | | 581,630 |
| Metals & Mining - 0.1% | | | |
| Freeport-McMoRan Inc 4.125% 3/1/2028 | | 130,000 | 126,466 |
| Freeport-McMoRan Inc 5.4% 11/14/2034 | | 140,000 | 138,443 |
| Newmont Corp 2.25% 10/1/2030 | | 100,000 | 86,365 |
| Newmont Corp 2.6% 7/15/2032 (d) | | 250,000 | 212,351 |
| Newmont Corp 2.8% 10/1/2029 | | 100,000 | 91,149 |
| Newmont Corp 5.45% 6/9/2044 | | 80,000 | 77,230 |
| Nucor Corp 3.125% 4/1/2032 | | 130,000 | 113,845 |
| Nucor Corp 6.4% 12/1/2037 | | 50,000 | 53,778 |
| | | | 899,627 |
TOTAL MATERIALS | | | 5,450,410 |
| | | | |
| Real Estate - 1.0% | | | |
| Diversified REITs - 0.1% | | | |
| Equinix Europe 2 Financing Corp LLC 5.5% 6/15/2034 | | 170,000 | 170,647 |
| GLP Capital LP / GLP Financing II Inc 5.625% 9/15/2034 | | 140,000 | 137,752 |
| Piedmont Operating Partnership LP 3.15% 8/15/2030 | | 30,000 | 25,732 |
| Safehold GL Holdings LLC 6.1% 4/1/2034 | | 30,000 | 30,521 |
| VICI Properties LP 4.75% 2/15/2028 | | 70,000 | 69,413 |
| VICI Properties LP 4.95% 2/15/2030 | | 60,000 | 58,812 |
| VICI Properties LP 5.125% 5/15/2032 | | 70,000 | 68,157 |
| VICI Properties LP 6.125% 4/1/2054 | | 40,000 | 39,743 |
| Vornado Realty LP 3.5% 1/15/2025 | | 110,000 | 109,878 |
| WP Carey Inc 3.85% 7/15/2029 | | 70,000 | 66,539 |
| | | | 777,194 |
| Health Care REITs - 0.1% | | | |
| Alexandria Real Estate Equities Inc 2% 5/18/2032 | | 125,000 | 99,639 |
| Alexandria Real Estate Equities Inc 3% 5/18/2051 | | 125,000 | 76,494 |
| Alexandria Real Estate Equities Inc 4.85% 4/15/2049 | | 90,000 | 77,256 |
| Healthpeak OP LLC 3% 1/15/2030 | | 250,000 | 226,242 |
| Omega Healthcare Investors Inc 5.25% 1/15/2026 | | 230,000 | 230,274 |
| Ventas Realty LP 4.4% 1/15/2029 | | 40,000 | 38,936 |
| Ventas Realty LP 4.875% 4/15/2049 | | 160,000 | 137,696 |
| Welltower OP LLC 4.95% 9/1/2048 | | 76,000 | 68,248 |
| | | | 954,785 |
| Industrial REITs - 0.0% | | | |
| LXP Industrial Trust 6.75% 11/15/2028 | | 50,000 | 52,355 |
| Prologis LP 1.75% 2/1/2031 | | 370,000 | 306,619 |
| Prologis LP 3% 4/15/2050 | | 145,000 | 92,929 |
| Prologis LP 5% 1/31/2035 | | 90,000 | 87,696 |
| | | | 539,599 |
| Office REITs - 0.1% | | | |
| Boston Properties LP 2.55% 4/1/2032 | | 90,000 | 72,862 |
| Boston Properties LP 2.9% 3/15/2030 | | 80,000 | 70,651 |
| Boston Properties LP 3.65% 2/1/2026 | | 100,000 | 98,561 |
| Boston Properties LP 5.75% 1/15/2035 | | 40,000 | 39,213 |
| Boston Properties LP 6.75% 12/1/2027 | | 180,000 | 187,699 |
| COPT Defense Properties LP 2.75% 4/15/2031 | | 50,000 | 42,682 |
| Highwoods Realty LP 4.125% 3/15/2028 | | 80,000 | 76,533 |
| Kilroy Realty LP 4.75% 12/15/2028 | | 80,000 | 78,102 |
| Kilroy Realty LP 6.25% 1/15/2036 | | 40,000 | 39,684 |
| | | | 705,987 |
| Real Estate Management & Development - 0.1% | | | |
| CBRE Services Inc 5.95% 8/15/2034 | | 50,000 | 51,557 |
| Digital Realty Trust LP 4.45% 7/15/2028 | | 120,000 | 117,782 |
| Essex Portfolio LP 2.65% 3/15/2032 | | 170,000 | 143,143 |
| Extra Space Storage LP 5.35% 1/15/2035 | | 50,000 | 49,318 |
| Extra Space Storage LP 5.4% 2/1/2034 | | 20,000 | 19,806 |
| Extra Space Storage LP 5.9% 1/15/2031 | | 150,000 | 154,729 |
| Mid-America Apartments LP 5% 3/15/2034 | | 40,000 | 38,909 |
| Tanger Properties LP 2.75% 9/1/2031 | | 30,000 | 25,303 |
| | | | 600,547 |
| Residential REITs - 0.1% | | | |
| American Homes 4 Rent LP 4.9% 2/15/2029 | | 130,000 | 128,959 |
| American Homes 4 Rent LP 5.5% 2/1/2034 | | 30,000 | 29,876 |
| AvalonBay Communities Inc 2.3% 3/1/2030 | | 130,000 | 114,391 |
| AvalonBay Communities Inc 3.2% 1/15/2028 | | 203,000 | 194,285 |
| AvalonBay Communities Inc 3.3% 6/1/2029 | | 100,000 | 93,776 |
| Camden Property Trust 4.9% 1/15/2034 | | 60,000 | 58,241 |
| ERP Operating LP 3.5% 3/1/2028 | | 61,000 | 58,752 |
| ERP Operating LP 4.15% 12/1/2028 (d) | | 330,000 | 322,526 |
| Invitation Homes Operating Partnership LP 2% 8/15/2031 | | 100,000 | 81,138 |
| Invitation Homes Operating Partnership LP 5.5% 8/15/2033 | | 50,000 | 49,707 |
| Sun Communities Operating LP 2.7% 7/15/2031 | | 80,000 | 67,265 |
| UDR Inc 2.1% 6/15/2033 | | 80,000 | 61,628 |
| | | | 1,260,544 |
| Retail REITs - 0.3% | | | |
| Agree LP 2% 6/15/2028 | | 140,000 | 126,787 |
| Brixmor Operating Partnership LP 4.05% 7/1/2030 | | 41,000 | 38,761 |
| Brixmor Operating Partnership LP 4.125% 5/15/2029 | | 19,000 | 18,233 |
| Brixmor Operating Partnership LP 5.5% 2/15/2034 | | 40,000 | 39,610 |
| Federal Realty OP LP 3.5% 6/1/2030 | | 70,000 | 64,210 |
| Federal Realty OP LP 5.375% 5/1/2028 | | 50,000 | 50,505 |
| Kimco Realty OP LLC 1.9% 3/1/2028 | | 570,000 | 520,692 |
| Kimco Realty OP LLC 3.3% 2/1/2025 | | 180,000 | 179,716 |
| Kite Realty Group LP 5.5% 3/1/2034 | | 30,000 | 29,839 |
| NNN REIT Inc 3% 4/15/2052 | | 100,000 | 60,695 |
| Realty Income Corp 2.1% 3/15/2028 (d) | | 90,000 | 82,715 |
| Realty Income Corp 3.25% 1/15/2031 | | 220,000 | 198,642 |
| Realty Income Corp 3.4% 1/15/2028 (d) | | 230,000 | 220,707 |
| Realty Income Corp 4.9% 7/15/2033 | | 50,000 | 48,441 |
| Realty Income Corp 5.125% 2/15/2034 | | 70,000 | 68,596 |
| Regency Centers LP 4.125% 3/15/2028 | | 60,000 | 58,532 |
| Regency Centers LP 5.1% 1/15/2035 | | 50,000 | 48,820 |
| Regency Centers LP 5.25% 1/15/2034 | | 70,000 | 68,984 |
| Simon Property Group LP 2.65% 7/15/2030 | | 125,000 | 111,256 |
| Simon Property Group LP 3.375% 12/1/2027 | | 935,000 | 905,550 |
| Simon Property Group LP 4.75% 9/26/2034 | | 130,000 | 123,170 |
| Simon Property Group LP 6.25% 1/15/2034 | | 20,000 | 21,209 |
| Simon Property Group LP 6.65% 1/15/2054 | | 50,000 | 55,651 |
| | | | 3,141,321 |
| Specialized REITs - 0.2% | | | |
| American Tower Corp 2.1% 6/15/2030 | | 160,000 | 137,110 |
| American Tower Corp 3.1% 6/15/2050 | | 160,000 | 102,630 |
| American Tower Corp 3.6% 1/15/2028 | | 32,000 | 30,766 |
| American Tower Corp 3.8% 8/15/2029 | | 70,000 | 66,267 |
| American Tower Corp 5.4% 1/31/2035 | | 20,000 | 19,781 |
| American Tower Corp 5.9% 11/15/2033 | | 110,000 | 113,318 |
| Crown Castle Inc 1.35% 7/15/2025 | | 79,000 | 77,484 |
| Crown Castle Inc 2.25% 1/15/2031 | | 280,000 | 235,297 |
| Crown Castle Inc 3.25% 1/15/2051 | | 40,000 | 26,060 |
| Crown Castle Inc 3.7% 6/15/2026 | | 100,000 | 98,367 |
| Crown Castle Inc 5.1% 5/1/2033 | | 160,000 | 155,829 |
| CubeSmart LP 3% 2/15/2030 | | 80,000 | 71,985 |
| EPR Properties 3.75% 8/15/2029 | | 70,000 | 64,852 |
| Public Storage Operating Co 5.125% 1/15/2029 | | 260,000 | 263,122 |
| Public Storage Operating Co 5.35% 8/1/2053 | | 30,000 | 28,516 |
| Weyerhaeuser Co 4% 11/15/2029 (d) | | 160,000 | 152,625 |
| | | | 1,644,009 |
TOTAL REAL ESTATE | | | 9,623,986 |
| | | | |
| Utilities - 2.2% | | | |
| Electric Utilities - 1.7% | | | |
| AEP Texas Inc 5.4% 6/1/2033 | | 100,000 | 99,077 |
| AEP Transmission Co LLC 5.4% 3/15/2053 | | 160,000 | 152,465 |
| Alabama Power Co 6% 3/1/2039 | | 180,000 | 187,696 |
| American Electric Power Co Inc 5.625% 3/1/2033 | | 140,000 | 141,429 |
| American Electric Power Co Inc 6.95% 12/15/2054 (b) | | 50,000 | 51,588 |
| Appalachian Power Co 3.3% 6/1/2027 | | 110,000 | 106,306 |
| Appalachian Power Co 4.45% 6/1/2045 | | 18,000 | 14,538 |
| Appalachian Power Co 4.5% 3/1/2049 | | 90,000 | 72,064 |
| Arizona Public Service Co 2.95% 9/15/2027 | | 68,000 | 64,758 |
| Arizona Public Service Co 3.5% 12/1/2049 | | 100,000 | 68,260 |
| Arizona Public Service Co 5.55% 8/1/2033 | | 30,000 | 30,002 |
| Baltimore Gas and Electric Co 2.9% 6/15/2050 | | 200,000 | 124,878 |
| Baltimore Gas and Electric Co 3.2% 9/15/2049 | | 150,000 | 99,092 |
| CenterPoint Energy Houston Electric LLC 3.35% 4/1/2051 | | 250,000 | 171,311 |
| Commonwealth Edison Co 2.75% 9/1/2051 | | 100,000 | 58,891 |
| Commonwealth Edison Co 3.2% 11/15/2049 | | 30,000 | 19,907 |
| Commonwealth Edison Co 4% 3/1/2048 | | 42,000 | 32,750 |
| Commonwealth Edison Co 4.9% 2/1/2033 | | 210,000 | 205,577 |
| Commonwealth Edison Co 6.45% 1/15/2038 | | 50,000 | 54,004 |
| Connecticut Light and Power Co/The 4.9% 7/1/2033 | | 140,000 | 136,800 |
| Consolidated Edison Co of New York Inc 3% 12/1/2060 | | 80,000 | 47,086 |
| Consolidated Edison Co of New York Inc 3.95% 4/1/2050 | | 130,000 | 101,197 |
| Consolidated Edison Co of New York Inc 4.65% 12/1/2048 | | 50,000 | 42,718 |
| Consolidated Edison Co of New York Inc 5.2% 3/1/2033 | | 100,000 | 100,030 |
| Consolidated Edison Co of New York Inc 5.5% 12/1/2039 | | 256,000 | 253,041 |
| Consolidated Edison Co of New York Inc 6.2% 6/15/2036 | | 150,000 | 158,829 |
| DTE Electric Co 3% 3/1/2032 | | 100,000 | 87,832 |
| DTE Electric Co 5.2% 3/1/2034 | | 60,000 | 59,774 |
| DTE Electric Co 5.4% 4/1/2053 | | 110,000 | 106,665 |
| Duke Energy Carolinas LLC 2.45% 8/15/2029 | | 190,000 | 170,891 |
| Duke Energy Carolinas LLC 3.95% 3/15/2048 | | 31,000 | 23,748 |
| Duke Energy Carolinas LLC 4.25% 12/15/2041 | | 341,000 | 289,006 |
| Duke Energy Corp 2.45% 6/1/2030 | | 182,000 | 159,526 |
| Duke Energy Corp 3.75% 9/1/2046 | | 80,000 | 58,900 |
| Duke Energy Corp 3.95% 8/15/2047 | | 250,000 | 186,021 |
| Duke Energy Corp 4.2% 6/15/2049 | | 90,000 | 69,533 |
| Duke Energy Corp 6.45% 9/1/2054 (b) | | 50,000 | 50,607 |
| Duke Energy Florida LLC 6.35% 9/15/2037 | | 110,000 | 116,924 |
| Duke Energy Florida LLC 6.4% 6/15/2038 | | 100,000 | 107,662 |
| Duke Energy Indiana LLC 2.75% 4/1/2050 | | 100,000 | 60,399 |
| Duke Energy Ohio Inc 2.125% 6/1/2030 | | 70,000 | 60,541 |
| Duke Energy Ohio Inc 3.65% 2/1/2029 | | 160,000 | 152,771 |
| Duke Energy Progress LLC 3.7% 10/15/2046 | | 170,000 | 126,002 |
| Duke Energy Progress LLC 5.25% 3/15/2033 | | 100,000 | 100,209 |
| Entergy Arkansas LLC 5.15% 1/15/2033 | | 110,000 | 109,487 |
| Entergy Arkansas LLC 5.75% 6/1/2054 | | 30,000 | 29,659 |
| Entergy Corp 0.9% 9/15/2025 | | 400,000 | 388,991 |
| Entergy Corp 7.125% 12/1/2054 (b) | | 40,000 | 40,769 |
| Entergy Louisiana LLC 3.05% 6/1/2031 | | 190,000 | 169,273 |
| Entergy Louisiana LLC 3.1% 6/15/2041 | | 110,000 | 78,901 |
| Entergy Louisiana LLC 4.2% 4/1/2050 | | 70,000 | 55,194 |
| Entergy Mississippi LLC 5% 9/1/2033 | | 90,000 | 88,053 |
| Entergy Tex Inc 3.55% 9/30/2049 | | 29,000 | 20,391 |
| Eversource Energy 2.55% 3/15/2031 | | 120,000 | 102,640 |
| Eversource Energy 3.3% 1/15/2028 | | 62,000 | 58,928 |
| Eversource Energy 3.45% 1/15/2050 | | 60,000 | 41,006 |
| Eversource Energy 5.45% 3/1/2028 | | 150,000 | 151,954 |
| Exelon Corp 3.4% 4/15/2026 | | 150,000 | 147,531 |
| Exelon Corp 4.05% 4/15/2030 | | 230,000 | 219,182 |
| Exelon Corp 4.45% 4/15/2046 | | 144,000 | 119,926 |
| Exelon Corp 5.45% 3/15/2034 | | 30,000 | 29,930 |
| FirstEnergy Corp 1.6% 1/15/2026 | | 85,000 | 81,945 |
| FirstEnergy Corp 4.85% 7/15/2047 (f) | | 140,000 | 119,410 |
| Florida Power & Light Co 2.85% 4/1/2025 | | 317,000 | 315,495 |
| Florida Power & Light Co 2.875% 12/4/2051 | | 150,000 | 93,754 |
| Florida Power & Light Co 3.15% 10/1/2049 | | 100,000 | 67,405 |
| Florida Power & Light Co 4.05% 10/1/2044 | | 90,000 | 73,306 |
| Florida Power & Light Co 4.125% 6/1/2048 | | 26,000 | 20,794 |
| Florida Power & Light Co 5.1% 4/1/2033 | | 70,000 | 69,546 |
| Florida Power & Light Co 5.6% 6/15/2054 | | 80,000 | 79,822 |
| Georgia Power Co 4.95% 5/17/2033 | | 200,000 | 195,858 |
| Georgia Power Co 5.25% 3/15/2034 | | 100,000 | 99,222 |
| Indiana Michigan Power Co 3.75% 7/1/2047 | | 100,000 | 74,216 |
| Interstate Power and Light Co 2.3% 6/1/2030 | | 93,000 | 80,508 |
| Interstate Power and Light Co 3.6% 4/1/2029 | | 80,000 | 75,767 |
| Jersey Central Power & Light Co 5.1% 1/15/2035 (c) | | 50,000 | 48,772 |
| Kentucky Utilities Co 5.125% 11/1/2040 | | 100,000 | 94,682 |
| MidAmerican Energy Co 3.65% 4/15/2029 | | 190,000 | 181,205 |
| MidAmerican Energy Co 3.65% 8/1/2048 | | 30,000 | 22,231 |
| MidAmerican Energy Co 5.8% 10/15/2036 | | 100,000 | 103,298 |
| MidAmerican Energy Co 5.85% 9/15/2054 | | 80,000 | 81,305 |
| Nevada Power Co 6% 3/15/2054 | | 20,000 | 20,423 |
| NextEra Energy Capital Holdings Inc 1.875% 1/15/2027 | | 500,000 | 472,447 |
| NextEra Energy Capital Holdings Inc 2.44% 1/15/2032 | | 500,000 | 416,973 |
| NextEra Energy Capital Holdings Inc 3.5% 4/1/2029 | | 140,000 | 132,113 |
| NextEra Energy Capital Holdings Inc 6.7% 9/1/2054 (b) | | 90,000 | 91,601 |
| NextEra Energy Capital Holdings Inc 6.75% 6/15/2054 (b) | | 60,000 | 61,469 |
| Northern States Power Co/MN 2.9% 3/1/2050 | | 80,000 | 51,180 |
| Northern States Power Co/MN 3.4% 8/15/2042 | | 100,000 | 75,957 |
| Northern States Power Co/MN 3.6% 9/15/2047 | | 50,000 | 36,942 |
| NSTAR Electric Co 4.95% 9/15/2052 | | 50,000 | 44,775 |
| Oglethorpe Power Corp 5.8% 6/1/2054 (c) | | 100,000 | 98,114 |
| Ohio Power Co 5.65% 6/1/2034 | | 120,000 | 120,786 |
| Oncor Electric Delivery Co LLC 3.1% 9/15/2049 | | 100,000 | 65,463 |
| Oncor Electric Delivery Co LLC 3.75% 4/1/2045 | | 120,000 | 92,167 |
| Oncor Electric Delivery Co LLC 4.55% 9/15/2032 | | 150,000 | 144,135 |
| Oncor Electric Delivery Co LLC 5.25% 9/30/2040 | | 90,000 | 87,413 |
| Oncor Electric Delivery Co LLC 5.35% 10/1/2052 | | 20,000 | 18,924 |
| Pacific Gas and Electric Co 2.1% 8/1/2027 (d) | | 210,000 | 195,908 |
| Pacific Gas and Electric Co 3.3% 8/1/2040 | | 100,000 | 74,827 |
| Pacific Gas and Electric Co 3.5% 8/1/2050 | | 682,000 | 467,196 |
| Pacific Gas and Electric Co 5.55% 5/15/2029 | | 130,000 | 132,120 |
| Pacific Gas and Electric Co 6.75% 1/15/2053 | | 100,000 | 108,953 |
| PacifiCorp 5.8% 1/15/2055 | | 150,000 | 145,762 |
| PacifiCorp 6% 1/15/2039 | | 235,000 | 239,714 |
| PECO Energy Co 3.9% 3/1/2048 | | 96,000 | 74,441 |
| PG&E Wildfire Recovery Funding LLC 5.099% 6/1/2054 | | 50,000 | 47,188 |
| PG&E Wildfire Recovery Funding LLC 5.212% 12/1/2049 | | 160,000 | 153,230 |
| PPL Capital Funding Inc 4% 9/15/2047 | | 20,000 | 14,047 |
| PPL Electric Utilities Corp 3% 10/1/2049 | | 100,000 | 65,624 |
| PPL Electric Utilities Corp 5.25% 5/15/2053 | | 20,000 | 19,078 |
| Public Service Co of Colorado 3.7% 6/15/2028 | | 87,000 | 83,958 |
| Public Service Co of Colorado 6.25% 9/1/2037 | | 182,000 | 192,341 |
| Public Service Co of Oklahoma 5.2% 1/15/2035 | | 100,000 | 96,813 |
| Public Service Electric and Gas Co 2.45% 1/15/2030 | | 70,000 | 62,521 |
| Public Service Electric and Gas Co 2.7% 5/1/2050 | | 100,000 | 60,971 |
| Public Service Electric and Gas Co 3.15% 1/1/2050 | | 70,000 | 47,078 |
| Public Service Electric and Gas Co 3.6% 12/1/2047 | | 44,000 | 32,446 |
| Public Service Electric and Gas Co 3.65% 9/1/2042 | | 70,000 | 54,529 |
| Public Service Electric and Gas Co 5.2% 8/1/2033 | | 40,000 | 40,026 |
| Public Service Electric and Gas Co 5.3% 8/1/2054 | | 50,000 | 47,618 |
| Puget Sound Energy Inc 4.223% 6/15/2048 | | 45,000 | 36,108 |
| Puget Sound Energy Inc 5.33% 6/15/2034 | | 100,000 | 99,346 |
| Southern California Edison Co 3.45% 2/1/2052 | | 90,000 | 60,871 |
| Southern California Edison Co 4% 4/1/2047 | | 562,000 | 432,628 |
| Southern California Edison Co 5.75% 4/15/2054 | | 20,000 | 19,611 |
| Southern California Edison Co 5.95% 2/1/2038 | | 50,000 | 51,192 |
| Southern Co/The 3.25% 7/1/2026 | | 352,000 | 344,744 |
| Southern Co/The 3.7% 4/30/2030 | | 120,000 | 112,705 |
| Southern Co/The 4% 1/15/2051 (b) | | 130,000 | 127,393 |
| Southern Co/The 4.25% 7/1/2036 | | 110,000 | 98,762 |
| Southwestern Electric Power Co 3.85% 2/1/2048 | | 190,000 | 136,759 |
| Southwestern Public Service Co 3.75% 6/15/2049 | | 80,000 | 58,012 |
| Tampa Electric Co 4.45% 6/15/2049 | | 100,000 | 82,361 |
| Tucson Electric Power Co 5.5% 4/15/2053 | | 50,000 | 47,672 |
| Union Electric Co 5.45% 3/15/2053 | | 130,000 | 124,479 |
| Virginia Electric and Power Co 2.4% 3/30/2032 | | 60,000 | 50,089 |
| Virginia Electric and Power Co 3.3% 12/1/2049 | | 60,000 | 40,616 |
| Virginia Electric and Power Co 3.8% 9/15/2047 | | 50,000 | 37,466 |
| Virginia Electric and Power Co 4.6% 12/1/2048 | | 52,000 | 43,855 |
| Virginia Electric and Power Co 4.625% 5/15/2052 | | 110,000 | 92,578 |
| Virginia Electric and Power Co 5.05% 8/15/2034 | | 120,000 | 117,011 |
| Virginia Electric and Power Co 5.3% 8/15/2033 | | 50,000 | 49,752 |
| Virginia Electric and Power Co 5.35% 1/15/2054 | | 20,000 | 18,809 |
| Virginia Electric and Power Co 5.7% 8/15/2053 | | 50,000 | 49,304 |
| Wisconsin Electric Power Co 4.6% 10/1/2034 | | 110,000 | 104,756 |
| Wisconsin Power and Light Co 4.95% 4/1/2033 | | 100,000 | 97,069 |
| Wisconsin Public Service Corp 4.55% 12/1/2029 | | 165,000 | 162,755 |
| Xcel Energy Inc 3.4% 6/1/2030 | | 63,000 | 57,789 |
| Xcel Energy Inc 4% 6/15/2028 | | 76,000 | 73,540 |
| | | | 15,726,964 |
| Gas Utilities - 0.1% | | | |
| Atmos Energy Corp 5.45% 10/15/2032 | | 180,000 | 184,332 |
| Atmos Energy Corp 5.9% 11/15/2033 | | 80,000 | 83,690 |
| Atmos Energy Corp 6.2% 11/15/2053 | | 60,000 | 63,738 |
| CenterPoint Energy Resources Corp 5.4% 7/1/2034 | | 130,000 | 129,655 |
| Piedmont Natural Gas Co Inc 2.5% 3/15/2031 | | 100,000 | 85,369 |
| Piedmont Natural Gas Co Inc 5.1% 2/15/2035 | | 50,000 | 48,465 |
| Southern California Gas Co 3.75% 9/15/2042 | | 100,000 | 78,118 |
| Southern California Gas Co 5.05% 9/1/2034 | | 60,000 | 59,120 |
| Southern California Gas Co 5.2% 6/1/2033 | | 100,000 | 99,491 |
| Southern Co Gas Capital Corp 3.95% 10/1/2046 | | 308,000 | 238,383 |
| Southwest Gas Corp 5.45% 3/23/2028 | | 76,000 | 76,939 |
| | | | 1,147,300 |
| Independent Power and Renewable Electricity Producers - 0.0% | | | |
| AES Corp/The 2.45% 1/15/2031 | | 70,000 | 58,332 |
| Constellation Energy Generation LLC 5.8% 3/1/2033 | | 130,000 | 132,835 |
| Constellation Energy Generation LLC 6.5% 10/1/2053 | | 70,000 | 74,148 |
| Southern Power Co 4.95% 12/15/2046 | | 80,000 | 70,164 |
| | | | 335,479 |
| Multi-Utilities - 0.4% | | | |
| Ameren Corp 5.7% 12/1/2026 | | 200,000 | 203,259 |
| Ameren Illinois Co 4.5% 3/15/2049 | | 30,000 | 25,325 |
| Ameren Illinois Co 4.95% 6/1/2033 (d) | | 140,000 | 137,405 |
| Ameren Illinois Co 5.55% 7/1/2054 | | 50,000 | 49,246 |
| Berkshire Hathaway Energy Co 4.25% 10/15/2050 | | 290,000 | 228,933 |
| Berkshire Hathaway Energy Co 4.45% 1/15/2049 | | 54,000 | 44,543 |
| CenterPoint Energy Inc 3.7% 9/1/2049 | | 80,000 | 56,867 |
| CMS Energy Corp 4.875% 3/1/2044 | | 40,000 | 35,592 |
| Consumers Energy Co 2.5% 5/1/2060 | | 100,000 | 55,073 |
| Consumers Energy Co 4.625% 5/15/2033 | | 130,000 | 125,399 |
| Consumers Energy Co 4.9% 2/15/2029 | | 110,000 | 110,283 |
| Dominion Energy Inc 3.375% 4/1/2030 | | 720,000 | 662,274 |
| Dominion Energy Inc 4.6% 3/15/2049 | | 50,000 | 41,195 |
| Dominion Energy Inc 4.7% 12/1/2044 | | 26,000 | 22,066 |
| Dominion Energy Inc 7% 6/1/2054 (b) | | 50,000 | 52,799 |
| Dominion Energy Inc 7% 6/15/2038 | | 130,000 | 144,700 |
| DTE Energy Co 2.85% 10/1/2026 | | 140,000 | 135,633 |
| DTE Energy Co 4.95% 7/1/2027 | | 220,000 | 220,825 |
| NiSource Inc 0.95% 8/15/2025 | | 280,000 | 273,099 |
| NiSource Inc 2.95% 9/1/2029 (d) | | 190,000 | 173,914 |
| NiSource Inc 3.49% 5/15/2027 | | 50,000 | 48,669 |
| NiSource Inc 3.95% 3/30/2048 | | 46,000 | 35,004 |
| NiSource Inc 5.25% 2/15/2043 | | 156,000 | 145,265 |
| NiSource Inc 6.95% 11/30/2054 (b) | | 50,000 | 50,905 |
| Public Service Enterprise Group Inc 5.85% 11/15/2027 | | 100,000 | 102,869 |
| Public Service Enterprise Group Inc 5.875% 10/15/2028 | | 70,000 | 72,198 |
| Public Service Enterprise Group Inc 6.125% 10/15/2033 | | 30,000 | 31,260 |
| Puget Energy Inc 4.1% 6/15/2030 | | 200,000 | 188,564 |
| San Diego Gas & Electric Co 5.35% 4/1/2053 | | 100,000 | 94,095 |
| San Diego Gas & Electric Co 5.55% 4/15/2054 | | 50,000 | 48,458 |
| Sempra 6% 10/15/2039 | | 274,000 | 279,351 |
| Sempra 6.875% 10/1/2054 (b) | | 150,000 | 151,675 |
| WEC Energy Group Inc 4.75% 1/15/2028 | | 100,000 | 99,776 |
| | | | 4,146,519 |
| Water Utilities - 0.0% | | | |
| American Water Capital Corp 3.75% 9/1/2028 | | 140,000 | 134,630 |
| American Water Capital Corp 3.75% 9/1/2047 | | 280,000 | 207,594 |
| | | | 342,224 |
TOTAL UTILITIES | | | 21,698,486 |
| | | | |
| TOTAL UNITED STATES | | | 212,501,469 |
| TOTAL NON-CONVERTIBLE CORPORATE BONDS (Cost $290,643,203) | | | 263,647,244 |
| | | | |
| U.S. Government Agency - Mortgage Securities - 25.3% |
| | | Principal Amount (a) | Value ($) |
| UNITED STATES - 25.3% | | | |
| Fannie Mae 2% 2/1/2051 | | 881,121 | 689,162 |
| Fannie Mae 2.5% 11/1/2032 | | 27,034 | 25,407 |
| Fannie Mae 4.5% 12/1/2054 | | 399,701 | 375,737 |
| Fannie Mae Mortgage pass-thru certificates 1.5% 1/1/2037 | | 383,739 | 330,065 |
| Fannie Mae Mortgage pass-thru certificates 1.5% 10/1/2036 | | 738,802 | 635,465 |
| Fannie Mae Mortgage pass-thru certificates 1.5% 10/1/2036 | | 1,459,543 | 1,255,396 |
| Fannie Mae Mortgage pass-thru certificates 1.5% 11/1/2036 | | 728,935 | 626,978 |
| Fannie Mae Mortgage pass-thru certificates 1.5% 11/1/2036 | | 349,452 | 300,574 |
| Fannie Mae Mortgage pass-thru certificates 1.5% 11/1/2051 | | 216,195 | 159,737 |
| Fannie Mae Mortgage pass-thru certificates 1.5% 12/1/2036 | | 295,220 | 253,927 |
| Fannie Mae Mortgage pass-thru certificates 1.5% 12/1/2050 | | 1,674,620 | 1,237,300 |
| Fannie Mae Mortgage pass-thru certificates 1.5% 12/1/2051 | | 400,492 | 295,906 |
| Fannie Mae Mortgage pass-thru certificates 1.5% 2/1/2036 | | 506,335 | 437,570 |
| Fannie Mae Mortgage pass-thru certificates 1.5% 4/1/2052 | | 180,444 | 133,322 |
| Fannie Mae Mortgage pass-thru certificates 1.5% 4/1/2052 | | 191,433 | 141,442 |
| Fannie Mae Mortgage pass-thru certificates 2% 1/1/2036 | | 296,434 | 263,222 |
| Fannie Mae Mortgage pass-thru certificates 2% 1/1/2037 | | 907,218 | 803,589 |
| Fannie Mae Mortgage pass-thru certificates 2% 1/1/2051 | | 225,121 | 176,076 |
| Fannie Mae Mortgage pass-thru certificates 2% 1/1/2052 | | 476,613 | 374,269 |
| Fannie Mae Mortgage pass-thru certificates 2% 10/1/2035 | | 480,033 | 427,300 |
| Fannie Mae Mortgage pass-thru certificates 2% 10/1/2036 | | 55,939 | 49,549 |
| Fannie Mae Mortgage pass-thru certificates 2% 10/1/2050 | | 50,966 | 39,926 |
| Fannie Mae Mortgage pass-thru certificates 2% 10/1/2050 | | 589,689 | 461,221 |
| Fannie Mae Mortgage pass-thru certificates 2% 10/1/2050 | | 72,425 | 56,646 |
| Fannie Mae Mortgage pass-thru certificates 2% 10/1/2051 | | 41,142 | 32,063 |
| Fannie Mae Mortgage pass-thru certificates 2% 11/1/2036 | | 953,820 | 844,868 |
| Fannie Mae Mortgage pass-thru certificates 2% 11/1/2051 | | 562,090 | 438,053 |
| Fannie Mae Mortgage pass-thru certificates 2% 11/1/2051 | | 1,852,654 | 1,443,828 |
| Fannie Mae Mortgage pass-thru certificates 2% 12/1/2035 | | 1,328,697 | 1,179,830 |
| Fannie Mae Mortgage pass-thru certificates 2% 12/1/2050 | | 8,501,850 | 6,649,653 |
| Fannie Mae Mortgage pass-thru certificates 2% 12/1/2050 | | 542,640 | 424,422 |
| Fannie Mae Mortgage pass-thru certificates 2% 12/1/2050 | | 206,108 | 161,721 |
| Fannie Mae Mortgage pass-thru certificates 2% 12/1/2051 | | 791,470 | 625,720 |
| Fannie Mae Mortgage pass-thru certificates 2% 12/1/2051 | | 649,276 | 512,087 |
| Fannie Mae Mortgage pass-thru certificates 2% 12/1/2051 | | 934,810 | 734,659 |
| Fannie Mae Mortgage pass-thru certificates 2% 12/1/2051 | | 1,202,690 | 935,788 |
| Fannie Mae Mortgage pass-thru certificates 2% 2/1/2037 | | 28,149 | 24,916 |
| Fannie Mae Mortgage pass-thru certificates 2% 2/1/2051 | | 420,193 | 329,701 |
| Fannie Mae Mortgage pass-thru certificates 2% 2/1/2051 | | 37,136 | 29,045 |
| Fannie Mae Mortgage pass-thru certificates 2% 2/1/2052 | | 51,719 | 40,242 |
| Fannie Mae Mortgage pass-thru certificates 2% 2/1/2052 | | 439,643 | 341,802 |
| Fannie Mae Mortgage pass-thru certificates 2% 2/1/2052 | | 2,546,166 | 1,981,119 |
| Fannie Mae Mortgage pass-thru certificates 2% 3/1/2037 | | 328,630 | 290,886 |
| Fannie Mae Mortgage pass-thru certificates 2% 3/1/2051 | | 928,304 | 724,615 |
| Fannie Mae Mortgage pass-thru certificates 2% 3/1/2051 | | 757,318 | 595,880 |
| Fannie Mae Mortgage pass-thru certificates 2% 3/1/2052 | | 413,209 | 321,380 |
| Fannie Mae Mortgage pass-thru certificates 2% 4/1/2051 | | 943,753 | 736,674 |
| Fannie Mae Mortgage pass-thru certificates 2% 4/1/2051 | | 17,973 | 14,125 |
| Fannie Mae Mortgage pass-thru certificates 2% 4/1/2051 | | 341,435 | 267,584 |
| Fannie Mae Mortgage pass-thru certificates 2% 4/1/2052 | | 124,988 | 97,251 |
| Fannie Mae Mortgage pass-thru certificates 2% 4/1/2052 | | 243,351 | 189,955 |
| Fannie Mae Mortgage pass-thru certificates 2% 6/1/2051 | | 147,148 | 114,401 |
| Fannie Mae Mortgage pass-thru certificates 2% 7/1/2035 | | 21,209 | 18,879 |
| Fannie Mae Mortgage pass-thru certificates 2% 7/1/2050 | | 111,180 | 87,097 |
| Fannie Mae Mortgage pass-thru certificates 2% 7/1/2050 | | 661,479 | 519,851 |
| Fannie Mae Mortgage pass-thru certificates 2% 7/1/2051 | | 249,632 | 195,560 |
| Fannie Mae Mortgage pass-thru certificates 2% 7/1/2051 | | 38,245 | 29,960 |
| Fannie Mae Mortgage pass-thru certificates 2% 8/1/2050 | | 304,792 | 238,772 |
| Fannie Mae Mortgage pass-thru certificates 2% 8/1/2050 | | 636,890 | 500,527 |
| Fannie Mae Mortgage pass-thru certificates 2% 8/1/2050 | | 61,495 | 48,174 |
| Fannie Mae Mortgage pass-thru certificates 2% 9/1/2037 | | 48,710 | 43,039 |
| Fannie Mae Mortgage pass-thru certificates 2% 9/1/2050 | | 27,286 | 21,375 |
| Fannie Mae Mortgage pass-thru certificates 2% 9/1/2050 | | 198,322 | 155,674 |
| Fannie Mae Mortgage pass-thru certificates 2.5% 1/1/2027 | | 1,777 | 1,745 |
| Fannie Mae Mortgage pass-thru certificates 2.5% 1/1/2033 | | 13,791 | 13,059 |
| Fannie Mae Mortgage pass-thru certificates 2.5% 1/1/2047 | | 28,474 | 23,878 |
| Fannie Mae Mortgage pass-thru certificates 2.5% 1/1/2051 | | 97,260 | 79,738 |
| Fannie Mae Mortgage pass-thru certificates 2.5% 1/1/2052 | | 90,903 | 74,584 |
| Fannie Mae Mortgage pass-thru certificates 2.5% 10/1/2031 | | 141,962 | 134,430 |
| Fannie Mae Mortgage pass-thru certificates 2.5% 10/1/2051 | | 625,823 | 511,711 |
| Fannie Mae Mortgage pass-thru certificates 2.5% 10/1/2051 | | 344,929 | 282,035 |
| Fannie Mae Mortgage pass-thru certificates 2.5% 10/1/2051 | | 125,005 | 102,563 |
| Fannie Mae Mortgage pass-thru certificates 2.5% 11/1/2032 | | 19,661 | 18,489 |
| Fannie Mae Mortgage pass-thru certificates 2.5% 11/1/2032 | | 72,918 | 68,610 |
| Fannie Mae Mortgage pass-thru certificates 2.5% 11/1/2051 | | 292,517 | 238,082 |
| Fannie Mae Mortgage pass-thru certificates 2.5% 12/1/2033 | | 21,163 | 19,575 |
| Fannie Mae Mortgage pass-thru certificates 2.5% 12/1/2037 | | 15,195 | 13,600 |
| Fannie Mae Mortgage pass-thru certificates 2.5% 12/1/2050 | | 457,313 | 374,927 |
| Fannie Mae Mortgage pass-thru certificates 2.5% 12/1/2051 | | 929,082 | 763,157 |
| Fannie Mae Mortgage pass-thru certificates 2.5% 12/1/2051 | | 809,661 | 665,823 |
| Fannie Mae Mortgage pass-thru certificates 2.5% 12/1/2051 | | 989,642 | 815,376 |
| Fannie Mae Mortgage pass-thru certificates 2.5% 2/1/2031 | | 15,001 | 14,658 |
| Fannie Mae Mortgage pass-thru certificates 2.5% 2/1/2032 | | 23,685 | 22,389 |
| Fannie Mae Mortgage pass-thru certificates 2.5% 2/1/2040 | | 77,985 | 68,039 |
| Fannie Mae Mortgage pass-thru certificates 2.5% 2/1/2051 | | 549,686 | 450,659 |
| Fannie Mae Mortgage pass-thru certificates 2.5% 3/1/2051 | | 308,182 | 252,277 |
| Fannie Mae Mortgage pass-thru certificates 2.5% 3/1/2052 | | 1,912,850 | 1,559,280 |
| Fannie Mae Mortgage pass-thru certificates 2.5% 4/1/2030 | | 18,152 | 17,590 |
| Fannie Mae Mortgage pass-thru certificates 2.5% 4/1/2035 | | 351,954 | 322,691 |
| Fannie Mae Mortgage pass-thru certificates 2.5% 4/1/2036 | | 12,242 | 11,289 |
| Fannie Mae Mortgage pass-thru certificates 2.5% 4/1/2051 | | 1,048,423 | 858,237 |
| Fannie Mae Mortgage pass-thru certificates 2.5% 5/1/2037 | | 162,117 | 148,131 |
| Fannie Mae Mortgage pass-thru certificates 2.5% 5/1/2040 | | 29,763 | 25,917 |
| Fannie Mae Mortgage pass-thru certificates 2.5% 5/1/2050 | | 56,817 | 46,634 |
| Fannie Mae Mortgage pass-thru certificates 2.5% 5/1/2051 | | 726,655 | 594,839 |
| Fannie Mae Mortgage pass-thru certificates 2.5% 5/1/2051 | | 1,447,995 | 1,188,040 |
| Fannie Mae Mortgage pass-thru certificates 2.5% 5/1/2053 | | 317,014 | 258,417 |
| Fannie Mae Mortgage pass-thru certificates 2.5% 6/1/2035 | | 9,805 | 8,978 |
| Fannie Mae Mortgage pass-thru certificates 2.5% 6/1/2051 | | 1,811,814 | 1,483,147 |
| Fannie Mae Mortgage pass-thru certificates 2.5% 7/1/2031 | | 29,289 | 27,765 |
| Fannie Mae Mortgage pass-thru certificates 2.5% 7/1/2034 | | 166,639 | 153,200 |
| Fannie Mae Mortgage pass-thru certificates 2.5% 7/1/2035 | | 125,398 | 114,815 |
| Fannie Mae Mortgage pass-thru certificates 2.5% 7/1/2050 | | 422,086 | 349,080 |
| Fannie Mae Mortgage pass-thru certificates 2.5% 7/1/2051 | | 332,070 | 271,832 |
| Fannie Mae Mortgage pass-thru certificates 2.5% 7/1/2051 | | 138,734 | 113,567 |
| Fannie Mae Mortgage pass-thru certificates 2.5% 7/1/2052 | | 146,125 | 118,932 |
| Fannie Mae Mortgage pass-thru certificates 2.5% 7/1/2052 | | 748,698 | 609,373 |
| Fannie Mae Mortgage pass-thru certificates 2.5% 8/1/2031 | | 25,171 | 23,839 |
| Fannie Mae Mortgage pass-thru certificates 2.5% 8/1/2035 | | 236,340 | 216,025 |
| Fannie Mae Mortgage pass-thru certificates 2.5% 8/1/2035 | | 257,780 | 235,622 |
| Fannie Mae Mortgage pass-thru certificates 2.5% 8/1/2037 | | 182,158 | 165,418 |
| Fannie Mae Mortgage pass-thru certificates 2.5% 9/1/2041 | | 144,754 | 124,512 |
| Fannie Mae Mortgage pass-thru certificates 2.5% 9/1/2050 | | 338,313 | 277,682 |
| Fannie Mae Mortgage pass-thru certificates 2.5% 9/1/2051 | | 535,741 | 438,054 |
| Fannie Mae Mortgage pass-thru certificates 2.5% 9/1/2051 | | 744,076 | 613,517 |
| Fannie Mae Mortgage pass-thru certificates 3% 1/1/2033 | | 37,678 | 35,868 |
| Fannie Mae Mortgage pass-thru certificates 3% 1/1/2035 | | 171,864 | 161,662 |
| Fannie Mae Mortgage pass-thru certificates 3% 1/1/2040 | | 405,153 | 363,010 |
| Fannie Mae Mortgage pass-thru certificates 3% 1/1/2044 | | 20,340 | 18,003 |
| Fannie Mae Mortgage pass-thru certificates 3% 1/1/2050 | | 735,355 | 631,980 |
| Fannie Mae Mortgage pass-thru certificates 3% 1/1/2050 | | 58,584 | 50,348 |
| Fannie Mae Mortgage pass-thru certificates 3% 1/1/2050 | | 394,711 | 339,593 |
| Fannie Mae Mortgage pass-thru certificates 3% 10/1/2033 | | 39,020 | 36,874 |
| Fannie Mae Mortgage pass-thru certificates 3% 10/1/2034 | | 113,548 | 106,808 |
| Fannie Mae Mortgage pass-thru certificates 3% 10/1/2042 | | 3,322 | 2,941 |
| Fannie Mae Mortgage pass-thru certificates 3% 10/1/2044 | | 333,800 | 295,373 |
| Fannie Mae Mortgage pass-thru certificates 3% 10/1/2047 | | 58,245 | 50,385 |
| Fannie Mae Mortgage pass-thru certificates 3% 10/1/2049 | | 60,519 | 52,182 |
| Fannie Mae Mortgage pass-thru certificates 3% 10/1/2049 | | 77,338 | 66,829 |
| Fannie Mae Mortgage pass-thru certificates 3% 10/1/2049 | | 235,625 | 202,722 |
| Fannie Mae Mortgage pass-thru certificates 3% 10/1/2049 | | 382,195 | 328,825 |
| Fannie Mae Mortgage pass-thru certificates 3% 10/1/2050 | | 128,768 | 110,304 |
| Fannie Mae Mortgage pass-thru certificates 3% 11/1/2033 | | 12,977 | 12,385 |
| Fannie Mae Mortgage pass-thru certificates 3% 11/1/2042 | | 7,633 | 6,752 |
| Fannie Mae Mortgage pass-thru certificates 3% 11/1/2046 | | 209,914 | 181,914 |
| Fannie Mae Mortgage pass-thru certificates 3% 11/1/2046 | | 15,953 | 13,825 |
| Fannie Mae Mortgage pass-thru certificates 3% 11/1/2046 | | 336,005 | 297,465 |
| Fannie Mae Mortgage pass-thru certificates 3% 11/1/2046 | | 15,271 | 13,532 |
| Fannie Mae Mortgage pass-thru certificates 3% 11/1/2048 | | 328,969 | 284,368 |
| Fannie Mae Mortgage pass-thru certificates 3% 12/1/2034 | | 189,102 | 178,114 |
| Fannie Mae Mortgage pass-thru certificates 3% 12/1/2034 | | 201,959 | 189,971 |
| Fannie Mae Mortgage pass-thru certificates 3% 12/1/2042 | | 9,884 | 8,741 |
| Fannie Mae Mortgage pass-thru certificates 3% 12/1/2046 | | 33,818 | 29,307 |
| Fannie Mae Mortgage pass-thru certificates 3% 12/1/2047 | | 9,657 | 8,348 |
| Fannie Mae Mortgage pass-thru certificates 3% 12/1/2049 | | 51,054 | 44,228 |
| Fannie Mae Mortgage pass-thru certificates 3% 2/1/2033 | | 20,440 | 19,508 |
| Fannie Mae Mortgage pass-thru certificates 3% 2/1/2034 | | 50,927 | 48,665 |
| Fannie Mae Mortgage pass-thru certificates 3% 2/1/2035 | | 9,057 | 8,511 |
| Fannie Mae Mortgage pass-thru certificates 3% 2/1/2047 | | 52,230 | 46,198 |
| Fannie Mae Mortgage pass-thru certificates 3% 2/1/2047 | | 7,670 | 6,783 |
| Fannie Mae Mortgage pass-thru certificates 3% 2/1/2047 | | 49,396 | 43,660 |
| Fannie Mae Mortgage pass-thru certificates 3% 2/1/2048 | | 38,646 | 33,406 |
| Fannie Mae Mortgage pass-thru certificates 3% 2/1/2050 | | 365,115 | 313,788 |
| Fannie Mae Mortgage pass-thru certificates 3% 2/1/2050 | | 83,729 | 71,958 |
| Fannie Mae Mortgage pass-thru certificates 3% 2/1/2051 | | 2,585,388 | 2,214,667 |
| Fannie Mae Mortgage pass-thru certificates 3% 3/1/2050 | | 261,716 | 225,660 |
| Fannie Mae Mortgage pass-thru certificates 3% 3/1/2050 | | 730,917 | 630,221 |
| Fannie Mae Mortgage pass-thru certificates 3% 3/1/2050 | | 304,871 | 262,679 |
| Fannie Mae Mortgage pass-thru certificates 3% 3/1/2050 | | 50,931 | 43,915 |
| Fannie Mae Mortgage pass-thru certificates 3% 3/1/2050 | | 296,136 | 254,506 |
| Fannie Mae Mortgage pass-thru certificates 3% 3/1/2052 | | 423,425 | 359,401 |
| Fannie Mae Mortgage pass-thru certificates 3% 4/1/2032 | | 108,219 | 103,507 |
| Fannie Mae Mortgage pass-thru certificates 3% 4/1/2033 | | 46,379 | 44,169 |
| Fannie Mae Mortgage pass-thru certificates 3% 4/1/2043 | | 15,645 | 13,840 |
| Fannie Mae Mortgage pass-thru certificates 3% 4/1/2047 | | 16,729 | 14,767 |
| Fannie Mae Mortgage pass-thru certificates 3% 4/1/2047 | | 1,946,784 | 1,724,103 |
| Fannie Mae Mortgage pass-thru certificates 3% 4/1/2048 | | 55,123 | 47,650 |
| Fannie Mae Mortgage pass-thru certificates 3% 4/1/2048 | | 71,383 | 63,188 |
| Fannie Mae Mortgage pass-thru certificates 3% 4/1/2048 | | 66,553 | 59,008 |
| Fannie Mae Mortgage pass-thru certificates 3% 4/1/2050 | | 131,202 | 113,127 |
| Fannie Mae Mortgage pass-thru certificates 3% 4/1/2052 | | 718,727 | 610,951 |
| Fannie Mae Mortgage pass-thru certificates 3% 4/1/2052 | | 45,621 | 38,780 |
| Fannie Mae Mortgage pass-thru certificates 3% 5/1/2033 | | 41,879 | 39,577 |
| Fannie Mae Mortgage pass-thru certificates 3% 5/1/2040 | | 562,050 | 515,707 |
| Fannie Mae Mortgage pass-thru certificates 3% 5/1/2043 | | 22,604 | 20,004 |
| Fannie Mae Mortgage pass-thru certificates 3% 5/1/2052 | | 703,129 | 597,033 |
| Fannie Mae Mortgage pass-thru certificates 3% 6/1/2035 | | 29,887 | 28,113 |
| Fannie Mae Mortgage pass-thru certificates 3% 6/1/2046 | | 20,691 | 17,944 |
| Fannie Mae Mortgage pass-thru certificates 3% 6/1/2052 | | 269,032 | 228,354 |
| Fannie Mae Mortgage pass-thru certificates 3% 7/1/2033 | | 12,668 | 11,971 |
| Fannie Mae Mortgage pass-thru certificates 3% 7/1/2035 | | 168,762 | 159,061 |
| Fannie Mae Mortgage pass-thru certificates 3% 7/1/2046 | | 30,610 | 27,050 |
| Fannie Mae Mortgage pass-thru certificates 3% 7/1/2050 | | 299,161 | 256,731 |
| Fannie Mae Mortgage pass-thru certificates 3% 7/1/2050 | | 917,571 | 795,175 |
| Fannie Mae Mortgage pass-thru certificates 3% 8/1/2032 | | 82,634 | 78,935 |
| Fannie Mae Mortgage pass-thru certificates 3% 8/1/2043 | | 16,587 | 14,666 |
| Fannie Mae Mortgage pass-thru certificates 3% 8/1/2045 | | 1,225,301 | 1,064,920 |
| Fannie Mae Mortgage pass-thru certificates 3% 8/1/2046 | | 4,622 | 4,009 |
| Fannie Mae Mortgage pass-thru certificates 3% 8/1/2049 | | 276,570 | 238,122 |
| Fannie Mae Mortgage pass-thru certificates 3% 8/1/2052 | | 116,658 | 99,055 |
| Fannie Mae Mortgage pass-thru certificates 3% 9/1/2032 | | 11,976 | 11,541 |
| Fannie Mae Mortgage pass-thru certificates 3% 9/1/2034 | | 160,426 | 151,204 |
| Fannie Mae Mortgage pass-thru certificates 3% 9/1/2043 | | 123,605 | 109,373 |
| Fannie Mae Mortgage pass-thru certificates 3% 9/1/2046 | | 53,096 | 46,013 |
| Fannie Mae Mortgage pass-thru certificates 3% 9/1/2046 | | 4,859 | 4,211 |
| Fannie Mae Mortgage pass-thru certificates 3% 9/1/2046 | | 30,470 | 26,963 |
| Fannie Mae Mortgage pass-thru certificates 3% 9/1/2048 | | 10,511 | 9,109 |
| Fannie Mae Mortgage pass-thru certificates 3% 9/1/2049 | | 657,751 | 565,902 |
| Fannie Mae Mortgage pass-thru certificates 3% 9/1/2049 | | 63,364 | 54,655 |
| Fannie Mae Mortgage pass-thru certificates 3% 9/1/2051 | | 93,874 | 79,709 |
| Fannie Mae Mortgage pass-thru certificates 3.5% 1/1/2038 | | 65,645 | 62,076 |
| Fannie Mae Mortgage pass-thru certificates 3.5% 1/1/2043 | | 130,144 | 119,203 |
| Fannie Mae Mortgage pass-thru certificates 3.5% 10/1/2049 | | 207,166 | 186,780 |
| Fannie Mae Mortgage pass-thru certificates 3.5% 11/1/2045 | | 306,829 | 277,115 |
| Fannie Mae Mortgage pass-thru certificates 3.5% 11/1/2048 | | 44,340 | 39,838 |
| Fannie Mae Mortgage pass-thru certificates 3.5% 12/1/2047 | | 44,018 | 39,507 |
| Fannie Mae Mortgage pass-thru certificates 3.5% 12/1/2049 | | 36,938 | 32,992 |
| Fannie Mae Mortgage pass-thru certificates 3.5% 2/1/2027 | | 18,429 | 18,227 |
| Fannie Mae Mortgage pass-thru certificates 3.5% 2/1/2035 | | 27,895 | 26,692 |
| Fannie Mae Mortgage pass-thru certificates 3.5% 2/1/2048 | | 75,902 | 68,077 |
| Fannie Mae Mortgage pass-thru certificates 3.5% 3/1/2035 | | 11,961 | 11,390 |
| Fannie Mae Mortgage pass-thru certificates 3.5% 3/1/2046 | | 383,381 | 350,783 |
| Fannie Mae Mortgage pass-thru certificates 3.5% 3/1/2046 | | 1,164,914 | 1,064,860 |
| Fannie Mae Mortgage pass-thru certificates 3.5% 4/1/2046 | | 43,845 | 39,558 |
| Fannie Mae Mortgage pass-thru certificates 3.5% 5/1/2029 | | 54,390 | 52,878 |
| Fannie Mae Mortgage pass-thru certificates 3.5% 5/1/2035 | | 25,327 | 24,116 |
| Fannie Mae Mortgage pass-thru certificates 3.5% 5/1/2035 | | 107,771 | 103,394 |
| Fannie Mae Mortgage pass-thru certificates 3.5% 6/1/2033 | | 11,427 | 10,963 |
| Fannie Mae Mortgage pass-thru certificates 3.5% 6/1/2049 | | 78,150 | 69,849 |
| Fannie Mae Mortgage pass-thru certificates 3.5% 6/1/2049 | | 126,411 | 113,893 |
| Fannie Mae Mortgage pass-thru certificates 3.5% 6/1/2052 | | 311,999 | 276,885 |
| Fannie Mae Mortgage pass-thru certificates 3.5% 7/1/2047 | | 329,313 | 301,108 |
| Fannie Mae Mortgage pass-thru certificates 3.5% 7/1/2049 | | 240,393 | 214,784 |
| Fannie Mae Mortgage pass-thru certificates 3.5% 7/1/2049 | | 60,263 | 54,484 |
| Fannie Mae Mortgage pass-thru certificates 3.5% 8/1/2033 | | 27,904 | 26,754 |
| Fannie Mae Mortgage pass-thru certificates 3.5% 8/1/2034 | | 16,309 | 15,606 |
| Fannie Mae Mortgage pass-thru certificates 3.5% 8/1/2043 | | 564,970 | 516,943 |
| Fannie Mae Mortgage pass-thru certificates 3.5% 8/1/2049 | | 152,475 | 136,232 |
| Fannie Mae Mortgage pass-thru certificates 3.5% 8/1/2050 | | 116,475 | 104,540 |
| Fannie Mae Mortgage pass-thru certificates 3.5% 9/1/2032 | | 22,649 | 21,757 |
| Fannie Mae Mortgage pass-thru certificates 3.5% 9/1/2033 | | 29,570 | 28,350 |
| Fannie Mae Mortgage pass-thru certificates 3.5% 9/1/2033 | | 15,344 | 14,712 |
| Fannie Mae Mortgage pass-thru certificates 3.5% 9/1/2044 | | 1,694,963 | 1,548,154 |
| Fannie Mae Mortgage pass-thru certificates 3.5% 9/1/2047 | | 248,480 | 223,252 |
| Fannie Mae Mortgage pass-thru certificates 3.5% 9/1/2050 | | 544,490 | 486,486 |
| Fannie Mae Mortgage pass-thru certificates 4% 1/1/2041 | | 5,242 | 4,943 |
| Fannie Mae Mortgage pass-thru certificates 4% 1/1/2042 | | 56,223 | 52,917 |
| Fannie Mae Mortgage pass-thru certificates 4% 1/1/2048 | | 51,272 | 47,544 |
| Fannie Mae Mortgage pass-thru certificates 4% 10/1/2040 | | 5,054 | 4,784 |
| Fannie Mae Mortgage pass-thru certificates 4% 10/1/2040 | | 8,829 | 8,352 |
| Fannie Mae Mortgage pass-thru certificates 4% 10/1/2040 | | 10,994 | 10,386 |
| Fannie Mae Mortgage pass-thru certificates 4% 10/1/2043 | | 31,643 | 29,650 |
| Fannie Mae Mortgage pass-thru certificates 4% 10/1/2046 | | 60,269 | 56,225 |
| Fannie Mae Mortgage pass-thru certificates 4% 10/1/2047 | | 32,086 | 29,753 |
| Fannie Mae Mortgage pass-thru certificates 4% 10/1/2048 | | 13,220 | 12,225 |
| Fannie Mae Mortgage pass-thru certificates 4% 10/1/2048 | | 8,459 | 7,823 |
| Fannie Mae Mortgage pass-thru certificates 4% 10/1/2049 | | 399,569 | 369,265 |
| Fannie Mae Mortgage pass-thru certificates 4% 10/1/2052 | | 446,737 | 408,353 |
| Fannie Mae Mortgage pass-thru certificates 4% 11/1/2043 | | 51,567 | 48,645 |
| Fannie Mae Mortgage pass-thru certificates 4% 11/1/2043 | | 36,684 | 34,328 |
| Fannie Mae Mortgage pass-thru certificates 4% 11/1/2043 | | 65,360 | 61,486 |
| Fannie Mae Mortgage pass-thru certificates 4% 11/1/2048 | | 126,046 | 116,565 |
| Fannie Mae Mortgage pass-thru certificates 4% 12/1/2040 | | 55,426 | 52,379 |
| Fannie Mae Mortgage pass-thru certificates 4% 12/1/2041 | | 66,538 | 62,691 |
| Fannie Mae Mortgage pass-thru certificates 4% 12/1/2043 | | 31,228 | 29,215 |
| Fannie Mae Mortgage pass-thru certificates 4% 12/1/2048 | | 5,357 | 4,954 |
| Fannie Mae Mortgage pass-thru certificates 4% 12/1/2048 | | 13,226 | 12,231 |
| Fannie Mae Mortgage pass-thru certificates 4% 12/1/2054 | | 323,942 | 295,856 |
| Fannie Mae Mortgage pass-thru certificates 4% 2/1/2039 | | 100,349 | 95,244 |
| Fannie Mae Mortgage pass-thru certificates 4% 2/1/2041 | | 11,840 | 11,192 |
| Fannie Mae Mortgage pass-thru certificates 4% 2/1/2042 | | 58,046 | 54,712 |
| Fannie Mae Mortgage pass-thru certificates 4% 2/1/2044 | | 28,435 | 26,595 |
| Fannie Mae Mortgage pass-thru certificates 4% 2/1/2045 | | 58,091 | 54,888 |
| Fannie Mae Mortgage pass-thru certificates 4% 2/1/2046 | | 7,624 | 7,125 |
| Fannie Mae Mortgage pass-thru certificates 4% 3/1/2044 | | 51,896 | 48,655 |
| Fannie Mae Mortgage pass-thru certificates 4% 3/1/2045 | | 22,336 | 21,031 |
| Fannie Mae Mortgage pass-thru certificates 4% 3/1/2049 | | 113,804 | 105,315 |
| Fannie Mae Mortgage pass-thru certificates 4% 3/1/2049 | | 54,969 | 50,835 |
| Fannie Mae Mortgage pass-thru certificates 4% 3/1/2052 | | 359,603 | 330,083 |
| Fannie Mae Mortgage pass-thru certificates 4% 4/1/2045 | | 955,940 | 894,138 |
| Fannie Mae Mortgage pass-thru certificates 4% 4/1/2048 | | 49,793 | 46,141 |
| Fannie Mae Mortgage pass-thru certificates 4% 4/1/2048 | | 19,554 | 18,095 |
| Fannie Mae Mortgage pass-thru certificates 4% 4/1/2054 | | 393,625 | 359,497 |
| Fannie Mae Mortgage pass-thru certificates 4% 5/1/2041 | | 8,878 | 8,390 |
| Fannie Mae Mortgage pass-thru certificates 4% 5/1/2046 | | 6,900 | 6,441 |
| Fannie Mae Mortgage pass-thru certificates 4% 5/1/2046 | | 56,422 | 52,671 |
| Fannie Mae Mortgage pass-thru certificates 4% 5/1/2048 | | 3,076 | 2,847 |
| Fannie Mae Mortgage pass-thru certificates 4% 5/1/2048 | | 32,329 | 29,988 |
| Fannie Mae Mortgage pass-thru certificates 4% 6/1/2034 | | 4,454 | 4,311 |
| Fannie Mae Mortgage pass-thru certificates 4% 6/1/2041 | | 38,171 | 36,063 |
| Fannie Mae Mortgage pass-thru certificates 4% 6/1/2046 | | 5,586 | 5,215 |
| Fannie Mae Mortgage pass-thru certificates 4% 6/1/2048 | | 9,980 | 9,236 |
| Fannie Mae Mortgage pass-thru certificates 4% 6/1/2048 | | 76,260 | 70,571 |
| Fannie Mae Mortgage pass-thru certificates 4% 6/1/2048 | | 1,457,689 | 1,348,957 |
| Fannie Mae Mortgage pass-thru certificates 4% 7/1/2046 | | 54,766 | 51,126 |
| Fannie Mae Mortgage pass-thru certificates 4% 7/1/2046 | | 6,125 | 5,718 |
| Fannie Mae Mortgage pass-thru certificates 4% 7/1/2047 | | 20,666 | 19,163 |
| Fannie Mae Mortgage pass-thru certificates 4% 7/1/2048 | | 27,484 | 25,434 |
| Fannie Mae Mortgage pass-thru certificates 4% 7/1/2049 | | 97,295 | 90,038 |
| Fannie Mae Mortgage pass-thru certificates 4% 7/1/2050 | | 217,277 | 200,934 |
| Fannie Mae Mortgage pass-thru certificates 4% 7/1/2052 | | 136,334 | 124,961 |
| Fannie Mae Mortgage pass-thru certificates 4% 8/1/2039 | | 13,901 | 13,183 |
| Fannie Mae Mortgage pass-thru certificates 4% 8/1/2046 | | 59,603 | 55,641 |
| Fannie Mae Mortgage pass-thru certificates 4% 8/1/2049 | | 90,003 | 83,205 |
| Fannie Mae Mortgage pass-thru certificates 4% 8/1/2052 | | 188,716 | 172,620 |
| Fannie Mae Mortgage pass-thru certificates 4% 8/1/2052 | | 513,438 | 469,645 |
| Fannie Mae Mortgage pass-thru certificates 4% 9/1/2046 | | 64,344 | 60,027 |
| Fannie Mae Mortgage pass-thru certificates 4% 9/1/2048 | | 253,497 | 234,588 |
| Fannie Mae Mortgage pass-thru certificates 4% 9/1/2048 | | 3,016 | 2,789 |
| Fannie Mae Mortgage pass-thru certificates 4% 9/1/2048 | | 6,432 | 5,948 |
| Fannie Mae Mortgage pass-thru certificates 4% 9/1/2049 | | 108,956 | 100,727 |
| Fannie Mae Mortgage pass-thru certificates 4.5% 1/1/2048 | | 14,490 | 13,837 |
| Fannie Mae Mortgage pass-thru certificates 4.5% 1/1/2049 | | 47,023 | 44,814 |
| Fannie Mae Mortgage pass-thru certificates 4.5% 10/1/2039 | | 38,225 | 37,216 |
| Fannie Mae Mortgage pass-thru certificates 4.5% 10/1/2048 | | 9,739 | 9,284 |
| Fannie Mae Mortgage pass-thru certificates 4.5% 10/1/2052 | | 327,781 | 308,898 |
| Fannie Mae Mortgage pass-thru certificates 4.5% 11/1/2048 | | 3,285 | 3,132 |
| Fannie Mae Mortgage pass-thru certificates 4.5% 11/1/2048 | | 12,983 | 12,377 |
| Fannie Mae Mortgage pass-thru certificates 4.5% 11/1/2049 | | 50,617 | 48,207 |
| Fannie Mae Mortgage pass-thru certificates 4.5% 11/1/2050 | | 95,028 | 90,303 |
| Fannie Mae Mortgage pass-thru certificates 4.5% 11/1/2052 | | 439,764 | 414,429 |
| Fannie Mae Mortgage pass-thru certificates 4.5% 12/1/2048 | | 8,470 | 8,075 |
| Fannie Mae Mortgage pass-thru certificates 4.5% 12/1/2050 | | 387,267 | 368,829 |
| Fannie Mae Mortgage pass-thru certificates 4.5% 2/1/2048 | | 77,089 | 73,612 |
| Fannie Mae Mortgage pass-thru certificates 4.5% 2/1/2049 | | 66,035 | 62,932 |
| Fannie Mae Mortgage pass-thru certificates 4.5% 3/1/2049 | | 43,131 | 41,105 |
| Fannie Mae Mortgage pass-thru certificates 4.5% 4/1/2048 | | 9,865 | 9,413 |
| Fannie Mae Mortgage pass-thru certificates 4.5% 4/1/2048 | | 12,689 | 12,109 |
| Fannie Mae Mortgage pass-thru certificates 4.5% 4/1/2049 | | 193,321 | 184,298 |
| Fannie Mae Mortgage pass-thru certificates 4.5% 4/1/2050 | | 510,983 | 486,336 |
| Fannie Mae Mortgage pass-thru certificates 4.5% 5/1/2047 | | 12,919 | 12,373 |
| Fannie Mae Mortgage pass-thru certificates 4.5% 5/1/2048 | | 26,883 | 25,628 |
| Fannie Mae Mortgage pass-thru certificates 4.5% 6/1/2048 | | 11,520 | 10,982 |
| Fannie Mae Mortgage pass-thru certificates 4.5% 6/1/2048 | | 189,351 | 180,514 |
| Fannie Mae Mortgage pass-thru certificates 4.5% 7/1/2047 | | 16,726 | 16,008 |
| Fannie Mae Mortgage pass-thru certificates 4.5% 7/1/2047 | | 57,205 | 55,636 |
| Fannie Mae Mortgage pass-thru certificates 4.5% 7/1/2048 | | 11,173 | 10,623 |
| Fannie Mae Mortgage pass-thru certificates 4.5% 7/1/2048 | | 79,887 | 76,283 |
| Fannie Mae Mortgage pass-thru certificates 4.5% 7/1/2049 | | 30,351 | 28,916 |
| Fannie Mae Mortgage pass-thru certificates 4.5% 8/1/2048 | | 19,983 | 19,050 |
| Fannie Mae Mortgage pass-thru certificates 4.5% 8/1/2049 | | 2,665 | 2,538 |
| Fannie Mae Mortgage pass-thru certificates 4.5% 8/1/2049 | | 2,358 | 2,245 |
| Fannie Mae Mortgage pass-thru certificates 4.5% 8/1/2053 | | 376,837 | 354,392 |
| Fannie Mae Mortgage pass-thru certificates 4.5% 9/1/2041 | | 21,513 | 20,874 |
| Fannie Mae Mortgage pass-thru certificates 4.5% 9/1/2054 | | 588,060 | 552,803 |
| Fannie Mae Mortgage pass-thru certificates 5% 1/1/2053 | | 535,471 | 517,433 |
| Fannie Mae Mortgage pass-thru certificates 5% 10/1/2048 | | 126,461 | 126,665 |
| Fannie Mae Mortgage pass-thru certificates 5% 10/1/2049 | | 14,436 | 14,143 |
| Fannie Mae Mortgage pass-thru certificates 5% 10/1/2050 | | 39,743 | 38,951 |
| Fannie Mae Mortgage pass-thru certificates 5% 10/1/2052 | | 504,303 | 487,787 |
| Fannie Mae Mortgage pass-thru certificates 5% 10/1/2052 | | 290,694 | 281,174 |
| Fannie Mae Mortgage pass-thru certificates 5% 10/1/2053 | | 95,090 | 91,768 |
| Fannie Mae Mortgage pass-thru certificates 5% 11/1/2049 | | 19,703 | 19,304 |
| Fannie Mae Mortgage pass-thru certificates 5% 11/1/2052 | | 85,545 | 82,743 |
| Fannie Mae Mortgage pass-thru certificates 5% 11/1/2053 | | 189,427 | 182,809 |
| Fannie Mae Mortgage pass-thru certificates 5% 11/1/2054 | | 398,465 | 384,389 |
| Fannie Mae Mortgage pass-thru certificates 5% 12/1/2048 | | 10,875 | 10,678 |
| Fannie Mae Mortgage pass-thru certificates 5% 12/1/2049 | | 55,925 | 54,793 |
| Fannie Mae Mortgage pass-thru certificates 5% 12/1/2049 | | 30,986 | 30,426 |
| Fannie Mae Mortgage pass-thru certificates 5% 12/1/2054 | | 424,958 | 410,211 |
| Fannie Mae Mortgage pass-thru certificates 5% 2/1/2049 | | 58,625 | 57,566 |
| Fannie Mae Mortgage pass-thru certificates 5% 2/1/2053 | | 356,705 | 344,689 |
| Fannie Mae Mortgage pass-thru certificates 5% 2/1/2054 | | 296,663 | 286,206 |
| Fannie Mae Mortgage pass-thru certificates 5% 3/1/2049 | | 7,222 | 7,092 |
| Fannie Mae Mortgage pass-thru certificates 5% 4/1/2049 | | 26,387 | 25,869 |
| Fannie Mae Mortgage pass-thru certificates 5% 5/1/2053 | | 166,547 | 160,825 |
| Fannie Mae Mortgage pass-thru certificates 5% 7/1/2048 | | 12,368 | 12,164 |
| Fannie Mae Mortgage pass-thru certificates 5% 8/1/2048 | | 22,466 | 22,095 |
| Fannie Mae Mortgage pass-thru certificates 5% 9/1/2048 | | 2,847 | 2,800 |
| Fannie Mae Mortgage pass-thru certificates 5% 9/1/2049 | | 290,098 | 284,858 |
| Fannie Mae Mortgage pass-thru certificates 5.5% 1/1/2049 | | 22,402 | 22,563 |
| Fannie Mae Mortgage pass-thru certificates 5.5% 1/1/2049 | | 18,875 | 19,011 |
| Fannie Mae Mortgage pass-thru certificates 5.5% 1/1/2049 | | 23,408 | 23,576 |
| Fannie Mae Mortgage pass-thru certificates 5.5% 11/1/2052 | | 23,640 | 23,403 |
| Fannie Mae Mortgage pass-thru certificates 5.5% 11/1/2052 | | 415,532 | 411,507 |
| Fannie Mae Mortgage pass-thru certificates 5.5% 12/1/2048 | | 18,505 | 18,696 |
| Fannie Mae Mortgage pass-thru certificates 5.5% 2/1/2049 | | 25,651 | 25,771 |
| Fannie Mae Mortgage pass-thru certificates 5.5% 2/1/2053 | | 610,558 | 604,071 |
| Fannie Mae Mortgage pass-thru certificates 5.5% 4/1/2049 | | 24,401 | 24,516 |
| Fannie Mae Mortgage pass-thru certificates 5.5% 5/1/2044 | | 25,066 | 25,634 |
| Fannie Mae Mortgage pass-thru certificates 5.5% 5/1/2053 | | 37,124 | 36,683 |
| Fannie Mae Mortgage pass-thru certificates 5.5% 6/1/2039 | | 63,494 | 63,901 |
| Fannie Mae Mortgage pass-thru certificates 5.5% 6/1/2054 | | 745,052 | 735,041 |
| Fannie Mae Mortgage pass-thru certificates 5.5% 6/1/2054 | | 1,909,866 | 1,884,205 |
| Fannie Mae Mortgage pass-thru certificates 5.5% 7/1/2053 | | 189,194 | 186,723 |
| Fannie Mae Mortgage pass-thru certificates 5.5% 7/1/2053 | | 334,949 | 333,588 |
| Fannie Mae Mortgage pass-thru certificates 5.5% 7/1/2054 | | 675,433 | 666,358 |
| Fannie Mae Mortgage pass-thru certificates 5.5% 8/1/2053 | | 440,026 | 434,527 |
| Fannie Mae Mortgage pass-thru certificates 5.5% 9/1/2053 | | 186,166 | 183,839 |
| Fannie Mae Mortgage pass-thru certificates 5.5% 9/1/2053 | | 295,179 | 291,766 |
| Fannie Mae Mortgage pass-thru certificates 5.5% 9/1/2054 | | 169,760 | 167,479 |
| Fannie Mae Mortgage pass-thru certificates 6% 1/1/2053 | | 326,278 | 328,557 |
| Fannie Mae Mortgage pass-thru certificates 6% 1/1/2054 | | 691,742 | 695,439 |
| Fannie Mae Mortgage pass-thru certificates 6% 10/1/2052 | | 217,992 | 219,992 |
| Fannie Mae Mortgage pass-thru certificates 6% 10/1/2053 | | 354,486 | 356,408 |
| Fannie Mae Mortgage pass-thru certificates 6% 10/1/2053 | | 402,109 | 404,290 |
| Fannie Mae Mortgage pass-thru certificates 6% 12/1/2052 | | 489,643 | 492,910 |
| Fannie Mae Mortgage pass-thru certificates 6% 12/1/2054 | | 347,755 | 351,814 |
| Fannie Mae Mortgage pass-thru certificates 6% 2/1/2054 | | 2,154,102 | 2,165,110 |
| Fannie Mae Mortgage pass-thru certificates 6% 3/1/2053 | | 678,576 | 683,103 |
| Fannie Mae Mortgage pass-thru certificates 6% 3/1/2054 | | 268,005 | 272,306 |
| Fannie Mae Mortgage pass-thru certificates 6% 4/1/2054 | | 243,043 | 244,308 |
| Fannie Mae Mortgage pass-thru certificates 6% 5/1/2054 | | 302,107 | 303,556 |
| Fannie Mae Mortgage pass-thru certificates 6% 6/1/2053 | | 118,003 | 118,643 |
| Fannie Mae Mortgage pass-thru certificates 6% 6/1/2054 | | 74,993 | 75,353 |
| Fannie Mae Mortgage pass-thru certificates 6% 6/1/2054 | | 347,634 | 349,954 |
| Fannie Mae Mortgage pass-thru certificates 6% 8/1/2053 | | 68,932 | 69,306 |
| Fannie Mae Mortgage pass-thru certificates 6.5% 10/1/2053 | | 326,415 | 333,597 |
| Fannie Mae Mortgage pass-thru certificates 6.5% 11/1/2053 | | 1,010,231 | 1,032,378 |
| Fannie Mae Mortgage pass-thru certificates 6.5% 4/1/2043 | | 56,283 | 57,671 |
| Fannie Mae Mortgage pass-thru certificates 6.5% 5/1/2053 | | 362,408 | 370,579 |
| Fannie Mae Mortgage pass-thru certificates 6.5% 9/1/2053 | | 80,911 | 82,736 |
| Fannie Mae Mortgage pass-thru certificates 7% 12/1/2053 | | 84,139 | 87,904 |
| Fannie Mae Mortgage pass-thru certificates 7% 12/1/2053 | | 81,525 | 84,864 |
| Freddie Mac Gold Pool 1.5% 10/1/2036 | | 359,765 | 309,444 |
| Freddie Mac Gold Pool 1.5% 10/1/2041 | | 210,578 | 169,320 |
| Freddie Mac Gold Pool 1.5% 10/1/2051 | | 1,689,692 | 1,248,437 |
| Freddie Mac Gold Pool 1.5% 10/1/2051 | | 179,949 | 132,956 |
| Freddie Mac Gold Pool 1.5% 11/1/2051 | | 502,620 | 371,363 |
| Freddie Mac Gold Pool 1.5% 11/1/2051 | | 97,125 | 71,762 |
| Freddie Mac Gold Pool 1.5% 2/1/2037 | | 74,743 | 64,195 |
| Freddie Mac Gold Pool 1.5% 3/1/2037 | | 86,932 | 74,664 |
| Freddie Mac Gold Pool 1.5% 7/1/2036 | | 262,208 | 225,942 |
| Freddie Mac Gold Pool 1.5% 7/1/2041 | | 543,405 | 438,224 |
| Freddie Mac Gold Pool 1.5% 7/1/2051 | | 483,354 | 357,128 |
| Freddie Mac Gold Pool 2% 1/1/2051 | | 1,498,749 | 1,172,234 |
| Freddie Mac Gold Pool 2% 1/1/2051 | | 377,467 | 296,176 |
| Freddie Mac Gold Pool 2% 1/1/2052 | | 1,945,316 | 1,513,611 |
| Freddie Mac Gold Pool 2% 10/1/2030 | | 90,893 | 85,621 |
| Freddie Mac Gold Pool 2% 10/1/2050 | | 39,869 | 31,233 |
| Freddie Mac Gold Pool 2% 10/1/2051 | | 616,042 | 480,100 |
| Freddie Mac Gold Pool 2% 10/1/2051 | | 3,128,160 | 2,437,868 |
| Freddie Mac Gold Pool 2% 11/1/2035 | | 280,341 | 248,931 |
| Freddie Mac Gold Pool 2% 11/1/2035 | | 96,804 | 85,958 |
| Freddie Mac Gold Pool 2% 11/1/2051 | | 1,412,146 | 1,100,527 |
| Freddie Mac Gold Pool 2% 11/1/2051 | | 938,977 | 734,120 |
| Freddie Mac Gold Pool 2% 11/1/2051 | | 797,824 | 623,762 |
| Freddie Mac Gold Pool 2% 12/1/2051 | | 914,476 | 721,251 |
| Freddie Mac Gold Pool 2% 12/1/2051 | | 224,999 | 175,067 |
| Freddie Mac Gold Pool 2% 2/1/2036 | | 847,689 | 752,715 |
| Freddie Mac Gold Pool 2% 2/1/2051 | | 618,555 | 483,798 |
| Freddie Mac Gold Pool 2% 3/1/2051 | | 2,148,922 | 1,683,449 |
| Freddie Mac Gold Pool 2% 4/1/2036 | | 1,641,993 | 1,455,972 |
| Freddie Mac Gold Pool 2% 4/1/2042 | | 936,168 | 784,928 |
| Freddie Mac Gold Pool 2% 5/1/2051 | | 1,725,093 | 1,346,572 |
| Freddie Mac Gold Pool 2% 7/1/2051 | | 1,155,653 | 905,690 |
| Freddie Mac Gold Pool 2% 8/1/2050 | | 20,132 | 15,878 |
| Freddie Mac Gold Pool 2% 8/1/2051 | | 282,980 | 220,535 |
| Freddie Mac Gold Pool 2% 8/1/2051 | | 21,781 | 17,063 |
| Freddie Mac Gold Pool 2% 9/1/2035 | | 187,572 | 166,967 |
| Freddie Mac Gold Pool 2% 9/1/2041 | | 1,958,273 | 1,630,786 |
| Freddie Mac Gold Pool 2% 9/1/2050 | | 20,654 | 16,180 |
| Freddie Mac Gold Pool 2% 9/1/2050 | | 183,735 | 143,936 |
| Freddie Mac Gold Pool 2% 9/1/2051 | | 1,095,709 | 853,918 |
| Freddie Mac Gold Pool 2.5% 1/1/2035 | | 494,592 | 453,469 |
| Freddie Mac Gold Pool 2.5% 1/1/2047 | | 21,723 | 18,217 |
| Freddie Mac Gold Pool 2.5% 1/1/2051 | | 2,342,576 | 1,920,557 |
| Freddie Mac Gold Pool 2.5% 10/1/2050 | | 795,007 | 652,530 |
| Freddie Mac Gold Pool 2.5% 10/1/2050 | | 1,278,440 | 1,058,514 |
| Freddie Mac Gold Pool 2.5% 10/1/2051 | | 807,190 | 660,007 |
| Freddie Mac Gold Pool 2.5% 11/1/2050 | | 616,031 | 509,479 |
| Freddie Mac Gold Pool 2.5% 11/1/2051 | | 476,218 | 389,385 |
| Freddie Mac Gold Pool 2.5% 12/1/2051 | | 789,561 | 648,553 |
| Freddie Mac Gold Pool 2.5% 2/1/2030 | | 48,080 | 46,194 |
| Freddie Mac Gold Pool 2.5% 2/1/2051 | | 758,246 | 621,646 |
| Freddie Mac Gold Pool 2.5% 2/1/2052 | | 2,152,721 | 1,756,832 |
| Freddie Mac Gold Pool 2.5% 3/1/2033 | | 20,286 | 19,076 |
| Freddie Mac Gold Pool 2.5% 3/1/2035 | | 498,555 | 457,102 |
| Freddie Mac Gold Pool 2.5% 3/1/2050 | | 36,674 | 29,860 |
| Freddie Mac Gold Pool 2.5% 4/1/2027 | | 25,379 | 24,857 |
| Freddie Mac Gold Pool 2.5% 4/1/2036 | | 158,861 | 144,808 |
| Freddie Mac Gold Pool 2.5% 4/1/2042 | | 333,523 | 285,633 |
| Freddie Mac Gold Pool 2.5% 4/1/2052 | | 99,858 | 81,400 |
| Freddie Mac Gold Pool 2.5% 4/1/2052 | | 521,466 | 426,382 |
| Freddie Mac Gold Pool 2.5% 5/1/2051 | | 1,234,295 | 1,010,391 |
| Freddie Mac Gold Pool 2.5% 7/1/2029 | | 23,638 | 22,985 |
| Freddie Mac Gold Pool 2.5% 7/1/2037 | | 410,983 | 373,215 |
| Freddie Mac Gold Pool 2.5% 7/1/2051 | | 1,315,175 | 1,076,599 |
| Freddie Mac Gold Pool 2.5% 7/1/2052 | | 1,239,736 | 1,009,034 |
| Freddie Mac Gold Pool 2.5% 8/1/2035 | | 202,165 | 184,787 |
| Freddie Mac Gold Pool 2.5% 8/1/2051 | | 2,528,969 | 2,070,210 |
| Freddie Mac Gold Pool 2.5% 9/1/2050 | | 63,030 | 51,734 |
| Freddie Mac Gold Pool 3% 1/1/2029 | | 20,180 | 19,654 |
| Freddie Mac Gold Pool 3% 1/1/2033 | | 5,848 | 5,574 |
| Freddie Mac Gold Pool 3% 10/1/2043 | | 137,061 | 121,716 |
| Freddie Mac Gold Pool 3% 11/1/2034 | | 49,296 | 46,370 |
| Freddie Mac Gold Pool 3% 2/1/2035 | | 76,776 | 72,147 |
| Freddie Mac Gold Pool 3% 2/1/2052 | | 47,894 | 40,652 |
| Freddie Mac Gold Pool 3% 3/1/2033 | | 4,382 | 4,175 |
| Freddie Mac Gold Pool 3% 3/1/2035 | | 48,499 | 45,575 |
| Freddie Mac Gold Pool 3% 3/1/2045 | | 27,335 | 23,815 |
| Freddie Mac Gold Pool 3% 4/1/2035 | | 8,919 | 8,376 |
| Freddie Mac Gold Pool 3% 4/1/2045 | | 37,388 | 32,738 |
| Freddie Mac Gold Pool 3% 4/1/2050 | | 173,543 | 149,635 |
| Freddie Mac Gold Pool 3% 7/1/2045 | | 12,790 | 11,131 |
| Freddie Mac Gold Pool 3% 7/1/2049 | | 352,026 | 303,088 |
| Freddie Mac Gold Pool 3% 8/1/2047 | | 27,763 | 24,049 |
| Freddie Mac Gold Pool 3% 8/1/2051 | | 141,267 | 121,143 |
| Freddie Mac Gold Pool 3% 8/1/2052 | | 2,290,500 | 1,974,232 |
| Freddie Mac Gold Pool 3% 8/1/2052 | | 125,000 | 106,099 |
| Freddie Mac Gold Pool 3% 9/1/2034 | | 1,528 | 1,441 |
| Freddie Mac Gold Pool 3.5% 1/1/2050 | | 45,628 | 40,753 |
| Freddie Mac Gold Pool 3.5% 1/1/2050 | | 93,868 | 83,810 |
| Freddie Mac Gold Pool 3.5% 10/1/2047 | | 140,473 | 126,211 |
| Freddie Mac Gold Pool 3.5% 12/1/2033 | | 161,322 | 154,619 |
| Freddie Mac Gold Pool 3.5% 2/1/2048 | | 57,485 | 51,629 |
| Freddie Mac Gold Pool 3.5% 2/1/2048 | | 9,463 | 8,505 |
| Freddie Mac Gold Pool 3.5% 2/1/2049 | | 15,512 | 13,908 |
| Freddie Mac Gold Pool 3.5% 3/1/2048 | | 81,138 | 73,125 |
| Freddie Mac Gold Pool 3.5% 3/1/2048 | | 193,205 | 173,521 |
| Freddie Mac Gold Pool 3.5% 3/1/2050 | | 226,004 | 201,716 |
| Freddie Mac Gold Pool 3.5% 3/1/2050 | | 1,289,809 | 1,163,288 |
| Freddie Mac Gold Pool 3.5% 5/1/2052 | | 513,773 | 454,827 |
| Freddie Mac Gold Pool 3.5% 6/1/2049 | | 91,478 | 81,761 |
| Freddie Mac Gold Pool 3.5% 6/1/2052 | | 174,292 | 154,676 |
| Freddie Mac Gold Pool 3.5% 7/1/2033 | | 26,020 | 24,963 |
| Freddie Mac Gold Pool 3.5% 7/1/2046 | | 788,722 | 715,051 |
| Freddie Mac Gold Pool 3.5% 7/1/2049 | | 285,879 | 255,424 |
| Freddie Mac Gold Pool 3.5% 8/1/2046 | | 93,381 | 84,130 |
| Freddie Mac Gold Pool 3.5% 9/1/2033 | | 39,695 | 38,058 |
| Freddie Mac Gold Pool 3.5% 9/1/2048 | | 48,245 | 43,270 |
| Freddie Mac Gold Pool 3.5% 9/1/2052 | | 846,334 | 748,173 |
| Freddie Mac Gold Pool 4% 1/1/2039 | | 92,637 | 87,695 |
| Freddie Mac Gold Pool 4% 1/1/2041 | | 30,166 | 28,564 |
| Freddie Mac Gold Pool 4% 1/1/2041 | | 61,974 | 58,694 |
| Freddie Mac Gold Pool 4% 1/1/2044 | | 35,198 | 32,984 |
| Freddie Mac Gold Pool 4% 1/1/2047 | | 176,257 | 164,541 |
| Freddie Mac Gold Pool 4% 10/1/2042 | | 12,696 | 11,953 |
| Freddie Mac Gold Pool 4% 10/1/2048 | | 48,244 | 44,675 |
| Freddie Mac Gold Pool 4% 10/1/2048 | | 77,253 | 71,345 |
| Freddie Mac Gold Pool 4% 10/1/2050 | | 134,039 | 123,538 |
| Freddie Mac Gold Pool 4% 11/1/2033 | | 50,075 | 48,459 |
| Freddie Mac Gold Pool 4% 11/1/2036 | | 71,790 | 68,743 |
| Freddie Mac Gold Pool 4% 11/1/2048 | | 7,576 | 7,006 |
| Freddie Mac Gold Pool 4% 11/1/2048 | | 243,207 | 224,914 |
| Freddie Mac Gold Pool 4% 11/1/2049 | | 80,145 | 74,017 |
| Freddie Mac Gold Pool 4% 12/1/2040 | | 32,791 | 31,056 |
| Freddie Mac Gold Pool 4% 2/1/2041 | | 10,654 | 10,062 |
| Freddie Mac Gold Pool 4% 2/1/2041 | | 39,466 | 37,394 |
| Freddie Mac Gold Pool 4% 2/1/2043 | | 51,523 | 48,361 |
| Freddie Mac Gold Pool 4% 2/1/2049 | | 25,379 | 23,470 |
| Freddie Mac Gold Pool 4% 3/1/2026 | | 3,007 | 2,990 |
| Freddie Mac Gold Pool 4% 3/1/2038 | | 177,356 | 170,361 |
| Freddie Mac Gold Pool 4% 4/1/2035 | | 62,932 | 60,823 |
| Freddie Mac Gold Pool 4% 4/1/2038 | | 162,371 | 155,967 |
| Freddie Mac Gold Pool 4% 4/1/2042 | | 23,806 | 22,542 |
| Freddie Mac Gold Pool 4% 4/1/2049 | | 490,334 | 453,299 |
| Freddie Mac Gold Pool 4% 4/1/2049 | | 335,024 | 311,500 |
| Freddie Mac Gold Pool 4% 5/1/2045 | | 10,744 | 10,117 |
| Freddie Mac Gold Pool 4% 5/1/2048 | | 21,425 | 19,854 |
| Freddie Mac Gold Pool 4% 6/1/2046 | | 53,119 | 49,984 |
| Freddie Mac Gold Pool 4% 6/1/2047 | | 930,994 | 859,681 |
| Freddie Mac Gold Pool 4% 6/1/2048 | | 31,395 | 29,092 |
| Freddie Mac Gold Pool 4% 6/1/2049 | | 14,105 | 13,039 |
| Freddie Mac Gold Pool 4% 7/1/2042 | | 10,834 | 10,257 |
| Freddie Mac Gold Pool 4% 7/1/2045 | | 50,655 | 47,849 |
| Freddie Mac Gold Pool 4% 8/1/2049 | | 26,871 | 24,842 |
| Freddie Mac Gold Pool 4% 9/1/2040 | | 10,248 | 9,709 |
| Freddie Mac Gold Pool 4% 9/1/2045 | | 92,214 | 85,941 |
| Freddie Mac Gold Pool 4% 9/1/2049 | | 272,795 | 252,106 |
| Freddie Mac Gold Pool 4% 9/1/2052 | | 332,633 | 304,573 |
| Freddie Mac Gold Pool 4.5% 1/1/2049 | | 24,042 | 22,913 |
| Freddie Mac Gold Pool 4.5% 1/1/2053 | | 182,421 | 171,798 |
| Freddie Mac Gold Pool 4.5% 10/1/2052 | | 775,958 | 731,255 |
| Freddie Mac Gold Pool 4.5% 10/1/2052 | | 259,012 | 243,977 |
| Freddie Mac Gold Pool 4.5% 10/1/2052 | | 274,304 | 258,501 |
| Freddie Mac Gold Pool 4.5% 10/1/2054 | | 199,999 | 188,009 |
| Freddie Mac Gold Pool 4.5% 11/1/2040 | | 413,311 | 401,924 |
| Freddie Mac Gold Pool 4.5% 11/1/2048 | | 45,993 | 43,846 |
| Freddie Mac Gold Pool 4.5% 11/1/2049 | | 22,947 | 21,854 |
| Freddie Mac Gold Pool 4.5% 11/1/2052 | | 615,598 | 580,133 |
| Freddie Mac Gold Pool 4.5% 12/1/2054 | | 174,983 | 164,492 |
| Freddie Mac Gold Pool 4.5% 3/1/2050 | | 52,366 | 49,856 |
| Freddie Mac Gold Pool 4.5% 4/1/2050 | | 67,112 | 63,896 |
| Freddie Mac Gold Pool 4.5% 6/1/2048 | | 93,349 | 88,992 |
| Freddie Mac Gold Pool 4.5% 6/1/2052 | | 204,311 | 192,668 |
| Freddie Mac Gold Pool 4.5% 7/1/2038 | | 181,879 | 177,932 |
| Freddie Mac Gold Pool 4.5% 7/1/2041 | | 102,444 | 99,458 |
| Freddie Mac Gold Pool 4.5% 7/1/2053 | | 187,506 | 176,572 |
| Freddie Mac Gold Pool 4.5% 8/1/2048 | | 283,028 | 269,818 |
| Freddie Mac Gold Pool 4.5% 9/1/2048 | | 38,244 | 36,508 |
| Freddie Mac Gold Pool 4.5% 9/1/2048 | | 3,586 | 3,418 |
| Freddie Mac Gold Pool 5% 11/1/2052 | | 186,491 | 180,383 |
| Freddie Mac Gold Pool 5% 12/1/2048 | | 7,860 | 7,718 |
| Freddie Mac Gold Pool 5% 12/1/2053 | | 98,527 | 95,085 |
| Freddie Mac Gold Pool 5% 2/1/2049 | | 16,371 | 16,097 |
| Freddie Mac Gold Pool 5% 2/1/2049 | | 11,683 | 11,472 |
| Freddie Mac Gold Pool 5% 3/1/2044 | | 174,596 | 171,225 |
| Freddie Mac Gold Pool 5% 3/1/2053 | | 681,951 | 658,978 |
| Freddie Mac Gold Pool 5% 3/1/2053 | | 387,312 | 374,568 |
| Freddie Mac Gold Pool 5% 4/1/2039 | | 167,579 | 166,713 |
| Freddie Mac Gold Pool 5% 4/1/2048 | | 12,396 | 12,227 |
| Freddie Mac Gold Pool 5% 4/1/2049 | | 115,259 | 112,961 |
| Freddie Mac Gold Pool 5% 5/1/2050 | | 57,016 | 55,844 |
| Freddie Mac Gold Pool 5% 6/1/2030 | | 4,634 | 4,650 |
| Freddie Mac Gold Pool 5% 6/1/2053 | | 1,182,526 | 1,141,952 |
| Freddie Mac Gold Pool 5% 7/1/2052 | | 346,080 | 335,612 |
| Freddie Mac Gold Pool 5% 8/1/2048 | | 13,659 | 13,434 |
| Freddie Mac Gold Pool 5% 8/1/2049 | | 12,646 | 12,394 |
| Freddie Mac Gold Pool 5% 8/1/2049 | | 34,808 | 34,114 |
| Freddie Mac Gold Pool 5% 8/1/2049 | | 515,061 | 504,792 |
| Freddie Mac Gold Pool 5% 9/1/2049 | | 329,915 | 323,235 |
| Freddie Mac Gold Pool 5% 9/1/2054 | | 541,761 | 522,622 |
| Freddie Mac Gold Pool 5.5% 1/1/2053 | | 202,261 | 200,026 |
| Freddie Mac Gold Pool 5.5% 1/1/2053 | | 264,970 | 261,931 |
| Freddie Mac Gold Pool 5.5% 10/1/2052 | | 357,930 | 354,351 |
| Freddie Mac Gold Pool 5.5% 11/1/2053 | | 476,959 | 470,700 |
| Freddie Mac Gold Pool 5.5% 12/1/2052 | | 431,522 | 426,937 |
| Freddie Mac Gold Pool 5.5% 12/1/2054 | | 1,442,428 | 1,423,047 |
| Freddie Mac Gold Pool 5.5% 3/1/2053 | | 426,533 | 421,469 |
| Freddie Mac Gold Pool 5.5% 4/1/2053 | | 616,031 | 609,487 |
| Freddie Mac Gold Pool 5.5% 4/1/2054 | | 364,953 | 360,049 |
| Freddie Mac Gold Pool 5.5% 6/1/2039 | | 172,327 | 173,430 |
| Freddie Mac Gold Pool 5.5% 6/1/2049 | | 117,398 | 118,242 |
| Freddie Mac Gold Pool 5.5% 7/1/2039 | | 174,002 | 175,116 |
| Freddie Mac Gold Pool 5.5% 7/1/2054 | | 47,901 | 47,257 |
| Freddie Mac Gold Pool 5.5% 8/1/2053 | | 193,926 | 191,502 |
| Freddie Mac Gold Pool 5.5% 9/1/2039 | | 61,123 | 61,534 |
| Freddie Mac Gold Pool 5.5% 9/1/2053 | | 335,669 | 334,410 |
| Freddie Mac Gold Pool 5.5% 9/1/2053 | | 49,566 | 48,976 |
| Freddie Mac Gold Pool 5.5% 9/1/2054 | | 386,598 | 381,404 |
| Freddie Mac Gold Pool 6% 1/1/2053 | | 681,158 | 685,703 |
| Freddie Mac Gold Pool 6% 11/1/2053 | | 282,195 | 283,726 |
| Freddie Mac Gold Pool 6% 11/1/2053 | | 50,503 | 50,761 |
| Freddie Mac Gold Pool 6% 12/1/2052 | | 82,559 | 83,109 |
| Freddie Mac Gold Pool 6% 12/1/2053 | | 399,699 | 405,753 |
| Freddie Mac Gold Pool 6% 3/1/2053 | | 342,482 | 344,767 |
| Freddie Mac Gold Pool 6% 4/1/2054 | | 727,203 | 740,918 |
| Freddie Mac Gold Pool 6% 5/1/2054 | | 306,241 | 307,710 |
| Freddie Mac Gold Pool 6% 7/1/2053 | | 23,091 | 23,217 |
| Freddie Mac Gold Pool 6.5% 10/1/2053 | | 310,844 | 317,659 |
| Freddie Mac Gold Pool 6.5% 10/1/2053 | | 633,982 | 647,881 |
| Freddie Mac Gold Pool 6.5% 11/1/2052 | | 196,541 | 201,335 |
| Freddie Mac Gold Pool 6.5% 12/1/2053 | | 251,324 | 259,740 |
| Freddie Mac Gold Pool 6.5% 2/1/2054 | | 442,568 | 456,696 |
| Freddie Mac Gold Pool 6.5% 6/1/2054 | | 437,172 | 453,314 |
| Freddie Mac Gold Pool 6.5% 6/1/2054 | | 217,968 | 227,242 |
| Freddie Mac Gold Pool 6.5% 8/1/2053 | | 79,021 | 80,803 |
| Freddie Mac Gold Pool 6.5% 9/1/2053 | | 269,194 | 275,096 |
| Freddie Mac Gold Pool 6.5% 9/1/2054 | | 252,399 | 263,237 |
| Freddie Mac Gold Pool 7% 1/1/2054 | | 90,907 | 95,173 |
| Freddie Mac Non Gold Pool 4.5% 2/1/2054 | | 197,097 | 185,294 |
| Freddie Mac Non Gold Pool 5.5% 4/1/2054 | | 250,896 | 247,995 |
| Ginnie Mae I Pool 3% 10/20/2042 | | 189,468 | 169,161 |
| Ginnie Mae I Pool 3% 11/20/2052 | | 170,701 | 148,250 |
| Ginnie Mae I Pool 3% 7/20/2052 | | 83,732 | 72,726 |
| Ginnie Mae I Pool 3.5% 10/20/2052 | | 436,756 | 390,202 |
| Ginnie Mae I Pool 3.5% 10/20/2054 | | 49,857 | 44,523 |
| Ginnie Mae I Pool 3.5% 11/20/2052 | | 46,193 | 41,265 |
| Ginnie Mae I Pool 3.5% 12/20/2052 | | 232,211 | 207,460 |
| Ginnie Mae I Pool 3.5% 7/20/2052 | | 169,384 | 151,382 |
| Ginnie Mae I Pool 3.5% 9/20/2052 | | 569,455 | 508,757 |
| Ginnie Mae I Pool 4% 1/20/2053 | | 175,774 | 162,141 |
| Ginnie Mae I Pool 4% 10/20/2052 | | 703,662 | 649,141 |
| Ginnie Mae I Pool 4% 12/20/2052 | | 140,341 | 129,456 |
| Ginnie Mae I Pool 4% 3/20/2047 | | 49,017 | 45,648 |
| Ginnie Mae I Pool 4% 8/20/2052 | | 256,973 | 237,062 |
| Ginnie Mae I Pool 4% 9/20/2052 | | 350,408 | 323,258 |
| Ginnie Mae I Pool 4.5% 10/20/2052 | | 433,414 | 410,659 |
| Ginnie Mae I Pool 4.5% 11/20/2052 | | 349,789 | 330,959 |
| Ginnie Mae I Pool 4.5% 4/20/2053 | | 186,561 | 176,518 |
| Ginnie Mae I Pool 4.5% 5/20/2053 | | 275,945 | 261,091 |
| Ginnie Mae I Pool 4.5% 8/20/2052 | | 424,094 | 401,032 |
| Ginnie Mae I Pool 5% 1/20/2053 | | 181,594 | 176,450 |
| Ginnie Mae I Pool 5% 10/20/2052 | | 419,749 | 407,859 |
| Ginnie Mae I Pool 5% 11/20/2049 | | 79,937 | 78,666 |
| Ginnie Mae I Pool 5% 11/20/2052 | | 85,284 | 82,895 |
| Ginnie Mae I Pool 5% 4/20/2053 | | 353,902 | 343,767 |
| Ginnie Mae I Pool 5% 6/20/2053 | | 182,635 | 177,747 |
| Ginnie Mae I Pool 5% 7/20/2052 | | 250,862 | 243,913 |
| Ginnie Mae I Pool 5% 9/20/2052 | | 83,896 | 81,598 |
| Ginnie Mae I Pool 5.5% 1/20/2053 | | 158,586 | 157,503 |
| Ginnie Mae I Pool 5.5% 10/20/2052 | | 315,085 | 312,836 |
| Ginnie Mae I Pool 5.5% 12/20/2052 | | 157,503 | 156,625 |
| Ginnie Mae I Pool 5.5% 2/20/2053 | | 161,690 | 160,789 |
| Ginnie Mae I Pool 5.5% 4/20/2053 | | 461,125 | 458,554 |
| Ginnie Mae I Pool 5.5% 5/20/2053 | | 351,876 | 349,914 |
| Ginnie Mae I Pool 6% 1/20/2053 | | 486,113 | 489,799 |
| Ginnie Mae I Pool 6% 12/20/2052 | | 274,417 | 276,412 |
| Ginnie Mae I Pool 6.5% 12/20/2052 | | 281,311 | 286,003 |
| Ginnie Mae II Pool 1.5% 5/20/2051 | | 97,487 | 74,587 |
| Ginnie Mae II Pool 2% 1/1/2055 (g) | | 50,000 | 39,933 |
| Ginnie Mae II Pool 2% 1/20/2052 | | 353,394 | 282,360 |
| Ginnie Mae II Pool 2% 11/20/2051 | | 900,182 | 719,521 |
| Ginnie Mae II Pool 2% 12/20/2050 | | 2,012,047 | 1,608,870 |
| Ginnie Mae II Pool 2% 12/20/2051 | | 158,760 | 126,898 |
| Ginnie Mae II Pool 2% 2/20/2051 | | 346,357 | 276,953 |
| Ginnie Mae II Pool 2% 2/20/2052 | | 195,872 | 156,500 |
| Ginnie Mae II Pool 2% 3/20/2051 | | 2,807,850 | 2,245,208 |
| Ginnie Mae II Pool 2% 3/20/2052 | | 49,999 | 39,949 |
| Ginnie Mae II Pool 2% 4/20/2051 | | 2,081,394 | 1,663,020 |
| Ginnie Mae II Pool 2% 4/20/2052 | | 830,492 | 663,558 |
| Ginnie Mae II Pool 2% 5/20/2052 | | 389,839 | 311,418 |
| Ginnie Mae II Pool 2% 6/20/2051 | | 212,589 | 169,990 |
| Ginnie Mae II Pool 2% 7/20/2051 | | 826,562 | 660,934 |
| Ginnie Mae II Pool 2.5% 1/1/2055 (g) | | 600,000 | 500,340 |
| Ginnie Mae II Pool 2.5% 1/20/2051 | | 400,397 | 334,808 |
| Ginnie Mae II Pool 2.5% 10/20/2046 | | 23,330 | 19,720 |
| Ginnie Mae II Pool 2.5% 10/20/2050 | | 616,395 | 516,002 |
| Ginnie Mae II Pool 2.5% 10/20/2051 | | 76,705 | 64,020 |
| Ginnie Mae II Pool 2.5% 10/20/2053 | | 130,340 | 108,846 |
| Ginnie Mae II Pool 2.5% 11/20/2050 | | 641,771 | 536,844 |
| Ginnie Mae II Pool 2.5% 12/20/2049 | | 121,580 | 101,816 |
| Ginnie Mae II Pool 2.5% 12/20/2050 | | 575,155 | 481,119 |
| Ginnie Mae II Pool 2.5% 2/20/2051 | | 282,758 | 236,175 |
| Ginnie Mae II Pool 2.5% 2/20/2052 | | 952,016 | 794,580 |
| Ginnie Mae II Pool 2.5% 4/20/2050 | | 61,121 | 51,166 |
| Ginnie Mae II Pool 2.5% 4/20/2051 | | 63,400 | 52,955 |
| Ginnie Mae II Pool 2.5% 4/20/2052 | | 188,975 | 157,694 |
| Ginnie Mae II Pool 2.5% 5/20/2050 | | 56,360 | 47,180 |
| Ginnie Mae II Pool 2.5% 5/20/2051 | | 1,452,080 | 1,212,402 |
| Ginnie Mae II Pool 2.5% 5/20/2052 | | 556,003 | 463,969 |
| Ginnie Mae II Pool 2.5% 6/20/2050 | | 270,216 | 226,205 |
| Ginnie Mae II Pool 2.5% 7/20/2051 | | 1,883,139 | 1,571,723 |
| Ginnie Mae II Pool 2.5% 8/20/2050 | | 994,337 | 832,388 |
| Ginnie Mae II Pool 2.5% 8/20/2051 | | 381,191 | 318,272 |
| Ginnie Mae II Pool 2.5% 9/20/2050 | | 593,275 | 496,648 |
| Ginnie Mae II Pool 2.5% 9/20/2051 | | 670,433 | 559,563 |
| Ginnie Mae II Pool 3% 1/20/2043 | | 3,175 | 2,832 |
| Ginnie Mae II Pool 3% 1/20/2048 | | 18,795 | 16,447 |
| Ginnie Mae II Pool 3% 1/20/2050 | | 569,336 | 495,700 |
| Ginnie Mae II Pool 3% 1/20/2051 | | 16,241 | 14,147 |
| Ginnie Mae II Pool 3% 10/20/2051 | | 35,180 | 30,523 |
| Ginnie Mae II Pool 3% 11/20/2047 | | 33,858 | 29,648 |
| Ginnie Mae II Pool 3% 11/20/2051 | | 90,743 | 78,730 |
| Ginnie Mae II Pool 3% 11/20/2053 | | 45,094 | 39,293 |
| Ginnie Mae II Pool 3% 11/20/2054 | | 100,000 | 86,621 |
| Ginnie Mae II Pool 3% 12/20/2047 | | 193,073 | 168,946 |
| Ginnie Mae II Pool 3% 12/20/2049 | | 118,024 | 102,797 |
| Ginnie Mae II Pool 3% 2/20/2046 | | 219,145 | 192,514 |
| Ginnie Mae II Pool 3% 2/20/2050 | | 321,749 | 280,135 |
| Ginnie Mae II Pool 3% 2/20/2051 | | 586,603 | 510,780 |
| Ginnie Mae II Pool 3% 3/20/2043 | | 6,511 | 5,806 |
| Ginnie Mae II Pool 3% 3/20/2048 | | 68,073 | 59,566 |
| Ginnie Mae II Pool 3% 3/20/2050 | | 73,202 | 63,735 |
| Ginnie Mae II Pool 3% 3/20/2052 | | 424,678 | 368,326 |
| Ginnie Mae II Pool 3% 4/20/2048 | | 76,500 | 66,940 |
| Ginnie Mae II Pool 3% 4/20/2049 | | 15,662 | 13,715 |
| Ginnie Mae II Pool 3% 4/20/2050 | | 27,917 | 24,306 |
| Ginnie Mae II Pool 3% 4/20/2051 | | 613,027 | 533,022 |
| Ginnie Mae II Pool 3% 4/20/2052 | | 128,610 | 111,504 |
| Ginnie Mae II Pool 3% 5/20/2051 | | 29,782 | 25,895 |
| Ginnie Mae II Pool 3% 5/20/2052 | | 1,236,299 | 1,071,862 |
| Ginnie Mae II Pool 3% 6/20/2050 | | 521,108 | 453,547 |
| Ginnie Mae II Pool 3% 6/20/2052 | | 87,875 | 76,160 |
| Ginnie Mae II Pool 3% 7/20/2042 | | 26,194 | 23,395 |
| Ginnie Mae II Pool 3% 7/20/2046 | | 115,079 | 101,094 |
| Ginnie Mae II Pool 3% 7/20/2049 | | 205,231 | 178,880 |
| Ginnie Mae II Pool 3% 7/20/2050 | | 193,717 | 168,602 |
| Ginnie Mae II Pool 3% 8/20/2043 | | 3,522 | 3,134 |
| Ginnie Mae II Pool 3% 8/20/2046 | | 767,541 | 674,267 |
| Ginnie Mae II Pool 3% 8/20/2050 | | 308,495 | 268,500 |
| Ginnie Mae II Pool 3% 8/20/2051 | | 487,862 | 423,125 |
| Ginnie Mae II Pool 3% 9/20/2049 | | 73,972 | 64,428 |
| Ginnie Mae II Pool 3.5% 1/1/2055 (g) | | 275,000 | 245,565 |
| Ginnie Mae II Pool 3.5% 1/20/2048 | | 28,143 | 25,424 |
| Ginnie Mae II Pool 3.5% 1/20/2050 | | 597,242 | 537,128 |
| Ginnie Mae II Pool 3.5% 11/20/2047 | | 60,965 | 55,114 |
| Ginnie Mae II Pool 3.5% 12/20/2047 | | 138,637 | 125,246 |
| Ginnie Mae II Pool 3.5% 12/20/2048 | | 175,689 | 158,554 |
| Ginnie Mae II Pool 3.5% 12/20/2049 | | 470,326 | 422,987 |
| Ginnie Mae II Pool 3.5% 12/20/2051 | | 186,239 | 166,853 |
| Ginnie Mae II Pool 3.5% 2/20/2046 | | 215,136 | 195,028 |
| Ginnie Mae II Pool 3.5% 2/20/2051 | | 595,632 | 535,494 |
| Ginnie Mae II Pool 3.5% 3/20/2048 | | 49,886 | 45,068 |
| Ginnie Mae II Pool 3.5% 3/20/2049 | | 310,188 | 279,452 |
| Ginnie Mae II Pool 3.5% 4/20/2046 | | 162,944 | 147,663 |
| Ginnie Mae II Pool 3.5% 4/20/2049 | | 35,454 | 31,941 |
| Ginnie Mae II Pool 3.5% 4/20/2050 | | 1,036,557 | 932,225 |
| Ginnie Mae II Pool 3.5% 5/20/2046 | | 39,089 | 35,423 |
| Ginnie Mae II Pool 3.5% 5/20/2051 | | 61,758 | 55,523 |
| Ginnie Mae II Pool 3.5% 6/20/2047 | | 34,185 | 30,926 |
| Ginnie Mae II Pool 3.5% 7/20/2049 | | 176,923 | 159,226 |
| Ginnie Mae II Pool 3.5% 8/20/2048 | | 43,074 | 38,873 |
| Ginnie Mae II Pool 3.5% 8/20/2049 | | 29,797 | 26,817 |
| Ginnie Mae II Pool 3.5% 9/20/2049 | | 13,884 | 12,487 |
| Ginnie Mae II Pool 4% 1/1/2055 (g) | | 100,000 | 92,023 |
| Ginnie Mae II Pool 4% 1/20/2049 | | 130,470 | 121,258 |
| Ginnie Mae II Pool 4% 1/20/2051 | | 45,330 | 41,935 |
| Ginnie Mae II Pool 4% 10/20/2048 | | 43,518 | 40,459 |
| Ginnie Mae II Pool 4% 10/20/2049 | | 215,965 | 200,379 |
| Ginnie Mae II Pool 4% 11/20/2047 | | 12,886 | 11,988 |
| Ginnie Mae II Pool 4% 12/20/2047 | | 38,557 | 35,871 |
| Ginnie Mae II Pool 4% 2/20/2050 | | 300,407 | 278,727 |
| Ginnie Mae II Pool 4% 2/20/2054 | | 367,950 | 338,636 |
| Ginnie Mae II Pool 4% 3/20/2048 | | 30,999 | 28,829 |
| Ginnie Mae II Pool 4% 3/20/2050 | | 426,263 | 395,367 |
| Ginnie Mae II Pool 4% 4/20/2047 | | 37,475 | 34,899 |
| Ginnie Mae II Pool 4% 4/20/2048 | | 47,875 | 44,525 |
| Ginnie Mae II Pool 4% 4/20/2049 | | 89,561 | 83,097 |
| Ginnie Mae II Pool 4% 5/20/2049 | | 96,966 | 89,968 |
| Ginnie Mae II Pool 4% 5/20/2050 | | 26,416 | 24,510 |
| Ginnie Mae II Pool 4% 5/20/2054 | | 173,290 | 159,485 |
| Ginnie Mae II Pool 4% 6/20/2048 | | 10,596 | 9,852 |
| Ginnie Mae II Pool 4% 6/20/2049 | | 177,873 | 165,036 |
| Ginnie Mae II Pool 4% 7/20/2048 | | 20,615 | 19,166 |
| Ginnie Mae II Pool 4% 8/20/2048 | | 43,463 | 40,408 |
| Ginnie Mae II Pool 4% 8/20/2050 | | 97,435 | 90,403 |
| Ginnie Mae II Pool 4% 9/20/2048 | | 21,524 | 20,011 |
| Ginnie Mae II Pool 4.5% 1/1/2055 (g) | | 325,000 | 307,072 |
| Ginnie Mae II Pool 4.5% 1/20/2047 | | 9,297 | 8,974 |
| Ginnie Mae II Pool 4.5% 1/20/2049 | | 24,107 | 23,005 |
| Ginnie Mae II Pool 4.5% 1/20/2050 | | 30,193 | 28,804 |
| Ginnie Mae II Pool 4.5% 1/20/2051 | | 35,295 | 33,726 |
| Ginnie Mae II Pool 4.5% 10/20/2047 | | 6,172 | 5,929 |
| Ginnie Mae II Pool 4.5% 10/20/2048 | | 17,814 | 17,011 |
| Ginnie Mae II Pool 4.5% 10/20/2049 | | 60,424 | 57,700 |
| Ginnie Mae II Pool 4.5% 10/20/2050 | | 66,767 | 63,882 |
| Ginnie Mae II Pool 4.5% 11/20/2048 | | 26,718 | 25,497 |
| Ginnie Mae II Pool 4.5% 11/20/2054 | | 99,999 | 94,507 |
| Ginnie Mae II Pool 4.5% 12/20/2048 | | 8,313 | 7,933 |
| Ginnie Mae II Pool 4.5% 12/20/2049 | | 16,616 | 15,856 |
| Ginnie Mae II Pool 4.5% 12/20/2054 | | 200,000 | 189,015 |
| Ginnie Mae II Pool 4.5% 2/20/2049 | | 18,319 | 17,476 |
| Ginnie Mae II Pool 4.5% 2/20/2050 | | 23,667 | 22,585 |
| Ginnie Mae II Pool 4.5% 3/20/2049 | | 29,643 | 28,288 |
| Ginnie Mae II Pool 4.5% 3/20/2051 | | 158,789 | 151,730 |
| Ginnie Mae II Pool 4.5% 4/20/2049 | | 11,000 | 10,497 |
| Ginnie Mae II Pool 4.5% 4/20/2050 | | 120,401 | 114,822 |
| Ginnie Mae II Pool 4.5% 4/20/2054 | | 223,559 | 211,280 |
| Ginnie Mae II Pool 4.5% 5/20/2049 | | 85,396 | 81,466 |
| Ginnie Mae II Pool 4.5% 5/20/2054 | | 197,248 | 186,414 |
| Ginnie Mae II Pool 4.5% 6/20/2054 | | 346,065 | 327,057 |
| Ginnie Mae II Pool 4.5% 7/20/2049 | | 31,463 | 30,015 |
| Ginnie Mae II Pool 4.5% 7/20/2053 | | 281,155 | 265,845 |
| Ginnie Mae II Pool 4.5% 8/20/2048 | | 85,828 | 81,959 |
| Ginnie Mae II Pool 4.5% 8/20/2050 | | 30,322 | 28,936 |
| Ginnie Mae II Pool 4.5% 8/20/2053 | | 188,699 | 178,408 |
| Ginnie Mae II Pool 4.5% 9/20/2047 | | 6,352 | 6,101 |
| Ginnie Mae II Pool 5% 1/1/2055 (g) | | 1,950,000 | 1,891,264 |
| Ginnie Mae II Pool 5% 11/20/2047 | | 12,991 | 12,922 |
| Ginnie Mae II Pool 5% 11/20/2048 | | 6,980 | 6,860 |
| Ginnie Mae II Pool 5% 11/20/2049 | | 27,604 | 27,217 |
| Ginnie Mae II Pool 5% 11/20/2053 | | 284,976 | 276,792 |
| Ginnie Mae II Pool 5% 12/20/2054 | | 200,000 | 194,054 |
| Ginnie Mae II Pool 5% 3/20/2048 | | 9,025 | 8,955 |
| Ginnie Mae II Pool 5% 3/20/2050 | | 53,364 | 52,916 |
| Ginnie Mae II Pool 5% 4/20/2050 | | 121,731 | 120,328 |
| Ginnie Mae II Pool 5% 5/20/2049 | | 8,016 | 7,879 |
| Ginnie Mae II Pool 5% 7/20/2048 | | 15,747 | 15,497 |
| Ginnie Mae II Pool 5% 7/20/2053 | | 460,071 | 446,896 |
| Ginnie Mae II Pool 5% 8/20/2053 | | 186,805 | 181,338 |
| Ginnie Mae II Pool 5% 9/20/2048 | | 8,693 | 8,554 |
| Ginnie Mae II Pool 5% 9/20/2053 | | 184,780 | 179,373 |
| Ginnie Mae II Pool 5.5% 1/1/2055 (g) | | 1,200,000 | 1,189,259 |
| Ginnie Mae II Pool 5.5% 1/20/2049 | | 9,119 | 9,222 |
| Ginnie Mae II Pool 5.5% 10/20/2053 | | 353,153 | 351,184 |
| Ginnie Mae II Pool 5.5% 12/20/2053 | | 135,043 | 133,910 |
| Ginnie Mae II Pool 5.5% 2/20/2054 | | 469,256 | 465,320 |
| Ginnie Mae II Pool 5.5% 6/20/2054 | | 222,631 | 220,764 |
| Ginnie Mae II Pool 5.5% 7/20/2054 | | 346,724 | 343,816 |
| Ginnie Mae II Pool 5.5% 8/20/2053 | | 172,889 | 171,546 |
| Ginnie Mae II Pool 5.5% 8/20/2054 | | 545,979 | 541,400 |
| Ginnie Mae II Pool 5.5% 9/20/2047 | | 18,806 | 19,097 |
| Ginnie Mae II Pool 5.5% 9/20/2053 | | 171,497 | 170,165 |
| Ginnie Mae II Pool 6% 1/1/2055 (g) | | 3,025,000 | 3,043,670 |
| Ginnie Mae II Pool 6% 12/20/2054 (g) | | 1,400,000 | 1,410,613 |
| Ginnie Mae II Pool 6% 2/1/2055 (g) | | 1,450,000 | 1,456,797 |
| Ginnie Mae II Pool 6.5% 1/1/2055 (g) | | 1,900,000 | 1,931,617 |
| Ginnie Mae II Pool 6.5% 2/1/2055 (g) | | 550,000 | 558,465 |
| Ginnie Mae II Pool 6.5% 7/20/2053 | | 122,075 | 124,092 |
| Uniform Mortgage Backed Securities 2% 1/1/2040 (g) | | 1,350,000 | 1,192,219 |
| Uniform Mortgage Backed Securities 2% 1/1/2055 (g) | | 2,450,000 | 1,903,344 |
| Uniform Mortgage Backed Securities 2.5% 1/1/2055 (g) | | 2,000,000 | 1,626,562 |
| Uniform Mortgage Backed Securities 3% 1/1/2055 (g) | | 50,000 | 42,413 |
| Uniform Mortgage Backed Securities 3.5% 1/1/2055 (g) | | 2,800,000 | 2,474,062 |
| Uniform Mortgage Backed Securities 4% 1/1/2055 (g) | | 100,000 | 91,311 |
| Uniform Mortgage Backed Securities 4.5% 1/1/2055 (g) | | 800,000 | 751,875 |
| Uniform Mortgage Backed Securities 5% 1/1/2055 (g) | | 2,750,000 | 2,652,139 |
| Uniform Mortgage Backed Securities 5.5% 1/1/2055 (g) | | 900,000 | 887,590 |
| Uniform Mortgage Backed Securities 7% 1/1/2055 (g) | | 1,325,000 | 1,373,445 |
TOTAL UNITED STATES | | | 245,888,218 |
| TOTAL U.S. GOVERNMENT AGENCY - MORTGAGE SECURITIES (Cost $274,701,202) | | | 245,888,218 |
| | | | |
| U.S. Government Agency Obligations - 0.4% |
| | | Principal Amount (a) | Value ($) |
| UNITED STATES - 0.4% | | | |
| Financials - 0.3% | | | |
| Financial Services - 0.3% | | | |
| Fannie Mae 0.875% 8/5/2030 | | 339,000 | 279,915 |
| Fannie Mae 1.875% 9/24/2026 | | 60,000 | 57,664 |
| Fannie Mae 5.625% 7/15/2037 | | 100,000 | 107,064 |
| Federal Farm Credit Banks Funding Corp 1.4% 3/10/2028 | | 900,000 | 816,858 |
| Federal Home Loan Bank 0.375% 9/4/2025 | | 160,000 | 155,821 |
| Federal Home Loan Bank 0.79% 2/25/2026 | | 750,000 | 720,760 |
| Federal Home Loan Bank 4.75% 3/10/2034 | | 130,000 | 129,758 |
| Federal Home Loan Bank 5.5% 7/15/2036 | | 150,000 | 159,548 |
| Freddie Mac Non Gold Pool 0% 11/15/2038 (e) | | 210,000 | 104,387 |
| Freddie Mac Non Gold Pool 6.25% 7/15/2032 | | 360,000 | 398,980 |
| | | | 2,930,755 |
| Utilities - 0.1% | | | |
| Independent Power and Renewable Electricity Producers - 0.1% | | | |
| Tennessee Valley Authority 0.75% 5/15/2025 | | 600,000 | 592,233 |
| Tennessee Valley Authority 2.875% 2/1/2027 | | 130,000 | 126,320 |
| Tennessee Valley Authority 4.25% 9/15/2065 | | 30,000 | 24,434 |
| Tennessee Valley Authority 4.375% 8/1/2034 | | 108,000 | 104,354 |
| Tennessee Valley Authority 5.25% 9/15/2039 | | 200,000 | 203,921 |
| Tennessee Valley Authority 5.88% 4/1/2036 | | 260,000 | 281,702 |
| | | | 1,332,964 |
| TOTAL UNITED STATES | | | 4,263,719 |
| TOTAL U.S. GOVERNMENT AGENCY OBLIGATIONS (Cost $4,511,882) | | | 4,263,719 |
| | | | |
| U.S. Treasury Obligations - 44.9% |
| | | Yield (%) (h) | Principal Amount (a) | Value ($) |
| US Treasury Bonds 1.125% 5/15/2040 | | 2.08 | 1,031,000 | 620,075 |
| US Treasury Bonds 1.125% 8/15/2040 | | 1.88 | 331,000 | 197,364 |
| US Treasury Bonds 1.25% 5/15/2050 | | 1.46 | 2,000 | 947 |
| US Treasury Bonds 1.375% 11/15/2040 | | 1.47 to 1.65 | 4,440,000 | 2,748,076 |
| US Treasury Bonds 1.375% 8/15/2050 | | 1.53 to 2.30 | 2,725,000 | 1,328,765 |
| US Treasury Bonds 1.625% 11/15/2050 | | 1.64 to 1.84 | 4,208,000 | 2,194,072 |
| US Treasury Bonds 1.75% 8/15/2041 | | 1.85 to 3.50 | 3,170,000 | 2,052,680 |
| US Treasury Bonds 1.875% 11/15/2051 | | 1.79 to 3.21 | 3,115,000 | 1,718,053 |
| US Treasury Bonds 1.875% 2/15/2041 | | 2.13 to 2.33 | 4,015,000 | 2,689,692 |
| US Treasury Bonds 1.875% 2/15/2051 | | 2.40 to 2.42 | 1,514,000 | 841,917 |
| US Treasury Bonds 2% 11/15/2041 | | 1.92 to 3.43 | 1,418,000 | 952,073 |
| US Treasury Bonds 2% 8/15/2051 | | 1.92 to 1.96 | 1,564,000 | 893,685 |
| US Treasury Bonds 2.25% 2/15/2052 | | 2.17 to 2.95 | 1,201,000 | 728,095 |
| US Treasury Bonds 2.25% 5/15/2041 | | 3.02 | 280,000 | 198,700 |
| US Treasury Bonds 2.25% 8/15/2046 | | 2.92 to 3.01 | 110,000 | 71,012 |
| US Treasury Bonds 2.25% 8/15/2049 | | 2.20 | 129,000 | 79,869 |
| US Treasury Bonds 2.375% 2/15/2042 | | 3.10 to 3.15 | 780,000 | 555,324 |
| US Treasury Bonds 2.375% 5/15/2051 | | 1.90 to 3.07 | 2,575,000 | 1,619,199 |
| US Treasury Bonds 2.5% 2/15/2045 | | 2.34 to 3.37 | 18,000 | 12,489 |
| US Treasury Bonds 2.5% 2/15/2046 | | 2.25 to 3.04 | 112,000 | 76,590 |
| US Treasury Bonds 2.5% 5/15/2046 | | 2.21 to 2.94 | 93,000 | 63,327 |
| US Treasury Bonds 2.75% 11/15/2042 | | 3.00 to 3.39 | 587,000 | 438,690 |
| US Treasury Bonds 2.75% 11/15/2047 | | 3.11 to 3.19 | 107,000 | 75,080 |
| US Treasury Bonds 2.75% 8/15/2042 | | 2.06 to 3.08 | 197,000 | 148,003 |
| US Treasury Bonds 2.75% 8/15/2047 | | 2.90 | 51,000 | 35,866 |
| US Treasury Bonds 2.875% 5/15/2043 | | 2.26 | 20,000 | 15,148 |
| US Treasury Bonds 2.875% 5/15/2049 | | 2.58 | 1,000 | 708 |
| US Treasury Bonds 2.875% 5/15/2052 | | 3.01 to 3.16 | 1,170,000 | 818,218 |
| US Treasury Bonds 2.875% 8/15/2045 | | 2.33 to 3.19 | 156,000 | 115,061 |
| US Treasury Bonds 3% 11/15/2044 | | 2.96 to 3.09 | 299,000 | 226,923 |
| US Treasury Bonds 3% 2/15/2047 | | 3.02 | 49,000 | 36,309 |
| US Treasury Bonds 3% 2/15/2048 | | 1.96 to 3.05 | 87,000 | 63,819 |
| US Treasury Bonds 3% 2/15/2049 | | 2.86 to 3.09 | 134,000 | 97,491 |
| US Treasury Bonds 3% 5/15/2042 | | 3.05 | 89,000 | 69,849 |
| US Treasury Bonds 3% 5/15/2045 | | 3.33 | 4,000 | 3,022 |
| US Treasury Bonds 3% 5/15/2047 | | 2.22 to 3.22 | 48,000 | 35,472 |
| US Treasury Bonds 3% 8/15/2048 | | 3.43 | 3,000 | 2,190 |
| US Treasury Bonds 3% 8/15/2052 | | 3.29 to 4.40 | 4,160,000 | 2,984,660 |
| US Treasury Bonds 3.125% 11/15/2041 | | 2.27 to 3.00 | 113,000 | 90,930 |
| US Treasury Bonds 3.125% 2/15/2042 | | 2.95 to 3.03 | 65,000 | 52,147 |
| US Treasury Bonds 3.125% 2/15/2043 | | 2.52 to 3.10 | 838,000 | 661,962 |
| US Treasury Bonds 3.125% 5/15/2048 | | 2.62 to 3.05 | 29,000 | 21,723 |
| US Treasury Bonds 3.125% 8/15/2044 | | 3.02 to 3.31 | 167,000 | 129,696 |
| US Treasury Bonds 3.25% 5/15/2042 | | 3.28 to 4.49 | 400,000 | 325,356 |
| US Treasury Bonds 3.375% 11/15/2048 | | 2.31 to 2.99 | 157,000 | 122,621 |
| US Treasury Bonds 3.375% 5/15/2044 | | 2.25 to 3.13 | 886,000 | 718,074 |
| US Treasury Bonds 3.375% 8/15/2042 | | 3.46 to 4.62 | 5,620,000 | 4,639,041 |
| US Treasury Bonds 3.5% 2/15/2039 | | 3.31 | 8,000 | 7,012 |
| US Treasury Bonds 3.625% 2/15/2044 | | 2.23 to 3.24 | 2,427,000 | 2,047,819 |
| US Treasury Bonds 3.625% 2/15/2053 | | 3.63 to 4.17 | 600,000 | 487,494 |
| US Treasury Bonds 3.625% 5/15/2053 | | 3.83 to 4.28 | 2,520,000 | 2,048,514 |
| US Treasury Bonds 3.75% 11/15/2043 | | 2.97 to 3.20 | 1,120,000 | 964,385 |
| US Treasury Bonds 3.75% 8/15/2041 | | 3.39 | 45,000 | 39,586 |
| US Treasury Bonds 3.875% 2/15/2043 | | 3.75 to 4.59 | 2,990,000 | 2,638,160 |
| US Treasury Bonds 3.875% 5/15/2043 | | 4.01 to 4.36 | 1,750,000 | 1,541,330 |
| US Treasury Bonds 3.875% 8/15/2040 | | 3.17 | 52,000 | 46,793 |
| US Treasury Bonds 4% 11/15/2042 | | 3.69 to 4.13 | 3,480,000 | 3,131,219 |
| US Treasury Bonds 4% 11/15/2052 | | 3.63 to 3.97 | 4,160,000 | 3,623,812 |
| US Treasury Bonds 4.125% 8/15/2044 | | 4.05 to 4.65 | 7,900,000 | 7,149,261 |
| US Treasury Bonds 4.125% 8/15/2053 | | 4.20 to 5.03 | 1,260,000 | 1,122,211 |
| US Treasury Bonds 4.25% 2/15/2054 | | 4.34 to 4.78 | 6,841,000 | 6,240,704 |
| US Treasury Bonds 4.25% 8/15/2054 | | 4.10 to 4.51 | 5,620,000 | 5,132,189 |
| US Treasury Bonds 4.375% 11/15/2039 | | 3.16 | 24,000 | 23,002 |
| US Treasury Bonds 4.375% 2/15/2038 | | 3.00 | 12,000 | 11,671 |
| US Treasury Bonds 4.375% 5/15/2041 | | 2.80 | 32,000 | 30,473 |
| US Treasury Bonds 4.375% 8/15/2043 | | 4.48 to 5.26 | 2,070,000 | 1,947,709 |
| US Treasury Bonds 4.5% 11/15/2054 | | 4.37 to 4.78 | 2,466,000 | 2,351,153 |
| US Treasury Bonds 4.5% 2/15/2044 | | 4.48 to 4.90 | 2,160,000 | 2,061,654 |
| US Treasury Bonds 4.5% 5/15/2038 | | 2.97 to 2.99 | 92,000 | 90,532 |
| US Treasury Bonds 4.5% 8/15/2039 | | 2.90 | 17,000 | 16,547 |
| US Treasury Bonds 4.625% 11/15/2044 | | 4.47 to 4.86 | 2,300,000 | 2,230,103 |
| US Treasury Bonds 4.625% 5/15/2044 | | 4.18 to 4.71 | 4,470,000 | 4,333,475 |
| US Treasury Bonds 4.625% 5/15/2054 | | 4.34 to 4.63 | 4,420,000 | 4,294,462 |
| US Treasury Bonds 4.75% 11/15/2043 | | 4.20 to 4.69 | 5,080,000 | 5,015,870 |
| US Treasury Bonds 4.75% 2/15/2041 | | 3.05 | 48,000 | 47,774 |
| US Treasury Bonds 5.5% 8/15/2028 | | 2.92 | 4,000 | 4,167 |
| US Treasury Notes 0.25% 5/31/2025 | | 0.28 to 0.52 | 224,000 | 220,365 |
| US Treasury Notes 0.25% 7/31/2025 | | 0.29 | 45,000 | 43,976 |
| US Treasury Notes 0.375% 7/31/2027 | | 0.48 to 0.49 | 509,000 | 460,994 |
| US Treasury Notes 0.375% 9/30/2027 | | 0.60 | 1,151,000 | 1,035,753 |
| US Treasury Notes 0.5% 10/31/2027 | | 1.05 | 3,232,000 | 2,909,156 |
| US Treasury Notes 0.5% 2/28/2026 | | 0.76 | 1,948,000 | 1,866,319 |
| US Treasury Notes 0.5% 4/30/2027 | | 0.53 | 718,000 | 658,606 |
| US Treasury Notes 0.5% 5/31/2027 | | 0.52 to 0.53 | 1,393,000 | 1,273,692 |
| US Treasury Notes 0.5% 6/30/2027 | | 0.41 to 0.47 | 2,827,000 | 2,577,484 |
| US Treasury Notes 0.625% 11/30/2027 | | 0.63 to 0.66 | 1,680,000 | 1,513,109 |
| US Treasury Notes 0.625% 12/31/2027 | | 0.66 to 0.74 | 3,820,000 | 3,430,388 |
| US Treasury Notes 0.625% 3/31/2027 | | 0.52 to 0.53 | 1,460,000 | 1,347,948 |
| US Treasury Notes 0.625% 5/15/2030 | | 0.81 to 1.39 | 2,549,000 | 2,091,546 |
| US Treasury Notes 0.625% 7/31/2026 | | 0.82 to 0.96 | 5,694,000 | 5,381,095 |
| US Treasury Notes 0.625% 8/15/2030 | | 1.71 | 360,000 | 292,354 |
| US Treasury Notes 0.75% 1/31/2028 | | 0.93 | 98,000 | 88,055 |
| US Treasury Notes 0.75% 3/31/2026 | | 0.85 | 2,331,000 | 2,232,723 |
| US Treasury Notes 0.75% 4/30/2026 | | 1.11 | 961,000 | 917,897 |
| US Treasury Notes 0.75% 5/31/2026 | | 0.74 | 1,269,000 | 1,208,619 |
| US Treasury Notes 1% 7/31/2028 | | 1.13 to 1.34 | 1,229,000 | 1,094,104 |
| US Treasury Notes 1.125% 2/28/2027 | | 0.54 to 0.75 | 691,000 | 646,846 |
| US Treasury Notes 1.125% 2/29/2028 | | 1.28 | 624,000 | 566,013 |
| US Treasury Notes 1.125% 8/31/2028 | | 1.39 | 110,000 | 98,111 |
| US Treasury Notes 1.25% 11/30/2026 | | 3.75 | 545,000 | 515,256 |
| US Treasury Notes 1.25% 12/31/2026 | | 2.48 to 2.49 | 2,240,000 | 2,112,690 |
| US Treasury Notes 1.25% 3/31/2028 | | 1.17 to 1.34 | 2,218,000 | 2,014,402 |
| US Treasury Notes 1.25% 4/30/2028 | | 1.24 | 2,488,000 | 2,253,983 |
| US Treasury Notes 1.25% 8/15/2031 | | 1.54 to 3.02 | 6,574,000 | 5,364,925 |
| US Treasury Notes 1.25% 9/30/2028 | | 1.43 | 748,000 | 668,500 |
| US Treasury Notes 1.375% 10/31/2028 | | 1.42 to 1.45 | 580,000 | 519,489 |
| US Treasury Notes 1.375% 8/31/2026 | | 1.72 | 253,000 | 241,441 |
| US Treasury Notes 1.5% 1/31/2027 | | 0.69 to 1.74 | 5,287,000 | 4,999,957 |
| US Treasury Notes 1.5% 11/30/2028 | | 1.39 to 1.75 | 1,091,000 | 979,861 |
| US Treasury Notes 1.5% 2/15/2030 | | 0.76 to 1.66 | 876,000 | 760,644 |
| US Treasury Notes 1.5% 8/15/2026 | | 2.59 to 2.95 | 557,000 | 533,203 |
| US Treasury Notes 1.625% 10/31/2026 | | 1.86 | 457,000 | 436,126 |
| US Treasury Notes 1.625% 11/30/2026 | | 1.76 to 1.84 | 180,000 | 171,400 |
| US Treasury Notes 1.625% 2/15/2026 | | 2.79 to 2.87 | 261,000 | 253,542 |
| US Treasury Notes 1.625% 5/15/2026 | | 2.93 to 3.03 | 264,000 | 254,810 |
| US Treasury Notes 1.625% 8/15/2029 | | 0.94 to 1.92 | 66,000 | 58,578 |
| US Treasury Notes 1.625% 9/30/2026 | | 1.69 to 1.85 | 653,000 | 624,470 |
| US Treasury Notes 1.75% 1/31/2029 | | 1.82 | 81,000 | 73,144 |
| US Treasury Notes 1.875% 2/28/2029 | | 1.75 | 230,000 | 208,313 |
| US Treasury Notes 1.875% 6/30/2026 | | 1.61 to 1.88 | 589,000 | 569,008 |
| US Treasury Notes 1.875% 7/31/2026 | | 1.48 to 1.61 | 909,000 | 876,411 |
| US Treasury Notes 2% 11/15/2026 | | 3.19 | 25,000 | 23,994 |
| US Treasury Notes 2% 2/15/2025 | | 2.88 | 82,000 | 81,766 |
| US Treasury Notes 2% 8/15/2025 | | 2.83 | 50,000 | 49,306 |
| US Treasury Notes 2.125% 5/15/2025 | | 2.86 | 13,000 | 12,898 |
| US Treasury Notes 2.25% 11/15/2027 | | 1.54 to 2.95 | 682,000 | 644,808 |
| US Treasury Notes 2.25% 2/15/2027 | | 2.55 to 3.08 | 393,000 | 377,145 |
| US Treasury Notes 2.25% 8/15/2027 | | 1.47 to 3.22 | 639,000 | 607,392 |
| US Treasury Notes 2.375% 4/30/2026 | | 1.89 to 2.35 | 405,000 | 395,188 |
| US Treasury Notes 2.375% 5/15/2027 | | 2.84 to 2.91 | 46,000 | 44,053 |
| US Treasury Notes 2.5% 2/28/2026 | | 2.44 | 191,000 | 187,251 |
| US Treasury Notes 2.5% 3/31/2027 | | 2.68 to 3.06 | 2,220,000 | 2,137,644 |
| US Treasury Notes 2.625% 1/31/2026 | | 2.49 to 2.59 | 461,000 | 453,193 |
| US Treasury Notes 2.625% 2/15/2029 | | 1.55 to 2.56 | 391,000 | 365,558 |
| US Treasury Notes 2.625% 5/31/2027 | | 2.84 | 2,770,000 | 2,666,611 |
| US Treasury Notes 2.625% 7/31/2029 | | 2.92 | 4,810,000 | 4,462,429 |
| US Treasury Notes 2.75% 2/15/2028 | | 2.36 to 2.86 | 363,000 | 346,610 |
| US Treasury Notes 2.75% 4/30/2027 | | 2.93 | 2,550,000 | 2,465,273 |
| US Treasury Notes 2.75% 5/31/2029 | | 2.88 | 530,000 | 495,533 |
| US Treasury Notes 2.75% 6/30/2025 | | 2.93 | 113,000 | 112,190 |
| US Treasury Notes 2.75% 7/31/2027 | | 2.65 to 3.18 | 2,460,000 | 2,369,160 |
| US Treasury Notes 2.75% 8/15/2032 | | 3.18 to 4.25 | 7,776,000 | 6,895,984 |
| US Treasury Notes 2.875% 5/15/2028 | | 2.20 to 2.68 | 216,000 | 206,324 |
| US Treasury Notes 2.875% 5/15/2032 | | 2.98 | 120,000 | 107,772 |
| US Treasury Notes 2.875% 5/31/2025 | | 2.61 | 144,000 | 143,166 |
| US Treasury Notes 2.875% 8/15/2028 | | 2.75 to 3.24 | 113,000 | 107,492 |
| US Treasury Notes 3% 10/31/2025 | | 2.67 | 130,000 | 128,680 |
| US Treasury Notes 3% 9/30/2025 | | 2.76 | 148,000 | 146,652 |
| US Treasury Notes 3.125% 11/15/2028 | | 1.54 to 2.89 | 940,000 | 899,473 |
| US Treasury Notes 3.125% 8/31/2027 | | 3.33 to 4.09 | 1,900,000 | 1,845,284 |
| US Treasury Notes 3.125% 8/31/2029 | | 3.97 | 820,000 | 776,699 |
| US Treasury Notes 3.25% 6/30/2027 | | 3.04 | 70,000 | 68,358 |
| US Treasury Notes 3.25% 6/30/2029 | | 2.70 | 100,000 | 95,423 |
| US Treasury Notes 3.375% 5/15/2033 | | 3.62 to 3.96 | 3,460,000 | 3,179,662 |
| US Treasury Notes 3.375% 9/15/2027 | | 3.44 to 3.56 | 3,590,000 | 3,508,219 |
| US Treasury Notes 3.5% 1/31/2028 | | 3.60 to 4.20 | 2,820,000 | 2,755,357 |
| US Treasury Notes 3.5% 1/31/2030 | | 3.56 to 4.07 | 2,340,000 | 2,244,942 |
| US Treasury Notes 3.5% 2/15/2033 | | 4.08 | 180,000 | 167,453 |
| US Treasury Notes 3.5% 4/30/2028 | | 3.51 to 4.02 | 4,620,000 | 4,503,977 |
| US Treasury Notes 3.5% 4/30/2030 | | 3.88 | 660,000 | 631,588 |
| US Treasury Notes 3.5% 9/30/2026 | | 3.65 to 4.08 | 7,270,000 | 7,178,427 |
| US Treasury Notes 3.5% 9/30/2029 | | 3.57 | 2,150,000 | 2,068,717 |
| US Treasury Notes 3.625% 3/31/2028 | | 3.62 to 3.77 | 1,770,000 | 1,733,578 |
| US Treasury Notes 3.625% 3/31/2030 | | 3.45 to 3.74 | 3,450,000 | 3,324,939 |
| US Treasury Notes 3.625% 9/30/2031 | | 3.64 to 4.14 | 1,760,000 | 1,672,459 |
| US Treasury Notes 3.75% 12/31/2028 | | 3.84 to 3.98 | 1,670,000 | 1,632,511 |
| US Treasury Notes 3.75% 12/31/2030 | | 4.09 to 4.11 | 1,360,000 | 1,310,312 |
| US Treasury Notes 3.75% 5/31/2030 | | 3.70 to 3.98 | 2,570,000 | 2,487,475 |
| US Treasury Notes 3.75% 6/30/2030 | | 4.30 to 4.39 | 1,600,000 | 1,547,808 |
| US Treasury Notes 3.75% 8/15/2027 | | 3.73 | 4,490,000 | 4,432,955 |
| US Treasury Notes 3.75% 8/31/2026 | | 3.59 | 1,840,000 | 1,825,437 |
| US Treasury Notes 3.75% 8/31/2031 | | 3.61 to 3.65 | 2,040,000 | 1,954,479 |
| US Treasury Notes 3.875% 10/15/2027 | | 4.03 to 4.16 | 6,030,000 | 5,966,623 |
| US Treasury Notes 3.875% 11/30/2027 | | 3.77 to 4.01 | 1,840,000 | 1,819,233 |
| US Treasury Notes 3.875% 11/30/2029 | | 3.57 to 3.99 | 2,450,000 | 2,394,983 |
| US Treasury Notes 3.875% 12/31/2027 | | 3.58 to 3.89 | 2,950,000 | 2,916,910 |
| US Treasury Notes 3.875% 8/15/2033 | | 4.20 to 4.88 | 1,590,000 | 1,513,234 |
| US Treasury Notes 3.875% 8/15/2034 | | 3.75 to 4.29 | 5,910,000 | 5,592,522 |
| US Treasury Notes 4% 1/15/2027 | | 4.01 | 1,440,000 | 1,432,920 |
| US Treasury Notes 4% 1/31/2029 | | 3.87 to 4.25 | 4,380,000 | 4,320,002 |
| US Treasury Notes 4% 1/31/2031 | | 3.91 to 4.34 | 3,980,000 | 3,883,083 |
| US Treasury Notes 4% 10/31/2029 | | 3.74 to 4.18 | 1,950,000 | 1,917,183 |
| US Treasury Notes 4% 12/15/2027 | | 4.22 to 4.28 | 5,410,000 | 5,368,992 |
| US Treasury Notes 4% 2/15/2026 | | 3.85 | 720,000 | 718,103 |
| US Treasury Notes 4% 2/15/2034 | | 4.22 to 4.69 | 1,060,000 | 1,014,801 |
| US Treasury Notes 4% 2/28/2030 | | 3.49 to 3.59 | 1,610,000 | 1,580,194 |
| US Treasury Notes 4% 2/29/2028 | | 3.51 to 3.59 | 3,120,000 | 3,091,630 |
| US Treasury Notes 4% 6/30/2028 | | 4.13 to 4.43 | 5,210,000 | 5,156,130 |
| US Treasury Notes 4% 7/31/2029 | | 3.62 | 1,930,000 | 1,900,195 |
| US Treasury Notes 4% 7/31/2030 | | 4.07 to 4.32 | 1,800,000 | 1,762,237 |
| US Treasury Notes 4.125% 10/31/2026 | | 4.16 | 2,450,000 | 2,444,423 |
| US Treasury Notes 4.125% 10/31/2027 | | 3.66 to 4.24 | 2,270,000 | 2,261,044 |
| US Treasury Notes 4.125% 10/31/2031 | | 4.13 to 4.34 | 5,850,000 | 5,726,045 |
| US Treasury Notes 4.125% 11/15/2027 | | 4.11 to 4.29 | 3,790,000 | 3,773,276 |
| US Treasury Notes 4.125% 11/15/2032 | | 3.62 to 3.95 | 2,940,000 | 2,867,437 |
| US Treasury Notes 4.125% 11/30/2029 | | 4.08 | 1,110,000 | 1,097,389 |
| US Treasury Notes 4.125% 11/30/2031 | | 4.32 | 730,000 | 714,414 |
| US Treasury Notes 4.125% 2/15/2027 | | 4.42 to 4.43 | 1,840,000 | 1,834,986 |
| US Treasury Notes 4.125% 6/15/2026 | | 4.50 to 4.53 | 2,680,000 | 2,675,395 |
| US Treasury Notes 4.125% 7/31/2028 | | 4.36 to 4.40 | 1,940,000 | 1,926,611 |
| US Treasury Notes 4.125% 7/31/2031 | | 3.70 to 3.96 | 7,100,000 | 6,961,193 |
| US Treasury Notes 4.125% 8/31/2030 | | 4.63 | 2,270,000 | 2,235,054 |
| US Treasury Notes 4.125% 9/30/2027 | | 4.00 to 4.37 | 4,180,000 | 4,163,493 |
| US Treasury Notes 4.25% 11/15/2034 | | 4.19 to 4.58 | 3,640,000 | 3,545,129 |
| US Treasury Notes 4.25% 11/30/2026 | | 4.17 | 1,750,000 | 1,749,652 |
| US Treasury Notes 4.25% 12/31/2026 | | 4.25 | 830,000 | 830,068 |
| US Treasury Notes 4.25% 2/28/2029 | | 4.20 to 4.24 | 1,820,000 | 1,811,493 |
| US Treasury Notes 4.25% 2/28/2031 | | 4.21 to 4.32 | 4,050,000 | 4,004,048 |
| US Treasury Notes 4.25% 3/15/2027 | | 4.37 to 4.40 | 1,280,000 | 1,279,666 |
| US Treasury Notes 4.25% 6/30/2029 | | 4.08 to 4.24 | 8,240,000 | 8,197,888 |
| US Treasury Notes 4.25% 6/30/2031 | | 4.11 to 4.16 | 7,480,000 | 7,385,940 |
| US Treasury Notes 4.375% 11/30/2028 | | 4.24 to 4.29 | 3,730,000 | 3,731,510 |
| US Treasury Notes 4.375% 11/30/2030 | | 3.81 to 4.36 | 2,370,000 | 2,361,372 |
| US Treasury Notes 4.375% 12/31/2029 | | 4.39 | 1,640,000 | 1,639,176 |
| US Treasury Notes 4.375% 12/31/2031 | | 4.49 | 1,830,000 | 1,831,523 |
| US Treasury Notes 4.375% 5/15/2034 | | 3.96 to 4.49 | 4,520,000 | 4,450,523 |
| US Treasury Notes 4.375% 7/15/2027 | | 3.71 to 4.24 | 12,670,000 | 12,705,686 |
| US Treasury Notes 4.375% 7/31/2026 | | 3.91 to 4.39 | 9,660,000 | 9,675,940 |
| US Treasury Notes 4.375% 8/15/2026 | | 4.66 | 720,000 | 721,331 |
| US Treasury Notes 4.5% 11/15/2033 | | 4.34 to 4.54 | 1,280,000 | 1,274,206 |
| US Treasury Notes 4.5% 4/15/2027 | | 4.87 | 440,000 | 442,207 |
| US Treasury Notes 4.5% 5/15/2027 | | 4.62 to 4.73 | 4,550,000 | 4,572,663 |
| US Treasury Notes 4.5% 5/31/2029 | | 4.49 | 1,280,000 | 1,286,116 |
| US Treasury Notes 4.5% 7/15/2026 | | 4.66 to 4.72 | 2,090,000 | 2,097,524 |
| US Treasury Notes 4.625% 11/15/2026 | | 4.42 to 4.47 | 2,850,000 | 2,868,572 |
| US Treasury Notes 4.625% 2/28/2026 | | 4.61 | 2,720,000 | 2,731,006 |
| US Treasury Notes 4.625% 4/30/2031 | | 4.51 to 4.70 | 2,500,000 | 2,521,128 |
| US Treasury Notes 4.625% 5/31/2031 | | 4.37 to 4.49 | 2,450,000 | 2,470,119 |
| US Treasury Notes 4.625% 6/30/2026 | | 4.42 to 4.73 | 9,360,000 | 9,410,125 |
| US Treasury Notes 4.625% 9/15/2026 | | 4.79 | 2,240,000 | 2,253,342 |
| US Treasury Notes 4.625% 9/30/2028 | | 4.60 | 3,190,000 | 3,219,828 |
| US Treasury Notes 4.875% 10/31/2028 | | 4.82 | 860,000 | 875,466 |
| US Treasury Notes 4.875% 10/31/2030 | | 4.89 | 990,000 | 1,011,845 |
| US Treasury Notes 4.875% 4/30/2026 | | 4.95 to 5.03 | 8,790,000 | 8,858,269 |
| US Treasury Notes 4.875% 5/31/2026 | | 4.83 to 4.86 | 7,660,000 | 7,723,421 |
| TOTAL U.S. TREASURY OBLIGATIONS (Cost $463,172,496) | | | | 435,140,571 |
| | | | | |
| Money Market Funds - 1.7% |
| | | Yield (%) | Shares | Value ($) |
| Fidelity Cash Central Fund (i) | | 4.36 | 11,105,980 | 11,108,201 |
| Fidelity Securities Lending Cash Central Fund (i)(j) | | 4.35 | 5,580,159 | 5,580,718 |
| TOTAL MONEY MARKET FUNDS (Cost $16,688,919) | | | | 16,688,919 |
| | | | | |
| TOTAL INVESTMENT IN SECURITIES - 103.0% (Cost $1,088,996,595) | 999,756,210 |
NET OTHER ASSETS (LIABILITIES) - (3.0)% | (30,248,184) |
| NET ASSETS - 100.0% | 969,508,026 |
| | |
| TBA Sale Commitments |
| | Principal Amount (a) | Value ($) |
| U.S. Government Agency - Mortgage Securities | | |
| Ginnie Mae II Pool 6% 1/1/2055 | (2,850,000) | (2,867,590) |
| Ginnie Mae II Pool 6.5% 1/1/2055 | (550,000) | (559,152) |
| Uniform Mortgage Backed Securities 2% 1/1/2055 | (150,000) | (116,531) |
| Uniform Mortgage Backed Securities 3.5% 1/1/2055 | (100,000) | (88,359) |
| Uniform Mortgage Backed Securities 4% 1/1/2055 | (100,000) | (91,312) |
| Uniform Mortgage Backed Securities 4.5% 1/1/2055 | (325,000) | (305,449) |
| Uniform Mortgage Backed Securities 5% 1/1/2055 | (1,225,000) | (1,181,407) |
| Uniform Mortgage Backed Securities 5.5% 1/1/2055 | (400,000) | (394,484) |
| | | |
| TOTAL U.S. GOVERNMENT AGENCY - MORTGAGE SECURITIES | | (5,604,284) |
| | | |
TOTAL TBA SALE COMMITMENTS (Proceeds $5,619,889) | | (5,604,284) |
Legend
| (a) | Amount is stated in United States dollars unless otherwise noted. |
| (b) | Coupon rates for floating and adjustable rate securities reflect the rates in effect at period end. |
| (c) | Security exempt from registration under Rule 144A of the Securities Act of 1933. These securities may be resold in transactions exempt from registration, normally to qualified institutional buyers. At the end of the period, the value of these securities amounted to $1,662,213 or 0.2% of net assets. |
| (d) | Security or a portion of the security is on loan at period end. |
| (e) | Security initially issued in zero coupon form which converts to coupon form at a specified rate and date. The rate shown is the rate at period end. |
| (f) | Security initially issued at one coupon which converts to a higher coupon at a specified date. The rate shown is the rate at period end. |
| (g) | Security or a portion of the security purchased on a delayed delivery or when-issued basis. |
| (h) | Yield represents either the annualized yield at the date of purchase, or the stated coupon rate, or, for floating and adjustable rate securities, the rate at period end. |
| (i) | Affiliated fund that is generally available only to investment companies and other accounts managed by Fidelity Investments. The rate quoted is the annualized seven-day yield of the fund at period end. A complete unaudited listing of the fund's holdings as of its most recent quarter end is available upon request. In addition, each Fidelity Central Fund's financial statements, which are not covered by the Fund's Report of Independent Registered Public Accounting Firm, are available on the SEC's website or upon request. |
| (j) | Investment made with cash collateral received from securities on loan. |
Affiliated Central Funds
Fiscal year to date information regarding the Fund's investments in Fidelity Central Funds, including the ownership percentage, is presented below.
| Affiliate | Value, beginning of period ($) | Purchases ($) | Sales Proceeds ($) | Dividend Income ($) | Realized Gain (loss) ($) | Change in Unrealized appreciation (depreciation) ($) | Value, end of period ($) | Shares, end of period | % ownership, end of period |
| Fidelity Cash Central Fund | 2,187,186 | 249,437,349 | 240,516,166 | 311,878 | (168) | - | 11,108,201 | 11,105,980 | 0.0% |
| Fidelity Securities Lending Cash Central Fund | - | 14,362,028 | 8,781,310 | 1,365 | - | - | 5,580,718 | 5,580,159 | 0.0% |
| Total | 2,187,186 | 263,799,377 | 249,297,476 | 313,243 | (168) | - | 16,688,919 | 16,686,139 | |
| | | | | | | | | | |
Amounts in the dividend income column in the above table include any capital gain distributions from underlying funds, which are presented in the corresponding line item in the Statement of Operations, if applicable.
Amounts in the dividend income column for Fidelity Securities Lending Cash Central Fund represents the income earned on investing cash collateral, less rebates paid to borrowers and any lending agent fees associated with the loan, plus any premium payments received for lending certain types of securities.
Amounts included in the purchases and sales proceeds columns may include in-kind transactions, if applicable.
Investment Valuation
The following is a summary of the inputs used, as of December 31, 2024, involving the Fund's assets and liabilities carried at fair value. The inputs or methodology used for valuing securities may not be an indication of the risk associated with investing in those securities. For more information on valuation inputs, and their aggregation into the levels used below, please refer to the Investment Valuation section in the accompanying Notes to Financial Statements.
| Valuation Inputs at Reporting Date: |
| Description | Total ($) | Level 1 ($) | Level 2 ($) | Level 3 ($) |
Investments in Securities: | | | | |
|
| Asset-Backed Securities | 2,993,494 | - | 2,993,494 | - |
|
| Bank Notes | | | | |
Financials | 2,153,928 | - | 2,153,928 | - |
|
| Commercial Mortgage Securities | 11,183,750 | - | 11,183,750 | - |
|
| Foreign Government and Government Agency Obligations | 14,224,662 | - | 14,224,662 | - |
|
| Municipal Securities | | | | |
Education | 276,024 | - | 276,024 | - |
Electric Utilities | 95,962 | - | 95,962 | - |
General Obligations | 1,328,803 | - | 1,328,803 | - |
Health Care | 211,120 | - | 211,120 | - |
Special Tax | 372,124 | - | 372,124 | - |
Transportation | 1,108,945 | - | 1,108,945 | - |
Water & Sewer | 178,727 | - | 178,727 | - |
|
| Non-Convertible Corporate Bonds | | | | |
Communication Services | 18,461,313 | - | 18,461,313 | - |
Consumer Discretionary | 15,396,144 | - | 15,396,144 | - |
Consumer Staples | 15,410,980 | - | 15,410,980 | - |
Energy | 16,690,095 | - | 16,690,095 | - |
Financials | 95,903,433 | - | 95,903,433 | - |
Health Care | 27,708,061 | - | 27,708,061 | - |
Industrials | 16,484,766 | - | 16,484,766 | - |
Information Technology | 18,604,186 | - | 18,604,186 | - |
Materials | 7,492,932 | - | 7,492,932 | - |
Real Estate | 9,623,986 | - | 9,623,986 | - |
Utilities | 21,871,348 | - | 21,871,348 | - |
|
| U.S. Government Agency - Mortgage Securities | 245,888,218 | - | 245,888,218 | - |
|
| U.S. Government Agency Obligations | | | | |
Financials | 2,930,755 | - | 2,930,755 | - |
Utilities | 1,332,964 | - | 1,332,964 | - |
|
| U.S. Treasury Obligations | 435,140,571 | - | 435,140,571 | - |
|
| Money Market Funds | 16,688,919 | 16,688,919 | - | - |
| Total Investments in Securities: | 999,756,210 | 16,688,919 | 983,067,291 | - |
Other Financial Instruments: | | | | |
| TBA Sale Commitments | (5,604,284) | - | (5,604,284) | - |
| Total Other Financial Instruments: | (5,604,284) | - | (5,604,284) | - |
Financial Statements
| Statement of Assets and Liabilities |
As of December 31, 2024 |
| Assets | | | | |
| Investment in securities, at value (including securities loaned of $5,404,577) - See accompanying schedule: | | | | |
Unaffiliated issuers (cost $1,072,307,676) | $ | 983,067,291 | | |
Fidelity Central Funds (cost $16,688,919) | | 16,688,919 | | |
| | | | | |
| | | | | |
| Total Investment in Securities (cost $1,088,996,595) | | | $ | 999,756,210 |
| Cash | | | | 175,990 |
| Foreign currency held at value (cost $86) | | | | 82 |
| Receivable for investments sold | | | | 3,518,013 |
| Receivable for TBA sale commitments | | | | 5,619,889 |
| Receivable for fund shares sold | | | | 349,629 |
| Interest receivable | | | | 7,652,303 |
| Distributions receivable from Fidelity Central Funds | | | | 23,936 |
Total assets | | | | 1,017,096,052 |
| Liabilities | | | | |
| Payable for investments purchased | | | | |
Regular delivery | $ | 9,929,784 | | |
Delayed delivery | | 25,914,224 | | |
| TBA sale commitments, at value | | 5,604,284 | | |
| Payable for fund shares redeemed | | 380,164 | | |
| Accrued management fee | | 72,840 | | |
| Distribution and service plan fees payable | | 65,546 | | |
| Other affiliated payables | | 40,466 | | |
| Collateral on securities loaned | | 5,580,718 | | |
| Total liabilities | | | | 47,588,026 |
| Net Assets | | | $ | 969,508,026 |
| Net Assets consist of: | | | | |
| Paid in capital | | | $ | 1,075,465,497 |
| Total accumulated earnings (loss) | | | | (105,957,471) |
| Net Assets | | | $ | 969,508,026 |
| | | | | |
| Net Asset Value and Maximum Offering Price | | | | |
| Initial Class : | | | | |
Net Asset Value, offering price and redemption price per share ($645,582,496 ÷ 67,918,820 shares) | | | $ | 9.51 |
| Service Class : | | | | |
Net Asset Value, offering price and redemption price per share ($12,218,359 ÷ 1,285,616 shares) | | | $ | 9.50 |
| Service Class 2 : | | | | |
Net Asset Value, offering price and redemption price per share ($311,707,171 ÷ 32,919,604 shares) | | | $ | 9.47 |
| Statement of Operations |
| Year ended December 31, 2024 |
| Investment Income | | | | |
| Interest | | | $ | 30,998,331 |
| Income from Fidelity Central Funds (including $1,365 from security lending) | | | | 313,243 |
| Total income | | | | 31,311,574 |
| Expenses | | | | |
| Management fee | $ | 784,003 | | |
| Transfer agent fees | | 435,557 | | |
| Distribution and service plan fees | | 655,519 | | |
| Independent trustees' fees and expenses | | 2,205 | | |
| Miscellaneous | | 5,157 | | |
| Total expenses before reductions | | 1,882,441 | | |
| Expense reductions | | (9,634) | | |
| Total expenses after reductions | | | | 1,872,807 |
| Net Investment income (loss) | | | | 29,438,767 |
| Realized and Unrealized Gain (Loss) | | | | |
| Net realized gain (loss) on: | | | | |
| Investment Securities: | | | | |
| Unaffiliated issuers | | (5,854,088) | | |
| Fidelity Central Funds | | (168) | | |
| Total net realized gain (loss) | | | | (5,854,256) |
| Change in net unrealized appreciation (depreciation) on: | | | | |
| Investment Securities: | | | | |
| Unaffiliated issuers | | (14,483,040) | | |
| Assets and liabilities in foreign currencies | | (4) | | |
| TBA Sale commitments | | 20,264 | | |
| Total change in net unrealized appreciation (depreciation) | | | | (14,462,780) |
| Net gain (loss) | | | | (20,317,036) |
| Net increase (decrease) in net assets resulting from operations | | | $ | 9,121,731 |
| Statement of Changes in Net Assets |
| |
| | Year ended December 31, 2024 | | Year ended December 31, 2023 |
| Increase (Decrease) in Net Assets | | | | |
| Operations | | | | |
| Net investment income (loss) | $ | 29,438,767 | $ | 19,791,679 |
| Net realized gain (loss) | | (5,854,256) | | (6,898,786) |
| Change in net unrealized appreciation (depreciation) | | (14,462,780) | | 24,384,524 |
| Net increase (decrease) in net assets resulting from operations | | 9,121,731 | | 37,277,417 |
| Distributions to shareholders | | (26,463,803) | | (17,505,569) |
| | | | | |
| Share transactions - net increase (decrease) | | 208,450,192 | | 108,820,685 |
| Total increase (decrease) in net assets | | 191,108,120 | | 128,592,533 |
| | | | | |
| Net Assets | | | | |
| Beginning of period | | 778,399,906 | | 649,807,373 |
| End of period | $ | 969,508,026 | $ | 778,399,906 |
| | | | | |
| | | | | |
Financial Highlights
VIP Bond Index Portfolio Initial Class |
| |
| Years ended December 31, | | 2024 | | 2023 | | 2022 | | 2021 | | 2020 |
Selected Per-Share Data | | | | | | | | | | |
| Net asset value, beginning of period | $ | 9.67 | $ | 9.40 | $ | 11.02 | $ | 11.35 | $ | 10.68 |
| Income from Investment Operations | | | | | | | | | | |
Net investment income (loss) A,B | | .333 | | .274 | | .196 | | .132 | | .183 |
| Net realized and unrealized gain (loss) | | (.212) | | .233 | | (1.646) | | (.353) | | .621 |
| Total from investment operations | | .121 | | .507 | | (1.450) | | (.221) | | .804 |
| Distributions from net investment income | | (.281) | | (.237) | | (.170) | | (.109) | | (.104) |
| Distributions from net realized gain | | - | | - | | - | | - | | (.030) |
| Total distributions | | (.281) | | (.237) | | (.170) | | (.109) | | (.134) |
| Net asset value, end of period | $ | 9.51 | $ | 9.67 | $ | 9.40 | $ | 11.02 | $ | 11.35 |
Total Return C,D | | | | 5.47% | | (13.19)% | | (1.95)% | | 7.53% |
Ratios to Average Net Assets B,E,F | | | | | | | | | | |
| Expenses before reductions | | .14% | | .14% | | .14% | | .14% | | .14% |
| Expenses net of fee waivers, if any | | | | .14% | | .14% | | .14% | | .14% |
| Expenses net of all reductions | | .14% | | .14% | | .14% | | .14% | | .14% |
| Net investment income (loss) | | 3.45% | | 2.89% | | 1.97% | | 1.19% | | 1.63% |
| Supplemental Data | | | | | | | | | | |
| Net assets, end of period (000 omitted) | $ | 645,582 | $ | 558,733 | $ | 461,166 | $ | 513,626 | $ | 569,594 |
Portfolio turnover rate G | | | | 36% | | 33% | | 138% | | 101% |
ACalculated based on average shares outstanding during the period.
BNet investment income (loss) is affected by the timing of the declaration of dividends by any underlying mutual funds or exchange-traded funds (ETFs). Net investment income (loss) of any mutual funds or ETFs is not included in the Fund's net investment income (loss) ratio.
CTotal returns do not reflect charges attributable to your insurance company's separate account. Inclusion of these charges would reduce the total returns shown.
DTotal returns would have been lower if certain expenses had not been reduced during the applicable periods shown.
EFees and expenses of any underlying mutual funds or exchange-traded funds (ETFs) are not included in the Fund's expense ratio. The Fund indirectly bears its proportionate share of these expenses. For additional expense information related to investments in Fidelity Central Funds, please refer to the "Investments in Fidelity Central Funds" note found in the Notes to Financial Statements section of the most recent Annual or Semi-Annual report.
FExpense ratios reflect operating expenses of the class. Expenses before reductions do not reflect amounts reimbursed, waived, or reduced through arrangements with the investment adviser, brokerage services, or other offset arrangements, if applicable, and do not represent the amount paid by the class during periods when reimbursements, waivers or reductions occur.
GAmount does not include the portfolio activity of any underlying mutual funds or exchange-traded funds (ETFs), derivatives or securities that mature within one year from acquisition.
VIP Bond Index Portfolio Service Class |
| |
| Years ended December 31, | | 2024 | | 2023 | | 2022 | | 2021 | | 2020 |
Selected Per-Share Data | | | | | | | | | | |
| Net asset value, beginning of period | $ | 9.67 | $ | 9.41 | $ | 11.03 | $ | 11.37 | $ | 10.67 |
| Income from Investment Operations | | | | | | | | | | |
Net investment income (loss) A,B | | .324 | | .261 | | .185 | | .119 | | .171 |
| Net realized and unrealized gain (loss) | | (.224) | | .234 | | (1.645) | | (.352) | | .632 |
| Total from investment operations | | .100 | | .495 | | (1.460) | | (.233) | | .803 |
| Distributions from net investment income | | (.270) | | (.235) | | (.160) | | (.107) | | (.073) |
| Distributions from net realized gain | | - | | - | | - | | - | | (.030) |
| Total distributions | | (.270) | | (.235) | | (.160) | | (.107) | | (.103) |
| Net asset value, end of period | $ | 9.50 | $ | 9.67 | $ | 9.41 | $ | 11.03 | $ | 11.37 |
Total Return C,D | | | | 5.34% | | (13.27)% | | (2.05)% | | 7.53% |
Ratios to Average Net Assets B,E,F | | | | | | | | | | |
| Expenses before reductions | | .24% | | .24% | | .24% | | .24% | | .24% |
| Expenses net of fee waivers, if any | | | | .24% | | .24% | | .24% | | .24% |
| Expenses net of all reductions | | .24% | | .24% | | .24% | | .24% | | .24% |
| Net investment income (loss) | | 3.35% | | 2.79% | | 1.87% | | 1.09% | | 1.53% |
| Supplemental Data | | | | | | | | | | |
| Net assets, end of period (000 omitted) | $ | 12,218 | $ | 11,066 | $ | 3,144 | $ | 2,759 | $ | 550 |
Portfolio turnover rate G | | | | 36% | | 33% | | 138% | | 101% |
ACalculated based on average shares outstanding during the period.
BNet investment income (loss) is affected by the timing of the declaration of dividends by any underlying mutual funds or exchange-traded funds (ETFs). Net investment income (loss) of any mutual funds or ETFs is not included in the Fund's net investment income (loss) ratio.
CTotal returns do not reflect charges attributable to your insurance company's separate account. Inclusion of these charges would reduce the total returns shown.
DTotal returns would have been lower if certain expenses had not been reduced during the applicable periods shown.
EFees and expenses of any underlying mutual funds or exchange-traded funds (ETFs) are not included in the Fund's expense ratio. The Fund indirectly bears its proportionate share of these expenses. For additional expense information related to investments in Fidelity Central Funds, please refer to the "Investments in Fidelity Central Funds" note found in the Notes to Financial Statements section of the most recent Annual or Semi-Annual report.
FExpense ratios reflect operating expenses of the class. Expenses before reductions do not reflect amounts reimbursed, waived, or reduced through arrangements with the investment adviser, brokerage services, or other offset arrangements, if applicable, and do not represent the amount paid by the class during periods when reimbursements, waivers or reductions occur.
GAmount does not include the portfolio activity of any underlying mutual funds or exchange-traded funds (ETFs), derivatives or securities that mature within one year from acquisition.
VIP Bond Index Portfolio Service Class 2 |
| |
| Years ended December 31, | | 2024 | | 2023 | | 2022 | | 2021 | | 2020 |
Selected Per-Share Data | | | | | | | | | | |
| Net asset value, beginning of period | $ | 9.63 | $ | 9.37 | $ | 10.98 | $ | 11.32 | $ | 10.68 |
| Income from Investment Operations | | | | | | | | | | |
Net investment income (loss) A,B | | .308 | | .249 | | .170 | | .104 | | .161 |
| Net realized and unrealized gain (loss) | | (.208) | | .225 | | (1.636) | | (.357) | | .614 |
| Total from investment operations | | .100 | | .474 | | (1.466) | | (.253) | | .775 |
| Distributions from net investment income | | (.260) | | (.214) | | (.144) | | (.087) | | (.105) |
| Distributions from net realized gain | | - | | - | | - | | - | | (.030) |
| Total distributions | | (.260) | | (.214) | | (.144) | | (.087) | | (.135) |
| Net asset value, end of period | $ | 9.47 | $ | 9.63 | $ | 9.37 | $ | 10.98 | $ | 11.32 |
Total Return C,D | | | | 5.13% | | (13.38)% | | (2.24)% | | 7.26% |
Ratios to Average Net Assets B,E,F | | | | | | | | | | |
| Expenses before reductions | | .39% | | .39% | | .39% | | .39% | | .37% |
| Expenses net of fee waivers, if any | | | | .39% | | .39% | | .39% | | .37% |
| Expenses net of all reductions | | .39% | | .39% | | .39% | | .39% | | .37% |
| Net investment income (loss) | | 3.20% | | 2.64% | | 1.72% | | .94% | | 1.40% |
| Supplemental Data | | | | | | | | | | |
| Net assets, end of period (000 omitted) | $ | 311,707 | $ | 208,601 | $ | 185,497 | $ | 227,058 | $ | 215,977 |
Portfolio turnover rate G | | | | 36% | | 33% | | 138% | | 101% |
ACalculated based on average shares outstanding during the period.
BNet investment income (loss) is affected by the timing of the declaration of dividends by any underlying mutual funds or exchange-traded funds (ETFs). Net investment income (loss) of any mutual funds or ETFs is not included in the Fund's net investment income (loss) ratio.
CTotal returns do not reflect charges attributable to your insurance company's separate account. Inclusion of these charges would reduce the total returns shown.
DTotal returns would have been lower if certain expenses had not been reduced during the applicable periods shown.
EFees and expenses of any underlying mutual funds or exchange-traded funds (ETFs) are not included in the Fund's expense ratio. The Fund indirectly bears its proportionate share of these expenses. For additional expense information related to investments in Fidelity Central Funds, please refer to the "Investments in Fidelity Central Funds" note found in the Notes to Financial Statements section of the most recent Annual or Semi-Annual report.
FExpense ratios reflect operating expenses of the class. Expenses before reductions do not reflect amounts reimbursed, waived, or reduced through arrangements with the investment adviser, brokerage services, or other offset arrangements, if applicable, and do not represent the amount paid by the class during periods when reimbursements, waivers or reductions occur.
GAmount does not include the portfolio activity of any underlying mutual funds or exchange-traded funds (ETFs), derivatives or securities that mature within one year from acquisition.
Notes to Financial Statements
For the period ended December 31, 2024
1. Organization.
VIP Bond Index Portfolio (the Fund) is a fund of Variable Insurance Products Fund V (the Trust) and is authorized to issue an unlimited number of shares. The Trust is registered under the Investment Company Act of 1940, as amended (the 1940 Act), as an open-end management investment company organized as a Massachusetts business trust. Shares of the Fund may only be purchased by insurance companies for the purpose of funding variable annuity or variable life insurance contracts. The Fund offers the following classes of shares: Initial Class shares, Service Class shares and Service Class 2 shares. All classes have equal rights and voting privileges, except for matters affecting a single class.
2. Investments in Fidelity Central Funds.
Funds may invest in Fidelity Central Funds, which are open-end investment companies generally available only to other investment companies and accounts managed by the investment adviser and its affiliates. The Schedule of Investments lists any Fidelity Central Funds held as an investment as of period end, but does not include the underlying holdings of each Fidelity Central Fund. An investing fund indirectly bears its proportionate share of the expenses of the underlying Fidelity Central Funds.
Based on its investment objective, each Fidelity Central Fund may invest or participate in various investment vehicles or strategies that are similar to those of the investing fund. These strategies are consistent with the investment objectives of the investing fund and may involve certain economic risks which may cause a decline in value of each of the Fidelity Central Funds and thus a decline in the value of the investing fund.
| Fidelity Central Fund | Investment Manager | Investment Objective | Investment Practices | Expense RatioA |
| Fidelity Money Market Central Funds | Fidelity Management & Research Company LLC (FMR) | Each fund seeks to obtain a high level of current income consistent with the preservation of capital and liquidity. | Short-term Investments | Less than .005% |
A Expenses expressed as a percentage of average net assets and are as of each underlying Central Fund's most recent annual or semi-annual shareholder report.
A complete unaudited list of holdings for each Fidelity Central Fund is available upon request or at the Securities and Exchange Commission website at www.sec.gov. In addition, the financial statements of the Fidelity Central Funds which contain the significant accounting policies (including investment valuation policies) of those funds, and are not covered by the Report of Independent Registered Public Accounting Firm, are available on the Securities and Exchange Commission website or upon request.
3. Significant Accounting Policies.
The Fund is an investment company and applies the accounting and reporting guidance of the Financial Accounting Standards Board (FASB) Accounting Standards Codification Topic 946 Financial Services - Investment Companies. The financial statements have been prepared in conformity with accounting principles generally accepted in the United States of America (GAAP), which require management to make certain estimates and assumptions at the date of the financial statements. Actual results could differ from those estimates. The Fund operates as a single operating segment. The Fund's income, expenses, assets, and performance are regularly monitored and assessed as a whole by the investment adviser and other individuals responsible for overnight functions of the Trust, using the information presented in the financial statements and financial highlights. Subsequent events, if any, through the date that the financial statements were issued have been evaluated in the preparation of the financial statements. The Fund's Schedule of Investments lists any underlying mutual funds or exchange-traded funds (ETFs) but does not include the underlying holdings of these funds. The following summarizes the significant accounting policies of the Fund:
Investment Valuation. Investments are valued as of 4:00 p.m. Eastern time on the last calendar day of the period. The Board of Trustees (the Board) has designated the Fund's investment adviser as the valuation designee responsible for the fair valuation function and performing fair value determinations as needed. The investment adviser has established a Fair Value Committee (the Committee) to carry out the day-to-day fair valuation responsibilities and has adopted policies and procedures to govern the fair valuation process and the activities of the Committee. In accordance with these fair valuation policies and procedures, which have been approved by the Board, the Fund attempts to obtain prices from one or more third party pricing services or brokers to value its investments. When current market prices, quotations or currency exchange rates are not readily available or reliable, investments will be fair valued in good faith by the Committee, in accordance with the policies and procedures. Factors used in determining fair value vary by investment type and may include market or investment specific events, transaction data, estimated cash flows, and market observations of comparable investments. The frequency that the fair valuation procedures are used cannot be predicted and they may be utilized to a significant extent. The Committee manages the Fund's fair valuation practices and maintains the fair valuation policies and procedures. The Fund's investment adviser reports to the Board information regarding the fair valuation process and related material matters.
The Fund categorizes the inputs to valuation techniques used to value its investments into a disclosure hierarchy consisting of three levels as shown below:
Level 1 - unadjusted quoted prices in active markets for identical investments
Level 2 - other significant observable inputs (including quoted prices for similar investments, interest rates, prepayment speeds, etc.)
Level 3 - unobservable inputs (including the Fund's own assumptions based on the best information available)
Valuation techniques used to value the Fund's investments by major category are as follows:
Debt securities, including restricted securities, are valued based on evaluated prices received from third party pricing services or from brokers who make markets in such securities. Corporate bonds, bank notes, foreign government and government agency obligations, municipal securities, supranational obligations and U.S. government and government agency obligations are valued by pricing services who utilize matrix pricing which considers yield or price of bonds of comparable quality, coupon, maturity and type or by broker-supplied prices. Asset backed securities, commercial mortgage securities and U.S. government agency mortgage securities are valued by pricing services who utilize matrix pricing which considers prepayment speed assumptions, attributes of the collateral, yield or price of bonds of comparable quality, coupon, maturity and type or by broker-supplied prices. When independent prices are unavailable or unreliable, debt securities may be valued utilizing pricing methodologies which consider similar factors that would be used by third party pricing services. Debt securities are generally categorized as Level 2 in the hierarchy but may be Level 3 depending on the circumstances.
Investments in open-end mutual funds, including the Fidelity Central Funds, are valued at their closing net asset value (NAV) each business day and are categorized as Level 1 in the hierarchy.
Changes in valuation techniques may result in transfers in or out of an assigned level within the disclosure hierarchy. The aggregate value of investments by input level as of December 31, 2024 is included at the end of the Fund's Schedule of Investments.
Foreign Currency. Certain Funds may use foreign currency contracts to facilitate transactions in foreign-denominated securities. Gains and losses from these transactions may arise from changes in the value of the foreign currency or if the counterparties do not perform under the contracts' terms.
Foreign-denominated assets, including investment securities, and liabilities are translated into U.S. dollars at the exchange rates at period end. Purchases and sales of investment securities, income and dividends received, and expenses denominated in foreign currencies are translated into U.S. dollars at the exchange rate in effect on the transaction date.
The effects of exchange rate fluctuations on investments are included with the net realized and unrealized gain (loss) on investment securities. Other foreign currency transactions resulting in realized and unrealized gain (loss) are disclosed separately.
Investment Transactions and Income. For financial reporting purposes, the Fund's investment holdings and NAV include trades executed through the end of the last business day of the period. The NAV per share for processing shareholder transactions is calculated as of the close of business of the New York Stock Exchange (NYSE), normally 4:00 p.m. Eastern time and includes trades executed through the end of the prior business day. Gains and losses on securities sold are determined on the basis of identified cost. Income and capital gain distributions from Fidelity Central Funds, if any, are recorded on the ex-dividend date. Interest income is accrued as earned and includes coupon interest and amortization of premium and accretion of discount on debt securities as applicable. Investment income is recorded net of foreign taxes withheld where recovery of such taxes is uncertain. Debt obligations may be placed on non-accrual status and related interest income may be reduced by ceasing current accruals and writing off interest receivables when the collection of all or a portion of interest has become doubtful based on consistently applied procedures. A debt obligation is removed from non-accrual status when the issuer resumes interest payments or when collectability of interest is reasonably assured.
Class Allocations and Expenses. Investment income, realized and unrealized capital gains and losses, common expenses of a fund, and certain fund-level expense reductions, if any, are allocated daily on a pro-rata basis to each class based on the relative net assets of each class to the total net assets of a fund. Each class differs with respect to transfer agent and distribution and service plan fees incurred, as applicable. Certain expense reductions may also differ by class, if applicable. For the reporting period, the allocated portion of income and expenses to each class as a percent of its average net assets may vary due to the timing of recording these transactions in relation to fluctuating net assets of the classes. Expenses directly attributable to a fund are charged to that fund. Expenses attributable to more than one fund are allocated among the respective funds on the basis of relative net assets or other appropriate methods. Expenses included in the accompanying financial statements reflect the expenses of that fund and do not include any expenses associated with any underlying mutual funds or exchange-traded funds (ETFs). Although not included in a fund's expenses, a fund indirectly bears its proportionate share of these expenses through the net asset value of each underlying mutual fund or exchange-traded fund (ETF). Expense estimates are accrued in the period to which they relate and adjustments are made when actual amounts are known.
Income Tax Information and Distributions to Shareholders. Each year, the Fund intends to qualify as a regulated investment company under Subchapter M of the Internal Revenue Code, including distributing substantially all of its taxable income and realized gains. As a result, no provision for U.S. Federal income taxes is required. As of December 31, 2024, the Fund did not have any unrecognized tax benefits in the financial statements; nor is the Fund aware of any tax positions for which it is reasonably possible that the total amounts of unrecognized tax benefits will significantly change in the next twelve months. The Fund files a U.S. federal tax return, in addition to state and local tax returns as required. The Fund's federal income tax returns are subject to examination by the Internal Revenue Service (IRS) for a period of three fiscal years after they are filed. State and local tax returns may be subject to examination for an additional fiscal year depending on the jurisdiction. Foreign taxes are provided for based on the Fund's understanding of the tax rules and rates that exist in the foreign markets in which it invests.
Distributions are declared and recorded on the ex-dividend date. Income and capital gain distributions are declared separately for each class. Income and capital gain distributions are determined in accordance with income tax regulations, which may differ from GAAP.
Capital accounts within the financial statements are adjusted for permanent book-tax differences. These adjustments have no impact on net assets or the results of operations. Capital accounts are not adjusted for temporary book-tax differences which will reverse in a subsequent period.
Book-tax differences are primarily due to market discount, capital loss carryforwards and losses deferred due to wash sales.
As of period end, the cost and unrealized appreciation (depreciation) in securities, and derivatives if applicable, for federal income tax purposes were as follows:
| Gross unrealized appreciation | $2,681,755 |
| Gross unrealized depreciation | (89,684,173) |
| Net unrealized appreciation (depreciation) | $(87,002,418) |
| Tax Cost | $1,086,774,233 |
The tax-based components of distributable earnings as of period end were as follows:
| Undistributed ordinary income | $5,129,946 |
| Capital loss carryforward | $(24,084,997) |
| Net unrealized appreciation (depreciation) on securities and other investments | $(87,002,422) |
| | |
Capital loss carryforwards are only available to offset future capital gains of the Fund to the extent provided by regulations and may be limited. The capital loss carryforward information presented below, including any applicable limitation, is estimated as of fiscal period end and is subject to adjustment.
Short-term | $(7,336,028) |
Long-term | (16,748,969) |
| Total capital loss carryforward | $(24,084,997) |
The tax character of distributions paid was as follows:
| | December 31, 2024 | December 31, 2023 |
| Ordinary Income | $26,463,803 | $ 17,505,569 |
Delayed Delivery Transactions and When-Issued Securities. During the period, certain Funds transacted in securities on a delayed delivery or when-issued basis. Payment and delivery may take place after the customary settlement period for that security. The price of the underlying securities and the date when the securities will be delivered and paid for are fixed at the time the transaction is negotiated. Securities purchased on a delayed delivery or when-issued basis are identified as such in the Schedule of Investments. Compensation for interest forgone in the purchase of a delayed delivery or when-issued debt security may be received. With respect to purchase commitments, each applicable Fund identifies securities as segregated in its records with a value at least equal to the amount of the commitment. Payables and receivables associated with the purchases and sales of delayed delivery securities having the same coupon, settlement date and broker are offset. Delayed delivery or when-issued securities that have been purchased from and sold to different brokers are reflected as both payables and receivables in the Statement of Assets and Liabilities under the caption "Delayed delivery", as applicable. Losses may arise due to changes in the value of the underlying securities or if the counterparty does not perform under the contract's terms, or if the issuer does not issue the securities due to political, economic, or other factors.
To-Be-Announced (TBA) Securities and Mortgage Dollar Rolls. TBA securities involve buying or selling mortgage-backed securities (MBS) on a forward commitment basis. A TBA transaction typically does not designate the actual security to be delivered and only includes an approximate principal amount; however delivered securities must meet specified terms defined by industry guidelines, including issuer, rate and current principal amount outstanding on underlying mortgage pools. Funds may enter into a TBA transaction with the intent to take possession of or deliver the underlying MBS, or a fund may elect to extend the settlement by entering into either a mortgage or reverse mortgage dollar roll. Mortgage dollar rolls are transactions where a fund sells TBA securities and simultaneously agrees to repurchase MBS on a later date at a lower price and with the same counterparty. Reverse mortgage dollar rolls involve the purchase and simultaneous agreement to sell TBA securities on a later date at a lower price. Transactions in mortgage dollar rolls and reverse mortgage dollar rolls are accounted for as purchases and sales and may result in an increase to a fund's portfolio turnover rate.
Purchases and sales of TBA securities involve risks similar to those discussed above for delayed delivery and when-issued securities. Also, if the counterparty in a mortgage dollar roll or a reverse mortgage dollar roll transaction files for bankruptcy or becomes insolvent, a fund's right to repurchase or sell securities may be limited. Additionally, when a fund sells TBA securities without already owning or having the right to obtain the deliverable securities (an uncovered forward commitment to sell), it incurs a risk of loss because it could have to purchase the securities at a price that is higher than the price at which it sold them. A fund may be unable to purchase the deliverable securities if the corresponding market is illiquid.
TBA securities subject to a forward commitment to sell at period end are included at the end of the Schedule of Investments under the caption "TBA Sale Commitments." The value of these commitments and proceeds to be received at contractual settlement date are reflected in the Statement of Assets and Liabilities as "TBA sale commitments, at value" and "Receivable for TBA sale commitments," respectively. If the TBA sale commitment is closed through the acquisition of an offsetting TBA purchase commitment, a fund realizes a gain or loss. If a fund delivers securities under the commitment, a fund realizes a gain or loss from the sale of the securities based upon the price established at the date the commitment was entered into.
Restricted Securities (including Private Placements). Funds may invest in securities that are subject to legal or contractual restrictions on resale. These securities generally may be resold in transactions exempt from registration or to the public if the securities are registered. Disposal of these securities may involve time-consuming negotiations and expense, and prompt sale at an acceptable price may be difficult. Information regarding restricted securities held at period end is included at the end of the Schedule of Investments, if applicable.
New Accounting Pronouncement. FASB Accounting Standards Update (ASU) 2023-07 Segment Reporting (Topic 280): Improvements to Reportable Segment Disclosures became effective in this reporting period. ASU 2023-07 enhances segment information disclosure in the notes to financial statements.
4. Purchases and Sales of Investments.
Purchases and sales of securities, other than short-term securities, U.S. government securities and in-kind transactions, as applicable, are noted in the table below.
| | Purchases ($) | Sales ($) |
| VIP Bond Index Portfolio | 295,009,818 | 242,515,235 |
5. Fees and Other Transactions with Affiliates.
Management Fee and Expense Contract. Fidelity Management & Research Company LLC (the investment adviser) and its affiliates provide the Fund with investment management related services for which the Fund pays a monthly management fee. The management fee is based on an annual rate of .09% of the Fund's average net assets. Under the management contract, the investment adviser pays all other fund-level expenses, except the compensation of the independent Trustees and certain miscellaneous expenses such as proxy and shareholder meeting expenses.
In addition, under the expense contract, the investment adviser pays class-level expenses as necessary so that the total expenses do not exceed certain amounts of each class' average net assets on an annual basis with certain exceptions, as noted in the following table:
Initial Class | .14% |
Service Class | .24% |
Service Class 2 | .39% |
Distribution and Service Plan Fees. In accordance with Rule 12b-1 of the 1940 Act, the Fund has adopted separate 12b-1 Plans for each Service Class of shares. Each Service Class pays Fidelity Distributors Company LLC (FDC), an affiliate of the investment adviser, a service fee. For the period, the service fee is based on an annual rate of .10% of Service Class' average net assets and .25% of Service Class 2's average net assets.
For the period, total fees, all of which were re-allowed to insurance companies for the distribution of shares and providing shareholder support services, were as follows:
| Service Class | $11,089 |
| Service Class 2 | 644,430 |
| | $655,519 |
Transfer Agent Fees. Fidelity Investments Institutional Operations Company LLC (FIIOC), an affiliate of the investment adviser, is the transfer, dividend disbursing, and shareholder servicing agent for each class. FIIOC receives asset-based fees based on each class's average net assets for transfer agent services, typesetting, and printing and mailing of shareholder reports, excluding mailing of proxy statements, equal to an annual rate of .06% of average net assets. Under the expense contract, each class pays a portion of the transfer agent fees equal to an annual rate of .05% of class-level average net assets. For the period, transfer agent fees for each class were as follows:
| Initial Class | $301,127 |
| Service Class | 5,544 |
| Service Class 2 | 128,886 |
| | $435,557 |
Interfund Trades. Funds may purchase from or sell securities to other Fidelity Funds under procedures adopted by the Board. The procedures have been designed to ensure these interfund trades are executed in accordance with Rule 17a-7 of the 1940 Act. Any interfund trades are included within the respective purchases and sales amounts shown in the Purchases and Sales of Investments note. During the period, there were no interfund trades.
Sub-Advisory Arrangements. Effective March 1, 2024, the Fund's sub-advisory agreements with FMR Investment Management (UK) Limited, Fidelity Management & Research (Hong Kong) Limited, and Fidelity Management & Research (Japan) Limited were amended to provide that the investment adviser pays each sub-adviser monthly fees equal to 110% of the sub-adviser's costs for providing sub-advisory services.
6. Committed Line of Credit.
Certain Funds participate with other funds managed by the investment adviser or an affiliate in a $4.25 billion credit facility (the "line of credit") to be utilized for temporary or emergency purposes to fund shareholder redemptions or for other short-term liquidity purposes.
Commitment fees are charged based on the unused amount of the line of credit at an annual rate of .10%, and then allocated to each participating fund based on its pro-rata portion of the line of credit. The commitment fees are borne by the investment adviser.
Interest is charged to a participating fund based on its borrowings at an annual rate of .75% plus the highest of (i) daily SOFR plus a .10% spread adjustment, (ii) Federal Funds Effective Rate, or (iii) Overnight Bank Funding Rate. During the period, there were no borrowings on this line of credit.
The line of credit agreement will expire in March 2025 unless extended or renewed.
7. Security Lending.
Funds lend portfolio securities from time to time in order to earn additional income. Lending agents are used, including National Financial Services (NFS), an affiliate of the investment adviser. Pursuant to a securities lending agreement, NFS will receive a fee, which is capped at 9.9% of a fund's daily lending revenue, for its services as lending agent. A fund may lend securities to certain qualified borrowers, including NFS. On the settlement date of the loan, a fund receives collateral (in the form of U.S. Treasury obligations, letters of credit and/or cash) against the loaned securities and maintains collateral in an amount not less than 100% of the market value of the loaned securities during the period of the loan. The market value of the loaned securities is determined at the close of business of a fund and any additional required collateral is delivered to a fund on the next business day. A fund or borrower may terminate the loan at any time, and if the borrower defaults on its obligation to return the securities loaned because of insolvency or other reasons, a fund may apply collateral received from the borrower against the obligation. A fund may experience delays and costs in recovering the securities loaned. Any cash collateral received is invested in the Fidelity Securities Lending Cash Central Fund. Any loaned securities are identified as such in the Schedule of Investments, and the value of loaned securities and cash collateral at period end, as applicable, are presented in the Statement of Assets and Liabilities. Security lending income represents the income earned on investing cash collateral, less rebates paid to borrowers and any lending agent fees associated with the loan, plus any premium payments received for lending certain types of securities. Security lending income is presented in the Statement of Operations as a component of income from Fidelity Central Funds. Affiliated security lending activity, if any, was as follows:
| | Total Security Lending Fees Paid to NFS ($) | Security Lending Income From Securities Loaned to NFS ($) | Value of Securities Loaned to NFS at Period End ($) |
| VIP Bond Index Portfolio | 124 | - | - |
8. Expense Reductions.
Through arrangements with the Fund's custodian, credits realized as a result of certain uninvested cash balances were used to reduce the Fund's expenses. During the period, custodian credits reduced the Fund's expenses by $9,634.
9. Distributions to Shareholders.
Distributions to shareholders of each class were as follows:
| | Year ended December 31, 2024 | Year ended December 31, 2023 |
| VIP Bond Index Portfolio | | |
| Distributions to shareholders | | |
| Initial Class | $18,353,549 | $12,805,218 |
| Service Class | 315,045 | 230,657 |
| Service Class 2 | 7,795,209 | 4,469,694 |
Total | $26,463,803 | $17,505,569 |
10. Share Transactions.
Transactions for each class of shares were as follows and may contain in-kind transactions:
| | Shares | Shares | Dollars | Dollars |
| | Year ended December 31, 2024 | Year ended December 31, 2023 | Year ended December 31, 2024 | Year ended December 31, 2023 |
| VIP Bond Index Portfolio | | | | |
| Initial Class | | | | |
| Shares sold | 16,473,534 | 13,031,159 | $159,670,830 | $124,143,132 |
| Reinvestment of distributions | 1,896,668 | 1,361,916 | 18,353,549 | 12,805,218 |
| Shares redeemed | (8,247,566) | (5,646,805) | (79,126,393) | (53,362,229) |
| Net increase (decrease) | 10,122,636 | 8,746,270 | $98,897,986 | $83,586,121 |
| Service Class | | | | |
| Shares sold | 579,163 | 1,097,939 | $5,619,010 | $10,375,229 |
| Reinvestment of distributions | 32,299 | 24,384 | 312,431 | 228,382 |
| Shares redeemed | (470,805) | (311,509) | (4,537,114) | (2,959,926) |
| Net increase (decrease) | 140,657 | 810,814 | $1,394,327 | $7,643,685 |
| Service Class 2 | | | | |
| Shares sold | 15,835,287 | 4,148,380 | $153,051,195 | $39,219,792 |
| Reinvestment of distributions | 807,277 | 476,666 | 7,792,848 | 4,467,751 |
| Shares redeemed | (5,373,399) | (2,761,504) | (52,686,164) | (26,096,664) |
| Net increase (decrease) | 11,269,165 | 1,863,542 | $108,157,879 | $17,590,879 |
11. Other.
A fund's organizational documents provide former and current trustees and officers with a limited indemnification against liabilities arising in connection with the performance of their duties to the fund. In the normal course of business, a fund may also enter into contracts that provide general indemnifications. A fund's maximum exposure under these arrangements is unknown as this would be dependent on future claims that may be made against a fund. The risk of material loss from such claims is considered remote.
At the end of the period, the investment adviser or its affiliates were owners of record of more than 10% and certain otherwise unaffiliated shareholders each were owners of record of more than 10% of the outstanding shares as follows:
| Fund | Affiliated % | Number ofUnaffiliated Shareholders | Unaffiliated Shareholders % |
| VIP Bond Index Portfolio | 55% | 2 | 38% |
12. Risk and Uncertainties.
Many factors affect a fund's performance. Developments that disrupt global economies and financial markets, such as pandemics, epidemics, outbreaks of infectious diseases, war, terrorism, and environmental disasters, may significantly affect a fund's investment performance. The effects of these developments to a fund will be impacted by the types of securities in which a fund invests, the financial condition, industry, economic sector, and geographic location of an issuer, and a fund's level of investment in the securities of that issuer. Significant concentrations in security types, issuers, industries, sectors, and geographic locations may magnify the factors that affect a fund's performance.
Report of Independent Registered Public Accounting Firm
To the Board of Trustees of Variable Insurance Products Fund V and the Shareholders of VIP Bond Index Portfolio:
Opinion on the Financial Statements and Financial Highlights
We have audited the accompanying statement of assets and liabilities of VIP Bond Index Portfolio (the "Fund"), a fund of Variable Insurance Products Fund V, including the schedule of investments, as of December 31, 2024, the related statement of operations for the year then ended, the statement of changes in net assets for each of the two years in the period then ended, the financial highlights for each of the five years in the period then ended, and the related notes. In our opinion, the financial statements and financial highlights present fairly, in all material respects, the financial position of the Fund as of December 31, 2024, and the results of its operations for the year then ended, the changes in its net assets for each of the two years in the period then ended, and the financial highlights for each of the five years in the period then ended in conformity with accounting principles generally accepted in the United States of America.
Basis for Opinion
These financial statements and financial highlights are the responsibility of the Fund's management. Our responsibility is to express an opinion on the Fund's financial statements and financial highlights based on our audits. We are a public accounting firm registered with the Public Company Accounting Oversight Board (United States) (PCAOB) and are required to be independent with respect to the Fund in accordance with the U.S. federal securities laws and the applicable rules and regulations of the Securities and Exchange Commission and the PCAOB.
We conducted our audits in accordance with the standards of the PCAOB. Those standards require that we plan and perform the audit to obtain reasonable assurance about whether the financial statements and financial highlights are free of material misstatement, whether due to error or fraud. The Fund is not required to have, nor were we engaged to perform, an audit of its internal control over financial reporting. As part of our audits, we are required to obtain an understanding of internal control over financial reporting but not for the purpose of expressing an opinion on the effectiveness of the Fund's internal control over financial reporting. Accordingly, we express no such opinion.
Our audits included performing procedures to assess the risks of material misstatement of the financial statements and financial highlights, whether due to error or fraud, and performing procedures that respond to those risks. Such procedures included examining, on a test basis, evidence regarding the amounts and disclosures in the financial statements and financial highlights. Our audits also included evaluating the accounting principles used and significant estimates made by management, as well as evaluating the overall presentation of the financial statements and financial highlights. Our procedures included confirmation of securities owned as of December 31, 2024, by correspondence with the custodian and brokers; when replies were not received from brokers, we performed other auditing procedures. We believe that our audits provide a reasonable basis for our opinion.
/s/ Deloitte & Touche LLP
Boston, Massachusetts
February 11, 2025
We have served as the auditor of one or more of the Fidelity investment companies since 1999.
Distributions
(Unaudited)The dividend and capital gains distributions for the fund(s) are available on Fidelity.com or Institutional.Fidelity.com.
A total of 41.80% of the dividends distributed during the fiscal year was derived from interest on U.S. Government securities which is generally exempt from state income tax.
The fund designates $26,463,804 of distributions paid during the fiscal year ended 2024 as qualifying to be taxed as section 163(j) interest dividends.
Item 8: Changes in and Disagreements with Accountants for Open-End Management Investment Companies
(Unaudited)
Note: This is not applicable for any fund included in this document.
Item 9: Proxy Disclosures for Open-End Management Investment Companies
(Unaudited)
Note: This is not applicable for any fund included in this document.
Item 10: Remuneration Paid to Directors, Officers, and others of Open-End Management Investment Companies
(Unaudited)
Note: This information is disclosed as part of the financial statements for each Fund as part of Item 7: Financial Statements and Financial Highlights for Open-End Management Investment companies.
Item 11: Statement Regarding Basis for Approval of Investment Advisory Contract
(Unaudited)
Board Approval of Investment Advisory Contracts and Management Fees
VIP Bond Index Portfolio
Each year, the Board of Trustees, including the Independent Trustees (together, the Board), considers the renewal of the fund's management contract with Fidelity Management & Research Company LLC (FMR) and the sub-advisory agreements (together, the Advisory Contracts) for the fund. FMR and the sub-advisers are referred to herein as the Investment Advisers. The Board, assisted by the advice of fund counsel and Independent Trustees' counsel, requests and considers a broad range of information relevant to the renewal of the Advisory Contracts throughout the year.
The Board meets regularly and, at each of its meetings, covers an extensive agenda of topics and materials and considers factors that are relevant to its annual consideration of the renewal of the fund's Advisory Contracts, including the services and support provided to the fund and its shareholders. The Board's Operations Committee, of which all the Independent Trustees are members, meets regularly throughout the year and requests, receives and considers, among other matters, information related to the annual consideration of the renewal of the fund's Advisory Contracts before making its recommendation to the Board. The Board also meets as needed to review matters specifically related to the Board's annual consideration of the renewal of the Advisory Contracts. Members of the Board may also meet from time to time with trustees of other Fidelity funds through joint ad hoc committees to discuss certain matters relevant to all of the Fidelity funds.
At its September 2024 meeting, the Board unanimously determined to renew the fund's Advisory Contracts. In reaching its determination, the Board considered all factors it believed relevant, including (i) the nature, extent, and quality of the services provided to the fund and its shareholders (including the investment performance of the fund); (ii) the competitiveness relative to peer funds of the fund's management fee and the total expense ratio of a representative class (Initial Class, which was selected because it was the largest class without 12b-1 fees); (iii) the total costs of the services provided by and the profits realized by FMR and its affiliates (Fidelity) from its relationships with the fund; and (iv) the extent to which, if any, economies of scale exist and are realized as the fund grows, and whether any economies of scale are appropriately shared with fund shareholders. The Board also considered the broad range of investment choices available to shareholders from FMR's competitors and that the fund's shareholders have chosen to invest in the fund, which is part of the Fidelity family of funds. The Board's decision to renew the Advisory Contracts was not based on any single factor and the factors may have been weighed differently by different Trustees.
The Board reached a determination, with the assistance of fund counsel and Independent Trustees' counsel and through the exercise of its business judgment, that the renewal of the Advisory Contracts was in the best interests of the fund and its shareholders and that the compensation payable under the Advisory Contracts was fair and reasonable in light of all of the surrounding circumstances.
Nature, Extent, and Quality of Services Provided. The Board considered Fidelity's staffing as it relates to the fund, including the backgrounds and experience of investment personnel, and also considered the Investment Advisers' implementation of the fund's investment program. The Independent Trustees also had discussions with senior management of Fidelity's investment operations and investment groups. The Board considered the structure of the investment personnel compensation program and whether this structure provides appropriate incentives to act in the best interests of the fund. Additionally, the Board considered the portfolio managers' investments, if any, in the funds that they manage.
Resources Dedicated to Investment Management and Support Services. The Board reviewed the general qualifications and capabilities of Fidelity's investment staff, including its size, education, experience, and resources, as well as Fidelity's approach to recruiting, training, managing, and compensating investment personnel. The Board noted the resources devoted to Fidelity's global investment organization, and that Fidelity's analysts have extensive resources, tools and capabilities that allow them to conduct quantitative and fundamental analysis, as well as credit analysis of issuers, counterparties and guarantors. Further, the Board considered that Fidelity's investment professionals have sufficient access to global information and data so as to provide competitive investment results over time, and that those professionals also have access to sophisticated tools that permit them to assess portfolio construction and risk and performance attribution characteristics continuously, as well as to transmit new information and research conclusions rapidly around the world. Additionally, in its deliberations, the Board considered Fidelity's trading, risk management, compliance, cybersecurity, and technology and operations capabilities and resources, which are integral parts of the investment management process.
Shareholder and Administrative Services. The Board considered (i) the nature, extent, quality, and cost of advisory, administrative, and shareholder services performed by the Investment Advisers and their affiliates under the Advisory Contracts and under separate agreements covering transfer agency and pricing and bookkeeping services for the fund; (ii) the nature and extent of Fidelity's supervision of third party service providers, principally custodians, subcustodians, and pricing vendors; and (iii) the resources devoted by Fidelity to, and the record of compliance with, the fund's compliance policies and procedures, including with respect to liquidity and derivatives risk management. The Board also considered the fund's securities lending activities and any payments made to Fidelity relating to securities lending under a separate agreement.
The Board noted that the growth of fund assets over time across the complex allows Fidelity to reinvest in the development of services designed to enhance the value and convenience of the Fidelity funds as investment vehicles. These services include 24-hour access to account information and market information over the Internet and through telephone representatives, investor education materials and asset allocation tools. The Board also considered that it reviews customer service metrics such as telephone response times, continuity of services on the website and metrics addressing services at Fidelity Investor Centers.
Investment in a Large Fund Family. The Board considered the benefits to shareholders of investing in a fund that is part of a large family of funds offering a variety of investment disciplines and providing a large variety of fund investor services. The Board noted that Fidelity had taken, or had made recommendations to the Board that resulted in the Fidelity funds taking, a number of actions over the previous year that benefited particular funds and/or the Fidelity funds in general.
Investment Performance. The Board took into account discussions that occur with representatives of the Investment Advisers, and reports that it receives, at Board meetings throughout the year relating to fund investment performance. In this regard the Board noted that as part of regularly scheduled fund reviews and other reports to the Board on fund performance, the Board considered annualized return information for the fund for different time periods, measured the securities market index the fund seeks to track (benchmark index). The Board also periodically considers the fund's tracking error versus its benchmark index. In its evaluation of fund investment performance at meetings throughout the year, the Board gave particular attention to information indicating underperformance of certain Fidelity funds over different time periods and discussed with the Investment Advisers the reasons for such underperformance.
In addition to reviewing absolute and relative fund performance, the Independent Trustees periodically consider the appropriateness of fund performance metrics in evaluating the results achieved. In general, the Independent Trustees believe that an index fund's performance should be evaluated based on gross performance (before fees and expenses but after transaction costs) of the fund compared to the fund's benchmark index, over appropriate time periods.
Based on its review, the Board concluded that the nature, extent, and quality of services provided to the fund under the Advisory Contracts should continue to benefit the shareholders of the fund.
Competitiveness of Management Fee and Total Expense Ratio. The Board was provided with information regarding industry trends in management fees and expenses. In its review of the fund's management fee and the total expense ratio of Initial Class, the Board considered the fund's management fee rate as well as other "fund-level" expenses, such as pricing and bookkeeping fees and custodial, legal, and audit fees, paid by FMR under the fund's management contract. The Board also considered other "class-level" expenses, such as transfer agent fees and fund-paid 12b-1 fees. The Board noted that Fidelity may agree to waive fees or reimburse expenses from time to time, and the extent to which, if any, it has done so for the fund.
Comparisons of Management Fees and Total Expense Ratios. Among other things, the Board reviewed data for selected groups of competitive funds and classes (referred to as "mapped groups") that were compiled by Fidelity based on combining similar investment objective categories (as classified by Morningstar) that have comparable investment mandates. The data reviewed by the Board included (i) gross management fee comparisons (before taking into account expense reimbursements or caps) relative to the total universe of funds within the mapped group; (ii) gross management fee comparisons relative to a subset of non-Fidelity funds in the mapped group that are similar in size and management fee structure to the fund (referred to as the "asset size peer group"); (iii) total expense comparisons of Initial Class of the fund relative to funds and classes in the mapped group that have a similar sales load structure to Initial Class of the fund (referred to as the "similar sales load structure group"); and (iv) total expense comparisons of Initial Class of the fund relative to funds and classes in the similar sales load structure group that are similar in size and management fee structure to the fund (referred to as the "total expense asset size peer group"). The total expense asset size peer group comparison excludes performance adjustments and fund-paid 12b-1 fees to eliminate variability in fee structures.
The information provided to the Board indicated that the fund's management fee rate ranked below the competitive median of the mapped group for 2023 and below the competitive median of the asset size peer group for 2023. Further, the information provided to the Board indicated that the total expense ratio of Initial Class of the fund below the competitive median of the similar sales load structure group for 2023 and below the competitive median of the total expense asset size peer group for 2023.
Other Contractual Arrangements. The Board considered that current contractual arrangements for the fund oblige FMR to pay all "class-level" expenses of each class of the fund to the extent necessary to limit total operating expenses, with certain exceptions, as follows: Initial Class: 0.14%; Service Class: 0.24%; and Service Class 2: 0.39%. These contractual arrangements may not be amended to increase the fees or expenses payable except by a vote of a majority of the Board.
Fees Charged to Other Fidelity Clients. The Board also considered Fidelity fee structures and other information with respect to clients of Fidelity, such as other funds advised or subadvised by Fidelity, pension plan clients, and other institutional clients with similar mandates. The Board noted that a joint ad hoc committee created by it and the boards of other Fidelity funds periodically reviews and compares Fidelity's institutional investment advisory business with its business of providing services to the Fidelity funds and also noted the most recent findings of the committee. The Board noted that the committee's review included a consideration of the differences in services provided, fees charged, and costs incurred, as well as competition in the markets serving the different categories of clients.
Based on its review, the Board concluded that the fund's management fee is fair and reasonable in light of the services that the fund receives and the other factors considered. Further, based on its review of total expense ratios and fees charged to other Fidelity clients, the Board concluded that the total expense ratio of each class of the fund was reasonable in light of the services that the fund and its shareholders receive and the other factors considered.
Costs of the Services and Profitability. The Board considered the revenues earned and the expenses incurred by Fidelity in conducting the business of developing, marketing, distributing, managing, administering and servicing the fund and servicing the fund's shareholders. The Board also considered the level of Fidelity's profits in respect of all the Fidelity funds.
On an annual basis, Fidelity presents to the Board information about the profitability of its relationships with the fund. Fidelity calculates profitability information for each Fidelity fund, as well as aggregate profitability information for groups of Fidelity funds and all Fidelity funds, using a series of detailed revenue and cost allocation methodologies which originate with the books and records of Fidelity on which Fidelity's audited financial statements are based. The Audit Committee of the Board reviews any significant changes from the prior year's methodologies.
A public accounting firm has been engaged annually by the Board as part of the Board's assessment of Fidelity's profitability analysis. The engagement includes the review and assessment of the methodologies used by Fidelity in determining the revenues and expenses attributable to Fidelity's fund business. After considering the reports issued under the engagement and information provided by Fidelity, the Board concluded that while other allocation methods may also be reasonable, Fidelity's profitability methodologies are reasonable in all material respects.
The Board also reviewed Fidelity's non-fund businesses and potential indirect benefits such businesses may have received as a result of their association with Fidelity's fund business (i.e., fall-out benefits) as well as cases where Fidelity's affiliates may benefit from the funds' business. The Board considered areas where potential indirect benefits to the Fidelity funds from their relationships with Fidelity may exist. The Board's consideration of these matters was informed by the findings of a joint ad hoc committee created by it and the boards of other Fidelity funds to evaluate potential fall-out benefits.
The Board considered the costs of the services provided by and the profits realized by Fidelity in connection with the operation of the fund and was satisfied that the profitability was not excessive.
Economies of Scale. The Board considered whether there have been economies of scale in respect of the management of the Fidelity funds, whether the Fidelity funds (including the fund) have appropriately benefited from any such economies of scale, and whether there is potential for realization of any further economies of scale. The Board considered the extent to which the fund will benefit from economies of scale as assets grow through increased services to the fund, through waivers or reimbursements, or through fee or expense ratio reductions. The Board recognized that, due to the fund's current contractual arrangements, the expense ratio of each class will not decline if the class's operating costs decrease as assets grow, or rise as assets decrease. The Board also noted that a committee created by it and the boards of other Fidelity funds periodically analyzes whether Fidelity attains economies of scale in respect of the management and servicing of the Fidelity funds, whether the Fidelity funds have appropriately benefited from such economies of scale, and whether there is potential for realization of any further economies of scale.
The Board concluded, taking into account the analysis of the committee, that economies of scale, if any, are being appropriately shared between fund shareholders and Fidelity.
Additional Information Requested by the Board. In order to develop fully the factual basis for consideration of the Fidelity funds' advisory contracts, the Board requested and received additional information on certain topics, including: (i) portfolio manager changes that have occurred during the past year; (ii) hiring, training, compensating, and retaining adviser and sub-adviser personnel; (iii) the terms of the funds' various management fee structures and arrangements for transfer agent and pricing and bookkeeping services; (iv) Fidelity's fund profitability methodology, profitability trends for certain funds, the allocation of various costs to different funds, and the impact of certain factors on fund profitability results; (v) the impact on fund profitability of recent industry trends, such as the growth in passively managed funds and the changes in flows for different types of funds; (vi) the types of management fee and total expense comparisons provided, and the challenges and limitations associated with such information; (vii) explanations regarding the relative total expense ratios and management fees of certain funds and classes, total expense and management fee competitive trends, and methodologies for total expense and management fee competitive comparisons; (viii) matters related to money market funds, exchange-traded funds, and target date funds; (ix) the arrangements with and compensation paid to certain fund sub-advisers and the treatment of such compensation within Fidelity's fund profitability methodology; and (x) the terms of management contracts between Fidelity and other funds and products not overseen by the Board.
Conclusion. Based on its evaluation of all of the conclusions noted above, and after considering all factors it believed relevant, the Board, including the Independent Trustees, concluded that the advisory and sub-advisory fee arrangements are fair and reasonable in light of all of the surrounding circumstances, and that the fund's Advisory Contracts should be renewed through September 30, 2025.
1.9887310.106
VUSB-ANN-0325
Fidelity® Variable Insurance Products:
VIP Investment Grade Bond Portfolio
Annual Report
December 31, 2024
Contents
To view a fund's proxy voting guidelines and proxy voting record for the 12-month period ended June 30, visit http://www.fidelity.com/proxyvotingresults or visit the Securities and Exchange Commission's (SEC) web site at http://www.sec.gov.
You may also call 1-877-208-0098 to request a free copy of the proxy voting guidelines.
Fidelity® Variable Insurance Products are separate account options which are purchased through a variable insurance contract.
Standard & Poor's, S&P and S&P 500 are registered service marks of The McGraw-Hill Companies, Inc. and have been licensed for use by Fidelity Distributors Corporation.
Other third-party marks appearing herein are the property of their respective owners.
All other marks appearing herein are registered or unregistered trademarks or service marks of FMR LLC or an affiliated company. © 2025 FMR LLC. All rights reserved.
This report and the financial statements contained herein are submitted for the general information of the shareholders of the Fund. This report is not authorized for distribution to prospective investors in the Fund unless preceded or accompanied by an effective prospectus.
A fund files its complete schedule of portfolio holdings with the SEC for the first and third quarters of each fiscal year on Form N-PORT. Forms N-PORT are available on the SEC's web site at http://www.sec.gov. A fund's Forms N-PORT may be reviewed and copied at the SEC's Public Reference Room in Washington, DC. Information regarding the operation of the SEC's Public Reference Room may be obtained by calling 1-800-SEC-0330.
For a complete list of a fund's portfolio holdings, view the most recent holdings listing, semiannual report, or annual report on Fidelity's web site at http://www.fidelity.com, http://www.institutional.fidelity.com, or http://www.401k.com, as applicable.
NOT FDIC INSURED •MAY LOSE VALUE •NO BANK GUARANTEE
Neither the Fund nor Fidelity Distributors Corporation is a bank.
Item 7: Financial Statements and Financial Highlights for Open-End Management Investment Companies (Annual Report)
VIP Investment Grade Bond Portfolio
Schedule of Investments December 31, 2024
Showing Percentage of Net Assets
| Asset-Backed Securities - 8.6% |
| | | Principal Amount (a) | Value ($) |
| BAILIWICK OF JERSEY - 0.3% | | | |
| Aimco Clo 22 Ltd / Aimco Clo 22 LLC Series 2024-22A Class A, CME Term SOFR 3 month Index + 1.5%, 6.1174% 4/19/2037 (b)(c)(d) | | 800,000 | 806,300 |
| Blueberry Park Clo Ltd Series 2024-1A Class A, CME Term SOFR 3 month Index + 1.35%, 6.4761% 10/20/2037 (b)(c)(d) | | 3,422,000 | 3,446,334 |
| Dryden 108 Clo Ltd / Dryden 108 Clo LLC Series 2024-108A Class A1R, CME Term SOFR 3 month Index + 1.36%, 5.9924% 7/18/2037 (b)(c)(d) | | 5,437,000 | 5,466,474 |
| Invesco US CLO Ltd Series 2024-3A Class A, CME Term SOFR 3 month Index + 1.51%, 6.8292% 7/20/2037 (b)(c)(d) | | 2,568,000 | 2,584,081 |
TOTAL BAILIWICK OF JERSEY | | | 12,303,189 |
| CANADA - 0.0% | | | |
| Chesapeake Funding II LLC Series 2023-2A Class A1, 6.16% 10/15/2035 (d) | | 822,019 | 833,994 |
| Chesapeake Funding II LLC Series 2024-1A Class A1, 5.52% 5/15/2036 (d) | | 1,164,999 | 1,177,585 |
TOTAL CANADA | | | 2,011,579 |
| GRAND CAYMAN (UK OVERSEAS TER) - 4.7% | | | |
| Aimco CDO Series 2024-10A Class ARR, CME Term SOFR 3 month Index + 1.41%, 6.0416% 7/22/2037 (b)(c)(d) | | 1,752,000 | 1,763,915 |
| Aimco CLO 11 Ltd Series 2024-11A Class A1R2, CME Term SOFR 3 month Index + 1.34%, 5.9875% 7/17/2037 (b)(c)(d) | | 3,101,000 | 3,124,530 |
| Aimco Clo 14 Ltd / Aimco Clo 14 LLC Series 2021-14A Class A, CME Term SOFR 3 month Index + 1.2516%, 5.869% 4/20/2034 (b)(c)(d) | | 5,797,905 | 5,806,289 |
| Allegro Clo Ltd Series 2021-1A Class A, CME Term SOFR 3 month Index + 1.4016%, 6.019% 7/20/2034 (b)(c)(d) | | 2,835,654 | 2,835,637 |
| Allegro Clo Xii Ltd Series 2024-1A Class A1R, CME Term SOFR 3 month Index + 1.44%, 6.7236% 7/21/2037 (b)(c)(d) | | 4,612,000 | 4,616,884 |
| Ares LIV CLO Ltd Series 2024-54A Class AR, CME Term SOFR 3 month Index + 1.27%, 5.9259% 10/15/2032 (b)(c)(d) | | 3,701,000 | 3,704,842 |
| Ares Lix Clo Ltd Series 2021-59A Class A, CME Term SOFR 3 month Index + 1.2916%, 5.9175% 4/25/2034 (b)(c)(d) | | 1,923,930 | 1,926,298 |
| Ares Lv Clo Ltd Series 2024-55A Class A1R2, CME Term SOFR 3 month Index + 1.37%, 6.0259% 10/15/2037 (b)(c)(d) | | 2,566,000 | 2,579,438 |
| Ares Lviii Clo Ltd / Ares Lviii Clo LLC Series 2022-58A Class AR, CME Term SOFR 3 month Index + 1.33%, 5.9859% 1/15/2035 (b)(c)(d) | | 4,768,241 | 4,773,586 |
| Ares XLI Clo Ltd Series 2021-41A Class AR2, CME Term SOFR 3 month Index + 1.3316%, 5.9875% 4/15/2034 (b)(c)(d) | | 4,022,144 | 4,026,673 |
| Babson CLO Ltd/Cayman Islands Series 2021-1A Class AR, CME Term SOFR 3 month Index + 1.4116%, 6.0675% 10/15/2036 (b)(c)(d) | | 2,392,281 | 2,395,664 |
| Babson CLO Ltd/Cayman Islands Series 2025-1A Class A1R2, CME Term SOFR 3 month Index + 1.26%, 1.26% 1/15/2038 (b)(c)(d) | | 2,392,000 | 2,392,000 |
| Barings Clo Ltd Series 2024-4A Class AR, 6.4518% 10/20/2037 (b)(d) | | 3,594,000 | 3,609,231 |
| Barings Clo Ltd Series 2021-1A Class A, CME Term SOFR 3 month Index + 1.2816%, 5.9075% 4/25/2034 (b)(c)(d) | | 4,224,812 | 4,234,195 |
| Beechwood Park Clo Ltd Series 2022-1A Class A1R, CME Term SOFR 3 month Index + 1.3%, 5.9475% 1/17/2035 (b)(c)(d) | | 4,846,852 | 4,856,517 |
| Bristol Park CLO LTD Series 2020-1A Class AR, CME Term SOFR 3 month Index + 1.2516%, 5.9075% 4/15/2029 (b)(c)(d) | | 354,900 | 355,135 |
| Carlyle US CLO Ltd Series 2024-10A Class A1R, CME Term SOFR 3 month Index + 1.31%, 5.6852% 1/20/2038 (b)(c)(d) | | 2,444,000 | 2,445,009 |
| Carlyle US CLO Ltd Series 2024-11A Class A1R, CME Term SOFR 3 month Index + 1.41%, 6.0359% 7/25/2037 (b)(c)(d) | | 3,967,000 | 3,982,376 |
| Cedar Fdg Xii Clo Ltd / Cedar Fdg Xii Clo LLC Series 2021-12A Class A1R, CME Term SOFR 3 month Index + 1.3916%, 6.0175% 10/25/2034 (b)(c)(d) | | 2,218,566 | 2,221,577 |
| Cedar Funding Ltd Series 2024-10A Class AR2, CME Term SOFR 3 month Index + 1.36%, 5.9069% 10/20/2037 (b)(c)(d) | | 2,890,000 | 2,895,023 |
| CEDF Series 2021-6A Class ARR, CME Term SOFR 3 month Index + 1.3116%, 5.929% 4/20/2034 (b)(c)(d) | | 3,494,185 | 3,500,398 |
| Columbia Cent Clo 29 Ltd / Columbia Cent Clo 29 Corp Series 2021-29A Class AR, CME Term SOFR 3 month Index + 1.4316%, 6.049% 10/20/2034 (b)(c)(d) | | 3,598,073 | 3,601,308 |
| Columbia Cent Clo 31 Ltd Series 2021-31A Class A1, CME Term SOFR 3 month Index + 1.4616%, 6.079% 4/20/2034 (b)(c)(d) | | 3,860,350 | 3,866,503 |
| Dryden CLO Ltd Series 2022-98A Class A, CME Term SOFR 3 month Index + 1.3%, 5.9174% 4/20/2035 (b)(c)(d) | | 2,526,193 | 2,531,877 |
| Dryden CLO Ltd Series 2024-83A Class AR, CME Term SOFR 3 month Index + 1.53%, 6.1624% 4/18/2037 (b)(c)(d) | | 3,244,000 | 3,263,711 |
| Dryden CLO Ltd Series 2024-85A Class A1R2, CME Term SOFR 3 month Index + 1.38%, 6.0359% 7/15/2037 (b)(c)(d) | | 3,148,000 | 3,160,350 |
| Dryden Senior Loan Fund Series 2021-90A Class A1A, CME Term SOFR 3 month Index + 1.3916%, 5.9126% 2/20/2035 (b)(c)(d) | | 1,889,869 | 1,890,218 |
| Eaton Vance CLO Ltd Series 2021-1A Class A13R, CME Term SOFR 3 month Index + 1.5116%, 6.1675% 1/15/2034 (b)(c)(d) | | 1,005,251 | 1,007,542 |
| Eaton Vance CLO Ltd Series 2024-1A Class ARR, CME Term SOFR 3 month Index + 1.39%, 6.0459% 10/15/2037 (b)(c)(d) | | 3,105,000 | 3,110,428 |
| Eaton Vance CLO Ltd Series 2024-2A Class AR2, CME Term SOFR 3 month Index + 1.38%, 6.0359% 10/15/2037 (b)(c)(d) | | 4,331,000 | 4,338,298 |
| Flatiron Clo 20 Ltd / Flatiron Clo 20 LLC Series 2024-1A Class AR, CME Term SOFR 3 month Index + 1.38%, 5.901% 5/20/2036 (b)(c)(d) | | 1,600,000 | 1,604,274 |
| Flatiron Clo Ltd Series 2024-1A Class A1R, CME Term SOFR 3 month Index + 1.36%, 5.9774% 10/19/2037 (b)(c)(d) | | 4,033,000 | 4,054,927 |
| Flatiron Clo Ltd Series 2021-1A Class AR, CME Term SOFR 3 month Index + 1.3416%, 5.827% 11/16/2034 (b)(c)(d) | | 2,357,041 | 2,361,998 |
| Horizon Aircraft Finance Ltd Series 2019-1 Class A, 3.721% 7/15/2039 (d) | | 901,084 | 856,021 |
| Invesco Clo Ltd Series 2021-3A Class A, CME Term SOFR 3 month Index + 1.3916%, 6.0232% 10/22/2034 (b)(c)(d) | | 2,531,935 | 2,537,310 |
| Invesco US CLO Series 2024-1RA Class AR, CME Term SOFR 3 month Index + 1.55%, 6.2059% 4/15/2037 (b)(c)(d) | | 2,010,000 | 2,025,746 |
| Kkr Clo 41 Ltd Series 2022-41A Class A1, CME Term SOFR 3 month Index + 1.33%, 5.9773% 4/15/2035 (b)(c)(d) | | 5,870,431 | 5,876,847 |
| Madison Park Funding 2015 Series 2024-19A Class AR3, CME Term SOFR 3 month Index + 1.6%, 6.2316% 1/22/2037 (b)(c)(d) | | 1,852,000 | 1,863,592 |
| Madison Pk Fdg L Ltd / Madison Pk Fdg L LLC Series 2021-50A Class A, CME Term SOFR 3 month Index + 1.4016%, 6.019% 4/19/2034 (b)(c)(d) | | 4,047,691 | 4,054,815 |
| Madison Pk Fdg Lii Ltd / Madison Pk Fdg Lii LLC Series 2021-52A Class A, CME Term SOFR 3 month Index + 1.3616%, 5.9932% 1/22/2035 (b)(c)(d) | | 4,115,814 | 4,124,400 |
| Madison Pk Fdg Xlv Ltd / Madison Pk Fdg Xlv LLC Series 2024-45A Class ARR, CME Term SOFR 3 month Index + 1.08%, 5.4618% 7/15/2034 (b)(c)(d) | | 2,572,810 | 2,573,253 |
| MAGNE AR Series 2021-27A Class AR, CME Term SOFR 3 month Index + 1.4016%, 6.019% 10/20/2034 (b)(c)(d) | | 1,041,994 | 1,042,932 |
| Magnetite CLO Ltd Series 2024-30A Class AR, CME Term SOFR 3 month Index + 1.35%, 6.1433% 10/25/2037 (b)(c)(d) | | 4,363,331 | 4,384,943 |
| Magnetite Xli Ltd Series 2024-41A Class A, CME Term SOFR 3 month Index + 1.29%, 5.603% 1/25/2038 (b)(c)(d) | | 2,000,000 | 2,000,342 |
| Magnetite XXI Ltd Series 2021-21A Class AR, CME Term SOFR 3 month Index + 1.2816%, 5.899% 4/20/2034 (b)(c)(d) | | 3,374,400 | 3,382,860 |
| Magnetite Xxix Ltd / Magnetite Xxix LLC Series 2024-29A Class AR, CME Term SOFR 3 month Index + 1.35%, 6.5917% 7/15/2037 (b)(c)(d) | | 3,646,000 | 3,652,406 |
| Magnetite Xxviii Ltd Series 2025-28A Class A1RR, CME Term SOFR 3 month Index + 1.24%, 1.24% 1/15/2038 (b)(c)(d) | | 3,245,000 | 3,245,000 |
| Milos CLO Ltd Series 2020-1A Class AR, CME Term SOFR 3 month Index + 1.3316%, 5.949% 10/20/2030 (b)(c)(d) | | 1,899,644 | 1,901,770 |
| Neuberger Berman Loan Advisers Clo 25 Ltd Series 2024-25A Class AR2, CME Term SOFR 3 month Index + 1.4%, 6.0324% 7/18/2038 (b)(c)(d) | | 2,994,000 | 3,009,868 |
| Oak Hill Credit Partners Series 2024-13A Class AR, CME Term SOFR 3 month Index + 1.35%, 5.9674% 7/20/2037 (b)(c)(d) | | 5,025,000 | 5,053,522 |
| Oha Cr Fdg 4 Ltd / Oha Cr Fdg 4 LLC Series 2024-4A Class AR2, CME Term SOFR 3 month Index + 1.29%, 6.3132% 1/22/2038 (b)(c)(d) | | 3,652,000 | 3,652,621 |
| OHA Credit Funding 6 Ltd Series 2024-6A Class AR2, CME Term SOFR 3 month Index + 1.33%, 5.9218% 10/20/2037 (b)(c)(d) | | 2,820,000 | 2,825,426 |
| OHA Credit Partners Ltd Series 2024-18A Class A1, CME Term SOFR 3 month Index + 1.5%, 6.1174% 4/20/2037 (b)(c)(d) | | 800,000 | 801,161 |
| OHA Credit Partners XVII Ltd Series 2024-17A Class A, CME Term SOFR 3 month Index + 1.32%, 5.7215% 1/18/2038 (b)(c)(d) | | 1,231,000 | 1,231,314 |
| Palmer Square Loan Funding Ltd Series 2024-2A Class A1N, CME Term SOFR 3 month Index + 1%, 5.45% 1/15/2033 (b)(c)(d) | | 1,913,000 | 1,915,584 |
| Peace Park Clo Ltd Series 2021-1A Class A, CME Term SOFR 3 month Index + 1.3916%, 6.009% 10/20/2034 (b)(c)(d) | | 1,408,460 | 1,410,405 |
| Project Silver Series 2019-1 Class A, 3.967% 7/15/2044 (d) | | 1,961,764 | 1,839,781 |
| Rockland Park Clo Ltd Series 2021-1A Class A, CME Term SOFR 3 month Index + 1.3816%, 5.999% 4/20/2034 (b)(c)(d) | | 4,820,896 | 4,827,713 |
| Rr 34 Ltd Series 2024-34RA Class A1R, CME Term SOFR 3 month Index + 1.35%, 5.9123% 10/15/2039 (b)(c)(d) | | 1,572,000 | 1,574,724 |
| Rr 7 Ltd Series 2022-7A Class A1AB, CME Term SOFR 3 month Index + 1.34%, 5.9959% 1/15/2037 (b)(c)(d) | | 4,874,693 | 4,885,086 |
| SYMP Series 2022-32A Class A1, CME Term SOFR 3 month Index + 1.32%, 5.9463% 4/23/2035 (b)(c)(d) | | 5,044,198 | 5,050,866 |
| Symphony Clo 43 Ltd Series 2024-43A Class A1, CME Term SOFR 3 month Index + 1.52%, 6.1759% 4/15/2037 (b)(c)(d) | | 2,544,000 | 2,555,636 |
| Symphony Clo Xxi Ltd Series 2021-21A Class AR, CME Term SOFR 3 month Index + 1.3216%, 5.9775% 7/15/2032 (b)(c)(d) | | 579,442 | 580,018 |
| Symphony Clo Xxvi Ltd / Symphony Clo Xxvi LLC Series 2021-26A Class AR, CME Term SOFR 3 month Index + 1.3416%, 5.959% 4/20/2033 (b)(c)(d) | | 3,547,707 | 3,551,517 |
| Thunderbolt Aircraft Lease Series 2018-A Class A, 4.147% 9/15/2038 (b)(d) | | 1,905,920 | 1,832,894 |
| Thunderbolt III Aircraft Lease Ltd Series 2019-1 Class A, 3.671% 11/15/2039 (d) | | 2,393,672 | 2,274,084 |
| Voya Clo Ltd Series 2024-1A Class A1, CME Term SOFR 3 month Index + 1.52%, 6.1759% 4/15/2037 (b)(c)(d) | | 2,428,000 | 2,440,138 |
| Voya CLO Ltd/Voya CLO LLC Series 2021-2A Class A1R, CME Term SOFR 3 month Index + 1.4216%, 6.039% 7/19/2034 (b)(c)(d) | | 1,200,896 | 1,200,896 |
| Voya CLO Ltd/Voya CLO LLC Series 2021-3A Class AR, CME Term SOFR 3 month Index + 1.4116%, 6.029% 10/20/2034 (b)(c)(d) | | 4,837,926 | 4,843,886 |
| Voya CLO Ltd/Voya CLO LLC Series 2025-2A Class A1RR, CME Term SOFR 3 month Index + 1.31%, 1.31% 1/20/2038 (b)(c)(d) | | 1,201,000 | 1,201,210 |
TOTAL GRAND CAYMAN (UK OVERSEAS TER) | | | 204,917,238 |
| IRELAND - 0.0% | | | |
| Volofin Finance Designated Activity Co Series 2024-1A Class A, 5.935% 6/15/2037 (d) | | 1,691,204 | 1,694,315 |
| MULTI-NATIONAL - 0.2% | | | |
| Aimco Clo 21 Ltd / Aimco Clo 21 LLC Series 2024-21A Class A1, CME Term SOFR 3 month Index + 1.5%, 6.1324% 4/18/2037 (b)(c)(d) | | 2,499,000 | 2,518,311 |
| Allegro Clo Xv Ltd / Allegro Clo Vx LLC Series 2022-1A Class A, CME Term SOFR 3 month Index + 1.5%, 6.1174% 7/20/2035 (b)(c)(d) | | 3,019,149 | 3,021,755 |
| Ares Ln Fdg V Ltd / Ares Ln Fdg V LLC Series 2024-ALF5A Class A1, CME Term SOFR 3 month Index + 1.5%, 6.8235% 7/27/2037 (b)(c)(d) | | 3,329,000 | 3,341,907 |
TOTAL MULTI-NATIONAL | | | 8,881,973 |
| UNITED STATES - 3.4% | | | |
| Aaset 2024-1 US Ltd / Aaset 2024-1 Intl Ltd Series 2024-1A Class A1, 6.261% 5/16/2049 (d) | | 2,259,963 | 2,275,935 |
| Aaset 2024-1 US Ltd / Aaset 2024-1 Intl Ltd Series 2024-1A Class A2, 6.261% 5/16/2049 (d) | | 2,065,975 | 2,080,575 |
| AASET Trust Series 2018-1A Class A, 3.844% 1/16/2038 (d) | | 1,115,798 | 845,211 |
| AASET Trust Series 2019-1 Class A, 3.844% 5/15/2039 (d) | | 101,139 | 98,114 |
| AASET Trust Series 2019-2 Class A, 3.376% 10/16/2039 (d) | | 1,799,262 | 1,727,424 |
| AASET Trust Series 2019-2 Class B, 4.458% 10/16/2039 (d) | | 713,637 | 428,325 |
| AASET Trust Series 2021-1A Class A, 2.95% 11/16/2041 (d) | | 1,986,221 | 1,852,864 |
| AASET Trust Series 2021-2A Class A, 2.798% 1/15/2047 (d) | | 4,698,755 | 4,275,941 |
| Achv Abs Trust Series 2024-3AL Class A, 5.01% 12/26/2031 (d) | | 417,727 | 417,684 |
| Affirm Asset Securitization Trust Series 2023-X1 Class A, 7.11% 11/15/2028 (d) | | 129,360 | 129,679 |
| Affirm Asset Securitization Trust Series 2024-A Class 1A, 5.61% 2/15/2029 (d) | | 600,000 | 604,321 |
| Affirm Asset Securitization Trust Series 2024-X1 Class A, 6.27% 5/15/2029 (d) | | 658,305 | 660,544 |
| Aimco Clo 17 Ltd / Aimco Clo 17 LLC Series 2024-17A Class A1R, CME Term SOFR 3 month Index + 1.35%, 5.9816% 7/20/2037 (b)(c)(d) | | 2,994,000 | 3,020,940 |
| Aimco Clo 19 Ltd / Aimco Clo 19 LLC Series 2024-19A Class A, CME Term SOFR 3 month Index + 1.35%, 5.9123% 10/20/2037 (b)(c)(d) | | 1,106,000 | 1,111,407 |
| Ally Auto Receivables Trust Series 2024-1 Class A3, 5.08% 12/15/2028 | | 1,889,000 | 1,902,328 |
| American Express Credit Account Master Trust Series 2023-1 Class A, 4.87% 5/15/2028 | | 3,780,000 | 3,799,928 |
| Apollo Aviation Securitization Equity Trust Series 2020-1A Class A, 3.351% 1/16/2040 (d) | | 579,663 | 556,498 |
| Apollo Aviation Securitization Equity Trust Series 2020-1A Class B, 4.335% 1/16/2040 (d) | | 161,711 | 141,494 |
| BETHP Series 2021-1A Class A, CME Term SOFR 3 month Index + 1.3916%, 6.0475% 1/15/2035 (b)(c)(d) | | 3,615,104 | 3,622,200 |
| Blackbird Cap II Aircraft Lease Ltd / Blackbird Cap II Aircraft Lease Us L Series 2021-1A Class A, 2.443% 7/15/2046 (d) | | 3,635,966 | 3,317,900 |
| Blackbird Capital Aircraft Lease Securitization Ltd Series 2016-1A Class A, 6.5% 12/16/2041 (d)(e) | | 1,811,803 | 1,808,107 |
| Bofa Auto Trust Series 2024-1A Class A3, 5.35% 11/15/2028 (d) | | 730,000 | 738,986 |
| CarMax Auto Owner Trust Series 2023-2 Class A2A, 5.5% 6/15/2026 | | 245,064 | 245,256 |
| CarMax Auto Owner Trust Series 2023-4 Class A3, 6% 7/17/2028 | | 1,737,000 | 1,768,158 |
| CarMax Auto Owner Trust Series 2024-2 Class A3, 5.5% 1/16/2029 | | 1,374,000 | 1,395,897 |
| Castlelake Aircraft Securitization Series 2018-1 Class A, 4.125% 6/15/2043 (d) | | 579,952 | 550,956 |
| Castlelake Aircraft Securitization Trust Series 2019-1A Class A, 3.967% 4/15/2039 (d) | | 1,889,183 | 1,738,172 |
| Castlelake Aircraft Securitization Trust Series 2019-1A Class B, 5.095% 4/15/2039 (d) | | 1,232,658 | 875,335 |
| Castlelake Aircraft Structured Trust Series 2021-1A Class A, 3.474% 1/15/2046 (d) | | 430,155 | 413,332 |
| Cedar Funding Ltd Series 2022-15A Class A, CME Term SOFR 3 month Index + 1.32%, 5.9374% 4/20/2035 (b)(c)(d) | | 4,498,016 | 4,499,600 |
| CFMT LLC Series 2023-HB12 Class A, 4.25% 4/25/2033 (d) | | 679,610 | 672,941 |
| Chase Auto Owner Trust Series 2024-1A Class A3, 5.13% 5/25/2029 (d) | | 1,776,000 | 1,789,468 |
| Citizens Auto Receivables Trust Series 2024-2 Class A3, 5.33% 8/15/2028 (d) | | 900,000 | 909,768 |
| Cnh Equipment Trust Series 2023-A Class A2, 5.34% 9/15/2026 | | 244,097 | 244,300 |
| DB Master Finance LLC Series 2017-1A Class A2II, 4.03% 11/20/2047 (d) | | 3,191,015 | 3,094,987 |
| DLLAA Series 2023-1A Class A2, 5.93% 7/20/2026 (d) | | 276,116 | 277,189 |
| DLLAA Series 2023-1A Class A3, 5.64% 2/22/2028 (d) | | 770,000 | 781,518 |
| DLLAD Series 2023-1A Class A3, 4.79% 1/20/2028 (d) | | 700,000 | 701,533 |
| DLLAD Series 2024-1A Class A3, 5.3% 7/20/2029 (d) | | 598,000 | 605,881 |
| Dllmt 2024-1 LLC Series 2024-1A Class A3, 4.84% 8/21/2028 (d) | | 2,300,000 | 2,305,627 |
| Eaton Vance CLO Ltd Series 2024-1A Class AR2, CME Term SOFR 3 month Index + 1.51%, 6.1659% 7/15/2037 (b)(c)(d) | | 3,140,000 | 3,144,983 |
| Enterprise Fleet Financing LLC Series 2023-3 Class A2, 6.4% 3/20/2030 (d) | | 2,260,170 | 2,302,777 |
| Enterprise Fleet Financing Series 2024-2 Class A2, 5.74% 12/20/2026 (d) | | 1,100,000 | 1,109,279 |
| Enterprise Fleet Financing Series 2024-2 Class A3, 5.61% 4/20/2028 (d) | | 1,100,000 | 1,118,938 |
| Flatiron Clo 26 Ltd / Flatiron Clo 26 LLC Series 2024-4A Class A, CME Term SOFR 3 month Index + 1.33%, 5.7719% 1/15/2038 (b)(c)(d) | | 3,037,000 | 3,041,021 |
| Ford Credit Auto Owner Trust Series 2022-1 Class A, 3.88% 11/15/2034 (d) | | 1,000,000 | 981,936 |
| Ford Credit Floorplan Master Owner Trust A Series 2023-1 Class A1, 4.92% 5/15/2028 (d) | | 2,100,000 | 2,110,003 |
| GM Financial Consumer Automobile Receivables Trust Series 2023-3 Class A3, 5.45% 6/16/2028 | | 1,600,000 | 1,617,267 |
| Gm Financial Leasing Trust Series 2023-3 Class A3, 5.38% 11/20/2026 | | 786,000 | 790,114 |
| GMF Floorplan Owner Revolving Trust Series 2024-4A Class A1, 4.73% 11/15/2029 (d) | | 2,515,000 | 2,516,176 |
| Hamlin Pk Clo Ltd / Hamlin Pk Clo LLC Series 2024-1A Class A, CME Term SOFR 3 month Index + 1.34%, 5.9013% 10/20/2037 (b)(c)(d) | | 3,080,000 | 3,101,178 |
| Honda Auto Receivables 2023-3 Owner Tr Series 2023-3 Class A3, 5.41% 2/18/2028 | | 800,000 | 807,971 |
| Horizon Aircraft Finance I Limited Series 2018-1 Class A, 4.458% 12/15/2038 (d) | | 1,049,021 | 1,007,054 |
| HPEFS Equipment Trust Series 2024-2A Class A3, 5.36% 10/20/2031 (d) | | 700,000 | 706,906 |
| Jersey Mike's Funding Series 2024-1A Class A2, 5.636% 2/15/2055 (d) | | 2,675,000 | 2,641,611 |
| Marlette Funding Trust Series 2024-1A Class A, 5.95% 7/17/2034 (d) | | 369,856 | 371,523 |
| Mercedes-Benz Auto Lease Trust Series 2024-A Class A3, 5.32% 1/18/2028 | | 2,000,000 | 2,023,664 |
| Mercedes-Benz Auto Lease Trust Series 2024-B Class A3, 4.23% 2/15/2028 | | 1,300,000 | 1,294,034 |
| Merchants Fleet Funding LLC Series 2023-1A Class A, 7.21% 5/20/2036 (d) | | 1,042,431 | 1,055,049 |
| Merchants Fleet Funding LLC Series 2024-1A Class A, 5.82% 4/20/2037 (d) | | 1,600,000 | 1,615,603 |
| OWN Equipment Fund I LLC Series 2024-2M Class A, 5.7% 12/20/2032 (d) | | 1,000,000 | 1,000,801 |
| Park Place Securities Inc Asset-Backed Pass-Through Certificates Series 2005-WCH1 Class M4, CME Term SOFR 1 month Index + 1.3595%, 5.6982% 1/25/2036 (b)(c) | | 17,489 | 17,376 |
| Pk Alift Loan Funding 3 LP Series 2024-1 Class A1, 5.842% 9/15/2039 (d) | | 645,021 | 648,292 |
| Planet Fitness Master Issuer LLC Series 2019-1A Class A2, 3.858% 12/5/2049 (d) | | 2,613,450 | 2,403,497 |
| Planet Fitness Master Issuer LLC Series 2022-1A Class A2I, 3.251% 12/5/2051 (d) | | 2,866,930 | 2,754,785 |
| Planet Fitness Master Issuer LLC Series 2022-1A Class A2II, 4.008% 12/5/2051 (d) | | 2,561,565 | 2,320,433 |
| PRMI Securitization Trust Series 2024-CMG1 Class A1, U.S. 30-Day Avg. SOFR Index + 1.3%, 6.3045% 7/25/2054 (b)(c)(d) | | 1,002,350 | 1,001,566 |
| PRPM Trust Series 2023-RCF2 Class A1, 4% 11/25/2053 (d) | | 736,618 | 715,375 |
| SAPPHIRE AVIATION FINANCE Series 2020-1A Class A, 3.228% 3/15/2040 (d) | | 2,017,375 | 1,896,393 |
| SAPPHIRE AVIATION FINANCE Series 2020-1A Class B, 4.335% 3/15/2040 (d) | | 411,408 | 349,713 |
| SBA Tower Trust Series 2019, 2.836% 1/15/2050 (d) | | 3,520,000 | 3,516,392 |
| SBA Tower Trust Series 2020, 1.884% 7/15/2050 (d) | | 1,356,000 | 1,313,873 |
| SBA Tower Trust Series 2020, 2.328% 7/15/2052 (d) | | 1,037,000 | 945,816 |
| Sbna Auto Lease Trust Series 2024-B Class A3, 5.56% 11/22/2027 (d) | | 1,600,000 | 1,619,887 |
| SBNA Auto Lease Trust Series 2024-C Class A3, 4.56% 2/22/2028 (d) | | 1,500,000 | 1,499,352 |
| Sfs Auto Receivables Securitization Trust Series 2024-2A Class A3, 5.33% 11/20/2029 (d) | | 1,090,000 | 1,100,686 |
| Subway Funding LLC 2024-1X Series 2024-1A Class A23, 6.505% 7/30/2054 (d) | | 2,734,000 | 2,806,101 |
| Subway Funding LLC 2024-1X Series 2024-3A Class A2I, 5.246% 7/30/2054 (d) | | 4,031,000 | 3,924,765 |
| Subway Funding LLC Series 2024-1A Class A2I, 6.028% 7/30/2054 (d) | | 5,244,000 | 5,307,310 |
| Subway Funding LLC Series 2024-1A Class A2II, 6.268% 7/30/2054 (d) | | 3,117,000 | 3,170,701 |
| Subway Funding LLC Series 2024-3A Class A23, 5.914% 7/30/2054 (d) | | 3,866,000 | 3,775,267 |
| Subway Funding LLC Series 2024-3A Class A2II, 5.566% 7/30/2054 (d) | | 1,907,000 | 1,852,902 |
| Terwin Mortgage Trust Series 2003-4HE Class A1, CME Term SOFR 1 month Index + 0.9745%, 5.3132% 9/25/2034 (b)(c) | | 3,777 | 3,874 |
| Tesla Auto Lease Trust 23-A Series 2023-A Class A3, 5.89% 6/22/2026 (d) | | 1,685,764 | 1,691,681 |
| Tesla Series 2024-A Class A2A, 5.37% 6/22/2026 (d) | | 493,711 | 494,728 |
| Toyota Lease Owner Trust Series 2023-A Class A3, 4.93% 4/20/2026 (d) | | 1,343,600 | 1,344,958 |
| Upgrade Receivables Trust Series 2024-1A Class A, 5.37% 2/18/2031 (d) | | 400,000 | 400,485 |
| Volvo Financial Equipment LLC Series 2024-1A Class A3, 4.29% 10/16/2028 (d) | | 800,000 | 794,262 |
| Wheels Fleet Lease Funding 1 LLC Series 2024-1A Class A1, 5.49% 2/18/2039 (d) | | 1,500,000 | 1,517,071 |
| Wheels Fleet Lease Funding 1 LLC Series 2024-2A Class A1, 4.87% 6/21/2039 (d) | | 2,957,000 | 2,960,647 |
| Willis Engine Structured Tr VII Series 2023-A Class A, 8% 10/15/2048 (d) | | 1,303,738 | 1,347,883 |
| World Omni Auto Receivables Trust 2023-B Series 2023-B Class A3, 4.66% 5/15/2028 | | 1,974,000 | 1,976,186 |
| World Omni Auto Receivables Trust 2023-C Series 2023-C Class A3, 5.15% 11/15/2028 | | 965,000 | 971,864 |
TOTAL UNITED STATES | | | 149,088,332 |
| TOTAL ASSET-BACKED SECURITIES (Cost $380,900,419) | | | 378,896,626 |
| | | | |
| Bank Notes - 0.2% |
| | | Principal Amount (a) | Value ($) |
| UNITED STATES - 0.2% | | | |
| Financials - 0.2% | | | |
| Banks - 0.2% | | | |
| Discover Bank USD SOFR Spread-Adj ICE Swap Rate 5Y + 1.73%, 5.974% 8/9/2028 (b)(c) | | 1,567,000 | 1,595,761 |
| KeyBank NA/Cleveland OH 6.95% 2/1/2028 | | 800,000 | 834,147 |
| Regions Bank/Birmingham AL 6.45% 6/26/2037 | | 4,383,000 | 4,468,172 |
| | | | |
| TOTAL BANK NOTES (Cost $8,378,870) | | | 6,898,080 |
| | | | |
| Collateralized Mortgage Obligations - 1.1% |
| | | Principal Amount (a) | Value ($) |
| UNITED STATES - 1.1% | | | |
| Binom Securitization Trust Series 2022-RPL1 Class A1, 3% 2/25/2061 (d) | | 2,403,435 | 2,185,355 |
| Bravo Residential Funding Trust Series 2022-RPL1 Class A1, 2.75% 9/25/2061 (d) | | 3,935,877 | 3,536,295 |
| Bravo Residential Funding Trust Series 2023-RPL1 Class A1, 5% 5/25/2063 (d) | | 1,772,958 | 1,741,714 |
| CFMT LLC Series 2022-HB10 Class A, 3.25% 11/25/2035 (d) | | 2,346,301 | 2,322,463 |
| CFMT LLC Series 2022-HB8 Class A, 3.75% 4/25/2025 (d) | | 1,653,240 | 1,643,155 |
| CFMT LLC Series 2024-HB13 Class A, 3% 5/25/2034 (b)(d) | | 959,486 | 936,587 |
| CFMT LLC Series 2024-HB15 Class A, 4% 8/25/2034 (b)(d) | | 712,610 | 702,263 |
| Fannie Mae Guaranteed REMICS Series 2017-32 Class PA, 2.7% 5/25/2047 | | 5,070,323 | 4,484,334 |
| Fannie Mae Guaranteed REMICS Series 2017-37 Class AB, 2.55% 9/25/2046 | | 1,001,040 | 897,752 |
| Fannie Mae Guaranteed REMICS Series 2020-51 Class BA, 2% 6/25/2046 | | 865,606 | 750,942 |
| Fannie Mae Guaranteed REMICS Series 2021-21 Class HG, 2% 11/25/2047 | | 427,697 | 374,288 |
| Fannie Mae Guaranteed REMICS Series 2021-45 Class DA, 3% 7/25/2051 | | 642,877 | 551,269 |
| Fannie Mae Guaranteed REMICS Series 2021-59 Class H, 2% 6/25/2048 | | 104,232 | 84,034 |
| Fannie Mae Guaranteed REMICS Series 2021-66 Class DA, 2% 1/25/2048 | | 110,332 | 89,634 |
| Fannie Mae Guaranteed REMICS Series 2021-66 Class DM, 2% 1/25/2048 | | 117,252 | 95,255 |
| Fannie Mae Guaranteed REMICS Series 2021-69 Class JK, 1.5% 10/25/2051 | | 359,486 | 294,539 |
| Fannie Mae Guaranteed REMICS Series 2021-85 Class L, 2.5% 8/25/2048 | | 96,609 | 82,891 |
| Fannie Mae Guaranteed REMICS Series 2021-95 Class BA, 2.5% 6/25/2049 | | 1,130,640 | 965,047 |
| Fannie Mae Guaranteed REMICS Series 2021-95, 2.5% 9/25/2048 | | 740,417 | 636,758 |
| Fannie Mae Guaranteed REMICS Series 2021-96 Class AH, 2.5% 3/25/2049 | | 1,705,367 | 1,467,514 |
| Fannie Mae Guaranteed REMICS Series 2021-96 Class HA, 2.5% 2/25/2050 | | 157,919 | 133,983 |
| Fannie Mae Guaranteed REMICS Series 2022-1 Class KA, 3% 5/25/2048 | | 371,103 | 332,994 |
| Fannie Mae Guaranteed REMICS Series 2022-11 Class B, 3% 6/25/2049 | | 431,451 | 387,042 |
| Fannie Mae Guaranteed REMICS Series 2022-13 Class HA, 3% 8/25/2046 | | 337,878 | 310,422 |
| Fannie Mae Guaranteed REMICS Series 2022-13 Class JA, 3% 5/25/2048 | | 380,107 | 343,082 |
| Fannie Mae Guaranteed REMICS Series 2022-2 Class TH, 2.5% 2/25/2052 | | 214,961 | 191,798 |
| Fannie Mae Guaranteed REMICS Series 2022-25 Class AB, 4% 9/25/2047 | | 531,132 | 509,084 |
| Fannie Mae Guaranteed REMICS Series 2022-3 Class D, 2% 2/25/2048 | | 1,093,318 | 948,534 |
| Fannie Mae Guaranteed REMICS Series 2022-3 Class N, 2% 10/25/2047 | | 2,981,822 | 2,557,291 |
| Fannie Mae Guaranteed REMICS Series 2022-4 Class B, 2.5% 5/25/2049 | | 114,695 | 98,100 |
| Fannie Mae Guaranteed REMICS Series 2022-42 Class BA, 4% 6/25/2050 | | 1,110,752 | 1,048,635 |
| Fannie Mae Guaranteed REMICS Series 2022-49 Class TC, 4% 12/25/2048 | | 330,850 | 316,247 |
| Fannie Mae Guaranteed REMICS Series 2022-5 Class BA, 2.5% 12/25/2049 | | 456,069 | 379,764 |
| Fannie Mae Guaranteed REMICS Series 2022-5 Class DA, 2.25% 11/25/2047 | | 1,281,555 | 1,113,199 |
| Fannie Mae Guaranteed REMICS Series 2022-7 Class A, 3% 5/25/2048 | | 527,559 | 473,460 |
| Fannie Mae Guaranteed REMICS Series 2022-7 Class E, 2.5% 11/25/2047 | | 1,088,372 | 956,418 |
| Fannie Mae Mortgage pass-thru certificates Series 1999-57 Class PH, 6.5% 12/25/2029 | | 20,700 | 21,133 |
| Fannie Mae Series 2022-30 Class E, 4.5% 7/25/2048 | | 1,043,760 | 1,010,020 |
| Freddie Mac Multiclass Mortgage participation certificates Series 2021-5159 Class EA, 2.5% 8/25/2048 | | 328,363 | 281,747 |
| Freddie Mac Multiclass Mortgage participation certificates Series 2021-5159 Class GC, 2% 11/25/2047 | | 90,771 | 77,615 |
| Freddie Mac Multiclass Mortgage participation certificates Series 2021-5164 Class M, 2.5% 7/25/2048 | | 335,320 | 288,063 |
| Freddie Mac Multiclass Mortgage participation certificates Series 2021-5165 Class PC, 1.5% 11/25/2051 | | 450,484 | 369,465 |
| Freddie Mac Multifamily Structured pass-thru certificates Series 2020-5018 Class LC, 3% 10/25/2040 | | 247,006 | 219,120 |
| Freddie Mac Multifamily Structured pass-thru certificates Series 2021-5083 Class VA, 1% 8/15/2038 | | 869,778 | 822,088 |
| Freddie Mac Multifamily Structured pass-thru certificates Series 2021-5141 Class JM, 1.5% 4/25/2051 | | 264,947 | 216,129 |
| Freddie Mac Multifamily Structured pass-thru certificates Series 2021-5148 Class AD, 1.5% 10/25/2051 | | 355,849 | 291,072 |
| Freddie Mac Multifamily Structured pass-thru certificates Series 2021-5148 Class PC, 1.5% 10/25/2051 | | 350,466 | 283,387 |
| Freddie Mac Multifamily Structured pass-thru certificates Series 2021-5169 Class TP, 2.5% 6/25/2049 | | 332,847 | 283,614 |
| Freddie Mac Multifamily Structured pass-thru certificates Series 2021-5175 Class CB, 2.5% 4/25/2050 | | 567,146 | 479,631 |
| Freddie Mac Multifamily Structured pass-thru certificates Series 2021-5180 Class KA, 2.5% 10/25/2047 | | 113,465 | 99,374 |
| Freddie Mac Multifamily Structured pass-thru certificates Series 2021-5182 Class A, 2.5% 10/25/2048 | | 752,913 | 647,282 |
| Freddie Mac Multifamily Structured pass-thru certificates Series 2022-5189 Class DA, 2.5% 5/25/2049 | | 276,205 | 235,881 |
| Freddie Mac Multifamily Structured pass-thru certificates Series 2022-5189 Class TP, 2.5% 5/25/2049 | | 256,966 | 219,450 |
| Freddie Mac Multifamily Structured pass-thru certificates Series 2022-5190 Class BA, 2.5% 11/25/2047 | | 275,294 | 240,931 |
| Freddie Mac Multifamily Structured pass-thru certificates Series 2022-5190 Class CA, 2.5% 5/25/2049 | | 214,829 | 183,389 |
| Freddie Mac Multifamily Structured pass-thru certificates Series 2022-5191 Class CA, 2.5% 4/25/2050 | | 133,383 | 112,177 |
| Freddie Mac Multifamily Structured pass-thru certificates Series 2022-5197 Class A, 2.5% 6/25/2049 | | 214,829 | 183,389 |
| Freddie Mac Multifamily Structured pass-thru certificates Series 2022-5197 Class DA, 2.5% 11/25/2047 | | 208,931 | 183,026 |
| Freddie Mac Multifamily Structured pass-thru certificates Series 2022-5198 Class BA, 2.5% 11/25/2047 | | 977,239 | 860,642 |
| Freddie Mac Multifamily Structured pass-thru certificates Series 2022-5202 Class LB, 2.5% 10/25/2047 | | 224,310 | 196,794 |
| Freddie Mac Multifamily Structured pass-thru certificates Series 2022-5210 Class AB, 3% 1/25/2042 | | 618,941 | 564,611 |
| Freddie Mac Multifamily Structured pass-thru certificates Series 2022-5236 Class P, 5% 4/25/2048 | | 392,801 | 389,610 |
| Freddie Mac Multifamily Structured pass-thru certificates Series 2022-5266 Class CD, 4.5% 10/25/2044 | | 1,006,163 | 989,357 |
| Ginnie Mae REMIC pass-thru certificates Series 2007-35 Class SC, CME Term SOFR 1 month Index x 39.5131%, 13.1306% 6/16/2037 (b)(c) | | 4,401 | 4,919 |
| GS Mortgage-Backed Securities Trust Series 2024-RPL2 Class A1, 3.75% 7/25/2061 (d) | | 460,294 | 441,637 |
| MFRA Trust Series 2024-RPL1 Class A1, 4.25% 2/25/2066 (b)(d) | | 481,305 | 442,999 |
| NYMT Loan Trust Series 2021-CP1 Class A1, 2.0424% 7/25/2061 (d) | | 1,254,342 | 1,143,646 |
| NYMT Loan Trust Series 2024-CP1 Class A1, 3.75% 2/25/2068 (d) | | 640,888 | 586,197 |
| Ocwen Loan Investment Trust Series 2023-HB1 Class A, 3% 6/25/2036 (d) | | 206,032 | 202,771 |
| Ocwen Loan Investment Trust Series 2024-HB1 Class A, 3% 2/25/2037 (d) | | 201,713 | 195,363 |
| Onity Loan Investment Trust 2024-Hb2 Series 2024-HB2 Class A, 5% 8/25/2037 (d) | | 438,662 | 437,336 |
| PRPM LLC Series 2024-RCF3 Class A1, 4% 5/25/2054 (d) | | 1,114,312 | 1,080,926 |
| PRPM LLC Series 2024-RCF4 Class A1, 4% 7/25/2054 (d) | | 352,248 | 341,212 |
| PRPM LLC Series 2024-RPL2 Class A1, 3.5% 5/25/2054 (b)(d) | | 1,210,940 | 1,157,399 |
| Sequoia Mortgage Trust Series 2004-6 Class A3B, CME Term SOFR 6 month Index + 1.3083%, 5.5914% 7/20/2034 (b)(c) | | 808 | 744 |
| Towd Point Mortgage Trust Series 2022-1 Class A1, 3.75% 7/25/2062 (d) | | 1,252,813 | 1,159,483 |
TOTAL UNITED STATES | | | 50,885,771 |
| TOTAL COLLATERALIZED MORTGAGE OBLIGATIONS (Cost $51,664,925) | | | 50,885,771 |
| | | | |
| Commercial Mortgage Securities - 5.9% |
| | | Principal Amount (a) | Value ($) |
| UNITED STATES - 5.9% | | | |
| BAMLL Commercial Mortgage Securities Trust Series 2019-BPR Class ANM, 3.112% 11/5/2032 (d) | | 2,189,000 | 2,014,099 |
| BAMLL Commercial Mortgage Securities Trust Series 2019-BPR Class BNM, 3.465% 11/5/2032 (d) | | 491,000 | 418,637 |
| BAMLL Commercial Mortgage Securities Trust Series 2019-BPR Class CNM, 3.7186% 11/5/2032 (b)(d) | | 248,000 | 177,981 |
| BAMLL Commercial Mortgage Securities Trust Series 2022-DKLX Class A, CME Term SOFR 1 month Index + 1.15%, 5.548% 1/15/2039 (b)(c)(d) | | 2,486,701 | 2,478,199 |
| BAMLL Commercial Mortgage Securities Trust Series 2022-DKLX Class B, CME Term SOFR 1 month Index + 1.55%, 5.948% 1/15/2039 (b)(c)(d) | | 560,468 | 556,461 |
| BAMLL Commercial Mortgage Securities Trust Series 2022-DKLX Class C, CME Term SOFR 1 month Index + 2.15%, 6.548% 1/15/2039 (b)(c)(d) | | 396,318 | 392,724 |
| BANK Series 2017-BNK5 Class ASB, 3.179% 6/15/2060 | | 925,635 | 908,861 |
| BANK Series 2018-BN10 Class A4, 3.428% 2/15/2061 | | 1,312,918 | 1,256,769 |
| BANK Series 2018-BN10 Class A5, 3.688% 2/15/2061 | | 218,564 | 210,247 |
| BANK Series 2018-BN10 Class ASB, 3.641% 2/15/2061 | | 304,010 | 299,787 |
| BANK Series 2018-BN14 Class A4, 4.231% 9/15/2060 | | 1,000,000 | 971,378 |
| BANK Series 2019-BN19 Class ASB, 3.071% 8/15/2061 | | 785,257 | 752,776 |
| BANK Series 2019-BN21 Class A5, 2.851% 10/17/2052 | | 373,546 | 335,107 |
| BANK Series 2019-BN23 Class ASB, 2.846% 12/15/2052 | | 199,479 | 189,631 |
| BANK Series 2020-BN26 Class ASB, 2.313% 3/15/2063 | | 1,400,000 | 1,313,356 |
| BANK Series 2021-BN33 Class XA, 1.0471% 5/15/2064 (b)(f) | | 13,368,516 | 605,202 |
| BANK Series 2021-BN35 Class ASB, 2.067% 6/15/2064 | | 700,000 | 626,300 |
| BBCMS Mortgage Trust Series 2022-C14 Class ASB, 2.901% 2/15/2055 | | 660,000 | 604,790 |
| BBCMS Mortgage Trust Series 2023-C21 Class A3, 6.2967% 9/15/2056 (b) | | 1,817,000 | 1,900,061 |
| Benchmark Mortgage Trust Series 2018-B4 Class A5, 4.121% 7/15/2051 | | 778,315 | 753,004 |
| Benchmark Mortgage Trust Series 2018-B8 Class A5, 4.2317% 1/15/2052 | | 5,335,798 | 5,107,569 |
| Benchmark Mortgage Trust Series 2019-B10 Class A4, 3.717% 3/15/2062 | | 1,021,545 | 966,058 |
| Benchmark Mortgage Trust Series 2021-B27 Class XA, 1.2513% 7/15/2054 (b)(f) | | 2,758,296 | 152,941 |
| Benchmark Mortgage Trust Series 2021-B28 Class ASB, 1.9804% 8/15/2054 | | 1,850,000 | 1,644,505 |
| BLP Commercial Mortgage Trust Series 2024-IND2 Class A, CME Term SOFR 1 month Index + 1.3422%, 5.7392% 3/15/2041 (b)(c)(d) | | 1,628,114 | 1,628,623 |
| BMO Mortgage Trust Series 2022-C3 Class ASB, 5.3255% 9/15/2054 (b) | | 700,000 | 711,748 |
| BMP Series 2024-MF23 Class A, CME Term SOFR 1 month Index + 1.3719%, 5.769% 6/15/2041 (b)(c)(d) | | 2,329,000 | 2,337,658 |
| BMP Series 2024-MF23 Class B, CME Term SOFR 1 month Index + 1.6416%, 6.0387% 6/15/2041 (b)(c)(d) | | 1,150,000 | 1,151,797 |
| BMP Series 2024-MF23 Class C, CME Term SOFR 1 month Index + 1.8413%, 6.2384% 6/15/2041 (b)(c)(d) | | 813,000 | 813,508 |
| BPR Trust Series 2022-OANA Class A, CME Term SOFR 1 month Index + 1.898%, 6.2951% 4/15/2037 (b)(c)(d) | | 7,237,933 | 7,265,075 |
| BPR Trust Series 2022-OANA Class B, CME Term SOFR 1 month Index + 2.447%, 6.8441% 4/15/2037 (b)(c)(d) | | 2,324,753 | 2,334,924 |
| BX Commercial Mortgage Trust Series 2019-IMC Class A, CME Term SOFR 1 month Index + 1.0463%, 5.4433% 4/15/2034 (b)(c)(d) | | 2,544,198 | 2,525,539 |
| BX Commercial Mortgage Trust Series 2019-IMC Class B, CME Term SOFR 1 month Index + 1.3463%, 5.7433% 4/15/2034 (b)(c)(d) | | 1,864,321 | 1,846,843 |
| BX Commercial Mortgage Trust Series 2019-IMC Class C, CME Term SOFR 1 month Index + 1.6463%, 6.0433% 4/15/2034 (b)(c)(d) | | 1,232,474 | 1,217,838 |
| BX Commercial Mortgage Trust Series 2019-IMC Class D, CME Term SOFR 1 month Index + 1.9463%, 6.3433% 4/15/2034 (b)(c)(d) | | 1,293,785 | 1,276,804 |
| BX Commercial Mortgage Trust Series 2021-PAC Class A, CME Term SOFR 1 month Index + 0.8036%, 5.2006% 10/15/2036 (b)(c)(d) | | 5,017,787 | 4,992,699 |
| BX Commercial Mortgage Trust Series 2021-PAC Class B, CME Term SOFR 1 month Index + 1.0133%, 5.4103% 10/15/2036 (b)(c)(d) | | 733,467 | 727,966 |
| BX Commercial Mortgage Trust Series 2021-PAC Class C, CME Term SOFR 1 month Index + 1.2131%, 5.6101% 10/15/2036 (b)(c)(d) | | 981,551 | 972,962 |
| BX Commercial Mortgage Trust Series 2021-PAC Class D, CME Term SOFR 1 month Index + 1.4128%, 5.8098% 10/15/2036 (b)(c)(d) | | 952,598 | 943,072 |
| BX Commercial Mortgage Trust Series 2021-PAC Class E, CME Term SOFR 1 month Index + 2.062%, 6.459% 10/15/2036 (b)(c)(d) | | 3,312,521 | 3,300,099 |
| BX Commercial Mortgage Trust Series 2021-VINO Class A, CME Term SOFR 1 month Index + 0.7668%, 5.1638% 5/15/2038 (b)(c)(d) | | 78,278 | 78,204 |
| BX Commercial Mortgage Trust Series 2022-IND Class A, CME Term SOFR 1 month Index + 1.491%, 5.8881% 4/15/2037 (b)(c)(d) | | 3,399,195 | 3,403,444 |
| BX Commercial Mortgage Trust Series 2022-LP2 Class A, CME Term SOFR 1 month Index + 1.0129%, 5.41% 2/15/2039 (b)(c)(d) | | 3,883,834 | 3,885,047 |
| BX Commercial Mortgage Trust Series 2022-LP2 Class B, CME Term SOFR 1 month Index + 1.3123%, 5.7094% 2/15/2039 (b)(c)(d) | | 1,404,350 | 1,399,084 |
| BX Commercial Mortgage Trust Series 2022-LP2 Class C, CME Term SOFR 1 month Index + 1.5617%, 5.9588% 2/15/2039 (b)(c)(d) | | 1,404,350 | 1,399,084 |
| BX Commercial Mortgage Trust Series 2022-LP2 Class D, CME Term SOFR 1 month Index + 1.9608%, 6.3579% 2/15/2039 (b)(c)(d) | | 1,404,350 | 1,399,084 |
| BX Commercial Mortgage Trust Series 2023-XL3 Class A, CME Term SOFR 1 month Index + 1.7614%, 6.1585% 12/9/2040 (b)(c)(d) | | 1,880,855 | 1,888,496 |
| BX Commercial Mortgage Trust Series 2023-XL3 Class B, CME Term SOFR 1 month Index + 2.1908%, 6.5879% 12/9/2040 (b)(c)(d) | | 415,622 | 416,011 |
| BX Commercial Mortgage Trust Series 2023-XL3 Class C, CME Term SOFR 1 month Index + 2.6402%, 7.0373% 12/9/2040 (b)(c)(d) | | 224,916 | 225,057 |
| BX Commercial Mortgage Trust Series 2024-5C6 Class A3, 5.3161% 9/15/2057 | | 1,800,000 | 1,805,133 |
| BX Commercial Mortgage Trust Series 2024-GPA3 Class A, CME Term SOFR 1 month Index + 1.2928%, 5.7998% 12/15/2039 (b)(c)(d) | | 1,194,000 | 1,194,367 |
| BX Commercial Mortgage Trust Series 2024-MDHS Class A, 6.0384% 5/15/2041 (b)(d) | | 4,290,870 | 4,310,984 |
| BX Commercial Mortgage Trust Series 2024-XL5 Class A, CME Term SOFR 1 month Index + 1.3917%, 5.7887% 3/15/2041 (b)(c)(d) | | 8,495,463 | 8,529,976 |
| BX Trust Series 2019-OC11 Class XA, 0.742% 12/9/2041 (b)(d)(f) | | 61,700,000 | 1,955,464 |
| BX Trust Series 2021-BXMF Class A, CME Term SOFR 1 month Index + 0.7504%, 5.1474% 10/15/2026 (b)(c)(d) | | 888,829 | 884,940 |
| BX Trust Series 2021-LBA Class AJV, CME Term SOFR 1 month Index + 0.9145%, 5.3125% 2/15/2036 (b)(c)(d) | | 300,000 | 300,000 |
| BX Trust Series 2022-IND Class B, CME Term SOFR 1 month Index + 1.94%, 6.3371% 4/15/2037 (b)(c)(d) | | 1,732,888 | 1,735,054 |
| BX Trust Series 2022-IND Class C, CME Term SOFR 1 month Index + 2.29%, 6.6871% 4/15/2037 (b)(c)(d) | | 391,239 | 391,973 |
| BX Trust Series 2022-IND Class D, CME Term SOFR 1 month Index + 2.839%, 7.2361% 4/15/2037 (b)(c)(d) | | 327,604 | 328,219 |
| BX Trust Series 2024-CNYN Class A, CME Term SOFR 1 month Index + 1.4419%, 5.839% 4/15/2041 (b)(c)(d) | | 5,228,379 | 5,241,451 |
| BX Trust Series 2024-CNYN Class B, CME Term SOFR 1 month Index + 1.6915%, 6.0886% 4/15/2041 (b)(c)(d) | | 833,585 | 835,876 |
| BX Trust Series 2024-CNYN Class C, CME Term SOFR 1 month Index + 1.9412%, 6.3383% 4/15/2041 (b)(c)(d) | | 691,902 | 693,199 |
| BX Trust Series 2024-XL4 Class A, CME Term SOFR 1 month Index + 1.442%, 5.8391% 2/15/2039 (b)(c)(d) | | 3,870,541 | 3,886,266 |
| BX Trust Series 2024-XL4 Class B, CME Term SOFR 1 month Index + 1.7915%, 6.1886% 2/15/2039 (b)(c)(d) | | 485,033 | 485,032 |
| BX Trust Series 2024-XL5 Class B, CME Term SOFR 1 month Index + 1.6912%, 6.0883% 3/15/2041 (b)(c)(d) | | 1,451,041 | 1,450,587 |
| BX Trust Series 2024-XL5 Class C, CME Term SOFR 1 month Index + 1.9409%, 6.338% 3/15/2041 (b)(c)(d) | | 1,926,881 | 1,926,279 |
| CAMB Commercial Mortgage Trust Series 2019-LIFE Class A, CME Term SOFR 1 month Index + 1.367%, 5.765% 12/15/2037 (b)(c)(d) | | 300,000 | 300,150 |
| CF Hippolyta Issuer LLC Series 2021-1A Class A1, 1.53% 3/15/2061 (d) | | 5,401,623 | 5,120,918 |
| Citigroup Commercial Mortgage Trust Series 2016-C1 Class A4, 3.209% 5/10/2049 | | 400,000 | 390,647 |
| Citigroup Commercial Mortgage Trust Series 2020-GC46 Class AAB, 2.614% 2/15/2053 | | 700,000 | 661,903 |
| COMM Mortgage Trust Series 2017-COR2 Class ASB, 3.317% 9/10/2050 | | 373,703 | 366,066 |
| Computershare Corporate Trust Series 2018-C48 Class A5, 4.302% 1/15/2052 | | 2,174,228 | 2,113,847 |
| CSMC Trust Series 2020-NET Class A, 2.2569% 8/15/2037 (d) | | 556,525 | 542,385 |
| DTP Coml Mtg Trust Series 2023-STE2 Class A, 5.8433% 1/15/2041 (b)(d) | | 775,000 | 783,265 |
| ELP Commercial Mortgage Trust Series 2021-ELP Class A, CME Term SOFR 1 month Index + 0.8155%, 5.2135% 11/15/2038 (b)(c)(d) | | 6,763,069 | 6,758,842 |
| ELP Commercial Mortgage Trust Series 2021-ELP Class B, CME Term SOFR 1 month Index + 1.2347%, 5.6327% 11/15/2038 (b)(c)(d) | | 898,954 | 897,830 |
| Extended Stay America Trust Series 2021-ESH Class A, CME Term SOFR 1 month Index + 1.1945%, 5.5915% 7/15/2038 (b)(c)(d) | | 1,483,252 | 1,484,179 |
| Extended Stay America Trust Series 2021-ESH Class B, CME Term SOFR 1 month Index + 1.4945%, 5.8915% 7/15/2038 (b)(c)(d) | | 1,125,651 | 1,126,354 |
| Extended Stay America Trust Series 2021-ESH Class C, CME Term SOFR 1 month Index + 1.8145%, 6.2115% 7/15/2038 (b)(c)(d) | | 830,586 | 831,624 |
| Extended Stay America Trust Series 2021-ESH Class D, CME Term SOFR 1 month Index + 2.3645%, 6.7615% 7/15/2038 (b)(c)(d) | | 1,672,622 | 1,676,803 |
| Freddie Mac Multifamily Structured pass-thru certificates Series 2015-K047 Class A2, 3.329% 5/25/2025 | | 2,632,059 | 2,616,039 |
| Freddie Mac Multifamily Structured pass-thru certificates Series 2015-K049 Class A2, 3.01% 7/25/2025 | | 317,698 | 314,881 |
| Freddie Mac Multifamily Structured pass-thru certificates Series 2016-K054 Class A2, 2.745% 1/25/2026 | | 1,694,509 | 1,665,561 |
| Freddie Mac Multifamily Structured pass-thru certificates Series 2016-K055 Class A2, 2.673% 3/25/2026 | | 3,475,902 | 3,403,692 |
| Freddie Mac Multifamily Structured pass-thru certificates Series 2016-K058 Class A2, 2.653% 8/25/2026 | | 2,700,000 | 2,620,501 |
| Freddie Mac Multifamily Structured pass-thru certificates Series 2017-K066 Class A2, 3.117% 6/25/2027 | | 400,000 | 386,804 |
| Freddie Mac Multifamily Structured pass-thru certificates Series 2017-K069 Class A2, 3.187% 9/25/2027 | | 495,749 | 478,141 |
| Freddie Mac Multifamily Structured pass-thru certificates Series 2017-K070 Class A2, 3.303% 11/25/2027 | | 1,400,000 | 1,351,489 |
| Freddie Mac Multifamily Structured pass-thru certificates Series 2017-K071 Class A2, 3.286% 11/25/2027 | | 1,000,000 | 964,024 |
| Freddie Mac Multifamily Structured pass-thru certificates Series 2018-K072 Class A2, 3.444% 12/25/2027 | | 1,200,000 | 1,160,795 |
| Freddie Mac Multifamily Structured pass-thru certificates Series 2018-K073 Class A2, 3.35% 1/25/2028 | | 1,600,000 | 1,542,914 |
| Freddie Mac Multifamily Structured pass-thru certificates Series 2018-K074 Class A2, 3.6% 1/25/2028 | | 3,400,000 | 3,300,367 |
| Freddie Mac Multifamily Structured pass-thru certificates Series 2018-K075 Class A2, 3.65% 2/25/2028 | | 4,400,000 | 4,271,882 |
| Freddie Mac Multifamily Structured pass-thru certificates Series 2018-K076 Class A2, 3.9% 4/25/2028 | | 700,000 | 683,840 |
| Freddie Mac Multifamily Structured pass-thru certificates Series 2018-K077 Class A2, 3.85% 5/25/2028 | | 2,400,000 | 2,339,383 |
| Freddie Mac Multifamily Structured pass-thru certificates Series 2018-K081 Class A2, 3.9% 8/25/2028 | | 500,000 | 486,978 |
| Freddie Mac Multifamily Structured pass-thru certificates Series 2018-K083 Class A2, 4.05% 9/25/2028 | | 600,000 | 586,930 |
| Freddie Mac Multifamily Structured pass-thru certificates Series 2018-K084 Class A2, 3.78% 10/25/2028 | | 500,000 | 483,755 |
| Freddie Mac Multifamily Structured pass-thru certificates Series 2018-K085 Class A2, 4.06% 10/25/2028 | | 800,000 | 781,441 |
| Freddie Mac Multifamily Structured pass-thru certificates Series 2019-K091 Class A2, 3.505% 3/25/2029 | | 1,200,000 | 1,146,232 |
| Freddie Mac Multifamily Structured pass-thru certificates Series 2019-K098 Class A2, 2.425% 8/25/2029 | | 400,000 | 362,422 |
| Freddie Mac Multifamily Structured pass-thru certificates Series 2020-K740 Class A2, 1.47% 9/25/2027 | | 1,400,000 | 1,288,989 |
| Freddie Mac Multifamily Structured pass-thru certificates Series 2021-K744 Class A2, 1.712% 7/25/2028 | | 676,517 | 614,596 |
| Freddie Mac Multifamily Structured pass-thru certificates Series 2021-K745 Class A2, 1.657% 8/25/2028 | | 700,000 | 630,953 |
| Freddie Mac Multifamily Structured pass-thru certificates Series 2022-151 Class A2, 3.8% 10/25/2032 | | 400,000 | 371,431 |
| Freddie Mac Multifamily Structured pass-thru certificates Series 2022-K140 Class A2, 2.25% 1/25/2032 | | 600,000 | 506,715 |
| Freddie Mac Multifamily Structured pass-thru certificates Series 2022-K748 Class A2, 2.26% 1/25/2029 | | 5,500,000 | 5,012,806 |
| Freddie Mac Multifamily Structured pass-thru certificates Series 2023-K751 Class A2, 4.412% 3/25/2030 | | 1,100,000 | 1,082,112 |
| Freddie Mac Multifamily Structured pass-thru certificates Series 2023-K752 Class A2, 4.284% 7/25/2030 | | 2,300,000 | 2,241,454 |
| Freddie Mac Multifamily Structured pass-thru certificates Series 2024-164 Class A2, 5% 5/25/2034 | | 200,000 | 200,431 |
| Freddie Mac Multifamily Structured pass-thru certificates Series 2024-165 Class A2, 4.489% 9/25/2034 | | 200,000 | 192,655 |
| Freddie Mac Multifamily Structured pass-thru certificates Series 2024-K517 Class A2, 5.355% 1/25/2029 | | 1,400,000 | 1,430,391 |
| Freddie Mac Multifamily Structured pass-thru certificates Series 2024-K758 Class A2, 4.68% 10/25/2031 | | 400,000 | 395,392 |
| GS Mortgage Securities Trust Series 2015-GC34 Class A3, 3.244% 10/10/2048 | | 178,110 | 176,512 |
| GS Mortgage Securities Trust Series 2017-GS6 Class A2, 3.164% 5/10/2050 | | 277,161 | 265,769 |
| GS Mortgage Securities Trust Series 2017-GS8 Class AAB, 3.313% 11/10/2050 | | 723,712 | 712,584 |
| GS Mortgage Securities Trust Series 2018-3PCK Class A, CME Term SOFR 1 month Index + 2.0645%, 6.4625% 9/15/2031 (b)(c)(d) | | 1,099,199 | 1,089,602 |
| GS Mortgage Securities Trust Series 2018-GS10 Class A4, 3.89% 7/10/2051 | | 600,000 | 571,638 |
| GS Mortgage Securities Trust Series 2018-GS10 Class A5, 4.155% 7/10/2051 | | 700,000 | 669,206 |
| GS Mortgage Securities Trust Series 2018-GS10 Class AAB, 4.106% 7/10/2051 | | 137,465 | 135,939 |
| GS Mortgage Securities Trust Series 2019-GSA1 Class A4, 3.0479% 11/10/2052 | | 500,000 | 456,930 |
| GS Mortgage Securities Trust Series 2021-IP Class A, CME Term SOFR 1 month Index + 1.0645%, 5.4625% 10/15/2036 (b)(c)(d) | | 3,667,747 | 3,643,045 |
| GS Mortgage Securities Trust Series 2021-IP Class B, CME Term SOFR 1 month Index + 1.2645%, 5.6625% 10/15/2036 (b)(c)(d) | | 544,915 | 535,576 |
| GS Mortgage Securities Trust Series 2021-IP Class C, CME Term SOFR 1 month Index + 1.6645%, 6.0625% 10/15/2036 (b)(c)(d) | | 449,243 | 443,727 |
| Intown Mortgage Trust Series 2022-STAY Class A, CME Term SOFR 1 month Index + 2.4886%, 6.8856% 8/15/2039 (b)(c)(d) | | 6,086,000 | 6,089,804 |
| JPMBB Commercial Mortgage Securities Trust Series 2015-C33 Class A3, 3.5043% 12/15/2048 | | 302,005 | 299,340 |
| JPMCC Commercial Mortgage Securities Trust Series 2016-JP4 Class ASB, 3.4743% 12/15/2049 | | 1,414,233 | 1,397,269 |
| JPMCC Commercial Mortgage Securities Trust Series 2017-JP6 Class ASB, 3.2829% 7/15/2050 | | 191,789 | 189,069 |
| JPMorgan Chase Commercial Mortgage Securities Trust Series 2018-WPT Class AFX, 4.2475% 7/5/2033 (d) | | 277,000 | 259,848 |
| JPMorgan Chase Commercial Mortgage Securities Trust Series 2018-WPT Class CFX, 4.9498% 7/5/2033 (d) | | 505,398 | 398,294 |
| JPMorgan Chase Commercial Mortgage Securities Trust Series 2018-WPT Class DFX, 5.3503% 7/5/2033 (d) | | 715,868 | 455,882 |
| JPMorgan Chase Commercial Mortgage Securities Trust Series 2022-NLP Class A, CME Term SOFR 1 month Index + 0.5965%, 4.9936% 4/15/2037 (b)(c)(d) | | 1,439,036 | 1,407,107 |
| Life Financial Services Trust Series 2022-BMR2 Class A1, CME Term SOFR 1 month Index + 1.2952%, 5.6923% 5/15/2039 (b)(c)(d) | | 5,702,564 | 5,574,257 |
| Life Financial Services Trust Series 2022-BMR2 Class B, CME Term SOFR 1 month Index + 1.7939%, 6.191% 5/15/2039 (b)(c)(d) | | 4,064,838 | 3,905,969 |
| Life Financial Services Trust Series 2022-BMR2 Class C, CME Term SOFR 1 month Index + 2.0931%, 6.4902% 5/15/2039 (b)(c)(d) | | 2,311,651 | 2,190,289 |
| Life Financial Services Trust Series 2022-BMR2 Class D, CME Term SOFR 1 month Index + 2.5419%, 6.939% 5/15/2039 (b)(c)(d) | | 2,054,528 | 1,903,527 |
| LIFE Mortgage Trust Series 2021-BMR Class A, CME Term SOFR 1 month Index + 0.8145%, 5.2115% 3/15/2038 (b)(c)(d) | | 2,463,277 | 2,432,486 |
| LIFE Mortgage Trust Series 2021-BMR Class B, CME Term SOFR 1 month Index + 0.9945%, 5.3915% 3/15/2038 (b)(c)(d) | | 792,459 | 782,058 |
| LIFE Mortgage Trust Series 2021-BMR Class C, CME Term SOFR 1 month Index + 1.2145%, 5.6115% 3/15/2038 (b)(c)(d) | | 498,439 | 491,273 |
| LIFE Mortgage Trust Series 2021-BMR Class D, CME Term SOFR 1 month Index + 1.5145%, 5.9115% 3/15/2038 (b)(c)(d) | | 693,402 | 683,001 |
| LIFE Mortgage Trust Series 2021-BMR Class E, CME Term SOFR 1 month Index + 1.8645%, 6.2615% 3/15/2038 (b)(c)(d) | | 606,051 | 590,900 |
| Morgan Stanley Capital I Trust Series 2017-HR2 Class A3, 3.33% 12/15/2050 | | 495,270 | 472,597 |
| Morgan Stanley Capital I Trust Series 2018-H4 Class A4, 4.31% 12/15/2051 | | 4,407,809 | 4,271,104 |
| Morgan Stanley Capital I Trust Series 2024-NSTB Class A, 3.9% 9/24/2057 (b)(d) | | 2,085,287 | 2,012,141 |
| Natixis Commercial Mortgage Securities Trust Series 2020-2PAC Class A, 2.966% 12/15/2038 (d) | | 2,402,749 | 2,251,881 |
| OPEN Trust Series 2023-AIR Class A, CME Term SOFR 1 month Index + 3.0891%, 7.4862% 11/15/2040 (b)(c)(d) | | 1,019,091 | 1,026,741 |
| OPEN Trust Series 2023-AIR Class B, CME Term SOFR 1 month Index + 3.838%, 8.2351% 11/15/2040 (b)(c)(d) | | 1,120,800 | 1,129,109 |
| OPG Trust Series 2021-PORT Class A, CME Term SOFR 1 month Index + 0.5985%, 4.9965% 10/15/2036 (b)(c)(d) | | 5,734,375 | 5,712,871 |
| Providence Place Group LP Series 2000-C1 Class A2, 7.75% 7/20/2028 (d) | | 1,332,172 | 1,357,648 |
| SPGN Mortgage Trust Series 2022-TFLM Class B, CME Term SOFR 1 month Index + 2%, 6.3971% 2/15/2039 (b)(c)(d) | | 1,190,000 | 1,169,530 |
| SPGN Mortgage Trust Series 2022-TFLM Class C, CME Term SOFR 1 month Index + 2.65%, 7.0471% 2/15/2039 (b)(c)(d) | | 619,000 | 606,828 |
| SREIT Trust Series 2021-FLWR Class A, CME Term SOFR 1 month Index + 0.691%, 5.088% 7/15/2036 (b)(c)(d) | | 1,392,068 | 1,390,328 |
| SREIT Trust Series 2021-MFP Class A, CME Term SOFR 1 month Index + 0.8453%, 5.2424% 11/15/2038 (b)(c)(d) | | 6,766,211 | 6,759,868 |
| SREIT Trust Series 2021-MFP Class B, CME Term SOFR 1 month Index + 1.1943%, 5.5914% 11/15/2038 (b)(c)(d) | | 2,984,257 | 2,978,662 |
| SREIT Trust Series 2021-MFP Class C, CME Term SOFR 1 month Index + 1.4435%, 5.8406% 11/15/2038 (b)(c)(d) | | 1,556,296 | 1,552,406 |
| SREIT Trust Series 2021-MFP Class D, CME Term SOFR 1 month Index + 1.6927%, 6.0898% 11/15/2038 (b)(c)(d) | | 1,022,864 | 1,021,584 |
| Taubman Centers Commercial Mortgage Trust Series 2024-DPM Class A, CME Term SOFR 1 month Index + 1.2429%, 5.7429% 12/15/2039 (b)(c)(d) | | 3,736,000 | 3,733,661 |
| Taubman Centers Commercial Mortgage Trust Series 2024-DPM Class B, CME Term SOFR 1 month Index + 1.5924%, 6.0924% 12/15/2039 (b)(c)(d) | | 910,000 | 909,431 |
| Taubman Centers Commercial Mortgage Trust Series 2024-DPM Class C, CME Term SOFR 1 month Index + 1.9919%, 6.4919% 12/15/2039 (b)(c)(d) | | 671,000 | 670,997 |
| UBS Commercial Mortgage Trust Series 2018-C9 Class A4, 4.117% 3/15/2051 | | 300,000 | 288,690 |
| VLS Commercial Mortgage Trust Series 2020-LAB Class A, 2.13% 10/10/2042 (d) | | 3,269,943 | 2,619,478 |
| VLS Commercial Mortgage Trust Series 2020-LAB Class B, 2.453% 10/10/2042 (d) | | 256,512 | 202,139 |
| Wells Fargo Commercial Mortgage Trust Series 2016-LC25 Class A3, 3.374% 12/15/2059 | | 1,260,731 | 1,230,690 |
| Wells Fargo Commercial Mortgage Trust Series 2020-C55 Class ASB, 2.651% 2/15/2053 | | 500,000 | 473,694 |
| Wells Fargo Commercial Mortgage Trust Series 2021-FCMT Class A, CME Term SOFR 1 month Index + 1.3145%, 5.7125% 5/15/2031 (b)(c)(d) | | 2,496,000 | 2,453,255 |
| Wells Fargo Commercial Mortgage Trust Series 2024-5C1 Class A3, 5.928% 7/15/2057 | | 800,000 | 824,304 |
| Wells Fargo Commercial Mortgage Trust Series 2024-MGP Class A11, CME Term SOFR 1 month Index + 1.9907%, 6.3878% 8/15/2041 (b)(c)(d) | | 600,000 | 602,713 |
| Wells Fargo Commercial Mortgage Trust Series 2024-MGP Class A12, CME Term SOFR 1 month Index + 1.6912%, 6.0882% 8/15/2041 (b)(c)(d) | | 1,400,000 | 1,406,401 |
TOTAL UNITED STATES | | | 263,582,370 |
| TOTAL COMMERCIAL MORTGAGE SECURITIES (Cost $267,614,385) | | | 263,582,370 |
| | | | |
| Fixed-Income Funds - 1.7% |
| | | Shares | Value ($) |
Fidelity Specialized High Income Central Fund (g) (Cost $79,909,281) | | 869,378 | 75,714,172 |
| | | | |
| Foreign Government and Government Agency Obligations - 0.1% |
| | | Principal Amount (a) | Value ($) |
| SAUDI ARABIA - 0.1% | | | |
| Kingdom of Saudi Arabia 3.25% 10/22/2030 (d) | | 1,788,000 | 1,610,318 |
| Kingdom of Saudi Arabia 4.5% 4/22/2060 (d) | | 1,363,000 | 1,043,485 |
TOTAL SAUDI ARABIA | | | 2,653,803 |
| TOTAL FOREIGN GOVERNMENT AND GOVERNMENT AGENCY OBLIGATIONS (Cost $3,466,715) | | | 2,653,803 |
| | | | |
| Non-Convertible Corporate Bonds - 23.3% |
| | | Principal Amount (a) | Value ($) |
| AUSTRALIA - 0.0% | | | |
| Financials - 0.0% | | | |
| Banks - 0.0% | | | |
| Commonwealth Bank of Australia 3.61% 9/12/2034 (b)(d) | | 1,485,000 | 1,366,321 |
| Westpac Banking Corp 4.11% 7/24/2034 (b) | | 2,107,000 | 1,984,230 |
| | | | |
| TOTAL AUSTRALIA | | | 3,350,551 |
| CANADA - 0.0% | | | |
| Energy - 0.0% | | | |
| Oil, Gas & Consumable Fuels - 0.0% | | | |
| Canadian Natural Resources Ltd 5.85% 2/1/2035 | | 1,417,000 | 1,422,403 |
| Enbridge Inc 4.25% 12/1/2026 | | 1,006,000 | 996,400 |
| | | | 2,418,803 |
| Utilities - 0.0% | | | |
| Independent Power and Renewable Electricity Producers - 0.0% | | | |
| Emera US Finance LP 3.55% 6/15/2026 | | 1,074,000 | 1,051,916 |
| TOTAL CANADA | | | 3,470,719 |
| FRANCE - 0.2% | | | |
| Financials - 0.2% | | | |
| Banks - 0.2% | | | |
| BNP Paribas SA 2.219% 6/9/2026 (b)(d) | | 4,281,000 | 4,225,656 |
| Societe Generale SA 1.488% 12/14/2026 (b)(d) | | 5,527,000 | 5,333,884 |
| | | | |
| TOTAL FRANCE | | | 9,559,540 |
| GERMANY - 0.3% | | | |
| Financials - 0.2% | | | |
| Capital Markets - 0.2% | | | |
| Deutsche Bank AG 4.5% 4/1/2025 | | 6,790,000 | 6,779,740 |
| Deutsche Bank AG/New York NY 4.999% 9/11/2030 (b) | | 2,000,000 | 1,954,948 |
| | | | 8,734,688 |
| Health Care - 0.1% | | | |
| Pharmaceuticals - 0.1% | | | |
| Bayer US Finance II LLC 4.25% 12/15/2025 (d) | | 2,477,000 | 2,460,304 |
| TOTAL GERMANY | | | 11,194,992 |
| IRELAND - 0.7% | | | |
| Financials - 0.5% | | | |
| Consumer Finance - 0.5% | | | |
| AerCap Ireland Capital DAC / AerCap Global Aviation Trust 2.45% 10/29/2026 | | 2,289,000 | 2,191,243 |
| AerCap Ireland Capital DAC / AerCap Global Aviation Trust 3% 10/29/2028 | | 2,397,000 | 2,219,526 |
| AerCap Ireland Capital DAC / AerCap Global Aviation Trust 3.3% 1/30/2032 | | 2,564,000 | 2,234,063 |
| AerCap Ireland Capital DAC / AerCap Global Aviation Trust 3.5% 1/15/2025 | | 4,712,000 | 4,709,350 |
| AerCap Ireland Capital DAC / AerCap Global Aviation Trust 4.45% 4/3/2026 | | 1,774,000 | 1,764,778 |
| AerCap Ireland Capital DAC / AerCap Global Aviation Trust 6.45% 4/15/2027 | | 7,503,000 | 7,736,487 |
| AerCap Ireland Capital DAC / AerCap Global Aviation Trust 6.5% 7/15/2025 | | 2,058,000 | 2,071,270 |
| | | | 22,926,717 |
| Industrials - 0.2% | | | |
| Transportation Infrastructure - 0.2% | | | |
| Avolon Holdings Funding Ltd 4.25% 4/15/2026 (d) | | 897,000 | 886,199 |
| Avolon Holdings Funding Ltd 4.375% 5/1/2026 (d) | | 2,653,000 | 2,623,918 |
| Avolon Holdings Funding Ltd 6.375% 5/4/2028 (d) | | 3,488,000 | 3,585,118 |
| | | | 7,095,235 |
| TOTAL IRELAND | | | 30,021,952 |
| ITALY - 0.2% | | | |
| Financials - 0.2% | | | |
| Banks - 0.2% | | | |
| Intesa Sanpaolo SpA 5.71% 1/15/2026 (d) | | 7,296,000 | 7,297,029 |
| MEXICO - 1.0% | | | |
| Energy - 1.0% | | | |
| Oil, Gas & Consumable Fuels - 1.0% | | | |
| Petroleos Mexicanos 4.5% 1/23/2026 | | 3,020,000 | 2,908,260 |
| Petroleos Mexicanos 5.95% 1/28/2031 | | 3,652,000 | 3,071,953 |
| Petroleos Mexicanos 6.35% 2/12/2048 | | 7,493,000 | 4,922,002 |
| Petroleos Mexicanos 6.49% 1/23/2027 | | 2,174,000 | 2,105,383 |
| Petroleos Mexicanos 6.5% 1/23/2029 | | 3,157,000 | 2,938,251 |
| Petroleos Mexicanos 6.5% 3/13/2027 | | 2,742,000 | 2,642,191 |
| Petroleos Mexicanos 6.7% 2/16/2032 | | 9,246,000 | 8,072,915 |
| Petroleos Mexicanos 6.75% 9/21/2047 | | 6,872,000 | 4,724,500 |
| Petroleos Mexicanos 6.84% 1/23/2030 | | 2,517,000 | 2,292,987 |
| Petroleos Mexicanos 6.95% 1/28/2060 | | 4,473,000 | 3,059,800 |
| Petroleos Mexicanos 7.69% 1/23/2050 | | 9,202,000 | 6,919,904 |
| | | | |
| TOTAL MEXICO | | | 43,658,146 |
| NETHERLANDS - 0.4% | | | |
| Financials - 0.4% | | | |
| Banks - 0.4% | | | |
| ABN AMRO Bank NV 4.988% 12/3/2028 (b)(d) | | 13,000,000 | 12,972,059 |
| Cooperatieve Rabobank UA 4.375% 8/4/2025 | | 4,230,000 | 4,212,942 |
| | | | |
| TOTAL NETHERLANDS | | | 17,185,001 |
| QATAR - 0.0% | | | |
| Utilities - 0.0% | | | |
| Gas Utilities - 0.0% | | | |
| Nakilat Inc 6.067% 12/31/2033 (d) | | 789,954 | 820,074 |
| SWITZERLAND - 0.4% | | | |
| Financials - 0.4% | | | |
| Capital Markets - 0.4% | | | |
| UBS Group AG 1.494% 8/10/2027 (b)(d) | | 3,309,000 | 3,130,889 |
| UBS Group AG 3.869% 1/12/2029 (b)(d) | | 2,282,000 | 2,197,372 |
| UBS Group AG 4.125% 9/24/2025 (d) | | 2,986,000 | 2,972,017 |
| UBS Group AG 4.194% 4/1/2031 (b)(d) | | 5,461,000 | 5,159,983 |
| UBS Group AG 4.55% 4/17/2026 | | 1,462,000 | 1,456,874 |
| | | | 14,917,135 |
| Insurance - 0.0% | | | |
| Swiss Re Finance Luxembourg SA 5% 4/2/2049 (b)(d) | | 600,000 | 595,029 |
| TOTAL SWITZERLAND | | | 15,512,164 |
| UNITED KINGDOM - 0.6% | | | |
| Consumer Staples - 0.2% | | | |
| Tobacco - 0.2% | | | |
| BAT Capital Corp 6.421% 8/2/2033 | | 1,907,000 | 2,015,579 |
| Imperial Brands Finance PLC 4.25% 7/21/2025 (d) | | 906,000 | 901,313 |
| Imperial Brands Finance PLC 6.125% 7/27/2027 (d) | | 1,890,000 | 1,940,592 |
| Reynolds American Inc 4.45% 6/12/2025 | | 824,000 | 821,703 |
| Reynolds American Inc 5.7% 8/15/2035 | | 689,000 | 690,972 |
| Reynolds American Inc 6.15% 9/15/2043 | | 2,271,000 | 2,246,223 |
| Reynolds American Inc 7.25% 6/15/2037 | | 1,681,000 | 1,847,763 |
| | | | 10,464,145 |
| Financials - 0.4% | | | |
| Banks - 0.4% | | | |
| Barclays PLC 5.088% 6/20/2030 (b) | | 4,171,000 | 4,062,881 |
| Barclays PLC 5.2% 5/12/2026 | | 3,533,000 | 3,537,028 |
| Barclays PLC 5.829% 5/9/2027 (b) | | 1,900,000 | 1,920,461 |
| Barclays PLC 6.224% 5/9/2034 (b) | | 1,900,000 | 1,951,660 |
| NatWest Group PLC 3.073% 5/22/2028 (b) | | 2,640,000 | 2,524,913 |
| | | | 13,996,943 |
| Industrials - 0.0% | | | |
| Aerospace & Defense - 0.0% | | | |
| BAE Systems PLC 3.4% 4/15/2030 (d) | | 1,287,000 | 1,187,117 |
| TOTAL UNITED KINGDOM | | | 25,648,205 |
| UNITED STATES - 19.5% | | | |
| Communication Services - 1.9% | | | |
| Diversified Telecommunication Services - 0.6% | | | |
| AT&T Inc 2.55% 12/1/2033 | | 8,483,000 | 6,833,342 |
| AT&T Inc 3.65% 9/15/2059 | | 821,000 | 543,802 |
| AT&T Inc 3.8% 12/1/2057 | | 8,657,000 | 5,972,497 |
| AT&T Inc 4.3% 2/15/2030 | | 1,940,000 | 1,878,841 |
| AT&T Inc 4.75% 5/15/2046 | | 10,884,000 | 9,447,615 |
| Verizon Communications Inc 2.55% 3/21/2031 | | 3,143,000 | 2,706,655 |
| | | | 27,382,752 |
| Media - 1.1% | | | |
| Charter Communications Operating LLC / Charter Communications Operating Capital 2.3% 2/1/2032 | | 545,000 | 431,604 |
| Charter Communications Operating LLC / Charter Communications Operating Capital 4.4% 4/1/2033 | | 1,435,000 | 1,282,014 |
| Charter Communications Operating LLC / Charter Communications Operating Capital 4.8% 3/1/2050 | | 1,091,000 | 819,512 |
| Charter Communications Operating LLC / Charter Communications Operating Capital 4.908% 7/23/2025 | | 505,000 | 504,399 |
| Charter Communications Operating LLC / Charter Communications Operating Capital 5.05% 3/30/2029 | | 1,180,000 | 1,154,618 |
| Charter Communications Operating LLC / Charter Communications Operating Capital 5.375% 5/1/2047 | | 10,656,000 | 8,746,142 |
| Charter Communications Operating LLC / Charter Communications Operating Capital 5.5% 4/1/2063 | | 1,435,000 | 1,141,742 |
| Charter Communications Operating LLC / Charter Communications Operating Capital 6.1% 6/1/2029 | | 2,136,000 | 2,177,282 |
| Charter Communications Operating LLC / Charter Communications Operating Capital 6.484% 10/23/2045 | | 1,557,000 | 1,471,237 |
| Charter Communications Operating LLC / Charter Communications Operating Capital 6.55% 6/1/2034 | | 1,474,000 | 1,507,765 |
| Discovery Communications LLC 3.625% 5/15/2030 | | 1,973,000 | 1,755,179 |
| Discovery Communications LLC 4.125% 5/15/2029 | | 118,000 | 109,938 |
| Time Warner Cable LLC 4.5% 9/15/2042 | | 525,000 | 392,751 |
| Time Warner Cable LLC 5.5% 9/1/2041 | | 965,000 | 818,896 |
| Time Warner Cable LLC 5.875% 11/15/2040 | | 852,000 | 762,367 |
| Time Warner Cable LLC 6.55% 5/1/2037 | | 11,472,000 | 11,092,007 |
| Time Warner Cable LLC 7.3% 7/1/2038 | | 2,146,000 | 2,183,181 |
| Warnermedia Holdings Inc 3.638% 3/15/2025 | | 1,270,000 | 1,265,916 |
| Warnermedia Holdings Inc 3.755% 3/15/2027 | | 2,484,000 | 2,393,163 |
| Warnermedia Holdings Inc 4.054% 3/15/2029 | | 743,000 | 691,323 |
| Warnermedia Holdings Inc 4.279% 3/15/2032 | | 3,451,000 | 3,041,046 |
| Warnermedia Holdings Inc 5.05% 3/15/2042 | | 1,789,000 | 1,436,356 |
| Warnermedia Holdings Inc 5.141% 3/15/2052 | | 5,047,000 | 3,749,943 |
| | | | 48,928,381 |
| Wireless Telecommunication Services - 0.2% | | | |
| T-Mobile USA Inc 3.75% 4/15/2027 | | 3,463,000 | 3,383,208 |
| T-Mobile USA Inc 3.875% 4/15/2030 | | 5,007,000 | 4,711,524 |
| | | | 8,094,732 |
TOTAL COMMUNICATION SERVICES | | | 84,405,865 |
| | | | |
| Consumer Discretionary - 0.3% | | | |
| Specialty Retail - 0.3% | | | |
| AutoNation Inc 4.75% 6/1/2030 | | 434,000 | 419,013 |
| AutoZone Inc 3.625% 4/15/2025 | | 649,000 | 646,801 |
| AutoZone Inc 4% 4/15/2030 | | 3,015,000 | 2,870,298 |
| Lowe's Cos Inc 3.35% 4/1/2027 | | 384,000 | 372,961 |
| Lowe's Cos Inc 3.75% 4/1/2032 | | 1,183,000 | 1,083,366 |
| Lowe's Cos Inc 4.45% 4/1/2062 | | 4,962,000 | 3,843,269 |
| Lowe's Cos Inc 4.5% 4/15/2030 | | 2,166,000 | 2,125,056 |
| O'Reilly Automotive Inc 4.2% 4/1/2030 | | 668,000 | 642,214 |
| | | | 12,002,978 |
| Consumer Staples - 0.3% | | | |
| Beverages - 0.2% | | | |
| Molson Coors Beverage Co 5% 5/1/2042 | | 7,433,000 | 6,831,787 |
| Consumer Staples Distribution & Retail - 0.0% | | | |
| Kroger Co/The 5% 9/15/2034 | | 2,170,000 | 2,101,666 |
| Food Products - 0.0% | | | |
| General Mills Inc 2.875% 4/15/2030 | | 408,000 | 366,966 |
| Tobacco - 0.1% | | | |
| Altria Group Inc 4.25% 8/9/2042 | | 3,140,000 | 2,503,985 |
| Altria Group Inc 4.5% 5/2/2043 | | 2,104,000 | 1,717,079 |
| Altria Group Inc 4.8% 2/14/2029 | | 575,000 | 568,145 |
| Altria Group Inc 5.95% 2/14/2049 | | 753,000 | 736,743 |
| | | | 5,525,952 |
TOTAL CONSUMER STAPLES | | | 14,826,371 |
| | | | |
| Energy - 1.9% | | | |
| Energy Equipment & Services - 0.0% | | | |
| Halliburton Co 4.85% 11/15/2035 | | 1,223,000 | 1,162,090 |
| Oil, Gas & Consumable Fuels - 1.9% | | | |
| Columbia Pipeline Group Inc 4.5% 6/1/2025 | | 758,000 | 755,994 |
| Columbia Pipelines Operating Co LLC 5.927% 8/15/2030 (d) | | 547,000 | 563,034 |
| Columbia Pipelines Operating Co LLC 6.036% 11/15/2033 (d) | | 1,473,000 | 1,511,005 |
| Columbia Pipelines Operating Co LLC 6.497% 8/15/2043 (d) | | 440,000 | 456,561 |
| Columbia Pipelines Operating Co LLC 6.544% 11/15/2053 (d) | | 793,000 | 831,043 |
| Columbia Pipelines Operating Co LLC 6.714% 8/15/2063 (d) | | 475,000 | 504,272 |
| DCP Midstream Operating LP 5.6% 4/1/2044 | | 697,000 | 651,463 |
| DCP Midstream Operating LP 6.45% 11/3/2036 (d) | | 1,406,000 | 1,446,520 |
| Energy Transfer LP 3.75% 5/15/2030 | | 1,314,000 | 1,225,928 |
| Energy Transfer LP 4.95% 6/15/2028 | | 2,298,000 | 2,293,943 |
| Energy Transfer LP 5% 5/15/2050 | | 3,733,000 | 3,166,913 |
| Energy Transfer LP 5.25% 4/15/2029 | | 1,165,000 | 1,169,152 |
| Energy Transfer LP 5.4% 10/1/2047 | | 766,000 | 688,194 |
| Energy Transfer LP 5.8% 6/15/2038 | | 1,282,000 | 1,260,036 |
| Energy Transfer LP 6% 6/15/2048 | | 834,000 | 805,570 |
| Energy Transfer LP 6.25% 4/15/2049 | | 800,000 | 800,670 |
| Hess Corp 4.3% 4/1/2027 | | 2,776,000 | 2,747,674 |
| Hess Corp 5.6% 2/15/2041 | | 7,441,000 | 7,348,561 |
| Hess Corp 7.125% 3/15/2033 | | 569,000 | 630,607 |
| Hess Corp 7.3% 8/15/2031 | | 762,000 | 846,259 |
| Hess Corp 7.875% 10/1/2029 | | 2,490,000 | 2,773,662 |
| Kinder Morgan Energy Partners LP 6.55% 9/15/2040 | | 261,000 | 271,181 |
| Kinder Morgan Inc 5.55% 6/1/2045 | | 1,383,000 | 1,292,544 |
| MPLX LP 4.8% 2/15/2029 | | 640,000 | 634,408 |
| MPLX LP 4.95% 9/1/2032 | | 3,480,000 | 3,355,120 |
| MPLX LP 5.5% 2/15/2049 | | 1,917,000 | 1,760,110 |
| Occidental Petroleum Corp 5.55% 3/15/2026 | | 3,587,000 | 3,599,590 |
| Occidental Petroleum Corp 6.2% 3/15/2040 | | 965,000 | 950,718 |
| Occidental Petroleum Corp 6.45% 9/15/2036 | | 2,612,000 | 2,673,980 |
| Occidental Petroleum Corp 6.6% 3/15/2046 | | 3,240,000 | 3,270,991 |
| Occidental Petroleum Corp 7.5% 5/1/2031 | | 4,360,000 | 4,766,610 |
| ONEOK Inc 4.25% 9/24/2027 | | 1,093,000 | 1,077,128 |
| ONEOK Inc 4.4% 10/15/2029 | | 1,143,000 | 1,108,141 |
| ONEOK Inc 4.75% 10/15/2031 | | 2,223,000 | 2,150,327 |
| Plains All American Pipeline LP / PAA Finance Corp 3.55% 12/15/2029 | | 751,000 | 698,516 |
| Sabine Pass Liquefaction LLC 4.5% 5/15/2030 | | 4,528,000 | 4,386,158 |
| Transcontinental Gas Pipe Line Co LLC 3.25% 5/15/2030 | | 577,000 | 525,647 |
| Western Gas Partners LP 3.95% 6/1/2025 | | 493,000 | 490,502 |
| Western Gas Partners LP 4.5% 3/1/2028 | | 1,136,000 | 1,112,101 |
| Western Gas Partners LP 4.65% 7/1/2026 | | 5,141,000 | 5,114,216 |
| Western Gas Partners LP 4.75% 8/15/2028 | | 656,000 | 644,321 |
| Williams Cos Inc/The 3.5% 11/15/2030 | | 4,829,000 | 4,437,018 |
| Williams Cos Inc/The 3.9% 1/15/2025 | | 690,000 | 689,715 |
| Williams Cos Inc/The 4.65% 8/15/2032 | | 3,633,000 | 3,457,708 |
| Williams Cos Inc/The 5.3% 8/15/2052 | | 824,000 | 753,278 |
| | | | 81,697,089 |
TOTAL ENERGY | | | 82,859,179 |
| | | | |
| Financials - 8.6% | | | |
| Banks - 3.3% | | | |
| Bank of America Corp 2.299% 7/21/2032 (b) | | 8,618,000 | 7,184,415 |
| Bank of America Corp 3.419% 12/20/2028 (b) | | 10,766,000 | 10,322,081 |
| Bank of America Corp 4.25% 10/22/2026 | | 2,419,000 | 2,398,242 |
| Bank of America Corp 4.45% 3/3/2026 | | 861,000 | 857,431 |
| Bank of America Corp 5.015% 7/22/2033 (b) | | 18,422,000 | 18,068,639 |
| Bank of America Corp 5.425% 8/15/2035 (b) | | 6,500,000 | 6,326,553 |
| Citigroup Inc 3.875% 3/26/2025 | | 5,393,000 | 5,378,663 |
| Citigroup Inc 4.3% 11/20/2026 | | 983,000 | 974,106 |
| Citigroup Inc 4.412% 3/31/2031 (b) | | 6,030,000 | 5,795,829 |
| Citigroup Inc 4.45% 9/29/2027 | | 9,708,000 | 9,576,478 |
| Citigroup Inc 4.6% 3/9/2026 | | 1,246,000 | 1,242,610 |
| Citigroup Inc 4.91% 5/24/2033 (b) | | 5,644,000 | 5,454,895 |
| Citigroup Inc 5.5% 9/13/2025 | | 3,136,000 | 3,149,837 |
| Citizens Financial Group Inc 2.638% 9/30/2032 | | 2,757,000 | 2,215,594 |
| Citizens Financial Group Inc 5.718% 7/23/2032 (b) | | 5,882,000 | 5,902,484 |
| Fifth Third Bancorp 4.895% 9/6/2030 (b) | | 4,500,000 | 4,438,468 |
| JPMorgan Chase & Co 2.956% 5/13/2031 (b) | | 2,452,000 | 2,193,336 |
| JPMorgan Chase & Co 4.493% 3/24/2031 (b) | | 7,267,000 | 7,080,817 |
| JPMorgan Chase & Co 4.586% 4/26/2033 (b) | | 15,530,000 | 14,893,730 |
| JPMorgan Chase & Co 4.912% 7/25/2033 (b) | | 4,507,000 | 4,406,570 |
| Santander Holdings USA Inc 2.49% 1/6/2028 (b) | | 3,241,000 | 3,073,673 |
| Wells Fargo & Co 3.526% 3/24/2028 (b) | | 5,273,000 | 5,114,433 |
| Wells Fargo & Co 4.478% 4/4/2031 (b) | | 8,118,000 | 7,858,030 |
| Wells Fargo & Co 5.013% 4/4/2051 (b) | | 9,125,000 | 8,099,798 |
| Wells Fargo & Co 5.499% 1/23/2035 (b) | | 2,849,000 | 2,836,891 |
| | | | 144,843,603 |
| Capital Markets - 2.7% | | | |
| Ares Capital Corp 3.875% 1/15/2026 | | 7,074,000 | 6,993,101 |
| Athene Global Funding 5.339% 1/15/2027 (d) | | 5,719,000 | 5,753,895 |
| Athene Global Funding 5.583% 1/9/2029 (d) | | 2,875,000 | 2,907,733 |
| Blackstone Private Credit Fund 4.7% 3/24/2025 | | 9,007,000 | 8,993,430 |
| Blackstone Private Credit Fund 7.05% 9/29/2025 | | 4,363,000 | 4,426,824 |
| Goldman Sachs Group Inc/The 2.383% 7/21/2032 (b) | | 5,355,000 | 4,462,864 |
| Goldman Sachs Group Inc/The 3.102% 2/24/2033 (b) | | 2,100,000 | 1,809,925 |
| Goldman Sachs Group Inc/The 3.691% 6/5/2028 (b) | | 23,641,000 | 22,961,608 |
| Goldman Sachs Group Inc/The 3.8% 3/15/2030 | | 8,794,000 | 8,246,840 |
| Goldman Sachs Group Inc/The 4.25% 10/21/2025 | | 1,288,000 | 1,280,894 |
| Goldman Sachs Group Inc/The 6.75% 10/1/2037 | | 1,275,000 | 1,364,964 |
| Moody's Corp 3.75% 3/24/2025 | | 2,881,000 | 2,873,741 |
| Morgan Stanley 3.125% 7/27/2026 | | 12,469,000 | 12,180,261 |
| Morgan Stanley 3.622% 4/1/2031 (b) | | 5,698,000 | 5,292,463 |
| Morgan Stanley 3.625% 1/20/2027 | | 6,245,000 | 6,131,166 |
| Morgan Stanley 4.431% 1/23/2030 (b) | | 2,495,000 | 2,428,280 |
| Morgan Stanley 4.889% 7/20/2033 (b) | | 9,357,000 | 9,065,054 |
| Morgan Stanley 5% 11/24/2025 | | 8,309,000 | 8,322,586 |
| Peachtree Corners Funding Trust 3.976% 2/15/2025 (d) | | 2,838,000 | 2,831,967 |
| | | | 118,327,596 |
| Consumer Finance - 1.0% | | | |
| Ally Financial Inc 5.543% 1/17/2031 (b) | | 672,000 | 662,520 |
| Ally Financial Inc 5.8% 5/1/2025 | | 2,973,000 | 2,976,398 |
| Ally Financial Inc 7.1% 11/15/2027 | | 4,120,000 | 4,348,425 |
| Ally Financial Inc 8% 11/1/2031 | | 1,535,000 | 1,697,140 |
| Capital One Financial Corp 2.636% 3/3/2026 (b) | | 2,766,000 | 2,754,247 |
| Capital One Financial Corp 3.273% 3/1/2030 (b) | | 3,538,000 | 3,271,019 |
| Capital One Financial Corp 3.65% 5/11/2027 | | 7,652,000 | 7,449,173 |
| Capital One Financial Corp 3.8% 1/31/2028 | | 4,006,000 | 3,866,706 |
| Capital One Financial Corp 4.985% 7/24/2026 (b) | | 3,566,000 | 3,563,188 |
| Capital One Financial Corp 5.247% 7/26/2030 (b) | | 4,600,000 | 4,585,869 |
| Discover Financial Services 4.1% 2/9/2027 | | 1,620,000 | 1,590,745 |
| Discover Financial Services 4.5% 1/30/2026 | | 2,660,000 | 2,648,820 |
| Synchrony Financial 3.95% 12/1/2027 | | 4,360,000 | 4,215,581 |
| Synchrony Financial 5.15% 3/19/2029 | | 1,906,000 | 1,877,375 |
| | | | 45,507,206 |
| Financial Services - 0.9% | | | |
| Corebridge Financial Inc 3.5% 4/4/2025 | | 1,148,000 | 1,143,894 |
| Corebridge Financial Inc 3.65% 4/5/2027 | | 3,963,000 | 3,853,192 |
| Corebridge Financial Inc 3.85% 4/5/2029 | | 1,606,000 | 1,533,581 |
| Corebridge Financial Inc 3.9% 4/5/2032 | | 1,912,000 | 1,740,218 |
| Corebridge Financial Inc 4.35% 4/5/2042 | | 435,000 | 362,125 |
| Corebridge Financial Inc 4.4% 4/5/2052 | | 1,286,000 | 1,033,100 |
| Corebridge Global Funding 4.9% 12/3/2029 (d) | | 3,500,000 | 3,474,631 |
| Corebridge Global Funding 5.9% 9/19/2028 (d) | | 2,307,000 | 2,371,944 |
| Equitable Holdings Inc 4.35% 4/20/2028 | | 2,412,000 | 2,363,186 |
| Equitable Holdings Inc 4.572% 2/15/2029 (d) | | 832,000 | 810,763 |
| Jackson Financial Inc 3.125% 11/23/2031 | | 436,000 | 371,644 |
| Jackson Financial Inc 5.17% 6/8/2027 | | 1,735,000 | 1,742,467 |
| Jackson Financial Inc 5.67% 6/8/2032 | | 1,866,000 | 1,878,348 |
| JBS USA Holding Lux Sarl/ JBS USA Food Co/ JBS Lux Co Sarl 2.5% 1/15/2027 | | 5,004,000 | 4,752,367 |
| JBS USA Holding Lux Sarl/ JBS USA Food Co/ JBS Lux Co Sarl 3% 5/15/2032 | | 4,479,000 | 3,728,591 |
| JBS USA Holding Lux Sarl/ JBS USA Food Co/ JBS Lux Co Sarl 3.625% 1/15/2032 | | 1,723,000 | 1,520,459 |
| JBS USA Holding Lux Sarl/ JBS USA Food Co/ JBS Lux Co Sarl 5.125% 2/1/2028 | | 1,885,000 | 1,871,798 |
| JBS USA Holding Lux Sarl/ JBS USA Food Co/ JBS Lux Co Sarl 5.5% 1/15/2030 | | 717,000 | 715,679 |
| JBS USA Holding Lux Sarl/ JBS USA Food Co/ JBS Lux Co Sarl 5.75% 4/1/2033 | | 2,818,000 | 2,805,086 |
| Pine Street Trust II 5.568% 2/15/2049 (d) | | 3,236,000 | 2,980,720 |
| | | | 41,053,793 |
| Insurance - 0.7% | | | |
| Five Corners Funding Trust II 2.85% 5/15/2030 (d) | | 6,263,000 | 5,598,548 |
| Liberty Mutual Group Inc 4.569% 2/1/2029 (d) | | 2,324,000 | 2,276,132 |
| Marsh & McLennan Cos Inc 4.375% 3/15/2029 | | 2,258,000 | 2,217,451 |
| Massachusetts Mutual Life Insurance Co 3.729% 10/15/2070 (d) | | 3,298,000 | 2,129,120 |
| MetLife Inc 5.375% 7/15/2033 | | 6,529,000 | 6,598,184 |
| Pacific LifeCorp 5.125% 1/30/2043 (d) | | 2,981,000 | 2,747,299 |
| Unum Group 3.875% 11/5/2025 | | 2,759,000 | 2,736,279 |
| Unum Group 4% 6/15/2029 | | 2,503,000 | 2,396,946 |
| Unum Group 5.75% 8/15/2042 | | 4,132,000 | 4,033,882 |
| | | | 30,733,841 |
TOTAL FINANCIALS | | | 380,466,039 |
| | | | |
| Health Care - 1.3% | | | |
| Biotechnology - 0.2% | | | |
| Amgen Inc 5.15% 3/2/2028 | | 2,052,000 | 2,066,928 |
| Amgen Inc 5.25% 3/2/2030 | | 1,874,000 | 1,891,486 |
| Amgen Inc 5.25% 3/2/2033 | | 2,115,000 | 2,099,388 |
| Amgen Inc 5.6% 3/2/2043 | | 2,009,000 | 1,953,001 |
| Amgen Inc 5.65% 3/2/2053 | | 178,000 | 171,373 |
| Amgen Inc 5.75% 3/2/2063 | | 1,820,000 | 1,745,485 |
| | | | 9,927,661 |
| Health Care Providers & Services - 1.0% | | | |
| Centene Corp 2.45% 7/15/2028 | | 5,569,000 | 5,011,587 |
| Centene Corp 2.625% 8/1/2031 | | 2,597,000 | 2,138,565 |
| Centene Corp 3.375% 2/15/2030 | | 2,896,000 | 2,579,409 |
| Centene Corp 4.25% 12/15/2027 | | 3,262,000 | 3,159,912 |
| Centene Corp 4.625% 12/15/2029 | | 5,066,000 | 4,791,221 |
| Cigna Group/The 4.8% 8/15/2038 | | 2,144,000 | 1,943,642 |
| CVS Health Corp 3% 8/15/2026 | | 355,000 | 343,877 |
| CVS Health Corp 3.625% 4/1/2027 | | 1,019,000 | 988,700 |
| CVS Health Corp 4.78% 3/25/2038 | | 3,388,000 | 2,929,509 |
| CVS Health Corp 5% 1/30/2029 | | 1,590,000 | 1,568,644 |
| CVS Health Corp 5.25% 1/30/2031 | | 652,000 | 636,770 |
| HCA Inc 3.5% 9/1/2030 | | 2,160,000 | 1,961,713 |
| HCA Inc 3.625% 3/15/2032 | | 487,000 | 429,227 |
| HCA Inc 5.45% 4/1/2031 | | 4,100,000 | 4,091,749 |
| HCA Inc 5.625% 9/1/2028 | | 2,246,000 | 2,275,746 |
| HCA Inc 5.875% 2/1/2029 | | 2,447,000 | 2,497,507 |
| Humana Inc 3.7% 3/23/2029 | | 1,508,000 | 1,423,423 |
| Sabra Health Care LP 3.2% 12/1/2031 | | 5,311,000 | 4,556,605 |
| Toledo Hospital/The Series 2018 B, 5.325% 11/15/2028 | | 1,197,000 | 1,175,717 |
| | | | 44,503,523 |
| Pharmaceuticals - 0.1% | | | |
| Elanco Animal Health Inc 6.65% 8/28/2028 (b) | | 757,000 | 767,480 |
| Mylan Inc 4.55% 4/15/2028 | | 2,271,000 | 2,224,940 |
| Utah Acquisition Sub Inc 3.95% 6/15/2026 | | 873,000 | 859,132 |
| | | | 3,851,552 |
TOTAL HEALTH CARE | | | 58,282,736 |
| | | | |
| Industrials - 0.4% | | | |
| Aerospace & Defense - 0.3% | | | |
| Boeing Co 5.04% 5/1/2027 | | 1,681,000 | 1,685,336 |
| Boeing Co 5.15% 5/1/2030 | | 1,681,000 | 1,657,437 |
| Boeing Co 5.705% 5/1/2040 | | 1,703,000 | 1,620,199 |
| Boeing Co 5.805% 5/1/2050 | | 1,703,000 | 1,584,051 |
| Boeing Co 5.93% 5/1/2060 | | 1,680,000 | 1,554,518 |
| Boeing Co 6.259% 5/1/2027 | | 888,000 | 909,121 |
| Boeing Co 6.298% 5/1/2029 | | 1,138,000 | 1,179,613 |
| Boeing Co 6.388% 5/1/2031 | | 862,000 | 901,239 |
| Boeing Co 6.528% 5/1/2034 | | 923,000 | 966,943 |
| Boeing Co 6.858% 5/1/2054 | | 1,389,000 | 1,476,294 |
| Boeing Co 7.008% 5/1/2064 | | 1,311,000 | 1,391,137 |
| | | | 14,925,888 |
| Building Products - 0.0% | | | |
| Carrier Global Corp 5.9% 3/15/2034 | | 365,000 | 377,934 |
| Carrier Global Corp 6.2% 3/15/2054 | | 226,000 | 238,929 |
| | | | 616,863 |
| Trading Companies & Distributors - 0.1% | | | |
| Air Lease Corp 3.375% 7/1/2025 | | 3,659,000 | 3,630,538 |
TOTAL INDUSTRIALS | | | 19,173,289 |
| | | | |
| Information Technology - 0.7% | | | |
| Electronic Equipment, Instruments & Components - 0.1% | | | |
| Dell International LLC / EMC Corp 6.02% 6/15/2026 | | 634,000 | 643,088 |
| Dell International LLC / EMC Corp 6.1% 7/15/2027 | | 1,349,000 | 1,388,476 |
| Dell International LLC / EMC Corp 6.2% 7/15/2030 | | 1,167,000 | 1,223,042 |
| | | | 3,254,606 |
| Semiconductors & Semiconductor Equipment - 0.4% | | | |
| Broadcom Inc 1.95% 2/15/2028 (d) | | 944,000 | 864,234 |
| Broadcom Inc 2.45% 2/15/2031 (d) | | 8,034,000 | 6,928,236 |
| Broadcom Inc 2.6% 2/15/2033 (d) | | 8,034,000 | 6,640,877 |
| Broadcom Inc 3.5% 2/15/2041 (d) | | 6,488,000 | 5,066,647 |
| | | | 19,499,994 |
| Software - 0.2% | | | |
| Oracle Corp 2.3% 3/25/2028 | | 5,824,000 | 5,384,211 |
| Oracle Corp 3.6% 4/1/2040 | | 3,327,000 | 2,601,226 |
| | | | 7,985,437 |
TOTAL INFORMATION TECHNOLOGY | | | 30,740,037 |
| | | | |
| Materials - 0.1% | | | |
| Chemicals - 0.1% | | | |
| Celanese US Holdings LLC 6.6% 11/15/2028 | | 1,918,000 | 1,964,705 |
| Celanese US Holdings LLC 6.8% 11/15/2030 | | 1,944,000 | 2,012,380 |
| Celanese US Holdings LLC 6.95% 11/15/2033 | | 1,136,000 | 1,178,914 |
| | | | 5,155,999 |
| Real Estate - 2.9% | | | |
| Diversified REITs - 0.5% | | | |
| Piedmont Operating Partnership LP 2.75% 4/1/2032 | | 834,000 | 662,385 |
| Store Capital LLC 2.75% 11/18/2030 | | 4,952,000 | 4,273,680 |
| Store Capital LLC 4.625% 3/15/2029 | | 1,018,000 | 980,603 |
| VICI Properties LP 4.375% 5/15/2025 | | 446,000 | 444,736 |
| VICI Properties LP 4.75% 2/15/2028 | | 3,531,000 | 3,501,318 |
| VICI Properties LP 4.95% 2/15/2030 | | 4,599,000 | 4,507,953 |
| VICI Properties LP 5.125% 5/15/2032 | | 1,205,000 | 1,173,281 |
| VICI Properties LP 5.75% 4/1/2034 | | 503,000 | 507,563 |
| Vornado Realty LP 2.15% 6/1/2026 | | 1,069,000 | 1,017,939 |
| WP Carey Inc 2.4% 2/1/2031 | | 2,157,000 | 1,833,120 |
| WP Carey Inc 3.85% 7/15/2029 | | 724,000 | 688,204 |
| WP Carey Inc 4% 2/1/2025 | | 3,043,000 | 3,039,079 |
| | | | 22,629,861 |
| Health Care REITs - 0.9% | | | |
| Alexandria Real Estate Equities Inc 4.9% 12/15/2030 | | 2,366,000 | 2,329,098 |
| Healthcare Realty Holdings LP 3.1% 2/15/2030 | | 745,000 | 669,514 |
| Healthcare Realty Holdings LP 3.5% 8/1/2026 | | 775,000 | 757,386 |
| Healthpeak OP LLC 3.25% 7/15/2026 | | 325,000 | 317,670 |
| Healthpeak OP LLC 3.5% 7/15/2029 | | 373,000 | 349,000 |
| Omega Healthcare Investors Inc 3.25% 4/15/2033 | | 3,556,000 | 2,973,768 |
| Omega Healthcare Investors Inc 3.375% 2/1/2031 | | 1,901,000 | 1,685,938 |
| Omega Healthcare Investors Inc 3.625% 10/1/2029 | | 3,357,000 | 3,096,364 |
| Omega Healthcare Investors Inc 4.5% 1/15/2025 | | 1,520,000 | 1,519,451 |
| Omega Healthcare Investors Inc 4.5% 4/1/2027 | | 9,194,000 | 9,076,297 |
| Omega Healthcare Investors Inc 4.75% 1/15/2028 | | 3,623,000 | 3,573,951 |
| Omega Healthcare Investors Inc 5.25% 1/15/2026 | | 3,228,000 | 3,231,848 |
| Ventas Realty LP 3% 1/15/2030 | | 4,331,000 | 3,912,377 |
| Ventas Realty LP 4% 3/1/2028 | | 1,273,000 | 1,238,729 |
| Ventas Realty LP 4.125% 1/15/2026 | | 884,000 | 876,925 |
| Ventas Realty LP 4.375% 2/1/2045 | | 433,000 | 353,202 |
| Ventas Realty LP 4.75% 11/15/2030 | | 5,686,000 | 5,560,248 |
| | | | 41,521,766 |
| Industrial REITs - 0.0% | | | |
| LXP Industrial Trust 2.7% 9/15/2030 | | 1,037,000 | 896,819 |
| Office REITs - 0.3% | | | |
| Boston Properties LP 3.25% 1/30/2031 | | 2,203,000 | 1,937,251 |
| Boston Properties LP 4.5% 12/1/2028 | | 2,209,000 | 2,149,464 |
| Boston Properties LP 6.75% 12/1/2027 | | 2,669,000 | 2,783,141 |
| COPT Defense Properties LP 2% 1/15/2029 | | 328,000 | 288,575 |
| COPT Defense Properties LP 2.25% 3/15/2026 | | 945,000 | 914,520 |
| COPT Defense Properties LP 2.75% 4/15/2031 | | 914,000 | 780,234 |
| Hudson Pacific Properties LP 4.65% 4/1/2029 | | 4,395,000 | 3,312,155 |
| | | | 12,165,340 |
| Real Estate Management & Development - 0.4% | | | |
| Brandywine Operating Partnership LP 3.95% 11/15/2027 | | 2,619,000 | 2,483,575 |
| Brandywine Operating Partnership LP 4.55% 10/1/2029 | | 3,316,000 | 2,993,232 |
| Brandywine Operating Partnership LP 8.3% 3/15/2028 | | 3,596,000 | 3,799,296 |
| CBRE Services Inc 2.5% 4/1/2031 | | 3,160,000 | 2,689,552 |
| Tanger Properties LP 2.75% 9/1/2031 | | 2,490,000 | 2,100,226 |
| Tanger Properties LP 3.125% 9/1/2026 | | 3,468,000 | 3,356,964 |
| | | | 17,422,845 |
| Residential REITs - 0.3% | | | |
| American Homes 4 Rent LP 2.375% 7/15/2031 | | 427,000 | 357,254 |
| American Homes 4 Rent LP 3.625% 4/15/2032 | | 1,758,000 | 1,571,550 |
| American Homes 4 Rent LP 5.5% 7/15/2034 | | 4,187,000 | 4,149,093 |
| Invitation Homes Operating Partnership LP 4.15% 4/15/2032 | | 2,644,000 | 2,438,551 |
| Sun Communities Operating LP 2.3% 11/1/2028 | | 948,000 | 854,614 |
| Sun Communities Operating LP 2.7% 7/15/2031 | | 2,448,000 | 2,058,306 |
| UDR Inc 5.125% 9/1/2034 | | 1,692,000 | 1,640,867 |
| | | | 13,070,235 |
| Retail REITs - 0.5% | | | |
| Brixmor Operating Partnership LP 4.05% 7/1/2030 | | 2,875,000 | 2,718,025 |
| Brixmor Operating Partnership LP 4.125% 5/15/2029 | | 2,868,000 | 2,752,233 |
| Brixmor Operating Partnership LP 4.125% 6/15/2026 | | 2,638,000 | 2,609,921 |
| Kite Realty Group Trust 4% 3/15/2025 | | 3,537,000 | 3,526,794 |
| Kite Realty Group Trust 4.75% 9/15/2030 | | 5,514,000 | 5,383,450 |
| Phillips Edison Grocery Center Operating Partnership I LP 5.75% 7/15/2034 | | 654,000 | 654,749 |
| Realty Income Corp 2.2% 6/15/2028 | | 453,000 | 414,537 |
| Realty Income Corp 2.85% 12/15/2032 | | 556,000 | 469,653 |
| Realty Income Corp 3.25% 1/15/2031 | | 579,000 | 522,790 |
| Realty Income Corp 3.4% 1/15/2028 | | 904,000 | 867,473 |
| Regency Centers LP 5.1% 1/15/2035 | | 1,953,000 | 1,906,900 |
| Simon Property Group LP 2.45% 9/13/2029 | | 924,000 | 830,865 |
| | | | 22,657,390 |
TOTAL REAL ESTATE | | | 130,364,256 |
| | | | |
| Utilities - 1.1% | | | |
| Electric Utilities - 0.6% | | | |
| Alabama Power Co 3.05% 3/15/2032 | | 3,742,000 | 3,283,884 |
| Cleco Corporate Holdings LLC 3.375% 9/15/2029 | | 1,957,000 | 1,759,524 |
| Cleco Corporate Holdings LLC 3.743% 5/1/2026 | | 7,482,000 | 7,328,630 |
| Consolidated Edison Co of New York Inc 3.35% 4/1/2030 | | 449,000 | 417,830 |
| Duke Energy Corp 2.45% 6/1/2030 | | 1,580,000 | 1,384,894 |
| Duquesne Light Holdings Inc 2.532% 10/1/2030 (d) | | 750,000 | 648,125 |
| Duquesne Light Holdings Inc 2.775% 1/7/2032 (d) | | 2,595,000 | 2,160,618 |
| Entergy Corp 2.8% 6/15/2030 | | 1,621,000 | 1,443,919 |
| Exelon Corp 2.75% 3/15/2027 | | 829,000 | 793,803 |
| Exelon Corp 3.35% 3/15/2032 | | 1,006,000 | 890,638 |
| Exelon Corp 4.05% 4/15/2030 | | 988,000 | 941,532 |
| Southern Co/The 4.85% 3/15/2035 | | 5,500,000 | 5,247,163 |
| | | | 26,300,560 |
| Independent Power and Renewable Electricity Producers - 0.2% | | | |
| AES Corp/The 2.45% 1/15/2031 | | 1,088,000 | 906,638 |
| AES Corp/The 3.3% 7/15/2025 (d) | | 4,877,000 | 4,830,108 |
| AES Corp/The 3.95% 7/15/2030 (d) | | 4,253,000 | 3,920,431 |
| | | | 9,657,177 |
| Multi-Utilities - 0.3% | | | |
| NiSource Inc 2.95% 9/1/2029 | | 4,856,000 | 4,444,856 |
| NiSource Inc 3.6% 5/1/2030 | | 2,477,000 | 2,310,514 |
| Puget Energy Inc 4.1% 6/15/2030 | | 1,909,000 | 1,799,843 |
| Puget Energy Inc 4.224% 3/15/2032 | | 3,417,000 | 3,123,227 |
| | | | 11,678,440 |
TOTAL UTILITIES | | | 47,636,177 |
| | | | |
| TOTAL UNITED STATES | | | 865,912,926 |
| TOTAL NON-CONVERTIBLE CORPORATE BONDS (Cost $1,137,321,143) | | | 1,033,631,299 |
| | | | |
| U.S. Government Agency - Mortgage Securities - 21.8% |
| | | Principal Amount (a) | Value ($) |
| UNITED STATES - 21.8% | | | |
| Fannie Mae Mortgage pass-thru certificates 1 year FTSE USD IBOR Consumer Fallbacks + 1.48%, 7.48% 7/1/2034 (b)(c) | | 1,390 | 1,410 |
| Fannie Mae Mortgage pass-thru certificates 1 year FTSE USD IBOR Consumer Fallbacks + 1.553%, 7.428% 6/1/2036 (b)(c) | | 3,450 | 3,511 |
| Fannie Mae Mortgage pass-thru certificates 1 year FTSE USD IBOR Consumer Fallbacks + 1.638%, 6.938% 11/1/2036 (b)(c) | | 30,267 | 30,803 |
| Fannie Mae Mortgage pass-thru certificates 1 year FTSE USD IBOR Consumer Fallbacks + 1.644%, 7.394% 5/1/2036 (b)(c) | | 19,466 | 19,819 |
| Fannie Mae Mortgage pass-thru certificates 1 year FTSE USD IBOR Consumer Fallbacks + 1.7%, 7.178% 6/1/2042 (b)(c) | | 20,112 | 20,546 |
| Fannie Mae Mortgage pass-thru certificates 1 year FTSE USD IBOR Consumer Fallbacks + 1.75%, 6.58% 7/1/2035 (b)(c) | | 2,041 | 2,088 |
| Fannie Mae Mortgage pass-thru certificates 1 year FTSE USD IBOR Consumer Fallbacks + 1.788%, 6.163% 2/1/2036 (b)(c) | | 10,767 | 11,063 |
| Fannie Mae Mortgage pass-thru certificates 1 year FTSE USD IBOR Consumer Fallbacks + 1.8%, 7.635% 7/1/2041 (b)(c) | | 4,687 | 4,794 |
| Fannie Mae Mortgage pass-thru certificates 1 year FTSE USD IBOR Consumer Fallbacks + 1.818%, 7.318% 9/1/2041 (b)(c) | | 8,970 | 9,194 |
| Fannie Mae Mortgage pass-thru certificates 1 year FTSE USD IBOR Consumer Fallbacks + 1.818%, 7.639% 7/1/2041 (b)(c) | | 11,973 | 12,259 |
| Fannie Mae Mortgage pass-thru certificates 1 year FTSE USD IBOR Consumer Fallbacks + 1.82%, 6.195% 12/1/2035 (b)(c) | | 11,352 | 11,600 |
| Fannie Mae Mortgage pass-thru certificates 1 year FTSE USD IBOR Consumer Fallbacks + 1.83%, 7.004% 10/1/2041 (b)(c) | | 8,036 | 8,248 |
| Fannie Mae Mortgage pass-thru certificates 1 year FTSE USD IBOR Consumer Fallbacks + 1.95%, 7.285% 9/1/2036 (b)(c) | | 20,551 | 21,049 |
| Fannie Mae Mortgage pass-thru certificates 1 year FTSE USD IBOR Consumer Fallbacks + 1.953%, 7.703% 7/1/2037 (b)(c) | | 7,712 | 7,905 |
| Fannie Mae Mortgage pass-thru certificates 1 year U.S. Treasury Index + 1.945%, 6.995% 10/1/2033 (b)(c) | | 28,575 | 28,930 |
| Fannie Mae Mortgage pass-thru certificates 1 year U.S. Treasury Index + 2.208%, 6.583% 3/1/2035 (b)(c) | | 2,448 | 2,484 |
| Fannie Mae Mortgage pass-thru certificates 1 year U.S. Treasury Index + 2.224%, 6.391% 8/1/2036 (b)(c) | | 34,431 | 35,035 |
| Fannie Mae Mortgage pass-thru certificates 1 year U.S. Treasury Index + 2.281%, 7.242% 10/1/2033 (b)(c) | | 3,725 | 3,788 |
| Fannie Mae Mortgage pass-thru certificates 1 year U.S. Treasury Index + 2.462%, 6.967% 5/1/2035 (b)(c) | | 4,169 | 4,246 |
| Fannie Mae Mortgage pass-thru certificates 1.5% 1/1/2036 | | 1,716,240 | 1,483,160 |
| Fannie Mae Mortgage pass-thru certificates 1.5% 1/1/2041 | | 189,240 | 153,488 |
| Fannie Mae Mortgage pass-thru certificates 1.5% 1/1/2051 | | 2,315,136 | 1,710,549 |
| Fannie Mae Mortgage pass-thru certificates 1.5% 11/1/2035 | | 1,029,279 | 889,495 |
| Fannie Mae Mortgage pass-thru certificates 1.5% 11/1/2035 | | 978,428 | 845,549 |
| Fannie Mae Mortgage pass-thru certificates 1.5% 11/1/2035 | | 28,786 | 24,876 |
| Fannie Mae Mortgage pass-thru certificates 1.5% 11/1/2035 | | 532,802 | 461,775 |
| Fannie Mae Mortgage pass-thru certificates 1.5% 11/1/2035 | | 19,910 | 17,206 |
| Fannie Mae Mortgage pass-thru certificates 1.5% 11/1/2040 | | 184,462 | 149,849 |
| Fannie Mae Mortgage pass-thru certificates 1.5% 11/1/2041 (j) | | 3,313,037 | 2,664,266 |
| Fannie Mae Mortgage pass-thru certificates 1.5% 12/1/2035 | | 20,188 | 17,446 |
| Fannie Mae Mortgage pass-thru certificates 1.5% 12/1/2035 | | 1,055,655 | 912,288 |
| Fannie Mae Mortgage pass-thru certificates 1.5% 12/1/2040 | | 186,856 | 151,671 |
| Fannie Mae Mortgage pass-thru certificates 1.5% 2/1/2041 | | 192,941 | 156,365 |
| Fannie Mae Mortgage pass-thru certificates 1.5% 2/1/2051 | | 1,868,173 | 1,380,308 |
| Fannie Mae Mortgage pass-thru certificates 1.5% 3/1/2036 | | 20,098 | 17,318 |
| Fannie Mae Mortgage pass-thru certificates 1.5% 3/1/2041 | | 196,636 | 159,252 |
| Fannie Mae Mortgage pass-thru certificates 1.5% 6/1/2051 | | 774,798 | 572,463 |
| Fannie Mae Mortgage pass-thru certificates 1.5% 9/1/2051 | | 1,084,597 | 801,360 |
| Fannie Mae Mortgage pass-thru certificates 2% 1/1/2037 | | 927,223 | 825,076 |
| Fannie Mae Mortgage pass-thru certificates 2% 1/1/2052 | | 4,280,303 | 3,375,894 |
| Fannie Mae Mortgage pass-thru certificates 2% 1/1/2052 | | 67,961 | 53,155 |
| Fannie Mae Mortgage pass-thru certificates 2% 1/1/2052 | | 2,798,774 | 2,175,919 |
| Fannie Mae Mortgage pass-thru certificates 2% 10/1/2040 | | 62,148 | 52,249 |
| Fannie Mae Mortgage pass-thru certificates 2% 10/1/2041 | | 18,830 | 15,681 |
| Fannie Mae Mortgage pass-thru certificates 2% 10/1/2050 | | 354,645 | 281,151 |
| Fannie Mae Mortgage pass-thru certificates 2% 10/1/2051 | | 1,916,840 | 1,517,810 |
| Fannie Mae Mortgage pass-thru certificates 2% 10/1/2051 | | 2,548,186 | 2,011,358 |
| Fannie Mae Mortgage pass-thru certificates 2% 10/1/2051 | | 2,182,141 | 1,725,837 |
| Fannie Mae Mortgage pass-thru certificates 2% 11/1/2040 | | 1,655,928 | 1,391,411 |
| Fannie Mae Mortgage pass-thru certificates 2% 11/1/2041 | | 1,021,717 | 851,810 |
| Fannie Mae Mortgage pass-thru certificates 2% 11/1/2041 | | 821,373 | 684,012 |
| Fannie Mae Mortgage pass-thru certificates 2% 11/1/2050 | | 258,405 | 203,321 |
| Fannie Mae Mortgage pass-thru certificates 2% 11/1/2051 | | 65,761 | 51,250 |
| Fannie Mae Mortgage pass-thru certificates 2% 11/1/2051 | | 67,384 | 52,514 |
| Fannie Mae Mortgage pass-thru certificates 2% 11/1/2051 | | 213,878 | 167,283 |
| Fannie Mae Mortgage pass-thru certificates 2% 12/1/2036 | | 168,615 | 149,618 |
| Fannie Mae Mortgage pass-thru certificates 2% 12/1/2040 | | 15,742 | 13,209 |
| Fannie Mae Mortgage pass-thru certificates 2% 12/1/2040 | | 203,413 | 171,927 |
| Fannie Mae Mortgage pass-thru certificates 2% 12/1/2051 | | 2,648,204 | 2,095,271 |
| Fannie Mae Mortgage pass-thru certificates 2% 12/1/2051 | | 1,096,566 | 864,866 |
| Fannie Mae Mortgage pass-thru certificates 2% 12/1/2051 | | 1,564,245 | 1,229,327 |
| Fannie Mae Mortgage pass-thru certificates 2% 12/1/2051 | | 1,821,756 | 1,436,827 |
| Fannie Mae Mortgage pass-thru certificates 2% 12/1/2051 | | 4,521,545 | 3,566,163 |
| Fannie Mae Mortgage pass-thru certificates 2% 2/1/2028 | | 727,196 | 705,316 |
| Fannie Mae Mortgage pass-thru certificates 2% 2/1/2041 | | 16,794 | 14,072 |
| Fannie Mae Mortgage pass-thru certificates 2% 2/1/2051 | | 17,324 | 13,593 |
| Fannie Mae Mortgage pass-thru certificates 2% 2/1/2052 | | 748,147 | 581,650 |
| Fannie Mae Mortgage pass-thru certificates 2% 3/1/2041 | | 17,151 | 14,363 |
| Fannie Mae Mortgage pass-thru certificates 2% 3/1/2042 | | 2,212,734 | 1,835,776 |
| Fannie Mae Mortgage pass-thru certificates 2% 3/1/2051 | | 18,496 | 14,512 |
| Fannie Mae Mortgage pass-thru certificates 2% 3/1/2052 | | 548,113 | 431,956 |
| Fannie Mae Mortgage pass-thru certificates 2% 3/1/2052 | | 652,662 | 507,619 |
| Fannie Mae Mortgage pass-thru certificates 2% 4/1/2041 | | 76,057 | 64,048 |
| Fannie Mae Mortgage pass-thru certificates 2% 4/1/2051 | | 8,224,998 | 6,394,562 |
| Fannie Mae Mortgage pass-thru certificates 2% 4/1/2051 | | 2,576,981 | 2,035,697 |
| Fannie Mae Mortgage pass-thru certificates 2% 4/1/2052 | | 325,558 | 253,107 |
| Fannie Mae Mortgage pass-thru certificates 2% 5/1/2042 | | 3,494,863 | 2,930,029 |
| Fannie Mae Mortgage pass-thru certificates 2% 5/1/2051 | | 999,901 | 777,377 |
| Fannie Mae Mortgage pass-thru certificates 2% 6/1/2041 | | 3,276,097 | 2,737,020 |
| Fannie Mae Mortgage pass-thru certificates 2% 6/1/2041 | | 55,416 | 46,656 |
| Fannie Mae Mortgage pass-thru certificates 2% 6/1/2052 | | 2,000,001 | 1,554,910 |
| Fannie Mae Mortgage pass-thru certificates 2% 7/1/2041 | | 142,089 | 118,596 |
| Fannie Mae Mortgage pass-thru certificates 2% 7/1/2041 | | 658,157 | 552,301 |
| Fannie Mae Mortgage pass-thru certificates 2% 7/1/2041 | | 966,375 | 806,917 |
| Fannie Mae Mortgage pass-thru certificates 2% 7/1/2050 | | 336,925 | 266,576 |
| Fannie Mae Mortgage pass-thru certificates 2% 7/1/2051 | | 112,269 | 88,687 |
| Fannie Mae Mortgage pass-thru certificates 2% 7/1/2051 | | 34,691 | 27,188 |
| Fannie Mae Mortgage pass-thru certificates 2.5% 1/1/2032 | | 244,657 | 231,426 |
| Fannie Mae Mortgage pass-thru certificates 2.5% 1/1/2037 | | 450,031 | 410,644 |
| Fannie Mae Mortgage pass-thru certificates 2.5% 1/1/2040 | | 15,804 | 13,784 |
| Fannie Mae Mortgage pass-thru certificates 2.5% 1/1/2043 | | 1,003,683 | 864,319 |
| Fannie Mae Mortgage pass-thru certificates 2.5% 1/1/2051 | | 371,884 | 305,585 |
| Fannie Mae Mortgage pass-thru certificates 2.5% 1/1/2052 | | 481,957 | 393,324 |
| Fannie Mae Mortgage pass-thru certificates 2.5% 1/1/2052 | | 136,354 | 111,875 |
| Fannie Mae Mortgage pass-thru certificates 2.5% 10/1/2031 | | 243,654 | 230,614 |
| Fannie Mae Mortgage pass-thru certificates 2.5% 10/1/2039 | | 184,926 | 161,943 |
| Fannie Mae Mortgage pass-thru certificates 2.5% 10/1/2050 | | 5,189,004 | 4,296,356 |
| Fannie Mae Mortgage pass-thru certificates 2.5% 10/1/2051 | | 3,544,264 | 2,898,004 |
| Fannie Mae Mortgage pass-thru certificates 2.5% 10/1/2051 | | 314,513 | 257,951 |
| Fannie Mae Mortgage pass-thru certificates 2.5% 10/1/2051 | | 187,508 | 153,845 |
| Fannie Mae Mortgage pass-thru certificates 2.5% 11/1/2029 | | 53,404 | 51,450 |
| Fannie Mae Mortgage pass-thru certificates 2.5% 11/1/2031 | | 157,944 | 149,574 |
| Fannie Mae Mortgage pass-thru certificates 2.5% 11/1/2032 | | 65,627 | 61,750 |
| Fannie Mae Mortgage pass-thru certificates 2.5% 11/1/2041 | | 1,038,949 | 893,662 |
| Fannie Mae Mortgage pass-thru certificates 2.5% 11/1/2041 | | 673,519 | 579,335 |
| Fannie Mae Mortgage pass-thru certificates 2.5% 11/1/2041 | | 137,799 | 118,873 |
| Fannie Mae Mortgage pass-thru certificates 2.5% 11/1/2051 | | 4,097,635 | 3,350,474 |
| Fannie Mae Mortgage pass-thru certificates 2.5% 11/1/2051 | | 1,757,867 | 1,443,930 |
| Fannie Mae Mortgage pass-thru certificates 2.5% 11/1/2051 | | 1,363,964 | 1,120,801 |
| Fannie Mae Mortgage pass-thru certificates 2.5% 12/1/2031 | | 435,951 | 412,378 |
| Fannie Mae Mortgage pass-thru certificates 2.5% 12/1/2033 | | 1,261,282 | 1,191,562 |
| Fannie Mae Mortgage pass-thru certificates 2.5% 12/1/2051 | | 2,469,610 | 2,028,563 |
| Fannie Mae Mortgage pass-thru certificates 2.5% 12/1/2051 | | 1,620,763 | 1,335,364 |
| Fannie Mae Mortgage pass-thru certificates 2.5% 2/1/2035 | | 104,410 | 95,729 |
| Fannie Mae Mortgage pass-thru certificates 2.5% 2/1/2035 | | 310,943 | 285,090 |
| Fannie Mae Mortgage pass-thru certificates 2.5% 2/1/2035 | | 137,203 | 129,931 |
| Fannie Mae Mortgage pass-thru certificates 2.5% 2/1/2041 | | 414,494 | 358,745 |
| Fannie Mae Mortgage pass-thru certificates 2.5% 2/1/2051 | | 15,406 | 12,659 |
| Fannie Mae Mortgage pass-thru certificates 2.5% 3/1/2040 | | 10,728 | 9,360 |
| Fannie Mae Mortgage pass-thru certificates 2.5% 3/1/2040 | | 129,569 | 112,838 |
| Fannie Mae Mortgage pass-thru certificates 2.5% 3/1/2041 | | 168,578 | 146,746 |
| Fannie Mae Mortgage pass-thru certificates 2.5% 4/1/2036 | | 244,049 | 231,109 |
| Fannie Mae Mortgage pass-thru certificates 2.5% 4/1/2041 | | 386,902 | 333,402 |
| Fannie Mae Mortgage pass-thru certificates 2.5% 4/1/2051 | | 2,078,536 | 1,728,117 |
| Fannie Mae Mortgage pass-thru certificates 2.5% 5/1/2040 | | 137,493 | 119,729 |
| Fannie Mae Mortgage pass-thru certificates 2.5% 5/1/2041 | | 151,890 | 131,932 |
| Fannie Mae Mortgage pass-thru certificates 2.5% 5/1/2041 | | 190,475 | 164,851 |
| Fannie Mae Mortgage pass-thru certificates 2.5% 5/1/2042 | | 54,406 | 46,832 |
| Fannie Mae Mortgage pass-thru certificates 2.5% 5/1/2042 | | 146,088 | 126,207 |
| Fannie Mae Mortgage pass-thru certificates 2.5% 5/1/2051 | | 1,412,490 | 1,156,262 |
| Fannie Mae Mortgage pass-thru certificates 2.5% 5/1/2051 | | 18,362 | 15,065 |
| Fannie Mae Mortgage pass-thru certificates 2.5% 5/1/2051 | | 605,264 | 496,603 |
| Fannie Mae Mortgage pass-thru certificates 2.5% 5/1/2051 | | 2,252,436 | 1,848,063 |
| Fannie Mae Mortgage pass-thru certificates 2.5% 5/1/2051 | | 612,372 | 502,434 |
| Fannie Mae Mortgage pass-thru certificates 2.5% 6/1/2033 | | 40,482 | 37,496 |
| Fannie Mae Mortgage pass-thru certificates 2.5% 6/1/2040 | | 257,194 | 223,732 |
| Fannie Mae Mortgage pass-thru certificates 2.5% 6/1/2050 | | 730,149 | 604,544 |
| Fannie Mae Mortgage pass-thru certificates 2.5% 7/1/2031 | | 3,918,407 | 3,717,159 |
| Fannie Mae Mortgage pass-thru certificates 2.5% 7/1/2040 | | 257,312 | 223,470 |
| Fannie Mae Mortgage pass-thru certificates 2.5% 7/1/2041 | | 266,769 | 229,881 |
| Fannie Mae Mortgage pass-thru certificates 2.5% 7/1/2041 | | 155,226 | 134,344 |
| Fannie Mae Mortgage pass-thru certificates 2.5% 8/1/2039 | | 38,997 | 34,145 |
| Fannie Mae Mortgage pass-thru certificates 2.5% 8/1/2051 | | 261,347 | 213,938 |
| Fannie Mae Mortgage pass-thru certificates 2.5% 8/1/2051 | | 2,106,257 | 1,728,127 |
| Fannie Mae Mortgage pass-thru certificates 2.5% 8/1/2051 | | 2,036,853 | 1,671,183 |
| Fannie Mae Mortgage pass-thru certificates 2.5% 8/1/2051 | | 2,614,544 | 2,145,162 |
| Fannie Mae Mortgage pass-thru certificates 2.5% 9/1/2035 | | 617,644 | 564,553 |
| Fannie Mae Mortgage pass-thru certificates 2.5% 9/1/2041 | | 866,206 | 745,618 |
| Fannie Mae Mortgage pass-thru certificates 2.5% 9/1/2051 | | 76,260 | 62,354 |
| Fannie Mae Mortgage pass-thru certificates 3% 1/1/2035 | | 723,768 | 680,806 |
| Fannie Mae Mortgage pass-thru certificates 3% 1/1/2035 | | 128,895 | 121,244 |
| Fannie Mae Mortgage pass-thru certificates 3% 1/1/2043 | | 18,480 | 16,399 |
| Fannie Mae Mortgage pass-thru certificates 3% 1/1/2043 | | 18,747 | 16,643 |
| Fannie Mae Mortgage pass-thru certificates 3% 1/1/2043 | | 20,500 | 18,169 |
| Fannie Mae Mortgage pass-thru certificates 3% 1/1/2043 | | 111,998 | 99,461 |
| Fannie Mae Mortgage pass-thru certificates 3% 1/1/2043 | | 127,873 | 113,347 |
| Fannie Mae Mortgage pass-thru certificates 3% 1/1/2043 | | 91,539 | 80,997 |
| Fannie Mae Mortgage pass-thru certificates 3% 1/1/2043 | | 45,332 | 40,531 |
| Fannie Mae Mortgage pass-thru certificates 3% 1/1/2043 | | 27,150 | 24,068 |
| Fannie Mae Mortgage pass-thru certificates 3% 1/1/2043 | | 19,511 | 17,236 |
| Fannie Mae Mortgage pass-thru certificates 3% 1/1/2043 | | 27,617 | 24,645 |
| Fannie Mae Mortgage pass-thru certificates 3% 1/1/2043 | | 32,610 | 28,888 |
| Fannie Mae Mortgage pass-thru certificates 3% 1/1/2043 | | 20,571 | 18,379 |
| Fannie Mae Mortgage pass-thru certificates 3% 1/1/2043 | | 8,511 | 7,502 |
| Fannie Mae Mortgage pass-thru certificates 3% 1/1/2051 | | 782,438 | 669,755 |
| Fannie Mae Mortgage pass-thru certificates 3% 1/1/2051 | | 16,066 | 13,707 |
| Fannie Mae Mortgage pass-thru certificates 3% 1/1/2052 | | 3,300,970 | 2,818,356 |
| Fannie Mae Mortgage pass-thru certificates 3% 1/1/2052 | | 673,763 | 575,257 |
| Fannie Mae Mortgage pass-thru certificates 3% 10/1/2049 | | 531,868 | 459,592 |
| Fannie Mae Mortgage pass-thru certificates 3% 10/1/2049 | | 39,713 | 34,167 |
| Fannie Mae Mortgage pass-thru certificates 3% 10/1/2049 | | 4,837 | 4,161 |
| Fannie Mae Mortgage pass-thru certificates 3% 10/1/2050 | | 45,679 | 39,129 |
| Fannie Mae Mortgage pass-thru certificates 3% 10/1/2051 (h) | | 6,450,575 | 5,547,795 |
| Fannie Mae Mortgage pass-thru certificates 3% 10/1/2051 | | 58,172 | 49,667 |
| Fannie Mae Mortgage pass-thru certificates 3% 10/1/2051 | | 46,854 | 40,004 |
| Fannie Mae Mortgage pass-thru certificates 3% 10/1/2051 | | 442,132 | 378,182 |
| Fannie Mae Mortgage pass-thru certificates 3% 11/1/2032 | | 22,021 | 21,016 |
| Fannie Mae Mortgage pass-thru certificates 3% 11/1/2034 | | 90,439 | 87,155 |
| Fannie Mae Mortgage pass-thru certificates 3% 11/1/2042 | | 35,479 | 31,361 |
| Fannie Mae Mortgage pass-thru certificates 3% 11/1/2042 | | 17,597 | 15,641 |
| Fannie Mae Mortgage pass-thru certificates 3% 11/1/2042 | | 13,436 | 11,840 |
| Fannie Mae Mortgage pass-thru certificates 3% 11/1/2042 | | 19,314 | 17,257 |
| Fannie Mae Mortgage pass-thru certificates 3% 11/1/2042 | | 18,862 | 17,001 |
| Fannie Mae Mortgage pass-thru certificates 3% 11/1/2050 | | 154,041 | 131,856 |
| Fannie Mae Mortgage pass-thru certificates 3% 11/1/2051 | | 353,399 | 301,951 |
| Fannie Mae Mortgage pass-thru certificates 3% 11/1/2051 | | 1,281,613 | 1,101,445 |
| Fannie Mae Mortgage pass-thru certificates 3% 12/1/2032 | | 308,120 | 293,822 |
| Fannie Mae Mortgage pass-thru certificates 3% 12/1/2032 | | 233,521 | 224,124 |
| Fannie Mae Mortgage pass-thru certificates 3% 12/1/2034 | | 283,636 | 266,799 |
| Fannie Mae Mortgage pass-thru certificates 3% 12/1/2034 | | 984,936 | 926,472 |
| Fannie Mae Mortgage pass-thru certificates 3% 12/1/2034 | | 141,823 | 133,582 |
| Fannie Mae Mortgage pass-thru certificates 3% 12/1/2042 | | 50,147 | 44,500 |
| Fannie Mae Mortgage pass-thru certificates 3% 12/1/2042 | | 46,874 | 41,615 |
| Fannie Mae Mortgage pass-thru certificates 3% 12/1/2042 | | 123,378 | 109,530 |
| Fannie Mae Mortgage pass-thru certificates 3% 12/1/2042 | | 67,810 | 60,180 |
| Fannie Mae Mortgage pass-thru certificates 3% 12/1/2042 | | 48,612 | 42,968 |
| Fannie Mae Mortgage pass-thru certificates 3% 12/1/2042 | | 50,371 | 44,525 |
| Fannie Mae Mortgage pass-thru certificates 3% 12/1/2042 | | 48,568 | 43,060 |
| Fannie Mae Mortgage pass-thru certificates 3% 12/1/2042 | | 20,442 | 18,288 |
| Fannie Mae Mortgage pass-thru certificates 3% 12/1/2042 | | 9,721 | 8,560 |
| Fannie Mae Mortgage pass-thru certificates 3% 12/1/2042 | | 18,956 | 16,852 |
| Fannie Mae Mortgage pass-thru certificates 3% 12/1/2042 | | 16,411 | 14,544 |
| Fannie Mae Mortgage pass-thru certificates 3% 12/1/2042 | | 7,513 | 6,740 |
| Fannie Mae Mortgage pass-thru certificates 3% 12/1/2044 | | 2,332 | 2,047 |
| Fannie Mae Mortgage pass-thru certificates 3% 12/1/2050 | | 1,421,648 | 1,216,908 |
| Fannie Mae Mortgage pass-thru certificates 3% 12/1/2051 | | 3,875,531 | 3,321,025 |
| Fannie Mae Mortgage pass-thru certificates 3% 12/1/2051 | | 488,759 | 418,064 |
| Fannie Mae Mortgage pass-thru certificates 3% 12/1/2051 | | 434,756 | 372,687 |
| Fannie Mae Mortgage pass-thru certificates 3% 12/1/2051 | | 556,372 | 477,810 |
| Fannie Mae Mortgage pass-thru certificates 3% 2/1/2031 | | 159,603 | 154,461 |
| Fannie Mae Mortgage pass-thru certificates 3% 2/1/2035 | | 62,242 | 60,009 |
| Fannie Mae Mortgage pass-thru certificates 3% 2/1/2043 | | 302,430 | 268,444 |
| Fannie Mae Mortgage pass-thru certificates 3% 2/1/2043 | | 774,433 | 686,076 |
| Fannie Mae Mortgage pass-thru certificates 3% 2/1/2043 | | 278,127 | 246,600 |
| Fannie Mae Mortgage pass-thru certificates 3% 2/1/2043 | | 588,954 | 521,767 |
| Fannie Mae Mortgage pass-thru certificates 3% 2/1/2043 | | 67,664 | 60,055 |
| Fannie Mae Mortgage pass-thru certificates 3% 2/1/2043 | | 40,740 | 36,018 |
| Fannie Mae Mortgage pass-thru certificates 3% 2/1/2043 | | 58,602 | 51,671 |
| Fannie Mae Mortgage pass-thru certificates 3% 2/1/2043 | | 4,575 | 4,180 |
| Fannie Mae Mortgage pass-thru certificates 3% 2/1/2050 | | 1,059,601 | 913,624 |
| Fannie Mae Mortgage pass-thru certificates 3% 2/1/2052 | | 1,079,774 | 924,944 |
| Fannie Mae Mortgage pass-thru certificates 3% 2/1/2052 | | 1,208,172 | 1,034,931 |
| Fannie Mae Mortgage pass-thru certificates 3% 2/1/2052 | | 2,525,859 | 2,156,570 |
| Fannie Mae Mortgage pass-thru certificates 3% 3/1/2033 | | 124,466 | 119,251 |
| Fannie Mae Mortgage pass-thru certificates 3% 3/1/2033 | | 47,250 | 44,943 |
| Fannie Mae Mortgage pass-thru certificates 3% 3/1/2033 | | 39,779 | 38,015 |
| Fannie Mae Mortgage pass-thru certificates 3% 3/1/2043 | | 62,386 | 55,339 |
| Fannie Mae Mortgage pass-thru certificates 3% 3/1/2044 | | 69,569 | 61,071 |
| Fannie Mae Mortgage pass-thru certificates 3% 3/1/2050 | | 9,350 | 8,042 |
| Fannie Mae Mortgage pass-thru certificates 3% 3/1/2050 | | 8,278 | 7,115 |
| Fannie Mae Mortgage pass-thru certificates 3% 3/1/2052 | | 660,486 | 563,921 |
| Fannie Mae Mortgage pass-thru certificates 3% 4/1/2043 | | 155,620 | 137,967 |
| Fannie Mae Mortgage pass-thru certificates 3% 4/1/2043 | | 125,159 | 110,311 |
| Fannie Mae Mortgage pass-thru certificates 3% 4/1/2051 | | 73,383 | 62,815 |
| Fannie Mae Mortgage pass-thru certificates 3% 5/1/2043 | | 57,252 | 50,710 |
| Fannie Mae Mortgage pass-thru certificates 3% 5/1/2043 | | 45,817 | 40,545 |
| Fannie Mae Mortgage pass-thru certificates 3% 5/1/2043 | | 41,813 | 37,003 |
| Fannie Mae Mortgage pass-thru certificates 3% 5/1/2043 | | 26,769 | 23,712 |
| Fannie Mae Mortgage pass-thru certificates 3% 5/1/2045 | | 81,627 | 71,224 |
| Fannie Mae Mortgage pass-thru certificates 3% 5/1/2045 | | 10,648 | 9,317 |
| Fannie Mae Mortgage pass-thru certificates 3% 5/1/2045 | | 8,547 | 7,516 |
| Fannie Mae Mortgage pass-thru certificates 3% 5/1/2050 | | 282,561 | 243,633 |
| Fannie Mae Mortgage pass-thru certificates 3% 6/1/2043 | | 53,768 | 47,680 |
| Fannie Mae Mortgage pass-thru certificates 3% 6/1/2045 | | 11,872 | 10,381 |
| Fannie Mae Mortgage pass-thru certificates 3% 6/1/2045 | | 30,856 | 26,904 |
| Fannie Mae Mortgage pass-thru certificates 3% 6/1/2050 | | 48,791 | 41,871 |
| Fannie Mae Mortgage pass-thru certificates 3% 6/1/2051 | | 3,798,499 | 3,258,576 |
| Fannie Mae Mortgage pass-thru certificates 3% 7/1/2033 | | 299,084 | 285,571 |
| Fannie Mae Mortgage pass-thru certificates 3% 7/1/2034 | | 182,758 | 176,366 |
| Fannie Mae Mortgage pass-thru certificates 3% 7/1/2043 | | 40,325 | 35,700 |
| Fannie Mae Mortgage pass-thru certificates 3% 7/1/2045 | | 34,835 | 30,460 |
| Fannie Mae Mortgage pass-thru certificates 3% 7/1/2045 | | 39,036 | 34,134 |
| Fannie Mae Mortgage pass-thru certificates 3% 7/1/2050 | | 1,761,920 | 1,518,637 |
| Fannie Mae Mortgage pass-thru certificates 3% 7/1/2051 | | 54,772 | 46,815 |
| Fannie Mae Mortgage pass-thru certificates 3% 7/1/2051 | | 25,929 | 22,138 |
| Fannie Mae Mortgage pass-thru certificates 3% 8/1/2032 | | 385,988 | 368,713 |
| Fannie Mae Mortgage pass-thru certificates 3% 8/1/2043 | | 365,232 | 322,814 |
| Fannie Mae Mortgage pass-thru certificates 3% 8/1/2045 | | 176,708 | 154,075 |
| Fannie Mae Mortgage pass-thru certificates 3% 8/1/2045 | | 24,254 | 21,148 |
| Fannie Mae Mortgage pass-thru certificates 3% 8/1/2045 | | 74,508 | 64,965 |
| Fannie Mae Mortgage pass-thru certificates 3% 8/1/2049 | | 66,216 | 56,970 |
| Fannie Mae Mortgage pass-thru certificates 3% 8/1/2050 | | 14,293 | 12,243 |
| Fannie Mae Mortgage pass-thru certificates 3% 8/1/2050 | | 636,771 | 546,061 |
| Fannie Mae Mortgage pass-thru certificates 3% 8/1/2051 | | 69,128 | 59,129 |
| Fannie Mae Mortgage pass-thru certificates 3% 8/1/2051 | | 772,192 | 664,121 |
| Fannie Mae Mortgage pass-thru certificates 3% 9/1/2032 | | 67,124 | 64,121 |
| Fannie Mae Mortgage pass-thru certificates 3% 9/1/2032 | | 82,469 | 78,843 |
| Fannie Mae Mortgage pass-thru certificates 3% 9/1/2035 | | 380,377 | 365,230 |
| Fannie Mae Mortgage pass-thru certificates 3% 9/1/2049 | | 435,767 | 375,869 |
| Fannie Mae Mortgage pass-thru certificates 3% 9/1/2050 | | 60,475 | 51,804 |
| Fannie Mae Mortgage pass-thru certificates 3% 9/1/2051 | | 30,326 | 25,892 |
| Fannie Mae Mortgage pass-thru certificates 3.5% 1/1/2043 | | 144,329 | 132,132 |
| Fannie Mae Mortgage pass-thru certificates 3.5% 1/1/2046 | | 61,865 | 55,816 |
| Fannie Mae Mortgage pass-thru certificates 3.5% 1/1/2047 | | 197,703 | 178,062 |
| Fannie Mae Mortgage pass-thru certificates 3.5% 1/1/2047 | | 129,581 | 116,708 |
| Fannie Mae Mortgage pass-thru certificates 3.5% 1/1/2047 | | 360,849 | 325,002 |
| Fannie Mae Mortgage pass-thru certificates 3.5% 1/1/2047 | | 120,251 | 108,305 |
| Fannie Mae Mortgage pass-thru certificates 3.5% 1/1/2047 | | 29,368 | 26,451 |
| Fannie Mae Mortgage pass-thru certificates 3.5% 1/1/2047 | | 967,296 | 872,412 |
| Fannie Mae Mortgage pass-thru certificates 3.5% 1/1/2047 | | 1,033,365 | 932,323 |
| Fannie Mae Mortgage pass-thru certificates 3.5% 1/1/2047 | | 131,420 | 118,200 |
| Fannie Mae Mortgage pass-thru certificates 3.5% 1/1/2048 | | 403,852 | 365,626 |
| Fannie Mae Mortgage pass-thru certificates 3.5% 1/1/2052 | | 159,216 | 142,006 |
| Fannie Mae Mortgage pass-thru certificates 3.5% 10/1/2046 | | 1,229,875 | 1,109,618 |
| Fannie Mae Mortgage pass-thru certificates 3.5% 10/1/2046 | | 128,087 | 115,523 |
| Fannie Mae Mortgage pass-thru certificates 3.5% 10/1/2047 | | 389,296 | 352,569 |
| Fannie Mae Mortgage pass-thru certificates 3.5% 10/1/2050 | | 11,197,261 | 9,986,923 |
| Fannie Mae Mortgage pass-thru certificates 3.5% 11/1/2042 | | 58,099 | 52,979 |
| Fannie Mae Mortgage pass-thru certificates 3.5% 11/1/2046 | | 50,962 | 45,963 |
| Fannie Mae Mortgage pass-thru certificates 3.5% 11/1/2051 | | 612,957 | 545,360 |
| Fannie Mae Mortgage pass-thru certificates 3.5% 2/1/2042 | | 60,255 | 55,178 |
| Fannie Mae Mortgage pass-thru certificates 3.5% 2/1/2046 | | 187,499 | 169,165 |
| Fannie Mae Mortgage pass-thru certificates 3.5% 2/1/2047 | | 83,412 | 75,126 |
| Fannie Mae Mortgage pass-thru certificates 3.5% 2/1/2052 | | 255,568 | 227,783 |
| Fannie Mae Mortgage pass-thru certificates 3.5% 2/1/2052 | | 171,773 | 153,152 |
| Fannie Mae Mortgage pass-thru certificates 3.5% 3/1/2043 | | 148,932 | 136,492 |
| Fannie Mae Mortgage pass-thru certificates 3.5% 3/1/2052 | | 438,180 | 390,782 |
| Fannie Mae Mortgage pass-thru certificates 3.5% 4/1/2042 | | 384,709 | 352,423 |
| Fannie Mae Mortgage pass-thru certificates 3.5% 4/1/2042 | | 89,187 | 81,517 |
| Fannie Mae Mortgage pass-thru certificates 3.5% 4/1/2042 | | 136,702 | 125,271 |
| Fannie Mae Mortgage pass-thru certificates 3.5% 4/1/2046 | | 617,998 | 557,956 |
| Fannie Mae Mortgage pass-thru certificates 3.5% 4/1/2046 | | 416,344 | 375,634 |
| Fannie Mae Mortgage pass-thru certificates 3.5% 4/1/2046 | | 736,466 | 664,914 |
| Fannie Mae Mortgage pass-thru certificates 3.5% 5/1/2042 | | 320,445 | 294,433 |
| Fannie Mae Mortgage pass-thru certificates 3.5% 5/1/2042 | | 229,588 | 210,518 |
| Fannie Mae Mortgage pass-thru certificates 3.5% 5/1/2042 | | 12,893 | 11,881 |
| Fannie Mae Mortgage pass-thru certificates 3.5% 5/1/2042 | | 39,033 | 35,628 |
| Fannie Mae Mortgage pass-thru certificates 3.5% 5/1/2046 | | 234,161 | 211,265 |
| Fannie Mae Mortgage pass-thru certificates 3.5% 5/1/2046 | | 89,151 | 80,434 |
| Fannie Mae Mortgage pass-thru certificates 3.5% 6/1/2051 | | 4,265,451 | 3,797,723 |
| Fannie Mae Mortgage pass-thru certificates 3.5% 7/1/2046 | | 175,646 | 158,471 |
| Fannie Mae Mortgage pass-thru certificates 3.5% 7/1/2046 | | 112,167 | 101,200 |
| Fannie Mae Mortgage pass-thru certificates 3.5% 7/1/2046 | | 118,633 | 107,033 |
| Fannie Mae Mortgage pass-thru certificates 3.5% 7/1/2046 | | 168,626 | 152,085 |
| Fannie Mae Mortgage pass-thru certificates 3.5% 7/1/2047 | | 721,037 | 656,846 |
| Fannie Mae Mortgage pass-thru certificates 3.5% 8/1/2037 | | 43,529 | 40,633 |
| Fannie Mae Mortgage pass-thru certificates 3.5% 8/1/2043 | | 172,515 | 158,129 |
| Fannie Mae Mortgage pass-thru certificates 3.5% 8/1/2046 | | 180,638 | 162,918 |
| Fannie Mae Mortgage pass-thru certificates 3.5% 8/1/2046 | | 172,794 | 155,844 |
| Fannie Mae Mortgage pass-thru certificates 3.5% 9/1/2046 | | 101,800 | 91,814 |
| Fannie Mae Mortgage pass-thru certificates 3.5% 9/1/2047 | | 244,811 | 221,715 |
| Fannie Mae Mortgage pass-thru certificates 4% 1/1/2041 | | 16,135 | 15,270 |
| Fannie Mae Mortgage pass-thru certificates 4% 1/1/2041 | | 3,529 | 3,337 |
| Fannie Mae Mortgage pass-thru certificates 4% 1/1/2042 | | 6,372 | 6,013 |
| Fannie Mae Mortgage pass-thru certificates 4% 1/1/2045 | | 97,082 | 90,508 |
| Fannie Mae Mortgage pass-thru certificates 4% 10/1/2040 | | 25,687 | 24,294 |
| Fannie Mae Mortgage pass-thru certificates 4% 10/1/2043 | | 176,096 | 166,003 |
| Fannie Mae Mortgage pass-thru certificates 4% 10/1/2045 | | 31,018 | 28,859 |
| Fannie Mae Mortgage pass-thru certificates 4% 10/1/2046 | | 429,239 | 400,440 |
| Fannie Mae Mortgage pass-thru certificates 4% 11/1/2040 | | 1,671 | 1,574 |
| Fannie Mae Mortgage pass-thru certificates 4% 11/1/2040 | | 2,102,855 | 1,988,534 |
| Fannie Mae Mortgage pass-thru certificates 4% 11/1/2041 | | 216,388 | 204,119 |
| Fannie Mae Mortgage pass-thru certificates 4% 12/1/2040 | | 3,974 | 3,755 |
| Fannie Mae Mortgage pass-thru certificates 4% 12/1/2040 | | 5,417 | 5,164 |
| Fannie Mae Mortgage pass-thru certificates 4% 12/1/2044 | | 61,434 | 57,492 |
| Fannie Mae Mortgage pass-thru certificates 4% 12/1/2045 | | 39,694 | 36,931 |
| Fannie Mae Mortgage pass-thru certificates 4% 2/1/2041 | | 16,555 | 15,595 |
| Fannie Mae Mortgage pass-thru certificates 4% 2/1/2042 | | 16,706 | 15,850 |
| Fannie Mae Mortgage pass-thru certificates 4% 2/1/2042 | | 10,793 | 10,175 |
| Fannie Mae Mortgage pass-thru certificates 4% 2/1/2042 | | 126,650 | 119,262 |
| Fannie Mae Mortgage pass-thru certificates 4% 2/1/2042 | | 13,824 | 13,005 |
| Fannie Mae Mortgage pass-thru certificates 4% 2/1/2047 | | 1,561,138 | 1,455,422 |
| Fannie Mae Mortgage pass-thru certificates 4% 3/1/2042 | | 30,084 | 28,370 |
| Fannie Mae Mortgage pass-thru certificates 4% 3/1/2042 | | 32,154 | 30,264 |
| Fannie Mae Mortgage pass-thru certificates 4% 3/1/2045 | | 969,277 | 906,366 |
| Fannie Mae Mortgage pass-thru certificates 4% 4/1/2042 | | 28,543 | 26,848 |
| Fannie Mae Mortgage pass-thru certificates 4% 4/1/2042 | | 200,402 | 188,835 |
| Fannie Mae Mortgage pass-thru certificates 4% 4/1/2042 | | 69,699 | 65,715 |
| Fannie Mae Mortgage pass-thru certificates 4% 4/1/2042 | | 4,020 | 3,784 |
| Fannie Mae Mortgage pass-thru certificates 4% 4/1/2044 | | 152,987 | 143,500 |
| Fannie Mae Mortgage pass-thru certificates 4% 4/1/2046 | | 21,053 | 19,641 |
| Fannie Mae Mortgage pass-thru certificates 4% 4/1/2048 | | 86,437 | 80,286 |
| Fannie Mae Mortgage pass-thru certificates 4% 4/1/2048 | | 88,036 | 81,772 |
| Fannie Mae Mortgage pass-thru certificates 4% 4/1/2048 | | 374,758 | 348,444 |
| Fannie Mae Mortgage pass-thru certificates 4% 4/1/2049 | | 603,322 | 556,245 |
| Fannie Mae Mortgage pass-thru certificates 4% 4/1/2052 | | 408,388 | 377,798 |
| Fannie Mae Mortgage pass-thru certificates 4% 5/1/2047 | | 405,973 | 377,467 |
| Fannie Mae Mortgage pass-thru certificates 4% 5/1/2048 | | 155,949 | 144,706 |
| Fannie Mae Mortgage pass-thru certificates 4% 5/1/2048 | | 949,641 | 881,179 |
| Fannie Mae Mortgage pass-thru certificates 4% 6/1/2041 | | 71,717 | 67,136 |
| Fannie Mae Mortgage pass-thru certificates 4% 6/1/2041 | | 52,523 | 49,676 |
| Fannie Mae Mortgage pass-thru certificates 4% 7/1/2039 | | 2,176 | 2,063 |
| Fannie Mae Mortgage pass-thru certificates 4% 7/1/2042 | | 5,418 | 5,099 |
| Fannie Mae Mortgage pass-thru certificates 4% 7/1/2046 | | 38,086 | 35,531 |
| Fannie Mae Mortgage pass-thru certificates 4% 7/1/2046 | | 390,995 | 365,007 |
| Fannie Mae Mortgage pass-thru certificates 4% 7/1/2047 | | 211,787 | 196,916 |
| Fannie Mae Mortgage pass-thru certificates 4% 8/1/2043 | | 157,388 | 147,545 |
| Fannie Mae Mortgage pass-thru certificates 4% 9/1/2040 | | 22,287 | 21,020 |
| Fannie Mae Mortgage pass-thru certificates 4% 9/1/2046 | | 19,982 | 18,629 |
| Fannie Mae Mortgage pass-thru certificates 4% 9/1/2046 | | 459,355 | 428,536 |
| Fannie Mae Mortgage pass-thru certificates 4.5% 1/1/2044 | | 26,951 | 26,021 |
| Fannie Mae Mortgage pass-thru certificates 4.5% 1/1/2045 | | 55,396 | 53,330 |
| Fannie Mae Mortgage pass-thru certificates 4.5% 10/1/2044 | | 13,996 | 13,492 |
| Fannie Mae Mortgage pass-thru certificates 4.5% 11/1/2040 | | 183,497 | 178,279 |
| Fannie Mae Mortgage pass-thru certificates 4.5% 11/1/2041 | | 19,073 | 18,547 |
| Fannie Mae Mortgage pass-thru certificates 4.5% 11/1/2042 | | 126,757 | 123,139 |
| Fannie Mae Mortgage pass-thru certificates 4.5% 11/1/2044 | | 116,915 | 112,701 |
| Fannie Mae Mortgage pass-thru certificates 4.5% 12/1/2038 | | 15,066 | 14,829 |
| Fannie Mae Mortgage pass-thru certificates 4.5% 12/1/2040 | | 394,752 | 383,325 |
| Fannie Mae Mortgage pass-thru certificates 4.5% 12/1/2043 | | 135,270 | 130,605 |
| Fannie Mae Mortgage pass-thru certificates 4.5% 12/1/2044 | | 46,159 | 44,495 |
| Fannie Mae Mortgage pass-thru certificates 4.5% 12/1/2044 | | 46,597 | 44,917 |
| Fannie Mae Mortgage pass-thru certificates 4.5% 12/1/2044 | | 43,274 | 41,660 |
| Fannie Mae Mortgage pass-thru certificates 4.5% 12/1/2044 | | 13,471 | 12,977 |
| Fannie Mae Mortgage pass-thru certificates 4.5% 12/1/2044 | | 57,797 | 55,641 |
| Fannie Mae Mortgage pass-thru certificates 4.5% 12/1/2044 | | 708 | 683 |
| Fannie Mae Mortgage pass-thru certificates 4.5% 12/1/2046 | | 31,211 | 29,940 |
| Fannie Mae Mortgage pass-thru certificates 4.5% 12/1/2048 | | 895,265 | 857,677 |
| Fannie Mae Mortgage pass-thru certificates 4.5% 2/1/2044 | | 31,630 | 30,509 |
| Fannie Mae Mortgage pass-thru certificates 4.5% 2/1/2045 | | 4,491 | 4,339 |
| Fannie Mae Mortgage pass-thru certificates 4.5% 2/1/2047 | | 339,580 | 327,339 |
| Fannie Mae Mortgage pass-thru certificates 4.5% 3/1/2046 | | 19,905 | 19,131 |
| Fannie Mae Mortgage pass-thru certificates 4.5% 4/1/2029 | | 916 | 910 |
| Fannie Mae Mortgage pass-thru certificates 4.5% 4/1/2039 | | 1,450,673 | 1,423,431 |
| Fannie Mae Mortgage pass-thru certificates 4.5% 4/1/2039 | | 252,399 | 247,921 |
| Fannie Mae Mortgage pass-thru certificates 4.5% 4/1/2041 | | 50,617 | 49,087 |
| Fannie Mae Mortgage pass-thru certificates 4.5% 4/1/2044 | | 99,040 | 95,532 |
| Fannie Mae Mortgage pass-thru certificates 4.5% 4/1/2044 | | 46,172 | 44,537 |
| Fannie Mae Mortgage pass-thru certificates 4.5% 4/1/2045 | | 30,394 | 29,261 |
| Fannie Mae Mortgage pass-thru certificates 4.5% 4/1/2048 | | 51,644 | 49,362 |
| Fannie Mae Mortgage pass-thru certificates 4.5% 5/1/2025 | | 884 | 882 |
| Fannie Mae Mortgage pass-thru certificates 4.5% 5/1/2044 | | 6,285 | 6,078 |
| Fannie Mae Mortgage pass-thru certificates 4.5% 6/1/2044 | | 59,067 | 56,974 |
| Fannie Mae Mortgage pass-thru certificates 4.5% 6/1/2047 | | 61,629 | 58,984 |
| Fannie Mae Mortgage pass-thru certificates 4.5% 6/1/2047 | | 16,405 | 15,716 |
| Fannie Mae Mortgage pass-thru certificates 4.5% 6/1/2047 | | 358,204 | 343,165 |
| Fannie Mae Mortgage pass-thru certificates 4.5% 7/1/2038 | | 52,911 | 51,450 |
| Fannie Mae Mortgage pass-thru certificates 4.5% 7/1/2047 | | 301,684 | 289,018 |
| Fannie Mae Mortgage pass-thru certificates 4.5% 8/1/2033 | | 12,781 | 12,572 |
| Fannie Mae Mortgage pass-thru certificates 4.5% 8/1/2033 | | 26,188 | 25,748 |
| Fannie Mae Mortgage pass-thru certificates 4.5% 8/1/2033 | | 68,083 | 66,919 |
| Fannie Mae Mortgage pass-thru certificates 4.5% 8/1/2037 | | 8,820 | 8,699 |
| Fannie Mae Mortgage pass-thru certificates 4.5% 8/1/2041 | | 25,804 | 25,059 |
| Fannie Mae Mortgage pass-thru certificates 4.5% 8/1/2041 | | 10,322 | 10,023 |
| Fannie Mae Mortgage pass-thru certificates 4.5% 8/1/2044 | | 41,983 | 40,470 |
| Fannie Mae Mortgage pass-thru certificates 4.5% 8/1/2044 | | 60,387 | 58,210 |
| Fannie Mae Mortgage pass-thru certificates 4.5% 8/1/2049 | | 1,011,388 | 963,867 |
| Fannie Mae Mortgage pass-thru certificates 4.5% 9/1/2033 | | 66,921 | 65,756 |
| Fannie Mae Mortgage pass-thru certificates 4.5% 9/1/2033 | | 30,566 | 30,034 |
| Fannie Mae Mortgage pass-thru certificates 4.5% 9/1/2033 | | 24,554 | 24,131 |
| Fannie Mae Mortgage pass-thru certificates 4.5% 9/1/2033 | | 13,959 | 13,718 |
| Fannie Mae Mortgage pass-thru certificates 4.5% 9/1/2035 | | 135,510 | 132,796 |
| Fannie Mae Mortgage pass-thru certificates 4.5% 9/1/2044 | | 89,684 | 86,451 |
| Fannie Mae Mortgage pass-thru certificates 5% 10/1/2041 | | 324,024 | 323,127 |
| Fannie Mae Mortgage pass-thru certificates 5% 10/1/2052 | | 1,242,098 | 1,209,960 |
| Fannie Mae Mortgage pass-thru certificates 5% 10/1/2052 | | 1,506,614 | 1,466,691 |
| Fannie Mae Mortgage pass-thru certificates 5% 11/1/2052 | | 1,841,980 | 1,797,775 |
| Fannie Mae Mortgage pass-thru certificates 5% 11/1/2052 | | 965,867 | 940,273 |
| Fannie Mae Mortgage pass-thru certificates 5% 12/1/2052 | | 1,029,216 | 1,002,265 |
| Fannie Mae Mortgage pass-thru certificates 5% 2/1/2035 | | 26,853 | 26,875 |
| Fannie Mae Mortgage pass-thru certificates 5% 3/1/2033 | | 12,418 | 12,430 |
| Fannie Mae Mortgage pass-thru certificates 5% 5/1/2044 | | 19,098 | 19,100 |
| Fannie Mae Mortgage pass-thru certificates 5% 9/1/2025 | | 203 | 203 |
| Fannie Mae Mortgage pass-thru certificates 5.5% 10/1/2054 | | 1,187,404 | 1,172,934 |
| Fannie Mae Mortgage pass-thru certificates 5.5% 11/1/2052 | | 3,751,255 | 3,716,091 |
| Fannie Mae Mortgage pass-thru certificates 5.5% 12/1/2054 | | 1,705,068 | 1,684,290 |
| Fannie Mae Mortgage pass-thru certificates 5.5% 2/1/2053 | | 304,705 | 302,706 |
| Fannie Mae Mortgage pass-thru certificates 5.5% 4/1/2054 | | 5,951,844 | 5,879,313 |
| Fannie Mae Mortgage pass-thru certificates 5.5% 6/1/2053 | | 611,855 | 608,988 |
| Fannie Mae Mortgage pass-thru certificates 5.5% 6/1/2053 | | 207,637 | 207,118 |
| Fannie Mae Mortgage pass-thru certificates 5.5% 6/1/2054 | | 1,513,446 | 1,495,002 |
| Fannie Mae Mortgage pass-thru certificates 5.5% 7/1/2053 | | 1,077,137 | 1,072,089 |
| Fannie Mae Mortgage pass-thru certificates 5.5% 7/1/2054 | | 977,582 | 971,473 |
| Fannie Mae Mortgage pass-thru certificates 5.5% 8/1/2053 | | 693,458 | 691,725 |
| Fannie Mae Mortgage pass-thru certificates 5.5% 8/1/2054 | | 394,079 | 389,277 |
| Fannie Mae Mortgage pass-thru certificates 5.5% 9/1/2054 | | 989,509 | 977,450 |
| Fannie Mae Mortgage pass-thru certificates 6 month FTSE USD IBOR Consumer Fallbacks + 1.313%, 5.938% 5/1/2034 (b)(c) | | 11,148 | 11,202 |
| Fannie Mae Mortgage pass-thru certificates 6 month FTSE USD IBOR Consumer Fallbacks + 1.42%, 6.572% 9/1/2033 (b)(c) | | 28,557 | 28,592 |
| Fannie Mae Mortgage pass-thru certificates 6 month FTSE USD IBOR Consumer Fallbacks + 1.55%, 7.08% 10/1/2033 (b)(c) | | 1,353 | 1,363 |
| Fannie Mae Mortgage pass-thru certificates 6 month FTSE USD IBOR Consumer Fallbacks + 1.565%, 7.315% 7/1/2035 (b)(c) | | 1,536 | 1,550 |
| Fannie Mae Mortgage pass-thru certificates 6% 1/1/2038 | | 72,109 | 74,812 |
| Fannie Mae Mortgage pass-thru certificates 6% 1/1/2040 | | 70,148 | 72,771 |
| Fannie Mae Mortgage pass-thru certificates 6% 1/1/2042 | | 6,939 | 7,212 |
| Fannie Mae Mortgage pass-thru certificates 6% 10/1/2034 | | 27,319 | 28,178 |
| Fannie Mae Mortgage pass-thru certificates 6% 10/1/2037 | | 72,702 | 75,378 |
| Fannie Mae Mortgage pass-thru certificates 6% 11/1/2035 | | 41,915 | 43,207 |
| Fannie Mae Mortgage pass-thru certificates 6% 11/1/2052 | | 1,083,307 | 1,093,244 |
| Fannie Mae Mortgage pass-thru certificates 6% 11/1/2053 | | 2,105,820 | 2,126,820 |
| Fannie Mae Mortgage pass-thru certificates 6% 11/1/2054 | | 273,922 | 280,201 |
| Fannie Mae Mortgage pass-thru certificates 6% 11/1/2054 | | 1,826,551 | 1,862,712 |
| Fannie Mae Mortgage pass-thru certificates 6% 11/1/2054 | | 673,780 | 688,172 |
| Fannie Mae Mortgage pass-thru certificates 6% 12/1/2052 | | 2,570,610 | 2,587,763 |
| Fannie Mae Mortgage pass-thru certificates 6% 3/1/2038 | | 26,543 | 27,539 |
| Fannie Mae Mortgage pass-thru certificates 6% 3/1/2054 | | 931,998 | 937,634 |
| Fannie Mae Mortgage pass-thru certificates 6% 5/1/2036 | | 529,970 | 547,899 |
| Fannie Mae Mortgage pass-thru certificates 6% 5/1/2040 | | 100,652 | 104,471 |
| Fannie Mae Mortgage pass-thru certificates 6% 5/1/2054 | | 2,447,836 | 2,462,639 |
| Fannie Mae Mortgage pass-thru certificates 6% 6/1/2053 | | 1,035,077 | 1,051,364 |
| Fannie Mae Mortgage pass-thru certificates 6% 6/1/2053 | | 1,432,186 | 1,455,169 |
| Fannie Mae Mortgage pass-thru certificates 6% 6/1/2054 | | 3,471,675 | 3,488,331 |
| Fannie Mae Mortgage pass-thru certificates 6% 6/1/2054 | | 2,769,451 | 2,786,200 |
| Fannie Mae Mortgage pass-thru certificates 6% 7/1/2038 | | 11,291 | 11,715 |
| Fannie Mae Mortgage pass-thru certificates 6% 7/1/2041 | | 213,724 | 221,690 |
| Fannie Mae Mortgage pass-thru certificates 6% 7/1/2054 (j) | | 19,728,341 | 19,822,990 |
| Fannie Mae Mortgage pass-thru certificates 6% 7/1/2054 | | 1,945,414 | 1,983,320 |
| Fannie Mae Mortgage pass-thru certificates 6% 7/1/2054 | | 1,643,990 | 1,653,932 |
| Fannie Mae Mortgage pass-thru certificates 6% 7/1/2054 | | 3,609,947 | 3,648,700 |
| Fannie Mae Mortgage pass-thru certificates 6% 8/1/2037 | | 117,293 | 120,787 |
| Fannie Mae Mortgage pass-thru certificates 6% 8/1/2054 | | 2,937,098 | 2,955,319 |
| Fannie Mae Mortgage pass-thru certificates 6% 9/1/2037 | | 6,491 | 6,736 |
| Fannie Mae Mortgage pass-thru certificates 6% 9/1/2053 | | 540,212 | 546,686 |
| Fannie Mae Mortgage pass-thru certificates 6% 9/1/2054 | | 3,328,108 | 3,348,755 |
| Fannie Mae Mortgage pass-thru certificates 6% 9/1/2054 | | 888,575 | 908,666 |
| Fannie Mae Mortgage pass-thru certificates 6.5% 11/1/2053 | | 1,266,994 | 1,309,024 |
| Fannie Mae Mortgage pass-thru certificates 6.5% 12/1/2032 | | 6,519 | 6,743 |
| Fannie Mae Mortgage pass-thru certificates 6.5% 12/1/2035 | | 66,613 | 69,035 |
| Fannie Mae Mortgage pass-thru certificates 6.5% 2/1/2036 | | 2,712 | 2,835 |
| Fannie Mae Mortgage pass-thru certificates 6.5% 3/1/2054 | | 881,689 | 901,638 |
| Fannie Mae Mortgage pass-thru certificates 6.5% 5/1/2053 | | 2,101,768 | 2,163,443 |
| Fannie Mae Mortgage pass-thru certificates 6.5% 5/1/2053 | | 988,916 | 1,019,171 |
| Fannie Mae Mortgage pass-thru certificates 6.5% 6/1/2054 | | 947,639 | 969,081 |
| Fannie Mae Mortgage pass-thru certificates 6.5% 7/1/2032 | | 18,670 | 19,312 |
| Fannie Mae Mortgage pass-thru certificates 6.5% 7/1/2032 | | 3,610 | 3,734 |
| Fannie Mae Mortgage pass-thru certificates 6.5% 7/1/2035 | | 7,554 | 7,840 |
| Fannie Mae Mortgage pass-thru certificates 6.5% 7/1/2054 | | 5,450,004 | 5,566,077 |
| Fannie Mae Mortgage pass-thru certificates 6.5% 7/1/2054 | | 1,273,942 | 1,302,766 |
| Fannie Mae Mortgage pass-thru certificates 6.5% 7/1/2054 | | 291,059 | 301,919 |
| Fannie Mae Mortgage pass-thru certificates 6.5% 8/1/2036 | | 56,885 | 58,951 |
| Fannie Mae Mortgage pass-thru certificates 6.5% 8/1/2036 | | 44,533 | 46,136 |
| Fannie Mae Mortgage pass-thru certificates 6.5% 8/1/2036 | | 10,581 | 10,961 |
| Fannie Mae Mortgage pass-thru certificates 6.5% 9/1/2053 | | 979,343 | 1,013,667 |
| Fannie Mae Mortgage pass-thru certificates 7% 1/1/2027 | | 669 | 693 |
| Fannie Mae Mortgage pass-thru certificates 7% 1/1/2028 | | 184 | 191 |
| Fannie Mae Mortgage pass-thru certificates 7% 1/1/2028 | | 141 | 146 |
| Fannie Mae Mortgage pass-thru certificates 7% 1/1/2028 | | 11 | 12 |
| Fannie Mae Mortgage pass-thru certificates 7% 1/1/2028 | | 527 | 546 |
| Fannie Mae Mortgage pass-thru certificates 7% 1/1/2029 | | 83 | 86 |
| Fannie Mae Mortgage pass-thru certificates 7% 10/1/2028 | | 423 | 438 |
| Fannie Mae Mortgage pass-thru certificates 7% 10/1/2028 | | 32 | 32 |
| Fannie Mae Mortgage pass-thru certificates 7% 11/1/2025 | | 108 | 109 |
| Fannie Mae Mortgage pass-thru certificates 7% 11/1/2025 | | 141 | 141 |
| Fannie Mae Mortgage pass-thru certificates 7% 11/1/2027 | | 763 | 790 |
| Fannie Mae Mortgage pass-thru certificates 7% 11/1/2027 | | 17 | 17 |
| Fannie Mae Mortgage pass-thru certificates 7% 12/1/2026 | | 14 | 14 |
| Fannie Mae Mortgage pass-thru certificates 7% 12/1/2027 | | 165 | 171 |
| Fannie Mae Mortgage pass-thru certificates 7% 12/1/2028 | | 292 | 303 |
| Fannie Mae Mortgage pass-thru certificates 7% 2/1/2028 | | 99 | 102 |
| Fannie Mae Mortgage pass-thru certificates 7% 2/1/2029 | | 8,986 | 9,312 |
| Fannie Mae Mortgage pass-thru certificates 7% 3/1/2026 | | 58 | 61 |
| Fannie Mae Mortgage pass-thru certificates 7% 4/1/2026 | | 876 | 880 |
| Fannie Mae Mortgage pass-thru certificates 7% 4/1/2026 | | 374 | 387 |
| Fannie Mae Mortgage pass-thru certificates 7% 4/1/2026 | | 108 | 112 |
| Fannie Mae Mortgage pass-thru certificates 7% 5/1/2026 | | 318 | 329 |
| Fannie Mae Mortgage pass-thru certificates 7% 5/1/2026 | | 98 | 102 |
| Fannie Mae Mortgage pass-thru certificates 7% 5/1/2026 | | 316 | 328 |
| Fannie Mae Mortgage pass-thru certificates 7% 5/1/2026 | | 81 | 81 |
| Fannie Mae Mortgage pass-thru certificates 7% 5/1/2027 | | 209 | 216 |
| Fannie Mae Mortgage pass-thru certificates 7% 6/1/2026 | | 1,301 | 1,348 |
| Fannie Mae Mortgage pass-thru certificates 7% 8/1/2025 | | 96 | 96 |
| Fannie Mae Mortgage pass-thru certificates 7% 8/1/2025 | | 17 | 17 |
| Fannie Mae Mortgage pass-thru certificates 7% 8/1/2025 | | 154 | 154 |
| Fannie Mae Mortgage pass-thru certificates 7% 8/1/2027 | | 84 | 87 |
| Fannie Mae Mortgage pass-thru certificates 7% 8/1/2032 | | 74 | 77 |
| Fannie Mae Mortgage pass-thru certificates 7% 9/1/2025 | | 87 | 88 |
| Fannie Mae Mortgage pass-thru certificates 7% 9/1/2026 | | 46 | 48 |
| Fannie Mae Mortgage pass-thru certificates 7.5% 1/1/2028 | | 653 | 670 |
| Fannie Mae Mortgage pass-thru certificates 7.5% 10/1/2026 | | 702 | 713 |
| Fannie Mae Mortgage pass-thru certificates 7.5% 10/1/2027 | | 113 | 116 |
| Fannie Mae Mortgage pass-thru certificates 7.5% 10/1/2029 | | 85 | 87 |
| Fannie Mae Mortgage pass-thru certificates 7.5% 11/1/2027 | | 570 | 584 |
| Fannie Mae Mortgage pass-thru certificates 7.5% 11/1/2028 | | 257 | 261 |
| Fannie Mae Mortgage pass-thru certificates 7.5% 11/1/2029 | | 278 | 289 |
| Fannie Mae Mortgage pass-thru certificates 7.5% 11/1/2029 | | 89 | 91 |
| Fannie Mae Mortgage pass-thru certificates 7.5% 11/1/2031 | | 4,934 | 5,170 |
| Fannie Mae Mortgage pass-thru certificates 7.5% 12/1/2027 | | 190 | 195 |
| Fannie Mae Mortgage pass-thru certificates 7.5% 12/1/2028 | | 51 | 53 |
| Fannie Mae Mortgage pass-thru certificates 7.5% 12/1/2029 | | 170 | 177 |
| Fannie Mae Mortgage pass-thru certificates 7.5% 12/1/2029 | | 14 | 14 |
| Fannie Mae Mortgage pass-thru certificates 7.5% 2/1/2026 | | 63 | 64 |
| Fannie Mae Mortgage pass-thru certificates 7.5% 2/1/2027 | | 391 | 400 |
| Fannie Mae Mortgage pass-thru certificates 7.5% 2/1/2028 | | 116 | 119 |
| Fannie Mae Mortgage pass-thru certificates 7.5% 3/1/2028 | | 334 | 344 |
| Fannie Mae Mortgage pass-thru certificates 7.5% 3/1/2029 | | 135 | 138 |
| Fannie Mae Mortgage pass-thru certificates 7.5% 4/1/2029 | | 52 | 53 |
| Fannie Mae Mortgage pass-thru certificates 7.5% 5/1/2027 | | 104 | 106 |
| Fannie Mae Mortgage pass-thru certificates 7.5% 5/1/2028 | | 1,283 | 1,322 |
| Fannie Mae Mortgage pass-thru certificates 7.5% 5/1/2029 | | 115 | 119 |
| Fannie Mae Mortgage pass-thru certificates 7.5% 6/1/2027 | | 2,838 | 2,910 |
| Fannie Mae Mortgage pass-thru certificates 7.5% 6/1/2028 | | 502 | 518 |
| Fannie Mae Mortgage pass-thru certificates 7.5% 7/1/2027 | | 86 | 88 |
| Fannie Mae Mortgage pass-thru certificates 7.5% 7/1/2028 | | 3,321 | 3,388 |
| Fannie Mae Mortgage pass-thru certificates 7.5% 7/1/2029 | | 296 | 302 |
| Fannie Mae Mortgage pass-thru certificates 7.5% 8/1/2028 | | 831 | 837 |
| Fannie Mae Mortgage pass-thru certificates 7.5% 8/1/2029 | | 231 | 239 |
| Fannie Mae Mortgage pass-thru certificates 7.5% 8/1/2029 | | 63 | 64 |
| Fannie Mae Mortgage pass-thru certificates 7.5% 8/1/2029 | | 1,092 | 1,137 |
| Fannie Mae Mortgage pass-thru certificates 7.5% 8/1/2029 | | 240 | 248 |
| Fannie Mae Mortgage pass-thru certificates 7.5% 8/1/2029 | | 89 | 92 |
| Fannie Mae Mortgage pass-thru certificates 7.5% 8/1/2029 | | 844 | 879 |
| Fannie Mae Mortgage pass-thru certificates 7.5% 8/1/2029 | | 28 | 28 |
| Fannie Mae Mortgage pass-thru certificates 7.5% 9/1/2025 | | 55 | 55 |
| Fannie Mae Mortgage pass-thru certificates 7.5% 9/1/2029 | | 545 | 569 |
| Fannie Mae Mortgage pass-thru certificates 7.5% 9/1/2029 | | 8,019 | 8,361 |
| Fannie Mae Mortgage pass-thru certificates 7.5% 9/1/2029 | | 24 | 25 |
| Fannie Mae Mortgage pass-thru certificates 8% 1/1/2030 | | 175 | 180 |
| Freddie Mac Gold Pool 1.5% 1/1/2036 | | 894,608 | 773,113 |
| Freddie Mac Gold Pool 1.5% 1/1/2051 | | 2,293,807 | 1,694,790 |
| Freddie Mac Gold Pool 1.5% 11/1/2035 | | 1,023,018 | 884,084 |
| Freddie Mac Gold Pool 1.5% 11/1/2035 | | 70,454 | 60,886 |
| Freddie Mac Gold Pool 1.5% 12/1/2035 | | 1,026,835 | 887,382 |
| Freddie Mac Gold Pool 1.5% 12/1/2040 | | 113,550 | 92,166 |
| Freddie Mac Gold Pool 1.5% 2/1/2041 | | 194,095 | 157,284 |
| Freddie Mac Gold Pool 1.5% 2/1/2051 | | 2,329,088 | 1,720,858 |
| Freddie Mac Gold Pool 1.5% 3/1/2036 | | 33,527 | 28,973 |
| Freddie Mac Gold Pool 1.5% 3/1/2041 | | 197,052 | 159,557 |
| Freddie Mac Gold Pool 1.5% 4/1/2041 | | 200,145 | 161,945 |
| Freddie Mac Gold Pool 1.5% 4/1/2051 | | 10,182,002 | 7,523,020 |
| Freddie Mac Gold Pool 1.5% 5/1/2036 | | 59,229 | 51,037 |
| Freddie Mac Gold Pool 1.5% 7/1/2035 | | 308,297 | 266,813 |
| Freddie Mac Gold Pool 1.5% 8/1/2035 | | 852,099 | 737,442 |
| Freddie Mac Gold Pool 2% 1/1/2052 | | 400,000 | 310,981 |
| Freddie Mac Gold Pool 2% 1/1/2052 | | 87,704 | 68,350 |
| Freddie Mac Gold Pool 2% 10/1/2041 | | 19,092 | 15,899 |
| Freddie Mac Gold Pool 2% 10/1/2051 | | 2,542,018 | 1,999,340 |
| Freddie Mac Gold Pool 2% 10/1/2051 | | 979,896 | 774,992 |
| Freddie Mac Gold Pool 2% 10/1/2051 | | 947,933 | 748,231 |
| Freddie Mac Gold Pool 2% 10/1/2051 | | 207,966 | 164,154 |
| Freddie Mac Gold Pool 2% 11/1/2041 | | 460,046 | 382,248 |
| Freddie Mac Gold Pool 2% 11/1/2051 | | 91,235 | 71,102 |
| Freddie Mac Gold Pool 2% 11/1/2051 | | 1,474,760 | 1,157,159 |
| Freddie Mac Gold Pool 2% 11/1/2051 | | 188,045 | 148,429 |
| Freddie Mac Gold Pool 2% 11/1/2051 | | 756,497 | 597,125 |
| Freddie Mac Gold Pool 2% 11/1/2051 | | 299,344 | 236,281 |
| Freddie Mac Gold Pool 2% 11/1/2051 | | 100,040 | 77,964 |
| Freddie Mac Gold Pool 2% 11/1/2051 | | 384,233 | 300,525 |
| Freddie Mac Gold Pool 2% 12/1/2051 | | 2,110,343 | 1,664,437 |
| Freddie Mac Gold Pool 2% 12/1/2051 | | 1,791,678 | 1,413,104 |
| Freddie Mac Gold Pool 2% 12/1/2051 | | 670,975 | 529,201 |
| Freddie Mac Gold Pool 2% 12/1/2051 | | 54,848 | 42,899 |
| Freddie Mac Gold Pool 2% 2/1/2042 | | 509,950 | 423,076 |
| Freddie Mac Gold Pool 2% 2/1/2052 | | 3,959,511 | 3,120,409 |
| Freddie Mac Gold Pool 2% 2/1/2052 | | 399,441 | 310,547 |
| Freddie Mac Gold Pool 2% 3/1/2041 | | 177,728 | 149,689 |
| Freddie Mac Gold Pool 2% 4/1/2041 | | 17,707 | 14,818 |
| Freddie Mac Gold Pool 2% 4/1/2052 | | 1,410,645 | 1,111,700 |
| Freddie Mac Gold Pool 2% 5/1/2041 | | 309,483 | 258,713 |
| Freddie Mac Gold Pool 2% 5/1/2051 | | 1,784,757 | 1,413,781 |
| Freddie Mac Gold Pool 2% 5/1/2051 | | 204,019 | 161,166 |
| Freddie Mac Gold Pool 2% 5/1/2051 | | 83,602 | 65,519 |
| Freddie Mac Gold Pool 2% 5/1/2051 | | 198,374 | 155,467 |
| Freddie Mac Gold Pool 2% 6/1/2041 | | 528,456 | 441,432 |
| Freddie Mac Gold Pool 2% 6/1/2050 | | 874,295 | 691,746 |
| Freddie Mac Gold Pool 2% 7/1/2041 | | 18,306 | 15,279 |
| Freddie Mac Gold Pool 2% 7/1/2041 | | 2,399,326 | 2,015,316 |
| Freddie Mac Gold Pool 2% 7/1/2051 | | 114,500 | 90,449 |
| Freddie Mac Gold Pool 2% 9/1/2051 | | 1,804,907 | 1,427,486 |
| Freddie Mac Gold Pool 2.5% 1/1/2033 | | 11,568 | 10,885 |
| Freddie Mac Gold Pool 2.5% 1/1/2041 | | 449,702 | 389,175 |
| Freddie Mac Gold Pool 2.5% 1/1/2042 | | 1,007,272 | 864,841 |
| Freddie Mac Gold Pool 2.5% 1/1/2052 | | 1,951,545 | 1,603,020 |
| Freddie Mac Gold Pool 2.5% 10/1/2040 | | 333,364 | 289,319 |
| Freddie Mac Gold Pool 2.5% 10/1/2041 | | 497,540 | 427,964 |
| Freddie Mac Gold Pool 2.5% 11/1/2031 | | 206,253 | 195,201 |
| Freddie Mac Gold Pool 2.5% 11/1/2041 | | 189,399 | 163,387 |
| Freddie Mac Gold Pool 2.5% 11/1/2041 | | 127,504 | 110,112 |
| Freddie Mac Gold Pool 2.5% 11/1/2041 | | 4,448,472 | 3,841,692 |
| Freddie Mac Gold Pool 2.5% 11/1/2049 | | 30,329 | 24,922 |
| Freddie Mac Gold Pool 2.5% 11/1/2050 | | 4,535,516 | 3,751,033 |
| Freddie Mac Gold Pool 2.5% 11/1/2051 | | 202,646 | 165,696 |
| Freddie Mac Gold Pool 2.5% 12/1/2051 | | 480,047 | 391,766 |
| Freddie Mac Gold Pool 2.5% 12/1/2051 | | 1,865,611 | 1,532,432 |
| Freddie Mac Gold Pool 2.5% 2/1/2035 | | 249,001 | 228,297 |
| Freddie Mac Gold Pool 2.5% 2/1/2042 | | 831,941 | 721,062 |
| Freddie Mac Gold Pool 2.5% 2/1/2051 | | 1,040,918 | 862,177 |
| Freddie Mac Gold Pool 2.5% 2/1/2051 | | 625,218 | 513,756 |
| Freddie Mac Gold Pool 2.5% 3/1/2033 | | 138,195 | 129,956 |
| Freddie Mac Gold Pool 2.5% 3/1/2051 | | 557,072 | 457,759 |
| Freddie Mac Gold Pool 2.5% 4/1/2033 | | 60,035 | 56,358 |
| Freddie Mac Gold Pool 2.5% 4/1/2042 | | 122,760 | 105,670 |
| Freddie Mac Gold Pool 2.5% 4/1/2047 | | 319,992 | 263,345 |
| Freddie Mac Gold Pool 2.5% 4/1/2052 | | 621,360 | 513,110 |
| Freddie Mac Gold Pool 2.5% 5/1/2033 | | 19,307 | 18,122 |
| Freddie Mac Gold Pool 2.5% 5/1/2035 | | 690,830 | 632,527 |
| Freddie Mac Gold Pool 2.5% 5/1/2041 | | 1,798,567 | 1,564,068 |
| Freddie Mac Gold Pool 2.5% 5/1/2051 | | 999,727 | 826,497 |
| Freddie Mac Gold Pool 2.5% 6/1/2041 | | 145,657 | 125,926 |
| Freddie Mac Gold Pool 2.5% 7/1/2032 | | 286,060 | 269,946 |
| Freddie Mac Gold Pool 2.5% 7/1/2036 | | 885,064 | 810,369 |
| Freddie Mac Gold Pool 2.5% 8/1/2041 | | 107,120 | 92,609 |
| Freddie Mac Gold Pool 2.5% 8/1/2041 | | 762,050 | 655,961 |
| Freddie Mac Gold Pool 2.5% 8/1/2050 | | 4,272,731 | 3,521,682 |
| Freddie Mac Gold Pool 2.5% 8/1/2050 | | 1,065,361 | 882,090 |
| Freddie Mac Gold Pool 2.5% 9/1/2039 | | 6,693 | 5,871 |
| Freddie Mac Gold Pool 2.5% 9/1/2041 | | 234,725 | 203,368 |
| Freddie Mac Gold Pool 2.5% 9/1/2051 | | 414,276 | 339,772 |
| Freddie Mac Gold Pool 3% 1/1/2033 | | 56,082 | 53,359 |
| Freddie Mac Gold Pool 3% 1/1/2033 | | 77,346 | 73,723 |
| Freddie Mac Gold Pool 3% 1/1/2034 | | 90,214 | 85,305 |
| Freddie Mac Gold Pool 3% 1/1/2043 | | 111,846 | 99,295 |
| Freddie Mac Gold Pool 3% 1/1/2052 | | 347,259 | 296,488 |
| Freddie Mac Gold Pool 3% 1/1/2052 | | 634,735 | 541,934 |
| Freddie Mac Gold Pool 3% 1/1/2052 | | 1,395,096 | 1,191,128 |
| Freddie Mac Gold Pool 3% 11/1/2042 | | 137,196 | 123,480 |
| Freddie Mac Gold Pool 3% 11/1/2042 | | 35,353 | 31,466 |
| Freddie Mac Gold Pool 3% 11/1/2042 | | 9,634 | 8,589 |
| Freddie Mac Gold Pool 3% 11/1/2050 | | 160,478 | 137,367 |
| Freddie Mac Gold Pool 3% 11/1/2051 | | 94,696 | 80,940 |
| Freddie Mac Gold Pool 3% 11/1/2051 | | 360,441 | 308,081 |
| Freddie Mac Gold Pool 3% 12/1/2030 | | 46,116 | 44,401 |
| Freddie Mac Gold Pool 3% 12/1/2032 | | 116,580 | 111,361 |
| Freddie Mac Gold Pool 3% 12/1/2044 | | 25,920 | 22,599 |
| Freddie Mac Gold Pool 3% 12/1/2046 | | 2,287,247 | 1,985,586 |
| Freddie Mac Gold Pool 3% 12/1/2049 | | 45,544 | 39,184 |
| Freddie Mac Gold Pool 3% 12/1/2050 | | 850,078 | 727,653 |
| Freddie Mac Gold Pool 3% 2/1/2033 | | 44,673 | 43,070 |
| Freddie Mac Gold Pool 3% 2/1/2043 | | 72,859 | 64,963 |
| Freddie Mac Gold Pool 3% 2/1/2043 | | 319,958 | 285,623 |
| Freddie Mac Gold Pool 3% 2/1/2043 | | 31,826 | 28,284 |
| Freddie Mac Gold Pool 3% 2/1/2043 | | 53,306 | 47,341 |
| Freddie Mac Gold Pool 3% 2/1/2043 | | 21,356 | 19,004 |
| Freddie Mac Gold Pool 3% 2/1/2043 | | 20,280 | 17,951 |
| Freddie Mac Gold Pool 3% 3/1/2033 | | 94,521 | 90,171 |
| Freddie Mac Gold Pool 3% 3/1/2052 | | 174,132 | 148,455 |
| Freddie Mac Gold Pool 3% 3/1/2052 | | 913,401 | 782,142 |
| Freddie Mac Gold Pool 3% 4/1/2032 | | 6,324 | 6,090 |
| Freddie Mac Gold Pool 3% 4/1/2032 | | 16,632 | 15,983 |
| Freddie Mac Gold Pool 3% 4/1/2033 | | 44,476 | 42,410 |
| Freddie Mac Gold Pool 3% 4/1/2034 | | 233,477 | 220,626 |
| Freddie Mac Gold Pool 3% 4/1/2046 | | 32,257 | 28,124 |
| Freddie Mac Gold Pool 3% 4/1/2046 | | 39,217 | 34,192 |
| Freddie Mac Gold Pool 3% 4/1/2050 | | 554,177 | 477,830 |
| Freddie Mac Gold Pool 3% 4/1/2051 | | 564,603 | 480,997 |
| Freddie Mac Gold Pool 3% 4/1/2052 | | 1,604,320 | 1,386,308 |
| Freddie Mac Gold Pool 3% 5/1/2045 | | 25,471 | 22,255 |
| Freddie Mac Gold Pool 3% 5/1/2045 | | 18,978 | 16,665 |
| Freddie Mac Gold Pool 3% 5/1/2045 | | 32,889 | 28,880 |
| Freddie Mac Gold Pool 3% 5/1/2045 | | 23,818 | 20,960 |
| Freddie Mac Gold Pool 3% 5/1/2046 | | 97,010 | 84,580 |
| Freddie Mac Gold Pool 3% 5/1/2046 | | 608,566 | 530,585 |
| Freddie Mac Gold Pool 3% 5/1/2051 | | 416,452 | 356,476 |
| Freddie Mac Gold Pool 3% 5/1/2051 | | 91,412 | 78,247 |
| Freddie Mac Gold Pool 3% 5/1/2052 | | 1,406,427 | 1,198,166 |
| Freddie Mac Gold Pool 3% 6/1/2031 | | 10,409 | 9,998 |
| Freddie Mac Gold Pool 3% 6/1/2031 | | 11,751 | 11,287 |
| Freddie Mac Gold Pool 3% 6/1/2031 | | 44,108 | 42,441 |
| Freddie Mac Gold Pool 3% 6/1/2031 | | 7,177 | 6,918 |
| Freddie Mac Gold Pool 3% 6/1/2031 | | 6,724 | 6,465 |
| Freddie Mac Gold Pool 3% 6/1/2031 | | 9,666 | 9,318 |
| Freddie Mac Gold Pool 3% 6/1/2031 | | 18,952 | 18,236 |
| Freddie Mac Gold Pool 3% 6/1/2045 | | 29,072 | 25,529 |
| Freddie Mac Gold Pool 3% 6/1/2045 | | 69,952 | 61,560 |
| Freddie Mac Gold Pool 3% 6/1/2045 | | 12,902 | 11,354 |
| Freddie Mac Gold Pool 3% 6/1/2046 | | 601,595 | 524,508 |
| Freddie Mac Gold Pool 3% 6/1/2050 | | 1,950,311 | 1,685,281 |
| Freddie Mac Gold Pool 3% 6/1/2052 | | 574,785 | 490,031 |
| Freddie Mac Gold Pool 3% 7/1/2032 | | 22,001 | 21,069 |
| Freddie Mac Gold Pool 3% 7/1/2045 | | 51,441 | 45,042 |
| Freddie Mac Gold Pool 3% 7/1/2045 | | 20,956 | 18,454 |
| Freddie Mac Gold Pool 3% 7/1/2051 | | 58,317 | 49,846 |
| Freddie Mac Gold Pool 3% 8/1/2032 | | 25,432 | 24,366 |
| Freddie Mac Gold Pool 3% 8/1/2032 | | 17,328 | 16,587 |
| Freddie Mac Gold Pool 3% 8/1/2042 | | 10,315 | 9,144 |
| Freddie Mac Gold Pool 3% 8/1/2042 | | 13,478 | 11,990 |
| Freddie Mac Gold Pool 3% 8/1/2045 | | 19,689 | 17,240 |
| Freddie Mac Gold Pool 3% 8/1/2045 | | 35,189 | 30,900 |
| Freddie Mac Gold Pool 3% 8/1/2045 | | 15,315 | 13,477 |
| Freddie Mac Gold Pool 3% 8/1/2045 | | 36,473 | 32,028 |
| Freddie Mac Gold Pool 3% 8/1/2045 | | 34,394 | 30,201 |
| Freddie Mac Gold Pool 3% 8/1/2049 | | 3,597 | 3,097 |
| Freddie Mac Gold Pool 3% 9/1/2050 | | 11,117 | 9,523 |
| Freddie Mac Gold Pool 3% 9/1/2051 | | 97,310 | 83,235 |
| Freddie Mac Gold Pool 3% 9/1/2051 | | 312,333 | 267,157 |
| Freddie Mac Gold Pool 3.5% 1/1/2043 | | 16,020 | 14,593 |
| Freddie Mac Gold Pool 3.5% 1/1/2046 | | 35,635 | 32,194 |
| Freddie Mac Gold Pool 3.5% 1/1/2048 | | 5,436 | 4,922 |
| Freddie Mac Gold Pool 3.5% 10/1/2040 | | 20,428 | 18,602 |
| Freddie Mac Gold Pool 3.5% 10/1/2042 | | 126,623 | 116,026 |
| Freddie Mac Gold Pool 3.5% 10/1/2047 | | 11,786 | 10,674 |
| Freddie Mac Gold Pool 3.5% 10/1/2049 | | 1,987,727 | 1,787,156 |
| Freddie Mac Gold Pool 3.5% 10/1/2049 | | 406,573 | 363,261 |
| Freddie Mac Gold Pool 3.5% 11/1/2033 | | 23,587 | 22,600 |
| Freddie Mac Gold Pool 3.5% 11/1/2040 | | 42,856 | 38,985 |
| Freddie Mac Gold Pool 3.5% 11/1/2042 | | 134,293 | 122,759 |
| Freddie Mac Gold Pool 3.5% 11/1/2046 | | 6,768 | 6,098 |
| Freddie Mac Gold Pool 3.5% 11/1/2047 | | 15,728 | 14,204 |
| Freddie Mac Gold Pool 3.5% 11/1/2047 | | 81,875 | 74,150 |
| Freddie Mac Gold Pool 3.5% 12/1/2033 | | 196,257 | 185,958 |
| Freddie Mac Gold Pool 3.5% 12/1/2040 | | 42,208 | 38,396 |
| Freddie Mac Gold Pool 3.5% 12/1/2047 | | 20,608 | 18,657 |
| Freddie Mac Gold Pool 3.5% 2/1/2034 | | 5,244,079 | 5,001,526 |
| Freddie Mac Gold Pool 3.5% 2/1/2034 | | 264,419 | 252,313 |
| Freddie Mac Gold Pool 3.5% 2/1/2043 | | 44,255 | 40,902 |
| Freddie Mac Gold Pool 3.5% 2/1/2043 | | 110,271 | 101,234 |
| Freddie Mac Gold Pool 3.5% 2/1/2043 | | 372,524 | 341,242 |
| Freddie Mac Gold Pool 3.5% 2/1/2052 | | 225,120 | 200,716 |
| Freddie Mac Gold Pool 3.5% 2/1/2052 | | 94,499 | 84,225 |
| Freddie Mac Gold Pool 3.5% 3/1/2032 | | 514,665 | 494,579 |
| Freddie Mac Gold Pool 3.5% 3/1/2045 | | 65,068 | 58,886 |
| Freddie Mac Gold Pool 3.5% 3/1/2045 | | 9,960 | 9,014 |
| Freddie Mac Gold Pool 3.5% 3/1/2045 | | 13,957 | 12,631 |
| Freddie Mac Gold Pool 3.5% 3/1/2045 | | 17,253 | 15,614 |
| Freddie Mac Gold Pool 3.5% 3/1/2052 | | 890,765 | 793,575 |
| Freddie Mac Gold Pool 3.5% 3/1/2052 (i) | | 3,528,812 | 3,144,893 |
| Freddie Mac Gold Pool 3.5% 3/1/2052 | | 941,269 | 838,768 |
| Freddie Mac Gold Pool 3.5% 4/1/2040 | | 50,753 | 46,248 |
| Freddie Mac Gold Pool 3.5% 4/1/2042 | | 47,463 | 43,639 |
| Freddie Mac Gold Pool 3.5% 4/1/2043 | | 179,292 | 164,068 |
| Freddie Mac Gold Pool 3.5% 4/1/2043 | | 88,002 | 80,619 |
| Freddie Mac Gold Pool 3.5% 4/1/2043 | | 828,093 | 757,742 |
| Freddie Mac Gold Pool 3.5% 4/1/2046 | | 276,536 | 249,832 |
| Freddie Mac Gold Pool 3.5% 4/1/2046 | | 504,936 | 456,492 |
| Freddie Mac Gold Pool 3.5% 5/1/2034 | | 233,345 | 220,663 |
| Freddie Mac Gold Pool 3.5% 5/1/2040 | | 105,281 | 95,937 |
| Freddie Mac Gold Pool 3.5% 5/1/2045 | | 683,436 | 618,506 |
| Freddie Mac Gold Pool 3.5% 5/1/2045 | | 8,441 | 7,634 |
| Freddie Mac Gold Pool 3.5% 5/1/2045 | | 13,315 | 12,050 |
| Freddie Mac Gold Pool 3.5% 5/1/2045 | | 7,279 | 6,583 |
| Freddie Mac Gold Pool 3.5% 5/1/2046 | | 453,541 | 410,594 |
| Freddie Mac Gold Pool 3.5% 6/1/2032 | | 2,438,449 | 2,340,328 |
| Freddie Mac Gold Pool 3.5% 6/1/2040 | | 91,099 | 82,957 |
| Freddie Mac Gold Pool 3.5% 6/1/2045 | | 828,837 | 749,575 |
| Freddie Mac Gold Pool 3.5% 6/1/2045 | | 129,793 | 117,462 |
| Freddie Mac Gold Pool 3.5% 6/1/2045 | | 15,914 | 14,407 |
| Freddie Mac Gold Pool 3.5% 6/1/2048 | | 17,074 | 15,323 |
| Freddie Mac Gold Pool 3.5% 7/1/2040 | | 13,068 | 11,900 |
| Freddie Mac Gold Pool 3.5% 7/1/2042 | | 63,512 | 58,367 |
| Freddie Mac Gold Pool 3.5% 7/1/2042 | | 333,672 | 305,599 |
| Freddie Mac Gold Pool 3.5% 7/1/2042 | | 152,141 | 139,489 |
| Freddie Mac Gold Pool 3.5% 7/1/2047 | | 202,548 | 183,502 |
| Freddie Mac Gold Pool 3.5% 7/1/2051 | | 1,226,411 | 1,091,929 |
| Freddie Mac Gold Pool 3.5% 8/1/2034 | | 384,101 | 362,864 |
| Freddie Mac Gold Pool 3.5% 8/1/2040 | | 59,439 | 54,126 |
| Freddie Mac Gold Pool 3.5% 8/1/2042 | | 23,281 | 21,334 |
| Freddie Mac Gold Pool 3.5% 8/1/2043 | | 10,212 | 9,349 |
| Freddie Mac Gold Pool 3.5% 8/1/2047 | | 36,316 | 32,890 |
| Freddie Mac Gold Pool 3.5% 8/1/2047 | | 307,951 | 278,898 |
| Freddie Mac Gold Pool 3.5% 8/1/2047 | | 24,147 | 21,869 |
| Freddie Mac Gold Pool 3.5% 9/1/2040 | | 44,925 | 40,910 |
| Freddie Mac Gold Pool 3.5% 9/1/2042 | | 8,027 | 7,344 |
| Freddie Mac Gold Pool 3.5% 9/1/2042 | | 537,406 | 492,034 |
| Freddie Mac Gold Pool 3.5% 9/1/2042 | | 434,617 | 397,694 |
| Freddie Mac Gold Pool 3.5% 9/1/2046 | | 189,809 | 171,657 |
| Freddie Mac Gold Pool 3.5% 9/1/2047 | | 6,581 | 5,960 |
| Freddie Mac Gold Pool 3.5% 9/1/2047 | | 6,165 | 5,583 |
| Freddie Mac Gold Pool 4% 1/1/2041 | | 517,709 | 490,215 |
| Freddie Mac Gold Pool 4% 1/1/2043 | | 9,082 | 8,531 |
| Freddie Mac Gold Pool 4% 1/1/2044 | | 18,377 | 17,215 |
| Freddie Mac Gold Pool 4% 10/1/2042 | | 7,114 | 6,779 |
| Freddie Mac Gold Pool 4% 10/1/2042 | | 4,778 | 4,489 |
| Freddie Mac Gold Pool 4% 10/1/2042 | | 11,655 | 10,983 |
| Freddie Mac Gold Pool 4% 10/1/2043 | | 14,009 | 13,128 |
| Freddie Mac Gold Pool 4% 10/1/2043 | | 51,856 | 48,673 |
| Freddie Mac Gold Pool 4% 10/1/2043 | | 23,740 | 22,240 |
| Freddie Mac Gold Pool 4% 10/1/2043 | | 11,701 | 11,001 |
| Freddie Mac Gold Pool 4% 10/1/2052 | | 425,797 | 394,036 |
| Freddie Mac Gold Pool 4% 11/1/2041 | | 2,926 | 2,763 |
| Freddie Mac Gold Pool 4% 11/1/2042 | | 25,456 | 23,971 |
| Freddie Mac Gold Pool 4% 11/1/2042 | | 40,868 | 38,507 |
| Freddie Mac Gold Pool 4% 11/1/2042 | | 34,917 | 32,840 |
| Freddie Mac Gold Pool 4% 11/1/2042 | | 15,395 | 14,467 |
| Freddie Mac Gold Pool 4% 11/1/2042 | | 1,686 | 1,619 |
| Freddie Mac Gold Pool 4% 11/1/2042 | | 1,353,488 | 1,278,450 |
| Freddie Mac Gold Pool 4% 11/1/2043 | | 227,449 | 214,015 |
| Freddie Mac Gold Pool 4% 12/1/2042 | | 12,630 | 11,972 |
| Freddie Mac Gold Pool 4% 12/1/2042 | | 26,005 | 24,458 |
| Freddie Mac Gold Pool 4% 2/1/2043 | | 38,051 | 35,773 |
| Freddie Mac Gold Pool 4% 2/1/2043 | | 24,268 | 22,803 |
| Freddie Mac Gold Pool 4% 2/1/2043 | | 25,016 | 23,501 |
| Freddie Mac Gold Pool 4% 2/1/2043 | | 10,725 | 10,067 |
| Freddie Mac Gold Pool 4% 2/1/2044 | | 14,524 | 13,595 |
| Freddie Mac Gold Pool 4% 2/1/2045 | | 348,340 | 326,656 |
| Freddie Mac Gold Pool 4% 2/1/2048 | | 29,070 | 27,037 |
| Freddie Mac Gold Pool 4% 3/1/2043 | | 21,373 | 20,166 |
| Freddie Mac Gold Pool 4% 4/1/2042 | | 1,020,108 | 961,568 |
| Freddie Mac Gold Pool 4% 4/1/2042 | | 588,746 | 555,516 |
| Freddie Mac Gold Pool 4% 4/1/2043 | | 9,486 | 9,034 |
| Freddie Mac Gold Pool 4% 4/1/2043 | | 17,458 | 16,439 |
| Freddie Mac Gold Pool 4% 4/1/2046 | | 115,143 | 107,237 |
| Freddie Mac Gold Pool 4% 5/1/2037 | | 1,462,299 | 1,390,678 |
| Freddie Mac Gold Pool 4% 5/1/2043 | | 15,568 | 14,602 |
| Freddie Mac Gold Pool 4% 5/1/2043 | | 23,142 | 21,740 |
| Freddie Mac Gold Pool 4% 5/1/2043 | | 8,581 | 8,050 |
| Freddie Mac Gold Pool 4% 5/1/2043 | | 4,068 | 3,822 |
| Freddie Mac Gold Pool 4% 5/1/2048 | | 546,598 | 507,872 |
| Freddie Mac Gold Pool 4% 5/1/2048 | | 807,141 | 748,700 |
| Freddie Mac Gold Pool 4% 6/1/2043 | | 16,554 | 15,534 |
| Freddie Mac Gold Pool 4% 6/1/2043 | | 28,612 | 26,994 |
| Freddie Mac Gold Pool 4% 7/1/2043 | | 22,335 | 21,018 |
| Freddie Mac Gold Pool 4% 7/1/2043 | | 10,416 | 9,767 |
| Freddie Mac Gold Pool 4% 7/1/2043 | | 44,727 | 41,993 |
| Freddie Mac Gold Pool 4% 7/1/2043 | | 40,723 | 38,328 |
| Freddie Mac Gold Pool 4% 7/1/2043 | | 20,746 | 19,481 |
| Freddie Mac Gold Pool 4% 7/1/2043 | | 13,485 | 12,644 |
| Freddie Mac Gold Pool 4% 7/1/2043 | | 15,544 | 14,580 |
| Freddie Mac Gold Pool 4% 8/1/2043 | | 24,645 | 23,130 |
| Freddie Mac Gold Pool 4% 8/1/2043 | | 20,514 | 19,371 |
| Freddie Mac Gold Pool 4% 8/1/2043 | | 29,656 | 27,951 |
| Freddie Mac Gold Pool 4% 8/1/2043 | | 7,793 | 7,308 |
| Freddie Mac Gold Pool 4% 8/1/2044 | | 6,507 | 6,127 |
| Freddie Mac Gold Pool 4% 8/1/2044 | | 9,044 | 8,475 |
| Freddie Mac Gold Pool 4% 9/1/2041 | | 41,788 | 39,490 |
| Freddie Mac Gold Pool 4% 9/1/2042 | | 26,243 | 24,869 |
| Freddie Mac Gold Pool 4% 9/1/2043 | | 29,542 | 27,718 |
| Freddie Mac Gold Pool 4% 9/1/2043 | | 40,778 | 38,322 |
| Freddie Mac Gold Pool 4% 9/1/2043 | | 39,323 | 36,930 |
| Freddie Mac Gold Pool 4% 9/1/2043 | | 24,899 | 23,402 |
| Freddie Mac Gold Pool 4% 9/1/2043 | | 24,922 | 23,367 |
| Freddie Mac Gold Pool 4% 9/1/2043 | | 29,716 | 27,944 |
| Freddie Mac Gold Pool 4% 9/1/2043 | | 5,027 | 4,740 |
| Freddie Mac Gold Pool 4% 9/1/2043 | | 11,330 | 10,616 |
| Freddie Mac Gold Pool 4.5% 1/1/2041 | | 16,046 | 15,654 |
| Freddie Mac Gold Pool 4.5% 1/1/2042 | | 644,157 | 626,696 |
| Freddie Mac Gold Pool 4.5% 1/1/2047 | | 24,776 | 23,798 |
| Freddie Mac Gold Pool 4.5% 10/1/2041 | | 178,578 | 173,512 |
| Freddie Mac Gold Pool 4.5% 10/1/2041 | | 8,752 | 8,536 |
| Freddie Mac Gold Pool 4.5% 10/1/2048 | | 57,047 | 54,458 |
| Freddie Mac Gold Pool 4.5% 10/1/2048 | | 1,206,457 | 1,157,350 |
| Freddie Mac Gold Pool 4.5% 12/1/2040 | | 47,756 | 46,503 |
| Freddie Mac Gold Pool 4.5% 12/1/2045 | | 49,337 | 48,108 |
| Freddie Mac Gold Pool 4.5% 12/1/2046 | | 20,630 | 19,816 |
| Freddie Mac Gold Pool 4.5% 12/1/2047 | | 332,891 | 318,717 |
| Freddie Mac Gold Pool 4.5% 2/1/2041 | | 29,276 | 28,487 |
| Freddie Mac Gold Pool 4.5% 2/1/2041 | | 12,404 | 12,054 |
| Freddie Mac Gold Pool 4.5% 2/1/2041 | | 21,560 | 20,995 |
| Freddie Mac Gold Pool 4.5% 2/1/2041 | | 18,219 | 17,753 |
| Freddie Mac Gold Pool 4.5% 2/1/2041 | | 29,489 | 28,678 |
| Freddie Mac Gold Pool 4.5% 2/1/2041 | | 21,822 | 21,197 |
| Freddie Mac Gold Pool 4.5% 2/1/2044 | | 110,113 | 106,354 |
| Freddie Mac Gold Pool 4.5% 2/1/2047 | | 76,503 | 73,437 |
| Freddie Mac Gold Pool 4.5% 3/1/2041 | | 122,063 | 118,769 |
| Freddie Mac Gold Pool 4.5% 3/1/2041 | | 20,188 | 19,634 |
| Freddie Mac Gold Pool 4.5% 3/1/2041 | | 28,114 | 27,355 |
| Freddie Mac Gold Pool 4.5% 3/1/2044 | | 82,118 | 79,314 |
| Freddie Mac Gold Pool 4.5% 3/1/2044 | | 97,846 | 94,505 |
| Freddie Mac Gold Pool 4.5% 3/1/2044 | | 112,706 | 108,859 |
| Freddie Mac Gold Pool 4.5% 3/1/2044 | | 39,832 | 38,472 |
| Freddie Mac Gold Pool 4.5% 4/1/2035 | | 1,206 | 1,185 |
| Freddie Mac Gold Pool 4.5% 4/1/2041 | | 200,172 | 194,699 |
| Freddie Mac Gold Pool 4.5% 4/1/2041 | | 29,676 | 28,820 |
| Freddie Mac Gold Pool 4.5% 4/1/2041 | | 29,226 | 28,414 |
| Freddie Mac Gold Pool 4.5% 4/1/2048 | | 60,750 | 58,164 |
| Freddie Mac Gold Pool 4.5% 4/1/2048 | | 59,479 | 56,928 |
| Freddie Mac Gold Pool 4.5% 4/1/2048 | | 185,904 | 177,930 |
| Freddie Mac Gold Pool 4.5% 5/1/2039 | | 96,763 | 94,427 |
| Freddie Mac Gold Pool 4.5% 5/1/2041 | | 30,979 | 30,087 |
| Freddie Mac Gold Pool 4.5% 5/1/2041 | | 31,643 | 30,753 |
| Freddie Mac Gold Pool 4.5% 5/1/2041 | | 4,596 | 4,467 |
| Freddie Mac Gold Pool 4.5% 5/1/2047 | | 192,773 | 184,926 |
| Freddie Mac Gold Pool 4.5% 5/1/2047 | | 62,320 | 59,823 |
| Freddie Mac Gold Pool 4.5% 5/1/2047 | | 143,737 | 137,977 |
| Freddie Mac Gold Pool 4.5% 5/1/2048 | | 121,478 | 116,267 |
| Freddie Mac Gold Pool 4.5% 6/1/2035 | | 591 | 581 |
| Freddie Mac Gold Pool 4.5% 6/1/2041 | | 33,456 | 32,596 |
| Freddie Mac Gold Pool 4.5% 6/1/2041 | | 20,977 | 20,444 |
| Freddie Mac Gold Pool 4.5% 6/1/2041 | | 24,415 | 23,714 |
| Freddie Mac Gold Pool 4.5% 6/1/2041 | | 10,278 | 10,033 |
| Freddie Mac Gold Pool 4.5% 6/1/2047 | | 91,371 | 87,795 |
| Freddie Mac Gold Pool 4.5% 6/1/2047 | | 275,767 | 264,542 |
| Freddie Mac Gold Pool 4.5% 7/1/2025 | | 2,305 | 2,302 |
| Freddie Mac Gold Pool 4.5% 7/1/2047 | | 115,755 | 111,043 |
| Freddie Mac Gold Pool 4.5% 7/1/2047 | | 68,558 | 65,853 |
| Freddie Mac Gold Pool 4.5% 7/1/2047 | | 155,066 | 148,996 |
| Freddie Mac Gold Pool 4.5% 8/1/2040 | | 5,067 | 4,936 |
| Freddie Mac Gold Pool 4.5% 8/1/2041 | | 4,457 | 4,338 |
| Freddie Mac Gold Pool 4.5% 8/1/2041 | | 62,084 | 60,377 |
| Freddie Mac Gold Pool 4.5% 9/1/2041 | | 468,645 | 455,745 |
| Freddie Mac Gold Pool 4.5% 9/1/2041 | | 10,367 | 10,088 |
| Freddie Mac Gold Pool 4.5% 9/1/2041 | | 84,652 | 82,350 |
| Freddie Mac Gold Pool 5% 1/1/2040 | | 69,513 | 69,507 |
| Freddie Mac Gold Pool 5% 1/1/2053 | | 981,037 | 951,975 |
| Freddie Mac Gold Pool 5% 10/1/2052 | | 1,052,976 | 1,025,731 |
| Freddie Mac Gold Pool 5% 11/1/2052 | | 1,109,133 | 1,082,515 |
| Freddie Mac Gold Pool 5% 12/1/2052 | | 1,224,715 | 1,192,644 |
| Freddie Mac Gold Pool 5% 12/1/2052 | | 1,115,506 | 1,085,598 |
| Freddie Mac Gold Pool 5% 12/1/2052 | | 288,237 | 280,509 |
| Freddie Mac Gold Pool 5% 12/1/2054 | | 4,076,786 | 3,932,767 |
| Freddie Mac Gold Pool 5% 4/1/2040 | | 111,630 | 111,495 |
| Freddie Mac Gold Pool 5% 5/1/2040 | | 10,701 | 10,702 |
| Freddie Mac Gold Pool 5% 6/1/2040 | | 38,319 | 38,274 |
| Freddie Mac Gold Pool 5% 6/1/2041 | | 197,035 | 196,746 |
| Freddie Mac Gold Pool 5% 6/1/2052 | | 841,558 | 821,887 |
| Freddie Mac Gold Pool 5% 7/1/2040 | | 12,746 | 12,750 |
| Freddie Mac Gold Pool 5% 8/1/2040 | | 59,022 | 59,032 |
| Freddie Mac Gold Pool 5.5% 2/1/2054 | | 270,608 | 267,311 |
| Freddie Mac Gold Pool 5.5% 3/1/2053 (i)(j)(l) | | 3,507,243 | 3,509,439 |
| Freddie Mac Gold Pool 6% 10/1/2054 | | 1,800,001 | 1,808,637 |
| Freddie Mac Gold Pool 6% 11/1/2053 | | 358,462 | 362,758 |
| Freddie Mac Gold Pool 6% 4/1/2032 | | 63,060 | 64,812 |
| Freddie Mac Gold Pool 6% 4/1/2054 | | 2,275,442 | 2,318,357 |
| Freddie Mac Gold Pool 6% 5/1/2033 | | 22,081 | 22,640 |
| Freddie Mac Gold Pool 6% 7/1/2037 | | 3,428 | 3,563 |
| Freddie Mac Gold Pool 6% 8/1/2037 | | 34,528 | 35,834 |
| Freddie Mac Gold Pool 6.5% 1/1/2054 | | 1,983,802 | 2,053,950 |
| Freddie Mac Gold Pool 6.5% 10/1/2053 | | 1,335,500 | 1,379,802 |
| Freddie Mac Gold Pool 6.5% 10/1/2053 | | 1,298,524 | 1,344,034 |
| Freddie Mac Gold Pool 6.5% 6/1/2054 | | 424,465 | 442,525 |
| Freddie Mac Gold Pool 6.5% 7/1/2054 | | 3,650,000 | 3,727,738 |
| Freddie Mac Gold Pool 6.5% 8/1/2054 | | 3,299,672 | 3,368,916 |
| Freddie Mac Gold Pool 6.5% 9/1/2053 | | 284,126 | 293,551 |
| Freddie Mac Gold Pool 6.5% 9/1/2053 | | 296,816 | 307,683 |
| Freddie Mac Gold Pool 6.5% 9/1/2054 | | 491,515 | 512,620 |
| Freddie Mac Gold Pool 7.5% 1/1/2027 | | 158 | 160 |
| Freddie Mac Gold Pool 7.5% 10/1/2027 | | 30 | 31 |
| Freddie Mac Gold Pool 7.5% 11/1/2029 | | 1,391 | 1,452 |
| Freddie Mac Gold Pool 7.5% 11/1/2031 | | 112 | 119 |
| Freddie Mac Gold Pool 7.5% 2/1/2028 | | 75 | 77 |
| Freddie Mac Gold Pool 7.5% 7/1/2031 | | 161 | 168 |
| Freddie Mac Gold Pool 7.5% 8/1/2026 | | 22 | 22 |
| Freddie Mac Gold Pool 7.5% 9/1/2031 | | 2,518 | 2,652 |
| Freddie Mac Gold Pool 8% 4/1/2027 | | 128 | 129 |
| Freddie Mac Gold Pool 8% 5/1/2027 | | 54 | 55 |
| Freddie Mac Gold Pool 8.5% 1/1/2028 | | 158 | 161 |
| Freddie Mac Gold Pool 8.5% 5/1/2027 | | 46 | 47 |
| Freddie Mac Non Gold Pool 1 year FTSE USD IBOR Consumer Fallbacks + 1.375%, 6.382% 3/1/2036 (b)(c) | | 17,540 | 17,693 |
| Freddie Mac Non Gold Pool 1 year FTSE USD IBOR Consumer Fallbacks + 1.88%, 7.255% 4/1/2041 (b)(c) | | 2,952 | 3,012 |
| Freddie Mac Non Gold Pool 1 year FTSE USD IBOR Consumer Fallbacks + 1.88%, 7.601% 9/1/2041 (b)(c) | | 12,640 | 12,920 |
| Freddie Mac Non Gold Pool 1 year FTSE USD IBOR Consumer Fallbacks + 1.91%, 7.156% 5/1/2041 (b)(c) | | 23,939 | 24,484 |
| Freddie Mac Non Gold Pool 1 year FTSE USD IBOR Consumer Fallbacks + 1.91%, 7.485% 5/1/2041 (b)(c) | | 16,374 | 16,737 |
| Freddie Mac Non Gold Pool 1 year FTSE USD IBOR Consumer Fallbacks + 1.91%, 7.628% 6/1/2041 (b)(c) | | 22,971 | 23,467 |
| Freddie Mac Non Gold Pool 1 year FTSE USD IBOR Consumer Fallbacks + 1.91%, 7.785% 6/1/2041 (b)(c) | | 6,541 | 6,682 |
| Freddie Mac Non Gold Pool 1 year FTSE USD IBOR Consumer Fallbacks + 2.031%, 7.658% 3/1/2033 (b)(c) | | 253 | 256 |
| Freddie Mac Non Gold Pool 1 year FTSE USD IBOR Consumer Fallbacks + 2.16%, 6.785% 11/1/2035 (b)(c) | | 1,263 | 1,291 |
| Freddie Mac Non Gold Pool 1 year U.S. Treasury Index + 2.247%, 6.371% 1/1/2035 (b)(c) | | 1,930 | 1,956 |
| Freddie Mac Non Gold Pool 5% 8/1/2053 | | 548,395 | 531,293 |
| Freddie Mac Non Gold Pool 5.5% 8/1/2053 | | 695,954 | 692,693 |
| Freddie Mac Non Gold Pool 5.5% 8/1/2053 | | 700,027 | 697,403 |
| Freddie Mac Non Gold Pool 5.5% 8/1/2053 (j) | | 1,802,600 | 1,795,843 |
| Freddie Mac Non Gold Pool 6 month FTSE USD IBOR Consumer Fallbacks + 1.655%, 7.071% 4/1/2035 (b)(c) | | 17,677 | 17,820 |
| Freddie Mac Non Gold Pool 6 month FTSE USD IBOR Consumer Fallbacks + 2.96%, 8.46% 10/1/2035 (b)(c) | | 809 | 830 |
| Freddie Mac Non Gold Pool 6% 6/1/2053 | | 791,142 | 803,838 |
| Freddie Mac Non Gold Pool 6% 6/1/2053 | | 670,649 | 681,202 |
| Freddie Mac Non Gold Pool 6% 6/1/2053 | | 811,986 | 823,494 |
| Freddie Mac Non Gold Pool 6% 7/1/2053 | | 241,429 | 245,228 |
| Freddie Mac Non Gold Pool 6% 7/1/2053 | | 274,217 | 278,617 |
| Freddie Mac Non Gold Pool 6% 9/1/2053 | | 777,832 | 787,154 |
| Ginnie Mae I Pool 2.5% 1/20/2052 | | 944,603 | 780,128 |
| Ginnie Mae I Pool 2.5% 12/20/2051 | | 960,403 | 793,177 |
| Ginnie Mae I Pool 2.5% 12/20/2051 | | 1,462,521 | 1,207,866 |
| Ginnie Mae I Pool 2.5% 12/20/2051 | | 759,677 | 627,401 |
| Ginnie Mae I Pool 2.5% 8/20/2051 | | 5,353,780 | 4,421,575 |
| Ginnie Mae I Pool 2.5% 8/20/2051 | | 809,287 | 668,374 |
| Ginnie Mae I Pool 2.5% 8/20/2051 | | 1,397,145 | 1,155,183 |
| Ginnie Mae I Pool 2.5% 9/20/2051 | | 2,384,999 | 1,969,721 |
| Ginnie Mae I Pool 2.5% 9/20/2051 | | 1,388,032 | 1,146,347 |
| Ginnie Mae I Pool 3% 1/15/2045 | | 4,024 | 3,529 |
| Ginnie Mae I Pool 3% 1/15/2045 | | 4,531 | 3,974 |
| Ginnie Mae I Pool 3% 12/20/2042 | | 1,190,892 | 1,064,179 |
| Ginnie Mae I Pool 3% 2/15/2045 | | 12,162 | 10,667 |
| Ginnie Mae I Pool 3% 2/15/2045 | | 5,476 | 4,803 |
| Ginnie Mae I Pool 3% 3/15/2045 | | 4,410 | 3,868 |
| Ginnie Mae I Pool 3% 3/15/2045 | | 5,691 | 4,992 |
| Ginnie Mae I Pool 3% 3/15/2045 | | 4,912 | 4,308 |
| Ginnie Mae I Pool 3% 3/15/2045 | | 19,343 | 16,965 |
| Ginnie Mae I Pool 3% 3/15/2045 | | 14,789 | 12,972 |
| Ginnie Mae I Pool 3% 3/15/2045 | | 9,872 | 8,658 |
| Ginnie Mae I Pool 3% 3/15/2045 | | 14,029 | 12,305 |
| Ginnie Mae I Pool 3% 3/15/2045 | | 3,848 | 3,375 |
| Ginnie Mae I Pool 3% 3/15/2045 | | 11,377 | 9,978 |
| Ginnie Mae I Pool 3% 3/15/2045 | | 10,549 | 9,252 |
| Ginnie Mae I Pool 3% 3/20/2043 | | 798,074 | 713,253 |
| Ginnie Mae I Pool 3% 3/20/2043 | | 337,542 | 301,899 |
| Ginnie Mae I Pool 3% 5/15/2045 | | 10,734 | 9,415 |
| Ginnie Mae I Pool 3% 6/15/2045 | | 7,840 | 6,876 |
| Ginnie Mae I Pool 3% 7/15/2045 | | 9,009 | 7,902 |
| Ginnie Mae I Pool 3% 7/15/2045 | | 5,327 | 4,672 |
| Ginnie Mae I Pool 3% 7/15/2045 | | 4,610 | 4,044 |
| Ginnie Mae I Pool 3% 7/15/2045 | | 11,980 | 10,508 |
| Ginnie Mae I Pool 3% 7/15/2045 | | 8,515 | 7,468 |
| Ginnie Mae I Pool 3.5% 1/15/2041 | | 66,991 | 61,686 |
| Ginnie Mae I Pool 3.5% 1/20/2050 | | 99,541 | 89,086 |
| Ginnie Mae I Pool 3.5% 1/20/2050 | | 351,907 | 313,738 |
| Ginnie Mae I Pool 3.5% 1/20/2050 | | 179,592 | 161,235 |
| Ginnie Mae I Pool 3.5% 1/20/2050 | | 175,325 | 156,911 |
| Ginnie Mae I Pool 3.5% 11/15/2042 | | 204,879 | 187,072 |
| Ginnie Mae I Pool 3.5% 12/20/2049 | | 20,392 | 18,180 |
| Ginnie Mae I Pool 3.5% 12/20/2049 | | 4,717 | 4,205 |
| Ginnie Mae I Pool 3.5% 12/20/2049 | | 15,796 | 14,181 |
| Ginnie Mae I Pool 3.5% 12/20/2049 | | 44,808 | 40,102 |
| Ginnie Mae I Pool 3.5% 2/15/2041 | | 97,637 | 89,475 |
| Ginnie Mae I Pool 3.5% 2/15/2042 | | 90,050 | 82,313 |
| Ginnie Mae I Pool 3.5% 3/15/2043 | | 96,095 | 87,313 |
| Ginnie Mae I Pool 3.5% 5/15/2042 | | 161,736 | 148,089 |
| Ginnie Mae I Pool 3.5% 5/15/2042 | | 231,688 | 212,320 |
| Ginnie Mae I Pool 3.5% 5/15/2042 | | 67,974 | 62,032 |
| Ginnie Mae I Pool 3.5% 7/15/2043 | | 141,387 | 128,340 |
| Ginnie Mae I Pool 3.5% 8/15/2042 | | 112,544 | 102,903 |
| Ginnie Mae I Pool 4% 1/15/2042 | | 6,646 | 6,294 |
| Ginnie Mae I Pool 4% 1/15/2043 | | 26,969 | 25,463 |
| Ginnie Mae I Pool 4% 10/15/2040 | | 23,446 | 22,256 |
| Ginnie Mae I Pool 4% 10/15/2041 | | 10,688 | 10,110 |
| Ginnie Mae I Pool 4% 10/15/2041 | | 197,682 | 186,996 |
| Ginnie Mae I Pool 4% 10/15/2041 | | 184,996 | 175,228 |
| Ginnie Mae I Pool 4% 10/15/2041 | | 99,645 | 94,432 |
| Ginnie Mae I Pool 4% 10/15/2041 | | 44,390 | 42,128 |
| Ginnie Mae I Pool 4% 10/15/2041 | | 31,434 | 29,760 |
| Ginnie Mae I Pool 4% 10/15/2041 | | 23,315 | 22,084 |
| Ginnie Mae I Pool 4% 10/15/2041 | | 21,588 | 20,477 |
| Ginnie Mae I Pool 4% 10/15/2041 | | 14,710 | 13,924 |
| Ginnie Mae I Pool 4% 10/15/2041 | | 23,464 | 22,236 |
| Ginnie Mae I Pool 4% 10/15/2041 | | 2,689 | 2,552 |
| Ginnie Mae I Pool 4% 10/15/2041 | | 153,041 | 144,746 |
| Ginnie Mae I Pool 4% 10/15/2041 | | 9,717 | 9,183 |
| Ginnie Mae I Pool 4% 11/15/2040 | | 11,216 | 10,631 |
| Ginnie Mae I Pool 4% 11/15/2040 | | 55,165 | 52,217 |
| Ginnie Mae I Pool 4% 11/15/2040 | | 6,659 | 6,304 |
| Ginnie Mae I Pool 4% 11/15/2041 | | 61,910 | 58,631 |
| Ginnie Mae I Pool 4% 11/15/2042 | | 5,652 | 5,340 |
| Ginnie Mae I Pool 4% 12/15/2041 | | 34,812 | 32,963 |
| Ginnie Mae I Pool 4% 12/15/2041 | | 88,938 | 84,172 |
| Ginnie Mae I Pool 4% 12/15/2041 | | 49,140 | 46,499 |
| Ginnie Mae I Pool 4% 12/15/2041 | | 19,085 | 18,051 |
| Ginnie Mae I Pool 4% 12/15/2041 | | 13,705 | 13,011 |
| Ginnie Mae I Pool 4% 12/15/2041 | | 2,577 | 2,440 |
| Ginnie Mae I Pool 4% 12/15/2042 | | 6,061 | 5,732 |
| Ginnie Mae I Pool 4% 2/15/2040 | | 16,169 | 15,340 |
| Ginnie Mae I Pool 4% 2/15/2041 | | 12,853 | 12,194 |
| Ginnie Mae I Pool 4% 2/15/2042 | | 8,536 | 8,078 |
| Ginnie Mae I Pool 4% 3/15/2040 | | 73,965 | 70,397 |
| Ginnie Mae I Pool 4% 3/15/2041 | | 8,123 | 7,706 |
| Ginnie Mae I Pool 4% 3/15/2042 | | 12,087 | 11,419 |
| Ginnie Mae I Pool 4% 3/15/2042 | | 32,559 | 30,799 |
| Ginnie Mae I Pool 4% 4/15/2042 | | 15,143 | 14,315 |
| Ginnie Mae I Pool 4% 4/15/2043 | | 5,187 | 4,930 |
| Ginnie Mae I Pool 4% 4/15/2046 | | 832,519 | 779,472 |
| Ginnie Mae I Pool 4% 4/20/2047 | | 314,893 | 292,856 |
| Ginnie Mae I Pool 4% 4/20/2047 | | 324,175 | 301,489 |
| Ginnie Mae I Pool 4% 4/20/2048 | | 236,998 | 219,597 |
| Ginnie Mae I Pool 4% 4/20/2048 | | 258,852 | 239,847 |
| Ginnie Mae I Pool 4% 6/15/2041 | | 9,492 | 8,991 |
| Ginnie Mae I Pool 4% 7/15/2040 | | 27,812 | 26,439 |
| Ginnie Mae I Pool 4% 7/15/2041 | | 17,154 | 16,246 |
| Ginnie Mae I Pool 4% 8/15/2041 | | 265,620 | 251,510 |
| Ginnie Mae I Pool 4% 8/15/2041 | | 26,040 | 24,674 |
| Ginnie Mae I Pool 4% 8/15/2043 | | 6,460 | 6,084 |
| Ginnie Mae I Pool 4% 9/15/2040 | | 12,231 | 11,606 |
| Ginnie Mae I Pool 4% 9/15/2041 | | 30,090 | 28,487 |
| Ginnie Mae I Pool 4% 9/15/2041 | | 23,961 | 22,703 |
| Ginnie Mae I Pool 4% 9/15/2041 | | 23,196 | 21,998 |
| Ginnie Mae I Pool 4% 9/15/2041 | | 3,505 | 3,346 |
| Ginnie Mae I Pool 4% 9/15/2041 | | 6,464 | 6,117 |
| Ginnie Mae I Pool 4.5% 2/15/2040 | | 23,171 | 22,495 |
| Ginnie Mae I Pool 4.5% 3/15/2041 | | 5,134 | 4,980 |
| Ginnie Mae I Pool 4.5% 3/15/2041 | | 437,141 | 422,865 |
| Ginnie Mae I Pool 4.5% 3/15/2041 | | 343,311 | 332,999 |
| Ginnie Mae I Pool 4.5% 3/15/2041 | | 114,653 | 111,247 |
| Ginnie Mae I Pool 4.5% 4/15/2040 | | 3,419 | 3,318 |
| Ginnie Mae I Pool 4.5% 4/15/2041 | | 46,914 | 45,438 |
| Ginnie Mae I Pool 4.5% 5/15/2039 | | 7,558 | 7,345 |
| Ginnie Mae I Pool 4.5% 6/15/2040 | | 43,148 | 41,885 |
| Ginnie Mae I Pool 4.5% 6/15/2040 | | 64,902 | 62,974 |
| Ginnie Mae I Pool 4.5% 6/15/2040 | | 30,617 | 29,717 |
| Ginnie Mae I Pool 4.5% 7/15/2040 | | 4,936 | 4,780 |
| Ginnie Mae I Pool 4.5% 7/15/2040 | | 82,838 | 80,386 |
| Ginnie Mae I Pool 4.5% 7/15/2040 | | 28,120 | 27,273 |
| Ginnie Mae I Pool 4.5% 7/15/2040 | | 39,544 | 38,370 |
| Ginnie Mae I Pool 4.5% 8/15/2039 | | 78,490 | 76,256 |
| Ginnie Mae I Pool 4.5% 8/15/2040 | | 30,169 | 29,263 |
| Ginnie Mae I Pool 5% 10/15/2039 | | 9,972 | 9,898 |
| Ginnie Mae I Pool 5% 10/15/2039 | | 23,164 | 22,984 |
| Ginnie Mae I Pool 5% 11/15/2040 | | 20,067 | 19,911 |
| Ginnie Mae I Pool 5% 11/15/2040 | | 7,915 | 7,841 |
| Ginnie Mae I Pool 5% 12/15/2039 | | 27,244 | 27,026 |
| Ginnie Mae I Pool 5% 3/15/2039 | | 13,589 | 13,493 |
| Ginnie Mae I Pool 5% 4/15/2040 | | 4,038 | 4,004 |
| Ginnie Mae I Pool 5% 4/15/2041 | | 3,800 | 3,767 |
| Ginnie Mae I Pool 5% 4/15/2041 | | 12,432 | 12,322 |
| Ginnie Mae I Pool 5% 4/15/2041 | | 7,227 | 7,171 |
| Ginnie Mae I Pool 5% 4/20/2048 | | 699,696 | 696,002 |
| Ginnie Mae I Pool 5% 6/15/2040 | | 17,213 | 17,074 |
| Ginnie Mae I Pool 5% 7/15/2040 | | 17,770 | 17,625 |
| Ginnie Mae I Pool 5% 7/15/2040 | | 24,335 | 24,138 |
| Ginnie Mae I Pool 5% 7/15/2040 | | 15,049 | 14,929 |
| Ginnie Mae I Pool 5% 8/15/2039 | | 2,117 | 2,100 |
| Ginnie Mae I Pool 5% 8/15/2039 | | 22,394 | 22,225 |
| Ginnie Mae I Pool 5% 8/15/2040 | | 43,020 | 42,673 |
| Ginnie Mae I Pool 5% 8/15/2040 | | 35,509 | 35,217 |
| Ginnie Mae I Pool 5% 9/15/2039 | | 17,534 | 17,400 |
| Ginnie Mae I Pool 5% 9/15/2040 | | 15,764 | 15,636 |
| Ginnie Mae I Pool 5% 9/15/2040 | | 26,307 | 26,098 |
| Ginnie Mae I Pool 6.5% 11/15/2035 | | 4,678 | 4,797 |
| Ginnie Mae I Pool 6.5% 4/15/2035 | | 6,096 | 6,245 |
| Ginnie Mae I Pool 6.5% 9/15/2035 | | 13,867 | 14,191 |
| Ginnie Mae I Pool 7% 1/15/2028 | | 1,027 | 1,039 |
| Ginnie Mae I Pool 7% 1/15/2028 | | 61 | 62 |
| Ginnie Mae I Pool 7% 10/15/2028 | | 45 | 44 |
| Ginnie Mae I Pool 7% 10/15/2028 | | 210 | 213 |
| Ginnie Mae I Pool 7% 10/15/2031 | | 3,887 | 3,972 |
| Ginnie Mae I Pool 7% 12/15/2028 | | 291 | 295 |
| Ginnie Mae I Pool 7% 12/15/2030 | | 6,023 | 6,149 |
| Ginnie Mae I Pool 7% 2/15/2028 | | 5,636 | 5,688 |
| Ginnie Mae I Pool 7% 2/15/2028 | | 86 | 87 |
| Ginnie Mae I Pool 7% 2/15/2031 | | 295 | 301 |
| Ginnie Mae I Pool 7% 2/15/2032 | | 404 | 413 |
| Ginnie Mae I Pool 7% 2/15/2032 | | 13,113 | 13,410 |
| Ginnie Mae I Pool 7% 3/15/2028 | | 308 | 311 |
| Ginnie Mae I Pool 7% 3/15/2029 | | 1,840 | 1,870 |
| Ginnie Mae I Pool 7% 3/15/2032 | | 66 | 68 |
| Ginnie Mae I Pool 7% 3/15/2032 | | 7,079 | 7,222 |
| Ginnie Mae I Pool 7% 3/15/2032 | | 6,817 | 6,950 |
| Ginnie Mae I Pool 7% 4/15/2028 | | 623 | 631 |
| Ginnie Mae I Pool 7% 4/15/2028 | | 48 | 48 |
| Ginnie Mae I Pool 7% 4/15/2029 | | 886 | 898 |
| Ginnie Mae I Pool 7% 4/15/2029 | | 2,197 | 2,232 |
| Ginnie Mae I Pool 7% 4/15/2031 | | 1,164 | 1,183 |
| Ginnie Mae I Pool 7% 4/15/2032 | | 380 | 388 |
| Ginnie Mae I Pool 7% 4/15/2032 | | 1,359 | 1,387 |
| Ginnie Mae I Pool 7% 4/15/2032 | | 1,988 | 2,035 |
| Ginnie Mae I Pool 7% 4/15/2032 | | 17,579 | 18,006 |
| Ginnie Mae I Pool 7% 5/15/2029 | | 1,900 | 1,932 |
| Ginnie Mae I Pool 7% 5/15/2032 | | 679 | 696 |
| Ginnie Mae I Pool 7% 6/15/2028 | | 743 | 753 |
| Ginnie Mae I Pool 7% 6/15/2028 | | 3,325 | 3,347 |
| Ginnie Mae I Pool 7% 6/15/2032 | | 153 | 157 |
| Ginnie Mae I Pool 7% 6/15/2032 | | 5,153 | 5,277 |
| Ginnie Mae I Pool 7% 6/15/2032 | | 141 | 145 |
| Ginnie Mae I Pool 7% 6/15/2032 | | 1,922 | 1,963 |
| Ginnie Mae I Pool 7% 7/15/2028 | | 1,195 | 1,201 |
| Ginnie Mae I Pool 7% 7/15/2028 | | 157 | 159 |
| Ginnie Mae I Pool 7% 7/15/2031 | | 736 | 753 |
| Ginnie Mae I Pool 7% 7/15/2031 | | 2,859 | 2,921 |
| Ginnie Mae I Pool 7% 7/15/2031 | | 1,284 | 1,309 |
| Ginnie Mae I Pool 7% 7/15/2032 | | 666 | 682 |
| Ginnie Mae I Pool 7% 7/15/2032 | | 2,038 | 2,074 |
| Ginnie Mae I Pool 7% 8/15/2031 | | 208 | 211 |
| Ginnie Mae I Pool 7% 8/15/2031 | | 1,765 | 1,805 |
| Ginnie Mae I Pool 7% 8/15/2031 | | 2,970 | 3,010 |
| Ginnie Mae I Pool 7% 9/15/2028 | | 70 | 71 |
| Ginnie Mae I Pool 7% 9/15/2028 | | 23 | 22 |
| Ginnie Mae I Pool 7% 9/15/2029 | | 10 | 8 |
| Ginnie Mae I Pool 7% 9/15/2031 | | 786 | 801 |
| Ginnie Mae I Pool 7% 9/15/2031 | | 2,640 | 2,690 |
| Ginnie Mae I Pool 7% 9/15/2031 | | 462 | 472 |
| Ginnie Mae I Pool 7.5% 1/15/2026 | | 20 | 19 |
| Ginnie Mae I Pool 7.5% 10/15/2027 | | 226 | 230 |
| Ginnie Mae I Pool 7.5% 10/15/2027 | | 369 | 374 |
| Ginnie Mae I Pool 7.5% 10/15/2028 | | 3,807 | 3,897 |
| Ginnie Mae I Pool 7.5% 11/15/2025 | | 12 | 11 |
| Ginnie Mae I Pool 7.5% 11/15/2027 | | 130 | 130 |
| Ginnie Mae I Pool 7.5% 12/15/2025 | | 23 | 22 |
| Ginnie Mae I Pool 7.5% 12/15/2027 | | 786 | 803 |
| Ginnie Mae I Pool 7.5% 2/15/2027 | | 252 | 255 |
| Ginnie Mae I Pool 7.5% 3/15/2028 | | 2,569 | 2,624 |
| Ginnie Mae I Pool 7.5% 4/15/2027 | | 1,125 | 1,141 |
| Ginnie Mae I Pool 7.5% 4/15/2027 | | 870 | 885 |
| Ginnie Mae I Pool 7.5% 4/15/2027 | | 183 | 185 |
| Ginnie Mae I Pool 7.5% 4/15/2027 | | 330 | 336 |
| Ginnie Mae I Pool 7.5% 4/15/2027 | | 94 | 96 |
| Ginnie Mae I Pool 7.5% 4/15/2027 | | 92 | 92 |
| Ginnie Mae I Pool 7.5% 4/15/2027 | | 397 | 404 |
| Ginnie Mae I Pool 7.5% 4/15/2027 | | 395 | 401 |
| Ginnie Mae I Pool 7.5% 4/15/2027 | | 116 | 118 |
| Ginnie Mae I Pool 7.5% 5/15/2027 | | 127 | 127 |
| Ginnie Mae I Pool 7.5% 6/15/2027 | | 102 | 103 |
| Ginnie Mae I Pool 7.5% 6/15/2027 | | 361 | 366 |
| Ginnie Mae I Pool 7.5% 7/15/2027 | | 778 | 781 |
| Ginnie Mae I Pool 7.5% 8/15/2028 | | 517 | 522 |
| Ginnie Mae I Pool 8% 3/15/2030 | | 1,220 | 1,250 |
| Ginnie Mae I Pool 8% 5/15/2030 | | 626 | 642 |
| Ginnie Mae I Pool 8% 9/15/2030 | | 1,248 | 1,280 |
| Ginnie Mae II Pool 2% 1/1/2055 (k) | | 57,500,000 | 45,922,766 |
| Ginnie Mae II Pool 2% 1/20/2051 | | 659,478 | 527,125 |
| Ginnie Mae II Pool 2% 10/20/2050 | | 7,823,345 | 6,255,690 |
| Ginnie Mae II Pool 2% 11/20/2050 | | 3,623,168 | 2,897,151 |
| Ginnie Mae II Pool 2% 12/20/2050 | | 5,028,202 | 4,020,642 |
| Ginnie Mae II Pool 2% 2/1/2055 (k) | | 13,500,000 | 10,785,558 |
| Ginnie Mae II Pool 2% 2/20/2051 | | 738,318 | 590,373 |
| Ginnie Mae II Pool 2% 2/20/2052 | | 3,649,998 | 2,916,324 |
| Ginnie Mae II Pool 2% 4/20/2051 | | 299,584 | 239,366 |
| Ginnie Mae II Pool 2% 4/20/2052 | | 6,299,997 | 5,033,656 |
| Ginnie Mae II Pool 2.5% 1/1/2055 (k) | | 26,350,000 | 21,973,283 |
| Ginnie Mae II Pool 2.5% 12/20/2051 | | 127,525 | 106,436 |
| Ginnie Mae II Pool 3% 1/1/2055 (k) | | 42,525,000 | 36,837,043 |
| Ginnie Mae II Pool 3% 1/20/2032 | | 368,852 | 354,008 |
| Ginnie Mae II Pool 3% 10/20/2031 | | 120,024 | 115,289 |
| Ginnie Mae II Pool 3% 11/20/2031 | | 130,079 | 124,896 |
| Ginnie Mae II Pool 3% 12/20/2031 | | 196,821 | 188,980 |
| Ginnie Mae II Pool 3% 12/20/2046 | | 600,559 | 527,390 |
| Ginnie Mae II Pool 3% 2/1/2055 (k) | | 15,050,000 | 13,037,565 |
| Ginnie Mae II Pool 3% 2/20/2031 | | 16,013 | 15,441 |
| Ginnie Mae II Pool 3% 3/20/2031 | | 32,795 | 31,610 |
| Ginnie Mae II Pool 3% 3/20/2046 | | 103,551 | 90,967 |
| Ginnie Mae II Pool 3% 4/20/2031 | | 121,952 | 117,493 |
| Ginnie Mae II Pool 3% 4/20/2047 | | 33,922 | 29,746 |
| Ginnie Mae II Pool 3% 5/20/2031 | | 255,570 | 246,119 |
| Ginnie Mae II Pool 3% 7/20/2031 | | 3,315 | 3,189 |
| Ginnie Mae II Pool 3% 8/20/2031 | | 39,255 | 37,754 |
| Ginnie Mae II Pool 3% 9/20/2031 | | 15,754 | 15,146 |
| Ginnie Mae II Pool 3.5% 1/1/2055 (k) | | 22,125,000 | 19,756,811 |
| Ginnie Mae II Pool 3.5% 12/20/2040 | | 100,302 | 92,631 |
| Ginnie Mae II Pool 3.5% 2/1/2055 (k) | | 10,900,000 | 9,735,003 |
| Ginnie Mae II Pool 4% 1/20/2041 | | 330,288 | 312,236 |
| Ginnie Mae II Pool 4% 1/20/2042 | | 1,123,427 | 1,059,781 |
| Ginnie Mae II Pool 4% 10/20/2040 | | 161,097 | 152,337 |
| Ginnie Mae II Pool 4% 11/20/2040 | | 650,422 | 614,961 |
| Ginnie Mae II Pool 4% 11/20/2054 | | 3,999,998 | 3,681,321 |
| Ginnie Mae II Pool 4% 12/20/2054 | | 100,000 | 92,033 |
| Ginnie Mae II Pool 4% 2/20/2041 | | 10,774 | 10,184 |
| Ginnie Mae II Pool 4% 3/20/2047 | | 168,505 | 156,923 |
| Ginnie Mae II Pool 4% 4/20/2047 | | 607,197 | 565,463 |
| Ginnie Mae II Pool 4% 5/20/2046 | | 941,509 | 877,680 |
| Ginnie Mae II Pool 4% 6/20/2045 | | 107,177 | 100,079 |
| Ginnie Mae II Pool 4% 7/20/2044 | | 6,724 | 6,311 |
| Ginnie Mae II Pool 4% 8/20/2043 | | 39,795 | 37,416 |
| Ginnie Mae II Pool 4% 8/20/2045 | | 776,842 | 725,391 |
| Ginnie Mae II Pool 4% 9/20/2040 | | 254,498 | 240,643 |
| Ginnie Mae II Pool 4.5% 11/20/2054 | | 12,599,303 | 11,907,281 |
| Ginnie Mae II Pool 4.5% 3/20/2041 | | 14,620 | 14,240 |
| Ginnie Mae II Pool 4.5% 5/20/2040 | | 97,573 | 95,118 |
| Ginnie Mae II Pool 4.5% 5/20/2041 | | 28,511 | 27,766 |
| Ginnie Mae II Pool 4.5% 7/20/2040 | | 74,317 | 72,426 |
| Ginnie Mae II Pool 4.5% 9/20/2040 | | 338,831 | 330,158 |
| Ginnie Mae II Pool 5% 1/1/2055 (k) | | 14,000,000 | 13,578,305 |
| Ginnie Mae II Pool 5% 11/20/2054 | | 1,149,999 | 1,115,807 |
| Ginnie Mae II Pool 5.5% 1/1/2055 (k) | | 18,000,000 | 17,838,878 |
| Ginnie Mae II Pool 6% 1/1/2055 (k) | | 53,200,000 | 53,528,345 |
| Ginnie Mae II Pool 6% 12/20/2054 (k) | | 1,300,000 | 1,309,855 |
| Ginnie Mae II Pool 6% 2/1/2055 (k) | | 21,150,000 | 21,249,141 |
| Ginnie Mae II Pool 6.5% 1/1/2055 (k) | | 7,600,000 | 7,726,469 |
| Ginnie Mae II Pool 6.5% 2/1/2055 (k) | | 2,250,000 | 2,284,629 |
| Uniform Mortgage Backed Securities 2% 1/1/2055 (k) | | 110,175,000 | 85,592,192 |
| Uniform Mortgage Backed Securities 2% 2/1/2055 (k) | | 26,425,000 | 20,540,274 |
| Uniform Mortgage Backed Securities 3% 1/1/2055 (k) | | 9,250,000 | 7,846,599 |
| Uniform Mortgage Backed Securities 3.5% 1/1/2055 (k) | | 11,400,000 | 10,072,967 |
| Uniform Mortgage Backed Securities 4.5% 1/1/2055 (k) | | 1,000,000 | 939,843 |
| Uniform Mortgage Backed Securities 5% 1/1/2040 (k) | | 9,300,000 | 9,250,594 |
| Uniform Mortgage Backed Securities 5% 1/1/2055 (k) | | 8,700,000 | 8,390,402 |
| Uniform Mortgage Backed Securities 5.5% 1/1/2055 (k) | | 11,150,000 | 10,996,252 |
| Uniform Mortgage Backed Securities 6% 1/1/2055 (k) | | 12,800,000 | 12,857,000 |
| Uniform Mortgage Backed Securities 6.5% 1/1/2055 (k) | | 11,000,000 | 11,231,172 |
TOTAL UNITED STATES | | | 967,066,319 |
| TOTAL U.S. GOVERNMENT AGENCY - MORTGAGE SECURITIES (Cost $1,015,173,713) | | | 967,066,319 |
| | | | |
| U.S. Treasury Obligations - 45.2% |
| | | Yield (%) (m) | Principal Amount (a) | Value ($) |
| US Treasury Bonds 1.125% 5/15/2040 | | 1.89 | 22,865,200 | 13,751,828 |
| US Treasury Bonds 1.75% 8/15/2041 | | 1.90 | 80,591,100 | 52,185,415 |
| US Treasury Bonds 1.875% 11/15/2051 | | 1.83 to 1.95 | 50,329,100 | 27,758,604 |
| US Treasury Bonds 2% 11/15/2041 | | 2.00 | 13,511,200 | 9,071,687 |
| US Treasury Bonds 2% 8/15/2051 | | 1.84 | 104,090,400 | 59,478,273 |
| US Treasury Bonds 2.25% 2/15/2052 | | 2.26 to 2.90 | 38,732,200 | 23,481,017 |
| US Treasury Bonds 3% 2/15/2047 | | 1.14 to 1.86 | 42,593,200 | 31,561,702 |
| US Treasury Bonds 3.375% 8/15/2042 | | 3.46 to 3.75 | 58,000,000 | 47,876,222 |
| US Treasury Bonds 3.625% 5/15/2053 | | 3.90 to 4.31 | 4,500,000 | 3,658,060 |
| US Treasury Bonds 4.125% 8/15/2044 | | 4.58 to 4.63 | 6,070,000 | 5,493,167 |
| US Treasury Bonds 4.125% 8/15/2053 | | 4.18 to 5.00 | 126,266,000 | 112,458,022 |
| US Treasury Bonds 4.25% 2/15/2054 | | 4.11 to 4.78 | 87,500,000 | 79,821,898 |
| US Treasury Bonds 4.25% 8/15/2054 | | 4.00 to 4.65 | 13,950,000 | 12,739,151 |
| US Treasury Bonds 4.5% 11/15/2054 | | 4.35 to 4.77 | 9,530,000 | 9,086,169 |
| US Treasury Bonds 4.625% 5/15/2054 | | 4.02 to 4.65 | 18,670,000 | 18,139,730 |
| US Treasury Notes 1.125% 8/31/2028 | | 1.40 | 70,526,300 | 62,903,753 |
| US Treasury Notes 1.25% 5/31/2028 | | 1.37 | 155,752,000 | 140,664,221 |
| US Treasury Notes 1.25% 9/30/2028 | | 1.41 | 15,938,200 | 14,244,232 |
| US Treasury Notes 1.75% 1/31/2029 | | 1.74 | 27,595,700 | 24,919,310 |
| US Treasury Notes 2.625% 7/31/2029 | | 3.08 | 37,400,000 | 34,697,473 |
| US Treasury Notes 2.875% 5/15/2032 | | 2.94 to 2.96 | 88,237,000 | 79,245,849 |
| US Treasury Notes 3.375% 5/15/2033 | | 3.64 to 4.04 | 181,445,000 | 166,743,856 |
| US Treasury Notes 3.5% 2/15/2033 | | 3.52 to 3.92 | 144,500,000 | 134,427,359 |
| US Treasury Notes 3.625% 9/30/2031 | | 4.00 | 23,600,000 | 22,426,149 |
| US Treasury Notes 3.75% 5/31/2030 | | 3.83 to 3.98 | 37,700,000 | 36,489,422 |
| US Treasury Notes 3.75% 6/30/2030 | | 4.11 | 7,000,000 | 6,771,661 |
| US Treasury Notes 3.75% 8/31/2031 | | 3.52 | 60,400,000 | 57,867,921 |
| US Treasury Notes 3.875% 8/15/2033 | | 4.02 to 4.90 | 42,294,000 | 40,252,016 |
| US Treasury Notes 3.875% 8/15/2034 | | 3.71 to 4.27 | 83,400,000 | 78,919,852 |
| US Treasury Notes 4% 1/31/2031 | | 4.13 to 4.15 | 110,400,000 | 107,711,654 |
| US Treasury Notes 4% 2/15/2034 | | 4.28 to 4.71 | 64,400,000 | 61,653,929 |
| US Treasury Notes 4% 6/30/2028 | | 4.23 | 25,000,000 | 24,741,509 |
| US Treasury Notes 4.125% 10/31/2031 | | 4.38 | 40,900,000 | 40,033,377 |
| US Treasury Notes 4.125% 11/15/2032 | | 3.54 | 18,600,000 | 18,140,929 |
| US Treasury Notes 4.125% 11/30/2031 | | 4.55 | 4,000,000 | 3,914,598 |
| US Treasury Notes 4.125% 7/31/2028 | | 4.18 | 25,000,000 | 24,827,466 |
| US Treasury Notes 4.125% 8/31/2030 | | 4.61 | 71,100,000 | 70,005,429 |
| US Treasury Notes 4.25% 6/30/2031 | | 4.12 | 49,300,000 | 48,680,061 |
| US Treasury Notes 4.375% 11/30/2030 | | 4.35 | 65,000,000 | 64,763,355 |
| US Treasury Notes 4.375% 12/31/2031 | | 4.43 to 4.44 | 44,000,000 | 44,036,629 |
| US Treasury Notes 4.5% 11/15/2033 | | 4.04 | 45,000,000 | 44,796,300 |
| US Treasury Notes 4.625% 4/30/2031 | | 4.50 | 43,300,000 | 43,665,930 |
| TOTAL U.S. TREASURY OBLIGATIONS (Cost $2,235,998,491) | | | | 2,004,105,185 |
| | | | | |
| Money Market Funds - 2.6% |
| | | Yield (%) | Shares | Value ($) |
Fidelity Cash Central Fund (n) (Cost $113,861,315) | | 4.36 | 113,838,907 | 113,861,675 |
| | | | | |
| Purchased Swaptions - 0.1% |
| | Expiration Date | Notional Amount | Value ($) |
| Put Swaptions - 0.1% | | | | |
| Option on an interest rate swap with Bank of America NA to pay annually a fixed rate of 3.14% and receive annually a floating rate based on US SOFR Index, expiring September 2035 | 9/12/25 | | 1,300,000 | 103,537 |
| Option on an interest rate swap with Bank of America NA to pay annually a fixed rate of 3.845% and receive annually a floating rate based on US SOFR Index, expiring October 2034 | 10/29/29 | | 10,700,000 | 466,173 |
| Option on an interest rate swap with Bank of America NA to pay annually a fixed rate of 4.07% and receive annually a floating rate based on US SOFR Index, expiring December 2034 | 12/19/29 | | 6,760,000 | 271,121 |
| Option on an interest rate swap with Citibank NA to pay annually a fixed rate of 3.755% and receive annually a floating rate based on the US SOFR Index, expiring March 2034 | 3/19/29 | | 2,500,000 | 109,036 |
| Option on an interest rate swap with Citibank NA to pay annually a fixed rate of 3.795% and receive annually a floating rate based on US SOFR Index, expiring November 2034 | 10/30/29 | | 11,100,000 | 494,382 |
| Option on an interest rate swap with Citibank NA to pay annually a fixed rate of 3.753% and receive annually a floating rate based on US SOFR Index, expiring November 2034 | 10/31/29 | | 2,400,000 | 108,936 |
| Option on an interest rate swap with Citibank NA to pay annually a fixed rate of 4.01% and receive annually a floating rate based on US SOFR Index, expiring December 2034 | 12/20/29 | | 2,700,000 | 111,071 |
| Option on an interest rate swap with JPMorgan Chase Bank NA to pay annually a fixed rate of 3.8225% and receive annually a floating rate based on the US SOFR Index, expiring February 2035 | 2/24/25 | | 11,900,000 | 300,046 |
| Option on an interest rate swap with JPMorgan Chase Bank NA to pay annually a fixed rate of 3.92% and receive annually a floating rate based on US SOFR Index, expiring November 2034 | 11/20/29 | | 3,600,000 | 152,859 |
| Option on an interest rate swap with Goldman Sachs Bank USA to pay annually a fixed rate of 3.53% and receive annually a floating rate based on US SOFR Index, expiring August 2034 | 8/01/29 | | 1,900,000 | 93,309 |
| Option on an interest rate swap with Goldman Sachs Bank USA to pay annually a fixed rate of 3.386% and receive annually a floating rate based on US SOFR Index, expiring August 2035 | 8/18/25 | | 6,300,000 | 392,819 |
| Option on an interest rate swap with Goldman Sachs Bank USA to pay annually a fixed rate of 3.455% and receive annually a floating rate based on US SOFR Index, expiring August 2034 | 8/29/29 | | 2,600,000 | 132,445 |
| Option on an interest rate swap with Goldman Sachs Bank USA to pay annually a fixed rate of 3.1415% and receive annually a floating rate based on US SOFR Index, expiring September 2035 | 9/15/25 | | 1,100,000 | 87,578 |
| Option on an interest rate swap with Morgan Stanley Capital Services LLC to pay annually a fixed rate of 3.17% and receive annually a floating rate based on US SOFR Index, expiring September 2035 | 9/18/25 | | 3,700,000 | 287,666 |
| Option on an interest rate swap with Morgan Stanley Capital Services LLC to pay annually a fixed rate of 3.87% and receive annually a floating rate based on US SOFR Index, expiring November 2034 | 11/07/29 | | 4,100,000 | 176,915 |
| | | | | |
| TOTAL PUT SWAPTIONS | | | | 3,287,893 |
| Call Swaptions - 0.0% | | | | |
| Option on an interest rate swap with Bank of America NA to receive annually a fixed rate of 3.14% and pay annually a floating rate based on US SOFR Index, expiring September 2035 | 9/12/25 | | 1,300,000 | 7,891 |
| Option on an interest rate swap with Bank of America NA to receive annually a fixed rate of 3.845% and pay annually a floating rate based on US SOFR Index, expiring October 2034 | 10/29/29 | | 10,700,000 | 363,919 |
| Option on an interest rate swap with Bank of America NA to receive annually a fixed rate of 4.07% and pay annually a floating rate based on US SOFR Index, expiring December 2034 | 12/19/29 | | 6,760,000 | 262,015 |
| Option on an interest rate swap with Citibank NA to receive annually a fixed rate of 3.755% and pay annually a floating rate based on the US SOFR Index, expiring March 2034 | 3/19/29 | | 2,500,000 | 77,670 |
| Option on an interest rate swap with Citibank NA to receive annually a fixed rate of 3.795% and pay annually a floating rate based on US SOFR Index, expiring November 2034 | 10/30/29 | | 11,100,000 | 367,688 |
| Option on an interest rate swap with Citibank NA to receive annually a fixed rate of 3.753% and pay annually a floating rate based on US SOFR Index, expiring November 2034 | 10/31/29 | | 2,400,000 | 77,799 |
| Option on an interest rate swap with Citibank NA to receive annually a fixed rate of 4.01% and pay annually a floating rate based on the US SOFR Index, expiring December 2034 | 12/20/29 | | 2,700,000 | 101,411 |
| Option on an interest rate swap with JPMorgan Chase Bank NA to receive annually a fixed rate of 3.8225% and pay annually a floating rate based on the US SOFR Index, expiring February 2035 | 2/24/25 | | 11,900,000 | 63,039 |
| Option on an interest rate swap with JPMorgan Chase Bank NA to receive annually a fixed rate of 3.92% and pay annually a floating rate based on US SOFR Index, expiring November 2034 | 11/20/29 | | 3,600,000 | 128,272 |
| Option on an interest rate swap with Goldman Sachs Bank USA to receive annually a fixed rate of 3.53% and pay annually a floating rate based on US SOFR Index, expiring August 2034 | 8/01/29 | | 1,900,000 | 53,052 |
| Option on an interest rate swap with Goldman Sachs Bank USA to receive annually a fixed rate of 3.386% and pay annually a floating rate based on US SOFR Index, expiring August 2035 | 8/18/25 | | 6,300,000 | 52,027 |
| Option on an interest rate swap with Goldman Sachs Bank USA to receive annually a fixed rate of 3.455% and pay annually a floating rate based on US SOFR Index, expiring August 2034 | 8/29/29 | | 2,600,000 | 70,024 |
| Option on an interest rate swap with Goldman Sachs Bank USA to receive annually a fixed rate of 3.1415% and pay annually a floating rate based on US SOFR Index, expiring September 2035 | 9/15/25 | | 1,100,000 | 6,806 |
| Option on an interest rate swap with Morgan Stanley Capital Services LLC to receive annually a fixed rate of 3.17% and pay annually a floating rate based on US SOFR Index, expiring September 2035 | 9/18/25 | | 3,700,000 | 24,309 |
| Option on an interest rate swap with Morgan Stanley Capital Services LLC to receive annually a fixed rate of 3.87% and pay annually a floating rate based on US SOFR Index, expiring November 2034 | 11/07/29 | | 4,100,000 | 141,462 |
| | | | | |
| TOTAL CALL SWAPTIONS | | | | 1,797,384 |
TOTAL PURCHASED SWAPTIONS (Cost $5,571,652) | | | | 5,085,277 |
| TOTAL INVESTMENT IN SECURITIES - 110.6% (Cost $5,299,860,909) | 4,902,380,577 |
NET OTHER ASSETS (LIABILITIES) - (10.6)% | (471,407,594) |
| NET ASSETS - 100.0% | 4,430,972,983 |
| | |
| TBA Sale Commitments |
| | Principal Amount (a) | Value ($) |
| U.S. Government Agency - Mortgage Securities | | |
| Ginnie Mae II Pool 2% 1/1/2055 | (20,575,000) | (16,432,364) |
| Ginnie Mae II Pool 3% 1/1/2055 | (30,100,000) | (26,073,956) |
| Ginnie Mae II Pool 3.5% 1/1/2055 | (10,900,000) | (9,733,299) |
| Ginnie Mae II Pool 5.5% 1/1/2055 | (7,500,000) | (7,432,866) |
| Ginnie Mae II Pool 6% 1/1/2055 | (31,950,000) | (32,147,192) |
| Ginnie Mae II Pool 6.5% 1/1/2055 | (2,250,000) | (2,287,441) |
| Uniform Mortgage Backed Securities 2% 1/1/2055 | (34,925,000) | (27,132,356) |
| Uniform Mortgage Backed Securities 3% 1/1/2055 | (4,700,000) | (3,986,921) |
| Uniform Mortgage Backed Securities 3.5% 1/1/2055 | (11,400,000) | (10,072,967) |
| Uniform Mortgage Backed Securities 4% 1/1/2055 | (4,000,000) | (3,652,500) |
| Uniform Mortgage Backed Securities 4.5% 1/1/2055 | (3,500,000) | (3,289,452) |
| Uniform Mortgage Backed Securities 5% 1/1/2055 | (8,700,000) | (8,390,402) |
| Uniform Mortgage Backed Securities 5.5% 1/1/2055 | (12,050,000) | (11,883,841) |
| Uniform Mortgage Backed Securities 6% 1/1/2055 | (13,100,000) | (13,158,336) |
| Uniform Mortgage Backed Securities 6.5% 1/1/2055 | (3,400,000) | (3,471,453) |
| | | |
| TOTAL U.S. GOVERNMENT AGENCY - MORTGAGE SECURITIES | | (179,145,346) |
| | | |
TOTAL TBA SALE COMMITMENTS (Proceeds $179,860,197) | | (179,145,346) |
| Futures Contracts |
| | Number of contracts | Expiration Date | Notional Amount ($) | Value ($) | Unrealized Appreciation/ (Depreciation) ($) |
| Purchased | | | | | |
| | | | | | |
| Interest Rate Contracts | | | | | |
| CBOT 10-Year U.S. Treasury Note Contracts (United States) | 214 | Mar 2025 | 23,272,500 | (129,782) | (129,782) |
| CBOT 2-Year U.S. Treasury Note Contracts (United States) | 110 | Mar 2025 | 22,617,031 | 12,785 | 12,785 |
| CBOT 5-Year U.S. Treasury Note Contracts (United States) | 1 | Mar 2025 | 106,305 | (48) | (48) |
| CBOT Long Term U.S. Treasury Bond Contracts (United States) | 47 | Mar 2025 | 5,350,656 | (93,297) | (93,297) |
| | | | | | |
| TOTAL PURCHASED | | | | | (210,342) |
| | | | | | |
| Sold | | | | | |
| | | | | | |
| Interest Rate Contracts | | | | | |
| CBOT Ultra Long Term U.S. Treasury Bond Contracts (United States) | 5 | Mar 2025 | 594,531 | 16,925 | 16,925 |
| | | | | | |
| TOTAL FUTURES CONTRACTS | | | | | (193,417) |
| The notional amount of futures purchased as a percentage of Net Assets is 1.1% |
| The notional amount of futures sold as a percentage of Net Assets is 0.0% |
| Credit Default Swaps |
| Underlying Reference | Rating(2) | Maturity Date | Clearinghouse / Counterparty | Fixed Payment Received/ (Paid) | Payment Frequency | Notional Amount(3)(1) | Value ($)(2) | Upfront Premium Received/ (Paid) ($) | Unrealized Appreciation/ (Depreciation) ($) |
| Buy Protection | | | | | | | | | | |
| CMBX BBB- Series 16 Index | | Apr 2065 | JP Morgan Securities LLC | (3%) | Monthly | | 130,000 | 19,566 | (38,802) | (19,236) |
| CMBX BBB- Series 17 Index | | Dec 2056 | JP Morgan Securities LLC | (3%) | Monthly | | 600,000 | 64,327 | (78,180) | (13,853) |
| CMBX AAA Series 13 Index | | Dec 2072 | Morgan Stanley Capital Services LLC | (0.5%) | Monthly | | 2,150,000 | 875 | (33,971) | (33,096) |
| CMBX BBB- Series 16 Index | | Apr 2065 | Morgan Stanley Capital Services LLC | (3%) | Monthly | | 180,000 | 27,092 | (44,893) | (17,801) |
| CMBX BBB- Series 16 Index | | Apr 2065 | Morgan Stanley Capital Services LLC | (3%) | Monthly | | 250,000 | 37,628 | (66,015) | (28,387) |
| CMBX BBB- Series 16 Index | | Apr 2065 | Morgan Stanley Capital Services LLC | (3%) | Monthly | | 460,000 | 69,235 | (112,693) | (43,458) |
| CMBX BBB- Series 16 Index | | Apr 2065 | Morgan Stanley Capital Services LLC | (3%) | Monthly | | 120,000 | 18,061 | (27,984) | (9,923) |
| CMBX BBB- Series 16 Index | | Apr 2065 | Morgan Stanley Capital Services LLC | (3%) | Monthly | | 210,000 | 31,607 | (47,658) | (16,051) |
| CMBX BBB- Series 16 Index | | Apr 2065 | Morgan Stanley Capital Services LLC | (3%) | Monthly | | 300,000 | 45,153 | (49,841) | (4,688) |
| CMBX BBB- Series 17 Index | | Dec 2056 | Morgan Stanley Capital Services LLC | (3%) | Monthly | | 100,000 | 10,721 | (13,782) | (3,061) |
| CMBX BBB- Series 17 Index | | Dec 2056 | Morgan Stanley Capital Services LLC | (3%) | Monthly | | 300,000 | 32,164 | (42,378) | (10,214) |
| CMBX AAA Series 13 Index | | Dec 2072 | Citigroup Global Markets Ltd | (0.5%) | Monthly | | 530,000 | 216 | (4,694) | (4,478) |
| CMBX AAA Series 13 Index | | Dec 2072 | Citigroup Global Markets Ltd | (0.5%) | Monthly | | 1,110,000 | 452 | (11,776) | (11,324) |
| CMBX BBB- Series 16 Index | | Apr 2065 | Citigroup Global Markets Ltd | (3%) | Monthly | | 490,000 | 73,750 | (127,109) | (53,359) |
| CMBX BBB- Series 16 Index | | Apr 2065 | Citigroup Global Markets Ltd | (3%) | Monthly | | 230,000 | 34,617 | (52,353) | (17,736) |
| CMBX BBB- Series 16 Index | | Apr 2065 | Citigroup Global Markets Ltd | (3%) | Monthly | | 40,000 | 6,020 | (8,803) | (2,783) |
| CMBX BBB- Series 16 Index | | Apr 2065 | Citigroup Global Markets Ltd | (3%) | Monthly | | 500,000 | 75,255 | (135,538) | (60,283) |
| CMBX BBB- Series 17 Index | | Dec 2056 | Citigroup Global Markets Ltd | (3%) | Monthly | | 200,000 | 21,442 | (32,011) | (10,569) |
| | | | | | | | | | | |
| TOTAL BUY PROTECTION | | | | | | | | 568,181 | (928,481) | (360,300) |
| Sell Protection | | | | | | | | | | |
| CMBX AAA Series 13 Index | NR | Dec 2072 | Morgan Stanley Capital Services LLC | 0.5% | Monthly | | 630,000 | (256) | 14,104 | 13,848 |
| CMBX AAA Series 13 Index | NR | Dec 2072 | Morgan Stanley Capital Services LLC | 0.5% | Monthly | | 3,160,000 | (1,286) | 72,757 | 71,471 |
| CMBX AAA Series 15 Index | NR | Nov 2064 | Morgan Stanley Capital Services LLC | 0.5% | Monthly | | 1,600,000 | (13,090) | 24,844 | 11,754 |
| CMBX AAA Series 17 Index | NR | Dec 2056 | Morgan Stanley Capital Services LLC | 0.5% | Monthly | | 100,000 | (1,744) | 2,093 | 349 |
| CMBX AAA Series 17 Index | NR | Dec 2056 | Morgan Stanley Capital Services LLC | 0.5% | Monthly | | 1,200,000 | (20,932) | 19,539 | (1,393) |
| CMBX AAA Series 15 Index | NR | Nov 2064 | Citigroup Global Markets Ltd | 0.5% | Monthly | | 1,900,000 | (15,544) | 25,681 | 10,137 |
| CMBX AAA Series 15 Index | NR | Nov 2064 | Citigroup Global Markets Ltd | 0.5% | Monthly | | 1,000,000 | (8,181) | 15,130 | 6,949 |
| CMBX AAA Series 17 Index | NR | Dec 2056 | Citigroup Global Markets Ltd | 0.5% | Monthly | | 1,300,000 | (22,676) | 32,115 | 9,439 |
| CMBX AAA Series 16 Index | NR | Apr 2065 | Citigroup Global Markets Ltd | 0.5% | Monthly | | 200,000 | (2,587) | 3,965 | 1,378 |
| CMBX AAA Series 17 Index | NR | Dec 2056 | Citigroup Global Markets Ltd | 0.5% | Monthly | | 100,000 | (1,744) | 2,486 | 742 |
| CMBX AAA Series 16 Index | NR | Apr 2065 | Citigroup Global Markets Ltd | 0.5% | Monthly | | 1,900,000 | (24,572) | 37,941 | 13,369 |
| CMBX AAA Series 16 Index | NR | Apr 2065 | Citigroup Global Markets Ltd | 0.5% | Monthly | | 600,000 | (7,760) | 9,411 | 1,651 |
| CMBX AAA Series 17 Index | NR | Dec 2056 | Citigroup Global Markets Ltd | 0.5% | Monthly | | 600,000 | (10,466) | 9,583 | (883) |
| CMBX AAA Series 16 Index | NR | Apr 2065 | Citigroup Global Markets Ltd | 0.5% | Monthly | | 700,000 | (9,053) | 7,997 | (1,056) |
| CMBX AAA Series 17 Index | NR | Dec 2056 | Citigroup Global Markets Ltd | 0.5% | Monthly | | 500,000 | (8,722) | 7,986 | (736) |
| | | | | | | | | | | |
| TOTAL SELL PROTECTION | | | | | | | | (148,613) | 285,632 | 137,019 |
| TOTAL CREDIT DEFAULT SWAPS | | | | | | | | 419,568 | (642,849) | (223,281) |
(1)Notional amount is stated in U.S. Dollars unless otherwise noted.
(2)Ratings are presented for credit default swaps in which the Fund has sold protection on the underlying referenced debt. Ratings for an underlying index represent a weighted average of the ratings of all securities included in the index. The credit rating or value can be measures of the current payment/performance risk. Ratings are from Moody's Investors Service, Inc. Where Moody's® ratings are not available, S&P® ratings are disclosed and are indicated as such. All ratings are as of the report date and do not reflect subsequent changes.
(3)The notional amount of each credit default swap where the Fund has sold protection approximates the maximum potential amount of future payments that the Fund could be required to make if a credit event were to occur.
| Interest Rate Swaps |
| Payment Received | Payment Frequency | Payment Paid | Payment Frequency | Clearinghouse / Counterparty(1) | Maturity Date | Notional Amount(3) | Value ($) | Upfront Premium Received/ (Paid) ($)(2) | Unrealized Appreciation/ (Depreciation) ($) |
UNITED STATES SOFR SECURED OVERNIGHT FINL RATE INDX(4) | Annual | 3% | Annual | LCH | Mar 2027 | | 31,009,000 | 116,263 | 0 | 116,263 |
UNITED STATES SOFR SECURED OVERNIGHT FINL RATE INDX(4) | Annual | 3% | Annual | LCH | Mar 2028 | | 34,685,000 | 235,514 | 0 | 235,514 |
UNITED STATES SOFR SECURED OVERNIGHT FINL RATE INDX(4) | Annual | 3% | Annual | LCH | Mar 2029 | | 5,875,000 | 61,174 | 0 | 61,174 |
UNITED STATES SOFR SECURED OVERNIGHT FINL RATE INDX(4) | Annual | 3% | Annual | LCH | Mar 2030 | | 9,431,000 | 131,336 | 0 | 131,336 |
UNITED STATES SOFR SECURED OVERNIGHT FINL RATE INDX(4) | Annual | 3.25% | Annual | LCH | Mar 2032 | | 12,917,000 | 258,703 | 0 | 258,703 |
| 3.25% | Annual | UNITED STATES SOFR SECURED OVERNIGHT FINL RATE INDX(4) | Annual | LCH | Mar 2035 | | 5,122,000 | (135,667) | 0 | (135,667) |
UNITED STATES SOFR SECURED OVERNIGHT FINL RATE INDX(4) | Annual | 3.25% | Annual | LCH | Mar 2045 | | 8,542,000 | 349,979 | 0 | 349,979 |
| 3.25% | Annual | UNITED STATES SOFR SECURED OVERNIGHT FINL RATE INDX(4) | Annual | LCH | Mar 2055 | | 1,491,000 | (55,622) | 0 | (55,622) |
| TOTAL INTEREST RATE SWAPS | | | | | | | | 961,680 | 0 | 961,680 |
| | | | | | | | | | | |
(1)Swaps with LCH Clearnet Group (LCH) are centrally cleared swaps.
(2)Any premiums for centrally cleared swaps are recorded periodically throughout the term of the swap to variation margin and included in unrealized appreciation (depreciation).
(3)Notional amount is stated in U.S. Dollars unless otherwise noted.
(4)Represents floating rate.
Legend
| (a) | Amount is stated in United States dollars unless otherwise noted. |
| (b) | Coupon rates for floating and adjustable rate securities reflect the rates in effect at period end. |
| (c) | Coupon is indexed to a floating interest rate which may be multiplied by a specified factor and/or subject to caps or floors. |
| (d) | Security exempt from registration under Rule 144A of the Securities Act of 1933. These securities may be resold in transactions exempt from registration, normally to qualified institutional buyers. At the end of the period, the value of these securities amounted to $694,441,703 or 15.7% of net assets. |
| (e) | Security initially issued at one coupon which converts to a higher coupon at a specified date. The rate shown is the rate at period end. |
| (f) | Interest Only (IO) security represents the right to receive only monthly interest payments on an underlying pool of mortgages or assets. Principal shown is the outstanding par amount of the pool as of the end of the period. |
| (g) | Affiliated fund that is generally available only to investment companies and other accounts managed by Fidelity Investments. A complete unaudited schedule of portfolio holdings for each Fidelity Central Fund is filed with the SEC for the first and third quarters of each fiscal year on Form N-PORT and is available upon request or at the SEC's website at www.sec.gov. An unaudited holdings listing for the Fund, which presents direct holdings as well as the pro-rata share of securities and other investments held indirectly through its investment in underlying non-money market Fidelity Central Funds, is available at fidelity.com and/or institutional.fidelity.com, as applicable. In addition, each Fidelity Central Fund's financial statements,which are not covered by the Fund's Report of Independent Registered Public Accounting Firm, are available on the SEC's website or upon request. |
| (h) | Security or a portion of the security was pledged to cover margin requirements for futures contracts. At period end, the value of securities pledged amounted to $882,773. |
| (i) | Security or a portion of the security was pledged to cover margin requirements for centrally cleared swaps. At period end, the value of securities pledged amounted to $2,615,310. |
| (j) | Security or a portion of the security has been segregated as collateral for mortgage-backed or asset-backed securities purchased on a delayed delivery or when-issued basis. At period end, the value of securities pledged amounted to $3,442,572. |
| (k) | Security or a portion of the security purchased on a delayed delivery or when-issued basis. |
| (l) | Security or a portion of the security has been segregated as collateral for open options and bi-lateral over the counter (OTC) swaps. At period end, the value of securities pledged amounted to $524,464. |
| (m) | Yield represents either the annualized yield at the date of purchase, or the stated coupon rate, or, for floating and adjustable rate securities, the rate at period end. |
| (n) | Affiliated fund that is generally available only to investment companies and other accounts managed by Fidelity Investments. The rate quoted is the annualized seven-day yield of the fund at period end. A complete unaudited listing of the fund's holdings as of its most recent quarter end is available upon request. In addition, each Fidelity Central Fund's financial statements, which are not covered by the Fund's Report of Independent Registered Public Accounting Firm, are available on the SEC's website or upon request. |
Affiliated Central Funds
Fiscal year to date information regarding the Fund's investments in Fidelity Central Funds, including the ownership percentage, is presented below.
| Affiliate | Value, beginning of period ($) | Purchases ($) | Sales Proceeds ($) | Dividend Income ($) | Realized Gain (loss) ($) | Change in Unrealized appreciation (depreciation) ($) | Value, end of period ($) | Shares, end of period | % ownership, end of period |
| Fidelity Cash Central Fund | 75,335,255 | 1,065,139,352 | 1,026,613,557 | 5,407,325 | 625 | - | 113,861,675 | 113,838,907 | 0.2% |
| Fidelity Securities Lending Cash Central Fund | - | 319,604,406 | 319,604,406 | 10,530 | - | - | - | - | 0.0% |
| Fidelity Specialized High Income Central Fund | 71,071,422 | 4,198,152 | - | 4,197,904 | - | 444,598 | 75,714,172 | 869,378 | 31.2% |
| Total | 146,406,677 | 1,388,941,910 | 1,346,217,963 | 9,615,759 | 625 | 444,598 | 189,575,847 | 114,708,285 | |
| | | | | | | | | | |
Amounts in the dividend income column in the above table include any capital gain distributions from underlying funds, which are presented in the corresponding line item in the Statement of Operations, if applicable.
Amounts in the dividend income column for Fidelity Securities Lending Cash Central Fund represents the income earned on investing cash collateral, less rebates paid to borrowers and any lending agent fees associated with the loan, plus any premium payments received for lending certain types of securities.
Amounts included in the purchases and sales proceeds columns may include in-kind transactions, if applicable.
Investment Valuation
The following is a summary of the inputs used, as of December 31, 2024, involving the Fund's assets and liabilities carried at fair value. The inputs or methodology used for valuing securities may not be an indication of the risk associated with investing in those securities. For more information on valuation inputs, and their aggregation into the levels used below, please refer to the Investment Valuation section in the accompanying Notes to Financial Statements.
| Valuation Inputs at Reporting Date: |
| Description | Total ($) | Level 1 ($) | Level 2 ($) | Level 3 ($) |
Investments in Securities: | | | | |
|
| Asset-Backed Securities | 378,896,626 | - | 378,896,626 | - |
|
| Bank Notes | | | | |
Financials | 6,898,080 | - | 6,898,080 | - |
|
| Collateralized Mortgage Obligations | 50,885,771 | - | 50,885,771 | - |
|
| Commercial Mortgage Securities | 263,582,370 | - | 263,582,370 | - |
|
| Fixed-Income Funds | 75,714,172 | 75,714,172 | - | - |
|
| Foreign Government and Government Agency Obligations | 2,653,803 | - | 2,653,803 | - |
|
| Non-Convertible Corporate Bonds | | | | |
Communication Services | 84,405,865 | - | 84,405,865 | - |
Consumer Discretionary | 12,002,978 | - | 12,002,978 | - |
Consumer Staples | 25,290,516 | - | 25,290,516 | - |
Energy | 128,936,128 | - | 128,936,128 | - |
Financials | 479,028,672 | - | 479,028,672 | - |
Health Care | 60,743,040 | - | 60,743,040 | - |
Industrials | 27,455,641 | - | 27,455,641 | - |
Information Technology | 30,740,037 | - | 30,740,037 | - |
Materials | 5,155,999 | - | 5,155,999 | - |
Real Estate | 130,364,256 | - | 130,364,256 | - |
Utilities | 49,508,167 | - | 49,508,167 | - |
|
| U.S. Government Agency - Mortgage Securities | 967,066,319 | - | 967,066,319 | - |
|
| U.S. Treasury Obligations | 2,004,105,185 | - | 2,004,105,185 | - |
|
| Money Market Funds | 113,861,675 | 113,861,675 | - | - |
|
| Purchased Swaptions | 5,085,277 | - | 5,085,277 | - |
| Total Investments in Securities: | 4,902,380,577 | 189,575,847 | 4,712,804,730 | - |
Derivative Instruments: Assets | | | | |
Futures Contracts | 29,710 | 29,710 | - | - |
Swaps | 1,721,150 | - | 1,721,150 | - |
| Total Assets | 1,750,860 | 29,710 | 1,721,150 | - |
| Liabilities | | | | |
Futures Contracts | (223,127) | (223,127) | - | - |
Swaps | (339,902) | - | (339,902) | - |
| Total Liabilities | (563,029) | (223,127) | (339,902) | - |
| Total Derivative Instruments: | 1,187,831 | (193,417) | 1,381,248 | - |
Other Financial Instruments: | | | | |
| TBA Sale Commitments | (179,145,346) | - | (179,145,346) | - |
| Total Other Financial Instruments: | (179,145,346) | - | (179,145,346) | - |
Value of Derivative Instruments
The following table is a summary of the Fund's value of derivative instruments by primary risk exposure as of December 31, 2024. For additional information on derivative instruments, please refer to the Derivative Instruments section in the accompanying Notes to Financial Statements.
Primary Risk Exposure / Derivative Type | Value |
| Asset ($) | Liability ($) |
| Credit Risk | | |
Swaps (a) | 568,181 | (148,613) |
| Total Credit Risk | 568,181 | (148,613) |
| Interest Rate Risk | | |
Futures Contracts (c) | 29,710 | (223,127) |
Purchased Swaptions (b) | 5,085,277 | 0 |
Swaps (a)(d) | 1,152,969 | (191,289) |
| Total Interest Rate Risk | 6,267,956 | (414,416) |
| Total Value of Derivatives | 6,836,137 | (563,029) |
(a)For bi-lateral over-the-counter (OTC) swaps, reflects gross value which is presented in the Statement of Assets and Liabilities in the bi-lateral OTC swaps, at value line-items.
(b)Gross value is included in the Statement of Assets and Liabilities in the investments in securities, at value line-item.
(c)Reflects gross cumulative appreciation (depreciation) on futures contracts as presented in the Schedule of Investments. In the Statement of Assets and Liabilities, the period end daily variation margin is included in receivable or payable for daily variation margin on futures contracts, and the net cumulative appreciation (depreciation) is included in Total accumulated earnings (loss).
(d)For centrally cleared swaps, reflects gross cumulative appreciation (depreciation) as presented in the Schedule of Investments. In the Statement of Assets and Liabilities, the period end daily variation margin for centrally cleared swaps is included in receivable or payable for daily variation margin on centrally cleared swaps, and the net cumulative appreciation (depreciation) for centrally cleared swaps is included in Total accumulated earnings (loss).
Financial Statements
| Statement of Assets and Liabilities |
As of December 31, 2024 |
| Assets | | | | |
| Investment in securities, at value - See accompanying schedule: | | | | |
Unaffiliated issuers (cost $5,106,090,313) | $ | 4,712,804,730 | | |
Fidelity Central Funds (cost $193,770,596) | | 189,575,847 | | |
| | | | | |
| | | | | |
| Total Investment in Securities (cost $5,299,860,909) | | | $ | 4,902,380,577 |
| Receivable for investments sold | | | | |
Regular delivery | | | | 536 |
Delayed delivery | | | | 489,665 |
| Receivable for TBA sale commitments | | | | 179,860,197 |
| Receivable for fund shares sold | | | | 4,914,375 |
| Interest receivable | | | | 39,443,162 |
| Distributions receivable from Fidelity Central Funds | | | | 485,603 |
| Receivable for daily variation margin on centrally cleared swaps | | | | 46,035 |
| Bi-lateral OTC swaps, at value | | | | 568,181 |
| Prepaid expenses | | | | 3,668 |
Total assets | | | | 5,128,191,999 |
| Liabilities | | | | |
| Payable to custodian bank | $ | 48,610 | | |
| Payable for investments purchased | | | | |
Regular delivery | | 56,576,062 | | |
Delayed delivery | | 457,383,563 | | |
| TBA sale commitments, at value | | 179,145,346 | | |
| Payable for fund shares redeemed | | 1,862,775 | | |
| Bi-lateral OTC swaps, at value | | 148,613 | | |
| Accrued management fee | | 1,398,750 | | |
| Distribution and service plan fees payable | | 527,637 | | |
| Payable for daily variation margin on futures contracts | | 56,269 | | |
| Other payables and accrued expenses | | 71,391 | | |
| Total liabilities | | | | 697,219,016 |
| Net Assets | | | $ | 4,430,972,983 |
| Net Assets consist of: | | | | |
| Paid in capital | | | $ | 5,060,558,527 |
| Total accumulated earnings (loss) | | | | (629,585,544) |
| Net Assets | | | $ | 4,430,972,983 |
| | | | | |
| Net Asset Value and Maximum Offering Price | | | | |
| Initial Class : | | | | |
Net Asset Value, offering price and redemption price per share ($638,892,650 ÷ 58,186,157 shares) | | | $ | 10.98 |
| Service Class : | | | | |
Net Asset Value, offering price and redemption price per share ($844,918,591 ÷ 78,149,541 shares) | | | $ | 10.81 |
| Service Class 2 : | | | | |
Net Asset Value, offering price and redemption price per share ($2,176,534,886 ÷ 204,997,076 shares) | | | $ | 10.62 |
| Investor Class : | | | | |
Net Asset Value, offering price and redemption price per share ($770,626,856 ÷ 70,562,428 shares) | | | $ | 10.92 |
| Statement of Operations |
| Year ended December 31, 2024 |
| Investment Income | | | | |
| Interest | | | $ | 163,802,964 |
| Income from Fidelity Central Funds (including $10,530 from security lending) | | | | 9,615,759 |
| Total income | | | | 173,418,723 |
| Expenses | | | | |
| Management fee | $ | 15,481,187 | | |
| Transfer agent fees | | 495,652 | | |
| Distribution and service plan fees | | 6,081,224 | | |
| Accounting fees | | 190,528 | | |
| Custodian fees and expenses | | 112,745 | | |
| Independent trustees' fees and expenses | | 10,927 | | |
| Registration fees | | 36,293 | | |
| Audit fees | | 47,852 | | |
| Legal | | 4,037 | | |
| Miscellaneous | | 163,790 | | |
| Total expenses before reductions | | 22,624,235 | | |
| Expense reductions | | (112,287) | | |
| Total expenses after reductions | | | | 22,511,948 |
| Net Investment income (loss) | | | | 150,906,775 |
| Realized and Unrealized Gain (Loss) | | | | |
| Net realized gain (loss) on: | | | | |
| Investment Securities: | | | | |
| Unaffiliated issuers | | (28,556,651) | | |
| Fidelity Central Funds | | 625 | | |
| Futures contracts | | (3,717,785) | | |
| Swaps | | 2,029,978 | | |
| Written options | | 25,125 | | |
| Total net realized gain (loss) | | | | (30,218,708) |
| Change in net unrealized appreciation (depreciation) on: | | | | |
| Investment Securities: | | | | |
| Unaffiliated issuers | | (57,530,917) | | |
| Fidelity Central Funds | | 444,598 | | |
| Futures contracts | | 720,362 | | |
| Swaps | | 2,095,586 | | |
| Written options | | (4,065) | | |
| TBA Sale commitments | | 2,413,844 | | |
| Total change in net unrealized appreciation (depreciation) | | | | (51,860,592) |
| Net gain (loss) | | | | (82,079,300) |
| Net increase (decrease) in net assets resulting from operations | | | $ | 68,827,475 |
| Statement of Changes in Net Assets |
| |
| | Year ended December 31, 2024 | | Year ended December 31, 2023 |
| Increase (Decrease) in Net Assets | | | | |
| Operations | | | | |
| Net investment income (loss) | $ | 150,906,775 | $ | 122,023,322 |
| Net realized gain (loss) | | (30,218,708) | | (130,976,357) |
| Change in net unrealized appreciation (depreciation) | | (51,860,592) | | 234,939,061 |
| Net increase (decrease) in net assets resulting from operations | | 68,827,475 | | 225,986,026 |
| Distributions to shareholders | | (149,339,514) | | (99,999,165) |
| | | | | |
| Share transactions - net increase (decrease) | | 438,473,568 | | 271,659,229 |
| Total increase (decrease) in net assets | | 357,961,529 | | 397,646,090 |
| | | | | |
| Net Assets | | | | |
| Beginning of period | | 4,073,011,454 | | 3,675,365,364 |
| End of period | $ | 4,430,972,983 | $ | 4,073,011,454 |
| | | | | |
| | | | | |
Financial Highlights
VIP Investment Grade Bond Portfolio Initial Class |
| |
| Years ended December 31, | | 2024 | | 2023 | | 2022 | | 2021 | | 2020 |
Selected Per-Share Data | | | | | | | | | | |
| Net asset value, beginning of period | $ | 11.17 | $ | 10.80 | $ | 13.35 | $ | 14.09 | $ | 13.17 |
| Income from Investment Operations | | | | | | | | | | |
Net investment income (loss) A,B | | .413 | | .364 | | .245 | | .228 | | .328 |
| Net realized and unrealized gain (loss) | | (.208) | | .296 | | (1.903) | | (.313) | | .903 |
| Total from investment operations | | .205 | | .660 | | (1.658) | | (.085) | | 1.231 |
| Distributions from net investment income | | (.395) | | (.290) | | (.264) | | (.282) | | (.306) |
| Distributions from net realized gain | | - | | - | | (.628) | | (.373) | | (.005) |
| Total distributions | | (.395) | | (.290) | | (.892) | | (.655) | | (.311) |
| Net asset value, end of period | $ | 10.98 | $ | 11.17 | $ | 10.80 | $ | 13.35 | $ | 14.09 |
Total Return C,D | | | | 6.20% | | (12.96)% | | (.61)% | | 9.39% |
Ratios to Average Net Assets B,E,F | | | | | | | | | | |
| Expenses before reductions | | .38% | | .41% | | .40% | | .39% | | .39% |
| Expenses net of fee waivers, if any | | | | .40% | | .40% | | .39% | | .39% |
| Expenses net of all reductions | | .38% | | .40% | | .40% | | .39% | | .39% |
| Net investment income (loss) | | 3.69% | | 3.31% | | 2.08% | | 1.66% | | 2.38% |
| Supplemental Data | | | | | | | | | | |
| Net assets, end of period (000 omitted) | $ | 638,893 | $ | 569,512 | $ | 533,204 | $ | 1,347,145 | $ | 1,322,750 |
Portfolio turnover rate G | | | | 188% | | 183% H | | 125% | | 11% |
ACalculated based on average shares outstanding during the period.
BNet investment income (loss) is affected by the timing of the declaration of dividends by any underlying mutual funds or exchange-traded funds (ETFs). Net investment income (loss) of any mutual funds or ETFs is not included in the Fund's net investment income (loss) ratio.
CTotal returns do not reflect charges attributable to your insurance company's separate account. Inclusion of these charges would reduce the total returns shown.
DTotal returns would have been lower if certain expenses had not been reduced during the applicable periods shown.
EFees and expenses of any underlying mutual funds or exchange-traded funds (ETFs) are not included in the Fund's expense ratio. The Fund indirectly bears its proportionate share of these expenses. For additional expense information related to investments in Fidelity Central Funds, please refer to the "Investments in Fidelity Central Funds" note found in the Notes to Financial Statements section of the most recent Annual or Semi-Annual report.
FExpense ratios reflect operating expenses of the class. Expenses before reductions do not reflect amounts reimbursed, waived, or reduced through arrangements with the investment adviser, brokerage services, or other offset arrangements, if applicable, and do not represent the amount paid by the class during periods when reimbursements, waivers or reductions occur.
GAmount does not include the portfolio activity of any underlying mutual funds or exchange-traded funds (ETFs), derivatives or securities that mature within one year from acquisition.
HPortfolio turnover rate excludes securities received or delivered in-kind.
VIP Investment Grade Bond Portfolio Service Class |
| |
| Years ended December 31, | | 2024 | | 2023 | | 2022 | | 2021 | | 2020 |
Selected Per-Share Data | | | | | | | | | | |
| Net asset value, beginning of period | $ | 11.01 | $ | 10.65 | $ | 13.18 | $ | 13.93 | $ | 13.02 |
| Income from Investment Operations | | | | | | | | | | |
Net investment income (loss) A,B | | .396 | | .347 | | .226 | | .212 | | .310 |
| Net realized and unrealized gain (loss) | | (.212) | | .295 | | (1.870) | | (.322) | | .899 |
| Total from investment operations | | .184 | | .642 | | (1.644) | | (.110) | | 1.209 |
| Distributions from net investment income | | (.384) | | (.282) | | (.258) | | (.267) | | (.294) |
| Distributions from net realized gain | | - | | - | | (.628) | | (.373) | | (.005) |
| Total distributions | | (.384) | | (.282) | | (.886) | | (.640) | | (.299) |
| Net asset value, end of period | $ | 10.81 | $ | 11.01 | $ | 10.65 | $ | 13.18 | $ | 13.93 |
Total Return C,D | | | | 6.12% | | (13.03)% | | (.79)% | | 9.33% |
Ratios to Average Net Assets B,E,F | | | | | | | | | | |
| Expenses before reductions | | .48% | | .51% | | .50% | | .49% | | .49% |
| Expenses net of fee waivers, if any | | | | .50% | | .50% | | .49% | | .49% |
| Expenses net of all reductions | | .48% | | .50% | | .50% | | .49% | | .49% |
| Net investment income (loss) | | 3.59% | | 3.21% | | 1.98% | | 1.56% | | 2.28% |
| Supplemental Data | | | | | | | | | | |
| Net assets, end of period (000 omitted) | $ | 844,919 | $ | 765,619 | $ | 669,290 | $ | 732,762 | $ | 692,787 |
Portfolio turnover rate G | | | | 188% | | 183% H | | 125% | | 11% |
ACalculated based on average shares outstanding during the period.
BNet investment income (loss) is affected by the timing of the declaration of dividends by any underlying mutual funds or exchange-traded funds (ETFs). Net investment income (loss) of any mutual funds or ETFs is not included in the Fund's net investment income (loss) ratio.
CTotal returns do not reflect charges attributable to your insurance company's separate account. Inclusion of these charges would reduce the total returns shown.
DTotal returns would have been lower if certain expenses had not been reduced during the applicable periods shown.
EFees and expenses of any underlying mutual funds or exchange-traded funds (ETFs) are not included in the Fund's expense ratio. The Fund indirectly bears its proportionate share of these expenses. For additional expense information related to investments in Fidelity Central Funds, please refer to the "Investments in Fidelity Central Funds" note found in the Notes to Financial Statements section of the most recent Annual or Semi-Annual report.
FExpense ratios reflect operating expenses of the class. Expenses before reductions do not reflect amounts reimbursed, waived, or reduced through arrangements with the investment adviser, brokerage services, or other offset arrangements, if applicable, and do not represent the amount paid by the class during periods when reimbursements, waivers or reductions occur.
GAmount does not include the portfolio activity of any underlying mutual funds or exchange-traded funds (ETFs), derivatives or securities that mature within one year from acquisition.
HPortfolio turnover rate excludes securities received or delivered in-kind.
VIP Investment Grade Bond Portfolio Service Class 2 |
| |
| Years ended December 31, | | 2024 | | 2023 | | 2022 | | 2021 | | 2020 |
Selected Per-Share Data | | | | | | | | | | |
| Net asset value, beginning of period | $ | 10.82 | $ | 10.47 | $ | 12.98 | $ | 13.72 | $ | 12.83 |
| Income from Investment Operations | | | | | | | | | | |
Net investment income (loss) A,B | | .373 | | .325 | | .206 | | .188 | | .285 |
| Net realized and unrealized gain (loss) | | (.206) | | .294 | | (1.848) | | (.310) | | .885 |
| Total from investment operations | | .167 | | .619 | | (1.642) | | (.122) | | 1.170 |
| Distributions from net investment income | | (.367) | | (.269) | | (.240) | | (.245) | | (.275) |
| Distributions from net realized gain | | - | | - | | (.628) | | (.373) | | (.005) |
| Total distributions | | (.367) | | (.269) | | (.868) | | (.618) | | (.280) |
| Net asset value, end of period | $ | 10.62 | $ | 10.82 | $ | 10.47 | $ | 12.98 | $ | 13.72 |
Total Return C,D | | | | 6.00% | | (13.21)% | | (.90)% | | 9.16% |
Ratios to Average Net Assets B,E,F | | | | | | | | | | |
| Expenses before reductions | | .63% | | .66% | | .65% | | .64% | | .64% |
| Expenses net of fee waivers, if any | | | | .65% | | .65% | | .64% | | .64% |
| Expenses net of all reductions | | .63% | | .65% | | .65% | | .64% | | .64% |
| Net investment income (loss) | | 3.44% | | 3.06% | | 1.83% | | 1.41% | | 2.13% |
| Supplemental Data | | | | | | | | | | |
| Net assets, end of period (000 omitted) | $ | 2,176,535 | $ | 1,999,157 | $ | 1,747,984 | $ | 2,135,986 | $ | 1,935,645 |
Portfolio turnover rate G | | | | 188% | | 183% H | | 125% | | 11% |
ACalculated based on average shares outstanding during the period.
BNet investment income (loss) is affected by the timing of the declaration of dividends by any underlying mutual funds or exchange-traded funds (ETFs). Net investment income (loss) of any mutual funds or ETFs is not included in the Fund's net investment income (loss) ratio.
CTotal returns do not reflect charges attributable to your insurance company's separate account. Inclusion of these charges would reduce the total returns shown.
DTotal returns would have been lower if certain expenses had not been reduced during the applicable periods shown.
EFees and expenses of any underlying mutual funds or exchange-traded funds (ETFs) are not included in the Fund's expense ratio. The Fund indirectly bears its proportionate share of these expenses. For additional expense information related to investments in Fidelity Central Funds, please refer to the "Investments in Fidelity Central Funds" note found in the Notes to Financial Statements section of the most recent Annual or Semi-Annual report.
FExpense ratios reflect operating expenses of the class. Expenses before reductions do not reflect amounts reimbursed, waived, or reduced through arrangements with the investment adviser, brokerage services, or other offset arrangements, if applicable, and do not represent the amount paid by the class during periods when reimbursements, waivers or reductions occur.
GAmount does not include the portfolio activity of any underlying mutual funds or exchange-traded funds (ETFs), derivatives or securities that mature within one year from acquisition.
HPortfolio turnover rate excludes securities received or delivered in-kind.
VIP Investment Grade Bond Portfolio Investor Class |
| |
| Years ended December 31, | | 2024 | | 2023 | | 2022 | | 2021 | | 2020 |
Selected Per-Share Data | | | | | | | | | | |
| Net asset value, beginning of period | $ | 11.11 | $ | 10.75 | $ | 13.29 | $ | 14.03 | $ | 13.12 |
| Income from Investment Operations | | | | | | | | | | |
Net investment income (loss) A,B | | .407 | | .358 | | .238 | | .223 | | .322 |
| Net realized and unrealized gain (loss) | | (.208) | | .289 | | (1.888) | | (.313) | | .896 |
| Total from investment operations | | .199 | | .647 | | (1.650) | | (.090) | | 1.218 |
| Distributions from net investment income | | (.389) | | (.287) | | (.262) | | (.277) | | (.303) |
| Distributions from net realized gain | | - | | - | | (.628) | | (.373) | | (.005) |
| Total distributions | | (.389) | | (.287) | | (.890) | | (.650) | | (.308) |
| Net asset value, end of period | $ | 10.92 | $ | 11.11 | $ | 10.75 | $ | 13.29 | $ | 14.03 |
Total Return C,D | | | | 6.11% | | (12.96)% | | (.64)% | | 9.33% |
Ratios to Average Net Assets B,E,F | | | | | | | | | | |
| Expenses before reductions | | .42% | | .44% | | .43% | | .42% | | .43% |
| Expenses net of fee waivers, if any | | | | .44% | | .43% | | .42% | | .43% |
| Expenses net of all reductions | | .41% | | .44% | | .43% | | .42% | | .43% |
| Net investment income (loss) | | 3.65% | | 3.27% | | 2.05% | | 1.63% | | 2.34% |
| Supplemental Data | | | | | | | | | | |
| Net assets, end of period (000 omitted) | $ | 770,627 | $ | 738,723 | $ | 724,888 | $ | 1,354,894 | $ | 1,438,829 |
Portfolio turnover rate G | | | | 188% | | 183% H | | 125% | | 11% |
ACalculated based on average shares outstanding during the period.
BNet investment income (loss) is affected by the timing of the declaration of dividends by any underlying mutual funds or exchange-traded funds (ETFs). Net investment income (loss) of any mutual funds or ETFs is not included in the Fund's net investment income (loss) ratio.
CTotal returns do not reflect charges attributable to your insurance company's separate account. Inclusion of these charges would reduce the total returns shown.
DTotal returns would have been lower if certain expenses had not been reduced during the applicable periods shown.
EFees and expenses of any underlying mutual funds or exchange-traded funds (ETFs) are not included in the Fund's expense ratio. The Fund indirectly bears its proportionate share of these expenses. For additional expense information related to investments in Fidelity Central Funds, please refer to the "Investments in Fidelity Central Funds" note found in the Notes to Financial Statements section of the most recent Annual or Semi-Annual report.
FExpense ratios reflect operating expenses of the class. Expenses before reductions do not reflect amounts reimbursed, waived, or reduced through arrangements with the investment adviser, brokerage services, or other offset arrangements, if applicable, and do not represent the amount paid by the class during periods when reimbursements, waivers or reductions occur.
GAmount does not include the portfolio activity of any underlying mutual funds or exchange-traded funds (ETFs), derivatives or securities that mature within one year from acquisition.
HPortfolio turnover rate excludes securities received or delivered in-kind.
Notes to Financial Statements
For the period ended December 31, 2024
1. Organization.
VIP Investment Grade Bond Portfolio (the Fund) is a fund of Variable Insurance Products Fund V (the Trust) and is authorized to issue an unlimited number of shares. The Trust is registered under the Investment Company Act of 1940, as amended (the 1940 Act), as an open-end management investment company organized as a Massachusetts business trust. Shares of the Fund may only be purchased by insurance companies for the purpose of funding variable annuity or variable life insurance contracts. The Fund offers the following classes of shares: Initial Class shares, Service Class shares, Service Class 2 shares and Investor Class shares. All classes have equal rights and voting privileges, except for matters affecting a single class.
2. Investments in Fidelity Central Funds.
Funds may invest in Fidelity Central Funds, which are open-end investment companies generally available only to other investment companies and accounts managed by the investment adviser and its affiliates. The Schedule of Investments lists any Fidelity Central Funds held as an investment as of period end, but does not include the underlying holdings of each Fidelity Central Fund. An investing fund indirectly bears its proportionate share of the expenses of the underlying Fidelity Central Funds.
Based on its investment objective, each Fidelity Central Fund may invest or participate in various investment vehicles or strategies that are similar to those of the investing fund. These strategies are consistent with the investment objectives of the investing fund and may involve certain economic risks which may cause a decline in value of each of the Fidelity Central Funds and thus a decline in the value of the investing fund.
| Fidelity Central Fund | Investment Manager | Investment Objective | Investment Practices | Expense RatioA |
| Fidelity Specialized High Income Central Fund | Fidelity Management & Research Company LLC (FMR) | Seeks a high level of current income by normally investing in income-producing debt securities, with an emphasis on lower-quality debt securities. | Loans & Direct Debt Instruments Restricted Securities | Less than .005% |
| Fidelity Money Market Central Funds | Fidelity Management & Research Company LLC (FMR) | Each fund seeks to obtain a high level of current income consistent with the preservation of capital and liquidity. | Short-term Investments | Less than .005% |
A Expenses expressed as a percentage of average net assets and are as of each underlying Central Fund's most recent annual or semi-annual shareholder report.
An unaudited holdings listing for the investing fund, which presents direct holdings as well as the pro-rata share of any securities and other investments held indirectly through its investment in underlying non-money market Fidelity Central Funds, is available at fidelity.com and/or institutional.fidelity.com, as applicable. A complete unaudited list of holdings for each Fidelity Central Fund is available upon request or at the Securities and Exchange Commission website at www.sec.gov. In addition, the financial statements of the Fidelity Central Funds which contain the significant accounting policies (including investment valuation policies) of those funds, and are not covered by the Report of Independent Registered Public Accounting Firm, are available on the Securities and Exchange Commission website or upon request.
3. Significant Accounting Policies.
The Fund is an investment company and applies the accounting and reporting guidance of the Financial Accounting Standards Board (FASB) Accounting Standards Codification Topic 946 Financial Services - Investment Companies. The financial statements have been prepared in conformity with accounting principles generally accepted in the United States of America (GAAP), which require management to make certain estimates and assumptions at the date of the financial statements. Actual results could differ from those estimates. The Fund operates as a single operating segment. The Fund's income, expenses, assets, and performance are regularly monitored and assessed as a whole by the investment adviser and other individuals responsible for oversight functions of the Trust, using the information presented in the financial statements and financial highlights. Subsequent events, if any, through the date that the financial statements were issued have been evaluated in the preparation of the financial statements. The Fund's Schedule of Investments lists any underlying mutual funds or exchange-traded funds (ETFs) but does not include the underlying holdings of these funds. The following summarizes the significant accounting policies of the Fund:
Investment Valuation. Investments are valued as of 4:00 p.m. Eastern time on the last calendar day of the period. The Board of Trustees (the Board) has designated the Fund's investment adviser as the valuation designee responsible for the fair valuation function and performing fair value determinations as needed. The investment adviser has established a Fair Value Committee (the Committee) to carry out the day-to-day fair valuation responsibilities and has adopted policies and procedures to govern the fair valuation process and the activities of the Committee. In accordance with these fair valuation policies and procedures, which have been approved by the Board, the Fund attempts to obtain prices from one or more third party pricing services or brokers to value its investments. When current market prices, quotations or currency exchange rates are not readily available or reliable, investments will be fair valued in good faith by the Committee, in accordance with the policies and procedures. Factors used in determining fair value vary by investment type and may include market or investment specific events, transaction data, estimated cash flows, and market observations of comparable investments. The frequency that the fair valuation procedures are used cannot be predicted and they may be utilized to a significant extent. The Committee manages the Fund's fair valuation practices and maintains the fair valuation policies and procedures. The Fund's investment adviser reports to the Board information regarding the fair valuation process and related material matters.
The Fund categorizes the inputs to valuation techniques used to value its investments into a disclosure hierarchy consisting of three levels as shown below:
Level 1 - unadjusted quoted prices in active markets for identical investments
Level 2 - other significant observable inputs (including quoted prices for similar investments, interest rates, prepayment speeds, etc.)
Level 3 - unobservable inputs (including the Fund's own assumptions based on the best information available)
Valuation techniques used to value the Fund's investments by major category are as follows:
Debt securities, including restricted securities, are valued based on evaluated prices received from third party pricing services or from brokers who make markets in such securities. Corporate bonds, bank notes, foreign government and government agency obligations and U.S. government and government agency obligations are valued by pricing services who utilize matrix pricing which considers yield or price of bonds of comparable quality, coupon, maturity and type or by broker-supplied prices. Asset backed securities, collateralized mortgage obligations, commercial mortgage securities and U.S. government agency mortgage securities are valued by pricing services who utilize matrix pricing which considers prepayment speed assumptions, attributes of the collateral, yield or price of bonds of comparable quality, coupon, maturity and type or by broker-supplied prices. Brokers which make markets in asset backed securities, collateralized mortgage obligations and commercial mortgage securities may also consider such factors as the structure of the issue, cash flow assumptions, the value of underlying assets as well as any guarantees. Swaps are marked-to-market daily based on valuations from third party pricing services, registered derivatives clearing organizations (clearinghouses) or broker-supplied valuations. These pricing sources may utilize inputs such as interest rate curves, credit spread curves, default possibilities and recovery rates. When independent prices are unavailable or unreliable, debt securities and swaps may be valued utilizing pricing methodologies which consider similar factors that would be used by third party pricing services. Debt securities and swaps are generally categorized as Level 2 in the hierarchy but may be Level 3 depending on the circumstances.
Futures contracts are valued at the settlement price established each day by the board of trade or exchange on which they are traded and are categorized as Level 1 in the hierarchy. Options traded over-the-counter are valued using service or broker-supplied valuations and are categorized as Level 2 in the hierarchy. Investments in open-end mutual funds, including the Fidelity Central Funds, are valued at their closing net asset value (NAV) each business day and are categorized as Level 1 in the hierarchy.
Changes in valuation techniques may result in transfers in or out of an assigned level within the disclosure hierarchy. The aggregate value of investments by input level as of December 31, 2024 is included at the end of the Fund's Schedule of Investments.
Investment Transactions and Income. For financial reporting purposes, the Fund's investment holdings and NAV include trades executed through the end of the last business day of the period. The NAV per share for processing shareholder transactions is calculated as of the close of business of the New York Stock Exchange (NYSE), normally 4:00 p.m. Eastern time and includes trades executed through the end of the prior business day. Gains and losses on securities sold are determined on the basis of identified cost. Income and capital gain distributions from Fidelity Central Funds, if any, are recorded on the ex-dividend date. Interest income is accrued as earned and includes coupon interest and amortization of premium and accretion of discount on debt securities as applicable. Debt obligations may be placed on non-accrual status and related interest income may be reduced by ceasing current accruals and writing off interest receivables when the collection of all or a portion of interest has become doubtful based on consistently applied procedures. A debt obligation is removed from non-accrual status when the issuer resumes interest payments or when collectability of interest is reasonably assured.
Class Allocations and Expenses. Investment income, realized and unrealized capital gains and losses, common expenses of a fund, and certain fund-level expense reductions, if any, are allocated daily on a pro-rata basis to each class based on the relative net assets of each class to the total net assets of a fund. Each class differs with respect to transfer agent and distribution and service plan fees incurred, as applicable. Certain expense reductions may also differ by class, if applicable. For the reporting period, the allocated portion of income and expenses to each class as a percent of its average net assets may vary due to the timing of recording these transactions in relation to fluctuating net assets of the classes. Expenses directly attributable to a fund are charged to that fund. Expenses attributable to more than one fund are allocated among the respective funds on the basis of relative net assets or other appropriate methods. Expenses included in the accompanying financial statements reflect the expenses of that fund and do not include any expenses associated with any underlying mutual funds or exchange-traded funds (ETFs). Although not included in a fund's expenses, a fund indirectly bears its proportionate share of these expenses through the net asset value of each underlying mutual fund or exchange-traded fund (ETF). Expense estimates are accrued in the period to which they relate and adjustments are made when actual amounts are known.
Income Tax Information and Distributions to Shareholders. Each year, the Fund intends to qualify as a regulated investment company under Subchapter M of the Internal Revenue Code, including distributing substantially all of its taxable income and realized gains. As a result, no provision for U.S. Federal income taxes is required. As of December 31, 2024, the Fund did not have any unrecognized tax benefits in the financial statements; nor is the Fund aware of any tax positions for which it is reasonably possible that the total amounts of unrecognized tax benefits will significantly change in the next twelve months. The Fund files a U.S. federal tax return, in addition to state and local tax returns as required. The Fund's federal income tax returns are subject to examination by the Internal Revenue Service (IRS) for a period of three fiscal years after they are filed. State and local tax returns may be subject to examination for an additional fiscal year depending on the jurisdiction.
Distributions are declared and recorded on the ex-dividend date. Income and capital gain distributions are declared separately for each class. Income and capital gain distributions are determined in accordance with income tax regulations, which may differ from GAAP.
Capital accounts within the financial statements are adjusted for permanent book-tax differences. These adjustments have no impact on net assets or the results of operations. Capital accounts are not adjusted for temporary book-tax differences which will reverse in a subsequent period.
Book-tax differences are primarily due to futures contracts, swap agreements, capital loss carryforwards and losses deferred due to wash sales and futures transactions.
As of period end, the cost and unrealized appreciation (depreciation) in securities, and derivatives if applicable, for federal income tax purposes were as follows:
| Gross unrealized appreciation | $9,222,076 |
| Gross unrealized depreciation | (406,100,978) |
| Net unrealized appreciation (depreciation) | $(396,878,902) |
| Tax Cost | $5,301,273,329 |
The tax-based components of distributable earnings as of period end were as follows:
| Undistributed ordinary income | $25,583,977 |
| Capital loss carryforward | $(258,234,851) |
| Net unrealized appreciation (depreciation) on securities and other investments | $(396,934,670) |
Capital loss carryforwards are only available to offset future capital gains of the Fund to the extent provided by regulations and may be limited. The capital loss carryforward information presented below, including any applicable limitation, is estimated as of fiscal period end and is subject to adjustment.
Short-term | $(107,595,166) |
Long-term | (150,639,685) |
| Total capital loss carryforward | $(258,234,851) |
The tax character of distributions paid was as follows:
| | December 31, 2024 | December 31, 2023 |
| Ordinary Income | $149,339,514 | $99,999,165 |
Delayed Delivery Transactions and When-Issued Securities. During the period, certain Funds transacted in securities on a delayed delivery or when-issued basis. Payment and delivery may take place after the customary settlement period for that security. The price of the underlying securities and the date when the securities will be delivered and paid for are fixed at the time the transaction is negotiated. Securities purchased on a delayed delivery or when-issued basis are identified as such in the Schedule of Investments. Compensation for interest forgone in the purchase of a delayed delivery or when-issued debt security may be received. With respect to purchase commitments, each applicable Fund identifies securities as segregated in its records with a value at least equal to the amount of the commitment. Payables and receivables associated with the purchases and sales of delayed delivery securities having the same coupon, settlement date and broker are offset. Delayed delivery or when-issued securities that have been purchased from and sold to different brokers are reflected as both payables and receivables in the Statement of Assets and Liabilities under the caption "Delayed delivery", as applicable. Losses may arise due to changes in the value of the underlying securities or if the counterparty does not perform under the contract's terms, or if the issuer does not issue the securities due to political, economic, or other factors.
To-Be-Announced (TBA) Securities and Mortgage Dollar Rolls. TBA securities involve buying or selling mortgage-backed securities (MBS) on a forward commitment basis. A TBA transaction typically does not designate the actual security to be delivered and only includes an approximate principal amount; however delivered securities must meet specified terms defined by industry guidelines, including issuer, rate and current principal amount outstanding on underlying mortgage pools. Funds may enter into a TBA transaction with the intent to take possession of or deliver the underlying MBS, or a fund may elect to extend the settlement by entering into either a mortgage or reverse mortgage dollar roll. Mortgage dollar rolls are transactions where a fund sells TBA securities and simultaneously agrees to repurchase MBS on a later date at a lower price and with the same counterparty. Reverse mortgage dollar rolls involve the purchase and simultaneous agreement to sell TBA securities on a later date at a lower price. Transactions in mortgage dollar rolls and reverse mortgage dollar rolls are accounted for as purchases and sales and may result in an increase to a fund's portfolio turnover rate.
Purchases and sales of TBA securities involve risks similar to those discussed above for delayed delivery and when-issued securities. Also, if the counterparty in a mortgage dollar roll or a reverse mortgage dollar roll transaction files for bankruptcy or becomes insolvent, a fund's right to repurchase or sell securities may be limited. Additionally, when a fund sells TBA securities without already owning or having the right to obtain the deliverable securities (an uncovered forward commitment to sell), it incurs a risk of loss because it could have to purchase the securities at a price that is higher than the price at which it sold them. A fund may be unable to purchase the deliverable securities if the corresponding market is illiquid.
TBA securities subject to a forward commitment to sell at period end are included at the end of the Schedule of Investments under the caption "TBA Sale Commitments." The value of these commitments and proceeds to be received at contractual settlement date are reflected in the Statement of Assets and Liabilities as "TBA sale commitments, at value" and "Receivable for TBA sale commitments," respectively. If the TBA sale commitment is closed through the acquisition of an offsetting TBA purchase commitment, a fund realizes a gain or loss. If a fund delivers securities under the commitment, a fund realizes a gain or loss from the sale of the securities based upon the price established at the date the commitment was entered into.
Restricted Securities (including Private Placements). Funds may invest in securities that are subject to legal or contractual restrictions on resale. These securities generally may be resold in transactions exempt from registration or to the public if the securities are registered. Disposal of these securities may involve time-consuming negotiations and expense, and prompt sale at an acceptable price may be difficult. Information regarding restricted securities held at period end is included at the end of the Schedule of Investments, if applicable.
New Accounting Pronouncement. FASB Accounting Standards Update (ASU) 2023-07 Segment Reporting (Topic 280): Improvements to Reportable Segment Disclosures became effective in this reporting period. ASU 2023-07 enhances segment information disclosure in the notes to financial statements.
4. Derivative Instruments.
Risk Exposures and the Use of Derivative Instruments. The Fund's investment objectives allow for various types of derivative instruments, including futures contracts, swaps and options. Derivatives are investments whose value is primarily derived from underlying assets, indices or reference rates and may be transacted on an exchange or over-the-counter (OTC). Derivatives may involve a future commitment to buy or sell a specified asset based on specified terms, to exchange future cash flows at periodic intervals based on a notional principal amount, or for one party to make one or more payments upon the occurrence of specified events in exchange for periodic payments from the other party.
Derivatives were used to increase returns, to gain exposure to certain types of assets and to manage exposure to certain risks as defined below. The success of any strategy involving derivatives depends on analysis of numerous economic factors, and if the strategies for investment do not work as intended, the objectives may not be achieved.
Derivatives were used to increase or decrease exposure to the following risk(s):
| | |
| Credit Risk | Credit risk relates to the ability of the issuer of a financial instrument to make further principal or interest payments on an obligation or commitment that it has to a fund. |
| Interest Rate Risk | Interest rate risk relates to the fluctuations in the value of interest-bearing securities due to changes in the prevailing levels of market interest rates. |
Funds are also exposed to additional risks from investing in derivatives, such as liquidity risk and counterparty credit risk. Liquidity risk is the risk that a fund will be unable to close out the derivative in the open market in a timely manner. Counterparty credit risk is the risk that the counterparty will not be able to fulfill its obligation to a fund. Derivative counterparty credit risk is managed through formal evaluation of the creditworthiness of all potential counterparties. On certain OTC derivatives such as options and bi-lateral swaps, a fund attempts to reduce its exposure to counterparty credit risk by entering into an International Swaps and Derivatives Association, Inc. (ISDA) Master Agreement with each of its counterparties. The ISDA Master Agreement gives a fund the right to terminate all transactions traded under such agreement upon the deterioration in the credit quality of the counterparty beyond specified levels. The ISDA Master Agreement gives each party the right, upon an event of default by the other party or a termination of the agreement, to close out all transactions traded under such agreement and to net amounts owed under each transaction to one net payable by one party to the other. To mitigate counterparty credit risk on bi-lateral OTC derivatives, a fund receives collateral in the form of cash or securities once net unrealized appreciation on outstanding derivative contracts under an ISDA Master Agreement exceeds certain applicable thresholds, subject to certain minimum transfer provisions. The collateral received is held in segregated accounts with the custodian bank in accordance with the collateral agreements entered into between a fund, the counterparty and the custodian bank. A fund could experience delays and costs in gaining access to the collateral even though it is held by the custodian bank. The maximum risk of loss to a fund from counterparty credit risk related to bi-lateral OTC derivatives is generally the aggregate unrealized appreciation and unpaid counterparty payments in excess of any collateral pledged by the counterparty to a fund. For OTC written options with upfront premiums received, a fund is obligated to perform and therefore does not have counterparty risk. For OTC written options with premiums to be received at a future date, the maximum risk of loss from counterparty credit risk is the amount of the premium in excess of any collateral pledged by the counterparty. A fund may be required to pledge collateral for the benefit of the counterparties on bi-lateral OTC derivatives in an amount not less than each counterparty's unrealized appreciation on outstanding derivative contracts, subject to certain minimum transfer provisions, and any such pledged collateral is identified in the Schedule of Investments. Exchange-traded contracts are not covered by the ISDA Master Agreement; however counterparty credit risk related to these contracts may be mitigated by the protection provided by the exchange on which they trade. Counterparty credit risk related to centrally cleared swaps may be mitigated by the protection provided by the clearinghouse.
Investing in derivatives may involve greater risks than investing in the underlying assets directly and, to varying degrees, may involve risk of loss in excess of any initial investment and collateral received and amounts recognized in the Statement of Assets and Liabilities. In addition, there may be the risk that the change in value of the derivative contract does not correspond to the change in value of the underlying instrument.
Net Realized Gain (Loss) and Change in Net Unrealized Appreciation (Depreciation) on Derivatives. The table below, which reflects the impacts of derivatives on the financial performance, summarizes the net realized gain (loss) and change in net unrealized appreciation (depreciation) for derivatives during the period as presented in the Statement of Operations.
| Primary Risk Exposure / Derivative Type | Net Realized Gain (Loss)($) | Change in Net Unrealized Appreciation (Depreciation)($) |
| VIP Investment Grade Bond Portfolio | | |
| Credit Risk | | |
| Swaps | (89,082) | (77,745) |
| Total Credit Risk | (89,082) | (77,745) |
| Interest Rate Risk | | |
| Futures Contracts | (3,717,785) | 720,362 |
| Purchased Options | (76,468) | (468,095) |
| Written Options | 25,125 | (4,065) |
| Swaps | 2,119,060 | 2,173,331 |
| Total Interest Rate Risk | (1,650,068) | 2,421,533 |
| Totals | (1,739,150) | 2,343,788 |
If there are any open positions at period end, a summary of the value of derivatives by primary risk exposure is included at the end of the Schedule of Investments.
Futures Contracts. A futures contract is an agreement between two parties to buy or sell a specified underlying instrument for a fixed price at a specified future date. Futures contracts were used to manage exposure to the bond market and fluctuations in interest rates.
Upon entering into a futures contract, a fund is required to deposit either cash or securities (initial margin) with a clearing broker in an amount equal to a certain percentage of the face value of the contract. Futures contracts are marked-to-market daily and subsequent daily payments are made or received by a fund depending on the daily fluctuations in the value of the futures contracts and are recorded as unrealized appreciation or (depreciation). This receivable and/or payable, if any, is included in daily variation margin on futures contracts in the Statement of Assets and Liabilities. Realized gain or (loss) is recorded upon the expiration or closing of a futures contract. The net realized gain (loss) and change in net unrealized appreciation (depreciation) on futures contracts during the period is presented in the Statement of Operations.
Any open futures contracts at period end are presented in the Schedule of Investments under the caption "Futures Contracts". The notional amount at value reflects each contract's exposure to the underlying instrument or index at period end, and is representative of volume of activity during the period, unless an average notional amount is presented in the table below.
| | Average Notional Amount ($) |
| VIP Investment Grade Bond Portfolio | 61,212,188 |
Any securities deposited to meet initial margin requirements are identified in the Schedule of Investments. Any cash deposited to meet initial margin requirements is presented as segregated cash with brokers for derivative instruments in the Statement of Assets and Liabilities.
Options. Options give the purchaser the right, but not the obligation, to buy (call) or sell (put) an underlying security or financial instrument at an agreed exercise or strike price between or on certain dates. Options obligate the seller (writer) to buy (put) or sell (call) an underlying instrument at the exercise or strike price or cash settle an underlying derivative instrument if the holder exercises the option on or before the expiration date. OTC options, such as swaptions, which are options where the underlying instrument is a swap, were used to manage exposure to fluctuations in interest rates.
Upon entering into an options contract, a fund will pay or receive a premium. Premiums paid on purchased options are reflected as cost of investments and premiums received on written options are reflected as a liability on the Statement of Assets and Liabilities. Certain options may be purchased or written with premiums to be paid or received on a future date. Options are valued daily and any unrealized appreciation (depreciation) is reflected in total accumulated earnings (loss) in the Statement of Assets and Liabilities. When an option is exercised, the cost or proceeds of the underlying instrument purchased or sold is adjusted by the amount of the premium. When an option is closed, a gain or loss is realized depending on whether the proceeds or amount paid for the closing sale transaction is greater or less than the premium received or paid. When an option expires, gains and losses are realized to the extent of premiums received and paid, respectively. The net realized and unrealized gains (losses) on purchased options are included in the Statement of Operations in net realized gain (loss) and change in net unrealized appreciation (depreciation) on investment securities. The net realized gain (loss) and change in net unrealized appreciation (depreciation) on written options are presented in the Statement of Operations.
Any open options at period end are presented in the Schedule of Investments under the captions "Purchased Options," "Purchased Swaptions," "Written Options" and "Written Swaptions," as applicable, and are representative of volume of activity during the period.
Writing puts and buying calls tend to increase exposure to the underlying instrument while buying puts and writing calls tend to decrease exposure to the underlying instrument. For purchased options, risk of loss is limited to the premium paid, and for written options, risk of loss is the change in value in excess of the premium received.
Swaps. A swap is a contract between two parties to exchange future cash flows at periodic intervals based on a notional principal amount. A bi-lateral OTC swap is a transaction between a fund and a dealer counterparty where cash flows are exchanged between the two parties for the life of the swap. A centrally cleared swap is a transaction executed between a fund and a dealer counterparty, then cleared by a futures commission merchant (FCM) through a clearinghouse. Once cleared, the clearinghouse serves as a central counterparty, with whom a fund exchanges cash flows for the life of the transaction, similar to transactions in futures contracts.
Bi-lateral OTC swaps are marked-to-market daily and changes in value are reflected in the Statement of Assets and Liabilities in the bi-lateral OTC swaps at value line items. Any upfront premiums paid or received upon entering a bi-lateral OTC swap to compensate for differences between stated terms of the swap and prevailing market conditions (e.g. credit spreads, interest rates or other factors) are recorded in total accumulated earnings (loss) in the Statement of Assets and Liabilities and amortized to realized gain or (loss) ratably over the term of the swap. Any unamortized upfront premiums are presented in the Schedule of Investments.
Centrally cleared swaps require a fund to deposit either cash or securities (initial margin) with the FCM, at the instruction of and for the benefit of the clearinghouse. Any securities deposited to meet initial margin requirements are identified in the Schedule of Investments. Any cash deposited to meet initial margin requirements is presented in segregated cash with brokers for derivative instruments in the Statement of Assets and Liabilities. Centrally cleared swaps are marked-to-market daily and subsequent payments (variation margin) are made or received depending on the daily fluctuations in the value of the swaps and are recorded as unrealized appreciation or (depreciation). These daily payments, if any, are included in receivable or payable for daily variation margin on centrally cleared swaps in the Statement of Assets and Liabilities. Any premiums for centrally cleared swaps are recorded periodically throughout the term of the swap to variation margin and included in total accumulated earnings (loss) in the Statement of Assets and Liabilities. Any premiums are recognized as realized gain (loss) upon termination or maturity of the swap.
For both bi-lateral and centrally cleared swaps, payments are exchanged at specified intervals, accrued daily commencing with the effective date of the contract and recorded as realized gain or (loss). Some swaps may be terminated prior to the effective date and realize a gain or loss upon termination. The net realized gain (loss) and change in net unrealized appreciation (depreciation) on swaps during the period is presented in the Statement of Operations.
Any open swaps at period end are included in the Schedule of Investments under the caption "Swaps", and are representative of volume of activity during the period.
Credit Default Swaps. Credit default swaps enable a fund to buy or sell protection against specified credit events on a single-name issuer or a traded credit index. Under the terms of a credit default swap the buyer of protection (buyer) receives credit protection in exchange for making periodic payments to the seller of protection (seller) based on a fixed percentage applied to a notional principal amount. In return for these payments, the seller will be required to make a payment upon the occurrence of one or more specified credit events. A fund enters into credit default swaps as a seller to gain credit exposure to an issuer and/or as a buyer to obtain a measure of protection against defaults of an issuer. Periodic payments are made over the life of the contract by the buyer provided that no credit event occurs.
For credit default swaps on most corporate and sovereign issuers, credit events include bankruptcy, failure to pay or repudiation/moratorium. For credit default swaps on corporate or sovereign issuers, the obligation that may be put to the seller is not limited to the specific reference obligation described in the Schedule of Investments. For credit default swaps on asset-backed securities, a credit event may be triggered by events such as failure to pay principal, maturity extension, rating downgrade or write-down. For credit default swaps on asset-backed securities, the reference obligation described represents the security that may be put to the seller. For credit default swaps on a traded credit index, a specified credit event may affect all or individual underlying securities included in the index.
As a seller, if an underlying credit event occurs, a fund will pay a net settlement amount of cash equal to the notional amount of the swap less the recovery value of the reference obligation or underlying securities comprising an index. Only in the event of the industry's inability to value the underlying asset will a fund be required to take delivery of the reference obligation or underlying securities comprising an index and pay an amount equal to the notional amount of the swap.
As a buyer, if an underlying credit event occurs, a fund will receive a net settlement amount of cash equal to the notional amount of the swap less the recovery value of the reference obligation or underlying securities comprising an index. Only in the event of the industry's inability to value the underlying asset will a fund be required to deliver the reference obligation or underlying securities comprising an index in exchange for payment of an amount equal to the notional amount of the swap.
Typically, the value of each credit default swap and credit rating disclosed for each reference obligation in the Schedule of Investments, where a fund is the seller, can be used as measures of the current payment/performance risk of the swap. As the value of the swap changes as a positive or negative percentage of the total notional amount, the payment/performance risk may decrease or increase, respectively. In addition to these measures, the investment adviser monitors a variety of factors including cash flow assumptions, market activity and market sentiment as part of its ongoing process of assessing payment/performance risk.
Interest Rate Swaps. Interest rate swaps are agreements between counterparties to exchange cash flows, one based on a fixed rate, and the other on a floating rate. A fund enters into interest rate swaps to manage its exposure to interest rate changes. Changes in interest rates can have an effect on both the value of bond holdings as well as the amount of interest income earned. In general, the value of bonds can fall when interest rates rise and can rise when interest rates fall.
5. Purchases and Sales of Investments.
Purchases and sales of securities, other than short-term securities, U.S. government securities and in-kind transactions, as applicable, are noted in the table below.
| | Purchases ($) | Sales ($) |
| VIP Investment Grade Bond Portfolio | 4,914,806,336 | 5,040,978,540 |
6. Fees and Other Transactions with Affiliates.
Management Fee. Fidelity Management & Research Company LLC (the investment adviser) and its affiliates provide the Fund with investment management related services for which the Fund pays a monthly management fee.
Effective March 1, 2024, the Fund's management contract was amended to incorporate administrative services previously covered under separate services agreements (Transfer Agent and Accounting agreements). The amended contract incorporates a management fee rate that may vary by class. The investment adviser or an affiliate pays certain expenses of managing and operating the Fund out of each class's management fee. Each class of the Fund pays a management fee to the investment adviser. The management fee is calculated and paid to the investment adviser every month. When determining a class's management fee, a mandate rate is calculated based on the monthly average net assets of a group of funds advised by FMR within a designated asset class. A discount rate is subtracted from the mandate rate once the Fund's monthly average net assets reach a certain level. The mandate rate and discount rate may vary by class. The annual management fee rate for a class of shares of the Fund is the lesser of (1) the class's mandate rate reduced by the class's discount rate (if applicable) or (2) the amount set forth in the following table.
| | Maximum Management Fee Rate % |
| Initial Class | .37 |
| Service Class | .37 |
| Service Class 2 | .37 |
| Investor Class | .41 |
One-twelfth of the management fee rate for a class is applied to the average net assets of the class for the month, giving a dollar amount which is the management fee for the class for that month. A different management fee rate may be applicable to each class of the Fund. The difference between classes is the result of separate arrangements for class-level services and/or waivers of certain expenses. It is not the result of any difference in advisory or custodial fees or other expenses related to the management of the Fund's assets, which do not vary by class. For the portion of the reporting period on or after March 1, 2024, the total annualized management fee rates were as follows:
| | Total Management Fee Rate % |
| Initial Class | .37 |
| Service Class | .37 |
| Service Class 2 | .37 |
| Investor Class | .41 |
Prior to March 1, 2024, the management fee was the sum of an individual fund fee rate that was based on an annual rate of .20% of the Fund's average net assets and an annualized group fee rate that averaged .10% during the period. The group fee rate was based upon the monthly average net assets of a group of registered investment companies with which the investment adviser has management contracts. The group fee rate decreased as assets under management increased and increased as assets under management decreased. For the portion of the reporting period prior to March 1, 2024, the total annualized management fee rate was .30%.
Effective March 1, 2024, the Fund's sub-advisory agreements with FMR Investment Management (UK) Limited, Fidelity Management & Research (Hong Kong) Limited, and Fidelity Management & Research (Japan) Limited were amended to provide that the investment adviser pays each sub-adviser monthly fees equal to 110% of the sub-adviser's costs for providing sub-advisory services.
Distribution and Service Plan Fees. In accordance with Rule 12b-1 of the 1940 Act, the Fund has adopted separate 12b-1 Plans for each Service Class of shares. Each Service Class pays Fidelity Distributors Company LLC (FDC), an affiliate of the investment adviser, a service fee. For the period, the service fee is based on an annual rate of .10% of Service Class' average net assets and .25% of Service Class 2's average net assets.
For the period, total fees, all of which were re-allowed to insurance companies for the distribution of shares and providing shareholder support services, were as follows:
| Service Class | $801,183 |
| Service Class 2 | 5,280,041 |
| | $6,081,224 |
Transfer Agent Fees. Fidelity Investments Institutional Operations Company LLC (FIIOC), an affiliate of the investment adviser, is the Fund's transfer, dividend disbursing, and shareholder servicing agent. Effective March 1, 2024, the Fund's management contract was amended to incorporate transfer agent services and associated fees previously covered under a separate services agreement.
During the period January 1, 2024 through February 29, 2024, the transfer agent fees for each class were a fixed annual rate of class-level average net assets as follows:
| | Amount ($) | % of Class-Level Average Net Assets |
| Initial Class | 63,499 | .0680 |
| Service Class | 84,498 | .0680 |
| Service Class 2 | 224,480 | .0680 |
| Investor Class | 123,175 | .1020 |
| | 495,652 | |
Accounting Fees. Fidelity Service Company, Inc. (FSC), an affiliate of the investment adviser, maintains the Fund's accounting records. Effective March 1, 2024, the Fund's management contract was amended to incorporate accounting services and associated fees previously covered under a separate services agreement.
During the period January 1, 2024 through February 29, 2024, the accounting fees were a fixed annual rate of average net assets as follows:
| | % of Average Net Assets |
| VIP Investment Grade Bond Portfolio | .0285 |
Interfund Trades. Funds may purchase from or sell securities to other Fidelity Funds under procedures adopted by the Board. The procedures have been designed to ensure these interfund trades are executed in accordance with Rule 17a-7 of the 1940 Act. Any interfund trades are included within the respective purchases and sales amounts shown in the Purchases and Sales of Investments note. During the period, there were no interfund trades.
7. Committed Line of Credit.
Certain Funds participate with other funds managed by the investment adviser or an affiliate in a $4.25 billion credit facility (the "line of credit") to be utilized for temporary or emergency purposes to fund shareholder redemptions or for other short-term liquidity purposes.
Commitment fees are charged based on the unused amount of the line of credit at an annual rate of .10%, and then allocated to each participating fund based on its pro-rata portion of the line of credit. The commitment fees are reflected in Miscellaneous expenses on the Statement of Operations, and are listed below.
Interest is charged to a participating fund based on its borrowings at an annual rate of .75% plus the highest of (i) daily SOFR plus a .10% spread adjustment, (ii) Federal Funds Effective Rate, or (iii) Overnight Bank Funding Rate. During the period, there were no borrowings on this line of credit.
The line of credit agreement will expire in March 2025 unless extended or renewed.
| | Amount ($) |
| VIP Investment Grade Bond Portfolio | 6,584 |
8. Security Lending.
Funds lend portfolio securities from time to time in order to earn additional income. Lending agents are used, including National Financial Services (NFS), an affiliate of the investment adviser. Pursuant to a securities lending agreement, NFS will receive a fee, which is capped at 9.9% of a fund's daily lending revenue, for its services as lending agent. A fund may lend securities to certain qualified borrowers, including NFS. On the settlement date of the loan, a fund receives collateral (in the form of U.S. Treasury obligations, letters of credit and/or cash) against the loaned securities and maintains collateral in an amount not less than 100% of the market value of the loaned securities during the period of the loan. The market value of the loaned securities is determined at the close of business of a fund and any additional required collateral is delivered to a fund on the next business day. A fund or borrower may terminate the loan at any time, and if the borrower defaults on its obligation to return the securities loaned because of insolvency or other reasons, a fund may apply collateral received from the borrower against the obligation. A fund may experience delays and costs in recovering the securities loaned. Any cash collateral received is invested in the Fidelity Securities Lending Cash Central Fund. Any loaned securities are identified as such in the Schedule of Investments, and the value of loaned securities and cash collateral at period end, as applicable, are presented in the Statement of Assets and Liabilities. Security lending income represents the income earned on investing cash collateral, less rebates paid to borrowers and any lending agent fees associated with the loan, plus any premium payments received for lending certain types of securities. Security lending income is presented in the Statement of Operations as a component of income from Fidelity Central Funds. Affiliated security lending activity, if any, was as follows:
| | Total Security Lending Fees Paid to NFS ($) | Security Lending Income From Securities Loaned to NFS ($) | Value of Securities Loaned to NFS at Period End ($) |
| VIP Investment Grade Bond Portfolio | 1,146 | - | - |
9. Expense Reductions.
Through arrangements with the Fund's custodian, credits realized as a result of certain uninvested cash balances were used to reduce the Fund's expenses. During the period, custodian credits reduced the Fund's expenses by $17,108.
In addition, during the period the investment adviser or an affiliate reimbursed and/or waived a portion of fund-level operating expenses in the amount of $95,179.
10. Distributions to Shareholders.
Distributions to shareholders of each class were as follows:
| | Year ended December 31, 2024 | Year ended December 31, 2023 |
| VIP Investment Grade Bond Portfolio | | |
| Distributions to shareholders | | |
| Initial Class | $21,881,384 | $14,499,097 |
| Service Class | 28,548,399 | 18,667,844 |
| Service Class 2 | 72,359,282 | 48,369,306 |
| Investor Class | 26,550,449 | 18,462,918 |
Total | $149,339,514 | $99,999,165 |
11. Share Transactions.
Transactions for each class of shares were as follows and may contain in-kind transactions:
| | Shares | Shares | Dollars | Dollars |
| | Year ended December 31, 2024 | Year ended December 31, 2023 | Year ended December 31, 2024 | Year ended December 31, 2023 |
| VIP Investment Grade Bond Portfolio | | | | |
| Initial Class | | | | |
| Shares sold | 15,935,926 | 7,882,154 | $179,537,463 | $86,980,935 |
| Reinvestment of distributions | 1,956,773 | 1,342,509 | 21,881,384 | 14,499,097 |
| Shares redeemed | (10,673,039) | (7,611,227) | (119,800,003) | (83,522,769) |
| Net increase (decrease) | 7,219,660 | 1,613,436 | $81,618,844 | $17,957,263 |
| Service Class | | | | |
| Shares sold | 19,562,539 | 18,583,199 | $215,211,721 | $201,692,921 |
| Reinvestment of distributions | 2,591,941 | 1,754,497 | 28,548,399 | 18,667,844 |
| Shares redeemed | (13,550,662) | (13,630,347) | (149,414,133) | (147,970,863) |
| Net increase (decrease) | 8,603,818 | 6,707,349 | $94,345,987 | $72,389,902 |
| Service Class 2 | | | | |
| Shares sold | 34,937,231 | 29,566,892 | $376,833,844 | $316,900,413 |
| Reinvestment of distributions | 6,690,779 | 4,624,217 | 72,359,282 | 48,369,306 |
| Shares redeemed | (21,438,997) | (16,273,521) | (232,918,112) | (173,410,540) |
| Net increase (decrease) | 20,189,013 | 17,917,588 | $216,275,014 | $191,859,179 |
| Investor Class | | | | |
| Shares sold | 7,932,960 | 5,031,435 | $88,739,505 | $55,201,298 |
| Reinvestment of distributions | 2,387,603 | 1,719,080 | 26,550,449 | 18,462,918 |
| Shares redeemed | (6,222,916) | (7,727,669) | (69,056,231) | (84,211,331) |
| Net increase (decrease) | 4,097,647 | (977,154) | $46,233,723 | $(10,547,115) |
12. Other.
A fund's organizational documents provide former and current trustees and officers with a limited indemnification against liabilities arising in connection with the performance of their duties to the fund. In the normal course of business, a fund may also enter into contracts that provide general indemnifications. A fund's maximum exposure under these arrangements is unknown as this would be dependent on future claims that may be made against a fund. The risk of material loss from such claims is considered remote.
At the end of the period, the investment adviser or its affiliates were owners of record of more than 10% and certain otherwise unaffiliated shareholders were owners of record of more than 10% of the outstanding shares as follows:
| Fund | Affiliated % | Number ofUnaffiliated Shareholders | Unaffiliated Shareholders % |
| VIP Investment Grade Bond Portfolio | 20% | 1 | 41% |
13. Risk and Uncertainties.
Many factors affect a fund's performance. Developments that disrupt global economies and financial markets, such as pandemics, epidemics, outbreaks of infectious diseases, war, terrorism, and environmental disasters, may significantly affect a fund's investment performance. The effects of these developments to a fund will be impacted by the types of securities in which a fund invests, the financial condition, industry, economic sector, and geographic location of an issuer, and a fund's level of investment in the securities of that issuer. Significant concentrations in security types, issuers, industries, sectors, and geographic locations may magnify the factors that affect a fund's performance.
Report of Independent Registered Public Accounting Firm
To the Board of Trustees of Variable Insurance Products Fund V and the Shareholders of VIP Investment Grade Bond Portfolio:
Opinion on the Financial Statements and Financial Highlights
We have audited the accompanying statement of assets and liabilities of VIP Investment Grade Bond Portfolio (the "Fund"), a fund of Variable Insurance Products Fund V, including the schedule of investments, as of December 31, 2024, the related statement of operations for the year then ended, the statement of changes in net assets for each of the two years in the period then ended, the financial highlights for each of the five years in the period then ended, and the related notes. In our opinion, the financial statements and financial highlights present fairly, in all material respects, the financial position of the Fund as of December 31, 2024, and the results of its operations for the year then ended, the changes in its net assets for each of the two years in the period then ended, and the financial highlights for each of the five years in the period then ended in conformity with accounting principles generally accepted in the United States of America.
Basis for Opinion
These financial statements and financial highlights are the responsibility of the Fund's management. Our responsibility is to express an opinion on the Fund's financial statements and financial highlights based on our audits. We are a public accounting firm registered with the Public Company Accounting Oversight Board (United States) (PCAOB) and are required to be independent with respect to the Fund in accordance with the U.S. federal securities laws and the applicable rules and regulations of the Securities and Exchange Commission and the PCAOB.
We conducted our audits in accordance with the standards of the PCAOB. Those standards require that we plan and perform the audit to obtain reasonable assurance about whether the financial statements and financial highlights are free of material misstatement, whether due to error or fraud. The Fund is not required to have, nor were we engaged to perform, an audit of its internal control over financial reporting. As part of our audits, we are required to obtain an understanding of internal control over financial reporting but not for the purpose of expressing an opinion on the effectiveness of the Fund's internal control over financial reporting. Accordingly, we express no such opinion.
Our audits included performing procedures to assess the risks of material misstatement of the financial statements and financial highlights, whether due to error or fraud, and performing procedures that respond to those risks. Such procedures included examining, on a test basis, evidence regarding the amounts and disclosures in the financial statements and financial highlights. Our audits also included evaluating the accounting principles used and significant estimates made by management, as well as evaluating the overall presentation of the financial statements and financial highlights. Our procedures included confirmation of securities owned as of December 31, 2024, by correspondence with the custodian and brokers; when replies were not received from brokers, we performed other auditing procedures. We believe that our audits provide a reasonable basis for our opinion.
/s/ Deloitte & Touche LLP
Boston, Massachusetts
February 13, 2025
We have served as the auditor of one or more of the Fidelity investment companies since 1999.
Distributions
(Unaudited)
The dividend and capital gains distributions for the fund(s) are available on Fidelity.com or Institutional.Fidelity.com.
A total of 37.73% of the dividends distributed during the fiscal year was derived from interest on U.S. Government securities which is generally exempt from state income tax.
The fund designates $149,190,502 of distributions paid during the fiscal year ended 2024 as qualifying to be taxed as section 163(j) interest dividends.
Item 8: Changes in and Disagreements with Accountants for Open-End Management Investment Companies
(Unaudited)
Note: This is not applicable for any fund included in this document.
Item 9: Proxy Disclosures for Open-End Management Investment Companies
(Unaudited)
Note: This is not applicable for any fund included in this document.
Item 10: Remuneration Paid to Directors, Officers, and others of Open-End Management Investment Companies
(Unaudited)
Note: This information is disclosed as part of the financial statements for each Fund as part of Item 7: Financial Statements and Financial Highlights for Open-End Management Investment companies.
Item 11: Statement Regarding Basis for Approval of Investment Advisory Contract
(Unaudited)
Board Approval of Investment Advisory Contracts and Management Fees
VIP Investment Grade Bond Portfolio
Each year, the Board of Trustees, including the Independent Trustees (together, the Board), considers the renewal of the fund's management contract with Fidelity Management & Research Company LLC (FMR) and the sub-advisory agreements (together, the Advisory Contracts) for the fund. FMR and the sub-advisers are referred to herein as the Investment Advisers. The Board, assisted by the advice of fund counsel and Independent Trustees' counsel, requests and considers a broad range of information relevant to the renewal of the Advisory Contracts throughout the year.
The Board meets regularly and, at each of its meetings, covers an extensive agenda of topics and materials and considers factors that are relevant to its annual consideration of the renewal of the fund's Advisory Contracts, including the services and support provided to the fund and its shareholders. The Board's Operations Committee, of which all the Independent Trustees are members, meets regularly throughout the year and requests, receives and considers, among other matters, information related to the annual consideration of the renewal of the fund's Advisory Contracts before making its recommendation to the Board. The Board also meets as needed to review matters specifically related to the Board's annual consideration of the renewal of the Advisory Contracts. Members of the Board may also meet from time to time with trustees of other Fidelity funds through joint ad hoc committees to discuss certain matters relevant to all of the Fidelity funds.
At its September 2024 meeting, the Board unanimously determined to renew the fund's Advisory Contracts. In reaching its determination, the Board considered all factors it believed relevant, including (i) the nature, extent, and quality of the services provided to the fund and its shareholders (including the investment performance of the fund); (ii) the competitiveness relative to peer funds of the fund's management fee and the total expense ratio of a representative class (Investor Class, which was selected because it was the largest class without 12b-1 fees); (iii) the total costs of the services provided by and the profits realized by FMR and its affiliates (Fidelity) from its relationships with the fund; and (iv) the extent to which, if any, economies of scale exist and are realized as the fund grows, and whether any economies of scale are appropriately shared with fund shareholders. The Board also considered the broad range of investment choices available to shareholders from FMR's competitors and that the fund's shareholders have chosen to invest in the fund, which is part of the Fidelity family of funds. The Board's decision to renew the Advisory Contracts was not based on any single factor and the factors may have been weighed differently by different Trustees.
The Board reached a determination, with the assistance of fund counsel and Independent Trustees' counsel and through the exercise of its business judgment, that the renewal of the Advisory Contracts was in the best interests of the fund and its shareholders and that the compensation payable under the Advisory Contracts was fair and reasonable in light of all of the surrounding circumstances.
Nature, Extent, and Quality of Services Provided. The Board considered Fidelity's staffing as it relates to the fund, including the backgrounds and experience of investment personnel, and also considered the Investment Advisers' implementation of the fund's investment program. The Independent Trustees also had discussions with senior management of Fidelity's investment operations and investment groups. The Board considered the structure of the investment personnel compensation program and whether this structure provides appropriate incentives to act in the best interests of the fund. Additionally, the Board considered the portfolio managers' investments, if any, in the funds that they manage.
Resources Dedicated to Investment Management and Support Services. The Board reviewed the general qualifications and capabilities of Fidelity's investment staff, including its size, education, experience, and resources, as well as Fidelity's approach to recruiting, training, managing, and compensating investment personnel. The Board noted the resources devoted to Fidelity's global investment organization, and that Fidelity's analysts have extensive resources, tools and capabilities that allow them to conduct quantitative and fundamental analysis, as well as credit analysis of issuers, counterparties and guarantors. Further, the Board considered that Fidelity's investment professionals have sufficient access to global information and data so as to provide competitive investment results over time, and that those professionals also have access to sophisticated tools that permit them to assess portfolio construction and risk and performance attribution characteristics continuously, as well as to transmit new information and research conclusions rapidly around the world. Additionally, in its deliberations, the Board considered Fidelity's trading, risk management, compliance, cybersecurity, and technology and operations capabilities and resources, which are integral parts of the investment management process.
Shareholder and Administrative Services. The Board considered (i) the nature, extent, quality, and cost of advisory, administrative, shareholder, transfer agency, and pricing and bookkeeping services performed by the Investment Advisers and their affiliates under the Advisory Contracts; (ii) the nature and extent of Fidelity's supervision of third party service providers, principally custodians, subcustodians, and pricing vendors; and (iii) the resources devoted by Fidelity to, and the record of compliance with, the fund's compliance policies and procedures, including with respect to liquidity and derivatives risk management. The Board also considered the fund's securities lending activities and any payments made to Fidelity relating to securities lending under a separate agreement.
The Board noted that the growth of fund assets over time across the complex allows Fidelity to reinvest in the development of services designed to enhance the value and convenience of the Fidelity funds as investment vehicles. These services include 24-hour access to account information and market information over the Internet and through telephone representatives, investor education materials and asset allocation tools. The Board also considered that it reviews customer service metrics such as telephone response times, continuity of services on the website and metrics addressing services at Fidelity Investor Centers.
Investment in a Large Fund Family. The Board considered the benefits to shareholders of investing in a fund that is part of a large family of funds offering a variety of investment disciplines and providing a large variety of fund investor services. The Board noted that Fidelity had taken, or had made recommendations to the Board that resulted in the Fidelity funds taking, a number of actions over the previous year that benefited particular funds and/or the Fidelity funds in general.
Investment Performance. The Board took into account discussions that occur with representatives of the Investment Advisers, and reports that it receives, at Board meetings throughout the year relating to fund investment performance. In this regard the Board noted that as part of regularly scheduled fund reviews and other reports to the Board on fund performance, the Board considered annualized return information for the fund for different time periods, measured against an appropriate securities market index (benchmark index) and an appropriate peer group of funds with similar objectives (peer group). The Board also considered information about performance attribution. In its evaluation of fund investment performance at meetings throughout the year, the Board gave particular attention to information indicating underperformance of certain Fidelity funds over different time periods and discussed with the Investment Advisers the reasons for such underperformance.
In addition to reviewing absolute and relative fund performance, the Independent Trustees periodically consider the appropriateness of fund performance metrics in evaluating the results achieved. The Independent Trustees generally give greater weight to fund performance over longer time periods than over shorter time periods. Depending on the circumstances, the Independent Trustees may be satisfied with a fund's performance notwithstanding that it lags its benchmark index or peer group for certain periods.
Based on its review, the Board concluded that the nature, extent, and quality of services provided to the fund under the Advisory Contracts should continue to benefit the shareholders of the fund.
Competitiveness of Management Fee and Total Expense Ratio. The Board was provided with information regarding industry trends in management fees and expenses. The Board considered that, effective March 1, 2024, an amended Advisory Contract with FMR went into effect with class-level management fees based on tiered schedules and subject to a maximum class-level rate (the management fee). The Board also considered that in exchange for the variable management fee, each class of the fund receives investment advisory, management, administrative, transfer agent, and pricing and bookkeeping services. In its review of the management fee and total expense ratio of Investor Class, the Board considered a pro forma management fee rate for Investor Class as if the new management fee structure had been in effect for the 12-month period ended December 31, 2023, as well as other third-party fund expenses, as applicable, such as custodial, legal, and audit fees and any fund-paid 12b-1 fees. The Board noted that Fidelity may agree to waive fees or reimburse expenses from time to time, and the extent to which, if any, it has done so for the fund.
Comparisons of Management Fees and Total Expense Ratios. Among other things, the Board reviewed data for selected groups of competitive funds and classes (referred to as "mapped groups") that were compiled by Fidelity based on combining similar investment objective categories (as classified by Morningstar) that have comparable investment mandates. The data reviewed by the Board included (i) gross management fee comparisons (before taking into account expense reimbursements or caps) relative to the total universe of funds within the mapped group; (ii) gross management fee comparisons relative to a subset of non-Fidelity funds in the mapped group that are similar in size and management fee structure to the fund (referred to as the "asset size peer group"); (iii) total expense comparisons of Investor Class of the fund relative to funds and classes in the mapped group that have a similar sales load structure to Investor Class of the fund (referred to as the "similar sales load structure group"); and (iv) total expense comparisons of Investor Class of the fund relative to funds and classes in the similar sales load structure group that are similar in size and management fee structure to the fund (referred to as the "total expense asset size peer group"). The total expense asset size peer group comparison excludes performance adjustments and fund-paid 12b-1 fees to eliminate variability in fee structures.
The information provided to the Board indicated that the fund's management fee rate ranked below the competitive median of the mapped group for 2023 and below the competitive median of the asset size peer group for 2023. Further, the information provided to the Board indicated that the total expense ratio of Investor Class of the fund ranked below the competitive median of the similar sales load structure group for 2023 and below the competitive median of the total expense asset size peer group for 2023.
The Board noted that a different variable management fee rate is applicable to each class of the fund. The Board considered that the difference in management fee rates between classes is the result of separate arrangements for class-level services and/or waivers of certain expenses and not the result of any difference in advisory or custodial fees or other expenses related to the management of the fund's assets, which do not vary by class.
Fees Charged to Other Fidelity Clients. The Board also considered Fidelity fee structures and other information with respect to clients of Fidelity, such as other funds advised or subadvised by Fidelity, pension plan clients, and other institutional clients with similar mandates. The Board noted that a joint ad hoc committee created by it and the boards of other Fidelity funds periodically reviews and compares Fidelity's institutional investment advisory business with its business of providing services to the Fidelity funds and also noted the most recent findings of the committee. The Board noted that the committee's review included a consideration of the differences in services provided, fees charged, and costs incurred, as well as competition in the markets serving the different categories of clients.
Based on its review, the Board concluded that the fund's management fee is fair and reasonable in light of the services that the fund receives and the other factors considered. Further, based on its review of total expense ratios and fees charged to other Fidelity clients, the Board concluded that the total expense ratio of each class of the fund was reasonable in light of the services that the fund and its shareholders receive and the other factors considered.
Costs of the Services and Profitability. The Board considered the revenues earned and the expenses incurred by Fidelity in conducting the business of developing, marketing, distributing, managing, administering and servicing the fund and servicing the fund's shareholders. The Board also considered the level of Fidelity's profits in respect of all the Fidelity funds.
On an annual basis, Fidelity presents to the Board information about the profitability of its relationships with the fund. Fidelity calculates profitability information for each Fidelity fund, as well as aggregate profitability information for groups of Fidelity funds and all Fidelity funds, using a series of detailed revenue and cost allocation methodologies which originate with the books and records of Fidelity on which Fidelity's audited financial statements are based. The Audit Committee of the Board reviews any significant changes from the prior year's methodologies.
A public accounting firm has been engaged annually by the Board as part of the Board's assessment of Fidelity's profitability analysis. The engagement includes the review and assessment of the methodologies used by Fidelity in determining the revenues and expenses attributable to Fidelity's fund business. After considering the reports issued under the engagement and information provided by Fidelity, the Board concluded that while other allocation methods may also be reasonable, Fidelity's profitability methodologies are reasonable in all material respects.
The Board also reviewed Fidelity's non-fund businesses and potential indirect benefits such businesses may have received as a result of their association with Fidelity's fund business (i.e., fall-out benefits) as well as cases where Fidelity's affiliates may benefit from the funds' business. The Board considered areas where potential indirect benefits to the Fidelity funds from their relationships with Fidelity may exist. The Board's consideration of these matters was informed by the findings of a joint ad hoc committee created by it and the boards of other Fidelity funds to evaluate potential fall-out benefits.
The Board considered the costs of the services provided by and the profits realized by Fidelity in connection with the operation of the fund and was satisfied that the profitability was not excessive.
Economies of Scale. The Board considered whether there have been economies of scale in respect of the management of the Fidelity funds, whether the Fidelity funds (including the fund) have appropriately benefited from any such economies of scale, and whether there is potential for realization of any further economies of scale. The Board considered the extent to which the fund will benefit from economies of scale as assets grow through increased services to the fund, through waivers or reimbursements, or through fee or expense ratio reductions. The Board also noted that a committee created by it and the boards of other Fidelity funds periodically analyzes whether Fidelity attains economies of scale in respect of the management and servicing of the Fidelity funds, whether the Fidelity funds have appropriately benefited from such economies of scale, and whether there is potential for realization of any further economies of scale.
The Board recognized that the fund's management contract incorporates a variable management fee structure, which provides breakpoints as a way to share, in part, any potential economies of scale that may exist at the asset class level determined based on the total net assets of specified Fidelity funds in the same asset class as the fund and through a discount determined based on both fund size and total assets of a broader group of specified Fidelity funds. The Board considered that the variable management fee is designed to deliver the benefits of economies of scale to fund shareholders even if assets of any particular fund are unchanged or have declined, because some portion of Fidelity's costs are attributable to services provided to all funds subject to the variable management fee, and all such funds benefit if those costs can be allocated among more assets. The Board concluded that, given the variable management fee structure, fund shareholders will benefit from lower management fees due to the application of the breakpoints and discount, regardless of whether Fidelity achieves any such economies of scale.
The Board concluded, taking into account the analysis of the committee, that economies of scale, if any, are being appropriately shared between fund shareholders and Fidelity.
Additional Information Requested by the Board. In order to develop fully the factual basis for consideration of the Fidelity funds' advisory contracts, the Board requested and received additional information on certain topics, including: (i) portfolio manager changes that have occurred during the past year; (ii) hiring, training, compensating, and retaining adviser and sub-adviser personnel; (iii) the terms of the funds' various management fee structures and arrangements for transfer agent and pricing and bookkeeping services; (iv) Fidelity's fund profitability methodology, profitability trends for certain funds, the allocation of various costs to different funds, and the impact of certain factors on fund profitability results; (v) the impact on fund profitability of recent industry trends, such as the growth in passively managed funds and the changes in flows for different types of funds; (vi) the types of management fee and total expense comparisons provided, and the challenges and limitations associated with such information; (vii) explanations regarding the relative total expense ratios and management fees of certain funds and classes, total expense and management fee competitive trends, and methodologies for total expense and management fee competitive comparisons; (viii) matters related to money market funds, exchange-traded funds, and target date funds; (ix) the arrangements with and compensation paid to certain fund sub-advisers and the treatment of such compensation within Fidelity's fund profitability methodology; and (x) the terms of management contracts between Fidelity and other funds and products not overseen by the Board.
Conclusion. Based on its evaluation of all of the conclusions noted above, and after considering all factors it believed relevant, the Board, including the Independent Trustees, concluded that the advisory and sub-advisory fee arrangements are fair and reasonable in light of all of the surrounding circumstances and that the fund's Advisory Contracts should be renewed through September 30, 2025.
1.540025.127
VIPIGB-ANN-0325
Fidelity® Variable Insurance Products:
VIP Government Money Market Portfolio
Annual Report
December 31, 2024
Contents
To view a fund's proxy voting guidelines and proxy voting record for the 12-month period ended June 30, visit http://www.fidelity.com/proxyvotingresults or visit the Securities and Exchange Commission's (SEC) web site at http://www.sec.gov.
You may also call 1-877-208-0098 to request a free copy of the proxy voting guidelines.
Fidelity® Variable Insurance Products are separate account options which are purchased through a variable insurance contract.
Standard & Poor's, S&P and S&P 500 are registered service marks of The McGraw-Hill Companies, Inc. and have been licensed for use by Fidelity Distributors Corporation.
Other third-party marks appearing herein are the property of their respective owners.
All other marks appearing herein are registered or unregistered trademarks or service marks of FMR LLC or an affiliated company. © 2025 FMR LLC. All rights reserved.
This report and the financial statements contained herein are submitted for the general information of the shareholders of the Fund. This report is not authorized for distribution to prospective investors in the Fund unless preceded or accompanied by an effective prospectus.
A fund files its complete schedule of portfolio holdings with the SEC for the first and third quarters of each fiscal year on Form N-PORT. Forms N-PORT are available on the SEC's web site at http://www.sec.gov. A fund's Forms N-PORT may be reviewed and copied at the SEC's Public Reference Room in Washington, DC. Information regarding the operation of the SEC's Public Reference Room may be obtained by calling 1-800-SEC-0330.
For a complete list of a fund's portfolio holdings, view the most recent holdings listing, semiannual report, or annual report on Fidelity's web site at http://www.fidelity.com, http://www.institutional.fidelity.com, or http://www.401k.com, as applicable.
NOT FDIC INSURED •MAY LOSE VALUE •NO BANK GUARANTEE
Neither the Fund nor Fidelity Distributors Corporation is a bank.
Item 7: Financial Statements and Financial Highlights for Open-End Management Investment Companies (Annual Report)
VIP Government Money Market Portfolio
Schedule of Investments December 31, 2024
Showing Percentage of Net Assets
| Repurchase Agreements - 37.1% |
| | | Maturity Amount ($) | Value ($) |
| Fixed Income Clearing Corp - Credit Agricole 4.44%, dated 1/2/2025 due 1/3/2025 (b) | | 160,019,733 | 160,000,000 |
| Fixed Income Clearing Corp - ING 4.43%, dated 1/2/2025 due 1/3/2025 (b) | | 21,002,584 | 21,000,000 |
| Investments in repurchase agreements in a joint trading account at 4.46%, dated 12/31/2024 due 1/2/2025 (Collateralized by U.S. Government Obligations)# | | 370,079,704 | 369,988,000 |
| Repurchase Agreements* | | 2,605,305,337 | 2,597,792,000 |
| TOTAL REPURCHASE AGREEMENTS (Cost $3,148,780,000) | | | 3,148,780,000 |
| | | | |
| U.S. Government Agency - Debt - 31.3% |
| | | Yield (%) (c) | Principal Amount (a) | Value ($) |
| Fannie Mae U.S. SOFR Index + 0.1%, 4.47% 6/18/2026 (d)(e) | | 4.47 | 14,000,000 | 14,000,000 |
| Fannie Mae U.S. SOFR Index + 0.135%, 4.505% 8/21/2026 (d)(e) | | 4.51 | 2,000,000 | 1,999,828 |
| Fannie Mae U.S. SOFR Index + 0.14%, 4.51% 10/23/2026 (d)(e) | | 4.51 | 13,000,000 | 13,000,000 |
| Fannie Mae U.S. SOFR Index + 0.14%, 4.51% 9/11/2026 (d)(e) | | 4.51 | 23,000,000 | 23,000,000 |
| Federal Farm Credit Banks Funding Corp 5% 4/4/2025 | | 5.08 | 3,000,000 | 2,999,377 |
| Federal Farm Credit Banks Funding Corp U.S. SOFR Index + 0.005%, 4.375% 5/27/2025 (d)(e) | | 4.38 | 1,000,000 | 1,000,000 |
| Federal Farm Credit Banks Funding Corp U.S. SOFR Index + 0.01%, 4.38% 6/26/2025 (d)(e) | | 4.38 | 2,000,000 | 2,000,000 |
| Federal Farm Credit Banks Funding Corp U.S. SOFR Index + 0.02%, 4.39% 5/2/2025 (d)(e) | | 4.39 | 1,000,000 | 1,000,000 |
| Federal Farm Credit Banks Funding Corp U.S. SOFR Index + 0.025%, 4.395% 9/10/2025 (d)(e) | | 4.39 | 2,000,000 | 2,000,000 |
| Federal Farm Credit Banks Funding Corp U.S. SOFR Index + 0.04%, 4.41% 1/28/2025 (d)(e) | | 4.41 | 1,000,000 | 1,000,006 |
| Federal Farm Credit Banks Funding Corp U.S. SOFR Index + 0.04%, 4.41% 6/10/2025 (d)(e) | | 4.41 | 2,000,000 | 2,000,000 |
| Federal Farm Credit Banks Funding Corp U.S. SOFR Index + 0.04%, 4.41% 6/6/2025 (d)(e) | | 4.41 | 1,000,000 | 1,000,000 |
| Federal Farm Credit Banks Funding Corp U.S. SOFR Index + 0.04%, 4.41% 7/29/2025 (d)(e) | | 4.41 | 3,000,000 | 3,000,000 |
| Federal Farm Credit Banks Funding Corp U.S. SOFR Index + 0.045%, 4.415% 2/12/2025 (d)(e) | | 4.42 | 2,000,000 | 1,999,989 |
| Federal Farm Credit Banks Funding Corp U.S. SOFR Index + 0.045%, 4.415% 6/11/2025 (d)(e) | | 4.42 | 1,000,000 | 1,000,000 |
| Federal Farm Credit Banks Funding Corp U.S. SOFR Index + 0.045%, 4.415% 7/23/2025 (d)(e) | | 4.42 | 2,000,000 | 2,000,000 |
| Federal Farm Credit Banks Funding Corp U.S. SOFR Index + 0.05%, 4.42% 1/22/2025 (d)(e) | | 4.42 | 3,000,000 | 3,000,000 |
| Federal Farm Credit Banks Funding Corp U.S. SOFR Index + 0.05%, 4.42% 6/20/2025 (d)(e) | | 4.42 | 3,000,000 | 3,000,045 |
| Federal Farm Credit Banks Funding Corp U.S. SOFR Index + 0.05%, 4.42% 7/18/2025 (d)(e) | | 4.42 | 2,000,000 | 1,999,731 |
| Federal Farm Credit Banks Funding Corp U.S. SOFR Index + 0.05%, 4.42% 8/6/2025 (d)(e) | | 4.42 | 6,000,000 | 6,000,000 |
| Federal Farm Credit Banks Funding Corp U.S. SOFR Index + 0.055%, 4.425% 11/18/2025 (d)(e) | | 4.43 | 3,000,000 | 3,000,000 |
| Federal Farm Credit Banks Funding Corp U.S. SOFR Index + 0.055%, 4.425% 11/25/2025 (d)(e) | | 4.43 | 2,000,000 | 2,000,000 |
| Federal Farm Credit Banks Funding Corp U.S. SOFR Index + 0.055%, 4.425% 12/2/2025 (d)(e) | | 4.43 | 2,000,000 | 2,000,000 |
| Federal Farm Credit Banks Funding Corp U.S. SOFR Index + 0.055%, 4.425% 12/30/2025 (d)(e) | | 4.43 | 1,000,000 | 1,000,000 |
| Federal Farm Credit Banks Funding Corp U.S. SOFR Index + 0.055%, 4.425% 8/19/2025 (d)(e) | | 4.43 | 3,000,000 | 3,000,000 |
| Federal Farm Credit Banks Funding Corp U.S. SOFR Index + 0.06%, 4.43% 9/30/2025 (d)(e) | | 4.43 | 1,000,000 | 999,926 |
| Federal Farm Credit Banks Funding Corp U.S. SOFR Index + 0.065%, 4.435% 8/28/2025 (d)(e) | | 4.43 | 2,000,000 | 2,000,000 |
| Federal Farm Credit Banks Funding Corp U.S. SOFR Index + 0.065%, 4.435% 9/5/2025 (d)(e) | | 4.43 | 6,000,000 | 6,000,000 |
| Federal Farm Credit Banks Funding Corp U.S. SOFR Index + 0.07%, 4.44% 11/17/2025 (d)(e) | | 4.44 | 2,000,000 | 2,000,000 |
| Federal Farm Credit Banks Funding Corp U.S. SOFR Index + 0.07%, 4.44% 12/17/2025 (d)(e) | | 4.44 | 4,000,000 | 4,000,000 |
| Federal Farm Credit Banks Funding Corp U.S. SOFR Index + 0.07%, 4.44% 12/23/2025 (d)(e) | | 4.44 | 1,000,000 | 1,000,000 |
| Federal Farm Credit Banks Funding Corp U.S. SOFR Index + 0.07%, 4.44% 12/9/2025 (d)(e) | | 4.44 | 2,000,000 | 2,000,000 |
| Federal Farm Credit Banks Funding Corp U.S. SOFR Index + 0.075%, 4.445% 11/26/2025 (d)(e) | | 4.45 | 2,000,000 | 1,999,851 |
| Federal Farm Credit Banks Funding Corp U.S. SOFR Index + 0.08%, 4.45% 1/28/2026 (d)(e) | | 4.45 | 3,000,000 | 3,000,000 |
| Federal Farm Credit Banks Funding Corp U.S. SOFR Index + 0.08%, 4.45% 1/8/2026 (d)(e) | | 4.45 | 3,000,000 | 2,999,589 |
| Federal Farm Credit Banks Funding Corp U.S. SOFR Index + 0.08%, 4.45% 10/21/2025 (d)(e) | | 4.45 | 2,000,000 | 1,999,845 |
| Federal Farm Credit Banks Funding Corp U.S. SOFR Index + 0.08%, 4.45% 12/12/2025 (d)(e) | | 4.45 | 2,000,000 | 2,000,058 |
| Federal Farm Credit Banks Funding Corp U.S. SOFR Index + 0.08%, 4.45% 2/10/2026 (d)(e) | | 4.45 | 2,000,000 | 2,000,000 |
| Federal Farm Credit Banks Funding Corp U.S. SOFR Index + 0.08%, 4.45% 2/17/2026 (d)(e) | | 4.45 | 1,000,000 | 999,946 |
| Federal Farm Credit Banks Funding Corp U.S. SOFR Index + 0.08%, 4.45% 3/4/2026 (d)(e) | | 4.45 | 3,000,000 | 2,999,831 |
| Federal Farm Credit Banks Funding Corp U.S. SOFR Index + 0.085%, 4.455% 11/13/2025 (d)(e) | | 4.46 | 2,000,000 | 2,000,000 |
| Federal Farm Credit Banks Funding Corp U.S. SOFR Index + 0.085%, 4.455% 3/20/2026 (d)(e) | | 4.46 | 1,000,000 | 1,000,000 |
| Federal Farm Credit Banks Funding Corp U.S. SOFR Index + 0.085%, 4.455% 9/25/2025 (d)(e) | | 4.46 | 1,000,000 | 999,982 |
| Federal Farm Credit Banks Funding Corp U.S. SOFR Index + 0.09%, 4.46% 1/23/2026 (d)(e) | | 4.46 | 1,000,000 | 1,000,000 |
| Federal Farm Credit Banks Funding Corp U.S. SOFR Index + 0.09%, 4.46% 2/2/2026 (d)(e) | | 4.46 | 2,000,000 | 2,000,000 |
| Federal Farm Credit Banks Funding Corp U.S. SOFR Index + 0.09%, 4.46% 9/22/2025 (d)(e) | | 4.46 | 4,000,000 | 4,000,894 |
| Federal Farm Credit Banks Funding Corp U.S. SOFR Index + 0.095%, 4.465% 12/12/2025 (d)(e) | | 4.46 to 4.47 | 6,000,000 | 6,000,518 |
| Federal Farm Credit Banks Funding Corp U.S. SOFR Index + 0.095%, 4.465% 12/26/2025 (d)(e) | | 4.47 | 1,000,000 | 1,000,000 |
| Federal Farm Credit Banks Funding Corp U.S. SOFR Index + 0.095%, 4.465% 4/17/2026 (d)(e) | | 4.47 | 3,000,000 | 2,999,631 |
| Federal Farm Credit Banks Funding Corp U.S. SOFR Index + 0.095%, 4.465% 5/5/2026 (d)(e) | | 4.47 | 3,000,000 | 2,999,807 |
| Federal Farm Credit Banks Funding Corp U.S. SOFR Index + 0.1%, 4.47% 1/15/2026 (d)(e) | | 4.47 | 1,000,000 | 1,000,000 |
| Federal Farm Credit Banks Funding Corp U.S. SOFR Index + 0.1%, 4.47% 2/25/2026 (d)(e) | | 4.47 | 5,000,000 | 5,001,078 |
| Federal Farm Credit Banks Funding Corp U.S. SOFR Index + 0.1%, 4.47% 5/13/2026 (d)(e) | | 4.47 | 11,000,000 | 11,000,000 |
| Federal Farm Credit Banks Funding Corp U.S. SOFR Index + 0.1%, 4.47% 5/20/2026 (d)(e) | | 4.47 | 1,000,000 | 1,000,000 |
| Federal Farm Credit Banks Funding Corp U.S. SOFR Index + 0.1%, 4.47% 6/18/2026 (d)(e) | | 4.47 | 3,000,000 | 3,000,000 |
| Federal Farm Credit Banks Funding Corp U.S. SOFR Index + 0.1%, 4.47% 6/24/2026 (d)(e) | | 4.47 | 3,000,000 | 3,000,000 |
| Federal Farm Credit Banks Funding Corp U.S. SOFR Index + 0.1%, 4.47% 6/5/2026 (d)(e) | | 4.47 | 2,000,000 | 1,999,864 |
| Federal Farm Credit Banks Funding Corp U.S. SOFR Index + 0.105%, 4.475% 1/8/2026 (d)(e) | | 4.47 | 4,000,000 | 4,000,067 |
| Federal Farm Credit Banks Funding Corp U.S. SOFR Index + 0.105%, 4.475% 2/20/2025 (d)(e) | | 4.48 | 6,000,000 | 6,000,000 |
| Federal Farm Credit Banks Funding Corp U.S. SOFR Index + 0.105%, 4.475% 2/26/2025 (d)(e) | | 4.48 | 7,000,000 | 6,999,689 |
| Federal Farm Credit Banks Funding Corp U.S. SOFR Index + 0.105%, 4.475% 3/18/2026 (d)(e) | | 4.47 | 5,000,000 | 5,000,136 |
| Federal Farm Credit Banks Funding Corp U.S. SOFR Index + 0.105%, 4.475% 4/24/2026 (d)(e) | | 4.48 | 1,000,000 | 1,000,000 |
| Federal Farm Credit Banks Funding Corp U.S. SOFR Index + 0.105%, 4.475% 6/12/2026 (d)(e) | | 4.48 | 4,000,000 | 4,000,000 |
| Federal Farm Credit Banks Funding Corp U.S. SOFR Index + 0.11%, 4.48% 3/11/2025 (d)(e) | | 4.48 | 1,000,000 | 1,000,000 |
| Federal Farm Credit Banks Funding Corp U.S. SOFR Index + 0.11%, 4.48% 3/11/2026 (d)(e) | | 4.48 | 3,000,000 | 3,000,000 |
| Federal Farm Credit Banks Funding Corp U.S. SOFR Index + 0.11%, 4.48% 4/21/2026 (d)(e) | | 4.48 | 1,000,000 | 1,000,000 |
| Federal Farm Credit Banks Funding Corp U.S. SOFR Index + 0.11%, 4.48% 6/24/2026 (d)(e) | | 4.48 | 2,000,000 | 2,000,000 |
| Federal Farm Credit Banks Funding Corp U.S. SOFR Index + 0.115%, 4.485% 6/16/2026 (d)(e) | | 4.48 | 3,000,000 | 3,000,000 |
| Federal Farm Credit Banks Funding Corp U.S. SOFR Index + 0.115%, 4.485% 7/8/2026 (d)(e) | | 4.48 | 6,000,000 | 6,000,000 |
| Federal Farm Credit Banks Funding Corp U.S. SOFR Index + 0.12%, 4.49% 3/12/2026 (d)(e) | | 4.49 | 1,000,000 | 999,977 |
| Federal Farm Credit Banks Funding Corp U.S. SOFR Index + 0.12%, 4.49% 4/15/2025 (d)(e) | | 4.49 | 3,000,000 | 3,000,000 |
| Federal Farm Credit Banks Funding Corp U.S. SOFR Index + 0.12%, 4.49% 5/26/2026 (d)(e) | | 4.49 | 2,000,000 | 2,000,000 |
| Federal Farm Credit Banks Funding Corp U.S. SOFR Index + 0.12%, 4.49% 5/8/2026 (d)(e) | | 4.49 | 13,000,000 | 13,001,367 |
| Federal Farm Credit Banks Funding Corp U.S. SOFR Index + 0.12%, 4.49% 6/20/2025 (d)(e) | | 4.49 | 1,000,000 | 1,000,000 |
| Federal Farm Credit Banks Funding Corp U.S. SOFR Index + 0.12%, 4.49% 7/10/2026 (d)(e) | | 4.49 | 3,000,000 | 3,000,000 |
| Federal Farm Credit Banks Funding Corp U.S. SOFR Index + 0.12%, 4.49% 7/15/2026 (d)(e) | | 4.49 | 14,000,000 | 14,000,557 |
| Federal Farm Credit Banks Funding Corp U.S. SOFR Index + 0.12%, 4.49% 7/23/2026 (d)(e) | | 4.49 | 3,000,000 | 3,000,000 |
| Federal Farm Credit Banks Funding Corp U.S. SOFR Index + 0.125%, 0% 10/6/2026 (d)(e) | | 4.44 | 1,000,000 | 1,000,000 |
| Federal Farm Credit Banks Funding Corp U.S. SOFR Index + 0.125%, 4.495% 10/21/2025 (d)(e) | | 4.50 | 1,000,000 | 999,959 |
| Federal Farm Credit Banks Funding Corp U.S. SOFR Index + 0.125%, 4.495% 2/4/2025 (d)(e) | | 4.49 | 3,000,000 | 3,000,211 |
| Federal Farm Credit Banks Funding Corp U.S. SOFR Index + 0.125%, 4.495% 3/5/2025 (d)(e) | | 4.49 | 9,000,000 | 9,000,000 |
| Federal Farm Credit Banks Funding Corp U.S. SOFR Index + 0.125%, 4.495% 3/5/2026 (d)(e) | | 4.49 | 1,000,000 | 1,000,151 |
| Federal Farm Credit Banks Funding Corp U.S. SOFR Index + 0.125%, 4.495% 5/20/2025 (d)(e) | | 4.50 | 2,000,000 | 1,999,963 |
| Federal Farm Credit Banks Funding Corp U.S. SOFR Index + 0.125%, 4.495% 7/21/2026 (d)(e) | | 4.50 | 1,000,000 | 1,000,000 |
| Federal Farm Credit Banks Funding Corp U.S. SOFR Index + 0.125%, 4.495% 8/27/2026 (d)(e) | | 4.49 | 3,000,000 | 3,000,000 |
| Federal Farm Credit Banks Funding Corp U.S. SOFR Index + 0.125%, 4.495% 9/8/2026 (d)(e) | | 4.50 | 1,000,000 | 1,000,000 |
| Federal Farm Credit Banks Funding Corp U.S. SOFR Index + 0.13%, 4.5% 1/28/2025 (d)(e) | | 4.50 | 2,000,000 | 2,000,000 |
| Federal Farm Credit Banks Funding Corp U.S. SOFR Index + 0.13%, 4.5% 2/20/2026 (d)(e) | | 4.50 | 3,000,000 | 3,000,976 |
| Federal Farm Credit Banks Funding Corp U.S. SOFR Index + 0.13%, 4.5% 3/20/2025 (d)(e) | | 4.50 | 5,000,000 | 5,000,000 |
| Federal Farm Credit Banks Funding Corp U.S. SOFR Index + 0.13%, 4.5% 4/3/2025 (d)(e) | | 4.50 | 5,000,000 | 5,000,222 |
| Federal Farm Credit Banks Funding Corp U.S. SOFR Index + 0.13%, 4.5% 6/24/2026 (d)(e) | | 4.50 | 4,000,000 | 4,000,000 |
| Federal Farm Credit Banks Funding Corp U.S. SOFR Index + 0.13%, 4.5% 6/26/2026 (d)(e) | | 4.50 | 2,000,000 | 2,000,000 |
| Federal Farm Credit Banks Funding Corp U.S. SOFR Index + 0.13%, 4.5% 7/29/2026 (d)(e) | | 4.50 | 3,000,000 | 3,000,000 |
| Federal Farm Credit Banks Funding Corp U.S. SOFR Index + 0.13%, 4.5% 8/12/2026 (d)(e) | | 4.50 | 4,000,000 | 4,000,000 |
| Federal Farm Credit Banks Funding Corp U.S. SOFR Index + 0.13%, 4.5% 8/28/2026 (d)(e) | | 4.50 | 2,000,000 | 2,000,000 |
| Federal Farm Credit Banks Funding Corp U.S. SOFR Index + 0.13%, 4.5% 8/6/2026 (d)(e) | | 4.50 | 4,000,000 | 4,000,000 |
| Federal Farm Credit Banks Funding Corp U.S. SOFR Index + 0.13%, 4.59% 7/2/2026 (d)(e) | | 4.59 | 6,000,000 | 6,000,333 |
| Federal Farm Credit Banks Funding Corp U.S. SOFR Index + 0.135%, 4.505% 11/18/2026 (d)(e) | | 4.51 | 1,000,000 | 999,980 |
| Federal Farm Credit Banks Funding Corp U.S. SOFR Index + 0.135%, 4.505% 11/23/2026 (d)(e) | | 4.51 | 4,000,000 | 4,000,000 |
| Federal Farm Credit Banks Funding Corp U.S. SOFR Index + 0.135%, 4.505% 4/29/2025 (d)(e) | | 4.51 | 5,000,000 | 5,000,000 |
| Federal Farm Credit Banks Funding Corp U.S. SOFR Index + 0.135%, 4.505% 8/19/2026 (d)(e) | | 4.51 | 7,000,000 | 7,000,000 |
| Federal Farm Credit Banks Funding Corp U.S. SOFR Index + 0.14%, 4.51% 1/30/2026 (d)(e) | | 4.51 | 2,000,000 | 2,000,000 |
| Federal Farm Credit Banks Funding Corp U.S. SOFR Index + 0.14%, 4.51% 10/23/2026 (d)(e) | | 4.51 | 3,000,000 | 3,000,000 |
| Federal Farm Credit Banks Funding Corp U.S. SOFR Index + 0.14%, 4.51% 10/9/2026 (d)(e) | | 4.51 | 26,000,000 | 26,005,984 |
| Federal Farm Credit Banks Funding Corp U.S. SOFR Index + 0.14%, 4.51% 11/25/2026 (d)(e) | | 4.51 | 2,000,000 | 2,000,000 |
| Federal Farm Credit Banks Funding Corp U.S. SOFR Index + 0.14%, 4.51% 11/4/2026 (d)(e) | | 4.51 | 2,000,000 | 2,000,000 |
| Federal Farm Credit Banks Funding Corp U.S. SOFR Index + 0.14%, 4.51% 12/2/2026 (d)(e) | | 4.51 | 2,000,000 | 2,000,000 |
| Federal Farm Credit Banks Funding Corp U.S. SOFR Index + 0.14%, 4.51% 12/30/2026 (d)(e) | | 4.51 | 3,000,000 | 3,000,000 |
| Federal Farm Credit Banks Funding Corp U.S. SOFR Index + 0.14%, 4.51% 2/26/2025 (d)(e) | | 4.51 | 4,000,000 | 4,000,064 |
| Federal Farm Credit Banks Funding Corp U.S. SOFR Index + 0.14%, 4.51% 5/27/2025 (d)(e) | | 4.51 | 6,000,000 | 6,000,000 |
| Federal Farm Credit Banks Funding Corp U.S. SOFR Index + 0.14%, 4.51% 6/24/2025 (d)(e) | | 4.51 | 4,000,000 | 4,000,000 |
| Federal Farm Credit Banks Funding Corp U.S. SOFR Index + 0.14%, 4.51% 8/22/2025 (d)(e) | | 4.51 | 6,000,000 | 6,000,136 |
| Federal Farm Credit Banks Funding Corp U.S. SOFR Index + 0.14%, 4.51% 8/26/2026 (d)(e) | | 4.51 | 4,000,000 | 4,000,000 |
| Federal Farm Credit Banks Funding Corp U.S. SOFR Index + 0.14%, 4.51% 9/3/2026 (d)(e) | | 4.51 | 4,000,000 | 4,000,000 |
| Federal Farm Credit Banks Funding Corp U.S. SOFR Index + 0.14%, 4.51% 9/4/2026 (d)(e) | | 4.51 | 2,000,000 | 2,000,000 |
| Federal Farm Credit Banks Funding Corp U.S. SOFR Index + 0.14%, 4.51% 9/9/2026 (d)(e) | | 4.51 | 1,000,000 | 1,000,000 |
| Federal Farm Credit Banks Funding Corp U.S. SOFR Index + 0.145%, 4.515% 1/12/2026 (d)(e) | | 4.51 to 4.52 | 9,000,000 | 9,001,604 |
| Federal Farm Credit Banks Funding Corp U.S. SOFR Index + 0.145%, 4.515% 12/16/2026 (d)(e) | | 4.52 | 3,000,000 | 3,000,000 |
| Federal Farm Credit Banks Funding Corp U.S. SOFR Index + 0.145%, 4.515% 6/27/2025 (d)(e) | | 4.51 to 4.52 | 9,000,000 | 9,002,262 |
| Federal Farm Credit Banks Funding Corp U.S. SOFR Index + 0.145%, 4.515% 7/10/2025 (d)(e) | | 4.52 | 5,000,000 | 5,000,000 |
| Federal Farm Credit Banks Funding Corp U.S. SOFR Index + 0.145%, 4.515% 7/17/2025 (d)(e) | | 4.52 | 3,000,000 | 3,000,000 |
| Federal Farm Credit Banks Funding Corp U.S. SOFR Index + 0.145%, 4.515% 7/25/2025 (d)(e) | | 4.52 | 9,000,000 | 9,000,000 |
| Federal Farm Credit Banks Funding Corp U.S. SOFR Index + 0.145%, 4.515% 7/30/2025 (d)(e) | | 4.52 | 1,000,000 | 1,000,000 |
| Federal Farm Credit Banks Funding Corp U.S. SOFR Index + 0.15%, 4.52% 1/3/2025 (d)(e) | | 4.52 | 2,000,000 | 2,000,000 |
| Federal Farm Credit Banks Funding Corp U.S. SOFR Index + 0.15%, 4.52% 11/27/2026 (d)(e) | | 4.52 | 6,000,000 | 6,000,000 |
| Federal Farm Credit Banks Funding Corp U.S. SOFR Index + 0.15%, 4.52% 12/15/2025 (d)(e) | | 4.52 | 4,000,000 | 3,999,994 |
| Federal Farm Credit Banks Funding Corp U.S. SOFR Index + 0.15%, 4.52% 12/23/2026 (d)(e) | | 4.52 | 3,000,000 | 3,000,000 |
| Federal Farm Credit Banks Funding Corp U.S. SOFR Index + 0.15%, 4.52% 12/4/2026 (d)(e) | | 4.52 | 2,000,000 | 2,000,000 |
| Federal Farm Credit Banks Funding Corp U.S. SOFR Index + 0.15%, 4.52% 5/27/2025 (d)(e) | | 4.52 | 2,000,000 | 2,000,000 |
| Federal Farm Credit Banks Funding Corp U.S. SOFR Index + 0.155%, 4.525% 1/23/2026 (d)(e) | | 4.52 | 2,000,000 | 2,000,000 |
| Federal Farm Credit Banks Funding Corp U.S. SOFR Index + 0.155%, 4.525% 10/6/2025 (d)(e) | | 4.53 | 1,000,000 | 999,964 |
| Federal Farm Credit Banks Funding Corp U.S. SOFR Index + 0.155%, 4.525% 11/14/2025 (d)(e) | | 4.52 | 5,000,000 | 5,000,317 |
| Federal Farm Credit Banks Funding Corp U.S. SOFR Index + 0.155%, 4.525% 11/28/2025 (d)(e) | | 4.52 | 8,000,000 | 8,000,281 |
| Federal Farm Credit Banks Funding Corp U.S. SOFR Index + 0.155%, 4.525% 12/1/2025 (d)(e) | | 4.52 | 6,000,000 | 6,000,091 |
| Federal Farm Credit Banks Funding Corp U.S. SOFR Index + 0.155%, 4.525% 2/10/2025 (d)(e) | | 4.52 | 4,000,000 | 4,000,000 |
| Federal Farm Credit Banks Funding Corp U.S. SOFR Index + 0.155%, 4.525% 7/17/2025 (d)(e) | | 4.53 | 3,000,000 | 2,999,923 |
| Federal Farm Credit Banks Funding Corp U.S. SOFR Index + 0.155%, 4.525% 8/28/2025 (d)(e) | | 4.52 | 2,000,000 | 2,000,000 |
| Federal Farm Credit Banks Funding Corp U.S. SOFR Index + 0.155%, 4.525% 9/15/2025 (d)(e) | | 4.52 to 4.53 | 4,542,000 | 4,542,266 |
| Federal Farm Credit Banks Funding Corp U.S. SOFR Index + 0.155%, 4.525% 9/25/2025 (d)(e) | | 4.52 | 1,000,000 | 1,000,653 |
| Federal Farm Credit Banks Funding Corp U.S. SOFR Index + 0.16%, 4.53% 10/17/2025 (d)(e) | | 4.53 | 1,000,000 | 1,000,000 |
| Federal Farm Credit Banks Funding Corp U.S. SOFR Index + 0.16%, 4.53% 10/27/2025 (d)(e) | | 4.53 | 2,000,000 | 2,000,136 |
| Federal Farm Credit Banks Funding Corp U.S. SOFR Index + 0.16%, 4.53% 10/6/2025 (d)(e) | | 4.53 | 2,000,000 | 2,000,000 |
| Federal Farm Credit Banks Funding Corp U.S. SOFR Index + 0.16%, 4.53% 11/3/2025 (d)(e) | | 4.53 | 4,000,000 | 4,000,278 |
| Federal Farm Credit Banks Funding Corp U.S. SOFR Index + 0.16%, 4.53% 7/7/2025 (d)(e) | | 4.53 | 1,000,000 | 1,000,109 |
| Federal Farm Credit Banks Funding Corp U.S. SOFR Index + 0.17%, 4.54% 10/23/2025 (d)(e) | | 4.54 | 1,000,000 | 999,995 |
| Federal Farm Credit Banks Funding Corp U.S. SOFR Index + 0.18%, 4.55% 1/3/2025 (d)(e) | | 4.54 | 1,000,000 | 1,000,008 |
| Federal Farm Credit Banks Funding Corp U.S. SOFR Index + 0.18%, 4.55% 3/7/2025 (d)(e) | | 4.54 | 6,000,000 | 6,001,333 |
| Federal Home Loan Bank 4.375% 7/8/2025 | | 4.51 | 21,000,000 | 20,986,262 |
| Federal Home Loan Bank 4.41% 4/9/2025 | | 4.46 | 13,000,000 | 12,998,313 |
| Federal Home Loan Bank 4.44% 3/21/2025 | | 4.48 | 10,000,000 | 9,999,133 |
| Federal Home Loan Bank 4.45% 3/24/2025 | | 4.48 | 7,000,000 | 6,999,500 |
| Federal Home Loan Bank 4.47% 3/10/2025 | | 4.50 | 29,000,000 | 28,998,140 |
| Federal Home Loan Bank 4.47% 3/11/2025 | | 4.50 | 5,000,000 | 4,999,675 |
| Federal Home Loan Bank 4.47% 3/18/2025 | | 4.49 | 5,000,000 | 4,999,771 |
| Federal Home Loan Bank 4.5% 10/8/2025 | | 4.53 | 12,000,000 | 11,997,008 |
| Federal Home Loan Bank 4.5% 11/10/2025 | | 4.53 | 10,000,000 | 9,997,866 |
| Federal Home Loan Bank 4.5% 12/22/2025 | | 4.51 | 49,000,000 | 48,991,125 |
| Federal Home Loan Bank 4.625% 3/3/2025 | | 4.89 | 18,000,000 | 17,992,169 |
| Federal Home Loan Bank 4.81% 1/10/2025 | | 4.92 | 1,000,000 | 999,974 |
| Federal Home Loan Bank 4.84% 1/3/2025 | | 4.87 | 25,000,000 | 24,999,964 |
| Federal Home Loan Bank 4.92% 1/14/2025 | | 4.94 | 10,000,000 | 9,999,943 |
| Federal Home Loan Bank 5% 2/20/2025 | | 5.09 | 5,000,000 | 4,999,424 |
| Federal Home Loan Bank 5.05% 2/10/2025 | | 5.09 | 11,000,000 | 10,999,611 |
| Federal Home Loan Bank 5.05% 2/18/2025 | | 5.08 | 16,000,000 | 15,999,397 |
| Federal Home Loan Bank 5.06% 2/25/2025 | | 5.09 | 11,000,000 | 10,999,526 |
| Federal Home Loan Bank 5.06% 2/25/2025 | | 5.09 | 11,000,000 | 10,999,526 |
| Federal Home Loan Bank 5.06% 2/26/2025 | | 5.08 | 18,000,000 | 17,999,505 |
| Federal Home Loan Bank 5.06% 2/26/2025 | | 5.09 | 11,000,000 | 10,999,530 |
| Federal Home Loan Bank 5.07% 2/25/2025 | | 5.10 | 11,000,000 | 10,999,521 |
| Federal Home Loan Bank 5.08% 2/26/2025 | | 5.10 | 4,000,000 | 3,999,886 |
| Federal Home Loan Bank 5.21% 4/10/2025 | | 5.22 | 18,000,000 | 17,999,558 |
| Federal Home Loan Bank Discount Notes 0% 1/15/2025 | | 4.59 | 9,000,000 | 8,984,110 |
| Federal Home Loan Bank Discount Notes 0% 1/16/2025 | | 5.08 | 22,000,000 | 21,955,542 |
| Federal Home Loan Bank Discount Notes 0% 1/17/2025 | | 4.59 | 4,000,000 | 3,991,929 |
| Federal Home Loan Bank Discount Notes 0% 1/2/2025 | | 4.57 | 3,000,000 | 2,999,622 |
| Federal Home Loan Bank Discount Notes 0% 1/22/2025 | | 4.55 to 4.58 | 13,000,000 | 12,965,674 |
| Federal Home Loan Bank Discount Notes 0% 1/29/2025 | | 4.56 to 4.58 | 21,000,000 | 20,926,197 |
| Federal Home Loan Bank Discount Notes 0% 1/3/2025 | | 4.65 | 3,000,000 | 2,999,234 |
| Federal Home Loan Bank Discount Notes 0% 2/19/2025 | | 4.31 | 1,000,000 | 994,173 |
| Federal Home Loan Bank Discount Notes 0% 2/21/2025 | | 4.49 to 4.53 | 13,000,000 | 12,918,188 |
| Federal Home Loan Bank Discount Notes 0% 2/24/2025 | | 4.48 | 1,000,000 | 993,392 |
| Federal Home Loan Bank Discount Notes 0% 2/26/2025 | | 4.49 | 5,000,000 | 4,965,467 |
| Federal Home Loan Bank Discount Notes 0% 2/28/2025 | | 4.48 | 2,000,000 | 1,985,805 |
| Federal Home Loan Bank Discount Notes 0% 2/7/2025 | | 4.51 | 14,000,000 | 13,935,898 |
| Federal Home Loan Bank Discount Notes 0% 3/14/2025 | | 4.45 to 4.47 | 12,000,000 | 11,894,870 |
| Federal Home Loan Bank Discount Notes 0% 3/19/2025 | | 4.46 | 10,000,000 | 9,906,317 |
| Federal Home Loan Bank Discount Notes 0% 3/21/2025 | | 4.32 to 4.44 | 13,000,000 | 12,875,860 |
| Federal Home Loan Bank Discount Notes 0% 3/7/2025 | | 4.41 to 4.47 | 6,000,000 | 5,952,640 |
| Federal Home Loan Bank Discount Notes 0% 4/10/2025 | | 4.42 | 3,000,000 | 2,964,319 |
| Federal Home Loan Bank Discount Notes 0% 4/2/2025 | | 4.41 | 9,000,000 | 8,901,720 |
| Federal Home Loan Bank Discount Notes 0% 4/25/2025 | | 4.39 | 12,000,000 | 11,836,980 |
| Federal Home Loan Bank Discount Notes 0% 4/28/2025 | | 4.38 | 5,000,000 | 4,930,450 |
| Federal Home Loan Bank Discount Notes 0% 4/4/2025 | | 4.41 to 4.43 | 11,000,000 | 10,876,736 |
| Federal Home Loan Bank Discount Notes 0% 5/2/2025 | | 4.37 | 11,000,000 | 10,842,129 |
| Federal Home Loan Bank Discount Notes 0% 5/9/2025 | | 4.40 | 10,000,000 | 9,847,289 |
| Federal Home Loan Bank U.S. SOFR Index + 0%, 4.37% 1/28/2025 (d)(e) | | 4.37 | 14,000,000 | 14,000,000 |
| Federal Home Loan Bank U.S. SOFR Index + 0%, 4.37% 1/29/2025 (d)(e) | | 4.37 | 24,000,000 | 24,000,000 |
| Federal Home Loan Bank U.S. SOFR Index + 0%, 4.37% 1/30/2025 (d)(e) | | 4.37 | 31,000,000 | 31,000,000 |
| Federal Home Loan Bank U.S. SOFR Index + 0%, 4.37% 1/30/2025 (d)(e) | | 4.37 | 3,000,000 | 3,000,000 |
| Federal Home Loan Bank U.S. SOFR Index + 0%, 4.37% 2/7/2025 (d)(e) | | 4.37 | 8,000,000 | 8,000,000 |
| Federal Home Loan Bank U.S. SOFR Index + 0%, 4.37% 5/13/2025 (d)(e) | | 4.37 | 5,000,000 | 5,000,000 |
| Federal Home Loan Bank U.S. SOFR Index + 0%, 4.37% 5/14/2025 (d)(e) | | 4.37 | 11,000,000 | 11,000,000 |
| Federal Home Loan Bank U.S. SOFR Index + 0%, 4.37% 5/19/2025 (d)(e) | | 4.37 | 15,000,000 | 15,000,000 |
| Federal Home Loan Bank U.S. SOFR Index + 0%, 4.37% 5/22/2025 (d)(e) | | 4.37 | 5,000,000 | 5,000,000 |
| Federal Home Loan Bank U.S. SOFR Index + 0%, 4.37% 5/27/2025 (d)(e) | | 4.37 | 2,000,000 | 2,000,000 |
| Federal Home Loan Bank U.S. SOFR Index + 0%, 4.37% 5/28/2025 (d)(e) | | 4.37 | 5,000,000 | 5,000,000 |
| Federal Home Loan Bank U.S. SOFR Index + 0.005%, 4.375% 1/13/2025 (d)(e) | | 4.38 | 5,000,000 | 5,000,000 |
| Federal Home Loan Bank U.S. SOFR Index + 0.005%, 4.375% 1/13/2025 (d)(e) | | 4.38 | 17,000,000 | 17,000,000 |
| Federal Home Loan Bank U.S. SOFR Index + 0.005%, 4.375% 1/21/2025 (d)(e) | | 4.38 | 5,000,000 | 5,000,000 |
| Federal Home Loan Bank U.S. SOFR Index + 0.005%, 4.375% 2/4/2025 (d)(e) | | 4.38 | 4,000,000 | 4,000,000 |
| Federal Home Loan Bank U.S. SOFR Index + 0.005%, 4.375% 3/3/2025 (d)(e) | | 4.38 | 11,000,000 | 11,000,000 |
| Federal Home Loan Bank U.S. SOFR Index + 0.005%, 4.375% 3/5/2025 (d)(e) | | 4.38 | 3,000,000 | 3,000,000 |
| Federal Home Loan Bank U.S. SOFR Index + 0.005%, 4.375% 3/7/2025 (d)(e) | | 4.38 | 8,000,000 | 8,000,000 |
| Federal Home Loan Bank U.S. SOFR Index + 0.005%, 4.375% 4/21/2025 (d)(e) | | 4.38 | 3,000,000 | 3,000,000 |
| Federal Home Loan Bank U.S. SOFR Index + 0.005%, 4.375% 4/28/2025 (d)(e) | | 4.38 | 8,000,000 | 8,000,000 |
| Federal Home Loan Bank U.S. SOFR Index + 0.005%, 4.375% 4/30/2025 (d)(e) | | 4.38 | 4,000,000 | 4,000,000 |
| Federal Home Loan Bank U.S. SOFR Index + 0.005%, 4.375% 5/1/2025 (d)(e) | | 4.38 | 4,000,000 | 4,000,000 |
| Federal Home Loan Bank U.S. SOFR Index + 0.005%, 4.375% 5/12/2025 (d)(e) | | 4.38 | 5,000,000 | 5,000,000 |
| Federal Home Loan Bank U.S. SOFR Index + 0.005%, 4.375% 5/5/2025 (d)(e) | | 4.38 | 8,000,000 | 8,000,000 |
| Federal Home Loan Bank U.S. SOFR Index + 0.005%, 4.375% 5/5/2025 (d)(e) | | 4.38 | 5,000,000 | 5,000,000 |
| Federal Home Loan Bank U.S. SOFR Index + 0.005%, 4.375% 5/7/2025 (d)(e) | | 4.38 | 11,000,000 | 11,000,000 |
| Federal Home Loan Bank U.S. SOFR Index + 0.005%, 4.375% 6/11/2025 (d)(e) | | 4.38 | 4,000,000 | 4,000,000 |
| Federal Home Loan Bank U.S. SOFR Index + 0.005%, 4.375% 6/11/2025 (d)(e) | | 4.38 | 3,000,000 | 3,000,000 |
| Federal Home Loan Bank U.S. SOFR Index + 0.005%, 4.375% 6/12/2025 (d)(e) | | 4.38 | 5,000,000 | 5,000,000 |
| Federal Home Loan Bank U.S. SOFR Index + 0.005%, 4.375% 6/16/2025 (d)(e) | | 4.38 | 13,000,000 | 13,000,000 |
| Federal Home Loan Bank U.S. SOFR Index + 0.005%, 4.375% 6/17/2025 (d)(e) | | 4.38 | 11,000,000 | 11,000,000 |
| Federal Home Loan Bank U.S. SOFR Index + 0.005%, 4.375% 6/23/2025 (d)(e) | | 4.38 | 5,000,000 | 5,000,000 |
| Federal Home Loan Bank U.S. SOFR Index + 0.005%, 4.375% 6/24/2025 (d)(e) | | 4.38 | 8,000,000 | 8,000,000 |
| Federal Home Loan Bank U.S. SOFR Index + 0.01%, 4.38% 1/10/2025 (d)(e) | | 4.38 | 4,000,000 | 4,000,000 |
| Federal Home Loan Bank U.S. SOFR Index + 0.01%, 4.38% 1/8/2025 (d)(e) | | 4.38 | 5,000,000 | 5,000,000 |
| Federal Home Loan Bank U.S. SOFR Index + 0.01%, 4.38% 3/5/2025 (d)(e) | | 4.38 | 11,000,000 | 11,000,000 |
| Federal Home Loan Bank U.S. SOFR Index + 0.01%, 4.38% 4/3/2025 (d)(e) | | 4.38 | 8,000,000 | 8,000,000 |
| Federal Home Loan Bank U.S. SOFR Index + 0.01%, 4.38% 4/9/2025 (d)(e) | | 4.38 | 11,000,000 | 11,000,000 |
| Federal Home Loan Bank U.S. SOFR Index + 0.01%, 4.38% 5/22/2025 (d)(e) | | 4.38 | 3,000,000 | 3,000,000 |
| Federal Home Loan Bank U.S. SOFR Index + 0.01%, 4.38% 5/23/2025 (d)(e) | | 4.38 | 6,000,000 | 6,000,000 |
| Federal Home Loan Bank U.S. SOFR Index + 0.01%, 4.38% 6/11/2025 (d)(e) | | 4.38 | 6,000,000 | 6,000,000 |
| Federal Home Loan Bank U.S. SOFR Index + 0.01%, 4.38% 6/11/2025 (d)(e) | | 4.38 | 10,000,000 | 10,000,000 |
| Federal Home Loan Bank U.S. SOFR Index + 0.01%, 4.38% 6/13/2025 (d)(e) | | 4.38 | 3,000,000 | 3,000,000 |
| Federal Home Loan Bank U.S. SOFR Index + 0.01%, 4.38% 6/18/2025 (d)(e) | | 4.38 | 3,000,000 | 3,000,000 |
| Federal Home Loan Bank U.S. SOFR Index + 0.01%, 4.38% 6/3/2025 (d)(e) | | 4.38 | 8,000,000 | 8,000,000 |
| Federal Home Loan Bank U.S. SOFR Index + 0.01%, 4.38% 6/5/2025 (d)(e) | | 4.38 | 8,000,000 | 8,000,000 |
| Federal Home Loan Bank U.S. SOFR Index + 0.01%, 4.38% 6/9/2025 (d)(e) | | 4.38 | 16,000,000 | 16,000,000 |
| Federal Home Loan Bank U.S. SOFR Index + 0.01%, 4.38% 7/28/2025 (d)(e) | | 4.38 | 9,000,000 | 9,000,000 |
| Federal Home Loan Bank U.S. SOFR Index + 0.015%, 4.385% 1/6/2025 (d)(e) | | 4.39 | 8,000,000 | 8,000,000 |
| Federal Home Loan Bank U.S. SOFR Index + 0.015%, 4.385% 1/6/2025 (d)(e) | | 4.39 | 10,000,000 | 10,000,000 |
| Federal Home Loan Bank U.S. SOFR Index + 0.015%, 4.385% 2/10/2025 (d)(e) | | 4.39 | 3,000,000 | 3,000,000 |
| Federal Home Loan Bank U.S. SOFR Index + 0.015%, 4.385% 2/10/2025 (d)(e) | | 4.39 | 3,000,000 | 3,000,000 |
| Federal Home Loan Bank U.S. SOFR Index + 0.015%, 4.385% 2/14/2025 (d)(e) | | 4.39 | 3,000,000 | 3,000,000 |
| Federal Home Loan Bank U.S. SOFR Index + 0.015%, 4.385% 2/6/2025 (d)(e) | | 4.39 | 6,000,000 | 6,000,000 |
| Federal Home Loan Bank U.S. SOFR Index + 0.015%, 4.385% 2/7/2025 (d)(e) | | 4.39 | 11,000,000 | 11,000,000 |
| Federal Home Loan Bank U.S. SOFR Index + 0.015%, 4.385% 4/30/2025 (d)(e) | | 4.39 | 5,000,000 | 5,000,000 |
| Federal Home Loan Bank U.S. SOFR Index + 0.015%, 4.385% 4/4/2025 (d)(e) | | 4.39 | 9,000,000 | 9,000,000 |
| Federal Home Loan Bank U.S. SOFR Index + 0.015%, 4.385% 5/23/2025 (d)(e) | | 4.39 | 5,000,000 | 5,000,000 |
| Federal Home Loan Bank U.S. SOFR Index + 0.015%, 4.385% 5/8/2025 (d)(e) | | 4.39 | 12,000,000 | 12,000,000 |
| Federal Home Loan Bank U.S. SOFR Index + 0.015%, 4.385% 6/2/2025 (d)(e) | | 4.39 | 3,000,000 | 3,000,000 |
| Federal Home Loan Bank U.S. SOFR Index + 0.015%, 4.385% 6/23/2025 (d)(e) | | 4.39 | 8,000,000 | 8,000,000 |
| Federal Home Loan Bank U.S. SOFR Index + 0.015%, 4.385% 7/18/2025 (d)(e) | | 4.39 | 3,000,000 | 3,000,000 |
| Federal Home Loan Bank U.S. SOFR Index + 0.015%, 4.385% 7/3/2025 (d)(e) | | 4.39 | 10,000,000 | 10,000,000 |
| Federal Home Loan Bank U.S. SOFR Index + 0.015%, 4.385% 7/7/2025 (d)(e) | | 4.39 | 8,000,000 | 8,000,000 |
| Federal Home Loan Bank U.S. SOFR Index + 0.015%, 4.385% 8/27/2025 (d)(e) | | 4.39 | 2,000,000 | 2,000,000 |
| Federal Home Loan Bank U.S. SOFR Index + 0.02%, 4.39% 3/10/2025 (d)(e) | | 4.39 | 4,000,000 | 4,000,000 |
| Federal Home Loan Bank U.S. SOFR Index + 0.02%, 4.39% 3/11/2025 (d)(e) | | 4.39 | 3,000,000 | 3,000,000 |
| Federal Home Loan Bank U.S. SOFR Index + 0.02%, 4.39% 3/3/2025 (d)(e) | | 4.39 | 3,000,000 | 3,000,000 |
| Federal Home Loan Bank U.S. SOFR Index + 0.02%, 4.39% 3/6/2025 (d)(e) | | 4.39 | 5,000,000 | 5,000,000 |
| Federal Home Loan Bank U.S. SOFR Index + 0.02%, 4.39% 3/7/2025 (d)(e) | | 4.39 | 6,000,000 | 6,000,000 |
| Federal Home Loan Bank U.S. SOFR Index + 0.02%, 4.39% 5/5/2025 (d)(e) | | 4.39 | 15,000,000 | 15,000,000 |
| Federal Home Loan Bank U.S. SOFR Index + 0.02%, 4.39% 6/6/2025 (d)(e) | | 4.39 | 18,000,000 | 18,000,447 |
| Federal Home Loan Bank U.S. SOFR Index + 0.02%, 4.39% 6/9/2025 (d)(e) | | 4.39 | 19,000,000 | 19,000,000 |
| Federal Home Loan Bank U.S. SOFR Index + 0.02%, 4.39% 7/25/2025 (d)(e) | | 4.39 | 3,000,000 | 3,000,000 |
| Federal Home Loan Bank U.S. SOFR Index + 0.025%, 4.395% 4/9/2025 (d)(e) | | 4.39 | 3,000,000 | 3,000,000 |
| Federal Home Loan Bank U.S. SOFR Index + 0.03%, 4.4% 3/24/2025 (d)(e) | | 4.40 | 2,000,000 | 2,000,000 |
| Federal Home Loan Bank U.S. SOFR Index + 0.03%, 4.4% 3/24/2025 (d)(e) | | 4.40 | 3,000,000 | 3,000,000 |
| Federal Home Loan Bank U.S. SOFR Index + 0.03%, 4.4% 3/26/2025 (d)(e) | | 4.40 | 4,000,000 | 4,000,000 |
| Federal Home Loan Bank U.S. SOFR Index + 0.03%, 4.4% 3/27/2025 (d)(e) | | 4.40 | 5,000,000 | 5,000,000 |
| Federal Home Loan Bank U.S. SOFR Index + 0.03%, 4.4% 3/28/2025 (d)(e) | | 4.40 | 3,000,000 | 3,000,000 |
| Federal Home Loan Bank U.S. SOFR Index + 0.03%, 4.4% 4/4/2025 (d)(e) | | 4.40 | 19,000,000 | 19,000,000 |
| Federal Home Loan Bank U.S. SOFR Index + 0.03%, 4.4% 4/4/2025 (d)(e) | | 4.40 | 8,000,000 | 8,000,000 |
| Federal Home Loan Bank U.S. SOFR Index + 0.04%, 4.41% 5/19/2025 (d)(e) | | 4.41 | 11,000,000 | 11,000,000 |
| Federal Home Loan Bank U.S. SOFR Index + 0.04%, 4.41% 5/20/2025 (d)(e) | | 4.41 | 12,000,000 | 12,000,000 |
| Federal Home Loan Bank U.S. SOFR Index + 0.04%, 4.41% 5/22/2025 (d)(e) | | 4.41 | 9,000,000 | 9,000,000 |
| Federal Home Loan Bank U.S. SOFR Index + 0.04%, 4.41% 5/23/2025 (d)(e) | | 4.41 | 2,000,000 | 2,000,000 |
| Federal Home Loan Bank U.S. SOFR Index + 0.04%, 4.41% 8/5/2025 (d)(e) | | 4.41 | 11,000,000 | 11,000,000 |
| Federal Home Loan Bank U.S. SOFR Index + 0.04%, 4.41% 8/6/2025 (d)(e) | | 4.41 | 9,000,000 | 9,000,000 |
| Federal Home Loan Bank U.S. SOFR Index + 0.05%, 4.42% 2/5/2025 (d)(e) | | 4.42 | 21,000,000 | 21,000,000 |
| Federal Home Loan Bank U.S. SOFR Index + 0.05%, 4.42% 8/8/2025 (d)(e) | | 4.42 | 13,000,000 | 13,000,000 |
| Federal Home Loan Bank U.S. SOFR Index + 0.06%, 4.43% 8/19/2025 (d)(e) | | 4.43 | 16,000,000 | 16,000,000 |
| Federal Home Loan Bank U.S. SOFR Index + 0.06%, 4.43% 8/21/2025 (d)(e) | | 4.43 | 16,000,000 | 16,000,000 |
| Federal Home Loan Bank U.S. SOFR Index + 0.07%, 4.44% 11/28/2025 (d)(e) | | 4.44 | 5,000,000 | 5,000,000 |
| Federal Home Loan Bank U.S. SOFR Index + 0.075%, 4.445% 9/19/2025 (d)(e) | | 4.45 | 1,000,000 | 999,919 |
| Federal Home Loan Bank U.S. SOFR Index + 0.08%, 4.45% 2/27/2026 (d)(e) | | 4.45 | 5,000,000 | 5,000,000 |
| Federal Home Loan Bank U.S. SOFR Index + 0.085%, 4.455% 1/2/2026 (d)(e) | | 4.45 | 5,000,000 | 5,000,583 |
| Federal Home Loan Bank U.S. SOFR Index + 0.085%, 4.455% 7/16/2025 (d)(e) | | 4.45 | 4,000,000 | 4,000,431 |
| Federal Home Loan Bank U.S. SOFR Index + 0.09%, 4.46% 1/12/2026 (d)(e) | | 4.46 | 5,000,000 | 5,000,000 |
| Federal Home Loan Bank U.S. SOFR Index + 0.09%, 4.46% 1/16/2026 (d)(e) | | 4.46 | 3,000,000 | 3,000,000 |
| Federal Home Loan Bank U.S. SOFR Index + 0.095%, 4.465% 12/23/2025 (d)(e) | | 4.47 | 8,000,000 | 8,000,000 |
| Federal Home Loan Bank U.S. SOFR Index + 0.095%, 4.465% 4/1/2025 (d)(e) | | 4.47 | 2,000,000 | 2,000,000 |
| Federal Home Loan Bank U.S. SOFR Index + 0.095%, 4.465% 4/1/2025 (d)(e) | | 4.47 | 1,000,000 | 1,000,000 |
| Federal Home Loan Bank U.S. SOFR Index + 0.095%, 4.465% 4/4/2025 (d)(e) | | 4.47 | 5,000,000 | 5,000,000 |
| Federal Home Loan Bank U.S. SOFR Index + 0.095%, 4.465% 9/19/2025 (d)(e) | | 4.46 | 1,000,000 | 1,000,215 |
| Federal Home Loan Bank U.S. SOFR Index + 0.095%, 4.465% 9/22/2025 (d)(e) | | 4.46 | 5,000,000 | 5,001,107 |
| Federal Home Loan Bank U.S. SOFR Index + 0.1%, 4.47% 10/16/2025 (d)(e) | | 4.47 | 3,000,000 | 3,000,735 |
| Federal Home Loan Bank U.S. SOFR Index + 0.1%, 4.47% 6/22/2026 (d)(e) | | 4.47 | 3,000,000 | 3,000,000 |
| Federal Home Loan Bank U.S. SOFR Index + 0.1%, 4.47% 6/24/2026 (d)(e) | | 4.47 | 3,000,000 | 3,000,000 |
| Federal Home Loan Bank U.S. SOFR Index + 0.1%, 4.47% 6/25/2026 (d)(e) | | 4.47 | 3,000,000 | 3,000,000 |
| Federal Home Loan Bank U.S. SOFR Index + 0.1%, 4.47% 6/26/2026 (d)(e) | | 4.47 | 6,000,000 | 6,000,000 |
| Federal Home Loan Bank U.S. SOFR Index + 0.105%, 4.475% 2/20/2026 (d)(e) | | 4.48 | 5,000,000 | 5,000,000 |
| Federal Home Loan Bank U.S. SOFR Index + 0.11%, 4.48% 4/24/2026 (d)(e) | | 4.48 | 3,000,000 | 3,000,000 |
| Federal Home Loan Bank U.S. SOFR Index + 0.11%, 4.48% 7/17/2025 (d)(e) | | 4.48 | 2,700,000 | 2,700,000 |
| Federal Home Loan Bank U.S. SOFR Index + 0.115%, 4.485% 7/8/2025 (d)(e) | | 4.48 | 5,000,000 | 5,000,000 |
| Federal Home Loan Bank U.S. SOFR Index + 0.12%, 4.49% 5/1/2025 (d)(e) | | 4.49 | 26,000,000 | 26,007,105 |
| Federal Home Loan Bank U.S. SOFR Index + 0.125%, 4.495% 10/16/2025 (d)(e) | | 4.49 | 11,000,000 | 11,000,000 |
| Federal Home Loan Bank U.S. SOFR Index + 0.125%, 4.495% 2/20/2025 (d)(e) | | 4.49 | 3,000,000 | 3,000,000 |
| Federal Home Loan Bank U.S. SOFR Index + 0.125%, 4.495% 2/24/2025 (d)(e) | | 4.49 | 11,000,000 | 11,000,000 |
| Federal Home Loan Bank U.S. SOFR Index + 0.125%, 4.495% 2/3/2025 (d)(e) | | 4.49 | 5,000,000 | 5,000,340 |
| Federal Home Loan Bank U.S. SOFR Index + 0.125%, 4.495% 5/15/2025 (d)(e) | | 4.49 | 12,000,000 | 12,000,000 |
| Federal Home Loan Bank U.S. SOFR Index + 0.125%, 4.495% 5/19/2025 (d)(e) | | 4.49 | 6,000,000 | 6,000,000 |
| Federal Home Loan Bank U.S. SOFR Index + 0.13%, 4.5% 1/27/2025 (d)(e) | | 4.50 | 10,000,000 | 10,000,000 |
| Federal Home Loan Bank U.S. SOFR Index + 0.13%, 4.5% 10/3/2025 (d)(e) | | 4.50 | 10,000,000 | 10,004,080 |
| Federal Home Loan Bank U.S. SOFR Index + 0.13%, 4.5% 2/12/2026 (d)(e) | | 4.50 | 3,000,000 | 3,000,887 |
| Federal Home Loan Bank U.S. SOFR Index + 0.13%, 4.5% 2/20/2026 (d)(e) | | 4.50 | 3,000,000 | 3,001,055 |
| Federal Home Loan Bank U.S. SOFR Index + 0.13%, 4.5% 2/9/2026 (d)(e) | | 4.50 | 3,000,000 | 3,000,701 |
| Federal Home Loan Bank U.S. SOFR Index + 0.13%, 4.5% 3/20/2025 (d)(e) | | 4.50 | 8,000,000 | 8,000,000 |
| Federal Home Loan Bank U.S. SOFR Index + 0.13%, 4.5% 3/27/2025 (d)(e) | | 4.50 | 13,000,000 | 13,000,000 |
| Federal Home Loan Bank U.S. SOFR Index + 0.13%, 4.5% 3/28/2025 (d)(e) | | 4.50 | 2,000,000 | 2,000,000 |
| Federal Home Loan Bank U.S. SOFR Index + 0.13%, 4.5% 3/6/2025 (d)(e) | | 4.50 | 7,000,000 | 7,000,000 |
| Federal Home Loan Bank U.S. SOFR Index + 0.13%, 4.5% 4/14/2025 (d)(e) | | 4.50 | 4,000,000 | 4,000,000 |
| Federal Home Loan Bank U.S. SOFR Index + 0.13%, 4.5% 5/9/2025 (d)(e) | | 4.50 | 12,000,000 | 12,000,000 |
| Federal Home Loan Bank U.S. SOFR Index + 0.13%, 4.5% 6/18/2026 (d)(e) | | 4.50 | 8,000,000 | 8,000,000 |
| Federal Home Loan Bank U.S. SOFR Index + 0.13%, 4.5% 6/24/2026 (d)(e) | | 4.50 | 8,000,000 | 8,000,000 |
| Federal Home Loan Bank U.S. SOFR Index + 0.13%, 4.5% 6/26/2026 (d)(e) | | 4.50 | 11,000,000 | 11,000,000 |
| Federal Home Loan Bank U.S. SOFR Index + 0.135%, 4.505% 11/12/2025 (d)(e) | | 4.51 | 11,000,000 | 11,000,000 |
| Federal Home Loan Bank U.S. SOFR Index + 0.135%, 4.505% 11/14/2025 (d)(e) | | 4.51 | 9,000,000 | 9,000,000 |
| Federal Home Loan Bank U.S. SOFR Index + 0.14%, 4.51% 1/16/2026 (d)(e) | | 4.51 | 3,000,000 | 3,001,353 |
| Federal Home Loan Bank U.S. SOFR Index + 0.14%, 4.51% 4/9/2025 (d)(e) | | 4.51 | 2,000,000 | 2,000,000 |
| Federal Home Loan Bank U.S. SOFR Index + 0.14%, 4.51% 5/22/2025 (d)(e) | | 4.51 | 5,000,000 | 5,000,000 |
| Federal Home Loan Bank U.S. SOFR Index + 0.14%, 4.51% 6/17/2025 (d)(e) | | 4.51 | 2,000,000 | 2,001,224 |
| Federal Home Loan Bank U.S. SOFR Index + 0.14%, 4.51% 8/14/2025 (d)(e) | | 4.51 | 12,000,000 | 12,000,000 |
| Federal Home Loan Bank U.S. SOFR Index + 0.14%, 4.51% 8/18/2025 (d)(e) | | 4.51 | 9,000,000 | 9,000,000 |
| Federal Home Loan Bank U.S. SOFR Index + 0.14%, 4.51% 8/21/2026 (d)(e) | | 4.51 | 11,000,000 | 11,000,000 |
| Federal Home Loan Bank U.S. SOFR Index + 0.14%, 4.51% 8/25/2025 (d)(e) | | 4.51 | 6,000,000 | 6,000,271 |
| Federal Home Loan Bank U.S. SOFR Index + 0.14%, 4.51% 9/10/2026 (d)(e) | | 4.51 | 3,000,000 | 3,000,000 |
| Federal Home Loan Bank U.S. SOFR Index + 0.14%, 4.51% 9/4/2026 (d)(e) | | 4.51 | 8,000,000 | 8,000,000 |
| Federal Home Loan Bank U.S. SOFR Index + 0.145%, 4.515% 10/10/2025 (d)(e) | | 4.52 | 6,000,000 | 6,000,000 |
| Federal Home Loan Bank U.S. SOFR Index + 0.145%, 4.515% 6/27/2025 (d)(e) | | 4.52 | 13,000,000 | 13,000,000 |
| Federal Home Loan Bank U.S. SOFR Index + 0.145%, 4.515% 7/2/2025 (d)(e) | | 4.52 | 3,000,000 | 3,000,000 |
| Federal Home Loan Bank U.S. SOFR Index + 0.145%, 4.515% 7/24/2025 (d)(e) | | 4.52 | 4,000,000 | 4,000,000 |
| Federal Home Loan Bank U.S. SOFR Index + 0.145%, 4.515% 7/25/2025 (d)(e) | | 4.52 | 3,000,000 | 3,000,000 |
| Federal Home Loan Bank U.S. SOFR Index + 0.145%, 4.515% 8/4/2025 (d)(e) | | 4.52 | 3,000,000 | 3,000,000 |
| Federal Home Loan Bank U.S. SOFR Index + 0.145%, 4.515% 9/25/2026 (d)(e) | | 4.52 | 21,000,000 | 21,000,000 |
| Federal Home Loan Bank U.S. SOFR Index + 0.145%, 4.515% 9/26/2025 (d)(e) | | 4.52 | 3,000,000 | 3,000,000 |
| Federal Home Loan Bank U.S. SOFR Index + 0.145%, 4.605% 1/2/2026 (d)(e) | | 4.60 | 5,000,000 | 5,000,170 |
| Federal Home Loan Bank U.S. SOFR Index + 0.15%, 4.52% 12/8/2025 (d)(e) | | 4.52 | 3,000,000 | 2,999,981 |
| Federal Home Loan Bank U.S. SOFR Index + 0.15%, 4.52% 12/8/2025 (d)(e) | | 4.52 | 11,050,000 | 11,049,949 |
| Federal Home Loan Bank U.S. SOFR Index + 0.15%, 4.52% 5/12/2025 (d)(e) | | 4.52 | 10,000,000 | 10,000,000 |
| Federal Home Loan Bank U.S. SOFR Index + 0.15%, 4.52% 5/16/2025 (d)(e) | | 4.52 | 4,000,000 | 4,000,000 |
| Federal Home Loan Bank U.S. SOFR Index + 0.15%, 4.52% 5/19/2025 (d)(e) | | 4.52 | 10,000,000 | 10,000,000 |
| Federal Home Loan Bank U.S. SOFR Index + 0.155%, 4.525% 11/14/2025 (d)(e) | | 4.52 | 3,000,000 | 3,000,188 |
| Federal Home Loan Bank U.S. SOFR Index + 0.155%, 4.525% 11/17/2025 (d)(e) | | 4.52 | 18,000,000 | 18,000,727 |
| Federal Home Loan Bank U.S. SOFR Index + 0.155%, 4.525% 12/11/2025 (d)(e) | | 4.52 | 6,000,000 | 6,000,000 |
| Federal Home Loan Bank U.S. SOFR Index + 0.155%, 4.525% 12/8/2025 (d)(e) | | 4.52 | 5,000,000 | 5,000,179 |
| Federal Home Loan Bank U.S. SOFR Index + 0.155%, 4.525% 7/8/2025 (d)(e) | | 4.52 to 4.53 | 5,970,000 | 5,971,483 |
| Federal Home Loan Bank U.S. SOFR Index + 0.155%, 4.525% 8/21/2025 (d)(e) | | 4.52 | 7,000,000 | 7,003,631 |
| Federal Home Loan Bank U.S. SOFR Index + 0.155%, 4.525% 8/22/2025 (d)(e) | | 4.52 | 10,000,000 | 10,000,176 |
| Federal Home Loan Bank U.S. SOFR Index + 0.155%, 4.525% 8/22/2025 (d)(e) | | 4.52 | 8,000,000 | 8,001,284 |
| Federal Home Loan Bank U.S. SOFR Index + 0.155%, 4.525% 9/26/2025 (d)(e) | | 4.52 | 4,000,000 | 4,000,548 |
| Federal Home Loan Bank U.S. SOFR Index + 0.16%, 4.53% 10/14/2025 (d)(e) | | 4.53 | 14,000,000 | 14,000,000 |
| Federal Home Loan Bank U.S. SOFR Index + 0.16%, 4.53% 10/20/2025 (d)(e) | | 4.53 | 5,000,000 | 5,000,000 |
| Federal Home Loan Bank U.S. SOFR Index + 0.16%, 4.53% 7/10/2025 (d)(e) | | 4.52 | 4,000,000 | 4,001,921 |
| Federal Home Loan Bank U.S. SOFR Index + 0.16%, 4.53% 7/14/2025 (d)(e) | | 4.53 | 2,000,000 | 2,000,000 |
| Federal Home Loan Bank U.S. SOFR Index + 0.16%, 4.53% 7/21/2025 (d)(e) | | 4.53 | 9,000,000 | 9,000,647 |
| Federal Home Loan Bank U.S. SOFR Index + 0.16%, 4.53% 7/24/2025 (d)(e) | | 4.53 | 9,000,000 | 9,000,000 |
| Federal Home Loan Bank U.S. SOFR Index + 0.16%, 4.53% 7/25/2025 (d)(e) | | 4.53 | 15,000,000 | 15,000,000 |
| Federal Home Loan Bank U.S. SOFR Index + 0.16%, 4.53% 7/25/2025 (d)(e) | | 4.53 | 5,000,000 | 5,000,000 |
| Federal Home Loan Bank U.S. SOFR Index + 0.16%, 4.53% 9/2/2025 (d)(e) | | 4.53 | 14,000,000 | 14,000,000 |
| Federal Home Loan Bank U.S. SOFR Index + 0.19%, 4.56% 12/18/2026 (d)(e) | | 4.56 | 13,000,000 | 13,000,000 |
| Federal Home Loan Bank U.S. SOFR Index + 0.19%, 4.56% 12/22/2026 (d)(e) | | 4.56 | 15,000,000 | 15,000,000 |
| Federal Home Loan Bank U.S. SOFR Index -0.005%, 4.365% 4/11/2025 (d)(e) | | 4.37 | 10,000,000 | 10,000,000 |
| Federal Home Loan Bank U.S. SOFR Index -0.005%, 4.365% 4/15/2025 (d)(e) | | 4.37 | 4,000,000 | 4,000,000 |
| Federal Home Loan Bank U.S. SOFR Index -0.005%, 4.365% 4/15/2025 (d)(e) | | 4.37 | 5,000,000 | 5,000,000 |
| Federal Home Loan Bank U.S. SOFR Index -0.005%, 4.365% 4/23/2025 (d)(e) | | 4.37 | 10,000,000 | 10,000,000 |
| Federal Home Loan Bank U.S. SOFR Index -0.005%, 4.365% 4/25/2025 (d)(e) | | 4.37 | 9,000,000 | 9,000,000 |
| Federal Home Loan Bank U.S. SOFR Index -0.005%, 4.365% 4/28/2025 (d)(e) | | 4.37 | 2,000,000 | 2,000,000 |
| Federal Home Loan Bank U.S. SOFR Index -0.005%, 4.365% 4/30/2025 (d)(e) | | 4.37 | 11,000,000 | 11,000,000 |
| Freddie Mac Discount Notes 0% 1/31/2025 | | 4.45 | 6,000,000 | 5,977,900 |
| Freddie Mac U.S. SOFR Index + 0.09%, 4.46% 1/26/2026 (d)(e) | | 4.46 | 43,000,000 | 43,000,000 |
| Freddie Mac U.S. SOFR Index + 0.1%, 4.47% 2/9/2026 (d)(e) | | 4.47 | 3,000,000 | 3,000,282 |
| Freddie Mac U.S. SOFR Index + 0.11%, 4.48% 3/5/2026 (d)(e) | | 4.48 | 17,000,000 | 17,000,000 |
| Freddie Mac U.S. SOFR Index + 0.11%, 4.48% 5/7/2026 (d)(e) | | 4.48 | 10,000,000 | 10,000,000 |
| Freddie Mac U.S. SOFR Index + 0.115%, 4.485% 4/2/2026 (d)(e) | | 4.48 | 28,000,000 | 28,000,422 |
| Freddie Mac U.S. SOFR Index + 0.14%, 4.51% 10/16/2026 (d)(e) | | 4.51 | 24,000,000 | 24,000,000 |
| Freddie Mac U.S. SOFR Index + 0.14%, 4.51% 10/29/2026 (d)(e) | | 4.51 | 17,000,000 | 17,000,000 |
| Freddie Mac U.S. SOFR Index + 0.14%, 4.51% 9/23/2026 (d)(e) | | 4.51 | 32,000,000 | 32,000,000 |
| Freddie Mac U.S. SOFR Index + 0.14%, 4.51% 9/4/2026 (d)(e) | | 4.51 | 11,000,000 | 11,000,000 |
| TOTAL U.S. GOVERNMENT AGENCY - DEBT (Cost $2,661,687,591) | | | | 2,661,687,591 |
| | | | | |
| U.S. Treasury Obligations - 32.4% |
| | | Yield (%) (c) | Principal Amount (a) | Value ($) |
| US Treasury Bills 0% 1/14/2025 | | 4.72 to 4.73 | 42,000,000 | 41,929,409 |
| US Treasury Bills 0% 1/16/2025 | | 4.57 to 4.93 | 17,000,000 | 16,967,465 |
| US Treasury Bills 0% 1/2/2025 | | 5.25 | 7,000,000 | 6,999,005 |
| US Treasury Bills 0% 1/21/2025 | | 4.51 to 4.73 | 102,000,000 | 101,737,433 |
| US Treasury Bills 0% 1/23/2025 | | 4.56 | 11,000,000 | 10,969,683 |
| US Treasury Bills 0% 1/28/2025 | | 4.53 | 16,000,000 | 15,946,000 |
| US Treasury Bills 0% 1/30/2025 | | 4.54 to 4.56 | 51,400,000 | 51,214,017 |
| US Treasury Bills 0% 1/7/2025 | | 4.60 to 4.89 | 123,500,000 | 123,401,223 |
| US Treasury Bills 0% 1/9/2025 | | 4.55 to 4.60 | 171,000,000 | 170,827,473 |
| US Treasury Bills 0% 2/11/2025 | | 4.51 to 4.54 | 55,000,000 | 54,720,959 |
| US Treasury Bills 0% 2/13/2025 | | 4.29 to 4.91 | 265,800,000 | 264,371,841 |
| US Treasury Bills 0% 2/18/2025 | | 4.49 to 4.53 | 173,000,000 | 171,976,722 |
| US Treasury Bills 0% 2/20/2025 | | 4.47 | 90,000,000 | 89,447,500 |
| US Treasury Bills 0% 2/25/2025 | | 4.51 to 4.54 | 96,000,000 | 95,347,685 |
| US Treasury Bills 0% 2/27/2025 | | 4.48 to 4.80 | 126,300,000 | 125,371,928 |
| US Treasury Bills 0% 2/4/2025 | | 4.48 to 4.49 | 30,000,000 | 29,874,977 |
| US Treasury Bills 0% 2/6/2025 | | 4.30 to 4.55 | 38,000,000 | 37,835,653 |
| US Treasury Bills 0% 3/11/2025 | | 4.48 | 89,000,000 | 88,247,727 |
| US Treasury Bills 0% 3/13/2025 | | 4.35 to 4.69 | 87,000,000 | 86,252,099 |
| US Treasury Bills 0% 3/18/2025 | | 4.39 to 4.48 | 9,000,000 | 8,916,774 |
| US Treasury Bills 0% 3/20/2025 | | 4.36 to 4.51 | 57,700,000 | 57,154,086 |
| US Treasury Bills 0% 3/25/2025 | | 4.45 to 4.46 | 33,000,000 | 32,665,677 |
| US Treasury Bills 0% 3/27/2025 | | 4.34 to 4.44 | 28,000,000 | 27,717,899 |
| US Treasury Bills 0% 3/4/2025 | | 4.50 to 4.53 | 96,000,000 | 95,267,243 |
| US Treasury Bills 0% 3/6/2025 | | 4.69 | 4,000,000 | 3,967,359 |
| US Treasury Bills 0% 4/10/2025 | | 4.37 to 4.40 | 31,000,000 | 30,633,854 |
| US Treasury Bills 0% 4/17/2025 | | 4.40 | 5,000,000 | 4,936,621 |
| US Treasury Bills 0% 4/24/2025 | | 4.40 to 4.46 | 119,000,000 | 117,387,269 |
| US Treasury Bills 0% 4/29/2025 | | 4.29 | 90,000,000 | 88,752,150 |
| US Treasury Bills 0% 4/3/2025 | | 4.33 to 4.39 | 19,000,000 | 18,791,738 |
| US Treasury Bills 0% 5/1/2025 | | 4.44 to 4.45 | 4,000,000 | 3,942,029 |
| US Treasury Bills 0% 5/29/2025 | | 4.44 | 44,000,000 | 43,214,942 |
| US Treasury Bills 0% 6/12/2025 | | 4.29 | 42,100,000 | 41,304,310 |
| US Treasury Bills 0% 6/26/2025 | | 4.26 to 4.41 | 54,000,000 | 52,896,182 |
| US Treasury Bonds Inflation-Indexed 2.375% 1/15/2025 | | 4.00 to 4.21 | 55,263,120 | 55,228,642 |
| US Treasury Notes 0.25% 10/31/2025 | | 4.45 | 1,000,000 | 966,220 |
| US Treasury Notes 0.25% 5/31/2025 | | 4.44 to 4.45 | 6,000,000 | 5,898,979 |
| US Treasury Notes 0.25% 6/30/2025 | | 4.33 to 4.37 | 26,000,000 | 25,487,998 |
| US Treasury Notes 0.25% 9/30/2025 | | 4.29 to 4.30 | 27,000,000 | 26,210,659 |
| US Treasury Notes 0.375% 11/30/2025 | | 4.43 to 4.45 | 16,000,000 | 15,426,722 |
| US Treasury Notes 0.375% 12/31/2025 | | 4.26 to 4.28 | 42,000,000 | 40,423,277 |
| US Treasury Notes 0.375% 4/30/2025 | | 4.46 to 5.25 | 22,000,000 | 21,686,449 |
| US Treasury Notes 0.5% 3/31/2025 | | 4.50 to 5.05 | 7,000,000 | 6,931,833 |
| US Treasury Notes 1.125% 2/28/2025 | | 4.54 | 1,000,000 | 994,628 |
| US Treasury Notes 2% 8/15/2025 | | 4.21 to 4.22 | 44,000,000 | 43,411,546 |
| US Treasury Notes 2.125% 5/15/2025 | | 4.42 to 4.43 | 5,000,000 | 4,958,583 |
| US Treasury Notes 2.625% 12/31/2025 | | 4.29 | 4,000,000 | 3,935,538 |
| US Treasury Notes 2.75% 5/15/2025 | | 4.42 to 5.25 | 39,000,000 | 38,687,349 |
| US Treasury Notes 2.875% 4/30/2025 | | 5.22 | 10,000,000 | 9,926,400 |
| US Treasury Notes 3 month U.S. Treasury Bill + 0.205%, 4.4807% 10/31/2026 (d)(e) | | 4.48 | 22,000,000 | 22,022,871 |
| US Treasury Notes 3.125% 8/15/2025 | | 4.20 | 22,000,000 | 21,856,826 |
| US Treasury Notes 3.875% 3/31/2025 | | 4.48 to 5.05 | 35,000,000 | 34,941,705 |
| US Treasury Notes 3.875% 4/30/2025 | | 4.42 to 5.26 | 43,000,000 | 42,860,230 |
| US Treasury Notes 4.25% 12/31/2025 | | 4.26 to 4.29 | 21,000,000 | 20,994,715 |
| US Treasury Notes 4.625% 2/28/2025 | | 4.54 to 4.55 | 8,000,000 | 8,000,976 |
| US Treasury Notes 4.625% 6/30/2025 | | 4.37 | 6,171,000 | 6,178,637 |
| US Treasury Notes 5% 10/31/2025 | | 4.45 | 1,000,000 | 1,004,388 |
| US Treasury Notes 5% 9/30/2025 | | 4.30 | 10,000,000 | 10,050,452 |
| US Treasury Notes Inflation-Indexed 0.25% 1/15/2025 | | 3.98 to 4.15 | 75,966,180 | 75,859,062 |
| TOTAL U.S. TREASURY OBLIGATIONS (Cost $2,754,931,617) | | | | 2,754,931,617 |
| | | | | |
| TOTAL INVESTMENT IN SECURITIES - 100.8% (Cost $8,565,399,208) | 8,565,399,208 |
NET OTHER ASSETS (LIABILITIES) - (0.8)% | (67,964,801) |
| NET ASSETS - 100.0% | 8,497,434,407 |
| | |
The date shown for securities represents the date when principal payments must be paid, taking into account any call options exercised by the issuer and any permissible maturity shortening features other than interest rate resets.
Legend
| (a) | Amount is stated in United States dollars unless otherwise noted. |
| (b) | Represents a forward settling transaction and therefore no collateral securities had been allocated as of period end. The agreement contemplated the delivery of U.S. Treasury Obligations as collateral on settlement date. |
| (c) | Yield represents either the annualized yield at the date of purchase, or the stated coupon rate, or, for floating and adjustable rate securities, the rate at period end. |
| (d) | Coupon rates for floating and adjustable rate securities reflect the rates in effect at period end. |
| (e) | Coupon is indexed to a floating interest rate which may be multiplied by a specified factor and/or subject to caps or floors. |
| (f) | Coupon is indexed to a floating interest rate which may be multiplied by a specified factor and / or subject to caps or floors. Coupon rates for floating and adjustable rate securities reflect the rates in effect at period end. The maturity amount is based on the rate at period end. |
| * Repurchase Agreements |
| Counterparty | Lending Rate (%) | Settlement Date | Maturity Date | Repurchase Agreement Value ($) | Repurchase Agreement Proceeds ($) | Collateralized By | Collateral Coupon (%) | Collateral Maturity Date | Collateral Value Received ($) |
| ABN AMRO Bank NV | 4.52 | 12/31/2024 | 1/2/2025 | 11,000,000 | 11,002,762 | Agency Mortgage-Backed Securities | 5.50 - 7.00 | 9/1/2052 - 12/1/2053 | 8,830,396 |
| | | | | | U.S. Treasuries (including strips) | 2.88 - 4.63 | 3/15/2027 - 4/30/2031 | 2,392,523 |
| | | | | | | | | | 11,222,919 |
| ABN AMRO Bank NV | 4.50 | 12/31/2024 | 1/2/2025 | 12,000,000 | 12,003,000 | U.S. Treasuries (including strips) | 2.88 - 4.63 | 10/15/2026 - 1/31/2031 | 12,243,069 |
| BMO Capital Markets Corp | 4.51 | 12/4/2024 | 1/27/2025 | 6,000,000 | 6,040,590 | U.S. Treasuries (including strips) | 0.25 - 4.88 | 7/15/2025 - 2/15/2050 | 6,142,240 |
| BMO Chicago Branch | 4.55 | 11/20/2024 | 1/21/2025 | 4,000,000 | 4,031,345 | U.S. Treasuries (including strips) | 2.25 | 8/15/2046 | 4,142,405 |
| BMO Chicago Branch | 4.55 | 11/20/2024 | 1/21/2025 | 4,000,000 | 4,031,345 | U.S. Treasuries (including strips) | 2.25 | 8/15/2046 | 4,142,405 |
| BMO Chicago Branch | 4.52 | 12/3/2024 | 1/21/2025 | 12,000,000 | 12,073,827 | Agency Mortgage-Backed Securities | 2.00 - 6.00 | 10/1/2036 - 12/1/2054 | 12,286,105 |
| BMO Chicago Branch | 4.56 | 11/18/2024 | 1/17/2025 | 6,000,000 | 6,045,600 | Agency Mortgage-Backed Securities | 4.50 | 12/1/2052 | 6,154,884 |
| BMO Chicago Branch | 4.31 | 12/19/2024 | 1/13/2025 | 8,000,000 | 8,023,945 | Agency Mortgage-Backed Securities | 2.00 | 10/1/2036 | 8,173,677 |
| BMO Chicago Branch | 4.60 | 11/5/2024 | 1/6/2025 | 4,000,000 | 4,031,689 | U.S. Treasuries (including strips) | 2.25 | 8/15/2046 | 4,150,570 |
| Barclays Bank PLC | 4.31 | 12/19/2024 | 1/17/2025 | 8,000,000 | 8,027,776 | Agency Mortgage-Backed Securities | 2.00 - 6.50 | 4/1/2025 - 4/15/2066 | 8,173,869 |
| Barclays Bank PLC | 4.47 | 12/31/2024 | 1/2/2025 | 11,000,000 | 11,002,732 | Agency Mortgage-Backed Securities | 4.50 - 6.00 | 1/15/2039 - 7/1/2054 | 7,696,967 |
| | | | | | Agency Collateralized Mortgage Obligation | 3.50 - 3.85 | 5/25/2028 - 12/1/2045 | 3,555,825 |
| | | | | | | | | | 11,252,792 |
| Barclays Capital Inc. | 4.31 | 12/19/2024 | 1/17/2025 | 4,000,000 | 4,013,888 | U.S. Treasuries (including strips) | 4.25 | 6/30/2029 | 4,086,883 |
| BofA Securities, Inc. | 4.44(f) | 12/24/2024 | 4/7/2025 | 5,000,000 | 5,064,134 | Agency Mortgage-Backed Securities | 3.00 - 6.00 | 9/1/2036 - 2/1/2053 | 3,847,447 |
| | | | | | Agency Debentures and Agency Strips | 4.00 | 9/26/2033 | 1,258,283 |
| | | | | | | | | | 5,105,730 |
| BofA Securities, Inc. | 4.44(f) | 12/6/2024 | 3/6/2025 | 11,000,000 | 11,122,100 | Agency Mortgage-Backed Securities | 3.00 - 5.50 | 5/1/2027 - 4/1/2054 | 8,004,531 |
| | | | | | U.S. Treasuries (including strips) | 0.75 | 5/31/2026 | 3,253,947 |
| | | | | | | | | | 11,258,478 |
| BofA Securities, Inc. | 4.44(f) | 12/4/2024 | 3/4/2025 | 3,000,000 | 3,033,300 | Agency Mortgage-Backed Securities | 3.50 - 4.50 | 7/20/2049 - 12/1/2054 | 3,071,291 |
| BofA Securities, Inc. | 4.44(f) | 12/2/2024 | 2/28/2025 | 30,000,000 | 30,325,600 | Agency Mortgage-Backed Securities | 3.00 - 6.50 | 2/20/2033 - 1/1/2055 | 22,716,077 |
| | | | | | Agency Debentures and Agency Strips | 2.87 | 2/25/2030 | 8,004,793 |
| | | | | | | | | | 30,720,870 |
| BofA Securities, Inc. | 4.44(f) | 11/1/2024 | 2/3/2025 | 8,000,000 | 8,092,747 | Agency Mortgage-Backed Securities | 1.50 - 6.50 | 1/1/2032 - 8/20/2054 | 6,587,249 |
| | | | | | Agency Debentures and Agency Strips | 4.00 | 9/26/2033 | 1,638,301 |
| | | | | | | | | | 8,225,550 |
| BofA Securities, Inc. | 4.44(f) | 10/30/2024 | 1/30/2025 | 23,000,000 | 23,260,974 | Agency Mortgage-Backed Securities | 2.50 - 6.00 | 8/20/2032 - 8/1/2054 | 23,654,822 |
| BofA Securities, Inc. | 4.53 | 11/29/2024 | 1/29/2025 | 13,000,000 | 13,099,786 | Agency Mortgage-Backed Securities | 2.00 - 8.00 | 9/1/2025 - 3/20/2064 | 13,316,731 |
| BofA Securities, Inc. | 4.44(f) | 10/28/2024 | 1/28/2025 | 5,000,000 | 5,056,734 | Agency Mortgage-Backed Securities | 3.00 - 6.00 | 8/15/2031 - 5/1/2050 | 5,143,740 |
| BofA Securities, Inc. | 4.54 | 11/27/2024 | 1/27/2025 | 5,000,000 | 5,038,464 | Agency Mortgage-Backed Securities | 4.50 - 6.50 | 11/1/2048 - 1/1/2055 | 3,865,637 |
| | | | | | Agency Debentures and Agency Strips | 4.88 | 12/11/2026 | 1,257,518 |
| | | | | | | | | | 5,123,155 |
| BofA Securities, Inc. | 4.54 | 11/18/2024 | 1/17/2025 | 4,000,000 | 4,030,266 | U.S. Treasuries (including strips) | 1.38 - 3.75 | 8/15/2027 - 11/15/2040 | 4,103,157 |
| Canadian Imperial Bank of Commerce | 4.45 | 12/9/2024 | 2/10/2025 | 11,000,000 | 11,085,662 | U.S. Treasuries (including strips) | 0.00 - 4.75 | 4/8/2025 - 8/15/2053 | 11,253,294 |
| Canadian Imperial Bank of Commerce | 4.49 | 12/5/2024 | 2/5/2025 | 3,000,000 | 3,023,199 | U.S. Treasuries (including strips) | 0.00 - 4.63 | 3/11/2025 - 2/15/2054 | 3,070,753 |
| Canadian Imperial Bank of Commerce | 4.36 | 12/19/2024 | 1/30/2025 | 1,000,000 | 1,005,087 | Agency Collateralized Mortgage Obligation | 0.00 - 6.10 | 6/20/2042 - 6/20/2071 | 354,985 |
| | | | | | Agency Debentures and Agency Strips | 0.10 - 6.00 | 12/15/2028 - 12/25/2054 | 697,529 |
| | | | | | | | | | 1,052,514 |
| Canadian Imperial Bank of Commerce | 4.32 | 12/19/2024 | 1/30/2025 | 20,000,000 | 20,100,800 | Agency Mortgage-Backed Securities | 2.05 - 7.00 | 11/1/2028 - 8/1/2054 | 20,434,272 |
| Canadian Imperial Bank of Commerce | 4.31 | 12/19/2024 | 1/30/2025 | 3,000,000 | 3,015,085 | U.S. Treasuries (including strips) | 0.50 - 4.63 | 10/31/2026 - 5/15/2054 | 3,094,649 |
| Canadian Imperial Bank of Commerce | 4.31 | 12/23/2024 | 1/23/2025 | 7,000,000 | 7,025,980 | U.S. Treasuries (including strips) | 0.38 - 4.52 | 1/31/2025 - 11/15/2052 | 7,148,593 |
| Canadian Imperial Bank of Commerce | 4.58 | 11/22/2024 | 1/21/2025 | 2,000,000 | 2,015,266 | Agency Mortgage-Backed Securities | 1.33 - 7.00 | 1/1/2028 - 1/1/2055 | 2,050,641 |
| Canadian Imperial Bank of Commerce | 4.44 | 12/12/2024 | 1/14/2025 | 10,000,000 | 10,040,654 | Agency Mortgage-Backed Securities | 1.33 - 7.23 | 4/1/2027 - 9/1/2061 | 3,820,986 |
| | | | | | U.S. Treasuries (including strips) | 0.38 - 2.63 | 1/31/2026 - 2/15/2030 | 6,405,402 |
| | | | | | | | | | 10,226,388 |
| Canadian Imperial Bank of Commerce | 4.42 | 12/13/2024 | 1/13/2025 | 15,000,000 | 15,057,092 | U.S. Treasuries (including strips) | 0.00 - 4.88 | 1/31/2025 - 8/15/2053 | 15,337,572 |
| Citigroup Global Capital Markets, Inc. | 4.45(f) | 12/26/2024 | 2/26/2025 | 21,000,000 | 21,160,941 | U.S. Treasuries (including strips) | 1.88 | 6/30/2026 | 21,438,969 |
| Citigroup Global Capital Markets, Inc. | 4.45(f) | 12/18/2024 | 2/18/2025 | 38,000,000 | 38,291,228 | U.S. Treasuries (including strips) | 2.13 | 5/15/2025 | 38,832,575 |
| Citigroup Global Capital Markets, Inc. | 4.45(f) | 12/6/2024 | 2/6/2025 | 21,000,000 | 21,160,941 | U.S. Treasuries (including strips) | 1.88 | 6/30/2026 | 21,493,647 |
| Credit AG | 4.45 | 12/31/2024 | 1/6/2025 | 3,000,000 | 3,002,225 | U.S. Treasuries (including strips) | 2.25 | 8/15/2027 | 3,060,839 |
| Credit AG | 4.44 | 12/31/2024 | 1/6/2025 | 3,000,000 | 3,002,220 | U.S. Treasuries (including strips) | 2.25 | 8/15/2027 | 3,060,839 |
| Fixed Income Clearing Corp - BNP | 4.45 | 12/31/2024 | 1/2/2025 | 36,792,000 | 36,801,096 | U.S. Treasuries (including strips) | 0.00 - 4.63 | 1/31/2025 - 9/30/2028 | 37,537,177 |
| Fixed Income Clearing Corp - BNYM | 4.45 | 12/31/2024 | 1/2/2025 | 445,000,000 | 445,110,014 | U.S. Treasuries (including strips) | 0.13 | 10/15/2026 | 453,900,058 |
| Fixed Income Clearing Corp - BONY | 4.46 | 12/31/2024 | 1/2/2025 | 42,000,000 | 42,010,407 | Agency Mortgage-Backed Securities | 2.00 - 5.50 | 7/1/2046 - 7/1/2053 | 42,840,000 |
| Fixed Income Clearing Corp - CIBC | 4.45 | 12/31/2024 | 1/2/2025 | 34,000,000 | 34,008,406 | U.S. Treasuries (including strips) | 4.25 | 3/15/2027 | 34,669,551 |
| Fixed Income Clearing Corp - Credit Agricole | 4.50 | 12/31/2024 | 1/2/2025 | 160,000,000 | 160,040,000 | U.S. Treasuries (including strips) | 4.38 | 5/15/2034 | 164,404,066 |
| Fixed Income Clearing Corp - Credit Agricole | 4.45 | 12/31/2024 | 1/2/2025 | 37,000,000 | 37,009,147 | U.S. Treasuries (including strips) | 2.38 - 2.88 | 5/15/2027 - 4/30/2029 | 37,717,256 |
| Fixed Income Clearing Corp - Goldman | 4.46 | 12/31/2024 | 1/2/2025 | 34,000,000 | 34,008,424 | U.S. Treasuries (including strips) | 2.88 | 5/15/2049 | 34,688,661 |
| Fixed Income Clearing Corp - ING | 4.45 | 12/31/2024 | 1/2/2025 | 27,000,000 | 27,006,675 | U.S. Treasuries (including strips) | 1.25 | 6/30/2028 | 27,541,659 |
| Fixed Income Clearing Corp - Mizuho | 4.46 | 12/31/2024 | 1/2/2025 | 38,000,000 | 38,009,416 | U.S. Treasuries (including strips) | 4.63 | 5/31/2031 | 38,769,682 |
| Fixed Income Clearing Corp - Natixis | 4.45 | 12/31/2024 | 1/2/2025 | 34,000,000 | 34,008,406 | U.S. Treasuries (including strips) | 0.88 | 9/30/2026 | 34,675,721 |
| Fixed Income Clearing Corp - Nomura | 4.48 | 12/31/2024 | 1/2/2025 | 41,000,000 | 41,010,204 | U.S. Treasuries (including strips) | 1.88 - 4.88 | 11/30/2025 - 2/15/2032 | 41,830,465 |
| Fixed Income Clearing Corp - State Street Bank | 4.70 | 12/31/2024 | 1/2/2025 | 37,000,000 | 37,009,661 | U.S. Treasuries (including strips) | 4.38 | 12/31/2031 | 37,740,163 |
| Fixed Income Clearing Corp - State Street Bank | 4.46 | 12/31/2024 | 1/2/2025 | 30,000,000 | 30,007,433 | Agency Mortgage-Backed Securities | 2.00 - 5.50 | 11/1/2040 - 1/1/2055 | 16,797,739 |
| | | | | | U.S. Treasuries (including strips) | 2.63 - 4.25 | 12/31/2025 - 2/28/2031 | 14,217,843 |
| | | | | | | | | | 31,015,582 |
| Fixed Income Clearing Corp - State Street Bank | 4.46 | 12/31/2024 | 1/2/2025 | 212,000,000 | 212,052,529 | U.S. Treasuries (including strips) | 4.00 | 12/15/2027 | 216,240,100 |
| Goldman Sachs & Co LLC | 4.40(f) | 12/24/2024 | 1/24/2025 | 41,000,000 | 41,155,344 | Agency Mortgage-Backed Securities | 2.50 - 6.50 | 10/20/2032 - 6/20/2064 | 20,000,452 |
| | | | | | U.S. Treasuries (including strips) | 2.75 - 4.50 | 1/15/2026 - 8/15/2042 | 21,866,109 |
| | | | | | | | | | 41,866,561 |
| Goldman Sachs & Co LLC | 4.40(f) | 12/26/2024 | 1/24/2025 | 41,000,000 | 41,145,322 | Agency Mortgage-Backed Securities | 1.50 - 6.50 | 2/15/2026 - 4/15/2062 | 41,841,253 |
| | | | | | Agency Debentures and Agency Strips | 4.50 | 9/13/2030 | 15,225 |
| | | | | | | | | | 41,856,478 |
| Goldman Sachs & Co LLC | 4.40(f) | 11/19/2024 | 1/17/2025 | 15,000,000 | 15,108,166 | U.S. Treasuries (including strips) | 0.38 - 3.63 | 1/31/2026 - 3/31/2028 | 15,385,234 |
| Goldman Sachs & Co LLC | 4.40(f) | 11/14/2024 | 1/14/2025 | 15,000,000 | 15,111,833 | U.S. Treasuries (including strips) | 0.38 - 4.38 | 1/31/2026 - 5/15/2042 | 15,395,184 |
| Goldman Sachs & Co LLC | 4.40(f) | 11/12/2024 | 1/13/2025 | 15,000,000 | 15,113,666 | U.S. Treasuries (including strips) | 1.38 - 3.88 | 8/15/2028 - 11/15/2040 | 15,399,078 |
| Goldman Sachs & Co LLC | 4.44 | 12/31/2024 | 1/7/2025 | 34,000,000 | 34,029,353 | Agency Mortgage-Backed Securities | 3.50 | 8/1/2039 | 1,716,548 |
| | | | | | U.S. Treasuries (including strips) | 0.25 - 4.38 | 8/31/2025 - 4/30/2027 | 32,972,079 |
| | | | | | | | | | 34,688,627 |
| Goldman Sachs & Co LLC | 4.40(f) | 11/7/2024 | 1/7/2025 | 15,000,000 | 15,111,833 | U.S. Treasuries (including strips) | 3.38 | 5/15/2044 | 15,409,414 |
| Goldman Sachs & Co LLC | 4.40(f) | 11/5/2024 | 1/6/2025 | 15,000,000 | 15,113,666 | U.S. Treasuries (including strips) | 1.25 - 1.88 | 5/31/2028 - 2/15/2041 | 15,413,521 |
| Goldman Sachs & Co LLC | 4.62 | 12/26/2024 | 1/2/2025 | 81,000,000 | 81,072,765 | Agency Mortgage-Backed Securities | 2.00 - 7.00 | 5/1/2030 - 12/20/2054 | 82,694,221 |
| HSBC Securities, Inc. (U.S.A.) | 4.45 | 12/31/2024 | 1/7/2025 | 13,000,000 | 13,011,249 | U.S. Treasuries (including strips) | 1.13 | 5/15/2040 | 13,263,290 |
| ING Financial Markets LLC | 4.36 | 12/19/2024 | 1/30/2025 | 32,000,000 | 32,162,774 | Agency Mortgage-Backed Securities | 5.50 | 3/1/2054 | 32,695,343 |
| JP Morgan Securities, LLC | 4.39(f) | 12/10/2024 | 1/2/2025 | 208,000,000 | 208,583,382 | U.S. Treasuries (including strips) | 1.25 | 12/31/2026 | 212,770,952 |
| Lloyds Bank Corp Mrkts | 4.40 | 12/23/2024 | 1/23/2025 | 3,000,000 | 3,011,367 | U.S. Treasuries (including strips) | 1.13 - 3.50 | 4/30/2028 - 2/15/2031 | 3,069,994 |
| Lloyds Bank Corp Mrkts | 4.37 | 12/19/2024 | 1/3/2025 | 9,000,000 | 9,016,388 | U.S. Treasuries (including strips) | 1.13 - 1.38 | 10/31/2028 - 2/15/2031 | 9,222,286 |
| Lloyds Bank PLC | 4.65 | 11/25/2024 | 2/25/2025 | 2,000,000 | 2,023,766 | U.S. Treasuries (including strips) | 1.88 - 2.88 | 5/15/2028 - 2/15/2032 | 2,060,702 |
| Lloyds Bank PLC | 4.65 | 11/19/2024 | 2/19/2025 | 3,000,000 | 3,035,650 | U.S. Treasuries (including strips) | 2.25 - 4.63 | 6/15/2027 - 5/15/2028 | 3,082,056 |
| Lloyds Bank PLC | 4.63 | 11/29/2024 | 2/7/2025 | 5,000,000 | 5,045,014 | U.S. Treasuries (including strips) | 2.88 - 4.63 | 6/15/2027 - 5/15/2028 | 5,118,447 |
| Lloyds Bank PLC | 4.62 | 11/29/2024 | 1/31/2025 | 5,000,000 | 5,040,425 | U.S. Treasuries (including strips) | 1.63 - 4.63 | 2/15/2026 - 5/15/2028 | 5,127,339 |
| Lloyds Bank PLC | 4.56 | 12/12/2024 | 1/21/2025 | 2,000,000 | 2,010,133 | U.S. Treasuries (including strips) | 2.88 - 4.63 | 6/15/2027 - 5/15/2033 | 2,056,228 |
| MUFG Securities (Canada), Ltd. | 4.37 | 12/19/2024 | 3/5/2025 | 8,000,000 | 8,073,804 | Agency Mortgage-Backed Securities | 1.50 - 7.00 | 12/1/2032 - 11/15/2059 | 8,151,332 |
| | | | | | U.S. Treasuries (including strips) | 0.00 - 0.38 | 1/15/2027 - 2/15/2028 | 22,756 |
| | | | | | | | | | 8,174,088 |
| MUFG Securities (Canada), Ltd. | 4.35 | 12/19/2024 | 3/5/2025 | 7,000,000 | 7,064,283 | U.S. Treasuries (including strips) | 0.25 - 4.43 | 9/30/2025 - 11/15/2052 | 7,152,138 |
| MUFG Securities (Canada), Ltd. | 4.32 | 12/19/2024 | 1/30/2025 | 4,000,000 | 4,020,160 | U.S. Treasuries (including strips) | 1.63 - 4.45 | 10/31/2025 - 8/15/2029 | 4,086,898 |
| MUFG Securities EMEA PLC | 4.47 | 12/9/2024 | 1/30/2025 | 22,000,000 | 22,142,047 | U.S. Treasuries (including strips) | 0.38 - 4.63 | 1/31/2026 - 11/15/2049 | 22,499,893 |
| MUFG Securities EMEA PLC | 4.38 | 12/19/2024 | 1/21/2025 | 22,000,000 | 22,088,330 | U.S. Treasuries (including strips) | 2.13 | 5/15/2025 | 22,466,361 |
| MUFG Securities EMEA PLC | 4.43 | 12/31/2024 | 1/2/2025 | 5,000,000 | 5,001,231 | U.S. Treasuries (including strips) | 1.13 | 2/15/2031 | 5,097,629 |
| Mitsubishi UFJ Securities (U.S.A.), Inc. | 4.37 | 12/19/2024 | 3/5/2025 | 35,000,000 | 35,322,894 | Agency Mortgage-Backed Securities | 1.50 - 6.50 | 3/1/2025 - 8/1/2054 | 35,760,670 |
| Mitsubishi UFJ Securities (U.S.A.), Inc. | 4.35 | 12/19/2024 | 3/5/2025 | 7,000,000 | 7,064,283 | U.S. Treasuries (including strips) | 0.00 - 6.00 | 2/28/2025 - 8/15/2050 | 7,152,079 |
| Mizuho Securities U.S.A., Inc. | 4.45 | 12/31/2024 | 1/6/2025 | 5,000,000 | 5,003,708 | U.S. Treasuries (including strips) | 4.88 | 10/31/2028 | 5,101,267 |
| NatWest Market Securities Inc | 4.49 | 12/27/2024 | 1/3/2025 | 13,000,000 | 13,011,350 | U.S. Treasuries (including strips) | 2.38 - 3.88 | 5/15/2043 - 5/15/2051 | 13,380,519 |
| Natixis SA | 4.58 | 12/26/2024 | 1/2/2025 | 19,000,000 | 19,016,921 | U.S. Treasuries (including strips) | 0.75 - 4.88 | 7/15/2025 - 5/15/2032 | 19,397,310 |
| RBC Dominion Securities | 4.30 | 12/19/2024 | 1/30/2025 | 30,000,000 | 30,150,500 | U.S. Treasuries (including strips) | 0.00 - 4.63 | 2/18/2025 - 11/15/2054 | 30,659,687 |
| RBC Dominion Securities | 4.53 | 12/6/2024 | 1/7/2025 | 16,000,000 | 16,064,427 | Agency Mortgage-Backed Securities | 2.00 - 6.50 | 9/20/2041 - 12/20/2054 | 16,315,034 |
| | | | | | U.S. Treasuries (including strips) | 0.00 - 4.25 | 11/30/2025 - 2/15/2049 | 60,421 |
| | | | | | | | | | 16,375,455 |
| RBC Dominion Securities | 4.39 | 12/24/2024 | 1/7/2025 | 8,000,000 | 8,013,658 | Agency Mortgage-Backed Securities | 0.75 - 6.50 | 10/8/2027 - 12/20/2054 | 3,267,561 |
| | | | | | U.S. Treasuries (including strips) | 0.00 - 4.50 | 3/31/2025 - 8/15/2053 | 4,943,554 |
| | | | | | | | | | 8,211,115 |
| RBC Dominion Securities | 4.38 | 12/24/2024 | 1/7/2025 | 7,000,000 | 7,011,923 | U.S. Treasuries (including strips) | 0.50 - 4.63 | 3/31/2026 - 2/28/2031 | 7,147,825 |
| RBC Dominion Securities | 4.34 | 12/23/2024 | 1/6/2025 | 16,000,000 | 16,027,004 | Agency Mortgage-Backed Securities | 3.00 - 7.00 | 7/1/2049 - 9/20/2054 | 16,336,270 |
| | | | | | U.S. Treasuries (including strips) | 0.00 - 3.75 | 4/15/2026 - 5/15/2049 | 3,430 |
| | | | | | | | | | 16,339,700 |
| RBC Financial Group | 4.57 | 11/4/2024 | 1/30/2025 | 2,000,000 | 2,022,088 | Agency Mortgage-Backed Securities | 2.00 - 6.50 | 2/1/2051 - 1/1/2055 | 46,311 |
| | | | | | U.S. Treasuries (including strips) | 0.00 - 4.46 | 4/30/2025 - 11/15/2044 | 2,009,109 |
| | | | | | | | | | 2,055,420 |
| RBC Financial Group | 4.55 | 11/8/2024 | 1/30/2025 | 82,000,000 | 82,860,203 | Agency Mortgage-Backed Securities | 2.00 - 6.50 | 8/1/2042 - 1/1/2055 | 1,460,491 |
| | | | | | U.S. Treasuries (including strips) | 0.00 - 4.46 | 4/30/2025 - 11/15/2044 | 9,520,244 |
| | | | | | Agency Debentures and Agency Strips | 2.50 - 6.50 | 9/1/2040 - 12/25/2054 | 73,955,143 |
| | | | | | | | | | 84,935,878 |
| SMBC Nikko Securities America, Inc. | 4.46 | 12/31/2024 | 1/2/2025 | 9,000,000 | 9,002,230 | Agency Mortgage-Backed Securities | 2.00 - 6.50 | 12/1/2048 - 10/1/2054 | 9,182,182 |
| | | | | | U.S. Treasuries (including strips) | 3.63 | 9/30/2031 | 96 |
| | | | | | | | | | 9,182,278 |
| Societe Generale | 4.46 | 12/31/2024 | 1/7/2025 | 30,000,000 | 30,026,017 | U.S. Treasuries (including strips) | 1.25 - 4.50 | 11/30/2026 - 5/31/2029 | 30,607,664 |
| Societe Generale | 4.45 | 12/30/2024 | 1/6/2025 | 7,000,000 | 7,006,057 | Agency Mortgage-Backed Securities | 2.50 | 9/1/2050 | 7,142,648 |
| TD Securities (U.S.A.) | 4.46 | 12/31/2024 | 1/2/2025 | 20,000,000 | 20,004,956 | Agency Mortgage-Backed Securities | 5.50 | 9/1/2054 | 20,405,055 |
| Wells Fargo Securities, LLC | 4.49 | 12/6/2024 | 3/5/2025 | 14,000,000 | 14,155,404 | Agency Mortgage-Backed Securities | 3.00 - 7.00 | 3/1/2045 - 8/1/2054 | 14,328,088 |
| Wells Fargo Securities, LLC | 4.40 | 12/19/2024 | 2/18/2025 | 22,000,000 | 22,164,022 | Agency Mortgage-Backed Securities | 1.50 - 7.00 | 11/1/2036 - 8/1/2054 | 22,478,398 |
| Wells Fargo Securities, LLC | 4.62 | 11/26/2024 | 1/24/2025 | 11,000,000 | 11,083,289 | Agency Mortgage-Backed Securities | 5.50 - 6.00 | 7/1/2039 - 9/1/2054 | 11,273,277 |
| Wells Fargo Securities, LLC | 4.63 | 11/21/2024 | 1/21/2025 | 27,000,000 | 27,211,823 | Agency Mortgage-Backed Securities | 6.00 | 12/1/2054 | 27,688,763 |
| Wells Fargo Securities, LLC | 4.62 | 11/15/2024 | 1/15/2025 | 11,000,000 | 11,086,112 | Agency Mortgage-Backed Securities | 3.00 - 6.50 | 5/1/2035 - 11/1/2054 | 11,289,115 |
| Wells Fargo Securities, LLC | 4.66 | 11/8/2024 | 1/8/2025 | 22,000,000 | 22,173,715 | Agency Mortgage-Backed Securities | 5.50 | 12/1/2054 | 22,599,760 |
| Total Repurchase Agreements | | | | $ 2,597,792,000 | 2,605,305,337 | | | | 2,656,584,961 |
Investment Valuation
All investments are categorized as Level 2 under the Fair Value Hierarchy. The inputs or methodology used for valuing securities may not be an indication of the risk associated with investing in these securities. For more information on valuation inputs, refer to the Investment Valuation section in the accompanying Notes to Financial Statements.
| Other Information |
| # Additional information on each counterparty to the repurchase agreement is as follows: |
| Repurchase Agreement / Counterparty | Value ($) | |
| $369,988,000 due 01/02/2025 at 4.46% | | |
| JP Morgan Securities LLC | 68,053,000 | |
| Bank of America NA | 31,002,000 | |
| HSBC Securities Inc. (U.S.A.) | 7,940,000 | |
| BofA Securities Inc | 10,284,000 | |
| Nomura Securities International Inc | 32,094,000 | |
| MUFG Securities (Canada) Ltd. | 22,684,000 | |
| Sumitomo Mitsui Banking Corp | 142,912,000 | |
| Rbc Dominion Securities Inc | 18,904,000 | |
| Bny Mellon Capital Market LLC | 18,724,000 | |
| Wells Fargo Securities LLC | 17,391,000 | |
| | 369,988,000 | |
Financial Statements
| Statement of Assets and Liabilities |
As of December 31, 2024 |
| Assets | | | | |
Investment in securities, at value (including repurchase agreements of $3,148,780,000) - See accompanying schedule Unaffiliated issuers (cost $8,565,399,208): | | | $ | 8,565,399,208 |
| Cash | | | | 26,999,966 |
| Receivable for fund shares sold | | | | 134,384,589 |
| Interest receivable | | | | 23,372,245 |
| Prepaid expenses | | | | 7,243 |
Total assets | | | | 8,750,163,251 |
| Liabilities | | | | |
| Payable for investments purchased | $ | 227,571,056 | | |
| Payable for fund shares redeemed | | 22,847,788 | | |
| Accrued management fee | | 1,948,907 | | |
| Distribution and service plan fees payable | | 285,625 | | |
| Other payables and accrued expenses | | 75,468 | | |
| Total liabilities | | | | 252,728,844 |
| Net Assets | | | $ | 8,497,434,407 |
| Net Assets consist of: | | | | |
| Paid in capital | | | $ | 8,497,122,971 |
| Total accumulated earnings (loss) | | | | 311,436 |
| Net Assets | | | $ | 8,497,434,407 |
| | | | | |
| Net Asset Value and Maximum Offering Price | | | | |
| Initial Class : | | | | |
Net Asset Value, offering price and redemption price per share ($2,267,617,587 ÷ 2,265,284,369 shares) | | | $ | 1.00 |
| Service Class : | | | | |
Net Asset Value, offering price and redemption price per share ($2,492,449,219 ÷ 2,493,475,815 shares) | | | $ | 1.00 |
| Service Class 2 : | | | | |
Net Asset Value, offering price and redemption price per share ($401,835,418 ÷ 402,082,814 shares) | | | $ | 1.00 |
| Investor Class : | | | | |
Net Asset Value, offering price and redemption price per share ($3,335,532,183 ÷ 3,336,091,530 shares) | | | $ | 1.00 |
| Statement of Operations |
| Year ended December 31, 2024 |
| Investment Income | | | | |
| Interest | | | $ | 438,763,156 |
| Expenses | | | | |
| Management fee | $ | 22,228,651 | | |
| Transfer agent fees | | 1,046,436 | | |
| Distribution and service plan fees | | 3,179,962 | | |
| Accounting fees and expenses | | 113,049 | | |
| Custodian fees and expenses | | 95,997 | | |
| Independent trustees' fees and expenses | | 21,684 | | |
| Registration fees | | 102,280 | | |
| Audit fees | | 50,682 | | |
| Legal | | 7,830 | | |
| Total expenses before reductions | | 26,846,571 | | |
| Expense reductions | | (197,615) | | |
| Total expenses after reductions | | | | 26,648,956 |
| Net Investment income (loss) | | | | 412,114,200 |
| Realized and Unrealized Gain (Loss) | | | | |
| Net realized gain (loss) on: | | | | |
| Investment Securities: | | | | |
| Unaffiliated issuers | | 3,579 | | |
| Total net realized gain (loss) | | | | 3,579 |
| Net increase in net assets resulting from operations | | | $ | 412,117,779 |
| Statement of Changes in Net Assets |
| |
| | Year ended December 31, 2024 | | Year ended December 31, 2023 |
| Increase (Decrease) in Net Assets | | | | |
| Operations | | | | |
| Net investment income (loss) | $ | 412,114,200 | $ | 342,328,322 |
| Net realized gain (loss) | | 3,579 | | (28,379) |
Net increase in net assets resulting from operations | | 412,117,779 | | 342,299,943 |
| Distributions to shareholders | | (412,087,912) | | (342,294,738) |
| | | | | |
| Share transactions - net increase (decrease) | | 277,213,860 | | 1,383,362,442 |
| Total increase (decrease) in net assets | | 277,243,727 | | 1,383,367,647 |
| | | | | |
| Net Assets | | | | |
| Beginning of period | | 8,220,190,680 | | 6,836,823,033 |
| End of period | $ | 8,497,434,407 | $ | 8,220,190,680 |
| | | | | |
| | | | | |
Financial Highlights
VIP Government Money Market Portfolio Initial Class |
| |
| Years ended December 31, | | 2024 | | 2023 | | 2022 | | 2021 | | 2020 |
Selected Per-Share Data | | | | | | | | | | |
| Net asset value, beginning of period | $ | 1.00 | $ | 1.00 | $ | 1.00 | $ | 1.00 | $ | 1.00 |
| Income from Investment Operations | | | | | | | | | | |
Net investment income (loss) A | | .050 | | .048 | | .014 | | - B | | .003 |
Net realized and unrealized gain (loss) B | | - | | - | | - | | - | | - |
| Total from investment operations | | .050 | | .048 | | .014 | | - B | | .003 |
| Distributions from net investment income | | (.050) | | (.048) | | (.014) | | - B | | (.003) |
| Total distributions | | (.050) | | (.048) | | (.014) | | - B | | (.003) |
| Net asset value, end of period | $ | 1.00 | $ | 1.00 | $ | 1.00 | $ | 1.00 | $ | 1.00 |
Total Return C,D | | | | 4.89% | | 1.44% | | .01% | | .32% |
Ratios to Average Net Assets A,E,F | | | | | | | | | | |
| Expenses before reductions | | .27% | | .29% | | .24% | | .23% | | .24% |
| Expenses net of fee waivers, if any | | | | .29% | | .22% | | .08% | | .20% |
| Expenses net of all reductions | | .27% | | .29% | | .22% | | .08% | | .20% |
| Net investment income (loss) | | 4.96% | | 4.83% | | 1.52% | | .01% | | .29% |
| Supplemental Data | | | | | | | | | | |
| Net assets, end of period (000 omitted) | $ | 2,267,618 | $ | 2,594,542 | $ | 2,210,498 | $ | 1,477,559 | $ | 2,255,440 |
ANet investment income (loss) is affected by the timing of the declaration of dividends by any underlying mutual funds or exchange-traded funds (ETFs). Net investment income (loss) of any mutual funds or ETFs is not included in the Fund's net investment income (loss) ratio.
BAmount represents less than $.0005 per share.
CTotal returns do not reflect charges attributable to your insurance company's separate account. Inclusion of these charges would reduce the total returns shown.
DTotal returns would have been lower if certain expenses had not been reduced during the applicable periods shown.
EFees and expenses of any underlying mutual funds or exchange-traded funds (ETFs) are not included in the Fund's expense ratio. The Fund indirectly bears its proportionate share of these expenses.
FExpense ratios reflect operating expenses of the class. Expenses before reductions do not reflect amounts reimbursed, waived, or reduced through arrangements with the investment adviser, brokerage services, or other offset arrangements, if applicable, and do not represent the amount paid by the class during periods when reimbursements, waivers or reductions occur.
VIP Government Money Market Portfolio Service Class |
| |
| Years ended December 31, | | 2024 | | 2023 | | 2022 | | 2021 | | 2020 |
Selected Per-Share Data | | | | | | | | | | |
| Net asset value, beginning of period | $ | 1.00 | $ | 1.00 | $ | 1.00 | $ | 1.00 | $ | 1.00 |
| Income from Investment Operations | | | | | | | | | | |
Net investment income (loss) A | | .049 | | .047 | | .013 | | - B | | .003 |
| Net realized and unrealized gain (loss) | | - B | | - B | | .001 | | - B | | - B |
| Total from investment operations | | .049 | | .047 | | .014 | | - B | | .003 |
| Distributions from net investment income | | (.049) | | (.047) | | (.014) | | - B | | (.003) |
| Total distributions | | (.049) | | (.047) | | (.014) | | - B | | (.003) |
| Net asset value, end of period | $ | 1.00 | $ | 1.00 | $ | 1.00 | $ | 1.00 | $ | 1.00 |
Total Return C,D | | | | 4.79% | | 1.36% | | .01% | | .28% |
Ratios to Average Net Assets A,E,F | | | | | | | | | | |
| Expenses before reductions | | .37% | | .39% | | .34% | | .33% | | .34% |
| Expenses net of fee waivers, if any | | | | .39% | | .30% | | .08% | | .23% |
| Expenses net of all reductions | | .37% | | .39% | | .29% | | .08% | | .23% |
| Net investment income (loss) | | 4.85% | | 4.73% | | 1.44% | | .01% | | .26% |
| Supplemental Data | | | | | | | | | | |
| Net assets, end of period (000 omitted) | $ | 2,492,449 | $ | 2,289,476 | $ | 1,796,084 | $ | 1,447,279 | $ | 1,641,207 |
ANet investment income (loss) is affected by the timing of the declaration of dividends by any underlying mutual funds or exchange-traded funds (ETFs). Net investment income (loss) of any mutual funds or ETFs is not included in the Fund's net investment income (loss) ratio.
BAmount represents less than $.0005 per share.
CTotal returns do not reflect charges attributable to your insurance company's separate account. Inclusion of these charges would reduce the total returns shown.
DTotal returns would have been lower if certain expenses had not been reduced during the applicable periods shown.
EFees and expenses of any underlying mutual funds or exchange-traded funds (ETFs) are not included in the Fund's expense ratio. The Fund indirectly bears its proportionate share of these expenses.
FExpense ratios reflect operating expenses of the class. Expenses before reductions do not reflect amounts reimbursed, waived, or reduced through arrangements with the investment adviser, brokerage services, or other offset arrangements, if applicable, and do not represent the amount paid by the class during periods when reimbursements, waivers or reductions occur.
VIP Government Money Market Portfolio Service Class 2 |
| |
| Years ended December 31, | | 2024 | | 2023 | | 2022 | | 2021 | | 2020 |
Selected Per-Share Data | | | | | | | | | | |
| Net asset value, beginning of period | $ | 1.00 | $ | 1.00 | $ | 1.00 | $ | 1.00 | $ | 1.00 |
| Income from Investment Operations | | | | | | | | | | |
Net investment income (loss) A | | .047 | | .045 | | .013 | | - B | | .002 |
Net realized and unrealized gain (loss) B | | - | | - | | - | | - | | - |
| Total from investment operations | | .047 | | .045 | | .013 | | - B | | .002 |
| Distributions from net investment income | | (.047) | | (.045) | | (.013) | | - B | | (.002) |
| Total distributions | | (.047) | | (.045) | | (.013) | | - B | | (.002) |
| Net asset value, end of period | $ | 1.00 | $ | 1.00 | $ | 1.00 | $ | 1.00 | $ | 1.00 |
Total Return C,D | | | | 4.63% | | 1.26% | | .01% | | .24% |
Ratios to Average Net Assets A,E,F | | | | | | | | | | |
| Expenses before reductions | | .52% | | .54% | | .49% | | .48% | | .49% |
| Expenses net of fee waivers, if any | | | | .54% | | .40% | | .08% | | .28% |
| Expenses net of all reductions | | .52% | | .54% | | .40% | | .08% | | .28% |
| Net investment income (loss) | | 4.70% | | 4.58% | | 1.34% | | .01% | | .21% |
| Supplemental Data | | | | | | | | | | |
| Net assets, end of period (000 omitted) | $ | 401,835 | $ | 319,430 | $ | 238,428 | $ | 203,035 | $ | 221,428 |
ANet investment income (loss) is affected by the timing of the declaration of dividends by any underlying mutual funds or exchange-traded funds (ETFs). Net investment income (loss) of any mutual funds or ETFs is not included in the Fund's net investment income (loss) ratio.
BAmount represents less than $.0005 per share.
CTotal returns do not reflect charges attributable to your insurance company's separate account. Inclusion of these charges would reduce the total returns shown.
DTotal returns would have been lower if certain expenses had not been reduced during the applicable periods shown.
EFees and expenses of any underlying mutual funds or exchange-traded funds (ETFs) are not included in the Fund's expense ratio. The Fund indirectly bears its proportionate share of these expenses.
FExpense ratios reflect operating expenses of the class. Expenses before reductions do not reflect amounts reimbursed, waived, or reduced through arrangements with the investment adviser, brokerage services, or other offset arrangements, if applicable, and do not represent the amount paid by the class during periods when reimbursements, waivers or reductions occur.
VIP Government Money Market Portfolio Investor Class |
| |
| Years ended December 31, | | 2024 | | 2023 | | 2022 | | 2021 | | 2020 |
Selected Per-Share Data | | | | | | | | | | |
| Net asset value, beginning of period | $ | 1.00 | $ | 1.00 | $ | 1.00 | $ | 1.00 | $ | 1.00 |
| Income from Investment Operations | | | | | | | | | | |
Net investment income (loss) A | | .050 | | .048 | | .014 | | - B | | .003 |
Net realized and unrealized gain (loss) B | | - | | - | | - | | - | | - |
| Total from investment operations | | .050 | | .048 | | .014 | | - B | | .003 |
| Distributions from net investment income | | (.050) | | (.048) | | (.014) | | - B | | (.003) |
| Total distributions | | (.050) | | (.048) | | (.014) | | - B | | (.003) |
| Net asset value, end of period | $ | 1.00 | $ | 1.00 | $ | 1.00 | $ | 1.00 | $ | 1.00 |
Total Return C,D | | | | 4.87% | | 1.42% | | .01% | | .31% |
Ratios to Average Net Assets A,E,F | | | | | | | | | | |
| Expenses before reductions | | .30% | | .32% | | .27% | | .25% | | .26% |
| Expenses net of fee waivers, if any | | | | .31% | | .24% | | .08% | | .21% |
| Expenses net of all reductions | | .30% | | .31% | | .24% | | .08% | | .21% |
| Net investment income (loss) | | 4.92% | | 4.81% | | 1.50% | | .01% | | .28% |
| Supplemental Data | | | | | | | | | | |
| Net assets, end of period (000 omitted) | $ | 3,335,532 | $ | 3,016,743 | $ | 2,591,813 | $ | 1,970,069 | $ | 2,094,839 |
ANet investment income (loss) is affected by the timing of the declaration of dividends by any underlying mutual funds or exchange-traded funds (ETFs). Net investment income (loss) of any mutual funds or ETFs is not included in the Fund's net investment income (loss) ratio.
BAmount represents less than $.0005 per share.
CTotal returns do not reflect charges attributable to your insurance company's separate account. Inclusion of these charges would reduce the total returns shown.
DTotal returns would have been lower if certain expenses had not been reduced during the applicable periods shown.
EFees and expenses of any underlying mutual funds or exchange-traded funds (ETFs) are not included in the Fund's expense ratio. The Fund indirectly bears its proportionate share of these expenses.
FExpense ratios reflect operating expenses of the class. Expenses before reductions do not reflect amounts reimbursed, waived, or reduced through arrangements with the investment adviser, brokerage services, or other offset arrangements, if applicable, and do not represent the amount paid by the class during periods when reimbursements, waivers or reductions occur.
Notes to Financial Statements
For the period ended December 31, 2024
1. Organization.
VIP Government Money Market Portfolio (the Fund) is a fund of Variable Insurance Products Fund V (the Trust) and is authorized to issue an unlimited number of shares. The Trust is registered under the Investment Company Act of 1940, as amended (the 1940 Act), as an open-end management investment company organized as a Massachusetts business trust. Shares of the Fund may only be purchased by insurance companies for the purpose of funding variable annuity or variable life insurance contracts. The Fund offers the following classes of shares: Initial Class shares, Service Class shares, Service Class 2 shares and Investor Class shares. All classes have equal rights and voting privileges, except for matters affecting a single class.
2. Significant Accounting Policies.
The Fund is an investment company and applies the accounting and reporting guidance of the Financial Accounting Standards Board (FASB) Accounting Standards Codification Topic 946 Financial Services - Investment Companies. The financial statements have been prepared in conformity with accounting principles generally accepted in the United States of America (GAAP), which require management to make certain estimates and assumptions at the date of the financial statements. Actual results could differ from those estimates. The Fund operates as a single operating segment. The Fund's income, expenses, assets, and performance are regularly monitored and assessed as a whole by the investment adviser and other individuals responsible for oversight functions of the Trust, using the information presented in the financial statements and financial highlights. Subsequent events, if any, through the date that the financial statements were issued have been evaluated in the preparation of the financial statements. The Fund's Schedule of Investments lists any underlying mutual funds or exchange-traded funds (ETFs) but does not include the underlying holdings of these funds. The following summarizes the significant accounting policies of the Fund:
Investment Valuation. The Fund categorizes the inputs to valuation techniques used to value its investments into a disclosure hierarchy consisting of three levels as shown below:
Level 1 - unadjusted quoted prices in active markets for identical investments
Level 2 - other significant observable inputs (including quoted prices for similar investments, interest rates, prepayment speeds, etc.)
Level 3 - unobservable inputs (including the Fund's own assumptions based on the best information available)
As permitted by compliance with certain conditions under Rule 2a-7 of the 1940 Act, securities are valued at amortized cost, which approximates fair value. The amortized cost of an instrument is determined by valuing it at its original cost and thereafter amortizing any discount or premium from its face value at a constant rate until maturity. Securities held by a money market fund are generally high quality and liquid; however, they are reflected as Level 2 because the inputs used to determine fair value are not quoted prices in an active market.
Investment Transactions and Income. Gains and losses on securities sold are determined on the basis of identified cost and include proceeds received from litigation. Interest income is accrued as earned and includes coupon interest and amortization of premium and accretion of discount on debt securities as applicable. The principal amount on inflation-indexed securities is periodically adjusted to the rate of inflation and interest is accrued based on the principal amount. The adjustments to principal due to inflation are reflected as increases or decreases to Interest in the accompanying Statement of Operations.
Class Allocations and Expenses. Investment income, realized and unrealized capital gains and losses, common expenses of a fund, and certain fund-level expense reductions, if any, are allocated daily on a pro-rata basis to each class based on the relative net assets of each class to the total net assets of a fund. Each class differs with respect to transfer agent and distribution and service plan fees incurred, as applicable. Certain expense reductions may also differ by class, if applicable. For the reporting period, the allocated portion of income and expenses to each class as a percent of its average net assets may vary due to the timing of recording these transactions in relation to fluctuating net assets of the classes. Expenses directly attributable to a fund are charged to that fund. Expenses attributable to more than one fund are allocated among the respective funds on the basis of relative net assets or other appropriate methods. Expenses included in the accompanying financial statements reflect the expenses of that fund and do not include any expenses associated with any underlying mutual funds or exchange-traded funds (ETFs). Although not included in a fund's expenses, a fund indirectly bears its proportionate share of these expenses through the net asset value of each underlying mutual fund or exchange-traded fund (ETF). Expense estimates are accrued in the period to which they relate and adjustments are made when actual amounts are known.
Income Tax Information and Distributions to Shareholders. Each year, the Fund intends to qualify as a regulated investment company under Subchapter M of the Internal Revenue Code, including distributing substantially all of its taxable income and realized gains. As a result, no provision for U.S. Federal income taxes is required. As of December 31, 2024, the Fund did not have any unrecognized tax benefits in the financial statements; nor is the Fund aware of any tax positions for which it is reasonably possible that the total amounts of unrecognized tax benefits will significantly change in the next twelve months. The Fund files a U.S. federal tax return, in addition to state and local tax returns as required. The Fund's federal income tax returns are subject to examination by the Internal Revenue Service (IRS) for a period of three fiscal years after they are filed. State and local tax returns may be subject to examination for an additional fiscal year depending on the jurisdiction.
Distributions are declared and recorded daily and paid monthly from net investment income. Distributions from realized gains, if any, are declared and recorded on the ex-dividend date. Income and capital gain distributions are declared separately for each class. Income and capital gain distributions are determined in accordance with income tax regulations, which may differ from GAAP.
Capital accounts within the financial statements are adjusted for permanent book-tax differences. These adjustments have no impact on net assets or the results of operations. Capital accounts are not adjusted for temporary book-tax differences which will reverse in a subsequent period.
Book-tax differences are primarily due to capital loss carryforwards.
As of period end, the cost and unrealized appreciation (depreciation) in securities for federal income tax purposes were as follows:
| Gross unrealized appreciation | $- |
| Gross unrealized depreciation | - |
| Net unrealized appreciation (depreciation) | $- |
| Tax Cost | $8,565,399,208 |
The tax-based components of distributable earnings as of period end were as follows:
| Undistributed ordinary income | $278,004 |
| Capital loss carryforward | $(24,521) |
| Net unrealized appreciation (depreciation) on securities and other investments | $- |
Capital loss carryforwards are only available to offset future capital gains of the Fund to the extent provided by regulations and may be limited. The capital loss carryforward information presented below, including any applicable limitation, is estimated as of fiscal period end and is subject to adjustment.
Long-term | (24,521) |
| Total capital loss carryforward | $(24,521) |
The tax character of distributions paid was as follows:
| | December 31, 2024 | December 31, 2023 |
| Ordinary Income | $412,087,912 | $ 342,294,738 |
| Total | $412,087,912 | $ 342,294,738 |
Repurchase Agreements. Pursuant to an Exemptive Order issued by the Securities and Exchange Commission, funds and other registered investment companies having management contracts with Fidelity Management and Research Company LLC, or its affiliates are permitted to transfer uninvested cash balances into joint trading accounts which are then invested in repurchase agreements. Funds may also invest directly with institutions in repurchase agreements. Repurchase agreements may be collateralized by cash or government securities. Upon settlement date, collateral is held in segregated accounts with custodian banks and may be obtained in the event of a default of the counterparty. The collateral balance is monitored on a daily basis to ensure it is at least equal to the principal amount of the repurchase agreement (including accrued interest). In the event of a default by the counterparty, realization of the collateral proceeds could be delayed, during which time the value of the collateral may decline.
New Rule Issuance. In July 2023, the Securities and Exchange Commission issued a Final Rule relative to Money Market Reform. Among other things, the Final Rule includes amendments for: (1) Removal of redemption gates except for liquidations; (2) Required liquidity fees for institutional prime and institutional tax-exempt money market funds; (3) Discretionary liquidity fees for non-government money market funds; (4) Higher liquidity requirements; and (5) Changes to reporting requirements for Form N-MFP and Form N-CR. The Final Rule imposes different implementation dates for the amendments through October 2, 2024. The amendments have been implemented to date, and management has concluded that there are no material impacts to the Fund's financial statements and related disclosures.
New Accounting Pronouncement. FASB Accounting Standards Update (ASU) 2023-07 Segment Reporting (Topic 280): Improvements to Reportable Segment Disclosures became effective in this reporting period. ASU 2023-07 enhances segment information disclosure in the notes to financial statements.
3. Fees and Other Transactions with Affiliates.
Management Fee. Fidelity Management & Research Company LLC (the investment adviser) and its affiliates provide the Fund with investment management related services for which the Fund pays a monthly management fee.
Effective March 1, 2024, the Fund's management contract was amended to incorporate administrative services previously covered under separate services agreements (Transfer Agent and Accounting agreements). The amended contract incorporates a management fee rate that may vary by class. The investment adviser or an affiliate pays certain expenses of managing and operating the Fund out of each class's management fee. Each class of the Fund pays a management fee to the investment adviser. The management fee is calculated and paid to the investment adviser every month. The management fee is determined by calculating a basic fee and then adding an income-related fee. When determining a class's management fee, a mandate rate is calculated based on the monthly average net assets of a group of funds advised by FMR within a designated asset class. A discount rate is subtracted from the mandate rate once the Fund's monthly average net assets reach a certain level. The mandate rate and discount rate may vary by class. The annual basic fee rate for a class of shares of the Fund is the lesser of (1) the class's mandate rate reduced by the class's discount rate (if applicable) or (2) the amount set forth in the following table.
| | Maximum Basic Fee Rate % |
| Initial Class | .15 |
| Service Class | .15 |
| Service Class 2 | .15 |
| Investor Class | .18 |
One-twelfth of the management fee rate for a class is applied to the average net assets of the class for the month, giving a dollar amount which is the management fee for the class for that month. The income-related fee varies depending on the level of the Fund's monthly gross income from an annualized rate of .05% (at a fund annualized gross yield of 0%) to .27% (at a fund annualized gross yield of 15%) of the Fund's average net assets throughout the month. The income-related fee is proportionately added to a class's basic fee. A different management fee rate may be applicable to each class of the Fund. The difference between classes is the result of separate arrangements for class-level services and/or waivers of certain expenses. It is not the result of any difference in advisory or custodial fees or other expenses related to the management of the Fund's assets, which do not vary by class. For the portion of the reporting period on or after March 1, 2024, the total annualized income-related fee and management fee rates were as follows:
| | Income-Related Fee $ | Income-Related Fee Rate % | Total Management Fee Rate % |
| VIP Government Money Market Portfolio | 8,026,513 | .11 | |
| Initial Class | | | .26 |
| Service Class | | | .26 |
| Service Class 2 | | | .26 |
| Investor Class | | | .29 |
Prior to March 1, 2024, the management fee was calculated on the basis of a group fee rate plus a total income-based component. The annualized group fee rate averaged .10% during the period. The group fee rate was based upon the monthly average net assets of a group of registered investment companies with which the investment adviser has management contracts. The group fee rate decreased as assets under management increased and increased as assets under management decreased. The total income-based component was comprised of an income-based fee and an asset-based fee and was calculated according to a graduated schedule providing for different rates based on the Fund's gross annualized yield. The rate increased as the Fund's gross yield increased. Prior to March 1, 2024, the income-based portion of this fee was $1,634,311 or an annualized rate of .12% of the Fund's average net assets. For the portion of the reporting period prior to March 1, 2024, the total annualized management fee rate was .22%.
Effective March 1, 2024, the Fund's sub-advisory agreements with FMR Investment Management (UK) Limited, Fidelity Management & Research (Hong Kong) Limited, and Fidelity Management & Research (Japan) Limited were amended to provide that the investment adviser pays each sub-adviser monthly fees equal to 110% of the sub-adviser's costs for providing sub-advisory services.
Distribution and Service Plan Fees. In accordance with Rule 12b-1 of the 1940 Act, the Fund has adopted separate 12b-1 Plans for each Service Class of shares. Each Service Class pays Fidelity Distributors Company LLC (FDC), an affiliate of the investment adviser, a service fee. For the period, the service fee is based on an annual rate of .10% of Service Class' average net assets and .25% of Service Class 2's average net assets.
For the period, total fees, all of which were re-allowed to insurance companies for the distribution of shares and providing shareholder support services, were as follows:
| Service Class | $2,257,509 |
| Service Class 2 | 922,453 |
| | $3,179,962 |
Transfer Agent Fees. Fidelity Investments Institutional Operations Company LLC (FIIOC), an affiliate of the investment adviser, is the Fund's transfer, dividend disbursing, and shareholder servicing agent. Effective March 1, 2024, the Fund's management contract was amended to incorporate transfer agent services and associated fees previously covered under a separate services agreement.
During the period January 1, 2024 through February 29, 2024, the transfer agent fees for each class were a fixed annual rate of class-level average net assets as follows:
| | Amount ($) | % of Class-Level Average Net Assets |
| Initial Class | 305,591 | .0680 |
| Service Class | 243,455 | .0680 |
| Service Class 2 | 36,423 | .0680 |
| Investor Class | 460,967 | .0920 |
| | 1,046,436 | |
Accounting Fees. Fidelity Service Company, Inc. (FSC), an affiliate of the investment adviser, maintains the Fund's accounting records. Effective March 1, 2024, the Fund's management contract was amended to incorporate accounting services and associated fees previously covered under a separate services agreement.
During the period January 1, 2024 through February 29, 2024, the accounting fees were a fixed annual rate of average net assets as follows:
| | % of Average Net Assets |
| VIP Government Money Market Portfolio | .0083 |
Interfund Trades. Funds may purchase from or sell securities to other Fidelity Funds under procedures adopted by the Board. The procedures have been designed to ensure these interfund trades are executed in accordance with Rule 17a-7 of the 1940 Act. During the period, there were no interfund trades.
4. Expense Reductions.
During the period the investment adviser or an affiliate reimbursed and/or waived a portion of fund-level operating expenses in the amount of $197,615.
5. Distributions to Shareholders.
Distributions to shareholders of each class were as follows:
| | Year ended December 31, 2024 | Year ended December 31, 2023 |
| VIP Government Money Market Portfolio | | |
| Distributions to shareholders | | |
| Initial Class | $129,204,435 | $102,114,967 |
| Service Class | 109,549,291 | 93,288,370 |
| Service Class 2 | 17,281,509 | 12,727,490 |
| Investor Class | 156,052,677 | 134,163,911 |
Total | $412,087,912 | $342,294,738 |
6. Share Transactions.
Transactions for each class of shares at a $1.00 per share were as follows and may contain in-kind transactions:
| | Shares | Shares | Dollars | Dollars |
| | Year ended December 31, 2024 | Year ended December 31, 2023 | Year ended December 31, 2024 | Year ended December 31, 2023 |
| VIP Government Money Market Portfolio | | | | |
| Initial Class | | | | |
| Shares sold | 2,178,894,018 | 2,678,433,367 | $2,178,894,018 | $2,678,433,368 |
| Reinvestment of distributions | 129,913,881 | 101,451,920 | 129,913,881 | 101,451,920 |
| Shares redeemed | (2,638,246,567) | (2,395,779,271) | (2,638,246,567) | (2,395,779,271) |
| Net increase (decrease) | (329,438,668) | 384,106,016 | $(329,438,668) | $384,106,017 |
| Service Class | | | | |
| Shares sold | 2,464,667,316 | 1,936,736,029 | $2,464,667,316 | $1,936,736,029 |
| Reinvestment of distributions | 110,180,749 | 92,851,034 | 110,180,749 | 92,851,034 |
| Shares redeemed | (2,370,916,323) | (1,536,162,855) | (2,370,916,323) | (1,536,162,855) |
| Net increase (decrease) | 203,931,742 | 493,424,208 | $203,931,742 | $493,424,208 |
| Service Class 2 | | | | |
| Shares sold | 643,287,594 | 324,195,319 | $643,287,594 | $324,195,319 |
| Reinvestment of distributions | 17,366,478 | 12,647,436 | 17,366,478 | 12,647,436 |
| Shares redeemed | (577,986,476) | (255,857,046) | (577,986,476) | (255,857,046) |
| Net increase (decrease) | 82,667,596 | 80,985,709 | $82,667,596 | $80,985,709 |
| Investor Class | | | | |
| Shares sold | 733,425,816 | 799,423,897 | $733,425,816 | $799,423,897 |
| Reinvestment of distributions | 156,891,427 | 133,600,121 | 156,891,427 | 133,600,121 |
| Shares redeemed | (570,264,053) | (508,177,510) | (570,264,053) | (508,177,510) |
| Net increase (decrease) | 320,053,190 | 424,846,508 | $320,053,190 | $424,846,508 |
7. Other.
A fund's organizational documents provide former and current trustees and officers with a limited indemnification against liabilities arising in connection with the performance of their duties to the fund. In the normal course of business, a fund may also enter into contracts that provide general indemnifications. A fund's maximum exposure under these arrangements is unknown as this would be dependent on future claims that may be made against a fund. The risk of material loss from such claims is considered remote.
At the end of the period, the investment adviser or its affiliates were owners of record of more than 10% and certain otherwise unaffiliated shareholders were owners of record of more than 10% of the outstanding shares as follows:
| Fund | Affiliated % | Number of Unaffiliated Shareholders | Unaffiliated Shareholders % |
VIP Government Money Market Portfolio | 42% | 1 | 14% |
8. Risk and Uncertainties.
Many factors affect a fund's performance. Developments that disrupt global economies and financial markets, such as pandemics, epidemics, outbreaks of infectious diseases, war, terrorism, and environmental disasters, may significantly affect a fund's investment performance. The effects of these developments to a fund will be impacted by the types of securities in which a fund invests, the financial condition, industry, economic sector, and geographic location of an issuer, and a fund's level of investment in the securities of that issuer. Significant concentrations in security types, issuers, industries, sectors, and geographic locations may magnify the factors that affect a fund's performance.
Report of Independent Registered Public Accounting Firm
To the Board of Trustees of Variable Insurance Products Fund V and Shareholders of VIP Government Money Market Portfolio
Opinion on the Financial Statements
We have audited the accompanying statement of assets and liabilities, including the schedule of investments, of VIP Government Money Market Portfolio (one of the funds constituting Variable Insurance Products Fund V, referred to hereafter as the "Fund") as of December 31, 2024, the related statement of operations for the year ended December 31, 2024, the statement of changes in net assets for each of the two years in the period ended December 31, 2024, including the related notes, and the financial highlights for each of the five years in the period ended December 31, 2024 (collectively referred to as the "financial statements"). In our opinion, the financial statements present fairly, in all material respects, the financial position of the Fund as of December 31, 2024, the results of its operations for the year then ended, the changes in its net assets for each of the two years in the period ended December 31, 2024 and the financial highlights for each of the five years in the period ended December 31, 2024 in conformity with accounting principles generally accepted in the United States of America.
Basis for Opinion
These financial statements are the responsibility of the Fund's management. Our responsibility is to express an opinion on the Fund's financial statements based on our audits. We are a public accounting firm registered with the Public Company Accounting Oversight Board (United States) (PCAOB) and are required to be independent with respect to the Fund in accordance with the U.S. federal securities laws and the applicable rules and regulations of the Securities and Exchange Commission and the PCAOB.
We conducted our audits of these financial statements in accordance with the standards of the PCAOB. Those standards require that we plan and perform the audit to obtain reasonable assurance about whether the financial statements are free of material misstatement, whether due to error or fraud.
Our audits included performing procedures to assess the risks of material misstatement of the financial statements, whether due to error or fraud, and performing procedures that respond to those risks. Such procedures included examining, on a test basis, evidence regarding the amounts and disclosures in the financial statements. Our audits also included evaluating the accounting principles used and significant estimates made by management, as well as evaluating the overall presentation of the financial statements. Our procedures included confirmation of securities owned as of December 31, 2024 by correspondence with the custodian and brokers; when replies were not received from brokers, we performed other auditing procedures. We believe that our audits provide a reasonable basis for our opinion.
/s/ PricewaterhouseCoopers LLP
Boston, Massachusetts
February 13, 2025
We have served as the auditor of one or more investment companies in the Fidelity group of funds since 1932.
Distributions
(Unaudited)The dividend and capital gains distributions for the fund(s) are available on Fidelity.com or Institutional.Fidelity.com.
A total of 55.08% of the dividends distributed during the fiscal year was derived from interest on U.S. Government securities which is generally exempt from state income tax.
The fund designates $412,087,912 of distributions paid during the fiscal year ended 2024 as qualifying to be taxed as section 163(j) interest dividends.
Item 8: Changes in and Disagreements with Accountants for Open-End Management Investment Companies
(Unaudited)
Note: This is not applicable for any fund included in this document.
Item 9: Proxy Disclosures for Open-End Management Investment Companies
(Unaudited)
Note: This is not applicable for any fund included in this document.
Item 10: Remuneration Paid to Directors, Officers, and others of Open-End Management Investment Companies
(Unaudited)
Note: This information is disclosed as part of the financial statements for each Fund as part of Item 7: Financial Statements and Financial Highlights for Open-End Management Investment companies.
Item 11: Statement Regarding Basis for Approval of Investment Advisory Contract
(Unaudited)
Board Approval of Investment Advisory Contracts and Management Fees
VIP Government Money Market Portfolio
Each year, the Board of Trustees, including the Independent Trustees (together, the Board), considers the renewal of the fund's management contract with Fidelity Management & Research Company LLC (FMR) and the sub-advisory agreements (together, the Advisory Contracts) for the fund. FMR and the sub-advisers are referred to herein as the Investment Advisers. The Board, assisted by the advice of fund counsel and Independent Trustees' counsel, requests and considers a broad range of information relevant to the renewal of the Advisory Contracts throughout the year.
The Board meets regularly and, at each of its meetings, covers an extensive agenda of topics and materials and considers factors that are relevant to its annual consideration of the renewal of the fund's Advisory Contracts, including the services and support provided to the fund and its shareholders. The Board's Operations Committee, of which all the Independent Trustees are members, meets regularly throughout the year and requests, receives and considers, among other matters, information related to the annual consideration of the renewal of the fund's Advisory Contracts before making its recommendation to the Board. The Board also meets as needed to review matters specifically related to the Board's annual consideration of the renewal of the Advisory Contracts. Members of the Board may also meet from time to time with trustees of other Fidelity funds through joint ad hoc committees to discuss certain matters relevant to all of the Fidelity funds.
At its September 2024 meeting, the Board unanimously determined to renew the fund's Advisory Contracts. In reaching its determination, the Board considered all factors it believed relevant, including (i) the nature, extent, and quality of the services provided to the fund and its shareholders (including the investment performance of the fund); (ii) the competitiveness relative to peer funds of the fund's management fee and the total expense ratio of a representative class (Investor Class, which was selected because it was the largest class without 12b-1 fees); (iii) the total costs of the services provided by and the profits realized by FMR and its affiliates (Fidelity) from its relationships with the fund; and (iv) the extent to which, if any, economies of scale exist and are realized as the fund grows, and whether any economies of scale are appropriately shared with fund shareholders. The Board also considered the broad range of investment choices available to shareholders from FMR's competitors and that the fund's shareholders have chosen to invest in the fund, which is part of the Fidelity family of funds. The Board's decision to renew the Advisory Contracts was not based on any single factor and the factors may have been weighed differently by different Trustees.
The Board reached a determination, with the assistance of fund counsel and Independent Trustees' counsel and through the exercise of its business judgment, that the renewal of the Advisory Contracts was in the best interests of the fund and its shareholders and that the compensation payable under the Advisory Contracts was fair and reasonable in light of all of the surrounding circumstances.
Nature, Extent, and Quality of Services Provided. The Board considered Fidelity's staffing as it relates to the fund, including the backgrounds and experience of investment personnel, and also considered the Investment Advisers' implementation of the fund's investment program. The Independent Trustees also had discussions with senior management of Fidelity's investment operations and investment groups. The Board considered the structure of the investment personnel compensation program and whether this structure provides appropriate incentives to act in the best interests of the fund. Additionally, the Board considered the portfolio managers' investments, if any, in the funds that they manage.
Resources Dedicated to Investment Management and Support Services. The Board reviewed the general qualifications and capabilities of Fidelity's investment staff, including its size, education, experience, and resources, as well as Fidelity's approach to recruiting, managing, training, and compensating investment personnel. The Board noted the resources devoted to Fidelity's global investment organization, and that Fidelity's analysts have extensive resources, tools and capabilities that allow them to conduct quantitative and fundamental analysis, as well as credit analysis of issuers, counterparties and guarantors. Further, the Board considered that Fidelity's investment professionals have sufficient access to global information and data so as to provide competitive investment results over time, and that those professionals also have access to sophisticated tools that permit them to assess portfolio construction and risk and performance attribution characteristics continuously, as well as to transmit new information and research conclusions rapidly around the world. Additionally, in its deliberations, the Board considered Fidelity's trading, risk management, compliance, cybersecurity, and technology and operations capabilities and resources, which are integral parts of the investment management process.
Shareholder and Administrative Services. The Board considered (i) the nature, extent, quality, and cost of advisory, administrative, shareholder, transfer agency, and pricing and bookkeeping services performed by the Investment Advisers and their affiliates under the Advisory Contracts; (ii) the nature and extent of Fidelity's supervision of third party service providers, principally custodians, subcustodians, and pricing vendors; and (iii) the resources devoted by Fidelity to, and the record of compliance with, the fund's compliance policies and procedures, including with respect to liquidity risk management.
The Board noted that the growth of fund assets over time across the complex allows Fidelity to reinvest in the development of services designed to enhance the value and convenience of the Fidelity funds as investment vehicles. These services include 24-hour access to account information and market information over the Internet and through telephone representatives, investor education materials and asset allocation tools. The Board also considered that it reviews customer service metrics such as telephone response times, continuity of services on the website and metrics addressing services at Fidelity Investor Centers.
Investment in a Large Fund Family. The Board considered the benefits to shareholders of investing in a fund that is part of a large family of funds offering a variety of investment disciplines and providing a large variety of fund investor services. The Board noted that Fidelity had taken, or had made recommendations to the Board that resulted in the Fidelity funds taking, a number of actions over the previous year that benefited particular funds and/or the Fidelity funds in general.
Investment Performance. The Board took into account discussions that occur with representatives of the Investment Advisers, and reports that it receives, at Board meetings throughout the year relating to fund investment performance. In this regard the Board noted that as part of regularly scheduled fund reviews and other reports to the Board on fund performance, the Board considered annualized return information for the fund for different time periods, measured against an appropriate peer group of funds with similar objectives (peer group). The Board also considered information about performance attribution. In its evaluation of fund investment performance at meetings throughout the year, the Board gave particular attention to information indicating underperformance of certain Fidelity funds over different time periods and discussed with the Investment Advisers the reasons for such underperformance.
In addition to reviewing absolute and relative fund performance, the Independent Trustees periodically consider the appropriateness of fund performance metrics in evaluating the results achieved. The Independent Trustees generally give greater weight to fund performance over longer time periods than over shorter time periods.
The Board recognizes that in interest rate environments where many competitors waive fees to maintain a minimum yield, relative money market fund performance on a net basis (after fees and expenses) may not be particularly meaningful due to miniscule performance differences among competitor funds. Depending on the circumstances, the Independent Trustees may be satisfied with a fund's performance notwithstanding that it lags its peer group for certain periods.
Based on its review, the Board concluded that the nature, extent, and quality of services provided to the fund under the Advisory Contracts should continue to benefit the shareholders of the fund.
Competitiveness of Management Fee and Total Expense Ratio. The Board was provided with information regarding industry trends in management fees and expenses. The Board considered that, effective March 1, 2024, an amended Advisory Contract with FMR went into effect with class-level management fees based on tiered schedules and subject to a maximum class-level rate (the management fee). The Board also considered that in exchange for the variable management fee, each class of the fund receives investment advisory, management, administrative, transfer agent, and pricing and bookkeeping services. In its review of the management fee and total expense ratio of Investor Class, the Board considered a pro forma management fee rate for Investor Class as if the new management fee structure had been in effect for the 12-month period ended December 31, 2023, as well as other third-party fund expenses, as applicable, such as custodial, legal, and audit fees and any fund-paid 12b-1 fees. The Board recognized that the income-based component of the fund's management fee, which no competitors have, varies depending on the level of the fund's monthly gross income, providing for higher fees at higher income levels, and for lower fees at lower income levels. The Board noted that Fidelity may agree to waive fees or reimburse expenses from time to time, and the extent to which, if any, it has done so for the fund.
Comparisons of Management Fees and Total Expense Ratios. Among other things, the Board reviewed data for selected groups of competitive funds and classes (referred to as "mapped groups") that were compiled by Fidelity based on combining similar investment objective categories (as classified by Morningstar) that have comparable investment mandates. The data reviewed by the Board included (i) gross management fee comparisons (before taking into account expense reimbursements or caps) relative to the total universe of funds within the mapped group; (ii) gross management fee comparisons relative to a subset of non-Fidelity funds in the mapped group that are similar in size and management fee structure to the fund (referred to as the "asset size peer group"); (iii) total expense comparisons of Investor Class of the fund relative to funds and classes in the mapped group that have a similar sales load structure to Investor Class of the fund (referred to as the "similar sales load structure group"); and (iv) total expense comparisons of Investor Class of the fund relative to funds and classes in the similar sales load structure group that are similar in size and management fee structure to the fund (referred to as the "total expense asset size peer group"). The total expense asset size peer group comparison excludes performance adjustments and fund-paid 12b-1 fees to eliminate variability in fee structures.
The information provided to the Board indicated that the fund's management fee rate ranked below the competitive median of the mapped group for 2023 and below the competitive median of the asset size peer group for 2023. Further, the information provided to the Board indicated that the total expense ratio of Investor Class of the fund ranked below the competitive median of the similar sales load structure group for 2023 and below the competitive median of the total expense asset size peer group for 2023.
The Board noted that a different variable management fee rate is applicable to each class of the fund. The Board considered that the difference in management fee rates between classes is the result of separate arrangements for class-level services and/or waivers of certain expenses and not the result of any difference in advisory or custodial fees or other expenses related to the management of the fund's assets, which do not vary by class.
The Board noted that the fund offers multiple classes, each of which has a different 12b-1 fee structure, and that the multiple structures are intended to offer a range of pricing options for the intermediary market. The Board also noted that the total expense ratios of the classes vary primarily by the level of their 12b-1 fees, although differences in transfer agent fees may also cause expenses to vary from class to class.
In the information provided to the Board, Fidelity noted that competitor comparisons for money market funds are challenging due, in part, to the frequent imposition of reimbursements and waivers on money market funds in recent years. The Board considered that Fidelity believes that excluding fee waivers and reimbursements provides a better total expense comparison until such waivers are less prevalent in competitor data. When fee waivers and reimbursements are excluded from competitor data, the fund's total expense ratio ranked below the competitive medians for 2023.
Fees Charged to Other Fidelity Clients. The Board also considered Fidelity fee structures and other information with respect to clients of Fidelity, such as other funds advised or subadvised by Fidelity, pension plan clients, and other institutional clients with similar mandates. The Board noted that a joint ad hoc committee created by it and the boards of other Fidelity funds periodically reviews and compares Fidelity's institutional investment advisory business with its business of providing services to the Fidelity funds and also noted the most recent findings of the committee. The Board noted that the committee's review included a consideration of the differences in services provided, fees charged, and costs incurred, as well as competition in the markets serving the different categories of clients.
Based on its review, the Board concluded that the fund's management fee is fair and reasonable in light of the services that the fund receives and the other factors considered. Further, based on its review of total expense ratios and fees charged to other Fidelity clients, the Board concluded that the total expense ratio of each class of the fund was reasonable in light of the services that the fund and its shareholders receive and the other factors considered.
Costs of the Services and Profitability. The Board considered the revenues earned and the expenses incurred by Fidelity in conducting the business of developing, marketing, distributing, managing, administering and servicing the fund and servicing the fund's shareholders. The Board also considered the level of Fidelity's profits in respect of all the Fidelity funds.
On an annual basis, Fidelity presents to the Board information about the profitability of its relationships with the fund. Fidelity calculates profitability information for each Fidelity fund, as well as aggregate profitability information for groups of Fidelity funds and all Fidelity funds, using a series of detailed revenue and cost allocation methodologies which originate with the books and records of Fidelity on which Fidelity's audited financial statements are based. The Audit Committee of the Board reviews any significant changes from the prior year's methodologies.
A public accounting firm has been engaged annually by the Board as part of the Board's assessment of Fidelity's profitability analysis. The engagement includes the review and assessment of the methodologies used by Fidelity in determining the revenues and expenses attributable to Fidelity's fund business. After considering the reports issued under the engagement and information provided by Fidelity, the Board concluded that while other allocation methods may also be reasonable, Fidelity's profitability methodologies are reasonable in all material respects.
The Board also reviewed Fidelity's non-fund businesses and potential indirect benefits such businesses may have received as a result of their association with Fidelity's fund business (i.e., fall-out benefits) as well as cases where Fidelity's affiliates may benefit from the funds' business. The Board considered areas where potential indirect benefits to the Fidelity funds from their relationships with Fidelity may exist. The Board's consideration of these matters was informed by the findings of a joint ad hoc committee created by it and the boards of other Fidelity funds to evaluate potential fall-out benefits.
The Board considered the costs of the services provided by and the profits realized by Fidelity in connection with the operation of the fund and was satisfied that the profitability was not excessive.
Economies of Scale. The Board considered whether there have been economies of scale in respect of the management of the Fidelity funds, whether the Fidelity funds (including the fund) have appropriately benefited from any such economies of scale, and whether there is potential for realization of any further economies of scale. The Board considered the extent to which the fund will benefit from economies of scale as assets grow through increased services to the fund, through waivers or reimbursements, or through fee or expense ratio reductions. The Board also noted that a committee created by it and the boards of other Fidelity funds periodically analyzes whether Fidelity attains economies of scale in respect of the management and servicing of the Fidelity funds, whether the Fidelity funds have appropriately benefited from such economies of scale, and whether there is potential for realization of any further economies of scale.
The Board recognized that the fund's management contract incorporates a variable management fee structure, which provides breakpoints as a way to share, in part, any potential economies of scale that may exist at the asset class level determined based on the total net assets of specified Fidelity funds in the same asset class as the fund and through a discount determined based on both fund size and total assets of a broader group of specified Fidelity funds. The Board considered that the variable management fee is designed to deliver the benefits of economies of scale to fund shareholders even if assets of any particular fund are unchanged or have declined, because some portion of Fidelity's costs are attributable to services provided to all funds subject to the variable management fee, and all such funds benefit if those costs can be allocated among more assets. The Board concluded that, given the variable management fee structure, fund shareholders will benefit from lower management fees due to the application of the breakpoints and discount, regardless of whether Fidelity achieves any such economies of scale.
The Board concluded, taking into account the analysis of the committee, that economies of scale, if any, are being appropriately shared between fund shareholders and Fidelity.
Additional Information Requested by the Board. In order to develop fully the factual basis for consideration of the Fidelity funds' advisory contracts, the Board requested and received additional information on certain topics, including: (i) portfolio manager changes that have occurred during the past year; (ii) hiring, training, compensating, and retaining adviser and sub-adviser personnel; (iii) the terms of the funds' various management fee structures and arrangements for transfer agent and pricing and bookkeeping services; (iv) Fidelity's fund profitability methodology, profitability trends for certain funds, the allocation of various costs to different funds, and the impact of certain factors on fund profitability results; (v) the impact on fund profitability of recent industry trends, such as the growth in passively managed funds and the changes in flows for different types of funds; (vi) the types of management fee and total expense comparisons provided, and the challenges and limitations associated with such information; (vii) explanations regarding the relative total expense ratios and management fees of certain funds and classes, total expense and management fee competitive trends, and methodologies for total expense and management fee competitive comparisons; (viii) matters related to money market funds, exchange-traded funds, and target date funds; (ix) the arrangements with and compensation paid to certain fund sub-advisers and the treatment of such compensation within Fidelity's fund profitability methodology; and (x) the terms of management contracts between Fidelity and other funds and products not overseen by the Board.
Conclusion. Based on its evaluation of all of the conclusions noted above, and after considering all factors it believed relevant, the Board, including the Independent Trustees, concluded that the advisory and sub-advisory fee arrangements are fair and reasonable in light of all of the surrounding circumstances and that the fund's Advisory Contracts should be renewed through September 30, 2025.
1.701157.127
VIPMM-ANN-0325
Fidelity® Variable Insurance Products:
VIP Target Volatility Portfolio
Annual Report
December 31, 2024
Contents
To view a fund's proxy voting guidelines and proxy voting record for the 12-month period ended June 30, visit http://www.fidelity.com/proxyvotingresults or visit the Securities and Exchange Commission's (SEC) web site at http://www.sec.gov.
You may also call 1-877-208-0098 to request a free copy of the proxy voting guidelines.
Fidelity® Variable Insurance Products are separate account options which are purchased through a variable insurance contract.
Standard & Poor's, S&P and S&P 500 are registered service marks of The McGraw-Hill Companies, Inc. and have been licensed for use by Fidelity Distributors Corporation.
Other third-party marks appearing herein are the property of their respective owners.
All other marks appearing herein are registered or unregistered trademarks or service marks of FMR LLC or an affiliated company. © 2025 FMR LLC. All rights reserved.
This report and the financial statements contained herein are submitted for the general information of the shareholders of the Fund. This report is not authorized for distribution to prospective investors in the Fund unless preceded or accompanied by an effective prospectus.
A fund files its complete schedule of portfolio holdings with the SEC for the first and third quarters of each fiscal year on Form N-PORT. Forms N-PORT are available on the SEC's web site at http://www.sec.gov. A fund's Forms N-PORT may be reviewed and copied at the SEC's Public Reference Room in Washington, DC. Information regarding the operation of the SEC's Public Reference Room may be obtained by calling 1-800-SEC-0330.
For a complete list of a fund's portfolio holdings, view the most recent holdings listing, semiannual report, or annual report on Fidelity's web site at http://www.fidelity.com, http://www.institutional.fidelity.com, or http://www.401k.com, as applicable.
NOT FDIC INSURED •MAY LOSE VALUE •NO BANK GUARANTEE
Neither the Fund nor Fidelity Distributors Corporation is a bank.
Item 7: Financial Statements and Financial Highlights for Open-End Management Investment Companies (Annual Report)
VIP Target Volatility Portfolio
Schedule of Investments December 31, 2024
Showing Percentage of Net Assets
| Alternative Funds - 2.0% |
| | | Shares | Value ($) |
Fidelity Hedged Equity Fund (b) (Cost $3,175,373) | | 263,370 | 3,471,214 |
| | | | |
| Bond Funds - 20.0% |
| | | Shares | Value ($) |
| Fidelity Long-Term Treasury Bond Index Fund (b) | | 39,372 | 361,041 |
| Fidelity Total Bond Fund (b) | | 3,575,184 | 33,606,729 |
| Fidelity U.S. Bond Index Fund (b) | | 49,016 | 500,944 |
| SPDR Bloomberg 1-10 Year TIPS ETF | | 32,935 | 608,968 |
| TOTAL BOND FUNDS (Cost $35,641,412) | | | 35,077,682 |
| | | | |
| Domestic Equity Funds - 45.1% |
| | | Shares | Value ($) |
| Fidelity Contrafund (b) | | 245,329 | 5,159,276 |
| Fidelity Enhanced Large Cap Core ETF (b)(c) | | 522,810 | 17,216,133 |
| Fidelity Low-Priced Stock Fund (b) | | 73,526 | 2,996,177 |
| Fidelity U.S. Low Volatility Equity Fund (b) | | 17,986 | 213,490 |
| VIP Stock Selector All Cap Portfolio - Investor Class (b) | | 4,385,653 | 53,504,970 |
| TOTAL DOMESTIC EQUITY FUNDS (Cost $66,104,937) | | | 79,090,046 |
| | | | |
| International Equity Funds - 32.6% |
| | | Shares | Value ($) |
| Fidelity Canada Fund (b) | | 23,969 | 1,574,312 |
| Fidelity Emerging Markets Fund (b) | | 377,614 | 14,379,550 |
| Fidelity Enhanced International ETF (b) | | 698,267 | 19,223,291 |
| Fidelity International Value Fund (b) | | 565,614 | 5,690,079 |
| Fidelity Japan Smaller Companies Fund (b) | | 117,662 | 1,835,521 |
| Fidelity Overseas Fund (b) | | 184,183 | 11,529,837 |
| iShares Core MSCI Emerging Markets ETF | | 57,656 | 3,010,796 |
| TOTAL INTERNATIONAL EQUITY FUNDS (Cost $52,151,277) | | | 57,243,386 |
| | | | |
| U.S. Treasury Obligations - 0.2% |
| | | Yield (%) (d) | Principal Amount (a) | Value ($) |
| US Treasury Bills 0% 2/27/2025 (e) | | 4.38 | 250,000 | 248,359 |
| US Treasury Bills 0% 2/6/2025 (e) | | 4.48 | 190,000 | 189,219 |
| TOTAL U.S. TREASURY OBLIGATIONS (Cost $437,442) | | | | 437,578 |
| | | | | |
| Money Market Funds - 1.1% |
| | | Yield (%) | Shares | Value ($) |
| Fidelity Cash Central Fund (f) | | 4.36 | 240,803 | 240,851 |
| Fidelity Investments Money Market Government Portfolio - Institutional Class (b)(g) | | 4.42 | 1,836 | 1,836 |
| Fidelity Securities Lending Cash Central Fund (f)(h) | | 4.35 | 1,667,083 | 1,667,250 |
| TOTAL MONEY MARKET FUNDS (Cost $1,909,937) | | | | 1,909,937 |
| | | | | |
| TOTAL INVESTMENT IN SECURITIES - 101.0% (Cost $159,420,378) | 177,229,843 |
NET OTHER ASSETS (LIABILITIES) - (1.0)% | (1,726,288) |
| NET ASSETS - 100.0% | 175,503,555 |
| | |
| Futures Contracts |
| | Number of contracts | Expiration Date | Notional Amount ($) | Value ($) | Unrealized Appreciation/ (Depreciation) ($) |
| Purchased | | | | | |
| | | | | | |
| Equity Contracts | | | | | |
| CME E-mini S&P 500 Index Contracts (United States) | 24 | Mar 2025 | 7,122,900 | (231,271) | (231,271) |
| ICE MSCI EAFE Index Contracts (United States) | 11 | Mar 2025 | 1,247,125 | (41,381) | (41,381) |
| ICE MSCI Emerging Markets Index Contracts (United States) | 10 | Mar 2025 | 536,900 | (19,844) | (19,844) |
| | | | | | |
| TOTAL FUTURES CONTRACTS | | | | | (292,496) |
| The notional amount of futures purchased as a percentage of Net Assets is 5.1% |
Security Type Abbreviations
Legend
| (a) | Amount is stated in United States dollars unless otherwise noted. |
| (c) | Security or a portion of the security is on loan at period end. |
| (d) | Yield represents either the annualized yield at the date of purchase, or the stated coupon rate, or, for floating and adjustable rate securities, the rate at period end. |
| (e) | Security or a portion of the security was pledged to cover margin requirements for futures contracts. At period end, the value of securities pledged amounted to $437,578. |
| (f) | Affiliated fund that is generally available only to investment companies and other accounts managed by Fidelity Investments. The rate quoted is the annualized seven-day yield of the fund at period end. A complete unaudited listing of the fund's holdings as of its most recent quarter end is available upon request. In addition, each Fidelity Central Fund's financial statements, which are not covered by the Fund's Report of Independent Registered Public Accounting Firm, are available on the SEC's website or upon request. |
| (g) | The rate quoted is the annualized seven-day yield of the fund at period end. |
| (h) | Investment made with cash collateral received from securities on loan. |
Affiliated Central Funds
Fiscal year to date information regarding the Fund's investments in Fidelity Central Funds, including the ownership percentage, is presented below.
| Affiliate | Value, beginning of period ($) | Purchases ($) | Sales Proceeds ($) | Dividend Income ($) | Realized Gain (loss) ($) | Change in Unrealized appreciation (depreciation) ($) | Value, end of period ($) | Shares, end of period | % ownership, end of period |
| Fidelity Cash Central Fund | 2,729,446 | 43,642,761 | 46,131,356 | 120,799 | - | - | 240,851 | 240,803 | 0.0% |
| Fidelity Securities Lending Cash Central Fund | 11,836,475 | 281,409,837 | 291,579,062 | 97,382 | - | - | 1,667,250 | 1,667,083 | 0.0% |
| Total | 14,565,921 | 325,052,598 | 337,710,418 | 218,181 | - | - | 1,908,101 | 1,907,886 | |
| | | | | | | | | | |
Amounts in the dividend income column in the above table include any capital gain distributions from underlying funds, which are presented in the corresponding line item in the Statement of Operations, if applicable.
Amounts in the dividend income column for Fidelity Securities Lending Cash Central Fund represents the income earned on investing cash collateral, less rebates paid to borrowers and any lending agent fees associated with the loan, plus any premium payments received for lending certain types of securities.
Amounts included in the purchases and sales proceeds columns may include in-kind transactions, if applicable.
Affiliated Underlying Funds
Fiscal year to date information regarding the Fund's investments in affiliated Underlying Funds is presented below. Exchanges between classes of the same affiliated Underlying Funds may occur. If an Underlying Funds changes its name, the name presented below is the name in effect at period end.
| Affiliate | Value, beginning of period ($) | Purchases ($) | Sales Proceeds ($) | Dividend Income ($) | Realized Gain (loss) ($) | Change in Unrealized appreciation (depreciation) ($) | Value, end of period ($) | Shares, end of period |
| Fidelity Canada Fund | 2,193,677 | 124,589 | 806,979 | 110,489 | 59,804 | 3,221 | 1,574,312 | 23,969 |
| Fidelity Contrafund | 4,275,973 | 1,363,168 | 1,688,530 | 212,838 | 337,370 | 871,295 | 5,159,276 | 245,329 |
| Fidelity Emerging Markets Fund | 14,932,757 | 3,672,031 | 4,879,079 | 93,217 | 282,388 | 371,453 | 14,379,550 | 377,614 |
| Fidelity Enhanced International ETF | 6,853,086 | 12,738,244 | - | 284,808 | - | (368,039) | 19,223,291 | 698,267 |
| Fidelity Enhanced Large Cap Core ETF | - | 26,309,769 | 9,827,441 | 51,324 | 199,334 | 534,471 | 17,216,133 | 522,810 |
| Fidelity Enhanced Large Cap Value ETF | 5,430,171 | - | 5,873,112 | 52,785 | 1,449,039 | (1,006,098) | - | - |
| Fidelity Equity-Income Fund | 2,458,571 | 19,922 | 2,701,566 | 18,810 | 644,908 | (421,835) | - | - |
| Fidelity Hedged Equity Fund | 982,202 | 2,784,340 | 569,613 | 20,428 | 74,981 | 199,304 | 3,471,214 | 263,370 |
| Fidelity International Value Fund | 8,175,363 | 214,191 | 3,010,851 | 162,850 | 342,720 | (31,344) | 5,690,079 | 565,614 |
| Fidelity Investments Money Market Government Portfolio - Institutional Class | 1,745 | 91 | - | 91 | - | - | 1,836 | 1,836 |
| Fidelity Japan Smaller Companies Fund | 1,698,068 | 79,776 | - | 79,777 | - | 57,677 | 1,835,521 | 117,662 |
| Fidelity Long-Term Treasury Bond Index Fund | 471,623 | 16,033 | 85,633 | 14,670 | (10,747) | (30,235) | 361,041 | 39,372 |
| Fidelity Low-Priced Stock Fund | 4,199,234 | 522,078 | 1,541,074 | 488,477 | (26,884) | (157,177) | 2,996,177 | 73,526 |
| Fidelity Overseas Fund | 14,119,442 | 2,089,617 | 5,205,936 | 158,905 | 365,291 | 161,423 | 11,529,837 | 184,183 |
| Fidelity Total Bond Fund | 38,425,479 | 23,033,791 | 26,989,969 | 1,626,427 | (1,833,650) | 971,078 | 33,606,729 | 3,575,184 |
| Fidelity U.S. Bond Index Fund | 3,593,376 | 5,727,588 | 8,854,353 | 103,171 | 117,704 | (83,371) | 500,944 | 49,016 |
| Fidelity U.S. Low Volatility Equity Fund | 975,054 | 13,235 | 867,516 | 6,143 | 143,162 | (50,445) | 213,490 | 17,986 |
| Fidelity Value Discovery Fund | 1,860,079 | 845 | 1,968,524 | - | 548,505 | (440,905) | - | - |
| VIP Stock Selector Portfolio - Investor Class | 60,022,974 | 586,326 | 17,058,190 | 364,739 | 1,838,052 | 8,115,808 | 53,504,970 | 4,385,653 |
| | 170,668,874 | 79,295,634 | 91,928,366 | 3,849,949 | 4,531,977 | 8,696,281 | 171,264,400 | 11,141,391 |
Amounts in the dividend income column in the above table include any capital gain distributions from underlying funds, which are presented in the corresponding line item in the Statement of Operations, if applicable.
Amounts included in the purchases and sales proceeds columns may include in-kind transactions, if applicable.
Investment Valuation
The following is a summary of the inputs used, as of December 31, 2024, involving the Fund's assets and liabilities carried at fair value. The inputs or methodology used for valuing securities may not be an indication of the risk associated with investing in those securities. For more information on valuation inputs, and their aggregation into the levels used below, please refer to the Investment Valuation section in the accompanying Notes to Financial Statements.
| Valuation Inputs at Reporting Date: |
| Description | Total ($) | Level 1 ($) | Level 2 ($) | Level 3 ($) |
Investments in Securities: | | | | |
|
| Alternative Funds | 3,471,214 | 3,471,214 | - | - |
|
| Bond Funds | 35,077,682 | 35,077,682 | - | - |
|
| Domestic Equity Funds | 79,090,046 | 79,090,046 | - | - |
|
| International Equity Funds | 57,243,386 | 57,243,386 | - | - |
|
| U.S. Treasury Obligations | 437,578 | - | 437,578 | - |
|
| Money Market Funds | 1,909,937 | 1,909,937 | - | - |
| Total Investments in Securities: | 177,229,843 | 176,792,265 | 437,578 | - |
Derivative Instruments: Liabilities | | | | |
Futures Contracts | (292,496) | (292,496) | - | - |
| Total Liabilities | (292,496) | (292,496) | - | - |
| Total Derivative Instruments: | (292,496) | (292,496) | - | - |
Value of Derivative Instruments
The following table is a summary of the Fund's value of derivative instruments by primary risk exposure as of December 31, 2024. For additional information on derivative instruments, please refer to the Derivative Instruments section in the accompanying Notes to Financial Statements.
Primary Risk Exposure / Derivative Type | Value |
| Asset ($) | Liability ($) |
| Equity Risk | | |
Futures Contracts (a) | 0 | (292,496) |
| Total Equity Risk | 0 | (292,496) |
| Total Value of Derivatives | 0 | (292,496) |
(a)Reflects gross cumulative appreciation (depreciation) on futures contracts as presented in the Schedule of Investments. In the Statement of Assets and Liabilities, the period end daily variation margin is included in receivable or payable for daily variation margin on futures contracts, and the net cumulative appreciation (depreciation) is included in Total accumulated earnings (loss).
Financial Statements
| Statement of Assets and Liabilities |
As of December 31, 2024 |
| Assets | | | | |
| Investment in securities, at value (including securities loaned of $1,626,742) - See accompanying schedule: | | | | |
Unaffiliated issuers (cost $4,322,680) | $ | 4,057,342 | | |
Fidelity Central Funds (cost $1,908,101) | | 1,908,101 | | |
Other affiliated issuers (cost $153,189,597) | | 171,264,400 | | |
| | | | | |
| | | | | |
| Total Investment in Securities (cost $159,420,378) | | | $ | 177,229,843 |
| Receivable for investments sold | | | | 50,371 |
| Receivable for fund shares sold | | | | 192,856 |
| Distributions receivable from Fidelity Central Funds | | | | 19,858 |
Total assets | | | | 177,492,928 |
| Liabilities | | | | |
| Payable for fund shares redeemed | $ | 243,226 | | |
| Accrued management fee | | 22,602 | | |
| Distribution and service plan fees payable | | 22,415 | | |
| Payable for daily variation margin on futures contracts | | 30,465 | | |
| Other affiliated payables | | 3,415 | | |
| Collateral on securities loaned | | 1,667,250 | | |
| Total liabilities | | | | 1,989,373 |
| Net Assets | | | $ | 175,503,555 |
| Net Assets consist of: | | | | |
| Paid in capital | | | $ | 157,435,589 |
| Total accumulated earnings (loss) | | | | 18,067,966 |
| Net Assets | | | $ | 175,503,555 |
| | | | | |
| Net Asset Value and Maximum Offering Price | | | | |
| Service Class : | | | | |
Net Asset Value, offering price and redemption price per share ($1,444,146 ÷ 116,444 shares) | | | $ | 12.40 |
| Service Class 2 : | | | | |
Net Asset Value, offering price and redemption price per share ($174,059,409 ÷ 14,094,973 shares) | | | $ | 12.35 |
| Statement of Operations |
| Year ended December 31, 2024 |
| Investment Income | | | | |
| Dividends: | | | | |
| Unaffiliated issuers | | | $ | 484,117 |
| Affiliated issuers | | | | 3,074,198 |
| Interest | | | | 7,251 |
| Income from Fidelity Central Funds (including $97,382 from security lending) | | | | 218,181 |
| Total income | | | | 3,783,747 |
| Expenses | | | | |
| Management fee | $ | 377,781 | | |
| Transfer agent fees | | 47,652 | | |
| Distribution and service plan fees | | 470,047 | | |
| Independent trustees' fees and expenses | | 493 | | |
| Total expenses before reductions | | 895,973 | | |
| Expense reductions | | (283,453) | | |
| Total expenses after reductions | | | | 612,520 |
| Net Investment income (loss) | | | | 3,171,227 |
| Realized and Unrealized Gain (Loss) | | | | |
| Net realized gain (loss) on: | | | | |
| Investment Securities: | | | | |
| Unaffiliated issuers | | 3,330,233 | | |
| Affiliated issuers | | 4,531,977 | | |
| Futures contracts | | (579,745) | | |
| Capital gain distributions from underlying funds: | | | | |
| Affiliated issuers | | 775,751 | | |
| Total net realized gain (loss) | | | | 8,058,216 |
| Change in net unrealized appreciation (depreciation) on: | | | | |
| Investment Securities: | | | | |
| Unaffiliated issuers | | (1,588,881) | | |
| Affiliated issuers | | 8,696,281 | | |
| Futures contracts | | (292,496) | | |
| Total change in net unrealized appreciation (depreciation) | | | | 6,814,904 |
| Net gain (loss) | | | | 14,873,120 |
| Net increase (decrease) in net assets resulting from operations | | | $ | 18,044,347 |
| Statement of Changes in Net Assets |
| |
| | Year ended December 31, 2024 | | Year ended December 31, 2023 |
| Increase (Decrease) in Net Assets | | | | |
| Operations | | | | |
| Net investment income (loss) | $ | 3,171,227 | $ | 3,839,367 |
| Net realized gain (loss) | | 8,058,216 | | (4,576,723) |
| Change in net unrealized appreciation (depreciation) | | 6,814,904 | | 26,376,042 |
| Net increase (decrease) in net assets resulting from operations | | 18,044,347 | | 25,638,686 |
| Distributions to shareholders | | (4,761,616) | | (3,856,525) |
| | | | | |
| Share transactions - net increase (decrease) | | (33,383,524) | | (28,701,243) |
| Total increase (decrease) in net assets | | (20,100,793) | | (6,919,082) |
| | | | | |
| Net Assets | | | | |
| Beginning of period | | 195,604,348 | | 202,523,430 |
| End of period | $ | 175,503,555 | $ | 195,604,348 |
| | | | | |
| | | | | |
Financial Highlights
VIP Target Volatility Portfolio Service Class |
| |
| Years ended December 31, | | 2024 | | 2023 | | 2022 | | 2021 | | 2020 |
Selected Per-Share Data | | | | | | | | | | |
| Net asset value, beginning of period | $ | 11.61 | $ | 10.39 | $ | 12.76 | $ | 13.05 | $ | 12.40 |
| Income from Investment Operations | | | | | | | | | | |
Net investment income (loss) A,B | | .23 | | .23 | | .17 | | .13 | | .14 |
| Net realized and unrealized gain (loss) | | .93 | | 1.24 | | (2.13) | | 1.46 | | .97 |
| Total from investment operations | | 1.16 | | 1.47 | | (1.96) | | 1.59 | | 1.11 |
| Distributions from net investment income | | (.25) | | (.25) | | (.27) | | - C | | (.18) |
| Distributions from net realized gain | | (.12) | | - | | (.14) | | (1.88) | | (.29) |
| Total distributions | | (.37) | | (.25) | | (.41) | | (1.88) | | (.46) D |
| Net asset value, end of period | $ | 12.40 | $ | 11.61 | $ | 10.39 | $ | 12.76 | $ | 13.05 |
Total Return E,F | | | | 14.14% | | (15.53)% | | 12.16% | | 9.13% |
Ratios to Average Net Assets B,G,H | | | | | | | | | | |
| Expenses before reductions | | .33% | | .32% | | .35% | | .41% | | .40% |
| Expenses net of fee waivers, if any | | | | .17% | | .20% | | .26% | | .25% |
| Expenses net of all reductions | | .18% | | .17% | | .20% | | .26% | | .25% |
| Net investment income (loss) | | 1.83% | | 2.10% | | 1.52% | | .93% | | 1.12% |
| Supplemental Data | | | | | | | | | | |
| Net assets, end of period (000 omitted) | $ | 1,444 | $ | 1,352 | $ | 1,210 | $ | 1,486 | $ | 1,519 |
Portfolio turnover rate I | | | | 61% | | 50% | | 64% | | 57% |
ACalculated based on average shares outstanding during the period.
BNet investment income (loss) is affected by the timing of the declaration of dividends by any underlying mutual funds or exchange-traded funds (ETFs). Net investment income (loss) of any mutual funds or ETFs is not included in the Fund's net investment income (loss) ratio.
CAmount represents less than $.005 per share.
DTotal distributions per share do not sum due to rounding.
ETotal returns do not reflect charges attributable to your insurance company's separate account. Inclusion of these charges would reduce the total returns shown.
FTotal returns would have been lower if certain expenses had not been reduced during the applicable periods shown.
GFees and expenses of any underlying mutual funds or exchange-traded funds (ETFs) are not included in the Fund's expense ratio. The Fund indirectly bears its proportionate share of these expenses. For additional expense information related to investments in Fidelity Central Funds, please refer to the "Investments in Fidelity Central Funds" note found in the Notes to Financial Statements section of the most recent Annual or Semi-Annual report.
HExpense ratios reflect operating expenses of the class. Expenses before reductions do not reflect amounts reimbursed, waived, or reduced through arrangements with the investment adviser, brokerage services, or other offset arrangements, if applicable, and do not represent the amount paid by the class during periods when reimbursements, waivers or reductions occur.
IAmount does not include the portfolio activity of any underlying mutual funds or exchange-traded funds (ETFs), derivatives or securities that mature within one year from acquisition.
VIP Target Volatility Portfolio Service Class 2 |
| |
| Years ended December 31, | | 2024 | | 2023 | | 2022 | | 2021 | | 2020 |
Selected Per-Share Data | | | | | | | | | | |
| Net asset value, beginning of period | $ | 11.56 | $ | 10.35 | $ | 12.71 | $ | 13.02 | $ | 12.37 |
| Income from Investment Operations | | | | | | | | | | |
Net investment income (loss) A,B | | .21 | | .21 | | .15 | | .11 | | .12 |
| Net realized and unrealized gain (loss) | | .92 | | 1.23 | | (2.11) | | 1.46 | | .97 |
| Total from investment operations | | 1.13 | | 1.44 | | (1.96) | | 1.57 | | 1.09 |
| Distributions from net investment income | | (.23) | | (.23) | | (.26) | | - C | | (.16) |
| Distributions from net realized gain | | (.12) | | - | | (.14) | | (1.88) | | (.29) |
| Total distributions | | (.34) D | | (.23) | | (.40) | | (1.88) | | (.44) D |
| Net asset value, end of period | $ | 12.35 | $ | 11.56 | $ | 10.35 | $ | 12.71 | $ | 13.02 |
Total Return E,F | | | | 13.93% | | (15.65)% | | 12.03% | | 8.99% |
Ratios to Average Net Assets B,G,H | | | | | | | | | | |
| Expenses before reductions | | .48% | | .47% | | .50% | | .56% | | .56% |
| Expenses net of fee waivers, if any | | | | .32% | | .35% | | .41% | | .40% |
| Expenses net of all reductions | | .33% | | .32% | | .35% | | .41% | | .40% |
| Net investment income (loss) | | 1.68% | | 1.95% | | 1.37% | | .78% | | .97% |
| Supplemental Data | | | | | | | | | | |
| Net assets, end of period (000 omitted) | $ | 174,059 | $ | 194,252 | $ | 201,313 | $ | 265,197 | $ | 269,141 |
Portfolio turnover rate I | | | | 61% | | 50% | | 64% | | 57% |
ACalculated based on average shares outstanding during the period.
BNet investment income (loss) is affected by the timing of the declaration of dividends by any underlying mutual funds or exchange-traded funds (ETFs). Net investment income (loss) of any mutual funds or ETFs is not included in the Fund's net investment income (loss) ratio.
CAmount represents less than $.005 per share.
DTotal distributions per share do not sum due to rounding.
ETotal returns would have been lower if certain expenses had not been reduced during the applicable periods shown.
FTotal returns do not reflect charges attributable to your insurance company's separate account. Inclusion of these charges would reduce the total returns shown.
GFees and expenses of any underlying mutual funds or exchange-traded funds (ETFs) are not included in the Fund's expense ratio. The Fund indirectly bears its proportionate share of these expenses. For additional expense information related to investments in Fidelity Central Funds, please refer to the "Investments in Fidelity Central Funds" note found in the Notes to Financial Statements section of the most recent Annual or Semi-Annual report.
HExpense ratios reflect operating expenses of the class. Expenses before reductions do not reflect amounts reimbursed, waived, or reduced through arrangements with the investment adviser, brokerage services, or other offset arrangements, if applicable, and do not represent the amount paid by the class during periods when reimbursements, waivers or reductions occur.
IAmount does not include the portfolio activity of any underlying mutual funds or exchange-traded funds (ETFs), derivatives or securities that mature within one year from acquisition.
Notes to Financial Statements
For the period ended December 31, 2024
1. Organization.
VIP Target Volatility Portfolio (the Fund) is a fund of Variable Insurance Products Fund V (the Trust) and is authorized to issue an unlimited number of shares. The Trust is registered under the Investment Company Act of 1940, as amended (the 1940 Act), as an open-end management investment company organized as a Massachusetts business trust. Shares of the Fund may only be purchased by insurance companies for the purpose of funding variable annuity or variable life insurance contracts. The Fund offers the following classes of shares: Service Class shares and Service Class 2 shares. All classes have equal rights and voting privileges, except for matters affecting a single class.
2. Investments in Fidelity Central Funds.
Funds may invest in Fidelity Central Funds, which are open-end investment companies generally available only to other investment companies and accounts managed by the investment adviser and its affiliates. The Schedule of Investments lists any Fidelity Central Funds held as an investment as of period end, but does not include the underlying holdings of each Fidelity Central Fund. An investing fund indirectly bears its proportionate share of the expenses of the underlying Fidelity Central Funds.
Based on its investment objective, each Fidelity Central Fund may invest or participate in various investment vehicles or strategies that are similar to those of the investing fund. These strategies are consistent with the investment objectives of the investing fund and may involve certain economic risks which may cause a decline in value of each of the Fidelity Central Funds and thus a decline in the value of the investing fund.
| Fidelity Central Fund | Investment Manager | Investment Objective | Investment Practices | Expense RatioA |
| Fidelity Money Market Central Funds | Fidelity Management & Research Company LLC (FMR) | Each fund seeks to obtain a high level of current income consistent with the preservation of capital and liquidity. | Short-term Investments | Less than .005% |
A Expenses expressed as a percentage of average net assets and are as of each underlying Central Fund's most recent annual or semi-annual shareholder report.
A complete unaudited list of holdings for each Fidelity Central Fund is available upon request or at the Securities and Exchange Commission website at www.sec.gov. In addition, the financial statements of the Fidelity Central Funds which contain the significant accounting policies (including investment valuation policies) of those funds, and are not covered by the Report of Independent Registered Public Accounting Firm, are available on the Securities and Exchange Commission website or upon request.
3. Significant Accounting Policies.
The Fund is an investment company and applies the accounting and reporting guidance of the Financial Accounting Standards Board (FASB) Accounting Standards Codification Topic 946 Financial Services - Investment Companies. The financial statements have been prepared in conformity with accounting principles generally accepted in the United States of America (GAAP), which require management to make certain estimates and assumptions at the date of the financial statements. Actual results could differ from those estimates. The Fund operates as a single operating segment. The Fund's income, expenses, assets, and performance are regularly monitored and assessed as a whole by the investment adviser and other individuals responsible for oversight functions of the Trust, using the information presented in the financial statements and financial highlights. Subsequent events, if any, through the date that the financial statements were issued have been evaluated in the preparation of the financial statements. The Fund's Schedule of Investments lists any underlying mutual funds or exchange-traded funds (ETFs) but does not include the underlying holdings of these funds. The following summarizes the significant accounting policies of the Fund:
Investment Valuation. Investments are valued as of 4:00 p.m. Eastern time on the last calendar day of the period. The Fund uses a third party pricing service approved by the Board of Trustees (the Board) to value its investments. The Board of Trustees (the Board) has designated the Fund's investment adviser as the valuation designee responsible for the fair valuation function and performing fair value determinations as needed. The investment adviser has established a Fair Value Committee (the Committee) to carry out the day-to-day fair valuation responsibilities and has adopted policies and procedures to govern the fair valuation process and the activities of the Committee. In accordance with these fair valuation policies and procedures, which have been approved by the Board, the Fund attempts to obtain prices from one or more third party pricing services or brokers to value its investments. When current market prices, quotations or currency exchange rates are not readily available or reliable, investments will be fair valued in good faith by the Committee, in accordance with the policies and procedures. Factors used in determining fair value vary by investment type and may include market or investment specific events, transaction data, estimated cash flows, and market observations of comparable investments. The frequency that the fair valuation procedures are used cannot be predicted and they may be utilized to a significant extent. The Committee manages the Fund's fair valuation practices and maintains the fair valuation policies and procedures. The Fund's investment adviser reports to the Board information regarding the fair valuation process and related material matters. The Fund categorizes the inputs to valuation techniques used to value its investments into a disclosure hierarchy consisting of three levels as shown below:
Level 1 - unadjusted quoted prices in active markets for identical investments
Level 2 - other significant observable inputs (including quoted prices for similar investments, interest rates, prepayment speeds, etc.)
Level 3 - unobservable inputs (including the Fund's own assumptions based on the best information available)
Valuation techniques used to value the Fund's investments by major category are as follows:
Investments in open-end mutual funds, including the Fidelity Central Funds, are valued at their closing net asset value (NAV) each business day and are categorized as Level 1 in the hierarchy.
Debt securities, including restricted securities, are valued based on evaluated prices received from third party pricing services or from brokers who make markets in such securities. U.S. government and government agency obligations are valued by pricing services who utilize matrix pricing which considers yield or price of bonds of comparable quality, coupon, maturity and type or by broker-supplied prices. When independent prices are unavailable or unreliable, debt securities may be valued utilizing pricing methodologies which consider similar factors that would be used by third party pricing services. Debt securities are generally categorized as Level 2 in the hierarchy but may be Level 3 depending on the circumstances.
ETFs are valued at their last sale price or official closing price as reported by a third party pricing service on the primary market or exchange on which they are traded and are categorized as Level 1 in the hierarchy. In the event there were no sales during the day but the exchange reports a closing bid level, ETFs are valued at the closing bid and would be categorized as Level 1 in the hierarchy. In the event there was no closing bid, ETFS may be valued by another method that the Board believes reflects fair value in accordance with the Board's fair value pricing policies and may be categorized as Level 2 in the hierarchy.
Futures contracts are valued at the settlement price established each day by the board of trade or exchange on which they are traded and are categorized as Level 1 in the hierarchy.
Changes in valuation techniques may result in transfers in or out of an assigned level within the disclosure hierarchy. The aggregate value of investments by input level as of December 31, 2024 is included at the end of the Fund's Schedule of Investments.
Investment Transactions and Income. For financial reporting purposes, the Fund's investment holdings and NAV include trades executed through the end of the last business day of the period. The NAV per share for processing shareholder transactions is calculated as of the close of business of the New York Stock Exchange (NYSE), normally 4:00 p.m. Eastern time and includes trades executed through the end of the prior business day. Gains and losses on securities sold are determined on the basis of identified cost. Income and capital gain distributions from any underlying mutual funds or exchange-traded funds (ETFs) are recorded on the ex-dividend date. Interest income is accrued as earned. Interest income includes coupon interest and amortization of premium and accretion of discount on debt securities as applicable.
Class Allocations and Expenses. Investment income, realized and unrealized capital gains and losses, common expenses of a fund, and certain fund-level expense reductions, if any, are allocated daily on a pro-rata basis to each class based on the relative net assets of each class to the total net assets of a fund. Each class differs with respect to transfer agent and distribution and service plan fees incurred, as applicable. Certain expense reductions may also differ by class, if applicable. For the reporting period, the allocated portion of income and expenses to each class as a percent of its average net assets may vary due to the timing of recording these transactions in relation to fluctuating net assets of the classes. Expenses directly attributable to a fund are charged to that fund. Expenses attributable to more than one fund are allocated among the respective funds on the basis of relative net assets or other appropriate methods. Expenses included in the accompanying financial statements reflect the expenses of that fund and do not include any expenses associated with any underlying mutual funds or exchange-traded funds (ETFs). Although not included in a fund's expenses, a fund indirectly bears its proportionate share of these expenses through the net asset value of each underlying mutual fund or exchange-traded fund (ETF). Expense estimates are accrued in the period to which they relate and adjustments are made when actual amounts are known.
Income Tax Information and Distributions to Shareholders. Each year, the Fund intends to qualify as a regulated investment company under Subchapter M of the Internal Revenue Code, including distributing substantially all of its taxable income and realized gains. As a result, no provision for U.S. Federal income taxes is required. As of December 31, 2024, the Fund did not have any unrecognized tax benefits in the financial statements; nor is the Fund aware of any tax positions for which it is reasonably possible that the total amounts of unrecognized tax benefits will significantly change in the next twelve months. The Fund files a U.S. federal tax return, in addition to state and local tax returns as required. The Fund's federal income tax returns are subject to examination by the Internal Revenue Service (IRS) for a period of three fiscal years after they are filed. State and local tax returns may be subject to examination for an additional fiscal year depending on the jurisdiction.
Distributions are declared and recorded on the ex-dividend date. Income and capital gain distributions are declared separately for each class. Income and capital gain distributions are determined in accordance with income tax regulations, which may differ from GAAP.
Capital accounts within the financial statements are adjusted for permanent book-tax differences. These adjustments have no impact on net assets or the results of operations. Capital accounts are not adjusted for temporary book-tax differences which will reverse in a subsequent period.
Book-tax differences are primarily due to the short-term gain distributions from the underlying mutual funds or exchange-traded funds (ETFs), futures contracts, capital loss carryforwards and losses deferred due to wash sales and excise tax regulations.
As of period end, the cost and unrealized appreciation (depreciation) in securities, and derivatives if applicable, for federal income tax purposes were as follows:
| Gross unrealized appreciation | $19,965,185 |
| Gross unrealized depreciation | (2,461,207) |
| Net unrealized appreciation (depreciation) | $17,503,978 |
| Tax Cost | $159,725,865 |
The tax-based components of distributable earnings as of period end were as follows:
| Undistributed ordinary income | $44,039 |
| Undistributed long-term capital gain | $793,035 |
| Net unrealized appreciation (depreciation) on securities and other investments | $17,503,978 |
The Fund intends to elect to defer to its next fiscal year $273,085 of capital losses recognized during the period November 1, 2024 to December 31, 2024.
The tax character of distributions paid was as follows:
| | December 31, 2024 | December 31, 2023 |
| Ordinary Income | $4,706,277 | $ 3,856,525 |
| Long-term Capital Gains | 55,339 | - |
| Total | $4,761,616 | $ 3,856,525 |
New Accounting Pronouncement. FASB Accounting Standards Update (ASU) 2023-07 Segment Reporting (Topic 280): Improvements to Reportable Segment Disclosures became effective in this reporting period. ASU 2023-07 enhances segment information disclosure in the notes to financial statements.
4. Derivative Instruments.
Risk Exposures and the Use of Derivative Instruments. The Fund's investment objectives allow for various types of derivative instruments, including futures contracts. Derivatives are investments whose value is primarily derived from underlying assets, indices or reference rates and may be transacted on an exchange or over-the-counter (OTC). Derivatives may involve a future commitment to buy or sell a specified asset based on specified terms, to exchange future cash flows at periodic intervals based on a notional principal amount, or for one party to make one or more payments upon the occurrence of specified events in exchange for periodic payments from the other party.
Derivatives were used to increase returns and to manage exposure to certain risks as defined below. The success of any strategy involving derivatives depends on analysis of numerous economic factors, and if the strategies for investment do not work as intended, the objectives may not be achieved.
Derivatives were used to increase or decrease exposure to the following risk(s):
| | |
| Equity Risk | Equity risk relates to the fluctuations in the value of financial instruments as a result of changes in market prices (other than those arising from interest rate risk or foreign exchange risk), whether caused by factors specific to an individual investment, its issuer, or all factors affecting all instruments traded in a market or market segment. |
Funds are also exposed to additional risks from investing in derivatives, such as liquidity risk and counterparty credit risk. Liquidity risk is the risk that a fund will be unable to close out the derivative in the open market in a timely manner. Counterparty credit risk is the risk that the counterparty will not be able to fulfill its obligation to a fund. Counterparty credit risk related to exchange-traded contracts may be mitigated by the protection provided by the exchange on which they trade.
Investing in derivatives may involve greater risks than investing in the underlying assets directly and, to varying degrees, may involve risk of loss in excess of any initial investment and collateral received and amounts recognized in the Statement of Assets and Liabilities. In addition, there may be the risk that the change in value of the derivative contract does not correspond to the change in value of the underlying instrument.
Futures Contracts. A futures contract is an agreement between two parties to buy or sell a specified underlying instrument for a fixed price at a specified future date. Futures contracts were used to manage exposure to the stock market.
Upon entering into a futures contract, a fund is required to deposit either cash or securities (initial margin) with a clearing broker in an amount equal to a certain percentage of the face value of the contract. Futures contracts are marked-to-market daily and subsequent daily payments are made or received by a fund depending on the daily fluctuations in the value of the futures contracts and are recorded as unrealized appreciation or (depreciation). This receivable and/or payable, if any, is included in daily variation margin on futures contracts in the Statement of Assets and Liabilities. Realized gain or (loss) is recorded upon the expiration or closing of a futures contract. The net realized gain (loss) and change in net unrealized appreciation (depreciation) on futures contracts during the period is presented in the Statement of Operations.
Any open futures contracts at period end are presented in the Schedule of Investments under the caption "Futures Contracts". The notional amount at value reflects each contract's exposure to the underlying instrument or index at period end, and is representative of volume of activity during the period.
Any securities deposited to meet initial margin requirements are identified in the Schedule of Investments. Any cash deposited to meet initial margin requirements is presented as segregated cash with brokers for derivative instruments in the Statement of Assets and Liabilities.
5. Purchases and Sales of Investments.
Purchases and sales of securities, other than short-term securities, U.S. government securities and in-kind transactions, as applicable, are noted in the table below.
| | Purchases ($) | Sales ($) |
| VIP Target Volatility Portfolio | 104,606,475 | 137,593,684 |
6. Fees and Other Transactions with Affiliates.
Management Fee. Fidelity Management & Research Company LLC (the investment adviser) provides the Fund with investment management related services. For these services the Fund pays a monthly management fee to the investment adviser. The management fee is computed at an annual rate of .20% of the Fund's average net assets. Under the management contract, the investment adviser pays all other fund-level operating expenses, except the compensation of the independent Trustees and certain other expenses such as interest expense.
During the period, the investment adviser waived a portion of its management fee as described in the Expense Reductions note.
Distribution and Service Plan Fees. In accordance with Rule 12b-1 of the 1940 Act, the Fund has adopted separate 12b-1 Plans for each Service Class of shares. Each Service Class pays Fidelity Distributors Company LLC (FDC), an affiliate of the investment adviser, a service fee. For the period, the service fee is based on an annual rate of .10% of Service Class' average net assets and .25% of Service Class 2's average net assets.
For the period, total fees, all of which were re-allowed to insurance companies for the distribution of shares and providing shareholder support services, were as follows:
| Service Class | $1,452 |
| Service Class 2 | 468,595 |
| | $470,047 |
During the period, the investment adviser or its affiliates waived a portion of these fees.
Transfer Agent Fees. Fidelity Investments Institutional Operations Company LLC (FIIOC), an affiliate of the investment adviser, is the Fund's transfer, dividend disbursing, and shareholder servicing agent. FIIOC receives an asset-based fee with respect to each class. Each class pays a fee for transfer agent services, typesetting and printing and mailing of shareholder reports, excluding mailing of proxy statements, equal to an annual rate of .14% of class-level average net assets invested in underlying mutual funds or exchange-traded funds (ETFs) that are not managed by the investment adviser or its affiliates. For the period, transfer agent fees for each class were as follows:
| | Amount ($) | % of Class-Level Average Net Assets |
| Service Class | 363 | .02 |
| Service Class 2 | 47,289 | .03 |
| | 47,652 | |
Brokerage Commissions. A portion of portfolio transactions were placed with brokerage firms which are affiliates of the investment adviser. Brokerage commissions are included in net realized gain (loss) and change in net unrealized appreciation (depreciation) in the Statement of Operations. The commissions paid to these affiliated firms were as follows:
| | Amount ($) |
| VIP Target Volatility Portfolio | 919 |
Interfund Trades. Funds may purchase from or sell securities to other Fidelity Funds under procedures adopted by the Board. The procedures have been designed to ensure these interfund trades are executed in accordance with Rule 17a-7 of the 1940 Act. Any interfund trades are included within the respective purchases and sales amounts shown in the Purchases and Sales of Investments note. During the period, there were no interfund trades.
7. Committed Line of Credit.
Certain Funds participate with other funds managed by the investment adviser or an affiliate in a $4.25 billion credit facility (the "line of credit") to be utilized for temporary or emergency purposes to fund shareholder redemptions or for other short-term liquidity purposes.
Commitment fees are charged based on the unused amount of the line of credit at an annual rate of .10%, and then allocated to each participating fund based on its pro-rata portion of the line of credit. The commitment fees are borne by the investment adviser.
Interest is charged to a participating fund based on its borrowings at an annual rate of .75% plus the highest of (i) daily SOFR plus a .10% spread adjustment, (ii) Federal Funds Effective Rate, or (iii) Overnight Bank Funding Rate. During the period, there were no borrowings on this line of credit.
The line of credit agreement will expire in March 2025 unless extended or renewed.
8. Security Lending.
Funds lend portfolio securities from time to time in order to earn additional income. Lending agents are used, including National Financial Services (NFS), an affiliate of the investment adviser. Pursuant to a securities lending agreement, NFS will receive a fee, which is capped at 9.9% of a fund's daily lending revenue, for its services as lending agent. A fund may lend securities to certain qualified borrowers, including NFS. On the settlement date of the loan, a fund receives collateral (in the form of U.S. Treasury obligations, letters of credit and/or cash) against the loaned securities and maintains collateral in an amount not less than 100% of the market value of the loaned securities during the period of the loan. The market value of the loaned securities is determined at the close of business of a fund and any additional required collateral is delivered to a fund on the next business day. A fund or borrower may terminate the loan at any time, and if the borrower defaults on its obligation to return the securities loaned because of insolvency or other reasons, a fund may apply collateral received from the borrower against the obligation. A fund may experience delays and costs in recovering the securities loaned. Any cash collateral received is invested in the Fidelity Securities Lending Cash Central Fund. Any loaned securities are identified as such in the Schedule of Investments, and the value of loaned securities and cash collateral at period end, as applicable, are presented in the Statement of Assets and Liabilities. Security lending income represents the income earned on investing cash collateral, less rebates paid to borrowers and any lending agent fees associated with the loan, plus any premium payments received for lending certain types of securities. Security lending income is presented in the Statement of Operations as a component of income from Fidelity Central Funds. Affiliated security lending activity, if any, was as follows:
| | Total Security Lending Fees Paid to NFS ($) | Security Lending Income From Securities Loaned to NFS ($) | Value of Securities Loaned to NFS at Period End ($) |
| VIP Target Volatility Portfolio | 10,532 | - | - |
9. Expense Reductions.
The investment adviser contractually agreed to waive the Fund's management fee in an amount equal to .05% of the Fund's average net assets until April 30, 2026. During the period, the Fund's management fee was reduced by $94,445.
In addition, FMR has contractually agreed to reimburse .10% of class-level expenses for Service Class and Service Class 2. During the period, this reimbursement reduced the Fund's Service Class and Service Class 2's expenses by the following amounts:| | Reimbursement ($) |
Service Class | 1,452 |
Service Class 2 | 187,438 |
Through arrangements with the Fund's custodian, credits realized as a result of certain uninvested cash balances were used to reduce the Fund's expenses. During the period, custodian credits reduced the Fund's expenses by $118 .
10. Distributions to Shareholders.
Distributions to shareholders of each class were as follows:
| | Year ended December 31, 2024 | Year ended December 31, 2023 |
| VIP Target Volatility Portfolio | | |
| Distributions to shareholders | | |
| Service Class | 42,494 | 29,104 |
| Service Class 2 | 4,719,122 | 3,827,421 |
Total | $4,761,616 | $3,856,525 |
11. Share Transactions.
Transactions for each class of shares were as follows and may contain in-kind transactions:
| | Shares | Shares | Dollars | Dollars |
| | Year ended December 31, 2024 | Year ended December 31, 2023 | Year ended December 31, 2024 | Year ended December 31, 2023 |
| VIP Target Volatility Portfolio | | | | |
| Service Class | | | | |
| Reinvestment of distributions | 22 | 16 | $279 | $190 |
| Shares redeemed | (11) | (12) | (132) | (133) |
| Net increase (decrease) | 11 | 4 | $147 | $57 |
| Service Class 2 | | | | |
| Shares sold | 535,378 | 537,799 | $6,745,571 | $5,874,801 |
| Reinvestment of distributions | 381,189 | 330,520 | 4,719,122 | 3,827,421 |
| Shares redeemed | (3,622,055) | (3,516,533) | (44,848,364) | (38,403,522) |
| Net increase (decrease) | (2,705,488) | (2,648,214) | $(33,383,671) | $(28,701,300) |
12. Other.
A fund's organizational documents provide former and current trustees and officers with a limited indemnification against liabilities arising in connection with the performance of their duties to the fund. In the normal course of business, a fund may also enter into contracts that provide general indemnifications. A fund's maximum exposure under these arrangements is unknown as this would be dependent on future claims that may be made against a fund. The risk of material loss from such claims is considered remote.
At the end of the period, certain otherwise unaffiliated shareholders were owners of record of more than 10% of the outstanding shares as follows:
| Fund | Affiliated % | Number ofUnaffiliated Shareholders | Unaffiliated Shareholders % |
| VIP Target Volatility Portfolio | - | 1 | 92% |
13. Risk and Uncertainties.
Many factors affect a fund's performance. Developments that disrupt global economies and financial markets, such as pandemics, epidemics, outbreaks of infectious diseases, war, terrorism, and environmental disasters, may significantly affect a fund's investment performance. The effects of these developments to a fund will be impacted by the types of securities in which a fund invests, the financial condition, industry, economic sector, and geographic location of an issuer, and a fund's level of investment in the securities of that issuer. Significant concentrations in security types, issuers, industries, sectors, and geographic locations may magnify the factors that affect a fund's performance.
Report of Independent Registered Public Accounting Firm
To the Board of Trustees of Variable Insurance Products Fund V and Shareholders of VIP Target Volatility Portfolio
Opinion on the Financial Statements
We have audited the accompanying statement of assets and liabilities, including the schedule of investments, of VIP Target Volatility Portfolio (one of the funds constituting Variable Insurance Products Fund V, referred to hereafter as the "Fund") as of December 31, 2024, the related statement of operations for the year ended December 31, 2024, the statement of changes in net assets for each of the two years in the period ended December 31, 2024, including the related notes, and the financial highlights for each of the five years in the period ended December 31, 2024 (collectively referred to as the "financial statements"). In our opinion, the financial statements present fairly, in all material respects, the financial position of the Fund as of December 31, 2024, the results of its operations for the year then ended, the changes in its net assets for each of the two years in the period ended December 31, 2024 and the financial highlights for each of the five years in the period ended December 31, 2024 in conformity with accounting principles generally accepted in the United States of America.
Basis for Opinion
These financial statements are the responsibility of the Fund's management. Our responsibility is to express an opinion on the Fund's financial statements based on our audits. We are a public accounting firm registered with the Public Company Accounting Oversight Board (United States) (PCAOB) and are required to be independent with respect to the Fund in accordance with the U.S. federal securities laws and the applicable rules and regulations of the Securities and Exchange Commission and the PCAOB.
We conducted our audits of these financial statements in accordance with the standards of the PCAOB. Those standards require that we plan and perform the audit to obtain reasonable assurance about whether the financial statements are free of material misstatement, whether due to error or fraud.
Our audits included performing procedures to assess the risks of material misstatement of the financial statements, whether due to error or fraud, and performing procedures that respond to those risks. Such procedures included examining, on a test basis, evidence regarding the amounts and disclosures in the financial statements. Our audits also included evaluating the accounting principles used and significant estimates made by management, as well as evaluating the overall presentation of the financial statements. Our procedures included confirmation of securities owned as of December 31, 2024 by correspondence with the custodian and brokers; when replies were not received from brokers, we performed other auditing procedures. We believe that our audits provide a reasonable basis for our opinion.
/s/ PricewaterhouseCoopers LLP
Boston, Massachusetts
February 13, 2025
We have served as the auditor of one or more investment companies in the Fidelity group of funds since 1932.
Distributions
(Unaudited)The dividend and capital gains distributions for the fund(s) are available on Fidelity.com or Institutional.Fidelity.com.
The fund hereby designates as a capital gain dividend with respect to the taxable year ended December 31, 2024, $848,374, or, if subsequently determined to be different, the net capital gain of such year.
A total of 8.73% of the dividends distributed during the fiscal year was derived from interest on U.S. Government securities which is generally exempt from state income tax.
The fund designates $1,609,542 of distributions paid during the fiscal year ended 2024 as qualifying to be taxed as section 163(j) interest dividends.
Service Class designates 10% and Service Class 2 designates 11% of the dividends distributed during the fiscal year as qualifying for the dividends-received deduction for corporate shareholders.
Item 8: Changes in and Disagreements with Accountants for Open-End Management Investment Companies
(Unaudited)
Note: This is not applicable for any fund included in this document.
Item 9: Proxy Disclosures for Open-End Management Investment Companies
(Unaudited)
Note: This is not applicable for any fund included in this document.
Item 10: Remuneration Paid to Directors, Officers, and others of Open-End Management Investment Companies
(Unaudited)
Note: This information is disclosed as part of the financial statements for each Fund as part of Item 7: Financial Statements and Financial Highlights for Open-End Management Investment companies.
Item 11: Statement Regarding Basis for Approval of Investment Advisory Contract
(Unaudited)
Board Approval of Investment Advisory Contracts and Management Fees
VIP Target Volatility Portfolio
Each year, the Board of Trustees, including the Independent Trustees (together, the Board), considers the renewal of the fund's management contract with Fidelity Management & Research Company LLC (FMR) (the Advisory Contract). The Board, assisted by the advice of fund counsel and Independent Trustees' counsel, requests and considers a broad range of information relevant to the renewal of the Advisory Contract throughout the year.
The Board meets regularly and, at each of its meetings, covers an extensive agenda of topics and materials and considers factors that are relevant to its annual consideration of the renewal of the fund's Advisory Contract, including the services and support provided to the fund and its shareholders. The Board's Operations Committee, of which all the Independent Trustees are members, meets regularly throughout the year and requests, receives and considers, among other matters, information related to the annual consideration of the renewal of the fund's Advisory Contract before making its recommendation to the Board. The Board also meets as needed to review matters specifically related to the Board's annual consideration of the renewal of the Advisory Contract. Members of the Board may also meet from time to time with trustees of other Fidelity funds through joint ad hoc committees to discuss certain matters relevant to all of the Fidelity funds.
At its September 2024 meeting, the Board unanimously determined to renew the fund's Advisory Contract. In reaching its determination, the Board considered all factors it believed relevant, including (i) the nature, extent, and quality of the services provided to the fund and its shareholders (including the investment performance of the fund); (ii) the competitiveness relative to peer funds of the fund's management fee and the total expense ratio of a representative class (Service Class 2); (iii) the total costs of the services provided by and the profits realized by FMR and its affiliates (Fidelity) from its relationships with the fund; and (iv) the extent to which, if any, economies of scale exist and are realized as the fund grows, and whether any economies of scale are appropriately shared with fund shareholders. The Board also considered the broad range of investment choices available to shareholders from FMR's competitors and that the fund's shareholders have chosen to invest in the fund, which is part of the Fidelity family of funds. The Board's decision to renew the Advisory Contracts was not based on any single factor and the factors may have been weighed differently by different Trustees.
The Board reached a determination, with the assistance of fund counsel and Independent Trustees' counsel and through the exercise of its business judgment, that the renewal of the Advisory Contract was in the best interests of the fund and its shareholders and that the compensation payable under the Advisory Contract was fair and reasonable in light of all of the surrounding circumstances.
Nature, Extent, and Quality of Services Provided. The Board considered Fidelity's staffing as it relates to the fund, including the backgrounds and experience of investment personnel of FMR, and also considered FMR's implementation of the fund's investment program. The Independent Trustees also had discussions with senior management of Fidelity's investment operations and investment groups with responsibility for the underlying Fidelity funds in which the fund invests. The Board considered the structure of the investment personnel compensation program and whether this structure provides appropriate incentives to act in the best interests of the fund. Additionally, the Board considered the portfolio managers' investments, if any, in the funds that they manage.
Resources Dedicated to Investment Management and Support Services. The Board reviewed the general qualifications and capabilities of Fidelity's investment staff, including its size, education, experience, and resources, as well as Fidelity's approach to recruiting, training, managing, and compensating investment personnel. The Board noted the resources devoted to Fidelity's global investment organization and that Fidelity's analysts have extensive resources, tools and capabilities that allow them to conduct quantitative and fundamental analysis, as well as credit analysis of issuers, counterparties, and guarantors. Further, the Board considered that Fidelity's investment professionals have sufficient access to global information and data so as to provide competitive investment results over time, and that those professionals also have access to sophisticated tools that permit them to assess portfolio construction and risk and performance attribution characteristics continuously, as well as to transmit new information and research conclusions rapidly around the world. Additionally, in its deliberations, the Board considered Fidelity's trading, risk management, compliance, cybersecurity, and technology and operations capabilities and resources, which are integral parts of the investment management process.
Shareholder and Administrative Services. The Board considered (i) the nature, extent, quality, and cost of advisory, administrative, and shareholder services performed by Fidelity under the Advisory Contract and under separate agreements covering transfer agency and pricing and bookkeeping services for the fund; (ii) the nature and extent of Fidelity's supervision of third party service providers, principally custodians, subcustodians, and pricing vendors; and (iii) the resources devoted by Fidelity to, and the record of compliance with, the fund's compliance policies and procedures, including with respect to liquidity risk management. The Board also reviewed the allocation of fund brokerage, including allocations to brokers affiliated with the investment adviser, the use of brokerage commissions to pay fund expenses, and the use of "soft" commission dollars to pay for research services. The Board also considered the fund's securities lending activities and any payments made to Fidelity relating to securities lending under a separate agreement.
The Board noted that the growth of fund assets over time across the complex allows Fidelity to reinvest in the development of services designed to enhance the value and convenience of the Fidelity funds as investment vehicles. These services include 24-hour access to account information and market information over the Internet and through telephone representatives, investor education materials and asset allocation tools. The Board also considered that it reviews customer service metrics such as telephone response times, continuity of services on the website and metrics addressing services at Fidelity Investor Centers.
Investment in a Large Fund Family. The Board considered the benefits to shareholders of investing in a fund that is part of a large family of funds offering a variety of investment disciplines and providing a large variety of fund investor services. The Board noted that Fidelity had taken, or had made recommendations to the Board that resulted in the Fidelity funds taking, a number of actions over the previous year that benefited particular funds and/or the Fidelity funds in general.
Investment Performance. The Board took into account discussions that occur with representatives of the Investment Advisers, and reports that it receives, at Board meetings throughout the year relating to fund investment performance. In this regard the Board noted that as part of regularly scheduled fund reviews and other reports to the Board on fund performance, the Board considered annualized return information for the fund for different time periods, measured against one or more appropriate securities market indices, including a customized blended index that reflects the respective weights of the fund's asset classes (each a benchmark index) and an appropriate peer group of funds with similar objectives (peer group). The Board also considered information about performance attribution. In its evaluation of fund investment performance at meetings throughout the year, the Board gave particular attention to information indicating underperformance of certain Fidelity funds over different time periods and discussed with the Investment Advisers the reasons for such underperformance.
In addition to reviewing absolute and relative fund performance, the Independent Trustees periodically consider the appropriateness of fund performance metrics in evaluating the results achieved. The Independent Trustees generally give greater weight to fund performance over longer time periods than over shorter time periods. Depending on the circumstances, the Independent Trustees may be satisfied with a fund's performance notwithstanding that it lags its benchmark index or peer group for certain periods.
Based on its review, the Board concluded that the nature, extent, and quality of services provided to the fund under the Advisory Contracts should continue to benefit the shareholders of the fund.
Competitiveness of Management Fee and Total Expense Ratio. The Board was provided with information regarding industry trends in management fees and expenses. In its review of the fund's management fee and the total expense ratio of Service Class 2, the Board considered the fund's management fee rate as well as other "fund-level" expenses, such as pricing and bookkeeping fees and custodial, legal, and audit fees, paid by FMR under the fund's management contract. The Board also considered other "class-level" expenses, such as transfer agent fees and fund-paid 12b-1 fees. The Board noted that Fidelity may agree to waive fees or reimburse expenses from time to time, and the extent to which, if any, it has done so for the fund.
Comparisons of Management Fees and Total Expense Ratios. Among other things, the Board reviewed data for selected groups of competitive funds and classes (referred to as "mapped groups") that were compiled by Fidelity based on combining similar investment objective categories (as classified by Morningstar) that have comparable investment mandates. The data reviewed by the Board included (i) gross management fee comparisons (before taking into account expense reimbursements or caps) relative to the total universe of funds within the mapped group; (ii) gross management fee comparisons relative to a subset of non-Fidelity funds in the mapped group that are similar in size and management fee structure to the fund (referred to as the "asset size peer group"); (iii) total expense comparisons of Service Class 2 of the fund relative to funds and classes in the mapped group that have a similar sales load structure to Service Class 2 the fund (referred to as the "similar sales load structure group"); and (iv) total expense comparisons of Service Class 2 of the fund relative to funds and classes in the similar sales load structure group that are similar in size and management fee structure to the fund (referred to as the "total expense asset size peer group"). The total expense asset size peer group comparison excludes performance adjustments and fund-paid 12b-1 fees to eliminate variability in fee structures.
The information provided to the Board indicated that the fund's management fee rate ranked below the competitive median of the mapped group for 2023 and below the competitive median of the asset size peer group for 2023. Further, the information provided to the Board indicated that the total expense ratio of Service Class 2 of the fund ranked above the competitive median of the similar sales load structure group for 2023 and below the competitive median of the total expense asset size peer group for 2023.
The Board considered that Service Class 2 has a 0.25% 12b-1 fee, whereas most of the classes in the insurance universe do not have 12b-1 fees. When excluding 12b-1 fees from both Fidelity and competitor classes, Service Class 2 of the fund ranked below the similar sales load type competitive median.
Other Contractual Arrangements. The Board considered that FMR has contractually agreed to waive 0.05% of the fund's management fee through April 30, 2025.
The Board further considered that FMR has contractually agreed to reimburse 0.10% of "class-level" expenses for Service Class and Service Class 2 as long as these classes continue to be sold to unaffiliated insurance companies.
Fees Charged to Other Fidelity Clients. The Board also considered Fidelity fee structures and other information with respect to clients of Fidelity, such as other funds advised or subadvised by Fidelity, pension plan clients, and other institutional clients with similar mandates. The Board noted that a joint ad hoc committee created by it and the boards of other Fidelity funds periodically reviews and compares Fidelity's institutional investment advisory business with its business of providing services to the Fidelity funds and also noted the most recent findings of the committee. The Board noted that the committee's review included a consideration of the differences in services provided, fees charged, and costs incurred, as well as competition in the markets serving the different categories of clients.
Based on its review, the Board concluded that the fund's management fee is fair and reasonable in light of the services that the fund receives and the other factors considered. Further, based on its review of total expense ratios and fees charged to other Fidelity clients, the Board concluded that the total expense ratio of each class of the fund was reasonable in light of the services that the fund and its shareholders receive and the other factors considered.
Costs of the Services and Profitability. The Board considered the revenues earned and the expenses incurred by Fidelity in conducting the business of developing, marketing, distributing, managing, administering and servicing the fund and servicing the fund's shareholders. The Board also considered the level of Fidelity's profits in respect of all the Fidelity funds, including the Fidelity funds in which the fund invests.
On an annual basis, Fidelity presents to the Board information about the profitability of its relationships with the fund. Fidelity calculates profitability information for each Fidelity fund, as well as aggregate profitability information for groups of Fidelity funds and all Fidelity funds, using a series of detailed revenue and cost allocation methodologies which originate with the books and records of Fidelity on which Fidelity's audited financial statements are based. The Audit Committee of the Board reviews any significant changes from the prior year's methodologies.
A public accounting firm has been engaged annually by the Board as part of the Board's assessment of Fidelity's profitability analysis. The engagement includes the review and assessment of the methodologies used by Fidelity in determining the revenues and expenses attributable to Fidelity's fund business. After considering the reports issued under the engagement and information provided by Fidelity, the Board concluded that while other allocation methods may also be reasonable, Fidelity's profitability methodologies are reasonable in all material respects.
The Board also reviewed Fidelity's non-fund businesses and potential indirect benefits such businesses may have received as a result of their association with Fidelity's fund business (i.e., fall-out benefits) as well as cases where Fidelity's affiliates may benefit from the funds' business. The Board considered areas where potential indirect benefits to the Fidelity funds from their relationships with Fidelity may exist. The Board's consideration of these matters was informed by the findings of a joint ad hoc committee created by it and the boards of other Fidelity funds to evaluate potential fall-out benefits.
The Board considered the costs of the services provided by and the profits realized by Fidelity in connection with the operation of the fund and was satisfied that the profitability was not excessive.
Economies of Scale. The Board considered whether there have been economies of scale in respect of the management of the Fidelity funds, whether the Fidelity funds (including the fund) have appropriately benefited from any such economies of scale, and whether there is potential for realization of any further economies of scale. The Board considered the extent to which the fund will benefit from economies of scale as assets grow through increased services to the fund, through waivers or reimbursements, or through fee or expense ratio reductions. The Board also noted that a committee created by it and the boards of other Fidelity funds periodically analyzes whether Fidelity attains economies of scale in respect of the management and servicing of the Fidelity funds, whether the Fidelity funds have appropriately benefited from such economies of scale, and whether there is potential for realization of any further economies of scale.
The Board concluded, taking into account the analysis of the committee, that economies of scale, if any, are being appropriately shared between fund shareholders and Fidelity.
Additional Information Requested by the Board. In order to develop fully the factual basis for consideration of the Fidelity funds' advisory contracts, the Board requested and received additional information on certain topics, including: (i) portfolio manager changes that have occurred during the past year; (ii) hiring, training, compensating, and retaining adviser and sub-adviser personnel; (iii) the terms of the funds' various management fee structures and arrangements for transfer agent and pricing and bookkeeping services; (iv) Fidelity's fund profitability methodology, profitability trends for certain funds, the allocation of various costs to different funds, and the impact of certain factors on fund profitability results; (v) the impact on fund profitability of recent industry trends, such as the growth in passively managed funds and the changes in flows for different types of funds; (vi) the types of management fee and total expense comparisons provided, and the challenges and limitations associated with such information; (vii) explanations regarding the relative total expense ratios and management fees of certain funds and classes, total expense and management fee competitive trends, and methodologies for total expense and management fee competitive comparisons; (viii) matters related to money market funds, exchange-traded funds, and target date funds; (ix) the arrangements with and compensation paid to certain fund sub-advisers and the treatment of such compensation within Fidelity's fund profitability methodology; and (x) the terms of management contracts between Fidelity and other funds and products not overseen by the Board.
Conclusion. Based on its evaluation of all of the conclusions noted above, and after considering all factors it believed relevant, the Board, including the Independent Trustees, concluded that the advisory fee arrangements are fair and reasonable in light of all of the surrounding circumstances and that the fund's Advisory Contract should be renewed through September 30, 2025.
1.955015.111
VIPTV-ANN-0325
Fidelity® Variable Insurance Products:
VIP Asset Manager: Growth Portfolio
(to be renamed VIP Asset Manager 70% Portfolio effective April 30, 2025)
Annual Report
December 31, 2024
Contents
To view a fund's proxy voting guidelines and proxy voting record for the 12-month period ended June 30, visit http://www.fidelity.com/proxyvotingresults or visit the Securities and Exchange Commission's (SEC) web site at http://www.sec.gov.
You may also call 1-877-208-0098 to request a free copy of the proxy voting guidelines.
Fidelity® Variable Insurance Products are separate account options which are purchased through a variable insurance contract.
Standard & Poor's, S&P and S&P 500 are registered service marks of The McGraw-Hill Companies, Inc. and have been licensed for use by Fidelity Distributors Corporation.
Other third-party marks appearing herein are the property of their respective owners.
All other marks appearing herein are registered or unregistered trademarks or service marks of FMR LLC or an affiliated company. © 2025 FMR LLC. All rights reserved.
This report and the financial statements contained herein are submitted for the general information of the shareholders of the Fund. This report is not authorized for distribution to prospective investors in the Fund unless preceded or accompanied by an effective prospectus.
A fund files its complete schedule of portfolio holdings with the SEC for the first and third quarters of each fiscal year on Form N-PORT. Forms N-PORT are available on the SEC's web site at http://www.sec.gov. A fund's Forms N-PORT may be reviewed and copied at the SEC's Public Reference Room in Washington, DC. Information regarding the operation of the SEC's Public Reference Room may be obtained by calling 1-800-SEC-0330.
For a complete list of a fund's portfolio holdings, view the most recent holdings listing, semiannual report, or annual report on Fidelity's web site at http://www.fidelity.com, http://www.institutional.fidelity.com, or http://www.401k.com, as applicable.
NOT FDIC INSURED •MAY LOSE VALUE •NO BANK GUARANTEE
Neither the Fund nor Fidelity Distributors Corporation is a bank.
Item 7: Financial Statements and Financial Highlights for Open-End Management Investment Companies (Annual Report)
VIP Asset Manager: Growth Portfolio
Schedule of Investments December 31, 2024
Showing Percentage of Net Assets
| Alternative Funds - 1.3% |
| | | Shares | Value ($) |
Fidelity Hedged Equity ETF (b) (Cost $3,194,849) | | 126,631 | 3,476,945 |
| | | | |
| Bond Funds - 23.6% |
| | | Shares | Value ($) |
| Fidelity Emerging Markets Debt Local Currency Central Fund (c) | | 23,334 | 1,917,327 |
| Fidelity Floating Rate Central Fund (c) | | 21,441 | 2,106,331 |
| Fidelity High Income Central Fund (c) | | 19,324 | 2,071,153 |
| Fidelity Inflation-Protected Bond Index Central Fund (c) | | 45,879 | 4,004,812 |
| Fidelity International Credit Central Fund (c) | | 8,590 | 695,530 |
| Fidelity VIP Investment Grade Central Fund (c) | | 569,650 | 52,111,590 |
| iShares 20+ Year Treasury Bond ETF | | 30,141 | 2,632,213 |
| TOTAL BOND FUNDS (Cost $69,814,659) | | | 65,538,956 |
| | | | |
| Domestic Equity Funds - 45.9% |
| | | Shares | Value ($) |
| Fidelity Blue Chip Growth ETF (b) | | 157,518 | 7,286,783 |
| Fidelity Commodity Strategy Central Fund (c) | | 12,887 | 1,133,011 |
| Fidelity Enhanced Large Cap Value ETF (b) | | 60,572 | 1,845,629 |
| Fidelity Enhanced Mid Cap ETF (b)(d) | | 64,872 | 2,131,045 |
| Fidelity Enhanced Small Cap ETF (b)(d) | | 78,625 | 2,543,519 |
| Fidelity Fundamental Small-Mid Cap ETF (b) | | 27,647 | 743,151 |
| Fidelity Real Estate Equity Central Fund (c) | | 9,964 | 1,352,349 |
| Fidelity U.S. Equity Central Fund (c) | | 806,597 | 110,294,042 |
| TOTAL DOMESTIC EQUITY FUNDS (Cost $71,205,843) | | | 127,329,529 |
| | | | |
| International Equity Funds - 28.0% |
| | | Shares | Value ($) |
| Fidelity Emerging Markets Equity Central Fund (c) | | 108,581 | 23,255,924 |
| Fidelity International Equity Central Fund (c) | | 534,915 | 54,534,613 |
| TOTAL INTERNATIONAL EQUITY FUNDS (Cost $64,990,372) | | | 77,790,537 |
| | | | |
| U.S. Treasury Obligations - 0.1% |
| | | Yield (%) (e) | Principal Amount (a) | Value ($) |
| US Treasury Bills 0% 1/16/2025 (f) | | 4.58 | 20,000 | 19,967 |
| US Treasury Bills 0% 1/30/2025 (f) | | 4.51 | 90,000 | 89,704 |
| US Treasury Bills 0% 1/9/2025 (f) | | 4.58 | 110,000 | 109,910 |
| US Treasury Bills 0% 3/27/2025 (f) | | 4.28 | 20,000 | 19,804 |
| TOTAL U.S. TREASURY OBLIGATIONS (Cost $239,328) | | | | 239,385 |
| | | | | |
| Money Market Funds - 1.6% |
| | | Yield (%) | Shares | Value ($) |
| Fidelity Cash Central Fund (g) | | 4.36 | 3,312,958 | 3,313,620 |
| Fidelity Securities Lending Cash Central Fund (g)(h) | | 4.35 | 1,215,853 | 1,215,975 |
| TOTAL MONEY MARKET FUNDS (Cost $4,529,595) | | | | 4,529,595 |
| | | | | |
| TOTAL INVESTMENT IN SECURITIES - 100.5% (Cost $213,974,646) | 278,904,947 |
NET OTHER ASSETS (LIABILITIES) - (0.5)% | (1,355,159) |
| NET ASSETS - 100.0% | 277,549,788 |
| | |
| Futures Contracts |
| | Number of contracts | Expiration Date | Notional Amount ($) | Value ($) | Unrealized Appreciation/ (Depreciation) ($) |
| Purchased | | | | | |
| | | | | | |
| Equity Contracts | | | | | |
| CME E-mini Russell 2000 Index Contracts (United States) | 61 | Mar 2025 | 6,861,890 | (5,132) | (5,132) |
| CME E-mini S&P MidCap 400 Index Contracts (United States) | 8 | Mar 2025 | 2,517,360 | 869 | 869 |
| | | | | | |
| TOTAL PURCHASED | | | | | (4,263) |
| | | | | | |
| Sold | | | | | |
| | | | | | |
| Equity Contracts | | | | | |
| CME E-mini S&P 500 Index Contracts (United States) | 47 | Mar 2025 | 13,949,013 | 151,246 | 151,246 |
| | | | | | |
| TOTAL FUTURES CONTRACTS | | | | | 146,983 |
| The notional amount of futures purchased as a percentage of Net Assets is 3.4% |
| The notional amount of futures sold as a percentage of Net Assets is 5.0% |
Security Type Abbreviations
Legend
| (a) | Amount is stated in United States dollars unless otherwise noted. |
| (c) | Affiliated fund that is generally available only to investment companies and other accounts managed by Fidelity Investments. A complete unaudited schedule of portfolio holdings for each Fidelity Central Fund is filed with the SEC for the first and third quarters of each fiscal year on Form N-PORT and is available upon request or at the SEC's website at www.sec.gov. An unaudited holdings listing for the Fund, which presents direct holdings as well as the pro-rata share of securities and other investments held indirectly through its investment in underlying non-money market Fidelity Central Funds, other than the Commodity Strategy Central Fund, is available at fidelity.com and/or institutional.fidelity.com, as applicable. In addition, each Fidelity Central Fund's financial statements,which are not covered by the Fund's Report of Independent Registered Public Accounting Firm, are available on the SEC's website or upon request. |
| (d) | Security or a portion of the security is on loan at period end. |
| (e) | Yield represents either the annualized yield at the date of purchase, or the stated coupon rate, or, for floating and adjustable rate securities, the rate at period end. |
| (f) | Security or a portion of the security was pledged to cover margin requirements for futures contracts. At period end, the value of securities pledged amounted to $239,385. |
| (g) | Affiliated fund that is generally available only to investment companies and other accounts managed by Fidelity Investments. The rate quoted is the annualized seven-day yield of the fund at period end. A complete unaudited listing of the fund's holdings as of its most recent quarter end is available upon request. In addition, each Fidelity Central Fund's financial statements, which are not covered by the Fund's Report of Independent Registered Public Accounting Firm, are available on the SEC's website or upon request. |
| (h) | Investment made with cash collateral received from securities on loan. |
Affiliated Central Funds
Fiscal year to date information regarding the Fund's investments in Fidelity Central Funds, including the ownership percentage, is presented below.
| Affiliate | Value, beginning of period ($) | Purchases ($) | Sales Proceeds ($) | Dividend Income ($) | Realized Gain (loss) ($) | Change in Unrealized appreciation (depreciation) ($) | Value, end of period ($) | Shares, end of period | % ownership, end of period |
| Fidelity Cash Central Fund | 1,090,775 | 13,910,118 | 11,687,273 | 92,383 | - | - | 3,313,620 | 3,312,958 | 0.0% |
| Fidelity Commodity Strategy Central Fund | 1,053,339 | 193,913 | 108,849 | 62,105 | (1,185) | (4,207) | 1,133,011 | 12,887 | 0.5% |
| Fidelity Emerging Markets Debt Central Fund | 570,487 | 86,204 | 656,987 | 11,413 | (111,709) | 112,005 | - | - | 0.0% |
| Fidelity Emerging Markets Debt Local Currency Central Fund | 1,910,336 | 191,540 | - | 138,376 | - | (184,549) | 1,917,327 | 23,334 | 0.7% |
| Fidelity Emerging Markets Equity Central Fund | 20,812,093 | 3,018,272 | 1,767,243 | 415,613 | 24,607 | 1,168,195 | 23,255,924 | 108,581 | 1.0% |
| Fidelity Floating Rate Central Fund | 1,891,798 | 383,670 | 163,276 | 185,965 | 112 | (5,973) | 2,106,331 | 21,441 | 0.1% |
| Fidelity Hedged Equity Central Fund | 3,091,142 | 931 | 3,372,197 | 932 | 518,821 | (238,697) | - | - | 0.0% |
| Fidelity High Income Central Fund | 1,227,069 | 952,048 | 159,234 | 131,833 | 865 | 50,405 | 2,071,153 | 19,324 | 0.1% |
| Fidelity Inflation-Protected Bond Index Central Fund | 4,671,445 | 864,321 | 1,486,590 | 171,532 | (143,684) | 99,320 | 4,004,812 | 45,879 | 0.7% |
| Fidelity International Credit Central Fund | 1,232,917 | 132,952 | 683,776 | 48,346 | (118,026) | 131,463 | 695,530 | 8,590 | 0.7% |
| Fidelity International Equity Central Fund | 45,759,132 | 11,431,640 | 4,262,262 | 1,530,054 | (3,166) | 1,609,269 | 54,534,613 | 534,915 | 1.0% |
| Fidelity Real Estate Equity Central Fund | 1,034,416 | 539,089 | 267,571 | 32,732 | 19,037 | 27,378 | 1,352,349 | 9,964 | 0.1% |
| Fidelity Securities Lending Cash Central Fund | - | 32,660,663 | 31,444,688 | 9,041 | - | - | 1,215,975 | 1,215,853 | 0.0% |
| Fidelity U.S. Equity Central Fund | 107,766,233 | 22,328,297 | 31,204,523 | 10,497,538 | 1,771,538 | 9,632,497 | 110,294,042 | 806,597 | 0.6% |
| Fidelity VIP Investment Grade Central Fund | 48,538,720 | 11,883,519 | 7,156,249 | 2,125,323 | (67,275) | (1,087,125) | 52,111,590 | 569,650 | 1.8% |
| Total | 240,649,902 | 98,577,177 | 94,420,718 | 15,453,186 | 1,889,935 | 11,309,981 | 258,006,277 | 6,689,973 | |
| | | | | | | | | | |
Amounts in the dividend income column in the above table include any capital gain distributions from underlying funds, which are presented in the corresponding line item in the Statement of Operations, if applicable.
Amounts in the dividend income column for Fidelity Securities Lending Cash Central Fund represents the income earned on investing cash collateral, less rebates paid to borrowers and any lending agent fees associated with the loan, plus any premium payments received for lending certain types of securities.
Amounts included in the purchases and sales proceeds columns may include in-kind transactions, if applicable.
Affiliated Underlying Funds
Fiscal year to date information regarding the Fund's investments in affiliated Underlying Funds is presented below. Exchanges between classes of the same affiliated Underlying Funds may occur. If an Underlying Funds changes its name, the name presented below is the name in effect at period end.
| Affiliate | Value, beginning of period ($) | Purchases ($) | Sales Proceeds ($) | Dividend Income ($) | Realized Gain (loss) ($) | Change in Unrealized appreciation (depreciation) ($) | Value, end of period ($) | Shares, end of period |
| Fidelity Blue Chip Growth ETF | - | 7,289,004 | - | - | - | (2,221) | 7,286,783 | 157,518 |
| Fidelity Enhanced Large Cap Value ETF | - | 1,844,296 | - | - | - | 1,333 | 1,845,629 | 60,572 |
| Fidelity Enhanced Mid Cap ETF | - | 2,138,217 | 98,811 | 8,109 | 6,635 | 85,004 | 2,131,045 | 64,872 |
| Fidelity Enhanced Small Cap ETF | - | 2,468,738 | - | 10,647 | - | 74,781 | 2,543,519 | 78,625 |
| Fidelity Fundamental Small-Mid Cap ETF | - | 743,868 | - | - | - | (717) | 743,151 | 27,647 |
| Fidelity Hedged Equity ETF | - | 3,364,543 | 172,802 | 17,539 | 3,108 | 282,096 | 3,476,945 | 126,631 |
| Fidelity Low Volatility Factor ETF | 2,432,488 | - | 2,475,742 | - | 83,840 | (40,586) | - | - |
| | 2,432,488 | 17,848,666 | 2,747,355 | 36,295 | 93,583 | 399,690 | 18,027,072 | 515,865 |
Amounts in the dividend income column in the above table include any capital gain distributions from underlying funds, which are presented in the corresponding line item in the Statement of Operations, if applicable.
Amounts included in the purchases and sales proceeds columns may include in-kind transactions, if applicable.
Investment Valuation
The following is a summary of the inputs used, as of December 31, 2024, involving the Fund's assets and liabilities carried at fair value. The inputs or methodology used for valuing securities may not be an indication of the risk associated with investing in those securities. For more information on valuation inputs, and their aggregation into the levels used below, please refer to the Investment Valuation section in the accompanying Notes to Financial Statements.
| Valuation Inputs at Reporting Date: |
| Description | Total ($) | Level 1 ($) | Level 2 ($) | Level 3 ($) |
Investments in Securities: | | | | |
|
| Alternative Funds | 3,476,945 | 3,476,945 | - | - |
|
| Bond Funds | 65,538,956 | 65,538,956 | - | - |
|
| Domestic Equity Funds | 127,329,529 | 127,329,529 | - | - |
|
| International Equity Funds | 77,790,537 | 77,790,537 | - | - |
|
| U.S. Treasury Obligations | 239,385 | - | 239,385 | - |
|
| Money Market Funds | 4,529,595 | 4,529,595 | - | - |
| Total Investments in Securities: | 278,904,947 | 278,665,562 | 239,385 | - |
Derivative Instruments: Assets | | | | |
Futures Contracts | 152,115 | 152,115 | - | - |
| Total Assets | 152,115 | 152,115 | - | - |
| Liabilities | | | | |
Futures Contracts | (5,132) | (5,132) | - | - |
| Total Liabilities | (5,132) | (5,132) | - | - |
| Total Derivative Instruments: | 146,983 | 146,983 | - | - |
Value of Derivative Instruments
The following table is a summary of the Fund's value of derivative instruments by primary risk exposure as of December 31, 2024. For additional information on derivative instruments, please refer to the Derivative Instruments section in the accompanying Notes to Financial Statements.
Primary Risk Exposure / Derivative Type | Value |
| Asset ($) | Liability ($) |
| Equity Risk | | |
Futures Contracts (a) | 152,115 | (5,132) |
| Total Equity Risk | 152,115 | (5,132) |
| Total Value of Derivatives | 152,115 | (5,132) |
(a)Reflects gross cumulative appreciation (depreciation) on futures contracts as presented in the Schedule of Investments. In the Statement of Assets and Liabilities, the period end daily variation margin is included in receivable or payable for daily variation margin on futures contracts, and the net cumulative appreciation (depreciation) is included in Total accumulated earnings (loss).
Financial Statements
| Statement of Assets and Liabilities |
As of December 31, 2024 |
| Assets | | | | |
| Investment in securities, at value (including securities loaned of $1,183,305) - See accompanying schedule: | | | | |
Unaffiliated issuers (cost $3,240,298) | $ | 2,871,598 | | |
Fidelity Central Funds (cost $193,147,552) | | 258,006,277 | | |
Other affiliated issuers (cost $17,586,796) | | 18,027,072 | | |
| | | | | |
| | | | | |
| Total Investment in Securities (cost $213,974,646) | | | $ | 278,904,947 |
| Receivable for investments sold | | | | 12,090,457 |
| Receivable for fund shares sold | | | | 47,914 |
| Distributions receivable from Fidelity Central Funds | | | | 15,719 |
| Prepaid expenses | | | | 230 |
| Other receivables | | | | 453 |
Total assets | | | | 291,059,720 |
| Liabilities | | | | |
| Payable for investments purchased | $ | 11,928,543 | | |
| Payable for fund shares redeemed | | 133,340 | | |
| Accrued management fee | | 147,584 | | |
| Distribution and service plan fees payable | | 7,098 | | |
| Payable for daily variation margin on futures contracts | | 36,726 | | |
| Other payables and accrued expenses | | 40,666 | | |
| Collateral on securities loaned | | 1,215,975 | | |
| Total liabilities | | | | 13,509,932 |
| Net Assets | | | $ | 277,549,788 |
| Net Assets consist of: | | | | |
| Paid in capital | | | $ | 202,656,774 |
| Total accumulated earnings (loss) | | | | 74,893,014 |
| Net Assets | | | $ | 277,549,788 |
| | | | | |
| Net Asset Value and Maximum Offering Price | | | | |
| Initial Class : | | | | |
Net Asset Value, offering price and redemption price per share ($89,191,669 ÷ 3,872,703 shares) | | | $ | 23.03 |
| Service Class : | | | | |
Net Asset Value, offering price and redemption price per share ($3,837,405 ÷ 168,404 shares) | | | $ | 22.79 |
| Service Class 2 : | | | | |
Net Asset Value, offering price and redemption price per share ($32,738,785 ÷ 1,453,985 shares) | | | $ | 22.52 |
| Investor Class : | | | | |
Net Asset Value, offering price and redemption price per share ($151,781,929 ÷ 6,645,213 shares) | | | $ | 22.84 |
| Statement of Operations |
| Year ended December 31, 2024 |
| Investment Income | | | | |
| Dividends (including $36,295 earned from affiliated issuers) | | | $ | 114,401 |
| Interest | | | | 18,168 |
| Income from Fidelity Central Funds (including $9,041 from security lending) | | | | 6,509,842 |
| Total income | | | | 6,642,411 |
| Expenses | | | | |
| Management fee | $ | 1,634,856 | | |
| Transfer agent fees | | 43,654 | | |
| Distribution and service plan fees | | 61,972 | | |
| Accounting fees | | 19,457 | | |
| Custodian fees and expenses | | 17,362 | | |
| Independent trustees' fees and expenses | | 676 | | |
| Audit fees | | 51,504 | | |
| Legal | | 2,395 | | |
| Miscellaneous | | 5,766 | | |
| Total expenses before reductions | | 1,837,642 | | |
| Expense reductions | | (25,644) | | |
| Total expenses after reductions | | | | 1,811,998 |
| Net Investment income (loss) | | | | 4,830,413 |
| Realized and Unrealized Gain (Loss) | | | | |
| Net realized gain (loss) on: | | | | |
| Investment Securities: | | | | |
| Unaffiliated issuers | | 47,661 | | |
| Fidelity Central Funds | | 1,889,935 | | |
| Other affiliated issuers | | 93,583 | | |
| Futures contracts | | (1,011,874) | | |
| Capital gain distributions from Fidelity Central Funds | | 8,943,344 | | |
| Total net realized gain (loss) | | | | 9,962,649 |
| Change in net unrealized appreciation (depreciation) on: | | | | |
| Investment Securities: | | | | |
| Unaffiliated issuers | | (311,148) | | |
| Fidelity Central Funds | | 11,309,981 | | |
| Other affiliated issuers | | 399,690 | | |
| Futures contracts | | 250,779 | | |
| Total change in net unrealized appreciation (depreciation) | | | | 11,649,302 |
| Net gain (loss) | | | | 21,611,951 |
| Net increase (decrease) in net assets resulting from operations | | | $ | 26,442,364 |
| Statement of Changes in Net Assets |
| |
| | Year ended December 31, 2024 | | Year ended December 31, 2023 |
| Increase (Decrease) in Net Assets | | | | |
| Operations | | | | |
| Net investment income (loss) | $ | 4,830,413 | $ | 4,099,740 |
| Net realized gain (loss) | | 9,962,649 | | 2,543,594 |
| Change in net unrealized appreciation (depreciation) | | 11,649,302 | | 28,430,492 |
| Net increase (decrease) in net assets resulting from operations | | 26,442,364 | | 35,073,826 |
| Distributions to shareholders | | (7,855,218) | | (4,166,216) |
| | | | | |
| Share transactions - net increase (decrease) | | 14,146,733 | | (5,267,979) |
| Total increase (decrease) in net assets | | 32,733,879 | | 25,639,631 |
| | | | | |
| Net Assets | | | | |
| Beginning of period | | 244,815,909 | | 219,176,278 |
| End of period | $ | 277,549,788 | $ | 244,815,909 |
| | | | | |
| | | | | |
Financial Highlights
VIP Asset Manager: Growth Portfolio Initial Class |
| |
| Years ended December 31, | | 2024 | | 2023 | | 2022 | | 2021 | | 2020 |
Selected Per-Share Data | | | | | | | | | | |
| Net asset value, beginning of period | $ | 21.41 | $ | 18.72 | $ | 24.38 | $ | 22.00 | $ | 19.20 |
| Income from Investment Operations | | | | | | | | | | |
Net investment income (loss) A,B | | .43 | | .37 | | .38 | | .35 | | .21 |
| Net realized and unrealized gain (loss) | | 1.87 | | 2.69 | | (4.33) | | 2.71 | | 3.09 |
| Total from investment operations | | 2.30 | | 3.06 | | (3.95) | | 3.06 | | 3.30 |
| Distributions from net investment income | | (.41) | | (.37) | | (.37) | | (.34) | | (.22) |
| Distributions from net realized gain | | (.26) | | - | | (1.34) | | (.34) | | (.27) |
| Total distributions | | (.68) C | | (.37) | | (1.71) | | (.68) | | (.50) C |
| Net asset value, end of period | $ | 23.03 | $ | 21.41 | $ | 18.72 | $ | 24.38 | $ | 22.00 |
Total Return D,E | | | | 16.37% | | (16.88)% | | 13.96% | | 17.27% |
Ratios to Average Net Assets B,F,G | | | | | | | | | | |
| Expenses before reductions | | .62% | | .67% | | .67% | | .67% | | .67% |
| Expenses net of fee waivers, if any | | | | .66% | | .67% | | .66% | | .67% |
| Expenses net of all reductions | | .61% | | .66% | | .67% | | .66% | | .67% |
| Net investment income (loss) | | 1.89% | | 1.84% | | 1.88% | | 1.46% | | 1.12% |
| Supplemental Data | | | | | | | | | | |
| Net assets, end of period (000 omitted) | $ | 89,192 | $ | 88,440 | $ | 85,620 | $ | 111,781 | $ | 106,148 |
Portfolio turnover rate H | | | | 25% | | 26% | | 25% | | 23% |
ACalculated based on average shares outstanding during the period.
BNet investment income (loss) is affected by the timing of the declaration of dividends by any underlying mutual funds or exchange-traded funds (ETFs). Net investment income (loss) of any mutual funds or ETFs is not included in the Fund's net investment income (loss) ratio.
CTotal distributions per share do not sum due to rounding.
DTotal returns do not reflect charges attributable to your insurance company's separate account. Inclusion of these charges would reduce the total returns shown.
ETotal returns would have been lower if certain expenses had not been reduced during the applicable periods shown.
FFees and expenses of any underlying mutual funds or exchange-traded funds (ETFs) are not included in the Fund's expense ratio. The Fund indirectly bears its proportionate share of these expenses. For additional expense information related to investments in Fidelity Central Funds, please refer to the "Investments in Fidelity Central Funds" note found in the Notes to Financial Statements section of the most recent Annual or Semi-Annual report.
GExpense ratios reflect operating expenses of the class. Expenses before reductions do not reflect amounts reimbursed, waived, or reduced through arrangements with the investment adviser, brokerage services, or other offset arrangements, if applicable, and do not represent the amount paid by the class during periods when reimbursements, waivers or reductions occur.
HAmount does not include the portfolio activity of any underlying mutual funds or exchange-traded funds (ETFs), derivatives or securities that mature within one year from acquisition.
VIP Asset Manager: Growth Portfolio Service Class |
| |
| Years ended December 31, | | 2024 | | 2023 | | 2022 | | 2021 | | 2020 |
Selected Per-Share Data | | | | | | | | | | |
| Net asset value, beginning of period | $ | 21.19 | $ | 18.54 | $ | 24.16 | $ | 21.80 | $ | 19.04 |
| Income from Investment Operations | | | | | | | | | | |
Net investment income (loss) A,B | | .40 | | .35 | | .35 | | .32 | | .19 |
| Net realized and unrealized gain (loss) | | 1.86 | | 2.65 | | (4.28) | | 2.70 | | 3.05 |
| Total from investment operations | | 2.26 | | 3.00 | | (3.93) | | 3.02 | | 3.24 |
| Distributions from net investment income | | (.39) | | (.35) | | (.35) | | (.32) | | (.20) |
| Distributions from net realized gain | | (.26) | | - | | (1.34) | | (.34) | | (.27) |
| Total distributions | | (.66) C | | (.35) | | (1.69) | | (.66) | | (.48) C |
| Net asset value, end of period | $ | 22.79 | $ | 21.19 | $ | 18.54 | $ | 24.16 | $ | 21.80 |
Total Return D,E | | | | 16.21% | | (16.95)% | | 13.89% | | 17.09% |
Ratios to Average Net Assets B,F,G | | | | | | | | | | |
| Expenses before reductions | | .72% | | .77% | | .77% | | .77% | | .77% |
| Expenses net of fee waivers, if any | | | | .76% | | .77% | | .76% | | .77% |
| Expenses net of all reductions | | .71% | | .76% | | .77% | | .76% | | .77% |
| Net investment income (loss) | | 1.79% | | 1.74% | | 1.78% | | 1.36% | | 1.02% |
| Supplemental Data | | | | | | | | | | |
| Net assets, end of period (000 omitted) | $ | 3,837 | $ | 3,618 | $ | 2,883 | $ | 3,609 | $ | 3,363 |
Portfolio turnover rate H | | | | 25% | | 26% | | 25% | | 23% |
ACalculated based on average shares outstanding during the period.
BNet investment income (loss) is affected by the timing of the declaration of dividends by any underlying mutual funds or exchange-traded funds (ETFs). Net investment income (loss) of any mutual funds or ETFs is not included in the Fund's net investment income (loss) ratio.
CTotal distributions per share do not sum due to rounding.
DTotal returns do not reflect charges attributable to your insurance company's separate account. Inclusion of these charges would reduce the total returns shown.
ETotal returns would have been lower if certain expenses had not been reduced during the applicable periods shown.
FFees and expenses of any underlying mutual funds or exchange-traded funds (ETFs) are not included in the Fund's expense ratio. The Fund indirectly bears its proportionate share of these expenses. For additional expense information related to investments in Fidelity Central Funds, please refer to the "Investments in Fidelity Central Funds" note found in the Notes to Financial Statements section of the most recent Annual or Semi-Annual report.
GExpense ratios reflect operating expenses of the class. Expenses before reductions do not reflect amounts reimbursed, waived, or reduced through arrangements with the investment adviser, brokerage services, or other offset arrangements, if applicable, and do not represent the amount paid by the class during periods when reimbursements, waivers or reductions occur.
HAmount does not include the portfolio activity of any underlying mutual funds or exchange-traded funds (ETFs), derivatives or securities that mature within one year from acquisition.
VIP Asset Manager: Growth Portfolio Service Class 2 |
| |
| Years ended December 31, | | 2024 | | 2023 | | 2022 | | 2021 | | 2020 |
Selected Per-Share Data | | | | | | | | | | |
| Net asset value, beginning of period | $ | 20.99 | $ | 18.39 | $ | 23.98 | $ | 21.65 | $ | 18.91 |
| Income from Investment Operations | | | | | | | | | | |
Net investment income (loss) A,B | | .36 | | .31 | | .32 | | .28 | | .16 |
| Net realized and unrealized gain (loss) | | 1.84 | | 2.64 | | (4.24) | | 2.67 | | 3.03 |
| Total from investment operations | | 2.20 | | 2.95 | | (3.92) | | 2.95 | | 3.19 |
| Distributions from net investment income | | (.40) | | (.35) | | (.33) | | (.29) | | (.17) |
| Distributions from net realized gain | | (.26) | | - | | (1.34) | | (.34) | | (.27) |
| Total distributions | | (.67) C | | (.35) | | (1.67) | | (.62) C | | (.45) C |
| Net asset value, end of period | $ | 22.52 | $ | 20.99 | $ | 18.39 | $ | 23.98 | $ | 21.65 |
Total Return D,E | | | | 16.05% | | (17.05)% | | 13.69% | | 16.95% |
Ratios to Average Net Assets B,F,G | | | | | | | | | | |
| Expenses before reductions | | .90% | | .92% | | .92% | | .92% | | .92% |
| Expenses net of fee waivers, if any | | | | .91% | | .92% | | .91% | | .92% |
| Expenses net of all reductions | | .89% | | .91% | | .92% | | .91% | | .92% |
| Net investment income (loss) | | 1.62% | | 1.59% | | 1.63% | | 1.21% | | .87% |
| Supplemental Data | | | | | | | | | | |
| Net assets, end of period (000 omitted) | $ | 32,739 | $ | 14,839 | $ | 4,015 | $ | 3,948 | $ | 3,359 |
Portfolio turnover rate H | | | | 25% | | 26% | | 25% | | 23% |
ACalculated based on average shares outstanding during the period.
BNet investment income (loss) is affected by the timing of the declaration of dividends by any underlying mutual funds or exchange-traded funds (ETFs). Net investment income (loss) of any mutual funds or ETFs is not included in the Fund's net investment income (loss) ratio.
CTotal distributions per share do not sum due to rounding.
DTotal returns do not reflect charges attributable to your insurance company's separate account. Inclusion of these charges would reduce the total returns shown.
ETotal returns would have been lower if certain expenses had not been reduced during the applicable periods shown.
FFees and expenses of any underlying mutual funds or exchange-traded funds (ETFs) are not included in the Fund's expense ratio. The Fund indirectly bears its proportionate share of these expenses. For additional expense information related to investments in Fidelity Central Funds, please refer to the "Investments in Fidelity Central Funds" note found in the Notes to Financial Statements section of the most recent Annual or Semi-Annual report.
GExpense ratios reflect operating expenses of the class. Expenses before reductions do not reflect amounts reimbursed, waived, or reduced through arrangements with the investment adviser, brokerage services, or other offset arrangements, if applicable, and do not represent the amount paid by the class during periods when reimbursements, waivers or reductions occur.
HAmount does not include the portfolio activity of any underlying mutual funds or exchange-traded funds (ETFs), derivatives or securities that mature within one year from acquisition.
VIP Asset Manager: Growth Portfolio Investor Class |
| |
| Years ended December 31, | | 2024 | | 2023 | | 2022 | | 2021 | | 2020 |
Selected Per-Share Data | | | | | | | | | | |
| Net asset value, beginning of period | $ | 21.24 | $ | 18.58 | $ | 24.21 | $ | 21.85 | $ | 19.07 |
| Income from Investment Operations | | | | | | | | | | |
Net investment income (loss) A,B | | .41 | | .35 | | .36 | | .33 | | .20 |
| Net realized and unrealized gain (loss) | | 1.85 | | 2.67 | | (4.29) | | 2.69 | | 3.06 |
| Total from investment operations | | 2.26 | | 3.02 | | (3.93) | | 3.02 | | 3.26 |
| Distributions from net investment income | | (.40) | | (.36) | | (.36) | | (.33) | | (.21) |
| Distributions from net realized gain | | (.26) | | - | | (1.34) | | (.34) | | (.27) |
| Total distributions | | (.66) | | (.36) | | (1.70) | | (.66) C | | (.48) |
| Net asset value, end of period | $ | 22.84 | $ | 21.24 | $ | 18.58 | $ | 24.21 | $ | 21.85 |
Total Return D,E | | | | 16.25% | | (16.93)% | | 13.89% | | 17.19% |
Ratios to Average Net Assets B,F,G | | | | | | | | | | |
| Expenses before reductions | | .70% | | .75% | | .75% | | .74% | | .75% |
| Expenses net of fee waivers, if any | | | | .74% | | .74% | | .74% | | .75% |
| Expenses net of all reductions | | .69% | | .74% | | .74% | | .74% | | .75% |
| Net investment income (loss) | | 1.81% | | 1.76% | | 1.80% | | 1.38% | | 1.04% |
| Supplemental Data | | | | | | | | | | |
| Net assets, end of period (000 omitted) | $ | 151,782 | $ | 137,920 | $ | 126,658 | $ | 154,034 | $ | 132,407 |
Portfolio turnover rate H | | | | 25% | | 26% | | 25% | | 23% |
ACalculated based on average shares outstanding during the period.
BNet investment income (loss) is affected by the timing of the declaration of dividends by any underlying mutual funds or exchange-traded funds (ETFs). Net investment income (loss) of any mutual funds or ETFs is not included in the Fund's net investment income (loss) ratio.
CTotal distributions per share do not sum due to rounding.
DTotal returns do not reflect charges attributable to your insurance company's separate account. Inclusion of these charges would reduce the total returns shown.
ETotal returns would have been lower if certain expenses had not been reduced during the applicable periods shown.
FFees and expenses of any underlying mutual funds or exchange-traded funds (ETFs) are not included in the Fund's expense ratio. The Fund indirectly bears its proportionate share of these expenses. For additional expense information related to investments in Fidelity Central Funds, please refer to the "Investments in Fidelity Central Funds" note found in the Notes to Financial Statements section of the most recent Annual or Semi-Annual report.
GExpense ratios reflect operating expenses of the class. Expenses before reductions do not reflect amounts reimbursed, waived, or reduced through arrangements with the investment adviser, brokerage services, or other offset arrangements, if applicable, and do not represent the amount paid by the class during periods when reimbursements, waivers or reductions occur.
HAmount does not include the portfolio activity of any underlying mutual funds or exchange-traded funds (ETFs), derivatives or securities that mature within one year from acquisition.
Notes to Financial Statements
For the period ended December 31, 2024
1. Organization.
VIP Asset Manager: Growth Portfolio (the Fund) is a fund of Variable Insurance Products Fund V (the Trust) and is authorized to issue an unlimited number of shares. The Trust is registered under the Investment Company Act of 1940, as amended (the 1940 Act), as an open-end management investment company organized as a Massachusetts business trust. Shares of the Fund may only be purchased by insurance companies for the purpose of funding variable annuity or variable life insurance contracts. The Fund offers the following classes of shares: Initial Class shares, Service Class shares, Service Class 2 shares and Investor Class shares. All classes have equal rights and voting privileges, except for matters affecting a single class.
During September 2024 the Board approved to change the name of the Fund to VIP Asset Manager 70% Portfolio effective April 30, 2025.
2.Investments in Fidelity Central Funds.
Funds may invest in Fidelity Central Funds, which are open-end investment companies generally available only to other investment companies and accounts managed by the investment adviser and its affiliates. The Schedule of Investments lists any Fidelity Central Funds held as an investment as of period end, but does not include the underlying holdings of each Fidelity Central Fund. An investing fund indirectly bears its proportionate share of the expenses of the underlying Fidelity Central Funds.
Based on its investment objective, each Fidelity Central Fund may invest or participate in various investment vehicles or strategies that are similar to those of the investing fund. These strategies are consistent with the investment objectives of the investing fund and may involve certain economic risks which may cause a decline in value of each of the Fidelity Central Funds and thus a decline in the value of the investing fund.
| Fidelity Central Fund | Investment Manager | Investment Objective | Investment Practices | Expense RatioA |
| Fidelity Commodity Strategy Central Fund | Geode Capital Management, LLC (Geode) | Seeks to provide investment returns that correspond to the performance of the commodities market. | Investment in commodity-related investments through a wholly-owned subsidiary organized under the laws of the Cayman Islands | .01% |
| Fidelity Emerging Markets Debt Central Fund | Fidelity Management & Research Company LLC (FMR) | Seeks high total return by normally investing in debt securities of issuers in emerging markets and other debt investments that are tied economically to emerging markets. | Foreign Securities Restricted Securities Futures | .01% |
| Fidelity Emerging Markets Equity Central Fund | Fidelity Management & Research Company LLC (FMR) | Seeks capital appreciation by investing primarily in equity securities of issuers in emerging markets. | Foreign Securities | .02% |
| Fidelity International Equity Central Fund | Fidelity Management & Research Company LLC (FMR) | Seeks capital appreciation by investing primarily in non-U.S. based common stocks, including securities of issuers located in emerging markets. | Foreign Securities Futures | .01% |
| Fidelity Floating Rate Central Fund | Fidelity Management & Research Company LLC (FMR) | Seeks a high level of income by normally investing in floating rate loans and other floating rate securities. | Restricted Securities Loans & Direct Debt Instruments | Less than .005% |
| Fidelity High Income Central Fund | Fidelity Management & Research Company LLC (FMR) | Seeks a high level of income and may also seek capital appreciation by investing primarily in debt securities, preferred stocks, and convertible securities, with an emphasis on lower-quality debt securities. | Loans & Direct Debt Instruments Restricted Securities | Less than .005% |
| Fidelity Inflation-Protected Bond Index Central Fund | Fidelity Management & Research Company LLC (FMR) | Seeks to provide investment results that correspond to the performance of the inflation-protected United States Treasury market, and may invest in derivatives. | | Less than .005% |
| Fidelity VIP Investment Grade Central Fund | Fidelity Management & Research Company LLC (FMR) | Seeks a high level of current income by normally investing in investment-grade debt securities and repurchase agreements. | Delayed Delivery & When Issued Securities Restricted Securities | Less than .005% |
| Fidelity Real Estate Equity Central Fund | Fidelity Management & Research Company LLC (FMR) | Seeks above-average income and long-term capital growth by investing primarily in equity securities of issuers in the real estate industry. | | Less than .005% |
| Fidelity International Credit Central Fund | Fidelity Management & Research Company LLC (FMR) | Seeks a high level of current income by normally investing in debt securities of foreign issuers, including debt securities of issuers located in emerging markets. Foreign currency exposure is hedged utilizing foreign currency contracts. | Foreign Securities Forward Foreign Currency Contracts Futures Restricted Securities Swaps | Less than .005% |
| Fidelity U.S. Equity Central Fund | Fidelity Management & Research Company LLC (FMR) | Seeks capital appreciation by investing primarily in common stocks, allocated across different market sectors. | Foreign Securities Restricted Securities Futures | Less than .005% |
| Fidelity Emerging Markets Debt Local Currency Central Fund | Fidelity Management & Research Company LLC (FMR) | Seeks high total return by normally investing in debt securities of issuers in emerging markets and other debt investments that are tied economically to emerging markets and denominated in the local currency of the issuer. | Foreign Securities Restricted Securities | .02% |
| Fidelity Money Market Central Funds | Fidelity Management & Research Company LLC (FMR) | Each fund seeks to obtain a high level of current income consistent with the preservation of capital and liquidity. | Short-term Investments | Less than .005% |
A Expenses expressed as a percentage of average net assets and are as of each underlying Central Fund's most recent annual or semi-annual shareholder report.
An unaudited holdings listing for the investing fund, which presents direct holdings as well as the pro-rata share of any securities and other investments held indirectly through its investment in underlying non-money market Fidelity Central Funds, is available at fidelity.com and/or institutional.fidelity.com, as applicable. A complete unaudited list of holdings for each Fidelity Central Fund is available upon request or at the Securities and Exchange Commission website at www.sec.gov. In addition, the financial statements of the Fidelity Central Funds which contain the significant accounting policies (including investment valuation policies) of those funds, and are not covered by the Report of Independent Registered Public Accounting Firm, are available on the Securities and Exchange Commission website or upon request.
3. Significant Accounting Policies.
The Fund is an investment company and applies the accounting and reporting guidance of the Financial Accounting Standards Board (FASB) Accounting Standards Codification Topic 946 Financial Services - Investment Companies. The financial statements have been prepared in conformity with accounting principles generally accepted in the United States of America (GAAP), which require management to make certain estimates and assumptions at the date of the financial statements. Actual results could differ from those estimates. The Fund operates as a single operating segment. The Fund's income, expenses, assets, and performance are regularly monitored and assessed as a whole by the investment adviser and other individuals responsible for oversight functions of the Trust, using the information presented in the financial statements and financial highlights. Subsequent events, if any, through the date that the financial statements were issued have been evaluated in the preparation of the financial statements. The Fund's Schedule of Investments lists any underlying mutual funds or exchange-traded funds (ETFs) but does not include the underlying holdings of these funds. The following summarizes the significant accounting policies of the Fund:
Investment Valuation. Investments are valued as of 4:00 p.m. Eastern time on the last calendar day of the period. The Board of Trustees (the Board) has designated the Fund's investment adviser as the valuation designee responsible for the fair valuation function and performing fair value determinations as needed. The investment adviser has established a Fair Value Committee (the Committee) to carry out the day-to-day fair valuation responsibilities and has adopted policies and procedures to govern the fair valuation process and the activities of the Committee. In accordance with these fair valuation policies and procedures, which have been approved by the Board, the Fund attempts to obtain prices from one or more third party pricing services or brokers to value its investments. When current market prices, quotations or currency exchange rates are not readily available or reliable, investments will be fair valued in good faith by the Committee, in accordance with the policies and procedures. Factors used in determining fair value vary by investment type and may include market or investment specific events, transaction data, estimated cash flows, and market observations of comparable investments. The frequency that the fair valuation procedures are used cannot be predicted and they may be utilized to a significant extent. The Committee manages the Fund's fair valuation practices and maintains the fair valuation policies and procedures. The Fund's investment adviser reports to the Board information regarding the fair valuation process and related material matters.
The Fund categorizes the inputs to valuation techniques used to value its investments into a disclosure hierarchy consisting of three levels as shown below:
Level 1 - unadjusted quoted prices in active markets for identical investments
Level 2 - other significant observable inputs (including quoted prices for similar investments, interest rates, prepayment speeds, etc.)
Level 3 - unobservable inputs (including the Fund's own assumptions based on the best information available)
Valuation techniques used to value the Fund's investments by major category are as follows:
Debt securities, including restricted securities, are valued based on evaluated prices received from third party pricing services or from brokers who make markets in such securities. U.S. government and government agency obligations are valued by pricing services who utilize matrix pricing which considers yield or price of bonds of comparable quality, coupon, maturity and type or by broker-supplied prices. When independent prices are unavailable or unreliable, debt securities may be valued utilizing pricing methodologies which consider similar factors that would be used by third party pricing services. Debt securities are generally categorized as Level 2 in the hierarchy but may be Level 3 depending on the circumstances.
Exchange-Traded Funds (ETFs) are valued at their last sale price or official closing price as reported by a third party pricing service on the primary market or exchange on which they are traded and are categorized as Level 1 in the hierarchy. In the event there were no sales during the day but the exchange reports a closing bid level, ETFs are valued at the closing bid and would be categorized as Level 1 in the hierarchy. In the event there was no closing bid, ETFs may be valued by another method that the Board believes reflects fair value in accordance with the Board's fair value pricing policies and may be categorized as Level 2 in the hierarchy.
Futures contracts are valued at the settlement price established each day by the board of trade or exchange on which they are traded and are categorized as Level 1 in the hierarchy. Investments in open-end mutual funds, including the Fidelity Central Funds, are valued at their closing net asset value (NAV) each business day and are categorized as Level 1 in the hierarchy.
Changes in valuation techniques may result in transfers in or out of an assigned level within the disclosure hierarchy. The aggregate value of investments by input level as of December 31, 2024 is included at the end of the Fund's Schedule of Investments.
Investment Transactions and Income. For financial reporting purposes, the Fund's investment holdings and NAV include trades executed through the end of the last business day of the period. The NAV per share for processing shareholder transactions is calculated as of the close of business of the New York Stock Exchange (NYSE), normally 4:00 p.m. Eastern time and includes trades executed through the end of the prior business day. Gains and losses on securities sold are determined on the basis of identified cost and include proceeds received from litigation. Commissions paid to certain brokers with whom the investment adviser, or its affiliates, places trades on behalf of a fund include an amount in addition to trade execution, which may be rebated back to a fund. Any such rebates are included in net realized gain (loss) on investments in the Statement of Operations. Dividend income is recorded on the ex-dividend date, except for certain dividends from foreign securities where the ex-dividend date may have passed, which are recorded as soon as the Fund is informed of the ex-dividend date. Non-cash dividends included in dividend income, if any, are recorded at the fair market value of the securities received. Income and capital gain distributions from Fidelity Central Funds, if any, are recorded on the ex-dividend date. Interest income is accrued as earned and includes coupon interest and amortization of premium and accretion of discount on debt securities as applicable. Debt obligations may be placed on non-accrual status and related interest income may be reduced by ceasing current accruals and writing off interest receivables when the collection of all or a portion of interest has become doubtful based on consistently applied procedures. A debt obligation is removed from non-accrual status when the issuer resumes interest payments or when collectability of interest is reasonably assured.
Class Allocations and Expenses. Investment income, realized and unrealized capital gains and losses, common expenses of a fund, and certain fund-level expense reductions, if any, are allocated daily on a pro-rata basis to each class based on the relative net assets of each class to the total net assets of a fund. Each class differs with respect to transfer agent and distribution and service plan fees incurred, as applicable. Certain expense reductions may also differ by class, if applicable. For the reporting period, the allocated portion of income and expenses to each class as a percent of its average net assets may vary due to the timing of recording these transactions in relation to fluctuating net assets of the classes. Expenses directly attributable to a fund are charged to that fund. Expenses attributable to more than one fund are allocated among the respective funds on the basis of relative net assets or other appropriate methods. Expenses included in the accompanying financial statements reflect the expenses of that fund and do not include any expenses associated with any underlying mutual funds or exchange-traded funds (ETFs). Although not included in a fund's expenses, a fund indirectly bears its proportionate share of these expenses through the net asset value of each underlying mutual fund or exchange-traded fund (ETF). Expense estimates are accrued in the period to which they relate and adjustments are made when actual amounts are known.
Income Tax Information and Distributions to Shareholders. Each year, the Fund intends to qualify as a regulated investment company under Subchapter M of the Internal Revenue Code, including distributing substantially all of its taxable income and realized gains. As a result, no provision for U.S. Federal income taxes is required. As of December 31, 2024, the Fund did not have any unrecognized tax benefits in the financial statements; nor is the Fund aware of any tax positions for which it is reasonably possible that the total amounts of unrecognized tax benefits will significantly change in the next twelve months. The Fund files a U.S. federal tax return, in addition to state and local tax returns as required. The Fund's federal income tax returns are subject to examination by the Internal Revenue Service (IRS) for a period of three fiscal years after they are filed. State and local tax returns may be subject to examination for an additional fiscal year depending on the jurisdiction.
Distributions are declared and recorded on the ex-dividend date. Income and capital gain distributions are declared separately for each class. Income and capital gain distributions are determined in accordance with income tax regulations, which may differ from GAAP.
Capital accounts within the financial statements are adjusted for permanent book-tax differences. These adjustments have no impact on net assets or the results of operations. Capital accounts are not adjusted for temporary book-tax differences which will reverse in a subsequent period.
Book-tax differences are primarily due to futures contracts, short-term gain distributions from the underlying funds and losses deferred due to wash sales.
As of period end, the cost and unrealized appreciation (depreciation) in securities, and derivatives if applicable, for federal income tax purposes were as follows:
| Gross unrealized appreciation | $71,167,334 |
| Gross unrealized depreciation | (5,669,527) |
| Net unrealized appreciation (depreciation) | $65,497,807 |
| Tax Cost | $213,407,140 |
The tax-based components of distributable earnings as of period end were as follows:
| Undistributed ordinary income | $919,786 |
| Undistributed long-term capital gain | $8,894,819 |
| Net unrealized appreciation (depreciation) on securities and other investments | $65,497,807 |
The tax character of distributions paid was as follows:
| | December 31, 2024 | December 31, 2023 |
| Ordinary Income | $5,389,863 | $ 4,166,216 |
| Long-term Capital Gains | 2,465,355 | - |
| Total | $7,855,218 | $ 4,166,216 |
New Accounting Pronouncement. FASB Accounting Standards Update (ASU) 2023-07 Segment Reporting (Topic 280): Improvements to Reportable Segment Disclosures became effective in this reporting period. ASU 2023-07 enhances segment information disclosure in the notes to financial statements.
4. Derivative Instruments.
Risk Exposures and the Use of Derivative Instruments. The Fund's investment objectives allow for various types of derivative instruments, including futures contracts. Derivatives are investments whose value is primarily derived from underlying assets, indices or reference rates and may be transacted on an exchange or over-the-counter (OTC). Derivatives may involve a future commitment to buy or sell a specified asset based on specified terms, to exchange future cash flows at periodic intervals based on a notional principal amount, or for one party to make one or more payments upon the occurrence of specified events in exchange for periodic payments from the other party.
Derivatives were used to increase returns and to manage exposure to certain risks as defined below. The success of any strategy involving derivatives depends on analysis of numerous economic factors, and if the strategies for investment do not work as intended, the objectives may not be achieved.
Derivatives were used to increase or decrease exposure to the following risk(s):
| | |
| Equity Risk | Equity risk relates to the fluctuations in the value of financial instruments as a result of changes in market prices (other than those arising from interest rate risk or foreign exchange risk), whether caused by factors specific to an individual investment, its issuer, or all factors affecting all instruments traded in a market or market segment. |
| Interest Rate Risk | Interest rate risk relates to the fluctuations in the value of interest-bearing securities due to changes in the prevailing levels of market interest rates. |
Funds are also exposed to additional risks from investing in derivatives, such as liquidity risk and counterparty credit risk. Liquidity risk is the risk that a fund will be unable to close out the derivative in the open market in a timely manner. Counterparty credit risk is the risk that the counterparty will not be able to fulfill its obligation to a fund. Counterparty credit risk related to exchange-traded contracts may be mitigated by the protection provided by the exchange on which they trade.
Investing in derivatives may involve greater risks than investing in the underlying assets directly and, to varying degrees, may involve risk of loss in excess of any initial investment and collateral received and amounts recognized in the Statement of Assets and Liabilities. In addition, there may be the risk that the change in value of the derivative contract does not correspond to the change in value of the underlying instrument.
Net Realized Gain (Loss) and Change in Net Unrealized Appreciation (Depreciation) on Derivatives. The table below, which reflects the impacts of derivatives on the financial performance, summarizes the net realized gain (loss) and change in net unrealized appreciation (depreciation) for derivatives during the period as presented in the Statement of Operations.
| Primary Risk Exposure / Derivative Type | Net Realized Gain (Loss)($) | Change in Net Unrealized Appreciation (Depreciation)($) |
| VIP Asset Manager: Growth Portfolio | | |
| Equity Risk | | |
| Futures Contracts | (886,487) | 250,779 |
| Total Equity Risk | (886,487) | 250,779 |
| Interest Rate Risk | | |
| Futures Contracts | (125,387) | - |
| Total Interest Rate Risk | (125,387) | - |
| Totals | (1,011,874) | 250,779 |
If there are any open positions at period end, a summary of the value of derivatives by primary risk exposure is included at the end of the Schedule of Investments.
Futures Contracts. A futures contract is an agreement between two parties to buy or sell a specified underlying instrument for a fixed price at a specified future date. Futures contracts were used to manage exposure to the stock market, bond market and fluctuations in interest rates.
Upon entering into a futures contract, a fund is required to deposit either cash or securities (initial margin) with a clearing broker in an amount equal to a certain percentage of the face value of the contract. Futures contracts are marked-to-market daily and subsequent daily payments are made or received by a fund depending on the daily fluctuations in the value of the futures contracts and are recorded as unrealized appreciation or (depreciation). This receivable and/or payable, if any, is included in daily variation margin on futures contracts in the Statement of Assets and Liabilities. Realized gain or (loss) is recorded upon the expiration or closing of a futures contract. The net realized gain (loss) and change in net unrealized appreciation (depreciation) on futures contracts during the period is presented in the Statement of Operations.
Any open futures contracts at period end are presented in the Schedule of Investments under the caption "Futures Contracts". The notional amount at value reflects each contract's exposure to the underlying instrument or index at period end, and is representative of volume of activity during the period.
Any securities deposited to meet initial margin requirements are identified in the Schedule of Investments. Any cash deposited to meet initial margin requirements is presented as segregated cash with brokers for derivative instruments in the Statement of Assets and Liabilities.
5. Purchases and Sales of Investments.
Purchases and sales of securities, other than short-term securities, U.S. government securities and in-kind transactions, as applicable, are noted in the table below.
| | Purchases ($) | Sales ($) |
| VIP Asset Manager: Growth Portfolio | 72,354,018 | 55,235,886 |
6. Fees and Other Transactions with Affiliates.
Management Fee. Fidelity Management & Research Company LLC (the investment adviser) and its affiliates provide the Fund with investment management related services for which the Fund pays a monthly management fee.
Effective March 1, 2024, the Fund's management contract was amended to incorporate administrative services previously covered under separate services agreements (Transfer Agent and Accounting agreements). The amended contract incorporates a management fee rate that may vary by class. The investment adviser or an affiliate pays certain expenses of managing and operating the Fund out of each class's management fee. Each class of the Fund pays a management fee to the investment adviser. The management fee is calculated and paid to the investment adviser every month. When determining a class's management fee, a mandate rate is calculated based on the monthly average net assets of a group of funds advised by FMR within a designated asset class. A discount rate is subtracted from the mandate rate once the Fund's monthly average net assets reach a certain level. The mandate rate and discount rate may vary by class. The annual management fee rate for a class of shares of the Fund is the lesser of (1) the class's mandate rate reduced by the class's discount rate (if applicable) or (2) the amount set forth in the following table.
| | Maximum Management Fee Rate % |
| Initial Class | .59 |
| Service Class | .59 |
| Service Class 2 | .59 |
| Investor Class | .67 |
One-twelfth of the management fee rate for a class is applied to the average net assets of the class for the month, giving a dollar amount which is the management fee for the class for that month. A different management fee rate may be applicable to each class of the Fund. The difference between classes is the result of separate arrangements for class-level services and/or waivers of certain expenses. It is not the result of any difference in advisory or custodial fees or other expenses related to the management of the Fund's assets, which do not vary by class. For the portion of the reporting period on or after March 1, 2024, the total annualized management fee rates were as follows:
| | Total Management Fee Rate % |
| Initial Class | .59 |
| Service Class | .59 |
| Service Class 2 | .59 |
| Investor Class | .67 |
Prior to March 1, 2024, the management fee was the sum of an individual fund fee rate that was based on an annual rate of .30% of the Fund's average net assets and an annualized group fee rate that averaged .22% during the period. The group fee rate was based upon the monthly average net assets of a group of registered investment companies with which the investment adviser has management contracts. The group fee rate decreased as assets under management increased and increased as assets under management decreased. For the portion of the reporting period prior to March 1, 2024, the total annualized management fee rate was .52%.
Effective March 1, 2024, the Fund's sub-advisory agreements with FMR Investment Management (UK) Limited, Fidelity Management & Research (Hong Kong) Limited, and Fidelity Management & Research (Japan) Limited were amended to provide that the investment adviser pays each sub-adviser monthly fees equal to 110% of the sub-adviser's costs for providing sub-advisory services.
Distribution and Service Plan Fees. In accordance with Rule 12b-1 of the 1940 Act, the Fund has adopted separate 12b-1 Plans for each Service Class of shares. Each Service Class pays Fidelity Distributors Company LLC (FDC), an affiliate of the investment adviser, a service fee. For the period, the service fee is based on an annual rate of .10% of Service Class' average net assets and .25% of Service Class 2's average net assets.
For the period, total fees, all of which were re-allowed to insurance companies for the distribution of shares and providing shareholder support services, were as follows:
| Service Class | $3,809 |
| Service Class 2 | 58,163 |
| | $61,972 |
Transfer Agent Fees. Fidelity Investments Institutional Operations Company LLC (FIIOC), an affiliate of the investment adviser, is the Fund's transfer, dividend disbursing, and shareholder servicing agent. Effective March 1, 2024, the Fund's management contract was amended to incorporate transfer agent services and associated fees previously covered under a separate services agreement.
During the period January 1, 2024 through February 29, 2024, the transfer agent fees for each class were a fixed annual rate of class-level average net assets as follows:
| | Amount ($) | % of Class-Level Average Net Assets |
| Initial Class | 9,278 | .0630 |
| Service Class | 382 | .0630 |
| Service Class 2 | 1,651 | .0630 |
| Investor Class | 32,343 | .1390 |
| | 43,654 | |
Accounting Fees. Fidelity Service Company, Inc. (FSC), an affiliate of the investment adviser, maintains the Fund's accounting records. Effective March 1, 2024, the Fund's management contract was amended to incorporate accounting services and associated fees previously covered under a separate services agreement.
During the period January 1, 2024 through February 29, 2024, the accounting fees were a fixed annual rate of average net assets as follows:
| | % of Average Net Assets |
| VIP Asset Manager: Growth Portfolio | .0472 |
Interfund Trades. Funds may purchase from or sell securities to other Fidelity Funds under procedures adopted by the Board. The procedures have been designed to ensure these interfund trades are executed in accordance with Rule 17a-7 of the 1940 Act. Any interfund trades are included within the respective purchases and sales amounts shown in the Purchases and Sales of Investments note. Interfund trades during the period are noted in the table below.
| | Purchases ($) | Sales ($) | Realized Gain (Loss) ($) |
| VIP Asset Manager: Growth Portfolio | 67,200 | 7,464 | (105) |
7. Committed Line of Credit.
Certain Funds participate with other funds managed by the investment adviser or an affiliate in a $4.25 billion credit facility (the "line of credit") to be utilized for temporary or emergency purposes to fund shareholder redemptions or for other short-term liquidity purposes.
Commitment fees are charged based on the unused amount of the line of credit at an annual rate of .10%, and then allocated to each participating fund based on its pro-rata portion of the line of credit. The commitment fees are reflected in Miscellaneous expenses on the Statement of Operations, and are listed below.
Interest is charged to a participating fund based on its borrowings at an annual rate of .75% plus the highest of (i) daily SOFR plus a .10% spread adjustment, (ii) Federal Funds Effective Rate, or (iii) Overnight Bank Funding Rate. During the period, there were no borrowings on this line of credit.
The line of credit agreement will expire in March 2025 unless extended or renewed.
| | Amount ($) |
| VIP Asset Manager: Growth Portfolio | 404 |
8. Security Lending.
Funds lend portfolio securities from time to time in order to earn additional income. Lending agents are used, including National Financial Services (NFS), an affiliate of the investment adviser. Pursuant to a securities lending agreement, NFS will receive a fee, which is capped at 9.9% of a fund's daily lending revenue, for its services as lending agent. A fund may lend securities to certain qualified borrowers, including NFS. On the settlement date of the loan, a fund receives collateral (in the form of U.S. Treasury obligations, letters of credit and/or cash) against the loaned securities and maintains collateral in an amount not less than 100% of the market value of the loaned securities during the period of the loan. The market value of the loaned securities is determined at the close of business of a fund and any additional required collateral is delivered to a fund on the next business day. A fund or borrower may terminate the loan at any time, and if the borrower defaults on its obligation to return the securities loaned because of insolvency or other reasons, a fund may apply collateral received from the borrower against the obligation. A fund may experience delays and costs in recovering the securities loaned. Any cash collateral received is invested in the Fidelity Securities Lending Cash Central Fund. Any loaned securities are identified as such in the Schedule of Investments, and the value of loaned securities and cash collateral at period end, as applicable, are presented in the Statement of Assets and Liabilities. Security lending income represents the income earned on investing cash collateral, less rebates paid to borrowers and any lending agent fees associated with the loan, plus any premium payments received for lending certain types of securities. Security lending income is presented in the Statement of Operations as a component of income from Fidelity Central Funds. Affiliated security lending activity, if any, was as follows:
| | Total Security Lending Fees Paid to NFS ($) | Security Lending Income From Securities Loaned to NFS ($) | Value of Securities Loaned to NFS at Period End ($) |
| VIP Asset Manager: Growth Portfolio | 995 | - | - |
9. Expense Reductions.
Effective November 1, 2023, the investment adviser has contractually agreed to waive the Fund's management fee with respect to the portion of the Fund's assets invested in certain affiliated ETFs. This waiver cannot be removed or modified without the approval of the Board. During the period this waiver reduced the Fund's management fee as follows:
| | Waiver ($) |
| VIP Asset Manager: Growth Portfolio | 13,833 |
Through arrangements with the Fund's custodian, credits realized as a result of certain uninvested cash balances were used to reduce the Fund's expenses. During the period, custodian credits reduced the Fund's expenses by $788.
In addition, during the period the investment adviser or an affiliate reimbursed and/or waived a portion of fund-level operating expenses in the amount of $11,023.
10. Distributions to Shareholders.
Distributions to shareholders of each class were as follows:
| | Year ended December 31, 2024 | Year ended December 31, 2023 |
| VIP Asset Manager: Growth Portfolio | | |
| Distributions to shareholders | | |
| Initial Class | $2,629,832 | $1,523,262 |
| Service Class | 109,353 | 59,300 |
| Service Class 2 | 800,399 | 236,126 |
| Investor Class | 4,315,634 | 2,347,528 |
Total | $7,855,218 | $4,166,216 |
11. Share Transactions.
Transactions for each class of shares were as follows and may contain in-kind transactions:
| | Shares | Shares | Dollars | Dollars |
| | Year ended December 31, 2024 | Year ended December 31, 2023 | Year ended December 31, 2024 | Year ended December 31, 2023 |
| VIP Asset Manager: Growth Portfolio | | | | |
| Initial Class | | | | |
| Shares sold | 95,836 | 89,121 | $2,191,675 | $1,783,560 |
| Reinvestment of distributions | 116,591 | 71,296 | 2,629,832 | 1,523,262 |
| Shares redeemed | (470,593) | (602,856) | (10,653,970) | (12,111,528) |
| Net increase (decrease) | (258,166) | (442,439) | $(5,832,463) | $(8,804,706) |
| Service Class | | | | |
| Shares sold | 4,889 | 25,260 | $109,620 | $490,035 |
| Reinvestment of distributions | 4,900 | 2,803 | 109,353 | 59,300 |
| Shares redeemed | (12,120) | (12,879) | (275,109) | (253,691) |
| Net increase (decrease) | (2,331) | 15,184 | $(56,136) | $295,644 |
| Service Class 2 | | | | |
| Shares sold | 781,226 | 508,123 | $17,503,767 | $10,104,265 |
| Reinvestment of distributions | 35,960 | 11,243 | 800,399 | 236,126 |
| Shares redeemed | (70,165) | (30,785) | (1,587,900) | (612,138) |
| Net increase (decrease) | 747,021 | 488,581 | $16,716,266 | $9,728,253 |
| Investor Class | | | | |
| Shares sold | 604,083 | 493,977 | $13,613,428 | $10,045,580 |
| Reinvestment of distributions | 192,806 | 110,735 | 4,315,634 | 2,347,528 |
| Shares redeemed | (644,746) | (929,205) | (14,609,996) | (18,880,278) |
| Net increase (decrease) | 152,143 | (324,493) | $3,319,066 | $(6,487,170) |
12. Other.
A fund's organizational documents provide former and current trustees and officers with a limited indemnification against liabilities arising in connection with the performance of their duties to the fund. In the normal course of business, a fund may also enter into contracts that provide general indemnifications. A fund's maximum exposure under these arrangements is unknown as this would be dependent on future claims that may be made against a fund. The risk of material loss from such claims is considered remote.
At the end of the period, the investment adviser or its affiliates were owners of record of more than 10% of the outstanding shares as follows:
| Fund | Affiliated % |
| VIP Asset Manager: Growth Portfolio | 78% |
13. Risk and Uncertainties.
Many factors affect a fund's performance. Developments that disrupt global economies and financial markets, such as pandemics, epidemics, outbreaks of infectious diseases, war, terrorism, and environmental disasters, may significantly affect a fund's investment performance. The effects of these developments to a fund will be impacted by the types of securities in which a fund invests, the financial condition, industry, economic sector, and geographic location of an issuer, and a fund's level of investment in the securities of that issuer. Significant concentrations in security types, issuers, industries, sectors, and geographic locations may magnify the factors that affect a fund's performance.
Report of Independent Registered Public Accounting Firm
To the Board of Trustees of Variable Insurance Products Fund V and the Shareholders of VIP Asset Manager: Growth Portfolio:
Opinion on the Financial Statements and Financial Highlights
We have audited the accompanying statement of assets and liabilities of VIP Asset Manager: Growth Portfolio (the "Fund"), a fund of Variable Insurance Products Fund V, including the schedule of investments, as of December 31, 2024, the related statement of operations for the year then ended, the statement of changes in net assets for each of the two years in the period then ended, the financial highlights for each of the five years in the period then ended, and the related notes. In our opinion, the financial statements and financial highlights present fairly, in all material respects, the financial position of the Fund as of December 31, 2024, and the results of its operations for the year then ended, the changes in its net assets for each of the two years in the period then ended, and the financial highlights for each of the five years in the period then ended in conformity with accounting principles generally accepted in the United States of America.
Basis for Opinion
These financial statements and financial highlights are the responsibility of the Fund's management. Our responsibility is to express an opinion on the Fund's financial statements and financial highlights based on our audits. We are a public accounting firm registered with the Public Company Accounting Oversight Board (United States) (PCAOB) and are required to be independent with respect to the Fund in accordance with the U.S. federal securities laws and the applicable rules and regulations of the Securities and Exchange Commission and the PCAOB.
We conducted our audits in accordance with the standards of the PCAOB. Those standards require that we plan and perform the audit to obtain reasonable assurance about whether the financial statements and financial highlights are free of material misstatement, whether due to error or fraud. The Fund is not required to have, nor were we engaged to perform, an audit of its internal control over financial reporting. As part of our audits, we are required to obtain an understanding of internal control over financial reporting but not for the purpose of expressing an opinion on the effectiveness of the Fund's internal control over financial reporting. Accordingly, we express no such opinion.
Our audits included performing procedures to assess the risks of material misstatement of the financial statements and financial highlights, whether due to error or fraud, and performing procedures that respond to those risks. Such procedures included examining, on a test basis, evidence regarding the amounts and disclosures in the financial statements and financial highlights. Our audits also included evaluating the accounting principles used and significant estimates made by management, as well as evaluating the overall presentation of the financial statements and financial highlights. Our procedures included confirmation of securities owned as of December 31, 2024, by correspondence with the custodian and brokers; when replies were not received from brokers, we performed other auditing procedures. We believe that our audits provide a reasonable basis for our opinion.
/s/ Deloitte & Touche LLP
Boston, Massachusetts
February 14, 2025
We have served as the auditor of one or more of the Fidelity investment companies since 1999.
Distributions
(Unaudited)The dividend and capital gains distributions for the fund(s) are available on Fidelity.com or Institutional.Fidelity.com.
The fund hereby designates as a capital gain dividend with respect to the taxable year ended December 31, 2024, $8,900,952, or, if subsequently determined to be different, the net capital gain of such year.
A total of 7.67% of the dividends distributed during the fiscal year was derived from interest on U.S. Government securities which is generally exempt from state income tax.
The fund designates $2,165,211 of distributions paid during the fiscal year ended 2024 as qualifying to be taxed as section 163(j) interest dividends.
Initial Class designates 2%, and 20%; Service Class designates 2%, and 21%; Service Class 2 designates 2%, and 21%; and Investor Class designates 2%, and 21%; of the dividends distributed in February and December, respectively, during the fiscal year as qualifying for the dividends-received deduction for corporate shareholders.
The amounts per share which represent income derived from sources within, and taxes paid to, foreign countries or possessions of the United States are as follows:
| | Pay Date | Income | Taxes |
| VIP Asset Manager Growth Portfolio | | | |
| Initial Class | 12/30/2024 | $0.1368 | $0.0198 |
| Service Class | 12/30/2024 | $0.1307 | $0.0198 |
| Service Class 2 | 12/30/2024 | $0.1341 | $0.0198 |
| Investor Class | 12/30/2024 | $0.1324 | $0.0198 |
.
Item 8: Changes in and Disagreements with Accountants for Open-End Management Investment Companies
(Unaudited)
Note: This is not applicable for any fund included in this document.
Item 9: Proxy Disclosures for Open-End Management Investment Companies
(Unaudited)
Note: This is not applicable for any fund included in this document.
Item 10: Remuneration Paid to Directors, Officers, and others of Open-End Management Investment Companies
(Unaudited)
Note: This information is disclosed as part of the financial statements for each Fund as part of Item 7: Financial Statements and Financial Highlights for Open-End Management Investment companies.
Item 11: Statement Regarding Basis for Approval of Investment Advisory Contract
(Unaudited)
Board Approval of Investment Advisory Contracts and Management Fees
VIP Asset Manager: Growth Portfolio
Each year, the Board of Trustees, including the Independent Trustees (together, the Board), considers the renewal of the fund's management contract with Fidelity Management & Research Company LLC (FMR) and the sub-advisory agreements (together, the Advisory Contracts) for the fund. FMR and the sub-advisers are referred to herein as the Investment Advisers. The Board, assisted by the advice of fund counsel and Independent Trustees' counsel, requests and considers a broad range of information relevant to the renewal of the Advisory Contracts throughout the year.
The Board meets regularly and, at each of its meetings, covers an extensive agenda of topics and materials and considers factors that are relevant to its annual consideration of the renewal of the fund's Advisory Contracts, including the services and support provided to the fund and its shareholders. The Board's Operations Committee, of which all the Independent Trustees are members, meets regularly throughout the year and requests, receives and considers, among other matters, information related to the annual consideration of the renewal of the fund's Advisory Contracts before making its recommendation to the Board. The Board also meets as needed to review matters specifically related to the Board's annual consideration of the renewal of the Advisory Contracts. Members of the Board may also meet from time to time with trustees of other Fidelity funds through joint ad hoc committees to discuss certain matters relevant to all of the Fidelity funds.
At its September 2024 meeting, the Board unanimously determined to renew the fund's Advisory Contracts. In reaching its determination, the Board considered all factors it believed relevant, including (i) the nature, extent, and quality of the services provided to the fund and its shareholders (including the investment performance of the fund); (ii) the competitiveness relative to peer funds of the fund's management fee and the total expense ratio of a representative class (Investor Class, which was selected because it was the largest class without 12b-1 fees); (iii) the total costs of the services provided by and the profits realized by FMR and its affiliates (Fidelity) from its relationships with the fund; and (iv) the extent to which, if any, economies of scale exist and are realized as the fund grows, and whether any economies of scale are appropriately shared with fund shareholders. The Board also considered the broad range of investment choices available to shareholders from FMR's competitors and that the fund's shareholders have chosen to invest in the fund, which is part of the Fidelity family of funds. The Board's decision to renew the Advisory Contracts was not based on any single factor and the factors may have been weighed differently by different Trustees.
The Board reached a determination, with the assistance of fund counsel and Independent Trustees' counsel and through the exercise of its business judgment, that the renewal of the Advisory Contracts was in the best interests of the fund and its shareholders and that the compensation payable under the Advisory Contracts was fair and reasonable in light of all of the surrounding circumstances.
Nature, Extent, and Quality of Services Provided. The Board considered Fidelity's staffing as it relates to the fund, including the backgrounds and experience of investment personnel, and also considered the Investment Advisers' implementation of the fund's investment program. The Independent Trustees also had discussions with senior management of Fidelity's investment operations and investment groups. The Board considered the structure of the investment personnel compensation program and whether this structure provides appropriate incentives to act in the best interests of the fund. Additionally, the Board considered the portfolio managers' investments, if any, in the funds that they manage.
Resources Dedicated to Investment Management and Support Services. The Board reviewed the general qualifications and capabilities of Fidelity's investment staff, including its size, education, experience, and resources, as well as Fidelity's approach to recruiting, training, managing, and compensating investment personnel. The Board noted the resources devoted to Fidelity's global investment organization, and that Fidelity's analysts have extensive resources, tools and capabilities that allow them to conduct quantitative and fundamental analysis, as well as credit analysis of issuers, counterparties and guarantors. Further, the Board considered that Fidelity's investment professionals have sufficient access to global information and data so as to provide competitive investment results over time, and that those professionals also have access to sophisticated tools that permit them to assess portfolio construction and risk and performance attribution characteristics continuously, as well as to transmit new information and research conclusions rapidly around the world. Additionally, in its deliberations, the Board considered Fidelity's trading, risk management, compliance, cybersecurity, and technology and operations capabilities and resources, which are integral parts of the investment management process.
Shareholder and Administrative Services. The Board considered (i) the nature, extent, quality, and cost of advisory, administrative, shareholder, transfer agency, and pricing and bookkeeping services performed by the Investment Advisers and their affiliates under the Advisory Contracts; (ii) the nature and extent of Fidelity's supervision of third party service providers, principally custodians, subcustodians, and pricing vendors; and (iii) the resources devoted by Fidelity to, and the record of compliance with, the fund's compliance policies and procedures, including with respect to liquidity risk management. The Board also reviewed the allocation of fund brokerage, including allocations to brokers affiliated with the Investment Advisers, the use of brokerage commissions to pay fund expenses, and the use of "soft" commission dollars to pay for research services. The Board also considered the fund's securities lending activities and any payments made to Fidelity relating to securities lending under a separate agreement.
The Board noted that the growth of fund assets over time across the complex allows Fidelity to reinvest in the development of services designed to enhance the value and convenience of the Fidelity funds as investment vehicles. These services include 24-hour access to account information and market information over the Internet and through telephone representatives, investor education materials and asset allocation tools. The Board also considered that it reviews customer service metrics such as telephone response times, continuity of services on the website and metrics addressing services at Fidelity Investor Centers.
Investment in a Large Fund Family. The Board considered the benefits to shareholders of investing in a fund that is part of a large family of funds offering a variety of investment disciplines and providing a large variety of fund investor services. The Board noted that Fidelity had taken, or had made recommendations to the Board that resulted in the Fidelity funds taking, a number of actions over the previous year that benefited particular funds and/or the Fidelity funds in general.
Investment Performance. The Board took into account discussions that occur with representatives of the Investment Advisers, and reports that it receives, at Board meetings throughout the year relating to fund investment performance. In this regard the Board noted that as part of regularly scheduled fund reviews and other reports to the Board on fund performance, the Board considered annualized return information for the fund for different time periods, measured against one or more appropriate securities market indices, including a customized blended index that reflects the respective weights of the fund's asset classes (each a benchmark index) and an appropriate peer group of funds with similar objectives (peer group). The Board also considered information about performance attribution. In its evaluation of fund investment performance at meetings throughout the year, the Board gave particular attention to information indicating underperformance of certain Fidelity funds over different time periods and discussed with the Investment Advisers the reasons for such underperformance. The fund underperformed its benchmark and peers for the one- and three-year periods ended May 31, 2024, and as a result, the Board continues to engage in discussions with FMR regarding the steps it is taking to address the fund's performance.
In addition to reviewing absolute and relative fund performance, the Independent Trustees periodically consider the appropriateness of fund performance metrics in evaluating the results achieved. The Independent Trustees generally give greater weight to fund performance over longer time periods than over shorter time periods. Depending on the circumstances, the Independent Trustees may be satisfied with a fund's performance notwithstanding that it lags its benchmark index or peer group for certain periods.
Based on its review, the Board concluded that the nature, extent, and quality of services provided to the fund under the Advisory Contracts should continue to benefit the shareholders of the fund.
Competitiveness of Management Fee and Total Expense Ratio. The Board was provided with information regarding industry trends in management fees and expenses. The Board considered that, effective March 1, 2024, an amended Advisory Contract with FMR went into effect with class-level management fees based on tiered schedules and subject to a maximum class-level rate (the management fee). The Board also considered that in exchange for the variable management fee, each class of the fund receives investment advisory, management, administrative, transfer agent, and pricing and bookkeeping services. In its review of the management fee and total expense ratio of Investor Class, the Board considered a pro forma management fee rate for Investor Class as if the new management fee structure had been in effect for the 12-month period ended December 31, 2023, as well as other third-party fund expenses, as applicable, such as custodial, legal, and audit fees and any fund-paid 12b-1 fees. The Board noted that Fidelity may agree to waive fees or reimburse expenses from time to time, and the extent to which, if any, it has done so for the fund.
Comparisons of Management Fees and Total Expense Ratios. Among other things, the Board reviewed data for selected groups of competitive funds and classes (referred to as "mapped groups") that were compiled by Fidelity based on combining similar investment objective categories (as classified by Morningstar) that have comparable investment mandates. The data reviewed by the Board included (i) gross management fee comparisons (before taking into account expense reimbursements or caps) relative to the total universe of funds within the mapped group; (ii) gross management fee comparisons relative to a subset of non-Fidelity funds in the mapped group that are similar in size and management fee structure to the fund (referred to as the "asset size peer group"); (iii) total expense comparisons of Investor Class of the fund relative to funds and classes in the mapped group that have a similar sales load structure to Investor Class of the fund (referred to as the "similar sales load structure group"); and (iv) total expense comparisons of Investor Class of the fund relative to funds and classes in the similar sales load structure group that are similar in size and management fee structure to the fund (referred to as the "total expense asset size peer group"). The total expense asset size peer group comparison excludes performance adjustments and fund-paid 12b-1 fees to eliminate variability in fee structures.
The information provided to the Board indicated that the fund's management fee rate ranked below the competitive median of the mapped group for 2023 and below the competitive median of the asset size peer group for 2023. Further, the information provided to the Board indicated that the total expense ratio of Investor Class of the fund ranked below the competitive median of the similar sales load structure group for 2023 and above the competitive median of the total expense asset size peer group for 2023. The Board noted that when servicing is provided at the annuity level it is not reflected in the total expense ratio of that class, which means that Investor Class shares are less comparable to competitors that have this type of structure.
The Board noted that a different variable management fee rate is applicable to each class of the fund. The Board considered that the difference in management fee rates between classes is the result of separate arrangements for class-level services and/or waivers of certain expenses and not the result of any difference in advisory or custodial fees or other expenses related to the management of the fund's assets, which do not vary by class.
Fees Charged to Other Fidelity Clients. The Board also considered Fidelity fee structures and other information with respect to clients of Fidelity, such as other funds advised or subadvised by Fidelity, pension plan clients, and other institutional clients with similar mandates. The Board noted that a joint ad hoc committee created by it and the boards of other Fidelity funds periodically reviews and compares Fidelity's institutional investment advisory business with its business of providing services to the Fidelity funds and also noted the most recent findings of the committee. The Board noted that the committee's review included a consideration of the differences in services provided, fees charged, and costs incurred, as well as competition in the markets serving the different categories of clients.
Based on its review, the Board concluded that the fund's management fee is fair and reasonable in light of the services that the fund receives and the other factors considered. Further, based on its review of total expense ratios and fees charged to other Fidelity clients, the Board concluded that the total expense ratio of each class of the fund was reasonable in light of the services that the fund and its shareholders receive and the other factors considered.
Costs of the Services and Profitability. The Board considered the revenues earned and the expenses incurred by Fidelity in conducting the business of developing, marketing, distributing, managing, administering and servicing the fund and servicing the fund's shareholders. The Board also considered the level of Fidelity's profits in respect of all the Fidelity funds.
On an annual basis, Fidelity presents to the Board information about the profitability of its relationships with the fund. Fidelity calculates profitability information for each Fidelity fund, as well as aggregate profitability information for groups of Fidelity funds and all Fidelity funds, using a series of detailed revenue and cost allocation methodologies which originate with the books and records of Fidelity on which Fidelity's audited financial statements are based. The Audit Committee of the Board reviews any significant changes from the prior year's methodologies.
A public accounting firm has been engaged annually by the Board as part of the Board's assessment of Fidelity's profitability analysis. The engagement includes the review and assessment of the methodologies used by Fidelity in determining the revenues and expenses attributable to Fidelity's fund business. After considering the reports issued under the engagement and information provided by Fidelity, the Board concluded that while other allocation methods may also be reasonable, Fidelity's profitability methodologies are reasonable in all material respects.
The Board also reviewed Fidelity's non-fund businesses and potential indirect benefits such businesses may have received as a result of their association with Fidelity's fund business (i.e., fall-out benefits) as well as cases where Fidelity's affiliates may benefit from the funds' business. The Board considered areas where potential indirect benefits to the Fidelity funds from their relationships with Fidelity may exist. The Board's consideration of these matters was informed by the findings of a joint ad hoc committee created by it and the boards of other Fidelity funds to evaluate potential fall-out benefits.
The Board considered the costs of the services provided by and the profits realized by Fidelity in connection with the operation of the fund and was satisfied that the profitability was not excessive.
Economies of Scale. The Board considered whether there have been economies of scale in respect of the management of the Fidelity funds, whether the Fidelity funds (including the fund) have appropriately benefited from any such economies of scale, and whether there is potential for realization of any further economies of scale. The Board considered the extent to which the fund will benefit from economies of scale as assets grow through increased services to the fund, through waivers or reimbursements, or through fee or expense ratio reductions. The Board also noted that a committee created by it and the boards of other Fidelity funds periodically analyzes whether Fidelity attains economies of scale in respect of the management and servicing of the Fidelity funds, whether the Fidelity funds have appropriately benefited from such economies of scale, and whether there is potential for realization of any further economies of scale.
The Board recognized that the fund's management contract incorporates a variable management fee structure, which provides breakpoints as a way to share, in part, any potential economies of scale that may exist at the asset class level determined based on the total net assets of specified Fidelity funds in the same asset class as the fund and through a discount determined based on both fund size and total assets of a broader group of specified Fidelity funds. The Board considered that the variable management fee is designed to deliver the benefits of economies of scale to fund shareholders even if assets of any particular fund are unchanged or have declined, because some portion of Fidelity's costs are attributable to services provided to all funds subject to the variable management fee, and all such funds benefit if those costs can be allocated among more assets. The Board concluded that, given the variable management fee structure, fund shareholders will benefit from lower management fees due to the application of the breakpoints and discount, regardless of whether Fidelity achieves any such economies of scale.
The Board concluded, taking into account the analysis of the committee, that economies of scale, if any, are being appropriately shared between fund shareholders and Fidelity.
Additional Information Requested by the Board. In order to develop fully the factual basis for consideration of the Fidelity funds' advisory contracts, the Board requested and received additional information on certain topics, including: (i) portfolio manager changes that have occurred during the past year; (ii) hiring, training, compensating, and retaining adviser and sub-adviser personnel; (iii) the terms of the funds' various management fee structures and arrangements for transfer agent and pricing and bookkeeping services; (iv) Fidelity's fund profitability methodology, profitability trends for certain funds, the allocation of various costs to different funds, and the impact of certain factors on fund profitability results; (v) the impact on fund profitability of recent industry trends, such as the growth in passively managed funds and the changes in flows for different types of funds; (vi) the types of management fee and total expense comparisons provided, and the challenges and limitations associated with such information; (vii) explanations regarding the relative total expense ratios and management fees of certain funds and classes, total expense and management fee competitive trends, and methodologies for total expense and management fee competitive comparisons; (viii) matters related to money market funds, exchange-traded funds, and target date funds; (ix) the arrangements with and compensation paid to certain fund sub-advisers and the treatment of such compensation within Fidelity's fund profitability methodology; and (x) the terms of management contracts between Fidelity and other funds and products not overseen by the Board.
Conclusion. Based on its evaluation of all of the conclusions noted above, and after considering all factors it believed relevant, the Board, including the Independent Trustees, concluded that the advisory and sub-advisory fee arrangements are fair and reasonable in light of all of the surrounding circumstances and that the fund's Advisory Contracts should be renewed through September 30, 2025.
1.540207.127
VIPAMG-ANN-0325
Item 8.
Changes in and Disagreements with Accountants for Open-End Management Investment Companies
See Item 7.
Item 9.
Proxy Disclosures for Open-End Management Investment Companies
See Item 7.
Item 10.
Remuneration Paid to Directors, Officers, and Others of Open-End Management Investment Companies
See Item 7.
Item 11.
Statement Regarding Basis for Approval of Investment Advisory Contract
See Item 7.
Item 12.
Disclosure of Proxy Voting Policies and Procedures for Closed-End Management Investment Companies
Not applicable.
Item 13.
Portfolio Managers of Closed-End Management Investment Companies
Not applicable.
Item 14.
Purchase of Equity Securities by Closed-End Management Investment Company and Affiliated Purchasers
Not applicable.
Item 15.
Submission of Matters to a Vote of Security Holders
There were no material changes to the procedures by which shareholders may recommend nominees to the trust’s Board of Trustees.
Item 16.
Controls and Procedures
(a)(i) The President and Treasurer and the Chief Financial Officer have concluded that the trust’s disclosure controls and procedures (as defined in Rule 30a-3(c) under the Investment Company Act) provide reasonable assurances that material information relating to the trust is made known to them by the appropriate persons, based on their evaluation of these controls and procedures as of a date within 90 days of the filing date of this report.
(a)(ii) There was no change in the trust’s internal control over financial reporting (as defined in Rule 30a-3(d) under the Investment Company Act) that occurred during the period covered by this report that has materially affected, or is reasonably likely to materially affect, the trust’s internal control over financial reporting.
Item 17.
Disclosure of Securities Lending Activities for Closed-End Management Investment Companies
Not applicable.
Item 18.
Recovery of Erroneously Awarded Compensation
(a)
Not applicable.
(b)
Not applicable.
Item 19.
Exhibits
SIGNATURES
Pursuant to the requirements of the Securities Exchange Act of 1934 and the Investment Company Act of 1940, the registrant has duly caused this report to be signed on its behalf by the undersigned, thereunto duly authorized.
Variable Insurance Products Fund V
|
By: | /s/Laura M. Del Prato |
| Laura M. Del Prato |
| President and Treasurer (Principal Executive Officer) |
|
|
Date: | February 21, 2025 |
Pursuant to the requirements of the Securities Exchange Act of 1934 and the Investment Company Act of 1940, this report has been signed below by the following persons on behalf of the registrant and in the capacities and on the dates indicated.
|
By: | /s/Laura M. Del Prato |
| Laura M. Del Prato |
| President and Treasurer (Principal Executive Officer) |
|
|
Date: | February 21, 2025 |
|
By: | /s/Stephanie Caron |
| Stephanie Caron |
| Chief Financial Officer (Principal Financial Officer) |
|
|
Date: | February 21, 2025 |