UNITED STATES
SECURITIES AND EXCHANGE COMMISSION
Washington, D.C. 20549
FORM N-CSR
CERTIFIED SHAREHOLDER REPORT OF REGISTERED
MANAGEMENT INVESTMENT COMPANIES
Investment Company Act file number 811-05361
Variable Insurance Products Fund V
(Exact name of registrant as specified in charter)
245 Summer St., Boston, Massachusetts 02210
(Address of principal executive offices) (Zip code)
Marc Bryant, Secretary
245 Summer St.
Boston, Massachusetts 02210
(Name and address of agent for service)
Registrant's telephone number, including area code:
617-563-7000
| |
Date of fiscal year end: | December 31 |
| |
Date of reporting period: | December 31, 2015 |
This report on Form N-CSR relates solely to the Registrant’s VIP Asset Manager Portfolio, VIP Asset Manager: Growth Portfolio, VIP Freedom 2005 Portfolio, VIP Freedom 2010 Portfolio, VIP Freedom 2015 Portfolio, VIP Freedom 2020 Portfolio, VIP Freedom 2025 Portfolio, VIP Freedom 2030 Portfolio, VIP Freedom 2035 Portfolio, VIP Freedom 2040 Portfolio, VIP Freedom 2045 Portfolio, VIP Freedom 2050 Portfolio, VIP Freedom Income Portfolio, VIP Freedom Lifetime Income I Portfolio, VIP Freedom Lifetime Income II Portfolio, VIP Freedom Lifetime Income III Portfolio, VIP FundsManager 20% Portfolio, VIP FundsManager 50% Portfolio, VIP FundsManager 60%, VIP FundsManager 70% Portfolio, VIP FundsManager 85% Portfolio, VIP Investment Grade Bond Portfolio, VIP Investor Freedom 2005 Portfolio, VIP Investor Freedom 2010 Portfolio, VIP Investor Freedom 2015 Portfolio, VIP Investor Freedom 2020 Portfolio, VIP Investor Freedom 2025 Portfolio, VIP Investor Freedom 2030 Portfolio, VIP Investor Freedom Income Portfolio, VIP Strategic Income Portfolio and VIP Target Volatility Portfolio series (each, a “Fund” and collectively, the “Funds”).
Item 1.
Reports to Stockholders
Fidelity® Variable Insurance Products:
FundsManager - 20%, 50%, 60%, 70%, 85% Portfolio
Annual Report December 31, 2015 |
 |
Contents
To view a fund's proxy voting guidelines and proxy voting record for the 12-month period ended June 30, visit http://www.fidelity.com/proxyvotingresults or visit the Securities and Exchange Commission's (SEC) web site at http://www.sec.gov.
You may also call 1-877-208-0098 to request a free copy of the proxy voting guidelines.
Fidelity® Variable Insurance Products are separate account options which are purchased through a variable insurance contract.
Standard & Poor's, S&P and S&P 500 are registered service marks of The McGraw-Hill Companies, Inc. and have been licensed for use by Fidelity Distributors Corporation.
Other third-party marks appearing herein are the property of their respective owners.
All other marks appearing herein are registered or unregistered trademarks or service marks of FMR LLC or an affiliated company. © 2016 FMR LLC. All rights reserved.
This report and the financial statements contained herein are submitted for the general information of the shareholders of the Funds. This report is not authorized for distribution to prospective investors in the Funds unless preceded or accompanied by an effective prospectus.
A fund files its complete schedule of portfolio holdings with the SEC for the first and third quarters of each fiscal year on Form N-Q. Forms N-Q are available on the SEC’s web site at http://www.sec.gov. A fund's Forms N-Q may be reviewed and copied at the SEC’s Public Reference Room in Washington, DC. Information regarding the operation of the SEC's Public Reference Room may be obtained by calling 1-800-SEC-0330.
For a complete list of a fund's portfolio holdings, view the most recent holdings listing, semiannual report, or annual report on Fidelity's web site at http://www.fidelity.com, http://www.advisor.fidelity.com, or http://www.401k.com, as applicable.
NOT FDIC INSURED •MAY LOSE VALUE •NO BANK GUARANTEE
Neither the Funds nor Fidelity Distributors Corporation is a bank.
VIP FundsManager® 20% Portfolio
Performance: The Bottom Line
Average annual total return reflects the change in the value of an investment, assuming reinvestment of distributions from dividend income and capital gains (the profits earned upon the sale of securities that have grown in value, if any) and assuming a constant rate of performance each year. During periods of reimbursement by Fidelity, a fund’s total return will be greater than it would be had the reimbursement not occurred. Performance numbers are net of all underlying fund operating expenses, but do not include any insurance charges imposed by your insurance company’s separate account. If performance information included the effect of these additional charges, the total returns would have been lower. How a fund did yesterday is no guarantee of how it will do tomorrow.
Average Annual Total Returns
| For the periods ended December 31, 2015 | Past 1 year | Past 5 years | Life of FundA |
| Service Class | (0.03)% | 3.52% | 3.85% |
| Service Class 2 | (0.17)% | 3.36% | 3.69% |
| Investor Class | (0.03)% | 3.50% | 3.84% |
A From April 13, 2006
$10,000 Over Life of Fund
Let's say hypothetically that $10,000 was invested in VIP FundsManager® 20% Portfolio - Investor Class on April 13, 2006, when the fund started.
The chart shows how the value of your investment would have changed, and also shows how the Barclays® U.S. Aggregate Bond Index performed over the same period.
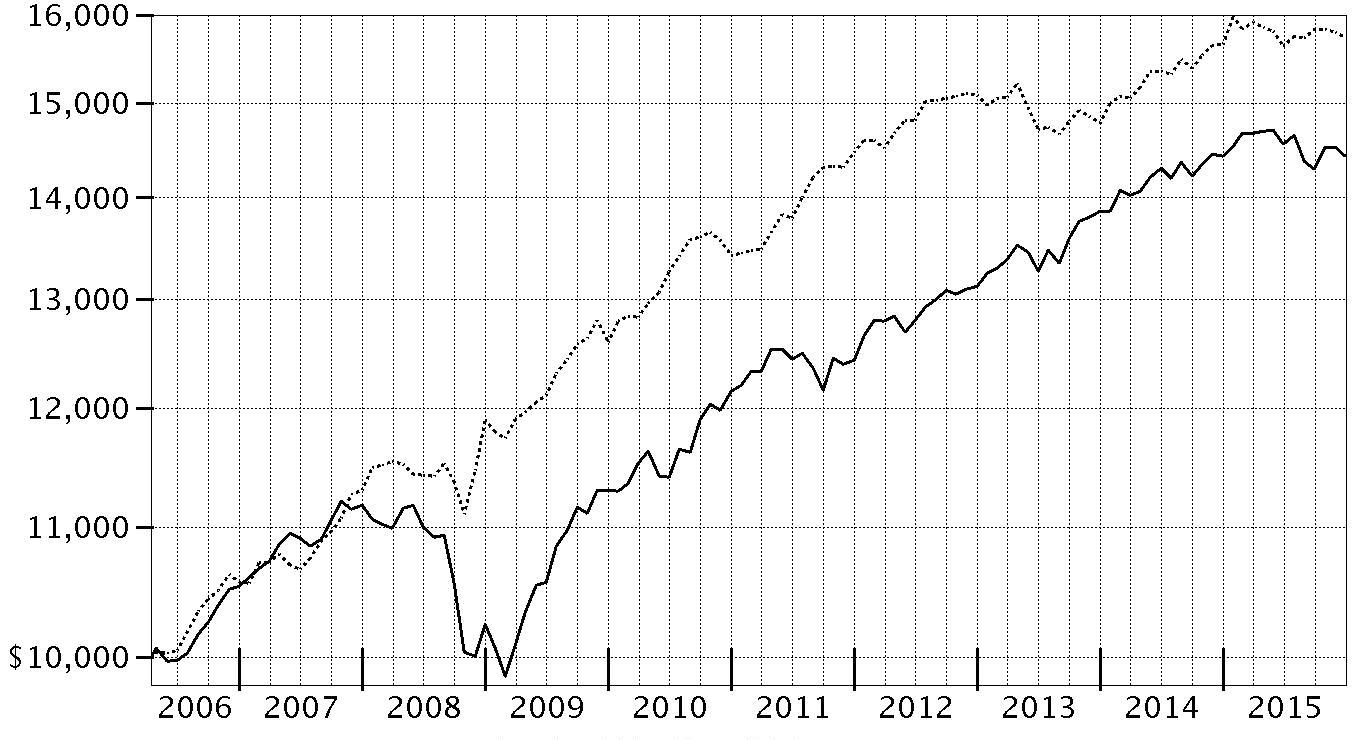
| Period Ending Values |
| $14,428 | VIP FundsManager® 20% Portfolio - Investor Class |
| $15,746 | Barclays® U.S. Aggregate Bond Index |
VIP FundsManager® 50% Portfolio
Performance: The Bottom Line
Average annual total return reflects the change in the value of an investment, assuming reinvestment of distributions from dividend income and capital gains (the profits earned upon the sale of securities that have grown in value, if any) and assuming a constant rate of performance each year. During periods of reimbursement by Fidelity, a fund’s total return will be greater than it would be had the reimbursement not occurred. Performance numbers are net of all underlying fund operating expenses, but do not include any insurance charges imposed by your insurance company’s separate account. If performance information included the effect of these additional charges, the total returns would have been lower. How a fund did yesterday is no guarantee of how it will do tomorrow.
Average Annual Total Returns
| For the periods ended December 31, 2015 | Past 1 year | Past 5 years | Life of FundA |
| Service Class | 0.06% | 5.81% | 4.74% |
| Service Class 2 | (0.02)% | 5.65% | 4.59% |
| Investor Class | 0.14% | 5.81% | 4.74% |
A From April 13, 2006
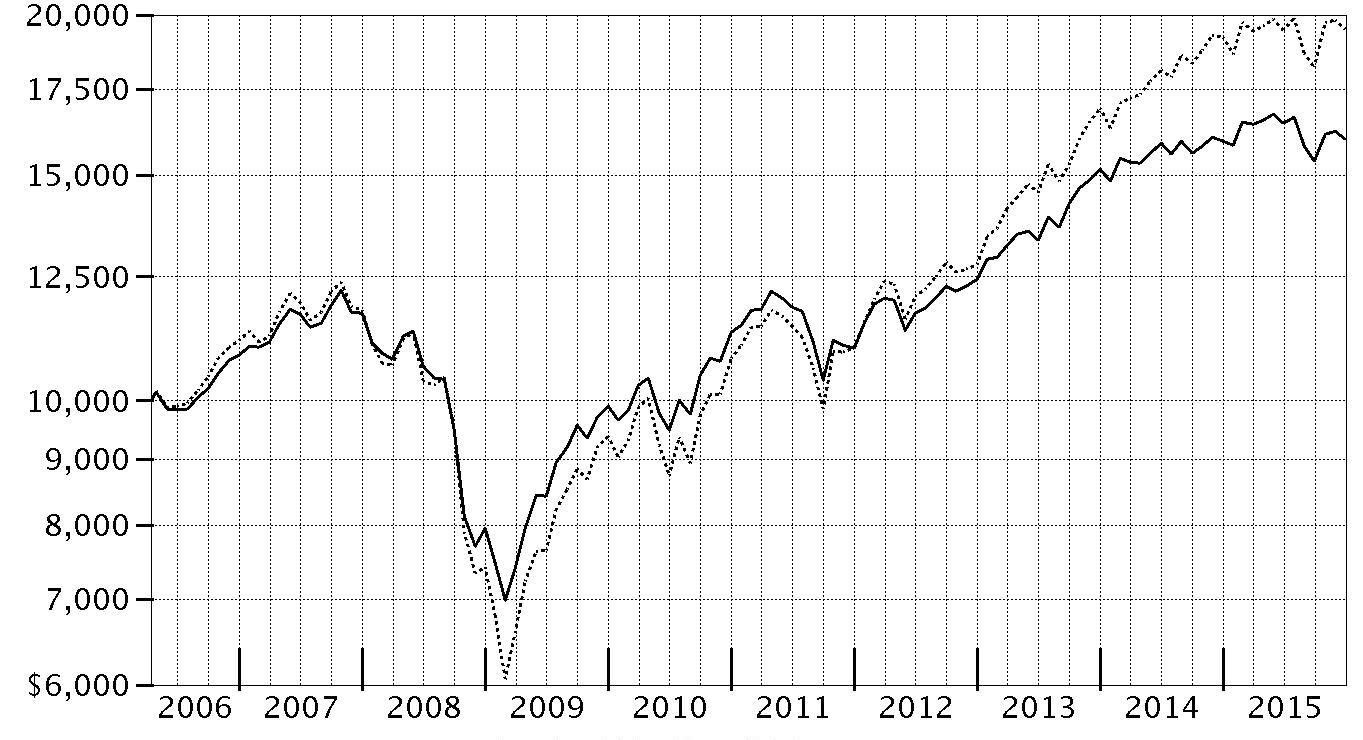
$10,000 Over Life of Fund
Let's say hypothetically that $10,000 was invested in VIP FundsManager® 50% Portfolio - Investor Class on April 13, 2006, when the fund started.
The chart shows how the value of your investment would have changed, and also shows how the S&P 500® Index performed over the same period.

| Period Ending Values |
| $15,693 | VIP FundsManager® 50% Portfolio - Investor Class |
| $19,498 | S&P 500® Index |
VIP FundsManager® 60% Portfolio
Performance: The Bottom Line
Average annual total return reflects the change in the value of an investment, assuming reinvestment of distributions from dividend income and capital gains (the profits earned upon the sale of securities that have grown in value, if any) and assuming a constant rate of performance each year. During periods of reimbursement by Fidelity, a fund’s total return will be greater than it would be had the reimbursement not occurred. Performance numbers are net of all underlying fund operating expenses, but do not include any insurance charges imposed by your insurance company’s separate account. If performance information included the effect of these additional charges, the total returns would have been lower. How a fund did yesterday is no guarantee of how it will do tomorrow.
Average Annual Total Returns
| For the periods ended December 31, 2015 | Past 1 year | Past 5 years | Life of FundA |
| Service Class | 0.41% | 6.54% | 4.56% |
| Service Class 2 | 0.27% | 6.38% | 4.41% |
| Investor Class | 0.41% | 6.54% | 4.56% |
A From August 22, 2007
$10,000 Over Life of Fund
Let's say hypothetically that $10,000 was invested in VIP FundsManager® 60% Portfolio - Investor Class on August 22, 2007, when the fund started.
The chart shows how the value of your investment would have changed, and also shows how the S&P 500® Index performed over the same period.
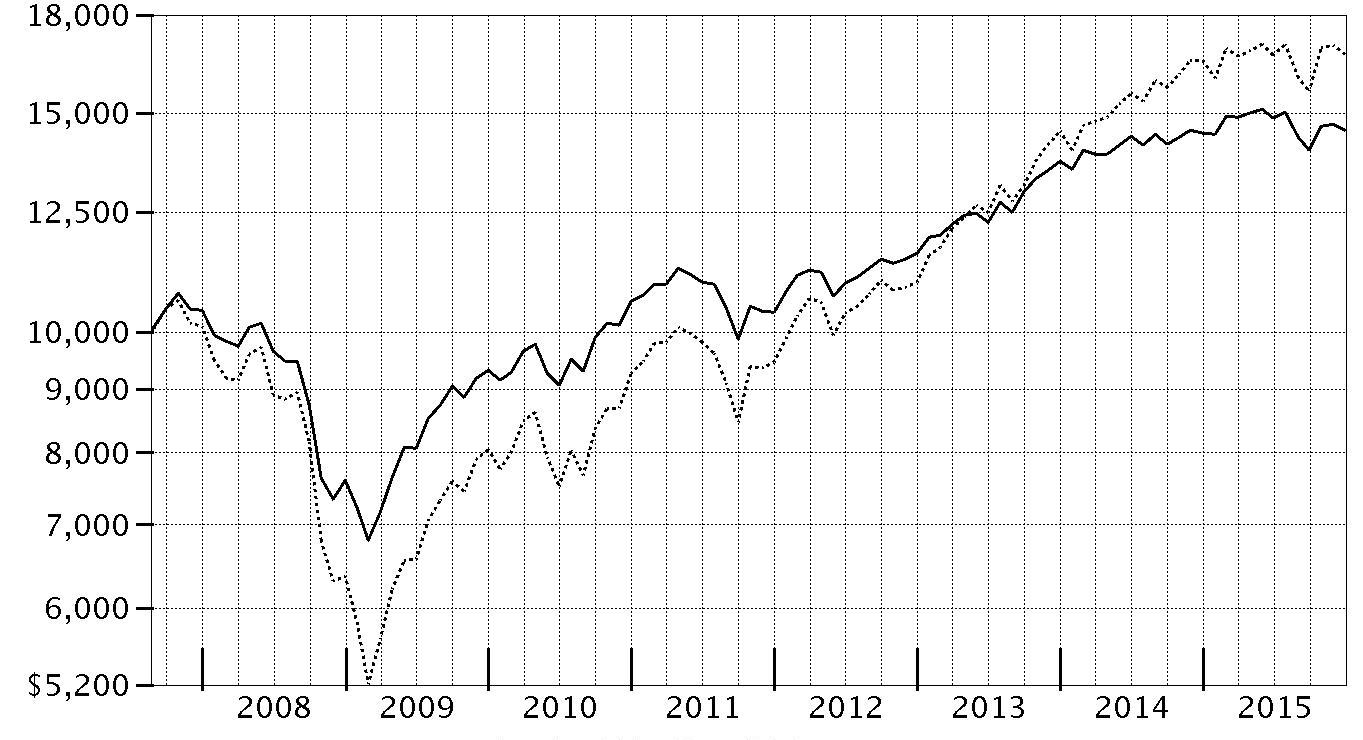
| Period Ending Values |
| $14,525 | VIP FundsManager® 60% Portfolio - Investor Class |
| $16,739 | S&P 500® Index |
VIP FundsManager® 70% Portfolio
Performance: The Bottom Line
Average annual total return reflects the change in the value of an investment, assuming reinvestment of distributions from dividend income and capital gains (the profits earned upon the sale of securities that have grown in value, if any) and assuming a constant rate of performance each year. During periods of reimbursement by Fidelity, a fund’s total return will be greater than it would be had the reimbursement not occurred. Performance numbers are net of all underlying fund operating expenses, but do not include any insurance charges imposed by your insurance company’s separate account. If performance information included the effect of these additional charges, the total returns would have been lower. How a fund did yesterday is no guarantee of how it will do tomorrow.
Average Annual Total Returns
| For the periods ended December 31, 2015 | Past 1 year | Past 5 years | Life of FundA |
| Service Class | 0.41% | 7.18% | 4.96% |
| Service Class 2 | 0.29% | 7.03% | 4.80% |
| Investor Class | 0.49% | 7.18% | 4.96% |
A From April 13, 2006
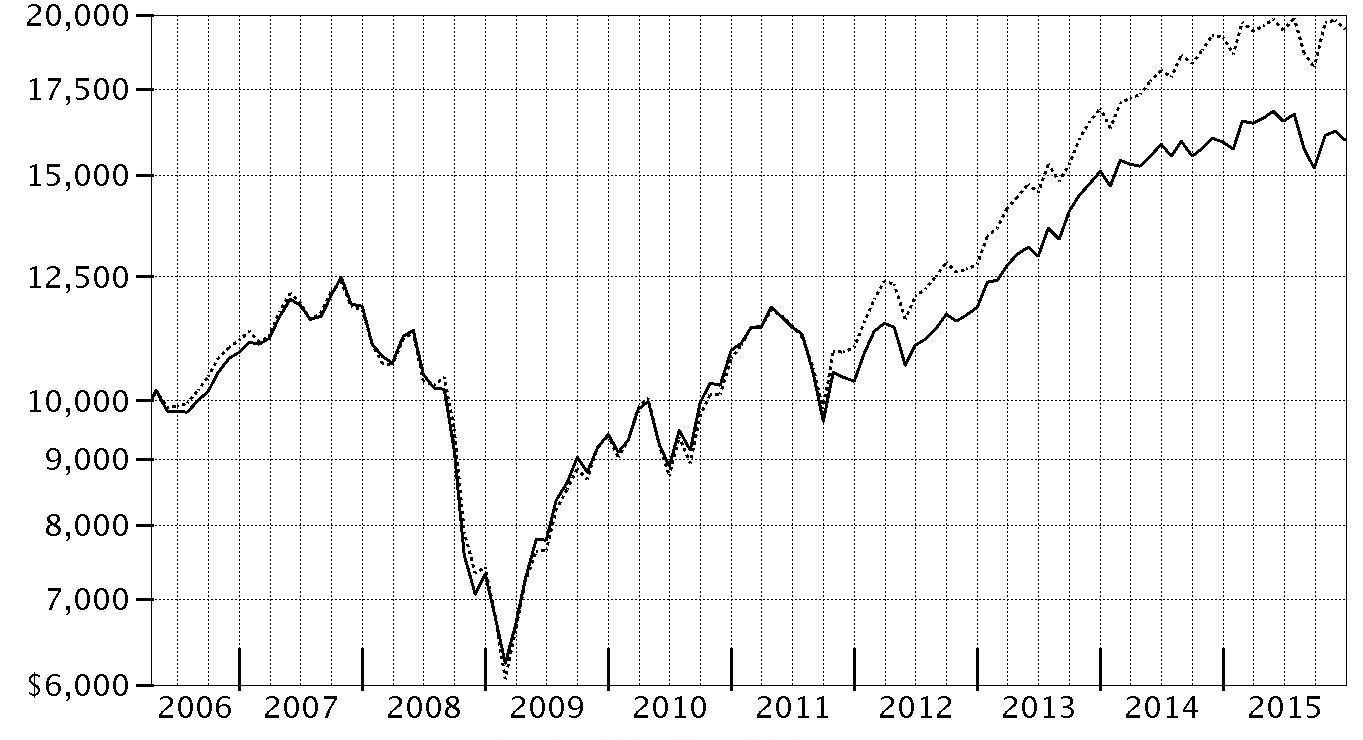
$10,000 Over Life of Fund
Let's say hypothetically that $10,000 was invested in VIP FundsManager® 70% Portfolio - Investor Class on April 13, 2006, when the fund started.
The chart shows how the value of your investment would have changed, and also shows how the S&P 500® Index performed over the same period.
| Period Ending Values |
| $16,005 | VIP FundsManager® 70% Portfolio - Investor Class |
| $19,498 | S&P 500® Index |
VIP FundsManager® 85% Portfolio
Performance: The Bottom Line
Average annual total return reflects the change in the value of an investment, assuming reinvestment of distributions from dividend income and capital gains (the profits earned upon the sale of securities that have grown in value, if any) and assuming a constant rate of performance each year. During periods of reimbursement by Fidelity, a fund’s total return will be greater than it would be had the reimbursement not occurred. Performance numbers are net of all underlying fund operating expenses, but do not include any insurance charges imposed by your insurance company’s separate account. If performance information included the effect of these additional charges, the total returns would have been lower. How a fund did yesterday is no guarantee of how it will do tomorrow.
Average Annual Total Returns
| For the periods ended December 31, 2015 | Past 1 year | Past 5 years | Life of FundA |
| Service Class | 0.39% | 7.87% | 4.93% |
| Service Class 2 | 0.35% | 7.71% | 4.77% |
| Investor Class | 0.39% | 7.85% | 4.93% |
A From April 13, 2006
$10,000 Over Life of Fund
Let's say hypothetically that $10,000 was invested in VIP FundsManager® 85% Portfolio - Investor Class on April 13, 2006, when the fund started.
The chart shows how the value of your investment would have changed, and also shows how the S&P 500® Index performed over the same period.
| Period Ending Values |
| $15,964 | VIP FundsManager® 85% Portfolio - Investor Class |
| $19,498 | S&P 500® Index |
Management's Discussion of Fund Performance
Market Recap: U.S. stocks gained modestly in 2015, rebounding from a steep decline in August and September over worries about China’s slowing economic growth. The S&P 500
® index rose 1.38% for the period, its lowest calendar-year return since 2008. After the late-summer rout, stocks sharply reversed course in October, lifted by the Federal Reserve’s decision to put off raising near-term interest rates until mid-December. Investors also were encouraged by an interest-rate cut in China and economic stimulus in Europe. Overall, growth stocks fared much better than their value counterparts, as investors sought growth in a subpar economic environment. This helped lift the technology-heavy Nasdaq Composite Index
® 6.96% for the year. Sector performance in the broader market was split, with five of 10 sectors in the S&P 500
® gaining ground and five retreating. Consumer discretionary (+10%) led the way, benefiting from rising personal income and low inflation. Health care (+7%), consumer staples (+7%) and information technology (+6%) also outpaced the broad market amid strong fundamentals. Conversely, the energy sector (-21%) was by far the worst performer, stung by deflated commodity prices that also hit materials (-8%). The defensive, but rate-sensitive utilities sector (-5%) lost ground on the cusp of Fed tightening, while industrials (-3%) were dragged down with energy prices and a slower-growing China.
Comments from Portfolio Manager Xuehai En: For the year, most of the Portfolios trailed their respective Composite benchmarks, except for the 85% Portfolio, which slightly outperformed. Asset allocation detracted from the Portfolios’ relative results, primarily due to out-of-benchmark exposure to emerging-markets (EM) equities, which were hampered by weakening global growth and falling commodities prices. Favorable EM stock picks partially offset this negative impact. An underweighting in investment-grade bonds, along with security selection in the asset class, also worked against the Portfolios’ relative returns. I increased the Portfolios’ allocations to foreign developed-markets equities to an overweighting during the year. For the period as a whole, this positioning detracted, but was more than offset by strong security selection. In fact, stock selection in foreign developed-markets equities was the single-biggest contributor to the Portfolios’ relative returns, fueled by strong picks across a number of sectors. The leading underlying fund in this regard was Fidelity
® Overseas Fund, which benefited from broadly positive stock selection, particularly in financials, information technology, consumer discretionary and materials. On a country basis, Fidelity
® Overseas Fund had the most success in the United Kingdom and Japan, complemented by out-of-benchmark picks in the United States. Conversely, selection in U.S. equities hampered the Portfolios’ relative returns. Several sharp market reversals during the period made it challenging for our underlying fund managers to maintain consistent active risk exposure. Additional underlying funds that had a significant positive influence on relative performance included several Fidelity
® Select Portfolios
®: Consumer Discretionary, Health Care and Technology. On the downside, reflecting the poor performance of energy over the past year, Select Energy Portfolio was the biggest relative detractor. Concerning notable changes, in October, I added exposure to Treasury Inflation-Protected Securities through Spartan
® Inflation-Protected Bond Index Fund.
The views expressed above reflect those of the portfolio manager(s) only through the end of the period as stated on the cover of this report and do not necessarily represent the views of Fidelity or any other person in the Fidelity organization. Any such views are subject to change at any time based upon market or other conditions and Fidelity disclaims any responsibility to update such views. These views may not be relied on as investment advice and, because investment decisions for a Fidelity fund are based on numerous factors, may not be relied on as an indication of trading intent on behalf of any Fidelity fund.
VIP FundsManager® 20% Portfolio
Investment Summary (Unaudited)
The information in the following tables is based on the direct investments of the Fund.
Fund Holdings as of December 31, 2015
| | % of fund's net assets | % of fund's net assets 6 months ago |
| Domestic Equity Funds | | |
| Fidelity Air Transportation Portfolio | 0.0 | 0.0 |
| Fidelity Banking Portfolio | 0.7 | 0.4 |
| Fidelity Blue Chip Growth Fund | 0.1 | 0.1 |
| Fidelity Blue Chip Value Fund | 0.3 | 0.2 |
| Fidelity Brokerage and Investment Management Portfolio | 0.0 | 0.2 |
| Fidelity Chemicals Portfolio | 0.3 | 0.4 |
| Fidelity Computers Portfolio | 0.3 | 0.5 |
| Fidelity Construction and Housing Portfolio | 0.6 | 0.5 |
| Fidelity Consumer Discretionary Portfolio | 1.1 | 1.7 |
| Fidelity Consumer Staples Portfolio | 1.2 | 1.1 |
| Fidelity Contrafund | 0.7 | 0.0 |
| Fidelity Defense and Aerospace Portfolio | 0.3 | 0.1 |
| Fidelity Dividend Growth Fund | 0.0 | 0.0 |
| Fidelity Electronics Portfolio | 0.3 | 0.5 |
| Fidelity Energy Portfolio | 0.7 | 0.7 |
| Fidelity Energy Service Portfolio | 0.1 | 0.2 |
| Fidelity Financial Services Portfolio | 1.1 | 1.9 |
| Fidelity Global Commodity Stock Fund | 0.0 | 0.0 |
| Fidelity Gold Portfolio | 0.0 | 0.0 |
| Fidelity Health Care Portfolio | 0.7 | 2.3 |
| Fidelity Health Care Services Portfolio | 0.3 | 0.1 |
| Fidelity Industrial Equipment Portfolio | 0.1 | 0.0 |
| Fidelity Industrials Portfolio | 0.9 | 1.1 |
| Fidelity Insurance Portfolio | 0.7 | 0.5 |
| Fidelity IT Services Portfolio | 0.3 | 0.3 |
| Fidelity Large Cap Stock Fund | 0.0 | 0.1 |
| Fidelity Low-Priced Stock Fund | 0.5 | 0.0 |
| Fidelity Materials Portfolio | 0.1 | 0.0 |
| Fidelity Medical Equipment and Systems Portfolio | 0.7 | 0.1 |
| Fidelity Mid Cap Value Fund | 0.0 | 0.2 |
| Fidelity Natural Gas Portfolio | 0.0 | 0.0 |
| Fidelity OTC Portfolio | 0.0 | 0.1 |
| Fidelity Pharmaceuticals Portfolio | 0.3 | 0.0 |
| Fidelity Real Estate Investment Portfolio | 0.4 | 0.4 |
| Fidelity Retailing Portfolio | 0.3 | 0.3 |
| Fidelity Series Commodity Strategy Fund | 0.0 | 0.0 |
| Fidelity Small Cap Stock Fund | 0.0 | 0.0 |
| Fidelity Software and IT Services Portfolio | 0.3 | 0.1 |
| Fidelity Stock Selector Large Cap Value Fund | 0.1 | 0.1 |
| Fidelity Technology Portfolio | 1.8 | 1.3 |
| Fidelity Telecommunications Portfolio | 0.4 | 0.1 |
| Fidelity Utilities Portfolio | 0.1 | 0.1 |
| Spartan Extended Market Index Fund Investor Class | 0.0 | 0.0 |
| Fidelity Communications Equipment Portfolio | 0.0 | 0.2 |
| Fidelity Leisure Portfolio | 0.0 | 0.0 |
| Fidelity Transportation Portfolio | 0.0 | 0.0 |
| | 15.8 | 15.9 |
| International Equity Funds | | |
| Fidelity China Region Fund | 0.2 | 0.3 |
| Fidelity Diversified International Fund | 1.6 | 3.4 |
| Fidelity Emerging Asia Fund | 0.6 | 0.8 |
| Fidelity Emerging Markets Fund | 0.1 | 0.9 |
| Fidelity Europe Fund | 0.6 | 0.6 |
| Fidelity International Capital Appreciation Fund | 0.0 | 0.1 |
| Fidelity International Discovery Fund | 0.4 | 0.5 |
| Fidelity International Real Estate Fund | 0.0 | 0.0 |
| Fidelity International Small Cap Fund | 0.3 | 0.3 |
| Fidelity International Small Cap Opportunities Fund | 0.5 | 0.1 |
| Fidelity Japan Fund | 0.3 | 0.3 |
| Fidelity Japan Smaller Companies Fund | 0.5 | 0.5 |
| Fidelity Overseas Fund | 2.5 | 2.2 |
| Fidelity Pacific Basin Fund | 0.2 | 0.2 |
| Spartan International Index Fund Investor Class | 1.0 | 1.2 |
| | 8.8 | 11.4 |
| Fixed-Income Funds | | |
| Fidelity Floating Rate High Income Fund | 0.5 | 0.6 |
| Fidelity Focused High Income Fund | 0.0 | 0.0 |
| Fidelity High Income Fund | 0.1 | 0.0 |
| Fidelity New Markets Income Fund | 0.5 | 0.4 |
| Fidelity Real Estate Income Fund | 0.4 | 0.3 |
| Spartan Inflation-Protected Bond Index Fund Investor Class | 1.5 | 0.0 |
| Spartan Long-Term Treasury Bond Index Fund Investor Class | 1.9 | 2.2 |
| Spartan U.S. Bond Index Fund Investor Class | 42.9 | 41.0 |
| | 47.8 | 44.5 |
| Money Market Funds | | |
| Fidelity Institutional Money Market Portfolio Class I 0.28% | 15.8 | 10.8 |
| Fidelity Institutional Prime Money Market Portfolio Class I 0.28% | 11.8 | 13.1 |
| Fidelity Select Money Market Portfolio 0.01% | 0.0 | 4.3 |
| | 27.6 | 28.2 |
| Net Other Assets (Liabilities) | 0.0 | 0.0 |
| | 100.0 | 100.0 |
Fidelity Health Care Services Portfolio was formerly known as Fidelity Medical Delivery Portfolio and
Fidelity Software and IT Services Portfolio was formerly known as Fidelity Software and Computer Services Portfolio
Asset Allocation (% of fund's net assets)
| As of December 31, 2015 |
| | Domestic Equity Funds | 15.8% |
| | International Equity Funds | 8.8% |
| | Fixed-Income Funds | 47.8% |
| | Money Market Funds | 27.6% |

| As of June 30, 2015 |
| | Domestic Equity Funds | 15.9% |
| | International Equity Funds | 11.4% |
| | Fixed-Income Funds | 44.5% |
| | Money Market Funds | 28.2% |

Percentages shown as 0.0% may reflect amounts less than 0.05%.
VIP FundsManager® 20% Portfolio
Investments December 31, 2015
Showing Percentage of Net Assets
| Equity Funds - 24.6% | | | |
| | | Shares | Value |
| Domestic Equity Funds - 15.8% | | | |
| Fidelity Air Transportation Portfolio (a) | | 4,414 | $274,921 |
| Fidelity Banking Portfolio (a) | | 203,116 | 5,195,707 |
| Fidelity Blue Chip Growth Fund (a) | | 11,775 | 812,111 |
| Fidelity Blue Chip Value Fund (a) | | 129,524 | 2,032,236 |
| Fidelity Brokerage and Investment Management Portfolio (a) | | 2,809 | 180,085 |
| Fidelity Chemicals Portfolio (a) | | 14,837 | 1,940,637 |
| Fidelity Computers Portfolio (a) | | 26,589 | 1,814,151 |
| Fidelity Construction and Housing Portfolio (a) | | 69,855 | 4,054,379 |
| Fidelity Consumer Discretionary Portfolio (a) | | 241,645 | 8,257,010 |
| Fidelity Consumer Staples Portfolio (a) | | 97,460 | 8,896,189 |
| Fidelity Contrafund (a) | | 49,573 | 4,905,226 |
| Fidelity Defense and Aerospace Portfolio (a) | | 18,416 | 2,117,669 |
| Fidelity Dividend Growth Fund (a) | | 707 | 21,407 |
| Fidelity Electronics Portfolio (a) | | 29,975 | 2,265,797 |
| Fidelity Energy Portfolio (a) | | 136,292 | 4,793,372 |
| Fidelity Energy Service Portfolio (a) | | 20,368 | 835,917 |
| Fidelity Financial Services Portfolio (a) | | 95,551 | 8,028,171 |
| Fidelity Global Commodity Stock Fund (a) | | 3,967 | 34,871 |
| Fidelity Gold Portfolio (a)(b) | | 6,965 | 94,034 |
| Fidelity Health Care Portfolio (a) | | 26,267 | 5,467,799 |
| Fidelity Health Care Services Portfolio (a) | | 22,329 | 1,885,014 |
| Fidelity Industrial Equipment Portfolio (a) | | 18,718 | 682,849 |
| Fidelity Industrials Portfolio (a) | | 231,094 | 6,750,268 |
| Fidelity Insurance Portfolio (a) | | 71,992 | 4,871,679 |
| Fidelity IT Services Portfolio (a) | | 57,862 | 2,312,759 |
| Fidelity Large Cap Stock Fund (a) | | 3,757 | 98,163 |
| Fidelity Low-Priced Stock Fund (a) | | 83,156 | 3,970,688 |
| Fidelity Materials Portfolio (a) | | 6,277 | 430,944 |
| Fidelity Medical Equipment and Systems Portfolio (a) | | 145,993 | 5,236,775 |
| Fidelity Mid Cap Value Fund (a) | | 10,377 | 231,827 |
| Fidelity Natural Gas Portfolio (a) | | 155 | 3,104 |
| Fidelity OTC Portfolio (a) | | 657 | 54,805 |
| Fidelity Pharmaceuticals Portfolio (a) | | 91,985 | 1,892,123 |
| Fidelity Real Estate Investment Portfolio (a) | | 78,938 | 3,203,294 |
| Fidelity Retailing Portfolio (a) | | 22,711 | 2,389,430 |
| Fidelity Series Commodity Strategy Fund (a)(b) | | 1,089 | 5,316 |
| Fidelity Small Cap Stock Fund (a) | | 6,268 | 108,883 |
| Fidelity Software and IT Services Portfolio (a) | | 15,686 | 1,904,420 |
| Fidelity Stock Selector Large Cap Value Fund (a) | | 40,754 | 663,483 |
| Fidelity Technology Portfolio (a) | | 112,895 | 13,331,780 |
| Fidelity Telecommunications Portfolio (a) | | 51,291 | 3,105,150 |
| Fidelity Utilities Portfolio (a) | | 15,177 | 973,785 |
| Spartan Extended Market Index Fund Investor Class (a) | | 325 | 16,301 |
|
| TOTAL DOMESTIC EQUITY FUNDS | | | 116,144,529 |
|
| International Equity Funds - 8.8% | | | |
| Fidelity China Region Fund (a) | | 65,154 | 1,656,220 |
| Fidelity Diversified International Fund (a) | | 329,829 | 11,563,792 |
| Fidelity Emerging Asia Fund (a) | | 139,073 | 4,173,569 |
| Fidelity Emerging Markets Fund (a) | | 49,412 | 1,074,715 |
| Fidelity Europe Fund (a) | | 123,384 | 4,462,814 |
| Fidelity International Capital Appreciation Fund (a) | | 21,429 | 355,942 |
| Fidelity International Discovery Fund (a) | | 65,821 | 2,593,993 |
| Fidelity International Real Estate Fund (a) | | 1,181 | 11,838 |
| Fidelity International Small Cap Fund (a) | | 90,945 | 2,011,705 |
| Fidelity International Small Cap Opportunities Fund (a) | | 261,959 | 3,908,429 |
| Fidelity Japan Fund (a) | | 192,316 | 2,271,246 |
| Fidelity Japan Smaller Companies Fund (a) | | 255,660 | 3,538,339 |
| Fidelity Overseas Fund (a) | | 456,258 | 18,642,686 |
| Fidelity Pacific Basin Fund (a) | | 61,754 | 1,625,358 |
| Spartan International Index Fund Investor Class (a) | | 195,245 | 7,015,151 |
|
| TOTAL INTERNATIONAL EQUITY FUNDS | | | 64,905,797 |
|
| TOTAL EQUITY FUNDS | | | |
| (Cost $166,722,538) | | | 181,050,326 |
|
| Fixed-Income Funds - 47.8% | | | |
| Fidelity Floating Rate High Income Fund (a) | | 429,449 | 3,920,869 |
| Fidelity Focused High Income Fund (a) | | 38,222 | 306,157 |
| Fidelity High Income Fund (a) | | 41,436 | 329,415 |
| Fidelity New Markets Income Fund (a) | | 253,344 | 3,678,555 |
| Fidelity Real Estate Income Fund (a) | | 228,253 | 2,565,568 |
| Spartan Inflation-Protected Bond Index Fund Investor Class (a) | | 1,185,015 | 11,115,443 |
| Spartan Long-Term Treasury Bond Index Fund Investor Class (a) | | 1,087,816 | 13,880,534 |
| Spartan U.S. Bond Index Fund Investor Class (a) | | 27,430,706 | 315,178,807 |
| TOTAL FIXED-INCOME FUNDS | | | |
| (Cost $345,827,763) | | | 350,975,348 |
|
| Money Market Funds - 27.6% | | | |
| Fidelity Institutional Money Market Portfolio Class I 0.28% (a)(c) | | 116,279,132 | 116,279,132 |
| Fidelity Institutional Prime Money Market Portfolio Class I 0.28% (a)(c) | | 86,244,202 | 86,244,202 |
| TOTAL MONEY MARKET FUNDS | | | |
| (Cost $202,523,334) | | | 202,523,334 |
| TOTAL INVESTMENT PORTFOLIO - 100.0% | | | |
| (Cost $715,073,635) | | | 734,549,008 |
| NET OTHER ASSETS (LIABILITIES) - 0.0% | | | (122,304) |
| NET ASSETS - 100% | | | $734,426,704 |
Legend
(a) Affiliated Fund
(b) Non-income producing
(c) The rate quoted is the annualized seven-day yield of the fund at period end.
Affiliated Underlying Funds
Information regarding the Fund's fiscal year to date purchases and sales of the affiliated Underlying Funds and income earned by the Fund from investments in affiliated Underlying Funds is as follows:
(Fidelity Health Care Services Portfolio was formerly known as Fidelity Medical Delivery Portfolio and Fidelity Software and IT Services Portfolio was formerly known as Fidelity Software and Computer Services Portfolio)
| Affiliate | Value, beginning of period | Purchases | Sales Proceeds | Dividend Income | Value, end of period |
| Fidelity Air Transportation Portfolio | $722,218 | $ 25,498 | $403,792 | $864 | $274,921 |
| Fidelity Banking Portfolio | 4,617,977 | 3,046,862 | 2,075,871 | 50,961 | 5,195,707 |
| Fidelity Biotechnology Portfolio | 30,278 | -- | 36,525 | -- | -- |
| Fidelity Blue Chip Growth Fund | 4,643,143 | 964,337 | 4,883,677 | 461 | 812,111 |
| Fidelity Blue Chip Value Fund | 1,002,736 | 1,336,392 | 245,008 | 33,413 | 2,032,236 |
| Fidelity Brokerage and Investment | 2,551,526 | 25,187 | 2,391,453 | 3,982 | 180,085 |
| Fidelity Canada Fund | 26,393 | -- | 25,515 | -- | -- |
| Fidelity Chemicals Portfolio | 3,553,417 | 240,647 | 1,590,187 | 28,287 | 1,940,637 |
| Fidelity China Region Fund | 535,940 | 1,894,374 | 368,561 | 19,508 | 1,656,220 |
| Fidelity Communications Equipment Portfolio | 1,240,631 | 4,715 | 1,176,527 | 429 | -- |
| Fidelity Computers Portfolio | 4,400,604 | 1,083,829 | 3,070,242 | 25,110 | 1,814,151 |
| Fidelity Construction and Housing Portfolio | 3,176,717 | 938,396 | 200,000 | 15,648 | 4,054,379 |
| Fidelity Consumer Discretionary Portfolio | 11,793,649 | 701,614 | 4,449,488 | 45,255 | 8,257,010 |
| Fidelity Consumer Finance Portfolio | 726,495 | -- | 721,124 | -- | -- |
| Fidelity Consumer Staples Portfolio | 12,347,828 | 2,432,743 | 5,314,542 | 138,930 | 8,896,189 |
| Fidelity Contrafund | 27,397 | 5,456,641 | 571,566 | 14,547 | 4,905,226 |
| Fidelity Defense and Aerospace Portfolio | -- | 2,236,312 | -- | 14,385 | 2,117,669 |
| Fidelity Diversified International Fund | 6,524,341 | 24,756,508 | 19,727,506 | 111,372 | 11,563,792 |
| Fidelity Dividend Growth Fund | 21,542 | 1,839 | -- | 310 | 21,407 |
| Fidelity Electronics Portfolio | 3,568,545 | 554,356 | 1,500,000 | 23,629 | 2,265,797 |
| Fidelity Emerging Asia Fund | 3,252,827 | 2,382,127 | 828,833 | 18,517 | 4,173,569 |
| Fidelity Emerging Markets Fund | 7,506,396 | 5,408 | 5,802,021 | 5,408 | 1,074,715 |
| Fidelity Energy Portfolio | 5,224,198 | 1,947,219 | 977,999 | 51,771 | 4,793,372 |
| Fidelity Energy Service Portfolio | 1,558,936 | 416,868 | 723,237 | 8,058 | 835,917 |
| Fidelity Equity Dividend Income Fund | 19,926 | 63 | 20,288 | -- | -- |
| Fidelity Europe Fund | 3,220,679 | 1,346,258 | 143,972 | 51,622 | 4,462,814 |
| Fidelity Financial Services Portfolio | 11,591,469 | 3,344,305 | 6,202,933 | 73,189 | 8,028,171 |
| Fidelity Floating Rate High Income Fund | 4,655,051 | 167,344 | 693,509 | 167,336 | 3,920,869 |
| Fidelity Focused High Income Fund | 312,169 | 14,492 | -- | 14,492 | 306,157 |
| Fidelity Fund | 34,121 | -- | 35,689 | -- | -- |
| Fidelity Global Commodity Stock Fund | 48,092 | 970 | -- | 931 | 34,871 |
| Fidelity Gold Portfolio | 114,512 | -- | -- | -- | 94,034 |
| Fidelity Growth & Income Portfolio | 3,436 | -- | 3,517 | -- | -- |
| Fidelity Health Care Portfolio | 18,500,783 | 1,541,455 | 15,164,197 | -- | 5,467,799 |
| Fidelity Health Care Services Portfolio | 432,954 | 1,548,689 | -- | 395 | 1,885,014 |
| Fidelity High Income Fund | 348,223 | 19,957 | -- | 19,957 | 329,415 |
| Fidelity Industrial Equipment Portfolio | -- | 690,826 | -- | 2,170 | 682,849 |
| Fidelity Industrials Portfolio | 8,110,539 | 1,499,760 | 2,197,408 | 45,759 | 6,750,268 |
| Fidelity Institutional Money Market | 13,209,159 | 103,069,974 | -- | 87,319 | 116,279,132 |
| Fidelity Institutional Prime Money Market | 143,215,804 | 53,671,830 | 110,643,432 | 79,943 | 86,244,202 |
| Fidelity Insurance Portfolio | 4,585,934 | 803,906 | 500,000 | 50,602 | 4,871,679 |
| Fidelity International Capital Appreciation | 4,624,124 | 5,487 | 4,530,480 | 1,456 | 355,942 |
| Fidelity International Discovery Fund | 4,610,578 | 93,947 | 2,361,650 | 26,644 | 2,593,993 |
| Fidelity International Real Estate Fund | 11,630 | 332 | -- | 193 | 11,838 |
| Fidelity International Small Cap Fund | -- | 3,052,477 | 800,000 | 35,926 | 2,011,705 |
| Fidelity International Small Cap | -- | 4,002,980 | -- | 15,085 | 3,908,429 |
| Fidelity International Value Fund | 1,090,843 | -- | 1,126,355 | -- | -- |
| Fidelity IT Services Portfolio | 266,995 | 1,950,138 | 100,000 | -- | 2,312,759 |
| Fidelity Japan Fund | 36,962 | 2,337,431 | -- | 13,187 | 2,271,246 |
| Fidelity Japan Smaller Companies Fund | 701,962 | 2,757,733 | -- | 22,821 | 3,538,339 |
| Fidelity Large Cap Stock Fund | 1,001,217 | 132,051 | 1,009,338 | 2,132 | 98,163 |
| Fidelity Leisure Portfolio | 653,398 | 4,071 | 694,673 | 291 | -- |
| Fidelity Leveraged Company Stock Fund | 8,995 | -- | 9,373 | -- | -- |
| Fidelity Low-Priced Stock Fund | -- | 4,735,750 | 710,000 | 35,763 | 3,970,688 |
| Fidelity Magellan Fund | 43,256 | -- | 44,939 | -- | -- |
| Fidelity Materials Portfolio | -- | 450,989 | -- | 4,633 | 430,944 |
| Fidelity Medical Equipment and Systems | 858,076 | 4,655,347 | -- | 833 | 5,236,775 |
| Fidelity Mega Cap Stock Fund | 2,778,809 | -- | 2,757,088 | -- | -- |
| Fidelity Mid Cap Value Fund | 1,266,383 | 1,737,909 | 2,675,115 | 11,430 | 231,827 |
| Fidelity Natural Gas Portfolio | 4,913 | 60 | -- | 60 | 3,104 |
| Fidelity New Markets Income Fund | 4,163,222 | 1,436,055 | 1,745,790 | 176,043 | 3,678,555 |
| Fidelity OTC Portfolio | 1,879,159 | 52,811 | 1,976,528 | -- | 54,805 |
| Fidelity Overseas Fund | 10,381,988 | 8,409,923 | 900,000 | 191,425 | 18,642,686 |
| Fidelity Pacific Basin Fund | 1,323,157 | 1,077,209 | 735,094 | 21,287 | 1,625,358 |
| Fidelity Pharmaceuticals Portfolio | 251,916 | 2,240,028 | 267,352 | 11,585 | 1,892,123 |
| Fidelity Real Estate Income Fund | 2,521,641 | 137,264 | -- | 106,027 | 2,565,568 |
| Fidelity Real Estate Investment Portfolio | 2,958,944 | 3,016,278 | 2,495,724 | 53,489 | 3,203,294 |
| Fidelity Retailing Portfolio | 2,015,796 | 169,100 | 150,000 | 4,233 | 2,389,430 |
| Fidelity Select Money Market Portfolio 0.02% | 32,976,771 | 5,884 | 32,982,655 | 3,945 | -- |
| Fidelity Series Commodity Strategy Fund | 7,114 | -- | -- | -- | 5,316 |
| Fidelity Small Cap Discovery Fund | 206,688 | -- | 210,328 | -- | -- |
| Fidelity Small Cap Growth Fund | -- | -- | -- | -- | -- |
| Fidelity Small Cap Stock Fund | 12,820 | 123,675 | 13,230 | 496 | 108,883 |
| Fidelity Small Cap Value Fund | 180,036 | -- | 183,174 | -- | -- |
| Fidelity Software and IT Services Portfolio | 1,091,688 | 1,290,214 | 500,000 | 769 | 1,904,420 |
| Fidelity Stock Selector Large Cap Value Fund | 5,919,753 | 755,460 | 6,080,476 | 8,711 | 663,483 |
| Fidelity Technology Portfolio | 14,324,700 | 4,214,582 | 5,404,839 | 10,749 | 13,331,780 |
| Fidelity Telecommunications Portfolio | 667,602 | 3,154,040 | 768,916 | 33,460 | 3,105,150 |
| Fidelity Transportation Portfolio | 1,885,324 | 10,217 | 1,720,393 | 1,441 | -- |
| Fidelity Utilities Portfolio | 2,178,020 | 941,694 | 1,904,751 | 29,144 | 973,785 |
| Spartan Extended Market Index Fund Investor | 16,866 | 975 | -- | 220 | 16,301 |
| Spartan Inflation-Protected Bond Index Fund | -- | 11,393,971 | 66,369 | -- | 11,115,443 |
| Spartan International Index Fund Investor | 8,774,771 | 351,823 | 1,920,000 | 180,281 | 7,015,151 |
| Spartan Long-Term Treasury Bond Index Fund | 4,248,533 | 17,308,511 | 6,583,736 | 395,810 | 13,880,534 |
| Spartan U.S. Bond Index Fund Investor Class | 358,803,414 | 29,341,282 | 66,214,289 | 7,704,568 | 315,178,807 |
| | $762,204,649 | $329,519,399 | $342,331,274 | $10,308,697 | $734,549,008 |
Investment Valuation
All investments are categorized as Level 1 under the Fair Value Hierarchy. The inputs or methodology used for valuing securities may not be an indication of the risk associated with investing in those securities. For more information on valuation inputs please refer to the Investment Valuation section in the accompanying Notes to Financial Statements.
See accompanying notes which are an integral part of the financial statements.
VIP FundsManager® 20% Portfolio
Financial Statements
Statement of Assets and Liabilities
| | | December 31, 2015 |
| Assets | | |
| Investment in securities, at value (cost $715,073,635) — See accompanying schedule | | $734,549,008 |
| Receivable for investments sold | | 60,975 |
| Receivable for fund shares sold | | 1,447,771 |
| Total assets | | 736,057,754 |
| Liabilities | | |
| Payable to custodian bank | $797 | |
| Payable for investments purchased | 1,504,794 | |
| Payable for fund shares redeemed | 2,752 | |
| Accrued management fee | 122,529 | |
| Distribution and service plan fees payable | 178 | |
| Total liabilities | | 1,631,050 |
| Net Assets | | $734,426,704 |
| Net Assets consist of: | | |
| Paid in capital | | $706,628,604 |
| Undistributed net investment income | | 14,504 |
| Accumulated undistributed net realized gain (loss) on investments | | 8,308,223 |
| Net unrealized appreciation (depreciation) on investments | | 19,475,373 |
| Net Assets | | $734,426,704 |
| Service Class: | | |
| Net Asset Value, offering price and redemption price per share ($62,201 ÷ 5,645 shares) | | $11.02 |
| Service Class 2: | | |
| Net Asset Value, offering price and redemption price per share ($1,453,941 ÷ 132,163 shares) | | $11.00 |
| Investor Class: | | |
| Net Asset Value, offering price and redemption price per share ($732,910,562 ÷ 66,542,868 shares) | | $11.01 |
See accompanying notes which are an integral part of the financial statements.
Statement of Operations
| | | Year ended December 31, 2015 |
| Investment Income | | |
| Income distributions from underlying funds | | $10,308,697 |
| Expenses | | |
| Management fee | $1,891,392 | |
| Distribution and service plan fees | 3,416 | |
| Independent trustees' compensation | 3,078 | |
| Total expenses before reductions | 1,897,886 | |
| Expense reductions | (380,242) | 1,517,644 |
| Net investment income (loss) | | 8,791,053 |
| Realized and Unrealized Gain (Loss) | | |
| Realized gain (loss) on sale of underlying fund shares | 4,173,900 | |
| Capital gain distributions from underlying funds | 6,211,874 | |
| Total net realized gain (loss) | | 10,385,774 |
| Change in net unrealized appreciation (depreciation) on underlying funds | | (19,017,635) |
| Net gain (loss) | | (8,631,861) |
| Net increase (decrease) in net assets resulting from operations | | $159,192 |
See accompanying notes which are an integral part of the financial statements.
Statement of Changes in Net Assets
| | Year ended December 31, 2015 | Year ended December 31, 2014 |
| Increase (Decrease) in Net Assets | | |
| Operations | | |
| Net investment income (loss) | $8,791,053 | $9,581,522 |
| Net realized gain (loss) | 10,385,774 | 25,705,734 |
| Change in net unrealized appreciation (depreciation) | (19,017,635) | (5,720,903) |
| Net increase (decrease) in net assets resulting from operations | 159,192 | 29,566,353 |
| Distributions to shareholders from net investment income | (8,798,379) | (9,574,383) |
| Distributions to shareholders from net realized gain | (23,627,789) | (9,285,360) |
| Total distributions | (32,426,168) | (18,859,743) |
| Share transactions - net increase (decrease) | 4,615,665 | 55,557,229 |
| Total increase (decrease) in net assets | (27,651,311) | 66,263,839 |
| Net Assets | | |
| Beginning of period | 762,078,015 | 695,814,176 |
| End of period (including undistributed net investment income of $14,504 and undistributed net investment income of $21,830, respectively) | $734,426,704 | $762,078,015 |
See accompanying notes which are an integral part of the financial statements.
Financial Highlights — VIP FundsManager 20% Portfolio Service Class
| | | | | |
| Years ended December 31, | 2015 | 2014 | 2013 | 2012 | 2011 |
| Selected Per–Share Data | | | | | |
| Net asset value, beginning of period | $11.51 | $11.33 | $11.10 | $10.68 | $10.63 |
| Income from Investment Operations | | | | | |
| Net investment income (loss)A | .13 | .15 | .14 | .17 | .20 |
| Net realized and unrealized gain (loss) | (.13) | .32 | .47 | .44 | .05 |
| Total from investment operations | –B | .47 | .61 | .61 | .25 |
| Distributions from net investment income | (.13) | (.15) | (.14) | (.16) | (.18) |
| Distributions from net realized gain | (.36) | (.15) | (.24) | (.03) | (.02) |
| Total distributions | (.49) | (.29)C | (.38) | (.19) | (.20) |
| Net asset value, end of period | $11.02 | $11.51 | $11.33 | $11.10 | $10.68 |
| Total ReturnD,E | (.03)% | 4.21% | 5.53% | 5.68% | 2.30% |
| Ratios to Average Net AssetsF,G | | | | | |
| Expenses before reductions | .35% | .35% | .35% | .35% | .35% |
| Expenses net of fee waivers, if any | .20% | .20% | .20% | .20% | .20% |
| Expenses net of all reductions | .20% | .20% | .20% | .20% | .20% |
| Net investment income (loss) | 1.16% | 1.31% | 1.23% | 1.51% | 1.84% |
| Supplemental Data | | | | | |
| Net assets, end of period (000 omitted) | $62 | $68 | $72 | $71 | $64 |
| Portfolio turnover rate F | 44% | 28% | 25% | 17% | 12% |
A Calculated based on average shares outstanding during the period.
B Amount represents less than $.005 per share.
C Total distributions of $.29 per share is comprised of distributions from net investment income of $.147 and distributions from net realized gain of $.147 per share.
D Total returns do not reflect charges attributable to your insurance company's separate account. Inclusion of these charges would reduce the total returns shown.
E Total returns would have been lower if certain expenses had not been reduced during the applicable periods shown.
F Amounts do not include the activity of the Underlying Funds.
G Expense ratios reflect operating expenses of the class. Expenses before reductions do not reflect amounts reimbursed by the investment adviser or reductions from expense offset arrangements and do not represent the amount paid by the class during periods when reimbursements or reductions occur. Expenses net of fee waivers reflect expenses after reimbursement by the investment adviser but prior to reductions from expense offset arrangements. Expenses net of all reductions represent the net expenses paid by the class but do not include expenses of the underlying funds in which the Fund invests.
See accompanying notes which are an integral part of the financial statements.
Financial Highlights — VIP FundsManager 20% Portfolio Service Class 2
| | | | | |
| Years ended December 31, | 2015 | 2014 | 2013 | 2012 | 2011 |
| Selected Per–Share Data | | | | | |
| Net asset value, beginning of period | $11.49 | $11.32 | $11.08 | $10.67 | $10.62 |
| Income from Investment Operations | | | | | |
| Net investment income (loss)A | .11 | .13 | .12 | .15 | .18 |
| Net realized and unrealized gain (loss) | (.12) | .32 | .48 | .43 | .05 |
| Total from investment operations | (.01) | .45 | .60 | .58 | .23 |
| Distributions from net investment income | (.12) | (.13) | (.12) | (.14) | (.16) |
| Distributions from net realized gain | (.36) | (.15) | (.24) | (.03) | (.02) |
| Total distributions | (.48) | (.28) | (.36) | (.17) | (.18) |
| Net asset value, end of period | $11.00 | $11.49 | $11.32 | $11.08 | $10.67 |
| Total ReturnB,C | (.17)% | 3.98% | 5.46% | 5.43% | 2.20% |
| Ratios to Average Net AssetsD,E | | | | | |
| Expenses before reductions | .50% | .50% | .50% | .50% | .50% |
| Expenses net of fee waivers, if any | .35% | .35% | .35% | .35% | .35% |
| Expenses net of all reductions | .35% | .35% | .35% | .35% | .35% |
| Net investment income (loss) | 1.01% | 1.16% | 1.08% | 1.36% | 1.69% |
| Supplemental Data | | | | | |
| Net assets, end of period (000 omitted) | $1,454 | $1,426 | $1,197 | $1,274 | $1,373 |
| Portfolio turnover rateD | 44% | 28% | 25% | 17% | 12% |
A Calculated based on average shares outstanding during the period.
B Total returns do not reflect charges attributable to your insurance company's separate account. Inclusion of these charges would reduce the total returns shown.
C Total returns would have been lower if certain expenses had not been reduced during the applicable periods shown.
D Amounts do not include the activity of the Underlying Funds.
E Expense ratios reflect operating expenses of the class. Expenses before reductions do not reflect amounts reimbursed by the investment adviser or reductions from expense offset arrangements and do not represent the amount paid by the class during periods when reimbursements or reductions occur. Expenses net of fee waivers reflect expenses after reimbursement by the investment adviser but prior to reductions from expense offset arrangements. Expenses net of all reductions represent the net expenses paid by the class but do not include expenses of the underlying funds in which the Fund invests.
See accompanying notes which are an integral part of the financial statements.
Financial Highlights — VIP FundsManager 20% Portfolio Investor Class
| | | | | |
| Years ended December 31, | 2015 | 2014 | 2013 | 2012 | 2011 |
| Selected Per–Share Data | | | | | |
| Net asset value, beginning of period | $11.50 | $11.33 | $11.09 | $10.68 | $10.63 |
| Income from Investment Operations | | | | | |
| Net investment income (loss)A | .13 | .15 | .14 | .17 | .20 |
| Net realized and unrealized gain (loss) | (.13) | .31 | .48 | .43 | .05 |
| Total from investment operations | –B | .46 | .62 | .60 | .25 |
| Distributions from net investment income | (.13) | (.15) | (.14) | (.16) | (.18) |
| Distributions from net realized gain | (.36) | (.15) | (.24) | (.03) | (.02) |
| Total distributions | (.49) | (.29)C | (.38) | (.19) | (.20) |
| Net asset value, end of period | $11.01 | $11.50 | $11.33 | $11.09 | $10.68 |
| Total ReturnD,E | (.03)% | 4.12% | 5.62% | 5.58% | 2.31% |
| Ratios to Average Net AssetsF,G | | | | | |
| Expenses before reductions | .25% | .25% | .25% | .25% | .25% |
| Expenses net of fee waivers, if any | .20% | .20% | .20% | .20% | .20% |
| Expenses net of all reductions | .20% | .20% | .20% | .20% | .20% |
| Net investment income (loss) | 1.16% | 1.31% | 1.23% | 1.51% | 1.84% |
| Supplemental Data | | | | | |
| Net assets, end of period (000 omitted) | $732,911 | $760,583 | $694,546 | $650,963 | $533,568 |
| Portfolio turnover rateF | 44% | 28% | 25% | 17% | 12% |
A Calculated based on average shares outstanding during the period.
B Amount represents less than $.005 per share.
C Total distributions of $.29 per share is comprised of distributions from net investment income of $.147 and distributions from net realized gain of $.147 per share.
D Total returns do not reflect charges attributable to your insurance company's separate account. Inclusion of these charges would reduce the total returns shown.
E Total returns would have been lower if certain expenses had not been reduced during the applicable periods shown.
F Amounts do not include the activity of the Underlying Funds.
G Expense ratios reflect operating expenses of the class. Expenses before reductions do not reflect amounts reimbursed by the investment adviser or reductions from expense offset arrangements and do not represent the amount paid by the class during periods when reimbursements or reductions occur. Expenses net of fee waivers reflect expenses after reimbursement by the investment adviser but prior to reductions from expense offset arrangements. Expenses net of all reductions represent the net expenses paid by the class but do not include expenses of the underlying funds in which the Fund invests.
See accompanying notes which are an integral part of the financial statements.
VIP FundsManager® 50% Portfolio
Investment Summary (Unaudited)
The information in the following tables is based on the direct investments of the Fund.
Fund Holdings as of December 31, 2015
| | % of fund's net assets | % of fund's net assets 6 months ago |
| Domestic Equity Funds | | |
| Fidelity Air Transportation Portfolio | 0.2 | 0.2 |
| Fidelity Automotive Portfolio | 0.1 | 0.2 |
| Fidelity Banking Portfolio | 1.4 | 1.3 |
| Fidelity Blue Chip Growth Fund | 1.8 | 1.4 |
| Fidelity Blue Chip Value Fund | 0.8 | 0.4 |
| Fidelity Brokerage and Investment Management Portfolio | 0.2 | 1.1 |
| Fidelity Chemicals Portfolio | 0.6 | 0.8 |
| Fidelity Computers Portfolio | 0.4 | 1.2 |
| Fidelity Construction and Housing Portfolio | 0.6 | 0.6 |
| Fidelity Consumer Discretionary Portfolio | 2.8 | 2.9 |
| Fidelity Consumer Finance Portfolio | 0.1 | 0.1 |
| Fidelity Consumer Staples Portfolio | 2.6 | 2.4 |
| Fidelity Contrafund | 1.1 | 0.0 |
| Fidelity Defense and Aerospace Portfolio | 0.6 | 0.2 |
| Fidelity Dividend Growth Fund | 0.0 | 0.0 |
| Fidelity Electronics Portfolio | 0.5 | 0.9 |
| Fidelity Energy Portfolio | 1.4 | 1.4 |
| Fidelity Energy Service Portfolio | 0.2 | 0.7 |
| Fidelity Financial Services Portfolio | 2.4 | 3.0 |
| Fidelity Global Commodity Stock Fund | 0.0 | 0.0 |
| Fidelity Gold Portfolio | 0.0 | 0.0 |
| Fidelity Growth Company Fund | 0.0 | 0.0 |
| Fidelity Health Care Portfolio | 2.6 | 3.9 |
| Fidelity Health Care Services Portfolio | 0.4 | 0.4 |
| Fidelity Industrial Equipment Portfolio | 0.6 | 0.4 |
| Fidelity Industrials Portfolio | 1.6 | 1.7 |
| Fidelity Insurance Portfolio | 1.1 | 0.6 |
| Fidelity IT Services Portfolio | 0.6 | 0.3 |
| Fidelity Large Cap Stock Fund | 0.6 | 0.9 |
| Fidelity Leisure Portfolio | 0.0 | 0.1 |
| Fidelity Low-Priced Stock Fund | 0.5 | 0.0 |
| Fidelity Magellan Fund | 0.0 | 0.0 |
| Fidelity Materials Portfolio | 0.1 | 0.0 |
| Fidelity Medical Equipment and Systems Portfolio | 0.7 | 0.2 |
| Fidelity Mega Cap Stock Fund | 0.6 | 0.8 |
| Fidelity Mid Cap Value Fund | 0.6 | 0.8 |
| Fidelity Nasdaq Composite Index Fund | 0.0 | 0.0 |
| Fidelity OTC Portfolio | 0.1 | 0.4 |
| Fidelity Pharmaceuticals Portfolio | 0.6 | 0.6 |
| Fidelity Real Estate Investment Portfolio | 0.5 | 0.4 |
| Fidelity Retailing Portfolio | 0.5 | 0.4 |
| Fidelity Series Commodity Strategy Fund | 0.0 | 0.0 |
| Fidelity Small Cap Growth Fund | 0.0 | 0.0 |
| Fidelity Small Cap Stock Fund | 0.2 | 0.2 |
| Fidelity Small Cap Value Fund | 0.0 | 0.0 |
| Fidelity Software and IT Services Portfolio | 0.9 | 0.3 |
| Fidelity Stock Selector Large Cap Value Fund | 1.1 | 1.2 |
| Fidelity Technology Portfolio | 3.6 | 2.8 |
| Fidelity Telecommunications Portfolio | 1.0 | 0.0 |
| Fidelity Utilities Portfolio | 0.2 | 0.2 |
| Fidelity Value Discovery Fund | 0.6 | 0.6 |
| Spartan 500 Index Fund Investor Class | 0.0 | 0.0 |
| Fidelity Communications Equipment Portfolio | 0.0 | 0.2 |
| Fidelity Multimedia Portfolio | 0.0 | 0.4 |
| Fidelity Natural Gas Portfolio | 0.0 | 0.0 |
| Fidelity Transportation Portfolio | 0.0 | 0.2 |
| | 37.1 | 36.8 |
| International Equity Funds | | |
| Fidelity China Region Fund | 0.2 | 0.2 |
| Fidelity Diversified International Fund | 5.5 | 7.3 |
| Fidelity Emerging Asia Fund | 0.8 | 1.0 |
| Fidelity Emerging Markets Fund | 0.1 | 0.9 |
| Fidelity Europe Fund | 1.8 | 1.8 |
| Fidelity International Capital Appreciation Fund | 0.0 | 0.1 |
| Fidelity International Discovery Fund | 1.6 | 1.9 |
| Fidelity International Real Estate Fund | 0.0 | 0.0 |
| Fidelity International Small Cap Fund | 0.3 | 0.2 |
| Fidelity International Small Cap Opportunities Fund | 0.8 | 0.5 |
| Fidelity International Value Fund | 0.1 | 0.2 |
| Fidelity Japan Fund | 0.8 | 0.8 |
| Fidelity Japan Smaller Companies Fund | 0.6 | 0.5 |
| Fidelity Nordic Fund | 0.3 | 0.3 |
| Fidelity Overseas Fund | 3.5 | 2.5 |
| Fidelity Pacific Basin Fund | 0.1 | 0.2 |
| Spartan International Index Fund Investor Class | 1.3 | 2.2 |
| Fidelity International Growth Fund | 0.0 | 0.0 |
| | 17.8 | 20.6 |
| Fixed-Income Funds | | |
| Fidelity Floating Rate High Income Fund | 0.5 | 0.6 |
| Fidelity Focused High Income Fund | 0.0 | 0.0 |
| Fidelity High Income Fund | 0.1 | 0.1 |
| Fidelity New Markets Income Fund | 0.3 | 0.4 |
| Fidelity Real Estate Income Fund | 0.3 | 0.3 |
| Spartan Inflation-Protected Bond Index Fund Investor Class | 1.7 | 0.0 |
| Spartan Long-Term Treasury Bond Index Fund Investor Class | 1.5 | 1.8 |
| Spartan U.S. Bond Index Fund Investor Class | 33.2 | 31.3 |
| | 37.6 | 34.5 |
| Money Market Funds | | |
| Fidelity Institutional Prime Money Market Portfolio Class I 0.28% | 7.5 | 7.9 |
| Fidelity Select Money Market Portfolio 0.01% | 0.0 | 0.2 |
| | 7.5 | 8.1 |
| Net Other Assets (Liabilities) | 0.0 | 0.0 |
| | 100.0 | 100.0 |
Fidelity Health Care Services Portfolio was formerly known as Fidelity Medical Delivery Portfolio and
Fidelity Software and IT Services Portfolio was formerly known as Fidelity Software and Computer Services Portfolio
Asset Allocation (% of fund's net assets)
| As of December 31, 2015 |
| | Domestic Equity Funds | 37.1% |
| | International Equity Funds | 17.8% |
| | Fixed-Income Funds | 37.6% |
| | Money Market Funds | 7.5% |

| As of June 30, 2015 |
| | Domestic Equity Funds | 36.8% |
| | International Equity Funds | 20.6% |
| | Fixed-Income Funds | 34.5% |
| | Money Market Funds | 8.1% |

Percentages shown as 0.0% may reflect amounts less than 0.05%.
VIP FundsManager® 50% Portfolio
Investments December 31, 2015
Showing Percentage of Net Assets
| Equity Funds - 54.9% | | | |
| | | Shares | Value |
| Domestic Equity Funds - 37.1% | | | |
| Fidelity Air Transportation Portfolio (a) | | 148,700 | $9,262,502 |
| Fidelity Automotive Portfolio (a) | | 162,832 | 6,469,331 |
| Fidelity Banking Portfolio (a) | | 3,346,131 | 85,594,035 |
| Fidelity Blue Chip Growth Fund (a) | | 1,575,739 | 108,678,685 |
| Fidelity Blue Chip Value Fund (a) | | 3,250,467 | 50,999,832 |
| Fidelity Brokerage and Investment Management Portfolio (a) | | 224,828 | 14,411,464 |
| Fidelity Chemicals Portfolio (a) | | 290,396 | 37,983,812 |
| Fidelity Computers Portfolio (a) | | 334,413 | 22,816,977 |
| Fidelity Construction and Housing Portfolio (a) | | 665,493 | 38,625,226 |
| Fidelity Consumer Discretionary Portfolio (a) | | 4,958,796 | 169,442,046 |
| Fidelity Consumer Finance Portfolio (a) | | 255,025 | 3,103,656 |
| Fidelity Consumer Staples Portfolio (a) | | 1,754,346 | 160,136,675 |
| Fidelity Contrafund (a) | | 691,127 | 68,386,975 |
| Fidelity Defense and Aerospace Portfolio (a) | | 323,294 | 37,175,626 |
| Fidelity Dividend Growth Fund (a) | | 5,687 | 172,271 |
| Fidelity Electronics Portfolio (a) | | 365,188 | 27,604,565 |
| Fidelity Energy Portfolio (a) | | 2,366,222 | 83,220,015 |
| Fidelity Energy Service Portfolio (a) | | 290,035 | 11,903,027 |
| Fidelity Financial Services Portfolio (a) | | 1,768,006 | 148,547,857 |
| Fidelity Global Commodity Stock Fund (a) | | 4,820 | 42,364 |
| Fidelity Gold Portfolio (a)(b) | | 5,877 | 79,341 |
| Fidelity Growth Company Fund (a) | | 1,510 | 206,713 |
| Fidelity Health Care Portfolio (a) | | 758,079 | 157,801,720 |
| Fidelity Health Care Services Portfolio (a) | | 265,033 | 22,374,105 |
| Fidelity Industrial Equipment Portfolio (a) | | 927,705 | 33,842,662 |
| Fidelity Industrials Portfolio (a) | | 3,448,704 | 100,736,644 |
| Fidelity Insurance Portfolio (a) | | 974,679 | 65,956,537 |
| Fidelity IT Services Portfolio (a) | | 923,763 | 36,922,810 |
| Fidelity Large Cap Stock Fund (a) | | 1,397,136 | 36,507,164 |
| Fidelity Leisure Portfolio (a) | | 6,077 | 789,702 |
| Fidelity Low-Priced Stock Fund (a) | | 650,108 | 31,042,654 |
| Fidelity Magellan Fund (a) | | 149 | 13,343 |
| Fidelity Materials Portfolio (a) | | 83,281 | 5,717,244 |
| Fidelity Medical Equipment and Systems Portfolio (a) | | 1,125,878 | 40,385,234 |
| Fidelity Mega Cap Stock Fund (a) | | 2,442,965 | 38,159,112 |
| Fidelity Mid Cap Value Fund (a) | | 1,616,588 | 36,114,586 |
| Fidelity Nasdaq Composite Index Fund (a) | | 10,854 | 711,818 |
| Fidelity OTC Portfolio (a) | | 102,699 | 8,568,139 |
| Fidelity Pharmaceuticals Portfolio (a) | | 1,730,297 | 35,592,219 |
| Fidelity Real Estate Investment Portfolio (a) | | 774,657 | 31,435,595 |
| Fidelity Retailing Portfolio (a) | | 291,648 | 30,684,296 |
| Fidelity Series Commodity Strategy Fund (a)(b) | | 1,089 | 5,316 |
| Fidelity Small Cap Growth Fund (a) | | 5,648 | 105,618 |
| Fidelity Small Cap Stock Fund (a) | | 827,898 | 14,380,585 |
| Fidelity Small Cap Value Fund (a) | | 12,260 | 205,240 |
| Fidelity Software and IT Services Portfolio (a) | | 467,153 | 56,717,029 |
| Fidelity Stock Selector Large Cap Value Fund (a) | | 4,329,013 | 70,476,339 |
| Fidelity Technology Portfolio (a) | | 1,843,861 | 217,741,598 |
| Fidelity Telecommunications Portfolio (a) | | 979,534 | 59,301,007 |
| Fidelity Utilities Portfolio (a) | | 225,399 | 14,461,606 |
| Fidelity Value Discovery Fund (a) | | 1,672,871 | 38,643,322 |
| Spartan 500 Index Fund Investor Class (a) | | 3,107 | 223,048 |
|
| TOTAL DOMESTIC EQUITY FUNDS | | | 2,270,479,287 |
|
| International Equity Funds - 17.8% | | | |
| Fidelity China Region Fund (a) | | 470,141 | 11,950,996 |
| Fidelity Diversified International Fund (a) | | 9,647,047 | 338,225,463 |
| Fidelity Emerging Asia Fund (a) | | 1,545,379 | 46,376,813 |
| Fidelity Emerging Markets Fund (a) | | 196,960 | 4,283,885 |
| Fidelity Europe Fund (a) | | 2,975,749 | 107,632,829 |
| Fidelity International Capital Appreciation Fund (a) | | 79,281 | 1,316,862 |
| Fidelity International Discovery Fund (a) | | 2,553,967 | 100,651,836 |
| Fidelity International Real Estate Fund (a) | | 15,815 | 158,466 |
| Fidelity International Small Cap Fund (a) | | 697,934 | 15,438,298 |
| Fidelity International Small Cap Opportunities Fund (a) | | 3,333,248 | 49,732,063 |
| Fidelity International Value Fund (a) | | 534,840 | 4,294,764 |
| Fidelity Japan Fund (a) | | 4,254,527 | 50,245,967 |
| Fidelity Japan Smaller Companies Fund (a) | | 2,856,183 | 39,529,567 |
| Fidelity Nordic Fund (a) | | 376,666 | 17,654,336 |
| Fidelity Overseas Fund (a) | | 5,239,916 | 214,102,961 |
| Fidelity Pacific Basin Fund (a) | | 350,614 | 9,228,168 |
| Spartan International Index Fund Investor Class (a) | | 2,299,868 | 82,634,239 |
|
| TOTAL INTERNATIONAL EQUITY FUNDS | | | 1,093,457,513 |
|
| TOTAL EQUITY FUNDS | | | |
| (Cost $3,218,934,264) | | | 3,363,936,800 |
|
| Fixed-Income Funds - 37.6% | | | |
| Fidelity Floating Rate High Income Fund (a) | | 3,518,371 | 32,122,729 |
| Fidelity Focused High Income Fund (a) | | 58,252 | 466,598 |
| Fidelity High Income Fund (a) | | 597,172 | 4,747,519 |
| Fidelity New Markets Income Fund (a) | | 1,390,548 | 20,190,757 |
| Fidelity Real Estate Income Fund (a) | | 1,457,209 | 16,379,032 |
| Spartan Inflation-Protected Bond Index Fund Investor Class (a) | | 11,070,084 | 103,837,384 |
| Spartan Long-Term Treasury Bond Index Fund Investor Class (a) | | 7,244,231 | 92,436,385 |
| Spartan U.S. Bond Index Fund Investor Class (a) | | 176,930,868 | 2,032,935,669 |
| TOTAL FIXED-INCOME FUNDS | | | |
| (Cost $2,323,940,974) | | | 2,303,116,073 |
|
| Money Market Funds - 7.5% | | | |
| Fidelity Institutional Prime Money Market Portfolio Class I 0.28% (a)(c) | | | |
| (Cost $463,644,497) | | 463,644,497 | 463,644,497 |
| TOTAL INVESTMENT PORTFOLIO - 100.0% | | | |
| (Cost $6,006,519,735) | | | 6,130,697,370 |
| NET OTHER ASSETS (LIABILITIES) - 0.0% | | | (1,040,074) |
| NET ASSETS - 100% | | | $6,129,657,296 |
Legend
(a) Affiliated Fund
(b) Non-income producing
(c) The rate quoted is the annualized seven-day yield of the fund at period end.
Affiliated Underlying Funds
Information regarding the Fund's fiscal year to date purchases and sales of the affiliated Underlying Funds and income earned by the Fund from investments in affiliated Underlying Funds is as follows:
(Fidelity Health Care Services Portfolio was formerly known as Fidelity Medical Delivery Portfolio and Fidelity Software and IT Services Portfolio was formerly known as Fidelity Software and Computer Services Portfolio)
| Affiliate | Value, beginning of period | Purchases | Sales Proceeds | Dividend Income | Value, end of period |
| Fidelity Air Transportation Portfolio | $14,033,803 | $799,419 | $3,800,000 | $23,482 | $9,262,502 |
| Fidelity Automotive Portfolio | 13,663,848 | 1,246,159 | 7,154,754 | 74,837 | 6,469,331 |
| Fidelity Banking Portfolio | 58,443,279 | 34,667,049 | 2,809,342 | 843,115 | 85,594,035 |
| Fidelity Biotechnology Portfolio | 82,496 | -- | 99,515 | -- | -- |
| Fidelity Blue Chip Growth Fund | 78,911,099 | 51,100,472 | 20,056,197 | 37,347 | 108,678,685 |
| Fidelity Blue Chip Value Fund | 14,525,539 | 38,431,974 | 430,092 | 747,096 | 50,999,832 |
| Fidelity Brokerage and Investment | 64,640,744 | 1,357,811 | 45,340,000 | 229,376 | 14,411,464 |
| Fidelity Canada Fund | 159,869 | -- | 154,550 | -- | -- |
| Fidelity Chemicals Portfolio | 46,192,682 | 15,653,013 | 19,358,631 | 494,045 | 37,983,812 |
| Fidelity China Region Fund | 1,563,244 | 13,001,183 | -- | 140,765 | 11,950,996 |
| Fidelity Communications Equipment Portfolio | 12,253,053 | 41,980 | 11,545,152 | 3,816 | -- |
| Fidelity Computers Portfolio | 89,364,757 | 6,345,948 | 62,938,045 | 363,005 | 22,816,977 |
| Fidelity Construction and Housing Portfolio | 30,118,536 | 7,993,605 | 500,000 | 147,136 | 38,625,226 |
| Fidelity Consumer Discretionary Portfolio | 147,770,012 | 34,746,457 | 14,758,390 | 847,195 | 169,442,046 |
| Fidelity Consumer Finance Portfolio | 6,618,628 | 397,821 | 3,350,000 | 54,645 | 3,103,656 |
| Fidelity Consumer Staples Portfolio | 170,760,736 | 49,386,639 | 50,577,238 | 2,443,182 | 160,136,675 |
| Fidelity Contrafund | -- | 71,927,337 | 3,191,044 | 203,133 | 68,386,975 |
| Fidelity Defense and Aerospace Portfolio | -- | 38,902,215 | -- | 200,687 | 37,175,626 |
| Fidelity Diversified International Fund | 243,174,845 | 183,690,636 | 89,836,156 | 3,345,356 | 338,225,463 |
| Fidelity Dividend Growth Fund | 173,358 | 14,803 | -- | 2,497 | 172,271 |
| Fidelity Electronics Portfolio | 43,560,401 | 11,927,836 | 22,604,629 | 290,331 | 27,604,565 |
| Fidelity Emerging Asia Fund | 34,128,365 | 21,013,963 | 2,445,061 | 203,158 | 46,376,813 |
| Fidelity Emerging Markets Fund | 49,977,814 | 21,558 | 39,494,118 | 21,558 | 4,283,885 |
| Fidelity Energy Portfolio | 56,470,073 | 48,141,896 | 683,989 | 873,575 | 83,220,015 |
| Fidelity Energy Service Portfolio | 25,298,308 | 16,515,562 | 22,475,391 | 114,740 | 11,903,027 |
| Fidelity Equity Dividend Income Fund | 14,973 | 47 | 15,245 | -- | -- |
| Fidelity Europe Fund | 86,588,307 | 20,144,089 | 72,806 | 1,244,992 | 107,632,829 |
| Fidelity Financial Services Portfolio | 164,157,468 | 13,205,838 | 19,137,539 | 1,351,341 | 148,547,857 |
| Fidelity Floating Rate High Income Fund | 32,985,781 | 1,331,220 | 483,451 | 1,331,220 | 32,122,729 |
| Fidelity Focused High Income Fund | 475,761 | 22,086 | -- | 22,086 | 466,598 |
| Fidelity Global Commodity Stock Fund | 58,425 | 1,178 | -- | 1,131 | 42,364 |
| Fidelity Gold Portfolio | 96,620 | -- | -- | -- | 79,341 |
| Fidelity Growth & Income Portfolio | 410,936 | -- | 420,594 | -- | -- |
| Fidelity Growth Company Fund | 191,703 | 7,809 | -- | -- | 206,713 |
| Fidelity Health Care Portfolio | 212,656,686 | 38,221,504 | 88,304,768 | -- | 157,801,720 |
| Fidelity Health Care Services Portfolio | 13,871,130 | 9,037,373 | 500,000 | 4,625 | 22,374,105 |
| Fidelity High Income Fund | 5,018,573 | 287,625 | -- | 287,625 | 4,747,519 |
| Fidelity Industrial Equipment Portfolio | 20,318,885 | 14,851,574 | 577,955 | 142,162 | 33,842,662 |
| Fidelity Industrials Portfolio | 86,134,465 | 44,204,267 | 20,876,361 | 698,798 | 100,736,644 |
| Fidelity Institutional Prime Money Market | 283,685,008 | 356,934,677 | 176,975,187 | 366,969 | 463,644,497 |
| Fidelity Insurance Portfolio | 34,576,188 | 32,992,181 | 480,000 | 645,372 | 65,956,537 |
| Fidelity International Capital Appreciation | 24,188,068 | 20,299 | 24,396,015 | 5,387 | 1,316,862 |
| Fidelity International Discovery Fund | 121,990,274 | 8,091,797 | 35,582,043 | 1,033,832 | 100,651,836 |
| Fidelity International Growth Fund | 5,310,374 | -- | 5,770,392 | -- | -- |
| Fidelity International Real Estate Fund | 155,686 | 4,441 | -- | 2,581 | 158,466 |
| Fidelity International Small Cap Fund | -- | 23,589,521 | 6,700,000 | 282,388 | 15,438,298 |
| Fidelity International Small Cap | 19,885,917 | 33,237,075 | 4,627,276 | 180,460 | 49,732,063 |
| Fidelity International Value Fund | 9,647,238 | 61,171 | 5,800,000 | 61,171 | 4,294,764 |
| Fidelity IT Services Portfolio | 329,674 | 44,722,989 | 9,200,000 | -- | 36,922,810 |
| Fidelity Japan Fund | 1,995,876 | 50,250,206 | -- | 291,730 | 50,245,967 |
| Fidelity Japan Smaller Companies Fund | 11,620,635 | 26,675,218 | -- | 251,881 | 39,529,567 |
| Fidelity Large Cap Stock Fund | 74,766,544 | 14,280,399 | 47,993,184 | 494,451 | 36,507,164 |
| Fidelity Latin America Fund | 16,892 | -- | 16,523 | -- | -- |
| Fidelity Leisure Portfolio | 2,691,760 | 76,673 | 2,000,000 | 10,135 | 789,702 |
| Fidelity Leveraged Company Stock Fund | 35,357 | -- | 36,839 | -- | -- |
| Fidelity Low-Priced Stock Fund | 56,651 | 44,393,923 | 12,748,240 | 376,698 | 31,042,654 |
| Fidelity Magellan Fund | 12,823 | 984 | -- | 76 | 13,343 |
| Fidelity Materials Portfolio | -- | 7,924,920 | 2,000,000 | 61,461 | 5,717,244 |
| Fidelity Medical Equipment and Systems | 7,281,737 | 35,318,388 | -- | 6,372 | 40,385,234 |
| Fidelity Mega Cap Stock Fund | 69,191,067 | 1,741,482 | 30,300,000 | 649,118 | 38,159,112 |
| Fidelity Mid Cap Value Fund | 38,929,241 | 48,454,203 | 46,751,851 | 740,041 | 36,114,586 |
| Fidelity Multimedia Portfolio | 28,241,741 | 468,463 | 28,301,894 | 5,341 | -- |
| Fidelity Nasdaq Composite Index Fund | 666,382 | 10,534 | -- | 5,926 | 711,818 |
| Fidelity Natural Gas Portfolio | 7,534,067 | 4,207 | 6,960,206 | 4,207 | -- |
| Fidelity New Markets Income Fund | 30,832,217 | 1,305,885 | 10,883,285 | 1,307,897 | 20,190,757 |
| Fidelity Nordic Fund | 15,834,294 | 229,391 | -- | 210,058 | 17,654,336 |
| Fidelity OTC Portfolio | 30,615,644 | 2,422,915 | 26,033,712 | -- | 8,568,139 |
| Fidelity Overseas Fund | 55,283,244 | 155,627,224 | -- | 1,993,562 | 214,102,961 |
| Fidelity Pacific Basin Fund | 9,473,038 | 3,638,363 | 3,600,000 | 120,859 | 9,228,168 |
| Fidelity Pharmaceuticals Portfolio | 35,366,779 | 7,666,294 | 6,000,000 | 268,206 | 35,592,219 |
| Fidelity Real Estate Income Fund | 16,098,595 | 876,316 | -- | 676,898 | 16,379,032 |
| Fidelity Real Estate Investment Portfolio | 23,039,479 | 22,164,172 | 12,181,598 | 487,307 | 31,435,595 |
| Fidelity Retailing Portfolio | 18,653,269 | 9,934,224 | 1,800,000 | 49,580 | 30,684,296 |
| Fidelity Select Money Market Portfolio 0.02% | 10,216,688 | 1,823 | 10,218,511 | 1,222 | -- |
| Fidelity Series Commodity Strategy Fund | 7,114 | -- | -- | -- | 5,316 |
| Fidelity Small Cap Discovery Fund | 1,045,800 | -- | 1,061,440 | -- | -- |
| Fidelity Small Cap Growth Fund | 99,836 | 4,387 | -- | -- | 105,618 |
| Fidelity Small Cap Stock Fund | 198,606 | 15,684,493 | -- | 49,876 | 14,380,585 |
| Fidelity Small Cap Value Fund | 208,583 | 21,253 | -- | 1,742 | 205,240 |
| Fidelity Software and IT Services Portfolio | 39,346,810 | 40,273,102 | 23,000,000 | 22,874 | 56,717,029 |
| Fidelity Stock Selector Large Cap Value Fund | 76,688,321 | 20,584,516 | 23,682,658 | 887,927 | 70,476,339 |
| Fidelity Technology Portfolio | 150,983,688 | 77,484,512 | 12,949,125 | 172,739 | 217,741,598 |
| Fidelity Telecom and Utilities Fund | 245,314 | -- | 242,671 | -- | -- |
| Fidelity Telecommunications Portfolio | 6,830,467 | 58,577,100 | 7,166,872 | 637,200 | 59,301,007 |
| Fidelity Transportation Portfolio | 26,227,422 | 163,030 | 23,548,764 | 21,121 | -- |
| Fidelity Utilities Portfolio | 30,036,219 | 9,953,739 | 22,408,623 | 410,339 | 14,461,606 |
| Fidelity Value Discovery Fund | 37,825,016 | 10,064,390 | 7,000,000 | 720,432 | 38,643,322 |
| Spartan 500 Index Fund Investor Class | 220,166 | 6,039 | -- | 4,634 | 223,048 |
| Spartan Inflation-Protected Bond Index Fund | -- | 105,903,396 | 112,128 | -- | 103,837,384 |
| Spartan International Index Fund Investor | 118,139,257 | 6,776,043 | 40,350,000 | 2,113,102 | 82,634,239 |
| Spartan Long-Term Treasury Bond Index Fund | 35,124,499 | 107,092,419 | 41,822,346 | 2,666,967 | 92,436,385 |
| Spartan U.S. Bond Index Fund Investor Class | 1,839,149,413 | 337,768,688 | 102,856,559 | 44,532,906 | 2,032,935,669 |
| | $5,175,464,180 | $2,512,117,411 | $1,377,548,955 | $79,621,102 | $6,130,697,370 |
Investment Valuation
All investments are categorized as Level 1 under the Fair Value Hierarchy. The inputs or methodology used for valuing securities may not be an indication of the risk associated with investing in those securities. For more information on valuation inputs please refer to the Investment Valuation section in the accompanying Notes to Financial Statements.
See accompanying notes which are an integral part of the financial statements.
VIP FundsManager® 50% Portfolio
Financial Statements
Statement of Assets and Liabilities
| | | December 31, 2015 |
| Assets | | |
| Investment in securities, at value (cost $6,006,519,735) — See accompanying schedule | | $6,130,697,370 |
| Receivable for investments sold | | 3,375,052 |
| Receivable for fund shares sold | | 1,727,553 |
| Total assets | | 6,135,799,975 |
| Liabilities | | |
| Payable to custodian bank | $849 | |
| Payable for investments purchased | 4,819,605 | |
| Payable for fund shares redeemed | 294,780 | |
| Accrued management fee | 1,016,968 | |
| Distribution and service plan fees payable | 10,477 | |
| Total liabilities | | 6,142,679 |
| Net Assets | | $6,129,657,296 |
| Net Assets consist of: | | |
| Paid in capital | | $5,938,263,415 |
| Accumulated undistributed net realized gain (loss) on investments | | 67,216,246 |
| Net unrealized appreciation (depreciation) on investments | | 124,177,635 |
| Net Assets | | $6,129,657,296 |
| Service Class: | | |
| Net Asset Value, offering price and redemption price per share ($64,201 ÷ 5,416 shares) | | $11.85 |
| Service Class 2: | | |
| Net Asset Value, offering price and redemption price per share ($83,447,268 ÷ 7,060,893 shares) | | $11.82 |
| Investor Class: | | |
| Net Asset Value, offering price and redemption price per share ($6,046,145,827 ÷ 510,160,119 shares) | | $11.85 |
See accompanying notes which are an integral part of the financial statements.
Statement of Operations
| | | Year ended December 31, 2015 |
| Investment Income | | |
| Income distributions from underlying funds | | $79,621,102 |
| Expenses | | |
| Management fee | $14,300,336 | |
| Distribution and service plan fees | 220,103 | |
| Independent trustees' compensation | 22,874 | |
| Total expenses before reductions | 14,543,313 | |
| Expense reductions | (2,955,052) | 11,588,261 |
| Net investment income (loss) | | 68,032,841 |
| Realized and Unrealized Gain (Loss) | | |
| Realized gain (loss) on sale of underlying fund shares | (12,516,740) | |
| Capital gain distributions from underlying funds | 102,639,432 | |
| Total net realized gain (loss) | | 90,122,692 |
| Change in net unrealized appreciation (depreciation) on underlying funds | | (166,818,526) |
| Net gain (loss) | | (76,695,834) |
| Net increase (decrease) in net assets resulting from operations | | $(8,662,993) |
See accompanying notes which are an integral part of the financial statements.
Statement of Changes in Net Assets
| | Year ended December 31, 2015 | Year ended December 31, 2014 |
| Increase (Decrease) in Net Assets | | |
| Operations | | |
| Net investment income (loss) | $68,032,841 | $58,874,202 |
| Net realized gain (loss) | 90,122,692 | 197,626,716 |
| Change in net unrealized appreciation (depreciation) | (166,818,526) | (43,354,982) |
| Net increase (decrease) in net assets resulting from operations | (8,662,993) | 213,145,936 |
| Distributions to shareholders from net investment income | (69,982,049) | (58,382,359) |
| Distributions to shareholders from net realized gain | (180,001,166) | (39,928,984) |
| Total distributions | (249,983,215) | (98,311,343) |
| Share transactions - net increase (decrease) | 1,213,704,685 | 1,651,229,085 |
| Total increase (decrease) in net assets | 955,058,477 | 1,766,063,678 |
| Net Assets | | |
| Beginning of period | 5,174,598,819 | 3,408,535,141 |
| End of period (including undistributed net investment income of $0 and $491,843, respectively) | $6,129,657,296 | $5,174,598,819 |
See accompanying notes which are an integral part of the financial statements.
Financial Highlights — VIP FundsManager 50% Portfolio Service Class
| | | | | |
| Years ended December 31, | 2015 | 2014 | 2013 | 2012 | 2011 |
| Selected Per–Share Data | | | | | |
| Net asset value, beginning of period | $12.39 | $12.01 | $10.62 | $9.78 | $10.02 |
| Income from Investment Operations | | | | | |
| Net investment income (loss)A | .15 | .17 | .15 | .18 | .19 |
| Net realized and unrealized gain (loss) | (.13) | .45 | 1.42 | .82 | (.23) |
| Total from investment operations | .02 | .62 | 1.57 | 1.00 | (.04) |
| Distributions from net investment income | (.14) | (.14) | (.12) | (.13) | (.18) |
| Distributions from net realized gain | (.42) | (.10) | (.07) | (.03) | (.02) |
| Total distributions | (.56) | (.24) | (.18)B | (.16) | (.20) |
| Net asset value, end of period | $11.85 | $12.39 | $12.01 | $10.62 | $9.78 |
| Total ReturnC,D | .06% | 5.18% | 14.79% | 10.24% | (.42)% |
| Ratios to Average Net AssetsE,F | | | | | |
| Expenses before reductions | .35% | .35% | .35% | .35% | .35% |
| Expenses net of fee waivers, if any | .20% | .20% | .20% | .20% | .20% |
| Expenses net of all reductions | .20% | .20% | .20% | .20% | .20% |
| Net investment income (loss) | 1.19% | 1.38% | 1.33% | 1.77% | 1.84% |
| Supplemental Data | | | | | |
| Net assets, end of period (000 omitted) | $64 | $73 | $80 | $72 | $59 |
| Portfolio turnover rateE | 24% | 25% | 15% | 15% | 14% |
A Calculated based on average shares outstanding during the period.
B Total distributions of $.18 per share is comprised of distributions from net investment income of $.115 and distributions from net realized gain of $.065 per share.
C Total returns do not reflect charges attributable to your insurance company's separate account. Inclusion of these charges would reduce the total returns shown.
D Total returns would have been lower if certain expenses had not been reduced during the applicable periods shown.
E Amounts do not include the activity of the Underlying Funds.
F Expense ratios reflect operating expenses of the class. Expenses before reductions do not reflect amounts reimbursed by the investment adviser or reductions from expense offset arrangements and do not represent the amount paid by the class during periods when reimbursements or reductions occur. Expenses net of fee waivers reflect expenses after reimbursement by the investment adviser but prior to reductions from expense offset arrangements. Expenses net of all reductions represent the net expenses paid by the class but do not include expenses of the underlying funds in which the Fund invests.
See accompanying notes which are an integral part of the financial statements.
Financial Highlights — VIP FundsManager 50% Portfolio Service Class 2
| | | | | |
| Years ended December 31, | 2015 | 2014 | 2013 | 2012 | 2011 |
| Selected Per–Share Data | | | | | |
| Net asset value, beginning of period | $12.35 | $11.98 | $10.59 | $9.75 | $10.01 |
| Income from Investment Operations | | | | | |
| Net investment income (loss)A | .13 | .15 | .13 | .17 | .17 |
| Net realized and unrealized gain (loss) | (.12) | .44 | 1.42 | .82 | (.24) |
| Total from investment operations | .01 | .59 | 1.55 | .99 | (.07) |
| Distributions from net investment income | (.12) | (.12) | (.10) | (.12) | (.17) |
| Distributions from net realized gain | (.42) | (.10) | (.07) | (.03) | (.02) |
| Total distributions | (.54) | (.22) | (.16)B | (.15) | (.19) |
| Net asset value, end of period | $11.82 | $12.35 | $11.98 | $10.59 | $9.75 |
| Total ReturnC,D | (.02)% | 4.95% | 14.66% | 10.12% | (.68)% |
| Ratios to Average Net AssetsE,F | | | | | |
| Expenses before reductions | .50% | .50% | .50% | .50% | .50% |
| Expenses net of fee waivers, if any | .35% | .35% | .35% | .35% | .35% |
| Expenses net of all reductions | .35% | .35% | .35% | .35% | .35% |
| Net investment income (loss) | 1.04% | 1.23% | 1.18% | 1.62% | 1.69% |
| Supplemental Data | | | | | |
| Net assets, end of period (000 omitted) | $83,447 | $88,771 | $89,164 | $81,647 | $17,800 |
| Portfolio turnover rateE | 24% | 25% | 15% | 15% | 14% |
A Calculated based on average shares outstanding during the period.
B Total distributions of $.16 per share is comprised of distributions from net investment income of $.097 and distributions from net realized gain of $.065 per share.
C Total returns do not reflect charges attributable to your insurance company's separate account. Inclusion of these charges would reduce the total returns shown.
D Total returns would have been lower if certain expenses had not been reduced during the applicable periods shown.
E Amounts do not include the activity of the Underlying Funds.
F Expense ratios reflect operating expenses of the class. Expenses before reductions do not reflect amounts reimbursed by the investment adviser or reductions from expense offset arrangements and do not represent the amount paid by the class during periods when reimbursements or reductions occur. Expenses net of fee waivers reflect expenses after reimbursement by the investment adviser but prior to reductions from expense offset arrangements. Expenses net of all reductions represent the net expenses paid by the class but do not include expenses of the underlying funds in which the Fund invests.
See accompanying notes which are an integral part of the financial statements.
Financial Highlights — VIP FundsManager 50% Portfolio Investor Class
| | | | | |
| Years ended December 31, | 2015 | 2014 | 2013 | 2012 | 2011 |
| Selected Per–Share Data | | | | | |
| Net asset value, beginning of period | $12.38 | $12.01 | $10.61 | $9.78 | $10.02 |
| Income from Investment Operations | | | | | |
| Net investment income (loss)A | .15 | .17 | .15 | .18 | .19 |
| Net realized and unrealized gain (loss) | (.12) | .44 | 1.43 | .81 | (.23) |
| Total from investment operations | .03 | .61 | 1.58 | .99 | (.04) |
| Distributions from net investment income | (.14) | (.14) | (.12) | (.13) | (.18) |
| Distributions from net realized gain | (.42) | (.10) | (.07) | (.03) | (.02) |
| Total distributions | (.56) | (.24) | (.18)B | (.16) | (.20) |
| Net asset value, end of period | $11.85 | $12.38 | $12.01 | $10.61 | $9.78 |
| Total ReturnC,D | .14% | 5.10% | 14.90% | 10.13% | (.42)% |
| Ratios to Average Net AssetsE,F | | | | | |
| Expenses before reductions | .25% | .25% | .25% | .25% | .25% |
| Expenses net of fee waivers, if any | .20% | .20% | .20% | .20% | .20% |
| Expenses net of all reductions | .20% | .20% | .20% | .20% | .20% |
| Net investment income (loss) | 1.19% | 1.38% | 1.33% | 1.77% | 1.84% |
| Supplemental Data | | | | | |
| Net assets, end of period (000 omitted) | $6,046,146 | $5,085,755 | $3,319,291 | $1,347,437 | $747,577 |
| Portfolio turnover rateE | 24% | 25% | 15% | 15% | 14% |
A Calculated based on average shares outstanding during the period.
B Total distributions of $.18 per share is comprised of distributions from net investment income of $.115 and distributions from net realized gain of $.065 per share.
C Total returns do not reflect charges attributable to your insurance company's separate account. Inclusion of these charges would reduce the total returns shown.
D Total returns would have been lower if certain expenses had not been reduced during the applicable periods shown.
E Amounts do not include the activity of the Underlying Funds.
F Expense ratios reflect operating expenses of the class. Expenses before reductions do not reflect amounts reimbursed by the investment adviser or reductions from expense offset arrangements and do not represent the amount paid by the class during periods when reimbursements or reductions occur. Expenses net of fee waivers reflect expenses after reimbursement by the investment adviser but prior to reductions from expense offset arrangements. Expenses net of all reductions represent the net expenses paid by the class but do not include expenses of the underlying funds in which the Fund invests.
See accompanying notes which are an integral part of the financial statements.
VIP FundsManager® 60% Portfolio
Investment Summary (Unaudited)
The information in the following tables is based on the direct investments of the Fund.
Fund Holdings as of December 31, 2015
| | % of fund's net assets | % of fund's net assets 6 months ago |
| Domestic Equity Funds | | |
| Fidelity Air Transportation Portfolio | 0.2 | 0.2 |
| Fidelity Automotive Portfolio | 0.1 | 0.2 |
| Fidelity Banking Portfolio | 2.2 | 2.3 |
| Fidelity Blue Chip Growth Fund | 0.9 | 0.5 |
| Fidelity Blue Chip Value Fund | 0.5 | 0.2 |
| Fidelity Brokerage and Investment Management Portfolio | 0.1 | 0.7 |
| Fidelity Chemicals Portfolio | 0.8 | 1.1 |
| Fidelity Computers Portfolio | 0.4 | 1.3 |
| Fidelity Construction and Housing Portfolio | 0.9 | 0.9 |
| Fidelity Consumer Discretionary Portfolio | 3.7 | 4.0 |
| Fidelity Consumer Finance Portfolio | 0.0 | 0.1 |
| Fidelity Consumer Staples Portfolio | 3.4 | 3.2 |
| Fidelity Contrafund | 1.1 | 0.0 |
| Fidelity Defense and Aerospace Portfolio | 0.6 | 0.2 |
| Fidelity Dividend Growth Fund | 0.0 | 0.0 |
| Fidelity Electronics Portfolio | 0.5 | 1.2 |
| Fidelity Energy Portfolio | 1.9 | 1.8 |
| Fidelity Energy Service Portfolio | 0.2 | 0.7 |
| Fidelity Financial Services Portfolio | 3.6 | 4.3 |
| Fidelity Global Commodity Stock Fund | 0.0 | 0.0 |
| Fidelity Gold Portfolio | 0.0 | 0.0 |
| Fidelity Health Care Portfolio | 3.5 | 5.2 |
| Fidelity Health Care Services Portfolio | 0.4 | 0.1 |
| Fidelity Industrial Equipment Portfolio | 0.7 | 0.5 |
| Fidelity Industrials Portfolio | 2.3 | 2.3 |
| Fidelity Insurance Portfolio | 1.1 | 0.9 |
| Fidelity IT Services Portfolio | 0.7 | 0.5 |
| Fidelity Large Cap Stock Fund | 0.7 | 0.8 |
| Fidelity Leisure Portfolio | 0.1 | 0.2 |
| Fidelity Low-Priced Stock Fund | 0.4 | 0.0 |
| Fidelity Magellan Fund | 0.0 | 0.0 |
| Fidelity Materials Portfolio | 0.1 | 0.0 |
| Fidelity Medical Equipment and Systems Portfolio | 0.7 | 0.3 |
| Fidelity Mega Cap Stock Fund | 0.3 | 0.3 |
| Fidelity Mid Cap Value Fund | 0.2 | 0.1 |
| Fidelity OTC Portfolio | 0.2 | 0.4 |
| Fidelity Pharmaceuticals Portfolio | 0.9 | 1.1 |
| Fidelity Real Estate Investment Portfolio | 0.4 | 0.4 |
| Fidelity Retailing Portfolio | 0.7 | 0.7 |
| Fidelity Series Commodity Strategy Fund | 0.0 | 0.0 |
| Fidelity Small Cap Growth Fund | 0.0 | 0.0 |
| Fidelity Small Cap Stock Fund | 0.2 | 0.2 |
| Fidelity Small Cap Value Fund | 0.0 | 0.0 |
| Fidelity Software and IT Services Portfolio | 1.3 | 0.3 |
| Fidelity Stock Selector All Cap Fund | 0.0 | 0.0 |
| Fidelity Stock Selector Large Cap Value Fund | 0.7 | 0.6 |
| Fidelity Technology Portfolio | 5.2 | 4.4 |
| Fidelity Telecommunications Portfolio | 1.2 | 0.0 |
| Fidelity Utilities Portfolio | 0.4 | 0.4 |
| Fidelity Value Discovery Fund | 0.3 | 0.2 |
| Spartan 500 Index Fund Investor Class | 0.0 | 0.0 |
| Fidelity Communications Equipment Portfolio | 0.0 | 0.2 |
| Fidelity Multimedia Portfolio | 0.0 | 0.4 |
| Fidelity Natural Gas Portfolio | 0.0 | 0.1 |
| Fidelity Transportation Portfolio | 0.0 | 0.2 |
| | 43.8 | 43.7 |
| International Equity Funds | | |
| Fidelity China Region Fund | 0.1 | 0.3 |
| Fidelity Diversified International Fund | 7.3 | 9.7 |
| Fidelity Emerging Asia Fund | 0.7 | 1.0 |
| Fidelity Emerging Markets Fund | 0.0 | 0.4 |
| Fidelity Europe Fund | 1.1 | 1.0 |
| Fidelity International Discovery Fund | 1.9 | 1.8 |
| Fidelity International Real Estate Fund | 0.0 | 0.0 |
| Fidelity International Small Cap Fund | 0.3 | 0.2 |
| Fidelity International Small Cap Opportunities Fund | 0.9 | 0.6 |
| Fidelity International Value Fund | 0.1 | 0.2 |
| Fidelity Japan Fund | 0.7 | 0.6 |
| Fidelity Japan Smaller Companies Fund | 0.6 | 0.5 |
| Fidelity Nordic Fund | 0.4 | 0.4 |
| Fidelity Overseas Fund | 4.9 | 3.4 |
| Fidelity Pacific Basin Fund | 0.4 | 0.7 |
| Spartan International Index Fund Investor Class | 1.4 | 2.3 |
| Fidelity International Capital Appreciation Fund | 0.0 | 0.5 |
| Fidelity International Growth Fund | 0.0 | 0.2 |
| | 20.8 | 23.8 |
| Fixed-Income Funds | | |
| Fidelity Floating Rate High Income Fund | 0.6 | 0.6 |
| Fidelity Focused High Income Fund | 0.0 | 0.0 |
| Fidelity High Income Fund | 0.1 | 0.1 |
| Fidelity New Markets Income Fund | 0.4 | 0.4 |
| Fidelity Real Estate Income Fund | 0.3 | 0.3 |
| Spartan Inflation-Protected Bond Index Fund Investor Class | 1.5 | 0.0 |
| Spartan Long-Term Treasury Bond Index Fund Investor Class | 1.4 | 1.8 |
| Spartan U.S. Bond Index Fund Investor Class | 28.7 | 27.1 |
| | 33.0 | 30.3 |
| Money Market Funds | | |
| Fidelity Institutional Prime Money Market Portfolio Class I 0.28% | 2.4 | 2.2 |
| Net Other Assets (Liabilities) | 0.0 | 0.0 |
| | 100.0 | 100.0 |
Fidelity Health Care Services Portfolio was formerly known as Fidelity Medical Delivery Portfolio and
Fidelity Software and IT Services Portfolio was formerly known as Fidelity Software and Computer Services Portfolio
Asset Allocation (% of fund's net assets)
| As of December 31, 2015 |
| | Domestic Equity Funds | 43.8% |
| | International Equity Funds | 20.8% |
| | Fixed-Income Funds | 33.0% |
| | Money Market Funds | 2.4% |

| As of June 30, 2015 |
| | Domestic Equity Funds | 43.7% |
| | International Equity Funds | 23.8% |
| | Fixed-Income Funds | 30.3% |
| | Money Market Funds | 2.2% |

Percentages shown as 0.0% may reflect amounts less than 0.05%.
VIP FundsManager® 60% Portfolio
Investments December 31, 2015
Showing Percentage of Net Assets
| Equity Funds - 64.6% | | | |
| | | Shares | Value |
| Domestic Equity Funds - 43.8% | | | |
| Fidelity Air Transportation Portfolio (a) | | 220,346 | $13,725,321 |
| Fidelity Automotive Portfolio (a) | | 196,464 | 7,805,525 |
| Fidelity Banking Portfolio (a) | | 5,827,026 | 149,055,336 |
| Fidelity Blue Chip Growth Fund (a) | | 935,966 | 64,553,577 |
| Fidelity Blue Chip Value Fund (a) | | 2,374,397 | 37,254,283 |
| Fidelity Brokerage and Investment Management Portfolio (a) | | 121,047 | 7,759,106 |
| Fidelity Chemicals Portfolio (a) | | 446,253 | 58,369,909 |
| Fidelity Computers Portfolio (a) | | 385,503 | 26,302,858 |
| Fidelity Construction and Housing Portfolio (a) | | 1,052,952 | 61,113,323 |
| Fidelity Consumer Discretionary Portfolio (a) | | 7,377,952 | 252,104,622 |
| Fidelity Consumer Finance Portfolio (a) | | 256,486 | 3,121,435 |
| Fidelity Consumer Staples Portfolio (a) | | 2,539,028 | 231,762,488 |
| Fidelity Contrafund (a) | | 799,842 | 79,144,355 |
| Fidelity Defense and Aerospace Portfolio (a) | | 368,856 | 42,414,711 |
| Fidelity Dividend Growth Fund (a) | | 2,670 | 80,881 |
| Fidelity Electronics Portfolio (a) | | 454,322 | 34,342,184 |
| Fidelity Energy Portfolio (a) | | 3,665,597 | 128,919,047 |
| Fidelity Energy Service Portfolio (a) | | 325,355 | 13,352,567 |
| Fidelity Financial Services Portfolio (a) | | 2,954,219 | 248,213,518 |
| Fidelity Global Commodity Stock Fund (a) | | 14,376 | 126,363 |
| Fidelity Gold Portfolio (a)(b) | | 28,629 | 386,492 |
| Fidelity Health Care Portfolio (a) | | 1,151,352 | 239,665,518 |
| Fidelity Health Care Services Portfolio (a) | | 310,698 | 26,229,149 |
| Fidelity Industrial Equipment Portfolio (a) | | 1,283,146 | 46,809,163 |
| Fidelity Industrials Portfolio (a) | | 5,333,569 | 155,793,541 |
| Fidelity Insurance Portfolio (a) | | 1,110,101 | 75,120,539 |
| Fidelity IT Services Portfolio (a) | | 1,162,917 | 46,481,797 |
| Fidelity Large Cap Stock Fund (a) | | 1,714,348 | 44,795,923 |
| Fidelity Leisure Portfolio (a) | | 48,979 | 6,364,294 |
| Fidelity Low-Priced Stock Fund (a) | | 565,848 | 27,019,263 |
| Fidelity Magellan Fund (a) | | 745 | 66,668 |
| Fidelity Materials Portfolio (a) | | 105,148 | 7,218,422 |
| Fidelity Medical Equipment and Systems Portfolio (a) | | 1,386,013 | 49,716,300 |
| Fidelity Mega Cap Stock Fund (a) | | 1,297,826 | 20,272,043 |
| Fidelity Mid Cap Value Fund (a) | | 540,150 | 12,066,946 |
| Fidelity OTC Portfolio (a) | | 151,896 | 12,672,706 |
| Fidelity Pharmaceuticals Portfolio (a) | | 3,168,217 | 65,170,232 |
| Fidelity Real Estate Investment Portfolio (a) | | 754,617 | 30,622,375 |
| Fidelity Retailing Portfolio (a) | | 482,106 | 50,722,386 |
| Fidelity Series Commodity Strategy Fund (a)(b) | | 1,149 | 5,609 |
| Fidelity Small Cap Growth Fund (a) | | 13,215 | 247,118 |
| Fidelity Small Cap Stock Fund (a) | | 962,146 | 16,712,482 |
| Fidelity Small Cap Value Fund (a) | | 17,333 | 290,157 |
| Fidelity Software and IT Services Portfolio (a) | | 723,246 | 87,809,252 |
| Fidelity Stock Selector All Cap Fund (a) | | 5,612 | 188,234 |
| Fidelity Stock Selector Large Cap Value Fund (a) | | 2,782,055 | 45,291,854 |
| Fidelity Technology Portfolio (a) | | 3,043,225 | 359,374,491 |
| Fidelity Telecommunications Portfolio (a) | | 1,326,229 | 80,289,885 |
| Fidelity Utilities Portfolio (a) | | 458,994 | 29,449,054 |
| Fidelity Value Discovery Fund (a) | | 801,723 | 18,519,807 |
| Spartan 500 Index Fund Investor Class (a) | | 2,453 | 176,093 |
|
| TOTAL DOMESTIC EQUITY FUNDS | | | 3,015,069,202 |
|
| International Equity Funds - 20.8% | | | |
| Fidelity China Region Fund (a) | | 197,896 | 5,030,513 |
| Fidelity Diversified International Fund (a) | | 14,268,571 | 500,256,086 |
| Fidelity Emerging Asia Fund (a) | | 1,524,537 | 45,751,359 |
| Fidelity Emerging Markets Fund (a) | | 35,786 | 778,337 |
| Fidelity Europe Fund (a) | | 2,028,649 | 73,376,220 |
| Fidelity International Discovery Fund (a) | | 3,322,034 | 130,921,373 |
| Fidelity International Real Estate Fund (a) | | 20,219 | 202,590 |
| Fidelity International Small Cap Fund (a) | | 951,946 | 21,057,050 |
| Fidelity International Small Cap Opportunities Fund (a) | | 4,214,264 | 62,876,817 |
| Fidelity International Value Fund (a) | | 514,299 | 4,129,818 |
| Fidelity Japan Fund (a) | | 3,874,524 | 45,758,125 |
| Fidelity Japan Smaller Companies Fund (a) | | 3,149,974 | 43,595,638 |
| Fidelity Nordic Fund (a) | | 588,240 | 27,570,823 |
| Fidelity Overseas Fund (a) | | 8,322,170 | 340,043,852 |
| Fidelity Pacific Basin Fund (a) | | 1,181,591 | 31,099,487 |
| Spartan International Index Fund Investor Class (a) | | 2,642,054 | 94,928,995 |
|
| TOTAL INTERNATIONAL EQUITY FUNDS | | | 1,427,377,083 |
|
| TOTAL EQUITY FUNDS | | | |
| (Cost $3,802,262,002) | | | 4,442,446,285 |
|
| Fixed-Income Funds - 33.0% | | | |
| Fidelity Floating Rate High Income Fund (a) | | 4,486,646 | 40,963,078 |
| Fidelity Focused High Income Fund (a) | | 93,094 | 745,686 |
| Fidelity High Income Fund (a) | | 906,763 | 7,208,765 |
| Fidelity New Markets Income Fund (a) | | 1,615,249 | 23,453,410 |
| Fidelity Real Estate Income Fund (a) | | 1,985,275 | 22,314,496 |
| Spartan Inflation-Protected Bond Index Fund Investor Class (a) | | 11,153,338 | 104,618,313 |
| Spartan Long-Term Treasury Bond Index Fund Investor Class (a) | | 7,271,861 | 92,788,952 |
| Spartan U.S. Bond Index Fund Investor Class (a) | | 171,997,960 | 1,976,256,563 |
| TOTAL FIXED-INCOME FUNDS | | | |
| (Cost $2,266,051,946) | | | 2,268,349,263 |
|
| Money Market Funds - 2.4% | | | |
| Fidelity Institutional Prime Money Market Portfolio Class I 0.28% (a)(c) | | | |
| (Cost $166,740,668) | | 166,740,668 | 166,740,668 |
| TOTAL INVESTMENT PORTFOLIO - 100.0% | | | |
| (Cost $6,235,054,616) | | | 6,877,536,216 |
| NET OTHER ASSETS (LIABILITIES) - 0.0% | | | (1,211,829) |
| NET ASSETS - 100% | | | $6,876,324,387 |
Legend
(a) Affiliated Fund
(b) Non-income producing
(c) The rate quoted is the annualized seven-day yield of the fund at period end.
Affiliated Underlying Funds
Information regarding the Fund's fiscal year to date purchases and sales of the affiliated Underlying Funds and income earned by the Fund from investments in affiliated Underlying Funds is as follows:
(Fidelity Health Care Services Portfolio was formerly known as Fidelity Medical Delivery Portfolio and Fidelity Software and IT Services Portfolio was formerly known as Fidelity Software and Computer Services Portfolio)
| Affiliate | Value, beginning of period | Purchases | Sales Proceeds | Dividend Income | Value, end of period |
| Fidelity Air Transportation Portfolio | $19,342,093 | $1,196,576 | $4,200,000 | $35,925 | $13,725,321 |
| Fidelity Automotive Portfolio | 15,571,453 | 1,339,434 | 7,987,706 | 85,895 | 7,805,525 |
| Fidelity Banking Portfolio | 151,614,028 | 13,795,779 | 8,713,500 | 1,589,570 | 149,055,336 |
| Fidelity Biotechnology Portfolio | 489,424 | -- | 590,396 | -- | -- |
| Fidelity Blue Chip Growth Fund | 46,320,409 | 42,399,398 | 23,750,503 | 20,235 | 64,553,577 |
| Fidelity Blue Chip Value Fund | 7,283,246 | 33,173,448 | 2,181,622 | 577,572 | 37,254,283 |
| Fidelity Brokerage and Investment | 52,970,970 | 840,459 | 39,405,038 | 137,135 | 7,759,106 |
| Fidelity Canada Fund | 141,644 | -- | 136,932 | -- | -- |
| Fidelity Chemicals Portfolio | 81,563,050 | 15,118,458 | 30,589,533 | 798,447 | 58,369,909 |
| Fidelity China Region Fund | 13,952,676 | 4,558,113 | 10,548,301 | 59,252 | 5,030,513 |
| Fidelity Communications Equipment Portfolio | 17,337,152 | 65,886 | 16,307,968 | 5,990 | -- |
| Fidelity Computers Portfolio | 143,066,671 | 5,642,194 | 110,279,458 | 467,110 | 26,302,858 |
| Fidelity Construction and Housing Portfolio | 55,017,119 | 8,945,916 | 4,800,000 | 235,492 | 61,113,323 |
| Fidelity Consumer Discretionary Portfolio | 243,937,218 | 38,863,476 | 34,429,294 | 1,287,197 | 252,104,622 |
| Fidelity Consumer Finance Portfolio | 10,722,560 | 505,615 | 7,440,000 | 50,965 | 3,121,435 |
| Fidelity Consumer Staples Portfolio | 278,534,436 | 52,608,853 | 84,774,539 | 3,595,051 | 231,762,488 |
| Fidelity Contrafund | 169,259 | 80,858,265 | 1,550,224 | 238,042 | 79,144,355 |
| Fidelity Defense and Aerospace Portfolio | -- | 44,413,650 | -- | 236,092 | 42,414,711 |
| Fidelity Diversified International Fund | 365,344,082 | 355,215,718 | 217,984,851 | 5,081,286 | 500,256,086 |
| Fidelity Dividend Growth Fund | 81,392 | 6,950 | -- | 1,172 | 80,881 |
| Fidelity Electronics Portfolio | 77,196,627 | 10,532,038 | 45,500,000 | 372,020 | 34,342,184 |
| Fidelity Emerging Asia Fund | 54,499,269 | 11,884,449 | 13,817,727 | 201,055 | 45,751,359 |
| Fidelity Emerging Europe, Middle East, | 601,148 | -- | 636,510 | -- | -- |
| Fidelity Emerging Markets Discovery Fund | 85,477 | -- | 86,505 | -- | -- |
| Fidelity Emerging Markets Fund | 37,428,113 | 3,917 | 33,796,887 | 3,917 | 778,337 |
| Fidelity Energy Portfolio | 98,588,012 | 65,618,929 | 2,246,217 | 1,372,252 | 128,919,047 |
| Fidelity Energy Service Portfolio | 44,946,363 | 11,442,454 | 33,296,735 | 128,712 | 13,352,567 |
| Fidelity Equity Dividend Income Fund | 142,536 | 447 | 145,128 | -- | -- |
| Fidelity Europe Fund | 37,608,202 | 37,112,180 | 38,571 | 848,745 | 73,376,220 |
| Fidelity Financial Services Portfolio | 291,238,067 | 12,911,848 | 39,592,582 | 2,259,408 | 248,213,518 |
| Fidelity Floating Rate High Income Fund | 42,923,786 | 1,698,966 | 1,477,833 | 1,698,966 | 40,963,078 |
| Fidelity Focused High Income Fund | 760,330 | 35,296 | -- | 35,296 | 745,686 |
| Fidelity Fund | 97,564 | -- | 102,049 | -- | -- |
| Fidelity Global Commodity Stock Fund | 174,270 | 3,513 | -- | 3,373 | 126,363 |
| Fidelity Gold Portfolio | 470,661 | -- | -- | -- | 386,492 |
| Fidelity Growth & Income Portfolio | 1,038,933 | -- | 1,063,350 | -- | -- |
| Fidelity Growth Company Fund | 4,329,177 | 6,860 | 4,532,742 | -- | -- |
| Fidelity Growth Discovery Fund | 11,404,528 | -- | 11,379,544 | -- | -- |
| Fidelity Health Care Portfolio | 356,158,155 | 43,731,875 | 154,278,963 | -- | 239,665,518 |
| Fidelity Health Care Services Portfolio | 3,796,276 | 24,796,214 | 500,000 | 5,491 | 26,229,149 |
| Fidelity High Income Fund | 7,620,339 | 436,740 | -- | 436,740 | 7,208,765 |
| Fidelity Industrial Equipment Portfolio | 39,988,029 | 12,233,468 | 4,129,564 | 221,200 | 46,809,163 |
| Fidelity Industrials Portfolio | 147,959,049 | 55,965,520 | 33,993,188 | 1,063,920 | 155,793,541 |
| Fidelity Institutional Prime Money Market | 30,780,345 | 287,524,532 | 151,564,209 | 135,306 | 166,740,668 |
| Fidelity Insurance Portfolio | 64,564,278 | 11,590,691 | 900,000 | 785,142 | 75,120,539 |
| Fidelity International Capital Appreciation | 80,905,801 | -- | 85,453,754 | -- | -- |
| Fidelity International Discovery Fund | 132,436,203 | 14,843,871 | 22,506,790 | 1,344,742 | 130,921,373 |
| Fidelity International Growth Fund | 19,401,332 | -- | 21,209,018 | -- | -- |
| Fidelity International Real Estate Fund | 199,036 | 5,677 | -- | 3,300 | 202,590 |
| Fidelity International Small Cap Fund | -- | 30,636,690 | 7,700,000 | 366,589 | 21,057,050 |
| Fidelity International Small Cap | 28,373,457 | 38,640,258 | 5,832,336 | 247,840 | 62,876,817 |
| Fidelity International Value Fund | 21,779,575 | 58,821 | 19,040,000 | 58,821 | 4,129,818 |
| Fidelity IT Services Portfolio | 192,761 | 59,270,879 | 13,564,634 | -- | 46,481,797 |
| Fidelity Japan Fund | 354,586 | 47,526,334 | -- | 265,673 | 45,758,125 |
| Fidelity Japan Smaller Companies Fund | 20,085,340 | 21,228,590 | -- | 281,897 | 43,595,638 |
| Fidelity Large Cap Stock Fund | 68,266,698 | 16,409,356 | 35,386,776 | 583,699 | 44,795,923 |
| Fidelity Latin America Fund | 93,973 | -- | 91,919 | -- | -- |
| Fidelity Leisure Portfolio | 13,490,235 | 490,568 | 7,700,000 | 76,742 | 6,364,294 |
| Fidelity Leveraged Company Stock Fund | -- | -- | -- | -- | -- |
| Fidelity Low-Priced Stock Fund | -- | 43,607,784 | 16,320,000 | 324,437 | 27,019,263 |
| Fidelity Magellan Fund | 64,070 | 4,918 | -- | 380 | 66,668 |
| Fidelity Materials Portfolio | -- | 7,610,717 | -- | 77,599 | 7,218,422 |
| Fidelity Medical Equipment and Systems | 11,593,811 | 40,787,048 | -- | 7,932 | 49,716,300 |
| Fidelity Mega Cap Stock Fund | 20,567,174 | 817,962 | -- | 310,210 | 20,272,043 |
| Fidelity Mid Cap Value Fund | 10,192,924 | 43,294,126 | 39,958,001 | 407,527 | 12,066,946 |
| Fidelity Multimedia Portfolio | 39,989,916 | 504,873 | 39,780,965 | 5,762 | -- |
| Fidelity Natural Gas Portfolio | 12,002,025 | 24,471 | 10,721,279 | 24,471 | -- |
| Fidelity New Markets Income Fund | 35,437,824 | 1,500,958 | 12,239,126 | 1,500,945 | 23,453,410 |
| Fidelity Nordic Fund | 32,523,084 | 358,240 | 8,000,000 | 328,048 | 27,570,823 |
| Fidelity OTC Portfolio | 26,269,717 | 2,048,299 | 16,797,876 | -- | 12,672,706 |
| Fidelity Overseas Fund | 185,415,776 | 142,656,840 | -- | 3,152,819 | 340,043,852 |
| Fidelity Pacific Basin Fund | 42,210,965 | 1,477,310 | 12,450,000 | 407,301 | 31,099,487 |
| Fidelity Pharmaceuticals Portfolio | 79,689,802 | 8,662,375 | 22,500,000 | 520,024 | 65,170,232 |
| Fidelity Real Estate Income Fund | 21,932,434 | 1,193,876 | -- | 922,193 | 22,314,496 |
| Fidelity Real Estate Investment Portfolio | 29,301,622 | 17,752,321 | 14,879,259 | 503,889 | 30,622,375 |
| Fidelity Retailing Portfolio | 38,923,561 | 6,455,650 | 1,900,000 | 87,074 | 50,722,386 |
| Fidelity Series Commodity Strategy Fund | 7,506 | -- | -- | -- | 5,609 |
| Fidelity Small Cap Discovery Fund | 1,202,794 | -- | 1,220,782 | -- | -- |
| Fidelity Small Cap Growth Fund | 233,588 | 10,264 | -- | -- | 247,118 |
| Fidelity Small Cap Stock Fund | -- | 18,867,726 | -- | 64,507 | 16,712,482 |
| Fidelity Small Cap Value Fund | 294,883 | 30,047 | -- | 2,463 | 290,157 |
| Fidelity Software and IT Services Portfolio | 51,782,816 | 67,624,439 | 32,697,144 | 35,793 | 87,809,252 |
| Fidelity Stock Selector All Cap Fund | 188,333 | 9,230 | -- | 1,221 | 188,234 |
| Fidelity Stock Selector Large Cap Value Fund | 42,415,433 | 24,341,289 | 19,791,866 | 568,507 | 45,291,854 |
| Fidelity Technology Portfolio | 292,437,067 | 82,757,958 | 22,030,245 | 293,835 | 359,374,491 |
| Fidelity Telecom and Utilities Fund | 810,232 | -- | 822,991 | -- | -- |
| Fidelity Telecommunications Portfolio | 16,331,387 | 79,670,280 | 17,197,291 | 862,793 | 80,289,885 |
| Fidelity Transportation Portfolio | 40,097,707 | 230,525 | 36,191,433 | 32,510 | -- |
| Fidelity Utilities Portfolio | 56,276,953 | 12,077,245 | 32,884,726 | 776,640 | 29,449,054 |
| Fidelity Value Discovery Fund | 9,177,687 | 10,417,805 | -- | 308,714 | 18,519,807 |
| Spartan 500 Index Fund Investor Class | 173,817 | 4,767 | -- | 3,659 | 176,093 |
| Spartan Inflation-Protected Bond Index Fund | -- | 107,198,927 | 593,111 | -- | 104,618,313 |
| Spartan International Index Fund Investor | 179,433,070 | 3,905,524 | 89,010,000 | 2,445,467 | 94,928,995 |
| Spartan Long-Term Treasury Bond Index Fund | 31,242,641 | 122,706,572 | 50,993,936 | 2,994,811 | 92,788,952 |
| Spartan U.S. Bond Index Fund Investor Class | 2,047,710,379 | 174,408,093 | 204,788,737 | 46,453,258 | 1,976,256,563 |
| | $6,599,368,411 | $2,539,207,628 | $2,061,002,164 | $90,728,063 | $6,877,536,216 |
Investment Valuation
All investments are categorized as Level 1 under the Fair Value Hierarchy. The inputs or methodology used for valuing securities may not be an indication of the risk associated with investing in those securities. For more information on valuation inputs please refer to the Investment Valuation section in the accompanying Notes to Financial Statements.
See accompanying notes which are an integral part of the financial statements.
VIP FundsManager® 60% Portfolio
Financial Statements
Statement of Assets and Liabilities
| | | December 31, 2015 |
| Assets | | |
| Investment in securities, at value (cost $6,235,054,616) — See accompanying schedule | | $6,877,536,216 |
| Receivable for investments sold | | 5,443,594 |
| Receivable for fund shares sold | | 255,329 |
| Total assets | | 6,883,235,139 |
| Liabilities | | |
| Payable to custodian bank | $833 | |
| Payable for investments purchased | 4,664,972 | |
| Payable for fund shares redeemed | 1,033,157 | |
| Accrued management fee | 1,149,260 | |
| Distribution and service plan fees payable | 62,530 | |
| Total liabilities | | 6,910,752 |
| Net Assets | | $6,876,324,387 |
| Net Assets consist of: | | |
| Paid in capital | | $6,023,220,428 |
| Undistributed net investment income | | 321,117 |
| Accumulated undistributed net realized gain (loss) on investments | | 210,301,242 |
| Net unrealized appreciation (depreciation) on investments | | 642,481,600 |
| Net Assets | | $6,876,324,387 |
| Service Class: | | |
| Net Asset Value, offering price and redemption price per share ($59,949 ÷ 5,419 shares) | | $11.06 |
| Service Class 2: | | |
| Net Asset Value, offering price and redemption price per share ($497,767,784 ÷ 45,085,738 shares) | | $11.04 |
| Investor Class: | | |
| Net Asset Value, offering price and redemption price per share ($6,378,496,654 ÷ 576,684,008 shares) | | $11.06 |
See accompanying notes which are an integral part of the financial statements.
Statement of Operations
| | | Year ended December 31, 2015 |
| Investment Income | | |
| Income distributions from underlying funds | | $90,728,063 |
| Expenses | | |
| Management fee | $17,253,883 | |
| Distribution and service plan fees | 1,181,256 | |
| Independent trustees' compensation | 27,888 | |
| Total expenses before reductions | 18,463,027 | |
| Expense reductions | (3,930,631) | 14,532,396 |
| Net investment income (loss) | | 76,195,667 |
| Realized and Unrealized Gain (Loss) | | |
| Realized gain (loss) on sale of underlying fund shares | 95,806,181 | |
| Capital gain distributions from underlying funds | 146,216,637 | |
| Total net realized gain (loss) | | 242,022,818 |
| Change in net unrealized appreciation (depreciation) on underlying funds | | (295,843,842) |
| Net gain (loss) | | (53,821,024) |
| Net increase (decrease) in net assets resulting from operations | | $22,374,643 |
See accompanying notes which are an integral part of the financial statements.
Statement of Changes in Net Assets
| | Year ended December 31, 2015 | Year ended December 31, 2014 |
| Increase (Decrease) in Net Assets | | |
| Operations | | |
| Net investment income (loss) | $76,195,667 | $81,340,804 |
| Net realized gain (loss) | 242,022,818 | 500,769,331 |
| Change in net unrealized appreciation (depreciation) | (295,843,842) | (241,588,513) |
| Net increase (decrease) in net assets resulting from operations | 22,374,643 | 340,521,622 |
| Distributions to shareholders from net investment income | (75,874,550) | (81,347,441) |
| Distributions to shareholders from net realized gain | (467,815,616) | (171,896,460) |
| Total distributions | (543,690,166) | (253,243,901) |
| Share transactions - net increase (decrease) | 799,417,199 | 101,007,004 |
| Total increase (decrease) in net assets | 278,101,676 | 188,284,725 |
| Net Assets | | |
| Beginning of period | 6,598,222,711 | 6,409,937,986 |
| End of period (including undistributed net investment income of $321,117 and $0, respectively) | $6,876,324,387 | $6,598,222,711 |
See accompanying notes which are an integral part of the financial statements.
Financial Highlights — VIP FundsManager 60% Portfolio Service Class
| | | | | |
| Years ended December 31, | 2015 | 2014 | 2013 | 2012 | 2011 |
| Selected Per–Share Data | | | | | |
| Net asset value, beginning of period | $11.97 | $11.81 | $10.44 | $9.53 | $9.88 |
| Income from Investment Operations | | | | | |
| Net investment income (loss)A | .13 | .15 | .13 | .15 | .18 |
| Net realized and unrealized gain (loss) | (.07) | .48 | 1.80 | .94 | (.37) |
| Total from investment operations | .06 | .63 | 1.93 | 1.09 | (.19) |
| Distributions from net investment income | (.13) | (.15) | (.13) | (.15) | (.14) |
| Distributions from net realized gain | (.84) | (.32) | (.43) | (.03) | (.02) |
| Total distributions | (.97) | (.47) | (.56) | (.18) | (.16) |
| Net asset value, end of period | $11.06 | $11.97 | $11.81 | $10.44 | $9.53 |
| Total ReturnB,C | .41% | 5.40% | 18.62% | 11.48% | (1.92)% |
| Ratios to Average Net AssetsD,E | | | | | |
| Expenses before reductions | .35% | .35% | .35% | .35% | .35% |
| Expenses net of fee waivers, if any | .20% | .20% | .20% | .20% | .20% |
| Expenses net of all reductions | .20% | .20% | .20% | .20% | .20% |
| Net investment income (loss) | 1.11% | 1.26% | 1.18% | 1.51% | 1.77% |
| Supplemental Data | | | | | |
| Net assets, end of period (000 omitted) | $60 | $69 | $75 | $66 | $58 |
| Portfolio turnover rateD | 30% | 36% | 21% | 19% | 9% |
A Calculated based on average shares outstanding during the period.
B Total returns do not reflect charges attributable to your insurance company's separate account. Inclusion of these charges would reduce the total returns shown.
C Total returns would have been lower if certain expenses had not been reduced during the applicable periods shown.
D Amounts do not include the activity of the Underlying Funds.
E Expense ratios reflect operating expenses of the class. Expenses before reductions do not reflect amounts reimbursed by the investment adviser or reductions from expense offset arrangements and do not represent the amount paid by the class during periods when reimbursements or reductions occur. Expense ratios before reductions for start-up periods may not be representative of longer-term operating periods. Expenses net of fee waivers reflect expenses after reimbursement by the investment adviser but prior to reductions from expense offset arrangements. Expenses net of all reductions represent the net expenses paid by the class but do not include expenses of the underlying funds in which the Fund invests.
See accompanying notes which are an integral part of the financial statements.
Financial Highlights — VIP FundsManager 60% Portfolio Service Class 2
| | | | | |
| Years ended December 31, | 2015 | 2014 | 2013 | 2012 | 2011 |
| Selected Per–Share Data | | | | | |
| Net asset value, beginning of period | $11.95 | $11.79 | $10.43 | $9.52 | $9.88 |
| Income from Investment Operations | | | | | |
| Net investment income (loss)A | .11 | .13 | .12 | .14 | .16 |
| Net realized and unrealized gain (loss) | (.07) | .48 | 1.78 | .94 | (.37) |
| Total from investment operations | .04 | .61 | 1.90 | 1.08 | (.21) |
| Distributions from net investment income | (.11) | (.13) | (.12) | (.14) | (.13) |
| Distributions from net realized gain | (.84) | (.32) | (.43) | (.03) | (.02) |
| Total distributions | (.95) | (.45) | (.54)B | (.17) | (.15) |
| Net asset value, end of period | $11.04 | $11.95 | $11.79 | $10.43 | $9.52 |
| Total ReturnC,D | .27% | 5.26% | 18.39% | 11.35% | (2.08)% |
| Ratios to Average Net AssetsE,F | | | | | |
| Expenses before reductions | .50% | .50% | .50% | .50% | .50% |
| Expenses net of fee waivers, if any | .35% | .35% | .35% | .35% | .35% |
| Expenses net of all reductions | .35% | .35% | .35% | .35% | .35% |
| Net investment income (loss) | .96% | 1.11% | 1.03% | 1.36% | 1.62% |
| Supplemental Data | | | | | |
| Net assets, end of period (000 omitted) | $497,768 | $425,719 | $372,191 | $254,505 | $45,494 |
| Portfolio turnover rateE | 30% | 36% | 21% | 19% | 9% |
A Calculated based on average shares outstanding during the period.
B Total distributions of $.54 per share is comprised of distributions from net investment income of $.119 and distributions from net realized gain of $.425 per share.
C Total returns do not reflect charges attributable to your insurance company's separate account. Inclusion of these charges would reduce the total returns shown.
D Total returns would have been lower if certain expenses had not been reduced during the applicable periods shown.
E Amounts do not include the activity of the Underlying Funds.
F Expense ratios reflect operating expenses of the class. Expenses before reductions do not reflect amounts reimbursed by the investment adviser or reductions from expense offset arrangements and do not represent the amount paid by the class during periods when reimbursements or reductions occur. Expense ratios before reductions for start-up periods may not be representative of longer-term operating periods. Expenses net of fee waivers reflect expenses after reimbursement by the investment adviser but prior to reductions from expense offset arrangements. Expenses net of all reductions represent the net expenses paid by the class but do not include expenses of the underlying funds in which the Fund invests.
See accompanying notes which are an integral part of the financial statements.
Financial Highlights — VIP FundsManager 60% Portfolio Investor Class
| | | | | |
| Years ended December 31, | 2015 | 2014 | 2013 | 2012 | 2011 |
| Selected Per–Share Data | | | | | |
| Net asset value, beginning of period | $11.97 | $11.81 | $10.44 | $9.52 | $9.88 |
| Income from Investment Operations | | | | | |
| Net investment income (loss)A | .13 | .15 | .13 | .15 | .17 |
| Net realized and unrealized gain (loss) | (.07) | .48 | 1.80 | .95 | (.37) |
| Total from investment operations | .06 | .63 | 1.93 | 1.10 | (.20) |
| Distributions from net investment income | (.13) | (.15) | (.13) | (.15) | (.14) |
| Distributions from net realized gain | (.84) | (.32) | (.43) | (.03) | (.02) |
| Total distributions | (.97) | (.47) | (.56) | (.18) | (.16) |
| Net asset value, end of period | $11.06 | $11.97 | $11.81 | $10.44 | $9.52 |
| Total ReturnB,C | .41% | 5.40% | 18.62% | 11.60% | (2.02)% |
| Ratios to Average Net AssetsD,E | | | | | |
| Expenses before reductions | .25% | .25% | .25% | .25% | .25% |
| Expenses net of fee waivers, if any | .20% | .20% | .20% | .20% | .20% |
| Expenses net of all reductions | .20% | .20% | .20% | .20% | .20% |
| Net investment income (loss) | 1.11% | 1.26% | 1.18% | 1.51% | 1.77% |
| Supplemental Data | | | | | |
| Net assets, end of period (000 omitted) | $6,378,497 | $6,172,435 | $6,037,672 | $5,275,474 | $4,094,228 |
| Portfolio turnover rateD | 30% | 36% | 21% | 19% | 9% |
A Calculated based on average shares outstanding during the period.
B Total returns do not reflect charges attributable to your insurance company's separate account. Inclusion of these charges would reduce the total returns shown.
C Total returns would have been lower if certain expenses had not been reduced during the applicable periods shown.
D Amounts do not include the activity of the Underlying Funds.
E Expense ratios reflect operating expenses of the class. Expenses before reductions do not reflect amounts reimbursed by the investment adviser or reductions from expense offset arrangements and do not represent the amount paid by the class during periods when reimbursements or reductions occur. Expense ratios before reductions for start-up periods may not be representative of longer-term operating periods. Expenses net of fee waivers reflect expenses after reimbursement by the investment adviser but prior to reductions from expense offset arrangements. Expenses net of all reductions represent the net expenses paid by the class but do not include expenses of the underlying funds in which the Fund invests.
See accompanying notes which are an integral part of the financial statements.
VIP FundsManager® 70% Portfolio
Investment Summary (Unaudited)
The information in the following tables is based on the direct investments of the Fund.
Fund Holdings as of December 31, 2015
| | % of fund's net assets | % of fund's net assets 6 months ago |
| Domestic Equity Funds | | |
| Fidelity Air Transportation Portfolio | 0.2 | 0.2 |
| Fidelity Banking Portfolio | 2.7 | 2.7 |
| Fidelity Blue Chip Growth Fund | 2.0 | 1.6 |
| Fidelity Blue Chip Value Fund | 1.3 | 0.4 |
| Fidelity Brokerage and Investment Management Portfolio | 0.1 | 1.0 |
| Fidelity Chemicals Portfolio | 0.7 | 1.0 |
| Fidelity Computers Portfolio | 0.4 | 1.2 |
| Fidelity Construction and Housing Portfolio | 1.2 | 1.1 |
| Fidelity Consumer Discretionary Portfolio | 3.7 | 4.7 |
| Fidelity Consumer Staples Portfolio | 3.7 | 3.3 |
| Fidelity Contrafund | 1.6 | 0.0 |
| Fidelity Defense and Aerospace Portfolio | 0.7 | 0.6 |
| Fidelity Dividend Growth Fund | 0.0 | 0.0 |
| Fidelity Electronics Portfolio | 0.5 | 1.6 |
| Fidelity Energy Portfolio | 2.0 | 2.2 |
| Fidelity Energy Service Portfolio | 0.2 | 0.5 |
| Fidelity Financial Services Portfolio | 3.3 | 3.9 |
| Fidelity Gold Portfolio | 0.0 | 0.0 |
| Fidelity Health Care Portfolio | 3.5 | 5.5 |
| Fidelity Health Care Services Portfolio | 0.7 | 0.8 |
| Fidelity Industrial Equipment Portfolio | 0.7 | 0.0 |
| Fidelity Industrials Portfolio | 2.6 | 2.9 |
| Fidelity Insurance Portfolio | 1.2 | 0.8 |
| Fidelity IT Services Portfolio | 0.7 | 0.5 |
| Fidelity Large Cap Stock Fund | 0.6 | 1.5 |
| Fidelity Low-Priced Stock Fund | 0.9 | 0.0 |
| Fidelity Magellan Fund | 0.0 | 0.0 |
| Fidelity Materials Portfolio | 0.2 | 0.0 |
| Fidelity Medical Equipment and Systems Portfolio | 1.1 | 0.9 |
| Fidelity Mega Cap Stock Fund | 0.3 | 0.3 |
| Fidelity Mid Cap Value Fund | 0.9 | 2.0 |
| Fidelity Nasdaq Composite Index Fund | 0.2 | 0.2 |
| Fidelity OTC Portfolio | 0.0 | 0.4 |
| Fidelity Pharmaceuticals Portfolio | 0.6 | 0.1 |
| Fidelity Real Estate Investment Portfolio | 0.4 | 0.4 |
| Fidelity Retailing Portfolio | 0.9 | 0.8 |
| Fidelity Series Commodity Strategy Fund | 0.0 | 0.0 |
| Fidelity Small Cap Stock Fund | 0.4 | 0.4 |
| Fidelity Software and IT Services Portfolio | 1.4 | 0.3 |
Fidelity Stock Selector Large Cap
Value Fund | 1.1 | 1.4 |
| Fidelity Technology Portfolio | 5.6 | 4.7 |
| Fidelity Telecommunications Portfolio | 1.4 | 0.0 |
| Fidelity Utilities Portfolio | 0.3 | 0.2 |
| Fidelity Value Discovery Fund | 0.7 | 0.2 |
| Spartan 500 Index Fund Investor Class | 0.0 | 0.0 |
| Fidelity Leisure Portfolio | 0.0 | 0.0 |
| Fidelity Natural Gas Portfolio | 0.0 | 0.1 |
| Fidelity Transportation Portfolio | 0.0 | 0.1 |
| | 50.7 | 50.5 |
| International Equity Funds | | |
| Fidelity China Region Fund | 0.1 | 0.2 |
| Fidelity Diversified International Fund | 6.7 | 10.4 |
| Fidelity Emerging Asia Fund | 0.6 | 0.9 |
| Fidelity Emerging Markets Fund | 0.1 | 0.8 |
| Fidelity Europe Fund | 2.2 | 2.2 |
| Fidelity International Capital Appreciation Fund | 0.0 | 0.2 |
| Fidelity International Discovery Fund | 2.2 | 2.3 |
| Fidelity International Real Estate Fund | 0.0 | 0.0 |
| Fidelity International Small Cap Fund | 0.5 | 0.5 |
| Fidelity International Small Cap Opportunities Fund | 1.0 | 0.7 |
| Fidelity Japan Fund | 0.8 | 0.9 |
| Fidelity Japan Smaller Companies Fund | 0.8 | 0.6 |
| Fidelity Overseas Fund | 7.2 | 4.6 |
| Fidelity Pacific Basin Fund | 0.4 | 0.6 |
| Spartan International Index Fund Investor Class | 1.2 | 2.1 |
| Fidelity International Growth Fund | 0.0 | 0.0 |
| | 23.8 | 27.0 |
| Fixed-Income Funds | | |
| Fidelity Floating Rate High Income Fund | 0.6 | 0.6 |
| Fidelity Focused High Income Fund | 0.1 | 0.1 |
| Fidelity High Income Fund | 0.0 | 0.0 |
| Fidelity New Markets Income Fund | 0.4 | 0.4 |
| Fidelity Real Estate Income Fund | 0.3 | 0.3 |
| Spartan Inflation-Protected Bond Index Fund Investor Class | 1.5 | 0.0 |
| Spartan Long-Term Treasury Bond Index Fund Investor Class | 1.4 | 1.8 |
| Spartan U.S. Bond Index Fund Investor Class | 18.8 | 17.2 |
| | 23.1 | 20.4 |
| Money Market Funds | | |
| Fidelity Institutional Prime Money Market Portfolio Class I 0.28% | 2.4 | 2.1 |
| Net Other Assets (Liabilities) | 0.0 | 0.0 |
| | 100.0 | 100.0 |
Fidelity Health Care Services Portfolio was formerly known as Fidelity Medical Delivery Portfolio and
Fidelity Software and IT Services Portfolio was formerly known as Fidelity Software and Computer Services Portfolio
Asset Allocation (% of fund's net assets)
| As of December 31, 2015 |
| | Domestic Equity Funds | 50.7% |
| | International Equity Funds | 23.8% |
| | Fixed-Income Funds | 23.1% |
| | Money Market Funds | 2.4% |

| As of June 30, 2015 |
| | Domestic Equity Funds | 50.5% |
| | International Equity Funds | 27.0% |
| | Fixed-Income Funds | 20.4% |
| | Money Market Funds | 2.1% |

Percentages shown as 0.0% may reflect amounts less than 0.05%.
VIP FundsManager® 70% Portfolio
Investments December 31, 2015
Showing Percentage of Net Assets
| Equity Funds - 74.5% | | | |
| | | Shares | Value |
| Domestic Equity Funds - 50.7% | | | |
| Fidelity Air Transportation Portfolio (a) | | 28,127 | $1,752,055 |
| Fidelity Banking Portfolio (a) | | 1,190,123 | 30,443,354 |
| Fidelity Blue Chip Growth Fund (a) | | 326,746 | 22,535,638 |
| Fidelity Blue Chip Value Fund (a) | | 944,103 | 14,812,968 |
| Fidelity Brokerage and Investment Management Portfolio (a) | | 16,678 | 1,069,066 |
| Fidelity Chemicals Portfolio (a) | | 57,463 | 7,516,222 |
| Fidelity Computers Portfolio (a) | | 61,726 | 4,211,545 |
| Fidelity Construction and Housing Portfolio (a) | | 222,342 | 12,904,758 |
| Fidelity Consumer Discretionary Portfolio (a) | | 1,214,244 | 41,490,727 |
| Fidelity Consumer Staples Portfolio (a) | | 451,092 | 41,175,715 |
| Fidelity Contrafund (a) | | 183,408 | 18,148,209 |
| Fidelity Defense and Aerospace Portfolio (a) | | 62,976 | 7,241,652 |
| Fidelity Dividend Growth Fund (a) | | 551 | 16,682 |
| Fidelity Electronics Portfolio (a) | | 66,878 | 5,055,291 |
| Fidelity Energy Portfolio (a) | | 624,182 | 21,952,494 |
| Fidelity Energy Service Portfolio (a) | | 59,536 | 2,443,375 |
| Fidelity Financial Services Portfolio (a) | | 430,510 | 36,171,417 |
| Fidelity Gold Portfolio (a)(b) | | 4,361 | 58,879 |
| Fidelity Health Care Portfolio (a) | | 188,047 | 39,143,901 |
| Fidelity Health Care Services Portfolio (a) | | 88,695 | 7,487,609 |
| Fidelity Industrial Equipment Portfolio (a) | | 200,351 | 7,308,805 |
| Fidelity Industrials Portfolio (a) | | 990,268 | 28,925,716 |
| Fidelity Insurance Portfolio (a) | | 197,585 | 13,370,609 |
| Fidelity IT Services Portfolio (a) | | 194,704 | 7,782,314 |
| Fidelity Large Cap Stock Fund (a) | | 238,943 | 6,243,589 |
| Fidelity Low-Priced Stock Fund (a) | | 219,888 | 10,499,657 |
| Fidelity Magellan Fund (a) | | 234 | 20,911 |
| Fidelity Materials Portfolio (a) | | 39,521 | 2,713,126 |
| Fidelity Medical Equipment and Systems Portfolio (a) | | 325,273 | 11,667,533 |
| Fidelity Mega Cap Stock Fund (a) | | 190,556 | 2,976,491 |
| Fidelity Mid Cap Value Fund (a) | | 462,986 | 10,343,099 |
| Fidelity Nasdaq Composite Index Fund (a) | | 28,499 | 1,868,971 |
| Fidelity OTC Portfolio (a) | | 5,173 | 431,553 |
| Fidelity Pharmaceuticals Portfolio (a) | | 351,050 | 7,221,097 |
| Fidelity Real Estate Investment Portfolio (a) | | 122,755 | 4,981,409 |
| Fidelity Retailing Portfolio (a) | | 93,134 | 9,798,609 |
| Fidelity Series Commodity Strategy Fund (a)(b) | | 1,089 | 5,316 |
| Fidelity Small Cap Stock Fund (a) | | 249,711 | 4,337,477 |
| Fidelity Software and IT Services Portfolio (a) | | 127,719 | 15,506,370 |
| Fidelity Stock Selector Large Cap Value Fund (a) | | 718,259 | 11,693,249 |
| Fidelity Technology Portfolio (a) | | 529,063 | 62,477,056 |
| Fidelity Telecommunications Portfolio (a) | | 248,151 | 15,023,040 |
| Fidelity Utilities Portfolio (a) | | 57,980 | 3,719,984 |
| Fidelity Value Discovery Fund (a) | | 316,388 | 7,308,562 |
| Spartan 500 Index Fund Investor Class (a) | | 348 | 25,015 |
|
| TOTAL DOMESTIC EQUITY FUNDS | | | 561,881,115 |
|
| International Equity Funds - 23.8% | | | |
| Fidelity China Region Fund (a) | | 24,589 | 625,046 |
| Fidelity Diversified International Fund (a) | | 2,124,624 | 74,489,316 |
| Fidelity Emerging Asia Fund (a) | | 212,025 | 6,362,876 |
| Fidelity Emerging Markets Fund (a) | | 69,107 | 1,503,073 |
| Fidelity Europe Fund (a) | | 662,968 | 23,979,545 |
| Fidelity International Capital Appreciation Fund (a) | | 29,695 | 493,228 |
| Fidelity International Discovery Fund (a) | | 603,839 | 23,797,296 |
| Fidelity International Real Estate Fund (a) | | 1,644 | 16,472 |
| Fidelity International Small Cap Fund (a) | | 240,318 | 5,315,824 |
| Fidelity International Small Cap Opportunities Fund (a) | | 721,306 | 10,761,880 |
| Fidelity Japan Fund (a) | | 788,775 | 9,315,436 |
| Fidelity Japan Smaller Companies Fund (a) | | 644,589 | 8,921,108 |
| Fidelity Overseas Fund (a) | | 1,949,357 | 79,650,717 |
| Fidelity Pacific Basin Fund (a) | | 176,311 | 4,640,495 |
| Spartan International Index Fund Investor Class (a) | | 384,465 | 13,813,833 |
|
| TOTAL INTERNATIONAL EQUITY FUNDS | | | 263,686,145 |
|
| TOTAL EQUITY FUNDS | | | |
| (Cost $754,471,748) | | | 825,567,260 |
|
| Fixed-Income Funds - 23.1% | | | |
| Fidelity Floating Rate High Income Fund (a) | | 673,804 | 6,151,835 |
| Fidelity Focused High Income Fund (a) | | 85,818 | 687,400 |
| Fidelity High Income Fund (a) | | 63,035 | 501,125 |
| Fidelity New Markets Income Fund (a) | | 269,226 | 3,909,162 |
| Fidelity Real Estate Income Fund (a) | | 321,062 | 3,608,742 |
| Spartan Inflation-Protected Bond Index Fund Investor Class (a) | | 1,801,797 | 16,900,858 |
| Spartan Long-Term Treasury Bond Index Fund Investor Class (a) | | 1,248,825 | 15,935,008 |
| Spartan U.S. Bond Index Fund Investor Class (a) | | 18,192,009 | 209,026,186 |
| TOTAL FIXED-INCOME FUNDS | | | |
| (Cost $253,052,450) | | | 256,720,316 |
|
| Money Market Funds - 2.4% | | | |
| Fidelity Institutional Prime Money Market Portfolio Class I 0.28% (a)(c) | | | |
| (Cost $26,701,665) | | 26,701,665 | 26,701,665 |
| TOTAL INVESTMENT PORTFOLIO - 100.0% | | | |
| (Cost $1,034,225,863) | | | 1,108,989,241 |
| NET OTHER ASSETS (LIABILITIES) - 0.0% | | | (187,470) |
| NET ASSETS - 100% | | | $1,108,801,771 |
Legend
(a) Affiliated Fund
(b) Non-income producing
(c) The rate quoted is the annualized seven-day yield of the fund at period end.
Affiliated Underlying Funds
Information regarding the Fund's fiscal year to date purchases and sales of the affiliated Underlying Funds and income earned by the Fund from investments in affiliated Underlying Funds is as follows:
(Fidelity Health Care Services Portfolio was formerly known as Fidelity Medical Delivery Portfolio and Fidelity Software and IT Services Portfolio was formerly known as Fidelity Software and Computer Services Portfolio)
| Affiliate | Value, beginning of period | Purchases | Sales Proceeds | Dividend Income | Value, end of period |
| Fidelity Air Transportation Portfolio | $2,939,818 | $151,215 | $1,000,000 | $4,442 | $1,752,055 |
| Fidelity Automotive Portfolio | 2,692,911 | -- | 2,581,537 | -- | -- |
| Fidelity Banking Portfolio | 26,377,616 | 6,882,140 | 1,194,594 | 316,564 | 30,443,354 |
| Fidelity Biotechnology Portfolio | 26,247 | -- | 31,662 | -- | -- |
| Fidelity Blue Chip Growth Fund | 19,675,213 | 8,379,980 | 5,548,845 | 7,597 | 22,535,638 |
| Fidelity Blue Chip Value Fund | 2,776,361 | 12,703,996 | 205,694 | 181,876 | 14,812,968 |
| Fidelity Brokerage and Investment | 12,417,360 | 159,833 | 10,273,305 | 25,089 | 1,069,066 |
| Fidelity Canada Fund | 105,307 | -- | 101,803 | -- | -- |
| Fidelity Chemicals Portfolio | 12,978,565 | 2,805,684 | 7,114,149 | 105,161 | 7,516,222 |
| Fidelity China Region Fund | 222,405 | 2,227,291 | 1,400,000 | 7,362 | 625,046 |
| Fidelity Communications Equipment Portfolio | 582,603 | -- | 596,509 | -- | -- |
| Fidelity Computers Portfolio | 20,564,166 | 1,174,286 | 15,570,474 | 69,125 | 4,211,545 |
| Fidelity Construction and Housing Portfolio | 11,314,411 | 1,350,858 | 147,508 | 49,786 | 12,904,758 |
| Fidelity Consumer Discretionary Portfolio | 45,729,066 | 7,206,938 | 12,246,824 | 217,172 | 41,490,727 |
| Fidelity Consumer Finance Portfolio | 1,120,890 | -- | 1,100,224 | -- | -- |
| Fidelity Consumer Staples Portfolio | 45,115,479 | 14,696,518 | 16,123,985 | 639,378 | 41,175,715 |
| Fidelity Contrafund | 35,204 | 18,389,662 | 86,516 | 54,459 | 18,148,209 |
| Fidelity Defense and Aerospace Portfolio | -- | 8,239,493 | 290,000 | 53,559 | 7,241,652 |
| Fidelity Diversified International Fund | 47,754,428 | 89,266,448 | 63,447,421 | 737,089 | 74,489,316 |
| Fidelity Dividend Growth Fund | 16,787 | 1,433 | -- | 242 | 16,682 |
| Fidelity Electronics Portfolio | 16,610,832 | 1,999,689 | 12,047,508 | 57,889 | 5,055,291 |
| Fidelity Emerging Asia Fund | 5,612,242 | 4,312,658 | 2,352,596 | 28,023 | 6,362,876 |
| Fidelity Emerging Markets Fund | 11,650,330 | 7,564 | 9,061,339 | 7,564 | 1,503,073 |
| Fidelity Energy Portfolio | 15,122,782 | 13,718,043 | 801,831 | 232,221 | 21,952,494 |
| Fidelity Energy Service Portfolio | 6,651,143 | 2,154,789 | 5,058,991 | 20,775 | 2,443,375 |
| Fidelity Equity Dividend Income Fund | 14,767 | 46 | 15,036 | -- | -- |
| Fidelity Europe Fund | 18,158,908 | 5,704,692 | -- | 277,372 | 23,979,545 |
| Fidelity Financial Services Portfolio | 40,339,534 | 4,468,721 | 6,284,604 | 329,309 | 36,171,417 |
| Fidelity Floating Rate High Income Fund | 6,583,097 | 255,146 | 358,652 | 255,146 | 6,151,835 |
| Fidelity Focused High Income Fund | 700,899 | 32,538 | -- | 32,538 | 687,400 |
| Fidelity Fund | 25,945 | -- | 27,138 | -- | -- |
| Fidelity Gold Portfolio | 71,702 | -- | -- | -- | 58,879 |
| Fidelity Growth & Income Portfolio | 397,927 | -- | 407,279 | -- | -- |
| Fidelity Growth Company Fund | 622,018 | 986 | 654,147 | -- | -- |
| Fidelity Growth Discovery Fund | 801,724 | -- | 816,489 | -- | -- |
| Fidelity Health Care Portfolio | 58,224,611 | 8,842,376 | 27,161,466 | -- | 39,143,901 |
| Fidelity Health Care Services Portfolio | 1,131,412 | 7,226,023 | 999,928 | 1,560 | 7,487,609 |
| Fidelity High Income Fund | 529,736 | 30,361 | -- | 30,361 | 501,125 |
| Fidelity Industrial Equipment Portfolio | -- | 7,418,685 | -- | 20,883 | 7,308,805 |
| Fidelity Industrials Portfolio | 26,238,381 | 12,468,230 | 7,117,556 | 197,878 | 28,925,716 |
| Fidelity Institutional Prime Money Market | 4,986,661 | 50,535,821 | 28,820,817 | 21,303 | 26,701,665 |
| Fidelity Insurance Portfolio | 9,070,907 | 4,975,351 | 499,621 | 135,196 | 13,370,609 |
| Fidelity International Capital Appreciation | 8,363,956 | 7,603 | 8,409,312 | 2,018 | 493,228 |
| Fidelity International Discovery Fund | 43,303,275 | 3,564,912 | 25,483,875 | 244,431 | 23,797,296 |
| Fidelity International Growth Fund | 372,757 | -- | 407,499 | -- | -- |
| Fidelity International Real Estate Fund | 16,183 | 462 | -- | 268 | 16,472 |
| Fidelity International Small Cap Fund | -- | 7,200,013 | 1,300,000 | 84,461 | 5,315,824 |
| Fidelity International Small Cap | -- | 10,957,903 | -- | 43,862 | 10,761,880 |
| Fidelity International Value Fund | 120,120 | -- | 127,133 | -- | -- |
| Fidelity IT Services Portfolio | 291,922 | 11,396,647 | 4,158,981 | -- | 7,782,314 |
| Fidelity Japan Fund | 131,061 | 9,562,740 | -- | 54,086 | 9,315,436 |
| Fidelity Japan Smaller Companies Fund | 2,639,812 | 6,018,441 | -- | 57,543 | 8,921,108 |
| Fidelity Large Cap Stock Fund | 16,263,471 | 8,305,594 | 16,791,811 | 118,977 | 6,243,589 |
| Fidelity Leisure Portfolio | 314,416 | 10,137 | 325,649 | 1,472 | -- |
| Fidelity Leveraged Company Stock Fund | 44,484 | -- | 46,349 | -- | -- |
| Fidelity Low-Priced Stock Fund | -- | 15,285,823 | 4,550,000 | 128,269 | 10,499,657 |
| Fidelity Magellan Fund | 20,096 | 1,543 | -- | 119 | 20,911 |
| Fidelity Materials Portfolio | -- | 2,843,979 | -- | 29,167 | 2,713,126 |
| Fidelity Medical Equipment and Systems | 2,450,947 | 9,980,354 | -- | 1,856 | 11,667,533 |
| Fidelity Mega Cap Stock Fund | 14,474,860 | 120,099 | 11,800,000 | 45,547 | 2,976,491 |
| Fidelity Mid Cap Value Fund | 14,384,854 | 14,830,837 | 17,249,972 | 215,168 | 10,343,099 |
| Fidelity Nasdaq Composite Index Fund | 1,749,674 | 27,659 | -- | 15,561 | 1,868,971 |
| Fidelity Natural Gas Portfolio | 4,057,781 | 8,274 | 3,731,949 | 8,274 | -- |
| Fidelity New Markets Income Fund | 5,562,127 | 295,246 | 1,742,375 | 237,646 | 3,909,162 |
| Fidelity OTC Portfolio | 4,173,412 | 983,230 | 4,776,799 | -- | 431,553 |
| Fidelity Overseas Fund | 26,793,766 | 51,980,804 | -- | 787,622 | 79,650,717 |
| Fidelity Pacific Basin Fund | 5,730,114 | 720,436 | 1,800,000 | 60,775 | 4,640,495 |
| Fidelity Pharmaceuticals Portfolio | 12,289,609 | 7,297,648 | 11,060,570 | 46,067 | 7,221,097 |
| Fidelity Real Estate Income Fund | 3,546,954 | 193,076 | -- | 149,139 | 3,608,742 |
| Fidelity Real Estate Investment Portfolio | 5,047,496 | 2,590,644 | 2,414,997 | 80,563 | 4,981,409 |
| Fidelity Retailing Portfolio | 7,122,070 | 1,781,065 | 500,000 | 17,182 | 9,798,609 |
| Fidelity Series Commodity Strategy Fund | 7,114 | -- | -- | -- | 5,316 |
| Fidelity Small Cap Discovery Fund | 276,003 | -- | 280,864 | -- | -- |
| Fidelity Small Cap Growth Fund | 140,471 | -- | 145,354 | -- | -- |
| Fidelity Small Cap Stock Fund | 12,293 | 4,984,436 | 12,686 | 22,722 | 4,337,477 |
| Fidelity Small Cap Value Fund | 143,234 | -- | 145,731 | -- | -- |
| Fidelity Software and IT Services Portfolio | 7,735,891 | 12,328,751 | 4,991,909 | 6,297 | 15,506,370 |
| Fidelity Stock Selector Large Cap Value Fund | 15,196,126 | 5,670,170 | 8,769,089 | 146,009 | 11,693,249 |
| Fidelity Technology Portfolio | 47,457,771 | 20,302,986 | 6,215,622 | 50,567 | 62,477,056 |
| Fidelity Telecommunications Portfolio | 2,706,553 | 14,835,815 | 2,843,278 | 161,552 | 15,023,040 |
| Fidelity Transportation Portfolio | 10,191,032 | 43,118 | 9,437,840 | 6,081 | -- |
| Fidelity Utilities Portfolio | 8,211,678 | 3,366,099 | 7,197,412 | 98,679 | 3,719,984 |
| Fidelity Value Discovery Fund | 3,348,744 | 5,586,616 | 1,108,078 | 136,016 | 7,308,562 |
| Spartan 500 Index Fund Investor Class | 24,691 | 677 | -- | 520 | 25,015 |
| Spartan Extended Market Index Fund Investor | 194,471 | -- | 201,766 | -- | -- |
| Spartan Inflation-Protected Bond Index Fund | -- | 17,287,479 | 63,815 | -- | 16,900,858 |
| Spartan International Index Fund Investor | 57,791,295 | 903,563 | 45,679,999 | 354,194 | 13,813,833 |
| Spartan Long-Term Treasury Bond Index Fund | 5,124,126 | 20,514,630 | 8,090,835 | 487,614 | 15,935,008 |
| Spartan Total Market Index Fund Investor | -- | -- | -- | -- | -- |
| Spartan U.S. Bond Index Fund Investor Class | 213,332,450 | 28,407,306 | 28,545,527 | 4,734,014 | 209,026,186 |
| | $1,027,149,555 | $597,984,309 | $481,953,124 | $12,751,257 | $1,108,989,241 |
Investment Valuation
All investments are categorized as Level 1 under the Fair Value Hierarchy. The inputs or methodology used for valuing securities may not be an indication of the risk associated with investing in those securities. For more information on valuation inputs please refer to the Investment Valuation section in the accompanying Notes to Financial Statements.
See accompanying notes which are an integral part of the financial statements.
VIP FundsManager® 70% Portfolio
Financial Statements
Statement of Assets and Liabilities
| | | December 31, 2015 |
| Assets | | |
| Investment in securities, at value (cost $1,034,225,863) — See accompanying schedule | | $1,108,989,241 |
| Receivable for investments sold | | 452,194 |
| Receivable for fund shares sold | | 611,618 |
| Total assets | | 1,110,053,053 |
| Liabilities | | |
| Payable to custodian bank | $942 | |
| Payable for investments purchased | 1,010,277 | |
| Payable for fund shares redeemed | 53,602 | |
| Accrued management fee | 184,971 | |
| Distribution and service plan fees payable | 1,490 | |
| Total liabilities | | 1,251,282 |
| Net Assets | | $1,108,801,771 |
| Net Assets consist of: | | |
| Paid in capital | | $992,872,602 |
| Undistributed net investment income | | 93,131 |
| Accumulated undistributed net realized gain (loss) on investments | | 41,072,660 |
| Net unrealized appreciation (depreciation) on investments | | 74,763,378 |
| Net Assets | | $1,108,801,771 |
| Service Class: | | |
| Net Asset Value, offering price and redemption price per share ($71,810 ÷ 5,958 shares) | | $12.05 |
| Service Class 2: | | |
| Net Asset Value, offering price and redemption price per share ($12,028,191 ÷ 1,000,741 shares) | | $12.02 |
| Investor Class: | | |
| Net Asset Value, offering price and redemption price per share ($1,096,701,770 ÷ 91,003,003 shares) | | $12.05 |
See accompanying notes which are an integral part of the financial statements.
Statement of Operations
| | | Year ended December 31, 2015 |
| Investment Income | | |
| Income distributions from underlying funds | | $12,751,257 |
| Expenses | | |
| Management fee | $2,721,471 | |
| Distribution and service plan fees | 24,490 | |
| Independent trustees' compensation | 4,387 | |
| Total expenses before reductions | 2,750,348 | |
| Expense reductions | (555,301) | 2,195,047 |
| Net investment income (loss) | | 10,556,210 |
| Realized and Unrealized Gain (Loss) | | |
| Realized gain (loss) on sale of underlying fund shares | 20,917,922 | |
| Capital gain distributions from underlying funds | 26,143,839 | |
| Total net realized gain (loss) | | 47,061,761 |
| Change in net unrealized appreciation (depreciation) on underlying funds | | (55,109,385) |
| Net gain (loss) | | (8,047,624) |
| Net increase (decrease) in net assets resulting from operations | | $2,508,586 |
See accompanying notes which are an integral part of the financial statements.
Statement of Changes in Net Assets
| | Year ended December 31, 2015 | Year ended December 31, 2014 |
| Increase (Decrease) in Net Assets | | |
| Operations | | |
| Net investment income (loss) | $10,556,210 | $11,756,273 |
| Net realized gain (loss) | 47,061,761 | 85,084,570 |
| Change in net unrealized appreciation (depreciation) | (55,109,385) | (48,267,458) |
| Net increase (decrease) in net assets resulting from operations | 2,508,586 | 48,573,385 |
| Distributions to shareholders from net investment income | (10,502,574) | (11,683,920) |
| Distributions to shareholders from net realized gain | (24,652,156) | (7,877,744) |
| Total distributions | (35,154,730) | (19,561,664) |
| Share transactions - net increase (decrease) | 114,469,310 | 121,343,274 |
| Total increase (decrease) in net assets | 81,823,166 | 150,354,995 |
| Net Assets | | |
| Beginning of period | 1,026,978,605 | 876,623,610 |
| End of period (including undistributed net investment income of $93,131 and undistributed net investment income of $72,353, respectively) | $1,108,801,771 | $1,026,978,605 |
See accompanying notes which are an integral part of the financial statements.
Financial Highlights — VIP FundsManager 70% Portfolio Service Class
| | | | | |
| Years ended December 31, | 2015 | 2014 | 2013 | 2012 | 2011 |
| Selected Per–Share Data | | | | | |
| Net asset value, beginning of period | $12.40 | $12.01 | $10.04 | $9.04 | $9.48 |
| Income from Investment Operations | | | | | |
| Net investment income (loss)A | .12 | .15 | .13 | .15 | .15 |
| Net realized and unrealized gain (loss) | (.06) | .48 | 2.05 | 1.03 | (.41) |
| Total from investment operations | .06 | .63 | 2.18 | 1.18 | (.26) |
| Distributions from net investment income | (.12) | (.14) | (.12) | (.15) | (.15) |
| Distributions from net realized gain | (.29) | (.10) | (.09) | (.03) | (.02) |
| Total distributions | (.41) | (.24) | (.21) | (.18) | (.18)B |
| Net asset value, end of period | $12.05 | $12.40 | $12.01 | $10.04 | $9.04 |
| Total ReturnC,D | .41% | 5.24% | 21.75% | 13.10% | (2.79)% |
| Ratios to Average Net AssetsE,F | | | | | |
| Expenses before reductions | .35% | .35% | .35% | .35% | .35% |
| Expenses net of fee waivers, if any | .20% | .20% | .20% | .20% | .20% |
| Expenses net of all reductions | .20% | .20% | .20% | .20% | .20% |
| Net investment income (loss) | .97% | 1.23% | 1.19% | 1.57% | 1.60% |
| Supplemental Data | | | | | |
| Net assets, end of period (000 omitted) | $72 | $78 | $91 | $77 | $63 |
| Portfolio turnover rateE | 44% | 49% | 31% | 24% | 16% |
A Calculated based on average shares outstanding during the period.
B Total distributions of $.18 per share is comprised of distributions from net investment income of $.151 and distributions from net realized gain of $.024 per share.
C Total returns do not reflect charges attributable to your insurance company's separate account. Inclusion of these charges would reduce the total returns shown.
D Total returns would have been lower if certain expenses had not been reduced during the applicable periods shown.
E Amounts do not include the activity of the Underlying Funds.
F Expense ratios reflect operating expenses of the class. Expenses before reductions do not reflect amounts reimbursed by the investment adviser or reductions from expense offset arrangements and do not represent the amount paid by the class during periods when reimbursements or reductions occur. Expenses net of fee waivers reflect expenses after reimbursement by the investment adviser but prior to reductions from expense offset arrangements. Expenses net of all reductions represent the net expenses paid by the class but do not include expenses of the underlying funds in which the Fund invests.
See accompanying notes which are an integral part of the financial statements.
Financial Highlights — VIP FundsManager 70% Portfolio Service Class 2
| | | | | |
| Years ended December 31, | 2015 | 2014 | 2013 | 2012 | 2011 |
| Selected Per–Share Data | | | | | |
| Net asset value, beginning of period | $12.37 | $11.98 | $10.02 | $9.02 | $9.46 |
| Income from Investment Operations | | | | | |
| Net investment income (loss)A | .10 | .13 | .12 | .14 | .14 |
| Net realized and unrealized gain (loss) | (.06) | .48 | 2.04 | 1.03 | (.42) |
| Total from investment operations | .04 | .61 | 2.16 | 1.17 | (.28) |
| Distributions from net investment income | (.10) | (.13) | (.11) | (.14) | (.14) |
| Distributions from net realized gain | (.29) | (.10) | (.09) | (.03) | (.02) |
| Total distributions | (.39) | (.22)B | (.20) | (.17) | (.16) |
| Net asset value, end of period | $12.02 | $12.37 | $11.98 | $10.02 | $9.02 |
| Total ReturnC,D | .29% | 5.10% | 21.54% | 12.98% | (2.94)% |
| Ratios to Average Net AssetsE,F | | | | | |
| Expenses before reductions | .50% | .50% | .50% | .50% | .50% |
| Expenses net of fee waivers, if any | .35% | .35% | .35% | .35% | .35% |
| Expenses net of all reductions | .35% | .35% | .35% | .35% | .35% |
| Net investment income (loss) | .82% | 1.08% | 1.04% | 1.42% | 1.45% |
| Supplemental Data | | | | | |
| Net assets, end of period (000 omitted) | $12,028 | $7,610 | $6,752 | $5,035 | $3,675 |
| Portfolio turnover rateE | 44% | 49% | 31% | 24% | 16% |
A Calculated based on average shares outstanding during the period.
B Total distributions of $.22 per share is comprised of distributions from net investment income of $.126 and distributions from net realized gain of $.097 per share.
C Total returns do not reflect charges attributable to your insurance company's separate account. Inclusion of these charges would reduce the total returns shown.
D Total returns would have been lower if certain expenses had not been reduced during the applicable periods shown.
E Amounts do not include the activity of the Underlying Funds.
F Expense ratios reflect operating expenses of the class. Expenses before reductions do not reflect amounts reimbursed by the investment adviser or reductions from expense offset arrangements and do not represent the amount paid by the class during periods when reimbursements or reductions occur. Expenses net of fee waivers reflect expenses after reimbursement by the investment adviser but prior to reductions from expense offset arrangements. Expenses net of all reductions represent the net expenses paid by the class but do not include expenses of the underlying funds in which the Fund invests.
See accompanying notes which are an integral part of the financial statements.
Financial Highlights — VIP FundsManager 70% Portfolio Investor Class
| | | | | |
| Years ended December 31, | 2015 | 2014 | 2013 | 2012 | 2011 |
| Selected Per–Share Data | | | | | |
| Net asset value, beginning of period | $12.39 | $12.01 | $10.04 | $9.03 | $9.48 |
| Income from Investment Operations | | | | | |
| Net investment income (loss)A | .12 | .15 | .13 | .15 | .15 |
| Net realized and unrealized gain (loss) | (.05) | .47 | 2.05 | 1.04 | (.42) |
| Total from investment operations | .07 | .62 | 2.18 | 1.19 | (.27) |
| Distributions from net investment income | (.12) | (.14) | (.12) | (.15) | (.15) |
| Distributions from net realized gain | (.29) | (.10) | (.09) | (.03) | (.02) |
| Total distributions | (.41) | (.24) | (.21) | (.18) | (.18)B |
| Net asset value, end of period | $12.05 | $12.39 | $12.01 | $10.04 | $9.03 |
| Total ReturnC,D | .49% | 5.15% | 21.75% | 13.22% | (2.90)% |
| Ratios to Average Net AssetsE,F | | | | | |
| Expenses before reductions | .25% | .25% | .25% | .25% | .25% |
| Expenses net of fee waivers, if any | .20% | .20% | .20% | .20% | .20% |
| Expenses net of all reductions | .20% | .20% | .20% | .20% | .20% |
| Net investment income (loss) | .97% | 1.23% | 1.19% | 1.57% | 1.60% |
| Supplemental Data | | | | | |
| Net assets, end of period (000 omitted) | $1,096,702 | $1,019,291 | $869,781 | $622,842 | $554,088 |
| Portfolio turnover rateE | 44% | 49% | 31% | 24% | 16% |
A Calculated based on average shares outstanding during the period.
B Total distributions of $.18 per share is comprised of distributions from net investment income of $.151 and distributions from net realized gain of $.024 per share.
C Total returns do not reflect charges attributable to your insurance company's separate account. Inclusion of these charges would reduce the total returns shown.
D Total returns would have been lower if certain expenses had not been reduced during the applicable periods shown.
E Amounts do not include the activity of the Underlying Funds.
F Expense ratios reflect operating expenses of the class. Expenses before reductions do not reflect amounts reimbursed by the investment adviser or reductions from expense offset arrangements and do not represent the amount paid by the class during periods when reimbursements or reductions occur. Expenses net of fee waivers reflect expenses after reimbursement by the investment adviser but prior to reductions from expense offset arrangements. Expenses net of all reductions represent the net expenses paid by the class but do not include expenses of the underlying funds in which the Fund invests.
See accompanying notes which are an integral part of the financial statements.
VIP FundsManager® 85% Portfolio
Investment Summary (Unaudited)
The information in the following tables is based on the direct investments of the Fund.
Fund Holdings as of December 31, 2015
| | % of fund's net assets | % of fund's net assets 6 months ago |
| Domestic Equity Funds | | |
| Fidelity Air Transportation Portfolio | 0.1 | 0.1 |
| Fidelity Banking Portfolio | 3.1 | 2.9 |
| Fidelity Blue Chip Growth Fund | 1.0 | 1.1 |
| Fidelity Blue Chip Value Fund | 1.3 | 0.4 |
| Fidelity Brokerage and Investment Management Portfolio | 0.1 | 1.1 |
| Fidelity Chemicals Portfolio | 0.9 | 1.5 |
| Fidelity Computers Portfolio | 0.4 | 1.1 |
| Fidelity Construction and Housing Portfolio | 1.2 | 1.2 |
| Fidelity Consumer Discretionary Portfolio | 5.4 | 6.6 |
| Fidelity Consumer Staples Portfolio | 4.7 | 4.3 |
| Fidelity Contrafund | 1.9 | 0.0 |
| Fidelity Defense and Aerospace Portfolio | 1.0 | 0.6 |
| Fidelity Dividend Growth Fund | 0.0 | 0.0 |
| Fidelity Electronics Portfolio | 0.5 | 1.1 |
| Fidelity Energy Portfolio | 2.6 | 3.1 |
| Fidelity Energy Service Portfolio | 0.2 | 0.5 |
| Fidelity Financial Services Portfolio | 4.8 | 6.3 |
| Fidelity Global Commodity Stock Fund | 0.0 | 0.0 |
| Fidelity Gold Portfolio | 0.0 | 0.0 |
| Fidelity Growth Company Fund | 0.0 | 0.0 |
| Fidelity Health Care Portfolio | 4.3 | 7.8 |
| Fidelity Health Care Services Portfolio | 0.9 | 0.8 |
| Fidelity Industrial Equipment Portfolio | 0.7 | 0.0 |
| Fidelity Industrials Portfolio | 3.4 | 4.0 |
| Fidelity Insurance Portfolio | 1.6 | 0.7 |
| Fidelity IT Services Portfolio | 0.7 | 1.7 |
| Fidelity Large Cap Stock Fund | 0.4 | 0.8 |
| Fidelity Leisure Portfolio | 0.0 | 0.0 |
| Fidelity Low-Priced Stock Fund | 0.7 | 0.0 |
| Fidelity Magellan Fund | 0.0 | 0.0 |
| Fidelity Materials Portfolio | 0.4 | 0.0 |
| Fidelity Medical Equipment and Systems Portfolio | 1.2 | 0.6 |
| Fidelity Mega Cap Stock Fund | 0.1 | 0.1 |
| Fidelity Mid Cap Value Fund | 0.9 | 2.2 |
| Fidelity Nasdaq Composite Index Fund | 0.0 | 0.0 |
| Fidelity OTC Portfolio | 0.2 | 0.3 |
| Fidelity Pharmaceuticals Portfolio | 1.2 | 0.0 |
| Fidelity Real Estate Investment Portfolio | 0.4 | 0.4 |
| Fidelity Retailing Portfolio | 0.8 | 0.7 |
| Fidelity Series Commodity Strategy Fund | 0.0 | 0.0 |
| Fidelity Small Cap Stock Fund | 0.5 | 0.4 |
| Fidelity Software and IT Services Portfolio | 2.0 | 0.0 |
| Fidelity Stock Selector Large Cap Value Fund | 1.7 | 1.2 |
| Fidelity Technology Portfolio | 7.8 | 6.9 |
| Fidelity Telecommunications Portfolio | 1.7 | 0.1 |
| Fidelity Utilities Portfolio | 0.5 | 0.2 |
| Fidelity Value Discovery Fund | 0.3 | 0.3 |
| Fidelity Natural Gas Portfolio | 0.0 | 0.0 |
| Fidelity Transportation Portfolio | 0.0 | 0.0 |
| | 61.6 | 61.1 |
| International Equity Funds | | |
| Fidelity China Region Fund | 0.2 | 0.4 |
| Fidelity Diversified International Fund | 8.0 | 12.6 |
| Fidelity Emerging Asia Fund | 0.7 | 1.4 |
| Fidelity Emerging Markets Fund | 0.0 | 0.7 |
| Fidelity Europe Fund | 2.5 | 2.3 |
| Fidelity International Discovery Fund | 2.4 | 2.2 |
| Fidelity International Real Estate Fund | 0.0 | 0.0 |
| Fidelity International Small Cap Fund | 0.5 | 0.8 |
| Fidelity International Small Cap Opportunities Fund | 1.2 | 0.6 |
| Fidelity Japan Fund | 1.1 | 1.1 |
| Fidelity Japan Smaller Companies Fund | 1.0 | 0.7 |
| Fidelity Overseas Fund | 9.9 | 6.7 |
| Fidelity Pacific Basin Fund | 0.2 | 0.3 |
| Spartan International Index Fund Investor Class | 0.5 | 1.3 |
| Fidelity International Capital Appreciation Fund | 0.0 | 0.1 |
| | 28.2 | 31.2 |
| Fixed-Income Funds | | |
| Fidelity Floating Rate High Income Fund | 0.0 | 0.0 |
| Fidelity Focused High Income Fund | 0.0 | 0.0 |
| Fidelity High Income Fund | 0.0 | 0.0 |
| Fidelity New Markets Income Fund | 0.5 | 0.4 |
| Fidelity Real Estate Income Fund | 0.4 | 0.4 |
| Spartan Inflation-Protected Bond Index Fund Investor Class | 2.1 | 0.0 |
| Spartan Long-Term Treasury Bond Index Fund Investor Class | 2.2 | 3.0 |
| Spartan U.S. Bond Index Fund Investor Class | 5.0 | 3.3 |
| | 10.2 | 7.1 |
| Money Market Funds | | |
| Fidelity Institutional Prime Money Market Portfolio Class I 0.28% | 0.0 | 0.6 |
| Net Other Assets (Liabilities) | 0.0 | 0.0 |
| | 100.0 | 100.0 |
Fidelity Health Care Services Portfolio was formerly known as Fidelity Medical Delivery Portfolio and
Fidelity Software and IT Services Portfolio was formerly known as Fidelity Software and Computer Services Portfolio
Asset Allocation (% of fund's net assets)
| As of December 31, 2015 |
| | Domestic Equity Funds | 61.6% |
| | International Equity Funds | 28.2% |
| | Fixed-Income Funds | 10.2% |

| As of June 30, 2015 |
| | Domestic Equity Funds | 61.1% |
| | International Equity Funds | 31.2% |
| | Fixed-Income Funds | 7.1% |
| | Money Market Funds | 0.6% |

Percentages shown as 0.0% may reflect amounts less than 0.05%.
VIP FundsManager® 85% Portfolio
Investments December 31, 2015
Showing Percentage of Net Assets
| Equity Funds - 89.8% | | | |
| | | Shares | Value |
| Domestic Equity Funds - 61.6% | | | |
| Fidelity Air Transportation Portfolio (a) | | 7,221 | $449,765 |
| Fidelity Banking Portfolio (a) | | 499,484 | 12,776,813 |
| Fidelity Blue Chip Growth Fund (a) | | 60,025 | 4,139,959 |
| Fidelity Blue Chip Value Fund (a) | | 343,778 | 5,393,876 |
| Fidelity Brokerage and Investment Management Portfolio (a) | | 3,578 | 229,318 |
| Fidelity Chemicals Portfolio (a) | | 27,104 | 3,545,242 |
| Fidelity Computers Portfolio (a) | | 22,485 | 1,534,138 |
| Fidelity Construction and Housing Portfolio (a) | | 82,660 | 4,797,593 |
| Fidelity Consumer Discretionary Portfolio (a) | | 645,082 | 22,042,447 |
| Fidelity Consumer Staples Portfolio (a) | | 212,738 | 19,418,724 |
| Fidelity Contrafund (a) | | 80,325 | 7,948,208 |
| Fidelity Defense and Aerospace Portfolio (a) | | 35,938 | 4,132,524 |
| Fidelity Dividend Growth Fund (a) | | 289 | 8,755 |
| Fidelity Electronics Portfolio (a) | | 24,741 | 1,870,180 |
| Fidelity Energy Portfolio (a) | | 307,520 | 10,815,474 |
| Fidelity Energy Service Portfolio (a) | | 21,096 | 865,797 |
| Fidelity Financial Services Portfolio (a) | | 231,439 | 19,445,527 |
| Fidelity Global Commodity Stock Fund (a) | | 1,909 | 16,779 |
| Fidelity Gold Portfolio (a)(b) | | 3,652 | 49,305 |
| Fidelity Growth Company Fund (a) | | 261 | 35,734 |
| Fidelity Health Care Portfolio (a) | | 84,317 | 17,551,447 |
| Fidelity Health Care Services Portfolio (a) | | 45,016 | 3,800,272 |
| Fidelity Industrial Equipment Portfolio (a) | | 82,221 | 2,999,410 |
| Fidelity Industrials Portfolio (a) | | 479,484 | 14,005,735 |
| Fidelity Insurance Portfolio(a) | | 97,366 | 6,588,736 |
| Fidelity IT Services Portfolio (a) | | 74,265 | 2,968,370 |
| Fidelity Large Cap Stock Fund (a) | | 69,575 | 1,817,995 |
| Fidelity Leisure Portfolio (a) | | 1,058 | 137,510 |
| Fidelity Low-Priced Stock Fund (a) | | 56,267 | 2,686,768 |
| Fidelity Magellan Fund (a) | | 161 | 14,424 |
| Fidelity Materials Portfolio (a) | | 25,416 | 1,744,807 |
| Fidelity Medical Equipment and Systems Portfolio (a) | | 139,715 | 5,011,560 |
| Fidelity Mega Cap Stock Fund (a) | | 26,978 | 421,394 |
| Fidelity Mid Cap Value Fund (a) | | 167,696 | 3,746,332 |
| Fidelity Nasdaq Composite Index Fund (a) | | 945 | 61,944 |
| Fidelity OTC Portfolio (a) | | 7,688 | 641,427 |
| Fidelity Pharmaceuticals Portfolio (a) | | 246,018 | 5,060,594 |
| Fidelity Real Estate Investment Portfolio (a) | | 40,243 | 1,633,071 |
| Fidelity Retailing Portfolio (a) | | 30,687 | 3,228,576 |
| Fidelity Series Commodity Strategy Fund (a)(b) | | 1,089 | 5,316 |
| Fidelity Small Cap Stock Fund (a) | | 109,812 | 1,907,435 |
| Fidelity Software and IT Services Portfolio (a) | | 65,811 | 7,990,086 |
| Fidelity Stock Selector Large Cap Value Fund (a) | | 418,077 | 6,806,289 |
| Fidelity Technology Portfolio (a) | | 271,420 | 32,051,942 |
| Fidelity Telecommunications Portfolio (a) | | 111,248 | 6,734,945 |
| Fidelity Utilities Portfolio (a) | | 31,852 | 2,043,648 |
| Fidelity Value Discovery Fund (a) | | 53,315 | 1,231,582 |
|
| TOTAL DOMESTIC EQUITY FUNDS | | | 252,407,773 |
|
| International Equity Funds - 28.2% | | | |
| Fidelity China Region Fund (a) | | 29,926 | 760,714 |
| Fidelity Diversified International Fund (a) | | 935,479 | 32,797,891 |
| Fidelity Emerging Asia Fund (a) | | 94,429 | 2,833,826 |
| Fidelity Emerging Markets Fund (a) | | 11,817 | 257,020 |
| Fidelity Europe Fund (a) | | 279,006 | 10,091,642 |
| Fidelity International Discovery Fund (a) | | 248,744 | 9,802,990 |
| Fidelity International Real Estate Fund (a) | | 1,498 | 15,012 |
| Fidelity International Small Cap Fund (a) | | 92,674 | 2,049,941 |
| Fidelity International Small Cap Opportunities Fund (a) | | 325,239 | 4,852,571 |
| Fidelity Japan Fund (a) | | 380,016 | 4,487,992 |
| Fidelity Japan Smaller Companies Fund (a) | | 295,487 | 4,089,540 |
| Fidelity Overseas Fund (a) | | 994,115 | 40,619,533 |
| Fidelity Pacific Basin Fund (a) | | 29,698 | 781,661 |
| Spartan International Index Fund Investor Class (a) | | 53,108 | 1,908,175 |
|
| TOTAL INTERNATIONAL EQUITY FUNDS | | | 115,348,508 |
|
| TOTAL EQUITY FUNDS | | | |
| (Cost $342,848,902) | | | 367,756,281 |
|
| Fixed-Income Funds - 10.2% | | | |
| Fidelity Floating Rate High Income Fund (a) | | 856 | 7,814 |
| Fidelity Focused High Income Fund (a) | | 10,783 | 86,370 |
| Fidelity High Income Fund (a) | | 21,045 | 167,309 |
| Fidelity New Markets Income Fund (a) | | 139,032 | 2,018,742 |
| Fidelity Real Estate Income Fund (a) | | 134,555 | 1,512,394 |
| Spartan Inflation-Protected Bond Index Fund Investor Class (a) | | 921,385 | 8,642,595 |
| Spartan Long-Term Treasury Bond Index Fund Investor Class (a) | | 708,679 | 9,042,749 |
| Spartan U.S. Bond Index Fund Investor Class (a) | | 1,760,915 | 20,232,915 |
| TOTAL FIXED-INCOME FUNDS | | | |
| (Cost $41,632,881) | | | 41,710,888 |
|
| Money Market Funds - 0.0% | | | |
| Fidelity Institutional Prime Money Market Portfolio Class I 0.28% (a)(c) | | | |
| (Cost $24,355) | | 24,355 | 24,355 |
| TOTAL INVESTMENT PORTFOLIO - 100.0% | | | |
| (Cost $384,506,138) | | | 409,491,524 |
| NET OTHER ASSETS (LIABILITIES) - 0.0% | | | (69,455) |
| NET ASSETS - 100% | | | $409,422,069 |
Legend
(a) Affiliated Fund
(b) Non-income producing
(c) The rate quoted is the annualized seven-day yield of the fund at period end.
Affiliated Underlying Funds
Information regarding the Fund's fiscal year to date purchases and sales of the affiliated Underlying Funds and income earned by the Fund from investments in affiliated Underlying Funds is as follows:
(Fidelity Health Care Services Portfolio was formerly known as Fidelity Medical Delivery Portfolio and Fidelity Software and IT Services Portfolio was formerly known as Fidelity Software and Computer Services Portfolio)
| Affiliate | Value, beginning of period | Purchases | Sales Proceeds | Dividend Income | Value, end of period |
| Fidelity Air Transportation Portfolio | $1,105,777 | $38,818 | $600,000 | $1,140 | $449,765 |
| Fidelity Automotive Portfolio | 1,401,688 | -- | 1,343,717 | -- | -- |
| Fidelity Banking Portfolio | 9,102,324 | 6,068,221 | 1,556,466 | 128,230 | 12,776,813 |
| Fidelity Biotechnology Portfolio | 113,249 | -- | 136,613 | -- | -- |
| Fidelity Blue Chip Growth Fund | 6,447,990 | 4,324,929 | 6,530,858 | 2,123 | 4,139,959 |
| Fidelity Blue Chip Value Fund | 531,973 | 5,371,127 | 352,923 | 69,057 | 5,393,876 |
| Fidelity Brokerage and Investment | 4,646,094 | 49,325 | 3,990,422 | 7,497 | 229,318 |
| Fidelity Canada Fund | 35,267 | -- | 34,094 | -- | -- |
| Fidelity Chemicals Portfolio | 4,206,766 | 2,658,507 | 2,729,226 | 47,554 | 3,545,242 |
| Fidelity China Region Fund | 173,776 | 1,361,498 | 480,000 | 8,960 | 760,714 |
| Fidelity Communications Equipment Portfolio | 84,103 | -- | 86,005 | -- | -- |
| Fidelity Computers Portfolio | 10,246,542 | 441,981 | 8,496,907 | 26,482 | 1,534,138 |
| Fidelity Construction and Housing Portfolio | 3,549,216 | 1,520,143 | 400,000 | 18,519 | 4,797,593 |
| Fidelity Consumer Discretionary Portfolio | 23,198,879 | 4,632,366 | 6,172,694 | 114,651 | 22,042,447 |
| Fidelity Consumer Finance Portfolio | 324,419 | -- | 325,570 | -- | -- |
| Fidelity Consumer Staples Portfolio | 20,972,236 | 6,847,013 | 7,231,232 | 299,401 | 19,418,724 |
| Fidelity Contrafund | -- | 8,247,441 | 215,557 | 23,830 | 7,948,208 |
| Fidelity Defense and Aerospace Portfolio | -- | 4,456,133 | -- | 28,917 | 4,132,524 |
| Fidelity Diversified International Fund | 34,359,788 | 35,484,154 | 38,887,916 | 310,268 | 32,797,891 |
| Fidelity Dividend Growth Fund | 8,811 | 752 | -- | 127 | 8,755 |
| Fidelity Electronics Portfolio | 8,977,039 | 1,133,838 | 7,579,249 | 23,101 | 1,870,180 |
| Fidelity Emerging Asia Fund | 3,065,534 | 2,731,974 | 2,203,246 | 12,470 | 2,833,826 |
| Fidelity Emerging Europe, Middle East, | 317,871 | -- | 336,570 | -- | -- |
| Fidelity Emerging Markets Fund | 5,596,916 | 1,293 | 5,079,161 | 1,293 | 257,020 |
| Fidelity Energy Portfolio | 6,443,445 | 7,836,202 | 382,101 | 114,246 | 10,815,474 |
| Fidelity Energy Service Portfolio | 2,291,629 | 1,112,240 | 2,024,309 | 8,346 | 865,797 |
| Fidelity Europe Fund | 6,422,278 | 3,729,773 | -- | 116,730 | 10,091,642 |
| Fidelity Financial Services Portfolio | 25,529,575 | 2,773,595 | 7,660,570 | 176,896 | 19,445,527 |
| Fidelity Floating Rate High Income Fund | 7,907 | 324 | -- | 324 | 7,814 |
| Fidelity Focused High Income Fund | 88,066 | 4,088 | -- | 4,088 | 86,370 |
| Fidelity Global Commodity Stock Fund | 23,141 | 467 | -- | 448 | 16,779 |
| Fidelity Gold Portfolio | 60,042 | -- | -- | -- | 49,305 |
| Fidelity Growth & Income Portfolio | 30,345 | -- | 31,169 | -- | -- |
| Fidelity Growth Company Fund | 33,139 | 1,350 | -- | -- | 35,734 |
| Fidelity Health Care Portfolio | 29,367,467 | 5,217,817 | 17,173,881 | -- | 17,551,447 |
| Fidelity Health Care Services Portfolio | 231,823 | 4,123,117 | 399,982 | 791 | 3,800,272 |
| Fidelity High Income Fund | 176,861 | 10,136 | -- | 10,136 | 167,309 |
| Fidelity Industrial Equipment Portfolio | -- | 3,033,691 | -- | 7,790 | 2,999,410 |
| Fidelity Industrials Portfolio | 13,859,596 | 4,966,698 | 3,545,623 | 97,039 | 14,005,735 |
| Fidelity Institutional Prime Money Market | -- | 16,840,630 | 16,816,274 | 1,556 | 24,355 |
| Fidelity Insurance Portfolio | 2,922,053 | 4,735,875 | 900,000 | 63,966 | 6,588,736 |
| Fidelity International Capital Appreciation | 4,243,006 | -- | 4,443,601 | -- | -- |
| Fidelity International Discovery Fund | 11,074,754 | 2,010,623 | 3,854,077 | 100,690 | 9,802,990 |
| Fidelity International Real Estate Fund | 14,748 | 421 | -- | 245 | 15,012 |
| Fidelity International Small Cap Fund | -- | 3,691,202 | 1,300,000 | 42,971 | 2,049,941 |
| Fidelity International Small Cap | -- | 4,921,693 | -- | 17,056 | 4,852,571 |
| Fidelity International Value Fund | 130,917 | -- | 138,560 | -- | -- |
| Fidelity IT Services Portfolio | 632,270 | 7,008,378 | 5,182,870 | -- | 2,968,370 |
| Fidelity Japan Fund | 98,029 | 4,562,360 | -- | 26,057 | 4,487,992 |
| Fidelity Japan Smaller Companies Fund | 1,020,167 | 2,973,745 | -- | 26,054 | 4,089,540 |
| Fidelity Large Cap Stock Fund | 6,519,340 | 1,908,698 | 6,274,632 | 32,246 | 1,817,995 |
| Fidelity Leisure Portfolio | 133,096 | 7,154 | -- | 1,322 | 137,510 |
| Fidelity Low-Priced Stock Fund | -- | 7,026,290 | 4,200,000 | 64,907 | 2,686,768 |
| Fidelity Magellan Fund | 13,862 | 1,064 | -- | 82 | 14,424 |
| Fidelity Materials Portfolio | -- | 1,834,550 | -- | 18,757 | 1,744,807 |
| Fidelity Medical Equipment and Systems | 405,235 | 4,914,781 | -- | 796 | 5,011,560 |
| Fidelity Mega Cap Stock Fund | 2,402,360 | 17,003 | 2,008,143 | 6,448 | 421,394 |
| Fidelity Mid Cap Value Fund | 2,795,151 | 8,928,989 | 7,056,900 | 82,881 | 3,746,332 |
| Fidelity Mid-Cap Stock Fund | -- | -- | -- | -- | -- |
| Fidelity Nasdaq Composite Index Fund | 57,990 | 917 | -- | 516 | 61,944 |
| Fidelity Natural Gas Portfolio | 2,531,472 | 5,161 | 2,431,148 | 5,161 | -- |
| Fidelity New Markets Income Fund | 2,259,093 | 702,814 | 847,766 | 95,967 | 2,018,742 |
| Fidelity OTC Portfolio | 2,350,535 | 203,346 | 2,029,283 | -- | 641,427 |
| Fidelity Overseas Fund | 7,973,723 | 33,353,726 | 776,672 | 414,044 | 40,619,533 |
| Fidelity Pacific Basin Fund | 331,588 | 1,037,131 | 500,000 | 10,237 | 781,661 |
| Fidelity Pharmaceuticals Portfolio | 3,854,851 | 5,864,470 | 3,730,984 | 31,239 | 5,060,594 |
| Fidelity Real Estate Income Fund | 1,486,499 | 80,917 | -- | 62,503 | 1,512,394 |
| Fidelity Real Estate Investment Portfolio | 1,719,394 | 1,186,245 | 1,162,601 | 27,004 | 1,633,071 |
| Fidelity Retailing Portfolio | 2,545,062 | 415,906 | 200,000 | 5,511 | 3,228,576 |
| Fidelity Series Commodity Strategy Fund | 7,114 | -- | -- | -- | 5,316 |
| Fidelity Small Cap Discovery Fund | 100,567 | -- | 102,338 | -- | -- |
| Fidelity Small Cap Growth Fund | 55,271 | -- | 57,193 | -- | -- |
| Fidelity Small Cap Stock Fund | 87,697 | 2,154,238 | 90,497 | 8,144 | 1,907,435 |
| Fidelity Small Cap Value Fund | 32,394 | -- | 32,959 | -- | -- |
| Fidelity Software and IT Services Portfolio | 391,271 | 7,864,641 | 380,386 | 3,242 | 7,990,086 |
| Fidelity Stock Selector Large Cap Value Fund | 11,626,830 | 5,498,722 | 10,364,771 | 52,668 | 6,806,289 |
| Fidelity Technology Portfolio | 24,329,695 | 17,756,762 | 10,183,985 | 25,924 | 32,051,942 |
| Fidelity Telecommunications Portfolio | 395,514 | 6,712,583 | 461,977 | 73,562 | 6,734,945 |
| Fidelity Transportation Portfolio | 3,749,677 | 14,731 | 3,469,602 | 2,077 | -- |
| Fidelity Utilities Portfolio | 3,340,552 | 1,889,361 | 2,855,763 | 54,249 | 2,043,648 |
| Fidelity Value Discovery Fund | 1,078,688 | 235,745 | 13,073 | 21,830 | 1,231,582 |
| Spartan 500 Index Fund Investor Class | 3,280,949 | 13,139 | 3,375,941 | 7,028 | -- |
| Spartan Inflation-Protected Bond Index Fund | -- | 8,835,110 | 26,194 | -- | 8,642,595 |
| Spartan International Index Fund Investor | 26,149,813 | 923,198 | 25,617,427 | 48,432 | 1,908,175 |
| Spartan Long-Term Treasury Bond Index Fund | 4,223,091 | 12,691,985 | 7,001,696 | 311,475 | 9,042,749 |
| Spartan Total Market Index Fund Investor | -- | -- | -- | -- | -- |
| Spartan U.S. Bond Index Fund Investor Class | 25,811,767 | 10,089,005 | 15,408,760 | 396,347 | 20,232,915 |
| | $385,207,657 | $307,092,320 | $269,282,134 | $3,803,648 | $409,491,524 |
Investment Valuation
All investments are categorized as Level 1 under the Fair Value Hierarchy. The inputs or methodology used for valuing securities may not be an indication of the risk associated with investing in those securities. For more information on valuation inputs please refer to the Investment Valuation section in the accompanying Notes to Financial Statements.
See accompanying notes which are an integral part of the financial statements.
VIP FundsManager® 85% Portfolio
Financial Statements
Statement of Assets and Liabilities
| | | December 31, 2015 |
| Assets | | |
| Investment in securities, at value (cost $384,506,138) — See accompanying schedule | | $409,491,524 |
| Cash | | 5 |
| Receivable for investments sold | | 600,333 |
| Receivable for fund shares sold | | 3,725 |
| Total assets | | 410,095,587 |
| Liabilities | | |
| Payable for investments purchased | $441,957 | |
| Payable for fund shares redeemed | 162,102 | |
| Accrued management fee | 68,177 | |
| Distribution and service plan fees payable | 1,282 | |
| Total liabilities | | 673,518 |
| Net Assets | | $409,422,069 |
| Net Assets consist of: | | |
| Paid in capital | | $367,784,645 |
| Accumulated undistributed net realized gain (loss) on investments | | 16,652,038 |
| Net unrealized appreciation (depreciation) on investments | | 24,985,386 |
| Net Assets | | $409,422,069 |
| Service Class: | | |
| Net Asset Value, offering price and redemption price per share ($8,030 ÷ 676.4 shares) | | $11.87 |
| Service Class 2: | | |
| Net Asset Value, offering price and redemption price per share ($10,345,863 ÷ 874,819.0 shares) | | $11.83 |
| Investor Class: | | |
| Net Asset Value, offering price and redemption price per share ($399,068,176 ÷ 33,605,928.0 shares) | | $11.87 |
See accompanying notes which are an integral part of the financial statements.
Statement of Operations
| | | Year ended December 31, 2015 |
| Investment Income | | |
| Income distributions from underlying funds | | $3,803,648 |
| Expenses | | |
| Management fee | $1,008,088 | |
| Distribution and service plan fees | 22,163 | |
| Independent trustees' compensation | 1,629 | |
| Total expenses before reductions | 1,031,880 | |
| Expense reductions | (210,907) | 820,973 |
| Net investment income (loss) | | 2,982,675 |
| Realized and Unrealized Gain (Loss) | | |
| Realized gain (loss) on sale of underlying fund shares | 8,903,941 | |
| Capital gain distributions from underlying funds | 11,587,676 | |
| Total net realized gain (loss) | | 20,491,617 |
| Change in net unrealized appreciation (depreciation) on underlying funds | | (22,430,265) |
| Net gain (loss) | | (1,938,648) |
| Net increase (decrease) in net assets resulting from operations | | $1,044,027 |
See accompanying notes which are an integral part of the financial statements.
Statement of Changes in Net Assets
| | Year ended December 31, 2015 | Year ended December 31, 2014 |
| Increase (Decrease) in Net Assets | | |
| Operations | | |
| Net investment income (loss) | $2,982,675 | $3,814,618 |
| Net realized gain (loss) | 20,491,617 | 37,623,582 |
| Change in net unrealized appreciation (depreciation) | (22,430,265) | (22,621,153) |
| Net increase (decrease) in net assets resulting from operations | 1,044,027 | 18,817,047 |
| Distributions to shareholders from net investment income | (5,527,890) | (3,791,312) |
| Distributions to shareholders from net realized gain | (15,161,464) | (3,833,595) |
| Total distributions | (20,689,354) | (7,624,907) |
| Share transactions - net increase (decrease) | 43,925,167 | 41,590,568 |
| Total increase (decrease) in net assets | 24,279,840 | 52,782,708 |
| Net Assets | | |
| Beginning of period | 385,142,229 | 332,359,521 |
| End of period (including $0 and undistributed net investment income of $23,306, respectively) | $409,422,069 | $385,142,229 |
See accompanying notes which are an integral part of the financial statements.
Financial Highlights — VIP FundsManager 85% Portfolio Service Class
| | | | | |
| Years ended December 31, | 2015 | 2014 | 2013 | 2012 | 2011 |
| Selected Per–Share Data | | | | | |
| Net asset value, beginning of period | $12.46 | $12.07 | $9.62 | $8.57 | $9.19 |
| Income from Investment Operations | | | | | |
| Net investment income (loss)A | .09 | .13 | .11 | .12 | .11 |
| Net realized and unrealized gain (loss) | (.03) | .51 | 2.57 | 1.09 | (.60) |
| Total from investment operations | .06 | .64 | 2.68 | 1.21 | (.49) |
| Distributions from net investment income | (.16)B | (.13) | (.10) | (.13) | (.11) |
| Distributions from net realized gain | (.49)B | (.13) | (.13) | (.03) | (.02) |
| Total distributions | (.65) | (.25)C | (.23) | (.16) | (.13) |
| Net asset value, end of period | $11.87 | $12.46 | $12.07 | $9.62 | $8.57 |
| Total ReturnD,E | .39% | 5.29% | 27.86% | 14.13% | (5.30)% |
| Ratios to Average Net AssetsF,G | | | | | |
| Expenses before reductions | .35% | .35% | .35% | .35% | .35% |
| Expenses net of fee waivers, if any | .20% | .20% | .20% | .20% | .20% |
| Expenses net of all reductions | .20% | .20% | .20% | .20% | .20% |
| Net investment income (loss) | .74% | 1.04% | 1.00% | 1.25% | 1.23% |
| Supplemental Data | | | | | |
| Net assets, end of period (000 omitted) | $8 | $8 | $242 | $149 | $183 |
| Portfolio turnover rateF | 67% | 72% | 51% | 50% | 26% |
A Calculated based on average shares outstanding during the period.
B The amounts shown reflect certain reclassifications related to book to tax differences that were made in the year shown.
C Total distributions of $.25 per share is comprised of distributions from net investment income of $.125 and distributions from net realized gain of $.126 per share.
D Total returns do not reflect charges attributable to your insurance company's separate account. Inclusion of these charges would reduce the total returns shown.
E Total returns would have been lower if certain expenses had not been reduced during the applicable periods shown.
F Amounts do not include the activity of the Underlying Funds.
G Expense ratios reflect operating expenses of the class. Expenses before reductions do not reflect amounts reimbursed by the investment adviser or reductions from expense offset arrangements and do not represent the amount paid by the class during periods when reimbursements or reductions occur. Expenses net of fee waivers reflect expenses after reimbursement by the investment adviser but prior to reductions from expense offset arrangements. Expenses net of all reductions represent the net expenses paid by the class but do not include expenses of the underlying funds in which the Fund invests.
See accompanying notes which are an integral part of the financial statements.
Financial Highlights — VIP FundsManager 85% Portfolio Service Class 2
| | | | | |
| Years ended December 31, | 2015 | 2014 | 2013 | 2012 | 2011 |
| Selected Per–Share Data | | | | | |
| Net asset value, beginning of period | $12.41 | $12.03 | $9.60 | $8.55 | $9.17 |
| Income from Investment Operations | | | | | |
| Net investment income (loss)A | .07 | .11 | .09 | .10 | .10 |
| Net realized and unrealized gain (loss) | (.01) | .50 | 2.55 | 1.10 | (.60) |
| Total from investment operations | .06 | .61 | 2.64 | 1.20 | (.50) |
| Distributions from net investment income | (.15)B | (.11) | (.09) | (.11) | (.10) |
| Distributions from net realized gain | (.49)B | (.13) | (.13) | (.03) | (.02) |
| Total distributions | (.64) | (.23)C | (.21)D | (.15)E | (.12) |
| Net asset value, end of period | $11.83 | $12.41 | $12.03 | $9.60 | $8.55 |
| Total ReturnF,G | .35% | 5.08% | 27.54% | 14.01% | (5.44)% |
| Ratios to Average Net AssetsH,I | | | | | |
| Expenses before reductions | .50% | .50% | .50% | .50% | .50% |
| Expenses net of fee waivers, if any | .35% | .35% | .35% | .35% | .35% |
| Expenses net of all reductions | .35% | .35% | .35% | .35% | .35% |
| Net investment income (loss) | .59% | .89% | .85% | 1.10% | 1.08% |
| Supplemental Data | | | | | |
| Net assets, end of period (000 omitted) | $10,346 | $8,207 | $6,862 | $4,812 | $3,574 |
| Portfolio turnover rateH | 67% | 72% | 51% | 50% | 26% |
A Calculated based on average shares outstanding during the period.
B The amounts shown reflect certain reclassifications related to book to tax differences that were made in the year shown.
C Total distributions of $.23 per share is comprised of distributions from net investment income of $.107 and distributions from net realized gain of $.126 per share.
D Total distributions of $.21 per share is comprised of distributions from net investment income of $.085 and distributions from net realized gain of $.128 per share.
E Total distributions of $.15 per share is comprised of distributions from net investment income of $.113 and distributions from net realized gain of $.033 per share.
F Total returns do not reflect charges attributable to your insurance company's separate account. Inclusion of these charges would reduce the total returns shown.
G Total returns would have been lower if certain expenses had not been reduced during the applicable periods shown.
H Amounts do not include the activity of the Underlying Funds.
I Expense ratios reflect operating expenses of the class. Expenses before reductions do not reflect amounts reimbursed by the investment adviser or reductions from expense offset arrangements and do not represent the amount paid by the class during periods when reimbursements or reductions occur. Expenses net of fee waivers reflect expenses after reimbursement by the investment adviser but prior to reductions from expense offset arrangements. Expenses net of all reductions represent the net expenses paid by the class but do not include expenses of the underlying funds in which the Fund invests.
See accompanying notes which are an integral part of the financial statements.
Financial Highlights — VIP FundsManager 85% Portfolio Investor Class
| | | | | |
| Years ended December 31, | 2015 | 2014 | 2013 | 2012 | 2011 |
| Selected Per–Share Data | | | | | |
| Net asset value, beginning of period | $12.46 | $12.07 | $9.63 | $8.58 | $9.20 |
| Income from Investment Operations | | | | | |
| Net investment income (loss)A | .09 | .13 | .11 | .12 | .11 |
| Net realized and unrealized gain (loss) | (.03) | .51 | 2.56 | 1.09 | (.60) |
| Total from investment operations | .06 | .64 | 2.67 | 1.21 | (.49) |
| Distributions from net investment income | (.16)B | (.13) | (.10) | (.13) | (.11) |
| Distributions from net realized gain | (.49)B | (.13) | (.13) | (.03) | (.02) |
| Total distributions | (.65) | (.25)C | (.23) | (.16) | (.13) |
| Net asset value, end of period | $11.87 | $12.46 | $12.07 | $9.63 | $8.58 |
| Total ReturnD,E | .39% | 5.29% | 27.73% | 14.11% | (5.29)% |
| Ratios to Average Net AssetsF,G | | | | | |
| Expenses before reductions | .25% | .25% | .25% | .25% | .25% |
| Expenses net of fee waivers, if any | .20% | .20% | .20% | .20% | .20% |
| Expenses net of all reductions | .20% | .20% | .20% | .20% | .20% |
| Net investment income (loss) | .74% | 1.04% | 1.00% | 1.25% | 1.23% |
| Supplemental Data | | | | | |
| Net assets, end of period (000 omitted) | $399,068 | $376,927 | $325,256 | $226,548 | $231,895 |
| Portfolio turnover rateF | 67% | 72% | 51% | 50% | 26% |
A Calculated based on average shares outstanding during the period.
B The amounts shown reflect certain reclassifications related to book to tax differences that were made in the year shown.
C Total distributions of $.25 per share is comprised of distributions from net investment income of $.125 and distributions from net realized gain of $.126 per share.
D Total returns do not reflect charges attributable to your insurance company's separate account. Inclusion of these charges would reduce the total returns shown.
E Total returns would have been lower if certain expenses had not been reduced during the applicable periods shown.
F Amounts do not include the activity of the Underlying Funds.
G Expense ratios reflect operating expenses of the class. Expenses before reductions do not reflect amounts reimbursed by the investment adviser or reductions from expense offset arrangements and do not represent the amount paid by the class during periods when reimbursements or reductions occur. Expenses net of fee waivers reflect expenses after reimbursement by the investment adviser but prior to reductions from expense offset arrangements. Expenses net of all reductions represent the net expenses paid by the class but do not include expenses of the underlying funds in which the Fund invests.
See accompanying notes which are an integral part of the financial statements.
Notes to Financial Statements
For the period ended December 31, 2015
1. Organization.
VIP FundsManager 20% Portfolio, VIP FundsManager 50% Portfolio, VIP FundsManager 60% Portfolio, VIP FundsManager 70% Portfolio, and VIP FundsManager 85% Portfolio (the Funds) are funds of Variable Insurance Products Fund V (the Trust). The Trust is registered under the Investment Company Act of 1940, as amended (the 1940 Act), as an open-end management investment company organized as a Massachusetts business trust. Each Fund is authorized to issue an unlimited number of shares. The Funds invest primarily in a combination of other Fidelity equity, fixed income, and short-term funds (the Underlying Funds) managed by Fidelity Management & Research Company (FMR). Shares of each Fund may only be purchased by insurance companies for the purpose of funding variable annuity or variable life insurance contracts. Each Fund offers three classes of shares: Service Class shares, Service Class 2 shares and Investor Class shares. All classes have equal rights and voting privileges, except for matters affecting a single class.
2. Significant Accounting Policies.
The financial statements have been prepared in conformity with accounting principles generally accepted in the United States of America (GAAP), which require management to make certain estimates and assumptions at the date of the financial statements. Actual results could differ from those estimates. Subsequent events, if any, through the date that the financial statements were issued have been evaluated in the preparation of the financial statements. The following summarizes the significant accounting policies of the Funds:
Investment Valuation. Investments are valued as of 4:00 p.m. Eastern time on the last calendar day of the period. Each Fund categorizes the inputs to valuation techniques used to value its investments into a disclosure hierarchy consisting of three levels as shown below:
- Level 1 – quoted prices in active markets for identical investments
- Level 2 – other significant observable inputs (including quoted prices for similar investments, interest rates, prepayment speeds, etc.)
- Level 3 – unobservable inputs (including the Fund's own assumptions based on the best information available)
Valuation techniques used to value each Fund's investments by major category are as follows. Investments in the Underlying Funds are valued at their closing net asset value (NAV) each business day and are categorized as Level 1 in the hierarchy.
Investment Transactions and Income. For financial reporting purposes, the Funds' investment holdings and NAV include trades executed through the end of the last business day of the period. The NAV per share for processing shareholder transactions is calculated as of the close of business of the New York Stock Exchange (NYSE), normally 4:00 p.m. Eastern time and includes trades executed through the end of the prior business day. Gains and losses on securities sold are determined on the basis of identified cost. Income and capital gain distributions from the Underlying Funds, if any, are recorded on the ex-dividend date. Distributions from the Underlying Funds that are deemed to be return of capital are recorded as a reduction of cost of investments.
Class Allocations and Expenses. Investment income, realized and unrealized capital gains and losses, common expenses of each Fund, and certain fund-level expense reductions, if any, are allocated daily on a pro-rata basis to each class based on the relative net assets of each class to the total net assets of each Fund. Each class differs with respect to distribution and service plan fees incurred. Certain expense reductions may also differ by class. For the reporting period, the allocated portion of income and expenses to each class as a percent of its average net assets may vary due to the timing of recording these transactions in relation to fluctuating net assets of the classes. Expenses directly attributable to a fund are charged to that fund. Expenses attributable to more than one fund are allocated among the respective funds on the basis of relative net assets or other appropriate methods. Expenses included in the accompanying financial statements reflect the expenses of each Fund and do not include any expenses associated with the Underlying Funds. Although not included in each Fund's expenses, each Fund indirectly bears its proportionate share of the Underlying Funds' expenses through the impact of these expenses on each Underlying Fund's NAV. Expense estimates are accrued in the period to which they relate and adjustments are made when actual amounts are known.
Income Tax Information and Distributions to Shareholders. Each year, each Fund intends to qualify as a regulated investment company under Subchapter M of the Internal Revenue Code, including distributing substantially all of its taxable income and realized gains. As a result, no provision for U.S. Federal income taxes is required. As of December 31, 2015, each Fund did not have any unrecognized tax benefits in the financial statements; nor is each Fund aware of any tax positions for which it is reasonably possible that the total amounts of unrecognized tax benefits will significantly change in the next twelve months. Each Fund files a U.S. federal tax return, in addition to state and local tax returns as required. Each Fund's federal income tax returns are subject to examination by the Internal Revenue Service (IRS) for a period of three fiscal years after they are filed. State and local tax returns may be subject to examination for an additional fiscal year depending on the jurisdiction.
Distributions are declared and recorded on the ex-dividend date. Income dividends and capital gain distributions are declared separately for each class. Income and capital gain distributions are determined in accordance with income tax regulations, which may differ from GAAP. These differences resulted in distribution reclassifications for the period ended December 31, 2015.
Capital accounts within the financial statements are adjusted for permanent book-tax differences. These adjustments have no impact on net assets or the results of operations. Capital accounts are not adjusted for temporary book-tax differences which will reverse in a subsequent period.
Book-tax differences are primarily due to the short-term gain distributions from the Underlying Funds, capital loss carryforwards and losses deferred due to wash sales.
The federal tax cost of investment securities and unrealized appreciation (depreciation) as of period end were as follows for each Fund:
| | Tax cost | Gross unrealized appreciation | Gross unrealized depreciation | Net unrealized appreciation (depreciation) on securities |
| VIP FundsManager 20% Portfolio | $715,616,149 | $28,039,045 | $(9,106,186) | $18,932,859 |
| VIP FundsManager 50% Portfolio | 6,010,499,100 | 258,822,535 | (138,624,265) | 120,198,270 |
| VIP FundsManager 60% Portfolio | 6,239,442,584 | 771,343,153 | (133,249,521) | 638,093,632 |
| VIP FundsManager 70% Portfolio | 1,035,249,778 | 99,456,101 | (25,716,638) | 73,739,463 |
| VIP FundsManager 85% Portfolio | 384,974,319 | 35,923,741 | (11,406,536) | 24,517,205 |
The tax-based components of distributable earnings as of period end were as follows for each Fund:
| | Undistributed ordinary income | Undistributed long-term capital gain | Net unrealized appreciation (depreciation) on securities and other investments |
| VIP FundsManager 20% Portfolio | $61,931 | $8,803,310 | $18,932,859 |
| VIP FundsManager 50% Portfolio | – | 71,195,611 | 120,198,270 |
| VIP FundsManager 60% Portfolio | 2,154,598 | 212,855,728 | 638,093,632 |
| VIP FundsManager 70% Portfolio | 93,130 | 42,096,577 | 73,739,463 |
| VIP FundsManager 85% Portfolio | – | 17,120,219 | 24,517,205 |
The tax character of distributions paid was as follows:
| December 31, 2015 | | | |
| | Ordinary Income | Long-term Capital Gains | Total |
| VIP FundsManager 20% Portfolio | $10,244,310 | $22,181,858 | $32,426,168 |
| VIP FundsManager 50% Portfolio | 92,303,132 | 157,680,083 | 249,983,215 |
| VIP FundsManager 60% Portfolio | 104,058,377 | 439,631,789 | 543,690,166 |
| VIP FundsManager 70% Portfolio | 15,927,676 | 19,227,054 | 35,154,730 |
| VIP FundsManager 85% Portfolio | 5,546,044 | 15,143,310 | 20,689,354 |
| December 31, 2014 | | | |
| | Ordinary Income | Long-term Capital Gains | Total |
| VIP FundsManager 20% Portfolio | $13,405,296 | $5,454,447 | $18,859,743 |
| VIP FundsManager 50% Portfolio | 95,620,770 | 2,690,573 | 98,311,343 |
| VIP FundsManager 60% Portfolio | 143,912,020 | 109,331,881 | 253,243,901 |
| VIP FundsManager 70% Portfolio | 19,561,664 | – | 19,561,664 |
| VIP FundsManager 85% Portfolio | 7,624,907 | – | 7,624,907 |
3. Purchases and Redemptions of Underlying Fund Shares.
Purchases and redemptions of the Underlying Fund shares, are noted in the table below.
| | Purchases ($) | Redemptions ($) |
| VIP FundsManager 20% Portfolio | 329,519,399 | 342,331,274 |
| VIP FundsManager 50% Portfolio | 2,512,117,411 | 1,377,548,955 |
| VIP FundsManager 60% Portfolio | 2,539,207,628 | 2,061,002,164 |
| VIP FundsManager 70% Portfolio | 597,984,309 | 481,953,124 |
| VIP FundsManager 85% Portfolio | 307,092,320 | 269,282,134 |
4. Fees and Other Transactions with Affiliates.
Management Fee. Effective October 1, 2015, FMR Co., Inc., an affiliate of Strategic Advisers, Inc. (SAI), replaced SAI as investment adviser to the Funds pursuant to a management contract between the Funds and FMR Co., Inc. The new contract does not impact the Funds' investment process, strategies or management fees. For investment management related services each Fund pays a monthly management fee to the investment adviser. The management fee is based on an annual rate of .25% of each Fund's average net assets. The management fee is reduced by an amount equal to the fees and expenses paid by the Funds to the independent Trustees.
The investment adviser has contractually agreed to waive 0.05% of its management fee, thereby limiting each Fund's management fee to an annual rate of 0.20% of average net assets, until April 30, 2017.
Other Transactions. The investment adviser has entered into an administration agreement with FMR under which FMR provides management and administrative services (other than investment advisory services) necessary for the operation of each Fund. Pursuant to this agreement, FMR pays all expenses of each Fund, excluding distribution and service fees, compensation of the independent Trustees and certain other expenses such as interest expense. FMR also contracts with other Fidelity companies to perform the services necessary for the operation of each Fund.
Distribution and Service Plan Fees. In accordance with Rule 12b-1 of the 1940 Act, the Funds have adopted separate 12b-1 Plans for each Service Class of shares. Each Service Class pays Fidelity Distributors Corporation (FDC), an affiliate of the investment adviser, a service fee. For the period, the service fee is based on an annual rate of .10% of Service Class' average net assets and .25% of Service Class 2's average net assets.
For the period, total fees, all of which were reallowed to insurance companies for the distribution of shares and providing shareholder support services were as follows:
| | Service
Class | Service
Class 2 | Total |
| VIP FundsManager 20% Portfolio | $67 | $3,349 | $3,416 |
| VIP FundsManager 50% Portfolio | 71 | 220,032 | 220,103 |
| VIP FundsManager 60% Portfolio | 66 | 1,181,190 | 1,181,256 |
| VIP FundsManager 70% Portfolio | 78 | 24,412 | 24,490 |
| VIP FundsManager 85% Portfolio | 8 | 22,155 | 22,163 |
5. Expense Reductions.
The investment adviser contractually agreed to limit each Funds' management fee to an annual rate of 0.20% of each Funds' average net assets until April 30, 2017. For the period, each Fund's management fees were reduced by the following amounts:
| | Management Fee Waiver |
| VIP FundsManager 20% Portfolio | $ 378,836 |
| VIP FundsManager 50% Portfolio | 2,866,995 |
| VIP FundsManager 60% Portfolio | 3,457,355 |
| VIP FundsManager 70% Portfolio | 545,416 |
| VIP FundsManager 85% Portfolio | 202,025 |
In addition, FMR has contractually agreed to reimburse 0.10% of class-level expenses for each Fund's Service Class and Service Class 2. During the period, this reimbursement reduced each Fund's Service Class and Service Class 2's expenses by the following amounts:
| | Reimbursement
|
| VIP FundsManager 20% Portfolio | |
| Service Class | $67 |
| Service Class 2 | 1,339 |
| VIP FundsManager 50% Portfolio | |
| Service Class | 71 |
| Service Class 2 | 87,986 |
| VIP FundsManager 60% Portfolio | |
| Service Class | 66 |
| Service Class 2 | 473,210 |
| VIP FundsManager 70% Portfolio | |
| Service Class | 78 |
| Service Class 2 | 9,807 |
| VIP FundsManager 85% Portfolio | |
| Service Class | 8 |
| Service Class 2 | 8,874 |
6. Distributions to Shareholders.
Distributions to shareholders of each class were as follows:
| Years ended December 31, | 2015 | 2014 |
| VIP FundsManager 20% Portfolio | | |
| From net investment income | | |
| Service Class | 756 | 979 |
| Service Class 2 | 15,426 | 16,002 |
| Investor Class | 8,782,197 | 9,557,402 |
| Total | $8,798,379 | $9,574,383 |
| From net realized gain | | |
| Service Class | 2,113 | 957 |
| Service Class 2 | 44,977 | 16,563 |
| Investor Class | 23,580,699 | 9,267,840 |
| Total | $23,627,789 | $9,285,360 |
| VIP FundsManager 50% Portfolio | | |
| From net investment income | | |
| Service Class | 747 | 1,098 |
| Service Class 2 | 830,790 | 881,998 |
| Investor Class | 69,150,512 | 57,499,263 |
| Total | $69,982,049 | $58,382,359 |
| From net realized gain | | |
| Service Class | 2,426 | 761 |
| Service Class 2 | 2,981,556 | 715,523 |
| Investor Class | 177,017,184 | 39,212,700 |
| Total | $180,001,166 | $39,928,984 |
| VIP FundsManager 60% Portfolio | | |
| From net investment income | | |
| Service Class | 677 | 985 |
| Service Class 2 | 4,850,081 | 4,680,118 |
| Investor Class | 71,023,792 | 76,666,338 |
| Total | $75,874,550 | $81,347,441 |
| From net realized gain | | |
| Service Class | 4,828 | 2,039 |
| Service Class 2 | 30,448,221 | 10,566,334 |
| Investor Class | 437,362,567 | 161,328,087 |
| Total | $467,815,616 | $171,896,460 |
| VIP FundsManager 70% Portfolio | | |
| From net investment income | | |
| Service Class | 690 | 1,032 |
| Service Class 2 | 99,217 | 76,126 |
| Investor Class | 10,402,667 | 11,606,762 |
| Total | $10,502,574 | $11,683,920 |
| From net realized gain | | |
| Service Class | 1,802 | 695 |
| Service Class 2 | 203,572 | 58,605 |
| Investor Class | 24,446,782 | 7,818,444 |
| Total | $24,652,156 | $7,877,744 |
| VIP FundsManager 85% Portfolio | | |
| From net investment income | | |
| Service Class | 108 | 654 |
| Service Class 2 | 126,841 | 70,488 |
| Investor Class | 5,400,941 | 3,720,170 |
| Total | $5,527,890 | $3,791,312 |
| From net realized gain | | |
| Service Class | 314 | 659 |
| Service Class 2 | 329,863 | 83,004 |
| Investor Class | 14,831,287 | 3,749,932 |
| Total | $15,161,464 | $3,833,595 |
7. Share Transactions.
Transactions for each class of shares were as follows:
| | Shares | Shares | Dollars | Dollars |
| Years ended December 31, | 2015 | 2014 | 2015 | 2014 |
| VIP FundsManager 20% Portfolio | | | | |
| Service Class | | | | |
| Shares sold | 282 | 605 | $3,201 | $6,960 |
| Reinvestment of distributions | 256 | 169 | 2,869 | 1,936 |
| Shares redeemed | (820) | (1,182) | (9,217) | (13,611) |
| Net increase (decrease) | (282) | (408) | $(3,147) | $(4,715) |
| Service Class 2 | | | | |
| Shares sold | 55,089 | 80,085 | $619,120 | $921,014 |
| Reinvestment of distributions | 5,394 | 2,844 | 60,403 | 32,565 |
| Shares redeemed | (52,490) | (64,497) | (595,169) | (746,239) |
| Net increase (decrease) | 7,993 | 18,432 | $84,354 | $207,340 |
| Investor Class | | | | |
| Shares sold | 4,314,478 | 7,360,070 | $48,892,189 | $84,639,225 |
| Reinvestment of distributions | 2,886,754 | 1,642,865 | 32,362,896 | 18,825,242 |
| Shares redeemed | (6,795,492) | (4,177,704) | (76,720,627) | (48,109,863) |
| Net increase (decrease) | 405,740 | 4,825,231 | $4,534,458 | $55,354,604 |
| VIP FundsManager 50% Portfolio | | | | |
| Service Class | | | | |
| Shares sold | 30 | 2,001 | $376 | $24,453 |
| Reinvestment of distributions | 261 | 149 | 3,173 | 1,859 |
| Shares redeemed | (767) | (2,910) | (9,305) | (36,173) |
| Net increase (decrease) | (476) | (760) | $(5,756) | $(9,861) |
| Service Class 2 | | | | |
| Shares sold | 1,197,918 | 924,485 | $14,606,195 | $11,192,972 |
| Reinvestment of distributions | 314,646 | 128,803 | 3,812,346 | 1,597,521 |
| Shares redeemed | (1,639,641) | (1,310,587) | (19,955,650) | (16,071,640) |
| Net increase (decrease) | (127,077) | (257,299) | $(1,537,109) | $(3,281,147) |
| Investor Class | | | | |
| Shares sold | 87,789,959 | 131,490,722 | $1,074,317,628 | $1,619,426,914 |
| Reinvestment of distributions | 20,301,767 | 7,774,660 | 246,167,696 | 96,711,963 |
| Shares redeemed | (8,600,399) | (5,005,123) | (105,237,774) | (61,618,784) |
| Net increase (decrease) | 99,491,327 | 134,260,259 | $1,215,247,550 | $1,654,520,093 |
| VIP FundsManager 60% Portfolio | | | | |
| Service Class | | | | |
| Shares sold | 92 | 463 | $1,058 | $5,525 |
| Reinvestment of distributions | 488 | 255 | 5,505 | 3,024 |
| Shares redeemed | (942) | (1,322) | (10,684) | (15,803) |
| Net increase (decrease) | (362) | (604) | $(4,121) | $(7,254) |
| Service Class 2 | | | | |
| Shares sold | 11,496,489 | 6,953,884 | $131,468,035 | $82,535,716 |
| Reinvestment of distributions | 3,139,200 | 1,285,709 | 35,298,302 | 15,246,452 |
| Shares redeemed | (5,178,599) | (4,175,282) | (58,979,106) | (49,658,448) |
| Net increase (decrease) | 9,457,090 | 4,064,311 | $107,787,231 | $48,123,720 |
| Investor Class | | | | |
| Shares sold | 54,600,995 | 14,294,873 | $628,143,142 | $171,539,075 |
| Reinvestment of distributions | 45,130,041 | 20,038,775 | 508,386,359 | 237,994,425 |
| Shares redeemed | (38,801,862) | (29,853,294) | (444,895,412) | (356,642,962) |
| Net increase (decrease) | 60,929,174 | 4,480,354 | $691,634,089 | $52,890,538 |
| VIP FundsManager 70% Portfolio | | | | |
| Service Class | | | | |
| Shares sold | 95 | 2,986 | $1,186 | $35,038 |
| Reinvestment of distributions | 202 | 139 | 2,492 | 1,727 |
| Shares redeemed | (608) | (4,423) | (7,499) | (54,626) |
| Net increase (decrease) | (311) | (1,298) | $(3,821) | $(17,861) |
| Service Class 2 | | | | |
| Shares sold | 433,265 | 112,676 | $5,385,934 | $1,387,511 |
| Reinvestment of distributions | 24,649 | 10,813 | 302,789 | 134,731 |
| Shares redeemed | (72,562) | (71,628) | (901,788) | (884,279) |
| Net increase (decrease) | 385,352 | 51,861 | $4,786,935 | $637,963 |
| Investor Class | | | | |
| Shares sold | 9,520,512 | 10,959,979 | $119,096,572 | $134,785,691 |
| Reinvestment of distributions | 2,825,692 | 1,555,261 | 34,849,407 | 19,425,206 |
| Shares redeemed | (3,585,245) | (2,713,625) | (44,259,783) | (33,487,725) |
| Net increase (decrease) | 8,760,959 | 9,801,615 | $109,686,196 | $120,723,172 |
| VIP FundsManager 85% Portfolio | | | | |
| Service Class | | | | |
| Shares sold | 152 | 2,972 | $1,870 | $36,635 |
| Reinvestment of distributions | 34 | 105 | 422 | 1,314 |
| Shares redeemed | (148) | (22,457) | (1,816) | (275,993) |
| Net increase (decrease) | 38 | (19,380) | $476 | $(238,044) |
| Service Class 2 | | | | |
| Shares sold | 324,229 | 148,009 | $3,937,469 | $1,809,858 |
| Reinvestment of distributions | 37,474 | 12,240 | 456,704 | 153,492 |
| Shares redeemed | (148,025) | (69,583) | (1,816,406) | (866,270) |
| Net increase (decrease) | 213,678 | 90,666 | $2,577,767 | $1,097,080 |
| Investor Class | | | | |
| Shares sold | 4,116,729 | 4,805,833 | $50,957,543 | $59,092,080 |
| Reinvestment of distributions | 1,652,617 | 593,808 | 20,232,228 | 7,470,102 |
| Shares redeemed | (2,415,852) | (2,089,886) | (29,842,847) | (25,830,650) |
| Net increase (decrease) | 3,353,494 | 3,309,755 | $41,346,924 | $40,731,532 |
8. Other.
The Funds' organizational documents provide former and current trustees and officers with a limited indemnification against liabilities arising in connection with the performance of their duties to the Funds. In the normal course of business, the Funds may also enter into contracts that provide general indemnifications. The Funds' maximum exposure under these arrangements is unknown as this would be dependent on future claims that may be made against the Funds. The risk of material loss from such claims is considered remote.
The Funds do not invest in the Underlying Funds for the purpose of exercising management or control: however, investments by the Funds within their principal investment strategies may represent a significant portion of the Underlying Fund's net assets.
At the end of the period, the following Funds were each the owners of record of 10% or more of the total outstanding shares of the Underlying Funds.
| Fund | VIP FundsManager 50% Portfolio | VIP FundsManager60% Portfolio |
| Fidelity Banking Portfolio | 12% | 21% |
| Fidelity Blue Chip Value Fund | 10% | – |
| Fidelity Construction and Housing Portfolio | – | 10% |
| Fidelity Consumer Discretionary Portfolio | 14% | 20% |
| Fidelity Financial Service Portfolio | 12% | 20% |
| Fidelity Industrial Portfolio | – | 14% |
| Fidelity Industrial Equipment Portfolio | 20% | 28% |
| Fidelity Insurance Portfolio | 13% | 15% |
| Fidelity Technology Portfolio | – | 12% |
| Fidelity Telecommunication Portfolio | 10% | 14% |
| Spartan Inflation-Protected Bond Index Fund | 19% | 19% |
The Funds, in aggregate, were the owners of record of more than 20% of the total outstanding shares of the following Underlying Funds.
| | % of shares held |
| Fidelity Banking Portfolio | 40% |
| Fidelity Blue Chip Value Portfolio | 22% |
| Fidelity Construction and Housing Portfolio | 20% |
| Fidelity Consumer Discretionary Portfolio | 39% |
| Fidelity Financial Service Portfolio | 37% |
| Fidelity Industrial Portfolio | 28% |
| Fidelity Industrial Equipment Portfolio | 55% |
| Fidelity Insurance Portfolio | 34% |
| Fidelity Japan Fund | 21% |
| Fidelity Technology Portfolio | 22% |
| Fidelity Tetecommunication Portfolio | 29% |
| Spartan Inflation-Protected Bond Index Fund | 46% |
| Spartan Long-Term Treasury Bond Index Fund | 23% |
| Spartan U.S. Bond Index Fund | 22% |
In addition, at the end of the period, the investment adviser or its affiliates and certain otherwise unaffiliated shareholders each were owners of record of more than 10% of the outstanding shares of the following funds:
| | Affiliated % | Number of Unaffiliated Shareholders | Unaffiliated Shareholders % |
| VIP FundsManager 20% Portfolio | 100% | – | – |
| VIP FundsManager 50% Portfolio | 22% | 1 | 72% |
| VIP FundsManager 60% Portfolio | 27% | 1 | 54% |
| VIP FundsManager 70% Portfolio | 99% | – | – |
| VIP FundsManager 85% Portfolio | 97% | – | – |
Report of Independent Registered Public Accounting Firm
To the Trustees of Variable Insurance Products and the Shareholders of VIP FundsManager 20% Portfolio, VIP FundsManager 50% Portfolio, VIP FundsManager 60% Portfolio, VIP FundsManager 70% Portfolio and VIP FundsManager 85% Portfolio:
In our opinion, the accompanying statements of assets and liabilities, including the schedules of investments, and the related statements of operations and of changes in net assets and the financial highlights present fairly, in all material respects, the financial position of VIP FundsManager 20% Portfolio, VIP FundsManager 50% Portfolio, VIP FundsManager 60% Portfolio, VIP FundsManager 70% Portfolio and VIP FundsManager 85% Portfolio (the Funds) each a fund of Variable Insurance Products Fund V at December 31, 2015, the results of each of their operations for the year then ended, the changes in each of their net assets for each of the two years in the period then ended and the financial highlights for each of the five years in the period then ended, in conformity with accounting principles generally accepted in the United States of America. These financial statements and financial highlights (hereafter referred to as “financial statements”) are the responsibility of the Funds' management. Our responsibility is to express an opinion on these financial statements based on our audits. We conducted our audits of these financial statements in accordance with the standards of the Public Company Accounting Oversight Board (United States). Those standards require that we plan and perform the audit to obtain reasonable assurance about whether the financial statements are free of material misstatement. An audit includes examining, on a test basis, evidence supporting the amounts and disclosures in the financial statements, assessing the accounting principles used and significant estimates made by management, and evaluating the overall financial statement presentation. We believe that our audits, which included confirmation of securities at December 31, 2015 by correspondence with the custodian and brokers, provide a reasonable basis for our opinion.
PricewaterhouseCoopers LLP
Boston, Massachusetts
February 24, 2016
Trustees and Officers
The Trustees, Members of the Advisory Board (if any), and officers of the trust and funds, as applicable, are listed below. The Board of Trustees governs each fund and is responsible for protecting the interests of shareholders. The Trustees are experienced executives who meet periodically throughout the year to oversee each fund's activities, review contractual arrangements with companies that provide services to each fund, oversee management of the risks associated with such activities and contractual arrangements, and review each fund's performance. If the interests of a fund and an underlying Fidelity® fund were to diverge, a conflict of interest could arise and affect how the Trustees and Members of the Advisory Board fulfill their fiduciary duties to the affected funds. FMRC has structured the funds to avoid these potential conflicts, although there may be situations where a conflict of interest is unavoidable. In such instances, FMRC, the Trustees, and Members of the Advisory Board would take reasonable steps to minimize and, if possible, eliminate the conflict. Except for Elizabeth S. Acton, John Engler, and Geoffrey A. von Kuhn, each of the Trustees oversees 236 funds. Ms. Acton and Mr. Engler each oversees 228 funds. Mr. von Kuhn oversees 148 funds.
The Trustees hold office without limit in time except that (a) any Trustee may resign; (b) any Trustee may be removed by written instrument, signed by at least two-thirds of the number of Trustees prior to such removal; (c) any Trustee who requests to be retired or who has become incapacitated by illness or injury may be retired by written instrument signed by a majority of the other Trustees; and (d) any Trustee may be removed at any special meeting of shareholders by a two-thirds vote of the outstanding voting securities of the trust. Each Trustee who is not an interested person (as defined in the 1940 Act) of the trust and the funds is referred to herein as an Independent Trustee. Each Independent Trustee shall retire not later than the last day of the calendar year in which his or her 75th birthday occurs. The Independent Trustees may waive this mandatory retirement age policy with respect to individual Trustees. Officers and Advisory Board Members hold office without limit in time, except that any officer or Advisory Board Member may resign or may be removed by a vote of a majority of the Trustees at any regular meeting or any special meeting of the Trustees. Except as indicated, each individual has held the office shown or other offices in the same company for the past five years.
Each fund’s Statement of Additional Information (SAI) includes more information about the Trustees. To request a free copy, call Fidelity at 1-877-208-0098.
Experience, Skills, Attributes, and Qualifications of the Trustees. The Governance and Nominating Committee has adopted a statement of policy that describes the experience, qualifications, attributes, and skills that are necessary and desirable for potential Independent Trustee candidates (Statement of Policy). The Board believes that each Trustee satisfied at the time he or she was initially elected or appointed a Trustee, and continues to satisfy, the standards contemplated by the Statement of Policy. The Governance and Nominating Committee also engages professional search firms to help identify potential Independent Trustee candidates who have the experience, qualifications, attributes, and skills consistent with the Statement of Policy. From time to time, additional criteria based on the composition and skills of the current Independent Trustees, as well as experience or skills that may be appropriate in light of future changes to board composition, business conditions, and regulatory or other developments, have also been considered by the professional search firms and the Governance and Nominating Committee. In addition, the Board takes into account the Trustees' commitment and participation in Board and committee meetings, as well as their leadership of standing and ad hoc committees throughout their tenure.
In determining that a particular Trustee was and continues to be qualified to serve as a Trustee, the Board has considered a variety of criteria, none of which, in isolation, was controlling. The Board believes that, collectively, the Trustees have balanced and diverse experience, qualifications, attributes, and skills, which allow the Board to operate effectively in governing each fund and protecting the interests of shareholders. Information about the specific experience, skills, attributes, and qualifications of each Trustee, which in each case led to the Board's conclusion that the Trustee should serve (or continue to serve) as a trustee of the funds, is provided below.
Board Structure and Oversight Function. Abigail P. Johnson is an interested person and currently serves as Chairman. The Trustees have determined that an interested Chairman is appropriate and benefits shareholders because an interested Chairman has a personal and professional stake in the quality and continuity of services provided to the funds. Independent Trustees exercise their informed business judgment to appoint an individual of their choosing to serve as Chairman, regardless of whether the Trustee happens to be independent or a member of management. The Independent Trustees have determined that they can act independently and effectively without having an Independent Trustee serve as Chairman and that a key structural component for assuring that they are in a position to do so is for the Independent Trustees to constitute a substantial majority for the Board. The Independent Trustees also regularly meet in executive session. Marie L. Knowles serves as Chairman of the Independent Trustees and as such (i) acts as a liaison between the Independent Trustees and management with respect to matters important to the Independent Trustees and (ii) with management prepares agendas for Board meetings.
Fidelity® funds are overseen by different Boards of Trustees. The funds' Board oversees Fidelity's investment-grade bond, money market, asset allocation and certain equity funds, and other Boards oversee Fidelity's high income, sector and other equity funds. The asset allocation funds may invest in Fidelity® funds that are overseen by such other Boards. The use of separate Boards, each with its own committee structure, allows the Trustees of each group of Fidelity® funds to focus on the unique issues of the funds they oversee, including common research, investment, and operational issues. On occasion, the separate Boards establish joint committees to address issues of overlapping consequences for the Fidelity® funds overseen by each Board.
The Trustees operate using a system of committees to facilitate the timely and efficient consideration of all matters of importance to the Trustees, each fund, and fund shareholders and to facilitate compliance with legal and regulatory requirements and oversight of the funds' activities and associated risks. The Board, acting through its committees, has charged FMR and its affiliates with (i) identifying events or circumstances the occurrence of which could have demonstrably adverse effects on the funds' business and/or reputation; (ii) implementing processes and controls to lessen the possibility that such events or circumstances occur or to mitigate the effects of such events or circumstances if they do occur; and (iii) creating and maintaining a system designed to evaluate continuously business and market conditions in order to facilitate the identification and implementation processes described in (i) and (ii) above. Because the day-to-day operations and activities of the funds are carried out by or through FMR, its affiliates, and other service providers, the funds' exposure to risks is mitigated but not eliminated by the processes overseen by the Trustees. While each of the Board's committees has responsibility for overseeing different aspects of the funds' activities, oversight is exercised primarily through the Operations and Audit Committees. In addition, an ad hoc Board committee of Independent Trustees has worked with FMR to enhance the Board's oversight of investment and financial risks, legal and regulatory risks, technology risks, and operational risks, including the development of additional risk reporting to the Board. Appropriate personnel, including but not limited to the funds' Chief Compliance Officer (CCO), FMR's internal auditor, the independent accountants, the funds' Treasurer and portfolio management personnel, make periodic reports to the Board's committees, as appropriate, including an annual review of Fidelity's risk management program for the Fidelity® funds. The responsibilities of each standing committee, including their oversight responsibilities, are described further under "Standing Committees of the Trustees."
Interested Trustees*:
Correspondence intended for a Trustee who is an interested person may be sent to Fidelity Investments, 245 Summer Street, Boston, Massachusetts 02210.
Name, Year of Birth; Principal Occupations and Other Relevant Experience+
Abigail P. Johnson (1961)
Year of Election or Appointment: 2009
Trustee
Chairman of the Board of Trustees
Ms. Johnson also serves as Trustee of other Fidelity® funds. Ms. Johnson serves as President (2013-present) and Chief Executive Officer (2014-present) of FMR LLC (diversified financial services company), President of Fidelity Financial Services (2012-present) and President of Personal, Workplace and Institutional Services (2005-present). Ms. Johnson is Chairman and Director of FMR Co., Inc. (investment adviser firm, 2011-present), Chairman and Director of FMR (investment adviser firm, 2011-present), and the Vice Chairman and Director (2007-present) of FMR LLC. Previously, Ms. Johnson served as President and a Director of FMR (2001-2005), a Trustee of other investment companies advised by FMR, Fidelity Investments Money Management, Inc. (investment adviser firm), and FMR Co., Inc. (2001-2005), Senior Vice President of the Fidelity® funds (2001-2005), and managed a number of Fidelity® funds. Ms. Abigail P. Johnson and Mr. Arthur E. Johnson are not related.
Geoffrey A. von Kuhn (1951)
Year of Election or Appointment: 2015
Trustee
Mr. von Kuhn also serves as Trustee or Member of the Advisory Board of other Fidelity funds. Mr. von Kuhn is Chief Administrative Officer for FMR LLC (diversified financial services company, 2013-present), a Director of Pembroke Real Estate, Inc. (2009-present), and a Director of Discovery Natural Resources LLC (2012-present). Previously, Mr. von Kuhn was a managing director of Crosby Group (private wealth management company, 2007-2013), a member of the management committee and senior executive in the Wealth Management Group of AmSouth Bank (2001-2006), and head of the U.S. private bank at Citigroup (2000-2001).
* Determined to be an “Interested Trustee” by virtue of, among other things, his or her affiliation with the trust or various entities under common control with FMR.
+ The information includes the Trustee's principal occupation during the last five years and other information relating to the experience, attributes, and skills relevant to the Trustee's qualifications to serve as a Trustee, which led to the conclusion that the Trustee should serve as a Trustee for each fund.
Independent Trustees:
Correspondence intended for an Independent Trustee may be sent to Fidelity Investments, P.O. Box 55235, Boston, Massachusetts 02205-5235.
Name, Year of Birth; Principal Occupations and Other Relevant Experience+
Elizabeth S. Acton (1951)
Year of Election or Appointment: 2013
Trustee
Ms. Acton also serves as Trustee or Member of the Advisory Board of other Fidelity® funds. Prior to her retirement in April 2012, Ms. Acton was Executive Vice President, Finance (2011-2012), Executive Vice President, Chief Financial Officer (2002-2011), and Treasurer (2004-2005) of Comerica Incorporated (financial services). Prior to joining Comerica, Ms. Acton held a variety of positions at Ford Motor Company (1983-2002), including Vice President and Treasurer (2000-2002) and Executive Vice President and Chief Financial Officer of Ford Motor Credit Company (1998-2000). Ms. Acton currently serves as a member of the Board of Directors and Audit and Finance Committees of Beazer Homes USA, Inc. (homebuilding, 2012-present).
John Engler (1948)
Year of Election or Appointment: 2014
Trustee
Mr. Engler also serves as Trustee or Member of the Advisory Board of other Fidelity® funds. He serves as president of the Business Roundtable (2011-present), and on the board of directors/trustees for Universal Forest Products (manufacturer and distributor of wood and wood-alternative products, 2003-present) and K12 Inc. (technology-based education company, 2012-present). Previously, Mr. Engler served as a trustee of The Munder Funds (2003-2014), president and CEO of the National Association of Manufacturers (2004-2011), member of the Board of Trustees of the Annie E. Casey Foundation (2004-2015), and as governor of Michigan (1991-2003). He is a past chairman of the National Governors Association.
Albert R. Gamper, Jr. (1942)
Year of Election or Appointment: 2007
Trustee
Mr. Gamper also serves as Trustee of other Fidelity® funds. Prior to his retirement in December 2004, Mr. Gamper served as Chairman of the Board of CIT Group Inc. (commercial finance). During his tenure with CIT Group Inc. Mr. Gamper served in numerous senior management positions, including Chairman (1987-1989; 1999-2001; 2002-2004), Chief Executive Officer (1987-2004), and President (2002-2003). Mr. Gamper currently serves as a member of the Board of Directors of Public Service Enterprise Group (utilities, 2000-present), and Member of the Board of Trustees of Barnabas Health Care System (1997-present). Previously, Mr. Gamper served as Chairman (2012-2015) and Vice Chairman (2011-2012) of the Independent Trustees of certain Fidelity® funds and as Chairman of the Board of Governors, Rutgers University (2004-2007).
Robert F. Gartland (1951)
Year of Election or Appointment: 2010
Trustee
Mr. Gartland also serves as Trustee of other Fidelity® funds. Mr. Gartland is Chairman and an investor in Gartland and Mellina Group Corp. (consulting, 2009-present). Previously, Mr. Gartland served as a partner and investor of Vietnam Partners LLC (investments and consulting, 2008-2011). Prior to his retirement, Mr. Gartland held a variety of positions at Morgan Stanley (financial services, 1979-2007) including Managing Director (1987-2007).
Arthur E. Johnson (1947)
Year of Election or Appointment: 2008
Trustee
Vice Chairman of the Independent Trustees
Mr. Johnson also serves as Trustee of other Fidelity® funds. Mr. Johnson serves as a member of the Board of Directors of Eaton Corporation plc (diversified power management, 2009-present), AGL Resources, Inc. (holding company, 2002-present) and Booz Allen Hamilton (management consulting, 2011-present). Prior to his retirement, Mr. Johnson served as Senior Vice President of Corporate Strategic Development of Lockheed Martin Corporation (defense contractor, 1999-2009). He previously served on the Board of Directors of IKON Office Solutions, Inc. (1999-2008) and Delta Airlines (2005-2007). Mr. Arthur E. Johnson is not related to Ms. Abigail P. Johnson.
Michael E. Kenneally (1954)
Year of Election or Appointment: 2009
Trustee
Mr. Kenneally also serves as Trustee of other Fidelity® funds. Prior to his retirement, Mr. Kenneally served as Chairman and Global Chief Executive Officer of Credit Suisse Asset Management. Before joining Credit Suisse, he was an Executive Vice President and Chief Investment Officer for Bank of America Corporation. Earlier roles at Bank of America included Director of Research, Senior Portfolio Manager and Research Analyst, and Mr. Kenneally was awarded the Chartered Financial Analyst (CFA) designation in 1991.
James H. Keyes (1940)
Year of Election or Appointment: 2007
Trustee
Mr. Keyes also serves as Trustee of other Fidelity® funds. Mr. Keyes serves as a member of the Board and Non-Executive Chairman of Navistar International Corporation (manufacture and sale of trucks, buses, and diesel engines, since 2002). Previously, Mr. Keyes served as a member of the Board of Pitney Bowes, Inc. (integrated mail, messaging, and document management solutions, 1998-2013). Prior to his retirement, Mr. Keyes served as Chairman (1993-2002) and Chief Executive Officer (1988-2002) of Johnson Controls (automotive, building, and energy) and as a member of the Board of LSI Logic Corporation (semiconductor technologies, 1984-2008).
Marie L. Knowles (1946)
Year of Election or Appointment: 2001
Trustee
Chairman of the Independent Trustees
Ms. Knowles also serves as Trustee of other Fidelity® funds. Prior to Ms. Knowles' retirement in June 2000, she served as Executive Vice President and Chief Financial Officer of Atlantic Richfield Company (ARCO) (diversified energy, 1996-2000). From 1993 to 1996, she was a Senior Vice President of ARCO and President of ARCO Transportation Company (pipeline and tanker operations). Ms. Knowles currently serves as a Director and Chairman of the Audit Committee of McKesson Corporation (healthcare service, since 2002). Ms. Knowles is a member of the Board of the Santa Catalina Island Company (real estate, 2009-present). Ms. Knowles is a Member of the Investment Company Institute Board of Governors and a Member of the Governing Council of the Independent Directors Council (2014-present). She also serves as a member of the Advisory Board for the School of Engineering of the University of Southern California. Previously, Ms. Knowles served as a Director of Phelps Dodge Corporation (copper mining and manufacturing, 1994-2007), URS Corporation (engineering and construction, 2000-2003) and America West (airline, 1999-2002). Ms. Knowles previously served as Vice Chairman of the Independent Trustees of certain Fidelity® funds (2012-2015).
+ The information includes the Trustee's principal occupation during the last five years and other information relating to the experience, attributes, and skills relevant to the Trustee's qualifications to serve as a Trustee, which led to the conclusion that the Trustee should serve as a Trustee for each fund.
Advisory Board Members and Officers:
Correspondence intended for an officer may be sent to Fidelity Investments, 245 Summer Street, Boston, Massachusetts 02210. Officers appear below in alphabetical order.
Name, Year of Birth; Principal Occupation
Marc R. Bryant (1966)
Year of Election or Appointment: 2015
Secretary and Chief Legal Officer (CLO)
Mr. Bryant also serves as Secretary and CLO of other funds. Mr. Bryant serves as CLO, Secretary, and Senior Vice President of Fidelity Management & Research Company (investment adviser firm, 2015-present) and FMR Co., Inc. (investment adviser firm, 2015-present); Secretary of Fidelity SelectCo, LLC (investment adviser firm, 2015-present) and Fidelity Investments Money Management, Inc. (investment adviser firm, 2015-present); and CLO of Fidelity Management & Research (Hong Kong) Limited (investment adviser firm, 2015-present). He is Senior Vice President and Deputy General Counsel of FMR LLC (diversified financial services company). Previously, Mr. Bryant served as Secretary and CLO of Fidelity Rutland Square Trust II (2010-2014) and Assistant Secretary of Fidelity's Fixed Income and Asset Allocation Funds (2013-2015). Prior to joining Fidelity Investments, Mr. Bryant served as a Senior Vice President and the Head of Global Retail Legal for AllianceBernstein L.P. (2006-2010), and as the General Counsel for ProFund Advisors LLC (2001-2006).
Jonathan Davis (1968)
Year of Election or Appointment: 2010
Assistant Treasurer
Mr. Davis also serves as Assistant Treasurer of other funds, and is an employee of Fidelity Investments. Previously, Mr. Davis served as Vice President and Associate General Counsel of FMR LLC (diversified financial services company, 2003-2010).
Adrien E. Deberghes (1967)
Year of Election or Appointment: 2010
Assistant Treasurer
Mr. Deberghes also serves as an officer of other funds. He is an employee of Fidelity Investments (2008-present). Prior to joining Fidelity Investments, Mr. Deberghes was Senior Vice President of Mutual Fund Administration at State Street Corporation (2007-2008), Senior Director of Mutual Fund Administration at Investors Bank & Trust (2005-2007), and Director of Finance for Dunkin' Brands (2000-2005).
Stephanie J. Dorsey (1969)
Year of Election or Appointment: 2013
President and Treasurer
Ms. Dorsey also serves as an officer of other funds. She is an employee of Fidelity Investments (2008-present) and has served in other fund officer roles. Prior to joining Fidelity Investments, Ms. Dorsey served as Treasurer (2004-2008) of the JPMorgan Mutual Funds and Vice President (2004-2008) of JPMorgan Chase Bank.
Howard J. Galligan III (1966)
Year of Election or Appointment: 2014
Chief Financial Officer
Mr. Galligan also serves as Chief Financial Officer of other funds. Mr. Galligan serves as President of Fidelity Pricing and Cash Management Services (FPCMS) (2014-present) and as a Director of Strategic Advisers, Inc. (investment adviser firm, 2008-present). Previously, Mr. Galligan served as Chief Administrative Officer of Asset Management (2011-2014) and Chief Operating Officer and Senior Vice President of Investment Support for Strategic Advisers, Inc. (2003-2011).
Scott C. Goebel (1968)
Year of Election or Appointment: 2015
Vice President
Mr. Goebel serves as Vice President of other funds and is an employee of Fidelity Investments (2001-present). Previously, Mr. Goebel served as Secretary of Fidelity SelectCo, LLC (investment adviser firm, 2013-2015), Fidelity Investments Money Management, Inc. (FIMM) (investment adviser firm, 2010-2015), and Fidelity Research and Analysis Company (FRAC) (investment adviser firm, 2010-2015); General Counsel, Secretary, and Senior Vice President of Fidelity Management & Research Company (investment adviser firm, 2008-2015) and FMR Co., Inc. (investment adviser firm, 2008-2015); Assistant Secretary of Fidelity Management & Research (Japan) Limited (investment adviser firm, 2008-2015) and FMR Investment Management (U.K.) Limited (investment adviser firm, 2008-2015); Chief Legal Officer (CLO) of Fidelity Management & Research (Hong Kong) Limited (investment adviser firm, 2008-2015); Secretary and CLO of certain Fidelity® funds (2008-2015); Assistant Secretary of FIMM (2008-2010), FRAC (2008-2010), and certain funds (2007-2008); and as Vice President and Secretary of Fidelity Distributors Corporation (FDC) (2005-2007).
Chris Maher (1972)
Year of Election or Appointment: 2013
Assistant Treasurer
Mr. Maher serves as Assistant Treasurer of other funds. Mr. Maher is Vice President of Valuation Oversight and is an employee of Fidelity Investments. Previously, Mr. Maher served as Vice President of Asset Management Compliance (2013), Vice President of the Program Management Group of FMR (investment adviser firm, 2010-2013), and Vice President of Valuation Oversight (2008-2010).
John F. Papandrea (1972)
Year of Election or Appointment: 2016
Anti-Money Laundering (AML) Officer
Mr. Papandrea also serves as AML Officer of other funds. Mr. Papandrea is Vice President of FMR LLC (diversified financial services company, 2008-present) and is an employee of Fidelity Investments (2005-present).
Jason P. Pogorelec (1975)
Year of Election or Appointment: 2015
Assistant Secretary
Mr. Pogorelec also serves as Assistant Secretary of other funds. Mr. Pogorelec serves as Vice President, Associate General Counsel (2010-present) and is an employee of Fidelity Investments (2006-present).
Nancy D. Prior (1967)
Year of Election or Appointment: 2014
Vice President
Ms. Prior also serves as Vice President of other funds. Ms. Prior serves as a Director of Fidelity Investments Money Management, Inc. (FIMM) (investment adviser firm, 2014-present), President, Fixed Income (2014-present), Vice Chairman of FIAM LLC (investment adviser firm, 2014-present), and is an employee of Fidelity Investments (2002-present). Previously, Ms. Prior served as Vice President of Fidelity's Money Market Funds (2012-2014), President, Money Market and Short Duration Bond Group of Fidelity Management & Research (FMR) (investment adviser firm, 2013-2014), President, Money Market Group of FMR (2011-2013), Managing Director of Research (2009-2011), Senior Vice President and Deputy General Counsel (2007-2009), and Assistant Secretary of other Fidelity® funds (2008-2009).
Kenneth B. Robins (1969)
Year of Election or Appointment: 2009
Assistant Treasurer
Mr. Robins also serves as an officer of other funds. Mr. Robins serves as Executive Vice President of Fidelity Investments Money Management, Inc. (FIMM) (investment adviser firm, 2013-present) and is an employee of Fidelity Investments (2004-present). Previously, Mr. Robins served in other fund officer roles.
Stacie M. Smith (1974)
Year of Election or Appointment: 2013
Assistant Treasurer
Ms. Smith also serves as an officer of other funds. She is an employee of Fidelity Investments (2009-present) and has served in other fund officer roles. Prior to joining Fidelity Investments, Ms. Smith served as Senior Audit Manager of Ernst & Young LLP (1996-2009).
Renee Stagnone (1975)
Year of Election or Appointment: 2013
Deputy Treasurer
Ms. Stagnone also serves as Deputy Treasurer of other funds. Ms. Stagnone is an employee of Fidelity Investments (1997-present).
Michael H. Whitaker (1967)
Year of Election or Appointment: 2008
Chief Compliance Officer
Mr. Whitaker also serves as Chief Compliance Officer of other funds. Mr. Whitaker also serves as Compliance Officer of FMR Co., Inc. (investment adviser firm, 2014-present), FMR (investment adviser firm, 2014-present), and Fidelity Investments Money Management, Inc. (investment adviser firm, 2014-present) and is an employee of Fidelity Investments (2007-present). Prior to joining Fidelity Investments, Mr. Whitaker worked at MFS Investment Management where he served as Senior Vice President and Chief Compliance Officer (2004-2006), and Assistant General Counsel.
Derek L. Young (1964)
Year of Election or Appointment: 2009
Vice President of Fidelity's Asset Allocation Funds
Mr. Young also serves as an officer of other funds. He is a Director of Strategic Advisers, Inc. (investment adviser firm, 2011-present), President of Fidelity Global Asset Allocation (GAA) (2011-present), and Vice Chairman of FIAM LLC (investment adviser firm, 2011-present). Previously, Mr. Young served as Trustee of certain funds (2012-2015), President of Strategic Advisers, Inc. (2011-2015), Chief Investment Officer of GAA (2009-2011), and as a portfolio manager.
Joseph F. Zambello (1957)
Year of Election or Appointment: 2011
Deputy Treasurer
Mr. Zambello also serves as Deputy Treasurer of other funds. Mr. Zambello is an employee of Fidelity Investments (1991-present). Previously, Mr. Zambello served as Vice President of the Program Management Group of FMR (investment adviser firm, 2009-2011) and Vice President of the Transfer Agent Oversight Group (2005-2009).
Shareholder Expense Example
As a shareholder of the Fund, you incur two types of costs: (1) transaction costs, and (2) ongoing costs, including distribution and/or service (12b-1) fees and other Fund expenses. This Example is intended to help you understand your ongoing costs (in dollars) of investing in the Fund and to compare these costs with the ongoing costs of investing in other mutual funds.
The Example is based on an investment of $1,000 invested at the beginning of the period and held for the entire period (July 1, 2015 to December 31, 2015).
Actual Expenses
The first line of the accompanying table for each class of each fund provides information about actual account values and actual expenses. You may use the information in this line, together with the amount you invested, to estimate the expenses that you paid over the period. Simply divide your account value by $1,000.00 (for example, an $8,600 account value divided by $1,000.00 = 8.6), then multiply the result by the number in the first line for a class of the fund under the heading entitled "Expenses Paid During Period" to estimate the expenses you paid on your account during this period. The estimate of expenses does not include any fees or other expenses of any variable annuity or variable life insurance product. If they were, the estimate of expenses you paid during the period would be higher, and your ending account value would be lower. In addition, each Fund, as a shareholder in underlying Fidelity Funds, will indirectly bear its pro-rata share of the fees and expenses incurred by the underlying Fidelity Funds. These fees and expenses are not included in each Fund's annualized expense ratio used to calculate the expense estimates in the table below.
Hypothetical Example for Comparison Purposes
The second line of the accompanying table for each class of each fund provides information about hypothetical account values and hypothetical expenses based on a Class' actual expense ratio and an assumed rate of return of 5% per year before expenses, which is not the Class' actual return. The hypothetical account values and expenses may not be used to estimate the actual ending account balance or expenses you paid for the period. You may use this information to compare the ongoing costs of investing in the Fund and other funds. To do so, compare this 5% hypothetical example with the 5% hypothetical examples that appear in the shareholder reports of the other funds. The estimate of expenses does not include any fees or other expenses of any variable annuity or variable life insurance product. If they were, the estimate of expenses you paid during the period would be higher, and your ending account value would be lower. In addition, each Fund, as a shareholder in underlying Fidelity Funds, will indirectly bear its pro-rata share of the fees and expenses incurred by the underlying Fidelity Funds. These fees and expenses are not included in each Fund's annualized expense ratio used to calculate the expense estimates in the table below.
Please note that the expenses shown in the table are meant to highlight your ongoing costs only and do not reflect any transaction costs. Therefore, the second line of the table is useful in comparing ongoing costs only, and will not help you determine the relative total costs of owning different funds.
| | Annualized Expense Ratio-A | Beginning
Account Value
July 1, 2015 | Ending
Account Value
December 31, 2015 | Expenses Paid
During Period-B
July 1, 2015
to December 31, 2015 |
| VIP FundsManager 20% Portfolio | | | | |
| Service Class | .20% | | | |
| Actual | | $1,000.00 | $991.40 | $1.00 |
| Hypothetical-C | | $1,000.00 | $1,024.20 | $1.02 |
| Service Class 2 | .35% | | | |
| Actual | | $1,000.00 | $990.90 | $1.76 |
| Hypothetical-C | | $1,000.00 | $1,023.44 | $1.79 |
| Investor Class | .20% | | | |
| Actual | | $1,000.00 | $991.40 | $1.00 |
| Hypothetical-C | | $1,000.00 | $1,024.20 | $1.02 |
| VIP FundsManager 50% Portfolio | | | | |
| Service Class | .20% | | | |
| Actual | | $1,000.00 | $979.00 | $1.00 |
| Hypothetical-C | | $1,000.00 | $1,024.20 | $1.02 |
| Service Class 2 | .35% | | | |
| Actual | | $1,000.00 | $979.10 | $1.75 |
| Hypothetical-C | | $1,000.00 | $1,023.44 | $1.79 |
| Investor Class | .20% | | | |
| Actual | | $1,000.00 | $979.00 | $1.00 |
| Hypothetical-C | | $1,000.00 | $1,024.20 | $1.02 |
| VIP FundsManager 60% Portfolio | | | | |
| Service Class | .20% | | | |
| Actual | | $1,000.00 | $976.50 | $1.00 |
| Hypothetical-C | | $1,000.00 | $1,024.20 | $1.02 |
| Service Class 2 | .35% | | | |
| Actual | | $1,000.00 | $975.90 | $1.74 |
| Hypothetical-C | | $1,000.00 | $1,023.44 | $1.79 |
| Investor Class | .20% | | | |
| Actual | | $1,000.00 | $976.50 | $1.00 |
| Hypothetical-C | | $1,000.00 | $1,024.20 | $1.02 |
| VIP FundsManager 70% Portfolio | | | | |
| Service Class | .20% | | | |
| Actual | | $1,000.00 | $972.30 | $.99 |
| Hypothetical-C | | $1,000.00 | $1,024.20 | $1.02 |
| Service Class 2 | .35% | | | |
| Actual | | $1,000.00 | $971.90 | $1.74 |
| Hypothetical-C | | $1,000.00 | $1,023.44 | $1.79 |
| Investor Class | .20% | | | |
| Actual | | $1,000.00 | $972.30 | $.99 |
| Hypothetical-C | | $1,000.00 | $1,024.20 | $1.02 |
| VIP FundsManager 85% Portfolio | | | | |
| Service Class | .20% | | | |
| Actual | | $1,000.00 | $966.80 | $.99 |
| Hypothetical-C | | $1,000.00 | 1,024.20 | $1.02 |
| Service Class 2 | .35% | | | |
| Actual | | $1,000.00 | $966.30 | $1.73 |
| Hypothetical-C | | $1,000.00 | $1,023.44 | $1.79 |
| Investor Class | .20% | | | |
| Actual | | $1,000.00 | $966.10 | $.99 |
| Hypothetical-C | | $1,000.00 | $1,024.20 | $1.02 |
| | | | | |
| | | | | |
| | | | | |
A Annualized expense ratio reflects expenses net of applicable fee waivers.
B Expenses are equal to each Class' annualized expense ratio, multiplied by the average account value over the period, multiplied by 184/ 365 (to reflect the one-half year period). The fees and expenses of the underlying Fidelity Funds in which each Fund invests are not included in each Class' annualized expense ratio.
C 5% return per year before expenses
Distributions (Unaudited)
The Board of Trustees of each voted to pay to shareholders of record at the opening of business on record date, the following distributions per share derived from capital gains realized from sales of portfolio securities, and dividends derived from net investment income:
| | Pay Date | Record Date | Dividends | Capital Gains |
| VIP Funds Manager 20% | | | | |
| Service Class | 02/12/16 | 02/12/16 | $0.001 | $0.134 |
| Service Class 2 | 02/12/16 | 02/12/16 | $0.001 | $0.134 |
| Investor Class | 02/12/16 | 02/12/16 | $0.001 | $0.134 |
| VIP Funds Manager 50% | | | | |
| Service Class | 02/12/16 | 02/12/16 | $0.000 | $0.138 |
| Service Class 2 | 02/12/16 | 02/12/16 | $0.000 | $0.138 |
| Investor Class | 02/12/16 | 02/12/16 | $0.000 | $0.138 |
| VIP Funds Manager 60% | | | | |
| Service Class | 02/12/16 | 02/12/16 | $0.001 | $0.348 |
| Service Class 2 | 02/12/16 | 02/12/16 | $0.001 | $0.348 |
| Investor Class | 02/12/16 | 02/12/16 | $0.001 | $0.348 |
| VIP Funds Manager 70% | | | | |
| Service Class | 02/12/16 | 02/12/16 | $0.002 | $0.459 |
| Service Class 2 | 02/12/16 | 02/12/16 | $0.002 | $0.459 |
| Investor Class | 02/12/16 | 02/12/16 | $0.002 | $0.459 |
| VIP Funds Manager 85% | | | | |
| Service Class | 02/12/16 | 02/12/16 | $0.000 | $0.499 |
| Service Class 2 | 02/12/16 | 02/12/16 | $0.000 | $0.499 |
| Investor Class | 02/12/16 | 02/12/16 | $0.000 | $0.499 |
|
The funds hereby designate as capital gain dividend the amounts noted below for the taxable year ended December 31, 2015, or, if subsequently determined to be different, the net capital gain of such year.
| Fund | |
| VIP Funds Manager 20% | $8,920,746 |
| VIP Funds Manager 50% | $73,058,611 |
| VIP Funds Manager 60% | $213,803,962 |
| VIP Funds Manager 70% | $42,174,899 |
| VIP Funds Manager 85% | $18,079,599 |
A percentage of the dividends distributed during the fiscal year for the following funds qualifies for the dividends–received deduction for corporate shareholders:
| Fund | February, 2015 | December, 2015 |
| VIP Funds Manager 20% | | |
| Service Class | 2% | 9% |
| Service Class 2 | 2% | 10% |
| Investor Class | 2% | 9% |
| VIP Funds Manager 50% | | |
| Service Class | 4% | 21% |
| Service Class 2 | 4% | 24% |
| Investor Class | 4% | 21% |
| VIP Funds Manager 60% | | |
| Service Class | 0% | 24% |
| Service Class 2 | 0% | 26% |
| Investor Class | 0% | 24% |
| VIP Funds Manager 70% | | |
| Service Class | 9% | 29% |
| Service Class 2 | 9% | 32% |
| Investor Class | 9% | 29% |
| VIP Funds Manager 85% | | |
| Service Class | 11% | 32% |
| Service Class 2 | 11% | 35% |
| Investor Class | 11% | 32% |
A percentage of the dividends distributed during the fiscal year for the following funds was derived from interest on U.S. Government securities which is generally exempt from state income tax:
| VIP Funds Manager 20% | | |
| Service Class | | 13.33% |
| Service Class 2 | | 13.33% |
| Investor Class | | 13.33% |
| VIP Funds Manager 50% | | |
| Service Class | | 6.98% |
| Service Class 2 | | 6.98% |
| Investor Class | | 6.98% |
| VIP Funds Manager 60% | | |
| Service Class | | 5.68% |
| Service Class 2 | | 5.68% |
| Investor Class | | 5.68% |
| VIP Funds Manager 70% | | |
| Service Class | | 3.88% |
| Service Class 2 | | 3.88% |
| Investor Class | | 3.88% |
| VIP Funds Manager 85% | | |
| Service Class | | 2.63% |
| Service Class 2 | | 2.63% |
| Investor Class | | 2.63% |
The amounts per share which represent income derived from sources within, and taxes paid to, foreign countries or possessions of the United States are as follows:
| Fund | Pay Date | Income | Taxes | |
| VIP Funds Manager 20% | | | | |
| Service Class | 12/29/15 | $0.0161 | $0.0014 | |
| Service Class 2 | 12/29/15 | $0.0144 | $0.0014 | |
| Investor Class | 12/29/15 | $0.0161 | $0.0014 | |
| VIP Funds Manager 50% | | | | |
| Service Class | 12/29/15 | $0.3110 | $0.0029 | |
| Service Class 2 | 12/29/15 | $0.0277 | $0.0029 | |
| Investor Class | 12/29/15 | $0.03110 | $0.0029 | |
| VIP Funds Manager 60% | | | | |
| Service Class | 12/29/15 | $0.0336 | $0.0030 | |
| Service Class 2 | 12/29/15 | $0.0305 | $0.0030 | |
| Investor Class | 12/29/15 | $0.0336 | $0.0030 | |
| VIP Funds Manager 70% | | | | |
| Service Class | 12/29/15 | $0.0401 | $0.0036 | |
| Service Class 2 | 12/29/15 | $0.0367 | $0.0036 | |
| Investor Class | 12/29/15 | $0.0401 | $0.0036 | |
| VIP Funds Manager 85% | | | | |
| Service Class | 12/29/15 | $0.0449 | $0.0041 | |
| Service Class 2 | 12/29/15 | $0.0412 | $0.0041 | |
| Investor Class | 12/29/15 | $0.0449 | $0.0041 | |
| | | | | |
Board Approval of Investment Advisory Contracts and Management Fees
VIP FundsManager Funds
Each year, the Board of Trustees, including the Independent Trustees (together, the Board), votes on the management and administration arrangements for each fund. The Board, assisted by the advice of fund counsel and Independent Trustees' counsel, requests and considers a broad range of information relevant to the contract arrangements throughout the year.
The Board meets regularly and, at each of its meetings, covers an extensive agenda of topics and materials and considers factors that are relevant to its annual consideration of each fund's management and administration arrangements, including the services and support provided to each fund and its shareholders. The Board has established four standing committees (Committees) — Operations, Audit, Fair Valuation, and Governance and Nominating — each composed of and chaired by Independent Trustees with varying backgrounds, to which the Board has assigned specific subject matter responsibilities in order to enhance effective decision-making by the Board. The Operations Committee, of which all of the Independent Trustees are members, meets regularly throughout the year and considers, among other matters, information specifically related to the annual consideration of each fund's management and administration arrangements. The Board, acting directly and through its Committees, requests and receives information concerning the annual consideration of each fund's management and administration arrangements. The Board also meets as needed to consider matters specifically related to the Board's annual consideration of the management and administration arrangements. Members of the Board may also meet with trustees of other Fidelity funds through ad hoc joint committees to discuss certain matters relevant to all of the Fidelity funds.
At its September 2015 meeting, the Board unanimously determined to approve an amended and restated management contract (Advisory Contract) and administration agreement for each fund to reflect the fact that, effective October 1, 2015, FMR Co., Inc. (FMRC), an affiliate of Strategic Advisers, Inc. (Strategic Advisers) and Fidelity Management & Research Company (FMR), would assume the duties and rights of Strategic Advisers under the fund's then current management contract. The Board noted that, with the exception of the date, term, and entity name, the terms of each fund's management contract, including the fees payable thereunder, would not change as a result of the approval of the Advisory Contract. The Board considered that FMRC would render the same services to the funds under the Advisory Contracts that Strategic Advisers rendered to the funds under the then current management contracts. The Board also considered that approval of the Advisory Contracts would not result in any changes to (i) the investment process or strategies employed in the management of the funds' assets; or (ii) the day-to-day management of the funds or the persons primarily responsible for such management. As a result, the Board considered that its prior experience with Strategic Advisers as investment adviser for the funds was relevant to its consideration of the Advisory Contracts. In reaching its determination, the Board considered all factors it believed relevant, including (i) the nature, extent, and quality of the services to be provided to each fund and its shareholders (including the investment performance of each fund); (ii) the competitiveness of each fund's management fee and total expense ratio relative to peer funds; (iii) the total costs of the services to be provided by and the profits to be realized by Fidelity from its relationship with each fund; and (iv) the extent to which (if any) economies of scale exist and would be realized as each fund grows, and whether any economies of scale are appropriately shared with fund shareholders.
In considering whether to approve the Advisory Contract for each fund, the Board reached a determination, with the assistance of fund counsel and Independent Trustees' counsel and through the exercise of its business judgment, that the approval of the Advisory Contract was in the best interests of each fund and its shareholders and that the compensation payable under the Advisory Contracts was fair and reasonable. The Board's decision to approve the Advisory Contracts was not based on any single factor, but rather was based on a comprehensive consideration of all the information provided to the Board at its meetings throughout the year. The Board, in reaching its determination to approve the Advisory Contracts, was aware that shareholders of each fund have a broad range of investment choices available to them, including a wide choice among funds offered by Fidelity's competitors, and that each fund's shareholders, who have the opportunity to review and weigh the disclosure provided by the fund in its prospectus and other public disclosures, have chosen to invest in that fund, which is part of the Fidelity family of funds.
Nature, Extent, and Quality of Services Provided. The Board considered Fidelity's staffing as it relates to the funds, including the backgrounds of investment personnel that provide services to the funds, and also considered the funds' investment objectives, strategies, and related investment philosophies. The Independent Trustees also had discussions with senior management of Fidelity's investment operations and investment groups with responsibility for the underlying Fidelity funds in which each fund invests. The Board considered the structure of the portfolio manager compensation program and whether this structure provides appropriate incentives to act in the best interests of each fund. Additionally, the Board considered the portfolio managers' investments, if any, in the funds that they manage.
Resources Dedicated to Investment Management and Support Services. The Board reviewed the general qualifications and capabilities of Fidelity's investment staff, including its size, education, experience, and resources, as well as Fidelity's approach to recruiting, training, managing, and compensating investment personnel. The Board noted that Fidelity has continued to increase the resources devoted to non-U.S. offices, including expansion of Fidelity's global investment organization. The Board also noted that Fidelity's analysts have extensive resources, tools and capabilities that allow them to conduct sophisticated quantitative and fundamental analysis, as well as credit analysis of issuers, counterparties and guarantors. Further, the Board considered that Fidelity's investment professionals have sufficient access to global information and data so as to provide competitive investment results over time, and that those professionals also have access to sophisticated tools that permit them to assess portfolio construction and risk and performance attribution characteristics continuously, as well as to transmit new information and research conclusions rapidly around the world. Additionally, in its deliberations, the Board considered Fidelity's risk management, compliance, and technology and operations capabilities and resources, which are integral parts of the investment management process.
Shareholder and Administrative Services. The Board considered (i) the nature, extent, quality, and cost of advisory, administrative, and shareholder services performed by Fidelity under the then current management contract (and to be performed under the Advisory Contract) and under separate agreements covering administration, transfer agency, and pricing and bookkeeping services for each fund; (ii) the nature and extent of the supervision of third party service providers, principally custodians, subcustodians, and pricing vendors; and (iii) the resources devoted to, and the record of compliance with, each fund's compliance policies and procedures.
The Board noted that the growth of fund assets over time across the complex allows Fidelity to reinvest in the development of services designed to enhance the value or convenience of the Fidelity funds as investment vehicles. These services include 24-hour access to account information and market information through telephone representatives and over the Internet, investor education materials and asset allocation tools, and the expanded availability of Fidelity Investor Centers.
Investment in a Large Fund Family. The Board considered the benefits to shareholders of investing in a Fidelity fund, including the benefits of investing in a fund that is part of a large family of funds offering a variety of investment disciplines and providing a large variety of mutual fund investor services. The Board noted that Fidelity had taken, or had made recommendations that resulted in the Fidelity funds taking, a number of actions over the previous year that benefited particular funds, including (i) continuing to dedicate additional resources to investment research and to the support of the senior management team that oversees asset management; (ii) continuing efforts to enhance Fidelity's global research capabilities; (iii) launching new funds and making other enhancements to meet client needs; (iv) reducing management fees and total expenses for certain index funds and diversified international funds; (v) continuing to launch dedicated lower cost underlying funds to meet portfolio construction needs related to expanding underlying fund options for Fidelity funds of funds, specifically for the Freedom Fund product lines; (vi) rationalizing product lines and gaining increased efficiencies through fund mergers; (vii) launching active fixed-income exchange-traded funds; (viii) continuing to develop, acquire and implement systems and technology to improve services to the funds and shareholders, strengthen information security, and increase efficiency; (ix) implementing investment enhancements to further strengthen Fidelity's target date product line to increase investors' probability of success in achieving their goals; (x) modifying the eligibility criteria for certain share classes to accommodate roll-over assets from employer-sponsored retirement plans; (xi) launching a new Class W of the Freedom Index Funds to attract and retain Fidelity record-kept retirement plan assets; and (xii) implementing changes to Fidelity's money market product line in response to recent money market regulatory reforms.
Investment Performance. The Board considered whether each fund has operated in accordance with its investment objective, as well as its record of compliance with its investment restrictions and its performance history, and noted that the approval of the Advisory Contract for each fund would not result in any changes to the fund's investment strategy or the personnel responsible for providing advisory services to the fund.
The Board took into account discussions with representatives of the investment adviser about fund investment performance that occur at Board meetings throughout the year. In this regard the Board noted that as part of regularly scheduled fund reviews and other reports to the Board on fund performance, the Board considers annualized return information for each fund for different time periods, measured against one or more securities market indices, including a customized blended index representative of the fund's asset classes (each a "benchmark index") and a peer group of funds with similar objectives ("peer group"), if any. In its evaluation of fund investment performance at meetings throughout the year, the Board gave particular attention to information indicating underperformance of certain Fidelity funds for specific time periods and discussed with the investment adviser the reasons for such underperformance.
In addition to reviewing absolute and relative fund performance, the Independent Trustees periodically consider the appropriateness of fund performance metrics in evaluating the results achieved. In general, the Independent Trustees believe that fund performance should be evaluated based on gross performance (before fees and expenses, including acquired fund fees and expenses, but after transaction costs, if any) compared to appropriate benchmark indices, over appropriate time periods that may include full market cycles, and on net performance (after fees and expenses) compared to peer groups, as applicable, over the same periods, taking into account relevant factors including the following: general market conditions; the extent to which particular underlying funds affected performance; and fund cash flows and other factors. Depending on the circumstances, the Independent Trustees may be satisfied with a fund's performance notwithstanding that it lags its benchmark index or peer group for certain periods.
The Independent Trustees recognize that shareholders evaluate performance on a net basis over their own holding periods, for which one-, three-, and five-year periods are often used as a proxy. For this reason, the performance information reviewed by the Board also included net cumulative calendar year total return information for each fund and an appropriate benchmark index for the most recent one-, three-, and five-year periods.
Based on its review, the Board concluded that the nature, extent, and quality of services provided to each fund under the Advisory Contracts should benefit the shareholders of each fund.
Competitiveness of Management Fee and Total Expense Ratio. The Board considered each fund's management fee and total expense ratio compared to "mapped groups" of competitive funds and classes created for the purpose of facilitating the Trustees' competitive analysis of management fees and total expenses, and also considered that each fund bears indirectly the fees and expenses, including the management fees, paid by the underlying Fidelity funds in which it invests. Fidelity creates "mapped groups" by combining similar Lipper investment objective categories that have comparable investment mandates. Combining Lipper investment objective categories aids the Board's management fee and total expense ratio comparisons by broadening the competitive group used for comparison.
Management Fee. The Board considered two proprietary management fee comparisons forthe 12-month periods shown in basis points (BP) in the charts below. The group of Lipper funds used by the Board for management fee comparisons is referred to below as the "Total Mapped Group." The Total Mapped Group comparison focuses on a fund's standing in terms of gross management fees before expense reimbursements or caps relative to the total universe of funds with comparable investment mandates, regardless of whether their management fee structures also are comparable. Funds with comparable investment mandates offer exposure to similar types of securities. Funds with comparable management fee structures have similar management fee contractual arrangements (
e.g., flat rate charged for advisory services, all-inclusive fee rate,
etc.). "TMG %" represents the percentage of funds in the Total Mapped Group that had management fees that were lower than a fund's. For example, a hypothetical TMG % of 20% would mean that 80% of the funds in the Total Mapped Group had higher, and 20% had lower, management fees than a fund. The funds' actual TMG %s and the number of funds in the Total Mapped Group are in the charts below. The "Asset-Size Peer Group" (ASPG) comparison focuses on a fund's standing relative to a subset of non-Fidelity funds within the Total Mapped Group that are similar in size and management fee structure. For example, if a fund is in the first quartile of the ASPG, the fund's management fee ranks in the least expensive or lowest 25% of funds in the ASPG. The ASPG represents at least 15% of the funds in the Total Mapped Group with comparable asset size and management fee structures, subject to a minimum of 50 funds (or all funds in the Total Mapped Group if fewer than 50). Additional information, such as the ASPG quartile in which a fund's management fee rate ranked, is also included in the charts and considered by the Board. Because the vast majority of competitor funds' management fees do not cover non-management expenses, for a more meaningful comparison of management fees, each fund is compared on the basis of a hypothetical "net management fee," which is derived by subtracting payments made by FMR (under the administration agreement) for non-management expenses (including pricing and bookkeeping fees and fees paid to non-affiliated custodians) from the fund's all-inclusive fee. In this regard, the Board considered that net management fees can vary from year to year because of differences in non-management expenses.
VIP FundsManager 20%
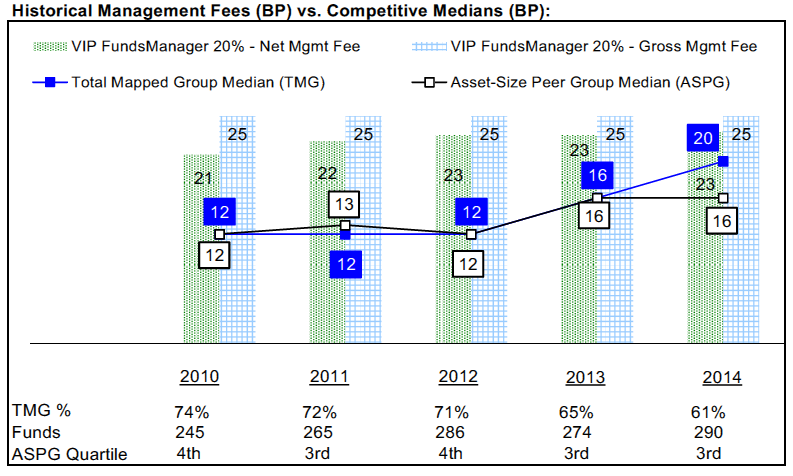
VIP FundsManager 50%
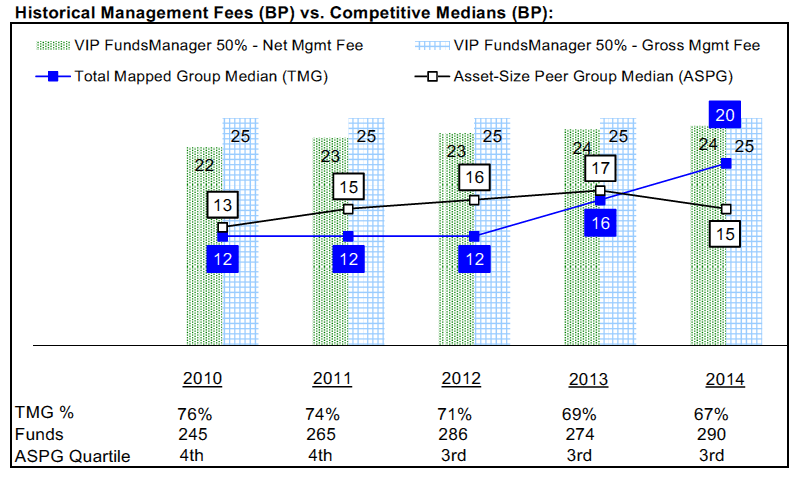
VIP FundsManager 60%
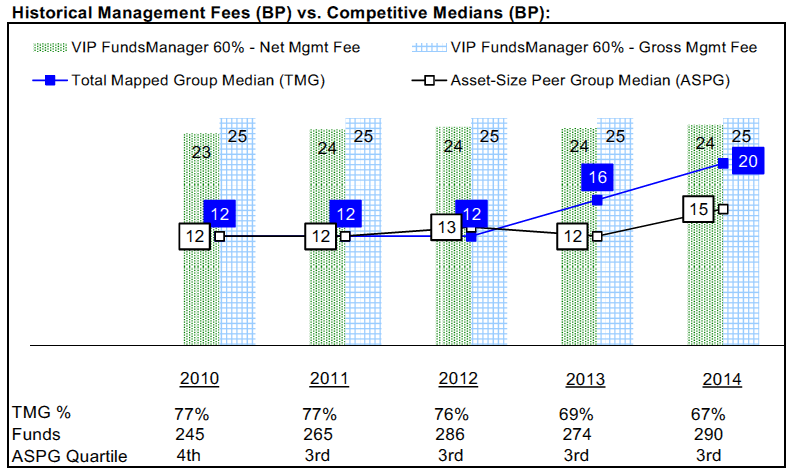
VIP FundsManager 70%
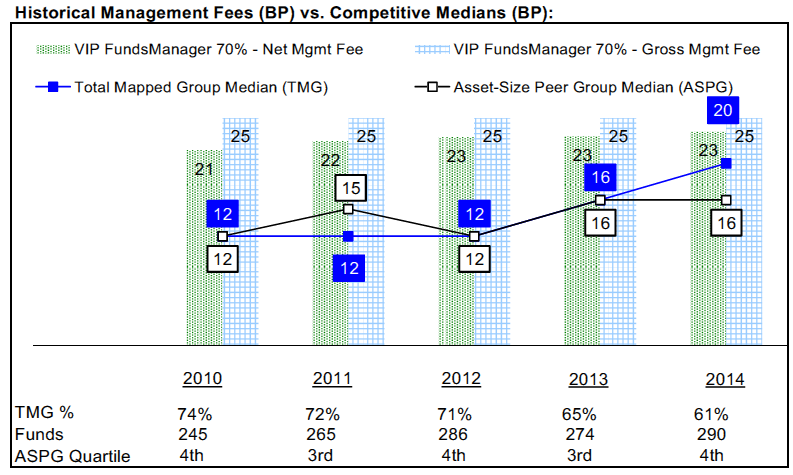
VIP FundsManager 85%
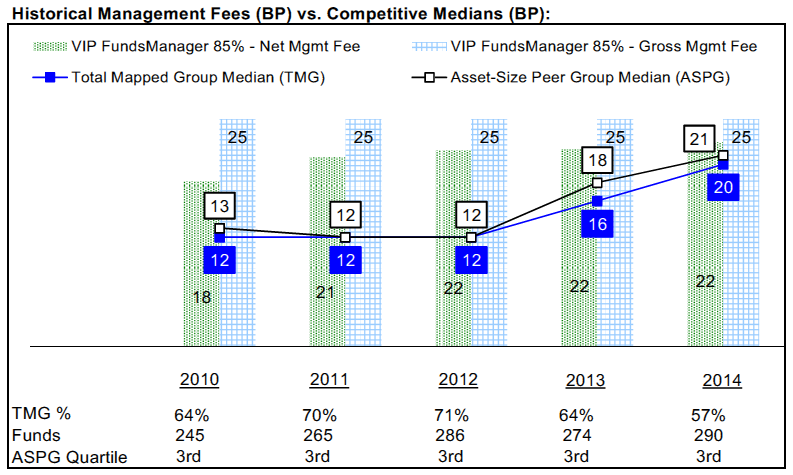
The Board noted that each fund's hypothetical net management fee rate ranked above the median of its Total Mapped Group and above the median of its ASPG for 2014. The Board considered that the funds are more actively managed than most funds in their TMG and ASPG, many of which are target date funds.
Furthermore, the Board considered that the investment adviser contractually agreed to waive 0.05% of each fund's management fee through April 30, 2016 and that, including the management fee waiver, each fund would be below the median of its Total Mapped Group and below the median of its ASPG for 2014.
The Board noted that, in 2014, the ad hoc Committee on Group Fee was formed by it and other Fidelity fund boards to conduct an in-depth review of the "group fee" component of the management fee of funds with such management fee structures, and that while the funds do not pay a management fee with a group fee component, they indirectly bear a portion of the management fees paid by the Fidelity funds in which they invest, some of which are subject to the group fee. Committee focus included the mechanics of the group fee, the competitive landscape of group fee structures, Fidelity funds with no group fee component and investment products not included in group fee assets. The Board also considered that, for funds subject to the group fee, FMR agreed to voluntarily waive fees over a specified period of time in amounts designed to account for assets converted from certain funds to certain collective investment trusts.
Based on its review, the Board concluded that each fund's management fee is fair and reasonable in light of the services that the fund receives and the other factors considered.
Total Expense Ratio. In its review of the total expense ratio of each class of each fund, the Board considered the fund's hypothetical net management fee rate as well as the fund's all-inclusive fee. The Board also considered other expenses, such as pricing and bookkeeping fees and custodial, legal, and audit fees, paid by FMR under the all-inclusive arrangement. The Board also considered fund-paid 12b-1 fees. The Board also noted that Fidelity may agree to waive fees and expenses from time to time, and the extent to which, if any, it has done so for the funds. As part of its review, the Board also considered the current and historical total expense ratios of each class of each fund compared to competitive fund median expenses. Each class of each fund is compared to those funds and classes in the Total Mapped Group (used by the Board for management fee comparisons) that have a similar sales load structure.
The Board noted that each fund offers multiple classes, each of which has a different 12b-1 fee structure, and that the multiple structures are intended to offer a range of pricing options for the intermediary market. The Board also noted that the total expense ratios of the classes of each fund vary primarily by the level of their 12b-1 fees.
The Board considered the total expense ratio of each fund, after the effect of the contractual expense cap arrangements discussed below. The Board noted that the total expense ratio of each of Investor Class and Service Class of each fund ranked below its competitive median for 2014 and the total expense ratio of Service Class 2 of each fund ranked above its competitive median for 2014. The Board considered that, in general, various factors can affect total expense ratios. The Board noted that the total expense ratio of Service Class 2 was above the competitive median primarily because of higher 12b-1 fees for Service Class 2 as compared to most competitor funds.
In considering the total expense ratio for each class of each fund, the Board also considered an alternative competitive analysis that included both top level (
i.e., direct) fund fees and acquired fund fees and expenses for the class and the other funds and classes in the mapped group. The Board noted that, under this alternative competitive analysis, the total expense ratio of each of Investor Class and Service Class of each fund, except VIP FundsManager 85%, ranked below its competitive median for 2014 and the total expense ratio of each of Investor Class and Service Class of VIP FundsManager 85% ranked above its competitive median for 2014 because of higher acquired fund fees and expenses compared to competitor funds. The Board noted that the total expense ratio of Service Class 2 of VIP FundsManager 20% and VIP FundsManager 50% ranked below its competitive median for 2014 and the total expense ratio of Service Class 2 of each other fund ranked above its competitive median for 2014.
The Board further considered that FMR contractually agreed to reimburse 0.10% of "class-level" expenses for Service Class and Service Class 2 as long as these classes continue to be sold to unaffiliated insurance companies.
Fees Charged to Other Fidelity Clients. The Board also considered Fidelity fee structures and other information with respect to clients of Fidelity, such as other funds advised or subadvised by Fidelity, pension plan clients, and other institutional clients with similar mandates. The Board noted the findings of the 2013 ad hoc joint committee (created with the board of other Fidelity funds), which reviewed and compared Fidelity's institutional investment advisory business with its business of providing services to the Fidelity funds, including the differences in services provided, fees charged, and costs incurred, as well as competition in their respective marketplaces.
Based on its review of total expense ratios and fees charged to other Fidelity clients, the Board concluded that, although Service Class 2 was above the median of the universe presented for comparison, the total expense ratio of each class of each fund was reasonable in light of the services that the fund and its shareholders receive and the other factors considered.
Costs of the Services and Profitability. The Board consideredthe revenues earned and the expenses incurred by Fidelity in conducting the business of developing, marketing, distributing, managing, administering and servicing each fund and servicing each fund's shareholders. The Board also considered the level of Fidelity's profits in respect of all the Fidelity funds, including the Fidelity funds in which the funds invest.
On an annual basis, Fidelity presents to the Board information about the profitability of its relationship with each fund. Fidelity calculates profitability information for each fund, as well as aggregate profitability information for groups of Fidelity funds and all Fidelity funds, using a series of detailed revenue and cost allocation methodologies which originate with the books and records of Fidelity on which Fidelity's audited financial statements are based. The Audit Committee of the Board reviews any significant changes from the prior year's methodologies.
PricewaterhouseCoopers LLP (PwC), independent registered public accounting firm and auditor to Fidelity and certain Fidelity funds, has been engaged annually by the Board as part of the Board's assessment of Fidelity's profitability analysis. PwC's engagement includes the review and assessment of the methodologies used by Fidelity in determining the revenues and expenses attributable to Fidelity's mutual fund business, and completion of agreed-upon procedures in respect of the mathematical accuracy of fund profitability and its conformity to established allocation methodologies. After considering PwC's reports issued under the engagement and information provided by Fidelity, the Board concluded that while other allocation methods may also be reasonable, Fidelity's profitability methodologies are reasonable in all material respects.
The Board also reviewed Fidelity's non-fund businesses and fall-out benefits related to the mutual fund business as well as cases where Fidelity's affiliates may benefit from or be related to the funds' business.
The Board considered the costs of the services provided by and the profits realized by Fidelity in connection with the operation of each fund and was satisfied that the profitability was not excessive.
Economies of Scale. The Board considered whether there have been economies of scale in respect of the management of the Fidelity funds, whether the Fidelity funds (including each fund) have appropriately benefited from any such economies of scale, and whether there is potential for realization of any further economies of scale. The Board considered the extent to which each fund will benefit from economies of scale as assets grow through increased services to the fund, through waivers or reimbursements, or through fee or expense ratio reductions. The Board also noted that in 2013, it and the boards of other Fidelity funds created an ad hoc committee (the Economies of Scale Committee) to analyze whether Fidelity attains economies of scale in respect of the management and servicing of the Fidelity funds, whether the Fidelity funds have appropriately benefited from such economies of scale, and whether there is potential for realization of any further economies of scale.
The Board concluded, taking into account the analysis of the Economies of Scale Committee, that economies of scale, if any, are being appropriately shared between fund shareholders and Fidelity.
Additional Information Requested by the Board. In order to develop fully the factual basis for consideration of the Fidelity funds' Advisory Contracts, the Board requested and received additional information on certain topics, including: (i) Fidelity's fund profitability methodology, profitability trends for certain funds, and the impact of certain factors on fund profitability results; (ii) portfolio manager changes that have occurred during the past year and the amount of the investment that each portfolio manager has made in the Fidelity fund(s) that he or she manages; (iii) Fidelity's compensation structure for portfolio managers, research analysts, and other key personnel, including its effects on fund profitability, the rationale for the compensation structure, and the extent to which current market conditions have affected retention and recruitment; (iv) the arrangements with and compensation paid to certain fund sub-advisers on behalf of the Fidelity funds; (v) Fidelity's voluntary waiver of its fees to maintain minimum yields for certain money market funds and classes as well as contractual waivers in place for certain funds; (vi) the methodology with respect to competitive fund data and peer group classifications; (vii) Fidelity's transfer agent fee, expense, and service structures for different funds and classes relative to competitive trends, and the impact of the increased use of omnibus accounts; (viii) Fidelity's long-term expectations for its offerings in the workplace investing channel; (ix) new developments in the retail and institutional marketplaces; and (x) the impact of money market reform on Fidelity's money market funds. In addition, the Board considered its discussions with Fidelity throughout the year regarding enhanced information security initiatives and the funds' fair valuation policies.
Based on its evaluation of all of the conclusions noted above, and after considering all factors it believed relevant, the Board concluded that the advisory fee structures are fair and reasonable, and that each fund's Advisory Contract should be approved.
Proxy Voting Results
A special meeting of shareholders was held on May 12, 2015. The results of votes taken among shareholders on the proposal before them are reported below. Each vote reported represents one dollar of net asset value held on the record date for the meeting.
PROPOSAL 1
To elect a Board of Trustees.
| | # of
Votes | % of
Votes |
| Elizabeth S. Acton | | |
| Affirmative | 24,469,831,790.28 | 97.003 |
| Withheld | 756,086,184.43 | 2.997 |
| TOTAL | 25,225,917,974.71 | 100.000 |
| John Engler | | |
| Affirmative | 24,404,438,415.74 | 96.744 |
| Withheld | 821,479,558.97 | 3.256 |
| TOTAL | 25,225,917,974.71 | 100.000 |
| Albert R. Gamper, Jr. | | |
| Affirmative | 24,431,670,090.08 | 96.852 |
| Withheld | 794,247,884.63 | 3.148 |
| TOTAL | 25,225,917,974.71 | 100.000 |
| Robert F. Gartland | | |
| Affirmative | 24,472,637,370.54 | 97.014 |
| Withheld | 753,280,604.17 | 2.986 |
| TOTAL | 25,225,917,974.71 | 100.000 |
| Abigail P. Johnson | | |
| Affirmative | 24,442,024,432.82 | 96.893 |
| Withheld | 783,893,541.89 | 3.107 |
| TOTAL | 25,225,917,974.71 | 100.000 |
| Arthur E. Johnson | | |
| Affirmative | 24,444,583,833.78 | 96.903 |
| Withheld | 781,334,140.93 | 3.097 |
| TOTAL | 25,225,917,974.71 | 100.000 |
| Michael E. Kenneally | | |
| Affirmative | 24,475,874,452.78 | 97.027 |
| Withheld | 750,043,521.93 | 2.973 |
| TOTAL | 25,225,917,974.71 | 100.000 |
| James H. Keyes | | |
| Affirmative | 24,434,496,321.71 | 96.863 |
| Withheld | 791,421,653.00 | 3.137 |
| TOTAL | 25,225,917,974.71 | 100.000 |
| Marie L. Knowles | | |
| Affirmative | 24,446,177,909.79 | 96.909 |
| Withheld | 779,740,064.92 | 3.091 |
| TOTAL | 25,225,917,974.71 | 100.000 |
| Geoffrey A. von Kuhn | | |
| Affirmative | 24,444,403,935.60 | 96.902 |
| Withheld | 781,514,039.11 | 3.098 |
| TOTAL | 25,225,917,974.71 | 100.000 |
| Proposal 1 reflects trust wide proposal and voting results. |

VIPFM-ANN-0216
1.843208.109
Fidelity® Variable Insurance Products: Investment Grade Bond Portfolio
Annual Report December 31, 2015 |
|
To view a fund's proxy voting guidelines and proxy voting record for the 12-month period ended June 30, visit http://www.fidelity.com/proxyvotingresults or visit the Securities and Exchange Commission's (SEC) web site at http://www.sec.gov.
You may also call 1-877-208-0098 to request a free copy of the proxy voting guidelines.
Fidelity® Variable Insurance Products are separate account options which are purchased through a variable insurance contract.
Standard & Poor's, S&P and S&P 500 are registered service marks of The McGraw-Hill Companies, Inc. and have been licensed for use by Fidelity Distributors Corporation.
Other third-party marks appearing herein are the property of their respective owners.
All other marks appearing herein are registered or unregistered trademarks or service marks of FMR LLC or an affiliated company. © 2016 FMR LLC. All rights reserved.
This report and the financial statements contained herein are submitted for the general information of the shareholders of the Fund. This report is not authorized for distribution to prospective investors in the Fund unless preceded or accompanied by an effective prospectus.
A fund files its complete schedule of portfolio holdings with the SEC for the first and third quarters of each fiscal year on Form N-Q. Forms N-Q are available on the SEC’s web site at http://www.sec.gov. A fund's Forms N-Q may be reviewed and copied at the SEC’s Public Reference Room in Washington, DC. Information regarding the operation of the SEC's Public Reference Room may be obtained by calling 1-800-SEC-0330.
For a complete list of a fund's portfolio holdings, view the most recent holdings listing, semiannual report, or annual report on Fidelity's web site at http://www.fidelity.com, http://www.advisor.fidelity.com, or http://www.401k.com, as applicable.
NOT FDIC INSURED •MAY LOSE VALUE •NO BANK GUARANTEE
Neither the Fund nor Fidelity Distributors Corporation is a bank.
VIP Investment Grade Bond Portfolio
Performance: The Bottom Line
Average annual total return reflects the change in the value of an investment, assuming reinvestment of distributions from dividend income and capital gains (the profits earned upon the sale of securities that have grown in value, if any) and assuming a constant rate of performance each year. During periods of reimbursement by Fidelity, a fund’s total return will be greater than it would be had the reimbursement not occurred. Performance numbers are net of all underlying fund operating expenses, but do not include any insurance charges imposed by your insurance company’s separate account. If performance information included the effect of these additional charges, the total returns would have been lower. How a fund did yesterday is no guarantee of how it will do tomorrow.
Average Annual Total Returns
| For the periods ended December 31, 2015 | Past 1 year | Past 5 years | Past 10 years |
| Initial Class | (0.60)% | 3.27% | 4.44% |
| Service Class | (0.71)% | 3.16% | 4.34% |
| Service Class 2 | (0.85)% | 3.00% | 4.18% |
| Investor Class | (0.71)% | 3.22% | 4.40% |
$10,000 Over 10 Years
Let's say hypothetically that $10,000 was invested in VIP Investment Grade Bond Portfolio - Initial Class on December 31, 2005.
The chart shows how the value of your investment would have changed, and also shows how the Barclays® U.S. Aggregate Bond Index performed over the same period.
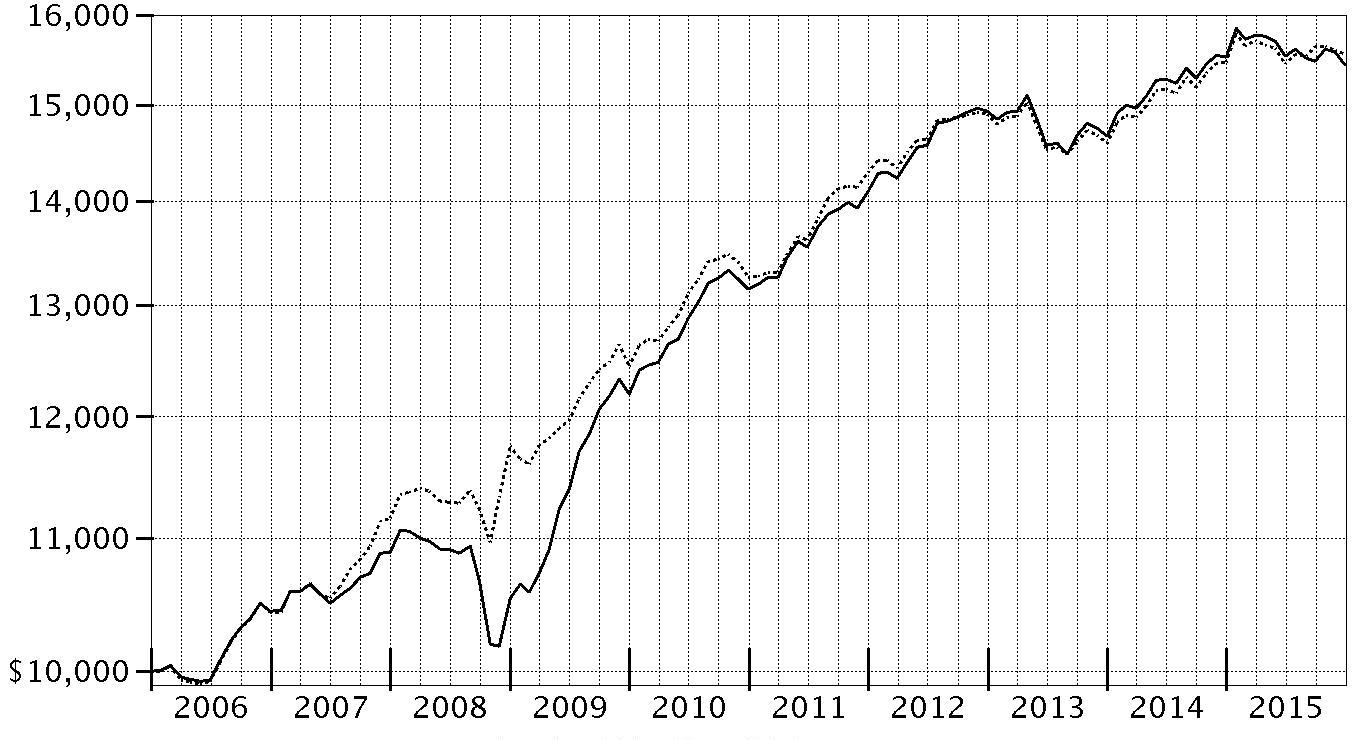
| Period Ending Values |
| $15,435 | VIP Investment Grade Bond Portfolio - Initial Class |
| $15,552 | Barclays® U.S. Aggregate Bond Index |
VIP Investment Grade Bond Portfolio
Management's Discussion of Fund Performance
Market Recap: U.S. taxable investment-grade bonds managed only a slight gain for calendar year 2015, in an environment of rising credit-risk premiums that made it difficult for many bond sectors to outperform U.S. Treasury investments. The Barclays
® U.S. Aggregate Bond Index returned 0.55%, with coupon (stated interest) payments roughly counterbalancing price weakness. Bonds suffered early in the period due to increased expectations for higher policy interest rates. The U.S. Federal Reserve, however, took no action to raise rates over the summer, amid a dampened global economic outlook. Rate-hike expectations cooled in August and September, in an environment of decreased bond issuance, weaker economic data emanating from China and falling crude-oil prices. They then rose significantly in late October and November, as the U.S. economy continued to improve, leading up to the Fed’s mid-December rate hike, its first since 2006. Among sectors in the Barclays
® index, U.S. Treasury and agency mortgage-backed securities managed slight gains, versus modest declines for investment-grade credit and government-related securities. Outside the index, U.S. corporate high-yield bonds fell sharply, according to Barclays, fueled by a broad retreat from risk assets, while Treasury Inflation Protected Securities (TIPS) declined amid low inflation expectations.
Comments from Portfolio Manager Ford O’Neil: For the year, the absolute return of the fund’s share classes were modestly negative, slightly trailing the benchmark Barclays
® U.S. Aggregate Bond Index. I attempt to add value through sector positioning. I also draw on Fidelity’s considerable bottom-up fundamental research to identify what we believe are the best ideas in each sector. I keep the fund’s duration, a measure of its sensitivity to interest rates, roughly in line with that the of the benchmark, but position the fund based on the shape and expected changes in the yield curve. Nearly all of the fund’s assets were invested in Fidelity
® VIP Investment Grade Central Fund – an investment-grade pool I manage for several VIP funds, including VIP Investment Grade Bond – with the remainder spread among Fidelity
® Specialized High Income Central Fund, individual securities and cash equivalents. Out-of-benchmark positions in BB-rated securities hampered results versus the benchmark. The fund’s underweighting in U.S. government-backed bonds detracted, as did its overweighting in TIPS. Holding taxable municipal bonds backed by Illinois and Chicago also hurt. In contrast, overweighting investment-grade corporate bonds added value, as did an overweighting in strong-performing financials and an underweighting in weaker industrials names. The fund’s yield-curve positioning was additive.
The views expressed above reflect those of the portfolio manager(s) only through the end of the period as stated on the cover of this report and do not necessarily represent the views of Fidelity or any other person in the Fidelity organization. Any such views are subject to change at any time based upon market or other conditions and Fidelity disclaims any responsibility to update such views. These views may not be relied on as investment advice and, because investment decisions for a Fidelity fund are based on numerous factors, may not be relied on as an indication of trading intent on behalf of any Fidelity fund.
VIP Investment Grade Bond Portfolio
Investment Summary (Unaudited)
Quality Diversification (% of fund's net assets)
| As of December 31, 2015 |
| | U.S. Government and U.S. Government Agency Obligations | 32.1% |
| | AAA | 3.3% |
| | AA | 3.8% |
| | A | 10.9% |
| | BBB | 33.5% |
| | BB and Below | 14.0% |
| | Short-Term Investments and Net Other Assets | 2.4% |
| As of June 30, 2015 |
| | U.S. Government and U.S. Government Agency Obligations | 36.4% |
| | AAA | 3.7% |
| | AA | 3.7% |
| | A | 14.3% |
| | BBB | 28.2% |
| | BB and Below | 12.1% |
| | Not Rated | 0.1% |
| | Short-Term Investments and Net Other Assets | 1.5% |

We have used ratings from Moody's Investors Service, Inc. Where Moody's® ratings are not available, we have used S&P® ratings. All ratings are as of the date indicated and do not reflect subsequent changes. Securities rated BB or below were rated investment grade at the time of acquisition. The information in the above tables is based on the combined investments of the Fund and its pro-rata share of investments of Fidelity's fixed-income central funds.
Weighted Average Maturity as of December 31, 2015
| | | 6 months ago |
| Years | 7.7 | 7.4 |
This is a weighted average of all the maturities of the securities held in a fund. Weighted Average Maturity (WAM) can be used as a measure of sensitivity to interest rate changes and market changes. Generally, the longer the maturity, the greater the sensitivity to such changes. WAM is based on the dollar-weighted average length of time until principal payments must be paid. Depending on the types of securities held in a fund, certain maturity shortening devices (e.g., demand features, interest rate resets, and call options) may be taken into account when calculating the WAM.
Duration as of December 31, 2015
| | | 6 months ago |
| Years | 5.4 | 5.4 |
Duration is a measure of a security's price sensitivity to changes in interest rates. Duration differs from maturity in that it considers a security's interest payments in addition to the amount of time until the security reaches maturity, and also takes into account certain maturity shortening features (e.g., demand features, interest rate resets, and call options) when applicable. Securities with longer durations generally tend to be more sensitive to interest rate changes than securities with shorter durations. A fund with a longer average duration generally can be expected to be more sensitive to interest rate changes than a fund with a shorter average duration.
Asset Allocation (% of fund's net assets)
| As of December 31, 2015 *,** |
| | Corporate Bonds | 51.3% |
| | U.S. Government and U.S. Government Agency Obligations | 32.1% |
| | Asset-Backed Securities | 0.9% |
| | CMOs and Other Mortgage Related Securities | 6.3% |
| | Municipal Bonds | 4.1% |
| | Other Investments | 2.9% |
| | Short-Term Investments and Net Other Assets (Liabilities) | 2.4% |

* Foreign investments - 14.5%
** Futures and Swaps - 0.0%
| As of June 30, 2015 *,** |
| | Corporate Bonds | 48.6% |
| | U.S. Government and U.S. Government Agency Obligations | 36.4% |
| | Asset-Backed Securities | 1.0% |
| | CMOs and Other Mortgage Related Securities | 7.2% |
| | Municipal Bonds | 3.9% |
| | Other Investments | 1.4% |
| | Short-Term Investments and Net Other Assets (Liabilities) | 1.5% |

* Foreign investments - 13.6%
** Futures and Swaps - 0.0%
The information in the above table is based on the combined investments of the Fund and its pro rata share of the investments of Fidelity's fixed-income central funds. An unaudited holdings listing for the Fund, which presents direct holdings as well as the pro rata share of any securities and other investments held indirectly through its investment in underlying non-money market Fidelity Central Funds, is available at advisor.fidelity.com. Fidelity VIP Investment Grade Central Fund's holdings and financial statements are included at the end of this report.
Percentages in the above tables are adjusted for the effect of TBA Sale Commitments.
VIP Investment Grade Bond Portfolio
Investments December 31, 2015
Showing Percentage of Net Assets
| Nonconvertible Bonds - 0.3% | | | |
| | | Principal Amount | Value |
| ENERGY - 0.1% | | | |
| Oil, Gas & Consumable Fuels - 0.1% | | | |
| Chesapeake Energy Corp. 5.75% 3/15/23 | | $8,800,000 | $2,552,000 |
| FINANCIALS - 0.1% | | | |
| Diversified Financial Services - 0.1% | | | |
| MSCI, Inc. 5.25% 11/15/24 (a) | | 3,400,000 | 3,451,000 |
| Real Estate Investment Trusts - 0.0% | | | |
| CommonWealth REIT 5.875% 9/15/20 | | 546,000 | 586,923 |
|
| TOTAL FINANCIALS | | | 4,037,923 |
|
| HEALTH CARE - 0.1% | | | |
| Health Care Providers & Services - 0.1% | | | |
| Sabra Health Care LP/Sabra Capital Corp. 5.5% 2/1/21 | | 5,515,000 | 5,694,238 |
| TOTAL NONCONVERTIBLE BONDS | | | |
| (Cost $18,690,032) | | | 12,284,161 |
|
| U.S. Treasury Obligations - 1.4% | | | |
| U.S. Treasury Bonds 2.875% 8/15/45 | | 20,030,000 | 19,415,800 |
| U.S. Treasury Notes 2% 8/15/25 | | 31,170,000 | 30,390,251 |
| TOTAL U.S. TREASURY OBLIGATIONS | | | |
| (Cost $50,827,997) | | | 49,806,051 |
|
| Collateralized Mortgage Obligations - 0.0% | | | |
| Private Sponsor - 0.0% | | | |
| MASTR Adjustable Rate Mortgages Trust Series 2007-3 Class 22A2, 0.407% 5/25/47 (b) | | $236,715 | $218,020 |
| Merrill Lynch Alternative Note Asset Trust floater Series 2007-OAR1 Class A1, 0.5916% 2/25/37 (b) | | 749,199 | 669,213 |
| Wells Fargo Mortgage Backed Securities Trust Series 2005-AR2 Class 1A2, 2.63% 3/25/35 (b) | | 527,832 | 487,953 |
| TOTAL PRIVATE SPONSOR | | | |
| (Cost $828,778) | | | 1,375,186 |
| | | Shares | Value |
|
| Fixed-Income Funds - 98.3% | | | |
| Fidelity Specialized High Income Central Fund (c) | | 2,796,333 | 270,964,634 |
| Fidelity VIP Investment Grade Central Fund (c)(d) | | 31,045,873 | 3,219,767,472 |
| TOTAL FIXED-INCOME FUNDS | | | |
| (Cost $3,510,068,252) | | | 3,490,732,106 |
|
| Money Market Funds - 0.4% | | | |
| Fidelity Cash Central Fund, 0.33% (e) | | | |
| (Cost $14,354,356) | | 14,354,356 | 14,354,356 |
| TOTAL INVESTMENT PORTFOLIO - 100.4% | | | |
| (Cost $3,594,769,415) | | | 3,568,551,860 |
| NET OTHER ASSETS (LIABILITIES) - (0.4)% | | | (15,949,542) |
| NET ASSETS - 100% | | | $3,552,602,318 |
LegendLegend
(a) Security exempt from registration under Rule 144A of the Securities Act of 1933. These securities may be resold in transactions exempt from registration, normally to qualified institutional buyers. At the end of the period, the value of these securities amounted to $3,451,000 or 0.1% of net assets.
(b) Coupon rates for floating and adjustable rate securities reflect the rates in effect at period end.
(c) Affiliated fund that is generally available only to investment companies and other accounts managed by Fidelity Investments. A complete unaudited schedule of portfolio holdings for each Fidelity Central Fund is filed with the SEC for the first and third quarters of each fiscal year on Form N-Q and is available upon request or at the SEC's website at www.sec.gov. An unaudited holdings listing for the Fund, which presents direct holdings as well as the pro-rata share of securities and other investments held indirectly through its investment in underlying non-money market Fidelity Central Funds, is available at advisor.fidelity.com. In addition, each Fidelity Central Fund's financial statements, which are not covered by the Fund's Report of Independent Registered Public Accounting Firm, are available on the SEC's website or upon request.
(d) Affiliated central fund that is available only to investment companies and other accounts managed by Fidelity Investments. Fidelity VIP Investment Grade Central Fund's investments and financial statements are included at the end of this report as an attachment.
(e) Affiliated fund that is generally available only to investment companies and other accounts managed by Fidelity Investments. The rate quoted is the annualized seven-day yield of the fund at period end. A complete unaudited listing of the fund's holdings as of its most recent quarter end is available upon request. In addition, each Fidelity Central Fund's financial statements, which are not covered by the Fund's Report of Independent Registered Public Accounting Firm, are available on the SEC's website or upon request.
Affiliated Central Funds
Information regarding fiscal year to date income earned by the Fund from investments in Fidelity Central Funds is as follows:
| Fund | Income earned |
| Fidelity Cash Central Fund | $47,830 |
| Fidelity Specialized High Income Central Fund | 12,216,236 |
| Fidelity VIP Investment Grade Central Fund | 97,232,608 |
| Total | $109,496,674 |
Additional information regarding the Fund's fiscal year to date purchases and sales, including the ownership percentage, of the non Money Market Central Funds is as follows:
| Fund | Value, beginning of period | Purchases | Sales Proceeds | Value, end of period | % ownership, end of period |
| Fidelity Specialized High Income Central Fund | $199,928,323 | $86,961,156 | $-- | $270,964,634 | 33.7% |
| Fidelity VIP Investment Grade Central Fund | 3,101,051,964 | 394,789,989 | 179,856,550 | 3,219,767,472 | 69.8% |
| Total | $3,300,980,287 | $481,751,145 | $179,856,550 | $3,490,732,106 | |
Investment Valuation
The following is a summary of the inputs used, as of December 31, 2015, involving the Fund's assets and liabilities carried at fair value. The inputs or methodology used for valuing securities may not be an indication of the risk associated with investing in those securities. For more information on valuation inputs, and their aggregation into the levels used below, please refer to the Investment Valuation section in the accompanying Notes to Financial Statements.
| | Valuation Inputs at Reporting Date: |
| Description | Total | Level 1 | Level 2 | Level 3 |
| Investments in Securities: | | | | |
| Corporate Bonds | $12,284,161 | $-- | $12,284,161 | $-- |
| U.S. Government and Government Agency Obligations | 49,806,051 | -- | 49,806,051 | -- |
| Collateralized Mortgage Obligations | 1,375,186 | -- | 1,375,186 | -- |
| Fixed-Income Funds | 3,490,732,106 | 3,490,732,106 | -- | -- |
| Money Market Funds | 14,354,356 | 14,354,356 | -- | -- |
| Total Investments in Securities: | $3,568,551,860 | $3,505,086,462 | $63,465,398 | $-- |
Other Information
Distribution of investments by country or territory of incorporation, as a percentage of Total Net Assets, is as follows (Unaudited):
| United States of America | 85.5% |
| United Kingdom | 3.1% |
| Mexico | 1.8% |
| Netherlands | 1.6% |
| Cayman Islands | 1.2% |
| Luxembourg | 1.2% |
| Others (Individually Less Than 1%) | 5.6% |
| | 100.0% |
The information in the above table is based on the combined investments of the fund and its pro-rata share of the investments of Fidelity's Fixed-Income Central Funds
See accompanying notes which are an integral part of the financial statements.
VIP Investment Grade Bond Portfolio
Financial Statements
Statement of Assets and Liabilities
| | | December 31, 2015 |
| Assets | | |
Investment in securities, at value — See accompanying schedule:
Unaffiliated issuers (cost $70,346,807) | $63,465,398 | |
| Fidelity Central Funds (cost $3,524,422,608) | 3,505,086,462 | |
| Total Investments (cost $3,594,769,415) | | $3,568,551,860 |
| Receivable for fund shares sold | | 4,918,761 |
| Interest receivable | | 763,007 |
| Distributions receivable from Fidelity Central Funds | | 3,013 |
| Prepaid expenses | | 7,791 |
| Total assets | | 3,574,244,432 |
| Liabilities | | |
| Payable for fund shares redeemed | $20,068,402 | |
| Accrued management fee | 925,491 | |
| Distribution and service plan fees payable | 293,241 | |
| Other affiliated payables | 318,335 | |
| Other payables and accrued expenses | 36,645 | |
| Total liabilities | | 21,642,114 |
| Net Assets | | $3,552,602,318 |
| Net Assets consist of: | | |
| Paid in capital | | $3,586,248,910 |
| Undistributed net investment income | | 1,745,501 |
| Accumulated undistributed net realized gain (loss) on investments | | (9,174,538) |
| Net unrealized appreciation (depreciation) on investments | | (26,217,555) |
| Net Assets | | $3,552,602,318 |
| Initial Class: | | |
| Net Asset Value, offering price and redemption price per share ($1,052,892,975 ÷ 85,130,829 shares) | | $12.37 |
| Service Class: | | |
| Net Asset Value, offering price and redemption price per share ($519,999,579 ÷ 42,479,461 shares) | | $12.24 |
| Service Class 2: | | |
| Net Asset Value, offering price and redemption price per share ($1,186,855,211 ÷ 98,145,226 shares) | | $12.09 |
| Investor Class: | | |
| Net Asset Value, offering price and redemption price per share ($792,854,553 ÷ 64,333,825 shares) | | $12.32 |
See accompanying notes which are an integral part of the financial statements.
Statement of Operations
| | | Year ended December 31, 2015 |
| Investment Income | | |
| Interest | | $2,576,926 |
| Income from Fidelity Central Funds | | 109,496,674 |
| Total income | | 112,073,600 |
| Expenses | | |
| Management fee | $11,176,425 | |
| Transfer agent fees | 2,733,003 | |
| Distribution and service plan fees | 3,465,485 | |
| Accounting and security lending fees | 1,113,781 | |
| Custodian fees and expenses | 7,713 | |
| Independent trustees' compensation | 14,660 | |
| Registration fees | 26,062 | |
| Audit | 51,707 | |
| Legal | 14,912 | |
| Miscellaneous | 165,157 | |
| Total expenses before reductions | 18,768,905 | |
| Expense reductions | (8,202) | 18,760,703 |
| Net investment income (loss) | | 93,312,897 |
| Realized and Unrealized Gain (Loss) | | |
| Net realized gain (loss) on: | | |
| Investment securities: | | |
| Unaffiliated issuers | (5,318,663) | |
| Fidelity Central Funds | (5,078,449) | |
| Capital gain distributions from Fidelity Central Funds | 2,299,416 | |
| Total net realized gain (loss) | | (8,097,696) |
| Change in net unrealized appreciation (depreciation) on investment securities | | (114,860,697) |
| Net gain (loss) | | (122,958,393) |
| Net increase (decrease) in net assets resulting from operations | | $(29,645,496) |
See accompanying notes which are an integral part of the financial statements.
Statement of Changes in Net Assets
| | Year ended December 31, 2015 | Year ended December 31, 2014 |
| Increase (Decrease) in Net Assets | | |
| Operations | | |
| Net investment income (loss) | $93,312,897 | $75,267,939 |
| Net realized gain (loss) | (8,097,696) | (1,144,373) |
| Change in net unrealized appreciation (depreciation) | (114,860,697) | 95,049,878 |
| Net increase (decrease) in net assets resulting from operations | (29,645,496) | 169,173,444 |
| Distributions to shareholders from net investment income | (91,918,960) | (70,644,189) |
| Distributions to shareholders from net realized gain | (2,733,126) | (1,215,407) |
| Total distributions | (94,652,086) | (71,859,596) |
| Share transactions - net increase (decrease) | 320,862,768 | 313,893,177 |
| Total increase (decrease) in net assets | 196,565,186 | 411,207,025 |
| Net Assets | | |
| Beginning of period | 3,356,037,132 | 2,944,830,107 |
| End of period (including undistributed net investment income of $1,745,501 and undistributed net investment income of $3,246,610, respectively) | $3,552,602,318 | $3,356,037,132 |
See accompanying notes which are an integral part of the financial statements.
Financial Highlights — VIP Investment Grade Bond Portfolio Initial Class
| | | | | | |
| Years ended December 31, | 2015 | 2014 | 2013 | 2012 | 2011 |
| Selected Per–Share Data | | | | | |
| Net asset value, beginning of period | $12.79 | $12.36 | $13.06 | $12.97 | $12.83 |
| Income from Investment Operations | | | | | |
| Net investment income (loss)A | .345 | .327 | .295 | .318 | .431 |
| Net realized and unrealized gain (loss) | (.419) | .392 | (.526) | .443 | .492 |
| Total from investment operations | (.074) | .719 | (.231) | .761 | .923 |
| Distributions from net investment income | (.336) | (.284) | (.310) | (.315) | (.436) |
| Distributions from net realized gain | (.010) | (.005) | (.159) | (.356) | (.347) |
| Total distributions | (.346) | (.289) | (.469) | (.671) | (.783) |
| Net asset value, end of period | $12.37 | $12.79 | $12.36 | $13.06 | $12.97 |
| Total ReturnB,C | (.60)% | 5.83% | (1.78)% | 5.90% | 7.33% |
| Ratios to Average Net AssetsD,E | | | | | |
| Expenses before reductions | .42% | .42% | .42% | .42% | .43% |
| Expenses net of fee waivers, if any | .42% | .42% | .42% | .42% | .42% |
| Expenses net of all reductions | .42% | .42% | .42% | .42% | .42% |
| Net investment income (loss) | 2.69% | 2.56% | 2.29% | 2.39% | 3.30% |
| Supplemental Data | | | | | |
| Net assets, end of period (000 omitted) | $1,052,893 | $1,081,564 | $981,378 | $1,149,849 | $1,116,778 |
| Portfolio turnover rateF | 9% | 7% | 4% | 2% | 5% |
A Calculated based on average shares outstanding during the period.
B Total returns do not reflect charges attributable to your insurance company's separate account. Inclusion of these charges would reduce the total returns shown.
C Total returns would have been lower if certain expenses had not been reduced during the applicable periods shown.
D Fees and expenses of any underlying Fidelity Central Funds are not included in the Fund's expense ratio. The Fund indirectly bears its proportionate share of the expenses of any underlying Fidelity Central Funds. Based on their most recent shareholder report date, the expenses of any underlying non-money market Fidelity Central Funds were less than .01%.
E Expense ratios reflect operating expenses of the class. Expenses before reductions do not reflect amounts reimbursed by the investment adviser or reductions from expense offset arrangements and do not represent the amount paid by the class during periods when reimbursements or reductions occur. Expenses net of fee waivers reflect expenses after reimbursement by the investment adviser but prior to reductions from expense offset arrangements. Expenses net of all reductions represent the net expenses paid by the class.
F Amount does not include the portfolio activity of any underlying Fidelity Central Funds.
See accompanying notes which are an integral part of the financial statements.
Financial Highlights — VIP Investment Grade Bond Portfolio Service Class
| | | | | | |
| Years ended December 31, | 2015 | 2014 | 2013 | 2012 | 2011 |
| Selected Per–Share Data | | | | | |
| Net asset value, beginning of period | $12.66 | $12.24 | $12.94 | $12.86 | $12.73 |
| Income from Investment Operations | | | | | |
| Net investment income (loss)A | .329 | .312 | .280 | .302 | .415 |
| Net realized and unrealized gain (loss) | (.416) | .391 | (.523) | .436 | .485 |
| Total from investment operations | (.087) | .703 | (.243) | .738 | .900 |
| Distributions from net investment income | (.323) | (.278) | (.298) | (.302) | (.423) |
| Distributions from net realized gain | (.010) | (.005) | (.159) | (.356) | (.347) |
| Total distributions | (.333) | (.283) | (.457) | (.658) | (.770) |
| Net asset value, end of period | $12.24 | $12.66 | $12.24 | $12.94 | $12.86 |
| Total ReturnB,C | (.71)% | 5.75% | (1.89)% | 5.77% | 7.21% |
| Ratios to Average Net AssetsD,E | | | | | |
| Expenses before reductions | .52% | .52% | .52% | .52% | .52% |
| Expenses net of fee waivers, if any | .52% | .52% | .52% | .52% | .52% |
| Expenses net of all reductions | .52% | .52% | .52% | .52% | .52% |
| Net investment income (loss) | 2.60% | 2.46% | 2.19% | 2.29% | 3.20% |
| Supplemental Data | | | | | |
| Net assets, end of period (000 omitted) | $520,000 | $432,656 | $265,505 | $288,708 | $277,732 |
| Portfolio turnover rateF | 9% | 7% | 4% | 2% | 5% |
A Calculated based on average shares outstanding during the period.
B Total returns do not reflect charges attributable to your insurance company's separate account. Inclusion of these charges would reduce the total returns shown.
C Total returns would have been lower if certain expenses had not been reduced during the applicable periods shown.
D Fees and expenses of any underlying Fidelity Central Funds are not included in the Fund's expense ratio. The Fund indirectly bears its proportionate share of the expenses of any underlying Fidelity Central Funds. Based on their most recent shareholder report date, the expenses of any underlying non-money market Fidelity Central Funds were less than.01%.
E Expense ratios reflect operating expenses of the class. Expenses before reductions do not reflect amounts reimbursed by the investment adviser or reductions from expense offset arrangements and do not represent the amount paid by the class during periods when reimbursements or reductions occur. Expenses net of fee waivers reflect expenses after reimbursement by the investment adviser but prior to reductions from expense offset arrangements. Expenses net of all reductions represent the net expenses paid by the class.
F Amount does not include the portfolio activity of any underlying Fidelity Central Funds.
See accompanying notes which are an integral part of the financial statements.
Financial Highlights — VIP Investment Grade Bond Portfolio Service Class 2
| | | | | | |
| Years ended December 31, | 2015 | 2014 | 2013 | 2012 | 2011 |
| Selected Per–Share Data | | | | | |
| Net asset value, beginning of period | $12.51 | $12.10 | $12.79 | $12.72 | $12.60 |
| Income from Investment Operations | | | | | |
| Net investment income (loss)A | .306 | .289 | .257 | .279 | .391 |
| Net realized and unrealized gain (loss) | (.410) | .379 | (.510) | .430 | .478 |
| Total from investment operations | (.104) | .668 | (.253) | .709 | .869 |
| Distributions from net investment income | (.306) | (.253) | (.278) | (.283) | (.402) |
| Distributions from net realized gain | (.010) | (.005) | (.159) | (.356) | (.347) |
| Total distributions | (.316) | (.258) | (.437) | (.639) | (.749) |
| Net asset value, end of period | $12.09 | $12.51 | $12.10 | $12.79 | $12.72 |
| Total ReturnB,C | (.85)% | 5.53% | (1.99)% | 5.60% | 7.03% |
| Ratios to Average Net AssetsD,E | | | | | |
| Expenses before reductions | .67% | .67% | .67% | .67% | .67% |
| Expenses net of fee waivers, if any | .67% | .67% | .67% | .67% | .67% |
| Expenses net of all reductions | .67% | .67% | .67% | .67% | .67% |
| Net investment income (loss) | 2.45% | 2.31% | 2.04% | 2.14% | 3.05% |
| Supplemental Data | | | | | |
| Net assets, end of period (000 omitted) | $1,186,855 | $1,082,467 | $1,115,493 | $1,198,326 | $972,651 |
| Portfolio turnover rateF | 9% | 7% | 4% | 2% | 5% |
A Calculated based on average shares outstanding during the period.
B Total returns do not reflect charges attributable to your insurance company's separate account. Inclusion of these charges would reduce the total returns shown.
C Total returns would have been lower if certain expenses had not been reduced during the applicable periods shown.
D Fees and expenses of any underlying Fidelity Central Funds are not included in the Fund's expense ratio. The Fund indirectly bears its proportionate share of the expenses of any underlying Fidelity Central Funds. Based on their most recent shareholder report date, the expenses of any underlying non-money market Fidelity Central Funds were less than .01%.
E Expense ratios reflect operating expenses of the class. Expenses before reductions do not reflect amounts reimbursed by the investment adviser or reductions from expense offset arrangements and do not represent the amount paid by the class during periods when reimbursements or reductions occur. Expenses net of fee waivers reflect expenses after reimbursement by the investment adviser but prior to reductions from expense offset arrangements. Expenses net of all reductions represent the net expenses paid by the class.
F Amount does not include the portfolio activity of any underlying Fidelity Central Funds.
See accompanying notes which are an integral part of the financial statements.
Financial Highlights — VIP Investment Grade Bond Portfolio Investor Class
| | | | | | |
| Years ended December 31, | 2015 | 2014 | 2013 | 2012 | 2011 |
| Selected Per–Share Data | | | | | |
| Net asset value, beginning of period | $12.75 | $12.32 | $13.02 | $12.93 | $12.80 |
| Income from Investment Operations | | | | | |
| Net investment income (loss)A | .340 | .322 | .290 | .313 | .426 |
| Net realized and unrealized gain (loss) | (.428) | .395 | (.526) | .444 | .484 |
| Total from investment operations | (.088) | .717 | (.236) | .757 | .910 |
| Distributions from net investment income | (.332) | (.282) | (.305) | (.311) | (.433) |
| Distributions from net realized gain | (.010) | (.005) | (.159) | (.356) | (.347) |
| Total distributions | (.342) | (.287) | (.464) | (.667) | (.780) |
| Net asset value, end of period | $12.32 | $12.75 | $12.32 | $13.02 | $12.93 |
| Total ReturnB,C | (.71)% | 5.83% | (1.82)% | 5.89% | 7.25% |
| Ratios to Average Net AssetsD,E | | | | | |
| Expenses before reductions | .45% | .45% | .45% | .46% | .46% |
| Expenses net of fee waivers, if any | .45% | .45% | .45% | .46% | .45% |
| Expenses net of all reductions | .45% | .45% | .45% | .46% | .45% |
| Net investment income (loss) | 2.66% | 2.53% | 2.26% | 2.36% | 3.27% |
| Supplemental Data | | | | | |
| Net assets, end of period (000 omitted) | $792,855 | $759,351 | $582,454 | $744,227 | $612,611 |
| Portfolio turnover rateF | 9% | 7% | 4% | 2% | 5% |
A Calculated based on average shares outstanding during the period.
B Total returns do not reflect charges attributable to your insurance company's separate account. Inclusion of these charges would reduce the total returns shown.
C Total returns would have been lower if certain expenses had not been reduced during the applicable periods shown.
D Fees and expenses of any underlying Fidelity Central Funds are not included in the Fund's expense ratio. The Fund indirectly bears its proportionate share of the expenses of any underlying Fidelity Central Funds. Based on their most recent shareholder report date, the expenses of any underlying non-money market Fidelity Central Funds were less than .01%.
E Expense ratios reflect operating expenses of the class. Expenses before reductions do not reflect amounts reimbursed by the investment adviser or reductions from expense offset arrangements and do not represent the amount paid by the class during periods when reimbursements or reductions occur. Expenses net of fee waivers reflect expenses after reimbursement by the investment adviser but prior to reductions from expense offset arrangements. Expenses net of all reductions represent the net expenses paid by the class.
F Amount does not include the portfolio activity of any underlying Fidelity Central Funds.
See accompanying notes which are an integral part of the financial statements.
Notes to Financial Statements
For the period ended December 31, 2015
1. Organization.
VIP Investment Grade Bond Portfolio (the Fund) is a fund of Variable Insurance Products Fund V (the Trust) and is authorized to issue an unlimited number of shares. The Trust is registered under the Investment Company Act of 1940, as amended (the 1940 Act), as an open-end management investment company organized as a Massachusetts business trust. Shares of the Fund may only be purchased by insurance companies for the purpose of funding variable annuity or variable life insurance contracts. The Fund offers the following classes of shares: Initial Class shares, Service Class shares, Service Class 2 shares and Investor Class shares. All classes have equal rights and voting privileges, except for matters affecting a single class.
2. Investments in Fidelity Central Funds.
The Fund invests in Fidelity Central Funds, which are open-end investment companies generally available only to other investment companies and accounts managed by the investment adviser and its affiliates. The Fund's Schedule of Investments lists each of the Fidelity Central Funds held as of period end, if any, as an investment of the Fund, but does not include the underlying holdings of each Fidelity Central Fund. As an Investing Fund, the Fund indirectly bears its proportionate share of the expenses of the underlying Fidelity Central Funds.
Based on its investment objective, each Fidelity Central Fund may invest or participate in various investment vehicles or strategies that are similar to those of the Fund. These strategies are consistent with the investment objectives of the Fund and may involve certain economic risks which may cause a decline in value of each of the Fidelity Central Funds and thus a decline in the value of the Fund. The Money Market Central Funds seek preservation of capital and current income and are managed by Fidelity Investments Money Management, Inc. (FIMM), an affiliate of the investment adviser. Annualized expenses of the Money Market Central Funds as of their most recent shareholder report date are less than .005%. The following summarizes the Fund's investment in each non-money market Fidelity Central Fund.
| Fidelity Central Fund | Investment Manager | Investment Objective | Investment Practices | Expense Ratio(a) |
| Fidelity Specialized High Income Central Fund | FMR Co., Inc. (FMRC) | Seeks a high level of current income by normally investing in income-producing debt securities, with an emphasis on lower-quality debt securities. | Loans & Direct Debt Instruments
Restricted Securities
| Less than .005% |
| Fidelity VIP Investment Grade Central Fund | FIMM | Seeks a high level of current income by normally investing in investment-grade debt securities and repurchase agreements. | Delayed Delivery & When Issued Securities
Futures
Repurchase
Agreements
Restricted Securities
Swaps | Less than .005% |
(a) Expenses expressed as a percentage of average net assets and are as of each underlying Central Fund's most recent annual or semi-annual shareholder report.
An unaudited holdings listing for each Fund, which presents direct holdings as well as the pro-rata share of any securities and other investments held indirectly through each Fund's investment in underlying non-money market Fidelity Central Funds, is available at advisor.fidelity.com. A complete unaudited list of holdings for each Fidelity Central Fund is available upon request or at the Securities and Exchange Commission (the SEC) website at www.sec.gov. In addition, the financial statements of the Fidelity Central Funds which contain the significant accounting policies (including investment valuation policies) of those funds, which are not covered by the Fund's Report of Independent Registered Public Accounting Firm, are available on the SEC website or upon request.
3. Significant Accounting Policies.
The financial statements have been prepared in conformity with accounting principles generally accepted in the United States of America (GAAP), which require management to make certain estimates and assumptions at the date of the financial statements. Actual results could differ from those estimates. Subsequent events, if any, through the date that the financial statements were issued have been evaluated in the preparation of the financial statements. The following summarizes the significant accounting policies of the Fund:
Investment Valuation. Investments are valued as of 4:00 p.m. Eastern time on the last calendar day of the period. The Board of Trustees (the Board) has delegated the day to day responsibility for the valuation of the Fund's investments to the Fidelity Management & Research Company (FMR) Fair Value Committee (the Committee). In accordance with valuation policies and procedures approved by the Board, the Fund attempts to obtain prices from one or more third party pricing vendors or brokers to value its investments. When current market prices, quotations or currency exchange rates are not readily available or reliable, investments will be fair valued in good faith by the Committee, in accordance with procedures adopted by the Board. Factors used in determining fair value vary by investment type and may include market or investment specific events, changes in interest rates and credit quality. The frequency with which these procedures are used cannot be predicted and they may be utilized to a significant extent. The Committee oversees the Fund's valuation policies and procedures and reports to the Board on the Committee's activities and fair value determinations. The Board monitors the appropriateness of the procedures used in valuing the Fund's investments and ratifies the fair value determinations of the Committee.
The Fund categorizes the inputs to valuation techniques used to value its investments into a disclosure hierarchy consisting of three levels as shown below:
- Level 1 – quoted prices in active markets for identical investments
- Level 2 – other significant observable inputs (including quoted prices for similar investments, interest rates, prepayment speeds, etc.)
- Level 3 – unobservable inputs (including the Fund's own assumptions based on the best information available)
Valuation techniques used to value the Fund's investments by major category are as follows:
Debt securities, including restricted securities, are valued based on evaluated prices received from third party pricing vendors or from brokers who make markets in such securities. Corporate bonds and U.S. government and government agency obligations are valued by pricing vendors who utilize matrix pricing which considers yield or price of bonds of comparable quality, coupon, maturity and type or by broker-supplied prices. Collateralized mortgage obligations are valued by pricing vendors who utilize matrix pricing which considers prepayment speed assumptions, attributes of the collateral, yield or price of bonds of comparable quality, coupon, maturity and type or by broker-supplied prices. When independent prices are unavailable or unreliable, debt securities may be valued utilizing pricing methodologies which consider similar factors that would be used by third party pricing vendors. Debt securities are generally categorized as Level 2 in the hierarchy but may be Level 3 depending on the circumstances.
Investments in open-end mutual funds, including the Fidelity Central Funds, are valued at their closing net asset value (NAV) each business day and are categorized as Level 1 in the hierarchy.
Changes in valuation techniques may result in transfers in or out of an assigned level within the disclosure hierarchy. The aggregate value of investments by input level as of December 31, 2015, is included at the end of the Fund's Schedule of Investments.
Investment Transactions and Income. For financial reporting purposes, the Fund's investment holdings and NAV include trades executed through the end of the last business day of the period. The NAV per share for processing shareholder transactions is calculated as of the close of business of the New York Stock Exchange (NYSE), normally 4:00 p.m. Eastern time and includes trades executed through the end of the prior business day. Gains and losses on securities sold are determined on the basis of identified cost. Income and capital gain distributions from Fidelity Central Funds, if any, are recorded on the ex-dividend date. Interest income is accrued as earned and includes coupon interest and amortization of premium and accretion of discount on debt securities as applicable. Debt obligations may be placed on non-accrual status and related interest income may be reduced by ceasing current accruals and writing off interest receivables when the collection of all or a portion of interest has become doubtful based on consistently applied procedures. A debt obligation is removed from non-accrual status when the issuer resumes interest payments or when collectability of interest is reasonably assured.
Class Allocations and Expenses. Investment income, realized and unrealized capital gains and losses, common expenses of the Fund, and certain fund-level expense reductions, if any, are allocated daily on a pro-rata basis to each class based on the relative net assets of each class to the total net assets of the Fund. Each class differs with respect to transfer agent and distribution and service plan fees incurred. Certain expense reductions may also differ by class. For the reporting period, the allocated portion of income and expenses to each class as a percent of its average net assets may vary due to the timing of recording these transactions in relation to fluctuating net assets of the classes. Expenses directly attributable to a fund are charged to that fund. Expenses attributable to more than one fund are allocated among the respective funds on the basis of relative net assets or other appropriate methods. Expense estimates are accrued in the period to which they relate and adjustments are made when actual amounts are known.
Income Tax Information and Distributions to Shareholders. Each year, the Fund intends to qualify as a regulated investment company under Subchapter M of the Internal Revenue Code, including distributing substantially all of its taxable income and realized gains. As a result, no provision for U.S. Federal income taxes is required. As of December 31, 2015, the Fund did not have any unrecognized tax benefits in the financial statements; nor is the Fund aware of any tax positions for which it is reasonably possible that the total amounts of unrecognized tax benefits will significantly change in the next twelve months. The Fund files a U.S. federal tax return, in addition to state and local tax returns as required. The Fund's federal income tax returns are subject to examination by the Internal Revenue Service (IRS) for a period of three fiscal years after they are filed. State and local tax returns may be subject to examination for an additional fiscal year depending on the jurisdiction.
Distributions are declared and recorded on the ex-dividend date. Income dividends and capital gain distributions are declared separately for each class. Income and capital gain distributions are determined in accordance with income tax regulations, which may differ from GAAP.
Capital accounts within the financial statements are adjusted for permanent book-tax differences. These adjustments have no impact on net assets or the results of operations. Capital accounts are not adjusted for temporary book-tax differences which will reverse in a subsequent period.
Book-tax differences are primarily due to partnerships (including allocations from Fidelity Central Funds), market discount, Short-term gain distributions from the fidelity central funds, capital loss carryforwards, deferred trustees compensation and losses deferred due to wash sales.
The federal tax cost of investment securities and unrealized appreciation (depreciation) as of period end were as follows:
| Gross unrealized appreciation | $78,754,752 |
| Gross unrealized depreciation | (51,090,915) |
| Net unrealized appreciation (depreciation) on securities | $27,663,837 |
| Tax Cost | $3,540,888,023 |
The tax-based components of distributable earnings as of period end were as follows:
| Undistributed ordinary income | $3,279,553 |
| Capital loss carryforward | $(9,837,955) |
| Net unrealized appreciation (depreciation) on securities and other investments | $27,663,837 |
Capital loss carryforwards are only available to offset future capital gains of the Fund to the extent provided by regulations and may be limited. Under the Regulated Investment Company Modernization Act of 2010 (the Act), the Fund is permitted to carry forward capital losses incurred in taxable years beginning after December 22, 2010 for an unlimited period and such capital losses are required to be used prior to any losses that expire. The capital loss carryforward information presented below, including any applicable limitation, is estimated as of fiscal period end and is subject to adjustment.
| Fiscal year of expiration | |
| No expiration | |
| Short-term | $(7,828,852) |
| Long-term | (2,009,103) |
| Total capital loss carryforward | $(9,837,955) |
The tax character of distributions paid was as follows:
| | December 31, 2015 | December 31, 2014 |
| Ordinary Income | $92,738,898 | $ 70,903,328 |
| Long-term Capital Gains | 1,913,188 | 956,268 |
| Total | $94,652,086 | $ 71,859,596 |
Restricted Securities. The Fund may invest in securities that are subject to legal or contractual restrictions on resale. These securities generally may be resold in transactions exempt from registration or to the public if the securities are registered. Disposal of these securities may involve time-consuming negotiations and expense, and prompt sale at an acceptable price may be difficult. Information regarding restricted securities is included at the end of the Fund's Schedule of Investments.
4. Purchases and Sales of Investments.
Purchases and sales of securities (Including the Fixed-Income Central Funds), other than short-term securities and U.S. government securities, aggregated $499,926,808 and $180,626,385, respectively.
5. Fees and Other Transactions with Affiliates.
Management Fee. Fidelity Management & Research Company (the investment adviser) and its affiliates provide the Fund with investment management related services for which the Fund pays a monthly management fee. The management fee is the sum of an individual fund fee rate that is based on an annual rate of .20% of the Fund's average net assets and an annualized group fee rate that averaged.11% during the period. The group fee rate is based upon the average net assets of all the mutual funds advised by the investment adviser, including any mutual funds previously advised by the investment adviser that are currently advised by Fidelity SelectCo, LLC, an affiliate of the investment adviser. The group fee rate decreases as assets under management increase and increases as assets under management decrease. For the reporting period, the total annual management fee rate was .31% of the Fund's average net assets.
Distribution and Service Plan Fees. In accordance with Rule 12b-1 of the 1940 Act, the Fund has adopted separate 12b-1 Plans for each Service Class of shares. Each Service Class pays Fidelity Distributors Corporation (FDC), an affiliate of the investment adviser, a service fee. For the period, the service fee is based on an annual rate of .10% of Service Class' average net assets and .25% of Service Class 2's average net assets.
For the period, total fees, all of which were re-allowed to insurance companies for the distribution of shares and providing shareholder support services, were as follows:
| Service Class | $544,061 |
| Service Class 2 | 2,921,424 |
| | $3,465,485 |
Transfer Agent Fees. Fidelity Investments Institutional Operations Company, Inc. (FIIOC), an affiliate of the investment adviser, is the Fund's transfer, dividend disbursing, and shareholder servicing agent. FIIOC receives an asset-based fee with respect to each class. Each class (with the exception of Investor Class) pays a fee for transfer agent services, typesetting, printing and mailing of shareholder reports, excluding mailing of proxy statements and out of pocket expenses, equal to an annual rate of .07% ( .10% for Investor Class) of class-level average net assets. For the period, transfer agent fees for each class, including out of pocket expenses, were as follows:
| Initial Class | $749,062 |
| Service Class | 370,503 |
| Service Class 2 | 795,828 |
| Investor Class | 817,610 |
| | $2,733,003 |
Accounting and Security Lending Fees. Fidelity Service Company, Inc. (FSC), an affiliate of the investment adviser, maintains the Fund's accounting records. The accounting fee is based on the level of average net assets for each month. Under a separate contract, FSC administers the security lending program. The security lending fee is based on the number and duration of lending transactions.
Interfund Trades. The Fund may purchase from or sell securities to other Fidelity Funds under procedures adopted by the Board. The procedures have been designed to ensure these interfund trades are executed in accordance with Rule 17a-7 of the 1940 Act. Interfund trades are included within the respective purchases and sales amounts shown in the Purchases and Sales of Investments note.
6. Committed Line of Credit.
The Fund participates with other funds managed by the investment adviser or an affiliate in a $4.25 billion credit facility (the "line of credit") to be utilized for temporary or emergency purposes to fund shareholder redemptions or for other short-term liquidity purposes. The Fund has agreed to pay commitment fees on its pro-rata portion of the line of credit, which amounted to $5,040 and is reflected in Miscellaneous expenses on the Statement of Operations. During the period, the Fund did not borrow on this line of credit.
7. Security Lending.
The Fund lends portfolio securities from time to time in order to earn additional income. On the settlement date of the loan, the Fund receives collateral (in the form of U.S. Treasury obligations, letters of credit and/or cash) against the loaned securities and maintains collateral in an amount not less than 100% of the market value of the loaned securities during the period of the loan. The market value of the loaned securities is determined at the close of business of the Fund and any additional required collateral is delivered to the Fund on the next business day. The Fund or borrower may terminate the loan at any time, and if the borrower defaults on its obligation to return the securities loaned because of insolvency or other reasons, the Fund may apply collateral received from the borrower against the obligation. The Fund may experience delays and costs in recovering the securities loaned. Any cash collateral received is maintained at the Fund's custodian and/or invested in cash equivalents. At period end, there were no security loans outstanding. Security lending income represents the income earned on investing cash collateral, less rebates paid to borrowers, plus any premium payments received for lending certain types of securities. Security lending income is presented in the Statement of Operations as a component of interest income. Total security lending income during the period amounted to $16,542.
8. Expense Reductions.
During the period the investment adviser reimbursed and/or waived a portion of operating expenses in the amount of $8,202.
9. Distributions to Shareholders.
Distributions to shareholders of each class were as follows:
| Years ended December 31, | 2015 | 2014 |
| From net investment income | | |
| Initial Class | $27,917,082 | $23,476,631 |
| Service Class | 13,896,003 | 9,308,715 |
| Service Class 2 | 29,321,568 | 21,500,125 |
| Investor Class | 20,784,307 | 16,358,718 |
| Total | $91,918,960 | $70,644,189 |
| From net realized gain | | |
| Initial Class | $853,091 | $396,937 |
| Service Class | 402,324 | 119,370 |
| Service Class 2 | 868,374 | 452,134 |
| Investor Class | 609,337 | 246,966 |
| Total | $2,733,126 | $1,215,407 |
10. Share Transactions.
Transactions for each class of shares were as follows:
| | Shares | Shares | Dollars | Dollars |
| Years ended December 31, | 2015 | 2014 | 2015 | 2014 |
| Initial Class | | | | |
| Shares sold | 14,124,329 | 14,887,162 | $181,300,197 | $191,382,664 |
| Reinvestment of distributions | 2,307,903 | 1,874,260 | 28,770,173 | 23,873,568 |
| Shares redeemed | (15,849,228) | (11,623,368) | (203,182,390) | (148,686,558) |
| Net increase (decrease) | 583,004 | 5,138,054 | $6,887,980 | $66,569,674 |
| Service Class | | | | |
| Shares sold | 16,473,822 | 15,305,544 | $209,904,413 | $196,687,350 |
| Reinvestment of distributions | 1,158,425 | 747,760 | 14,298,327 | 9,428,085 |
| Shares redeemed | (9,317,150) | (3,573,520) | (117,443,843) | (45,315,403) |
| Net increase (decrease) | 8,315,097 | 12,479,784 | $106,758,897 | $160,800,032 |
| Service Class 2 | | | | |
| Shares sold | 25,136,170 | 9,674,571 | $316,191,051 | $121,180,701 |
| Reinvestment of distributions | 2,475,925 | 1,762,226 | 30,189,942 | 21,952,259 |
| Shares redeemed | (15,972,221) | (17,157,102) | (199,946,110) | (214,534,274) |
| Net increase (decrease) | 11,639,874 | (5,720,305) | $146,434,883 | $(71,401,314) |
| Investor Class | | | | |
| Shares sold | 10,950,224 | 16,034,544 | $140,247,630 | $205,597,932 |
| Reinvestment of distributions | 1,721,835 | 1,307,748 | 21,393,644 | 16,605,684 |
| Shares redeemed | (7,902,704) | (5,058,062) | (100,860,266) | (64,278,831) |
| Net increase (decrease) | 4,769,355 | 12,284,230 | $60,781,008 | $157,924,785 |
11. Other.
The Fund's organizational documents provide former and current trustees and officers with a limited indemnification against liabilities arising in connection with the performance of their duties to the Fund. In the normal course of business, the Fund may also enter into contracts that provide general indemnifications. The Fund's maximum exposure under these arrangements is unknown as this would be dependent on future claims that may be made against the Fund. The risk of material loss from such claims is considered remote.
At the end of the period, the investment adviser or its affiliates were the owners of record of 23% of the total outstanding shares of the Fund and one otherwise unaffiliated shareholder was the owner of record of 20% of the total outstanding shares of the Fund.
VIP Investment Grade Bond Portfolio
Report of Independent Registered Public Accounting Firm
To the Trustees of Variable Insurance Products Fund V and Shareholders of VIP Investment Grade Bond Portfolio:
We have audited the accompanying statement of assets and liabilities of VIP Investment Grade Bond Portfolio (the Fund), a fund of Variable Insurance Products Fund V, including the schedule of investments, as of December 31, 2015, and the related statement of operations for the year then ended, the statement of changes in net assets for each of the two years in the period then ended, and the financial highlights for each of the five years in the period then ended. These financial statements and financial highlights are the responsibility of the Fund's management. Our responsibility is to express an opinion on these financial statements and financial highlights based on our audits.
We conducted our audits in accordance with the standards of the Public Company Accounting Oversight Board (United States). Those standards require that we plan and perform the audit to obtain reasonable assurance about whether the financial statements and financial highlights are free of material misstatement. The Fund is not required to have, nor were we engaged to perform, an audit of its internal control over financial reporting. Our audits included consideration of internal control over financial reporting as a basis for designing audit procedures that are appropriate in the circumstances, but not for the purpose of expressing an opinion on the effectiveness of the Fund's internal control over financial reporting. Accordingly, we express no such opinion. An audit also includes examining, on a test basis, evidence supporting the amounts and disclosures in the financial statements, assessing the accounting principles used and significant estimates made by management, as well as evaluating the overall financial statement presentation. Our procedures included confirmation of securities owned as of December 31, 2015, by correspondence with the custodians and brokers. We believe that our audits provide a reasonable basis for our opinion.
In our opinion, such financial statements and financial highlights referred to above present fairly, in all material respects, the financial position of VIP Investment Grade Bond Portfolio as of December 31, 2015, the results of its operations for the year then ended, the changes in its net assets for each of the two years in the period then ended, and the financial highlights for each of the five years in the period then ended in conformity with accounting principles generally accepted in the United States of America.
DELOITTE & TOUCHE LLP
Boston, Massachusetts
February 23, 2016
VIP Investment Grade Bond Portfolio
Trustees and Officers
The Trustees, Members of the Advisory Board (if any), and officers of the trust and fund, as applicable, are listed below. The Board of Trustees governs the fund and is responsible for protecting the interests of shareholders. The Trustees are experienced executives who meet periodically throughout the year to oversee the fund's activities, review contractual arrangements with companies that provide services to the fund, oversee management of the risks associated with such activities and contractual arrangements, and review the fund's performance. Except for Elizabeth S. Acton, John Engler, and Geoffrey A. von Kuhn, each of the Trustees oversees 236 funds. Ms. Acton and Mr. Engler each oversees 228 funds. Mr. von Kuhn oversees 148 funds.
The Trustees hold office without limit in time except that (a) any Trustee may resign; (b) any Trustee may be removed by written instrument, signed by at least two-thirds of the number of Trustees prior to such removal; (c) any Trustee who requests to be retired or who has become incapacitated by illness or injury may be retired by written instrument signed by a majority of the other Trustees; and (d) any Trustee may be removed at any special meeting of shareholders by a two-thirds vote of the outstanding voting securities of the trust. Each Trustee who is not an interested person (as defined in the 1940 Act) of the trust and the fund is referred to herein as an Independent Trustee. Each Independent Trustee shall retire not later than the last day of the calendar year in which his or her 75th birthday occurs. The Independent Trustees may waive this mandatory retirement age policy with respect to individual Trustees. Officers and Advisory Board Members hold office without limit in time, except that any officer or Advisory Board Member may resign or may be removed by a vote of a majority of the Trustees at any regular meeting or any special meeting of the Trustees. Except as indicated, each individual has held the office shown or other offices in the same company for the past five years.
The fund’s Statement of Additional Information (SAI) includes more information about the Trustees. To request a free copy, call Fidelity at 1-877-208-0098.
Experience, Skills, Attributes, and Qualifications of the Trustees. The Governance and Nominating Committee has adopted a statement of policy that describes the experience, qualifications, attributes, and skills that are necessary and desirable for potential Independent Trustee candidates (Statement of Policy). The Board believes that each Trustee satisfied at the time he or she was initially elected or appointed a Trustee, and continues to satisfy, the standards contemplated by the Statement of Policy. The Governance and Nominating Committee also engages professional search firms to help identify potential Independent Trustee candidates who have the experience, qualifications, attributes, and skills consistent with the Statement of Policy. From time to time, additional criteria based on the composition and skills of the current Independent Trustees, as well as experience or skills that may be appropriate in light of future changes to board composition, business conditions, and regulatory or other developments, have also been considered by the professional search firms and the Governance and Nominating Committee. In addition, the Board takes into account the Trustees' commitment and participation in Board and committee meetings, as well as their leadership of standing and ad hoc committees throughout their tenure.
In determining that a particular Trustee was and continues to be qualified to serve as a Trustee, the Board has considered a variety of criteria, none of which, in isolation, was controlling. The Board believes that, collectively, the Trustees have balanced and diverse experience, qualifications, attributes, and skills, which allow the Board to operate effectively in governing the fund and protecting the interests of shareholders. Information about the specific experience, skills, attributes, and qualifications of each Trustee, which in each case led to the Board's conclusion that the Trustee should serve (or continue to serve) as a trustee of the fund, is provided below.
Board Structure and Oversight Function. Abigail P. Johnson is an interested person and currently serves as Chairman. The Trustees have determined that an interested Chairman is appropriate and benefits shareholders because an interested Chairman has a personal and professional stake in the quality and continuity of services provided to the fund. Independent Trustees exercise their informed business judgment to appoint an individual of their choosing to serve as Chairman, regardless of whether the Trustee happens to be independent or a member of management. The Independent Trustees have determined that they can act independently and effectively without having an Independent Trustee serve as Chairman and that a key structural component for assuring that they are in a position to do so is for the Independent Trustees to constitute a substantial majority for the Board. The Independent Trustees also regularly meet in executive session. Marie L. Knowles serves as Chairman of the Independent Trustees and as such (i) acts as a liaison between the Independent Trustees and management with respect to matters important to the Independent Trustees and (ii) with management prepares agendas for Board meetings.
Fidelity® funds are overseen by different Boards of Trustees. The fund's Board oversees Fidelity's investment-grade bond, money market, asset allocation and certain equity funds, and other Boards oversee Fidelity's high income, sector and other equity funds. The asset allocation funds may invest in Fidelity® funds that are overseen by such other Boards. The use of separate Boards, each with its own committee structure, allows the Trustees of each group of Fidelity® funds to focus on the unique issues of the funds they oversee, including common research, investment, and operational issues. On occasion, the separate Boards establish joint committees to address issues of overlapping consequences for the Fidelity® funds overseen by each Board.
The Trustees operate using a system of committees to facilitate the timely and efficient consideration of all matters of importance to the Trustees, the fund, and fund shareholders and to facilitate compliance with legal and regulatory requirements and oversight of the fund's activities and associated risks. The Board, acting through its committees, has charged FMR and its affiliates with (i) identifying events or circumstances the occurrence of which could have demonstrably adverse effects on the fund's business and/or reputation; (ii) implementing processes and controls to lessen the possibility that such events or circumstances occur or to mitigate the effects of such events or circumstances if they do occur; and (iii) creating and maintaining a system designed to evaluate continuously business and market conditions in order to facilitate the identification and implementation processes described in (i) and (ii) above. Because the day-to-day operations and activities of the fund are carried out by or through FMR, its affiliates, and other service providers, the fund's exposure to risks is mitigated but not eliminated by the processes overseen by the Trustees. While each of the Board's committees has responsibility for overseeing different aspects of the fund's activities, oversight is exercised primarily through the Operations and Audit Committees. In addition, an ad hoc Board committee of Independent Trustees has worked with FMR to enhance the Board's oversight of investment and financial risks, legal and regulatory risks, technology risks, and operational risks, including the development of additional risk reporting to the Board. Appropriate personnel, including but not limited to the fund's Chief Compliance Officer (CCO), FMR's internal auditor, the independent accountants, the fund's Treasurer and portfolio management personnel, make periodic reports to the Board's committees, as appropriate, including an annual review of Fidelity's risk management program for the Fidelity® funds. The responsibilities of each standing committee, including their oversight responsibilities, are described further under "Standing Committees of the Trustees."
Interested Trustees*:
Correspondence intended for a Trustee who is an interested person may be sent to Fidelity Investments, 245 Summer Street, Boston, Massachusetts 02210.
Name, Year of Birth; Principal Occupations and Other Relevant Experience+
Abigail P. Johnson (1961)
Year of Election or Appointment: 2009
Trustee
Chairman of the Board of Trustees
Ms. Johnson also serves as Trustee of other Fidelity® funds. Ms. Johnson serves as President (2013-present) and Chief Executive Officer (2014-present) of FMR LLC (diversified financial services company), President of Fidelity Financial Services (2012-present) and President of Personal, Workplace and Institutional Services (2005-present). Ms. Johnson is Chairman and Director of FMR Co., Inc. (investment adviser firm, 2011-present), Chairman and Director of FMR (investment adviser firm, 2011-present), and the Vice Chairman and Director (2007-present) of FMR LLC. Previously, Ms. Johnson served as President and a Director of FMR (2001-2005), a Trustee of other investment companies advised by FMR, Fidelity Investments Money Management, Inc. (investment adviser firm), and FMR Co., Inc. (2001-2005), Senior Vice President of the Fidelity® funds (2001-2005), and managed a number of Fidelity® funds. Ms. Abigail P. Johnson and Mr. Arthur E. Johnson are not related.
Geoffrey A. von Kuhn (1951)
Year of Election or Appointment: 2015
Trustee
Mr. von Kuhn also serves as Trustee or Member of the Advisory Board of other Fidelity funds. Mr. von Kuhn is Chief Administrative Officer for FMR LLC (diversified financial services company, 2013-present), a Director of Pembroke Real Estate, Inc. (2009-present), and a Director of Discovery Natural Resources LLC (2012-present). Previously, Mr. von Kuhn was a managing director of Crosby Group (private wealth management company, 2007-2013), a member of the management committee and senior executive in the Wealth Management Group of AmSouth Bank (2001-2006), and head of the U.S. private bank at Citigroup (2000-2001).
* Determined to be an “Interested Trustee” by virtue of, among other things, his or her affiliation with the trust or various entities under common control with FMR.
+ The information includes the Trustee's principal occupation during the last five years and other information relating to the experience, attributes, and skills relevant to the Trustee's qualifications to serve as a Trustee, which led to the conclusion that the Trustee should serve as a Trustee for the fund.
Independent Trustees:
Correspondence intended for an Independent Trustee may be sent to Fidelity Investments, P.O. Box 55235, Boston, Massachusetts 02205-5235.
Name, Year of Birth; Principal Occupations and Other Relevant Experience+
Elizabeth S. Acton (1951)
Year of Election or Appointment: 2013
Trustee
Ms. Acton also serves as Trustee or Member of the Advisory Board of other Fidelity® funds. Prior to her retirement in April 2012, Ms. Acton was Executive Vice President, Finance (2011-2012), Executive Vice President, Chief Financial Officer (2002-2011), and Treasurer (2004-2005) of Comerica Incorporated (financial services). Prior to joining Comerica, Ms. Acton held a variety of positions at Ford Motor Company (1983-2002), including Vice President and Treasurer (2000-2002) and Executive Vice President and Chief Financial Officer of Ford Motor Credit Company (1998-2000). Ms. Acton currently serves as a member of the Board of Directors and Audit and Finance Committees of Beazer Homes USA, Inc. (homebuilding, 2012-present).
John Engler (1948)
Year of Election or Appointment: 2014
Trustee
Mr. Engler also serves as Trustee or Member of the Advisory Board of other Fidelity® funds. He serves as president of the Business Roundtable (2011-present), and on the board of directors/trustees for Universal Forest Products (manufacturer and distributor of wood and wood-alternative products, 2003-present) and K12 Inc. (technology-based education company, 2012-present). Previously, Mr. Engler served as a trustee of The Munder Funds (2003-2014), president and CEO of the National Association of Manufacturers (2004-2011), member of the Board of Trustees of the Annie E. Casey Foundation (2004-2015), and as governor of Michigan (1991-2003). He is a past chairman of the National Governors Association.
Albert R. Gamper, Jr. (1942)
Year of Election or Appointment: 2007
Trustee
Mr. Gamper also serves as Trustee of other Fidelity® funds. Prior to his retirement in December 2004, Mr. Gamper served as Chairman of the Board of CIT Group Inc. (commercial finance). During his tenure with CIT Group Inc. Mr. Gamper served in numerous senior management positions, including Chairman (1987-1989; 1999-2001; 2002-2004), Chief Executive Officer (1987-2004), and President (2002-2003). Mr. Gamper currently serves as a member of the Board of Directors of Public Service Enterprise Group (utilities, 2000-present), and Member of the Board of Trustees of Barnabas Health Care System (1997-present). Previously, Mr. Gamper served as Chairman (2012-2015) and Vice Chairman (2011-2012) of the Independent Trustees of certain Fidelity® funds and as Chairman of the Board of Governors, Rutgers University (2004-2007).
Robert F. Gartland (1951)
Year of Election or Appointment: 2010
Trustee
Mr. Gartland also serves as Trustee of other Fidelity® funds. Mr. Gartland is Chairman and an investor in Gartland and Mellina Group Corp. (consulting, 2009-present). Previously, Mr. Gartland served as a partner and investor of Vietnam Partners LLC (investments and consulting, 2008-2011). Prior to his retirement, Mr. Gartland held a variety of positions at Morgan Stanley (financial services, 1979-2007) including Managing Director (1987-2007).
Arthur E. Johnson (1947)
Year of Election or Appointment: 2008
Trustee
Vice Chairman of the Independent Trustees
Mr. Johnson also serves as Trustee of other Fidelity® funds. Mr. Johnson serves as a member of the Board of Directors of Eaton Corporation plc (diversified power management, 2009-present), AGL Resources, Inc. (holding company, 2002-present) and Booz Allen Hamilton (management consulting, 2011-present). Prior to his retirement, Mr. Johnson served as Senior Vice President of Corporate Strategic Development of Lockheed Martin Corporation (defense contractor, 1999-2009). He previously served on the Board of Directors of IKON Office Solutions, Inc. (1999-2008) and Delta Airlines (2005-2007). Mr. Arthur E. Johnson is not related to Ms. Abigail P. Johnson.
Michael E. Kenneally (1954)
Year of Election or Appointment: 2009
Trustee
Mr. Kenneally also serves as Trustee of other Fidelity® funds. Prior to his retirement, Mr. Kenneally served as Chairman and Global Chief Executive Officer of Credit Suisse Asset Management. Before joining Credit Suisse, he was an Executive Vice President and Chief Investment Officer for Bank of America Corporation. Earlier roles at Bank of America included Director of Research, Senior Portfolio Manager and Research Analyst, and Mr. Kenneally was awarded the Chartered Financial Analyst (CFA) designation in 1991.
James H. Keyes (1940)
Year of Election or Appointment: 2007
Trustee
Mr. Keyes also serves as Trustee of other Fidelity® funds. Mr. Keyes serves as a member of the Board and Non-Executive Chairman of Navistar International Corporation (manufacture and sale of trucks, buses, and diesel engines, since 2002). Previously, Mr. Keyes served as a member of the Board of Pitney Bowes, Inc. (integrated mail, messaging, and document management solutions, 1998-2013). Prior to his retirement, Mr. Keyes served as Chairman (1993-2002) and Chief Executive Officer (1988-2002) of Johnson Controls (automotive, building, and energy) and as a member of the Board of LSI Logic Corporation (semiconductor technologies, 1984-2008).
Marie L. Knowles (1946)
Year of Election or Appointment: 2001
Trustee
Chairman of the Independent Trustees
Ms. Knowles also serves as Trustee of other Fidelity® funds. Prior to Ms. Knowles' retirement in June 2000, she served as Executive Vice President and Chief Financial Officer of Atlantic Richfield Company (ARCO) (diversified energy, 1996-2000). From 1993 to 1996, she was a Senior Vice President of ARCO and President of ARCO Transportation Company (pipeline and tanker operations). Ms. Knowles currently serves as a Director and Chairman of the Audit Committee of McKesson Corporation (healthcare service, since 2002). Ms. Knowles is a member of the Board of the Santa Catalina Island Company (real estate, 2009-present). Ms. Knowles is a Member of the Investment Company Institute Board of Governors and a Member of the Governing Council of the Independent Directors Council (2014-present). She also serves as a member of the Advisory Board for the School of Engineering of the University of Southern California. Previously, Ms. Knowles served as a Director of Phelps Dodge Corporation (copper mining and manufacturing, 1994-2007), URS Corporation (engineering and construction, 2000-2003) and America West (airline, 1999-2002). Ms. Knowles previously served as Vice Chairman of the Independent Trustees of certain Fidelity® funds (2012-2015).
+ The information includes the Trustee's principal occupation during the last five years and other information relating to the experience, attributes, and skills relevant to the Trustee's qualifications to serve as a Trustee, which led to the conclusion that the Trustee should serve as a Trustee for the fund.
Advisory Board Members and Officers:
Correspondence intended for an officer may be sent to Fidelity Investments, 245 Summer Street, Boston, Massachusetts 02210. Officers appear below in alphabetical order.
Name, Year of Birth; Principal Occupation
Marc R. Bryant (1966)
Year of Election or Appointment: 2015
Secretary and Chief Legal Officer (CLO)
Mr. Bryant also serves as Secretary and CLO of other funds. Mr. Bryant serves as CLO, Secretary, and Senior Vice President of Fidelity Management & Research Company (investment adviser firm, 2015-present) and FMR Co., Inc. (investment adviser firm, 2015-present); Secretary of Fidelity SelectCo, LLC (investment adviser firm, 2015-present) and Fidelity Investments Money Management, Inc. (investment adviser firm, 2015-present); and CLO of Fidelity Management & Research (Hong Kong) Limited (investment adviser firm, 2015-present). He is Senior Vice President and Deputy General Counsel of FMR LLC (diversified financial services company). Previously, Mr. Bryant served as Secretary and CLO of Fidelity Rutland Square Trust II (2010-2014) and Assistant Secretary of Fidelity's Fixed Income and Asset Allocation Funds (2013-2015). Prior to joining Fidelity Investments, Mr. Bryant served as a Senior Vice President and the Head of Global Retail Legal for AllianceBernstein L.P. (2006-2010), and as the General Counsel for ProFund Advisors LLC (2001-2006).
Jonathan Davis (1968)
Year of Election or Appointment: 2010
Assistant Treasurer
Mr. Davis also serves as Assistant Treasurer of other funds, and is an employee of Fidelity Investments. Previously, Mr. Davis served as Vice President and Associate General Counsel of FMR LLC (diversified financial services company, 2003-2010).
Adrien E. Deberghes (1967)
Year of Election or Appointment: 2010
Assistant Treasurer
Mr. Deberghes also serves as an officer of other funds. He is an employee of Fidelity Investments (2008-present). Prior to joining Fidelity Investments, Mr. Deberghes was Senior Vice President of Mutual Fund Administration at State Street Corporation (2007-2008), Senior Director of Mutual Fund Administration at Investors Bank & Trust (2005-2007), and Director of Finance for Dunkin' Brands (2000-2005).
Stephanie J. Dorsey (1969)
Year of Election or Appointment: 2013
President and Treasurer
Ms. Dorsey also serves as an officer of other funds. She is an employee of Fidelity Investments (2008-present) and has served in other fund officer roles. Prior to joining Fidelity Investments, Ms. Dorsey served as Treasurer (2004-2008) of the JPMorgan Mutual Funds and Vice President (2004-2008) of JPMorgan Chase Bank.
Howard J. Galligan III (1966)
Year of Election or Appointment: 2014
Chief Financial Officer
Mr. Galligan also serves as Chief Financial Officer of other funds. Mr. Galligan serves as President of Fidelity Pricing and Cash Management Services (FPCMS) (2014-present) and as a Director of Strategic Advisers, Inc. (investment adviser firm, 2008-present). Previously, Mr. Galligan served as Chief Administrative Officer of Asset Management (2011-2014) and Chief Operating Officer and Senior Vice President of Investment Support for Strategic Advisers, Inc. (2003-2011).
Scott C. Goebel (1968)
Year of Election or Appointment: 2015
Vice President
Mr. Goebel serves as Vice President of other funds and is an employee of Fidelity Investments (2001-present). Previously, Mr. Goebel served as Secretary of Fidelity SelectCo, LLC (investment adviser firm, 2013-2015), Fidelity Investments Money Management, Inc. (FIMM) (investment adviser firm, 2010-2015), and Fidelity Research and Analysis Company (FRAC) (investment adviser firm, 2010-2015); General Counsel, Secretary, and Senior Vice President of Fidelity Management & Research Company (investment adviser firm, 2008-2015) and FMR Co., Inc. (investment adviser firm, 2008-2015); Assistant Secretary of Fidelity Management & Research (Japan) Limited (investment adviser firm, 2008-2015) and FMR Investment Management (U.K.) Limited (investment adviser firm, 2008-2015); Chief Legal Officer (CLO) of Fidelity Management & Research (Hong Kong) Limited (investment adviser firm, 2008-2015); Secretary and CLO of certain Fidelity® funds (2008-2015); Assistant Secretary of FIMM (2008-2010), FRAC (2008-2010), and certain funds (2007-2008); and as Vice President and Secretary of Fidelity Distributors Corporation (FDC) (2005-2007).
Chris Maher (1972)
Year of Election or Appointment: 2013
Assistant Treasurer
Mr. Maher serves as Assistant Treasurer of other funds. Mr. Maher is Vice President of Valuation Oversight and is an employee of Fidelity Investments. Previously, Mr. Maher served as Vice President of Asset Management Compliance (2013), Vice President of the Program Management Group of FMR (investment adviser firm, 2010-2013), and Vice President of Valuation Oversight (2008-2010).
John F. Papandrea (1972)
Year of Election or Appointment: 2016
Anti-Money Laundering (AML) Officer
Mr. Papandrea also serves as AML Officer of other funds. Mr. Papandrea is Vice President of FMR LLC (diversified financial services company, 2008-present) and is an employee of Fidelity Investments (2005-present).
Jason P. Pogorelec (1975)
Year of Election or Appointment: 2015
Assistant Secretary
Mr. Pogorelec also serves as Assistant Secretary of other funds. Mr. Pogorelec serves as Vice President, Associate General Counsel (2010-present) and is an employee of Fidelity Investments (2006-present).
Nancy D. Prior (1967)
Year of Election or Appointment: 2014
Vice President
Ms. Prior also serves as Vice President of other funds. Ms. Prior serves as a Director of Fidelity Investments Money Management, Inc. (FIMM) (investment adviser firm, 2014-present), President, Fixed Income (2014-present), Vice Chairman of FIAM LLC (investment adviser firm, 2014-present), and is an employee of Fidelity Investments (2002-present). Previously, Ms. Prior served as Vice President of Fidelity's Money Market Funds (2012-2014), President, Money Market and Short Duration Bond Group of Fidelity Management & Research (FMR) (investment adviser firm, 2013-2014), President, Money Market Group of FMR (2011-2013), Managing Director of Research (2009-2011), Senior Vice President and Deputy General Counsel (2007-2009), and Assistant Secretary of other Fidelity® funds (2008-2009).
Kenneth B. Robins (1969)
Year of Election or Appointment: 2009
Assistant Treasurer
Mr. Robins also serves as an officer of other funds. Mr. Robins serves as Executive Vice President of Fidelity Investments Money Management, Inc. (FIMM) (investment adviser firm, 2013-present) and is an employee of Fidelity Investments (2004-present). Previously, Mr. Robins served in other fund officer roles.
Stacie M. Smith (1974)
Year of Election or Appointment: 2013
Assistant Treasurer
Ms. Smith also serves as an officer of other funds. She is an employee of Fidelity Investments (2009-present) and has served in other fund officer roles. Prior to joining Fidelity Investments, Ms. Smith served as Senior Audit Manager of Ernst & Young LLP (1996-2009).
Renee Stagnone (1975)
Year of Election or Appointment: 2013
Deputy Treasurer
Ms. Stagnone also serves as Deputy Treasurer of other funds. Ms. Stagnone is an employee of Fidelity Investments (1997-present).
Christine J. Thompson (1958)
Year of Election or Appointment: 2015
Vice President of Fidelity's Bond Funds
Ms. Thompson also serves as Vice President of other funds. Ms. Thompson also serves as Chief Investment Officer of FMR's Bond Group (2010-present) and is an employee of Fidelity Investments (1985-present). Previously, Ms. Thompson served as Vice President of Fidelity's Bond Funds (2010-2012).
Michael H. Whitaker (1967)
Year of Election or Appointment: 2008
Chief Compliance Officer
Mr. Whitaker also serves as Chief Compliance Officer of other funds. Mr. Whitaker also serves as Compliance Officer of FMR Co., Inc. (investment adviser firm, 2014-present), FMR (investment adviser firm, 2014-present), and Fidelity Investments Money Management, Inc. (investment adviser firm, 2014-present) and is an employee of Fidelity Investments (2007-present). Prior to joining Fidelity Investments, Mr. Whitaker worked at MFS Investment Management where he served as Senior Vice President and Chief Compliance Officer (2004-2006), and Assistant General Counsel.
Joseph F. Zambello (1957)
Year of Election or Appointment: 2011
Deputy Treasurer
Mr. Zambello also serves as Deputy Treasurer of other funds. Mr. Zambello is an employee of Fidelity Investments (1991-present). Previously, Mr. Zambello served as Vice President of the Program Management Group of FMR (investment adviser firm, 2009-2011) and Vice President of the Transfer Agent Oversight Group (2005-2009).
VIP Investment Grade Bond Portfolio
Shareholder Expense Example
As a shareholder of the Fund, you incur two types of costs: (1) transaction costs and (2) ongoing costs, including other Fund expenses. This Example is intended to help you understand your ongoing costs (in dollars) of investing in the Fund and to compare these costs with the ongoing costs of investing in other mutual funds.
The Example is based on an investment of $1,000 invested at the beginning of the period and held for the entire period (July 1, 2015 to December 31, 2015).
Actual Expenses
The first line of the accompanying table for each class of the Fund provides information about actual account values and actual expenses. You may use the information in this line, together with the amount you invested, to estimate the expenses that you paid over the period. Simply divide your account value by $1,000.00 (for example, an $8,600 account value divided by $1,000.00 = 8.6), then multiply the result by the number in the first line for a class of the Fund under the heading entitled "Expenses Paid During Period" to estimate the expenses you paid on your account during this period. The estimate of expenses does not include any fees or other expenses of any variable annuity or variable life insurance product. If they were, the estimate of expenses you paid during the period would be higher, and your ending account value would be lower. In addition, the Fund, as a shareholder in the underlying Fidelity Central Funds, will indirectly bear its pro-rata share of the fees and expenses incurred by the underlying Fidelity Central Funds. These fees and expenses are not included in the Fund's annualized expense ratio used to calculate the expense estimate in the table below.
Hypothetical Example for Comparison Purposes
The second line of the accompanying table for each class of the Fund provides information about hypothetical account values and hypothetical expenses based on a Class' actual expense ratio and an assumed rate of return of 5% per year before expenses, which is not the Class' actual return. The hypothetical account values and expenses may not be used to estimate the actual ending account balance or expenses you paid for the period. You may use this information to compare the ongoing costs of investing in the Fund and other funds. To do so, compare this 5% hypothetical example with the 5% hypothetical examples that appear in the shareholder reports of the other funds. The estimate of expenses does not include any fees or other expenses of any variable annuity or variable life insurance product. If they were, the estimate of expenses you paid during the period would be higher, and your ending account value would be lower. In addition, the Fund, as a shareholder in the underlying Fidelity Central Funds, will indirectly bear its pro-rata share of the fees and expenses incurred by the underlying Fidelity Central Funds. These fees and expenses are not included in the Fund's annualized expense ratio used to calculate the expense estimate in the table below.
Please note that the expenses shown in the table are meant to highlight your ongoing costs only and do not reflect any transaction costs. Therefore, the second line of the table is useful in comparing ongoing costs only, and will not help you determine the relative total costs of owning different funds.
| | Annualized Expense Ratio--A,B- | Beginning
Account Value
July 1, 2015 | Ending
Account Value
December 31, 2015 | Expenses Paid
During Period-C
July 1, 2015
to December 31, 2015 |
| Initial Class | .41% | | | |
| Actual | | $1,000.00 | $994.00 | $2.06 |
| Hypothetical-D | | $1,000.00 | $1,023.14 | $2.09 |
| Service Class | .51% | | | |
| Actual | | $1,000.00 | $993.70 | $2.56 |
| Hypothetical-D | | $1,000.00 | $1,022.63 | $2.60 |
| Service Class 2 | .66% | | | |
| Actual | | $1,000.00 | $993.10 | $3.32 |
| Hypothetical-D | | $1,000.00 | $1,021.88 | $3.36 |
| Investor Class | .44% | | | |
| Actual | | $1,000.00 | $993.60 | $2.21 |
| Hypothetical-D | | $1,000.00 | $1,022.99 | $2.24 |
A Annualized expense ratio reflects expenses net of applicable fee waivers.
B In addition to the expenses noted above, the Fund also indirectly bears its proportional share of the expenses of the underlying Fidelity Central Funds. Annualized expenses of the underlying non-money market Fidelity Central Funds as of their most recent fiscal half year were less than .005%.
C Expenses are equal to each Class' annualized expense ratio, multiplied by the average account value over the period, multiplied by 184/365 (to reflect the one-half year period). The fees and expenses of the underlying Fidelity Central Funds in which the Fund invests are not included in each Class' annualized expense ratio.
D 5% return per year before expenses
VIP Investment Grade Bond Portfolio
Distributions (Unaudited)
The Board of Trustees of VIP Investment Grade Bond Portfolio voted to pay to shareholders of record at the opening of business on record date, the following distributions per share derived from capital gains realized from sales of portfolio securities, and dividends derived from net investment income:
| | Pay Date | Record Date | Dividends | Capital Gains |
| Initial Class | 02/12/16 | 02/12/16 | $0.007 | $0.006 |
| | | | | |
| Service Class | 02/12/16 | 02/12/16 | $0.007 | $0.006 |
| | | | | |
| Service Class 2 | 02/12/16 | 02/12/16 | $0.007 | $0.006 |
| | | | | |
| Investor Class | 02/12/16 | 02/12/16 | $0.007 | $0.006 |
| | | | | |
A total of 6.9853% of the dividends distributed during the fiscal year was derived from interest on U.S. Government securities which is generally exempt from state income tax.
Board Approval of Investment Advisory Contracts and Management Fees
VIP Investment Grade Bond Portfolio
Each year, the Board of Trustees, including the Independent Trustees (together, the Board), votes on the renewal of the management contract with Fidelity Management & Research Company (FMR) and the sub-advisory agreements (together, the Advisory Contracts) for the fund. The Board, assisted by the advice of fund counsel and Independent Trustees' counsel, requests and considers a broad range of information relevant to the renewal of the Advisory Contracts throughout the year.
The Board meets regularly and, at each of its meetings, covers an extensive agenda of topics and materials and considers factors that are relevant to its annual consideration of the renewal of the fund's Advisory Contracts, including the services and support provided to the fund and its shareholders. The Board has established four standing committees (Committees) — Operations, Audit, Fair Valuation, and Governance and Nominating — each composed of and chaired by Independent Trustees with varying backgrounds, to which the Board has assigned specific subject matter responsibilities in order to enhance effective decision-making by the Board. The Operations Committee, of which all of the Independent Trustees are members, meets regularly throughout the year and considers, among other matters, information specifically related to the annual consideration of the renewal of the fund's Advisory Contracts. The Board, acting directly and through its Committees, requests and receives information concerning the annual consideration of the renewal of the fund's Advisory Contracts. The Board also meets as needed to consider matters specifically related to the Board's annual consideration of the renewal of the Advisory Contracts. Members of the Board may also meet with trustees of other Fidelity funds through ad hoc joint committees to discuss certain matters relevant to all of the Fidelity funds.
At its September 2015 meeting, the Board unanimously determined to renew the fund's Advisory Contracts. In reaching its determination, the Board considered all factors it believed relevant, including (i) the nature, extent, and quality of the services to be provided to the fund and its shareholders (including the investment performance of the fund); (ii) the competitiveness of the fund's management fee and total expense ratio relative to peer funds; (iii) the total costs of the services to be provided by and the profits to be realized by Fidelity from its relationship with the fund; and (iv) the extent to which (if any) economies of scale exist and would be realized as the fund grows, and whether any economies of scale are appropriately shared with fund shareholders.
In considering whether to renew the Advisory Contracts for the fund, the Board reached a determination, with the assistance of fund counsel and Independent Trustees' counsel and through the exercise of its business judgment, that the renewal of the Advisory Contracts was in the best interests of the fund and its shareholders and that the compensation payable under the Advisory Contracts was fair and reasonable. The Board's decision to renew the Advisory Contracts was not based on any single factor, but rather was based on a comprehensive consideration of all the information provided to the Board at its meetings throughout the year. The Board, in reaching its determination to renew the Advisory Contracts, was aware that shareholders of the fund have a broad range of investment choices available to them, including a wide choice among funds offered by Fidelity's competitors, and that the fund's shareholders, who have the opportunity to review and weigh the disclosure provided by the fund in its prospectus and other public disclosures, have chosen to invest in this fund, which is part of the Fidelity family of funds.
Nature, Extent, and Quality of Services Provided. The Board considered Fidelity's staffing as it relates to the fund, including the backgrounds of investment personnel of Fidelity, and also considered the fund's investment objective, strategies, and related investment philosophy. The Independent Trustees also had discussions with senior management of Fidelity's investment operations and investment groups. The Board considered the structure of the portfolio manager compensation program and whether this structure provides appropriate incentives to act in the best interests of the fund. Additionally, the Board considered the portfolio managers' investments, if any, in the funds that they manage.
Resources Dedicated to Investment Management and Support Services. The Board reviewed the general qualifications and capabilities of Fidelity's investment staff, including its size, education, experience, and resources, as well as Fidelity's approach to recruiting, training, managing, and compensating investment personnel. The Board noted that Fidelity has continued to increase the resources devoted to non-U.S. offices, including expansion of Fidelity's global investment organization. The Board also noted that Fidelity's analysts have extensive resources, tools and capabilities that allow them to conduct sophisticated quantitative and fundamental analysis, as well as credit analysis of issuers, counterparties and guarantors. Further, the Board considered that Fidelity's investment professionals have sufficient access to global information and data so as to provide competitive investment results over time, and that those professionals also have access to sophisticated tools that permit them to assess portfolio construction and risk and performance attribution characteristics continuously, as well as to transmit new information and research conclusions rapidly around the world. Additionally, in its deliberations, the Board considered Fidelity's trading, risk management, compliance, and technology and operations capabilities and resources, which are integral parts of the investment management process.
Shareholder and Administrative Services. The Board considered (i) the nature, extent, quality, and cost of advisory, administrative, and shareholder services performed by FMR, the sub-advisers (together with FMR, the Investment Advisers), and their affiliates under the Advisory Contracts and under separate agreements covering transfer agency, pricing and bookkeeping, and securities lending services for the fund; (ii) the nature and extent of the supervision of third party service providers, principally custodians, subcustodians, and pricing vendors; and (iii) the resources devoted to, and the record of compliance with, the fund's compliance policies and procedures.
The Board noted that the growth of fund assets over time across the complex allows Fidelity to reinvest in the development of services designed to enhance the value or convenience of the Fidelity funds as investment vehicles. These services include 24-hour access to account information and market information through telephone representatives and over the Internet, investor education materials and asset allocation tools, and the expanded availability of Fidelity Investor Centers.
Investment in a Large Fund Family. The Board considered the benefits to shareholders of investing in a Fidelity fund, including the benefits of investing in a fund that is part of a large family of funds offering a variety of investment disciplines and providing a large variety of mutual fund investor services. The Board noted that Fidelity had taken, or had made recommendations that resulted in the Fidelity funds taking, a number of actions over the previous year that benefited particular funds, including (i) continuing to dedicate additional resources to investment research and to the support of the senior management team that oversees asset management; (ii) continuing efforts to enhance Fidelity's global research capabilities; (iii) launching new funds and making other enhancements to meet client needs; (iv) reducing management fees and total expenses for certain index funds and diversified international funds; (v) continuing to launch dedicated lower cost underlying funds to meet portfolio construction needs related to expanding underlying fund options for Fidelity funds of funds, specifically for the Freedom Fund product lines; (vi) rationalizing product lines and gaining increased efficiencies through fund mergers; (vii) launching active fixed-income exchange-traded funds; (viii) continuing to develop, acquire and implement systems and technology to improve services to the funds and shareholders, strengthen information security, and increase efficiency; (ix) implementing investment enhancements to further strengthen Fidelity's target date product line to increase investors' probability of success in achieving their goals; (x) modifying the eligibility criteria for certain share classes to accommodate roll-over assets from employer-sponsored retirement plans; (xi) launching a new Class W of the Freedom Index Funds to attract and retain Fidelity record-kept retirement plan assets; and (xii) implementing changes to Fidelity's money market product line in response to recent money market regulatory reforms.
Investment Performance. The Board considered whether the fund has operated in accordance with its investment objective, as well as its record of compliance with its investment restrictions and its performance history. The Board noted that there was a portfolio management change for the fund in January 2015.
The Board took into account discussions with representatives of the Investment Advisers about fund investment performance that occur at Board meetings throughout the year. In this regard the Board noted that as part of regularly scheduled fund reviews and other reports to the Board on fund performance, the Board considers annualized return information for the fund for different time periods, measured against a securities market index ("benchmark index") and a peer group of funds with similar objectives ("peer group"), if any. In its evaluation of fund investment performance at meetings throughout the year, the Board gave particular attention to information indicating underperformance of certain Fidelity funds for specific time periods and discussed with the Investment Advisers the reasons for such underperformance.
In addition to reviewing absolute and relative fund performance, the Independent Trustees periodically consider the appropriateness of fund performance metrics in evaluating the results achieved. In general, the Independent Trustees believe that fund performance should be evaluated based on gross performance (before fees and expenses but after transaction costs) compared to appropriate benchmark indices, over appropriate time periods that may include full market cycles, and on net performance (after fees and expenses) compared to peer groups, as applicable, over the same periods, taking into account relevant factors including the following: general market conditions; expectations for interest rate levels and credit conditions; issuer-specific information including credit quality; the potential for incremental return versus the fund's benchmark index weighed against the risks involved in obtaining that incremental return, including the risk of diminished or negative total returns; and fund cash flows and other factors. Depending on the circumstances, the Independent Trustees may be satisfied with a fund's performance notwithstanding that it lags its benchmark index or peer group for certain periods.
The Independent Trustees recognize that shareholders evaluate performance on a net basis over their own holding periods, for which one-, three-, and five-year periods are often used as a proxy. For this reason, the performance information reviewed by the Board also included net cumulative calendar year total return information for the fund and an appropriate benchmark index and peer group for the most recent one-, three-, and five-year periods.
Based on its review, the Board concluded that the nature, extent, and quality of services provided to the fund under the Advisory Contracts should benefit the shareholders of the fund.
Competitiveness of Management Fee and Total Expense Ratio. The Board considered the fund's management fee and total expense ratio compared to "mapped groups" of competitive funds and classes created for the purpose of facilitating the Trustees' competitive analysis of management fees and total expenses. Fidelity creates "mapped groups" by combining similar Lipper investment objective categories that have comparable investment mandates. Combining Lipper investment objective categories aids the Board's management fee and total expense ratio comparisons by broadening the competitive group used for comparison.
Management Fee. The Board considered two proprietary management fee comparisons for the 12-month periods shown in basis points (BP) in the chart below. The group of Lipper funds used by the Board for management fee comparisons is referred to below as the "Total Mapped Group" and, for the reasons explained above, is broader than the Lipper peer group used by the Board for performance comparisons. The Total Mapped Group comparison focuses on a fund's standing in terms of gross management fees before expense reimbursements or caps relative to the total universe of funds with comparable investment mandates, regardless of whether their management fee structures also are comparable. Funds with comparable investment mandates offer exposure to similar types of securities. Funds with comparable management fee structures have similar management fee contractual arrangements (
e.g., flat rate charged for advisory services, all-inclusive fee rate,
etc.). "TMG %" represents the percentage of funds in the Total Mapped Group that had management fees that were lower than the fund's. For example, a hypothetical TMG % of 20% would mean that 80% of the funds in the Total Mapped Group had higher, and 20% had lower, management fees than the fund. The fund's actual TMG %s and the number of funds in the Total Mapped Group are in the chart below. The "Asset-Size Peer Group" (ASPG) comparison focuses on a fund's standing relative to a subset of non-Fidelity funds within the Total Mapped Group that are similar in size and management fee structure. For example, if a fund is in the first quartile of the ASPG, the fund's management fee ranks in the least expensive or lowest 25% of funds in the ASPG. The ASPG represents at least 15% of the funds in the Total Mapped Group with comparable asset size and management fee structures, subject to a minimum of 50 funds (or all funds in the Total Mapped Group if fewer than 50). Additional information, such as the ASPG quartile in which the fund's management fee rate ranked, is also included in the chart and considered by the Board.
VIP Investment Grade Bond Portfolio
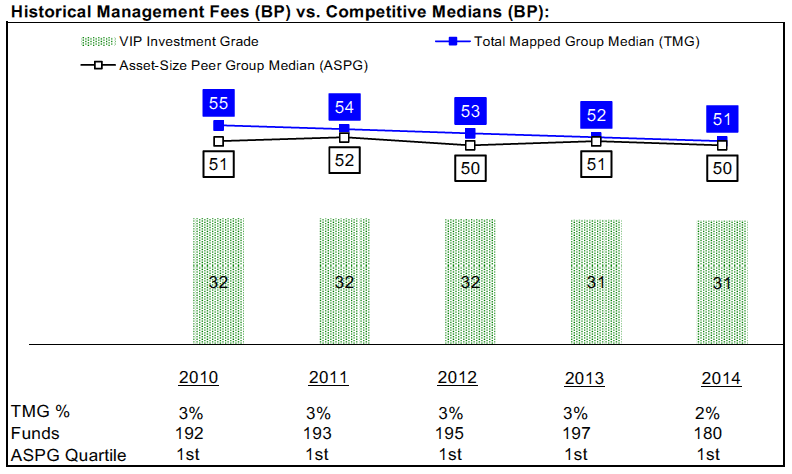
The Board noted that the fund's management fee rate ranked below the median of its Total Mapped Group and below the median of its ASPG for 2014.
The Board noted that, in 2014, the ad hoc Committee on Group Fee was formed by it and other Fidelity fund boards to conduct an in-depth review of the "group fee" component of the management fee of funds with such management fee structures. Committee focus included the mechanics of the group fee, the competitive landscape of group fee structures, Fidelity funds with no group fee component and investment products not included in group fee assets. The Board also considered that, for funds subject to the group fee, FMR agreed to voluntarily waive fees over a specified period of time in amounts designed to account for assets converted from certain funds to certain collective investment trusts.
Based on its review, the Board concluded that the fund's management fee is fair and reasonable in light of the services that the fund receives and the other factors considered.
Total Expense Ratio. In its review of each class's total expense ratio, the Board considered the fund's management fee rate as well as other fund or class expenses, as applicable, such as transfer agent fees, pricing and bookkeeping fees, fund-paid 12b-1 fees, and custodial, legal, and audit fees. The Board also noted that Fidelity may agree to waive fees and expenses from time to time, and the extent to which, if any, it has done so for the fund. As part of its review, the Board also considered the current and historical total expense ratios of each class of the fund compared to competitive fund median expenses. Each class of the fund is compared to those funds and classes in the Total Mapped Group (used by the Board for management fee comparisons) that have a similar sales load structure.
The Board noted that the total expense ratio of each class ranked below its competitive median for 2014.
Fees Charged to Other Fidelity Clients. The Board also considered Fidelity fee structures and other information with respect to clients of Fidelity, such as other funds advised or subadvised by Fidelity, pension plan clients, and other institutional clients with similar mandates. The Board noted the findings of the 2013 ad hoc joint committee (created with the board of other Fidelity funds), which reviewed and compared Fidelity's institutional investment advisory business with its business of providing services to the Fidelity funds, including the differences in services provided, fees charged, and costs incurred, as well as competition in their respective marketplaces.
Based on its review of total expense ratios and fees charged to other Fidelity clients, the Board concluded that the total expense ratio of each class of the fund was reasonable in light of the services that the fund and its shareholders receive and the other factors considered.
Costs of the Services and Profitability. The Board considered the revenues earned and the expenses incurred by Fidelity in conducting the business of developing, marketing, distributing, managing, administering and servicing the fund and servicing the fund's shareholders. The Board also considered the level of Fidelity's profits in respect of all the Fidelity funds.
On an annual basis, Fidelity presents to the Board information about the profitability of its relationship with the fund. Fidelity calculates profitability information for each fund, as well as aggregate profitability information for groups of Fidelity funds and all Fidelity funds, using a series of detailed revenue and cost allocation methodologies which originate with the books and records of Fidelity on which Fidelity's audited financial statements are based. The Audit Committee of the Board reviews any significant changes from the prior year's methodologies.
PricewaterhouseCoopers LLP (PwC), independent registered public accounting firm and auditor to Fidelity and certain Fidelity funds, has been engaged annually by the Board as part of the Board's assessment of Fidelity's profitability analysis. PwC's engagement includes the review and assessment of the methodologies used by Fidelity in determining the revenues and expenses attributable to Fidelity's mutual fund business, and completion of agreed-upon procedures in respect of the mathematical accuracy of fund profitability and its conformity to established allocation methodologies. After considering PwC's reports issued under the engagement and information provided by Fidelity, the Board concluded that while other allocation methods may also be reasonable, Fidelity's profitability methodologies are reasonable in all material respects.
The Board also reviewed Fidelity's non-fund businesses and fall-out benefits related to the mutual fund business as well as cases where Fidelity's affiliates may benefit from or be related to the fund's business.
The Board considered the costs of the services provided by and the profits realized by Fidelity in connection with the operation of the fund and was satisfied that the profitability was not excessive.
Economies of Scale. The Board considered whether there have been economies of scale in respect of the management of the Fidelity funds, whether the Fidelity funds (including the fund) have appropriately benefited from any such economies of scale, and whether there is potential for realization of any further economies of scale. The Board considered the extent to which the fund will benefit from economies of scale as assets grow through increased services to the fund, through waivers or reimbursements, or through fee or expense ratio reductions. The Board also noted that in 2013, it and the boards of other Fidelity funds created an ad hoc committee (the Economies of Scale Committee) to analyze whether Fidelity attains economies of scale in respect of the management and servicing of the Fidelity funds, whether the Fidelity funds have appropriately benefited from such economies of scale, and whether there is potential for realization of any further economies of scale.
The Board recognized that the fund's management contract incorporates a "group fee" structure, which provides for lower group fee rates as total group assets increase, and for higher group fee rates as total group assets decrease (with "group assets" defined to include fund assets under FMR's management plus sector fund assets previously under FMR's management and currently managed by Fidelity SelectCo, LLC). FMR calculates the group fee rates based on a tiered asset "breakpoint" schedule that varies based on asset class. The Board considered that the group fee is designed to deliver the benefits of economies of scale to fund shareholders when total Fidelity fund assets increase, even if assets of any particular fund are unchanged or have declined, because some portion of Fidelity's costs are attributable to services provided to all Fidelity funds, and all funds benefit if those costs can be allocated among more assets. The Board concluded that, given the group fee structure, fund shareholders will benefit from lower management fees as group assets increase at the fund complex level, regardless of whether Fidelity achieves any such economies of scale.
The Board concluded, taking into account the analysis of the Economies of Scale Committee, that economies of scale, if any, are being appropriately shared between fund shareholders and Fidelity.
Additional Information Requested by the Board. In order to develop fully the factual basis for consideration of the Fidelity funds' Advisory Contracts, the Board requested and received additional information on certain topics, including: (i) Fidelity's fund profitability methodology, profitability trends for certain funds, and the impact of certain factors on fund profitability results; (ii) portfolio manager changes that have occurred during the past year and the amount of the investment that each portfolio manager has made in the Fidelity fund(s) that he or she manages; (iii) Fidelity's compensation structure for portfolio managers, research analysts, and other key personnel, including its effects on fund profitability, the rationale for the compensation structure, and the extent to which current market conditions have affected retention and recruitment; (iv) the arrangements with and compensation paid to certain fund sub-advisers on behalf of the Fidelity funds; (v) Fidelity's voluntary waiver of its fees to maintain minimum yields for certain money market funds and classes as well as contractual waivers in place for certain funds; (vi) the methodology with respect to competitive fund data and peer group classifications; (vii) Fidelity's transfer agent fee, expense, and service structures for different funds and classes relative to competitive trends, and the impact of the increased use of omnibus accounts; (viii) Fidelity's long-term expectations for its offerings in the workplace investing channel; (ix) new developments in the retail and institutional marketplaces; and (x) the impact of money market reform on Fidelity's money market funds. In addition, the Board considered its discussions with Fidelity throughout the year regarding enhanced information security initiatives and the funds' fair valuation policies.
Based on its evaluation of all of the conclusions noted above, and after considering all factors it believed relevant, the Board concluded that the advisory fee structures are fair and reasonable, and that the fund's Advisory Contracts should be renewed.
VIP Investment Grade Bond Portfolio
Proxy Voting Results
A special meeting of shareholders was held on May 12, 2015. The results of votes taken among shareholders on the proposal before them are reported below. Each vote reported represents one dollar of net asset value held on the record date for the meeting.
PROPOSAL 1
To elect a Board of Trustees.
| | # of
Votes | % of
Votes |
| Elizabeth S. Acton | | |
| Affirmative | 24,469,831,790.28 | 97.003 |
| Withheld | 756,086,184.43 | 2.997 |
| TOTAL | 25,225,917,974.71 | 100.000 |
| John Engler | | |
| Affirmative | 24,404,438,415.74 | 96.744 |
| Withheld | 821,479,558.97 | 3.256 |
| TOTAL | 25,225,917,974.71 | 100.000 |
| Albert R. Gamper, Jr. | | |
| Affirmative | 24,431,670,090.08 | 96.852 |
| Withheld | 794,247,884.63 | 3.148 |
| TOTAL | 25,225,917,974.71 | 100.000 |
| Robert F. Gartland | | |
| Affirmative | 24,472,637,370.54 | 97.014 |
| Withheld | 753,280,604.17 | 2.986 |
| TOTAL | 25,225,917,974.71 | 100.000 |
| Abigail P. Johnson | | |
| Affirmative | 24,442,024,432.82 | 96.893 |
| Withheld | 783,893,541.89 | 3.107 |
| TOTAL | 25,225,917,974.71 | 100.000 |
| Arthur E. Johnson | | |
| Affirmative | 24,444,583,833.78 | 96.903 |
| Withheld | 781,334,140.93 | 3.097 |
| TOTAL | 25,225,917,974.71 | 100.000 |
| Michael E. Kenneally | | |
| Affirmative | 24,475,874,452.78 | 97.027 |
| Withheld | 750,043,521.93 | 2.973 |
| TOTAL | 25,225,917,974.71 | 100.000 |
| James H. Keyes | | |
| Affirmative | 24,434,496,321.71 | 96.863 |
| Withheld | 791,421,653.00 | 3.137 |
| TOTAL | 25,225,917,974.71 | 100.000 |
| Marie L. Knowles | | |
| Affirmative | 24,446,177,909.79 | 96.909 |
| Withheld | 779,740,064.92 | 3.091 |
| TOTAL | 25,225,917,974.71 | 100.000 |
| Geoffrey A. von Kuhn | | |
| Affirmative | 24,444,403,935.60 | 96.902 |
| Withheld | 781,514,039.11 | 3.098 |
| TOTAL | 25,225,917,974.71 | 100.000 |
| Proposal 1 reflects trust wide proposal and voting results. |
The following are the financial statements for the Fidelity® VIP Investment Grade Central Fund as of December 31, 2015 which is a direct investment of VIP Investment Grade Bond Portfolio.
Fidelity® VIP Investment Grade Central Fund
Performance: The Bottom Line
Average annual total return reflects the change in the value of an investment, assuming reinvestment of distributions from dividend income and capital gains (the profits earned upon the sale of securities that have grown in value, if any) and assuming a constant rate of performance each year. The hypothetical investment and the average annual total returns do not reflect the deduction of taxes that a shareholder would pay on fund distributions or the redemption of fund shares. During periods of reimbursement by Fidelity, a fund’s total return will be greater than it would be had the reimbursement not occurred. How a fund did yesterday is no guarantee of how it will do tomorrow.
Average Annual Total Returns
| For the periods ended December 31, 2015 | Past 1 year | Past 5 years | Life of fundA |
| Fidelity VIP Investment Grade Central Fund | 0.18% | 3.78% | 5.30% |
A From June 23, 2006
$10,000 Over Life of Fund
Let's say hypothetically that $10,000 was invested in Fidelity® VIP Investment Grade Central Fund on June 23, 2006, when the fund started.
The chart shows how the value of your investment would have changed, and also shows how the Barclays® U.S. Aggregate Bond Index performed over the same period.
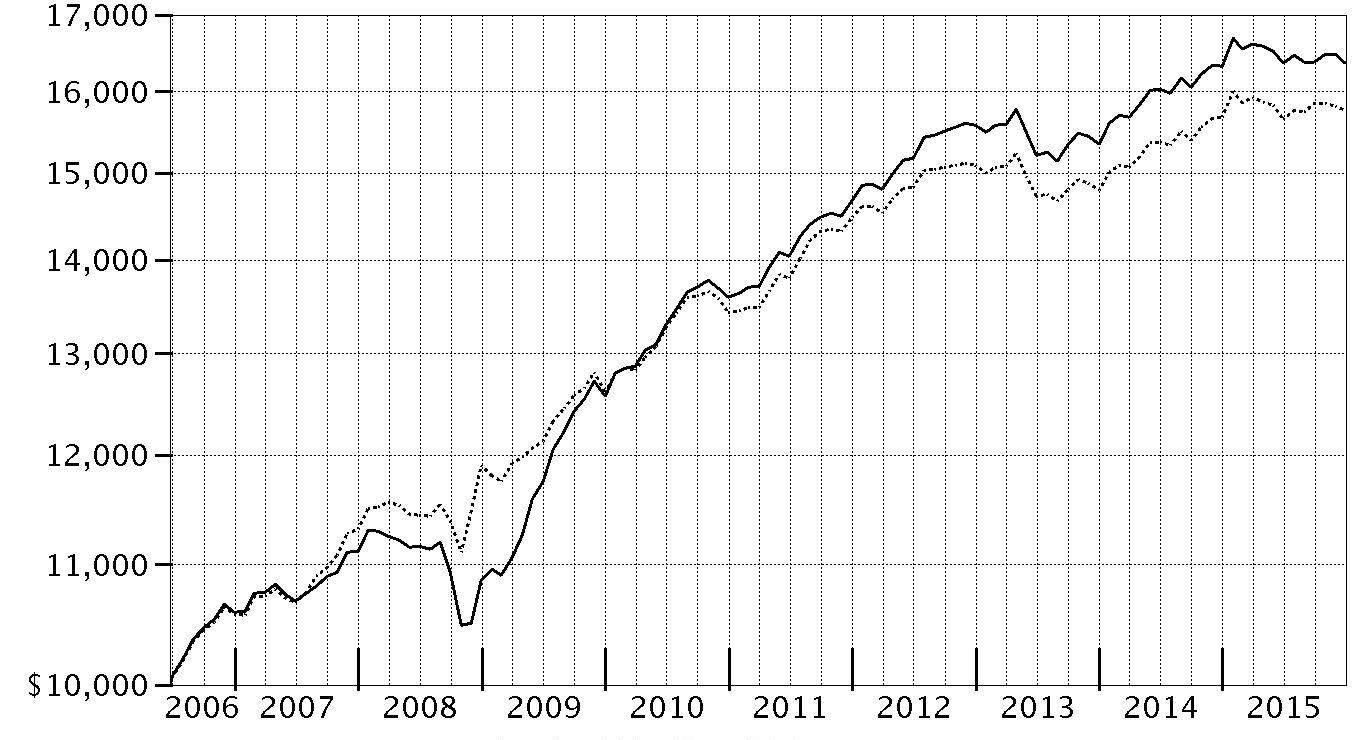
| Period Ending Values |
| $16,359 | Fidelity VIP Investment Grade Central Fund |
| $15,760 | Barclays® U.S. Aggregate Bond Index |
Fidelity® VIP Investment Grade Central Fund
Management's Discussion of Fund Performance
Market Recap: U.S. taxable investment-grade bonds managed only a slight gain for calendar year 2015, in an environment of rising credit-risk premiums that made it difficult for many bond sectors to outperform U.S. Treasury investments. The Barclays
® U.S. Aggregate Bond Index returned 0.55%, with coupon (stated interest) payments roughly counterbalancing price weakness. Bonds suffered early in the period due to increased expectations for higher policy interest rates. The U.S. Federal Reserve, however, took no action to raise rates over the summer, amid a dampened global economic outlook. Rate-hike expectations cooled in August and September, in an environment of decreased bond issuance, weaker economic data emanating from China and falling crude-oil prices. They then rose significantly in late October and November, as the U.S. economy continued to improve, leading up to the Fed’s mid-December rate hike, its first since 2006. Among sectors in the Barclays
® index, U.S. Treasury and agency mortgage-backed securities managed slight gains, versus modest declines for investment-grade credit and government-related securities. Outside the index, U.S. corporate high-yield bonds fell sharply, according to Barclays, fueled by a broad retreat from risk assets, while Treasury Inflation-Protected Securities (TIPS) declined amid low inflation expectations.
Comments from Portfolio Manager Ford O’Neil, who rejoined the fund on July 27, 2015, after having managed the fund from 2006 through January 2015: For the year, the fund trailed the benchmark Barclays
® U.S. Aggregate Bond Index.
I attempted to add value through sector positioning. I also drew on Fidelity’s bottom-up fundamental research to identify what we believed were the best ideas in each sector. I kept the fund’s interest rate sensitivity, as measured by duration, roughly in line with that of the benchmark, but positioned the fund based on yield-curve changes that I anticipated, as well as the yield curve's shape. The fund’s underweighting in U.S. government bonds – Treasuries and agency mortgage-backed securities – detracted from performance versus the benchmark. Both sectors performed comparatively well as investors sought haven amid global economic uncertainty. The fund’s overweighting in TIPS also detracted, as investors shunned inflation protection amid a steep slump in commodity prices. Holdings in taxable municipal bonds backed by Illinois and Chicago hurt as well. They were under pressure for much of the period due to credit-rating actions in light of their respective pension and budget challenges. In contrast, overweighting investment-grade corporate bonds added value. Within investment-grade corporates, an overweighted position in financials aided the fund’s relative return. In addition, the fund’s overall yield-curve positioning was additive.
The views expressed above reflect those of the portfolio manager(s) only through the end of the period as stated on the cover of this report and do not necessarily represent the views of Fidelity or any other person in the Fidelity organization. Any such views are subject to change at any time based upon market or other conditions and Fidelity disclaims any responsibility to update such views. These views may not be relied on as investment advice and, because investment decisions for a Fidelity fund are based on numerous factors, may not be relied on as an indication of trading intent on behalf of any Fidelity fund.
Fidelity® VIP Investment Grade Central Fund
Investment Summary (Unaudited)
Quality Diversification (% of fund's net assets)
| As of December 31, 2015 |
| | U.S. Government and U.S. Government Agency Obligations | 33.8% |
| | AAA | 3.4% |
| | AA | 4.2% |
| | A | 12.2% |
| | BBB | 36.8% |
| | BB and Below | 7.2% |
| | Not Rated | 0.1% |
| | Short-Term Investments and Net Other Assets | 2.3% |
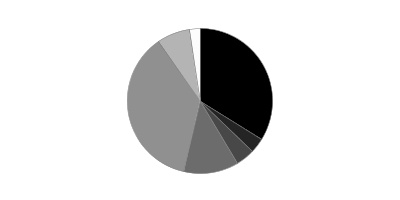
| As of June 30, 2015 |
| | U.S. Government and U.S. Government Agency Obligations | 38.3% |
| | AAA | 3.8% |
| | AA | 4.2% |
| | A | 15.6% |
| | BBB | 30.6% |
| | BB and Below | 6.9% |
| | Not Rated | 0.1% |
| | Short-Term Investments and Net Other Assets | 0.5% |
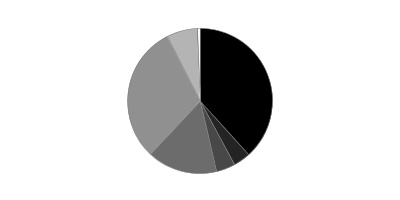
We have used ratings from Moody's Investors Service, Inc. Where Moody's® ratings are not available, we have used S&P® ratings. All ratings are as of the date indicated and do not reflect subsequent changes. Securities rated BB or below were rated investment grade at the time of acquisition.
Weighted Average Maturity as of December 31, 2015
| | | 6 months ago |
| Years | 7.8 | 7.4 |
This is a weighted average of all the maturities of the securities held in a fund. Weighted Average Maturity (WAM) can be used as a measure of sensitivity to interest rate changes and market changes. Generally, the longer the maturity, the greater the sensitivity to such changes. WAM is based on the dollar-weighted average length of time until principal payments must be paid. Depending on the types of securities held in a fund, certain maturity shortening devices (e.g., demand features, interest rate resets, and call options) may be taken into account when calculating the WAM.
Duration as of December 31, 2015
| | | 6 months ago |
| Years | 5.4 | 5.4 |
Duration is a measure of a security's price sensitivity to changes in interest rates. Duration differs from maturity in that it considers a security's interest payments in addition to the amount of time until the security reaches maturity, and also takes into account certain maturity shortening features (e.g., demand features, interest rate resets, and call options) when applicable. Securities with longer durations generally tend to be more sensitive to interest rate changes than securities with shorter durations. A fund with a longer average duration generally can be expected to be more sensitive to interest rate changes than a fund with a shorter average duration.
Asset Allocation (% of fund's net assets)
| As of December 31, 2015 *,** |
| | Corporate Bonds | 49.7% |
| | U.S. Government and U.S. Government Agency Obligations | 33.8% |
| | Asset-Backed Securities | 1.1% |
| | CMOs and Other Mortgage Related Securities | 7.0% |
| | Municipal Bonds | 4.5% |
| | Other Investments | 1.6% |
| | Short-Term Investments and Net Other Assets (Liabilities) | 2.3% |

* Foreign investments - 13.6%
** Futures and Swaps - 0.0%
| As of June 30, 2015 *,** |
| | Corporate Bonds | 47.6% |
| | U.S. Government and U.S. Government Agency Obligations | 38.3% |
| | Asset-Backed Securities | 1.1% |
| | CMOs and Other Mortgage Related Securities | 7.7% |
| | Municipal Bonds | 4.3% |
| | Other Investments | 0.5% |
| | Short-Term Investments and Net Other Assets (Liabilities) | 0.5% |

* Foreign investments - 13.2%
** Futures and Swaps - 0.0%
Percentages in the above tables are adjusted for the effect of TBA Sale Commitments.
Fidelity® VIP Investment Grade Central Fund
Investments December 31, 2015
Showing Percentage of Net Assets
| Nonconvertible Bonds - 49.7% | | | |
| | | Principal Amount | Value |
| CONSUMER DISCRETIONARY - 3.1% | | | |
| Automobiles - 1.2% | | | |
| Daimler Finance North America LLC 1.45% 8/1/16 (a) | | $2,724,000 | $2,727,808 |
| General Motors Co.: | | | |
| 3.5% 10/2/18 | | 3,528,000 | 3,563,421 |
| 6.25% 10/2/43 | | 599,000 | 632,028 |
| General Motors Financial Co., Inc.: | | | |
| 2.4% 4/10/18 | | 9,383,000 | 9,336,779 |
| 2.625% 7/10/17 | | 1,120,000 | 1,123,394 |
| 3% 9/25/17 | | 2,587,000 | 2,595,778 |
| 3.2% 7/13/20 | | 10,000,000 | 9,846,010 |
| 3.25% 5/15/18 | | 1,860,000 | 1,869,257 |
| 3.5% 7/10/19 | | 4,187,000 | 4,201,826 |
| 4.25% 5/15/23 | | 2,080,000 | 2,057,623 |
| 4.375% 9/25/21 | | 15,702,000 | 15,930,653 |
| 4.75% 8/15/17 | | 1,940,000 | 2,010,785 |
| | | | 55,895,362 |
| Diversified Consumer Services - 0.1% | | | |
| Ingersoll-Rand Global Holding Co. Ltd.: | | | |
| 2.875% 1/15/19 | | 416,000 | 420,260 |
| 4.25% 6/15/23 | | 2,932,000 | 3,020,095 |
| | | | 3,440,355 |
| Hotels, Restaurants & Leisure - 0.1% | | | |
| McDonald's Corp.: | | | |
| 2.75% 12/9/20 | | 910,000 | 909,551 |
| 3.7% 1/30/26 | | 2,400,000 | 2,398,625 |
| 4.7% 12/9/35 | | 1,239,000 | 1,234,317 |
| 4.875% 12/9/45 | | 1,944,000 | 1,954,468 |
| | | | 6,496,961 |
| Media - 1.7% | | | |
| 21st Century Fox America, Inc.: | | | |
| 6.15% 2/15/41 | | 3,454,000 | 3,883,063 |
| 7.75% 12/1/45 | | 3,169,000 | 4,127,220 |
| AOL Time Warner, Inc. 7.625% 4/15/31 | | 1,625,000 | 2,010,656 |
| Charter Communications Operating LLC/Charter Communications Operating Capital Corp.: | | | |
| 4.464% 7/23/22 (a) | | 5,742,000 | 5,722,018 |
| 4.908% 7/23/25 (a) | | 3,860,000 | 3,856,206 |
| DIRECTV Holdings LLC/DIRECTV Financing, Inc. 5.875% 10/1/19 | | 4,711,000 | 5,259,718 |
| Discovery Communications LLC: | | | |
| 3.25% 4/1/23 | | 604,000 | 556,874 |
| 6.35% 6/1/40 | | 2,421,000 | 2,409,449 |
| Thomson Reuters Corp.: | | | |
| 1.3% 2/23/17 | | 1,374,000 | 1,367,504 |
| 3.85% 9/29/24 | | 3,379,000 | 3,311,802 |
| Time Warner Cable, Inc.: | | | |
| 4% 9/1/21 | | 7,363,000 | 7,434,495 |
| 5.5% 9/1/41 | | 1,700,000 | 1,536,237 |
| 5.85% 5/1/17 | | 1,239,000 | 1,296,196 |
| 5.875% 11/15/40 | | 1,500,000 | 1,421,205 |
| 6.55% 5/1/37 | | 10,935,000 | 11,060,096 |
| 6.75% 7/1/18 | | 4,425,000 | 4,828,883 |
| 7.3% 7/1/38 | | 3,781,000 | 4,100,449 |
| 8.25% 4/1/19 | | 7,716,000 | 8,867,520 |
| Time Warner, Inc. 6.5% 11/15/36 | | 2,337,000 | 2,645,874 |
| Viacom, Inc.: | | | |
| 2.5% 9/1/18 | | 546,000 | 544,702 |
| 3.5% 4/1/17 | | 1,312,000 | 1,335,339 |
| | | | 77,575,506 |
|
| TOTAL CONSUMER DISCRETIONARY | | | 143,408,184 |
|
| CONSUMER STAPLES - 1.7% | | | |
| Food & Staples Retailing - 0.3% | | | |
| CVS Health Corp.: | | | |
| 3.5% 7/20/22 | | 2,525,000 | 2,570,604 |
| 3.875% 7/20/25 | | 4,800,000 | 4,899,581 |
| Walgreens Boots Alliance, Inc.: | | | |
| 2.7% 11/18/19 | | 2,460,000 | 2,456,416 |
| 3.3% 11/18/21 | | 2,918,000 | 2,863,010 |
| | | | 12,789,611 |
| Food Products - 0.0% | | | |
| ConAgra Foods, Inc. 1.9% 1/25/18 | | 1,554,000 | 1,545,483 |
| Tobacco - 1.4% | | | |
| Altria Group, Inc.: | | | |
| 4% 1/31/24 | | 2,227,000 | 2,307,328 |
| 4.25% 8/9/42 | | 2,952,000 | 2,708,407 |
| 4.75% 5/5/21 | | 4,000,000 | 4,342,136 |
| 5.375% 1/31/44 | | 4,099,000 | 4,408,241 |
| Imperial Tobacco Finance PLC: | | | |
| 3.75% 7/21/22 (a) | | 4,804,000 | 4,823,778 |
| 4.25% 7/21/25 (a) | | 4,804,000 | 4,875,705 |
| Reynolds American, Inc.: | | | |
| 2.3% 6/12/18 | | 2,110,000 | 2,123,396 |
| 3.25% 6/12/20 | | 1,745,000 | 1,773,627 |
| 3.25% 11/1/22 | | 2,224,000 | 2,200,197 |
| 4% 6/12/22 | | 3,228,000 | 3,357,943 |
| 4.45% 6/12/25 | | 7,107,000 | 7,436,886 |
| 4.75% 11/1/42 | | 3,437,000 | 3,279,957 |
| 5.7% 8/15/35 | | 1,215,000 | 1,331,159 |
| 5.85% 8/15/45 | | 9,320,000 | 10,354,595 |
| 6.15% 9/15/43 | | 4,000,000 | 4,533,568 |
| 7.25% 6/15/37 | | 2,962,000 | 3,626,069 |
| | | | 63,482,992 |
|
| TOTAL CONSUMER STAPLES | | | 77,818,086 |
|
| ENERGY - 7.7% | | | |
| Energy Equipment & Services - 0.5% | | | |
| DCP Midstream LLC: | | | |
| 4.75% 9/30/21 (a) | | 3,739,000 | 2,907,555 |
| 5.35% 3/15/20 (a) | | 3,724,000 | 3,202,785 |
| El Paso Pipeline Partners Operating Co. LLC 5% 10/1/21 | | 1,517,000 | 1,432,277 |
| Halliburton Co.: | | | |
| 3.8% 11/15/25 | | 2,467,000 | 2,403,709 |
| 4.85% 11/15/35 | | 2,154,000 | 2,115,952 |
| 5% 11/15/45 | | 2,951,000 | 2,915,086 |
| Noble Holding International Ltd.: | | | |
| 4% 3/16/18 | | 342,000 | 309,725 |
| 5.95% 4/1/25 | | 2,180,000 | 1,504,405 |
| 6.95% 4/1/45 | | 2,104,000 | 1,346,316 |
| Transocean, Inc. 5.55% 12/15/16 (b) | | 2,488,000 | 2,413,360 |
| | | | 20,551,170 |
| Oil, Gas & Consumable Fuels - 7.2% | | | |
| Anadarko Petroleum Corp. 6.375% 9/15/17 | | 6,869,000 | 7,202,840 |
| BP Capital Markets PLC: | | | |
| 1.674% 2/13/18 | | 11,342,000 | 11,329,875 |
| 2.315% 2/13/20 | | 16,534,000 | 16,296,588 |
| 4.5% 10/1/20 | | 1,811,000 | 1,938,333 |
| 4.742% 3/11/21 | | 3,000,000 | 3,295,443 |
| Canadian Natural Resources Ltd.: | | | |
| 1.75% 1/15/18 | | 1,762,000 | 1,714,017 |
| 3.8% 4/15/24 | | 6,783,000 | 5,992,957 |
| Cenovus Energy, Inc. 5.7% 10/15/19 | | 3,719,000 | 3,898,910 |
| Columbia Pipeline Group, Inc.: | | | |
| 2.45% 6/1/18 (a) | | 894,000 | 874,175 |
| 3.3% 6/1/20 (a) | | 4,379,000 | 4,265,588 |
| 4.5% 6/1/25 (a) | | 1,336,000 | 1,210,926 |
| ConocoPhillips Co. 5.75% 2/1/19 | | 3,900,000 | 4,221,204 |
| DCP Midstream Operating LP: | | | |
| 2.5% 12/1/17 | | 1,990,000 | 1,790,799 |
| 2.7% 4/1/19 | | 4,300,000 | 3,483,387 |
| 3.875% 3/15/23 | | 1,771,000 | 1,336,809 |
| 5.6% 4/1/44 | | 1,227,000 | 745,184 |
| Duke Energy Field Services 6.45% 11/3/36 (a) | | 2,477,000 | 1,669,505 |
| El Paso Natural Gas Co. 5.95% 4/15/17 | | 3,330,000 | 3,367,949 |
| Empresa Nacional de Petroleo 4.375% 10/30/24 (a) | | 3,540,000 | 3,398,616 |
| Enable Midstream Partners LP: | | | |
| 2.4% 5/15/19 | | 1,253,000 | 1,113,422 |
| 3.9% 5/15/24 | | 1,322,000 | 1,011,277 |
| Enbridge Energy Partners LP: | | | |
| 4.2% 9/15/21 | | 4,399,000 | 4,195,647 |
| 4.375% 10/15/20 | | 3,093,000 | 3,018,456 |
| EnLink Midstream Partners LP 2.7% 4/1/19 | | 6,288,000 | 5,737,108 |
| Enterprise Products Operating LP: | | | |
| 1.65% 5/7/18 | | 1,969,000 | 1,920,801 |
| 2.55% 10/15/19 | | 863,000 | 827,638 |
| 3.7% 2/15/26 | | 4,800,000 | 4,309,186 |
| 3.75% 2/15/25 | | 2,900,000 | 2,654,138 |
| Marathon Petroleum Corp. 5.125% 3/1/21 | | 2,187,000 | 2,296,044 |
| Motiva Enterprises LLC 5.75% 1/15/20 (a) | | 1,496,000 | 1,610,806 |
| MPLX LP 4% 2/15/25 | | 683,000 | 574,277 |
| Nakilat, Inc. 6.067% 12/31/33 (a) | | 1,808,000 | 1,985,184 |
| Petro-Canada 6.05% 5/15/18 | | 1,480,000 | 1,586,570 |
| Petrobras Global Finance BV: | | | |
| 1.9896% 5/20/16 (b) | | 3,810,000 | 3,714,750 |
| 3% 1/15/19 | | 446,000 | 338,960 |
| 3.25% 3/17/17 | | 14,978,000 | 13,854,650 |
| 4.375% 5/20/23 | | 7,020,000 | 4,633,200 |
| 4.875% 3/17/20 | | 21,747,000 | 16,310,250 |
| 5.625% 5/20/43 | | 6,681,000 | 4,058,708 |
| 7.25% 3/17/44 | | 24,245,000 | 16,365,375 |
| Petrobras International Finance Co. Ltd.: | | | |
| 3.875% 1/27/16 | | 3,612,000 | 3,597,552 |
| 5.375% 1/27/21 | | 17,294,000 | 12,884,030 |
| 5.75% 1/20/20 | | 6,461,000 | 5,071,885 |
| 5.875% 3/1/18 | | 1,901,000 | 1,691,890 |
| 6.125% 10/6/16 | | 2,000,000 | 1,980,000 |
| 7.875% 3/15/19 | | 4,277,000 | 3,785,145 |
| Petroleos Mexicanos: | | | |
| 3.125% 1/23/19 | | 642,000 | 621,064 |
| 3.5% 7/18/18 | | 5,440,000 | 5,397,949 |
| 3.5% 7/23/20 (a) | | 32,555,000 | 30,813,308 |
| 3.5% 1/30/23 | | 3,410,000 | 2,975,225 |
| 4.5% 1/23/26 (a) | | 6,809,000 | 5,981,707 |
| 4.875% 1/24/22 | | 3,398,000 | 3,270,575 |
| 4.875% 1/18/24 | | 4,539,000 | 4,232,618 |
| 5.5% 1/21/21 | | 3,601,000 | 3,632,329 |
| 5.5% 6/27/44 | | 7,799,000 | 5,867,500 |
| 5.625% 1/23/46 (a) | | 8,402,000 | 6,429,210 |
| 6% 3/5/20 | | 1,625,000 | 1,688,375 |
| 6.375% 1/23/45 | | 4,048,000 | 3,426,150 |
| 6.5% 6/2/41 | | 7,675,000 | 6,635,038 |
| 8% 5/3/19 | | 2,537,000 | 2,792,907 |
| Phillips 66 Co. 4.3% 4/1/22 | | 3,770,000 | 3,880,702 |
| Phillips 66 Partners LP 2.646% 2/15/20 | | 375,000 | 353,943 |
| Plains All American Pipeline LP/PAA Finance Corp.: | | | |
| 3.65% 6/1/22 | | 1,784,000 | 1,531,566 |
| 6.125% 1/15/17 | | 1,250,000 | 1,284,350 |
| Shell International Finance BV 4.375% 5/11/45 | | 10,660,000 | 10,064,415 |
| Southwestern Energy Co.: | | | |
| 3.3% 1/23/18 | | 1,762,000 | 1,444,840 |
| 4.05% 1/23/20 | | 3,196,000 | 2,317,100 |
| 4.95% 1/23/25 | | 2,509,000 | 1,580,670 |
| Spectra Energy Capital, LLC 3.3% 3/15/23 | | 5,000,000 | 4,279,690 |
| Spectra Energy Partners, LP: | | | |
| 2.95% 6/15/16 | | 668,000 | 670,412 |
| 2.95% 9/25/18 | | 733,000 | 720,304 |
| Suncor Energy, Inc. 6.1% 6/1/18 | | 4,665,000 | 5,018,010 |
| The Williams Companies, Inc.: | | | |
| 3.7% 1/15/23 | | 1,208,000 | 834,437 |
| 4.55% 6/24/24 | | 13,337,000 | 9,268,068 |
| Transcontinental Gas Pipe Line Corp. 6.4% 4/15/16 | | 615,000 | 622,539 |
| Western Gas Partners LP 5.375% 6/1/21 | | 4,325,000 | 4,379,145 |
| Williams Partners LP 4.3% 3/4/24 | | 3,059,000 | 2,425,184 |
| | | | 333,599,384 |
|
| TOTAL ENERGY | | | 354,150,554 |
|
| FINANCIALS - 26.6% | | | |
| Banks - 12.0% | | | |
| Banco Nacional de Desenvolvimento Economico e Social: | | | |
| 3.375% 9/26/16 (a) | | 4,235,000 | 4,192,650 |
| 4% 4/14/19 (a) | | 5,277,000 | 4,828,455 |
| 5.5% 7/12/20 (a) | | 28,200,000 | 26,155,500 |
| 5.75% 9/26/23 (a) | | 3,877,000 | 3,342,749 |
| 6.5% 6/10/19 (a) | | 1,340,000 | 1,309,850 |
| Bank of America Corp.: | | | |
| 2.25% 4/21/20 | | 3,337,000 | 3,257,226 |
| 2.6% 1/15/19 | | 7,155,000 | 7,179,291 |
| 3.875% 3/22/17 | | 10,557,000 | 10,826,721 |
| 3.95% 4/21/25 | | 6,000,000 | 5,843,154 |
| 4.2% 8/26/24 | | 4,984,000 | 4,991,237 |
| 4.25% 10/22/26 | | 4,261,000 | 4,218,117 |
| 5.75% 12/1/17 | | 12,290,000 | 13,147,903 |
| 5.875% 1/5/21 | | 1,785,000 | 2,020,897 |
| 6.5% 8/1/16 | | 3,000,000 | 3,087,426 |
| Bank of Tokyo-Mitsubishi UFJ Ltd.: | | | |
| 1.7% 3/5/18 (a) | | 13,516,000 | 13,405,966 |
| 2.3% 3/5/20 (a) | | 11,510,000 | 11,350,448 |
| Barclays PLC: | | | |
| 2% 3/16/18 | | 17,646,000 | 17,540,689 |
| 2.75% 11/8/19 | | 3,581,000 | 3,567,919 |
| Capital One NA 2.95% 7/23/21 | | 5,645,000 | 5,588,928 |
| Citigroup, Inc.: | | | |
| 1.3% 11/15/16 | | 6,383,000 | 6,367,528 |
| 1.7% 4/27/18 | | 4,662,000 | 4,617,930 |
| 1.8% 2/5/18 | | 68,000,000 | 67,763,428 |
| 1.85% 11/24/17 | | 8,579,000 | 8,566,784 |
| 2.15% 7/30/18 | | 9,998,000 | 9,990,741 |
| 2.5% 7/29/19 | | 12,575,000 | 12,557,445 |
| 3.875% 3/26/25 | | 9,500,000 | 9,254,026 |
| 4.05% 7/30/22 | | 1,800,000 | 1,838,875 |
| 4.3% 11/20/26 | | 9,000,000 | 8,961,309 |
| 5.5% 9/13/25 | | 1,663,000 | 1,806,374 |
| Citizens Financial Group, Inc. 4.15% 9/28/22 (a) | | 4,259,000 | 4,274,064 |
| Credit Suisse AG 6% 2/15/18 | | 6,486,000 | 6,971,393 |
| Credit Suisse Group Funding Guernsey Ltd.: | | | |
| 2.75% 3/26/20 (a) | | 4,667,000 | 4,623,210 |
| 3.75% 3/26/25 (a) | | 4,660,000 | 4,502,012 |
| 3.8% 9/15/22 (a) | | 7,240,000 | 7,237,220 |
| Discover Bank: | | | |
| 4.2% 8/8/23 | | 2,849,000 | 2,910,744 |
| 7% 4/15/20 | | 2,309,000 | 2,629,392 |
| Fifth Third Bancorp: | | | |
| 2.875% 7/27/20 | | 3,000,000 | 2,997,834 |
| 4.5% 6/1/18 | | 1,179,000 | 1,241,692 |
| 8.25% 3/1/38 | | 4,319,000 | 6,009,958 |
| HBOS PLC 6.75% 5/21/18 (a) | | 2,600,000 | 2,835,994 |
| HSBC Holdings PLC 4.25% 3/14/24 | | 2,200,000 | 2,210,142 |
| HSBC U.S.A., Inc. 1.625% 1/16/18 | | 3,721,000 | 3,702,912 |
| Huntington Bancshares, Inc. 7% 12/15/20 | | 1,004,000 | 1,169,369 |
| Intesa Sanpaolo SpA 5.017% 6/26/24 (a) | | 3,027,000 | 2,979,618 |
| JPMorgan Chase & Co.: | | | |
| 2.75% 6/23/20 | | 5,755,000 | 5,781,818 |
| 3.875% 9/10/24 | | 48,329,000 | 48,099,534 |
| 4.125% 12/15/26 | | 22,108,000 | 22,068,228 |
| KeyBank NA 5.45% 3/3/16 | | 1,618,000 | 1,629,025 |
| Mizuho Bank Ltd. 1.8% 3/26/18 (a) | | 20,622,000 | 20,485,544 |
| MUFG Americas Holdings Corp. 2.25% 2/10/20 | | 4,493,000 | 4,419,526 |
| PNC Bank NA 2.3% 6/1/20 | | 1,450,000 | 1,437,265 |
| Rabobank Nederland 4.375% 8/4/25 | | 7,451,000 | 7,579,031 |
| Regions Bank 6.45% 6/26/37 | | 7,720,000 | 8,984,227 |
| Regions Financial Corp. 2% 5/15/18 | | 4,497,000 | 4,465,512 |
| Royal Bank of Scotland Group PLC: | | | |
| 5.125% 5/28/24 | | 42,740,000 | 43,318,828 |
| 6% 12/19/23 | | 8,517,000 | 9,172,860 |
| 6.1% 6/10/23 | | 11,522,000 | 12,385,263 |
| 6.125% 12/15/22 | | 8,239,000 | 8,969,873 |
| The Toronto-Dominion Bank 1.625% 3/13/18 | | 20,050,000 | 19,995,123 |
| | | | 552,666,777 |
| Capital Markets - 5.0% | | | |
| Affiliated Managers Group, Inc.: | | | |
| 3.5% 8/1/25 | | 5,125,000 | 4,877,519 |
| 4.25% 2/15/24 | | 3,833,000 | 3,872,146 |
| Deutsche Bank AG 4.5% 4/1/25 | | 10,381,000 | 9,550,738 |
| Deutsche Bank AG London Branch 1.875% 2/13/18 | | 24,542,000 | 24,332,681 |
| Goldman Sachs Group, Inc.: | | | |
| 1.748% 9/15/17 | | 13,467,000 | 13,441,992 |
| 2.55% 10/23/19 | | 59,670,000 | 59,659,140 |
| 2.625% 1/31/19 | | 16,652,000 | 16,773,360 |
| 2.9% 7/19/18 | | 6,251,000 | 6,373,276 |
| 5.25% 7/27/21 | | 1,125,000 | 1,244,426 |
| 5.625% 1/15/17 | | 3,000,000 | 3,115,986 |
| 5.95% 1/18/18 | | 755,000 | 813,097 |
| 6.15% 4/1/18 | | 5,954,000 | 6,465,633 |
| Lazard Group LLC: | | | |
| 4.25% 11/14/20 | | 3,307,000 | 3,426,680 |
| 6.85% 6/15/17 | | 689,000 | 733,574 |
| Morgan Stanley: | | | |
| 1.875% 1/5/18 | | 4,357,000 | 4,352,613 |
| 2.125% 4/25/18 | | 4,257,000 | 4,266,531 |
| 2.65% 1/27/20 | | 15,070,000 | 15,034,284 |
| 4.875% 11/1/22 | | 7,751,000 | 8,230,818 |
| 5% 11/24/25 | | 1,047,000 | 1,112,087 |
| 5.45% 1/9/17 | | 4,980,000 | 5,169,325 |
| 5.75% 1/25/21 | | 3,512,000 | 3,944,991 |
| 6.625% 4/1/18 | | 10,165,000 | 11,147,325 |
| Peachtree Corners Funding Trust 3.976% 2/15/25 (a) | | 5,000,000 | 4,964,350 |
| UBS AG Stamford Branch: | | | |
| 1.375% 6/1/17 | | 3,574,000 | 3,557,213 |
| 1.8% 3/26/18 | | 6,894,000 | 6,882,887 |
| 2.35% 3/26/20 | | 1,450,000 | 1,447,705 |
| UBS Group Funding Ltd. 4.125% 9/24/25 (a) | | 5,261,000 | 5,258,832 |
| | | | 230,049,209 |
| Consumer Finance - 1.6% | | | |
| Discover Financial Services: | | | |
| 3.85% 11/21/22 | | 5,040,000 | 4,997,916 |
| 3.95% 11/6/24 | | 2,847,000 | 2,807,626 |
| Ford Motor Credit Co. LLC: | | | |
| 1.461% 3/27/17 | | 24,000,000 | 23,773,128 |
| 1.5% 1/17/17 | | 2,686,000 | 2,667,091 |
| 1.7% 5/9/16 | | 6,586,000 | 6,592,382 |
| 2.24% 6/15/18 | | 5,000,000 | 4,954,875 |
| 2.875% 10/1/18 | | 4,500,000 | 4,507,695 |
| Hyundai Capital America: | | | |
| 1.45% 2/6/17 (a) | | 5,241,000 | 5,216,467 |
| 1.875% 8/9/16 (a) | | 1,083,000 | 1,084,470 |
| 2% 3/19/18 (a) | | 6,308,000 | 6,233,414 |
| 2.125% 10/2/17 (a) | | 4,770,000 | 4,741,628 |
| 2.875% 8/9/18 (a) | | 1,921,000 | 1,941,432 |
| Synchrony Financial: | | | |
| 1.875% 8/15/17 | | 994,000 | 989,424 |
| 3% 8/15/19 | | 1,459,000 | 1,457,261 |
| 3.75% 8/15/21 | | 2,203,000 | 2,201,599 |
| 4.25% 8/15/24 | | 2,218,000 | 2,188,230 |
| | | | 76,354,638 |
| Diversified Financial Services - 0.4% | | | |
| Brixmor Operating Partnership LP 3.875% 8/15/22 | | 3,297,000 | 3,282,236 |
| GE Capital International Funding Co. 0.964% 4/15/16 (a) | | 10,807,000 | 10,811,874 |
| IntercontinentalExchange, Inc.: | | | |
| 2.75% 12/1/20 | | 1,628,000 | 1,628,275 |
| 3.75% 12/1/25 | | 2,910,000 | 2,919,853 |
| | | | 18,642,238 |
| Insurance - 2.5% | | | |
| ACE INA Holdings, Inc.: | | | |
| 2.875% 11/3/22 | | 2,975,000 | 2,954,237 |
| 3.35% 5/3/26 | | 2,398,000 | 2,391,084 |
| 4.35% 11/3/45 | | 2,436,000 | 2,475,553 |
| AFLAC, Inc. 2.4% 3/16/20 | | 4,500,000 | 4,524,800 |
| AIA Group Ltd. 2.25% 3/11/19 (a) | | 913,000 | 908,097 |
| American International Group, Inc.: | | | |
| 3.75% 7/10/25 | | 8,311,000 | 8,241,553 |
| 5.6% 10/18/16 | | 3,756,000 | 3,876,395 |
| Aon Corp.: | | | |
| 3.125% 5/27/16 | | 3,681,000 | 3,709,579 |
| 5% 9/30/20 | | 1,402,000 | 1,532,678 |
| Five Corners Funding Trust 4.419% 11/15/23 (a) | | 4,110,000 | 4,291,239 |
| Liberty Mutual Group, Inc. 5% 6/1/21 (a) | | 4,093,000 | 4,378,941 |
| Marsh & McLennan Companies, Inc. 4.8% 7/15/21 | | 2,278,000 | 2,479,680 |
| Massachusetts Mutual Life Insurance Co.: | | | |
| 4.5% 4/15/65 (a) | | 5,285,000 | 4,727,396 |
| 5.375% 12/1/41 (a) | | 1,135,000 | 1,228,893 |
| MetLife, Inc.: | | | |
| 1.903% 12/15/17 (b) | | 886,000 | 891,231 |
| 4.368% 9/15/23 | | 3,574,000 | 3,838,587 |
| 4.75% 2/8/21 | | 1,477,000 | 1,616,740 |
| 6.75% 6/1/16 | | 3,234,000 | 3,308,036 |
| Metropolitan Life Global Funding I 3% 1/10/23 (a) | | 2,636,000 | 2,622,970 |
| Pacific Life Insurance Co. 9.25% 6/15/39 (a) | | 2,297,000 | 3,334,842 |
| Pacific LifeCorp: | | | |
| 5.125% 1/30/43 (a) | | 5,252,000 | 5,347,334 |
| 6% 2/10/20 (a) | | 4,627,000 | 5,147,690 |
| Prudential Financial, Inc.: | | | |
| 2.3% 8/15/18 | | 599,000 | 603,389 |
| 4.5% 11/16/21 | | 2,157,000 | 2,329,750 |
| 6.2% 11/15/40 | | 1,297,000 | 1,530,154 |
| 7.375% 6/15/19 | | 1,250,000 | 1,450,680 |
| Symetra Financial Corp. 6.125% 4/1/16 (a) | | 6,355,000 | 6,420,539 |
| Teachers Insurance & Annuity Association of America 4.9% 9/15/44 (a) | | 5,347,000 | 5,400,759 |
| TIAA Asset Management Finance LLC: | | | |
| 2.95% 11/1/19 (a) | | 1,222,000 | 1,224,949 |
| 4.125% 11/1/24 (a) | | 1,771,000 | 1,777,985 |
| Unum Group: | | | |
| 3.875% 11/5/25 | | 4,535,000 | 4,464,277 |
| 4% 3/15/24 | | 5,930,000 | 5,920,435 |
| 5.625% 9/15/20 | | 2,889,000 | 3,177,669 |
| 5.75% 8/15/42 | | 5,234,000 | 5,774,049 |
| | | | 113,902,190 |
| Real Estate Investment Trusts - 3.0% | | | |
| Alexandria Real Estate Equities, Inc.: | | | |
| 2.75% 1/15/20 | | 879,000 | 864,383 |
| 4.6% 4/1/22 | | 1,200,000 | 1,245,620 |
| American Campus Communities Operating Partnership LP 3.75% 4/15/23 | | 1,184,000 | 1,165,048 |
| American Tower Corp. 2.8% 6/1/20 | | 9,000,000 | 8,898,543 |
| AvalonBay Communities, Inc.: | | | |
| 3.625% 10/1/20 | | 1,872,000 | 1,943,413 |
| 4.2% 12/15/23 | | 4,000,000 | 4,169,540 |
| Boston Properties, Inc. 3.85% 2/1/23 | | 4,708,000 | 4,806,515 |
| Camden Property Trust: | | | |
| 2.95% 12/15/22 | | 1,607,000 | 1,542,383 |
| 4.25% 1/15/24 | | 3,408,000 | 3,530,167 |
| Corporate Office Properties LP 5% 7/1/25 | | 2,283,000 | 2,243,988 |
| DDR Corp.: | | | |
| 3.625% 2/1/25 | | 2,136,000 | 2,016,655 |
| 4.25% 2/1/26 | | 1,807,000 | 1,762,839 |
| 4.625% 7/15/22 | | 2,855,000 | 2,951,430 |
| 4.75% 4/15/18 | | 3,691,000 | 3,861,650 |
| 7.5% 4/1/17 | | 1,944,000 | 2,071,081 |
| 9.625% 3/15/16 | | 1,253,000 | 1,272,571 |
| Digital Delta Holdings LLC: | | | |
| 3.4% 10/1/20 (a) | | 4,915,000 | 4,922,486 |
| 4.75% 10/1/25 (a) | | 3,533,000 | 3,564,861 |
| Duke Realty LP: | | | |
| 3.625% 4/15/23 | | 2,123,000 | 2,074,528 |
| 3.75% 12/1/24 | | 1,576,000 | 1,533,699 |
| 3.875% 10/15/22 | | 3,512,000 | 3,529,202 |
| 4.375% 6/15/22 | | 2,340,000 | 2,411,527 |
| 5.95% 2/15/17 | | 86,000 | 89,794 |
| 6.5% 1/15/18 | | 2,445,000 | 2,644,392 |
| Equity One, Inc.: | | | |
| 3.75% 11/15/22 | | 5,500,000 | 5,311,422 |
| 6% 9/15/17 | | 2,405,000 | 2,545,279 |
| ERP Operating LP: | | | |
| 2.375% 7/1/19 | | 2,683,000 | 2,690,451 |
| 4.625% 12/15/21 | | 5,595,000 | 6,074,939 |
| 4.75% 7/15/20 | | 2,827,000 | 3,054,921 |
| 5.375% 8/1/16 | | 1,066,000 | 1,090,351 |
| 5.75% 6/15/17 | | 5,343,000 | 5,645,761 |
| Federal Realty Investment Trust 5.9% 4/1/20 | | 1,046,000 | 1,181,348 |
| HCP, Inc. 3.75% 2/1/16 | | 2,272,000 | 2,275,197 |
| Health Care REIT, Inc.: | | | |
| 2.25% 3/15/18 | | 1,731,000 | 1,729,470 |
| 4% 6/1/25 | | 3,216,000 | 3,163,984 |
| 4.7% 9/15/17 | | 568,000 | 593,737 |
| HRPT Properties Trust 6.25% 6/15/17 | | 3,000,000 | 3,098,508 |
| Lexington Corporate Properties Trust 4.4% 6/15/24 | | 1,441,000 | 1,433,975 |
| Omega Healthcare Investors, Inc.: | | | |
| 4.5% 1/15/25 | | 1,371,000 | 1,338,378 |
| 4.5% 4/1/27 | | 16,195,000 | 15,257,601 |
| 4.95% 4/1/24 | | 1,354,000 | 1,367,548 |
| 5.25% 1/15/26 (a) | | 5,686,000 | 5,807,567 |
| Retail Opportunity Investments Partnership LP: | | | |
| 4% 12/15/24 | | 978,000 | 923,996 |
| 5% 12/15/23 | | 737,000 | 752,804 |
| Simon Property Group LP 4.125% 12/1/21 | | 2,399,000 | 2,557,972 |
| Weingarten Realty Investors 3.375% 10/15/22 | | 812,000 | 792,501 |
| WP Carey, Inc. 4% 2/1/25 | | 5,360,000 | 5,127,874 |
| | | | 138,931,899 |
| Real Estate Management & Development - 2.1% | | | |
| BioMed Realty LP: | | | |
| 2.625% 5/1/19 | | 2,289,000 | 2,224,501 |
| 3.85% 4/15/16 | | 5,219,000 | 5,234,954 |
| 4.25% 7/15/22 | | 1,842,000 | 1,831,064 |
| 6.125% 4/15/20 | | 1,392,000 | 1,510,153 |
| Brandywine Operating Partnership LP: | | | |
| 3.95% 2/15/23 | | 4,271,000 | 4,159,843 |
| 4.1% 10/1/24 | | 4,251,000 | 4,110,368 |
| 4.55% 10/1/29 | | 4,251,000 | 4,084,875 |
| 4.95% 4/15/18 | | 3,196,000 | 3,345,077 |
| 5.7% 5/1/17 | | 5,000,000 | 5,215,260 |
| 6% 4/1/16 | | 1,005,000 | 1,015,212 |
| Digital Realty Trust LP: | | | |
| 3.95% 7/1/22 | | 3,213,000 | 3,190,875 |
| 5.25% 3/15/21 | | 1,953,000 | 2,109,006 |
| Essex Portfolio LP 5.5% 3/15/17 | | 670,000 | 697,595 |
| Liberty Property LP: | | | |
| 3.375% 6/15/23 | | 2,202,000 | 2,088,852 |
| 4.125% 6/15/22 | | 2,007,000 | 2,030,964 |
| 4.4% 2/15/24 | | 4,876,000 | 4,942,762 |
| 4.75% 10/1/20 | | 4,185,000 | 4,447,404 |
| 5.5% 12/15/16 | | 2,290,000 | 2,365,256 |
| 6.625% 10/1/17 | | 2,673,000 | 2,868,503 |
| Mack-Cali Realty LP: | | | |
| 2.5% 12/15/17 | | 2,995,000 | 2,993,991 |
| 3.15% 5/15/23 | | 4,988,000 | 4,306,864 |
| 4.5% 4/18/22 | | 1,218,000 | 1,171,581 |
| Mid-America Apartments LP: | | | |
| 4% 11/15/25 | | 1,181,000 | 1,173,307 |
| 4.3% 10/15/23 | | 831,000 | 851,983 |
| Post Apartment Homes LP 3.375% 12/1/22 | | 790,000 | 766,234 |
| Reckson Operating Partnership LP 6% 3/31/16 | | 4,360,000 | 4,400,696 |
| Regency Centers LP 5.875% 6/15/17 | | 1,821,000 | 1,920,372 |
| Tanger Properties LP: | | | |
| 3.75% 12/1/24 | | 2,960,000 | 2,902,458 |
| 3.875% 12/1/23 | | 1,792,000 | 1,785,325 |
| 6.125% 6/1/20 | | 4,876,000 | 5,503,702 |
| Ventas Realty LP: | | | |
| 1.55% 9/26/16 | | 2,853,000 | 2,855,026 |
| 3.5% 2/1/25 | | 1,277,000 | 1,222,879 |
| 4.125% 1/15/26 | | 1,557,000 | 1,552,055 |
| 4.375% 2/1/45 | | 763,000 | 698,868 |
| Ventas Realty LP/Ventas Capital Corp.: | | | |
| 2% 2/15/18 | | 2,696,000 | 2,683,108 |
| 4% 4/30/19 | | 1,357,000 | 1,411,087 |
| | | | 95,672,060 |
|
| TOTAL FINANCIALS | | | 1,226,219,011 |
|
| HEALTH CARE - 3.3% | | | |
| Biotechnology - 0.9% | | | |
| AbbVie, Inc.: | | | |
| 1.75% 11/6/17 | | 4,266,000 | 4,257,942 |
| 1.8% 5/14/18 | | 12,344,000 | 12,287,971 |
| 2.9% 11/6/22 | | 4,038,000 | 3,909,345 |
| 3.2% 11/6/22 | | 4,580,000 | 4,510,141 |
| 3.6% 5/14/25 | | 5,737,000 | 5,662,775 |
| Amgen, Inc.: | | | |
| 1.25% 5/22/17 | | 4,146,000 | 4,130,573 |
| 2.2% 5/22/19 | | 4,398,000 | 4,393,118 |
| | | | 39,151,865 |
| Health Care Equipment & Supplies - 0.4% | | | |
| Becton, Dickinson & Co. 2.675% 12/15/19 | | 1,327,000 | 1,334,596 |
| Zimmer Biomet Holdings, Inc.: | | | |
| 1.45% 4/1/17 | | 8,772,000 | 8,729,587 |
| 2% 4/1/18 | | 9,035,000 | 8,980,302 |
| | | | 19,044,485 |
| Health Care Providers & Services - 0.9% | | | |
| Express Scripts Holding Co. 4.75% 11/15/21 | | 4,787,000 | 5,133,770 |
| HCA Holdings, Inc.: | | | |
| 3.75% 3/15/19 | | 6,803,000 | 6,854,023 |
| 4.25% 10/15/19 | | 11,265,000 | 11,490,300 |
| 4.75% 5/1/23 | | 215,000 | 212,850 |
| 5.875% 3/15/22 | | 260,000 | 274,300 |
| 6.5% 2/15/20 | | 7,140,000 | 7,779,030 |
| Medco Health Solutions, Inc. 4.125% 9/15/20 | | 2,723,000 | 2,856,996 |
| UnitedHealth Group, Inc.: | | | |
| 3.35% 7/15/22 | | 1,747,000 | 1,787,115 |
| 3.75% 7/15/25 | | 4,817,000 | 4,970,267 |
| | | | 41,358,651 |
| Life Sciences Tools & Services - 0.1% | | | |
| Thermo Fisher Scientific, Inc.: | | | |
| 1.3% 2/1/17 | | 1,129,000 | 1,124,993 |
| 2.4% 2/1/19 | | 712,000 | 711,879 |
| 4.15% 2/1/24 | | 1,093,000 | 1,135,908 |
| | | | 2,972,780 |
| Pharmaceuticals - 1.0% | | | |
| Actavis Funding SCS: | | | |
| 1.85% 3/1/17 | | 16,317,000 | 16,346,779 |
| 2.35% 3/12/18 | | 11,511,000 | 11,524,802 |
| 3% 3/12/20 | | 3,962,000 | 3,958,842 |
| 3.45% 3/15/22 | | 6,868,000 | 6,878,968 |
| Mylan, Inc. 1.35% 11/29/16 | | 1,345,000 | 1,333,756 |
| Perrigo Co. PLC: | | | |
| 1.3% 11/8/16 | | 1,103,000 | 1,095,245 |
| 2.3% 11/8/18 | | 1,180,000 | 1,163,399 |
| Perrigo Finance PLC: | | | |
| 3.5% 12/15/21 | | 1,065,000 | 1,035,716 |
| 4.9% 12/15/44 | | 696,000 | 628,107 |
| Watson Pharmaceuticals, Inc. 1.875% 10/1/17 | | 1,428,000 | 1,426,268 |
| Zoetis, Inc.: | | | |
| 1.875% 2/1/18 | | 676,000 | 666,948 |
| 3.25% 2/1/23 | | 1,649,000 | 1,574,835 |
| | | | 47,633,665 |
|
| TOTAL HEALTH CARE | | | 150,161,446 |
|
| INDUSTRIALS - 0.6% | | | |
| Airlines - 0.1% | | | |
| Continental Airlines, Inc.: | | | |
| 6.648% 3/15/19 | | 393,964 | 403,064 |
| 6.795% 2/2/20 | | 456,082 | 462,923 |
| Northwest Airlines, Inc. pass-thru trust certificates 7.027% 11/1/19 | | 2,219,111 | 2,472,756 |
| U.S. Airways pass-thru trust certificates: | | | |
| 6.85% 1/30/18 | | 736,967 | 781,185 |
| 8.36% 1/20/19 | | 2,354,016 | 2,436,406 |
| | | | 6,556,334 |
| Trading Companies & Distributors - 0.5% | | | |
| Air Lease Corp.: | | | |
| 2.125% 1/15/18 | | 2,155,000 | 2,117,288 |
| 2.625% 9/4/18 | | 4,630,000 | 4,577,598 |
| 3.75% 2/1/22 | | 4,522,000 | 4,441,802 |
| 3.875% 4/1/21 | | 4,057,000 | 4,077,285 |
| 4.25% 9/15/24 | | 3,565,000 | 3,493,700 |
| 4.75% 3/1/20 | | 3,519,000 | 3,686,153 |
| | | | 22,393,826 |
|
| TOTAL INDUSTRIALS | | | 28,950,160 |
|
| INFORMATION TECHNOLOGY - 0.6% | | | |
| Electronic Equipment & Components - 0.1% | | | |
| Amphenol Corp. 3.125% 9/15/21 | | 1,394,000 | 1,379,052 |
| Tyco Electronics Group SA 2.375% 12/17/18 | | 832,000 | 830,963 |
| | | | 2,210,015 |
| Technology Hardware, Storage & Peripherals - 0.5% | | | |
| Apple, Inc. 4.375% 5/13/45 | | 10,649,000 | 10,744,415 |
| Hewlett Packard Enterprise Co.: | | | |
| 3.6% 10/15/20 (a) | | 4,703,000 | 4,714,287 |
| 4.9% 10/15/25 (a) | | 4,703,000 | 4,618,727 |
| 6.35% 10/15/45 (a) | | 4,703,000 | 4,464,520 |
| | | | 24,541,949 |
|
| TOTAL INFORMATION TECHNOLOGY | | | 26,751,964 |
|
| MATERIALS - 0.9% | | | |
| Chemicals - 0.1% | | | |
| The Dow Chemical Co.: | | | |
| 4.125% 11/15/21 | | 3,587,000 | 3,761,665 |
| 4.25% 11/15/20 | | 1,196,000 | 1,252,480 |
| | | | 5,014,145 |
| Metals & Mining - 0.8% | | | |
| Alcoa, Inc. 5.125% 10/1/24 | | 2,956,000 | 2,689,960 |
| BHP Billiton Financial (U.S.A.) Ltd.: | | | |
| 6.25% 10/19/75 (a)(b) | | 1,921,000 | 1,880,179 |
| 6.75% 10/19/75 (a)(b) | | 4,773,000 | 4,605,945 |
| Corporacion Nacional del Cobre de Chile (Codelco): | | | |
| 3.875% 11/3/21 (a) | | 3,750,000 | 3,604,058 |
| 4.5% 8/13/23 (a) | | 9,000,000 | 8,726,058 |
| 4.875% 11/4/44 (a) | | 1,712,000 | 1,367,867 |
| Freeport-McMoRan, Inc. 2.3% 11/14/17 | | 2,852,000 | 2,431,330 |
| Rio Tinto Finance (U.S.A.) PLC 2.25% 12/14/18 | | 4,174,000 | 4,069,980 |
| Vale Overseas Ltd.: | | | |
| 4.375% 1/11/22 | | 3,818,000 | 2,889,573 |
| 6.25% 1/23/17 | | 3,115,000 | 3,109,082 |
| | | | 35,374,032 |
|
| TOTAL MATERIALS | | | 40,388,177 |
|
| TELECOMMUNICATION SERVICES - 2.0% | | | |
| Diversified Telecommunication Services - 1.9% | | | |
| AT&T, Inc. 2.45% 6/30/20 | | 3,187,000 | 3,139,842 |
| CenturyLink, Inc.: | | | |
| 5.15% 6/15/17 | | 330,000 | 339,075 |
| 6% 4/1/17 | | 825,000 | 853,875 |
| 6.15% 9/15/19 | | 2,305,000 | 2,351,100 |
| Embarq Corp. 7.995% 6/1/36 | | 29,008,000 | 29,878,240 |
| Verizon Communications, Inc.: | | | |
| 1.35% 6/9/17 | | 6,483,000 | 6,464,543 |
| 2.625% 2/21/20 | | 6,253,000 | 6,275,949 |
| 4.5% 9/15/20 | | 11,000,000 | 11,820,116 |
| 5.012% 8/21/54 | | 9,569,000 | 8,759,558 |
| 6.25% 4/1/37 | | 1,380,000 | 1,549,120 |
| 6.4% 9/15/33 | | 4,059,000 | 4,624,536 |
| 6.55% 9/15/43 | | 11,032,000 | 13,096,937 |
| | | | 89,152,891 |
| Wireless Telecommunication Services - 0.1% | | | |
| America Movil S.A.B. de CV 2.375% 9/8/16 | | 5,411,000 | 5,430,842 |
|
| TOTAL TELECOMMUNICATION SERVICES | | | 94,583,733 |
|
| UTILITIES - 3.2% | | | |
| Electric Utilities - 2.2% | | | |
| AmerenUE 6.4% 6/15/17 | | 3,819,000 | 4,079,631 |
| American Electric Power Co., Inc. 1.65% 12/15/17 | | 1,748,000 | 1,735,019 |
| American Transmission Systems, Inc. 5% 9/1/44 (a) | | 605,000 | 606,294 |
| Dayton Power & Light Co. 1.875% 9/15/16 | | 1,393,000 | 1,394,178 |
| Duquesne Light Holdings, Inc.: | | | |
| 5.9% 12/1/21 (a) | | 2,664,000 | 2,971,631 |
| 6.4% 9/15/20 (a) | | 7,513,000 | 8,508,172 |
| Edison International 3.75% 9/15/17 | | 2,401,000 | 2,477,001 |
| Entergy Corp. 4% 7/15/22 | | 4,900,000 | 4,999,436 |
| Eversource Energy: | | | |
| 1.45% 5/1/18 | | 1,125,000 | 1,106,719 |
| 2.8% 5/1/23 | | 5,110,000 | 4,922,698 |
| Exelon Corp.: | | | |
| 1.55% 6/9/17 | | 934,000 | 930,099 |
| 3.95% 6/15/25 (a) | | 4,402,000 | 4,398,703 |
| FirstEnergy Corp.: | | | |
| 2.75% 3/15/18 | | 10,761,000 | 10,809,694 |
| 4.25% 3/15/23 | | 11,729,000 | 11,939,242 |
| 7.375% 11/15/31 | | 5,897,000 | 7,182,151 |
| FirstEnergy Solutions Corp. 6.05% 8/15/21 | | 7,286,000 | 7,775,743 |
| IPALCO Enterprises, Inc. 3.45% 7/15/20 | | 7,767,000 | 7,611,660 |
| LG&E and KU Energy LLC 3.75% 11/15/20 | | 525,000 | 542,303 |
| Nevada Power Co. 6.5% 5/15/18 | | 3,165,000 | 3,525,766 |
| NV Energy, Inc. 6.25% 11/15/20 | | 1,238,000 | 1,406,335 |
| Pennsylvania Electric Co. 6.05% 9/1/17 | | 2,905,000 | 3,092,201 |
| Progress Energy, Inc.: | | | |
| 4.4% 1/15/21 | | 4,274,000 | 4,522,631 |
| 5.625% 1/15/16 | | 2,000,000 | 2,001,996 |
| TECO Finance, Inc.: | | | |
| 4% 3/15/16 | | 1,075,000 | 1,080,207 |
| 5.15% 3/15/20 | | 1,545,000 | 1,659,339 |
| | | | 101,278,849 |
| Gas Utilities - 0.0% | | | |
| Southern Natural Gas Co./Southern Natural Issuing Corp. 4.4% 6/15/21 | | 1,182,000 | 1,098,059 |
| Multi-Utilities - 1.0% | | | |
| Berkshire Hathaway Energy Co. 1.1% 5/15/17 | | 5,903,000 | 5,849,289 |
| Dominion Resources, Inc.: | | | |
| 1.25% 3/15/17 | | 8,300,000 | 8,248,864 |
| 2.9031% 9/30/66 (b) | | 15,230,000 | 10,520,518 |
| NiSource Finance Corp.: | | | |
| 5.45% 9/15/20 | | 4,156,000 | 4,556,082 |
| 6.4% 3/15/18 | | 1,300,000 | 1,416,466 |
| PG&E Corp. 2.4% 3/1/19 | | 600,000 | 598,854 |
| Puget Energy, Inc.: | | | |
| 6% 9/1/21 | | 4,807,000 | 5,416,979 |
| 6.5% 12/15/20 | | 1,534,000 | 1,757,496 |
| Sempra Energy 2.3% 4/1/17 | | 4,185,000 | 4,209,269 |
| Wisconsin Energy Corp. 6.25% 5/15/67 (b) | | 1,426,000 | 1,062,370 |
| | | | 43,636,187 |
|
| TOTAL UTILITIES | | | 146,013,095 |
|
| TOTAL NONCONVERTIBLE BONDS | | | |
| (Cost $2,332,917,753) | | | 2,288,444,410 |
|
| U.S. Government and Government Agency Obligations - 12.2% | | | |
| U.S. Treasury Inflation-Protected Obligations - 4.1% | | | |
| U.S. Treasury Inflation-Indexed Bonds: | | | |
| 0.75% 2/15/45 | | $48,621,881 | $42,323,676 |
| 1.375% 2/15/44 | | 45,489,233 | 46,211,054 |
| U.S. Treasury Inflation-Indexed Notes: | | | |
| 0.125% 7/15/24 | | 56,412,928 | 53,554,200 |
| 0.25% 1/15/25 | | 49,397,151 | 47,116,534 |
|
| TOTAL U.S. TREASURY INFLATION-PROTECTED OBLIGATIONS | | | 189,205,464 |
|
| U.S. Treasury Obligations - 8.1% | | | |
| U.S. Treasury Bonds: | | | |
| 2.875% 8/15/45 | | 28,820,000 | 27,936,264 |
| 3% 5/15/45 | | 120,503,000 | 119,721,418 |
| U.S. Treasury Notes: | | | |
| 0.875% 11/30/17 (c) | | 110,000,000 | 109,692,220 |
| 2% 11/30/22 | | 100,100,000 | 99,553,654 |
| 2% 8/15/25 | | 3,400,000 | 3,314,946 |
| 2.125% 5/15/25 (d)(e) | | 14,091,000 | 13,906,281 |
|
| TOTAL U.S. TREASURY OBLIGATIONS | | | 374,124,783 |
|
| TOTAL U.S. GOVERNMENT AND GOVERNMENT AGENCY OBLIGATIONS | | | |
| (Cost $580,404,555) | | | 563,330,247 |
|
| U.S. Government Agency - Mortgage Securities - 21.4% | | | |
| Fannie Mae - 12.9% | | | |
| 1.721% 5/1/34 (b) | | 671,054 | 689,738 |
| 1.838% 9/1/33 (b) | | 354,375 | 365,467 |
| 1.94% 7/1/35 (b) | | 22,219 | 23,107 |
| 2.048% 10/1/33 (b) | | 21,580 | 22,402 |
| 2.175% 3/1/35 (b) | | 5,529 | 5,743 |
| 2.21% 10/1/33 (b) | | 463,093 | 484,765 |
| 2.23% 7/1/34 (b) | | 35,906 | 37,516 |
| 2.302% 6/1/36 (b) | | 83,833 | 88,133 |
| 2.351% 7/1/35 (b) | | 51,478 | 54,344 |
| 2.394% 2/1/36 (b) | | 542,842 | 574,809 |
| 2.394% 8/1/36 (b) | | 1,415,340 | 1,502,037 |
| 2.419% 11/1/36 (b) | | 745,160 | 787,699 |
| 2.445% 12/1/35 (b) | | 262,594 | 278,364 |
| 2.458% 3/1/35 (b) | | 35,322 | 37,486 |
| 2.5% 9/1/27 to 1/1/43 | | 22,464,576 | 22,428,173 |
| 2.5% 1/1/31 (f) | | 27,800,000 | 28,020,715 |
| 2.557% 6/1/42 (b) | | 440,783 | 451,490 |
| 2.559% 10/1/33 (b) | | 48,173 | 51,120 |
| 2.619% 5/1/36 (b) | | 229,669 | 243,738 |
| 2.628% 7/1/37 (b) | | 102,358 | 108,628 |
| 2.633% 9/1/36 (b) | | 734,293 | 779,272 |
| 2.689% 5/1/35 (b) | | 134,463 | 142,700 |
| 2.951% 11/1/40 (b) | | 279,708 | 290,784 |
| 2.98% 9/1/41 (b) | | 312,736 | 325,875 |
| 2.991% 10/1/41 (b) | | 136,782 | 142,306 |
| 3% 8/1/29 to 10/1/45 | | 95,246,074 | 95,567,665 |
| 3.242% 7/1/41 (b) | | 494,381 | 519,002 |
| 3.347% 10/1/41 (b) | | 255,075 | 265,801 |
| 3.5% 10/1/25 to 10/1/45 | | 137,273,341 | 142,400,674 |
| 3.5% 1/1/46 (f) | | 18,200,000 | 18,773,558 |
| 3.553% 7/1/41 (b) | | 583,259 | 613,204 |
| 4% 9/1/26 to 9/1/45 | | 101,304,649 | 107,551,921 |
| 4% 1/1/46 (f) | | 5,000,000 | 5,289,996 |
| 4.5% 5/1/25 to 4/1/45 | | 44,789,943 | 48,580,500 |
| 4.5% 1/1/46 (f) | | 200,000 | 215,995 |
| 4.5% 1/1/46 (f) | | 100,000 | 107,998 |
| 4.5% 1/1/46 (f) | | 22,400,000 | 24,191,476 |
| 4.5% 1/1/46 (f) | | 17,800,000 | 19,223,583 |
| 5% 9/1/20 to 11/1/44 | | 18,163,281 | 20,017,613 |
| 5.5% 3/1/18 to 3/1/41 | | 33,726,491 | 37,736,673 |
| 6% 10/1/34 to 1/1/42 | | 8,508,448 | 9,670,240 |
| 6.5% 2/1/17 to 8/1/36 | | 3,135,292 | 3,551,399 |
| 7% 11/1/23 to 8/1/32 | | 703,346 | 801,422 |
| 7.5% 7/1/16 to 11/1/31 | | 549,409 | 640,444 |
| 8% 1/1/30 to 5/1/30 | | 9,550 | 11,360 |
| 8.5% 3/1/25 to 6/1/25 | | 533 | 631 |
|
| TOTAL FANNIE MAE | | | 593,667,566 |
|
| Freddie Mac - 5.1% | | | |
| 2.075% 3/1/36 (b) | | 113,944 | 118,559 |
| 2.135% 4/1/35 (b) | | 499,669 | 520,891 |
| 2.373% 1/1/35 (b) | | 77,875 | 82,646 |
| 2.76% 3/1/33 (b) | | 6,931 | 7,355 |
| 2.804% 11/1/35 (b) | | 210,976 | 220,274 |
| 3% 8/1/42 to 8/1/45 | | 53,147,969 | 53,173,974 |
| 3% 1/1/46 (f) | | 23,400,000 | 23,364,612 |
| 3.211% 9/1/41 (b) | | 327,955 | 342,058 |
| 3.226% 4/1/41 (b) | | 333,150 | 347,340 |
| 3.239% 10/1/35 (b) | | 80,116 | 85,023 |
| 3.298% 6/1/41 (b) | | 369,821 | 388,358 |
| 3.451% 5/1/41 (b) | | 285,190 | 296,271 |
| 3.5% 1/1/42 to 11/1/45 | | 57,592,811 | 59,396,795 |
| 3.618% 6/1/41 (b) | | 525,798 | 553,797 |
| 3.704% 5/1/41 (b) | | 434,866 | 458,900 |
| 4% 6/1/24 to 10/1/44 | | 36,658,695 | 38,886,194 |
| 4% 1/1/46 (f) | | 8,400,000 | 8,872,755 |
| 4% 1/1/46 (f) | | 3,200,000 | 3,380,097 |
| 4.5% 7/1/25 to 1/1/45 | | 23,832,183 | 25,817,005 |
| 5% 1/1/35 to 6/1/41 | | 7,470,433 | 8,255,886 |
| 5.5% 1/1/38 to 6/1/41 | | 10,138,255 | 11,322,436 |
| 6% 4/1/32 to 8/1/37 | | 1,410,469 | 1,597,958 |
| 7.5% 5/1/17 to 11/1/31 | | 61,568 | 72,258 |
| 8% 7/1/17 to 5/1/27 | | 3,989 | 4,698 |
| 8.5% 3/1/20 to 1/1/28 | | 44,804 | 52,042 |
|
| TOTAL FREDDIE MAC | | | 237,618,182 |
|
| Ginnie Mae - 3.4% | | | |
| 3% 6/20/42 to 12/20/45 | | 26,501,205 | 26,902,575 |
| 3.5% 1/15/41 to 8/20/45 | | 56,185,390 | 58,671,125 |
| 4% 2/15/40 to 11/20/45 | | 30,947,932 | 33,074,511 |
| 4% 1/1/46 (f) | | 1,700,000 | 1,805,030 |
| 4.5% 5/15/39 to 5/20/41 | | 25,964,387 | 28,109,235 |
| 5% 3/15/39 to 4/15/41 | | 3,717,547 | 4,156,976 |
| 5.5% 6/15/35 | | 1,124,460 | 1,264,505 |
| 6.5% 4/15/35 to 11/15/35 | | 110,452 | 127,805 |
| 7% 1/15/28 to 7/15/32 | | 1,469,334 | 1,717,580 |
| 7.5% 4/15/22 to 10/15/28 | | 375,921 | 437,001 |
| 8% 2/15/17 to 9/15/30 | | 23,436 | 27,446 |
| 8.5% 3/15/30 | | 3,656 | 4,017 |
|
| TOTAL GINNIE MAE | | | 156,297,806 |
|
| TOTAL U.S. GOVERNMENT AGENCY - MORTGAGE SECURITIES | | | |
| (Cost $984,925,850) | | | 987,583,554 |
|
| Asset-Backed Securities - 1.1% | | | |
| Accredited Mortgage Loan Trust Series 2005-1 Class M1, 1.1266% 4/25/35 (b) | | $234,160 | $213,249 |
| Airspeed Ltd. Series 2007-1A Class C1, 2.8305% 6/15/32 (a)(b) | | 2,080,525 | 936,236 |
| Ameriquest Mortgage Securities, Inc. pass-thru certificates: | | | |
| Series 2003-10 Class M1, 1.4716% 12/25/33 (b) | | 16,414 | 15,337 |
| Series 2004-R2 Class M3, 1.2466% 4/25/34 (b) | | 31,593 | 23,983 |
| Argent Securities, Inc. pass-thru certificates: | | | |
| Series 2003-W7 Class A2, 1.2016% 3/25/34 (b) | | 16,878 | 15,639 |
| Series 2004-W11 Class M2, 1.4716% 11/25/34 (b) | | 198,000 | 193,180 |
| Series 2004-W7 Class M1, 1.2466% 5/25/34 (b) | | 208,902 | 196,621 |
| Series 2006-W4 Class A2C, 0.5816% 5/25/36 (b) | | 404,870 | 142,972 |
| Asset Backed Securities Corp. Home Equity Loan Trust Series 2004-HE2 Class M1, 1.2466% 4/25/34 (b) | | 592,645 | 535,950 |
| Capital Auto Receivables Trust Series 2013-3 Class A3, 1.31% 12/20/17 | | 2,929,944 | 2,929,784 |
| Carrington Mortgage Loan Trust Series 2007-RFC1 Class A3, 0.5616% 12/25/36 (b) | | 635,000 | 424,588 |
| CFC LLC Series 2013-2A Class A, 1.75% 11/15/17 (a) | | 80,383 | 80,353 |
| Citibank Credit Card Issuance Trust Series 2014-A8 Class A8, 1.73% 4/9/20 | | 8,400,000 | 8,419,653 |
| Countrywide Home Loans, Inc.: | | | |
| Series 2003-BC1 Class B1, 5.6716% 3/25/32 (b) | | 11,075 | 10,414 |
| Series 2004-3 Class M4, 1.8766% 4/25/34 (b) | | 22,973 | 21,186 |
| Series 2004-4 Class M2, 1.2166% 6/25/34 (b) | | 35,021 | 32,148 |
| Series 2004-7 Class AF5, 5.868% 1/25/35 | | 1,079,818 | 1,119,522 |
| Fannie Mae Series 2004-T5 Class AB3, 0.9931% 5/28/35 (b) | | 13,702 | 12,698 |
| Fieldstone Mortgage Investment Corp. Series 2004-3 Class M5, 2.396% 8/25/34 (b) | | 102,000 | 96,508 |
| First Franklin Mortgage Loan Trust Series 2004-FF2 Class M3, 1.2466% 3/25/34 (b) | | 2,545 | 2,205 |
| Ford Credit Floorplan Master Owner Trust Series 2015-1 Class B, 1.62% 1/15/20 | | 5,416,000 | 5,392,149 |
| Fremont Home Loan Trust Series 2005-A: | | | |
| Class M3, 1.1566% 1/25/35 (b) | | 334,000 | 294,265 |
| Class M4, 1.4416% 1/25/35 (b) | | 122,221 | 69,122 |
| GCO Education Loan Funding Master Trust II Series 2007-1A Class C1L, 0.7732% 2/25/47 (a)(b) | | 354,556 | 319,398 |
| GSAMP Trust Series 2004-AR1 Class B4, 5.5% 6/25/34 (a) | | 77,573 | 2,145 |
| Home Equity Asset Trust: | | | |
| Series 2003-3 Class M1, 1.7116% 8/25/33 (b) | | 157,151 | 149,141 |
| Series 2003-5 Class A2, 1.1216% 12/25/33 (b) | | 11,595 | 10,925 |
| HSI Asset Securitization Corp. Trust Series 2007-HE1 Class 2A3, 0.6116% 1/25/37 (b) | | 436,000 | 281,913 |
| Invitation Homes Trust Series 2015-SFR3 Class E, 3.9473% 8/17/32 (a)(b) | | 1,446,000 | 1,418,582 |
| JPMorgan Mortgage Acquisition Trust Series 2007-CH1 Class AV4, 0.5516% 11/25/36 (b) | | 43,421 | 43,390 |
| KeyCorp Student Loan Trust Series 1999-A Class A2, 0.9331% 12/27/29 (b) | | 29,141 | 28,927 |
| MASTR Asset Backed Securities Trust Series 2007-HE1 Class M1, 0.7216% 5/25/37 (b) | | 103,499 | 1,385 |
| Merrill Lynch Mortgage Investors Trust: | | | |
| Series 2003-OPT1 Class M1, 1.3966% 7/25/34 (b) | | 15,340 | 14,341 |
| Series 2006-FM1 Class A2B, 0.5316% 4/25/37 (b) | | 51,011 | 50,617 |
| Series 2006-OPT1 Class A1A, 0.9416% 6/25/35 (b) | | 272,566 | 264,396 |
| Morgan Stanley ABS Capital I Trust: | | | |
| Series 2004-HE6 Class A2, 1.1016% 8/25/34 (b) | | 20,187 | 18,845 |
| Series 2004-NC6 Class M3, 2.5966% 7/25/34 (b) | | 54,718 | 44,834 |
| Series 2004-NC8 Class M6, 2.2966% 9/25/34 (b) | | 62,196 | 57,198 |
| Series 2005-NC1 Class M1, 1.0816% 1/25/35 (b) | | 90,038 | 82,109 |
| New Century Home Equity Loan Trust Series 2005-4 Class M2, 0.9316% 9/25/35 (b) | | 503,000 | 451,888 |
| Park Place Securities, Inc.: | | | |
| Series 2004-WCW1: | | | |
| Class M3, 2.2966% 9/25/34 (b) | | 188,000 | 177,110 |
| Class M4, 2.5966% 9/25/34 (b) | | 241,000 | 155,490 |
| Series 2005-WCH1 Class M4, 1.6666% 1/25/36 (b) | | 520,000 | 468,023 |
| Salomon Brothers Mortgage Securities VII, Inc. Series 2003-HE1 Class A, 1.2216% 4/25/33 (b) | | 1,796 | 1,681 |
| Santander Drive Auto Receivables Trust: | | | |
| Series 2014-4 Class C, 2.6% 11/16/20 | | 2,365,000 | 2,368,976 |
| Series 2015-1: | | | |
| Class A3, 1.27% 2/15/19 | | 12,161,000 | 12,119,925 |
| Class C, 2.57% 4/15/21 | | 8,000,000 | 7,952,606 |
| Saxon Asset Securities Trust Series 2004-1 Class M1, 1.2166% 3/25/35 (b) | | 266,303 | 247,891 |
| SLM Private Credit Student Loan Trust Series 2004-A Class C, 1.462% 6/15/33 (b) | | 198,561 | 192,506 |
| Structured Asset Investment Loan Trust Series 2004-8 Class M5, 2.1466% 9/25/34 (b) | | 14,503 | 12,456 |
| Terwin Mortgage Trust Series 2003-4HE Class A1, 1.2816% 9/25/34 (b) | | 10,148 | 8,990 |
| Whinstone Capital Management Ltd. Series 1A Class B3, 2.1199% 10/25/44 (a)(b) | | 630,180 | 630,054 |
| TOTAL ASSET-BACKED SECURITIES | | | |
| (Cost $49,566,096) | | | 48,753,504 |
|
| Collateralized Mortgage Obligations - 0.2% | | | |
| Private Sponsor - 0.0% | | | |
| Bear Stearns ALT-A Trust floater Series 2005-1 Class A1, 0.9816% 1/25/35 (b) | | 348,450 | 339,037 |
| Granite Mortgages PLC floater Series 2003-3 Class 1C, 2.7672% 1/20/44 (b) | | 151,584 | 151,433 |
| MASTR Adjustable Rate Mortgages Trust Series 2007-3 Class 22A2, 0.407% 5/25/47 (b) | | 123,782 | 114,007 |
| Merrill Lynch Alternative Note Asset Trust floater Series 2007-OAR1 Class A1, 0.5916% 2/25/37 (b) | | 211,187 | 188,641 |
| Opteum Mortgage Acceptance Corp. floater Series 2005-3 Class APT, 0.7116% 7/25/35 (b) | | 316,645 | 300,568 |
| RESI Finance LP/RESI Finance DE Corp. floater Series 2003-B Class B5, 2.5445% 6/10/35 (a)(b) | | 61,677 | 56,324 |
| Sequoia Mortgage Trust floater Series 2004-6 Class A3B, 1.3234% 7/20/34 (b) | | 7,982 | 7,830 |
|
| TOTAL PRIVATE SPONSOR | | | 1,157,840 |
|
| U.S. Government Agency - 0.2% | | | |
| Fannie Mae planned amortization class: | | | |
| Series 1999-54 Class PH, 6.5% 11/18/29 | | 465,929 | 499,847 |
| Series 1999-57 Class PH, 6.5% 12/25/29 | | 384,064 | 438,637 |
| Series 2002-9 Class PC, 6% 3/25/17 | | 10,054 | 10,264 |
| Freddie Mac planned amortization class Series 2500 Class TE, 5.5% 9/15/17 | | 382,020 | 391,891 |
| Ginnie Mae guaranteed REMIC pass-thru certificates: | | | |
| Series 2007-35 Class SC, 38.133% 6/16/37 (b)(g) | | 47,423 | 90,336 |
| Series 2015-H21 Class JA, 2.5% 6/20/65 (h) | | 7,240,076 | 7,327,332 |
|
| TOTAL U.S. GOVERNMENT AGENCY | | | 8,758,307 |
|
| TOTAL COLLATERALIZED MORTGAGE OBLIGATIONS | | | |
| (Cost $9,750,187) | | | 9,916,147 |
|
| Commercial Mortgage Securities - 7.0% | | | |
| Banc of America Commercial Mortgage Trust: | | | |
| sequential payer: | | | |
| Series 2006-2 Class A4, 5.9975% 5/10/45 (b) | | 801,969 | 803,018 |
| Series 2006-3 Class A4, 5.889% 7/10/44 (b) | | 19,670,793 | 19,774,639 |
| Series 2006-4 Class A1A, 5.617% 7/10/46 (b) | | 9,720,158 | 9,805,127 |
| Series 2007-2 Class A4, 5.7866% 4/10/49 (b) | | 5,232,000 | 5,294,645 |
| Series 2007-3 Class A4, 5.7295% 6/10/49 (b) | | 2,393,799 | 2,460,334 |
| Banc of America Commercial Mortgage, Inc. sequential payer Series 2001-1 Class A4, 5.451% 1/15/49 | | 7,300,788 | 7,488,824 |
| Bayview Commercial Asset Trust floater: | | | |
| Series 2005-4A: | | | |
| Class A2, 0.8116% 1/25/36 (a)(b) | | 407,257 | 362,570 |
| Class M1, 0.8716% 1/25/36 (a)(b) | | 85,212 | 69,742 |
| Class M2, 0.8916% 1/25/36 (a)(b) | | 25,706 | 20,413 |
| Class M3, 0.9216% 1/25/36 (a)(b) | | 37,370 | 28,470 |
| Series 2007-1 Class A2, 0.6916% 3/25/37 (a)(b) | | 111,411 | 93,838 |
| Series 2007-2A: | | | |
| Class A1, 0.6916% 7/25/37 (a)(b) | | 118,277 | 101,287 |
| Class A2, 0.7416% 7/25/37 (a)(b) | | 110,707 | 89,168 |
| Class M2, 0.8316% 7/25/37 (a)(b) | | 61,504 | 43,496 |
| Class M3, 0.9116% 7/25/37 (a)(b) | | 46,805 | 28,711 |
| Series 2007-3: | | | |
| Class A2, 0.7116% 7/25/37 (a)(b) | | 162,328 | 132,433 |
| Class M1, 0.7316% 7/25/37 (a)(b) | | 66,500 | 50,761 |
| Class M2, 0.7616% 7/25/37 (a)(b) | | 69,910 | 50,716 |
| Class M3, 0.7916% 7/25/37 (a)(b) | | 152,779 | 75,612 |
| Class M4, 0.9216% 7/25/37 (a)(b) | | 241,446 | 68,149 |
| Class M5, 1.0216% 7/25/37 (a)(b) | | 83,614 | 13,024 |
| C-BASS Trust floater Series 2006-SC1 Class A, 0.6916% 5/25/36 (a)(b) | | 75,161 | 72,474 |
| CDGJ Commercial Mortgage Trust Series 2014-BXCH Class DPA, 3.197% 12/15/27 (a)(b) | | 1,795,000 | 1,762,355 |
| CGBAM Commercial Mortgage Trust Series 2015-SMRT Class D, 3.768% 4/10/28 (a)(b) | | 2,236,000 | 2,260,159 |
| Citigroup/Deutsche Bank Commercial Mortgage Trust sequential payer: | | | |
| Series 2006-CD3 Class A5, 5.617% 10/15/48 | | 826,482 | 834,610 |
| Series 2007-CD4 Class A4, 5.322% 12/11/49 | | 14,420,457 | 14,663,203 |
| COMM Mortgage Trust pass-thru certificates: | | | |
| floater Series 2005-F10A Class J, 1.1805% 4/15/17 (a)(b) | | 44,103 | 44,202 |
| sequential payer Series 2006-C7 Class A1A, 5.9504% 6/10/46 (b) | | 6,000,712 | 6,045,563 |
| Credit Suisse Commercial Mortgage Trust: | | | |
| sequential payer: | | | |
| Series 2007-C2 Class A2, 5.448% 1/15/49 (b) | | 10,599 | 10,572 |
| Series 2007-C3 Class A4, 5.8889% 6/15/39 (b) | | 2,208,313 | 2,267,210 |
| Series 2007-C5 Class A4, 5.695% 9/15/40 (b) | | 2,642,335 | 2,729,938 |
| Credit Suisse First Boston Mortgage Securities Corp. Series 2001-CKN5 Class AX, 0.0059% 9/15/34 (a)(b)(i) | | 1,865 | 0 |
| CSMC Series 2015-TOWN: | | | |
| Class B, 2.097% 3/15/17 (a)(b) | | 870,000 | 862,896 |
| Class C, 2.447% 3/15/17 (a)(b) | | 848,000 | 840,443 |
| Class D, 3.397% 3/15/17 (a)(b) | | 1,283,000 | 1,268,301 |
| GAHR Commercial Mortgage Trust Series 2015-NRF: | | | |
| Class BFX, 3.3822% 12/15/19 (a)(b) | | 4,550,000 | 4,540,489 |
| Class CFX, 3.3822% 12/15/19 (a)(b) | | 3,823,000 | 3,732,882 |
| Class DFX, 3.3822% 12/15/19 (a)(b) | | 3,240,000 | 3,116,473 |
| GE Capital Commercial Mortgage Corp. sequential payer Series 2007-C1 Class A4, 5.543% 12/10/49 | | 12,036,500 | 12,381,092 |
| Greenwich Capital Commercial Funding Corp.: | | | |
| sequential payer Series 2007-GG9 Class A4, 5.444% 3/10/39 | | 1,763,864 | 1,803,162 |
| Series 2006-GG7 Class A4, 6.0208% 7/10/38 (b) | | 5,950,037 | 5,977,395 |
| GS Mortgage Securities Trust sequential payer Series 2006-GG8 Class A4, 5.56% 11/10/39 | | 771,781 | 770,453 |
| Hilton U.S.A. Trust Series 2013-HLT: | | | |
| Class CFX, 3.7141% 11/5/30 (a) | | 890,000 | 882,938 |
| Class DFX, 4.4065% 11/5/30 (a) | | 8,320,000 | 8,280,462 |
| JPMorgan Chase Commercial Mortgage Securities Trust: | | | |
| floater: | | | |
| Series 2006-FL2A: | | | |
| Class E, 0.6105% 11/15/18 (a)(b) | | 29,751 | 29,351 |
| Class F, 0.6605% 11/15/18 (a)(b) | | 88,352 | 87,237 |
| Class G, 0.6905% 11/15/18 (a)(b) | | 76,973 | 76,022 |
| Class H, 0.8305% 11/15/18 (a)(b) | | 58,914 | 58,332 |
| Series 2014-BXH: | | | |
| Class C, 1.9805% 4/15/27 (a)(b) | | 1,359,000 | 1,357,521 |
| Class D, 2.5805% 4/15/27 (a)(b) | | 2,897,000 | 2,891,685 |
| sequential payer: | | | |
| Series 2006-CB16: | | | |
| Class A1A, 5.546% 5/12/45 | | 5,526,708 | 5,592,938 |
| Class A4, 5.552% 5/12/45 | | 1,206,976 | 1,221,140 |
| Series 2006-CB17 Class A4, 5.429% 12/12/43 | | 2,677,647 | 2,722,526 |
| Series 2006-LDP8 Class A1A, 5.397% 5/15/45 | | 2,053,751 | 2,074,330 |
| Series 2007-CB18 Class A4, 5.44% 6/12/47 | | 784,355 | 803,181 |
| Series 2007-CB19 Class A4, 5.6946% 2/12/49 (b) | | 4,784,178 | 4,942,094 |
| Series 2007-LD11 Class A4, 5.9609% 6/15/49 (b) | | 6,664,597 | 6,796,515 |
| Series 2007-LDPX Class A3, 5.42% 1/15/49 | | 4,903,961 | 5,005,003 |
| Series 2006-LDP7 Class A4, 5.9085% 4/15/45 (b) | | 6,736,455 | 6,758,029 |
| Series 2007-CB20 Class A1A, 5.746% 2/12/51 | | 13,571,404 | 14,191,839 |
| Series 2007-LDP10 Class CS, 5.466% 1/15/49 (b) | | 496,508 | 8 |
| LB Commercial Conduit Mortgage Trust sequential payer Series 2007-C3 Class A4, 6.0966% 7/15/44 (b) | | 3,645,344 | 3,780,697 |
| LB-UBS Commercial Mortgage Trust: | | | |
| sequential payer: | | | |
| Series 2007-C1 Class A4, 5.424% 2/15/40 | | 11,902,737 | 12,175,533 |
| Series 2007-C2 Class A3, 5.43% 2/15/40 | | 946,258 | 971,134 |
| Series 2006-C1 Class AM, 5.217% 2/15/31 (b) | | 1,112,748 | 1,113,110 |
| Series 2007-C7 Class A3, 5.866% 9/15/45 | | 4,384,474 | 4,601,321 |
| Merrill Lynch Mortgage Trust Series 2007-C1 Class A4, 6.0298% 6/12/50 (b) | | 10,916,000 | 11,263,353 |
| Merrill Lynch-CFC Commercial Mortgage Trust sequential payer: | | | |
| Series 2006-4 Class A3, 5.172% 12/12/49 (b) | | 399,756 | 406,208 |
| Series 2007-5 Class A4, 5.378% 8/12/48 | | 2,219,807 | 2,272,325 |
| Series 2007-6 Class A4, 5.485% 3/12/51 (b) | | 3,875,000 | 3,972,960 |
| Series 2007-9 Class A4, 5.7% 9/12/49 | | 5,346,597 | 5,561,619 |
| Morgan Stanley Capital I Trust: | | | |
| floater: | | | |
| Series 2006-XLF Class C, 1.531% 7/15/19 (a)(b) | | 113,478 | 113,728 |
| Series 2007-XLFA: | | | |
| Class D, 0.387% 10/15/20 (a)(b) | | 98,072 | 98,095 |
| Class E, 0.447% 10/15/20 (a)(b) | | 294,000 | 294,055 |
| Class F, 0.497% 10/15/20 (a)(b) | | 176,000 | 176,033 |
| Class G, 0.537% 10/15/20 (a)(b) | | 218,000 | 218,041 |
| Class H, 0.627% 10/15/20 (a)(b) | | 137,000 | 139,348 |
| Class J, 0.777% 10/15/20 (a)(b) | | 79,407 | 76,962 |
| sequential payer Series 2007-HQ11 Class A31, 5.439% 2/12/44 | | 517,824 | 517,280 |
| Series 2007-IQ14 Class A4, 5.692% 4/15/49 | | 25,182,000 | 25,827,304 |
| Providence Place Group Ltd. Partnership Series 2000-C1 Class A2, 7.75% 7/20/28 (a) | | 4,386,209 | 5,467,849 |
| Wachovia Bank Commercial Mortgage Trust: | | | |
| sequential payer: | | | |
| Series 2006-C28 Class A4, 5.572% 10/15/48 | | 3,415,366 | 3,463,758 |
| Series 2006-C29 Class A1A, 5.297% 11/15/48 | | 3,020,429 | 3,087,302 |
| Series 2007-C30 Class A5, 5.342% 12/15/43 | | 20,930,000 | 21,482,592 |
| Series 2007-C31 Class A4, 5.509% 4/15/47 | | 8,121,000 | 8,255,113 |
| Series 2007-C32 Class A3, 5.8992% 6/15/49 (b) | | 11,032,000 | 11,283,708 |
| Series 2007-C33 Class A4, 6.1504% 2/15/51 (b) | | 7,312,057 | 7,558,454 |
| Series 2006-C26 Class A1A, 6.009% 6/15/45 (b) | | 4,210,478 | 4,241,207 |
| Series 2006-C27 Class A1A, 5.749% 7/15/45 (b) | | 7,997,119 | 8,063,315 |
| TOTAL COMMERCIAL MORTGAGE SECURITIES | | | |
| (Cost $335,405,140) | | | 323,092,404 |
|
| Municipal Securities - 4.5% | | | |
| California Gen. Oblig.: | | | |
| Series 2009, 7.35% 11/1/39 | | $805,000 | $1,140,242 |
| 6.65% 3/1/22 | | 4,360,000 | 5,245,560 |
| 7.3% 10/1/39 | | 6,270,000 | 8,775,429 |
| 7.5% 4/1/34 | | 5,055,000 | 7,053,595 |
| 7.55% 4/1/39 | | 6,085,000 | 8,838,523 |
| 7.6% 11/1/40 | | 10,310,000 | 15,302,618 |
| 7.625% 3/1/40 | | 20,390,000 | 29,693,345 |
| Chicago Gen. Oblig.: | | | |
| (Taxable Proj.): | | | |
| Series 2008 B, 5.63% 1/1/22 | | 880,000 | 868,622 |
| Series 2010 C1, 7.781% 1/1/35 | | 10,090,000 | 11,045,826 |
| Series 2012 B, 5.432% 1/1/42 | | 1,205,000 | 1,027,154 |
| 6.314% 1/1/44 | | 5,300,000 | 5,070,457 |
| Illinois Gen. Oblig.: | | | |
| Series 2003: | | | |
| 4.35% 6/1/18 | | 2,520,000 | 2,576,070 |
| 4.95% 6/1/23 | | 4,950,000 | 4,961,187 |
| 5.1% 6/1/33 | | 55,215,000 | 52,214,065 |
| Series 2010 5, 6.2% 7/1/21 | | 2,260,000 | 2,426,562 |
| Series 2010-1, 6.63% 2/1/35 | | 12,290,000 | 12,818,470 |
| Series 2010-3: | | | |
| 5.547% 4/1/19 | | 120,000 | 126,679 |
| 6.725% 4/1/35 | | 9,480,000 | 9,899,490 |
| 7.35% 7/1/35 | | 5,540,000 | 6,072,062 |
| Series 2011: | | | |
| 4.961% 3/1/16 | | 365,000 | 367,259 |
| 5.365% 3/1/17 | | 140,000 | 145,198 |
| 5.665% 3/1/18 | | 4,465,000 | 4,727,765 |
| 5.877% 3/1/19 | | 14,325,000 | 15,348,665 |
| Series 2013: | | | |
| 2.69% 12/1/17 | | 1,225,000 | 1,221,938 |
| 3.14% 12/1/18 | | 1,270,000 | 1,269,771 |
| TOTAL MUNICIPAL SECURITIES | | | |
| (Cost $211,159,172) | | | 208,236,552 |
|
| Bank Notes - 1.6% | | | |
| Bank of America NA: | | | |
| 1.65% 3/26/18 | | 6,382,000 | 6,338,551 |
| 5.3% 3/15/17 | | 3,403,000 | 3,540,005 |
| Capital One NA 1.65% 2/5/18 | | 20,761,000 | 20,555,051 |
| Discover Bank: | | | |
| (Delaware) 3.2% 8/9/21 | | 6,249,000 | 6,209,406 |
| 3.1% 6/4/20 | | 6,380,000 | 6,397,475 |
| 8.7% 11/18/19 | | 1,503,000 | 1,778,692 |
| KeyBank NA: | | | |
| 2.25% 3/16/20 | | 9,000,000 | 8,901,369 |
| 6.95% 2/1/28 | | 800,000 | 991,298 |
| Marshall & Ilsley Bank 5% 1/17/17 | | 4,952,000 | 5,104,502 |
| Regions Bank 7.5% 5/15/18 | | 13,237,000 | 14,708,359 |
| TOTAL BANK NOTES | | | |
| (Cost $73,731,767) | | | 74,524,708 |
| | | Shares | Value |
|
| Money Market Funds - 4.5% | | | |
| Fidelity Cash Central Fund, 0.33% (j) | | | |
| (Cost $207,816,993) | | 207,816,993 | 207,816,993 |
| TOTAL INVESTMENT PORTFOLIO - 102.2% | | | |
| (Cost $4,785,677,513) | | | 4,711,698,519 |
| NET OTHER ASSETS (LIABILITIES) - (2.2)%(k) | | | (100,162,189) |
| NET ASSETS - 100% | | | $4,611,536,330 |
| TBA Sale Commitments | | |
| | Principal Amount | Value |
| Fannie Mae | | |
| 4% 1/1/46 | | |
| (Proceeds $1,796,156) | $(1,700,000) | $(1,798,599 ) |
Swaps
| Underlying Reference | Rating(1) | Expiration Date | Clearinghouse/Counterparty | Fixed Payment Received/(Paid) | Notional Amount(2) | Value(1) | Upfront Premium Received/(Paid) | Unrealized Appreciation/(Depreciation) |
| Credit Default Swaps | | | | | | | | |
| Sell Protection | | | | | | | | |
| Ameriquest Mortgage Securities Inc Series 2004-R11 Class M9 | C | Dec. 2034 | Bank of America | 4.25% | USD 46,188 | $(44,363) | $0 | $(44,363) |
| Ameriquest Mortgage Securities Inc Series 2004-R11 Class M9 | C | Dec. 2034 | Credit Suisse International | 4.25% | 80,238 | (77,073) | 0 | (77,073) |
|
| TOTAL CREDIT DEFAULT SWAPS | | | | | | $(121,436) | $0 | $(121,436) |
|
(1) Ratings are presented for credit default swaps in which the Fund has sold protection on the underlying referenced debt. Ratings for an underlying index represent a weighted average of the ratings of all securities included in the index. The credit rating or value can be measures of the current payment/performance risk. Ratings are from Moody's Investors Service, Inc. Where Moody's® ratings are not available, S&P® ratings are disclosed and are indicated as such. All ratings are as of the report date and do not reflect subsequent changes.
(2) The notional amount of each credit default swap where the Fund has sold protection approximates the maximum potential amount of future payments that the Portfolio could be required to make if a credit event were to occur.
LegendLegend
(a) Security exempt from registration under Rule 144A of the Securities Act of 1933. These securities may be resold in transactions exempt from registration, normally to qualified institutional buyers. At the end of the period, the value of these securities amounted to $393,123,431 or 8.5% of net assets.
(b) Coupon rates for floating and adjustable rate securities reflect the rates in effect at period end.
(c) Security or a portion of the security is on loan at period end.
(d) Security or a portion of the security has been segregated as collateral for open bi-lateral over-the-counter (OTC) swaps. At period end, the value of securities pledged amounted to $1,189,204.
(e) Security or a portion of the security has been segregated as collateral for mortgage-backed or asset-backed securities purchased on a delayed delivery or when-issued basis. At period end, the value of securities pledged amounted to $374,032.
(f) Security or a portion of the security purchased on a delayed delivery or when-issued basis.
(g) Coupon is inversely indexed to a floating interest rate multiplied by a specified factor. The price may be considerably more volatile than the price of a comparable fixed rate security.
(h) Represents an investment in an underlying pool of reverse mortgages which typically do not require regular principal and interest payments as repayment is deferred until a maturity event.
(i) Security represents right to receive monthly interest payments on an underlying pool of mortgages or assets. Principal shown is the outstanding par amount of the pool as of the end of the period.
(j) Affiliated fund that is generally available only to investment companies and other accounts managed by Fidelity Investments. The rate quoted is the annualized seven-day yield of the fund at period end. A complete unaudited listing of the fund's holdings as of its most recent quarter end is available upon request. In addition, each Fidelity Central Fund's financial statements, which are not covered by the Fund's Report of Independent Registered Public Accounting Firm, are available on the SEC's website or upon request.
(k) Includes cash collateral of $91,721,700 from securities on loan.
Affiliated Central Funds
Information regarding fiscal year to date income earned by the Fund from investments in Fidelity Central Funds is as follows:
| Fund | Income earned |
| Fidelity Cash Central Fund | $339,467 |
| Total | $339,467 |
Investment Valuation
The following is a summary of the inputs used, as of December 31, 2015, involving the Fund's assets and liabilities carried at fair value. The inputs or methodology used for valuing securities may not be an indication of the risk associated with investing in those securities. For more information on valuation inputs, and their aggregation into the levels used below, please refer to the Investment Valuation section in the accompanying Notes to Financial Statements.
| | Valuation Inputs at Reporting Date: |
| Description | Total | Level 1 | Level 2 | Level 3 |
| Investments in Securities: | | | | |
| Corporate Bonds | $2,288,444,410 | $-- | $2,288,444,410 | $-- |
| U.S. Government and Government Agency Obligations | 563,330,247 | -- | 563,330,247 | -- |
| U.S. Government Agency - Mortgage Securities | 987,583,554 | -- | 987,583,554 | -- |
| Asset-Backed Securities | 48,753,504 | -- | 47,817,268 | 936,236 |
| Collateralized Mortgage Obligations | 9,916,147 | -- | 9,916,147 | -- |
| Commercial Mortgage Securities | 323,092,404 | -- | 323,092,404 | -- |
| Municipal Securities | 208,236,552 | -- | 208,236,552 | -- |
| Bank Notes | 74,524,708 | -- | 74,524,708 | -- |
| Money Market Funds | 207,816,993 | 207,816,993 | -- | -- |
| Total Investments in Securities: | $4,711,698,519 | $207,816,993 | $4,502,945,290 | $936,236 |
| Derivative Instruments: | | | | |
| Liabilities | | | | |
| Swaps | $(121,436) | $-- | $(121,436) | $-- |
| Total Liabilities | $(121,436) | $-- | $(121,436) | $-- |
| Total Derivative Instruments: | $(121,436) | $-- | $(121,436) | $-- |
| Other Financial Instruments: | | | | |
| TBA Sale Commitments | $(1,798,599) | $-- | $(1,798,599) | $-- |
| Total Other Financial Instruments: | $(1,798,599) | $-- | $(1,798,599) | $-- |
Value of Derivative Instruments
The following table is a summary of the Fund's value of derivative instruments by primary risk exposure as of December 31, 2015. For additional information on derivative instruments, please refer to the Derivative Instruments section in the accompanying Notes to Financial Statements.
| Primary Risk Exposure / Derivative Type | Value |
| | Asset | Liability |
| Credit Risk | | |
| Swaps(a) | $0 | $(121,436) |
| Total Credit Risk | $0 | $(121,436) |
| Total Value of Derivatives | $0 | $(121,436) |
(a) For bi-lateral over-the-counter (OTC) swaps, reflects gross value which is presented in the Statement of Assets and Liabilities in the bi-lateral OTC swaps, at value line-items.
Other Information
Distribution of investments by country or territory of incorporation, as a percentage of Total Net Assets, is as follows (Unaudited):
| United States of America | 86.4% |
| United Kingdom | 3.3% |
| Mexico | 2.0% |
| Netherlands | 1.8% |
| Luxembourg | 1.0% |
| Others (Individually Less Than 1%) | 5.5% |
| | 100.0% |
See accompanying notes which are an integral part of the financial statements.
Fidelity® VIP Investment Grade Central Fund
Financial Statements
Statement of Assets and Liabilities
| | | December 31, 2015 |
| Assets | | |
Investment in securities, at value (including securities loaned of $89,748,180) — See accompanying schedule:
Unaffiliated issuers (cost $4,577,860,520) | $4,503,881,526 | |
| Fidelity Central Funds (cost $207,816,993) | 207,816,993 | |
| Total Investments (cost $4,785,677,513) | | $4,711,698,519 |
| Cash | | 91,727,372 |
| Receivable for investments sold | | 109,718 |
| Receivable for TBA sale commitments | | 1,796,156 |
| Receivable for fund shares sold | | 13,458 |
| Interest receivable | | 33,388,802 |
| Distributions receivable from Fidelity Central Funds | | 42,092 |
| Total assets | | 4,838,776,117 |
| Liabilities | | |
| TBA sale commitments, at value | $1,798,599 | |
| Payable for investments purchased on a delayed delivery basis | 133,398,914 | |
| Payable for fund shares redeemed | 186,571 | |
| Bi-lateral OTC swaps, at value | 121,436 | |
| Other payables and accrued expenses | 12,567 | |
| Collateral on securities loaned, at value | 91,721,700 | |
| Total liabilities | | 227,239,787 |
| Net Assets | | $4,611,536,330 |
| Net Assets consist of: | | |
| Paid in capital | | $4,634,308,062 |
| Undistributed net investment income | | 7,207,039 |
| Accumulated undistributed net realized gain (loss) on investments | | 44,124,102 |
| Net unrealized appreciation (depreciation) on investments | | (74,102,873) |
| Net Assets, for 44,465,034 shares outstanding | | $4,611,536,330 |
| Net Asset Value, offering price and redemption price per share ($4,611,536,330 ÷ 44,465,034 shares) | | $103.71 |
See accompanying notes which are an integral part of the financial statements.
Statement of Operations
| | | Year ended December 31, 2015 |
| Investment Income | | |
| Interest | | $145,650,706 |
| Income from Fidelity Central Funds | | 339,467 |
| Total income | | 145,990,173 |
| Expenses | | |
| Custodian fees and expenses | $77,060 | |
| Independent trustees' compensation | 18,944 | |
| Total expenses before reductions | 96,004 | |
| Expense reductions | (23,119) | 72,885 |
| Net investment income (loss) | | 145,917,288 |
| Realized and Unrealized Gain (Loss) | | |
| Net realized gain (loss) on: | | |
| Investment securities: | | |
| Unaffiliated issuers | 50,147,918 | |
| Futures contracts | 312,563 | |
| Swaps | (59,595) | |
| Total net realized gain (loss) | | 50,400,886 |
Change in net unrealized appreciation (depreciation) on:
Investment securities | (191,415,444) | |
| Swaps | 71,624 | |
| Delayed delivery commitments | 83,994 | |
| Total change in net unrealized appreciation (depreciation) | | (191,259,826) |
| Net gain (loss) | | (140,858,940) |
| Net increase (decrease) in net assets resulting from operations | | $5,058,348 |
See accompanying notes which are an integral part of the financial statements.
Statement of Changes in Net Assets
| | Year ended December 31, 2015 | Year ended December 31, 2014 |
| Increase (Decrease) in Net Assets | | |
| Operations | | |
| Net investment income (loss) | $145,917,288 | $125,558,728 |
| Net realized gain (loss) | 50,400,886 | 18,392,238 |
| Change in net unrealized appreciation (depreciation) | (191,259,826) | 112,392,803 |
| Net increase (decrease) in net assets resulting from operations | 5,058,348 | 256,343,769 |
| Distributions to shareholders from net investment income | (138,953,417) | (122,583,776) |
| Distributions to shareholders from net realized gain | (3,297,143) | – |
| Total distributions | (142,250,560) | (122,583,776) |
| Share transactions | | |
| Proceeds from sales of shares | 513,825,585 | 489,849,977 |
| Reinvestment of distributions | 142,250,560 | 122,583,763 |
| Cost of shares redeemed | (301,190,265) | (298,099,997) |
| Net increase (decrease) in net assets resulting from share transactions | 354,885,880 | 314,333,743 |
| Total increase (decrease) in net assets | 217,693,668 | 448,093,736 |
| Net Assets | | |
| Beginning of period | 4,393,842,662 | 3,945,748,926 |
| End of period (including undistributed net investment income of $7,207,039 and undistributed net investment income of $2,033,152, respectively) | $4,611,536,330 | $4,393,842,662 |
| Other Information | | |
| Shares | | |
| Sold | 4,808,405 | 4,633,829 |
| Issued in reinvestment of distributions | 1,342,876 | 1,157,237 |
| Redeemed | (2,865,332) | (2,814,399) |
| Net increase (decrease) | 3,285,949 | 2,976,667 |
See accompanying notes which are an integral part of the financial statements.
Financial Highlights — Fidelity VIP Investment Grade Central Fund
| | | | | | |
| Years ended December 31, | 2015 | 2014 | 2013 | 2012 | 2011 |
| Selected Per–Share Data | | | | | |
| Net asset value, beginning of period | $106.70 | $103.29 | $108.89 | $107.64 | $105.18 |
| Income from Investment Operations | | | | | |
| Net investment income (loss)A | 3.292 | 3.178 | 2.829 | 3.111 | 3.817 |
| Net realized and unrealized gain (loss) | (3.071) | 3.336 | (4.398) | 3.442 | 4.385 |
| Total from investment operations | .221 | 6.514 | (1.569) | 6.553 | 8.202 |
| Distributions from net investment income | (3.137) | (3.104) | (2.826) | (3.056) | (3.851) |
| Distributions from net realized gain | (.074) | – | (1.205) | (2.247) | (1.891) |
| Total distributions | (3.211) | (3.104) | (4.031) | (5.303) | (5.742) |
| Net asset value, end of period | $103.71 | $106.70 | $103.29 | $108.89 | $107.64 |
| Total ReturnB | .18% | 6.37% | (1.46)% | 6.16% | 7.96% |
| Ratios to Average Net AssetsC,D | | | | | |
| Expenses before reductionsE | -% | -% | -% | -% | -% |
| Expenses net of fee waivers, if anyE | -% | -% | -% | -% | -% |
| Expenses net of all reductionsE | -% | -% | -% | -% | -% |
| Net investment income (loss) | 3.11% | 3.01% | 2.68% | 2.84% | 3.57% |
| Supplemental Data | | | | | |
| Net assets, end of period (000 omitted) | $4,611,536 | $4,393,843 | $3,945,749 | $4,252,424 | $3,790,381 |
| Portfolio turnover rateF | 248% | 151% | 333% | 291% | 302% |
A Calculated based on average shares outstanding during the period.
B Total returns would have been lower if certain expenses had not been reduced during the applicable periods shown.
C Fees and expenses of any underlying Fidelity Central Funds are not included in the Fund's expense ratio. The Fund indirectly bears its proportionate share of the expenses of any underlying Fidelity Central Funds.
D Expense ratios reflect operating expenses of the Fund. Expenses before reductions do not reflect amounts reimbursed by the investment adviser or reductions from expense offset arrangements and do not represent the amount paid by the Fund during periods when reimbursements or reductions occur. Expenses net of fee waivers reflect expenses after reimbursement by the investment adviser but prior to reductions from expense offset arrangements. Expenses net of all reductions represent the net expenses paid by the Fund.
E Amount represents less than .005%.
F Amount does not include the portfolio activity of any underlying Fidelity Central Funds.
See accompanying notes which are an integral part of the financial statements.
Notes to Financial Statements
For the period ended December 31, 2015
1. Organization.
Fidelity VIP Investment Grade Central Fund (the Fund) is a fund of Fidelity Garrison Street Trust (the Trust) and is authorized to issue an unlimited number of shares. The Trust is registered under the Investment Company Act of 1940, as amended (the 1940 Act), as an open-end management investment company organized as a Massachusetts business trust. Shares of the Fund are only offered to other investment companies and accounts managed by Fidelity Management & Research Company (FMR), or its affiliates (the Investing Funds).
2. Investments in Fidelity Central Funds.
The Fund invests in Fidelity Central Funds, which are open-end investment companies generally available only to other investment companies and accounts managed by the investment adviser and its affiliates. The Fund's Schedule of Investments lists each of the Fidelity Central Funds held as of period end, if any, as an investment of the Fund, but does not include the underlying holdings of each Fidelity Central Fund. As an Investing Fund, the Fund indirectly bears its proportionate share of the expenses of the underlying Fidelity Central Funds.
The Money Market Central Funds seek preservation of capital and current income and are managed by Fidelity Investments Money Management, Inc. (FIMM), an affiliate of the investment adviser. Annualized expenses of the Money Market Central Funds as of their most recent shareholder report date are less than .005%.
A complete unaudited list of holdings for each Fidelity Central Fund is available upon request or at the Securities and Exchange Commission (the SEC) website at www.sec.gov. In addition, the financial statements of the Fidelity Central Funds, which are not covered by the Fund's Report of Independent Registered Public Accounting Firm, are available on the SEC website or upon request.
3. Significant Accounting Policies.
The financial statements have been prepared in conformity with accounting principles generally accepted in the United States of America (GAAP), which require management to make certain estimates and assumptions at the date of the financial statements. Actual results could differ from those estimates. Subsequent events, if any, through the date that the financial statements were issued have been evaluated in the preparation of the financial statements. The following summarizes the significant accounting policies of the Fund:
Investment Valuation. Investments are valued as of 4:00 p.m. Eastern time on the last calendar day of the period. The Board of Trustees (the Board) has delegated the day to day responsibility for the valuation of the Fund's investments to the FMR Fair Value Committee (the Committee). In accordance with valuation policies and procedures approved by the Board, the Fund attempts to obtain prices from one or more third party pricing vendors or brokers to value its investments. When current market prices, quotations or currency exchange rates are not readily available or reliable, investments will be fair valued in good faith by the Committee, in accordance with procedures adopted by the Board. Factors used in determining fair value vary by investment type and may include market or investment specific events, changes in interest rates and credit quality. The frequency with which these procedures are used cannot be predicted and they may be utilized to a significant extent. The Committee oversees the Fund's valuation policies and procedures and reports to the Board on the Committee's activities and fair value determinations. The Board monitors the appropriateness of the procedures used in valuing the Fund's investments and ratifies the fair value determinations of the Committee.
The Fund categorizes the inputs to valuation techniques used to value its investments into a disclosure hierarchy consisting of three levels as shown below:
- Level 1 – quoted prices in active markets for identical investments
- Level 2 – other significant observable inputs (including quoted prices for similar investments, interest rates, prepayment speeds, etc.)
- Level 3 – unobservable inputs (including the Fund's own assumptions based on the best information available)
Valuation techniques used to value the Fund's investments by major category are as follows:
Debt securities, including restricted securities, are valued based on evaluated prices received from third party pricing vendors or from brokers who make markets in such securities. Corporate bonds, bank notes, municipal securities and U.S. government and government agency obligations are valued by pricing vendors who utilize matrix pricing which considers yield or price of bonds of comparable quality, coupon, maturity and type or by broker-supplied prices. Asset backed securities, collateralized mortgage obligations, commercial mortgage securities and U.S. government agency mortgage securities are valued by pricing vendors who utilize matrix pricing which considers prepayment speed assumptions, attributes of the collateral, yield or price of bonds of comparable quality, coupon, maturity and type or by broker-supplied prices. Brokers which make markets in asset backed securities, collateralized mortgage obligations and commercial mortgage securities may also consider such factors as the structure of the issue, cash flow assumptions, the value of underlying assets as well as any guarantees. Swaps are marked-to-market daily based on valuations from third party pricing vendors, registered derivatives clearing organizations (clearinghouses) or broker-supplied valuations. These pricing sources may utilize inputs such as interest rate curves, credit spread curves, default possibilities and recovery rates. When independent prices are unavailable or unreliable, debt securities and swaps may be valued utilizing pricing methodologies which consider similar factors that would be used by third party pricing vendors. Debt securities and swaps are generally categorized as Level 2 in the hierarchy but may be Level 3 depending on the circumstances.
Investments in open-end mutual funds, including the Fidelity Central Funds, are valued at their closing net asset value (NAV) each business day and are categorized as Level 1 in the hierarchy.
Changes in valuation techniques may result in transfers in or out of an assigned level within the disclosure hierarchy. The aggregate value of investments by input level as of December 31, 2015, is included at the end of the Fund's Schedule of Investments.
Investment Transactions and Income. For financial reporting purposes, the Fund's investment holdings and NAV include trades executed through the end of the last business day of the period. The NAV per share for processing shareholder transactions is calculated as of the close of business of the New York Stock Exchange (NYSE), normally 4:00 p.m. Eastern time and includes trades executed through the end of the prior business day. Gains and losses on securities sold are determined on the basis of identified cost and may include proceeds received from litigation. Income and capital gain distributions from Fidelity Central Funds, if any, are recorded on the ex-dividend date. Interest income is accrued as earned and includes coupon interest and amortization of premium and accretion of discount on debt securities as applicable. The principal amount on inflation-indexed securities is periodically adjusted to the rate of inflation and interest is accrued based on the principal amount. The adjustments to principal due to inflation are reflected as increases or decreases to Interest in the accompanying Statement of Operations. Debt obligations may be placed on non-accrual status and related interest income may be reduced by ceasing current accruals and writing off interest receivables when the collection of all or a portion of interest has become doubtful based on consistently applied procedures. A debt obligation is removed from non-accrual status when the issuer resumes interest payments or when collectability of interest is reasonably assured.
Expenses. Expenses directly attributable to a fund are charged to that fund. Expenses attributable to more than one fund are allocated among the respective funds on the basis of relative net assets or other appropriate methods. Expense estimates are accrued in the period to which they relate and adjustments are made when actual amounts are known.
Income Tax Information and Distributions to Shareholders. Each year, the Fund intends to qualify as a regulated investment company under Subchapter M of the Internal Revenue Code, including distributing substantially all of its taxable income and realized gains. As a result, no provision for U.S. Federal income taxes is required. As of December 31, 2015, the Fund did not have any unrecognized tax benefits in the financial statements; nor is the Fund aware of any tax positions for which it is reasonably possible that the total amounts of unrecognized tax benefits will significantly change in the next twelve months. The Fund files a U.S. federal tax return, in addition to state and local tax returns as required. The Fund's federal income tax returns are subject to examination by the Internal Revenue Service (IRS) for a period of three fiscal years after they are filed. State and local tax returns may be subject to examination for an additional fiscal year depending on the jurisdiction.
Dividends are declared and recorded daily and paid monthly from net investment income. Distributions from realized gains, if any, are declared and recorded on the ex-dividend date. Income and capital gain distributions are determined in accordance with income tax regulations, which may differ from GAAP.
Capital accounts within the financial statements are adjusted for permanent book-tax differences. These adjustments have no impact on net assets or the results of operations. Capital accounts are not adjusted for temporary book-tax differences which will reverse in a subsequent period.
Book-tax differences are primarily due to futures contracts, market discount, financing transactions, capital loss carryforwards and losses deferred due to wash sales and excise tax regulations.
The federal tax cost of investment securities and unrealized appreciation (depreciation) as of period end were as follows:
| Gross unrealized appreciation | $62,401,211 |
| Gross unrealized depreciation | (131,391,438) |
| Net unrealized appreciation (depreciation) on securities | $(68,990,227) |
| Tax Cost | $4,780,688,746 |
The tax-based components of distributable earnings as of period end were as follows:
| Undistributed ordinary income | $1,705,507 |
| Undistributed long-term capital gain | $46,195,555 |
| Net unrealized appreciation (depreciation) on securities and other investments | $(69,114,132) |
The Fund intends to elect to defer to its next fiscal year $1,558,662 of capital losses recognized during the period November 1, 2015 to December 31, 2015.
The tax character of distributions paid was as follows:
| | December 31, 2015 | December 31, 2014 |
| Ordinary Income | $142,250,560 | $ 122,583,776 |
Delayed Delivery Transactions and When-Issued Securities. During the period, the Fund transacted in securities on a delayed delivery or when-issued basis. Payment and delivery may take place after the customary settlement period for that security. The price of the underlying securities and the date when the securities will be delivered and paid for are fixed at the time the transaction is negotiated. The securities purchased on a delayed delivery or when-issued basis are identified as such in the Fund's Schedule of Investments. The Fund may receive compensation for interest forgone in the purchase of a delayed delivery or when-issued security. With respect to purchase commitments, the Fund identifies securities as segregated in its records with a value at least equal to the amount of the commitment. Losses may arise due to changes in the value of the underlying securities or if the counterparty does not perform under the contract's terms, or if the issuer does not issue the securities due to political, economic, or other factors.
To-Be-Announced (TBA) Securities and Mortgage Dollar Rolls. During the period, the Fund transacted in TBA securities that involved buying or selling mortgage-backed securities (MBS) on a forward commitment basis. A TBA transaction typically does not designate the actual security to be delivered and only includes an approximate principal amount; however delivered securities must meet specified terms defined by industry guidelines, including issuer, rate and current principal amount outstanding on underlying mortgage pools. The Fund may enter into a TBA transaction with the intent to take possession of or deliver the underlying MBS, or the Fund may elect to extend the settlement by entering into either a mortgage or reverse mortgage dollar roll. Mortgage dollar rolls are transactions where a fund sells TBA securities and simultaneously agrees to repurchase MBS on a later date at a lower price and with the same counterparty. Reverse mortgage dollar rolls involve the purchase and simultaneous agreement to sell TBA securities on a later date at a lower price. Transactions in mortgage dollar rolls and reverse mortgage dollar rolls are accounted for as purchases and sales and may result in an increase to the Fund's portfolio turnover rate.
Purchases and sales of TBA securities involve risks similar to those discussed above for delayed delivery and when-issued securities. Also, if the counterparty in a mortgage dollar roll or a reverse mortgage dollar roll transaction files for bankruptcy or becomes insolvent, the Fund's right to repurchase or sell securities may be limited. Additionally, when a fund sells TBA securities without already owning or having the right to obtain the deliverable securities (an uncovered forward commitment to sell), it incurs a risk of loss because it could have to purchase the securities at a price that is higher than the price at which it sold them. A fund may be unable to purchase the deliverable securities if the corresponding market is illiquid.
TBA securities subject to a forward commitment to sell at period end are included at the end of the Fund's Schedule of Investments under the caption "TBA Sale Commitments." The proceeds and value of these commitments are reflected in the Fund's Statement of Assets and Liabilities as Receivable for TBA sale commitments and TBA sale commitments, at value, respectively.
Restricted Securities. The Fund may invest in securities that are subject to legal or contractual restrictions on resale. These securities generally may be resold in transactions exempt from registration or to the public if the securities are registered. Disposal of these securities may involve time-consuming negotiations and expense, and prompt sale at an acceptable price may be difficult. Information regarding restricted securities is included at the end of the Fund's Schedule of Investments.
4. Derivative Instruments.
Risk Exposures and the Use of Derivative Instruments. The Fund's investment objective allows the Fund to enter into various types of derivative contracts, including futures contracts and swaps. Derivatives are investments whose value is primarily derived from underlying assets, indices or reference rates and may be transacted on an exchange or over-the-counter (OTC). Derivatives may involve a future commitment to buy or sell a specified asset based on specified terms, to exchange future cash flows at periodic intervals based on a notional principal amount, or for one party to make one or more payments upon the occurrence of specified events in exchange for periodic payments from the other party.
The Fund used derivatives to increase returns, to gain exposure to certain types of assets and to manage exposure to certain risks as defined below. The success of any strategy involving derivatives depends on analysis of numerous economic factors, and if the strategies for investment do not work as intended, the Fund may not achieve its objectives.
The Fund's use of derivatives increased or decreased its exposure to the following risks:
| Credit Risk | Credit risk relates to the ability of the issuer of a financial instrument to make further principal or interest payments on an obligation or commitment that it has to the Fund.
|
| Interest Rate Risk | Interest rate risk relates to the fluctuations in the value of interest-bearing securities due to changes in the prevailing levels of market interest rates. |
The Fund is also exposed to additional risks from investing in derivatives, such as liquidity risk and counterparty credit risk. Liquidity risk is the risk that the Fund will be unable to close out the derivative in the open market in a timely manner. Counterparty credit risk is the risk that the counterparty will not be able to fulfill its obligation to the Fund. Derivative counterparty credit risk is managed through formal evaluation of the creditworthiness of all potential counterparties. On certain OTC derivatives such as bi-lateral swaps, the Fund attempts to reduce its exposure to counterparty credit risk by entering into an International Swaps and Derivatives Association, Inc. (ISDA) Master Agreement with each of its counterparties. The ISDA Master Agreement gives the Fund the right to terminate all transactions traded under such agreement upon the deterioration in the credit quality of the counterparty beyond specified levels. The ISDA Master Agreement gives each party the right, upon an event of default by the other party or a termination of the agreement, to close out all transactions traded under such agreement and to net amounts owed under each transaction to one net payable by one party to the other. To mitigate counterparty credit risk on bi-lateral OTC derivatives, the Fund receives collateral in the form of cash or securities once the Fund's net unrealized appreciation on outstanding derivative contracts under an ISDA Master Agreement exceeds certain applicable thresholds, subject to certain minimum transfer provisions. The collateral received is held in segregated accounts with the Fund's custodian bank in accordance with the collateral agreements entered into between the Fund, the counterparty and the Fund's custodian bank. The Fund could experience delays and costs in gaining access to the collateral even though it is held by the Fund's custodian bank. The Fund's maximum risk of loss from counterparty credit risk related to bi-lateral OTC derivatives is generally the aggregate unrealized appreciation and unpaid counterparty payments in excess of any collateral pledged by the counterparty to the Fund. The Fund may be required to pledge collateral for the benefit of the counterparties on bi-lateral OTC derivatives in an amount not less than each counterparty's unrealized appreciation on outstanding derivative contracts, subject to certain minimum transfer provisions, and any such pledged collateral is identified in the Schedule of Investments. Exchange-traded futures contracts are not covered by the ISDA Master Agreement; however counterparty credit risk related to exchange-traded futures contracts may be mitigated by the protection provided by the exchange on which they trade.
Investing in derivatives may involve greater risks than investing in the underlying assets directly and, to varying degrees, may involve risk of loss in excess of any initial investment and collateral received and amounts recognized in the Statement of Assets and Liabilities. In addition, there may be the risk that the change in value of the derivative contract does not correspond to the change in value of the underlying instrument.
Net Realized Gain (Loss) and Change in Net Unrealized Appreciation (Depreciation) on Derivatives. The table below, which reflects the impacts of derivatives on the financial performance of the Fund, summarizes the net realized gain (loss) and change in net unrealized appreciation (depreciation) for derivatives during the period as presented in the Statement of Operations.
| Primary Risk Exposure / Derivative Type | Net Realized Gain (Loss) | Change in Net Unrealized Appreciation (Depreciation) |
| Credit Risk | | |
| Swaps | $(59,595) | $71,624 |
| Interest Risk | | |
| Futures Contracts | 312,563 | – |
| Totals(a) | $252,968 | $71,624 |
(a) A summary of the value of derivatives by primary risk exposure as of period end, is included at the end of the Schedule of Investments.
Futures Contracts. A futures contract is an agreement between two parties to buy or sell a specified underlying instrument for a fixed price at a specified future date. The Fund used futures contracts to manage its exposure to the bond market and fluctuations in interest rates.
Upon entering into a futures contract, a fund is required to deposit either cash or securities (initial margin) with a clearing broker in an amount equal to a certain percentage of the face value of the contract. Futures contracts are marked-to-market daily and subsequent daily payments (variation margin) are made or received by a fund depending on the daily fluctuations in the value of the futures contracts and are recorded as unrealized appreciation or (depreciation). This receivable and/or payable, if any, is included in daily variation margin for derivative instruments in the Statement of Assets and Liabilities. Realized gain or (loss) is recorded upon the expiration or closing of a futures contract. The net realized gain (loss) and change in net unrealized appreciation (depreciation) on futures contracts during the period is included in the Statement of Operations.
Any open futures contracts at period end are presented in the Schedule of Investments under the caption "Futures Contracts". The underlying face amount at value reflects each contract's exposure to the underlying instrument or index at period end.
Swaps. A swap is a contract between two parties to exchange future cash flows at periodic intervals based on a notional principal amount. A bi-lateral OTC swap is a transaction between a fund and a dealer counterparty where cash flows are exchanged between the two parties for the life of the swap.
Bi-lateral OTC swaps are marked-to-market daily and changes in value are reflected in the Statement of Assets and Liabilities in the bi-lateral OTC swaps at value line items. Any upfront premiums paid or received upon entering a bi-lateral OTC swap to compensate for differences between stated terms of the swap and prevailing market conditions (e.g. credit spreads, interest rates or other factors) are recorded in net unrealized appreciation (depreciation) in the Statement of Assets and Liabilities and amortized to realized gain or (loss) ratably over the term of the swap. Any unamortized upfront premiums are presented in the Schedule of Investments.
Payments are exchanged at specified intervals, accrued daily commencing with the effective date of the contract and recorded as realized gain or (loss). Some swaps may be terminated prior to the effective date and realize a gain or loss upon termination. The net realized gain (loss) and change in net unrealized appreciation (depreciation) on swaps during the period is included in the Statement of Operations.
Any open swaps at period end are included in the Schedule of Investments under the caption "Swaps" and are representative of volume of activity during the period.
Credit Default Swaps. Credit default swaps enable the Fund to buy or sell protection against specified credit events on a single-name issuer or a traded credit index. Under the terms of a credit default swap the buyer of protection (buyer) receives credit protection in exchange for making periodic payments to the seller of protection (seller) based on a fixed percentage applied to a notional principal amount. In return for these payments, the seller will be required to make a payment upon the occurrence of one or more specified credit events. The Fund enters into credit default swaps as a seller to gain credit exposure to an issuer and/or as a buyer to obtain a measure of protection against defaults of an issuer. Periodic payments are made over the life of the contract by the buyer provided that no credit event occurs.
For credit default swaps on most corporate and sovereign issuers, credit events include bankruptcy, failure to pay or repudiation/moratorium. For credit default swaps on corporate or sovereign issuers, the obligation that may be put to the seller is not limited to the specific reference obligation described in the Schedule of Investments. For credit default swaps on asset-backed securities, a credit event may be triggered by events such as failure to pay principal, maturity extension, rating downgrade or write-down. For credit default swaps on asset-backed securities, the reference obligation described represents the security that may be put to the seller. For credit default swaps on a traded credit index, a specified credit event may affect all or individual underlying securities included in the index.
As a seller, if an underlying credit event occurs, the Fund will pay a net settlement amount of cash equal to the notional amount of the swap less the recovery value of the reference obligation or underlying securities comprising an index. Only in the event of the industry's inability to value the underlying asset will the Fund be required to take delivery of the reference obligation or underlying securities comprising an index and pay an amount equal to the notional amount of the swap.
As a buyer, if an underlying credit event occurs, the Fund will receive a net settlement amount of cash equal to the notional amount of the swap less the recovery value of the reference obligation or underlying securities comprising an index. Only in the event of the industry's inability to value the underlying asset will the Fund be required to deliver the reference obligation or underlying securities comprising an index in exchange for payment of an amount equal to the notional amount of the swap.
Typically, the value of each credit default swap and credit rating disclosed for each reference obligation in the Schedule of Investments, where the Fund is the seller, can be used as measures of the current payment/performance risk of the swap. As the value of the swap changes as a positive or negative percentage of the total notional amount, the payment/performance risk may decrease or increase, respectively. In addition to these measures, the investment adviser monitors a variety of factors including cash flow assumptions, market activity and market sentiment as part of its ongoing process of assessing payment/performance risk.
5. Purchases and Sales of Investments.
Purchases and sales of securities, other than short-term securities and U.S. government securities, aggregated $1,504,533,646 and $554,216,892, respectively.
6. Fees and Other Transactions with Affiliates.
Management Fee and Expense Contract. Fidelity Investments Money Management, Inc. (the investment adviser), an affiliate of FMR, provides the Fund with investment management services. The Fund does not pay any fees for these services. Pursuant to the Fund's management contract with the investment adviser, FMR pays the investment adviser a portion of the management fees it receives from the Investing Funds. In addition, under an expense contract, FMR also pays all other expenses of the Fund, excluding custody fees, the compensation of the independent Trustees, and certain exceptions such as interest expense.
Interfund Trades. The Fund may purchase from or sell securities to other Fidelity Funds under procedures adopted by the Board. The procedures have been designed to ensure these interfund trades are executed in accordance with Rule 17a-7 of the 1940 Act. Interfund trades are included within the respective purchases and sales amounts shown in the Purchases and Sales of Investments note.
7. Security Lending.
The Fund lends portfolio securities from time to time in order to earn additional income. On the settlement date of the loan, the Fund receives collateral (in the form of U.S. Treasury obligations, letters of credit and/or cash) against the loaned securities and maintains collateral in an amount not less than 100% of the market value of the loaned securities during the period of the loan. The market value of the loaned securities is determined at the close of business of the Fund and any additional required collateral is delivered to the Fund on the next business day. The Fund or borrower may terminate the loan at any time, and if the borrower defaults on its obligation to return the securities loaned because of insolvency or other reasons, the Fund may apply collateral received from the borrower against the obligation. The Fund may experience delays and costs in recovering the securities loaned. Any cash collateral received is maintained at the Fund's custodian and/or invested in cash equivalents. The value of loaned securities and cash collateral at period end are disclosed on the Fund's Statement of Assets and Liabilities. Security lending income represents the income earned on investing cash collateral, less rebates paid to borrowers, plus any premium payments received for lending certain types of securities. Security lending income is presented in the Statement of Operations as a component of interest income. Total security lending income during the period amounted to $215,965.
8. Expense Reductions.
FMR has voluntarily agreed to reimburse a portion of the Fund's operating expenses. For the period, the reimbursement reduced the expenses by $18,944.
In addition, through arrangements with the Fund's custodian, credits realized as a result of certain uninvested cash balances were used to reduce the Fund's expenses. During the period, these credits reduced the Fund's custody expenses by $4,175.
9. Other.
The Fund's organizational documents provide former and current trustees and officers with a limited indemnification against liabilities arising in connection with the performance of their duties to the Fund. In the normal course of business, the Fund may also enter into contracts that provide general indemnifications. The Fund's maximum exposure under these arrangements is unknown as this would be dependent on future claims that may be made against the Fund. The risk of material loss from such claims is considered remote.
At the end of the period, mutual funds managed by FMR or its affiliates were the owners of record of all of the outstanding shares of the Fund according to the following schedule.
| Fund | Ownership % |
| VIP Asset Manager Portfolio | 9.5% |
| VIP Asset Manager: Growth Portfolio | 0.9% |
| VIP Balanced Portfolio | 19.8% |
| VIP Investment Grade Bond Portfolio | 69.8% |
10. Credit Risk.
The Fund invests a portion of its assets in structured securities of issuers backed by commercial and residential mortgage loans, credit card receivables and automotive loans. The value and related income of these securities is sensitive to changes in economic conditions, including delinquencies and/or defaults.
Fidelity
® VIP Investment Grade Central Fund
Report of Independent Registered Public Accounting Firm
To the Trustees of Fidelity Garrison Street Trust and Shareholders of Fidelity® VIP Investment Grade Central Fund:
We have audited the accompanying statement of assets and liabilities of Fidelity® VIP Investment Grade Central Fund (the Fund), a fund of Fidelity Garrison Street Trust, including the schedule of investments, as of December 31, 2015, and the related statement of operations for the year then ended, the statement of changes in net assets for each of the two years in the period then ended, and the financial highlights for each of the five years in the period then ended. These financial statements and financial highlights are the responsibility of the Fund's management. Our responsibility is to express an opinion on these financial statements and financial highlights based on our audits.
We conducted our audits in accordance with the standards of the Public Company Accounting Oversight Board (United States). Those standards require that we plan and perform the audit to obtain reasonable assurance about whether the financial statements and financial highlights are free of material misstatement. The Fund is not required to have, nor were we engaged to perform, an audit of its internal control over financial reporting. Our audits included consideration of internal control over financial reporting as a basis for designing audit procedures that are appropriate in the circumstances, but not for the purpose of expressing an opinion on the effectiveness of the Fund's internal control over financial reporting. Accordingly, we express no such opinion. An audit also includes examining, on a test basis, evidence supporting the amounts and disclosures in the financial statements, assessing the accounting principles used and significant estimates made by management, as well as evaluating the overall financial statement presentation. Our procedures included confirmation of securities owned as of December 31, 2015, by correspondence with the custodians and brokers; when replies were not received from brokers, we performed other auditing procedures. We believe that our audits provide a reasonable basis for our opinion.
In our opinion, such financial statements and financial highlights referred to above present fairly, in all material respects, the financial position of Fidelity® VIP Investment Grade Central Fund as of December 31, 2015, the results of its operations for the year then ended, the changes in its net assets for each of the two years in the period then ended, and the financial highlights for each of the five years in the period then ended in conformity with accounting principles generally accepted in the United States of America.
DELOITTE & TOUCHE LLP
Boston, Massachusetts
February 23, 2016
Trustees and Officers
Fidelity® VIP Investment Grade Central Fund
The Trustees, Members of the Advisory Board (if any), and officers of the trust and fund, as applicable, are listed below. The Board of Trustees governs the fund and is responsible for protecting the interests of shareholders. The Trustees are experienced executives who meet periodically throughout the year to oversee the fund's activities, review contractual arrangements with companies that provide services to the fund, oversee management of the risks associated with such activities and contractual arrangements, and review the fund's performance. Except for Elizabeth S. Acton, John Engler, and Geoffrey A. von Kuhn, each of the Trustees oversees 236 funds. Ms. Acton and Mr. Engler each oversees 228 funds. Mr. von Kuhn oversees 148 funds.
The Trustees hold office without limit in time except that (a) any Trustee may resign; (b) any Trustee may be removed by written instrument, signed by at least two-thirds of the number of Trustees prior to such removal; (c) any Trustee who requests to be retired or who has become incapacitated by illness or injury may be retired by written instrument signed by a majority of the other Trustees; and (d) any Trustee may be removed at any special meeting of shareholders by a two-thirds vote of the outstanding voting securities of the trust. Each Trustee who is not an interested person (as defined in the 1940 Act) of the trust and the fund is referred to herein as an Independent Trustee. Each Independent Trustee shall retire not later than the last day of the calendar year in which his or her 75th birthday occurs. The Independent Trustees may waive this mandatory retirement age policy with respect to individual Trustees. Officers and Advisory Board Members hold office without limit in time, except that any officer or Advisory Board Member may resign or may be removed by a vote of a majority of the Trustees at any regular meeting or any special meeting of the Trustees. Except as indicated, each individual has held the office shown or other offices in the same company for the past five years.
The fund’s Statement of Additional Information (SAI) includes more information about the Trustees. To request a free copy, call Fidelity at 1-877-208-0098.
Experience, Skills, Attributes, and Qualifications of the Trustees. The Governance and Nominating Committee has adopted a statement of policy that describes the experience, qualifications, attributes, and skills that are necessary and desirable for potential Independent Trustee candidates (Statement of Policy). The Board believes that each Trustee satisfied at the time he or she was initially elected or appointed a Trustee, and continues to satisfy, the standards contemplated by the Statement of Policy. The Governance and Nominating Committee also engages professional search firms to help identify potential Independent Trustee candidates who have the experience, qualifications, attributes, and skills consistent with the Statement of Policy. From time to time, additional criteria based on the composition and skills of the current Independent Trustees, as well as experience or skills that may be appropriate in light of future changes to board composition, business conditions, and regulatory or other developments, have also been considered by the professional search firms and the Governance and Nominating Committee. In addition, the Board takes into account the Trustees' commitment and participation in Board and committee meetings, as well as their leadership of standing and ad hoc committees throughout their tenure.
In determining that a particular Trustee was and continues to be qualified to serve as a Trustee, the Board has considered a variety of criteria, none of which, in isolation, was controlling. The Board believes that, collectively, the Trustees have balanced and diverse experience, qualifications, attributes, and skills, which allow the Board to operate effectively in governing the fund and protecting the interests of shareholders. Information about the specific experience, skills, attributes, and qualifications of each Trustee, which in each case led to the Board's conclusion that the Trustee should serve (or continue to serve) as a trustee of the fund, is provided below.
Board Structure and Oversight Function. Abigail P. Johnson is an interested person and currently serves as Chairman. The Trustees have determined that an interested Chairman is appropriate and benefits shareholders because an interested Chairman has a personal and professional stake in the quality and continuity of services provided to the fund. Independent Trustees exercise their informed business judgment to appoint an individual of their choosing to serve as Chairman, regardless of whether the Trustee happens to be independent or a member of management. The Independent Trustees have determined that they can act independently and effectively without having an Independent Trustee serve as Chairman and that a key structural component for assuring that they are in a position to do so is for the Independent Trustees to constitute a substantial majority for the Board. The Independent Trustees also regularly meet in executive session. Marie L. Knowles serves as Chairman of the Independent Trustees and as such (i) acts as a liaison between the Independent Trustees and management with respect to matters important to the Independent Trustees and (ii) with management prepares agendas for Board meetings.
Fidelity® funds are overseen by different Boards of Trustees. The fund's Board oversees Fidelity's investment-grade bond, money market, asset allocation and certain equity funds, and other Boards oversee Fidelity's high income, sector and other equity funds. The asset allocation funds may invest in Fidelity® funds that are overseen by such other Boards. The use of separate Boards, each with its own committee structure, allows the Trustees of each group of Fidelity® funds to focus on the unique issues of the funds they oversee, including common research, investment, and operational issues. On occasion, the separate Boards establish joint committees to address issues of overlapping consequences for the Fidelity® funds overseen by each Board.
The Trustees operate using a system of committees to facilitate the timely and efficient consideration of all matters of importance to the Trustees, the fund, and fund shareholders and to facilitate compliance with legal and regulatory requirements and oversight of the fund's activities and associated risks. The Board, acting through its committees, has charged FMR and its affiliates with (i) identifying events or circumstances the occurrence of which could have demonstrably adverse effects on the fund's business and/or reputation; (ii) implementing processes and controls to lessen the possibility that such events or circumstances occur or to mitigate the effects of such events or circumstances if they do occur; and (iii) creating and maintaining a system designed to evaluate continuously business and market conditions in order to facilitate the identification and implementation processes described in (i) and (ii) above. Because the day-to-day operations and activities of the fund are carried out by or through FMR, its affiliates, and other service providers, the fund's exposure to risks is mitigated but not eliminated by the processes overseen by the Trustees. While each of the Board's committees has responsibility for overseeing different aspects of the fund's activities, oversight is exercised primarily through the Operations and Audit Committees. In addition, an ad hoc Board committee of Independent Trustees has worked with FMR to enhance the Board's oversight of investment and financial risks, legal and regulatory risks, technology risks, and operational risks, including the development of additional risk reporting to the Board. Appropriate personnel, including but not limited to the fund's Chief Compliance Officer (CCO), FMR's internal auditor, the independent accountants, the fund's Treasurer and portfolio management personnel, make periodic reports to the Board's committees, as appropriate, including an annual review of Fidelity's risk management program for the Fidelity® funds. The responsibilities of each standing committee, including their oversight responsibilities, are described further under "Standing Committees of the Trustees."
Interested Trustees*:
Correspondence intended for a Trustee who is an interested person may be sent to Fidelity Investments, 245 Summer Street, Boston, Massachusetts 02210.
Name, Year of Birth; Principal Occupations and Other Relevant Experience+
Abigail P. Johnson (1961)
Year of Election or Appointment: 2009
Trustee
Chairman of the Board of Trustees
Ms. Johnson also serves as Trustee of other Fidelity® funds. Ms. Johnson serves as President (2013-present) and Chief Executive Officer (2014-present) of FMR LLC (diversified financial services company), President of Fidelity Financial Services (2012-present) and President of Personal, Workplace and Institutional Services (2005-present). Ms. Johnson is Chairman and Director of FMR Co., Inc. (investment adviser firm, 2011-present), Chairman and Director of FMR (investment adviser firm, 2011-present), and the Vice Chairman and Director (2007-present) of FMR LLC. Previously, Ms. Johnson served as President and a Director of FMR (2001-2005), a Trustee of other investment companies advised by FMR, Fidelity Investments Money Management, Inc. (investment adviser firm), and FMR Co., Inc. (2001-2005), Senior Vice President of the Fidelity® funds (2001-2005), and managed a number of Fidelity® funds. Ms. Abigail P. Johnson and Mr. Arthur E. Johnson are not related.
Geoffrey A. von Kuhn (1951)
Year of Election or Appointment: 2015
Trustee
Mr. von Kuhn also serves as Trustee or Member of the Advisory Board of other Fidelity funds. Mr. von Kuhn is Chief Administrative Officer for FMR LLC (diversified financial services company, 2013-present), a Director of Pembroke Real Estate, Inc. (2009-present), and a Director of Discovery Natural Resources LLC (2012-present). Previously, Mr. von Kuhn was a managing director of Crosby Group (private wealth management company, 2007-2013), a member of the management committee and senior executive in the Wealth Management Group of AmSouth Bank (2001-2006), and head of the U.S. private bank at Citigroup (2000-2001).
* Determined to be an “Interested Trustee” by virtue of, among other things, his or her affiliation with the trust or various entities under common control with FMR.
+ The information includes the Trustee's principal occupation during the last five years and other information relating to the experience, attributes, and skills relevant to the Trustee's qualifications to serve as a Trustee, which led to the conclusion that the Trustee should serve as a Trustee for the fund.
Independent Trustees:
Correspondence intended for an Independent Trustee may be sent to Fidelity Investments, P.O. Box 55235, Boston, Massachusetts 02205-5235.
Name, Year of Birth; Principal Occupations and Other Relevant Experience+
Elizabeth S. Acton (1951)
Year of Election or Appointment: 2013
Trustee
Ms. Acton also serves as Trustee or Member of the Advisory Board of other Fidelity® funds. Prior to her retirement in April 2012, Ms. Acton was Executive Vice President, Finance (2011-2012), Executive Vice President, Chief Financial Officer (2002-2011), and Treasurer (2004-2005) of Comerica Incorporated (financial services). Prior to joining Comerica, Ms. Acton held a variety of positions at Ford Motor Company (1983-2002), including Vice President and Treasurer (2000-2002) and Executive Vice President and Chief Financial Officer of Ford Motor Credit Company (1998-2000). Ms. Acton currently serves as a member of the Board of Directors and Audit and Finance Committees of Beazer Homes USA, Inc. (homebuilding, 2012-present).
John Engler (1948)
Year of Election or Appointment: 2014
Trustee
Mr. Engler also serves as Trustee or Member of the Advisory Board of other Fidelity® funds. He serves as president of the Business Roundtable (2011-present), and on the board of directors/trustees for Universal Forest Products (manufacturer and distributor of wood and wood-alternative products, 2003-present) and K12 Inc. (technology-based education company, 2012-present). Previously, Mr. Engler served as a trustee of The Munder Funds (2003-2014), president and CEO of the National Association of Manufacturers (2004-2011), member of the Board of Trustees of the Annie E. Casey Foundation (2004-2015), and as governor of Michigan (1991-2003). He is a past chairman of the National Governors Association.
Albert R. Gamper, Jr. (1942)
Year of Election or Appointment: 2006
Trustee
Mr. Gamper also serves as Trustee of other Fidelity® funds. Prior to his retirement in December 2004, Mr. Gamper served as Chairman of the Board of CIT Group Inc. (commercial finance). During his tenure with CIT Group Inc. Mr. Gamper served in numerous senior management positions, including Chairman (1987-1989; 1999-2001; 2002-2004), Chief Executive Officer (1987-2004), and President (2002-2003). Mr. Gamper currently serves as a member of the Board of Directors of Public Service Enterprise Group (utilities, 2000-present), and Member of the Board of Trustees of Barnabas Health Care System (1997-present). Previously, Mr. Gamper served as Chairman (2012-2015) and Vice Chairman (2011-2012) of the Independent Trustees of certain Fidelity® funds and as Chairman of the Board of Governors, Rutgers University (2004-2007).
Robert F. Gartland (1951)
Year of Election or Appointment: 2010
Trustee
Mr. Gartland also serves as Trustee of other Fidelity® funds. Mr. Gartland is Chairman and an investor in Gartland and Mellina Group Corp. (consulting, 2009-present). Previously, Mr. Gartland served as a partner and investor of Vietnam Partners LLC (investments and consulting, 2008-2011). Prior to his retirement, Mr. Gartland held a variety of positions at Morgan Stanley (financial services, 1979-2007) including Managing Director (1987-2007).
Arthur E. Johnson (1947)
Year of Election or Appointment: 2008
Trustee
Vice Chairman of the Independent Trustees
Mr. Johnson also serves as Trustee of other Fidelity® funds. Mr. Johnson serves as a member of the Board of Directors of Eaton Corporation plc (diversified power management, 2009-present), AGL Resources, Inc. (holding company, 2002-present) and Booz Allen Hamilton (management consulting, 2011-present). Prior to his retirement, Mr. Johnson served as Senior Vice President of Corporate Strategic Development of Lockheed Martin Corporation (defense contractor, 1999-2009). He previously served on the Board of Directors of IKON Office Solutions, Inc. (1999-2008) and Delta Airlines (2005-2007). Mr. Arthur E. Johnson is not related to Ms. Abigail P. Johnson.
Michael E. Kenneally (1954)
Year of Election or Appointment: 2009
Trustee
Mr. Kenneally also serves as Trustee of other Fidelity® funds. Prior to his retirement, Mr. Kenneally served as Chairman and Global Chief Executive Officer of Credit Suisse Asset Management. Before joining Credit Suisse, he was an Executive Vice President and Chief Investment Officer for Bank of America Corporation. Earlier roles at Bank of America included Director of Research, Senior Portfolio Manager and Research Analyst, and Mr. Kenneally was awarded the Chartered Financial Analyst (CFA) designation in 1991.
James H. Keyes (1940)
Year of Election or Appointment: 2007
Trustee
Mr. Keyes also serves as Trustee of other Fidelity® funds. Mr. Keyes serves as a member of the Board and Non-Executive Chairman of Navistar International Corporation (manufacture and sale of trucks, buses, and diesel engines, since 2002). Previously, Mr. Keyes served as a member of the Board of Pitney Bowes, Inc. (integrated mail, messaging, and document management solutions, 1998-2013). Prior to his retirement, Mr. Keyes served as Chairman (1993-2002) and Chief Executive Officer (1988-2002) of Johnson Controls (automotive, building, and energy) and as a member of the Board of LSI Logic Corporation (semiconductor technologies, 1984-2008).
Marie L. Knowles (1946)
Year of Election or Appointment: 2001
Trustee
Chairman of the Independent Trustees
Ms. Knowles also serves as Trustee of other Fidelity® funds. Prior to Ms. Knowles' retirement in June 2000, she served as Executive Vice President and Chief Financial Officer of Atlantic Richfield Company (ARCO) (diversified energy, 1996-2000). From 1993 to 1996, she was a Senior Vice President of ARCO and President of ARCO Transportation Company (pipeline and tanker operations). Ms. Knowles currently serves as a Director and Chairman of the Audit Committee of McKesson Corporation (healthcare service, since 2002). Ms. Knowles is a member of the Board of the Santa Catalina Island Company (real estate, 2009-present). Ms. Knowles is a Member of the Investment Company Institute Board of Governors and a Member of the Governing Council of the Independent Directors Council (2014-present). She also serves as a member of the Advisory Board for the School of Engineering of the University of Southern California. Previously, Ms. Knowles served as a Director of Phelps Dodge Corporation (copper mining and manufacturing, 1994-2007), URS Corporation (engineering and construction, 2000-2003) and America West (airline, 1999-2002). Ms. Knowles previously served as Vice Chairman of the Independent Trustees of certain Fidelity® funds (2012-2015).
+ The information includes the Trustee's principal occupation during the last five years and other information relating to the experience, attributes, and skills relevant to the Trustee's qualifications to serve as a Trustee, which led to the conclusion that the Trustee should serve as a Trustee for the fund.
Advisory Board Members and Officers:
Correspondence intended for an officer may be sent to Fidelity Investments, 245 Summer Street, Boston, Massachusetts 02210. Officers appear below in alphabetical order.
Name, Year of Birth; Principal Occupation
Marc R. Bryant (1966)
Year of Election or Appointment: 2015
Secretary and Chief Legal Officer (CLO)
Mr. Bryant also serves as Secretary and CLO of other funds. Mr. Bryant serves as CLO, Secretary, and Senior Vice President of Fidelity Management & Research Company (investment adviser firm, 2015-present) and FMR Co., Inc. (investment adviser firm, 2015-present); Secretary of Fidelity SelectCo, LLC (investment adviser firm, 2015-present) and Fidelity Investments Money Management, Inc. (investment adviser firm, 2015-present); and CLO of Fidelity Management & Research (Hong Kong) Limited (investment adviser firm, 2015-present). He is Senior Vice President and Deputy General Counsel of FMR LLC (diversified financial services company). Previously, Mr. Bryant served as Secretary and CLO of Fidelity Rutland Square Trust II (2010-2014) and Assistant Secretary of Fidelity's Fixed Income and Asset Allocation Funds (2013-2015). Prior to joining Fidelity Investments, Mr. Bryant served as a Senior Vice President and the Head of Global Retail Legal for AllianceBernstein L.P. (2006-2010), and as the General Counsel for ProFund Advisors LLC (2001-2006).
Jonathan Davis (1968)
Year of Election or Appointment: 2010
Assistant Treasurer
Mr. Davis also serves as Assistant Treasurer of other funds, and is an employee of Fidelity Investments. Previously, Mr. Davis served as Vice President and Associate General Counsel of FMR LLC (diversified financial services company, 2003-2010).
Adrien E. Deberghes (1967)
Year of Election or Appointment: 2010
Assistant Treasurer
Mr. Deberghes also serves as an officer of other funds. He is an employee of Fidelity Investments (2008-present). Prior to joining Fidelity Investments, Mr. Deberghes was Senior Vice President of Mutual Fund Administration at State Street Corporation (2007-2008), Senior Director of Mutual Fund Administration at Investors Bank & Trust (2005-2007), and Director of Finance for Dunkin' Brands (2000-2005).
Stephanie J. Dorsey (1969)
Year of Election or Appointment: 2013
President and Treasurer
Ms. Dorsey also serves as an officer of other funds. She is an employee of Fidelity Investments (2008-present) and has served in other fund officer roles. Prior to joining Fidelity Investments, Ms. Dorsey served as Treasurer (2004-2008) of the JPMorgan Mutual Funds and Vice President (2004-2008) of JPMorgan Chase Bank.
Howard J. Galligan III (1966)
Year of Election or Appointment: 2014
Chief Financial Officer
Mr. Galligan also serves as Chief Financial Officer of other funds. Mr. Galligan serves as President of Fidelity Pricing and Cash Management Services (FPCMS) (2014-present) and as a Director of Strategic Advisers, Inc. (investment adviser firm, 2008-present). Previously, Mr. Galligan served as Chief Administrative Officer of Asset Management (2011-2014) and Chief Operating Officer and Senior Vice President of Investment Support for Strategic Advisers, Inc. (2003-2011).
Scott C. Goebel (1968)
Year of Election or Appointment: 2015
Vice President
Mr. Goebel serves as Vice President of other funds and is an employee of Fidelity Investments (2001-present). Previously, Mr. Goebel served as Secretary of Fidelity SelectCo, LLC (investment adviser firm, 2013-2015), Fidelity Investments Money Management, Inc. (FIMM) (investment adviser firm, 2010-2015), and Fidelity Research and Analysis Company (FRAC) (investment adviser firm, 2010-2015); General Counsel, Secretary, and Senior Vice President of Fidelity Management & Research Company (investment adviser firm, 2008-2015) and FMR Co., Inc. (investment adviser firm, 2008-2015); Assistant Secretary of Fidelity Management & Research (Japan) Limited (investment adviser firm, 2008-2015) and FMR Investment Management (U.K.) Limited (investment adviser firm, 2008-2015); Chief Legal Officer (CLO) of Fidelity Management & Research (Hong Kong) Limited (investment adviser firm, 2008-2015); Secretary and CLO of certain Fidelity® funds (2008-2015); Assistant Secretary of FIMM (2008-2010), FRAC (2008-2010), and certain funds (2007-2008); and as Vice President and Secretary of Fidelity Distributors Corporation (FDC) (2005-2007).
Chris Maher (1972)
Year of Election or Appointment: 2013
Assistant Treasurer
Mr. Maher serves as Assistant Treasurer of other funds. Mr. Maher is Vice President of Valuation Oversight and is an employee of Fidelity Investments. Previously, Mr. Maher served as Vice President of Asset Management Compliance (2013), Vice President of the Program Management Group of FMR (investment adviser firm, 2010-2013), and Vice President of Valuation Oversight (2008-2010).
Jason P. Pogorelec (1975)
Year of Election or Appointment: 2015
Assistant Secretary
Mr. Pogorelec also serves as Assistant Secretary of other funds. Mr. Pogorelec serves as Vice President, Associate General Counsel (2010-present) and is an employee of Fidelity Investments (2006-present).
John F. Papandrea (1972)
Year of Election or Appointment: 2016
Anti-Money Laundering (AML) Officer
Mr. Papandrea also serves as AML Officer of other funds. Mr. Papandrea is VIce Presidnet of FMR LLC (diversified financial services company, 2008-present) and is an employee of Fidelity Investments (2005-present).
Nancy D. Prior (1967)
Year of Election or Appointment: 2014
Vice President
Ms. Prior also serves as Vice President of other funds. Ms. Prior serves as a Director of Fidelity Investments Money Management, Inc. (FIMM) (investment adviser firm, 2014-present), President, Fixed Income (2014-present), Vice Chairman of FIAM LLC (investment adviser firm, 2014-present), and is an employee of Fidelity Investments (2002-present). Previously, Ms. Prior served as Vice President of Fidelity's Money Market Funds (2012-2014), President, Money Market and Short Duration Bond Group of Fidelity Management & Research (FMR) (investment adviser firm, 2013-2014), President, Money Market Group of FMR (2011-2013), Managing Director of Research (2009-2011), Senior Vice President and Deputy General Counsel (2007-2009), and Assistant Secretary of other Fidelity® funds (2008-2009).
Kenneth B. Robins (1969)
Year of Election or Appointment: 2009
Assistant Treasurer
Mr. Robins also serves as an officer of other funds. Mr. Robins serves as Executive Vice President of Fidelity Investments Money Management, Inc. (FIMM) (investment adviser firm, 2013-present) and is an employee of Fidelity Investments (2004-present). Previously, Mr. Robins served in other fund officer roles.
Stacie M. Smith (1974)
Year of Election or Appointment: 2013
Assistant Treasurer
Ms. Smith also serves as an officer of other funds. She is an employee of Fidelity Investments (2009-present) and has served in other fund officer roles. Prior to joining Fidelity Investments, Ms. Smith served as Senior Audit Manager of Ernst & Young LLP (1996-2009).
Renee Stagnone (1975)
Year of Election or Appointment: 2013
Deputy Treasurer
Ms. Stagnone also serves as Deputy Treasurer of other funds. Ms. Stagnone is an employee of Fidelity Investments (1997-present).
Christine J. Thompson (1958)
Year of Election or Appointment: 2015
Vice President of Fidelity's Bond Funds
Ms. Thompson also serves as Vice President of other funds. Ms. Thompson also serves as Chief Investment Officer of FMR's Bond Group (2010-present) and is an employee of Fidelity Investments (1985-present). Previously, Ms. Thompson served as Vice President of Fidelity's Bond Funds (2010-2012).
Michael H. Whitaker (1967)
Year of Election or Appointment: 2008
Chief Compliance Officer
Mr. Whitaker also serves as Chief Compliance Officer of other funds. Mr. Whitaker also serves as Compliance Officer of FMR Co., Inc. (investment adviser firm, 2014-present), FMR (investment adviser firm, 2014-present), and Fidelity Investments Money Management, Inc. (investment adviser firm, 2014-present) and is an employee of Fidelity Investments (2007-present). Prior to joining Fidelity Investments, Mr. Whitaker worked at MFS Investment Management where he served as Senior Vice President and Chief Compliance Officer (2004-2006), and Assistant General Counsel.
Joseph F. Zambello (1957)
Year of Election or Appointment: 2011
Deputy Treasurer
Mr. Zambello also serves as Deputy Treasurer of other funds. Mr. Zambello is an employee of Fidelity Investments (1991-present). Previously, Mr. Zambello served as Vice President of the Program Management Group of FMR (investment adviser firm, 2009-2011) and Vice President of the Transfer Agent Oversight Group (2005-2009).
Fidelity
® VIP Investment Grade Central Fund
Shareholder Expense Example
As a shareholder of the Fund, you incur two types of costs: (1) transaction costs and (2) ongoing costs, including other Fund expenses. This Example is intended to help you understand your ongoing costs (in dollars) of investing in the Fund and to compare these costs with the ongoing costs of investing in other mutual funds.
The Example is based on an investment of $1,000 invested at the beginning of the period and held for the entire period (July 1, 2015 to December 31, 2015).
Actual Expenses
The first line of the accompanying table provides information about actual account values and actual expenses. You may use the information in this line, together with the amount you invested, to estimate the expenses that you paid over the period. Simply divide your account value by $1,000.00 (for example, an $8,600 account value divided by $1,000.00 = 8.6), then multiply the result by the number in the first line under the heading entitled "Expenses Paid During Period" to estimate the expenses you paid on your account during this period. In addition, the Fund, as a shareholder in the underlying Fidelity Central Funds, will indirectly bear its pro-rata share of the fees and expenses incurred by the underlying Fidelity Central Funds. These fees and expenses are not included in the Fund's annualized expense ratio used to calculate the expense estimate in the table below.
Hypothetical Example for Comparison Purposes
The second line of the accompanying table provides information about hypothetical account values and hypothetical expenses based on the Fund's actual expense ratio and an assumed rate of return of 5% per year before expenses, which is not the Fund's actual return. The hypothetical account values and expenses may not be used to estimate the actual ending account balance or expenses you paid for the period. You may use this information to compare the ongoing costs of investing in the Fund and other funds. To do so, compare this 5% hypothetical example with the 5% hypothetical examples that appear in the shareholder reports of the other funds. In addition, the Fund, as a shareholder in the underlying Fidelity Central Funds, will indirectly bear its pro-rata share of the fees and expenses incurred by the underlying Fidelity Central Funds. These fees and expenses are not included in the Fund's annualized expense ratio used to calculate the expense estimate in the table below.
Please note that the expenses shown in the table are meant to highlight your ongoing costs only and do not reflect any transaction costs. Therefore, the second line of the table is useful in comparing ongoing costs only, and will not help you determine the relative total costs of owning different funds.
| | Annualized Expense Ratio-A | Beginning
Account Value
July 1, 2015 | Ending
Account Value
December 31, 2015 | Expenses Paid
During Period-B
July 1, 2015
to December 31, 2015 |
| Actual | .0015% | $1,000.00 | $1,000.10 | $.01 |
| Hypothetical-C | | $1,000.00 | $1,025.20 | $.01 |
A Annualized expense ratio reflects expenses net of applicable fee waivers.
B Expenses are equal to the Fund's annualized expense ratio, multiplied by the average account value over the period, multiplied by 184/365 (to reflect the one-half year period).
C 5% return per year before expenses
Fidelity® VIP Investment Grade Central Fund
Distributions (Unaudited)
The Board of Trustees of VIP Investment Grade Central Fund voted to pay on February 12, 2016, to shareholders of record at the opening of business on February 12, 2016 a distribution of $1.069 per share derived from capital gains realized from sales of portfolio securities.
The fund hereby designates as a capital gain dividend with respect to the taxable year ended December 31, 2015, $46,195,555, or, if subsequently determined to be different, the net capital gain of such year.
Board Approval of Investment Advisory Contracts and Management Fees
VIP Investment Grade Central Fund
Each year, the Board of Trustees, including the Independent Trustees (together, the Board), votes on the renewal of the management contract with Fidelity Investments Money Management, Inc. (FIMM) and the sub-advisory agreements (together, the Advisory Contracts) for the fund. The Board, assisted by the advice of fund counsel and Independent Trustees' counsel, requests and considers a broad range of information relevant to the renewal of the Advisory Contracts throughout the year.
The Board meets regularly and, at each of its meetings, covers an extensive agenda of topics and materials and considers factors that are relevant to its annual consideration of the renewal of the fund's Advisory Contracts, including the services and support provided to the fund and its shareholders. The Board has established four standing committees (Committees) — Operations, Audit, Fair Valuation, and Governance and Nominating — each composed of and chaired by Independent Trustees with varying backgrounds, to which the Board has assigned specific subject matter responsibilities in order to enhance effective decision-making by the Board. The Operations Committee, of which all of the Independent Trustees are members, meets regularly throughout the year and considers, among other matters, information specifically related to the annual consideration of the renewal of the fund's Advisory Contracts. The Board, acting directly and through its Committees, requests and receives information concerning the annual consideration of the renewal of the fund's Advisory Contracts. The Board also meets as needed to consider matters specifically related to the Board's annual consideration of the renewal of the Advisory Contracts. Members of the Board may also meet with trustees of other Fidelity funds through ad hoc joint committees to discuss certain matters relevant to all of the Fidelity funds.
At its September 2015 meeting, the Board unanimously determined to renew the fund's Advisory Contracts. In reaching its determination, the Board considered all factors it believed relevant and reached a determination, with the assistance of fund counsel and Independent Trustees' counsel and through the exercise of its business judgment, that the renewal of the Advisory Contracts was in the best interests of the fund and its shareholders and the fact that no fee is payable under the management contract was fair and reasonable.
Nature, Extent, and Quality of Services Provided. The Board considered Fidelity's staffing as it relates to the fund, including the backgrounds of investment personnel of Fidelity, and also considered the fund's investment objective, strategies, and related investment philosophy. The Independent Trustees also had discussions with senior management of Fidelity's investment operations and investment groups. The Board considered the structure of the portfolio manager compensation program and whether this structure provides appropriate incentives to act in the best interests of the fund.
Resources Dedicated to Investment Management and Support Services. The Board reviewed the general qualifications and capabilities of Fidelity's investment staff, including its size, education, experience, and resources, as well as Fidelity's approach to recruiting, training, managing, and compensating investment personnel. The Board noted that Fidelity has continued to increase the resources devoted to non-U.S. offices, including expansion of Fidelity's global investment organization. The Board also noted that Fidelity's analysts have extensive resources, tools and capabilities that allow them to conduct sophisticated quantitative and fundamental analysis, as well as credit analysis of issuers, counterparties and guarantors. Further, the Board considered that Fidelity's investment professionals have sufficient access to global information and data so as to provide competitive investment results over time, and that those professionals also have access to sophisticated tools that permit them to assess portfolio construction and risk and performance attribution characteristics continuously, as well as to transmit new information and research conclusions rapidly around the world. Additionally, in its deliberations, the Board considered Fidelity's trading, risk management, compliance, and technology and operations capabilities and resources, which are integral parts of the investment management process.
Administrative Services. The Board considered (i) the nature, extent, quality, and cost of advisory and administrative services performed by FIMM, the sub-advisers, and their affiliates under the Advisory Contracts and under separate agreements covering transfer agency, pricing and bookkeeping, and securities lending services for the fund; (ii) the nature and extent of the supervision of third party service providers, principally custodians, subcustodians, and pricing vendors; and (iii) the resources devoted to, and the record of compliance with, the fund's compliance policies and procedures.
Investment Performance. The Board considered whether the fund has operated in accordance with its investment objective, as well as its record of compliance with its investment restrictions. The Board reviewed the fund's absolute investment performance, as well as the fund's relative investment performance, but did not consider performance to be a material factor in its decision to renew the fund's Advisory Contracts, as the fund is not publicly offered as a stand-alone investment product. In this regard, the Board noted that the fund is designed to offer a liquid investment option for other Fidelity funds and accounts and ultimately to enhance the performance of those funds and accounts.
Based on its review, the Board concluded that the nature, extent, and quality of services provided to the fund under the Advisory Contracts should benefit the shareholders of the fund.
Competitiveness of Management Fee and Total Expense Ratio. The Board considered that while the fund does not pay a management fee, Fidelity Management & Research Company (FMR) pays a management fee on behalf of the fund and receives fees for providing services to funds that invest in the fund. The Board also noted that FMR bears all expenses of the fund, except expenses related to the fund's investment activities (primarily custody expenses). Based on its review, the Board concluded that the management fee paid on behalf of the fund and the fund's total expense ratio were reasonable in light of the services that the fund and its shareholders receive and the other factors considered.
Costs of the Services and Profitability. The Board considered the level of Fidelity's profits in respect of all the Fidelity funds, as well as the profitability of each fund that invests in this fund.
PricewaterhouseCoopers LLP (PwC), independent registered public accounting firm and auditor to Fidelity and certain Fidelity funds, has been engaged annually by the Board as part of the Board's assessment of Fidelity's profitability analysis. PwC's engagement includes the review and assessment of the methodologies used by Fidelity in determining the revenues and expenses attributable to Fidelity's mutual fund business, and completion of agreed-upon procedures in respect of the mathematical accuracy of fund profitability and its conformity to established allocation methodologies. After considering PwC's reports issued under the engagement and information provided by Fidelity, the Board concluded that while other allocation methods may also be reasonable, Fidelity's profitability methodologies are reasonable in all material respects.
The Board also reviewed Fidelity's non-fund businesses and fall-out benefits related to the mutual fund business as well as cases where Fidelity's affiliates may benefit from or be related to the fund's business.
The Board concluded that the costs of the services provided by and the profits realized by Fidelity in connection with the operation of the fund were not relevant to the renewal of the Advisory Contracts because the fund pays no advisory fees and FMR bears all expenses of the fund, except expenses related to the fund's investment activities.
Economies of Scale. The Board concluded that because the fund pays no advisory fees and FMR bears all expenses of the fund, except expenses related to the fund's investment activities, economies of scale cannot be realized by the fund.
Additional Information Requested by the Board. In order to develop fully the factual basis for consideration of the Fidelity funds' Advisory Contracts, the Board requested and received additional information on certain topics, including: (i) Fidelity's fund profitability methodology, profitability trends for certain funds, and the impact of certain factors on fund profitability results; (ii) portfolio manager changes that have occurred during the past year and the amount of the investment that each portfolio manager has made in the Fidelity fund(s) that he or she manages; (iii) Fidelity's compensation structure for portfolio managers, research analysts, and other key personnel, including its effects on fund profitability, the rationale for the compensation structure, and the extent to which current market conditions have affected retention and recruitment; (iv) the arrangements with and compensation paid to certain fund sub-advisers on behalf of the Fidelity funds; (v) Fidelity's voluntary waiver of its fees to maintain minimum yields for certain money market funds and classes as well as contractual waivers in place for certain funds; (vi) the methodology with respect to competitive fund data and peer group classifications; (vii) Fidelity's transfer agent fee, expense, and service structures for different funds and classes relative to competitive trends, and the impact of the increased use of omnibus accounts; (viii) Fidelity's long-term expectations for its offerings in the workplace investing channel; (ix) new developments in the retail and institutional marketplaces; and (x) the impact of money market reform on Fidelity's money market funds. In addition, the Board considered its discussions with Fidelity throughout the year regarding enhanced information security initiatives and the funds' fair valuation policies.
Based on its evaluation of all of the conclusions noted above, and after considering all factors it believed relevant, the Board concluded that the advisory fee structures are fair and reasonable, and that the fund's Advisory Contracts should be renewed.
Fidelity
® VIP Investment Grade Central Fund
Proxy Voting Results
A special meeting of shareholders was held on November 18, 2015. The results of votes taken among shareholders on the proposal before them are reported below. Each vote reported represents one dollar of net asset value held on the record date for the meeting.
PROPOSAL 1
| To elect a Board of Trustees. |
| | # of
Votes | % of
Votes |
| Elizabeth S. Acton | | |
| Affirmative | 5,966,899,870.80 | 100.000 |
| Withheld | 0.00 | 0.000 |
| TOTAL | 5,966,899,870.80 | 100.000 |
| John Engler | | |
| Affirmative | 5,966,899,870.80 | 100.000 |
| Withheld | 0.00 | 0.000 |
| TOTAL | 5,966,899,870.80 | 100.000 |
| Albert R. Gamper, Jr. | | |
| Affirmative | 5,966,899,870.80 | 100.000 |
| Withheld | 0.00 | 0.000 |
| TOTAL | 5,966,899,870.80 | 100.000 |
| Robert F. Gartland | | |
| Affirmative | 5,966,899,870.80 | 100.000 |
| Withheld | 0.00 | 0.000 |
| TOTAL | 5,966,899,870.80 | 100.000 |
| Abigail P. Johnson | | |
| Affirmative | 5,966,899,870.80 | 100.000 |
| Withheld | 0.00 | 0.000 |
| TOTAL | 5,966,899,870.80 | 100.000 |
| Arthur E. Johnson | | |
| Affirmative | 5,966,899,870.80 | 100.000 |
| Withheld | 0.00 | 0.000 |
| TOTAL | 5,966,899,870.80 | 100.000 |
| Michael E. Kenneally | | |
| Affirmative | 5,966,899,870.80 | 100.000 |
| Withheld | 0.00 | 0.000 |
| TOTAL | 5,966,899,870.80 | 100.000 |
| James H. Keyes | | |
| Affirmative | 5,966,899,870.80 | 100.000 |
| Withheld | 0.00 | 0.000 |
| TOTAL | 5,966,899,870.80 | 100.000 |
| Marie L. Knowles | | |
| Affirmative | 5,966,899,870.80 | 100.000 |
| Withheld | 0.00 | 0.000 |
| TOTAL | 5,966,899,870.80 | 100.000 |
| Geoffrey A. von Kuhn | | |
| Affirmative | 5,966,899,870.80 | 100.000 |
| Withheld | 0.00 | 0.000 |
| TOTAL | 5,966,899,870.80 | 100.000 |
| Proposal 1 reflects trust wide proposal and voting results. |
VIPIGB-ANN-0216
1.540025.118
Fidelity® Variable Insurance Products:
Freedom Lifetime Income Funds - Portfolios I, II & III
Annual Report December 31, 2015 |
|
Contents
To view a fund's proxy voting guidelines and proxy voting record for the 12-month period ended June 30, visit http://www.fidelity.com/proxyvotingresults or visit the Securities and Exchange Commission's (SEC) web site at http://www.sec.gov.
You may also call 1-877-208-0098 to request a free copy of the proxy voting guidelines.
Fidelity® Variable Insurance Products are separate account options which are purchased through a variable insurance contract.
Standard & Poor's, S&P and S&P 500 are registered service marks of The McGraw-Hill Companies, Inc. and have been licensed for use by Fidelity Distributors Corporation.
Other third-party marks appearing herein are the property of their respective owners.
All other marks appearing herein are registered or unregistered trademarks or service marks of FMR LLC or an affiliated company. © 2016 FMR LLC. All rights reserved.
This report and the financial statements contained herein are submitted for the general information of the shareholders of the Funds. This report is not authorized for distribution to prospective investors in the Funds unless preceded or accompanied by an effective prospectus.
A fund files its complete schedule of portfolio holdings with the SEC for the first and third quarters of each fiscal year on Form N-Q. Forms N-Q are available on the SEC’s web site at http://www.sec.gov. A fund's Forms N-Q may be reviewed and copied at the SEC’s Public Reference Room in Washington, DC. Information regarding the operation of the SEC's Public Reference Room may be obtained by calling 1-800-SEC-0330.
For a complete list of a fund's portfolio holdings, view the most recent holdings listing, semiannual report, or annual report on Fidelity's web site at http://www.fidelity.com, http://www.advisor.fidelity.com, or http://www.401k.com, as applicable.
NOT FDIC INSURED •MAY LOSE VALUE •NO BANK GUARANTEE
Neither the Funds nor Fidelity Distributors Corporation is a bank.
VIP Freedom Lifetime Income® I Portfolio
Performance: The Bottom Line
Average annual total return reflects the change in the value of an investment, assuming reinvestment of distributions from dividend income and capital gains (the profits earned upon the sale of securities that have grown in value, if any) and assuming a constant rate of performance each year. During periods of reimbursement by Fidelity, a fund’s total return will be greater than it would be had the reimbursement not occurred. Performance numbers are net of all underlying fund operating expenses, but do not include any insurance charges imposed by your insurance company’s separate account. If performance information included the effect of these additional charges, the total returns would have been lower. How a fund did yesterday is no guarantee of how it will do tomorrow.
Average Annual Total Returns
| For the periods ended December 31, 2015 | Past 1 year | Past 5 years | Past 10 years |
| VIP Freedom Lifetime Income® I Portfolio | (0.35)% | 4.94% | 4.78% |
$10,000 Over 10 Years
Let's say hypothetically that $10,000 was invested in VIP Freedom Lifetime Income® I Portfolio on December 31, 2005.
The chart shows how the value of your investment would have changed, and also shows how the Barclays® U.S. Aggregate Bond Index performed over the same period.
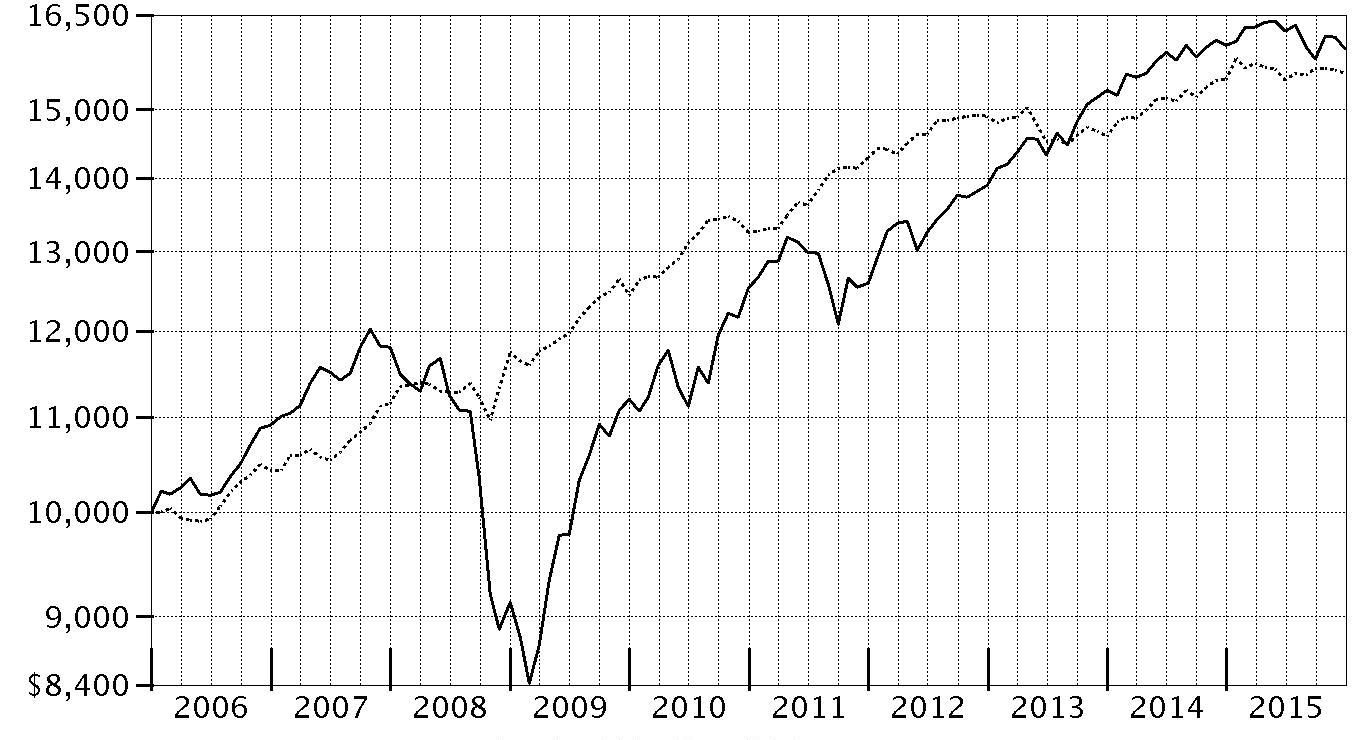
| Period Ending Values |
| $15,948 | VIP Freedom Lifetime Income® I Portfolio |
| $15,552 | Barclays® U.S. Aggregate Bond Index |
VIP Freedom Lifetime Income® II Portfolio
Performance: The Bottom Line
Average annual total return reflects the change in the value of an investment, assuming reinvestment of distributions from dividend income and capital gains (the profits earned upon the sale of securities that have grown in value, if any) and assuming a constant rate of performance each year. During periods of reimbursement by Fidelity, a fund’s total return will be greater than it would be had the reimbursement not occurred. Performance numbers are net of all underlying fund operating expenses, but do not include any insurance charges imposed by your insurance company’s separate account. If performance information included the effect of these additional charges, the total returns would have been lower. How a fund did yesterday is no guarantee of how it will do tomorrow.
Average Annual Total Returns
| For the periods ended December 31, 2015 | Past 1 year | Past 5 years | Past 10 years |
| VIP Freedom Lifetime Income® II Portfolio | (0.23)% | 5.74% | 5.13% |
$10,000 Over 10 Years
Let's say hypothetically that $10,000 was invested in VIP Freedom Lifetime Income® II Portfolio on December 31, 2005.
The chart shows how the value of your investment would have changed, and also shows how the Barclays® U.S. Aggregate Bond Index performed over the same period.
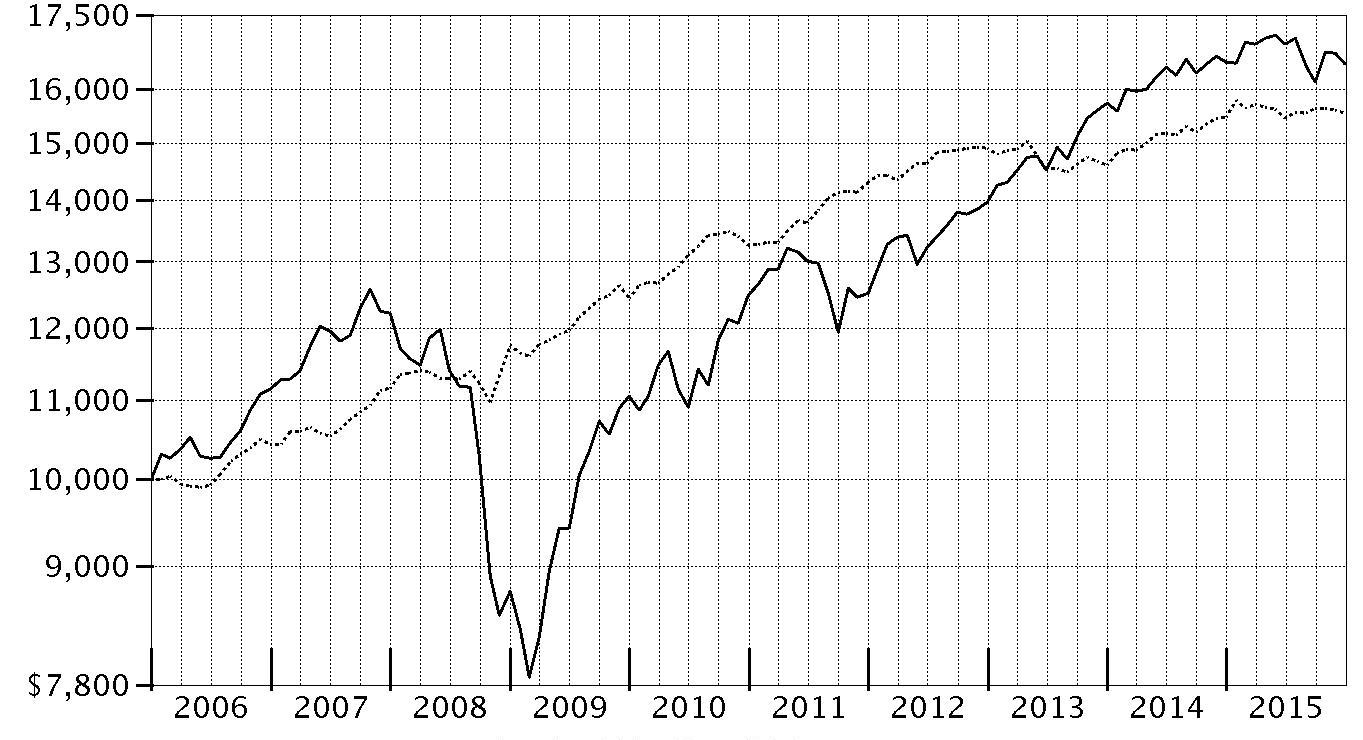
| Period Ending Values |
| $16,499 | VIP Freedom Lifetime Income® II Portfolio |
| $15,552 | Barclays® U.S. Aggregate Bond Index |
VIP Freedom Lifetime Income® III Portfolio
Performance: The Bottom Line
Average annual total return reflects the change in the value of an investment, assuming reinvestment of distributions from dividend income and capital gains (the profits earned upon the sale of securities that have grown in value, if any) and assuming a constant rate of performance each year. During periods of reimbursement by Fidelity, a fund’s total return will be greater than it would be had the reimbursement not occurred. Performance numbers are net of all underlying fund operating expenses, but do not include any insurance charges imposed by your insurance company’s separate account. If performance information included the effect of these additional charges, the total returns would have been lower. How a fund did yesterday is no guarantee of how it will do tomorrow.
Average Annual Total Returns
| For the periods ended December 31, 2015 | Past 1 year | Past 5 years | Past 10 years |
| VIP Freedom Lifetime Income® III Portfolio | (0.27)% | 7.30% | 5.70% |
$10,000 Over 10 Years
Let's say hypothetically that $10,000 was invested in VIP Freedom Lifetime Income® III Portfolio on December 31, 2005.
The chart shows how the value of your investment would have changed, and also shows how the S&P 500® Index performed over the same period.

| Period Ending Values |
| $17,409 | VIP Freedom Lifetime Income® III Portfolio |
| $20,242 | S&P 500® Index |
Management's Discussion of Fund Performance
Market Recap: Largely buoyed by the U.S., developed-markets equities finished 2015 nearly flat overall, rebounding from a steep decline in August and September over worries about China’s slowing economic growth. The MSCI World Index returned -0.44% for the 12 months ending December 31, 2015. Modest gains in the first half of the year were quickly erased amid the late-summer rout, but stocks sharply reversed course in October, lifted by the U.S. Federal Reserve’s decision to put off raising near-term interest rates until mid-December. Investors also were encouraged by an interest-rate cut in China and economic stimulus in Europe. Excess supply of oil and natural gas weighed on commodities, the year’s worst-performing asset class. Lower energy costs and improving wages drove consumer spending, though, helping retailers. Also, low interest rates and pent-up demand boosted global auto sales: December results sent annual totals past the previous record, set in 2000.
The broad Dow Jones U.S. Total Stock Market Index℠ gained 0.44% for the year. Large-cap stocks outpaced small-caps by a comfortable margin, with the S&P 500
® and the Russell 2000
® Index returning 1.38% and -4.41%, respectively. Meanwhile, non-U.S. developed-markets returned -3.04%, as measured by the MSCI World ex USA Index, and the MSCI Emerging Markets Index returned -14.60%, beset by numerous challenges, U.S.-dollar strengthening throughout the period not the least of them. Globally, growth- led value-oriented stocks across market-cap segments. Outside the U.S., large-caps lagged small-caps substantially.
Looking within the bellwether S&P 500
®, the downtrodden energy (-21%), materials (-8%) and utilities (-5%) sectors weighed on the index. Health care (+7%) helped alleviate the pain, and investors’ preference for growth stocks braced technology (+6%), which also benefited from strong fundamentals and attractive relative valuations. This sector performance pattern was generally similar worldwide.
In fixed income, the Barclays
® Global Aggregate GDP Weighted Index returned -3.90%, affected in part by the Fed’s first interest-rate hike since 2006. The investment-grade Barclays
® U.S. Aggregate Bond Index returned 0.55%; The BofA Merrill Lynch℠ US High Yield Constrained Index, -4.61%. Energy- and commodity-related securities performed worst. U.S. Treasury Inflation-Protected Securities (TIPS) suffered amid stubbornly low inflation. Meanwhile, emerging-markets debt rebounded strongly in the fall, overcoming multiple threats including China’s economic slowdown and currency headwinds.
Comments from Co-Portfolio Managers Andrew Dierdorf and Brett Sumsion: For the year, each VIP Freedom Lifetime Income
® Fund posted a modestly negative return that lagged the slightly positive result of its respective Composite benchmark.
(For specific Fund results, please refer to the performance section of this report.) Generally speaking, the Funds' non-U.S. equity investments added value overall by meaningfully outperforming the asset-class benchmark. In particular VIP Overseas Portfolio, which seeks to own high-quality companies purchased at attractive prices that the manager believes can outperform the market over the long term, produced a solid gain. Similarly, VIP Emerging Markets Portfolio, despite its negative result, finished well ahead of its fund-level benchmark. Relative gains here were undermined largely by results from VIP Investment Grade Bond Portfolio, which emphasized corporate bonds and underweighted U.S. Treasuries; the Portfolio underperformed the Barclays
® U.S. Aggregate Bond Index. Out-of-benchmark allocations to high-yield debt also detracted from results. Lastly, the Funds' U.S. equity allocation underperformed overall. Intra-asset allocation decisions – that is, weightings among underlying portfolios – detracted from results. Most notably VIP Growth & Income Portfolio, the Funds' largest U.S. equity holding, underperformed its benchmark this period.
The views expressed above reflect those of the portfolio manager(s) only through the end of the period as stated on the cover of this report and do not necessarily represent the views of Fidelity or any other person in the Fidelity organization. Any such views are subject to change at any time based upon market or other conditions and Fidelity disclaims any responsibility to update such views. These views may not be relied on as investment advice and, because investment decisions for a Fidelity fund are based on numerous factors, may not be relied on as an indication of trading intent on behalf of any Fidelity fund.
VIP Freedom Lifetime Income® I Portfolio
Investment Summary (Unaudited)
The information in the following tables is based on the direct investments of the Fund.
Fund Holdings as of December 31, 2015
| | % of fund's net assets | % of fund's net assets 6 months ago |
| Domestic Equity Funds | | |
| VIP Contrafund Portfolio Investor Class | 3.2 | 3.4 |
| VIP Equity-Income Portfolio Investor Class | 3.4 | 3.6 |
| VIP Growth & Income Portfolio Investor Class | 3.8 | 4.1 |
| VIP Growth Portfolio Investor Class | 3.4 | 3.6 |
| VIP Mid Cap Portfolio Investor Class | 0.9 | 1.0 |
| VIP Value Portfolio Investor Class | 2.4 | 2.7 |
| VIP Value Strategies Portfolio Investor Class | 1.2 | 1.3 |
| | 18.3 | 19.7 |
| Developed International Equity Funds | | |
| VIP Overseas Portfolio Investor Class | 5.4 | 5.7 |
| Emerging Markets Equity Funds | | |
| VIP Emerging Markets Portfolio Investor Class | 1.4 | 1.5 |
| High Yield Bond Funds | | |
| VIP High Income Portfolio Investor Class | 4.9 | 5.0 |
| Investment Grade Bond Funds | | |
| VIP Investment Grade Bond Portfolio Investor Class | 54.8 | 53.0 |
| Short-Term Funds | | |
| VIP Government Money Market Portfolio Investor Class 0.03% | 15.2 | 15.1 |
| Net Other Assets (Liabilities) | | |
| Net Other Assets | 0.0 | 0.0 |
| | 100.0 | 100.0 |
VIP Government Money Market Portfolio Investor Class was formerly known as VIP Money Market Portfolio Investor Class
Asset Allocation (% of fund's net assets)
| Period end |
| | Domestic Equity Funds | 18.3% |
| | Developed International Equity Funds | 5.4% |
| | Emerging Markets Equity Funds | 1.4% |
| | High Yield Bond Funds | 4.9% |
| | Investment Grade Bond Funds | 54.8% |
| | Short-Term Funds | 15.2% |

| Six months ago |
| | Domestic Equity Funds | 19.7% |
| | Developed International Equity Funds | 5.7% |
| | Emerging Markets Equity Funds | 1.5% |
| | High Yield Bond Funds | 5.0% |
| | Investment Grade Bond Funds | 53.0% |
| | Short-Term Funds | 15.1% |

Percentages shown as 0.0% may reflect amounts less than 0.05%.
VIP Freedom Lifetime Income® I Portfolio
Investments December 31, 2015
Showing Percentage of Net Assets
| Domestic Equity Funds - 18.3% | | | |
| | | Shares | Value |
| Domestic Equity Funds - 18.3% | | | |
| VIP Contrafund Portfolio Investor Class (a) | | 13,007 | $439,232 |
| VIP Equity-Income Portfolio Investor Class (a) | | 22,740 | 463,448 |
| VIP Growth & Income Portfolio Investor Class (a) | | 27,662 | 520,601 |
| VIP Growth Portfolio Investor Class (a) | | 6,974 | 457,143 |
| VIP Mid Cap Portfolio Investor Class (a) | | 3,865 | 125,620 |
| VIP Value Portfolio Investor Class (a) | | 25,025 | 334,079 |
| VIP Value Strategies Portfolio Investor Class (a) | | 11,171 | 161,638 |
| TOTAL DOMESTIC EQUITY FUNDS | | | |
| (Cost $2,151,138) | | | 2,501,761 |
|
| International Equity Funds - 6.8% | | | |
| Developed International Equity Funds - 5.4% | | | |
| VIP Overseas Portfolio Investor Class (a) | | 38,914 | 740,146 |
| Emerging Markets Equity Funds - 1.4% | | | |
| VIP Emerging Markets Portfolio Investor Class (a) | | 22,472 | 182,251 |
| TOTAL INTERNATIONAL EQUITY FUNDS | | | |
| (Cost $950,502) | | | 922,397 |
|
| Bond Funds - 59.7% | | | |
| High Yield Bond Funds - 4.9% | | | |
| VIP High Income Portfolio Investor Class (a) | | 135,568 | 668,352 |
| Investment Grade Bond Funds - 54.8% | | | |
| VIP Investment Grade Bond Portfolio Investor Class (a) | | 606,814 | 7,475,949 |
| TOTAL BOND FUNDS | | | |
| (Cost $8,530,694) | | | 8,144,301 |
|
| Short-Term Funds - 15.2% | | | |
| VIP Government Money Market Portfolio Investor Class 0.03% (a)(b) | | | |
| (Cost $2,066,985) | | 2,066,985 | 2,066,985 |
| TOTAL INVESTMENT PORTFOLIO - 100.0% | | | |
| (Cost $13,699,319) | | | 13,635,444 |
| NET OTHER ASSETS (LIABILITIES) - 0.0% | | | 0 |
| NET ASSETS - 100% | | | $13,635,444 |
Legend
(a) Affiliated Fund
(b) The rate quoted is the annualized seven-day yield of the fund at period end.
Affiliated Underlying Funds
Information regarding the Fund's fiscal year to date purchases and sales of the affiliated Underlying Funds and income earned by the Fund from investments in affiliated Underlying Funds is as follows:
(VIP Government Money Market Portfolio Investor Class was formerly known as VIP Money Market Portfolio Investor Class)
| Affiliate | Value, beginning of period | Purchases | Sales Proceeds | Dividend Income | Value, end of period |
| VIP Contrafund Portfolio Investor Class | $561,906 | $93,703 | $172,588 | $4,393 | $439,232 |
| VIP Emerging Markets Portfolio Investor Class | 233,947 | 18,585 | 50,063 | 1,022 | 182,251 |
| VIP Equity-Income Portfolio Investor Class | 589,502 | 106,915 | 148,870 | 15,293 | 463,448 |
| VIP Government Money Market Portfolio Investor Class 0.03% | 2,163,032 | 150,186 | 246,235 | 242 | 2,066,985 |
| VIP Growth & Income Portfolio Investor Class | 669,453 | 95,629 | 193,400 | 11,155 | 520,601 |
| VIP Growth Portfolio Investor Class | 568,440 | 52,836 | 185,440 | 879 | 457,143 |
| VIP High Income Portfolio Investor Class | 719,165 | 80,336 | 59,783 | 47,012 | 668,352 |
| VIP Investment Grade Bond Portfolio Investor Class | 7,431,462 | 919,424 | 617,839 | 196,680 | 7,475,949 |
| VIP Mid Cap Portfolio Investor Class | 170,238 | 28,633 | 53,959 | 568 | 125,620 |
| VIP Overseas Portfolio Investor Class | 900,247 | 73,432 | 264,476 | 9,851 | 740,146 |
| VIP Value Portfolio Investor Class | 438,731 | 89,691 | 135,456 | 4,442 | 334,079 |
| VIP Value Strategies Portfolio Investor Class | 217,247 | 15,186 | 65,808 | 1,905 | 161,638 |
| Total | $14,663,370 | $1,724,556 | $2,193,917 | $293,442 | $13,635,444 |
Investment Valuation
All investments are categorized as Level 1 under the Fair Value Hierarchy. The inputs or methodology used for valuing securities may not be an indication of the risk associated with investing in those securities. For more information on valuation inputs please refer to the Investment Valuation section in the accompanying Notes to Financial Statements.
See accompanying notes which are an integral part of the financial statements.
VIP Freedom Lifetime Income® I Portfolio
Financial Statements
Statement of Assets and Liabilities
| | | December 31, 2015 |
| Assets | | |
| Investment in securities, at value (cost $13,699,319) — See accompanying schedule | | $13,635,444 |
| Receivable for investments sold | | 225 |
| Total assets | | 13,635,669 |
| Liabilities | | |
| Payable for fund shares redeemed | $225 | |
| Total liabilities | | 225 |
| Net Assets | | $13,635,444 |
| Net Assets consist of: | | |
| Paid in capital | | $13,502,151 |
| Undistributed net investment income | | 582 |
| Accumulated undistributed net realized gain (loss) on investments | | 196,586 |
| Net unrealized appreciation (depreciation) on investments | | (63,875) |
| Net Assets, for 1,280,035 shares outstanding | | $13,635,444 |
| Net Asset Value, offering price and redemption price per share ($13,635,444 ÷ 1,280,035 shares) | | $10.65 |
See accompanying notes which are an integral part of the financial statements.
Statement of Operations
| | | Year ended December 31, 2015 |
| Investment Income | | |
| Income distributions from underlying funds | | $293,442 |
| Expenses | | |
| Independent trustees' compensation | $58 | |
| Total expenses before reductions | 58 | |
| Expense reductions | (58) | – |
| Net investment income (loss) | | 293,442 |
| Realized and Unrealized Gain (Loss) | | |
| Realized gain (loss) on sale of underlying fund shares | 43,769 | |
| Capital gain distributions from underlying funds | 228,392 | |
| Total net realized gain (loss) | | 272,161 |
| Change in net unrealized appreciation (depreciation) on underlying funds | | (602,334) |
| Net gain (loss) | | (330,173) |
| Net increase (decrease) in net assets resulting from operations | | $(36,731) |
See accompanying notes which are an integral part of the financial statements.
Statement of Changes in Net Assets
| | Year ended December 31, 2015 | Year ended December 31, 2014 |
| Increase (Decrease) in Net Assets | | |
| Operations | | |
| Net investment income (loss) | $293,442 | $254,907 |
| Net realized gain (loss) | 272,161 | 118,548 |
| Change in net unrealized appreciation (depreciation) | (602,334) | 233,188 |
| Net increase (decrease) in net assets resulting from operations | (36,731) | 606,643 |
| Distributions to shareholders from net investment income | (293,803) | (253,965) |
| Distributions to shareholders from net realized gain | (113,181) | (290,356) |
| Total distributions | (406,984) | (544,321) |
| Share transactions | | |
| Proceeds from sales of shares | 562,289 | 2,329,257 |
| Reinvestment of distributions | 406,984 | 544,321 |
| Cost of shares redeemed | (1,553,484) | (1,263,956) |
| Net increase (decrease) in net assets resulting from share transactions | (584,211) | 1,609,622 |
| Total increase (decrease) in net assets | (1,027,926) | 1,671,944 |
| Net Assets | | |
| Beginning of period | 14,663,370 | 12,991,426 |
| End of period (including undistributed net investment income of $582 and undistributed net investment income of $943, respectively) | $13,635,444 | $14,663,370 |
| Other Information | | |
| Shares | | |
| Sold | 50,508 | 210,461 |
| Issued in reinvestment of distributions | 37,852 | 49,792 |
| Redeemed | (140,207) | (114,496) |
| Net increase (decrease) | (51,847) | 145,757 |
See accompanying notes which are an integral part of the financial statements.
Financial Highlights — VIP Freedom Lifetime Income I Portfolio
| | | December 31, | | | |
| Years ended December 31, | 2015 | 2014 | 2013 | 2012 | 2011 |
| Selected Per–Share Data | | | | | |
| Net asset value, beginning of period | $11.01 | $10.95 | $10.26 | $9.65 | $9.88 |
| Income from Investment Operations | | | | | |
| Net investment income (loss)A | .23 | .21 | .19 | .20 | .22 |
| Net realized and unrealized gain (loss) | (.27) | .29 | .83 | .80 | (.17) |
| Total from investment operations | (.04) | .50 | 1.02 | 1.00 | .05 |
| Distributions from net investment income | (.24) | (.20) | (.20) | (.20) | (.21) |
| Distributions from net realized gain | (.09) | (.25) | (.13) | (.19) | (.06) |
| Total distributions | (.32)B | (.44)C | (.33) | (.39) | (.28)D |
| Net asset value, end of period | $10.65 | $11.01 | $10.95 | $10.26 | $9.65 |
| Total ReturnE,F | (.35)% | 4.68% | 9.96% | 10.42% | .48% |
| Ratios to Average Net AssetsG,H | | | | | |
| Expenses before reductionsI | -% | -% | -% | -% | -% |
| Expenses net of fee waivers, if any | -% | -% | -% | -% | -% |
| Expenses net of all reductions | -% | -% | -% | -% | -% |
| Net investment income (loss) | 2.05% | 1.89% | 1.81% | 1.97% | 2.25% |
| Supplemental Data | | | | | |
| Net assets, end of period (000 omitted) | $13,635 | $14,663 | $12,991 | $12,037 | $10,747 |
| Portfolio turnover rateG | 12% | 12% | 22% | 19% | 17% |
A Calculated based on average shares outstanding during the period.
B Total distributions of $.32 per share is comprised of distributions from net investment income of $.235 and distributions from net realized gain of $.088 per share.
C Total distributions of $.44 per share is comprised of distributions from net investment income of $.196 and distributions from net realized gain of $.248 per share.
D Total distributions of $.28 per share is comprised of distributions from net investment income of $.214 and distributions from net realized gain of $.064 per share.
E Total returns do not reflect charges attributable to your insurance company's separate account. Inclusion of these charges would reduce the total returns shown.
F Total returns would have been lower if certain expenses had not been reduced during the applicable periods shown.
G Amounts do not include the activity of the Underlying Funds.
H Expense ratios reflect operating expenses of the Fund. Expenses before reductions do not reflect amounts reimbursed by the investment adviser or reductions from expense offset arrangements and do not represent the amount paid by the Fund during periods when reimbursements or reductions occur. Expenses net of fee waivers reflect expenses after reimbursement by the investment adviser but prior to reductions from expense offset arrangements. Expenses net of all reductions represent the net expenses paid by the Fund but do not include expenses of the underlying funds in which the Fund invests.
I Amount represents less than .005%.
See accompanying notes which are an integral part of the financial statements.
VIP Freedom Lifetime Income® II Portfolio
Investment Summary (Unaudited)
The information in the following tables is based on the direct investments of the Fund.
Fund Holdings as of December 31, 2015
| | % of fund's net assets | % of fund's net assets 6 months ago |
| Domestic Equity Funds | | |
| VIP Contrafund Portfolio Investor Class | 5.7 | 5.7 |
| VIP Equity-Income Portfolio Investor Class | 6.1 | 6.0 |
| VIP Growth & Income Portfolio Investor Class | 6.8 | 6.8 |
| VIP Growth Portfolio Investor Class | 6.0 | 5.9 |
| VIP Mid Cap Portfolio Investor Class | 1.6 | 1.7 |
| VIP Value Portfolio Investor Class | 4.4 | 4.4 |
| VIP Value Strategies Portfolio Investor Class | 2.1 | 2.1 |
| | 32.7 | 32.6 |
| Developed International Equity Funds | | |
| VIP Overseas Portfolio Investor Class | 9.7 | 9.4 |
| Emerging Markets Equity Funds | | |
| VIP Emerging Markets Portfolio Investor Class | 2.4 | 2.5 |
| High Yield Bond Funds | | |
| VIP High Income Portfolio Investor Class | 4.9 | 5.0 |
| Investment Grade Bond Funds | | |
| VIP Investment Grade Bond Portfolio Investor Class | 39.9 | 40.4 |
| Short-Term Funds | | |
| VIP Government Money Market Portfolio Investor Class 0.03% | 10.4 | 10.1 |
| Net Other Assets (Liabilities) | | |
| Net Other Assets | 0.0 | 0.0 |
| | 100.0 | 100.0 |
VIP Government Money Market Portfolio Investor Class was formerly known as VIP Money Market Portfolio Investor Class
Asset Allocation (% of fund's net assets)
| Period end |
| | Domestic Equity Funds | 32.7% |
| | Developed International Equity Funds | 9.7% |
| | Emerging Markets Equity Funds | 2.4% |
| | High Yield Bond Funds | 4.9% |
| | Investment Grade Bond Funds | 39.9% |
| | Short-Term Funds | 10.4% |

| Six months ago |
| | Domestic Equity Funds | 32.6% |
| | Developed International Equity Funds | 9.4% |
| | Emerging Markets Equity Funds | 2.5% |
| | High Yield Bond Funds | 5.0% |
| | Investment Grade Bond Funds | 40.4% |
| | Short-Term Funds | 10.1% |

Percentages shown as 0.0% may reflect amounts less than 0.05%.
VIP Freedom Lifetime Income® II Portfolio
Investments December 31, 2015
Showing Percentage of Net Assets
| Domestic Equity Funds - 32.7% | | | |
| | | Shares | Value |
| Domestic Equity Funds - 32.7% | | | |
| VIP Contrafund Portfolio Investor Class (a) | | 51,570 | $1,741,532 |
| VIP Equity-Income Portfolio Investor Class (a) | | 90,112 | 1,836,484 |
| VIP Growth & Income Portfolio Investor Class (a) | | 110,122 | 2,072,499 |
| VIP Growth Portfolio Investor Class (a) | | 27,630 | 1,811,176 |
| VIP Mid Cap Portfolio Investor Class (a) | | 15,317 | 497,802 |
| VIP Value Portfolio Investor Class (a) | | 99,604 | 1,329,719 |
| VIP Value Strategies Portfolio Investor Class (a) | | 44,273 | 640,635 |
| TOTAL DOMESTIC EQUITY FUNDS | | | |
| (Cost $9,012,332) | | | 9,929,847 |
|
| International Equity Funds - 12.1% | | | |
| Developed International Equity Funds - 9.7% | | | |
| VIP Overseas Portfolio Investor Class (a) | | 154,229 | 2,933,427 |
| Emerging Markets Equity Funds - 2.4% | | | |
| VIP Emerging Markets Portfolio Investor Class (a) | | 89,118 | 722,744 |
| TOTAL INTERNATIONAL EQUITY FUNDS | | | |
| (Cost $3,798,658) | | | 3,656,171 |
|
| Bond Funds - 44.8% | | | |
| High Yield Bond Funds - 4.9% | | | |
| VIP High Income Portfolio Investor Class (a) | | 302,478 | 1,491,216 |
| Investment Grade Bond Funds - 39.9% | | | |
| VIP Investment Grade Bond Portfolio Investor Class (a) | | 983,350 | 12,114,868 |
| TOTAL BOND FUNDS | | | |
| (Cost $14,258,100) | | | 13,606,084 |
|
| Short-Term Funds - 10.4% | | | |
| VIP Government Money Market Portfolio Investor Class 0.03% (a)(b) | | | |
| (Cost $3,155,418) | | 3,155,418 | 3,155,418 |
| TOTAL INVESTMENT PORTFOLIO - 100.0% | | | |
| (Cost $30,224,508) | | | 30,347,520 |
| NET OTHER ASSETS (LIABILITIES) - 0.0% | | | 2 |
| NET ASSETS - 100% | | | $30,347,522 |
Legend
(a) Affiliated Fund
(b) The rate quoted is the annualized seven-day yield of the fund at period end.
Affiliated Underlying Funds
Information regarding the Fund's fiscal year to date purchases and sales of the affiliated Underlying Funds and income earned by the Fund from investments in affiliated Underlying Funds is as follows:
(VIP Government Money Market Portfolio Investor Class was formerly known as VIP Money Market Portfolio Investor Class)
| Affiliate | Value, beginning of period | Purchases | Sales Proceeds | Dividend Income | Value, end of period |
| VIP Contrafund Portfolio Investor Class | $1,737,205 | $416,720 | $260,700 | $17,266 | $1,741,532 |
| VIP Emerging Markets Portfolio Investor Class | 733,722 | 173,750 | 107,761 | 3,923 | 722,744 |
| VIP Equity-Income Portfolio Investor Class | 1,828,256 | 489,040 | 186,180 | 59,954 | 1,836,484 |
| VIP Government Money Market Portfolio Investor Class 0.03% | 2,881,189 | 546,860 | 272,631 | 342 | 3,155,418 |
| VIP Growth & Income Portfolio Investor Class | 2,087,777 | 469,139 | 300,974 | 43,835 | 2,072,499 |
| VIP Growth Portfolio Investor Class | 1,752,802 | 280,093 | 293,807 | 3,467 | 1,811,176 |
| VIP High Income Portfolio Investor Class | 1,482,419 | 282,271 | 112,379 | 104,027 | 1,491,216 |
| VIP Investment Grade Bond Portfolio Investor Class | 11,646,708 | 2,549,674 | 1,665,051 | 317,320 | 12,114,868 |
| VIP Mid Cap Portfolio Investor Class | 509,713 | 126,515 | 71,537 | 2,236 | 497,802 |
| VIP Overseas Portfolio Investor Class | 2,859,019 | 518,869 | 517,653 | 38,845 | 2,933,427 |
| VIP Value Portfolio Investor Class | 1,351,302 | 401,898 | 200,327 | 17,470 | 1,329,719 |
| VIP Value Strategies Portfolio Investor Class | 660,889 | 104,371 | 100,127 | 7,511 | 640,635 |
| Total | $29,531,001 | $6,359,200 | $4,089,127 | $616,196 | $30,347,520 |
Investment Valuation
All investments are categorized as Level 1 under the Fair Value Hierarchy. The inputs or methodology used for valuing securities may not be an indication of the risk associated with investing in those securities. For more information on valuation inputs please refer to the Investment Valuation section in the accompanying Notes to Financial Statements.
See accompanying notes which are an integral part of the financial statements.
VIP Freedom Lifetime Income® II Portfolio
Financial Statements
Statement of Assets and Liabilities
| | | December 31, 2015 |
| Assets | | |
| Investment in securities, at value (cost $30,224,508) — See accompanying schedule | | $30,347,520 |
| Cash | | 3 |
| Receivable for investments sold | | 502 |
| Total assets | | 30,348,025 |
| Liabilities | | |
| Payable for fund shares redeemed | $503 | |
| Total liabilities | | 503 |
| Net Assets | | $30,347,522 |
| Net Assets consist of: | | |
| Paid in capital | | $29,927,826 |
| Undistributed net investment income | | 326 |
| Accumulated undistributed net realized gain (loss) on investments | | 296,358 |
| Net unrealized appreciation (depreciation) on investments | | 123,012 |
| Net Assets, for 2,646,814 shares outstanding | | $30,347,522 |
| Net Asset Value, offering price and redemption price per share ($30,347,522 ÷ 2,646,814 shares) | | $11.47 |
See accompanying notes which are an integral part of the financial statements.
Statement of Operations
| | | Year ended December 31, 2015 |
| Investment Income | | |
| Income distributions from underlying funds | | $616,196 |
| Expenses | | |
| Independent trustees' compensation | $121 | |
| Total expenses before reductions | 121 | |
| Expense reductions | (121) | – |
| Net investment income (loss) | | 616,196 |
| Realized and Unrealized Gain (Loss) | | |
| Realized gain (loss) on sale of underlying fund shares | (153,072) | |
| Capital gain distributions from underlying funds | 750,507 | |
| Total net realized gain (loss) | | 597,435 |
| Change in net unrealized appreciation (depreciation) on underlying funds | | (1,300,487) |
| Net gain (loss) | | (703,052) |
| Net increase (decrease) in net assets resulting from operations | | $(86,856) |
See accompanying notes which are an integral part of the financial statements.
Statement of Changes in Net Assets
| | Year ended December 31, 2015 | Year ended December 31, 2014 |
| Increase (Decrease) in Net Assets | | |
| Operations | | |
| Net investment income (loss) | $616,196 | $506,056 |
| Net realized gain (loss) | 597,435 | 116,503 |
| Change in net unrealized appreciation (depreciation) | (1,300,487) | 619,028 |
| Net increase (decrease) in net assets resulting from operations | (86,856) | 1,241,587 |
| Distributions to shareholders from net investment income | (615,872) | (506,719) |
| Distributions to shareholders from net realized gain | (67,280) | (105,771) |
| Total distributions | (683,152) | (612,490) |
| Share transactions | | |
| Proceeds from sales of shares | 3,498,442 | 7,257,216 |
| Reinvestment of distributions | 683,152 | 612,490 |
| Cost of shares redeemed | (2,595,069) | (2,038,640) |
| Net increase (decrease) in net assets resulting from share transactions | 1,586,525 | 5,831,066 |
| Total increase (decrease) in net assets | 816,517 | 6,460,163 |
| Net Assets | | |
| Beginning of period | 29,531,005 | 23,070,842 |
| End of period (including undistributed net investment income of $326 and $0, respectively) | $30,347,522 | $29,531,005 |
| Other Information | | |
| Shares | | |
| Sold | 293,574 | 616,429 |
| Issued in reinvestment of distributions | 59,250 | 51,862 |
| Redeemed | (217,466) | (174,877) |
| Net increase (decrease) | 135,358 | 493,414 |
See accompanying notes which are an integral part of the financial statements.
Financial Highlights — VIP Freedom Lifetime Income II Portfolio
| | | December 31, | | | |
| Years ended December 31, | 2015 | 2014 | 2013 | 2012 | 2011 |
| Selected Per–Share Data | | | | | |
| Net asset value, beginning of period | $11.76 | $11.43 | $10.36 | $9.55 | $9.79 |
| Income from Investment Operations | | | | | |
| Net investment income (loss)A | .24 | .23 | .20 | .21 | .23 |
| Net realized and unrealized gain (loss) | (.27) | .35 | 1.12 | .90 | (.21) |
| Total from investment operations | (.03) | .58 | 1.32 | 1.11 | .02 |
| Distributions from net investment income | (.24) | (.21) | (.21) | (.21) | (.22) |
| Distributions from net realized gain | (.03) | (.04) | (.05) | (.09) | (.04) |
| Total distributions | (.26)B | (.25) | (.25)C | (.30) | (.26) |
| Net asset value, end of period | $11.47 | $11.76 | $11.43 | $10.36 | $9.55 |
| Total ReturnD,E | (.23)% | 5.06% | 12.76% | 11.60% | .25% |
| Ratios to Average Net AssetsF,G | | | | | |
| Expenses before reductionsH | -% | -% | -% | -% | -% |
| Expenses net of fee waivers, if any | -% | -% | -% | -% | -% |
| Expenses net of all reductions | -% | -% | -% | -% | -% |
| Net investment income (loss) | 2.06% | 1.97% | 1.86% | 2.06% | 2.33% |
| Supplemental Data | | | | | |
| Net assets, end of period (000 omitted) | $30,348 | $29,531 | $23,071 | $19,722 | $16,594 |
| Portfolio turnover rateF | 14% | 9% | 13% | 25% | 12% |
A Calculated based on average shares outstanding during the period.
B Total distributions of $.26 per share is comprised of distributions from net investment income of $.238 and distributions from net realized gain of $.026 per share.
C Total distributions of $.25 per share is comprised of distributions from net investment income of $.206 and distributions from net realized gain of $.045 per share.
D Total returns do not reflect charges attributable to your insurance company's separate account. Inclusion of these charges would reduce the total returns shown.
E Total returns would have been lower if certain expenses had not been reduced during the applicable periods shown.
F Amounts do not include the activity of the Underlying Funds.
G Expense ratios reflect operating expenses of the Fund. Expenses before reductions do not reflect amounts reimbursed by the investment adviser or reductions from expense offset arrangements and do not represent the amount paid by the Fund during periods when reimbursements or reductions occur. Expenses net of fee waivers reflect expenses after reimbursement by the investment adviser but prior to reductions from expense offset arrangements. Expenses net of all reductions represent the net expenses paid by the Fund but do not include expenses of the underlying funds in which the Fund invests.
H Amount represents less than .005%.
See accompanying notes which are an integral part of the financial statements.
VIP Freedom Lifetime Income® III Portfolio
Investment Summary (Unaudited)
The information in the following tables is based on the direct investments of the Fund.
Fund Holdings as of December 31, 2015
| | % of fund's net assets | % of fund's net assets 6 months ago |
| Domestic Equity Funds | | |
| VIP Contrafund Portfolio Investor Class | 8.3 | 8.5 |
| VIP Equity-Income Portfolio Investor Class | 8.8 | 8.9 |
| VIP Growth & Income Portfolio Investor Class | 9.9 | 10.1 |
| VIP Growth Portfolio Investor Class | 8.7 | 8.7 |
| VIP Mid Cap Portfolio Investor Class | 2.4 | 2.5 |
| VIP Value Portfolio Investor Class | 6.4 | 6.5 |
| VIP Value Strategies Portfolio Investor Class | 3.1 | 3.2 |
| | 47.6 | 48.4 |
| Developed International Equity Funds | | |
| VIP Overseas Portfolio Investor Class | 14.0 | 14.1 |
| Emerging Markets Equity Funds | | |
| VIP Emerging Markets Portfolio Investor Class | 3.5 | 3.6 |
| High Yield Bond Funds | | |
| VIP High Income Portfolio Investor Class | 7.2 | 7.4 |
| Investment Grade Bond Funds | | |
| VIP Investment Grade Bond Portfolio Investor Class | 26.4 | 25.6 |
| Short-Term Funds | | |
| VIP Government Money Market Portfolio Investor Class 0.03% | 1.3 | 0.9 |
| Net Other Assets (Liabilities) | | |
| Net Other Assets | 0.0 | 0.0 |
| | 100.0 | 100.0 |
VIP Government Money Market Portfolio Investor Class was formerly known as VIP Money Market Portfolio Investor Class
Asset Allocation (% of fund's net assets)
| Period end |
| | Domestic Equity Funds | 47.6% |
| | Developed International Equity Funds | 14.0% |
| | Emerging Markets Equity Funds | 3.5% |
| | High Yield Bond Funds | 7.2% |
| | Investment Grade Bond Funds | 26.4% |
| | Short-Term Funds | 1.3% |

| Six months ago |
| | Domestic Equity Funds | 48.4% |
| | Developed International Equity Funds | 14.1% |
| | Emerging Markets Equity Funds | 3.6% |
| | High Yield Bond Funds | 7.4% |
| | Investment Grade Bond Funds | 25.6% |
| | Short-Term Funds | 0.9% |

Percentages shown as 0.0% may reflect amounts less than 0.05%.
VIP Freedom Lifetime Income® III Portfolio
Investments December 31, 2015
Showing Percentage of Net Assets
| Domestic Equity Funds - 47.6% | | | |
| | | Shares | Value |
| Domestic Equity Funds - 47.6% | | | |
| VIP Contrafund Portfolio Investor Class (a) | | 52,311 | $1,766,556 |
| VIP Equity-Income Portfolio Investor Class (a) | | 91,482 | 1,864,411 |
| VIP Growth & Income Portfolio Investor Class (a) | | 111,733 | 2,102,822 |
| VIP Growth Portfolio Investor Class (a) | | 28,035 | 1,837,663 |
| VIP Mid Cap Portfolio Investor Class (a) | | 15,555 | 505,543 |
| VIP Value Portfolio Investor Class (a) | | 101,072 | 1,349,315 |
| VIP Value Strategies Portfolio Investor Class (a) | | 44,984 | 650,916 |
| TOTAL DOMESTIC EQUITY FUNDS | | | |
| (Cost $9,448,702) | | | 10,077,226 |
|
| International Equity Funds - 17.5% | | | |
| Developed International Equity Funds - 14.0% | | | |
| VIP Overseas Portfolio Investor Class (a) | | 156,546 | 2,977,503 |
| Emerging Markets Equity Funds - 3.5% | | | |
| VIP Emerging Markets Portfolio Investor Class (a) | | 90,522 | 734,136 |
| TOTAL INTERNATIONAL EQUITY FUNDS | | | |
| (Cost $3,788,993) | | | 3,711,639 |
|
| Bond Funds - 33.6% | | | |
| High Yield Bond Funds - 7.2% | | | |
| VIP High Income Portfolio Investor Class (a) | | 308,485 | 1,520,831 |
| Investment Grade Bond Funds - 26.4% | | | |
| VIP Investment Grade Bond Portfolio Investor Class (a) | | 453,751 | 5,590,216 |
| TOTAL BOND FUNDS | | | |
| (Cost $7,546,753) | | | 7,111,047 |
|
| Short-Term Funds - 1.3% | | | |
| VIP Government Money Market Portfolio Investor Class 0.03% (a)(b) | | | |
| (Cost $279,914) | | 279,914 | 279,914 |
| TOTAL INVESTMENT PORTFOLIO - 100.0% | | | |
| (Cost $21,064,362) | | | 21,179,826 |
| NET OTHER ASSETS (LIABILITIES) - 0.0% | | | 0 |
| NET ASSETS - 100% | | | $21,179,826 |
Legend
(a) Affiliated Fund
(b) The rate quoted is the annualized seven-day yield of the fund at period end.
Affiliated Underlying Funds
Information regarding the Fund's fiscal year to date purchases and sales of the affiliated Underlying Funds and income earned by the Fund from investments in affiliated Underlying Funds is as follows:
(VIP Government Money Market Portfolio Investor Class was formerly known as VIP Money Market Portfolio Investor Class)
| Affiliate | Value, beginning of period | Purchases | Sales Proceeds | Dividend Income | Value, end of period |
| VIP Contrafund Portfolio Investor Class | $1,481,925 | $624,891 | $206,956 | $16,859 | $1,766,556 |
| VIP Emerging Markets Portfolio Investor Class | 603,193 | 261,375 | 58,245 | 3,804 | 734,136 |
| VIP Equity-Income Portfolio Investor Class | 1,550,495 | 723,006 | 141,707 | 58,485 | 1,864,411 |
| VIP Government Money Market Portfolio Investor Class 0.03% | 112,642 | 177,269 | 9,997 | 22 | 279,914 |
| VIP Growth & Income Portfolio Investor Class | 1,768,877 | 719,384 | 219,914 | 42,804 | 2,102,822 |
| VIP Growth Portfolio Investor Class | 1,513,732 | 519,424 | 269,204 | 3,390 | 1,837,663 |
| VIP High Income Portfolio Investor Class | 1,252,811 | 540,617 | 111,884 | 101,874 | 1,520,831 |
| VIP Investment Grade Bond Portfolio Investor Class | 4,220,337 | 2,277,821 | 716,498 | 140,495 | 5,590,216 |
| VIP Mid Cap Portfolio Investor Class | 435,530 | 180,655 | 50,507 | 2,185 | 505,543 |
| VIP Overseas Portfolio Investor Class | 2,386,447 | 877,337 | 360,302 | 37,982 | 2,977,503 |
| VIP Value Portfolio Investor Class | 1,149,317 | 544,049 | 134,310 | 17,065 | 1,349,315 |
| VIP Value Strategies Portfolio Investor Class | 561,688 | 178,762 | 65,077 | 7,343 | 650,916 |
| Total | $17,036,994 | $7,624,590 | $2,344,601 | $432,308 | $21,179,826 |
Investment Valuation
All investments are categorized as Level 1 under the Fair Value Hierarchy. The inputs or methodology used for valuing securities may not be an indication of the risk associated with investing in those securities. For more information on valuation inputs please refer to the Investment Valuation section in the accompanying Notes to Financial Statements.
See accompanying notes which are an integral part of the financial statements.
VIP Freedom Lifetime Income® III Portfolio
Financial Statements
Statement of Assets and Liabilities
| | | December 31, 2015 |
| Assets | | |
| Investment in securities, at value (cost $21,064,362) — See accompanying schedule | | $21,179,826 |
| Receivable for investments sold | | 351 |
| Total assets | | 21,180,177 |
| Liabilities | | |
| Payable for fund shares redeemed | $351 | |
| Total liabilities | | 351 |
| Net Assets | | $21,179,826 |
| Net Assets consist of: | | |
| Paid in capital | | $20,610,592 |
| Accumulated undistributed net realized gain (loss) on investments | | 453,770 |
| Net unrealized appreciation (depreciation) on investments | | 115,464 |
| Net Assets, for 1,826,981 shares outstanding | | $21,179,826 |
| Net Asset Value, offering price and redemption price per share ($21,179,826 ÷ 1,826,981 shares) | | $11.59 |
See accompanying notes which are an integral part of the financial statements.
Statement of Operations
| | | Year ended December 31, 2015 |
| Investment Income | | |
| Income distributions from underlying funds | | $432,308 |
| Expenses | | |
| Independent trustees' compensation | $77 | |
| Total expenses before reductions | 77 | |
| Expense reductions | (77) | – |
| Net investment income (loss) | | 432,308 |
| Realized and Unrealized Gain (Loss) | | |
| Realized gain (loss) on sale of underlying fund shares | (39,930) | |
| Capital gain distributions from underlying funds | 674,233 | |
| Total net realized gain (loss) | | 634,303 |
| Change in net unrealized appreciation (depreciation) on underlying funds | | (1,097,228) |
| Net gain (loss) | | (462,925) |
| Net increase (decrease) in net assets resulting from operations | | $(30,617) |
See accompanying notes which are an integral part of the financial statements.
Statement of Changes in Net Assets
| | Year ended December 31, 2015 | Year ended December 31, 2014 |
| Increase (Decrease) in Net Assets | | |
| Operations | | |
| Net investment income (loss) | $432,308 | $307,021 |
| Net realized gain (loss) | 634,303 | 59,466 |
| Change in net unrealized appreciation (depreciation) | (1,097,228) | 331,436 |
| Net increase (decrease) in net assets resulting from operations | (30,617) | 697,923 |
| Distributions to shareholders from net investment income | (433,328) | (305,780) |
| Distributions to shareholders from net realized gain | (80,775) | (274,379) |
| Total distributions | (514,103) | (580,159) |
| Share transactions | | |
| Proceeds from sales of shares | 5,690,316 | 6,163,079 |
| Reinvestment of distributions | 514,103 | 580,159 |
| Cost of shares redeemed | (1,516,869) | (2,485,280) |
| Net increase (decrease) in net assets resulting from share transactions | 4,687,550 | 4,257,958 |
| Total increase (decrease) in net assets | 4,142,830 | 4,375,722 |
| Net Assets | | |
| Beginning of period | 17,036,996 | 12,661,274 |
| End of period (including undistributed net investment income of $0 and undistributed net investment income of $1,241, respectively) | $21,179,826 | $17,036,996 |
| Other Information | | |
| Shares | | |
| Sold | 478,113 | 511,816 |
| Issued in reinvestment of distributions | 43,907 | 48,809 |
| Redeemed | (125,385) | (208,948) |
| Net increase (decrease) | 396,635 | 351,677 |
See accompanying notes which are an integral part of the financial statements.
Financial Highlights — VIP Freedom Lifetime Income III Portfolio
| | | December 31, | | | |
| Years ended December 31, | 2015 | 2014 | 2013 | 2012 | 2011 |
| Selected Per–Share Data | | | | | |
| Net asset value, beginning of period | $11.91 | $11.74 | $9.99 | $8.92 | $9.37 |
| Income from Investment Operations | | | | | |
| Net investment income (loss)A | .27 | .25 | .23 | .23 | .20 |
| Net realized and unrealized gain (loss) | (.30) | .37 | 1.81 | 1.12 | (.42) |
| Total from investment operations | (.03) | .62 | 2.04 | 1.35 | (.22) |
| Distributions from net investment income | (.24) | (.22) | (.20) | (.22) | (.20) |
| Distributions from net realized gain | (.05) | (.23) | (.09) | (.07) | (.03) |
| Total distributions | (.29) | (.45) | (.29) | (.28)B | (.23) |
| Net asset value, end of period | $11.59 | $11.91 | $11.74 | $9.99 | $8.92 |
| Total ReturnC,D | (.27)% | 5.30% | 20.43% | 15.20% | (2.36)% |
| Ratios to Average Net AssetsE,F | | | | | |
| Expenses before reductionsG | -% | -% | -% | -% | -% |
| Expenses net of fee waivers, if any | -% | -% | -% | -% | -% |
| Expenses net of all reductions | -% | -% | -% | -% | -% |
| Net investment income (loss) | 2.23% | 2.07% | 2.07% | 2.34% | 2.13% |
| Supplemental Data | | | | | |
| Net assets, end of period (000 omitted) | $21,180 | $17,037 | $12,661 | $8,319 | $6,824 |
| Portfolio turnover rateE | 12% | 18% | 19% | 20% | 16% |
A Calculated based on average shares outstanding during the period.
B Total distributions of $.28 per share is comprised of distributions from net investment income of $.218 and distributions from net realized gain of $.065 per share.
C Total returns do not reflect charges attributable to your insurance company's separate account. Inclusion of these charges would reduce the total returns shown.
D Total returns would have been lower if certain expenses had not been reduced during the applicable periods shown.
E Amounts do not include the activity of the Underlying Funds.
F Expense ratios reflect operating expenses of the Fund. Expenses before reductions do not reflect amounts reimbursed by the investment adviser or reductions from expense offset arrangements and do not represent the amount paid by the Fund during periods when reimbursements or reductions occur. Expenses net of fee waivers reflect expenses after reimbursement by the investment adviser but prior to reductions from expense offset arrangements. Expenses net of all reductions represent the net expenses paid by the Fund but do not include expenses of the underlying funds in which the Fund invests.
G Amount represents less than .005%.
See accompanying notes which are an integral part of the financial statements.
Notes to Financial Statements
For the period ended December 31, 2015
1. Organization.
VIP Freedom Lifetime Income I Portfolio, VIP Freedom Lifetime Income II Portfolio, and VIP Freedom Lifetime Income III Portfolio (the Funds) are funds of Variable Insurance Products Fund V (the Trust). The Trust is registered under the Investment Company Act of 1940, as amended (the 1940 Act), as an open-end management investment company organized as a Massachusetts business trust. Each Fund is authorized to issue an unlimited number of shares. The Funds invest primarily in a combination of other VIP equity, bond, and short-term funds (the Underlying Funds) managed by Fidelity Management & Research Company (FMR). Shares of each Fund may only be purchased by insurance companies for the purpose of funding variable annuity or variable life insurance contracts.
2. Significant Accounting Policies.
The financial statements have been prepared in conformity with accounting principles generally accepted in the United States of America (GAAP), which require management to make certain estimates and assumptions at the date of the financial statements. Actual results could differ from those estimates. Subsequent events, if any, through the date that the financial statements were issued have been evaluated in the preparation of the financial statements. The following summarizes the significant accounting policies of the Funds:
Investment Valuation. Investments are valued as of 4:00 p.m. Eastern time on the last calendar day of the period. Each Fund categorizes the inputs to valuation techniques used to value its investments into a disclosure hierarchy consisting of three levels as shown below:
- Level 1 – quoted prices in active markets for identical investments
- Level 2 – other significant observable inputs (including quoted prices for similar investments, interest rates, prepayment speeds, etc.)
- Level 3 – unobservable inputs (including the Fund's own assumptions based on the best information available)
Valuation techniques used to value each Fund's investments by major category are as follows. Investments in the Underlying Funds are valued at their closing net asset value (NAV) each business day and are categorized as Level 1 in the hierarchy.
Investment Transactions and Income. For financial reporting purposes, the Funds' investment holdings and NAV include trades executed through the end of the last business day of the period. The NAV per share for processing shareholder transactions is calculated as of the close of business of the New York Stock Exchange (NYSE), normally 4:00 p.m. Eastern time and includes trades executed through the end of the prior business day. Gains and losses on securities sold are determined on the basis of identified cost. Income and capital gain distributions from the Underlying Funds, if any, are recorded on the ex-dividend date.
Expenses. Expenses directly attributable to a fund are charged to that fund. Expenses attributable to more than one fund are allocated among the respective funds on the basis of relative net assets or other appropriate methods. Expenses included in the accompanying financial statements reflect the expenses of each Fund and do not include any expenses associated with the Underlying Funds. Although not included in each Fund's expenses, each Fund indirectly bears its proportionate share of the Underlying Funds' expenses through the impact of these expenses on each Underlying Fund's NAV. Expense estimates are accrued in the period to which they relate and adjustments are made when actual amounts are known.
Income Tax Information and Distributions to Shareholders. Each year, each Fund intends to qualify as a regulated investment company under Subchapter M of the Internal Revenue Code, including distributing substantially all of its taxable income and realized gains. As a result, no provision for U.S. Federal income taxes is required. As of December 31, 2015, each Fund did not have any unrecognized tax benefits in the financial statements; nor is each Fund aware of any tax positions for which it is reasonably possible that the total amounts of unrecognized tax benefits will significantly change in the next twelve months. Each Fund files a U.S. federal tax return, in addition to state and local tax returns as required. Each Fund's federal income tax returns are subject to examination by the Internal Revenue Service (IRS) for a period of three fiscal years after they are filed. State and local tax returns may be subject to examination for an additional fiscal year depending on the jurisdiction.
Distributions are declared and recorded on the ex-dividend date. Income and capital gain distributions are determined in accordance with income tax regulations, which may differ from GAAP.
Capital accounts within the financial statements are adjusted for permanent book-tax differences. These adjustments have no impact on net assets or the results of operations. Capital accounts are not adjusted for temporary book-tax differences which will reverse in a subsequent period.
Book-tax differences are primarily due to the short-term gain distributions from Underlying Funds, capital loss carryforwards and losses deferred due to wash sales.
The federal tax cost of investment securities and unrealized appreciation (depreciation) as of period end were as follows for each Fund:
| | Tax cost | Gross unrealized appreciation | Gross unrealized depreciation | Net unrealized appreciation (depreciation) on securities |
| VIP Freedom Lifetime Income I | $13,744,051 | $470,433 | $(579,040) | $(108,607) |
| VIP Freedom Lifetime Income II | 30,432,580 | 1,394,249 | (1,479,309) | (85,060) |
| VIP Freedom Lifetime Income III | 21,209,942 | 1,161,193 | (1,191,309) | (30,116) |
The tax-based components of distributable earnings as of period end were as follows for each Fund:
| | Undistributed ordinary income | Undistributed long-term capital gain | Net unrealized appreciation (depreciation) on securities and other investments |
| VIP Freedom Lifetime Income I | $696 | $241,205 | $(108,607) |
| VIP Freedom Lifetime Income II | 537 | 504,217 | (85,060) |
| VIP Freedom Lifetime Income III | 14 | 599,335 | (30,116) |
The tax character of distributions paid was as follows:
| December 31, 2015 | | | |
| | Ordinary Income | Long-term Capital Gains | Total |
| VIP Freedom Lifetime Income I | $326,450 | $80,534 | $406,984 |
| VIP Freedom Lifetime Income II | 683,152 | – | 683,152 |
| VIP Freedom Lifetime Income III | 500,830 | 13,273 | 514,103 |
| December 31, 2014 | | | |
| | Ordinary Income | Long-term Capital Gains | Total |
| VIP Freedom Lifetime Income I | $300,775 | $243,546 | $544,321 |
| VIP Freedom Lifetime Income II | 612,490 | – | 612,490 |
| VIP Freedom Lifetime Income III | 421,588 | 158,571 | 580,159 |
3. Purchases and Redemptions of Underlying Fund Shares.
Purchases and redemptions of the Underlying Fund shares are noted in the table below.
| | Purchases ($) | Redemptions ($) |
| VIP Freedom Lifetime Income I | 1,724,556 | 2,193,917 |
| VIP Freedom Lifetime Income II | 6,359,200 | 4,089,127 |
| VIP Freedom Lifetime Income III | 7,624,590 | 2,344,601 |
4. Fees and Other Transactions with Affiliates.
Management Fee. Effective October 1, 2015, FMR Co., Inc., an affiliate of Strategic Advisers, Inc. (SAI), replaced SAI as investment adviser to the Funds pursuant to a management contract between the Funds and FMR Co., Inc. The new contract does not impact the Funds' investment process, strategies or management fees. The Funds do not pay any fees for investment management related services.
Other Transactions. The investment adviser has entered into an administration agreement with FMR under which FMR provides management and administrative services (other than investment advisory services) necessary for the operation of each Fund. Pursuant to this agreement, FMR pays all expenses of each Fund, excluding compensation of the independent Trustees and certain other expenses such as interest expense. FMR also contracts with other Fidelity companies to perform the services necessary for the operation of each Fund. The Funds do not pay any fees for these services.
5. Expense Reductions.
FMR voluntarily agreed to reimburse each Fund to the extent annual operating expenses exceeded certain levels of average net assets as noted in the table below. Some expenses, for example interest expense, are excluded from this reimbursement.
The following Funds were in reimbursement during the period:
| | Expense Limitations | Reimbursement |
| VIP Freedom Lifetime Income I | -% | $58 |
| VIP Freedom Lifetime Income II | -% | $121 |
| VIP Freedom Lifetime Income III | -% | $77 |
6. Other.
The Funds' organizational documents provide former and current trustees and officers with a limited indemnification against liabilities arising in connection with the performance of their duties to the Funds. In the normal course of business, the Funds may also enter into contracts that provide general indemnifications. The Funds' maximum exposure under these arrangements is unknown as this would be dependent on future claims that may be made against the Funds. The risk of material loss from such claims is considered remote.
At the end of the period, the investment adviser or its affiliates were the owners of record of all the total outstanding shares of the Fund.
Report of Independent Registered Public Accounting Firm
To the Trustees of Variable Insurance Products Fund V and the Shareholders of VIP Freedom Lifetime Income I Portfolio, VIP Freedom Lifetime Income II Portfolio and VIP Freedom Lifetime Income III Portfolio:
We have audited the accompanying statements of assets and liabilities of VIP Freedom Lifetime Income I Portfolio, VIP Freedom Lifetime Income II Portfolio and VIP Freedom Lifetime III Portfolio (the Funds), each a fund of the Variable Insurance Products Fund V, including the schedules of investments, as of December 31, 2015, and the related statements of operations for the year then ended, the statements of changes in net assets for each of the two years in the period then ended, and the financial highlights for each of the five years in the period then ended. These financial statements and financial highlights are the responsibility of the Funds' management. Our responsibility is to express an opinion on these financial statements and financial highlights based on our audits.
We conducted our audits in accordance with the standards of the Public Company Accounting Oversight Board (United States). Those standards require that we plan and perform the audit to obtain reasonable assurance about whether the financial statements and financial highlights are free of material misstatement. The Funds are not required to have, nor were we engaged to perform, an audit of their internal control over financial reporting. Our audits included consideration of internal control over financial reporting as a basis for designing audit procedures that are appropriate in the circumstances, but not for the purpose of expressing an opinion on the effectiveness of the Funds' internal control over financial reporting. Accordingly, we express no such opinion. An audit also includes examining, on a test basis, evidence supporting the amounts and disclosures in the financial statements, assessing the accounting principles used and significant estimates made by management, as well as evaluating the overall financial statement presentation. Our procedures included confirmation of securities owned as of December 31, 2015, by correspondence with the custodians. We believe that our audits provide a reasonable basis for our opinion.
In our opinion, such financial statements and financial highlights referred to above present fairly, in all material respects, the financial position of VIP Freedom Lifetime Income I Portfolio, VIP Freedom Lifetime Income II Portfolio and VIP Freedom Lifetime III Portfolio as of December 31, 2015, the results of their operations for the year then ended, the changes in their net assets for each of the two years in the period then ended, and the financial highlights for each of the five years in the period then ended in conformity with accounting principles generally accepted in the United States of America.
DELOITTE & TOUCHE LLP
Boston, Massachusetts
February 22, 2016
Trustees and Officers
The Trustees, Members of the Advisory Board (if any), and officers of the trust and funds, as applicable, are listed below. The Board of Trustees governs each fund and is responsible for protecting the interests of shareholders. The Trustees are experienced executives who meet periodically throughout the year to oversee each fund's activities, review contractual arrangements with companies that provide services to each fund, oversee management of the risks associated with such activities and contractual arrangements, and review each fund's performance. If the interests of a fund and an underlying Fidelity® fund were to diverge, a conflict of interest could arise and affect how the Trustees and Members of the Advisory Board fulfill their fiduciary duties to the affected funds. FMRC has structured the funds to avoid these potential conflicts, although there may be situations where a conflict of interest is unavoidable. In such instances, FMRC, the Trustees, and Members of the Advisory Board would take reasonable steps to minimize and, if possible, eliminate the conflict. Except for Elizabeth S. Acton, John Engler, and Geoffrey A. von Kuhn, each of the Trustees oversees 236 funds. Ms. Acton and Mr. Engler each oversees 228 funds. Mr. von Kuhn oversees 148 funds.
The Trustees hold office without limit in time except that (a) any Trustee may resign; (b) any Trustee may be removed by written instrument, signed by at least two-thirds of the number of Trustees prior to such removal; (c) any Trustee who requests to be retired or who has become incapacitated by illness or injury may be retired by written instrument signed by a majority of the other Trustees; and (d) any Trustee may be removed at any special meeting of shareholders by a two-thirds vote of the outstanding voting securities of the trust. Each Trustee who is not an interested person (as defined in the 1940 Act) of the trust and the funds is referred to herein as an Independent Trustee. Each Independent Trustee shall retire not later than the last day of the calendar year in which his or her 75th birthday occurs. The Independent Trustees may waive this mandatory retirement age policy with respect to individual Trustees. Officers and Advisory Board Members hold office without limit in time, except that any officer or Advisory Board Member may resign or may be removed by a vote of a majority of the Trustees at any regular meeting or any special meeting of the Trustees. Except as indicated, each individual has held the office shown or other offices in the same company for the past five years.
Each fund’s Statement of Additional Information (SAI) includes more information about the Trustees. To request a free copy, call Fidelity at 1-877-208-0098.
Experience, Skills, Attributes, and Qualifications of the Trustees. The Governance and Nominating Committee has adopted a statement of policy that describes the experience, qualifications, attributes, and skills that are necessary and desirable for potential Independent Trustee candidates (Statement of Policy). The Board believes that each Trustee satisfied at the time he or she was initially elected or appointed a Trustee, and continues to satisfy, the standards contemplated by the Statement of Policy. The Governance and Nominating Committee also engages professional search firms to help identify potential Independent Trustee candidates who have the experience, qualifications, attributes, and skills consistent with the Statement of Policy. From time to time, additional criteria based on the composition and skills of the current Independent Trustees, as well as experience or skills that may be appropriate in light of future changes to board composition, business conditions, and regulatory or other developments, have also been considered by the professional search firms and the Governance and Nominating Committee. In addition, the Board takes into account the Trustees' commitment and participation in Board and committee meetings, as well as their leadership of standing and ad hoc committees throughout their tenure.
In determining that a particular Trustee was and continues to be qualified to serve as a Trustee, the Board has considered a variety of criteria, none of which, in isolation, was controlling. The Board believes that, collectively, the Trustees have balanced and diverse experience, qualifications, attributes, and skills, which allow the Board to operate effectively in governing each fund and protecting the interests of shareholders. Information about the specific experience, skills, attributes, and qualifications of each Trustee, which in each case led to the Board's conclusion that the Trustee should serve (or continue to serve) as a trustee of the funds, is provided below.
Board Structure and Oversight Function. Abigail P. Johnson is an interested person and currently serves as Chairman. The Trustees have determined that an interested Chairman is appropriate and benefits shareholders because an interested Chairman has a personal and professional stake in the quality and continuity of services provided to the funds. Independent Trustees exercise their informed business judgment to appoint an individual of their choosing to serve as Chairman, regardless of whether the Trustee happens to be independent or a member of management. The Independent Trustees have determined that they can act independently and effectively without having an Independent Trustee serve as Chairman and that a key structural component for assuring that they are in a position to do so is for the Independent Trustees to constitute a substantial majority for the Board. The Independent Trustees also regularly meet in executive session. Marie L. Knowles serves as Chairman of the Independent Trustees and as such (i) acts as a liaison between the Independent Trustees and management with respect to matters important to the Independent Trustees and (ii) with management prepares agendas for Board meetings.
Fidelity® funds are overseen by different Boards of Trustees. The funds' Board oversees Fidelity's investment-grade bond, money market, asset allocation and certain equity funds, and other Boards oversee Fidelity's high income, sector and other equity funds. The asset allocation funds may invest in Fidelity® funds that are overseen by such other Boards. The use of separate Boards, each with its own committee structure, allows the Trustees of each group of Fidelity® funds to focus on the unique issues of the funds they oversee, including common research, investment, and operational issues. On occasion, the separate Boards establish joint committees to address issues of overlapping consequences for the Fidelity® funds overseen by each Board.
The Trustees operate using a system of committees to facilitate the timely and efficient consideration of all matters of importance to the Trustees, each fund, and fund shareholders and to facilitate compliance with legal and regulatory requirements and oversight of the funds' activities and associated risks. The Board, acting through its committees, has charged FMR and its affiliates with (i) identifying events or circumstances the occurrence of which could have demonstrably adverse effects on the funds' business and/or reputation; (ii) implementing processes and controls to lessen the possibility that such events or circumstances occur or to mitigate the effects of such events or circumstances if they do occur; and (iii) creating and maintaining a system designed to evaluate continuously business and market conditions in order to facilitate the identification and implementation processes described in (i) and (ii) above. Because the day-to-day operations and activities of the funds are carried out by or through FMR, its affiliates, and other service providers, the funds' exposure to risks is mitigated but not eliminated by the processes overseen by the Trustees. While each of the Board's committees has responsibility for overseeing different aspects of the funds' activities, oversight is exercised primarily through the Operations and Audit Committees. In addition, an ad hoc Board committee of Independent Trustees has worked with FMR to enhance the Board's oversight of investment and financial risks, legal and regulatory risks, technology risks, and operational risks, including the development of additional risk reporting to the Board. Appropriate personnel, including but not limited to the funds' Chief Compliance Officer (CCO), FMR's internal auditor, the independent accountants, the funds' Treasurer and portfolio management personnel, make periodic reports to the Board's committees, as appropriate, including an annual review of Fidelity's risk management program for the Fidelity® funds. The responsibilities of each standing committee, including their oversight responsibilities, are described further under "Standing Committees of the Trustees."
Interested Trustees*:
Correspondence intended for a Trustee who is an interested person may be sent to Fidelity Investments, 245 Summer Street, Boston, Massachusetts 02210.
Name, Year of Birth; Principal Occupations and Other Relevant Experience+
Abigail P. Johnson (1961)
Year of Election or Appointment: 2009
Trustee
Chairman of the Board of Trustees
Ms. Johnson also serves as Trustee of other Fidelity® funds. Ms. Johnson serves as President (2013-present) and Chief Executive Officer (2014-present) of FMR LLC (diversified financial services company), President of Fidelity Financial Services (2012-present) and President of Personal, Workplace and Institutional Services (2005-present). Ms. Johnson is Chairman and Director of FMR Co., Inc. (investment adviser firm, 2011-present), Chairman and Director of FMR (investment adviser firm, 2011-present), and the Vice Chairman and Director (2007-present) of FMR LLC. Previously, Ms. Johnson served as President and a Director of FMR (2001-2005), a Trustee of other investment companies advised by FMR, Fidelity Investments Money Management, Inc. (investment adviser firm), and FMR Co., Inc. (2001-2005), Senior Vice President of the Fidelity® funds (2001-2005), and managed a number of Fidelity® funds. Ms. Abigail P. Johnson and Mr. Arthur E. Johnson are not related.
Geoffrey A. von Kuhn (1951)
Year of Election or Appointment: 2015
Trustee
Mr. von Kuhn also serves as Trustee or Member of the Advisory Board of other Fidelity funds. Mr. von Kuhn is Chief Administrative Officer for FMR LLC (diversified financial services company, 2013-present), a Director of Pembroke Real Estate, Inc. (2009-present), and a Director of Discovery Natural Resources LLC (2012-present). Previously, Mr. von Kuhn was a managing director of Crosby Group (private wealth management company, 2007-2013), a member of the management committee and senior executive in the Wealth Management Group of AmSouth Bank (2001-2006), and head of the U.S. private bank at Citigroup (2000-2001).
* Determined to be an “Interested Trustee” by virtue of, among other things, his or her affiliation with the trust or various entities under common control with FMR.
+ The information includes the Trustee's principal occupation during the last five years and other information relating to the experience, attributes, and skills relevant to the Trustee's qualifications to serve as a Trustee, which led to the conclusion that the Trustee should serve as a Trustee for each fund.
Independent Trustees:
Correspondence intended for an Independent Trustee may be sent to Fidelity Investments, P.O. Box 55235, Boston, Massachusetts 02205-5235.
Name, Year of Birth; Principal Occupations and Other Relevant Experience+
Elizabeth S. Acton (1951)
Year of Election or Appointment: 2013
Trustee
Ms. Acton also serves as Trustee or Member of the Advisory Board of other Fidelity® funds. Prior to her retirement in April 2012, Ms. Acton was Executive Vice President, Finance (2011-2012), Executive Vice President, Chief Financial Officer (2002-2011), and Treasurer (2004-2005) of Comerica Incorporated (financial services). Prior to joining Comerica, Ms. Acton held a variety of positions at Ford Motor Company (1983-2002), including Vice President and Treasurer (2000-2002) and Executive Vice President and Chief Financial Officer of Ford Motor Credit Company (1998-2000). Ms. Acton currently serves as a member of the Board of Directors and Audit and Finance Committees of Beazer Homes USA, Inc. (homebuilding, 2012-present).
John Engler (1948)
Year of Election or Appointment: 2014
Trustee
Mr. Engler also serves as Trustee or Member of the Advisory Board of other Fidelity® funds. He serves as president of the Business Roundtable (2011-present), and on the board of directors/trustees for Universal Forest Products (manufacturer and distributor of wood and wood-alternative products, 2003-present) and K12 Inc. (technology-based education company, 2012-present). Previously, Mr. Engler served as a trustee of The Munder Funds (2003-2014), president and CEO of the National Association of Manufacturers (2004-2011), member of the Board of Trustees of the Annie E. Casey Foundation (2004-2015), and as governor of Michigan (1991-2003). He is a past chairman of the National Governors Association.
Albert R. Gamper, Jr. (1942)
Year of Election or Appointment: 2007
Trustee
Mr. Gamper also serves as Trustee of other Fidelity® funds. Prior to his retirement in December 2004, Mr. Gamper served as Chairman of the Board of CIT Group Inc. (commercial finance). During his tenure with CIT Group Inc. Mr. Gamper served in numerous senior management positions, including Chairman (1987-1989; 1999-2001; 2002-2004), Chief Executive Officer (1987-2004), and President (2002-2003). Mr. Gamper currently serves as a member of the Board of Directors of Public Service Enterprise Group (utilities, 2000-present), and Member of the Board of Trustees of Barnabas Health Care System (1997-present). Previously, Mr. Gamper served as Chairman (2012-2015) and Vice Chairman (2011-2012) of the Independent Trustees of certain Fidelity® funds and as Chairman of the Board of Governors, Rutgers University (2004-2007).
Robert F. Gartland (1951)
Year of Election or Appointment: 2010
Trustee
Mr. Gartland also serves as Trustee of other Fidelity® funds. Mr. Gartland is Chairman and an investor in Gartland and Mellina Group Corp. (consulting, 2009-present). Previously, Mr. Gartland served as a partner and investor of Vietnam Partners LLC (investments and consulting, 2008-2011). Prior to his retirement, Mr. Gartland held a variety of positions at Morgan Stanley (financial services, 1979-2007) including Managing Director (1987-2007).
Arthur E. Johnson (1947)
Year of Election or Appointment: 2008
Trustee
Vice Chairman of the Independent Trustees
Mr. Johnson also serves as Trustee of other Fidelity® funds. Mr. Johnson serves as a member of the Board of Directors of Eaton Corporation plc (diversified power management, 2009-present), AGL Resources, Inc. (holding company, 2002-present) and Booz Allen Hamilton (management consulting, 2011-present). Prior to his retirement, Mr. Johnson served as Senior Vice President of Corporate Strategic Development of Lockheed Martin Corporation (defense contractor, 1999-2009). He previously served on the Board of Directors of IKON Office Solutions, Inc. (1999-2008) and Delta Airlines (2005-2007). Mr. Arthur E. Johnson is not related to Ms. Abigail P. Johnson.
Michael E. Kenneally (1954)
Year of Election or Appointment: 2009
Trustee
Mr. Kenneally also serves as Trustee of other Fidelity® funds. Prior to his retirement, Mr. Kenneally served as Chairman and Global Chief Executive Officer of Credit Suisse Asset Management. Before joining Credit Suisse, he was an Executive Vice President and Chief Investment Officer for Bank of America Corporation. Earlier roles at Bank of America included Director of Research, Senior Portfolio Manager and Research Analyst, and Mr. Kenneally was awarded the Chartered Financial Analyst (CFA) designation in 1991.
James H. Keyes (1940)
Year of Election or Appointment: 2007
Trustee
Mr. Keyes also serves as Trustee of other Fidelity® funds. Mr. Keyes serves as a member of the Board and Non-Executive Chairman of Navistar International Corporation (manufacture and sale of trucks, buses, and diesel engines, since 2002). Previously, Mr. Keyes served as a member of the Board of Pitney Bowes, Inc. (integrated mail, messaging, and document management solutions, 1998-2013). Prior to his retirement, Mr. Keyes served as Chairman (1993-2002) and Chief Executive Officer (1988-2002) of Johnson Controls (automotive, building, and energy) and as a member of the Board of LSI Logic Corporation (semiconductor technologies, 1984-2008).
Marie L. Knowles (1946)
Year of Election or Appointment: 2001
Trustee
Chairman of the Independent Trustees
Ms. Knowles also serves as Trustee of other Fidelity® funds. Prior to Ms. Knowles' retirement in June 2000, she served as Executive Vice President and Chief Financial Officer of Atlantic Richfield Company (ARCO) (diversified energy, 1996-2000). From 1993 to 1996, she was a Senior Vice President of ARCO and President of ARCO Transportation Company (pipeline and tanker operations). Ms. Knowles currently serves as a Director and Chairman of the Audit Committee of McKesson Corporation (healthcare service, since 2002). Ms. Knowles is a member of the Board of the Santa Catalina Island Company (real estate, 2009-present). Ms. Knowles is a Member of the Investment Company Institute Board of Governors and a Member of the Governing Council of the Independent Directors Council (2014-present). She also serves as a member of the Advisory Board for the School of Engineering of the University of Southern California. Previously, Ms. Knowles served as a Director of Phelps Dodge Corporation (copper mining and manufacturing, 1994-2007), URS Corporation (engineering and construction, 2000-2003) and America West (airline, 1999-2002). Ms. Knowles previously served as Vice Chairman of the Independent Trustees of certain Fidelity® funds (2012-2015).
+ The information includes the Trustee's principal occupation during the last five years and other information relating to the experience, attributes, and skills relevant to the Trustee's qualifications to serve as a Trustee, which led to the conclusion that the Trustee should serve as a Trustee for each fund.
Advisory Board Members and Officers:
Correspondence intended for an officer may be sent to Fidelity Investments, 245 Summer Street, Boston, Massachusetts 02210. Officers appear below in alphabetical order.
Name, Year of Birth; Principal Occupation
Marc R. Bryant (1966)
Year of Election or Appointment: 2015
Secretary and Chief Legal Officer (CLO)
Mr. Bryant also serves as Secretary and CLO of other funds. Mr. Bryant serves as CLO, Secretary, and Senior Vice President of Fidelity Management & Research Company (investment adviser firm, 2015-present) and FMR Co., Inc. (investment adviser firm, 2015-present); Secretary of Fidelity SelectCo, LLC (investment adviser firm, 2015-present) and Fidelity Investments Money Management, Inc. (investment adviser firm, 2015-present); and CLO of Fidelity Management & Research (Hong Kong) Limited (investment adviser firm, 2015-present). He is Senior Vice President and Deputy General Counsel of FMR LLC (diversified financial services company). Previously, Mr. Bryant served as Secretary and CLO of Fidelity Rutland Square Trust II (2010-2014) and Assistant Secretary of Fidelity's Fixed Income and Asset Allocation Funds (2013-2015). Prior to joining Fidelity Investments, Mr. Bryant served as a Senior Vice President and the Head of Global Retail Legal for AllianceBernstein L.P. (2006-2010), and as the General Counsel for ProFund Advisors LLC (2001-2006).
Jonathan Davis (1968)
Year of Election or Appointment: 2010
Assistant Treasurer
Mr. Davis also serves as Assistant Treasurer of other funds, and is an employee of Fidelity Investments. Previously, Mr. Davis served as Vice President and Associate General Counsel of FMR LLC (diversified financial services company, 2003-2010).
Adrien E. Deberghes (1967)
Year of Election or Appointment: 2010
Assistant Treasurer
Mr. Deberghes also serves as an officer of other funds. He is an employee of Fidelity Investments (2008-present). Prior to joining Fidelity Investments, Mr. Deberghes was Senior Vice President of Mutual Fund Administration at State Street Corporation (2007-2008), Senior Director of Mutual Fund Administration at Investors Bank & Trust (2005-2007), and Director of Finance for Dunkin' Brands (2000-2005).
Stephanie J. Dorsey (1969)
Year of Election or Appointment: 2013
President and Treasurer
Ms. Dorsey also serves as an officer of other funds. She is an employee of Fidelity Investments (2008-present) and has served in other fund officer roles. Prior to joining Fidelity Investments, Ms. Dorsey served as Treasurer (2004-2008) of the JPMorgan Mutual Funds and Vice President (2004-2008) of JPMorgan Chase Bank.
Howard J. Galligan III (1966)
Year of Election or Appointment: 2014
Chief Financial Officer
Mr. Galligan also serves as Chief Financial Officer of other funds. Mr. Galligan serves as President of Fidelity Pricing and Cash Management Services (FPCMS) (2014-present) and as a Director of Strategic Advisers, Inc. (investment adviser firm, 2008-present). Previously, Mr. Galligan served as Chief Administrative Officer of Asset Management (2011-2014) and Chief Operating Officer and Senior Vice President of Investment Support for Strategic Advisers, Inc. (2003-2011).
Scott C. Goebel (1968)
Year of Election or Appointment: 2015
Vice President
Mr. Goebel serves as Vice President of other funds and is an employee of Fidelity Investments (2001-present). Previously, Mr. Goebel served as Secretary of Fidelity SelectCo, LLC (investment adviser firm, 2013-2015), Fidelity Investments Money Management, Inc. (FIMM) (investment adviser firm, 2010-2015), and Fidelity Research and Analysis Company (FRAC) (investment adviser firm, 2010-2015); General Counsel, Secretary, and Senior Vice President of Fidelity Management & Research Company (investment adviser firm, 2008-2015) and FMR Co., Inc. (investment adviser firm, 2008-2015); Assistant Secretary of Fidelity Management & Research (Japan) Limited (investment adviser firm, 2008-2015) and FMR Investment Management (U.K.) Limited (investment adviser firm, 2008-2015); Chief Legal Officer (CLO) of Fidelity Management & Research (Hong Kong) Limited (investment adviser firm, 2008-2015); Secretary and CLO of certain Fidelity® funds (2008-2015); Assistant Secretary of FIMM (2008-2010), FRAC (2008-2010), and certain funds (2007-2008); and as Vice President and Secretary of Fidelity Distributors Corporation (FDC) (2005-2007).
Chris Maher (1972)
Year of Election or Appointment: 2013
Assistant Treasurer
Mr. Maher serves as Assistant Treasurer of other funds. Mr. Maher is Vice President of Valuation Oversight and is an employee of Fidelity Investments. Previously, Mr. Maher served as Vice President of Asset Management Compliance (2013), Vice President of the Program Management Group of FMR (investment adviser firm, 2010-2013), and Vice President of Valuation Oversight (2008-2010).
Jason P. Pogorelec (1975)
Year of Election or Appointment: 2015
Assistant Secretary
Mr. Pogorelec also serves as Assistant Secretary of other funds. Mr. Pogorelec serves as Vice President, Associate General Counsel (2010-present) and is an employee of Fidelity Investments (2006-present).
John F. Papandrea (1972)
Year of Election or Appointment: 2016
Anti-Money Laundering (AML) Officer
Mr. Papandrea also serves as AML Officer of other funds. Mr. Papandrea is Vice President of FMR LLC (diversified financial services company, 2008-present) and is an employee of Fidelity Investments (2005-present).
Nancy D. Prior (1967)
Year of Election or Appointment: 2014
Vice President
Ms. Prior also serves as Vice President of other funds. Ms. Prior serves as a Director of Fidelity Investments Money Management, Inc. (FIMM) (investment adviser firm, 2014-present), President, Fixed Income (2014-present), Vice Chairman of FIAM LLC (investment adviser firm, 2014-present), and is an employee of Fidelity Investments (2002-present). Previously, Ms. Prior served as Vice President of Fidelity's Money Market Funds (2012-2014), President, Money Market and Short Duration Bond Group of Fidelity Management & Research (FMR) (investment adviser firm, 2013-2014), President, Money Market Group of FMR (2011-2013), Managing Director of Research (2009-2011), Senior Vice President and Deputy General Counsel (2007-2009), and Assistant Secretary of other Fidelity® funds (2008-2009).
Kenneth B. Robins (1969)
Year of Election or Appointment: 2009
Assistant Treasurer
Mr. Robins also serves as an officer of other funds. Mr. Robins serves as Executive Vice President of Fidelity Investments Money Management, Inc. (FIMM) (investment adviser firm, 2013-present) and is an employee of Fidelity Investments (2004-present). Previously, Mr. Robins served in other fund officer roles.
Stacie M. Smith (1974)
Year of Election or Appointment: 2013
Assistant Treasurer
Ms. Smith also serves as an officer of other funds. She is an employee of Fidelity Investments (2009-present) and has served in other fund officer roles. Prior to joining Fidelity Investments, Ms. Smith served as Senior Audit Manager of Ernst & Young LLP (1996-2009).
Renee Stagnone (1975)
Year of Election or Appointment: 2013
Deputy Treasurer
Ms. Stagnone also serves as Deputy Treasurer of other funds. Ms. Stagnone is an employee of Fidelity Investments (1997-present).
Michael H. Whitaker (1967)
Year of Election or Appointment: 2008
Chief Compliance Officer
Mr. Whitaker also serves as Chief Compliance Officer of other funds. Mr. Whitaker also serves as Compliance Officer of FMR Co., Inc. (investment adviser firm, 2014-present), FMR (investment adviser firm, 2014-present), and Fidelity Investments Money Management, Inc. (investment adviser firm, 2014-present) and is an employee of Fidelity Investments (2007-present). Prior to joining Fidelity Investments, Mr. Whitaker worked at MFS Investment Management where he served as Senior Vice President and Chief Compliance Officer (2004-2006), and Assistant General Counsel.
Derek L. Young (1964)
Year of Election or Appointment: 2009
Vice President of Fidelity's Asset Allocation Funds
Mr. Young also serves as an officer of other funds. He is a Director of Strategic Advisers, Inc. (investment adviser firm, 2011-present), President of Fidelity Global Asset Allocation (GAA) (2011-present), and Vice Chairman of FIAM LLC (investment adviser firm, 2011-present). Previously, Mr. Young served as Trustee of certain funds (2012-2015), President of Strategic Advisers, Inc. (2011-2015), Chief Investment Officer of GAA (2009-2011), and as a portfolio manager.
Joseph F. Zambello (1957)
Year of Election or Appointment: 2011
Deputy Treasurer
Mr. Zambello also serves as Deputy Treasurer of other funds. Mr. Zambello is an employee of Fidelity Investments (1991-present). Previously, Mr. Zambello served as Vice President of the Program Management Group of FMR (investment adviser firm, 2009-2011) and Vice President of the Transfer Agent Oversight Group (2005-2009).
Shareholder Expense Example
As a shareholder of a Fund, you incur two types of costs: (1) transaction costs, and (2) ongoing costs, including other Fund expenses. This Example is intended to help you understand your ongoing costs (in dollars) of investing in the Funds and to compare these costs with the ongoing costs of investing in other mutual funds.
The Example is based on an investment of $1,000 invested at the beginning of the period and held for the entire period (July 1, 2015 to December 31, 2015).
Actual Expenses
The first line of the accompanying table for each fund provides information about actual account values and actual expenses. You may use the information in this line, together with the amount you invested, to estimate the expenses that you paid over the period. Simply divide your account value by $1,000.00 (for example, an $8,600 account value divided by $1,000.00 = 8.6), then multiply the result by the number in the first line for a fund under the heading entitled "Expenses Paid During Period" to estimate the expenses you paid on your account during this period. The estimate of expenses does not include any fees or other expenses of any variable annuity or variable life insurance product. If they were, the estimate of expenses you paid during the period would be higher, and your ending account value would be lower. In addition, each Fund, as a shareholder in underlying Fidelity Funds, will indirectly bear its pro-rata share of the fees and expenses incurred by the underlying Fidelity Funds. These fees and expenses are not included in each Fund's annualized expense ratio used to calculate the expense estimates in the table below.
Hypothetical Example for Comparison Purposes
The second line of the accompanying table for each fund provides information about hypothetical account values and hypothetical expenses based on a fund's actual expense ratio and an assumed rate of return of 5% per year before expenses, which is not the Fund's actual return. The hypothetical account values and expenses may not be used to estimate the actual ending account balance or expenses you paid for the period. You may use this information to compare the ongoing costs of investing in the Fund and other funds. To do so, compare this 5% hypothetical example with the 5% hypothetical examples that appear in the shareholder reports of the other funds. The estimate of expenses does not include any fees or other expenses of any variable annuity or variable life insurance product. If they were, the estimate of expenses you paid during the period would be higher, and your ending account value would be lower. In addition, each Fund, as a shareholder in underlying Fidelity Funds, will indirectly bear its pro-rata share of the fees and expenses incurred by the underlying Fidelity Funds. These fees and expenses are not included in each Fund's annualized expense ratio used to calculate the expense estimates in the table below.
Please note that the expenses shown in the table are meant to highlight your ongoing costs only and do not reflect any transaction costs. Therefore, the second line of the table is useful in comparing ongoing costs only, and will not help you determine the relative total costs of owning different funds.
| | Annualized Expense Ratio-A | Beginning
Account Value
July 1, 2015 | Ending
Account Value
December 31, 2015 | Expenses Paid
During Period-B
July 1, 2015
to December 31, 2015 |
| VIP Freedom Lifetime Income I | - % | | | |
| Actual | | $1,000.00 | $982.50 | $- |
| Hypothetical-C | | $1,000.00 | $1,025.21 | $- |
| VIP Freedom Lifetime Income II | - % | | | |
| Actual | | $1,000.00 | $976.90 | $- |
| Hypothetical-C | | $1,000.00 | $1,025.21 | $- |
| VIP Freedom Lifetime Income III | - % | | | |
| Actual | | $1,000.00 | $966.30 | $- |
| Hypothetical-C | | $1,000.00 | $1,025.21 | $- |
A Annualized expense ratio reflects expenses net of applicable fee waivers.
B Expenses are equal to each Fund's annualized expense ratio, multiplied by the average account value over the period, multiplied by 184/365 (to reflect the one-half year period). The fees and expenses of the underlying Fidelity Funds in which [[each Fund invests are not included in each Fund's annualized expense ratio.
C 5% return per year before expenses
Distributions (Unaudited)
The Board of Trustees of each fund voted to pay to shareholders of record at the opening of business on record date, the following distributions per share derived from capital gains realized from sales of portfolio securities, and dividends derived from net investment income:
| Fund | Pay Date | Record Date | Dividends | Capital Gains |
| VIP Freedom Lifetime Income I | 02/12/16 | 02/12/16 | $0.001 | $0.191 |
| VIP Freedom Lifetime Income II | 02/12/16 | 02/12/16 | $0.000 | $0.193 |
| VIP Freedom Lifetime Income III | 02/12/16 | 02/12/16 | $0.000 | $0.325 |
The funds hereby designate as capital gain dividends the amounts noted below for the taxable year ended December 31, 2015, or, if subsequently determined to be different, the net capital gain of such year.
| Fund | |
| VIP Freedom Lifetime Income I | $ 241,248 |
| VIP Freedom Lifetime Income II | $ 504,217 |
| VIP Freedom Lifetime Income III | $ 601,290 |
A percentage of the dividends distributed during the fiscal year for the following funds qualify for the dividends–received deduction for corporate shareholders:
| Fund | February
2015 | December
2015 |
| VIP Freedom Lifetime Income I | 3% | 12% |
| VIP Freedom Lifetime Income II | –% | 22% |
| VIP Freedom Lifetime Income III | 10% | 29% |
A percentage of the dividends distributed during the fiscal year for the following funds were derived from interest on U.S. Government securities which is generally exempt from state income tax:
| VIP Freedom Lifetime Income I | 2.56% |
| VIP Freedom Lifetime Income II | 1.60% |
|
The amounts per share which represent income derived from sources within, and taxes paid to, foreign countries or possessions of the United States are as follows:
| Fund | Pay Date
| Income
| Taxes
|
| VIP Freedom Lifetime Income I | 02/06/2015 | $0.0000 | $0.0000 |
| | 12/29/2015 | $0.0102 | $0.0009 |
| VIP Freedom Lifetime Income II | 02/06/2015 | $0.0000 | $0.0000 |
| | 12/29/2015 | $0.0194 | $0.0017 |
| VIP Freedom Lifetime Income III | 02/06/2015 | $0.0000 | $0.0000 |
| | 12/29/2015 | $0.0275 | $0.0024 |
Board Approval of Investment Advisory Contracts and Management Fees
VIP Freedom Lifetime Income Funds
Each year, the Board of Trustees, including the Independent Trustees (together, the Board), votes on the management and administration arrangements for each fund. The Board, assisted by the advice of fund counsel and Independent Trustees' counsel, requests and considers a broad range of information relevant to the contract arrangements throughout the year.
The Board meets regularly and, at each of its meetings, covers an extensive agenda of topics and materials and considers factors that are relevant to its annual consideration of each fund's management and administration arrangements, including the services and support provided to each fund and its shareholders. The Board has established four standing committees (Committees) — Operations, Audit, Fair Valuation, and Governance and Nominating — each composed of and chaired by Independent Trustees with varying backgrounds, to which the Board has assigned specific subject matter responsibilities in order to enhance effective decision-making by the Board. The Operations Committee, of which all of the Independent Trustees are members, meets regularly throughout the year and considers, among other matters, information specifically related to the annual consideration of each fund's management and administration arrangements. The Board, acting directly and through its Committees, requests and receives information concerning the annual consideration of each fund's management and administration arrangements. The Board also meets as needed to consider matters specifically related to the Board's annual consideration of the management and administration arrangements. Members of the Board may also meet with trustees of other Fidelity funds through ad hoc joint committees to discuss certain matters relevant to all of the Fidelity funds.
At its September 2015 meeting, the Board unanimously determined to approve an amended and restated management contract (Advisory Contract) and administration agreement for each fund to reflect the fact that, effective October 1, 2015, FMR Co., Inc. (FMRC), an affiliate of Strategic Advisers, Inc. (Strategic Advisers) and Fidelity Management & Research Company (FMR), would assume the duties and rights of Strategic Advisers under the fund's then current management contract. The Board noted that, with the exception of the date, term, and entity name, the terms of each fund's management contract, including the lack of fees payable thereunder, would not change as a result of the approval of the Advisory Contract. The Board considered that FMRC would render the same services to the funds under the Advisory Contracts that Strategic Advisers rendered to the funds under the then current management contracts. The Board also considered that approval of the Advisory Contracts would not result in any changes to (i) the investment process or strategies employed in the management of the funds' assets; or (ii) the day-to-day management of the funds or the persons primarily responsible for such management. As a result, the Board considered that its prior experience with Strategic Advisers as investment adviser for the funds was relevant to its consideration of the Advisory Contracts.
In reaching its determination, the Board considered all factors it believed relevant and reached a determination, with the assistance of fund counsel and Independent Trustees' counsel and through the exercise of its business judgment, that the approval of the Advisory Contract was in the best interests of each fund and its shareholders and that the fact that no fees are payable under the Advisory Contracts was fair and reasonable. The Board's decision to approve the Advisory Contracts was not based on any single factor, but rather was based on a comprehensive consideration of all the information provided to the Board at its meetings throughout the year. In reaching its determination, the Board was aware that shareholders of each fund have a broad range of investment choices available to them, including a wide choice among funds offered by Fidelity's competitors, and that each fund's shareholders, who have the opportunity to review and weigh the disclosure provided by the fund in its prospectus and other public disclosures, have chosen to invest in that fund, which is part of the Fidelity family of funds.
Nature, Extent, and Quality of Services Provided. The Board considered Fidelity's staffing as it relates to the funds, including the backgrounds of investment personnel that provide services to the funds, and also considered the funds' investment objectives, strategies, and related investment philosophies. The Independent Trustees also had discussions with senior management of Fidelity's investment operations and investment groups with responsibility for the underlying Fidelity funds in which each fund invests. The Board considered the structure of the portfolio manager compensation program and whether this structure provides appropriate incentives to act in the best interests of each fund. Additionally, the Board considered the portfolio managers' investments, if any, in the funds that they manage.
Resources Dedicated to Investment Management and Support Services. The Board reviewed the general qualifications and capabilities of Fidelity's investment staff, including its size, education, experience, and resources, as well as Fidelity's approach to recruiting, training, managing, and compensating investment personnel. The Board noted that Fidelity has continued to increase the resources devoted to non-U.S. offices, including expansion of Fidelity's global investment organization. The Board also noted that Fidelity's analysts have extensive resources, tools and capabilities that allow them to conduct sophisticated quantitative and fundamental analysis, as well as credit analysis of issuers, counterparties and guarantors. Further, the Board considered that Fidelity's investment professionals have sufficient access to global information and data so as to provide competitive investment results over time, and that those professionals also have access to sophisticated tools that permit them to assess portfolio construction and risk and performance attribution characteristics continuously, as well as to transmit new information and research conclusions rapidly around the world. Additionally, in its deliberations, the Board considered Fidelity's risk management, compliance, and technology and operations capabilities and resources, which are integral parts of the investment management process.
Shareholder and Administrative Services. The Board considered (i) the nature, extent, quality, and cost of advisory, administrative, and shareholder services performed by Fidelity under the then current management contract (and to be performed under the Advisory Contract) and under separate agreements covering administration, transfer agency, and pricing and bookkeeping services for each fund; (ii) the nature and extent of the supervision of third party service providers, principally custodians, subcustodians, and pricing vendors; and (iii) the resources devoted to, and the record of compliance with, each fund's compliance policies and procedures.
The Board noted that the growth of fund assets over time across the complex allows Fidelity to reinvest in the development of services designed to enhance the value or convenience of the Fidelity funds as investment vehicles. These services include 24-hour access to account information and market information through telephone representatives and over the Internet, investor education materials and asset allocation tools, and the expanded availability of Fidelity Investor Centers.
Investment in a Large Fund Family. The Board considered the benefits to shareholders of investing in a Fidelity fund, including the benefits of investing in a fund that is part of a large family of funds offering a variety of investment disciplines and providing a large variety of mutual fund investor services. The Board noted that Fidelity had taken, or had made recommendations that resulted in the Fidelity funds taking, a number of actions over the previous year that benefited particular funds, including (i) continuing to dedicate additional resources to investment research and to the support of the senior management team that oversees asset management; (ii) continuing efforts to enhance Fidelity's global research capabilities; (iii) launching new funds and making other enhancements to meet client needs; (iv) reducing management fees and total expenses for certain index funds and diversified international funds; (v) continuing to launch dedicated lower cost underlying funds to meet portfolio construction needs related to expanding underlying fund options for Fidelity funds of funds, specifically for the Freedom Fund product lines; (vi) rationalizing product lines and gaining increased efficiencies through fund mergers; (vii) launching active fixed-income exchange-traded funds; (viii) continuing to develop, acquire and implement systems and technology to improve services to the funds and shareholders, strengthen information security, and increase efficiency; (ix) implementing investment enhancements to further strengthen Fidelity's target date product line to increase investors' probability of success in achieving their goals; (x) modifying the eligibility criteria for certain share classes to accommodate roll-over assets from employer-sponsored retirement plans; (xi) launching a new Class W of the Freedom Index Funds to attract and retain Fidelity record-kept retirement plan assets; and (xii) implementing changes to Fidelity's money market product line in response to recent money market regulatory reforms.
Investment Performance. The Board considered whether each fund has operated in accordance with its investment objective, as well as its record of compliance with its investment restrictions and its performance history, and noted that the approval of the Advisory Contract for each fund would not result in any changes to the fund's investment strategy or the personnel responsible for providing advisory services to the fund.
The Board took into account discussions with representatives of the investment adviser about fund investment performance that occur at Board meetings throughout the year. In this regard the Board noted that as part of regularly scheduled fund reviews and other reports to the Board on fund performance, the Board considers annualized return information for each fund for different time periods, measured against one or more securities market indices, including a customized blended index representative of the fund's asset classes (each a "benchmark index") and a peer group of funds with similar objectives ("peer group"), if any. In its evaluation of fund investment performance at meetings throughout the year, the Board gave particular attention to information indicating underperformance of certain Fidelity funds for specific time periods and discussed with the investment adviser the reasons for such underperformance.
In addition to reviewing absolute and relative fund performance, the Independent Trustees periodically consider the appropriateness of fund performance metrics in evaluating the results achieved. In general, the Independent Trustees believe that fund performance should be evaluated based on gross performance (before fees and expenses, including acquired fund fees and expenses, but after transaction costs, if any) compared to appropriate benchmark indices, over appropriate time periods that may include full market cycles, and on net performance (after fees and expenses) compared to peer groups, as applicable, over the same periods, taking into account relevant factors including the following: general market conditions; the extent to which particular underlying funds affected performance; and fund cash flows and other factors. Depending on the circumstances, the Independent Trustees may be satisfied with a fund's performance notwithstanding that it lags its benchmark index or peer group for certain periods.
The Independent Trustees recognize that shareholders evaluate performance on a net basis over their own holding periods, for which one-, three-, and five-year periods are often used as a proxy. For this reason, the performance information reviewed by the Board also included net cumulative calendar year total return information for each fund and an appropriate benchmark index for the most recent one-, three-, and five-year periods.
Based on its review, the Board concluded that the nature, extent, and quality of services provided to each fund under the Advisory Contracts should benefit the shareholders of each fund.
Competitiveness of Management Fee and Total Expense Ratio. The Board noted that the funds did not pay Strategic Advisers, and would not pay FMRC, a management fee for investment advisory services, and that each fund bears indirectly the fees and expenses, including the management fees, paid by the underlying Fidelity funds in which it invests. The Board considered each fund's management fee and total expense ratio compared to "mapped groups" of competitive funds and classes created for the purpose of facilitating the Trustees' competitive analysis of management fees and total expenses. Fidelity creates "mapped groups" by combining similar Lipper investment objective categories that have comparable investment mandates. Combining Lipper investment objective categories aids the Board's management fee and total expense ratio comparisons by broadening the competitive group used for comparison.
Management Fee. The Board considered two proprietary management fee comparisons for the 12-month periods shown in basis points (BP) in the charts below. The group of Lipper funds used by the Board for management fee comparisons is referred to below as the "Total Mapped Group." The Total Mapped Group comparison focuses on a fund's standing in terms of gross management fees before expense reimbursements or caps relative to the total universe of funds with comparable investment mandates, regardless of whether their management fee structures also are comparable. Funds with comparable investment mandates offer exposure to similar types of securities. Funds with comparable management fee structures have similar management fee contractual arrangements (
e.g., flat rate charged for advisory services, all-inclusive fee rate,
etc.). "TMG %" represents the percentage of funds in the Total Mapped Group that had management fees that were lower than a fund's. For example, a hypothetical TMG % of 20% would mean that 80% of the funds in the Total Mapped Group had higher, and 20% had lower, management fees than a fund. The funds' actual TMG %s and the number of funds in the Total Mapped Group are in the charts below. The "Asset-Size Peer Group" (ASPG) comparison focuses on a fund's standing relative to a subset of non-Fidelity funds within the Total Mapped Group that are similar in size and management fee structure. For example, if a fund is in the first quartile of the ASPG, the fund's management fee ranks in the least expensive or lowest 25% of funds in the ASPG. The ASPG represents at least 15% of the funds in the Total Mapped Group with comparable asset size and management fee structures, subject to a minimum of 50 funds (or all funds in the Total Mapped Group if fewer than 50). Additional information, such as the ASPG quartile in which a fund's management fee rate ranked, is also included in the charts and considered by the Board.
VIP Freedom Lifetime Income I Portfolio
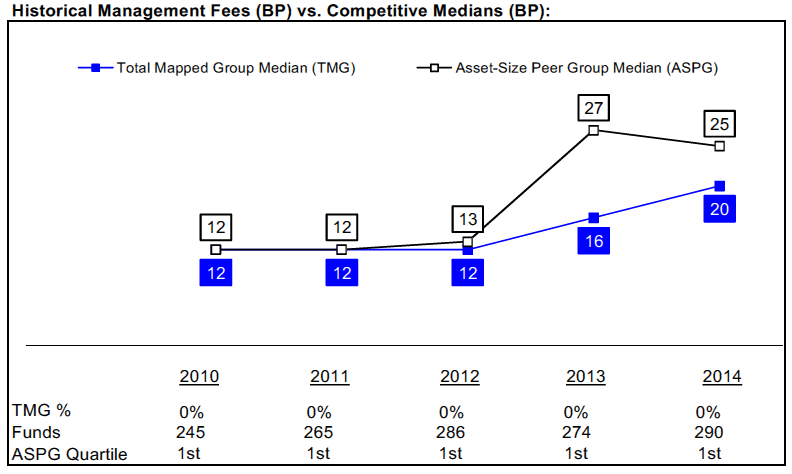
VIP Freedom Lifetime Income II Portfolio
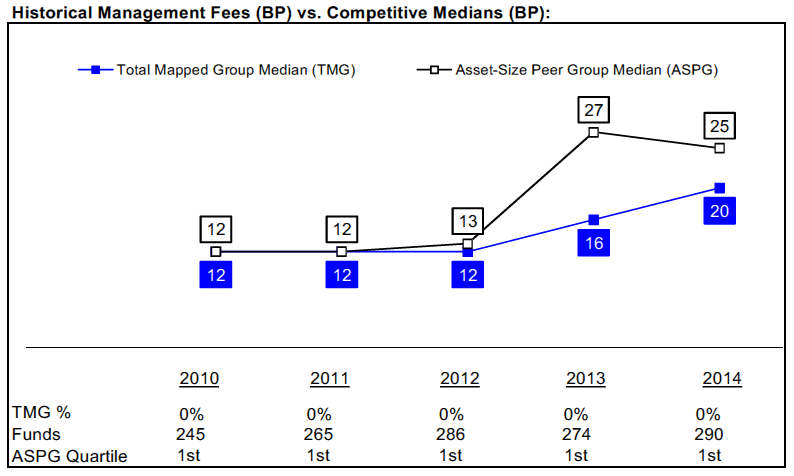
VIP Freedom Lifetime Income III Portfolio
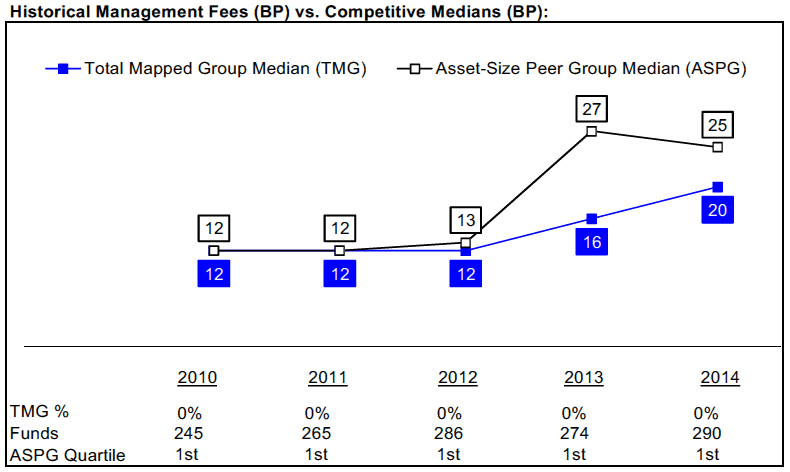
The Board noted that each fund's management fee rate of 0.00% ranked below the median of its Total Mapped Group and below the median of its ASPG for 2014. The Board further noted that many peer funds pay fund-level expenses, including management fees, to which the funds are not subject.
The Board noted that, in 2014, the ad hoc Committee on Group Fee was formed by it and other Fidelity fund boards to conduct an in-depth review of the "group fee" component of the management fee of funds with such management fee structures, and that while the funds do not pay a management fee, they indirectly bear a portion of the management fees paid by the Fidelity funds in which they invest, some of which are subject to the group fee. Committee focus included the mechanics of the group fee, the competitive landscape of group fee structures, Fidelity funds with no group fee component and investment products not included in group fee assets. The Board also considered that, for funds subject to the group fee, FMR agreed to voluntarily waive fees over a specified period of time in amounts designed to account for assets converted from certain funds to certain collective investment trusts.
Based on its review, the Board concluded that each fund's management fee is fair and reasonable in light of the services that the fund receives and the other factors considered.
Total Expense Ratio. In its review of each fund's total expense ratio, the Board considered that the funds do not pay transfer agent fees. Instead, the applicable class of each underlying Fidelity fund bears its pro rata portion of each fund's transfer agent fee according to the percentage of each fund's assets invested in that underlying fund. The Board further noted that FMR pays all other expenses of each fund, with limited exceptions.
The Board noted that each fund's total expense ratio ranked below its competitive median for 2014.
In considering each fund's total expense ratio, the Board also considered an alternative competitive analysis that included both top level (
i.e., direct) fund fees and acquired fund fees and expenses for the fund and the other funds in the mapped group. The Board noted that, under this alternative competitive analysis, each fund's total expense ratio ranked below its competitive median for 2014.
Fees Charged to Other Fidelity Clients. The Board also considered Fidelity fee structures and other information with respect to clients of Fidelity, such as other funds advised or subadvised by Fidelity, pension plan clients, and other institutional clients with similar mandates. The Board noted the findings of the 2013 ad hoc joint committee (created with the board of other Fidelity funds), which reviewed and compared Fidelity's institutional investment advisory business with its business of providing services to the Fidelity funds, including the differences in services provided, fees charged, and costs incurred, as well as competition in their respective marketplaces.
Based on its review of total expense ratios and fees charged to other Fidelity clients, the Board concluded that each fund's total expense ratio was reasonable in light of the services that the fund and its shareholders receive and the other factors considered.
Costs of the Services and Profitability. The Board considered the level of Fidelity's profits in respect of all the Fidelity funds, including the Fidelity funds in which the funds invest.
PricewaterhouseCoopers LLP (PwC), independent registered public accounting firm and auditor to Fidelity and certain Fidelity funds, has been engaged annually by the Board as part of the Board's assessment of Fidelity's profitability analysis. PwC's engagement includes the review and assessment of the methodologies used by Fidelity in determining the revenues and expenses attributable to Fidelity's mutual fund business, and completion of agreed-upon procedures in respect of the mathematical accuracy of fund profitability and its conformity to established allocation methodologies. After considering PwC's reports issued under the engagement and information provided by Fidelity, the Board concluded that while other allocation methods may also be reasonable, Fidelity's profitability methodologies are reasonable in all material respects.
The Board also reviewed Fidelity's non-fund businesses and fall-out benefits related to the mutual fund business as well as cases where Fidelity's affiliates may benefit from or be related to the funds' business.
The Board concluded that the costs of the services provided by and the profits realized by Fidelity in connection with the operation of each fund were not relevant to the approval of each fund's Advisory Contract because the funds do not pay management fees and FMR pays all other expenses of each fund, with limited exceptions.
Economies of Scale. The Board concluded that because the funds do not pay management fees and FMR pays all other expenses of each fund, with limited exceptions, economies of scale cannot be realized by the funds, but may be realized by the other Fidelity funds in which each fund invests, many of which may benefit from breakpoints under the group fee arrangement.
Additional Information Requested by the Board. In order to develop fully the factual basis for consideration of the Fidelity funds' Advisory Contracts, the Board requested and received additional information on certain topics, including: (i) Fidelity's fund profitability methodology, profitability trends for certain funds, and the impact of certain factors on fund profitability results; (ii) portfolio manager changes that have occurred during the past year and the amount of the investment that each portfolio manager has made in the Fidelity fund(s) that he or she manages; (iii) Fidelity's compensation structure for portfolio managers, research analysts, and other key personnel, including its effects on fund profitability, the rationale for the compensation structure, and the extent to which current market conditions have affected retention and recruitment; (iv) the arrangements with and compensation paid to certain fund sub-advisers on behalf of the Fidelity funds; (v) Fidelity's voluntary waiver of its fees to maintain minimum yields for certain money market funds and classes as well as contractual waivers in place for certain funds; (vi) the methodology with respect to competitive fund data and peer group classifications; (vii) Fidelity's transfer agent fee, expense, and service structures for different funds and classes relative to competitive trends, and the impact of the increased use of omnibus accounts; (viii) Fidelity's long-term expectations for its offerings in the workplace investing channel; (ix) new developments in the retail and institutional marketplaces; and (x) the impact of money market reform on Fidelity's money market funds. In addition, the Board considered its discussions with Fidelity throughout the year regarding enhanced information security initiatives and the funds' fair valuation policies.
Based on its evaluation of all of the conclusions noted above, and after considering all factors it believed relevant, the Board concluded that the advisory fee structures are fair and reasonable, and that each fund's Advisory Contract should be approved.
Proxy Voting Results
A special meeting of shareholders was held on May 12, 2015. The results of votes taken among shareholders on the proposal before them are reported below. Each vote reported represents one dollar of net asset value held on the record date for the meeting.
PROPOSAL 1
To elect a Board of Trustees.
| | # of
Votes | % of
Votes |
| Elizabeth S. Acton | | |
| Affirmative | 24,469,831,790.28 | 97.003 |
| Withheld | 756,086,184.43 | 2.997 |
| TOTAL | 25,225,917,974.71 | 100.000 |
| John Engler | | |
| Affirmative | 24,404,438,415.74 | 96.744 |
| Withheld | 821,479,558.97 | 3.256 |
| TOTAL | 25,225,917,974.71 | 100.000 |
| Albert R. Gamper, Jr. | | |
| Affirmative | 24,431,670,090.08 | 96.852 |
| Withheld | 794,247,884.63 | 3.148 |
| TOTAL | 25,225,917,974.71 | 100.000 |
| Robert F. Gartland | | |
| Affirmative | 24,472,637,370.54 | 97.014 |
| Withheld | 753,280,604.17 | 2.986 |
| TOTAL | 25,225,917,974.71 | 100.000 |
| Abigail P. Johnson | | |
| Affirmative | 24,442,024,432.82 | 96.893 |
| Withheld | 783,893,541.89 | 3.107 |
| TOTAL | 25,225,917,974.71 | 100.000 |
| Arthur E. Johnson | | |
| Affirmative | 24,444,583,833.78 | 96.903 |
| Withheld | 781,334,140.93 | 3.097 |
| TOTAL | 25,225,917,974.71 | 100.000 |
| Michael E. Kenneally | | |
| Affirmative | 24,475,874,452.78 | 97.027 |
| Withheld | 750,043,521.93 | 2.973 |
| TOTAL | 25,225,917,974.71 | 100.000 |
| James H. Keyes | | |
| Affirmative | 24,434,496,321.71 | 96.863 |
| Withheld | 791,421,653.00 | 3.137 |
| TOTAL | 25,225,917,974.71 | 100.000 |
| Marie L. Knowles | | |
| Affirmative | 24,446,177,909.79 | 96.909 |
| Withheld | 779,740,064.92 | 3.091 |
| TOTAL | 25,225,917,974.71 | 100.000 |
| Geoffrey A. von Kuhn | | |
| Affirmative | 24,444,403,935.60 | 96.902 |
| Withheld | 781,514,039.11 | 3.098 |
| TOTAL | 25,225,917,974.71 | 100.000 |
| Proposal 1 reflects trust wide proposal and voting results. |
VIPFLI-ANN-0216
1.816199.110
Fidelity® Variable Insurance Products: Target Volatility Portfolio
Annual Report December 31, 2015 |
|
Contents
To view a fund's proxy voting guidelines and proxy voting record for the 12-month period ended June 30, visit http://www.fidelity.com/proxyvotingresults or visit the Securities and Exchange Commission's (SEC) web site at http://www.sec.gov.
You may also call 1-877-208-0098 to request a free copy of the proxy voting guidelines.
Fidelity® Variable Insurance Products are separate account options which are purchased through a variable insurance contract.
Standard & Poor's, S&P and S&P 500 are registered service marks of The McGraw-Hill Companies, Inc. and have been licensed for use by Fidelity Distributors Corporation.
Other third-party marks appearing herein are the property of their respective owners.
All other marks appearing herein are registered or unregistered trademarks or service marks of FMR LLC or an affiliated company. © 2016 FMR LLC. All rights reserved.
This report and the financial statements contained herein are submitted for the general information of the shareholders of the Fund. This report is not authorized for distribution to prospective investors in the Fund unless preceded or accompanied by an effective prospectus.
A fund files its complete schedule of portfolio holdings with the SEC for the first and third quarters of each fiscal year on Form N-Q. Forms N-Q are available on the SEC’s web site at http://www.sec.gov. A fund's Forms N-Q may be reviewed and copied at the SEC’s Public Reference Room in Washington, DC. Information regarding the operation of the SEC's Public Reference Room may be obtained by calling 1-800-SEC-0330.
For a complete list of a fund's portfolio holdings, view the most recent holdings listing, semiannual report, or annual report on Fidelity's web site at http://www.fidelity.com, http://www.advisor.fidelity.com, or http://www.401k.com, as applicable.
NOT FDIC INSURED •MAY LOSE VALUE •NO BANK GUARANTEE
Neither the Fund nor Fidelity Distributors Corporation is a bank.
Performance: The Bottom Line
Average annual total return reflects the change in the value of an investment, assuming reinvestment of distributions from dividend income and capital gains (the profits earned upon the sale of securities that have grown in value, if any) and assuming a constant rate of performance each year. During periods of reimbursement by Fidelity, a fund’s total return will be greater than it would be had the reimbursement not occurred. Performance numbers are net of all underlying fund operating expenses, but do not include any insurance charges imposed by your insurance company’s separate account. If performance information included the effect of these additional charges, the total returns would have been lower. How a fund did yesterday is no guarantee of how it will do tomorrow.
Average Annual Total Returns
| For the periods ended December 31, 2015 | Past 1 year | Life of FundA |
| Service Class | (1.22)% | 6.47% |
| Service Class 2 | (1.34)% | 6.31% |
A From February 13, 2013
$10,000 Over Life of Fund
Let's say hypothetically that $10,000 was invested in VIP Target Volatility Portfolio - Service Class on February 13, 2013, when the fund started.
The chart shows how the value of your investment would have changed, and also shows how the S&P 500® Index performed over the same period.
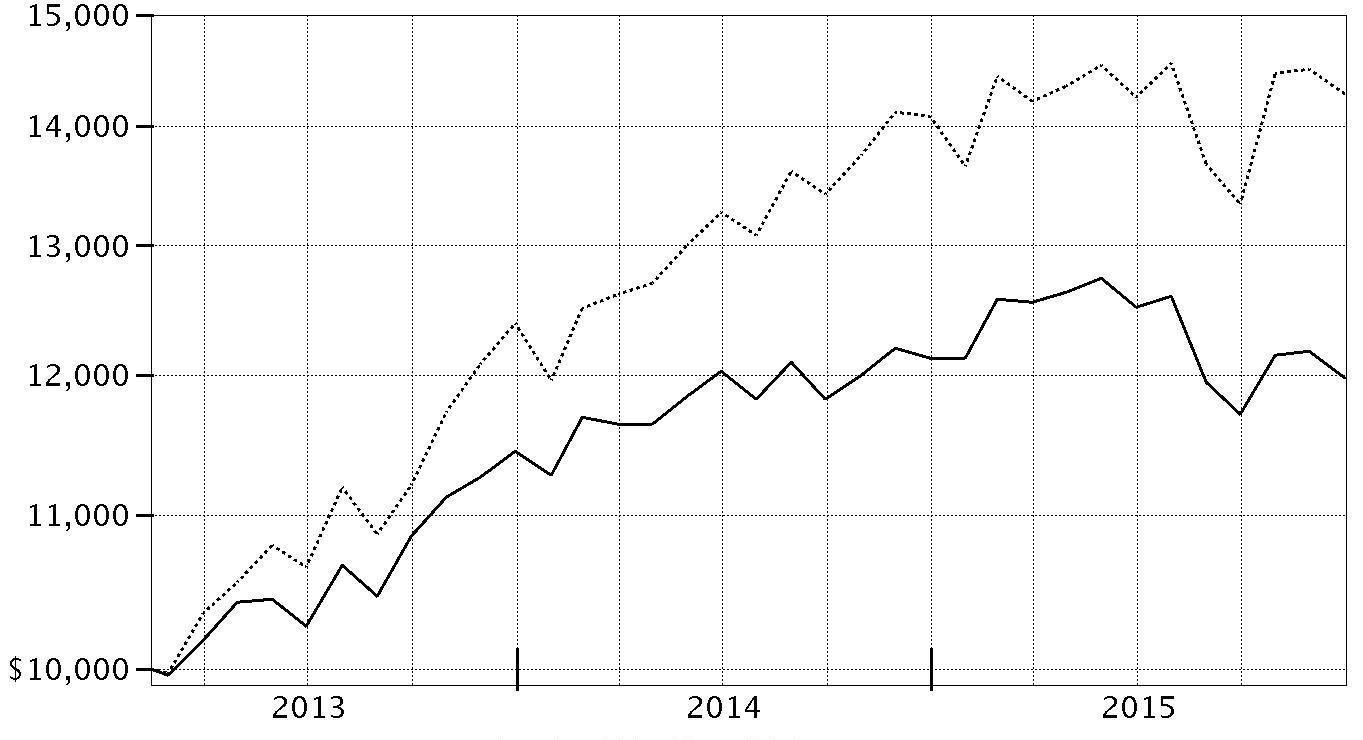
| Period Ending Values |
| $11,977 | VIP Target Volatility Portfolio - Service Class |
| $14,278 | S&P 500® Index |
Management's Discussion of Fund Performance
Market Recap: U.S. stocks gained modestly in 2015, rebounding from a steep decline in August and September over worries about China’s slowing economic growth. The S&P 500
® index rose 1.38% for the period, its lowest calendar-year return since 2008. After the late-summer rout, stocks sharply reversed course in October, lifted by the Federal Reserve’s decision to put off raising near-term interest rates until mid-December. Investors also were encouraged by an interest-rate cut in China and economic stimulus in Europe. Overall, growth stocks fared much better than their value counterparts, as investors sought growth in a subpar economic environment. This helped lift the technology-heavy Nasdaq Composite Index
® 6.96% for the year. Sector performance in the broader market was split, with five of 10 sectors in the S&P 500
® gaining ground and five retreating. Consumer discretionary (+10%) led the way, benefiting from rising personal income and low inflation. Health care (+7%), consumer staples (+7%) and information technology (+6%) also outpaced the broad market amid strong fundamentals. Conversely, the energy sector (-21%) was by far the worst performer, stung by deflated commodity prices that also hit materials (-8%). The defensive, but rate-sensitive utilities sector (-5%) lost ground on the cusp of Fed tightening, while industrials (-3%) were dragged down with energy prices and a slower-growing China.
Comments from Portfolio Manager Xuehai En: For the year, the fund's share classes trailed the 0.51% return of the VIP Target Volatility Composite Index℠, and also lagged the S&P 500
® index. Relative to the Composite index, asset allocation detracted, whereas security selection contributed on a net basis. Asset allocation was hampered by out-of-benchmark exposure to emerging-markets (EM) equities, as many underlying fund holdings in this category substantially underperformed our Composite index. Favorable stock picks partially offset the overall negative impact of our EM equity allocation. A sizable underweighting in investment-grade bonds, along with security selection in that asset class, also notably hampered the fund's relative return. Adverse investment-grade bond selection resulted primarily from holdings of corporate bonds and long-term U.S. Treasuries via Fidelity
® Total Bond Fund and Spartan
® Long-Term Treasury Bond Index Fund. Stock picks in foreign developed-markets equities contributed most to relative performance, and more than offset unfavorable security selection elsewhere. The leading underlying fund in this area was Fidelity
® Overseas Fund, which benefited from broadly positive stock selection, particularly in financials, information technology, consumer discretionary and materials. Selection in U.S. equities worked against relative performance, with Fidelity
® Select Energy Portfolio being the primary detractor in this category. Concerning notable portfolio changes, in October, I added exposure to Treasury Inflation-Protected Securities through Spartan
® Inflation-Protected Bond Index Fund.
The views expressed above reflect those of the portfolio manager(s) only through the end of the period as stated on the cover of this report and do not necessarily represent the views of Fidelity or any other person in the Fidelity organization. Any such views are subject to change at any time based upon market or other conditions and Fidelity disclaims any responsibility to update such views. These views may not be relied on as investment advice and, because investment decisions for a Fidelity fund are based on numerous factors, may not be relied on as an indication of trading intent on behalf of any Fidelity fund.
Investment Summary (Unaudited)
The information in the following tables is based on the direct investments of the Fund.
Fund Holdings as of December 31, 2015
| | % of fund's net assets | % of fund's net assets 6 months ago |
| Domestic Equity Funds | | |
| Energy Select Sector SPDR ETF | 0.3 | 0.4 |
| Fidelity Air Transportation Portfolio | 0.0 | 0.0 |
| Fidelity Banking Portfolio | 1.3 | 0.8 |
| Fidelity Blue Chip Growth Fund | 4.2 | 3.4 |
| Fidelity Blue Chip Value Fund | 2.8 | 1.4 |
| Fidelity Chemicals Portfolio | 0.6 | 0.8 |
| Fidelity Construction and Housing Portfolio | 0.4 | 0.4 |
| Fidelity Consumer Discretionary Portfolio | 2.3 | 3.7 |
| Fidelity Consumer Staples Portfolio | 2.9 | 2.4 |
| Fidelity Contrafund | 2.4 | 0.0 |
| Fidelity Defense and Aerospace Portfolio | 1.3 | 1.3 |
| Fidelity Electronics Portfolio | 0.2 | 1.3 |
| Fidelity Energy Portfolio | 1.5 | 1.7 |
| Fidelity Energy Service Portfolio | 0.0 | 0.0 |
| Fidelity Financial Services Portfolio | 0.6 | 1.6 |
| Fidelity Health Care Portfolio | 1.0 | 4.7 |
| Fidelity Health Care Services Portfolio | 1.1 | 0.5 |
| Fidelity Industrial Equipment Portfolio | 0.3 | 0.0 |
| Fidelity Industrials Portfolio | 1.9 | 1.5 |
| Fidelity Insurance Portfolio | 1.1 | 0.0 |
| Fidelity IT Services Portfolio | 0.5 | 2.4 |
| Fidelity Low-Priced Stock Fund | 1.3 | 0.0 |
| Fidelity Materials Portfolio | 0.3 | 0.0 |
| Fidelity Medical Equipment and Systems Portfolio | 1.3 | 0.5 |
| Fidelity Mega Cap Stock Fund | 0.0 | 0.4 |
| Fidelity Mid Cap Value Fund | 0.9 | 3.4 |
| Fidelity Pharmaceuticals Portfolio | 0.9 | 0.0 |
| Fidelity Real Estate Investment Portfolio | 0.5 | 0.4 |
| Fidelity Retailing Portfolio | 0.9 | 0.8 |
| Fidelity Small Cap Stock Fund | 0.5 | 0.7 |
| Fidelity Software and IT Services Portfolio | 1.0 | 0.0 |
| Fidelity Stock Selector Large Cap Value Fund | 1.3 | 0.4 |
| Fidelity Technology Portfolio | 4.6 | 1.1 |
| Fidelity Telecommunications Portfolio | 1.1 | 0.2 |
| Fidelity Utilities Portfolio | 0.2 | 0.0 |
| Fidelity Value Discovery Fund | 0.4 | 0.4 |
| KBW Regional Banking ETF | 2.5 | 4.3 |
| Vanguard Telecommunication Services ETF | 0.1 | 0.0 |
| Fidelity Brokerage and Investment Management Portfolio | 0.0 | 0.0 |
| Fidelity Computers Portfolio | 0.0 | 0.6 |
| Fidelity Gold Portfolio | 0.0 | 0.1 |
| Fidelity Large Cap Stock Fund | 0.0 | 1.8 |
| Fidelity OTC Portfolio | 0.0 | 0.3 |
| iShares Dow Jones U.S. Technology Sector Index ETF | 0.0 | 0.2 |
| Market Vectors Gold Miners ETF | 0.0 | 0.2 |
| | 44.5 | 44.1 |
| International Equity Funds | | |
| Fidelity Diversified International Fund | 0.3 | 2.0 |
| Fidelity Emerging Asia Fund | 0.2 | 2.3 |
| Fidelity Europe Fund | 2.4 | 2.3 |
| Fidelity International Discovery Fund | 0.2 | 0.0 |
| Fidelity International Small Cap Fund | 0.5 | 0.2 |
| Fidelity International Small Cap Opportunities Fund | 2.1 | 1.3 |
| Fidelity Japan Fund | 0.7 | 0.5 |
| Fidelity Japan Smaller Companies Fund | 0.7 | 0.6 |
| Fidelity Overseas Fund | 10.0 | 7.7 |
| iShares MSCI EAFE Index ETF | 0.6 | 2.1 |
| Spartan International Index Fund Investor Class | 0.4 | 0.0 |
| WisdomTree Europe Hedged Equity ETF | 0.7 | 1.9 |
| WisdomTree Japan Hedged Equity ETF | 0.3 | 3.6 |
| Fidelity China Region Fund | 0.0 | 0.7 |
| Fidelity Emerging Markets Fund | 0.0 | 0.1 |
| Fidelity Pacific Basin Fund | 0.0 | 0.9 |
| iShares MSCI Emerging Markets Index ETF | 0.0 | 0.6 |
| iShares MSCI Taiwan Index ETF | 0.0 | 0.6 |
| | 19.1 | 27.4 |
| Fixed-Income Funds | | |
| Fidelity Corporate Bond Fund | 5.1 | 0.3 |
| Fidelity High Income Fund | 0.1 | 0.0 |
| Fidelity Inflation Protected Bond Fund | 2.7 | 0.0 |
| Fidelity New Markets Income Fund | 0.3 | 0.2 |
| Fidelity Real Estate Income Fund | 0.2 | 0.2 |
| Fidelity Total Bond Fund | 17.9 | 20.2 |
| iShares 20+ Year Treasury Bond ETF | 0.1 | 0.7 |
| iShares JPMorgan USD Emerging Markets Bond ETF | 0.2 | 0.5 |
| Spartan Inflation-Protected Bond Index Fund Investor Class | 3.0 | 0.0 |
| Spartan Long-Term Treasury Bond Index Fund Investor Class | 2.0 | 2.1 |
| SPDR Lehman High Yield Bond ETF | 1.4 | 1.8 |
| | 33.0 | 26.0 |
| U.S. Treasury Obligations | | |
| U.S. Treasury Bills, yield at date of purchase 0.06% to 0.22% 2/4/16 to 3/17/16 | 0.1 | 0.0 |
| U.S. Treasury Bills, yield at date of purchase 0.02% 8/13/15 | 0.0 | 0.1 |
| | 0.1 | 0.1 |
| Cash Equivalents | | |
| Investments in repurchase agreements in a joint trading account at 0.12%, dated 6/30/15 due 7/1/15 (Collateralized by U.S. Treasury Obligations) | 0.0 | 2.4 |
| Net Other Assets (Liabilities) | 3.3 | 0.0 |
| | 100.0 | 100.0 |
Fidelity Software and IT Services Portfolio was formerly known as Fidelity Software and Computer Services Portfolio
Fidelity Health Care Services Portfolio was formerly known as Fidelity Medical Delivery Portfolio
Asset Allocation (% of fund's net assets)
| As of December 31, 2015* |
| | Domestic Equity Funds | 44.5% |
| | International Equity Funds | 19.1% |
| | Fixed-Income Funds | 33.0% |
| | Short-Term Investments | 0.1% |
| | Net Other Assets (Liabilities) | 3.3% |

* Futures - 2.0%
| As of June 30, 2015* |
| | Domestic Equity Funds | 44.1% |
| | International Equity Funds | 27.4% |
| | Fixed-Income Funds | 26.0% |
| | Cash Equivalents | 2.4% |
| | Short-Term Investments | 0.1% |

* Futures - 1.3%
Percentages shown as 0.0% may reflect amounts less than 0.05%.
Investments December 31, 2015
Showing Percentage of Net Assets
| Equity Funds - 63.6% | | | |
| | | Shares | Value |
| Domestic Equity Funds - 44.5% | | | |
| Energy Select Sector SPDR ETF | | 9,818 | $594,480 |
| Fidelity Air Transportation Portfolio (a) | | 1,093 | 68,092 |
| Fidelity Banking Portfolio (a) | | 108,870 | 2,784,888 |
| Fidelity Blue Chip Growth Fund (a) | | 129,030 | 8,899,173 |
| Fidelity Blue Chip Value Fund (a) | | 370,788 | 5,817,657 |
| Fidelity Chemicals Portfolio (a) | | 9,453 | 1,236,411 |
| Fidelity Construction and Housing Portfolio (a) | | 14,887 | 864,046 |
| Fidelity Consumer Discretionary Portfolio (a) | | 143,202 | 4,893,218 |
| Fidelity Consumer Staples Portfolio (a) | | 67,812 | 6,189,852 |
| Fidelity Contrafund (a) | | 50,394 | 4,986,532 |
| Fidelity Defense and Aerospace Portfolio (a) | | 24,158 | 2,777,934 |
| Fidelity Electronics Portfolio (a) | | 6,321 | 477,825 |
| Fidelity Energy Portfolio (a) | | 86,830 | 3,053,811 |
| Fidelity Energy Service Portfolio (a) | | 1,043 | 42,788 |
| Fidelity Financial Services Portfolio (a) | | 16,147 | 1,356,675 |
| Fidelity Health Care Portfolio (a) | | 10,479 | 2,181,221 |
| Fidelity Health Care Services Portfolio (a) | | 26,558 | 2,241,999 |
| Fidelity Industrial Equipment Portfolio (a) | | 14,665 | 534,971 |
| Fidelity Industrials Portfolio (a) | | 139,617 | 4,078,221 |
| Fidelity Insurance Portfolio (a) | | 33,143 | 2,242,763 |
| Fidelity IT Services Portfolio (a) | | 24,716 | 987,894 |
| Fidelity Low-Priced Stock Fund (a) | | 58,811 | 2,808,217 |
| Fidelity Materials Portfolio (a) | | 8,744 | 600,264 |
| Fidelity Medical Equipment and Systems Portfolio (a) | | 78,126 | 2,802,374 |
| Fidelity Mega Cap Stock Fund (a) | | 328 | 5,131 |
| Fidelity Mid Cap Value Fund (a) | | 88,604 | 1,979,419 |
| Fidelity Pharmaceuticals Portfolio (a) | | 91,686 | 1,885,975 |
| Fidelity Real Estate Investment Portfolio (a) | | 24,563 | 996,749 |
| Fidelity Retailing Portfolio (a) | | 17,375 | 1,828,033 |
| Fidelity Small Cap Stock Fund (a) | | 58,912 | 1,023,296 |
| Fidelity Software and IT Services Portfolio (a) | | 17,516 | 2,126,558 |
| Fidelity Stock Selector Large Cap Value Fund (a) | | 161,412 | 2,627,784 |
| Fidelity Technology Portfolio (a) | | 82,857 | 9,784,564 |
| Fidelity Telecommunications Portfolio (a) | | 39,193 | 2,372,730 |
| Fidelity Utilities Portfolio (a) | | 7,262 | 465,956 |
| Fidelity Value Discovery Fund (a) | | 39,214 | 905,832 |
| KBW Regional Banking ETF | | 126,077 | 5,285,148 |
| Vanguard Telecommunication Services ETF | | 2,404 | 201,720 |
|
| TOTAL DOMESTIC EQUITY FUNDS | | | 94,010,201 |
|
| International Equity Funds - 19.1% | | | |
| Fidelity Diversified International Fund (a) | | 19,102 | 669,702 |
| Fidelity Emerging Asia Fund (a) | | 14,468 | 434,189 |
| Fidelity Europe Fund (a) | | 143,189 | 5,179,160 |
| Fidelity International Discovery Fund (a) | | 11,344 | 447,051 |
| Fidelity International Small Cap Fund (a) | | 45,291 | 1,001,835 |
| Fidelity International Small Cap Opportunities Fund (a) | | 298,379 | 4,451,820 |
| Fidelity Japan Fund (a) | | 126,391 | 1,492,678 |
| Fidelity Japan Smaller Companies Fund (a) | | 102,650 | 1,420,678 |
| Fidelity Overseas Fund (a) | | 518,760 | 21,196,546 |
| iShares MSCI EAFE Index ETF | | 19,903 | 1,169,301 |
| Spartan International Index Fund Investor Class (a) | | 23,005 | 826,554 |
| WisdomTree Europe Hedged Equity ETF | | 26,755 | 1,439,687 |
| WisdomTree Japan Hedged Equity ETF | | 11,344 | 568,108 |
|
| TOTAL INTERNATIONAL EQUITY FUNDS | | | 40,297,309 |
|
| TOTAL EQUITY FUNDS | | | |
| (Cost $138,877,964) | | | 134,307,510 |
|
| Fixed-Income Funds - 33.0% | | | |
| Fidelity Corporate Bond Fund (a) | | 991,705 | 10,849,255 |
| Fidelity High Income Fund (a) | | 27,788 | 220,912 |
| Fidelity Inflation Protected Bond Fund (a) | | 492,552 | 5,728,383 |
| Fidelity New Markets Income Fund (a) | | 38,562 | 559,927 |
| Fidelity Real Estate Income Fund (a) | | 39,917 | 448,668 |
| Fidelity Total Bond Fund (a) | | 3,681,514 | 37,772,328 |
| iShares 20+ Year Treasury Bond ETF | | 2,282 | 275,255 |
| iShares JPMorgan USD Emerging Markets Bond ETF | | 4,199 | 444,170 |
| Spartan Inflation-Protected Bond Index Fund Investor Class (a) | | 680,145 | 6,379,763 |
| Spartan Long-Term Treasury Bond Index Fund Investor Class (a) | | 329,270 | 4,201,487 |
| SPDR Lehman High Yield Bond ETF | | 84,639 | 2,870,108 |
| TOTAL FIXED-INCOME FUNDS | | | |
| (Cost $71,858,107) | | | 69,750,256 |
| | | Principal Amount | Value |
|
| U.S. Treasury Obligations - 0.1% | | | |
| U.S. Treasury Bills, yield at date of purchase 0.06% to 0.22% 2/4/16 to 3/17/16 (b) | | | |
| (Cost $189,969) | | 190,000 | 189,978 |
| TOTAL INVESTMENT PORTFOLIO - 96.7% | | | |
| (Cost $210,926,040) | | | 204,247,744 |
| NET OTHER ASSETS (LIABILITIES) - 3.3% | | | 7,002,775 |
| NET ASSETS - 100% | | | $211,250,519 |
| Futures Contracts | | | |
| | Expiration Date | Underlying Face Amount at Value | Unrealized Appreciation/(Depreciation) |
| Purchased | | | |
| Equity Index Contracts | | | |
| 1 CME E-mini S&P 500 Index Contracts (United States) | March 2016 | 101,770 | $1,714 |
| 50 ICE E-mini MSCI EAFE Index Contracts (United States) | March 2016 | 4,245,500 | 81,571 |
| TOTAL FUTURES CONTRACTS | | | $83,285 |
The face value of futures purchased as a percentage of Net Assets is 2%
Security Type Abbreviations
ETF – Exchange-Traded Fund
Legend
(a) Affiliated Fund
(b) Security or a portion of the security was pledged to cover margin requirements for futures contracts. At period end, the value of securities pledged amounted to $184,979.
Affiliated Underlying Funds
Information regarding the Fund's fiscal year to date purchases and sales of the affiliated Underlying Funds and income earned by the Fund from investments in affiliated Underlying Funds is as follows:
Fidelity Software and IT Services Portfolio was formerly known as Fidelity Software and Computer Services Portfolio
Fidelity Health Care Services Portfolio was formerly known as Fidelity Medical Delivery Portfolio
| Affiliate | Value, beginning of period | Purchases | Sales Proceeds | Dividend Income | Value, end of period |
| Fidelity Air Transportation Portfolio | $76,083 | $5,877 | $1,532 | $173 | $68,092 |
| Fidelity Banking Portfolio | 649,182 | 2,373,463 | 57,871 | 25,533 | 2,784,888 |
| Fidelity Blue Chip Growth Fund | 4,655,034 | 7,345,238 | 2,927,932 | 2,444 | 8,899,173 |
| Fidelity Blue Chip Value Fund | -- | 6,081,158 | -- | 71,270 | 5,817,657 |
| Fidelity Brokerage and Investment Management Portfolio | 78,015 | 662 | 77,535 | 93 | -- |
| Fidelity Chemicals Portfolio | 213,761 | 1,626,221 | 450,775 | 13,451 | 1,236,411 |
| Fidelity China Region Fund | -- | 1,100,366 | 868,567 | -- | -- |
| Fidelity Communications Equipment Portfolio | 71,927 | -- | 72,931 | -- | -- |
| Fidelity Computers Portfolio | 1,969,968 | 333,874 | 2,176,015 | 1,141 | -- |
| Fidelity Construction and Housing Portfolio | 165,577 | 703,941 | 4,208 | 3,152 | 864,046 |
| Fidelity Consumer Discretionary Portfolio | 5,054,442 | 2,437,577 | 2,567,035 | 24,810 | 4,893,218 |
| Fidelity Consumer Staples Portfolio | 4,084,531 | 4,949,580 | 2,411,176 | 93,122 | 6,189,852 |
| Fidelity Contrafund | -- | 5,197,557 | 25,082 | 14,721 | 4,986,532 |
| Fidelity Corporate Bond Fund | 6,136,508 | 14,171,823 | 9,001,056 | 171,697 | 10,849,255 |
| Fidelity Defense and Aerospace Portfolio | -- | 3,757,933 | 682,736 | 21,938 | 2,777,934 |
| Fidelity Diversified International Fund | 11,493,402 | 12,208,590 | 23,766,122 | 7,623 | 669,702 |
| Fidelity Electronics Portfolio | 1,958,928 | 509,689 | 1,819,074 | 5,793 | 477,825 |
| Fidelity Emerging Asia Fund | 1,390,409 | 2,783,519 | 3,031,488 | 1,902 | 434,189 |
| Fidelity Emerging Europe, Middle East, Africa (EMEA) Fund | 830 | -- | 879 | -- | -- |
| Fidelity Emerging Markets Discovery Fund | 45,064 | -- | 45,594 | -- | -- |
| Fidelity Emerging Markets Fund | 1,134,376 | -- | 1,135,482 | -- | -- |
| Fidelity Energy Portfolio | 918,533 | 3,015,996 | 77,114 | 32,165 | 3,053,811 |
| Fidelity Energy Service Portfolio | 168,902 | 646,889 | 761,683 | 412 | 42,788 |
| Fidelity Europe Fund | -- | 5,759,210 | 267,878 | 59,907 | 5,179,160 |
| Fidelity Financial Services Portfolio | 6,557,549 | 3,048,764 | 8,250,054 | 12,590 | 1,356,675 |
| Fidelity Gold Portfolio | 160,983 | 121,971 | 221,689 | -- | -- |
| Fidelity Health Care Portfolio | 6,298,447 | 2,684,200 | 6,893,592 | -- | 2,181,221 |
| Fidelity Health Care Services Portfolio | 98,821 | 2,541,356 | 198,197 | 460 | 2,241,999 |
| Fidelity High Income Fund | 98,637 | 196,403 | 59,242 | 4,939 | 220,912 |
| Fidelity Industrial Equipment Portfolio | -- | 543,015 | -- | 1,599 | 534,971 |
| Fidelity Industrials Portfolio | 1,672,293 | 3,183,798 | 421,190 | 25,261 | 4,078,221 |
| Fidelity Inflation Protected Bond Fund | -- | 5,867,710 | 41,789 | 3,090 | 5,728,383 |
| Fidelity Insurance Portfolio | -- | 2,335,456 | -- | 19,817 | 2,242,763 |
| Fidelity International Capital Appreciation Fund | 497,114 | -- | 509,817 | -- | -- |
| Fidelity International Discovery Fund | 1,267,927 | 660,764 | 1,577,695 | 4,592 | 447,051 |
| Fidelity International Small Cap Fund | -- | 1,040,576 | -- | 12,747 | 1,001,835 |
| Fidelity International Small Cap Opportunities Fund | -- | 4,485,253 | -- | 21,600 | 4,451,820 |
| Fidelity IT Services Portfolio | 1,611,380 | 3,667,179 | 4,668,064 | -- | 987,894 |
| Fidelity Japan Fund | -- | 1,540,902 | -- | 8,666 | 1,492,678 |
| Fidelity Japan Smaller Companies Fund | -- | 1,407,404 | -- | 8,914 | 1,420,678 |
| Fidelity Large Cap Stock Fund | 1,016,964 | 3,189,722 | 3,894,669 | 9,638 | -- |
| Fidelity Low-Priced Stock Fund | -- | 3,101,552 | 170,000 | 35,966 | 2,808,217 |
| Fidelity Materials Portfolio | -- | 819,269 | 200,000 | 6,453 | 600,264 |
| Fidelity Medical Equipment and Systems Portfolio | 393,804 | 2,572,217 | 14,708 | 436 | 2,802,374 |
| Fidelity Mega Cap Stock Fund | 3,670,195 | 2,711 | 3,694,461 | 965 | 5,131 |
| Fidelity Mid Cap Value Fund | 4,821,407 | 4,170,926 | 6,478,574 | 50,075 | 1,979,419 |
| Fidelity Natural Gas Portfolio | 451,988 | 902 | 437,749 | 902 | -- |
| Fidelity New Markets Income Fund | 384,206 | 264,673 | 64,600 | 19,867 | 559,927 |
| Fidelity OTC Portfolio | 1,460,379 | 933,654 | 2,464,115 | -- | -- |
| Fidelity Overseas Fund | -- | 21,834,597 | 16,522 | 211,531 | 21,196,546 |
| Fidelity Pacific Basin Fund | 13,717 | 1,595,382 | 1,404,993 | -- | -- |
| Fidelity Pharmaceuticals Portfolio | -- | 2,228,235 | -- | 11,404 | 1,885,975 |
| Fidelity Real Estate Income Fund | 461,354 | 24,074 | 20,649 | 18,606 | 448,668 |
| Fidelity Real Estate Investment Portfolio | 911,569 | 1,588,875 | 1,408,183 | 12,301 | 996,749 |
| Fidelity Retailing Portfolio | 656,638 | 972,581 | 15,631 | 2,426 | 1,828,033 |
| Fidelity Small Cap Stock Fund | -- | 1,576,596 | 374,605 | 5,783 | 1,023,296 |
| Fidelity Small Cap Value Fund | 80,095 | -- | 81,406 | -- | -- |
| Fidelity Software and IT Services Portfolio | -- | 2,108,918 | -- | 849 | 2,126,558 |
| Fidelity Stock Selector Large Cap Value Fund | 5,347,512 | 2,751,251 | 5,407,970 | 32,439 | 2,627,784 |
| Fidelity Technology Portfolio | 1,536,103 | 9,319,338 | 820,391 | 7,908 | 9,784,564 |
| Fidelity Telecommunications Portfolio | -- | 2,352,333 | -- | 25,836 | 2,372,730 |
| Fidelity Total Bond Fund | 29,311,437 | 35,279,401 | 25,380,348 | 982,142 | 37,772,328 |
| Fidelity Transportation Portfolio | 1,388,426 | 5,939 | 1,286,068 | 838 | -- |
| Fidelity Utilities Portfolio | 399,927 | 1,059,240 | 940,674 | 18,429 | 465,956 |
| Fidelity Value Discovery Fund | 1,605,580 | 3,364,288 | 4,107,629 | 14,368 | 905,832 |
| Spartan Inflation-Protected Bond Index Fund Investor Class | -- | 6,504,805 | -- | -- | 6,379,763 |
| Spartan International Index Fund Investor Class | 153,109 | 871,304 | 153,314 | 21,304 | 826,554 |
| Spartan Long-Term Treasury Bond Index Fund Investor Class | 656,820 | 8,494,101 | 4,692,723 | 104,347 | 4,201,487 |
| Spartan U.S. Bond Index Fund Investor Class | -- | 25,808,070 | 25,881,082 | 53,965 | -- |
| Total | $113,249,853 | $251,128,868 | $164,482,158 | $2,324,400 | $191,209,789 |
Investment Valuation
The following is a summary of the inputs used, as of December 31, 2015, involving the Fund's assets and liabilities carried at fair value. The inputs or methodology used for valuing securities may not be an indication of the risk associated with investing in those securities. For more information on valuation inputs, and their aggregation into the levels used below, please refer to the Investment Valuation section in the accompanying Notes to Financial Statements.
| | Valuation Inputs at Reporting Date: |
| Description | Total | Level 1 | Level 2 | Level 3 |
| Investments in Securities: | | | | |
| Equity Funds | $134,307,510 | $134,307,510 | $-- | $-- |
| Fixed-Income Funds | 69,750,256 | 69,750,256 | -- | -- |
| U.S. Treasury Obligations | 189,978 | -- | 189,978 | -- |
| Total Investments in Securities: | $204,247,744 | $204,057,766 | $189,978 | $-- |
| Derivative Instruments: | | | | |
| Assets | | | | |
| Futures Contracts | $83,285 | $83,285 | $-- | $-- |
| Total Assets | $83,285 | $83,285 | $-- | $-- |
| Total Derivative Instruments: | $83,285 | $83,285 | $-- | $-- |
Value of Derivative Instruments
The following table is a summary of the Fund's value of derivative instruments by primary risk exposure as of December 31, 2015. For additional information on derivative instruments, please refer to the Derivative Instruments section in the accompanying Notes to Financial Statements.
| Primary Risk Exposure / Derivative Type | Value |
| | Asset | Liability |
| Equity Risk | | |
| Futures Contracts(a) | $83,285 | $0 |
| Total Equity Risk | 83,285 | 0 |
| Total Value of Derivatives | $83,285 | $0 |
(a) Reflects gross cumulative appreciation (depreciation) on futures contracts as presented in the Schedule of Investments. Only the period end receivable or payable for daily variation margin and net unrealized appreciation (depreciation) are presented in the Statement of Assets and Liabilities.
See accompanying notes which are an integral part of the financial statements.
Financial Statements
Statement of Assets and Liabilities
| | | December 31, 2015 |
| Assets | | |
Investment in securities, at value — See accompanying schedule:
Unaffiliated issuers (cost $14,081,457) | $13,037,955 | |
| Affiliated issuers (cost $196,844,583) | 191,209,789 | |
| Total Investments (cost $210,926,040) | | $204,247,744 |
| Cash | | 7,040,677 |
| Receivable for investments sold | | 408,206 |
| Receivable for fund shares sold | | 232,844 |
| Dividends receivable | | 15,971 |
| Other receivables | | 4,496 |
| Total assets | | 211,949,938 |
| Liabilities | | |
| Payable for fund shares redeemed | $570,832 | |
| Accrued management fee | 43,678 | |
| Distribution and service plan fees payable | 25,934 | |
| Payable for daily variation margin for derivative instruments | 57,210 | |
| Other affiliated payables | 1,765 | |
| Total liabilities | | 699,419 |
| Net Assets | | $211,250,519 |
| Net Assets consist of: | | |
| Paid in capital | | $217,914,838 |
| Undistributed net investment income | | 14 |
| Accumulated undistributed net realized gain (loss) on investments | | (69,322) |
| Net unrealized appreciation (depreciation) on investments | | (6,595,011) |
| Net Assets | | $211,250,519 |
| Service Class: | | |
| Net Asset Value, offering price and redemption price per share ($2,142,685 ÷ 197,089 shares) | | $10.87 |
| Service Class 2: | | |
| Net Asset Value, offering price and redemption price per share ($209,107,834 ÷ 19,272,131 shares) | | $10.85 |
See accompanying notes which are an integral part of the financial statements.
Statement of Operations
| | | Year ended December 31, 2015 |
| Investment Income | | |
| Dividends from underlying Funds: | | |
| Unaffiliated issuers | | $544,291 |
| Affiliated issuers | | 2,324,400 |
| Interest | | 7,591 |
| Total income | | 2,876,282 |
| Expenses | | |
| Management fee | $524,120 | |
| Transfer agent fees | 29,713 | |
| Distribution and service plan fees | 434,040 | |
| Independent trustees' compensation | 682 | |
| Miscellaneous | 29 | |
| Total expenses before reductions | 988,584 | |
| Expense reductions | (281,982) | 706,602 |
| Net investment income (loss) | | 2,169,680 |
| Realized and Unrealized Gain (Loss) | | |
| Net realized gain (loss) on: | | |
| Investment securities: | | |
| Unaffiliated issuers | (1,003,487) | |
| Affiliated issuers | (1,700,536) | |
| Futures contracts | (155,817) | |
| Realized gain distributions from underlying funds: | | |
| Unaffiliated issuers | 126,820 | |
| Affiliated issuers | 3,657,718 | |
| Total net realized gain (loss) | | 924,698 |
Change in net unrealized appreciation (depreciation) on:
Investment securities | (7,660,456) | |
| Futures contracts | 45,408 | |
| Total change in net unrealized appreciation (depreciation) | | (7,615,048) |
| Net gain (loss) | | (6,690,350) |
| Net increase (decrease) in net assets resulting from operations | | $(4,520,670) |
See accompanying notes which are an integral part of the financial statements.
Statement of Changes in Net Assets
| | Year ended December 31, 2015 | Year ended December 31, 2014 |
| Increase (Decrease) in Net Assets | | |
| Operations | | |
| Net investment income (loss) | $2,169,680 | $1,306,302 |
| Net realized gain (loss) | 924,698 | 4,897,561 |
| Change in net unrealized appreciation (depreciation) | (7,615,048) | (766,805) |
| Net increase (decrease) in net assets resulting from operations | (4,520,670) | 5,437,058 |
| Distributions to shareholders from net investment income | (2,188,957) | (1,303,333) |
| Distributions to shareholders from net realized gain | (2,870,478) | (3,702,981) |
| Total distributions | (5,059,435) | (5,006,314) |
| Share transactions - net increase (decrease) | 86,531,305 | 70,615,698 |
| Total increase (decrease) in net assets | 76,951,200 | 71,046,442 |
| Net Assets | | |
| Beginning of period | 134,299,319 | 63,252,877 |
| End of period (including undistributed net investment income of $14 and $0, respectively) | $211,250,519 | $134,299,319 |
See accompanying notes which are an integral part of the financial statements.
Financial Highlights — VIP Target Volatility Portfolio Service Class
| | | | |
| Years ended December 31, | 2015 | 2014 | 2013 A |
| Selected Per–Share Data | | | |
| Net asset value, beginning of period | $11.34 | $11.19 | $10.00 |
| Income from Investment Operations | | | |
| Net investment income (loss)B | .16 | .17 | .19 |
| Net realized and unrealized gain (loss) | (.29) | .49 | 1.26 |
| Total from investment operations | (.13) | .66 | 1.45 |
| Distributions from net investment income | (.13) | (.13) | (.07) |
| Distributions from net realized gain | (.21) | (.38) | (.18) |
| Total distributions | (.34) | (.51) | (.26)C |
| Net asset value, end of period | $10.87 | $11.34 | $11.19 |
| Total ReturnD,E,F | (1.22)% | 5.94% | 14.46% |
| Ratios to Average Net AssetsG | | | |
| Expenses before reductions | .42% | .41% | .42%H |
| Expenses net of fee waivers, if any | .27% | .26% | .26%H |
| Expenses net of all reductions | .26% | .26% | .26%H |
| Net investment income (loss) | 1.39% | 1.49% | 1.98%H |
| Supplemental Data | | | |
| Net assets, end of period (000 omitted) | $2,143 | $2,880 | $2,802 |
| Portfolio turnover rateI | 119% | 80% | 91%H |
A For the period February 13, 2013 (commencement of operations) to December 31, 2013.
B Calculated based on average shares outstanding during the period.
C Total distributions of $.26 per share is comprised of distributions from net investment income of $.072 and distributions from net realized gain of $.183 per share.
D Total returns for periods of less than one year are not annualized.
E Total returns do not reflect charges attributable to your insurance company's separate account. Inclusion of these charges would reduce the total returns shown.
F Total returns would have been lower if certain expenses had not been reduced during the applicable periods shown.
G Expense ratios reflect operating expenses of the class. Expenses before reductions do not reflect amounts reimbursed by the investment adviser or reductions from brokerage service arrangements or reductions from other expense offset arrangements and do not represent the amount paid by the class during periods when reimbursements or reductions occur. Expense ratios before reductions for start-up periods may not be representative of longer-term operating periods. Expenses net of fee waivers reflect expenses after reimbursement by the investment adviser but prior to reductions from brokerage service arrangements or other expense offset arrangements. Expenses net of all reductions represent the net expenses paid by the class.
H Annualized
I Amount does not include the portfolio activity of any Underlying Funds.
See accompanying notes which are an integral part of the financial statements.
Financial Highlights — VIP Target Volatility Portfolio Service Class 2
| Years ended December 31, | 2015 | 2014 | 2013 A |
| Selected Per–Share Data | | | |
| Net asset value, beginning of period | $11.32 | $11.18 | $10.00 |
| Income from Investment Operations | | | |
| Net investment income (loss)B | .14 | .15 | .17 |
| Net realized and unrealized gain (loss) | (.28) | .49 | 1.26 |
| Total from investment operations | (.14) | .64 | 1.43 |
| Distributions from net investment income | (.11) | (.12) | (.07) |
| Distributions from net realized gain | (.21) | (.38) | (.18) |
| Total distributions | (.33)C | (.50) | (.25) |
| Net asset value, end of period | $10.85 | $11.32 | $11.18 |
| Total ReturnD,E,F | (1.34)% | 5.74% | 14.32% |
| Ratios to Average Net AssetsG | | | |
| Expenses before reductions | .57% | .56% | .56%H |
| Expenses net of fee waivers, if any | .42% | .41% | .41%H |
| Expenses net of all reductions | .41% | .41% | .40%H |
| Net investment income (loss) | 1.24% | 1.34% | 1.83%H |
| Supplemental Data | | | |
| Net assets, end of period (000 omitted) | $209,108 | $131,419 | $60,451 |
| Portfolio turnover rateI | 119% | 80% | 91%H |
A For the period February 13, 2013 (commencement of operations) to December 31, 2013.
B Calculated based on average shares outstanding during the period.
C Total distributions of $.33 per share is comprised of distributions from net investment income of $.114 and distributions from net realized gain of $.212 per share.
D Total returns for periods of less than one year are not annualized.
E Total returns do not reflect charges attributable to your insurance company's separate account. Inclusion of these charges would reduce the total returns shown.
F Total returns would have been lower if certain expenses had not been reduced during the applicable periods shown.
G Expense ratios reflect operating expenses of the class. Expenses before reductions do not reflect amounts reimbursed by the investment adviser or reductions from brokerage service arrangements or reductions from other expense offset arrangements and do not represent the amount paid by the class during periods when reimbursements or reductions occur. Expenses net of fee waivers reflect expenses after reimbursement by the investment adviser but prior to reductions from brokerage service arrangements or other expense offset arrangements. Expenses net of all reductions represent the net expenses paid by the class.
H Annualized
I Amount does not include the portfolio activity of any Underlying Funds.
See accompanying notes which are an integral part of the financial statements.
Notes to Financial Statements
For the period ended December 31, 2015
1. Organization.
VIP Target Volatility Portfolio (the Fund) is a fund of Variable Insurance Products Fund V (the Trust) and is authorized to issue an unlimited number of shares. The Trust is registered under the Investment Company Act of 1940, as amended (the 1940 Act), as an open-end management investment company organized as a Massachusetts business trust. Shares of the Fund may only be purchased by insurance companies for the purpose of funding variable annuity or variable life insurance contracts. The Fund offers the following classes of shares: Service Class shares and Service Class 2 shares. All classes have equal rights and voting privileges, except for matters affecting a single class.
2. Significant Accounting Policies.
The financial statements have been prepared in conformity with accounting principles generally accepted in the United States of America (GAAP), which require management to make certain estimates and assumptions at the date of the financial statements. Actual results could differ from those estimates. Subsequent events, if any, through the date that the financial statements were issued have been evaluated in the preparation of the financial statements. The Fund's Schedule of Investments lists each of the Underlying Funds as an investment of the Fund but does not include the underlying holdings of each Underlying Fund. The following summarizes the significant accounting policies of the Fund:
Investment Valuation. Investments are valued as of 4:00 p.m. Eastern time on the last calendar day of the period. The Fund uses a third party pricing vendor approved by the Board of Trustees (the Board) to value its investments. The Board of Trustees (the Board) has delegated the day to day responsibility for the valuation of the Fund's investments to the Fidelity Management & Research Company (FMR) Fair Value Committee (the Committee). In accordance with valuation policies and procedures approved by the Board, the Fund attempts to obtain prices from one or more third party pricing vendors or brokers to value its investments. When current market prices, quotations or currency exchange rates are not readily available or reliable, investments will be fair valued in good faith by the Committee, in accordance with procedures adopted by the Board. Factors used in determining fair value vary by investment type and may include market or investment specific events, changes in interest rates and credit quality. The frequency with which these procedures are used cannot be predicted and they may be utilized to a significant extent. The Committee oversees the Fund's valuation policies and procedures and reports to the Board on the Committee's activities and fair value determinations. The Board monitors the appropriateness of the procedures used in valuing the Fund's investments and ratifies the fair value determinations of the Committee. The Fund categorizes the inputs to valuation techniques used to value its investments into a disclosure hierarchy consisting of three levels as shown below:
- Level 1 – quoted prices in active markets for identical investments
- Level 2 – other significant observable inputs (including quoted prices for similar investments, interest rates, prepayment speeds, etc.)
- Level 3 – unobservable inputs (including the Fund's own assumptions based on the best information available)
Valuation techniques used to value the Fund's investments by major category are as follows. Investments in open-end mutual funds are valued at their closing net asset value (NAV) each business day and are categorized as Level 1 in the hierarchy. If an unaffiliated open-end mutual fund's NAV is unavailable, shares of that fund may be valued by another method that the Board believes reflects fair value in accordance with the Board's fair value pricing policies and is categorized as Level 2 in the hierarchy. Debt securities, including restricted securities, are valued based on evaluated prices received from third party pricing vendors or brokers who make markets in such securities. For U.S. government and government agency obligations, pricing vendors utilize matrix pricing which considers yield of price of bonds of comparable quality, coupon, maturity and type as well as broker-supplied prices. When independent prices are unavailable or unreliable, debt securities may be valued utilizing pricing methodologies which consider similar factors that would be used by third party pricing vendors. Debt securities are generally categorized as Level 2 in the hierarchy but may be Level 3 depending on the circumstances. Exchange-Traded Funds (ETFs) are valued at their last sale price or official closing price as reported by a third party pricing vendor on the primary market or exchange on which they are traded and are categorized as Level 1 in the hierarchy. In the event there were no sales during the day but the exchange reports a closing bid level, ETFs are valued at the closing bid and would be categorized as Level 1 in the hierarchy. In the event there was no closing bid, ETFs may be valued by another method that the Board believes reflects fair value in accordance with the Board's fair value pricing policies and may be categorized as Level 2 in the hierarchy.
Futures contracts are valued at the settlement price established each day by the board of trade or exchange on which they are traded and are categorized as Level 1 in the hierarchy.
Changes in valuation techniques may result in transfers in or out of an assigned level within the disclosure hierarchy. The aggregate value of investments by input level, as of December 31, 2015, is included at the end of the Fund's Schedule of Investments.
Investment Transactions and Income. For financial reporting purposes, the Fund's investment holdings and NAV include trades executed through the end of the last business day of the period. The NAV per share for processing shareholder transactions is calculated as of the close of business of the New York Stock Exchange (NYSE), normally 4:00 p.m. Eastern time and includes trades executed through the end of the prior business day. Gains and losses on securities sold are determined on the basis of identified cost. Income and capital gain distributions from the Underlying Funds, if any, are recorded on the ex-dividend date. Interest income is accrued as earned. Interest income includes coupon interest and amortization of premium and accretion of discount on debt securities as applicable.
Class Allocations and Expenses. Investment income, realized and unrealized capital gains and losses, common expenses of the Fund, and certain fund-level expense reductions, if any, are allocated daily on a pro-rata basis to each class based on the relative net assets of each class to the total net assets of the Fund. Each class differs with respect to transfer agent and distribution and service plan fees incurred. Certain expense reductions may also differ by class. For the reporting period, the allocated portion of income and expenses to each class as a percent of its average net assets may vary due to the timing of recording these transactions in relation to fluctuating net assets of the classes. Expenses directly attributable to a fund are charged to that fund. Expenses attributable to more than one fund are allocated among the respective funds on the basis of relative net assets or other appropriate methods. Expenses included in the accompanying financial statements reflect the expenses of the Fund and do not include any expenses associated with the Underlying Funds. Although not included in the Fund's expenses, the Fund indirectly bears its proportionate share of the Underlying Funds' expenses through the impact of these expenses on each Underlying Fund's NAV. Expense estimates are accrued in the period to which they relate and adjustments are made when actual amounts are known.
Income Tax Information and Distributions to Shareholders. Each year, the Fund intends to qualify as a regulated investment company under Subchapter M of the Internal Revenue Code, including distributing substantially all of its taxable income and realized gains. As a result, no provision for U.S. Federal income taxes is required. As of December 31, 2015, the Fund did not have any unrecognized tax benefits in the financial statements; nor is the Fund aware of any tax positions for which it is reasonably possible that the total amounts of unrecognized tax benefits will significantly change in the next twelve months. The Fund files a U.S. federal tax return, in addition to state and local tax returns as required. The Fund's federal income tax returns are subject to examination by the Internal Revenue Service (IRS) for a period of three fiscal years after they are filed. State and local tax returns may be subject to examination for an additional fiscal year depending on the jurisdiction.
Distributions are declared and recorded on the ex-dividend date. Income dividends and capital gain distributions are declared separately for each class. Income and capital gain distributions are determined in accordance with income tax regulations, which may differ from GAAP.
Capital accounts within the financial statements are adjusted for permanent book-tax differences. These adjustments have no impact on net assets or the results of operations. Capital accounts are not adjusted for temporary book-tax differences which will reverse in a subsequent period.
Book-tax differences are primarily due to short-term gain distributions from the Underlying Funds, futures contracts, market discount and losses deferred due to wash sales.
The federal tax cost of investment securities and unrealized appreciation (depreciation) as of period end were as follows:
| Gross unrealized appreciation | $1,522,011 |
| Gross unrealized depreciation | (8,905,064) |
| Net unrealized appreciation (depreciation) on securities | $(7,383,053) |
| Tax Cost | $211,630,797 |
The tax-based components of distributable earnings as of period end were as follows:
| Undistributed long-term capital gain | $718,734 |
| Net unrealized appreciation (depreciation) on securities and other investments | $(7,383,053) |
The tax character of distributions paid was as follows:
| | December 31, 2015 | December 31, 2014 |
| Ordinary Income | $2,994,471 | $ 3,149,163 |
| Long-term Capital Gains | 2,064,964 | 1,857,151 |
| Total | $5,059,435 | $ 5,006,314 |
3. Derivative Instruments.
Risk Exposures and the Use of Derivative Instruments. The Fund's investment objective allows the Fund to enter into various types of derivative contracts, including futures contracts. Derivatives are investments whose value is primarily derived from underlying assets, indices or reference rates and may be transacted on an exchange or over-the-counter (OTC). Derivatives may involve a future commitment to buy or sell a specified asset based on specified terms, to exchange future cash flows at periodic intervals based on a notional principal amount, or for one party to make one or more payments upon the occurrence of specified events in exchange for periodic payments from the other party.
The Fund used derivatives to increase returns and to manage exposure to certain risks as defined below. The success of any strategy involving derivatives depends on analysis of numerous economic factors, and if the strategies for investment do not work as intended, the Fund may not achieve its objectives.
The Fund's use of derivatives increased or decreased its exposure to the following risk:
| Equity Risk | Equity risk relates to the fluctuations in the value of financial instruments as a result of changes in market prices (other than those arising from interest rate risk or foreign exchange risk), whether caused by factors specific to an individual investment, its issuer, or all factors affecting all instruments traded in a market or market segment.
|
The Fund is also exposed to additional risks from investing in derivatives, such as liquidity risk and counterparty credit risk. Liquidity risk is the risk that the Fund will be unable to close out the derivative in the open market in a timely manner. Counterparty credit risk is the risk that the counterparty will not be able to fulfill its obligation to the Fund. Counterparty credit risk related to exchange-traded futures contracts may be mitigated by the protection provided by the exchange on which they trade.
Investing in derivatives may involve greater risks than investing in the underlying assets directly and, to varying degrees, may involve risk of loss in excess of any initial investment and collateral received and amounts recognized in the Statement of Assets and Liabilities. In addition, there may be the risk that the change in value of the derivative contract does not correspond to the change in value of the underlying instrument.
Futures Contracts. A futures contract is an agreement between two parties to buy or sell a specified underlying instrument for a fixed price at a specified future date. The Fund used futures contracts to manage its exposure to the stock market.
Upon entering into a futures contract, a fund is required to deposit either cash or securities (initial margin) with a clearing broker in an amount equal to a certain percentage of the face value of the contract. Futures contracts are marked-to-market daily and subsequent daily payments (variation margin) are made or received by a fund depending on the daily fluctuations in the value of the futures contracts and are recorded as unrealized appreciation or (depreciation). This receivable and/or payable, if any, is included in daily variation margin for derivative instruments in the Statement of Assets and Liabilities. Realized gain or (loss) is recorded upon the expiration or closing of a futures contract.
Any open futures contracts at period end are presented in the Schedule of Investments under the caption "Futures Contracts". The underlying face amount at value reflects each contract's exposure to the underlying instrument or index at period end and is representative of volume of activity during the period. Securities deposited to meet initial margin requirements are identified in the Schedule of Investments.
During the period the Fund recognized net realized gain (loss) of $(155,817) and a change in net unrealized appreciation (depreciation) of $45,408 related to its investment in futures contracts. These amounts are included in the Statement of Operations.
4. Purchases and Redemptions of Underlying Fund Shares.
Purchases and redemptions of the Underlying Fund shares, other than short-term securities and U.S. government obligations, aggregated $281,258,344 and $198,393,933, respectively.
5. Fees and Other Transactions with Affiliates.
Management Fee. Effective October 1, 2015, FMR Co., Inc., an affiliate of Strategic Advisers, Inc. (SAI), replaced SAI as investment adviser to the Fund pursuant to a management contract between the Fund and FMR Co., Inc. The new contract does not impact the Fund's investment process, strategies or management fees. For investment management related services the Fund pays a monthly management fee to the investment adviser. The management fee is computed at an annual rate of .30% of the Fund's average net assets.
During the period, the investment adviser waived a portion of its management fee as described in the Expense Reductions note.
Other Transactions. The investment adviser has entered into an administration agreement with FMR under which FMR provides management and administrative services (other than investment advisory services) necessary for the operation of the Fund. Pursuant to this agreement, FMR pays all expenses of the Fund, excluding distribution and service fees, transfer agent fees, compensation of the independent Trustees and certain other expenses such as interest expense. FMR also contracts with other Fidelity companies to perform the services necessary for the operation of the Fund.
Distribution and Service Plan Fees. In accordance with Rule 12b-1 of the 1940 Act, the Fund has adopted separate 12b-1 Plans for each Service Class of shares. Each Service Class pays Fidelity Distributors Corporation (FDC), an affiliate of the investment adviser, a service fee. For the period, the service fee is based on an annual rate of .10% of Service Class' average net assets and .25% of Service Class 2's average net assets.
For the period, total fees, all of which were re-allowed to insurance companies for the distribution of shares and providing shareholder support services, were as follows:
| Service Class | $2,478 |
| Service Class 2 | 431,562 |
| | $434,040 |
Transfer Agent Fees. Fidelity Investments Institutional Operations Company, Inc. (FIIOC), an affiliate of the investment adviser, is the Fund's transfer, dividend disbursing, and shareholder servicing agent. FIIOC receives an asset-based fee with respect to each class. Each class pays a fee for transfer agent services, typesetting, printing and mailing of shareholder reports, excluding mailing of proxy statements and out of pocket expenses, equal to an annual rate of .15% of class-level average net assets invested in Underlying Funds that are not managed by the investment adviser or its affiliates. For the period, transfer agent fees for each class, including out of pocket expenses, were as follows:
| Service Class | $446 |
| Service Class 2 | 29,267 |
| | $29,713 |
Interfund Trades. The Fund may purchase from or sell securities to other Fidelity Funds under procedures adopted by the Board. The procedures have been designed to ensure these interfund trades are executed in accordance with Rule 17a-7 of the 1940 Act. Interfund trades are included within the respective purchases and sales amounts shown in the Purchases and Sales of Investments note.
6. Committed Line of Credit.
The Fund participates with other funds managed by the investment adviser or an affiliate in a $4.25 billion credit facility (the "line of credit") to be utilized for temporary or emergency purposes to fund shareholder redemptions or for other short-term liquidity purposes. The Fund has agreed to pay commitment fees on its pro-rata portion of the line of credit, which amounted to $29 and is reflected in Miscellaneous expenses on the Statement of Operations. During the period, the Fund did not borrow on this line of credit.
7. Expense Reductions.
The investment adviser contractually agreed to waive the Fund's management fee in an amount equal to .05% of the Funds' average net assets until April 30, 2017. During the period, the Fund's management fee was reduced by $87,551.
In addition, FMR has contractually agreed to reimburse .10% of class-level expenses for Service Class and Service Class 2. During the period, this reimbursement reduced the Fund's Service Class and Service Class 2's expenses by the following amounts:
| | Reimbursement
|
| Service Class | $2,478 |
| Service Class 2 | 173,345 |
Commissions paid to certain brokers with whom the investment adviser, or its affiliates, places trades on behalf of the Fund include an amount in addition to trade execution, which may be rebated back to the Fund to offset certain expenses. This amount totaled $18,336 for the period. In addition, through arrangements with the Fund's custodian, credits realized as a result of certain uninvested cash balances were used to reduce the Fund's expenses. During the period, these credits reduced the Fund's custody expenses by $77.
In addition, during the period the investment adviser reimbursed and/or waived a portion of class-level operating expenses as follows:
| | Amount |
| Service Class | $7 |
| Service Class 2 | 188 |
| | $195 |
8. Distributions to Shareholders.
Distributions to shareholders of each class were as follows:
| Years ended December 31, | 2015 | 2014 |
| From net investment income | | |
| Service Class | $25,024 | $32,409 |
| Service Class 2 | 2,163,933 | 1,270,924 |
| Total | $2,188,957 | $1,303,333 |
| From net realized gain | | |
| Service Class | $49,362 | $97,138 |
| Service Class 2 | 2,821,116 | 3,605,843 |
| Total | $2,870,478 | $3,702,981 |
9. Share Transactions.
Transactions for each class of shares were as follows:
| | Shares | Shares | Dollars | Dollars |
| Years ended December 31, | 2015 | 2014 | 2015 | 2014 |
| Service Class | | | | |
| Shares sold | 124 | 5,081 | $1,394 | $58,995 |
| Reinvestment of distributions | 6,624 | 11,424 | 74,386 | 129,547 |
| Shares redeemed | (63,653) | (12,812) | (729,058) | (145,291) |
| Net increase (decrease) | (56,905) | 3,693 | $(653,278) | $43,251 |
| Service Class 2 | | | | |
| Shares sold | 9,933,172 | 6,800,617 | $112,937,814 | $77,418,610 |
| Reinvestment of distributions | 447,494 | 429,364 | 4,985,049 | 4,876,767 |
| Shares redeemed | (2,716,121) | (1,027,568) | (30,738,280) | (11,722,930) |
| Net increase (decrease) | 7,664,545 | 6,202,413 | $87,184,583 | $70,572,447 |
10. Other.
The Fund's organizational documents provide former and current trustees and officers with a limited indemnification against liabilities arising in connection with the performance of their duties to the Fund. In the normal course of business, the Fund may also enter into contracts that provide general indemnifications. The Fund's maximum exposure under these arrangements is unknown as this would be dependent on future claims that may be made against the Fund. The risk of material loss from such claims is considered remote.
At the end of the period, one otherwise unaffiliated shareholder was the owner of record of 94% of the total outstanding shares of the Fund.
Report of Independent Registered Public Accounting Firm
To the Trustees of Variable Insurance Products Fund V and Shareholders of VIP Target Volatility Portfolio:
In our opinion, the accompanying statement of assets and liabilities, including the schedule of investments, and the related statements of operations and of changes in net assets and the financial highlights present fairly, in all material respects, the financial position of VIP Target Volatility Portfolio (a fund of Variable Insurance Products Fund V) at December 31, 2015, the results of its operations for the year then ended, the changes in its net assets for each of the two years in the period then ended and the financial highlights for each of the periods indicated, in conformity with accounting principles generally accepted in the United States of America. These financial statements and financial highlights (hereafter referred to as “financial statements”) are the responsibility of the VIP Target Volatility Portfolio’s management. Our responsibility is to express an opinion on these financial statements based on our audits. We conducted our audits of these financial statements in accordance with the standards of the Public Company Accounting Oversight Board (United States). Those standards require that we plan and perform the audit to obtain reasonable assurance about whether the financial statements are free of material misstatement. An audit includes examining, on a test basis, evidence supporting the amounts and disclosures in the financial statements, assessing the accounting principles used and significant estimates made by management, and evaluating the overall financial statement presentation. We believe that our audits, which included confirmation of securities at December 31, 2015 by correspondence with the custodian and brokers, provide a reasonable basis for our opinion.
PricewaterhouseCoopers LLP
Boston, Massachusetts
February 23, 2016
Trustees and Officers
The Trustees, Members of the Advisory Board (if any), and officers of the trust and fund, as applicable, are listed below. The Board of Trustees governs the fund and is responsible for protecting the interests of shareholders. The Trustees are experienced executives who meet periodically throughout the year to oversee the fund's activities, review contractual arrangements with companies that provide services to the fund, oversee management of the risks associated with such activities and contractual arrangements, and review the fund's performance. If the interests of the fund and an underlying Fidelity® fund were to diverge, a conflict of interest could arise and affect how the Trustees and Members of the Advisory Board fulfill their fiduciary duties to the affected funds. FMRC has structured the fund to avoid these potential conflicts, although there may be situations where a conflict of interest is unavoidable. In such instances, FMRC, the Trustees, and Members of the Advisory Board would take reasonable steps to minimize and, if possible, eliminate the conflict. Except for Elizabeth S. Acton, John Engler, and Geoffrey A. von Kuhn, each of the Trustees oversees 236 funds. Ms. Acton and Mr. Engler each oversees 228 funds. Mr. von Kuhn oversees 148 funds.
The Trustees hold office without limit in time except that (a) any Trustee may resign; (b) any Trustee may be removed by written instrument, signed by at least two-thirds of the number of Trustees prior to such removal; (c) any Trustee who requests to be retired or who has become incapacitated by illness or injury may be retired by written instrument signed by a majority of the other Trustees; and (d) any Trustee may be removed at any special meeting of shareholders by a two-thirds vote of the outstanding voting securities of the trust. Each Trustee who is not an interested person (as defined in the 1940 Act) of the trust and the fund is referred to herein as an Independent Trustee. Each Independent Trustee shall retire not later than the last day of the calendar year in which his or her 75th birthday occurs. The Independent Trustees may waive this mandatory retirement age policy with respect to individual Trustees. Officers and Advisory Board Members hold office without limit in time, except that any officer or Advisory Board Member may resign or may be removed by a vote of a majority of the Trustees at any regular meeting or any special meeting of the Trustees. Except as indicated, each individual has held the office shown or other offices in the same company for the past five years.
The fund’s Statement of Additional Information (SAI) includes more information about the Trustees. To request a free copy, call Fidelity at 1-877-208-0098.
Experience, Skills, Attributes, and Qualifications of the Trustees. The Governance and Nominating Committee has adopted a statement of policy that describes the experience, qualifications, attributes, and skills that are necessary and desirable for potential Independent Trustee candidates (Statement of Policy). The Board believes that each Trustee satisfied at the time he or she was initially elected or appointed a Trustee, and continues to satisfy, the standards contemplated by the Statement of Policy. The Governance and Nominating Committee also engages professional search firms to help identify potential Independent Trustee candidates who have the experience, qualifications, attributes, and skills consistent with the Statement of Policy. From time to time, additional criteria based on the composition and skills of the current Independent Trustees, as well as experience or skills that may be appropriate in light of future changes to board composition, business conditions, and regulatory or other developments, have also been considered by the professional search firms and the Governance and Nominating Committee. In addition, the Board takes into account the Trustees' commitment and participation in Board and committee meetings, as well as their leadership of standing and ad hoc committees throughout their tenure.
In determining that a particular Trustee was and continues to be qualified to serve as a Trustee, the Board has considered a variety of criteria, none of which, in isolation, was controlling. The Board believes that, collectively, the Trustees have balanced and diverse experience, qualifications, attributes, and skills, which allow the Board to operate effectively in governing the fund and protecting the interests of shareholders. Information about the specific experience, skills, attributes, and qualifications of each Trustee, which in each case led to the Board's conclusion that the Trustee should serve (or continue to serve) as a trustee of the fund, is provided below.
Board Structure and Oversight Function. Abigail P. Johnson is an interested person and currently serves as Chairman. The Trustees have determined that an interested Chairman is appropriate and benefits shareholders because an interested Chairman has a personal and professional stake in the quality and continuity of services provided to the fund. Independent Trustees exercise their informed business judgment to appoint an individual of their choosing to serve as Chairman, regardless of whether the Trustee happens to be independent or a member of management. The Independent Trustees have determined that they can act independently and effectively without having an Independent Trustee serve as Chairman and that a key structural component for assuring that they are in a position to do so is for the Independent Trustees to constitute a substantial majority for the Board. The Independent Trustees also regularly meet in executive session. Marie L. Knowles serves as Chairman of the Independent Trustees and as such (i) acts as a liaison between the Independent Trustees and management with respect to matters important to the Independent Trustees and (ii) with management prepares agendas for Board meetings.
Fidelity® funds are overseen by different Boards of Trustees. The fund's Board oversees Fidelity's investment-grade bond, money market, asset allocation and certain equity funds, and other Boards oversee Fidelity's high income, sector and other equity funds. The asset allocation funds may invest in Fidelity® funds that are overseen by such other Boards. The use of separate Boards, each with its own committee structure, allows the Trustees of each group of Fidelity® funds to focus on the unique issues of the funds they oversee, including common research, investment, and operational issues. On occasion, the separate Boards establish joint committees to address issues of overlapping consequences for the Fidelity® funds overseen by each Board.
The Trustees operate using a system of committees to facilitate the timely and efficient consideration of all matters of importance to the Trustees, the fund, and fund shareholders and to facilitate compliance with legal and regulatory requirements and oversight of the fund's activities and associated risks. The Board, acting through its committees, has charged FMR and its affiliates with (i) identifying events or circumstances the occurrence of which could have demonstrably adverse effects on the fund's business and/or reputation; (ii) implementing processes and controls to lessen the possibility that such events or circumstances occur or to mitigate the effects of such events or circumstances if they do occur; and (iii) creating and maintaining a system designed to evaluate continuously business and market conditions in order to facilitate the identification and implementation processes described in (i) and (ii) above. Because the day-to-day operations and activities of the fund are carried out by or through FMR, its affiliates, and other service providers, the fund's exposure to risks is mitigated but not eliminated by the processes overseen by the Trustees. While each of the Board's committees has responsibility for overseeing different aspects of the fund's activities, oversight is exercised primarily through the Operations and Audit Committees. In addition, an ad hoc Board committee of Independent Trustees has worked with FMR to enhance the Board's oversight of investment and financial risks, legal and regulatory risks, technology risks, and operational risks, including the development of additional risk reporting to the Board. Appropriate personnel, including but not limited to the fund's Chief Compliance Officer (CCO), FMR's internal auditor, the independent accountants, the fund's Treasurer and portfolio management personnel, make periodic reports to the Board's committees, as appropriate, including an annual review of Fidelity's risk management program for the Fidelity® funds. The responsibilities of each standing committee, including their oversight responsibilities, are described further under "Standing Committees of the Trustees."
Interested Trustees*:
Correspondence intended for a Trustee who is an interested person may be sent to Fidelity Investments, 245 Summer Street, Boston, Massachusetts 02210.
Name, Year of Birth; Principal Occupations and Other Relevant Experience+
Abigail P. Johnson (1961)
Year of Election or Appointment: 2009
Trustee
Chairman of the Board of Trustees
Ms. Johnson also serves as Trustee of other Fidelity® funds. Ms. Johnson serves as President (2013-present) and Chief Executive Officer (2014-present) of FMR LLC (diversified financial services company), President of Fidelity Financial Services (2012-present) and President of Personal, Workplace and Institutional Services (2005-present). Ms. Johnson is Chairman and Director of FMR Co., Inc. (investment adviser firm, 2011-present), Chairman and Director of FMR (investment adviser firm, 2011-present), and the Vice Chairman and Director (2007-present) of FMR LLC. Previously, Ms. Johnson served as President and a Director of FMR (2001-2005), a Trustee of other investment companies advised by FMR, Fidelity Investments Money Management, Inc. (investment adviser firm), and FMR Co., Inc. (2001-2005), Senior Vice President of the Fidelity® funds (2001-2005), and managed a number of Fidelity® funds. Ms. Abigail P. Johnson and Mr. Arthur E. Johnson are not related.
Geoffrey A. von Kuhn (1951)
Year of Election or Appointment: 2015
Trustee
Mr. von Kuhn also serves as Trustee or Member of the Advisory Board of other Fidelity funds. Mr. von Kuhn is Chief Administrative Officer for FMR LLC (diversified financial services company, 2013-present), a Director of Pembroke Real Estate, Inc. (2009-present), and a Director of Discovery Natural Resources LLC (2012-present). Previously, Mr. von Kuhn was a managing director of Crosby Group (private wealth management company, 2007-2013), a member of the management committee and senior executive in the Wealth Management Group of AmSouth Bank (2001-2006), and head of the U.S. private bank at Citigroup (2000-2001).
* Determined to be an “Interested Trustee” by virtue of, among other things, his or her affiliation with the trust or various entities under common control with FMR.
+ The information includes the Trustee's principal occupation during the last five years and other information relating to the experience, attributes, and skills relevant to the Trustee's qualifications to serve as a Trustee, which led to the conclusion that the Trustee should serve as a Trustee for the fund.
Independent Trustees:
Correspondence intended for an Independent Trustee may be sent to Fidelity Investments, P.O. Box 55235, Boston, Massachusetts 02205-5235.
Name, Year of Birth; Principal Occupations and Other Relevant Experience+
Elizabeth S. Acton (1951)
Year of Election or Appointment: 2013
Trustee
Ms. Acton also serves as Trustee or Member of the Advisory Board of other Fidelity® funds. Prior to her retirement in April 2012, Ms. Acton was Executive Vice President, Finance (2011-2012), Executive Vice President, Chief Financial Officer (2002-2011), and Treasurer (2004-2005) of Comerica Incorporated (financial services). Prior to joining Comerica, Ms. Acton held a variety of positions at Ford Motor Company (1983-2002), including Vice President and Treasurer (2000-2002) and Executive Vice President and Chief Financial Officer of Ford Motor Credit Company (1998-2000). Ms. Acton currently serves as a member of the Board of Directors and Audit and Finance Committees of Beazer Homes USA, Inc. (homebuilding, 2012-present).
John Engler (1948)
Year of Election or Appointment: 2014
Trustee
Mr. Engler also serves as Trustee or Member of the Advisory Board of other Fidelity® funds. He serves as president of the Business Roundtable (2011-present), and on the board of directors/trustees for Universal Forest Products (manufacturer and distributor of wood and wood-alternative products, 2003-present) and K12 Inc. (technology-based education company, 2012-present). Previously, Mr. Engler served as a trustee of The Munder Funds (2003-2014), president and CEO of the National Association of Manufacturers (2004-2011), member of the Board of Trustees of the Annie E. Casey Foundation (2004-2015), and as governor of Michigan (1991-2003). He is a past chairman of the National Governors Association.
Albert R. Gamper, Jr. (1942)
Year of Election or Appointment: 2007
Trustee
Mr. Gamper also serves as Trustee of other Fidelity® funds. Prior to his retirement in December 2004, Mr. Gamper served as Chairman of the Board of CIT Group Inc. (commercial finance). During his tenure with CIT Group Inc. Mr. Gamper served in numerous senior management positions, including Chairman (1987-1989; 1999-2001; 2002-2004), Chief Executive Officer (1987-2004), and President (2002-2003). Mr. Gamper currently serves as a member of the Board of Directors of Public Service Enterprise Group (utilities, 2000-present), and Member of the Board of Trustees of Barnabas Health Care System (1997-present). Previously, Mr. Gamper served as Chairman (2012-2015) and Vice Chairman (2011-2012) of the Independent Trustees of certain Fidelity® funds and as Chairman of the Board of Governors, Rutgers University (2004-2007).
Robert F. Gartland (1951)
Year of Election or Appointment: 2010
Trustee
Mr. Gartland also serves as Trustee of other Fidelity® funds. Mr. Gartland is Chairman and an investor in Gartland and Mellina Group Corp. (consulting, 2009-present). Previously, Mr. Gartland served as a partner and investor of Vietnam Partners LLC (investments and consulting, 2008-2011). Prior to his retirement, Mr. Gartland held a variety of positions at Morgan Stanley (financial services, 1979-2007) including Managing Director (1987-2007).
Arthur E. Johnson (1947)
Year of Election or Appointment: 2008
Trustee
Vice Chairman of the Independent Trustees
Mr. Johnson also serves as Trustee of other Fidelity® funds. Mr. Johnson serves as a member of the Board of Directors of Eaton Corporation plc (diversified power management, 2009-present), AGL Resources, Inc. (holding company, 2002-present) and Booz Allen Hamilton (management consulting, 2011-present). Prior to his retirement, Mr. Johnson served as Senior Vice President of Corporate Strategic Development of Lockheed Martin Corporation (defense contractor, 1999-2009). He previously served on the Board of Directors of IKON Office Solutions, Inc. (1999-2008) and Delta Airlines (2005-2007). Mr. Arthur E. Johnson is not related to Ms. Abigail P. Johnson.
Michael E. Kenneally (1954)
Year of Election or Appointment: 2009
Trustee
Mr. Kenneally also serves as Trustee of other Fidelity® funds. Prior to his retirement, Mr. Kenneally served as Chairman and Global Chief Executive Officer of Credit Suisse Asset Management. Before joining Credit Suisse, he was an Executive Vice President and Chief Investment Officer for Bank of America Corporation. Earlier roles at Bank of America included Director of Research, Senior Portfolio Manager and Research Analyst, and Mr. Kenneally was awarded the Chartered Financial Analyst (CFA) designation in 1991.
James H. Keyes (1940)
Year of Election or Appointment: 2007
Trustee
Mr. Keyes also serves as Trustee of other Fidelity® funds. Mr. Keyes serves as a member of the Board and Non-Executive Chairman of Navistar International Corporation (manufacture and sale of trucks, buses, and diesel engines, since 2002). Previously, Mr. Keyes served as a member of the Board of Pitney Bowes, Inc. (integrated mail, messaging, and document management solutions, 1998-2013). Prior to his retirement, Mr. Keyes served as Chairman (1993-2002) and Chief Executive Officer (1988-2002) of Johnson Controls (automotive, building, and energy) and as a member of the Board of LSI Logic Corporation (semiconductor technologies, 1984-2008).
Marie L. Knowles (1946)
Year of Election or Appointment: 2001
Trustee
Chairman of the Independent Trustees
Ms. Knowles also serves as Trustee of other Fidelity® funds. Prior to Ms. Knowles' retirement in June 2000, she served as Executive Vice President and Chief Financial Officer of Atlantic Richfield Company (ARCO) (diversified energy, 1996-2000). From 1993 to 1996, she was a Senior Vice President of ARCO and President of ARCO Transportation Company (pipeline and tanker operations). Ms. Knowles currently serves as a Director and Chairman of the Audit Committee of McKesson Corporation (healthcare service, since 2002). Ms. Knowles is a member of the Board of the Santa Catalina Island Company (real estate, 2009-present). Ms. Knowles is a Member of the Investment Company Institute Board of Governors and a Member of the Governing Council of the Independent Directors Council (2014-present). She also serves as a member of the Advisory Board for the School of Engineering of the University of Southern California. Previously, Ms. Knowles served as a Director of Phelps Dodge Corporation (copper mining and manufacturing, 1994-2007), URS Corporation (engineering and construction, 2000-2003) and America West (airline, 1999-2002). Ms. Knowles previously served as Vice Chairman of the Independent Trustees of certain Fidelity® funds (2012-2015).
+ The information includes the Trustee's principal occupation during the last five years and other information relating to the experience, attributes, and skills relevant to the Trustee's qualifications to serve as a Trustee, which led to the conclusion that the Trustee should serve as a Trustee for the fund.
Advisory Board Members and Officers:
Correspondence intended for an officer may be sent to Fidelity Investments, 245 Summer Street, Boston, Massachusetts 02210. Officers appear below in alphabetical order.
Name, Year of Birth; Principal Occupation
Marc R. Bryant (1966)
Year of Election or Appointment: 2015
Secretary and Chief Legal Officer (CLO)
Mr. Bryant also serves as Secretary and CLO of other funds. Mr. Bryant serves as CLO, Secretary, and Senior Vice President of Fidelity Management & Research Company (investment adviser firm, 2015-present) and FMR Co., Inc. (investment adviser firm, 2015-present); Secretary of Fidelity SelectCo, LLC (investment adviser firm, 2015-present) and Fidelity Investments Money Management, Inc. (investment adviser firm, 2015-present); and CLO of Fidelity Management & Research (Hong Kong) Limited (investment adviser firm, 2015-present). He is Senior Vice President and Deputy General Counsel of FMR LLC (diversified financial services company). Previously, Mr. Bryant served as Secretary and CLO of Fidelity Rutland Square Trust II (2010-2014) and Assistant Secretary of Fidelity's Fixed Income and Asset Allocation Funds (2013-2015). Prior to joining Fidelity Investments, Mr. Bryant served as a Senior Vice President and the Head of Global Retail Legal for AllianceBernstein L.P. (2006-2010), and as the General Counsel for ProFund Advisors LLC (2001-2006).
Jonathan Davis (1968)
Year of Election or Appointment: 2010
Assistant Treasurer
Mr. Davis also serves as Assistant Treasurer of other funds, and is an employee of Fidelity Investments. Previously, Mr. Davis served as Vice President and Associate General Counsel of FMR LLC (diversified financial services company, 2003-2010).
Adrien E. Deberghes (1967)
Year of Election or Appointment: 2010
Assistant Treasurer
Mr. Deberghes also serves as an officer of other funds. He is an employee of Fidelity Investments (2008-present). Prior to joining Fidelity Investments, Mr. Deberghes was Senior Vice President of Mutual Fund Administration at State Street Corporation (2007-2008), Senior Director of Mutual Fund Administration at Investors Bank & Trust (2005-2007), and Director of Finance for Dunkin' Brands (2000-2005).
Stephanie J. Dorsey (1969)
Year of Election or Appointment: 2013
President and Treasurer
Ms. Dorsey also serves as an officer of other funds. She is an employee of Fidelity Investments (2008-present) and has served in other fund officer roles. Prior to joining Fidelity Investments, Ms. Dorsey served as Treasurer (2004-2008) of the JPMorgan Mutual Funds and Vice President (2004-2008) of JPMorgan Chase Bank.
Howard J. Galligan III (1966)
Year of Election or Appointment: 2014
Chief Financial Officer
Mr. Galligan also serves as Chief Financial Officer of other funds. Mr. Galligan serves as President of Fidelity Pricing and Cash Management Services (FPCMS) (2014-present) and as a Director of Strategic Advisers, Inc. (investment adviser firm, 2008-present). Previously, Mr. Galligan served as Chief Administrative Officer of Asset Management (2011-2014) and Chief Operating Officer and Senior Vice President of Investment Support for Strategic Advisers, Inc. (2003-2011).
Scott C. Goebel (1968)
Year of Election or Appointment: 2015
Vice President
Mr. Goebel serves as Vice President of other funds and is an employee of Fidelity Investments (2001-present). Previously, Mr. Goebel served as Secretary of Fidelity SelectCo, LLC (investment adviser firm, 2013-2015), Fidelity Investments Money Management, Inc. (FIMM) (investment adviser firm, 2010-2015), and Fidelity Research and Analysis Company (FRAC) (investment adviser firm, 2010-2015); General Counsel, Secretary, and Senior Vice President of Fidelity Management & Research Company (investment adviser firm, 2008-2015) and FMR Co., Inc. (investment adviser firm, 2008-2015); Assistant Secretary of Fidelity Management & Research (Japan) Limited (investment adviser firm, 2008-2015) and FMR Investment Management (U.K.) Limited (investment adviser firm, 2008-2015); Chief Legal Officer (CLO) of Fidelity Management & Research (Hong Kong) Limited (investment adviser firm, 2008-2015); Secretary and CLO of certain Fidelity® funds (2008-2015); Assistant Secretary of FIMM (2008-2010), FRAC (2008-2010), and certain funds (2007-2008); and as Vice President and Secretary of Fidelity Distributors Corporation (FDC) (2005-2007).
Chris Maher (1972)
Year of Election or Appointment: 2013
Assistant Treasurer
Mr. Maher serves as Assistant Treasurer of other funds. Mr. Maher is Vice President of Valuation Oversight and is an employee of Fidelity Investments. Previously, Mr. Maher served as Vice President of Asset Management Compliance (2013), Vice President of the Program Management Group of FMR (investment adviser firm, 2010-2013), and Vice President of Valuation Oversight (2008-2010).
Jason P. Pogorelec (1975)
Year of Election or Appointment: 2015
Assistant Secretary
Mr. Pogorelec also serves as Assistant Secretary of other funds. Mr. Pogorelec serves as Vice President, Associate General Counsel (2010-present) and is an employee of Fidelity Investments (2006-present).
John F. Papandrea (1972)
Year of Election or Appointment: 2016
Anti-Money Laundering (AML) Officer
Mr. Papandrea also serves as AML Officer of other funds. Mr. Papandrea is Vice President of FMR LLC (diversified financial services company, 2008-present) and is an employee of Fidelity Investments (2005-present).
Nancy D. Prior (1967)
Year of Election or Appointment: 2014
Vice President
Ms. Prior also serves as Vice President of other funds. Ms. Prior serves as a Director of Fidelity Investments Money Management, Inc. (FIMM) (investment adviser firm, 2014-present), President, Fixed Income (2014-present), Vice Chairman of FIAM LLC (investment adviser firm, 2014-present), and is an employee of Fidelity Investments (2002-present). Previously, Ms. Prior served as Vice President of Fidelity's Money Market Funds (2012-2014), President, Money Market and Short Duration Bond Group of Fidelity Management & Research (FMR) (investment adviser firm, 2013-2014), President, Money Market Group of FMR (2011-2013), Managing Director of Research (2009-2011), Senior Vice President and Deputy General Counsel (2007-2009), and Assistant Secretary of other Fidelity® funds (2008-2009).
Kenneth B. Robins (1969)
Year of Election or Appointment: 2009
Assistant Treasurer
Mr. Robins also serves as an officer of other funds. Mr. Robins serves as Executive Vice President of Fidelity Investments Money Management, Inc. (FIMM) (investment adviser firm, 2013-present) and is an employee of Fidelity Investments (2004-present). Previously, Mr. Robins served in other fund officer roles.
Stacie M. Smith (1974)
Year of Election or Appointment: 2013
Assistant Treasurer
Ms. Smith also serves as an officer of other funds. She is an employee of Fidelity Investments (2009-present) and has served in other fund officer roles. Prior to joining Fidelity Investments, Ms. Smith served as Senior Audit Manager of Ernst & Young LLP (1996-2009).
Renee Stagnone (1975)
Year of Election or Appointment: 2013
Deputy Treasurer
Ms. Stagnone also serves as Deputy Treasurer of other funds. Ms. Stagnone is an employee of Fidelity Investments (1997-present).
Michael H. Whitaker (1967)
Year of Election or Appointment: 2008
Chief Compliance Officer
Mr. Whitaker also serves as Chief Compliance Officer of other funds. Mr. Whitaker also serves as Compliance Officer of FMR Co., Inc. (investment adviser firm, 2014-present), FMR (investment adviser firm, 2014-present), and Fidelity Investments Money Management, Inc. (investment adviser firm, 2014-present) and is an employee of Fidelity Investments (2007-present). Prior to joining Fidelity Investments, Mr. Whitaker worked at MFS Investment Management where he served as Senior Vice President and Chief Compliance Officer (2004-2006), and Assistant General Counsel.
Derek L. Young (1964)
Year of Election or Appointment: 2009
Vice President of Fidelity's Asset Allocation Funds
Mr. Young also serves as an officer of other funds. He is a Director of Strategic Advisers, Inc. (investment adviser firm, 2011-present), President of Fidelity Global Asset Allocation (GAA) (2011-present), and Vice Chairman of FIAM LLC (investment adviser firm, 2011-present). Previously, Mr. Young served as Trustee of certain funds (2012-2015), President of Strategic Advisers, Inc. (2011-2015), Chief Investment Officer of GAA (2009-2011), and as a portfolio manager.
Joseph F. Zambello (1957)
Year of Election or Appointment: 2011
Deputy Treasurer
Mr. Zambello also serves as Deputy Treasurer of other funds. Mr. Zambello is an employee of Fidelity Investments (1991-present). Previously, Mr. Zambello served as Vice President of the Program Management Group of FMR (investment adviser firm, 2009-2011) and Vice President of the Transfer Agent Oversight Group (2005-2009).
Shareholder Expense Example
As a shareholder of the Fund, you incur two types of costs: (1) transaction costs, and (2) ongoing costs, including management fees, distribution and/or service (12b-1) fees and other Fund expenses. This Example is intended to help you understand your ongoing costs (in dollars) of investing in the Fund and to compare these costs with the ongoing costs of investing in other mutual funds.
The Example is based on an investment of $1,000 invested at the beginning of the period and held for the entire period (July 1, 2015 to December 31, 2015).
Actual Expenses
The first line of the accompanying table for each class of the Fund provides information about actual account values and actual expenses. You may use the information in this line, together with the amount you invested, to estimate the expenses that you paid over the period. Simply divide your account value by $1,000.00 (for example, an $8,600 account value divided by $1,000.00 = 8.6), then multiply the result by the number in the first line for a class of the Fund under the heading entitled "Expenses Paid During Period" to estimate the expenses you paid on your account during this period. The estimate of expenses does not include any fees or other expenses of any variable annuity or variable life insurance product. If they were, the estimate of expenses you paid during the period would be higher, and your ending account value would be lower. In addition, the Fund, as a shareholder in underlying mutual funds and exchange-traded funds (ETFs)(the Underlying Funds), will indirectly bear its pro-rata share of the fees and expenses incurred by the underlying Fidelity Funds. These fees and expenses are not included in the Fund's annualized expense ratio used to calculate the expense estimate in the table below.
Hypothetical Example for Comparison Purposes
The second line of the accompanying table for each class of the Fund provides information about hypothetical account values and hypothetical expenses based on a Class' actual expense ratio and an assumed rate of return of 5% per year before expenses, which is not the Class' actual return. The hypothetical account values and expenses may not be used to estimate the actual ending account balance or expenses you paid for the period. You may use this information to compare the ongoing costs of investing in the Fund and other funds. To do so, compare this 5% hypothetical example with the 5% hypothetical examples that appear in the shareholder reports of the other funds. The estimate of expenses does not include any fees or other expenses of any variable annuity or variable life insurance product. If they were, the estimate of expenses you paid during the period would be higher, and your ending account value would be lower. In addition, the Fund, as a shareholder in underlying mutual funds and exchange-traded funds (ETFs)(the Underlying Funds), will indirectly bear its pro-rata share of the fees and expenses incurred by the underlying Fidelity Funds. These fees and expenses are not included in the Fund's annualized expense ratio used to calculate the expense estimate in the table below.
Please note that the expenses shown in the table are meant to highlight your ongoing costs only and do not reflect any transaction costs. Therefore, the second line of the table is useful in comparing ongoing costs only, and will not help you determine the relative total costs of owning different funds.
| | Annualized Expense Ratio-A | Beginning
Account Value
July 1, 2015 | Ending
Account Value
December 31, 2015 | Expenses Paid
During Period-B
July 1, 2015
to December 31, 2015 |
| Service Class | .26% | | | |
| Actual | | $1,000.00 | $957.30 | $1.28 |
| Hypothetical-C | | $1,000.00 | $1,023.89 | $1.33 |
| Service Class 2 | .41% | | | |
| Actual | | $1,000.00 | $956.90 | $2.02 |
| Hypothetical-C | | $1,000.00 | $1,023.14 | $2.09 |
A Annualized expense ratio reflects expenses net of applicable fee waivers.
B Expenses are equal to each Class' annualized expense ratio, multiplied by the average account value over the period, multiplied by 184/365 (to reflect the one-half year period).
C 5% return per year before expenses
Distributions (Unaudited)
The Board of Trustees of VIP Target Volatility Portfolio voted to pay to shareholders of record at the opening of business on record date, the following distributions per share derived from capital gains realized from sales of portfolio securities, and dividends derived from net investment income:
| | Pay Date | Record Date | Dividends | Capital Gains |
| Service Class | 02/12/2016 | 02/12/2016 | $0.000 | $0.038 |
| Service Class 2 | 02/12/2016 | 02/12/2016 | $0.000 | $0.038 |
The fund hereby designates as a capital gain dividend with respect to the taxable year ended December 31, 2015, $766,398, or, if subsequently determined to be different, the net capital gain of such year.
Service Class designates 23 % and Service Class 2 designates 25% of the dividends distributed in December 2015 respectively, during the fiscal year as qualifying for the dividends-received deduction for corporate shareholders.
The amounts per share which represent income derived from sources within, and taxes paid to, foreign countries or possessions of the United States are as follows:
| | Pay Date | Income | Taxes |
| Service Class | 12/29/2015 | $0.0360 | $0.0031 |
| Service Class 2 | 12/29/2015 | $0.0333 | $0.0031 |
Board Approval of Investment Advisory Contracts and Management Fees
VIP Target Volatility Portfolio
Each year, the Board of Trustees, including the Independent Trustees (together, the Board), votes on the management and administration arrangements for the fund. The Board, assisted by the advice of fund counsel and Independent Trustees' counsel, requests and considers a broad range of information relevant to the contract arrangements throughout the year.
The Board meets regularly and, at each of its meetings, covers an extensive agenda of topics and materials and considers factors that are relevant to its annual consideration of the fund's management and administration arrangements, including the services and support provided to the fund and its shareholders. The Board has established four standing committees (Committees) — Operations, Audit, Fair Valuation, and Governance and Nominating — each composed of and chaired by Independent Trustees with varying backgrounds, to which the Board has assigned specific subject matter responsibilities in order to enhance effective decision-making by the Board. The Operations Committee, of which all of the Independent Trustees are members, meets regularly throughout the year and considers, among other matters, information specifically related to the annual consideration of the fund's management and administration arrangements. The Board, acting directly and through its Committees, requests and receives information concerning the annual consideration of the fund's management and administration arrangements. The Board also meets as needed to consider matters specifically related to the Board's annual consideration of the management and administration arrangements. Members of the Board may also meet with trustees of other Fidelity funds through ad hoc joint committees to discuss certain matters relevant to all of the Fidelity funds.
At its September 2015 meeting, the Board unanimously determined to approve an amended and restated management contract (Advisory Contract) and administration agreement for the fund to reflect the fact that, effective October 1, 2015, FMR Co., Inc. (FMRC), an affiliate of Strategic Advisers, Inc. (Strategic Advisers) and Fidelity Management & Research Company (FMR), would assume the duties and rights of Strategic Advisers under the fund's then current management contract. The Board noted that, with the exception of the date, term, and entity name, the terms of the fund's management contract, including the fees payable thereunder, would not change as a result of the approval of the Advisory Contract. The Board considered that FMRC would render the same services to the fund under the Advisory Contract that Strategic Advisers rendered to the fund under the then current management contract. The Board also considered that approval of the Advisory Contract would not result in any changes to (i) the investment process or strategies employed in the management of the fund's assets; or (ii) the day-to-day management of the fund or the persons primarily responsible for such management. As a result, the Board considered that its prior experience with Strategic Advisers as investment adviser for the fund was relevant to its consideration of the Advisory Contract. In reaching its determination, the Board considered all factors it believed relevant, including (i) the nature, extent, and quality of the services to be provided to the fund and its shareholders (including the investment performance of the fund); (ii) the competitiveness of the fund's management fee and total expense ratio relative to peer funds; (iii) the total costs of the services to be provided by and the profits to be realized by Fidelity from its relationship with the fund; and (iv) the extent to which (if any) economies of scale exist and would be realized as the fund grows, and whether any economies of scale are appropriately shared with fund shareholders.
In considering whether to approve the Advisory Contract for the fund, the Board reached a determination, with the assistance of fund counsel and Independent Trustees' counsel and through the exercise of its business judgment, that the approval of the Advisory Contract was in the best interests of the fund and its shareholders and that the compensation payable under the Advisory Contract was fair and reasonable. The Board's decision to approve the Advisory Contract was not based on any single factor, but rather was based on a comprehensive consideration of all the information provided to the Board at its meetings throughout the year. The Board, in reaching its determination to approve the Advisory Contract, was aware that shareholders of the fund have a broad range of investment choices available to them, including a wide choice among funds offered by Fidelity's competitors, and that the fund's shareholders, who have the opportunity to review and weigh the disclosure provided by the fund in its prospectus and other public disclosures, have chosen to invest in this fund, which is part of the Fidelity family of funds.
Nature, Extent, and Quality of Services Provided. The Board considered Fidelity's staffing as it relates to the fund, including the backgrounds of investment personnel that provide services to the fund, and also considered the fund's investment objective, strategies, and related investment philosophy. The Independent Trustees also had discussions with senior management of Fidelity's investment operations and investment groups with responsibility for the underlying Fidelity funds in which the fund invests. The Board considered the structure of the portfolio manager compensation program and whether this structure provides appropriate incentives to act in the best interests of the fund. Additionally, the Board considered the portfolio managers' investments, if any, in the funds that they manage.
Resources Dedicated to Investment Management and Support Services. The Board reviewed the general qualifications and capabilities of Fidelity's investment staff, including its size, education, experience, and resources, as well as Fidelity's approach to recruiting, training, managing, and compensating investment personnel. The Board noted that Fidelity has continued to increase the resources devoted to non-U.S. offices, including expansion of Fidelity's global investment organization. The Board also noted that Fidelity's analysts have extensive resources, tools and capabilities that allow them to conduct sophisticated quantitative and fundamental analysis, as well as credit analysis of issuers, counterparties and guarantors. Further, the Board considered that Fidelity's investment professionals have sufficient access to global information and data so as to provide competitive investment results over time, and that those professionals also have access to sophisticated tools that permit them to assess portfolio construction and risk and performance attribution characteristics continuously, as well as to transmit new information and research conclusions rapidly around the world. Additionally, in its deliberations, the Board considered Fidelity's trading, risk management, compliance, and technology and operations capabilities and resources, which are integral parts of the investment management process.
Shareholder and Administrative Services. The Board considered (i) the nature, extent, quality, and cost of advisory, administrative, and shareholder services performed by Fidelity under the then current management contract (and to be performed under the Advisory Contract) and under separate agreements covering administration, transfer agency, pricing and bookkeeping, and securities lending services for the fund; (ii) the nature and extent of the supervision of third party service providers, principally custodians, subcustodians, and pricing vendors; and (iii) the resources devoted to, and the record of compliance with, the fund's compliance policies and procedures. The Board also reviewed the allocation of fund brokerage, including allocations to brokers affiliated with the investment adviser, the use of brokerage commissions to pay fund expenses, and the use of "soft" commission dollars to pay for research services.
The Board noted that the growth of fund assets over time across the complex allows Fidelity to reinvest in the development of services designed to enhance the value or convenience of the Fidelity funds as investment vehicles. These services include 24-hour access to account information and market information through telephone representatives and over the Internet, investor education materials and asset allocation tools, and the expanded availability of Fidelity Investor Centers.
Investment in a Large Fund Family. The Board considered the benefits to shareholders of investing in a Fidelity fund, including the benefits of investing in a fund that is part of a large family of funds offering a variety of investment disciplines and providing a large variety of mutual fund investor services. The Board noted that Fidelity had taken, or had made recommendations that resulted in the Fidelity funds taking, a number of actions over the previous year that benefited particular funds, including (i) continuing to dedicate additional resources to investment research and to the support of the senior management team that oversees asset management; (ii) continuing efforts to enhance Fidelity's global research capabilities; (iii) launching new funds and making other enhancements to meet client needs; (iv) reducing management fees and total expenses for certain index funds and diversified international funds; (v) continuing to launch dedicated lower cost underlying funds to meet portfolio construction needs related to expanding underlying fund options for Fidelity funds of funds, specifically for the Freedom Fund product lines; (vi) rationalizing product lines and gaining increased efficiencies through fund mergers; (vii) launching active fixed-income exchange-traded funds; (viii) continuing to develop, acquire and implement systems and technology to improve services to the funds and shareholders, strengthen information security, and increase efficiency; (ix) implementing investment enhancements to further strengthen Fidelity's target date product line to increase investors' probability of success in achieving their goals; (x) modifying the eligibility criteria for certain share classes to accommodate roll-over assets from employer-sponsored retirement plans; (xi) launching a new Class W of the Freedom Index Funds to attract and retain Fidelity record-kept retirement plan assets; and (xii) implementing changes to Fidelity's money market product line in response to recent money market regulatory reforms.
Investment Performance. The Board considered whether the fund has operated in accordance with its investment objective, as well as its record of compliance with its investment restrictions and its performance history, and noted that the approval of the Advisory Contract for the fund would not result in any changes to the fund's investment strategy or the personnel responsible for providing advisory services to the fund.
The Board took into account discussions with representatives of the investment adviser about fund investment performance that occur at Board meetings throughout the year. In this regard the Board noted that as part of regularly scheduled fund reviews and other reports to the Board on fund performance, the Board considers annualized return information for the fund for different time periods, measured against one or more securities market indices, including a customized blended index representative of the fund's asset classes (each a "benchmark index") and a peer group of funds with similar objectives ("peer group"), if any. In its evaluation of fund investment performance at meetings throughout the year, the Board gave particular attention to information indicating underperformance of certain Fidelity funds for specific time periods and discussed with the investment adviser the reasons for such underperformance.
In addition to reviewing absolute and relative fund performance, the Independent Trustees periodically consider the appropriateness of fund performance metrics in evaluating the results achieved. In general, the Independent Trustees believe that fund performance should be evaluated based on gross performance (before fees and expenses, including acquired fund fees and expenses, but after transaction costs, if any) compared to appropriate benchmark indices, over appropriate time periods that may include full market cycles, and on net performance (after fees and expenses) compared to peer groups, as applicable, over the same periods, taking into account relevant factors including the following: general market conditions; the extent to which particular underlying funds affected performance; and fund cash flows and other factors. Depending on the circumstances, the Independent Trustees may be satisfied with a fund's performance notwithstanding that it lags its benchmark index or peer group for certain periods.
The Independent Trustees recognize that shareholders evaluate performance on a net basis over their own holding periods, for which one-, three-, and five-year periods are often used as a proxy. For this reason, the performance information reviewed by the Board also included net cumulative calendar year total return information for the fund and an appropriate benchmark index for the most recent one-year period.
Based on its review, the Board concluded that the nature, extent, and quality of services provided to the fund under the Advisory Contract should benefit the shareholders of the fund.
Competitiveness of Management Fee and Total Expense Ratio. The Board considered the fund's management fee and total expense ratio compared to "mapped groups" of competitive funds and classes created for the purpose of facilitating the Trustees' competitive analysis of management fees and total expenses, and also considered that the fund bears indirectly the fees and expenses, including the management fees, paid by the underlying funds in which it invests. Fidelity creates "mapped groups" by combining similar Lipper investment objective categories that have comparable investment mandates. Combining Lipper investment objective categories aids the Board's management fee and total expense ratio comparisons by broadening the competitive group used for comparison.
Management Fee. The Board considered two proprietary management fee comparisons for the 12-month (or shorter) periods shown in basis points (BP) in the chart below. The group of Lipper funds used by the Board for management fee comparisons is referred to below as the "Total Mapped Group." The Total Mapped Group comparison focuses on a fund's standing in terms of gross management fees before expense reimbursements or caps relative to the total universe of funds with comparable investment mandates, regardless of whether their management fee structures also are comparable. Funds with comparable investment mandates offer exposure to similar types of securities. Funds with comparable management fee structures have similar management fee contractual arrangements (
e.g., flat rate charged for advisory services, all-inclusive fee rate,
etc.). "TMG %" represents the percentage of funds in the Total Mapped Group that had management fees that were lower than the fund's. For example, a hypothetical TMG % of 20% would mean that 80% of the funds in the Total Mapped Group had higher, and 20% had lower, management fees than the fund. The fund's actual TMG %s and the number of funds in the Total Mapped Group are in the chart below. The "Asset-Size Peer Group" (ASPG) comparison focuses on a fund's standing relative to a subset of non-Fidelity funds within the Total Mapped Group that are similar in size and management fee structure. For example, if a fund is in the first quartile of the ASPG, the fund's management fee ranks in the least expensive or lowest 25% of funds in the ASPG. The ASPG represents at least 15% of the funds in the Total Mapped Group with comparable asset size and management fee structures, subject to a minimum of 50 funds (or all funds in the Total Mapped Group if fewer than 50). Additional information, such as the ASPG quartile in which the fund's management fee rate ranked, is also included in the chart and considered by the Board. Because the vast majority of competitor funds' management fees do not cover non-management expenses, for a more meaningful comparison of management fees, the fund is compared on the basis of a hypothetical "net management fee," which is derived by subtracting payments made by the investment adviser for "fund-level" non-management expenses (including pricing and bookkeeping fees and fees paid to non-affiliated custodians) from the fund's management fee. In this regard, the Board considered that net management fees can vary from year to year because of differences in "fund-level" non-management expenses. The Board noted, however, that the investment adviser does not pay transfer agent fees or other "class-level" expenses (including 12b-1 fees, if applicable) under the fund's management contract.
VIP Target Volatility Portfolio
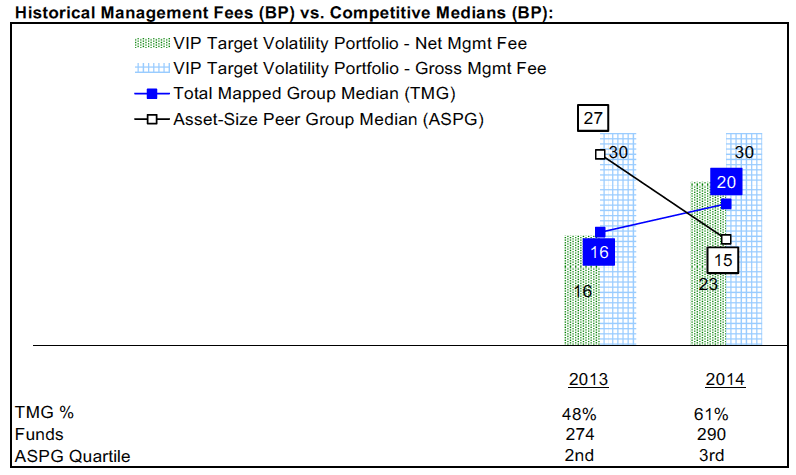
The Board noted that the fund's hypothetical net management fee rate ranked above the median of its Total Mapped Group and above the median of its ASPG for 2014. The Board considered that the fund is more actively managed than most funds in its TMG and ASPG, many of which are target date funds.
Furthermore, the Board considered that the investment adviser contractually agreed to waive 0.05% of the fund's management fee through April 30, 2016.
The Board noted that, in 2014, the ad hoc Committee on Group Fee was formed by it and other Fidelity fund boards to conduct an in-depth review of the "group fee" component of the management fee of funds with such management fee structures, and that while the fund does not pay a management fee with a group fee component, it indirectly bears a portion of the management fees paid by the Fidelity funds in which it invests, some of which are subject to the group fee. Committee focus included the mechanics of the group fee, the competitive landscape of group fee structures, Fidelity funds with no group fee component and investment products not included in group fee assets. The Board also considered that, for funds subject to the group fee, FMR agreed to voluntarily waive fees over a specified period of time in amounts designed to account for assets converted from certain funds to certain collective investment trusts.
Based on its review, the Board concluded that the fund's management fee is fair and reasonable in light of the services that the fund receives and the other factors considered.
Total Expense Ratio. In its review of each class's total expense ratio, the Board considered the fund's hypothetical net management fee rate as well as the fund's gross management fee. The Board also considered other "fund-level" expenses, such as pricing and bookkeeping fees and custodial, legal, and audit fees. The Board also considered other "class-level" expenses, such as transfer agent fees and fund-paid 12b-1 fees. The Board also noted that Fidelity may agree to waive fees and expenses from time to time, and the extent to which, if any, it has done so for the fund. As part of its review, the Board also considered the current and historical total expense ratios of each class of the fund compared to competitive fund median expenses. Each class of the fund is compared to those funds and classes in the Total Mapped Group (used by the Board for management fee comparisons) that have a similar sales load structure.
The Board considered the total expense ratio of the fund, after the effect of the contractual expense cap arrangements discussed below. The Board noted that the total expense ratio of Service Class ranked below its competitive median for 2014 and the total expense ratio of Service Class 2 ranked above its competitive median for 2014. The Board considered that, in general, various factors can affect total expense ratios. The Board noted that the total expense ratio of Service Class 2 was above the competitive median primarily because of higher 12b-1 fees for Service Class 2 as compared to most competitor funds. The Board noted that the fund offers multiple classes, each of which has a different 12b-1 fee structure, and that the multiple structures are intended to offer a range of pricing options for the intermediary market. The Board also noted that the total expense ratios of the classes vary primarily by the level of their 12b-1 fees, although differences in transfer agent fees may also cause expenses to vary from class to class.
In considering the fund's total expense ratio, the Board also considered an alternative competitive analysis that included both top level (
i.e., direct) fund fees and acquired fund fees and expenses for the fund and the other funds in the mapped group. The Board noted that, under this alternative competitive analysis, the total expense ratio of Service Class ranked below its competitive median for 2014 and the total expense ratio of Service Class 2 ranked above its competitive median for 2014.
The Board further considered that FMR contractually agreed to reimburse 0.10% of "class-level" expenses for Service Class and Service Class 2 as long as these classes continue to be sold to unaffiliated insurance companies.
Fees Charged to Other Fidelity Clients. The Board also considered Fidelity fee structures and other information with respect to clients of Fidelity, such as other funds advised or subadvised by Fidelity, pension plan clients, and other institutional clients with similar mandates. The Board noted the findings of the 2013 ad hoc joint committee (created with the board of other Fidelity funds), which reviewed and compared Fidelity's institutional investment advisory business with its business of providing services to the Fidelity funds, including the differences in services provided, fees charged, and costs incurred, as well as competition in their respective marketplaces.
Based on its review of total expense ratios and fees charged to other Fidelity clients, the Board concluded that, although Service Class 2 was above the median of the universe presented for comparison, the total expense ratio of each class of the fund was reasonable in light of the services that the fund and its shareholders receive and the other factors considered.
Costs of the Services and Profitability. The Board considered the revenues earned and the expenses incurred by Fidelity in conducting the business of developing, marketing, distributing, managing, administering and servicing the fund and servicing the fund's shareholders. The Board also considered the level of Fidelity's profits in respect of all the Fidelity funds, including the funds in which the fund invests.
On an annual basis, Fidelity presents to the Board information about the profitability of its relationship with the fund. Fidelity calculates profitability information for each fund, as well as aggregate profitability information for groups of Fidelity funds and all Fidelity funds, using a series of detailed revenue and cost allocation methodologies which originate with the books and records of Fidelity on which Fidelity's audited financial statements are based. The Audit Committee of the Board reviews any significant changes from the prior year's methodologies.
PricewaterhouseCoopers LLP (PwC), independent registered public accounting firm and auditor to Fidelity and certain Fidelity funds, has been engaged annually by the Board as part of the Board's assessment of Fidelity's profitability analysis. PwC's engagement includes the review and assessment of the methodologies used by Fidelity in determining the revenues and expenses attributable to Fidelity's mutual fund business, and completion of agreed-upon procedures in respect of the mathematical accuracy of fund profitability and its conformity to established allocation methodologies. After considering PwC's reports issued under the engagement and information provided by Fidelity, the Board concluded that while other allocation methods may also be reasonable, Fidelity's profitability methodologies are reasonable in all material respects.
The Board also reviewed Fidelity's non-fund businesses and fall-out benefits related to the mutual fund business as well as cases where Fidelity's affiliates may benefit from or be related to the fund's business.
The Board considered the costs of the services provided by and the profits realized by Fidelity in connection with the operation of the fund and was satisfied that the profitability was not excessive.
Economies of Scale. The Board considered whether there have been economies of scale in respect of the management of the Fidelity funds, whether the Fidelity funds (including the fund) have appropriately benefited from any such economies of scale, and whether there is potential for realization of any further economies of scale. The Board considered the extent to which the fund will benefit from economies of scale as assets grow through increased services to the fund, through waivers or reimbursements, or through fee or expense ratio reductions. The Board also noted that in 2013, it and the boards of other Fidelity funds created an ad hoc committee (the Economies of Scale Committee) to analyze whether Fidelity attains economies of scale in respect of the management and servicing of the Fidelity funds, whether the Fidelity funds have appropriately benefited from such economies of scale, and whether there is potential for realization of any further economies of scale.
The Board concluded, taking into account the analysis of the Economies of Scale Committee, that economies of scale, if any, are being appropriately shared between fund shareholders and Fidelity.
Additional Information Requested by the Board. In order to develop fully the factual basis for consideration of the Fidelity funds' Advisory Contracts, the Board requested and received additional information on certain topics, including: (i) Fidelity's fund profitability methodology, profitability trends for certain funds, and the impact of certain factors on fund profitability results; (ii) portfolio manager changes that have occurred during the past year and the amount of the investment that each portfolio manager has made in the Fidelity fund(s) that he or she manages; (iii) Fidelity's compensation structure for portfolio managers, research analysts, and other key personnel, including its effects on fund profitability, the rationale for the compensation structure, and the extent to which current market conditions have affected retention and recruitment; (iv) the arrangements with and compensation paid to certain fund sub-advisers on behalf of the Fidelity funds; (v) Fidelity's voluntary waiver of its fees to maintain minimum yields for certain money market funds and classes as well as contractual waivers in place for certain funds; (vi) the methodology with respect to competitive fund data and peer group classifications; (vii) Fidelity's transfer agent fee, expense, and service structures for different funds and classes relative to competitive trends, and the impact of the increased use of omnibus accounts; (viii) Fidelity's long-term expectations for its offerings in the workplace investing channel; (ix) new developments in the retail and institutional marketplaces; and (x) the impact of money market reform on Fidelity's money market funds. In addition, the Board considered its discussions with Fidelity throughout the year regarding enhanced information security initiatives and the funds' fair valuation policies.
Based on its evaluation of all of the conclusions noted above, and after considering all factors it believed relevant, the Board concluded that the advisory fee structures are fair and reasonable, and that the fund's Advisory Contract should be approved.
Proxy Voting Results
A special meeting of shareholders was held on May 12, 2015. The results of votes taken among shareholders on the proposal before them are reported below. Each vote reported represents one dollar of net asset value held on the record date for the meeting.
PROPOSAL 1
To elect a Board of Trustees.
| | # of
Votes | % of
Votes |
| Elizabeth S. Acton | | |
| Affirmative | 24,469,831,790.28 | 97.003 |
| Withheld | 756,086,184.43 | 2.997 |
| TOTAL | 25,225,917,974.71 | 100.000 |
| John Engler | | |
| Affirmative | 24,404,438,415.74 | 96.744 |
| Withheld | 821,479,558.97 | 3.256 |
| TOTAL | 25,225,917,974.71 | 100.000 |
| Albert R. Gamper, Jr. | | |
| Affirmative | 24,431,670,090.08 | 96.852 |
| Withheld | 794,247,884.63 | 3.148 |
| TOTAL | 25,225,917,974.71 | 100.000 |
| Robert F. Gartland | | |
| Affirmative | 24,472,637,370.54 | 97.014 |
| Withheld | 753,280,604.17 | 2.986 |
| TOTAL | 25,225,917,974.71 | 100.000 |
| Abigail P. Johnson | | |
| Affirmative | 24,442,024,432.82 | 96.893 |
| Withheld | 783,893,541.89 | 3.107 |
| TOTAL | 25,225,917,974.71 | 100.000 |
| Arthur E. Johnson | | |
| Affirmative | 24,444,583,833.78 | 96.903 |
| Withheld | 781,334,140.93 | 3.097 |
| TOTAL | 25,225,917,974.71 | 100.000 |
| Michael E. Kenneally | | |
| Affirmative | 24,475,874,452.78 | 97.027 |
| Withheld | 750,043,521.93 | 2.973 |
| TOTAL | 25,225,917,974.71 | 100.000 |
| James H. Keyes | | |
| Affirmative | 24,434,496,321.71 | 96.863 |
| Withheld | 791,421,653.00 | 3.137 |
| TOTAL | 25,225,917,974.71 | 100.000 |
| Marie L. Knowles | | |
| Affirmative | 24,446,177,909.79 | 96.909 |
| Withheld | 779,740,064.92 | 3.091 |
| TOTAL | 25,225,917,974.71 | 100.000 |
| Geoffrey A. von Kuhn | | |
| Affirmative | 24,444,403,935.60 | 96.902 |
| Withheld | 781,514,039.11 | 3.098 |
| TOTAL | 25,225,917,974.71 | 100.000 |
| Proposal 1 reflects trust wide proposal and voting results. |
VIPTV-ANN-0216
1.955015.102
Fidelity® Variable Insurance Products: Asset Manager: Growth Portfolio
Annual Report December 31, 2015 |
|
Contents
To view a fund's proxy voting guidelines and proxy voting record for the 12-month period ended June 30, visit http://www.fidelity.com/proxyvotingresults or visit the Securities and Exchange Commission's (SEC) web site at http://www.sec.gov.
You may also call 1-877-208-0098 to request a free copy of the proxy voting guidelines.
Fidelity® Variable Insurance Products are separate account options which are purchased through a variable insurance contract.
Standard & Poor's, S&P and S&P 500 are registered service marks of The McGraw-Hill Companies, Inc. and have been licensed for use by Fidelity Distributors Corporation.
Other third-party marks appearing herein are the property of their respective owners.
All other marks appearing herein are registered or unregistered trademarks or service marks of FMR LLC or an affiliated company. © 2016 FMR LLC. All rights reserved.
This report and the financial statements contained herein are submitted for the general information of the shareholders of the Fund. This report is not authorized for distribution to prospective investors in the Fund unless preceded or accompanied by an effective prospectus.
A fund files its complete schedule of portfolio holdings with the SEC for the first and third quarters of each fiscal year on Form N-Q. Forms N-Q are available on the SEC’s web site at http://www.sec.gov. A fund's Forms N-Q may be reviewed and copied at the SEC’s Public Reference Room in Washington, DC. Information regarding the operation of the SEC's Public Reference Room may be obtained by calling 1-800-SEC-0330.
For a complete list of a fund's portfolio holdings, view the most recent holdings listing, semiannual report, or annual report on Fidelity's web site at http://www.fidelity.com, http://www.advisor.fidelity.com, or http://www.401k.com, as applicable.
NOT FDIC INSURED •MAY LOSE VALUE •NO BANK GUARANTEE
Neither the Fund nor Fidelity Distributors Corporation is a bank.
Performance: The Bottom Line
Average annual total return reflects the change in the value of an investment, assuming reinvestment of distributions from dividend income and capital gains (the profits earned upon the sale of securities that have grown in value, if any) and assuming a constant rate of performance each year. During periods of reimbursement by Fidelity, a fund’s total return will be greater than it would be had the reimbursement not occurred. Performance numbers are net of all underlying fund operating expenses, but do not include any insurance charges imposed by your insurance company’s separate account. If performance information included the effect of these additional charges, the total returns would have been lower. How a fund did yesterday is no guarantee of how it will do tomorrow.
Average Annual Total Returns
| For the periods ended December 31, 2015 | Past 1 year | Past 5 years | Past 10 years |
| Initial Class | 0.03% | 7.03% | 5.90% |
| Service Class | (0.03)% | 6.93% | 5.80% |
| Service Class 2 | (0.18)% | 6.73% | 5.60% |
| Investor Class | 0.01% | 6.96% | 5.80% |
$10,000 Over 10 Years
Let's say hypothetically that $10,000 was invested in VIP Asset Manager: Growth Portfolio - Initial Class on December 31, 2005.
The chart shows how the value of your investment would have changed, and also shows how the S&P 500® Index performed over the same period.

| Period Ending Values |
| $17,742 | VIP Asset Manager: Growth Portfolio - Initial Class |
| $20,242 | S&P 500® Index |
Management's Discussion of Fund Performance
Market Recap: Largely buoyed by the U.S., developed-markets equities finished 2015 nearly flat overall, rebounding from a steep decline in August and September over worries about China’s slowing economic growth. The MSCI World Index returned -0.44% for the 12 months ending December 31, 2015. Modest gains in the first half of the year were quickly erased amid the late-summer rout, but stocks sharply reversed course in October, lifted by the U.S. Federal Reserve’s decision to put off raising near-term interest rates until mid-December. Investors also were encouraged by an interest-rate cut in China and economic stimulus in Europe. Excess supply of oil and natural gas weighed on commodities, the year’s worst-performing asset class. Lower energy costs and improving wages drove consumer spending, though, helping retailers. Also, low interest rates and pent-up demand boosted global auto sales: December results sent annual totals past the previous record, set in 2000.
The broad Dow Jones U.S. Total Stock Market Index℠ gained 0.44% for the year. Large-cap stocks outpaced small-caps by a comfortable margin, with the S&P 500
® and the Russell 2000
® Index returning 1.38% and -4.41%, respectively. Meanwhile, non-U.S. developed-markets returned -3.04%, as measured by the MSCI World ex USA Index, and the MSCI Emerging Markets Index returned -14.60%, beset by numerous challenges, U.S.-dollar strengthening throughout the period not the least of them. Globally, growth- led value-oriented stocks across market-cap segments. Outside the U.S., large-caps lagged small-caps substantially.
Looking within the bellwether S&P 500
®, the downtrodden energy (-21%), materials (-8%) and utilities (-5%) sectors weighed on the index. Health care (+7%) helped alleviate the pain, and investors’ preference for growth stocks braced technology (+6%), which also benefited from strong fundamentals and attractive relative valuations. This sector performance pattern was generally similar worldwide.
In fixed income, the Barclays
® Global Aggregate GDP Weighted Index returned -3.90%, affected in part by the Fed’s first interest-rate hike since 2006. The investment-grade Barclays
® U.S. Aggregate Bond Index returned 0.55%; The BofA Merrill Lynch℠ US High Yield Constrained Index, -4.61%. Energy- and commodity-related securities performed worst. U.S. Treasury Inflation-Protected Securities (TIPS) suffered amid stubbornly low inflation. Meanwhile, emerging-markets debt rebounded strongly in the fall, overcoming multiple threats including China’s economic slowdown and currency headwinds.
Comments from Portfolio Manager Geoff Stein: For the year, the fund's share classes slightly lagged the 0.14% return of the Fidelity Asset Manager 70% Composite Index℠. Relative to the benchmark, asset allocation marginally detracted, whereas security selection contributed, led by U.S. equity stock picks. Asset allocation was hampered by out-of-benchmark exposure to high-yield bonds, as this asset class performed poorly during the second half of the period. Our core equity allocation strategy – overweighting domestic stocks, modestly underweighting foreign developed-markets equities and slightly greater-than-benchmark exposure to emerging markets (EM) stocks – had a neutral impact on relative performance. Modestly positive results from our developed markets' positioning was negated by a double-digit decline in EM equities. The domestic equity subportfolio was the biggest contributor to the fund's relative return, benefiting from solid picks in technology, along with favorable overall positioning in health care and a sizable underweighting in energy. Here, some non-U.S. holdings contributed, despite headwinds from the stronger dollar. Stock selection in foreign developed-markets equities also was modestly additive. Within investment-grade fixed income, our central fund was hurt by exposure to underperforming energy and communications issuers. Additionally, energy holdings within the government agencies sector, as well as an allocation to TIPS further hampered its performance. Effective October 1, 2015, the benchmark for the foreign developed-markets equities component of the fund's Composite benchmark was changed from the MSCI EAFE Index to the MSCI ACWI (All Country World Index) ex USA Index.
The views expressed above reflect those of the portfolio manager(s) only through the end of the period as stated on the cover of this report and do not necessarily represent the views of Fidelity or any other person in the Fidelity organization. Any such views are subject to change at any time based upon market or other conditions and Fidelity disclaims any responsibility to update such views. These views may not be relied on as investment advice and, because investment decisions for a Fidelity fund are based on numerous factors, may not be relied on as an indication of trading intent on behalf of any Fidelity fund.
Investment Summary (Unaudited)
The information in the following tables is based on the combined investments of the Fund and its pro-rata share of the investments of Fidelity's Central Funds, other than the Commodity Strategy and Money Market Central Funds.
Top Ten Stocks as of December 31, 2015
| | % of fund's net assets | % of fund's net assets 6 months ago |
| Apple, Inc. | 1.9 | 2.4 |
| Alphabet, Inc. Class A | 1.7 | 0.0 |
| Celgene Corp. | 1.5 | 1.4 |
| Gilead Sciences, Inc. | 1.4 | 1.5 |
| Amazon.com, Inc. | 1.3 | 0.0 |
| Alexion Pharmaceuticals, Inc. | 1.2 | 0.9 |
| The Boeing Co. | 1.2 | 1.1 |
| American Airlines Group, Inc. | 1.2 | 1.2 |
| Facebook, Inc. Class A | 1.1 | 1.0 |
| Visa, Inc. Class A | 1.1 | 0.9 |
| | 13.6 | |
Market Sectors as of December 31, 2015
| (stocks only) | % of fund's net assets | % of fund's net assets 6 months ago |
| Health Care | 15.2 | 18.5 |
| Information Technology | 12.8 | 10.1 |
| Consumer Discretionary | 11.9 | 14.2 |
| Financials | 8.3 | 9.3 |
| Industrials | 7.4 | 7.5 |
| Consumer Staples | 3.2 | 4.1 |
| Energy | 1.9 | 2.1 |
| Materials | 1.3 | 2.1 |
| Telecommunication Services | 0.7 | 1.0 |
| Utilities | 0.7 | 0.9 |
Asset Allocation (% of fund's net assets)
| As of December 31, 2015* |
| | Stock Class and Equity Futures** | 68.8% |
| | Bond Class | 26.5% |
| | Short-Term Class | 4.7% |

* Foreign investments - 29.1%
** Includes investment in Fidelity® Commodity Strategy Central Fund of 0.4%
| As of June 30, 2015 * |
| | Stock Class and Equity Futures** | 70.9% |
| | Bond Class | 27.2% |
| | Short-Term Class | 1.9% |

* Foreign investments - 33.6%
** Includes investment in Fidelity® Commodity Strategy Central Fund of 0.2%
Asset allocations in the pie charts reflect the categorization of assets as defined in the Fund's prospectus in effect as of the time periods indicated above. Financial Statement categorizations conform to accounting standards and will differ from the pie chart. Percentages are adjusted for the effect of future contracts and swap contracts, if applicable.
An unaudited holdings listing for the Fund, which presents direct holdings as well as the pro-rata share of any securities and other investments held indirectly through its investment in underlying Fidelity Central Funds, other than the Commodity Strategy and Money Market Central Funds, is available at advisor.fidelity.com.
Percentages in the above tables are adjusted for the effect of TBA Sale Commitments.
Percentages shown as 0.0% may reflect amounts less than 0.05%.
Investments December 31, 2015
Showing Percentage of Net Assets
| Common Stocks - 46.8% | | | |
| | | Shares | Value |
| CONSUMER DISCRETIONARY - 9.9% | | | |
| Auto Components - 0.2% | | | |
| Delphi Automotive PLC | | 4,300 | $368,639 |
| Automobiles - 0.6% | | | |
| General Motors Co. | | 28,900 | 982,889 |
| Tesla Motors, Inc. (a) | | 1,700 | 408,017 |
| | | | 1,390,906 |
| Hotels, Restaurants & Leisure - 0.9% | | | |
| Chipotle Mexican Grill, Inc. (a) | | 2,600 | 1,247,610 |
| Fiesta Restaurant Group, Inc. (a) | | 9,400 | 315,840 |
| Papa John's International, Inc. | | 5,900 | 329,633 |
| | | | 1,893,083 |
| Household Durables - 2.1% | | | |
| Barratt Developments PLC | | 56,400 | 520,487 |
| Bellway PLC | | 10,300 | 430,626 |
| D.R. Horton, Inc. | | 48,800 | 1,563,064 |
| KB Home (b) | | 41,700 | 514,161 |
| PulteGroup, Inc. | | 61,900 | 1,103,058 |
| Taylor Morrison Home Corp. (a) | | 11,200 | 179,200 |
| Taylor Wimpey PLC | | 92,700 | 277,553 |
| | | | 4,588,149 |
| Internet & Catalog Retail - 2.3% | | | |
| Amazon.com, Inc. (a) | | 4,100 | 2,771,149 |
| JD.com, Inc. sponsored ADR (a) | | 10,100 | 325,877 |
| Priceline Group, Inc. (a) | | 1,300 | 1,657,435 |
| Vipshop Holdings Ltd. ADR (a) | | 24,400 | 372,588 |
| | | | 5,127,049 |
| Leisure Products - 0.1% | | | |
| Vista Outdoor, Inc. (a) | | 6,800 | 302,668 |
| Media - 0.6% | | | |
| ITV PLC | | 144,800 | 590,442 |
| Liberty Global PLC Class C (a) | | 6,900 | 281,313 |
| Naspers Ltd. Class N | | 1,700 | 232,363 |
| Twenty-First Century Fox, Inc. Class B | | 11,800 | 321,314 |
| | | | 1,425,432 |
| Multiline Retail - 0.1% | | | |
| Burlington Stores, Inc. (a) | | 6,800 | 291,720 |
| Specialty Retail - 1.8% | | | |
| Home Depot, Inc. | | 12,700 | 1,679,575 |
| Lowe's Companies, Inc. | | 21,500 | 1,634,860 |
| TJX Companies, Inc. | | 9,200 | 652,372 |
| | | | 3,966,807 |
| Textiles, Apparel & Luxury Goods - 1.2% | | | |
| Michael Kors Holdings Ltd. (a) | | 46,259 | 1,853,136 |
| Pandora A/S | | 6,000 | 756,503 |
| | | | 2,609,639 |
|
| TOTAL CONSUMER DISCRETIONARY | | | 21,964,092 |
|
| CONSUMER STAPLES - 1.6% | | | |
| Beverages - 1.0% | | | |
| Monster Beverage Corp. | | 15,100 | 2,249,296 |
| Food & Staples Retailing - 0.4% | | | |
| CVS Health Corp. | | 8,400 | 821,268 |
| Tobacco - 0.2% | | | |
| Imperial Tobacco Group PLC | | 8,455 | 447,034 |
|
| TOTAL CONSUMER STAPLES | | | 3,517,598 |
|
| ENERGY - 1.0% | | | |
| Energy Equipment & Services - 0.3% | | | |
| Baker Hughes, Inc. | | 11,900 | 549,185 |
| Independence Contract Drilling, Inc. (a) | | 8,600 | 43,430 |
| | | | 592,615 |
| Oil, Gas & Consumable Fuels - 0.7% | | | |
| Chevron Corp. | | 9,600 | 863,616 |
| Cimarex Energy Co. | | 2,900 | 259,202 |
| Continental Resources, Inc. (a) | | 6,400 | 147,072 |
| EOG Resources, Inc. | | 3,700 | 261,923 |
| | | | 1,531,813 |
|
| TOTAL ENERGY | | | 2,124,428 |
|
| FINANCIALS - 2.9% | | | |
| Banks - 0.7% | | | |
| Bank of America Corp. | | 93,000 | 1,565,190 |
| Capital Markets - 1.1% | | | |
| BlackRock, Inc. Class A | | 2,100 | 715,092 |
| Morgan Stanley | | 24,000 | 763,440 |
| The Blackstone Group LP | | 33,100 | 967,844 |
| | | | 2,446,376 |
| Consumer Finance - 0.5% | | | |
| OneMain Holdings, Inc. (a) | | 28,100 | 1,167,274 |
| Diversified Financial Services - 0.5% | | | |
| McGraw Hill Financial, Inc. | | 10,100 | 995,658 |
| Real Estate Investment Trusts - 0.1% | | | |
| American Tower Corp. | | 2,100 | 203,595 |
|
| TOTAL FINANCIALS | | | 6,378,093 |
|
| HEALTH CARE - 13.7% | | | |
| Biotechnology - 10.4% | | | |
| AbbVie, Inc. | | 20,000 | 1,184,800 |
| Acorda Therapeutics, Inc. (a) | | 15,300 | 654,534 |
| Actelion Ltd. | | 5,283 | 734,039 |
| Alexion Pharmaceuticals, Inc. (a) | | 14,200 | 2,708,650 |
| Alnylam Pharmaceuticals, Inc. (a) | | 3,600 | 338,904 |
| Amgen, Inc. | | 5,000 | 811,650 |
| Amicus Therapeutics, Inc. (a) | | 28,000 | 271,600 |
| BioCryst Pharmaceuticals, Inc. (a) | | 31,100 | 320,952 |
| BioMarin Pharmaceutical, Inc. (a) | | 11,200 | 1,173,312 |
| bluebird bio, Inc. (a) | | 300 | 19,266 |
| Celgene Corp. (a) | | 28,100 | 3,365,256 |
| Celldex Therapeutics, Inc. (a)(b) | | 7,800 | 122,304 |
| Clovis Oncology, Inc. (a) | | 3,600 | 126,000 |
| Genmab A/S (a) | | 7,800 | 1,037,119 |
| Gilead Sciences, Inc. | | 29,900 | 3,025,581 |
| Heron Therapeutics, Inc. (a) | | 3,700 | 98,790 |
| Intercept Pharmaceuticals, Inc. (a) | | 4,630 | 691,491 |
| Medivation, Inc. (a) | | 45,800 | 2,213,972 |
| Medy-Tox, Inc. | | 470 | 202,627 |
| NantKwest, Inc. (a)(b) | | 2,500 | 43,325 |
| Novavax, Inc. (a) | | 62,300 | 522,697 |
| Regeneron Pharmaceuticals, Inc. (a) | | 1,100 | 597,157 |
| TESARO, Inc. (a) | | 4,500 | 235,440 |
| United Therapeutics Corp. (a) | | 5,700 | 892,677 |
| Vertex Pharmaceuticals, Inc. (a) | | 13,000 | 1,635,790 |
| vTv Therapeutics, Inc. Class A (a) | | 7,900 | 53,799 |
| | | | 23,081,732 |
| Health Care Equipment & Supplies - 0.2% | | | |
| Innocoll AG ADR (a) | | 18,700 | 155,210 |
| Neovasc, Inc. (a) | | 14,200 | 63,900 |
| Nevro Corp. (a) | | 3,200 | 216,032 |
| | | | 435,142 |
| Health Care Providers & Services - 0.5% | | | |
| AmSurg Corp. (a) | | 5,300 | 402,800 |
| Express Scripts Holding Co. (a) | | 7,700 | 673,057 |
| | | | 1,075,857 |
| Pharmaceuticals - 2.6% | | | |
| Akorn, Inc. (a) | | 5,600 | 208,936 |
| Allergan PLC (a) | | 4,900 | 1,531,250 |
| Bristol-Myers Squibb Co. | | 15,700 | 1,080,003 |
| Jazz Pharmaceuticals PLC (a) | | 6,000 | 843,360 |
| Ocular Therapeutix, Inc. (a) | | 29,300 | 274,541 |
| Pacira Pharmaceuticals, Inc. (a) | | 5,100 | 391,629 |
| Relypsa, Inc. (a)(b) | | 13,000 | 368,420 |
| Shire PLC | | 1,100 | 75,468 |
| Supernus Pharmaceuticals, Inc. (a) | | 7,400 | 99,456 |
| Valeant Pharmaceuticals International, Inc. (Canada) (a) | | 8,500 | 863,453 |
| | | | 5,736,516 |
|
| TOTAL HEALTH CARE | | | 30,329,247 |
|
| INDUSTRIALS - 5.6% | | | |
| Aerospace & Defense - 1.7% | | | |
| Huntington Ingalls Industries, Inc. | | 6,200 | 786,470 |
| The Boeing Co. | | 18,500 | 2,674,915 |
| TransDigm Group, Inc. (a) | | 1,200 | 274,140 |
| | | | 3,735,525 |
| Airlines - 3.7% | | | |
| American Airlines Group, Inc. | | 60,100 | 2,545,235 |
| Delta Air Lines, Inc. | | 36,400 | 1,845,116 |
| Norwegian Air Shuttle A/S (a)(b) | | 5,000 | 181,624 |
| Southwest Airlines Co. | | 53,900 | 2,320,934 |
| United Continental Holdings, Inc. (a) | | 23,400 | 1,340,820 |
| | | | 8,233,729 |
| Construction & Engineering - 0.0% | | | |
| Hyundai Industrial Development & Construction Co. | | 2,670 | 87,049 |
| Professional Services - 0.2% | | | |
| Robert Half International, Inc. | | 8,200 | 386,548 |
|
| TOTAL INDUSTRIALS | | | 12,442,851 |
|
| INFORMATION TECHNOLOGY - 11.6% | | | |
| Communications Equipment - 0.2% | | | |
| Arista Networks, Inc. (a)(b) | | 6,000 | 467,040 |
| Internet Software & Services - 4.8% | | | |
| 58.com, Inc. ADR (a) | | 8,300 | 547,468 |
| Akamai Technologies, Inc. (a) | | 4,100 | 215,783 |
| Alibaba Group Holding Ltd. sponsored ADR (a) | | 23,200 | 1,885,464 |
| Alphabet, Inc. Class A (a) | | 4,800 | 3,734,448 |
| Cornerstone OnDemand, Inc. (a) | | 6,800 | 234,804 |
| Facebook, Inc. Class A (a) | | 24,280 | 2,541,145 |
| Just Dial Ltd. | | 6,897 | 87,407 |
| Tencent Holdings Ltd. | | 65,600 | 1,284,447 |
| | | | 10,530,966 |
| IT Services - 2.1% | | | |
| FleetCor Technologies, Inc. (a) | | 3,000 | 428,790 |
| MasterCard, Inc. Class A | | 15,600 | 1,518,816 |
| PayPal Holdings, Inc. (a) | | 9,000 | 325,800 |
| Visa, Inc. Class A | | 31,400 | 2,435,070 |
| | | | 4,708,476 |
| Semiconductors & Semiconductor Equipment - 1.5% | | | |
| Avago Technologies Ltd. | | 6,100 | 885,415 |
| NXP Semiconductors NV (a) | | 26,300 | 2,215,775 |
| Qorvo, Inc. (a) | | 4,700 | 239,230 |
| | | | 3,340,420 |
| Software - 1.1% | | | |
| Adobe Systems, Inc. (a) | | 21,200 | 1,991,528 |
| Atlassian Corp. PLC | | 600 | 18,048 |
| Fleetmatics Group PLC (a) | | 7,100 | 360,609 |
| Mobileye NV (a) | | 2,900 | 122,612 |
| | | | 2,492,797 |
| Technology Hardware, Storage & Peripherals - 1.9% | | | |
| Apple, Inc. | | 39,600 | 4,168,296 |
| Nimble Storage, Inc. (a) | | 10,900 | 100,280 |
| | | | 4,268,576 |
|
| TOTAL INFORMATION TECHNOLOGY | | | 25,808,275 |
|
| MATERIALS - 0.3% | | | |
| Chemicals - 0.3% | | | |
| LyondellBasell Industries NV Class A | | 7,500 | 651,750 |
| UTILITIES - 0.2% | | | |
| Independent Power and Renewable Electricity Producers - 0.2% | | | |
| Dynegy, Inc. (a) | | 36,900 | 494,460 |
| TOTAL COMMON STOCKS | | | |
| (Cost $75,968,968) | | | 103,710,794 |
| | | Principal Amount | Value |
|
| U.S. Treasury Obligations - 0.5% | | | |
| U.S. Treasury Bills, yield at date of purchase 0.06% 2/4/16 (c) | | | |
| (Cost $1,119,936) | | 1,120,000 | 1,119,903 |
| | | Shares | Value |
|
| Fixed-Income Funds - 27.3% | | | |
| Fidelity Emerging Markets Debt Central Fund (d) | | 116,217 | $1,050,601 |
| Fidelity Floating Rate Central Fund (d) | | 22,947 | 2,243,724 |
| Fidelity High Income Central Fund 1 (d) | | 116,616 | 10,566,557 |
| Fidelity Inflation-Protected Bond Index Central Fund (a)(d) | | 65,264 | 6,360,635 |
| Fidelity VIP Investment Grade Central Fund (d) | | 389,229 | 40,366,961 |
| TOTAL FIXED-INCOME FUNDS | | | |
| (Cost $60,897,958) | | | 60,588,478 |
|
| Money Market Funds - 3.6% | | | |
| Fidelity Cash Central Fund, 0.33% (e) | | 6,296,898 | 6,296,898 |
| Fidelity Securities Lending Cash Central Fund, 0.35% (e)(f) | | 1,713,020 | 1,713,020 |
| TOTAL MONEY MARKET FUNDS | | | |
| (Cost $8,009,918) | | | 8,009,918 |
|
| Equity Funds - 21.2% | | | |
| Domestic Equity Funds - 1.5% | | | |
| Fidelity Commodity Strategy Central Fund (d) | | 138,007 | 814,239 |
| Fidelity Real Estate Equity Central Fund (d) | | 24,964 | 2,555,834 |
|
| TOTAL DOMESTIC EQUITY FUNDS | | | 3,370,073 |
|
| International Equity Funds - 19.7% | | | |
| Fidelity Emerging Markets Equity Central Fund (d) | | 29,963 | 5,218,391 |
| Fidelity International Equity Central Fund (d) | | 409,037 | 30,444,622 |
| iShares MSCI Emerging Markets Index ETF | | 44,622 | 1,436,382 |
| iShares S&P 500 Index ETF | | 31,454 | 6,443,978 |
|
| TOTAL INTERNATIONAL EQUITY FUNDS | | | 43,543,373 |
|
| TOTAL EQUITY FUNDS | | | |
| (Cost $48,376,437) | | | 46,913,446 |
| TOTAL INVESTMENT PORTFOLIO - 99.4% | | | |
| (Cost $194,373,217) | | | 220,342,539 |
| NET OTHER ASSETS (LIABILITIES) - 0.6% | | | 1,333,815 |
| NET ASSETS - 100% | | | $221,676,354 |
| Futures Contracts | | | |
| | Expiration Date | Underlying Face Amount at Value | Unrealized Appreciation/(Depreciation) |
| Purchased | | | |
| Equity Index Contracts | | | |
| 84 Eurex Euro Stoxx 50 Index Contracts (Germany) | March 2016 | $2,996,039 | $82,529 |
The face value of futures purchased as a percentage of Net Assets is 1.4%
For the period, the average monthly underlying face amount at value for futures contracts in the aggregate was $5,270,992.
Security Type Abbreviations
ETF – Exchange-Traded Fund
Legend
(a) Non-income producing
(b) Security or a portion of the security is on loan at period end.
(c) Security or a portion of the security was pledged to cover margin requirements for futures contracts. At period end, the value of securities pledged amounted to $708,938.
(d) Affiliated fund that is generally available only to investment companies and other accounts managed by Fidelity Investments. A complete unaudited schedule of portfolio holdings for each Fidelity Central Fund is filed with the SEC for the first and third quarters of each fiscal year on Form N-Q and is available upon request or at the SEC's website at www.sec.gov. An unaudited holdings listing for the Fund, which presents direct holdings as well as the pro-rata share of securities and other investments held indirectly through its investment in underlying non-money market Fidelity Central Funds, other than the Commodity Strategy Central Fund, is available at advisor.fidelity.com. In addition, each Fidelity Central Fund's financial statements, which are not covered by the Fund's Report of Independent Registered Public Accounting Firm, are available on the SEC's website or upon request.
(e) Affiliated fund that is generally available only to investment companies and other accounts managed by Fidelity Investments. The rate quoted is the annualized seven-day yield of the fund at period end. A complete unaudited listing of the fund's holdings as of its most recent quarter end is available upon request. In addition, each Fidelity Central Fund's financial statements, which are not covered by the Fund's Report of Independent Registered Public Accounting Firm, are available on the SEC's website or upon request.
(f) Investment made with cash collateral received from securities on loan.
Affiliated Central Funds
Information regarding fiscal year to date income earned by the Fund from investments in Fidelity Central Funds is as follows:
| Fund | Income earned |
| Fidelity Cash Central Fund | $14,339 |
| Fidelity Commodity Strategy Central Fund | 625 |
| Fidelity Emerging Markets Debt Central Fund | 72,805 |
| Fidelity Emerging Markets Equity Central Fund | 45,339 |
| Fidelity Floating Rate Central Fund | 114,856 |
| Fidelity High Income Central Fund 1 | 602,580 |
| Fidelity International Equity Central Fund | 1,271,056 |
| Fidelity Real Estate Equity Central Fund | 62,641 |
| Fidelity Securities Lending Cash Central Fund | 28,182 |
| Fidelity VIP Investment Grade Central Fund | 1,335,990 |
| Total | $3,548,413 |
Additional information regarding the Fund's fiscal year to date purchases and sales, including the ownership percentage, of the non Money Market Central Funds is as follows:
| Fund | Value, beginning of period | Purchases | Sales Proceeds | Value, end of period | % ownership, end of period |
| Fidelity Commodity Strategy Central Fund | $469,646 | $516,157 | $52,017 | $814,239 | 0.3% |
| Fidelity Emerging Markets Debt Central Fund | 1,006,297 | 190,696 | 95,769 | 1,050,601 | 1.0% |
| Fidelity Emerging Markets Equity Central Fund | 5,838,089 | 3,906,001 | 4,207,233 | 5,218,391 | 1.5% |
| Fidelity Floating Rate Central Fund | 1,838,697 | 969,634 | 405,553 | 2,243,724 | 0.2% |
| Fidelity High Income Central Fund 1 | 7,544,165 | 4,762,402 | 816,964 | 10,566,557 | 1.0% |
| Fidelity Inflation-Protected Bond Index Central Fund | 2,563,837 | 4,212,565 | 355,861 | 6,360,635 | 1.0% |
| Fidelity International Equity Central Fund | 38,168,699 | 6,759,149 | 12,794,270 | 30,444,622 | 1.4% |
| Fidelity Real Estate Equity Central Fund | 1,461,046 | 1,360,491 | 226,129 | 2,555,834 | 1.0% |
| Fidelity VIP Investment Grade Central Fund | 42,961,732 | 15,508,059 | 16,769,209 | 40,366,961 | 0.9% |
| Total | $101,852,208 | $38,185,154 | $35,723,005 | $99,621,564 | |
Investment Valuation
The following is a summary of the inputs used, as of December 31, 2015, involving the Fund's assets and liabilities carried at fair value. The inputs or methodology used for valuing securities may not be an indication of the risk associated with investing in those securities. For more information on valuation inputs, and their aggregation into the levels used below, please refer to the Investment Valuation section in the accompanying Notes to Financial Statements.
| | Valuation Inputs at Reporting Date: |
| Description | Total | Level 1 | Level 2 | Level 3 |
| Investments in Securities: | | | | |
| Equities: | | | | |
| Consumer Discretionary | $21,964,092 | $20,975,226 | $988,866 | $-- |
| Consumer Staples | 3,517,598 | 3,517,598 | -- | -- |
| Energy | 2,124,428 | 2,124,428 | -- | -- |
| Financials | 6,378,093 | 6,378,093 | -- | -- |
| Health Care | 30,329,247 | 28,279,994 | 2,049,253 | -- |
| Industrials | 12,442,851 | 12,174,178 | 268,673 | -- |
| Information Technology | 25,808,275 | 24,436,421 | 1,371,854 | -- |
| Materials | 651,750 | 651,750 | -- | -- |
| Utilities | 494,460 | 494,460 | -- | -- |
| U.S. Government and Government Agency Obligations | 1,119,903 | -- | 1,119,903 | -- |
| Fixed-Income Funds | 60,588,478 | 60,588,478 | -- | -- |
| Money Market Funds | 8,009,918 | 8,009,918 | -- | -- |
| Equity Funds | 46,913,446 | 46,913,446 | -- | -- |
| Total Investments in Securities: | $220,342,539 | $214,543,990 | $5,798,549 | $-- |
| Derivative Instruments: | | | | |
| Assets | | | | |
| Futures Contracts | $82,529 | $82,529 | $-- | $-- |
| Total Assets | $82,529 | $82,529 | $-- | $-- |
| Total Derivative Instruments: | $82,529 | $82,529 | $-- | $-- |
Value of Derivative Instruments
The following table is a summary of the Fund's value of derivative instruments by primary risk exposure as of December 31, 2015. For additional information on derivative instruments, please refer to the Derivative Instruments section in the accompanying Notes to Financial Statements.
| Primary Risk Exposure / Derivative Type | Value |
| | Asset | Liability |
| Equity Risk | | |
| Futures Contracts(a) | $82,529 | $0 |
| Total Equity Risk | 82,529 | 0 |
| Total Value of Derivatives | $82,529 | $0 |
(a) Reflects gross cumulative appreciation (depreciation) on futures contracts as presented in the Schedule of Investments. Only the period end receivable or payable for daily variation margin is presented in the Statement of Assets and Liabilities.
Other Information
The information in the following tables is based on the combined investments of the Fund and its pro-rata share of the investments of Fidelity's Central Funds, other than the Commodity Strategy and Money Market Central Funds. Percentages in the below tables are adjusted for the effect of TBA Sale Commitments.
The composition of credit quality ratings as a percentage of Total Net Assets is as follows (Unaudited):
| U.S. Government and U.S. Government Agency Obligations | 9.2% |
| AAA,AA,A | 3.4% |
| BBB | 6.9% |
| BB | 4.0% |
| B | 2.6% |
| CCC,CC,C | 0.5% |
| D | 0.0% |
| Not Rated | 0.1% |
| Equities | 67.4% |
| Short-Term Investments and Net Other Assets | 5.9% |
| | 100.0% |
Percentages shown as 0.0% may reflect amounts less than 0.05%.
We have used ratings from Moody's Investors Service, Inc. Where Moody's® ratings are not available, we have used S&P® ratings. All ratings are as of the date indicated and do not reflect subsequent changes. Percentages are adjusted for the effect of futures contracts, if applicable.
Distribution of investments by country or territory of incorporation, as a percentage of Total Net Assets, is as follows (Unaudited):
| United States of America | 70.9% |
| United Kingdom | 5.2% |
| Cayman Islands | 2.7% |
| Japan | 2.6% |
| Netherlands | 2.0% |
| Ireland | 1.7% |
| France | 1.6% |
| Canada | 1.4% |
| Denmark | 1.2% |
| Switzerland | 1.1% |
| Others (Individually Less Than 1%) | 9.6% |
| | 100.0% |
See accompanying notes which are an integral part of the financial statements.
Financial Statements
Statement of Assets and Liabilities
| | | December 31, 2015 |
| Assets | | |
Investment in securities, at value (including securities loaned of $1,646,003) — See accompanying schedule:
Unaffiliated issuers (cost $85,231,761) | $112,711,057 | |
| Fidelity Central Funds (cost $109,141,456) | 107,631,482 | |
| Total Investments (cost $194,373,217) | | $220,342,539 |
| Cash | | 36,209 |
| Receivable for investments sold | | 3,162,026 |
| Receivable for fund shares sold | | 7,433 |
| Dividends receivable | | 41,061 |
| Distributions receivable from Fidelity Central Funds | | 3,375 |
| Prepaid expenses | | 500 |
| Other receivables | | 2,719 |
| Total assets | | 223,595,862 |
| Liabilities | | |
| Payable for fund shares redeemed | $16,556 | |
| Accrued management fee | 102,046 | |
| Distribution and service plan fees payable | 1,004 | |
| Payable for daily variation margin for derivative instruments | 24,134 | |
| Other affiliated payables | 28,804 | |
| Other payables and accrued expenses | 33,944 | |
| Collateral on securities loaned, at value | 1,713,020 | |
| Total liabilities | | 1,919,508 |
| Net Assets | | $221,676,354 |
| Net Assets consist of: | | |
| Paid in capital | | $192,939,019 |
| Undistributed net investment income | | 51,762 |
| Accumulated undistributed net realized gain (loss) on investments and foreign currency transactions | | 2,631,989 |
| Net unrealized appreciation (depreciation) on investments and assets and liabilities in foreign currencies | | 26,053,584 |
| Net Assets | | $221,676,354 |
| Initial Class: | | |
| Net Asset Value, offering price and redemption price per share ($108,323,673 ÷ 5,729,910 shares) | | $18.90 |
| Service Class: | | |
| Net Asset Value, offering price and redemption price per share ($2,877,393 ÷ 153,138 shares) | | $18.79 |
| Service Class 2: | | |
| Net Asset Value, offering price and redemption price per share ($3,533,091 ÷ 188,981 shares) | | $18.70 |
| Investor Class: | | |
| Net Asset Value, offering price and redemption price per share ($106,942,197 ÷ 5,683,613 shares) | | $18.82 |
See accompanying notes which are an integral part of the financial statements.
Statement of Operations
| | | Year ended December 31, 2015 |
| Investment Income | | |
| Dividends | | $1,139,545 |
| Interest | | 171 |
| Income from Fidelity Central Funds | | 3,548,413 |
| Total income | | 4,688,129 |
| Expenses | | |
| Management fee | $1,248,642 | |
| Transfer agent fees | 235,098 | |
| Distribution and service plan fees | 12,289 | |
| Accounting and security lending fees | 112,354 | |
| Custodian fees and expenses | 12,127 | |
| Independent trustees' compensation | 951 | |
| Audit | 48,555 | |
| Legal | 1,991 | |
| Miscellaneous | 10,775 | |
| Total expenses before reductions | 1,682,782 | |
| Expense reductions | (12,963) | 1,669,819 |
| Net investment income (loss) | | 3,018,310 |
| Realized and Unrealized Gain (Loss) | | |
| Net realized gain (loss) on: | | |
| Investment securities: | | |
| Unaffiliated issuers | 6,171,180 | |
| Fidelity Central Funds | (4,271,116) | |
| Foreign currency transactions | (9,225) | |
| Futures contracts | 702,751 | |
| Capital gain distributions from Fidelity Central Funds | 29,985 | |
| Total net realized gain (loss) | | 2,623,575 |
Change in net unrealized appreciation (depreciation) on:
Investment securities | (6,063,696) | |
| Assets and liabilities in foreign currencies | 1,816 | |
| Futures contracts | (17,113) | |
| Total change in net unrealized appreciation (depreciation) | | (6,078,993) |
| Net gain (loss) | | (3,455,418) |
| Net increase (decrease) in net assets resulting from operations | | $(437,108) |
See accompanying notes which are an integral part of the financial statements.
Statement of Changes in Net Assets
| | Year ended December 31, 2015 | Year ended December 31, 2014 |
| Increase (Decrease) in Net Assets | | |
| Operations | | |
| Net investment income (loss) | $3,018,310 | $2,407,771 |
| Net realized gain (loss) | 2,623,575 | 11,259,502 |
| Change in net unrealized appreciation (depreciation) | (6,078,993) | (2,355,819) |
| Net increase (decrease) in net assets resulting from operations | (437,108) | 11,311,454 |
| Distributions to shareholders from net investment income | (2,709,407) | (2,311,469) |
| Distributions to shareholders from net realized gain | (139,825) | (166,468) |
| Total distributions | (2,849,232) | (2,477,937) |
| Share transactions - net increase (decrease) | 8,953,394 | 14,641,735 |
| Total increase (decrease) in net assets | 5,667,054 | 23,475,252 |
| Net Assets | | |
| Beginning of period | 216,009,300 | 192,534,048 |
| End of period (including undistributed net investment income of $51,762 and undistributed net investment income of $7,246, respectively) | $221,676,354 | $216,009,300 |
See accompanying notes which are an integral part of the financial statements.
Financial Highlights — VIP Asset Manager: Growth Portfolio Initial Class
| | | | | |
| Years ended December 31, | 2015 | 2014 | 2013 | 2012 | 2011 |
| Selected Per–Share Data | | | | | |
| Net asset value, beginning of period | $19.15 | $18.30 | $15.14 | $13.35 | $14.52 |
| Income from Investment Operations | | | | | |
| Net investment income (loss)A | .27 | .23 | .17 | .19 | .22 |
| Net realized and unrealized gain (loss) | (.27) | .85 | 3.22 | 1.87 | (1.12) |
| Total from investment operations | – | 1.08 | 3.39 | 2.06 | (.90) |
| Distributions from net investment income | (.24) | (.21) | (.18) | (.21) | (.24) |
| Distributions from net realized gain | (.01) | (.02) | (.05) | (.06) | (.03) |
| Total distributions | (.25) | (.23) | (.23) | (.27) | (.27) |
| Net asset value, end of period | $18.90 | $19.15 | $18.30 | $15.14 | $13.35 |
| Total ReturnB,C | .03% | 5.87% | 22.41% | 15.45% | (6.17)% |
| Ratios to Average Net AssetsD,E | | | | | |
| Expenses before reductions | .70% | .70% | .72% | .72% | .73% |
| Expenses net of fee waivers, if any | .70% | .70% | .71% | .72% | .72% |
| Expenses net of all reductions | .69% | .70% | .71% | .71% | .71% |
| Net investment income (loss) | 1.37% | 1.19% | 1.05% | 1.29% | 1.49% |
| Supplemental Data | | | | | |
| Net assets, end of period (000 omitted) | $108,324 | $122,484 | $127,423 | $116,252 | $113,899 |
| Portfolio turnover rateF | 49% | 38% | 52% | 59% | 71% |
A Calculated based on average shares outstanding during the period.
B Total returns do not reflect charges attributable to your insurance company's separate account. Inclusion of these charges would reduce the total returns shown.
C Total returns would have been lower if certain expenses had not been reduced during the applicable periods shown.
D Fees and expenses of any underlying Fidelity Central Funds are not included in the Fund's expense ratio. The Fund indirectly bears its proportionate share of the expenses of any underlying Fidelity Central Funds. Based on their most recent shareholder report date, the expenses of any underlying non-money market Fidelity Central Funds ranged from less than .005% to .15%.
E Expense ratios reflect operating expenses of the class. Expenses before reductions do not reflect amounts reimbursed by the investment adviser or reductions from brokerage service arrangements or reductions from other expense offset arrangements and do not represent the amount paid by the class during periods when reimbursements or reductions occur. Expenses net of fee waivers reflect expenses after reimbursement by the investment adviser but prior to reductions from brokerage service arrangements or other expense offset arrangements. Expenses net of all reductions represent the net expenses paid by the class.
F Amount does not include the portfolio activity of any underlying Fidelity Central Funds.
See accompanying notes which are an integral part of the financial statements.
Financial Highlights — VIP Asset Manager: Growth Portfolio Service Class
| | | | | | |
| Years ended December 31, | 2015 | 2014 | 2013 | 2012 | 2011 |
| Selected Per–Share Data | | | | | |
| Net asset value, beginning of period | $19.03 | $18.19 | $15.04 | $13.26 | $14.42 |
| Income from Investment Operations | | | | | |
| Net investment income (loss)A | .25 | .21 | .16 | .17 | .20 |
| Net realized and unrealized gain (loss) | (.26) | .84 | 3.19 | 1.86 | (1.11) |
| Total from investment operations | (.01) | 1.05 | 3.35 | 2.03 | (.91) |
| Distributions from net investment income | (.22) | (.19) | (.15) | (.20) | (.22) |
| Distributions from net realized gain | (.01) | (.02) | (.05) | (.06) | (.03) |
| Total distributions | (.23) | (.21) | (.20) | (.25)B | (.25) |
| Net asset value, end of period | $18.79 | $19.03 | $18.19 | $15.04 | $13.26 |
| Total ReturnC,D | (.03)% | 5.75% | 22.34% | 15.34% | (6.26)% |
| Ratios to Average Net AssetsE,F | | | | | |
| Expenses before reductions | .80% | .80% | .82% | .82% | .83% |
| Expenses net of fee waivers, if any | .80% | .80% | .82% | .82% | .82% |
| Expenses net of all reductions | .79% | .80% | .81% | .81% | .81% |
| Net investment income (loss) | 1.27% | 1.09% | .95% | 1.19% | 1.39% |
| Supplemental Data | | | | | |
| Net assets, end of period (000 omitted) | $2,877 | $3,265 | $3,191 | $3,541 | $5,654 |
| Portfolio turnover rateG | 49% | 38% | 52% | 59% | 71% |
A Calculated based on average shares outstanding during the period.
B Total distributions of $.25 per share is comprised of distributions from net investment income of $.195 and distributions from net realized gain of $.055 per share.
C Total returns do not reflect charges attributable to your insurance company's separate account. Inclusion of these charges would reduce the total returns shown.
D Total returns would have been lower if certain expenses had not been reduced during the applicable periods shown.
E Fees and expenses of any underlying Fidelity Central Funds are not included in the Fund's expense ratio. The Fund indirectly bears its proportionate share of the expenses of any underlying Fidelity Central Funds. Based on their most recent shareholder report date, the expenses of any underlying non-money market Fidelity Central Funds ranged from less than .005% to .15%.
F Expense ratios reflect operating expenses of the class. Expenses before reductions do not reflect amounts reimbursed by the investment adviser or reductions from brokerage service arrangements or reductions from other expense offset arrangements and do not represent the amount paid by the class during periods when reimbursements or reductions occur. Expenses net of fee waivers reflect expenses after reimbursement by the investment adviser but prior to reductions from brokerage service arrangements or other expense offset arrangements. Expenses net of all reductions represent the net expenses paid by the class.
G Amount does not include the portfolio activity of any underlying Fidelity Central Funds.
See accompanying notes which are an integral part of the financial statements.
Financial Highlights — VIP Asset Manager: Growth Portfolio Service Class 2
| | | | | | |
| Years ended December 31, | 2015 | 2014 | 2013 | 2012 | 2011 |
| Selected Per–Share Data | | | | | |
| Net asset value, beginning of period | $18.94 | $18.10 | $14.97 | $13.21 | $14.36 |
| Income from Investment Operations | | | | | |
| Net investment income (loss)A | .21 | .17 | .12 | .14 | .17 |
| Net realized and unrealized gain (loss) | (.25) | .84 | 3.18 | 1.84 | (1.09) |
| Total from investment operations | (.04) | 1.01 | 3.30 | 1.98 | (.92) |
| Distributions from net investment income | (.19) | (.15) | (.12) | (.17) | (.20) |
| Distributions from net realized gain | (.01) | (.02) | (.05) | (.06) | (.03) |
| Total distributions | (.20) | (.17) | (.17) | (.22)B | (.23) |
| Net asset value, end of period | $18.70 | $18.94 | $18.10 | $14.97 | $13.21 |
| Total ReturnC,D | (.18)% | 5.55% | 22.09% | 15.03% | (6.39)% |
| Ratios to Average Net AssetsE,F | | | | | |
| Expenses before reductions | .96% | 1.01% | 1.03% | 1.04% | 1.01% |
| Expenses net of fee waivers, if any | .96% | 1.01% | 1.02% | 1.04% | 1.01% |
| Expenses net of all reductions | .95% | 1.00% | 1.02% | 1.03% | 1.00% |
| Net investment income (loss) | 1.11% | .88% | .74% | .97% | 1.20% |
| Supplemental Data | | | | | |
| Net assets, end of period (000 omitted) | $3,533 | $3,573 | $3,626 | $3,621 | $3,260 |
| Portfolio turnover rateG | 49% | 38% | 52% | 59% | 71% |
A Calculated based on average shares outstanding during the period.
B Total distributions of $.22 per share is comprised of distributions from net investment income of $.167 and distributions from net realized gain of $.055 per share.
C Total returns do not reflect charges attributable to your insurance company's separate account. Inclusion of these charges would reduce the total returns shown.
D Total returns would have been lower if certain expenses had not been reduced during the applicable periods shown.
E Fees and expenses of any underlying Fidelity Central Funds are not included in the Fund's expense ratio. The Fund indirectly bears its proportionate share of the expenses of any underlying Fidelity Central Funds. Based on their most recent shareholder report date, the expenses of any underlying non-money market Fidelity Central Funds ranged from less than .005% to .15%.
F Expense ratios reflect operating expenses of the class. Expenses before reductions do not reflect amounts reimbursed by the investment adviser or reductions from brokerage service arrangements or reductions from other expense offset arrangements and do not represent the amount paid by the class during periods when reimbursements or reductions occur. Expenses net of fee waivers reflect expenses after reimbursement by the investment adviser but prior to reductions from brokerage service arrangements or other expense offset arrangements. Expenses net of all reductions represent the net expenses paid by the class.
G Amount does not include the portfolio activity of any underlying Fidelity Central Funds.
See accompanying notes which are an integral part of the financial statements.
Financial Highlights — VIP Asset Manager: Growth Portfolio Investor Class
| | | | | | |
| Years ended December 31, | 2015 | 2014 | 2013 | 2012 | 2011 |
| Selected Per–Share Data | | | | | |
| Net asset value, beginning of period | $19.06 | $18.22 | $15.08 | $13.30 | $14.46 |
| Income from Investment Operations | | | | | |
| Net investment income (loss)A | .25 | .21 | .16 | .18 | .20 |
| Net realized and unrealized gain (loss) | (.25) | .85 | 3.20 | 1.86 | (1.10) |
| Total from investment operations | – | 1.06 | 3.36 | 2.04 | (.90) |
| Distributions from net investment income | (.23) | (.20) | (.17) | (.20) | (.23) |
| Distributions from net realized gain | (.01) | (.02) | (.05) | (.06) | (.03) |
| Total distributions | (.24) | (.22) | (.22) | (.26) | (.26) |
| Net asset value, end of period | $18.82 | $19.06 | $18.22 | $15.08 | $13.30 |
| Total ReturnB,C | .01% | 5.79% | 22.30% | 15.34% | (6.20)% |
| Ratios to Average Net AssetsD,E | | | | | |
| Expenses before reductions | .78% | .78% | .80% | .81% | .81% |
| Expenses net of fee waivers, if any | .78% | .78% | .80% | .81% | .81% |
| Expenses net of all reductions | .77% | .78% | .79% | .79% | .80% |
| Net investment income (loss) | 1.29% | 1.11% | .97% | 1.21% | 1.41% |
| Supplemental Data | | | | | |
| Net assets, end of period (000 omitted) | $106,942 | $86,687 | $58,295 | $37,574 | $36,235 |
| Portfolio turnover rateF | 49% | 38% | 52% | 59% | 71% |
A Calculated based on average shares outstanding during the period.
B Total returns do not reflect charges attributable to your insurance company's separate account. Inclusion of these charges would reduce the total returns shown.
C Total returns would have been lower if certain expenses had not been reduced during the applicable periods shown.
D Fees and expenses of any underlying Fidelity Central Funds are not included in the Fund's expense ratio. The Fund indirectly bears its proportionate share of the expenses of any underlying Fidelity Central Funds. Based on their most recent shareholder report date, the expenses of any underlying non-money market Fidelity Central Funds ranged from less than .005% to .15%.
E Expense ratios reflect operating expenses of the class. Expenses before reductions do not reflect amounts reimbursed by the investment adviser or reductions from brokerage service arrangements or reductions from other expense offset arrangements and do not represent the amount paid by the class during periods when reimbursements or reductions occur. Expenses net of fee waivers reflect expenses after reimbursement by the investment adviser but prior to reductions from brokerage service arrangements or other expense offset arrangements. Expenses net of all reductions represent the net expenses paid by the class.
F Amount does not include the portfolio activity of any underlying Fidelity Central Funds.
See accompanying notes which are an integral part of the financial statements.
Notes to Financial Statements
For the period ended December 31, 2015
1. Organization.
VIP Asset Manager: Growth Portfolio (the Fund) is a fund of Variable Insurance Products Fund V (the Trust) and is authorized to issue an unlimited number of shares. The Trust is registered under the Investment Company Act of 1940, as amended (the 1940 Act), as an open-end management investment company organized as a Massachusetts business trust. Shares of the Fund may only be purchased by insurance companies for the purpose of funding variable annuity or variable life insurance contracts. The Fund offers the following classes of shares: Initial Class shares, Service Class shares, Service Class 2 shares, and Investor Class shares. All classes have equal rights and voting privileges, except for matters affecting a single class.
2. Investments in Fidelity Central Funds.
The Fund invests in Fidelity Central Funds, which are open-end investment companies generally available only to other investment companies and accounts managed by the investment adviser and its affiliates. The Fund's Schedule of Investments lists each of the Fidelity Central Funds held as of period end, as an investment of the Fund, but does not include the underlying holdings of each Fidelity Central Fund. As an Investing Fund, the Fund indirectly bears its proportionate share of the expenses of the underlying Fidelity Central Funds. Based on its investment objective, each Fidelity Central Fund may invest or participate in various investment vehicles or strategies that are similar to those of the Fund. These strategies are consistent with the investment objectives of the Fund and may involve certain economic risks which may cause a decline in value of each of the Fidelity Central Funds and thus a decline in the value of the Fund. The following summarizes the Fund's investment in each Fidelity Central Fund.
| Fidelity Central Fund | Investment Manager | Investment Objective | Investment Practices | Expense Ratio(a) |
| Fidelity Commodity Strategy Central Fund | Geode Capital Management, LLC (Geode) | Seeks to provide investment returns that correspond to the performance of the commodities market. | Investment in commodity-related investments through a wholly-owned subsidiary organized under the laws of the Cayman Islands
Futures
Swaps | .05% |
| Fidelity Emerging Markets Debt Central Fund | FMR Co., Inc. (FMRC) | Seeks high total return by normally investing in debt securities of issuers in emerging markets and other debt investments that are tied economically to emerging markets. | Foreign Securities
Loans & Direct Debt Instruments
Restricted Securities | .01% |
| Fidelity Emerging Markets Equity Central Fund | FMRC | Seeks capital appreciation by investing primarily in equity securities of issuers in emerging markets. | Delayed Delivery & When Issued Securities
Foreign Securities
Futures | .15% |
| Fidelity International Equity Central Fund | FMRC | Seeks capital appreciation by investing primarily in non-U.S. based common stocks, including securities of issuers located in emerging markets. | Foreign Securities
Futures
| .01% |
| Fidelity Floating Rate Central Fund | FMRC | Seeks a high level of income by normally investing in floating rate loans and other floating rate securities. | Loans & Direct Debt Instruments
Restricted Securities
| Less than .005% |
| Fidelity High Income Central Fund 1 | FMRC | Seeks a high level of income and may also seek capital appreciation by investing primarily in debt securities, preferred stocks, and convertible securities, with an emphasis on lower-quality debt securities. | Loans & Direct Debt Instruments
Restricted Securities | Less than .005% |
| Fidelity Inflation-Protected Bond Index Central Fund | Fidelity Investment Money Management, Inc. (FIMM) | Seeks to provide investment results that correspond to the performance of the inflation-protected United States Treasury market, and may invest in derivatives. | | Less than .005% |
| Fidelity VIP Investment Grade Central Fund | FIMM | Seeks a high level of current income by normally investing in investment-grade debt securities and repurchase agreements. | Delayed Delivery & When Issued Securities
Futures
Repurchase Agreements
Restricted Securities
Swaps | Less than .005% |
| Fidelity Real Estate Equity Central Fund | FMRC | Seeks above-average income and long-term capital growth by investing primarily in equity securities of issuers in the real estate industry. | | .01% |
| Fidelity Money Market Central Funds | FIMM | Each fund seeks to obtain a high level of current income consistent with the preservation of capital and liquidity. | Short-term Investments | Less than .005% |
(a) Expenses expressed as a percentage of average net assets and are as of each underlying Central Fund's most recent annual or semi-annual shareholder report.
An unaudited holdings listing for the Fund, which presents direct holdings as well as the pro-rata share of any securities and other investments held indirectly through its investment in underlying non-money market Fidelity Central Funds, is available at advisor.fidelity.com. A complete unaudited list of holdings for each Fidelity Central Fund is available upon request or at the Securities and Exchange Commission (the SEC) website at www.sec.gov. In addition, the financial statements of the Fidelity Central Funds which contain the significant accounting policies (including investment valuation policies) of those funds, which are not covered by the Fund's Report of Independent Registered Public Accounting Firm, are available on the SEC website or upon request.
3. Significant Accounting Policies.
The financial statements have been prepared in conformity with accounting principles generally accepted in the United States of America (GAAP), which require management to make certain estimates and assumptions at the date of the financial statements. Actual results could differ from those estimates. Subsequent events, if any, through the date that the financial statements were issued have been evaluated in the preparation of the financial statements. The following summarizes the significant accounting policies of the Fund:
Investment Valuation. Investments are valued as of 4:00 p.m. Eastern time on the last calendar day of the period. The Board of Trustees (the Board) has delegated the day to day responsibility for the valuation of the Fund's investments to the Fidelity Management & Research Company (FMR) Fair Value Committee (the Committee). In accordance with valuation policies and procedures approved by the Board, the Fund attempts to obtain prices from one or more third party pricing vendors or brokers to value its investments. When current market prices, quotations or currency exchange rates are not readily available or reliable, investments will be fair valued in good faith by the Committee, in accordance with procedures adopted by the Board. Factors used in determining fair value vary by investment type and may include market or investment specific events, changes in interest rates and credit quality. The frequency with which these procedures are used cannot be predicted and they may be utilized to a significant extent. The Committee oversees the Fund's valuation policies and procedures and reports to the Board on the Committee's activities and fair value determinations. The Board monitors the appropriateness of the procedures used in valuing the Fund's investments and ratifies the fair value determinations of the Committee.
The Fund categorizes the inputs to valuation techniques used to value its investments into a disclosure hierarchy consisting of three levels as shown below:
- Level 1 – quoted prices in active markets for identical investments
- Level 2 – other significant observable inputs (including quoted prices for similar investments, interest rates, prepayment speeds, etc.)
- Level 3 – unobservable inputs (including the Fund's own assumptions based on the best information available)
Valuation techniques used to value the Fund's investments by major category are as follows:
Equity securities, including restricted securities, for which market quotations are readily available, are valued at the last reported sale price or official closing price as reported by a third party pricing vendor on the primary market or exchange on which they are traded and are categorized as Level 1 in the hierarchy. In the event there were no sales during the day or closing prices are not available, securities are valued at the last quoted bid price or may be valued using the last available price and are generally categorized as Level 2 in the hierarchy. For foreign equity securities, when market or security specific events arise, comparisons to the valuation of American Depositary Receipts (ADRs), futures contracts, Exchange-Traded Funds (ETFs) and certain indexes as well as quoted prices for similar securities may be used and would be categorized as Level 2 in the hierarchy. Utilizing these techniques may result in transfers between Level 1 and Level 2. For equity securities, including restricted securities, where observable inputs are limited, assumptions about market activity and risk are used and these securities may be categorized as Level 3 in the hierarchy.
Debt securities, including restricted securities, are valued based on evaluated prices received from third party pricing vendors or from brokers who make markets in such securities. U.S. government and government agency obligations are valued by pricing vendors who utilize matrix pricing which considers yield or price of bonds of comparable quality, coupon, maturity and type or by broker-supplied prices. When independent prices are unavailable or unreliable, debt securities may be valued utilizing pricing methodologies which consider similar factors that would be used by third party pricing vendors. Debt securities are generally categorized as Level 2 in the hierarchy but may be Level 3 depending on the circumstances. ETFs are valued at their last sale price or official closing price as reported by a third party pricing vendor on the primary market or exchange on which they are traded and are categorized as Level 1 in the hierarchy. In the event there were no sales during the day but the exchange reports a closing bid level, ETFs are valued at the closing bid and would be categorized as Level 1 in the hierarchy. In the event there was no closing bid, ETFs may be valued by another method that the Board believes reflects fair value in accordance with the Board's fair value pricing policies and may be categorized as Level 2 in the hierarchy.
Futures contracts are valued at the settlement price established each day by the board of trade or exchange on which they are traded and are categorized as Level 1 in the hierarchy. Investments in open-end mutual funds, including the Fidelity Central Funds, are valued at their closing net asset value (NAV) each business day and are categorized as Level 1 in the hierarchy. If an unaffiliated open-end mutual fund's NAV is unavailable, shares of that fund may be valued by another method that the Board believes reflects fair value in accordance with the Board's fair value pricing policies and is categorized as Level 2 in the hierarchy.
Changes in valuation techniques may result in transfers in or out of an assigned level within the disclosure hierarchy. The aggregate value of investments by input level as of December 31, 2015 is included at the end of the Fund's Schedule of Investments.
Foreign Currency. The Fund may use foreign currency contracts to facilitate transactions in foreign-denominated securities. Gains and losses from these transactions may arise from changes in the value of the foreign currency or if the counterparties do not perform under the contracts' terms.
Foreign-denominated assets, including investment securities, and liabilities are translated into U.S. dollars at the exchange rates at period end. Purchases and sales of investment securities, income and dividends received and expenses denominated in foreign currencies are translated into U.S. dollars at the exchange rate in effect on the transaction date.
The effects of exchange rate fluctuations on investments are included with the net realized and unrealized gain (loss) on investment securities. Other foreign currency transactions resulting in realized and unrealized gain (loss) are disclosed separately.
Investment Transactions and Income. For financial reporting purposes, the Fund's investment holdings and NAV include trades executed through the end of the last business day of the period. The NAV per share for processing shareholder transactions is calculated as of the close of business of the New York Stock Exchange (NYSE), normally 4:00 p.m. Eastern time and includes trades executed through the end of the prior business day. Gains and losses on securities sold are determined on the basis of identified cost and may include proceeds received from litigation. Dividend income is recorded on the ex-dividend date, except for certain dividends from foreign securities where the ex-dividend date may have passed, which are recorded as soon as the Fund is informed of the ex-dividend date. Non-cash dividends included in dividend income, if any, are recorded at the fair market value of the securities received. Income and capital gain distributions from Fidelity Central Funds, if any, are recorded on the ex-dividend date. Distributions received on securities that represent a return of capital or capital gain are recorded as a reduction of cost of investments and/or as a realized gain. Subsequent to ex-dividend date the Fund determines the components of these distributions, based upon receipt of tax filings or other correspondence relating to the underlying investment. Interest income is accrued as earned and includes coupon interest and amortization of premium and accretion of discount on debt securities as applicable. Investment income is recorded net of foreign taxes withheld where recovery of such taxes is uncertain.
Class Allocations and Expenses. Investment income, realized and unrealized capital gains and losses, common expenses of the Fund, and certain fund-level expense reductions, if any, are allocated daily on a pro-rata basis to each class based on the relative net assets of each class to the total net assets of the Fund. Each class differs with respect to transfer agent and distribution and service plan fees incurred. Certain expense reductions may also differ by class. For the reporting period, the allocated portion of income and expenses to each class as a percent of its average net assets may vary due to the timing of recording these transactions in relation to fluctuating net assets of the classes. Expenses directly attributable to a fund are charged to that fund. Expenses attributable to more than one fund are allocated among the respective funds on the basis of relative net assets or other appropriate methods. Expense estimates are accrued in the period to which they relate and adjustments are made when actual amounts are known. Expenses included in the accompanying financial statements reflect the expenses of the Fund and do not include any expenses of the Fidelity Central Funds. Although not included in the Fund's expenses, the Fund indirectly bears its proportionate share of the Fidelity Central Funds' expenses through the impact of these expenses on each Fidelity Central Fund's NAV.
Income Tax Information and Distributions to Shareholders. Each year, the Fund intends to qualify as a regulated investment company under Subchapter M of the Internal Revenue Code, including distributing substantially all of its taxable income and realized gains. As a result, no provision for U.S. Federal income taxes is required. As of December 31, 2015, the Fund did not have any unrecognized tax benefits in the financial statements; nor is the Fund aware of any tax positions for which it is reasonably possible that the total amounts of unrecognized tax benefits will significantly change in the next twelve months. The Fund files a U.S. federal tax return, in addition to state and local tax returns as required. The Fund's federal income tax returns are subject to examination by the Internal Revenue Service (IRS) for a period of three fiscal years after they are filed. State and local tax returns may be subject to examination for an additional fiscal year depending on the jurisdiction. Foreign taxes are provided for based on the Fund's understanding of the tax rules and rates that exist in the foreign markets in which it invests.
Distributions are declared and recorded on the ex-dividend date. Income dividends and capital gain distributions are declared separately for each class. Income and capital gain distributions are determined in accordance with income tax regulations, which may differ from GAAP. In addition, the Fund claimed a portion of the payment made to redeeming shareholders as a distribution for income tax purposes.
Capital accounts within the financial statements are adjusted for permanent book-tax differences. These adjustments have no impact on net assets or the results of operations. Capital accounts are not adjusted for temporary book-tax differences which will reverse in a subsequent period.
Book-tax differences are primarily due to short-term gain distributions from the Fidelity Central Funds, futures contracts, foreign currency transactions, market discount, partnerships (including allocations from Fidelity Central Funds), deferred trustees compensation, capital loss carryforwards and losses deferred due to wash sales.
The federal tax cost of investment securities and unrealized appreciation (depreciation) as of period end were as follows:
| Gross unrealized appreciation | $34,021,334 |
| Gross unrealized depreciation | (7,952,150) |
| Net unrealized appreciation (depreciation) on securities | $26,069,184 |
| Tax Cost | $194,273,355 |
The tax-based components of distributable earnings as of period end were as follows:
| Undistributed ordinary income | $53,510 |
| Undistributed long-term capital gain | $3,034,164 |
| Net unrealized appreciation (depreciation) on securities and other investments | $26,069,066 |
The tax character of distributions paid was as follows:
| | December 31, 2015 | December 31, 2014 |
| Ordinary Income | $2,849,232 | $ 2,477,937 |
4. Derivative Instruments.
Risk Exposures and the Use of Derivative Instruments. The Fund's investment objective allows the Fund to enter into various types of derivative contracts, including futures contracts. Derivatives are investments whose value is primarily derived from underlying assets, indices or reference rates and may be transacted on an exchange or over-the-counter (OTC). Derivatives may involve a future commitment to buy or sell a specified asset based on specified terms, to exchange future cash flows at periodic intervals based on a notional principal amount, or for one party to make one or more payments upon the occurrence of specified events in exchange for periodic payments from the other party.
The Fund used derivatives to increase returns and to manage exposure to certain risks as defined below. The success of any strategy involving derivatives depends on analysis of numerous economic factors, and if the strategies for investment do not work as intended, the Fund may not achieve its objectives.
The Fund's use of derivatives increased or decreased its exposure to the following risk:
| Equity Risk | Equity risk relates to the fluctuations in the value of financial instruments as a result of changes in market prices (other than those arising from interest rate risk or foreign exchange risk), whether caused by factors specific to an individual investment, its issuer, or all factors affecting all instruments traded in a market or market segment.
|
The Fund is also exposed to additional risks from investing in derivatives, such as liquidity risk and counterparty credit risk. Liquidity risk is the risk that the Fund will be unable to close out the derivative in the open market in a timely manner. Counterparty credit risk is the risk that the counterparty will not be able to fulfill its obligation to the Fund. Counterparty credit risk related to exchange-traded futures contracts may be mitigated by the protection provided by the exchange on which they trade.
Investing in derivatives may involve greater risks than investing in the underlying assets directly and, to varying degrees, may involve risk of loss in excess of any initial investment and collateral received and amounts recognized in the Statement of Assets and Liabilities. In addition, there may be the risk that the change in value of the derivative contract does not correspond to the change in value of the underlying instrument.
Futures Contracts. A futures contract is an agreement between two parties to buy or sell a specified underlying instrument for a fixed price at a specified future date. The Fund used futures contracts to manage its exposure to the stock market.
Upon entering into a futures contract, a fund is required to deposit either cash or securities (initial margin) with a clearing broker in an amount equal to a certain percentage of the face value of the contract. Futures contracts are marked-to-market daily and subsequent daily payments (variation margin) are made or received by a fund depending on the daily fluctuations in the value of the futures contracts and are recorded as unrealized appreciation or (depreciation). This receivable and/or payable, if any, is included in daily variation margin for derivative instruments in the Statement of Assets and Liabilities. Realized gain or (loss) is recorded upon the expiration or closing of a futures contract.
Any open futures contracts at period end are presented in the Schedule of Investments under the caption "Futures Contracts". The underlying face amount at value reflects each contract's exposure to the underlying instrument or index at period end. Securities deposited to meet initial margin requirements are identified in the Schedule of Investments.
During the period the Fund recognized net realized gain (loss) of $702,751 and a change in net unrealized appreciation (depreciation) of $(17,113) related to its investment in futures contracts. These amounts are included in the Statement of Operations.
5. Purchases and Sales of Investments.
Purchases and sales of securities (including the Equity and Fixed-Income Central Funds), other than short-term securities, aggregated $112,176,789 and $106,993,779, respectively.
6. Fees and Other Transactions with Affiliates.
Management Fee. Fidelity Management & Research Company (the investment adviser) and its affiliates provide the Fund with investment management related services for which the Fund pays a monthly management fee. The management fee is the sum of an individual fund fee rate that is based on an annual rate of .30% of the Fund's average net assets and an annualized group fee rate that averaged .25% during the period. The group fee rate is based upon the average net assets of all the mutual funds advised by the investment adviser, including any mutual funds previously advised by the investment adviser that are currently advised by Fidelity SelectCo, LLC, an affiliate of the investment adviser. The group fee rate decreases as assets under management increase and increases as assets under management decrease. For the reporting period, the total annual management fee rate was .55% of the Fund's average net assets.
The investment adviser pays a portion of the management fees received from the Fund to the Fidelity Central Funds' investment advisers, who are also affiliates, for managing the assets of the Fidelity Central Funds.
Distribution and Service Plan Fees. In accordance with Rule 12b-1 of the 1940 Act, the Fund has adopted separate 12b-1 Plans for each Service Class of shares. Each Service Class pays Fidelity Distributors Corporation (FDC), an affiliate of the investment adviser, a service fee. For the period, the service fee is based on an annual rate of .10% of Service Class' average net assets and .25% of Service Class 2's average net assets.
For the period, total fees, all of which were re-allowed to insurance companies for the distribution of shares and providing shareholder support services, were as follows:
| Service Class | $3,143 |
| Service Class 2 | 9,146 |
| | $12,289 |
Transfer Agent Fees. Fidelity Investments Institutional Operations Company, Inc. (FIIOC), an affiliate of the investment adviser, is the Fund's transfer, dividend disbursing, and shareholder servicing agent. FIIOC receives an asset-based fee with respect to each class. Each class (with the exception of Investor Class) pays a fee for transfer agent services, typesetting, printing and mailing of shareholder reports, excluding mailing of proxy statements and out of pocket expenses, equal to an annual rate of .07%(.15% for Investor Class) of class-level average net assets. For the period, transfer agent fees for each class, including out of pocket expenses, were as follows:
| Initial Class | $79,029 |
| Service Class | 2,113 |
| Service Class 2 | 2,807 |
| Investor Class | 151,149 |
| | $235,098 |
Accounting and Security Lending Fees. Fidelity Service Company, Inc. (FSC), an affiliate of the investment adviser, maintains the Fund's accounting records. The accounting fee is based on the level of average net assets for each month. Under a separate contract, FSC administers the security lending program. The security lending fee is based on the number and duration of lending transactions.
Brokerage Commissions. The Fund placed a portion of its portfolio transactions with brokerage firms which are affiliates of the investment adviser. Brokerage commissions are included in net realized gain (loss) and change in net unrealized appreciation (depreciation) in the Statement of Operations. The commissions paid to these affiliated firms were $1,002 for the period.
Interfund Trades. The Fund may purchase from or sell securities to other Fidelity Funds under procedures adopted by the Board. The procedures have been designed to ensure these interfund trades are executed in accordance with Rule 17a-7 of the 1940 Act. Interfund trades are included within the respective purchases and sales amounts shown in the Purchases and Sales of Investments note.
7. Committed Line of Credit.
The Fund participates with other funds managed by the investment adviser or an affiliate in a $4.25 billion credit facility (the "line of credit") to be utilized for temporary or emergency purposes to fund shareholder redemptions or for other short-term liquidity purposes. The Fund has agreed to pay commitment fees on its pro-rata portion of the line of credit, which amounted to $323 and is reflected in Miscellaneous expenses on the Statement of Operations. During the period, the Fund did not borrow on this line of credit.
8. Security Lending.
The Fund lends portfolio securities through a lending agent from time to time in order to earn additional income. For equity securities, a lending agent is used and may loan securities to certain qualified borrowers, including Fidelity Capital Markets (FCM), a broker-dealer affiliated with the Fund. On the settlement date of the loan, the Fund receives collateral (in the form of U.S. Treasury obligations, letters of credit and/or cash) against the loaned securities and maintains collateral in an amount not less than 100% of the market value of the loaned securities during the period of the loan. The market value of the loaned securities is determined at the close of business of the Fund and any additional required collateral is delivered to the Fund on the next business day. The Fund or borrower may terminate the loan at any time, and if the borrower defaults on its obligation to return the securities loaned because of insolvency or other reasons, the Fund may apply collateral received from the borrower against the obligation. The Fund may experience delays and costs in recovering the securities loaned. Any cash collateral received is invested in the Fidelity Securities Lending Cash Central Fund. The value of loaned securities and cash collateral at period end are disclosed on the Fund's Statement of Assets and Liabilities. At period end, there were no security loans outstanding with FCM. Security lending income represents the income earned on investing cash collateral, less rebates paid to borrowers and any lending agent fees associated with the loan, plus any premium payments received for lending certain types of securities. Security lending income is presented in the Statement of Operations as a component of income from Fidelity Central Funds. Total security lending income during the period amounted to $28,182, including $558 from securities loaned to FCM.
9. Expense Reductions.
Commissions paid to certain brokers with whom the investment adviser, or its affiliates, places trades on behalf of the Fund include an amount in addition to trade execution, which may be rebated back to the Fund to offset certain expenses. This amount totaled $10,443 for the period.
In addition, during the period the investment adviser reimbursed and/or waived a portion of fund-level operating expenses in the amount of $926 and a portion of class-level operating expenses as follows:
| | Amount |
| Investor Class | $1,594 |
10. Distributions to Shareholders.
Distributions to shareholders of each class were as follows:
| Years ended December 31, | 2015 | 2014 |
| From net investment income | | |
| Initial Class | $1,364,340 | $1,342,745 |
| Service Class | 32,613 | 32,583 |
| Service Class 2 | 37,340 | 28,313 |
| Investor Class | 1,275,114 | 907,828 |
| Total | $2,709,407 | $2,311,469 |
| From net realized gain | | |
| Initial Class | $68,121 | $96,965 |
| Service Class | 1,783 | 2,581 |
| Service Class 2 | 2,358 | 2,869 |
| Investor Class | 67,563 | 64,053 |
| Total | $139,825 | $166,468 |
11. Share Transactions.
Transactions for each class of shares were as follows:
| | Shares | Shares | Dollars | Dollars |
| Years ended December 31, | 2015 | 2014 | 2015 | 2014 |
| Initial Class | | | | |
| Shares sold | 157,200 | 253,552 | $3,129,085 | $4,879,183 |
| Reinvestment of distributions | 76,835 | 74,811 | 1,432,461 | 1,439,710 |
| Shares redeemed | (901,132) | (895,801) | (17,745,220) | (17,160,429) |
| Net increase (decrease) | (667,097) | (567,438) | $(13,183,674) | $(10,841,536) |
| Service Class | | | | |
| Shares sold | 13,010 | 14,063 | $247,977 | $259,729 |
| Reinvestment of distributions | 1,857 | 1,839 | 34,396 | 35,164 |
| Shares redeemed | (33,327) | (19,750) | (645,177) | (371,841) |
| Net increase (decrease) | (18,460) | (3,848) | $(362,804) | $(76,948) |
| Service Class 2 | | | | |
| Shares sold | 37,238 | 33,664 | $719,311 | $633,615 |
| Reinvestment of distributions | 2,155 | 1,638 | 39,698 | 31,182 |
| Shares redeemed | (39,082) | (47,001) | (752,402) | (892,418) |
| Net increase (decrease) | 311 | (11,699) | $6,607 | $(227,621) |
| Investor Class | | | | |
| Shares sold | 1,485,488 | 1,620,922 | $29,406,847 | $30,952,753 |
| Reinvestment of distributions | 72,380 | 50,734 | 1,342,677 | 971,881 |
| Shares redeemed | (422,349) | (323,164) | (8,256,259) | (6,136,794) |
| Net increase (decrease) | 1,135,519 | 1,348,492 | $22,493,265 | $25,787,840 |
12. Other.
The Fund's organizational documents provide former and current trustees and officers with a limited indemnification against liabilities arising in connection with the performance of their duties to the Fund. In the normal course of business, the Fund may also enter into contracts that provide general indemnifications. The Fund's maximum exposure under these arrangements is unknown as this would be dependent on future claims that may be made against the Fund. The risk of material loss from such claims is considered remote.
At the end of the period, the investment adviser or its affiliates were the owners of record of 85% of the total outstanding shares of the Fund.
Report of Independent Registered Public Accounting Firm
To the Trustees of Variable Insurance Products Fund V and Shareholders of VIP Asset Manager: Growth Portfolio:
We have audited the accompanying statement of assets and liabilities of VIP Asset Manager: Growth Portfolio (the Fund), a fund of Variable Insurance Products Fund V, including the schedule of investments, as of December 31, 2015, and the related statement of operations for the year then ended, the statement of changes in net assets for each of the two years in the period then ended, and the financial highlights for each of the five years in the period then ended. These financial statements and financial highlights are the responsibility of the Fund's management. Our responsibility is to express an opinion on these financial statements and financial highlights based on our audits.
We conducted our audits in accordance with the standards of the Public Company Accounting Oversight Board (United States). Those standards require that we plan and perform the audit to obtain reasonable assurance about whether the financial statements and financial highlights are free of material misstatement. The Fund is not required to have, nor were we engaged to perform, an audit of its internal control over financial reporting. Our audits included consideration of internal control over financial reporting as a basis for designing audit procedures that are appropriate in the circumstances, but not for the purpose of expressing an opinion on the effectiveness of the Fund's internal control over financial reporting. Accordingly, we express no such opinion. An audit also includes examining, on a test basis, evidence supporting the amounts and disclosures in the financial statements, assessing the accounting principles used and significant estimates made by management, as well as evaluating the overall financial statement presentation. Our procedures included confirmation of securities owned as of December 31, 2015, by correspondence with the custodians and brokers. We believe that our audits provide a reasonable basis for our opinion.
In our opinion, such financial statements and financial highlights referred to above present fairly, in all material respects, the financial position of VIP Asset Manager: Growth Portfolio as of December 31, 2015, the results of its operations for the year then ended, the changes in its net assets for each of the two years in the period then ended, and the financial highlights for each of the five years in the period then ended, in conformity with accounting principles generally accepted in the United States of America.
DELOITTE & TOUCHE LLP
Boston, Massachusetts
February 22, 2016
Trustees and Officers
The Trustees, Members of the Advisory Board (if any), and officers of the trust and fund, as applicable, are listed below. The Board of Trustees governs the fund and is responsible for protecting the interests of shareholders. The Trustees are experienced executives who meet periodically throughout the year to oversee the fund's activities, review contractual arrangements with companies that provide services to the fund, oversee management of the risks associated with such activities and contractual arrangements, and review the fund's performance. Except for Elizabeth S. Acton, John Engler, and Geoffrey A. von Kuhn, each of the Trustees oversees 236 funds. Ms. Acton and Mr. Engler each oversees 228 funds. Mr. von Kuhn oversees 148 funds.
The Trustees hold office without limit in time except that (a) any Trustee may resign; (b) any Trustee may be removed by written instrument, signed by at least two-thirds of the number of Trustees prior to such removal; (c) any Trustee who requests to be retired or who has become incapacitated by illness or injury may be retired by written instrument signed by a majority of the other Trustees; and (d) any Trustee may be removed at any special meeting of shareholders by a two-thirds vote of the outstanding voting securities of the trust. Each Trustee who is not an interested person (as defined in the 1940 Act) of the trust and the fund is referred to herein as an Independent Trustee. Each Independent Trustee shall retire not later than the last day of the calendar year in which his or her 75th birthday occurs. The Independent Trustees may waive this mandatory retirement age policy with respect to individual Trustees. Officers and Advisory Board Members hold office without limit in time, except that any officer or Advisory Board Member may resign or may be removed by a vote of a majority of the Trustees at any regular meeting or any special meeting of the Trustees. Except as indicated, each individual has held the office shown or other offices in the same company for the past five years.
The fund’s Statement of Additional Information (SAI) includes more information about the Trustees. To request a free copy, call Fidelity at 1-877-208-0098.
Experience, Skills, Attributes, and Qualifications of the Trustees. The Governance and Nominating Committee has adopted a statement of policy that describes the experience, qualifications, attributes, and skills that are necessary and desirable for potential Independent Trustee candidates (Statement of Policy). The Board believes that each Trustee satisfied at the time he or she was initially elected or appointed a Trustee, and continues to satisfy, the standards contemplated by the Statement of Policy. The Governance and Nominating Committee also engages professional search firms to help identify potential Independent Trustee candidates who have the experience, qualifications, attributes, and skills consistent with the Statement of Policy. From time to time, additional criteria based on the composition and skills of the current Independent Trustees, as well as experience or skills that may be appropriate in light of future changes to board composition, business conditions, and regulatory or other developments, have also been considered by the professional search firms and the Governance and Nominating Committee. In addition, the Board takes into account the Trustees' commitment and participation in Board and committee meetings, as well as their leadership of standing and ad hoc committees throughout their tenure.
In determining that a particular Trustee was and continues to be qualified to serve as a Trustee, the Board has considered a variety of criteria, none of which, in isolation, was controlling. The Board believes that, collectively, the Trustees have balanced and diverse experience, qualifications, attributes, and skills, which allow the Board to operate effectively in governing the fund and protecting the interests of shareholders. Information about the specific experience, skills, attributes, and qualifications of each Trustee, which in each case led to the Board's conclusion that the Trustee should serve (or continue to serve) as a trustee of the fund, is provided below.
Board Structure and Oversight Function. Abigail P. Johnson is an interested person and currently serves as Chairman. The Trustees have determined that an interested Chairman is appropriate and benefits shareholders because an interested Chairman has a personal and professional stake in the quality and continuity of services provided to the fund. Independent Trustees exercise their informed business judgment to appoint an individual of their choosing to serve as Chairman, regardless of whether the Trustee happens to be independent or a member of management. The Independent Trustees have determined that they can act independently and effectively without having an Independent Trustee serve as Chairman and that a key structural component for assuring that they are in a position to do so is for the Independent Trustees to constitute a substantial majority for the Board. The Independent Trustees also regularly meet in executive session. Marie L. Knowles serves as Chairman of the Independent Trustees and as such (i) acts as a liaison between the Independent Trustees and management with respect to matters important to the Independent Trustees and (ii) with management prepares agendas for Board meetings.
Fidelity® funds are overseen by different Boards of Trustees. The fund's Board oversees Fidelity's investment-grade bond, money market, asset allocation and certain equity funds, and other Boards oversee Fidelity's high income, sector and other equity funds. The asset allocation funds may invest in Fidelity® funds that are overseen by such other Boards. The use of separate Boards, each with its own committee structure, allows the Trustees of each group of Fidelity® funds to focus on the unique issues of the funds they oversee, including common research, investment, and operational issues. On occasion, the separate Boards establish joint committees to address issues of overlapping consequences for the Fidelity® funds overseen by each Board.
The Trustees operate using a system of committees to facilitate the timely and efficient consideration of all matters of importance to the Trustees, the fund, and fund shareholders and to facilitate compliance with legal and regulatory requirements and oversight of the fund's activities and associated risks. The Board, acting through its committees, has charged FMR and its affiliates with (i) identifying events or circumstances the occurrence of which could have demonstrably adverse effects on the fund's business and/or reputation; (ii) implementing processes and controls to lessen the possibility that such events or circumstances occur or to mitigate the effects of such events or circumstances if they do occur; and (iii) creating and maintaining a system designed to evaluate continuously business and market conditions in order to facilitate the identification and implementation processes described in (i) and (ii) above. Because the day-to-day operations and activities of the fund are carried out by or through FMR, its affiliates, and other service providers, the fund's exposure to risks is mitigated but not eliminated by the processes overseen by the Trustees. While each of the Board's committees has responsibility for overseeing different aspects of the fund's activities, oversight is exercised primarily through the Operations and Audit Committees. In addition, an ad hoc Board committee of Independent Trustees has worked with FMR to enhance the Board's oversight of investment and financial risks, legal and regulatory risks, technology risks, and operational risks, including the development of additional risk reporting to the Board. Appropriate personnel, including but not limited to the fund's Chief Compliance Officer (CCO), FMR's internal auditor, the independent accountants, the fund's Treasurer and portfolio management personnel, make periodic reports to the Board's committees, as appropriate, including an annual review of Fidelity's risk management program for the Fidelity® funds. The responsibilities of each standing committee, including their oversight responsibilities, are described further under "Standing Committees of the Trustees."
Interested Trustees*:
Correspondence intended for a Trustee who is an interested person may be sent to Fidelity Investments, 245 Summer Street, Boston, Massachusetts 02210.
Name, Year of Birth; Principal Occupations and Other Relevant Experience+
Abigail P. Johnson (1961)
Year of Election or Appointment: 2009
Trustee
Chairman of the Board of Trustees
Ms. Johnson also serves as Trustee of other Fidelity® funds. Ms. Johnson serves as President (2013-present) and Chief Executive Officer (2014-present) of FMR LLC (diversified financial services company), President of Fidelity Financial Services (2012-present) and President of Personal, Workplace and Institutional Services (2005-present). Ms. Johnson is Chairman and Director of FMR Co., Inc. (investment adviser firm, 2011-present), Chairman and Director of FMR (investment adviser firm, 2011-present), and the Vice Chairman and Director (2007-present) of FMR LLC. Previously, Ms. Johnson served as President and a Director of FMR (2001-2005), a Trustee of other investment companies advised by FMR, Fidelity Investments Money Management, Inc. (investment adviser firm), and FMR Co., Inc. (2001-2005), Senior Vice President of the Fidelity® funds (2001-2005), and managed a number of Fidelity® funds. Ms. Abigail P. Johnson and Mr. Arthur E. Johnson are not related.
Geoffrey A. von Kuhn (1951)
Year of Election or Appointment: 2015
Trustee
Mr. von Kuhn also serves as Trustee or Member of the Advisory Board of other Fidelity funds. Mr. von Kuhn is Chief Administrative Officer for FMR LLC (diversified financial services company, 2013-present), a Director of Pembroke Real Estate, Inc. (2009-present), and a Director of Discovery Natural Resources LLC (2012-present). Previously, Mr. von Kuhn was a managing director of Crosby Group (private wealth management company, 2007-2013), a member of the management committee and senior executive in the Wealth Management Group of AmSouth Bank (2001-2006), and head of the U.S. private bank at Citigroup (2000-2001).
* Determined to be an “Interested Trustee” by virtue of, among other things, his or her affiliation with the trust or various entities under common control with FMR.
+ The information includes the Trustee's principal occupation during the last five years and other information relating to the experience, attributes, and skills relevant to the Trustee's qualifications to serve as a Trustee, which led to the conclusion that the Trustee should serve as a Trustee for the fund.
Independent Trustees:
Correspondence intended for an Independent Trustee may be sent to Fidelity Investments, P.O. Box 55235, Boston, Massachusetts 02205-5235.
Name, Year of Birth; Principal Occupations and Other Relevant Experience+
Elizabeth S. Acton (1951)
Year of Election or Appointment: 2013
Trustee
Ms. Acton also serves as Trustee or Member of the Advisory Board of other Fidelity® funds. Prior to her retirement in April 2012, Ms. Acton was Executive Vice President, Finance (2011-2012), Executive Vice President, Chief Financial Officer (2002-2011), and Treasurer (2004-2005) of Comerica Incorporated (financial services). Prior to joining Comerica, Ms. Acton held a variety of positions at Ford Motor Company (1983-2002), including Vice President and Treasurer (2000-2002) and Executive Vice President and Chief Financial Officer of Ford Motor Credit Company (1998-2000). Ms. Acton currently serves as a member of the Board of Directors and Audit and Finance Committees of Beazer Homes USA, Inc. (homebuilding, 2012-present).
John Engler (1948)
Year of Election or Appointment: 2014
Trustee
Mr. Engler also serves as Trustee or Member of the Advisory Board of other Fidelity® funds. He serves as president of the Business Roundtable (2011-present), and on the board of directors/trustees for Universal Forest Products (manufacturer and distributor of wood and wood-alternative products, 2003-present) and K12 Inc. (technology-based education company, 2012-present). Previously, Mr. Engler served as a trustee of The Munder Funds (2003-2014), president and CEO of the National Association of Manufacturers (2004-2011), member of the Board of Trustees of the Annie E. Casey Foundation (2004-2015), and as governor of Michigan (1991-2003). He is a past chairman of the National Governors Association.
Albert R. Gamper, Jr. (1942)
Year of Election or Appointment: 2007
Trustee
Mr. Gamper also serves as Trustee of other Fidelity® funds. Prior to his retirement in December 2004, Mr. Gamper served as Chairman of the Board of CIT Group Inc. (commercial finance). During his tenure with CIT Group Inc. Mr. Gamper served in numerous senior management positions, including Chairman (1987-1989; 1999-2001; 2002-2004), Chief Executive Officer (1987-2004), and President (2002-2003). Mr. Gamper currently serves as a member of the Board of Directors of Public Service Enterprise Group (utilities, 2000-present), and Member of the Board of Trustees of Barnabas Health Care System (1997-present). Previously, Mr. Gamper served as Chairman (2012-2015) and Vice Chairman (2011-2012) of the Independent Trustees of certain Fidelity® funds and as Chairman of the Board of Governors, Rutgers University (2004-2007).
Robert F. Gartland (1951)
Year of Election or Appointment: 2010
Trustee
Mr. Gartland also serves as Trustee of other Fidelity® funds. Mr. Gartland is Chairman and an investor in Gartland and Mellina Group Corp. (consulting, 2009-present). Previously, Mr. Gartland served as a partner and investor of Vietnam Partners LLC (investments and consulting, 2008-2011). Prior to his retirement, Mr. Gartland held a variety of positions at Morgan Stanley (financial services, 1979-2007) including Managing Director (1987-2007).
Arthur E. Johnson (1947)
Year of Election or Appointment: 2008
Trustee
Vice Chairman of the Independent Trustees
Mr. Johnson also serves as Trustee of other Fidelity® funds. Mr. Johnson serves as a member of the Board of Directors of Eaton Corporation plc (diversified power management, 2009-present), AGL Resources, Inc. (holding company, 2002-present) and Booz Allen Hamilton (management consulting, 2011-present). Prior to his retirement, Mr. Johnson served as Senior Vice President of Corporate Strategic Development of Lockheed Martin Corporation (defense contractor, 1999-2009). He previously served on the Board of Directors of IKON Office Solutions, Inc. (1999-2008) and Delta Airlines (2005-2007). Mr. Arthur E. Johnson is not related to Ms. Abigail P. Johnson.
Michael E. Kenneally (1954)
Year of Election or Appointment: 2009
Trustee
Mr. Kenneally also serves as Trustee of other Fidelity® funds. Prior to his retirement, Mr. Kenneally served as Chairman and Global Chief Executive Officer of Credit Suisse Asset Management. Before joining Credit Suisse, he was an Executive Vice President and Chief Investment Officer for Bank of America Corporation. Earlier roles at Bank of America included Director of Research, Senior Portfolio Manager and Research Analyst, and Mr. Kenneally was awarded the Chartered Financial Analyst (CFA) designation in 1991.
James H. Keyes (1940)
Year of Election or Appointment: 2007
Trustee
Mr. Keyes also serves as Trustee of other Fidelity® funds. Mr. Keyes serves as a member of the Board and Non-Executive Chairman of Navistar International Corporation (manufacture and sale of trucks, buses, and diesel engines, since 2002). Previously, Mr. Keyes served as a member of the Board of Pitney Bowes, Inc. (integrated mail, messaging, and document management solutions, 1998-2013). Prior to his retirement, Mr. Keyes served as Chairman (1993-2002) and Chief Executive Officer (1988-2002) of Johnson Controls (automotive, building, and energy) and as a member of the Board of LSI Logic Corporation (semiconductor technologies, 1984-2008).
Marie L. Knowles (1946)
Year of Election or Appointment: 2001
Trustee
Chairman of the Independent Trustees
Ms. Knowles also serves as Trustee of other Fidelity® funds. Prior to Ms. Knowles' retirement in June 2000, she served as Executive Vice President and Chief Financial Officer of Atlantic Richfield Company (ARCO) (diversified energy, 1996-2000). From 1993 to 1996, she was a Senior Vice President of ARCO and President of ARCO Transportation Company (pipeline and tanker operations). Ms. Knowles currently serves as a Director and Chairman of the Audit Committee of McKesson Corporation (healthcare service, since 2002). Ms. Knowles is a member of the Board of the Santa Catalina Island Company (real estate, 2009-present). Ms. Knowles is a Member of the Investment Company Institute Board of Governors and a Member of the Governing Council of the Independent Directors Council (2014-present). She also serves as a member of the Advisory Board for the School of Engineering of the University of Southern California. Previously, Ms. Knowles served as a Director of Phelps Dodge Corporation (copper mining and manufacturing, 1994-2007), URS Corporation (engineering and construction, 2000-2003) and America West (airline, 1999-2002). Ms. Knowles previously served as Vice Chairman of the Independent Trustees of certain Fidelity® funds (2012-2015).
+ The information includes the Trustee's principal occupation during the last five years and other information relating to the experience, attributes, and skills relevant to the Trustee's qualifications to serve as a Trustee, which led to the conclusion that the Trustee should serve as a Trustee for the fund.
Advisory Board Members and Officers:
Correspondence intended for an officer may be sent to Fidelity Investments, 245 Summer Street, Boston, Massachusetts 02210. Officers appear below in alphabetical order.
Name, Year of Birth; Principal Occupation
Marc R. Bryant (1966)
Year of Election or Appointment: 2015
Secretary and Chief Legal Officer (CLO)
Mr. Bryant also serves as Secretary and CLO of other funds. Mr. Bryant serves as CLO, Secretary, and Senior Vice President of Fidelity Management & Research Company (investment adviser firm, 2015-present) and FMR Co., Inc. (investment adviser firm, 2015-present); Secretary of Fidelity SelectCo, LLC (investment adviser firm, 2015-present) and Fidelity Investments Money Management, Inc. (investment adviser firm, 2015-present); and CLO of Fidelity Management & Research (Hong Kong) Limited (investment adviser firm, 2015-present). He is Senior Vice President and Deputy General Counsel of FMR LLC (diversified financial services company). Previously, Mr. Bryant served as Secretary and CLO of Fidelity Rutland Square Trust II (2010-2014) and Assistant Secretary of Fidelity's Fixed Income and Asset Allocation Funds (2013-2015). Prior to joining Fidelity Investments, Mr. Bryant served as a Senior Vice President and the Head of Global Retail Legal for AllianceBernstein L.P. (2006-2010), and as the General Counsel for ProFund Advisors LLC (2001-2006).
Jonathan Davis (1968)
Year of Election or Appointment: 2010
Assistant Treasurer
Mr. Davis also serves as Assistant Treasurer of other funds, and is an employee of Fidelity Investments. Previously, Mr. Davis served as Vice President and Associate General Counsel of FMR LLC (diversified financial services company, 2003-2010).
Adrien E. Deberghes (1967)
Year of Election or Appointment: 2010
Assistant Treasurer
Mr. Deberghes also serves as an officer of other funds. He is an employee of Fidelity Investments (2008-present). Prior to joining Fidelity Investments, Mr. Deberghes was Senior Vice President of Mutual Fund Administration at State Street Corporation (2007-2008), Senior Director of Mutual Fund Administration at Investors Bank & Trust (2005-2007), and Director of Finance for Dunkin' Brands (2000-2005).
Stephanie J. Dorsey (1969)
Year of Election or Appointment: 2013
President and Treasurer
Ms. Dorsey also serves as an officer of other funds. She is an employee of Fidelity Investments (2008-present) and has served in other fund officer roles. Prior to joining Fidelity Investments, Ms. Dorsey served as Treasurer (2004-2008) of the JPMorgan Mutual Funds and Vice President (2004-2008) of JPMorgan Chase Bank.
Howard J. Galligan III (1966)
Year of Election or Appointment: 2014
Chief Financial Officer
Mr. Galligan also serves as Chief Financial Officer of other funds. Mr. Galligan serves as President of Fidelity Pricing and Cash Management Services (FPCMS) (2014-present) and as a Director of Strategic Advisers, Inc. (investment adviser firm, 2008-present). Previously, Mr. Galligan served as Chief Administrative Officer of Asset Management (2011-2014) and Chief Operating Officer and Senior Vice President of Investment Support for Strategic Advisers, Inc. (2003-2011).
Scott C. Goebel (1968)
Year of Election or Appointment: 2015
Vice President
Mr. Goebel serves as Vice President of other funds and is an employee of Fidelity Investments (2001-present). Previously, Mr. Goebel served as Secretary of Fidelity SelectCo, LLC (investment adviser firm, 2013-2015), Fidelity Investments Money Management, Inc. (FIMM) (investment adviser firm, 2010-2015), and Fidelity Research and Analysis Company (FRAC) (investment adviser firm, 2010-2015); General Counsel, Secretary, and Senior Vice President of Fidelity Management & Research Company (investment adviser firm, 2008-2015) and FMR Co., Inc. (investment adviser firm, 2008-2015); Assistant Secretary of Fidelity Management & Research (Japan) Limited (investment adviser firm, 2008-2015) and FMR Investment Management (U.K.) Limited (investment adviser firm, 2008-2015); Chief Legal Officer (CLO) of Fidelity Management & Research (Hong Kong) Limited (investment adviser firm, 2008-2015); Secretary and CLO of certain Fidelity® funds (2008-2015); Assistant Secretary of FIMM (2008-2010), FRAC (2008-2010), and certain funds (2007-2008); and as Vice President and Secretary of Fidelity Distributors Corporation (FDC) (2005-2007).
Chris Maher (1972)
Year of Election or Appointment: 2013
Assistant Treasurer
Mr. Maher serves as Assistant Treasurer of other funds. Mr. Maher is Vice President of Valuation Oversight and is an employee of Fidelity Investments. Previously, Mr. Maher served as Vice President of Asset Management Compliance (2013), Vice President of the Program Management Group of FMR (investment adviser firm, 2010-2013), and Vice President of Valuation Oversight (2008-2010).
Jason P. Pogorelec (1975)
Year of Election or Appointment: 2015
Assistant Secretary
Mr. Pogorelec also serves as Assistant Secretary of other funds. Mr. Pogorelec serves as Vice President, Associate General Counsel (2010-present) and is an employee of Fidelity Investments (2006-present).
John F. Papandrea (1972)
Year of Election or Appointment: 2016
Anti-Money Laundering (AML) Officer
Mr. Papandrea also serves as AML Officer of other funds. Mr. Papandrea is Vice President of FMR LLC (diversified financial services company, 2008-present) and is an employee of Fidelity Investments (2005-present).
Nancy D. Prior (1967)
Year of Election or Appointment: 2014
Vice President
Ms. Prior also serves as Vice President of other funds. Ms. Prior serves as a Director of Fidelity Investments Money Management, Inc. (FIMM) (investment adviser firm, 2014-present), President, Fixed Income (2014-present), Vice Chairman of FIAM LLC (investment adviser firm, 2014-present), and is an employee of Fidelity Investments (2002-present). Previously, Ms. Prior served as Vice President of Fidelity's Money Market Funds (2012-2014), President, Money Market and Short Duration Bond Group of Fidelity Management & Research (FMR) (investment adviser firm, 2013-2014), President, Money Market Group of FMR (2011-2013), Managing Director of Research (2009-2011), Senior Vice President and Deputy General Counsel (2007-2009), and Assistant Secretary of other Fidelity® funds (2008-2009).
Kenneth B. Robins (1969)
Year of Election or Appointment: 2009
Assistant Treasurer
Mr. Robins also serves as an officer of other funds. Mr. Robins serves as Executive Vice President of Fidelity Investments Money Management, Inc. (FIMM) (investment adviser firm, 2013-present) and is an employee of Fidelity Investments (2004-present). Previously, Mr. Robins served in other fund officer roles.
Stacie M. Smith (1974)
Year of Election or Appointment: 2013
Assistant Treasurer
Ms. Smith also serves as an officer of other funds. She is an employee of Fidelity Investments (2009-present) and has served in other fund officer roles. Prior to joining Fidelity Investments, Ms. Smith served as Senior Audit Manager of Ernst & Young LLP (1996-2009).
Renee Stagnone (1975)
Year of Election or Appointment: 2013
Deputy Treasurer
Ms. Stagnone also serves as Deputy Treasurer of other funds. Ms. Stagnone is an employee of Fidelity Investments (1997-present).
Michael H. Whitaker (1967)
Year of Election or Appointment: 2008
Chief Compliance Officer
Mr. Whitaker also serves as Chief Compliance Officer of other funds. Mr. Whitaker also serves as Compliance Officer of FMR Co., Inc. (investment adviser firm, 2014-present), FMR (investment adviser firm, 2014-present), and Fidelity Investments Money Management, Inc. (investment adviser firm, 2014-present) and is an employee of Fidelity Investments (2007-present). Prior to joining Fidelity Investments, Mr. Whitaker worked at MFS Investment Management where he served as Senior Vice President and Chief Compliance Officer (2004-2006), and Assistant General Counsel.
Derek L. Young (1964)
Year of Election or Appointment: 2009
Vice President of Fidelity's Asset Allocation Funds
Mr. Young also serves as an officer of other funds. He is a Director of Strategic Advisers, Inc. (investment adviser firm, 2011-present), President of Fidelity Global Asset Allocation (GAA) (2011-present), and Vice Chairman of FIAM LLC (investment adviser firm, 2011-present). Previously, Mr. Young served as Trustee of certain funds (2012-2015), President of Strategic Advisers, Inc. (2011-2015), Chief Investment Officer of GAA (2009-2011), and as a portfolio manager.
Joseph F. Zambello (1957)
Year of Election or Appointment: 2011
Deputy Treasurer
Mr. Zambello also serves as Deputy Treasurer of other funds. Mr. Zambello is an employee of Fidelity Investments (1991-present). Previously, Mr. Zambello served as Vice President of the Program Management Group of FMR (investment adviser firm, 2009-2011) and Vice President of the Transfer Agent Oversight Group (2005-2009).
Shareholder Expense Example
As a shareholder of the Fund, you incur two types of costs: (1) transaction costs, and (2) ongoing costs, including management fees, distribution and/or service (12b-1) fees and other Fund expenses. This Example is intended to help you understand your ongoing costs (in dollars) of investing in the Fund and to compare these costs with the ongoing costs of investing in other mutual funds.
The Example is based on an investment of $1,000 invested at the beginning of the period and held for the entire period (July 1, 2015 to December 31, 2015).
Actual Expenses
The first line of the accompanying table for each class of the Fund provides information about actual account values and actual expenses. You may use the information in this line, together with the amount you invested, to estimate the expenses that you paid over the period. Simply divide your account value by $1,000.00 (for example, an $8,600 account value divided by $1,000.00 = 8.6), then multiply the result by the number in the first line for a class of the Fund under the heading entitled "Expenses Paid During Period" to estimate the expenses you paid on your account during this period. The estimate of expenses does not include any fees or other expenses of any variable annuity or variable life insurance product. If they were, the estimate of expenses you paid during the period would be higher, and your ending account value would be lower. In addition, the Fund, as a shareholder in the underlying Fidelity Central Funds, will indirectly bear its pro-rata share of the fees and expenses incurred by the underlying Fidelity Central Funds. These fees and expenses are not included in the Fund's annualized expense ratio used to calculate the expense estimate in the table below.
Hypothetical Example for Comparison Purposes
The second line of the accompanying table for each class of the Fund provides information about hypothetical account values and hypothetical expenses based on a Class' actual expense ratio and an assumed rate of return of 5% per year before expenses, which is not the Class' actual return. The hypothetical account values and expenses may not be used to estimate the actual ending account balance or expenses you paid for the period. You may use this information to compare the ongoing costs of investing in the Fund and other funds. To do so, compare this 5% hypothetical example with the 5% hypothetical examples that appear in the shareholder reports of the other funds. The estimate of expenses does not include any fees or other expenses of any variable annuity or variable life insurance product. If they were, the estimate of expenses you paid during the period would be higher, and your ending account value would be lower. In addition, the Fund, as a shareholder in the underlying Fidelity Central Funds, will indirectly bear its pro-rata share of the fees and expenses incurred by the underlying Fidelity Central Funds. These fees and expenses are not included in the Fund's annualized expense ratio used to calculate the expense estimate in the table below.
Please note that the expenses shown in the table are meant to highlight your ongoing costs only and do not reflect any transaction costs. Therefore, the second line of the table is useful in comparing ongoing costs only, and will not help you determine the relative total costs of owning different funds.
In addition to the expenses noted below, the Fund also indirectly bears its proportional share of the expenses of the underlying Fidelity Central Funds. Annualized expenses of the underlying non-money market Fidelity Central Funds as of their most recent fiscal half year ranged from less than .005% to .22%.
| | Annualized Expense Ratio-A | Beginning
Account Value
July 1, 2015 | Ending
Account Value
December 31, 2015 | Expenses Paid
During Period-B
July 1, 2015
to December 31, 2015 |
| Initial Class | .69% | | | |
| Actual | | $1,000.00 | $958.60 | $3.41 |
| Hypothetical-C | | $1,000.00 | $1,021.73 | $3.52 |
| Service Class | .79% | | | |
| Actual | | $1,000.00 | $958.30 | $3.90 |
| Hypothetical-C | | $1,000.00 | $1,021.22 | $4.02 |
| Service Class 2 | .94% | | | |
| Actual | | $1,000.00 | $957.70 | $4.64 |
| Hypothetical-C | | $1,000.00 | $1,020.47 | $4.79 |
| Investor Class | .77% | | | |
| Actual | | $1,000.00 | $958.70 | $3.80 |
| Hypothetical-C | | $1,000.00 | $1,021.32 | $3.92 |
A Annualized expense ratio reflects expenses net of applicable fee waivers.
B Expenses are equal to each Class' annualized expense ratio, multiplied by the average account value over the period, multiplied by 184/365 (to reflect the one-half year period). The fees and expenses of the underlying Fidelity Central Funds in which the Fund invests are not included in each Class' annualized expense ratio.
C 5% return per year before expenses
Distributions (Unaudited)
The Board of Trustees of VIP Asset Manager: Growth Portfolio voted to pay to shareholders of record at the opening of business on record date, the following distributions per share derived from capital gains realized from sales of portfolio securities, and dividends derived from net investment income:
| | Pay Date | Record Date | Dividends | Capital Gains |
| Initial Class | 02/12/2016 | 02/12/2016 | $0.005 | $0.264 |
| Service Class | 02/12/2016 | 02/12/2016 | $0.005 | $0.264 |
| Service Class 2 | 02/12/2016 | 02/12/2016 | $0.005 | $0.264 |
| Investor Class | 02/12/2016 | 02/12/2016 | $0.005 | $0.264 |
Initial Class designates 28%, Service Class designates 31%, Service Class 2 designates 35%, and Investor Class designates 30%, of the dividends distributed in December 2015 as qualifying for the dividends–received deduction for corporate shareholders.
A total of 2.1804% of the dividends distributed during the fiscal year was derived from interest on U.S. Government securities which is generally exempt from state income tax.
Board Approval of Investment Advisory Contracts and Management Fees
VIP Asset Manager: Growth Portfolio
Each year, the Board of Trustees, including the Independent Trustees (together, the Board), votes on the renewal of the management contract with Fidelity Management & Research Company (FMR) and the sub-advisory agreements (together, the Advisory Contracts) for the fund. The Board, assisted by the advice of fund counsel and Independent Trustees' counsel, requests and considers a broad range of information relevant to the renewal of the Advisory Contracts throughout the year.
The Board meets regularly and, at each of its meetings, covers an extensive agenda of topics and materials and considers factors that are relevant to its annual consideration of the renewal of the fund's Advisory Contracts, including the services and support provided to the fund and its shareholders. The Board has established four standing committees (Committees) — Operations, Audit, Fair Valuation, and Governance and Nominating — each composed of and chaired by Independent Trustees with varying backgrounds, to which the Board has assigned specific subject matter responsibilities in order to enhance effective decision-making by the Board. The Operations Committee, of which all of the Independent Trustees are members, meets regularly throughout the year and considers, among other matters, information specifically related to the annual consideration of the renewal of the fund's Advisory Contracts. The Board, acting directly and through its Committees, requests and receives information concerning the annual consideration of the renewal of the fund's Advisory Contracts. The Board also meets as needed to consider matters specifically related to the Board's annual consideration of the renewal of the Advisory Contracts. Members of the Board may also meet with trustees of other Fidelity funds through ad hoc joint committees to discuss certain matters relevant to all of the Fidelity funds.
At its September 2015 meeting, the Board unanimously determined to renew the fund's Advisory Contracts. In reaching its determination, the Board considered all factors it believed relevant, including (i) the nature, extent, and quality of the services to be provided to the fund and its shareholders (including the investment performance of the fund); (ii) the competitiveness of the fund's management fee and total expense ratio relative to peer funds; (iii) the total costs of the services to be provided by and the profits to be realized by Fidelity from its relationship with the fund; and (iv) the extent to which (if any) economies of scale exist and would be realized as the fund grows, and whether any economies of scale are appropriately shared with fund shareholders.
In considering whether to renew the Advisory Contracts for the fund, the Board reached a determination, with the assistance of fund counsel and Independent Trustees' counsel and through the exercise of its business judgment, that the renewal of the Advisory Contracts was in the best interests of the fund and its shareholders and that the compensation payable under the Advisory Contracts was fair and reasonable. The Board's decision to renew the Advisory Contracts was not based on any single factor, but rather was based on a comprehensive consideration of all the information provided to the Board at its meetings throughout the year. The Board, in reaching its determination to renew the Advisory Contracts, was aware that shareholders of the fund have a broad range of investment choices available to them, including a wide choice among funds offered by Fidelity's competitors, and that the fund's shareholders, who have the opportunity to review and weigh the disclosure provided by the fund in its prospectus and other public disclosures, have chosen to invest in this fund, which is part of the Fidelity family of funds.
Nature, Extent, and Quality of Services Provided. The Board considered Fidelity's staffing as it relates to the fund, including the backgrounds of investment personnel of Fidelity, and also considered the fund's investment objective, strategies, and related investment philosophy. The Independent Trustees also had discussions with senior management of Fidelity's investment operations and investment groups. The Board considered the structure of the portfolio manager compensation program and whether this structure provides appropriate incentives to act in the best interests of the fund. Additionally, the Board considered the portfolio managers' investments, if any, in the funds that they manage.
Resources Dedicated to Investment Management and Support Services. The Board reviewed the general qualifications and capabilities of Fidelity's investment staff, including its size, education, experience, and resources, as well as Fidelity's approach to recruiting, training, managing, and compensating investment personnel. The Board noted that Fidelity has continued to increase the resources devoted to non-U.S. offices, including expansion of Fidelity's global investment organization. The Board also noted that Fidelity's analysts have extensive resources, tools and capabilities that allow them to conduct sophisticated quantitative and fundamental analysis, as well as credit analysis of issuers, counterparties and guarantors. Further, the Board considered that Fidelity's investment professionals have sufficient access to global information and data so as to provide competitive investment results over time, and that those professionals also have access to sophisticated tools that permit them to assess portfolio construction and risk and performance attribution characteristics continuously, as well as to transmit new information and research conclusions rapidly around the world. Additionally, in its deliberations, the Board considered Fidelity's trading, risk management, compliance, and technology and operations capabilities and resources, which are integral parts of the investment management process.
Shareholder and Administrative Services. The Board considered (i) the nature, extent, quality, and cost of advisory, administrative, and shareholder services performed by FMR, the sub-advisers (together with FMR, the Investment Advisers), and their affiliates under the Advisory Contracts and under separate agreements covering transfer agency, pricing and bookkeeping, and securities lending services for the fund; (ii) the nature and extent of the supervision of third party service providers, principally custodians, subcustodians, and pricing vendors; and (iii) the resources devoted to, and the record of compliance with, the fund's compliance policies and procedures. The Board also reviewed the allocation of fund brokerage, including allocations to brokers affiliated with the Investment Advisers, the use of brokerage commissions to pay fund expenses, and the use of "soft" commission dollars to pay for research services.
The Board noted that the growth of fund assets over time across the complex allows Fidelity to reinvest in the development of services designed to enhance the value or convenience of the Fidelity funds as investment vehicles. These services include 24-hour access to account information and market information through telephone representatives and over the Internet, investor education materials and asset allocation tools, and the expanded availability of Fidelity Investor Centers.
Investment in a Large Fund Family. The Board considered the benefits to shareholders of investing in a Fidelity fund, including the benefits of investing in a fund that is part of a large family of funds offering a variety of investment disciplines and providing a large variety of mutual fund investor services. The Board noted that Fidelity had taken, or had made recommendations that resulted in the Fidelity funds taking, a number of actions over the previous year that benefited particular funds, including (i) continuing to dedicate additional resources to investment research and to the support of the senior management team that oversees asset management; (ii) continuing efforts to enhance Fidelity's global research capabilities; (iii) launching new funds and making other enhancements to meet client needs; (iv) reducing management fees and total expenses for certain index funds and diversified international funds; (v) continuing to launch dedicated lower cost underlying funds to meet portfolio construction needs related to expanding underlying fund options for Fidelity funds of funds, specifically for the Freedom Fund product lines; (vi) rationalizing product lines and gaining increased efficiencies through fund mergers; (vii) launching active fixed-income exchange-traded funds; (viii) continuing to develop, acquire and implement systems and technology to improve services to the funds and shareholders, strengthen information security, and increase efficiency; (ix) implementing investment enhancements to further strengthen Fidelity's target date product line to increase investors' probability of success in achieving their goals; (x) modifying the eligibility criteria for certain share classes to accommodate roll-over assets from employer-sponsored retirement plans; (xi) launching a new Class W of the Freedom Index Funds to attract and retain Fidelity record-kept retirement plan assets; and (xii) implementing changes to Fidelity's money market product line in response to recent money market regulatory reforms.
Investment Performance. The Board considered whether the fund has operated in accordance with its investment objective, as well as its record of compliance with its investment restrictions and its performance history.
The Board took into account discussions with representatives of the Investment Advisers about fund investment performance that occur at Board meetings throughout the year. In this regard the Board noted that as part of regularly scheduled fund reviews and other reports to the Board on fund performance, the Board considers annualized return information for the fund for different time periods, measured against one or more securities market indices, including a customized blended index representative of the fund's asset classes (each a "benchmark index") and a peer group of funds with similar objectives ("peer group"), if any. In its evaluation of fund investment performance at meetings throughout the year, the Board gave particular attention to information indicating underperformance of certain Fidelity funds for specific time periods and discussed with the Investment Advisers the reasons for such underperformance.
In addition to reviewing absolute and relative fund performance, the Independent Trustees periodically consider the appropriateness of fund performance metrics in evaluating the results achieved. In general, the Independent Trustees believe that fund performance should be evaluated based on gross performance (before fees and expenses but after transaction costs) compared to appropriate benchmark indices, over appropriate time periods that may include full market cycles, and on net performance (after fees and expenses) compared to peer groups, as applicable, over the same periods, taking into account relevant factors including the following: general market conditions; expectations for interest rate levels and credit conditions; issuer-specific information including credit quality; and fund cash flows and other factors. Depending on the circumstances, the Independent Trustees may be satisfied with a fund's performance notwithstanding that it lags its benchmark index or peer group for certain periods.
The Independent Trustees recognize that shareholders evaluate performance on a net basis over their own holding periods, for which one-, three-, and five-year periods are often used as a proxy. For this reason, the performance information reviewed by the Board also included net cumulative calendar year total return information for the fund and an appropriate benchmark index and peer group for the most recent one-, three-, and five-year periods.
Based on its review, the Board concluded that the nature, extent, and quality of services provided to the fund under the Advisory Contracts should benefit the shareholders of the fund.
Competitiveness of Management Fee and Total Expense Ratio. The Board considered the fund's management fee and total expense ratio compared to "mapped groups" of competitive funds and classes created for the purpose of facilitating the Trustees' competitive analysis of management fees and total expenses. Fidelity creates "mapped groups" by combining similar Lipper investment objective categories that have comparable investment mandates. Combining Lipper investment objective categories aids the Board's management fee and total expense ratio comparisons by broadening the competitive group used for comparison.
Management Fee. The Board considered two proprietary management fee comparisons for the 12-month periods shown in basis points (BP) in the chart below. The group of Lipper funds used by the Board for management fee comparisons is referred to below as the "Total Mapped Group." The Total Mapped Group comparison focuses on a fund's standing in terms of gross management fees before expense reimbursements or caps relative to the total universe of funds with comparable investment mandates, regardless of whether their management fee structures also are comparable. Funds with comparable investment mandates offer exposure to similar types of securities. Funds with comparable management fee structures have similar management fee contractual arrangements (
e.g., flat rate charged for advisory services, all-inclusive fee rate,
etc.). "TMG %" represents the percentage of funds in the Total Mapped Group that had management fees that were lower than the fund's. For example, a hypothetical TMG % of 20% would mean that 80% of the funds in the Total Mapped Group had higher, and 20% had lower, management fees than the fund. The fund's actual TMG %s and the number of funds in the Total Mapped Group are in the chart below. The "Asset-Size Peer Group" (ASPG) comparison focuses on a fund's standing relative to a subset of non-Fidelity funds within the Total Mapped Group that are similar in size and management fee structure. For example, if a fund is in the first quartile of the ASPG, the fund's management fee ranks in the least expensive or lowest 25% of funds in the ASPG. The ASPG represents at least 15% of the funds in the Total Mapped Group with comparable asset size and management fee structures, subject to a minimum of 50 funds (or all funds in the Total Mapped Group if fewer than 50). Additional information, such as the ASPG quartile in which the fund's management fee rate ranked, is also included in the chart and considered by the Board.
VIP Asset Manager: Growth Portfolio
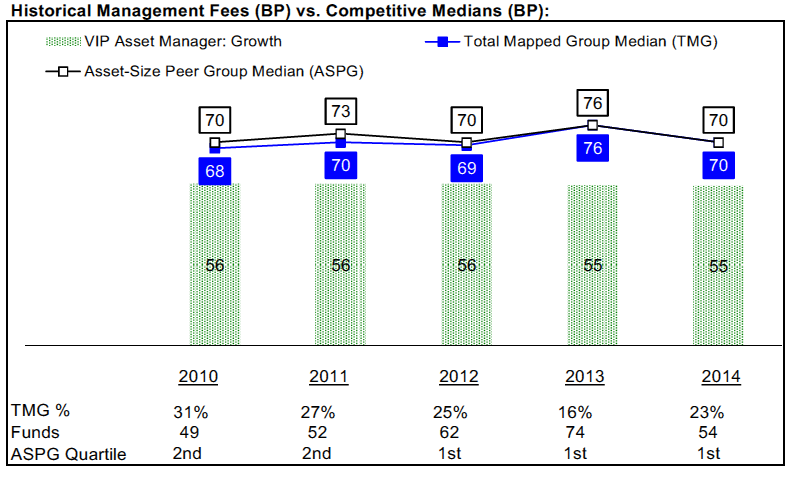
The Board noted that the fund's management fee rate ranked below the median of its Total Mapped Group and below the median of its ASPG for 2014.
The Board noted that, in 2014, the ad hoc Committee on Group Fee was formed by it and other Fidelity fund boards to conduct an in-depth review of the "group fee" component of the management fee of funds with such management fee structures. Committee focus included the mechanics of the group fee, the competitive landscape of group fee structures, Fidelity funds with no group fee component and investment products not included in group fee assets. The Board also considered that, for funds subject to the group fee, FMR agreed to voluntarily waive fees over a specified period of time in amounts designed to account for assets converted from certain funds to certain collective investment trusts.
Based on its review, the Board concluded that the fund's management fee is fair and reasonable in light of the services that the fund receives and the other factors considered.
Total Expense Ratio. In its review of each class's total expense ratio, the Board considered the fund's management fee rate as well as other fund or class expenses, as applicable, such as transfer agent fees, pricing and bookkeeping fees, fund-paid 12b-1 fees, and custodial, legal, and audit fees. The Board also noted that Fidelity may agree to waive fees and expenses from time to time, and the extent to which, if any, it has done so for the fund. As part of its review, the Board also considered the current and historical total expense ratios of each class of the fund compared to competitive fund median expenses. Each class of the fund is compared to those funds and classes in the Total Mapped Group (used by the Board for management fee comparisons) that have a similar sales load structure.
The Board noted that the total expense ratio of each of Initial Class, Investor Class, and Service Class ranked below its competitive median for 2014 and the total expense ratio of Service Class 2 ranked above its competitive median for 2014. The Board considered that, in general, various factors can affect total expense ratios. The Board noted that the total expense ratio of Service Class 2 was above the competitive median primarily because of higher 12b-1 fees for Service Class 2 as compared to most competitor funds. The Board noted that the fund offers multiple classes, each of which has a different 12b-1 fee structure, and that the multiple structures are intended to offer a range of pricing options for the intermediary market. The Board also noted that the total expense ratios of the classes vary primarily by the level of their 12b-1 fees, although differences in transfer agent fees may also cause expenses to vary from class to class.
Fees Charged to Other Fidelity Clients. The Board also considered Fidelity fee structures and other information with respect to clients of Fidelity, such as other funds advised or subadvised by Fidelity, pension plan clients, and other institutional clients with similar mandates. The Board noted the findings of the 2013 ad hoc joint committee (created with the board of other Fidelity funds), which reviewed and compared Fidelity's institutional investment advisory business with its business of providing services to the Fidelity funds, including the differences in services provided, fees charged, and costs incurred, as well as competition in their respective marketplaces.
Based on its review of total expense ratios and fees charged to other Fidelity clients, the Board concluded that, although Service Class 2 was above the median of the universe presented for comparison, the total expense ratio of each class of the fund was reasonable in light of the services that the fund and its shareholders receive and the other factors considered.
Costs of the Services and Profitability. The Board considered the revenues earned and the expenses incurred by Fidelity in conducting the business of developing, marketing, distributing, managing, administering and servicing the fund and servicing the fund's shareholders. The Board also considered the level of Fidelity's profits in respect of all the Fidelity funds.
On an annual basis, Fidelity presents to the Board information about the profitability of its relationship with the fund. Fidelity calculates profitability information for each fund, as well as aggregate profitability information for groups of Fidelity funds and all Fidelity funds, using a series of detailed revenue and cost allocation methodologies which originate with the books and records of Fidelity on which Fidelity's audited financial statements are based. The Audit Committee of the Board reviews any significant changes from the prior year's methodologies.
PricewaterhouseCoopers LLP (PwC), independent registered public accounting firm and auditor to Fidelity and certain Fidelity funds, has been engaged annually by the Board as part of the Board's assessment of Fidelity's profitability analysis. PwC's engagement includes the review and assessment of the methodologies used by Fidelity in determining the revenues and expenses attributable to Fidelity's mutual fund business, and completion of agreed-upon procedures in respect of the mathematical accuracy of fund profitability and its conformity to established allocation methodologies. After considering PwC's reports issued under the engagement and information provided by Fidelity, the Board concluded that while other allocation methods may also be reasonable, Fidelity's profitability methodologies are reasonable in all material respects.
The Board also reviewed Fidelity's non-fund businesses and fall-out benefits related to the mutual fund business as well as cases where Fidelity's affiliates may benefit from or be related to the fund's business.
The Board considered the costs of the services provided by and the profits realized by Fidelity in connection with the operation of the fund and was satisfied that the profitability was not excessive.
Economies of Scale. The Board considered whether there have been economies of scale in respect of the management of the Fidelity funds, whether the Fidelity funds (including the fund) have appropriately benefited from any such economies of scale, and whether there is potential for realization of any further economies of scale. The Board considered the extent to which the fund will benefit from economies of scale as assets grow through increased services to the fund, through waivers or reimbursements, or through fee or expense ratio reductions. The Board also noted that in 2013, it and the boards of other Fidelity funds created an ad hoc committee (the Economies of Scale Committee) to analyze whether Fidelity attains economies of scale in respect of the management and servicing of the Fidelity funds, whether the Fidelity funds have appropriately benefited from such economies of scale, and whether there is potential for realization of any further economies of scale.
The Board recognized that the fund's management contract incorporates a "group fee" structure, which provides for lower group fee rates as total group assets increase, and for higher group fee rates as total group assets decrease (with "group assets" defined to include fund assets under FMR's management plus sector fund assets previously under FMR's management and currently managed by Fidelity SelectCo, LLC). FMR calculates the group fee rates based on a tiered asset "breakpoint" schedule that varies based on asset class. The Board considered that the group fee is designed to deliver the benefits of economies of scale to fund shareholders when total Fidelity fund assets increase, even if assets of any particular fund are unchanged or have declined, because some portion of Fidelity's costs are attributable to services provided to all Fidelity funds, and all funds benefit if those costs can be allocated among more assets. The Board concluded that, given the group fee structure, fund shareholders will benefit from lower management fees as group assets increase at the fund complex level, regardless of whether Fidelity achieves any such economies of scale.
The Board concluded, taking into account the analysis of the Economies of Scale Committee, that economies of scale, if any, are being appropriately shared between fund shareholders and Fidelity.
Additional Information Requested by the Board. In order to develop fully the factual basis for consideration of the Fidelity funds' Advisory Contracts, the Board requested and received additional information on certain topics, including: (i) Fidelity's fund profitability methodology, profitability trends for certain funds, and the impact of certain factors on fund profitability results; (ii) portfolio manager changes that have occurred during the past year and the amount of the investment that each portfolio manager has made in the Fidelity fund(s) that he or she manages; (iii) Fidelity's compensation structure for portfolio managers, research analysts, and other key personnel, including its effects on fund profitability, the rationale for the compensation structure, and the extent to which current market conditions have affected retention and recruitment; (iv) the arrangements with and compensation paid to certain fund sub-advisers on behalf of the Fidelity funds; (v) Fidelity's voluntary waiver of its fees to maintain minimum yields for certain money market funds and classes as well as contractual waivers in place for certain funds; (vi) the methodology with respect to competitive fund data and peer group classifications; (vii) Fidelity's transfer agent fee, expense, and service structures for different funds and classes relative to competitive trends, and the impact of the increased use of omnibus accounts; (viii) Fidelity's long-term expectations for its offerings in the workplace investing channel; (ix) new developments in the retail and institutional marketplaces; and (x) the impact of money market reform on Fidelity's money market funds. In addition, the Board considered its discussions with Fidelity throughout the year regarding enhanced information security initiatives and the funds' fair valuation policies.
Based on its evaluation of all of the conclusions noted above, and after considering all factors it believed relevant, the Board concluded that the advisory fee structures are fair and reasonable, and that the fund's Advisory Contracts should be renewed.
Proxy Voting Results
A special meeting of shareholders was held on May 12, 2015. The results of votes taken among shareholders on the proposal before them are reported below. Each vote reported represents one dollar of net asset value held on the record date for the meeting.
PROPOSAL 1
To elect a Board of Trustees.
| | # of
Votes | % of
Votes |
| Elizabeth S. Acton | | |
| Affirmative | 24,469,831,790.28 | 97.003 |
| Withheld | 756,086,184.43 | 2.997 |
| TOTAL | 25,225,917,974.71 | 100.000 |
| John Engler | | |
| Affirmative | 24,404,438,415.74 | 96.744 |
| Withheld | 821,479,558.97 | 3.256 |
| TOTAL | 25,225,917,974.71 | 100.000 |
| Albert R. Gamper, Jr. | | |
| Affirmative | 24,431,670,090.08 | 96.852 |
| Withheld | 794,247,884.63 | 3.148 |
| TOTAL | 25,225,917,974.71 | 100.000 |
| Robert F. Gartland | | |
| Affirmative | 24,472,637,370.54 | 97.014 |
| Withheld | 753,280,604.17 | 2.986 |
| TOTAL | 25,225,917,974.71 | 100.000 |
| Abigail P. Johnson | | |
| Affirmative | 24,442,024,432.82 | 96.893 |
| Withheld | 783,893,541.89 | 3.107 |
| TOTAL | 25,225,917,974.71 | 100.000 |
| Arthur E. Johnson | | |
| Affirmative | 24,444,583,833.78 | 96.903 |
| Withheld | 781,334,140.93 | 3.097 |
| TOTAL | 25,225,917,974.71 | 100.000 |
| Michael E. Kenneally | | |
| Affirmative | 24,475,874,452.78 | 97.027 |
| Withheld | 750,043,521.93 | 2.973 |
| TOTAL | 25,225,917,974.71 | 100.000 |
| James H. Keyes | | |
| Affirmative | 24,434,496,321.71 | 96.863 |
| Withheld | 791,421,653.00 | 3.137 |
| TOTAL | 25,225,917,974.71 | 100.000 |
| Marie L. Knowles | | |
| Affirmative | 24,446,177,909.79 | 96.909 |
| Withheld | 779,740,064.92 | 3.091 |
| TOTAL | 25,225,917,974.71 | 100.000 |
| Geoffrey A. von Kuhn | | |
| Affirmative | 24,444,403,935.60 | 96.902 |
| Withheld | 781,514,039.11 | 3.098 |
| TOTAL | 25,225,917,974.71 | 100.000 |
| Proposal 1 reflects trust wide proposal and voting results. |
VIPAMG-ANN-0216
1.540207.118
Fidelity® Variable Insurance Products:
Investor Freedom® Funds - Income, 2005, 2010, 2015, 2020, 2025, 2030
Annual Report December 31, 2015 |
|
Contents
To view a fund's proxy voting guidelines and proxy voting record for the 12-month period ended June 30, visit http://www.fidelity.com/proxyvotingresults or visit the Securities and Exchange Commission's (SEC) web site at http://www.sec.gov.
You may also call 1-877-208-0098 to request a free copy of the proxy voting guidelines.
Fidelity® Variable Insurance Products are separate account options which are purchased through a variable insurance contract.
Standard & Poor's, S&P and S&P 500 are registered service marks of The McGraw-Hill Companies, Inc. and have been licensed for use by Fidelity Distributors Corporation.
Other third-party marks appearing herein are the property of their respective owners.
All other marks appearing herein are registered or unregistered trademarks or service marks of FMR LLC or an affiliated company. © 2016 FMR LLC. All rights reserved.
This report and the financial statements contained herein are submitted for the general information of the shareholders of the Funds. This report is not authorized for distribution to prospective investors in the Funds unless preceded or accompanied by an effective prospectus.
A fund files its complete schedule of portfolio holdings with the SEC for the first and third quarters of each fiscal year on Form N-Q. Forms N-Q are available on the SEC’s web site at http://www.sec.gov. A fund's Forms N-Q may be reviewed and copied at the SEC’s Public Reference Room in Washington, DC. Information regarding the operation of the SEC's Public Reference Room may be obtained by calling 1-800-SEC-0330.
For a complete list of a fund's portfolio holdings, view the most recent holdings listing, semiannual report, or annual report on Fidelity's web site at http://www.fidelity.com, http://www.advisor.fidelity.com, or http://www.401k.com, as applicable.
NOT FDIC INSURED •MAY LOSE VALUE •NO BANK GUARANTEE
Neither the Funds nor Fidelity Distributors Corporation is a bank.
VIP Investor Freedom Income Portfolio℠
Performance: The Bottom Line
Average annual total return reflects the change in the value of an investment, assuming reinvestment of distributions from dividend income and capital gains (the profits earned upon the sale of securities that have grown in value, if any) and assuming a constant rate of performance each year. During periods of reimbursement by Fidelity, a fund’s total return will be greater than it would be had the reimbursement not occurred. Performance numbers are net of all underlying fund operating expenses, but do not include any insurance charges imposed by your insurance company’s separate account. If performance information included the effect of these additional charges, the total returns would have been lower. How a fund did yesterday is no guarantee of how it will do tomorrow.
Average Annual Total Returns
| For the periods ended December 31, 2015 | Past 1 year | Past 5 years | Past 10 years |
| VIP Investor Freedom Income Portfolio | (0.37)% | 3.36% | 3.97% |
$10,000 Over 10 Years
Let's say hypothetically that $10,000 was invested in VIP Investor Freedom Income Portfolio℠ on December 31, 2005.
The chart shows how the value of your investment would have changed, and also shows how the Barclays® U.S. Aggregate Bond Index performed over the same period.
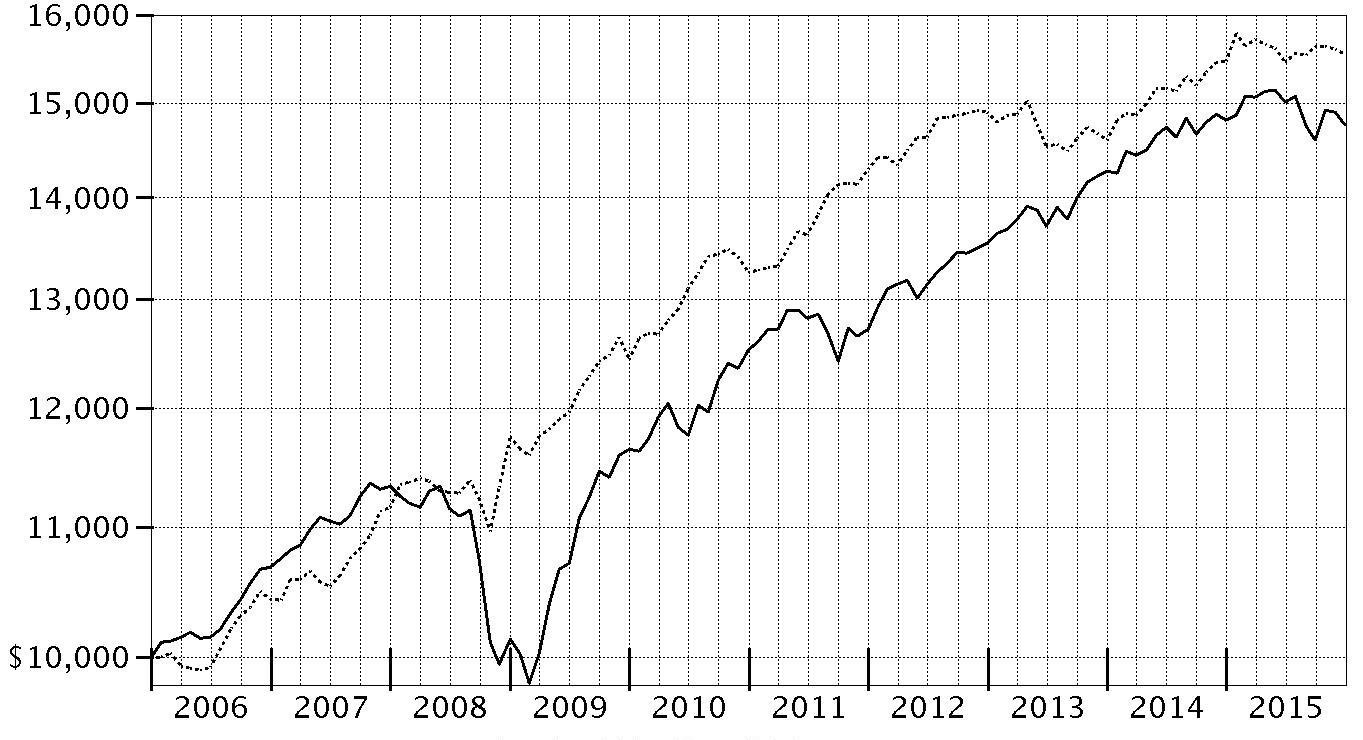
| Period Ending Values |
| $14,763 | VIP Investor Freedom Income Portfolio℠ |
| $15,552 | Barclays® U.S. Aggregate Bond Index |
VIP Investor Freedom 2005 Portfolio℠
Performance: The Bottom Line
Average annual total return reflects the change in the value of an investment, assuming reinvestment of distributions from dividend income and capital gains (the profits earned upon the sale of securities that have grown in value, if any) and assuming a constant rate of performance each year. During periods of reimbursement by Fidelity, a fund’s total return will be greater than it would be had the reimbursement not occurred. Performance numbers are net of all underlying fund operating expenses, but do not include any insurance charges imposed by your insurance company’s separate account. If performance information included the effect of these additional charges, the total returns would have been lower. How a fund did yesterday is no guarantee of how it will do tomorrow.
Average Annual Total Returns
| For the periods ended December 31, 2015 | Past 1 year | Past 5 years | Past 10 years |
| VIP Investor Freedom 2005 Portfolio | (0.31)% | 4.57% | 4.47% |
$10,000 Over 10 Years
Let's say hypothetically that $10,000 was invested in VIP Investor Freedom 2005 Portfolio℠ on December 31, 2005.
The chart shows how the value of your investment would have changed, and also shows how the Barclays® U.S. Aggregate Bond Index performed over the same period.
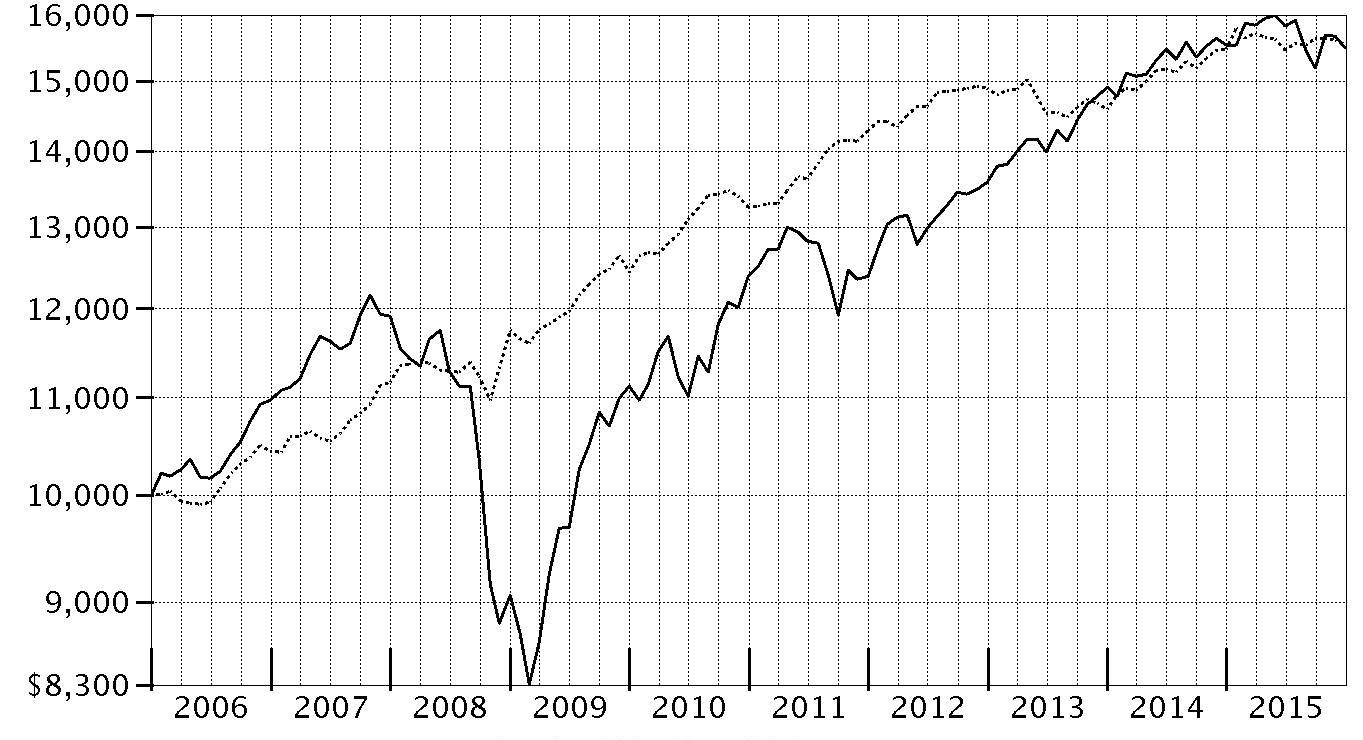
| Period Ending Values |
| $15,488 | VIP Investor Freedom 2005 Portfolio℠ |
| $15,552 | Barclays® U.S. Aggregate Bond Index |
VIP Investor Freedom 2010 Portfolio℠
Performance: The Bottom Line
Average annual total return reflects the change in the value of an investment, assuming reinvestment of distributions from dividend income and capital gains (the profits earned upon the sale of securities that have grown in value, if any) and assuming a constant rate of performance each year. During periods of reimbursement by Fidelity, a fund’s total return will be greater than it would be had the reimbursement not occurred. Performance numbers are net of all underlying fund operating expenses, but do not include any insurance charges imposed by your insurance company’s separate account. If performance information included the effect of these additional charges, the total returns would have been lower. How a fund did yesterday is no guarantee of how it will do tomorrow.
Average Annual Total Returns
| For the periods ended December 31, 2015 | Past 1 year | Past 5 years | Past 10 years |
| VIP Investor Freedom 2010 Portfolio | (0.34)% | 5.66% | 5.11% |
$10,000 Over 10 Years
Let's say hypothetically that $10,000 was invested in VIP Investor Freedom 2010 Portfolio℠ on December 31, 2005.
The chart shows how the value of your investment would have changed, and also shows how the Barclays® U.S. Aggregate Bond Index performed over the same period.
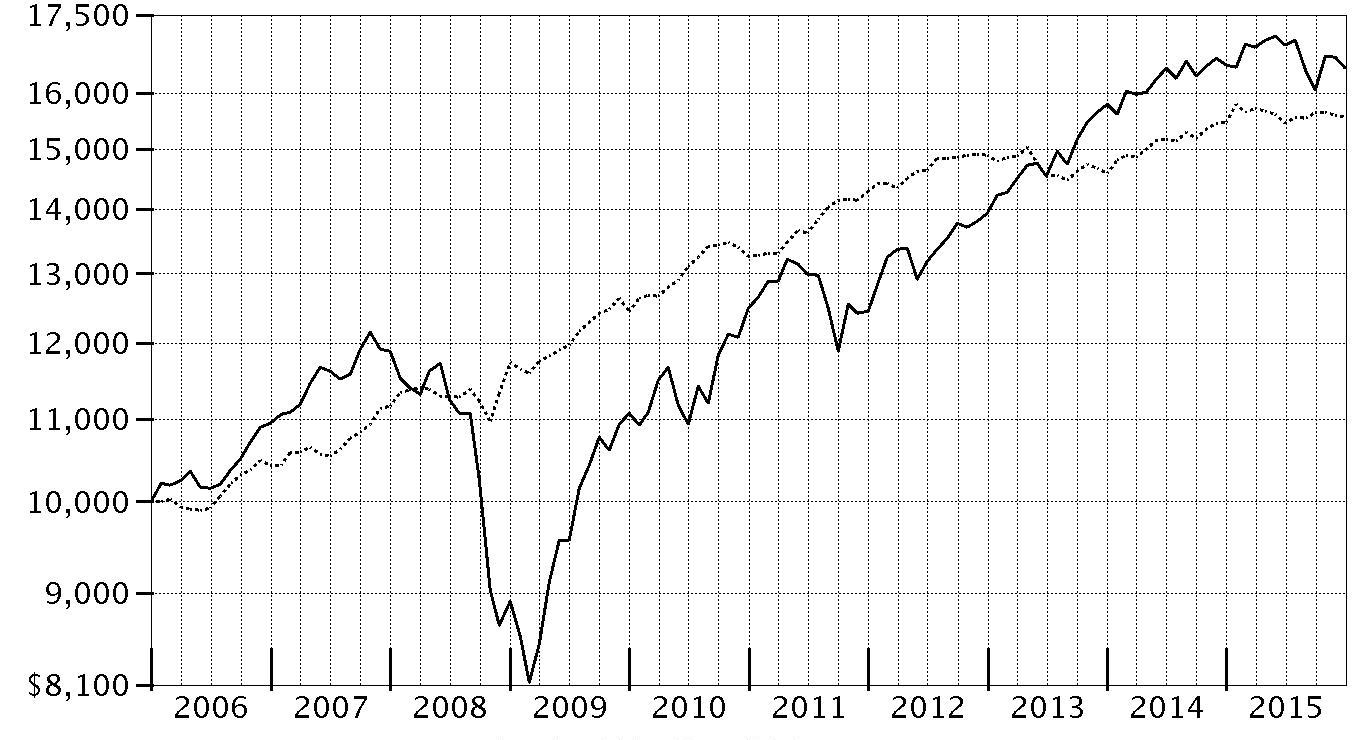
| Period Ending Values |
| $16,457 | VIP Investor Freedom 2010 Portfolio℠ |
| $15,552 | Barclays® U.S. Aggregate Bond Index |
VIP Investor Freedom 2015 Portfolio℠
Performance: The Bottom Line
Average annual total return reflects the change in the value of an investment, assuming reinvestment of distributions from dividend income and capital gains (the profits earned upon the sale of securities that have grown in value, if any) and assuming a constant rate of performance each year. During periods of reimbursement by Fidelity, a fund’s total return will be greater than it would be had the reimbursement not occurred. Performance numbers are net of all underlying fund operating expenses, but do not include any insurance charges imposed by your insurance company’s separate account. If performance information included the effect of these additional charges, the total returns would have been lower. How a fund did yesterday is no guarantee of how it will do tomorrow.
Average Annual Total Returns
| For the periods ended December 31, 2015 | Past 1 year | Past 5 years | Past 10 years |
| VIP Investor Freedom 2015 Portfolio | (0.34)% | 5.91% | 5.24% |
$10,000 Over 10 Years
Let's say hypothetically that $10,000 was invested in VIP Investor Freedom 2015 Portfolio℠ on December 31, 2005.
The chart shows how the value of your investment would have changed, and also shows how the S&P 500® Index performed over the same period.

| Period Ending Values |
| $16,662 | VIP Investor Freedom 2015 Portfolio℠ |
| $20,242 | S&P 500® Index |
VIP Investor Freedom 2020 Portfolio℠
Performance: The Bottom Line
Average annual total return reflects the change in the value of an investment, assuming reinvestment of distributions from dividend income and capital gains (the profits earned upon the sale of securities that have grown in value, if any) and assuming a constant rate of performance each year. During periods of reimbursement by Fidelity, a fund’s total return will be greater than it would be had the reimbursement not occurred. Performance numbers are net of all underlying fund operating expenses, but do not include any insurance charges imposed by your insurance company’s separate account. If performance information included the effect of these additional charges, the total returns would have been lower. How a fund did yesterday is no guarantee of how it will do tomorrow.
Average Annual Total Returns
| For the periods ended December 31, 2015 | Past 1 year | Past 5 years | Past 10 years |
| VIP Investor Freedom 2020 Portfolio | (0.35)% | 6.28% | 5.19% |
$10,000 Over 10 Years
Let's say hypothetically that $10,000 was invested in VIP Investor Freedom 2020 Portfolio℠ on December 31, 2005.
The chart shows how the value of your investment would have changed, and also shows how the S&P 500® Index performed over the same period.

| Period Ending Values |
| $16,592 | VIP Investor Freedom 2020 Portfolio℠ |
| $20,242 | S&P 500® Index |
VIP Investor Freedom 2025 Portfolio℠
Performance: The Bottom Line
Average annual total return reflects the change in the value of an investment, assuming reinvestment of distributions from dividend income and capital gains (the profits earned upon the sale of securities that have grown in value, if any) and assuming a constant rate of performance each year. During periods of reimbursement by Fidelity, a fund’s total return will be greater than it would be had the reimbursement not occurred. Performance numbers are net of all underlying fund operating expenses, but do not include any insurance charges imposed by your insurance company’s separate account. If performance information included the effect of these additional charges, the total returns would have been lower. How a fund did yesterday is no guarantee of how it will do tomorrow.
Average Annual Total Returns
| For the periods ended December 31, 2015 | Past 1 year | Past 5 years | Past 10 years |
| VIP Investor Freedom 2025 Portfolio | (0.32)% | 7.14% | 5.65% |
$10,000 Over 10 Years
Let's say hypothetically that $10,000 was invested in VIP Investor Freedom 2025 Portfolio℠ on December 31, 2005.
The chart shows how the value of your investment would have changed, and also shows how the S&P 500® Index performed over the same period.

| Period Ending Values |
| $17,323 | VIP Investor Freedom 2025 Portfolio℠ |
| $20,242 | S&P 500® Index |
VIP Investor Freedom 2030 Portfolio℠
Performance: The Bottom Line
Average annual total return reflects the change in the value of an investment, assuming reinvestment of distributions from dividend income and capital gains (the profits earned upon the sale of securities that have grown in value, if any) and assuming a constant rate of performance each year. During periods of reimbursement by Fidelity, a fund’s total return will be greater than it would be had the reimbursement not occurred. Performance numbers are net of all underlying fund operating expenses, but do not include any insurance charges imposed by your insurance company’s separate account. If performance information included the effect of these additional charges, the total returns would have been lower. How a fund did yesterday is no guarantee of how it will do tomorrow.
Average Annual Total Returns
| For the periods ended December 31, 2015 | Past 1 year | Past 5 years | Past 10 years |
| VIP Investor Freedom 2030 Portfolio | (0.32)% | 7.39% | 5.45% |
$10,000 Over 10 Years
Let's say hypothetically that $10,000 was invested in VIP Investor Freedom 2030 Portfolio℠ on December 31, 2005.
The chart shows how the value of your investment would have changed, and also shows how the S&P 500® Index performed over the same period.
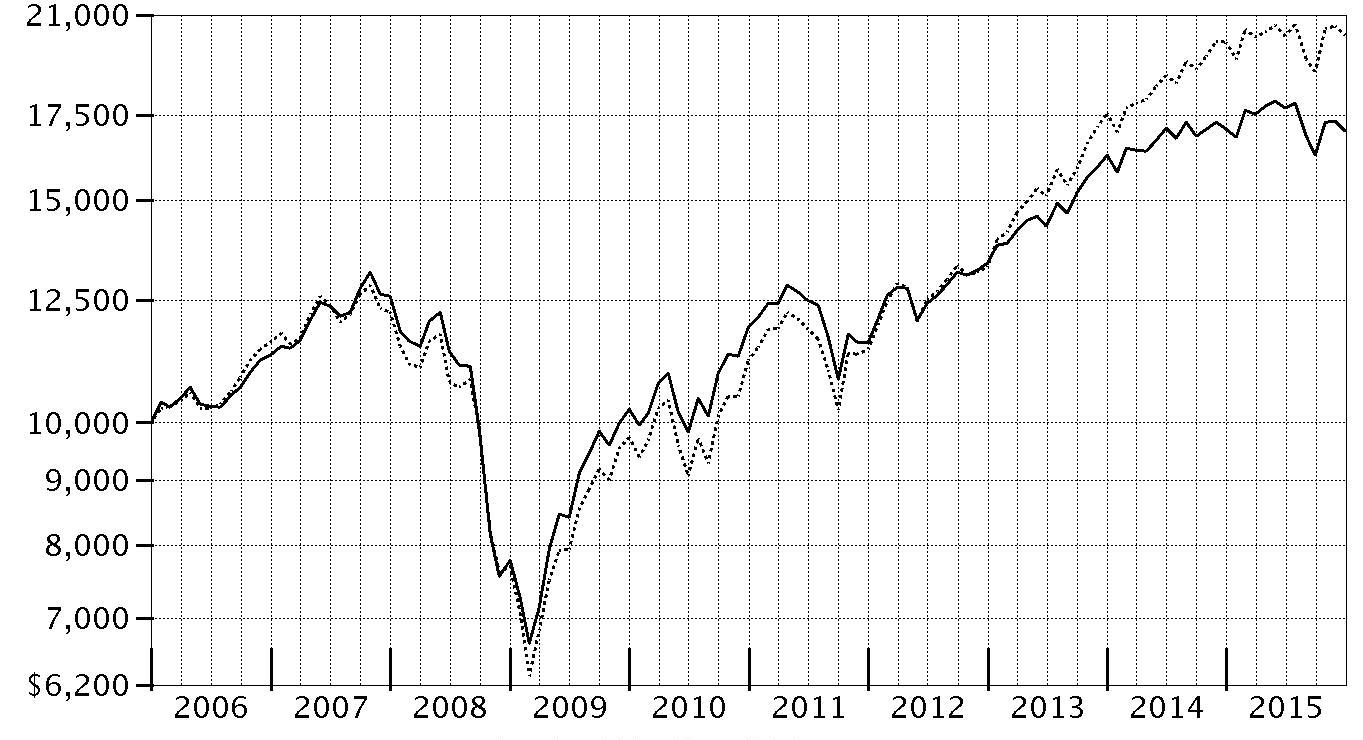
| Period Ending Values |
| $16,995 | VIP Investor Freedom 2030 Portfolio℠ |
| $20,242 | S&P 500® Index |
Management's Discussion of Fund Performance
Market Recap: Largely buoyed by the U.S., developed-markets equities finished 2015 nearly flat overall, rebounding from a steep decline in August and September over worries about China’s slowing economic growth. The MSCI World Index returned -0.44% for the 12 months ending December 31, 2015. Modest gains in the first half of the year were quickly erased amid the late-summer rout, but stocks sharply reversed course in October, lifted by the U.S. Federal Reserve’s decision to put off raising near-term interest rates until mid-December. Investors also were encouraged by an interest-rate cut in China and economic stimulus in Europe. Excess supply of oil and natural gas weighed on commodities, the year’s worst-performing asset class. Lower energy costs and improving wages drove consumer spending, though, helping retailers. Also, low interest rates and pent-up demand boosted global auto sales: December results sent annual totals past the previous record, set in 2000.
The broad Dow Jones U.S. Total Stock Market Index℠ gained 0.44% for the year. Large-cap stocks outpaced small-caps by a comfortable margin, with the S&P 500
® and the Russell 2000
® Index returning 1.38% and -4.41%, respectively. Meanwhile, non-U.S. developed-markets returned -3.04%, as measured by the MSCI World ex USA Index, and the MSCI Emerging Markets Index returned -14.60%, beset by numerous challenges, U.S.-dollar strengthening throughout the period not the least of them. Globally, growth- led value-oriented stocks across market-cap segments. Outside the U.S., large-caps lagged small-caps substantially.
Looking within the bellwether S&P 500
®, the downtrodden energy (-21%), materials (-8%) and utilities (-5%) sectors weighed on the index. Health care (+7%) helped alleviate the pain, and investors’ preference for growth stocks braced technology (+6%), which also benefited from strong fundamentals and attractive relative valuations. This sector performance pattern was generally similar worldwide.
In fixed income, the Barclays
® Global Aggregate GDP Weighted Index returned -3.90%, affected in part by the Fed’s first interest-rate hike since 2006. The investment-grade Barclays
® U.S. Aggregate Bond Index returned 0.55%; The BofA Merrill Lynch℠ US High Yield Constrained Index, -4.61%. Energy- and commodity-related securities performed worst. U.S. Treasury Inflation-Protected Securities (TIPS) suffered amid stubbornly low inflation. Meanwhile, emerging-markets debt rebounded strongly in the fall, overcoming multiple threats including China’s economic slowdown and currency headwinds.
Comments from Co-Portfolio Managers Andrew Dierdorf and Brett Sumsion: For the year, each VIP Investor Freedom Fund posted a slightly negative absolute return. On a relative basis, the longer-dated Funds outperformed their respective Composite index, whereas the shorter-dated Funds and Income Fund lagged slightly.
(For specific Fund results, please refer to the performance section of this report.) Asset allocation decisions detracted overall, most notably an overweighting in the U.S. equity asset class and our underweighting of investment-grade bonds. Generally speaking, the Funds' non-U.S. equity investments added value overall by meaningfully outperforming the asset-class benchmark. In particular, VIP Overseas Portfolio, which seeks to own high-quality companies purchased at attractive prices that the manager believes can outperform the market over the long term, produced a solid gain. Similarly, VIP Emerging Markets Portfolio, despite its negative result, finished well ahead of its fund-level benchmark. Relative gains here were undermined largely by results from VIP Investment Grade Bond Portfolio, which emphasized corporate bonds and underweighted U.S. Treasuries; the Portfolio underperformed the Barclays
® U.S. Aggregate Bond Index. Out-of-benchmark allocations to high-yield debt also hurt. Lastly, the Funds' U.S. equity allocation underperformed overall. Intra-asset allocation decisions – that is, weightings among underlying portfolios – detracted from results. Most notably VIP Growth & Income Portfolio, the Funds' largest U.S. equity holding, underperformed its benchmark the past year.
The views expressed above reflect those of the portfolio manager(s) only through the end of the period as stated on the cover of this report and do not necessarily represent the views of Fidelity or any other person in the Fidelity organization. Any such views are subject to change at any time based upon market or other conditions and Fidelity disclaims any responsibility to update such views. These views may not be relied on as investment advice and, because investment decisions for a Fidelity fund are based on numerous factors, may not be relied on as an indication of trading intent on behalf of any Fidelity fund.
VIP Investor Freedom Income Portfolio℠
Investment Summary (Unaudited)
The information in the following tables is based on the direct investments of the Fund.
Fund Holdings as of December 31, 2015
| | % of fund's net assets | % of fund's net assets 6 months ago |
| Domestic Equity Funds | | |
| VIP Contrafund Portfolio Investor Class | 3.2 | 3.2 |
| VIP Equity-Income Portfolio Investor Class | 3.3 | 3.3 |
| VIP Growth & Income Portfolio Investor Class | 3.8 | 3.8 |
| VIP Growth Portfolio Investor Class | 3.3 | 3.2 |
| VIP Mid Cap Portfolio Investor Class | 0.9 | 0.9 |
| VIP Value Portfolio Investor Class | 2.4 | 2.4 |
| VIP Value Strategies Portfolio Investor Class | 1.2 | 1.2 |
| | 18.1 | 18.0 |
| International Equity Funds | | |
| VIP Emerging Markets Portfolio Investor Class | 3.6 | 3.1 |
| VIP Overseas Portfolio Investor Class | 3.8 | 4.4 |
| | 7.4 | 7.5 |
| Bond Funds | | |
| VIP High Income Portfolio Investor Class | 3.7 | 4.0 |
| VIP Investment Grade Bond Portfolio Investor Class | 42.3 | 43.5 |
| | 46.0 | 47.5 |
| Short-Term Funds | | |
| VIP Government Money Market Portfolio Investor Class 0.03% | 28.5 | 27.0 |
| Net Other Assets (Liabilities) | | |
| Net Other Assets | 0.0 | 0.0 |
| | 100.0 | 100.0 |
VIP Government Money Market Portfolio Investor Class was formerly known as VIP Money Market Portfolio Investor Class
Asset Allocation (% of fund's net assets)
| Period end |
| | Domestic Equity Funds | 18.1% |
| | International Equity Funds | 7.4% |
| | Bond Funds | 46.0% |
| | Short-Term Funds | 28.5% |

| Six months ago |
| | Domestic Equity Funds | 18.0% |
| | International Equity Funds | 7.5% |
| | Bond Funds | 47.5% |
| | Short-Term Funds | 27.0% |

Percentages shown as 0.0% may reflect amounts less than 0.05%.
VIP Investor Freedom Income Portfolio℠
Investments December 31, 2015
Showing Percentage of Net Assets
| Domestic Equity Funds - 18.1% | | | |
| | | Shares | Value |
| VIP Contrafund Portfolio Investor Class (a) | | 60,203 | $2,033,060 |
| VIP Equity-Income Portfolio Investor Class (a) | | 104,980 | 2,139,495 |
| VIP Growth & Income Portfolio Investor Class (a) | | 128,153 | 2,411,847 |
| VIP Growth Portfolio Investor Class (a) | | 32,212 | 2,111,509 |
| VIP Mid Cap Portfolio Investor Class (a) | | 17,839 | 579,782 |
| VIP Value Portfolio Investor Class (a) | | 115,887 | 1,547,097 |
| VIP Value Strategies Portfolio Investor Class (a) | | 51,531 | 745,650 |
| TOTAL DOMESTIC EQUITY FUNDS | | | |
| (Cost $9,880,594) | | | 11,568,440 |
|
| International Equity Funds - 7.4% | | | |
| VIP Emerging Markets Portfolio Investor Class (a) | | 282,785 | 2,293,387 |
| VIP Overseas Portfolio Investor Class (a) | | 129,648 | 2,465,902 |
| TOTAL INTERNATIONAL EQUITY FUNDS | | | |
| (Cost $4,387,065) | | | 4,759,289 |
|
| Bond Funds - 46.0% | | | |
| VIP High Income Portfolio Investor Class (a) | | 483,190 | 2,382,126 |
| VIP Investment Grade Bond Portfolio Investor Class (a) | | 2,200,496 | 27,110,106 |
| TOTAL BOND FUNDS | | | |
| (Cost $30,487,321) | | | 29,492,232 |
|
| Short-Term Funds - 28.5% | | | |
| VIP Government Money Market Portfolio Investor Class 0.03% (a)(b) | | | |
| (Cost $18,211,442) | | 18,211,442 | 18,211,442 |
| TOTAL INVESTMENT PORTFOLIO - 100.0% | | | |
| (Cost $62,966,422) | | | 64,031,403 |
| NET OTHER ASSETS (LIABILITIES) - 0.0% | | | 2 |
| NET ASSETS - 100% | | | $64,031,405 |
Legend
(a) Affiliated Fund
(b) The rate quoted is the annualized seven-day yield of the fund at period end.
Affiliated Underlying Funds
Information regarding the Fund's fiscal year to date purchases and sales of the affiliated Underlying Funds and income earned by the Fund from investments in affiliated Underlying Funds is as follows:
(VIP Government Money Market Portfolio Investor Class was formerly known as VIP Money Market Portfolio Investor Class)
| Affiliate | Value, beginning of period | Purchases | Sales Proceeds | Dividend Income | Value, end of period |
| VIP Contrafund Portfolio Investor Class | $2,126,440 | $917,000 | $827,198 | $20,589 | $2,033,060 |
| VIP Emerging Markets Portfolio Investor Class | 1,685,288 | 1,584,936 | 733,012 | 12,260 | 2,293,387 |
| VIP Equity-Income Portfolio Investor Class | 2,228,435 | 1,016,285 | 744,071 | 71,525 | 2,139,495 |
| VIP Government Money Market Portfolio Investor Class 0.03% | 16,778,684 | 5,921,047 | 4,488,288 | 2,041 | 18,211,442 |
| VIP Growth & Income Portfolio Investor Class | 2,532,573 | 1,094,681 | 994,172 | 52,272 | 2,411,847 |
| VIP Growth Portfolio Investor Class | 2,176,251 | 765,875 | 923,527 | 4,133 | 2,111,509 |
| VIP High Income Portfolio Investor Class | 2,502,164 | 890,996 | 736,675 | 170,211 | 2,382,126 |
| VIP Investment Grade Bond Portfolio Investor Class | 29,459,936 | 7,650,016 | 9,067,431 | 728,010 | 27,110,106 |
| VIP Mid Cap Portfolio Investor Class | 631,043 | 252,035 | 221,467 | 2,665 | 579,782 |
| VIP Overseas Portfolio Investor Class | 3,537,055 | 1,192,872 | 2,396,513 | 33,403 | 2,465,902 |
| VIP Value Portfolio Investor Class | 1,648,804 | 777,895 | 611,513 | 20,829 | 1,547,097 |
| VIP Value Strategies Portfolio Investor Class | 814,189 | 263,485 | 301,455 | 8,951 | 745,650 |
| Total | $66,120,862 | $22,327,123 | $22,045,322 | $1,126,889 | $64,031,403 |
Investment Valuation
All investments are categorized as Level 1 under the Fair Value Hierarchy. The inputs or methodology used for valuing securities may not be an indication of the risk associated with investing in those securities. For more information on valuation inputs please refer to the Investment Valuation section in the accompanying Notes to Financial Statements.
See accompanying notes which are an integral part of the financial statements.
VIP Investor Freedom Income Portfolio℠
Financial Statements
Statement of Assets and Liabilities
| | | December 31, 2015 |
| Assets | | |
| Investment in securities, at value (cost $62,966,422) — See accompanying schedule | | $64,031,403 |
| Receivable for investments sold | | 49,965 |
| Total assets | | 64,081,368 |
| Liabilities | | |
| Payable for fund shares redeemed | $49,963 | |
| Total liabilities | | 49,963 |
| Net Assets | | $64,031,405 |
| Net Assets consist of: | | |
| Paid in capital | | $62,511,158 |
| Undistributed net investment income | | 3,928 |
| Accumulated undistributed net realized gain (loss) on investments | | 451,338 |
| Net unrealized appreciation (depreciation) on investments | | 1,064,981 |
| Net Assets, for 5,897,304 shares outstanding | | $64,031,405 |
| Net Asset Value, offering price and redemption price per share ($64,031,405 ÷ 5,897,304 shares) | | $10.86 |
See accompanying notes which are an integral part of the financial statements.
Statement of Operations
| | | Year ended December 31, 2015 |
| Investment Income | | |
| Income distributions from underlying funds | | $1,126,889 |
| Expenses | | |
| Independent trustees' compensation | $273 | |
| Total expenses before reductions | 273 | |
| Expense reductions | (273) | – |
| Net investment income (loss) | | 1,126,889 |
| Realized and Unrealized Gain (Loss) | | |
| Realized gain (loss) on sale of underlying fund shares | (187,992) | |
| Capital gain distributions from underlying funds | 927,846 | |
| Total net realized gain (loss) | | 739,854 |
| Change in net unrealized appreciation (depreciation) on underlying funds | | (2,183,270) |
| Net gain (loss) | | (1,443,416) |
| Net increase (decrease) in net assets resulting from operations | | $(316,527) |
See accompanying notes which are an integral part of the financial statements.
Statement of Changes in Net Assets
| | Year ended December 31, 2015 | Year ended December 31, 2014 |
| Increase (Decrease) in Net Assets | | |
| Operations | | |
| Net investment income (loss) | $1,126,889 | $992,244 |
| Net realized gain (loss) | 739,854 | 48,934 |
| Change in net unrealized appreciation (depreciation) | (2,183,270) | 1,282,078 |
| Net increase (decrease) in net assets resulting from operations | (316,527) | 2,323,256 |
| Distributions to shareholders from net investment income | (1,122,664) | (993,138) |
| Distributions to shareholders from net realized gain | (87,017) | (582,121) |
| Total distributions | (1,209,681) | (1,575,259) |
| Share transactions | | |
| Proceeds from sales of shares | 16,249,289 | 15,935,125 |
| Reinvestment of distributions | 1,209,681 | 1,575,259 |
| Cost of shares redeemed | (18,022,221) | (12,351,794) |
| Net increase (decrease) in net assets resulting from share transactions | (563,251) | 5,158,590 |
| Total increase (decrease) in net assets | (2,089,459) | 5,906,587 |
| Net Assets | | |
| Beginning of period | 66,120,864 | 60,214,277 |
| End of period (including undistributed net investment income of $3,928 and undistributed net investment income of $0, respectively) | $64,031,405 | $66,120,864 |
| Other Information | | |
| Shares | | |
| Sold | 1,445,091 | 1,430,960 |
| Issued in reinvestment of distributions | 111,049 | 142,181 |
| Redeemed | (1,609,852) | (1,109,644) |
| Net increase (decrease) | (53,712) | 463,497 |
See accompanying notes which are an integral part of the financial statements.
Financial Highlights — VIP Investor Freedom Income Portfolio
| | | December 31, | | | |
| Years ended December 31, | 2015 | 2014 | 2013 | 2012 | 2011 |
| Selected Per–Share Data | | | | | |
| Net asset value, beginning of period | $11.11 | $10.97 | $10.65 | $10.30 | $10.40 |
| Income from Investment Operations | | | | | |
| Net investment income (loss)A | .19 | .17 | .19 | .17 | .18 |
| Net realized and unrealized gain (loss) | (.23) | .25 | .39 | .50 | (.02) |
| Total from investment operations | (.04) | .42 | .58 | .67 | .16 |
| Distributions from net investment income | (.19) | (.17) | (.17) | (.16) | (.19) |
| Distributions from net realized gain | (.01) | (.10) | (.09) | (.16) | (.07) |
| Total distributions | (.21)B | (.28)C | (.26) | (.32) | (.26) |
| Net asset value, end of period | $10.86 | $11.11 | $10.97 | $10.65 | $10.30 |
| Total ReturnD,E | (.37)% | 3.80% | 5.43% | 6.54% | 1.54% |
| Ratios to Average Net AssetsF,G | | | | | |
| Expenses before reductionsH | -% | -% | -% | -% | -% |
| Expenses net of fee waivers, if any | -% | -% | -% | -% | -% |
| Expenses net of all reductions | -% | -% | -% | -% | -% |
| Net investment income (loss) | 1.68% | 1.57% | 1.77% | 1.63% | 1.74% |
| Supplemental Data | | | | | |
| Net assets, end of period (000 omitted) | $64,031 | $66,121 | $60,214 | $38,545 | $30,547 |
| Portfolio turnover rateF | 33% | 26% | 33% | 15% | 28% |
A Calculated based on average shares outstanding during the period.
B Total distributions of $.21 per share is comprised of distributions from net investment income of $.194 and distributions from net realized gain of $.015 per share.
C Total distributions of $.28 per share is comprised of distributions from net investment income of $.170 and distributions from net realized gain of $.105 per share.
D Total returns do not reflect charges attributable to your insurance company's separate account. Inclusion of these charges would reduce the total returns shown.
E Total returns would have been lower if certain expenses had not been reduced during the applicable periods shown.
F Amounts do not include the activity of the Underlying Funds.
G Expense ratios reflect operating expenses of the Fund. Expenses before reductions do not reflect amounts reimbursed by the investment adviser or reductions from expense offset arrangements and do not represent the amount paid by the Fund during periods when reimbursements or reductions occur. Expenses net of fee waivers reflect expenses after reimbursement by the investment adviser but prior to reductions from expense offset arrangements. Expenses net of all reductions represent the net expenses paid by the Fund but do not include expenses of the underlying funds in which the Fund invests.
H Amount represents less than .005%.
See accompanying notes which are an integral part of the financial statements.
VIP Investor Freedom 2005 Portfolio℠
Investment Summary (Unaudited)
The information in the following tables is based on the direct investments of the Fund.
Fund Holdings as of December 31, 2015
| | % of fund's net assets | % of fund's net assets 6 months ago |
| Domestic Equity Funds | | |
| VIP Contrafund Portfolio Investor Class | 4.8 | 4.8 |
| VIP Equity-Income Portfolio Investor Class | 5.0 | 5.1 |
| VIP Growth & Income Portfolio Investor Class | 5.7 | 5.7 |
| VIP Growth Portfolio Investor Class | 5.0 | 4.9 |
| VIP Mid Cap Portfolio Investor Class | 1.4 | 1.4 |
| VIP Value Portfolio Investor Class | 3.6 | 3.7 |
| VIP Value Strategies Portfolio Investor Class | 1.7 | 1.8 |
| | 27.2 | 27.4 |
| International Equity Funds | | |
| VIP Emerging Markets Portfolio Investor Class | 4.6 | 4.2 |
| VIP Overseas Portfolio Investor Class | 7.1 | 7.6 |
| | 11.7 | 11.8 |
| Bond Funds | | |
| VIP High Income Portfolio Investor Class | 3.7 | 4.0 |
| VIP Investment Grade Bond Portfolio Investor Class | 37.4 | 38.5 |
| | 41.1 | 42.5 |
| Short-Term Funds | | |
| VIP Government Money Market Portfolio Investor Class 0.03% | 20.0 | 18.3 |
| Net Other Assets (Liabilities) | | |
| Net Other Assets | 0.0 | 0.0 |
| | 100.0 | 100.0 |
VIP Government Money Market Portfolio Investor Class was formerly known as VIP Money Market Portfolio Investor Class
Asset Allocation (% of fund's net assets)
| Period end |
| | Domestic Equity Funds | 27.2% |
| | International Equity Funds | 11.7% |
| | Bond Funds | 41.1% |
| | Short-Term Funds | 20.0% |

| Six months ago |
| | Domestic Equity Funds | 27.4% |
| | International Equity Funds | 11.8% |
| | Bond Funds | 42.5% |
| | Short-Term Funds | 18.3% |

Percentages shown as 0.0% may reflect amounts less than 0.05%.
VIP Investor Freedom 2005 Portfolio℠
Investments December 31, 2015
Showing Percentage of Net Assets
| Domestic Equity Funds - 27.2% | | | |
| | | Shares | Value |
| VIP Contrafund Portfolio Investor Class (a) | | 28,852 | $974,344 |
| VIP Equity-Income Portfolio Investor Class (a) | | 50,448 | 1,028,129 |
| VIP Growth & Income Portfolio Investor Class (a) | | 61,584 | 1,159,012 |
| VIP Growth Portfolio Investor Class (a) | | 15,476 | 1,014,430 |
| VIP Mid Cap Portfolio Investor Class (a) | | 8,571 | 278,550 |
| VIP Value Portfolio Investor Class (a) | | 55,692 | 743,491 |
| VIP Value Strategies Portfolio Investor Class (a) | | 24,767 | 358,379 |
| TOTAL DOMESTIC EQUITY FUNDS | | | |
| (Cost $4,876,344) | | | 5,556,335 |
|
| International Equity Funds - 11.7% | | | |
| VIP Emerging Markets Portfolio Investor Class (a) | | 116,228 | 942,609 |
| VIP Overseas Portfolio Investor Class (a) | | 75,379 | 1,433,700 |
| TOTAL INTERNATIONAL EQUITY FUNDS | | | |
| (Cost $2,377,379) | | | 2,376,309 |
|
| Bond Funds - 41.1% | | | |
| VIP High Income Portfolio Investor Class (a) | | 154,333 | 760,864 |
| VIP Investment Grade Bond Portfolio Investor Class (a) | | 620,111 | 7,639,773 |
| TOTAL BOND FUNDS | | | |
| (Cost $8,696,827) | | | 8,400,637 |
|
| Short-Term Funds - 20.0% | | | |
| VIP Government Money Market Portfolio Investor Class 0.03% (a)(b) | | | |
| (Cost $4,075,046) | | 4,075,046 | 4,075,046 |
| TOTAL INVESTMENT PORTFOLIO - 100.0% | | | |
| (Cost $20,025,596) | | | 20,408,327 |
| NET OTHER ASSETS (LIABILITIES) - 0.0% | | | 2 |
| NET ASSETS - 100% | | | $20,408,329 |
Legend
(a) Affiliated Fund
(b) The rate quoted is the annualized seven-day yield of the fund at period end.
Affiliated Underlying Funds
Information regarding the Fund's fiscal year to date purchases and sales of the affiliated Underlying Funds and income earned by the Fund from investments in affiliated Underlying Funds is as follows:
(VIP Government Money Market Portfolio Investor Class was formerly known as VIP Money Market Portfolio Investor Class)
| Affiliate | Value, beginning of period | Purchases | Sales Proceeds | Dividend Income | Value, end of period |
| VIP Contrafund Portfolio Investor Class | $1,116,660 | $283,416 | $328,266 | $9,908 | $974,344 |
| VIP Emerging Markets Portfolio Investor Class | 810,861 | 412,043 | 175,039 | 5,125 | 942,609 |
| VIP Equity-Income Portfolio Investor Class | 1,174,343 | 317,771 | 280,460 | 34,452 | 1,028,129 |
| VIP Government Money Market Portfolio Investor Class 0.03% | 3,600,088 | 1,435,031 | 960,074 | 442 | 4,075,046 |
| VIP Growth & Income Portfolio Investor Class | 1,339,140 | 326,589 | 392,707 | 25,154 | 1,159,012 |
| VIP Growth Portfolio Investor Class | 1,143,171 | 205,530 | 376,623 | 1,986 | 1,014,430 |
| VIP High Income Portfolio Investor Class | 858,976 | 202,519 | 216,299 | 54,507 | 760,864 |
| VIP Investment Grade Bond Portfolio Investor Class | 8,812,509 | 1,601,058 | 2,509,774 | 205,641 | 7,639,773 |
| VIP Mid Cap Portfolio Investor Class | 325,610 | 81,990 | 86,689 | 1,280 | 278,550 |
| VIP Overseas Portfolio Investor Class | 1,973,630 | 278,676 | 894,201 | 19,419 | 1,433,700 |
| VIP Value Portfolio Investor Class | 860,451 | 255,580 | 239,064 | 10,020 | 743,491 |
| VIP Value Strategies Portfolio Investor Class | 421,092 | 70,646 | 120,020 | 4,302 | 358,379 |
| Total | $22,436,531 | $5,470,849 | $6,579,216 | $372,236 | $20,408,327 |
Investment Valuation
All investments are categorized as Level 1 under the Fair Value Hierarchy. The inputs or methodology used for valuing securities may not be an indication of the risk associated with investing in those securities. For more information on valuation inputs please refer to the Investment Valuation section in the accompanying Notes to Financial Statements.
See accompanying notes which are an integral part of the financial statements.
VIP Investor Freedom 2005 Portfolio℠
Financial Statements
Statement of Assets and Liabilities
| | | December 31, 2015 |
| Assets | | |
| Investment in securities, at value (cost $20,025,596) — See accompanying schedule | | $20,408,327 |
| Receivable for investments sold | | 121 |
| Total assets | | 20,408,448 |
| Liabilities | | |
| Payable for fund shares redeemed | $119 | |
| Total liabilities | | 119 |
| Net Assets | | $20,408,329 |
| Net Assets consist of: | | |
| Paid in capital | | $19,816,237 |
| Accumulated undistributed net realized gain (loss) on investments | | 209,361 |
| Net unrealized appreciation (depreciation) on investments | | 382,731 |
| Net Assets, for 1,892,279 shares outstanding | | $20,408,329 |
| Net Asset Value, offering price and redemption price per share ($20,408,329 ÷ 1,892,279 shares) | | $10.79 |
See accompanying notes which are an integral part of the financial statements.
Statement of Operations
| | | Year ended December 31, 2015 |
| Investment Income | | |
| Income distributions from underlying funds | | $372,236 |
| Expenses | | |
| Independent trustees' compensation | $89 | |
| Total expenses before reductions | 89 | |
| Expense reductions | (89) | – |
| Net investment income (loss) | | 372,236 |
| Realized and Unrealized Gain (Loss) | | |
| Realized gain (loss) on sale of underlying fund shares | (70,475) | |
| Capital gain distributions from underlying funds | 479,444 | |
| Total net realized gain (loss) | | 408,969 |
| Change in net unrealized appreciation (depreciation) on underlying funds | | (849,358) |
| Net gain (loss) | | (440,389) |
| Net increase (decrease) in net assets resulting from operations | | $(68,153) |
See accompanying notes which are an integral part of the financial statements.
Statement of Changes in Net Assets
| | Year ended December 31, 2015 | Year ended December 31, 2014 |
| Increase (Decrease) in Net Assets | | |
| Operations | | |
| Net investment income (loss) | $372,236 | $366,134 |
| Net realized gain (loss) | 408,969 | (11,550) |
| Change in net unrealized appreciation (depreciation) | (849,358) | 521,801 |
| Net increase (decrease) in net assets resulting from operations | (68,153) | 876,385 |
| Distributions to shareholders from net investment income | (374,953) | (363,292) |
| Distributions to shareholders from net realized gain | (46,350) | (246,466) |
| Total distributions | (421,303) | (609,758) |
| Share transactions | | |
| Proceeds from sales of shares | 3,074,118 | 7,767,419 |
| Reinvestment of distributions | 421,303 | 609,758 |
| Cost of shares redeemed | (5,034,163) | (5,119,195) |
| Net increase (decrease) in net assets resulting from share transactions | (1,538,742) | 3,257,982 |
| Total increase (decrease) in net assets | (2,028,198) | 3,524,609 |
| Net Assets | | |
| Beginning of period | 22,436,527 | 18,911,918 |
| End of period (including undistributed net investment income of $0 and undistributed net investment income of $2,843, respectively) | $20,408,329 | $22,436,527 |
| Other Information | | |
| Shares | | |
| Sold | 274,716 | 700,374 |
| Issued in reinvestment of distributions | 38,848 | 55,338 |
| Redeemed | (452,381) | (460,420) |
| Net increase (decrease) | (138,817) | 295,292 |
See accompanying notes which are an integral part of the financial statements.
Financial Highlights — VIP Investor Freedom 2005 Portfolio
| | | December 31, | | | |
| Years ended December 31, | 2015 | 2014 | 2013 | 2012 | 2011 |
| Selected Per–Share Data | | | | | |
| Net asset value, beginning of period | $11.05 | $10.90 | $10.20 | $9.60 | $9.85 |
| Income from Investment Operations | | | | | |
| Net investment income (loss)A | .19 | .19 | .18 | .19 | .17 |
| Net realized and unrealized gain (loss) | (.22) | .27 | .81 | .73 | (.17) |
| Total from investment operations | (.03) | .46 | .99 | .92 | –B |
| Distributions from net investment income | (.20) | (.18) | (.17) | (.16) | (.19) |
| Distributions from net realized gain | (.03) | (.14) | (.12) | (.16) | (.07) |
| Total distributions | (.23) | (.31)C | (.29) | (.32) | (.25)D |
| Net asset value, end of period | $10.79 | $11.05 | $10.90 | $10.20 | $9.60 |
| Total ReturnE,F | (.31)% | 4.25% | 9.73% | 9.61% | .02% |
| Ratios to Average Net AssetsG,H | | | | | |
| Expenses before reductionsI | -% | -% | -% | -% | -% |
| Expenses net of fee waivers, if any | -% | -% | -% | -% | -% |
| Expenses net of all reductions | -% | -% | -% | -% | -% |
| Net investment income (loss) | 1.70% | 1.71% | 1.68% | 1.87% | 1.72% |
| Supplemental Data | | | | | |
| Net assets, end of period (000 omitted) | $20,408 | $22,437 | $18,912 | $14,096 | $9,777 |
| Portfolio turnover rateG | 25% | 30% | 46% | 33% | 45% |
A Calculated based on average shares outstanding during the period.
B Amount represents less than $.005 per share.
C Total distributions of $.31 per share is comprised of distributions from net investment income of $.175 and distributions from net realized gain of $.135 per share.
D Total distributions of $.25 per share is comprised of distributions from net investment income of $.185 and distributions from net realized gain of $.067 per share.
E Total returns do not reflect charges attributable to your insurance company's separate account. Inclusion of these charges would reduce the total returns shown.
F Total returns would have been lower if certain expenses had not been reduced during the applicable periods shown.
G Amounts do not include the activity of the Underlying Funds.
H Expense ratios reflect operating expenses of the Fund. Expenses before reductions do not reflect amounts reimbursed by the investment adviser or reductions from expense offset arrangements and do not represent the amount paid by the Fund during periods when reimbursements or reductions occur. Expenses net of fee waivers reflect expenses after reimbursement by the investment adviser but prior to reductions from expense offset arrangements. Expenses net of all reductions represent the net expenses paid by the Fund but do not include expenses of the underlying funds in which the Fund invests.
I Amount represents less than .005%.
See accompanying notes which are an integral part of the financial statements.
VIP Investor Freedom 2010 Portfolio℠
Investment Summary (Unaudited)
The information in the following tables is based on the direct investments of the Fund.
Fund Holdings as of December 31, 2015
| | % of fund's net assets | % of fund's net assets 6 months ago |
| Domestic Equity Funds | | |
| VIP Contrafund Portfolio Investor Class | 5.8 | 5.9 |
| VIP Equity-Income Portfolio Investor Class | 6.2 | 6.2 |
| VIP Growth & Income Portfolio Investor Class | 7.0 | 7.1 |
| VIP Growth Portfolio Investor Class | 6.1 | 6.0 |
| VIP Mid Cap Portfolio Investor Class | 1.7 | 1.7 |
| VIP Value Portfolio Investor Class | 4.5 | 4.6 |
| VIP Value Strategies Portfolio Investor Class | 2.1 | 2.2 |
| | 33.4 | 33.7 |
| International Equity Funds | | |
| VIP Emerging Markets Portfolio Investor Class | 5.4 | 5.1 |
| VIP Overseas Portfolio Investor Class | 9.2 | 9.7 |
| | 14.6 | 14.8 |
| Bond Funds | | |
| VIP High Income Portfolio Investor Class | 3.7 | 4.0 |
| VIP Investment Grade Bond Portfolio Investor Class | 33.7 | 34.6 |
| | 37.4 | 38.6 |
| Short-Term Funds | | |
| VIP Government Money Market Portfolio Investor Class 0.03% | 14.6 | 12.9 |
| Net Other Assets (Liabilities) | | |
| Net Other Assets | 0.0 | 0.0 |
| | 100.0 | 100.0 |
VIP Government Money Market Portfolio Investor Class was formerly known as VIP Money Market Portfolio Investor Class
Asset Allocation (% of fund's net assets)
| Period end |
| | Domestic Equity Funds | 33.4% |
| | International Equity Funds | 14.6% |
| | Bond Funds | 37.4% |
| | Short-Term Funds | 14.6% |

| Six months ago |
| | Domestic Equity Funds | 33.7% |
| | International Equity Funds | 14.8% |
| | Bond Funds | 38.6% |
| | Short-Term Funds | 12.9% |

Percentages shown as 0.0% may reflect amounts less than 0.05%.
VIP Investor Freedom 2010 Portfolio℠
Investments December 31, 2015
Showing Percentage of Net Assets
| Domestic Equity Funds - 33.4% | | | |
| | | Shares | Value |
| VIP Contrafund Portfolio Investor Class (a) | | 103,244 | $3,486,556 |
| VIP Equity-Income Portfolio Investor Class (a) | | 180,525 | 3,679,100 |
| VIP Growth & Income Portfolio Investor Class (a) | | 220,424 | 4,148,377 |
| VIP Growth Portfolio Investor Class (a) | | 55,355 | 3,628,546 |
| VIP Mid Cap Portfolio Investor Class (a) | | 30,681 | 997,137 |
| VIP Value Portfolio Investor Class (a) | | 199,339 | 2,661,176 |
| VIP Value Strategies Portfolio Investor Class (a) | | 88,677 | 1,283,156 |
| TOTAL DOMESTIC EQUITY FUNDS | | | |
| (Cost $17,512,083) | | | 19,884,048 |
|
| International Equity Funds - 14.6% | | | |
| VIP Emerging Markets Portfolio Investor Class (a) | | 396,800 | 3,218,047 |
| VIP Overseas Portfolio Investor Class (a) | | 286,807 | 5,455,076 |
| TOTAL INTERNATIONAL EQUITY FUNDS | | | |
| (Cost $9,117,797) | | | 8,673,123 |
|
| Bond Funds - 37.4% | | | |
| VIP High Income Portfolio Investor Class (a) | | 450,551 | 2,221,215 |
| VIP Investment Grade Bond Portfolio Investor Class (a) | | 1,626,550 | 20,039,100 |
| TOTAL BOND FUNDS | | | |
| (Cost $23,059,409) | | | 22,260,315 |
|
| Short-Term Funds - 14.6% | | | |
| VIP Government Money Market Portfolio Investor Class 0.03% (a)(b) | | | |
| (Cost $8,651,848) | | 8,651,848 | 8,651,848 |
| TOTAL INVESTMENT PORTFOLIO - 100.0% | | | |
| (Cost $58,341,137) | | | 59,469,334 |
| NET OTHER ASSETS (LIABILITIES) - 0.0% | | | 7 |
| NET ASSETS - 100% | | | $59,469,341 |
Legend
(a) Affiliated Fund
(b) The rate quoted is the annualized seven-day yield of the fund at period end.
Affiliated Underlying Funds
Information regarding the Fund's fiscal year to date purchases and sales of the affiliated Underlying Funds and income earned by the Fund from investments in affiliated Underlying Funds is as follows:
(VIP Government Money Market Portfolio Investor Class was formerly known as VIP Money Market Portfolio Investor Class)
| Affiliate | Value, beginning of period | Purchases | Sales Proceeds | Dividend Income | Value, end of period |
| VIP Contrafund Portfolio Investor Class | $3,825,297 | $736,965 | $742,830 | $34,829 | $3,486,556 |
| VIP Emerging Markets Portfolio Investor Class | 2,763,005 | 1,206,815 | 389,826 | 17,188 | 3,218,047 |
| VIP Equity-Income Portfolio Investor Class | 4,017,342 | 871,906 | 577,342 | 121,066 | 3,679,100 |
| VIP Government Money Market Portfolio Investor Class 0.03% | 6,461,552 | 3,286,497 | 1,096,201 | 866 | 8,651,848 |
| VIP Growth & Income Portfolio Investor Class | 4,574,085 | 785,283 | 814,380 | 88,426 | 4,148,377 |
| VIP Growth Portfolio Investor Class | 3,888,196 | 497,787 | 907,361 | 6,985 | 3,628,546 |
| VIP High Income Portfolio Investor Class | 2,472,873 | 340,611 | 354,561 | 156,460 | 2,221,215 |
| VIP Investment Grade Bond Portfolio Investor Class | 22,012,267 | 3,085,215 | 4,377,642 | 529,739 | 20,039,100 |
| VIP Mid Cap Portfolio Investor Class | 1,122,098 | 244,344 | 224,390 | 4,504 | 997,137 |
| VIP Overseas Portfolio Investor Class | 6,781,699 | 696,609 | 2,259,946 | 72,645 | 5,455,076 |
| VIP Value Portfolio Investor Class | 2,968,890 | 725,799 | 568,442 | 35,231 | 2,661,176 |
| VIP Value Strategies Portfolio Investor Class | 1,452,122 | 182,143 | 302,486 | 15,131 | 1,283,156 |
| Total | $62,339,426 | $12,659,974 | $12,615,407 | $1,083,070 | $59,469,334 |
Investment Valuation
All investments are categorized as Level 1 under the Fair Value Hierarchy. The inputs or methodology used for valuing securities may not be an indication of the risk associated with investing in those securities. For more information on valuation inputs please refer to the Investment Valuation section in the accompanying Notes to Financial Statements.
See accompanying notes which are an integral part of the financial statements.
VIP Investor Freedom 2010 Portfolio℠
Financial Statements
Statement of Assets and Liabilities
| | | December 31, 2015 |
| Assets | | |
| Investment in securities, at value (cost $58,341,137) — See accompanying schedule | | $59,469,334 |
| Cash | | 6 |
| Receivable for investments sold | | 5,933 |
| Total assets | | 59,475,273 |
| Liabilities | | |
| Payable for fund shares redeemed | $5,932 | |
| Total liabilities | | 5,932 |
| Net Assets | | $59,469,341 |
| Net Assets consist of: | | |
| Paid in capital | | $57,580,108 |
| Undistributed net investment income | | 3,216 |
| Accumulated undistributed net realized gain (loss) on investments | | 757,820 |
| Net unrealized appreciation (depreciation) on investments | | 1,128,197 |
| Net Assets, for 5,176,622 shares outstanding | | $59,469,341 |
| Net Asset Value, offering price and redemption price per share ($59,469,341 ÷ 5,176,622 shares) | | $11.49 |
See accompanying notes which are an integral part of the financial statements.
Statement of Operations
| | | Year ended December 31, 2015 |
| Investment Income | | |
| Income distributions from underlying funds | | $1,083,070 |
| Expenses | | |
| Independent trustees' compensation | $250 | |
| Total expenses before reductions | 250 | |
| Expense reductions | (250) | – |
| Net investment income (loss) | | 1,083,070 |
| Realized and Unrealized Gain (Loss) | | |
| Realized gain (loss) on sale of underlying fund shares | (403,459) | |
| Capital gain distributions from underlying funds | 1,622,240 | |
| Total net realized gain (loss) | | 1,218,781 |
| Change in net unrealized appreciation (depreciation) on underlying funds | | (2,511,202) |
| Net gain (loss) | | (1,292,421) |
| Net increase (decrease) in net assets resulting from operations | | $(209,351) |
See accompanying notes which are an integral part of the financial statements.
Statement of Changes in Net Assets
| | Year ended December 31, 2015 | Year ended December 31, 2014 |
| Increase (Decrease) in Net Assets | | |
| Operations | | |
| Net investment income (loss) | $1,083,070 | $997,947 |
| Net realized gain (loss) | 1,218,781 | 190,944 |
| Change in net unrealized appreciation (depreciation) | (2,511,202) | 1,389,354 |
| Net increase (decrease) in net assets resulting from operations | (209,351) | 2,578,245 |
| Distributions to shareholders from net investment income | (1,080,478) | (996,193) |
| Distributions to shareholders from net realized gain | (142,181) | (1,033,958) |
| Total distributions | (1,222,659) | (2,030,151) |
| Share transactions | | |
| Proceeds from sales of shares | 5,286,344 | 10,603,953 |
| Reinvestment of distributions | 1,222,659 | 2,030,151 |
| Cost of shares redeemed | (7,947,083) | (13,414,020) |
| Net increase (decrease) in net assets resulting from share transactions | (1,438,080) | (779,916) |
| Total increase (decrease) in net assets | (2,870,090) | (231,822) |
| Net Assets | | |
| Beginning of period | 62,339,431 | 62,571,253 |
| End of period (including undistributed net investment income of $3,216 and undistributed net investment income of $1,754, respectively) | $59,469,341 | $62,339,431 |
| Other Information | | |
| Shares | | |
| Sold | 441,693 | 895,459 |
| Issued in reinvestment of distributions | 105,736 | 173,322 |
| Redeemed | (668,798) | (1,144,278) |
| Net increase (decrease) | (121,369) | (75,497) |
See accompanying notes which are an integral part of the financial statements.
Financial Highlights — VIP Investor Freedom 2010 Portfolio
| | | December 31, | | | |
| Years ended December 31, | 2015 | 2014 | 2013 | 2012 | 2011 |
| Selected Per–Share Data | | | | | |
| Net asset value, beginning of period | $11.77 | $11.64 | $10.57 | $9.77 | $10.06 |
| Income from Investment Operations | | | | | |
| Net investment income (loss)A | .21 | .20 | .20 | .20 | .21 |
| Net realized and unrealized gain (loss) | (.25) | .33 | 1.21 | .95 | (.24) |
| Total from investment operations | (.04) | .53 | 1.41 | 1.15 | (.03) |
| Distributions from net investment income | (.21) | (.19) | (.20) | (.20) | (.21) |
| Distributions from net realized gain | (.03) | (.20) | (.14) | (.15) | (.04) |
| Total distributions | (.24) | (.40)B | (.34) | (.35) | (.26)C |
| Net asset value, end of period | $11.49 | $11.77 | $11.64 | $10.57 | $9.77 |
| Total ReturnD,E | (.34)% | 4.56% | 13.41% | 11.82% | (.35)% |
| Ratios to Average Net AssetsF,G | | | | | |
| Expenses before reductionsH | -% | -% | -% | -% | -% |
| Expenses net of fee waivers, if any | -% | -% | -% | -% | -% |
| Expenses net of all reductions | -% | -% | -% | -% | -% |
| Net investment income (loss) | 1.76% | 1.66% | 1.76% | 1.88% | 2.02% |
| Supplemental Data | | | | | |
| Net assets, end of period (000 omitted) | $59,469 | $62,339 | $62,571 | $54,659 | $51,167 |
| Portfolio turnover rateF | 21% | 27% | 23% | 21% | 24% |
A Calculated based on average shares outstanding during the period.
B Total distributions of $.40 per share is comprised of distributions from net investment income of $.192 and distributions from net realized gain of $.204 per share.
C Total distributions of $.26 per share is comprised of distributions from net investment income of $.214 and distributions from net realized gain of $.041 per share.
D Total returns do not reflect charges attributable to your insurance company's separate account. Inclusion of these charges would reduce the total returns shown.
E Total returns would have been lower if certain expenses had not been reduced during the applicable periods shown.
F Amounts do not include the activity of the Underlying Funds.
G Expense ratios reflect operating expenses of the Fund. Expenses before reductions do not reflect amounts reimbursed by the investment adviser or reductions from expense offset arrangements and do not represent the amount paid by the Fund during periods when reimbursements or reductions occur. Expenses net of fee waivers reflect expenses after reimbursement by the investment adviser but prior to reductions from expense offset arrangements. Expenses net of all reductions represent the net expenses paid by the Fund but do not include expenses of the underlying funds in which the Fund invests.
H Amount represents less than .005%.
See accompanying notes which are an integral part of the financial statements.
VIP Investor Freedom 2015 Portfolio℠
Investment Summary (Unaudited)
The information in the following tables is based on the direct investments of the Fund.
Fund Holdings as of December 31, 2015
| | % of fund's net assets | % of fund's net assets 6 months ago |
| Domestic Equity Funds | | |
| VIP Contrafund Portfolio Investor Class | 6.9 | 6.9 |
| VIP Equity-Income Portfolio Investor Class | 7.3 | 7.2 |
| VIP Growth & Income Portfolio Investor Class | 8.2 | 8.3 |
| VIP Growth Portfolio Investor Class | 7.2 | 7.1 |
| VIP Mid Cap Portfolio Investor Class | 2.0 | 2.0 |
| VIP Value Portfolio Investor Class | 5.3 | 5.3 |
| VIP Value Strategies Portfolio Investor Class | 2.5 | 2.6 |
| | 39.4 | 39.4 |
| International Equity Funds | | |
| VIP Emerging Markets Portfolio Investor Class | 6.0 | 5.7 |
| VIP Overseas Portfolio Investor Class | 11.2 | 11.6 |
| | 17.2 | 17.3 |
| Bond Funds | | |
| VIP High Income Portfolio Investor Class | 3.7 | 4.0 |
| VIP Investment Grade Bond Portfolio Investor Class | 30.3 | 31.4 |
| | 34.0 | 35.4 |
| Short-Term Funds | | |
| VIP Government Money Market Portfolio Investor Class 0.03% | 9.4 | 7.9 |
| Net Other Assets (Liabilities) | | |
| Net Other Assets | 0.0 | 0.0 |
| | 100.0 | 100.0 |
VIP Government Money Market Portfolio Investor Class was formerly known as VIP Money Market Portfolio Investor Class
Asset Allocation (% of fund's net assets)
| Period end |
| | Domestic Equity Funds | 39.4% |
| | International Equity Funds | 17.2% |
| | Bond Funds | 34.0% |
| | Short-Term Funds | 9.4% |

| Six months ago |
| | Domestic Equity Funds | 39.4% |
| | International Equity Funds | 17.3% |
| | Bond Funds | 35.4% |
| | Short-Term Funds | 7.9% |

Percentages shown as 0.0% may reflect amounts less than 0.05%.
VIP Investor Freedom 2015 Portfolio℠
Investments December 31, 2015
Showing Percentage of Net Assets
| Domestic Equity Funds - 39.4% | | | |
| | | Shares | Value |
| VIP Contrafund Portfolio Investor Class (a) | | 195,835 | $6,613,348 |
| VIP Equity-Income Portfolio Investor Class (a) | | 342,407 | 6,978,262 |
| VIP Growth & Income Portfolio Investor Class (a) | | 418,062 | 7,867,933 |
| VIP Growth Portfolio Investor Class (a) | | 105,011 | 6,883,498 |
| VIP Mid Cap Portfolio Investor Class (a) | | 58,191 | 1,891,221 |
| VIP Value Portfolio Investor Class (a) | | 378,067 | 5,047,197 |
| VIP Value Strategies Portfolio Investor Class (a) | | 168,171 | 2,433,435 |
| TOTAL DOMESTIC EQUITY FUNDS | | | |
| (Cost $32,335,363) | | | 37,714,894 |
|
| International Equity Funds - 17.2% | | | |
| VIP Emerging Markets Portfolio Investor Class (a) | | 703,274 | 5,703,549 |
| VIP Overseas Portfolio Investor Class (a) | | 565,197 | 10,750,051 |
| TOTAL INTERNATIONAL EQUITY FUNDS | | | |
| (Cost $16,499,563) | | | 16,453,600 |
|
| Bond Funds - 34.0% | | | |
| VIP High Income Portfolio Investor Class (a) | | 726,411 | 3,581,208 |
| VIP Investment Grade Bond Portfolio Investor Class (a) | | 2,352,201 | 28,979,120 |
| TOTAL BOND FUNDS | | | |
| (Cost $33,771,956) | | | 32,560,328 |
|
| Short-Term Funds - 9.4% | | | |
| VIP Government Money Market Portfolio Investor Class 0.03% (a)(b) | | | |
| (Cost $9,032,226) | | 9,032,226 | 9,032,226 |
| TOTAL INVESTMENT PORTFOLIO - 100.0% | | | |
| (Cost $91,639,108) | | | 95,761,048 |
| NET OTHER ASSETS (LIABILITIES) - 0.0% | | | (3) |
| NET ASSETS - 100% | | | $95,761,045 |
Legend
(a) Affiliated Fund
(b) The rate quoted is the annualized seven-day yield of the fund at period end.
Affiliated Underlying Funds
Information regarding the Fund's fiscal year to date purchases and sales of the affiliated Underlying Funds and income earned by the Fund from investments in affiliated Underlying Funds is as follows:
(VIP Government Money Market Portfolio Investor Class was formerly known as VIP Money Market Portfolio Investor Class)
| Affiliate | Value, beginning of period | Purchases | Sales Proceeds | Dividend Income | Value, end of period |
| VIP Contrafund Portfolio Investor Class | $7,162,928 | $1,301,883 | $1,217,444 | $66,433 | $6,613,348 |
| VIP Emerging Markets Portfolio Investor Class | 5,011,900 | 2,206,173 | 859,867 | 30,796 | 5,703,549 |
| VIP Equity-Income Portfolio Investor Class | 7,543,694 | 1,679,301 | 1,040,857 | 230,925 | 6,978,262 |
| VIP Government Money Market Portfolio Investor Class 0.03% | 6,075,547 | 4,090,458 | 1,133,778 | 869 | 9,032,226 |
| VIP Growth & Income Portfolio Investor Class | 8,604,648 | 1,613,393 | 1,596,075 | 168,689 | 7,867,933 |
| VIP Growth Portfolio Investor Class | 7,324,301 | 784,065 | 1,501,558 | 13,326 | 6,883,498 |
| VIP High Income Portfolio Investor Class | 4,031,513 | 541,555 | 604,486 | 253,783 | 3,581,208 |
| VIP Investment Grade Bond Portfolio Investor Class | 32,689,592 | 5,232,253 | 7,953,919 | 770,825 | 28,979,120 |
| VIP Mid Cap Portfolio Investor Class | 2,098,701 | 405,429 | 338,331 | 8,591 | 1,891,221 |
| VIP Overseas Portfolio Investor Class | 12,944,925 | 1,809,189 | 4,434,173 | 143,975 | 10,750,051 |
| VIP Value Portfolio Investor Class | 5,538,000 | 1,248,822 | 852,593 | 67,200 | 5,047,197 |
| VIP Value Strategies Portfolio Investor Class | 2,714,092 | 269,596 | 456,371 | 28,867 | 2,433,435 |
| Total | $101,739,841 | $21,182,117 | $21,989,452 | $1,784,279 | $95,761,048 |
Investment Valuation
All investments are categorized as Level 1 under the Fair Value Hierarchy. The inputs or methodology used for valuing securities may not be an indication of the risk associated with investing in those securities. For more information on valuation inputs please refer to the Investment Valuation section in the accompanying Notes to Financial Statements.
See accompanying notes which are an integral part of the financial statements.
VIP Investor Freedom 2015 Portfolio℠
Financial Statements
Statement of Assets and Liabilities
| | | December 31, 2015 |
| Assets | | |
| Investment in securities, at value (cost $91,639,108) — See accompanying schedule | | $95,761,048 |
| Receivable for investments sold | | 125,165 |
| Total assets | | 95,886,213 |
| Liabilities | | |
| Payable for fund shares redeemed | $125,168 | |
| Total liabilities | | 125,168 |
| Net Assets | | $95,761,045 |
| Net Assets consist of: | | |
| Paid in capital | | $89,801,440 |
| Undistributed net investment income | | 6,610 |
| Accumulated undistributed net realized gain (loss) on investments | | 1,831,055 |
| Net unrealized appreciation (depreciation) on investments | | 4,121,940 |
| Net Assets, for 8,444,259 shares outstanding | | $95,761,045 |
| Net Asset Value, offering price and redemption price per share ($95,761,045 ÷ 8,444,259 shares) | | $11.34 |
See accompanying notes which are an integral part of the financial statements.
Statement of Operations
| | | Year ended December 31, 2015 |
| Investment Income | | |
| Income distributions from underlying funds | | $1,784,279 |
| Expenses | | |
| Independent trustees' compensation | $410 | |
| Total expenses before reductions | 410 | |
| Expense reductions | (410) | – |
| Net investment income (loss) | | 1,784,279 |
| Realized and Unrealized Gain (Loss) | | |
| Realized gain (loss) on sale of underlying fund shares | (400,891) | |
| Capital gain distributions from underlying funds | 3,071,481 | |
| Total net realized gain (loss) | | 2,670,590 |
| Change in net unrealized appreciation (depreciation) on underlying funds | | (4,770,564) |
| Net gain (loss) | | (2,099,974) |
| Net increase (decrease) in net assets resulting from operations | | $(315,695) |
See accompanying notes which are an integral part of the financial statements.
Statement of Changes in Net Assets
| | Year ended December 31, 2015 | Year ended December 31, 2014 |
| Increase (Decrease) in Net Assets | | |
| Operations | | |
| Net investment income (loss) | $1,784,279 | $1,663,852 |
| Net realized gain (loss) | 2,670,590 | 305,661 |
| Change in net unrealized appreciation (depreciation) | (4,770,564) | 2,532,868 |
| Net increase (decrease) in net assets resulting from operations | (315,695) | 4,502,381 |
| Distributions to shareholders from net investment income | (1,779,697) | (1,659,964) |
| Distributions to shareholders from net realized gain | (306,141) | (1,575,500) |
| Total distributions | (2,085,838) | (3,235,464) |
| Share transactions | | |
| Proceeds from sales of shares | 9,844,723 | 13,258,460 |
| Reinvestment of distributions | 2,085,838 | 3,235,463 |
| Cost of shares redeemed | (15,507,818) | (13,242,070) |
| Net increase (decrease) in net assets resulting from share transactions | (3,577,257) | 3,251,853 |
| Total increase (decrease) in net assets | (5,978,790) | 4,518,770 |
| Net Assets | | |
| Beginning of period | 101,739,835 | 97,221,065 |
| End of period (including undistributed net investment income of $6,610 and undistributed net investment income of $2,361, respectively) | $95,761,045 | $101,739,835 |
| Other Information | | |
| Shares | | |
| Sold | 831,807 | 1,142,192 |
| Issued in reinvestment of distributions | 182,435 | 279,268 |
| Redeemed | (1,320,033) | (1,141,505) |
| Net increase (decrease) | (305,791) | 279,955 |
See accompanying notes which are an integral part of the financial statements.
Financial Highlights — VIP Investor Freedom 2015 Portfolio
| | | December 31, | | | |
| Years ended December 31, | 2015 | 2014 | 2013 | 2012 | 2011 |
| Selected Per–Share Data | | | | | |
| Net asset value, beginning of period | $11.63 | $11.48 | $10.34 | $9.55 | $9.87 |
| Income from Investment Operations | | | | | |
| Net investment income (loss)A | .21 | .19 | .20 | .21 | .21 |
| Net realized and unrealized gain (loss) | (.25) | .34 | 1.27 | .94 | (.24) |
| Total from investment operations | (.04) | .53 | 1.47 | 1.15 | (.03) |
| Distributions from net investment income | (.22) | (.19) | (.20) | (.20) | (.21) |
| Distributions from net realized gain | (.04) | (.19) | (.13) | (.16) | (.08) |
| Total distributions | (.25)B | (.38) | (.33) | (.36) | (.29) |
| Net asset value, end of period | $11.34 | $11.63 | $11.48 | $10.34 | $9.55 |
| Total ReturnC,D | (.34)% | 4.65% | 14.35% | 12.10% | (.33)% |
| Ratios to Average Net AssetsE,F | | | | | |
| Expenses before reductionsG | -% | -% | -% | -% | -% |
| Expenses net of fee waivers, if any | -% | -% | -% | -% | -% |
| Expenses net of all reductions | -% | -% | -% | -% | -% |
| Net investment income (loss) | 1.77% | 1.67% | 1.86% | 2.02% | 2.07% |
| Supplemental Data | | | | | |
| Net assets, end of period (000 omitted) | $95,761 | $101,740 | $97,221 | $79,002 | $67,804 |
| Portfolio turnover rateE | 21% | 20% | 21% | 18% | 30% |
A Calculated based on average shares outstanding during the period.
B Total distributions of $.25 per share is comprised of distributions from net investment income of $.215 and distributions from net realized gain of $.037 per share.
C Total returns do not reflect charges attributable to your insurance company's separate account. Inclusion of these charges would reduce the total returns shown.
D Total returns would have been lower if certain expenses had not been reduced during the applicable periods shown.
E Amounts do not include the activity of the Underlying Funds.
F Expense ratios reflect operating expenses of the Fund. Expenses before reductions do not reflect amounts reimbursed by the investment adviser or reductions from expense offset arrangements and do not represent the amount paid by the Fund during periods when reimbursements or reductions occur. Expenses net of fee waivers reflect expenses after reimbursement by the investment adviser but prior to reductions from expense offset arrangements. Expenses net of all reductions represent the net expenses paid by the Fund but do not include expenses of the underlying funds in which the Fund invests.
G Amount represents less than .005%.
See accompanying notes which are an integral part of the financial statements.
VIP Investor Freedom 2020 Portfolio℠
Investment Summary (Unaudited)
The information in the following tables is based on the direct investments of the Fund.
Fund Holdings as of December 31, 2015
| | % of fund's net assets | % of fund's net assets 6 months ago |
| Domestic Equity Funds | | |
| VIP Contrafund Portfolio Investor Class | 7.7 | 7.6 |
| VIP Equity-Income Portfolio Investor Class | 8.1 | 8.0 |
| VIP Growth & Income Portfolio Investor Class | 9.1 | 9.2 |
| VIP Growth Portfolio Investor Class | 8.0 | 7.8 |
| VIP Mid Cap Portfolio Investor Class | 2.2 | 2.2 |
| VIP Value Portfolio Investor Class | 5.8 | 5.9 |
| VIP Value Strategies Portfolio Investor Class | 2.8 | 2.9 |
| | 43.7 | 43.6 |
| International Equity Funds | | |
| VIP Emerging Markets Portfolio Investor Class | 6.4 | 6.1 |
| VIP Overseas Portfolio Investor Class | 12.6 | 13.0 |
| | 19.0 | 19.1 |
| Bond Funds | | |
| VIP High Income Portfolio Investor Class | 3.7 | 4.0 |
| VIP Investment Grade Bond Portfolio Investor Class | 27.1 | 28.3 |
| | 30.8 | 32.3 |
| Short-Term Funds | | |
| VIP Government Money Market Portfolio Investor Class 0.03% | 6.5 | 5.0 |
| Net Other Assets (Liabilities) | | |
| Net Other Assets | 0.0 | 0.0 |
| | 100.0 | 100.0 |
VIP Government Money Market Portfolio Investor Class was formerly known as VIP Money Market Portfolio Investor Class
Asset Allocation (% of fund's net assets)
| Period end |
| | Domestic Equity Funds | 43.7% |
| | International Equity Funds | 19.0% |
| | Bond Funds | 30.8% |
| | Short-Term Funds | 6.5% |

| Six months ago |
| | Domestic Equity Funds | 43.6% |
| | International Equity Funds | 19.1% |
| | Bond Funds | 32.3% |
| | Short-Term Funds | 5.0% |

Percentages shown as 0.0% may reflect amounts less than 0.05%.
VIP Investor Freedom 2020 Portfolio℠
Investments December 31, 2015
Showing Percentage of Net Assets
| Domestic Equity Funds - 43.7% | | | |
| | | Shares | Value |
| VIP Contrafund Portfolio Investor Class (a) | | 424,884 | $14,348,330 |
| VIP Equity-Income Portfolio Investor Class (a) | | 742,888 | 15,140,056 |
| VIP Growth & Income Portfolio Investor Class (a) | | 907,087 | 17,071,374 |
| VIP Growth Portfolio Investor Class (a) | | 227,813 | 14,933,171 |
| VIP Mid Cap Portfolio Investor Class (a) | | 126,266 | 4,103,630 |
| VIP Value Portfolio Investor Class (a) | | 820,341 | 10,951,556 |
| VIP Value Strategies Portfolio Investor Class (a) | | 364,933 | 5,280,581 |
| TOTAL DOMESTIC EQUITY FUNDS | | | |
| (Cost $72,087,397) | | | 81,828,698 |
|
| International Equity Funds - 19.0% | | | |
| VIP Emerging Markets Portfolio Investor Class (a) | | 1,471,042 | 11,930,150 |
| VIP Overseas Portfolio Investor Class (a) | | 1,244,842 | 23,676,893 |
| TOTAL INTERNATIONAL EQUITY FUNDS | | | |
| (Cost $35,948,170) | | | 35,607,043 |
|
| Bond Funds - 30.8% | | | |
| VIP High Income Portfolio Investor Class (a) | | 1,423,181 | 7,016,283 |
| VIP Investment Grade Bond Portfolio Investor Class (a) | | 4,129,421 | 50,874,469 |
| TOTAL BOND FUNDS | | | |
| (Cost $60,444,264) | | | 57,890,752 |
|
| Short-Term Funds - 6.5% | | | |
| VIP Government Money Market Portfolio Investor Class 0.03% (a)(b) | | | |
| (Cost $12,111,836) | | 12,111,836 | 12,111,836 |
| TOTAL INVESTMENT PORTFOLIO - 100.0% | | | |
| (Cost $180,591,667) | | | 187,438,329 |
| NET OTHER ASSETS (LIABILITIES) - 0.0% | | | (4) |
| NET ASSETS - 100% | | | $187,438,325 |
Legend
(a) Affiliated Fund
(b) The rate quoted is the annualized seven-day yield of the fund at period end.
Affiliated Underlying Funds
Information regarding the Fund's fiscal year to date purchases and sales of the affiliated Underlying Funds and income earned by the Fund from investments in affiliated Underlying Funds is as follows:
(VIP Government Money Market Portfolio Investor Class was formerly known as VIP Money Market Portfolio Investor Class)
| Affiliate | Value, beginning of period | Purchases | Sales Proceeds | Dividend Income | Value, end of period |
| VIP Contrafund Portfolio Investor Class | $15,017,855 | $2,765,607 | $2,083,450 | $142,987 | $14,348,330 |
| VIP Emerging Markets Portfolio Investor Class | 10,297,245 | 4,019,990 | 1,003,501 | 63,847 | 11,930,150 |
| VIP Equity-Income Portfolio Investor Class | 15,777,775 | 3,525,445 | 1,594,266 | 496,900 | 15,140,056 |
| VIP Government Money Market Portfolio Investor Class 0.03% | 6,683,032 | 6,681,349 | 1,252,545 | 1,059 | 12,111,836 |
| VIP Growth & Income Portfolio Investor Class | 17,983,610 | 3,521,515 | 2,820,350 | 363,050 | 17,071,374 |
| VIP Growth Portfolio Investor Class | 15,263,910 | 1,735,798 | 2,651,212 | 28,690 | 14,933,171 |
| VIP High Income Portfolio Investor Class | 7,744,975 | 1,039,797 | 1,015,973 | 493,402 | 7,016,283 |
| VIP Investment Grade Bond Portfolio Investor Class | 54,382,224 | 8,727,202 | 10,466,431 | 1,341,106 | 50,874,469 |
| VIP Mid Cap Portfolio Investor Class | 4,414,121 | 856,068 | 580,851 | 18,499 | 4,103,630 |
| VIP Overseas Portfolio Investor Class | 26,870,793 | 2,731,992 | 6,745,572 | 314,689 | 23,676,893 |
| VIP Value Portfolio Investor Class | 11,621,708 | 2,736,391 | 1,503,332 | 144,652 | 10,951,556 |
| VIP Value Strategies Portfolio Investor Class | 5,707,236 | 561,522 | 775,622 | 62,152 | 5,280,581 |
| Total | $191,764,484 | $38,902,676 | $32,493,105 | $3,471,033 | $187,438,329 |
Investment Valuation
All investments are categorized as Level 1 under the Fair Value Hierarchy. The inputs or methodology used for valuing securities may not be an indication of the risk associated with investing in those securities. For more information on valuation inputs please refer to the Investment Valuation section in the accompanying Notes to Financial Statements.
See accompanying notes which are an integral part of the financial statements.
VIP Investor Freedom 2020 Portfolio℠
Financial Statements
Statement of Assets and Liabilities
| | | December 31, 2015 |
| Assets | | |
| Investment in securities, at value (cost $180,591,667) — See accompanying schedule | | $187,438,329 |
| Receivable for investments sold | | 90,175 |
| Total assets | | 187,528,504 |
| Liabilities | | |
| Payable for fund shares redeemed | $90,179 | |
| Total liabilities | | 90,179 |
| Net Assets | | $187,438,325 |
| Net Assets consist of: | | |
| Paid in capital | | $176,769,831 |
| Undistributed net investment income | | 2,306 |
| Accumulated undistributed net realized gain (loss) on investments | | 3,819,526 |
| Net unrealized appreciation (depreciation) on investments | | 6,846,662 |
| Net Assets, for 16,524,306 shares outstanding | | $187,438,325 |
| Net Asset Value, offering price and redemption price per share ($187,438,325 ÷ 16,524,306 shares) | | $11.34 |
See accompanying notes which are an integral part of the financial statements.
Statement of Operations
| | | Year ended December 31, 2015 |
| Investment Income | | |
| Income distributions from underlying funds | | $3,471,033 |
| Expenses | | |
| Independent trustees' compensation | $788 | |
| Total expenses before reductions | 788 | |
| Expense reductions | (788) | – |
| Net investment income (loss) | | 3,471,033 |
| Realized and Unrealized Gain (Loss) | | |
| Realized gain (loss) on sale of underlying fund shares | (1,120,800) | |
| Capital gain distributions from underlying funds | 6,489,200 | |
| Total net realized gain (loss) | | 5,368,400 |
| Change in net unrealized appreciation (depreciation) on underlying funds | | (9,614,929) |
| Net gain (loss) | | (4,246,529) |
| Net increase (decrease) in net assets resulting from operations | | $(775,496) |
See accompanying notes which are an integral part of the financial statements.
Statement of Changes in Net Assets
| | Year ended December 31, 2015 | Year ended December 31, 2014 |
| Increase (Decrease) in Net Assets | | |
| Operations | | |
| Net investment income (loss) | $3,471,033 | $3,117,689 |
| Net realized gain (loss) | 5,368,400 | 584,331 |
| Change in net unrealized appreciation (depreciation) | (9,614,929) | 4,515,791 |
| Net increase (decrease) in net assets resulting from operations | (775,496) | 8,217,811 |
| Distributions to shareholders from net investment income | (3,468,810) | (3,115,242) |
| Distributions to shareholders from net realized gain | (599,888) | (2,807,737) |
| Total distributions | (4,068,698) | (5,922,979) |
| Share transactions | | |
| Proceeds from sales of shares | 16,584,508 | 34,925,299 |
| Reinvestment of distributions | 4,068,698 | 5,922,978 |
| Cost of shares redeemed | (20,135,166) | (12,471,254) |
| Net increase (decrease) in net assets resulting from share transactions | 518,040 | 28,377,023 |
| Total increase (decrease) in net assets | (4,326,154) | 30,671,855 |
| Net Assets | | |
| Beginning of period | 191,764,479 | 161,092,624 |
| End of period (including undistributed net investment income of $2,306 and undistributed net investment income of $2,447, respectively) | $187,438,325 | $191,764,479 |
| Other Information | | |
| Shares | | |
| Sold | 1,395,722 | 2,995,604 |
| Issued in reinvestment of distributions | 355,554 | 510,708 |
| Redeemed | (1,713,983) | (1,064,875) |
| Net increase (decrease) | 37,293 | 2,441,437 |
See accompanying notes which are an integral part of the financial statements.
Financial Highlights — VIP Investor Freedom 2020 Portfolio
| | | December 31, | | | |
| Years ended December 31, | 2015 | 2014 | 2013 | 2012 | 2011 |
| Selected Per–Share Data | | | | | |
| Net asset value, beginning of period | $11.63 | $11.47 | $10.20 | $9.31 | $9.68 |
| Income from Investment Operations | | | | | |
| Net investment income (loss)A | .21 | .20 | .20 | .21 | .21 |
| Net realized and unrealized gain (loss) | (.25) | .34 | 1.42 | 1.02 | (.32) |
| Total from investment operations | (.04) | .54 | 1.62 | 1.23 | (.11) |
| Distributions from net investment income | (.21) | (.19) | (.20) | (.21) | (.21) |
| Distributions from net realized gain | (.04) | (.19) | (.15) | (.14) | (.05) |
| Total distributions | (.25) | (.38) | (.35) | (.34)B | (.26) |
| Net asset value, end of period | $11.34 | $11.63 | $11.47 | $10.20 | $9.31 |
| Total ReturnC,D | (.35)% | 4.75% | 15.96% | 13.30% | (1.11)% |
| Ratios to Average Net AssetsE,F | | | | | |
| Expenses before reductionsG | -% | -% | -% | -% | -% |
| Expenses net of fee waivers, if any | -% | -% | -% | -% | -% |
| Expenses net of all reductions | -% | -% | -% | -% | -% |
| Net investment income (loss) | 1.79% | 1.74% | 1.87% | 2.13% | 2.20% |
| Supplemental Data | | | | | |
| Net assets, end of period (000 omitted) | $187,438 | $191,764 | $161,093 | $123,726 | $102,875 |
| Portfolio turnover rateE | 17% | 13% | 22% | 18% | 16% |
A Calculated based on average shares outstanding during the period.
B Total distributions of $.34 per share is comprised of distributions from net investment income of $.205 and distributions from net realized gain of $.137 per share.
C Total returns do not reflect charges attributable to your insurance company's separate account. Inclusion of these charges would reduce the total returns shown.
D Total returns would have been lower if certain expenses had not been reduced during the applicable periods shown.
E Amounts do not include the activity of the Underlying Funds.
F Expense ratios reflect operating expenses of the Fund. Expenses before reductions do not reflect amounts reimbursed by the investment adviser or reductions from expense offset arrangements and do not represent the amount paid by the Fund during periods when reimbursements or reductions occur. Expenses net of fee waivers reflect expenses after reimbursement by the investment adviser but prior to reductions from expense offset arrangements. Expenses net of all reductions represent the net expenses paid by the Fund but do not include expenses of the underlying funds in which the Fund invests.
G Amount represents less than .005%.
See accompanying notes which are an integral part of the financial statements.
VIP Investor Freedom 2025 Portfolio℠
Investment Summary (Unaudited)
The information in the following tables is based on the direct investments of the Fund.
Fund Holdings as of December 31, 2015
| | % of fund's net assets | % of fund's net assets 6 months ago |
| Domestic Equity Funds | | |
| VIP Contrafund Portfolio Investor Class | 8.6 | 8.7 |
| VIP Equity-Income Portfolio Investor Class | 9.0 | 9.1 |
| VIP Growth & Income Portfolio Investor Class | 10.2 | 10.4 |
| VIP Growth Portfolio Investor Class | 8.9 | 8.9 |
| VIP Mid Cap Portfolio Investor Class | 2.4 | 2.5 |
| VIP Value Portfolio Investor Class | 6.5 | 6.7 |
| VIP Value Strategies Portfolio Investor Class | 3.2 | 3.2 |
| | 48.8 | 49.5 |
| International Equity Funds | | |
| VIP Emerging Markets Portfolio Investor Class | 6.8 | 6.6 |
| VIP Overseas Portfolio Investor Class | 14.4 | 15.0 |
| | 21.2 | 21.6 |
| Bond Funds | | |
| VIP High Income Portfolio Investor Class | 3.7 | 4.1 |
| VIP Investment Grade Bond Portfolio Investor Class | 23.0 | 22.8 |
| | 26.7 | 26.9 |
| Short-Term Funds | | |
| VIP Government Money Market Portfolio Investor Class 0.03% | 3.3 | 2.0 |
| Net Other Assets (Liabilities) | | |
| Net Other Assets | 0.0 | 0.0 |
| | 100.0 | 100.0 |
VIP Government Money Market Portfolio Investor Class was formerly known as VIP Money Market Portfolio Investor Class
Asset Allocation (% of fund's net assets)
| Period end |
| | Domestic Equity Funds | 48.8% |
| | International Equity Funds | 21.2% |
| | Bond Funds | 26.7% |
| | Short-Term Funds | 3.3% |

| Six months ago |
| | Domestic Equity Funds | 49.5% |
| | International Equity Funds | 21.6% |
| | Bond Funds | 26.9% |
| | Short-Term Funds | 2.0% |

Percentages shown as 0.0% may reflect amounts less than 0.05%.
VIP Investor Freedom 2025 Portfolio℠
Investments December 31, 2015
Showing Percentage of Net Assets
| Domestic Equity Funds - 48.8% | | | |
| | | Shares | Value |
| VIP Contrafund Portfolio Investor Class (a) | | 395,388 | $13,352,251 |
| VIP Equity-Income Portfolio Investor Class (a) | | 691,537 | 14,093,525 |
| VIP Growth & Income Portfolio Investor Class (a) | | 844,320 | 15,890,106 |
| VIP Growth Portfolio Investor Class (a) | | 212,115 | 13,904,121 |
| VIP Mid Cap Portfolio Investor Class (a) | | 117,530 | 3,819,714 |
| VIP Value Portfolio Investor Class (a) | | 763,579 | 10,193,783 |
| VIP Value Strategies Portfolio Investor Class (a) | | 339,632 | 4,914,472 |
| TOTAL DOMESTIC EQUITY FUNDS | | | |
| (Cost $65,539,931) | | | 76,167,972 |
|
| International Equity Funds - 21.2% | | | |
| VIP Emerging Markets Portfolio Investor Class (a) | | 1,317,904 | 10,688,200 |
| VIP Overseas Portfolio Investor Class (a) | | 1,183,232 | 22,505,080 |
| TOTAL INTERNATIONAL EQUITY FUNDS | | | |
| (Cost $32,511,388) | | | 33,193,280 |
|
| Bond Funds - 26.7% | | | |
| VIP High Income Portfolio Investor Class (a) | | 1,187,257 | 5,853,178 |
| VIP Investment Grade Bond Portfolio Investor Class (a) | | 2,910,020 | 35,851,441 |
| TOTAL BOND FUNDS | | | |
| (Cost $43,788,124) | | | 41,704,619 |
|
| Short-Term Funds - 3.3% | | | |
| VIP Government Money Market Portfolio Investor Class 0.03% (a)(b) | | | |
| (Cost $5,152,241) | | 5,152,241 | 5,152,241 |
| TOTAL INVESTMENT PORTFOLIO - 100.0% | | | |
| (Cost $146,991,684) | | | 156,218,112 |
| NET OTHER ASSETS (LIABILITIES) - 0.0% | | | 1 |
| NET ASSETS - 100% | | | $156,218,113 |
Legend
(a) Affiliated Fund
(b) The rate quoted is the annualized seven-day yield of the fund at period end.
Affiliated Underlying Funds
Information regarding the Fund's fiscal year to date purchases and sales of the affiliated Underlying Funds and income earned by the Fund from investments in affiliated Underlying Funds is as follows:
(VIP Government Money Market Portfolio Investor Class was formerly known as VIP Money Market Portfolio Investor Class)
| Affiliate | Value, beginning of period | Purchases | Sales Proceeds | Dividend Income | Value, end of period |
| VIP Contrafund Portfolio Investor Class | $12,445,871 | $3,528,196 | $1,451,300 | $134,166 | $13,352,251 |
| VIP Emerging Markets Portfolio Investor Class | 8,391,890 | 4,748,762 | 1,189,596 | 57,084 | 10,688,200 |
| VIP Equity-Income Portfolio Investor Class | 13,054,735 | 4,503,986 | 1,203,337 | 465,581 | 14,093,525 |
| VIP Government Money Market Portfolio Investor Class 0.03% | 1,769,091 | 3,782,728 | 399,577 | 373 | 5,152,241 |
| VIP Growth & Income Portfolio Investor Class | 14,901,512 | 4,341,661 | 1,901,478 | 340,648 | 15,890,106 |
| VIP Growth Portfolio Investor Class | 12,714,834 | 2,717,153 | 2,039,777 | 26,970 | 13,904,121 |
| VIP High Income Portfolio Investor Class | 5,683,544 | 1,722,021 | 892,643 | 413,125 | 5,853,178 |
| VIP Investment Grade Bond Portfolio Investor Class | 30,297,707 | 14,354,139 | 7,488,856 | 946,663 | 35,851,441 |
| VIP Mid Cap Portfolio Investor Class | 3,638,059 | 1,084,920 | 395,999 | 17,390 | 3,819,714 |
| VIP Overseas Portfolio Investor Class | 22,657,251 | 4,766,372 | 5,472,440 | 302,032 | 22,505,080 |
| VIP Value Portfolio Investor Class | 9,636,136 | 3,383,921 | 1,082,527 | 135,802 | 10,193,783 |
| VIP Value Strategies Portfolio Investor Class | 4,716,722 | 952,032 | 529,242 | 58,421 | 4,914,472 |
| Total | $139,907,352 | $49,885,891 | $24,046,772 | $2,898,255 | $156,218,112 |
Investment Valuation
All investments are categorized as Level 1 under the Fair Value Hierarchy. The inputs or methodology used for valuing securities may not be an indication of the risk associated with investing in those securities. For more information on valuation inputs please refer to the Investment Valuation section in the accompanying Notes to Financial Statements.
See accompanying notes which are an integral part of the financial statements.
VIP Investor Freedom 2025 Portfolio℠
Financial Statements
Statement of Assets and Liabilities
| | | December 31, 2015 |
| Assets | | |
| Investment in securities, at value (cost $146,991,684) — See accompanying schedule | | $156,218,112 |
| Receivable for fund shares sold | | 162,001 |
| Total assets | | 156,380,113 |
| Liabilities | | |
| Payable for investments purchased | $161,933 | |
| Payable for fund shares redeemed | 67 | |
| Total liabilities | | 162,000 |
| Net Assets | | $156,218,113 |
| Net Assets consist of: | | |
| Paid in capital | | $143,413,670 |
| Accumulated undistributed net realized gain (loss) on investments | | 3,578,015 |
| Net unrealized appreciation (depreciation) on investments | | 9,226,428 |
| Net Assets, for 12,978,161 shares outstanding | | $156,218,113 |
| Net Asset Value, offering price and redemption price per share ($156,218,113 ÷ 12,978,161 shares) | | $12.04 |
See accompanying notes which are an integral part of the financial statements.
Statement of Operations
| | | Year ended December 31, 2015 |
| Investment Income | | |
| Income distributions from underlying funds | | $2,898,255 |
| Expenses | | |
| Independent trustees' compensation | $613 | |
| Total expenses before reductions | 613 | |
| Expense reductions | (613) | – |
| Net investment income (loss) | | 2,898,255 |
| Realized and Unrealized Gain (Loss) | | |
| Realized gain (loss) on sale of underlying fund shares | (771,547) | |
| Capital gain distributions from underlying funds | 5,463,115 | |
| Total net realized gain (loss) | | 4,691,568 |
| Change in net unrealized appreciation (depreciation) on underlying funds | | (8,756,815) |
| Net gain (loss) | | (4,065,247) |
| Net increase (decrease) in net assets resulting from operations | | $(1,166,992) |
See accompanying notes which are an integral part of the financial statements.
Statement of Changes in Net Assets
| | Year ended December 31, 2015 | Year ended December 31, 2014 |
| Increase (Decrease) in Net Assets | | |
| Operations | | |
| Net investment income (loss) | $2,898,255 | $2,207,383 |
| Net realized gain (loss) | 4,691,568 | 666,953 |
| Change in net unrealized appreciation (depreciation) | (8,756,815) | 3,437,611 |
| Net increase (decrease) in net assets resulting from operations | (1,166,992) | 6,311,947 |
| Distributions to shareholders from net investment income | (2,895,777) | (2,209,226) |
| Distributions to shareholders from net realized gain | (552,053) | (2,227,137) |
| Total distributions | (3,447,830) | (4,436,363) |
| Share transactions | | |
| Proceeds from sales of shares | 34,295,736 | 29,053,993 |
| Reinvestment of distributions | 3,447,830 | 4,436,363 |
| Cost of shares redeemed | (16,817,984) | (9,865,585) |
| Net increase (decrease) in net assets resulting from share transactions | 20,925,582 | 23,624,771 |
| Total increase (decrease) in net assets | 16,310,760 | 25,500,355 |
| Net Assets | | |
| Beginning of period | 139,907,353 | 114,406,998 |
| End of period | $156,218,113 | $139,907,353 |
| Other Information | | |
| Shares | | |
| Sold | 2,718,882 | 2,366,320 |
| Issued in reinvestment of distributions | 283,671 | 360,288 |
| Redeemed | (1,356,599) | (801,217) |
| Net increase (decrease) | 1,645,954 | 1,925,391 |
See accompanying notes which are an integral part of the financial statements.
Financial Highlights — VIP Investor Freedom 2025 Portfolio
| | | December 31, | | | |
| Years ended December 31, | 2015 | 2014 | 2013 | 2012 | 2011 |
| Selected Per–Share Data | | | | | |
| Net asset value, beginning of period | $12.35 | $12.16 | $10.45 | $9.36 | $9.83 |
| Income from Investment Operations | | | | | |
| Net investment income (loss)A | .24 | .21 | .24 | .24 | .22 |
| Net realized and unrealized gain (loss) | (.28) | .40 | 1.83 | 1.16 | (.44) |
| Total from investment operations | (.04) | .61 | 2.07 | 1.40 | (.22) |
| Distributions from net investment income | (.23) | (.20) | (.21) | (.21) | (.21) |
| Distributions from net realized gain | (.04) | (.22) | (.15) | (.10) | (.04) |
| Total distributions | (.27) | (.42) | (.36) | (.31) | (.25) |
| Net asset value, end of period | $12.04 | $12.35 | $12.16 | $10.45 | $9.36 |
| Total ReturnB,C | (.32)% | 5.04% | 19.95% | 15.05% | (2.28)% |
| Ratios to Average Net AssetsD,E | | | | | |
| Expenses before reductionsF | -% | -% | -% | -% | -% |
| Expenses net of fee waivers, if any | -% | -% | -% | -% | -% |
| Expenses net of all reductions | -% | -% | -% | -% | -% |
| Net investment income (loss) | 1.89% | 1.71% | 2.09% | 2.33% | 2.26% |
| Supplemental Data | | | | | |
| Net assets, end of period (000 omitted) | $156,218 | $139,907 | $114,407 | $72,387 | $52,278 |
| Portfolio turnover rateD | 16% | 13% | 15% | 13% | 15% |
A Calculated based on average shares outstanding during the period.
B Total returns do not reflect charges attributable to your insurance company's separate account. Inclusion of these charges would reduce the total returns shown.
C Total returns would have been lower if certain expenses had not been reduced during the applicable periods shown.
D Amounts do not include the activity of the Underlying Funds.
E Expense ratios reflect operating expenses of the Fund. Expenses before reductions do not reflect amounts reimbursed by the investment adviser or reductions from expense offset arrangements and do not represent the amount paid by the Fund during periods when reimbursements or reductions occur. Expenses net of fee waivers reflect expenses after reimbursement by the investment adviser but prior to reductions from expense offset arrangements. Expenses net of all reductions represent the net expenses paid by the Fund but do not include expenses of the underlying funds in which the Fund invests.
F Amount represents less than .005%.
See accompanying notes which are an integral part of the financial statements.
VIP Investor Freedom 2030 Portfolio℠
Investment Summary (Unaudited)
The information in the following tables is based on the direct investments of the Fund.
Fund Holdings as of December 31, 2015
| | % of fund's net assets | % of fund's net assets 6 months ago |
| Domestic Equity Funds | | |
| VIP Contrafund Portfolio Investor Class | 10.3 | 10.4 |
| VIP Equity-Income Portfolio Investor Class | 10.9 | 10.9 |
| VIP Growth & Income Portfolio Investor Class | 12.3 | 12.5 |
| VIP Growth Portfolio Investor Class | 10.7 | 10.6 |
| VIP Mid Cap Portfolio Investor Class | 2.9 | 3.0 |
| VIP Value Portfolio Investor Class | 7.9 | 8.0 |
| VIP Value Strategies Portfolio Investor Class | 3.8 | 3.9 |
| | 58.8 | 59.3 |
| International Equity Funds | | |
| VIP Emerging Markets Portfolio Investor Class | 7.8 | 7.6 |
| VIP Overseas Portfolio Investor Class | 17.8 | 18.2 |
| | 25.6 | 25.8 |
| Bond Funds | | |
| VIP High Income Portfolio Investor Class | 3.8 | 4.0 |
| VIP Investment Grade Bond Portfolio Investor Class | 10.5 | 9.6 |
| | 14.3 | 13.6 |
| Short-Term Funds | | |
| VIP Government Money Market Portfolio Investor Class 0.03% | 1.3 | 1.3 |
| Net Other Assets (Liabilities) | | |
| Net Other Assets | 0.0 | 0.0 |
| | 100.0 | 100.0 |
VIP Government Money Market Portfolio Investor Class was formerly known as VIP Money Market Portfolio Investor Class
Asset Allocation (% of fund's net assets)
| Period end |
| | Domestic Equity Funds | 58.8% |
| | International Equity Funds | 25.6% |
| | Bond Funds | 14.3% |
| | Short-Term Funds | 1.3% |

| Six months ago |
| | Domestic Equity Funds | 59.3% |
| | International Equity Funds | 25.8% |
| | Bond Funds | 13.6% |
| | Short-Term Funds | 1.3% |

Percentages shown as 0.0% may reflect amounts less than 0.05%.
VIP Investor Freedom 2030 Portfolio℠
Investments December 31, 2015
Showing Percentage of Net Assets
| Domestic Equity Funds - 58.8% | | | |
| | | Shares | Value |
| VIP Contrafund Portfolio Investor Class (a) | | 441,657 | $14,914,752 |
| VIP Equity-Income Portfolio Investor Class (a) | | 772,218 | 15,737,798 |
| VIP Growth & Income Portfolio Investor Class (a) | | 943,109 | 17,749,313 |
| VIP Growth Portfolio Investor Class (a) | | 236,747 | 15,518,771 |
| VIP Mid Cap Portfolio Investor Class (a) | | 131,283 | 4,266,706 |
| VIP Value Portfolio Investor Class (a) | | 852,897 | 11,386,176 |
| VIP Value Strategies Portfolio Investor Class (a) | | 379,411 | 5,490,080 |
| TOTAL DOMESTIC EQUITY FUNDS | | | |
| (Cost $76,660,701) | | | 85,063,596 |
|
| International Equity Funds - 25.6% | | | |
| VIP Emerging Markets Portfolio Investor Class (a) | | 1,391,653 | 11,286,309 |
| VIP Overseas Portfolio Investor Class (a) | | 1,355,855 | 25,788,371 |
| TOTAL INTERNATIONAL EQUITY FUNDS | | | |
| (Cost $37,176,940) | | | 37,074,680 |
|
| Bond Funds - 14.3% | | | |
| VIP High Income Portfolio Investor Class (a) | | 1,101,572 | 5,430,752 |
| VIP Investment Grade Bond Portfolio Investor Class (a) | | 1,234,380 | 15,207,568 |
| TOTAL BOND FUNDS | | | |
| (Cost $21,989,132) | | | 20,638,320 |
|
| Short-Term Funds - 1.3% | | | |
| VIP Government Money Market Portfolio Investor Class 0.03% (a)(b) | | | |
| (Cost $1,915,331) | | 1,915,331 | 1,915,331 |
| TOTAL INVESTMENT PORTFOLIO - 100.0% | | | |
| (Cost $137,742,104) | | | 144,691,927 |
| NET OTHER ASSETS (LIABILITIES) - 0.0% | | | 0 |
| NET ASSETS - 100% | | | $144,691,927 |
Legend
(a) Affiliated Fund
(b) The rate quoted is the annualized seven-day yield of the fund at period end.
Affiliated Underlying Funds
Information regarding the Fund's fiscal year to date purchases and sales of the affiliated Underlying Funds and income earned by the Fund from investments in affiliated Underlying Funds is as follows:
(VIP Government Money Market Portfolio Investor Class was formerly known as VIP Money Market Portfolio Investor Class)
| Affiliate | Value, beginning of period | Purchases | Sales Proceeds | Dividend Income | Value, end of period |
| VIP Contrafund Portfolio Investor Class | $13,926,089 | $3,577,556 | $1,276,629 | $146,385 | $14,914,752 |
| VIP Emerging Markets Portfolio Investor Class | 9,111,528 | 4,187,111 | 722,089 | 59,289 | 11,286,309 |
| VIP Equity-Income Portfolio Investor Class | 14,630,477 | 4,370,276 | 748,292 | 508,193 | 15,737,798 |
| VIP Government Money Market Portfolio Investor Class 0.03% | 6,530 | 2,237,687 | 328,886 | 154 | 1,915,331 |
| VIP Growth & Income Portfolio Investor Class | 16,686,385 | 4,285,143 | 1,627,253 | 371,664 | 17,749,313 |
| VIP Growth Portfolio Investor Class | 14,179,513 | 2,377,832 | 1,606,789 | 29,410 | 15,518,771 |
| VIP High Income Portfolio Investor Class | 5,270,926 | 1,379,469 | 630,470 | 375,075 | 5,430,752 |
| VIP Investment Grade Bond Portfolio Investor Class | 12,220,075 | 6,463,604 | 2,946,145 | 392,441 | 15,207,568 |
| VIP Mid Cap Portfolio Investor Class | 4,104,227 | 1,065,895 | 334,517 | 18,962 | 4,266,706 |
| VIP Overseas Portfolio Investor Class | 25,254,705 | 4,759,166 | 4,873,084 | 338,049 | 25,788,371 |
| VIP Value Portfolio Investor Class | 10,755,834 | 3,293,942 | 744,752 | 148,134 | 11,386,176 |
| VIP Value Strategies Portfolio Investor Class | 5,278,922 | 821,014 | 368,922 | 63,698 | 5,490,080 |
| Total | $131,425,211 | $38,818,695 | $16,207,828 | $2,451,454 | $144,691,927 |
Investment Valuation
All investments are categorized as Level 1 under the Fair Value Hierarchy. The inputs or methodology used for valuing securities may not be an indication of the risk associated with investing in those securities. For more information on valuation inputs please refer to the Investment Valuation section in the accompanying Notes to Financial Statements.
See accompanying notes which are an integral part of the financial statements.
VIP Investor Freedom 2030 Portfolio℠
Financial Statements
Statement of Assets and Liabilities
| | | December 31, 2015 |
| Assets | | |
| Investment in securities, at value (cost $137,742,104) — See accompanying schedule | | $144,691,927 |
| Receivable for fund shares sold | | 36,416 |
| Total assets | | 144,728,343 |
| Liabilities | | |
| Payable for investments purchased | $36,349 | |
| Payable for fund shares redeemed | 67 | |
| Total liabilities | | 36,416 |
| Net Assets | | $144,691,927 |
| Net Assets consist of: | | |
| Paid in capital | | $133,295,917 |
| Undistributed net investment income | | 3,295 |
| Accumulated undistributed net realized gain (loss) on investments | | 4,442,892 |
| Net unrealized appreciation (depreciation) on investments | | 6,949,823 |
| Net Assets, for 12,385,099 shares outstanding | | $144,691,927 |
| Net Asset Value, offering price and redemption price per share ($144,691,927 ÷ 12,385,099 shares) | | $11.68 |
See accompanying notes which are an integral part of the financial statements.
Statement of Operations
| | | Year ended December 31, 2015 |
| Investment Income | | |
| Income distributions from underlying funds | | $2,451,454 |
| Expenses | | |
| Independent trustees' compensation | $568 | |
| Total expenses before reductions | 568 | |
| Expense reductions | (568) | – |
| Net investment income (loss) | | 2,451,454 |
| Realized and Unrealized Gain (Loss) | | |
| Realized gain (loss) on sale of underlying fund shares | (525,784) | |
| Capital gain distributions from underlying funds | 6,137,524 | |
| Total net realized gain (loss) | | 5,611,740 |
| Change in net unrealized appreciation (depreciation) on underlying funds | | (8,818,365) |
| Net gain (loss) | | (3,206,625) |
| Net increase (decrease) in net assets resulting from operations | | $(755,171) |
See accompanying notes which are an integral part of the financial statements.
Statement of Changes in Net Assets
| | Year ended December 31, 2015 | Year ended December 31, 2014 |
| Increase (Decrease) in Net Assets | | |
| Operations | | |
| Net investment income (loss) | $2,451,454 | $1,960,549 |
| Net realized gain (loss) | 5,611,740 | 768,585 |
| Change in net unrealized appreciation (depreciation) | (8,818,365) | 3,205,313 |
| Net increase (decrease) in net assets resulting from operations | (755,171) | 5,934,447 |
| Distributions to shareholders from net investment income | (2,448,159) | (1,957,068) |
| Distributions to shareholders from net realized gain | (636,185) | (2,273,757) |
| Total distributions | (3,084,344) | (4,230,825) |
| Share transactions | | |
| Proceeds from sales of shares | 23,531,499 | 23,492,280 |
| Reinvestment of distributions | 3,084,344 | 4,230,825 |
| Cost of shares redeemed | (9,509,608) | (9,158,880) |
| Net increase (decrease) in net assets resulting from share transactions | 17,106,235 | 18,564,225 |
| Total increase (decrease) in net assets | 13,266,720 | 20,267,847 |
| Net Assets | | |
| Beginning of period | 131,425,207 | 111,157,360 |
| End of period (including undistributed net investment income of $3,295 and undistributed net investment income of $0, respectively) | $144,691,927 | $131,425,207 |
| Other Information | | |
| Shares | | |
| Sold | 1,925,216 | 1,968,586 |
| Issued in reinvestment of distributions | 260,745 | 354,225 |
| Redeemed | (779,308) | (757,636) |
| Net increase (decrease) | 1,406,653 | 1,565,175 |
See accompanying notes which are an integral part of the financial statements.
Financial Highlights — VIP Investor Freedom 2030 Portfolio
| | | December 31, | | | |
| Years ended December 31, | 2015 | 2014 | 2013 | 2012 | 2011 |
| Selected Per–Share Data | | | | | |
| Net asset value, beginning of period | $11.97 | $11.81 | $10.00 | $8.92 | $9.41 |
| Income from Investment Operations | | | | | |
| Net investment income (loss)A | .21 | .19 | .21 | .22 | .20 |
| Net realized and unrealized gain (loss) | (.24) | .38 | 1.95 | 1.16 | (.46) |
| Total from investment operations | (.03) | .57 | 2.16 | 1.38 | (.26) |
| Distributions from net investment income | (.20) | (.18) | (.19) | (.21) | (.20) |
| Distributions from net realized gain | (.05) | (.22) | (.16) | (.09) | (.03) |
| Total distributions | (.26)B | (.41)C | (.35) | (.30) | (.23) |
| Net asset value, end of period | $11.68 | $11.97 | $11.81 | $10.00 | $8.92 |
| Total ReturnD,E | (.32)% | 4.83% | 21.72% | 15.50% | (2.78)% |
| Ratios to Average Net AssetsF,G | | | | | |
| Expenses before reductionsH | -% | -% | -% | -% | -% |
| Expenses net of fee waivers, if any | -% | -% | -% | -% | -% |
| Expenses net of all reductions | -% | -% | -% | -% | -% |
| Net investment income (loss) | 1.73% | 1.58% | 1.94% | 2.28% | 2.16% |
| Supplemental Data | | | | | |
| Net assets, end of period (000 omitted) | $144,692 | $131,425 | $111,157 | $67,610 | $51,478 |
| Portfolio turnover rateF | 12% | 13% | 27% | 14% | 14% |
A Calculated based on average shares outstanding during the period.
B Total distributions of $.26 per share is comprised of distributions from net investment income of $.202 and distributions from net realized gain of $.053 per share.
C Total distributions of $.41 per share is comprised of distributions from net investment income of $.182 and distributions from net realized gain of $.224 per share.
D Total returns do not reflect charges attributable to your insurance company's separate account. Inclusion of these charges would reduce the total returns shown.
E Total returns would have been lower if certain expenses had not been reduced during the applicable periods shown.
F Amounts do not include the activity of the Underlying Funds.
G Expense ratios reflect operating expenses of the Fund. Expenses before reductions do not reflect amounts reimbursed by the investment adviser or reductions from expense offset arrangements and do not represent the amount paid by the Fund during periods when reimbursements or reductions occur. Expenses net of fee waivers reflect expenses after reimbursement by the investment adviser but prior to reductions from expense offset arrangements. Expenses net of all reductions represent the net expenses paid by the Fund but do not include expenses of the underlying funds in which the Fund invests.
H Amount represents less than .005%.
See accompanying notes which are an integral part of the financial statements.
Notes to Financial Statements
For the period ended December 31, 2015
1. Organization.
VIP Investor Freedom Income Portfolio, VIP Investor Freedom 2005 Portfolio, VIP Investor Freedom 2010 Portfolio, VIP Investor Freedom 2015 Portfolio, VIP Investor Freedom 2020 Portfolio, VIP Investor Freedom 2025 Portfolio and VIP Investor Freedom 2030 Portfolio (the Funds) are funds of Variable Insurance Products Fund V (the Trust). The Trust is registered under the Investment Company Act of 1940, as amended (the 1940 Act), as an open-end management investment company organized as a Massachusetts business trust. Each Fund is authorized to issue an unlimited number of shares. The Funds invest primarily in a combination of other VIP equity, bond, and short-term funds (the Underlying Funds) managed by Fidelity Management & Research Company (FMR). Shares of each Fund may only be purchased by insurance companies for the purpose of funding variable annuity or variable life insurance contracts.
2. Significant Accounting Policies.
The financial statements have been prepared in conformity with accounting principles generally accepted in the United States of America (GAAP), which require management to make certain estimates and assumptions at the date of the financial statements. Actual results could differ from those estimates. Subsequent events, if any, through the date that the financial statements were issued have been evaluated in the preparation of the financial statements. The following summarizes the significant accounting policies of the Funds:
Investment Valuation. Investments are valued as of 4:00 p.m. Eastern time on the last calendar day of the period. Each Fund categorizes the inputs to valuation techniques used to value its investments into a disclosure hierarchy consisting of three levels as shown below:
- Level 1 – quoted prices in active markets for identical investments
- Level 2 – other significant observable inputs (including quoted prices for similar investments, interest rates, prepayment speeds, etc.)
- Level 3 – unobservable inputs (including the Fund's own assumptions based on the best information available)
Valuation techniques used to value each Fund's investments by major category are as follows. Investments in the Underlying Funds are valued at their closing net asset value (NAV) each business day and are categorized as Level 1 in the hierarchy.
Investment Transactions and Income. For financial reporting purposes, the Funds' investment holdings and NAV include trades executed through the end of the last business day of the period. The NAV per share for processing shareholder transactions is calculated as of the close of business of the New York Stock Exchange (NYSE), normally 4:00 p.m. Eastern time and includes trades executed through the end of the prior business day. Gains and losses on securities sold are determined on the basis of identified cost. Income and capital gain distributions from the Underlying Funds, if any, are recorded on the ex-dividend date.
Expenses. Expenses directly attributable to a fund are charged to that fund. Expenses attributable to more than one fund are allocated among the respective funds on the basis of relative net assets or other appropriate methods. Expenses included in the accompanying financial statements reflect the expenses of each Fund and do not include any expenses associated with the Underlying Funds. Although not included in each Fund's expenses, each Fund indirectly bears its proportionate share of the Underlying Funds' expenses through the impact of these expenses on each Underlying Fund's NAV. Expense estimates are accrued in the period to which they relate and adjustments are made when actual amounts are known.
Income Tax Information and Distributions to Shareholders. Each year, each Fund intends to qualify as a regulated investment company under Subchapter M of the Internal Revenue Code, including distributing substantially all of its taxable income and realized gains. As a result, no provision for U.S. Federal income taxes is required. As of December 31, 2015, each Fund did not have any unrecognized tax benefits in the financial statements; nor is each Fund aware of any tax positions for which it is reasonably possible that the total amounts of unrecognized tax benefits will significantly change in the next twelve months. Each Fund files a U.S. federal tax return, in addition to state and local tax returns as required. Each Fund's federal income tax returns are subject to examination by the Internal Revenue Service (IRS) for a period of three fiscal years after they are filed. State and local tax returns may be subject to examination for an additional fiscal year depending on the jurisdiction.
Distributions are declared and recorded on the ex-dividend date. Income and capital gain distributions are determined in accordance with income tax regulations, which may differ from GAAP.
Capital accounts within the financial statements are adjusted for permanent book-tax differences. These adjustments have no impact on net assets or the results of operations. Capital accounts are not adjusted for temporary book-tax differences which will reverse in a subsequent period.
Book-tax differences are primarily due to short-term gain distributions from the Underlying Funds, capital loss carryforwards and losses deferred due to wash sales.
The federal tax cost of investment securities and unrealized appreciation (depreciation) as of period end were as follows for each Fund:
| | Tax cost | Gross unrealized appreciation | Gross unrealized depreciation | Net unrealized appreciation (depreciation) on securities |
| VIP Investor Freedom Income | $63,282,661 | $2,532,227 | $(1,783,485) | $748,742 |
| VIP Investor Freedom 2005 | 20,119,892 | 976,140 | (687,705) | 288,435 |
| VIP Investor Freedom 2010 | 58,669,669 | 3,291,616 | (2,491,951) | 799,665 |
| VIP Investor Freedom 2015 | 92,214,468 | 7,276,445 | (3,729,865) | 3,546,580 |
| VIP Investor Freedom 2020 | 181,519,014 | 14,183,131 | (8,263,816) | 5,919,315 |
| VIP Investor Freedom 2025 | 148,138,138 | 14,736,408 | (6,656,434) | 8,079,974 |
| VIP Investor Freedom 2030 | 138,537,089 | 13,061,761 | (6,906,923) | 6,154,838 |
The tax-based components of distributable earnings as of period end were as follows for each Fund:
| | Undistributed ordinary income | Undistributed long-term capital gain | Net unrealized appreciation (depreciation) on securities and other investments |
| VIP Investor Freedom Income | $3,928 | $767,576 | $748,742 |
| VIP Investor Freedom 2005 | – | 303,658 | 288,435 |
| VIP Investor Freedom 2010 | 3,216 | 1,086,351 | 799,665 |
| VIP Investor Freedom 2015 | 6,610 | 2,406,416 | 3,546,580 |
| VIP Investor Freedom 2020 | 2,307 | 4,746,872 | 5,919,315 |
| VIP Investor Freedom 2025 | – | 4,724,469 | 8,079,974 |
| VIP Investor Freedom 2030 | 7,814 | 5,233,357 | 6,154,838 |
The tax character of distributions paid was as follows:
| December 31, 2015 | | | | | |
| | Ordinary Income |
| VIP Investor Freedom Income | $1,209,681 |
| VIP Investor Freedom 2005 | 421,303 |
| VIP Investor Freedom 2010 | 1,222,659 |
| VIP Investor Freedom 2015 | 2,085,838 |
| VIP Investor Freedom 2020 | 4,068,698 |
| VIP Investor Freedom 2025 | 3,447,830 |
| VIP Investor Freedom 2030 | 3,084,344 |
| December 31, 2014 | | | | | |
| | Ordinary Income | Long-term Capital Gains | Total |
| VIP Investor Freedom Income | $1,115,451 | $459,808 | $1,575,259 |
| VIP Investor Freedom 2005 | 433,543 | 176,215 | 609,758 |
| VIP Investor Freedom 2010 | 1,284,912 | 745,239 | 2,030,151 |
| VIP Investor Freedom 2015 | 2,140,713 | 1,094,751 | 3,235,464 |
| VIP Investor Freedom 2020 | 4,031,876 | 1,891,102 | 5,922,978 |
| VIP Investor Freedom 2025 | 3,026,640 | 1,409,723 | 4,436,363 |
| VIP Investor Freedom 2030 | 2,860,330 | 1,370,495 | 4,230,825 |
3. Purchases and Redemptions of Underlying Fund Shares.
Purchases and redemptions of the Underlying Fund shares, are noted in the table below.
| | Purchases ($) | Redemptions ($) |
| VIP Investor Freedom Income | 22,327,123 | 22,045,322 |
| VIP Investor Freedom 2005 | 5,470,849 | 6,579,216 |
| VIP Investor Freedom 2010 | 12,659,974 | 12,615,407 |
| VIP Investor Freedom 2015 | 21,182,117 | 21,989,452 |
| VIP Investor Freedom 2020 | 38,902,676 | 32,493,105 |
| VIP Investor Freedom 2025 | 49,885,891 | 24,046,772 |
| VIP Investor Freedom 2030 | 38,818,695 | 16,207,828 |
4. Fees and Other Transactions with Affiliates.
Management Fee. Effective October 1, 2015, FMR Co., Inc., an affiliate of Strategic Advisers, Inc. (SAI), replaced SAI as investment adviser to the Funds pursuant to a management contract between the Funds and FMR Co., Inc. The new contract does not impact the Funds' investment process, strategies or management fees. The Funds do not pay any fees for investment management related services.
Other Transactions. The investment adviser has entered into an administration agreement with FMR under which FMR provides management and administrative services (other than investment advisory services) necessary for the operation of each Fund. Pursuant to this agreement, FMR pays all expenses of each Fund, excluding compensation of the independent Trustees and certain other expenses such as interest expense. FMR also contracts with other Fidelity companies to perform the services necessary for the operation of each Fund. The Funds do not pay any fees for these services.
5. Expense Reductions.
FMR voluntarily agreed to reimburse each Fund to the extent annual operating expenses exceeded certain levels of average net assets as noted in the table below. Some expenses, for example interest expense, are excluded from this reimbursement.
The following Funds were in reimbursement during the period:
| | Expense Limitations | Reimbursement |
| VIP Investor Freedom Income | -% | $273 |
| VIP Investor Freedom 2005 | -% | $89 |
| VIP Investor Freedom 2010 | -% | $250 |
| VIP Investor Freedom 2015 | -% | $410 |
| VIP Investor Freedom 2020 | -% | $788 |
| VIP Investor Freedom 2025 | -% | $613 |
| VIP Investor Freedom 2030 | -% | $568 |
6. Other.
The Funds' organizational documents provide former and current trustees and officers with a limited indemnification against liabilities arising in connection with the performance of their duties to the Funds. In the normal course of business, the Funds may also enter into contracts that provide general indemnifications. The Funds' maximum exposure under these arrangements is unknown as this would be dependent on future claims that may be made against the Funds. The risk of material loss from such claims is considered remote.
At the end of the period, the investment adviser or its affiliates were the owners of record of all of the outstanding shares of the Funds.
Report of Independent Registered Public Accounting Firm
To the Trustees of Variable Insurance Products Fund V and the Shareholders of VIP Investor Freedom Income Portfolio, VIP Investor Freedom 2005 Portfolio, VIP Investor Freedom 2010 Portfolio, VIP Investor Freedom 2015 Portfolio, VIP Investor Freedom 2020 Portfolio, VIP Investor Freedom 2025 Portfolio and VIP Investor Freedom 2030 Portfolio:
In our opinion, the accompanying statements of assets and liabilities, including the schedules of investments, and the related statements of operations and of changes in net assets and the financial highlights present fairly, in all material respects, the financial position of VIP Investor Freedom Income Portfolio, VIP Investor Freedom 2005 Portfolio, VIP Investor Freedom 2010 Portfolio, VIP Investor Freedom 2015 Portfolio, VIP Investor Freedom 2020 Portfolio, VIP Investor Freedom 2025 Portfolio and VIP Investor Freedom 2030 Portfolio (the Funds) each a fund of Variable Insurance Products Fund V at December 31, 2015, the results of each of their operations for the year then ended, the changes in each of their net assets for each of the two years in the period then ended and the financial highlights for each of the five years in the period then ended, in conformity with accounting principles generally accepted in the United States of America. These financial statements and financial highlights (hereafter referred to as “financial statements”) are the responsibility of the Funds' management. Our responsibility is to express an opinion on these financial statements based on our audits. We conducted our audits of these financial statements in accordance with the standards of the Public Company Accounting Oversight Board (United States). Those standards require that we plan and perform the audit to obtain reasonable assurance about whether the financial statements are free of material misstatement. An audit includes examining, on a test basis, evidence supporting the amounts and disclosures in the financial statements, assessing the accounting principles used and significant estimates made by management, and evaluating the overall financial statement presentation. We believe that our audits, which included confirmation of securities at December 31, 2015 by correspondence with the custodian and brokers, provide a reasonable basis for our opinion.
PricewaterhouseCoopers LLP
Boston, Massachusetts
February 23, 2016
Trustees and Officers
The Trustees, Members of the Advisory Board (if any), and officers of the trust and funds, as applicable, are listed below. The Board of Trustees governs each fund and is responsible for protecting the interests of shareholders. The Trustees are experienced executives who meet periodically throughout the year to oversee each fund's activities, review contractual arrangements with companies that provide services to each fund, oversee management of the risks associated with such activities and contractual arrangements, and review each fund's performance. If the interests of a fund and an underlying Fidelity® fund were to diverge, a conflict of interest could arise and affect how the Trustees and Members of the Advisory Board fulfill their fiduciary duties to the affected funds. FMRC has structured the funds to avoid these potential conflicts, although there may be situations where a conflict of interest is unavoidable. In such instances, FMRC, the Trustees, and Members of the Advisory Board would take reasonable steps to minimize and, if possible, eliminate the conflict. Except for Elizabeth S. Acton, John Engler, and Geoffrey A. von Kuhn, each of the Trustees oversees 236 funds. Ms. Acton and Mr. Engler each oversees 228 funds. Mr. von Kuhn oversees 148 funds.
The Trustees hold office without limit in time except that (a) any Trustee may resign; (b) any Trustee may be removed by written instrument, signed by at least two-thirds of the number of Trustees prior to such removal; (c) any Trustee who requests to be retired or who has become incapacitated by illness or injury may be retired by written instrument signed by a majority of the other Trustees; and (d) any Trustee may be removed at any special meeting of shareholders by a two-thirds vote of the outstanding voting securities of the trust. Each Trustee who is not an interested person (as defined in the 1940 Act) of the trust and the funds is referred to herein as an Independent Trustee. Each Independent Trustee shall retire not later than the last day of the calendar year in which his or her 75th birthday occurs. The Independent Trustees may waive this mandatory retirement age policy with respect to individual Trustees. Officers and Advisory Board Members hold office without limit in time, except that any officer or Advisory Board Member may resign or may be removed by a vote of a majority of the Trustees at any regular meeting or any special meeting of the Trustees. Except as indicated, each individual has held the office shown or other offices in the same company for the past five years.
Each fund’s Statement of Additional Information (SAI) includes more information about the Trustees. To request a free copy, call Fidelity at 1-877-208-0098.
Experience, Skills, Attributes, and Qualifications of the Trustees. The Governance and Nominating Committee has adopted a statement of policy that describes the experience, qualifications, attributes, and skills that are necessary and desirable for potential Independent Trustee candidates (Statement of Policy). The Board believes that each Trustee satisfied at the time he or she was initially elected or appointed a Trustee, and continues to satisfy, the standards contemplated by the Statement of Policy. The Governance and Nominating Committee also engages professional search firms to help identify potential Independent Trustee candidates who have the experience, qualifications, attributes, and skills consistent with the Statement of Policy. From time to time, additional criteria based on the composition and skills of the current Independent Trustees, as well as experience or skills that may be appropriate in light of future changes to board composition, business conditions, and regulatory or other developments, have also been considered by the professional search firms and the Governance and Nominating Committee. In addition, the Board takes into account the Trustees' commitment and participation in Board and committee meetings, as well as their leadership of standing and ad hoc committees throughout their tenure.
In determining that a particular Trustee was and continues to be qualified to serve as a Trustee, the Board has considered a variety of criteria, none of which, in isolation, was controlling. The Board believes that, collectively, the Trustees have balanced and diverse experience, qualifications, attributes, and skills, which allow the Board to operate effectively in governing each fund and protecting the interests of shareholders. Information about the specific experience, skills, attributes, and qualifications of each Trustee, which in each case led to the Board's conclusion that the Trustee should serve (or continue to serve) as a trustee of the funds, is provided below.
Board Structure and Oversight Function. Abigail P. Johnson is an interested person and currently serves as Chairman. The Trustees have determined that an interested Chairman is appropriate and benefits shareholders because an interested Chairman has a personal and professional stake in the quality and continuity of services provided to the funds. Independent Trustees exercise their informed business judgment to appoint an individual of their choosing to serve as Chairman, regardless of whether the Trustee happens to be independent or a member of management. The Independent Trustees have determined that they can act independently and effectively without having an Independent Trustee serve as Chairman and that a key structural component for assuring that they are in a position to do so is for the Independent Trustees to constitute a substantial majority for the Board. The Independent Trustees also regularly meet in executive session. Marie L. Knowles serves as Chairman of the Independent Trustees and as such (i) acts as a liaison between the Independent Trustees and management with respect to matters important to the Independent Trustees and (ii) with management prepares agendas for Board meetings.
Fidelity® funds are overseen by different Boards of Trustees. The funds' Board oversees Fidelity's investment-grade bond, money market, asset allocation and certain equity funds, and other Boards oversee Fidelity's high income, sector and other equity funds. The asset allocation funds may invest in Fidelity® funds that are overseen by such other Boards. The use of separate Boards, each with its own committee structure, allows the Trustees of each group of Fidelity® funds to focus on the unique issues of the funds they oversee, including common research, investment, and operational issues. On occasion, the separate Boards establish joint committees to address issues of overlapping consequences for the Fidelity® funds overseen by each Board.
The Trustees operate using a system of committees to facilitate the timely and efficient consideration of all matters of importance to the Trustees, each fund, and fund shareholders and to facilitate compliance with legal and regulatory requirements and oversight of the funds' activities and associated risks. The Board, acting through its committees, has charged FMR and its affiliates with (i) identifying events or circumstances the occurrence of which could have demonstrably adverse effects on the funds' business and/or reputation; (ii) implementing processes and controls to lessen the possibility that such events or circumstances occur or to mitigate the effects of such events or circumstances if they do occur; and (iii) creating and maintaining a system designed to evaluate continuously business and market conditions in order to facilitate the identification and implementation processes described in (i) and (ii) above. Because the day-to-day operations and activities of the funds are carried out by or through FMR, its affiliates, and other service providers, the funds' exposure to risks is mitigated but not eliminated by the processes overseen by the Trustees. While each of the Board's committees has responsibility for overseeing different aspects of the funds' activities, oversight is exercised primarily through the Operations and Audit Committees. In addition, an ad hoc Board committee of Independent Trustees has worked with FMR to enhance the Board's oversight of investment and financial risks, legal and regulatory risks, technology risks, and operational risks, including the development of additional risk reporting to the Board. Appropriate personnel, including but not limited to the funds' Chief Compliance Officer (CCO), FMR's internal auditor, the independent accountants, the funds' Treasurer and portfolio management personnel, make periodic reports to the Board's committees, as appropriate, including an annual review of Fidelity's risk management program for the Fidelity® funds. The responsibilities of each standing committee, including their oversight responsibilities, are described further under "Standing Committees of the Trustees."
Interested Trustees*:
Correspondence intended for a Trustee who is an interested person may be sent to Fidelity Investments, 245 Summer Street, Boston, Massachusetts 02210.
Name, Year of Birth; Principal Occupations and Other Relevant Experience+
Abigail P. Johnson (1961)
Year of Election or Appointment: 2009
Trustee
Chairman of the Board of Trustees
Ms. Johnson also serves as Trustee of other Fidelity® funds. Ms. Johnson serves as President (2013-present) and Chief Executive Officer (2014-present) of FMR LLC (diversified financial services company), President of Fidelity Financial Services (2012-present) and President of Personal, Workplace and Institutional Services (2005-present). Ms. Johnson is Chairman and Director of FMR Co., Inc. (investment adviser firm, 2011-present), Chairman and Director of FMR (investment adviser firm, 2011-present), and the Vice Chairman and Director (2007-present) of FMR LLC. Previously, Ms. Johnson served as President and a Director of FMR (2001-2005), a Trustee of other investment companies advised by FMR, Fidelity Investments Money Management, Inc. (investment adviser firm), and FMR Co., Inc. (2001-2005), Senior Vice President of the Fidelity® funds (2001-2005), and managed a number of Fidelity® funds. Ms. Abigail P. Johnson and Mr. Arthur E. Johnson are not related.
Geoffrey A. von Kuhn (1951)
Year of Election or Appointment: 2015
Trustee
Mr. von Kuhn also serves as Trustee or Member of the Advisory Board of other Fidelity funds. Mr. von Kuhn is Chief Administrative Officer for FMR LLC (diversified financial services company, 2013-present), a Director of Pembroke Real Estate, Inc. (2009-present), and a Director of Discovery Natural Resources LLC (2012-present). Previously, Mr. von Kuhn was a managing director of Crosby Group (private wealth management company, 2007-2013), a member of the management committee and senior executive in the Wealth Management Group of AmSouth Bank (2001-2006), and head of the U.S. private bank at Citigroup (2000-2001).
* Determined to be an “Interested Trustee” by virtue of, among other things, his or her affiliation with the trust or various entities under common control with FMR.
+ The information includes the Trustee's principal occupation during the last five years and other information relating to the experience, attributes, and skills relevant to the Trustee's qualifications to serve as a Trustee, which led to the conclusion that the Trustee should serve as a Trustee for each fund.
Independent Trustees:
Correspondence intended for an Independent Trustee may be sent to Fidelity Investments, P.O. Box 55235, Boston, Massachusetts 02205-5235.
Name, Year of Birth; Principal Occupations and Other Relevant Experience+
Elizabeth S. Acton (1951)
Year of Election or Appointment: 2013
Trustee
Ms. Acton also serves as Trustee or Member of the Advisory Board of other Fidelity® funds. Prior to her retirement in April 2012, Ms. Acton was Executive Vice President, Finance (2011-2012), Executive Vice President, Chief Financial Officer (2002-2011), and Treasurer (2004-2005) of Comerica Incorporated (financial services). Prior to joining Comerica, Ms. Acton held a variety of positions at Ford Motor Company (1983-2002), including Vice President and Treasurer (2000-2002) and Executive Vice President and Chief Financial Officer of Ford Motor Credit Company (1998-2000). Ms. Acton currently serves as a member of the Board of Directors and Audit and Finance Committees of Beazer Homes USA, Inc. (homebuilding, 2012-present).
John Engler (1948)
Year of Election or Appointment: 2014
Trustee
Mr. Engler also serves as Trustee or Member of the Advisory Board of other Fidelity® funds. He serves as president of the Business Roundtable (2011-present), and on the board of directors/trustees for Universal Forest Products (manufacturer and distributor of wood and wood-alternative products, 2003-present) and K12 Inc. (technology-based education company, 2012-present). Previously, Mr. Engler served as a trustee of The Munder Funds (2003-2014), president and CEO of the National Association of Manufacturers (2004-2011), member of the Board of Trustees of the Annie E. Casey Foundation (2004-2015), and as governor of Michigan (1991-2003). He is a past chairman of the National Governors Association.
Albert R. Gamper, Jr. (1942)
Year of Election or Appointment: 2007
Trustee
Mr. Gamper also serves as Trustee of other Fidelity® funds. Prior to his retirement in December 2004, Mr. Gamper served as Chairman of the Board of CIT Group Inc. (commercial finance). During his tenure with CIT Group Inc. Mr. Gamper served in numerous senior management positions, including Chairman (1987-1989; 1999-2001; 2002-2004), Chief Executive Officer (1987-2004), and President (2002-2003). Mr. Gamper currently serves as a member of the Board of Directors of Public Service Enterprise Group (utilities, 2000-present), and Member of the Board of Trustees of Barnabas Health Care System (1997-present). Previously, Mr. Gamper served as Chairman (2012-2015) and Vice Chairman (2011-2012) of the Independent Trustees of certain Fidelity® funds and as Chairman of the Board of Governors, Rutgers University (2004-2007).
Robert F. Gartland (1951)
Year of Election or Appointment: 2010
Trustee
Mr. Gartland also serves as Trustee of other Fidelity® funds. Mr. Gartland is Chairman and an investor in Gartland and Mellina Group Corp. (consulting, 2009-present). Previously, Mr. Gartland served as a partner and investor of Vietnam Partners LLC (investments and consulting, 2008-2011). Prior to his retirement, Mr. Gartland held a variety of positions at Morgan Stanley (financial services, 1979-2007) including Managing Director (1987-2007).
Arthur E. Johnson (1947)
Year of Election or Appointment: 2008
Trustee
Vice Chairman of the Independent Trustees
Mr. Johnson also serves as Trustee of other Fidelity® funds. Mr. Johnson serves as a member of the Board of Directors of Eaton Corporation plc (diversified power management, 2009-present), AGL Resources, Inc. (holding company, 2002-present) and Booz Allen Hamilton (management consulting, 2011-present). Prior to his retirement, Mr. Johnson served as Senior Vice President of Corporate Strategic Development of Lockheed Martin Corporation (defense contractor, 1999-2009). He previously served on the Board of Directors of IKON Office Solutions, Inc. (1999-2008) and Delta Airlines (2005-2007). Mr. Arthur E. Johnson is not related to Ms. Abigail P. Johnson.
Michael E. Kenneally (1954)
Year of Election or Appointment: 2009
Trustee
Mr. Kenneally also serves as Trustee of other Fidelity® funds. Prior to his retirement, Mr. Kenneally served as Chairman and Global Chief Executive Officer of Credit Suisse Asset Management. Before joining Credit Suisse, he was an Executive Vice President and Chief Investment Officer for Bank of America Corporation. Earlier roles at Bank of America included Director of Research, Senior Portfolio Manager and Research Analyst, and Mr. Kenneally was awarded the Chartered Financial Analyst (CFA) designation in 1991.
James H. Keyes (1940)
Year of Election or Appointment: 2007
Trustee
Mr. Keyes also serves as Trustee of other Fidelity® funds. Mr. Keyes serves as a member of the Board and Non-Executive Chairman of Navistar International Corporation (manufacture and sale of trucks, buses, and diesel engines, since 2002). Previously, Mr. Keyes served as a member of the Board of Pitney Bowes, Inc. (integrated mail, messaging, and document management solutions, 1998-2013). Prior to his retirement, Mr. Keyes served as Chairman (1993-2002) and Chief Executive Officer (1988-2002) of Johnson Controls (automotive, building, and energy) and as a member of the Board of LSI Logic Corporation (semiconductor technologies, 1984-2008).
Marie L. Knowles (1946)
Year of Election or Appointment: 2001
Trustee
Chairman of the Independent Trustees
Ms. Knowles also serves as Trustee of other Fidelity® funds. Prior to Ms. Knowles' retirement in June 2000, she served as Executive Vice President and Chief Financial Officer of Atlantic Richfield Company (ARCO) (diversified energy, 1996-2000). From 1993 to 1996, she was a Senior Vice President of ARCO and President of ARCO Transportation Company (pipeline and tanker operations). Ms. Knowles currently serves as a Director and Chairman of the Audit Committee of McKesson Corporation (healthcare service, since 2002). Ms. Knowles is a member of the Board of the Santa Catalina Island Company (real estate, 2009-present). Ms. Knowles is a Member of the Investment Company Institute Board of Governors and a Member of the Governing Council of the Independent Directors Council (2014-present). She also serves as a member of the Advisory Board for the School of Engineering of the University of Southern California. Previously, Ms. Knowles served as a Director of Phelps Dodge Corporation (copper mining and manufacturing, 1994-2007), URS Corporation (engineering and construction, 2000-2003) and America West (airline, 1999-2002). Ms. Knowles previously served as Vice Chairman of the Independent Trustees of certain Fidelity® funds (2012-2015).
+ The information includes the Trustee's principal occupation during the last five years and other information relating to the experience, attributes, and skills relevant to the Trustee's qualifications to serve as a Trustee, which led to the conclusion that the Trustee should serve as a Trustee for each fund.
Advisory Board Members and Officers:
Correspondence intended for an officer may be sent to Fidelity Investments, 245 Summer Street, Boston, Massachusetts 02210. Officers appear below in alphabetical order.
Name, Year of Birth; Principal Occupation
Marc R. Bryant (1966)
Year of Election or Appointment: 2015
Secretary and Chief Legal Officer (CLO)
Mr. Bryant also serves as Secretary and CLO of other funds. Mr. Bryant serves as CLO, Secretary, and Senior Vice President of Fidelity Management & Research Company (investment adviser firm, 2015-present) and FMR Co., Inc. (investment adviser firm, 2015-present); Secretary of Fidelity SelectCo, LLC (investment adviser firm, 2015-present) and Fidelity Investments Money Management, Inc. (investment adviser firm, 2015-present); and CLO of Fidelity Management & Research (Hong Kong) Limited (investment adviser firm, 2015-present). He is Senior Vice President and Deputy General Counsel of FMR LLC (diversified financial services company). Previously, Mr. Bryant served as Secretary and CLO of Fidelity Rutland Square Trust II (2010-2014) and Assistant Secretary of Fidelity's Fixed Income and Asset Allocation Funds (2013-2015). Prior to joining Fidelity Investments, Mr. Bryant served as a Senior Vice President and the Head of Global Retail Legal for AllianceBernstein L.P. (2006-2010), and as the General Counsel for ProFund Advisors LLC (2001-2006).
Jonathan Davis (1968)
Year of Election or Appointment: 2010
Assistant Treasurer
Mr. Davis also serves as Assistant Treasurer of other funds, and is an employee of Fidelity Investments. Previously, Mr. Davis served as Vice President and Associate General Counsel of FMR LLC (diversified financial services company, 2003-2010).
Adrien E. Deberghes (1967)
Year of Election or Appointment: 2010
Assistant Treasurer
Mr. Deberghes also serves as an officer of other funds. He is an employee of Fidelity Investments (2008-present). Prior to joining Fidelity Investments, Mr. Deberghes was Senior Vice President of Mutual Fund Administration at State Street Corporation (2007-2008), Senior Director of Mutual Fund Administration at Investors Bank & Trust (2005-2007), and Director of Finance for Dunkin' Brands (2000-2005).
Stephanie J. Dorsey (1969)
Year of Election or Appointment: 2013
President and Treasurer
Ms. Dorsey also serves as an officer of other funds. She is an employee of Fidelity Investments (2008-present) and has served in other fund officer roles. Prior to joining Fidelity Investments, Ms. Dorsey served as Treasurer (2004-2008) of the JPMorgan Mutual Funds and Vice President (2004-2008) of JPMorgan Chase Bank.
Howard J. Galligan III (1966)
Year of Election or Appointment: 2014
Chief Financial Officer
Mr. Galligan also serves as Chief Financial Officer of other funds. Mr. Galligan serves as President of Fidelity Pricing and Cash Management Services (FPCMS) (2014-present) and as a Director of Strategic Advisers, Inc. (investment adviser firm, 2008-present). Previously, Mr. Galligan served as Chief Administrative Officer of Asset Management (2011-2014) and Chief Operating Officer and Senior Vice President of Investment Support for Strategic Advisers, Inc. (2003-2011).
Scott C. Goebel (1968)
Year of Election or Appointment: 2015
Vice President
Mr. Goebel serves as Vice President of other funds and is an employee of Fidelity Investments (2001-present). Previously, Mr. Goebel served as Secretary of Fidelity SelectCo, LLC (investment adviser firm, 2013-2015), Fidelity Investments Money Management, Inc. (FIMM) (investment adviser firm, 2010-2015), and Fidelity Research and Analysis Company (FRAC) (investment adviser firm, 2010-2015); General Counsel, Secretary, and Senior Vice President of Fidelity Management & Research Company (investment adviser firm, 2008-2015) and FMR Co., Inc. (investment adviser firm, 2008-2015); Assistant Secretary of Fidelity Management & Research (Japan) Limited (investment adviser firm, 2008-2015) and FMR Investment Management (U.K.) Limited (investment adviser firm, 2008-2015); Chief Legal Officer (CLO) of Fidelity Management & Research (Hong Kong) Limited (investment adviser firm, 2008-2015); Secretary and CLO of certain Fidelity® funds (2008-2015); Assistant Secretary of FIMM (2008-2010), FRAC (2008-2010), and certain funds (2007-2008); and as Vice President and Secretary of Fidelity Distributors Corporation (FDC) (2005-2007).
Chris Maher (1972)
Year of Election or Appointment: 2013
Assistant Treasurer
Mr. Maher serves as Assistant Treasurer of other funds. Mr. Maher is Vice President of Valuation Oversight and is an employee of Fidelity Investments. Previously, Mr. Maher served as Vice President of Asset Management Compliance (2013), Vice President of the Program Management Group of FMR (investment adviser firm, 2010-2013), and Vice President of Valuation Oversight (2008-2010).
John F. Papandrea (1972)
Year of Election or Appointment: 2016
Anti-Money Laundering (AML) Officer
Mr. Papandrea also serves as AML Officer of other funds. Mr. Papandrea is Vice President of FMR LLC (diversified financial services company, 2008-present) and is an employee of Fidelity Investments (2005-present).
Jason P. Pogorelec (1975)
Year of Election or Appointment: 2015
Assistant Secretary
Mr. Pogorelec also serves as Assistant Secretary of other funds. Mr. Pogorelec serves as Vice President, Associate General Counsel (2010-present) and is an employee of Fidelity Investments (2006-present).
Nancy D. Prior (1967)
Year of Election or Appointment: 2014
Vice President
Ms. Prior also serves as Vice President of other funds. Ms. Prior serves as a Director of Fidelity Investments Money Management, Inc. (FIMM) (investment adviser firm, 2014-present), President, Fixed Income (2014-present), Vice Chairman of FIAM LLC (investment adviser firm, 2014-present), and is an employee of Fidelity Investments (2002-present). Previously, Ms. Prior served as Vice President of Fidelity's Money Market Funds (2012-2014), President, Money Market and Short Duration Bond Group of Fidelity Management & Research (FMR) (investment adviser firm, 2013-2014), President, Money Market Group of FMR (2011-2013), Managing Director of Research (2009-2011), Senior Vice President and Deputy General Counsel (2007-2009), and Assistant Secretary of other Fidelity® funds (2008-2009).
Kenneth B. Robins (1969)
Year of Election or Appointment: 2009
Assistant Treasurer
Mr. Robins also serves as an officer of other funds. Mr. Robins serves as Executive Vice President of Fidelity Investments Money Management, Inc. (FIMM) (investment adviser firm, 2013-present) and is an employee of Fidelity Investments (2004-present). Previously, Mr. Robins served in other fund officer roles.
Stacie M. Smith (1974)
Year of Election or Appointment: 2013
Assistant Treasurer
Ms. Smith also serves as an officer of other funds. She is an employee of Fidelity Investments (2009-present) and has served in other fund officer roles. Prior to joining Fidelity Investments, Ms. Smith served as Senior Audit Manager of Ernst & Young LLP (1996-2009).
Renee Stagnone (1975)
Year of Election or Appointment: 2013
Deputy Treasurer
Ms. Stagnone also serves as Deputy Treasurer of other funds. Ms. Stagnone is an employee of Fidelity Investments (1997-present).
Michael H. Whitaker (1967)
Year of Election or Appointment: 2008
Chief Compliance Officer
Mr. Whitaker also serves as Chief Compliance Officer of other funds. Mr. Whitaker also serves as Compliance Officer of FMR Co., Inc. (investment adviser firm, 2014-present), FMR (investment adviser firm, 2014-present), and Fidelity Investments Money Management, Inc. (investment adviser firm, 2014-present) and is an employee of Fidelity Investments (2007-present). Prior to joining Fidelity Investments, Mr. Whitaker worked at MFS Investment Management where he served as Senior Vice President and Chief Compliance Officer (2004-2006), and Assistant General Counsel.
Derek L. Young (1964)
Year of Election or Appointment: 2009
Vice President of Fidelity's Asset Allocation Funds
Mr. Young also serves as an officer of other funds. He is a Director of Strategic Advisers, Inc. (investment adviser firm, 2011-present), President of Fidelity Global Asset Allocation (GAA) (2011-present), and Vice Chairman of FIAM LLC (investment adviser firm, 2011-present). Previously, Mr. Young served as Trustee of certain funds (2012-2015), President of Strategic Advisers, Inc. (2011-2015), Chief Investment Officer of GAA (2009-2011), and as a portfolio manager.
Joseph F. Zambello (1957)
Year of Election or Appointment: 2011
Deputy Treasurer
Mr. Zambello also serves as Deputy Treasurer of other funds. Mr. Zambello is an employee of Fidelity Investments (1991-present). Previously, Mr. Zambello served as Vice President of the Program Management Group of FMR (investment adviser firm, 2009-2011) and Vice President of the Transfer Agent Oversight Group (2005-2009).
Shareholder Expense Example
As a shareholder of a Fund, you incur two types of costs: (1) transaction costs, and (2) ongoing costs, including other Fund expenses. This Example is intended to help you understand your ongoing costs (in dollars) of investing in the Funds and to compare these costs with the ongoing costs of investing in other mutual funds.
The Example is based on an investment of $1,000 invested at the beginning of the period and held for the entire period (July 1, 2015 to December 31, 2015).
Actual Expenses
The first line of the accompanying table for each fund provides information about actual account values and actual expenses. You may use the information in this line, together with the amount you invested, to estimate the expenses that you paid over the period. Simply divide your account value by $1,000.00 (for example, an $8,600 account value divided by $1,000.00 = 8.6), then multiply the result by the number in the first line for a fund under the heading entitled "Expenses Paid During Period" to estimate the expenses you paid on your account during this period. The estimate of expenses does not include any fees or other expenses of any variable annuity or variable life insurance product. If they were, the estimate of expenses you paid during the period would be higher, and your ending account value would be lower. In addition, each Fund, as a shareholder in underlying Fidelity Funds, will indirectly bear its pro-rata share of the fees and expenses incurred by the underlying Fidelity Funds. These fees and expenses are not included in each Fund's annualized expense ratio used to calculate the expense estimates in the table below.
Hypothetical Example for Comparison Purposes
The second line of the accompanying table for each fund provides information about hypothetical account values and hypothetical expenses based on a fund's actual expense ratio and an assumed rate of return of 5% per year before expenses, which is not the Fund's actual return. The hypothetical account values and expenses may not be used to estimate the actual ending account balance or expenses you paid for the period. You may use this information to compare the ongoing costs of investing in the Fund and other funds. To do so, compare this 5% hypothetical example with the 5% hypothetical examples that appear in the shareholder reports of the other funds. The estimate of expenses does not include any fees or other expenses of any variable annuity or variable life insurance product. If they were, the estimate of expenses you paid during the period would be higher, and your ending account value would be lower. In addition, each Fund, as a shareholder in underlying Fidelity Funds, will indirectly bear its pro-rata share of the fees and expenses incurred by the underlying Fidelity Funds. These fees and expenses are not included in each Fund's annualized expense ratio used to calculate the expense estimates in the table below.
Please note that the expenses shown in the table are meant to highlight your ongoing costs only and do not reflect any transaction costs. Therefore, the second line of the table is useful in comparing ongoing costs only, and will not help you determine the relative total costs of owning different funds.
| | Annualized Expense Ratio-A | Beginning
Account Value
July 1, 2015 | Ending
Account Value
December 31, 2015 | Expenses Paid
During Period-B
July 1, 2015
to December 31, 2015 |
| VIP Investor Freedom Income | - % | | | |
| Actual | | $1,000.00 | $983.70 | $- |
| Hypothetical-C | | $1,000.00 | $1,025.21 | $- |
| VIP Investor Freedom 2005 | - % | | | |
| Actual | | $1,000.00 | $978.90 | $- |
| Hypothetical-C | | $1,000.00 | $1,025.21 | $- |
| VIP Investor Freedom 2010 | - % | | | |
| Actual | | $1,000.00 | $974.00 | $- |
| Hypothetical-C | | $1,000.00 | $1,025.21 | $- |
| VIP Investor Freedom 2015 | - % | | | |
| Actual | | $1,000.00 | $970.50 | $- |
| Hypothetical-C | | $1,000.00 | $1,025.21 | $- |
| VIP Investor Freedom 2020 | - % | | | |
| Actual | | $1,000.00 | $968.00 | $- |
| Hypothetical-C | | $1,000.00 | $1,025.21 | $- |
| VIP Investor Freedom 2025 | - % | | | |
| Actual | | $1,000.00 | $965.30 | $- |
| Hypothetical-C | | $1,000.00 | $1,025.21 | $- |
| VIP Investor Freedom 2030 | - % | | | |
| Actual | | $1,000.00 | $959.50 | $- |
| Hypothetical-C | | $1,000.00 | $1,025.21 | $- |
A Annualized expense ratio reflects expenses net of applicable fee waivers.
B Expenses are equal to each Fund's annualized expense ratio, multiplied by the average account value over the period, multiplied by 184/365 (to reflect the one-half year period). The fees and expenses of the underlying Fidelity Funds in which each Fund invests are not included in each Fund's annualized expense ratio.
C 5% return per year before expenses
Distributions (Unaudited)
The Board of Trustees of each fund voted to pay to shareholders of record at the opening of business on record date, the following distributions per share derived from capital gains realized from sales of portfolio securities, and dividends derived from net investment income:
| Fund | Pay Date | Record Date | Dividends | Capital Gains |
| VIP Investor Freedom Income Portfolio | 02/12/2016 | 02/12/2016 | $0.001 | $0.132 |
| VIP Investor Freedom 2005 Portfolio | 02/12/2016 | 02/12/2016 | $0.000 | $0.166 |
| VIP Investor Freedom 2010 Portfolio | 02/12/2016 | 02/12/2016 | $0.001 | $0.210 |
| VIP Investor Freedom 2015 Portfolio | 02/12/2016 | 02/12/2016 | $0.001 | $0.291 |
| VIP Investor Freedom 2020 Portfolio | 02/12/2016 | 02/12/2016 | $0.001 | $0.290 |
| VIP Investor Freedom 2025 Portfolio | 02/12/2016 | 02/12/2016 | $0.000 | $0.376 |
| VIP Investor Freedom 2030 Portfolio | 02/12/2016 | 02/12/2016 | $0.000 | $0.426 |
The funds hereby designate as capital gain dividend the amounts noted below for the taxable year ended December 31, 2015, or, if subsequently determined to be different, the net capital gain of such year.
| Fund | |
| VIP Investor Freedom Income Portfolio | $767,559 |
| VIP Investor Freedom 2005 Portfolio | $310,320 |
| VIP Investor Freedom 2010 Portfolio | $1,086,351 |
| VIP Investor Freedom 2015 Portfolio | $2,406,416 |
| VIP Investor Freedom 2020 Portfolio | $4,746,871 |
| VIP Investor Freedom 2025 Portfolio | $4,724,852 |
| VIP Investor Freedom 2030 Portfolio | $5,233,357 |
A percentage of the dividends distributed during the fiscal year for the following funds were derived from interest on U.S. Government securities which is generally exempt from state income tax:
| VIP Investor Freedom Income Portfolio | 2.47% |
| VIP Investor Freedom 2005 Portfolio | 1.66% |
| VIP Investor Freedom 2010 Portfolio | 1.35% |
| VIP Investor Freedom 2015 Portfolio | 1.08% |
A percentage of the dividends distributed during the fiscal year for the following funds qualifies for the dividends–received deduction for corporate shareholders:
| Fund | February 2015 | December 2015 |
| VIP Investor Freedom Income Portfolio | 10% | 15% |
| VIP Investor Freedom 2005 Portfolio | 10% | 20% |
| VIP Investor Freedom 2010 Portfolio | 18% | 25% |
| VIP Investor Freedom 2015 Portfolio | 24% | 27% |
| VIP Investor Freedom 2020 Portfolio | 18% | 30% |
| VIP Investor Freedom 2025 Portfolio | 12% | 33% |
| VIP Investor Freedom 2030 Portfolio | 12% | 41% |
The amounts per share which represent income derived from sources within, and taxes paid to, foreign countries or possessions of the United States are as follows:
| Fund | Pay Date | Income | Taxes |
| VIP Investor Freedom Income Portfolio | 12/29/2015 | $0.0096 | $0.0012 |
| VIP Investor Freedom 2005 Portfolio | 12/29/2015 | $0.0159 | $0.0018 |
| VIP Investor Freedom 2010 Portfolio | 12/29/2015 | $0.0212 | $0.0024 |
| VIP Investor Freedom 2015 Portfolio | 12/29/2015 | $0.0252 | $0.0027 |
| VIP Investor Freedom 2020 Portfolio | 12/29/2015 | $0.0278 | $0.0030 |
| VIP Investor Freedom 2025 Portfolio | 12/29/2015 | $0.0338 | $0.0035 |
| VIP Investor Freedom 2030 Portfolio | 12/29/2015 | $0.0389 | $0.0040 |
Board Approval of Investment Advisory Contracts and Management Fees
VIP Investor Freedom Funds
Each year, the Board of Trustees, including the Independent Trustees (together, the Board), votes on the management and administration arrangements for each fund. The Board, assisted by the advice of fund counsel and Independent Trustees' counsel, requests and considers a broad range of information relevant to the contract arrangements throughout the year.
The Board meets regularly and, at each of its meetings, covers an extensive agenda of topics and materials and considers factors that are relevant to its annual consideration of each fund's management and administration arrangements, including the services and support provided to each fund and its shareholders. The Board has established four standing committees (Committees) — Operations, Audit, Fair Valuation, and Governance and Nominating — each composed of and chaired by Independent Trustees with varying backgrounds, to which the Board has assigned specific subject matter responsibilities in order to enhance effective decision-making by the Board. The Operations Committee, of which all of the Independent Trustees are members, meets regularly throughout the year and considers, among other matters, information specifically related to the annual consideration of each fund's management and administration arrangements. The Board, acting directly and through its Committees, requests and receives information concerning the annual consideration of each fund's management and administration arrangements. The Board also meets as needed to consider matters specifically related to the Board's annual consideration of the management and administration arrangements. Members of the Board may also meet with trustees of other Fidelity funds through ad hoc joint committees to discuss certain matters relevant to all of the Fidelity funds.
At its September 2015 meeting, the Board unanimously determined to approve an amended and restated management contract (Advisory Contract) and administration agreement for each fund to reflect the fact that, effective October 1, 2015, FMR Co., Inc. (FMRC), an affiliate of Strategic Advisers, Inc. (Strategic Advisers) and Fidelity Management & Research Company (FMR), would assume the duties and rights of Strategic Advisers under the fund's then current management contract. The Board noted that, with the exception of the date, term, and entity name, the terms of each fund's management contract, including the lack of fees payable thereunder, would not change as a result of the approval of the Advisory Contract. The Board considered that FMRC would render the same services to the funds under the Advisory Contracts that Strategic Advisers rendered to the funds under the then current management contracts. The Board also considered that approval of the Advisory Contracts would not result in any changes to (i) the investment process or strategies employed in the management of the funds' assets; or (ii) the day-to-day management of the funds or the persons primarily responsible for such management. As a result, the Board considered that its prior experience with Strategic Advisers as investment adviser for the funds was relevant to its consideration of the Advisory Contracts.
In reaching its determination, the Board considered all factors it believed relevant and reached a determination, with the assistance of fund counsel and Independent Trustees' counsel and through the exercise of its business judgment, that the approval of the Advisory Contract was in the best interests of each fund and its shareholders and that the fact that no fees are payable under the Advisory Contracts was fair and reasonable. The Board's decision to approve the Advisory Contracts was not based on any single factor, but rather was based on a comprehensive consideration of all the information provided to the Board at its meetings throughout the year. In reaching its determination, the Board was aware that shareholders of each fund have a broad range of investment choices available to them, including a wide choice among funds offered by Fidelity's competitors, and that each fund's shareholders, who have the opportunity to review and weigh the disclosure provided by the fund in its prospectus and other public disclosures, have chosen to invest in that fund, which is part of the Fidelity family of funds.
Nature, Extent, and Quality of Services Provided. The Board considered Fidelity's staffing as it relates to the funds, including the backgrounds of investment personnel that provide services to the funds, and also considered the funds' investment objectives, strategies, and related investment philosophies. The Independent Trustees also had discussions with senior management of Fidelity's investment operations and investment groups with responsibility for the underlying Fidelity funds in which each fund invests. The Board considered the structure of the portfolio manager compensation program and whether this structure provides appropriate incentives to act in the best interests of each fund. Additionally, the Board considered the portfolio managers' investments, if any, in the funds that they manage.
Resources Dedicated to Investment Management and Support Services. The Board reviewed the general qualifications and capabilities of Fidelity's investment staff, including its size, education, experience, and resources, as well as Fidelity's approach to recruiting, training, managing, and compensating investment personnel. The Board noted that Fidelity has continued to increase the resources devoted to non-U.S. offices, including expansion of Fidelity's global investment organization. The Board also noted that Fidelity's analysts have extensive resources, tools and capabilities that allow them to conduct sophisticated quantitative and fundamental analysis, as well as credit analysis of issuers, counterparties and guarantors. Further, the Board considered that Fidelity's investment professionals have sufficient access to global information and data so as to provide competitive investment results over time, and that those professionals also have access to sophisticated tools that permit them to assess portfolio construction and risk and performance attribution characteristics continuously, as well as to transmit new information and research conclusions rapidly around the world. Additionally, in its deliberations, the Board considered Fidelity's risk management, compliance, and technology and operations capabilities and resources, which are integral parts of the investment management process.
Shareholder and Administrative Services. The Board considered (i) the nature, extent, quality, and cost of advisory, administrative, and shareholder services performed by Fidelity under the then current management contract (and to be performed under the Advisory Contract) and under separate agreements covering administration, transfer agency, and pricing and bookkeeping services for each fund; (ii) the nature and extent of the supervision of third party service providers, principally custodians, subcustodians, and pricing vendors; and (iii) the resources devoted to, and the record of compliance with, each fund's compliance policies and procedures.
The Board noted that the growth of fund assets over time across the complex allows Fidelity to reinvest in the development of services designed to enhance the value or convenience of the Fidelity funds as investment vehicles. These services include 24-hour access to account information and market information through telephone representatives and over the Internet, investor education materials and asset allocation tools, and the expanded availability of Fidelity Investor Centers.
Investment in a Large Fund Family. The Board considered the benefits to shareholders of investing in a Fidelity fund, including the benefits of investing in a fund that is part of a large family of funds offering a variety of investment disciplines and providing a large variety of mutual fund investor services. The Board noted that Fidelity had taken, or had made recommendations that resulted in the Fidelity funds taking, a number of actions over the previous year that benefited particular funds, including (i) continuing to dedicate additional resources to investment research and to the support of the senior management team that oversees asset management; (ii) continuing efforts to enhance Fidelity's global research capabilities; (iii) launching new funds and making other enhancements to meet client needs; (iv) reducing management fees and total expenses for certain index funds and diversified international funds; (v) continuing to launch dedicated lower cost underlying funds to meet portfolio construction needs related to expanding underlying fund options for Fidelity funds of funds, specifically for the Freedom Fund product lines; (vi) rationalizing product lines and gaining increased efficiencies through fund mergers; (vii) launching active fixed-income exchange-traded funds; (viii) continuing to develop, acquire and implement systems and technology to improve services to the funds and shareholders, strengthen information security, and increase efficiency; (ix) implementing investment enhancements to further strengthen Fidelity's target date product line to increase investors' probability of success in achieving their goals; (x) modifying the eligibility criteria for certain share classes to accommodate roll-over assets from employer-sponsored retirement plans; (xi) launching a new Class W of the Freedom Index Funds to attract and retain Fidelity record-kept retirement plan assets; and (xii) implementing changes to Fidelity's money market product line in response to recent money market regulatory reforms.
Investment Performance. The Board considered whether each fund has operated in accordance with its investment objective, as well as its record of compliance with its investment restrictions and its performance history, and noted that the approval of the Advisory Contract for each fund would not result in any changes to the fund's investment strategy or the personnel responsible for providing advisory services to the fund.
The Board took into account discussions with representatives of the investment adviser about fund investment performance that occur at Board meetings throughout the year. In this regard the Board noted that as part of regularly scheduled fund reviews and other reports to the Board on fund performance, the Board considers annualized return information for each fund for different time periods, measured against one or more securities market indices, including a customized blended index representative of the fund's asset classes (each a "benchmark index") and a peer group of funds with similar objectives ("peer group"), if any. In its evaluation of fund investment performance at meetings throughout the year, the Board gave particular attention to information indicating underperformance of certain Fidelity funds for specific time periods and discussed with the investment adviser the reasons for such underperformance.
In addition to reviewing absolute and relative fund performance, the Independent Trustees periodically consider the appropriateness of fund performance metrics in evaluating the results achieved. In general, the Independent Trustees believe that fund performance should be evaluated based on gross performance (before fees and expenses, including acquired fund fees and expenses, but after transaction costs, if any) compared to appropriate benchmark indices, over appropriate time periods that may include full market cycles, and on net performance (after fees and expenses) compared to peer groups, as applicable, over the same periods, taking into account relevant factors including the following: general market conditions; the extent to which particular underlying funds affected performance; and fund cash flows and other factors. Depending on the circumstances, the Independent Trustees may be satisfied with a fund's performance notwithstanding that it lags its benchmark index or peer group for certain periods.
The Independent Trustees recognize that shareholders evaluate performance on a net basis over their own holding periods, for which one-, three-, and five-year periods are often used as a proxy. For this reason, the performance information reviewed by the Board also included net cumulative calendar year total return information for each fund and an appropriate benchmark index for the most recent one-, three-, and five-year periods.
Based on its review, the Board concluded that the nature, extent, and quality of services provided to each fund under the Advisory Contracts should benefit the shareholders of each fund.
Competitiveness of Management Fee and Total Expense Ratio. The Board noted that the funds did not pay Strategic Advisers, and would not pay FMRC, a management fee for investment advisory services, and that each fund bears indirectly the fees and expenses, including the management fees, paid by the underlying Fidelity funds in which it invests. The Board considered each fund's management fee and total expense ratio compared to "mapped groups" of competitive funds and classes created for the purpose of facilitating the Trustees' competitive analysis of management fees and total expenses. Fidelity creates "mapped groups" by combining similar Lipper investment objective categories that have comparable investment mandates. Combining Lipper investment objective categories aids the Board's management fee and total expense ratio comparisons by broadening the competitive group used for comparison.
Management Fee. The Board considered two proprietary management fee comparisons for the 12-month periods shown in basis points (BP) in the charts below. The group of Lipper funds used by the Board for management fee comparisons is referred to below as the "Total Mapped Group." The Total Mapped Group comparison focuses on a fund's standing in terms of gross management fees before expense reimbursements or caps relative to the total universe of funds with comparable investment mandates, regardless of whether their management fee structures also are comparable. Funds with comparable investment mandates offer exposure to similar types of securities. Funds with comparable management fee structures have similar management fee contractual arrangements (
e.g., flat rate charged for advisory services, all-inclusive fee rate,
etc.). "TMG %" represents the percentage of funds in the Total Mapped Group that had management fees that were lower than a fund's. For example, a hypothetical TMG % of 20% would mean that 80% of the funds in the Total Mapped Group had higher, and 20% had lower, management fees than a fund. The funds' actual TMG %s and the number of funds in the Total Mapped Group are in the charts below. The "Asset-Size Peer Group" (ASPG) comparison focuses on a fund's standing relative to a subset of non-Fidelity funds within the Total Mapped Group that are similar in size and management fee structure. For example, if a fund is in the first quartile of the ASPG, the fund's management fee ranks in the least expensive or lowest 25% of funds in the ASPG. The ASPG represents at least 15% of the funds in the Total Mapped Group with comparable asset size and management fee structures, subject to a minimum of 50 funds (or all funds in the Total Mapped Group if fewer than 50). Additional information, such as the ASPG quartile in which a fund's management fee rate ranked, is also included in the charts and considered by the Board.
VIP Investor Freedom 2005 Portfolio
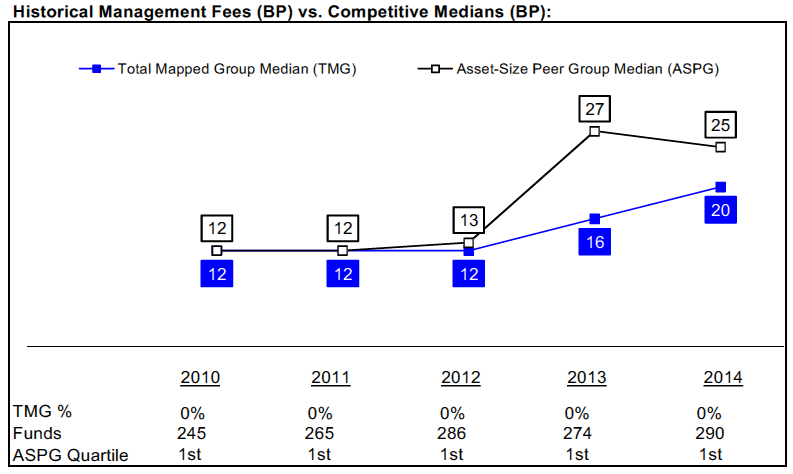
VIP Investor Freedom 2010 Portfolio
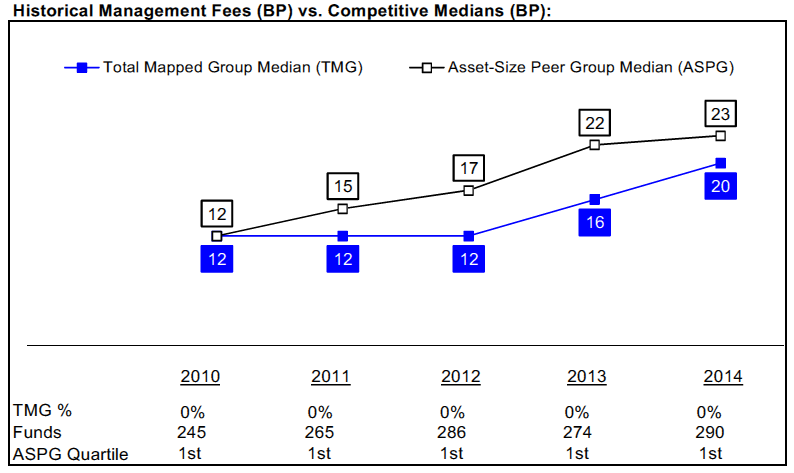
VIP Investor Freedom 2015 Portfolio
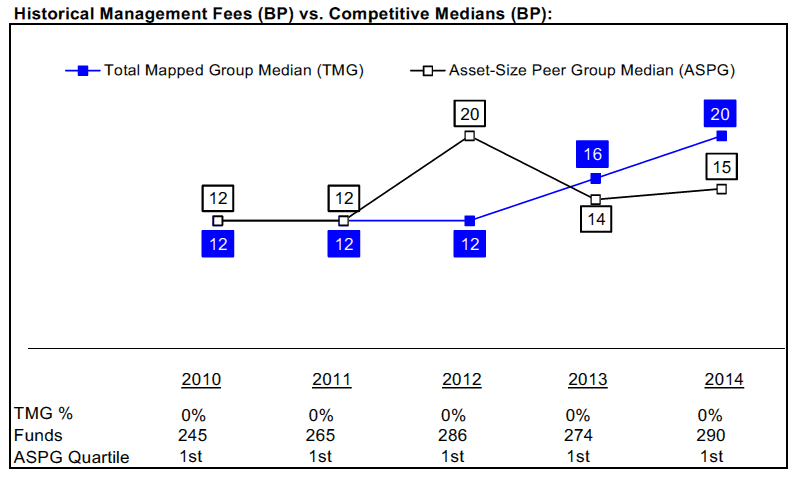
VIP Investor Freedom 2020 Portfolio
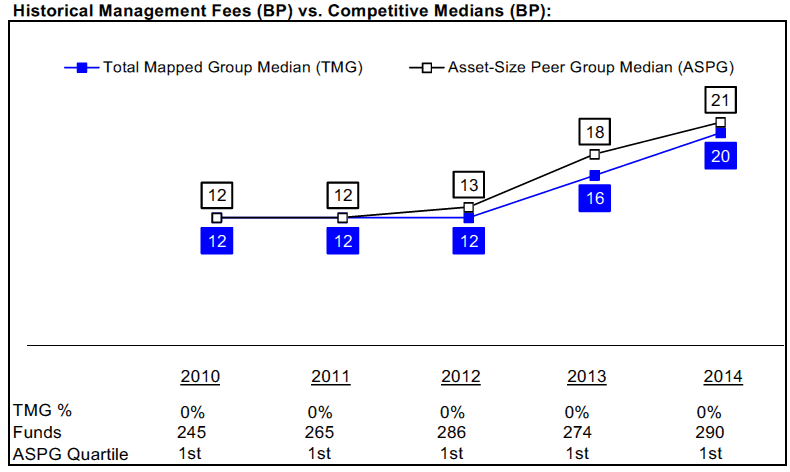
VIP Investor Freedom 2025 Portfolio
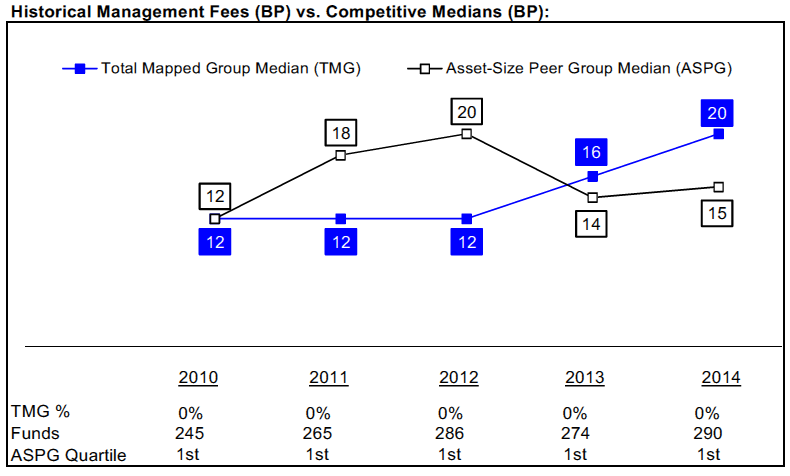
VIP Investor Freedom 2030 Portfolio
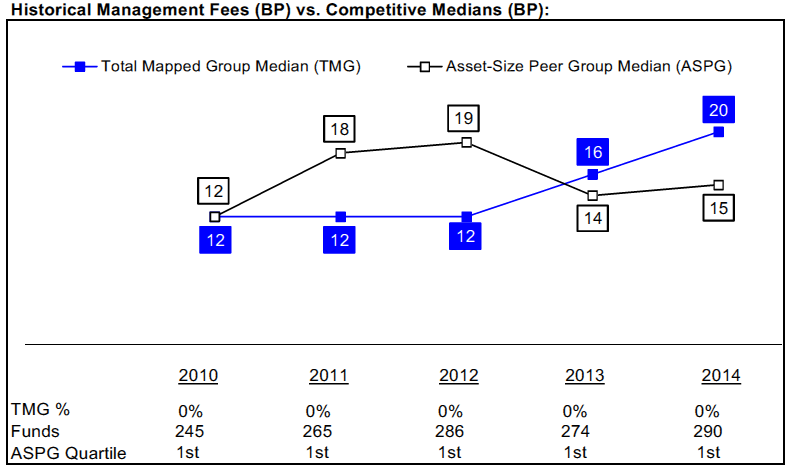
VIP Investor Freedom Income Portfolio
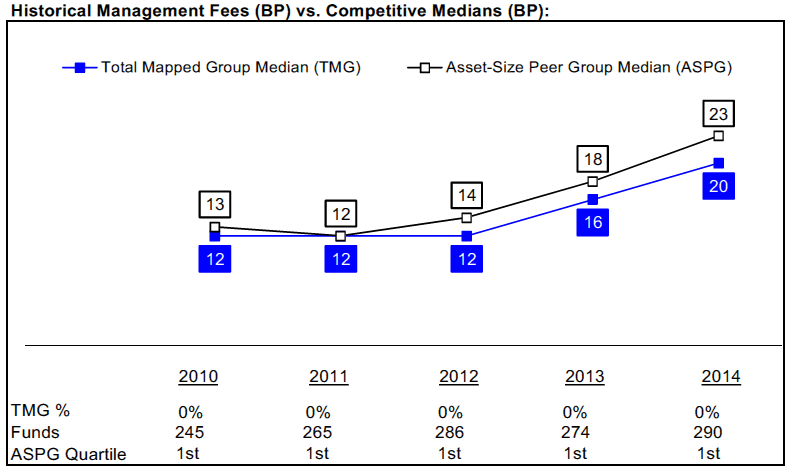
The Board noted that each fund's management fee rate of 0.00% ranked below the median of its Total Mapped Group and below the median of its ASPG for 2014. The Board further noted that many peer funds pay fund-level expenses, including management fees, to which the funds are not subject.
The Board noted that, in 2014, the ad hoc Committee on Group Fee was formed by it and other Fidelity fund boards to conduct an in-depth review of the "group fee" component of the management fee of funds with such management fee structures, and that while the funds do not pay a management fee, they indirectly bear a portion of the management fees paid by the Fidelity funds in which they invest, some of which are subject to the group fee. Committee focus included the mechanics of the group fee, the competitive landscape of group fee structures, Fidelity funds with no group fee component and investment products not included in group fee assets. The Board also considered that, for funds subject to the group fee, FMR agreed to voluntarily waive fees over a specified period of time in amounts designed to account for assets converted from certain funds to certain collective investment trusts.
Based on its review, the Board concluded that each fund's management fee is fair and reasonable in light of the services that the fund receives and the other factors considered.
Total Expense Ratio. In its review of each fund's total expense ratio, the Board considered that the funds do not pay transfer agent fees. Instead, the applicable class of each underlying Fidelity fund bears its pro rata portion of each fund's transfer agent fee according to the percentage of each fund's assets invested in that underlying fund. The Board further noted that FMR pays all other expenses of each fund, with limited exceptions.
The Board noted that each fund's total expense ratio ranked below its competitive median for 2014.
In considering each fund's total expense ratio, the Board also considered an alternative competitive analysis that included both top level (
i.e., direct) fund fees and acquired fund fees and expenses for the fund and the other funds in the mapped group. The Board noted that, under this alternative competitive analysis, each fund's total expense ratio ranked below its competitive median for 2014.
Fees Charged to Other Fidelity Clients. The Board also considered Fidelity fee structures and other information with respect to clients of Fidelity, such as other funds advised or subadvised by Fidelity, pension plan clients, and other institutional clients with similar mandates. The Board noted the findings of the 2013 ad hoc joint committee (created with the board of other Fidelity funds), which reviewed and compared Fidelity's institutional investment advisory business with its business of providing services to the Fidelity funds, including the differences in services provided, fees charged, and costs incurred, as well as competition in their respective marketplaces.
Based on its review of total expense ratios and fees charged to other Fidelity clients, the Board concluded that each fund's total expense ratio was reasonable in light of the services that the fund and its shareholders receive and the other factors considered.
Costs of the Services and Profitability. The Board considered the level of Fidelity's profits in respect of all the Fidelity funds, including the Fidelity funds in which the funds invest.
PricewaterhouseCoopers LLP (PwC), independent registered public accounting firm and auditor to Fidelity and certain Fidelity funds, has been engaged annually by the Board as part of the Board's assessment of Fidelity's profitability analysis. PwC's engagement includes the review and assessment of the methodologies used by Fidelity in determining the revenues and expenses attributable to Fidelity's mutual fund business, and completion of agreed-upon procedures in respect of the mathematical accuracy of fund profitability and its conformity to established allocation methodologies. After considering PwC's reports issued under the engagement and information provided by Fidelity, the Board concluded that while other allocation methods may also be reasonable, Fidelity's profitability methodologies are reasonable in all material respects.
The Board also reviewed Fidelity's non-fund businesses and fall-out benefits related to the mutual fund business as well as cases where Fidelity's affiliates may benefit from or be related to the funds' business.
The Board concluded that the costs of the services provided by and the profits realized by Fidelity in connection with the operation of each fund were not relevant to the approval of each fund's Advisory Contract because the funds do not pay management fees and FMR pays all other expenses of each fund, with limited exceptions.
Economies of Scale. The Board concluded that because the funds do not pay management fees and FMR pays all other expenses of each fund, with limited exceptions, economies of scale cannot be realized by the funds, but may be realized by the other Fidelity funds in which each fund invests, many of which may benefit from breakpoints under the group fee arrangement.
Additional Information Requested by the Board. In order to develop fully the factual basis for consideration of the Fidelity funds' Advisory Contracts, the Board requested and received additional information on certain topics, including: (i) Fidelity's fund profitability methodology, profitability trends for certain funds, and the impact of certain factors on fund profitability results; (ii) portfolio manager changes that have occurred during the past year and the amount of the investment that each portfolio manager has made in the Fidelity fund(s) that he or she manages; (iii) Fidelity's compensation structure for portfolio managers, research analysts, and other key personnel, including its effects on fund profitability, the rationale for the compensation structure, and the extent to which current market conditions have affected retention and recruitment; (iv) the arrangements with and compensation paid to certain fund sub-advisers on behalf of the Fidelity funds; (v) Fidelity's voluntary waiver of its fees to maintain minimum yields for certain money market funds and classes as well as contractual waivers in place for certain funds; (vi) the methodology with respect to competitive fund data and peer group classifications; (vii) Fidelity's transfer agent fee, expense, and service structures for different funds and classes relative to competitive trends, and the impact of the increased use of omnibus accounts; (viii) Fidelity's long-term expectations for its offerings in the workplace investing channel; (ix) new developments in the retail and institutional marketplaces; and (x) the impact of money market reform on Fidelity's money market funds. In addition, the Board considered its discussions with Fidelity throughout the year regarding enhanced information security initiatives and the funds' fair valuation policies.
Based on its evaluation of all of the conclusions noted above, and after considering all factors it believed relevant, the Board concluded that the advisory fee structures are fair and reasonable, and that each fund's Advisory Contract should be approved.
Proxy Voting Results
A special meeting of shareholders was held on May 12, 2015. The results of votes taken among shareholders on the proposal before them are reported below. Each vote reported represents one dollar of net asset value held on the record date for the meeting.
PROPOSAL 1
To elect a Board of Trustees.
| | # of
Votes | % of
Votes |
| Elizabeth S. Acton | | |
| Affirmative | 24,469,831,790.28 | 97.003 |
| Withheld | 756,086,184.43 | 2.997 |
| TOTAL | 25,225,917,974.71 | 100.000 |
| John Engler | | |
| Affirmative | 24,404,438,415.74 | 96.744 |
| Withheld | 821,479,558.97 | 3.256 |
| TOTAL | 25,225,917,974.71 | 100.000 |
| Albert R. Gamper, Jr. | | |
| Affirmative | 24,431,670,090.08 | 96.852 |
| Withheld | 794,247,884.63 | 3.148 |
| TOTAL | 25,225,917,974.71 | 100.000 |
| Robert F. Gartland | | |
| Affirmative | 24,472,637,370.54 | 97.014 |
| Withheld | 753,280,604.17 | 2.986 |
| TOTAL | 25,225,917,974.71 | 100.000 |
| Abigail P. Johnson | | |
| Affirmative | 24,442,024,432.82 | 96.893 |
| Withheld | 783,893,541.89 | 3.107 |
| TOTAL | 25,225,917,974.71 | 100.000 |
| Arthur E. Johnson | | |
| Affirmative | 24,444,583,833.78 | 96.903 |
| Withheld | 781,334,140.93 | 3.097 |
| TOTAL | 25,225,917,974.71 | 100.000 |
| Michael E. Kenneally | | |
| Affirmative | 24,475,874,452.78 | 97.027 |
| Withheld | 750,043,521.93 | 2.973 |
| TOTAL | 25,225,917,974.71 | 100.000 |
| James H. Keyes | | |
| Affirmative | 24,434,496,321.71 | 96.863 |
| Withheld | 791,421,653.00 | 3.137 |
| TOTAL | 25,225,917,974.71 | 100.000 |
| Marie L. Knowles | | |
| Affirmative | 24,446,177,909.79 | 96.909 |
| Withheld | 779,740,064.92 | 3.091 |
| TOTAL | 25,225,917,974.71 | 100.000 |
| Geoffrey A. von Kuhn | | |
| Affirmative | 24,444,403,935.60 | 96.902 |
| Withheld | 781,514,039.11 | 3.098 |
| TOTAL | 25,225,917,974.71 | 100.000 |
| Proposal 1 reflects trust wide proposal and voting results. |
VIPIFF-ANN-0216
1.814507.110
Fidelity® Variable Insurance Products:
Freedom Funds - Income, 2005, 2010, 2015, 2020, 2025, 2030, 2035, 2040, 2045, 2050
Annual Report December 31, 2015 |
|
Contents
To view a fund's proxy voting guidelines and proxy voting record for the 12-month period ended June 30, visit http://www.fidelity.com/proxyvotingresults or visit the Securities and Exchange Commission's (SEC) web site at http://www.sec.gov.
You may also call 1-877-208-0098 to request a free copy of the proxy voting guidelines.
Fidelity® Variable Insurance Products are separate account options which are purchased through a variable insurance contract.
Standard & Poor's, S&P and S&P 500 are registered service marks of The McGraw-Hill Companies, Inc. and have been licensed for use by Fidelity Distributors Corporation.
Other third-party marks appearing herein are the property of their respective owners.
All other marks appearing herein are registered or unregistered trademarks or service marks of FMR LLC or an affiliated company. © 2016 FMR LLC. All rights reserved.
This report and the financial statements contained herein are submitted for the general information of the shareholders of the Funds. This report is not authorized for distribution to prospective investors in the Funds unless preceded or accompanied by an effective prospectus.
A fund files its complete schedule of portfolio holdings with the SEC for the first and third quarters of each fiscal year on Form N-Q. Forms N-Q are available on the SEC’s web site at http://www.sec.gov. A fund's Forms N-Q may be reviewed and copied at the SEC’s Public Reference Room in Washington, DC. Information regarding the operation of the SEC's Public Reference Room may be obtained by calling 1-800-SEC-0330.
For a complete list of a fund's portfolio holdings, view the most recent holdings listing, semiannual report, or annual report on Fidelity's web site at http://www.fidelity.com, http://www.advisor.fidelity.com, or http://www.401k.com, as applicable.
NOT FDIC INSURED •MAY LOSE VALUE •NO BANK GUARANTEE
Neither the Funds nor Fidelity Distributors Corporation is a bank.
VIP Freedom Income Portfolio℠
Performance: The Bottom Line
Average annual total return reflects the change in the value of an investment, assuming reinvestment of distributions from dividend income and capital gains (the profits earned upon the sale of securities that have grown in value, if any) and assuming a constant rate of performance each year. During periods of reimbursement by Fidelity, a fund’s total return will be greater than it would be had the reimbursement not occurred. Performance numbers are net of all underlying fund operating expenses, but do not include any insurance charges imposed by your insurance company’s separate account. If performance information included the effect of these additional charges, the total returns would have been lower. How a fund did yesterday is no guarantee of how it will do tomorrow.
Average Annual Total Returns
| For the periods ended December 31, 2015 | Past 1 year | Past 5 years | Past 10 years |
| Initial Class | (0.34)% | 3.40% | 4.02% |
| Service Class | (0.42)% | 3.30% | 3.92% |
| Service Class 2 | (0.57)% | 3.13% | 3.76% |
$10,000 Over 10 Years
Let's say hypothetically that $10,000 was invested in VIP Freedom Income Portfolio℠ - Initial Class on December 31, 2005.
The chart shows how the value of your investment would have changed, and also shows how the Barclays® U.S. Aggregate Bond Index performed over the same period.

| Period Ending Values |
| $14,837 | VIP Freedom Income Portfolio℠ - Initial Class |
| $15,552 | Barclays® U.S. Aggregate Bond Index |
VIP Freedom 2005 Portfolio℠
Performance: The Bottom Line
Average annual total return reflects the change in the value of an investment, assuming reinvestment of distributions from dividend income and capital gains (the profits earned upon the sale of securities that have grown in value, if any) and assuming a constant rate of performance each year. During periods of reimbursement by Fidelity, a fund’s total return will be greater than it would be had the reimbursement not occurred. Performance numbers are net of all underlying fund operating expenses, but do not include any insurance charges imposed by your insurance company’s separate account. If performance information included the effect of these additional charges, the total returns would have been lower. How a fund did yesterday is no guarantee of how it will do tomorrow.
Average Annual Total Returns
| For the periods ended December 31, 2015 | Past 1 year | Past 5 years | Past 10 years |
| Initial Class | (0.25)% | 4.62% | 4.53% |
| Service Class | (0.35)% | 4.51% | 4.42% |
| Service Class 2 | (0.49)% | 4.37% | 4.27% |
$10,000 Over 10 Years
Let's say hypothetically that $10,000 was invested in VIP Freedom 2005 Portfolio℠ - Initial Class on December 31, 2005.
The chart shows how the value of your investment would have changed, and also shows how the Barclays® U.S. Aggregate Bond Index performed over the same period.
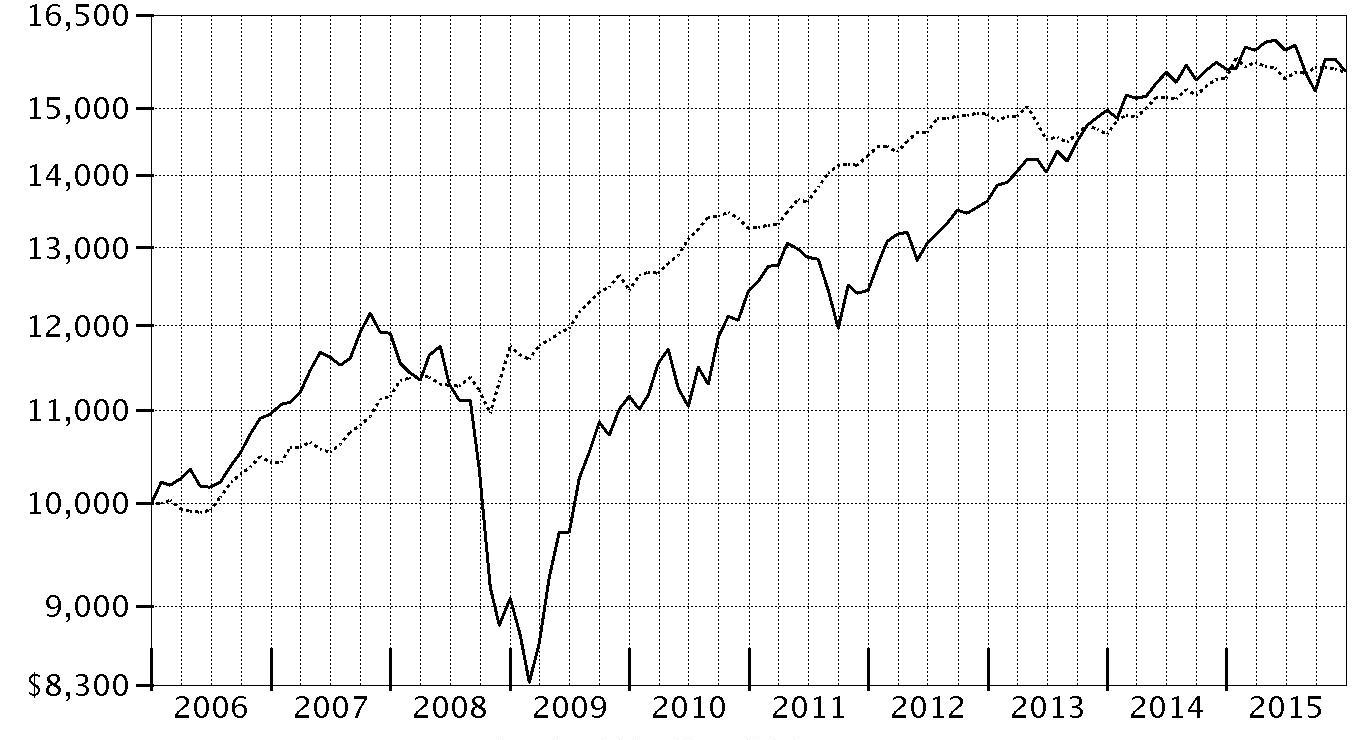
| Period Ending Values |
| $15,568 | VIP Freedom 2005 Portfolio℠ - Initial Class |
| $15,552 | Barclays® U.S. Aggregate Bond Index |
VIP Freedom 2010 Portfolio℠
Performance: The Bottom Line
Average annual total return reflects the change in the value of an investment, assuming reinvestment of distributions from dividend income and capital gains (the profits earned upon the sale of securities that have grown in value, if any) and assuming a constant rate of performance each year. During periods of reimbursement by Fidelity, a fund’s total return will be greater than it would be had the reimbursement not occurred. Performance numbers are net of all underlying fund operating expenses, but do not include any insurance charges imposed by your insurance company’s separate account. If performance information included the effect of these additional charges, the total returns would have been lower. How a fund did yesterday is no guarantee of how it will do tomorrow.
Average Annual Total Returns
| For the periods ended December 31, 2015 | Past 1 year | Past 5 years | Past 10 years |
| Initial Class | (0.29)% | 5.70% | 5.18% |
| Service Class | (0.31)% | 5.61% | 5.09% |
| Service Class 2 | (0.53)% | 5.45% | 4.92% |
$10,000 Over 10 Years
Let's say hypothetically that $10,000 was invested in VIP Freedom 2010 Portfolio℠ - Initial Class on December 31, 2005.
The chart shows how the value of your investment would have changed, and also shows how the Barclays® U.S. Aggregate Bond Index performed over the same period.
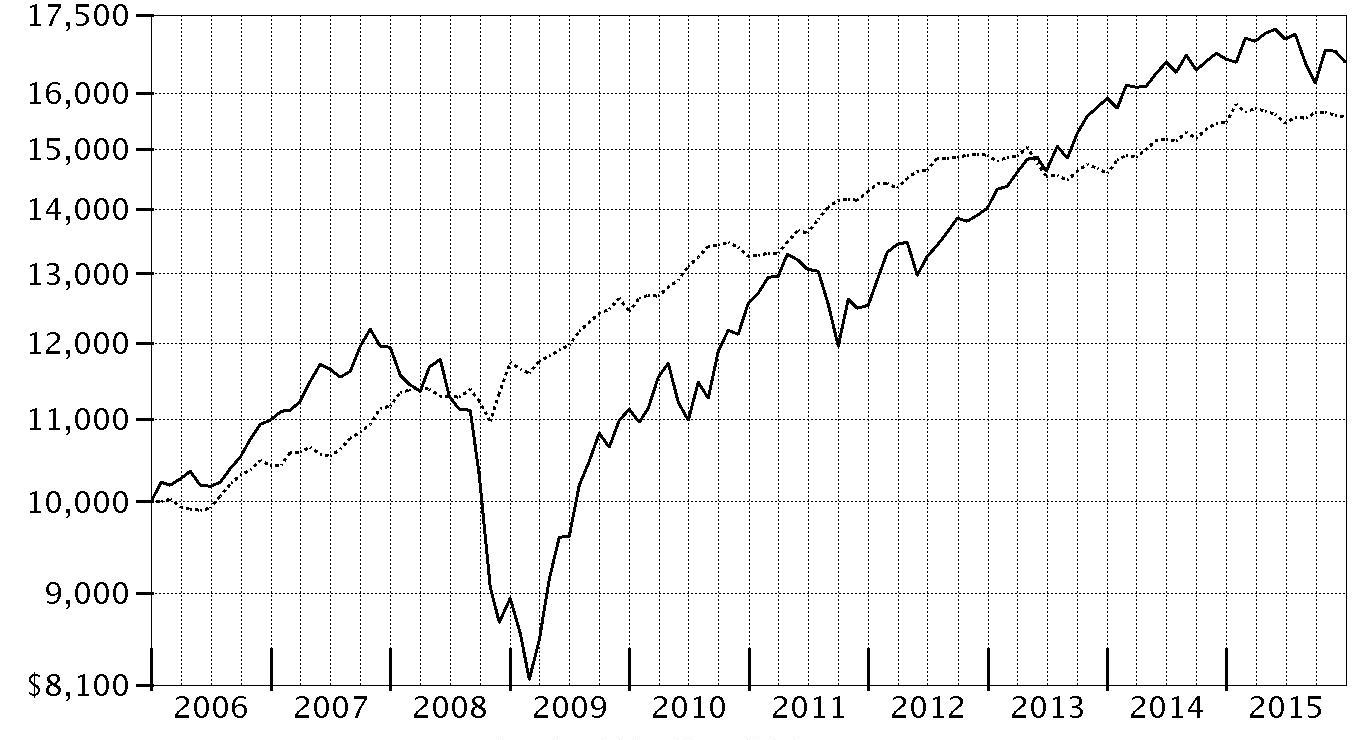
| Period Ending Values |
| $16,576 | VIP Freedom 2010 Portfolio℠ - Initial Class |
| $15,552 | Barclays® U.S. Aggregate Bond Index |
VIP Freedom 2015 Portfolio℠
Performance: The Bottom Line
Average annual total return reflects the change in the value of an investment, assuming reinvestment of distributions from dividend income and capital gains (the profits earned upon the sale of securities that have grown in value, if any) and assuming a constant rate of performance each year. During periods of reimbursement by Fidelity, a fund’s total return will be greater than it would be had the reimbursement not occurred. Performance numbers are net of all underlying fund operating expenses, but do not include any insurance charges imposed by your insurance company’s separate account. If performance information included the effect of these additional charges, the total returns would have been lower. How a fund did yesterday is no guarantee of how it will do tomorrow.
Average Annual Total Returns
| For the periods ended December 31, 2015 | Past 1 year | Past 5 years | Past 10 years |
| Initial Class | (0.33)% | 5.95% | 5.30% |
| Service Class | (0.44)% | 5.85% | 5.19% |
| Service Class 2 | (0.51)% | 5.71% | 5.05% |
$10,000 Over 10 Years
Let's say hypothetically that $10,000 was invested in VIP Freedom 2015 Portfolio℠ - Initial Class on December 31, 2005.
The chart shows how the value of your investment would have changed, and also shows how the S&P 500® Index performed over the same period.

| Period Ending Values |
| $16,757 | VIP Freedom 2015 Portfolio℠ - Initial Class |
| $20,242 | S&P 500® Index |
VIP Freedom 2020 Portfolio℠
Performance: The Bottom Line
Average annual total return reflects the change in the value of an investment, assuming reinvestment of distributions from dividend income and capital gains (the profits earned upon the sale of securities that have grown in value, if any) and assuming a constant rate of performance each year. During periods of reimbursement by Fidelity, a fund’s total return will be greater than it would be had the reimbursement not occurred. Performance numbers are net of all underlying fund operating expenses, but do not include any insurance charges imposed by your insurance company’s separate account. If performance information included the effect of these additional charges, the total returns would have been lower. How a fund did yesterday is no guarantee of how it will do tomorrow.
Average Annual Total Returns
| For the periods ended December 31, 2015 | Past 1 year | Past 5 years | Past 10 years |
| Initial Class | (0.27)% | 6.36% | 5.27% |
| Service Class | (0.37)% | 6.24% | 5.16% |
| Service Class 2 | (0.46)% | 6.10% | 5.01% |
$10,000 Over 10 Years
Let's say hypothetically that $10,000 was invested in VIP Freedom 2020 Portfolio℠ - Initial Class on December 31, 2005.
The chart shows how the value of your investment would have changed, and also shows how the S&P 500® Index performed over the same period.

| Period Ending Values |
| $16,714 | VIP Freedom 2020 Portfolio℠ - Initial Class |
| $20,242 | S&P 500® Index |
VIP Freedom 2025 Portfolio℠
Performance: The Bottom Line
Average annual total return reflects the change in the value of an investment, assuming reinvestment of distributions from dividend income and capital gains (the profits earned upon the sale of securities that have grown in value, if any) and assuming a constant rate of performance each year. During periods of reimbursement by Fidelity, a fund’s total return will be greater than it would be had the reimbursement not occurred. Performance numbers are net of all underlying fund operating expenses, but do not include any insurance charges imposed by your insurance company’s separate account. If performance information included the effect of these additional charges, the total returns would have been lower. How a fund did yesterday is no guarantee of how it will do tomorrow.
Average Annual Total Returns
| For the periods ended December 31, 2015 | Past 1 year | Past 5 years | Past 10 years |
| Initial Class | (0.18)% | 7.23% | 5.74% |
| Service Class | (0.36)% | 7.10% | 5.62% |
| Service Class 2 | (0.50)% | 6.96% | 5.47% |
$10,000 Over 10 Years
Let's say hypothetically that $10,000 was invested in VIP Freedom 2025 Portfolio℠ - Initial Class on December 31, 2005.
The chart shows how the value of your investment would have changed, and also shows how the S&P 500® Index performed over the same period.
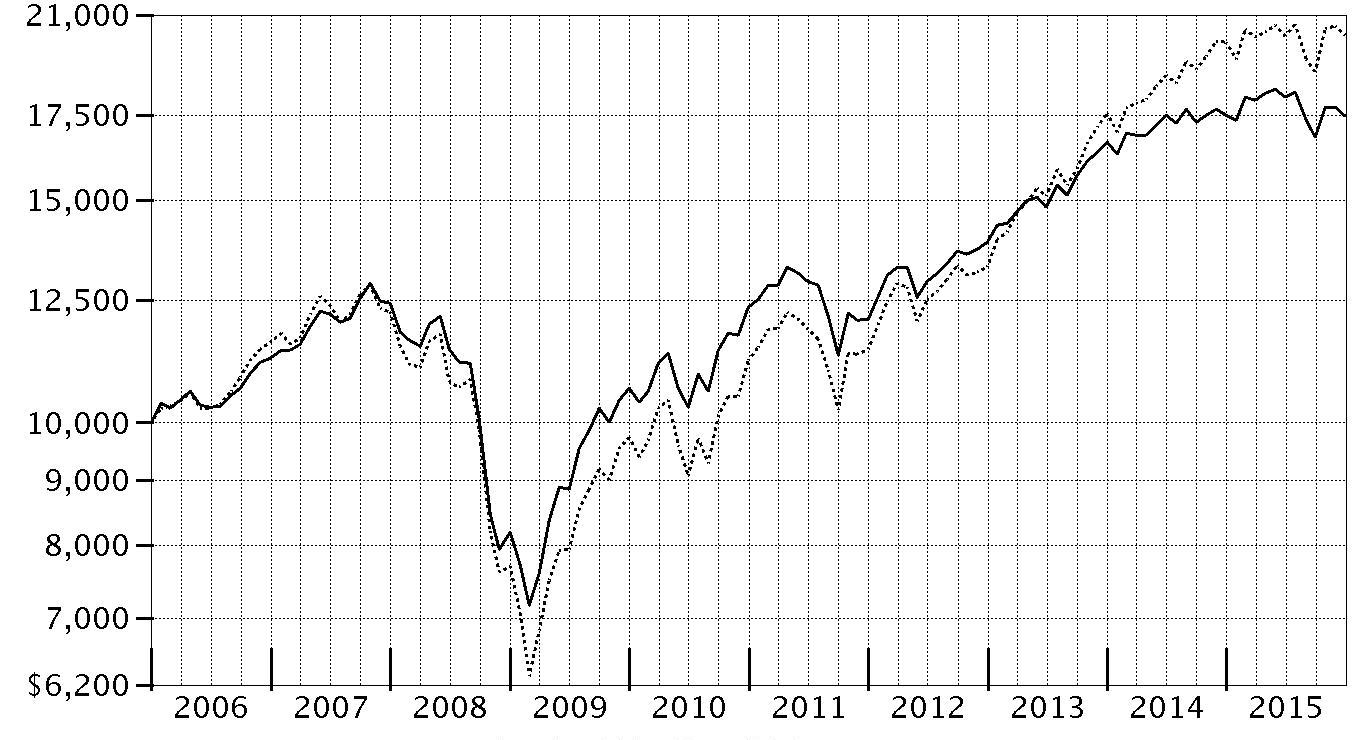
| Period Ending Values |
| $17,468 | VIP Freedom 2025 Portfolio℠ - Initial Class |
| $20,242 | S&P 500® Index |
VIP Freedom 2030 Portfolio℠
Performance: The Bottom Line
Average annual total return reflects the change in the value of an investment, assuming reinvestment of distributions from dividend income and capital gains (the profits earned upon the sale of securities that have grown in value, if any) and assuming a constant rate of performance each year. During periods of reimbursement by Fidelity, a fund’s total return will be greater than it would be had the reimbursement not occurred. Performance numbers are net of all underlying fund operating expenses, but do not include any insurance charges imposed by your insurance company’s separate account. If performance information included the effect of these additional charges, the total returns would have been lower. How a fund did yesterday is no guarantee of how it will do tomorrow.
Average Annual Total Returns
| For the periods ended December 31, 2015 | Past 1 year | Past 5 years | Past 10 years |
| Initial Class | (0.24)% | 7.48% | 5.52% |
| Service Class | (0.34)% | 7.37% | 5.42% |
| Service Class 2 | (0.53)% | 7.20% | 5.26% |
$10,000 Over 10 Years
Let's say hypothetically that $10,000 was invested in VIP Freedom 2030 Portfolio℠ - Initial Class on December 31, 2005.
The chart shows how the value of your investment would have changed, and also shows how the S&P 500® Index performed over the same period.
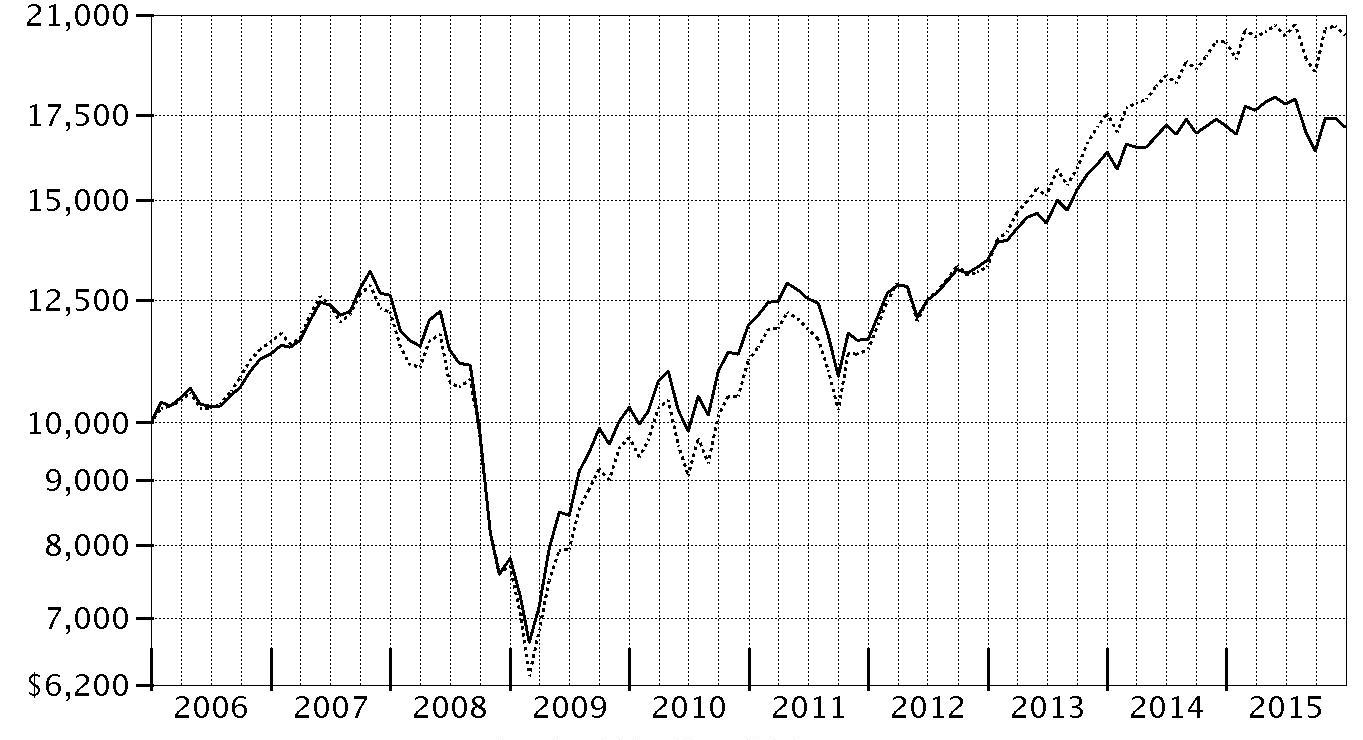
| Period Ending Values |
| $17,120 | VIP Freedom 2030 Portfolio℠ - Initial Class |
| $20,242 | S&P 500® Index |
VIP Freedom 2035 Portfolio℠
Performance: The Bottom Line
Average annual total return reflects the change in the value of an investment, assuming reinvestment of distributions from dividend income and capital gains (the profits earned upon the sale of securities that have grown in value, if any) and assuming a constant rate of performance each year. During periods of reimbursement by Fidelity, a fund’s total return will be greater than it would be had the reimbursement not occurred. Performance numbers are net of all underlying fund operating expenses, but do not include any insurance charges imposed by your insurance company’s separate account. If performance information included the effect of these additional charges, the total returns would have been lower. How a fund did yesterday is no guarantee of how it will do tomorrow.
Average Annual Total Returns
| For the periods ended December 31, 2015 | Past 1 year | Past 5 years | Life of FundA |
| Initial Class | (0.31)% | 7.93% | 13.89% |
| Service Class | (0.40)% | 7.83% | 13.78% |
| Service Class 2 | (0.51)% | 7.68% | 13.61% |
A From April 8, 2009
$10,000 Over Life of Fund
Let's say hypothetically that $10,000 was invested in VIP Freedom 2035 Portfolio℠ - Initial Class on April 8, 2009, when the fund started.
The chart shows how the value of your investment would have changed, and also shows how the S&P 500® Index performed over the same period.

| Period Ending Values |
| $24,003 | VIP Freedom 2035 Portfolio℠ - Initial Class |
| $28,551 | S&P 500® Index |
VIP Freedom 2040 Portfolio℠
Performance: The Bottom Line
Average annual total return reflects the change in the value of an investment, assuming reinvestment of distributions from dividend income and capital gains (the profits earned upon the sale of securities that have grown in value, if any) and assuming a constant rate of performance each year. During periods of reimbursement by Fidelity, a fund’s total return will be greater than it would be had the reimbursement not occurred. Performance numbers are net of all underlying fund operating expenses, but do not include any insurance charges imposed by your insurance company’s separate account. If performance information included the effect of these additional charges, the total returns would have been lower. How a fund did yesterday is no guarantee of how it will do tomorrow.
Average Annual Total Returns
| For the periods ended December 31, 2015 | Past 1 year | Past 5 years | Life of FundA |
| Initial Class | (0.26)% | 8.03% | 14.09% |
| Service Class | (0.35)% | 7.93% | 13.98% |
| Service Class 2 | (0.49)% | 7.76% | 13.81% |
A From April 8, 2009
$10,000 Over Life of Fund
Let's say hypothetically that $10,000 was invested in VIP Freedom 2040 Portfolio℠ - Initial Class on April 8, 2009, when the fund started.
The chart shows how the value of your investment would have changed, and also shows how the S&P 500® Index performed over the same period.

| Period Ending Values |
| $24,298 | VIP Freedom 2040 Portfolio℠ - Initial Class |
| $28,551 | S&P 500® Index |
VIP Freedom 2045 Portfolio℠
Performance: The Bottom Line
Average annual total return reflects the change in the value of an investment, assuming reinvestment of distributions from dividend income and capital gains (the profits earned upon the sale of securities that have grown in value, if any) and assuming a constant rate of performance each year. During periods of reimbursement by Fidelity, a fund’s total return will be greater than it would be had the reimbursement not occurred. Performance numbers are net of all underlying fund operating expenses, but do not include any insurance charges imposed by your insurance company’s separate account. If performance information included the effect of these additional charges, the total returns would have been lower. How a fund did yesterday is no guarantee of how it will do tomorrow.
Average Annual Total Returns
| For the periods ended December 31, 2015 | Past 1 year | Past 5 years | Life of FundA |
| Initial Class | (0.26)% | 8.16% | 14.26% |
| Service Class | (0.37)% | 8.05% | 14.15% |
| Service Class 2 | (0.53)% | 7.88% | 13.97% |
A From April 8, 2009
$10,000 Over Life of Fund
Let's say hypothetically that $10,000 was invested in VIP Freedom 2045 Portfolio℠ - Initial Class on April 8, 2009, when the fund started.
The chart shows how the value of your investment would have changed, and also shows how the S&P 500® Index performed over the same period.
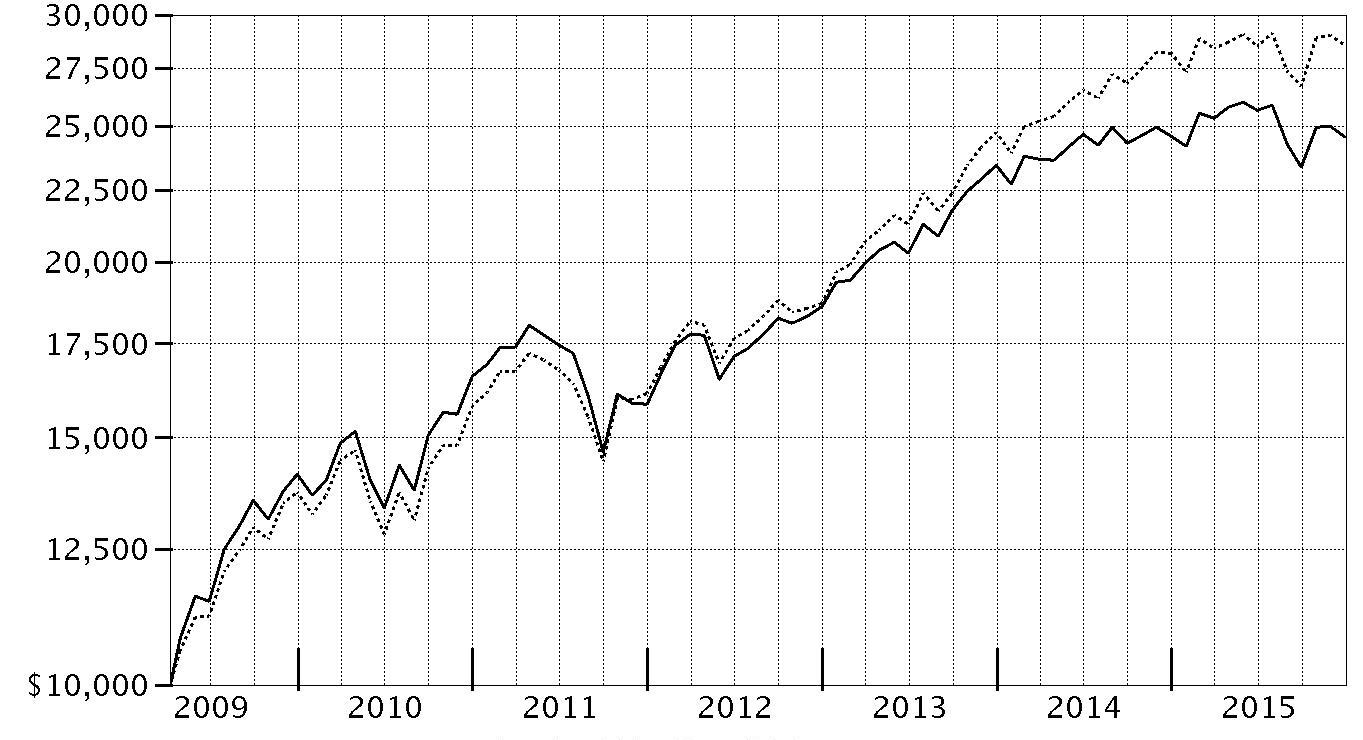
| Period Ending Values |
| $24,544 | VIP Freedom 2045 Portfolio℠ - Initial Class |
| $28,551 | S&P 500® Index |
VIP Freedom 2050 Portfolio℠
Performance: The Bottom Line
Average annual total return reflects the change in the value of an investment, assuming reinvestment of distributions from dividend income and capital gains (the profits earned upon the sale of securities that have grown in value, if any) and assuming a constant rate of performance each year. During periods of reimbursement by Fidelity, a fund’s total return will be greater than it would be had the reimbursement not occurred. Performance numbers are net of all underlying fund operating expenses, but do not include any insurance charges imposed by your insurance company’s separate account. If performance information included the effect of these additional charges, the total returns would have been lower. How a fund did yesterday is no guarantee of how it will do tomorrow.
Average Annual Total Returns
| For the periods ended December 31, 2015 | Past 1 year | Past 5 years | Life of FundA |
| Initial Class | (0.29)% | 8.16% | 14.47% |
| Service Class | (0.38)% | 8.05% | 14.35% |
| Service Class 2 | (0.58)% | 7.89% | 14.17% |
A From April 8, 2009
$10,000 Over Life of Fund
Let's say hypothetically that $10,000 was invested in VIP Freedom 2050 Portfolio℠ - Initial Class on April 8, 2009, when the fund started.
The chart shows how the value of your investment would have changed, and also shows how the S&P 500® Index performed over the same period.

| Period Ending Values |
| $24,840 | VIP Freedom 2050 Portfolio℠ - Initial Class |
| $28,551 | S&P 500® Index |
Management's Discussion of Fund Performance
Market Recap: Largely buoyed by the U.S., developed-markets equities finished 2015 nearly flat overall, rebounding from a steep decline in August and September over worries about China’s slowing economic growth. The MSCI World Index returned -0.44% for the 12 months ending December 31, 2015. Modest gains in the first half of the year were quickly erased amid the late-summer rout, but stocks sharply reversed course in October, lifted by the U.S. Federal Reserve’s decision to put off raising near-term interest rates until mid-December. Investors also were encouraged by an interest-rate cut in China and economic stimulus in Europe. Excess supply of oil and natural gas weighed on commodities, the year’s worst-performing asset class. Lower energy costs and improving wages drove consumer spending, though, helping retailers. Also, low interest rates and pent-up demand boosted global auto sales: December results sent annual totals past the previous record, set in 2000.
The broad Dow Jones U.S. Total Stock Market Index℠ gained 0.44% for the year. Large-cap stocks outpaced small-caps by a comfortable margin, with the S&P 500
® and the Russell 2000
® Index returning 1.38% and -4.41%, respectively. Meanwhile, non-U.S. developed-markets returned -3.04%, as measured by the MSCI World ex USA Index, and the MSCI Emerging Markets Index returned -14.60%, beset by numerous challenges, U.S.-dollar strengthening throughout the period not the least of them. Globally, growth- led value-oriented stocks across market-cap segments. Outside the U.S., large-caps lagged small-caps substantially.
Looking within the bellwether S&P 500
®, the downtrodden energy (-21%), materials (-8%) and utilities (-5%) sectors weighed on the index. Health care (+7%) helped alleviate the pain, and investors’ preference for growth stocks braced technology (+6%), which also benefited from strong fundamentals and attractive relative valuations. This sector performance pattern was generally similar worldwide.
In fixed income, the Barclays
® Global Aggregate GDP Weighted Index returned -3.90%, affected in part by the Fed’s first interest-rate hike since 2006. The investment-grade Barclays
® U.S. Aggregate Bond Index returned 0.55%; The BofA Merrill Lynch℠ US High Yield Constrained Index, -4.61%. Energy- and commodity-related securities performed worst. U.S. Treasury Inflation-Protected Securities (TIPS) suffered amid stubbornly low inflation. Meanwhile, emerging-markets debt rebounded strongly in the fall, overcoming multiple threats including China’s economic slowdown and currency headwinds.
Comments from Co-Portfolio Managers Andrew Dierdorf and Brett Sumsion: For the year, the share classes of each VIP Freedom Fund posted a slightly negative absolute return. On a relative basis, the longer-dated Funds outperformed their respective Composite index, whereas the shorter-dated Funds and Income Fund lagged slightly.
(For specific Fund results, please refer to the performance section of this report.) Asset allocation decisions detracted overall, most notably an overweighting in the U.S. equity asset class and our underweighting of investment-grade bonds. Generally speaking, the Funds' non-U.S. equity investments added value overall by meaningfully outperforming the asset-class benchmark. In particular, VIP Overseas Portfolio, which seeks to own high-quality companies purchased at attractive prices that the manager believes can outperform the market over the long term, produced a solid gain. Similarly, VIP Emerging Markets Portfolio, despite its negative result, finished well ahead of its fund-level benchmark. Relative gains here were undermined largely by results from VIP Investment Grade Bond Portfolio, which emphasized corporate bonds and underweighted U.S. Treasuries; the Portfolio underperformed the Barclays
® U.S. Aggregate Bond Index. Out-of-benchmark allocations to high-yield debt also hurt. Lastly, the Funds' U.S. equity allocation underperformed overall. Intra-asset allocation decisions – that is, weightings among underlying portfolios – detracted from results. Most notably VIP Growth & Income Portfolio, the Funds' largest U.S. equity holding, underperformed its benchmark the past year.
The views expressed above reflect those of the portfolio manager(s) only through the end of the period as stated on the cover of this report and do not necessarily represent the views of Fidelity or any other person in the Fidelity organization. Any such views are subject to change at any time based upon market or other conditions and Fidelity disclaims any responsibility to update such views. These views may not be relied on as investment advice and, because investment decisions for a Fidelity fund are based on numerous factors, may not be relied on as an indication of trading intent on behalf of any Fidelity fund.
VIP Freedom Income Portfolio℠
Investment Summary (Unaudited)
The information in the following tables is based on the direct investments of the Fund.
Fund Holdings as of December 31, 2015
| | % of fund's net assets | % of fund's net assets 6 months ago |
| Domestic Equity Funds | | |
| VIP Contrafund Portfolio Initial Class | 3.2 | 3.2 |
| VIP Equity-Income Portfolio Initial Class | 3.3 | 3.3 |
| VIP Growth & Income Portfolio Initial Class | 3.8 | 3.8 |
| VIP Growth Portfolio Initial Class | 3.3 | 3.2 |
| VIP Mid Cap Portfolio Initial Class | 0.9 | 0.9 |
| VIP Value Portfolio Initial Class | 2.4 | 2.4 |
| VIP Value Strategies Portfolio Initial Class | 1.2 | 1.2 |
| | 18.1 | 18.0 |
| International Equity Funds | | |
| VIP Emerging Markets Portfolio Initial Class | 3.6 | 3.1 |
| VIP Overseas Portfolio Initial Class | 3.8 | 4.5 |
| | 7.4 | 7.6 |
| Bond Funds | | |
| VIP High Income Portfolio Initial Class | 3.7 | 4.0 |
| VIP Investment Grade Bond Portfolio Initial Class | 42.4 | 43.4 |
| | 46.1 | 47.4 |
| Short-Term Funds | | |
| VIP Government Money Market Portfolio Initial Class 0.05% | 28.4 | 27.0 |
| Net Other Assets (Liabilities) | | |
| Net Other Assets | 0.0 | 0.0 |
| | 100.0 | 100.0 |
VIP Government Money Market Portfolio Initial Class was formerly known as VIP Money Market Portfolio Initial Class
Asset Allocation (% of fund's net assets)
| Period end |
| | Domestic Equity Funds | 18.1% |
| | International Equity Funds | 7.4% |
| | Bond Funds | 46.1% |
| | Short-Term Funds | 28.4% |

| Six months ago |
| | Domestic Equity Funds | 18.0% |
| | International Equity Funds | 7.6% |
| | Bond Funds | 47.4% |
| | Short-Term Funds | 27.0% |

Percentages shown as 0.0% may reflect amounts less than 0.05%.
VIP Freedom Income Portfolio℠
Investments December 31, 2015
Showing Percentage of Net Assets
| Domestic Equity Funds - 18.1% | | | |
| | | Shares | Value |
| VIP Contrafund Portfolio Initial Class (a) | | 35,327 | $1,198,299 |
| VIP Equity-Income Portfolio Initial Class (a) | | 61,667 | 1,261,713 |
| VIP Growth & Income Portfolio Initial Class (a) | | 75,344 | 1,422,495 |
| VIP Growth Portfolio Initial Class (a) | | 18,933 | 1,244,836 |
| VIP Mid Cap Portfolio Initial Class (a) | | 10,474 | 341,971 |
| VIP Value Portfolio Initial Class (a) | | 68,268 | 912,060 |
| VIP Value Strategies Portfolio Initial Class (a) | | 30,267 | 440,077 |
| TOTAL DOMESTIC EQUITY FUNDS | | | |
| (Cost $6,056,241) | | | 6,821,451 |
|
| International Equity Funds - 7.4% | | | |
| VIP Emerging Markets Portfolio Initial Class (a) | | 166,207 | 1,352,923 |
| VIP Overseas Portfolio Initial Class (a) | | 76,214 | 1,454,171 |
| TOTAL INTERNATIONAL EQUITY FUNDS | | | |
| (Cost $2,634,146) | | | 2,807,094 |
|
| Bond Funds - 46.1% | | | |
| VIP High Income Portfolio Initial Class (a) | | 283,406 | 1,402,858 |
| VIP Investment Grade Bond Portfolio Initial Class (a) | | 1,292,354 | 15,986,426 |
| TOTAL BOND FUNDS | | | |
| (Cost $17,962,935) | | | 17,389,284 |
|
| Short-Term Funds - 28.4% | | | |
| VIP Government Money Market Portfolio Initial Class 0.05% (a)(b) | | | |
| (Cost $10,734,197) | | 10,734,197 | 10,734,197 |
| TOTAL INVESTMENT PORTFOLIO - 100.0% | | | |
| (Cost $37,387,519) | | | 37,752,026 |
| NET OTHER ASSETS (LIABILITIES) - 0.0% | | | (3,589) |
| NET ASSETS - 100% | | | $37,748,437 |
Legend
(a) Affiliated Fund
(b) The rate quoted is the annualized seven-day yield of the fund at period end.
Affiliated Underlying Funds
Information regarding the Fund's fiscal year to date purchases and sales of the affiliated Underlying Funds and income earned by the Fund from investments in affiliated Underlying Funds is as follows:
(VIP Government Money Market Portfolio Initial Class was formerly known as VIP Money Market Portfolio Initial Class)
| Affiliate | Value, beginning of period | Purchases | Sales Proceeds | Dividend Income | Value, end of period |
| VIP Contrafund Portfolio Initial Class | $1,025,009 | $767,187 | $501,496 | $12,844 | $1,198,299 |
| VIP Emerging Markets Portfolio Initial Class | 807,469 | 1,045,266 | 360,518 | 8,171 | 1,352,923 |
| VIP Equity-Income Portfolio Initial Class | 1,077,800 | 840,883 | 468,967 | 42,363 | 1,261,713 |
| VIP Government Money Market Portfolio Initial Class 0.05% | 8,303,172 | 5,329,890 | 2,898,865 | 2,717 | 10,734,197 |
| VIP Growth & Income Portfolio Initial Class | 1,227,153 | 929,035 | 615,012 | 31,583 | 1,422,495 |
| VIP Growth Portfolio Initial Class | 1,046,244 | 697,225 | 549,722 | 3,258 | 1,244,836 |
| VIP High Income Portfolio Initial Class | 1,216,775 | 789,365 | 437,003 | 98,471 | 1,402,858 |
| VIP Investment Grade Bond Portfolio Initial | 14,539,867 | 7,160,958 | 5,153,315 | 424,979 | 15,986,426 |
| VIP Mid Cap Portfolio Initial Class | 299,455 | 217,648 | 133,512 | 1,818 | 341,971 |
| VIP Overseas Portfolio Initial Class | 1,720,288 | 1,054,936 | 1,369,955 | 20,531 | 1,454,171 |
| VIP Value Portfolio Initial Class | 791,331 | 647,061 | 376,463 | 12,831 | 912,060 |
| VIP Value Strategies Portfolio Initial Class | 386,476 | 253,384 | 180,038 | 5,492 | 440,077 |
| Total | $32,441,039 | $19,732,838 | $13,044,866 | $665,058 | $37,752,026 |
Investment Valuation
All investments are categorized as Level 1 under the Fair Value Hierarchy. The inputs or methodology used for valuing securities may not be an indication of the risk associated with investing in those securities. For more information on valuation inputs please refer to the Investment Valuation section in the accompanying Notes to Financial Statements.
See accompanying notes which are an integral part of the financial statements.
VIP Freedom Income Portfolio℠
Financial Statements
Statement of Assets and Liabilities
| | | December 31, 2015 |
| Assets | | |
| Investment in securities, at value (cost $37,387,519) — See accompanying schedule | | $37,752,026 |
| Receivable for investments sold | | 117,197 |
| Receivable for fund shares sold | | 14,350 |
| Total assets | | 37,883,573 |
| Liabilities | | |
| Payable for investments purchased | $7,382 | |
| Payable for fund shares redeemed | 124,164 | |
| Distribution and service plan fees payable | 3,590 | |
| Total liabilities | | 135,136 |
| Net Assets | | $37,748,437 |
| Net Assets consist of: | | |
| Paid in capital | | $37,204,043 |
| Accumulated undistributed net realized gain (loss) on investments | | 179,887 |
| Net unrealized appreciation (depreciation) on investments | | 364,507 |
| Net Assets | | $37,748,437 |
| Initial Class: | | |
| Net Asset Value, offering price and redemption price per share ($14,548,067 ÷ 1,349,494 shares) | | $10.78 |
| Service Class: | | |
| Net Asset Value, offering price and redemption price per share ($9,825,113 ÷ 911,434 shares) | | $10.78 |
| Service Class 2: | | |
| Net Asset Value, offering price and redemption price per share ($13,375,257 ÷ 1,245,332 shares) | | $10.74 |
See accompanying notes which are an integral part of the financial statements.
Statement of Operations
| | | Year ended December 31, 2015 |
| Investment Income | | |
| Income distributions from underlying funds | | $665,058 |
| Expenses | | |
| Distribution and service plan fees | $39,039 | |
| Independent trustees' compensation | 144 | |
| Total expenses before reductions | 39,183 | |
| Expense reductions | (144) | 39,039 |
| Net investment income (loss) | | 626,019 |
| Realized and Unrealized Gain (Loss) | | |
| Realized gain (loss) on sale of underlying fund shares | (84,997) | |
| Capital gain distributions from underlying funds | 459,071 | |
| Total net realized gain (loss) | | 374,074 |
| Change in net unrealized appreciation (depreciation) on underlying funds | | (1,291,995) |
| Net gain (loss) | | (917,921) |
| Net increase (decrease) in net assets resulting from operations | | $(291,902) |
See accompanying notes which are an integral part of the financial statements.
Statement of Changes in Net Assets
| | Year ended December 31, 2015 | Year ended December 31, 2014 |
| Increase (Decrease) in Net Assets | | |
| Operations | | |
| Net investment income (loss) | $626,019 | $474,069 |
| Net realized gain (loss) | 374,074 | 10,499 |
| Change in net unrealized appreciation (depreciation) | (1,291,995) | 612,129 |
| Net increase (decrease) in net assets resulting from operations | (291,902) | 1,096,697 |
| Distributions to shareholders from net investment income | (637,437) | (463,895) |
| Distributions to shareholders from net realized gain | (50,115) | (268,988) |
| Total distributions | (687,552) | (732,883) |
| Share transactions - net increase (decrease) | 6,289,229 | 3,065,906 |
| Total increase (decrease) in net assets | 5,309,775 | 3,429,720 |
| Net Assets | | |
| Beginning of period | 32,438,662 | 29,008,942 |
| End of period (including undistributed net investment income of $0 and $10,174, respectively) | $37,748,437 | $32,438,662 |
See accompanying notes which are an integral part of the financial statements.
Financial Highlights — VIP Freedom Income Portfolio Initial Class
| | | | | | |
| Years ended December 31, | 2015 | 2014 | 2013 | 2012 | 2011 |
| Selected Per–Share Data | | | | | |
| Net asset value, beginning of period | $11.03 | $10.89 | $10.57 | $10.21 | $10.27 |
| Income from Investment Operations | | | | | |
| Net investment income (loss)A | .21 | .18 | .18 | .16 | .19 |
| Net realized and unrealized gain (loss) | (.25) | .23 | .40 | .50 | (.02) |
| Total from investment operations | (.04) | .41 | .58 | .66 | .17 |
| Distributions from net investment income | (.20) | (.17) | (.17) | (.16) | (.19) |
| Distributions from net realized gain | (.02) | (.10) | (.10) | (.14) | (.04) |
| Total distributions | (.21)B | (.27) | (.26)C | (.30) | (.23) |
| Net asset value, end of period | $10.78 | $11.03 | $10.89 | $10.57 | $10.21 |
| Total ReturnD,E | (.34)% | 3.78% | 5.55% | 6.52% | 1.63% |
| Ratios to Average Net AssetsF,G | | | | | |
| Expenses before reductionsH | -% | -% | -% | -% | -% |
| Expenses net of fee waivers, if any | -% | -% | -% | -% | -% |
| Expenses net of all reductions | -% | -% | -% | -% | -% |
| Net investment income (loss) | 1.85% | 1.62% | 1.67% | 1.55% | 1.85% |
| Supplemental Data | | | | | |
| Net assets, end of period (000 omitted) | $14,548 | $17,386 | $16,980 | $14,184 | $10,938 |
| Portfolio turnover rateF | 36% | 32% | 43% | 43% | 49% |
A Calculated based on average shares outstanding during the period.
B Total distributions of $.21 per share is comprised of distributions from net investment income of $.198 and distributions from net realized gain of $.015 per share.
C Total distributions of $.26 per share is comprised of distributions from net investment income of $.166 and distributions from net realized gain of $.097 per share.
D Total returns do not reflect charges attributable to your insurance company's separate account. Inclusion of these charges would reduce the total returns shown.
E Total returns would have been lower if certain expenses had not been reduced during the applicable periods shown.
F Amounts do not include the activity of the Underlying Funds.
G Expense ratios reflect operating expenses of the class. Expenses before reductions do not reflect amounts reimbursed by the investment adviser or reductions from expense offset arrangements and do not represent the amount paid by the class during periods when reimbursements or reductions occur. Expenses net of fee waivers reflect expenses after reimbursement by the investment adviser but prior to reductions from expense offset arrangements. Expenses net of all reductions represent the net expenses paid by the class but do not include expenses of the underlying funds in which the Fund invests.
H Amount represents less than .005%.
See accompanying notes which are an integral part of the financial statements.
Financial Highlights — VIP Freedom Income Portfolio Service Class
| | | | | | |
| Years ended December 31, | 2015 | 2014 | 2013 | 2012 | 2011 |
| Selected Per–Share Data | | | | | |
| Net asset value, beginning of period | $11.03 | $10.89 | $10.58 | $10.22 | $10.28 |
| Income from Investment Operations | | | | | |
| Net investment income (loss)A | .19 | .17 | .17 | .15 | .18 |
| Net realized and unrealized gain (loss) | (.24) | .23 | .40 | .50 | (.02) |
| Total from investment operations | (.05) | .40 | .57 | .65 | .16 |
| Distributions from net investment income | (.19) | (.16) | (.16) | (.15) | (.18) |
| Distributions from net realized gain | (.02) | (.10) | (.10) | (.14) | (.04) |
| Total distributions | (.20)B | (.26) | (.26) | (.29) | (.22) |
| Net asset value, end of period | $10.78 | $11.03 | $10.89 | $10.58 | $10.22 |
| Total ReturnC,D | (.42)% | 3.69% | 5.38% | 6.42% | 1.56% |
| Ratios to Average Net AssetsE,F | | | | | |
| Expenses before reductions | .10% | .10% | .10% | .10% | .10% |
| Expenses net of fee waivers, if any | .10% | .10% | .10% | .10% | .10% |
| Expenses net of all reductions | .10% | .10% | .10% | .10% | .10% |
| Net investment income (loss) | 1.75% | 1.52% | 1.57% | 1.45% | 1.75% |
| Supplemental Data | | | | | |
| Net assets, end of period (000 omitted) | $9,825 | $6,193 | $4,529 | $2,467 | $2,505 |
| Portfolio turnover rateE | 36% | 32% | 43% | 43% | 49% |
A Calculated based on average shares outstanding during the period.
B Total distributions of $.20 per share is comprised of distributions from net investment income of $.189 and distributions from net realized gain of $.015 per share.
C Total returns do not reflect charges attributable to your insurance company's separate account. Inclusion of these charges would reduce the total returns shown.
D Total returns would have been lower if certain expenses had not been reduced during the applicable periods shown.
E Amounts do not include the activity of the Underlying Funds.
F Expense ratios reflect operating expenses of the class. Expenses before reductions do not reflect amounts reimbursed by the investment adviser or reductions from expense offset arrangements and do not represent the amount paid by the class during periods when reimbursements or reductions occur. Expenses net of fee waivers reflect expenses after reimbursement by the investment adviser but prior to reductions from expense offset arrangements. Expenses net of all reductions represent the net expenses paid by the class but do not include expenses of the underlying funds in which the Fund invests.
See accompanying notes which are an integral part of the financial statements.
Financial Highlights — VIP Freedom Income Portfolio Service Class 2
| | | | | | |
| Years ended December 31, | 2015 | 2014 | 2013 | 2012 | 2011 |
| Selected Per–Share Data | | | | | |
| Net asset value, beginning of period | $10.99 | $10.85 | $10.54 | $10.18 | $10.24 |
| Income from Investment Operations | | | | | |
| Net investment income (loss)A | .18 | .15 | .15 | .14 | .17 |
| Net realized and unrealized gain (loss) | (.24) | .23 | .40 | .49 | (.03) |
| Total from investment operations | (.06) | .38 | .55 | .63 | .14 |
| Distributions from net investment income | (.17) | (.14) | (.14) | (.13) | (.16) |
| Distributions from net realized gain | (.02) | (.10) | (.10) | (.14) | (.04) |
| Total distributions | (.19) | (.24) | (.24) | (.27) | (.20) |
| Net asset value, end of period | $10.74 | $10.99 | $10.85 | $10.54 | $10.18 |
| Total ReturnB,C | (.57)% | 3.54% | 5.21% | 6.26% | 1.39% |
| Ratios to Average Net AssetsD,E | | | | | |
| Expenses before reductions | .25% | .25% | .25% | .25% | .25% |
| Expenses net of fee waivers, if any | .25% | .25% | .25% | .25% | .25% |
| Expenses net of all reductions | .25% | .25% | .25% | .25% | .25% |
| Net investment income (loss) | 1.60% | 1.37% | 1.42% | 1.30% | 1.60% |
| Supplemental Data | | | | | |
| Net assets, end of period (000 omitted) | $13,375 | $8,860 | $7,500 | $6,495 | $7,731 |
| Portfolio turnover rateD | 36% | 32% | 43% | 43% | 49% |
A Calculated based on average shares outstanding during the period.
B Total returns do not reflect charges attributable to your insurance company's separate account. Inclusion of these charges would reduce the total returns shown.
C Total returns would have been lower if certain expenses had not been reduced during the applicable periods shown.
D Amounts do not include the activity of the Underlying Funds.
E Expense ratios reflect operating expenses of the class. Expenses before reductions do not reflect amounts reimbursed by the investment adviser or reductions from expense offset arrangements and do not represent the amount paid by the class during periods when reimbursements or reductions occur. Expenses net of fee waivers reflect expenses after reimbursement by the investment adviser but prior to reductions from expense offset arrangements. Expenses net of all reductions represent the net expenses paid by the class but do not include expenses of the underlying funds in which the Fund invests.
See accompanying notes which are an integral part of the financial statements.
VIP Freedom 2005 Portfolio℠
Investment Summary (Unaudited)
The information in the following tables is based on the direct investments of the Fund.
Fund Holdings as of December 31, 2015
| | % of fund's net assets | % of fund's net assets 6 months ago |
| Domestic Equity Funds | | |
| VIP Contrafund Portfolio Initial Class | 4.8 | 4.8 |
| VIP Equity-Income Portfolio Initial Class | 5.0 | 5.1 |
| VIP Growth & Income Portfolio Initial Class | 5.7 | 5.8 |
| VIP Growth Portfolio Initial Class | 5.0 | 5.0 |
| VIP Mid Cap Portfolio Initial Class | 1.4 | 1.4 |
| VIP Value Portfolio Initial Class | 3.6 | 3.7 |
| VIP Value Strategies Portfolio Initial Class | 1.7 | 1.8 |
| | 27.2 | 27.6 |
| International Equity Funds | | |
| VIP Emerging Markets Portfolio Initial Class | 4.6 | 4.3 |
| VIP Overseas Portfolio Initial Class | 7.1 | 7.7 |
| | 11.7 | 12.0 |
| Bond Funds | | |
| VIP High Income Portfolio Initial Class | 3.7 | 4.0 |
| VIP Investment Grade Bond Portfolio Initial Class | 37.4 | 38.3 |
| | 41.1 | 42.3 |
| Short-Term Funds | | |
| VIP Government Money Market Portfolio Initial Class 0.05% | 20.0 | 18.1 |
| Net Other Assets (Liabilities) | | |
| Net Other Assets | 0.0 | 0.0 |
| | 100.0 | 100.0 |
VIP Government Money Market Portfolio Initial Class was formerly known as VIP Money Market Portfolio Initial Class
Asset Allocation (% of fund's net assets)
| Period end |
| | Domestic Equity Funds | 27.2% |
| | International Equity Funds | 11.7% |
| | Bond Funds | 41.1% |
| | Short-Term Funds | 20.0% |

| Six months ago |
| | Domestic Equity Funds | 27.6% |
| | International Equity Funds | 12.0% |
| | Bond Funds | 42.3% |
| | Short-Term Funds | 18.1% |

Percentages shown as 0.0% may reflect amounts less than 0.05%.
VIP Freedom 2005 Portfolio℠
Investments December 31, 2015
Showing Percentage of Net Assets
| Domestic Equity Funds - 27.2% | | | |
| | | Shares | Value |
| VIP Contrafund Portfolio Initial Class (a) | | 10,181 | $345,345 |
| VIP Equity-Income Portfolio Initial Class (a) | | 17,812 | 364,438 |
| VIP Growth & Income Portfolio Initial Class (a) | | 21,759 | 410,815 |
| VIP Growth Portfolio Initial Class (a) | | 5,469 | 359,571 |
| VIP Mid Cap Portfolio Initial Class (a) | | 3,024 | 98,732 |
| VIP Value Portfolio Initial Class (a) | | 19,716 | 263,408 |
| VIP Value Strategies Portfolio Initial Class (a) | | 8,739 | 127,061 |
| TOTAL DOMESTIC EQUITY FUNDS | | | |
| (Cost $1,659,581) | | | 1,969,370 |
|
| International Equity Funds - 11.7% | | | |
| VIP Emerging Markets Portfolio Initial Class (a) | | 41,038 | 334,048 |
| VIP Overseas Portfolio Initial Class (a) | | 26,643 | 508,345 |
| TOTAL INTERNATIONAL EQUITY FUNDS | | | |
| (Cost $856,694) | | | 842,393 |
|
| Bond Funds - 41.1% | | | |
| VIP High Income Portfolio Initial Class (a) | | 54,393 | 269,246 |
| VIP Investment Grade Bond Portfolio Initial Class (a) | | 218,934 | 2,708,209 |
| TOTAL BOND FUNDS | | | |
| (Cost $3,080,150) | | | 2,977,455 |
|
| Short-Term Funds - 20.0% | | | |
| VIP Government Money Market Portfolio Initial Class 0.05% (a)(b) | | | |
| (Cost $1,444,116) | | 1,444,116 | 1,444,116 |
| TOTAL INVESTMENT PORTFOLIO - 100.0% | | | |
| (Cost $7,040,541) | | | 7,233,334 |
| NET OTHER ASSETS (LIABILITIES) - 0.0% | | | (51) |
| NET ASSETS - 100% | | | $7,233,283 |
Legend
(a) Affiliated Fund
(b) The rate quoted is the annualized seven-day yield of the fund at period end.
Affiliated Underlying Funds
Information regarding the Fund's fiscal year to date purchases and sales of the affiliated Underlying Funds and income earned by the Fund from investments in affiliated Underlying Funds is as follows:
(VIP Government Money Market Portfolio Initial Class was formerly known as VIP Money Market Portfolio Initial Class)
| Affiliate | Value, beginning of period | Purchases | Sales Proceeds | Dividend Income | Value, end of period |
| VIP Contrafund Portfolio Initial Class | $429,166 | $104,416 | $150,168 | $3,797 | $345,345 |
| VIP Emerging Markets Portfolio Initial Class | 302,225 | 164,733 | 91,084 | 2,128 | 334,048 |
| VIP Equity-Income Portfolio Initial Class | 451,699 | 115,364 | 131,533 | 12,575 | 364,438 |
| VIP Government Money Market Portfolio Initial Class 0.05% | 1,365,111 | 468,769 | 389,764 | 418 | 1,444,116 |
| VIP Growth & Income Portfolio Initial Class | 514,395 | 120,268 | 179,079 | 9,341 | 410,815 |
| VIP Growth Portfolio Initial Class | 435,099 | 79,717 | 171,218 | 957 | 359,571 |
| VIP High Income Portfolio Initial Class | 323,437 | 67,469 | 91,849 | 19,509 | 269,246 |
| VIP Investment Grade Bond Portfolio Initial | 3,352,792 | 477,419 | 1,029,660 | 74,108 | 2,708,209 |
| VIP Mid Cap Portfolio Initial Class | 126,267 | 30,009 | 41,302 | 535 | 98,732 |
| VIP Overseas Portfolio Initial Class | 737,266 | 127,477 | 384,397 | 7,301 | 508,345 |
| VIP Value Portfolio Initial Class | 332,265 | 90,738 | 109,804 | 3,785 | 263,408 |
| VIP Value Strategies Portfolio Initial Class | 163,932 | 20,681 | 52,567 | 1,614 | 127,061 |
| Total | $8,533,654 | $1,867,060 | $2,822,425 | $136,068 | $7,233,334 |
Investment Valuation
All investments are categorized as Level 1 under the Fair Value Hierarchy. The inputs or methodology used for valuing securities may not be an indication of the risk associated with investing in those securities. For more information on valuation inputs please refer to the Investment Valuation section in the accompanying Notes to Financial Statements.
See accompanying notes which are an integral part of the financial statements.
VIP Freedom 2005 Portfolio℠
Financial Statements
Statement of Assets and Liabilities
| | | December 31, 2015 |
| Assets | | |
| Investment in securities, at value (cost $7,040,541) — See accompanying schedule | | $7,233,334 |
| Receivable for investments sold | | 27 |
| Receivable for fund shares sold | | 1,038 |
| Total assets | | 7,234,399 |
| Liabilities | | |
| Payable for investments purchased | $1,029 | |
| Payable for fund shares redeemed | 28 | |
| Distribution and service plan fees payable | 59 | |
| Total liabilities | | 1,116 |
| Net Assets | | $7,233,283 |
| Net Assets consist of: | | |
| Paid in capital | | $7,015,798 |
| Accumulated undistributed net realized gain (loss) on investments | | 24,692 |
| Net unrealized appreciation (depreciation) on investments | | 192,793 |
| Net Assets | | $7,233,283 |
| Initial Class: | | |
| Net Asset Value, offering price and redemption price per share ($6,656,876 ÷ 589,466 shares) | | $11.29 |
| Service Class: | | |
| Net Asset Value, offering price and redemption price per share ($483,974 ÷ 42,601 shares) | | $11.36 |
| Service Class 2: | | |
| Net Asset Value, offering price and redemption price per share ($92,433 ÷ 8,194 shares) | | $11.28 |
See accompanying notes which are an integral part of the financial statements.
Statement of Operations
| | | Year ended December 31, 2015 |
| Investment Income | | |
| Income distributions from underlying funds | | $136,068 |
| Expenses | | |
| Distribution and service plan fees | $677 | |
| Independent trustees' compensation | 34 | |
| Total expenses before reductions | 711 | |
| Expense reductions | (34) | 677 |
| Net investment income (loss) | | 135,391 |
| Realized and Unrealized Gain (Loss) | | |
| Realized gain (loss) on sale of underlying fund shares | (42,764) | |
| Capital gain distributions from underlying funds | 183,169 | |
| Total net realized gain (loss) | | 140,405 |
| Change in net unrealized appreciation (depreciation) on underlying funds | | (302,191) |
| Net gain (loss) | | (161,786) |
| Net increase (decrease) in net assets resulting from operations | | $(26,395) |
See accompanying notes which are an integral part of the financial statements.
Statement of Changes in Net Assets
| | Year ended December 31, 2015 | Year ended December 31, 2014 |
| Increase (Decrease) in Net Assets | | |
| Operations | | |
| Net investment income (loss) | $135,391 | $136,009 |
| Net realized gain (loss) | 140,405 | 7,133 |
| Change in net unrealized appreciation (depreciation) | (302,191) | 198,304 |
| Net increase (decrease) in net assets resulting from operations | (26,395) | 341,446 |
| Distributions to shareholders from net investment income | (135,627) | (135,563) |
| Distributions to shareholders from net realized gain | (15,795) | (75,085) |
| Total distributions | (151,422) | (210,648) |
| Share transactions - net increase (decrease) | (1,122,509) | 1,030,173 |
| Total increase (decrease) in net assets | (1,300,326) | 1,160,971 |
| Net Assets | | |
| Beginning of period | 8,533,609 | 7,372,638 |
| End of period (including undistributed net investment income of $0 and $445, respectively) | $7,233,283 | $8,533,609 |
See accompanying notes which are an integral part of the financial statements.
Financial Highlights — VIP Freedom 2005 Portfolio Initial Class
| | | | | | |
| Years ended December 31, | 2015 | 2014 | 2013 | 2012 | 2011 |
| Selected Per–Share Data | | | | | |
| Net asset value, beginning of period | $11.56 | $11.37 | $10.56 | $9.86 | $10.07 |
| Income from Investment Operations | | | | | |
| Net investment income (loss)A | .19 | .20 | .17 | .18 | .22 |
| Net realized and unrealized gain (loss) | (.22) | .29 | .86 | .76 | (.20) |
| Total from investment operations | (.03) | .49 | 1.03 | .94 | .02 |
| Distributions from net investment income | (.22) | (.19) | (.18) | (.17) | (.19) |
| Distributions from net realized gain | (.03) | (.11) | (.04) | (.07) | (.04) |
| Total distributions | (.24)B | (.30) | (.22) | (.24) | (.23) |
| Net asset value, end of period | $11.29 | $11.56 | $11.37 | $10.56 | $9.86 |
| Total ReturnC,D | (.25)% | 4.30% | 9.74% | 9.57% | .18% |
| Ratios to Average Net AssetsE,F | | | | | |
| Expenses before reductionsG | -% | -% | -% | -% | -% |
| Expenses net of fee waivers, if any | -% | -% | -% | -% | -% |
| Expenses net of all reductions | -% | -% | -% | -% | -% |
| Net investment income (loss) | 1.64% | 1.71% | 1.57% | 1.72% | 2.17% |
| Supplemental Data | | | | | |
| Net assets, end of period (000 omitted) | $6,657 | $8,047 | $7,145 | $5,971 | $5,224 |
| Portfolio turnover rateE | 23% | 21% | 54% | 30% | 54% |
A Calculated based on average shares outstanding during the period.
B Total distributions of $.24 per share is comprised of distributions from net investment income of $.217 and distributions from net realized gain of $.025 per share.
C Total returns do not reflect charges attributable to your insurance company's separate account. Inclusion of these charges would reduce the total returns shown.
D Total returns would have been lower if certain expenses had not been reduced during the applicable periods shown.
E Amounts do not include the activity of the Underlying Funds.
F Expense ratios reflect operating expenses of the class. Expenses before reductions do not reflect amounts reimbursed by the investment adviser or reductions from expense offset arrangements and do not represent the amount paid by the class during periods when reimbursements or reductions occur. Expenses net of fee waivers reflect expenses after reimbursement by the investment adviser but prior to reductions from expense offset arrangements. Expenses net of all reductions represent the net expenses paid by the class but do not include expenses of the underlying funds in which the Fund invests.
G Amount represents less than .005%.
See accompanying notes which are an integral part of the financial statements.
Financial Highlights — VIP Freedom 2005 Portfolio Service Class
| | | | | | |
| Years ended December 31, | 2015 | 2014 | 2013 | 2012 | 2011 |
| Selected Per–Share Data | | | | | |
| Net asset value, beginning of period | $11.63 | $11.44 | $10.57 | $9.86 | $10.08 |
| Income from Investment Operations | | | | | |
| Net investment income (loss)A | .18 | .19 | .16 | .17 | .21 |
| Net realized and unrealized gain (loss) | (.22) | .29 | .85 | .77 | (.21) |
| Total from investment operations | (.04) | .48 | 1.01 | .94 | –B |
| Distributions from net investment income | (.21) | (.18) | (.11) | (.16) | (.18) |
| Distributions from net realized gain | (.03) | (.11) | (.04) | (.07) | (.04) |
| Total distributions | (.23)C | (.29) | (.14)D | (.23) | (.22) |
| Net asset value, end of period | $11.36 | $11.63 | $11.44 | $10.57 | $9.86 |
| Total ReturnE,F | (.35)% | 4.18% | 9.60% | 9.59% | (.04)% |
| Ratios to Average Net AssetsG,H | | | | | |
| Expenses before reductions | .10% | .10% | .10% | .10% | .10% |
| Expenses net of fee waivers, if any | .10% | .10% | .10% | .10% | .10% |
| Expenses net of all reductions | .10% | .10% | .10% | .10% | .10% |
| Net investment income (loss) | 1.54% | 1.61% | 1.47% | 1.62% | 2.07% |
| Supplemental Data | | | | | |
| Net assets, end of period (000 omitted) | $484 | $408 | $125 | $177 | $95 |
| Portfolio turnover rateG | 23% | 21% | 54% | 30% | 54% |
A Calculated based on average shares outstanding during the period.
B Amount represents less than $.005 per share.
C Total distributions of $.23 per share is comprised of distributions from net investment income of $.206 and distributions from net realized gain of $.025 per share.
D Total distributions of $.14 per share is comprised of distributions from net investment income of $.107 and distributions from net realized gain of $.037 per share.
E Total returns do not reflect charges attributable to your insurance company's separate account. Inclusion of these charges would reduce the total returns shown.
F Total returns would have been lower if certain expenses had not been reduced during the applicable periods shown.
G Amounts do not include the activity of the Underlying Funds.
H Expense ratios reflect operating expenses of the class. Expenses before reductions do not reflect amounts reimbursed by the investment adviser or reductions from expense offset arrangements and do not represent the amount paid by the class during periods when reimbursements or reductions occur. Expenses net of fee waivers reflect expenses after reimbursement by the investment adviser but prior to reductions from expense offset arrangements. Expenses net of all reductions represent the net expenses paid by the class but do not include expenses of the underlying funds in which the Fund invests.
See accompanying notes which are an integral part of the financial statements.
Financial Highlights — VIP Freedom 2005 Portfolio Service Class 2
| | | | | | |
| Years ended December 31, | 2015 | 2014 | 2013 | 2012 | 2011 |
| Selected Per–Share Data | | | | | |
| Net asset value, beginning of period | $11.55 | $11.36 | $10.55 | $9.85 | $10.08 |
| Income from Investment Operations | | | | | |
| Net investment income (loss)A | .16 | .17 | .15 | .15 | .19 |
| Net realized and unrealized gain (loss) | (.21) | .29 | .85 | .77 | (.20) |
| Total from investment operations | (.05) | .46 | 1.00 | .92 | (.01) |
| Distributions from net investment income | (.19) | (.16) | (.15) | (.15) | (.18) |
| Distributions from net realized gain | (.03) | (.11) | (.04) | (.07) | (.04) |
| Total distributions | (.22) | (.27) | (.19) | (.22) | (.22) |
| Net asset value, end of period | $11.28 | $11.55 | $11.36 | $10.55 | $9.85 |
| Total ReturnB,C | (.49)% | 4.04% | 9.46% | 9.35% | (.09)% |
| Ratios to Average Net AssetsD,E | | | | | |
| Expenses before reductions | .25% | .25% | .25% | .25% | .25% |
| Expenses net of fee waivers, if any | .25% | .25% | .25% | .25% | .25% |
| Expenses net of all reductions | .25% | .25% | .25% | .25% | .25% |
| Net investment income (loss) | 1.39% | 1.46% | 1.31% | 1.48% | 1.92% |
| Supplemental Data | | | | | |
| Net assets, end of period (000 omitted) | $92 | $79 | $102 | $251 | $226 |
| Portfolio turnover rateD | 23% | 21% | 54% | 30% | 54% |
A Calculated based on average shares outstanding during the period.
B Total returns do not reflect charges attributable to your insurance company's separate account. Inclusion of these charges would reduce the total returns shown.
C Total returns would have been lower if certain expenses had not been reduced during the applicable periods shown.
D Amounts do not include the activity of the Underlying Funds.
E Expense ratios reflect operating expenses of the class. Expenses before reductions do not reflect amounts reimbursed by the investment adviser or reductions from expense offset arrangements and do not represent the amount paid by the class during periods when reimbursements or reductions occur. Expenses net of fee waivers reflect expenses after reimbursement by the investment adviser but prior to reductions from expense offset arrangements. Expenses net of all reductions represent the net expenses paid by the class but do not include expenses of the underlying funds in which the Fund invests.
See accompanying notes which are an integral part of the financial statements.
VIP Freedom 2010 Portfolio℠
Investment Summary (Unaudited)
The information in the following tables is based on the direct investments of the Fund.
Fund Holdings as of December 31, 2015
| | % of fund's net assets | % of fund's net assets 6 months ago |
| Domestic Equity Funds | | |
| VIP Contrafund Portfolio Initial Class | 5.8 | 5.9 |
| VIP Equity-Income Portfolio Initial Class | 6.2 | 6.2 |
| VIP Growth & Income Portfolio Initial Class | 7.0 | 7.1 |
| VIP Growth Portfolio Initial Class | 6.1 | 6.0 |
| VIP Mid Cap Portfolio Initial Class | 1.7 | 1.7 |
| VIP Value Portfolio Initial Class | 4.5 | 4.6 |
| VIP Value Strategies Portfolio Initial Class | 2.1 | 2.2 |
| | 33.4 | 33.7 |
| International Equity Funds | | |
| VIP Emerging Markets Portfolio Initial Class | 5.4 | 5.1 |
| VIP Overseas Portfolio Initial Class | 9.2 | 9.7 |
| | 14.6 | 14.8 |
| Bond Funds | | |
| VIP High Income Portfolio Initial Class | 3.7 | 4.0 |
| VIP Investment Grade Bond Portfolio Initial Class | 33.7 | 34.7 |
| | 37.4 | 38.7 |
| Short-Term Funds | | |
| VIP Government Money Market Portfolio Initial Class 0.05% | 14.6 | 12.8 |
| Net Other Assets (Liabilities) | | |
| Net Other Assets | 0.0 | 0.0 |
| | 100.0 | 100.0 |
VIP Government Money Market Portfolio Initial Class was formerly known as VIP Money Market Portfolio Initial Class
Asset Allocation (% of fund's net assets)
| Period end |
| | Domestic Equity Funds | 33.4% |
| | International Equity Funds | 14.6% |
| | Bond Funds | 37.4% |
| | Short-Term Funds | 14.6% |

| Six months ago |
| | Domestic Equity Funds | 33.7% |
| | International Equity Funds | 14.8% |
| | Bond Funds | 38.7% |
| | Short-Term Funds | 12.8% |

Percentages shown as 0.0% may reflect amounts less than 0.05%.
VIP Freedom 2010 Portfolio℠
Investments December 31, 2015
Showing Percentage of Net Assets
| Domestic Equity Funds - 33.4% | | | |
| | | Shares | Value |
| VIP Contrafund Portfolio Initial Class (a) | | 506,115 | $17,167,420 |
| VIP Equity-Income Portfolio Initial Class (a) | | 885,313 | 18,113,503 |
| VIP Growth & Income Portfolio Initial Class (a) | | 1,081,830 | 20,424,953 |
| VIP Growth Portfolio Initial Class (a) | | 271,768 | 17,868,742 |
| VIP Mid Cap Portfolio Initial Class (a) | | 150,398 | 4,910,483 |
| VIP Value Portfolio Initial Class (a) | | 980,276 | 13,096,481 |
| VIP Value Strategies Portfolio Initial Class (a) | | 434,658 | 6,319,924 |
| TOTAL DOMESTIC EQUITY FUNDS | | | |
| (Cost $77,247,210) | | | 97,901,506 |
|
| International Equity Funds - 14.6% | | | |
| VIP Emerging Markets Portfolio Initial Class (a) | | 1,945,880 | 15,839,466 |
| VIP Overseas Portfolio Initial Class (a) | | 1,408,254 | 26,869,493 |
| TOTAL INTERNATIONAL EQUITY FUNDS | | | |
| (Cost $40,477,577) | | | 42,708,959 |
|
| Bond Funds - 37.4% | | | |
| VIP High Income Portfolio Initial Class (a) | | 2,206,700 | 10,923,164 |
| VIP Investment Grade Bond Portfolio Initial Class (a) | | 7,979,378 | 98,704,908 |
| TOTAL BOND FUNDS | | | |
| (Cost $113,767,085) | | | 109,628,072 |
|
| Short-Term Funds - 14.6% | | | |
| VIP Government Money Market Portfolio Initial Class 0.05% (a)(b) | | | |
| (Cost $42,599,519) | | 42,599,519 | 42,599,519 |
| TOTAL INVESTMENT PORTFOLIO - 100.0% | | | |
| (Cost $274,091,391) | | | 292,838,056 |
| NET OTHER ASSETS (LIABILITIES) - 0.0% | | | (51,643) |
| NET ASSETS - 100% | | | $292,786,413 |
Legend
(a) Affiliated Fund
(b) The rate quoted is the annualized seven-day yield of the fund at period end.
Affiliated Underlying Funds
Information regarding the Fund's fiscal year to date purchases and sales of the affiliated Underlying Funds and income earned by the Fund from investments in affiliated Underlying Funds is as follows:
(VIP Government Money Market Portfolio Initial Class was formerly known as VIP Money Market Portfolio Initial Class)
| Affiliate | Value, beginning of period | Purchases | Sales Proceeds | Dividend Income | Value, end of period |
| VIP Contrafund Portfolio Initial Class | $17,993,230 | $3,899,270 | $3,175,740 | $183,135 | $17,167,420 |
| VIP Emerging Markets Portfolio Initial Class | 12,818,859 | 6,169,555 | 1,441,039 | 97,174 | 15,839,466 |
| VIP Equity-Income Portfolio Initial Class | 18,925,465 | 4,798,520 | 2,615,305 | 605,367 | 18,113,503 |
| VIP Government Money Market Portfolio Initial Class 0.05% | 31,056,485 | 15,735,769 | 4,192,734 | 10,283 | 42,599,519 |
| VIP Growth & Income Portfolio Initial Class | 21,568,420 | 4,991,840 | 4,288,607 | 450,407 | 20,424,953 |
| VIP Growth Portfolio Initial Class | 18,380,527 | 2,614,395 | 3,866,382 | 46,296 | 17,868,742 |
| VIP High Income Portfolio Initial Class | 11,488,205 | 1,834,809 | 1,222,287 | 765,671 | 10,923,164 |
| VIP Investment Grade Bond Portfolio Initial | 105,330,703 | 16,498,747 | 19,879,524 | 2,614,798 | 98,704,908 |
| VIP Mid Cap Portfolio Initial Class | 5,333,273 | 1,212,784 | 948,769 | 25,842 | 4,910,483 |
| VIP Overseas Portfolio Initial Class | 32,101,367 | 4,875,359 | 11,200,990 | 375,585 | 26,869,493 |
| VIP Value Portfolio Initial Class | 13,926,397 | 3,710,141 | 2,303,530 | 182,752 | 13,096,481 |
| VIP Value Strategies Portfolio Initial Class | 6,856,342 | 893,542 | 1,197,338 | 78,065 | 6,319,924 |
| Total | $295,779,273 | $67,234,731 | $56,332,245 | $5,435,375 | $292,838,056 |
Investment Valuation
All investments are categorized as Level 1 under the Fair Value Hierarchy. The inputs or methodology used for valuing securities may not be an indication of the risk associated with investing in those securities. For more information on valuation inputs please refer to the Investment Valuation section in the accompanying Notes to Financial Statements.
See accompanying notes which are an integral part of the financial statements.
VIP Freedom 2010 Portfolio℠
Financial Statements
Statement of Assets and Liabilities
| | | December 31, 2015 |
| Assets | | |
| Investment in securities, at value (cost $274,091,391) — See accompanying schedule | | $292,838,056 |
| Cash | | 3 |
| Receivable for investments sold | | 16,893 |
| Receivable for fund shares sold | | 6,136 |
| Total assets | | 292,861,088 |
| Liabilities | | |
| Payable for fund shares redeemed | $23,027 | |
| Distribution and service plan fees payable | 51,648 | |
| Total liabilities | | 74,675 |
| Net Assets | | $292,786,413 |
| Net Assets consist of: | | |
| Paid in capital | | $268,977,792 |
| Undistributed net investment income | | 1,103 |
| Accumulated undistributed net realized gain (loss) on investments | | 5,060,853 |
| Net unrealized appreciation (depreciation) on investments | | 18,746,665 |
| Net Assets | | $292,786,413 |
| Initial Class: | | |
| Net Asset Value, offering price and redemption price per share ($31,047,510 ÷ 2,554,750 shares) | | $12.15 |
| Service Class: | | |
| Net Asset Value, offering price and redemption price per share ($23,769,506 ÷ 1,958,000 shares) | | $12.14 |
| Service Class 2: | | |
| Net Asset Value, offering price and redemption price per share ($237,969,397 ÷ 19,692,026 shares) | | $12.08 |
See accompanying notes which are an integral part of the financial statements.
Statement of Operations
| | | Year ended December 31, 2015 |
| Investment Income | | |
| Income distributions from underlying funds | | $5,435,375 |
| Expenses | | |
| Distribution and service plan fees | $613,070 | |
| Independent trustees' compensation | 1,198 | |
| Total expenses before reductions | 614,268 | |
| Expense reductions | (1,198) | 613,070 |
| Net investment income (loss) | | 4,822,305 |
| Realized and Unrealized Gain (Loss) | | |
| Realized gain (loss) on sale of underlying fund shares | (761,816) | |
| Capital gain distributions from underlying funds | 7,710,260 | |
| Total net realized gain (loss) | | 6,948,444 |
| Change in net unrealized appreciation (depreciation) on underlying funds | | (13,081,892) |
| Net gain (loss) | | (6,133,448) |
| Net increase (decrease) in net assets resulting from operations | | $(1,311,143) |
See accompanying notes which are an integral part of the financial statements.
Statement of Changes in Net Assets
| | Year ended December 31, 2015 | Year ended December 31, 2014 |
| Increase (Decrease) in Net Assets | | |
| Operations | | |
| Net investment income (loss) | $4,822,305 | $4,276,913 |
| Net realized gain (loss) | 6,948,444 | 1,022,409 |
| Change in net unrealized appreciation (depreciation) | (13,081,892) | 6,948,502 |
| Net increase (decrease) in net assets resulting from operations | (1,311,143) | 12,247,824 |
| Distributions to shareholders from net investment income | (4,856,161) | (4,247,245) |
| Distributions to shareholders from net realized gain | (854,192) | (4,532,892) |
| Total distributions | (5,710,353) | (8,780,137) |
| Share transactions - net increase (decrease) | 4,077,539 | 11,313,204 |
| Total increase (decrease) in net assets | (2,943,957) | 14,780,891 |
| Net Assets | | |
| Beginning of period | 295,730,370 | 280,949,479 |
| End of period (including undistributed net investment income of $1,103 and undistributed net investment income of $34,959, respectively) | $292,786,413 | $295,730,370 |
See accompanying notes which are an integral part of the financial statements.
Financial Highlights — VIP Freedom 2010 Portfolio Initial Class
| | | | | | |
| Years ended December 31, | 2015 | 2014 | 2013 | 2012 | 2011 |
| Selected Per–Share Data | | | | | |
| Net asset value, beginning of period | $12.45 | $12.30 | $11.15 | $10.31 | $10.61 |
| Income from Investment Operations | | | | | |
| Net investment income (loss)A | .23 | .21 | .22 | .23 | .24 |
| Net realized and unrealized gain (loss) | (.26) | .34 | 1.27 | .98 | (.26) |
| Total from investment operations | (.03) | .55 | 1.49 | 1.21 | (.02) |
| Distributions from net investment income | (.23) | (.21) | (.21) | (.21) | (.23) |
| Distributions from net realized gain | (.04) | (.20) | (.14) | (.16) | (.06) |
| Total distributions | (.27) | (.40)B | (.34)C | (.37) | (.28)D |
| Net asset value, end of period | $12.15 | $12.45 | $12.30 | $11.15 | $10.31 |
| Total ReturnE,F | (.29)% | 4.53% | 13.49% | 11.78% | (.19)% |
| Ratios to Average Net AssetsG,H | | | | | |
| Expenses before reductionsI | -% | -% | -% | -% | -% |
| Expenses net of fee waivers, if any | -% | -% | -% | -% | -% |
| Expenses net of all reductions | -% | -% | -% | -% | -% |
| Net investment income (loss) | 1.84% | 1.67% | 1.83% | 2.07% | 2.27% |
| Supplemental Data | | | | | |
| Net assets, end of period (000 omitted) | $31,048 | $43,381 | $44,430 | $27,416 | $22,338 |
| Portfolio turnover rateG | 19% | 19% | 19% | 18% | 17% |
A Calculated based on average shares outstanding during the period.
B Total distributions of $.40 per share is comprised of distributions from net investment income of $.206 and distributions from net realized gain of $.196 per share.
C Total distributions of $.34 per share is comprised of distributions from net investment income of $.205 and distributions from net realized gain of $.139 per share.
D Total distributions of $.28 per share is comprised of distributions from net investment income of $.225 and distributions from net realized gain of $.055 per share.
E Total returns do not reflect charges attributable to your insurance company's separate account. Inclusion of these charges would reduce the total returns shown.
F Total returns would have been lower if certain expenses had not been reduced during the applicable periods shown.
G Amounts do not include the activity of the Underlying Funds.
H Expense ratios reflect operating expenses of the class. Expenses before reductions do not reflect amounts reimbursed by the investment adviser or reductions from expense offset arrangements and do not represent the amount paid by the class during periods when reimbursements or reductions occur. Expenses net of fee waivers reflect expenses after reimbursement by the investment adviser but prior to reductions from expense offset arrangements. Expenses net of all reductions represent the net expenses paid by the class but do not include expenses of the underlying funds in which the Fund invests.
I Amount represents less than .005%.
See accompanying notes which are an integral part of the financial statements.
Financial Highlights — VIP Freedom 2010 Portfolio Service Class
| | | | | | |
| Years ended December 31, | 2015 | 2014 | 2013 | 2012 | 2011 |
| Selected Per–Share Data | | | | | |
| Net asset value, beginning of period | $12.43 | $12.29 | $11.14 | $10.30 | $10.60 |
| Income from Investment Operations | | | | | |
| Net investment income (loss)A | .22 | .20 | .20 | .22 | .23 |
| Net realized and unrealized gain (loss) | (.26) | .33 | 1.28 | .98 | (.26) |
| Total from investment operations | (.04) | .53 | 1.48 | 1.20 | (.03) |
| Distributions from net investment income | (.22) | (.19) | (.19) | (.20) | (.22) |
| Distributions from net realized gain | (.04) | (.20) | (.14) | (.16) | (.06) |
| Total distributions | (.25)B | (.39) | (.33) | (.36) | (.27)C |
| Net asset value, end of period | $12.14 | $12.43 | $12.29 | $11.14 | $10.30 |
| Total ReturnD,E | (.31)% | 4.35% | 13.39% | 11.69% | (.28)% |
| Ratios to Average Net AssetsF,G | | | | | |
| Expenses before reductions | .10% | .10% | .10% | .10% | .10% |
| Expenses net of fee waivers, if any | .10% | .10% | .10% | .10% | .10% |
| Expenses net of all reductions | .10% | .10% | .10% | .10% | .10% |
| Net investment income (loss) | 1.74% | 1.57% | 1.73% | 1.97% | 2.17% |
| Supplemental Data | | | | | |
| Net assets, end of period (000 omitted) | $23,770 | $28,049 | $27,143 | $23,896 | $20,927 |
| Portfolio turnover rateF | 19% | 19% | 19% | 18% | 17% |
A Calculated based on average shares outstanding during the period.
B Total distributions of $.25 per share is comprised of distributions from net investment income of $.217and distributions from net realized gain of $.036 per share.
C Total distributions of $.27 per share is comprised of distributions from net investment income of $.215 and distributions from net realized gain of $.055 per share.
D Total returns do not reflect charges attributable to your insurance company's separate account. Inclusion of these charges would reduce the total returns shown.
E Total returns would have been lower if certain expenses had not been reduced during the applicable periods shown.
F Amounts do not include the activity of the Underlying Funds.
G Expense ratios reflect operating expenses of the class. Expenses before reductions do not reflect amounts reimbursed by the investment adviser or reductions from expense offset arrangements and do not represent the amount paid by the class during periods when reimbursements or reductions occur. Expenses net of fee waivers reflect expenses after reimbursement by the investment adviser but prior to reductions from expense offset arrangements. Expenses net of all reductions represent the net expenses paid by the class but do not include expenses of the underlying funds in which the Fund invests.
See accompanying notes which are an integral part of the financial statements.
Financial Highlights — VIP Freedom 2010 Portfolio Service Class 2
| | | | | | |
| Years ended December 31, | 2015 | 2014 | 2013 | 2012 | 2011 |
| Selected Per–Share Data | | | | | |
| Net asset value, beginning of period | $12.38 | $12.24 | $11.10 | $10.26 | $10.56 |
| Income from Investment Operations | | | | | |
| Net investment income (loss)A | .20 | .18 | .19 | .20 | .22 |
| Net realized and unrealized gain (loss) | (.26) | .33 | 1.27 | .98 | (.26) |
| Total from investment operations | (.06) | .51 | 1.46 | 1.18 | (.04) |
| Distributions from net investment income | (.20) | (.18) | (.18) | (.19) | (.20) |
| Distributions from net realized gain | (.04) | (.20) | (.14) | (.16) | (.06) |
| Total distributions | (.24) | (.37)B | (.32) | (.34)C | (.26) |
| Net asset value, end of period | $12.08 | $12.38 | $12.24 | $11.10 | $10.26 |
| Total ReturnD,E | (.53)% | 4.21% | 13.20% | 11.58% | (.43)% |
| Ratios to Average Net AssetsF,G | | | | | |
| Expenses before reductions | .25% | .25% | .25% | .25% | .25% |
| Expenses net of fee waivers, if any | .25% | .25% | .25% | .25% | .25% |
| Expenses net of all reductions | .25% | .25% | .25% | .25% | .25% |
| Net investment income (loss) | 1.59% | 1.42% | 1.58% | 1.82% | 2.02% |
| Supplemental Data | | | | | |
| Net assets, end of period (000 omitted) | $237,969 | $224,300 | $209,377 | $167,502 | $136,353 |
| Portfolio turnover rateF | 19% | 19% | 19% | 18% | 17% |
A Calculated based on average shares outstanding during the period.
B Total distributions of $.37 per share is comprised of distributions from net investment income of $.175 and distributions from net realized gain of $.196 per share.
C Total distributions of $.34 per share is comprised of distributions from net investment income of $.186 and distributions from net realized gain of $.157 per share.
D Total returns do not reflect charges attributable to your insurance company's separate account. Inclusion of these charges would reduce the total returns shown.
E Total returns would have been lower if certain expenses had not been reduced during the applicable periods shown.
F Amounts do not include the activity of the Underlying Funds.
G Expense ratios reflect operating expenses of the class. Expenses before reductions do not reflect amounts reimbursed by the investment adviser or reductions from expense offset arrangements and do not represent the amount paid by the class during periods when reimbursements or reductions occur. Expenses net of fee waivers reflect expenses after reimbursement by the investment adviser but prior to reductions from expense offset arrangements. Expenses net of all reductions represent the net expenses paid by the class but do not include expenses of the underlying funds in which the Fund invests.
See accompanying notes which are an integral part of the financial statements.
VIP Freedom 2015 Portfolio℠
Investment Summary (Unaudited)
The information in the following tables is based on the direct investments of the Fund.
Fund Holdings as of December 31, 2015
| | % of fund's net assets | % of fund's net assets 6 months ago |
| Domestic Equity Funds | | |
| VIP Contrafund Portfolio Initial Class | 6.9 | 6.9 |
| VIP Equity-Income Portfolio Initial Class | 7.3 | 7.2 |
| VIP Growth & Income Portfolio Initial Class | 8.2 | 8.3 |
| VIP Growth Portfolio Initial Class | 7.2 | 7.1 |
| VIP Mid Cap Portfolio Initial Class | 2.0 | 2.0 |
| VIP Value Portfolio Initial Class | 5.3 | 5.3 |
| VIP Value Strategies Portfolio Initial Class | 2.5 | 2.6 |
| | 39.4 | 39.4 |
| International Equity Funds | | |
| VIP Emerging Markets Portfolio Initial Class | 6.0 | 5.7 |
| VIP Overseas Portfolio Initial Class | 11.2 | 11.6 |
| | 17.2 | 17.3 |
| Bond Funds | | |
| VIP High Income Portfolio Initial Class | 3.7 | 4.0 |
| VIP Investment Grade Bond Portfolio Initial Class | 30.3 | 31.4 |
| | 34.0 | 35.4 |
| Short-Term Funds | | |
| VIP Government Money Market Portfolio Initial Class 0.05% | 9.4 | 7.9 |
| Net Other Assets (Liabilities) | | |
| Net Other Assets | 0.0 | 0.0 |
| | 100.0 | 100.0 |
VIP Government Money Market Portfolio Initial Class was formerly known as VIP Money Market Portfolio Initial Class
Asset Allocation (% of fund's net assets)
| Period end |
| | Domestic Equity Funds | 39.4% |
| | International Equity Funds | 17.2% |
| | Bond Funds | 34.0% |
| | Short-Term Funds | 9.4% |

| Six months ago |
| | Domestic Equity Funds | 39.4% |
| | International Equity Funds | 17.3% |
| | Bond Funds | 35.4% |
| | Short-Term Funds | 7.9% |

Percentages shown as 0.0% may reflect amounts less than 0.05%.
VIP Freedom 2015 Portfolio℠
Investments December 31, 2015
Showing Percentage of Net Assets
| Domestic Equity Funds - 39.4% | | | |
| | | Shares | Value |
| VIP Contrafund Portfolio Initial Class (a) | | 222,794 | $7,557,166 |
| VIP Equity-Income Portfolio Initial Class (a) | | 389,736 | 7,973,999 |
| VIP Growth & Income Portfolio Initial Class (a) | | 476,301 | 8,992,564 |
| VIP Growth Portfolio Initial Class (a) | | 119,610 | 7,864,375 |
| VIP Mid Cap Portfolio Initial Class (a) | | 66,217 | 2,162,001 |
| VIP Value Portfolio Initial Class (a) | | 431,584 | 5,765,964 |
| VIP Value Strategies Portfolio Initial Class (a) | | 191,385 | 2,782,739 |
| TOTAL DOMESTIC EQUITY FUNDS | | | |
| (Cost $31,478,373) | | | 43,098,808 |
|
| International Equity Funds - 17.2% | | | |
| VIP Emerging Markets Portfolio Initial Class (a) | | 800,663 | 6,517,393 |
| VIP Overseas Portfolio Initial Class (a) | | 643,932 | 12,286,227 |
| TOTAL INTERNATIONAL EQUITY FUNDS | | | |
| (Cost $17,573,573) | | | 18,803,620 |
|
| Bond Funds - 34.0% | | | |
| VIP High Income Portfolio Initial Class (a) | | 825,708 | 4,087,254 |
| VIP Investment Grade Bond Portfolio Initial Class (a) | | 2,677,018 | 33,114,714 |
| TOTAL BOND FUNDS | | | |
| (Cost $38,076,507) | | | 37,201,968 |
|
| Short-Term Funds - 9.4% | | | |
| VIP Government Money Market Portfolio Initial Class 0.05% (a)(b) | | | |
| (Cost $10,316,981) | | 10,316,981 | 10,316,981 |
| TOTAL INVESTMENT PORTFOLIO - 100.0% | | | |
| (Cost $97,445,434) | | | 109,421,377 |
| NET OTHER ASSETS (LIABILITIES) - 0.0% | | | (13,280) |
| NET ASSETS - 100% | | | $109,408,097 |
Legend
(a) Affiliated Fund
(b) The rate quoted is the annualized seven-day yield of the fund at period end.
Affiliated Underlying Funds
Information regarding the Fund's fiscal year to date purchases and sales of the affiliated Underlying Funds and income earned by the Fund from investments in affiliated Underlying Funds is as follows:
(VIP Government Money Market Portfolio Initial Class was formerly known as VIP Money Market Portfolio Initial Class)
| Affiliate | Value, beginning of period | Purchases | Sales Proceeds | Dividend Income | Value, end of period |
| VIP Contrafund Portfolio Initial Class | $8,362,521 | $2,061,302 | $2,161,902 | $80,091 | $7,557,166 |
| VIP Emerging Markets Portfolio Initial Class | 5,839,832 | 2,740,940 | 1,340,123 | 40,011 | 6,517,393 |
| VIP Equity-Income Portfolio Initial Class | 8,798,141 | 2,317,047 | 1,790,512 | 264,857 | 7,973,999 |
| VIP Government Money Market Portfolio Initial Class 0.05% | 7,109,197 | 4,995,021 | 1,787,238 | 2,409 | 10,316,981 |
| VIP Growth & Income Portfolio Initial Class | 10,043,820 | 2,334,983 | 2,541,772 | 196,997 | 8,992,564 |
| VIP Growth Portfolio Initial Class | 8,578,430 | 1,558,817 | 2,598,868 | 20,233 | 7,864,375 |
| VIP High Income Portfolio Initial Class | 4,692,962 | 769,071 | 947,295 | 285,031 | 4,087,254 |
| VIP Investment Grade Bond Portfolio Initial | 37,989,174 | 6,703,790 | 10,502,320 | 873,241 | 33,114,714 |
| VIP Mid Cap Portfolio Initial Class | 2,438,071 | 621,230 | 590,157 | 11,295 | 2,162,001 |
| VIP Overseas Portfolio Initial Class | 15,164,327 | 3,547,821 | 6,930,369 | 170,527 | 12,286,227 |
| VIP Value Portfolio Initial Class | 6,458,857 | 1,864,955 | 1,566,504 | 79,909 | 5,765,964 |
| VIP Value Strategies Portfolio Initial Class | 3,156,921 | 504,642 | 777,266 | 34,122 | 2,782,739 |
| Total | $118,632,253 | $30,019,619 | $33,534,326 | $2,058,723 | $109,421,377 |
Investment Valuation
All investments are categorized as Level 1 under the Fair Value Hierarchy. The inputs or methodology used for valuing securities may not be an indication of the risk associated with investing in those securities. For more information on valuation inputs please refer to the Investment Valuation section in the accompanying Notes to Financial Statements.
See accompanying notes which are an integral part of the financial statements.
VIP Freedom 2015 Portfolio℠
Financial Statements
Statement of Assets and Liabilities
| | | December 31, 2015 |
| Assets | | |
| Investment in securities, at value (cost $97,445,434) — See accompanying schedule | | $109,421,377 |
| Cash | | 9 |
| Receivable for investments sold | | 2,634 |
| Receivable for fund shares sold | | 91,586 |
| Total assets | | 109,515,606 |
| Liabilities | | |
| Payable for investments purchased | $6,506 | |
| Payable for fund shares redeemed | 87,711 | |
| Distribution and service plan fees payable | 13,292 | |
| Total liabilities | | 107,509 |
| Net Assets | | $109,408,097 |
| Net Assets consist of: | | |
| Paid in capital | | $95,209,026 |
| Accumulated undistributed net realized gain (loss) on investments | | 2,223,128 |
| Net unrealized appreciation (depreciation) on investments | | 11,975,943 |
| Net Assets | | $109,408,097 |
| Initial Class: | | |
| Net Asset Value, offering price and redemption price per share ($35,351,506 ÷ 2,887,414 shares) | | $12.24 |
| Service Class: | | |
| Net Asset Value, offering price and redemption price per share ($16,377,815 ÷ 1,339,813 shares) | | $12.22 |
| Service Class 2: | | |
| Net Asset Value, offering price and redemption price per share ($57,678,776 ÷ 4,733,176 shares) | | $12.19 |
See accompanying notes which are an integral part of the financial statements.
Statement of Operations
| | | Year ended December 31, 2015 |
| Investment Income | | |
| Income distributions from underlying funds | | $2,058,723 |
| Expenses | | |
| Distribution and service plan fees | $165,731 | |
| Independent trustees' compensation | 461 | |
| Total expenses before reductions | 166,192 | |
| Expense reductions | (461) | 165,731 |
| Net investment income (loss) | | 1,892,992 |
| Realized and Unrealized Gain (Loss) | | |
| Realized gain (loss) on sale of underlying fund shares | (238,266) | |
| Capital gain distributions from underlying funds | 3,464,273 | |
| Total net realized gain (loss) | | 3,226,007 |
| Change in net unrealized appreciation (depreciation) on underlying funds | | (5,457,901) |
| Net gain (loss) | | (2,231,894) |
| Net increase (decrease) in net assets resulting from operations | | $(338,902) |
See accompanying notes which are an integral part of the financial statements.
Statement of Changes in Net Assets
| | Year ended December 31, 2015 | Year ended December 31, 2014 |
| Increase (Decrease) in Net Assets | | |
| Operations | | |
| Net investment income (loss) | $1,892,992 | $1,774,198 |
| Net realized gain (loss) | 3,226,007 | 532,975 |
| Change in net unrealized appreciation (depreciation) | (5,457,901) | 2,796,078 |
| Net increase (decrease) in net assets resulting from operations | (338,902) | 5,103,251 |
| Distributions to shareholders from net investment income | (1,908,034) | (1,766,365) |
| Distributions to shareholders from net realized gain | (580,275) | (1,976,863) |
| Total distributions | (2,488,309) | (3,743,228) |
| Share transactions - net increase (decrease) | (6,382,025) | 2,772,488 |
| Total increase (decrease) in net assets | (9,209,236) | 4,132,511 |
| Net Assets | | |
| Beginning of period | 118,617,333 | 114,484,822 |
| End of period (including undistributed net investment income of $0 and $13,065, respectively) | $109,408,097 | $118,617,333 |
See accompanying notes which are an integral part of the financial statements.
Financial Highlights — VIP Freedom 2015 Portfolio Initial Class
| | | | | | |
| Years ended December 31, | 2015 | 2014 | 2013 | 2012 | 2011 |
| Selected Per–Share Data | | | | | |
| Net asset value, beginning of period | $12.58 | $12.43 | $11.22 | $10.38 | $10.70 |
| Income from Investment Operations | | | | | |
| Net investment income (loss)A | .23 | .21 | .21 | .22 | .23 |
| Net realized and unrealized gain (loss) | (.27) | .37 | 1.39 | 1.04 | (.27) |
| Total from investment operations | (.04) | .58 | 1.60 | 1.26 | (.04) |
| Distributions from net investment income | (.24) | (.21) | (.22) | (.23) | (.23) |
| Distributions from net realized gain | (.07) | (.22) | (.18) | (.20) | (.06) |
| Total distributions | (.30)B | (.43) | (.39)C | (.42)D | (.28)E |
| Net asset value, end of period | $12.24 | $12.58 | $12.43 | $11.22 | $10.38 |
| Total ReturnF,G | (.33)% | 4.70% | 14.41% | 12.23% | (.36)% |
| Ratios to Average Net AssetsH,I | | | | | |
| Expenses before reductionsJ | -% | -% | -% | -% | -% |
| Expenses net of fee waivers, if any | -% | -% | -% | -% | -% |
| Expenses net of all reductions | -% | -% | -% | -% | -% |
| Net investment income (loss) | 1.82% | 1.68% | 1.79% | 2.01% | 2.16% |
| Supplemental Data | | | | | |
| Net assets, end of period (000 omitted) | $35,352 | $39,455 | $41,070 | $36,449 | $38,879 |
| Portfolio turnover rateH | 27% | 29% | 29% | 28% | 26% |
A Calculated based on average shares outstanding during the period.
B Total distributions of $.30 per share is comprised of distributions from net investment income of $.236 and distributions from net realized gain of $.065 per share.
C Total distributions of $.39 per share is comprised of distributions from net investment income of $.217 and distributions from net realized gain of $.175 per share.
D Total distributions of $.42 per share is comprised of distributions from net investment income of $.227 and distributions from net realized gain of $.195 per share.
E Total distributions of $.28 per share is comprised of distributions from net investment income of $.227 and distributions from net realized gain of $.055 per share.
F Total returns do not reflect charges attributable to your insurance company's separate account. Inclusion of these charges would reduce the total returns shown.
G Total returns would have been lower if certain expenses had not been reduced during the applicable periods shown.
H Amounts do not include the activity of the Underlying Funds.
I Expense ratios reflect operating expenses of the class. Expenses before reductions do not reflect amounts reimbursed by the investment adviser or reductions from expense offset arrangements and do not represent the amount paid by the class during periods when reimbursements or reductions occur. Expenses net of fee waivers reflect expenses after reimbursement by the investment adviser but prior to reductions from expense offset arrangements. Expenses net of all reductions represent the net expenses paid by the class but do not include expenses of the underlying funds in which the Fund invests.
J Amount represents less than .005%.
See accompanying notes which are an integral part of the financial statements.
Financial Highlights — VIP Freedom 2015 Portfolio Service Class
| | | | | | |
| Years ended December 31, | 2015 | 2014 | 2013 | 2012 | 2011 |
| Selected Per–Share Data | | | | | |
| Net asset value, beginning of period | $12.56 | $12.41 | $11.21 | $10.37 | $10.69 |
| Income from Investment Operations | | | | | |
| Net investment income (loss)A | .22 | .20 | .20 | .21 | .22 |
| Net realized and unrealized gain (loss) | (.27) | .37 | 1.38 | 1.04 | (.26) |
| Total from investment operations | (.05) | .57 | 1.58 | 1.25 | (.04) |
| Distributions from net investment income | (.22) | (.20) | (.21) | (.22) | (.22) |
| Distributions from net realized gain | (.07) | (.22) | (.18) | (.20) | (.06) |
| Total distributions | (.29) | (.42) | (.38)B | (.41)C | (.28) |
| Net asset value, end of period | $12.22 | $12.56 | $12.41 | $11.21 | $10.37 |
| Total ReturnD,E | (.44)% | 4.63% | 14.24% | 12.13% | (.41)% |
| Ratios to Average Net AssetsF,G | | | | | |
| Expenses before reductions | .10% | .10% | .10% | .10% | .10% |
| Expenses net of fee waivers, if any | .10% | .10% | .10% | .10% | .10% |
| Expenses net of all reductions | .10% | .10% | .10% | .10% | .10% |
| Net investment income (loss) | 1.72% | 1.58% | 1.69% | 1.91% | 2.06% |
| Supplemental Data | | | | | |
| Net assets, end of period (000 omitted) | $16,378 | $15,842 | $10,762 | $6,600 | $7,743 |
| Portfolio turnover rateF | 27% | 29% | 29% | 28% | 26% |
A Calculated based on average shares outstanding during the period.
B Total distributions of $.38 per share is comprised of distributions from net investment income of $.207 and distributions from net realized gain of $.175 per share.
C Total distributions of $.41 per share is comprised of distributions from net investment income of $.216 and distributions from net realized gain of $.195 per share.
D Total returns do not reflect charges attributable to your insurance company's separate account. Inclusion of these charges would reduce the total returns shown.
E Total returns would have been lower if certain expenses had not been reduced during the applicable periods shown.
F Amounts do not include the activity of the Underlying Funds.
G Expense ratios reflect operating expenses of the class. Expenses before reductions do not reflect amounts reimbursed by the investment adviser or reductions from expense offset arrangements and do not represent the amount paid by the class during periods when reimbursements or reductions occur. Expenses net of fee waivers reflect expenses after reimbursement by the investment adviser but prior to reductions from expense offset arrangements. Expenses net of all reductions represent the net expenses paid by the class but do not include expenses of the underlying funds in which the Fund invests.
See accompanying notes which are an integral part of the financial statements.
Financial Highlights — VIP Freedom 2015 Portfolio Service Class 2
| | | | | | |
| Years ended December 31, | 2015 | 2014 | 2013 | 2012 | 2011 |
| Selected Per–Share Data | | | | | |
| Net asset value, beginning of period | $12.52 | $12.37 | $11.17 | $10.34 | $10.65 |
| Income from Investment Operations | | | | | |
| Net investment income (loss)A | .20 | .18 | .18 | .19 | .21 |
| Net realized and unrealized gain (loss) | (.26) | .37 | 1.38 | 1.03 | (.26) |
| Total from investment operations | (.06) | .55 | 1.56 | 1.22 | (.05) |
| Distributions from net investment income | (.20) | (.18) | (.19) | (.20) | (.20) |
| Distributions from net realized gain | (.07) | (.22) | (.18) | (.20) | (.06) |
| Total distributions | (.27) | (.40) | (.36)B | (.39)C | (.26) |
| Net asset value, end of period | $12.19 | $12.52 | $12.37 | $11.17 | $10.34 |
| Total ReturnD,E | (.51)% | 4.45% | 14.10% | 11.90% | (.52)% |
| Ratios to Average Net AssetsF,G | | | | | |
| Expenses before reductions | .25% | .25% | .25% | .25% | .25% |
| Expenses net of fee waivers, if any | .25% | .25% | .25% | .25% | .25% |
| Expenses net of all reductions | .25% | .25% | .25% | .25% | .25% |
| Net investment income (loss) | 1.57% | 1.43% | 1.54% | 1.76% | 1.91% |
| Supplemental Data | | | | | |
| Net assets, end of period (000 omitted) | $57,679 | $63,321 | $62,652 | $60,594 | $55,246 |
| Portfolio turnover rateF | 27% | 29% | 29% | 28% | 26% |
A Calculated based on average shares outstanding during the period.
B Total distributions of $.36 per share is comprised of distributions from net investment income of $.186 and distributions from net realized gain of $.175 per share.
C Total distributions of $.39 per share is comprised of distributions from net investment income of $.199 and distributions from net realized gain of $.195 per share.
D Total returns do not reflect charges attributable to your insurance company's separate account. Inclusion of these charges would reduce the total returns shown.
E Total returns would have been lower if certain expenses had not been reduced during the applicable periods shown.
F Amounts do not include the activity of the Underlying Funds.
G Expense ratios reflect operating expenses of the class. Expenses before reductions do not reflect amounts reimbursed by the investment adviser or reductions from expense offset arrangements and do not represent the amount paid by the class during periods when reimbursements or reductions occur. Expenses net of fee waivers reflect expenses after reimbursement by the investment adviser but prior to reductions from expense offset arrangements. Expenses net of all reductions represent the net expenses paid by the class but do not include expenses of the underlying funds in which the Fund invests.
See accompanying notes which are an integral part of the financial statements.
VIP Freedom 2020 Portfolio℠
Investment Summary (Unaudited)
The information in the following tables is based on the direct investments of the Fund.
Fund Holdings as of December 31, 2015
| | % of fund's net assets | % of fund's net assets 6 months ago |
| Domestic Equity Funds | | |
| VIP Contrafund Portfolio Initial Class | 7.7 | 7.7 |
| VIP Equity-Income Portfolio Initial Class | 8.1 | 8.0 |
| VIP Growth & Income Portfolio Initial Class | 9.1 | 9.2 |
| VIP Growth Portfolio Initial Class | 8.0 | 7.9 |
| VIP Mid Cap Portfolio Initial Class | 2.2 | 2.2 |
| VIP Value Portfolio Initial Class | 5.8 | 5.9 |
| VIP Value Strategies Portfolio Initial Class | 2.8 | 2.9 |
| | 43.7 | 43.8 |
| International Equity Funds | | |
| VIP Emerging Markets Portfolio Initial Class | 6.4 | 6.1 |
| VIP Overseas Portfolio Initial Class | 12.6 | 13.1 |
| | 19.0 | 19.2 |
| Bond Funds | | |
| VIP High Income Portfolio Initial Class | 3.7 | 4.0 |
| VIP Investment Grade Bond Portfolio Initial Class | 27.1 | 28.1 |
| | 30.8 | 32.1 |
| Short-Term Funds | | |
| VIP Government Money Market Portfolio Initial Class 0.05% | 6.5 | 4.9 |
| Net Other Assets (Liabilities) | | |
| Net Other Assets | 0.0 | 0.0 |
| | 100.0 | 100.0 |
VIP Government Money Market Portfolio Initial Class was formerly known as VIP Money Market Portfolio Initial Class
Asset Allocation (% of fund's net assets)
| Period end |
| | Domestic Equity Funds | 43.7% |
| | International Equity Funds | 19.0% |
| | Bond Funds | 30.8% |
| | Short-Term Funds | 6.5% |

| Six months ago |
| | Domestic Equity Funds | 43.8% |
| | International Equity Funds | 19.2% |
| | Bond Funds | 32.1% |
| | Short-Term Funds | 4.9% |

Percentages shown as 0.0% may reflect amounts less than 0.05%.
VIP Freedom 2020 Portfolio℠
Investments December 31, 2015
Showing Percentage of Net Assets
| Domestic Equity Funds - 43.7% | | | |
| | | Shares | Value |
| VIP Contrafund Portfolio Initial Class (a) | | 1,650,004 | $55,968,120 |
| VIP Equity-Income Portfolio Initial Class (a) | | 2,886,290 | 59,053,501 |
| VIP Growth & Income Portfolio Initial Class (a) | | 3,526,960 | 66,589,000 |
| VIP Growth Portfolio Initial Class (a) | | 886,001 | 58,254,565 |
| VIP Mid Cap Portfolio Initial Class (a) | | 490,307 | 16,008,525 |
| VIP Value Portfolio Initial Class (a) | | 3,195,779 | 42,695,610 |
| VIP Value Strategies Portfolio Initial Class (a) | | 1,417,003 | 20,603,221 |
| TOTAL DOMESTIC EQUITY FUNDS | | | |
| (Cost $235,317,387) | | | 319,172,542 |
|
| International Equity Funds - 19.0% | | | |
| VIP Emerging Markets Portfolio Initial Class (a) | | 5,715,876 | 46,527,233 |
| VIP Overseas Portfolio Initial Class (a) | | 4,841,773 | 92,381,031 |
| TOTAL INTERNATIONAL EQUITY FUNDS | | | |
| (Cost $128,775,103) | | | 138,908,264 |
|
| Bond Funds - 30.8% | | | |
| VIP High Income Portfolio Initial Class (a) | | 5,521,487 | 27,331,359 |
| VIP Investment Grade Bond Portfolio Initial Class (a) | | 16,047,982 | 198,513,537 |
| TOTAL BOND FUNDS | | | |
| (Cost $236,606,272) | | | 225,844,896 |
|
| Short-Term Funds - 6.5% | | | |
| VIP Government Money Market Portfolio Initial Class 0.05% (a)(b) | | | |
| (Cost $47,243,314) | | 47,243,314 | 47,243,314 |
| TOTAL INVESTMENT PORTFOLIO - 100.0% | | | |
| (Cost $647,942,076) | | | 731,169,016 |
| NET OTHER ASSETS (LIABILITIES) - 0.0% | | | (122,848) |
| NET ASSETS - 100% | | | $731,046,168 |
Legend
(a) Affiliated Fund
(b) The rate quoted is the annualized seven-day yield of the fund at period end.
Affiliated Underlying Funds
Information regarding the Fund's fiscal year to date purchases and sales of the affiliated Underlying Funds and income earned by the Fund from investments in affiliated Underlying Funds is as follows:
(VIP Government Money Market Portfolio Initial Class was formerly known as VIP Money Market Portfolio Initial Class)
| Affiliate | Value, beginning of period | Purchases | Sales Proceeds | Dividend Income | Value, end of period |
| VIP Contrafund Portfolio Initial Class | $59,565,879 | $10,020,218 | $8,356,868 | $598,448 | $55,968,120 |
| VIP Emerging Markets Portfolio Initial Class | 40,294,212 | 15,218,634 | 3,700,597 | 287,840 | 46,527,233 |
| VIP Equity-Income Portfolio Initial Class | 62,616,674 | 12,403,958 | 5,962,868 | 1,978,161 | 59,053,501 |
| VIP Government Money Market Portfolio Initial Class 0.05% | 26,538,252 | 24,475,458 | 3,770,396 | 10,076 | 47,243,314 |
| VIP Growth & Income Portfolio Initial Class | 71,345,864 | 12,128,132 | 10,589,069 | 1,471,865 | 66,589,000 |
| VIP Growth Portfolio Initial Class | 60,753,411 | 6,745,080 | 11,586,458 | 151,235 | 58,254,565 |
| VIP High Income Portfolio Initial Class | 30,526,423 | 3,483,559 | 3,780,998 | 1,924,219 | 27,331,359 |
| VIP Investment Grade Bond Portfolio Initial | 217,034,230 | 25,601,052 | 37,486,615 | 5,273,066 | 198,513,537 |
| VIP Mid Cap Portfolio Initial Class | 17,665,272 | 3,358,309 | 2,707,182 | 84,421 | 16,008,525 |
| VIP Overseas Portfolio Initial Class | 106,967,502 | 13,788,277 | 31,800,456 | 1,293,939 | 92,381,031 |
| VIP Value Portfolio Initial Class | 46,110,861 | 10,370,046 | 6,352,255 | 597,143 | 42,695,610 |
| VIP Value Strategies Portfolio Initial Class | 22,419,977 | 2,200,685 | 3,215,341 | 255,028 | 20,603,221 |
| Total | $761,838,557 | $139,793,408 | $129,309,103 | $13,925,441 | $731,169,016 |
Investment Valuation
All investments are categorized as Level 1 under the Fair Value Hierarchy. The inputs or methodology used for valuing securities may not be an indication of the risk associated with investing in those securities. For more information on valuation inputs please refer to the Investment Valuation section in the accompanying Notes to Financial Statements.
See accompanying notes which are an integral part of the financial statements.
VIP Freedom 2020 Portfolio℠
Financial Statements
Statement of Assets and Liabilities
| | | December 31, 2015 |
| Assets | | |
| Investment in securities, at value (cost $647,942,076) — See accompanying schedule | | $731,169,016 |
| Cash | | 1 |
| Receivable for investments sold | | 239,346 |
| Receivable for fund shares sold | | 343,241 |
| Total assets | | 731,751,604 |
| Liabilities | | |
| Payable for investments purchased | $180,558 | |
| Payable for fund shares redeemed | 402,030 | |
| Distribution and service plan fees payable | 122,848 | |
| Total liabilities | | 705,436 |
| Net Assets | | $731,046,168 |
| Net Assets consist of: | | |
| Paid in capital | | $628,731,829 |
| Accumulated undistributed net realized gain (loss) on investments | | 19,087,399 |
| Net unrealized appreciation (depreciation) on investments | | 83,226,940 |
| Net Assets | | $731,046,168 |
| Initial Class: | | |
| Net Asset Value, offering price and redemption price per share ($87,495,880 ÷ 7,031,898 shares) | | $12.44 |
| Service Class: | | |
| Net Asset Value, offering price and redemption price per share ($94,022,104 ÷ 7,573,893 shares) | | $12.41 |
| Service Class 2: | | |
| Net Asset Value, offering price and redemption price per share ($549,528,184 ÷ 44,405,975 shares) | | $12.38 |
See accompanying notes which are an integral part of the financial statements.
Statement of Operations
| | | Year ended December 31, 2015 |
| Investment Income | | |
| Income distributions from underlying funds | | $13,925,441 |
| Expenses | | |
| Distribution and service plan fees | $1,529,552 | |
| Independent trustees' compensation | 3,071 | |
| Total expenses before reductions | 1,532,623 | |
| Expense reductions | (3,071) | 1,529,552 |
| Net investment income (loss) | | 12,395,889 |
| Realized and Unrealized Gain (Loss) | | |
| Realized gain (loss) on sale of underlying fund shares | (1,253,363) | |
| Capital gain distributions from underlying funds | 25,440,631 | |
| Total net realized gain (loss) | | 24,187,268 |
| Change in net unrealized appreciation (depreciation) on underlying funds | | (39,900,486) |
| Net gain (loss) | | (15,713,218) |
| Net increase (decrease) in net assets resulting from operations | | $(3,317,329) |
See accompanying notes which are an integral part of the financial statements.
Statement of Changes in Net Assets
| | Year ended December 31, 2015 | Year ended December 31, 2014 |
| Increase (Decrease) in Net Assets | | |
| Operations | | |
| Net investment income (loss) | $12,395,889 | $11,200,881 |
| Net realized gain (loss) | 24,187,268 | 3,826,894 |
| Change in net unrealized appreciation (depreciation) | (39,900,486) | 18,597,644 |
| Net increase (decrease) in net assets resulting from operations | (3,317,329) | 33,625,419 |
| Distributions to shareholders from net investment income | (12,431,723) | (11,161,646) |
| Distributions to shareholders from net realized gain | (3,252,644) | (13,279,401) |
| Total distributions | (15,684,367) | (24,441,047) |
| Share transactions - net increase (decrease) | (11,659,744) | 12,605,571 |
| Total increase (decrease) in net assets | (30,661,440) | 21,789,943 |
| Net Assets | | |
| Beginning of period | 761,707,608 | 739,917,665 |
| End of period (including undistributed net investment income of $0 and $49,928, respectively) | $731,046,168 | $761,707,608 |
See accompanying notes which are an integral part of the financial statements.
Financial Highlights — VIP Freedom 2020 Portfolio Initial Class
| | | | | | |
| Years ended December 31, | 2015 | 2014 | 2013 | 2012 | 2011 |
| Selected Per–Share Data | | | | | |
| Net asset value, beginning of period | $12.77 | $12.61 | $11.21 | $10.21 | $10.59 |
| Income from Investment Operations | | | | | |
| Net investment income (loss)A | .24 | .22 | .22 | .24 | .26 |
| Net realized and unrealized gain (loss) | (.27) | .38 | 1.56 | 1.12 | (.37) |
| Total from investment operations | (.03) | .60 | 1.78 | 1.36 | (.11) |
| Distributions from net investment income | (.24) | (.22) | (.22) | (.23) | (.23) |
| Distributions from net realized gain | (.06) | (.23) | (.16) | (.13) | (.04) |
| Total distributions | (.30) | (.44)B | (.38) | (.36) | (.27) |
| Net asset value, end of period | $12.44 | $12.77 | $12.61 | $11.21 | $10.21 |
| Total ReturnC,D | (.27)% | 4.82% | 16.01% | 13.38% | (1.03)% |
| Ratios to Average Net AssetsE,F | | | | | |
| Expenses before reductionsG | -% | -% | -% | -% | -% |
| Expenses net of fee waivers, if any | -% | -% | -% | -% | -% |
| Expenses net of all reductions | -% | -% | -% | -% | -% |
| Net investment income (loss) | 1.84% | 1.70% | 1.84% | 2.16% | 2.47% |
| Supplemental Data | | | | | |
| Net assets, end of period (000 omitted) | $87,496 | $101,533 | $91,328 | $58,113 | $47,731 |
| Portfolio turnover rateE | 17% | 15% | 20% | 15% | 10% |
A Calculated based on average shares outstanding during the period.
B Total distributions of $.44 per share is comprised of distributions from net investment income of $.216 and distributions from net realized gain of $.227 per share.
C Total returns do not reflect charges attributable to your insurance company's separate account. Inclusion of these charges would reduce the total returns shown.
D Total returns would have been lower if certain expenses had not been reduced during the applicable periods shown.
E Amounts do not include the activity of the Underlying Funds.
F Expense ratios reflect operating expenses of the class. Expenses before reductions do not reflect amounts reimbursed by the investment adviser or reductions from expense offset arrangements and do not represent the amount paid by the class during periods when reimbursements or reductions occur. Expenses net of fee waivers reflect expenses after reimbursement by the investment adviser but prior to reductions from expense offset arrangements. Expenses net of all reductions represent the net expenses paid by the class but do not include expenses of the underlying funds in which the Fund invests.
G Amount represents less than .005%.
See accompanying notes which are an integral part of the financial statements.
Financial Highlights — VIP Freedom 2020 Portfolio Service Class
| | | | | | |
| Years ended December 31, | 2015 | 2014 | 2013 | 2012 | 2011 |
| Selected Per–Share Data | | | | | |
| Net asset value, beginning of period | $12.74 | $12.59 | $11.19 | $10.20 | $10.58 |
| Income from Investment Operations | | | | | |
| Net investment income (loss)A | .23 | .20 | .21 | .23 | .25 |
| Net realized and unrealized gain (loss) | (.27) | .38 | 1.56 | 1.11 | (.37) |
| Total from investment operations | (.04) | .58 | 1.77 | 1.34 | (.12) |
| Distributions from net investment income | (.23) | (.21) | (.21) | (.22) | (.22) |
| Distributions from net realized gain | (.06) | (.23) | (.16) | (.13) | (.04) |
| Total distributions | (.29) | (.43)B | (.37) | (.35) | (.26) |
| Net asset value, end of period | $12.41 | $12.74 | $12.59 | $11.19 | $10.20 |
| Total ReturnC,D | (.37)% | 4.66% | 15.95% | 13.19% | (1.12)% |
| Ratios to Average Net AssetsE,F | | | | | |
| Expenses before reductions | .10% | .10% | .10% | .10% | .10% |
| Expenses net of fee waivers, if any | .10% | .10% | .10% | .10% | .10% |
| Expenses net of all reductions | .10% | .10% | .10% | .10% | .10% |
| Net investment income (loss) | 1.74% | 1.60% | 1.74% | 2.06% | 2.37% |
| Supplemental Data | | | | | |
| Net assets, end of period (000 omitted) | $94,022 | $76,679 | $65,867 | $45,779 | $36,818 |
| Portfolio turnover rateE | 17% | 15% | 20% | 15% | 10% |
A Calculated based on average shares outstanding during the period.
B Total distributions of $.43 per share is comprised of distributions from net investment income of $.205 and distributions from net realized gain of $.227 per share.
C Total returns do not reflect charges attributable to your insurance company's separate account. Inclusion of these charges would reduce the total returns shown.
D Total returns would have been lower if certain expenses had not been reduced during the applicable periods shown.
E Amounts do not include the activity of the Underlying Funds.
F Expense ratios reflect operating expenses of the class. Expenses before reductions do not reflect amounts reimbursed by the investment adviser or reductions from expense offset arrangements and do not represent the amount paid by the class during periods when reimbursements or reductions occur. Expenses net of fee waivers reflect expenses after reimbursement by the investment adviser but prior to reductions from expense offset arrangements. Expenses net of all reductions represent the net expenses paid by the class but do not include expenses of the underlying funds in which the Fund invests.
See accompanying notes which are an integral part of the financial statements.
Financial Highlights — VIP Freedom 2020 Portfolio Service Class 2
| | | | | | |
| Years ended December 31, | 2015 | 2014 | 2013 | 2012 | 2011 |
| Selected Per–Share Data | | | | | |
| Net asset value, beginning of period | $12.70 | $12.54 | $11.16 | $10.17 | $10.55 |
| Income from Investment Operations | | | | | |
| Net investment income (loss)A | .21 | .18 | .19 | .21 | .24 |
| Net realized and unrealized gain (loss) | (.27) | .39 | 1.54 | 1.11 | (.37) |
| Total from investment operations | (.06) | .57 | 1.73 | 1.32 | (.13) |
| Distributions from net investment income | (.21) | (.18) | (.19) | (.20) | (.21) |
| Distributions from net realized gain | (.06) | (.23) | (.16) | (.13) | (.04) |
| Total distributions | (.26)B | (.41) | (.35) | (.33) | (.25) |
| Net asset value, end of period | $12.38 | $12.70 | $12.54 | $11.16 | $10.17 |
| Total ReturnC,D | (.46)% | 4.60% | 15.63% | 13.07% | (1.24)% |
| Ratios to Average Net AssetsE,F | | | | | |
| Expenses before reductions | .25% | .25% | .25% | .25% | .25% |
| Expenses net of fee waivers, if any | .25% | .25% | .25% | .25% | .25% |
| Expenses net of all reductions | .25% | .25% | .25% | .25% | .25% |
| Net investment income (loss) | 1.59% | 1.45% | 1.59% | 1.91% | 2.22% |
| Supplemental Data | | | | | |
| Net assets, end of period (000 omitted) | $549,528 | $583,496 | $582,722 | $520,011 | $426,477 |
| Portfolio turnover rateE | 17% | 15% | 20% | 15% | 10% |
A Calculated based on average shares outstanding during the period.
B Total distributions of $.26 per share is comprised of distributions from net investment income of $.208 and distributions from net realized gain of $.056 per share.
C Total returns do not reflect charges attributable to your insurance company's separate account. Inclusion of these charges would reduce the total returns shown.
D Total returns would have been lower if certain expenses had not been reduced during the applicable periods shown.
E Amounts do not include the activity of the Underlying Funds.
F Expense ratios reflect operating expenses of the class. Expenses before reductions do not reflect amounts reimbursed by the investment adviser or reductions from expense offset arrangements and do not represent the amount paid by the class during periods when reimbursements or reductions occur. Expenses net of fee waivers reflect expenses after reimbursement by the investment adviser but prior to reductions from expense offset arrangements. Expenses net of all reductions represent the net expenses paid by the class but do not include expenses of the underlying funds in which the Fund invests.
See accompanying notes which are an integral part of the financial statements.
VIP Freedom 2025 Portfolio℠
Investment Summary (Unaudited)
The information in the following tables is based on the direct investments of the Fund.
Fund Holdings as of December 31, 2015
| | % of fund's net assets | % of fund's net assets 6 months ago |
| Domestic Equity Funds | | |
| VIP Contrafund Portfolio Initial Class | 8.6 | 8.6 |
| VIP Equity-Income Portfolio Initial Class | 9.0 | 9.1 |
| VIP Growth & Income Portfolio Initial Class | 10.2 | 10.4 |
| VIP Growth Portfolio Initial Class | 8.9 | 8.8 |
| VIP Mid Cap Portfolio Initial Class | 2.4 | 2.5 |
| VIP Value Portfolio Initial Class | 6.5 | 6.6 |
| VIP Value Strategies Portfolio Initial Class | 3.2 | 3.3 |
| | 48.8 | 49.3 |
| International Equity Funds | | |
| VIP Emerging Markets Portfolio Initial Class | 6.8 | 6.7 |
| VIP Overseas Portfolio Initial Class | 14.4 | 14.9 |
| | 21.2 | 21.6 |
| Bond Funds | | |
| VIP High Income Portfolio Initial Class | 3.7 | 4.0 |
| VIP Investment Grade Bond Portfolio Initial Class | 23.0 | 23.1 |
| | 26.7 | 27.1 |
| Short-Term Funds | | |
| VIP Government Money Market Portfolio Initial Class 0.05% | 3.3 | 2.0 |
| Net Other Assets (Liabilities) | | |
| Net Other Assets | 0.0 | 0.0 |
| | 100.0 | 100.0 |
VIP Government Money Market Portfolio Initial Class was formerly known as VIP Money Market Portfolio Initial Class
Asset Allocation (% of fund's net assets)
| Period end |
| | Domestic Equity Funds | 48.8% |
| | International Equity Funds | 21.2% |
| | Bond Funds | 26.7% |
| | Short-Term Funds | 3.3% |

| Six months ago |
| | Domestic Equity Funds | 49.3% |
| | International Equity Funds | 21.6% |
| | Bond Funds | 27.1% |
| | Short-Term Funds | 2.0% |

Percentages shown as 0.0% may reflect amounts less than 0.05%.
VIP Freedom 2025 Portfolio℠
Investments December 31, 2015
Showing Percentage of Net Assets
| Domestic Equity Funds - 48.8% | | | |
| | | Shares | Value |
| VIP Contrafund Portfolio Initial Class (a) | | 287,665 | $9,757,612 |
| VIP Equity-Income Portfolio Initial Class (a) | | 503,416 | 10,299,890 |
| VIP Growth & Income Portfolio Initial Class (a) | | 615,173 | 11,614,475 |
| VIP Growth Portfolio Initial Class (a) | | 154,512 | 10,159,178 |
| VIP Mid Cap Portfolio Initial Class (a) | | 85,517 | 2,792,118 |
| VIP Value Portfolio Initial Class (a) | | 557,394 | 7,446,789 |
| VIP Value Strategies Portfolio Initial Class (a) | | 247,155 | 3,593,628 |
| TOTAL DOMESTIC EQUITY FUNDS | | | |
| (Cost $45,610,112) | | | 55,663,690 |
|
| International Equity Funds - 21.2% | | | |
| VIP Emerging Markets Portfolio Initial Class (a) | | 959,722 | 7,812,141 |
| VIP Overseas Portfolio Initial Class (a) | | 862,099 | 16,448,853 |
| TOTAL INTERNATIONAL EQUITY FUNDS | | | |
| (Cost $23,108,253) | | | 24,260,994 |
|
| Bond Funds - 26.7% | | | |
| VIP High Income Portfolio Initial Class (a) | | 863,062 | 4,272,157 |
| VIP Investment Grade Bond Portfolio Initial Class (a) | | 2,118,232 | 26,202,534 |
| TOTAL BOND FUNDS | | | |
| (Cost $32,024,434) | | | 30,474,691 |
|
| Short-Term Funds - 3.3% | | | |
| VIP Government Money Market Portfolio Initial Class 0.05% (a)(b) | | | |
| (Cost $3,765,099) | | 3,765,099 | 3,765,099 |
| TOTAL INVESTMENT PORTFOLIO - 100.0% | | | |
| (Cost $104,507,898) | | | 114,164,474 |
| NET OTHER ASSETS (LIABILITIES) - 0.0% | | | (13,949) |
| NET ASSETS - 100% | | | $114,150,525 |
Legend
(a) Affiliated Fund
(b) The rate quoted is the annualized seven-day yield of the fund at period end.
Affiliated Underlying Funds
Information regarding the Fund's fiscal year to date purchases and sales of the affiliated Underlying Funds and income earned by the Fund from investments in affiliated Underlying Funds is as follows:
(VIP Government Money Market Portfolio Initial Class was formerly known as VIP Money Market Portfolio Initial Class)
| Affiliate | Value, beginning of period | Purchases | Sales Proceeds | Dividend Income | Value, end of period |
| VIP Contrafund Portfolio Initial Class | $9,448,520 | $2,929,765 | $1,759,246 | $103,964 | $9,757,612 |
| VIP Emerging Markets Portfolio Initial Class | 6,327,228 | 3,299,302 | 933,051 | 47,966 | 7,812,141 |
| VIP Equity-Income Portfolio Initial Class | 9,935,230 | 3,368,363 | 1,336,454 | 343,482 | 10,299,890 |
| VIP Government Money Market Portfolio Initial Class 0.05% | 1,343,742 | 2,747,096 | 325,739 | 640 | 3,765,099 |
| VIP Growth & Income Portfolio Initial Class | 11,331,875 | 3,566,675 | 2,234,140 | 255,719 | 11,614,475 |
| VIP Growth Portfolio Initial Class | 9,660,133 | 2,158,199 | 2,057,151 | 26,302 | 10,159,178 |
| VIP High Income Portfolio Initial Class | 4,285,163 | 1,129,949 | 682,884 | 298,773 | 4,272,157 |
| VIP Investment Grade Bond Portfolio Initial Class | 22,727,235 | 10,027,606 | 5,629,140 | 689,974 | 26,202,534 |
| VIP Mid Cap Portfolio Initial Class | 2,750,969 | 823,983 | 405,625 | 14,683 | 2,792,118 |
| VIP Overseas Portfolio Initial Class | 17,140,652 | 4,400,116 | 5,610,289 | 229,763 | 16,448,853 |
| VIP Value Portfolio Initial Class | 7,290,067 | 2,620,604 | 1,200,411 | 103,787 | 7,446,789 |
| VIP Value Strategies Portfolio Initial Class | 3,565,679 | 712,510 | 538,128 | 44,356 | 3,593,628 |
| Total | $105,806,493 | $37,784,168 | $22,712,258 | $2,159,409 | $114,164,474 |
Investment Valuation
All investments are categorized as Level 1 under the Fair Value Hierarchy. The inputs or methodology used for valuing securities may not be an indication of the risk associated with investing in those securities. For more information on valuation inputs please refer to the Investment Valuation section in the accompanying Notes to Financial Statements.
See accompanying notes which are an integral part of the financial statements.
VIP Freedom 2025 Portfolio℠
Financial Statements
Statement of Assets and Liabilities
| | | December 31, 2015 |
| Assets | | |
| Investment in securities, at value (cost $104,507,898) — See accompanying schedule | | $114,164,474 |
| Receivable for investments sold | | 71,331 |
| Receivable for fund shares sold | | 69,504 |
| Total assets | | 114,305,309 |
| Liabilities | | |
| Payable for investments purchased | $5,350 | |
| Payable for fund shares redeemed | 135,485 | |
| Distribution and service plan fees payable | 13,949 | |
| Total liabilities | | 154,784 |
| Net Assets | | $114,150,525 |
| Net Assets consist of: | | |
| Paid in capital | | $101,660,600 |
| Accumulated undistributed net realized gain (loss) on investments | | 2,833,349 |
| Net unrealized appreciation (depreciation) on investments | | 9,656,576 |
| Net Assets | | $114,150,525 |
| Initial Class: | | |
| Net Asset Value, offering price and redemption price per share ($25,152,327 ÷ 1,962,480 shares) | | $12.82 |
| Service Class: | | |
| Net Asset Value, offering price and redemption price per share ($36,677,409 ÷ 2,867,308 shares) | | $12.79 |
| Service Class 2: | | |
| Net Asset Value, offering price and redemption price per share ($52,320,789 ÷ 4,107,619 shares) | | $12.74 |
See accompanying notes which are an integral part of the financial statements.
Statement of Operations
| | | Year ended December 31, 2015 |
| Investment Income | | |
| Income distributions from underlying funds | | $2,159,409 |
| Expenses | | |
| Distribution and service plan fees | $163,911 | |
| Independent trustees' compensation | 454 | |
| Total expenses before reductions | 164,365 | |
| Expense reductions | (454) | 163,911 |
| Net investment income (loss) | | 1,995,498 |
| Realized and Unrealized Gain (Loss) | | |
| Realized gain (loss) on sale of underlying fund shares | (268,022) | |
| Capital gain distributions from underlying funds | 4,164,269 | |
| Total net realized gain (loss) | | 3,896,247 |
| Change in net unrealized appreciation (depreciation) on underlying funds | | (6,445,911) |
| Net gain (loss) | | (2,549,664) |
| Net increase (decrease) in net assets resulting from operations | | $(554,166) |
See accompanying notes which are an integral part of the financial statements.
Statement of Changes in Net Assets
| | Year ended December 31, 2015 | Year ended December 31, 2014 |
| Increase (Decrease) in Net Assets | | |
| Operations | | |
| Net investment income (loss) | $1,995,498 | $1,610,466 |
| Net realized gain (loss) | 3,896,247 | 693,939 |
| Change in net unrealized appreciation (depreciation) | (6,445,911) | 2,297,020 |
| Net increase (decrease) in net assets resulting from operations | (554,166) | 4,601,425 |
| Distributions to shareholders from net investment income | (1,997,317) | (1,605,249) |
| Distributions to shareholders from net realized gain | (616,161) | (1,979,200) |
| Total distributions | (2,613,478) | (3,584,449) |
| Share transactions - net increase (decrease) | 11,524,589 | 12,068,974 |
| Total increase (decrease) in net assets | 8,356,945 | 13,085,950 |
| Net Assets | | |
| Beginning of period | 105,793,580 | 92,707,630 |
| End of period | $114,150,525 | $105,793,580 |
See accompanying notes which are an integral part of the financial statements.
Financial Highlights — VIP Freedom 2025 Portfolio Initial Class
| | | | | | |
| Years ended December 31, | 2015 | 2014 | 2013 | 2012 | 2011 |
| Selected Per–Share Data | | | | | |
| Net asset value, beginning of period | $13.16 | $12.99 | $11.20 | $10.02 | $10.49 |
| Income from Investment Operations | | | | | |
| Net investment income (loss)A | .26 | .24 | .25 | .24 | .24 |
| Net realized and unrealized gain (loss) | (.28) | .41 | 1.97 | 1.27 | (.46) |
| Total from investment operations | (.02) | .65 | 2.22 | 1.51 | (.22) |
| Distributions from net investment income | (.25) | (.22) | (.23) | (.21) | (.22) |
| Distributions from net realized gain | (.07) | (.26) | (.20) | (.12) | (.03) |
| Total distributions | (.32) | (.48) | (.43) | (.33) | (.25) |
| Net asset value, end of period | $12.82 | $13.16 | $12.99 | $11.20 | $10.02 |
| Total ReturnB,C | (.18)% | 5.06% | 19.95% | 15.11% | (2.11)% |
| Ratios to Average Net AssetsD,E | | | | | |
| Expenses before reductionsF | -% | -% | -% | -% | -% |
| Expenses net of fee waivers, if any | -% | -% | -% | -% | -% |
| Expenses net of all reductions | -% | -% | -% | -% | -% |
| Net investment income (loss) | 1.91% | 1.78% | 2.03% | 2.17% | 2.25% |
| Supplemental Data | | | | | |
| Net assets, end of period (000 omitted) | $25,152 | $26,137 | $24,548 | $17,792 | $15,537 |
| Portfolio turnover rateD | 20% | 29% | 30% | 34% | 21% |
A Calculated based on average shares outstanding during the period.
B Total returns do not reflect charges attributable to your insurance company's separate account. Inclusion of these charges would reduce the total returns shown.
C Total returns would have been lower if certain expenses had not been reduced during the applicable periods shown.
D Amounts do not include the activity of the Underlying Funds.
E Expense ratios reflect operating expenses of the class. Expenses before reductions do not reflect amounts reimbursed by the investment adviser or reductions from expense offset arrangements and do not represent the amount paid by the class during periods when reimbursements or reductions occur. Expenses net of fee waivers reflect expenses after reimbursement by the investment adviser but prior to reductions from expense offset arrangements. Expenses net of all reductions represent the net expenses paid by the class but do not include expenses of the underlying funds in which the Fund invests.
F Amount represents less than .005%.
See accompanying notes which are an integral part of the financial statements.
Financial Highlights — VIP Freedom 2025 Portfolio Service Class
| | | | | | |
| Years ended December 31, | 2015 | 2014 | 2013 | 2012 | 2011 |
| Selected Per–Share Data | | | | | |
| Net asset value, beginning of period | $13.14 | $12.97 | $11.18 | $10.01 | $10.49 |
| Income from Investment Operations | | | | | |
| Net investment income (loss)A | .24 | .22 | .23 | .22 | .23 |
| Net realized and unrealized gain (loss) | (.28) | .42 | 1.98 | 1.27 | (.47) |
| Total from investment operations | (.04) | .64 | 2.21 | 1.49 | (.24) |
| Distributions from net investment income | (.23) | (.21) | (.22) | (.20) | (.21) |
| Distributions from net realized gain | (.07) | (.26) | (.20) | (.12) | (.03) |
| Total distributions | (.31)B | (.47) | (.42) | (.32) | (.24) |
| Net asset value, end of period | $12.79 | $13.14 | $12.97 | $11.18 | $10.01 |
| Total ReturnC,D | (.36)% | 4.98% | 19.89% | 14.97% | (2.26)% |
| Ratios to Average Net AssetsE,F | | | | | |
| Expenses before reductions | .10% | .10% | .10% | .10% | .10% |
| Expenses net of fee waivers, if any | .10% | .10% | .10% | .10% | .10% |
| Expenses net of all reductions | .10% | .10% | .10% | .10% | .10% |
| Net investment income (loss) | 1.81% | 1.68% | 1.93% | 2.07% | 2.16% |
| Supplemental Data | | | | | |
| Net assets, end of period (000 omitted) | $36,677 | $30,291 | $21,780 | $16,558 | $7,149 |
| Portfolio turnover rateE | 20% | 29% | 30% | 34% | 21% |
A Calculated based on average shares outstanding during the period.
B Total distributions of $.31 per share is comprised of distributions from net investment income of $.234 and distributions from net realized gain of $.072 per share.
C Total returns do not reflect charges attributable to your insurance company's separate account. Inclusion of these charges would reduce the total returns shown.
D Total returns would have been lower if certain expenses had not been reduced during the applicable periods shown.
E Amounts do not include the activity of the Underlying Funds.
F Expense ratios reflect operating expenses of the class. Expenses before reductions do not reflect amounts reimbursed by the investment adviser or reductions from expense offset arrangements and do not represent the amount paid by the class during periods when reimbursements or reductions occur. Expenses net of fee waivers reflect expenses after reimbursement by the investment adviser but prior to reductions from expense offset arrangements. Expenses net of all reductions represent the net expenses paid by the class but do not include expenses of the underlying funds in which the Fund invests.
See accompanying notes which are an integral part of the financial statements.
Financial Highlights — VIP Freedom 2025 Portfolio Service Class 2
| | | | | | |
| Years ended December 31, | 2015 | 2014 | 2013 | 2012 | 2011 |
| Selected Per–Share Data | | | | | |
| Net asset value, beginning of period | $13.09 | $12.92 | $11.14 | $9.97 | $10.44 |
| Income from Investment Operations | | | | | |
| Net investment income (loss)A | .22 | .20 | .22 | .21 | .21 |
| Net realized and unrealized gain (loss) | (.28) | .42 | 1.96 | 1.26 | (.45) |
| Total from investment operations | (.06) | .62 | 2.18 | 1.47 | (.24) |
| Distributions from net investment income | (.22) | (.19) | (.20) | (.18) | (.19) |
| Distributions from net realized gain | (.07) | (.26) | (.20) | (.12) | (.03) |
| Total distributions | (.29) | (.45) | (.40) | (.30) | (.23)B |
| Net asset value, end of period | $12.74 | $13.09 | $12.92 | $11.14 | $9.97 |
| Total ReturnC,D | (.50)% | 4.85% | 19.71% | 14.80% | (2.35)% |
| Ratios to Average Net AssetsE,F | | | | | |
| Expenses before reductions | .25% | .25% | .25% | .25% | .25% |
| Expenses net of fee waivers, if any | .25% | .25% | .25% | .25% | .25% |
| Expenses net of all reductions | .25% | .25% | .25% | .25% | .25% |
| Net investment income (loss) | 1.66% | 1.53% | 1.78% | 1.92% | 2.00% |
| Supplemental Data | | | | | |
| Net assets, end of period (000 omitted) | $52,321 | $49,366 | $46,379 | $33,051 | $25,869 |
| Portfolio turnover rateE | 20% | 29% | 30% | 34% | 21% |
A Calculated based on average shares outstanding during the period.
B Total distributions of $.23 per share is comprised of distributions from net investment income of $.192 and distributions from net realized gain of $.033 per share.
C Total returns do not reflect charges attributable to your insurance company's separate account. Inclusion of these charges would reduce the total returns shown.
D Total returns would have been lower if certain expenses had not been reduced during the applicable periods shown.
E Amounts do not include the activity of the Underlying Funds.
F Expense ratios reflect operating expenses of the class. Expenses before reductions do not reflect amounts reimbursed by the investment adviser or reductions from expense offset arrangements and do not represent the amount paid by the class during periods when reimbursements or reductions occur. Expenses net of fee waivers reflect expenses after reimbursement by the investment adviser but prior to reductions from expense offset arrangements. Expenses net of all reductions represent the net expenses paid by the class but do not include expenses of the underlying funds in which the Fund invests.
See accompanying notes which are an integral part of the financial statements.
VIP Freedom 2030 Portfolio℠
Investment Summary (Unaudited)
The information in the following tables is based on the direct investments of the Fund.
Fund Holdings as of December 31, 2015
| | % of fund's net assets | % of fund's net assets 6 months ago |
| Domestic Equity Funds | | |
| VIP Contrafund Portfolio Initial Class | 10.3 | 10.4 |
| VIP Equity-Income Portfolio Initial Class | 10.9 | 10.9 |
| VIP Growth & Income Portfolio Initial Class | 12.3 | 12.4 |
| VIP Growth Portfolio Initial Class | 10.7 | 10.7 |
| VIP Mid Cap Portfolio Initial Class | 2.9 | 3.0 |
| VIP Value Portfolio Initial Class | 7.9 | 8.0 |
| VIP Value Strategies Portfolio Initial Class | 3.8 | 3.9 |
| | 58.8 | 59.3 |
| International Equity Funds | | |
| VIP Emerging Markets Portfolio Initial Class | 7.8 | 7.6 |
| VIP Overseas Portfolio Initial Class | 17.8 | 18.2 |
| | 25.6 | 25.8 |
| Bond Funds | | |
| VIP High Income Portfolio Initial Class | 3.8 | 4.0 |
| VIP Investment Grade Bond Portfolio Initial Class | 10.5 | 9.6 |
| | 14.3 | 13.6 |
| Short-Term Funds | | |
| VIP Government Money Market Portfolio Initial Class 0.05% | 1.3 | 1.3 |
| Net Other Assets (Liabilities) | | |
| Net Other Assets | 0.0 | 0.0 |
| | 100.0 | 100.0 |
VIP Government Money Market Portfolio Initial Class was formerly known as VIP Money Market Portfolio Initial Class
Asset Allocation (% of fund's net assets)
| Period end |
| | Domestic Equity Funds | 58.8% |
| | International Equity Funds | 25.6% |
| | Bond Funds | 14.3% |
| | Short-Term Funds | 1.3% |

| Six months ago |
| | Domestic Equity Funds | 59.3% |
| | International Equity Funds | 25.8% |
| | Bond Funds | 13.6% |
| | Short-Term Funds | 1.3% |

Percentages shown as 0.0% may reflect amounts less than 0.05%.
VIP Freedom 2030 Portfolio℠
Investments December 31, 2015
Showing Percentage of Net Assets
| Domestic Equity Funds - 58.8% | | | |
| | | Shares | Value |
| VIP Contrafund Portfolio Initial Class (a) | | 795,492 | $26,983,105 |
| VIP Equity-Income Portfolio Initial Class (a) | | 1,391,306 | 28,466,124 |
| VIP Growth & Income Portfolio Initial Class (a) | | 1,699,938 | 32,094,830 |
| VIP Growth Portfolio Initial Class (a) | | 427,243 | 28,091,218 |
| VIP Mid Cap Portfolio Initial Class (a) | | 236,362 | 7,717,230 |
| VIP Value Portfolio Initial Class (a) | | 1,540,484 | 20,580,872 |
| VIP Value Strategies Portfolio Initial Class (a) | | 682,931 | 9,929,818 |
| TOTAL DOMESTIC EQUITY FUNDS | | | |
| (Cost $127,304,534) | | | 153,863,197 |
|
| International Equity Funds - 25.6% | | | |
| VIP Emerging Markets Portfolio Initial Class (a) | | 2,507,179 | 20,408,441 |
| VIP Overseas Portfolio Initial Class (a) | | 2,446,817 | 46,685,271 |
| TOTAL INTERNATIONAL EQUITY FUNDS | | | |
| (Cost $64,206,415) | | | 67,093,712 |
|
| Bond Funds - 14.3% | | | |
| VIP High Income Portfolio Initial Class (a) | | 1,982,252 | 9,812,148 |
| VIP Investment Grade Bond Portfolio Initial Class (a) | | 2,225,678 | 27,531,638 |
| TOTAL BOND FUNDS | | | |
| (Cost $39,637,246) | | | 37,343,786 |
|
| Short-Term Funds - 1.3% | | | |
| VIP Government Money Market Portfolio Initial Class 0.05% (a)(b) | | | |
| (Cost $3,467,507) | | 3,467,507 | 3,467,507 |
| TOTAL INVESTMENT PORTFOLIO - 100.0% | | | |
| (Cost $234,615,702) | | | 261,768,202 |
| NET OTHER ASSETS (LIABILITIES) - 0.0% | | | (33,317) |
| NET ASSETS - 100% | | | $261,734,885 |
Legend
(a) Affiliated Fund
(b) The rate quoted is the annualized seven-day yield of the fund at period end.
Affiliated Underlying Funds
Information regarding the Fund's fiscal year to date purchases and sales of the affiliated Underlying Funds and income earned by the Fund from investments in affiliated Underlying Funds is as follows:
(VIP Government Money Market Portfolio Initial Class was formerly known as VIP Money Market Portfolio Initial Class)
| Affiliate | Value, beginning of period | Purchases | Sales Proceeds | Dividend Income | Value, end of period |
| VIP Contrafund Portfolio Initial Class | $29,282,420 | $6,639,333 | $6,299,322 | $ 290,460 | $26,983,105 |
| VIP Emerging Markets Portfolio Initial Class | 19,087,595 | 9,011,894 | 5,092,479 | 127,825 | 20,408,441 |
| VIP Equity-Income Portfolio Initial Class | 30,778,400 | 8,521,592 | 5,786,546 | 960,340 | 28,466,124 |
| VIP Government Money Market Portfolio Initial Class 0.05% | -- | 4,522,843 | 1,055,336 | 817 | 3,467,507 |
| VIP Growth & Income Portfolio Initial Class | 35,127,823 | 8,345,747 | 8,175,325 | 714,367 | 32,094,830 |
| VIP Growth Portfolio Initial Class | 29,947,300 | 4,787,046 | 7,799,337 | 73,400 | 28,091,218 |
| VIP High Income Portfolio Initial Class | 11,247,552 | 2,814,577 | 3,181,977 | 695,853 | 9,812,148 |
| VIP Investment Grade Bond Portfolio Initial Class | 25,791,800 | 13,004,328 | 10,330,583 | 732,961 | 27,531,638 |
| VIP Mid Cap Portfolio Initial Class | 8,532,626 | 2,085,742 | 1,756,996 | 40,969 | 7,717,230 |
| VIP Overseas Portfolio Initial Class | 53,605,943 | 8,951,125 | 17,285,327 | 658,187 | 46,685,271 |
| VIP Value Portfolio Initial Class | 22,578,214 | 6,104,145 | 4,423,811 | 289,804 | 20,580,872 |
| VIP Value Strategies Portfolio Initial Class | 11,053,629 | 1,597,758 | 2,287,963 | 123,744 | 9,929,818 |
| Total | $277,033,302 | $76,386,130 | $73,475,002 | $ 4,708,727 | $261,768,202 |
Investment Valuation
All investments are categorized as Level 1 under the Fair Value Hierarchy. The inputs or methodology used for valuing securities may not be an indication of the risk associated with investing in those securities. For more information on valuation inputs please refer to the Investment Valuation section in the accompanying Notes to Financial Statements.
See accompanying notes which are an integral part of the financial statements.
VIP Freedom 2030 Portfolio℠
Financial Statements
Statement of Assets and Liabilities
| | | December 31, 2015 |
| Assets | | |
| Investment in securities, at value (cost $234,615,702) — See accompanying schedule | | $261,768,202 |
| Receivable for investments sold | | 76,111 |
| Receivable for fund shares sold | | 81,764 |
| Total assets | | 261,926,077 |
| Liabilities | | |
| Payable for fund shares redeemed | $157,878 | |
| Distribution and service plan fees payable | 33,314 | |
| Total liabilities | | 191,192 |
| Net Assets | | $261,734,885 |
| Net Assets consist of: | | |
| Paid in capital | | $226,590,939 |
| Accumulated undistributed net realized gain (loss) on investments | | 7,991,446 |
| Net unrealized appreciation (depreciation) on investments | | 27,152,500 |
| Net Assets | | $261,734,885 |
| Initial Class: | | |
| Net Asset Value, offering price and redemption price per share ($68,660,999 ÷ 5,415,596 shares) | | $12.68 |
| Service Class: | | |
| Net Asset Value, offering price and redemption price per share ($59,096,169 ÷ 4,667,843 shares) | | $12.66 |
| Service Class 2: | | |
| Net Asset Value, offering price and redemption price per share ($133,977,717 ÷ 10,615,539 shares) | | $12.62 |
See accompanying notes which are an integral part of the financial statements.
Statement of Operations
| | | Year ended December 31, 2015 |
| Investment Income | | |
| Income distributions from underlying funds | | $4,708,727 |
| Expenses | | |
| Distribution and service plan fees | $450,101 | |
| Independent trustees' compensation | 1,158 | |
| Total expenses before reductions | 451,259 | |
| Expense reductions | (1,158) | 450,101 |
| Net investment income (loss) | | 4,258,626 |
| Realized and Unrealized Gain (Loss) | | |
| Realized gain (loss) on sale of underlying fund shares | (1,636,349) | |
| Capital gain distributions from underlying funds | 12,404,173 | |
| Total net realized gain (loss) | | 10,767,824 |
| Change in net unrealized appreciation (depreciation) on underlying funds | | (16,539,898) |
| Net gain (loss) | | (5,772,074) |
| Net increase (decrease) in net assets resulting from operations | | $(1,513,448) |
See accompanying notes which are an integral part of the financial statements.
Statement of Changes in Net Assets
| | Year ended December 31, 2015 | Year ended December 31, 2014 |
| Increase (Decrease) in Net Assets | | |
| Operations | | |
| Net investment income (loss) | $4,258,626 | $3,952,206 |
| Net realized gain (loss) | 10,767,824 | 1,858,371 |
| Change in net unrealized appreciation (depreciation) | (16,539,898) | 6,891,326 |
| Net increase (decrease) in net assets resulting from operations | (1,513,448) | 12,701,903 |
| Distributions to shareholders from net investment income | (4,262,242) | (3,942,760) |
| Distributions to shareholders from net realized gain | (1,432,334) | (4,966,245) |
| Total distributions | (5,694,576) | (8,909,005) |
| Share transactions - net increase (decrease) | (8,052,132) | 30,231,660 |
| Total increase (decrease) in net assets | (15,260,156) | 34,024,558 |
| Net Assets | | |
| Beginning of period | 276,995,041 | 242,970,483 |
| End of period (including undistributed net investment income of $0 and $9,446, respectively) | $261,734,885 | $276,995,041 |
See accompanying notes which are an integral part of the financial statements.
Financial Highlights — VIP Freedom 2030 Portfolio Initial Class
| | | | | | |
| Years ended December 31, | 2015 | 2014 | 2013 | 2012 | 2011 |
| Selected Per–Share Data | | | | | |
| Net asset value, beginning of period | $13.01 | $12.84 | $10.88 | $9.70 | $10.21 |
| Income from Investment Operations | | | | | |
| Net investment income (loss)A | .22 | .22 | .22 | .25 | .23 |
| Net realized and unrealized gain (loss) | (.25) | .41 | 2.12 | 1.26 | (.49) |
| Total from investment operations | (.03) | .63 | 2.34 | 1.51 | (.26) |
| Distributions from net investment income | (.23) | (.21) | (.21) | (.23) | (.22) |
| Distributions from net realized gain | (.07) | (.25) | (.17) | (.10) | (.03) |
| Total distributions | (.30) | (.46) | (.38) | (.33) | (.25) |
| Net asset value, end of period | $12.68 | $13.01 | $12.84 | $10.88 | $9.70 |
| Total ReturnB,C | (.24)% | 4.96% | 21.66% | 15.58% | (2.60)% |
| Ratios to Average Net AssetsD,E | | | | | |
| Expenses before reductionsF | -% | -% | -% | -% | -% |
| Expenses net of fee waivers, if any | -% | -% | -% | -% | -% |
| Expenses net of all reductions | -% | -% | -% | -% | -% |
| Net investment income (loss) | 1.66% | 1.70% | 1.88% | 2.39% | 2.27% |
| Supplemental Data | | | | | |
| Net assets, end of period (000 omitted) | $68,661 | $72,243 | $64,173 | $39,111 | $30,601 |
| Portfolio turnover rateD | 26% | 18% | 30% | 17% | 16% |
A Calculated based on average shares outstanding during the period.
B Total returns do not reflect charges attributable to your insurance company's separate account. Inclusion of these charges would reduce the total returns shown.
C Total returns would have been lower if certain expenses had not been reduced during the applicable periods shown.
D Amounts do not include the activity of the Underlying Funds.
E Expense ratios reflect operating expenses of the class. Expenses before reductions do not reflect amounts reimbursed by the investment adviser or reductions from expense offset arrangements and do not represent the amount paid by the class during periods when reimbursements or reductions occur. Expenses net of fee waivers reflect expenses after reimbursement by the investment adviser but prior to reductions from expense offset arrangements. Expenses net of all reductions represent the net expenses paid by the class but do not include expenses of the underlying funds in which the Fund invests.
F Amount represents less than .005%.
See accompanying notes which are an integral part of the financial statements.
Financial Highlights — VIP Freedom 2030 Portfolio Service Class
| | | | | | |
| Years ended December 31, | 2015 | 2014 | 2013 | 2012 | 2011 |
| Selected Per–Share Data | | | | | |
| Net asset value, beginning of period | $12.99 | $12.82 | $10.87 | $9.69 | $10.20 |
| Income from Investment Operations | | | | | |
| Net investment income (loss)A | .21 | .21 | .21 | .24 | .22 |
| Net realized and unrealized gain (loss) | (.25) | .41 | 2.11 | 1.26 | (.49) |
| Total from investment operations | (.04) | .62 | 2.32 | 1.50 | (.27) |
| Distributions from net investment income | (.22) | (.19) | (.20) | (.22) | (.21) |
| Distributions from net realized gain | (.07) | (.25) | (.17) | (.10) | (.03) |
| Total distributions | (.29) | (.45)B | (.37) | (.32) | (.24) |
| Net asset value, end of period | $12.66 | $12.99 | $12.82 | $10.87 | $9.69 |
| Total ReturnC,D | (.34)% | 4.86% | 21.50% | 15.48% | (2.70)% |
| Ratios to Average Net AssetsE,F | | | | | |
| Expenses before reductions | .10% | .10% | .10% | .10% | .10% |
| Expenses net of fee waivers, if any | .10% | .10% | .10% | .10% | .10% |
| Expenses net of all reductions | .10% | .10% | .10% | .10% | .10% |
| Net investment income (loss) | 1.56% | 1.60% | 1.78% | 2.29% | 2.17% |
| Supplemental Data | | | | | |
| Net assets, end of period (000 omitted) | $59,096 | $53,484 | $46,868 | $32,295 | $28,666 |
| Portfolio turnover rateE | 26% | 18% | 30% | 17% | 16% |
A Calculated based on average shares outstanding during the period.
B Total distributions of $.45 per share is comprised of distributions from net investment income of $.194 and distributions from net realized gain of $.254 per share.
C Total returns do not reflect charges attributable to your insurance company's separate account. Inclusion of these charges would reduce the total returns shown.
D Total returns would have been lower if certain expenses had not been reduced during the applicable periods shown.
E Amounts do not include the activity of the Underlying Funds.
F Expense ratios reflect operating expenses of the class. Expenses before reductions do not reflect amounts reimbursed by the investment adviser or reductions from expense offset arrangements and do not represent the amount paid by the class during periods when reimbursements or reductions occur. Expenses net of fee waivers reflect expenses after reimbursement by the investment adviser but prior to reductions from expense offset arrangements. Expenses net of all reductions represent the net expenses paid by the class but do not include expenses of the underlying funds in which the Fund invests.
See accompanying notes which are an integral part of the financial statements.
Financial Highlights — VIP Freedom 2030 Portfolio Service Class 2
| | | | | | |
| Years ended December 31, | 2015 | 2014 | 2013 | 2012 | 2011 |
| Selected Per–Share Data | | | | | |
| Net asset value, beginning of period | $12.95 | $12.78 | $10.83 | $9.67 | $10.18 |
| Income from Investment Operations | | | | | |
| Net investment income (loss)A | .19 | .19 | .19 | .23 | .21 |
| Net realized and unrealized gain (loss) | (.25) | .41 | 2.11 | 1.23 | (.50) |
| Total from investment operations | (.06) | .60 | 2.30 | 1.46 | (.29) |
| Distributions from net investment income | (.20) | (.18) | (.18) | (.21) | (.19) |
| Distributions from net realized gain | (.07) | (.25) | (.17) | (.10) | (.03) |
| Total distributions | (.27) | (.43) | (.35) | (.30)B | (.22) |
| Net asset value, end of period | $12.62 | $12.95 | $12.78 | $10.83 | $9.67 |
| Total ReturnC,D | (.53)% | 4.74% | 21.41% | 15.18% | (2.83)% |
| Ratios to Average Net AssetsE,F | | | | | |
| Expenses before reductions | .25% | .25% | .25% | .25% | .25% |
| Expenses net of fee waivers, if any | .25% | .25% | .25% | .25% | .25% |
| Expenses net of all reductions | .25% | .25% | .25% | .25% | .25% |
| Net investment income (loss) | 1.41% | 1.45% | 1.63% | 2.14% | 2.02% |
| Supplemental Data | | | | | |
| Net assets, end of period (000 omitted) | $133,978 | $151,268 | $131,930 | $94,419 | $59,671 |
| Portfolio turnover rateE | 26% | 18% | 30% | 17% | 16% |
A Calculated based on average shares outstanding during the period.
B Total distributions of $.30 per share is comprised of distributions from net investment income of $.207 and distributions from net realized gain of $.096 per share.
C Total returns do not reflect charges attributable to your insurance company's separate account. Inclusion of these charges would reduce the total returns shown.
D Total returns would have been lower if certain expenses had not been reduced during the applicable periods shown.
E Amounts do not include the activity of the Underlying Funds.
F Expense ratios reflect operating expenses of the class. Expenses before reductions do not reflect amounts reimbursed by the investment adviser or reductions from expense offset arrangements and do not represent the amount paid by the class during periods when reimbursements or reductions occur. Expenses net of fee waivers reflect expenses after reimbursement by the investment adviser but prior to reductions from expense offset arrangements. Expenses net of all reductions represent the net expenses paid by the class but do not include expenses of the underlying funds in which the Fund invests.
See accompanying notes which are an integral part of the financial statements.
VIP Freedom 2035 Portfolio℠
Investment Summary (Unaudited)
The information in the following tables is based on the direct investments of the Fund.
Fund Holdings as of December 31, 2015
| | % of fund's net assets | % of fund's net assets 6 months ago |
| Domestic Equity Funds | | |
| VIP Contrafund Portfolio Initial Class | 11.3 | 11.3 |
| VIP Equity-Income Portfolio Initial Class | 12.0 | 11.9 |
| VIP Growth & Income Portfolio Initial Class | 13.5 | 13.5 |
| VIP Growth Portfolio Initial Class | 11.8 | 11.6 |
| VIP Mid Cap Portfolio Initial Class | 3.2 | 3.3 |
| VIP Value Portfolio Initial Class | 8.7 | 8.7 |
| VIP Value Strategies Portfolio Initial Class | 4.2 | 4.2 |
| | 64.7 | 64.5 |
| International Equity Funds | | |
| VIP Emerging Markets Portfolio Initial Class | 8.3 | 8.2 |
| VIP Overseas Portfolio Initial Class | 19.9 | 19.9 |
| | 28.2 | 28.1 |
| Bond Funds | | |
| VIP High Income Portfolio Initial Class | 3.8 | 4.0 |
| VIP Investment Grade Bond Portfolio Initial Class | 2.0 | 2.1 |
| | 5.8 | 6.1 |
| Short-Term Funds | | |
| VIP Government Money Market Portfolio Initial Class 0.05% | 1.3 | 1.3 |
| Net Other Assets (Liabilities) | | |
| Net Other Assets | 0.0 | 0.0 |
| | 100.0 | 100.0 |
VIP Government Money Market Portfolio Initial Class was formerly known as VIP Money Market Portfolio Initial Class
Asset Allocation (% of fund's net assets)
| Period end |
| | Domestic Equity Funds | 64.7% |
| | International Equity Funds | 28.2% |
| | Bond Funds | 5.8% |
| | Short-Term Funds | 1.3% |

| Six months ago |
| | Domestic Equity Funds | 64.5% |
| | International Equity Funds | 28.1% |
| | Bond Funds | 6.1% |
| | Short-Term Funds | 1.3% |

Percentages shown as 0.0% may reflect amounts less than 0.05%.
VIP Freedom 2035 Portfolio℠
Investments December 31, 2015
Showing Percentage of Net Assets
| Domestic Equity Funds - 64.7% | | | |
| | | Shares | Value |
| VIP Contrafund Portfolio Initial Class (a) | | 78,790 | $2,672,572 |
| VIP Equity-Income Portfolio Initial Class (a) | | 137,857 | 2,820,554 |
| VIP Growth & Income Portfolio Initial Class (a) | | 168,513 | 3,181,522 |
| VIP Growth Portfolio Initial Class (a) | | 42,284 | 2,780,156 |
| VIP Mid Cap Portfolio Initial Class (a) | | 23,426 | 764,849 |
| VIP Value Portfolio Initial Class (a) | | 152,695 | 2,040,008 |
| VIP Value Strategies Portfolio Initial Class (a) | | 67,738 | 984,905 |
| TOTAL DOMESTIC EQUITY FUNDS | | | |
| (Cost $15,438,049) | | | 15,244,566 |
|
| International Equity Funds - 28.2% | | | |
| VIP Emerging Markets Portfolio Initial Class (a) | | 241,017 | 1,961,877 |
| VIP Overseas Portfolio Initial Class (a) | | 245,319 | 4,680,687 |
| TOTAL INTERNATIONAL EQUITY FUNDS | | | |
| (Cost $6,876,613) | | | 6,642,564 |
|
| Bond Funds - 5.8% | | | |
| VIP High Income Portfolio Initial Class (a) | | 178,588 | 884,011 |
| VIP Investment Grade Bond Portfolio Initial Class (a) | | 38,872 | 480,847 |
| TOTAL BOND FUNDS | | | |
| (Cost $1,497,365) | | | 1,364,858 |
|
| Short-Term Funds - 1.3% | | | |
| VIP Government Money Market Portfolio Initial Class 0.05% (a)(b) | | | |
| (Cost $312,017) | | 312,017 | 312,017 |
| TOTAL INVESTMENT PORTFOLIO - 100.0% | | | |
| (Cost $24,124,044) | | | 23,564,005 |
| NET OTHER ASSETS (LIABILITIES) - 0.0% | | | (4,248) |
| NET ASSETS - 100% | | | $23,559,757 |
Legend
(a) Affiliated Fund
(b) The rate quoted is the annualized seven-day yield of the fund at period end.
Affiliated Underlying Funds
Information regarding the Fund's fiscal year to date purchases and sales of the affiliated Underlying Funds and income earned by the Fund from investments in affiliated Underlying Funds is as follows:
(VIP Government Money Market Portfolio Initial Class was formerly known as VIP Money Market Portfolio Initial Class)
| Affiliate | Value, beginning of period | Purchases | Sales Proceeds | Dividend Income | Value, end of period |
| VIP Contrafund Portfolio Initial Class | $1,725,497 | $1,535,574 | $403,687 | $ 27,536 | $2,672,572 |
| VIP Emerging Markets Portfolio Initial Class | 1,116,750 | 1,338,533 | 298,493 | 11,455 | 1,961,877 |
| VIP Equity-Income Portfolio Initial Class | 1,814,775 | 1,765,555 | 390,896 | 90,741 | 2,820,554 |
| VIP Government Money Market Portfolio Initial Class 0.05% | -- | 372,012 | 59,995 | 55 | 312,017 |
| VIP Growth & Income Portfolio Initial Class | 2,070,946 | 1,840,506 | 488,426 | 67,737 | 3,181,522 |
| VIP Growth Portfolio Initial Class | 1,768,000 | 1,395,082 | 469,159 | 6,997 | 2,780,156 |
| VIP High Income Portfolio Initial Class | 588,751 | 593,831 | 199,761 | 59,430 | 884,011 |
| VIP Investment Grade Bond Portfolio Initial Class | 473,109 | 350,048 | 327,995 | 12,383 | 480,847 |
| VIP Mid Cap Portfolio Initial Class | 503,509 | 450,171 | 107,168 | 3,906 | 764,849 |
| VIP Overseas Portfolio Initial Class | 3,172,445 | 2,475,678 | 1,008,164 | 63,547 | 4,680,687 |
| VIP Value Portfolio Initial Class | 1,331,887 | 1,320,856 | 297,659 | 27,544 | 2,040,008 |
| VIP Value Strategies Portfolio Initial Class | 650,424 | 528,685 | 147,706 | 11,806 | 984,905 |
| Total | $15,216,093 | $13,966,531 | $4,199,109 | $ 383,137 | $23,564,005 |
Investment Valuation
All investments are categorized as Level 1 under the Fair Value Hierarchy. The inputs or methodology used for valuing securities may not be an indication of the risk associated with investing in those securities. For more information on valuation inputs please refer to the Investment Valuation section in the accompanying Notes to Financial Statements.
See accompanying notes which are an integral part of the financial statements.
VIP Freedom 2035 Portfolio℠
Financial Statements
Statement of Assets and Liabilities
| | | December 31, 2015 |
| Assets | | |
| Investment in securities, at value (cost $24,124,044) — See accompanying schedule | | $23,564,005 |
| Receivable for investments sold | | 22 |
| Receivable for fund shares sold | | 19,963 |
| Total assets | | 23,583,990 |
| Liabilities | | |
| Payable to custodian bank | $2,617 | |
| Payable for investments purchased | 13,315 | |
| Payable for fund shares redeemed | 4,052 | |
| Distribution and service plan fees payable | 4,249 | |
| Total liabilities | | 24,233 |
| Net Assets | | $23,559,757 |
| Net Assets consist of: | | |
| Paid in capital | | $23,534,065 |
| Undistributed net investment income | | 396 |
| Accumulated undistributed net realized gain (loss) on investments | | 585,335 |
| Net unrealized appreciation (depreciation) on investments | | (560,039) |
| Net Assets | | $23,559,757 |
| Initial Class: | | |
| Net Asset Value, offering price and redemption price per share ($1,544,810 ÷ 81,073 shares) | | $19.05 |
| Service Class: | | |
| Net Asset Value, offering price and redemption price per share ($2,010,327 ÷ 105,603 shares) | | $19.04 |
| Service Class 2: | | |
| Net Asset Value, offering price and redemption price per share ($20,004,620 ÷ 1,055,235 shares) | | $18.96 |
See accompanying notes which are an integral part of the financial statements.
Statement of Operations
| | | Year ended December 31, 2015 |
| Investment Income | | |
| Income distributions from underlying funds | | $383,137 |
| Expenses | | |
| Distribution and service plan fees | $43,393 | |
| Independent trustees' compensation | 75 | |
| Total expenses before reductions | 43,468 | |
| Expense reductions | (75) | 43,393 |
| Net investment income (loss) | | 339,744 |
| Realized and Unrealized Gain (Loss) | | |
| Realized gain (loss) on sale of underlying fund shares | (117,856) | |
| Capital gain distributions from underlying funds | 846,795 | |
| Total net realized gain (loss) | | 728,939 |
| Change in net unrealized appreciation (depreciation) on underlying funds | | (1,301,660) |
| Net gain (loss) | | (572,721) |
| Net increase (decrease) in net assets resulting from operations | | $(232,977) |
See accompanying notes which are an integral part of the financial statements.
Statement of Changes in Net Assets
| | Year ended December 31, 2015 | Year ended December 31, 2014 |
| Increase (Decrease) in Net Assets | | |
| Operations | | |
| Net investment income (loss) | $339,744 | $199,121 |
| Net realized gain (loss) | 728,939 | 78,318 |
| Change in net unrealized appreciation (depreciation) | (1,301,660) | 209,879 |
| Net increase (decrease) in net assets resulting from operations | (232,977) | 487,318 |
| Distributions to shareholders from net investment income | (339,892) | (199,065) |
| Distributions to shareholders from net realized gain | (114,912) | (156,391) |
| Total distributions | (454,804) | (355,456) |
| Share transactions - net increase (decrease) | 9,034,191 | 9,314,575 |
| Total increase (decrease) in net assets | 8,346,410 | 9,446,437 |
| Net Assets | | |
| Beginning of period | 15,213,347 | 5,766,910 |
| End of period (including undistributed net investment income of $396 and undistributed net investment income of $544, respectively) | $23,559,757 | $15,213,347 |
See accompanying notes which are an integral part of the financial statements.
Financial Highlights — VIP Freedom 2035 Portfolio Initial Class
| | | | | | |
| Years ended December 31, | 2015 | 2014 | 2013 | 2012 | 2011 |
| Selected Per–Share Data | | | | | |
| Net asset value, beginning of period | $19.52 | $19.16 | $15.76 | $13.82 | $14.74 |
| Income from Investment Operations | | | | | |
| Net investment income (loss)A | .39 | .39 | .66 | .49 | .27 |
| Net realized and unrealized gain (loss) | (.44) | .55 | 3.24 | 1.83 | (.85) |
| Total from investment operations | (.05) | .94 | 3.90 | 2.32 | (.58) |
| Distributions from net investment income | (.32) | (.29) | (.29) | (.31) | (.28) |
| Distributions from net realized gain | (.10) | (.29) | (.20) | (.07) | (.06) |
| Total distributions | (.42) | (.58) | (.50)B | (.38) | (.34) |
| Net asset value, end of period | $19.05 | $19.52 | $19.16 | $15.76 | $13.82 |
| Total ReturnC,D | (.31)% | 4.93% | 24.84% | 16.82% | (3.99)% |
| Ratios to Average Net AssetsE,F | | | | | |
| Expenses before reductionsG | -% | -% | -% | -% | -% |
| Expenses net of fee waivers, if any | -% | -% | -% | -% | -% |
| Expenses net of all reductions | -% | -% | -% | -% | -% |
| Net investment income (loss) | 1.98% | 2.02% | 3.72% | 3.20% | 1.82% |
| Supplemental Data | | | | | |
| Net assets, end of period (000 omitted) | $1,545 | $539 | $1,054 | $128 | $97 |
| Portfolio turnover rateE | 22% | 26% | 31% | 19% | 38% |
A Calculated based on average shares outstanding during the period.
B Total distributions of $.50 per share is comprised of distributions from net investment income of $.292 and distributions from net realized gain of $.204 per share.
C Total returns do not reflect charges attributable to your insurance company's separate account. Inclusion of these charges would reduce the total returns shown.
D Total returns would have been lower if certain expenses had not been reduced during the applicable periods shown.
E Amounts do not include the activity of the Underlying Funds.
F Expense ratios reflect operating expenses of the class. Expenses before reductions do not reflect amounts reimbursed by the investment adviser or reductions from expense offset arrangements and do not represent the amount paid by the class during periods when reimbursements or reductions occur. Expenses net of fee waivers reflect expenses after reimbursement by the investment adviser but prior to reductions from expense offset arrangements. Expenses net of all reductions represent the net expenses paid by the class but do not include expenses of the underlying funds in which the Fund invests.
G Amount represents less than .005%.
See accompanying notes which are an integral part of the financial statements.
Financial Highlights — VIP Freedom 2035 Portfolio Service Class
| | | | | | |
| Years ended December 31, | 2015 | 2014 | 2013 | 2012 | 2011 |
| Selected Per–Share Data | | | | | |
| Net asset value, beginning of period | $19.51 | $19.15 | $15.76 | $13.82 | $14.74 |
| Income from Investment Operations | | | | | |
| Net investment income (loss)A | .37 | .38 | .64 | .47 | .25 |
| Net realized and unrealized gain (loss) | (.44) | .55 | 3.24 | 1.84 | (.85) |
| Total from investment operations | (.07) | .93 | 3.88 | 2.31 | (.60) |
| Distributions from net investment income | (.30) | (.28) | (.28) | (.30) | (.26) |
| Distributions from net realized gain | (.10) | (.29) | (.20) | (.07) | (.06) |
| Total distributions | (.40) | (.57) | (.49)B | (.37) | (.32) |
| Net asset value, end of period | $19.04 | $19.51 | $19.15 | $15.76 | $13.82 |
| Total ReturnC,D | (.40)% | 4.87% | 24.72% | 16.71% | (4.10)% |
| Ratios to Average Net AssetsE,F | | | | | |
| Expenses before reductions | .10% | .10% | .10% | .10% | .10% |
| Expenses net of fee waivers, if any | .10% | .10% | .10% | .10% | .10% |
| Expenses net of all reductions | .10% | .10% | .10% | .10% | .10% |
| Net investment income (loss) | 1.88% | 1.92% | 3.62% | 3.10% | 1.72% |
| Supplemental Data | | | | | |
| Net assets, end of period (000 omitted) | $2,010 | $1,639 | $289 | $105 | $90 |
| Portfolio turnover rateE | 22% | 26% | 31% | 19% | 38% |
A Calculated based on average shares outstanding during the period.
B Total distributions of $.49 per share is comprised of distributions from net investment income of $.283 and distributions from net realized gain of $.204 per share.
C Total returns do not reflect charges attributable to your insurance company's separate account. Inclusion of these charges would reduce the total returns shown.
D Total returns would have been lower if certain expenses had not been reduced during the applicable periods shown.
E Amounts do not include the activity of the Underlying Funds.
F Expense ratios reflect operating expenses of the class. Expenses before reductions do not reflect amounts reimbursed by the investment adviser or reductions from expense offset arrangements and do not represent the amount paid by the class during periods when reimbursements or reductions occur. Expenses net of fee waivers reflect expenses after reimbursement by the investment adviser but prior to reductions from expense offset arrangements. Expenses net of all reductions represent the net expenses paid by the class but do not include expenses of the underlying funds in which the Fund invests.
See accompanying notes which are an integral part of the financial statements.
Financial Highlights — VIP Freedom 2035 Portfolio Service Class 2
| | | | | | |
| Years ended December 31, | 2015 | 2014 | 2013 | 2012 | 2011 |
| Selected Per–Share Data | | | | | |
| Net asset value, beginning of period | $19.43 | $19.09 | $15.73 | $13.80 | $14.72 |
| Income from Investment Operations | | | | | |
| Net investment income (loss)A | .34 | .34 | .62 | .45 | .23 |
| Net realized and unrealized gain (loss) | (.43) | .54 | 3.22 | 1.84 | (.85) |
| Total from investment operations | (.09) | .88 | 3.84 | 2.29 | (.62) |
| Distributions from net investment income | (.28) | (.26) | (.27) | (.29) | (.24) |
| Distributions from net realized gain | (.10) | (.29) | (.20) | (.07) | (.06) |
| Total distributions | (.38) | (.54)B | (.48)C | (.36) | (.30) |
| Net asset value, end of period | $18.96 | $19.43 | $19.09 | $15.73 | $13.80 |
| Total ReturnD,E | (.51)% | 4.65% | 24.50% | 16.61% | (4.25)% |
| Ratios to Average Net AssetsF,G | | | | | |
| Expenses before reductions | .25% | .25% | .25% | .25% | .25% |
| Expenses net of fee waivers, if any | .25% | .25% | .25% | .25% | .25% |
| Expenses net of all reductions | .25% | .25% | .25% | .25% | .25% |
| Net investment income (loss) | 1.73% | 1.77% | 3.48% | 2.95% | 1.57% |
| Supplemental Data | | | | | |
| Net assets, end of period (000 omitted) | $20,005 | $13,035 | $4,423 | $808 | $276 |
| Portfolio turnover rateF | 22% | 26% | 31% | 19% | 38% |
A Calculated based on average shares outstanding during the period.
B Total distributions of $.54 per share is comprised of distributions from net investment income of $.257 and distributions from net realized gain of $.287 per share.
C Total distributions of $.48 per share is comprised of distributions from net investment income of $.271 and distributions from net realized gain of $.204 per share.
D Total returns do not reflect charges attributable to your insurance company's separate account. Inclusion of these charges would reduce the total returns shown.
E Total returns would have been lower if certain expenses had not been reduced during the applicable periods shown.
F Amounts do not include the activity of the Underlying Funds.
G Expense ratios reflect operating expenses of the class. Expenses before reductions do not reflect amounts reimbursed by the investment adviser or reductions from expense offset arrangements and do not represent the amount paid by the class during periods when reimbursements or reductions occur. Expenses net of fee waivers reflect expenses after reimbursement by the investment adviser but prior to reductions from expense offset arrangements. Expenses net of all reductions represent the net expenses paid by the class but do not include expenses of the underlying funds in which the Fund invests.
See accompanying notes which are an integral part of the financial statements.
VIP Freedom 2040 Portfolio℠
Investment Summary (Unaudited)
The information in the following tables is based on the direct investments of the Fund.
Fund Holdings as of December 31, 2015
| | % of fund's net assets | % of fund's net assets 6 months ago |
| Domestic Equity Funds | | |
| VIP Contrafund Portfolio Initial Class | 11.3 | 11.3 |
| VIP Equity-Income Portfolio Initial Class | 12.0 | 11.9 |
| VIP Growth & Income Portfolio Initial Class | 13.5 | 13.6 |
| VIP Growth Portfolio Initial Class | 11.8 | 11.5 |
| VIP Mid Cap Portfolio Initial Class | 3.2 | 3.3 |
| VIP Value Portfolio Initial Class | 8.7 | 8.7 |
| VIP Value Strategies Portfolio Initial Class | 4.2 | 4.2 |
| | 64.7 | 64.5 |
| International Equity Funds | | |
| VIP Emerging Markets Portfolio Initial Class | 8.3 | 8.2 |
| VIP Overseas Portfolio Initial Class | 19.9 | 19.9 |
| | 28.2 | 28.1 |
| Bond Funds | | |
| VIP High Income Portfolio Initial Class | 3.8 | 4.0 |
| VIP Investment Grade Bond Portfolio Initial Class | 2.0 | 2.1 |
| | 5.8 | 6.1 |
| Short-Term Funds | | |
| VIP Government Money Market Portfolio Initial Class 0.05% | 1.3 | 1.3 |
| Net Other Assets (Liabilities) | | |
| Net Other Assets | 0.0 | 0.0 |
| | 100.0 | 100.0 |
VIP Government Money Market Portfolio Initial Class was formerly known as VIP Money Market Portfolio Initial Class
Asset Allocation (% of fund's net assets)
| Period end |
| | Domestic Equity Funds | 64.7% |
| | International Equity Funds | 28.2% |
| | Bond Funds | 5.8% |
| | Short-Term Funds | 1.3% |

| Six months ago |
| | Domestic Equity Funds | 64.5% |
| | International Equity Funds | 28.1% |
| | Bond Funds | 6.1% |
| | Short-Term Funds | 1.3% |

Percentages shown as 0.0% may reflect amounts less than 0.05%.
VIP Freedom 2040 Portfolio℠
Investments December 31, 2015
Showing Percentage of Net Assets
| Domestic Equity Funds - 64.7% | | | |
| | | Shares | Value |
| VIP Contrafund Portfolio Initial Class (a) | | 154,698 | $5,247,350 |
| VIP Equity-Income Portfolio Initial Class (a) | | 270,633 | 5,537,158 |
| VIP Growth & Income Portfolio Initial Class (a) | | 330,694 | 6,243,507 |
| VIP Growth Portfolio Initial Class (a) | | 83,068 | 5,461,754 |
| VIP Mid Cap Portfolio Initial Class (a) | | 45,967 | 1,500,827 |
| VIP Value Portfolio Initial Class (a) | | 299,631 | 4,003,065 |
| VIP Value Strategies Portfolio Initial Class (a) | | 132,859 | 1,931,763 |
| TOTAL DOMESTIC EQUITY FUNDS | | | |
| (Cost $28,889,985) | | | 29,925,424 |
|
| International Equity Funds - 28.2% | | | |
| VIP Emerging Markets Portfolio Initial Class (a) | | 472,743 | 3,848,130 |
| VIP Overseas Portfolio Initial Class (a) | | 481,902 | 9,194,682 |
| TOTAL INTERNATIONAL EQUITY FUNDS | | | |
| (Cost $13,182,680) | | | 13,042,812 |
|
| Bond Funds - 5.8% | | | |
| VIP High Income Portfolio Initial Class (a) | | 350,565 | 1,735,296 |
| VIP Investment Grade Bond Portfolio Initial Class (a) | | 76,370 | 944,695 |
| TOTAL BOND FUNDS | | | |
| (Cost $2,958,630) | | | 2,679,991 |
|
| Short-Term Funds - 1.3% | | | |
| VIP Government Money Market Portfolio Initial Class 0.05% (a)(b) | | | |
| (Cost $613,131) | | 613,131 | 613,131 |
| TOTAL INVESTMENT PORTFOLIO - 100.0% | | | |
| (Cost $45,644,426) | | | 46,261,358 |
| NET OTHER ASSETS (LIABILITIES) - 0.0% | | | (4,178) |
| NET ASSETS - 100% | | | $46,257,180 |
Legend
(a) Affiliated Fund
(b) The rate quoted is the annualized seven-day yield of the fund at period end.
Affiliated Underlying Funds
Information regarding the Fund's fiscal year to date purchases and sales of the affiliated Underlying Funds and income earned by the Fund from investments in affiliated Underlying Funds is as follows:
(VIP Government Money Market Portfolio Initial Class was formerly known as VIP Money Market Portfolio Initial Class)
| Affiliate | Value, beginning of period | Purchases | Sales Proceeds | Dividend Income | Value, end of period |
| VIP Contrafund Portfolio Initial Class | $4,140,749 | $2,472,251 | $931,057 | $ 55,960 | $5,247,350 |
| VIP Emerging Markets Portfolio Initial Class | 2,674,158 | 2,404,259 | 780,748 | 23,525 | 3,848,130 |
| VIP Equity-Income Portfolio Initial Class | 4,355,995 | 2,908,709 | 887,018 | 184,603 | 5,537,158 |
| VIP Government Money Market Portfolio Initial Class 0.05% | -- | 733,894 | 120,763 | 124 | 613,131 |
| VIP Growth & Income Portfolio Initial Class | 4,968,899 | 2,950,131 | 1,126,746 | 137,624 | 6,243,507 |
| VIP Growth Portfolio Initial Class | 4,235,604 | 2,131,400 | 1,085,413 | 14,191 | 5,461,754 |
| VIP High Income Portfolio Initial Class | 1,408,220 | 943,356 | 417,014 | 121,138 | 1,735,296 |
| VIP Investment Grade Bond Portfolio Initial Class | 1,130,954 | 601,780 | 759,484 | 25,282 | 944,695 |
| VIP Mid Cap Portfolio Initial Class | 1,207,567 | 731,462 | 249,863 | 7,921 | 1,500,827 |
| VIP Overseas Portfolio Initial Class | 7,602,926 | 3,992,940 | 2,542,658 | 128,888 | 9,194,682 |
| VIP Value Portfolio Initial Class | 3,195,856 | 2,144,778 | 664,803 | 55,916 | 4,003,065 |
| VIP Value Strategies Portfolio Initial Class | 1,561,446 | 778,093 | 311,636 | 23,932 | 1,931,763 |
| Total | $36,482,374 | $22,793,053 | $9,877,203 | $779,104 | $46,261,358 |
Investment Valuation
All investments are categorized as Level 1 under the Fair Value Hierarchy. The inputs or methodology used for valuing securities may not be an indication of the risk associated with investing in those securities. For more information on valuation inputs please refer to the Investment Valuation section in the accompanying Notes to Financial Statements.
See accompanying notes which are an integral part of the financial statements.
VIP Freedom 2040 Portfolio℠
Financial Statements
Statement of Assets and Liabilities
| | | December 31, 2015 |
| Assets | | |
| Investment in securities, at value (cost $45,644,426) — See accompanying schedule | | $46,261,358 |
| Receivable for investments sold | | 169,894 |
| Receivable for fund shares sold | | 79,196 |
| Total assets | | 46,510,448 |
| Liabilities | | |
| Payable for investments purchased | $319 | |
| Payable for fund shares redeemed | 248,772 | |
| Distribution and service plan fees payable | 4,177 | |
| Total liabilities | | 253,268 |
| Net Assets | | $46,257,180 |
| Net Assets consist of: | | |
| Paid in capital | | $44,283,183 |
| Accumulated undistributed net realized gain (loss) on investments | | 1,357,065 |
| Net unrealized appreciation (depreciation) on investments | | 616,932 |
| Net Assets | | $46,257,180 |
| Initial Class: | | |
| Net Asset Value, offering price and redemption price per share ($15,387,980 ÷ 845,904 shares) | | $18.19 |
| Service Class: | | |
| Net Asset Value, offering price and redemption price per share ($18,401,265 ÷ 1,012,731 shares) | | $18.17 |
| Service Class 2: | | |
| Net Asset Value, offering price and redemption price per share ($12,467,935 ÷ 688,230 shares) | | $18.12 |
See accompanying notes which are an integral part of the financial statements.
Statement of Operations
| | | Year ended December 31, 2015 |
| Investment Income | | |
| Income distributions from underlying funds | | $779,104 |
| Expenses | | |
| Distribution and service plan fees | $45,460 | |
| Independent trustees' compensation | 172 | |
| Total expenses before reductions | 45,632 | |
| Expense reductions | (172) | 45,460 |
| Net investment income (loss) | | 733,644 |
| Realized and Unrealized Gain (Loss) | | |
| Realized gain (loss) on sale of underlying fund shares | (196,576) | |
| Capital gain distributions from underlying funds | 1,957,762 | |
| Total net realized gain (loss) | | 1,761,186 |
| Change in net unrealized appreciation (depreciation) on underlying funds | | (2,940,295) |
| Net gain (loss) | | (1,179,109) |
| Net increase (decrease) in net assets resulting from operations | | $(445,465) |
See accompanying notes which are an integral part of the financial statements.
Statement of Changes in Net Assets
| | Year ended December 31, 2015 | Year ended December 31, 2014 |
| Increase (Decrease) in Net Assets | | |
| Operations | | |
| Net investment income (loss) | $733,644 | $518,447 |
| Net realized gain (loss) | 1,761,186 | 224,362 |
| Change in net unrealized appreciation (depreciation) | (2,940,295) | 639,214 |
| Net increase (decrease) in net assets resulting from operations | (445,465) | 1,382,023 |
| Distributions to shareholders from net investment income | (734,120) | (517,725) |
| Distributions to shareholders from net realized gain | (287,093) | (465,973) |
| Total distributions | (1,021,213) | (983,698) |
| Share transactions - net increase (decrease) | 11,244,253 | 13,928,833 |
| Total increase (decrease) in net assets | 9,777,575 | 14,327,158 |
| Net Assets | | |
| Beginning of period | 36,479,605 | 22,152,447 |
| End of period (including undistributed net investment income of $0 and $723, respectively) | $46,257,180 | $36,479,605 |
See accompanying notes which are an integral part of the financial statements.
Financial Highlights — VIP Freedom 2040 Portfolio Initial Class
| | | | | | |
| Years ended December 31, | 2015 | 2014 | 2013 | 2012 | 2011 |
| Selected Per–Share Data | | | | | |
| Net asset value, beginning of period | $18.66 | $18.35 | $15.03 | $13.16 | $14.02 |
| Income from Investment Operations | | | | | |
| Net investment income (loss)A | .34 | .34 | .38 | .42 | .35 |
| Net realized and unrealized gain (loss) | (.38) | .56 | 3.41 | 1.81 | (.91) |
| Total from investment operations | (.04) | .90 | 3.79 | 2.23 | (.56) |
| Distributions from net investment income | (.31) | (.28) | (.27) | (.29) | (.27) |
| Distributions from net realized gain | (.12) | (.31) | (.19) | (.07) | (.02) |
| Total distributions | (.43) | (.59) | (.47)B | (.36) | (.30)C |
| Net asset value, end of period | $18.19 | $18.66 | $18.35 | $15.03 | $13.16 |
| Total ReturnD,E | (.26)% | 4.91% | 25.29% | 16.95% | (4.02)% |
| Ratios to Average Net AssetsF,G | | | | | |
| Expenses before reductionsH | -% | -% | -% | -% | -% |
| Expenses net of fee waivers, if any | -% | -% | -% | -% | -% |
| Expenses net of all reductions | -% | -% | -% | -% | -% |
| Net investment income (loss) | 1.80% | 1.82% | 2.26% | 2.91% | 2.50% |
| Supplemental Data | | | | | |
| Net assets, end of period (000 omitted) | $15,388 | $15,234 | $10,262 | $3,369 | $1,559 |
| Portfolio turnover rateF | 23% | 19% | 36% | 39% | 42% |
A Calculated based on average shares outstanding during the period.
B Total distributions of $.47 per share is comprised of distributions from net investment income of $.272 and distributions from net realized gain of $.193 per share.
C Total distributions of $.30 per share is comprised of distributions from net investment income of .274 and distributions from net realized gain of $.022 per share.
D Total returns do not reflect charges attributable to your insurance company's separate account. Inclusion of these charges would reduce the total returns shown.
E Total returns would have been lower if certain expenses had not been reduced during the applicable periods shown.
F Amounts do not include the activity of the Underlying Funds.
G Expense ratios reflect operating expenses of the class. Expenses before reductions do not reflect amounts reimbursed by the investment adviser or reductions from expense offset arrangements and do not represent the amount paid by the class during periods when reimbursements or reductions occur. Expenses net of fee waivers reflect expenses after reimbursement by the investment adviser but prior to reductions from expense offset arrangements. Expenses net of all reductions represent the net expenses paid by the class but do not include expenses of the underlying funds in which the Fund invests.
H Amount represents less than .005%.
See accompanying notes which are an integral part of the financial statements.
Financial Highlights — VIP Freedom 2040 Portfolio Service Class
| | | | | | |
| Years ended December 31, | 2015 | 2014 | 2013 | 2012 | 2011 |
| Selected Per–Share Data | | | | | |
| Net asset value, beginning of period | $18.64 | $18.33 | $15.02 | $13.15 | $14.02 |
| Income from Investment Operations | | | | | |
| Net investment income (loss)A | .32 | .32 | .36 | .41 | .33 |
| Net realized and unrealized gain (loss) | (.38) | .56 | 3.40 | 1.81 | (.91) |
| Total from investment operations | (.06) | .88 | 3.76 | 2.22 | (.58) |
| Distributions from net investment income | (.29) | (.27) | (.26) | (.28) | (.26) |
| Distributions from net realized gain | (.12) | (.31) | (.19) | (.07) | (.02) |
| Total distributions | (.41) | (.57)B | (.45) | (.35) | (.29)C |
| Net asset value, end of period | $18.17 | $18.64 | $18.33 | $15.02 | $13.15 |
| Total ReturnD,E | (.35)% | 4.83% | 25.16% | 16.88% | (4.17)% |
| Ratios to Average Net AssetsF,G | | | | | |
| Expenses before reductions | .10% | .10% | .10% | .10% | .10% |
| Expenses net of fee waivers, if any | .10% | .10% | .10% | .10% | .10% |
| Expenses net of all reductions | .10% | .10% | .10% | .10% | .10% |
| Net investment income (loss) | 1.70% | 1.72% | 2.16% | 2.81% | 2.41% |
| Supplemental Data | | | | | |
| Net assets, end of period (000 omitted) | $18,401 | $12,905 | $9,076 | $4,600 | $1,058 |
| Portfolio turnover rateF | 23% | 19% | 36% | 39% | 42% |
A Calculated based on average shares outstanding during the period.
B Total distributions of $.57 per share is comprised of distributions from net investment income of $.266 and distributions from net realized gain of $.305 per share.
C Total distributions of $.29 per share is comprised of distributions from net investment income of $.264 and distributions from net realized gain of $.022 per share.
D Total returns do not reflect charges attributable to your insurance company's separate account. Inclusion of these charges would reduce the total returns shown.
E Total returns would have been lower if certain expenses had not been reduced during the applicable periods shown.
F Amounts do not include the activity of the Underlying Funds.
G Expense ratios reflect operating expenses of the class. Expenses before reductions do not reflect amounts reimbursed by the investment adviser or reductions from expense offset arrangements and do not represent the amount paid by the class during periods when reimbursements or reductions occur. Expenses net of fee waivers reflect expenses after reimbursement by the investment adviser but prior to reductions from expense offset arrangements. Expenses net of all reductions represent the net expenses paid by the class but do not include expenses of the underlying funds in which the Fund invests.
See accompanying notes which are an integral part of the financial statements.
Financial Highlights — VIP Freedom 2040 Portfolio Service Class 2
| | | | | | |
| Years ended December 31, | 2015 | 2014 | 2013 | 2012 | 2011 |
| Selected Per–Share Data | | | | | |
| Net asset value, beginning of period | $18.59 | $18.29 | $15.00 | $13.15 | $14.02 |
| Income from Investment Operations | | | | | |
| Net investment income (loss)A | .29 | .29 | .34 | .39 | .32 |
| Net realized and unrealized gain (loss) | (.38) | .56 | 3.39 | 1.79 | (.92) |
| Total from investment operations | (.09) | .85 | 3.73 | 2.18 | (.60) |
| Distributions from net investment income | (.27) | (.25) | (.25) | (.27) | (.24) |
| Distributions from net realized gain | (.12) | (.31) | (.19) | (.07) | (.02) |
| Total distributions | (.38)B | (.55)C | (.44) | (.33)D | (.27)E |
| Net asset value, end of period | $18.12 | $18.59 | $18.29 | $15.00 | $13.15 |
| Total ReturnF,G | (.49)% | 4.70% | 24.99% | 16.64% | (4.32)% |
| Ratios to Average Net AssetsH,I | | | | | |
| Expenses before reductions | .25% | .25% | .25% | .25% | .25% |
| Expenses net of fee waivers, if any | .25% | .25% | .25% | .25% | .25% |
| Expenses net of all reductions | .25% | .25% | .25% | .25% | .25% |
| Net investment income (loss) | 1.55% | 1.57% | 2.01% | 2.66% | 2.25% |
| Supplemental Data | | | | | |
| Net assets, end of period (000 omitted) | $12,468 | $8,341 | $2,815 | $581 | $137 |
| Portfolio turnover rateH | 23% | 19% | 36% | 39% | 42% |
A Calculated based on average shares outstanding during the period.
B Total distributions of $.38 per share is comprised of distributions from net investment income of $.268 and distributions from net realized gain of $.116 per share.
C Total distributions of $.55 per share is comprised of distributions from net investment income of $.249 and distributions from net realized gain of $.305 per share.
D Total distributions of $.33 per share is comprised of distributions from net investment income of $.265 and distributions from net realized gain of $.069 per share.
E Total distributions of $.27 per share is comprised of distributions from net investment income of $.243 and distributions from net realized gain of $.022 per share.
F Total returns do not reflect charges attributable to your insurance company's separate account. Inclusion of these charges would reduce the total returns shown.
G Total returns would have been lower if certain expenses had not been reduced during the applicable periods shown.
H Amounts do not include the activity of the Underlying Funds.
I Expense ratios reflect operating expenses of the class. Expenses before reductions do not reflect amounts reimbursed by the investment adviser or reductions from expense offset arrangements and do not represent the amount paid by the class during periods when reimbursements or reductions occur. Expenses net of fee waivers reflect expenses after reimbursement by the investment adviser but prior to reductions from expense offset arrangements. Expenses net of all reductions represent the net expenses paid by the class but do not include expenses of the underlying funds in which the Fund invests.
See accompanying notes which are an integral part of the financial statements.
VIP Freedom 2045 Portfolio℠
Investment Summary (Unaudited)
The information in the following tables is based on the direct investments of the Fund.
Fund Holdings as of December 31, 2015
| | % of fund's net assets | % of fund's net assets 6 months ago |
| Domestic Equity Funds | | |
| VIP Contrafund Portfolio Initial Class | 11.4 | 11.3 |
| VIP Equity-Income Portfolio Initial Class | 12.0 | 11.9 |
| VIP Growth & Income Portfolio Initial Class | 13.5 | 13.5 |
| VIP Growth Portfolio Initial Class | 11.8 | 11.6 |
| VIP Mid Cap Portfolio Initial Class | 3.2 | 3.3 |
| VIP Value Portfolio Initial Class | 8.6 | 8.7 |
| VIP Value Strategies Portfolio Initial Class | 4.2 | 4.2 |
| | 64.7 | 64.5 |
| International Equity Funds | | |
| VIP Emerging Markets Portfolio Initial Class | 8.3 | 8.2 |
| VIP Overseas Portfolio Initial Class | 19.9 | 19.9 |
| | 28.2 | 28.1 |
| Bond Funds | | |
| VIP High Income Portfolio Initial Class | 3.8 | 4.0 |
| VIP Investment Grade Bond Portfolio Initial Class | 2.0 | 2.1 |
| | 5.8 | 6.1 |
| Short-Term Funds | | |
| VIP Government Money Market Portfolio Initial Class 0.05% | 1.3 | 1.3 |
| Net Other Assets (Liabilities) | | |
| Net Other Assets | 0.0 | 0.0 |
| | 100.0 | 100.0 |
VIP Government Money Market Portfolio Initial Class was formerly known as VIP Money Market Portfolio Initial Class
Asset Allocation (% of fund's net assets)
| Period end |
| | Domestic Equity Funds | 64.7% |
| | International Equity Funds | 28.2% |
| | Bond Funds | 5.8% |
| | Short-Term Funds | 1.3% |

| Six months ago |
| | Domestic Equity Funds | 64.5% |
| | International Equity Funds | 28.1% |
| | Bond Funds | 6.1% |
| | Short-Term Funds | 1.3% |

Percentages shown as 0.0% may reflect amounts less than 0.05%.
VIP Freedom 2045 Portfolio℠
Investments December 31, 2015
Showing Percentage of Net Assets
| Domestic Equity Funds - 64.7% | | | |
| | | Shares | Value |
| VIP Contrafund Portfolio Initial Class (a) | | 41,153 | $1,395,911 |
| VIP Equity-Income Portfolio Initial Class (a) | | 71,724 | 1,467,471 |
| VIP Growth & Income Portfolio Initial Class (a) | | 87,903 | 1,659,610 |
| VIP Growth Portfolio Initial Class (a) | | 22,075 | 1,451,452 |
| VIP Mid Cap Portfolio Initial Class (a) | | 12,200 | 398,334 |
| VIP Value Portfolio Initial Class (a) | | 79,496 | 1,062,071 |
| VIP Value Strategies Portfolio Initial Class (a) | | 35,165 | 511,292 |
| TOTAL DOMESTIC EQUITY FUNDS | | | |
| (Cost $7,966,817) | | | 7,946,141 |
|
| International Equity Funds - 28.2% | | | |
| VIP Emerging Markets Portfolio Initial Class (a) | | 125,547 | 1,021,953 |
| VIP Overseas Portfolio Initial Class (a) | | 127,980 | 2,441,862 |
| TOTAL INTERNATIONAL EQUITY FUNDS | | | |
| (Cost $3,550,919) | | | 3,463,815 |
|
| Bond Funds - 5.8% | | | |
| VIP High Income Portfolio Initial Class (a) | | 93,075 | 460,721 |
| VIP Investment Grade Bond Portfolio Initial Class (a) | | 20,302 | 251,131 |
| TOTAL BOND FUNDS | | | |
| (Cost $776,604) | | | 711,852 |
|
| Short-Term Funds - 1.3% | | | |
| VIP Government Money Market Portfolio Initial Class 0.05% (a)(b) | | | |
| (Cost $163,036) | | 163,036 | 163,036 |
| TOTAL INVESTMENT PORTFOLIO - 100.0% | | | |
| (Cost $12,457,376) | | | 12,284,844 |
| NET OTHER ASSETS (LIABILITIES) - 0.0% | | | (2,463) |
| NET ASSETS - 100% | | | $12,282,381 |
Legend
(a) Affiliated Fund
(b) The rate quoted is the annualized seven-day yield of the fund at period end.
Affiliated Underlying Funds
Information regarding the Fund's fiscal year to date purchases and sales of the affiliated Underlying Funds and income earned by the Fund from investments in affiliated Underlying Funds is as follows:
(VIP Government Money Market Portfolio Initial Class was formerly known as VIP Money Market Portfolio Initial Class)
| Affiliate | Value, beginning of period | Purchases | Sales Proceeds | Dividend Income | Value, end of period |
| VIP Contrafund Portfolio Initial Class | $914,242 | $837,993 | $256,708 | $15,404 | $1,395,911 |
| VIP Emerging Markets Portfolio Initial Class | 596,334 | 749,930 | 215,521 | 6,376 | 1,021,953 |
| VIP Equity-Income Portfolio Initial Class | 961,856 | 963,207 | 254,531 | 50,554 | 1,467,471 |
| VIP Government Money Market Portfolio Initial Class 0.05% | 79 | 202,828 | 39,871 | 30 | 163,036 |
| VIP Growth & Income Portfolio Initial Class | 1,097,436 | 1,012,861 | 318,211 | 37,873 | 1,659,610 |
| VIP Growth Portfolio Initial Class | 935,225 | 757,948 | 291,445 | 3,910 | 1,451,452 |
| VIP High Income Portfolio Initial Class | 314,400 | 326,046 | 123,625 | 33,159 | 460,721 |
| VIP Investment Grade Bond Portfolio Initial Class | 253,487 | 188,081 | 182,548 | 6,906 | 251,131 |
| VIP Mid Cap Portfolio Initial Class | 266,910 | 248,545 | 72,857 | 2,183 | 398,334 |
| VIP Overseas Portfolio Initial Class | 1,680,108 | 1,435,700 | 687,771 | 35,508 | 2,441,862 |
| VIP Value Portfolio Initial Class | 705,223 | 725,804 | 194,111 | 15,377 | 1,062,071 |
| VIP Value Strategies Portfolio Initial Class | 344,932 | 283,722 | 91,059 | 6,578 | 511,292 |
| Total | $8,070,232 | $7,732,665 | $2,728,258 | $213,858 | $12,284,844 |
Investment Valuation
All investments are categorized as Level 1 under the Fair Value Hierarchy. The inputs or methodology used for valuing securities may not be an indication of the risk associated with investing in those securities. For more information on valuation inputs please refer to the Investment Valuation section in the accompanying Notes to Financial Statements.
See accompanying notes which are an integral part of the financial statements.
VIP Freedom 2045 Portfolio℠
Financial Statements
Statement of Assets and Liabilities
| | | December 31, 2015 |
| Assets | | |
| Investment in securities, at value (cost $12,457,376) — See accompanying schedule | | $12,284,844 |
| Receivable for investments sold | | 9,011 |
| Receivable for fund shares sold | | 4,570 |
| Total assets | | 12,298,425 |
| Liabilities | | |
| Payable to custodian bank | $4,547 | |
| Payable for fund shares redeemed | 9,037 | |
| Distribution and service plan fees payable | 2,460 | |
| Total liabilities | | 16,044 |
| Net Assets | | $12,282,381 |
| Net Assets consist of: | | |
| Paid in capital | | $12,194,490 |
| Accumulated undistributed net realized gain (loss) on investments | | 260,423 |
| Net unrealized appreciation (depreciation) on investments | | (172,532) |
| Net Assets | | $12,282,381 |
| Initial Class: | | |
| Net Asset Value, offering price and redemption price per share ($541,819 ÷ 30,054 shares) | | $18.03 |
| Service Class: | | |
| Net Asset Value, offering price and redemption price per share ($342,608 ÷ 19,013 shares) | | $18.02 |
| Service Class 2: | | |
| Net Asset Value, offering price and redemption price per share ($11,397,954 ÷ 634,905 shares) | | $17.95 |
See accompanying notes which are an integral part of the financial statements.
Statement of Operations
| | | Year ended December 31, 2015 |
| Investment Income | | |
| Income distributions from underlying funds | | $213,858 |
| Expenses | | |
| Distribution and service plan fees | $25,007 | |
| Independent trustees' compensation | 41 | |
| Total expenses before reductions | 25,048 | |
| Expense reductions | (41) | 25,007 |
| Net investment income (loss) | | 188,851 |
| Realized and Unrealized Gain (Loss) | | |
| Realized gain (loss) on sale of underlying fund shares | (127,205) | |
| Capital gain distributions from underlying funds | 459,272 | |
| Total net realized gain (loss) | | 332,067 |
| Change in net unrealized appreciation (depreciation) on underlying funds | | (662,594) |
| Net gain (loss) | | (330,527) |
| Net increase (decrease) in net assets resulting from operations | | $(141,676) |
See accompanying notes which are an integral part of the financial statements.
Statement of Changes in Net Assets
| | Year ended December 31, 2015 | Year ended December 31, 2014 |
| Increase (Decrease) in Net Assets | | |
| Operations | | |
| Net investment income (loss) | $188,851 | $106,238 |
| Net realized gain (loss) | 332,067 | 48,869 |
| Change in net unrealized appreciation (depreciation) | (662,594) | 89,302 |
| Net increase (decrease) in net assets resulting from operations | (141,676) | 244,409 |
| Distributions to shareholders from net investment income | (190,223) | (106,045) |
| Distributions to shareholders from net realized gain | (65,189) | (84,124) |
| Total distributions | (255,412) | (190,169) |
| Share transactions - net increase (decrease) | 4,610,754 | 5,080,204 |
| Total increase (decrease) in net assets | 4,213,666 | 5,134,444 |
| Net Assets | | |
| Beginning of period | 8,068,715 | 2,934,271 |
| End of period (including undistributed net investment income of $0 and $193, respectively) | $12,282,381 | $8,068,715 |
See accompanying notes which are an integral part of the financial statements.
Financial Highlights — VIP Freedom 2045 Portfolio Initial Class
| | | | | | |
| Years ended December 31, | 2015 | 2014 | 2013 | 2012 | 2011 |
| Selected Per–Share Data | | | | | |
| Net asset value, beginning of period | $18.50 | $18.18 | $14.83 | $13.38 | $14.61 |
| Income from Investment Operations | | | | | |
| Net investment income (loss)A | .38 | .40 | .52 | .44 | .27 |
| Net realized and unrealized gain (loss) | (.42) | .50 | 3.33 | 1.84 | (.89) |
| Total from investment operations | (.04) | .90 | 3.85 | 2.28 | (.62) |
| Distributions from net investment income | (.33) | (.28) | (.29) | (.30) | (.28) |
| Distributions from net realized gain | (.10) | (.30) | (.21) | (.53) | (.34) |
| Total distributions | (.43) | (.58) | (.50) | (.83) | (.61)B |
| Net asset value, end of period | $18.03 | $18.50 | $18.18 | $14.83 | $13.38 |
| Total ReturnC,D | (.26)% | 4.95% | 26.07% | 17.33% | (4.41)% |
| Ratios to Average Net AssetsE,F | | | | | |
| Expenses before reductionsG | -% | -% | -% | -% | -% |
| Expenses net of fee waivers, if any | -% | -% | -% | -% | -% |
| Expenses net of all reductions | -% | -% | -% | -% | -% |
| Net investment income (loss) | 2.01% | 2.14% | 3.13% | 3.07% | 1.88% |
| Supplemental Data | | | | | |
| Net assets, end of period (000 omitted) | $542 | $342 | $272 | $136 | $95 |
| Portfolio turnover rateE | 26% | 19% | 42% | 16% | 29% |
A Calculated based on average shares outstanding during the period.
B Total distributions of $.61 per share is comprised of distributions from net investment income of $.279 and distributions from net realized gain of $.335 per share.
C Total returns do not reflect charges attributable to your insurance company's separate account. Inclusion of these charges would reduce the total returns shown.
D Total returns would have been lower if certain expenses had not been reduced during the applicable periods shown.
E Amounts do not include the activity of the Underlying Funds.
F Expense ratios reflect operating expenses of the class. Expenses before reductions do not reflect amounts reimbursed by the investment adviser or reductions from expense offset arrangements and do not represent the amount paid by the class during periods when reimbursements or reductions occur. Expenses net of fee waivers reflect expenses after reimbursement by the investment adviser but prior to reductions from expense offset arrangements. Expenses net of all reductions represent the net expenses paid by the class but do not include expenses of the underlying funds in which the Fund invests.
G Amount represents less than .005%.
See accompanying notes which are an integral part of the financial statements.
Financial Highlights — VIP Freedom 2045 Portfolio Service Class
| | | | | | |
| Years ended December 31, | 2015 | 2014 | 2013 | 2012 | 2011 |
| Selected Per–Share Data | | | | | |
| Net asset value, beginning of period | $18.49 | $18.18 | $14.83 | $13.38 | $14.61 |
| Income from Investment Operations | | | | | |
| Net investment income (loss)A | .36 | .38 | .51 | .43 | .26 |
| Net realized and unrealized gain (loss) | (.42)�� | .49 | 3.33 | 1.83 | (.89) |
| Total from investment operations | (.06) | .87 | 3.84 | 2.26 | (.63) |
| Distributions from net investment income | (.31) | (.27) | (.27) | (.29) | (.26) |
| Distributions from net realized gain | (.10) | (.30) | (.21) | (.53) | (.34) |
| Total distributions | (.41) | (.56)B | (.49)C | (.81)D | (.60) |
| Net asset value, end of period | $18.02 | $18.49 | $18.18 | $14.83 | $13.38 |
| Total ReturnE,F | (.37)% | 4.83% | 25.96% | 17.24% | (4.52)% |
| Ratios to Average Net AssetsG,H | | | | | |
| Expenses before reductions | .10% | .10% | .10% | .10% | .10% |
| Expenses net of fee waivers, if any | .10% | .10% | .10% | .10% | .10% |
| Expenses net of all reductions | .10% | .10% | .10% | .10% | .10% |
| Net investment income (loss) | 1.91% | 2.04% | 3.03% | 2.97% | 1.78% |
| Supplemental Data | | | | | |
| Net assets, end of period (000 omitted) | $343 | $364 | $169 | $134 | $90 |
| Portfolio turnover rateG | 26% | 19% | 42% | 16% | 29% |
A Calculated based on average shares outstanding during the period.
B Total distributions of $.56 per share is comprised of distributions from net investment income of $.266 and distributions from net realized gain of $.298 per share.
C Total distributions of $.49 per share is comprised of distributions from net investment income of $.271 and distributions from net realized gain of $.214 per share.
D Total distributions of $.81 per share is comprised of distributions from net investment income of $.289 and distributions from net realized gain of $.525 per share.
E Total returns do not reflect charges attributable to your insurance company's separate account. Inclusion of these charges would reduce the total returns shown.
F Total returns would have been lower if certain expenses had not been reduced during the applicable periods shown.
G Amounts do not include the activity of the Underlying Funds.
H Expense ratios reflect operating expenses of the class. Expenses before reductions do not reflect amounts reimbursed by the investment adviser or reductions from expense offset arrangements and do not represent the amount paid by the class during periods when reimbursements or reductions occur. Expenses net of fee waivers reflect expenses after reimbursement by the investment adviser but prior to reductions from expense offset arrangements. Expenses net of all reductions represent the net expenses paid by the class but do not include expenses of the underlying funds in which the Fund invests.
See accompanying notes which are an integral part of the financial statements.
Financial Highlights — VIP Freedom 2045 Portfolio Service Class 2
| | | | | | |
| Years ended December 31, | 2015 | 2014 | 2013 | 2012 | 2011 |
| Selected Per–Share Data | | | | | |
| Net asset value, beginning of period | $18.43 | $18.13 | $14.81 | $13.38 | $14.61 |
| Income from Investment Operations | | | | | |
| Net investment income (loss)A | .33 | .35 | .49 | .41 | .23 |
| Net realized and unrealized gain (loss) | (.42) | .49 | 3.31 | 1.83 | (.88) |
| Total from investment operations | (.09) | .84 | 3.80 | 2.24 | (.65) |
| Distributions from net investment income | (.29) | (.25) | (.27) | (.28) | (.25) |
| Distributions from net realized gain | (.10) | (.30) | (.21) | (.53) | (.34) |
| Total distributions | (.39) | (.54)B | (.48) | (.81) | (.58)C |
| Net asset value, end of period | $17.95 | $18.43 | $18.13 | $14.81 | $13.38 |
| Total ReturnD,E | (.53)% | 4.68% | 25.76% | 17.02% | (4.64)% |
| Ratios to Average Net AssetsF,G | | | | | |
| Expenses before reductions | .25% | .25% | .25% | .25% | .25% |
| Expenses net of fee waivers, if any | .25% | .25% | .25% | .25% | .25% |
| Expenses net of all reductions | .25% | .25% | .25% | .25% | .25% |
| Net investment income (loss) | 1.76% | 1.89% | 2.88% | 2.82% | 1.63% |
| Supplemental Data | | | | | |
| Net assets, end of period (000 omitted) | $11,398 | $7,363 | $2,493 | $486 | $143 |
| Portfolio turnover rateF | 26% | 19% | 42% | 16% | 29% |
A Calculated based on average shares outstanding during the period.
B Total distributions of $.54 per share is comprised of distributions from net investment income of $.245 and distributions from net realized gain of $.298 per share.
C Total distributions of $.58 per share is comprised of distributions from net investment income of $.245 and distributions from net realized gain of $.335 per share.
D Total returns do not reflect charges attributable to your insurance company's separate account. Inclusion of these charges would reduce the total returns shown.
E Total returns would have been lower if certain expenses had not been reduced during the applicable periods shown.
F Amounts do not include the activity of the Underlying Funds.
G Expense ratios reflect operating expenses of the class. Expenses before reductions do not reflect amounts reimbursed by the investment adviser or reductions from expense offset arrangements and do not represent the amount paid by the class during periods when reimbursements or reductions occur. Expenses net of fee waivers reflect expenses after reimbursement by the investment adviser but prior to reductions from expense offset arrangements. Expenses net of all reductions represent the net expenses paid by the class but do not include expenses of the underlying funds in which the Fund invests.
See accompanying notes which are an integral part of the financial statements.
VIP Freedom 2050 Portfolio℠
Investment Summary (Unaudited)
The information in the following tables is based on the direct investments of the Fund.
Fund Holdings as of December 31, 2015
| | % of fund's net assets | % of fund's net assets 6 months ago |
| Domestic Equity Funds | | |
| VIP Contrafund Portfolio Initial Class | 11.4 | 11.3 |
| VIP Equity-Income Portfolio Initial Class | 12.0 | 11.9 |
| VIP Growth & Income Portfolio Initial Class | 13.5 | 13.5 |
| VIP Growth Portfolio Initial Class | 11.8 | 11.6 |
| VIP Mid Cap Portfolio Initial Class | 3.2 | 3.3 |
| VIP Value Portfolio Initial Class | 8.6 | 8.7 |
| VIP Value Strategies Portfolio Initial Class | 4.2 | 4.3 |
| | 64.7 | 64.6 |
| International Equity Funds | | |
| VIP Emerging Markets Portfolio Initial Class | 8.3 | 8.1 |
| VIP Overseas Portfolio Initial Class | 19.9 | 19.9 |
| | 28.2 | 28.0 |
| Bond Funds | | |
| VIP High Income Portfolio Initial Class | 3.8 | 4.0 |
| VIP Investment Grade Bond Portfolio Initial Class | 2.0 | 2.1 |
| | 5.8 | 6.1 |
| Short-Term Funds | | |
| VIP Government Money Market Portfolio Initial Class 0.05% | 1.3 | 1.3 |
| Net Other Assets (Liabilities) | | |
| Net Other Assets | 0.0 | 0.0 |
| | 100.0 | 100.0 |
VIP Government Money Market Portfolio Initial Class was formerly known as VIP Money Market Portfolio Initial Class
Asset Allocation (% of fund's net assets)
| Period end |
| | Domestic Equity Funds | 64.7% |
| | International Equity Funds | 28.2% |
| | Bond Funds | 5.8% |
| | Short-Term Funds | 1.3% |

| Six months ago |
| | Domestic Equity Funds | 64.6% |
| | International Equity Funds | 28.0% |
| | Bond Funds | 6.1% |
| | Short-Term Funds | 1.3% |

Percentages shown as 0.0% may reflect amounts less than 0.05%.
VIP Freedom 2050 Portfolio℠
Investments December 31, 2015
Showing Percentage of Net Assets
| Domestic Equity Funds - 64.7% | | | |
| | | Shares | Value |
| VIP Contrafund Portfolio Initial Class (a) | | 43,261 | $1,467,418 |
| VIP Equity-Income Portfolio Initial Class (a) | | 75,442 | 1,543,548 |
| VIP Growth & Income Portfolio Initial Class (a) | | 92,363 | 1,743,810 |
| VIP Growth Portfolio Initial Class (a) | | 23,276 | 1,530,404 |
| VIP Mid Cap Portfolio Initial Class (a) | | 12,815 | 418,396 |
| VIP Value Portfolio Initial Class (a) | | 83,538 | 1,116,066 |
| VIP Value Strategies Portfolio Initial Class (a) | | 36,917 | 536,774 |
| TOTAL DOMESTIC EQUITY FUNDS | | | |
| (Cost $8,213,301) | | | 8,356,416 |
|
| International Equity Funds - 28.2% | | | |
| VIP Emerging Markets Portfolio Initial Class (a) | | 132,083 | 1,075,159 |
| VIP Overseas Portfolio Initial Class (a) | | 134,662 | 2,569,351 |
| TOTAL INTERNATIONAL EQUITY FUNDS | | | |
| (Cost $3,704,888) | | | 3,644,510 |
|
| Bond Funds - 5.8% | | | |
| VIP High Income Portfolio Initial Class (a) | | 97,779 | 484,004 |
| VIP Investment Grade Bond Portfolio Initial Class (a) | | 21,341 | 263,991 |
| TOTAL BOND FUNDS | | | |
| (Cost $816,538) | | | 747,995 |
|
| Short-Term Funds - 1.3% | | | |
| VIP Government Money Market Portfolio Initial Class 0.05% (a)(b) | | | |
| (Cost $171,714) | | 171,714 | 171,714 |
| TOTAL INVESTMENT PORTFOLIO - 100.0% | | | |
| (Cost $12,906,441) | | | 12,920,635 |
| NET OTHER ASSETS (LIABILITIES) - 0.0% | | | (2,062) |
| NET ASSETS - 100% | | | $12,918,573 |
Legend
(a) Affiliated Fund
(b) The rate quoted is the annualized seven-day yield of the fund at period end.
Affiliated Underlying Funds
Information regarding the Fund's fiscal year to date purchases and sales of the affiliated Underlying Funds and income earned by the Fund from investments in affiliated Underlying Funds is as follows:
(VIP Government Money Market Portfolio Initial Class was formerly known as VIP Money Market Portfolio Initial Class)
| Affiliate | Value, beginning of period | Purchases | Sales Proceeds | Dividend Income | Value, end of period |
| VIP Contrafund Portfolio Initial Class | $1,247,615 | $808,363 | $461,815 | $17,371 | $1,467,418 |
| VIP Emerging Markets Portfolio Initial Class | 807,918 | 773,440 | 374,560 | 7,257 | 1,075,159 |
| VIP Equity-Income Portfolio Initial Class | 1,312,510 | 952,844 | 472,907 | 57,098 | 1,543,548 |
| VIP Government Money Market Portfolio Initial Class 0.05% | -- | 229,585 | 57,871 | 36 | 171,714 |
| VIP Growth & Income Portfolio Initial Class | 1,497,298 | 978,257 | 567,441 | 42,713 | 1,743,810 |
| VIP Growth Portfolio Initial Class | 1,276,213 | 698,146 | 499,477 | 4,410 | 1,530,404 |
| VIP High Income Portfolio Initial Class | 426,466 | 318,670 | 198,828 | 37,502 | 484,004 |
| VIP Investment Grade Bond Portfolio Initial Class | 343,805 | 184,848 | 256,217 | 7,820 | 263,991 |
| VIP Mid Cap Portfolio Initial Class | 363,275 | 239,626 | 129,356 | 2,458 | 418,396 |
| VIP Overseas Portfolio Initial Class | 2,291,444 | 1,373,359 | 1,126,476 | 40,003 | 2,569,351 |
| VIP Value Portfolio Initial Class | 962,734 | 719,719 | 361,982 | 17,342 | 1,116,066 |
| VIP Value Strategies Portfolio Initial Class | 469,968 | 270,547 | 173,983 | 7,413 | 536,774 |
| Total | $10,999,246 | $7,547,404 | $4,680,913 | $241,423 | $12,920,635 |
Investment Valuation
All investments are categorized as Level 1 under the Fair Value Hierarchy. The inputs or methodology used for valuing securities may not be an indication of the risk associated with investing in those securities. For more information on valuation inputs please refer to the Investment Valuation section in the accompanying Notes to Financial Statements.
See accompanying notes which are an integral part of the financial statements.
VIP Freedom 2050 Portfolio℠
Financial Statements
Statement of Assets and Liabilities
| | | December 31, 2015 |
| Assets | | |
| Investment in securities, at value (cost $12,906,441) — See accompanying schedule | | $12,920,635 |
| Receivable for investments sold | | 11,131 |
| Receivable for fund shares sold | | 8,114 |
| Total assets | | 12,939,880 |
| Liabilities | | |
| Payable for fund shares redeemed | $19,240 | |
| Distribution and service plan fees payable | 2,067 | |
| Total liabilities | | 21,307 |
| Net Assets | | $12,918,573 |
| Net Assets consist of: | | |
| Paid in capital | | $12,637,750 |
| Undistributed net investment income | | 20,030 |
| Accumulated undistributed net realized gain (loss) on investments | | 246,599 |
| Net unrealized appreciation (depreciation) on investments | | 14,194 |
| Net Assets | | $12,918,573 |
| Initial Class: | | |
| Net Asset Value, offering price and redemption price per share ($2,266,056 ÷ 138,032 shares) | | $16.42 |
| Service Class: | | |
| Net Asset Value, offering price and redemption price per share ($3,003,757 ÷ 183,230 shares) | | $16.39 |
| Service Class 2: | | |
| Net Asset Value, offering price and redemption price per share ($7,648,760 ÷ 467,688 shares) | | $16.35 |
See accompanying notes which are an integral part of the financial statements.
Statement of Operations
| | | Year ended December 31, 2015 |
| Investment Income | | |
| Income distributions from underlying funds | | $241,423 |
| Expenses | | |
| Distribution and service plan fees | $22,733 | |
| Independent trustees' compensation | 51 | |
| Total expenses before reductions | 22,784 | |
| Expense reductions | (51) | 22,733 |
| Net investment income (loss) | | 218,690 |
| Realized and Unrealized Gain (Loss) | | |
| Realized gain (loss) on sale of underlying fund shares | (223,550) | |
| Capital gain distributions from underlying funds | 570,585 | |
| Total net realized gain (loss) | | 347,035 |
| Change in net unrealized appreciation (depreciation) on underlying funds | | (721,553) |
| Net gain (loss) | | (374,518) |
| Net increase (decrease) in net assets resulting from operations | | $(155,828) |
See accompanying notes which are an integral part of the financial statements.
Statement of Changes in Net Assets
| | Year ended December 31, 2015 | Year ended December 31, 2014 |
| Increase (Decrease) in Net Assets | | |
| Operations | | |
| Net investment income (loss) | $218,690 | $147,159 |
| Net realized gain (loss) | 347,035 | 57,571 |
| Change in net unrealized appreciation (depreciation) | (721,553) | 159,195 |
| Net increase (decrease) in net assets resulting from operations | (155,828) | 363,925 |
| Distributions to shareholders from net investment income | (200,903) | (144,914) |
| Distributions to shareholders from net realized gain | (80,362) | (119,127) |
| Total distributions | (281,265) | (264,041) |
| Share transactions - net increase (decrease) | 2,357,902 | 6,459,204 |
| Total increase (decrease) in net assets | 1,920,809 | 6,559,088 |
| Net Assets | | |
| Beginning of period | 10,997,764 | 4,438,676 |
| End of period (including undistributed net investment income of $20,030 and $2,245, respectively) | $12,918,573 | $10,997,764 |
See accompanying notes which are an integral part of the financial statements.
Financial Highlights — VIP Freedom 2050 Portfolio Initial Class
| | | | | | |
| Years ended December 31, | 2015 | 2014 | 2013 | 2012 | 2011 |
| Selected Per–Share Data | | | | | |
| Net asset value, beginning of period | $16.86 | $16.55 | $13.41 | $13.34 | $15.82 |
| Income from Investment Operations | | | | | |
| Net investment income (loss)A | .32 | .35 | .37 | .47 | .26 |
| Net realized and unrealized gain (loss) | (.36) | .47 | 3.16 | 1.72 | (1.03) |
| Total from investment operations | (.04) | .82 | 3.53 | 2.19 | (.77) |
| Distributions from net investment income | (.29) | (.25) | (.22) | (.28) | (.28) |
| Distributions from net realized gain | (.11) | (.27) | (.18) | (1.84) | (1.43) |
| Total distributions | (.40) | (.51)B | (.39)C | (2.12) | (1.71) |
| Net asset value, end of period | $16.42 | $16.86 | $16.55 | $13.41 | $13.34 |
| Total ReturnD,E | (.29)% | 5.01% | 26.44% | 17.64% | (4.93)% |
| Ratios to Average Net AssetsF,G | | | | | |
| Expenses before reductionsH | -% | -% | -% | -% | -% |
| Expenses net of fee waivers, if any | -% | -% | -% | -% | -% |
| Expenses net of all reductions | -% | -% | -% | -% | -% |
| Net investment income (loss) | 1.89% | 2.06% | 2.42% | 3.57% | 1.67% |
| Supplemental Data | | | | | |
| Net assets, end of period (000 omitted) | $2,266 | $1,684 | $880 | $441 | $253 |
| Portfolio turnover rateF | 37% | 22% | 59% | 24% | 92% |
A Calculated based on average shares outstanding during the period.
B Total distributions of $.51 per share is comprised of distributions from net investment income of $.248 and distributions from net realized gain of $.266 per share.
C Total distributions of $.39 per share is comprised of distributions from net investment income of $.218 and distributions from net realized gain of $.175 per share.
D Total returns do not reflect charges attributable to your insurance company's separate account. Inclusion of these charges would reduce the total returns shown.
E Total returns would have been lower if certain expenses had not been reduced during the applicable periods shown.
F Amounts do not include the activity of the Underlying Funds.
G Expense ratios reflect operating expenses of the class. Expenses before reductions do not reflect amounts reimbursed by the investment adviser or reductions from expense offset arrangements and do not represent the amount paid by the class during periods when reimbursements or reductions occur. Expenses net of fee waivers reflect expenses after reimbursement by the investment adviser but prior to reductions from expense offset arrangements. Expenses net of all reductions represent the net expenses paid by the class but do not include expenses of the underlying funds in which the Fund invests.
H Amount represents less than .005%.
See accompanying notes which are an integral part of the financial statements.
Financial Highlights — VIP Freedom 2050 Portfolio Service Class
| | | | | | |
| Years ended December 31, | 2015 | 2014 | 2013 | 2012 | 2011 |
| Selected Per–Share Data | | | | | |
| Net asset value, beginning of period | $16.83 | $16.54 | $13.41 | $13.34 | $15.82 |
| Income from Investment Operations | | | | | |
| Net investment income (loss)A | .31 | .33 | .35 | .46 | .25 |
| Net realized and unrealized gain (loss) | (.37) | .46 | 3.17 | 1.73 | (1.04) |
| Total from investment operations | (.06) | .79 | 3.52 | 2.19 | (.79) |
| Distributions from net investment income | (.27) | (.24) | (.21) | (.27) | (.26) |
| Distributions from net realized gain | (.11) | (.27) | (.18) | (1.84) | (1.43) |
| Total distributions | (.38) | (.50)B | (.39) | (2.12)C | (1.69) |
| Net asset value, end of period | $16.39 | $16.83 | $16.54 | $13.41 | $13.34 |
| Total ReturnD,E | (.38)% | 4.81% | 26.32% | 17.59% | (5.06)% |
| Ratios to Average Net AssetsF,G | | | | | |
| Expenses before reductions | .10% | .10% | .10% | .10% | .10% |
| Expenses net of fee waivers, if any | .10% | .10% | .10% | .10% | .10% |
| Expenses net of all reductions | .10% | .10% | .10% | .10% | .10% |
| Net investment income (loss) | 1.79% | 1.96% | 2.32% | 3.47% | 1.57% |
| Supplemental Data | | | | | |
| Net assets, end of period (000 omitted) | $3,004 | $2,878 | $1,892 | $490 | $91 |
| Portfolio turnover rateF | 37% | 22% | 59% | 24% | 92% |
A Calculated based on average shares outstanding during the period.
B Total distributions of $.50 per share is comprised of distributions from net investment income of $.236 and distributions from net realized gain of $.266 per share.
C Total distributions of $2.12 per share is comprised of distributions from net investment income of $.272 and distributions from net realized gain of $1.843 per share.
D Total returns do not reflect charges attributable to your insurance company's separate account. Inclusion of these charges would reduce the total returns shown.
E Total returns would have been lower if certain expenses had not been reduced during the applicable periods shown.
F Amounts do not include the activity of the Underlying Funds.
G Expense ratios reflect operating expenses of the class. Expenses before reductions do not reflect amounts reimbursed by the investment adviser or reductions from expense offset arrangements and do not represent the amount paid by the class during periods when reimbursements or reductions occur. Expenses net of fee waivers reflect expenses after reimbursement by the investment adviser but prior to reductions from expense offset arrangements. Expenses net of all reductions represent the net expenses paid by the class but do not include expenses of the underlying funds in which the Fund invests.
See accompanying notes which are an integral part of the financial statements.
Financial Highlights — VIP Freedom 2050 Portfolio Service Class 2
| | | | | | |
| Years ended December 31, | 2015 | 2014 | 2013 | 2012 | 2011 |
| Selected Per–Share Data | | | | | |
| Net asset value, beginning of period | $16.80 | $16.51 | $13.39 | $13.33 | $15.81 |
| Income from Investment Operations | | | | | |
| Net investment income (loss)A | .28 | .30 | .33 | .43 | .22 |
| Net realized and unrealized gain (loss) | (.37) | .47 | 3.16 | 1.73 | (1.02) |
| Total from investment operations | (.09) | .77 | 3.49 | 2.16 | (.80) |
| Distributions from net investment income | (.25) | (.22) | (.19) | (.26) | (.25) |
| Distributions from net realized gain | (.11) | (.27) | (.18) | (1.84) | (1.43) |
| Total distributions | (.36) | (.48)B | (.37) | (2.10) | (1.68) |
| Net asset value, end of period | $16.35 | $16.80 | $16.51 | $13.39 | $13.33 |
| Total ReturnC,D | (.58)% | 4.71% | 26.13% | 17.38% | (5.16)% |
| Ratios to Average Net AssetsE,F | | | | | |
| Expenses before reductions | .25% | .25% | .25% | .25% | .25% |
| Expenses net of fee waivers, if any | .25% | .25% | .25% | .25% | .25% |
| Expenses net of all reductions | .25% | .25% | .25% | .25% | .25% |
| Net investment income (loss) | 1.64% | 1.81% | 2.17% | 3.32% | 1.42% |
| Supplemental Data | | | | | |
| Net assets, end of period (000 omitted) | $7,649 | $6,436 | $1,666 | $390 | $163 |
| Portfolio turnover rateE | 37% | 22% | 59% | 24% | 92% |
A Calculated based on average shares outstanding during the period.
B Total distributions of $.48 per share is comprised of distributions from net investment income of $.218 and distributions from net realized gain of $.266 per share.
C Total returns do not reflect charges attributable to your insurance company's separate account. Inclusion of these charges would reduce the total returns shown.
D Total returns would have been lower if certain expenses had not been reduced during the applicable periods shown.
E Amounts do not include the activity of the Underlying Funds.
F Expense ratios reflect operating expenses of the class. Expenses before reductions do not reflect amounts reimbursed by the investment adviser or reductions from expense offset arrangements and do not represent the amount paid by the class during periods when reimbursements or reductions occur. Expenses net of fee waivers reflect expenses after reimbursement by the investment adviser but prior to reductions from expense offset arrangements. Expenses net of all reductions represent the net expenses paid by the class but do not include expenses of the underlying funds in which the Fund invests.
See accompanying notes which are an integral part of the financial statements.
Notes to Financial Statements
For the period ended December 31, 2015
1. Organization.
VIP Freedom Income Portfolio, VIP Freedom 2005 Portfolio, VIP Freedom 2010 Portfolio, VIP Freedom 2015 Portfolio, VIP Freedom 2020 Portfolio, VIP Freedom 2025 Portfolio, VIP Freedom 2030 Portfolio, VIP Freedom 2035 Portfolio, VIP Freedom 2040 Portfolio, VIP Freedom 2045 Portfolio and VIP Freedom 2050 Portfolio (the Funds) are funds of Variable Insurance Products Fund V (the Trust). The Trust is registered under the Investment Company Act of 1940, as amended (the 1940 Act), as an open-end management investment company organized as a Massachusetts business trust. Each Fund is authorized to issue an unlimited number of shares. The Funds invest primarily in a combination of other VIP equity, bond, and short-term funds (the Underlying Funds) managed by Fidelity Management & Research Company (FMR). Shares of each Fund may only be purchased by insurance companies for the purpose of funding variable annuity or variable life insurance contracts. Each Fund offers three classes of shares: Initial Class shares, Service Class shares and Service Class 2 shares. All classes have equal rights and voting privileges, except for matters affecting a single class.
2. Significant Accounting Policies.
The financial statements have been prepared in conformity with accounting principles generally accepted in the United States of America (GAAP), which require management to make certain estimates and assumptions at the date of the financial statements. Actual results could differ from those estimates. Subsequent events, if any, through the date that the financial statements were issued have been evaluated in the preparation of the financial statements. The following summarizes the significant accounting policies of the Funds:
Investment Valuation. Investments are valued as of 4:00 p.m. Eastern time on the last calendar day of the period. Each Fund categorizes the inputs to valuation techniques used to value its investments into a disclosure hierarchy consisting of three levels as shown below:
- Level 1 – quoted prices in active markets for identical investments
- Level 2 – other significant observable inputs (including quoted prices for similar investments, interest rates, prepayment speeds, etc.)
- Level 3 – unobservable inputs (including the Fund's own assumptions based on the best information available)
Valuation techniques used to value each Fund's investments by major category are as follows. Investments in the Underlying Funds are valued at their closing net asset value (NAV) each business day and are categorized as Level 1 in the hierarchy.
Investment Transactions and Income. For financial reporting purposes, the Funds' investment holdings and NAV include trades executed through the end of the last business day of the period. The NAV per share for processing shareholder transactions is calculated as of the close of business of the New York Stock Exchange (NYSE), normally 4:00 p.m. Eastern time and includes trades executed through the end of the prior business day. Gains and losses on securities sold are determined on the basis of identified cost. Income and capital gain distributions from the Underlying Funds, if any, are recorded on the ex-dividend date.
Class Allocations and Expenses. Investment income, realized and unrealized capital gains and losses, common expenses of each Fund, and certain fund-level expense reductions, if any, are allocated daily on a pro-rata basis to each class based on the relative net assets of each class to the total net assets of each Fund. Each class differs with respect to distribution and service plan fees incurred. Certain expense reductions may also differ by class. For the reporting period, the allocated portion of income and expenses to each class as a percent of its average net assets may vary due to the timing of recording these transactions in relation to fluctuating net assets of the classes. Expenses directly attributable to a fund are charged to that fund. Expenses attributable to more than one fund are allocated among the respective funds on the basis of relative net assets or other appropriate methods. Expenses included in the accompanying financial statements reflect the expenses of each Fund and do not include any expenses associated with the Underlying Funds. Although not included in each Fund's expenses, each Fund indirectly bears its proportionate share of the Underlying Funds' expenses through the impact of these expenses on each Underlying Fund's NAV. Expense estimates are accrued in the period to which they relate and adjustments are made when actual amounts are known.
Income Tax Information and Distributions to Shareholders. Each year, each Fund intends to qualify as a regulated investment company under Subchapter M of the Internal Revenue Code, including distributing substantially all of its taxable income and realized gains. As a result, no provision for U.S. Federal income taxes is required. As of December 31, 2015, each Fund did not have any unrecognized tax benefits in the financial statements; nor is each Fund aware of any tax positions for which it is reasonably possible that the total amounts of unrecognized tax benefits will significantly change in the next twelve months. Each Fund files a U.S. federal tax return, in addition to state and local tax returns as required. Each Fund's federal income tax returns are subject to examination by the Internal Revenue Service (IRS) for a period of three fiscal years after they are filed. State and local tax returns may be subject to examination for an additional fiscal year depending on the jurisdiction.
Distributions are declared and recorded on the ex-dividend date. Income dividends and capital gain distributions are declared separately for each class. Income and capital gain distributions are determined in accordance with income tax regulations, which may differ from GAAP.
Capital accounts within the financial statements are adjusted for permanent book-tax differences. These adjustments have no impact on net assets or the results of operations. Capital accounts are not adjusted for temporary book-tax differences which will reverse in a subsequent period.
Book-tax differences are primarily due to the short-term gain distributions from the Underlying Funds, capital loss carryforwards and losses deferred due to wash sales.
The federal tax cost of investment securities and unrealized appreciation (depreciation) as of period end were as follows for each Fund:
| | Tax cost | Gross unrealized appreciation | Gross unrealized depreciation | Net unrealized appreciation (depreciation) on securities |
| VIP Freedom Income | $37,577,116 | $1,281,361 | $(1,106,451) | $174,910 |
| VIP Freedom 2005 | 7,103,791 | 378,021 | (248,478) | 129,543 |
| VIP Freedom 2010 | 275,510,109 | 26,261,681 | (8,933,734) | 17,327,947 |
| VIP Freedom 2015 | 98,025,115 | 68,932,390 | (57,536,128) | 11,396,262 |
| VIP Freedom 2020 | 650,740,666 | 103,509,318 | (23,080,968) | 80,428,350 |
| VIP Freedom 2025 | 105,179,923 | 13,285,465 | (4,300,914) | 8,984,551 |
| VIP Freedom 2030 | 236,592,974 | 34,817,644 | (9,642,416) | 25,175,228 |
| VIP Freedom 2035 | 24,280,018 | 696,780 | (1,412,793) | (716,013) |
| VIP Freedom 2040 | 45,976,991 | 2,708,546 | (2,424,179) | 284,367 |
| VIP Freedom 2045 | 12,596,039 | 468,624 | (779,819) | (311,195) |
| VIP Freedom 2050 | 13,132,516 | 598,291 | (810,172) | (211,881) |
The tax-based components of distributable earnings as of period end were as follows for each Fund:
| | Undistributed ordinary income | Undistributed long-term capital gain | Net unrealized appreciation (depreciation) on securities and other investments |
| VIP Freedom Income | $1,836 | $367,649 | 174,910 |
| VIP Freedom 2005 | - | 87,942 | 129,543 |
| VIP Freedom 2010 | 82,259 | 6,398,415 | 17,327,947 |
| VIP Freedom 2015 | - | 2,802,807 | 11,396,262 |
| VIP Freedom 2020 | - | 21,885,989 | 80,428,350 |
| VIP Freedom 2025 | - | 3,505,374 | 8,984,551 |
| VIP Freedom 2030 | - | 9,968,718 | 25,175,228 |
| VIP Freedom 2035 | 826 | 740,878 | (716,013) |
| VIP Freedom 2040 | - | 1,690,340 | 284,367 |
| VIP Freedom 2045 | - | 399,086 | (311,195) |
| VIP Freedom 2050 | 20,031 | 472,674 | (211,881) |
The tax character of distributions paid was as follows:
| December 31, 2015 | | | |
| | Ordinary Income | Long-term Capital Gains | Total |
| VIP Freedom Income | $687,552 | $– | $687,552 |
| VIP Freedom 2005 | 151,422 | – | 151,422 |
| VIP Freedom 2010 | 5,710,353 | – | 5,710,353 |
| VIP Freedom 2015 | 2,387,422 | 100,887 | 2,488,309 |
| VIP Freedom 2020 | 15,684,367 | – | 15,684,367 |
| VIP Freedom 2025 | 2,442,559 | 170,919 | 2,613,478 |
| VIP Freedom 2030 | 5,694,576 | – | 5,694,576 |
| VIP Freedom 2035 | 444,931 | 9,873 | 454,804 |
| VIP Freedom 2040 | 1,004,597 | 16,616 | 1,021,213 |
| VIP Freedom 2045 | 250,779 | 4,633 | 255,412 |
| VIP Freedom 2050 | 273,376 | 7,889 | 281,265 |
| December 31, 2014 | | | |
| | Ordinary Income | Long-term Capital Gains | Total |
| VIP Freedom Income | $519,023 | $213,860 | $732,883 |
| VIP Freedom 2005 | 160,902 | 49,746 | 210,648 |
| VIP Freedom 2010 | 5,739,394 | 3,040,743 | 8,780,137 |
| VIP Freedom 2015 | 2,321,440 | 1,421,788 | 3,743,228 |
| VIP Freedom 2020 | 15,090,674 | 9,350,373 | 24,441,047 |
| VIP Freedom 2025 | 2,493,078 | 1,091,371 | 3,584,449 |
| VIP Freedom 2030 | 5,893,022 | 3,015,983 | 8,909,005 |
| VIP Freedom 2035 | 295,138 | 60,318 | 355,456 |
| VIP Freedom 2040 | 758,484 | 225,214 | 983,698 |
| VIP Freedom 2045 | 157,061 | 33,108 | 190,169 |
| VIP Freedom 2050 | 220,719 | 43,322 | 264,041 |
VIP Freedom 2040 intends to elect to defer to its next fiscal year $709 of capital losses recognized during the period November 1, 2015 to December 31, 2015.
3. Purchases and Redemptions of Underlying Fund Shares.
Purchases and redemptions of the Underlying Fund shares, are noted in the table below.
| | Purchases ($) | Redemptions ($) |
| VIP Freedom Income | 19,732,838 | 13,044,866 |
| VIP Freedom 2005 | 1,867,060 | 2,822,425 |
| VIP Freedom 2010 | 67,234,731 | 56,332,245 |
| VIP Freedom 2015 | 30,019,619 | 33,534,326 |
| VIP Freedom 2020 | 139,793,408 | 129,309,103 |
| VIP Freedom 2025 | 37,784,168 | 22,712,258 |
| VIP Freedom 2030 | 76,386,130 | 73,475,002 |
| VIP Freedom 2035 | 13,966,531 | 4,199,109 |
| VIP Freedom 2040 | 22,793,053 | 9,877,203 |
| VIP Freedom 2045 | 7,732,665 | 2,728,258 |
| VIP Freedom 2050 | 7,547,404 | 4,680,913 |
4. Fees and Other Transactions with Affiliates.
Management Fee. Effective October 1, 2015, FMR Co., Inc., an affiliate of Strategic Advisers, Inc. (SAI), replaced SAI as investment adviser to the Funds pursuant to a management contract between the Funds and FMR Co., Inc. The new contract does not impact the Funds' investment process, strategies or management fees. The Funds do not pay any fees for investment management related services.
Other Transactions. The investment adviser has entered into an administration agreement with FMR under which FMR provides management and administrative services (other than investment advisory services) necessary for the operation of each Fund. Pursuant to this agreement, FMR pays all expenses of each Fund, excluding distribution and service fees, compensation of the independent Trustees and certain other expenses such as interest expense. FMR also contracts with other Fidelity companies to perform the services necessary for the operation of each Fund. The Funds do not pay any fees for these services.
Distribution and Service Plan Fees. In accordance with Rule 12b-1 of the 1940 Act, the Funds have adopted separate 12b-1 Plans for each Service Class of shares. Each Service Class pays Fidelity Distributors Corporation (FDC), an affiliate of the investment adviser, a service fee. For the period, the service fee is based on an annual rate of .10% of Service Class' average net assets and .25% of Service Class 2's average net assets.
For the period, total fees, all of which were reallowed to insurance companies for the distribution of shares and providing shareholder support services were as follows:
| | Service Class | Service Class 2 | Total |
| VIP Freedom Income | $8,847 | $30,192 | $39,039 |
| VIP Freedom 2005 | 456 | 221 | 677 |
| VIP Freedom 2010 | 25,581 | 587,489 | 613,070 |
| VIP Freedom 2015 | 16,437 | 149,294 | 165,731 |
| VIP Freedom 2020 | 87,314 | 1,442,238 | 1,529,552 |
| VIP Freedom 2025 | 35,564 | 128,347 | 163,911 |
| VIP Freedom 2030 | 58,524 | 391,577 | 450,101 |
| VIP Freedom 2035 | 1,863 | 41,530 | 43,393 |
| VIP Freedom 2040 | 17,163 | 28,297 | 45,460 |
| VIP Freedom 2045 | 372 | 24,635 | 25,007 |
| VIP Freedom 2050 | 2,811 | 19,922 | 22,733 |
5. Expense Reductions.
FMR voluntarily agreed to reimburse funds to the extent annual operating expenses exceeded certain levels of average net assets as noted in the table below. Some expenses, for example interest expense, are excluded from this reimbursement.
The following classes of each applicable Fund were in reimbursement during the period:
| | Expense
Limitations | Reimbursement |
| VIP Freedom Income | | |
| Initial Class | -% | $60 |
| Service Class | .10% | 35 |
| Service Class 2 | .25% | 49 |
| VIP Freedom 2005 | | |
| Initial Class | -% | $32 |
| Service Class | .10% | 2 |
| Service Class 2 | .25% | – |
| VIP Freedom 2010 | | |
| Initial Class | -% | $140 |
| Service Class | .10% | 104 |
| Service Class 2 | .25% | 954 |
| VIP Freedom 2015 | | |
| Initial Class | -% | $151 |
| Service Class | .10% | 67 |
| Service Class 2 | .25% | 243 |
| VIP Freedom 2020 | | |
| Initial Class | -% | $371 |
| Service Class | .10% | 355 |
| Service Class 2 | .25% | 2,345 |
| VIP Freedom 2025 | | |
| Initial Class | -% | $104 |
| Service Class | .10% | 143 |
| Service Class 2 | .25% | 207 |
| VIP Freedom 2030 | | |
| Initial Class | -% | $281 |
| Service Class | .10% | 239 |
| Service Class 2 | .25% | 638 |
| VIP Freedom 2035 | | |
| Initial Class | -% | $3 |
| Service Class | .10% | 7 |
| Service Class 2 | .25% | 65 |
| VIP Freedom 2040 | | |
| Initial Class | -% | $59 |
| Service Class | .10% | 68 |
| Service Class 2 | .25% | 45 |
| VIP Freedom 2045 | | |
| Initial Class | -% | $2 |
| Service Class | .10% | 1 |
| Service Class 2 | .25% | 38 |
| VIP Freedom 2050 | | |
| Initial Class | -% | $8 |
| Service Class | .10% | 12 |
| Service Class 2 | .25% | 31 |
6. Distributions to Shareholders.
Distributions to shareholders of each class were as follows:
| Years ended December 31, | 2015 | 2014 |
| VIP Freedom Income | | |
| From net investment income | | |
| Initial Class | $262,328 | $262,491 |
| Service Class | 170,784 | 88,443 |
| Service Class 2 | 204,325 | 112,961 |
| Total | $637,437 | $463,895 |
| From net realized gain | | |
| Initial Class | $19,906 | $154,449 |
| Service Class | 13,128 | 42,797 |
| Service Class 2 | 17,081 | 71,742 |
| Total | $50,115 | $268,988 |
| VIP Freedom 2005 | | |
| From net investment income | | |
| Initial Class | $125,531 | $128,377 |
| Service Class | 8,573 | 6,128 |
| Service Class 2 | 1,523 | 1,058 |
| Total | $135,627 | $135,563 |
| From net realized gain | | |
| Initial Class | $14,560 | $70,498 |
| Service Class | 1,035 | 3,684 |
| Service Class 2 | 200 | 903 |
| Total | $15,795 | $75,085 |
| VIP Freedom 2010 | | |
| From net investment income | | |
| Initial Class | $577,376 | $704,165 |
| Service Class | 414,530 | 429,735 |
| Service Class 2 | 3,864,255 | 3,113,345 |
| Total | $4,856,161 | $4,247,245 |
| From net realized gain | | |
| Initial Class | $93,377 | $698,347 |
| Service Class | 69,574 | 424,495 |
| Service Class 2 | 691,241 | 3,410,050 |
| Total | $854,192 | $4,532,892 |
| VIP Freedom 2015 | | |
| From net investment income | | |
| Initial Class | $667,184 | $655,980 |
| Service Class | 291,636 | 244,819 |
| Service Class 2 | 949,214 | 865,566 |
| Total | $1,908,034 | $1,766,365 |
| From net realized gain | | |
| Initial Class | $189,896 | $691,468 |
| Service Class | 83,523 | 202,514 |
| Service Class 2 | 306,856 | 1,082,881 |
| Total | $580,275 | $1,976,863 |
| VIP Freedom 2020 | | |
| From net investment income | | |
| Initial Class | $1,662,333 | $1,679,710 |
| Service Class | 1,701,924 | 1,185,964 |
| Service Class 2 | 9,067,466 | 8,295,972 |
| Total | $12,431,723 | $11,161,646 |
| From net realized gain | | |
| Initial Class | $393,448 | $1,649,471 |
| Service Class | 404,517 | 1,226,045 |
| Service Class 2 | 2,454,679 | 10,403,885 |
| Total | $3,252,644 | $13,279,401 |
| VIP Freedom 2025 | | |
| From net investment income | | |
| Initial Class | $473,802 | $425,688 |
| Service Class | 661,964 | 475,300 |
| Service Class 2 | 861,551 | 704,261 |
| Total | $1,997,317 | $1,605,249 |
| From net realized gain | | |
| Initial Class | $138,753 | $504,076 |
| Service Class | 194,650 | 512,120 |
| Service Class 2 | 282,758 | 963,004 |
| Total | $616,161 | $1,979,200 |
| VIP Freedom 2030 | | |
| From net investment income | | |
| Initial Class | $1,233,440 | $1,123,914 |
| Service Class | 1,005,250 | 776,962 |
| Service Class 2 | 2,023,552 | 2,041,884 |
| Total | $4,262,242 | $3,942,760 |
| From net realized gain | | |
| Initial Class | $373,156 | $1,285,630 |
| Service Class | 313,207 | 960,757 |
| Service Class 2 | 745,971 | 2,719,858 |
| Total | $1,432,334 | $4,966,245 |
| VIP Freedom 2035 | | |
| From net investment income | | |
| Initial Class | $25,177 | $9,169 |
| Service Class | 30,980 | 23,173 |
| Service Class 2 | 283,735 | 166,723 |
| Total | $339,892 | $199,065 |
| From net realized gain | | |
| Initial Class | $7,250 | $11,230 |
| Service Class | 10,046 | 12,893 |
| Service Class 2 | 97,616 | 132,268 |
| Total | $114,912 | $156,391 |
| VIP Freedom 2040 | | |
| From net investment income | | |
| Initial Class | $257,127 | $225,564 |
| Service Class | 297,556 | 183,653 |
| Service Class 2 | 179,437 | 108,508 |
| Total | $734,120 | $517,725 |
| From net realized gain | | |
| Initial Class | $95,975 | $206,415 |
| Service Class | 115,149 | 172,404 |
| Service Class 2 | 75,969 | 87,154 |
| Total | $287,093 | $465,973 |
| VIP Freedom 2045 | | |
| From net investment income | | |
| Initial Class | $9,613 | $5,234 |
| Service Class | 5,729 | 5,167 |
| Service Class 2 | 174,881 | 95,644 |
| Total | $190,223 | $106,045 |
| From net realized gain | | |
| Initial Class | $2,892 | $4,305 |
| Service Class | 1,923 | 3,986 |
| Service Class 2 | 60,374 | 75,833 |
| Total | $65,189 | $84,124 |
| VIP Freedom 2050 | | |
| From net investment income | | |
| Initial Class | $38,897 | $24,335 |
| Service Class | 49,301 | 39,473 |
| Service Class 2 | 112,705 | 81,106 |
| Total | $200,903 | $144,914 |
| From net realized gain | | |
| Initial Class | $14,034 | $19,643 |
| Service Class | 18,785 | 35,809 |
| Service Class 2 | 47,543 | 63,675 |
| Total | $80,362 | $119,127 |
7. Share Transactions.
Transactions for each class of shares were as follows:
| | Shares | Shares | Dollars | Dollars |
| Years ended December 31, | 2015 | 2014 | 2015 | 2014 |
| VIP Freedom Income | | | | |
| Initial Class | | | | |
| Shares sold | 339,365 | 375,885 | $3,775,187 | $4,159,554 |
| Reinvestment of distributions | 26,086 | 37,909 | 282,234 | 416,940 |
| Shares redeemed | (592,382) | (397,094) | (6,571,758) | (4,398,794) |
| Net increase (decrease) | (226,931) | 16,700 | $(2,514,337) | $177,700 |
| Service Class | | | | |
| Shares sold | 534,312 | 313,956 | $5,937,119 | $3,474,181 |
| Reinvestment of distributions | 17,002 | 11,923 | 183,912 | 131,240 |
| Shares redeemed | (201,312) | (180,302) | (2,233,670) | (1,981,326) |
| Net increase (decrease) | 350,002 | 145,577 | $3,887,361 | $1,624,095 |
| Service Class 2 | | | | |
| Shares sold | 757,309 | 358,308 | $8,438,417 | $3,948,810 |
| Reinvestment of distributions | 20,544 | 16,846 | 221,406 | 184,703 |
| Shares redeemed | (338,685) | (260,148) | (3,743,618) | (2,869,402) |
| Net increase (decrease) | 439,168 | 115,006 | $4,916,205 | $1,264,111 |
| VIP Freedom 2005 | | | | |
| Initial Class | | | | |
| Shares sold | 60,424 | 111,193 | $709,728 | $1,282,516 |
| Reinvestment of distributions | 12,337 | 17,218 | 140,091 | 198,875 |
| Shares redeemed | (179,193) | (60,760) | (2,077,063) | (703,354) |
| Net increase (decrease) | (106,432) | 67,651 | $(1,227,244) | $778,037 |
| Service Class | | | | |
| Shares sold | 19,795 | 49,405 | $231,657 | $569,553 |
| Reinvestment of distributions | 841 | 845 | 9,608 | 9,812 |
| Shares redeemed | (13,086) | (26,163) | (152,657) | (303,043) |
| Net increase (decrease) | 7,550 | 24,087 | $88,608 | $276,322 |
| Service Class 2 | | | | |
| Shares sold | 1,929 | 1,015 | $22,541 | $11,729 |
| Reinvestment of distributions | 152 | 170 | 1,723 | 1,961 |
| Shares redeemed | (707) | (3,325) | (8,137) | (37,876) |
| Net increase (decrease) | 1,374 | (2,140) | $16,127 | $(24,186) |
| VIP Freedom 2010 | | | | |
| Initial Class | | | | |
| Shares sold | 344,077 | 817,145 | $4,317,350 | $10,159,087 |
| Reinvestment of distributions | 54,791 | 113,210 | 670,753 | 1,402,512 |
| Shares redeemed | (1,328,939) | (1,057,832) | (16,779,464) | (13,187,201) |
| Net increase (decrease) | (930,071) | (127,477) | $(11,791,361) | $(1,625,602) |
| Service Class | | | | |
| Shares sold | 252,289 | 505,198 | $3,174,992 | $6,309,044 |
| Reinvestment of distributions | 39,582 | 68,995 | 484,104 | 854,230 |
| Shares redeemed | (589,582) | (527,518) | (7,419,736) | (6,548,142) |
| Net increase (decrease) | (297,711) | 46,675 | $(3,760,640) | $615,132 |
| Service Class 2 | | | | |
| Shares sold | 2,422,231 | 1,910,653 | $30,376,391 | $23,611,898 |
| Reinvestment of distributions | 374,338 | 529,283 | 4,555,496 | 6,523,395 |
| Shares redeemed | (1,221,007) | (1,435,390) | (15,302,347) | (17,811,619) |
| Net increase (decrease) | 1,575,562 | 1,004,546 | $19,629,540 | $12,323,674 |
| VIP Freedom 2015 | | | | |
| Initial Class | | | | |
| Shares sold | 420,581 | 385,733 | $5,358,376 | $4,842,707 |
| Reinvestment of distributions | 69,232 | 107,592 | 857,080 | 1,347,448 |
| Shares redeemed | (739,545) | (660,826) | (9,437,771) | (8,301,187) |
| Net increase (decrease) | (249,732) | (167,501) | $(3,222,315) | $(2,111,032) |
| Service Class | | | | |
| Shares sold | 498,796 | 866,111 | $6,305,741 | $11,001,902 |
| Reinvestment of distributions | 30,361 | 35,692 | 375,159 | 447,334 |
| Shares redeemed | (450,970) | (507,284) | (5,724,379) | (6,439,617) |
| Net increase (decrease) | 78,187 | 394,519 | $956,521 | $5,009,619 |
| Service Class 2 | | | | |
| Shares sold | 813,492 | 1,120,974 | $10,278,936 | $14,020,798 |
| Reinvestment of distributions | 101,931 | 156,473 | 1,256,070 | 1,948,446 |
| Shares redeemed | (1,240,391) | (1,283,440) | (15,651,237) | (16,095,343) |
| Net increase (decrease) | (324,968) | (5,993) | $(4,116,231) | $(126,099) |
| VIP Freedom 2020 | | | | |
| Initial Class | | | | |
| Shares sold | 1,368,062 | 1,883,216 | $17,708,590 | $24,061,467 |
| Reinvestment of distributions | 163,581 | 261,587 | 2,055,781 | 3,329,180 |
| Shares redeemed | (2,449,771) | (1,436,782) | (31,880,324) | (18,313,542) |
| Net increase (decrease) | (918,128) | 708,021 | $(12,115,953) | $9,077,105 |
| Service Class | | | | |
| Shares sold | 2,570,538 | 1,733,219 | $33,320,721 | $22,273,989 |
| Reinvestment of distributions | 168,073 | 189,965 | 2,106,441 | 2,412,009 |
| Shares redeemed | (1,181,862) | (1,139,322) | (15,229,965) | (14,503,262) |
| Net increase (decrease) | 1,556,749 | 783,862 | $20,197,197 | $10,182,736 |
| Service Class 2 | | | | |
| Shares sold | 2,413,177 | 2,268,817 | $31,270,547 | $28,790,824 |
| Reinvestment of distributions | 921,983 | 1,479,960 | 11,522,145 | 18,699,856 |
| Shares redeemed | (4,868,275) | (4,260,717) | (62,533,680) | (54,144,950) |
| Net increase (decrease) | (1,533,115) | (511,940) | $(19,740,988) | $(6,654,270) |
| VIP Freedom 2025 | | | | |
| Initial Class | | | | |
| Shares sold | 375,179 | 348,503 | $4,976,692 | $4,591,726 |
| Reinvestment of distributions | 47,214 | 70,770 | 612,555 | 929,764 |
| Shares redeemed | (445,275) | (323,217) | (5,967,956) | (4,281,455) |
| Net increase (decrease) | (22,882) | 96,056 | $(378,709) | $1,240,035 |
| Service Class | | | | |
| Shares sold | 933,734 | 1,081,241 | $12,363,927 | $14,285,176 |
| Reinvestment of distributions | 66,146 | 75,172 | 856,614 | 987,420 |
| Shares redeemed | (437,815) | (530,281) | (5,813,665) | (7,054,103) |
| Net increase (decrease) | 562,065 | 626,132 | $7,406,876 | $8,218,493 |
| Service Class 2 | | | | |
| Shares sold | 1,318,158 | 1,317,051 | $17,477,251 | $17,273,698 |
| Reinvestment of distributions | 88,740 | 127,758 | 1,144,309 | 1,667,265 |
| Shares redeemed | (1,071,673) | (1,261,769) | (14,125,138) | (16,330,517) |
| Net increase (decrease) | 335,225 | 183,040 | $4,496,422 | $2,610,446 |
| VIP Freedom 2030 | | | | |
| Initial Class | | | | |
| Shares sold | 952,711 | 1,270,289 | $12,631,715 | $16,571,361 |
| Reinvestment of distributions | 125,011 | 185,629 | 1,606,596 | 2,409,544 |
| Shares redeemed | (1,214,789) | (900,927) | (16,182,194) | (11,625,782) |
| Net increase (decrease) | (137,067) | 554,991 | $(1,943,883) | $7,355,123 |
| Service Class | | | | |
| Shares sold | 1,316,268 | 972,738 | $17,520,725 | $12,664,120 |
| Reinvestment of distributions | 102,766 | 134,151 | 1,318,457 | 1,737,719 |
| Shares redeemed | (867,757) | (645,163) | (11,431,396) | (8,355,317) |
| Net increase (decrease) | 551,277 | 461,726 | $7,407,786 | $6,046,522 |
| Service Class 2 | | | | |
| Shares sold | 2,996,955 | 3,438,648 | $39,890,524 | $43,867,490 |
| Reinvestment of distributions | 216,259 | 368,844 | 2,769,523 | 4,761,742 |
| Shares redeemed | (4,280,826) | (2,444,609) | (56,176,082) | (31,799,217) |
| Net increase (decrease) | (1,067,612) | 1,362,883 | $(13,516,035) | $16,830,015 |
| VIP Freedom 2035 | | | | |
| Initial Class | | | | |
| Shares sold | 69,244 | 30,345 | $1,355,411 | $588,990 |
| Reinvestment of distributions | 1,679 | 1,049 | 32,427 | 20,399 |
| Shares redeemed | (17,459) | (58,809) | (349,771) | (1,144,872) |
| Net increase (decrease) | 53,464 | (27,415) | $1,038,067 | $(535,483) |
| Service Class | | | | |
| Shares sold | 43,090 | 84,185 | $845,029 | $1,630,037 |
| Reinvestment of distributions | 2,124 | 1,834 | 41,026 | 36,066 |
| Shares redeemed | (23,646) | (17,080) | (471,066) | (332,033) |
| Net increase (decrease) | 21,568 | 68,939 | $414,989 | $1,334,070 |
| Service Class 2 | | | | |
| Shares sold | 575,880 | 514,701 | $11,361,119 | $9,981,898 |
| Reinvestment of distributions | 19,826 | 15,326 | 381,351 | 298,991 |
| Shares redeemed | (211,248) | (90,965) | (4,161,335) | (1,764,901) |
| Net increase (decrease) | 384,458 | 439,062 | $7,581,135 | $8,515,988 |
| VIP Freedom 2040 | | | | |
| Initial Class | | | | |
| Shares sold | 210,577 | 347,127 | $4,032,196 | $6,459,009 |
| Reinvestment of distributions | 19,134 | 23,119 | 353,102 | 431,979 |
| Shares redeemed | (200,035) | (113,362) | (3,816,485) | (2,101,018) |
| Net increase (decrease) | 29,676 | 256,884 | $568,813 | $4,789,970 |
| Service Class | | | | |
| Shares sold | 535,036 | 332,214 | $10,162,149 | $6,217,955 |
| Reinvestment of distributions | 22,392 | 19,073 | 412,705 | 356,057 |
| Shares redeemed | (236,839) | (154,261) | (4,513,032) | (2,882,686) |
| Net increase (decrease) | 320,589 | 197,026 | $6,061,822 | $3,691,326 |
| Service Class 2 | | | | |
| Shares sold | 365,794 | 322,076 | $6,983,427 | $5,944,430 |
| Reinvestment of distributions | 13,903 | 10,481 | 255,406 | 195,662 |
| Shares redeemed | (140,107) | (37,791) | (2,625,215) | (692,555) |
| Net increase (decrease) | 239,590 | 294,766 | $4,613,618 | $5,447,537 |
| VIP Freedom 2045 | | | | |
| Initial Class | | | | |
| Shares sold | 17,269 | 17,923 | $324,086 | $331,772 |
| Reinvestment of distributions | 684 | 515 | 12,505 | 9,538 |
| Shares redeemed | (6,373) | (14,896) | (120,815) | (269,781) |
| Net increase (decrease) | 11,580 | 3,542 | $215,776 | $71,529 |
| Service Class | | | | |
| Shares sold | 9,629 | 11,016 | $179,791 | $207,804 |
| Reinvestment of distributions | 419 | 493 | 7,652 | 9,153 |
| Shares redeemed | (10,722) | (1,138) | (200,928) | (20,656) |
| Net increase (decrease) | (674) | 10,371 | $(13,485) | $196,301 |
| Service Class 2 | | | | |
| Shares sold | 384,866 | 300,588 | $7,194,399 | $5,516,130 |
| Reinvestment of distributions | 12,916 | 9,267 | 235,255 | 171,477 |
| Shares redeemed | (162,324) | (47,917) | (3,021,191) | (875,233) |
| Net increase (decrease) | 235,458 | 261,938 | $4,408,463 | $4,812,374 |
| VIP Freedom 2050 | | | | |
| Initial Class | | | | |
| Shares sold | 58,084 | 63,355 | $994,708 | $1,075,716 |
| Reinvestment of distributions | 3,177 | 2,604 | 52,931 | 43,978 |
| Shares redeemed | (23,146) | (19,200) | (396,298) | (324,621) |
| Net increase (decrease) | 38,115 | 46,759 | $651,341 | $795,073 |
| Service Class | | | | |
| Shares sold | 66,182 | 78,954 | $1,125,460 | $1,344,245 |
| Reinvestment of distributions | 4,091 | 4,467 | 68,086 | 75,282 |
| Shares redeemed | (58,008) | (26,875) | (980,918) | (448,019) |
| Net increase (decrease) | 12,265 | 56,546 | $212,628 | $971,508 |
| Service Class 2 | | | | |
| Shares sold | 283,095 | 336,972 | $4,830,393 | $5,620,131 |
| Reinvestment of distributions | 9,649 | 8,582 | 160,248 | 144,781 |
| Shares redeemed | (208,192) | (63,356) | (3,496,708) | (1,072,289) |
| Net increase (decrease) | 84,552 | 282,198 | $1,493,933 | $4,692,623 |
8. Other.
The Funds' organizational documents provide former and current trustees and officers with a limited indemnification against liabilities arising in connection with the performance of their duties to the Funds. In the normal course of business, the Funds may also enter into contracts that provide general indemnifications. The Funds' maximum exposure under these arrangements is unknown as this would be dependent on future claims that may be made against the Funds. The risk of material loss from such claims is considered remote.
The Funds do not invest in the Underlying Funds for the purpose of exercising management or control; however, investments by the Funds within their principal investment strategies may represent a significant portion of the Underlying Fund's net assets. At the end of the period, the following Funds were the owners of record of 10% or more of the total outstanding shares of the Underlying Funds.
| Fund | VIP Freedom 2020 Portfolio Fund | VIP Freedom 2030 Portfolio Fund |
| VIP Value Portfolio | 14% | -% |
| VIP Emerging Markets Portfolio | 24% | 10% |
The Funds, in aggregate, were the owners of record of more than 20% of the total outstanding shares of the following Underlying Funds.
| Fund | % of shares held |
| VIP Value Portfolio | 32% |
| VIP Emerging Markets Portfolio | 54% |
In addition, at the end of the period the investment adviser or its affiliates were owners of record of more than 10%, respectively, of the outstanding shares of the following Funds:
| | Affiliated % | Number of
Unaffiliated Shareholders | Unaffiliated Shareholders % |
| VIP Freedom Income | 32% | 2 | 29% |
| VIP Freedom 2005 | 91% | – | –% |
| VIP Freedom 2010 | –% | 1 | 83% |
| VIP Freedom 2015 | 27% | 3 | 45% |
| VIP Freedom 2020 | –% | 1 | 73% |
| VIP Freedom 2025 | 13% | 3 | 60% |
| VIP Freedom 2030 | –% | 2 | 54% |
| VIP Freedom 2035 | –% | 4 | 86% |
| VIP Freedom 2040 | –% | 3 | 76% |
| VIP Freedom 2045 | –% | 3 | 89% |
| VIP Freedom 2050 | –% | 4 | 94% |
Report of Independent Registered Public Accounting Firm
To the Trustees of Variable Insurance Products Fund V and the Shareholders of VIP Freedom Income Portfolio, VIP Freedom 2005 Portfolio, VIP Freedom 2010 Portfolio, VIP Freedom 2015 Portfolio, VIP Freedom 2020 Portfolio, VIP Freedom 2025 Portfolio, VIP Freedom 2030 Portfolio, VIP Freedom 2035 Portfolio, VIP Freedom 2040 Portfolio, VIP Freedom 2045 Portfolio and VIP Freedom 2050 Portfolio:
We have audited the accompanying statements of assets and liabilities of VIP Freedom Income Portfolio, VIP Freedom 2005 Portfolio, VIP Freedom 2010 Portfolio, VIP Freedom 2015 Portfolio, VIP Freedom 2020 Portfolio, VIP Freedom 2025 Portfolio, VIP Freedom 2030 Portfolio, VIP Freedom 2035 Portfolio, VIP Freedom 2040 Portfolio, VIP Freedom 2045 Portfolio and VIP Freedom 2050 Portfolio (the Funds), each a fund of the Variable Insurance Products Fund V, including the schedules of investments, as of December 31, 2015, and the related statements of operations for the year then ended, the statements of changes in net assets for each of the two years in the period then ended, and the financial highlights for each of the five years in the period then ended. These financial statements and financial highlights are the responsibility of the Funds' management. Our responsibility is to express an opinion on these financial statements and financial highlights based on our audits.
We conducted our audits in accordance with the standards of the Public Company Accounting Oversight Board (United States). Those standards require that we plan and perform the audit to obtain reasonable assurance about whether the financial statements and financial highlights are free of material misstatement. The Funds are not required to have, nor were we engaged to perform, an audit of their internal control over financial reporting. Our audits included consideration of internal control over financial reporting as a basis for designing audit procedures that are appropriate in the circumstances, but not for the purpose of expressing an opinion on the effectiveness of the Funds' internal control over financial reporting. Accordingly, we express no such opinion. An audit also includes examining, on a test basis, evidence supporting the amounts and disclosures in the financial statements, assessing the accounting principles used and significant estimates made by management, as well as evaluating the overall financial statement presentation. Our procedures included confirmation of securities owned as of December 31, 2015, by correspondence with the custodians. We believe that our audits provide a reasonable basis for our opinion.
In our opinion, such financial statements and financial highlights referred to above present fairly, in all material respects, the financial position of VIP Freedom Income Portfolio, VIP Freedom 2005 Portfolio, VIP Freedom 2010 Portfolio, VIP Freedom 2015 Portfolio, VIP Freedom 2020 Portfolio, VIP Freedom 2025 Portfolio, VIP Freedom 2030 Portfolio, VIP Freedom 2035 Portfolio, VIP Freedom 2040 Portfolio, VIP Freedom 2045 Portfolio and VIP Freedom 2050 Portfolio as of December 31, 2015, the results of their operations for the year then ended, the changes in their net assets for each of the two years in the period then ended, and the financial highlights for each of the five years in the period then ended, in conformity with accounting principles generally accepted in the United States of America.
DELOITTE & TOUCHE LLP
Boston, Massachusetts
February 23, 2016
Trustees and Officers
The Trustees, Members of the Advisory Board (if any), and officers of the trust and funds, as applicable, are listed below. The Board of Trustees governs each fund and is responsible for protecting the interests of shareholders. The Trustees are experienced executives who meet periodically throughout the year to oversee each fund's activities, review contractual arrangements with companies that provide services to each fund, oversee management of the risks associated with such activities and contractual arrangements, and review each fund's performance. If the interests of a fund and an underlying Fidelity® fund were to diverge, a conflict of interest could arise and affect how the Trustees and Members of the Advisory Board fulfill their fiduciary duties to the affected funds. FMRC has structured the funds to avoid these potential conflicts, although there may be situations where a conflict of interest is unavoidable. In such instances, FMRC, the Trustees, and Members of the Advisory Board would take reasonable steps to minimize and, if possible, eliminate the conflict. Except for Elizabeth S. Acton, John Engler, and Geoffrey A. von Kuhn, each of the Trustees oversees 236 funds. Ms. Acton and Mr. Engler each oversees 228 funds. Mr. von Kuhn oversees 148 funds.
The Trustees hold office without limit in time except that (a) any Trustee may resign; (b) any Trustee may be removed by written instrument, signed by at least two-thirds of the number of Trustees prior to such removal; (c) any Trustee who requests to be retired or who has become incapacitated by illness or injury may be retired by written instrument signed by a majority of the other Trustees; and (d) any Trustee may be removed at any special meeting of shareholders by a two-thirds vote of the outstanding voting securities of the trust. Each Trustee who is not an interested person (as defined in the 1940 Act) of the trust and the funds is referred to herein as an Independent Trustee. Each Independent Trustee shall retire not later than the last day of the calendar year in which his or her 75th birthday occurs. The Independent Trustees may waive this mandatory retirement age policy with respect to individual Trustees. Officers and Advisory Board Members hold office without limit in time, except that any officer or Advisory Board Member may resign or may be removed by a vote of a majority of the Trustees at any regular meeting or any special meeting of the Trustees. Except as indicated, each individual has held the office shown or other offices in the same company for the past five years.
Each fund’s Statement of Additional Information (SAI) includes more information about the Trustees. To request a free copy, call Fidelity at 1-877-208-0098.
Experience, Skills, Attributes, and Qualifications of the Trustees. The Governance and Nominating Committee has adopted a statement of policy that describes the experience, qualifications, attributes, and skills that are necessary and desirable for potential Independent Trustee candidates (Statement of Policy). The Board believes that each Trustee satisfied at the time he or she was initially elected or appointed a Trustee, and continues to satisfy, the standards contemplated by the Statement of Policy. The Governance and Nominating Committee also engages professional search firms to help identify potential Independent Trustee candidates who have the experience, qualifications, attributes, and skills consistent with the Statement of Policy. From time to time, additional criteria based on the composition and skills of the current Independent Trustees, as well as experience or skills that may be appropriate in light of future changes to board composition, business conditions, and regulatory or other developments, have also been considered by the professional search firms and the Governance and Nominating Committee. In addition, the Board takes into account the Trustees' commitment and participation in Board and committee meetings, as well as their leadership of standing and ad hoc committees throughout their tenure.
In determining that a particular Trustee was and continues to be qualified to serve as a Trustee, the Board has considered a variety of criteria, none of which, in isolation, was controlling. The Board believes that, collectively, the Trustees have balanced and diverse experience, qualifications, attributes, and skills, which allow the Board to operate effectively in governing each fund and protecting the interests of shareholders. Information about the specific experience, skills, attributes, and qualifications of each Trustee, which in each case led to the Board's conclusion that the Trustee should serve (or continue to serve) as a trustee of the funds, is provided below.
Board Structure and Oversight Function. Abigail P. Johnson is an interested person and currently serves as Chairman. The Trustees have determined that an interested Chairman is appropriate and benefits shareholders because an interested Chairman has a personal and professional stake in the quality and continuity of services provided to the funds. Independent Trustees exercise their informed business judgment to appoint an individual of their choosing to serve as Chairman, regardless of whether the Trustee happens to be independent or a member of management. The Independent Trustees have determined that they can act independently and effectively without having an Independent Trustee serve as Chairman and that a key structural component for assuring that they are in a position to do so is for the Independent Trustees to constitute a substantial majority for the Board. The Independent Trustees also regularly meet in executive session. Marie L. Knowles serves as Chairman of the Independent Trustees and as such (i) acts as a liaison between the Independent Trustees and management with respect to matters important to the Independent Trustees and (ii) with management prepares agendas for Board meetings.
Fidelity® funds are overseen by different Boards of Trustees. The funds' Board oversees Fidelity's investment-grade bond, money market, asset allocation and certain equity funds, and other Boards oversee Fidelity's high income, sector and other equity funds. The asset allocation funds may invest in Fidelity® funds that are overseen by such other Boards. The use of separate Boards, each with its own committee structure, allows the Trustees of each group of Fidelity® funds to focus on the unique issues of the funds they oversee, including common research, investment, and operational issues. On occasion, the separate Boards establish joint committees to address issues of overlapping consequences for the Fidelity® funds overseen by each Board.
The Trustees operate using a system of committees to facilitate the timely and efficient consideration of all matters of importance to the Trustees, each fund, and fund shareholders and to facilitate compliance with legal and regulatory requirements and oversight of the funds' activities and associated risks. The Board, acting through its committees, has charged FMR and its affiliates with (i) identifying events or circumstances the occurrence of which could have demonstrably adverse effects on the funds' business and/or reputation; (ii) implementing processes and controls to lessen the possibility that such events or circumstances occur or to mitigate the effects of such events or circumstances if they do occur; and (iii) creating and maintaining a system designed to evaluate continuously business and market conditions in order to facilitate the identification and implementation processes described in (i) and (ii) above. Because the day-to-day operations and activities of the funds are carried out by or through FMR, its affiliates, and other service providers, the funds' exposure to risks is mitigated but not eliminated by the processes overseen by the Trustees. While each of the Board's committees has responsibility for overseeing different aspects of the funds' activities, oversight is exercised primarily through the Operations and Audit Committees. In addition, an ad hoc Board committee of Independent Trustees has worked with FMR to enhance the Board's oversight of investment and financial risks, legal and regulatory risks, technology risks, and operational risks, including the development of additional risk reporting to the Board. Appropriate personnel, including but not limited to the funds' Chief Compliance Officer (CCO), FMR's internal auditor, the independent accountants, the funds' Treasurer and portfolio management personnel, make periodic reports to the Board's committees, as appropriate, including an annual review of Fidelity's risk management program for the Fidelity® funds. The responsibilities of each standing committee, including their oversight responsibilities, are described further under "Standing Committees of the Trustees."
Interested Trustees*:
Correspondence intended for a Trustee who is an interested person may be sent to Fidelity Investments, 245 Summer Street, Boston, Massachusetts 02210.
Name, Year of Birth; Principal Occupations and Other Relevant Experience+
Abigail P. Johnson (1961)
Year of Election or Appointment: 2009
Trustee
Chairman of the Board of Trustees
Ms. Johnson also serves as Trustee of other Fidelity® funds. Ms. Johnson serves as President (2013-present) and Chief Executive Officer (2014-present) of FMR LLC (diversified financial services company), President of Fidelity Financial Services (2012-present) and President of Personal, Workplace and Institutional Services (2005-present). Ms. Johnson is Chairman and Director of FMR Co., Inc. (investment adviser firm, 2011-present), Chairman and Director of FMR (investment adviser firm, 2011-present), and the Vice Chairman and Director (2007-present) of FMR LLC. Previously, Ms. Johnson served as President and a Director of FMR (2001-2005), a Trustee of other investment companies advised by FMR, Fidelity Investments Money Management, Inc. (investment adviser firm), and FMR Co., Inc. (2001-2005), Senior Vice President of the Fidelity® funds (2001-2005), and managed a number of Fidelity® funds. Ms. Abigail P. Johnson and Mr. Arthur E. Johnson are not related.
Geoffrey A. von Kuhn (1951)
Year of Election or Appointment: 2015
Trustee
Mr. von Kuhn also serves as Trustee or Member of the Advisory Board of other Fidelity funds. Mr. von Kuhn is Chief Administrative Officer for FMR LLC (diversified financial services company, 2013-present), a Director of Pembroke Real Estate, Inc. (2009-present), and a Director of Discovery Natural Resources LLC (2012-present). Previously, Mr. von Kuhn was a managing director of Crosby Group (private wealth management company, 2007-2013), a member of the management committee and senior executive in the Wealth Management Group of AmSouth Bank (2001-2006), and head of the U.S. private bank at Citigroup (2000-2001).
* Determined to be an “Interested Trustee” by virtue of, among other things, his or her affiliation with the trust or various entities under common control with FMR.
+ The information includes the Trustee's principal occupation during the last five years and other information relating to the experience, attributes, and skills relevant to the Trustee's qualifications to serve as a Trustee, which led to the conclusion that the Trustee should serve as a Trustee for each fund.
Independent Trustees:
Correspondence intended for an Independent Trustee may be sent to Fidelity Investments, P.O. Box 55235, Boston, Massachusetts 02205-5235.
Name, Year of Birth; Principal Occupations and Other Relevant Experience+
Elizabeth S. Acton (1951)
Year of Election or Appointment: 2013
Trustee
Ms. Acton also serves as Trustee or Member of the Advisory Board of other Fidelity® funds. Prior to her retirement in April 2012, Ms. Acton was Executive Vice President, Finance (2011-2012), Executive Vice President, Chief Financial Officer (2002-2011), and Treasurer (2004-2005) of Comerica Incorporated (financial services). Prior to joining Comerica, Ms. Acton held a variety of positions at Ford Motor Company (1983-2002), including Vice President and Treasurer (2000-2002) and Executive Vice President and Chief Financial Officer of Ford Motor Credit Company (1998-2000). Ms. Acton currently serves as a member of the Board of Directors and Audit and Finance Committees of Beazer Homes USA, Inc. (homebuilding, 2012-present).
John Engler (1948)
Year of Election or Appointment: 2014
Trustee
Mr. Engler also serves as Trustee or Member of the Advisory Board of other Fidelity® funds. He serves as president of the Business Roundtable (2011-present), and on the board of directors/trustees for Universal Forest Products (manufacturer and distributor of wood and wood-alternative products, 2003-present) and K12 Inc. (technology-based education company, 2012-present). Previously, Mr. Engler served as a trustee of The Munder Funds (2003-2014), president and CEO of the National Association of Manufacturers (2004-2011), member of the Board of Trustees of the Annie E. Casey Foundation (2004-2015), and as governor of Michigan (1991-2003). He is a past chairman of the National Governors Association.
Albert R. Gamper, Jr. (1942)
Year of Election or Appointment: 2007
Trustee
Mr. Gamper also serves as Trustee of other Fidelity® funds. Prior to his retirement in December 2004, Mr. Gamper served as Chairman of the Board of CIT Group Inc. (commercial finance). During his tenure with CIT Group Inc. Mr. Gamper served in numerous senior management positions, including Chairman (1987-1989; 1999-2001; 2002-2004), Chief Executive Officer (1987-2004), and President (2002-2003). Mr. Gamper currently serves as a member of the Board of Directors of Public Service Enterprise Group (utilities, 2000-present), and Member of the Board of Trustees of Barnabas Health Care System (1997-present). Previously, Mr. Gamper served as Chairman (2012-2015) and Vice Chairman (2011-2012) of the Independent Trustees of certain Fidelity® funds and as Chairman of the Board of Governors, Rutgers University (2004-2007).
Robert F. Gartland (1951)
Year of Election or Appointment: 2010
Trustee
Mr. Gartland also serves as Trustee of other Fidelity® funds. Mr. Gartland is Chairman and an investor in Gartland and Mellina Group Corp. (consulting, 2009-present). Previously, Mr. Gartland served as a partner and investor of Vietnam Partners LLC (investments and consulting, 2008-2011). Prior to his retirement, Mr. Gartland held a variety of positions at Morgan Stanley (financial services, 1979-2007) including Managing Director (1987-2007).
Arthur E. Johnson (1947)
Year of Election or Appointment: 2008
Trustee
Vice Chairman of the Independent Trustees
Mr. Johnson also serves as Trustee of other Fidelity® funds. Mr. Johnson serves as a member of the Board of Directors of Eaton Corporation plc (diversified power management, 2009-present), AGL Resources, Inc. (holding company, 2002-present) and Booz Allen Hamilton (management consulting, 2011-present). Prior to his retirement, Mr. Johnson served as Senior Vice President of Corporate Strategic Development of Lockheed Martin Corporation (defense contractor, 1999-2009). He previously served on the Board of Directors of IKON Office Solutions, Inc. (1999-2008) and Delta Airlines (2005-2007). Mr. Arthur E. Johnson is not related to Ms. Abigail P. Johnson.
Michael E. Kenneally (1954)
Year of Election or Appointment: 2009
Trustee
Mr. Kenneally also serves as Trustee of other Fidelity® funds. Prior to his retirement, Mr. Kenneally served as Chairman and Global Chief Executive Officer of Credit Suisse Asset Management. Before joining Credit Suisse, he was an Executive Vice President and Chief Investment Officer for Bank of America Corporation. Earlier roles at Bank of America included Director of Research, Senior Portfolio Manager and Research Analyst, and Mr. Kenneally was awarded the Chartered Financial Analyst (CFA) designation in 1991.
James H. Keyes (1940)
Year of Election or Appointment: 2007
Trustee
Mr. Keyes also serves as Trustee of other Fidelity® funds. Mr. Keyes serves as a member of the Board and Non-Executive Chairman of Navistar International Corporation (manufacture and sale of trucks, buses, and diesel engines, since 2002). Previously, Mr. Keyes served as a member of the Board of Pitney Bowes, Inc. (integrated mail, messaging, and document management solutions, 1998-2013). Prior to his retirement, Mr. Keyes served as Chairman (1993-2002) and Chief Executive Officer (1988-2002) of Johnson Controls (automotive, building, and energy) and as a member of the Board of LSI Logic Corporation (semiconductor technologies, 1984-2008).
Marie L. Knowles (1946)
Year of Election or Appointment: 2001
Trustee
Chairman of the Independent Trustees
Ms. Knowles also serves as Trustee of other Fidelity® funds. Prior to Ms. Knowles' retirement in June 2000, she served as Executive Vice President and Chief Financial Officer of Atlantic Richfield Company (ARCO) (diversified energy, 1996-2000). From 1993 to 1996, she was a Senior Vice President of ARCO and President of ARCO Transportation Company (pipeline and tanker operations). Ms. Knowles currently serves as a Director and Chairman of the Audit Committee of McKesson Corporation (healthcare service, since 2002). Ms. Knowles is a member of the Board of the Santa Catalina Island Company (real estate, 2009-present). Ms. Knowles is a Member of the Investment Company Institute Board of Governors and a Member of the Governing Council of the Independent Directors Council (2014-present). She also serves as a member of the Advisory Board for the School of Engineering of the University of Southern California. Previously, Ms. Knowles served as a Director of Phelps Dodge Corporation (copper mining and manufacturing, 1994-2007), URS Corporation (engineering and construction, 2000-2003) and America West (airline, 1999-2002). Ms. Knowles previously served as Vice Chairman of the Independent Trustees of certain Fidelity® funds (2012-2015).
+ The information includes the Trustee's principal occupation during the last five years and other information relating to the experience, attributes, and skills relevant to the Trustee's qualifications to serve as a Trustee, which led to the conclusion that the Trustee should serve as a Trustee for each fund.
Advisory Board Members and Officers:
Correspondence intended for an officer may be sent to Fidelity Investments, 245 Summer Street, Boston, Massachusetts 02210. Officers appear below in alphabetical order.
Name, Year of Birth; Principal Occupation
Marc R. Bryant (1966)
Year of Election or Appointment: 2015
Secretary and Chief Legal Officer (CLO)
Mr. Bryant also serves as Secretary and CLO of other funds. Mr. Bryant serves as CLO, Secretary, and Senior Vice President of Fidelity Management & Research Company (investment adviser firm, 2015-present) and FMR Co., Inc. (investment adviser firm, 2015-present); Secretary of Fidelity SelectCo, LLC (investment adviser firm, 2015-present) and Fidelity Investments Money Management, Inc. (investment adviser firm, 2015-present); and CLO of Fidelity Management & Research (Hong Kong) Limited (investment adviser firm, 2015-present). He is Senior Vice President and Deputy General Counsel of FMR LLC (diversified financial services company). Previously, Mr. Bryant served as Secretary and CLO of Fidelity Rutland Square Trust II (2010-2014) and Assistant Secretary of Fidelity's Fixed Income and Asset Allocation Funds (2013-2015). Prior to joining Fidelity Investments, Mr. Bryant served as a Senior Vice President and the Head of Global Retail Legal for AllianceBernstein L.P. (2006-2010), and as the General Counsel for ProFund Advisors LLC (2001-2006).
Jonathan Davis (1968)
Year of Election or Appointment: 2010
Assistant Treasurer
Mr. Davis also serves as Assistant Treasurer of other funds, and is an employee of Fidelity Investments. Previously, Mr. Davis served as Vice President and Associate General Counsel of FMR LLC (diversified financial services company, 2003-2010).
Adrien E. Deberghes (1967)
Year of Election or Appointment: 2010
Assistant Treasurer
Mr. Deberghes also serves as an officer of other funds. He is an employee of Fidelity Investments (2008-present). Prior to joining Fidelity Investments, Mr. Deberghes was Senior Vice President of Mutual Fund Administration at State Street Corporation (2007-2008), Senior Director of Mutual Fund Administration at Investors Bank & Trust (2005-2007), and Director of Finance for Dunkin' Brands (2000-2005).
Stephanie J. Dorsey (1969)
Year of Election or Appointment: 2013
President and Treasurer
Ms. Dorsey also serves as an officer of other funds. She is an employee of Fidelity Investments (2008-present) and has served in other fund officer roles. Prior to joining Fidelity Investments, Ms. Dorsey served as Treasurer (2004-2008) of the JPMorgan Mutual Funds and Vice President (2004-2008) of JPMorgan Chase Bank.
Howard J. Galligan III (1966)
Year of Election or Appointment: 2014
Chief Financial Officer
Mr. Galligan also serves as Chief Financial Officer of other funds. Mr. Galligan serves as President of Fidelity Pricing and Cash Management Services (FPCMS) (2014-present) and as a Director of Strategic Advisers, Inc. (investment adviser firm, 2008-present). Previously, Mr. Galligan served as Chief Administrative Officer of Asset Management (2011-2014) and Chief Operating Officer and Senior Vice President of Investment Support for Strategic Advisers, Inc. (2003-2011).
Scott C. Goebel (1968)
Year of Election or Appointment: 2015
Vice President
Mr. Goebel serves as Vice President of other funds and is an employee of Fidelity Investments (2001-present). Previously, Mr. Goebel served as Secretary of Fidelity SelectCo, LLC (investment adviser firm, 2013-2015), Fidelity Investments Money Management, Inc. (FIMM) (investment adviser firm, 2010-2015), and Fidelity Research and Analysis Company (FRAC) (investment adviser firm, 2010-2015); General Counsel, Secretary, and Senior Vice President of Fidelity Management & Research Company (investment adviser firm, 2008-2015) and FMR Co., Inc. (investment adviser firm, 2008-2015); Assistant Secretary of Fidelity Management & Research (Japan) Limited (investment adviser firm, 2008-2015) and FMR Investment Management (U.K.) Limited (investment adviser firm, 2008-2015); Chief Legal Officer (CLO) of Fidelity Management & Research (Hong Kong) Limited (investment adviser firm, 2008-2015); Secretary and CLO of certain Fidelity® funds (2008-2015); Assistant Secretary of FIMM (2008-2010), FRAC (2008-2010), and certain funds (2007-2008); and as Vice President and Secretary of Fidelity Distributors Corporation (FDC) (2005-2007).
Chris Maher (1972)
Year of Election or Appointment: 2013
Assistant Treasurer
Mr. Maher serves as Assistant Treasurer of other funds. Mr. Maher is Vice President of Valuation Oversight and is an employee of Fidelity Investments. Previously, Mr. Maher served as Vice President of Asset Management Compliance (2013), Vice President of the Program Management Group of FMR (investment adviser firm, 2010-2013), and Vice President of Valuation Oversight (2008-2010).
Jason P. Pogorelec (1975)
Year of Election or Appointment: 2015
Assistant Secretary
Mr. Pogorelec also serves as Assistant Secretary of other funds. Mr. Pogorelec serves as Vice President, Associate General Counsel (2010-present) and is an employee of Fidelity Investments (2006-present).
John F. Papandrea (1972)
Year of Election or Appointment: 2016
Anti-Money Laundering (AML) Officer
Mr. Papandrea also serves as AML Officer of other funds. Mr. Papandrea is Vice President of FMR LLC (diversified financial services company, 2008-present) and is an employee of Fidelity Investments (2005-present).
Nancy D. Prior (1967)
Year of Election or Appointment: 2014
Vice President
Ms. Prior also serves as Vice President of other funds. Ms. Prior serves as a Director of Fidelity Investments Money Management, Inc. (FIMM) (investment adviser firm, 2014-present), President, Fixed Income (2014-present), Vice Chairman of FIAM LLC (investment adviser firm, 2014-present), and is an employee of Fidelity Investments (2002-present). Previously, Ms. Prior served as Vice President of Fidelity's Money Market Funds (2012-2014), President, Money Market and Short Duration Bond Group of Fidelity Management & Research (FMR) (investment adviser firm, 2013-2014), President, Money Market Group of FMR (2011-2013), Managing Director of Research (2009-2011), Senior Vice President and Deputy General Counsel (2007-2009), and Assistant Secretary of other Fidelity® funds (2008-2009).
Kenneth B. Robins (1969)
Year of Election or Appointment: 2009
Assistant Treasurer
Mr. Robins also serves as an officer of other funds. Mr. Robins serves as Executive Vice President of Fidelity Investments Money Management, Inc. (FIMM) (investment adviser firm, 2013-present) and is an employee of Fidelity Investments (2004-present). Previously, Mr. Robins served in other fund officer roles.
Stacie M. Smith (1974)
Year of Election or Appointment: 2013
Assistant Treasurer
Ms. Smith also serves as an officer of other funds. She is an employee of Fidelity Investments (2009-present) and has served in other fund officer roles. Prior to joining Fidelity Investments, Ms. Smith served as Senior Audit Manager of Ernst & Young LLP (1996-2009).
Renee Stagnone (1975)
Year of Election or Appointment: 2013
Deputy Treasurer
Ms. Stagnone also serves as Deputy Treasurer of other funds. Ms. Stagnone is an employee of Fidelity Investments (1997-present).
Michael H. Whitaker (1967)
Year of Election or Appointment: 2008
Chief Compliance Officer
Mr. Whitaker also serves as Chief Compliance Officer of other funds. Mr. Whitaker also serves as Compliance Officer of FMR Co., Inc. (investment adviser firm, 2014-present), FMR (investment adviser firm, 2014-present), and Fidelity Investments Money Management, Inc. (investment adviser firm, 2014-present) and is an employee of Fidelity Investments (2007-present). Prior to joining Fidelity Investments, Mr. Whitaker worked at MFS Investment Management where he served as Senior Vice President and Chief Compliance Officer (2004-2006), and Assistant General Counsel.
Derek L. Young (1964)
Year of Election or Appointment: 2009
Vice President of Fidelity's Asset Allocation Funds
Mr. Young also serves as an officer of other funds. He is a Director of Strategic Advisers, Inc. (investment adviser firm, 2011-present), President of Fidelity Global Asset Allocation (GAA) (2011-present), and Vice Chairman of FIAM LLC (investment adviser firm, 2011-present). Previously, Mr. Young served as Trustee of certain funds (2012-2015), President of Strategic Advisers, Inc. (2011-2015), Chief Investment Officer of GAA (2009-2011), and as a portfolio manager.
Joseph F. Zambello (1957)
Year of Election or Appointment: 2011
Deputy Treasurer
Mr. Zambello also serves as Deputy Treasurer of other funds. Mr. Zambello is an employee of Fidelity Investments (1991-present). Previously, Mr. Zambello served as Vice President of the Program Management Group of FMR (investment adviser firm, 2009-2011) and Vice President of the Transfer Agent Oversight Group (2005-2009).
Shareholder Expense Example
As a shareholder of the Fund, you incur two types of costs: (1) transaction costs and (2) ongoing costs, including distribution and/or service (12b-1) fees and other Fund expenses. This Example is intended to help you understand your ongoing costs (in dollars) of investing in the Fund and to compare these costs with the ongoing costs of investing in other mutual funds.
The Example is based on an investment of $1,000 invested at the beginning of the period and held for the entire period (July 1, 2015 to December 31, 2015).
Actual Expenses
The first line of the accompanying table for each class of each fund provides information about actual account values and actual expenses. You may use the information in this line, together with the amount you invested, to estimate the expenses that you paid over the period. Simply divide your account value by $1,000.00 (for example, an $8,600 account value divided by $1,000.00 = 8.6), then multiply the result by the number in the first line for a class of the fund under the heading entitled "Expenses Paid During Period" to estimate the expenses you paid on your account during this period. The estimate of expenses does not include any fees or other expenses of any variable annuity or variable life insurance product. If they were, the estimate of expenses you paid during the period would be higher, and your ending account value would be lower. In addition, each Fund, as a shareholder in underlying Fidelity Funds, will indirectly bear its pro-rata share of the fees and expenses incurred by the underlying Fidelity Funds. These fees and expenses are not included in each Fund's annualized expense ratio used to calculate the expense estimates in the table below.
Hypothetical Example for Comparison Purposes
The second line of the accompanying table for each class of each fund provides information about hypothetical account values and hypothetical expenses based on a Class' actual expense ratio and an assumed rate of return of 5% per year before expenses, which is not the Class' actual return. The hypothetical account values and expenses may not be used to estimate the actual ending account balance or expenses you paid for the period. You may use this information to compare the ongoing costs of investing in the Fund and other funds. To do so, compare this 5% hypothetical example with the 5% hypothetical examples that appear in the shareholder reports of the other funds. The estimate of expenses does not include any fees or other expenses of any variable annuity or variable life insurance product. If they were, the estimate of expenses you paid during the period would be higher, and your ending account value would be lower. In addition, each Fund, as a shareholder in underlying Fidelity Funds, will indirectly bear its pro-rata share of the fees and expenses incurred by the underlying Fidelity Funds. These fees and expenses are not included in each Fund's annualized expense ratio used to calculate the expense estimates in the table below.
Please note that the expenses shown in the table are meant to highlight your ongoing costs only and do not reflect any transaction costs. Therefore, the second line of the table is useful in comparing ongoing costs only, and will not help you determine the relative total costs of owning different funds.
| | Annualized Expense RatioA | Beginning
Account Value
July 1, 2015 | Ending
Account Value
December 31, 2015 | Expenses Paid
During Period-B
July 1, 2015
to December 31, 2015 |
| VIP Freedom Income | | | | |
| Initial Class | - % | | | |
| Actual | | $1,000.00 | $983.60 | $- |
| Hypothetical-C | | $1,000.00 | $1,025.21 | $- |
| Service Class | .10% | | | |
| Actual | | $1,000.00 | $983.60 | $.50 |
| Hypothetical-C | | $1,000.00 | $1,024.70 | $.51 |
| Service Class 2 | .25% | | | |
| Actual | | $1,000.00 | $983.00 | $1.25 |
| Hypothetical-C | | $1,000.00 | $1,023.95 | $1.28 |
| VIP Freedom 2005 | | | | |
| Initial Class | - % | | | |
| Actual | | $1,000.00 | $977.80 | $- |
| Hypothetical-C | | $1,000.00 | $1,025.21 | $- |
| Service Class | .10% | | | |
| Actual | | $1,000.00 | $977.80 | $.50 |
| Hypothetical-C | | $1,000.00 | $1,024.70 | $.51 |
| Service Class 2 | .25% | | | |
| Actual | | $1,000.00 | $977.10 | $1.25 |
| Hypothetical-C | | $1,000.00 | $1,023.95 | $1.28 |
| VIP Freedom 2010 | | | | |
| Initial Class | - % | | | |
| Actual | | $1,000.00 | $974.00 | $- |
| Hypothetical-C | | $1,000.00 | $1,025.21 | $- |
| Service Class | .10% | | | |
| Actual | | $1,000.00 | $973.70 | $.50 |
| Hypothetical-C | | $1,000.00 | $1,024.70 | $.51 |
| Service Class 2 | .25% | | | |
| Actual | | $1,000.00 | $973.00 | $1.24 |
| Hypothetical-C | | $1,000.00 | $1,023.95 | $1.28 |
| VIP Freedom 2015 | | | | |
| Initial Class | - % | | | |
| Actual | | $1,000.00 | $970.70 | $- |
| Hypothetical-C | | $1,000.00 | $1,025.21 | $- |
| Service Class | .10% | | | |
| Actual | | $1,000.00 | $969.70 | $.50 |
| Hypothetical-C | | $1,000.00 | $1,024.70 | $.51 |
| Service Class 2 | .25% | | | |
| Actual | | $1,000.00 | $969.70 | $1.24 |
| Hypothetical-C | | $1,000.00 | $1,023.95 | $1.28 |
| VIP Freedom 2020 | | | | |
| Initial Class | - % | | | |
| Actual | | $1,000.00 | $968.50 | $- |
| Hypothetical-C | | $1,000.00 | $1,025.21 | $- |
| Service Class | .10% | | | |
| Actual | | $1,000.00 | $967.50 | $.50 |
| Hypothetical-C | | $1,000.00 | $1,024.70 | $.51 |
| Service Class 2 | .25% | | | |
| Actual | | $1,000.00 | $968.00 | $1.24 |
| Hypothetical-C | | $1,000.00 | $1,023.95 | $1.28 |
| VIP Freedom 2025 | | | | |
| Initial Class | - % | | | |
| Actual | | $1,000.00 | $965.60 | $- |
| Hypothetical-C | | $1,000.00 | $1,025.21 | $- |
| Service Class | .10% | | | |
| Actual | | $1,000.00 | $964.60 | $.50 |
| Hypothetical-C | | $1,000.00 | $1,024.70 | $.51 |
| Service Class 2 | .25% | | | |
| Actual | | $1,000.00 | $964.50 | $1.24 |
| Hypothetical-C | | $1,000.00 | $1,023.95 | $1.28 |
| VIP Freedom 2030 | | | | |
| Initial Class | - % | | | |
| Actual | | $1,000.00 | $959.70 | $- |
| Hypothetical-C | | $1,000.00 | $1,025.21 | $- |
| Service Class | .10% | | | |
| Actual | | $1,000.00 | $958.70 | $.49 |
| Hypothetical-C | | $1,000.00 | $1,024.70 | $.51 |
| Service Class 2 | .25% | | | |
| Actual | | $1,000.00 | $958.10 | $1.23 |
| Hypothetical-C | | $1,000.00 | $1,023.95 | $1.28 |
| VIP Freedom 2035 | | | | |
| Initial Class | - % | | | |
| Actual | | $1,000.00 | $956.20 | $- |
| Hypothetical-C | | $1,000.00 | $1,025.21 | $- |
| Service Class | .10% | | | |
| Actual | | $1,000.00 | $956.20 | $.49 |
| Hypothetical-C | | $1,000.00 | $1,024.70 | $.51 |
| Service Class 2 | .25% | | | |
| Actual | | $1,000.00 | $955.40 | $1.23 |
| Hypothetical-C | | $1,000.00 | $1,023.95 | $1.28 |
| VIP Freedom 2040 | | | | |
| Initial Class | - % | | | |
| Actual | | $1,000.00 | $956.40 | $- |
| Hypothetical-C | | $1,000.00 | $1,025.21 | $- |
| Service Class | .10% | | | |
| Actual | | $1,000.00 | $956.00 | $.49 |
| Hypothetical-C | | $1,000.00 | $1,024.70 | $.51 |
| Service Class 2 | .25% | | | |
| Actual | | $1,000.00 | $955.60 | $1.23 |
| Hypothetical-C | | $1,000.00 | $1,023.95 | $1.28 |
| VIP Freedom 2045 | | | | |
| Initial Class | - % | | | |
| Actual | | $1,000.00 | $956.50 | $- |
| Hypothetical-C | | $1,000.00 | $1,025.21 | $- |
| Service Class | .10% | | | |
| Actual | | $1,000.00 | $955.90 | $.49 |
| Hypothetical-C | | $1,000.00 | $1,024.70 | $.51 |
| Service Class 2 | .25% | | | |
| Actual | | $1,000.00 | $955.20 | $1.23 |
| Hypothetical-C | | $1,000.00 | $1,023.95 | $1.28 |
| VIP Freedom 2050 | | | | |
| Initial Class | - % | | | |
| Actual | | $1,000.00 | $956.30 | $- |
| Hypothetical-C | | $1,000.00 | $1,025.21 | $- |
| Service Class | .10% | | | |
| Actual | | $1,000.00 | $955.90 | $.49 |
| Hypothetical-C | | $1,000.00 | $1,024.70 | $.51 |
| Service Class 2 | .25% | | | |
| Actual | | $1,000.00 | $955.10 | $1.23 |
| Hypothetical-C | | $1,000.00 | $1,023.95 | $1.28 |
| | | | | |
| | | | | |
| | | | | |
A Annualized expense ratio reflects expenses net of applicable fee waivers.
B Expenses are equal to each Class' annualized expense ratio, multiplied by the average account value over the period, multiplied by 184/ 365 (to reflect the one-half year period). The fees and expenses of the underlying Fidelity Funds in which each Fund invests are not included in each Class' annualized expense ratio.
C 5% return per year before expenses
Distributions (Unaudited)
The Board of Trustees of each portfolio voted to pay to shareholders of record at the opening of business on record date, the following distributions per share derived from capital gains realized from sales of portfolio securities and dividends derived from net investment income:
| | Pay Date | Record Date | Dividends | Capital Gains |
| VIP Freedom Income Portfolio | | | | |
| Initial Class | 02/12/2016 | 02/12/2016 | $0.000 | $0.107 |
| Service Class | 02/12/2016 | 02/12/2016 | $0.000 | $0.107 |
| Service Class 2 | 02/12/2016 | 02/12/2016 | $0.000 | $0.107 |
| VIP Freedom 2005 Portfolio | | | | |
| Initial Class | 02/12/2016 | 02/12/2016 | $0.000 | $0.144 |
| Service Class | 02/12/2016 | 02/12/2016 | $0.000 | $0.144 |
| Service Class 2 | 02/12/2016 | 02/12/2016 | $0.000 | $0.144 |
| VIP Freedom 2010 Portfolio | | | | |
| Initial Class | 02/12/2016 | 02/12/2016 | $0.000 | $0.272 |
| Service Class | 02/12/2016 | 02/12/2016 | $0.000 | $0.272 |
| Service Class 2 | 02/12/2016 | 02/12/2016 | $0.000 | $0.272 |
| VIP Freedom 2015 Portfolio | | | | |
| Initial Class | 02/12/2016 | 02/12/2016 | $0.000 | $0.323 |
| Service Class | 02/12/2016 | 02/12/2016 | $0.000 | $0.323 |
| Service Class 2 | 02/12/2016 | 02/12/2016 | $0.000 | $0.323 |
| VIP Freedom 2020 Portfolio | | | | |
| Initial Class | 02/12/2016 | 02/12/2016 | $0.000 | $0.378 |
| Service Class | 02/12/2016 | 02/12/2016 | $0.000 | $0.378 |
| Service Class 2 | 02/12/2016 | 02/12/2016 | $0.000 | $0.378 |
| VIP Freedom 2025 Portfolio | | | | |
| Initial Class | 02/12/2016 | 02/12/2016 | $0.000 | $0.392 |
| Service Class | 02/12/2016 | 02/12/2016 | $0.000 | $0.392 |
| Service Class 2 | 02/12/2016 | 02/12/2016 | $0.000 | $0.392 |
| VIP Freedom 2030 Portfolio | | | | |
| Initial Class | 02/12/2016 | 02/12/2016 | $0.000 | $0.482 |
| Service Class | 02/12/2016 | 02/12/2016 | $0.000 | $0.482 |
| Service Class 2 | 02/12/2016 | 02/12/2016 | $0.000 | $0.482 |
| VIP Freedom 2035 Portfolio | | | | |
| Initial Class | 02/12/2016 | 02/12/2016 | $0.001 | $0.573 |
| Service Class | 02/12/2016 | 02/12/2016 | $0.001 | $0.573 |
| Service Class 2 | 02/12/2016 | 02/12/2016 | $0.001 | $0.573 |
| VIP Freedom 2040 Portfolio | | | | |
| Initial Class | 02/12/2016 | 02/12/2016 | $0.000 | $0.653 |
| Service Class | 02/12/2016 | 02/12/2016 | $0.000 | $0.653 |
| Service Class 2 | 02/12/2016 | 02/12/2016 | $0.000 | $0.653 |
| VIP Freedom 2045 Portfolio | | | | |
| Initial Class | 02/12/2016 | 02/12/2016 | $0.000 | $0.566 |
| Service Class | 02/12/2016 | 02/12/2016 | $0.000 | $0.566 |
| Service Class 2 | 02/12/2016 | 02/12/2016 | $0.000 | $0.566 |
| VIP Freedom 2050 Portfolio | | | | |
| Initial Class | 02/12/2016 | 02/12/2016 | $0.026 | $0.597 |
| Service Class | 02/12/2016 | 02/12/2016 | $0.026 | $0.597 |
| Service Class 2 | 02/12/2016 | 02/12/2016 | $0.026 | $0.597 |
The funds hereby designate as capital gain dividend the amounts noted below for the taxable year ended December 31, 2015, or, if subsequently determined to be different, the net capital gain of such year.
| VIP Freedom Income Portfolio | $367,649 |
| VIP Freedom 2005 Portfolio | $89,023 |
| VIP Freedom 2010 Portfolio | $6,398,415 |
| VIP Freedom 2015 Portfolio | $2,845,175 |
| VIP Freedom 2020 Portfolio | $22,079,540 |
| VIP Freedom 2025 Portfolio | $3,533,252 |
| VIP Freedom 2030 Portfolio | $10,121,111 |
| VIP Freedom 2035 Portfolio | $742,695 |
| VIP Freedom 2040 Portfolio | $1,702,045 |
| VIP Freedom 2045 Portfolio | $400,022 |
| VIP Freedom 2050 Portfolio | $484,939 |
A percentage of the dividends distributed during the fiscal year for the following funds were derived from interest on U.S. Government securities which is generally exempt from state income tax:
| VIP Freedom Income Portfolio | |
| Initial Class | 2.64% |
| Service Class | 2.64% |
| Service Class 2 | 2.64% |
| VIP Freedom 2005 Portfolio | |
| Initial Class | 1.63% |
| Service Class | 1.63% |
| Service Class 2 | 1.63% |
| VIP Freedom 2010 Portfolio | |
| Initial Class | 1.36% |
| Service Class | 1.36% |
| Service Class 2 | 1.36% |
| VIP Freedom 2015 Portfolio | |
| Initial Class | 1.06% |
| Service Class | 1.06% |
| Service Class 2 | 1.06% |
|
A percentage of the dividends distributed during the fiscal year for the following funds qualify for the dividends–received deduction for corporate shareholders:
| | February
2015 | December
2015 |
| VIP Freedom Income Portfolio | | |
| Initial Class | 3% | 15% |
| Service Class | 3% | 15% |
| Service Class 2 | 3% | 17% |
| VIP Freedom 2005 Portfolio | | |
| Initial Class | 13% | 20% |
| Service Class | 13% | 21% |
| Service Class 2 | 13% | 23% |
| VIP Freedom 2010 Portfolio | | |
| Initial Class | 6% | 24% |
| Service Class | 6% | 25% |
| Service Class 2 | 6% | 27% |
| VIP Freedom 2015 Portfolio | | |
| Initial Class | 2% | 27% |
| Service Class | 2% | 28% |
| Service Class 2 | 2% | 30% |
| VIP Freedom 2020 Portfolio | | |
| Initial Class | 6% | 29% |
| Service Class | 6% | 30% |
| Service Class 2 | 6% | 33% |
| VIP Freedom 2025 Portfolio | | |
| Initial Class | 0% | 32% |
| Service Class | 0% | 34% |
| Service Class 2 | 0% | 36% |
| VIP Freedom 2030 Portfolio | | |
| Initial Class | 6% | 40% |
| Service Class | 6% | 42% |
| Service Class 2 | 6% | 46% |
| VIP Freedom 2035 Portfolio | | |
| Initial Class | 0% | 45% |
| | February
2015 | December
2015 |
| Service Class | 0% | 47% |
| Service Class 2 | 0% | 50% |
| VIP Freedom 2040 Portfolio | | |
| Initial Class | 11% | 43% |
| Service Class | 11% | 44% |
| Service Class 2 | 11% | 48% |
| VIP Freedom 2045 Portfolio | | |
| Initial Class | 15% | 44% |
| Service Class | 15% | 46% |
| Service Class 2 | 15% | 49% |
| VIP Freedom 2050 Portfolio | | |
| Initial Class | 11% | 46% |
| Service Class | 11% | 48% |
| Service Class 2 | 11% | 51% |
The amounts per share which represent income derived from sources within, and taxes paid to, foreign countries or possessions of the United States are as follows:
| | Pay Date | Income | Taxes |
| VIP Freedom Income Portfolio | | | |
| Initial Class | 02/13/2015 | $0.00 | $0.00 |
| | 12/29/2015 | $0.01 | $0.00 |
| Service Class | 02/13/2015 | $0.00 | $0.00 |
| | 12/29/2015 | $0.01 | $0.00 |
| Service Class 2 | 02/13/2015 | $0.00 | $0.00 |
| | 12/29/2015 | $0.01 | $0.00 |
| VIP Freedom 2005 Portfolio | | | |
| Initial Class | 02/13/2015 | $0.00 | $0.00 |
| | 12/29/2015 | $0.02 | $0.00 |
| Service Class | 02/13/2015 | $0.00 | $0.00 |
| | 12/29/2015 | $0.02 | $0.00 |
| Service Class 2 | 02/13/2015 | $0.00 | $0.00 |
| | 12/29/2015 | $0.02 | $0.00 |
| VIP Freedom 2010 Portfolio | | | |
| Initial Class | 02/13/2015 | $0.00 | $0.00 |
| | 12/29/2015 | $0.03 | $0.00 |
| Service Class | 02/13/2015 | $0.00 | $0.00 |
| | 12/29/2015 | $0.02 | $0.00 |
| Service Class 2 | 02/13/2015 | $0.00 | $0.00 |
| | 12/29/2015 | $0.02 | $0.00 |
| VIP Freedom 2015 Portfolio | | | |
| Initial Class | 02/13/2015 | $0.00 | $0.00 |
| | 12/29/2015 | $0.03 | $0.00 |
| Service Class | 02/13/2015 | $0.00 | $0.00 |
| | 12/29/2015 | $0.03 | $0.00 |
| Service Class 2 | 02/13/2015 | $0.00 | $0.00 |
| | 12/29/2015 | $0.03 | $0.00 |
| VIP Freedom 2020 Portfolio | | | |
| Initial Class | 02/13/2015 | $0.00 | $0.00 |
| | 12/29/2015 | $0.04 | $0.00 |
| Service Class | 02/13/2015 | $0.00 | $0.00 |
| | 12/29/2015 | $0.03 | $0.00 |
| Service Class 2 | 02/13/2015 | $0.00 | $0.00 |
| | 12/29/2015 | $0.03 | $0.00 |
| VIP Freedom 2025 Portfolio | | | |
| Initial Class | 02/13/2015 | $0.00 | $0.00 |
| | 12/29/2015 | $0.04 | $0.00 |
| Service Class | 02/13/2015 | $0.00 | $0.00 |
| | 12/29/2015 | $0.04 | $0.00 |
| Service Class 2 | 02/13/2015 | $0.00 | $0.00 |
| | 12/29/2015 | $0.04 | $0.00 |
| VIP Freedom 2030 Portfolio | | | |
| Initial Class | 02/13/2015 | $0.00 | $0.00 |
| | 12/29/2015 | $0.05 | $0.00 |
| Service Class | 02/13/2015 | $0.00 | $0.00 |
| | 12/29/2015 | $0.05 | $0.00 |
| Service Class 2 | 02/13/2015 | $0.00 | $0.00 |
| | 12/29/2015 | $0.04 | $0.00 |
| VIP Freedom 2035 Portfolio | | | |
| Initial Class | 02/13/2015 | $0.00 | $0.00 |
| | 12/29/2015 | $0.08 | $0.01 |
| Service Class | 02/13/2015 | $0.00 | $0.00 |
| | 12/29/2015 | $0.08 | $0.01 |
| Service Class 2 | 02/13/2015 | $0.00 | $0.00 |
| | 12/29/2015 | $0.07 | $0.01 |
| VIP Freedom 2040 Portfolio | | | |
| Initial Class | 02/13/2015 | $0.00 | $0.00 |
| | 12/29/2015 | $0.07 | $0.01 |
| Service Class | 02/13/2015 | $0.00 | $0.00 |
| | 12/29/2015 | $0.07 | $0.01 |
| Service Class 2 | 02/13/2015 | $0.00 | $0.00 |
| | 12/29/2015 | $0.07 | $0.01 |
| VIP Freedom 2045 Portfolio | | | |
| Initial Class | 02/13/2015 | $0.00 | $0.00 |
| | 12/29/2015 | $0.08 | $0.01 |
| Service Class | 02/13/2015 | $0.00 | $0.00 |
| | 12/29/2015 | $0.08 | $0.01 |
| Service Class 2 | 02/13/2015 | $0.00 | $0.00 |
| | 12/29/2015 | $0.07 | $0.01 |
| VIP Freedom 2050 Portfolio | | | |
| Initial Class | 02/13/2015 | $0.00 | $0.00 |
| | 12/29/2015 | $0.08 | $0.01 |
| Service Class | 02/13/2015 | $0.00 | $0.00 |
| | 12/29/2015 | $0.07 | $0.01 |
| Service Class 2 | 02/13/2015 | $0.00 | $0.00 |
| | 12/29/2015 | $0.07 | $0.01 |
Board Approval of Investment Advisory Contracts and Management Fees
VIP Freedom Funds
Each year, the Board of Trustees, including the Independent Trustees (together, the Board), votes on the management and administration arrangements for each fund. The Board, assisted by the advice of fund counsel and Independent Trustees' counsel, requests and considers a broad range of information relevant to the contract arrangements throughout the year.
The Board meets regularly and, at each of its meetings, covers an extensive agenda of topics and materials and considers factors that are relevant to its annual consideration of each fund's management and administration arrangements, including the services and support provided to each fund and its shareholders. The Board has established four standing committees (Committees) — Operations, Audit, Fair Valuation, and Governance and Nominating — each composed of and chaired by Independent Trustees with varying backgrounds, to which the Board has assigned specific subject matter responsibilities in order to enhance effective decision-making by the Board. The Operations Committee, of which all of the Independent Trustees are members, meets regularly throughout the year and considers, among other matters, information specifically related to the annual consideration of each fund's management and administration arrangements. The Board, acting directly and through its Committees, requests and receives information concerning the annual consideration of each fund's management and administration arrangements. The Board also meets as needed to consider matters specifically related to the Board's annual consideration of the management and administration arrangements. Members of the Board may also meet with trustees of other Fidelity funds through ad hoc joint committees to discuss certain matters relevant to all of the Fidelity funds.
At its September 2015 meeting, the Board unanimously determined to approve an amended and restated management contract (Advisory Contract) and administration agreement for each fund to reflect the fact that, effective October 1, 2015, FMR Co., Inc. (FMRC), an affiliate of Strategic Advisers, Inc. (Strategic Advisers) and Fidelity Management & Research Company (FMR), would assume the duties and rights of Strategic Advisers under the fund's then current management contract. The Board noted that, with the exception of the date, term, and entity name, the terms of each fund's management contract, including the lack of fees payable thereunder, would not change as a result of the approval of the Advisory Contract. The Board considered that FMRC would render the same services to the funds under the Advisory Contracts that Strategic Advisers rendered to the funds under the then current management contracts. The Board also considered that approval of the Advisory Contracts would not result in any changes to (i) the investment process or strategies employed in the management of the funds' assets; or (ii) the day-to-day management of the funds or the persons primarily responsible for such management. As a result, the Board considered that its prior experience with Strategic Advisers as investment adviser for the funds was relevant to its consideration of the Advisory Contracts.
In reaching its determination, the Board considered all factors it believed relevant and reached a determination, with the assistance of fund counsel and Independent Trustees' counsel and through the exercise of its business judgment, that the approval of the Advisory Contract was in the best interests of each fund and its shareholders and that the fact that no fees are payable under the Advisory Contracts was fair and reasonable. The Board's decision to approve the Advisory Contracts was not based on any single factor, but rather was based on a comprehensive consideration of all the information provided to the Board at its meetings throughout the year. In reaching its determination, the Board was aware that shareholders of each fund have a broad range of investment choices available to them, including a wide choice among funds offered by Fidelity's competitors, and that each fund's shareholders, who have the opportunity to review and weigh the disclosure provided by the fund in its prospectus and other public disclosures, have chosen to invest in that fund, which is part of the Fidelity family of funds.
Nature, Extent, and Quality of Services Provided. The Board considered Fidelity's staffing as it relates to the funds, including the backgrounds of investment personnel that provide services to the funds, and also considered the funds' investment objectives, strategies, and related investment philosophies. The Independent Trustees also had discussions with senior management of Fidelity's investment operations and investment groups with responsibility for the underlying Fidelity funds in which each fund invests. The Board considered the structure of the portfolio manager compensation program and whether this structure provides appropriate incentives to act in the best interests of each fund. Additionally, the Board considered the portfolio managers' investments, if any, in the funds that they manage.
Resources Dedicated to Investment Management and Support Services. The Board reviewed the general qualifications and capabilities of Fidelity's investment staff, including its size, education, experience, and resources, as well as Fidelity's approach to recruiting, training, managing, and compensating investment personnel. The Board noted that Fidelity has continued to increase the resources devoted to non-U.S. offices, including expansion of Fidelity's global investment organization. The Board also noted that Fidelity's analysts have extensive resources, tools and capabilities that allow them to conduct sophisticated quantitative and fundamental analysis, as well as credit analysis of issuers, counterparties and guarantors. Further, the Board considered that Fidelity's investment professionals have sufficient access to global information and data so as to provide competitive investment results over time, and that those professionals also have access to sophisticated tools that permit them to assess portfolio construction and risk and performance attribution characteristics continuously, as well as to transmit new information and research conclusions rapidly around the world. Additionally, in its deliberations, the Board considered Fidelity's risk management, compliance, and technology and operations capabilities and resources, which are integral parts of the investment management process.
Shareholder and Administrative Services. The Board considered (i) the nature, extent, quality, and cost of advisory, administrative, and shareholder services performed by Fidelity under the then current management contract (and to be performed under the Advisory Contract) and under separate agreements covering administration, transfer agency, and pricing and bookkeeping services for each fund; (ii) the nature and extent of the supervision of third party service providers, principally custodians, subcustodians, and pricing vendors; and (iii) the resources devoted to, and the record of compliance with, each fund's compliance policies and procedures.
The Board noted that the growth of fund assets over time across the complex allows Fidelity to reinvest in the development of services designed to enhance the value or convenience of the Fidelity funds as investment vehicles. These services include 24-hour access to account information and market information through telephone representatives and over the Internet, investor education materials and asset allocation tools, and the expanded availability of Fidelity Investor Centers.
Investment in a Large Fund Family. The Board considered the benefits to shareholders of investing in a Fidelity fund, including the benefits of investing in a fund that is part of a large family of funds offering a variety of investment disciplines and providing a large variety of mutual fund investor services. The Board noted that Fidelity had taken, or had made recommendations that resulted in the Fidelity funds taking, a number of actions over the previous year that benefited particular funds, including (i) continuing to dedicate additional resources to investment research and to the support of the senior management team that oversees asset management; (ii) continuing efforts to enhance Fidelity's global research capabilities; (iii) launching new funds and making other enhancements to meet client needs; (iv) reducing management fees and total expenses for certain index funds and diversified international funds; (v) continuing to launch dedicated lower cost underlying funds to meet portfolio construction needs related to expanding underlying fund options for Fidelity funds of funds, specifically for the Freedom Fund product lines; (vi) rationalizing product lines and gaining increased efficiencies through fund mergers; (vii) launching active fixed-income exchange-traded funds; (viii) continuing to develop, acquire and implement systems and technology to improve services to the funds and shareholders, strengthen information security, and increase efficiency; (ix) implementing investment enhancements to further strengthen Fidelity's target date product line to increase investors' probability of success in achieving their goals; (x) modifying the eligibility criteria for certain share classes to accommodate roll-over assets from employer-sponsored retirement plans; (xi) launching a new Class W of the Freedom Index Funds to attract and retain Fidelity record-kept retirement plan assets; and (xii) implementing changes to Fidelity's money market product line in response to recent money market regulatory reforms.
Investment Performance. The Board considered whether each fund has operated in accordance with its investment objective, as well as its record of compliance with its investment restrictions and its performance history, and noted that the approval of the Advisory Contract for each fund would not result in any changes to the fund's investment strategy or the personnel responsible for providing advisory services to the fund.
The Board took into account discussions with representatives of the investment adviser about fund investment performance that occur at Board meetings throughout the year. In this regard the Board noted that as part of regularly scheduled fund reviews and other reports to the Board on fund performance, the Board considers annualized return information for each fund for different time periods, measured against one or more securities market indices, including a customized blended index representative of the fund's asset classes (each a "benchmark index") and a peer group of funds with similar objectives ("peer group"), if any. In its evaluation of fund investment performance at meetings throughout the year, the Board gave particular attention to information indicating underperformance of certain Fidelity funds for specific time periods and discussed with the investment adviser the reasons for such underperformance.
In addition to reviewing absolute and relative fund performance, the Independent Trustees periodically consider the appropriateness of fund performance metrics in evaluating the results achieved. In general, the Independent Trustees believe that fund performance should be evaluated based on gross performance (before fees and expenses, including acquired fund fees and expenses, but after transaction costs, if any) compared to appropriate benchmark indices, over appropriate time periods that may include full market cycles, and on net performance (after fees and expenses) compared to peer groups, as applicable, over the same periods, taking into account relevant factors including the following: general market conditions; the extent to which particular underlying funds affected performance; and fund cash flows and other factors. Depending on the circumstances, the Independent Trustees may be satisfied with a fund's performance notwithstanding that it lags its benchmark index or peer group for certain periods.
The Independent Trustees recognize that shareholders evaluate performance on a net basis over their own holding periods, for which one-, three-, and five-year periods are often used as a proxy. For this reason, the performance information reviewed by the Board also included net cumulative calendar year total return information for each fund and an appropriate benchmark index for the most recent one-, three-, and five-year periods.
Based on its review, the Board concluded that the nature, extent, and quality of services provided to each fund under the Advisory Contracts should benefit the shareholders of each fund.
Competitiveness of Management Fee and Total Expense Ratio. The Board noted that the funds did not pay Strategic Advisers, and would not pay FMRC, a management fee for investment advisory services, and that each fund bears indirectly the fees and expenses, including the management fees, paid by the underlying Fidelity funds in which it invests. The Board considered each fund's management fee and total expense ratio compared to "mapped groups" of competitive funds and classes created for the purpose of facilitating the Trustees' competitive analysis of management fees and total expenses. Fidelity creates "mapped groups" by combining similar Lipper investment objective categories that have comparable investment mandates. Combining Lipper investment objective categories aids the Board's management fee and total expense ratio comparisons by broadening the competitive group used for comparison.
Management Fee. The Board considered two proprietary management fee comparisons for the 12-month periods shown in basis points (BP) in the charts below. The group of Lipper funds used by the Board for management fee comparisons is referred to below as the "Total Mapped Group." The Total Mapped Group comparison focuses on a fund's standing in terms of gross management fees before expense reimbursements or caps relative to the total universe of funds with comparable investment mandates, regardless of whether their management fee structures also are comparable. Funds with comparable investment mandates offer exposure to similar types of securities. Funds with comparable management fee structures have similar management fee contractual arrangements (
e.g., flat rate charged for advisory services, all-inclusive fee rate,
etc.). "TMG %" represents the percentage of funds in the Total Mapped Group that had management fees that were lower than a fund's. For example, a hypothetical TMG % of 20% would mean that 80% of the funds in the Total Mapped Group had higher, and 20% had lower, management fees than a fund. The funds' actual TMG %s and the number of funds in the Total Mapped Group are in the charts below. The "Asset-Size Peer Group" (ASPG) comparison focuses on a fund's standing relative to a subset of non-Fidelity funds within the Total Mapped Group that are similar in size and management fee structure. For example, if a fund is in the first quartile of the ASPG, the fund's management fee ranks in the least expensive or lowest 25% of funds in the ASPG. The ASPG represents at least 15% of the funds in the Total Mapped Group with comparable asset size and management fee structures, subject to a minimum of 50 funds (or all funds in the Total Mapped Group if fewer than 50). Additional information, such as the ASPG quartile in which a fund's management fee rate ranked, is also included in the charts and considered by the Board.
VIP Freedom 2005 Portfolio
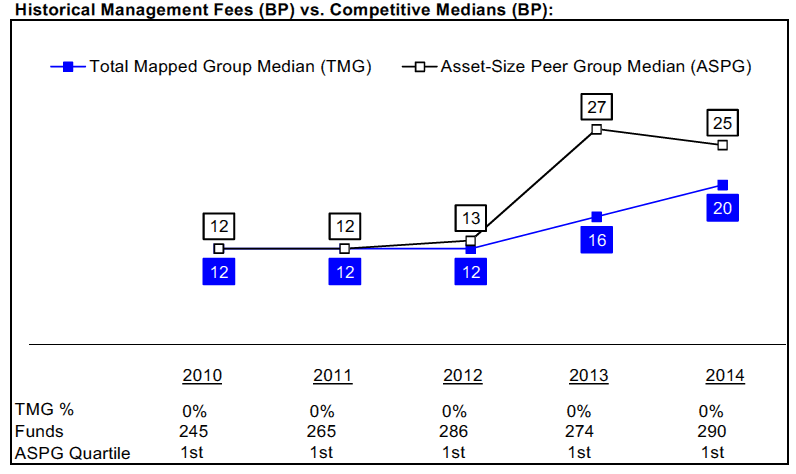
VIP Freedom 2010 Portfolio
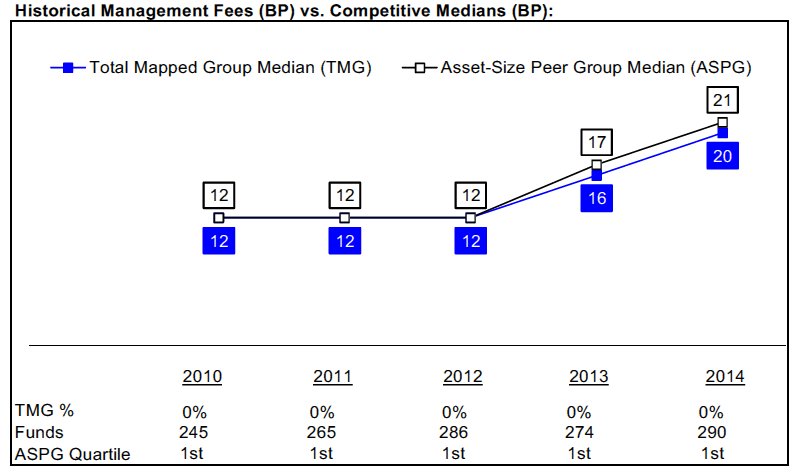
VIP Freedom 2015 Portfolio
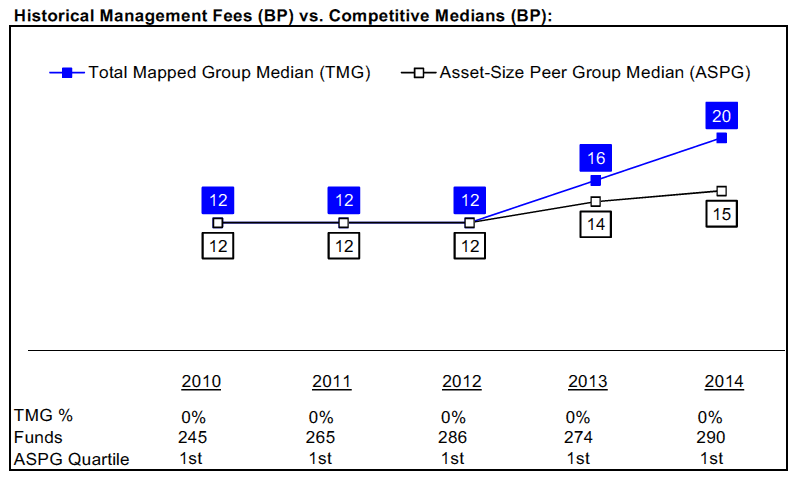
VIP Freedom 2020 Portfolio
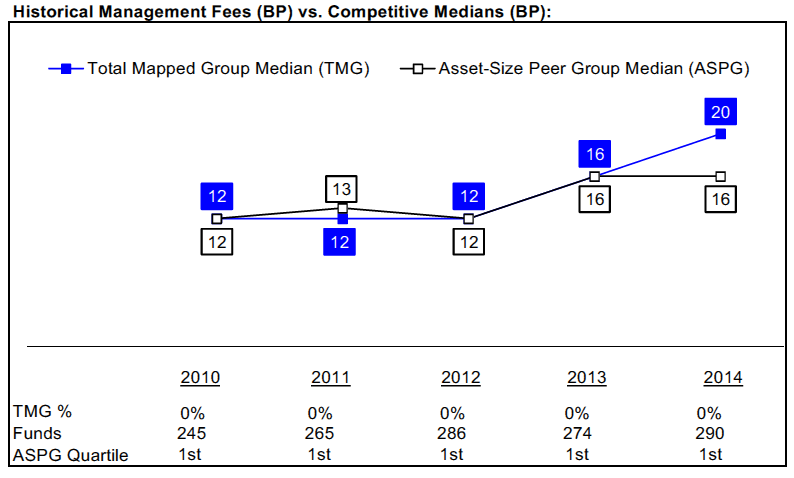
VIP Freedom 2025 Portfolio
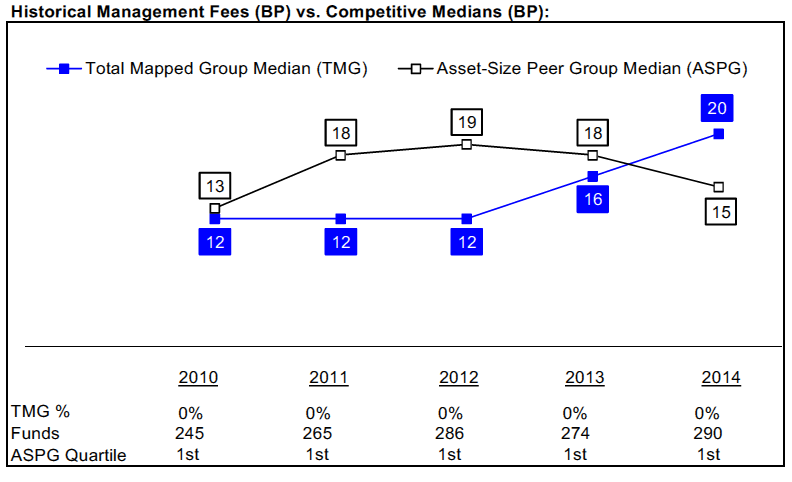
VIP Freedom 2030 Portfolio
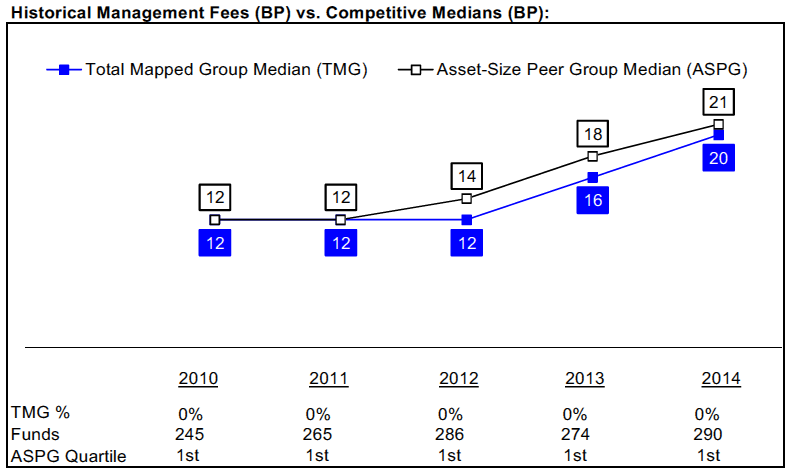
VIP Freedom 2035 Portfolio
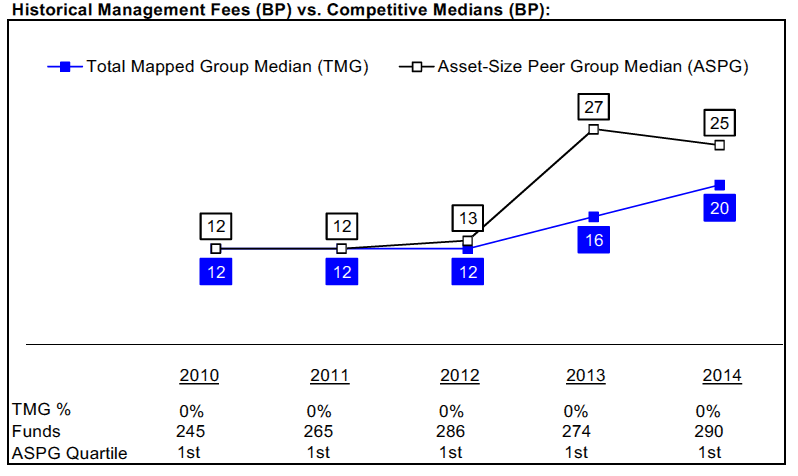
VIP Freedom 2040 Portfolio
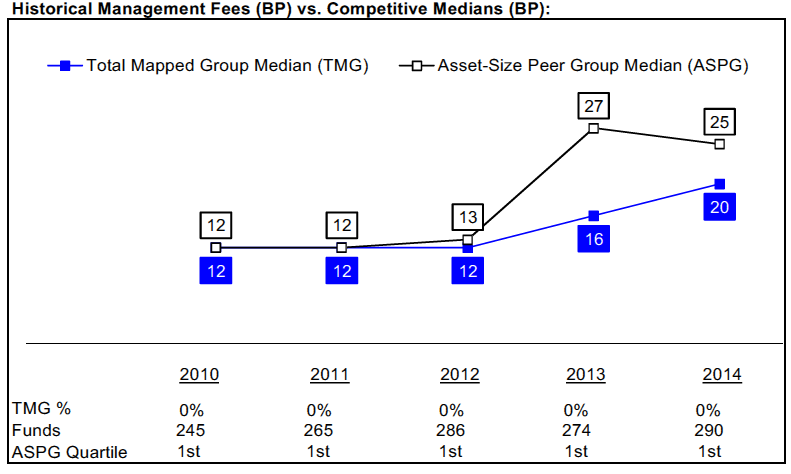
VIP Freedom 2045 Portfolio
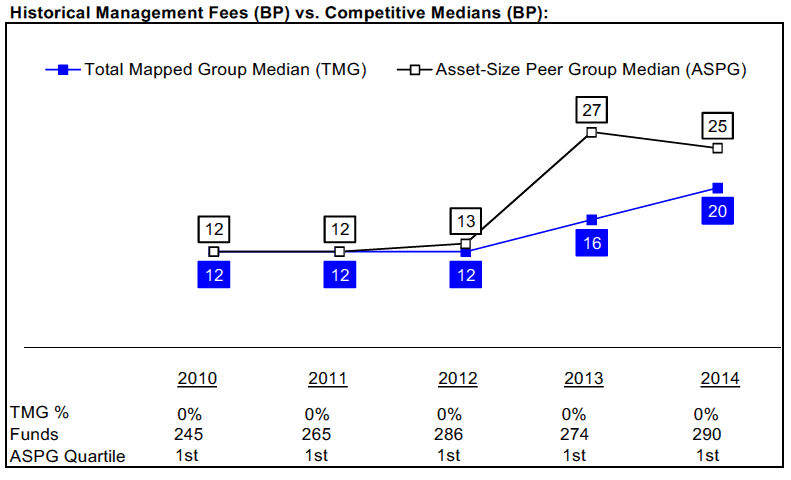
VIP Freedom 2050 Portfolio
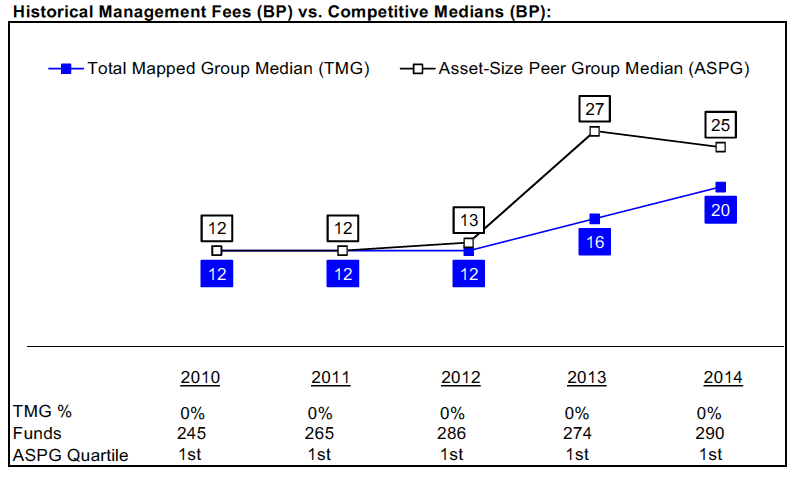
VIP Freedom Income Portfolio
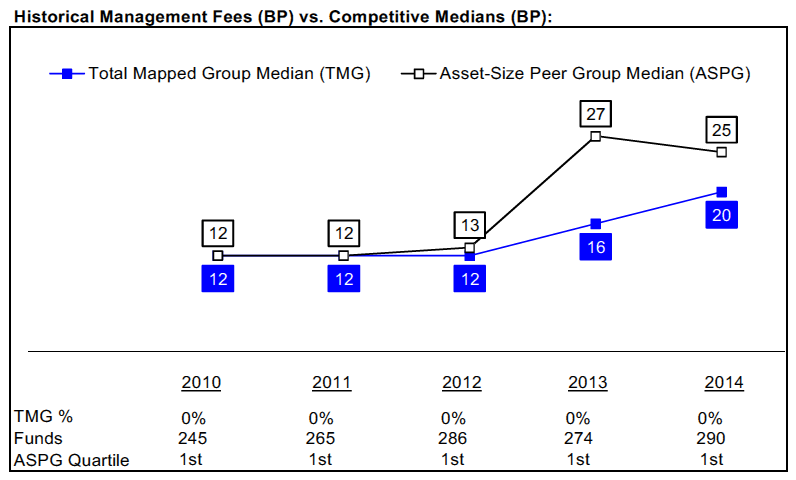
The Board noted that each fund's management fee rate of 0.00% ranked below the median of its Total Mapped Group and below the median of its ASPG for 2014. The Board further noted that many peer funds pay fund-level expenses, including management fees, to which the funds are not subject.
The Board noted that, in 2014, the ad hoc Committee on Group Fee was formed by it and other Fidelity fund boards to conduct an in-depth review of the "group fee" component of the management fee of funds with such management fee structures, and that while the funds do not pay a management fee, they indirectly bear a portion of the management fees paid by the Fidelity funds in which they invest, some of which are subject to the group fee. Committee focus included the mechanics of the group fee, the competitive landscape of group fee structures, Fidelity funds with no group fee component and investment products not included in group fee assets. The Board also considered that, for funds subject to the group fee, FMR agreed to voluntarily waive fees over a specified period of time in amounts designed to account for assets converted from certain funds to certain collective investment trusts.
Based on its review, the Board concluded that each fund's management fee is fair and reasonable in light of the services that the fund receives and the other factors considered.
Total Expense Ratio. In its review of the total expense ratio of each class of each fund, the Board considered fund-paid 12b-1 fees and noted that each fund invests in a class of shares of the underlying Fidelity fund that does not charge a 12b-1 fee to avoid charging fund-paid 12b-1 fees at both fund levels. The Board considered that the funds do not pay transfer agent fees. Instead, the applicable class of each underlying Fidelity fund bears its pro rata portion of each fund's transfer agent fee according to the percentage of each fund's assets invested in that underlying fund. The Board further noted that FMR pays all other expenses of each fund, with limited exceptions.
The Board noted that the total expense ratio of each class of each fund ranked below its competitive median for 2014.
In considering the total expense ratio for each class of each fund, the Board also considered an alternative competitive analysis that included both top level (
i.e., direct) fund fees and acquired fund fees and expenses for the class and the other funds and classes in the mapped group. The Board noted that, under this alternative competitive analysis, the total expense ratio of each of Initial Class and Service Class of each fund ranked below its competitive median for 2014. The Board noted that the total expense ratio of Service Class 2 of VIP Freedom 2005 Portfolio, VIP Freedom 2010 Portfolio, VIP Freedom 2015 Portfolio, VIP Freedom 2020 Portfolio, VIP Freedom 2025 Portfolio, VIP Freedom 2030 Portfolio, and VIP Freedom Income Portfolio ranked below its competitive median for 2014 and the total expense ratio of Service Class 2 of each other fund ranked equal to its competitive median for 2014.
Fees Charged to Other Fidelity Clients. The Board also considered Fidelity fee structures and other information with respect to clients of Fidelity, such as other funds advised or subadvised by Fidelity, pension plan clients, and other institutional clients with similar mandates. The Board noted the findings of the 2013 ad hoc joint committee (created with the board of other Fidelity funds), which reviewed and compared Fidelity's institutional investment advisory business with its business of providing services to the Fidelity funds, including the differences in services provided, fees charged, and costs incurred, as well as competition in their respective marketplaces.
Based on its review of total expense ratios and fees charged to other Fidelity clients, the Board concluded that the total expense ratio of each class of each fund was reasonable in light of the services that the fund and its shareholders receive and the other factors considered.
Costs of the Services and Profitability. The Board considered the level of Fidelity's profits in respect of all the Fidelity funds, including the Fidelity funds in which the funds invest.
PricewaterhouseCoopers LLP (PwC), independent registered public accounting firm and auditor to Fidelity and certain Fidelity funds, has been engaged annually by the Board as part of the Board's assessment of Fidelity's profitability analysis. PwC's engagement includes the review and assessment of the methodologies used by Fidelity in determining the revenues and expenses attributable to Fidelity's mutual fund business, and completion of agreed-upon procedures in respect of the mathematical accuracy of fund profitability and its conformity to established allocation methodologies. After considering PwC's reports issued under the engagement and information provided by Fidelity, the Board concluded that while other allocation methods may also be reasonable, Fidelity's profitability methodologies are reasonable in all material respects.
The Board also reviewed Fidelity's non-fund businesses and fall-out benefits related to the mutual fund business as well as cases where Fidelity's affiliates may benefit from or be related to the funds' business.
The Board concluded that the costs of the services provided by and the profits realized by Fidelity in connection with the operation of each fund were not relevant to the approval of each fund's Advisory Contract because the funds do not pay management fees and FMR pays all other expenses of each fund, with limited exceptions.
Economies of Scale. The Board concluded that because the funds do not pay management fees and FMR pays all other expenses of each fund, with limited exceptions, economies of scale cannot be realized by the funds, but may be realized by the other Fidelity funds in which each fund invests, many of which may benefit from breakpoints under the group fee arrangement.
Additional Information Requested by the Board. In order to develop fully the factual basis for consideration of the Fidelity funds' Advisory Contracts, the Board requested and received additional information on certain topics, including: (i) Fidelity's fund profitability methodology, profitability trends for certain funds, and the impact of certain factors on fund profitability results; (ii) portfolio manager changes that have occurred during the past year and the amount of the investment that each portfolio manager has made in the Fidelity fund(s) that he or she manages; (iii) Fidelity's compensation structure for portfolio managers, research analysts, and other key personnel, including its effects on fund profitability, the rationale for the compensation structure, and the extent to which current market conditions have affected retention and recruitment; (iv) the arrangements with and compensation paid to certain fund sub-advisers on behalf of the Fidelity funds; (v) Fidelity's voluntary waiver of its fees to maintain minimum yields for certain money market funds and classes as well as contractual waivers in place for certain funds; (vi) the methodology with respect to competitive fund data and peer group classifications; (vii) Fidelity's transfer agent fee, expense, and service structures for different funds and classes relative to competitive trends, and the impact of the increased use of omnibus accounts; (viii) Fidelity's long-term expectations for its offerings in the workplace investing channel; (ix) new developments in the retail and institutional marketplaces; and (x) the impact of money market reform on Fidelity's money market funds. In addition, the Board considered its discussions with Fidelity throughout the year regarding enhanced information security initiatives and the funds' fair valuation policies.
Based on its evaluation of all of the conclusions noted above, and after considering all factors it believed relevant, the Board concluded that the advisory fee structures are fair and reasonable, and that each fund's Advisory Contract should be approved.
Proxy Voting Results
A special meeting of shareholders was held on May 12, 2015. The results of votes taken among shareholders on the proposal before them are reported below. Each vote reported represents one dollar of net asset value held on the record date for the meeting.
PROPOSAL 1
To elect a Board of Trustees.
| | # of
Votes | % of
Votes |
| Elizabeth S. Acton | | |
| Affirmative | 24,469,831,790.28 | 97.003 |
| Withheld | 756,086,184.43 | 2.997 |
| TOTAL | 25,225,917,974.71 | 100.000 |
| John Engler | | |
| Affirmative | 24,404,438,415.74 | 96.744 |
| Withheld | 821,479,558.97 | 3.256 |
| TOTAL | 25,225,917,974.71 | 100.000 |
| Albert R. Gamper, Jr. | | |
| Affirmative | 24,431,670,090.08 | 96.852 |
| Withheld | 794,247,884.63 | 3.148 |
| TOTAL | 25,225,917,974.71 | 100.000 |
| Robert F. Gartland | | |
| Affirmative | 24,472,637,370.54 | 97.014 |
| Withheld | 753,280,604.17 | 2.986 |
| TOTAL | 25,225,917,974.71 | 100.000 |
| Abigail P. Johnson | | |
| Affirmative | 24,442,024,432.82 | 96.893 |
| Withheld | 783,893,541.89 | 3.107 |
| TOTAL | 25,225,917,974.71 | 100.000 |
| Arthur E. Johnson | | |
| Affirmative | 24,444,583,833.78 | 96.903 |
| Withheld | 781,334,140.93 | 3.097 |
| TOTAL | 25,225,917,974.71 | 100.000 |
| Michael E. Kenneally | | |
| Affirmative | 24,475,874,452.78 | 97.027 |
| Withheld | 750,043,521.93 | 2.973 |
| TOTAL | 25,225,917,974.71 | 100.000 |
| James H. Keyes | | |
| Affirmative | 24,434,496,321.71 | 96.863 |
| Withheld | 791,421,653.00 | 3.137 |
| TOTAL | 25,225,917,974.71 | 100.000 |
| Marie L. Knowles | | |
| Affirmative | 24,446,177,909.79 | 96.909 |
| Withheld | 779,740,064.92 | 3.091 |
| TOTAL | 25,225,917,974.71 | 100.000 |
| Geoffrey A. von Kuhn | | |
| Affirmative | 24,444,403,935.60 | 96.902 |
| Withheld | 781,514,039.11 | 3.098 |
| TOTAL | 25,225,917,974.71 | 100.000 |
| Proposal 1 reflects trust wide proposal and voting results. |
VIPFF2K-ANN-0216
1.826371.111
Fidelity® Variable Insurance Products: Asset Manager Portfolio
Annual Report December 31, 2015 |
|
Contents
To view a fund's proxy voting guidelines and proxy voting record for the 12-month period ended June 30, visit http://www.fidelity.com/proxyvotingresults or visit the Securities and Exchange Commission's (SEC) web site at http://www.sec.gov.
You may also call 1-877-208-0098 to request a free copy of the proxy voting guidelines.
Fidelity® Variable Insurance Products are separate account options which are purchased through a variable insurance contract.
Standard & Poor's, S&P and S&P 500 are registered service marks of The McGraw-Hill Companies, Inc. and have been licensed for use by Fidelity Distributors Corporation.
Other third-party marks appearing herein are the property of their respective owners.
All other marks appearing herein are registered or unregistered trademarks or service marks of FMR LLC or an affiliated company. © 2016 FMR LLC. All rights reserved.
This report and the financial statements contained herein are submitted for the general information of the shareholders of the Fund. This report is not authorized for distribution to prospective investors in the Fund unless preceded or accompanied by an effective prospectus.
A fund files its complete schedule of portfolio holdings with the SEC for the first and third quarters of each fiscal year on Form N-Q. Forms N-Q are available on the SEC’s web site at http://www.sec.gov. A fund's Forms N-Q may be reviewed and copied at the SEC’s Public Reference Room in Washington, DC. Information regarding the operation of the SEC's Public Reference Room may be obtained by calling 1-800-SEC-0330.
For a complete list of a fund's portfolio holdings, view the most recent holdings listing, semiannual report, or annual report on Fidelity's web site at http://www.fidelity.com, http://www.advisor.fidelity.com, or http://www.401k.com, as applicable.
NOT FDIC INSURED •MAY LOSE VALUE •NO BANK GUARANTEE
Neither the Fund nor Fidelity Distributors Corporation is a bank.
Performance: The Bottom Line
Average annual total return reflects the change in the value of an investment, assuming reinvestment of distributions from dividend income and capital gains (the profits earned upon the sale of securities that have grown in value, if any) and assuming a constant rate of performance each year. During periods of reimbursement by Fidelity, a fund’s total return will be greater than it would be had the reimbursement not occurred. Performance numbers are net of all underlying fund operating expenses, but do not include any insurance charges imposed by your insurance company’s separate account. If performance information included the effect of these additional charges, the total returns would have been lower. How a fund did yesterday is no guarantee of how it will do tomorrow.
Average Annual Total Returns
| For the periods ended December 31, 2015 | Past 1 year | Past 5 years | Past 10 years |
| Initial Class | 0.14% | 6.09% | 5.77% |
| Service Class | 0.03% | 5.97% | 5.64% |
| Service Class 2 | (0.06)% | 5.82% | 5.49% |
| Investor Class | 0.07% | 6.00% | 5.67% |
$10,000 Over 10 Years
Let's say hypothetically that $10,000 was invested in VIP Asset Manager Portfolio - Initial Class on December 31, 2005.
The chart shows how the value of your investment would have changed, and also shows how the S&P 500® Index performed over the same period.

| Period Ending Values |
| $17,520 | VIP Asset Manager Portfolio - Initial Class |
| $20,242 | S&P 500® Index |
Management's Discussion of Fund Performance
Market Recap: Largely buoyed by the U.S., developed-markets equities finished 2015 nearly flat overall, rebounding from a steep decline in August and September over worries about China’s slowing economic growth. The MSCI World Index returned -0.44% for the 12 months ending December 31, 2015. Modest gains in the first half of the year were quickly erased amid the late-summer rout, but stocks sharply reversed course in October, lifted by the U.S. Federal Reserve’s decision to put off raising near-term interest rates until mid-December. Investors also were encouraged by an interest-rate cut in China and economic stimulus in Europe. Excess supply of oil and natural gas weighed on commodities, the year’s worst-performing asset class. Lower energy costs and improving wages drove consumer spending, though, helping retailers. Also, low interest rates and pent-up demand boosted global auto sales: December results sent annual totals past the previous record, set in 2000.
The broad Dow Jones U.S. Total Stock Market Index℠ gained 0.44% for the year. Large-cap stocks outpaced small-caps by a comfortable margin, with the S&P 500
® and the Russell 2000
® Index returning 1.38% and -4.41%, respectively. Meanwhile, non-U.S. developed-markets returned -3.04%, as measured by the MSCI World ex USA Index, and the MSCI Emerging Markets Index returned -14.60%, beset by numerous challenges, U.S.-dollar strengthening throughout the period not the least of them. Globally, growth- led value-oriented stocks across market-cap segments. Outside the U.S., large-caps lagged small-caps substantially.
Looking within the bellwether S&P 500
®, the downtrodden energy (-21%), materials (-8%) and utilities (-5%) sectors weighed on the index. Health care (+7%) helped alleviate the pain, and investors’ preference for growth stocks braced technology (+6%), which also benefited from strong fundamentals and attractive relative valuations. This sector performance pattern was generally similar worldwide.
In fixed income, the Barclays
® Global Aggregate GDP Weighted Index returned -3.90%, affected in part by the Fed’s first interest-rate hike since 2006. The investment-grade Barclays
® U.S. Aggregate Bond Index returned 0.55%; The BofA Merrill Lynch℠ US High Yield Constrained Index, -4.61%. Energy- and commodity-related securities performed worst. U.S. Treasury Inflation-Protected Securities (TIPS) suffered amid stubbornly low inflation. Meanwhile, emerging-markets debt rebounded strongly in the fall, overcoming multiple threats including China’s economic slowdown and currency headwinds.
Comments from Portfolio Manager Geoff Stein: For the year, the fund's share classes slightly lagged the 0.32% return of the Fidelity Asset Manager 50% Composite Index℠. Relative to the benchmark, asset allocation marginally detracted, whereas security selection contributed, led by U.S. equity stock picks. Asset allocation was hampered by out-of-benchmark exposure to high-yield bonds, as this asset class performed poorly during the second half of the period. Our core equity allocation strategy – overweighting domestic stocks, modestly underweighting foreign developed-markets equities and slightly greater-than-benchmark exposure to emerging markets (EM) stocks – marginally contributed to relative performance. Unfortunately, most of the benefit of this positioning was offset by a double-digit decline in EM equities. The domestic equity subportfolio was the biggest contributor to the fund's relative return, benefiting from solid picks in technology, along with favorable overall positioning in health care and a sizable underweighting in energy. Here, some non-U.S. holdings contributed, despite headwinds from the stronger dollar. Within investment-grade fixed income, our central fund was hurt by exposure to underperforming energy and communications issuers. Additionally, energy holdings within the government agencies sector, as well as an allocation to TIPS further hampered its performance. Effective October 1, 2015, the benchmark for the foreign developed-markets equities component of the fund's Composite benchmark was changed from the MSCI EAFE Index to the MSCI ACWI (All Country World Index) ex USA Index.
The views expressed above reflect those of the portfolio manager(s) only through the end of the period as stated on the cover of this report and do not necessarily represent the views of Fidelity or any other person in the Fidelity organization. Any such views are subject to change at any time based upon market or other conditions and Fidelity disclaims any responsibility to update such views. These views may not be relied on as investment advice and, because investment decisions for a Fidelity fund are based on numerous factors, may not be relied on as an indication of trading intent on behalf of any Fidelity fund.
Investment Summary (Unaudited)
The information in the following tables is based on the combined investments of the Fund and its pro-rata share of the investments of Fidelity's Central Funds, other than the Commodity Strategy and Money Market Central Funds.
Top Five Stocks as of December 31, 2015
| | % of fund's net assets | % of fund's net assets 6 months ago |
| Apple, Inc. | 1.4 | 1.8 |
| Alphabet, Inc. Class A | 1.2 | 0.0 |
| Celgene Corp. | 1.1 | 1.0 |
| Gilead Sciences, Inc. | 1.0 | 1.1 |
| Amazon.com, Inc | 0.9 | 0.0 |
| | 5.6 | |
Top Five Bond Issuers as of December 31, 2015
| (with maturities greater than one year) | % of fund's net assets | % of fund's net assets 6 months ago |
| U.S. Treasury Obligations | 7.3 | 8.9 |
| Fannie Mae | 4.6 | 5.0 |
| Freddie Mac | 1.8 | 1.3 |
| Ginnie Mae | 1.2 | 1.3 |
| Citigroup, Inc. | 1.0 | 1.0 |
| | 15.9 | |
Top Five Market Sectors as of December 31, 2015
| | % of fund's net assets | % of fund's net assets 6 months ago |
| Financials | 16.6 | 17.3 |
| Health Care | 12.8 | 15.0 |
| Consumer Discretionary | 10.9 | 12.0 |
| Information Technology | 10.0 | 7.5 |
| Industrials | 6.2 | 6.4 |
Asset Allocation (% of fund's net assets)
| As of December 31, 2015* |
| | Stock Class and Equity Futures** | 49.0% |
| | Bond Class | 43.2% |
| | Short-Term Class | 7.8% |

* Foreign investments - 24.1%
** Includes investment in Fidelity® Commodity Strategy Central Fund of 0.4%
| As of June 30, 2015* |
| | Stock Class and Equity Futures** | 51.4% |
| | Bond Class | 44.7% |
| | Short-Term Class | 3.9% |

* Foreign investments - 27.0%
** Includes investment in Fidelity® Commodity Strategy Central Fund of 0.2%
Asset allocations in the pie charts reflect the categorization of assets as defined in the Fund's prospectus in effect as of the time periods indicated above. Financial Statement categorizations conform to accounting standards and will differ from the pie chart. Percentages are adjusted for the effect of future contracts and swap contracts, if applicable.
An unaudited holdings listing for the Fund, which presents direct holdings as well as the pro-rata share of any securities and other investments held indirectly through its investment in underlying Fidelity Central Funds, other than the Commodity Strategy and Money Market Central Funds, is available at advisor.fidelity.com.
Percentages in the above tables are adjusted for the effect of TBA Sale Commitments.
Percentages shown as 0.0% may reflect amounts less than 0.05%.
Investments December 31, 2015
Showing Percentage of Net Assets
| Common Stocks - 34.3% | | | |
| | | Shares | Value |
| CONSUMER DISCRETIONARY - 7.2% | | | |
| Auto Components - 0.1% | | | |
| Delphi Automotive PLC | | 14,500 | $1,243,085 |
| Automobiles - 0.5% | | | |
| General Motors Co. | | 117,800 | 4,006,378 |
| Tesla Motors, Inc. (a) | | 6,500 | 1,560,065 |
| | | | 5,566,443 |
| Hotels, Restaurants & Leisure - 0.6% | | | |
| Chipotle Mexican Grill, Inc. (a) | | 11,000 | 5,278,350 |
| Fiesta Restaurant Group, Inc. (a) | | 36,900 | 1,239,840 |
| Papa John's International, Inc. | | 24,600 | 1,374,402 |
| | | | 7,892,592 |
| Household Durables - 1.5% | | | |
| Barratt Developments PLC | | 224,600 | 2,072,719 |
| Bellway PLC | | 46,200 | 1,931,544 |
| D.R. Horton, Inc. | | 189,300 | 6,063,279 |
| KB Home (b) | | 156,300 | 1,927,179 |
| PulteGroup, Inc. | | 251,700 | 4,485,294 |
| Taylor Morrison Home Corp. (a) | | 52,000 | 832,000 |
| Taylor Wimpey PLC | | 388,600 | 1,163,507 |
| | | | 18,475,522 |
| Internet & Catalog Retail - 1.7% | | | |
| Amazon.com, Inc. (a) | | 16,500 | 11,152,185 |
| JD.com, Inc. sponsored ADR (a) | | 41,000 | 1,322,865 |
| Priceline Group, Inc. (a) | | 5,300 | 6,757,235 |
| Vipshop Holdings Ltd. ADR (a) | | 100,100 | 1,528,527 |
| | | | 20,760,812 |
| Leisure Products - 0.1% | | | |
| Vista Outdoor, Inc. (a) | | 30,100 | 1,339,751 |
| Media - 0.5% | | | |
| ITV PLC | | 563,700 | 2,298,564 |
| Liberty Global PLC Class C (a) | | 29,500 | 1,202,715 |
| Naspers Ltd. Class N | | 5,800 | 792,769 |
| Twenty-First Century Fox, Inc. Class B | | 47,700 | 1,298,871 |
| | | | 5,592,919 |
| Multiline Retail - 0.1% | | | |
| Burlington Stores, Inc. (a) | | 28,100 | 1,205,490 |
| Specialty Retail - 1.2% | | | |
| Home Depot, Inc. | | 49,000 | 6,480,250 |
| Lowe's Companies, Inc. | | 84,000 | 6,387,360 |
| TJX Companies, Inc. | | 35,300 | 2,503,123 |
| | | | 15,370,733 |
| Textiles, Apparel & Luxury Goods - 0.9% | | | |
| Michael Kors Holdings Ltd. (a) | | 189,563 | 7,593,894 |
| Pandora A/S | | 23,900 | 3,013,404 |
| | | | 10,607,298 |
|
| TOTAL CONSUMER DISCRETIONARY | | | 88,054,645 |
|
| CONSUMER STAPLES - 1.2% | | | |
| Beverages - 0.8% | | | |
| Monster Beverage Corp. | | 62,200 | 9,265,312 |
| Food & Staples Retailing - 0.3% | | | |
| CVS Health Corp. | | 32,400 | 3,167,748 |
| Tobacco - 0.1% | | | |
| Imperial Tobacco Group PLC | | 35,287 | 1,865,701 |
|
| TOTAL CONSUMER STAPLES | | | 14,298,761 |
|
| ENERGY - 0.7% | | | |
| Energy Equipment & Services - 0.2% | | | |
| Baker Hughes, Inc. | | 48,600 | 2,242,890 |
| Independence Contract Drilling, Inc. (a) | | 40,000 | 202,000 |
| | | | 2,444,890 |
| Oil, Gas & Consumable Fuels - 0.5% | | | |
| Chevron Corp. | | 38,900 | 3,499,444 |
| Cimarex Energy Co. | | 13,100 | 1,170,878 |
| Continental Resources, Inc. (a) | | 28,100 | 645,738 |
| EOG Resources, Inc. | | 14,500 | 1,026,455 |
| | | | 6,342,515 |
|
| TOTAL ENERGY | | | 8,787,405 |
|
| FINANCIALS - 2.0% | | | |
| Banks - 0.5% | | | |
| Bank of America Corp. | | 360,200 | 6,062,166 |
| Capital Markets - 0.7% | | | |
| BlackRock, Inc. Class A | | 7,800 | 2,656,056 |
| Morgan Stanley | | 92,600 | 2,945,606 |
| The Blackstone Group LP | | 129,200 | 3,777,808 |
| | | | 9,379,470 |
| Consumer Finance - 0.4% | | | |
| OneMain Holdings, Inc. (a) | | 113,500 | 4,714,790 |
| Diversified Financial Services - 0.3% | | | |
| McGraw Hill Financial, Inc. | | 39,900 | 3,933,342 |
| Real Estate Investment Trusts - 0.1% | | | |
| American Tower Corp. | | 8,700 | 843,465 |
|
| TOTAL FINANCIALS | | | 24,933,233 |
|
| HEALTH CARE - 10.2% | | | |
| Biotechnology - 7.8% | | | |
| AbbVie, Inc. | | 81,500 | 4,828,060 |
| Acorda Therapeutics, Inc. (a) | | 70,900 | 3,033,102 |
| Actelion Ltd. | | 25,367 | 3,524,583 |
| Alexion Pharmaceuticals, Inc. (a) | | 57,800 | 11,025,350 |
| Alnylam Pharmaceuticals, Inc. (a) | | 16,400 | 1,543,896 |
| Amgen, Inc. | | 19,600 | 3,181,668 |
| Amicus Therapeutics, Inc. (a) | | 110,800 | 1,074,760 |
| BioCryst Pharmaceuticals, Inc. (a) | | 136,600 | 1,409,712 |
| BioMarin Pharmaceutical, Inc. (a) | | 44,100 | 4,619,916 |
| bluebird bio, Inc. (a) | | 1,900 | 122,018 |
| Celgene Corp. (a) | | 115,900 | 13,880,184 |
| Celldex Therapeutics, Inc. (a)(b) | | 43,100 | 675,808 |
| Clovis Oncology, Inc. (a) | | 16,800 | 588,000 |
| Genmab A/S (a) | | 34,900 | 4,640,445 |
| Gilead Sciences, Inc. | | 121,600 | 12,304,704 |
| Heron Therapeutics, Inc. (a) | | 14,800 | 395,160 |
| Intercept Pharmaceuticals, Inc. (a) | | 24,010 | 3,585,894 |
| Medivation, Inc. (a) | | 185,800 | 8,981,572 |
| Medy-Tox, Inc. | | 2,055 | 885,954 |
| NantKwest, Inc. (a)(b) | | 10,200 | 176,766 |
| Novavax, Inc. (a) | | 250,500 | 2,101,695 |
| Regeneron Pharmaceuticals, Inc. (a) | | 4,700 | 2,551,489 |
| TESARO, Inc. (a) | | 20,000 | 1,046,400 |
| United Therapeutics Corp. (a) | | 22,200 | 3,476,742 |
| Vertex Pharmaceuticals, Inc. (a) | | 52,700 | 6,631,241 |
| vTv Therapeutics, Inc. Class A (a) | | 32,500 | 221,325 |
| | | | 96,506,444 |
| Health Care Equipment & Supplies - 0.2% | | | |
| Innocoll AG ADR (a) | | 86,800 | 720,440 |
| Neovasc, Inc. (a) | | 65,300 | 293,850 |
| Nevro Corp. (a) | | 13,000 | 877,630 |
| | | | 1,891,920 |
| Health Care Providers & Services - 0.3% | | | |
| AmSurg Corp. (a) | | 21,400 | 1,626,400 |
| Express Scripts Holding Co. (a) | | 28,800 | 2,517,408 |
| | | | 4,143,808 |
| Pharmaceuticals - 1.9% | | | |
| Akorn, Inc. (a) | | 21,800 | 813,358 |
| Allergan PLC (a) | | 18,900 | 5,906,250 |
| Bristol-Myers Squibb Co. | | 63,900 | 4,395,681 |
| Jazz Pharmaceuticals PLC (a) | | 27,000 | 3,795,120 |
| Ocular Therapeutix, Inc. (a) | | 118,900 | 1,114,093 |
| Pacira Pharmaceuticals, Inc. (a) | | 19,200 | 1,474,368 |
| Relypsa, Inc. (a)(b) | | 57,400 | 1,626,716 |
| Shire PLC | | 4,900 | 336,176 |
| Supernus Pharmaceuticals, Inc. (a) | | 30,600 | 411,264 |
| Valeant Pharmaceuticals International, Inc. (Canada) (a) | | 34,000 | 3,453,812 |
| | | | 23,326,838 |
|
| TOTAL HEALTH CARE | | | 125,869,010 |
|
| INDUSTRIALS - 4.1% | | | |
| Aerospace & Defense - 1.2% | | | |
| Huntington Ingalls Industries, Inc. | | 23,900 | 3,031,715 |
| The Boeing Co. | | 75,200 | 10,873,168 |
| TransDigm Group, Inc. (a) | | 5,300 | 1,210,785 |
| | | | 15,115,668 |
| Airlines - 2.7% | | | |
| American Airlines Group, Inc. | | 240,600 | 10,189,410 |
| Delta Air Lines, Inc. | | 146,625 | 7,432,421 |
| Norwegian Air Shuttle A/S (a)(b) | | 20,100 | 730,128 |
| Southwest Airlines Co. | | 217,500 | 9,365,550 |
| United Continental Holdings, Inc. (a) | | 93,200 | 5,340,360 |
| | | | 33,057,869 |
| Construction & Engineering - 0.1% | | | |
| Hyundai Industrial Development & Construction Co. | | 12,361 | 403,003 |
| Professional Services - 0.1% | | | |
| Robert Half International, Inc. | | 34,600 | 1,631,044 |
|
| TOTAL INDUSTRIALS | | | 50,207,584 |
|
| INFORMATION TECHNOLOGY - 8.5% | | | |
| Communications Equipment - 0.2% | | | |
| Arista Networks, Inc. (a)(b) | | 25,900 | 2,016,056 |
| Internet Software & Services - 3.4% | | | |
| 58.com, Inc. ADR (a) | | 34,700 | 2,288,812 |
| Akamai Technologies, Inc. (a) | | 18,100 | 952,603 |
| Alibaba Group Holding Ltd. sponsored ADR (a) | | 94,000 | 7,639,380 |
| Alphabet, Inc. Class A (a) | | 19,300 | 15,015,593 |
| Cornerstone OnDemand, Inc. (a) | | 31,400 | 1,084,242 |
| Facebook, Inc. Class A (a) | | 95,121 | 9,955,364 |
| Just Dial Ltd. | | 29,117 | 369,004 |
| Tencent Holdings Ltd. | | 263,000 | 5,149,536 |
| | | | 42,454,534 |
| IT Services - 1.6% | | | |
| FleetCor Technologies, Inc. (a) | | 16,700 | 2,386,931 |
| MasterCard, Inc. Class A | | 61,300 | 5,968,168 |
| PayPal Holdings, Inc. (a) | | 36,600 | 1,324,920 |
| Visa, Inc. Class A | | 130,500 | 10,120,275 |
| | | | 19,800,294 |
| Semiconductors & Semiconductor Equipment - 1.1% | | | |
| Avago Technologies Ltd. | | 24,900 | 3,614,235 |
| NXP Semiconductors NV (a) | | 104,700 | 8,820,975 |
| Qorvo, Inc. (a) | | 19,700 | 1,002,730 |
| | | | 13,437,940 |
| Software - 0.8% | | | |
| Adobe Systems, Inc. (a) | | 85,600 | 8,041,264 |
| Atlassian Corp. PLC | | 3,500 | 105,280 |
| Fleetmatics Group PLC (a) | | 29,700 | 1,508,463 |
| Mobileye NV (a) | | 12,900 | 545,412 |
| | | | 10,200,419 |
| Technology Hardware, Storage & Peripherals - 1.4% | | | |
| Apple, Inc. | | 158,800 | 16,715,288 |
| Nimble Storage, Inc. (a)(b) | | 50,000 | 460,000 |
| | | | 17,175,288 |
|
| TOTAL INFORMATION TECHNOLOGY | | | 105,084,531 |
|
| MATERIALS - 0.2% | | | |
| Chemicals - 0.2% | | | |
| LyondellBasell Industries NV Class A | | 31,000 | 2,693,900 |
| UTILITIES - 0.2% | | | |
| Independent Power and Renewable Electricity Producers - 0.2% | | | |
| Dynegy, Inc. (a) | | 158,400 | 2,122,560 |
| TOTAL COMMON STOCKS | | | |
| (Cost $300,357,637) | | | 422,051,629 |
| | | Principal Amount | Value |
|
| U.S. Treasury Obligations - 0.3% | | | |
| U.S. Treasury Bills, yield at date of purchase 0.06% 2/4/16 (c) | | | |
| (Cost $3,969,773) | | 3,970,000 | 3,969,655 |
| | | Shares | Value |
|
| Fixed-Income Funds - 44.6% | | | |
| Fidelity Emerging Markets Debt Central Fund (d) | | 647,107 | $5,849,849 |
| Fidelity Floating Rate Central Fund (d) | | 125,408 | 12,262,439 |
| Fidelity High Income Central Fund 1 (d) | | 650,586 | 58,949,570 |
| Fidelity Inflation-Protected Bond Index Central Fund (a)(d) | | 362,970 | 35,375,063 |
| Fidelity VIP Investment Grade Central Fund (d) | | 4,203,798 | 435,975,868 |
| TOTAL FIXED-INCOME FUNDS | | | |
| (Cost $546,271,987) | | | 548,412,789 |
|
| Money Market Funds - 5.5% | | | |
| Fidelity Cash Central Fund, 0.33% (e) | | 61,469,440 | 61,469,440 |
| Fidelity Money Market Central Fund, 0.55% (e) | | 2,398,390 | 2,398,390 |
| Fidelity Securities Lending Cash Central Fund, 0.35% (e)(f) | | 3,679,033 | 3,679,033 |
| TOTAL MONEY MARKET FUNDS | | | |
| (Cost $67,546,863) | | | 67,546,863 |
|
| Equity Funds - 14.5% | | | |
| Domestic Equity Funds - 1.5% | | | |
| Fidelity Commodity Strategy Central Fund (d) | | 748,647 | 4,417,018 |
| Fidelity Real Estate Equity Central Fund (d) | | 137,956 | 14,123,909 |
|
| TOTAL DOMESTIC EQUITY FUNDS | | | 18,540,927 |
|
| International Equity Funds - 13.0% | | | |
| Fidelity Emerging Markets Equity Central Fund (d) | | 99,140 | 17,266,161 |
| Fidelity International Equity Central Fund (d) | | 1,585,447 | 118,004,789 |
| iShares MSCI Emerging Markets Index ETF | | 249,248 | 8,023,293 |
| iShares S&P 500 Index ETF | | 83,208 | 17,046,824 |
|
| TOTAL INTERNATIONAL EQUITY FUNDS | | | 160,341,067 |
|
| TOTAL EQUITY FUNDS | | | |
| (Cost $176,774,968) | | | 178,881,994 |
| TOTAL INVESTMENT PORTFOLIO - 99.2% | | | |
| (Cost $1,094,921,228) | | | 1,220,862,930 |
| NET OTHER ASSETS (LIABILITIES) - 0.8% | | | 9,715,080 |
| NET ASSETS - 100% | | | $1,230,578,010 |
| Futures Contracts | | | |
| | Expiration Date | Underlying Face Amount at Value | Unrealized Appreciation/(Depreciation) |
| Purchased | | | |
| Equity Index Contracts | | | |
| 205 Eurex Euro Stoxx 50 Index Contracts (Germany) | March 2016 | $7,311,763 | $201,409 |
The face value of futures purchased as a percentage of Net Assets is 0.6%
For the period, the average monthly underlying face amount at value for futures contracts in the aggregate was $16,425,872.
Security Type Abbreviations
ETF – Exchange-Traded Fund
Legend
(a) Non-income producing
(b) Security or a portion of the security is on loan at period end.
(c) Security or a portion of the security was pledged to cover margin requirements for futures contracts. At period end, the value of securities pledged amounted to $1,725,850.
(d) Affiliated fund that is generally available only to investment companies and other accounts managed by Fidelity Investments. A complete unaudited schedule of portfolio holdings for each Fidelity Central Fund is filed with the SEC for the first and third quarters of each fiscal year on Form N-Q and is available upon request or at the SEC's website at www.sec.gov. An unaudited holdings listing for the Fund, which presents direct holdings as well as the pro-rata share of securities and other investments held indirectly through its investment in underlying non-money market Fidelity Central Funds, other than the Commodity Strategy Central Fund, is available at advisor.fidelity.com. In addition, each Fidelity Central Fund's financial statements, which are not covered by the Fund's Report of Independent Registered Public Accounting Firm, are available on the SEC's website or upon request.
(e) Affiliated fund that is generally available only to investment companies and other accounts managed by Fidelity Investments. The rate quoted is the annualized seven-day yield of the fund at period end. A complete unaudited listing of the fund's holdings as of its most recent quarter end is available upon request. In addition, each Fidelity Central Fund's financial statements, which are not covered by the Fund's Report of Independent Registered Public Accounting Firm, are available on the SEC's website or upon request.
(f) Investment made with cash collateral received from securities on loan.
Affiliated Central Funds
Information regarding fiscal year to date income earned by the Fund from investments in Fidelity Central Funds is as follows:
| Fund | Income earned |
| Fidelity Cash Central Fund | $106,515 |
| Fidelity Commodity Strategy Central Fund | 3,322 |
| Fidelity Emerging Markets Debt Central Fund | 423,976 |
| Fidelity Emerging Markets Equity Central Fund | 142,264 |
| Fidelity Floating Rate Central Fund | 904,723 |
| Fidelity High Income Central Fund 1 | 3,398,056 |
| Fidelity International Equity Central Fund | 5,096,619 |
| Fidelity Money Market Central Fund | 5,269 |
| Fidelity Real Estate Equity Central Fund | 360,161 |
| Fidelity Securities Lending Cash Central Fund | 117,572 |
| Fidelity VIP Investment Grade Central Fund | 14,348,233 |
| Total | $24,906,710 |
Additional information regarding the Fund's fiscal year to date purchases and sales, including the ownership percentage, of the non Money Market Central Funds is as follows:
| Fund | Value, beginning of period | Purchases | Sales Proceeds | Value, end of period | % ownership, end of period |
| Fidelity Commodity Strategy Central Fund | $2,903,260 | $2,531,214 | $361,729 | $4,417,018 | 1.5% |
| Fidelity Emerging Markets Debt Central Fund | 6,277,486 | 513,408 | 661,288 | 5,849,849 | 5.7% |
| Fidelity Emerging Markets Equity Central Fund | 24,989,164 | 13,191,033 | 19,996,930 | 17,266,161 | 5.1% |
| Fidelity Floating Rate Central Fund | 26,416,003 | 1,220,239 | 14,741,122 | 12,262,439 | 0.8% |
| Fidelity High Income Central Fund 1 | 44,761,978 | 24,696,627 | 5,521,775 | 58,949,570 | 5.4% |
| Fidelity Inflation-Protected Bond Index Central Fund | 15,287,008 | 22,815,809 | 2,402,882 | 35,375,063 | 5.4% |
| Fidelity International Equity Central Fund | 160,007,751 | 13,841,403 | 50,129,614 | 118,004,789 | 5.4% |
| Fidelity Real Estate Equity Central Fund | 8,972,891 | 6,961,401 | 1,554,137 | 14,123,909 | 5.3% |
| Fidelity VIP Investment Grade Central Fund | 487,922,319 | 80,368,676 | 119,761,515 | 435,975,868 | 9.5% |
| Total | $777,537,860 | $166,139,810 | $215,130,992 | $702,224,666 | |
Investment Valuation
The following is a summary of the inputs used, as of December 31, 2015, involving the Fund's assets and liabilities carried at fair value. The inputs or methodology used for valuing securities may not be an indication of the risk associated with investing in those securities. For more information on valuation inputs, and their aggregation into the levels used below, please refer to the Investment Valuation section in the accompanying Notes to Financial Statements.
| | Valuation Inputs at Reporting Date: |
| Description | Total | Level 1 | Level 2 | Level 3 |
| Investments in Securities: | | | | |
| Equities: | | | | |
| Consumer Discretionary | $88,054,645 | $84,248,472 | $3,806,173 | $-- |
| Consumer Staples | 14,298,761 | 14,298,761 | -- | -- |
| Energy | 8,787,405 | 8,787,405 | -- | -- |
| Financials | 24,933,233 | 24,933,233 | -- | -- |
| Health Care | 125,869,010 | 116,481,852 | 9,387,158 | -- |
| Industrials | 50,207,584 | 49,074,453 | 1,133,131 | -- |
| Information Technology | 105,084,531 | 99,565,991 | 5,518,540 | -- |
| Materials | 2,693,900 | 2,693,900 | -- | -- |
| Utilities | 2,122,560 | 2,122,560 | -- | -- |
| U.S. Government and Government Agency Obligations | 3,969,655 | -- | 3,969,655 | -- |
| Fixed-Income Funds | 548,412,789 | 548,412,789 | -- | -- |
| Money Market Funds | 67,546,863 | 67,546,863 | -- | -- |
| Equity Funds | 178,881,994 | 178,881,994 | -- | -- |
| Total Investments in Securities: | $1,220,862,930 | $1,197,048,273 | $23,814,657 | $-- |
| Derivative Instruments: | | | | |
| Assets | | | | |
| Futures Contracts | $201,409 | $201,409 | $-- | $-- |
| Total Assets | $201,409 | $201,409 | $-- | $-- |
| Total Derivative Instruments: | $201,409 | $201,409 | $-- | $-- |
Value of Derivative Instruments
The following table is a summary of the Fund's value of derivative instruments by primary risk exposure as of December 31, 2015. For additional information on derivative instruments, please refer to the Derivative Instruments section in the accompanying Notes to Financial Statements.
| Primary Risk Exposure / Derivative Type | Value |
| | Asset | Liability |
| Equity Risk | | |
| Futures Contracts(a) | $201,409 | $0 |
| Total Equity Risk | 201,409 | 0 |
| Total Value of Derivatives | $201,409 | $0 |
(a) Reflects gross cumulative appreciation (depreciation) on futures contracts as presented in the Schedule of Investments. Only the period end receivable or payable for daily variation margin is presented in the Statement of Assets and Liabilities.
Other Information
The information in the following tables is based on the combined investments of the Fund and its pro-rata share of the investments of Fidelity's Central Funds, other than the Commodity Strategy and Money Market Central Funds. Percentages in the below tables are adjusted for the effect of TBA Sale Commitments.
The composition of credit quality ratings as a percentage of Total Net Assets is as follows (Unaudited):
| U.S. Government and U.S. Government Agency Obligations | 15.0% |
| AAA,AA,A | 7.2% |
| BBB | 13.2% |
| BB | 4.9% |
| B | 2.6% |
| CCC,CC,C | 0.5% |
| D | 0.0% |
| Not Rated | 0.1% |
| Equities | 48.4% |
| Short-Term Investments and Net Other Assets | 8.1% |
| | 100.0% |
Percentages shown as 0.0% may reflect amounts less than 0.05%.
We have used ratings from Moody's Investors Service, Inc. Where Moody's® ratings are not available, we have used S&P® ratings. All ratings are as of the date indicated and do not reflect subsequent changes. Percentages are adjusted for the effect of futures contracts, if applicable.
Distribution of investments by country or territory of incorporation, as a percentage of Total Net Assets, is as follows (Unaudited):
| United States of America | 75.9% |
| United Kingdom | 4.2% |
| Japan | 2.0% |
| Cayman Islands | 1.9% |
| Netherlands | 1.6% |
| Canada | 1.3% |
| Ireland | 1.3% |
| Mexico | 1.1% |
| France | 1.0% |
| Switzerland | 1.0% |
| Others (Individually Less Than 1%) | 8.7% |
| | 100.0% |
See accompanying notes which are an integral part of the financial statements.
Financial Statements
Statement of Assets and Liabilities
| | | December 31, 2015 |
| Assets | | |
Investment in securities, at value (including securities loaned of $3,528,059) — See accompanying schedule:
Unaffiliated issuers (cost $330,512,535) | $451,091,401 | |
| Fidelity Central Funds (cost $764,408,693) | 769,771,529 | |
| Total Investments (cost $1,094,921,228) | | $1,220,862,930 |
| Receivable for investments sold | | 13,985,472 |
| Receivable for fund shares sold | | 277,465 |
| Dividends receivable | | 162,775 |
| Distributions receivable from Fidelity Central Funds | | 18,284 |
| Prepaid expenses | | 2,870 |
| Other receivables | | 58,914 |
| Total assets | | 1,235,368,710 |
| Liabilities | | |
| Payable for investments purchased | $23,593 | |
| Payable for fund shares redeemed | 227,207 | |
| Accrued management fee | 514,265 | |
| Distribution and service plan fees payable | 5,815 | |
| Payable for daily variation margin for derivative instruments | 129,813 | |
| Other affiliated payables | 125,807 | |
| Other payables and accrued expenses | 85,167 | |
| Collateral on securities loaned, at value | 3,679,033 | |
| Total liabilities | | 4,790,700 |
| Net Assets | | $1,230,578,010 |
| Net Assets consist of: | | |
| Paid in capital | | $1,070,152,861 |
| Distributions in excess of net investment income | | (55,704) |
| Accumulated undistributed net realized gain (loss) on investments and foreign currency transactions | | 34,333,141 |
| Net unrealized appreciation (depreciation) on investments and assets and liabilities in foreign currencies | | 126,147,712 |
| Net Assets | | $1,230,578,010 |
| Initial Class: | | |
| Net Asset Value, offering price and redemption price per share ($1,008,017,559 ÷ 63,962,990 shares) | | $15.76 |
| Service Class: | | |
| Net Asset Value, offering price and redemption price per share ($5,806,364 ÷ 371,158 shares) | | $15.64 |
| Service Class 2: | | |
| Net Asset Value, offering price and redemption price per share ($24,519,838 ÷ 1,587,499 shares) | | $15.45 |
| Investor Class: | | |
| Net Asset Value, offering price and redemption price per share ($192,234,249 ÷ 12,261,006 shares) | | $15.68 |
See accompanying notes which are an integral part of the financial statements.
Statement of Operations
| | | Year ended December 31, 2015 |
| Investment Income | | |
| Dividends | | $4,793,985 |
| Interest | | 614 |
| Income from Fidelity Central Funds | | 24,906,710 |
| Total income | | 29,701,309 |
| Expenses | | |
| Management fee | $6,551,728 | |
| Transfer agent fees | 1,026,924 | |
| Distribution and service plan fees | 75,482 | |
| Accounting and security lending fees | 534,938 | |
| Custodian fees and expenses | 20,964 | |
| Independent trustees' compensation | 5,636 | |
| Appreciation in deferred trustee compensation account | 84 | |
| Audit | 52,278 | |
| Legal | 11,902 | |
| Miscellaneous | 74,028 | |
| Total expenses before reductions | 8,353,964 | |
| Expense reductions | (56,800) | 8,297,164 |
| Net investment income (loss) | | 21,404,145 |
| Realized and Unrealized Gain (Loss) | | |
| Net realized gain (loss) on: | | |
| Investment securities: | | |
| Unaffiliated issuers | 44,631,281 | |
| Fidelity Central Funds | (16,611,213) | |
| Foreign currency transactions | (66,703) | |
| Futures contracts | 2,663,492 | |
| Capital gain distributions from Fidelity Central Funds | 317,333 | |
| Total net realized gain (loss) | | 30,934,190 |
Change in net unrealized appreciation (depreciation) on:
Investment securities | (48,559,644) | |
| Assets and liabilities in foreign currencies | 4,803 | |
| Futures contracts | (211,296) | |
| Total change in net unrealized appreciation (depreciation) | | (48,766,137) |
| Net gain (loss) | | (17,831,947) |
| Net increase (decrease) in net assets resulting from operations | | $3,572,198 |
See accompanying notes which are an integral part of the financial statements.
Statement of Changes in Net Assets
| | Year ended December 31, 2015 | Year ended December 31, 2014 |
| Increase (Decrease) in Net Assets | | |
| Operations | | |
| Net investment income (loss) | $21,404,145 | $20,727,295 |
| Net realized gain (loss) | 30,934,190 | 78,006,239 |
| Change in net unrealized appreciation (depreciation) | (48,766,137) | (22,425,069) |
| Net increase (decrease) in net assets resulting from operations | 3,572,198 | 76,308,465 |
| Distributions to shareholders from net investment income | (20,099,593) | (20,072,700) |
| Distributions to shareholders from net realized gain | (90,567,976) | (62,505,726) |
| Total distributions | (110,667,569) | (82,578,426) |
| Share transactions - net increase (decrease) | 4,619,610 | 1,239,935 |
| Total increase (decrease) in net assets | (102,475,761) | (5,030,026) |
| Net Assets | | |
| Beginning of period | 1,333,053,771 | 1,338,083,797 |
| End of period (including distributions in excess of net investment income of $55,704 and undistributed net investment income of $617,520, respectively) | $1,230,578,010 | $1,333,053,771 |
See accompanying notes which are an integral part of the financial statements.
Financial Highlights — VIP Asset Manager Portfolio Initial Class
| | | | | | |
| Years ended December 31, | 2015 | 2014 | 2013 | 2012 | 2011 |
| Selected Per–Share Data | | | | | |
| Net asset value, beginning of period | $17.15 | $17.24 | $15.17 | $13.80 | $14.54 |
| Income from Investment Operations | | | | | |
| Net investment income (loss)A | .27 | .27 | .23 | .23 | .28 |
| Net realized and unrealized gain (loss) | (.22) | .72 | 2.15 | 1.49 | (.66) |
| Total from investment operations | .05 | .99 | 2.38 | 1.72 | (.38) |
| Distributions from net investment income | (.26) | (.27) | (.26) | (.24) | (.29) |
| Distributions from net realized gain | (1.17) | (.81) | (.04) | (.11) | (.07) |
| Total distributions | (1.44)B | (1.08) | (.31)C | (.35) | (.36) |
| Net asset value, end of period | $15.76 | $17.15 | $17.24 | $15.17 | $13.80 |
| Total ReturnD,E | .14% | 5.83% | 15.71% | 12.48% | (2.56)% |
| Ratios to Average Net AssetsF,G | | | | | |
| Expenses before reductions | .62% | .61% | .62% | .63% | .63% |
| Expenses net of fee waivers, if any | .62% | .61% | .62% | .63% | .63% |
| Expenses net of all reductions | .61% | .61% | .61% | .62% | .62% |
| Net investment income (loss) | 1.65% | 1.54% | 1.40% | 1.57% | 1.91% |
| Supplemental Data | | | | | |
| Net assets, end of period (000 omitted) | $1,008,018 | $1,117,675 | $1,160,093 | $1,114,021 | $1,108,494 |
| Portfolio turnover rateH | 39% | 30% | 41% | 47% | 56% |
A Calculated based on average shares outstanding during the period.
B Total distributions of $1.44 per share is comprised of distributions from net investment income of $.263 and distributions from net realized gain of $1.174 per share.
C Total distributions of $.31 per share is comprised of distributions from net investment income of $.264 and distributions from net realized gain of $.041 per share.
D Total returns do not reflect charges attributable to your insurance company's separate account. Inclusion of these charges would reduce the total returns shown.
E Total returns would have been lower if certain expenses had not been reduced during the applicable periods shown.
F Fees and expenses of any underlying Fidelity Central Funds are not included in the Fund's expense ratio. The Fund indirectly bears its proportionate share of the expenses of any underlying Fidelity Central Funds. Based on their most recent shareholder report date, the expenses of any underlying non-money market Fidelity Central Funds ranged from less than .005% to .15%.
G Expense ratios reflect operating expenses of the class. Expenses before reductions do not reflect amounts reimbursed by the investment adviser or reductions from brokerage service arrangements or reductions from other expense offset arrangements and do not represent the amount paid by the class during periods when reimbursements or reductions occur. Expenses net of fee waivers reflect expenses after reimbursement by the investment adviser but prior to reductions from brokerage service arrangements or other expense offset arrangements. Expenses net of all reductions represent the net expenses paid by the class.
H Amount does not include the portfolio activity of any underlying Fidelity Central Funds.
See accompanying notes which are an integral part of the financial statements.
Financial Highlights — VIP Asset Manager Portfolio Service Class
| | | | | | |
| Years ended December 31, | 2015 | 2014 | 2013 | 2012 | 2011 |
| Selected Per–Share Data | | | | | |
| Net asset value, beginning of period | $17.03 | $17.13 | $15.08 | $13.71 | $14.45 |
| Income from Investment Operations | | | | | |
| Net investment income (loss)A | .25 | .25 | .21 | .21 | .26 |
| Net realized and unrealized gain (loss) | (.22) | .71 | 2.13 | 1.49 | (.65) |
| Total from investment operations | .03 | .96 | 2.34 | 1.70 | (.39) |
| Distributions from net investment income | (.24) | (.25) | (.24) | (.22) | (.28) |
| Distributions from net realized gain | (1.17) | (.81) | (.04) | (.11) | (.07) |
| Total distributions | (1.42)B | (1.06) | (.29)C | (.33) | (.35) |
| Net asset value, end of period | $15.64 | $17.03 | $17.13 | $15.08 | $13.71 |
| Total ReturnD,E | .03% | 5.69% | 15.53% | 12.43% | (2.69)% |
| Ratios to Average Net AssetsF,G | | | | | |
| Expenses before reductions | .72% | .73% | .74% | .74% | .75% |
| Expenses net of fee waivers, if any | .72% | .73% | .73% | .74% | .74% |
| Expenses net of all reductions | .72% | .73% | .73% | .73% | .74% |
| Net investment income (loss) | 1.54% | 1.43% | 1.28% | 1.45% | 1.79% |
| Supplemental Data | | | | | |
| Net assets, end of period (000 omitted) | $5,806 | $6,990 | $7,970 | $8,429 | $8,042 |
| Portfolio turnover rateH | 39% | 30% | 41% | 47% | 56% |
A Calculated based on average shares outstanding during the period.
B Total distributions of $1.42 per share is comprised of distributions from net investment income of $.244 and distributions from net realized gain of $1.174 per share.
C Total distributions of $.29 per share is comprised of distributions from net investment income of $.244 and distributions from net realized gain of $.041 per share.
D Total returns do not reflect charges attributable to your insurance company's separate account. Inclusion of these charges would reduce the total returns shown.
E Total returns would have been lower if certain expenses had not been reduced during the applicable periods shown.
F Fees and expenses of any underlying Fidelity Central Funds are not included in the Fund's expense ratio. The Fund indirectly bears its proportionate share of the expenses of any underlying Fidelity Central Funds. Based on their most recent shareholder report date, the expenses of any underlying non-money market Fidelity Central Funds ranged from less than .005% to .15%.
G Expense ratios reflect operating expenses of the class. Expenses before reductions do not reflect amounts reimbursed by the investment adviser or reductions from brokerage service arrangements or reductions from other expense offset arrangements and do not represent the amount paid by the class during periods when reimbursements or reductions occur. Expenses net of fee waivers reflect expenses after reimbursement by the investment adviser but prior to reductions from brokerage service arrangements or other expense offset arrangements. Expenses net of all reductions represent the net expenses paid by the class.
H Amount does not include the portfolio activity of any underlying Fidelity Central Funds.
See accompanying notes which are an integral part of the financial statements.
Financial Highlights — VIP Asset Manager Portfolio Service Class 2
| | | | | | |
| Years ended December 31, | 2015 | 2014 | 2013 | 2012 | 2011 |
| Selected Per–Share Data | | | | | |
| Net asset value, beginning of period | $16.83 | $16.94 | $14.92 | $13.57 | $14.30 |
| Income from Investment Operations | | | | | |
| Net investment income (loss)A | .23 | .22 | .18 | .19 | .24 |
| Net realized and unrealized gain (loss) | (.21) | .70 | 2.10 | 1.47 | (.65) |
| Total from investment operations | .02 | .92 | 2.28 | 1.66 | (.41) |
| Distributions from net investment income | (.22) | (.22) | (.22) | (.19) | (.25) |
| Distributions from net realized gain | (1.17) | (.81) | (.04) | (.11) | (.07) |
| Total distributions | (1.40)B | (1.03) | (.26) | (.31)C | (.32) |
| Net asset value, end of period | $15.45 | $16.83 | $16.94 | $14.92 | $13.57 |
| Total ReturnD,E | (.06)% | 5.54% | 15.34% | 12.24% | (2.82)% |
| Ratios to Average Net AssetsF,G | | | | | |
| Expenses before reductions | .87% | .88% | .88% | .89% | .90% |
| Expenses net of fee waivers, if any | .87% | .88% | .88% | .89% | .89% |
| Expenses net of all reductions | .87% | .87% | .88% | .88% | .89% |
| Net investment income (loss) | 1.39% | 1.28% | 1.14% | 1.30% | 1.64% |
| Supplemental Data | | | | | |
| Net assets, end of period (000 omitted) | $24,520 | $28,230 | $31,119 | $29,966 | $32,508 |
| Portfolio turnover rateH | 39% | 30% | 41% | 47% | 56% |
A Calculated based on average shares outstanding during the period.
B Total distributions of $1.40 per share is comprised of distributions from net investment income of $.221 and distributions from net realized gain of $1.174 per share.
C Total distributions of $.31 per share is comprised of distributions from net investment income of $.194 and distributions from net realized gain of $.113 per share.
D Total returns do not reflect charges attributable to your insurance company's separate account. Inclusion of these charges would reduce the total returns shown.
E Total returns would have been lower if certain expenses had not been reduced during the applicable periods shown.
F Fees and expenses of any underlying Fidelity Central Funds are not included in the Fund's expense ratio. The Fund indirectly bears its proportionate share of the expenses of any underlying Fidelity Central Funds. Based on their most recent shareholder report date, the expenses of any underlying non-money market Fidelity Central Funds ranged from less than .005% to .15%.
G Expense ratios reflect operating expenses of the class. Expenses before reductions do not reflect amounts reimbursed by the investment adviser or reductions from brokerage service arrangements or reductions from other expense offset arrangements and do not represent the amount paid by the class during periods when reimbursements or reductions occur. Expenses net of fee waivers reflect expenses after reimbursement by the investment adviser but prior to reductions from brokerage service arrangements or other expense offset arrangements. Expenses net of all reductions represent the net expenses paid by the class.
H Amount does not include the portfolio activity of any underlying Fidelity Central Funds.
See accompanying notes which are an integral part of the financial statements.
Financial Highlights — VIP Asset Manager Portfolio Investor Class
| | | | | | |
| Years ended December 31, | 2015 | 2014 | 2013 | 2012 | 2011 |
| Selected Per–Share Data | | | | | |
| Net asset value, beginning of period | $17.07 | $17.17 | $15.11 | $13.74 | $14.49 |
| Income from Investment Operations | | | | | |
| Net investment income (loss)A | .26 | .25 | .21 | .22 | .27 |
| Net realized and unrealized gain (loss) | (.22) | .72 | 2.14 | 1.49 | (.67) |
| Total from investment operations | .04 | .97 | 2.35 | 1.71 | (.40) |
| Distributions from net investment income | (.25) | (.26) | (.25) | (.22) | (.28) |
| Distributions from net realized gain | (1.17) | (.81) | (.04) | (.11) | (.07) |
| Total distributions | (1.43)B | (1.07) | (.29) | (.34)C | (.35) |
| Net asset value, end of period | $15.68 | $17.07 | $17.17 | $15.11 | $13.74 |
| Total ReturnD,E | .07% | 5.73% | 15.62% | 12.44% | (2.72)% |
| Ratios to Average Net AssetsF,G | | | | | |
| Expenses before reductions | .70% | .70% | .71% | .71% | .71% |
| Expenses net of fee waivers, if any | .70% | .70% | .70% | .71% | .71% |
| Expenses net of all reductions | .69% | .69% | .70% | .70% | .70% |
| Net investment income (loss) | 1.57% | 1.46% | 1.31% | 1.48% | 1.82% |
| Supplemental Data | | | | | |
| Net assets, end of period (000 omitted) | $192,234 | $180,160 | $138,902 | $111,985 | $103,290 |
| Portfolio turnover rateH | 39% | 30% | 41% | 47% | 56% |
A Calculated based on average shares outstanding during the period.
B Total distributions of $1.43 per share is comprised of distributions from net investment income of $.251 and distributions from net realized gain of $1.174 per share.
C Total distributions of $.34 per share is comprised of distributions from net investment income of $.223 and distributions from net realized gain of $.113 per share.
D Total returns do not reflect charges attributable to your insurance company's separate account. Inclusion of these charges would reduce the total returns shown.
E Total returns would have been lower if certain expenses had not been reduced during the applicable periods shown.
F Fees and expenses of any underlying Fidelity Central Funds are not included in the Fund's expense ratio. The Fund indirectly bears its proportionate share of the expenses of any underlying Fidelity Central Funds. Based on their most recent shareholder report date, the expenses of any underlying non-money market Fidelity Central Funds ranged from less than .005% to .15%.
G Expense ratios reflect operating expenses of the class. Expenses before reductions do not reflect amounts reimbursed by the investment adviser or reductions from brokerage service arrangements or reductions from other expense offset arrangements and do not represent the amount paid by the class during periods when reimbursements or reductions occur. Expenses net of fee waivers reflect expenses after reimbursement by the investment adviser but prior to reductions from brokerage service arrangements or other expense offset arrangements. Expenses net of all reductions represent the net expenses paid by the class.
H Amount does not include the portfolio activity of any underlying Fidelity Central Funds.
See accompanying notes which are an integral part of the financial statements.
Notes to Financial Statements
For the period ended December 31, 2015
1. Organization.
VIP Asset Manager Portfolio (the Fund) is a fund of Variable Insurance Products Fund V (the Trust) and is authorized to issue an unlimited number of shares. The Trust is registered under the Investment Company Act of 1940, as amended (the 1940 Act), as an open-end management investment company organized as a Massachusetts business trust. Shares of the Fund may only be purchased by insurance companies for the purpose of funding variable annuity or variable life insurance contracts. The Fund offers the following classes of shares: Initial Class shares, Service Class shares, Service Class 2 shares and Investor Class shares. All classes have equal rights and voting privileges, except for matters affecting a single class.
2. Investments in Fidelity Central Funds.
The fund invests in Fidelity Central Funds, which are open-end investment companies generally available only to other investment companies and accounts managed by the investment adviser and its affiliates. The Fund's Schedule of Investments lists each of the Fidelity Central Funds held as of period end, as an investment of the Fund, but does not include the underlying holdings of each Fidelity Central Fund. As an Investing Fund, the Fund indirectly bears its proportionate share of the expenses of the underlying Fidelity Central Funds. Based on its investment objective, each Fidelity Central Fund may invest or participate in various investment vehicles or strategies that are similar to those of the Fund. These strategies are consistent with the investment objectives of the Fund and may involve certain economic risks which may cause a decline in value of each of the Fidelity Central Funds and thus a decline in the value of the Fund. The following summarizes the Fund's investment in each Fidelity Central Fund.
| Fidelity Central Fund | Investment Manager | Investment Objective | Investment Practices | Expense Ratio(a) |
| Fidelity Commodity Strategy Central Fund | Geode Capital Management, LLC (Geode) | Seeks to provide investment returns that correspond to the performance of the commodities market. | Investment in commodity-related investments through a wholly-owned subsidiary organized under the laws of the Cayman Islands
Futures
Swaps | .05% |
| Fidelity Emerging Markets Debt Central Fund | FMR Co., Inc. (FMRC) | Seeks high total return by normally investing in debt securities of issuers in emerging markets and other debt investments that are tied economically to emerging markets. | Foreign Securities
Loans & Direct Debt Instruments
Restricted Securities | .01% |
| Fidelity Emerging Markets Equity Central Fund | FMRC | Seeks capital appreciation by investing primarily in equity securities of issuers in emerging markets. | Delayed Delivery & When Issued Securities
Foreign Securities
Futures | .15% |
| Fidelity International Equity Central Fund | FMRC | Seeks capital appreciation by investing primarily in non-U.S. based common stocks, including securities of issuers located in emerging markets. | Foreign Securities
Futures
| .01% |
| Fidelity Floating Rate Central Fund | FMRC | Seeks a high level of income by normally investing in floating rate loans and other floating rate securities. | Loans & Direct Debt Instruments
Restricted Securities
| Less than .005% |
| Fidelity High Income Central Fund 1 | FMRC | Seeks a high level of income and may also seek capital appreciation by investing primarily in debt securities, preferred stocks, and convertible securities, with an emphasis on lower-quality debt securities. | Loans & Direct Debt Instruments
Restricted Securities | Less than .005% |
| Fidelity Inflation-Protected Bond Index Central Fund | Fidelity Investment Money Management, Inc. (FIMM) | Seeks to provide investment results that correspond to the performance of the inflation-protected United States Treasury market, and may invest in derivatives. | | Less than .005% |
| Fidelity VIP Investment Grade Central Fund | FIMM | Seeks a high level of current income by normally investing in investment-grade debt securities and repurchase agreements. | Delayed Delivery & When Issued Securities
Futures
Repurchase Agreements
Restricted Securities
Swaps | Less than .005% |
| Fidelity Real Estate Equity Central Fund | FMRC | Seeks above-average income and long-term capital growth by investing primarily in equity securities of issuers in the real estate industry. | | .01% |
| Fidelity Money Market Central Funds | FIMM | Each fund seeks to obtain a high level of current income consistent with the preservation of capital and liquidity. | Short-term Investments | Less than .005% |
(a) Expenses expressed as a percentage of average net assets and are as of each underlying Central Fund's most recent annual or semi-annual shareholder report.
An unaudited holdings listing for the Fund, which presents direct holdings as well as the pro-rata share of any securities and other investments held indirectly through its investment in underlying non-money market Fidelity Central Funds, is available at advisor.fidelity.com. A complete unaudited list of holdings for each Fidelity Central Fund is available upon request or at the Securities and Exchange Commission (the SEC) website at www.sec.gov. In addition, the financial statements of the Fidelity Central Funds which contain the significant accounting policies (including investment valuation policies) of those funds, which are not covered by the Fund's Report of Independent Registered Public Accounting Firm, are available on the SEC website or upon request.
3. Significant Accounting Policies.
The financial statements have been prepared in conformity with accounting principles generally accepted in the United States of America (GAAP), which require management to make certain estimates and assumptions at the date of the financial statements. Actual results could differ from those estimates. Subsequent events, if any, through the date that the financial statements were issued have been evaluated in the preparation of the financial statements. The following summarizes the significant accounting policies of the Fund:
Investment Valuation. Investments are valued as of 4:00 p.m. Eastern time on the last calendar day of the period. The Board of Trustees (the Board) has delegated the day to day responsibility for the valuation of the Fund's investments to the Fidelity Management & Research Company (FMR) Fair Value Committee (the Committee). In accordance with valuation policies and procedures approved by the Board, the Fund attempts to obtain prices from one or more third party pricing vendors or brokers to value its investments. When current market prices, quotations or currency exchange rates are not readily available or reliable, investments will be fair valued in good faith by the Committee, in accordance with procedures adopted by the Board. Factors used in determining fair value vary by investment type and may include market or investment specific events, changes in interest rates and credit quality. The frequency with which these procedures are used cannot be predicted and they may be utilized to a significant extent. The Committee oversees the Fund's valuation policies and procedures and reports to the Board on the Committee's activities and fair value determinations. The Board monitors the appropriateness of the procedures used in valuing the Fund's investments and ratifies the fair value determinations of the Committee.
The Fund categorizes the inputs to valuation techniques used to value its investments into a disclosure hierarchy consisting of three levels as shown below:
- Level 1 – quoted prices in active markets for identical investments
- Level 2 – other significant observable inputs (including quoted prices for similar investments, interest rates, prepayment speeds, etc.)
- Level 3 – unobservable inputs (including the Fund's own assumptions based on the best information available)
Valuation techniques used to value the Fund's investments by major category are as follows:
Equity securities, including restricted securities, for which market quotations are readily available, are valued at the last reported sale price or official closing price as reported by a third party pricing vendor on the primary market or exchange on which they are traded and are categorized as Level 1 in the hierarchy. In the event there were no sales during the day or closing prices are not available, securities are valued at the last quoted bid price or may be valued using the last available price and are generally categorized as Level 2 in the hierarchy. For foreign equity securities, when market or security specific events arise, comparisons to the valuation of American Depositary Receipts (ADRs), futures contracts, Exchange-Traded Funds (ETFs) and certain indexes as well as quoted prices for similar securities may be used and would be categorized as Level 2 in the hierarchy. Utilizing these techniques may result in transfers between Level 1 and Level 2. For equity securities, including restricted securities, where observable inputs are limited, assumptions about market activity and risk are used and these securities may be categorized as Level 3 in the hierarchy.
Debt securities, including restricted securities, are valued based on evaluated prices received from third party pricing vendors or from brokers who make markets in such securities. U.S. government and government agency obligations are valued by pricing vendors who utilize matrix pricing which considers yield or price of bonds of comparable quality, coupon, maturity and type or by broker-supplied prices. When independent prices are unavailable or unreliable, debt securities may be valued utilizing pricing methodologies which consider similar factors that would be used by third party pricing vendors. Debt securities are generally categorized as Level 2 in the hierarchy but may be Level 3 depending on the circumstances. ETFs are valued at their last sale price or official closing price as reported by a third party pricing vendor on the primary market or exchange on which they are traded and are categorized as Level 1 in the hierarchy. In the event there were no sales during the day but the exchange reports a closing bid level, ETFs are valued at the closing bid and would be categorized as Level 1 in the hierarchy. In the event there was no closing bid, ETFs may be valued by another method that the Board believes reflects fair value in accordance with the Board's fair value pricing policies and may be categorized as Level 2 in the hierarchy.
Futures contracts are valued at the settlement price established each day by the board of trade or exchange on which they are traded and are categorized as Level 1 in the hierarchy. Investments in open-end mutual funds, including the Fidelity Central Funds, are valued at their closing net asset value (NAV) each business day and are categorized as Level 1 in the hierarchy. If an unaffiliated open-end mutual fund's NAV is unavailable, shares of that fund may be valued by another method that the Board believes reflects fair value in accordance with the Board's fair value pricing policies and is categorized as Level 2 in the hierarchy.
Changes in valuation techniques may result in transfers in or out of an assigned level within the disclosure hierarchy. The aggregate value of investments by input level as of December 31, 2015 is included at the end of the Fund's Schedule of Investments.
Foreign Currency. The Fund may use foreign currency contracts to facilitate transactions in foreign-denominated securities. Gains and losses from these transactions may arise from changes in the value of the foreign currency or if the counterparties do not perform under the contracts' terms.
Foreign-denominated assets, including investment securities, and liabilities are translated into U.S. dollars at the exchange rates at period end. Purchases and sales of investment securities, income and dividends received and expenses denominated in foreign currencies are translated into U.S. dollars at the exchange rate in effect on the transaction date.
The effects of exchange rate fluctuations on investments are included with the net realized and unrealized gain (loss) on investment securities. Other foreign currency transactions resulting in realized and unrealized gain (loss) are disclosed separately.
Investment Transactions and Income. For financial reporting purposes, the Fund's investment holdings and NAV include trades executed through the end of the last business day of the period. The NAV per share for processing shareholder transactions is calculated as of the close of business of the New York Stock Exchange (NYSE), normally 4:00 p.m. Eastern time and includes trades executed through the end of the prior business day. Gains and losses on securities sold are determined on the basis of identified cost and may include proceeds received from litigation. Dividend income is recorded on the ex-dividend date, except for certain dividends from foreign securities where the ex-dividend date may have passed, which are recorded as soon as the Fund is informed of the ex-dividend date. Non-cash dividends included in dividend income, if any, are recorded at the fair market value of the securities received. Income and capital gain distributions from Fidelity Central Funds, if any, are recorded on the ex-dividend date. Distributions received on securities that represent a return of capital or capital gain are recorded as a reduction of cost of investments and/or as a realized gain. Subsequent to ex-dividend date the Fund determines the components of these distributions, based upon receipt of tax filings or other correspondence relating to the underlying investment. Interest income is accrued as earned and includes coupon interest and amortization of premium and accretion of discount on debt securities as applicable. Investment income is recorded net of foreign taxes withheld where recovery of such taxes is uncertain.
Class Allocations and Expenses. Investment income, realized and unrealized capital gains and losses, common expenses of the Fund, and certain fund-level expense reductions, if any, are allocated daily on a pro-rata basis to each class based on the relative net assets of each class to the total net assets of the Fund. Each class differs with respect to transfer agent and distribution and service plan fees incurred. Certain expense reductions may also differ by class. For the reporting period, the allocated portion of income and expenses to each class as a percent of its average net assets may vary due to the timing of recording these transactions in relation to fluctuating net assets of the classes. Expenses directly attributable to a fund are charged to that fund. Expenses attributable to more than one fund are allocated among the respective funds on the basis of relative net assets or other appropriate methods. Expense estimates are accrued in the period to which they relate and adjustments are made when actual amounts are known. Expenses included in the accompanying financial statements reflect the expenses of the Fund and do not include any expenses of the Fidelity Central Funds. Although not included in the Fund's expenses, the Fund indirectly bears its proportionate share of the Fidelity Central Funds' expenses through the impact of these expenses on each Fidelity Central Fund's NAV.
Deferred Trustee Compensation. Under a Deferred Compensation Plan (the Plan), independent Trustees may elect to defer receipt of a portion of their annual compensation. Deferred amounts are invested in a cross-section of Fidelity funds, are marked-to-market and remain in the Fund until distributed in accordance with the Plan. The investment of deferred amounts and the offsetting payable to the Trustees are included in the accompanying Statement of Assets and Liabilities.
Income Tax Information and Distributions to Shareholders. Each year, the Fund intends to qualify as a regulated investment company under Subchapter M of the Internal Revenue Code, including distributing substantially all of its taxable income and realized gains. As a result, no provision for U.S. Federal income taxes is required. As of December 31, 2015, the Fund did not have any unrecognized tax benefits in the financial statements; nor is the Fund aware of any tax positions for which it is reasonably possible that the total amounts of unrecognized tax benefits will significantly change in the next twelve months. The Fund files a U.S. federal tax return, in addition to state and local tax returns as required. The Fund's federal income tax returns are subject to examination by the Internal Revenue Service (IRS) for a period of three fiscal years after they are filed. State and local tax returns may be subject to examination for an additional fiscal year depending on the jurisdiction. Foreign taxes are provided for based on the Fund's understanding of the tax rules and rates that exist in the foreign markets in which it invests.
Distributions are declared and recorded on the ex-dividend date. Income dividends and capital gain distributions are declared separately for each class. Income and capital gain distributions are determined in accordance with income tax regulations, which may differ from GAAP.
Capital accounts within the financial statements are adjusted for permanent book-tax differences. These adjustments have no impact on net assets or the results of operations. Capital accounts are not adjusted for temporary book-tax differences which will reverse in a subsequent period.
Book-tax differences are primarily due to the short-term gain distributions from the Fidelity Central Funds, futures contracts, market discount, foreign currency transactions, partnerships (including allocations from Fidelity Central Funds), deferred trustees compensation and losses deferred due to wash sales and excise tax regulations.
The federal tax cost of investment securities and unrealized appreciation (depreciation) as of period end were as follows:
| Gross unrealized appreciation | $155,555,899 |
| Gross unrealized depreciation | (32,227,256) |
| Net unrealized appreciation (depreciation) on securities | $123,328,643 |
| Tax Cost | $1,097,534,287 |
The tax-based components of distributable earnings as of period end were as follows:
| Undistributed long-term capital gain | $48,627,854 |
| Net unrealized appreciation (depreciation) on securities and other investments | $123,327,329 |
The tax character of distributions paid was as follows:
| | December 31, 2015 | December 31, 2014 |
| Ordinary Income | $21,644,920 | $ 29,064,845 |
| Long-term Capital Gains | 89,022,649 | 53,513,581 |
| Total | $110,667,569 | $ 82,578,426 |
4. Derivative Instruments.
Risk Exposures and the Use of Derivative Instruments. The Fund's investment objective allows the Fund to enter into various types of derivative contracts, including futures contracts. Derivatives are investments whose value is primarily derived from underlying assets, indices or reference rates and may be transacted on an exchange or over-the-counter (OTC). Derivatives may involve a future commitment to buy or sell a specified asset based on specified terms, to exchange future cash flows at periodic intervals based on a notional principal amount, or for one party to make one or more payments upon the occurrence of specified events in exchange for periodic payments from the other party.
The Fund used derivatives to increase returns and to manage exposure to certain risks as defined below. The success of any strategy involving derivatives depends on analysis of numerous economic factors, and if the strategies for investment do not work as intended, the Fund may not achieve its objectives.
The Fund's use of derivatives increased or decreased its exposure to the following risk:
| Equity Risk | Equity risk relates to the fluctuations in the value of financial instruments as a result of changes in market prices (other than those arising from interest rate risk or foreign exchange risk), whether caused by factors specific to an individual investment, its issuer, or all factors affecting all instruments traded in a market or market segment.
|
The Fund is also exposed to additional risks from investing in derivatives, such as liquidity risk and counterparty credit risk. Liquidity risk is the risk that the Fund will be unable to close out the derivative in the open market in a timely manner. Counterparty credit risk is the risk that the counterparty will not be able to fulfill its obligation to the Fund. Counterparty credit risk related to exchange-traded futures contracts may be mitigated by the protection provided by the exchange on which they trade.
Investing in derivatives may involve greater risks than investing in the underlying assets directly and, to varying degrees, may involve risk of loss in excess of any initial investment and collateral received and amounts recognized in the Statement of Assets and Liabilities. In addition, there may be the risk that the change in value of the derivative contract does not correspond to the change in value of the underlying instrument.
Futures Contracts. A futures contract is an agreement between two parties to buy or sell a specified underlying instrument for a fixed price at a specified future date. The Fund used futures contracts to manage its exposure to the stock market.
Upon entering into a futures contract, a fund is required to deposit either cash or securities (initial margin) with a clearing broker in an amount equal to a certain percentage of the face value of the contract. Futures contracts are marked-to-market daily and subsequent daily payments (variation margin) are made or received by a fund depending on the daily fluctuations in the value of the futures contracts and are recorded as unrealized appreciation or (depreciation). This receivable and/or payable, if any, is included in daily variation margin for derivative instruments in the Statement of Assets and Liabilities. Realized gain or (loss) is recorded upon the expiration or closing of a futures contract.
Any open futures contracts at period end are presented in the Schedule of Investments under the caption "Futures Contracts". The underlying face amount at value reflects each contract's exposure to the underlying instrument or index at period end. Securities deposited to meet initial margin requirements are identified in the Schedule of Investments.
During the period the Fund recognized net realized gain (loss) of $2,663,492 and a change in net unrealized appreciation (depreciation) of $(211,296) related to its investment in futures contracts. These amounts are included in the Statement of Operations.
5. Purchases and Sales of Investments.
Purchases and sales of securities (including the Equity and Fixed-Income Central Funds), other than short-term securities, aggregated $486,911,902 and $597,349,997, respectively.
6. Fees and Other Transactions with Affiliates.
Management Fee. Fidelity Management & Research Company (the investment adviser) and its affiliates provide the Fund with investment management related services for which the Fund pays a monthly management fee. The management fee is the sum of an individual fund fee rate that is based on an annual rate of .25% of the Fund's average net assets and an annualized group fee rate that averaged .25% during the period. The group fee rate is based upon the average net assets of all the mutual funds advised by the investment adviser, including any mutual funds previously advised by the investment adviser that are currently advised by Fidelity SelectCo, LLC, an affiliate of the investment adviser. The group fee rate decreases as assets under management increase and increases as assets under management decrease. For the reporting period, the total annual management fee rate was .50% of the Fund's average net assets.
The investment adviser pays a portion of the management fees received from the Fund to the Fidelity Central Funds' investment advisers, who are also affiliates, for managing the assets of the Fidelity Central Funds.
Distribution and Service Plan Fees. In accordance with Rule 12b-1 of the 1940 Act, the Fund has adopted separate 12b-1 Plans for each Service Class of shares. Each Service Class pays Fidelity Distributors Corporation (FDC), an affiliate of the investment adviser, a service fee. For the period, the service fee is based on an annual rate of .10% of Service Class' average net assets and .25% of Service Class 2's average net assets.
For the period, total fees, all of which were re-allowed to insurance companies for the distribution of shares and providing shareholder support services, were as follows:
| Service Class | $6,506 |
| Service Class 2 | 68,976 |
| | $75,482 |
Transfer Agent Fees. Fidelity Investments Institutional Operations Company, Inc. (FIIOC), an affiliate of the investment adviser, is the Fund's transfer, dividend disbursing, and shareholder servicing agent. FIIOC receives an asset-based fee with respect to each class. Each class (with the exception of Investor Class) pays a fee for transfer agent services, typesetting, printing and mailing of shareholder reports, excluding mailing of proxy statements and out of pocket expenses, equal to an annual rate of .07%(.15% for Investor Class) of class-level average net assets. For the period, transfer agent fees for each class, including out of pocket expenses, were as follows:
| Initial Class | $719,157 |
| Service Class | 4,496 |
| Service Class 2 | 18,815 |
| Investor Class | 284,456 |
| | $1,026,924 |
Accounting and Security Lending Fees. Fidelity Service Company, Inc. (FSC), an affiliate of the investment adviser, maintains the Fund's accounting records. The accounting fee is based on the level of average net assets for each month. Under a separate contract, FSC administers the security lending program. The security lending fee is based on the number and duration of lending transactions.
Brokerage Commissions. The Fund placed a portion of its portfolio transactions with brokerage firms which are affiliates of the investment adviser. Brokerage commissions are included in net realized gain (loss) and change in net unrealized appreciation (depreciation) in the Statement of Operations. The commissions paid to these affiliated firms were $4,594 for the period.
Interfund Trades. The Fund may purchase from or sell securities to other Fidelity Funds under procedures adopted by the Board. The procedures have been designed to ensure these interfund trades are executed in accordance with Rule 17a-7 of the 1940 Act. Interfund trades are included within the respective purchases and sales amounts shown in the Purchases and Sales of Investments note.
7. Committed Line of Credit.
The Fund participates with other funds managed by the investment adviser or an affiliate in a $4.25 billion credit facility (the "line of credit") to be utilized for temporary or emergency purposes to fund shareholder redemptions or for other short-term liquidity purposes. The Fund has agreed to pay commitment fees on its pro-rata portion of the line of credit, which amounted to $1,923 and is reflected in Miscellaneous expenses on the Statement of Operations. During the period, the Fund did not borrow on this line of credit.
8. Security Lending.
The Fund lends portfolio securities through a lending agent from time to time in order to earn additional income. For equity securities, a lending agent is used and may loan securities to certain qualified borrowers, including Fidelity Capital Markets (FCM), a broker-dealer affiliated with the Fund. On the settlement date of the loan, the Fund receives collateral (in the form of U.S. Treasury obligations, letters of credit and/or cash) against the loaned securities and maintains collateral in an amount not less than 100% of the market value of the loaned securities during the period of the loan. The market value of the loaned securities is determined at the close of business of the Fund and any additional required collateral is delivered to the Fund on the next business day. The Fund or borrower may terminate the loan at any time, and if the borrower defaults on its obligation to return the securities loaned because of insolvency or other reasons, the Fund may apply collateral received from the borrower against the obligation. The Fund may experience delays and costs in recovering the securities loaned. Any cash collateral received is invested in the Fidelity Securities Lending Cash Central Fund. The value of loaned securities and cash collateral at period end are disclosed on the Fund's Statement of Assets and Liabilities. At period end, there were no security loans outstanding with FCM. Security lending income represents the income earned on investing cash collateral, less rebates paid to borrowers and any lending agent fees associated with the loan, plus any premium payments received for lending certain types of securities. Security lending income is presented in the Statement of Operations as a component of income from Fidelity Central Funds. Total security lending income during the period amounted to $117,572 including $3,266 from securities loaned to FCM.
9. Expense Reductions.
Commissions paid to certain brokers with whom the investment adviser, or its affiliates, places trades on behalf of the Fund include an amount in addition to trade execution, which may be rebated back to the Fund to offset certain expenses. This amount totaled $47,802 for the period.
In addition, during the period the investment adviser reimbursed and/or waived a portion of fund-level operating expenses in the amount of $5,319 and a portion of class-level operating expenses as follows:
| | Amount |
| Investor Class | $3,679 |
10. Distributions to Shareholders.
Distributions to shareholders of each class were as follows:
| Years ended December 31, | 2015 | 2014 |
| From net investment income | | |
| Initial Class | $16,635,429 | $16,978,850 |
| Service Class | 89,574 | 99,193 |
| Service Class 2 | 362,301 | 361,806 |
| Investor Class | 3,012,289 | 2,632,851 |
| Total | $20,099,593 | $20,072,700 |
| From net realized gain | | |
| Initial Class | $75,551,716 | $53,648,905 |
| Service Class | 460,907 | 372,743 |
| Service Class 2 | 1,958,727 | 1,456,505 |
| Investor Class | 12,596,626 | 7,027,573 |
| Total | $90,567,976 | $62,505,726 |
11. Share Transactions.
Transactions for each class of shares were as follows:
| | Shares | Shares | Dollars | Dollars |
| Years ended December 31, | 2015 | 2014 | 2015 | 2014 |
| Initial Class | | | | |
| Shares sold | 1,672,902 | 1,808,578 | $27,640,893 | $31,420,590 |
| Reinvestment of distributions | 5,676,691 | 4,129,526 | 92,187,145 | 70,627,755 |
| Shares redeemed | (8,565,186) | (8,040,509) | (141,192,707) | (139,554,070) |
| Net increase (decrease) | (1,215,593) | (2,102,405) | $(21,364,669) | $(37,505,725) |
| Service Class | | | | |
| Shares sold | 45,400 | 45,635 | $750,309 | $786,518 |
| Reinvestment of distributions | 34,136 | 27,797 | 550,481 | 471,936 |
| Shares redeemed | (118,820) | (128,226) | (1,951,896) | (2,208,854) |
| Net increase (decrease) | (39,284) | (54,794) | $(651,106) | $(950,400) |
| Service Class 2 | | | | |
| Shares sold | 160,158 | 254,702 | $2,610,339 | $4,344,583 |
| Reinvestment of distributions | 145,682 | 108,382 | 2,321,028 | 1,818,311 |
| Shares redeemed | (395,476) | (522,612) | (6,360,083) | (8,894,554) |
| Net increase (decrease) | (89,636) | (159,528) | $(1,428,716) | $(2,731,660) |
| Investor Class | | | | |
| Shares sold | 1,787,640 | 2,538,511 | $29,509,426 | $43,815,932 |
| Reinvestment of distributions | 967,074 | 567,223 | 15,608,915 | 9,660,424 |
| Shares redeemed | (1,049,116) | (640,042) | (17,054,240) | (11,048,636) |
| Net increase (decrease) | 1,705,598 | 2,465,692 | $28,064,101 | $42,427,720 |
12. Other.
The Fund's organizational documents provide former and current trustees and officers with a limited indemnification against liabilities arising in connection with the performance of their duties to the Fund. In the normal course of business, the Fund may also enter into contracts that provide general indemnifications. The Fund's maximum exposure under these arrangements is unknown as this would be dependent on future claims that may be made against the Fund. The risk of material loss from such claims is considered remote.
At the end of the period, the investment adviser or its affiliates were the owners of record of 37% of the total outstanding shares of the Fund and two otherwise unaffiliated shareholders were the owners of record of 28% of the total outstanding shares of the Fund.
Report of Independent Registered Public Accounting Firm
To the Trustees of Variable Insurance Products Fund V and Shareholders of VIP Asset Manager Portfolio:
We have audited the accompanying statement of assets and liabilities of VIP Asset Manager Portfolio (the Fund), a fund of Variable Insurance Products Fund V, including the schedule of investments, as of December 31, 2015, and the related statement of operations for the year then ended, the statement of changes in net assets for each of the two years in the period then ended, and the financial highlights for each of the five years in the period then ended. These financial statements and financial highlights are the responsibility of the Fund's management. Our responsibility is to express an opinion on these financial statements and financial highlights based on our audits.
We conducted our audits in accordance with the standards of the Public Company Accounting Oversight Board (United States). Those standards require that we plan and perform the audit to obtain reasonable assurance about whether the financial statements and financial highlights are free of material misstatement. The Fund is not required to have, nor were we engaged to perform, an audit of its internal control over financial reporting. Our audits included consideration of internal control over financial reporting as a basis for designing audit procedures that are appropriate in the circumstances, but not for the purpose of expressing an opinion on the effectiveness of the Fund's internal control over financial reporting. Accordingly, we express no such opinion. An audit also includes examining, on a test basis, evidence supporting the amounts and disclosures in the financial statements, assessing the accounting principles used and significant estimates made by management, as well as evaluating the overall financial statement presentation. Our procedures included confirmation of securities owned as of December 31, 2015, by correspondence with the custodians and brokers; when replies were not received from brokers, we performed other auditing procedures. We believe that our audits provide a reasonable basis for our opinion.
In our opinion, such financial statements and financial highlights referred to above present fairly, in all material respects, the financial position of VIP Asset Manager Portfolio as of December 31, 2015, the results of its operations for the year then ended, the changes in its net assets for each of the two years in the period then ended, and the financial highlights for each of the five years in the period then ended, in conformity with accounting principles generally accepted in the United States of America.
DELOITTE & TOUCHE LLP
Boston, Massachusetts
February 22, 2016
Trustees and Officers
The Trustees, Members of the Advisory Board (if any), and officers of the trust and fund, as applicable, are listed below. The Board of Trustees governs the fund and is responsible for protecting the interests of shareholders. The Trustees are experienced executives who meet periodically throughout the year to oversee the fund's activities, review contractual arrangements with companies that provide services to the fund, oversee management of the risks associated with such activities and contractual arrangements, and review the fund's performance. Except for Elizabeth S. Acton, John Engler, and Geoffrey A. von Kuhn, each of the Trustees oversees 236 funds. Ms. Acton and Mr. Engler each oversees 228 funds. Mr. von Kuhn oversees 148 funds.
The Trustees hold office without limit in time except that (a) any Trustee may resign; (b) any Trustee may be removed by written instrument, signed by at least two-thirds of the number of Trustees prior to such removal; (c) any Trustee who requests to be retired or who has become incapacitated by illness or injury may be retired by written instrument signed by a majority of the other Trustees; and (d) any Trustee may be removed at any special meeting of shareholders by a two-thirds vote of the outstanding voting securities of the trust. Each Trustee who is not an interested person (as defined in the 1940 Act) of the trust and the fund is referred to herein as an Independent Trustee. Each Independent Trustee shall retire not later than the last day of the calendar year in which his or her 75th birthday occurs. The Independent Trustees may waive this mandatory retirement age policy with respect to individual Trustees. Officers and Advisory Board Members hold office without limit in time, except that any officer or Advisory Board Member may resign or may be removed by a vote of a majority of the Trustees at any regular meeting or any special meeting of the Trustees. Except as indicated, each individual has held the office shown or other offices in the same company for the past five years.
The fund’s Statement of Additional Information (SAI) includes more information about the Trustees. To request a free copy, call Fidelity at 1-877-208-0098.
Experience, Skills, Attributes, and Qualifications of the Trustees. The Governance and Nominating Committee has adopted a statement of policy that describes the experience, qualifications, attributes, and skills that are necessary and desirable for potential Independent Trustee candidates (Statement of Policy). The Board believes that each Trustee satisfied at the time he or she was initially elected or appointed a Trustee, and continues to satisfy, the standards contemplated by the Statement of Policy. The Governance and Nominating Committee also engages professional search firms to help identify potential Independent Trustee candidates who have the experience, qualifications, attributes, and skills consistent with the Statement of Policy. From time to time, additional criteria based on the composition and skills of the current Independent Trustees, as well as experience or skills that may be appropriate in light of future changes to board composition, business conditions, and regulatory or other developments, have also been considered by the professional search firms and the Governance and Nominating Committee. In addition, the Board takes into account the Trustees' commitment and participation in Board and committee meetings, as well as their leadership of standing and ad hoc committees throughout their tenure.
In determining that a particular Trustee was and continues to be qualified to serve as a Trustee, the Board has considered a variety of criteria, none of which, in isolation, was controlling. The Board believes that, collectively, the Trustees have balanced and diverse experience, qualifications, attributes, and skills, which allow the Board to operate effectively in governing the fund and protecting the interests of shareholders. Information about the specific experience, skills, attributes, and qualifications of each Trustee, which in each case led to the Board's conclusion that the Trustee should serve (or continue to serve) as a trustee of the fund, is provided below.
Board Structure and Oversight Function. Abigail P. Johnson is an interested person and currently serves as Chairman. The Trustees have determined that an interested Chairman is appropriate and benefits shareholders because an interested Chairman has a personal and professional stake in the quality and continuity of services provided to the fund. Independent Trustees exercise their informed business judgment to appoint an individual of their choosing to serve as Chairman, regardless of whether the Trustee happens to be independent or a member of management. The Independent Trustees have determined that they can act independently and effectively without having an Independent Trustee serve as Chairman and that a key structural component for assuring that they are in a position to do so is for the Independent Trustees to constitute a substantial majority for the Board. The Independent Trustees also regularly meet in executive session. Marie L. Knowles serves as Chairman of the Independent Trustees and as such (i) acts as a liaison between the Independent Trustees and management with respect to matters important to the Independent Trustees and (ii) with management prepares agendas for Board meetings.
Fidelity® funds are overseen by different Boards of Trustees. The fund's Board oversees Fidelity's investment-grade bond, money market, asset allocation and certain equity funds, and other Boards oversee Fidelity's high income, sector and other equity funds. The asset allocation funds may invest in Fidelity® funds that are overseen by such other Boards. The use of separate Boards, each with its own committee structure, allows the Trustees of each group of Fidelity® funds to focus on the unique issues of the funds they oversee, including common research, investment, and operational issues. On occasion, the separate Boards establish joint committees to address issues of overlapping consequences for the Fidelity® funds overseen by each Board.
The Trustees operate using a system of committees to facilitate the timely and efficient consideration of all matters of importance to the Trustees, the fund, and fund shareholders and to facilitate compliance with legal and regulatory requirements and oversight of the fund's activities and associated risks. The Board, acting through its committees, has charged FMR and its affiliates with (i) identifying events or circumstances the occurrence of which could have demonstrably adverse effects on the fund's business and/or reputation; (ii) implementing processes and controls to lessen the possibility that such events or circumstances occur or to mitigate the effects of such events or circumstances if they do occur; and (iii) creating and maintaining a system designed to evaluate continuously business and market conditions in order to facilitate the identification and implementation processes described in (i) and (ii) above. Because the day-to-day operations and activities of the fund are carried out by or through FMR, its affiliates, and other service providers, the fund's exposure to risks is mitigated but not eliminated by the processes overseen by the Trustees. While each of the Board's committees has responsibility for overseeing different aspects of the fund's activities, oversight is exercised primarily through the Operations and Audit Committees. In addition, an ad hoc Board committee of Independent Trustees has worked with FMR to enhance the Board's oversight of investment and financial risks, legal and regulatory risks, technology risks, and operational risks, including the development of additional risk reporting to the Board. Appropriate personnel, including but not limited to the fund's Chief Compliance Officer (CCO), FMR's internal auditor, the independent accountants, the fund's Treasurer and portfolio management personnel, make periodic reports to the Board's committees, as appropriate, including an annual review of Fidelity's risk management program for the Fidelity® funds. The responsibilities of each standing committee, including their oversight responsibilities, are described further under "Standing Committees of the Trustees."
Interested Trustees*:
Correspondence intended for a Trustee who is an interested person may be sent to Fidelity Investments, 245 Summer Street, Boston, Massachusetts 02210.
Name, Year of Birth; Principal Occupations and Other Relevant Experience+
Abigail P. Johnson (1961)
Year of Election or Appointment: 2009
Trustee
Chairman of the Board of Trustees
Ms. Johnson also serves as Trustee of other Fidelity® funds. Ms. Johnson serves as President (2013-present) and Chief Executive Officer (2014-present) of FMR LLC (diversified financial services company), President of Fidelity Financial Services (2012-present) and President of Personal, Workplace and Institutional Services (2005-present). Ms. Johnson is Chairman and Director of FMR Co., Inc. (investment adviser firm, 2011-present), Chairman and Director of FMR (investment adviser firm, 2011-present), and the Vice Chairman and Director (2007-present) of FMR LLC. Previously, Ms. Johnson served as President and a Director of FMR (2001-2005), a Trustee of other investment companies advised by FMR, Fidelity Investments Money Management, Inc. (investment adviser firm), and FMR Co., Inc. (2001-2005), Senior Vice President of the Fidelity® funds (2001-2005), and managed a number of Fidelity® funds. Ms. Abigail P. Johnson and Mr. Arthur E. Johnson are not related.
Geoffrey A. von Kuhn (1951)
Year of Election or Appointment: 2015
Trustee
Mr. von Kuhn also serves as Trustee or Member of the Advisory Board of other Fidelity funds. Mr. von Kuhn is Chief Administrative Officer for FMR LLC (diversified financial services company, 2013-present), a Director of Pembroke Real Estate, Inc. (2009-present), and a Director of Discovery Natural Resources LLC (2012-present). Previously, Mr. von Kuhn was a managing director of Crosby Group (private wealth management company, 2007-2013), a member of the management committee and senior executive in the Wealth Management Group of AmSouth Bank (2001-2006), and head of the U.S. private bank at Citigroup (2000-2001).
* Determined to be an “Interested Trustee” by virtue of, among other things, his or her affiliation with the trust or various entities under common control with FMR.
+ The information includes the Trustee's principal occupation during the last five years and other information relating to the experience, attributes, and skills relevant to the Trustee's qualifications to serve as a Trustee, which led to the conclusion that the Trustee should serve as a Trustee for the fund.
Independent Trustees:
Correspondence intended for an Independent Trustee may be sent to Fidelity Investments, P.O. Box 55235, Boston, Massachusetts 02205-5235.
Name, Year of Birth; Principal Occupations and Other Relevant Experience+
Elizabeth S. Acton (1951)
Year of Election or Appointment: 2013
Trustee
Ms. Acton also serves as Trustee or Member of the Advisory Board of other Fidelity® funds. Prior to her retirement in April 2012, Ms. Acton was Executive Vice President, Finance (2011-2012), Executive Vice President, Chief Financial Officer (2002-2011), and Treasurer (2004-2005) of Comerica Incorporated (financial services). Prior to joining Comerica, Ms. Acton held a variety of positions at Ford Motor Company (1983-2002), including Vice President and Treasurer (2000-2002) and Executive Vice President and Chief Financial Officer of Ford Motor Credit Company (1998-2000). Ms. Acton currently serves as a member of the Board of Directors and Audit and Finance Committees of Beazer Homes USA, Inc. (homebuilding, 2012-present).
John Engler (1948)
Year of Election or Appointment: 2014
Trustee
Mr. Engler also serves as Trustee or Member of the Advisory Board of other Fidelity® funds. He serves as president of the Business Roundtable (2011-present), and on the board of directors/trustees for Universal Forest Products (manufacturer and distributor of wood and wood-alternative products, 2003-present) and K12 Inc. (technology-based education company, 2012-present). Previously, Mr. Engler served as a trustee of The Munder Funds (2003-2014), president and CEO of the National Association of Manufacturers (2004-2011), member of the Board of Trustees of the Annie E. Casey Foundation (2004-2015), and as governor of Michigan (1991-2003). He is a past chairman of the National Governors Association.
Albert R. Gamper, Jr. (1942)
Year of Election or Appointment: 2007
Trustee
Mr. Gamper also serves as Trustee of other Fidelity® funds. Prior to his retirement in December 2004, Mr. Gamper served as Chairman of the Board of CIT Group Inc. (commercial finance). During his tenure with CIT Group Inc. Mr. Gamper served in numerous senior management positions, including Chairman (1987-1989; 1999-2001; 2002-2004), Chief Executive Officer (1987-2004), and President (2002-2003). Mr. Gamper currently serves as a member of the Board of Directors of Public Service Enterprise Group (utilities, 2000-present), and Member of the Board of Trustees of Barnabas Health Care System (1997-present). Previously, Mr. Gamper served as Chairman (2012-2015) and Vice Chairman (2011-2012) of the Independent Trustees of certain Fidelity® funds and as Chairman of the Board of Governors, Rutgers University (2004-2007).
Robert F. Gartland (1951)
Year of Election or Appointment: 2010
Trustee
Mr. Gartland also serves as Trustee of other Fidelity® funds. Mr. Gartland is Chairman and an investor in Gartland and Mellina Group Corp. (consulting, 2009-present). Previously, Mr. Gartland served as a partner and investor of Vietnam Partners LLC (investments and consulting, 2008-2011). Prior to his retirement, Mr. Gartland held a variety of positions at Morgan Stanley (financial services, 1979-2007) including Managing Director (1987-2007).
Arthur E. Johnson (1947)
Year of Election or Appointment: 2008
Trustee
Vice Chairman of the Independent Trustees
Mr. Johnson also serves as Trustee of other Fidelity® funds. Mr. Johnson serves as a member of the Board of Directors of Eaton Corporation plc (diversified power management, 2009-present), AGL Resources, Inc. (holding company, 2002-present) and Booz Allen Hamilton (management consulting, 2011-present). Prior to his retirement, Mr. Johnson served as Senior Vice President of Corporate Strategic Development of Lockheed Martin Corporation (defense contractor, 1999-2009). He previously served on the Board of Directors of IKON Office Solutions, Inc. (1999-2008) and Delta Airlines (2005-2007). Mr. Arthur E. Johnson is not related to Ms. Abigail P. Johnson.
Michael E. Kenneally (1954)
Year of Election or Appointment: 2009
Trustee
Mr. Kenneally also serves as Trustee of other Fidelity® funds. Prior to his retirement, Mr. Kenneally served as Chairman and Global Chief Executive Officer of Credit Suisse Asset Management. Before joining Credit Suisse, he was an Executive Vice President and Chief Investment Officer for Bank of America Corporation. Earlier roles at Bank of America included Director of Research, Senior Portfolio Manager and Research Analyst, and Mr. Kenneally was awarded the Chartered Financial Analyst (CFA) designation in 1991.
James H. Keyes (1940)
Year of Election or Appointment: 2007
Trustee
Mr. Keyes also serves as Trustee of other Fidelity® funds. Mr. Keyes serves as a member of the Board and Non-Executive Chairman of Navistar International Corporation (manufacture and sale of trucks, buses, and diesel engines, since 2002). Previously, Mr. Keyes served as a member of the Board of Pitney Bowes, Inc. (integrated mail, messaging, and document management solutions, 1998-2013). Prior to his retirement, Mr. Keyes served as Chairman (1993-2002) and Chief Executive Officer (1988-2002) of Johnson Controls (automotive, building, and energy) and as a member of the Board of LSI Logic Corporation (semiconductor technologies, 1984-2008).
Marie L. Knowles (1946)
Year of Election or Appointment: 2001
Trustee
Chairman of the Independent Trustees
Ms. Knowles also serves as Trustee of other Fidelity® funds. Prior to Ms. Knowles' retirement in June 2000, she served as Executive Vice President and Chief Financial Officer of Atlantic Richfield Company (ARCO) (diversified energy, 1996-2000). From 1993 to 1996, she was a Senior Vice President of ARCO and President of ARCO Transportation Company (pipeline and tanker operations). Ms. Knowles currently serves as a Director and Chairman of the Audit Committee of McKesson Corporation (healthcare service, since 2002). Ms. Knowles is a member of the Board of the Santa Catalina Island Company (real estate, 2009-present). Ms. Knowles is a Member of the Investment Company Institute Board of Governors and a Member of the Governing Council of the Independent Directors Council (2014-present). She also serves as a member of the Advisory Board for the School of Engineering of the University of Southern California. Previously, Ms. Knowles served as a Director of Phelps Dodge Corporation (copper mining and manufacturing, 1994-2007), URS Corporation (engineering and construction, 2000-2003) and America West (airline, 1999-2002). Ms. Knowles previously served as Vice Chairman of the Independent Trustees of certain Fidelity® funds (2012-2015).
+ The information includes the Trustee's principal occupation during the last five years and other information relating to the experience, attributes, and skills relevant to the Trustee's qualifications to serve as a Trustee, which led to the conclusion that the Trustee should serve as a Trustee for the fund.
Advisory Board Members and Officers:
Correspondence intended for an officer may be sent to Fidelity Investments, 245 Summer Street, Boston, Massachusetts 02210. Officers appear below in alphabetical order.
Name, Year of Birth; Principal Occupation
Marc R. Bryant (1966)
Year of Election or Appointment: 2015
Secretary and Chief Legal Officer (CLO)
Mr. Bryant also serves as Secretary and CLO of other funds. Mr. Bryant serves as CLO, Secretary, and Senior Vice President of Fidelity Management & Research Company (investment adviser firm, 2015-present) and FMR Co., Inc. (investment adviser firm, 2015-present); Secretary of Fidelity SelectCo, LLC (investment adviser firm, 2015-present) and Fidelity Investments Money Management, Inc. (investment adviser firm, 2015-present); and CLO of Fidelity Management & Research (Hong Kong) Limited (investment adviser firm, 2015-present). He is Senior Vice President and Deputy General Counsel of FMR LLC (diversified financial services company). Previously, Mr. Bryant served as Secretary and CLO of Fidelity Rutland Square Trust II (2010-2014) and Assistant Secretary of Fidelity's Fixed Income and Asset Allocation Funds (2013-2015). Prior to joining Fidelity Investments, Mr. Bryant served as a Senior Vice President and the Head of Global Retail Legal for AllianceBernstein L.P. (2006-2010), and as the General Counsel for ProFund Advisors LLC (2001-2006).
Jonathan Davis (1968)
Year of Election or Appointment: 2010
Assistant Treasurer
Mr. Davis also serves as Assistant Treasurer of other funds, and is an employee of Fidelity Investments. Previously, Mr. Davis served as Vice President and Associate General Counsel of FMR LLC (diversified financial services company, 2003-2010).
Adrien E. Deberghes (1967)
Year of Election or Appointment: 2010
Assistant Treasurer
Mr. Deberghes also serves as an officer of other funds. He is an employee of Fidelity Investments (2008-present). Prior to joining Fidelity Investments, Mr. Deberghes was Senior Vice President of Mutual Fund Administration at State Street Corporation (2007-2008), Senior Director of Mutual Fund Administration at Investors Bank & Trust (2005-2007), and Director of Finance for Dunkin' Brands (2000-2005).
Stephanie J. Dorsey (1969)
Year of Election or Appointment: 2013
President and Treasurer
Ms. Dorsey also serves as an officer of other funds. She is an employee of Fidelity Investments (2008-present) and has served in other fund officer roles. Prior to joining Fidelity Investments, Ms. Dorsey served as Treasurer (2004-2008) of the JPMorgan Mutual Funds and Vice President (2004-2008) of JPMorgan Chase Bank.
Howard J. Galligan III (1966)
Year of Election or Appointment: 2014
Chief Financial Officer
Mr. Galligan also serves as Chief Financial Officer of other funds. Mr. Galligan serves as President of Fidelity Pricing and Cash Management Services (FPCMS) (2014-present) and as a Director of Strategic Advisers, Inc. (investment adviser firm, 2008-present). Previously, Mr. Galligan served as Chief Administrative Officer of Asset Management (2011-2014) and Chief Operating Officer and Senior Vice President of Investment Support for Strategic Advisers, Inc. (2003-2011).
Scott C. Goebel (1968)
Year of Election or Appointment: 2015
Vice President
Mr. Goebel serves as Vice President of other funds and is an employee of Fidelity Investments (2001-present). Previously, Mr. Goebel served as Secretary of Fidelity SelectCo, LLC (investment adviser firm, 2013-2015), Fidelity Investments Money Management, Inc. (FIMM) (investment adviser firm, 2010-2015), and Fidelity Research and Analysis Company (FRAC) (investment adviser firm, 2010-2015); General Counsel, Secretary, and Senior Vice President of Fidelity Management & Research Company (investment adviser firm, 2008-2015) and FMR Co., Inc. (investment adviser firm, 2008-2015); Assistant Secretary of Fidelity Management & Research (Japan) Limited (investment adviser firm, 2008-2015) and FMR Investment Management (U.K.) Limited (investment adviser firm, 2008-2015); Chief Legal Officer (CLO) of Fidelity Management & Research (Hong Kong) Limited (investment adviser firm, 2008-2015); Secretary and CLO of certain Fidelity® funds (2008-2015); Assistant Secretary of FIMM (2008-2010), FRAC (2008-2010), and certain funds (2007-2008); and as Vice President and Secretary of Fidelity Distributors Corporation (FDC) (2005-2007).
Chris Maher (1972)
Year of Election or Appointment: 2013
Assistant Treasurer
Mr. Maher serves as Assistant Treasurer of other funds. Mr. Maher is Vice President of Valuation Oversight and is an employee of Fidelity Investments. Previously, Mr. Maher served as Vice President of Asset Management Compliance (2013), Vice President of the Program Management Group of FMR (investment adviser firm, 2010-2013), and Vice President of Valuation Oversight (2008-2010).
Jason P. Pogorelec (1975)
Year of Election or Appointment: 2015
Assistant Secretary
Mr. Pogorelec also serves as Assistant Secretary of other funds. Mr. Pogorelec serves as Vice President, Associate General Counsel (2010-present) and is an employee of Fidelity Investments (2006-present).
John F. Papandrea (1972)
Year of Election or Appointment: 2016
Anti-Money Laundering (AML) Officer
Mr. Papandrea also serves as AML Officer of other funds. Mr. Papandrea is Vice President of FMR LLC (diversified financial services company, 2008-present) and is an employee of Fidelity Investments (2005-present).
Nancy D. Prior (1967)
Year of Election or Appointment: 2014
Vice President
Ms. Prior also serves as Vice President of other funds. Ms. Prior serves as a Director of Fidelity Investments Money Management, Inc. (FIMM) (investment adviser firm, 2014-present), President, Fixed Income (2014-present), Vice Chairman of FIAM LLC (investment adviser firm, 2014-present), and is an employee of Fidelity Investments (2002-present). Previously, Ms. Prior served as Vice President of Fidelity's Money Market Funds (2012-2014), President, Money Market and Short Duration Bond Group of Fidelity Management & Research (FMR) (investment adviser firm, 2013-2014), President, Money Market Group of FMR (2011-2013), Managing Director of Research (2009-2011), Senior Vice President and Deputy General Counsel (2007-2009), and Assistant Secretary of other Fidelity® funds (2008-2009).
Kenneth B. Robins (1969)
Year of Election or Appointment: 2009
Assistant Treasurer
Mr. Robins also serves as an officer of other funds. Mr. Robins serves as Executive Vice President of Fidelity Investments Money Management, Inc. (FIMM) (investment adviser firm, 2013-present) and is an employee of Fidelity Investments (2004-present). Previously, Mr. Robins served in other fund officer roles.
Stacie M. Smith (1974)
Year of Election or Appointment: 2013
Assistant Treasurer
Ms. Smith also serves as an officer of other funds. She is an employee of Fidelity Investments (2009-present) and has served in other fund officer roles. Prior to joining Fidelity Investments, Ms. Smith served as Senior Audit Manager of Ernst & Young LLP (1996-2009).
Renee Stagnone (1975)
Year of Election or Appointment: 2013
Deputy Treasurer
Ms. Stagnone also serves as Deputy Treasurer of other funds. Ms. Stagnone is an employee of Fidelity Investments (1997-present).
Michael H. Whitaker (1967)
Year of Election or Appointment: 2008
Chief Compliance Officer
Mr. Whitaker also serves as Chief Compliance Officer of other funds. Mr. Whitaker also serves as Compliance Officer of FMR Co., Inc. (investment adviser firm, 2014-present), FMR (investment adviser firm, 2014-present), and Fidelity Investments Money Management, Inc. (investment adviser firm, 2014-present) and is an employee of Fidelity Investments (2007-present). Prior to joining Fidelity Investments, Mr. Whitaker worked at MFS Investment Management where he served as Senior Vice President and Chief Compliance Officer (2004-2006), and Assistant General Counsel.
Derek L. Young (1964)
Year of Election or Appointment: 2009
Vice President of Fidelity's Asset Allocation Funds
Mr. Young also serves as an officer of other funds. He is a Director of Strategic Advisers, Inc. (investment adviser firm, 2011-present), President of Fidelity Global Asset Allocation (GAA) (2011-present), and Vice Chairman of FIAM LLC (investment adviser firm, 2011-present). Previously, Mr. Young served as Trustee of certain funds (2012-2015), President of Strategic Advisers, Inc. (2011-2015), Chief Investment Officer of GAA (2009-2011), and as a portfolio manager.
Joseph F. Zambello (1957)
Year of Election or Appointment: 2011
Deputy Treasurer
Mr. Zambello also serves as Deputy Treasurer of other funds. Mr. Zambello is an employee of Fidelity Investments (1991-present). Previously, Mr. Zambello served as Vice President of the Program Management Group of FMR (investment adviser firm, 2009-2011) and Vice President of the Transfer Agent Oversight Group (2005-2009).
Shareholder Expense Example
As a shareholder of the Fund, you incur two types of costs: (1) transaction costs, and (2) ongoing costs, including management fees, distribution and/or service (12b-1) fees and other Fund expenses. This Example is intended to help you understand your ongoing costs (in dollars) of investing in the Fund and to compare these costs with the ongoing costs of investing in other mutual funds.
The Example is based on an investment of $1,000 invested at the beginning of the period and held for the entire period (July 1, 2015 to December 31, 2015).
Actual Expenses
The first line of the accompanying table for each class of the Fund provides information about actual account values and actual expenses. You may use the information in this line, together with the amount you invested, to estimate the expenses that you paid over the period. Simply divide your account value by $1,000.00 (for example, an $8,600 account value divided by $1,000.00 = 8.6), then multiply the result by the number in the first line for a class of the Fund under the heading entitled "Expenses Paid During Period" to estimate the expenses you paid on your account during this period. The estimate of expenses does not include any fees or other expenses of any variable annuity or variable life insurance product. If they were, the estimate of expenses you paid during the period would be higher, and your ending account value would be lower. In addition, the Fund, as a shareholder in the underlying Fidelity Central Funds, will indirectly bear its pro-rata share of the fees and expenses incurred by the underlying Fidelity Central Funds. These fees and expenses are not included in the Fund's annualized expense ratio used to calculate the expense estimate in the table below.
Hypothetical Example for Comparison Purposes
The second line of the accompanying table for each class of the Fund provides information about hypothetical account values and hypothetical expenses based on a Class' actual expense ratio and an assumed rate of return of 5% per year before expenses, which is not the Class' actual return. The hypothetical account values and expenses may not be used to estimate the actual ending account balance or expenses you paid for the period. You may use this information to compare the ongoing costs of investing in the Fund and other funds. To do so, compare this 5% hypothetical example with the 5% hypothetical examples that appear in the shareholder reports of the other funds. The estimate of expenses does not include any fees or other expenses of any variable annuity or variable life insurance product. If they were, the estimate of expenses you paid during the period would be higher, and your ending account value would be lower. In addition, the Fund, as a shareholder in the underlying Fidelity Central Funds, will indirectly bear its pro-rata share of the fees and expenses incurred by the underlying Fidelity Central Funds. These fees and expenses are not included in the Fund's annualized expense ratio used to calculate the expense estimate in the table below.
Please note that the expenses shown in the table are meant to highlight your ongoing costs only and do not reflect any transaction costs. Therefore, the second line of the table is useful in comparing ongoing costs only, and will not help you determine the relative total costs of owning different funds.
In addition to the expenses noted below, the Fund also indirectly bears its proportional share of the expenses of the underlying Fidelity Central Funds. Annualized expenses of the underlying non-money market Fidelity Central Funds as of their most recent fiscal half year ranged from less than .005% to .22%.
| | Annualized Expense Ratio-A | Beginning
Account Value
July 1, 2015 | Ending
Account Value
December 31, 2015 | Expenses Paid
During Period-B
July 1, 2015
to December 31, 2015 |
| Initial Class | .61% | | | |
| Actual | | $1,000.00 | $969.00 | $3.03 |
| Hypothetical-C | | $1,000.00 | $1,022.13 | $3.11 |
| Service Class | .71% | | | |
| Actual | | $1,000.00 | $968.20 | $3.52 |
| Hypothetical-C | | $1,000.00 | $1,021.63 | $3.62 |
| Service Class 2 | .86% | | | |
| Actual | | $1,000.00 | $967.60 | $4.27 |
| Hypothetical-C | | $1,000.00 | $1,020.87 | $4.38 |
| Investor Class | .69% | | | |
| Actual | | $1,000.00 | $968.70 | $3.42 |
| Hypothetical-C | | $1,000.00 | $1,021.73 | $3.52 |
A Annualized expense ratio reflects expenses net of applicable fee waivers.
B Expenses are equal to each Class' annualized expense ratio, multiplied by the average account value over the period, multiplied by 184/365 (to reflect the one-half year period). The fees and expenses of the underlying Fidelity Central Funds in which the Fund invests are not included in each Class' annualized expense ratio.
C 5% return per year before expenses
Distributions (Unaudited)
The Board of Trustees of VIP II Asset Manager Portfolio voted to pay to shareholders of record at the opening of business on record date, the following distributions per share derived from capital gains realized from sales of portfolio securities:
| | Pay Date | Record Date | Capital Gains |
| Initial Class | 02/12/2016 | 02/12/2016 | $0.631 |
| Service Class | 02/12/2016 | 02/12/2016 | $0.631 |
| Service Class 2 | 02/12/2016 | 02/12/2016 | $0.631 |
| Investor Class | 02/12/2016 | 02/12/2016 | $0.631 |
The fund hereby designates as a capital gain dividend with respect to the taxable year ended December 31, 2015, $48,755,314 or, if subsequently determined to be different, the net capital gain of such year.
Initial Class designates 16%; Service Class designates 17%; Service Class 2 designates 19%; and Investor Class designates 17%; of the dividends distributed during the fiscal year as qualifying for the dividends–received deduction for corporate shareholders.
Board Approval of Investment Advisory Contracts and Management Fees
VIP Asset Manager Portfolio
Each year, the Board of Trustees, including the Independent Trustees (together, the Board), votes on the renewal of the management contract with Fidelity Management & Research Company (FMR) and the sub-advisory agreements (together, the Advisory Contracts) for the fund. The Board, assisted by the advice of fund counsel and Independent Trustees' counsel, requests and considers a broad range of information relevant to the renewal of the Advisory Contracts throughout the year.
The Board meets regularly and, at each of its meetings, covers an extensive agenda of topics and materials and considers factors that are relevant to its annual consideration of the renewal of the fund's Advisory Contracts, including the services and support provided to the fund and its shareholders. The Board has established four standing committees (Committees) — Operations, Audit, Fair Valuation, and Governance and Nominating — each composed of and chaired by Independent Trustees with varying backgrounds, to which the Board has assigned specific subject matter responsibilities in order to enhance effective decision-making by the Board. The Operations Committee, of which all of the Independent Trustees are members, meets regularly throughout the year and considers, among other matters, information specifically related to the annual consideration of the renewal of the fund's Advisory Contracts. The Board, acting directly and through its Committees, requests and receives information concerning the annual consideration of the renewal of the fund's Advisory Contracts. The Board also meets as needed to consider matters specifically related to the Board's annual consideration of the renewal of the Advisory Contracts. Members of the Board may also meet with trustees of other Fidelity funds through ad hoc joint committees to discuss certain matters relevant to all of the Fidelity funds.
At its September 2015 meeting, the Board unanimously determined to renew the fund's Advisory Contracts. In reaching its determination, the Board considered all factors it believed relevant, including (i) the nature, extent, and quality of the services to be provided to the fund and its shareholders (including the investment performance of the fund); (ii) the competitiveness of the fund's management fee and total expense ratio relative to peer funds; (iii) the total costs of the services to be provided by and the profits to be realized by Fidelity from its relationship with the fund; and (iv) the extent to which (if any) economies of scale exist and would be realized as the fund grows, and whether any economies of scale are appropriately shared with fund shareholders.
In considering whether to renew the Advisory Contracts for the fund, the Board reached a determination, with the assistance of fund counsel and Independent Trustees' counsel and through the exercise of its business judgment, that the renewal of the Advisory Contracts was in the best interests of the fund and its shareholders and that the compensation payable under the Advisory Contracts was fair and reasonable. The Board's decision to renew the Advisory Contracts was not based on any single factor, but rather was based on a comprehensive consideration of all the information provided to the Board at its meetings throughout the year. The Board, in reaching its determination to renew the Advisory Contracts, was aware that shareholders of the fund have a broad range of investment choices available to them, including a wide choice among funds offered by Fidelity's competitors, and that the fund's shareholders, who have the opportunity to review and weigh the disclosure provided by the fund in its prospectus and other public disclosures, have chosen to invest in this fund, which is part of the Fidelity family of funds.
Nature, Extent, and Quality of Services Provided. The Board considered Fidelity's staffing as it relates to the fund, including the backgrounds of investment personnel of Fidelity, and also considered the fund's investment objective, strategies, and related investment philosophy. The Independent Trustees also had discussions with senior management of Fidelity's investment operations and investment groups. The Board considered the structure of the portfolio manager compensation program and whether this structure provides appropriate incentives to act in the best interests of the fund. Additionally, the Board considered the portfolio managers' investments, if any, in the funds that they manage.
Resources Dedicated to Investment Management and Support Services. The Board reviewed the general qualifications and capabilities of Fidelity's investment staff, including its size, education, experience, and resources, as well as Fidelity's approach to recruiting, training, managing, and compensating investment personnel. The Board noted that Fidelity has continued to increase the resources devoted to non-U.S. offices, including expansion of Fidelity's global investment organization. The Board also noted that Fidelity's analysts have extensive resources, tools and capabilities that allow them to conduct sophisticated quantitative and fundamental analysis, as well as credit analysis of issuers, counterparties and guarantors. Further, the Board considered that Fidelity's investment professionals have sufficient access to global information and data so as to provide competitive investment results over time, and that those professionals also have access to sophisticated tools that permit them to assess portfolio construction and risk and performance attribution characteristics continuously, as well as to transmit new information and research conclusions rapidly around the world. Additionally, in its deliberations, the Board considered Fidelity's trading, risk management, compliance, and technology and operations capabilities and resources, which are integral parts of the investment management process.
Shareholder and Administrative Services. The Board considered (i) the nature, extent, quality, and cost of advisory, administrative, and shareholder services performed by FMR, the sub-advisers (together with FMR, the Investment Advisers), and their affiliates under the Advisory Contracts and under separate agreements covering transfer agency, pricing and bookkeeping, and securities lending services for the fund; (ii) the nature and extent of the supervision of third party service providers, principally custodians, subcustodians, and pricing vendors; and (iii) the resources devoted to, and the record of compliance with, the fund's compliance policies and procedures. The Board also reviewed the allocation of fund brokerage, including allocations to brokers affiliated with the Investment Advisers, the use of brokerage commissions to pay fund expenses, and the use of "soft" commission dollars to pay for research services.
The Board noted that the growth of fund assets over time across the complex allows Fidelity to reinvest in the development of services designed to enhance the value or convenience of the Fidelity funds as investment vehicles. These services include 24-hour access to account information and market information through telephone representatives and over the Internet, investor education materials and asset allocation tools, and the expanded availability of Fidelity Investor Centers.
Investment in a Large Fund Family. The Board considered the benefits to shareholders of investing in a Fidelity fund, including the benefits of investing in a fund that is part of a large family of funds offering a variety of investment disciplines and providing a large variety of mutual fund investor services. The Board noted that Fidelity had taken, or had made recommendations that resulted in the Fidelity funds taking, a number of actions over the previous year that benefited particular funds, including (i) continuing to dedicate additional resources to investment research and to the support of the senior management team that oversees asset management; (ii) continuing efforts to enhance Fidelity's global research capabilities; (iii) launching new funds and making other enhancements to meet client needs; (iv) reducing management fees and total expenses for certain index funds and diversified international funds; (v) continuing to launch dedicated lower cost underlying funds to meet portfolio construction needs related to expanding underlying fund options for Fidelity funds of funds, specifically for the Freedom Fund product lines; (vi) rationalizing product lines and gaining increased efficiencies through fund mergers; (vii) launching active fixed-income exchange-traded funds; (viii) continuing to develop, acquire and implement systems and technology to improve services to the funds and shareholders, strengthen information security, and increase efficiency; (ix) implementing investment enhancements to further strengthen Fidelity's target date product line to increase investors' probability of success in achieving their goals; (x) modifying the eligibility criteria for certain share classes to accommodate roll-over assets from employer-sponsored retirement plans; (xi) launching a new Class W of the Freedom Index Funds to attract and retain Fidelity record-kept retirement plan assets; and (xii) implementing changes to Fidelity's money market product line in response to recent money market regulatory reforms.
Investment Performance. The Board considered whether the fund has operated in accordance with its investment objective, as well as its record of compliance with its investment restrictions and its performance history.
The Board took into account discussions with representatives of the Investment Advisers about fund investment performance that occur at Board meetings throughout the year. In this regard the Board noted that as part of regularly scheduled fund reviews and other reports to the Board on fund performance, the Board considers annualized return information for the fund for different time periods, measured against one or more securities market indices, including a customized blended index representative of the fund's asset classes (each a "benchmark index") and a peer group of funds with similar objectives ("peer group"), if any. In its evaluation of fund investment performance at meetings throughout the year, the Board gave particular attention to information indicating underperformance of certain Fidelity funds for specific time periods and discussed with the Investment Advisers the reasons for such underperformance.
In addition to reviewing absolute and relative fund performance, the Independent Trustees periodically consider the appropriateness of fund performance metrics in evaluating the results achieved. In general, the Independent Trustees believe that fund performance should be evaluated based on gross performance (before fees and expenses but after transaction costs) compared to appropriate benchmark indices, over appropriate time periods that may include full market cycles, and on net performance (after fees and expenses) compared to peer groups, as applicable, over the same periods, taking into account relevant factors including the following: general market conditions; expectations for interest rate levels and credit conditions; issuer-specific information including credit quality; and fund cash flows and other factors. Depending on the circumstances, the Independent Trustees may be satisfied with a fund's performance notwithstanding that it lags its benchmark index or peer group for certain periods.
The Independent Trustees recognize that shareholders evaluate performance on a net basis over their own holding periods, for which one-, three-, and five-year periods are often used as a proxy. For this reason, the performance information reviewed by the Board also included net cumulative calendar year total return information for the fund and an appropriate benchmark index and peer group for the most recent one-, three-, and five-year periods.
Based on its review, the Board concluded that the nature, extent, and quality of services provided to the fund under the Advisory Contracts should benefit the shareholders of the fund.
Competitiveness of Management Fee and Total Expense Ratio. The Board considered the fund's management fee and total expense ratio compared to "mapped groups" of competitive funds and classes created for the purpose of facilitating the Trustees' competitive analysis of management fees and total expenses. Fidelity creates "mapped groups" by combining similar Lipper investment objective categories that have comparable investment mandates. Combining Lipper investment objective categories aids the Board's management fee and total expense ratio comparisons by broadening the competitive group used for comparison.
Management Fee. The Board considered two proprietary management fee comparisons for the 12-month periods shown in basis points (BP) in the chart below. The group of Lipper funds used by the Board for management fee comparisons is referred to below as the "Total Mapped Group." The Total Mapped Group comparison focuses on a fund's standing in terms of gross management fees before expense reimbursements or caps relative to the total universe of funds with comparable investment mandates, regardless of whether their management fee structures also are comparable. Funds with comparable investment mandates offer exposure to similar types of securities. Funds with comparable management fee structures have similar management fee contractual arrangements (
e.g., flat rate charged for advisory services, all-inclusive fee rate,
etc.). "TMG %" represents the percentage of funds in the Total Mapped Group that had management fees that were lower than the fund's. For example, a hypothetical TMG % of 20% would mean that 80% of the funds in the Total Mapped Group had higher, and 20% had lower, management fees than the fund. The fund's actual TMG %s and the number of funds in the Total Mapped Group are in the chart below. The "Asset-Size Peer Group" (ASPG) comparison focuses on a fund's standing relative to a subset of non-Fidelity funds within the Total Mapped Group that are similar in size and management fee structure. For example, if a fund is in the first quartile of the ASPG, the fund's management fee ranks in the least expensive or lowest 25% of funds in the ASPG. The ASPG represents at least 15% of the funds in the Total Mapped Group with comparable asset size and management fee structures, subject to a minimum of 50 funds (or all funds in the Total Mapped Group if fewer than 50). Additional information, such as the ASPG quartile in which the fund's management fee rate ranked, is also included in the chart and considered by the Board.
VIP Asset Manager Portfolio
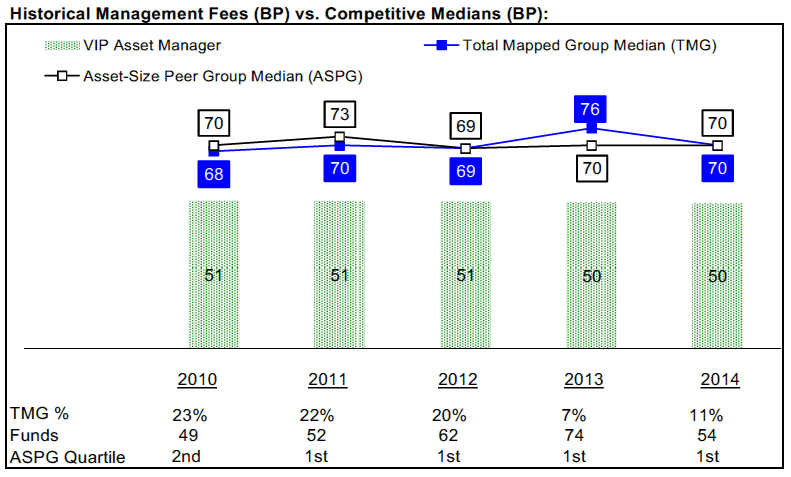
The Board noted that the fund's management fee rate ranked below the median of its Total Mapped Group and below the median of its ASPG for 2014.
The Board noted that, in 2014, the ad hoc Committee on Group Fee was formed by it and other Fidelity fund boards to conduct an in-depth review of the "group fee" component of the management fee of funds with such management fee structures. Committee focus included the mechanics of the group fee, the competitive landscape of group fee structures, Fidelity funds with no group fee component and investment products not included in group fee assets. The Board also considered that, for funds subject to the group fee, FMR agreed to voluntarily waive fees over a specified period of time in amounts designed to account for assets converted from certain funds to certain collective investment trusts.
Based on its review, the Board concluded that the fund's management fee is fair and reasonable in light of the services that the fund receives and the other factors considered.
Total Expense Ratio. In its review of each class's total expense ratio, the Board considered the fund's management fee rate as well as other fund or class expenses, as applicable, such as transfer agent fees, pricing and bookkeeping fees, fund-paid 12b-1 fees, and custodial, legal, and audit fees. The Board also noted that Fidelity may agree to waive fees and expenses from time to time, and the extent to which, if any, it has done so for the fund. As part of its review, the Board also considered the current and historical total expense ratios of each class of the fund compared to competitive fund median expenses. Each class of the fund is compared to those funds and classes in the Total Mapped Group (used by the Board for management fee comparisons) that have a similar sales load structure.
The Board noted that the total expense ratio of each of Initial Class, Investor Class, and Service Class ranked below its competitive median for 2014 and the total expense ratio of Service Class 2 ranked equal to its competitive median for 2014.
Fees Charged to Other Fidelity Clients. The Board also considered Fidelity fee structures and other information with respect to clients of Fidelity, such as other funds advised or subadvised by Fidelity, pension plan clients, and other institutional clients with similar mandates. The Board noted the findings of the 2013 ad hoc joint committee (created with the board of other Fidelity funds), which reviewed and compared Fidelity's institutional investment advisory business with its business of providing services to the Fidelity funds, including the differences in services provided, fees charged, and costs incurred, as well as competition in their respective marketplaces.
Based on its review of total expense ratios and fees charged to other Fidelity clients, the Board concluded that the total expense ratio of each class of the fund was reasonable in light of the services that the fund and its shareholders receive and the other factors considered.
Costs of the Services and Profitability. The Board considered the revenues earned and the expenses incurred by Fidelity in conducting the business of developing, marketing, distributing, managing, administering and servicing the fund and servicing the fund's shareholders. The Board also considered the level of Fidelity's profits in respect of all the Fidelity funds.
On an annual basis, Fidelity presents to the Board information about the profitability of its relationship with the fund. Fidelity calculates profitability information for each fund, as well as aggregate profitability information for groups of Fidelity funds and all Fidelity funds, using a series of detailed revenue and cost allocation methodologies which originate with the books and records of Fidelity on which Fidelity's audited financial statements are based. The Audit Committee of the Board reviews any significant changes from the prior year's methodologies.
PricewaterhouseCoopers LLP (PwC), independent registered public accounting firm and auditor to Fidelity and certain Fidelity funds, has been engaged annually by the Board as part of the Board's assessment of Fidelity's profitability analysis. PwC's engagement includes the review and assessment of the methodologies used by Fidelity in determining the revenues and expenses attributable to Fidelity's mutual fund business, and completion of agreed-upon procedures in respect of the mathematical accuracy of fund profitability and its conformity to established allocation methodologies. After considering PwC's reports issued under the engagement and information provided by Fidelity, the Board concluded that while other allocation methods may also be reasonable, Fidelity's profitability methodologies are reasonable in all material respects.
The Board also reviewed Fidelity's non-fund businesses and fall-out benefits related to the mutual fund business as well as cases where Fidelity's affiliates may benefit from or be related to the fund's business.
The Board considered the costs of the services provided by and the profits realized by Fidelity in connection with the operation of the fund and was satisfied that the profitability was not excessive.
Economies of Scale. The Board considered whether there have been economies of scale in respect of the management of the Fidelity funds, whether the Fidelity funds (including the fund) have appropriately benefited from any such economies of scale, and whether there is potential for realization of any further economies of scale. The Board considered the extent to which the fund will benefit from economies of scale as assets grow through increased services to the fund, through waivers or reimbursements, or through fee or expense ratio reductions. The Board also noted that in 2013, it and the boards of other Fidelity funds created an ad hoc committee (the Economies of Scale Committee) to analyze whether Fidelity attains economies of scale in respect of the management and servicing of the Fidelity funds, whether the Fidelity funds have appropriately benefited from such economies of scale, and whether there is potential for realization of any further economies of scale.
The Board recognized that the fund's management contract incorporates a "group fee" structure, which provides for lower group fee rates as total group assets increase, and for higher group fee rates as total group assets decrease (with "group assets" defined to include fund assets under FMR's management plus sector fund assets previously under FMR's management and currently managed by Fidelity SelectCo, LLC). FMR calculates the group fee rates based on a tiered asset "breakpoint" schedule that varies based on asset class. The Board considered that the group fee is designed to deliver the benefits of economies of scale to fund shareholders when total Fidelity fund assets increase, even if assets of any particular fund are unchanged or have declined, because some portion of Fidelity's costs are attributable to services provided to all Fidelity funds, and all funds benefit if those costs can be allocated among more assets. The Board concluded that, given the group fee structure, fund shareholders will benefit from lower management fees as group assets increase at the fund complex level, regardless of whether Fidelity achieves any such economies of scale.
The Board concluded, taking into account the analysis of the Economies of Scale Committee, that economies of scale, if any, are being appropriately shared between fund shareholders and Fidelity.
Additional Information Requested by the Board. In order to develop fully the factual basis for consideration of the Fidelity funds' Advisory Contracts, the Board requested and received additional information on certain topics, including: (i) Fidelity's fund profitability methodology, profitability trends for certain funds, and the impact of certain factors on fund profitability results; (ii) portfolio manager changes that have occurred during the past year and the amount of the investment that each portfolio manager has made in the Fidelity fund(s) that he or she manages; (iii) Fidelity's compensation structure for portfolio managers, research analysts, and other key personnel, including its effects on fund profitability, the rationale for the compensation structure, and the extent to which current market conditions have affected retention and recruitment; (iv) the arrangements with and compensation paid to certain fund sub-advisers on behalf of the Fidelity funds; (v) Fidelity's voluntary waiver of its fees to maintain minimum yields for certain money market funds and classes as well as contractual waivers in place for certain funds; (vi) the methodology with respect to competitive fund data and peer group classifications; (vii) Fidelity's transfer agent fee, expense, and service structures for different funds and classes relative to competitive trends, and the impact of the increased use of omnibus accounts; (viii) Fidelity's long-term expectations for its offerings in the workplace investing channel; (ix) new developments in the retail and institutional marketplaces; and (x) the impact of money market reform on Fidelity's money market funds. In addition, the Board considered its discussions with Fidelity throughout the year regarding enhanced information security initiatives and the funds' fair valuation policies.
Based on its evaluation of all of the conclusions noted above, and after considering all factors it believed relevant, the Board concluded that the advisory fee structures are fair and reasonable, and that the fund's Advisory Contracts should be renewed.
Proxy Voting Results
A special meeting of shareholders was held on May 12, 2015. The results of votes taken among shareholders on the proposal before them are reported below. Each vote reported represents one dollar of net asset value held on the record date for the meeting.
PROPOSAL 1
To elect a Board of Trustees.
| | # of
Votes | % of
Votes |
| Elizabeth S. Acton | | |
| Affirmative | 24,469,831,790.28 | 97.003 |
| Withheld | 756,086,184.43 | 2.997 |
| TOTAL | 25,225,917,974.71 | 100.000 |
| John Engler | | |
| Affirmative | 24,404,438,415.74 | 96.744 |
| Withheld | 821,479,558.97 | 3.256 |
| TOTAL | 25,225,917,974.71 | 100.000 |
| Albert R. Gamper, Jr. | | |
| Affirmative | 24,431,670,090.08 | 96.852 |
| Withheld | 794,247,884.63 | 3.148 |
| TOTAL | 25,225,917,974.71 | 100.000 |
| Robert F. Gartland | | |
| Affirmative | 24,472,637,370.54 | 97.014 |
| Withheld | 753,280,604.17 | 2.986 |
| TOTAL | 25,225,917,974.71 | 100.000 |
| Abigail P. Johnson | | |
| Affirmative | 24,442,024,432.82 | 96.893 |
| Withheld | 783,893,541.89 | 3.107 |
| TOTAL | 25,225,917,974.71 | 100.000 |
| Arthur E. Johnson | | |
| Affirmative | 24,444,583,833.78 | 96.903 |
| Withheld | 781,334,140.93 | 3.097 |
| TOTAL | 25,225,917,974.71 | 100.000 |
| Michael E. Kenneally | | |
| Affirmative | 24,475,874,452.78 | 97.027 |
| Withheld | 750,043,521.93 | 2.973 |
| TOTAL | 25,225,917,974.71 | 100.000 |
| James H. Keyes | | |
| Affirmative | 24,434,496,321.71 | 96.863 |
| Withheld | 791,421,653.00 | 3.137 |
| TOTAL | 25,225,917,974.71 | 100.000 |
| Marie L. Knowles | | |
| Affirmative | 24,446,177,909.79 | 96.909 |
| Withheld | 779,740,064.92 | 3.091 |
| TOTAL | 25,225,917,974.71 | 100.000 |
| Geoffrey A. von Kuhn | | |
| Affirmative | 24,444,403,935.60 | 96.902 |
| Withheld | 781,514,039.11 | 3.098 |
| TOTAL | 25,225,917,974.71 | 100.000 |
| Proposal 1 reflects trust wide proposal and voting results. |
VIPAM-ANN-0216
1.540206.118
Fidelity® Variable Insurance Products: Strategic Income Portfolio
Annual Report December 31, 2015 |
|
Contents
To view a fund's proxy voting guidelines and proxy voting record for the 12-month period ended June 30, visit http://www.fidelity.com/proxyvotingresults or visit the Securities and Exchange Commission's (SEC) web site at http://www.sec.gov.
You may also call 1-877-208-0098 to request a free copy of the proxy voting guidelines.
Fidelity® Variable Insurance Products are separate account options which are purchased through a variable insurance contract.
Standard & Poor's, S&P and S&P 500 are registered service marks of The McGraw-Hill Companies, Inc. and have been licensed for use by Fidelity Distributors Corporation.
Other third-party marks appearing herein are the property of their respective owners.
All other marks appearing herein are registered or unregistered trademarks or service marks of FMR LLC or an affiliated company. © 2016 FMR LLC. All rights reserved.
This report and the financial statements contained herein are submitted for the general information of the shareholders of the Fund. This report is not authorized for distribution to prospective investors in the Fund unless preceded or accompanied by an effective prospectus.
A fund files its complete schedule of portfolio holdings with the SEC for the first and third quarters of each fiscal year on Form N-Q. Forms N-Q are available on the SEC’s web site at http://www.sec.gov. A fund's Forms N-Q may be reviewed and copied at the SEC’s Public Reference Room in Washington, DC. Information regarding the operation of the SEC's Public Reference Room may be obtained by calling 1-800-SEC-0330.
For a complete list of a fund's portfolio holdings, view the most recent holdings listing, semiannual report, or annual report on Fidelity's web site at http://www.fidelity.com, http://www.advisor.fidelity.com, or http://www.401k.com, as applicable.
NOT FDIC INSURED •MAY LOSE VALUE •NO BANK GUARANTEE
Neither the Fund nor Fidelity Distributors Corporation is a bank.
Performance: The Bottom Line
Average annual total return reflects the change in the value of an investment, assuming reinvestment of distributions from dividend income and capital gains (the profits earned upon the sale of securities that have grown in value, if any) and assuming a constant rate of performance each year. During periods of reimbursement by Fidelity, a fund’s total return will be greater than it would be had the reimbursement not occurred. Performance numbers are net of all underlying fund operating expenses, but do not include any insurance charges imposed by your insurance company’s separate account. If performance information included the effect of these additional charges, the total returns would have been lower. How a fund did yesterday is no guarantee of how it will do tomorrow.
Average Annual Total Returns
| For the periods ended December 31, 2015 | Past 1 year | Past 5 years | Past 10 years |
| Initial Class | (1.63)% | 3.40% | 5.59% |
| Service Class | (1.73)% | 3.30% | 5.49% |
| Service Class 2 | (1.94)% | 3.15% | 5.32% |
| Investor Class | (1.66)% | 3.37% | 5.56% |
$10,000 Over 10 Years
Let's say hypothetically that $10,000 was invested in VIP Strategic Income Portfolio - Initial Class on December 31, 2005.
The chart shows how the value of your investment would have changed, and also shows how the Barclays® U.S. Universal Bond Index and The BofA Merrill Lynch℠ US High Yield Constrained Index performed over the same period.
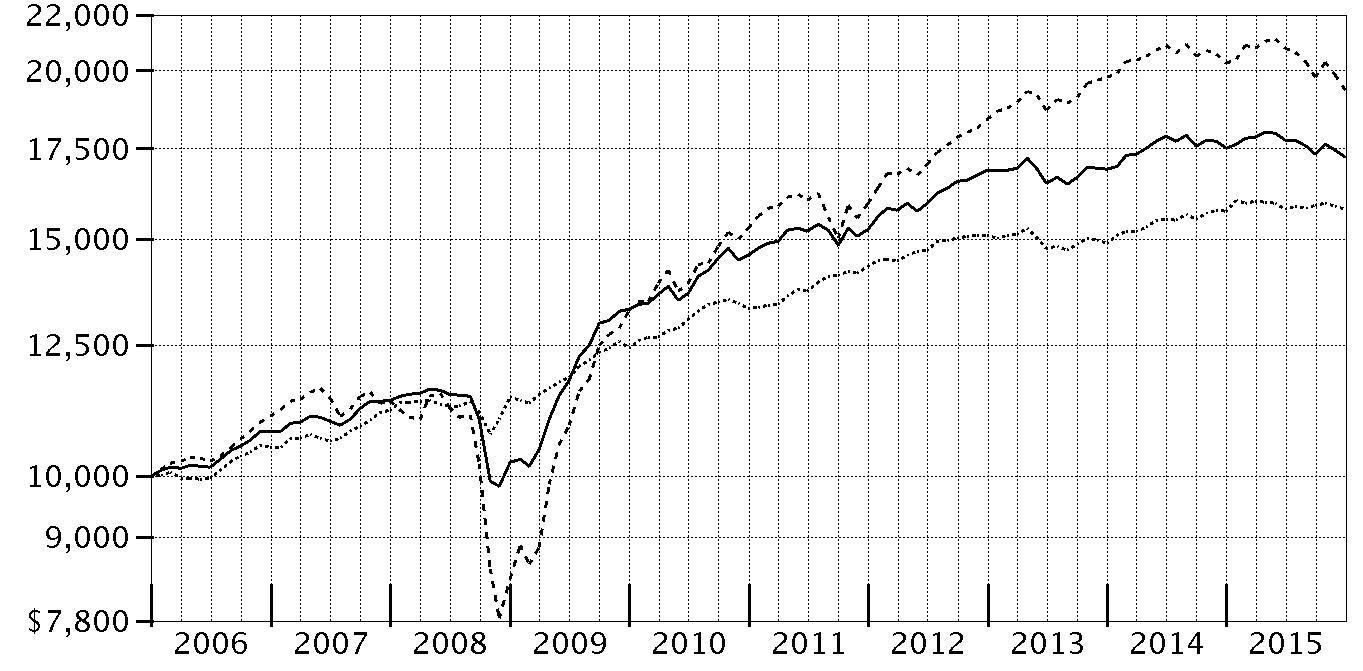
| Period Ending Values |
| $17,234 | VIP Strategic Income Portfolio - Initial Class |
| $15,791 | Barclays® U.S. Universal Bond Index |
| $19,335 | The BofA Merrill Lynch℠ US High Yield Constrained Index |
Effective February 1, 2015, the fund began comparing its performance to the Barclays® U.S. Universal Bond Index rather than The BofA Merrill Lynch℠ US High Yield Constrained Index because the Barclays® U.S. Universal Bond Index conforms more closely to the fund's investment policies.
Management's Discussion of Fund Performance
Market Recap: For the 12 months ending December 31, 2015, the Fidelity Strategic Income Composite Index℠ returned -2.36%. Among the asset classes that make up the Composite index, emerging-markets debt (EMD) fared best, up 1.29% according to the Barclays
® Emerging Markets Aggregate USD Bond Index. After a stretch of underperformance, EMD rebounded, benefiting from investor's increasing appetite for risk later in the year. The index was lifted in particular by Argentina and Venezuela, two of the top-performing markets in the EMD universe. Back in the U.S., government bonds and floating-rate high-yield securities also recorded positive results, albeit more modest. Accordingly, the Barclays
® U.S. Government Bond Index and the S&P
®/LSTA Leveraged Performing Loan Index returned 0.86% and 0.10%, respectively. On the negative side, U.S. high-yield bonds, as measured by The BofA Merrill Lynch℠ US High Yield Constrained Index returned -4.61%. A steep drop in the energy and materials sectors, compounded by market liquidity concerns, drove a sell-off in the high-yield market during the second half of 2015. Turning to foreign developed markets, the Barclays
® Global Aggregate Developed Markets GDP Weighted Ex USD Index returned -6.77%. Here, the U.S. dollar's relative strength was a detractor for a large majority of countries and regions.
Comments from Lead Co-Portfolio Manager Joanna Bewick: The fund’s shares classes outpaced the Composite benchmark through successful security selection within the fund's subportfolios. Specifically, security selection within the high-yield debt sleeve was by far the biggest relative contributor. Both market allocation and security selection significantly helped the subportfolio’s relative performance. Included were several individual holdings in energy, plus an underweighting in this poor-performing sector. An underweighting in metals & mining – another sector hard hit by volatile commodities prices – also was a plus. The emerging-markets and foreign developed-markets debts sleeves also outperformed their respective benchmarks, lifting the fund’s relative results. Meanwhile, the floating-rate high-yield debt subportfolio underperformed its benchmark, which detracted. Asset allocation decisions had mixed results the past year. While an underweighting in U.S. government debt and an overweighting in high-yield debt weighed on relative performance, it helped to underweight foreign developed-markets debt.
Note to shareholders:
On February 1, 2015, Fidelity modified the fund’s Composite benchmark to include a five-percentage-point increase to high-yield debt and a corresponding decrease in U.S. government and investment-grade debt. This was achieved by establishing a new, 5% allocation to floating-rate loans within the fund’s already existing high-yield securities category, while also reducing exposure to investment-grade securities by a corresponding amount.
As a result, the fund’s overall credit quality decreased, but its sensitivity to shifts in interest rates also has been reduced.
The benchmarks for the emerging-markets debt and foreign developed-markets debt sleeves were changed to the Barclays
® Emerging Markets Aggregate USD Bond Index and the Barclays
® Global Aggregate Developed Markets GDP Weighted Ex USD Index, respectively. We believe these indexes better reflect the broader opportunities available in those markets.
Additionally, the fund’s SEC benchmark became the Barclays
® U.S. Universal Bond Index, a multisector fixed-income index that closely aligns with the asset classes in the fund’s investment universe.
Importantly, the fund’s investment approach did not change. We believe these enhancements have improved – and should continue to improve – asset allocation flexibility and help us to take greater advantage of Fidelity’s investment expertise while positioning the fund to meet our shareholders’ expectations.
The views expressed above reflect those of the portfolio manager(s) only through the end of the period as stated on the cover of this report and do not necessarily represent the views of Fidelity or any other person in the Fidelity organization. Any such views are subject to change at any time based upon market or other conditions and Fidelity disclaims any responsibility to update such views. These views may not be relied on as investment advice and, because investment decisions for a Fidelity fund are based on numerous factors, may not be relied on as an indication of trading intent on behalf of any Fidelity fund.
Investment Summary (Unaudited)
The information in the following tables is based on the combined investments of the Fund and its pro-rata share of the investments of Fidelity's Fixed-Income Central Funds.
Top Five Holdings as of December 31, 2015
| (by issuer, excluding cash equivalents) | % of fund's net assets | % of fund's net assets 6 months ago |
| U.S. Treasury Obligations | 13.7 | 15.1 |
| Japan Government | 2.7 | 2.7 |
| Ginnie Mae guaranteed REMIC pass-thru certificates | 2.4 | 1.6 |
| Freddie Mac | 1.8 | 1.7 |
| T-Mobile U.S.A., Inc. | 1.8 | 1.7 |
| | 22.4 | |
Top Five Market Sectors as of December 31, 2015
| | % of fund's net assets | % of fund's net assets 6 months ago |
| Financials | 12.8 | 10.8 |
| Consumer Discretionary | 10.7 | 10.6 |
| Energy | 5.9 | 7.6 |
| Telecommunication Services | 5.9 | 5.3 |
| Information Technology | 4.9 | 4.5 |
Quality Diversification (% of fund's net assets)
| As of December 31, 2015 |
| | U.S. Government and U.S. Government Agency Obligations* | 20.3% |
| | AAA,AA,A | 8.0% |
| | BBB | 11.4% |
| | BB | 21.3% |
| | B | 17.8% |
| | CCC,CC,C | 6.1% |
| | Not Rated | 4.8% |
| | Other Investments | 4.6% |
| | Short-Term Investments and Net Other Assets | 5.7% |
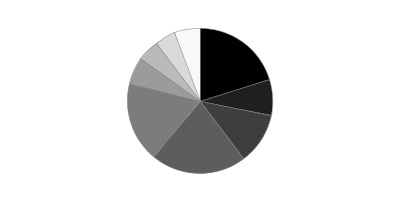
* Includes NCUA Guaranteed Notes
| As of June 30, 2015 |
| | U.S. Government and U.S. Government Agency Obligations* | 20.5% |
| | AAA,AA,A | 10.3% |
| | BBB | 8.4% |
| | BB | 20.9% |
| | B | 19.5% |
| | CCC,CC,C | 6.3% |
| | Not Rated | 4.8% |
| | Other Investments | 5.2% |
| | Short-Term Investments and Net Other Assets | 4.1% |
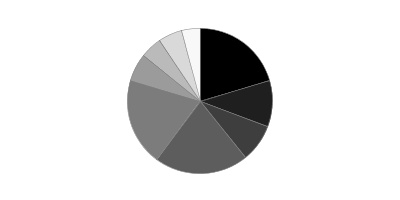
* Includes NCUA Guaranteed Notes
We have used ratings from Moody's Investors Service, Inc. Where Moody's® ratings are not available, we have used S&P® ratings. All ratings are as of the date indicated and do not reflect subsequent changes.
Asset Allocation (% of fund's net assets)
| As of December 31, 2015*,** |
| | Preferred Securities | 3.1% |
| | Corporate Bonds | 43.3% |
| | U.S. Government and U.S. Government Agency Obligations*** | 20.3% |
| | Foreign Government & Government Agency Obligations | 15.6% |
| | Bank Loan Obligations | 7.3% |
| | Stocks | 4.6% |
| | Other Investments | 0.1% |
| | Short-Term Investments and Net Other Assets (Liabilities) | 5.7% |

* Foreign investments - 35.7%
** Futures and Swaps - 0.6%
*** Includes NCUA Guaranteed Notes
| As of June 30, 2015*,** |
| | Preferred Securities | 2.8% |
| | Corporate Bonds | 43.3% |
| | U.S. Government and U.S. Government Agency Obligations*** | 20.5% |
| | Foreign Government & Government Agency Obligations | 16.5% |
| | Bank Loan Obligations | 7.5% |
| | Stocks | 5.2% |
| | Other Investments | 0.1% |
| | Short-Term Investments and Net Other Assets (Liabilities) | 4.1% |
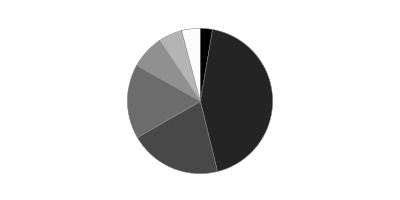
* Foreign investments - 35.2%
** Futures and Swaps - 1.2%
*** Includes NCUA Guaranteed Notes
An unaudited holdings listing for the Fund, which presents direct holdings as well as the pro-rata share of any securities and other investments held indirectly through its investment in underlying non-money market Fidelity Central Funds, is available at advisor.fidelity.com.
Investments December 31, 2015
Showing Percentage of Net Assets
| Corporate Bonds - 43.2% | | | |
| | | Principal Amount(a) | Value |
| Convertible Bonds - 0.0% | | | |
| CONSUMER DISCRETIONARY - 0.0% | | | |
| Auto Components - 0.0% | | | |
| Exide Technologies 7% 4/30/25 pay-in-kind | | $504,704 | $343,199 |
| Nonconvertible Bonds - 43.2% | | | |
| CONSUMER DISCRETIONARY - 7.4% | | | |
| Auto Components - 0.6% | | | |
| Affinia Group, Inc. 7.75% 5/1/21 | | 110,000 | 111,958 |
| Dana Holding Corp.: | | | |
| 5.375% 9/15/21 | | 380,000 | 377,150 |
| 6% 9/15/23 | | 380,000 | 380,950 |
| Delphi Automotive PLC 1.5% 3/10/25 | EUR | 450,000 | 451,675 |
| Delphi Corp. 5% 2/15/23 | | 953,000 | 1,008,274 |
| Exide Technologies 11% 4/30/20 pay-in-kind | | 484,776 | 394,688 |
| International Automotive Components Group SA 9.125% 6/1/18 (b) | | 495,000 | 423,225 |
| Lear Corp. 4.75% 1/15/23 | | 665,000 | 668,325 |
| Schaeffler Holding Finance BV: | | | |
| 6.25% 11/15/19 pay-in-kind (b)(c) | | 375,000 | 393,750 |
| 6.75% 11/15/22 pay-in-kind (b)(c) | | 495,000 | 529,650 |
| Tenedora Nemak SA de CV 5.5% 2/28/23 (b) | | 1,040,000 | 1,042,600 |
| Tenneco, Inc. 6.875% 12/15/20 | | 545,000 | 564,075 |
| Tupy Overseas SA 6.625% 7/17/24 (b) | | 400,000 | 349,000 |
| | | | 6,695,320 |
| Automobiles - 0.0% | | | |
| General Motors Financial Co., Inc. 4.25% 5/15/23 | | 270,000 | 267,095 |
| Distributors - 0.0% | | | |
| American Builders & Contractors Supply Co., Inc. 5.625% 4/15/21 (b) | | 160,000 | 162,000 |
| LKQ Corp. 4.75% 5/15/23 | | 115,000 | 107,813 |
| | | | 269,813 |
| Diversified Consumer Services - 0.1% | | | |
| Laureate Education, Inc. 9.25% 9/1/19 (b)(c) | | 2,490,000 | 1,543,800 |
| Hotels, Restaurants & Leisure - 1.0% | | | |
| 24 Hour Holdings III LLC 8% 6/1/22 (b) | | 220,000 | 178,750 |
| Arcos Dorados Holdings, Inc. 10.25% 7/13/16 (b) | BRL | 3,450,000 | 800,095 |
| Caesars Growth Properties Holdings LLC/Caesars Growth Properties Finance, Inc. 9.375% 5/1/22 | | 3,605,000 | 2,956,100 |
| Choice Hotels International, Inc. 5.75% 7/1/22 | | 145,000 | 155,150 |
| FelCor Lodging LP: | | | |
| 5.625% 3/1/23 | | 440,000 | 446,600 |
| 6% 6/1/25 | | 1,145,000 | 1,162,175 |
| Landry's Acquisition Co. 9.375% 5/1/20 (b) | | 95,000 | 99,988 |
| LTF Merger Sub, Inc. 8.5% 6/15/23 (b) | | 580,000 | 553,900 |
| Mohegan Tribal Gaming Authority 11% 9/15/18 pay-in-kind (b)(c) | | 45,000 | 44,775 |
| Palace Entertainment Holdings LLC/Corp. 8.875% 4/15/17 (b) | | 100,000 | 98,000 |
| Paris Las Vegas Holding LLC/Harrah's Las Vegas LLC/Flamingo Las Vegas Holdings, Inc.: | | | |
| 8% 10/1/20 | | 580,000 | 551,000 |
| 11% 10/1/21 | | 1,455,000 | 1,320,413 |
| Playa Resorts Holding BV 8% 8/15/20 (b) | | 1,640,000 | 1,664,600 |
| RHP Hotel Properties LP/RHP Finance Corp. 5% 4/15/21 | | 460,000 | 468,050 |
| Six Flags Entertainment Corp. 5.25% 1/15/21 (b) | | 785,000 | 794,813 |
| Waterford Gaming LLC/Waterford Gaming Finance Corp. 8.625% 3/31/15 (b)(d) | | 24,461 | 0 |
| | | | 11,294,409 |
| Household Durables - 0.9% | | | |
| Brookfield Residential Properties, Inc./Brookfield Residential U.S. Corp. 6.125% 7/1/22 (b) | | 335,000 | 309,875 |
| Brookfield Residential Properties, Inc. 6.5% 12/15/20 (b) | | 740,000 | 713,175 |
| Calatlantic Group, Inc.: | | | |
| 8.375% 5/15/18 | | 220,000 | 245,520 |
| 8.375% 1/15/21 | | 420,000 | 487,200 |
| D.R. Horton, Inc.: | | | |
| 4.375% 9/15/22 | | 565,000 | 561,469 |
| 4.75% 2/15/23 | | 465,000 | 473,603 |
| 5.75% 8/15/23 | | 255,000 | 271,830 |
| Lennar Corp. 4.5% 11/15/19 | | 425,000 | 432,172 |
| Reynolds Group Issuer, Inc./Reynolds Group Issuer LLC/Reynolds Group Issuer (Luxembourg) SA: | | | |
| 5.75% 10/15/20 | | 2,555,000 | 2,598,920 |
| 6.875% 2/15/21 | | 565,000 | 581,950 |
| 8.25% 2/15/21 (c) | | 625,000 | 601,563 |
| 9.875% 8/15/19 | | 121,000 | 121,908 |
| Springs Industries, Inc. 6.25% 6/1/21 | | 160,000 | 158,400 |
| Taylor Morrison Communities, Inc./Monarch Communities, Inc. 5.875% 4/15/23 (b) | | 435,000 | 429,563 |
| Tempur Sealy International, Inc. 6.875% 12/15/20 | | 210,000 | 219,975 |
| Toll Brothers Finance Corp.: | | | |
| 4.375% 4/15/23 | | 1,106,000 | 1,072,820 |
| 5.875% 2/15/22 | | 565,000 | 593,250 |
| TRI Pointe Homes, Inc.: | | | |
| 4.375% 6/15/19 | | 320,000 | 312,800 |
| 5.875% 6/15/24 | | 780,000 | 758,550 |
| William Lyon Homes, Inc. 8.5% 11/15/20 | | 250,000 | 264,375 |
| | | | 11,208,918 |
| Internet & Catalog Retail - 0.3% | | | |
| Netflix, Inc.: | | | |
| 5.375% 2/1/21 (b) | | 420,000 | 441,000 |
| 5.75% 3/1/24 (b) | | 612,000 | 628,830 |
| 5.875% 2/15/25 (b) | | 1,395,000 | 1,429,875 |
| Priceline Group, Inc. 1.8% 3/3/27 | EUR | 850,000 | 817,651 |
| Zayo Group LLC/Zayo Capital, Inc. 6% 4/1/23 | | 580,000 | 548,100 |
| | | | 3,865,456 |
| Media - 4.1% | | | |
| Altice SA: | | | |
| 5.375% 7/15/23 (b) | | 1,000,000 | 1,002,500 |
| 7.625% 2/15/25 (b) | | 1,585,000 | 1,367,063 |
| 7.75% 5/15/22 (b) | | 3,275,000 | 2,955,688 |
| AMC Entertainment, Inc. 5.75% 6/15/25 | | 870,000 | 874,350 |
| AMC Networks, Inc. 4.75% 12/15/22 | | 320,000 | 320,000 |
| British Sky Broadcasting Group PLC 1.5% 9/15/21 (Reg. S) | EUR | 1,000,000 | 1,090,556 |
| CBS Outdoor Americas Capital LLC/CBS Outdoor Americas Capital Corp.: | | | |
| 5.25% 2/15/22 | | 115,000 | 117,588 |
| 5.625% 2/15/24 | | 1,625,000 | 1,669,688 |
| CCO Holdings LLC/CCO Holdings Capital Corp.: | | | |
| 5.125% 2/15/23 | | 1,565,000 | 1,566,956 |
| 5.125% 5/1/23 (b) | | 720,000 | 720,000 |
| 5.375% 5/1/25 (b) | | 720,000 | 716,400 |
| 5.75% 9/1/23 | | 500,000 | 512,500 |
| 5.75% 1/15/24 | | 555,000 | 570,263 |
| 6.625% 1/31/22 | | 345,000 | 363,544 |
| CCOH Safari LLC 5.75% 2/15/26 (b) | | 1,030,000 | 1,032,575 |
| Cequel Communications Holdings I LLC/Cequel Capital Corp. 5.125% 12/15/21 (b) | | 1,490,000 | 1,341,000 |
| Cinemark U.S.A., Inc.: | | | |
| 4.875% 6/1/23 | | 525,000 | 511,875 |
| 5.125% 12/15/22 | | 155,000 | 153,838 |
| Clear Channel Communications, Inc. 14% 2/1/21 pay-in-kind (c) | | 571,975 | 151,097 |
| Columbus International, Inc. 7.375% 3/30/21 (b) | | 400,000 | 396,000 |
| Comcast Corp. 5.5% 11/23/29 | GBP | 375,000 | 670,898 |
| DISH DBS Corp. 5% 3/15/23 | | 1,481,000 | 1,284,768 |
| DreamWorks Animation SKG, Inc. 6.875% 8/15/20 (b) | | 245,000 | 241,325 |
| Gannett Co., Inc.: | | | |
| 4.875% 9/15/21 (b) | | 410,000 | 411,025 |
| 5.5% 9/15/24 (b) | | 410,000 | 410,000 |
| Globo Comunicacao e Participacoes SA: | | | |
| 4.843% 6/8/25 (b) | | 790,000 | 711,000 |
| 4.875% 4/11/22 (b) | | 250,000 | 241,875 |
| Grupo Televisa SA de CV: | | | |
| 4.625% 1/30/26 | | 200,000 | 197,612 |
| 6.125% 1/31/46 | | 205,000 | 203,791 |
| 6.625% 3/18/25 | | 315,000 | 357,938 |
| Liberty Media Corp.: | | | |
| 8.25% 2/1/30 | | 1,845,000 | 1,835,775 |
| 8.5% 7/15/29 | | 545,000 | 549,088 |
| McGraw-Hill Global Education Holdings LLC/McGraw-Hill Global Education Finance 9.75% 4/1/21 (c) | | 1,560,000 | 1,653,600 |
| MDC Partners, Inc. 6.75% 4/1/20 (b) | | 595,000 | 612,850 |
| MHGE Parent LLC / MHGE Parent Finance, Inc. 8.5% 8/1/19 pay-in-kind (b)(c) | | 1,140,000 | 1,128,600 |
| Myriad International Holding BV: | | | |
| 5.5% 7/21/25 (b) | | 400,000 | 384,813 |
| 6% 7/18/20 (b) | | 220,000 | 234,065 |
| Nielsen Finance LLC/Nielsen Finance Co. 5% 4/15/22 (b) | | 295,000 | 291,313 |
| Numericable Group SA: | | | |
| 4.875% 5/15/19 (b) | | 820,000 | 812,825 |
| 6% 5/15/22 (b) | | 6,120,000 | 5,936,400 |
| 6.25% 5/15/24 (b) | | 6,405,000 | 6,180,825 |
| Quebecor Media, Inc. 5.75% 1/15/23 | | 790,000 | 795,925 |
| RCN Telecom Services LLC/RCN Capital Corp. 8.5% 8/15/20 (b) | | 315,000 | 318,150 |
| Sinclair Television Group, Inc. 5.375% 4/1/21 | | 520,000 | 521,300 |
| Sirius XM Radio, Inc.: | | | |
| 4.25% 5/15/20 (b) | | 650,000 | 656,500 |
| 4.625% 5/15/23 (b) | | 260,000 | 254,800 |
| 5.25% 8/15/22 (b) | | 750,000 | 791,250 |
| 5.375% 4/15/25 (b) | | 620,000 | 623,875 |
| Starz LLC/Starz Finance Corp. 5% 9/15/19 | | 440,000 | 445,500 |
| TV Azteca SA de CV 7.5% 5/25/18 (Reg. S) | | 1,000,000 | 680,000 |
| Unitymedia Hessen GmbH & Co. KG/Unitymedia NRW GmbH 5.5% 1/15/23 (b) | | 575,000 | 573,563 |
| VTR Finance BV 6.875% 1/15/24 (b) | | 830,000 | 763,600 |
| Wave Holdco LLC/Wave Holdco Corp. 9% 7/15/19 pay-in-kind (b)(c) | | 120,000 | 110,820 |
| WMG Acquisition Corp. 5.625% 4/15/22 (b) | | 115,000 | 111,838 |
| | | | 48,430,988 |
| Specialty Retail - 0.3% | | | |
| CST Brands, Inc. 5% 5/1/23 | | 140,000 | 138,600 |
| Jaguar Land Rover PLC 4.25% 11/15/19 (b) | | 565,000 | 570,650 |
| L Brands, Inc.: | | | |
| 5.625% 10/15/23 | | 520,000 | 551,200 |
| 6.875% 11/1/35 (b) | | 670,000 | 688,425 |
| L Brands, Inc. 5.625% 2/15/22 | | 685,000 | 727,813 |
| Sally Holdings LLC 5.625% 12/1/25 | | 525,000 | 530,250 |
| Sonic Automotive, Inc. 5% 5/15/23 | | 85,000 | 80,750 |
| | | | 3,287,688 |
| Textiles, Apparel & Luxury Goods - 0.1% | | | |
| PVH Corp. 4.5% 12/15/22 | | 1,137,000 | 1,111,418 |
| TOTAL CONSUMER DISCRETIONARY | | | 87,974,905 |
| CONSUMER STAPLES - 2.1% | | | |
| Beverages - 0.1% | | | |
| Constellation Brands, Inc.: | | | |
| 3.875% 11/15/19 | | 415,000 | 426,413 |
| 4.75% 11/15/24 | | 560,000 | 571,200 |
| | | | 997,613 |
| Food & Staples Retailing - 0.7% | | | |
| BI-LO LLC/BI-LO Finance Corp.: | | | |
| 8.625% 9/15/18 pay-in-kind (b)(c) | | 790,000 | 671,500 |
| 9.25% 2/15/19 (b) | | 1,160,000 | 1,168,700 |
| ESAL GmbH 6.25% 2/5/23 (b) | | 1,705,000 | 1,504,663 |
| Hearthside Group Holdings LLC/Hearthside Finance, Inc. 6.5% 5/1/22 (b) | | 155,000 | 143,375 |
| Minerva Luxembourg SA 7.75% 1/31/23 (Reg. S) | | 690,000 | 648,600 |
| Rite Aid Corp.: | | | |
| 6.125% 4/1/23 (b) | | 1,155,000 | 1,195,425 |
| 6.75% 6/15/21 | | 1,470,000 | 1,539,825 |
| 9.25% 3/15/20 | | 360,000 | 380,700 |
| Shearers Foods LLC/Chip Finance Corp. 9% 11/1/19 (b) | | 152,000 | 160,170 |
| Tops Holding LLC / Tops Markets II Corp. 8% 6/15/22 (b) | | 580,000 | 571,300 |
| | | | 7,984,258 |
| Food Products - 0.9% | | | |
| B&G Foods, Inc. 4.625% 6/1/21 | | 565,000 | 559,350 |
| Barry Callebaut Services NV 5.5% 6/15/23 (b) | | 635,000 | 666,115 |
| FAGE Dairy Industry SA/FAGE U.S.A. Dairy Industry, Inc. 9.875% 2/1/20 (b) | | 590,000 | 613,600 |
| Gruma S.A.B. de CV 4.875% 12/1/24 (b) | | 275,000 | 281,188 |
| JBS Investments GmbH 7.25% 4/3/24 (b) | | 2,205,000 | 2,012,063 |
| JBS U.S.A. LLC/JBS U.S.A. Finance, Inc.: | | | |
| 5.75% 6/15/25 (b) | | 1,030,000 | 896,100 |
| 5.875% 7/15/24 (b) | | 1,812,000 | 1,639,860 |
| 7.25% 6/1/21 (b) | | 350,000 | 347,375 |
| 8.25% 2/1/20 (b) | | 330,000 | 330,000 |
| Mondelez International, Inc.: | | | |
| 1.625% 3/8/27 | EUR | 600,000 | 596,443 |
| 2.375% 3/6/35 | EUR | 200,000 | 188,196 |
| Pilgrim's Pride Corp. 5.75% 3/15/25 (b) | | 865,000 | 841,213 |
| Post Holdings, Inc.: | | | |
| 6% 12/15/22 (b) | | 290,000 | 284,200 |
| 7.375% 2/15/22 | | 370,000 | 385,725 |
| 7.75% 3/15/24 (b) | | 465,000 | 487,088 |
| 8% 7/15/25 (b) | | 230,000 | 243,800 |
| Sigma Alimentos SA de CV 6.875% 12/16/19 (b) | | 250,000 | 271,250 |
| TreeHouse Foods, Inc. 4.875% 3/15/22 | | 200,000 | 190,500 |
| | | | 10,834,066 |
| Household Products - 0.2% | | | |
| Edgewell Personal Care Co. 5.5% 6/15/25 (b) | | 375,000 | 352,500 |
| Spectrum Brands Holdings, Inc.: | | | |
| 5.75% 7/15/25 (b) | | 600,000 | 615,000 |
| 6.375% 11/15/20 | | 850,000 | 903,125 |
| 6.625% 11/15/22 | | 175,000 | 184,625 |
| | | | 2,055,250 |
| Personal Products - 0.2% | | | |
| First Quality Finance Co., Inc. 4.625% 5/15/21 (b) | | 135,000 | 122,850 |
| Prestige Brands, Inc.: | | | |
| 5.375% 12/15/21 (b) | | 725,000 | 696,000 |
| 8.125% 2/1/20 | | 75,000 | 77,625 |
| Revlon Consumer Products Corp. 5.75% 2/15/21 | | 1,979,000 | 1,914,683 |
| | | | 2,811,158 |
| Tobacco - 0.0% | | | |
| BAT International Finance PLC 2% 3/13/45 (Reg. S) | EUR | 300,000 | 263,986 |
| TOTAL CONSUMER STAPLES | | | 24,946,331 |
| ENERGY - 5.5% | | | |
| Energy Equipment & Services - 0.2% | | | |
| Compressco Partners LP/Compressco Finance, Inc. 7.25% 8/15/22 | | 395,000 | 292,300 |
| Exterran Partners LP/EXLP Finance Corp. 6% 10/1/22 | | 385,000 | 313,775 |
| Forbes Energy Services Ltd. 9% 6/15/19 | | 350,000 | 168,000 |
| Forum Energy Technologies, Inc. 6.25% 10/1/21 | | 715,000 | 593,450 |
| Gulfmark Offshore, Inc. 6.375% 3/15/22 | | 20,000 | 10,750 |
| Hornbeck Offshore Services, Inc. 5.875% 4/1/20 | | 415,000 | 286,350 |
| MPLX LP 5.5% 2/15/23 (b) | | 350,000 | 306,250 |
| State Oil Co. of Azerbaijan Republic 4.75% 3/13/23 (Reg. S) | | 400,000 | 337,906 |
| Summit Midstream Holdings LLC 7.5% 7/1/21 | | 220,000 | 184,800 |
| Trinidad Drilling Ltd. 7.875% 1/15/19 (b) | | 140,000 | 123,200 |
| Unit Corp. 6.625% 5/15/21 | | 120,000 | 86,400 |
| | | | 2,703,181 |
| Oil, Gas & Consumable Fuels - 5.3% | | | |
| Access Midstream Partners LP/ACMP Finance Corp.: | | | |
| 4.875% 5/15/23 | | 735,000 | 595,839 |
| 4.875% 3/15/24 | | 315,000 | 252,391 |
| Afren PLC: | | | |
| 6.625% 12/9/20 (b)(d) | | 487,918 | 4,977 |
| 10.25% 4/8/19 (Reg. S) (d) | | 780,669 | 7,963 |
| American Energy-Permian Basin LLC/ AEPB Finance Corp. 13% 11/30/20 (b) | | 585,000 | 605,475 |
| Antero Resources Corp. 5.625% 6/1/23 (b) | | 525,000 | 409,500 |
| Carrizo Oil & Gas, Inc.: | | | |
| 6.25% 4/15/23 | | 380,000 | 307,800 |
| 7.5% 9/15/20 | | 245,000 | 214,069 |
| Chaparral Energy, Inc. 9.875% 10/1/20 | | 135,000 | 33,750 |
| Crestwood Midstream Partners LP/Crestwood Midstream Finance Corp.: | | | |
| 6% 12/15/20 | | 695,000 | 510,825 |
| 6.125% 3/1/22 | | 963,000 | 669,285 |
| 6.25% 4/1/23 (b) | | 1,975,000 | 1,377,563 |
| CVR Refining LLC/Coffeyville Finance, Inc. 6.5% 11/1/22 | | 1,070,000 | 1,037,900 |
| Denbury Resources, Inc.: | | | |
| 4.625% 7/15/23 | | 165,000 | 53,110 |
| 5.5% 5/1/22 | | 50,000 | 16,599 |
| 6.375% 8/15/21 | | 440,000 | 158,400 |
| Eagle Rock Energy Partners LP/Eagle Rock Energy Finance Corp. 8.375% 6/1/19 | | 480,000 | 100,800 |
| EDC Finance Ltd. 4.875% 4/17/20 (b) | | 1,600,000 | 1,402,234 |
| Empresa Nacional de Petroleo 4.75% 12/6/21 (b) | | 100,000 | 100,996 |
| Endeavor Energy Resources LP/EER Finance, Inc. 7% 8/15/21 (b) | | 530,000 | 471,700 |
| Energy Transfer Equity LP 5.5% 6/1/27 | | 860,000 | 653,600 |
| EP Energy LLC/Everest Acquisition Finance, Inc.: | | | |
| 7.75% 9/1/22 | | 60,000 | 30,600 |
| 9.375% 5/1/20 | | 515,000 | 328,313 |
| EV Energy Partners LP/EV Energy Finance Corp. 8% 4/15/19 | | 482,500 | 241,250 |
| Genesis Energy LP/Genesis Energy Finance Corp. 5.75% 2/15/21 | | 250,000 | 211,250 |
| Georgian Oil & Gas Corp. 6.875% 5/16/17 (b) | | 600,000 | 604,440 |
| Global Partners LP/GLP Finance Corp.: | | | |
| 6.25% 7/15/22 | | 130,000 | 104,000 |
| 7% 6/15/23 | | 580,000 | 475,600 |
| Goodrich Petroleum Corp. 8.875% 3/15/18 | | 128,000 | 5,120 |
| Hiland Partners LP/Finance Corp. 7.25% 10/1/20 (b) | | 395,000 | 398,950 |
| Hilcorp Energy I LP/Hilcorp Finance Co.: | | | |
| 5% 12/1/24 (b) | | 510,000 | 423,300 |
| 5.75% 10/1/25 (b) | | 580,000 | 504,600 |
| 7.625% 4/15/21 (b) | | 380,000 | 364,800 |
| Holly Energy Partners LP/Holly Finance Corp. 6.5% 3/1/20 | | 485,000 | 480,150 |
| Indo Energy Finance BV 7% 5/7/18 (b) | | 200,000 | 114,149 |
| Jupiter Resources, Inc. 8.5% 10/1/22 (b) | | 1,295,000 | 518,000 |
| Kinder Morgan, Inc. 1.5% 3/16/22 | EUR | 300,000 | 264,053 |
| Kosmos Energy Ltd. 7.875% 8/1/21 (b) | | 290,000 | 233,450 |
| Laredo Petroleum, Inc. 7.375% 5/1/22 (Reg. S) | | 600,000 | 552,000 |
| MPLX LP 4.875% 12/1/24 (b) | | 2,370,000 | 2,127,075 |
| Newfield Exploration Co.: | | | |
| 5.375% 1/1/26 | | 475,000 | 375,250 |
| 5.625% 7/1/24 | | 75,000 | 63,938 |
| Noble Energy, Inc. 5.875% 6/1/22 | | 545,000 | 518,459 |
| Northern Tier Energy LLC/Northern Tier Finance Corp. 7.125% 11/15/20 | | 235,000 | 237,350 |
| Nostrum Oil & Gas Finance BV 6.375% 2/14/19 (b) | | 940,000 | 732,025 |
| Pacific Rubiales Energy Corp. 7.25% 12/12/21 (b) | | 2,605,000 | 521,000 |
| Pan American Energy LLC 7.875% 5/7/21 (b) | | 255,000 | 249,263 |
| PBF Holding Co. LLC/PBF Finance Corp.: | | | |
| 7% 11/15/23 (b) | | 730,000 | 711,750 |
| 8.25% 2/15/20 | | 930,000 | 962,550 |
| PBF Logistics LP/PBF Logistics Finance, Inc. 6.875% 5/15/23 | | 435,000 | 395,850 |
| Pemex Project Funding Master Trust: | | | |
| 6.625% 6/15/35 | | 1,565,000 | 1,398,719 |
| 8.625% 12/1/23 (c) | | 250,000 | 289,375 |
| PetroBakken Energy Ltd. 8.625% 2/1/20 (b) | | 1,225,000 | 275,625 |
| Petrobras Global Finance BV: | | | |
| 2.4605% 1/15/19 (c) | | 1,320,000 | 1,003,200 |
| 3% 1/15/19 | | 1,425,000 | 1,083,000 |
| 6.25% 3/17/24 | | 570,000 | 408,975 |
| 7.25% 3/17/44 | | 270,000 | 182,250 |
| Petrobras International Finance Co. Ltd.: | | | |
| 5.75% 1/20/20 | | 1,025,000 | 804,625 |
| 5.875% 3/1/18 | | 1,515,000 | 1,348,350 |
| 6.875% 1/20/40 | | 1,760,000 | 1,144,000 |
| Petroleos de Venezuela SA: | | | |
| 5.375% 4/12/27 | | 930,000 | 337,125 |
| 5.5% 4/12/37 | | 285,000 | 103,313 |
| 6% 5/16/24 (b) | | 360,000 | 133,200 |
| 6% 11/15/26 (b) | | 275,000 | 101,063 |
| 8.5% 11/2/17 (b) | | 4,893,333 | 2,605,700 |
| 9.75% 5/17/35 (b) | | 1,365,000 | 566,475 |
| 12.75% 2/17/22 (b) | | 1,055,000 | 474,750 |
| Petroleos Mexicanos: | | | |
| 3.5% 1/30/23 | | 495,000 | 431,888 |
| 4.875% 1/18/24 | | 570,000 | 531,525 |
| 5.5% 1/21/21 | | 345,000 | 348,002 |
| 5.5% 6/27/44 (b) | | 530,000 | 398,740 |
| 5.5% 6/27/44 | | 605,000 | 455,166 |
| 6.375% 1/23/45 | | 765,000 | 647,481 |
| 6.5% 6/2/41 | | 1,530,000 | 1,322,685 |
| 6.625% (b)(e) | | 2,610,000 | 2,414,250 |
| PT Pertamina Persero: | | | |
| 4.875% 5/3/22 (b) | | 375,000 | 359,560 |
| 5.25% 5/23/21 (b) | | 295,000 | 294,401 |
| 6% 5/3/42 (b) | | 175,000 | 143,289 |
| 6.5% 5/27/41 (b) | | 915,000 | 799,548 |
| QEP Resources, Inc. 5.25% 5/1/23 | | 610,000 | 433,100 |
| Range Resources Corp. 5% 3/15/23 | | 960,000 | 715,200 |
| Repsol International Finance BV: | | | |
| 2.625% 5/28/20 (Reg. S) | EUR | 500,000 | 553,655 |
| 3.625% 10/7/21 (Reg. S) | EUR | 600,000 | 691,792 |
| Rice Energy, Inc.: | | | |
| 6.25% 5/1/22 | | 1,005,000 | 723,600 |
| 7.25% 5/1/23 (b) | | 510,000 | 372,300 |
| RSP Permian, Inc. 6.625% 10/1/22 | | 230,000 | 211,600 |
| Sabine Pass Liquefaction LLC: | | | |
| 5.625% 3/1/25 (b) | | 2,375,000 | 2,009,844 |
| 5.75% 5/15/24 | | 590,000 | 513,300 |
| SemGroup Corp. 7.5% 6/15/21 | | 440,000 | 393,800 |
| Sibur Securities Ltd. 3.914% 1/31/18 (b) | | 525,000 | 509,292 |
| SM Energy Co. 5.625% 6/1/25 | | 280,000 | 184,800 |
| Southern Star Central Corp. 5.125% 7/15/22 (b) | | 320,000 | 264,000 |
| Sunoco LP / Sunoco Finance Corp. 6.375% 4/1/23 (b) | | 405,000 | 380,700 |
| Teekay Corp.: | | | |
| 8.5% 1/15/20 (b) | | 585,000 | 394,875 |
| 8.5% 1/15/20 | | 295,000 | 199,125 |
| Teine Energy Ltd. 6.875% 9/30/22 (b) | | 590,000 | 474,950 |
| Tennessee Gas Pipeline Co. 7.625% 4/1/37 | | 50,000 | 48,699 |
| Tesoro Corp.: | | | |
| 4.25% 10/1/17 | | 305,000 | 311,863 |
| 5.125% 4/1/24 | | 60,000 | 59,700 |
| 5.375% 10/1/22 | | 345,000 | 345,863 |
| Tesoro Logistics LP/Tesoro Logistics Finance Corp.: | | | |
| 5.5% 10/15/19 (b) | | 320,000 | 310,400 |
| 5.875% 10/1/20 | | 197,000 | 189,120 |
| 6.125% 10/15/21 | | 420,000 | 399,000 |
| 6.25% 10/15/22 (b) | | 2,160,000 | 2,046,600 |
| Transportadora de Gas del Sur SA 9.625% 5/14/20 (b) | | 1,413,395 | 1,445,196 |
| Western Refining Logistics LP/WNRL Finance Co. 7.5% 2/15/23 | | 530,000 | 506,150 |
| Western Refining, Inc. 6.25% 4/1/21 | | 1,440,000 | 1,382,400 |
| WPX Energy, Inc. 6% 1/15/22 | | 690,000 | 483,000 |
| YPF SA: | | | |
| 8.5% 7/28/25 (b) | | 680,000 | 647,700 |
| 8.75% 4/4/24 (b) | | 1,430,000 | 1,387,100 |
| 8.875% 12/19/18 (b) | | 795,000 | 803,944 |
| Zhaikmunai International BV 7.125% 11/13/19 (b) | | 1,175,000 | 913,563 |
| | | | 62,445,822 |
| TOTAL ENERGY | | | 65,149,003 |
| FINANCIALS - 9.7% | | | |
| Banks - 3.8% | | | |
| ABN AMRO Bank NV 7.125% 7/6/22 | EUR | 600,000 | 818,135 |
| Allied Irish Banks PLC 2.75% 4/16/19 (Reg. S) | EUR | 600,000 | 685,460 |
| Banco de Galicia y Buenos Aires SA 16% 1/1/19 (Reg. S) | | 296,145 | 298,736 |
| Banco Hipotecario SA 9.75% 11/30/20 (b) | | 295,000 | 300,900 |
| Banco Nacional de Desenvolvimento Economico e Social: | | | |
| 5.5% 7/12/20 (b) | | 510,000 | 473,025 |
| 5.75% 9/26/23 (b) | | 315,000 | 271,593 |
| 6.369% 6/16/18 (b) | | 275,000 | 270,188 |
| Bank of America Corp. 1.375% 9/10/21 (Reg. S) | EUR | 850,000 | 928,537 |
| Bank of Ireland 1.25% 4/9/20 | EUR | 1,600,000 | 1,751,719 |
| Banque Centrale de Tunisie 5.75% 1/30/25 (b) | | 260,000 | 225,022 |
| Barclays Bank PLC: | | | |
| 2.625% 11/11/25 (Reg. S) (c) | EUR | 700,000 | 759,292 |
| 10% 5/21/21 | GBP | 600,000 | 1,140,666 |
| BBVA Bancomer SA 6.75% 9/30/22 (b) | | 175,000 | 192,500 |
| BBVA Colombia SA 4.875% 4/21/25 (b) | | 170,000 | 162,775 |
| BBVA Paraguay SA 9.75% 2/11/16 (b) | | 600,000 | 601,820 |
| BPCE SA 2.75% 11/30/27 (Reg. S) (c) | EUR | 1,100,000 | 1,197,885 |
| CIT Group, Inc.: | | | |
| 5% 8/15/22 | | 845,000 | 867,714 |
| 5.375% 5/15/20 | | 1,055,000 | 1,105,113 |
| 5.5% 2/15/19 (b) | | 2,355,000 | 2,460,975 |
| Citigroup, Inc. 2.125% 9/10/26 (Reg. S) | EUR | 1,050,000 | 1,137,032 |
| Commonwealth Bank of Australia 2% 4/22/27 (Reg. S) (c) | EUR | 850,000 | 877,135 |
| Export Credit Bank of Turkey 5.875% 4/24/19 (b) | | 450,000 | 464,732 |
| Export-Import Bank of Korea 6% 6/4/16 (Reg. S) | INR | 16,500,000 | 247,874 |
| Finansbank A/S: | | | |
| 5.5% 5/11/16 (Reg. S) | | 400,000 | 404,032 |
| 6.25% 4/30/19 (b) | | 475,000 | 498,675 |
| Georgia Bank Joint Stock Co.: | | | |
| 7.75% 7/5/17 (b) | | 890,000 | 918,507 |
| 7.75% 7/5/17 (Reg. S) | | 200,000 | 206,406 |
| GTB Finance BV: | | | |
| 6% 11/8/18 (b) | | 1,320,000 | 1,210,981 |
| 7.5% 5/19/16 (b) | | 400,000 | 399,200 |
| HSBC Bank PLC 5% 3/20/23 (c) | GBP | 900,000 | 1,383,418 |
| HSBK BV 7.25% 5/3/17 (b) | | 1,000,000 | 1,028,196 |
| Industrial Senior Trust 5.5% 11/1/22 (b) | | 100,000 | 92,125 |
| ING Bank NV: | | | |
| 6.125% 5/29/23 (c) | EUR | 1,400,000 | 1,691,530 |
| 6.875% 5/29/23 (c) | GBP | 1,750,000 | 2,812,073 |
| Intesa Sanpaolo SpA: | | | |
| 1.125% 1/14/20 (Reg. S) | EUR | 550,000 | 599,620 |
| 1.125% 3/4/22 | EUR | 650,000 | 687,287 |
| Itau Unibanco Holding SA: | | | |
| 5.125% 5/13/23 (Reg. S) | | 680,000 | 596,700 |
| 5.5% 8/6/22 (b) | | 490,000 | 444,063 |
| 6.2% 12/21/21 (Reg. S) | | 425,000 | 408,000 |
| KBC Groep NV 1.875% 3/11/27 (Reg. S) (c) | EUR | 1,300,000 | 1,375,317 |
| Lloyds Bank PLC 6.5% 3/24/20 | EUR | 650,000 | 854,647 |
| Nacional Financiera SNC 3.375% 11/5/20 (b) | | 440,000 | 435,765 |
| National Westminster Bank PLC 6.5% 9/7/21 | GBP | 1,010,000 | 1,684,470 |
| OJSC Russian Agricultural Bank 7.75% 5/29/18 (Issued by RSHB Capital SA for OJSC Russian Agricultural Bank) (b) | | 360,000 | 377,564 |
| Rabobank Nederland 6.875% 3/19/20 (Reg. S) | EUR | 2,150,000 | 2,774,609 |
| Royal Bank of Scotland Group PLC 1.625% 6/25/19 (Reg. S) | EUR | 1,000,000 | 1,106,264 |
| Royal Bank of Scotland PLC 6.934% 4/9/18 | EUR | 550,000 | 669,275 |
| RSHB Capital SA 5.298% 12/27/17 (b) | | 440,000 | 440,572 |
| SB Capital SA 5.5% 2/26/24 (b)(c) | | 790,000 | 693,818 |
| Turkiye Halk Bankasi A/S 4.75% 6/4/19 (b) | | 460,000 | 454,314 |
| Turkiye Vakiflar Bankasi TAO 6.875% 2/3/25 (b)(c) | | 280,000 | 271,326 |
| UniCredit SpA: | | | |
| 3.25% 1/14/21 (Reg. S) | EUR | 900,000 | 1,059,402 |
| 6.95% 10/31/22 (Reg. S) | EUR | 750,000 | 952,445 |
| Zenith Bank PLC 6.25% 4/22/19 (b) | | 1,480,000 | 1,331,260 |
| | | | 45,100,689 |
| Capital Markets - 0.7% | | | |
| Argos Merger Sub, Inc. 7.125% 3/15/23 (b) | | 865,000 | 857,648 |
| Credit Suisse Group AG 5.75% 9/18/25 (Reg. S) (c) | EUR | 1,650,000 | 1,954,072 |
| Criteria Caixaholding SA 1.625% 4/21/22 | EUR | 2,500,000 | 2,581,721 |
| Goldman Sachs Group, Inc. 2.875% 6/3/26 (Reg. S) | EUR | 200,000 | 232,451 |
| Morgan Stanley 5.375% 8/10/20 | EUR | 1,500,000 | 1,946,584 |
| UBS Group Funding Ltd. 1.75% 11/16/22 (Reg. S) | EUR | 675,000 | 734,390 |
| | | | 8,306,866 |
| Consumer Finance - 2.6% | | | |
| AerCap Ireland Capital Ltd./AerCap Global Aviation Trust: | | | |
| 4.25% 7/1/20 | | 580,000 | 584,350 |
| 4.5% 5/15/21 | | 995,000 | 1,011,169 |
| 4.625% 7/1/22 | | 1,170,000 | 1,183,163 |
| 5% 10/1/21 | | 300,000 | 309,000 |
| Ally Financial, Inc.: | | | |
| 4.125% 2/13/22 | | 1,160,000 | 1,148,400 |
| 4.625% 3/30/25 | | 1,065,000 | 1,051,688 |
| 5.125% 9/30/24 | | 2,510,000 | 2,569,613 |
| 8% 11/1/31 | | 10,353,000 | 11,957,660 |
| Credito Real S.A.B. de CV 7.5% 3/13/19 (b) | | 400,000 | 396,000 |
| FCA Capital Ireland PLC 1.375% 4/17/20 (Reg. S) | EUR | 1,600,000 | 1,720,007 |
| Ford Credit Europe PLC 1.134% 2/10/22 (Reg. S) | EUR | 1,000,000 | 1,050,845 |
| General Motors Acceptance Corp. 8% 11/1/31 | | 823,000 | 967,025 |
| Navient Corp.: | | | |
| 5% 10/26/20 | | 395,000 | 346,613 |
| 5.875% 10/25/24 | | 850,000 | 680,000 |
| SLM Corp.: | | | |
| 5.5% 1/25/23 | | 2,410,000 | 1,945,955 |
| 7.25% 1/25/22 | | 2,840,000 | 2,655,400 |
| 8% 3/25/20 | | 725,000 | 716,300 |
| | | | 30,293,188 |
| Diversified Financial Services - 1.0% | | | |
| Cimpor Financial Operations BV 5.75% 7/17/24 (b) | | 370,000 | 246,050 |
| Icahn Enterprises LP/Icahn Enterprises Finance Corp.: | | | |
| 4.875% 3/15/19 | | 855,000 | 847,305 |
| 5.875% 2/1/22 | | 3,505,000 | 3,426,138 |
| 6% 8/1/20 | | 2,980,000 | 3,005,032 |
| KfW 2.6% 6/20/37 | JPY | 75,000,000 | 843,692 |
| MSCI, Inc.: | | | |
| 5.25% 11/15/24 (b) | | 345,000 | 350,175 |
| 5.75% 8/15/25 (b) | | 365,000 | 374,125 |
| Nationwide Building Society 4.125% 3/20/23 (Reg. S) (c) | EUR | 1,700,000 | 1,959,218 |
| TMK Capital SA 7.75% 1/27/18 | | 430,000 | 427,148 |
| Wendel SA 2.75% 10/2/24 (Reg. S) | EUR | 800,000 | 878,551 |
| | | | 12,357,434 |
| Insurance - 0.5% | | | |
| Alliant Holdings Co.-Issuer, Inc. / Wayne Merger Sub, LLC 8.25% 8/1/23 (b) | | 1,440,000 | 1,353,600 |
| Allianz SE 2.241% 7/7/45 (Reg. S) (c) | EUR | 1,000,000 | 998,700 |
| Assicurazioni Generali SpA 7.75% 12/12/42 (c) | EUR | 500,000 | 662,809 |
| Aviva PLC 3.375% 12/4/45 (Reg. S) (c) | EUR | 350,000 | 362,388 |
| Direct Line Insurance Group PLC 9.25% 4/27/42 (c) | GBP | 150,000 | 271,397 |
| Hockey Merger Sub 2, Inc. 7.875% 10/1/21 (b) | | 1,135,000 | 1,021,500 |
| RSA Insurance Group PLC 5.125% 10/10/45 (Reg. S) (c) | GBP | 689,000 | 983,942 |
| SCOR SE 3% 6/8/46 (Reg. S) (c) | EUR | 600,000 | 632,912 |
| | | | 6,287,248 |
| Real Estate Investment Trusts - 0.6% | | | |
| Crown Castle International Corp. 5.25% 1/15/23 | | 1,530,000 | 1,608,413 |
| CTR Partnership LP/CareTrust Capital Corp. 5.875% 6/1/21 | | 85,000 | 85,744 |
| MPT Operating Partnership LP/MPT Finance Corp. 6.375% 2/15/22 | | 475,000 | 484,500 |
| Omega Healthcare Investors, Inc. 5.875% 3/15/24 | | 1,385,000 | 1,433,475 |
| Prologis LP 3% 6/2/26 | EUR | 700,000 | 785,608 |
| The GEO Group, Inc.: | | | |
| 5.125% 4/1/23 | | 200,000 | 189,500 |
| 5.875% 10/15/24 | | 3,000,000 | 2,910,000 |
| | | | 7,497,240 |
| Real Estate Management & Development - 0.5% | | | |
| CBRE Group, Inc.: | | | |
| 5% 3/15/23 | | 1,075,000 | 1,080,471 |
| 5.25% 3/15/25 | | 665,000 | 673,597 |
| Deutsche Annington Finance BV: | | | |
| 1.625% 12/15/20 (Reg. S) | EUR | 300,000 | 325,347 |
| 2.125% 7/9/22 (Reg. S) | EUR | 365,000 | 399,513 |
| 3.125% 7/25/19 | EUR | 100,000 | 115,855 |
| Grand City Properties SA 1.5% 4/17/25 (Reg. S) | EUR | 600,000 | 587,654 |
| Howard Hughes Corp. 6.875% 10/1/21 (b) | | 1,210,000 | 1,234,200 |
| Inversiones y Representaciones SA 11.5% 7/20/20 (Reg. S) | | 85,000 | 89,675 |
| Taylor Morrison Communities, Inc./Monarch Communities, Inc. 5.25% 4/15/21 (b) | | 785,000 | 785,000 |
| | | | 5,291,312 |
| TOTAL FINANCIALS | | | 115,133,977 |
| HEALTH CARE - 2.7% | | | |
| Biotechnology - 0.0% | | | |
| AMAG Pharmaceuticals, Inc. 7.875% 9/1/23 (b) | | 305,000 | 268,400 |
| Health Care Equipment & Supplies - 0.3% | | | |
| Alere, Inc. 6.375% 7/1/23 (b) | | 260,000 | 243,100 |
| Hill-Rom Holdings, Inc. 5.75% 9/1/23 (b) | | 290,000 | 295,800 |
| Hologic, Inc. 5.25% 7/15/22 (b) | | 630,000 | 642,600 |
| Mallinckrodt International Finance SA/Mallinckrodt CB LLC 5.5% 4/15/25 (b) | | 2,155,000 | 1,982,600 |
| | | | 3,164,100 |
| Health Care Providers & Services - 1.5% | | | |
| AmSurg Corp. 5.625% 7/15/22 | | 520,000 | 514,800 |
| Hanger, Inc. 7.125% 11/15/18 | | 1,230,000 | 1,125,450 |
| HCA Holdings, Inc.: | | | |
| 4.75% 5/1/23 | | 630,000 | 623,700 |
| 5.375% 2/1/25 | | 1,155,000 | 1,140,563 |
| 5.875% 3/15/22 | | 1,915,000 | 2,020,325 |
| 5.875% 5/1/23 | | 2,145,000 | 2,198,625 |
| 5.875% 2/15/26 | | 1,495,000 | 1,500,606 |
| 6.5% 2/15/20 | | 2,410,000 | 2,625,695 |
| 7.5% 2/15/22 | | 1,175,000 | 1,301,313 |
| HealthSouth Corp.: | | | |
| 5.125% 3/15/23 | | 330,000 | 315,975 |
| 5.75% 11/1/24 (b) | | 375,000 | 357,656 |
| 5.75% 11/1/24 | | 760,000 | 724,850 |
| InVentiv Health, Inc. 10% 8/15/18 (c) | | 75,000 | 74,250 |
| Jaguar Holding Co. II / Pharmaceutical Product Development LLC 6.375% 8/1/23 (b) | | 570,000 | 555,750 |
| Quintiles Transnational Corp. 4.875% 5/15/23 (b) | | 445,000 | 447,225 |
| Sabra Health Care LP/Sabra Capital Corp.: | | | |
| 5.375% 6/1/23 | | 330,000 | 332,475 |
| 5.5% 2/1/21 | | 265,000 | 273,613 |
| Tenet Healthcare Corp. 6.875% 11/15/31 | | 1,210,000 | 980,100 |
| Truven Health Analytics, Inc. 10.625% 6/1/20 | | 435,000 | 437,175 |
| | | | 17,550,146 |
| Life Sciences Tools & Services - 0.0% | | | |
| Eurofins Scientific SA 3.375% 1/30/23 (Reg. S) | EUR | 450,000 | 487,664 |
| Pharmaceuticals - 0.9% | | | |
| Concordia Healthcare Corp. 7% 4/15/23 (b) | | 275,000 | 238,563 |
| Endo Finance LLC/Endo Ltd./Endo Finco, Inc.: | | | |
| 6% 7/15/23 (b) | | 735,000 | 731,325 |
| 6% 2/1/25 (b) | | 800,000 | 788,000 |
| JLL/Delta Dutch Pledgeco BV 8.75% 5/1/20 pay-in-kind (b)(c) | | 305,000 | 294,325 |
| Pinnacle Merger Sub, Inc. 9.5% 10/1/23 (b) | | 657,000 | 714,488 |
| Valeant Pharmaceuticals International, Inc.: | | | |
| 5.375% 3/15/20 (b) | | 720,000 | 676,800 |
| 5.625% 12/1/21 (b) | | 635,000 | 584,200 |
| 5.875% 5/15/23 (b) | | 2,595,000 | 2,316,038 |
| 6.125% 4/15/25 (b) | | 2,810,000 | 2,507,925 |
| 6.75% 8/15/21 (b) | | 580,000 | 559,700 |
| 7.5% 7/15/21 (b) | | 220,000 | 219,450 |
| VPI Escrow Corp. 6.375% 10/15/20 (b) | | 1,120,000 | 1,080,800 |
| | | | 10,711,614 |
| TOTAL HEALTH CARE | | | 32,181,924 |
| INDUSTRIALS - 3.4% | | | |
| Aerospace & Defense - 0.2% | | | |
| GenCorp, Inc. 7.125% 3/15/21 | | 140,000 | 145,600 |
| Huntington Ingalls Industries, Inc.: | | | |
| 5% 12/15/21 (b) | | 345,000 | 351,469 |
| 5% 11/15/25 (b) | | 550,000 | 558,250 |
| KLX, Inc. 5.875% 12/1/22 (b) | | 1,455,000 | 1,382,250 |
| Triumph Group, Inc. 4.875% 4/1/21 | | 520,000 | 418,925 |
| | | | 2,856,494 |
| Airlines - 0.3% | | | |
| Air Canada: | | | |
| 5.375% 11/15/22 (b) | | 156,575 | 157,749 |
| 7.75% 4/15/21 (b) | | 470,000 | 488,800 |
| Allegiant Travel Co. 5.5% 7/15/19 | | 160,000 | 162,000 |
| Aviation Capital Group Corp. 4.625% 1/31/18 (b) | | 372,000 | 379,440 |
| Continental Airlines, Inc.: | | | |
| pass-thru trust certificates 6.903% 4/19/22 | | 36,524 | 37,756 |
| 6.125% 4/29/18 | | 180,000 | 183,600 |
| 7.25% 11/10/19 | | 281,003 | 316,831 |
| Delta Air Lines, Inc. pass-thru trust certificates: | | | |
| 6.821% 8/10/22 | | 528,820 | 609,094 |
| 8.021% 8/10/22 | | 159,852 | 179,434 |
| Hawaiian Airlines pass-thru certificates Series 2013-1 Class B, 4.95% 1/15/22 | | 246,163 | 235,701 |
| Northwest Airlines, Inc. pass-thru trust certificates: | | | |
| 7.027% 11/1/19 | | 96,866 | 107,938 |
| 8.028% 11/1/17 | | 29,064 | 31,406 |
| U.S. Airways pass-thru certificates: | | | |
| Series 2011-1 Class A, 7.125% 4/22/25 | | 369,655 | 425,103 |
| Series 2012-2 Class B, 6.75% 12/3/22 | | 170,168 | 179,953 |
| Series 2013-1 Class B, 5.375% 5/15/23 | | 229,243 | 229,243 |
| United Air Lines, Inc. pass-thru trust certificates 9.75% 1/15/17 | | 262,256 | 276,680 |
| | | | 4,000,728 |
| Building Products - 0.0% | | | |
| Shea Homes Ltd. Partnership/Corp.: | | | |
| 5.875% 4/1/23 (b) | | 185,000 | 189,625 |
| 6.125% 4/1/25 (b) | | 185,000 | 190,088 |
| | | | 379,713 |
| Commercial Services & Supplies - 0.6% | | | |
| ADT Corp. 6.25% 10/15/21 | | 1,560,000 | 1,629,498 |
| APX Group, Inc. 8.75% 12/1/20 | | 986,000 | 801,125 |
| Cenveo Corp. 6% 8/1/19 (b) | | 315,000 | 222,075 |
| Clean Harbors, Inc.: | | | |
| 5.125% 6/1/21 | | 320,000 | 324,000 |
| 5.25% 8/1/20 | | 1,050,000 | 1,071,000 |
| Covanta Holding Corp.: | | | |
| 5.875% 3/1/24 | | 1,870,000 | 1,683,000 |
| 7.25% 12/1/20 | | 430,000 | 444,781 |
| Garda World Security Corp. 7.25% 11/15/21 (b) | | 225,000 | 193,500 |
| TMS International Corp. 7.625% 10/15/21 (b) | | 110,000 | 84,975 |
| | | | 6,453,954 |
| Construction & Engineering - 0.1% | | | |
| AECOM Technology Corp.: | | | |
| 5.75% 10/15/22 | | 280,000 | 288,400 |
| 5.875% 10/15/24 | | 240,000 | 244,800 |
| Cementos Progreso Trust 7.125% 11/6/23 (b) | | 240,000 | 238,200 |
| Odebrecht Finance Ltd. 4.375% 4/25/25 (b) | | 475,000 | 247,000 |
| | | | 1,018,400 |
| Electrical Equipment - 0.1% | | | |
| Sensata Technologies BV: | | | |
| 4.875% 10/15/23 (b) | | 265,000 | 257,713 |
| 5% 10/1/25 (b) | | 575,000 | 562,063 |
| | | | 819,776 |
| Industrial Conglomerates - 0.0% | | | |
| Alfa SA de CV 5.25% 3/25/24 (b) | | 200,000 | 202,500 |
| Machinery - 0.1% | | | |
| Schaeffler Finance BV 4.75% 5/15/21 (b) | | 520,000 | 522,600 |
| Terex Corp. 6% 5/15/21 | | 495,000 | 455,400 |
| | | | 978,000 |
| Marine - 0.0% | | | |
| Navios Maritime Holdings, Inc. 7.375% 1/15/22 (b) | | 180,000 | 90,000 |
| Navios South American Logistics, Inc./Navios Logistics Finance U.S., Inc. 7.25% 5/1/22 (b) | | 490,000 | 320,950 |
| Ultrapetrol (Bahamas) Ltd. 8.875% 6/15/21 | | 60,000 | 6,000 |
| | | | 416,950 |
| Professional Services - 0.1% | | | |
| Bureau Veritas SA 3.125% 1/21/21 (Reg. S) | EUR | 600,000 | 692,639 |
| Road & Rail - 0.0% | | | |
| JSC Georgian Railway 7.75% 7/11/22 (b) | | 200,000 | 202,448 |
| Lima Metro Line 2 Finance Ltd. 5.875% 7/5/34 (b) | | 250,000 | 242,500 |
| | | | 444,948 |
| Trading Companies & Distributors - 1.8% | | | |
| Aircastle Ltd.: | | | |
| 4.625% 12/15/18 | | 395,000 | 403,888 |
| 5.5% 2/15/22 | | 555,000 | 568,875 |
| 6.25% 12/1/19 | | 610,000 | 655,750 |
| 7.625% 4/15/20 | | 380,000 | 427,500 |
| Ashtead Capital, Inc. 5.625% 10/1/24 (b) | | 550,000 | 556,875 |
| Glencore Finance (Europe) SA: | | | |
| 1.75% 3/17/25 (Reg. S) | EUR | 600,000 | 409,161 |
| 3.375% 9/30/20 (Reg. S) | EUR | 450,000 | 402,585 |
| International Lease Finance Corp.: | | | |
| 3.875% 4/15/18 | | 750,000 | 755,625 |
| 4.625% 4/15/21 | | 700,000 | 717,500 |
| 5.875% 4/1/19 | | 3,945,000 | 4,181,700 |
| 5.875% 8/15/22 | | 1,090,000 | 1,160,850 |
| 6.25% 5/15/19 | | 2,550,000 | 2,731,688 |
| 8.25% 12/15/20 | | 2,870,000 | 3,393,775 |
| 8.625% 1/15/22 | | 2,290,000 | 2,770,900 |
| NES Rentals Holdings, Inc. 7.875% 5/1/18 (b) | | 160,000 | 145,600 |
| United Rentals North America, Inc.: | | | |
| 4.625% 7/15/23 | | 505,000 | 503,738 |
| 5.5% 7/15/25 | | 1,905,000 | 1,847,850 |
| | | | 21,633,860 |
| Transportation Infrastructure - 0.1% | | | |
| Aeropuertos Argentina 2000 SA: | | | |
| 10.75% 12/1/20 (b) | | 597,800 | 629,185 |
| 10.75% 12/1/20 (Reg. S) | | 42,000 | 44,205 |
| Autoridad del Canal de Panama 4.95% 7/29/35 (b) | | 260,000 | 266,332 |
| | | | 939,722 |
| TOTAL INDUSTRIALS | | | 40,837,684 |
| INFORMATION TECHNOLOGY - 2.6% | | | |
| Communications Equipment - 0.6% | | | |
| Alcatel-Lucent U.S.A., Inc.: | | | |
| 6.75% 11/15/20 (b) | | 961,000 | 1,012,654 |
| 8.875% 1/1/20 (b) | | 295,000 | 312,700 |
| Banglalink Digital Communications Ltd. 8.625% 5/6/19 (b) | | 1,075,000 | 1,109,938 |
| Brocade Communications Systems, Inc. 4.625% 1/15/23 | | 350,000 | 332,500 |
| Lucent Technologies, Inc.: | | | |
| 6.45% 3/15/29 | | 3,359,000 | 3,400,988 |
| 6.5% 1/15/28 | | 560,000 | 562,800 |
| | | | 6,731,580 |
| Electronic Equipment & Components - 0.1% | | | |
| Flextronics International Ltd.: | | | |
| 4.625% 2/15/20 | | 500,000 | 516,968 |
| 5% 2/15/23 | | 260,000 | 263,575 |
| Jabil Circuit, Inc. 4.7% 9/15/22 | | 265,000 | 257,050 |
| | | | 1,037,593 |
| Internet Software & Services - 0.1% | | | |
| CyrusOne LP/CyrusOne Finance Corp. 6.375% 11/15/22 | | 370,000 | 381,100 |
| j2 Global, Inc. 8% 8/1/20 | | 350,000 | 365,750 |
| VeriSign, Inc.: | | | |
| 4.625% 5/1/23 | | 465,000 | 450,236 |
| 5.25% 4/1/25 | | 565,000 | 570,650 |
| | | | 1,767,736 |
| IT Services - 0.2% | | | |
| CDW LLC/CDW Finance Corp. 5% 9/1/23 | | 565,000 | 573,475 |
| Ceridian HCM Holding, Inc. 11% 3/15/21 (b) | | 250,000 | 196,250 |
| Everi Payments, Inc. 10% 1/15/22 | | 650,000 | 572,000 |
| First Data Corp. 5.375% 8/15/23 (b) | | 865,000 | 869,325 |
| | | | 2,211,050 |
| Semiconductors & Semiconductor Equipment - 0.8% | | | |
| Entegris, Inc. 6% 4/1/22 (b) | | 155,000 | 156,938 |
| Micron Technology, Inc.: | | | |
| 5.25% 8/1/23 (b) | | 230,000 | 206,425 |
| 5.25% 1/15/24 (b) | | 490,000 | 431,200 |
| 5.5% 2/1/25 | | 1,605,000 | 1,396,350 |
| 5.625% 1/15/26 (b) | | 1,930,000 | 1,669,450 |
| 5.875% 2/15/22 | | 345,000 | 335,513 |
| NXP BV/NXP Funding LLC: | | | |
| 3.75% 6/1/18 (b) | | 590,000 | 592,950 |
| 4.625% 6/15/22 (b) | | 400,000 | 393,000 |
| 5.75% 2/15/21 (b) | | 525,000 | 546,000 |
| 5.75% 3/15/23 (b) | | 2,415,000 | 2,493,488 |
| Qorvo, Inc.: | | | |
| 6.75% 12/1/23 (b) | | 190,000 | 193,800 |
| 7% 12/1/25 (b) | | 405,000 | 417,150 |
| Sensata Technologies UK Financing Co. PLC 6.25% 2/15/26 (b) | | 585,000 | 608,400 |
| | | | 9,440,664 |
| Software - 0.7% | | | |
| Activision Blizzard, Inc.: | | | |
| 5.625% 9/15/21 (b) | | 3,695,000 | 3,870,513 |
| 6.125% 9/15/23 (b) | | 770,000 | 816,200 |
| Blue Coat Systems, Inc. 8.375% 6/1/23 (b) | | 510,000 | 512,550 |
| BMC Software Finance, Inc. 8.125% 7/15/21 (b) | | 1,370,000 | 911,050 |
| BMC Software, Inc. 7.25% 6/1/18 | | 115,000 | 94,875 |
| Ensemble S Merger Sub, Inc. 9% 9/30/23 (b) | | 970,000 | 937,263 |
| Italics Merger Sub, Inc. 7.125% 7/15/23 (b) | | 290,000 | 262,450 |
| Nuance Communications, Inc. 5.375% 8/15/20 (b) | | 250,000 | 250,330 |
| SS&C Technologies Holdings, Inc. 5.875% 7/15/23 (b) | | 455,000 | 469,788 |
| | | | 8,125,019 |
| Technology Hardware, Storage & Peripherals - 0.1% | | | |
| Seagate HDD Cayman: | | | |
| 4.75% 6/1/23 | | 1,050,000 | 919,045 |
| 4.75% 1/1/25 | | 540,000 | 449,660 |
| | | | 1,368,705 |
| TOTAL INFORMATION TECHNOLOGY | | | 30,682,347 |
| MATERIALS - 3.1% | | | |
| Chemicals - 1.1% | | | |
| Albemarle Corp. U.S. 1.875% 12/8/21 (Reg. S) | EUR | 1,300,000 | 1,360,196 |
| Braskem Finance Ltd.: | | | |
| 5.375% 5/2/22 (b) | | 400,000 | 332,000 |
| 5.75% 4/15/21 (b) | | 400,000 | 348,000 |
| 6.45% 2/3/24 | | 400,000 | 344,000 |
| Chemtura Corp. 5.75% 7/15/21 | | 255,000 | 256,275 |
| Mexichem S.A.B. de CV 4.875% 9/19/22 (b) | | 275,000 | 273,625 |
| Momentive Performance Materials, Inc.: | | | |
| 3.88% 10/24/21 | | 3,580,000 | 2,470,200 |
| 4.69% 4/24/22 | | 1,515,000 | 749,925 |
| 10% 10/15/20 (d) | | 1,515,000 | 0 |
| MPM Escrow LLC/MPM Finance Escrow Corp. 8.875% 10/15/20 (d) | | 3,580,000 | 0 |
| Nufarm Australia Ltd. 6.375% 10/15/19 (b) | | 210,000 | 207,900 |
| OCP SA 5.625% 4/25/24 (b) | | 200,000 | 202,950 |
| Platform Specialty Products Corp.: | | | |
| 6.5% 2/1/22 (b) | | 435,000 | 376,275 |
| 10.375% 5/1/21 (b) | | 175,000 | 174,563 |
| PolyOne Corp. 5.25% 3/15/23 | | 320,000 | 312,000 |
| Rentech Nitrogen Partners LP/Rentech Nitrogen Finance Corp. 6.5% 4/15/21 (b) | | 170,000 | 164,900 |
| Solvay SA: | | | |
| 1.625% 12/2/22 (Reg. S) | EUR | 400,000 | 434,139 |
| 2.75% 12/2/27 (Reg. S) | EUR | 700,000 | 765,683 |
| SPCM SA 2.875% 6/15/23 (Reg. S) | EUR | 440,000 | 456,652 |
| TPC Group, Inc. 8.75% 12/15/20 (b) | | 765,000 | 497,250 |
| U.S. Coatings Acquisition, Inc./Flash Dutch 2 BV 7.375% 5/1/21 (b) | | 255,000 | 268,866 |
| W. R. Grace & Co.-Conn.: | | | |
| 5.125% 10/1/21 (b) | | 1,647,000 | 1,663,470 |
| 5.625% 10/1/24 (b) | | 1,870,000 | 1,888,700 |
| | | | 13,547,569 |
| Construction Materials - 0.1% | | | |
| CEMEX Finance LLC: | | | |
| 6% 4/1/24 (b) | | 200,000 | 171,500 |
| 9.375% 10/12/22 (b) | | 300,000 | 315,750 |
| Prince Mineral Holding Corp. 11.5% 12/15/19 (b) | | 175,000 | 126,000 |
| Union Andina de Cementos SAA 5.875% 10/30/21 (b) | | 300,000 | 289,500 |
| | | | 902,750 |
| Containers & Packaging - 0.7% | | | |
| Ardagh Finance Holdings SA 8.625% 6/15/19 pay-in-kind (b)(c) | | 3,245,023 | 3,185,920 |
| Ardagh Packaging Finance PLC/Ardagh MP Holdings U.S.A., Inc.: | | | |
| 6% 6/30/21 (b) | | 350,000 | 326,375 |
| 6.25% 1/31/19 (b) | | 285,000 | 273,600 |
| 6.75% 1/31/21 (b) | | 605,000 | 580,800 |
| 7% 11/15/20 (b) | | 55,588 | 54,615 |
| Beverage Packaging Holdings II SA (Luxembourg): | | | |
| 5.625% 12/15/16 (b) | | 625,000 | 617,969 |
| 6% 6/15/17 (b) | | 315,000 | 304,763 |
| Consolidated Container Co. LLC/Consolidated Container Capital, Inc. 10.125% 7/15/20 (b) | | 210,000 | 172,200 |
| Crown Cork & Seal, Inc.: | | | |
| 7.375% 12/15/26 | | 1,210,000 | 1,300,750 |
| 7.5% 12/15/96 | | 160,000 | 146,200 |
| Graphic Packaging International, Inc. 4.75% 4/15/21 | | 165,000 | 168,300 |
| Sealed Air Corp. 5.25% 4/1/23 (b) | | 270,000 | 275,400 |
| Silgan Holdings, Inc. 5% 4/1/20 | | 960,000 | 976,800 |
| | | | 8,383,692 |
| Metals & Mining - 1.0% | | | |
| Aleris International, Inc. 6% 6/1/20 (b) | | 1,759 | 1,759 |
| Alrosa Finance SA 7.75% 11/3/20 (b) | | 200,000 | 210,350 |
| Compania Minera Ares SAC 7.75% 1/23/21 (b) | | 400,000 | 373,000 |
| EVRAZ Group SA: | | | |
| 6.5% 4/22/20 (b) | | 1,080,000 | 1,011,960 |
| 9.5% 4/24/18 (Reg. S) | | 1,225,000 | 1,283,800 |
| Evraz, Inc. NA Canada 7.5% 11/15/19 (b) | | 485,000 | 453,475 |
| Ferrexpo Finance PLC 10.375% 4/7/19 (b) | | 1,293,000 | 704,685 |
| FMG Resources (August 2006) Pty Ltd. 9.75% 3/1/22 (b) | | 510,000 | 466,650 |
| Gerdau Trade, Inc. 5.75% 1/30/21 (b) | | 200,000 | 158,500 |
| Gold Fields Orogen Holding BVI Ltd. 4.875% 10/7/20 (b) | | 1,525,000 | 1,136,125 |
| GTL Trade Finance, Inc. 5.893% 4/29/24 (b) | | 600,000 | 426,000 |
| Metalloinvest Finance Ltd. 5.625% 4/17/20 (b) | | 695,000 | 668,048 |
| Metinvest BV: | | | |
| 8.75% 2/14/18 (Reg. S) | | 200,000 | 85,100 |
| 10.5% 11/28/17 (b) | | 1,732,000 | 770,740 |
| Mirabela Nickel Ltd. 1% 9/10/44 (b) | | 1,278 | 0 |
| New Gold, Inc. 7% 4/15/20 (b) | | 150,000 | 135,000 |
| Nord Gold NV 6.375% 5/7/18 (b) | | 320,000 | 321,789 |
| Polyus Gold International Ltd.: | | | |
| 5.625% 4/29/20 (b) | | 1,200,000 | 1,149,000 |
| 5.625% 4/29/20 (Reg. S) | | 200,000 | 191,500 |
| Ryerson, Inc./Joseph T Ryerson & Son, Inc.: | | | |
| 9% 10/15/17 | | 155,000 | 119,350 |
| 11.25% 10/15/18 | | 735,000 | 547,575 |
| Samarco Mineracao SA 5.75% 10/24/23 (b) | | 290,000 | 92,800 |
| Southern Copper Corp. 7.5% 7/27/35 | | 450,000 | 420,656 |
| Vale Overseas Ltd.: | | | |
| 6.25% 1/11/16 | | 245,000 | 244,963 |
| 6.875% 11/21/36 | | 280,000 | 195,731 |
| Vedanta Resources PLC 6% 1/31/19 (b) | | 475,000 | 300,645 |
| | | | 11,469,201 |
| Paper & Forest Products - 0.2% | | | |
| Boise Cascade Co. 6.375% 11/1/20 | | 145,000 | 149,350 |
| Mercer International, Inc.: | | | |
| 7% 12/1/19 | | 395,000 | 395,988 |
| 7.75% 12/1/22 | | 1,710,000 | 1,727,100 |
| NewPage Corp.: | | | |
| 0% 5/1/12 (c)(d) | | 90,000 | 0 |
| 11.375% 12/31/14 (d) | | 318,200 | 0 |
| Sino-Forest Corp. 6.25% 10/21/17 (b)(d) | | 565,000 | 0 |
| | | | 2,272,438 |
| TOTAL MATERIALS | | | 36,575,650 |
| TELECOMMUNICATION SERVICES - 5.3% | | | |
| Diversified Telecommunication Services - 1.5% | | | |
| Altice Financing SA: | | | |
| 6.5% 1/15/22 (b) | | 1,435,000 | 1,420,650 |
| 6.625% 2/15/23 (b) | | 1,080,000 | 1,066,500 |
| 7.875% 12/15/19 (b) | | 440,000 | 457,600 |
| Altice Finco SA: | | | |
| 8.125% 1/15/24 (b) | | 3,320,000 | 3,212,100 |
| 9.875% 12/15/20 (b) | | 655,000 | 697,575 |
| Citizens Communications Co.: | | | |
| 7.875% 1/15/27 | | 280,000 | 229,600 |
| 9% 8/15/31 | | 220,000 | 184,800 |
| Eileme 2 AB 11.625% 1/31/20 (b) | | 935,000 | 991,100 |
| FairPoint Communications, Inc. 8.75% 8/15/19 (b) | | 335,000 | 329,975 |
| GCI, Inc. 6.875% 4/15/25 | | 560,000 | 572,600 |
| Level 3 Communications, Inc. 5.75% 12/1/22 | | 595,000 | 608,388 |
| Level 3 Financing, Inc.: | | | |
| 5.125% 5/1/23 (b) | | 575,000 | 570,688 |
| 5.375% 5/1/25 (b) | | 575,000 | 572,125 |
| Lynx I Corp. 5.375% 4/15/21 (b) | | 301,500 | 311,299 |
| Lynx II Corp. 6.375% 4/15/23 (b) | | 200,000 | 203,000 |
| Qtel International Finance Ltd. 5% 10/19/25 (b) | | 275,000 | 296,656 |
| Sable International Finance Ltd. 6.875% 8/1/22 (b) | | 2,030,000 | 1,958,950 |
| Sprint Capital Corp.: | | | |
| 6.875% 11/15/28 | | 2,787,000 | 1,943,933 |
| 8.75% 3/15/32 | | 1,326,000 | 994,500 |
| Telefonica Celular del Paraguay SA 6.75% 12/13/22 (b) | | 200,000 | 182,500 |
| U.S. West Communications: | | | |
| 6.875% 9/15/33 | | 170,000 | 163,131 |
| 7.25% 9/15/25 | | 35,000 | 37,232 |
| 7.25% 10/15/35 | | 70,000 | 68,775 |
| UPCB Finance IV Ltd. 5.375% 1/15/25 (b) | | 615,000 | 579,638 |
| Virgin Media Finance PLC 4.875% 2/15/22 | | 565,000 | 512,031 |
| | | | 18,165,346 |
| Wireless Telecommunication Services - 3.8% | | | |
| America Movil S.A.B. de CV 6.45% 12/5/22 | MXN | 11,000,000 | 605,065 |
| Comcel Trust 6.875% 2/6/24 (b) | | 450,000 | 346,500 |
| Digicel Group Ltd.: | | | |
| 6.75% 3/1/23 (b) | | 385,000 | 321,475 |
| 7% 2/15/20 (b) | | 1,200,000 | 1,092,000 |
| 7.125% 4/1/22 (b) | | 3,685,000 | 2,763,750 |
| 8.25% 9/30/20 (b) | | 2,425,000 | 2,000,625 |
| Intelsat Jackson Holdings SA: | | | |
| 6.625% 12/15/22 (Reg. S) | | 2,665,000 | 1,698,938 |
| 7.25% 10/15/20 | | 500,000 | 437,500 |
| 7.5% 4/1/21 | | 585,000 | 508,950 |
| Millicom International Cellular SA: | | | |
| 4.75% 5/22/20 (b) | | 555,000 | 496,725 |
| 6% 3/15/25 (b) | | 1,145,000 | 973,250 |
| 6.625% 10/15/21 (b) | | 965,000 | 891,419 |
| MTS International Funding Ltd. 8.625% 6/22/20 (b) | | 1,285,000 | 1,416,070 |
| Neptune Finco Corp.: | | | |
| 6.625% 10/15/25 (b) | | 1,125,000 | 1,170,000 |
| 10.125% 1/15/23 (b) | | 1,160,000 | 1,209,300 |
| 10.875% 10/15/25 (b) | | 2,800,000 | 2,933,000 |
| Sprint Communications, Inc. 6% 11/15/22 | | 765,000 | 539,325 |
| Sprint Corp.: | | | |
| 7.125% 6/15/24 | | 2,765,000 | 1,994,256 |
| 7.625% 2/15/25 | | 1,500,000 | 1,095,000 |
| 7.875% 9/15/23 | | 1,505,000 | 1,130,255 |
| T-Mobile U.S.A., Inc.: | | | |
| 6% 3/1/23 | | 955,000 | 966,938 |
| 6.125% 1/15/22 | | 1,875,000 | 1,926,563 |
| 6.25% 4/1/21 | | 1,750,000 | 1,802,500 |
| 6.375% 3/1/25 | | 4,300,000 | 4,343,000 |
| 6.5% 1/15/24 | | 3,483,000 | 3,552,660 |
| 6.542% 4/28/20 | | 780,000 | 813,150 |
| 6.625% 4/1/23 | | 2,341,000 | 2,387,820 |
| 6.633% 4/28/21 | | 860,000 | 892,250 |
| 6.731% 4/28/22 | | 565,000 | 589,013 |
| 6.836% 4/28/23 | | 665,000 | 688,275 |
| TBG Global Pte. Ltd. 4.625% 4/3/18 (Reg. S) | | 220,000 | 214,500 |
| Vimpel Communications 9.125% 4/30/18 (Reg. S) (Issued by VIP Finance Ireland Ltd. for Vimpel Communications) | | 275,000 | 297,013 |
| Vimpel Communications OJSC 7.748% 2/2/21 (Issued by VIP Finance Ireland Ltd. for Vimpel Communications) (b) | | 1,810,000 | 1,850,327 |
| VimpelCom Holdings BV: | | | |
| 9% 2/13/18 (b) | RUB | 10,000,000 | 129,692 |
| 9% 2/13/18 (Reg S.) | RUB | 22,500,000 | 291,807 |
| | | | 44,368,911 |
| TOTAL TELECOMMUNICATION SERVICES | | | 62,534,257 |
| UTILITIES - 1.4% | | | |
| Electric Utilities - 0.1% | | | |
| Hrvatska Elektroprivreda 5.875% 10/23/22 (b) | | 200,000 | 202,016 |
| Israel Electric Corp. Ltd. 7.75% 12/15/27 (Reg. S) | | 250,000 | 294,825 |
| Lamar Funding Ltd. 3.958% 5/7/25 (b) | | 250,000 | 222,125 |
| RJS Power Holdings LLC 5.125% 7/15/19 (b) | | 535,000 | 401,250 |
| | | | 1,120,216 |
| Gas Utilities - 0.1% | | | |
| Intergas Finance BV 6.375% 5/14/17 (Reg. S) | | 280,000 | 285,163 |
| Southern Natural Gas Co.: | | | |
| 7.35% 2/15/31 | | 175,000 | 160,637 |
| 8% 3/1/32 | | 335,000 | 328,965 |
| | | | 774,765 |
| Independent Power and Renewable Electricity Producers - 1.2% | | | |
| Dynegy, Inc.: | | | |
| 7.375% 11/1/22 | | 480,000 | 417,600 |
| 7.625% 11/1/24 | | 740,000 | 632,552 |
| Energy Future Holdings Corp.: | | | |
| 10.875% 11/1/17 (d) | | 1,125,000 | 1,102,500 |
| 11.25% 11/1/17 pay-in-kind (c)(d) | | 896,100 | 878,178 |
| Energy Future Intermediate Holding Co. LLC/Energy Future Intermediate Holding Finance, Inc.: | | | |
| 11% 10/1/21 (d) | | 1,972,457 | 2,085,874 |
| 12.25% 3/1/22 (b)(d) | | 2,285,067 | 2,433,597 |
| Listrindo Capital BV 6.95% 2/21/19 (Reg. S) | | 200,000 | 205,000 |
| PPL Energy Supply LLC 6.5% 6/1/25 (b) | | 460,000 | 303,600 |
| TerraForm Power Operating LLC: | | | |
| 5.875% 2/1/23 (b) | | 350,000 | 289,625 |
| 6.125% 6/15/25 (b) | | 180,000 | 144,900 |
| The AES Corp.: | | | |
| 4.875% 5/15/23 | | 590,000 | 516,250 |
| 5.5% 3/15/24 | | 315,000 | 281,138 |
| TXU Corp.: | | | |
| 5.55% 11/15/14 (d) | | 186,000 | 152,520 |
| 6.5% 11/15/24 (d) | | 3,225,000 | 2,644,500 |
| 6.55% 11/15/34 (d) | | 2,775,000 | 2,275,500 |
| | | | 14,363,334 |
| TOTAL UTILITIES | | | 16,258,315 |
|
| TOTAL NONCONVERTIBLE BONDS | | | 512,274,393 |
|
| TOTAL CORPORATE BONDS | | | |
| (Cost $545,031,078) | | | 512,617,592 |
|
| U.S. Government and Government Agency Obligations - 14.7% | | | |
| U.S. Government Agency Obligations - 0.4% | | | |
| Federal Home Loan Bank 1% 6/21/17 | | 880,000 | 879,562 |
| Tennessee Valley Authority: | | | |
| 1.75% 10/15/18 | | $1,672,000 | $1,689,108 |
| 4.25% 9/15/65 | | 1,270,000 | 1,244,473 |
| 5.25% 9/15/39 | | 126,000 | 152,398 |
| 5.375% 4/1/56 | | 414,000 | 494,543 |
|
| TOTAL U.S. GOVERNMENT AGENCY OBLIGATIONS | | | 4,460,084 |
|
| U.S. Treasury Inflation-Protected Obligations - 0.4% | | | |
| U.S. Treasury Inflation-Indexed Bonds: | | | |
| 0.75% 2/15/45 | | 3,109,821 | 2,706,992 |
| 1.375% 2/15/44 | | 1,600,160 | 1,625,551 |
|
| TOTAL U.S. TREASURY INFLATION-PROTECTED OBLIGATIONS | | | 4,332,543 |
|
| U.S. Treasury Obligations - 13.3% | | | |
| U.S. Treasury Bonds: | | | |
| 2.875% 8/15/45 | | 4,299,000 | 4,167,175 |
| 3.375% 5/15/44 | | 559,000 | 598,762 |
| 3.625% 2/15/44 | | 8,756,000 | 9,830,974 |
| 4.25% 5/15/39 | | 2,600,000 | 3,205,899 |
| 4.375% 2/15/38 | | 675,000 | 850,389 |
| 4.75% 2/15/37 | | 450,000 | 595,566 |
| 5.25% 2/15/29 | | 2,206,000 | 2,890,370 |
| 5.375% 2/15/31 (f) | | 1,869,000 | 2,534,035 |
| 6.25% 8/15/23 (g) | | 2,249,000 | 2,903,495 |
| 7.875% 2/15/21 | | 200,000 | 259,114 |
| U.S. Treasury Notes: | | | |
| 0.5% 7/31/17 | | 2,652,000 | 2,631,951 |
| 0.625% 8/31/17 | | 3,000,000 | 2,980,893 |
| 0.75% 4/15/18 | | 1,331,000 | 1,318,216 |
| 0.875% 8/15/17 | | 6,000,000 | 5,986,998 |
| 0.875% 11/30/17 | | 3,562,000 | 3,552,034 |
| 0.875% 1/31/18 | | 950,000 | 945,341 |
| 0.875% 7/31/19 | | 4,926,000 | 4,815,332 |
| 1% 5/31/18 | | 2,020,000 | 2,009,884 |
| 1% 8/15/18 | | 1,000,000 | 993,626 |
| 1.125% 6/15/18 | | 3,500,000 | 3,492,230 |
| 1.25% 11/30/18 | | 3,700,000 | 3,694,287 |
| 1.25% 12/15/18 | | 2,445,000 | 2,440,174 |
| 1.375% 7/31/18 | | 361,000 | 362,437 |
| 1.375% 9/30/18 | | 1,503,000 | 1,507,925 |
| 1.375% 2/28/19 | | 4,070,000 | 4,067,912 |
| 1.375% 3/31/20 | | 2,856,000 | 2,821,422 |
| 1.375% 4/30/20 | | 9,580,000 | 9,458,075 |
| 1.5% 12/31/18 | | 416,000 | 417,951 |
| 1.5% 1/31/19 | | 3,585,000 | 3,598,178 |
| 1.5% 1/31/22 | | 3,727,000 | 3,623,538 |
| 1.625% 4/30/19 | | 4,433,000 | 4,459,616 |
| 1.625% 6/30/19 | | 5,374,000 | 5,399,166 |
| 1.625% 6/30/20 | | 114,000 | 113,560 |
| 1.625% 7/31/20 | | 1,500,000 | 1,493,217 |
| 1.625% 11/30/20 | | 2,594,000 | 2,579,300 |
| 1.75% 9/30/19 | | 6,510,000 | 6,555,381 |
| 1.75% 12/31/20 | | 1,000,000 | 999,195 |
| 1.875% 8/31/17 | | 3,300,000 | 3,345,807 |
| 1.875% 9/30/17 | | 1,900,000 | 1,927,130 |
| 1.875% 10/31/17 | | 5,554,000 | 5,635,527 |
| 2% 5/31/21 | | 3,700,000 | 3,726,007 |
| 2% 11/30/22 | | 8,443,000 | 8,396,918 |
| 2% 8/15/25 | | 4,193,000 | 4,088,108 |
| 2.125% 6/30/21 | | 1,500,000 | 1,519,281 |
| 2.125% 12/31/22 | | 1,000,000 | 1,001,918 |
| 2.25% 3/31/21 | | 7,324,000 | 7,475,072 |
| 2.25% 4/30/21 | | 5,470,000 | 5,580,221 |
| 2.25% 11/15/25 | | 650,000 | 648,545 |
| 2.375% 7/31/17 | | 141,000 | 144,005 |
| 2.375% 8/15/24 | | 3,069,000 | 3,100,783 |
| 3.5% 2/15/18 | | 1,501,000 | 1,576,505 |
|
| TOTAL U.S. TREASURY OBLIGATIONS | | | 158,319,445 |
|
| Other Government Related - 0.6% | | | |
| National Credit Union Administration Guaranteed Notes: | | | |
| Series 2010-A1 Class A, 0.637% 12/7/20 (NCUA Guaranteed) (c) | | 156,591 | 156,178 |
| Series 2011-R1 Class 1A, 0.7186% 1/8/20 (NCUA Guaranteed) (c) | | 342,965 | 343,849 |
| Series 2011-R4 Class 1A, 0.6486% 3/6/20 (NCUA Guaranteed) (c) | | 116,920 | 117,002 |
| National Credit Union Administration Guaranteed Notes Master Trust: | | | |
| 2.35% 6/12/17 (NCUA Guaranteed) | | 2,930,000 | 2,994,870 |
| 3.45% 6/12/21 (NCUA Guaranteed) | | 3,400,000 | 3,686,756 |
|
| TOTAL OTHER GOVERNMENT RELATED | | | 7,298,655 |
|
| TOTAL U.S. GOVERNMENT AND GOVERNMENT AGENCY OBLIGATIONS | | | |
| (Cost $172,749,185) | | | 174,410,727 |
|
| U.S. Government Agency - Mortgage Securities - 0.7% | | | |
| Fannie Mae - 0.4% | | | |
| 1.99% 11/1/35 (c) | | 17,306 | 17,981 |
| 2.026% 9/1/33 (c) | | 23,164 | 24,041 |
| 2.115% 10/1/35 (c) | | 1,140 | 1,187 |
| 2.19% 3/1/37 (c) | | 1,538 | 1,622 |
| 2.204% 1/1/35 (c) | | 11,107 | 11,605 |
| 2.215% 2/1/36 (c) | | 646 | 680 |
| 2.278% 6/1/47 (c) | | 7,921 | 8,396 |
| 2.29% 11/1/33 (c) | | 2,491 | 2,593 |
| 2.302% 6/1/36 (c) | | 2,676 | 2,813 |
| 2.351% 7/1/35 (c) | | 17,694 | 18,679 |
| 2.358% 3/1/33 (c) | | 5,397 | 5,661 |
| 2.372% 2/1/37 (c) | | 25,769 | 27,328 |
| 2.393% 9/1/36 (c) | | 4,358 | 4,581 |
| 2.419% 11/1/36 (c) | | 3,287 | 3,475 |
| 2.51% 4/1/36(c) | | 14,702 | 15,603 |
| 2.525% 5/1/36 (c) | | 2,060 | 2,186 |
| 2.557% 6/1/42 (c) | | 32,252 | 33,036 |
| 2.686% 2/1/42 (c) | | 230,313 | 237,996 |
| 2.759% 1/1/42 (c) | | 204,769 | 212,195 |
| 2.903% 8/1/35 (c) | | 27,070 | 28,728 |
| 2.951% 11/1/40 (c) | | 23,975 | 24,924 |
| 2.98% 9/1/41 (c) | | 27,594 | 28,754 |
| 2.991% 10/1/41 (c) | | 10,011 | 10,415 |
| 3.242% 7/1/41 (c) | | 37,453 | 39,318 |
| 3.347% 10/1/41 (c) | | 21,864 | 22,783 |
| 3.553% 7/1/41 (c) | | 42,677 | 44,869 |
| 4.5% 7/1/33 to 4/1/39 | | 1,864,646 | 2,026,334 |
| 5% 7/1/35 | | 598,760 | 659,927 |
| 5.5% 10/1/20 to 1/1/29 | | 324,463 | 352,927 |
| 6% 6/1/16 to 10/1/16 | | 406 | 410 |
| 6.5% 6/1/16 to 8/1/36 | | 451,093 | 520,359 |
|
| TOTAL FANNIE MAE | | | 4,391,406 |
|
| Freddie Mac - 0.1% | | | |
| 1.825% 3/1/37 (c) | | 1,039 | 1,079 |
| 1.925% 3/1/35 (c) | | 6,121 | 6,325 |
| 1.985% 1/1/36 (c) | | 5,238 | 5,436 |
| 2.034% 2/1/37 (c) | | 2,802 | 2,925 |
| 2.095% 8/1/37 (c) | | 4,364 | 4,583 |
| 2.114% 1/1/37 (c) | | 15,476 | 16,159 |
| 2.175% 6/1/37 (c) | | 1,746 | 1,824 |
| 2.246% 5/1/37 (c) | | 4,349 | 4,568 |
| 2.275% 6/1/33 (c) | | 13,121 | 13,783 |
| 2.29% 7/1/36 (c) | | 312,664 | 329,740 |
| 2.333% 4/1/37 (c) | | 5,333 | 5,649 |
| 2.35% 7/1/35 (c) | | 8,589 | 9,017 |
| 2.364% 10/1/42 (c) | | 234,084 | 248,224 |
| 2.403% 10/1/36 (c) | | 17,244 | 18,134 |
| 2.415% 6/1/37 (c) | | 14,684 | 15,583 |
| 2.426% 10/1/35 (c) | | 7,543 | 7,942 |
| 2.436% 5/1/37 (c) | | 3,871 | 4,108 |
| 2.483% 5/1/37 (c) | | 46,805 | 49,625 |
| 2.507% 6/1/37 (c) | | 3,052 | 3,225 |
| 2.51% 5/1/37 (c) | | 18,828 | 19,914 |
| 2.595% 4/1/37 (c) | | 475 | 504 |
| 2.615% 9/1/35 (c) | | 3,448 | 3,647 |
| 2.795% 7/1/36 (c) | | 4,267 | 4,529 |
| 2.798% 7/1/35 (c) | | 10,084 | 10,702 |
| 3.078% 9/1/41 (c) | | 221,076 | 229,194 |
| 3.211% 9/1/41 (c) | | 28,937 | 30,182 |
| 3.226% 4/1/41 (c) | | 24,377 | 25,415 |
| 3.239% 10/1/35 (c) | | 2,289 | 2,429 |
| 3.298% 6/1/41 (c) | | 30,818 | 32,363 |
| 3.451% 5/1/41 (c) | | 20,371 | 21,162 |
| 3.618% 6/1/41 (c) | | 38,101 | 40,130 |
| 3.704% 5/1/41 (c) | | 31,512 | 33,254 |
| 6% 1/1/24 | | 120,410 | 131,142 |
| 6.5% 1/1/17 to 3/1/22 | | 24,683 | 26,778 |
|
| TOTAL FREDDIE MAC | | | 1,359,274 |
|
| Ginnie Mae - 0.2% | | | |
| 4.3% 8/20/61 (h) | | 318,160 | 330,410 |
| 4.649% 2/20/62 (h) | | 217,235 | 229,630 |
| 4.682% 2/20/62 (h) | | 284,891 | 300,110 |
| 4.684% 1/20/62 (h) | | 1,311,741 | 1,380,556 |
| 5.47% 8/20/59 (h) | | 99,107 | 101,424 |
| 5.5% 11/15/35 | | 190,503 | 213,901 |
| 5.612% 4/20/58 (h) | | 40,604 | 40,993 |
| 6% 6/15/36 | | 358,680 | 412,468 |
|
| TOTAL GINNIE MAE | | | 3,009,492 |
|
| TOTAL U.S. GOVERNMENT AGENCY - MORTGAGE SECURITIES | | | |
| (Cost $8,687,321) | | | 8,760,172 |
|
| Collateralized Mortgage Obligations - 3.2% | | | |
| U.S. Government Agency - 3.2% | | | |
| Fannie Mae: | | | |
| floater Series 2010-15 Class FJ, 1.3516% 6/25/36 (c) | | $404,019 | $411,475 |
| planned amortization class: | | | |
| Series 2002-9 Class PC, 6% 3/25/17 | | 282 | 288 |
| Series 2003-70 Class BJ, 5% 7/25/33 | | 21,211 | 23,391 |
| Series 2005-19 Class PA, 5.5% 7/25/34 | | 134,189 | 143,346 |
| Series 2005-27 Class NE, 5.5% 5/25/34 | | 121,371 | 124,642 |
| Series 2005-64 Class PX, 5.5% 6/25/35 | | 133,024 | 144,505 |
| Series 2005-68 Class CZ, 5.5% 8/25/35 | | 450,931 | 500,930 |
| Series 2010-118 Class PB, 4.5% 10/25/40 | | 300,000 | 317,846 |
| Series 2015-54 Class GA, 2.5% 7/25/45 | | 722,221 | 728,142 |
| sequential payer: | | | |
| Series 2002-57 Class BD, 5.5% 9/25/17 | | 1,629 | 1,670 |
| Series 2003-117 Class MD, 5% 12/25/23 | | 92,474 | 100,545 |
| Series 2004-52 Class KZ, 5.5% 7/25/34 | | 977,341 | 1,093,160 |
| Series 2004-91 Class Z, 5% 12/25/34 | | 368,187 | 406,236 |
| Series 2005-117 Class JN, 4.5% 1/25/36 | | 40,000 | 43,034 |
| Series 2005-14 Class ZB, 5% 3/25/35 | | 144,578 | 159,526 |
| Series 2006-72 Class CY, 6% 8/25/26 | | 69,415 | 75,927 |
| Series 2009-59 Class HB, 5% 8/25/39 | | 195,760 | 215,943 |
| Series 2010-88 Class NA, 4% 8/25/28 | | 675,217 | 682,285 |
| Series 2009-85 Class IB, 4.5% 8/25/24 (i) | | 21,472 | 1,612 |
| Series 2009-93 Class IC, 4.5% 9/25/24 (i) | | 32,426 | 2,383 |
| Series 2010-139 Class NI, 4.5% 2/25/40 (i) | | 214,847 | 28,570 |
| Series 2010-39 Class FG, 1.3416% 3/25/36 (c) | | 261,099 | 267,648 |
| Series 2010-97 Class CI, 4.5% 8/25/25 (i) | | 70,393 | 5,044 |
| Series 2011-67 Class AI, 4% 7/25/26 (i) | | 65,470 | 7,111 |
| Series 2012-27 Class EZ, 4.25% 3/25/42 | | 488,752 | 539,658 |
| Freddie Mac: | | | |
| floater: | | | |
| Series 2630 Class FL, 0.8305% 6/15/18 (c) | | 352 | 352 |
| Series 2711 Class FC, 1.2305% 2/15/33 (c) | | 150,344 | 152,862 |
| floater planned amortization class Series 2770 Class FH, 0.7305% 3/15/34 (c) | | 171,677 | 172,906 |
| planned amortization class: | | | |
| Series 2101 Class PD, 6% 11/15/28 | | 3,111 | 3,379 |
| Series 2376 Class JE, 5.5% 11/15/16 | | 979 | 993 |
| Series 2381 Class OG, 5.5% 11/15/16 | | 400 | 405 |
| Series 2425 Class JH, 6% 3/15/17 | | 1,591 | 1,627 |
| Series 2996 Class MK, 5.5% 6/15/35 | | 6,753 | 7,489 |
| Series 3415 Class PC, 5% 12/15/37 | | 65,001 | 69,503 |
| Series 3763 Class QA, 4% 4/15/34 | | 139,571 | 143,247 |
| Series 3840 Class VA, 4.5% 9/15/27 | | 251,883 | 267,852 |
| planned amortization class sequential payer Series 2005-2963 Class VB, 5% 11/15/34 | | 180,072 | 182,958 |
| sequential payer: | | | |
| Series 2004-2802 Class ZG, 5.5% 5/15/34 | | 717,021 | 799,780 |
| Series 2303 Class ZV, 6% 4/15/31 | | 7,518 | 8,199 |
| Series 2877 Class ZD, 5% 10/15/34 | | 435,443 | 479,386 |
| Series 3745 Class KV, 4.5% 12/15/26 | | 432,344 | 469,390 |
| Series 3843 Class PZ, 5% 4/15/41 | | 141,444 | 165,250 |
| Ginnie Mae guaranteed REMIC pass-thru certificates: | | | |
| floater: | | | |
| Series 2007-59 Class FC, 0.7068% 7/20/37 (c) | | 84,865 | 85,530 |
| Series 2008-2 Class FD, 0.6868% 1/20/38 (c) | | 20,978 | 21,138 |
| Series 2008-73 Class FA, 1.0668% 8/20/38 (c) | | 130,606 | 133,252 |
| Series 2008-83 Class FB, 1.1068% 9/20/38 (c) | | 125,218 | 127,828 |
| Series 2009-108 Class CF, 0.9445% 11/16/39 (c) | | 104,287 | 105,354 |
| Series 2009-116 Class KF, 0.8745% 12/16/39 (c) | | 81,870 | 82,590 |
| Series 2010-H17 Class FA, 0.5235% 7/20/60 (c)(h) | | 454,135 | 448,423 |
| Series 2010-H18 Class AF, 0.4947% 9/20/60 (c)(h) | | 548,062 | 540,084 |
| Series 2010-H19 Class FG, 0.4947% 8/20/60 (c)(h) | | 626,430 | 618,219 |
| Series 2010-H27 Series FA, 0.5747% 12/20/60 (c)(h) | | 252,927 | 249,574 |
| Series 2011-H05 Class FA, 0.6947% 12/20/60 (c)(h) | | 347,046 | 344,859 |
| Series 2011-H07 Class FA, 0.692% 2/20/61 (c)(h) | | 594,222 | 591,534 |
| Series 2011-H12 Class FA, 0.682% 2/20/61 (c)(h) | | 846,882 | 838,570 |
| Series 2011-H13 Class FA, 0.6947% 4/20/61 (c)(h) | | 309,922 | 307,789 |
| Series 2011-H14: | | | |
| Class FB, 0.6947% 5/20/61 (c)(h) | | 364,831 | 362,497 |
| Class FC, 0.6947% 5/20/61 (c)(h) | | 330,322 | 328,428 |
| Series 2011-H17 Class FA, 0.7247% 6/20/61 (c)(h) | | 426,376 | 422,950 |
| Series 2011-H21 Class FA, 0.7947% 10/20/61 (c)(h) | | 480,075 | 479,101 |
| Series 2012-H01 Class FA, 0.8947% 11/20/61 (c)(h) | | 410,272 | 410,214 |
| Series 2012-H03 Class FA, 0.8947% 1/20/62 (c)(h) | | 259,925 | 260,482 |
| Series 2012-H06 Class FA, 0.8247% 1/20/62 (c)(h) | | 394,623 | 394,411 |
| Series 2012-H07 Class FA, 0.8247% 3/20/62 (c)(h) | | 242,436 | 242,131 |
| Series 2013-H19 Class FD, 0.7947% 8/20/63 (c)(h) | | 204,111 | 203,554 |
| Series 2014-H11 Class BA, 0.692% 6/20/64 (c)(h) | | 1,863,564 | 1,849,737 |
| Series 2015-H13 Class FL, 0.472% 5/20/63 (c)(h) | | 2,410,089 | 2,404,138 |
| Series 2015-H19 Class FA, 0.392% 4/20/63 (c)(h) | | 2,302,911 | 2,294,367 |
| floater sequential payer Series 2011-150 Class D, 3% 4/20/37 | | 8,683 | 8,738 |
| planned amortization class Series 2011-136 Class WI, 4.5% 5/20/40 (i) | | 150,652 | 20,406 |
| sequential payer: | | | |
| Series 2011-69 Class GX, 4.5% 5/16/40 | | 470,000 | 512,717 |
| Series 2014-H12 Class KA, 2.75% 5/20/64 (h) | | 396,138 | 403,240 |
| Series 2010-H15 Class TP, 5.15% 8/20/60 (h) | | 1,062,483 | 1,127,135 |
| Series 2010-H17 Class XP, 5.3015% 7/20/60 (c)(h) | | 1,427,656 | 1,510,628 |
| Series 2010-H18 Class PL, 5.01% 9/20/60 (c)(h) | | 1,071,884 | 1,136,848 |
| Series 2012-64 Class KB, 7.0242% 5/20/41 (c) | | 54,659 | 64,423 |
| Series 2013-124: | | | |
| Class ES, 8.391% 4/20/39 (c)(j) | | 534,863 | 588,491 |
| Class ST, 8.5243% 8/20/39 (c)(j) | | 1,004,740 | 1,162,358 |
| Series 2015-H17 Class HA, 2.5% 5/20/65 (h) | | 1,342,311 | 1,358,597 |
| Series 2015-H21: | | | |
| Class HA, 2.5% 6/20/63 (h) | | 3,071,573 | 3,108,666 |
| Class JA, 2.5% 6/20/65 (h) | | 389,283 | 393,975 |
| Series 2015-H30 Class HA, 1.75% 9/20/62 (c)(h) | | 2,773,391 | 2,743,367 |
| Series 2090-118 Class XZ, 5% 12/20/39 | | 708,234 | 828,380 |
| TOTAL COLLATERALIZED MORTGAGE OBLIGATIONS | | | |
|
| (Cost $38,081,294) | | | 38,065,218 |
|
|
| Commercial Mortgage Securities - 1.7% | | | |
| Freddie Mac: | | | |
| pass-thru certificates floater Series KF01 Class A, 0.542% 4/25/19(c) | | 6,366 | 6,361 |
| pass-thru certificates sequential payer Series K011 Class A2, 4.084% 11/25/20 | | 260,000 | 280,954 |
| sequential payer: | | | |
| Series K006 Class A2, 4.251% 1/25/20 | | 1,410,000 | 1,518,461 |
| Series K009 Class A2, 3.808% 8/25/20 | | 2,150,000 | 2,301,915 |
| Series K027 Class A2, 2.637% 1/25/23 | | 377,000 | 376,295 |
| Series K029 Class A2, 3.32% 2/25/23 (c) | | 198,000 | 206,576 |
| Series K034 Class A1, 2.669% 2/25/23 | | 1,028,812 | 1,051,949 |
| Series K717 Class A2, 2.991% 9/25/21 | | 1,172,000 | 1,202,918 |
| Series K039 Class A2, 3.303% 7/25/24 | | 2,013,000 | 2,069,758 |
| Series K042 Class A2, 2.67% 12/25/24 | | 1,700,000 | 1,671,881 |
| Series K501 Class A2, 1.655% 11/25/16 | | 526,307 | 527,486 |
| Series K714 Class A2, 3.034% 10/25/20 | | 3,500,000 | 3,618,526 |
| Series K716 Class A2, 3.13% 6/25/21 | | 1,200,000 | 1,241,287 |
| Series K720 Class A2, 2.716% 6/25/22 | | 790,000 | 794,675 |
| Freddie Mac Multi-family Structured pass-thru certificates: | | | |
| sequential payer Series K718 Class A2, 2.791% 1/25/22 | | 1,842,000 | 1,867,323 |
| Series K044 Class A2, 2.811% 1/25/25 | | 1,600,000 | 1,575,374 |
| TOTAL COMMERCIAL MORTGAGE SECURITIES | | | |
| (Cost $20,443,425) | | | 20,311,739 |
|
| Foreign Government and Government Agency Obligations - 15.6% | | | |
| Argentine Republic: | | | |
| 7% 4/17/17 | | 8,400,000 | 8,497,533 |
| 8.28% 12/31/33 (d) | | 602,876 | 693,308 |
| 8.75% 6/2/17 (d) | | 1,070,000 | 1,222,475 |
| Australian Commonwealth: | | | |
| 3.25% 4/21/25 (Reg. S) | AUD | 2,425,000 | 1,827,914 |
| 4.25% 7/21/17 | AUD | 4,950,000 | 3,728,024 |
| 4.25% 4/21/26 | AUD | 3,000,000 | 2,449,267 |
| Azerbaijan Republic 4.75% 3/18/24 (b) | | 250,000 | 233,195 |
| Belarus Republic 8.95% 1/26/18 | | 1,790,000 | 1,829,881 |
| Brazilian Federative Republic: | | | |
| 4.25% 1/7/25 | | 830,000 | 668,150 |
| 5.625% 1/7/41 | | 1,450,000 | 1,051,250 |
| 7.125% 1/20/37 | | 1,685,000 | 1,453,313 |
| 8.25% 1/20/34 | | 2,175,000 | 2,093,438 |
| Buenos Aires Province: | | | |
| 9.375% 9/14/18 (b) | | 510,000 | 520,200 |
| 9.95% 6/9/21(b) | | 420,000 | 428,925 |
| 10.875% 1/26/21 (b) | | 100,000 | 105,500 |
| 10.875% 1/26/21 (Reg. S) | | 1,930,000 | 2,036,150 |
| Buoni del Tesoro Poliennali: | | | |
| 1.05% 12/1/19 | EUR | 2,700,000 | 3,006,172 |
| 1.25% 9/15/32 (b) | EUR | 1,600,000 | 1,797,450 |
| 1.45% 9/15/22 | EUR | 2,600,000 | 2,900,145 |
| 1.65% 3/1/32 | EUR | 450,000 | 464,493 |
| 2.5% 12/1/24 | EUR | 2,200,000 | 2,596,607 |
| 4.5% 3/1/24 | EUR | 2,725,000 | 3,678,774 |
| Canadian Government: | | | |
| 1.5% 2/1/17 | CAD | 6,500,000 | 4,749,270 |
| 1.5% 3/1/20 | CAD | 3,000,000 | 2,244,504 |
| 1.5% 6/1/26 | CAD | 3,000,000 | 2,161,617 |
| 3.5% 12/1/45 | CAD | 1,300,000 | 1,218,685 |
| Central Bank of Nigeria warrants 11/15/20 (k)(l) | | 750 | 36,200 |
| City of Buenos Aires: | | | |
| 8.95% 2/19/21 (b) | | 495,000 | 522,225 |
| 9.95% 3/1/17 (b) | | 325,000 | 336,781 |
| Colombian Republic: | | | |
| 4.375% 3/21/23 | COP | 3,268,000,000 | 858,564 |
| 5% 6/15/45 | | 200,000 | 167,000 |
| 5.625% 2/26/44 | | 200,000 | 182,500 |
| 7.375% 9/18/37 | | 365,000 | 402,413 |
| 10.375% 1/28/33 | | 905,000 | 1,276,050 |
| Congo Republic 4% 6/30/29 (m) | | 1,970,775 | 1,547,058 |
| Costa Rican Republic: | | | |
| 4.25% 1/26/23 (b) | | 300,000 | 262,500 |
| 7% 4/4/44 (b) | | 670,000 | 558,613 |
| Croatia Republic: | | | |
| 5.5% 4/4/23 (b) | | 175,000 | 177,660 |
| 6% 1/26/24 (b) | | 200,000 | 208,346 |
| 6.375% 3/24/21 (b) | | 300,000 | 318,600 |
| 6.625% 7/14/20 (b) | | 170,000 | 182,164 |
| 6.75% 11/5/19 (b) | | 155,000 | 166,044 |
| Danish Kingdom 1.75% 11/15/25 | DKK | 9,600,000 | 1,502,644 |
| Democratic Socialist Republic of Sri Lanka: | | | |
| 6.25% 10/4/20 (b) | | 480,000 | 462,718 |
| 6.25% 7/27/21 (b) | | 210,000 | 199,658 |
| Dominican Republic: | | | |
| 1.4674% 8/30/24 (c) | | 1,570,000 | 1,536,638 |
| 5.5% 1/27/25 (b) | | 215,000 | 206,938 |
| 6.85% 1/27/45 (b) | | 690,000 | 650,325 |
| 7.45% 4/30/44 (b) | | 830,000 | 836,225 |
| 7.5% 5/6/21 (b) | | 515,000 | 552,338 |
| Georgia Republic 6.875% 4/12/21 (b) | | 210,000 | 217,056 |
| German Federal Republic: | | | |
| 0.25% 10/16/20 | EUR | 2,700,000 | 2,975,087 |
| 0.5% 2/15/25 | EUR | 100,000 | 107,931 |
| 2.5% 8/15/46 | EUR | 1,800,000 | 2,439,894 |
| Hong Kong Government SAR 1.32% 12/23/19 | HKD | 2,700,000 | 353,373 |
| Hungarian Republic: | | | |
| 5.375% 3/25/24 | | 268,000 | 293,460 |
| 5.75% 11/22/23 | | 427,000 | 477,770 |
| 7.625% 3/29/41 | | 454,000 | 614,316 |
| Indonesian Republic: | | | |
| 3.375% 4/15/23 (b) | | 280,000 | 260,188 |
| 4.75% 1/8/26 (b) | | 295,000 | 291,360 |
| 5.25% 1/17/42 (b) | | 270,000 | 243,812 |
| 5.375% 10/17/23 | | 200,000 | 207,938 |
| 5.95% 1/8/46 (b) | | 290,000 | 285,527 |
| 6.625% 2/17/37 (b) | | 525,000 | 550,088 |
| 6.75% 1/15/44 (b) | | 205,000 | 219,720 |
| 7.75% 1/17/38 (b) | | 1,070,000 | 1,251,726 |
| 8.5% 10/12/35 (Reg. S) | | 800,000 | 994,997 |
| Irish Republic: | | | |
| 2% 2/18/45 (Reg.S) | EUR | 975,000 | 1,016,011 |
| 2.4% 5/15/30 (Reg. S) | EUR | 1,050,000 | 1,245,885 |
| Islamic Republic of Pakistan: | | | |
| 7.125% 3/31/16 (b) | | 1,325,000 | 1,326,738 |
| 7.25% 4/15/19 (b) | | 965,000 | 982,839 |
| 8.25% 4/15/24 (b) | | 200,000 | 205,080 |
| 8.25% 9/30/25 (b) | | 295,000 | 299,767 |
| Israeli State (guaranteed by U.S. Government through Agency for International Development): | | | |
| 5.5% 9/18/23 | | 4,140,000 | 4,961,459 |
| 5.5% 12/4/23 | | 1,628,000 | 1,959,029 |
| Italian Republic 4.75% 9/1/44 | EUR | 750,000 | 1,151,227 |
| Ivory Coast 5.75% 12/31/32 | | 1,125,000 | 1,000,058 |
| Japan Government: | | | |
| 0.1% 1/15/16 | JPY | 85,000,000 | 707,212 |
| 0.1% 2/15/16 | JPY | 350,000,000 | 2,912,401 |
| 0.1% 3/15/16 | JPY | 300,000,000 | 2,496,593 |
| 0.1% 12/15/16 | JPY | 74,000,000 | 616,485 |
| 0.3% 6/20/16 | JPY | 231,000,000 | 1,924,817 |
| 0.9% 3/20/22 | JPY | 100,000,000 | 876,243 |
| 0.9% 6/20/22 | JPY | 964,050,000 | 8,459,851 |
| 1.5% 12/20/44 | JPY | 220,000,000 | 1,934,781 |
| 1.9% 9/20/30 | JPY | 975,000,000 | 9,606,421 |
| Jordanian Kingdom: | | | |
| 2.503% 10/30/20 | | 2,924,000 | 2,998,074 |
| 3% 6/30/25 | | 1,179,000 | 1,212,868 |
| Kazakhstan Republic: | | | |
| 5.125% 7/21/25 (b) | | 205,000 | 202,032 |
| 6.5% 7/21/45 (b) | | 285,000 | 280,166 |
| Kingdom of Norway 3.75% 5/25/21 | NOK | 4,800,000 | 619,394 |
| Lebanese Republic: | | | |
| 4% 12/31/17 | | 702,000 | 692,523 |
| 5.45% 11/28/19 | | 255,000 | 250,430 |
| 6.375% 3/9/20 | | 150,000 | 151,109 |
| New Zealand Government 6% 5/15/21 | NZD | 1,000,000 | 784,192 |
| Panamanian Republic: | | | |
| 6.7% 1/26/36 | | 140,000 | 166,250 |
| 8.875% 9/30/27 | | 75,000 | 103,688 |
| 9.375% 4/1/29 | | 140,000 | 201,600 |
| Peruvian Republic 4% 3/7/27 (m) | | 570,000 | 570,000 |
| Philippine Republic: | | | |
| 7.75% 1/14/31 | | 305,000 | 428,516 |
| 9.5% 2/2/30 | | 300,000 | 472,487 |
| Provincia de Cordoba 12.375% 8/17/17 (b) | | 890,000 | 921,150 |
| Republic of Angola 7% 8/16/19 (Issued by Northern Lights III BV for Republic of Angola) (Reg. S) | | 492,188 | 473,829 |
| Republic of Armenia: | | | |
| 6% 9/30/20 (b) | | 920,000 | 892,060 |
| 7.15% 3/26/25 (b) | | 400,000 | 386,444 |
| Republic of Iceland 5.875% 5/11/22 (b) | | 240,000 | 272,229 |
| Republic of Iraq 5.8% 1/15/28 (Reg. S) | | 1,750,000 | 1,177,820 |
| Republic of Nigeria 5.125% 7/12/18 (b) | | 605,000 | 576,263 |
| Republic of Serbia: | | | |
| 6.75% 11/1/24 (b) | | 832,658 | 847,230 |
| 7.25% 9/28/21 (b) | | 400,000 | 452,181 |
| Republic of Singapore 3.25% 9/1/20 | SGD | 3,400,000 | 2,536,991 |
| Romanian Republic: | | | |
| 4.375% 8/22/23 (b) | | 308,000 | 320,613 |
| 6.125% 1/22/44 (b) | | 238,000 | 278,460 |
| Russian Federation: | | | |
| 4.875% 9/16/23 (b) | | 600,000 | 609,600 |
| 5% 4/29/20 (b) | | 300,000 | 309,600 |
| 5.625% 4/4/42 (b) | | 400,000 | 378,400 |
| 5.875% 9/16/43 (b) | | 800,000 | 778,160 |
| 12.75% 6/24/28 (Reg. S) | | 2,695,000 | 4,259,879 |
| Spanish Kingdom: | | | |
| 1.15% 7/30/20 | EUR | 3,600,000 | 3,994,458 |
| 2.75% 10/31/24 (Reg. S) | EUR | 2,500,000 | 2,964,246 |
| 5.15% 10/31/44 | EUR | 350,000 | 538,738 |
| Sweden Kingdom 3.5% 6/1/22 | SEK | 18,500,000 | 2,587,890 |
| Switzerland Confederation 4.25% 6/5/17 | CHF | 3,350,000 | 3,582,119 |
| Turkish Republic: | | | |
| 4.875% 4/16/43 | | 275,000 | 242,000 |
| 5.125% 3/25/22 | | 185,000 | 189,856 |
| 5.625% 3/30/21 | | 490,000 | 518,128 |
| 6.25% 9/26/22 | | 275,000 | 298,540 |
| 6.75% 4/3/18 | | 205,000 | 220,580 |
| 6.75% 5/30/40 | | 495,000 | 550,181 |
| 6.875% 3/17/36 | | 505,000 | 565,539 |
| 7% 3/11/19 | | 345,000 | 377,347 |
| 7.25% 3/5/38 | | 345,000 | 404,143 |
| 7.375% 2/5/25 | | 400,000 | 467,040 |
| 7.5% 11/7/19 | | 945,000 | 1,059,600 |
| 8% 2/14/34 | | 300,000 | 374,970 |
| 11.875% 1/15/30 | | 555,000 | 909,523 |
| Ukraine Government: | | | |
| 0% 5/31/40 (b)(c) | | 304,000 | 120,080 |
| 7.75% 9/1/20 (b) | | 368,000 | 338,560 |
| 7.75% 9/1/21 (b) | | 328,000 | 298,008 |
| 7.75% 9/1/22 (b) | | 226,000 | 204,706 |
| 7.75% 9/1/23 (b) | | 105,000 | 93,471 |
| 7.75% 9/1/24 (b) | | 105,000 | 92,916 |
| 7.75% 9/1/25 (b) | | 105,000 | 92,356 |
| 7.75% 9/1/27 (b) | | 150,000 | 130,500 |
| United Kingdom, Great Britain and Northern Ireland: | | | |
| 2% 9/7/25(Reg. S) | GBP | 1,500,000 | 2,223,064 |
| 3.5% 7/22/68 | GBP | 1,500,000 | 2,859,089 |
| 4.25% 3/7/36 | GBP | 800,000 | 1,487,996 |
| United Mexican States: | | | |
| 4% 10/2/23 | | 558,000 | 565,254 |
| 4.6% 1/23/46 | | 300,000 | 265,500 |
| 4.75% 3/8/44 | | 204,000 | 185,844 |
| 5.55% 1/21/45 | | 265,000 | 271,625 |
| 6.05% 1/11/40 | | 307,000 | 336,165 |
| 6.5% 6/10/21 | MXN | 8,965,000 | 538,136 |
| Uruguay Republic 7.875% 1/15/33 pay-in-kind | | 440,000 | 547,800 |
| Venezuelan Republic: | | | |
| oil recovery rights 4/15/20 (l) | | 10,236 | 66,534 |
| 5.75% 2/26/16 (Reg S.) | | 3,400,000 | 3,051,500 |
| 9.25% 9/15/27 | | 445,000 | 182,450 |
| 11.75% 10/21/26 (Reg. S) | | 440,000 | 195,800 |
| 11.95% 8/5/31 (Reg. S) | | 1,780,000 | 787,650 |
| 12.75% 8/23/22 | | 540,000 | 241,650 |
| Vietnamese Socialist Republic: | | | |
| 1.3725% 3/12/16 (c) | | 67,826 | 67,063 |
| 4% 3/12/28 (m) | | 1,957,500 | 1,908,563 |
| 4.8% 11/19/24 (b) | | 200,000 | 192,076 |
| 6.75% 1/29/20 (b) | | 400,000 | 438,376 |
| TOTAL FOREIGN GOVERNMENT AND GOVERNMENT AGENCY OBLIGATIONS | | | |
| (Cost $188,957,212) | | | 184,505,450 |
|
| Supranational Obligations - 0.0% | | | |
European Bank for Reconstruction & Development 6% 3/3/16
(Cost $241,998) | INR | 15,500,000 | 233,952 |
| | | Shares | Value |
|
| Common Stocks - 4.4% | | | |
| CONSUMER DISCRETIONARY - 1.2% | | | |
| Auto Components - 0.3% | | | |
| Chassix Holdings, Inc. | | 33,750 | 959,513 |
| Chassix Holdings, Inc. warrants (k) | | 1,921 | 3,880 |
| Delphi Automotive PLC | | 9,900 | 848,727 |
| Exide Technologies | | 2,115 | 0 |
| Exide Technologies | | 7,052 | 0 |
| Lear Corp. | | 4,600 | 565,018 |
| Tenneco, Inc. (k) | | 14,900 | 684,059 |
| | | | 3,061,197 |
| Automobiles - 0.0% | | | |
| General Motors Co. | | 328 | 11,155 |
| Diversified Consumer Services - 0.0% | | | |
| Houghton Mifflin Harcourt Co. warrants 6/22/19 (k)(n) | | 2,218 | 27,506 |
| Hotels, Restaurants & Leisure - 0.1% | | | |
| Extended Stay America, Inc. unit | | 68,300 | 1,085,970 |
| Fiesta Restaurant Group, Inc. (k) | | 12,900 | 433,440 |
| | | | 1,519,410 |
| Household Durables - 0.3% | | | |
| CalAtlantic Group, Inc. | | 19,740 | 748,541 |
| Harman International Industries, Inc. | | 11,100 | 1,045,731 |
| Lennar Corp. Class A | | 26,700 | 1,305,897 |
| Taylor Morrison Home Corp. (k) | | 41,100 | 657,600 |
| | | | 3,757,769 |
| Media - 0.3% | | | |
| AMC Networks, Inc. Class A (k) | | 17,000 | 1,269,560 |
| Naspers Ltd. Class N | | 9,500 | 1,298,501 |
| Sinclair Broadcast Group, Inc. Class A | | 50,200 | 1,633,508 |
| | | | 4,201,569 |
| Specialty Retail - 0.1% | | | |
| Office Depot, Inc. (k) | | 154,900 | 873,636 |
| Textiles, Apparel & Luxury Goods - 0.1% | | | |
| Deckers Outdoor Corp. (k) | | 8,500 | 401,200 |
| Michael Kors Holdings Ltd. (k) | | 10,000 | 400,600 |
| | | | 801,800 |
|
| TOTAL CONSUMER DISCRETIONARY | | | 14,254,042 |
|
| CONSUMER STAPLES - 0.0% | | | |
| Food & Staples Retailing - 0.0% | | | |
| Ovation Acquisition I LLC (n) | | 158,313 | 1,583 |
| Food Products - 0.0% | | | |
| Reddy Ice Holdings, Inc. (k) | | 5,683 | 2,813 |
|
| TOTAL CONSUMER STAPLES | | | 4,396 |
|
| ENERGY - 0.0% | | | |
| Energy Equipment & Services - 0.0% | | | |
| Hornbeck Offshore Services, Inc. (k) | | 14,400 | 143,136 |
| Oil, Gas & Consumable Fuels - 0.0% | | | |
| Crestwood Equity Partners LP | | 7,975 | 165,721 |
| Southwestern Energy Co. (k) | | 19,200 | 136,512 |
| | | | 302,233 |
|
| TOTAL ENERGY | | | 445,369 |
|
| FINANCIALS - 0.2% | | | |
| Capital Markets - 0.1% | | | |
| Penson Worldwide, Inc. Class A (k) | | 314,563 | 3 |
| The Blackstone Group LP | | 24,700 | 722,228 |
| | | | 722,231 |
| Consumer Finance - 0.1% | | | |
| OneMain Holdings, Inc. (k) | | 27,700 | 1,150,658 |
|
| TOTAL FINANCIALS | | | 1,872,889 |
|
| HEALTH CARE - 0.9% | | | |
| Biotechnology - 0.4% | | | |
| Biogen, Inc. (k) | | 4,800 | 1,470,480 |
| Celgene Corp. (k) | | 12,500 | 1,497,000 |
| Gilead Sciences, Inc. | | 15,500 | 1,568,445 |
| | | | 4,535,925 |
| Health Care Providers & Services - 0.2% | | | |
| HCA Holdings, Inc. (k) | | 27,100 | 1,832,773 |
| Rotech Healthcare, Inc. (k) | | 6,069 | 192,934 |
| | | | 2,025,707 |
| Pharmaceuticals - 0.3% | | | |
| Allergan PLC (k) | | 7,600 | 2,375,000 |
| Endo Health Solutions, Inc. (k) | | 15,600 | 955,032 |
| Teva Pharmaceutical Industries Ltd. sponsored ADR | | 11,100 | 728,604 |
| | | | 4,058,636 |
|
| TOTAL HEALTH CARE | | | 10,620,268 |
|
| INDUSTRIALS - 0.4% | | | |
| Airlines - 0.1% | | | |
| Air Canada (k) | | 106,500 | 785,839 |
| Delta Air Lines, Inc. | | 10,800 | 547,452 |
| | | | 1,333,291 |
| Commercial Services & Supplies - 0.0% | | | |
| WP Rocket Holdings, Inc. (k)(n) | | 894,972 | 53,698 |
| Marine - 0.0% | | | |
| U.S. Shipping Partners Corp. (k) | | 644 | 129 |
| U.S. Shipping Partners Corp. warrants 12/31/29 (k) | | 6,028 | 0 |
| | | | 129 |
| Road & Rail - 0.0% | | | |
| Avis Budget Group, Inc. (k) | | 10,500 | 381,045 |
| Trading Companies & Distributors - 0.3% | | | |
| Air Lease Corp. Class A | | 15,600 | 522,288 |
| HD Supply Holdings, Inc. (k) | | 37,300 | 1,120,119 |
| Penhall Acquisition Co.: | | | |
| Class A (k) | | 321 | 25,407 |
| Class B (k) | | 107 | 8,469 |
| United Rentals, Inc. (k) | | 20,100 | 1,458,054 |
| | | | 3,134,337 |
| Transportation Infrastructure - 0.0% | | | |
| DeepOcean Group Holding BV (b)(k) | | 31,897 | 287,018 |
|
| TOTAL INDUSTRIALS | | | 5,189,518 |
|
| INFORMATION TECHNOLOGY - 1.4% | | | |
| Electronic Equipment & Components - 0.1% | | | |
| CDW Corp. | | 28,100 | 1,181,324 |
| Internet Software & Services - 0.5% | | | |
| Alibaba Group Holding Ltd. sponsored ADR (k) | | 32,900 | 2,673,783 |
| Alphabet, Inc. Class A (k) | | 2,300 | 1,789,423 |
| Baidu.com, Inc. sponsored ADR (k) | | 3,400 | 642,736 |
| Facebook, Inc. Class A (k) | | 10,400 | 1,088,464 |
| | | | 6,194,406 |
| IT Services - 0.1% | | | |
| MasterCard, Inc. Class A | | 8,900 | 866,504 |
| PayPal Holdings, Inc. (k) | | 19,200 | 695,040 |
| | | | 1,561,544 |
| Semiconductors & Semiconductor Equipment - 0.6% | | | |
| Avago Technologies Ltd. | | 13,000 | 1,886,950 |
| Cypress Semiconductor Corp. | | 309 | 3,031 |
| MagnaChip Semiconductor Corp. (k) | | 2,669 | 14,119 |
| NXP Semiconductors NV (k) | | 12,717 | 1,071,407 |
| Qorvo, Inc. (k) | | 33,195 | 1,689,626 |
| Skyworks Solutions, Inc. | | 26,800 | 2,059,044 |
| | | | 6,724,177 |
| Technology Hardware, Storage & Peripherals - 0.1% | | | |
| Apple, Inc. | | 10,300 | 1,084,178 |
|
| TOTAL INFORMATION TECHNOLOGY | | | 16,745,629 |
|
| MATERIALS - 0.2% | | | |
| Chemicals - 0.1% | | | |
| LyondellBasell Industries NV Class A | | 5,700 | 495,330 |
| Containers & Packaging - 0.1% | | | |
| WestRock Co. | | 26,532 | 1,210,390 |
| Metals & Mining - 0.0% | | | |
| Aleris International, Inc. (k)(n) | | 2,037 | 21,877 |
| Mirabela Nickel Ltd. (k) | | 217,900 | 13,179 |
| | | | 35,056 |
|
| TOTAL MATERIALS | | | 1,740,776 |
|
| TELECOMMUNICATION SERVICES - 0.1% | | | |
| Wireless Telecommunication Services - 0.1% | | | |
| T-Mobile U.S., Inc. (k) | | 34,700 | 1,357,464 |
| UTILITIES - 0.0% | | | |
| Electric Utilities - 0.0% | | | |
| Portland General Electric Co. | | 140 | 5,092 |
| TOTAL COMMON STOCKS | | | |
| (Cost $56,051,645) | | | 52,235,443 |
|
| Preferred Stocks - 0.2% | | | |
| Convertible Preferred Stocks - 0.1% | | | |
| CONSUMER STAPLES - 0.0% | | | |
| Food Products - 0.0% | | | |
| Reddy Ice Holdings, Inc. 7.00% pay-in-kind (k) | | 2,286 | 19,237 |
| HEALTH CARE - 0.1% | | | |
| Pharmaceuticals - 0.1% | | | |
| Allergan PLC 5.50% | | 1,500 | 1,545,270 |
|
| TOTAL CONVERTIBLE PREFERRED STOCKS | | | 1,564,507 |
|
| Nonconvertible Preferred Stocks - 0.1% | | | |
| FINANCIALS - 0.1% | | | |
| Capital Markets - 0.1% | | | |
| Goldman Sachs Group, Inc. Series K 6.375% | | 26,704 | 742,104 |
| TOTAL PREFERRED STOCKS | | | |
| (Cost $2,183,917) | | | 2,306,611 |
| | | Principal Amount(a) | Value |
|
| Bank Loan Obligations - 1.8% | | | |
| CONSUMER DISCRETIONARY - 0.2% | | | |
| Auto Components - 0.0% | | | |
| Chassix, Inc. term loan 12% 7/29/19 | | 424,742 | 420,494 |
| Diversified Consumer Services - 0.1% | | | |
| KC Mergersub, Inc.: | | | |
| Tranche 1LN, term loan 6% 8/13/22 (c) | | 658,350 | 641,891 |
| Tranche L 2LN, term loan 10.25% 8/13/23 (c) | | 245,000 | 240,100 |
| | | | 881,991 |
| Hotels, Restaurants & Leisure - 0.1% | | | |
| Caesars Growth Properties Holdings, LLC Tranche 1LN, term loan 6.25% 5/8/21 (c) | | 162,874 | 142,515 |
| Hilton Worldwide Finance, LLC Tranche B, term loan 3.5% 10/25/20 (c) | | 814,424 | 812,136 |
| MGM Mirage, Inc. Tranche B, term loan 3.5% 12/20/19 (c) | | 271,600 | 267,526 |
| TGI Friday's, Inc. Tranche B 1LN, term loan 5.25% 7/15/20 (c) | | 46,574 | 46,458 |
| | | | 1,268,635 |
|
| TOTAL CONSUMER DISCRETIONARY | | | 2,571,120 |
|
| CONSUMER STAPLES - 0.1% | | | |
| Food & Staples Retailing - 0.0% | | | |
| Focus Brands, Inc. Tranche 2LN, term loan 10.25% 8/21/18 (c) | | 285,000 | 286,425 |
| Personal Products - 0.1% | | | |
| Revlon Consumer Products Corp.: | | | |
| term loan 4% 8/19/19 (c) | | 808,397 | 803,094 |
| Tranche B, term loan 3.25% 11/19/17 (c) | | 364,574 | 363,054 |
| | | | 1,166,148 |
|
| TOTAL CONSUMER STAPLES | | | 1,452,573 |
|
| ENERGY - 0.1% | | | |
| Oil, Gas & Consumable Fuels - 0.1% | | | |
| Alon U.S.A. Partners LP term loan 9.25% 11/26/18 (c) | | 326,029 | 324,399 |
| TPF II Power, LLC Tranche B, term loan 5.5% 10/2/21 (c) | | 221,321 | 216,065 |
| | | | 540,464 |
| FINANCIALS - 0.0% | | | |
| Real Estate Management & Development - 0.0% | | | |
| Realogy Corp. Credit-Linked Deposit 4.4463% 10/10/16 (c) | | 23,792 | 23,435 |
| HEALTH CARE - 0.1% | | | |
| Health Care Providers & Services - 0.1% | | | |
| Emergency Medical Services Corp. Tranche B, term loan 4.25% 5/25/18 (c) | | 1,051,479 | 1,043,152 |
| INDUSTRIALS - 0.0% | | | |
| Commercial Services & Supplies - 0.0% | | | |
| GCA Services Group, Inc. Tranche 2LN, term loan 9.25% 11/1/20 (c) | | 180,000 | 175,950 |
| INFORMATION TECHNOLOGY - 0.2% | | | |
| Semiconductors & Semiconductor Equipment - 0.1% | | | |
| Avago Technologies, Inc. Tranche B, term loan 3.75% 5/6/21 (c) | | 967,299 | 964,078 |
| Software - 0.1% | | | |
| BMC Software Finance, Inc. Tranche B, term loan 5% 9/10/20 (c) | | 458,787 | 376,531 |
| Sophia L.P. Tranche B, term loan 4.75% 9/30/22 (c) | | 1,162,088 | 1,146,469 |
| Transfirst, Inc.: | | | |
| Tranche 2LN, term loan 9% 11/12/22 (c) | | 60,000 | 58,575 |
| Tranche B 1LN, term loan 4.75% 11/12/21 (c) | | 49,501 | 49,015 |
| | | | 1,630,590 |
|
| TOTAL INFORMATION TECHNOLOGY | | | 2,594,668 |
|
| MATERIALS - 0.1% | | | |
| Containers & Packaging - 0.1% | | | |
| Berry Plastics Corp. Tranche E, term loan 3.75% 1/6/21 (c) | | 462,117 | 454,783 |
| Metals & Mining - 0.0% | | | |
| Essar Steel Algoma, Inc. Tranche B, term loan 5.4375% 8/16/19 (c) | | 267,300 | 63,617 |
| MRC Global, Inc. Tranche B, term loan 4.75% 11/9/19 (c) | | 225,230 | 206,085 |
| | | | 269,702 |
|
| TOTAL MATERIALS | | | 724,485 |
|
| TELECOMMUNICATION SERVICES - 0.1% | | | |
| Diversified Telecommunication Services - 0.1% | | | |
| Integra Telecom Holdings, Inc. Tranche B 1LN, term loan 5.25% 8/14/20 (c) | | 575,650 | 555,502 |
| Wireless Telecommunication Services - 0.0% | | | |
| Digicel International Finance Ltd.: | | | |
| Tranche D 1LN, term loan 4.125% 3/31/17(c) | | 172,466 | 155,219 |
| Tranche D 2LN, term loan 4.1031% 3/31/19 (c) | | 172,535 | 155,281 |
| | | | 310,500 |
|
| TOTAL TELECOMMUNICATION SERVICES | | | 866,002 |
|
| UTILITIES - 0.9% | | | |
| Electric Utilities - 0.0% | | | |
| Essential Power LLC Tranche B, term loan 4.75% 8/8/19 (c) | | 303,045 | 298,121 |
| Independent Power and Renewable Electricity Producers - 0.9% | | | |
| Energy Future Holdings Corp. Tranche 1LN, term loan 4.25% 6/19/16 (c) | | 10,612,004 | 10,561,597 |
|
| TOTAL UTILITIES | | | 10,859,718 |
|
| TOTAL BANK LOAN OBLIGATIONS | | | |
| (Cost $21,233,226) | | | 20,851,567 |
|
| Sovereign Loan Participations - 0.1% | | | |
Indonesian Republic loan participation:
| | | |
| Citibank 1.4375% 12/14/19 (c) | | 209,584 | 205,392 |
| Goldman Sachs 1.4375% 12/14/19 (c) | | 377,222 | 369,678 |
| Mizuho 1.4375% 12/14/19 (c) | | 282,070 | 276,428 |
| TOTAL SOVEREIGN LOAN PARTICIPATIONS | | | |
| (Cost $819,363) | | | 851,498 |
| | | Shares | Value |
|
| Fixed-Income Funds - 6.0% | | | |
| Fidelity Floating Rate Central Fund (o) | | | |
| (Cost $75,141,855) | | 723,012 | 70,696,113 |
| | | Principal Amount(a) | Value |
|
| Preferred Securities - 3.1% | | | |
| CONSUMER DISCRETIONARY - 0.1% | | | |
| Media - 0.1% | | | |
| NBCUniversal Enterprise, Inc. 5.25% (b)(e) | | 770,000 | 817,644 |
| CONSUMER STAPLES - 0.1% | | | |
| Food Products - 0.1% | | | |
| Cosan Overseas Ltd. 8.25% (e) | | 960,000 | 777,867 |
| ENERGY - 0.0% | | | |
| Oil, Gas & Consumable Fuels - 0.0% | | | |
| Total SA 2.25% (Reg. S) (c)(e) | EUR | 300,000 | 306,968 |
| FINANCIALS - 2.8% | | | |
| Banks - 2.2% | | | |
| Banco Do Brasil SA 9% (b)(c)(e) | | 800,000 | 526,754 |
| Bank of America Corp.: | | | |
| 5.125% (c)(e) | | 1,345,000 | 1,283,938 |
| 5.2% (c)(e) | | 2,762,000 | 2,584,277 |
| 6.25% (c)(e) | | 910,000 | 930,713 |
| 8% (c)(e) | | 255,000 | 268,055 |
| 8.125% (c)(e) | | 145,000 | 149,059 |
| Barclays Bank PLC 7.625% 11/21/22 | | 2,140,000 | 2,455,305 |
| Citigroup, Inc.: | | | |
| 5.8% (c)(e) | | 1,130,000 | 1,128,858 |
| 5.9% (c)(e) | | 1,455,000 | 1,461,963 |
| 5.95% (c)(e) | | 2,675,000 | 2,684,526 |
| 6.3% (c)(e) | | 270,000 | 265,446 |
| JPMorgan Chase & Co.: | | | |
| 5% (c)(e) | | 1,615,000 | 1,574,625 |
| 5.3% (c)(e) | | 865,000 | 869,439 |
| 6% (c)(e) | | 2,580,000 | 2,640,758 |
| 6.125% (c)(e) | | 725,000 | 740,800 |
| 6.75% (c)(e) | | 400,000 | 447,226 |
| Wells Fargo & Co.: | | | |
| 5.875% (c)(e) | | 2,600,000 | 2,743,595 |
| 5.9% (c)(e) | | 3,065,000 | 3,100,218 |
| 7.98% (c)(e) | | 135,000 | 143,428 |
| | | | 25,998,983 |
| Capital Markets - 0.4% | | | |
| Bank of Scotland 7.281% (c)(e) | GBP | 350,000 | 609,567 |
| Goldman Sachs Group, Inc.: | | | |
| 5.375% (c)(e) | | 735,000 | 736,050 |
| 5.7% (c)(e) | | 1,701,000 | 1,704,220 |
| Morgan Stanley 5.55% (c)(e) | | 870,000 | 892,306 |
| | | | 3,942,143 |
| Consumer Finance - 0.1% | | | |
| American Express Co.: | | | |
| 4.9% (c)(e) | | 520,000 | 501,560 |
| 5.2% (c)(e) | | 925,000 | 916,179 |
| | | | 1,417,739 |
| Diversified Financial Services - 0.0% | | | |
| Magnesita Finance Ltd. 8.625% (b)(e) | | 400,000 | 224,250 |
| Insurance - 0.1% | | | |
| Credit Agricole Assurances SA 4.25% (Reg. S) (c)(e) | EUR | 300,000 | 322,717 |
| Elm BV (SWISS REIN CO) 2.6% (Reg. S) (c)(e) | EUR | 500,000 | 504,538 |
| Society of Lloyd's 7.421% (c)(e) | GBP | 400,000 | 642,423 |
| | | | 1,469,678 |
|
| TOTAL FINANCIALS | | | 33,052,793 |
|
| INDUSTRIALS - 0.1% | | | |
| Construction& Engineering - 0.1% | | | |
| Odebrecht Finance Ltd.: | | | |
| 7.5% (b)(e) | | 2,350,000 | 1,257,153 |
| 7.5% (Reg. S) (e) | | 100,000 | 53,496 |
| | | | 1,310,649 |
| MATERIALS - 0.0% | | | |
| Metals & Mining - 0.0% | | | |
| CSN Islands XII Corp. 7% (Reg. S) (e) | | 1,220,000 | 416,912 |
| TOTAL PREFERRED SECURITIES | | | |
| (Cost $38,780,036) | | | 36,682,833 |
| | | Shares | Value |
|
| Money Market Funds - 4.4% | | | |
| Fidelity Cash Central Fund, 0.33% (p) | | | |
| (Cost $51,880,241) | | 51,880,241 | 51,880,241 |
| TOTAL INVESTMENT PORTFOLIO - 99.1% | | | |
| (Cost $1,220,281,796) | | | 1,174,409,156 |
| NET OTHER ASSETS (LIABILITIES) - 0.9% | | | 11,248,896 |
| NET ASSETS - 100% | | | $1,185,658,052 |
| Futures Contracts | | | |
| | Expiration Date | Underlying Face Amount at Value | Unrealized Appreciation/(Depreciation) |
| Purchased | | | |
| Treasury Contracts | | | |
| 20 CBOT 2 Year U.S. Treasury Note Contracts (United States) | March 2016 | 4,344,688 | $(6,289) |
| 29 CBOT Ultra Long Term U.S. Treasury Bond Contracts (United States) | March 2016 | 4,601,938 | 35,953 |
| TOTAL FUTURES CONTRACTS | | | $29,664 |
The face value of futures purchased as a percentage of Net Assets is 0.8%
Swaps
| Clearinghouse/Counterparty(1) | Expiration Date | Notional Amount | Payment Received | Payment Paid | Value | Upfront Premium Received/(Paid)(2) | Unrealized Appreciation/(Depreciation) |
| Interest Rate Swaps | | | | | | | |
| LCH | Mar. 2018 | $800,000 | 3-month LIBOR | 1.5% | $1,501 | $0 | $1,501 |
| LCH | Mar. 2021 | 500,000 | 3-month LIBOR | 2% | 1,773 | 0 | 1,773 |
| CME | Mar. 2026 | 100,000 | 2.5% | 3-month LIBOR | (951) | 0 | (951) |
| LCH | Mar. 2046 | 1,100,000 | 3-month LIBOR | 2.75% | 11,740 | 0 | 11,740 |
|
| TOTAL INTEREST RATE SWAPS | | | | | $14,063 | $0 | $14,063 |
|
(1) Swaps with CME Group (CME) and LCH Clearnet Group (LCH) are centrally cleared over-the-counter (OTC) swaps.
(2) Any premiums for centrally cleared over-the-counter (OTC) swaps are recorded periodically throughout the term of the swap to variation margin and included in unrealized appreciation (depreciation).
Currency Abbreviations
AUD – Australian dollar
BRL – Brazilian real
CAD – Canadian dollar
CHF – Swiss franc
COP – Colombian peso
DKK – Danish krone
EUR – European Monetary Unit
GBP – British pound
HKD – Hong Kong dollar
INR – Indian rupee
JPY – Japanese yen
MXN – Mexican peso
NOK – Norwegian krone
NZD – New Zealand dollar
RUB – Russian ruble
SEK – Swedish krona
SGD – Singapore dollar
Legend
(a) Amount is stated in United States dollars unless otherwise noted.
(b) Security exempt from registration under Rule 144A of the Securities Act of 1933. These securities may be resold in transactions exempt from registration, normally to qualified institutional buyers. At the end of the period, the value of these securities amounted to $241,628,693 or 20.4% of net assets.
(c) Coupon rates for floating and adjustable rate securities reflect the rates in effect at period end.
(d) Non-income producing - Security is in default.
(e) Security is perpetual in nature with no stated maturity date.
(f) Security or a portion of the security was pledged to cover margin requirements for centrally cleared OTC swaps. At period end, the value of securities pledged amounted to $183,036.
(g) Security or a portion of the security was pledged to cover margin requirements for futures contracts. At period end, the value of securities pledged amounted to $147,176.
(h) Represents an investment in an underlying pool of reverse mortgages which typically do not require regular principal and interest payments as repayment is deferred until a maturity event.
(i) Security represents right to receive monthly interest payments on an underlying pool of mortgages or assets. Principal shown is the outstanding par amount of the pool as of the end of the period.
(j) Coupon is inversely indexed to a floating interest rate multiplied by a specified factor. The price may be considerably more volatile than the price of a comparable fixed rate security.
(k) Non-income producing
(l) Quantity represents share amount.
(m) Security initially issued at one coupon which converts to a higher coupon at a specified date. The rate shown is the rate at period end.
(n) Restricted securities - Investment in securities not registered under the Securities Act of 1933 (excluding 144A issues). At the end of the period, the value of restricted securities (excluding 144A issues) amounted to $104,664 or 0.0% of net assets.
(o) Affiliated fund that is generally available only to investment companies and other accounts managed by Fidelity Investments. A complete unaudited schedule of portfolio holdings for each Fidelity Central Fund is filed with the SEC for the first and third quarters of each fiscal year on Form N-Q and is available upon request or at the SEC's website at www.sec.gov. An unaudited holdings listing for the Fund, which presents direct holdings as well as the pro-rata share of securities and other investments held indirectly through its investment in underlying non-money market Fidelity Central Fund, is available at advisor.fidelity.com. In addition, each Fidelity Central Fund's financial statements, which are not covered by the Fund's Report of Independent Registered Public Accounting Firm, are available on the SEC's website or upon request.
(p) Affiliated fund that is generally available only to investment companies and other accounts managed by Fidelity Investments. The rate quoted is the annualized seven-day yield of the fund at period end. A complete unaudited listing of the fund's holdings as of its most recent quarter end is available upon request. In addition, each Fidelity Central Fund's financial statements, which are not covered by the Fund's Report of Independent Registered Public Accounting Firm, are available on the SEC's website or upon request.
Additional information on each restricted holding is as follows:
| Security | Acquisition Date | Acquisition Cost |
| Aleris International, Inc. | 6/1/10 | $71,295 |
| Houghton Mifflin Harcourt Co. warrants 6/22/19 | 6/22/12 | $4,281 |
| Ovation Acquisition I LLC | 12/23/15 | $1,583 |
| WP Rocket Holdings, Inc. | 6/24/11 - 2/2/15 | $466,147 |
Affiliated Central Funds
Information regarding fiscal year to date income earned by the Fund from investments in Fidelity Central Funds is as follows:
| Fund | Income earned |
| Fidelity Cash Central Fund | $93,763 |
| Fidelity Floating Rate Central Fund | 3,555,092 |
| Total | $3,648,855 |
Additional information regarding the Fund's fiscal year to date purchases and sales, including the ownership percentage, of the non Money Market Central Funds is as follows:
| Fund | Value, beginning of period | Purchases | Sales Proceeds | Value, end of period | % ownership, end of period |
| Fidelity Floating Rate Central Fund | $47,644,690 | $29,865,605 | $1,751,336 | $70,696,113 | 4.9% |
| Total | $47,644,690 | $29,865,605 | $1,751,336 | $70,696,113 | |
Investment Valuation
The following is a summary of the inputs used, as of December 31, 2015, involving the Fund's assets and liabilities carried at fair value. The inputs or methodology used for valuing securities may not be an indication of the risk associated with investing in those securities. For more information on valuation inputs, and their aggregation into the levels used below, please refer to the Investment Valuation section in the accompanying Notes to Financial Statements.
| | Valuation Inputs at Reporting Date: |
| Description | Total | Level 1 | Level 2 | Level 3 |
| Investments in Securities: | | | | |
| Equities: | | | | |
| Consumer Discretionary | $14,254,042 | $11,964,642 | $1,326,007 | $963,393 |
| Consumer Staples | 23,633 | -- | 2,813 | 20,820 |
| Energy | 445,369 | 445,369 | -- | -- |
| Financials | 2,614,993 | 2,614,990 | -- | 3 |
| Health Care | 12,165,538 | 11,972,604 | -- | 192,934 |
| Industrials | 5,189,518 | 4,814,797 | -- | 374,721 |
| Information Technology | 16,745,629 | 16,745,629 | -- | -- |
| Materials | 1,740,776 | 1,705,720 | -- | 35,056 |
| Telecommunication Services | 1,357,464 | 1,357,464 | -- | -- |
| Utilities | 5,092 | 5,092 | -- | -- |
| Corporate Bonds | 512,617,592 | -- | 512,610,713 | 6,879 |
| U.S. Government and Government Agency Obligations | 174,410,727 | -- | 174,410,727 | -- |
| U.S. Government Agency - Mortgage Securities | 8,760,172 | -- | 8,760,172 | -- |
| Collateralized Mortgage Obligations | 38,065,218 | -- | 38,065,218 | -- |
| Commercial Mortgage Securities | 20,311,739 | -- | 20,311,739 | -- |
| Foreign Government and Government Agency Obligations | 184,505,450 | -- | 183,868,916 | 636,534 |
| Supranational Obligations | 233,952 | -- | 233,952 | -- |
| Bank Loan Obligations | 20,851,567 | -- | 20,097,138 | 754,429 |
| Sovereign Loan Participations | 851,498 | -- | -- | 851,498 |
| Fixed-Income Funds | 70,696,113 | 70,696,113 | -- | -- |
| Preferred Securities | 36,682,833 | -- | 36,682,833 | -- |
| Money Market Funds | 51,880,241 | 51,880,241 | -- | -- |
| Total Investments in Securities: | $1,174,409,156 | $174,202,661 | $996,370,228 | $3,836,267 |
| Derivative Instruments: | | | | |
| Assets | | | | |
| Futures Contracts | $35,953 | $35,953 | $-- | $-- |
| Swaps | 15,014 | -- | 15,014 | -- |
| Total Assets | $50,967 | $35,953 | $15,014 | $-- |
| Liabilities | | | | |
| Futures Contracts | $(6,289) | $(6,289) | $-- | $-- |
| Swaps | (951) | -- | (951) | -- |
| Total Liabilities | $(7,240) | $(6,289) | $(951) | $-- |
| Total Derivative Instruments: | $43,727 | $29,664 | $14,063 | $-- |
Value of Derivative Instruments
The following table is a summary of the Fund's value of derivative instruments by primary risk exposure as of December 31, 2015. For additional information on derivative instruments, please refer to the Derivative Instruments section in the accompanying Notes to Financial Statements.
| Primary Risk Exposure / Derivative Type | Value |
| | Asset | Liability |
| Interest Rate Risk | | |
| Futures Contracts(a) | $35,953 | $(6,289) |
| Swaps(b) | 15,014 | (951) |
| Total Interest Rate Risk | $50,967 | $(7,240) |
(a) Reflects gross cumulative appreciation (depreciation) on futures contracts as presented in the Schedule of Investments. Only the period end receivable or payable for daily variation margin and net unrealized appreciation (depreciation) are presented in the Statement of Assets and Liabilities.
(b) For centrally cleared over-the-counter (OTC) swaps, reflects gross cumulative appreciation (depreciation) as presented in the Schedule of Investments. For centrally cleared OTC swaps, only the period end receivable or payable for daily variation margin and net unrealized appreciation (depreciation) are presented in the Statement of Assets and Liabilities
Other Information
Distribution of investments by country or territory of incorporation, as a percentage of Total Net Assets, is as follows (Unaudited):
| United States of America | 64.3% |
| Netherlands | 2.7% |
| Japan | 2.7% |
| Luxembourg | 2.5% |
| United Kingdom | 2.5% |
| Canada | 2.2% |
| Ireland | 2.1% |
| Italy | 1.9% |
| Argentina | 1.8% |
| France | 1.5% |
| Cayman Islands | 1.2% |
| Mexico | 1.1% |
| Australia | 1.0% |
| Others (Individually Less Than 1%) | 12.5% |
| | 100.0% |
The information in the above tables is based on the combined investments of the fund and its pro-rata share of the investments of Fidelity's Fixed-Income Central Funds
See accompanying notes which are an integral part of the financial statements.
Financial Statements
Statement of Assets and Liabilities
| | | December 31, 2015 |
| Assets | | |
Investment in securities, at value — See accompanying schedule:
Unaffiliated issuers (cost $1,093,259,700) | $1,051,832,802 | |
| Fidelity Central Funds (cost $127,022,096) | 122,576,354 | |
| Total Investments (cost $1,220,281,796) | | $1,174,409,156 |
| Cash | | 137,848 |
| Foreign currency held at value (cost $342) | | 338 |
| Receivable for investments sold | | 1,921,939 |
| Receivable for fund shares sold | | 129,597 |
| Dividends receivable | | 35,454 |
| Interest receivable | | 12,812,972 |
| Distributions receivable from Fidelity Central Funds | | 333,888 |
| Receivable for daily variation margin for derivative instruments | | 20,008 |
| Prepaid expenses | | 2,689 |
| Other receivables | | 5,218 |
| Total assets | | 1,189,809,107 |
| Liabilities | | |
| Payable for investments purchased | $3,006,175 | |
| Payable for fund shares redeemed | 282,798 | |
| Accrued management fee | 558,405 | |
| Distribution and service plan fees payable | 38,734 | |
| Other affiliated payables | 128,501 | |
| Other payables and accrued expenses | 136,442 | |
| Total liabilities | | 4,151,055 |
| Net Assets | | $1,185,658,052 |
| Net Assets consist of: | | |
| Paid in capital | | $1,236,802,060 |
| Undistributed net investment income | | 2,664,758 |
| Accumulated undistributed net realized gain (loss) on investments and foreign currency transactions | | (7,944,826) |
| Net unrealized appreciation (depreciation) on investments and assets and liabilities in foreign currencies | | (45,863,940) |
| Net Assets | | $1,185,658,052 |
| Initial Class: | | |
| Net Asset Value, offering price and redemption price per share ($91,713,524 ÷ 8,652,126 shares) | | $10.60 |
| Service Class: | | |
| Net Asset Value, offering price and redemption price per share ($753,045 ÷ 71,105 shares) | | $10.59 |
| Service Class 2: | | |
| Net Asset Value, offering price and redemption price per share ($185,925,308 ÷ 17,671,913 shares) | | $10.52 |
| Investor Class: | | |
| Net Asset Value, offering price and redemption price per share ($907,266,175 ÷ 85,849,263 shares) | | $10.57 |
See accompanying notes which are an integral part of the financial statements.
Statement of Operations
| | | Year ended December 31, 2015 |
| Investment Income | | |
| Dividends | | $2,791,759 |
| Interest | | 48,118,750 |
| Income from Fidelity Central Funds | | 3,648,855 |
| Total income | | 54,559,364 |
| Expenses | | |
| Management fee | $6,986,649 | |
| Transfer agent fees | 1,180,023 | |
| Distribution and service plan fees | 424,687 | |
| Accounting fees and expenses | 432,288 | |
| Custodian fees and expenses | 71,641 | |
| Independent trustees' compensation | 5,061 | |
| Registration fees | 6 | |
| Audit | 87,210 | |
| Legal | 134,663 | |
| Miscellaneous | 44,066 | |
| Total expenses before reductions | 9,366,294 | |
| Expense reductions | (3,930) | 9,362,364 |
| Net investment income (loss) | | 45,197,000 |
| Realized and Unrealized Gain (Loss) | | |
| Net realized gain (loss) on: | | |
| Investment securities: | | |
| Unaffiliated issuers | (16,624,106) | |
| Fidelity Central Funds | (151,971) | |
| Foreign currency transactions | (97,746) | |
| Futures contracts | 236,408 | |
| Swaps | (78,850) | |
| Total net realized gain (loss) | | (16,716,265) |
Change in net unrealized appreciation (depreciation) on:
Investment securities | (49,628,644) | |
| Assets and liabilities in foreign currencies | 5,222 | |
| Futures contracts | (199,441) | |
| Swaps | 2,890 | |
| Total change in net unrealized appreciation (depreciation) | | (49,819,973) |
| Net gain (loss) | | (66,536,238) |
| Net increase (decrease) in net assets resulting from operations | | $(21,339,238) |
See accompanying notes which are an integral part of the financial statements.
Statement of Changes in Net Assets
| | Year ended December 31, 2015 | Year ended December 31, 2014 |
| Increase (Decrease) in Net Assets | | |
| Operations | | |
| Net investment income (loss) | $45,197,000 | $41,570,013 |
| Net realized gain (loss) | (16,716,265) | 8,783,280 |
| Change in net unrealized appreciation (depreciation) | (49,819,973) | (11,446,565) |
| Net increase (decrease) in net assets resulting from operations | (21,339,238) | 38,906,728 |
| Distributions to shareholders from net investment income | (32,938,370) | (36,724,038) |
| Distributions to shareholders from net realized gain | – | (14,133,853) |
| Distributions to shareholders from tax return of capital | (3,700,630) | – |
| Total distributions | (36,639,000) | (50,857,891) |
| Share transactions - net increase (decrease) | 15,137,477 | 113,176,111 |
| Total increase (decrease) in net assets | (42,840,761) | 101,224,948 |
| Net Assets | | |
| Beginning of period | 1,228,498,813 | 1,127,273,865 |
| End of period (including undistributed net investment income of $2,664,758 and undistributed net investment income of $1,899,755, respectively) | $1,185,658,052 | $1,228,498,813 |
See accompanying notes which are an integral part of the financial statements.
Financial Highlights — VIP Strategic Income Portfolio Initial Class
| | | | | | |
| Years ended December 31, | 2015 | 2014 | 2013 | 2012 | 2011 |
| Selected Per–Share Data | | | | | |
| Net asset value, beginning of period | $11.12 | $11.20 | $11.76 | $11.15 | $11.36 |
| Income from Investment Operations | | | | | |
| Net investment income (loss)A | .413 | .413 | .437 | .465 | .511 |
| Net realized and unrealized gain (loss) | (.593) | (.010) | (.403) | .704 | .013 |
| Total from investment operations | (.180) | .403 | .034 | 1.169 | .524 |
| Distributions from net investment income | (.306) | (.350) | (.483) | (.425) | (.486) |
| Distributions from net realized gain | – | (.133) | (.111) | (.134) | (.248) |
| Tax return of capital | (.034) | – | – | – | – |
| Total distributions | (.340) | (.483) | (.594) | (.559) | (.734) |
| Net asset value, end of period | $10.60 | $11.12 | $11.20 | $11.76 | $11.15 |
| Total ReturnB,C | (1.63)% | 3.60% | .29% | 10.50% | 4.66% |
| Ratios to Average Net AssetsD,E | | | | | |
| Expenses before reductions | .69% | .68% | .68% | .69% | .69% |
| Expenses net of fee waivers, if any | .69% | .68% | .68% | .69% | .69% |
| Expenses net of all reductions | .69% | .68% | .68% | .69% | .69% |
| Net investment income (loss) | 3.69% | 3.56% | 3.74% | 3.97% | 4.38% |
| Supplemental Data | | | | | |
| Net assets, end of period (000 omitted) | $91,714 | $107,847 | $119,063 | $164,166 | $164,168 |
| Portfolio turnover rateF | 92% | 119% | 141% | 129% | 224% |
A Calculated based on average shares outstanding during the period.
B Total returns do not reflect charges attributable to your insurance company's separate account. Inclusion of these charges would reduce the total returns shown.
C Total returns would have been lower if certain expenses had not been reduced during the applicable periods shown.
D Fees and expenses of any underlying Fidelity Central Funds are not included in the Fund's expense ratio. The Fund indirectly bears its proportionate share of the expenses of any underlying Fidelity Central Funds. Based on their most recent shareholder report date, the expenses of any underlying non-money market Fidelity Central Funds were less than .005%
E Expense ratios reflect operating expenses of the class. Expenses before reductions do not reflect amounts reimbursed by the investment adviser or reductions from brokerage service arrangements or reductions from other expense offset arrangements and do not represent the amount paid by the class during periods when reimbursements or reductions occur. Expenses net of fee waivers reflect expenses after reimbursement by the investment adviser but prior to reductions from brokerage service arrangements or other expense offset arrangements. Expenses net of all reductions represent the net expenses paid by the class.
F Amount does not include the portfolio activity of any underlying Fidelity Central Funds.
See accompanying notes which are an integral part of the financial statements.
Financial Highlights — VIP Strategic Income Portfolio Service Class
| | | | | | |
| Years ended December 31, | 2015 | 2014 | 2013 | 2012 | 2011 |
| Selected Per–Share Data | | | | | |
| Net asset value, beginning of period | $11.11 | $11.19 | $11.75 | $11.14 | $11.35 |
| Income from Investment Operations | | | | | |
| Net investment income (loss)A | .401 | .401 | .425 | .453 | .499 |
| Net realized and unrealized gain (loss) | (.592) | (.009) | (.403) | .704 | .009 |
| Total from investment operations | (.191) | .392 | .022 | 1.157 | .508 |
| Distributions from net investment income | (.295) | (.339) | (.471) | (.413) | (.470) |
| Distributions from net realized gain | – | (.133) | (.111) | (.134) | (.248) |
| Tax return of capital | (.034) | – | – | – | – |
| Total distributions | (.329) | (.472) | (.582) | (.547) | (.718) |
| Net asset value, end of period | $10.59 | $11.11 | $11.19 | $11.75 | $11.14 |
| Total ReturnB,C | (1.73)% | 3.51% | .19% | 10.40% | 4.52% |
| Ratios to Average Net AssetsD,E | | | | | |
| Expenses before reductions | .79% | .78% | .78% | .78% | .80% |
| Expenses net of fee waivers, if any | .79% | .78% | .78% | .78% | .80% |
| Expenses net of all reductions | .79% | .78% | .78% | .78% | .80% |
| Net investment income (loss) | 3.59% | 3.46% | 3.64% | 3.87% | 4.28% |
| Supplemental Data | | | | | |
| Net assets, end of period (000 omitted) | $753 | $831 | $837 | $975 | $883 |
| Portfolio turnover rateF | 92% | 119% | 141% | 129% | 224% |
A Calculated based on average shares outstanding during the period.
B Total returns do not reflect charges attributable to your insurance company's separate account. Inclusion of these charges would reduce the total returns shown.
C Total returns would have been lower if certain expenses had not been reduced during the applicable periods shown.
D Fees and expenses of any underlying Fidelity Central Funds are not included in the Fund's expense ratio. The Fund indirectly bears its proportionate share of the expenses of any underlying Fidelity Central Funds. Based on their most recent shareholder report date, the expenses of any underlying non-money market Fidelity Central Funds were less than .005%.
E Expense ratios reflect operating expenses of the class. Expenses before reductions do not reflect amounts reimbursed by the investment adviser or reductions from brokerage service arrangements or reductions from other expense offset arrangements and do not represent the amount paid by the class during periods when reimbursements or reductions occur. Expenses net of fee waivers reflect expenses after reimbursement by the investment adviser but prior to reductions from brokerage service arrangements or other expense offset arrangements. Expenses net of all reductions represent the net expenses paid by the class.
F Amount does not include the portfolio activity of any underlying Fidelity Central Funds.
See accompanying notes which are an integral part of the financial statements.
Financial Highlights — VIP Strategic Income Portfolio Service Class 2
| | | | | | |
| Years ended December 31, | 2015 | 2014 | 2013 | 2012 | 2011 |
| Selected Per–Share Data | | | | | |
| Net asset value, beginning of period | $11.05 | $11.14 | $11.71 | $11.11 | $11.33 |
| Income from Investment Operations | | | | | |
| Net investment income (loss)A | .380 | .380 | .404 | .434 | .478 |
| Net realized and unrealized gain (loss) | (.593) | (.005) | (.400) | .701 | .021 |
| Total from investment operations | (.213) | .375 | .004 | 1.135 | .499 |
| Distributions from net investment income | (.283) | (.332) | (.463) | (.401) | (.471) |
| Distributions from net realized gain | – | (.133) | (.111) | (.134) | (.248) |
| Tax return of capital | (.034) | – | – | – | – |
| Total distributions | (.317) | (.465) | (.574) | (.535) | (.719) |
| Net asset value, end of period | $10.52 | $11.05 | $11.14 | $11.71 | $11.11 |
| Total ReturnB,C | (1.94)% | 3.37% | .03% | 10.23% | 4.45% |
| Ratios to Average Net AssetsD,E | | | | | |
| Expenses before reductions | .94% | .93% | .93% | .94% | .95% |
| Expenses net of fee waivers, if any | .94% | .93% | .93% | .94% | .94% |
| Expenses net of all reductions | .94% | .93% | .93% | .94% | .94% |
| Net investment income (loss) | 3.44% | 3.31% | 3.49% | 3.72% | 4.13% |
| Supplemental Data | | | | | |
| Net assets, end of period (000 omitted) | $185,925 | $137,892 | $68,196 | $41,502 | $25,652 |
| Portfolio turnover rateF | 92% | 119% | 141% | 129% | 224% |
A Calculated based on average shares outstanding during the period.
B Total returns do not reflect charges attributable to your insurance company's separate account. Inclusion of these charges would reduce the total returns shown.
C Total returns would have been lower if certain expenses had not been reduced during the applicable periods shown.
D Fees and expenses of any underlying Fidelity Central Funds are not included in the Fund's expense ratio. The Fund indirectly bears its proportionate share of the expenses of any underlying Fidelity Central Funds. Based on their most recent shareholder report date, the expenses of any underlying non-money market Fidelity Central Funds were less than .005%.
E Expense ratios reflect operating expenses of the class. Expenses before reductions do not reflect amounts reimbursed by the investment adviser or reductions from brokerage service arrangements or reductions from other expense offset arrangements and do not represent the amount paid by the class during periods when reimbursements or reductions occur. Expenses net of fee waivers reflect expenses after reimbursement by the investment adviser but prior to reductions from brokerage service arrangements or other expense offset arrangements. Expenses net of all reductions represent the net expenses paid by the class.
F Amount does not include the portfolio activity of any underlying Fidelity Central Funds.
See accompanying notes which are an integral part of the financial statements.
Financial Highlights — VIP Strategic Income Portfolio Investor Class
| | | | | | |
| Years ended December 31, | 2015 | 2014 | 2013 | 2012 | 2011 |
| Selected Per–Share Data | | | | | |
| Net asset value, beginning of period | $11.09 | $11.17 | $11.73 | $11.12 | $11.34 |
| Income from Investment Operations | | | | | |
| Net investment income (loss)A | .408 | .408 | .432 | .460 | .510 |
| Net realized and unrealized gain (loss) | (.591) | (.008) | (.401) | .700 | – |
| Total from investment operations | (.183) | .400 | .031 | 1.166 | .511 |
| Distributions from net investment income | (.303) | (.347) | (.480) | (.422) | (.483) |
| Distributions from net realized gain | – | (.133) | (.111) | (.134) | (.248) |
| Tax return of capital | (.034) | – | – | – | – |
| Total distributions | (.337) | (.480) | (.591) | (.556) | (.731) |
| Net asset value, end of period | $10.57 | $11.09 | $11.17 | $11.73 | $11.12 |
| Total ReturnB,C | (1.66)% | 3.58% | .27% | 10.50% | 4.55% |
| Ratios to Average Net AssetsD,E | | | | | |
| Expenses before reductions | .72% | .71% | .72% | .72% | .73% |
| Expenses net of fee waivers, if any | .72% | .71% | .71% | .72% | .73% |
| Expenses net of all reductions | .72% | .71% | .71% | .72% | .73% |
| Net investment income (loss) | 3.65% | 3.52% | 3.70% | 3.94% | 4.35% |
| Supplemental Data | | | | | |
| Net assets, end of period (000 omitted) | $907,266 | $981,928 | $939,177 | $1,085,039 | $817,192 |
| Portfolio turnover rateF | 92% | 119% | 141% | 129% | 224% |
A Calculated based on average shares outstanding during the period.
B Total returns do not reflect charges attributable to your insurance company's separate account. Inclusion of these charges would reduce the total returns shown.
C Total returns would have been lower if certain expenses had not been reduced during the applicable periods shown.
D Fees and expenses of any underlying Fidelity Central Funds are not included in the Fund's expense ratio. The Fund indirectly bears its proportionate share of the expenses of any underlying Fidelity Central Funds. Based on their most recent shareholder report date, the expenses of any underlying non-money market Fidelity Central Funds were less than .005%.
E Expense ratios reflect operating expenses of the class. Expenses before reductions do not reflect amounts reimbursed by the investment adviser or reductions from brokerage service arrangements or reductions from other expense offset arrangements and do not represent the amount paid by the class during periods when reimbursements or reductions occur. Expenses net of fee waivers reflect expenses after reimbursement by the investment adviser but prior to reductions from brokerage service arrangements or other expense offset arrangements. Expenses net of all reductions represent the net expenses paid by the class.
F Amount does not include the portfolio activity of any underlying Fidelity Central Funds.
See accompanying notes which are an integral part of the financial statements.
Notes to Financial Statements
For the period ended December 31, 2015
1. Organization.
VIP Strategic Income Portfolio (the Fund) is a fund of Variable Insurance Products Fund V (the Trust) and is authorized to issue an unlimited number of shares. The Trust is registered under the Investment Company Act of 1940, as amended (the 1940 Act), as an open-end management investment company organized as a Massachusetts business trust. Shares of the Fund may only be purchased by insurance companies for the purpose of funding variable annuity or variable life insurance contracts. The Fund offers the following classes of shares: Initial Class shares, Service Class shares, Service Class 2 shares, and Investor Class shares. All classes have equal rights and voting privileges, except for matters affecting a single class.
2. Investments in Fidelity Central Funds.
The Fund invests in Fidelity Central Funds, which are open-end investment companies generally available only to other investment companies and accounts managed by the investment adviser and its affiliates. The Fund's Schedule of Investments lists each of the Fidelity Central Funds held as of period end, if any, as an investment of the Fund, but does not include the underlying holdings of each Fidelity Central Fund. As an Investing Fund, the Fund indirectly bears its proportionate share of the expenses of the underlying Fidelity Central Funds.
Based on its investment objective, each Fidelity Central Fund may invest or participate in various investment vehicles or strategies that are similar to those of the Fund. These strategies are consistent with the investment objectives of the Fund and may involve certain economic risks which may cause a decline in value of each of the Fidelity Central Funds and thus a decline in the value of the Fund. The Money Market Central Funds seek preservation of capital and current income and are managed by Fidelity Investments Money Management, Inc. (FIMM), an affiliate of the investment adviser. Annualized expenses of the Money Market Central Funds as of their most recent shareholder report date are less than .005%. The following summarizes the Fund's investment in each non-money market Fidelity Central Fund.
| Fidelity Central Fund | Investment Manager | Investment Objective | Investment Practices | Expense Ratio* |
| Fidelity Floating Rate Central Fund | FMR Co., Inc. (FMRC) | Seeks a high level of income by normally investing in floating rate loans and other floating rate securities. | Loans and Direct Debt Instruments
Restricted Securities
| Less than .005% |
*Expenses expressed as a percentage of average net assets and are as of each underlying Central Fund's most recent annual or semi-annual shareholder report.
An unaudited holdings listing for the Fund, which presents direct holdings as well as the pro-rata share of any securities and other investments held indirectly through its investment in underlying non-money market Fidelity Central Funds, is available at advisor.fidelity.com. A complete unaudited list of holdings for each Fidelity Central Fund is available upon request or at the Securities and Exchange Commission (the SEC) website at www.sec.gov. In addition, the financial statements of the Fidelity Central Funds which contain the significant accounting policies (including investment valuation policies) of those funds, which are not covered by the Fund's Report of Independent Registered Public Accounting Firm, are available on the SEC website or upon request.
3. Significant Accounting Policies.
The financial statements have been prepared in conformity with accounting principles generally accepted in the United States of America (GAAP), which require management to make certain estimates and assumptions at the date of the financial statements. Actual results could differ from those estimates. Subsequent events, if any, through the date that the financial statements were issued have been evaluated in the preparation of the financial statements. The following summarizes the significant accounting policies of the Fund:
Investment Valuation. Investments are valued as of 4:00 p.m. Eastern time on the last calendar day of the period. The Board of Trustees (the Board) has delegated the day to day responsibility for the valuation of the Fund's investments to the Fidelity Management & Research Company (FMR) Fair Value Committee (the Committee). In accordance with valuation policies and procedures approved by the Board, the Fund attempts to obtain prices from one or more third party pricing vendors or brokers to value its investments. When current market prices, quotations or currency exchange rates are not readily available or reliable, investments will be fair valued in good faith by the Committee, in accordance with procedures adopted by the Board. Factors used in determining fair value vary by investment type and may include market or investment specific events, changes in interest rates and credit quality. The frequency with which these procedures are used cannot be predicted and they may be utilized to a significant extent. The Committee oversees the Fund's valuation policies and procedures and reports to the Board on the Committee's activities and fair value determinations. The Board monitors the appropriateness of the procedures used in valuing the Fund's investments and ratifies the fair value determinations of the Committee.
The Fund categorizes the inputs to valuation techniques used to value its investments into a disclosure hierarchy consisting of three levels as shown below:
- Level 1 – quoted prices in active markets for identical investments
- Level 2 – other significant observable inputs (including quoted prices for similar investments, interest rates, prepayment speeds, etc.)
- Level 3 – unobservable inputs (including the Fund's own assumptions based on the best information available)
Valuation techniques used to value the Fund's investments by major category are as follows:
Debt securities, including restricted securities, are valued based on evaluated prices received from third party pricing vendors or from brokers who make markets in such securities. Corporate bonds, bank loan obligations, foreign government and government agency obligations, preferred securities, supranational obligations, U.S. government and government agency obligations and sovereign loan participations are valued by pricing vendors who utilize matrix pricing which considers yield or price of bonds of comparable quality, coupon, maturity and type or by broker-supplied prices. Collateralized mortgage obligations, commercial mortgage securities and U.S. government agency mortgage securities are valued by pricing vendors who utilize matrix pricing which considers prepayment speed assumptions, attributes of the collateral, yield or price of bonds of comparable quality, coupon, maturity and type or by broker-supplied prices. Swaps are marked-to-market daily based on valuations from third party pricing vendors, registered derivatives clearing organizations (clearinghouses) or broker-supplied valuations. These pricing sources may utilize inputs such as interest rate curves, credit spread curves, default possibilities and recovery rates. When independent prices are unavailable or unreliable, debt securities and swaps may be valued utilizing pricing methodologies which consider similar factors that would be used by third party pricing vendors. Debt securities and swaps are generally categorized as Level 2 in the hierarchy but may be Level 3 depending on the circumstances. The Fund invests a significant portion of its assets in below investment grade securities. The value of these securities can be more volatile due to changes in the credit quality of the issuer and is sensitive to changes in economic, market and regulatory conditions.
Equity securities, including restricted securities, for which market quotations are readily available, are valued at the last reported sale price or official closing price as reported by a third party pricing vendor on the primary market or exchange on which they are traded and are categorized as Level 1 in the hierarchy. In the event there were no sales during the day or closing prices are not available, securities are valued at the last quoted bid price or may be valued using the last available price and are generally categorized as Level 2 in the hierarchy. For foreign equity securities, when market or security specific events arise, comparisons to the valuation of American Depositary Receipts (ADRs), futures contracts, Exchange-Traded Funds (ETFs) and certain indexes as well as quoted prices for similar securities may be used and would be categorized as Level 2 in the hierarchy. Utilizing these techniques may result in transfers between Level 1 and Level 2. For equity securities, including restricted securities, where observable inputs are limited, assumptions about market activity and risk are used and these securities may be categorized as Level 3 in the hierarchy.
Futures contracts are valued at the settlement price established each day by the board of trade or exchange on which they are traded and are categorized as Level 1 in the hierarchy. Investments in open-end mutual funds, including the Fidelity Central Funds, are valued at their closing net asset value (NAV) each business day and are categorized as Level 1 in the hierarchy.
Changes in valuation techniques may result in transfers in or out of an assigned level within the disclosure hierarchy. The aggregate value of investments by input level as of December 31, 2015, is included at the end of the Fund's Schedule of Investments.
Foreign Currency. The Fund may use foreign currency contracts to facilitate transactions in foreign-denominated securities. Gains and losses from these transactions may arise from changes in the value of the foreign currency or if the counterparties do not perform under the contracts' terms.
Foreign-denominated assets, including investment securities, and liabilities are translated into U.S. dollars at the exchange rates at period end. Purchases and sales of investment securities, income and dividends received and expenses denominated in foreign currencies are translated into U.S. dollars at the exchange rate in effect on the transaction date.
The effects of exchange rate fluctuations on investments are included with the net realized and unrealized gain (loss) on investment securities. Other foreign currency transactions resulting in realized and unrealized gain (loss) are disclosed separately.
Investment Transactions and Income. For financial reporting purposes, the Fund's investment holdings and NAV include trades executed through the end of the last business day of the period. The NAV per share for processing shareholder transactions is calculated as of the close of business of the New York Stock Exchange (NYSE), normally 4:00 p.m. Eastern time and includes trades executed through the end of the prior business day. Gains and losses on securities sold are determined on the basis of identified cost. Dividend income is recorded on the ex-dividend date, except for certain dividends from foreign securities where the ex-dividend date may have passed, which are recorded as soon as the Fund is informed of the ex-dividend date. Non-cash dividends included in dividend income, if any, are recorded at the fair market value of the securities received. Income and capital gain distributions from Fidelity Central Funds, if any, are recorded on the ex-dividend date. Distributions received on securities that represent a return of capital or capital gain are recorded as a reduction of cost of investments and/or as a realized gain. Subsequent to ex-dividend date the Fund determines the components of these distributions, based upon receipt of tax filings or other correspondence relating to the underlying investment. Interest income is accrued as earned and includes coupon interest and amortization of premium and accretion of discount on debt securities as applicable. The principal amount on inflation-indexed securities is periodically adjusted to the rate of inflation and interest is accrued based on the principal amount. The adjustments to principal due to inflation are reflected as increases or decreases to Interest in the accompanying Statement of Operations. Investment income is recorded net of foreign taxes withheld where recovery of such taxes is uncertain. Debt obligations may be placed on non-accrual status and related interest income may be reduced by ceasing current accruals and writing off interest receivables when the collection of all or a portion of interest has become doubtful based on consistently applied procedures. A debt obligation is removed from non-accrual status when the issuer resumes interest payments or when collectability of interest is reasonably assured.
Class Allocations and Expenses. Investment income, realized and unrealized capital gains and losses, common expenses of the Fund, and certain fund-level expense reductions, if any, are allocated daily on a pro-rata basis to each class based on the relative net assets of each class to the total net assets of the Fund. Each class differs with respect to transfer agent and distribution and service plan fees incurred. Certain expense reductions may also differ by class. For the reporting period, the allocated portion of income and expenses to each class as a percent of its average net assets may vary due to the timing of recording these transactions in relation to fluctuating net assets of the classes. Expenses directly attributable to a fund are charged to that fund. Expenses attributable to more than one fund are allocated among the respective funds on the basis of relative net assets or other appropriate methods. Expense estimates are accrued in the period to which they relate and adjustments are made when actual amounts are known.
Income Tax Information and Distributions to Shareholders. Each year, the Fund intends to qualify as a regulated investment company under Subchapter M of the Internal Revenue Code, including distributing substantially all of its taxable income and realized gains. As a result, no provision for U.S. Federal income taxes is required. As of December 31, 2015, the Fund did not have any unrecognized tax benefits in the financial statements; nor is the Fund aware of any tax positions for which it is reasonably possible that the total amounts of unrecognized tax benefits will significantly change in the next twelve months. The Fund files a U.S. federal tax return, in addition to state and local tax returns as required. The Fund's federal income tax returns are subject to examination by the Internal Revenue Service (IRS) for a period of three fiscal years after they are filed. State and local tax returns may be subject to examination for an additional fiscal year depending on the jurisdiction. Foreign taxes are provided for based on the Fund's understanding of the tax rules and rates that exist in the foreign markets in which it invests.
Distributions are declared and recorded on the ex-dividend date. Income dividends and capital gain distributions are declared separately for each class. Income and capital gain distributions are determined in accordance with income tax regulations, which may differ from GAAP.
Capital accounts within the financial statements are adjusted for permanent book-tax differences. These adjustments have no impact on net assets or the results of operations. Capital accounts are not adjusted for temporary book-tax differences which will reverse in a subsequent period.
Book-tax differences are primarily due to futures contracts, swaps, foreign currency transactions, defaulted bonds, market discount, tax return of capital distribution, partnerships (including allocations from Fidelity Central Funds), capital loss carryforwards, equity-debt classifications, contingent interest and losses deferred due to wash sales and excise tax regulations.
For the period ended December 31, 2015, the Fund's distributions exceeded the aggregate amount of taxable income and net realized gains resulting in a return of capital for tax purposes. This was due to reductions in taxable income available for distribution after certain distributions had been made.
The federal tax cost of investment securities and unrealized appreciation (depreciation) as of period end were as follows:
| Gross unrealized appreciation | $26,270,739 |
| Gross unrealized depreciation | (70,845,201) |
| Net unrealized appreciation (depreciation) on securities | $(44,574,462) |
| Tax Cost | $1,218,983,618 |
The tax-based components of distributable earnings as of period end were as follows:
| Capital loss carryforward | $(4,523,387) |
| Net unrealized appreciation (depreciation) on securities and other investments | $(44,596,507) |
Capital loss carryforwards are only available to offset future capital gains of the Fund to the extent provided by regulations and may be limited. Under the Regulated Investment Company Modernization Act of 2010 (the Act), the Fund is permitted to carry forward capital losses incurred in taxable years beginning after December 22, 2010 for an unlimited period and such capital losses are required to be used prior to any losses that expire. The capital loss carryforward information presented below, including any applicable limitation, is estimated as of fiscal period end and is subject to adjustment.
| No expiration | |
| Short-term | $(4,523,387) |
The Fund intends to elect to defer to its next fiscal year $1,233,309 of capital losses recognized during the period November 1, 2015 to December 31, 2015. The Fund intends to elect to defer to its next fiscal year $727,406 of ordinary losses recognized during the period November 1, 2015 to Fund's current fiscal year end December 31, 2015.
The tax character of distributions paid was as follows:
| | December 31, 2015 | December 31,2014 |
| Ordinary Income | $32,938,370 | $ 41,612,437 |
| Long-term Capital Gains | – | 9,245,454 |
| Tax Return of Capital | 3,700,630 | – |
| Total | $36,639,000 | $ 50,857,891 |
Restricted Securities. The Fund may invest in securities that are subject to legal or contractual restrictions on resale. These securities generally may be resold in transactions exempt from registration or to the public if the securities are registered. Disposal of these securities may involve time-consuming negotiations and expense, and prompt sale at an acceptable price may be difficult. Information regarding restricted securities is included at the end of the Fund's Schedule of Investments.
Loans and Other Direct Debt Instruments. The Fund invests in direct debt instruments which are interests in amounts owed to lenders by corporate or other borrowers. These instruments may be in the form of loans, trade claims or other receivables and may include standby financing commitments such as revolving credit facilities that obligate the Fund to supply additional cash to the borrower on demand. Loans may be acquired through assignment or participation. The Fund did not have any unfunded loan commitments, which are contractual obligations for future funding, at period end.
4. Derivative Instruments.
Risk Exposures and the Use of Derivative Instruments. The Fund's investment objective allows the Fund to enter into various types of derivative contracts, including futures contracts, options and swaps. Derivatives are investments whose value is primarily derived from underlying assets, indices or reference rates and may be transacted on an exchange or over-the-counter (OTC). Derivatives may involve a future commitment to buy or sell a specified asset based on specified terms, to exchange future cash flows at periodic intervals based on a notional principal amount, or for one party to make one or more payments upon the occurrence of specified events in exchange for periodic payments from the other party.
The Fund used derivatives to increase returns, to gain exposure to certain types of assets and to manage exposure to certain risks as defined below. The success of any strategy involving derivatives depends on analysis of numerous economic factors, and if the strategies for investment do not work as intended, the Fund may not achieve its objectives.
The Fund's use of derivatives increased or decreased its exposure to the following risk:
| Interest Rate Risk | Interest rate risk relates to the fluctuations in the value of interest-bearing securities due to changes in the prevailing levels of market interest rates. |
The Fund is also exposed to additional risks from investing in derivatives, such as liquidity risk and counterparty credit risk. Liquidity risk is the risk that the Fund will be unable to close out the derivative in the open market in a timely manner. Counterparty credit risk is the risk that the counterparty will not be able to fulfill its obligation to the Fund. Derivative counterparty credit risk is managed through formal evaluation of the creditworthiness of all potential counterparties. On certain OTC derivatives such as options, the Fund attempts to reduce its exposure to counterparty credit risk by entering into an International Swaps and Derivatives Association, Inc. (ISDA) Master Agreement with each of its counterparties. The ISDA Master Agreement gives the Fund the right to terminate all transactions traded under such agreement upon the deterioration in the credit quality of the counterparty beyond specified levels. The ISDA Master Agreement gives each party the right, upon an event of default by the other party or a termination of the agreement, to close out all transactions traded under such agreement and to net amounts owed under each transaction to one net payable by one party to the other. To mitigate counterparty credit risk on bi-lateral OTC derivatives, the Fund receives collateral in the form of cash or securities once the Fund's net unrealized appreciation on outstanding derivative contracts under an ISDA Master Agreement exceeds certain applicable thresholds, subject to certain minimum transfer provisions. The collateral received is held in segregated accounts with the Fund's custodian bank in accordance with the collateral agreements entered into between the Fund, the counterparty and the Fund's custodian bank. The Fund could experience delays and costs in gaining access to the collateral even though it is held by the Fund's custodian bank. The Fund's maximum risk of loss from counterparty credit risk related to bi-lateral OTC derivatives is generally the aggregate unrealized appreciation and unpaid counterparty payments in excess of any collateral pledged by the counterparty to the Fund. The Fund may be required to pledge collateral for the benefit of the counterparties on bi-lateral OTC derivatives in an amount not less than each counterparty's unrealized appreciation on outstanding derivative contracts, subject to certain minimum transfer provisions, and any such pledged collateral is identified in the Schedule of Investments. Exchange-traded futures contracts are not covered by the ISDA Master Agreement; however counterparty credit risk related to exchange-traded futures contracts may be mitigated by the protection provided by the exchange on which they trade. Counterparty credit risk related to centrally cleared OTC swaps may be mitigated by the protection provided by the clearinghouse.
Investing in derivatives may involve greater risks than investing in the underlying assets directly and, to varying degrees, may involve risk of loss in excess of any initial investment and collateral received and amounts recognized in the Statement of Assets and Liabilities. In addition, there may be the risk that the change in value of the derivative contract does not correspond to the change in value of the underlying instrument.
Net Realized Gain (Loss) and Change in Net Unrealized Appreciation (Depreciation) on Derivatives. The table below, which reflects the impacts of derivatives on the financial performance of the Fund, summarizes the net realized gain (loss) and change in net unrealized appreciation (depreciation) for derivatives during the period as presented in the Statement of Operations.
| Primary Risk Exposure / Derivative Type | Net Realized Gain (Loss) | Change in Net Unrealized Appreciation (Depreciation) |
| Interest Rate Risk | | |
| Futures Contracts | $236,408 | $(199,441) |
| Purchased Options | (90,290) | 90,290 |
| Swaps | (78,850) | 2,890 |
| Totals(a) | $67,268 | $(106,261) |
(a) A summary of the value of derivatives by primary risk exposure as of period end, is included at the end of the Schedule of Investments.
Futures Contracts. A futures contract is an agreement between two parties to buy or sell a specified underlying instrument for a fixed price at a specified future date. The Fund used futures contracts to manage its exposure to the bond market and fluctuations in interest rates.
Upon entering into a futures contract, a fund is required to deposit either cash or securities (initial margin) with a clearing broker in an amount equal to a certain percentage of the face value of the contract. Futures contracts are marked-to-market daily and subsequent daily payments (variation margin) are made or received by a fund depending on the daily fluctuations in the value of the futures contracts and are recorded as unrealized appreciation or (depreciation). This receivable and/or payable, if any, is included in daily variation margin for derivative instruments in the Statement of Assets and Liabilities. Realized gain or (loss) is recorded upon the expiration or closing of a futures contract. The net realized gain (loss) and change in net unrealized appreciation (depreciation) on futures contracts during the period is included in the Statement of Operations.
Any open futures contracts at period end are presented in the Schedule of Investments under the caption "Futures Contracts". The underlying face amount at value reflects each contract's exposure to the underlying instrument or index at period end and is representative of volume of activity during the period. Securities deposited to meet initial margin requirements are identified in the Schedule of Investments.
Options. Options give the purchaser the right, but not the obligation, to buy (call) or sell (put) an underlying security or financial instrument at an agreed exercise or strike price between or on certain dates. Options obligate the seller (writer) to buy (put) or sell (call) an underlying instrument at the exercise or strike price or cash settle an underlying derivative instrument if the holder exercises the option on or before the expiration date. The Fund uses OTC options, such as swaptions, which are options where the underlying instrument is a swap, to manage its exposure to fluctuations in interest rates.
Upon entering into an options contract, a fund will pay or receive a premium. Premiums paid on purchased options are reflected as cost of investments and premiums received on written options are reflected as a liability on the Statement of Assets and Liabilities. Certain options may be purchased or written with premiums to be paid or received on a future date. Options are valued daily and any unrealized appreciation (depreciation) is reflected on the Statement of Assets and Liabilities. When an option is exercised, the cost or proceeds of the underlying instrument purchased or sold is adjusted by the amount of the premium. When an option is closed the Fund will realize a gain or loss depending on whether the proceeds or amount paid for the closing sale transaction is greater or less than the premium received or paid. When an option expires, gains and losses are realized to the extent of premiums received and paid, respectively. The net realized and unrealized gains (losses) on purchased options are included on the Statement of Operations in net realized gain (loss) and change in net unrealized appreciation (depreciation) on investment securities. The net realized gain (loss) and change in net unrealized appreciation (depreciation) on written options are reflected separately on the Statement of Operations.
Any open options at period end are presented in the Schedule of Investments under the captions "Purchased Options," "Purchased Swaptions," "Written Options" and "Written Swaptions," as applicable.
Swaps. A swap is a contract between two parties to exchange future cash flows at periodic intervals based on a notional principal amount. A centrally cleared OTC swap is a transaction executed between a fund and a dealer counterparty, then cleared by a futures commission merchant (FCM) through a clearinghouse. Once cleared, the clearinghouse serves as a central counterparty, with whom a fund exchanges cash flows for the life of the transaction, similar to transactions in futures contracts.
Centrally cleared OTC swaps require a fund to deposit either cash or securities (initial margin) with the FCM, at the instruction of and for the benefit of the clearinghouse. Securities deposited to meet initial margin requirements are identified in the Schedule of Investments. Centrally cleared OTC swaps are marked-to-market daily and subsequent payments (variation margin) are made or received depending on the daily fluctuations in the value of the swaps and are recorded as unrealized appreciation or (depreciation). These daily payments, if any, are included in receivable or payable for daily variation margin for derivative instruments in the Statement of Assets and Liabilities. Any premiums for centrally cleared OTC swaps are recorded periodically throughout the term of the swap to variation margin and included in unrealized appreciation (depreciation) in the Statement of Assets and Liabilities. Any premiums are recognized as realized gain (loss) upon termination or maturity of the swap.
Payments are exchanged at specified intervals, accrued daily commencing with the effective date of the contract and recorded as realized gain or (loss). Some swaps may be terminated prior to the effective date and realize a gain or loss upon termination. The net realized gain (loss) and change in net unrealized appreciation (depreciation) on swaps during the period is included in the Statement of Operations.
Any open swaps at period end are included in the Schedule of Investments under the caption "Swaps" and are representative of volume of activity during the period.
Interest Rate Swaps. Interest rate swaps are agreements between counterparties to exchange cash flows, one based on a fixed rate, and the other on a floating rate. The Fund entered into interest rate swaps to manage its exposure to interest rate changes. Changes in interest rates can have an effect on both the value of bond holdings as well as the amount of interest income earned. In general, the value of bonds can fall when interest rates rise and can rise when interest rates fall.
5. Purchases and Sales of Investments.
Purchases and sales of securities (including the Fixed-Income Central Funds), other than short-term securities and U.S. government securities, aggregated $911,261,291 and $811,073,518, respectively.
6. Fees and Other Transactions with Affiliates.
Management Fee. Fidelity Management & Research Company (the investment adviser) and its affiliates provide the Fund with investment management related services for which the Fund pays a monthly management fee. The management fee is the sum of an individual fund fee rate that is based on an annual rate of .45% of the Fund's average net assets and an annualized group fee rate that averaged .11% during the period. The group fee rate is based upon the average net assets of all the mutual funds advised by the investment adviser, including any mutual funds previously advised by the investment adviser that are currently advised by Fidelity SelectCo, LLC, an affiliate of the investment adviser. The group fee rate decreases as assets under management increase and increases as assets under management decrease. For the reporting period, the total annual management fee rate was .56% of the Fund's average net assets.
Distribution and Service Plan Fees. In accordance with Rule 12b-1 of the 1940 Act, the Fund has adopted separate 12b-1 Plans for each Service Class of shares. Each Service Class pays Fidelity Distributors Corporation (FDC), an affiliate of the investment adviser, a service fee. For the period, the service fee is based on an annual rate of .10% of Service Class' average net assets and .25% of Service Class 2's average net assets.
For the period, total fees, all of which were re-allowed to insurance companies for the distribution of shares and providing shareholder support services, were as follows:
| Service Class | $815 |
| Service Class 2 | 423,872 |
| | $424,687 |
Transfer Agent Fees. Fidelity Investments Institutional Operations Company, Inc. (FIIOC), an affiliate of the investment adviser, is the Fund's transfer, dividend disbursing, and shareholder servicing agent. FIIOC receives an asset-based fee with respect to each class. Each class (with the exception of Investor Class) pays a fee for transfer agent services, typesetting, printing and mailing of shareholder reports, excluding mailing of proxy statements and out of pocket expenses, equal to an annual rate of .07% (.10% for Investor Class) of class-level average net assets. For the period, transfer agent fees for each class, including out of pocket expenses, were as follows:
| Initial Class | $69,793 |
| Service Class | 559 |
| Service Class 2 | 115,531 |
| Investor Class | 994,140 |
| | $1,180,023 |
Accounting Fees. Fidelity Service Company, Inc. (FSC), an affiliate of the investment adviser, maintains the Fund's accounting records. The fee is based on the level of average net assets for each month.
Brokerage Commissions. The Fund placed a portion of its portfolio transactions with brokerage firms which are affiliates of the investment adviser. Brokerage commissions are included in net realized gain (loss) and change in net unrealized appreciation (depreciation) in the Statement of Operations. The commissions paid to these affiliated firms were $242 for the period.
Interfund Trades. The Fund may purchase from or sell securities to other Fidelity Funds under procedures adopted by the Board. The procedures have been designed to ensure these interfund trades are executed in accordance with Rule 17a-7 of the 1940 Act. Interfund trades are included within the respective purchases and sales amounts shown in the Purchases and Sales of Investments note.
7. Committed Line of Credit.
The Fund participates with other funds managed by the investment adviser or an affiliate in a $4.25 billion credit facility (the "line of credit") to be utilized for temporary or emergency purposes to fund shareholder redemptions or for other short-term liquidity purposes. The Fund has agreed to pay commitment fees on its pro-rata portion of the line of credit, which amounted to $1,796 and is reflected in Miscellaneous expenses on the Statement of Operations. During the period, the Fund did not borrow on this line of credit.
8. Expense Reductions.
Commissions paid to certain brokers with whom the investment adviser, or its affiliates, places trades on behalf of the Fund include an amount in addition to trade execution, which may be rebated back to the Fund to offset certain expenses. This amount totaled $1,072 for the period.
In addition, during the period the investment adviser reimbursed and/or waived a portion of fund-level operating expenses in the amount of $2,858.
9. Distributions to Shareholders.
Distributions to shareholders of each class were as follows:
| Years ended December 31, | 2015 | 2014 |
| From net investment income | | |
| Initial Class | $2,608,355 | $3,269,156 |
| Service Class | 20,999 | 25,357 |
| Service Class 2 | 4,841,746 | 3,960,327 |
| Investor Class | 25,467,270 | 29,469,198 |
| Total | $32,938,370 | $36,724,038 |
| Tax Return of Capital | | |
| Initial Class | $287,413 | $– |
| Service Class | 2,400 | – |
| Service Class 2 | 576,830 | – |
| Investor Class | 2,833,987 | – |
| Total | $3,700,630 | $– |
| From net realized gain | | |
| Initial Class | $– | $1,242,279 |
| Service Class | – | 9,948 |
| Service Class 2 | – | 1,586,516 |
| Investor Class | – | 11,295,110 |
| Total | $– | $14,133,853 |
10. Share Transactions.
Transactions for each class of shares were as follows:
| | Shares | Shares | Dollars | Dollars |
| Years ended December 31, | 2015 | 2014 | 2015 | 2014 |
| Initial Class | | | | |
| Shares sold | 438,630 | 745,338 | $4,928,200 | $8,663,108 |
| Reinvestment of distributions | 272,415 | 406,070 | 2,895,768 | 4,511,435 |
| Shares redeemed | (1,754,032) | (2,086,629) | (19,582,348) | (24,079,212) |
| Net increase (decrease) | (1,042,987) | (935,221) | $(11,758,380) | $(10,904,669) |
| Service Class | | | | |
| Reinvestment of distributions | 2,203 | 3,181 | $23,399 | $35,305 |
| Shares redeemed | (5,901) | (3,178) | (64,952) | (35,305) |
| Net increase (decrease) | (3,698) | 3 | $(41,553) | $– |
| Service Class 2 | | | | |
| Shares sold | 7,779,897 | 7,688,623 | $86,550,696 | $88,930,893 |
| Reinvestment of distributions | 513,609 | 502,887 | 5,418,575 | 5,546,843 |
| Shares redeemed | (3,102,820) | (1,833,227) | (34,258,336) | (21,154,484) |
| Net increase (decrease) | 5,190,686 | 6,358,283 | $57,710,935 | $73,323,252 |
| Investor Class | | | | |
| Shares sold | 3,943,346 | 7,190,870 | $44,206,013 | $83,664,126 |
| Reinvestment of distributions | 2,669,930 | 3,679,089 | 28,301,258 | 40,764,308 |
| Shares redeemed | (9,288,284) | (6,422,064) | (103,280,796) | (73,670,906) |
| Net increase (decrease) | (2,675,008) | 4,447,895 | $(30,773,525) | $50,757,528 |
11. Other.
The Fund's organizational documents provide former and current trustees and officers with a limited indemnification against liabilities arising in connection with the performance of their duties to the Fund. In the normal course of business, the Fund may also enter into contracts that provide general indemnifications. The Fund's maximum exposure under these arrangements is unknown as this would be dependent on future claims that may be made against the Fund. The risk of material loss from such claims is considered remote.
At the period end, the investment advisor or its affiliates were the owners of record of 83% of the total outstanding shares of the Fund.
12. Credit Risk.
The Fund's relatively large investment in countries with limited or developing capital markets may involve greater risks than investments in more developed markets and the prices of such investments may be volatile. The yields of emerging market debt obligations reflect, among other things, perceived credit risk. The consequences of political, social or economic changes in these markets may have disruptive effects on the market prices of the Fund's investments and the income they generate, as well as the Fund's ability to repatriate such amounts.
13. Litigation.
The Fund, and other entities managed by FMR or its affiliates, became aware in March 2015 that they were named as defendants in a lawsuit originally filed in the United States Bankruptcy Court for the Southern District of New York in 2009. The lawsuit was brought by creditors of Motors Liquidation Company (f/k/a General Motors), which went through Chapter 11 bankruptcy proceedings in 2009, and is captioned Official Committee of Unsecured Creditors of Motors Liquidation Company v. JPMorgan Chase Bank, N.A., et al., Adversary No. 09-00504 (REG). The plaintiffs are seeking an order that the Fund and other defendants return proceeds received in 2009 in full payment of the principal and interest on General Motors secured debt. The plaintiffs contend that the Fund and the other defendants were not secured creditors at the time of the 2009 payments and, thus, were not entitled to payment in full. In January 2015, the Court of Appeals ruled that JPMorgan, as administrative agent for all of the debtholders, released the security interest on certain collateral securing the debt prior to the 2009 payments. The parties to the dispute have commenced discovery on the value of remaining, unreleased collateral. At this time, Management cannot determine the amount of loss that may be realized, but expects the amount to be less than the $1,208,199 received in 2009. The Fund was not previously aware that it had been named as a defendant in this case because, in 2009, the Bankruptcy Court allowed the plaintiffs to refrain from serving any of the defendants other than JPMorgan with notice of the filing of the lawsuit. The Fund will explore all available options for minimizing any loss to the Fund. The Fund will also incur legal costs in defending the case.
Report of Independent Registered Public Accounting Firm
To the Trustees of Variable Insurance Products Fund V and Shareholders of VIP Strategic Income Portfolio:
In our opinion, the accompanying statement of assets and liabilities, including the schedule of investments, and the related statements of operations and of changes in net assets and the financial highlights present fairly, in all material respects, the financial position of VIP Strategic Income Portfolio (a fund of Variable Insurance Products Fund V) at December 31, 2015, the results of its operations for the year then ended, the changes in its net assets for each of the two years in the period then ended and the financial highlights for each of the five years in the period then ended, in conformity with accounting principles generally accepted in the United States of America. These financial statements and financial highlights (hereafter referred to as “financial statements”) are the responsibility of the VIP Strategic Income Portfolio’s management. Our responsibility is to express an opinion on these financial statements based on our audits. We conducted our audits of these financial statements in accordance with the standards of the Public Company Accounting Oversight Board (United States). Those standards require that we plan and perform the audit to obtain reasonable assurance about whether the financial statements are free of material misstatement. An audit includes examining, on a test basis, evidence supporting the amounts and disclosures in the financial statements, assessing the accounting principles used and significant estimates made by management, and evaluating the overall financial statement presentation. We believe that our audits, which included confirmation of securities at December 31, 2015 by correspondence with the custodian and brokers, provide a reasonable basis for our opinion.
PricewaterhouseCoopers LLP
Boston, Massachusetts
February 23, 2016
Trustees and Officers
The Trustees, Members of the Advisory Board (if any), and officers of the trust and fund, as applicable, are listed below. The Board of Trustees governs the fund and is responsible for protecting the interests of shareholders. The Trustees are experienced executives who meet periodically throughout the year to oversee the fund's activities, review contractual arrangements with companies that provide services to the fund, oversee management of the risks associated with such activities and contractual arrangements, and review the fund's performance. Except for Elizabeth S. Acton, John Engler, and Geoffrey A. von Kuhn, each of the Trustees oversees 236 funds. Ms. Acton and Mr. Engler each oversees 228 funds. Mr. von Kuhn oversees 148 funds.
The Trustees hold office without limit in time except that (a) any Trustee may resign; (b) any Trustee may be removed by written instrument, signed by at least two-thirds of the number of Trustees prior to such removal; (c) any Trustee who requests to be retired or who has become incapacitated by illness or injury may be retired by written instrument signed by a majority of the other Trustees; and (d) any Trustee may be removed at any special meeting of shareholders by a two-thirds vote of the outstanding voting securities of the trust. Each Trustee who is not an interested person (as defined in the 1940 Act) of the trust and the fund is referred to herein as an Independent Trustee. Each Independent Trustee shall retire not later than the last day of the calendar year in which his or her 75th birthday occurs. The Independent Trustees may waive this mandatory retirement age policy with respect to individual Trustees. Officers and Advisory Board Members hold office without limit in time, except that any officer or Advisory Board Member may resign or may be removed by a vote of a majority of the Trustees at any regular meeting or any special meeting of the Trustees. Except as indicated, each individual has held the office shown or other offices in the same company for the past five years.
The fund’s Statement of Additional Information (SAI) includes more information about the Trustees. To request a free copy, call Fidelity at 1-877-208-0098.
Experience, Skills, Attributes, and Qualifications of the Trustees. The Governance and Nominating Committee has adopted a statement of policy that describes the experience, qualifications, attributes, and skills that are necessary and desirable for potential Independent Trustee candidates (Statement of Policy). The Board believes that each Trustee satisfied at the time he or she was initially elected or appointed a Trustee, and continues to satisfy, the standards contemplated by the Statement of Policy. The Governance and Nominating Committee also engages professional search firms to help identify potential Independent Trustee candidates who have the experience, qualifications, attributes, and skills consistent with the Statement of Policy. From time to time, additional criteria based on the composition and skills of the current Independent Trustees, as well as experience or skills that may be appropriate in light of future changes to board composition, business conditions, and regulatory or other developments, have also been considered by the professional search firms and the Governance and Nominating Committee. In addition, the Board takes into account the Trustees' commitment and participation in Board and committee meetings, as well as their leadership of standing and ad hoc committees throughout their tenure.
In determining that a particular Trustee was and continues to be qualified to serve as a Trustee, the Board has considered a variety of criteria, none of which, in isolation, was controlling. The Board believes that, collectively, the Trustees have balanced and diverse experience, qualifications, attributes, and skills, which allow the Board to operate effectively in governing the fund and protecting the interests of shareholders. Information about the specific experience, skills, attributes, and qualifications of each Trustee, which in each case led to the Board's conclusion that the Trustee should serve (or continue to serve) as a trustee of the fund, is provided below.
Board Structure and Oversight Function. Abigail P. Johnson is an interested person and currently serves as Chairman. The Trustees have determined that an interested Chairman is appropriate and benefits shareholders because an interested Chairman has a personal and professional stake in the quality and continuity of services provided to the fund. Independent Trustees exercise their informed business judgment to appoint an individual of their choosing to serve as Chairman, regardless of whether the Trustee happens to be independent or a member of management. The Independent Trustees have determined that they can act independently and effectively without having an Independent Trustee serve as Chairman and that a key structural component for assuring that they are in a position to do so is for the Independent Trustees to constitute a substantial majority for the Board. The Independent Trustees also regularly meet in executive session. Marie L. Knowles serves as Chairman of the Independent Trustees and as such (i) acts as a liaison between the Independent Trustees and management with respect to matters important to the Independent Trustees and (ii) with management prepares agendas for Board meetings.
Fidelity® funds are overseen by different Boards of Trustees. The fund's Board oversees Fidelity's investment-grade bond, money market, asset allocation and certain equity funds, and other Boards oversee Fidelity's high income, sector and other equity funds. The asset allocation funds may invest in Fidelity® funds that are overseen by such other Boards. The use of separate Boards, each with its own committee structure, allows the Trustees of each group of Fidelity® funds to focus on the unique issues of the funds they oversee, including common research, investment, and operational issues. On occasion, the separate Boards establish joint committees to address issues of overlapping consequences for the Fidelity® funds overseen by each Board.
The Trustees operate using a system of committees to facilitate the timely and efficient consideration of all matters of importance to the Trustees, the fund, and fund shareholders and to facilitate compliance with legal and regulatory requirements and oversight of the fund's activities and associated risks. The Board, acting through its committees, has charged FMR and its affiliates with (i) identifying events or circumstances the occurrence of which could have demonstrably adverse effects on the fund's business and/or reputation; (ii) implementing processes and controls to lessen the possibility that such events or circumstances occur or to mitigate the effects of such events or circumstances if they do occur; and (iii) creating and maintaining a system designed to evaluate continuously business and market conditions in order to facilitate the identification and implementation processes described in (i) and (ii) above. Because the day-to-day operations and activities of the fund are carried out by or through FMR, its affiliates, and other service providers, the fund's exposure to risks is mitigated but not eliminated by the processes overseen by the Trustees. While each of the Board's committees has responsibility for overseeing different aspects of the fund's activities, oversight is exercised primarily through the Operations and Audit Committees. In addition, an ad hoc Board committee of Independent Trustees has worked with FMR to enhance the Board's oversight of investment and financial risks, legal and regulatory risks, technology risks, and operational risks, including the development of additional risk reporting to the Board. Appropriate personnel, including but not limited to the fund's Chief Compliance Officer (CCO), FMR's internal auditor, the independent accountants, the fund's Treasurer and portfolio management personnel, make periodic reports to the Board's committees, as appropriate, including an annual review of Fidelity's risk management program for the Fidelity® funds. The responsibilities of each standing committee, including their oversight responsibilities, are described further under "Standing Committees of the Trustees."
Interested Trustees*:
Correspondence intended for a Trustee who is an interested person may be sent to Fidelity Investments, 245 Summer Street, Boston, Massachusetts 02210.
Name, Year of Birth; Principal Occupations and Other Relevant Experience+
Abigail P. Johnson (1961)
Year of Election or Appointment: 2009
Trustee
Chairman of the Board of Trustees
Ms. Johnson also serves as Trustee of other Fidelity® funds. Ms. Johnson serves as President (2013-present) and Chief Executive Officer (2014-present) of FMR LLC (diversified financial services company), President of Fidelity Financial Services (2012-present) and President of Personal, Workplace and Institutional Services (2005-present). Ms. Johnson is Chairman and Director of FMR Co., Inc. (investment adviser firm, 2011-present), Chairman and Director of FMR (investment adviser firm, 2011-present), and the Vice Chairman and Director (2007-present) of FMR LLC. Previously, Ms. Johnson served as President and a Director of FMR (2001-2005), a Trustee of other investment companies advised by FMR, Fidelity Investments Money Management, Inc. (investment adviser firm), and FMR Co., Inc. (2001-2005), Senior Vice President of the Fidelity® funds (2001-2005), and managed a number of Fidelity® funds. Ms. Abigail P. Johnson and Mr. Arthur E. Johnson are not related.
Geoffrey A. von Kuhn (1951)
Year of Election or Appointment: 2015
Trustee
Mr. von Kuhn also serves as Trustee or Member of the Advisory Board of other Fidelity funds. Mr. von Kuhn is Chief Administrative Officer for FMR LLC (diversified financial services company, 2013-present), a Director of Pembroke Real Estate, Inc. (2009-present), and a Director of Discovery Natural Resources LLC (2012-present). Previously, Mr. von Kuhn was a managing director of Crosby Group (private wealth management company, 2007-2013), a member of the management committee and senior executive in the Wealth Management Group of AmSouth Bank (2001-2006), and head of the U.S. private bank at Citigroup (2000-2001).
* Determined to be an “Interested Trustee” by virtue of, among other things, his or her affiliation with the trust or various entities under common control with FMR.
+ The information includes the Trustee's principal occupation during the last five years and other information relating to the experience, attributes, and skills relevant to the Trustee's qualifications to serve as a Trustee, which led to the conclusion that the Trustee should serve as a Trustee for the fund.
Independent Trustees:
Correspondence intended for an Independent Trustee may be sent to Fidelity Investments, P.O. Box 55235, Boston, Massachusetts 02205-5235.
Name, Year of Birth; Principal Occupations and Other Relevant Experience+
Elizabeth S. Acton (1951)
Year of Election or Appointment: 2013
Trustee
Ms. Acton also serves as Trustee or Member of the Advisory Board of other Fidelity® funds. Prior to her retirement in April 2012, Ms. Acton was Executive Vice President, Finance (2011-2012), Executive Vice President, Chief Financial Officer (2002-2011), and Treasurer (2004-2005) of Comerica Incorporated (financial services). Prior to joining Comerica, Ms. Acton held a variety of positions at Ford Motor Company (1983-2002), including Vice President and Treasurer (2000-2002) and Executive Vice President and Chief Financial Officer of Ford Motor Credit Company (1998-2000). Ms. Acton currently serves as a member of the Board of Directors and Audit and Finance Committees of Beazer Homes USA, Inc. (homebuilding, 2012-present).
John Engler (1948)
Year of Election or Appointment: 2014
Trustee
Mr. Engler also serves as Trustee or Member of the Advisory Board of other Fidelity® funds. He serves as president of the Business Roundtable (2011-present), and on the board of directors/trustees for Universal Forest Products (manufacturer and distributor of wood and wood-alternative products, 2003-present) and K12 Inc. (technology-based education company, 2012-present). Previously, Mr. Engler served as a trustee of The Munder Funds (2003-2014), president and CEO of the National Association of Manufacturers (2004-2011), member of the Board of Trustees of the Annie E. Casey Foundation (2004-2015), and as governor of Michigan (1991-2003). He is a past chairman of the National Governors Association.
Albert R. Gamper, Jr. (1942)
Year of Election or Appointment: 2007
Trustee
Mr. Gamper also serves as Trustee of other Fidelity® funds. Prior to his retirement in December 2004, Mr. Gamper served as Chairman of the Board of CIT Group Inc. (commercial finance). During his tenure with CIT Group Inc. Mr. Gamper served in numerous senior management positions, including Chairman (1987-1989; 1999-2001; 2002-2004), Chief Executive Officer (1987-2004), and President (2002-2003). Mr. Gamper currently serves as a member of the Board of Directors of Public Service Enterprise Group (utilities, 2000-present), and Member of the Board of Trustees of Barnabas Health Care System (1997-present). Previously, Mr. Gamper served as Chairman (2012-2015) and Vice Chairman (2011-2012) of the Independent Trustees of certain Fidelity® funds and as Chairman of the Board of Governors, Rutgers University (2004-2007).
Robert F. Gartland (1951)
Year of Election or Appointment: 2010
Trustee
Mr. Gartland also serves as Trustee of other Fidelity® funds. Mr. Gartland is Chairman and an investor in Gartland and Mellina Group Corp. (consulting, 2009-present). Previously, Mr. Gartland served as a partner and investor of Vietnam Partners LLC (investments and consulting, 2008-2011). Prior to his retirement, Mr. Gartland held a variety of positions at Morgan Stanley (financial services, 1979-2007) including Managing Director (1987-2007).
Arthur E. Johnson (1947)
Year of Election or Appointment: 2008
Trustee
Vice Chairman of the Independent Trustees
Mr. Johnson also serves as Trustee of other Fidelity® funds. Mr. Johnson serves as a member of the Board of Directors of Eaton Corporation plc (diversified power management, 2009-present), AGL Resources, Inc. (holding company, 2002-present) and Booz Allen Hamilton (management consulting, 2011-present). Prior to his retirement, Mr. Johnson served as Senior Vice President of Corporate Strategic Development of Lockheed Martin Corporation (defense contractor, 1999-2009). He previously served on the Board of Directors of IKON Office Solutions, Inc. (1999-2008) and Delta Airlines (2005-2007). Mr. Arthur E. Johnson is not related to Ms. Abigail P. Johnson.
Michael E. Kenneally (1954)
Year of Election or Appointment: 2009
Trustee
Mr. Kenneally also serves as Trustee of other Fidelity® funds. Prior to his retirement, Mr. Kenneally served as Chairman and Global Chief Executive Officer of Credit Suisse Asset Management. Before joining Credit Suisse, he was an Executive Vice President and Chief Investment Officer for Bank of America Corporation. Earlier roles at Bank of America included Director of Research, Senior Portfolio Manager and Research Analyst, and Mr. Kenneally was awarded the Chartered Financial Analyst (CFA) designation in 1991.
James H. Keyes (1940)
Year of Election or Appointment: 2007
Trustee
Mr. Keyes also serves as Trustee of other Fidelity® funds. Mr. Keyes serves as a member of the Board and Non-Executive Chairman of Navistar International Corporation (manufacture and sale of trucks, buses, and diesel engines, since 2002). Previously, Mr. Keyes served as a member of the Board of Pitney Bowes, Inc. (integrated mail, messaging, and document management solutions, 1998-2013). Prior to his retirement, Mr. Keyes served as Chairman (1993-2002) and Chief Executive Officer (1988-2002) of Johnson Controls (automotive, building, and energy) and as a member of the Board of LSI Logic Corporation (semiconductor technologies, 1984-2008).
Marie L. Knowles (1946)
Year of Election or Appointment: 2001
Trustee
Chairman of the Independent Trustees
Ms. Knowles also serves as Trustee of other Fidelity® funds. Prior to Ms. Knowles' retirement in June 2000, she served as Executive Vice President and Chief Financial Officer of Atlantic Richfield Company (ARCO) (diversified energy, 1996-2000). From 1993 to 1996, she was a Senior Vice President of ARCO and President of ARCO Transportation Company (pipeline and tanker operations). Ms. Knowles currently serves as a Director and Chairman of the Audit Committee of McKesson Corporation (healthcare service, since 2002). Ms. Knowles is a member of the Board of the Santa Catalina Island Company (real estate, 2009-present). Ms. Knowles is a Member of the Investment Company Institute Board of Governors and a Member of the Governing Council of the Independent Directors Council (2014-present). She also serves as a member of the Advisory Board for the School of Engineering of the University of Southern California. Previously, Ms. Knowles served as a Director of Phelps Dodge Corporation (copper mining and manufacturing, 1994-2007), URS Corporation (engineering and construction, 2000-2003) and America West (airline, 1999-2002). Ms. Knowles previously served as Vice Chairman of the Independent Trustees of certain Fidelity® funds (2012-2015).
+ The information includes the Trustee's principal occupation during the last five years and other information relating to the experience, attributes, and skills relevant to the Trustee's qualifications to serve as a Trustee, which led to the conclusion that the Trustee should serve as a Trustee for the fund.
Advisory Board Members and Officers:
Correspondence intended for an officer may be sent to Fidelity Investments, 245 Summer Street, Boston, Massachusetts 02210. Officers appear below in alphabetical order.
Name, Year of Birth; Principal Occupation
Marc R. Bryant (1966)
Year of Election or Appointment: 2015
Secretary and Chief Legal Officer (CLO)
Mr. Bryant also serves as Secretary and CLO of other funds. Mr. Bryant serves as CLO, Secretary, and Senior Vice President of Fidelity Management & Research Company (investment adviser firm, 2015-present) and FMR Co., Inc. (investment adviser firm, 2015-present); Secretary of Fidelity SelectCo, LLC (investment adviser firm, 2015-present) and Fidelity Investments Money Management, Inc. (investment adviser firm, 2015-present); and CLO of Fidelity Management & Research (Hong Kong) Limited (investment adviser firm, 2015-present). He is Senior Vice President and Deputy General Counsel of FMR LLC (diversified financial services company). Previously, Mr. Bryant served as Secretary and CLO of Fidelity Rutland Square Trust II (2010-2014) and Assistant Secretary of Fidelity's Fixed Income and Asset Allocation Funds (2013-2015). Prior to joining Fidelity Investments, Mr. Bryant served as a Senior Vice President and the Head of Global Retail Legal for AllianceBernstein L.P. (2006-2010), and as the General Counsel for ProFund Advisors LLC (2001-2006).
Jonathan Davis (1968)
Year of Election or Appointment: 2010
Assistant Treasurer
Mr. Davis also serves as Assistant Treasurer of other funds, and is an employee of Fidelity Investments. Previously, Mr. Davis served as Vice President and Associate General Counsel of FMR LLC (diversified financial services company, 2003-2010).
Adrien E. Deberghes (1967)
Year of Election or Appointment: 2010
Assistant Treasurer
Mr. Deberghes also serves as an officer of other funds. He is an employee of Fidelity Investments (2008-present). Prior to joining Fidelity Investments, Mr. Deberghes was Senior Vice President of Mutual Fund Administration at State Street Corporation (2007-2008), Senior Director of Mutual Fund Administration at Investors Bank & Trust (2005-2007), and Director of Finance for Dunkin' Brands (2000-2005).
Stephanie J. Dorsey (1969)
Year of Election or Appointment: 2013
President and Treasurer
Ms. Dorsey also serves as an officer of other funds. She is an employee of Fidelity Investments (2008-present) and has served in other fund officer roles. Prior to joining Fidelity Investments, Ms. Dorsey served as Treasurer (2004-2008) of the JPMorgan Mutual Funds and Vice President (2004-2008) of JPMorgan Chase Bank.
Howard J. Galligan III (1966)
Year of Election or Appointment: 2014
Chief Financial Officer
Mr. Galligan also serves as Chief Financial Officer of other funds. Mr. Galligan serves as President of Fidelity Pricing and Cash Management Services (FPCMS) (2014-present) and as a Director of Strategic Advisers, Inc. (investment adviser firm, 2008-present). Previously, Mr. Galligan served as Chief Administrative Officer of Asset Management (2011-2014) and Chief Operating Officer and Senior Vice President of Investment Support for Strategic Advisers, Inc. (2003-2011).
Scott C. Goebel (1968)
Year of Election or Appointment: 2015
Vice President
Mr. Goebel serves as Vice President of other funds and is an employee of Fidelity Investments (2001-present). Previously, Mr. Goebel served as Secretary of Fidelity SelectCo, LLC (investment adviser firm, 2013-2015), Fidelity Investments Money Management, Inc. (FIMM) (investment adviser firm, 2010-2015), and Fidelity Research and Analysis Company (FRAC) (investment adviser firm, 2010-2015); General Counsel, Secretary, and Senior Vice President of Fidelity Management & Research Company (investment adviser firm, 2008-2015) and FMR Co., Inc. (investment adviser firm, 2008-2015); Assistant Secretary of Fidelity Management & Research (Japan) Limited (investment adviser firm, 2008-2015) and FMR Investment Management (U.K.) Limited (investment adviser firm, 2008-2015); Chief Legal Officer (CLO) of Fidelity Management & Research (Hong Kong) Limited (investment adviser firm, 2008-2015); Secretary and CLO of certain Fidelity® funds (2008-2015); Assistant Secretary of FIMM (2008-2010), FRAC (2008-2010), and certain funds (2007-2008); and as Vice President and Secretary of Fidelity Distributors Corporation (FDC) (2005-2007).
Chris Maher (1972)
Year of Election or Appointment: 2013
Assistant Treasurer
Mr. Maher serves as Assistant Treasurer of other funds. Mr. Maher is Vice President of Valuation Oversight and is an employee of Fidelity Investments. Previously, Mr. Maher served as Vice President of Asset Management Compliance (2013), Vice President of the Program Management Group of FMR (investment adviser firm, 2010-2013), and Vice President of Valuation Oversight (2008-2010).
Jason P. Pogorelec (1975)
Year of Election or Appointment: 2015
Assistant Secretary
Mr. Pogorelec also serves as Assistant Secretary of other funds. Mr. Pogorelec serves as Vice President, Associate General Counsel (2010-present) and is an employee of Fidelity Investments (2006-present).
John F. Papandrea (1972)
Year of Election or Appointment: 2016
Anti-Money Laundering (AML) Officer
Mr. Papandrea also serves as AML Officer of other funds. Mr. Papandrea is Vice President of FMR LLC (diversified financial services company, 2008-present) and is an employee of Fidelity Investments (2005-present).
Nancy D. Prior (1967)
Year of Election or Appointment: 2014
Vice President
Ms. Prior also serves as Vice President of other funds. Ms. Prior serves as a Director of Fidelity Investments Money Management, Inc. (FIMM) (investment adviser firm, 2014-present), President, Fixed Income (2014-present), Vice Chairman of FIAM LLC (investment adviser firm, 2014-present), and is an employee of Fidelity Investments (2002-present). Previously, Ms. Prior served as Vice President of Fidelity's Money Market Funds (2012-2014), President, Money Market and Short Duration Bond Group of Fidelity Management & Research (FMR) (investment adviser firm, 2013-2014), President, Money Market Group of FMR (2011-2013), Managing Director of Research (2009-2011), Senior Vice President and Deputy General Counsel (2007-2009), and Assistant Secretary of other Fidelity® funds (2008-2009).
Kenneth B. Robins (1969)
Year of Election or Appointment: 2009
Assistant Treasurer
Mr. Robins also serves as an officer of other funds. Mr. Robins serves as Executive Vice President of Fidelity Investments Money Management, Inc. (FIMM) (investment adviser firm, 2013-present) and is an employee of Fidelity Investments (2004-present). Previously, Mr. Robins served in other fund officer roles.
Stacie M. Smith (1974)
Year of Election or Appointment: 2013
Assistant Treasurer
Ms. Smith also serves as an officer of other funds. She is an employee of Fidelity Investments (2009-present) and has served in other fund officer roles. Prior to joining Fidelity Investments, Ms. Smith served as Senior Audit Manager of Ernst & Young LLP (1996-2009).
Renee Stagnone (1975)
Year of Election or Appointment: 2013
Deputy Treasurer
Ms. Stagnone also serves as Deputy Treasurer of other funds. Ms. Stagnone is an employee of Fidelity Investments (1997-present).
Michael H. Whitaker (1967)
Year of Election or Appointment: 2008
Chief Compliance Officer
Mr. Whitaker also serves as Chief Compliance Officer of other funds. Mr. Whitaker also serves as Compliance Officer of FMR Co., Inc. (investment adviser firm, 2014-present), FMR (investment adviser firm, 2014-present), and Fidelity Investments Money Management, Inc. (investment adviser firm, 2014-present) and is an employee of Fidelity Investments (2007-present). Prior to joining Fidelity Investments, Mr. Whitaker worked at MFS Investment Management where he served as Senior Vice President and Chief Compliance Officer (2004-2006), and Assistant General Counsel.
Derek L. Young (1964)
Year of Election or Appointment: 2009
Vice President of Fidelity's Asset Allocation Funds
Mr. Young also serves as an officer of other funds. He is a Director of Strategic Advisers, Inc. (investment adviser firm, 2011-present), President of Fidelity Global Asset Allocation (GAA) (2011-present), and Vice Chairman of FIAM LLC (investment adviser firm, 2011-present). Previously, Mr. Young served as Trustee of certain funds (2012-2015), President of Strategic Advisers, Inc. (2011-2015), Chief Investment Officer of GAA (2009-2011), and as a portfolio manager.
Joseph F. Zambello (1957)
Year of Election or Appointment: 2011
Deputy Treasurer
Mr. Zambello also serves as Deputy Treasurer of other funds. Mr. Zambello is an employee of Fidelity Investments (1991-present). Previously, Mr. Zambello served as Vice President of the Program Management Group of FMR (investment adviser firm, 2009-2011) and Vice President of the Transfer Agent Oversight Group (2005-2009).
Shareholder Expense Example
As a shareholder of the Fund, you incur two types of costs: (1) transaction costs and (2) ongoing costs, including management fees, distribution and/or service (12b-1) fees and other Fund expenses. This Example is intended to help you understand your ongoing costs (in dollars) of investing in the Fund and to compare these costs with the ongoing costs of investing in other mutual funds.
The Example is based on an investment of $1,000 invested at the beginning of the period and held for the entire period (July 1, 2015 to December 31, 2015).
Actual Expenses
The first line of the accompanying table for each class of the Fund provides information about actual account values and actual expenses. You may use the information in this line, together with the amount you invested, to estimate the expenses that you paid over the period. Simply divide your account value by $1,000.00 (for example, an $8,600 account value divided by $1,000.00 = 8.6), then multiply the result by the number in the first line for a class of the Fund under the heading entitled "Expenses Paid During Period" to estimate the expenses you paid on your account during this period. The estimate of expenses does not include any fees or other expenses of any variable annuity or variable life insurance product. If they were, the estimate of expenses you paid during the period would be higher, and your ending account value would be lower. In addition, the Fund, as a shareholder in the underlying Fidelity Central Funds, will indirectly bear its pro-rata share of the fees and expenses incurred by the underlying Fidelity Central Funds. These fees and expenses are not included in the Fund's annualized expense ratio used to calculate the expense estimate in the table below.
Hypothetical Example for Comparison Purposes
The second line of the accompanying table for each class of the Fund provides information about hypothetical account values and hypothetical expenses based on a Class' actual expense ratio and an assumed rate of return of 5% per year before expenses, which is not the Class' actual return. The hypothetical account values and expenses may not be used to estimate the actual ending account balance or expenses you paid for the period. You may use this information to compare the ongoing costs of investing in the Fund and other funds. To do so, compare this 5% hypothetical example with the 5% hypothetical examples that appear in the shareholder reports of the other funds. The estimate of expenses does not include any fees or other expenses of any variable annuity or variable life insurance product. If they were, the estimate of expenses you paid during the period would be higher, and your ending account value would be lower. In addition, the Fund, as a shareholder in the underlying Fidelity Central Funds, will indirectly bear its pro-rata share of the fees and expenses incurred by the underlying Fidelity Central Funds. These fees and expenses are not included in the Fund's annualized expense ratio used to calculate the expense estimate in the table below.
Please note that the expenses shown in the table are meant to highlight your ongoing costs only and do not reflect any transaction costs. Therefore, the second line of the table is useful in comparing ongoing costs only, and will not help you determine the relative total costs of owning different funds.
In addition to the expenses noted below, the Fund also indirectly bears its proportional share of the expenses of the underlying Fidelity Central Funds. Annualized expenses of the underlying non-money market Fidelity Central Funds as of their most recent fiscal half year were less than .005%.
| | Annualized Expense Ratio-A | Beginning
Account Value
July 1, 2015 | Ending
Account Value
December 31, 2015 | Expenses Paid
During Period-B
July 1, 2015
to December 31, 2015 |
| Initial Class | .69% | | | |
| Actual | | $1,000.00 | $969.80 | $3.43 |
| Hypothetical-C | | $1,000.00 | $1,021.73 | $3.52 |
| Service Class | .79% | | | |
| Actual | | $1,000.00 | $969.60 | $3.92 |
| Hypothetical-C | | $1,000.00 | $1,021.22 | $4.02 |
| Service Class 2 | .94% | | | |
| Actual | | $1,000.00 | $968.40 | $4.66 |
| Hypothetical-C | | $1,000.00 | $1,020.47 | $4.79 |
| Investor Class | .72% | | | |
| Actual | | $1,000.00 | $970.30 | $3.58 |
| Hypothetical-C | | $1,000.00 | $1,021.58 | $3.67 |
A Annualized expense ratio reflects expenses net of applicable fee waivers.
B Expenses are equal to each Class' annualized expense ratio, multiplied by the average account value over the period, multiplied by 184/365 (to reflect the one-half year period). The fees and expenses of the underlying Fidelity Central Funds in which the Fund invests are not included in each Class' annualized expense ratio.
C 5% return per year before expenses
Distributions (Unaudited)
A total of 5.84% of the dividends distributed during the fiscal year was derived from interest on U.S. Government securities which is generally exempt from state income tax.
Board Approval of Investment Advisory Contracts and Management Fees
VIP Strategic Income Portfolio
Each year, the Board of Trustees, including the Independent Trustees (together, the Board), votes on the renewal of the management contract with Fidelity Management & Research Company (FMR) and the sub-advisory agreements (together, the Advisory Contracts) for the fund. The Board, assisted by the advice of fund counsel and Independent Trustees' counsel, requests and considers a broad range of information relevant to the renewal of the Advisory Contracts throughout the year.
The Board meets regularly and, at each of its meetings, covers an extensive agenda of topics and materials and considers factors that are relevant to its annual consideration of the renewal of the fund's Advisory Contracts, including the services and support provided to the fund and its shareholders. The Board has established four standing committees (Committees) — Operations, Audit, Fair Valuation, and Governance and Nominating — each composed of and chaired by Independent Trustees with varying backgrounds, to which the Board has assigned specific subject matter responsibilities in order to enhance effective decision-making by the Board. The Operations Committee, of which all of the Independent Trustees are members, meets regularly throughout the year and considers, among other matters, information specifically related to the annual consideration of the renewal of the fund's Advisory Contracts. The Board, acting directly and through its Committees, requests and receives information concerning the annual consideration of the renewal of the fund's Advisory Contracts. The Board also meets as needed to consider matters specifically related to the Board's annual consideration of the renewal of the Advisory Contracts. Members of the Board may also meet with trustees of other Fidelity funds through ad hoc joint committees to discuss certain matters relevant to all of the Fidelity funds.
At its September 2015 meeting, the Board unanimously determined to renew the fund's Advisory Contracts. In reaching its determination, the Board considered all factors it believed relevant, including (i) the nature, extent, and quality of the services to be provided to the fund and its shareholders (including the investment performance of the fund); (ii) the competitiveness of the fund's management fee and total expense ratio relative to peer funds; (iii) the total costs of the services to be provided by and the profits to be realized by Fidelity from its relationship with the fund; and (iv) the extent to which (if any) economies of scale exist and would be realized as the fund grows, and whether any economies of scale are appropriately shared with fund shareholders.
In considering whether to renew the Advisory Contracts for the fund, the Board reached a determination, with the assistance of fund counsel and Independent Trustees' counsel and through the exercise of its business judgment, that the renewal of the Advisory Contracts was in the best interests of the fund and its shareholders and that the compensation payable under the Advisory Contracts was fair and reasonable. The Board's decision to renew the Advisory Contracts was not based on any single factor, but rather was based on a comprehensive consideration of all the information provided to the Board at its meetings throughout the year. The Board, in reaching its determination to renew the Advisory Contracts, was aware that shareholders of the fund have a broad range of investment choices available to them, including a wide choice among funds offered by Fidelity's competitors, and that the fund's shareholders, who have the opportunity to review and weigh the disclosure provided by the fund in its prospectus and other public disclosures, have chosen to invest in this fund, which is part of the Fidelity family of funds.
Nature, Extent, and Quality of Services Provided. The Board considered Fidelity's staffing as it relates to the fund, including the backgrounds of investment personnel of Fidelity, and also considered the fund's investment objective, strategies, and related investment philosophy. The Independent Trustees also had discussions with senior management of Fidelity's investment operations and investment groups. The Board considered the structure of the portfolio manager compensation program and whether this structure provides appropriate incentives to act in the best interests of the fund. Additionally, the Board considered the portfolio managers' investments, if any, in the funds that they manage.
Resources Dedicated to Investment Management and Support Services. The Board reviewed the general qualifications and capabilities of Fidelity's investment staff, including its size, education, experience, and resources, as well as Fidelity's approach to recruiting, training, managing, and compensating investment personnel. The Board noted that Fidelity has continued to increase the resources devoted to non-U.S. offices, including expansion of Fidelity's global investment organization. The Board also noted that Fidelity's analysts have extensive resources, tools and capabilities that allow them to conduct sophisticated quantitative and fundamental analysis, as well as credit analysis of issuers, counterparties and guarantors. Further, the Board considered that Fidelity's investment professionals have sufficient access to global information and data so as to provide competitive investment results over time, and that those professionals also have access to sophisticated tools that permit them to assess portfolio construction and risk and performance attribution characteristics continuously, as well as to transmit new information and research conclusions rapidly around the world. Additionally, in its deliberations, the Board considered Fidelity's trading, risk management, compliance, and technology and operations capabilities and resources, which are integral parts of the investment management process.
Shareholder and Administrative Services. The Board considered (i) the nature, extent, quality, and cost of advisory, administrative, and shareholder services performed by FMR, the sub-advisers (together with FMR, the Investment Advisers), and their affiliates under the Advisory Contracts and under separate agreements covering transfer agency, pricing and bookkeeping, and securities lending services for the fund; (ii) the nature and extent of the supervision of third party service providers, principally custodians, subcustodians, and pricing vendors; and (iii) the resources devoted to, and the record of compliance with, the fund's compliance policies and procedures. The Board also reviewed the allocation of fund brokerage, including allocations to brokers affiliated with the Investment Advisers, the use of brokerage commissions to pay fund expenses, and the use of "soft" commission dollars to pay for research services.
The Board noted that the growth of fund assets over time across the complex allows Fidelity to reinvest in the development of services designed to enhance the value or convenience of the Fidelity funds as investment vehicles. These services include 24-hour access to account information and market information through telephone representatives and over the Internet, investor education materials and asset allocation tools, and the expanded availability of Fidelity Investor Centers.
Investment in a Large Fund Family. The Board considered the benefits to shareholders of investing in a Fidelity fund, including the benefits of investing in a fund that is part of a large family of funds offering a variety of investment disciplines and providing a large variety of mutual fund investor services. The Board noted that Fidelity had taken, or had made recommendations that resulted in the Fidelity funds taking, a number of actions over the previous year that benefited particular funds, including (i) continuing to dedicate additional resources to investment research and to the support of the senior management team that oversees asset management; (ii) continuing efforts to enhance Fidelity's global research capabilities; (iii) launching new funds and making other enhancements to meet client needs; (iv) reducing management fees and total expenses for certain index funds and diversified international funds; (v) continuing to launch dedicated lower cost underlying funds to meet portfolio construction needs related to expanding underlying fund options for Fidelity funds of funds, specifically for the Freedom Fund product lines; (vi) rationalizing product lines and gaining increased efficiencies through fund mergers; (vii) launching active fixed-income exchange-traded funds; (viii) continuing to develop, acquire and implement systems and technology to improve services to the funds and shareholders, strengthen information security, and increase efficiency; (ix) implementing investment enhancements to further strengthen Fidelity's target date product line to increase investors' probability of success in achieving their goals; (x) modifying the eligibility criteria for certain share classes to accommodate roll-over assets from employer-sponsored retirement plans; (xi) launching a new Class W of the Freedom Index Funds to attract and retain Fidelity record-kept retirement plan assets; and (xii) implementing changes to Fidelity's money market product line in response to recent money market regulatory reforms.
Investment Performance. The Board considered whether the fund has operated in accordance with its investment objective, as well as its record of compliance with its investment restrictions and its performance history. The Board noted that there was a portfolio management change for the fund in January 2015.
The Board took into account discussions with representatives of the Investment Advisers about fund investment performance that occur at Board meetings throughout the year. In this regard the Board noted that as part of regularly scheduled fund reviews and other reports to the Board on fund performance, the Board considers annualized return information for the fund for different time periods, measured against one or more securities market indices, including a customized blended index representative of the fund's asset classes (each a "benchmark index") and a peer group of funds with similar objectives ("peer group"), if any. In its evaluation of fund investment performance at meetings throughout the year, the Board gave particular attention to information indicating underperformance of certain Fidelity funds for specific time periods and discussed with the Investment Advisers the reasons for such underperformance.
In addition to reviewing absolute and relative fund performance, the Independent Trustees periodically consider the appropriateness of fund performance metrics in evaluating the results achieved. In general, the Independent Trustees believe that fund performance should be evaluated based on gross performance (before fees and expenses but after transaction costs) compared to appropriate benchmark indices, over appropriate time periods that may include full market cycles, and on net performance (after fees and expenses) compared to peer groups, as applicable, over the same periods, taking into account relevant factors including the following: general market conditions; expectations for interest rate levels and credit conditions; issuer-specific information including credit quality; and fund cash flows and other factors. Depending on the circumstances, the Independent Trustees may be satisfied with a fund's performance notwithstanding that it lags its benchmark index or peer group for certain periods.
The Independent Trustees recognize that shareholders evaluate performance on a net basis over their own holding periods, for which one-, three-, and five-year periods are often used as a proxy. For this reason, the performance information reviewed by the Board also included net cumulative calendar year total return information for the fund and an appropriate benchmark index and peer group for the most recent one-, three-, and five-year periods.
Based on its review, the Board concluded that the nature, extent, and quality of services provided to the fund under the Advisory Contracts should benefit the shareholders of the fund.
Competitiveness of Management Fee and Total Expense Ratio. The Board considered the fund's management fee and total expense ratio compared to "mapped groups" of competitive funds and classes created for the purpose of facilitating the Trustees' competitive analysis of management fees and total expenses. Fidelity creates "mapped groups" by combining similar Lipper investment objective categories that have comparable investment mandates. Combining Lipper investment objective categories aids the Board's management fee and total expense ratio comparisons by broadening the competitive group used for comparison.
Management Fee. The Board considered two proprietary management fee comparisons for the 12-month periods shown in basis points (BP) in the chart below. The group of Lipper funds used by the Board for management fee comparisons is referred to below as the "Total Mapped Group." The Total Mapped Group comparison focuses on a fund's standing in terms of gross management fees before expense reimbursements or caps relative to the total universe of funds with comparable investment mandates, regardless of whether their management fee structures also are comparable. Funds with comparable investment mandates offer exposure to similar types of securities. Funds with comparable management fee structures have similar management fee contractual arrangements (
e.g., flat rate charged for advisory services, all-inclusive fee rate,
etc.). "TMG %" represents the percentage of funds in the Total Mapped Group that had management fees that were lower than the fund's. For example, a hypothetical TMG % of 20% would mean that 80% of the funds in the Total Mapped Group had higher, and 20% had lower, management fees than the fund. The fund's actual TMG %s and the number of funds in the Total Mapped Group are in the chart below. The "Asset-Size Peer Group" (ASPG) comparison focuses on a fund's standing relative to a subset of non-Fidelity funds within the Total Mapped Group that are similar in size and management fee structure. For example, if a fund is in the first quartile of the ASPG, the fund's management fee ranks in the least expensive or lowest 25% of funds in the ASPG. The ASPG represents at least 15% of the funds in the Total Mapped Group with comparable asset size and management fee structures, subject to a minimum of 50 funds (or all funds in the Total Mapped Group if fewer than 50). Additional information, such as the ASPG quartile in which the fund's management fee rate ranked, is also included in the chart and considered by the Board.
VIP Strategic Income Portfolio
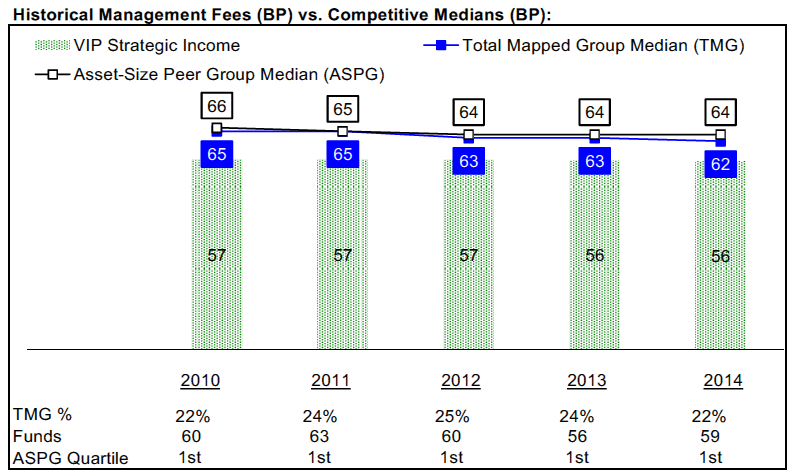
The Board noted that the fund's management fee rate ranked below the median of its Total Mapped Group and below the median of its ASPG for 2014.
The Board noted that, in 2014, the ad hoc Committee on Group Fee was formed by it and other Fidelity fund boards to conduct an in-depth review of the "group fee" component of the management fee of funds with such management fee structures. Committee focus included the mechanics of the group fee, the competitive landscape of group fee structures, Fidelity funds with no group fee component and investment products not included in group fee assets. The Board also considered that, for funds subject to the group fee, FMR agreed to voluntarily waive fees over a specified period of time in amounts designed to account for assets converted from certain funds to certain collective investment trusts.
Based on its review, the Board concluded that the fund's management fee is fair and reasonable in light of the services that the fund receives and the other factors considered.
Total Expense Ratio. In its review of each class's total expense ratio, the Board considered the fund's management fee rate as well as other fund or class expenses, as applicable, such as transfer agent fees, pricing and bookkeeping fees, fund-paid 12b-1 fees, and custodial, legal, and audit fees. The Board also noted that Fidelity may agree to waive fees and expenses from time to time, and the extent to which, if any, it has done so for the fund. As part of its review, the Board also considered the current and historical total expense ratios of each class of the fund compared to competitive fund median expenses. Each class of the fund is compared to those funds and classes in the Total Mapped Group (used by the Board for management fee comparisons) that have a similar sales load structure.
The Board noted that the total expense ratio of each of Initial Class, Investor Class, and Service Class ranked below its competitive median for 2014 and the total expense ratio of Service Class 2 ranked above its competitive median for 2014. The Board considered that, in general, various factors can affect total expense ratios. The Board noted that the total expense ratio of Service Class 2 was above the competitive median primarily because of higher 12b-1 fees for Service Class 2 as compared to most competitor funds. The Board noted that the fund offers multiple classes, each of which has a different 12b-1 fee structure, and that the multiple structures are intended to offer a range of pricing options for the intermediary market. The Board also noted that the total expense ratios of the classes vary primarily by the level of their 12b-1 fees, although differences in transfer agent fees may also cause expenses to vary from class to class.
Fees Charged to Other Fidelity Clients. The Board also considered Fidelity fee structures and other information with respect to clients of Fidelity, such as other funds advised or subadvised by Fidelity, pension plan clients, and other institutional clients with similar mandates. The Board noted the findings of the 2013 ad hoc joint committee (created with the board of other Fidelity funds), which reviewed and compared Fidelity's institutional investment advisory business with its business of providing services to the Fidelity funds, including the differences in services provided, fees charged, and costs incurred, as well as competition in their respective marketplaces.
Based on its review of total expense ratios and fees charged to other Fidelity clients, the Board concluded that, although Service Class 2 was above the median of the universe presented for comparison, the total expense ratio of each class of the fund was reasonable in light of the services that the fund and its shareholders receive and the other factors considered.
Costs of the Services and Profitability. The Board considered the revenues earned and the expenses incurred by Fidelity in conducting the business of developing, marketing, distributing, managing, administering and servicing the fund and servicing the fund's shareholders. The Board also considered the level of Fidelity's profits in respect of all the Fidelity funds.
On an annual basis, Fidelity presents to the Board information about the profitability of its relationship with the fund. Fidelity calculates profitability information for each fund, as well as aggregate profitability information for groups of Fidelity funds and all Fidelity funds, using a series of detailed revenue and cost allocation methodologies which originate with the books and records of Fidelity on which Fidelity's audited financial statements are based. The Audit Committee of the Board reviews any significant changes from the prior year's methodologies.
PricewaterhouseCoopers LLP (PwC), independent registered public accounting firm and auditor to Fidelity and certain Fidelity funds, has been engaged annually by the Board as part of the Board's assessment of Fidelity's profitability analysis. PwC's engagement includes the review and assessment of the methodologies used by Fidelity in determining the revenues and expenses attributable to Fidelity's mutual fund business, and completion of agreed-upon procedures in respect of the mathematical accuracy of fund profitability and its conformity to established allocation methodologies. After considering PwC's reports issued under the engagement and information provided by Fidelity, the Board concluded that while other allocation methods may also be reasonable, Fidelity's profitability methodologies are reasonable in all material respects.
The Board also reviewed Fidelity's non-fund businesses and fall-out benefits related to the mutual fund business as well as cases where Fidelity's affiliates may benefit from or be related to the fund's business.
The Board considered the costs of the services provided by and the profits realized by Fidelity in connection with the operation of the fund and was satisfied that the profitability was not excessive.
Economies of Scale. The Board considered whether there have been economies of scale in respect of the management of the Fidelity funds, whether the Fidelity funds (including the fund) have appropriately benefited from any such economies of scale, and whether there is potential for realization of any further economies of scale. The Board considered the extent to which the fund will benefit from economies of scale as assets grow through increased services to the fund, through waivers or reimbursements, or through fee or expense ratio reductions. The Board also noted that in 2013, it and the boards of other Fidelity funds created an ad hoc committee (the Economies of Scale Committee) to analyze whether Fidelity attains economies of scale in respect of the management and servicing of the Fidelity funds, whether the Fidelity funds have appropriately benefited from such economies of scale, and whether there is potential for realization of any further economies of scale.
The Board recognized that the fund's management contract incorporates a "group fee" structure, which provides for lower group fee rates as total group assets increase, and for higher group fee rates as total group assets decrease (with "group assets" defined to include fund assets under FMR's management plus sector fund assets previously under FMR's management and currently managed by Fidelity SelectCo, LLC). FMR calculates the group fee rates based on a tiered asset "breakpoint" schedule that varies based on asset class. The Board considered that the group fee is designed to deliver the benefits of economies of scale to fund shareholders when total Fidelity fund assets increase, even if assets of any particular fund are unchanged or have declined, because some portion of Fidelity's costs are attributable to services provided to all Fidelity funds, and all funds benefit if those costs can be allocated among more assets. The Board concluded that, given the group fee structure, fund shareholders will benefit from lower management fees as group assets increase at the fund complex level, regardless of whether Fidelity achieves any such economies of scale.
The Board concluded, taking into account the analysis of the Economies of Scale Committee, that economies of scale, if any, are being appropriately shared between fund shareholders and Fidelity.
Additional Information Requested by the Board. In order to develop fully the factual basis for consideration of the Fidelity funds' Advisory Contracts, the Board requested and received additional information on certain topics, including: (i) Fidelity's fund profitability methodology, profitability trends for certain funds, and the impact of certain factors on fund profitability results; (ii) portfolio manager changes that have occurred during the past year and the amount of the investment that each portfolio manager has made in the Fidelity fund(s) that he or she manages; (iii) Fidelity's compensation structure for portfolio managers, research analysts, and other key personnel, including its effects on fund profitability, the rationale for the compensation structure, and the extent to which current market conditions have affected retention and recruitment; (iv) the arrangements with and compensation paid to certain fund sub-advisers on behalf of the Fidelity funds; (v) Fidelity's voluntary waiver of its fees to maintain minimum yields for certain money market funds and classes as well as contractual waivers in place for certain funds; (vi) the methodology with respect to competitive fund data and peer group classifications; (vii) Fidelity's transfer agent fee, expense, and service structures for different funds and classes relative to competitive trends, and the impact of the increased use of omnibus accounts; (viii) Fidelity's long-term expectations for its offerings in the workplace investing channel; (ix) new developments in the retail and institutional marketplaces; and (x) the impact of money market reform on Fidelity's money market funds. In addition, the Board considered its discussions with Fidelity throughout the year regarding enhanced information security initiatives and the funds' fair valuation policies.
Based on its evaluation of all of the conclusions noted above, and after considering all factors it believed relevant, the Board concluded that the advisory fee structures are fair and reasonable, and that the fund's Advisory Contracts should be renewed.
Proxy Voting Results
A special meeting of shareholders was held on May 12, 2015. The results of votes taken among shareholders on the proposal before them are reported below. Each vote reported represents one dollar of net asset value held on the record date for the meeting.
PROPOSAL 1
To elect a Board of Trustees.
| | # of
Votes | % of
Votes |
| Elizabeth S. Acton | | |
| Affirmative | 24,469,831,790.28 | 97.003 |
| Withheld | 756,086,184.43 | 2.997 |
| TOTAL | 25,225,917,974.71 | 100.000 |
| John Engler | | |
| Affirmative | 24,404,438,415.74 | 96.744 |
| Withheld | 821,479,558.97 | 3.256 |
| TOTAL | 25,225,917,974.71 | 100.000 |
| Albert R. Gamper, Jr. | | |
| Affirmative | 24,431,670,090.08 | 96.852 |
| Withheld | 794,247,884.63 | 3.148 |
| TOTAL | 25,225,917,974.71 | 100.000 |
| Robert F. Gartland | | |
| Affirmative | 24,472,637,370.54 | 97.014 |
| Withheld | 753,280,604.17 | 2.986 |
| TOTAL | 25,225,917,974.71 | 100.000 |
| Abigail P. Johnson | | |
| Affirmative | 24,442,024,432.82 | 96.893 |
| Withheld | 783,893,541.89 | 3.107 |
| TOTAL | 25,225,917,974.71 | 100.000 |
| Arthur E. Johnson | | |
| Affirmative | 24,444,583,833.78 | 96.903 |
| Withheld | 781,334,140.93 | 3.097 |
| TOTAL | 25,225,917,974.71 | 100.000 |
| Michael E. Kenneally | | |
| Affirmative | 24,475,874,452.78 | 97.027 |
| Withheld | 750,043,521.93 | 2.973 |
| TOTAL | 25,225,917,974.71 | 100.000 |
| James H. Keyes | | |
| Affirmative | 24,434,496,321.71 | 96.863 |
| Withheld | 791,421,653.00 | 3.137 |
| TOTAL | 25,225,917,974.71 | 100.000 |
| Marie L. Knowles | | |
| Affirmative | 24,446,177,909.79 | 96.909 |
| Withheld | 779,740,064.92 | 3.091 |
| TOTAL | 25,225,917,974.71 | 100.000 |
| Geoffrey A. von Kuhn | | |
| Affirmative | 24,444,403,935.60 | 96.902 |
| Withheld | 781,514,039.11 | 3.098 |
| TOTAL | 25,225,917,974.71 | 100.000 |
| Proposal 1 reflects trust wide proposal and voting results. |
VIPSI-ANN-0216
1.796350.113
Item 2.
Code of Ethics
As of the end of the period, December 31, 2015, Variable Insurance Products Fund V (the trust) has adopted a code of ethics, as defined in Item 2 of Form N-CSR, that applies to its President and Treasurer and its Chief Financial Officer. A copy of the code of ethics is filed as an exhibit to this Form N-CSR.
Item 3.
Audit Committee Financial Expert
The Board of Trustees of the trust has determined that Elizabeth S. Acton is an audit committee financial expert, as defined in Item 3 of Form N-CSR. Ms. Acton is independent for purposes of Item 3 of Form N-CSR.
Item 4.
Principal Accountant Fees and Services
Fees and Services
The following table presents fees billed by Deloitte & Touche LLP, the member firms of Deloitte Touche Tohmatsu, and their respective affiliates (collectively, “Deloitte Entities”) in each of the last two fiscal years for services rendered to VIP Asset Manager Portfolio, VIP Asset Manager: Growth Portfolio, VIP Freedom 2005 Portfolio, VIP Freedom 2010 Portfolio, VIP Freedom 2015 Portfolio, VIP Freedom 2020 Portfolio, VIP Freedom 2025 Portfolio, VIP Freedom 2030 Portfolio, VIP Freedom 2035 Portfolio, VIP Freedom 2040 Portfolio, VIP Freedom 2045 Portfolio, VIP Freedom 2050 Portfolio, VIP Freedom Income Portfolio, VIP Freedom Lifetime Income I Portfolio, VIP Freedom Lifetime Income II Portfolio, VIP Freedom Lifetime Income III Portfolio and VIP Investment Grade Bond Portfolio (the “Funds”):
Services Billed by Deloitte Entities
December 31, 2015 FeesA
| | | | |
| Audit Fees | Audit-Related Fees | Tax Fees | All Other Fees |
VIP Asset Manager Portfolio | $37,000 | $- | $7,700 | $900 |
VIP Asset Manager: Growth Portfolio | $35,000 | $- | $5,500 | $700 |
VIP Freedom 2005 Portfolio | $22,000 | $- | $4,900 | $600 |
VIP Freedom 2010 Portfolio | $22,000 | $- | $4,900 | $600 |
VIP Freedom 2015 Portfolio | $22,000 | $- | $4,900 | $600 |
VIP Freedom 2020 Portfolio | $22,000 | $- | $4,900 | $600 |
VIP Freedom 2025 Portfolio | $22,000 | $- | $4,900 | $600 |
VIP Freedom 2030 Portfolio | $22,000 | $- | $4,900 | $600 |
VIP Freedom 2035 Portfolio | $21,000 | $- | $4,900 | $600 |
VIP Freedom 2040 Portfolio | $21,000 | $- | $4,900 | $600 |
VIP Freedom 2045 Portfolio | $21,000 | $- | $4,900 | $600 |
VIP Freedom 2050 Portfolio | $21,000 | $- | $4,900 | $600 |
VIP Freedom Income Portfolio | $22,000 | $- | $4,900 | $600 |
VIP Freedom Lifetime Income I Portfolio | $22,000 | $- | $4,900 | $600 |
VIP Freedom Lifetime Income II Portfolio | $22,000 | $- | $4,900 | $600 |
VIP Freedom Lifetime Income III Portfolio | $22,000 | $- | $4,900 | $600 |
VIP Investment Grade Bond Portfolio | $39,000 | $- | $6,300 | $1,400 |
| | | | |
| Audit Fees | Audit-Related Fees | Tax Fees | All Other Fees |
VIP Asset Manager Portfolio | $36,000 | $- | $7,700 | $900 |
VIP Asset Manager: Growth Portfolio | $34,000 | $- | $5,500 | $700 |
VIP Freedom 2005 Portfolio | $22,000 | $- | $4,900 | $600 |
VIP Freedom 2010 Portfolio | $22,000 | $- | $4,900 | $600 |
VIP Freedom 2015 Portfolio | $22,000 | $- | $4,900 | $600 |
VIP Freedom 2020 Portfolio | $22,000 | $- | $4,900 | $600 |
VIP Freedom 2025 Portfolio | $22,000 | $- | $4,900 | $600 |
VIP Freedom 2030 Portfolio | $22,000 | $- | $4,900 | $600 |
VIP Freedom 2035 Portfolio | $20,000 | $- | $4,900 | $600 |
VIP Freedom 2040 Portfolio | $20,000 | $- | $4,900 | $600 |
VIP Freedom 2045 Portfolio | $20,000 | $- | $4,900 | $600 |
VIP Freedom 2050 Portfolio | $20,000 | $- | $4,900 | $600 |
VIP Freedom Income Portfolio | $22,000 | $- | $4,900 | $600 |
VIP Freedom Lifetime Income I Portfolio | $22,000 | $- | $4,900 | $600 |
VIP Freedom Lifetime Income II Portfolio | $22,000 | $- | $4,900 | $600 |
VIP Freedom Lifetime Income III Portfolio | $22,000 | $- | $4,900 | $600 |
VIP Investment Grade Bond Portfolio | $38,000 | $- | $6,300 | $1,300 |
A Amounts may reflect rounding.
The following table presents fees billed by PricewaterhouseCoopers LLP (“PwC”) in each of the last two fiscal years for services rendered to VIP FundsManager 20% Portfolio, VIP FundsManager 50% Portfolio, VIP FundsManager 60%, VIP FundsManager 70% Portfolio, VIP FundsManager 85% Portfolio, VIP Investor Freedom 2005 Portfolio, VIP Investor Freedom 2010 Portfolio, VIP Investor Freedom 2015 Portfolio, VIP Investor Freedom 2020 Portfolio, VIP Investor Freedom 2025 Portfolio, VIP Investor Freedom 2030 Portfolio, VIP Investor Freedom Income Portfolio, VIP Strategic Income Portfolio and VIP Target Volatility Portfolio (the “Funds”):
Services Billed by PwC
December 31, 2015 FeesA
| | | | |
| Audit Fees | Audit-Related Fees | Tax Fees | All Other Fees |
VIP FundsManager 20% Portfolio | $31,000 | $- | $2,700 | $1,300 |
VIP FundsManager 50% Portfolio | $31,000 | $- | $2,700 | $1,300 |
VIP FundsManager 60% Portfolio | $31,000 | $- | $2,700 | $1,300 |
VIP FundsManager 70% Portfolio | $31,000 | $- | $2,700 | $1,300 |
VIP FundsManager 85% Portfolio | $31,000 | $- | $2,700 | $1,300 |
VIP Investor Freedom 2005 Portfolio | $22,000 | $- | $2,900 | $1,300 |
VIP Investor Freedom 2010 Portfolio | $22,000 | $- | $2,900 | $1,300 |
VIP Investor Freedom 2015 Portfolio | $22,000 | $- | $2,900 | $1,300 |
VIP Investor Freedom 2020 Portfolio | $22,000 | $- | $2,900 | $1,300 |
VIP Investor Freedom 2025 Portfolio | $22,000 | $- | $2,900 | $1,300 |
VIP Investor Freedom 2030 Portfolio | $22,000 | $- | $2,900 | $1,300 |
VIP Investor Freedom Income Portfolio | $22,000 | $- | $2,900 | $1,300 |
VIP Strategic Income Portfolio | $80,000 | $- | $5,700 | $1,900 |
VIP Target Volatility Portfolio | $33,000 | $- | $3,600 | $1,500 |
| | | | |
| Audit Fees | Audit-Related Fees | Tax Fees | All Other Fees |
VIP FundsManager 20% Portfolio | $29,000 | $- | $2,800 | $- |
VIP FundsManager 50% Portfolio | $29,000 | $- | $2,800 | $- |
VIP FundsManager 60% Portfolio | $29,000 | $- | $2,800 | $- |
VIP FundsManager 70% Portfolio | $29,000 | $- | $2,800 | $- |
VIP FundsManager 85% Portfolio | $29,000 | $- | $2,800 | $- |
VIP Investor Freedom 2005 Portfolio | $20,000 | $- | $3,000 | $- |
VIP Investor Freedom 2010 Portfolio | $20,000 | $- | $3,000 | $- |
VIP Investor Freedom 2015 Portfolio | $20,000 | $- | $3,000 | $- |
VIP Investor Freedom 2020 Portfolio | $20,000 | $- | $3,000 | $- |
VIP Investor Freedom 2025 Portfolio | $20,000 | $- | $3,000 | $- |
VIP Investor Freedom 2030 Portfolio | $20,000 | $- | $3,000 | $- |
VIP Investor Freedom Income Portfolio | $20,000 | $- | $3,000 | $- |
VIP Strategic Income Portfolio | $78,000 | $- | $3,600 | $2,100 |
VIP Target Volatility Portfolio | $30,000 | $- | $3,200 | $1,700 |
A Amounts may reflect rounding.
The following table presents fees billed by PwC and Deloitte Entities that were required to be approved by the Audit Committee for services that relate directly to the operations and financial reporting of the Funds and that are rendered on behalf of Fidelity Management & Research Company (“FMR”) and entities controlling, controlled by, or under common control with FMR (not including any sub-adviser whose role is primarily portfolio management and is subcontracted with or overseen by another investment adviser) that provide ongoing services to the Funds (“Fund Service Providers”):
Services Billed by Deloitte Entities
| | |
| December 31, 2015A | December 31, 2014A |
Audit-Related Fees | $- | $- |
Tax Fees | $10,000 | $- |
All Other Fees | $- | $650,000 |
A Amounts may reflect rounding.
Services Billed by PwC
| | |
| December 31, 2015A | December 31, 2014A |
Audit-Related Fees | $5,290,000 | $5,950,000 |
Tax Fees | $- | $- |
All Other Fees | $- | $- |
A Amounts may reflect rounding.
“Audit-Related Fees” represent fees billed for assurance and related services that are reasonably related to the performance of the fund audit or the review of the fund's financial statements and that are not reported under Audit Fees.
“Tax Fees” represent fees billed for tax compliance, tax advice or tax planning that relate directly to the operations and financial reporting of the fund.
“All Other Fees” represent fees billed for services provided to the fund or Fund Service Provider, a significant portion of which are assurance related, that relate directly to the operations and financial reporting of the fund, excluding those services that are reported under Audit Fees, Audit-Related Fees or Tax Fees.
Assurance services must be performed by an independent public accountant.
* * *
The aggregate non-audit fees billed by PwC and Deloitte Entities for services rendered to the Funds, FMR (not including any sub-adviser whose role is primarily portfolio management and is subcontracted with or overseen by another investment adviser), and any Fund Service Provider for each of the last two fiscal years of the Funds are as follows:
| | |
Billed By | December 31, 2015 A | December 31, 2014 A |
PwC | $5,705,000 | $8,145,000 |
Deloitte Entities | $135,000 | $1,905,000 |
A Amounts may reflect rounding.
The trust's Audit Committee has considered non-audit services that were not pre-approved that were provided by PwC and Deloitte Entities to Fund Service Providers to be compatible with maintaining the independence of PwC and Deloitte Entities in their audits of the Funds, taking into account representations from PwC and Deloitte Entities, in accordance with Public Company Accounting Oversight Board rules, regarding their independence from the Funds and their related entities and FMR’s review of the appropriateness and permissibility under applicable law of such non-audit services prior to their provision to the Fund Service Providers.
Audit Committee Pre-Approval Policies and Procedures
The trust’s Audit Committee must pre-approve all audit and non-audit services provided by a fund’s independent registered public accounting firm relating to the operations or financial reporting of the fund. Prior to the commencement of any audit or non-audit services to a fund, the Audit Committee reviews the services to determine whether they are appropriate and permissible under applicable law.
The Audit Committee has adopted policies and procedures to, among other purposes, provide a framework for the Committee’s consideration of non-audit services by the audit firms that audit the Fidelity funds. The policies and procedures require that any non-audit service provided by a fund audit firm to a Fidelity fund and any non-audit service provided by a fund auditor to a Fund Service Provider that relates directly to the operations and financial reporting of a Fidelity fund (“Covered Service”) are subject to approval by the Audit Committee before such service is provided.
All Covered Services must be approved in advance of provision of the service either: (i) by formal resolution of the Audit Committee, or (ii) by oral or written approval of the service by the Chair of the Audit Committee (or if the Chair is unavailable, such other member of the Audit Committee as may be designated by the Chair to act in the Chair’s absence). The approval contemplated by (ii) above is permitted where the Treasurer determines that action on such an engagement is necessary before the next meeting of the Audit Committee.
Non-audit services provided by a fund audit firm to a Fund Service Provider that do not relate directly to the operations and financial reporting of a Fidelity fund are reported to the Audit Committee on a periodic basis.
Non-Audit Services Approved Pursuant to Rule 2-01(c)(7)(i)(C) and (ii) of Regulation S-X (“De Minimis Exception”)
There were no non-audit services approved or required to be approved by the Audit Committee pursuant to the De Minimis Exception during the Funds’ last two fiscal years relating to services provided to (i) the Funds or (ii) any Fund Service Provider that relate directly to the operations and financial reporting of the Funds.
Item 5.
Audit Committee of Listed Registrants
Not applicable.
Item 6.
Investments
(a)
Not applicable.
(b)
Not applicable
Item 7.
Disclosure of Proxy Voting Policies and Procedures for Closed-End Management Investment Companies
Not applicable.
Item 8.
Portfolio Managers of Closed-End Management Investment Companies
Not applicable.
Item 9.
Purchase of Equity Securities by Closed-End Management Investment Company and Affiliated Purchasers
Not applicable.
Item 10.
Submission of Matters to a Vote of Security Holders
There were no material changes to the procedures by which shareholders may recommend nominees to the trust’s Board of Trustees.
Item 11.
Controls and Procedures
(a)(i) The President and Treasurer and the Chief Financial Officer have concluded that the disclosure controls and procedures (as defined in Rule 30a-3(c) under the Investment Company Act) for each Fund provide reasonable assurances that material information relating to such Fund is made known to them by the appropriate persons, based on their evaluation of these controls and procedures as of a date within 90 days of the filing date of this report.
(a)(ii) There was no change in a Fund’s internal control over financial reporting (as defined in Rule 30a-3(d) under the Investment Company Act) that occurred during the second fiscal quarter of the period covered by this report that has materially affected, or is reasonably likely to materially affect, a Fund’s internal control over financial reporting.
Item 12.
Exhibits
| | |
(a) | (1) | Code of Ethics pursuant to Item 2 of Form N-CSR is filed and attached hereto as EX-99.CODE ETH. |
(a) | (2) | Certification pursuant to Rule 30a-2(a) under the Investment Company Act of 1940 (17 CFR 270.30a-2(a)) is filed and attached hereto as Exhibit 99.CERT. |
(a) | (3) | Not applicable. |
(b) | | Certification pursuant to Rule 30a-2(b) under the Investment Company Act of 1940 (17 CFR 270.30a-2(b)) is furnished and attached hereto as Exhibit 99.906CERT. |
SIGNATURES
Pursuant to the requirements of the Securities Exchange Act of 1934 and the Investment Company Act of 1940, the registrant has duly caused this report to be signed on its behalf by the undersigned, thereunto duly authorized.
Variable Insurance Products Fund V
| |
By: | /s/Stephanie J. Dorsey |
| Stephanie J. Dorsey |
| President and Treasurer |
| |
Date: | February 26, 2016 |
Pursuant to the requirements of the Securities Exchange Act of 1934 and the Investment Company Act of 1940, this report has been signed below by the following persons on behalf of the registrant and in the capacities and on the dates indicated.
| |
By: | /s/Stephanie J. Dorsey |
| Stephanie J. Dorsey |
| President and Treasurer |
| |
Date: | February 26, 2016 |
| |
By: | /s/Howard J. Galligan III |
| Howard J. Galligan III |
| Chief Financial Officer |
| |
Date: | February 26, 2016 |