UNITED STATES
SECURITIES AND EXCHANGE COMMISSION
Washington, D.C. 20549
FORM N-CSR
Certified Shareholder Report of
Registered Management Investment Companies
Investment Company Act File Number: 811-05364
American High-Income Trust
(Exact Name of Registrant as Specified in Charter)
333 South Hope Street, 55th Floor
Los Angeles, California 90071
(Address of Principal Executive Offices)
Registrant's telephone number, including area code: (949) 975-5000
Date of fiscal year end: September 30
Date of reporting period: March 31, 2023
Becky L. Park
American High-Income Trust
6455 Irvine Center Drive
Los Angeles, California 90071
(Name and Address of Agent for Service)
ITEM 1 – Reports to Stockholders
American High-Income Trust® Semi-annual report
for the six months ended
March 31, 2023 |  |

Pursue sustainable
income over time
American High-Income Trust seeks to provide you with a high level of current income. Its secondary investment objective is capital appreciation.
This fund is one of more than 40 offered by Capital Group, home of American Funds, one of the nation’s largest mutual fund families. For over 90 years, Capital Group has invested with a long-term focus based on thorough research and attention to risk.
Fund results shown in this report, unless otherwise indicated, are for Class F-2 shares. Class A share results are shown at net asset value unless otherwise indicated. If a sales charge (maximum 3.75%) had been deducted from Class A shares, the results would have been lower. Results are for past periods and are not predictive of results for future periods. Current and future results may be lower or higher than those shown. Prices and returns will vary, so investors may lose money. Investing for short periods makes losses more likely. For current information and month-end results, refer to capitalgroup.com.
Here are the average annual total returns on a $1,000 investment with all distributions reinvested for periods ended March 31, 2023:
| | | 1 year | | 5 years | | 10 years |
| | | | | | | |
| Class F-2 shares | | | –2.92 | % | | | 3.87 | % | | | 3.87 | % |
| Class A shares (reflecting 3.75% maximum sales charge) | | | –6.82 | | | | 2.79 | | | | 3.21 | |
For other share class results, refer to capitalgroup.com and americanfundsretirement.com.
The total annual fund operating expense ratios were 0.40% for Class F-2 shares and 0.69% for Class A shares as of the prospectus dated December 1, 2022.
Investment results assume all distributions are reinvested and reflect applicable fees and expenses. When applicable, investment results reflect fee waivers and/or expense reimbursements, without which results would have been lower. Refer to capitalgroup.com for more information.
The fund’s 30-day yield as of March 31, 2023, calculated in accordance with the U.S. Securities and Exchange Commission (SEC) formula, was 7.54% for Class F-2 shares and 6.98% for Class A shares. The fund’s 12-month distribution rate as of that date was 6.03% for Class F-2 shares and 5.53% for Class A shares. Class A shares reflect the 3.75% maximum sales charge. The SEC yield reflects the rate at which the fund is earning income on its current portfolio of securities while the distribution rate reflects the fund’s past dividends paid to shareholders. Accordingly, the fund’s SEC yield and distribution rate may differ.
The return of principal for bond funds and for funds with significant underlying bond holdings is not guaranteed. Fund shares are subject to the same interest rate, inflation and credit risks associated with the underlying bond holdings. High-yield bonds are subject to greater fluctuations in value and risk of loss of income and principal than investment-grade bonds. Bond ratings, which typically range from AAA/Aaa (highest) to D (lowest), are assigned by credit rating agencies such as Standard & Poor’s, Moody’s and/or Fitch as an indication of an issuer’s creditworthiness. Investing in bonds issued outside the U.S. may be subject to additional risks. They include currency fluctuations, political and social instability, differing securities regulations and accounting standards, higher transaction costs, possible changes in taxation, illiquidity and price volatility. These risks may be heightened in connection with investments in developing countries. Refer to the fund prospectus and the Risk Factors section of this report for more information on these and other risks associated with investing in the fund.
Investments are not FDIC-insured, nor are they deposits of or guaranteed by a bank or any other entity, so they may lose value.
Fellow investors:
Results for American High-Income Trust for the periods ended March 31, 2023, are shown in the table below, as well as results of the fund’s benchmark and peer group indexes.
For additional information about the fund, its investment results, holdings and portfolio managers, refer to capitalgroup.com/individual/investments/fund/ahifx. You can also access information about Capital Group’s American Funds and read our insights about the markets, retirement, saving for college, investing fundamentals and more at capitalgroup.com.
Contents
Results at a glance
For periods ended March 31, 2023, with all distributions reinvested
| | | Cumulative total returns | | Average annual total returns |
| | | 6 months | | | 1 year | | | 5 years | | | 10 years | | | Lifetime (since
Class A inception
on 2/19/88) | |
| | | | | | | | | | | | | | | | |
| American High-Income Trust (Class F-2 shares)1 | | | 7.03 | % | | | –2.92 | % | | | 3.87 | % | | | 3.87 | % | | | 7.43 | % |
| American High-Income Trust (Class A shares) | | | 6.87 | | | | –3.20 | | | | 3.58 | | | | 3.61 | | | | 7.19 | |
| Bloomberg U.S. Corporate High Yield 2% Issuer Capped Index2 | | | 7.88 | | | | –3.35 | | | | 3.19 | | | | 4.09 | | | | 7.55 | |
| Lipper High Yield Funds Average3 | | | 7.28 | | | | –3.85 | | | | 2.58 | | | | 3.27 | | | | 6.73 | |
There may have been periods when the results lagged the index(es). The indexes are unmanaged and, therefore, have no expenses. Investors cannot invest directly in an index. Past results are not predictive of results in future periods.
| 1 | Class F-2 shares were first offered on August 1, 2008. Class F-2 share results prior to the date of first sale are hypothetical based on the results of the original share class of the fund without a sales charge, adjusted for typical estimated expenses. Refer to capitalgroup.com for more information on specific expense adjustments and the actual dates of first sale. |
| 2 | Source: Bloomberg Index Services Ltd. From February 19, 1988, through December 31, 1992, the Credit Suisse High Yield Index was used because the Bloomberg U.S. Corporate High Yield 2% Issuer Capped Index did not yet exist. Since January 1, 1993, the Bloomberg U.S. Corporate High Yield 2% Issuer Capped Index has been used. It is unmanaged and, therefore, has no expenses. Investors cannot invest directly in an index. Bloomberg U.S. Corporate High Yield 2% Issuer Capped Index covers the universe of fixed-rate, non-investment-grade debt. The index limits the maximum exposure of any one issuer to 2%. This index is unmanaged, and its results include reinvested distributions but do not reflect the effect of sales charges, commissions, account fees, expenses or U.S. federal income taxes. |
| 3 | Source: Refinitiv Lipper. Lipper averages reflect the current composition of all eligible mutual funds (all share classes) within a given category. Lipper High Yield Funds Index is an equally weighted index of funds that aim at high (relative) current yield from fixed-income securities, have no quality or maturity restrictions and tend to invest in lower grade debt issues. The results of the underlying funds in the index include reinvestment of dividends and capital gain distributions, as well as brokerage commissions paid by the funds for portfolio transactions and other fund expenses, but do not reflect the effect of sales charges, account fees or U.S. federal income taxes. |
| American High-Income Trust | 1 |
| Investment portfolio March 31, 2023 | unaudited |
| | |
| Portfolio by type of security | Percent of net assets |
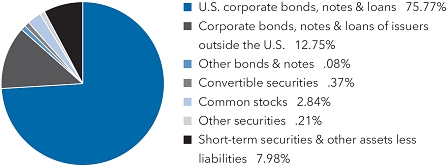
| Bonds, notes & other debt instruments 88.60% | | Principal amount
(000) | | | Value
(000) | |
| Corporate bonds, notes & loans 88.52% | | | | | | | | |
| Energy 15.27% | | | | | | | | |
| Aethon United BR, LP / Aethon United Finance Corp. 8.25% 2/15/20261 | | USD | 6,600 | | | $ | 6,483 | |
| Antero Midstream Partners, LP 5.375% 6/15/20291 | | | 10,095 | | | | 9,513 | |
| Antero Resources Corp. 7.625% 2/1/20291 | | | 4,356 | | | | 4,458 | |
| Antero Resources Corp. 5.375% 3/1/20301 | | | 5,950 | | | | 5,542 | |
| Apache Corp. 4.625% 11/15/2025 | | | 5,540 | | | | 5,349 | |
| Apache Corp. 6.00% 1/15/2037 | | | 2,910 | | | | 2,710 | |
| Apache Corp. 5.10% 9/1/2040 | | | 17,300 | | | | 14,688 | |
| Apache Corp. 4.75% 4/15/2043 | | | 5,725 | | | | 4,306 | |
| Apache Corp. 4.25% 1/15/2044 | | | 270 | | | | 198 | |
| Apache Corp. 5.35% 7/1/2049 | | | 4,520 | | | | 3,500 | |
| Ascent Resources - Utica, LLC, Term Loan, (3-month USD-LIBOR + 9.00%) 10.00% 11/1/20251,2,3 | | | 4,446 | | | | 4,721 | |
| Ascent Resources Utica Holdings, LLC 7.00% 11/1/20261 | | | 38,410 | | | | 37,165 | |
| Ascent Resources Utica Holdings, LLC 9.00% 11/1/20271 | | | 4,380 | | | | 5,330 | |
| Ascent Resources Utica Holdings, LLC 8.25% 12/31/20281 | | | 4,042 | | | | 3,914 | |
| Ascent Resources Utica Holdings, LLC 5.875% 6/30/20291 | | | 21,835 | | | | 19,291 | |
| BIP-V Chinook Holdco, LLC 5.50% 6/15/20311 | | | 33,080 | | | | 29,773 | |
| Blue Racer Midstream, LLC 7.625% 12/15/20251 | | | 9,754 | | | | 9,665 | |
| Bonanza Creek Energy, Inc. 5.00% 10/15/20261 | | | 17,860 | | | | 16,811 | |
| California Resources Corp. 7.125% 2/1/20261 | | | 6,275 | | | | 6,358 | |
| Callon Petroleum Co. 7.50% 6/15/20301 | | | 29,225 | | | | 27,500 | |
| Cenovus Energy, Inc. 5.375% 7/15/2025 | | | 204 | | | | 205 | |
| Cenovus Energy, Inc. 4.25% 4/15/2027 | | | 390 | | | | 379 | |
| Cenovus Energy, Inc. 5.25% 6/15/2037 | | | 400 | | | | 378 | |
| Cenovus Energy, Inc. 5.40% 6/15/2047 | | | 390 | | | | 363 | |
| Centennial Resource Production, LLC 6.875% 4/1/20271 | | | 6,752 | | | | 6,614 | |
| Cheniere Energy Partners, LP 4.50% 10/1/2029 | | | 19,427 | | | | 18,066 | |
| Cheniere Energy Partners, LP 4.00% 3/1/2031 | | | 8,180 | | | | 7,288 | |
| Cheniere Energy Partners, LP 3.25% 1/31/2032 | | | 12,185 | | | | 10,078 | |
| Cheniere Energy, Inc. 4.625% 10/15/2028 | | | 64,554 | | | | 61,419 | |
| Chesapeake Energy Corp. 4.875% 4/15/20224 | | | 28,871 | | | | 505 | |
| Chesapeake Energy Corp. 5.75% 9/15/20234 | | | 1,730 | | | | 30 | |
| Chesapeake Energy Corp. 5.50% 2/1/20261 | | | 20,225 | | | | 19,923 | |
| Chesapeake Energy Corp. 5.875% 2/1/20291 | | | 37,920 | | | | 36,141 | |
| Chesapeake Energy Corp. 6.75% 4/15/20291 | | | 14,610 | | | | 14,518 | |
| CNX Midstream Partners, LP 4.75% 4/15/20301 | | | 5,745 | | | | 4,948 | |
| CNX Resources Corp. 7.25% 3/14/20271 | | | 23,882 | | | | 23,789 | |
| CNX Resources Corp. 6.00% 1/15/20291 | | | 33,223 | | | | 31,103 | |
| CNX Resources Corp. 7.375% 1/15/20311 | | | 20,279 | | | | 19,998 | |
| Colgate Energy Partners III, LLC 5.875% 7/1/20291 | | | 1,375 | | | | 1,304 | |
| Comstock Resources, Inc. 6.75% 3/1/20291 | | | 19,495 | | | | 17,856 | |
| Comstock Resources, Inc. 5.875% 1/15/20301 | | | 25,605 | | | | 22,022 | |
| Constellation Oil Services Holding SA 13.50% 6/30/20251,5 | | | 5,794 | | | | 5,794 | |
| Constellation Oil Services Holding SA 4.00% PIK 12/31/20266 | | | 46,589 | | | | 27,575 | |
| Continental Resources, Inc. 5.75% 1/15/20311 | | | 7,250 | | | | 6,972 | |
| 2 | American High-Income Trust |
| Bonds, notes & other debt instruments (continued) | | Principal amount
(000) | | | Value
(000) | |
| Corporate bonds, notes & loans (continued) | | | | | | | | |
| Energy (continued) | | | | | | | | |
| Crescent Energy Finance, LLC 9.25% 2/15/20281 | | USD | 38,527 | | | $ | 36,976 | |
| Crestwood Midstream Partners, LP 5.625% 5/1/20271 | | | 5,000 | | | | 4,823 | |
| Crestwood Midstream Partners, LP 6.00% 2/1/20291 | | | 11,325 | | | | 10,796 | |
| Crestwood Midstream Partners, LP 8.00% 4/1/20291 | | | 33,755 | | | | 34,460 | |
| Crestwood Midstream Partners, LP 7.375% 2/1/20311 | | | 13,462 | | | | 13,475 | |
| Devon Energy Corp. 5.875% 6/15/2028 | | | 2,830 | | | | 2,884 | |
| Devon Energy Corp. 4.50% 1/15/2030 | | | 10,040 | | | | 9,598 | |
| Diamond Foreign Asset Co. 9.00% Cash 4/22/20271,3,6 | | | 2,584 | | | | 2,494 | |
| Diamond Foreign Asset Co. 9.00% Cash 4/22/20276 | | | 2,337 | | | | 2,255 | |
| DT Midstream, Inc. 4.125% 6/15/20291 | | | 28,835 | | | | 25,313 | |
| DT Midstream, Inc. 4.375% 6/15/20311 | | | 16,380 | | | | 14,293 | |
| Encino Acquisition Partners Holdings, LLC 8.50% 5/1/20281 | | | 4,914 | | | | 4,304 | |
| Energean Israel Finance, Ltd. 4.50% 3/30/20241 | | | 8,305 | | | | 8,144 | |
| Energean Israel Finance, Ltd. 4.875% 3/30/20261 | | | 20,000 | | | | 18,575 | |
| Energean Israel Finance, Ltd. 5.875% 3/30/20311 | | | 1,580 | | | | 1,388 | |
| Energean PLC 6.50% 4/30/20271 | | | 12,805 | | | | 11,763 | |
| EQM Midstream Partners, LP 6.00% 7/1/20251 | | | 4,000 | | | | 3,959 | |
| EQM Midstream Partners, LP 4.125% 12/1/2026 | | | 4,911 | | | | 4,466 | |
| EQM Midstream Partners, LP 7.50% 6/1/20271 | | | 8,031 | | | | 8,071 | |
| EQM Midstream Partners, LP 6.50% 7/1/20271 | | | 42,825 | | | | 41,554 | |
| EQM Midstream Partners, LP 5.50% 7/15/2028 | | | 17,346 | | | | 15,777 | |
| EQM Midstream Partners, LP 4.50% 1/15/20291 | | | 21,410 | | | | 18,226 | |
| EQM Midstream Partners, LP 7.50% 6/1/20301 | | | 21,425 | | | | 20,781 | |
| EQM Midstream Partners, LP 4.75% 1/15/20311 | | | 33,208 | | | | 27,609 | |
| EQM Midstream Partners, LP 6.50% 7/15/2048 | | | 19,603 | | | | 15,170 | |
| EQT Corp. 5.00% 1/15/2029 | | | 5,715 | | | | 5,426 | |
| EQT Corp. 7.25% 2/1/20307 | | | 5,395 | | | | 5,652 | |
| EQT Corp. 3.625% 5/15/20311 | | | 9,080 | | | | 7,879 | |
| Genesis Energy, LP 6.50% 10/1/2025 | | | 32,102 | | | | 31,125 | |
| Genesis Energy, LP 6.25% 5/15/2026 | | | 6,115 | | | | 5,843 | |
| Genesis Energy, LP 8.00% 1/15/2027 | | | 57,399 | | | | 56,814 | |
| Genesis Energy, LP 7.75% 2/1/2028 | | | 7,180 | | | | 6,970 | |
| Genesis Energy, LP 8.875% 4/15/2030 | | | 20,378 | | | | 20,651 | |
| Harbour Energy PLC 5.50% 10/15/20261 | | | 32,030 | | | | 28,068 | |
| Harvest Midstream I, LP 7.50% 9/1/20281 | | | 36,075 | | | | 36,022 | |
| Hess Midstream Operations, LP 4.25% 2/15/20301 | | | 28,875 | | | | 25,823 | |
| Hess Midstream Operations, LP 5.50% 10/15/20301 | | | 12,720 | | | | 11,847 | |
| Hess Midstream Partners, LP 5.125% 6/15/20281 | | | 16,888 | | | | 16,050 | |
| Hilcorp Energy I, LP 6.25% 11/1/20281 | | | 3,515 | | | | 3,340 | |
| Hilcorp Energy I, LP 5.75% 2/1/20291 | | | 19,025 | | | | 17,537 | |
| Hilcorp Energy I, LP 6.00% 4/15/20301 | | | 18,338 | | | | 16,933 | |
| Hilcorp Energy I, LP 6.00% 2/1/20311 | | | 13,382 | | | | 12,372 | |
| Hilcorp Energy I, LP 6.25% 4/15/20321 | | | 16,545 | | | | 15,323 | |
| Holly Energy Partners, LP / Holly Energy Finance Corp. 6.375% 4/15/20271 | | | 4,305 | | | | 4,262 | |
| Howard Midstream Energy Partners, LLC 6.75% 1/15/20271 | | | 2,310 | | | | 2,181 | |
| Independence Energy Finance, LLC 7.25% 5/1/20261 | | | 8,650 | | | | 8,139 | |
| Murphy Oil Corp. 5.75% 8/15/2025 | | | 2,768 | | | | 2,744 | |
| Murphy Oil Corp. 5.625% 5/1/2027 | | | 6,700 | | | | 6,493 | |
| Murphy Oil Corp. 6.375% 7/15/2028 | | | 8,000 | | | | 7,890 | |
| Murphy Oil USA, Inc. 4.75% 9/15/2029 | | | 16,330 | | | | 14,896 | |
| Murphy Oil USA, Inc. 3.75% 2/15/20311 | | | 27,230 | | | | 22,969 | |
| Nabors Industries, Inc. 7.375% 5/15/20271 | | | 30,625 | | | | 30,022 | |
| Nabors Industries, Ltd. 7.25% 1/15/20261 | | | 6,500 | | | | 6,206 | |
| Neptune Energy Group Holdings, Ltd. 6.625% 5/15/20251 | | | 21,325 | | | | 20,693 | |
| New Fortress Energy, Inc. 6.75% 9/15/20251 | | | 30,685 | | | | 29,567 | |
| New Fortress Energy, Inc. 6.50% 9/30/20261 | | | 85,393 | | | | 78,640 | |
| NGL Energy Operating, LLC 7.50% 2/1/20261 | | | 173,599 | | | | 167,659 | |
| NGL Energy Partners, LP 6.125% 3/1/2025 | | | 41,177 | | | | 37,005 | |
| NGL Energy Partners, LP 7.50% 4/15/2026 | | | 14,050 | | | | 12,166 | |
| NGPL PipeCo, LLC 4.875% 8/15/20271 | | | 1,010 | | | | 980 | |
| Northern Oil and Gas, Inc. 8.125% 3/1/20281 | | | 37,565 | | | | 37,296 | |
| NorthRiver Midstream Finance, LP 5.625% 2/15/20261 | | | 10,800 | | | | 10,148 | |
| NuStar Logistics, LP 6.00% 6/1/2026 | | | 6,129 | | | | 6,015 | |
| Oasis Petroleum, Inc. 6.375% 6/1/20261 | | | 19,756 | | | | 19,592 | |
| Occidental Petroleum Corp. 2.90% 8/15/2024 | | | 10,480 | | | | 10,187 | |
| Occidental Petroleum Corp. 5.875% 9/1/2025 | | | 12,395 | | | | 12,503 | |
| Occidental Petroleum Corp. 3.00% 2/15/2027 | | | 500 | | | | 458 | |
| American High-Income Trust | 3 |
| Bonds, notes & other debt instruments (continued) | | Principal amount
(000) | | | Value
(000) | |
| Corporate bonds, notes & loans (continued) | | | | | | | | |
| Energy (continued) | | | | | | | | |
| Occidental Petroleum Corp. 6.375% 9/1/2028 | | USD | 4,575 | | | $ | 4,742 | |
| Occidental Petroleum Corp. 8.875% 7/15/2030 | | | 12,675 | | | | 14,755 | |
| Occidental Petroleum Corp. 6.625% 9/1/2030 | | | 20,235 | | | | 21,329 | |
| Occidental Petroleum Corp. 6.125% 1/1/2031 | | | 11,610 | | | | 12,057 | |
| Occidental Petroleum Corp. 6.45% 9/15/2036 | | | 5,090 | | | | 5,357 | |
| Occidental Petroleum Corp. 6.20% 3/15/2040 | | | 3,495 | | | | 3,519 | |
| Occidental Petroleum Corp. 6.60% 3/15/2046 | | | 7,290 | | | | 7,673 | |
| Occidental Petroleum Corp. 4.20% 3/15/2048 | | | 2,543 | | | | 1,975 | |
| Parkland Corp. 4.625% 5/1/20301 | | | 15,355 | | | | 13,673 | |
| Patterson-UTI Energy, Inc. 5.15% 11/15/2029 | | | 1,595 | | | | 1,471 | |
| PDC Energy, Inc. 5.75% 5/15/2026 | | | 12,000 | | | | 11,698 | |
| Petrobras Global Finance Co. 6.75% 6/3/2050 | | | 5,701 | | | | 5,040 | |
| Petrobras Global Finance Co. 5.50% 6/10/2051 | | | 3,999 | | | | 3,108 | |
| Petróleos Mexicanos 4.875% 1/18/2024 | | | 4,467 | | | | 4,410 | |
| Petróleos Mexicanos 6.875% 10/16/2025 | | | 6,200 | | | | 6,139 | |
| Petróleos Mexicanos 6.875% 8/4/2026 | | | 5,000 | | | | 4,751 | |
| Petróleos Mexicanos 8.75% 6/2/2029 | | | 14,137 | | | | 13,161 | |
| Petrorio Luxembourg SARL 6.125% 6/9/20261 | | | 6,800 | | | | 6,392 | |
| Range Resources Corp. 4.875% 5/15/2025 | | | 5,803 | | | | 5,696 | |
| Range Resources Corp. 8.25% 1/15/2029 | | | 17,375 | | | | 18,330 | |
| Range Resources Corp. 4.75% 2/15/20301 | | | 24,510 | | | | 22,374 | |
| Rockies Express Pipeline, LLC 4.95% 7/15/20291 | | | 11,193 | | | | 9,986 | |
| Sabine Pass Liquefaction, LLC 4.50% 5/15/2030 | | | 4,219 | | | | 4,072 | |
| Sanchez Energy Corp. 7.25% 2/15/20241,4 | | | 22,796 | | | | 199 | |
| SM Energy Co. 5.625% 6/1/2025 | | | 5,270 | | | | 5,116 | |
| SM Energy Co. 6.50% 7/15/2028 | | | 2,910 | | | | 2,780 | |
| Southwestern Energy Co. 5.70% 1/23/20257 | | | 5,630 | | | | 5,638 | |
| Southwestern Energy Co. 8.375% 9/15/2028 | | | 8,875 | | | | 9,339 | |
| Southwestern Energy Co. 5.375% 2/1/2029 | | | 6,470 | | | | 6,105 | |
| Southwestern Energy Co. 5.375% 3/15/2030 | | | 46,000 | | | | 43,301 | |
| Southwestern Energy Co. 4.75% 2/1/2032 | | | 24,695 | | | | 21,842 | |
| Suburban Propane Partners, LP / Suburban Energy Finance Corp. 5.00% 6/1/20311 | | | 4,610 | | | | 4,034 | |
| Sunoco, LP 6.00% 4/15/2027 | | | 12,591 | | | | 12,446 | |
| Sunoco, LP 5.875% 3/15/2028 | | | 4,885 | | | | 4,696 | |
| Sunoco, LP 4.50% 5/15/2029 | | | 38,080 | | | | 35,002 | |
| Sunoco, LP 4.50% 4/30/2030 | | | 31,235 | | | | 28,283 | |
| Superior Plus, LP and Superior General Partner, Inc. 4.50% 3/15/20291 | | | 7,994 | | | | 7,147 | |
| Tallgrass Energy Partners, LP 7.50% 10/1/20251 | | | 2,535 | | | | 2,536 | |
| Targa Resources Partners, LP 6.50% 7/15/2027 | | | 4,322 | | | | 4,410 | |
| Targa Resources Partners, LP 6.875% 1/15/2029 | | | 18,530 | | | | 18,904 | |
| Targa Resources Partners, LP 5.50% 3/1/2030 | | | 16,729 | | | | 16,365 | |
| Targa Resources Partners, LP 4.875% 2/1/2031 | | | 13,835 | | | | 12,960 | |
| Transocean Poseidon, Ltd. 6.875% 2/1/20271 | | | 6,216 | | | | 6,099 | |
| Transocean Titan Financing, Ltd. 8.375% 2/1/20281 | | | 24,931 | | | | 25,679 | |
| Transocean, Inc. 7.25% 11/1/20251 | | | 8,700 | | | | 8,232 | |
| Transocean, Inc. 11.50% 1/30/20271 | | | 5,405 | | | | 5,587 | |
| Transocean, Inc. 8.75% 2/15/20301 | | | 16,384 | | | | 16,726 | |
| Transocean, Inc. 6.80% 3/15/2038 | | | 10,600 | | | | 7,352 | |
| USA Compression Partners, LP 6.875% 4/1/2026 | | | 15,811 | | | | 15,383 | |
| USA Compression Partners, LP 6.875% 9/1/2027 | | | 2,403 | | | | 2,299 | |
| Venture Global Calcasieu Pass, LLC 6.25% 1/15/20301 | | | 11,517 | | | | 11,615 | |
| Venture Global Calcasieu Pass, LLC 4.125% 8/15/20311 | | | 54,765 | | | | 48,171 | |
| Venture Global Calcasieu Pass, LLC 3.875% 11/1/20331 | | | 21,525 | | | | 18,106 | |
| W&T Offshore, Inc. 11.75% 2/1/20261 | | | 7,100 | | | | 6,964 | |
| Weatherford International, Ltd. 11.00% 12/1/20241 | | | 3,050 | | | | 3,133 | |
| Weatherford International, Ltd. 6.50% 9/15/20281 | | | 42,845 | | | | 42,959 | |
| Weatherford International, Ltd. 8.625% 4/30/20301 | | | 75,551 | | | | 77,361 | |
| Western Gas Partners, LP 3.95% 6/1/2025 | | | 1,280 | | | | 1,226 | |
| Western Gas Partners, LP 4.50% 3/1/2028 | | | 15,688 | | | | 14,856 | |
| Western Midstream Operating, LP 3.35% 2/1/20257 | | | 14,110 | | | | 13,488 | |
| Western Midstream Operating, LP 4.75% 8/15/2028 | | | 2,830 | | | | 2,696 | |
| Western Midstream Operating, LP 4.30% 2/1/20307 | | | 9,650 | | | | 8,794 | |
| Western Midstream Operating, LP 6.15% 4/1/2033 | | | 14,175 | | | | 14,385 | |
| Western Midstream Operating, LP 5.50% 2/1/20507 | | | 24,725 | | | | 21,016 | |
| | | | | | | | 2,599,021 | |
| 4 | American High-Income Trust |
| Bonds, notes & other debt instruments (continued) | | Principal amount
(000) | | | Value
(000) | |
| Corporate bonds, notes & loans (continued) | | | | | | | | |
| Consumer discretionary 12.25% | | | | | | | | |
| Adient Global Holdings, Ltd. 4.875% 8/15/20261 | | USD | 9,660 | | | $ | 9,320 | |
| Affinity Interactive 6.875% 12/15/20271 | | | 13,245 | | | | 11,827 | |
| Allied Universal Holdco, LLC 6.625% 7/15/20261 | | | 8,658 | | | | 8,329 | |
| Allied Universal Holdco, LLC 9.75% 7/15/20271 | | | 17,402 | | | | 15,527 | |
| Allied Universal Holdco, LLC 4.625% 6/1/20281 | | | 14,520 | | | | 12,301 | |
| Allied Universal Holdco, LLC 6.00% 6/1/20291 | | | 55,202 | | | | 41,269 | |
| Asbury Automotive Group, Inc. 4.50% 3/1/2028 | | | 5,000 | | | | 4,557 | |
| Asbury Automotive Group, Inc. 4.625% 11/15/20291 | | | 30,700 | | | | 27,518 | |
| Asbury Automotive Group, Inc. 5.00% 2/15/20321 | | | 27,590 | | | | 24,207 | |
| Atlas LuxCo 4 SARL 4.625% 6/1/20281 | | | 7,925 | | | | 6,661 | |
| AutoNation, Inc. 2.40% 8/1/2031 | | | 12,000 | | | | 9,251 | |
| Bath & Body Works, Inc. 6.625% 10/1/20301 | | | 7,375 | | | | 7,196 | |
| Bath & Body Works, Inc. 6.875% 11/1/2035 | | | 18,693 | | | | 16,868 | |
| Bath & Body Works, Inc. 6.75% 7/1/2036 | | | 13,030 | | | | 11,659 | |
| Beazer Homes USA, Inc. 5.875% 10/15/2027 | | | 10,802 | | | | 9,855 | |
| Boyd Gaming Corp. 4.75% 12/1/2027 | | | 8,389 | | | | 8,053 | |
| Boyd Gaming Corp. 4.75% 6/15/20311 | | | 6,835 | | | | 6,214 | |
| Boyne USA, Inc. 4.75% 5/15/20291 | | | 12,285 | | | | 10,982 | |
| Caesars Entertainment, Inc. 6.25% 7/1/20251 | | | 15,390 | | | | 15,405 | |
| Caesars Entertainment, Inc. 8.125% 7/1/20271 | | | 14,425 | | | | 14,726 | |
| Caesars Entertainment, Inc. 4.625% 10/15/20291 | | | 28,148 | | | | 24,645 | |
| Caesars Entertainment, Inc. 7.00% 2/15/20301 | | | 38,790 | | | | 39,504 | |
| Caesars Entertainment, Inc., Term Loan B, (USD-SOFR + 3.25%) 7.00% 2/1/20291,2,3 | | | 9,479 | | | | 9,445 | |
| Caesars Resort Collection, LLC 5.75% 7/1/20251 | | | 6,965 | | | | 6,973 | |
| Carnival Corp. 10.50% 2/1/20261 | | | 27,520 | | | | 28,699 | |
| Carnival Corp. 7.625% 3/1/20261 | | | 450 | | | | 411 | |
| Carnival Corp. 4.00% 8/1/20281 | | | 55,985 | | | | 48,252 | |
| Carnival Corp. 6.00% 5/1/20291 | | | 7,825 | | | | 6,230 | |
| Carnival Corp. 10.50% 6/1/20301 | | | 2,000 | | | | 1,922 | |
| CDI Escrow Issuer, Inc. 5.75% 4/1/20301 | | | 12,370 | | | | 11,959 | |
| CEC Entertainment, Inc. 6.75% 5/1/20261 | | | 6,500 | | | | 6,181 | |
| Dana, Inc. 4.25% 9/1/2030 | | | 2,150 | | | | 1,726 | |
| Dana, Inc. 4.50% 2/15/2032 | | | 8,510 | | | | 6,726 | |
| Empire Resorts, Inc. 7.75% 11/1/20261 | | | 11,045 | | | | 9,151 | |
| Everi Holdings, Inc. 5.00% 7/15/20291 | | | 3,000 | | | | 2,673 | |
| Fertitta Entertainment, Inc. 4.625% 1/15/20291 | | | 28,070 | | | | 24,669 | |
| Fertitta Entertainment, Inc. 6.75% 1/15/20301 | | | 91,165 | | | | 75,086 | |
| First Student Bidco, Inc. 4.00% 7/31/20291 | | | 21,615 | | | | 18,828 | |
| Ford Motor Co. 2.30% 2/10/2025 | | | 6,625 | | | | 6,149 | |
| Ford Motor Co. 6.10% 8/19/2032 | | | 13,685 | | | | 13,281 | |
| Ford Motor Credit Company, LLC 3.81% 1/9/2024 | | | 3,398 | | | | 3,362 | |
| Ford Motor Credit Company, LLC 5.584% 3/18/2024 | | | 934 | | | | 926 | |
| Ford Motor Credit Company, LLC 3.664% 9/8/2024 | | | 1,438 | | | | 1,382 | |
| Ford Motor Credit Company, LLC 5.125% 6/16/2025 | | | 44,310 | | | | 43,435 | |
| Ford Motor Credit Company, LLC 3.375% 11/13/2025 | | | 11,000 | | | | 10,325 | |
| Ford Motor Credit Company, LLC 4.542% 8/1/2026 | | | 21,795 | | | | 20,694 | |
| Ford Motor Credit Company, LLC 2.70% 8/10/2026 | | | 9,330 | | | | 8,315 | |
| Ford Motor Credit Company, LLC 4.271% 1/9/2027 | | | 4,575 | | | | 4,266 | |
| Ford Motor Credit Company, LLC 4.95% 5/28/2027 | | | 7,420 | | | | 7,088 | |
| Ford Motor Credit Company, LLC 4.125% 8/17/2027 | | | 13,940 | | | | 12,791 | |
| Ford Motor Credit Company, LLC 3.815% 11/2/2027 | | | 16,990 | | | | 15,251 | |
| Ford Motor Credit Company, LLC 2.90% 2/16/2028 | | | 5,850 | | | | 5,037 | |
| Ford Motor Credit Company, LLC 5.113% 5/3/2029 | | | 2,845 | | | | 2,675 | |
| Ford Motor Credit Company, LLC 4.00% 11/13/2030 | | | 11,468 | | | | 9,760 | |
| Group 1 Automotive, Inc. 4.00% 8/15/20281 | | | 7,380 | | | | 6,507 | |
| Hanesbrands, Inc. 4.875% 5/15/20261 | | | 21,712 | | | | 20,599 | |
| Hanesbrands, Inc. 9.00% 2/15/20311 | | | 26,254 | | | | 26,903 | |
| Hanesbrands, Inc., Term Loan B, (1-month USD CME Term SOFR + 3.75%) 8.557% 3/8/20302,3 | | | 12,418 | | | | 12,387 | |
| Hilton Grand Vacations Borrower 5.00% 6/1/20291 | | | 12,490 | | | | 11,107 | |
| Hilton Worldwide Holdings, Inc. 3.75% 5/1/20291 | | | 4,250 | | | | 3,808 | |
| Hilton Worldwide Holdings, Inc. 4.875% 1/15/2030 | | | 8,287 | | | | 7,946 | |
| Hilton Worldwide Holdings, Inc. 4.00% 5/1/20311 | | | 20,465 | | | | 17,940 | |
| International Game Technology PLC 6.50% 2/15/20251 | | | 12,403 | | | | 12,545 | |
| International Game Technology PLC 4.125% 4/15/20261 | | | 18,730 | | | | 18,096 | |
| International Game Technology PLC 5.25% 1/15/20291 | | | 53,932 | | | | 51,694 | |
| Jacobs Entertainment, Inc. 6.75% 2/15/20291 | | | 18,230 | | | | 15,944 | |
| American High-Income Trust | 5 |
| Bonds, notes & other debt instruments (continued) | | Principal amount
(000) | | | Value
(000) | |
| Corporate bonds, notes & loans (continued) | | | | | | | | |
| Consumer discretionary (continued) | | | | | | | | |
| Jacobs Entertainment, Inc. 6.75% 2/15/20291 | | USD | 10,230 | | | $ | 8,947 | |
| KB Home 6.875% 6/15/2027 | | | 6,170 | | | | 6,275 | |
| KB Home 7.25% 7/15/2030 | | | 6,770 | | | | 6,875 | |
| Kontoor Brands, Inc. 4.125% 11/15/20291 | | | 6,770 | | | | 5,819 | |
| LCM Investments Holdings II, LLC 4.875% 5/1/20291 | | | 77,320 | | | | 64,774 | |
| Levi Strauss & Co. 3.50% 3/1/20311 | | | 16,150 | | | | 13,786 | |
| Lindblad Expeditions, LLC 6.75% 2/15/20271 | | | 4,075 | | | | 3,950 | |
| Lithia Motors, Inc. 4.625% 12/15/20271 | | | 7,250 | | | | 6,752 | |
| Lithia Motors, Inc. 3.875% 6/1/20291 | | | 27,860 | | | | 24,134 | |
| Lithia Motors, Inc. 4.375% 1/15/20311 | | | 16,400 | | | | 14,148 | |
| LSF9 Atlantis Holdings, LLC / Victra Finance Corp. 7.75% 2/15/20261 | | | 6,655 | | | | 6,052 | |
| M.D.C. Holdings, Inc. 6.00% 1/15/2043 | | | 11,252 | | | | 9,793 | |
| Macy’s Retail Holdings, LLC 6.125% 3/15/20321 | | | 1,230 | | | | 1,084 | |
| Marriott International, Inc. 4.90% 4/15/2029 | | | 3,407 | | | | 3,379 | |
| Marriott International, Inc. 3.50% 10/15/2032 | | | 9,400 | | | | 8,248 | |
| Marriott International, Inc. 2.75% 10/15/2033 | | | 8,500 | | | | 6,888 | |
| Marriott Ownership Resorts, Inc. 4.75% 1/15/2028 | | | 2,500 | | | | 2,237 | |
| Marriott Ownership Resorts, Inc. 4.50% 6/15/20291 | | | 23,410 | | | | 19,953 | |
| Melco International Development, Ltd. 4.875% 6/6/20251 | | | 16,485 | | | | 15,521 | |
| Melco International Development, Ltd. 5.75% 7/21/20281 | | | 8,910 | | | | 7,716 | |
| Merlin Entertainment 5.75% 6/15/20261 | | | 10,798 | | | | 10,254 | |
| MGM Resorts International 5.50% 4/15/2027 | | | 5,707 | | | | 5,543 | |
| Mohegan Gaming & Entertainment 8.00% 2/1/20261 | | | 620 | | | | 568 | |
| Motel 6 Operating, LP, Term Loan B, (1-month USD-LIBOR + 5.00%) 9.719% 9/9/20262,3 | | | 8,825 | | | | 8,781 | |
| NCL Corp., Ltd. 3.625% 12/15/20241 | | | 6,450 | | | | 6,006 | |
| NCL Corp., Ltd. 5.875% 3/15/20261 | | | 8,100 | | | | 6,902 | |
| NCL Corp., Ltd. 5.875% 2/15/20271 | | | 29,965 | | | | 27,977 | |
| NCL Corp., Ltd. 7.75% 2/15/20291 | | | 7,115 | | | | 6,108 | |
| Neiman Marcus Group, LLC 7.125% 4/1/20261 | | | 35,980 | | | | 33,813 | |
| Panther BF Aggregator 2, LP 6.25% 5/15/20261 | | | 3,667 | | | | 3,662 | |
| Panther BF Aggregator 2, LP 8.50% 5/15/20271 | | | 4,155 | | | | 4,178 | |
| Party City Holdings, Inc. 6.125% 8/15/20231,4 | | | 9,100 | | | | 68 | |
| Party City Holdings, Inc. (6-month USD-LIBOR + 5.00%) 10.13% 7/15/20251,3,4 | | | 4,705 | | | | 659 | |
| Party City Holdings, Inc. 8.75% 2/15/20261,4 | | | 151,988 | | | | 22,988 | |
| Party City Holdings, Inc. 6.625% 8/1/20261,4 | | | 5,000 | | | | 50 | |
| Party City Holdings, Inc., Term Loan DIP, 14.55% 6/18/20232,3 | | | 27,180 | | | | 28,132 | |
| Penske Automotive Group, Inc. 3.75% 6/15/2029 | | | 13,325 | | | | 11,522 | |
| PetSmart, Inc. 4.75% 2/15/20281 | | | 17,050 | | | | 16,021 | |
| PetSmart, Inc. 7.75% 2/15/20291 | | | 23,775 | | | | 23,363 | |
| Premier Entertainment Sub, LLC 5.625% 9/1/20291 | | | 5,300 | | | | 3,919 | |
| QVC, Inc. 4.85% 4/1/2024 | | | 18,375 | | | | 14,723 | |
| Rakuten Group, Inc. 10.25% 11/30/20241 | | | 7,650 | | | | 7,277 | |
| Raptor Acquisition Corp. 4.875% 11/1/20261 | | | 10,725 | | | | 9,986 | |
| Real Hero Merger Sub 2, Inc. 6.25% 2/1/20291 | | | 2,335 | | | | 1,729 | |
| Royal Caribbean Cruises, Ltd. 11.50% 6/1/20251 | | | 47,103 | | | | 50,268 | |
| Royal Caribbean Cruises, Ltd. 4.25% 7/1/20261 | | | 36,740 | | | | 33,015 | |
| Royal Caribbean Cruises, Ltd. 5.50% 8/31/20261 | | | 14,200 | | | | 13,301 | |
| Royal Caribbean Cruises, Ltd. 5.375% 7/15/20271 | | | 28,035 | | | | 25,004 | |
| Royal Caribbean Cruises, Ltd. 3.70% 3/15/2028 | | | 40,875 | | | | 33,482 | |
| Royal Caribbean Cruises, Ltd. 5.50% 4/1/20281 | | | 31,350 | | | | 27,713 | |
| Royal Caribbean Cruises, Ltd. 8.25% 1/15/20291 | | | 34,915 | | | | 36,515 | |
| Royal Caribbean Cruises, Ltd. 9.25% 1/15/20291 | | | 19,925 | | | | 21,190 | |
| Royal Caribbean Cruises, Ltd. 7.25% 1/15/20301 | | | 11,562 | | | | 11,645 | |
| Sally Holdings, LLC 5.625% 12/1/2025 | | | 25,859 | | | | 25,483 | |
| Sands China, Ltd. 5.625% 8/8/2025 | | | 6,522 | | | | 6,362 | |
| Sands China, Ltd. 5.90% 8/8/2028 | | | 648 | | | | 616 | |
| Sands China, Ltd. 4.875% 6/18/2030 | | | 2,000 | | | | 1,774 | |
| Sands China, Ltd. 3.75% 8/8/20317 | | | 1,500 | | | | 1,206 | |
| Scientific Games Corp. 8.625% 7/1/20251 | | | 25,415 | | | | 26,043 | |
| Scientific Games Corp. 7.00% 5/15/20281 | | | 20,347 | | | | 20,163 | |
| Scientific Games Corp. 7.25% 11/15/20291 | | | 19,650 | | | | 19,706 | |
| Scientific Games Holdings, LP 6.625% 3/1/20301 | | | 22,515 | | | | 19,918 | |
| Sonic Automotive, Inc. 4.625% 11/15/20291 | | | 28,980 | | | | 24,311 | |
| Sonic Automotive, Inc. 4.875% 11/15/20311 | | | 45,779 | | | | 36,960 | |
| Tempur Sealy International, Inc. 4.00% 4/15/20291 | | | 5,255 | | | | 4,630 | |
| The Gap, Inc. 3.625% 10/1/20291 | | | 3,225 | | | | 2,303 | |
| The Gap, Inc. 3.875% 10/1/20311 | | | 2,148 | | | | 1,492 | |
| 6 | American High-Income Trust |
| Bonds, notes & other debt instruments (continued) | | Principal amount
(000) | | | Value
(000) | |
| Corporate bonds, notes & loans (continued) | | | | | | | | |
| Consumer discretionary (continued) | | | | | | | | |
| The Home Co., Inc. 7.25% 10/15/20251 | | USD | 7,735 | | | $ | 7,164 | |
| Travel + Leisure Co. 6.00% 4/1/2027 | | | 4,000 | | | | 3,972 | |
| Travel + Leisure Co. 4.50% 12/1/20291 | | | 18,625 | | | | 16,174 | |
| Universal Entertainment Corp. 8.50% 12/11/20241 | | | 58,885 | | | | 55,482 | |
| Vail Resorts, Inc. 6.25% 5/15/20251 | | | 4,090 | | | | 4,103 | |
| VICI Properties, LP / VICI Note Co., Inc. 5.625% 5/1/20241 | | | 9,113 | | | | 9,045 | |
| VICI Properties, LP / VICI Note Co., Inc. 3.75% 2/15/20271 | | | 243 | | | | 225 | |
| WASH Multifamily Acquisition, Inc. 5.75% 4/15/20261 | | | 23,650 | | | | 22,405 | |
| Wheel Pros, Inc., Term Loan, (3-month USD-LIBOR + 4.50%) 9.316% 5/11/20282,3 | | | 16,538 | | | | 11,880 | |
| Wyndham Destinations, Inc. 6.625% 7/31/20261 | | | 8,975 | | | | 9,019 | |
| Wyndham Destinations, Inc. 4.625% 3/1/20301 | | | 5,575 | | | | 4,787 | |
| Wyndham Worldwide Corp. 4.375% 8/15/20281 | | | 19,510 | | | | 17,992 | |
| Wynn Resorts Finance, LLC 5.125% 10/1/20291 | | | 9,225 | | | | 8,390 | |
| Wynn Resorts Finance, LLC 7.125% 2/15/20311 | | | 5,546 | | | | 5,631 | |
| Yahoo Holdings, Inc., Term Loan B, (1-month USD-LIBOR + 5.50%) 10.34% 9/1/20272,3 | | | 10,200 | | | | 9,949 | |
| | | | | | | | 2,084,896 | |
| | | | | | | | | |
| Communication services 10.82% | | | | | | | | |
| Altice France Holding SA 10.50% 5/15/20271 | | | 19,485 | | | | 14,924 | |
| Altice France Holding SA 5.125% 7/15/20291 | | | 33,804 | | | | 25,470 | |
| Brightstar Escrow Corp. 9.75% 10/15/20251 | | | 2,720 | | | | 2,475 | |
| Cablevision Systems Corp. 5.50% 4/15/20271 | | | 2,700 | | | | 2,276 | |
| Cablevision Systems Corp. 5.375% 2/1/20281 | | | 3,775 | | | | 3,096 | |
| CCO Holdings, LLC 5.125% 5/1/20271 | | | 9,878 | | | | 9,347 | |
| CCO Holdings, LLC 5.00% 2/1/20281 | | | 16,374 | | | | 15,125 | |
| CCO Holdings, LLC 6.375% 9/1/20291 | | | 4,400 | | | | 4,206 | |
| CCO Holdings, LLC 4.75% 3/1/20301 | | | 60,731 | | | | 52,684 | |
| CCO Holdings, LLC 4.50% 8/15/20301 | | | 65,679 | | | | 55,573 | |
| CCO Holdings, LLC 4.25% 2/1/20311 | | | 40,930 | | | | 33,515 | |
| CCO Holdings, LLC 4.75% 2/1/20321 | | | 37,601 | | | | 31,627 | |
| CCO Holdings, LLC 4.50% 5/1/2032 | | | 35,527 | | | | 29,093 | |
| CCO Holdings, LLC 4.50% 6/1/20331 | | | 27,049 | | | | 21,809 | |
| CCO Holdings, LLC 4.25% 1/15/20341 | | | 41,875 | | | | 32,796 | |
| CCO Holdings, LLC and CCO Holdings Capital Corp. 5.50% 5/1/20261 | | | 2,094 | | | | 2,039 | |
| CCO Holdings, LLC and CCO Holdings Capital Corp. 5.375% 6/1/20291 | | | 7,126 | | | | 6,551 | |
| CCO Holdings, LLC and CCO Holdings Capital Corp. 2.80% 4/1/2031 | | | 950 | | | | 765 | |
| Centerfield Media Parent, Inc. 6.625% 8/1/20261 | | | 16,900 | | | | 11,006 | |
| Clear Channel Worldwide Holdings, Inc. 7.75% 4/15/20281 | | | 11,000 | | | | 8,260 | |
| Clear Channel Worldwide Holdings, Inc. 7.50% 6/1/20291 | | | 5,000 | | | | 3,558 | |
| Cogent Communications Group, Inc. 3.50% 5/1/20261 | | | 8,445 | | | | 7,883 | |
| Connect Finco SARL 6.75% 10/1/20261 | | | 14,525 | | | | 13,667 | |
| Consolidated Communications, Inc. 5.00% 10/1/20281 | | | 14,350 | | | | 9,762 | |
| CSC Holdings, LLC 6.50% 2/1/20291 | | | 10,000 | | | | 8,314 | |
| CSC Holdings, LLC 3.375% 2/15/20311 | | | 12,700 | | | | 8,797 | |
| Diamond Sports Group, LLC 5.375% 8/15/20261 | | | 9,835 | | | | 553 | |
| Diamond Sports Group, LLC 6.625% 8/15/20271 | | | 18,432 | | | | 253 | |
| DIRECTV Financing, LLC 5.875% 8/15/20271 | | | 48,235 | | | | 43,733 | |
| DIRECTV Financing, LLC, Term Loan, (3-month USD-LIBOR + 5.00%) 9.84% 8/2/20272,3 | | | 29,964 | | | | 28,911 | |
| DISH Network Corp. 11.75% 11/15/20271 | | | 117,385 | | | | 113,987 | |
| Embarq Corp. 7.995% 6/1/2036 | | | 70,126 | | | | 29,554 | |
| Epicor Software Corp., Term Loan, (3-month USD-LIBOR + 7.75%) 12.59% 7/31/20282,3 | | | 7,250 | | | | 7,232 | |
| Frontier Communications Corp. 5.875% 10/15/20271 | | | 30,110 | | | | 27,400 | |
| Frontier Communications Corp. 5.00% 5/1/20281 | | | 81,605 | | | | 70,905 | |
| Frontier Communications Corp. 6.75% 5/1/20291 | | | 33,250 | | | | 26,383 | |
| Frontier Communications Holdings, LLC 5.875% 11/1/2029 | | | 26,207 | | | | 20,010 | |
| Frontier Communications Holdings, LLC 6.00% 1/15/20301 | | | 14,100 | | | | 10,739 | |
| Frontier Communications Holdings, LLC 8.75% 5/15/20301 | | | 18,775 | | | | 18,720 | |
| Gray Escrow II, Inc. 5.375% 11/15/20311 | | | 21,425 | | | | 14,251 | |
| Gray Television, Inc. 5.875% 7/15/20261 | | | 20,065 | | | | 17,377 | |
| Gray Television, Inc. 7.00% 5/15/20271 | | | 17,554 | | | | 14,713 | |
| Gray Television, Inc. 4.75% 10/15/20301 | | | 6,210 | | | | 4,130 | |
| iHeartCommunications, Inc. 6.375% 5/1/2026 | | | 236 | | | | 208 | |
| iHeartCommunications, Inc. 8.375% 5/1/2027 | | | 427 | | | | 311 | |
| iHeartCommunications, Inc. 5.25% 8/15/20271 | | | 30,323 | | | | 24,818 | |
| iHeartCommunications, Inc. 4.75% 1/15/20281 | | | 5,000 | | | | 3,955 | |
| Intelsat Jackson Holding Co. 6.50% 3/15/20301 | | | 35,007 | | | | 32,179 | |
| Kantar Group, LLC, Term Loan B2, (3-month USD-LIBOR + 4.50%) 9.659% 12/4/20262,3 | | | 6,324 | | | | 5,928 | |
| American High-Income Trust | 7 |
| Bonds, notes & other debt instruments (continued) | | Principal amount
(000) | | | Value
(000) | |
| Corporate bonds, notes & loans (continued) | | | | | | | | |
| Communication services (continued) | | | | | | | | |
| Lamar Media Corp. 3.75% 2/15/2028 | | USD | 2,567 | | | $ | 2,377 | |
| Lamar Media Corp. 4.875% 1/15/2029 | | | 3,600 | | | | 3,391 | |
| Lamar Media Corp. 3.625% 1/15/2031 | | | 10,950 | | | | 9,427 | |
| Level 3 Financing, Inc. 3.75% 7/15/20291 | | | 11,500 | | | | 6,146 | |
| Ligado Networks, LLC 15.50% PIK 11/1/20231,6 | | | 49,148 | | | | 15,113 | |
| Live Nation Entertainment, Inc. 4.75% 10/15/20271 | | | 4,910 | | | | 4,547 | |
| Live Nation Entertainment, Inc. 3.75% 1/15/20281 | | | 5,750 | | | | 5,161 | |
| Midas OpCo Holdings, LLC 5.625% 8/15/20291 | | | 53,860 | | | | 47,289 | |
| Netflix, Inc. 4.875% 4/15/2028 | | | 6,190 | | | | 6,165 | |
| Netflix, Inc. 5.375% 11/15/20291 | | | 875 | | | | 890 | |
| Netflix, Inc. 4.875% 6/15/20301 | | | 2,050 | | | | 2,043 | |
| News Corp. 3.875% 5/15/20291 | | | 45,995 | | | | 40,922 | |
| News Corp. 5.125% 2/15/20321 | | | 31,705 | | | | 29,771 | |
| Nexstar Broadcasting, Inc. 4.75% 11/1/20281 | | | 65,616 | | | | 58,434 | |
| Nexstar Escrow Corp. 5.625% 7/15/20271 | | | 11,995 | | | | 11,097 | |
| OUTFRONT Media Capital, LLC 4.625% 3/15/20301 | | | 60 | | | | 50 | |
| Scripps Escrow II, Inc. 3.875% 1/15/20291 | | | 14,018 | | | | 11,017 | |
| Sinclair Television Group, Inc. 4.125% 12/1/20301 | | | 7,700 | | | | 6,217 | |
| Sirius XM Radio, Inc. 3.125% 9/1/20261 | | | 43,930 | | | | 39,671 | |
| Sirius XM Radio, Inc. 4.00% 7/15/20281 | | | 61,990 | | | | 53,311 | |
| Sirius XM Radio, Inc. 4.125% 7/1/20301 | | | 18,625 | | | | 15,247 | |
| Sirius XM Radio, Inc. 3.875% 9/1/20311 | | | 51,380 | | | | 39,999 | |
| Sprint Corp. 7.625% 3/1/2026 | | | 9,450 | | | | 10,002 | |
| Sprint Corp. 6.875% 11/15/2028 | | | 27,744 | | | | 29,839 | |
| Sprint Corp. 8.75% 3/15/2032 | | | 30,459 | | | | 37,116 | |
| TEGNA, Inc. 5.00% 9/15/2029 | | | 8,337 | | | | 7,216 | |
| T-Mobile US, Inc. 2.625% 4/15/2026 | | | 1,350 | | | | 1,261 | |
| T-Mobile US, Inc. 3.375% 4/15/2029 | | | 15,950 | | | | 14,556 | |
| Univision Communications, Inc. 5.125% 2/15/20251 | | | 60,818 | | | | 59,806 | |
| Univision Communications, Inc. 6.625% 6/1/20271 | | | 82,870 | | | | 78,652 | |
| Univision Communications, Inc. 4.50% 5/1/20291 | | | 89,675 | | | | 75,431 | |
| Univision Communications, Inc. 7.375% 6/30/20301 | | | 32,328 | | | | 30,593 | |
| Univision Communications, Inc., Term Loan, (3-month USD CME Term SOFR + 4.25%) 9.148% 6/24/20292,3 | | | 1,237 | | | | 1,231 | |
| UPC Broadband Finco BV 4.875% 7/15/20311 | | | 8,830 | | | | 7,646 | |
| Virgin Media O2 4.25% 1/31/20311 | | | 44,720 | | | | 38,101 | |
| Virgin Media Secured Finance PLC 4.50% 8/15/20301 | | | 14,955 | | | | 12,879 | |
| VZ Secured Financing BV 5.00% 1/15/20321 | | | 21,075 | | | | 17,216 | |
| Warner Music Group 3.75% 12/1/20291 | | | 32,463 | | | | 28,794 | |
| Warner Music Group 3.875% 7/15/20301 | | | 12,507 | | | | 10,994 | |
| Warner Music Group 3.00% 2/15/20311 | | | 4,050 | | | | 3,390 | |
| WarnerMedia Holdings, Inc. 4.279% 3/15/20321 | | | 3,805 | | | | 3,400 | |
| Ziggo Bond Co. BV 5.125% 2/28/20301 | | | 13,368 | | | | 10,765 | |
| Ziggo Bond Finance BV 4.875% 1/15/20301 | | | 28,685 | | | | 24,484 | |
| | | | | | | | 1,842,525 | |
| | | | | | | | | |
| Health care 9.91% | | | | | | | | |
| 1375209 B.C., Ltd. 9.00% 1/30/20281 | | | 14,425 | | | | 14,317 | |
| AdaptHealth, LLC 6.125% 8/1/20281 | | | 8,780 | | | | 8,069 | |
| AdaptHealth, LLC 5.125% 3/1/20301 | | | 20,760 | | | | 17,632 | |
| Avantor Funding, Inc. 4.625% 7/15/20281 | | | 41,175 | | | | 39,051 | |
| Avantor Funding, Inc. 3.875% 11/1/20291 | | | 6,900 | | | | 6,182 | |
| Bausch Health Americas, Inc. 9.25% 4/1/20261 | | | 35,840 | | | | 26,626 | |
| Bausch Health Americas, Inc. 8.50% 1/31/20271 | | | 5,171 | | | | 2,369 | |
| Bausch Health Companies, Inc. 9.00% 12/15/20251 | | | 34,021 | | | | 27,122 | |
| Bausch Health Companies, Inc. 6.125% 2/1/20271 | | | 4,370 | | | | 2,833 | |
| Bausch Health Companies, Inc. 5.75% 8/15/20271 | | | 16,063 | | | | 10,021 | |
| Bausch Health Companies, Inc. 7.00% 1/15/20281 | | | 8,262 | | | | 3,335 | |
| Bausch Health Companies, Inc. 5.00% 1/30/20281 | | | 18,310 | | | | 6,981 | |
| Bausch Health Companies, Inc. 4.875% 6/1/20281 | | | 66,925 | | | | 39,546 | |
| Bausch Health Companies, Inc. 5.00% 2/15/20291 | | | 95 | | | | 37 | |
| Bausch Health Companies, Inc. 7.25% 5/30/20291 | | | 8,112 | | | | 3,114 | |
| Bausch Health Companies, Inc. 5.25% 1/30/20301 | | | 33,642 | | | | 12,595 | |
| Bausch Health Companies, Inc. 14.00% 10/15/20301 | | | 13,950 | | | | 7,923 | |
| Bausch Health Companies, Inc. 5.25% 2/15/20311 | | | 78,304 | | | | 30,343 | |
| Catalent Pharma Solutions, Inc. 5.00% 7/15/20271 | | | 5,859 | | | | 5,727 | |
| Catalent Pharma Solutions, Inc. 3.125% 2/15/20291 | | | 2,975 | | | | 2,618 | |
| 8 | American High-Income Trust |
| Bonds, notes & other debt instruments (continued) | | Principal amount
(000) | | | Value
(000) | |
| Corporate bonds, notes & loans (continued) | | | | | | | | |
| Health care (continued) | | | | | | | | |
| Catalent Pharma Solutions, Inc. 3.50% 4/1/20301 | | USD | 41,375 | | | $ | 36,399 | |
| Centene Corp. 4.25% 12/15/2027 | | | 20,407 | | | | 19,682 | |
| Centene Corp. 2.45% 7/15/2028 | | | 20,245 | | | | 17,631 | |
| Centene Corp. 4.625% 12/15/2029 | | | 35,635 | | | | 33,537 | |
| Centene Corp. 3.375% 2/15/2030 | | | 8,361 | | | | 7,302 | |
| Centene Corp. 3.00% 10/15/2030 | | | 10,575 | | | | 8,915 | |
| Centene Corp. 2.50% 3/1/2031 | | | 24,825 | | | | 20,126 | |
| Centene Corp. 2.625% 8/1/2031 | | | 17,525 | | | | 14,216 | |
| Charles River Laboratories International, Inc. 4.25% 5/1/20281 | | | 13,673 | | | | 12,813 | |
| Charles River Laboratories International, Inc. 3.75% 3/15/20291 | | | 12,765 | | | | 11,344 | |
| Charles River Laboratories International, Inc. 4.00% 3/15/20311 | | | 7,525 | | | | 6,591 | |
| Community Health Systems, Inc. 8.00% 3/15/20261 | | | 11,500 | | | | 11,126 | |
| Community Health Systems, Inc. 5.625% 3/15/20271 | | | 32,685 | | | | 28,728 | |
| Community Health Systems, Inc. 6.00% 1/15/20291 | | | 9,622 | | | | 8,149 | |
| Community Health Systems, Inc. 6.875% 4/15/20291 | | | 4,500 | | | | 2,791 | |
| Community Health Systems, Inc. 5.25% 5/15/20301 | | | 26,635 | | | | 20,918 | |
| Community Health Systems, Inc. 4.75% 2/15/20311 | | | 1,608 | | | | 1,189 | |
| DaVita, Inc. 4.625% 6/1/20301 | | | 16,310 | | | | 13,937 | |
| Encompass Health Corp. 4.50% 2/1/2028 | | | 7,054 | | | | 6,582 | |
| Encompass Health Corp. 4.75% 2/1/2030 | | | 3,841 | | | | 3,496 | |
| Endo DAC 6.00% 6/30/20281,4 | | | 45,278 | | | | 3,509 | |
| Endo DAC / Endo Finance, LLC / Endo Finco 9.50% 7/31/20271,4 | | | 6,243 | | | | 484 | |
| Endo International PLC 5.875% 10/15/20241 | | | 10,374 | | | | 7,750 | |
| Endo Luxembourg Finance Co. I SARL / Endo U.S., Inc. 6.125% 4/1/20291 | | | 15,320 | | | | 11,346 | |
| Grifols Escrow Issuer SA 4.75% 10/15/20281 | | | 12,075 | | | | 9,914 | |
| HCA, Inc. 5.375% 2/1/2025 | | | 1,000 | | | | 1,001 | |
| HCA, Inc. 5.875% 2/15/2026 | | | 2,902 | | | | 2,947 | |
| HCA, Inc. 4.50% 2/15/2027 | | | 71 | | | | 69 | |
| HCA, Inc. 5.625% 9/1/2028 | | | 22,625 | | | | 22,906 | |
| HCA, Inc. 5.875% 2/1/2029 | | | 2,450 | | | | 2,505 | |
| HCA, Inc. 3.50% 9/1/2030 | | | 24,300 | | | | 21,660 | |
| HCA, Inc. 7.50% 11/15/2095 | | | 5,000 | | | | 5,492 | |
| HealthEquity, Inc. 4.50% 10/1/20291 | | | 15,845 | | | | 14,098 | |
| IMS Health Holdings, Inc. 5.00% 10/15/20261 | | | 24,059 | | | | 23,543 | |
| Jazz Securities DAC 4.375% 1/15/20291 | | | 10,185 | | | | 9,379 | |
| Mallinckrodt PLC 10.00% 4/15/20251 | | | 17,362 | | | | 14,784 | |
| Medline Borrower, LP, Term Loan, (3-month USD-LIBOR + 3.25%) 8.09% 10/23/20282,3 | | | 7,062 | | | | 6,894 | |
| Minerva Merger Sub, Inc. 6.50% 2/15/20301 | | | 13,000 | | | | 10,553 | |
| Molina Healthcare, Inc. 4.375% 6/15/20281 | | | 25,955 | | | | 24,169 | |
| Molina Healthcare, Inc. 3.875% 11/15/20301 | | | 55,775 | | | | 48,715 | |
| Molina Healthcare, Inc. 3.875% 5/15/20321 | | | 45,350 | | | | 38,153 | |
| Mozart Debt Merger Sub, Inc. 3.875% 4/1/20291 | | | 5,000 | | | | 4,343 | |
| Mozart Debt Merger Sub, Inc. 5.25% 10/1/20291 | | | 36,430 | | | | 31,642 | |
| Option Care Health, Inc. 4.375% 10/31/20291 | | | 6,115 | | | | 5,407 | |
| Owens & Minor, Inc. 4.375% 12/15/2024 | | | 25,411 | | | | 24,544 | |
| Owens & Minor, Inc. 4.50% 3/31/20291 | | | 30,970 | | | | 24,198 | |
| Owens & Minor, Inc. 6.625% 4/1/20301 | | | 45,095 | | | | 38,766 | |
| Par Pharmaceutical, Inc. 7.50% 4/1/20271 | | | 106,234 | | | | 79,129 | |
| Radiology Partners, Inc. 9.25% 2/1/20281 | | | 38,699 | | | | 21,435 | |
| Radiology Partners, Inc., Term Loan, (3-month USD-LIBOR + 4.25%) 8.885% 7/9/20252,3 | | | 1,815 | | | | 1,472 | |
| RP Escrow Issuer, LLC 5.25% 12/15/20251 | | | 25,435 | | | | 19,297 | |
| Select Medical Holdings Corp. 6.25% 8/15/20261 | | | 9,039 | | | | 8,777 | |
| Surgery Center Holdings 10.00% 4/15/20271 | | | 4,742 | | | | 4,840 | |
| Syneos Health, Inc. 3.625% 1/15/20291 | | | 5,780 | | | | 4,757 | |
| Team Health Holdings, Inc. 6.375% 2/1/20251 | | | 6,359 | | | | 3,835 | |
| Team Health Holdings, Inc., Term Loan B, (3-month USD CME Term SOFR + 5.25%) 10.057% 3/2/20272,3 | | | 5,467 | | | | 3,818 | |
| Tenet Healthcare Corp. 4.625% 7/15/2024 | | | 4,274 | | | | 4,220 | |
| Tenet Healthcare Corp. 4.875% 1/1/2026 | | | 111,349 | | | | 109,284 | |
| Tenet Healthcare Corp. 6.25% 2/1/2027 | | | 8,995 | | | | 8,856 | |
| Tenet Healthcare Corp. 5.125% 11/1/2027 | | | 3,980 | | | | 3,825 | |
| Tenet Healthcare Corp. 4.625% 6/15/2028 | | | 18,000 | | | | 16,625 | |
| Tenet Healthcare Corp. 6.125% 10/1/2028 | | | 14,815 | | | | 14,213 | |
| Tenet Healthcare Corp. 4.25% 6/1/2029 | | | 20,860 | | | | 18,891 | |
| Tenet Healthcare Corp. 4.375% 1/15/2030 | | | 25,005 | | | | 22,464 | |
| Tenet Healthcare Corp. 6.875% 11/15/2031 | | | 2,000 | | | | 1,912 | |
| Teva Pharmaceutical Finance Co. BV 2.80% 7/21/2023 | | | 8,206 | | | | 8,117 | |
| American High-Income Trust | 9 |
| Bonds, notes & other debt instruments (continued) | | Principal amount
(000) | | | Value
(000) | |
| Corporate bonds, notes & loans (continued) | | | | | | | | |
| Health care (continued) | | | | | | | | |
| Teva Pharmaceutical Finance Co. BV 6.00% 4/15/2024 | | USD | 46,824 | | | $ | 46,875 | |
| Teva Pharmaceutical Finance Co. BV 3.15% 10/1/2026 | | | 65,186 | | | | 59,057 | |
| Teva Pharmaceutical Finance Co. BV 4.75% 5/9/2027 | | | 24,040 | | | | 22,470 | |
| Teva Pharmaceutical Finance Co. BV 6.75% 3/1/2028 | | | 24,371 | | | | 24,403 | |
| Teva Pharmaceutical Finance Co. BV 5.125% 5/9/2029 | | | 110,110 | | | | 99,848 | |
| Teva Pharmaceutical Finance Co. BV 7.875% 9/15/2029 | | | 15,340 | | | | 16,069 | |
| Teva Pharmaceutical Finance Co. BV 8.125% 9/15/2031 | | | 21,537 | | | | 22,634 | |
| Teva Pharmaceutical Finance Co. BV 4.10% 10/1/2046 | | | 16,337 | | | | 10,901 | |
| Valeant Pharmaceuticals International, Inc. 5.50% 11/1/20251 | | | 83,325 | | | | 68,602 | |
| | | | | | | | 1,687,310 | |
| | | | | | | | | |
| Materials 9.51% | | | | | | | | |
| Alcoa Nederland Holding BV 5.50% 12/15/20271 | | | 10,760 | | | | 10,640 | |
| Alcoa Nederland Holding BV 4.125% 3/31/20291 | | | 6,250 | | | | 5,570 | |
| Allegheny Technologies, Inc. 4.875% 10/1/2029 | | | 21,320 | | | | 19,435 | |
| Allegheny Technologies, Inc. 5.125% 10/1/2031 | | | 22,140 | | | | 20,180 | |
| ArcelorMittal 4.25% 7/16/2029 | | | 940 | | | | 892 | |
| ArcelorMittal 7.00% 10/15/2039 | | | 10,104 | | | | 10,636 | |
| ArcelorMittal 6.75% 3/1/2041 | | | 15,173 | | | | 15,408 | |
| Ardagh Group SA 6.50% Cash 6/30/20271,6 | | | 8,809 | | | | 6,749 | |
| Ardagh Metal Packaging Finance USA, LLC 6.00% 6/15/20271 | | | 1,500 | | | | 1,489 | |
| Ardagh Metal Packaging Finance USA, LLC 3.25% 9/1/20281 | | | 5,000 | | | | 4,309 | |
| Ardagh Metal Packaging Finance USA, LLC 4.00% 9/1/20291 | | | 16,970 | | | | 13,295 | |
| Ardagh Packaging Finance PLC 5.25% 4/30/20251 | | | 570 | | | | 562 | |
| Ardagh Packaging Finance PLC 4.125% 8/15/20261 | | | 11,435 | | | | 10,679 | |
| Ardagh Packaging Finance PLC 5.25% 8/15/20271 | | | 10,000 | | | | 7,894 | |
| Avient Corp. 7.125% 8/1/20301 | | | 6,750 | | | | 6,968 | |
| Axalta Coating Systems, LLC 4.75% 6/15/20271 | | | 6,495 | | | | 6,179 | |
| Ball Corp. 6.875% 3/15/2028 | | | 21,175 | | | | 21,938 | |
| Ball Corp. 2.875% 8/15/2030 | | | 3,250 | | | | 2,710 | |
| Ball Corp. 3.125% 9/15/2031 | | | 26,280 | | | | 21,772 | |
| Braskem Idesa SAPI 6.99% 2/20/20321 | | | 1,370 | | | | 1,035 | |
| CAN-PACK SA 3.875% 11/15/20291 | | | 26,795 | | | | 21,725 | |
| Cleveland-Cliffs, Inc. 6.75% 3/15/20261 | | | 9,823 | | | | 10,010 | |
| Cleveland-Cliffs, Inc. 7.00% 3/15/2027 | | | 3,853 | | | | 3,776 | |
| Cleveland-Cliffs, Inc. 5.875% 6/1/2027 | | | 63,955 | | | | 63,392 | |
| Cleveland-Cliffs, Inc. 4.625% 3/1/20291 | | | 39,643 | | | | 36,416 | |
| Cleveland-Cliffs, Inc. 4.875% 3/1/20311 | | | 43,344 | | | | 39,452 | |
| Consolidated Energy Finance SA 6.50% 5/15/20261 | | | 2,013 | | | | 1,897 | |
| Consolidated Energy Finance SA 5.625% 10/15/20281 | | | 3,680 | | | | 3,169 | |
| CROWN Americas, LLC 5.25% 4/1/2030 | | | 2,775 | | | | 2,675 | |
| Crown Holdings, Inc. 7.375% 12/15/2026 | | | 2,000 | | | | 2,115 | |
| CVR Partners, LP 6.125% 6/15/20281 | | | 22,525 | | | | 19,993 | |
| Element Solutions, Inc. 3.875% 9/1/20281 | | | 8,300 | | | | 7,294 | |
| First Quantum Minerals, Ltd. 7.50% 4/1/20251 | | | 76,007 | | | | 76,021 | |
| First Quantum Minerals, Ltd. 6.875% 3/1/20261 | | | 55,328 | | | | 53,722 | |
| First Quantum Minerals, Ltd. 6.875% 10/15/20271 | | | 141,914 | | | | 136,940 | |
| Freeport-McMoRan, Inc. 4.25% 3/1/2030 | | | 303 | | | | 281 | |
| Freeport-McMoRan, Inc. 4.625% 8/1/2030 | | | 900 | | | | 851 | |
| Freeport-McMoRan, Inc. 5.40% 11/14/2034 | | | 4,288 | | | | 4,207 | |
| Freeport-McMoRan, Inc. 5.45% 3/15/2043 | | | 8,393 | | | | 7,860 | |
| FXI Holdings, Inc. 7.875% 11/1/20241 | | | 135,382 | | | | 126,437 | |
| FXI Holdings, Inc. 12.25% 11/15/20261 | | | 158,184 | | | | 140,784 | |
| Graphic Packaging International, LLC 3.75% 2/1/20301 | | | 10,000 | | | | 8,688 | |
| Hexion, Inc., Term Loan, (3-month USD CME Term SOFR + 4.50%) 9.454% 3/15/20292,3 | | | 11,195 | | | | 10,090 | |
| INEOS Finance PLC 6.75% 5/15/20281 | | | 10,200 | | | | 9,858 | |
| Kaiser Aluminum Corp. 4.625% 3/1/20281 | | | 12,698 | | | | 11,318 | |
| LABL, Inc. 5.875% 11/1/20281 | | | 14,600 | | | | 13,000 | |
| LABL, Inc. 9.50% 11/1/20281 | | | 3,277 | | | | 3,310 | |
| LABL, Inc. 8.25% 11/1/20291 | | | 15,215 | | | | 13,003 | |
| LSB Industries, Inc. 6.25% 10/15/20281 | | | 49,875 | | | | 44,437 | |
| LSF11 A5 HoldCo, LLC 6.625% 10/15/20291 | | | 1,425 | | | | 1,200 | |
| Mauser Packaging Solutions Holding Co. 7.875% 8/15/20261 | | | 21,143 | | | | 21,162 | |
| Mauser Packaging Solutions Holding Co. 9.25% 4/15/20271 | | | 12,500 | | | | 11,562 | |
| Methanex Corp. 5.125% 10/15/2027 | | | 73,490 | | | | 69,341 | |
| Methanex Corp. 5.25% 12/15/2029 | | | 12,718 | | | | 11,905 | |
| Methanex Corp. 5.65% 12/1/2044 | | | 9,445 | | | | 7,787 | |
| 10 | American High-Income Trust |
| Bonds, notes & other debt instruments (continued) | | Principal amount
(000) | | | Value
(000) | |
| Corporate bonds, notes & loans (continued) | | | | | | | | |
| Materials (continued) | | | | | | | | |
| Mineral Resources, Ltd. 8.00% 11/1/20271 | | USD | 25,450 | | | $ | 26,201 | |
| Mineral Resources, Ltd. 8.50% 5/1/20301 | | | 25,920 | | | | 26,628 | |
| Nova Chemicals Corp. 4.875% 6/1/20241 | | | 15,785 | | | | 15,592 | |
| Nova Chemicals Corp. 5.25% 6/1/20271 | | | 31,493 | | | | 28,750 | |
| Nova Chemicals Corp. 4.25% 5/15/20291 | | | 36,067 | | | | 29,524 | |
| Novelis Corp. 3.25% 11/15/20261 | | | 16,285 | | | | 14,897 | |
| Novelis Corp. 4.75% 1/30/20301 | | | 11,093 | | | | 10,206 | |
| Novelis Corp. 3.875% 8/15/20311 | | | 22,344 | | | | 18,852 | |
| Olin Corp. 5.625% 8/1/2029 | | | 5,700 | | | | 5,500 | |
| Olin Corp. 5.00% 2/1/2030 | | | 3,365 | | | | 3,158 | |
| Owens-Illinois, Inc. 5.875% 8/15/20231 | | | 4,082 | | | | 4,080 | |
| Owens-Illinois, Inc. 6.375% 8/15/20251 | | | 5,341 | | | | 5,349 | |
| SCIH Salt Holdings, Inc. 4.875% 5/1/20281 | | | 41,413 | | | | 36,970 | |
| SCIH Salt Holdings, Inc. 6.625% 5/1/20291 | | | 18,600 | | | | 15,415 | |
| Scotts Miracle-Gro Co. 4.50% 10/15/2029 | | | 7,776 | | | | 6,695 | |
| Scotts Miracle-Gro Co. 4.375% 2/1/2032 | | | 7,620 | | | | 6,132 | |
| Sealed Air Corp. 4.00% 12/1/20271 | | | 7,559 | | | | 7,061 | |
| Sealed Air Corp. 6.125% 2/1/20281 | | | 15,912 | | | | 16,106 | |
| Sealed Air Corp. 5.00% 4/15/20291 | | | 13,750 | | | | 12,938 | |
| SPCM SA 3.375% 3/15/20301 | | | 10,732 | | | | 8,866 | |
| Summit Materials, LLC 6.50% 3/15/20271 | | | 5,478 | | | | 5,438 | |
| Summit Materials, LLC 5.25% 1/15/20291 | | | 15,015 | | | | 14,211 | |
| Trivium Packaging BV 5.50% 8/15/20261 | | | 6,445 | | | | 6,182 | |
| Trivium Packaging BV 8.50% 8/15/20271 | | | 19,352 | | | | 17,629 | |
| Tronox, Ltd. 4.625% 3/15/20291 | | | 14,155 | | | | 11,870 | |
| Valvoline, Inc. 4.25% 2/15/20301 | | | 3,691 | | | | 3,623 | |
| Valvoline, Inc. 3.625% 6/15/20311 | | | 8,405 | | | | 7,147 | |
| Venator Finance SARL 9.50% 7/1/20251 | | | 33,482 | | | | 20,926 | |
| Venator Finance SARL 5.75% 7/15/20251 | | | 70,528 | | | | 10,253 | |
| Venator Finance SARL, Term Loan, (3-month USD-LIBOR + 3.00%) 8.159% 8/8/20242,3 | | | 9,064 | | | | 6,007 | |
| W. R. Grace Holdings, LLC 5.625% 8/15/20291 | | | 6,495 | | | | 5,521 | |
| Warrior Met Coal, Inc. 7.875% 12/1/20281 | | | 26,880 | | | | 27,058 | |
| | | | | | | | 1,618,803 | |
| | | | | | | | | |
| Industrials 8.67% | | | | | | | | |
| AAdvantage Loyalty IP, Ltd. 5.50% 4/20/20261 | | | 15,095 | | | | 14,874 | |
| ADT Security Corp. 4.125% 8/1/20291 | | | 4,815 | | | | 4,300 | |
| Allison Transmission Holdings, Inc. 3.75% 1/30/20311 | | | 24,820 | | | | 21,203 | |
| Ashtead Capital, Inc. 5.50% 8/11/20321 | | | 10,743 | | | | 10,574 | |
| Atkore, Inc. 4.25% 6/1/20311 | | | 6,650 | | | | 5,827 | |
| Atlantic Aviation FBO, Inc., Term Loan, (3-month USD-LIBOR + 5.75%) 10.385% 9/21/20292,3 | | | 67,254 | | | | 66,127 | |
| Avis Budget Car Rental, LLC 5.75% 7/15/20271 | | | 18,910 | | | | 17,736 | |
| Avis Budget Group, Inc. 4.75% 4/1/20281 | | | 1,000 | | | | 911 | |
| Avis Budget Group, Inc. 5.375% 3/1/20291 | | | 23,995 | | | | 22,309 | |
| Avolon Holdings Funding, Ltd. 5.25% 5/15/20241 | | | 17,340 | | | | 17,176 | |
| Avolon Holdings Funding, Ltd. 2.528% 11/18/20271 | | | 36,710 | | | | 31,096 | |
| BlueLinx Holdings, Inc. 6.00% 11/15/20291 | | | 6,795 | | | | 5,618 | |
| Boeing Company 3.90% 5/1/2049 | | | 540 | | | | 409 | |
| Bohai Financial Investment Holding Co., Ltd. 5.50% 2/15/20241 | | | 1,258 | | | | 1,247 | |
| Bombardier, Inc. 7.50% 3/15/20251 | | | 5,102 | | | | 5,107 | |
| Bombardier, Inc. 7.125% 6/15/20261 | | | 67,460 | | | | 67,764 | |
| Bombardier, Inc. 7.875% 4/15/20271 | | | 41,960 | | | | 42,518 | |
| Bombardier, Inc. 6.00% 2/15/20281 | | | 25,648 | | | | 25,007 | |
| Bombardier, Inc. 7.50% 2/1/20291 | | | 13,681 | | | | 13,989 | |
| Bombardier, Inc. 7.45% 5/1/20341 | | | 1,850 | | | | 2,081 | |
| BWX Technologies, Inc. 4.125% 6/30/20281 | | | 15,932 | | | | 14,365 | |
| BWX Technologies, Inc. 4.125% 4/15/20291 | | | 18,130 | | | | 16,099 | |
| Chart Industries, Inc. 7.50% 1/1/20301 | | | 10,389 | | | | 10,747 | |
| Clarivate Science Holdings Corp. 3.875% 7/1/20281 | | | 31,755 | | | | 28,375 | |
| Clarivate Science Holdings Corp. 4.875% 7/1/20291 | | | 18,675 | | | | 16,907 | |
| Clean Harbors, Inc. 4.875% 7/15/20271 | | | 12,014 | | | | 11,600 | |
| Clean Harbors, Inc. 5.125% 7/15/20291 | | | 5,000 | | | | 4,773 | |
| Clean Harbors, Inc. 6.375% 2/1/20311 | | | 17,247 | | | | 17,614 | |
| CoreLogic, Inc. 4.50% 5/1/20281 | | | 75,882 | | | | 57,646 | |
| CoreLogic, Inc., Term Loan, (3-month USD-LIBOR + 6.50%) 11.375% 6/4/20292,3 | | | 22,275 | | | | 16,637 | |
| Covanta Holding Corp. 4.875% 12/1/20291 | | | 18,260 | | | | 16,266 | |
| | | | | | | | | |
| American High-Income Trust | 11 |
| Bonds, notes & other debt instruments (continued) | | Principal amount
(000) | | | Value
(000) | |
| Corporate bonds, notes & loans (continued) | | | | | | | | |
| Industrials (continued) | | | | | | | | |
| Covanta Holding Corp. 5.00% 9/1/2030 | | USD | 28,240 | | | $ | 24,353 | |
| Dun & Bradstreet Corp. 5.00% 12/15/20291 | | | 24,367 | | | | 21,126 | |
| Garda World Security Corp. 6.00% 6/1/20291 | | | 3,200 | | | | 2,548 | |
| GFL Environmental, Inc. 3.50% 9/1/20281 | | | 10,000 | | | | 9,059 | |
| Harsco Corp. 5.75% 7/31/20271 | | | 7,265 | | | | 5,712 | |
| Herc Holdings, Inc. 5.50% 7/15/20271 | | | 3,200 | | | | 3,092 | |
| Howmet Aerospace, Inc. 6.875% 5/1/2025 | | | 1,510 | | | | 1,569 | |
| Howmet Aerospace, Inc. 5.95% 2/1/2037 | | | 9,125 | | | | 9,204 | |
| Icahn Enterprises Finance Corp. 4.75% 9/15/2024 | | | 24,105 | | | | 23,544 | |
| Icahn Enterprises, LP 5.25% 5/15/2027 | | | 5,503 | | | | 5,170 | |
| Icahn Enterprises, LP 4.375% 2/1/2029 | | | 9,175 | | | | 7,903 | |
| LABL Escrow Issuer, LLC 6.75% 7/15/20261 | | | 560 | | | | 541 | |
| LABL Escrow Issuer, LLC 10.50% 7/15/20271 | | | 36,018 | | | | 33,355 | |
| LSC Communications, Inc. 8.75% 10/15/20231,4,5 | | | 114,646 | | | | 346 | |
| LSC Communications, Inc., Term Loan B, (3-month USD-LIBOR + 4.50%) 7.75% 9/30/20222,3,4,5 | | | 8,059 | | | | 24 | |
| Masonite International Corp. 3.50% 2/15/20301 | | | 11,831 | | | | 9,825 | |
| MasTec, Inc. 4.50% 8/15/20281 | | | 9,375 | | | | 8,674 | |
| Mileage Plus Holdings, LLC 6.50% 6/20/20271 | | | 68,387 | | | | 68,234 | |
| Mueller Water Products, Inc. 4.00% 6/15/20291 | | | 5,115 | | | | 4,574 | |
| Park River Holdings, Inc. 5.625% 2/1/20291 | | | 17,205 | | | | 11,750 | |
| PGT Innovations, Inc. 4.375% 10/1/20291 | | | 22,759 | | | | 20,597 | |
| Pitney Bowes, Inc. 6.875% 3/15/20271 | | | 11,500 | | | | 9,118 | |
| PM General Purchaser, LLC 9.50% 10/1/20281 | | | 50,749 | | | | 46,540 | |
| Prime Security Services Borrower, LLC 3.375% 8/31/20271 | | | 8,100 | | | | 7,269 | |
| Prime Security Services Borrower, LLC 6.25% 1/15/20281 | | | 11,833 | | | | 11,075 | |
| R.R. Donnelley & Sons Co. 6.125% 11/1/20261 | | | 12,125 | | | | 12,174 | |
| Regal Rexnord Corp. 6.40% 4/15/20331 | | | 19,125 | | | | 19,160 | |
| Ritchie Bros. Holdings, Inc. 6.75% 3/15/20281 | | | 13,643 | | | | 14,067 | |
| Ritchie Bros. Holdings, Inc. 7.75% 3/15/20311 | | | 46,887 | | | | 49,197 | |
| Roller Bearing Company of America, Inc. 4.375% 10/15/20291 | | | 3,325 | | | | 2,973 | |
| Rolls-Royce PLC 5.75% 10/15/20271 | | | 9,915 | | | | 9,886 | |
| Sabre GLBL, Inc. 7.375% 9/1/20251 | | | 3,617 | | | | 3,235 | |
| Sabre GLBL, Inc. 11.25% 12/15/20271 | | | 17,689 | | | | 16,494 | |
| Sabre Holdings Corp. 9.25% 4/15/20251 | | | 16,754 | | | | 15,798 | |
| Sensata Technologies Holding BV 4.00% 4/15/20291 | | | 3,225 | | | | 2,917 | |
| Sensata Technologies, Inc. 3.75% 2/15/20311 | | | 8,800 | | | | 7,708 | |
| SkyMiles IP, Ltd. 4.75% 10/20/20281 | | | 19,430 | | | | 18,766 | |
| Spirit AeroSystems, Inc. 7.50% 4/15/20251 | | | 3,425 | | | | 3,428 | |
| Spirit AeroSystems, Inc. 4.60% 6/15/2028 | | | 31,555 | | | | 26,780 | |
| Spirit AeroSystems, Inc. 9.375% 11/30/20291 | | | 21,688 | | | | 23,694 | |
| Spirit AeroSystems, Inc., Term Loan, (3-month CME Term SOFR + 4.50%) 9.176% 1/15/20272,3 | | | 7,663 | | | | 7,677 | |
| SRS Distribution, Inc. 4.625% 7/1/20281 | | | 10,080 | | | | 8,966 | |
| SRS Distribution, Inc. 6.125% 7/1/20291 | | | 615 | | | | 520 | |
| Stericycle, Inc. 5.375% 7/15/20241 | | | 20,884 | | | | 20,746 | |
| Stericycle, Inc. 3.875% 1/15/20291 | | | 16,235 | | | | 14,193 | |
| The Brink’s Co. 4.625% 10/15/20271 | | | 10,371 | | | | 9,785 | |
| The Hertz Corp. 5.00% 12/1/20291 | | | 7,500 | | | | 6,220 | |
| Titan International, Inc. 7.00% 4/30/2028 | | | 11,500 | | | | 10,372 | |
| TK Elevator Holdco GmbH 7.625% 7/15/20281 | | | 1,375 | | | | 1,190 | |
| TransDigm, Inc. 6.25% 3/15/20261 | | | 32,470 | | | | 32,533 | |
| TransDigm, Inc. 6.875% 5/15/2026 | | | 12,740 | | | | 12,561 | |
| TransDigm, Inc. 6.375% 6/15/2026 | | | 5,560 | | | | 5,441 | |
| TransDigm, Inc. 7.50% 3/15/2027 | | | 770 | | | | 769 | |
| TransDigm, Inc. 5.50% 11/15/2027 | | | 19,810 | | | | 18,701 | |
| TransDigm, Inc. 6.75% 8/15/20281 | | | 14,070 | | | | 14,228 | |
| TransDigm, Inc. 4.625% 1/15/2029 | | | 2,971 | | | | 2,644 | |
| TransDigm, Inc. 4.875% 5/1/2029 | | | 4,180 | | | | 3,704 | |
| Triumph Group, Inc. 7.75% 8/15/2025 | | | 21,075 | | | | 19,365 | |
| Triumph Group, Inc. 9.00% 3/15/20281 | | | 31,249 | | | | 31,321 | |
| Uber Technologies, Inc. 8.00% 11/1/20261 | | | 10,000 | | | | 10,262 | |
| United Airlines, Inc. 4.375% 4/15/20261 | | | 5,125 | | | | 4,909 | |
| United Airlines, Inc. 4.625% 4/15/20291 | | | 10,100 | | | | 9,149 | |
| United Rentals, Inc. 5.25% 1/15/2030 | | | 5,484 | | | | 5,284 | |
| United Rentals, Inc. 3.875% 2/15/2031 | | | 9,450 | | | | 8,350 | |
| United Rentals, Inc. 3.75% 1/15/2032 | | | 8,360 | | | | 7,209 | |
| | |
| 12 | American High-Income Trust |
| Bonds, notes & other debt instruments (continued) | | Principal amount
(000) | | | Value
(000) | |
| Corporate bonds, notes & loans (continued) | | | | | | | | |
| Industrials (continued) | | | | | | | | |
| Vertical U.S. Newco, Inc. 5.25% 7/15/20271 | | USD | 29,545 | | | $ | 27,932 | |
| WESCO Distribution, Inc. 7.125% 6/15/20251 | | | 11,475 | | | | 11,675 | |
| WESCO Distribution, Inc. 7.25% 6/15/20281 | | | 10,900 | | | | 11,203 | |
| | | | | | | | 1,475,290 | |
| | | | | | | | | |
| Financials 7.20% | | | | | | | | |
| Advisor Group Holdings, LLC 6.25% 3/1/20281 | | | 41,998 | | | | 37,874 | |
| AG Merger Sub II, Inc. 10.75% 8/1/20271 | | | 76,600 | | | | 77,818 | |
| AG TTMT Escrow Issuer, LLC 8.625% 9/30/20271 | | | 21,016 | | | | 21,174 | |
| Alliant Holdings Intermediate, LLC 4.25% 10/15/20271 | | | 14,020 | | | | 12,574 | |
| Alliant Holdings Intermediate, LLC 6.75% 10/15/20271 | | | 33,300 | | | | 30,917 | |
| Alliant Holdings Intermediate, LLC 6.75% 4/15/20281 | | | 7,130 | | | | 7,057 | |
| Alliant Holdings Intermediate, LLC 5.875% 11/1/20291 | | | 31,605 | | | | 26,709 | |
| AmWINS Group, Inc. 4.875% 6/30/20291 | | | 27,142 | | | | 24,056 | |
| Aretec Escrow Issuer, Inc. 7.50% 4/1/20291 | | | 57,872 | | | | 47,387 | |
| Ascensus, Inc., Term Loan, (3-month USD-LIBOR + 6.50%) 11.313% 8/2/20292,3 | | | 22,600 | | | | 20,340 | |
| AssuredPartners, Inc. 7.00% 8/15/20251 | | | 226 | | | | 220 | |
| AssuredPartners, Inc. 8.00% 5/15/20271 | | | 8,409 | | | | 8,035 | |
| AssuredPartners, Inc. 5.625% 1/15/20291 | | | 4,895 | | | | 4,236 | |
| Blackstone Private Credit Fund 7.05% 9/29/20251 | | | 12,730 | | | | 12,568 | |
| Block, Inc. 2.75% 6/1/2026 | | | 28,750 | | | | 26,248 | |
| Block, Inc. 3.50% 6/1/2031 | | | 31,175 | | | | 25,633 | |
| BroadStreet Partners, Inc. 5.875% 4/15/20291 | | | 9,950 | | | | 8,426 | |
| Castlelake Aviation Finance DAC 5.00% 4/15/20271 | | | 17,105 | | | | 15,185 | |
| Coinbase Global, Inc. 3.375% 10/1/20281 | | | 26,075 | | | | 16,128 | |
| Coinbase Global, Inc. 3.625% 10/1/20311 | | | 30,431 | | | | 17,074 | |
| Compass Diversified Holdings 5.25% 4/15/20291 | | | 90,012 | | | | 79,365 | |
| Compass Diversified Holdings 5.00% 1/15/20321 | | | 21,655 | | | | 17,583 | |
| Credit Acceptance Corp. 5.125% 12/31/20241 | | | 7,030 | | | | 6,689 | |
| Credit Suisse Group AG 7.50% junior subordinated perpetual bonds (USD Semi Annual 30/360 (vs. 3-month USD-LIBOR) + 4.60% on 7/17/2023)1,4,7 | | | 2,295 | | | | 132 | |
| FS Energy and Power Fund 7.50% 8/15/20231 | | | 54,954 | | | | 54,919 | |
| Hightower Holding, LLC 6.75% 4/15/20291 | | | 18,130 | | | | 15,448 | |
| HUB International, Ltd. 7.00% 5/1/20261 | | | 35,178 | | | | 34,607 | |
| HUB International, Ltd. 5.625% 12/1/20291 | | | 3,745 | | | | 3,268 | |
| Iron Mountain Information Management Services, Inc. 5.00% 7/15/20321 | | | 18,510 | | | | 15,913 | |
| JPMorgan Chase & Co. 2.956% 5/13/2031 (USD-SOFR + 2.515% on 5/13/2030)7 | | | 3,100 | | | | 2,682 | |
| Ladenburg Thalmann Financial Services, Inc. 6.50% 11/30/2027 | | | 80 | | | | 1,285 | |
| LPL Holdings, Inc. 4.625% 11/15/20271 | | | 29,103 | | | | 27,529 | |
| LPL Holdings, Inc. 4.00% 3/15/20291 | | | 48,520 | | | | 43,716 | |
| LPL Holdings, Inc. 4.375% 5/15/20311 | | | 23,445 | | | | 20,754 | |
| MGIC Investment Corp. 5.25% 8/15/2028 | | | 7,625 | | | | 7,256 | |
| MSCI, Inc. 4.00% 11/15/20291 | | | 15,793 | | | | 14,427 | |
| MSCI, Inc. 3.625% 9/1/20301 | | | 5,559 | | | | 4,837 | |
| MSCI, Inc. 3.875% 2/15/20311 | | | 31,490 | | | | 28,058 | |
| MSCI, Inc. 3.625% 11/1/20311 | | | 46,121 | | | | 39,542 | |
| MSCI, Inc. 3.25% 8/15/20331 | | | 25,004 | | | | 20,499 | |
| National Financial Partners Corp. 6.875% 8/15/20281 | | | 11,239 | | | | 9,655 | |
| Navient Corp. 6.125% 3/25/2024 | | | 21,112 | | | | 20,850 | |
| Navient Corp. 5.875% 10/25/2024 | | | 25,680 | | | | 24,977 | |
| Navient Corp. 6.75% 6/25/2025 | | | 11,000 | | | | 10,702 | |
| Navient Corp. 6.75% 6/15/2026 | | | 12,310 | | | | 12,017 | |
| Navient Corp. 5.00% 3/15/2027 | | | 53,762 | | | | 47,423 | |
| Navient Corp. 4.875% 3/15/2028 | | | 5,570 | | | | 4,691 | |
| Navient Corp. 5.50% 3/15/2029 | | | 45,671 | | | | 38,651 | |
| Navient Corp. 5.625% 8/1/2033 | | | 27,712 | | | | 20,593 | |
| OneMain Finance Corp. 3.875% 9/15/2028 | | | 3,989 | | | | 3,167 | |
| OneMain Holdings, Inc. 7.125% 3/15/2026 | | | 24,220 | | | | 23,307 | |
| Owl Rock Capital Corp. 4.00% 3/30/2025 | | | 449 | | | | 419 | |
| Owl Rock Capital Corp. 3.75% 7/22/2025 | | | 12,093 | | | | 11,041 | |
| Owl Rock Capital Corp. 3.40% 7/15/2026 | | | 5,685 | | | | 5,028 | |
| Owl Rock Capital Corp. 2.625% 1/15/2027 | | | 400 | | | | 339 | |
| Owl Rock Capital Corp. II 4.625% 11/26/20241 | | | 9,835 | | | | 9,442 | |
| Owl Rock Capital Corp. III 3.125% 4/13/2027 | | | 11,350 | | | | 9,549 | |
| Owl Rock Core Income Corp. 4.70% 2/8/2027 | | | 15,700 | | | | 14,205 | |
| Oxford Finance, LLC 6.375% 2/1/20271 | | | 38,985 | | | | 36,499 | |
| Quicken Loans, LLC 3.625% 3/1/20291 | | | 6,605 | | | | 5,680 | |
| | |
| American High-Income Trust | 13 |
| Bonds, notes & other debt instruments (continued) | | Principal amount
(000) | | | Value
(000) | |
| Corporate bonds, notes & loans (continued) | | | | | | | | |
| Financials (continued) | | | | | | | | |
| Rocket Mortgage, LLC 2.875% 10/15/20261 | | USD | 9,410 | | | $ | 8,432 | |
| Ryan Specialty Group, LLC 4.375% 2/1/20301 | | | 12,050 | | | | 10,551 | |
| Springleaf Finance Corp. 6.125% 3/15/2024 | | | 3,700 | | | | 3,608 | |
| Starwood Property Trust, Inc. 5.50% 11/1/20231 | | | 7,195 | | | | 7,216 | |
| Starwood Property Trust, Inc. 4.375% 1/15/20271 | | | 11,835 | | | | 9,795 | |
| | | | | | | | 1,226,005 | |
| | | | | | | | | |
| Information technology 4.30% | | | | | | | | |
| Almonde, Inc., Term Loan B, (3-month USD-LIBOR + 3.50%) 8.325% 6/13/20242,3 | | | 15,848 | | | | 14,913 | |
| Almonde, Inc., Term Loan, (3-month USD-LIBOR + 7.25%) 12.075% 6/13/20252,3 | | | 81,669 | | | | 66,152 | |
| Black Knight, Inc. 3.625% 9/1/20281 | | | 8,470 | | | | 7,718 | |
| BMC Software, Inc. 7.125% 10/2/20251 | | | 3,545 | | | | 3,532 | |
| BMC Software, Inc. 9.125% 3/1/20261 | | | 4,290 | | | | 4,176 | |
| BMC Software, Inc., Term Loan, (3-month USD-LIBOR + 5.50%) 10.34% 2/27/20262,3 | | | 23,325 | | | | 22,679 | |
| Booz Allen Hamilton, Inc. 3.875% 9/1/20281 | | | 9,362 | | | | 8,552 | |
| Booz Allen Hamilton, Inc. 4.00% 7/1/20291 | | | 5,633 | | | | 5,088 | |
| CA Magnum Holdings 5.375% 10/31/20261 | | | 1,075 | | | | 944 | |
| CDK Global, Inc. 7.25% 6/15/20291 | | | 11,650 | | | | 11,461 | |
| CommScope Finance, LLC 6.00% 3/1/20261 | | | 16,030 | | | | 15,488 | |
| CommScope Finance, LLC 8.25% 3/1/20271 | | | 24,731 | | | | 20,279 | |
| CommScope Technologies, LLC 6.00% 6/15/20251 | | | 41,921 | | | | 39,520 | |
| CommScope Technologies, LLC 5.00% 3/15/20271 | | | 13,025 | | | | 9,540 | |
| CommScope, Inc. 7.125% 7/1/20281 | | | 9,869 | | | | 7,291 | |
| Condor Merger Sub, Inc. 7.375% 2/15/20301 | | | 8,000 | | | | 6,715 | |
| Diebold Nixdorf Dutch Holding BV 9.00% 7/15/2025 | | EUR | 25,040 | | | | 13,985 | |
| Diebold Nixdorf, Inc. 9.375% 7/15/20251 | | USD | 151,093 | | | | 77,435 | |
| Diebold Nixdorf, Inc., units, 8.50% PIK or 8.50% Cash 10/15/20261,6 | | | 53,944 | | | | 13,773 | |
| Diebold Nixdorf, Inc., Term Loan, (3-month USD CME Term SOFR + 7.00%) 14.75% 6/5/20232,3 | | | 15,141 | | | | 15,141 | |
| Diebold Nixdorf, Inc., Term Loan, (3-month USD CME Term SOFR + 5.25%) 10.479% 7/15/20252,3 | | | 53,938 | | | | 27,509 | |
| Diebold Nixdorf, Inc., Term Loan, (3-month USD CME Term SOFR + 6.50%) 11.629% 7/15/20252,3 | | | 47,768 | | | | 50,156 | |
| Entegris Escrow Corp. 4.75% 4/15/20291 | | | 7,610 | | | | 7,201 | |
| Fair Isaac Corp. 4.00% 6/15/20281 | | | 18,315 | | | | 17,004 | |
| Finastra, Ltd., Term Loan B, (3-month EUR-EURIBOR + 3.00%) 5.492% 6/13/20242,3 | | EUR | 19,007 | | | | 18,623 | |
| Gartner, Inc. 4.50% 7/1/20281 | | USD | 37,332 | | | | 35,472 | |
| Gartner, Inc. 3.625% 6/15/20291 | | | 3,657 | | | | 3,266 | |
| Gartner, Inc. 3.75% 10/1/20301 | | | 20,136 | | | | 18,093 | |
| GoDaddy Operating Co. 5.25% 12/1/20271 | | | 7,725 | | | | 7,525 | |
| GoDaddy Operating Co. 3.50% 3/1/20291 | | | 10,575 | | | | 9,153 | |
| Imola Merger Corp. 4.75% 5/15/20291 | | | 5,000 | | | | 4,479 | |
| J2 Global, Inc. 4.625% 10/15/20301 | | | 339 | | | | 293 | |
| MicroStrategy, Inc. 6.125% 6/15/20281 | | | 6,425 | | | | 5,710 | |
| MoneyGram International, Inc. 5.375% 8/1/20261 | | | 18,775 | | | | 18,839 | |
| NCR Corp. 5.125% 4/15/20291 | | | 35,955 | | | | 31,146 | |
| NCR Corp. 6.125% 9/1/20291 | | | 9,550 | | | | 9,428 | |
| Open Text Corp., Term Loan B, (3-month USD CME Term SOFR + 3.50%) 8.407% 1/31/20302,3 | | | 7,000 | | | | 6,989 | |
| Rocket Software, Inc. 6.50% 2/15/20291 | | | 9,075 | | | | 7,156 | |
| Synaptics, Inc. 4.00% 6/15/20291 | | | 5,225 | | | | 4,508 | |
| Tibco Software, Inc., Term Loan A, (3-month USD CME Term SOFR + 4.50%) 9.498% 9/29/20282,3 | | | 25,785 | | | | 23,432 | |
| UKG, Inc., Term Loan B, (3-month USD-LIBOR + 3.25%) 8.032% 5/4/20262,3 | | | 8,815 | | | | 8,601 | |
| UKG, Inc., Term Loan, (3-month USD-LIBOR + 5.25%) 10.032% 5/3/20272,3 | | | 26,300 | | | | 25,379 | |
| Unisys Corp. 6.875% 11/1/20271 | | | 19,140 | | | | 12,227 | |
| VeriSign, Inc. 5.25% 4/1/2025 | | | 3,068 | | | | 3,067 | |
| Viavi Solutions, Inc. 3.75% 10/1/20291 | | | 3,750 | | | | 3,211 | |
| Xerox Corp. 5.50% 8/15/20281 | | | 11,000 | | | | 9,532 | |
| | | | | | | | 732,381 | |
| | | | | | | | | |
| Consumer staples 4.11% | | | | | | | | |
| Albertsons Companies, Inc. 4.625% 1/15/20271 | | | 7,215 | | | | 6,985 | |
| Albertsons Companies, Inc. 3.50% 3/15/20291 | | | 68,823 | | | | 59,947 | |
| Albertsons Companies, Inc. 4.875% 2/15/20301 | | | 11,915 | | | | 11,134 | |
| B&G Foods, Inc. 5.25% 4/1/2025 | | | 26,687 | | | | 24,881 | |
| B&G Foods, Inc. 5.25% 9/15/2027 | | | 41,606 | | | | 35,718 | |
| | |
| 14 | American High-Income Trust |
| Bonds, notes & other debt instruments (continued) | | Principal amount
(000) | | | Value
(000) | |
| Corporate bonds, notes & loans (continued) | | | | | | | | |
| Consumer staples (continued) | | | | | | | | |
| BJ’s Wholesale Club, Term Loan, (3-month USD CME Term SOFR + 2.75%) 7.448% 2/3/20272,3 | | USD | 4,985 | | | $ | 4,997 | |
| Central Garden & Pet Co. 4.125% 10/15/2030 | | | 14,556 | | | | 12,875 | |
| Central Garden & Pet Co. 4.125% 4/30/20311 | | | 16,755 | | | | 14,484 | |
| Coty, Inc. 5.00% 4/15/20261 | | | 11,000 | | | | 10,623 | |
| Coty, Inc. 6.50% 4/15/20261 | | | 11,005 | | | | 10,961 | |
| Coty, Inc. 4.75% 1/15/20291 | | | 30,080 | | | | 28,117 | |
| Darling Ingredients, Inc. 5.25% 4/15/20271 | | | 6,431 | | | | 6,276 | |
| Darling Ingredients, Inc. 6.00% 6/15/20301 | | | 25,170 | | | | 25,107 | |
| Energizer Holdings, Inc. 4.375% 3/31/20291 | | | 9,560 | | | | 8,413 | |
| Ingles Markets, Inc. 4.00% 6/15/20311 | | | 5,070 | | | | 4,411 | |
| Kraft Heinz Company 3.00% 6/1/2026 | | | 6,360 | | | | 6,079 | |
| Kraft Heinz Company 3.875% 5/15/2027 | | | 5,545 | | | | 5,418 | |
| Kraft Heinz Company 4.375% 6/1/2046 | | | 6,215 | | | | 5,420 | |
| Kraft Heinz Company 4.875% 10/1/2049 | | | 9,975 | | | | 9,279 | |
| Kronos Acquisition Holdings, Inc. 5.00% 12/31/20261 | | | 38,550 | | | | 35,298 | |
| Kronos Acquisition Holdings, Inc. 7.00% 12/31/20271 | | | 60,572 | | | | 52,904 | |
| Kronos Acquisition Holdings, Inc., Term Loan B2, (3-month USD CME Term SOFR + 6.00%) 11.023% 12/22/20262,3 | | | 1,980 | | | | 1,926 | |
| Lamb Weston Holdings, Inc. 4.125% 1/31/20301 | | | 43,015 | | | | 39,399 | |
| Lamb Weston Holdings, Inc. 4.375% 1/31/20321 | | | 8,500 | | | | 7,716 | |
| Nestle Skin Health SA, Term Loan B3, (3-month USD-LIBOR + 3.75%) 8.909% 10/1/20262,3 | | | 23,261 | | | | 23,068 | |
| Performance Food Group, Inc. 5.50% 10/15/20271 | | | 16,205 | | | | 15,857 | |
| Performance Food Group, Inc. 4.25% 8/1/20291 | | | 5,785 | | | | 5,201 | |
| Post Holdings, Inc. 5.625% 1/15/20281 | | | 24,830 | | | | 24,357 | |
| Post Holdings, Inc. 5.50% 12/15/20291 | | | 19,834 | | | | 18,713 | |
| Post Holdings, Inc. 4.625% 4/15/20301 | | | 61,665 | | | | 55,323 | |
| Post Holdings, Inc. 4.50% 9/15/20311 | | | 24,475 | | | | 21,562 | |
| Prestige Brands International, Inc. 5.125% 1/15/20281 | | | 11,533 | | | | 11,194 | |
| Prestige Brands International, Inc. 3.75% 4/1/20311 | | | 14,440 | | | | 12,252 | |
| Simmons Foods, Inc. 4.625% 3/1/20291 | | | 15,605 | | | | 12,701 | |
| TreeHouse Foods, Inc. 4.00% 9/1/2028 | | | 28,436 | | | | 25,170 | |
| United Natural Foods, Inc. 6.75% 10/15/20281 | | | 42,695 | | | | 39,720 | |
| US Foods, Inc. 4.625% 6/1/20301 | | | 7,180 | | | | 6,484 | |
| | | | | | | | 699,970 | |
| | | | | | | | | |
| Real estate 3.40% | | | | | | | | |
| Anywhere Real Estate Group, LLC 5.75% 1/15/20291 | | | 20,435 | | | | 15,316 | |
| Anywhere Real Estate Group, LLC 5.25% 4/15/20301 | | | 33,120 | | | | 24,170 | |
| Brookfield Property REIT, Inc. 5.75% 5/15/20261 | | | 27,215 | | | | 24,372 | |
| Brookfield Property REIT, Inc. 4.50% 4/1/20271 | | | 4,045 | | | | 3,252 | |
| Forestar Group, Inc. 3.85% 5/15/20261 | | | 10,830 | | | | 9,757 | |
| Forestar Group, Inc. 5.00% 3/1/20281 | | | 1,905 | | | | 1,708 | |
| Hospitality Properties Trust 4.35% 10/1/2024 | | | 2,855 | | | | 2,735 | |
| Hospitality Properties Trust 4.50% 3/15/2025 | | | 6,150 | | | | 5,659 | |
| Howard Hughes Corp. 5.375% 8/1/20281 | | | 29,474 | | | | 26,883 | |
| Howard Hughes Corp. 4.125% 2/1/20291 | | | 29,513 | | | | 25,039 | |
| Howard Hughes Corp. 4.375% 2/1/20311 | | | 52,202 | | | | 42,089 | |
| Iron Mountain, Inc. 4.875% 9/15/20271 | | | 29,660 | | | | 28,073 | |
| Iron Mountain, Inc. 5.25% 3/15/20281 | | | 24,088 | | | | 22,979 | |
| Iron Mountain, Inc. 5.00% 7/15/20281 | | | 4,702 | | | | 4,380 | |
| Iron Mountain, Inc. 5.25% 7/15/20301 | | | 57,225 | | | | 51,653 | |
| Iron Mountain, Inc. 4.50% 2/15/20311 | | | 26,670 | | | | 22,944 | |
| Kennedy-Wilson Holdings, Inc. 4.75% 3/1/2029 | | | 40,015 | | | | 31,859 | |
| Kennedy-Wilson Holdings, Inc. 4.75% 2/1/2030 | | | 48,594 | | | | 35,913 | |
| Kennedy-Wilson Holdings, Inc. 5.00% 3/1/2031 | | | 38,630 | | | | 28,381 | |
| Ladder Capital Finance Holdings LLLP 5.25% 10/1/20251 | | | 14,495 | | | | 12,768 | |
| Ladder Capital Finance Holdings LLLP 4.25% 2/1/20271 | | | 28,586 | | | | 22,610 | |
| Ladder Capital Finance Holdings LLLP 4.75% 6/15/20291 | | | 2,015 | | | | 1,459 | |
| Medical Properties Trust, Inc. 5.00% 10/15/2027 | | | 13,527 | | | | 11,141 | |
| Medical Properties Trust, Inc. 3.50% 3/15/2031 | | | 3,437 | | | | 2,317 | |
| Park Intermediate Holdings, LLC 4.875% 5/15/20291 | | | 16,445 | | | | 14,167 | |
| RHP Hotel Properties, LP 4.50% 2/15/20291 | | | 11,330 | | | | 10,248 | |
| RLJ Lodging Trust, LP 3.75% 7/1/20261 | | | 5,535 | | | | 5,073 | |
| RLJ Lodging Trust, LP 4.00% 9/15/20291 | | | 14,905 | | | | 12,463 | |
| VICI Properties, LP 3.50% 2/15/20251 | | | 5,104 | | | | 4,844 | |
| | |
| American High-Income Trust | 15 |
| Bonds, notes & other debt instruments (continued) | | Principal amount
(000) | | | Value
(000) | |
| Corporate bonds, notes & loans (continued) | | | | | | | | |
| Real estate (continued) | | | | | | | | |
| VICI Properties, LP 4.625% 6/15/20251 | | USD | 12,470 | | | $ | 12,072 | |
| VICI Properties, LP 4.25% 12/1/20261 | | | 9,323 | | | | 8,707 | |
| VICI Properties, LP 3.875% 2/15/20291 | | | 13,935 | | | | 12,404 | |
| VICI Properties, LP 4.625% 12/1/20291 | | | 1,657 | | | | 1,510 | |
| VICI Properties, LP 4.125% 8/15/20301 | | | 2,233 | | | | 1,974 | |
| WeWork Companies, Inc. 7.875% 5/1/20251 | | | 1,925 | | | | 1,066 | |
| WeWork Companies, LLC 5.00% 7/10/20251 | | | 63,725 | | | | 32,347 | |
| Xenia Hotels & Resorts, Inc. 6.375% 8/15/20251 | | | 4,740 | | | | 4,654 | |
| | | | | | | | 578,986 | |
| | | | | | | | | |
| Utilities 3.08% | | | | | | | | |
| AmeriGas Partners, LP 5.75% 5/20/2027 | | | 5,878 | | | | 5,540 | |
| Calpine Corp. 5.25% 6/1/20261 | | | 1,051 | | | | 1,026 | |
| Calpine Corp. 4.50% 2/15/20281 | | | 4,000 | | | | 3,715 | |
| Calpine Corp. 5.125% 3/15/20281 | | | 8,282 | | | | 7,594 | |
| Calpine Corp. 3.75% 3/1/20311 | | | 9,175 | | | | 7,748 | |
| DPL, Inc. 4.125% 7/1/2025 | | | 10,965 | | | | 10,487 | |
| Emera, Inc. 6.75% 6/15/2076 (3-month USD-LIBOR + 5.44% on 6/15/2026)7 | | | 18,225 | | | | 17,050 | |
| Enfragen Energia Sur SA 5.375% 12/30/20301 | | | 4,850 | | | | 2,916 | |
| FirstEnergy Corp. 2.65% 3/1/2030 | | | 3,534 | | | | 3,010 | |
| FirstEnergy Corp. 2.25% 9/1/2030 | | | 19,000 | | | | 15,703 | |
| FirstEnergy Corp. 7.375% 11/15/2031 | | | 7,191 | | | | 8,073 | |
| FirstEnergy Corp. 3.40% 3/1/2050 | | | 10,069 | | | | 6,919 | |
| FirstEnergy Corp., Series C, 5.10% 7/15/20477 | | | 5,065 | | | | 4,499 | |
| FirstEnergy Transmission, LLC 2.866% 9/15/20281 | | | 10,562 | | | | 9,542 | |
| FirstEnergy Transmission, LLC 4.55% 4/1/20491 | | | 2,000 | | | | 1,686 | |
| NextEra Energy Partners, LP 4.25% 7/15/20241 | | | 3,163 | | | | 3,126 | |
| NextEra Energy Partners, LP 3.875% 10/15/20261 | �� | | 2,373 | | | | 2,212 | |
| NRG Energy, Inc. 3.625% 2/15/20311 | | | 2,000 | | | | 1,606 | |
| Pacific Gas and Electric Co. 1.70% 11/15/2023 | | | 6,000 | | | | 5,855 | |
| Pacific Gas and Electric Co. 5.45% 6/15/2027 | | | 7,720 | | | | 7,651 | |
| Pacific Gas and Electric Co. 2.10% 8/1/2027 | | | 2,965 | | | | 2,588 | |
| Pacific Gas and Electric Co. 3.30% 12/1/2027 | | | 3,055 | | | | 2,754 | |
| Pacific Gas and Electric Co. 3.75% 7/1/2028 | | | 6,310 | | | | 5,813 | |
| Pacific Gas and Electric Co. 4.55% 7/1/2030 | | | 4,170 | | | | 3,910 | |
| Pacific Gas and Electric Co. 2.50% 2/1/2031 | | | 7,695 | | | | 6,241 | |
| Pacific Gas and Electric Co. 3.25% 6/1/2031 | | | 2,135 | | | | 1,811 | |
| Pacific Gas and Electric Co. 3.30% 8/1/2040 | | | 5,540 | | | | 3,938 | |
| Pacific Gas and Electric Co. 3.50% 8/1/2050 | | | 16,465 | | | | 10,891 | |
| PG&E Corp. 5.00% 7/1/2028 | | | 58,570 | | | | 55,366 | |
| PG&E Corp. 5.25% 7/1/2030 | | | 60,380 | | | | 56,128 | |
| PG&E Corp., Term Loan, (3-month USD-LIBOR + 3.00%) 7.875% 6/23/20252,3 | | | 487 | | | | 487 | |
| Talen Energy Corp. 10.50% 1/15/20261,4 | | | 59,967 | | | | 24,212 | |
| Talen Energy Corp. 7.25% 5/15/20271 | | | 101,607 | | | | 104,420 | |
| Talen Energy Corp. 6.625% 1/15/20281 | | | 1,819 | | | | 1,849 | |
| Talen Energy Corp., Term Loan, (3-month USD CME Term SOFR + 4.75%) 9.506% 11/13/20232,3 | | | 62,105 | | | | 62,571 | |
| Talen Energy Corp., Term Loan B, (3-month USD-LIBOR + 3.75%) 8.32% 7/8/20262,3 | | | 12,145 | | | | 12,266 | |
| Talen Energy Supply, LLC 7.625% 6/1/20281 | | | 9,825 | | | | 10,152 | |
| Targa Resources Partners, LP 4.00% 1/15/2032 | | | 1,175 | | | | 1,025 | |
| Venture Global Calcasieu Pass, LLC 3.875% 8/15/20291 | | | 28,325 | | | | 25,575 | |
| Vistra Operations Co., LLC 3.55% 7/15/20241 | | | 5,769 | | | | 5,573 | |
| | | | | | | | 523,528 | |
| | | | | | | | | |
| Total corporate bonds, notes & loans | | | | | | | 15,068,715 | |
| | | | | | | | | |
| Mortgage-backed obligations 0.08% | | | | | | | | |
| Collateralized mortgage-backed obligations 0.08% | | | | | | | | |
| Treehouse Park Improvement Assn. No.1 - Anleihen 9.75% 12/1/20331,5 | | | 15,299 | | | | 13,534 | |
| | | | | | | | | |
| Total bonds, notes & other debt instruments (cost: $16,954,318,000) | | | | | | | 15,082,249 | |
| | |
| 16 | American High-Income Trust |
| Convertible bonds & notes 0.14% | | Principal amount
(000) | | | Value
(000) | |
| Communication services 0.13% | | | | | | |
| DISH DBS Corp., convertible notes, 3.375% 8/15/2026 | | USD | 42,635 | | | $ | 22,170 | |
| | | | | | | | | |
| Energy 0.01% | | | | | | | | |
| Mesquite Energy, Inc., convertible notes, 13.14% Cash 7/15/20231,5,6 | | | 2,454 | | | | 2,454 | |
| | | | | | | | | |
| Total convertible bonds & notes (cost: $46,860,000) | | | | | | | 24,624 | |
| | | | | | | | | |
| Convertible stocks 0.23% | | | Shares | | | | | |
| Financials 0.18% | | | | | | | | |
| 2020 Cash Mandatory Exchangeable Trust, convertible preferred shares, 5.25% 6/1/20231 | | | 26,724 | | | | 31,140 | |
| | | | | | | | | |
| Utilities 0.05% | | | | | | | | |
| PG&E Corp., convertible preferred units, 5.50% 8/16/2023 | | | 57,000 | | | | 8,113 | |
| | | | | | | | | |
| Total convertible stocks (cost: $28,401,000) | | | | | | | 39,253 | |
| | | | | | | | | |
| Common stocks 2.84% | | | | | | | | |
| Health care 1.21% | | | | | | | | |
| Rotech Healthcare, Inc.5,8,9,10 | | | 1,916,276 | | | | 205,042 | |
| | | | | | | | | |
| Energy 0.97% | | | | | | | | |
| Chesapeake Energy Corp. | | | 610,745 | | | | 46,441 | |
| Weatherford International9 | | | 562,156 | | | | 33,364 | |
| Denbury, Inc.9 | | | 219,000 | | | | 19,191 | |
| Diamond Offshore Drilling, Inc.9 | | | 1,516,891 | | | | 18,263 | |
| Ascent Resources - Utica, LLC, Class A5,9,10 | | | 90,532,504 | | | | 18,107 | |
| Altera Infrastructure, LP5,9 | | | 112,537 | | | | 9,460 | |
| California Resources Corp. | | | 183,103 | | | | 7,049 | |
| Constellation Oil Services Holding SA, Class B-15,9 | | | 51,096,574 | | | | 5,621 | |
| Civitas Resources, Inc. | | | 57,659 | | | | 3,940 | |
| McDermott International, Ltd.9 | | | 2,999,554 | | | | 1,020 | |
| McDermott International, Ltd.9,10 | | | 1,745,604 | | | | 593 | |
| Southwestern Energy Co.9 | | | 229,524 | | | | 1,148 | |
| Mesquite Energy, Inc.5,9 | | | 109,992 | | | | 660 | |
| Petroplus Holdings AG5,9 | | | 3,360,000 | | | | — | 11 |
| Bighorn Permian Resources, LLC5 | | | 42,744 | | | | — | 11 |
| | | | | | | | 164,857 | |
| | | | | | | | | |
| Financials 0.24% | | | | | | | | |
| Jonah Energy Parent, LLC5,8 | | | 747,471 | | | | 31,954 | |
| Navient Corp. | | | 537,500 | | | | 8,595 | |
| | | | | | | | 40,549 | |
| | | | | | | | | |
| Consumer discretionary 0.19% | | | | | | | | |
| NMG Parent, LLC5,9 | | | 182,562 | | | | 25,102 | |
| MYT Holding Co., Class B5,8,9 | | | 7,468,376 | | | | 7,842 | |
| | | | | | | | 32,944 | |
| | | | | | | | | |
| Communication services 0.15% | | | | | | | | |
| Frontier Communications Parent, Inc.9 | | | 600,000 | | | | 13,662 | |
| Intelsat SA5,9 | | | 318,478 | | | | 7,803 | |
| Cumulus Media, Inc., Class A9 | | | 561,836 | | | | 2,073 | |
| iHeartMedia, Inc., Class A9 | | | 378,645 | | | | 1,477 | |
| Clear Channel Outdoor Holdings, Inc.9 | | | 890,868 | | | | 1,069 | |
| | | | | | | | 26,084 | |
| | | | | | | | | |
| Information technology 0.08% | | | | | | | | |
| MoneyGram International, Inc.9 | | | 1,310,886 | | | | 13,659 | |
| | | | | | | | | |
| Total common stocks (cost: $434,097,000) | | | | | | | 483,135 | |
| | | | | | | | | |
| American High-Income Trust | 17 |
| Preferred securities 0.16% | | Shares | | | Value
(000) | |
| Consumer discretionary 0.11% | | | | | | | | |
| MYT Holdings, LLC, Series A, 10.00% preferred shares5,8,9 | | | 19,884,070 | | | $ | 18,890 | |
| | | | | | | | | |
| | | | | | | | | |
| Industrials 0.05% | | | | | | | | |
| ACR III LSC Holdings, LLC, Series B, preferred shares1,5,9 | | | 13,566 | | | | 8,185 | |
| | | | | | | | | |
| Energy 0.00% | | | | | | | | |
| McDermott International, Inc., 8.00% cumulative preferred shares5,9 | | | 1,130 | | | | 56 | |
| | | | | | | | | |
| Total preferred securities (cost: $32,392,000) | | | | | | | 27,131 | |
| | | | | | | | | |
| Rights & warrants 0.05% | | | | | | | | |
| Consumer discretionary 0.05% | | | | | | | | |
| NMG Parent, LLC, warrants, expire 9/24/20279 | | | 407,047 | | | | 8,522 | |
| | | | | | | | | |
| Communication services 0.00% | | | | | | | | |
| Intelsat Jackson Holdings SA (CVR), Series A5,9 | | | 33,352 | | | | 234 | |
| Intelsat Jackson Holdings SA (CVR), Series B5,9 | | | 33,352 | | | | 208 | |
| | | | | | | | 442 | |
| Energy 0.00% | | | | | | | | |
| California Resources Corp., warrants, expire 10/27/20249 | | | 16,108 | | | | 137 | |
| Denbury, Inc., Series B, warrants, expire 9/18/20231,9 | | | 155 | | | | 8 | |
| McDermott International, Inc., warrants, expire 7/1/20275,9 | | | 400,530 | | | | — | 11 |
| McDermott International, Inc., warrants, expire 7/1/20275,9 | | | 445,033 | | | | — | 11 |
| Constellation Oil Services Holding SA, Class D, warrants, expire 6/10/20715,9 | | | 18 | | | | — | 11 |
| | | | | | | | 145 | |
| | | | | | | | | |
| Total rights & warrants (cost: $4,601,000) | | | | | | | 9,109 | |
| | | | | | | | | |
| Short-term securities 6.27% | | | | | | | | |
| Money market investments 6.27% | | | | | | | | |
| Capital Group Central Cash Fund 4.86%8,12 | | | 10,676,702 | | | | 1,067,670 | |
| | | | | | | | | |
| Total short-term securities (cost: $1,067,798,000) | | | | | | | 1,067,670 | |
| Total investment securities 98.29% (cost: $18,568,467,000) | | | | | | | 16,733,171 | |
| Other assets less liabilities 1.71% | | | | | | | 290,436 | |
| | | | | | | | | |
| Net assets 100.00% | | | | | | $ | 17,023,607 | |
Futures contracts
| Contracts | | Type | | Number of
contracts | | | Expiration | | Notional
amount
(000) | | | Value and
unrealized
(depreciation)
appreciation
at 3/31/2023
(000) | |
| 30 Day Federal Funds Futures | | Long | | | 736 | | | April 2023 | | USD | 291,924 | | | | $ | (94 | ) |
| 2 Year U.S. Treasury Note Futures | | Long | | | 633 | | | June 2023 | | | 130,685 | | | | | 61 | |
| 5 Year U.S. Treasury Note Futures | | Long | | | 608 | | | June 2023 | | | 66,581 | | | | | 877 | |
| 10 Year U.S. Treasury Note Futures | | Short | | | 160 | | | June 2023 | | | (18,387 | ) | | | | 93 | |
| 30 Year Ultra U.S. Treasury Bond Futures | | Short | | | 30 | | | June 2023 | | | (4,234 | ) | | | | (179 | ) |
| | | | | | | | | | | | | | | | $ | 758 | |
| | |
| 18 | American High-Income Trust |
Swap contracts
Credit default swaps
Centrally cleared credit default swaps on credit indices — buy protection
Reference
index | | Financing
rate paid | | Payment
frequency | | Expiration
date | | Notional
amount
(000) | | | Value at
3/31/2023
(000) | | | Upfront
premium
received
(000) | | | Unrealized
appreciation
(depreciation)
at 3/31/2023
(000) | |
| CDX.NA.HY.39 | | 5.00% | | Quarterly | | 12/20/2027 | | USD | 75,600 | | | $ | (832 | ) | | $ | (1,631 | ) | | $ | 799 | |
| CDX.NA.HY.40 | | 5.00% | | Quarterly | | 6/20/2028 | | | 133,510 | | | | (1,990 | ) | | | (1,181 | ) | | | (809 | ) |
| | | | | | | | | | | | | $ | (2,822 | ) | | $ | (2,812 | ) | | $ | (10 | ) |
Investments in affiliates8
| | | Value of
affiliates at
10/1/2022
(000) | | | Additions
(000) | | | Reductions
(000) | | | Net
realized
gain
(000) | | | Net
unrealized
(depreciation)
appreciation
(000) | | | Value of
affiliates at
3/31/2023
(000) | | | Dividend
income
(000) | |
| Common stocks 1.44% | | | | | | | | | | | | | | | | | | | | | | | | | | | | |
| Health care 1.20% | | | | | | | | | | | | | | | | | | | | | | | | | | | | |
| Rotech Healthcare, Inc.5,9,10 | | $ | 205,042 | | | $ | — | | | $ | — | | | $ | — | | | $ | — | | | $ | 205,042 | | | $ | — | |
| Financials 0.19% | | | | | | | | | | | | | | | | | | | | | | | | | | | | |
| Jonah Energy Parent, LLC5 | | | 53,310 | | | | — | | | | — | | | | — | | | | (21,356 | ) | | | 31,954 | | | | 28,202 | |
| Consumer discretionary 0.05% | | | | | | | | | | | | | | | | | | | | | | | | | | | | |
| MYT Holding Co., Class B5,9 | | | 13,070 | | | | — | | | | — | | | | — | | | | (5,228 | ) | | | 7,842 | | | | — | |
| Total common stocks | | | | | | | | | | | | | | | | | | | | | | | 244,838 | | | | | |
| Preferred securities 0.11% | | | | | | | | | | | | | | | | | | | | | | | | | | | | |
| Consumer discretionary 0.11% | | | | | | | | | | | | | | | | | | | | | | | | | | | | |
| MYT Holdings, LLC, Series A, 10.00% preferred shares5,9 | | | 21,773 | | | | — | | | | — | | | | — | | | | (2,883 | ) | | | 18,890 | | | | — | |
| Short-term securities 6.27% | | | | | | | | | | | | | | | | | | | | | | | | | | | | |
| Money market investments 6.27% | | | | | | | | | | | | | | | | | | | | | | | | | | | | |
| Capital Group Central Cash Fund 4.86%12 | | | 724,312 | | | | 1,592,865 | | | | 1,249,606 | | | | 86 | | | | 13 | | | | 1,067,670 | | | | 18,901 | |
| Total 7.82% | | | | | | | | | | | | | | $ | 86 | | | $ | (29,454 | ) | | $ | 1,331,398 | | | $ | 47,103 | |
Restricted securities10
| | | Acquisition
date(s) | | | Cost
(000) | | | | Value
(000) | | | | Percent
of net
assets | |
| Rotech Healthcare, Inc.5,8,9 | | 9/26/2013 | | $ | 41,128 | | | $ | 205,042 | | | | 1.20 | % |
| Ascent Resources - Utica, LLC, Class A5,9 | | 4/25/2016-11/15/2016 | | | 4,340 | | | | 18,107 | | | | .11 | |
| McDermott International, Ltd.9 | | 4/4/2018-12/31/2020 | | | 7,967 | | | | 593 | | | | .00 | 13 |
| Total | | | | $ | 53,435 | | | $ | 223,742 | | | | 1.31 | % |
| | |
| American High-Income Trust | 19 |
| 1 | Acquired in a transaction exempt from registration under Rule 144A or, for commercial paper, Section 4(a)(2) of the Securities Act of 1933. May be resold in the U.S. in transactions exempt from registration, normally to qualified institutional buyers. The total value of all such securities was $10,932,520,000, which represented 64.22% of the net assets of the fund. |
| 2 | Loan participations and assignments; may be subject to legal or contractual restrictions on resale. The total value of all such loans was $652,572,000, which represented 3.83% of the net assets of the fund. |
| 3 | Coupon rate may change periodically. Reference rate and spread are as of the most recent information available. Some coupon rates are determined by the issuer or agent based on current market conditions; therefore, the reference rate and spread are not available. |
| 4 | Scheduled interest and/or principal payment was not received. |
| 5 | Value determined using significant unobservable inputs. |
| 6 | Payment in kind; the issuer has the option of paying additional securities in lieu of cash. Payment methods and rates are as of the most recent payment when available. |
| 7 | Step bond; coupon rate may change at a later date. |
| 8 | Affiliate of the fund or part of the same “group of investment companies” as the fund, as defined under the Investment Company Act of 1940, as amended. |
| 9 | Security did not produce income during the last 12 months. |
| 10 | Restricted security, other than Rule 144A securities or commercial paper issued pursuant to Section 4(a)(2) of the Securities Act of 1933. The total value of all such restricted securities was $223,742,000, which represented 1.31% of the net assets of the fund. |
| 11 | Amount less than one thousand. |
| 12 | Rate represents the seven-day yield at 3/31/2023. |
| 13 | Amount less than .01%. |
Key to abbreviations
Assn. = Association
CME = CME Group
CVR = Contingent Value Rights
DAC = Designated Activity Company
EUR = Euros
EURIBOR = Euro Interbank Offered Rate
LIBOR = London Interbank Offered Rate
PIK = Payment In Kind
REIT = Real Estate Investment Trust
SOFR = Secured Overnight Financing Rate
USD = U.S. dollars
Refer to the notes to financial statements.
| 20 | American High-Income Trust |
Financial statements
| Statement of assets and liabilities | unaudited |
| at March 31, 2023 | (dollars in thousands) |
| Assets: | | | | | | |
| Investment securities, at value: | | | | | | | | |
| Unaffiliated issuers (cost: $17,424,504) | | $ | 15,401,773 | | | | | |
| Affiliated issuers (cost: $1,143,963) | | | 1,331,398 | | | $ | 16,733,171 | |
| Cash | | | | | | | 17,272 | |
| Cash collateral pledged for futures contracts | | | | | | | 2,304 | |
| Cash collateral pledged for swap contracts | | | | | | | 12,610 | |
| Cash denominated in currencies other than U.S. dollars (cost: $36) | | | | | | | 36 | |
| Unrealized appreciation on unfunded commitments | | | | | | | 10,534 | |
| Receivables for: | | | | | | | | |
| Sales of investments | | | 55,540 | | | | | |
| Sales of fund’s shares | | | 57,832 | | | | | |
| Dividends and interest | | | 270,582 | | | | | |
| Variation margin on futures contracts | | | 227 | | | | 384,181 | |
| | | | | | | | 17,160,108 | |
| Liabilities: | | | | | | | | |
| Unrealized depreciation on unfunded commitments | | | | | | | 83 | |
| Payables for: | | | | | | | | |
| Purchases of investments | | | 95,719 | | | | | |
| Repurchases of fund’s shares | | | 28,214 | | | | | |
| Dividends on fund’s shares | | | 3,542 | | | | | |
| Investment advisory services | | | 3,980 | | | | | |
| Services provided by related parties | | | 3,343 | | | | | |
| Trustees’ deferred compensation | | | 302 | | | | | |
| Variation margin on futures contracts | | | 95 | | | | | |
| Variation margin on centrally cleared swap contracts | | | 1,038 | | | | | |
| Other | | | 185 | | | | 136,418 | |
| Net assets at March 31, 2023 | | | | | | $ | 17,023,607 | |
| | | | | | | | | |
| Net assets consist of: | | | | | | | | |
| Capital paid in on shares of beneficial interest | | | | | | $ | 20,954,580 | |
| Total accumulated loss | | | | | | | (3,930,973 | ) |
| Net assets at March 31, 2023 | | | | | | $ | 17,023,607 | |
Refer to the notes to financial statements.
| American High-Income Trust | 21 |
Financial statements (continued)
| Statement of assets and liabilities | unaudited |
| at March 31, 2023 (continued) | (dollars and shares in thousands, except per-share amounts) |
Shares of beneficial interest issued and outstanding (no stated par value) —
unlimited shares authorized (1,854,902 total shares outstanding)
| | | Net assets | | | Shares
outstanding | | | Net asset value
per share | |
| Class A | | $ | 9,987,398 | | | | 1,088,234 | | | $ | 9.18 | |
| Class C | | | 220,448 | | | | 24,020 | | | | 9.18 | |
| Class T | | | 9 | | | | 1 | | | | 9.18 | |
| Class F-1 | | | 286,453 | | | | 31,212 | | | | 9.18 | |
| Class F-2 | | | 1,938,861 | | | | 211,259 | | | | 9.18 | |
| Class F-3 | | | 972,815 | | | | 105,998 | | | | 9.18 | |
| Class 529-A | | | 302,489 | | | | 32,959 | | | | 9.18 | |
| Class 529-C | | | 9,773 | | | | 1,065 | | | | 9.18 | |
| Class 529-E | | | 11,390 | | | | 1,241 | | | | 9.18 | |
| Class 529-T | | | 12 | | | | 1 | | | | 9.18 | |
| Class 529-F-1 | | | 11 | | | | 1 | | | | 9.18 | |
| Class 529-F-2 | | | 33,266 | | | | 3,625 | | | | 9.18 | |
| Class 529-F-3 | | | 11 | | | | 1 | | | | 9.18 | |
| Class R-1 | | | 12,284 | | | | 1,338 | | | | 9.18 | |
| Class R-2 | | | 109,243 | | | | 11,903 | | | | 9.18 | |
| Class R-2E | | | 7,018 | | | | 765 | | | | 9.18 | |
| Class R-3 | | | 134,927 | | | | 14,702 | | | | 9.18 | |
| Class R-4 | | | 114,737 | | | | 12,502 | | | | 9.18 | |
| Class R-5E | | | 19,418 | | | | 2,116 | | | | 9.18 | |
| Class R-5 | | | 28,943 | | | | 3,154 | | | | 9.18 | |
| Class R-6 | | | 2,834,101 | | | | 308,805 | | | | 9.18 | |
Refer to the notes to financial statements.
| 22 | American High-Income Trust |
Financial statements (continued)
| Statement of operations | unaudited |
| for the six months ended March 31, 2023 | (dollars in thousands) |
| Investment income: | | | | | | |
| Income: | | | | | | |
| Interest from unaffiliated issuers | | $ | 526,803 | | | | | |
| Dividends (includes $47,103 from affiliates) | | | 52,270 | | | $ | 579,073 | |
| Fees and expenses*: | | | | | | | | |
| Investment advisory services | | | 23,919 | | | | | |
| Distribution services | | | 15,199 | | | | | |
| Transfer agent services | | | 8,897 | | | | | |
| Administrative services | | | 2,505 | | | | | |
| 529 plan services | | | 107 | | | | | |
| Reports to shareholders | | | 382 | | | | | |
| Registration statement and prospectus | | | 405 | | | | | |
| Trustees’ compensation | | | 38 | | | | | |
| Auditing and legal | | | 21 | | | | | |
| Custodian | | | 21 | | | | | |
| Other | | | 188 | | | | 51,682 | |
| Net investment income | | | | | | | 527,391 | |
| | | | | | | | | |
| Net realized loss and unrealized appreciation: | | | | | | | | |
| Net realized (loss) gain on: | | | | | | | | |
| Investments: | | | | | | | | |
| Unaffiliated issuers | | | (216,695 | ) | | | | |
| Affiliated issuers | | | 86 | | | | | |
| Futures contracts | | | 1,868 | | | | | |
| Swap contracts | | | (14,270 | ) | | | | |
| Currency transactions | | | (493 | ) | | | (229,504 | ) |
| Net unrealized appreciation (depreciation) on: | | | | | | | | |
| Investments: | | | | | | | | |
| Unaffiliated issuers | | | 838,282 | | | | | |
| Affiliated issuers | | | (29,454 | ) | | | | |
| Futures contracts | | | 174 | | | | | |
| Swap contracts | | | 749 | | | | | |
| Currency translations | | | (259 | ) | | | 809,492 | |
| Net realized loss and unrealized appreciation | | | | | | | 579,988 | |
| | | | | | | | | |
| Net increase in net assets resulting from operations | | | | | | $ | 1,107,379 | |
| * | Additional information related to class-specific fees and expenses is included in the notes to financial statements. |
Refer to the notes to financial statements.
| American High-Income Trust | 23 |
Financial statements (continued)
| Statements of changes in net assets | | |
| | | (dollars in thousands) |
| | | Six months ended
March 31,
2023* | | | Year ended
September 30,
2022 | |
| Operations: | | | | | | |
| Net investment income | | $ | 527,391 | | | $ | 934,219 | |
| Net realized loss | | | (229,504 | ) | | | (104,410 | ) |
| Net unrealized appreciation (depreciation) | | | 809,492 | | | | (3,145,073 | ) |
| Net increase (decrease) in net assets resulting from operations | | | 1,107,379 | | | | (2,315,264 | ) |
| | | | | | | | | |
| Distributions paid or accrued to shareholders | | | (530,069 | ) | | | (919,673 | ) |
| | | | | | | | | |
| Net capital share transactions | | | 235,650 | | | | (554,431 | ) |
| | | | | | | | | |
| Total increase (decrease) in net assets | | | 812,960 | | | | (3,789,368 | ) |
| | | | | | | | | |
| Net assets: | | | | | | | | |
| Beginning of period | | | 16,210,647 | | | | 20,000,015 | |
| End of period | | $ | 17,023,607 | | | $ | 16,210,647 | |
| | | | | | | | | |
| *Unaudited. | | | | | | | | |
Refer to the notes to financial statements.
| 24 | American High-Income Trust |
| Notes to financial statements | unaudited |
1. Organization
American High-Income Trust (the “fund”) is registered under the Investment Company Act of 1940, as amended (the “1940 Act”), as an open-end, diversified management investment company. The fund seeks to provide a high level of current income. Its secondary investment objective is capital appreciation.
The fund has 21 share classes consisting of six retail share classes (Classes A, C, T, F-1, F-2 and F-3), seven 529 college savings plan share classes (Classes 529-A, 529-C, 529-E, 529-T, 529-F-1, 529-F-2 and 529-F-3) and eight retirement plan share classes (Classes R-1, R-2, R-2E, R-3, R-4, R-5E, R-5 and R-6). The 529 college savings plan share classes can be used to save for college education. The retirement plan share classes are generally offered only through eligible employer-sponsored retirement plans. The fund’s share classes are described further in the following table:
| Share class | | Initial sales charge | | Contingent deferred sales
charge upon redemption | | Conversion feature |
| Classes A and 529-A | | Up to 3.75% for Class A; up to 3.50% for Class 529-A | | None (except 1.00% for certain redemptions within 18 months of purchase without an initial sales charge) | | None |
| Classes C and 529-C | | None | | 1.00% for redemptions within one year of purchase | | Class C converts to Class A after eight years and Class 529-C converts to Class 529-A after five years |
| Class 529-E | | None | | None | | None |
| Classes T and 529-T* | | Up to 2.50% | | None | | None |
| Classes F-1, F-2, F-3, 529-F-1, 529-F-2 and 529-F-3 | | None | | None | | None |
| Classes R-1, R-2, R-2E, R-3, R-4, R-5E, R-5 and R-6 | | None | | None | | None |
| * | Class T and 529-T shares are not available for purchase. |
Holders of all share classes have equal pro rata rights to the assets, dividends and liquidation proceeds of the fund. Each share class has identical voting rights, except for the exclusive right to vote on matters affecting only its class. Share classes have different fees and expenses (“class-specific fees and expenses”), primarily due to different arrangements for distribution, transfer agent and administrative services. Differences in class-specific fees and expenses will result in differences in net investment income and, therefore, the payment of different per-share dividends by each share class.
2. Significant accounting policies
The fund is an investment company that applies the accounting and reporting guidance issued in Topic 946 by the U.S. Financial Accounting Standards Board. The fund’s financial statements have been prepared to comply with U.S. generally accepted accounting principles (“U.S. GAAP”). These principles require the fund’s investment adviser to make estimates and assumptions that affect reported amounts and disclosures. Actual results could differ from those estimates. Subsequent events, if any, have been evaluated through the date of issuance in the preparation of the financial statements. The fund follows the significant accounting policies described in this section, as well as the valuation policies described in the next section on valuation.
Security transactions and related investment income — Security transactions are recorded by the fund as of the date the trades are executed with brokers. Realized gains and losses from security transactions are determined based on the specific identified cost of the securities. In the event a security is purchased with a delayed payment date, the fund will segregate liquid assets sufficient to meet its payment obligations. Dividend income is recognized on the ex-dividend date and interest income is recognized on an accrual basis. Market discounts, premiums and original issue discounts on fixed-income securities are amortized daily over the expected life of the security.
Class allocations — Income, fees and expenses (other than class-specific fees and expenses) are allocated daily among the various share classes based on the relative value of their settled shares. Realized gains and losses and unrealized appreciation and depreciation are allocated daily among the various share classes based on their relative net assets. Class-specific fees and expenses, such as distribution, transfer agent and administrative services, are charged directly to the respective share class.
Distributions paid or accrued to shareholders — Income dividends are declared daily after the determination of the fund’s net investment income and are paid to shareholders monthly. Capital gain distributions are recorded on the ex-dividend date.
| American High-Income Trust | 25 |
Currency translation — Assets and liabilities, including investment securities, denominated in currencies other than U.S. dollars are translated into U.S. dollars at the exchange rates supplied by one or more pricing vendors on the valuation date. Purchases and sales of investment securities and income and expenses are translated into U.S. dollars at the exchange rates on the dates of such transactions. The effects of changes in exchange rates on investment securities are included with the net realized gain or loss and net unrealized appreciation or depreciation on investments in the fund’s statement of operations. The realized gain or loss and unrealized appreciation or depreciation resulting from all other transactions denominated in currencies other than U.S. dollars are disclosed separately.
3. Valuation
Capital Research and Management Company (“CRMC”), the fund’s investment adviser, values the fund’s investments at fair value as defined by U.S. GAAP. The net asset value per share is calculated once daily as of the close of regular trading on the New York Stock Exchange, normally 4 p.m. New York time, each day the New York Stock Exchange is open.
Methods and inputs — The fund’s investment adviser uses the following methods and inputs to establish the fair value of the fund’s assets and liabilities. Use of particular methods and inputs may vary over time based on availability and relevance as market and economic conditions evolve.
Equity securities, including depositary receipts, are generally valued at the official closing price of, or the last reported sale price on, the exchange or market on which such securities are traded, as of the close of business on the day the securities are being valued or, lacking any sales, at the last available bid price. Prices for each security are taken from the principal exchange or market on which the security trades.
Fixed-income securities, including short-term securities, are generally valued at evaluated prices obtained from third-party pricing vendors. Vendors value such securities based on one or more of the inputs described in the following table. The table provides examples of inputs that are commonly relevant for valuing particular classes of fixed-income securities in which the fund is authorized to invest. However, these classifications are not exclusive, and any of the inputs may be used to value any other class of fixed-income security.
| Fixed-income class | Examples of standard inputs |
| All | Benchmark yields, transactions, bids, offers, quotations from dealers and trading systems, new issues, spreads and other relationships observed in the markets among comparable securities; and proprietary pricing models such as yield measures calculated using factors such as cash flows, financial or collateral performance and other reference data (collectively referred to as “standard inputs”) |
| Corporate bonds, notes & loans; convertible securities | Standard inputs and underlying equity of the issuer |
| Bonds & notes of governments & government agencies | Standard inputs and interest rate volatilities |
| Mortgage-backed; asset-backed obligations | Standard inputs and cash flows, prepayment information, default rates, delinquency and loss assumptions, collateral characteristics, credit enhancements and specific deal information |
| Municipal securities | Standard inputs and, for certain distressed securities, cash flows or liquidation values using a net present value calculation based on inputs that include, but are not limited to, financial statements and debt contracts |
Securities with both fixed-income and equity characteristics, or equity securities traded principally among fixed-income dealers, are generally valued in the manner described for either equity or fixed-income securities, depending on which method is deemed most appropriate by the fund’s investment adviser. The Capital Group Central Cash Fund (“CCF”), a fund within the Capital Group Central Fund Series (“Central Funds”), is valued based upon a floating net asset value, which fluctuates with changes in the value of CCF’s portfolio securities. The underlying securities are valued based on the policies and procedures in CCF’s statement of additional information. Exchange-traded futures are generally valued at the official settlement price of the exchange or market on which such instruments are traded, as of the close of business on the day the futures are being valued. Swaps are generally valued using evaluated prices obtained from third-party pricing vendors who calculate these values based on market inputs that may include the yields of the indices referenced in the instrument and the relevant curve, dealer quotes, default probabilities and recovery rates, other reference data, and terms of the contract.
| 26 | American High-Income Trust |
Securities and other assets for which representative market quotations are not readily available or are considered unreliable by the fund’s investment adviser are fair valued as determined in good faith under fair valuation guidelines adopted by the fund’s investment adviser and approved by the board of trustees as further described. The investment adviser follows fair valuation guidelines, consistent with U.S. Securities and Exchange Commission rules and guidance, to consider relevant principles and factors when making fair value determinations. The investment adviser considers relevant indications of value that are reasonably and timely available to it in determining the fair value to be assigned to a particular security, such as the type and cost of the security, contractual or legal restrictions on resale of the security, relevant financial or business developments of the issuer, actively traded similar or related securities, dealer or broker quotes, conversion or exchange rights on the security, related corporate actions, significant events occurring after the close of trading in the security, and changes in overall market conditions. In addition, the closing prices of equity securities that trade in markets outside U.S. time zones may be adjusted to reflect significant events that occur after the close of local trading but before the net asset value of each share class of the fund is determined. Fair valuations of investments that are not actively trading involve judgment and may differ materially from valuations that would have been used had greater market activity occurred.
Processes and structure — The fund’s board of trustees has designated the fund’s investment adviser to make fair value determinations, subject to board oversight. The investment adviser has established a Joint Fair Valuation Committee (the “Committee”) to administer, implement and oversee the fair valuation process and to make fair value decisions. The Committee regularly reviews its own fair value decisions, as well as decisions made under its standing instructions to the investment adviser’s valuation team. The Committee reviews changes in fair value measurements from period to period, pricing vendor information and market data, and may, as deemed appropriate, update the fair valuation guidelines to better reflect the results of back testing and address new or evolving issues. Pricing decisions, processes and controls over security valuation are also subject to additional internal reviews facilitated by the investment adviser’s global risk management group. The Committee reports changes to the fair valuation guidelines to the board of trustees. The fund’s board and audit committee also regularly review reports that describe fair value determinations and methods.
Classifications — The fund’s investment adviser classifies the fund’s assets and liabilities into three levels based on the inputs used to value the assets or liabilities. Level 1 values are based on quoted prices in active markets for identical securities. Level 2 values are based on significant observable market inputs, such as quoted prices for similar securities and quoted prices in inactive markets. Certain securities trading outside the U.S. may transfer between Level 1 and Level 2 due to valuation adjustments resulting from significant market movements following the close of local trading. Level 3 values are based on significant unobservable inputs that reflect the investment adviser’s determination of assumptions that market participants might reasonably use in valuing the securities. The valuation levels are not necessarily an indication of the risk or liquidity associated with the underlying investment. For example, U.S. government securities are reflected as Level 2 because the inputs used to determine fair value may not always be quoted prices in an active market. The following tables present the fund’s valuation levels as of March 31, 2023 (dollars in thousands):
| | | Investment securities | |
| | | Level 1 | | | Level 2 | | | Level 3 | | | Total | |
| Assets: | | | | | | | | | | | | | | | | |
| Bonds, notes & other debt instruments: | | | | | | | | | | | | | | | | |
| Corporate bonds, notes & loans | | $ | — | | | $ | 15,062,551 | | | $ | 6,164 | | | $ | 15,068,715 | |
| Mortgage-backed obligations | | | — | | | | — | | | | 13,534 | | | | 13,534 | |
| Convertible bonds & notes | | | — | | | | 22,170 | | | | 2,454 | | | | 24,624 | |
| Convertible stocks | | | 8,113 | | | | 31,140 | | | | — | | | | 39,253 | |
| Common stocks | | | 171,544 | | | | — | | | | 311,591 | | | | 483,135 | |
| Preferred securities | | | — | | | | — | | | | 27,131 | | | | 27,131 | |
| Rights & warrants | | | 145 | | | | 8,522 | | | | 442 | | | | 9,109 | |
| Short-term securities | | | 1,067,670 | | | | — | | | | — | | | | 1,067,670 | |
| Total | | $ | 1,247,472 | | | $ | 15,124,383 | | | $ | 361,316 | | | $ | 16,733,171 | |
| | | | | | | | | | | | | | | | | |
| | | Other investments1 | |
| | | Level 1 | | | Level 2 | | | Level 3 | | | Total | |
| Assets: | | | | | | | | | | | | | | | | |
| Unrealized appreciation on futures contracts | | $ | 1,031 | | | $ | — | | | $ | — | | | $ | 1,031 | |
| Unrealized appreciation on centrally cleared credit default swaps | | | — | | | | 799 | | | | — | | | | 799 | |
| Liabilities: | | | | | | | | | | | | | | | | |
| Unrealized depreciation on futures contracts | | | (273 | ) | | | — | | | | — | | | | (273 | ) |
| Unrealized depreciation on centrally cleared credit default swaps | | | — | | | | (809 | ) | | | — | | | | (809 | ) |
| Total | | $ | 758 | | | $ | (10 | ) | | $ | — | | | $ | 748 | |
| 1 | Futures contracts and credit default swaps are not included in the investment portfolio. |
| American High-Income Trust | 27 |
The following table reconciles the valuation of the fund’s Level 3 investment securities and related transactions for the six months ended March 31, 2023 (dollars in thousands):
| | | Beginning
value at
10/1/2022 | | | Transfers
into
Level 32 | | | Purchases | | | Sales | | | Net
realized
loss3 | | | Unrealized
depreciation3 | | | Transfers
out of
Level 32 | | | Ending
value at
3/31/2023 | |
| Investment securities | | $ | 395,342 | | | $ | 27,841 | | | $ | 87,447 | | | $ | (74,781 | ) | | $ | (524 | ) | | $ | (28,661 | ) | | $ | (45,348 | ) | | $ | 361,316 | |
| | | | | | | | | | | | | | | | | | | | | | | | | | | | | | | | | |
| Net unrealized depreciation during the period on Level 3 investment securities held at March 31, 2023 | | | $ | (46,799 | ) |
| 2 | Transfers into or out of Level 3 are based on the beginning market value of the quarter in which they occurred. These transfers are the result of changes in the availability of pricing sources and/or in the observability of significant inputs used in valuing the securities. |
| 3 | Net realized loss and unrealized depreciation are included in the related amounts on investments in the fund’s statement of operations. |
Unobservable inputs — Valuation of the fund’s Level 3 securities is based on significant unobservable inputs that reflect the investment adviser’s determination of assumptions that market participants might reasonably use in valuing the securities. The following table provides additional information used by the fund’s investment adviser to fair value the fund’s Level 3 securities (dollars in thousands):
| | | Value at
3/31/2023 | | | Valuation
techniques | | Unobservable
inputs | | Range
(if applicable) | | Weighted
average* | | Impact to
valuation from
an increase in
input† |
| Bonds, notes & other debt instruments | | $ | 19,698 | | | Estimated recovery value | | Expected proceeds | | Not applicable | | Not applicable | | Not applicable |
| | | | Transaction | | Transaction price | | Not applicable | | Not applicable | | Not applicable |
| | | | | Net adjustment (decrease) based on movement of market comparables | | 10% | | 10% | | Decrease |
| Convertible bonds & notes | | | 2,454 | | | Transaction | | Transaction price | | Not applicable | | Not applicable | | Not applicable |
| Common stocks | | | 311,591 | | | Estimated recovery value | | Expected proceeds | | Not applicable | | Not applicable | | Not applicable |
| | | | | | EV/EBITDA multiple | | 7.5x | | 7.5x | | Increase |
| | | | | | DLOM | | 15% | | 15% | | Decrease |
| | | | | | Vendor price | | Not applicable | | Not applicable | | Not applicable |
| | | | | | Risk discount | | 90% | | 90% | | Decrease |
| | | | | | Net adjustment (decrease) based on movement of market comparables | | 20% | | 20% | | Decrease |
| | | | | Market comparable companies | | EV/EBITDA multiple | | 3.7x | | 3.7x | | Increase |
| | | | | | EV/EBITDA less CapEx multiple | | 10.2x | | 10.2x | | Increase |
| | | | | | DLOM | | 17% | | 17% | | Decrease |
| | | | | Transaction | | Transaction price | | Not applicable | | Not applicable | | Not applicable |
| | | | | | Discount for uncertainty | | 5% | | 5% | | Decrease |
| | | | | Indicative market quotation | | Broker quote | | Not applicable | | Not applicable | | Not applicable |
| Preferred securities | | | 27,131 | | | Indicative market quotation | | Broker quote | | Not applicable | | Not applicable | | Not applicable |
| | | | | Market comparable companies | | EV/EBITDA multiple | | 3.3x | | 3.3x | | Increase |
| | | | | | DLOM | | 30% | | 30% | | Decrease |
| | | | | Estimated recovery value | | Expected proceeds | | Not applicable | | Not applicable | | Not applicable |
| | | | | | Risk discount | | 95% | | 95% | | Decrease |
| Rights & warrants | | | 442 | | | Indicative market quotation | | Broker quote | | Not applicable | | Not applicable | | Not applicable |
| | | | | Estimated recovery value | | Expected proceeds | | Not applicable | | Not applicable | | Not applicable |
| Total | | $ | 361,316 | | | | | | | | | | | |
| * | Weighted average is by relative fair value. |
| † | This column represents the directional change in fair value of the Level 3 securities that would result in an increase from the corresponding input. Significant increases and decreases in these inputs in isolation could result in significantly higher or lower fair value measurements. |
Key to abbreviations
CapEx = Capital expenditures
DLOM = Discount for lack of marketability
EBITDA = Earnings before income taxes, depreciation and amortization
EV = Enterprise value
| 28 | American High-Income Trust |
4. Risk factors
Investing in the fund may involve certain risks including, but not limited to, those described below.
Market conditions — The prices of, and the income generated by, the securities held by the fund may decline — sometimes rapidly or unpredictably — due to various factors, including events or conditions affecting the general economy or particular industries or companies; overall market changes; local, regional or global political, social or economic instability; governmental, governmental agency or central bank responses to economic conditions; and currency exchange rate, interest rate and commodity price fluctuations.
Economies and financial markets throughout the world are highly interconnected. Economic, financial or political events, trading and tariff arrangements, wars, terrorism, cybersecurity events, natural disasters, public health emergencies (such as the spread of infectious disease) and other circumstances in one country or region, including actions taken by governmental or quasi-governmental authorities in response to any of the foregoing, could have impacts on global economies or markets. As a result, whether or not the fund invests in securities of issuers located in or with significant exposure to the countries affected, the value and liquidity of the fund’s investments may be negatively affected by developments in other countries and regions.
Issuer risks — The prices of, and the income generated by, securities held by the fund may decline in response to various factors directly related to the issuers of such securities, including reduced demand for an issuer’s goods or services, poor management performance, major litigation, investigations or other controversies related to the issuer, changes in financial condition or credit rating, changes in government regulations affecting the issuer or its competitive environment and strategic initiatives such as mergers, acquisitions or dispositions and the market response to any such initiatives.
Investing in debt instruments — The prices of, and the income generated by, bonds and other debt securities held by the fund may be affected by factors such as the interest rates, maturities and credit quality of these securities.
Rising interest rates will generally cause the prices of bonds and other debt securities to fall. Also, when interest rates rise, issuers are less likely to refinance existing debt securities, causing the average life of such securities to extend. A general rise in interest rates may cause investors to sell debt securities on a large scale, which could also adversely affect the price and liquidity of debt securities and could also result in increased redemptions from the fund. Falling interest rates may cause an issuer to redeem, call or refinance a debt security before its stated maturity, which may result in the fund failing to recoup the full amount of its initial investment and having to reinvest the proceeds in lower yielding securities. Longer maturity debt securities generally have greater sensitivity to changes in interest rates and may be subject to greater price fluctuations than shorter maturity debt securities.
Bonds and other debt securities are also subject to credit risk, which is the possibility that the credit strength of an issuer or guarantor will weaken or be perceived to be weaker, and/or an issuer of a debt security will fail to make timely payments of principal or interest and the security will go into default. Changes in actual or perceived creditworthiness may occur quickly. A downgrade or default affecting any of the fund’s securities could cause the value of the fund’s shares to decrease. Lower quality debt securities generally have higher rates of interest and may be subject to greater price fluctuations than higher quality debt securities. Credit risk is gauged, in part, by the credit ratings of the debt securities in which the fund invests. However, ratings are only the opinions of the rating agencies issuing them and are not guarantees as to credit quality or an evaluation of market risk. The fund’s investment adviser relies on its own credit analysts to research issuers and issues in assessing credit and default risks.
Investing in lower rated debt instruments — Lower rated bonds and other lower rated debt securities generally have higher rates of interest and involve greater risk of default or price declines due to changes in the issuer’s creditworthiness than those of higher quality debt securities. The market prices of these securities may fluctuate more than the prices of higher quality debt securities and may decline significantly in periods of general economic difficulty. These risks may be increased with respect to investments in junk bonds.
Liquidity risk — Certain fund holdings may be or may become difficult or impossible to sell, particularly during times of market turmoil. Liquidity may be impacted by the lack of an active market for a holding, legal or contractual restrictions on resale, or the reduced number and capacity of market participants to make a market in such holding. Market prices for less liquid or illiquid holdings may be volatile or difficult to determine, and reduced liquidity may have an adverse impact on the market price of such holdings. Additionally, the sale of less liquid or illiquid holdings may involve substantial delays (including delays in settlement) and additional costs and the fund may be unable to sell such holdings when necessary to meet its liquidity needs, or to try to limit losses, or may be forced to sell at a loss.
| American High-Income Trust | 29 |
Investing in derivatives — The use of derivatives involves a variety of risks, which may be different from, or greater than, the risks associated with investing in traditional securities, such as stocks and bonds. Changes in the value of a derivative may not correlate perfectly with, and may be more sensitive to market events than, the underlying asset, rate or index, and a derivative instrument may cause the fund to lose significantly more than its initial investment. Derivatives may be difficult to value, difficult for the fund to buy or sell at an opportune time or price and difficult, or even impossible, to terminate or otherwise offset. The fund’s use of derivatives may result in losses to the fund, and investing in derivatives may reduce the fund’s returns and increase the fund’s price volatility. The fund’s counterparty to a derivative transaction (including, if applicable, the fund’s clearing broker, the derivatives exchange or the clearinghouse) may be unable or unwilling to honor its financial obligations in respect of the transaction. In certain cases, the fund may be hindered or delayed in exercising remedies against or closing out derivative instruments with a counterparty, which may result in additional losses. Derivatives are also subject to operational risk (such as documentation issues, settlement issues and systems failures) and legal risk (such as insufficient documentation, insufficient capacity or authority of a counterparty, and issues with the legality or enforceability of a contract).
Investing outside the U.S. — Securities of issuers domiciled outside the U.S., or with significant operations or revenues outside the U.S., may lose value because of adverse political, social, economic or market developments (including social instability, regional conflicts, terrorism and war) in the countries or regions in which the issuers operate or generate revenue. These securities may also lose value due to changes in foreign currency exchange rates against the U.S. dollar and/or currencies of other countries. Issuers of these securities may be more susceptible to actions of foreign governments, such as nationalization, currency blockage or the imposition of price controls, sanctions, or punitive taxes, each of which could adversely impact the value of these securities. Securities markets in certain countries may be more volatile and/or less liquid than those in the U.S. Investments outside the U.S. may also be subject to different regulatory, legal, accounting, auditing, financial reporting and recordkeeping requirements, and may be more difficult to value, than those in the U.S. In addition, the value of investments outside the U.S. may be reduced by foreign taxes, including foreign withholding taxes on interest and dividends. Further, there may be increased risks of delayed settlement of securities purchased or sold by the fund, which could impact the liquidity of the fund’s portfolio. The risks of investing outside the U.S. may be heightened in connection with investments in emerging markets.
Management — The investment adviser to the fund actively manages the fund’s investments. Consequently, the fund is subject to the risk that the methods and analyses, including models, tools and data, employed by the investment adviser in this process may be flawed or incorrect and may not produce the desired results. This could cause the fund to lose value or its investment results to lag relevant benchmarks or other funds with similar objectives.
5. Certain investment techniques
Loan transactions — The fund has entered into loan transactions in which the fund acquires a loan either through an agent, by assignment from another holder, or as a participation interest in another holder’s portion of a loan. The loan is often administered by a financial institution that acts as agent for the holders of the loan, and the fund may be required to receive approval from the agent and/or borrower prior to the sale of the investment. The loan’s interest rate and maturity date may change based on the terms of the loan, including potential early payments of principal.
Unfunded commitments — The fund has participated in transactions that involve unfunded commitments, which may obligate the fund to purchase new or additional bonds if certain contingencies are met. As of March 31, 2023, the fund’s maximum exposure of unfunded bond commitments was $79,484,000, which would represent ..47% of the net assets of the fund should such commitments become due. Unrealized appreciation of $10,534,000 is disclosed as unrealized appreciation on unfunded commitments and unrealized depreciation of $83,000 is disclosed as unrealized depreciation on unfunded commitments in the fund’s statement of assets and liabilities. Both are included in net unrealized appreciation on investments in unaffiliated issuers in the fund’s statement of operations.
Futures contracts — The fund has entered into futures contracts, which provide for the future sale by one party and purchase by another party of a specified amount of a specific financial instrument for a specified price, date, time and place designated at the time the contract is made. Futures contracts are used to strategically manage the fund’s interest rate sensitivity by increasing or decreasing the duration of the fund or a portion of the fund’s portfolio.
Upon entering into futures contracts, and to maintain the fund’s open positions in futures contracts, the fund is required to deposit with a futures broker, known as a futures commission merchant (“FCM”), in a segregated account in the name of the FCM an amount of cash, U.S. government securities or other liquid securities, known as initial margin. The margin required for a particular futures contract is set by the exchange on which the contract is traded to serve as collateral, and may be significantly modified from time to time by the exchange during the term of the contract.
| 30 | American High-Income Trust |
On a daily basis, the fund pays or receives variation margin based on the increase or decrease in the value of the futures contracts and records variation margin on futures contracts in the statement of assets and liabilities. Futures contracts may involve a risk of loss in excess of the variation margin shown on the fund’s statement of assets and liabilities. The fund records realized gains or losses at the time the futures contract is closed or expires. Net realized gains or losses and net unrealized appreciation or depreciation from futures contracts are recorded in the fund’s statement of operations. The average month-end notional amount of futures contracts while held was $156,297,000.
Swap contracts — The fund has entered into swap agreements, which are two-party contracts entered into primarily by institutional investors for a specified time period. In a typical swap transaction, two parties agree to exchange the returns earned or realized from one or more underlying assets or rates of return. Swap agreements can be traded on a swap execution facility (SEF) and cleared through a central clearinghouse (cleared), traded over-the-counter (OTC) and cleared, or traded bilaterally and not cleared. Because clearing interposes a central clearinghouse as the ultimate counterparty to each participant’s swap, and margin is required to be exchanged under the rules of the clearinghouse, central clearing is intended to decrease (but not eliminate) counterparty risk relative to uncleared bilateral swaps. To the extent the fund enters into bilaterally negotiated swap transactions, the fund will enter into swap agreements only with counterparties that meet certain credit standards and subject to agreed collateralized procedures. The term of a swap can be days, months or years and certain swaps may be less liquid than others.
Upon entering into a centrally cleared swap contract, the fund is required to deposit cash, U.S. government securities or other liquid securities, which is known as initial margin. Generally, the initial margin required for a particular swap is set and held as collateral by the clearinghouse on which the contract is cleared. The amount of initial margin required may be significantly modified from time to time by the clearinghouse during the term of the contract.
On a daily basis, interest accruals related to the exchange of future payments are recorded as a receivable and payable in the fund’s statement of assets and liabilities for centrally cleared swaps and as unrealized appreciation or depreciation in the fund’s statement of assets and liabilities for bilateral swaps. For centrally cleared swaps, the fund also pays or receives a variation margin based on the increase or decrease in the value of the swaps, including accrued interest as applicable, and records variation margin in the statement of assets and liabilities. The fund records realized gains and losses on both the net accrued interest and any gain or loss recognized at the time the swap is closed or expires. Net realized gains or losses, as well as any net unrealized appreciation or depreciation, from swaps are recorded in the fund’s statement of operations.
Swap agreements can take different forms. The fund has entered into the following types of swap agreements:
Credit default swap indices — The fund has entered into centrally cleared credit default swap indices, including CDX and iTraxx indices (collectively referred to as “CDSI”), in order to assume exposure to a diversified portfolio of credits or to hedge against existing credit risks. A CDSI is based on a portfolio of credit default swaps with similar characteristics, such as credit default swaps on high-yield bonds. In a typical CDSI transaction, one party (the protection buyer) is obligated to pay the other party (the protection seller) a stream of periodic payments over the term of the contract. If a credit event, such as a default or restructuring, occurs with respect to any of the underlying reference obligations, the protection seller must pay the protection buyer the loss on those credits.
The fund may enter into a CDSI transaction as either protection buyer or protection seller. If the fund is a protection buyer, it would pay the counterparty a periodic stream of payments over the term of the contract and would not recover any of those payments if no credit events were to occur with respect to any of the underlying reference obligations. However, if a credit event did occur, the fund, as a protection buyer, would have the right to deliver the referenced debt obligations or a specified amount of cash, depending on the terms of the applicable agreement, and to receive the par value of such debt obligations from the counterparty protection seller. As a protection seller, the fund would receive fixed payments throughout the term of the contract if no credit events were to occur with respect to any of the underlying reference obligations. If a credit event were to occur, however, the value of any deliverable obligation received by the fund, coupled with the periodic payments previously received by the fund, may be less than the full notional value that the fund, as a protection seller, pays to the counterparty protection buyer, effectively resulting in a loss of value to the fund. Furthermore, as a protection seller, the fund would effectively add leverage to its portfolio because it would have investment exposure to the notional amount of the swap transaction. The average month-end notional amount of credit default swaps while held was $254,864,000.
| American High-Income Trust | 31 |
The following tables identify the location and fair value amounts on the fund’s statement of assets and liabilities and the effect on the fund’s statement of operations resulting from the fund’s use of futures contracts and credit default swaps as of, or for the six months ended, March 31, 2023 (dollars in thousands):
| | | | | Assets | | | Liabilities | |
| Contracts | | Risk type | | Location on statement of
assets and liabilities | | Value | | | Location on statement of
assets and liabilities | | Value | |
| Futures | | Interest | | Unrealized appreciation* | | $ | 1,031 | | | Unrealized depreciation* | | $ | 273 | |
| Swap (centrally cleared) | | Credit | | Unrealized appreciation* | | | 799 | | | Unrealized depreciation* | | | 809 | |
| | | | | | | $ | 1,830 | | | | | $ | 1,082 | |
| | | | | | | | | | | | | | | |
| | | | | Net realized gain (loss) | | | Net unrealized appreciation | |
| Contracts | | Risk type | | Location on statement of operations | | | Value | | | Location on statement of operations | | | Value | |
| Futures | | Interest | | Net realized gain on futures contracts | | $ | 1,868 | | | Net unrealized appreciation on futures contracts | | $ | 174 | |
| Swap | | Credit | | Net realized loss on swap contracts | | | (14,270 | ) | | Net unrealized appreciation on swap contracts | | | 749 | |
| | | | | | | $ | (12,402 | ) | | | | $ | 923 | |
| * | Includes cumulative appreciation/depreciation on futures contracts and centrally cleared credit default swaps as reported in the applicable tables following the fund’s investment portfolio. Only current day’s variation margin is reported within the fund’s statement of assets and liabilities. |
Collateral — The fund receives or pledges highly liquid assets, such as cash or U.S. government securities, as collateral due to its use of futures contracts and credit default swaps. The purpose of the collateral is to cover potential losses that could occur in the event that either party cannot meet its contractual obligation. Non-cash collateral pledged by the fund, if any, is disclosed in the fund’s investment portfolio, and cash collateral pledged by the fund, if any, is held in a segregated account with the fund’s custodian, which is reflected as pledged cash collateral in the fund’s statement of assets and liabilities.
6. Taxation and distributions
Federal income taxation — The fund complies with the requirements under Subchapter M of the Internal Revenue Code applicable to regulated investment companies and intends to distribute substantially all of its net taxable income and net capital gains each year. The fund is not subject to income taxes to the extent such distributions are made. Therefore, no federal income tax provision is required.
As of and during the period ended March 31, 2023, the fund did not have a liability for any unrecognized tax benefits. The fund recognizes interest and penalties, if any, related to unrecognized tax benefits as income tax expense in the statement of operations. During the period, the fund did not incur any significant interest or penalties.
The fund’s tax returns are generally not subject to examination by federal, state and, if applicable, non-U.S. tax authorities after the expiration of each jurisdiction’s statute of limitations, which is typically three years after the date of filing but can be extended in certain jurisdictions.
Non-U.S. taxation — Dividend and interest income are recorded net of non-U.S. taxes paid. The fund may file withholding tax reclaims in certain jurisdictions to recover a portion of amounts previously withheld. These reclaims are recorded when the amount is known and there are no significant uncertainties on collectability. Gains realized by the fund on the sale of securities in certain countries, if any, may be subject to non-U.S. taxes. If applicable, the fund records an estimated deferred tax liability based on unrealized gains to provide for potential non-U.S. taxes payable upon the sale of these securities.
Distributions — Distributions determined on a tax basis may differ from net investment income and net realized gains for financial reporting purposes. These differences are due primarily to different treatment for items such as currency gains and losses; short-term capital gains and losses; capital losses related to sales of certain securities within 30 days of purchase; cost of investments sold; net capital losses and income on certain investments. The fiscal year in which amounts are distributed may differ from the year in which the net investment income and net realized gains are recorded by the fund for financial reporting purposes.
| 32 | American High-Income Trust |
The components of distributable earnings on a tax basis are reported as of the fund’s most recent year-end. As of September 30, 2022, the components of distributable earnings on a tax basis were as follows (dollars in thousands):
| Undistributed ordinary income | | $ | 25,468 | |
| Capital loss carryforward1 | | | (1,555,540 | ) |
| Post-October capital loss deferral2 | | | (201,079 | ) |
| 1 | The capital loss carryforward will be used to offset any capital gains realized by the fund in the current year or in subsequent years. The fund will not make distributions from capital gains while a capital loss carryforward remains. |
| 2 | This deferral is considered incurred in the subsequent year. |
As of March 31, 2023, the tax basis unrealized appreciation (depreciation) and cost of investments were as follows (dollars in thousands):
| Gross unrealized appreciation on investments | | $ | 217,110 | |
| Gross unrealized depreciation on investments | | | (2,197,406 | ) |
| Net unrealized depreciation on investments | | | (1,980,296 | ) |
| Cost of investments | | | 18,717,027 | |
Tax-basis distributions paid or accrued to shareholders from ordinary income were as follows (dollars in thousands):
| Share class | | Six months ended
March 31,
2023 | | | Year ended
September 30,
2022 | |
| Class A | | $ | 309,319 | | | $ | 523,071 | |
| Class C | | | 6,239 | | | | 11,439 | |
| Class T | | | — | 3 | | | — | 3 |
| Class F-1 | | | 8,642 | | | | 15,774 | |
| Class F-2 | | | 59,302 | | | | 91,492 | |
| Class F-3 | | | 32,142 | | | | 51,182 | |
| Class 529-A | | | 9,279 | | | | 15,906 | |
| Class 529-C | | | 276 | | | | 539 | |
| Class 529-E | | | 347 | | | | 585 | |
| Class 529-T | | | — | 3 | | | 1 | |
| Class 529-F-1 | | | — | 3 | | | 1 | |
| Class 529-F-2 | | | 1,070 | | | | 1,788 | |
| Class 529-F-3 | | | — | 3 | | | 1 | |
| Class R-1 | | | 340 | | | | 545 | |
| Class R-2 | | | 2,973 | | | | 4,891 | |
| Class R-2E | | | 193 | | | | 298 | |
| Class R-3 | | | 3,978 | | | | 6,830 | |
| Class R-4 | | | 3,506 | | | | 6,029 | |
| Class R-5E | | | 596 | | | | 884 | |
| Class R-5 | | | 948 | | | | 2,500 | |
| Class R-6 | | | 90,919 | | | | 185,917 | |
| Total | | $ | 530,069 | | | $ | 919,673 | |
| 3 | Amount less than one thousand. |
7. Fees and transactions with related parties
CRMC, the fund’s investment adviser, is the parent company of American Funds Distributors®, Inc. (“AFD”), the principal underwriter of the fund’s shares, and American Funds Service Company® (“AFS”), the fund’s transfer agent. CRMC, AFD and AFS are considered related parties to the fund.
| American High-Income Trust | 33 |
Investment advisory services — The fund has an investment advisory and service agreement with CRMC that provides for monthly fees accrued daily. At the beginning of the year, these fees were based on a series of decreasing annual rates beginning with 0.300% on the first $60 million of daily net assets and decreasing to 0.132% on such assets in excess of $21 billion. On March 6, 2023, the fund’s board of trustees approved an amended investment advisory and service agreement effective May 1, 2023, replacing the prior series of rates and breakpoints with a new series of decreasing annual rates beginning with 0.157% on the first $15 billion of daily net assets and decreasing to 0.132% on such assets in excess of $21 billion. The agreement also provides for monthly fees, accrued daily, based on a series of decreasing rates beginning with 3.00% on the first $8,333,333 of the fund’s monthly gross income and decreasing to 1.50% on such income in excess of $50,000,000. For the six months ended March 31, 2023, the investment advisory services fees were $23,919,000, which were equivalent to an annualized rate of 0.286% of average daily net assets.
Class-specific fees and expenses — Expenses that are specific to individual share classes are accrued directly to the respective share class. The principal class-specific fees and expenses are further described below:
Distribution services — The fund has plans of distribution for all share classes, except Class F-2, F-3, 529-F-2, 529-F-3, R-5E, R-5 and R-6 shares. Under the plans, the board of trustees approves certain categories of expenses that are used to finance activities primarily intended to sell fund shares and service existing accounts. The plans provide for payments, based on an annualized percentage of average daily net assets, ranging from 0.30% to 1.00% as noted in this section. In some cases, the board of trustees has limited the amounts that may be paid to less than the maximum allowed by the plans. All share classes with a plan may use up to 0.25% of average daily net assets to pay service fees, or to compensate AFD for paying service fees, to firms that have entered into agreements with AFD to provide certain shareholder services. The remaining amounts available to be paid under each plan are paid to dealers to compensate them for their sales activities.
| Share class | | Currently approved limits | | Plan limits |
| Class A | | | 0.30 | % | | | 0.30 | % | |
| Class 529-A | | | 0.30 | | | | 0.50 | | |
| Classes C, 529-C and R-1 | | | 1.00 | | | | 1.00 | | |
| Class R-2 | | | 0.75 | | | | 1.00 | | |
| Class R-2E | | | 0.60 | | | | 0.85 | | |
| Classes 529-E and R-3 | | | 0.50 | | | | 0.75 | | |
| Classes T, F-1, 529-T, 529-F-1 and R-4 | | | 0.25 | | | | 0.50 | | |
For Class A and 529-A shares, distribution-related expenses include the reimbursement of dealer and wholesaler commissions paid by AFD for certain shares sold without a sales charge. These share classes reimburse AFD for amounts billed within the prior 15 months but only to the extent that the overall annual expense limits are not exceeded. As of March 31, 2023, there were no unreimbursed expenses subject to reimbursement for Class A or 529-A shares.
Transfer agent services — The fund has a shareholder services agreement with AFS under which the fund compensates AFS for providing transfer agent services to each of the fund’s share classes. These services include recordkeeping, shareholder communications and transaction processing. In addition, the fund reimburses AFS for amounts paid to third parties for performing transfer agent services on behalf of fund shareholders.
Administrative services — The fund has an administrative services agreement with CRMC under which the fund compensates CRMC for providing administrative services to all share classes. Administrative services are provided by CRMC and its affiliates to help assist third parties providing non-distribution services to fund shareholders. These services include providing in-depth information on the fund and market developments that impact fund investments. Administrative services also include, but are not limited to, coordinating, monitoring and overseeing third parties that provide services to fund shareholders. The agreement provides the fund the ability to charge an administrative services fee at the annual rate of 0.05% of the average daily net assets attributable to each share class of the fund. Currently the fund pays CRMC an administrative services fee at the annual rate of 0.03% of the average daily net assets attributable to each share class of the fund for CRMC’s provision of administrative services.
529 plan services — Each 529 share class is subject to service fees to compensate the Virginia College Savings Plan (“Virginia529”) for its oversight and administration of the CollegeAmerica 529 college savings plan. The fees are based on the combined net assets invested in Class 529 and ABLE shares of the American Funds. Class ABLE shares are offered on other American Funds by Virginia529 through ABLEAmerica®, a tax-advantaged savings program for individuals with disabilities. Virginia529 is not considered a related party to the fund.
| 34 | American High-Income Trust |
The quarterly fees are based on a series of decreasing annual rates beginning with 0.09% on the first $20 billion of the combined net assets invested in the American Funds and decreasing to 0.03% on such assets in excess of $75 billion. The fees for any given calendar quarter are accrued and calculated on the basis of the average net assets of Class 529 and ABLE shares of the American Funds for the last month of the prior calendar quarter. For the six months ended March 31, 2023, the 529 plan services fees were $107,000, which were equivalent to 0.061% of the average daily net assets of each 529 share class.
For the six months ended March 31, 2023, class-specific expenses under the agreements were as follows (dollars in thousands):
| Share class | | Distribution
services | | | Transfer agent
services | | | Administrative
services | | | | 529 plan
services | |
| Class A | | | $12,350 | | | | $6,982 | | | | $1,485 | | | | Not applicable | |
| Class C | | | 1,122 | | | | 161 | | | | 34 | | | | Not applicable | |
| Class T | | | — | | | | — | * | | | — | * | | | Not applicable | |
| Class F-1 | | | 340 | | | | 216 | | | | 42 | | | | Not applicable | |
| Class F-2 | | | Not applicable | | | | 921 | | | | 272 | | | | Not applicable | |
| Class F-3 | | | Not applicable | | | | 5 | | | | 145 | | | | Not applicable | |
| Class 529-A | | | 352 | | | | 197 | | | | 45 | | | | $91 | |
| Class 529-C | | | 51 | | | | 7 | | | | 1 | | | | 3 | |
| Class 529-E | | | 29 | | | | 3 | | | | 2 | | | | 3 | |
| Class 529-T | | | — | | | | — | * | | | — | * | | | — | * |
| Class 529-F-1 | | | — | | | | — | * | | | — | * | | | — | * |
| Class 529-F-2 | | | Not applicable | | | | 5 | | | | 5 | | | | 10 | |
| Class 529-F-3 | | | Not applicable | | | | — | * | | | — | * | | | — | * |
| Class R-1 | | | 61 | | | | 7 | | | | 2 | | | | Not applicable | |
| Class R-2 | | | 403 | | | | 190 | | | | 16 | | | | Not applicable | |
| Class R-2E | | | 20 | | | | 7 | | | | 1 | | | | Not applicable | |
| Class R-3 | | | 332 | | | | 104 | | | | 20 | | | | Not applicable | |
| Class R-4 | | | 139 | | | | 55 | | | | 17 | | | | Not applicable | |
| Class R-5E | | | Not applicable | | | | 14 | | | | 3 | | | | Not applicable | |
| Class R-5 | | | Not applicable | | | | 8 | | | | 4 | | | | Not applicable | |
| Class R-6 | | | Not applicable | | | | 15 | | | | 411 | | | | Not applicable | |
| Total class-specific expenses | | | $15,199 | | | | $8,897 | | | | $2,505 | | | | $107 | |
| | |
| * | Amount less than one thousand. |
Trustees’ deferred compensation — Trustees who are unaffiliated with CRMC may elect to defer the cash payment of part or all of their compensation. These deferred amounts, which remain as liabilities of the fund, are treated as if invested in shares of the fund or other American Funds. These amounts represent general, unsecured liabilities of the fund and vary according to the total returns of the selected funds. Trustees’ compensation of $38,000 in the fund’s statement of operations reflects $30,000 in current fees (either paid in cash or deferred) and a net increase of $8,000 in the value of the deferred amounts.
Affiliated officers and trustees — Officers and certain trustees of the fund are or may be considered to be affiliated with CRMC, AFD and AFS. No affiliated officers or trustees received any compensation directly from the fund.
Investment in CCF — The fund holds shares of CCF, an institutional prime money market fund managed by CRMC. CCF invests in high-quality, short-term money market instruments. CCF is used as the primary investment vehicle for the fund’s short-term instruments. CCF shares are only available for purchase by CRMC, its affiliates, and other funds managed by CRMC or its affiliates, and are not available to the public. CRMC does not receive an investment advisory services fee from CCF.
Security transactions with related funds — The fund has sold investment securities to other funds managed by CRMC (or funds managed by certain affiliates of CRMC) under procedures adopted by the fund’s board of trustees. The funds involved in such transactions are considered related by virtue of having a common investment adviser (or affiliated investment advisers), common trustees and/or common officers. Each transaction was executed at the current market price of the security and no brokerage commissions or fees were paid in accordance with Rule 17a-7 of the 1940 Act. During the six months ended March 31, 2023, the fund engaged in such sale transactions with related funds in the amount of $6,637,000, which generated $4,492,000 of net realized gains from such sales.
| American High-Income Trust | 35 |
Interfund lending — Pursuant to an exemptive order issued by the SEC, the fund, along with other CRMC-managed funds (or funds managed by certain affiliates of CRMC), may participate in an interfund lending program. The program provides an alternate credit facility that permits the funds to lend or borrow cash for temporary purposes directly to or from one another, subject to the conditions of the exemptive order. The fund did not lend or borrow cash through the interfund lending program at any time during the six months ended March 31, 2023.
8. Committed line of credit
The fund participates with other funds managed by CRMC (or funds managed by certain affiliates of CRMC) in a $1.5 billion credit facility (the “line of credit”) to be utilized for temporary purposes to support shareholder redemptions. The fund has agreed to pay commitment fees on its pro-rata portion of the line of credit, which are reflected in other expenses in the fund’s statement of operations. The fund did not borrow on this line of credit at any time during the six months ended March 31, 2023.
9. Indemnifications
The fund’s organizational documents provide board members and officers with indemnification against certain liabilities or expenses in connection with the performance of their duties to the fund. In the normal course of business, the fund may also enter into contracts that provide general indemnifications. The fund’s maximum exposure under these arrangements is unknown since it is dependent on future claims that may be made against the fund. The risk of material loss from such claims is considered remote. Insurance policies are also available to the fund’s board members and officers.
10. Capital share transactions
Capital share transactions in the fund were as follows (dollars and shares in thousands):
| | | Sales* | | | Reinvestments of
distributions | | | Repurchases* | | | Net (decrease)
increase | |
| Share class | | Amount | | | Shares | | | Amount | | | Shares | | | Amount | | | Shares | | | Amount | | | Shares | |
| | | | | | | | | | | | | | | | | | | | | | | | | |
| Six months ended March 31, 2023 |
| | | | | | | | | | | | | | | | | | | | | | | | | | | | | | | | | |
| Class A | | $ | 481,491 | | | | 52,685 | | | $ | 298,061 | | | | 32,619 | | | $ | (875,208 | ) | | | (96,026 | ) | | $ | (95,656 | ) | | | (10,722 | ) |
| Class C | | | 16,647 | | | | 1,822 | | | | 6,020 | | | | 659 | | | | (41,429 | ) | | | (4,542 | ) | | | (18,762 | ) | | | (2,061 | ) |
| Class T | | | — | | | | — | | | | — | | | | — | | | | — | | | | — | | | | — | | | | — | |
| Class F-1 | | | 133,848 | | | | 14,696 | | | | 8,242 | | | | 902 | | | | (130,019 | ) | | | (14,272 | ) | | | 12,071 | | | | 1,326 | |
| Class F-2 | | | 554,626 | | | | 60,747 | | | | 56,040 | | | | 6,132 | | | | (406,800 | ) | | | (44,577 | ) | | | 203,866 | | | | 22,302 | |
| Class F-3 | | | 280,245 | | | | 30,768 | | | | 31,437 | | | | 3,440 | | | | (261,307 | ) | | | (28,653 | ) | | | 50,375 | | | | 5,555 | |
| Class 529-A | | | 17,018 | | | | 1,860 | | | | 9,244 | | | | 1,012 | | | | (27,019 | ) | | | (2,955 | ) | | | (757 | ) | | | (83 | ) |
| Class 529-C | | | 957 | | | | 105 | | | | 275 | | | | 30 | | | | (2,484 | ) | | | (272 | ) | | | (1,252 | ) | | | (137 | ) |
| Class 529-E | | | 483 | | | | 53 | | | | 345 | | | | 38 | | | | (1,264 | ) | | | (138 | ) | | | (436 | ) | | | (47 | ) |
| Class 529-T | | | — | | | | — | | | | — | † | | | — | † | | | — | | | | — | | | | — | † | | | — | † |
| Class 529-F-1 | | | — | | | | — | | | | — | † | | | — | † | | | — | | | | — | | | | — | † | | | — | † |
| Class 529-F-2 | | | 3,749 | | | | 412 | | | | 1,063 | | | | 116 | | | | (4,299 | ) | | | (471 | ) | | | 513 | | | | 57 | |
| Class 529-F-3 | | | — | | | | — | | | | — | † | | | — | † | | | — | | | | — | | | | — | † | | | — | † |
| Class R-1 | | | 822 | | | | 90 | | | | 339 | | | | 37 | | | | (1,341 | ) | | | (148 | ) | | | (180 | ) | | | (21 | ) |
| Class R-2 | | | 9,436 | | | | 1,033 | | | | 2,953 | | | | 323 | | | | (13,037 | ) | | | (1,433 | ) | | | (648 | ) | | | (77 | ) |
| Class R-2E | | | 1,166 | | | | 129 | | | | 193 | | | | 21 | | | | (473 | ) | | | (52 | ) | | | 886 | | | | 98 | |
| Class R-3 | | | 14,065 | | | | 1,539 | | | | 3,944 | | | | 432 | | | | (18,338 | ) | | | (2,011 | ) | | | (329 | ) | | | (40 | ) |
| Class R-4 | | | 13,871 | | | | 1,518 | | | | 3,484 | | | | 381 | | | | (13,309 | ) | | | (1,459 | ) | | | 4,046 | | | | 440 | |
| Class R-5E | | | 2,056 | | | | 226 | | | | 594 | | | | 65 | | | | (1,321 | ) | | | (145 | ) | | | 1,329 | | | | 146 | |
| Class R-5 | | | 2,582 | | | | 282 | | | | 941 | | | | 103 | | | | (3,804 | ) | | | (415 | ) | | | (281 | ) | | | (30 | ) |
| Class R-6 | | | 141,475 | | | | 15,501 | | | | 90,769 | | | | 9,932 | | | | (151,379 | ) | | | (16,694 | ) | | | 80,865 | | | | 8,739 | |
| Total net increase (decrease) | | $ | 1,674,537 | | | | 183,466 | | | $ | 513,944 | | | | 56,242 | | | $ | (1,952,831 | ) | | | (214,263 | ) | | $ | 235,650 | | | | 25,445 | |
Refer to the end of the tables for footnotes.
| 36 | American High-Income Trust |
| | | Sales* | | | Reinvestments of
distributions | | | Repurchases* | | | Net increase
(decrease) | |
| Share class | | Amount | | | Shares | | | Amount | | | Shares | | | Amount | | | Shares | | | Amount | | | Shares | |
| | | | | | | | | | | | | | | | | | | | | | | | | | | | | | | | | |
| Year ended September 30, 2022 |
| | | | | | | | | | | | | | | | | | | | | | | | | | | | | | | | | |
| Class A | | $ | 1,092,727 | | | | 109,073 | | | $ | 503,816 | | | | 51,559 | | | $ | (1,587,874 | ) | | | (161,339 | ) | | $ | 8,669 | | | | (707 | ) |
| Class C | | | 41,310 | | | | 4,126 | | | | 11,009 | | | | 1,124 | | | | (99,720 | ) | | | (10,107 | ) | | | (47,401 | ) | | | (4,857 | ) |
| Class T | | | — | | | | — | | | | — | | | | — | | | | — | | | | — | | | | — | | | | — | |
| Class F-1 | | | 199,247 | | | | 20,391 | | | | 15,058 | | | | 1,533 | | | | (310,396 | ) | | | (31,344 | ) | | | (96,091 | ) | | | (9,420 | ) |
| Class F-2 | | | 799,547 | | | | 81,166 | | | | 86,723 | | | | 8,873 | | | | (788,097 | ) | | | (80,098 | ) | | | 98,173 | | | | 9,941 | |
| Class F-3 | | | 698,630 | | | | 69,445 | | | | 49,909 | | | | 5,104 | | | | (891,592 | ) | | | (88,409 | ) | | | (143,053 | ) | | | (13,860 | ) |
| Class 529-A | | | 36,332 | | | | 3,634 | | | | 15,848 | | | | 1,621 | | | | (60,667 | ) | | | (6,163 | ) | | | (8,487 | ) | | | (908 | ) |
| Class 529-C | | | 2,960 | | | | 294 | | | | 536 | | | | 55 | | | | (6,632 | ) | | | (667 | ) | | | (3,136 | ) | | | (318 | ) |
| Class 529-E | | | 1,428 | | | | 143 | | | | 583 | | | | 60 | | | | (2,516 | ) | | | (252 | ) | | | (505 | ) | | | (49 | ) |
| Class 529-T | | | — | | | | — | | | | 1 | | | | — | † | | | — | | | | — | | | | 1 | | | | — | † |
| Class 529-F-1 | | | — | | | | — | | | | 1 | | | | — | † | | | — | | | | — | | | | 1 | | | | — | † |
| Class 529-F-2 | | | 6,535 | | | | 651 | | | | 1,779 | | | | 182 | | | | (8,138 | ) | | | (817 | ) | | | 176 | | | | 16 | |
| Class 529-F-3 | | | — | | | | — | | | | 1 | | | | — | † | | | — | | | | — | | | | 1 | | | | — | † |
| Class R-1 | | | 2,186 | | | | 221 | | | | 543 | | | | 56 | | | | (2,767 | ) | | | (282 | ) | | | (38 | ) | | | (5 | ) |
| Class R-2 | | | 24,469 | | | | 2,456 | | | | 4,850 | | | | 496 | | | | (37,633 | ) | | | (3,760 | ) | | | (8,314 | ) | | | (808 | ) |
| Class R-2E | | | 2,402 | | | | 241 | | | | 297 | | | | 30 | | | | (3,275 | ) | | | (329 | ) | | | (576 | ) | | | (58 | ) |
| Class R-3 | | | 32,214 | | | | 3,232 | | | | 6,764 | | | | 692 | | | | (49,578 | ) | | | (4,990 | ) | | | (10,600 | ) | | | (1,066 | ) |
| Class R-4 | | | 26,446 | | | | 2,623 | | | | 5,999 | | | | 613 | | | | (39,596 | ) | | | (4,011 | ) | | | (7,151 | ) | | | (775 | ) |
| Class R-5E | | | 8,396 | | | | 831 | | | | 882 | | | | 91 | | | | (3,739 | ) | | | (381 | ) | | | 5,539 | | | | 541 | |
| Class R-5 | | | 10,147 | | | | 999 | | | | 2,350 | | | | 236 | | | | (60,889 | ) | | | (5,989 | ) | | | (48,392 | ) | | | (4,754 | ) |
| Class R-6 | | | 730,330 | | | | 70,891 | | | | 185,873 | | | | 18,992 | | | | (1,209,450 | ) | | | (129,324 | ) | | | (293,247 | ) | | | (39,441 | ) |
| Total net increase (decrease) | | $ | 3,715,306 | | | | 370,417 | | | $ | 892,822 | | | | 91,317 | | | $ | (5,162,559 | ) | | | (528,262 | ) | | $ | (554,431 | ) | | | (66,528 | ) |
| * | Includes exchanges between share classes of the fund. |
| † | Amount less than one thousand. |
11. Investment transactions
The fund engaged in purchases and sales of investment securities, excluding short-term securities and U.S. government obligations, if any, of $2,763,710,000 and $3,056,318,000, respectively, during the six months ended March 31, 2023.
| American High-Income Trust | 37 |
Financial highlights
| | | | | | Income (loss) from
investment operations1 | | | | | | | | | | | | | | | | | | | | | | |
| Year ended | | Net asset
value,
beginning
of year | | | Net
investment
income | | | Net gains
(losses) on
securities
(both
realized and
unrealized) | | | Total from
investment
operations | | | Dividends
(from net
investment
income) | | | Net assets
value, end
of year | | | Total
return2,3 | | | Net assets,
end of year
(in millions) | | | Ratio of
expenses to
average net
assets before
reimburse-
ments4 | | | Ratio of
expenses to
average net
assets after
reimburse-
ments3,4 | | | Ratio of
net income
to average
net assets3 | |
| Class A: | | | | | | | | | | | | | | | | | | | | | | | | | | | | | | | | | | | | | | | | | | | | |
| 3/31/20235,6 | | $ | 8.86 | | | $ | .28 | | | $ | .32 | | | $ | .60 | | | $ | (.28 | ) | | $ | 9.18 | | | | 6.87 | %7 | | $ | 9,987 | | | | .72 | %8 | | | .72 | %8 | | | 6.22 | %8 |
| 9/30/2022 | | | 10.55 | | | | .48 | | | | (1.70 | ) | | | (1.22 | ) | | | (.47 | ) | | | 8.86 | | | | (11.86 | ) | | | 9,738 | | | | .68 | | | | .68 | | | | 4.86 | |
| 9/30/2021 | | | 9.63 | | | | .47 | | | | .95 | | | | 1.42 | | | | (.50 | ) | | | 10.55 | | | | 15.05 | | | | 11,600 | | | | .69 | | | | .69 | | | | 4.61 | |
| 9/30/2020 | | | 9.96 | | | | .58 | | | | (.33 | ) | | | .25 | | | | (.58 | ) | | | 9.63 | | | | 2.71 | | | | 10,008 | | | | .73 | | | | .73 | | | | 6.11 | |
| 9/30/2019 | | | 10.25 | | | | .62 | | | | (.29 | ) | | | .33 | | | | (.62 | ) | | | 9.96 | | | | 3.39 | | | | 10,428 | | | | .72 | | | | .72 | | | | 6.14 | |
| 9/30/2018 | | | 10.48 | | | | .61 | | | | (.25 | ) | | | .36 | | | | (.59 | ) | | | 10.25 | | | | 3.59 | | | | 10,753 | | | | .69 | | | | .69 | | | | 5.92 | |
| Class C: | | | | | | | | | | | | | | | | | | | | | | | | | | | | | | | | | | | | | | | | | | | | |
| 3/31/20235,6 | | | 8.86 | | | | .25 | | | | .32 | | | | .57 | | | | (.25 | ) | | | 9.18 | | | | 6.48 | 7 | | | 221 | | | | 1.46 | 8 | | | 1.46 | 8 | | | 5.48 | 8 |
| 9/30/2022 | | | 10.55 | | | | .41 | | | | (1.70 | ) | | | (1.29 | ) | | | (.40 | ) | | | 8.86 | | | | (12.52 | ) | | | 231 | | | | 1.43 | | | | 1.43 | | | | 4.09 | |
| 9/30/2021 | | | 9.63 | | | | .40 | | | | .95 | | | | 1.35 | | | | (.43 | ) | | | 10.55 | | | | 14.22 | | | | 326 | | | | 1.43 | | | | 1.43 | | | | 3.89 | |
| 9/30/2020 | | | 9.96 | | | | .52 | | | | (.34 | ) | | | .18 | | | | (.51 | ) | | | 9.63 | | | | 1.96 | | | | 330 | | | | 1.47 | | | | 1.47 | | | | 5.41 | |
| 9/30/2019 | | | 10.25 | | | | .55 | | | | (.29 | ) | | | .26 | | | | (.55 | ) | | | 9.96 | | | | 2.61 | | | | 521 | | | | 1.48 | | | | 1.48 | | | | 5.38 | |
| 9/30/2018 | | | 10.48 | | | | .53 | | | | (.25 | ) | | | .28 | | | | (.51 | ) | | | 10.25 | | | | 2.77 | | | | 616 | | | | 1.48 | | | | 1.48 | | | | 5.11 | |
| Class T: | | | | | | | | | | | | | | | | | | | | | | | | | | | | | | | | | | | | | | | | | | | | |
| 3/31/20235,6 | | | 8.86 | | | | .30 | | | | .32 | | | | .62 | | | | (.30 | ) | | | 9.18 | | | | 7.01 | 7,9 | | | — | 10 | | | .45 | 8,9 | | | .45 | 8,9 | | | 6.47 | 8,9 |
| 9/30/2022 | | | 10.55 | | | | .51 | | | | (1.70 | ) | | | (1.19 | ) | | | (.50 | ) | | | 8.86 | | | | (11.63 | )9 | | | — | 10 | | | .42 | 9 | | | .42 | 9 | | | 5.12 | 9 |
| 9/30/2021 | | | 9.63 | | | | .50 | | | | .95 | | | | 1.45 | | | | (.53 | ) | | | 10.55 | | | | 15.36 | 9 | | | — | 10 | | | .43 | 9 | | | .43 | 9 | | | 4.87 | 9 |
| 9/30/2020 | | | 9.96 | | | | .61 | | | | (.34 | ) | | | .27 | | | | (.60 | ) | | | 9.63 | | | | 2.97 | 9 | | | — | 10 | | | .47 | 9 | | | .47 | 9 | | | 6.37 | 9 |
| 9/30/2019 | | | 10.25 | | | | .65 | | | | (.29 | ) | | | .36 | | | | (.65 | ) | | | 9.96 | | | | 3.65 | 9 | | | — | 10 | | | .47 | 9 | | | .47 | 9 | | | 6.39 | 9 |
| 9/30/2018 | | | 10.48 | | | | .63 | | | | (.25 | ) | | | .38 | | | | (.61 | ) | | | 10.25 | | | | 3.82 | 9 | | | — | 10 | | | .47 | 9 | | | .47 | 9 | | | 6.13 | 9 |
| Class F-1: | | | | | | | | | | | | | | | | | | | | | | | | | | | | | | | | | | | | | | | | | | | | |
| 3/31/20235,6 | | | 8.86 | | | | .28 | | | | .32 | | | | .60 | | | | (.28 | ) | | | 9.18 | | | | 6.87 | 7 | | | 287 | | | | .73 | 8 | | | .73 | 8 | | | 6.20 | 8 |
| 9/30/2022 | | | 10.55 | | | | .48 | | | | (1.70 | ) | | | (1.22 | ) | | | (.47 | ) | | | 8.86 | | | | (11.88 | ) | | | 265 | | | | .70 | | | | .70 | | | | 4.79 | |
| 9/30/2021 | | | 9.63 | | | | .47 | | | | .95 | | | | 1.42 | | | | (.50 | ) | | | 10.55 | | | | 15.05 | | | | 415 | | | | .70 | | | | .70 | | | | 4.62 | |
| 9/30/2020 | | | 9.96 | | | | .59 | | | | (.34 | ) | | | .25 | | | | (.58 | ) | | | 9.63 | | | | 2.71 | | | | 401 | | | | .73 | | | | .73 | | | | 6.11 | |
| 9/30/2019 | | | 10.25 | | | | .62 | | | | (.29 | ) | | | .33 | | | | (.62 | ) | | | 9.96 | | | | 3.37 | | | | 446 | | | | .74 | | | | .74 | | | | 6.12 | |
| 9/30/2018 | | | 10.48 | | | | .61 | | | | (.25 | ) | | | .36 | | | | (.59 | ) | | | 10.25 | | | | 3.54 | | | | 481 | | | | .73 | | | | .73 | | | | 5.86 | |
| Class F-2: | | | | | | | | | | | | | | | | | | | | | | | | | | | | | | | | | | | | | | | | | | | | |
| 3/31/20235,6 | | | 8.86 | | | | .30 | | | | .32 | | | | .62 | | | | (.30 | ) | | | 9.18 | | | | 7.03 | 7 | | | 1,939 | | | | .43 | 8 | | | .43 | 8 | | | 6.50 | 8 |
| 9/30/2022 | | | 10.55 | | | | .51 | | | | (1.70 | ) | | | (1.19 | ) | | | (.50 | ) | | | 8.86 | | | | (11.62 | ) | | | 1,674 | | | | .40 | | | | .40 | | | | 5.14 | |
| 9/30/2021 | | | 9.63 | | | | .50 | | | | .95 | | | | 1.45 | | | | (.53 | ) | | | 10.55 | | | | 15.39 | | | | 1,888 | | | | .40 | | | | .40 | | | | 4.89 | |
| 9/30/2020 | | | 9.96 | | | | .61 | | | | (.33 | ) | | | .28 | | | | (.61 | ) | | | 9.63 | | | | 3.00 | | | | 1,368 | | | | .44 | | | | .44 | | | | 6.38 | |
| 9/30/2019 | | | 10.25 | | | | .65 | | | | (.29 | ) | | | .36 | | | | (.65 | ) | | | 9.96 | | | | 3.66 | | | | 1,281 | | | | .46 | | | | .46 | | | | 6.41 | |
| 9/30/2018 | | | 10.48 | | | | .64 | | | | (.25 | ) | | | .39 | | | | (.62 | ) | | | 10.25 | | | | 3.82 | | | | 1,155 | | | | .46 | | | | .46 | | | | 6.15 | |
| Class F-3: | | | | | | | | | | | | | | | | | | | | | | | | | | | | | | | | | | | | | | | | | | | | |
| 3/31/20235,6 | | | 8.86 | | | | .30 | | | | .32 | | | | .62 | | | | (.30 | ) | | | 9.18 | | | | 7.08 | 7 | | | 973 | | | | .33 | 8 | | | .33 | 8 | | | 6.59 | 8 |
| 9/30/2022 | | | 10.55 | | | | .52 | | | | (1.70 | ) | | | (1.18 | ) | | | (.51 | ) | | | 8.86 | | | | (11.52 | ) | | | 890 | | | | .30 | | | | .30 | | | | 5.23 | |
| 9/30/2021 | | | 9.63 | | | | .51 | | | | .95 | | | | 1.46 | | | | (.54 | ) | | | 10.55 | | | | 15.50 | | | | 1,206 | | | | .30 | | | | .30 | | | | 4.96 | |
| 9/30/2020 | | | 9.96 | | | | .63 | | | | (.34 | ) | | | .29 | | | | (.62 | ) | | | 9.63 | | | | 3.11 | | | | 595 | | | | .34 | | | | .34 | | | | 6.48 | |
| 9/30/2019 | | | 10.25 | | | | .66 | | | | (.29 | ) | | | .37 | | | | (.66 | ) | | | 9.96 | | | | 3.77 | | | | 523 | | | | .36 | | | | .36 | | | | 6.50 | |
| 9/30/2018 | | | 10.48 | | | | .65 | | | | (.25 | ) | | | .40 | | | | (.63 | ) | | | 10.25 | | | | 3.93 | | | | 437 | | | | .36 | | | | .36 | | | | 6.26 | |
| Class 529-A: | | | | | | | | | | | | | | | | | | | | | | | | | | | | | | | | | | | | | | | | | | |
| 3/31/20235,6 | | | 8.86 | | | | .28 | | | | .32 | | | | .60 | | | | (.28 | ) | | | 9.18 | | | | 6.85 | 7 | | | 303 | | | | .76 | 8 | | | .76 | 8 | | | 6.18 | 8 |
| 9/30/2022 | | | 10.55 | | | | .48 | | | | (1.70 | ) | | | (1.22 | ) | | | (.47 | ) | | | 8.86 | | | | (11.88 | ) | | | 293 | | | | .71 | | | | .71 | | | | 4.83 | |
| 9/30/2021 | | | 9.63 | | | | .47 | | | | .95 | | | | 1.42 | | | | (.50 | ) | | | 10.55 | | | | 15.03 | | | | 358 | | | | .71 | | | | .71 | | | | 4.59 | |
| 9/30/2020 | | | 9.96 | | | | .58 | | | | (.33 | ) | | | .25 | | | | (.58 | ) | | | 9.63 | | | | 2.68 | | | | 322 | | | | .76 | | | | .76 | | | | 6.08 | |
| 9/30/2019 | | | 10.25 | | | | .62 | | | | (.29 | ) | | | .33 | | | | (.62 | ) | | | 9.96 | | | | 3.34 | | | | 317 | | | | .78 | | | | .78 | | | | 6.08 | |
| 9/30/2018 | | | 10.48 | | | | .60 | | | | (.25 | ) | | | .35 | | | | (.58 | ) | | | 10.25 | | | | 3.51 | | | | 330 | | | | .77 | | | | .77 | | | | 5.84 | |
Refer to the end of the table for footnotes.
| 38 | American High-Income Trust |
Financial highlights (continued)
| | | | | | Income (loss) from
investment operations1 | | | | | | | | | | | | | | | | | | | | | | |
| Year ended | | Net asset
value,
beginning
of year | | | Net
investment
income | | | Net gains
(losses) on
securities
(both
realized and
unrealized) | | | Total from
investment
operations | | | Dividends
(from net
investment
income) | | | Net assets
value, end
of year | | | Total
return2,3 | | | Net assets,
end of year
(in millions) | | | Ratio of
expenses to
average net
assets before
reimburse-
ments4 | | | Ratio of
expenses to
average net
assets after
reimburse-
ments3,4 | | | Ratio of
net income
to average
net assets3 | |
| Class 529-C: | | | | | | | | | | | | | | | | | | | | | | | | | | | | | | | | | | | | | | | | | | | | |
| 3/31/20235,6 | | $ | 8.86 | | | $ | .25 | | | $ | .32 | | | $ | .57 | | | $ | (.25 | ) | | $ | 9.18 | | | | 6.45 | %7 | | $ | 10 | | | | 1.52 | %8 | | | 1.52 | %8 | | | 5.42 | %8 |
| 9/30/2022 | | | 10.55 | | | | .40 | | | | (1.70 | ) | | | (1.30 | ) | | | (.39 | ) | | | 8.86 | | | | (12.56 | ) | | | 11 | | | | 1.48 | | | | 1.48 | | | | 4.03 | |
| 9/30/2021 | | | 9.63 | | | | .40 | | | | .95 | | | | 1.35 | | | | (.43 | ) | | | 10.55 | | | | 14.19 | | | | 16 | | | | 1.45 | | | | 1.45 | | | | 3.87 | |
| 9/30/2020 | | | 9.96 | | | | .50 | | | | (.33 | ) | | | .17 | | | | (.50 | ) | | | 9.63 | | | | 1.92 | | | | 18 | | | | 1.50 | | | | 1.50 | | | | 5.41 | |
| 9/30/2019 | | | 10.25 | | | | .54 | | | | (.29 | ) | | | .25 | | | | (.54 | ) | | | 9.96 | | | | 2.58 | | | | 53 | | | | 1.51 | | | | 1.51 | | | | 5.35 | |
| 9/30/2018 | | | 10.48 | | | | .53 | | | | (.25 | ) | | | .28 | | | | (.51 | ) | | | 10.25 | | | | 2.73 | | | | 65 | | | | 1.53 | | | | 1.53 | | | | 5.06 | |
| Class 529-E: | | | | | | | | | | | | | | | | | | | | | | | | | | | | | | | | | | | | | | | | | | | | |
| 3/31/20235,6 | | | 8.86 | | | | .27 | | | | .32 | | | | .59 | | | | (.27 | ) | | | 9.18 | | | | 6.76 | 7 | | | 11 | | | | .94 | 8 | | | .94 | 8 | | | 5.99 | 8 |
| 9/30/2022 | | | 10.55 | | | | .46 | | | | (1.70 | ) | | | (1.24 | ) | | | (.45 | ) | | | 8.86 | | | | (12.06 | ) | | | 11 | | | | .90 | | | | .90 | | | | 4.64 | |
| 9/30/2021 | | | 9.63 | | | | .45 | | | | .95 | | | | 1.40 | | | | (.48 | ) | | | 10.55 | | | | 14.81 | | | | 14 | | | | .90 | | | | .90 | | | | 4.41 | |
| 9/30/2020 | | | 9.96 | | | | .57 | | | | (.34 | ) | | | .23 | | | | (.56 | ) | | | 9.63 | | | | 2.50 | | | | 14 | | | | .94 | | | | .94 | | | | 5.91 | |
| 9/30/2019 | | | 10.25 | | | | .60 | | | | (.29 | ) | | | .31 | | | | (.60 | ) | | | 9.96 | | | | 3.15 | | | | 16 | | | | .96 | | | | .96 | | | | 5.90 | |
| 9/30/2018 | | | 10.48 | | | | .58 | | | | (.25 | ) | | | .33 | | | | (.56 | ) | | | 10.25 | | | | 3.31 | | | | 16 | | | | .96 | | | | .96 | | | | 5.64 | |
| Class 529-T: | | | | | | | | | | | | | | | | | | | | | | | | | | | | | | | | | | | | | | | | | | | | |
| 3/31/20235,6 | | | 8.86 | | | | .29 | | | | .32 | | | | .61 | | | | (.29 | ) | | | 9.18 | | | | 6.98 | 7,9 | | | — | 10 | | | .51 | 8,9 | | | .51 | 8,9 | | | 6.41 | 8,9 |
| 9/30/2022 | | | 10.55 | | | | .50 | | | | (1.70 | ) | | | (1.20 | ) | | | (.49 | ) | | | 8.86 | | | | (11.68 | )9 | | | — | 10 | | | .48 | 9 | | | .48 | 9 | | | 5.07 | 9 |
| 9/30/2021 | | | 9.63 | | | | .50 | | | | .95 | | | | 1.45 | | | | (.53 | ) | | | 10.55 | | | | 15.30 | 9 | | | — | 10 | | | .48 | 9 | | | .48 | 9 | | | 4.82 | 9 |
| 9/30/2020 | | | 9.96 | | | | .60 | | | | (.33 | ) | | | .27 | | | | (.60 | ) | | | 9.63 | | | | 2.92 | 9 | | | — | 10 | | | .52 | 9 | | | .52 | 9 | | | 6.30 | 9 |
| 9/30/2019 | | | 10.25 | | | | .64 | | | | (.29 | ) | | | .35 | | | | (.64 | ) | | | 9.96 | | | | 3.59 | 9 | | | — | 10 | | | .53 | 9 | | | .53 | 9 | | | 6.32 | 9 |
| 9/30/2018 | | | 10.48 | | | | .63 | | | | (.25 | ) | | | .38 | | | | (.61 | ) | | | 10.25 | | | | 3.76 | 9 | | | — | 10 | | | .52 | 9 | | | .52 | 9 | | | 6.08 | 9 |
| Class 529-F-1: | | | | | | | | | | | | | | | | | | | | | | | | | | | | | | | | | | | | | | | | | | | | |
| 3/31/20235,6 | | | 8.86 | | | | .29 | | | | .32 | | | | .61 | | | | (.29 | ) | | | 9.18 | | | | 6.96 | 7,9 | | | — | 10 | | | .56 | 8,9 | | | .56 | 8,9 | | | 6.37 | 8,9 |
| 9/30/2022 | | | 10.55 | | | | .50 | | | | (1.70 | ) | | | (1.20 | ) | | | (.49 | ) | | | 8.86 | | | | (11.72 | )9 | | | — | 10 | | | .52 | 9 | | | .52 | 9 | | | 5.03 | 9 |
| 9/30/2021 | | | 9.63 | | | | .49 | | | | .95 | | | | 1.44 | | | | (.52 | ) | | | 10.55 | | | | 15.27 | 9 | | | — | 10 | | | .49 | 9 | | | .49 | 9 | | | 5.26 | 9 |
| 9/30/2020 | | | 9.96 | | | | .60 | | | | (.33 | ) | | | .27 | | | | (.60 | ) | | | 9.63 | | | | 2.92 | | | | 31 | | | | .53 | | | | .53 | | | | 6.31 | |
| 9/30/2019 | | | 10.25 | | | | .64 | | | | (.29 | ) | | | .35 | | | | (.64 | ) | | | 9.96 | | | | 3.58 | | | | 33 | | | | .54 | | | | .54 | | | | 6.32 | |
| 9/30/2018 | | | 10.48 | | | | .63 | | | | (.25 | ) | | | .38 | | | | (.61 | ) | | | 10.25 | | | | 3.75 | | | | 29 | | | | .54 | | | | .54 | | | | 6.07 | |
| Class 529-F-2: | | | | | | | | | | | | | | | | | | | | | | | | | | | | | | | | | | | | | | | | | | | | |
| 3/31/20235,6 | | | 8.86 | | | | .30 | | | | .32 | | | | .62 | | | | (.30 | ) | | | 9.18 | | | | 7.03 | 7 | | | 33 | | | | .42 | 8 | | | .42 | 8 | | | 6.51 | 8 |
| 9/30/2022 | | | 10.55 | | | | .51 | | | | (1.70 | ) | | | (1.19 | ) | | | (.50 | ) | | | 8.86 | | | | (11.62 | ) | | | 32 | | | | .41 | | | | .41 | | | | 5.13 | |
| 9/30/20215,11 | | | 9.62 | | | | .46 | | | | .95 | | | | 1.41 | | | | (.48 | ) | | | 10.55 | | | | 14.92 | 7 | | | 38 | | | | .44 | 8 | | | .44 | 8 | | | 4.82 | 8 |
| Class 529-F-3: | | | | | | | | | | | | | | | | | | | | | | | | | | | | | | | | | | | | | | | | | | | | |
| 3/31/20235,6 | | | 8.86 | | | | .30 | | | | .32 | | | | .62 | | | | (.30 | ) | | | 9.18 | | | | 7.04 | 7 | | | — | 10 | | | .40 | 8 | | | .40 | 8 | | | 6.53 | 8 |
| 9/30/2022 | | | 10.55 | | | | .51 | | | | (1.70 | ) | | | (1.19 | ) | | | (.50 | ) | | | 8.86 | | | | (11.59 | ) | | | — | 10 | | | .37 | | | | .37 | | | | 5.18 | |
| 9/30/20215,11 | | | 9.62 | | | | .46 | | | | .96 | | | | 1.42 | | | | (.49 | ) | | | 10.55 | | | | 14.99 | 7 | | | — | 10 | | | .43 | 8 | | | .37 | 8 | | | 4.90 | 8 |
| Class R-1: | | | | | | | | | | | | | | | | | | | | | | | | | | | | | | | | | | | | | | | | | | | | |
| 3/31/20235,6 | | | 8.86 | | | | .25 | | | | .32 | | | | .57 | | | | (.25 | ) | | | 9.18 | | | | 6.50 | 7 | | | 12 | | | | 1.43 | 8 | | | 1.43 | 8 | | | 5.51 | 8 |
| 9/30/2022 | | | 10.55 | | | | .41 | | | | (1.70 | ) | | | (1.29 | ) | | | (.40 | ) | | | 8.86 | | | | (12.50 | ) | | | 12 | | | | 1.41 | | | | 1.41 | | | | 4.14 | |
| 9/30/2021 | | | 9.63 | | | | .40 | | | | .95 | | | | 1.35 | | | | (.43 | ) | | | 10.55 | | | | 14.22 | | | | 14 | | | | 1.43 | | | | 1.43 | | | | 3.88 | |
| 9/30/2020 | | | 9.96 | | | | .51 | | | | (.33 | ) | | | .18 | | | | (.51 | ) | | | 9.63 | | | | 1.94 | | | | 12 | | | | 1.49 | | | | 1.49 | | | | 5.37 | |
| 9/30/2019 | | | 10.25 | | | | .55 | | | | (.29 | ) | | | .26 | | | | (.55 | ) | | | 9.96 | | | | 2.61 | | | | 9 | | | | 1.49 | | | | 1.49 | | | | 5.38 | |
| 9/30/2018 | | | 10.48 | | | | .53 | | | | (.25 | ) | | | .28 | | | | (.51 | ) | | | 10.25 | | | | 2.77 | | | | 11 | | | | 1.48 | | | | 1.48 | | | | 5.12 | |
Refer to the end of the table for footnotes.
| American High-Income Trust | 39 |
Financial highlights (continued)
| | | | | | Income (loss) from
investment operations1 | | | | | | | | | | | | | | | | | | | | | | |
| Year ended | | Net asset
value,
beginning
of year | | | Net
investment
income | | | Net gains
(losses) on
securities
(both
realized and
unrealized) | | | Total from
investment
operations | | | Dividends
(from net
investment
income) | | | Net assets
value, end
of year | | | Total
return2,3 | | | Net assets,
end of year
(in millions) | | | Ratio of
expenses to
average net
assets before
reimburse-
ments4 | | | Ratio of
expenses to
average net
assets after
reimburse-
ments3,4 | | | Ratio of
net income
to average
net assets3 | |
| Class R-2: | | | | | | | | | | | | | | | | | | | | | | | | | | | | | | | | | | | | | | | | | | | | |
| 3/31/20235,6 | | $ | 8.86 | | | $ | .25 | | | $ | .32 | | | $ | .57 | | | $ | (.25 | ) | | $ | 9.18 | | | | 6.50 | %7 | | $ | 109 | | | | 1.43 | %8 | | | 1.43 | %8 | | | 5.50 | %8 |
| 9/30/2022 | | | 10.55 | | | | .41 | | | | (1.70 | ) | | | (1.29 | ) | | | (.40 | ) | | | 8.86 | | | | (12.49 | ) | | | 106 | | | | 1.40 | | | | 1.40 | | | | 4.13 | |
| 9/30/2021 | | | 9.63 | | | | .40 | | | | .95 | | | | 1.35 | | | | (.43 | ) | | | 10.55 | | | | 14.25 | | | | 135 | | | | 1.40 | | | | 1.40 | | | | 3.91 | |
| 9/30/2020 | | | 9.96 | | | | .52 | | | | (.34 | ) | | | .18 | | | | (.51 | ) | | | 9.63 | | | | 1.96 | | | | 122 | | | | 1.46 | | | | 1.46 | | | | 5.39 | |
| 9/30/2019 | | | 10.25 | | | | .55 | | | | (.29 | ) | | | .26 | | | | (.55 | ) | | | 9.96 | | | | 2.63 | | | | 143 | | | | 1.46 | | | | 1.46 | | | | 5.40 | |
| 9/30/2018 | | | 10.48 | | | | .53 | | | | (.25 | ) | | | .28 | | | | (.51 | ) | | | 10.25 | | | | 2.80 | | | | 150 | | | | 1.46 | | | | 1.46 | | | | 5.14 | |
| Class R-2E: | | | | | | | | | | | | | | | | | | | | | | | | | | | | | | | | | | | | | | | | | | | | |
| 3/31/20235,6 | | | 8.86 | | | | .27 | | | | .32 | | | | .59 | | | | (.27 | ) | | | 9.18 | | | | 6.66 | 7 | | | 7 | | | | 1.14 | 8 | | | 1.14 | 8 | | | 5.81 | 8 |
| 9/30/2022 | | | 10.55 | | | | .44 | | | | (1.70 | ) | | | (1.26 | ) | | | (.43 | ) | | | 8.86 | | | | (12.24 | ) | | | 6 | | | | 1.11 | | | | 1.11 | | | | 4.42 | |
| 9/30/2021 | | | 9.63 | | | | .43 | | | | .95 | | | | 1.38 | | | | (.46 | ) | | | 10.55 | | | | 14.57 | | | | 8 | | | | 1.12 | | | | 1.12 | | | | 4.20 | |
| 9/30/2020 | | | 9.96 | | | | .54 | | | | (.33 | ) | | | .21 | | | | (.54 | ) | | | 9.63 | | | | 2.26 | | | | 8 | | | | 1.17 | | | | 1.17 | | | | 5.68 | |
| 9/30/2019 | | | 10.25 | | | | .58 | | | | (.29 | ) | | | .29 | | | | (.58 | ) | | | 9.96 | | | | 2.93 | | | | 9 | | | | 1.17 | | | | 1.17 | | | | 5.68 | |
| 9/30/2018 | | | 10.48 | | | | .56 | | | | (.25 | ) | | | .31 | | | | (.54 | ) | | | 10.25 | | | | 3.09 | | | | 7 | | | | 1.18 | | | | 1.18 | | | | 5.44 | |
| Class R-3: | | | | | | | | | | | | | | | | | | | | | | | | | | | | | | | | | | | | | | | | | | | | |
| 3/31/20235,6 | | | 8.86 | | | | .27 | | | | .32 | | | | .59 | | | | (.27 | ) | | | 9.18 | | | | 6.74 | 7 | | | 135 | | | | .99 | 8 | | | .99 | 8 | | | 5.95 | 8 |
| 9/30/2022 | | | 10.55 | | | | .46 | | | | (1.70 | ) | | | (1.24 | ) | | | (.45 | ) | | | 8.86 | | | | (12.10 | ) | | | 131 | | | | .95 | | | | .95 | | | | 4.58 | |
| 9/30/2021 | | | 9.63 | | | | .45 | | | | .95 | | | | 1.40 | | | | (.48 | ) | | | 10.55 | | | | 14.76 | | | | 167 | | | | .96 | | | | .96 | | | | 4.35 | |
| 9/30/2020 | | | 9.96 | | | | .55 | | | | (.33 | ) | | | .22 | | | | (.55 | ) | | | 9.63 | | | | 2.43 | | | | 142 | | | | 1.00 | | | | 1.00 | | | | 5.85 | |
| 9/30/2019 | | | 10.25 | | | | .59 | | | | (.29 | ) | | | .30 | | | | (.59 | ) | | | 9.96 | | | | 3.09 | | | | 164 | | | | 1.01 | | | | 1.01 | | | | 5.85 | |
| 9/30/2018 | | | 10.48 | | | | .58 | | | | (.25 | ) | | | .33 | | | | (.56 | ) | | | 10.25 | | | | 3.26 | | | | 175 | | | | 1.01 | | | | 1.01 | | | | 5.60 | |
| Class R-4: | | | | | | | | | | | | | | | | | | | | | | | | | | | | | | | | | | | | | | | | | | | | |
| 3/31/20235,6 | | | 8.86 | | | | .29 | | | | .32 | | | | .61 | | | | (.29 | ) | | | 9.18 | | | | 6.90 | 7 | | | 115 | | | | .68 | 8 | | | .68 | 8 | | | 6.26 | 8 |
| 9/30/2022 | | | 10.55 | | | | .49 | | | | (1.70 | ) | | | (1.21 | ) | | | (.48 | ) | | | 8.86 | | | | (11.83 | ) | | | 107 | | | | .65 | | | | .65 | | | | 4.89 | |
| 9/30/2021 | | | 9.63 | | | | .48 | | | | .95 | | | | 1.43 | | | | (.51 | ) | | | 10.55 | | | | 15.10 | | | | 135 | | | | .65 | | | | .65 | | | | 4.66 | |
| 9/30/2020 | | | 9.96 | | | | .58 | | | | (.33 | ) | | | .25 | | | | (.58 | ) | | | 9.63 | | | | 2.75 | | | | 120 | | | | .69 | | | | .69 | | | | 6.16 | |
| 9/30/2019 | | | 10.25 | | | | .63 | | | | (.29 | ) | | | .34 | | | | (.63 | ) | | | 9.96 | | | | 3.41 | | | | 138 | | | | .71 | | | | .71 | | | | 6.16 | |
| 9/30/2018 | | | 10.48 | | | | .61 | | | | (.25 | ) | | | .36 | | | | (.59 | ) | | | 10.25 | | | | 3.57 | | | | 138 | | | | .70 | | | | .70 | | | | 5.90 | |
| Class R-5E: | | | | | | | | | | | | | | | | | | | | | | | | | | | | | | | | | | | | | | | | | | | | |
| 3/31/20235,6 | | | 8.86 | | | | .29 | | | | .32 | | | | .61 | | | | (.29 | ) | | | 9.18 | | | | 7.00 | 7 | | | 19 | | | | .49 | 8 | | | .49 | 8 | | | 6.45 | 8 |
| 9/30/2022 | | | 10.55 | | | | .51 | | | | (1.70 | ) | | | (1.19 | ) | | | (.50 | ) | | | 8.86 | | | | (11.66 | ) | | | 17 | | | | .45 | | | | .45 | | | | 5.15 | |
| 9/30/2021 | | | 9.63 | | | | .50 | | | | .95 | | | | 1.45 | | | | (.53 | ) | | | 10.55 | | | | 15.33 | | | | 15 | | | | .45 | | | | .45 | | | | 4.85 | |
| 9/30/2020 | | | 9.96 | | | | .60 | | | | (.33 | ) | | | .27 | | | | (.60 | ) | | | 9.63 | | | | 2.95 | | | | 11 | | | | .49 | | | | .49 | | | | 6.32 | |
| 9/30/2019 | | | 10.25 | | | | .65 | | | | (.29 | ) | | | .36 | | | | (.65 | ) | | | 9.96 | | | | 3.62 | | | | 8 | | | | .49 | | | | .49 | | | | 6.35 | |
| 9/30/2018 | | | 10.48 | | | | .63 | | | | (.25 | ) | | | .38 | | | | (.61 | ) | | | 10.25 | | | | 3.80 | | | | 3 | | | | .48 | | | | .48 | | | | 6.22 | |
| Class R-5: | | | | | | | | | | | | | | | | | | | | | | | | | | | | | | | | | | | | | | | | | | | | |
| 3/31/20235,6 | | | 8.86 | | | | .30 | | | | .32 | | | | .62 | | | | (.30 | ) | | | 9.18 | | | | 7.05 | 7 | | | 29 | | | | .38 | 8 | | | .38 | 8 | | | 6.55 | 8 |
| 9/30/2022 | | | 10.55 | | | | .51 | | | | (1.70 | ) | | | (1.19 | ) | | | (.50 | ) | | | 8.86 | | | | (11.58 | ) | | | 28 | | | | .36 | | | | .36 | | | | 4.97 | |
| 9/30/2021 | | | 9.63 | | | | .51 | | | | .95 | | | | 1.46 | | | | (.54 | ) | | | 10.55 | | | | 15.44 | | | | 84 | | | | .35 | | | | .35 | | | | 4.95 | |
| 9/30/2020 | | | 9.96 | | | | .62 | | | | (.34 | ) | | | .28 | | | | (.61 | ) | | | 9.63 | | | | 3.06 | | | | 74 | | | | .39 | | | | .39 | | | | 6.46 | |
| 9/30/2019 | | | 10.25 | | | | .66 | | | | (.29 | ) | | | .37 | | | | (.66 | ) | | | 9.96 | | | | 3.72 | | | | 79 | | | | .41 | | | | .41 | | | | 6.46 | |
| 9/30/2018 | | | 10.48 | | | | .64 | | | | (.25 | ) | | | .39 | | | | (.62 | ) | | | 10.25 | | | | 3.88 | | | | 84 | | | | .40 | | | | .40 | | | | 6.20 | |
| Class R-6: | | | | | | | | | | | | | | | | | | | | | | | | | | | | | | | | | | | | | | | | | | | | |
| 3/31/20235,6 | | | 8.86 | | | | .30 | | | | .32 | | | | .62 | | | | (.30 | ) | | | 9.18 | | | | 7.08 | 7 | | | 2,834 | | | | .33 | 8 | | | .33 | 8 | | | 6.61 | 8 |
| 9/30/2022 | | | 10.55 | | | | .52 | | | | (1.70 | ) | | | (1.18 | ) | | | (.51 | ) | | | 8.86 | | | | (11.52 | ) | | | 2,659 | | | | .30 | | | | .30 | | | | 5.25 | |
| 9/30/2021 | | | 9.63 | | | | .51 | | | | .95 | | | | 1.46 | | | | (.54 | ) | | | 10.55 | | | | 15.50 | | | | 3,581 | | | | .30 | | | | .30 | | | | 5.01 | |
| 9/30/2020 | | | 9.96 | | | | .63 | | | | (.34 | ) | | | .29 | | | | (.62 | ) | | | 9.63 | | | | 3.11 | | | | 3,169 | | | | .33 | | | | .33 | | | | 6.46 | |
| 9/30/2019 | | | 10.25 | | | | .66 | | | | (.29 | ) | | | .37 | | | | (.66 | ) | | | 9.96 | | | | 3.78 | | | | 2,301 | | | | .35 | | | | .35 | | | | 6.51 | |
| 9/30/2018 | | | 10.48 | | | | .65 | | | | (.25 | ) | | | .40 | | | | (.63 | ) | | | 10.25 | | | | 3.94 | | | | 1,994 | | | | .35 | | | | .35 | | | | 6.26 | |
Refer to the end of the table for footnotes.
| 40 | American High-Income Trust |
Financial highlights (continued)
| | | Six months
ended
March 31,
20235,6,7 | | |
Year ended September 30, |
| | 2022 | | | 2021 | | | 2020 | | | 2019 | | | 2018 | |
| Portfolio turnover rate for all share classes12 | | | 18% | | | | 40% | | | | 66% | | | | 75% | | | | 52% | | | | 62% | |
| 1 | Based on average shares outstanding. |
| 2 | Total returns exclude any applicable sales charges, including contingent deferred sales charges. |
| 3 | This column reflects the impact, if any, of certain reimbursements from CRMC. During one of the years shown, CRMC reimbursed a portion of transfer agent services fees for Class 529-F-3 shares. |
| 4 | Ratios do not include expenses of any Central Funds. The fund indirectly bears its proportionate share of the expenses of any Central Funds. |
| 5 | Based on operations for a period that is less than a full year. |
| 6 | Unaudited. |
| 7 | Not annualized. |
| 8 | Annualized. |
| 9 | All or a significant portion of assets in this class consisted of seed capital invested by CRMC and/or its affiliates. Fees for distribution services are not charged or accrued on these seed capital assets. If such fees were paid by the fund on seed capital assets, fund expenses would have been higher and net income and total return would have been lower. |
| 10 | Amount less than $1 million. |
| 11 | Class 529-F-2 and 529-F-3 shares began investment operations on October 30, 2020. |
| 12 | Rates do not include the fund’s portfolio activity with respect to any Central Funds. |
Refer to the notes to financial statements.
| American High-Income Trust | 41 |
As a fund shareholder, you incur two types of costs: (1) transaction costs, such as initial sales charges on purchase payments and contingent deferred sales charges on redemptions (loads), and (2) ongoing costs, including management fees, distribution and service (12b-1) fees, and other expenses. This example is intended to help you understand your ongoing costs (in dollars) of investing in the fund so you can compare these costs with the ongoing costs of investing in other mutual funds. The example is based on an investment of $1,000 invested at the beginning of the period and held for the entire six-month period (October 1, 2022, through March 31, 2023).
Actual expenses:
The first line of each share class in the table on the following page provides information about actual account values and actual expenses. You may use the information in this line, together with the amount you invested, to estimate the expenses that you paid over the period. Simply divide your account value by $1,000 (for example, an $8,600 account value divided by $1,000 = 8.6), then multiply the result by the number in the first line under the heading titled “Expenses paid during period” to estimate the expenses you paid on your account during this period.
Hypothetical example for comparison purposes:
The second line of each share class in the table on the following page provides information about hypothetical account values and hypothetical expenses based on the actual expense ratio for the share class and an assumed rate of return of 5.00% per year before expenses, which is not the actual return of the share class. The hypothetical account values and expenses may not be used to estimate the actual ending account balance or expenses you paid for the period. You may use this information to compare the ongoing costs of investing in the fund and other funds. To do so, compare this 5.00% hypothetical example with the 5.00% hypothetical examples that appear in the shareholder reports of the other funds.
Notes:
Retirement plan participants may be subject to certain fees charged by the plan sponsor, and Class F-1, F-2, F-3, 529-F-1, 529-F-2 and 529-F-3 shareholders may be subject to fees charged by financial intermediaries, typically ranging from 0.75% to 1.50% of assets annually depending on services offered. You can estimate the impact of these fees by adding the amount of the fees to the total estimated expenses you paid on your account during the period as calculated above. In addition, your ending account value would be lower by the amount of these fees.
Note that the expenses shown in the table on the following page are meant to highlight your ongoing costs only and do not reflect any transactional costs, such as sales charges (loads). Therefore, the second line of each share class in the table is useful in comparing ongoing costs only and will not help you determine the relative total costs of owning different funds. In addition, if these transactional costs were included, your costs would have been higher.
| 42 | American High-Income Trust |
Expense example (continued)
| | | Beginning
account value
10/1/2022 | | | Ending
account value
3/31/2023 | | | Expenses paid
during period* | | | Annualized
expense ratio | |
| Class A – actual return | | $ | 1,000.00 | | | $ | 1,068.74 | | | $ | 3.71 | | | | .72 | % |
| Class A – assumed 5% return | | | 1,000.00 | | | | 1,021.34 | | | | 3.63 | | | | .72 | |
| Class C – actual return | | | 1,000.00 | | | | 1,064.84 | | | | 7.52 | | | | 1.46 | |
| Class C – assumed 5% return | | | 1,000.00 | | | | 1,017.65 | | | | 7.34 | | | | 1.46 | |
| Class T – actual return | | | 1,000.00 | | | | 1,070.13 | | | | 2.32 | | | | .45 | |
| Class T – assumed 5% return | | | 1,000.00 | | | | 1,022.69 | | | | 2.27 | | | | .45 | |
| Class F-1 – actual return | | | 1,000.00 | | | | 1,068.70 | | | | 3.77 | | | | .73 | |
| Class F-1 – assumed 5% return | | | 1,000.00 | | | | 1,021.29 | | | | 3.68 | | | | .73 | |
| Class F-2 – actual return | | | 1,000.00 | | | | 1,070.28 | | | | 2.22 | | | | .43 | |
| Class F-2 – assumed 5% return | | | 1,000.00 | | | | 1,022.79 | | | | 2.17 | | | | .43 | |
| Class F-3 – actual return | | | 1,000.00 | | | | 1,070.82 | | | | 1.70 | | | | .33 | |
| Class F-3 – assumed 5% return | | | 1,000.00 | | | | 1,023.29 | | | | 1.66 | | | | .33 | |
| Class 529-A – actual return | | | 1,000.00 | | | | 1,068.54 | | | | 3.92 | | | | .76 | |
| Class 529-A – assumed 5% return | | | 1,000.00 | | | | 1,021.14 | | | | 3.83 | | | | .76 | |
| Class 529-C – actual return | | | 1,000.00 | | | | 1,064.49 | | | | 7.82 | | | | 1.52 | |
| Class 529-C – assumed 5% return | | | 1,000.00 | | | | 1,017.35 | | | | 7.64 | | | | 1.52 | |
| Class 529-E – actual return | | | 1,000.00 | | | | 1,067.58 | | | | 4.85 | | | | .94 | |
| Class 529-E – assumed 5% return | | | 1,000.00 | | | | 1,020.24 | | | | 4.73 | | | | .94 | |
| Class 529-T – actual return | | | 1,000.00 | | | | 1,069.79 | | | | 2.63 | | | | .51 | |
| Class 529-T – assumed 5% return | | | 1,000.00 | | | | 1,022.39 | | | | 2.57 | | | | .51 | |
| Class 529-F-1 – actual return | | | 1,000.00 | | | | 1,069.58 | | | | 2.89 | | | | .56 | |
| Class 529-F-1 – assumed 5% return | | | 1,000.00 | | | | 1,022.14 | | | | 2.82 | | | | .56 | |
| Class 529-F-2 – actual return | | | 1,000.00 | | | | 1,070.31 | | | | 2.17 | | | | .42 | |
| Class 529-F-2 – assumed 5% return | | | 1,000.00 | | | | 1,022.84 | | | | 2.12 | | | | .42 | |
| Class 529-F-3 – actual return | | | 1,000.00 | | | | 1,070.42 | | | | 2.06 | | | | .40 | |
| Class 529-F-3 – assumed 5% return | | | 1,000.00 | | | | 1,022.94 | | | | 2.02 | | | | .40 | |
| Class R-1 – actual return | | | 1,000.00 | | | | 1,064.98 | | | | 7.36 | | | | 1.43 | |
| Class R-1 – assumed 5% return | | | 1,000.00 | | | | 1,017.80 | | | | 7.19 | | | | 1.43 | |
| Class R-2 – actual return | | | 1,000.00 | | | | 1,064.98 | | | | 7.36 | | | | 1.43 | |
| Class R-2 – assumed 5% return | | | 1,000.00 | | | | 1,017.80 | | | | 7.19 | | | | 1.43 | |
| Class R-2E – actual return | | | 1,000.00 | | | | 1,066.56 | | | | 5.87 | | | | 1.14 | |
| Class R-2E – assumed 5% return | | | 1,000.00 | | | | 1,019.25 | | | | 5.74 | | | | 1.14 | |
| Class R-3 – actual return | | | 1,000.00 | | | | 1,067.36 | | | | 5.10 | | | | .99 | |
| Class R-3 – assumed 5% return | | | 1,000.00 | | | | 1,020.00 | | | | 4.99 | | | | .99 | |
| Class R-4 – actual return | | | 1,000.00 | | | | 1,068.97 | | | | 3.51 | | | | .68 | |
| Class R-4 – assumed 5% return | | | 1,000.00 | | | | 1,021.54 | | | | 3.43 | | | | .68 | |
| Class R-5E – actual return | | | 1,000.00 | | | | 1,069.98 | | | | 2.53 | | | | .49 | |
| Class R-5E – assumed 5% return | | | 1,000.00 | | | | 1,022.49 | | | | 2.47 | | | | .49 | |
| Class R-5 – actual return | | | 1,000.00 | | | | 1,070.51 | | | | 1.96 | | | | .38 | |
| Class R-5 – assumed 5% return | | | 1,000.00 | | | | 1,023.04 | | | | 1.92 | | | | .38 | |
| Class R-6 – actual return | | | 1,000.00 | | | | 1,070.82 | | | | 1.70 | | | | .33 | |
| Class R-6 – assumed 5% return | | | 1,000.00 | | | | 1,023.29 | | | | 1.66 | | | | .33 | |
|
| * | The “expenses paid during period” are equal to the “annualized expense ratio,” multiplied by the average account value over the period, multiplied by the number of days in the period, and divided by 365 (to reflect the one-half year period). |
| American High-Income Trust | 43 |
Approval of Investment Advisory and Service Agreement
The fund’s board has approved the continuation of the fund’s Investment Advisory and Service Agreement (the “agreement”) with Capital Research and Management Company (“CRMC”) for an additional one-year term through April 30, 2024. The agreement was amended to lower the current fee schedule resulting in an overall lower advisory fee. The board approved the agreement following the recommendation of the fund’s Contracts Committee (the “committee”), which is composed of all the fund’s independent board members. The board and the committee determined in the exercise of their business judgment that the fund’s advisory fee structure was fair and reasonable in relation to the services provided, and that approving the agreement was in the best interests of the fund and its shareholders.
In reaching this decision, the board and the committee took into account their interactions with CRMC as well as information furnished to them throughout the year and otherwise provided to them, as well as information prepared specifically in connection with their review of the agreement, and were advised by their independent counsel with respect to the matters considered. They considered the following factors, among others, but did not identify any single issue or particular piece of information that, in isolation, was the controlling factor, and each board and committee member did not necessarily attribute the same weight to each factor.
1. Nature, extent and quality of services
The board and the committee considered the depth and quality of CRMC’s investment management process, including its global research capabilities; the experience, capability and integrity of its senior management and other personnel; the low turnover rates of its key personnel; the overall financial strength and stability of CRMC and the Capital Group organization; the resources and systems CRMC devotes to investment management (the manner in which the fund’s assets are managed, including liquidity management), financial, investment operations, compliance, trading, proxy voting, shareholder communications, and other services; and the ongoing evolution of CRMC’s organizational structure designed to maintain and strengthen these qualities. The board and the committee also considered the nature, extent and quality of administrative and shareholder services provided by CRMC to the fund under the agreement and other agreements, as well as the benefits to fund shareholders from investing in a fund that is part of a large family of funds. The board and the committee considered the risks assumed by CRMC in providing services to the fund, including operational, business, financial, reputational, regulatory and litigation risks. The board and the committee concluded that the nature, extent and quality of the services provided by CRMC have benefited and should continue to benefit the fund and its shareholders.
2. Investment results
The board and the committee considered the investment results of the fund in light of its objective. They compared the fund’s investment results with those of other funds (including funds that currently form the basis of the Lipper index for the category in which the fund is included) and data such as relevant market and fund indexes over various periods (including the fund’s lifetime) through September 30, 2022. They generally placed greater emphasis on investment results over longer term periods. On the basis of this evaluation and the board’s and the committee’s ongoing review of investment results, and considering the relative market conditions during certain reporting periods, the board and the committee concluded that the fund’s investment results have been satisfactory for renewal of the agreement, and that CRMC’s record in managing the fund indicated that its continued management should benefit the fund and its shareholders.
3. Advisory fees and total expenses
The board and the committee compared the advisory fees and total expense levels of the fund to those of other relevant funds. They observed that the fund’s advisory fees and expenses generally compared favorably to those of other similar funds included in the comparable Lipper category. The board and the committee also considered the breakpoint discounts in the fund’s advisory fee structure that reduce the level of fees charged by CRMC to the fund as fund assets increase. In addition, they reviewed information regarding the effective advisory fees charged to non-mutual fund clients by CRMC and its affiliates. They noted that, to the extent there were differences between the advisory fees paid by the fund and the advisory fees paid by those clients, the differences appropriately reflected the investment, operational, regulatory and market differences between advising the fund and the other clients. The board and the committee concluded that the fund’s cost structure was fair and reasonable in relation to the services provided, as well as in relation to the risks assumed by the adviser in sponsoring and managing the fund, and that the fund’s shareholders receive reasonable value in return for the advisory fees and other amounts paid to CRMC by the fund.
| 44 | American High-Income Trust |
4. Ancillary benefits
The board and the committee considered a variety of other benefits that CRMC and its affiliates receive as a result of CRMC’s relationship with the fund and other American Funds, including fees for administrative services provided to certain share classes; fees paid to CRMC’s affiliated transfer agent; sales charges and distribution fees received and retained by the fund’s principal underwriter, an affiliate of CRMC; and possible ancillary benefits to CRMC and its institutional management affiliates in managing other investment vehicles. The board and the committee reviewed CRMC’s portfolio trading practices, noting that CRMC bears the cost of third-party research. The board and committee also noted that CRMC benefitted from the use of commissions from portfolio transactions made on behalf of the fund to facilitate payment to certain broker-dealers for research to comply with regulatory requirements applicable to these firms, with all such amounts reimbursed by CRMC. The board and the committee took these ancillary benefits into account in evaluating the reasonableness of the advisory fees and other amounts paid to CRMC by the fund.
5. Adviser financial information
The board and the committee reviewed information regarding CRMC’s costs of providing services to the American Funds, including personnel, systems and resources of investment, compliance, trading, accounting and other administrative operations. They considered CRMC’s costs and related cost allocation methodology as well as its track record of investing in technology, infrastructure and staff to maintain and expand services and capabilities, respond to industry and regulatory developments, and attract and retain qualified personnel. They noted information regarding the compensation structure for CRMC’s investment professionals. They reviewed information on the profitability of the investment adviser and its affiliates. The board and the committee also compared CRMC’s profitability and compensation data to the reported results and data of a number of large, publicly held investment management companies. The board and the committee noted the competitiveness and cyclicality of both the mutual fund industry and the capital markets, and the importance in that environment of CRMC’s long-term profitability for maintaining its independence, company culture and management continuity. They further considered the breakpoint discounts in the fund’s advisory fee structure and CRMC’s sharing of potential economies of scale, or efficiencies, through breakpoints and other fee reductions and costs voluntarily absorbed. The board and the committee concluded that the fund’s advisory fee structure reflected a reasonable sharing of benefits between CRMC and the fund’s shareholders.
| American High-Income Trust | 45 |
| Liquidity Risk Management Program | unaudited |
The fund has adopted a liquidity risk management program (the “program”). The fund’s board has designated Capital Research and Management Company (“CRMC”) as the administrator of the program. Personnel of CRMC or its affiliates conduct the day-to-day operation of the program pursuant to policies and procedures administered by the Capital Group Liquidity Risk Management Committee.
Under the program, CRMC manages the fund’s liquidity risk, which is the risk that the fund could not meet shareholder redemption requests without significant dilution of remaining shareholders’ interests in the fund. This risk is managed by monitoring the degree of liquidity of the fund’s investments, limiting the amount of the fund’s illiquid investments, and utilizing various risk management tools and facilities available to the fund for meeting shareholder redemptions, among other means. CRMC’s process of determining the degree of liquidity of the fund’s investments is supported by one or more third-party liquidity assessment vendors.
The fund’s board reviewed a report prepared by CRMC regarding the operation and effectiveness of the program for the period October 1, 2021, through September 30, 2022. No significant liquidity events impacting the fund were noted in the report. In addition, CRMC provided its assessment that the program had been effective in managing the fund’s liquidity risk.
| 46 | American High-Income Trust |
This page was intentionally left blank.
| American High-Income Trust | 47 |
This page was intentionally left blank.
| 48 | American High-Income Trust |
This page was intentionally left blank.
| American High-Income Trust | 49 |
This page was intentionally left blank.
| 50 | American High-Income Trust |
This page was intentionally left blank.
| American High-Income Trust | 51 |
Office of the fund
333 South Hope Street
Los Angeles, CA 90071-1406
Investment adviser
Capital Research and Management Company
333 South Hope Street
Los Angeles, CA 90071-1406
Transfer agent for shareholder accounts
American Funds Service Company
(Write to the address nearest you.)
P.O. Box 6007
Indianapolis, IN 46206-6007
P.O. Box 2280
Norfolk, VA 23501-2280
Custodian of assets
JPMorgan Chase Bank
270 Park Avenue
New York, NY 10017-2070
Counsel
Morgan, Lewis & Bockius LLP
One Federal Street
Boston, MA 02110-1726
Independent registered public accounting firm
Deloitte & Touche LLP
695 Town Center Drive
Suite 1000
Costa Mesa, CA 92626-7188
Principal underwriter
American Funds Distributors, Inc.
333 South Hope Street
Los Angeles, CA 90071-1406
| 52 | American High-Income Trust |
Investors should carefully consider investment objectives, risks, charges and expenses. This and other important information is contained in the fund prospectus and summary prospectus, which can be obtained from your financial professional and should be read carefully before investing. You may also call American Funds Service Company (AFS) at (800) 421-4225 or refer to the Capital Group website at capitalgroup.com.
“American Funds Proxy Voting Procedures and Principles” — which describes how we vote proxies relating to portfolio securities — is available on our website or upon request by calling AFS. The fund files its proxy voting record with the U.S. Securities and Exchange Commission (SEC) for the 12 months ended June 30 by August 31. The proxy voting record is available free of charge on the SEC website at sec.gov and on our website.
American High-Income Trust files a complete list of its portfolio holdings with the SEC for the first and third quarters of each fiscal year on Form NPORT-P. The list of portfolio holdings is available free of charge on the SEC website and on our website.
This report is for the information of shareholders of American High-Income Trust, but it also may be used as sales literature when preceded or accompanied by the current prospectus or summary prospectus, which gives details about charges, expenses, investment objectives and operating policies of the fund. If used as sales material after June 30, 2023, this report must be accompanied by an American Funds statistical update for the most recently completed calendar quarter.
Bloomberg® is a trademark of Bloomberg Finance L.P. (collectively “Bloomberg”). Bloomberg or Bloomberg’s licensors own all proprietary rights in the Bloomberg Indices. Neither Bloomberg nor Bloomberg’s licensors approves or endorses this material, or guarantees the accuracy or completeness of any information herein, or makes any warranty, express or implied, as to the results to be obtained therefrom and, to the maximum extent allowed by law, neither shall have any liability or responsibility for injury or damages arising in connection therewith.
American Funds Distributors, Inc.
The Capital Advantage®
Since 1931, Capital Group, home of American Funds, has helped investors pursue long-term investment success. Our consistent approach — in combination with The Capital SystemTM — has resulted in superior outcomes.
| | Aligned with investor success We base our decisions on a long-term perspective, which we believe aligns our goals with the interests of our clients. Our portfolio managers average 28 years of investment industry experience, including 22 years at our company, reflecting a career commitment to our long-term approach.1 The Capital System The Capital System combines individual accountability with teamwork. Funds using The Capital System are divided into portions that are managed independently by investment professionals with diverse backgrounds, ages and investment approaches. An extensive global research effort is the backbone of our system. American Funds’ superior outcomes Equity-focused funds have beaten their Lipper peer indexes in 90% of 10-year periods and 99% of 20-year periods.2 Relative to their peers, our fixed income funds have helped investors achieve better diversification through attention to correlation between bonds and equities.3 Fund management fees have been among the lowest in the industry.4 |
| | | |
| | 1 | Investment industry experience as of December 31, 2022. |
| | 2 | Based on Class F-2 share results for rolling monthly 10- and 20-year periods starting with the first 10- or 20-year period after each mutual fund’s inception through December 31, 2022. Periods covered are the shorter of the fund’s lifetime or since the comparable Lipper index inception date (except Capital Income Builder and SMALLCAP World Fund, for which the Lipper average was used). Expenses differ for each share class, so results will vary. Past results are not predictive of results in future periods. |
| | 3 | Based on Class F-2 share results as of December 31, 2022. Sixteen of the 18 fixed income American Funds that have been in existence for the three-year period showed a three-year correlation lower than their respective Morningstar peer group averages. S&P 500 Index was used as an equity market proxy. Correlation based on monthly total returns. Correlation is a statistical measure of how two securities move in relation to each other. A correlation ranges from –1 to 1. A positive correlation close to 1 implies that as one security moves, either up or down, the other security will move in “lockstep,” in the same direction. A negative correlation close to –1 indicates that the securities have moved in the opposite direction. |
| | 4 | On average, our mutual fund management fees were in the lowest quintile 62% of the time, based on the 20-year period ended December 31, 2022, versus comparable Lipper categories, excluding funds of funds. |
Class F-2 shares were first offered on August 1, 2008. Class F-2 share results prior to the date of first sale are hypothetical based on the results of the original share class of the fund without a sales charge, adjusted for typical estimated expenses. Results for certain funds with an inception date after August 1, 2008, also include hypothetical returns because those funds’ Class F-2 shares sold after the funds’ date of first offering. Refer to capitalgroup.com for more information on specific expense adjustments and the actual dates of first sale.
All Capital Group trademarks mentioned are owned by The Capital Group Companies, Inc., an affiliated company or fund. All other company and product names mentioned are the property of their respective companies.

ITEM 2 – Code of Ethics
Not applicable for filing of semi-annual reports to shareholders.
ITEM 3 – Audit Committee Financial Expert
Not applicable for filing of semi-annual reports to shareholders.
ITEM 4 – Principal Accountant Fees and Services
Not applicable for filing of semi-annual reports to shareholders.
ITEM 5 – Audit Committee of Listed Registrants
Not applicable to this Registrant, insofar as the Registrant is not a listed issuer as defined in Rule 10A-3 under the Securities Exchange Act of 1934.
ITEM 6 – Schedule of Investments
Not applicable, insofar as the schedule is included as part of the report to shareholders filed under Item 1 of this Form.
ITEM 7 – Disclosure of Proxy Voting Policies and Procedures for Closed-End Management Investment Companies.
Not applicable to this Registrant, insofar as the Registrant is not a closed-end management investment company.
ITEM 8 – Portfolio Managers of Closed-End Management Investment Companies
Not applicable to this Registrant, insofar as the Registrant is not a closed-end management investment company.
ITEM 9 – Purchases of Equity Securities by Closed-End Management Investment Company and Affiliated Purchasers
Not applicable to this Registrant, insofar as the Registrant is not a closed-end management investment company.
ITEM 10 – Submission of Matters to a Vote of Security Holders
There have been no material changes to the procedures by which shareholders may recommend nominees to the Registrant’s board of trustees since the Registrant last submitted a proxy statement to its shareholders. The procedures are as follows. The Registrant has a nominating and governance committee comprised solely of persons who are not considered ‘‘interested persons’’ of the Registrant within the meaning of the Investment Company Act of 1940, as amended. The committee periodically reviews such issues as the board’s composition, responsibilities, committees, compensation and other relevant issues, and recommends any appropriate changes to the full board of trustees. While the committee normally is able to identify from its own resources an ample number of qualified candidates, it will consider shareholder suggestions of persons to be considered as nominees to fill future vacancies on the board. Such suggestions must be sent in writing to the nominating and governance committee of the Registrant, c/o the Registrant’s Secretary, and must be accompanied by complete biographical and occupational data on the prospective nominee, along with a written consent of the prospective nominee for consideration of his or her name by the nominating and governance committee.
ITEM 11 – Controls and Procedures
| (a) | The Registrant’s Principal Executive Officer and Principal Financial Officer have concluded, based on their evaluation of the Registrant’s disclosure controls and procedures (as such term is defined in Rule 30a-3 under the Investment Company Act of 1940), that such controls and procedures are adequate and reasonably designed to achieve the purposes described in paragraph (c) of such rule. |
| | |
| (b) | There were no changes in the Registrant’s internal controls over financial reporting (as defined in Rule 30a-3(d) under the Investment Company Act of 1940) that occurred during the Registrant’s semi-annual period covered by this report that has materially affected, or is reasonably likely to materially affect, the Registrant’s internal control over financial reporting. |
ITEM 12 – Exhibits
| (a)(1) | Not applicable for filing of semi-annual reports to shareholders. |
| | |
| (a)(2) | The certifications required by Rule 30a-2 of the Investment Company Act of 1940 and Sections 302 and 906 of the Sarbanes-Oxley Act of 2002 are attached as exhibits hereto. |
SIGNATURES
Pursuant to the requirements of the Securities Exchange Act of 1934 and the Investment Company Act of 1940, the Registrant has duly caused this report to be signed on its behalf by the undersigned, thereunto duly authorized.
| | AMERICAN HIGH-INCOME TRUST |
| | |
| | By __/s/ Kristine M. Nishiyama____________________ |
| | Kristine M. Nishiyama, Principal Executive Officer |
| | |
| | Date: May 31, 2023 |
Pursuant to the requirements of the Securities Exchange Act of 1934 and the Investment Company Act of 1940, this report has been signed below by the following persons on behalf of the Registrant and in the capacities and on the dates indicated.
| By __/s/ Kristine M. Nishiyama_________________ |
Kristine M. Nishiyama, Principal Executive Officer |
| |
| Date: May 31, 2023 |
| By ___/s/ Becky L. Park __________ |
Becky L. Park, Treasurer and Principal Financial Officer |
| |
| Date: May 31, 2023 |