UNITED STATES
SECURITIES AND EXCHANGE COMMISSION
Washington, D.C. 20549
FORM N-CSR
Certified Shareholder Report of
Registered Management Investment Companies
Investment Company Act File Number: 811-05364
American High-Income Trust
(Exact Name of Registrant as Specified in Charter)
333 South Hope Street
Los Angeles, California 90071
(Address of Principal Executive Offices)
Registrant's telephone number, including area code: (213) 486-9200
Date of fiscal year end: September 30
Date of reporting period: March 31, 2019
Brian C. Janssen
American High-Income Trust
333 South Hope Street
Los Angeles, California 90071
(Name and Address of Agent for Service)
ITEM 1 – Reports to Stockholders
American High-Income Trust® Semi-annual report
for the six months ended
March 31, 2019 |  |

Pursue sustainable
income over time
Beginning January 1, 2021, as permitted by regulations adopted by the U.S. Securities and Exchange Commission, we intend to no longer mail paper copies of the fund’s shareholder reports, unless specifically requested from American Funds or your financial intermediary, such as a broker-dealer or bank. Instead, the reports will be made available on the American Funds website (americanfunds.com); you will be notified by mail and provided with a website link to access the report each time a report is posted. If you have already elected to receive shareholder reports electronically, you will not be affected by this change and do not need to take any action. If you prefer to receive shareholder reports and other communications electronically, you may update your mailing preferences with your financial intermediary, or enroll in e-delivery at americanfunds.com (for accounts held directly with the fund).
You may elect to receive paper copies of all future reports free of charge. If you invest through a financial intermediary, you may contact your financial intermediary to request that you continue to receive paper copies of your shareholder reports. If you invest directly with the fund, you may inform American Funds that you wish to continue receiving paper copies of your shareholder reports by contacting us at (800) 421-4225. Your election to receive paper reports will apply to all funds held with American Funds or through your financial intermediary.
American High-Income Trust seeks to provide you with a high level of current income. Its secondary investment objective is capital appreciation.
This fund is one of more than 40 offered by Capital Group, home of American Funds, one of the nation’s largest mutual fund families. For more than 85 years, Capital Group has invested with a long-term focus based on thorough research and attention to risk.
Fund results shown in this report, unless otherwise indicated, are for Class A shares at net asset value. If a sales charge (maximum 3.75%) had been deducted, the results would have been lower. Results are for past periods and are not predictive of results for future periods. Current and future results may be lower or higher than those shown. Share prices and returns will vary, so investors may lose money. Investing for short periods makes losses more likely. For current information and month-end results, visit americanfunds.com.
Here are the average annual total returns on a $1,000 investment with all distributions reinvested for periods ended March 31, 2019:
| Class A shares | 1 year | 5 years | 10 years |
| | | | |
| Reflecting 3.75% maximum sales charge | 1.67% | 2.69% | 9.27% |
For other share class results, visit americanfunds.com and americanfundsretirement.com.
The total annual fund operating expense ratio was 0.68% for Class A shares as of the prospectus dated December 1, 2018 (as supplemented to date).
Investment results assume all distributions are reinvested and reflect applicable fees and expenses. When applicable, investment results reflect fee waivers, without which results would have been lower. Visit americanfunds.com for more information.
The return of principal for bond funds and for funds with significant underlying bond holdings is not guaranteed. Fund shares are subject to the same interest rate, inflation and credit risks associated with the underlying bond holdings. High-yield bonds are subject to greater fluctuations in value and risk of loss of income and principal than investment-grade bonds. Bond ratings, which typically range from AAA/Aaa (highest) to D (lowest), are assigned by credit rating agencies such as Standard & Poor’s, Moody’s and/or Fitch as an indication of an issuer’s creditworthiness. Investing in bonds issued outside the U.S. may be subject to additional risks. They include currency fluctuations, political and social instability, differing securities regulations and accounting standards, higher transaction costs, possible changes in taxation, illiquidity and price volatility. These risks may be heightened in connection with investments in developing countries. Refer to the fund prospectus and the Risk Factors section of this report for more information on these and other risks associated with investing in the fund.
Investments are not FDIC-insured, nor are they deposits of or guaranteed by a bank or any other entity, so they may lose value.
Fellow investors:
For the six-month period ended March 31, 2019, American High-Income Trust reported a total return of 1.99%. By comparison, the fund’s benchmark, the Bloomberg Barclays U.S. Corporate High Yield 2% Issuer Capped Index, an unmanaged index with no expenses, returned 2.39%. The Lipper High Yield Funds Average, a benchmark of similar funds, posted a total return of 1.73%.
For the period, the fund distributed a total monthly dividend of 31 cents a share. Shareholders who reinvested dividends received an income return of 3.10%. Those who elected to take their dividends in cash received an income return of 3.06%.
High-yield market overview
Risk markets made a dramatic round trip over the reporting period. The S&P 500 Index declined 13.5% in the fourth quarter of 2018, only to rise 13.7% in the first quarter of 2019. The high-yield benchmark index yield rose only slightly over the six months, from 6.2% at the beginning of October to 6.4% at the end of March, but reached nearly 8% at year-end. Risk premiums on high-yield bonds rose sharply and then fell just as precipitously, following the volatility and direction of equity markets.
When the U.S. Federal Reserve (Fed) indicated early in the fourth quarter that it would continue to actively increase short-term interest rates, risk assets declined in value. A turnaround began, however, early in 2019 when the Fed reversed course, indicating that it would slow the pace of rate increases. This policy change led to a decline in longer-dated Treasury yields, with the yield on the five-year Treasury declining from 2.94% at the start of the fourth quarter to 2.23% by the end of the first quarter.
Results at a glance
For periods ended March 31, 2019, with all distributions reinvested
| | | Cumulative total returns | | Average annual total returns |
| | | 6 months | | 1 year | | 5 years | | 10 years | | Lifetime
(since 2/19/88) |
| | | | | | | | | | | |
| American High-Income Trust (Class A shares) | | | 1.99 | % | | | 5.67 | % | | | 3.49 | % | | | 9.68 | % | | | 7.74 | % |
| Bloomberg Barclays U.S. Corporate High Yield 2% Issuer Capped Index* | | | 2.39 | | | | 5.93 | | | | 4.69 | | | | 11.21 | | | | — | |
| Lipper High Yield Funds Average† | | | 1.73 | | | | 4.39 | | | | 3.43 | | | | 9.57 | | | | 6.98 | |
| * | Source: Bloomberg Index Services Ltd. This market index did not exist prior to December 31, 1992. It is unmanaged and, therefore, has no expenses. Investors cannot invest directly in an index. |
| † | Source: Thomson Reuters Lipper. Lipper averages reflect the current composition of all eligible mutual funds (all share classes) within a given category. |
| American High-Income Trust | 1 |
As a result, spreads on high-yield bonds – the difference between the yield on high-yield bonds and the yield on Treasury bonds of comparable maturity – increased from 3.16% on October 3, 2018 to 3.99% on March 29, 2019 – approximately 1.5% below long-term averages. We believe this level is consistent with a reasonably strong economic outlook and correspondingly low anticipated default rates.
Inside the portfolio
The fund continues to maintain a lower duration and lower credit quality bias relative to the index, with an overall risk profile similar to that of the index. The fund’s security selection was the primary driver of results that outpaced those of the index. Select investments in four sectors – health care, materials, retailing and technology – provided most of the excess returns.
Detracting from relative results was a slight overweight allocation in one of the largest high-yield industry sectors, energy. The fund maintains a highly diversified energy portfolio in order to dampen the inherent volatility associated with commodity price fluctuations. Notwithstanding that diversification, the fund’s energy portfolio underperformed the index as commodity prices weakened in the fourth quarter.
Looking ahead
Favorable economic conditions and robust global demand for yield continue to benefit high-yield securities. However, we are mindful that current yields and risk premiums are below their long-term averages. The fund’s short duration positioning should help to protect against rising yields, and issuer selection can help us avoid issuers that may be more exposed to eventual economic weakness.
The more favorable conditions promoted by a pause in rate increases by the Fed may reduce the likelihood of a near-term recession. Current conditions are characterized by low inflation, solid economic growth, and low default rates, which have contributed to high-yield bond yields lower than historical averages. We need to look forward and position the fund to withstand a deterioration in conditions that would lead to higher risk premiums, higher yields, and lower valuations.
The fund’s 30-day yield for Class A shares as of April 30, 2019, calculated in accordance with the U.S. Securities and Exchange Commission (SEC) formula, was 5.15%. The fund’s 12-month distribution rate for Class A shares as of that date was 5.79%. Both reflect the 3.75% maximum sales charge.The SEC yield reflects the rate at which the fund is earning income on its current portfolio of securities while the distribution rate reflects the fund’s past dividends paid to shareholders. Accordingly, the fund’s SEC yield and distribution rate may differ.
| 2 | American High-Income Trust |
Investors who have maintained a long-term perspective have received attractive returns and a steady source of income from investing in the fund. As of March 31, 2019, fund shareholders who reinvested dividends earned an average annual total return of 3.49% over five years and 9.68% over 10 years.
For the same time periods, investment-grade bonds, by contrast, returned 2.74% over five years and 3.77% over 10 years, as measured by the Bloomberg Barclays U.S. Aggregate Index, which is unmanaged and has no expenses.
As always, we appreciate your continued support and long-term investment perspective.
Sincerely

David A. Daigle
President
May 10, 2019
For current information about the fund, visit americanfunds.com.
| American High-Income Trust | 3 |
| Summary investment portfolio March 31, 2019 | unaudited |
| | |
| Portfolio by type of security | Percent of net assets |
| | |
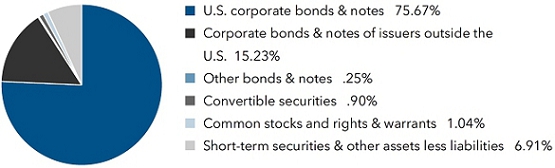
| Bonds, notes & other debt instruments 91.15% | | Principal amount
(000) | | | Value
(000) | |
| Corporate bonds & notes 90.90% | | | | | | | | |
| Communication services 14.43% | | | | | | | | |
| CCO Holdings LLC and CCO Holdings Capital Corp. 5.75% 20261 | | $ | 69,400 | | | $ | 72,870 | |
| CCO Holdings LLC and CCO Holdings Capital Corp. 5.125% 20271 | | | 62,990 | | | | 63,541 | |
| CCO Holdings LLC and CCO Holdings Capital Corp. 4.00%–5.88% 2023–20281 | | | 125,035 | | | | 125,601 | |
| CenturyLink, Inc. 6.75% 2023 | | | 60,675 | | | | 63,481 | |
| Frontier Communications Corp. 10.50% 2022 | | | 131,757 | | | | 101,123 | |
| Frontier Communications Corp. 11.00% 2025 | | | 185,454 | | | | 123,127 | |
| Frontier Communications Corp. 8.00%–9.25% 2021–20271 | | | 92,315 | | | | 87,876 | |
| Gogo Inc. 12.50% 20221 | | | 126,460 | | | | 136,893 | |
| MDC Partners Inc. 6.50% 20241 | | | 136,458 | | | | 113,601 | |
| Meredith Corp. 6.875% 2026 | | | 126,769 | | | | 134,058 | |
| Sprint Corp. 11.50% 2021 | | | 78,780 | | | | 91,582 | |
| Sprint Corp. 6.875% 2028 | | | 75,850 | | | | 73,100 | |
| Sprint Corp. 7.25%–8.75% 2021–2032 | | | 58,630 | | | | 61,753 | |
| Univision Communications Inc. 5.125% 20231 | | | 66,857 | | | | 63,848 | |
| Other securities | | | | | | | 1,055,758 | |
| | | | | | | | 2,368,212 | |
| | | | | | | | | |
| Energy 13.66% | | | | | | | | |
| Blackstone CQP Holdco LP 6.50% 20211,2 | | | 159,710 | | | | 159,710 | |
| Blackstone CQP Holdco LP 6.00% 20211,2 | | | 18,400 | | | | 18,400 | |
| Cheniere Energy Partners, LP 5.25% 2025 | | | 10,400 | | | | 10,673 | |
| Cheniere Energy, Inc. 5.88%–7.00% 2024–2025 | | | 27,980 | | | | 31,128 | |
| Sabine Pass Liquefaction, LLC 5.63% 2021–20253 | | | 4,905 | | | | 5,208 | |
| Teekay Corp. 8.50% 2020 | | | 104,385 | | | | 105,429 | |
| Other securities | | | | | | | 1,910,147 | |
| | | | | | | | 2,240,695 | |
| | | | | | | | | |
| Health care 13.36% | | | | | | | | |
| Bausch Health Companies Inc. 5.75% 20271 | | | 8,110 | | | | 8,333 | |
| Centene Corp. 4.75%–6.13% 2021–20261 | | | 168,440 | | | | 173,403 | |
| Endo International PLC 5.75%–6.00% 2022–20251,3 | | | 131,734 | | | | 114,083 | |
| Kinetic Concepts, Inc. 12.50% 20211 | | | 94,530 | | | | 102,565 | |
| Molina Healthcare, Inc. 5.375% 2022 | | | 109,511 | | | | 114,095 | |
| Molina Healthcare, Inc. 4.875% 20251 | | | 51,880 | | | | 51,491 | |
| Par Pharmaceutical Companies Inc. 7.50% 20271 | | | 62,725 | | | | 63,744 | |
| 4 | American High-Income Trust |
| | | Principal amount
(000) | | | Value
(000) | |
| Rotech Healthcare Inc., Term Loan, (3-month USD-LIBOR + 11.00%) 13.41% 2023 (100% PIK)4,5,6,7,8 | | $ | 79,992 | | | $ | 77,140 | |
| Tenet Healthcare Corp. 6.00% 2020 | | | 98,845 | | | | 102,675 | |
| Tenet Healthcare Corp. 4.38%–8.13% 2020–20271 | | | 193,326 | | | | 199,233 | |
| Teva Pharmaceutical Finance Co. BV 6.00% 2024 | | | 68,388 | | | | 68,689 | |
| Valeant Pharmaceuticals International, Inc. 5.875% 20231 | | | 78,720 | | | | 79,802 | |
| Valeant Pharmaceuticals International, Inc. 6.125% 20251 | | | 151,758 | | | | 150,620 | |
| Valeant Pharmaceuticals International, Inc. 9.25% 20261 | | | 66,700 | | | | 73,157 | |
| Valeant Pharmaceuticals International, Inc. 5.63%–9.00% 2021–20271 | | | 98,088 | | | | 104,222 | |
| Valeant Pharmaceuticals International, Inc., Term Loan B, (3-month USD-LIBOR + 3.00%) 5.481% 20256,8 | | | 8,328 | | | | 8,278 | |
| Other securities | | | | | | | 699,888 | |
| | | | | | | | 2,191,418 | |
| | | | | | | | | |
| Materials 11.83% | | | | | | | | |
| Cleveland-Cliffs Inc. 5.75% 2025 | | | 137,410 | | | | 131,914 | |
| Cleveland-Cliffs Inc. 4.88% 2021–20241 | | | 62,375 | | | | 62,294 | |
| First Quantum Minerals Ltd. 7.50% 20251 | | | 109,700 | | | | 105,860 | |
| First Quantum Minerals Ltd. 6.50%–7.25% 2021–20261 | | | 213,203 | | | | 206,412 | |
| FXI Holdings, Inc. 7.875% 20241 | | | 70,055 | | | | 65,326 | |
| LSB Industries, Inc. 9.625% 20231 | | | 69,610 | | | | 72,408 | |
| Ryerson Inc. 11.00% 20221 | | | 93,330 | | | | 98,696 | |
| Other securities | | | | | | | 1,198,389 | |
| | | | | | | | 1,941,299 | |
| | | | | | | | | |
| Industrials 10.80% | | | | | | | | |
| Associated Materials, LLC 9.00% 20241 | | | 82,390 | | | | 81,360 | |
| Builders FirstSource, Inc. 5.625% 20241 | | | 98,633 | | | | 97,523 | |
| DAE Aviation Holdings, Inc. 10.00% 20231 | | | 150,175 | | | | 161,438 | |
| Deck Chassis Acquisition Inc. 10.00% 20231 | | | 92,560 | | | | 98,229 | |
| LSC Communications, Inc. 8.75% 20231 | | | 94,823 | | | | 100,749 | |
| Pisces Parent LLC 8.00% 20261 | | | 105,946 | | | | 95,539 | |
| Standard Aero Holdings, Inc., Term Loan B, 6.25% 20224,6,8 | | | 5,761 | | | | 5,765 | |
| Other securities | | | | | | | 1,132,254 | |
| | | | | | | | 1,772,857 | |
| | | | | | | | | |
| Consumer discretionary 9.70% | | | | | | | | |
| Cirsa Gaming Corp. SA 7.875% 20231 | | | 95,885 | | | | 99,434 | |
| Petsmart, Inc. 7.125% 20231 | | | 143,774 | | | | 107,830 | |
| Petsmart, Inc. 5.875% 20251 | | | 153,500 | | | | 129,324 | |
| Petsmart, Inc. 8.875% 20251 | | | 82,085 | | | | 61,769 | |
| Sally Holdings LLC and Sally Capital Inc. 5.625% 2025 | | | 77,835 | | | | 77,640 | |
| Scientific Games Corp. 8.25% 20261 | | | 82,095 | | | | 83,942 | |
| Scientific Games Corp. 5.00%–10.00% 2020–20251 | | | 98,147 | | | | 100,728 | |
| Uber Technologies, Inc. 8.00% 20261 | | | 63,775 | | | | 68,080 | |
| Other securities | | | | | | | 863,332 | |
| | | | | | | | 1,592,079 | |
| | | | | | | | | |
| Information technology 7.08% | | | | | | | | |
| Almonde Inc., Term Loan, (3-month USD-LIBOR + 7.25%) 9.851% 20256,8 | | | 84,233 | | | | 81,306 | |
| Camelot Finance SA 7.875% 20241 | | | 110,733 | | | | 117,377 | |
| Infor (US), Inc. 6.50% 2022 | | | 69,115 | | | | 70,325 | |
| Infor Software 7.125% 20211,7 | | | 67,151 | | | | 67,578 | |
| Kronos Inc., Term Loan B, (3-month USD-LIBOR + 8.25%) 10.986% 20246,8 | | | 92,085 | | | | 93,680 | |
| American High-Income Trust | 5 |
| Bonds, notes & other debt instruments (continued) | | Principal amount
(000) | | | Value
(000) | |
| Corporate bonds & notes (continued) | | | | | | | | |
| Information technology (continued) | | | | | | | | |
| Unisys Corp. 10.75% 20221 | | $ | 77,660 | | | $ | 85,911 | |
| Other securities | | | | | | | 646,293 | |
| | | | | | | | 1,162,470 | |
| | | | | | | | | |
| Financials 3.25% | | | | | | | | |
| Compass Diversified Holdings 8.00% 20261 | | | 62,501 | | | | 65,118 | |
| HUB International Ltd. 7.00% 20261 | | | 64,366 | | | | 63,883 | |
| Other securities | | | | | | | 403,843 | |
| | | | | | | | 532,844 | |
| | | | | | | | | |
| Utilities 2.55% | | | | | | | | |
| Talen Energy Corp. 9.50% 20221 | | | 63,530 | | | | 68,612 | |
| Other securities | | | | | | | 349,243 | |
| | | | | | | | 417,855 | |
| | | | | | | | | |
| Real estate 2.41% | | | | | | | | |
| Howard Hughes Corp. 5.375% 20251 | | | 75,685 | | | | 75,685 | |
| Other securities | | | | | | | 319,746 | |
| | | | | | | | 395,431 | |
| | | | | | | | | |
| Consumer staples 1.83% | | | | | | | | |
| Other securities | | | | | | | 299,524 | |
| | | | | | | | | |
| Total corporate bonds & notes | | | | | | | 14,914,684 | |
| | | | | | | | | |
| U.S. Treasury bonds & notes 0.24% | | | | | | | | |
| U.S. Treasury 0.24% | | | | | | | | |
| Other securities | | | | | | | 40,034 | |
| | | | | | | | | |
| Municipals 0.01% | | | | | | | | |
| Other securities | | | | | | | 1,715 | |
| | | | | | | | | |
| Total bonds, notes & other debt instruments (cost: $15,355,395,000) | | | | | | | 14,956,433 | |
| | | | | | | | | |
| Convertible bonds 0.59% | | | | | | | | |
| Other 0.59% | | | | | | | | |
| Other securities | | | | | | | 96,531 | |
| | | | | | | | | |
| Total convertible bonds (cost: $102,067,000) | | | | | | | 96,531 | |
| | | | | | | | | |
| Convertible stocks 0.31% | | | Shares | | | | | |
| Other 0.31% | | | | | | | | |
| Other securities | | | | | | | 51,298 | |
| | | | | | | | | |
| Total convertible stocks (cost: $49,441,000) | | | | | | | 51,298 | |
| | | | | | | | | |
| Common stocks 1.03% | | | | | | | | |
| Communication services 0.08% | | | | | | | | |
| Frontier Communications Corp., Class B9 | | | 93,331 | | | | 186 | |
| Other securities | | | | | | | 12,389 | |
| | | | | | | | 12,575 | |
| 6 | American High-Income Trust |
| | | | | | Value | |
| | | Shares | | | (000) | |
| Other 0.95% | | | | | | | | |
| Other securities | | | | | | $ | 156,487 | |
| | | | | | | | | |
| Total common stocks (cost: $269,949,000) | | | | | | | 169,062 | |
| | | | | | | | | |
| Rights & warrants 0.01% | | | | | | | | |
| Energy 0.01% | | | | | | | | |
| Other securities | | | | | | | 1,151 | |
| | | | | | | | | |
| Total rights & warrants (cost: $572,000) | | | | | | | 1,151 | |
| | | | | | | | | |
| Short-term securities 5.58% | | | | | | | | |
| Money market investments 5.58% | | | | | | | | |
| Capital Group Central Cash Fund | | | 9,151 | | | | 914,945 | |
| | | | | | | | | |
| Total short-term securities (cost: $915,041,000) | | | | | | | 914,945 | |
| Total investment securities 98.67% (cost: $16,692,465,000) | | | | | | | 16,189,420 | |
| Other assets less liabilities 1.33% | | | | | | | 218,312 | |
| | | | | | | | | |
| Net assets 100.00% | | | | | | $ | 16,407,732 | |
This summary investment portfolio is designed to streamline the report and help investors better focus on the fund’s principal holdings. See the inside back cover for details on how to obtain a complete schedule of portfolio holdings.
“Other securities” includes all issues that are not disclosed separately in the summary investment portfolio. “Other securities” also includes a security which was pledged as collateral. The total value of pledged collateral was $7,029,000, which represented 0.04% of the net assets of the fund.
Swap contracts
Credit default swaps
Centrally cleared credit default swaps on credit indices — buy protection
| Receive | | Pay/
Payment frequency | | Expiration
date | | Notional
(000) | | | Value at
3/31/2019
(000) | | | Upfront
payments
(000) | | | Unrealized
depreciation
at 3/31/2019
(000) | |
| CDX.NA.HY.32 | | 5.00%/Quarterly | | 6/20/2024 | | $ | 69,600 | | | $ | (4,626 | ) | | $ | (4,216 | ) | | $ | (410 | ) |
| CDX.NA.IG.32 | | 1.00%/Quarterly | | 6/20/2024 | | | 426,275 | | | | (7,570 | ) | | | (7,021 | ) | | | (549 | ) |
| | | | | | | | | | | | | | | $ | (11,237 | ) | | $ | (959 | ) |
| American High-Income Trust | 7 |
Investments in affiliates
A company is an affiliate of the fund under the Investment Company Act of 1940 if the fund’s holdings in that company represent 5% or more of the outstanding voting shares. The value of the fund’s affiliated-company holdings is either shown in the summary investment portfolio or included in the value of “Other securities” under the respective industry sectors. Further details on these holdings and related transactions during the six months ended March 31, 2019, appear below.
| | | Beginning
shares or
principal
amount | | | Additions | | | Reductions | | | Ending
shares or
principal
amount | |
| Corporate bonds & notes 0.11% | | | | | | | | | | | | | | | | |
| Energy 0.05% | | | | | | | | | | | | | | | | |
| Ascent Resources Marcellus Holdings, Inc., Term Loan B, (3-month USD-LIBOR + 6.50%) 8.993% 20236,8 | | $ | 7,958,333 | | | | — | | | | — | | | $ | 7,958,333 | |
| Health care 0.06% | | | | | | | | | | | | | | | | |
| Concordia International Corp., Term Loan, (3-month USD-LIBOR + 5.50%) 7.993% 20246,8 | | $ | 5,895,000 | | | | — | | | $ | 58,950 | | | $ | 5,836,050 | |
| Concordia International Corp. 8.00% 2024 | | $ | 5,062,000 | | | | — | | | | — | | | $ | 5,062,000 | |
| Common stocks 0.63% | | | | | | | | | | | | | | | | |
| Health care 0.35% | | | | | | | | | | | | | | | | |
| Rotech Healthcare Inc.2,4,5,9 | | | 1,916,276 | | | | — | | | | — | | | | 1,916,276 | |
| Advanz Pharma Corp.2,9,10 | | | 2,244,779 | | | | — | | | | — | | | | 2,244,779 | |
| Advanz Pharma Corp.9,10 | | | 434,451 | | | | — | | | | — | | | | 434,451 | |
| Energy 0.28% | | | | | | | | | | | | | | | | |
| Ascent Resources - Utica, LLC, Class A2,4,5,9 | | | 90,532,504 | | | | — | | | | — | | | | 90,532,504 | |
| Tribune Resources, Inc.4,9 | | | 6,028,136 | | | | — | | | | — | | | | 6,028,136 | |
| White Star Petroleum Corp., Class A2,4,5,9 | | | 24,665,117 | | | | — | | | | — | | | | 24,665,117 | |
| Rights & warrants 0.01% | | | | | | | | | | | | | | | | |
| Energy 0.01% | | | | | | | | | | | | | | | | |
| Tribune Resources, Inc., Class A, warrants, expire 20234,5,9 | | | 2,032,968 | | | | — | | | | — | | | | 2,032,968 | |
| Tribune Resources, Inc., Class B, warrants, expire 20234,5,9 | | | 1,581,198 | | | | — | | | | — | | | | 1,581,198 | |
| Tribune Resources, Inc., Class C, warrants, expire 20234,5,9 | | | 1,480,250 | | | | — | | | | — | | | | 1,480,250 | |
| | | | | | | | | | | | | | | | | |
| | | Net
realized
gain (loss)
(000) | | | Net
unrealized
appreciation
(depreciation)
(000) | | | Dividend
or interest
income
(000) | | | Value of
affiliates at
3/31/2019
(000) | |
| Corporate bonds & notes 0.11% | | | | | | | | | | | | | | | | |
| Energy 0.05% | | | | | | | | | | | | | | | | |
| Ascent Resources Marcellus Holdings, Inc., Term Loan B, (3-month USD-LIBOR + 6.50%) 8.993% 20236,8 | | $ | — | | | $ | 730 | | | $ | — | | | $ | 7,978 | |
| Health care 0.06% | | | | | | | | | | | | | | | | |
| Concordia International Corp., Term Loan, (3-month USD-LIBOR + 5.50%) 7.993% 20246,8 | | | 4 | | | | (220 | ) | | | 248 | | | | 5,531 | |
| Concordia International Corp. 8.00% 2024 | | | — | | | | (172 | ) | | | 185 | | | | 4,784 | |
| | | | | | | | | | | | | | | | 10,315 | |
| 8 | American High-Income Trust |
| | | Net
realized
gain (loss)
(000) | | | Net
unrealized
appreciation
(depreciation)
(000) | | | Dividend
or interest
income
(000) | | | Value of
affiliates at
3/31/2019
(000) | |
| Common stocks 0.63% | | | | | | | | | | | | | | | | |
| Health care 0.35% | | | | | | | | | | | | | | | | |
| Rotech Healthcare Inc.2,4,5,9 | | $ | — | | | $ | 7,665 | | | $ | — | | | $ | 11,498 | |
| Advanz Pharma Corp.2,9,10 | | | — | | | | (2,573 | ) | | | — | | | | 39,014 | |
| Advanz Pharma Corp.9,10 | | | (52,782 | ) | | | 51,584 | | | | — | | | | 7,551 | |
| | | | | | | | | | | | | | | | 58,063 | |
| Energy 0.28% | | | | | | | | | | | | | | | | |
| Ascent Resources - Utica, LLC, Class A2,4,5,9 | | | — | | | | (9,053 | ) | | | — | | | | 19,917 | |
| Tribune Resources, Inc.4,9 | | | — | | | | (2,110 | ) | | | — | | | | 16,879 | |
| White Star Petroleum Corp., Class A2,4,5,9 | | | — | | | | (6,906 | ) | | | — | | | | 8,633 | |
| | | | | | | | | | | | | | | | 45,429 | |
| Rights & warrants 0.01% | | | | | | | | | | | | | | | | |
| Energy 0.01% | | | | | | | | | | | | | | | | |
| Tribune Resources, Inc., Class A, warrants, expire 20234,5,9 | | | — | | | | (411 | ) | | | — | | | | 498 | |
| Tribune Resources, Inc., Class B, warrants, expire 20234,5,9 | | | — | | | | (269 | ) | | | — | | | | 287 | |
| Tribune Resources, Inc., Class C, warrants, expire 20234,5,9 | | | — | | | | (215 | ) | | | — | | | | 208 | |
| | | | | | | | | | | | | | | | 993 | |
| Total 0.75% | | $ | (52,778 | ) | | $ | 38,050 | | | $ | 433 | | | $ | 122,778 | |
| American High-Income Trust | 9 |
The following footnotes apply to either the individual securities noted or one or more of the securities aggregated and listed as a single line item.
| 1 | Acquired in a transaction exempt from registration under Rule 144A of the Securities Act of 1933. May be resold in the U.S. in transactions exempt from registration, normally to qualified institutional buyers. The total value of all such securities, including those in “Other securities,” was $9,032,012,000, which represented 55.05% of the net assets of the fund. |
| 2 | Acquired through a private placement transaction exempt from registration under the Securities Act of 1933. May be subject to legal or contractual restrictions on resale. Further details on these holdings appear below. |
| 3 | Step bond; coupon rate may change at a later date. |
| 4 | Valued under fair value procedures adopted by authority of the board of trustees. The total value of all such securities, including those in “Other securities,” was $266,449,000, which represented 1.62% of the net assets of the fund. |
| 5 | Value determined using significant unobservable inputs. |
| 6 | Loan participations and assignments; may be subject to legal or contractual restrictions on resale. The total value of all such loans, including those in “Other securities,” was $1,059,865,000, which represented 6.46% of the net assets of the fund. |
| 7 | Payment in kind; the issuer has the option of paying additional securities in lieu of cash. Most recent payment was 100% cash unless otherwise noted. |
| 8 | Coupon rate may change periodically. |
| 9 | Security did not produce income during the last 12 months. |
| 10 | This security changed its name during the reporting period. |
| Private placement securities | | Acquisition
date(s) | | Cost
(000) | | | Value
(000) | | | Percent
of net
assets | |
| Blackstone CQP Holdco LP 6.50% 2021 | | 3/6/2017-2/5/2018 | | $ | 159,710 | | | $ | 159,710 | | | | .97 | % |
| Blackstone CQP Holdco LP 6.00% 2021 | | 8/9/2017 | | | 18,400 | | | | 18,400 | | | | .11 | |
| Advanz Pharma Corp. | | 8/31/2018 | | | 28,414 | | | | 39,014 | | | | .24 | |
| Ascent Resources - Utica, LLC, Class A | | 4/25/2016-11/15/2016 | | | 4,340 | | | | 19,917 | | | | .12 | |
| Rotech Healthcare Inc. | | 9/26/2013 | | | 41,128 | | | | 11,498 | | | | .07 | |
| White Star Petroleum Corp., Class A | | 6/30/2016 | | | 16,491 | | | | 8,633 | | | | .05 | |
| Other private placement securities | | 11/26/2014-3/19/2019 | | | 6,086 | | | | 5,578 | | | | .04 | |
| Total private placement securities | | | | $ | 274,569 | | | $ | 262,750 | | | | 1.60 | % |
Key to abbreviations and symbol
LIBOR = London Interbank Offered Rate
USD/$ = U.S. dollars
See notes to financial statements
| 10 | American High-Income Trust |
Financial statements
Statement of assets and liabilities
at March 31, 2019 | unaudited
(dollars in thousands) | |
| Assets: | | | | | | | | |
| Investment securities, at value: | | | | | | | | |
| Unaffiliated issuers (cost: $16,514,721) | | $ | 16,066,642 | | | | | |
| Affiliated issuers (cost: $177,744) | | | 122,778 | | | $ | 16,189,420 | |
| Cash | | | | | | | 25,340 | |
| Receivables for: | | | | | | | | |
| Sales of investments | | | 38,349 | | | | | |
| Sales of fund’s shares | | | 20,405 | | | | | |
| Dividends and interest | | | 293,846 | | | | | |
| Other | | | 121 | | | | 352,721 | |
| | | | | | | | 16,567,481 | |
| Liabilities: | | | | | | | | |
| Payables for: | | | | | | | | |
| Purchases of investments | | | 120,465 | | | | | |
| Repurchases of fund’s shares | | | 26,150 | | | | | |
| Dividends on fund’s shares | | | 3,877 | | | | | |
| Investment advisory services | | | 3,997 | | | | | |
| Services provided by related parties | | | 3,952 | | | | | |
| Trustees’ deferred compensation | | | 312 | | | | | |
| Variation margin on swap contracts | | | 918 | | | | | |
| Other | | | 78 | | | | 159,749 | |
| Net assets at March 31, 2019 | | | | | | $ | 16,407,732 | |
| | | | | | | | | |
| Net assets consist of: | | | | | | | | |
| Capital paid in on shares of beneficial interest | | | | | | $ | 18,463,117 | |
| Total accumulated loss | | | | | | | (2,055,385 | ) |
| Net assets at March 31, 2019 | | | | | | $ | 16,407,732 | |
See notes to financial statements
| American High-Income Trust | 11 |
(dollars and shares in thousands, except per-share amounts)
Shares of beneficial interest issued and outstanding (no stated par value) —
unlimited shares authorized (1,618,945 total shares outstanding)
| | | Net assets | | | Shares
outstanding | | | Net asset
value per share | |
| Class A | | $ | 10,419,945 | | | | 1,028,132 | | | $ | 10.13 | |
| Class C | | | 557,151 | | | | 54,974 | | | | 10.13 | |
| Class T | | | 10 | | | | 1 | | | | 10.13 | |
| Class F-1 | | | 481,727 | | | | 47,532 | | | | 10.13 | |
| Class F-2 | | | 1,317,976 | | | | 130,044 | | | | 10.13 | |
| Class F-3 | | | 475,430 | | | | 46,911 | | | | 10.13 | |
| Class 529-A | | | 320,266 | | | | 31,601 | | | | 10.13 | |
| Class 529-C | | | 59,130 | | | | 5,834 | | | | 10.13 | |
| Class 529-E | | | 15,764 | | | | 1,555 | | | | 10.13 | |
| Class 529-T | | | 11 | | | | 1 | | | | 10.13 | |
| Class 529-F-1 | | | 33,352 | | | | 3,291 | | | | 10.13 | |
| Class R-1 | | | 9,985 | | | | 985 | | | | 10.13 | |
| Class R-2 | | | 144,690 | | | | 14,276 | | | | 10.13 | |
| Class R-2E | | | 7,782 | | | | 768 | | | | 10.13 | |
| Class R-3 | | | 170,027 | | | | 16,776 | | | | 10.13 | |
| Class R-4 | | | 137,287 | | | | 13,546 | | | | 10.13 | |
| Class R-5E | | | 6,424 | | | | 634 | | | | 10.13 | |
| Class R-5 | | | 79,100 | | | | 7,805 | | | | 10.13 | |
| Class R-6 | | | 2,171,675 | | | | 214,279 | | | | 10.13 | |
See notes to financial statements
| 12 | American High-Income Trust |
| Statement of operations | unaudited |
| for the six months ended March 31, 2019 | (dollars in thousands) |
| Investment income: | | | | | | | | |
| Income: | | | | | | | | |
| Interest (includes $433 from affiliates) | | $ | 552,305 | | | | | |
| Dividends | | | 1,619 | | | $ | 553,924 | |
| Fees and expenses*: | | | | | | | | |
| Investment advisory services | | | 23,215 | | | | | |
| Distribution services | | | 18,965 | | | | | |
| Transfer agent services | | | 9,316 | | | | | |
| Administrative services | | | 1,935 | | | | | |
| Reports to shareholders | | | 458 | | | | | |
| Registration statement and prospectus | | | 1,005 | | | | | |
| Trustees’ compensation | | | 62 | | | | | |
| Auditing and legal | | | 56 | | | | | |
| Custodian | | | 22 | | | | | |
| Other | | | 472 | | | | 55,506 | |
| Net investment income | | | | | | | 498,418 | |
| | | | | | | | | |
| Net realized gain and unrealized depreciation: | | | | | | | | |
| Net realized gain (loss) on: | | | | | | | | |
| Investments: | | | | | | | | |
| Unaffiliated issuers | | | 47,182 | | | | | |
| Affiliated issuers | | | (52,778 | ) | | | | |
| Futures contracts | | | 769 | | | | | |
| Swap contracts | | | 10,832 | | | | | |
| Currency transactions | | | 1 | | | | 6,006 | |
| Net unrealized (depreciation) appreciation on: | | | | | | | | |
| Investments: | | | | | | | | |
| Unaffiliated issuers | | | (221,633 | ) | | | | |
| Affiliated issuers | | | 38,050 | | | | | |
| Futures contracts | | | (977 | ) | | | | |
| Swap contracts | | | (3,317 | ) | | | | |
| Currency translations | | | 20 | | | | (187,857 | ) |
| Net realized gain and unrealized depreciation | | | | | | | (181,851 | ) |
| | | | | | | | | |
| Net increase in net assets resulting from operations | | | | | | $ | 316,567 | |
| * | Additional information related to class-specific fees and expenses is included in the notes to financial statements. |
See notes to financial statements
| American High-Income Trust | 13 |
| Statements of changes in net assets | | |
| | (dollars in thousands) |
| | | Six months ended
March 31, 2019* | | | Year ended
September 30, 2018 | |
| Operations: | | | | | | | | |
| Net investment income | | $ | 498,418 | | | $ | 981,323 | |
| Net realized gain (loss) | | | 6,006 | | | | (102,216 | ) |
| Net unrealized depreciation | | | (187,857 | ) | | | (301,587 | ) |
| Net increase in net assets resulting from operations | | | 316,567 | | | | 577,520 | |
| | | | | | | | | |
| Distributions paid or accrued to shareholders | | | (504,513 | ) | | | (953,777 | ) |
| | | | | | | | | |
| Net capital share transactions | | | 151,366 | | | | (528,429 | ) |
| | | | | | | | | |
| Total decrease in net assets | | | (36,580 | ) | | | (904,686 | ) |
| | | | | | | | | |
| Net assets: | | | | | | | | |
| Beginning of period | | | 16,444,312 | | | | 17,348,998 | |
| End of period | | $ | 16,407,732 | | | $ | 16,444,312 | |
See notes to financial statements
| 14 | American High-Income Trust |
| Notes to financial statements | unaudited |
1. Organization
American High-Income Trust (the “fund”) is registered under the Investment Company Act of 1940 as an open-end, diversified management investment company. The fund seeks to provide a high level of current income. Its secondary investment objective is capital appreciation.
The fund has 19 share classes consisting of six retail share classes (Classes A, C, T, F-1, F-2 and F-3), five 529 college savings plan share classes (Classes 529-A, 529-C, 529-E, 529-T and 529-F-1) and eight retirement plan share classes (Classes R-1, R-2, R-2E, R-3, R-4, R-5E, R-5 and R-6). The 529 college savings plan share classes can be used to save for college education. The retirement plan share classes are generally offered only through eligible employer-sponsored retirement plans. The fund’s share classes are described further in the following table:
| Share class | | Initial sales
charge | | Contingent deferred sales
charge upon redemption | | Conversion feature | |
| Classes A and 529-A | | Up to 3.75% | | None (except 1% for certain redemptions within 18 months of purchase without an initial sales charge) | | None | |
| Class C | | None | | 1% for redemptions within one year of purchase | | Class C converts to Class F-1 after 10 years | |
| Class 529-C | | None | | 1% for redemptions within one year of purchase | | Class 529-C converts to Class 529-A after 10 years | |
| Class 529-E | | None | | None | | None | |
| Classes T and 529-T* | | Up to 2.50% | | None | | None | |
Classes F-1, F-2,
F-3 and 529-F-1 | | None | | None | | None | |
Classes R-1, R-2, R-2E,
R-3, R-4, R-5E, R-5 and R-6 | | None | | None | | None | |
| * | Class T and 529-T shares are not available for purchase. |
Holders of all share classes have equal pro rata rights to the assets, dividends and liquidation proceeds of the fund. Each share class has identical voting rights, except for the exclusive right to vote on matters affecting only its class. Share classes have different fees and expenses (“class-specific fees and expenses”), primarily due to different arrangements for distribution, transfer agent and administrative services. Differences in class-specific fees and expenses will result in differences in net investment income and, therefore, the payment of different per-share dividends by each share class.
| American High-Income Trust | 15 |
2. Significant accounting policies
The fund is an investment company that applies the accounting and reporting guidance issued in Topic 946 by the U.S. Financial Accounting Standards Board. The fund’s financial statements have been prepared to comply with U.S. generally accepted accounting principles (“U.S. GAAP”). These principles require the fund’s investment adviser to make estimates and assumptions that affect reported amounts and disclosures. Actual results could differ from those estimates. Subsequent events, if any, have been evaluated through the date of issuance in the preparation of the financial statements. The fund follows the significant accounting policies described in this section, as well as the valuation policies described in the next section on valuation.
Security transactions and related investment income— Security transactions are recorded by the fund as of the date the trades are executed with brokers. Realized gains and losses from security transactions are determined based on the specific identified cost of the securities. In the event a security is purchased with a delayed payment date, the fund will segregate liquid assets sufficient to meet its payment obligations. Dividend income is recognized on the ex-dividend date and interest income is recognized on an accrual basis. Market discounts, premiums and original issue discounts on fixed-income securities are amortized daily over the expected life of the security.
Class allocations— Income, fees and expenses (other than class-specific fees and expenses) are allocated daily among the various share classes based on the relative value of their settled shares. Realized and unrealized gains and losses are allocated daily among the various share classes based on their relative net assets. Class-specific fees and expenses, such as distribution, transfer agent and administrative services, are charged directly to the respective share class.
Distributions paid or accrued to shareholders— Income dividends are declared daily after the determination of the fund’s net investment income and are paid to shareholders monthly. Capital gain distributions are recorded on the ex-dividend date.
Currency translation— Assets and liabilities, including investment securities, denominated in currencies other than U.S. dollars are translated into U.S. dollars at the exchange rates supplied by one or more pricing vendors on the valuation date. Purchases and sales of investment securities and income and expenses are translated into U.S. dollars at the exchange rates on the dates of such transactions. The effects of changes in exchange rates on investment securities are included with the net realized gain or loss and net unrealized appreciation or depreciation on investments in the fund’s statement of operations. The realized gain or loss and unrealized appreciation or depreciation resulting from all other transactions denominated in currencies other than U.S. dollars are disclosed separately.
| 16 | American High-Income Trust |
3. Valuation
Capital Research and Management Company (“CRMC”), the fund’s investment adviser, values the fund’s investments at fair value as defined by U.S. GAAP. The net asset value of each share class of the fund is generally determined as of approximately 4:00 p.m. New York time each day the New York Stock Exchange is open.
Methods and inputs— The fund’s investment adviser uses the following methods and inputs to establish the fair value of the fund’s assets and liabilities. Use of particular methods and inputs may vary over time based on availability and relevance as market and economic conditions evolve.
Equity securities are generally valued at the official closing price of, or the last reported sale price on, the exchange or market on which such securities are traded, as of the close of business on the day the securities are being valued or, lacking any sales, at the last available bid price. Prices for each security are taken from the principal exchange or market on which the security trades.
Fixed-income securities, including short-term securities, are generally valued at prices obtained from one or more pricing vendors. Vendors value such securities based on one or more of the inputs described in the following table. The table provides examples of inputs that are commonly relevant for valuing particular classes of fixed-income securities in which the fund is authorized to invest. However, these classifications are not exclusive, and any of the inputs may be used to value any other class of fixed-income security.
| Fixed-income class | Examples of standard inputs |
| All | Benchmark yields, transactions, bids, offers, quotations from dealers and trading systems, new issues, spreads and other relationships observed in the markets among comparable securities; and proprietary pricing models such as yield measures calculated using factors such as cash flows, financial or collateral performance and other reference data (collectively referred to as “standard inputs”) |
| Corporate bonds & notes; convertible securities | Standard inputs and underlying equity of the issuer |
| Bonds & notes of governments & government agencies | Standard inputs and interest rate volatilities |
| Mortgage-backed; asset-backed obligations | Standard inputs and cash flows, prepayment information, default rates, delinquency and loss assumptions, collateral characteristics, credit enhancements and specific deal information |
| Municipal securities | Standard inputs and, for certain distressed securities, cash flows or liquidation values using a net present value calculation based on inputs that include, but are not limited to, financial statements and debt contracts |
| American High-Income Trust | 17 |
When the fund’s investment adviser deems it appropriate to do so (such as when vendor prices are unavailable or deemed to be not representative), fixed-income securities will be valued in good faith at the mean quoted bid and ask prices that are reasonably and timely available (or bid prices, if ask prices are not available) or at prices for securities of comparable maturity, quality and type.
Securities with both fixed-income and equity characteristics, or equity securities traded principally among fixed-income dealers, are generally valued in the manner described for either equity or fixed-income securities, depending on which method is deemed most appropriate by the fund’s investment adviser. The Capital Group Central Cash Fund (“CCF”) is valued based on the policies and procedures in CCF’s statement of additional information. Interest rate swaps and credit default swaps are generally valued by pricing vendors based on market inputs that include the index and term of index, reset frequency, payer/receiver, currency and pay frequency.
Securities and other assets for which representative market quotations are not readily available or are considered unreliable by the fund’s investment adviser are fair valued as determined in good faith under fair valuation guidelines adopted by authority of the fund’s board of trustees as further described. The investment adviser follows fair valuation guidelines, consistent with U.S. Securities and Exchange Commission rules and guidance, to consider relevant principles and factors when making fair value determinations. The investment adviser considers relevant indications of value that are reasonably and timely available to it in determining the fair value to be assigned to a particular security, such as the type and cost of the security; contractual or legal restrictions on resale of the security; relevant financial or business developments of the issuer; actively traded similar or related securities; conversion or exchange rights on the security; related corporate actions; significant events occurring after the close of trading in the security; and changes in overall market conditions. In addition, the closing prices of equity securities that trade in markets outside U.S. time zones may be adjusted to reflect significant events that occur after the close of local trading but before the net asset value of each share class of the fund is determined. Fair valuations and valuations of investments that are not actively trading involve judgment and may differ materially from valuations that would have been used had greater market activity occurred.
Processes and structure— The fund’s board of trustees has delegated authority to the fund’s investment adviser to make fair value determinations, subject to board oversight. The investment adviser has established a Joint Fair Valuation Committee (the “Fair Valuation Committee”) to administer, implement and oversee the fair valuation process, and to make fair value decisions. The Fair Valuation Committee regularly reviews its own fair value decisions, as well as decisions made under its standing instructions to the investment adviser’s valuation teams. The Fair Valuation Committee reviews changes in fair value measurements from period to period and may, as deemed appropriate, update the fair valuation guidelines to better reflect the results of back testing and address new or evolving issues. The Fair Valuation Committee reports any changes to the fair valuation guidelines to the board of trustees. The fund’s board and audit committee also regularly review reports that describe fair value determinations and methods.
| 18 | American High-Income Trust |
The fund’s investment adviser has also established a Fixed-Income Pricing Review Group to administer and oversee the fixed-income valuation process, including the use of fixed-income pricing vendors. This group regularly reviews pricing vendor information and market data. Pricing decisions, processes and controls over security valuation are also subject to additional internal reviews, including an annual control self-evaluation program facilitated by the investment adviser’s compliance group.
Classifications— The fund’s investment adviser classifies the fund’s assets and liabilities into three levels based on the inputs used to value the assets or liabilities. Level 1 values are based on quoted prices in active markets for identical securities. Level 2 values are based on significant observable market inputs, such as quoted prices for similar securities and quoted prices in inactive markets. Certain securities trading outside the U.S. may transfer between Level 1 and Level 2 due to valuation adjustments resulting from significant market movements following the close of local trading. Level 3 values are based on significant unobservable inputs that reflect the investment adviser’s determination of assumptions that market participants might reasonably use in valuing the securities. The valuation levels are not necessarily an indication of the risk or liquidity associated with the underlying investment. For example, U.S. government securities are reflected as Level 2 because the inputs used to determine fair value may not always be quoted prices in an active market. The following tables present the fund’s valuation levels as of March 31, 2019 (dollars in thousands):
| | | Investment securities | |
| | | Level 1 | | | Level 2 | | | Level 3 | | | Total | |
| Assets: | | | | | | | | | | | | | | | | |
| Bonds, notes & other debt | | | | | | | | | | | | | | | | |
| instruments: | | | | | | | | | | | | | | | | |
| Corporate bonds & notes | | $ | — | | | $ | 14,820,593 | | | $ | 94,091 | | | $ | 14,914,684 | |
| U.S. Treasury bonds & notes | | | — | | | | 40,034 | | | | — | | | | 40,034 | |
| Municipals | | | — | | | | 1,715 | | | | — | | | | 1,715 | |
| Convertible bonds | | | — | | | | 96,531 | | | | — | | | | 96,531 | |
| Convertible stocks | | | 8,042 | | | | — | | | | 43,256 | | | | 51,298 | |
| Common stocks | | | 104,782 | | | | 23,940 | | | | 40,340 | | | | 169,062 | |
| Rights & warrants | | | 158 | | | | — | | | | 993 | | | | 1,151 | |
| Short-term securities | | | 914,945 | | | | — | | | | — | | | | 914,945 | |
| Total | | $ | 1,027,927 | | | $ | 14,982,813 | | | $ | 178,680 | | | $ | 16,189,420 | |
| American High-Income Trust | 19 |
| | | Other investments1 | |
| | | Level 1 | | | Level 2 | | | Level 3 | | | Total | |
| Liabilities: | | | | | | | | | | | | | | | | |
| Unrealized depreciation on credit default swaps | | $ | — | | | $ | (959 | ) | | $ | — | | | $ | (959 | ) |
| 1 | Credit default swaps are not included in the investment portfolio. |
The following table reconciles the valuation of the fund’s Level 3 investment securities and related transactions for the year ended March 31, 2019 (dollars in thousands):
Beginning
value at
10/1/2018 | | | Transfers
into
Level 32 | | Purchases | | | Sales | | | Net
realized
gain3 | | | Unrealized
depreciation3 | | | Transfers
out of
Level 32 | | | Ending
value at
3/31/2019 | |
| $ | 190,080 | | $ | — | | $ | 5,124 | | | $ | (107 | ) | | $ | 72 | | | $ | (16,226 | ) | | $ | (263 | ) | | $ | 178,680 | |
| Net unrealized depreciation during the period on Level 3 investment securities held at March 31, 2019 | | | $ | (16,238 | ) |
| 2 | Transfers into or out of Level 3 are based on the beginning market value of the quarter in which they occurred. |
| 3 | Net realized gain and unrealized depreciation are included in the related amounts on investments in the statement of operations. |
| 20 | American High-Income Trust |
Unobservable inputs— Valuation of the fund’s Level 3 securities is based on significant unobservable inputs that reflect the investment adviser’s determination of assumptions that market participants might reasonably use in valuing the securities. The following table provides additional information used by the fund’s investment adviser to fair value the fund’s Level 3 securities (dollars in thousands):
| | | Value at
3/31/2019 | | | Valuation
techniques | | Unobservable
input(s) | | | Range | | | Weighted
Average | | | Impact to
valuation from
an increase in
input* |
| Bonds, notes & other debt instruments | | $ | 94,091 | | | Yield analysis | | Yield to maturity risk premium | | | 0 bps - 400 bps | | | | 328 bps | | | Decrease |
| Convertible stocks | | | 43,256 | | | Enterprise value | | Revenue multiple | | | 0.7x | | | | 0.7x | | | Increase |
| Common stocks | | | 40,340 | | | Inputs to market comparables and | | Weight ascribed to market comparables | | | 50% | | | | N/A | | | N/A |
| | | | | | | transaction price | | | | | | | | | | | | |
| | | | | | | | | Weight ascribed to transaction price | | | 50% | | | | N/A | | | N/A |
| | | | | | | Enterprise value | | Revenue multiple | | | 1.3x | | | | 1.3x | | | Increase |
| | | | | | | Expected proceeds | | Discount to reflect timing of receipt and amount of proceeds | | | 50% | | | | 50% | | | Decrease |
| | | | | | | Market | | EBITDA multiple | | | 4.0x | | | | 4.0x | | | Increase |
| | | | | | | comparables | | $ Per Boe | | | $7,000 | | | | $7,000 | | | Increase |
| | | | | | | | | $ Per thousand Boe per day | | | $30,000 | | | | $30,000 | | | Increase |
| | | | | | | | | $ Per acre | | | $3,000 | | | | $3,000 | | | Increase |
| | | | | | | | | Risk discounts | | | 8% | | | | 8% | | | Decrease |
| | | | | | | De minimis | | N/A | | | N/A | | | | N/A | | | N/A |
| Rights & warrants | | | 993 | | | Black-Scholes | | Implied volatility | | | 30% | | | | 30% | | | Increase |
| | | $ | 178,680 | | | | | | | | | | | | | | | |
| * | This column represents the directional change in fair value of the Level 3 securities that would result in an increase from the corresponding input. A decrease to the unobservable input would have the opposite effect. Significant increases and decreases in these inputs in isolation could result in significantly higher or lower fair value measurements. |
Key to abbreviations
EBITDA = Earnings before income taxes, depreciation and amortization
Boe = Barrel of oil equivalent
| American High-Income Trust | 21 |
4. Risk factors
Investing in the fund may involve certain risks including, but not limited to, those described below.
Market conditions— The prices of, and the income generated by, the securities held by the fund may decline — sometimes rapidly or unpredictably — due to various factors, including events or conditions affecting the general economy or particular industries; overall market changes; local, regional or global political, social or economic instability; governmental, governmental agency or central bank responses to economic conditions; and currency exchange rate, interest rate and commodity price fluctuations.
Issuer risks— The prices of, and the income generated by, securities held by the fund may decline in response to various factors directly related to the issuers of such securities, including reduced demand for an issuer’s goods or services, poor management performance, major litigation against the issuer, changes in government regulations affecting the issuer or its competitive environment and strategic initiatives such as mergers, acquisitions or dispositions and the market response to any such initiatives.
Investing in debt instruments— The prices of, and the income generated by, bonds and other debt securities held by the fund may be affected by changing interest rates and by changes in the effective maturities and credit ratings of these securities.
Rising interest rates will generally cause the prices of bonds and other debt securities to fall. A general rise in interest rates may cause investors to move out of debt securities on a large scale, which could also adversely affect the price and liquidity of debt securities and could also result in increased redemptions from the fund. Falling interest rates may cause an issuer to redeem, call or refinance a debt security before its stated maturity, which may result in the fund failing to recoup the full amount of its initial investment and having to reinvest the proceeds in lower yielding securities. Longer maturity debt securities generally have greater sensitivity to changes in interest rates and may be subject to greater price fluctuations than shorter maturity debt securities.
Bonds and other debt securities are also subject to credit risk, which is the possibility that the credit strength of an issuer or guarantor will weaken or be perceived to be weaker, and/or an issuer of a debt security will fail to make timely payments of principal or interest and the security will go into default. A downgrade or default affecting any of the fund’s securities could cause the value of the fund’s shares to decrease. Lower quality debt securities generally have higher rates of interest and may be subject to greater price fluctuations than higher quality debt securities. Credit risk is gauged, in part, by the credit ratings of the debt securities in which the fund invests. However, ratings are only the opinions of the rating agencies issuing them and are not guarantees as to credit quality or an evaluation of market risk. The fund’s investment adviser relies on its own credit analysts to research issuers and issues in seeking to assess credit and default risks.
| 22 | American High-Income Trust |
Investing in lower rated debt instruments— Lower rated bonds and other lower rated debt securities generally have higher rates of interest and involve greater risk of default or price declines due to changes in the issuer’s creditworthiness than those of higher quality debt securities. The market prices of these securities may fluctuate more than the prices of higher quality debt securities and may decline significantly in periods of general economic difficulty. These risks may be increased with respect to investments in junk bonds.
Liquidity risk— Certain fund holdings may be or become difficult or impossible to sell, particularly during times of market turmoil. Illiquidity may result from the lack of an active market for a holding, legal or contractual restrictions on resale, or the reduced number and capacity of market participants to make a market in such holding. Market prices for less liquid or illiquid holdings may be volatile, and reduced liquidity may have an adverse impact on the market price of such holdings. Additionally, the sale of less liquid or illiquid holdings may involve substantial delays (including delays in settlement) and additional costs and the fund may be unable to sell such holdings when necessary to meet its liquidity needs or may be forced to sell at a loss.
Investing in derivatives— The use of derivatives involves a variety of risks, which may be different from, or greater than, the risks associated with investing in traditional securities, such as stocks and bonds. Changes in the value of a derivative may not correlate perfectly with, and may be more sensitive to market events than, the underlying asset, rate or index, and a derivative instrument may expose the fund to losses in excess of its initial investment. Derivatives may be difficult to value, difficult for the fund to buy or sell at an opportune time or price and difficult to terminate or otherwise offset. The fund’s use of derivatives may result in losses to the fund, and investing in derivatives may reduce the fund’s returns and increase the fund’s price volatility. The fund’s counterparty to a derivative transaction (including, if applicable, the fund’s clearing broker, the derivatives exchange or the clearinghouse) may be unable or unwilling to honor its financial obligations in respect of the transaction.
Investing outside the U.S.— Securities of issuers domiciled outside the U.S., or with significant operations or revenues outside the U.S., may lose value because of adverse political, social, economic or market developments (including social instability, regional conflicts, terrorism and war) in the countries or regions in which the issuers operate or generate revenue. These securities may also lose value due to changes in foreign currency exchange rates against the U.S. dollar and/or currencies of other countries. Issuers of these securities may be more susceptible to actions of foreign governments, such as nationalization, currency blockage or the imposition of price controls or punitive taxes, each of which could adversely impact the value of these securities. Securities markets in certain countries may be more volatile and/or less liquid than those in the U.S. Investments outside the U.S. may also be subject to different accounting practices and different regulatory, legal and reporting standards and practices, and may be more difficult to value, than those in the U.S. In addition, the value of investments outside the U.S. may be reduced by foreign taxes, including foreign withholding taxes on interest and
| American High-Income Trust | 23 |
dividends. Further, there may be increased risks of delayed settlement of securities purchased or sold by the fund. The risks of investing outside the U.S. may be heightened in connection with investments in emerging markets.
Management— The investment adviser to the fund actively manages the fund’s investments. Consequently, the fund is subject to the risk that the methods and analyses, including models, tools and data, employed by the investment adviser in this process may be flawed or incorrect and may not produce the desired results. This could cause the fund to lose value or its investment results to lag relevant benchmarks or other funds with similar objectives.
5. Certain investment techniques
Loan transactions— The fund has entered into loan transactions in which the fund acquires a loan either through an agent, by assignment from another holder, or as a participation interest in another holder’s portion of a loan. The loan is often administered by a financial institution that acts as agent for the holders of the loan, and the fund may be required to receive approval from the agent and/or borrower prior to the sale of the investment. The loan’s interest rate and maturity date may change based on the terms of the loan, including potential early payments of principal.
Unfunded commitments— The fund has participated in transactions that involve unfunded commitments, which may obligate the fund to purchase new or additional bonds if certain contingencies are met. As of March 31, 2019, the fund’s maximum exposure of unfunded bond commitments was $66,028,000, which would represent ..40% of the net assets of the fund should such commitments become due.
Short-term securities— The fund holds shares of CCF, an institutional prime money market fund managed by CRMC. CCF invests in high-quality, short-term money market instruments. CCF is used as the primary investment vehicle for the fund’s short-term investments. CCF shares are only available for purchase by CRMC, its affiliates, and other funds managed by CRMC and are not available to the public.
Interest rate swaps— The fund has entered into interest rate swap contracts, which are agreements to exchange one stream of future interest payments for another based on a specified notional amount. Typically, interest rate swaps exchange a fixed interest rate for a payment that floats relative to a benchmark or vice versa. The fund’s investment adviser uses interest rate swaps to seek to manage the interest rate sensitivity of the fund by increasing or decreasing the duration of the fund or a portion of the fund’s portfolio. Risks may arise as a result of the fund’s investment adviser incorrectly anticipating changes in interest rates, increased volatility, reduced liquidity and the potential inability of counterparties to meet the terms of their agreements.
Upon entering into an interest rate swap contract, the fund is required to deposit cash, U.S. government securities or other liquid securities, which is known as initial margin. Generally, the initial margin required for a particular interest rate swap is set and held as
| 24 | American High-Income Trust |
collateral by the clearinghouse on which the contract is cleared. The amount of initial margin required may be significantly modified from time to time by the clearinghouse during the term of the contract.
On a daily basis, the fund’s investment adviser records daily interest accruals related to the exchange of future payments as a receivable and payable in the fund’s statement of assets and liabilities. The fund also pays or receives a variation margin based on the increase or decrease in the value of the interest rate swaps, including accrued interest, and records variation margin on interest rate swaps in the statement of assets and liabilities. The fund records realized gains and losses on both the net accrued interest and any gain or loss recognized at the time the interest rate swap is closed or expires. Net realized gains or losses, as well as any net unrealized appreciation or depreciation, from interest rate swaps are recorded in the fund’s statement of operations. As of March 31, 2019, the fund did not have any interest rate swaps. The average month-end notional amount of interest rate swaps while held was $343,464,000.
Credit default swap indices— The fund has entered into centrally cleared credit default swap agreements on credit indices (“CDSI”) that involve one party (the protection buyer) making a stream of payments to another party (the protection seller) in exchange for the right to receive a specified return upon the occurrence of a credit event, such as a default or restructuring, with respect to any of the underlying issuers (reference obligations) in the referenced index. The fund’s investment adviser uses credit default swaps to assume exposure to a diversified portfolio of credits or to hedge against existing credit risks.
CDSI are portfolios of credit instruments or exposures designed to be representative of some part of the credit market, such as the high-yield or investment-grade credit market. CDSI are generally traded using standardized terms, including a fixed spread and standard maturity dates, and reference all the names in the index. If there is a credit event, it is settled based on that name’s weight in the index. The composition of the underlying issuers or obligations within a particular index may change periodically, usually every six months. A specified credit event may affect all or individual underlying reference obligations included in the index, and will be settled based upon the relative weighting of the affected obligation(s) within the index. The value of each CDSI can be used as a measure of the current payment/performance risk of the CDSI and represents the likelihood of an expected liability or profit should the notional amount of the CDSI be closed or sold as of the period end. An increasing value, as compared to the notional amount of the CDSI, represents a deterioration of the referenced indices’ credit soundness and a greater likelihood of risk of default or other credit event occurring as defined under the terms of the agreement. When the fund provides sell protection, its maximum exposure is the notional amount of the credit default swap agreement.
Upon entering into a centrally cleared CDSI contract, the fund is required to deposit with a derivatives clearing member (“DCM”) in a segregated account in the name of the DCM an amount of cash, U.S. government securities or other liquid securities, which is known as initial margin. Generally, the initial margin required for a particular credit default swap is set and held as collateral by the clearinghouse on which the contract is cleared. The
| American High-Income Trust | 25 |
amount of initial margin required may be significantly modified from time to time by the clearinghouse during the term of the contract. Securities deposited as initial margin are designated on the investment portfolio.
On a daily basis, interest accruals related to the exchange of future payments are recorded as a receivable and payable in the fund’s statement of assets and liabilities. The fund also pays or receives a variation margin based on the increase or decrease in the value of the CDSI, and records variation margin in the statement of assets and liabilities. The fund records realized gains and losses on both the net accrued interest and any gain or loss recognized at the time the swap is closed or expires. Net realized gains or losses, as well as any net unrealized appreciation or depreciation, from credit default swaps are recorded in the fund’s statement of operations. The average month-end notional amount of credit default swaps while held was $568,444,000.
The following tables identify the location and fair value amounts on the fund’s statement of assets and liabilities and the effect on the fund’s statement of operations resulting from the fund’s use of futures contracts, interest rate swaps and credit default swaps as of, or for the six months ended, March 31, 2019 (dollars in thousands):
| | | | | Assets | | | Liabilities | |
| Contracts | | Risk type | | Location on statement of
assets and liabilities | | Value | | | Location on statement of
assets and liabilities | | Value | |
| Swaps | | Credit | | Unrealized appreciation* | | $ | — | | | Unrealized depreciation* | | $ | 959 | |
| | | | | | | | | | | | | | | |
| | | | | Net realized gain | | | Net unrealized (depreciation)
appreciation | |
| Contracts | | Risk type | | Location on statement of
operations | | Value | | | Location on statement of
operations | | Value | |
| Futures | | Interest | | Net realized gain on futures contracts | | $ | 769 | | | Net unrealized depreciation on futures contracts | | $ | (977 | ) |
| Swaps | | Interest | | Net realized gain on swap contracts | | | 1,948 | | | Net unrealized depreciation on swap contracts | | | (3,519 | ) |
| Swaps | | Credit | | Net realized gain on swap contracts | | | 8,884 | | | Net unrealized appreciation on swap contracts | | | 202 | |
| | | | | | | $ | 11,601 | | | | | $ | (4,294 | ) |
| * | Includes cumulative appreciation/depreciation on credit default swaps as reported in the applicable table following the fund’s investment portfolio. Only current day’s variation margin is reported within the statement of assets and liabilities. |
| 26 | American High-Income Trust |
Collateral— The fund participates in a collateral program due to its use of interest rate swaps and credit default swaps that calls for the fund to pledge highly liquid assets, such as cash or U.S. government securities, as collateral for initial and variation margin by contract. The purpose of the collateral is to cover potential losses that could occur in the event that either party cannot meet its contractual obligation. Non-cash collateral pledged by the fund, if any, is disclosed in the fund’s investment portfolio, and cash collateral pledged by the fund, if any, is held in a segregated account with the fund’s custodian, which is reflected as pledged cash in the fund’s statement of assets and liabilities.
6. Taxation and distributions
Federal income taxation— The fund complies with the requirements under Subchapter M of the Internal Revenue Code applicable to mutual funds and intends to distribute substantially all of its net taxable income and net capital gains each year. The fund is not subject to income taxes to the extent such distributions are made. Therefore, no federal income tax provision is required.
As of and during the period ended March 31, 2019, the fund did not have a liability for any unrecognized tax benefits. The fund recognizes interest and penalties, if any, related to unrecognized tax benefits as income tax expense in the statement of operations. During the period, the fund did not incur any significant interest or penalties.
The fund’s tax returns are not subject to examination by federal, state and, if applicable, non-U.S. tax authorities after the expiration of each jurisdiction’s statute of limitations, which is generally three years after the date of filing but can be extended in certain jurisdictions.
Non-U.S. taxation— Dividend and interest income are recorded net of non-U.S. taxes paid. The fund may file withholding tax reclaims in certain jurisdictions to recover a portion of amounts previously withheld. These reclaims are recorded when the amount is known and there are no significant uncertainties on collectability. Gains realized by the fund on the sale of securities in certain countries, if any, may be subject to non-U.S. taxes. If applicable, the fund records an estimated deferred tax liability based on unrealized gains to provide for potential non-U.S. taxes payable upon the sale of these securities.
Distributions— Distributions paid to shareholders are based on net investment income and net realized gains determined on a tax basis, which may differ from net investment income and net realized gains for financial reporting purposes. These differences are due primarily to different treatment for items such as currency gains and losses; short-term capital gains and losses; capital losses related to sales of certain securities within 30 days of purchase; cost of investments sold; net capital losses and income on certain investments. The fiscal year in which amounts are distributed may differ from the year in which the net investment income and net realized gains are recorded by the fund for financial reporting purposes.
| American High-Income Trust | 27 |
The components of distributable earnings on a tax basis are reported as of the fund’s most recent year-end. As of September 30, 2018, the components of distributable earnings on a tax basis were as follows (dollars in thousands):
| Undistributed ordinary income | | $ | 22,773 | |
| Capital loss carryforward* | | | (1,263,424 | ) |
| * | The capital loss carryforward will be used to offset any capital gains realized by the fund in the current year or in subsequent years. The fund will not make distributions from capital gains while a capital loss carryforward remains. |
As of March 31, 2019, the tax basis unrealized appreciation (depreciation) and cost of investments were as follows (dollars in thousands):
| Gross unrealized appreciation on investments | | $ | 25,664 | |
| Gross unrealized depreciation on investments | | | (819,394 | ) |
| Net unrealized depreciation on investments | | | (793,730 | ) |
| Cost of investments | | | 16,993,428 | |
Tax-basis distributions paid or accrued to shareholders from ordinary income were as follows (dollars in thousands):
| Share class | | Six months ended
March 31, 2019 | | | Year ended
September 30, 2018 | |
| Class A | | $ | 321,995 | | | $ | 632,836 | |
| Class C | | | 15,872 | | | | 33,392 | |
| Class T | | | — | * | | | — | * |
| Class F-1 | | | 14,273 | | | | 30,320 | |
| Class F-2 | | | 40,494 | | | | 62,889 | |
| Class F-3 | | | 14,327 | | | | 23,744 | |
| Class 529-A | | | 9,824 | | | | 18,692 | |
| Class 529-C | | | 1,669 | | | | 3,660 | |
| Class 529-E | | | 475 | | | | 905 | |
| Class 529-T | | | — | * | | | 1 | |
| Class 529-F-1 | | | 1,019 | | | | 1,655 | |
| Class R-1 | | | 276 | | | | 542 | |
| Class R-2 | | | 3,946 | | | | 7,714 | |
| Class R-2E | | | 208 | | | | 331 | |
| Class R-3 | | | 5,028 | | | | 9,950 | |
| Class R-4 | | | 4,238 | | | | 8,404 | |
| Class R-5E | | | 163 | | | | 106 | |
| Class R-5 | | | 2,560 | | | | 4,874 | |
| Class R-6 | | | 68,146 | | | | 113,762 | |
| Total | | $ | 504,513 | | | $ | 953,777 | |
| * | Amount less than one thousand. |
| 28 | American High-Income Trust |
7. Fees and transactions with related parties
CRMC, the fund’s investment adviser, is the parent company of American Funds Distributors,® Inc. (“AFD”), the principal underwriter of the fund’s shares, and American Funds Service Company® (“AFS”), the fund’s transfer agent. CRMC, AFD and AFS are considered related parties to the fund.
Investment advisory services— The fund has an investment advisory and service agreement with CRMC that provides for monthly fees accrued daily. These fees are based on a series of decreasing annual rates beginning with 0.300% on the first $60 million of daily net assets and decreasing to 0.132% on such assets in excess of $21 billion. The agreement also provides for monthly fees, accrued daily, based on a series of decreasing rates beginning with 3.00% on the first $8,333,333 of the fund’s monthly gross income and decreasing to 1.50% on such income in excess of $50,000,000. For the six months ended March 31, 2019, the investment advisory services fee was $23,215,000, which was equivalent to an annualized rate of 0.292% of average daily net assets.
Class-specific fees and expenses— Expenses that are specific to individual share classes are accrued directly to the respective share class. The principal class-specific fees and expenses are further described below:
Distribution services— The fund has plans of distribution for all share classes, except Class F-2, F-3, R-5E, R-5 and R-6 shares. Under the plans, the board of trustees approves certain categories of expenses that are used to finance activities primarily intended to sell fund shares and service existing accounts. The plans provide for payments, based on an annualized percentage of average daily net assets, ranging from 0.30% to 1.00% as noted in this section. In some cases, the board of trustees has limited the amounts that may be paid to less than the maximum allowed by the plans. All share classes with a plan may use up to 0.25% of average daily net assets to pay service fees, or to compensate AFD for paying service fees, to firms that have entered into agreements with AFD to provide certain shareholder services. The remaining amounts available to be paid under each plan are paid to dealers to compensate them for their sales activities.
| Share class | | Currently approved limits | | Plan limits | |
| Class A | | | 0.30 | % | | | 0.30 | % | |
| Class 529-A | | | 0.30 | | | | 0.50 | | |
| Classes C, 529-C and R-1 | | | 1.00 | | | | 1.00 | | |
| Class R-2 | | | 0.75 | | | | 1.00 | | |
| Class R-2E | | | 0.60 | | | | 0.85 | | |
| Classes 529-E and R-3 | | | 0.50 | | | | 0.75 | | |
| Classes T, F-1, 529-T, 529-F-1 and R-4 | | | 0.25 | | | | 0.50 | | |
For Class A and 529-A shares, distribution-related expenses include the reimbursement of dealer and wholesaler commissions paid by AFD for certain shares sold without a sales charge. These share classes reimburse AFD for amounts
| American High-Income Trust | 29 |
billed within the prior 15 months but only to the extent that the overall annual expense limits are not exceeded. As of March 31, 2019, there were no unreimbursed expenses subject to reimbursement for Class A or 529-A shares.
Transfer agent services— The fund has a shareholder services agreement with AFS under which the fund compensates AFS for providing transfer agent services to each of the fund’s share classes. These services include recordkeeping, shareholder communications and transaction processing. In addition, the fund reimburses AFS for amounts paid to third parties for performing transfer agent services on behalf of fund shareholders.
Administrative services— The fund has an administrative services agreement with CRMC under which the fund compensates CRMC for providing administrative services to Class A, C, T, F, 529 and R shares. Administrative services are provided by CRMC to help assist third parties providing non-distribution services to fund shareholders. These services include providing in depth information on the fund and market developments that impact fund investments. Administrative services also include, but are not limited to, coordinating, monitoring and overseeing third parties that provide services to fund shareholders. The agreement between the fund and the investment adviser provides the fund the ability to charge an administrative services fee of 0.05% of average daily net assets for all share classes. Currently Class A shares pay an annual fee of 0.01% of average daily net assets (which could be increased as noted above) and Class C, T, F, 529 and R shares pay an annual fee of 0.05% of their respective average daily net assets.
529 plan services— Each 529 share class is subject to service fees to compensate the Virginia College Savings Plan (“Virginia529”) for its oversight and administration of the CollegeAmerica 529 college savings plan. The fee is based on the combined net assets invested in Class 529 and ABLE shares of the American Funds. Class ABLE shares are offered on other American Funds by Virginia529 through ABLEAmerica, a tax-advantaged savings program for individuals with disabilities. The quarterly fee is based on a series of decreasing annual rates beginning with 0.10% on the first $20 billion of the combined net assets invested in the American Funds and decreasing to 0.03% on such assets in excess of $100 billion. The fee for any given calendar quarter is accrued and calculated on the basis of the average net assets of Class 529 and ABLE shares of the American Funds for the last month of the prior calendar quarter. The fee is included in other expenses in the fund’s statement of operations. Virginia529 is not considered a related party to the fund.
| 30 | American High-Income Trust |
For the six months ended March 31, 2019, class-specific expenses under the agreements were as follows (dollars in thousands):
| Share class | | Distribution
services | | | Transfer agent
services | | | Administrative
services | | | 529 plan
services | |
| Class A | | | $13,658 | | | | $7,120 | | | | $511 | | | Not applicable | |
| Class C | | | 2,846 | | | | 401 | | | | 143 | | | Not applicable | |
| Class T | | | — | | | | — | * | | | — | * | | Not applicable | |
| Class F-1 | | | 566 | | | | 334 | | | | 114 | | | Not applicable | |
| Class F-2 | | | Not applicable | | | | 655 | | | | 308 | | | Not applicable | |
| Class F-3 | | | Not applicable | | | | 17 | | | | 107 | | | Not applicable | |
| Class 529-A | | | 373 | | | | 199 | | | | 79 | | | $104 | |
| Class 529-C | | | 295 | | | | 39 | | | | 15 | | | 20 | |
| Class 529-E | | | 38 | | | | 4 | | | | 4 | | | 5 | |
| Class 529-T | | | — | | | | — | * | | | — | * | | — | * |
| Class 529-F-1 | | | — | | | | 19 | | | | 8 | | | 11 | |
| Class R-1 | | | 50 | | | | 7 | | | | 2 | | | Not applicable | |
| Class R-2 | | | 533 | | | | 266 | | | | 36 | | | Not applicable | |
| Class R-2E | | | 21 | | | | 8 | | | | 2 | | | Not applicable | |
| Class R-3 | | | 419 | | | | 142 | | | | 42 | | | Not applicable | |
| Class R-4 | | | 166 | | | | 73 | | | | 34 | | | Not applicable | |
| Class R-5E | | | Not applicable | | | | 4 | | | | 1 | | | Not applicable | |
| Class R-5 | | | Not applicable | | | | 22 | | | | 19 | | | Not applicable | |
| Class R-6 | | | Not applicable | | | | 6 | | | | 510 | | | Not applicable | |
| Total class-specific expenses | | | $18,965 | | | | $9,316 | | | | $1,935 | | | $140 | |
| * | Amount less than one thousand. |
Trustees’ deferred compensation— Trustees who are unaffiliated with CRMC may elect to defer the cash payment of part or all of their compensation. These deferred amounts, which remain as liabilities of the fund, are treated as if invested in shares of the fund or other American Funds. These amounts represent general, unsecured liabilities of the fund and vary according to the total returns of the selected funds. Trustees’ compensation of $62,000 in the fund’s statement of operations reflects $65,000 in current fees (either paid in cash or deferred) and a net decrease of $3,000 in the value of the deferred amounts.
Affiliated officers and trustees— Officers and certain trustees of the fund are or may be considered to be affiliated with CRMC, AFD and AFS. No affiliated officers or trustees received any compensation directly from the fund.
Security transactions with related funds— The fund may purchase from, or sell securities to, other funds managed by CRMC (or funds managed by certain affiliates of CRMC) under procedures adopted by the fund’s board of trustees. The funds involved in such transactions are considered related by virtue of having a common investment adviser (or affiliated investment advisers), common trustees and/or common officers. When such transactions occur, each transaction is executed at the current market price of the security and no brokerage commissions or fees are paid in accordance with Rule 17a-7 of the 1940 Act.
| American High-Income Trust | 31 |
Interfund lending— Pursuant to an exemptive order issued by the SEC, the fund, along with other CRMC-managed funds (or funds managed by certain affiliates of CRMC), may participate in an interfund lending program. The program provides an alternate credit facility that permits the funds to lend or borrow cash for temporary purposes directly to or from one another, subject to the conditions of the exemptive order. The fund did not lend or borrow cash through the interfund lending program at any time during the six months ended March 31, 2019.
8. Committed line of credit
The fund participates with other funds managed by CRMC (or funds managed by certain affiliates of CRMC) in a $1.5 billion credit facility (the “line of credit”) to be utilized for temporary purposes to support shareholder redemptions. The fund has agreed to pay commitment fees on its pro-rata portion of the line of credit, which are reflected in other expenses in the fund’s statement of operations. The fund did not borrow on this line of credit at any time during the six months ended March 31, 2019.
9. Capital share transactions
Capital share transactions in the fund were as follows (dollars and shares in thousands):
| | | Sales* | | | Reinvestments of
distributions | | | Repurchases* | | | Net (decrease)
increase | |
| Share class | | Amount | | | Shares | | | Amount | | | Shares | | | Amount | | | Shares | | | Amount | | | Shares | |
| | | | | | | | | | | | | | | | | | | | | | | | | |
| Six months ended March 31, 2019 | | | | | | | | | | | | | |
| | | | | | | | | | | | | | | | | | | | | | | | | | | | | | | | | |
| Class A | | $ | 580,712 | | | | 58,169 | | | $ | 307,094 | | | | 30,874 | | | $ | (1,094,282 | ) | | | (109,751 | ) | | $ | (206,476 | ) | | | (20,708 | ) |
| Class C | | | 38,157 | | | | 3,825 | | | | 14,998 | | | | 1,508 | | | | (103,772 | ) | | | (10,416 | ) | | | (50,617 | ) | | | (5,083 | ) |
| Class T | | | — | | | | — | | | | — | | | | — | | | | — | | | | — | | | | — | | | | — | |
| Class F-1 | | | 103,063 | | | | 10,392 | | | | 13,690 | | | | 1,376 | | | | (111,409 | ) | | | (11,171 | ) | | | 5,344 | | | | 597 | |
| Class F-2 | | | 598,120 | | | | 59,680 | | | | 37,784 | | | | 3,798 | | | | (459,228 | ) | | | (46,063 | ) | | | 176,676 | | | | 17,415 | |
| Class F-3 | | | 159,126 | | | | 15,857 | | | | 13,790 | | | | 1,386 | | | | (130,339 | ) | | | (13,002 | ) | | | 42,577 | | | | 4,241 | |
| Class 529-A | | | 21,999 | | | | 2,206 | | | | 9,771 | | | | 983 | | | | (37,561 | ) | | | (3,776 | ) | | | (5,791 | ) | | | (587 | ) |
| Class 529-C | | | 4,795 | | | | 481 | | | | 1,656 | | | | 166 | | | | (11,155 | ) | | | (1,123 | ) | | | (4,704 | ) | | | (476 | ) |
| Class 529-E | | | 1,134 | | | | 113 | | | | 471 | | | | 47 | | | | (1,862 | ) | | | (187 | ) | | | (257 | ) | | | (27 | ) |
| Class 529-T | | | — | | | | — | | | | — | † | | | — | † | | | — | | | | — | | | | — | † | | | — | † |
| Class 529-F-1 | | | 7,127 | | | | 710 | | | | 1,014 | | | | 102 | | | | (3,103 | ) | | | (313 | ) | | | 5,038 | | | | 499 | |
| Class R-1 | | | 1,296 | | | | 130 | | | | 274 | | | | 27 | | | | (2,215 | ) | | | (221 | ) | | | (645 | ) | | | (64 | ) |
| Class R-2 | | | 16,401 | | | | 1,646 | | | | 3,901 | | | | 392 | | | | (23,685 | ) | | | (2,383 | ) | | | (3,383 | ) | | | (345 | ) |
| Class R-2E | | | 1,702 | | | | 171 | | | | 207 | | | | 21 | | | | (909 | ) | | | (92 | ) | | | 1,000 | | | | 100 | |
| Class R-3 | | | 20,336 | | | | 2,046 | | | | 4,992 | | | | 502 | | | | (28,079 | ) | | | (2,831 | ) | | | (2,751 | ) | | | (283 | ) |
| Class R-4 | | | 15,215 | | | | 1,524 | | | | 4,222 | | | | 424 | | | | (18,366 | ) | | | (1,848 | ) | | | 1,071 | | | | 100 | |
| Class R-5E | | | 3,080 | | | | 311 | | | | 162 | | | | 16 | | | | (306 | ) | | | (30 | ) | | | 2,936 | | | | 297 | |
| Class R-5 | | | 8,906 | | | | 892 | | | | 2,549 | | | | 257 | | | | (15,602 | ) | | | (1,560 | ) | | | (4,147 | ) | | | (411 | ) |
| Class R-6 | | | 229,536 | | | | 23,073 | | | | 68,137 | | | | 6,847 | | | | (102,178 | ) | | | (10,185 | ) | | | 195,495 | | | | 19,735 | |
| Total net increase (decrease) | | $ | 1,810,705 | | | | 181,226 | | | $ | 484,712 | | | | 48,726 | | | $ | (2,144,051 | ) | | | (214,952 | ) | | $ | 151,366 | | | | 15,000 | |
| 32 | American High-Income Trust |
| | | Sales* | | | Reinvestments of
distributions | | | Repurchases* | | | Net (decrease)
increase | |
| Share class | | Amount | | | Shares | | | Amount | | | Shares | | | Amount | | | Shares | | | Amount | | | Shares | |
| | | | | | | | | | | | | | | | | | | | | | | | | | | | | | | | | |
| Year ended September 30, 2018 | | | | | | | | | |
| | | | | | | | | | | | | | | | | | | | | | | | | | | | | | | | | |
| Class A | | $ | 975,121 | | | | 94,672 | | | $ | 600,402 | | | | 58,440 | | | $ | (2,237,260 | ) | | | (217,176 | ) | | $ | (661,737 | ) | | | (64,064 | ) |
| Class C | | | 59,352 | | | | 5,760 | | | | 31,433 | | | | 3,059 | | | | (219,232 | ) | | | (21,294 | ) | | | (128,447 | ) | | | (12,475 | ) |
| Class T | | | — | | | | — | | | | — | | | | — | | | | — | | | | — | | | | — | | | | — | |
| Class F-1 | | | 153,893 | | | | 14,978 | | | | 29,181 | | | | 2,838 | | | | (300,048 | ) | | | (29,212 | ) | | | (116,974 | ) | | | (11,396 | ) |
| Class F-2 | | | 569,367 | | | | 55,323 | | | | 60,287 | | | | 5,868 | | | | (554,380 | ) | | | (53,758 | ) | | | 75,274 | | | | 7,433 | |
| Class F-3 | | | 217,161 | | | | 21,089 | | | | 22,639 | | | | 2,205 | | | | (147,758 | ) | | | (14,361 | ) | | | 92,042 | | | | 8,933 | |
| Class 529-A | | | 71,420 | | | | 6,913 | | | | 18,579 | | | | 1,809 | | | | (72,429 | ) | | | (7,037 | ) | | | 17,570 | | | | 1,685 | |
| Class 529-C | | | 10,310 | | | | 1,000 | | | | 3,617 | | | | 352 | | | | (47,218 | ) | | | (4,564 | ) | | | (33,291 | ) | | | (3,212 | ) |
| Class 529-E | | | 2,081 | | | | 203 | | | | 899 | | | | 87 | | | | (3,778 | ) | | | (367 | ) | | | (798 | ) | | | (77 | ) |
| Class 529-T | | | — | | | | — | | | | 1 | | | | — | † | | | — | | | | — | | | | 1 | | | | — | † |
| Class 529-F-1 | | | 7,040 | | | | 683 | | | | 1,645 | | | | 160 | | | | (7,058 | ) | | | (686 | ) | | | 1,627 | | | | 157 | |
| Class R-1 | | | 2,388 | | | | 233 | | | | 537 | | | | 52 | | | | (4,117 | ) | | | (399 | ) | | | (1,192 | ) | | | (114 | ) |
| Class R-2 | | | 32,956 | | | | 3,200 | | | | 7,621 | | | | 742 | | | | (52,771 | ) | | | (5,126 | ) | | | (12,194 | ) | | | (1,184 | ) |
| Class R-2E | | | 2,881 | | | | 280 | | | | 330 | | | | 32 | | | | (1,853 | ) | | | (181 | ) | | | 1,358 | | | | 131 | |
| Class R-3 | | | 47,053 | | | | 4,569 | | | | 9,850 | | | | 959 | | | | (67,734 | ) | | | (6,580 | ) | | | (10,831 | ) | | | (1,052 | ) |
| Class R-4 | | | 32,413 | | | | 3,146 | | | | 8,338 | | | | 812 | | | | (58,041 | ) | | | (5,636 | ) | | | (17,290 | ) | | | (1,678 | ) |
| Class R-5E | | | 3,456 | | | | 336 | | | | 105 | | | | 10 | | | | (110 | ) | | | (11 | ) | | | 3,451 | | | | 335 | |
| Class R-5 | | | 22,245 | | | | 2,158 | | | | 4,856 | | | | 473 | | | | (23,424 | ) | | | (2,275 | ) | | | 3,677 | | | | 356 | |
| Class R-6 | | | 428,678 | | | | 41,550 | | | | 113,590 | | | | 11,060 | | | | (282,943 | ) | | | (27,498 | ) | | | 259,325 | | | | 25,112 | |
| Total net increase (decrease) | | $ | 2,637,815 | | | | 256,093 | | | $ | 913,910 | | | | 88,958 | | | $ | (4,080,154 | ) | | | (396,161 | ) | | $ | (528,429 | ) | | | (51,110 | ) |
| * | Includes exchanges between share classes of the fund. |
| † | Amount less than one thousand. |
10. Investment transactions
The fund made purchases and sales of investment securities, excluding short-term securities and U.S. government obligations, if any, of $4,614,048,000 and $3,397,790,000, respectively, during the six months ended March 31, 2019.
| American High-Income Trust | 33 |
Financial highlights
| | | | | | Income (loss) from investment operations1 |
| Period ended | | Net asset
value,
beginning
of period | | | Net
investment
income | | | Net (losses)
gains on
securities (both
realized and
unrealized) | | | Total from
investment
operations | |
| Class A: | | | | | | | | | | | | | | | | |
| 3/31/20194,5 | | $ | 10.25 | | | $ | .31 | | | $ | (.12 | ) | | $ | .19 | |
| 9/30/2018 | | | 10.48 | | | | .61 | | | | (.25 | ) | | | .36 | |
| 9/30/2017 | | | 10.18 | | | | .60 | | | | .27 | | | | .87 | |
| 9/30/2016 | | | 9.83 | | | | .61 | | | | .34 | | | | .95 | |
| 9/30/2015 | | | 11.09 | | | | .64 | | | | (1.25 | ) | | | (.61 | ) |
| 9/30/2014 | | | 11.22 | | | | .68 | | | | (.13 | ) | | | .55 | |
| Class C: | | | | | | | | | | | | | | | | |
| 3/31/20194,5 | | | 10.25 | | | | .28 | | | | (.12 | ) | | | .16 | |
| 9/30/2018 | | | 10.48 | | | | .53 | | | | (.25 | ) | | | .28 | |
| 9/30/2017 | | | 10.18 | | | | .52 | | | | .27 | | | | .79 | |
| 9/30/2016 | | | 9.83 | | | | .53 | | | | .34 | | | | .87 | |
| 9/30/2015 | | | 11.09 | | | | .55 | | | | (1.25 | ) | | | (.70 | ) |
| 9/30/2014 | | | 11.22 | | | | .59 | | | | (.13 | ) | | | .46 | |
| Class T: | | | | | | | | | | | | | | | | |
| 3/31/20194,5 | | | 10.25 | | | | .33 | | | | (.12 | ) | | | .21 | |
| 9/30/2018 | | | 10.48 | | | | .63 | | | | (.25 | ) | | | .38 | |
| 9/30/20174,10 | | | 10.40 | | | | .30 | | | | .06 | | | | .36 | |
| Class F-1: | | | | | | | | | | | | | | | | |
| 3/31/20194,5 | | | 10.25 | | | | .31 | | | | (.12 | ) | | | .19 | |
| 9/30/2018 | | | 10.48 | | | | .61 | | | | (.25 | ) | | | .36 | |
| 9/30/2017 | | | 10.18 | | | | .60 | | | | .26 | | | | .86 | |
| 9/30/2016 | | | 9.83 | | | | .61 | | | | .34 | | | | .95 | |
| 9/30/2015 | | | 11.09 | | | | .63 | | | | (1.25 | ) | | | (.62 | ) |
| 9/30/2014 | | | 11.22 | | | | .68 | | | | (.13 | ) | | | .55 | |
| Class F-2: | | | | | | | | | | | | | | | | |
| 3/31/20194,5 | | | 10.25 | | | | .33 | | | | (.12 | ) | | | .21 | |
| 9/30/2018 | | | 10.48 | | | | .64 | | | | (.25 | ) | | | .39 | |
| 9/30/2017 | | | 10.18 | | | | .62 | | | | .27 | | | | .89 | |
| 9/30/2016 | | | 9.83 | | | | .63 | | | | .34 | | | | .97 | |
| 9/30/2015 | | | 11.09 | | | | .66 | | | | (1.25 | ) | | | (.59 | ) |
| 9/30/2014 | | | 11.22 | | | | .71 | | | | (.13 | ) | | | .58 | |
| Class F-3: | | | | | | | | | | | | | | | | |
| 3/31/20194,5 | | | 10.25 | | | | .33 | | | | (.12 | ) | | | .21 | |
| 9/30/2018 | | | 10.48 | | | | .65 | | | | (.25 | ) | | | .40 | |
| 9/30/20174,11 | | | 10.38 | | | | .43 | | | | .08 | | | | .51 | |
| 34 | American High-Income Trust |
Dividends
(from net
investment
income) | | | Net asset
value, end
of period | | | Total
return2,3 | | | Net assets,
end of period
(in millions) | | | Ratio of
expenses to
average
net assets
before
reimbursements | | | Ratio of
expenses to
average
net assets
after
reimbursements3 | | | Ratio of
net income
to average
net assets3 | |
| | | | | | | | | | | | | | | | | | | | | | | | | | | |
| $ | (.31 | ) | | $ | 10.13 | | | | 1.99 | %6 | | $ | 10,420 | | | | .73 | %7 | | | .73 | %7 | | | 6.23 | %7 |
| | (.59 | ) | | | 10.25 | | | | 3.59 | | | | 10,753 | | | | .69 | | | | .69 | | | | 5.92 | |
| | (.57 | ) | | | 10.48 | | | | 8.73 | | | | 11,666 | | | | .69 | | | | .69 | | | | 5.79 | |
| | (.60 | ) | | | 10.18 | | | | 10.15 | | | | 11,897 | | | | .71 | | | | .71 | | | | 6.28 | |
| | (.65 | ) | | | 9.83 | | | | (5.84 | ) | | | 12,033 | | | | .67 | | | | .67 | | | | 5.94 | |
| | (.68 | ) | | | 11.09 | | | | 4.93 | | | | 14,286 | | | | .66 | | | | .66 | | | | 5.99 | |
| | | | | | | | | | | | | | | | | | | | | | | | | | | |
| | (.28 | ) | | | 10.13 | | | | 1.60 | 6 | | | 557 | | | | 1.50 | 7 | | | 1.50 | 7 | | | 5.46 | 7 |
| | (.51 | ) | | | 10.25 | | | | 2.77 | | | | 616 | | | | 1.48 | | | | 1.48 | | | | 5.11 | |
| | (.49 | ) | | | 10.48 | | | | 7.87 | | | | 760 | | | | 1.48 | | | | 1.48 | | | | 5.00 | |
| | (.52 | ) | | | 10.18 | | | | 9.28 | | | | 871 | | | | 1.51 | | | | 1.51 | | | | 5.49 | |
| | (.56 | ) | | | 9.83 | | | | (6.59 | ) | | | 967 | | | | 1.47 | | | | 1.47 | | | | 5.14 | |
| | (.59 | ) | | | 11.09 | | | | 4.11 | | | | 1,238 | | | | 1.46 | | | | 1.46 | | | | 5.20 | |
| | | | | | | | | | | | | | | | | | | | | | | | | | | |
| | (.33 | ) | | | 10.13 | | | | 2.11 | 6,8 | | | — | 9 | | | .48 | 7,8 | | | .48 | 7,8 | | | 6.48 | 7,8 |
| | (.61 | ) | | | 10.25 | | | | 3.82 | 8 | | | — | 9 | | | .47 | 8 | | | .47 | 8 | | | 6.13 | 8 |
| | (.28 | ) | | | 10.48 | | | | 3.54 | 6,8 | | | — | 9 | | | .23 | 6,8 | | | .23 | 6,8 | | | 2.84 | 6,8 |
| | | | | | | | | | | | | | | | | | | | | | | | | | | |
| | (.31 | ) | | | 10.13 | | | | 1.97 | 6 | | | 482 | | | | .76 | 7 | | | .76 | 7 | | | 6.20 | 7 |
| | (.59 | ) | | | 10.25 | | | | 3.54 | | | | 481 | | | | .73 | | | | .73 | | | | 5.86 | |
| | (.56 | ) | | | 10.48 | | | | 8.69 | | | | 611 | | | | .73 | | | | .73 | | | | 5.75 | |
| | (.60 | ) | | | 10.18 | | | | 10.12 | | | | 643 | | | | .74 | | | | .74 | | | | 6.26 | |
| | (.64 | ) | | | 9.83 | | | | (5.87 | ) | | | 677 | | | | .70 | | | | .70 | | | | 5.91 | |
| | (.68 | ) | | | 11.09 | | | | 4.87 | | | | 927 | | | | .71 | | | | .71 | | | | 5.96 | |
| | | | | | | | | | | | | | | | | | | | | | | | | | | |
| | (.33 | ) | | | 10.13 | | | | 2.12 | 6 | | | 1,318 | | | | .47 | 7 | | | .47 | 7 | | | 6.50 | 7 |
| | (.62 | ) | | | 10.25 | | | | 3.82 | | | | 1,155 | | | | .46 | | | | .46 | | | | 6.15 | |
| | (.59 | ) | | | 10.48 | | | | 8.99 | | | | 1,103 | | | | .46 | | | | .46 | | | | 6.04 | |
| | (.62 | ) | | | 10.18 | | | | 10.41 | | | | 1,171 | | | | .48 | | | | .48 | | | | 6.53 | |
| | (.67 | ) | | | 9.83 | | | | (5.64 | ) | | | 1,281 | | | | .45 | | | | .45 | | | | 6.15 | |
| | (.71 | ) | | | 11.09 | | | | 5.15 | | | | 1,322 | | | | .44 | | | | .44 | | | | 6.21 | |
| | | | | | | | | | | | | | | | | | | | | | | | | | | |
| | (.33 | ) | | | 10.13 | | | | 2.17 | 6 | | | 476 | | | | .37 | 7 | | | .37 | 7 | | | 6.59 | 7 |
| | (.63 | ) | | | 10.25 | | | | 3.93 | | | | 437 | | | | .36 | | | | .36 | | | | 6.26 | |
| | (.41 | ) | | | 10.48 | | | | 4.95 | 6 | | | 354 | | | | .35 | 7 | | | .35 | 7 | | | 6.05 | 7 |
See end of table for footnotes.
| American High-Income Trust | 35 |
Financial highlights (continued)
| | | | | | Income (loss) from investment operations1 |
| Period ended | | Net asset
value,
beginning
of period | | | Net
investment
income | | | Net (losses)
gains on
securities (both
realized and
unrealized) | | | Total from
investment
operations | |
| Class 529-A: | | | | | | | | | | | | | | | | |
| 3/31/20194,5 | | $ | 10.25 | | | $ | .31 | | | $ | (.12 | ) | | $ | .19 | |
| 9/30/2018 | | | 10.48 | | | | .60 | | | | (.25 | ) | | | .35 | |
| 9/30/2017 | | | 10.18 | | | | .59 | | | | .27 | | | | .86 | |
| 9/30/2016 | | | 9.83 | | | | .60 | | | | .34 | | | | .94 | |
| 9/30/2015 | | | 11.09 | | | | .63 | | | | (1.25 | ) | | | (.62 | ) |
| 9/30/2014 | | | 11.22 | | | | .67 | | | | (.13 | ) | | | .54 | |
| Class 529-C: | | | | | | | | | | | | | | | | |
| 3/31/20194,5 | | | 10.25 | | | | .27 | | | | (.12 | ) | | | .15 | |
| 9/30/2018 | | | 10.48 | | | | .53 | | | | (.25 | ) | | | .28 | |
| 9/30/2017 | | | 10.18 | | | | .51 | | | | .27 | | | | .78 | |
| 9/30/2016 | | | 9.83 | | | | .53 | | | | .34 | | | | .87 | |
| 9/30/2015 | | | 11.09 | | | | .55 | | | | (1.25 | ) | | | (.70 | ) |
| 9/30/2014 | | | 11.22 | | | | .58 | | | | (.13 | ) | | | .45 | |
| Class 529-E: | | | | | | | | | | | | | | | | |
| 3/31/20194,5 | | | 10.25 | | | | .30 | | | | (.12 | ) | | | .18 | |
| 9/30/2018 | | | 10.48 | | | | .58 | | | | (.25 | ) | | | .33 | |
| 9/30/2017 | | | 10.18 | | | | .57 | | | | .27 | | | | .84 | |
| 9/30/2016 | | | 9.83 | | | | .58 | | | | .34 | | | | .92 | |
| 9/30/2015 | | | 11.09 | | | | .61 | | | | (1.25 | ) | | | (.64 | ) |
| 9/30/2014 | | | 11.22 | | | | .65 | | | | (.13 | ) | | | .52 | |
| Class 529-T: | | | | | | | | | | | | | | | | |
| 3/31/20194,5 | | | 10.25 | | | | .32 | | | | (.12 | ) | | | .20 | |
| 9/30/2018 | | | 10.48 | | | | .63 | | | | (.25 | ) | | | .38 | |
| 9/30/20174,10 | | | 10.40 | | | | .29 | | | | .07 | | | | .36 | |
| Class 529-F-1: | | | | | | | | | | | | | | | | |
| 3/31/20194,5 | | | 10.25 | | | | .32 | | | | (.12 | ) | | | .20 | |
| 9/30/2018 | | | 10.48 | | | | .63 | | | | (.25 | ) | | | .38 | |
| 9/30/2017 | | | 10.18 | | | | .62 | | | | .26 | | | | .88 | |
| 9/30/2016 | | | 9.83 | | | | .62 | | | | .34 | | | | .96 | |
| 9/30/2015 | | | 11.09 | | | | .65 | | | | (1.25 | ) | | | (.60 | ) |
| 9/30/2014 | | | 11.22 | | | | .70 | | | | (.13 | ) | | | .57 | |
| Class R-1: | | | | | | | | | | | | | | | | |
| 3/31/20194,5 | | | 10.25 | | | | .28 | | | | (.12 | ) | | | .16 | |
| 9/30/2018 | | | 10.48 | | | | .53 | | | | (.25 | ) | | | .28 | |
| 9/30/2017 | | | 10.18 | | | | .52 | | | | .27 | | | | .79 | |
| 9/30/2016 | | | 9.83 | | | | .53 | | | | .34 | | | | .87 | |
| 9/30/2015 | | | 11.09 | | | | .55 | | | | (1.25 | ) | | | (.70 | ) |
| 9/30/2014 | | | 11.22 | | | | .59 | | | | (.13 | ) | | | .46 | |
| 36 | American High-Income Trust |
Dividends
(from net
investment
income) | | | Net asset
value, end
of period | | | Total
return2,3 | | | Net assets,
end of period
(in millions) | | | Ratio of
expenses to
average
net assets
before
reimbursements | | | Ratio of
expenses to
average
net assets
after
reimbursements3 | | | Ratio of
net income
to average
net assets3 | |
| | | | | | | | | | | | | | | | | | | | |
| $ | (.31 | ) | | $ | 10.13 | | | | 1.96 | %6 | | $ | 320 | | | | .80 | %7 | | | .80 | %7 | | | 6.16 | %7 |
| | (.58 | ) | | | 10.25 | | | | 3.51 | | | | 330 | | | | .77 | | | | .77 | | | | 5.84 | |
| | (.56 | ) | | | 10.48 | | | | 8.66 | | | | 320 | | | | .76 | | | | .76 | | | | 5.72 | |
| | (.59 | ) | | | 10.18 | | | | 10.05 | | | | 314 | | | | .81 | | | | .81 | | | | 6.18 | |
| | (.64 | ) | | | 9.83 | | | | (5.93 | ) | | | 312 | | | | .76 | | | | .76 | | | | 5.84 | |
| | (.67 | ) | | | 11.09 | | | | 4.83 | | | | 367 | | | | .75 | | | | .75 | | | | 5.89 | |
| | | | | | | | | | | | | | | | | | | | | | | | | | | |
| | (.27 | ) | | | 10.13 | | | | 1.58 | 6 | | | 59 | | | | 1.53 | 7 | | | 1.53 | 7 | | | 5.43 | 7 |
| | (.51 | ) | | | 10.25 | | | | 2.73 | | | | 65 | | | | 1.53 | | | | 1.53 | | | | 5.06 | |
| | (.48 | ) | | | 10.48 | | | | 7.83 | | | | 100 | | | | 1.53 | | | | 1.53 | | | | 4.95 | |
| | (.52 | ) | | | 10.18 | | | | 9.22 | | | | 104 | | | | 1.57 | | | | 1.57 | | | | 5.43 | |
| | (.56 | ) | | | 9.83 | | | | (6.65 | ) | | | 108 | | | | 1.53 | | | | 1.53 | | | | 5.07 | |
| | (.58 | ) | | | 11.09 | | | | 4.03 | | | | 133 | | | | 1.53 | | | | 1.53 | | | | 5.12 | |
| | | | | | | | | | | | | | | | | | | | | | | | | | | |
| | (.30 | ) | | | 10.13 | | | | 1.87 | 6 | | | 16 | | | | .97 | 7 | | | .97 | 7 | | | 5.99 | 7 |
| | (.56 | ) | | | 10.25 | | | | 3.31 | | | | 16 | | | | .96 | | | | .96 | | | | 5.64 | |
| | (.54 | ) | | | 10.48 | | | | 8.44 | | | | 17 | | | | .96 | | | | .96 | | | | 5.52 | |
| | (.57 | ) | | | 10.18 | | | | 9.85 | | | | 17 | | | | 1.00 | | | | 1.00 | | | | 5.99 | |
| | (.62 | ) | | | 9.83 | | | | (6.12 | ) | | | 17 | | | | .97 | | | | .97 | | | | 5.63 | |
| | (.65 | ) | | | 11.09 | | | | 4.60 | | | | 20 | | | | .98 | | | | .98 | | | | 5.67 | |
| | | | | | | | | | | | | | | | | | | | | | | | | | | |
| | (.32 | ) | | | 10.13 | | | | 2.09 | 6,8 | | | — | 9 | | | .54 | 7,8 | | | .54 | 7,8 | | | 6.42 | 7,8 |
| | (.61 | ) | | | 10.25 | | | | 3.76 | 8 | | | — | 9 | | | .52 | 8 | | | .52 | 8 | | | 6.08 | 8 |
| | (.28 | ) | | | 10.48 | | | | 3.51 | 6,8 | | | — | 9 | | | .26 | 6,8 | | | .26 | 6,8 | | | 2.81 | 6,8 |
| | | | | | | | | | | | | | | | | | | | | | | | | | | |
| | (.32 | ) | | | 10.13 | | | | 2.08 | 6 | | | 33 | | | | .56 | 7 | | | .56 | 7 | | | 6.41 | 7 |
| | (.61 | ) | | | 10.25 | | | | 3.75 | | | | 29 | | | | .54 | | | | .54 | | | | 6.07 | |
| | (.58 | ) | | | 10.48 | | | | 8.89 | | | | 28 | | | | .54 | | | | .54 | | | | 5.94 | |
| | (.61 | ) | | | 10.18 | | | | 10.30 | | | | 24 | | | | .58 | | | | .58 | | | | 6.40 | |
| | (.66 | ) | | | 9.83 | | | | (5.71 | ) | | | 22 | | | | .54 | | | | .54 | | | | 6.07 | |
| | (.70 | ) | | | 11.09 | | | | 5.06 | | | | 25 | | | | .53 | | | | .53 | | | | 6.11 | |
| | | | | | | | | | | | | | | | | | | | | | | | | | | |
| | (.28 | ) | | | 10.13 | | | | 1.60 | 6 | | | 10 | | | | 1.51 | 7 | | | 1.51 | 7 | | | 5.45 | 7 |
| | (.51 | ) | | | 10.25 | | | | 2.77 | | | | 11 | | | | 1.48 | | | | 1.48 | | | | 5.12 | |
| | (.49 | ) | | | 10.48 | | | | 7.89 | | | | 12 | | | | 1.47 | | | | 1.47 | | | | 5.02 | |
| | (.52 | ) | | | 10.18 | | | | 9.29 | | | | 16 | | | | 1.50 | | | | 1.50 | | | | 5.51 | |
| | (.56 | ) | | | 9.83 | | | | (6.58 | ) | | | 19 | | | | 1.46 | | | | 1.46 | | | | 5.15 | |
| | (.59 | ) | | | 11.09 | | | | 4.11 | | | | 24 | | | | 1.46 | | | | 1.46 | | | | 5.19 | |
See end of table for footnotes.
| American High-Income Trust | 37 |
Financial highlights (continued)
| | | | | | Income (loss) from investment operations1 |
| Period ended | | Net asset
value,
beginning
of period | | | Net
investment
income | | | Net (losses)
gains on
securities (both
realized and
unrealized) | | | Total from
investment
operations | |
| Class R-2: | | | | | | | | | | | | | | | | |
| 3/31/20194,5 | | $ | 10.25 | | | $ | .28 | | | $ | (.12 | ) | | $ | .16 | |
| 9/30/2018 | | | 10.48 | | | | .53 | | | | (.25 | ) | | | .28 | |
| 9/30/2017 | | | 10.18 | | | | .52 | | | | .27 | | | | .79 | |
| 9/30/2016 | | | 9.83 | | | | .53 | | | | .34 | | | | .87 | |
| 9/30/2015 | | | 11.09 | | | | .55 | | | | (1.25 | ) | | | (.70 | ) |
| 9/30/2014 | | | 11.22 | | | | .59 | | | | (.13 | ) | | | .46 | |
| Class R-2E: | | | | | | | | | | | | | | | | |
| 3/31/20194,5 | | | 10.25 | | | | .29 | | | | (.12 | ) | | | .17 | |
| 9/30/2018 | | | 10.48 | | | | .56 | | | | (.25 | ) | | | .31 | |
| 9/30/2017 | | | 10.18 | | | | .55 | | | | .27 | | | | .82 | |
| 9/30/2016 | | | 9.83 | | | | .57 | | | | .34 | | | | .91 | |
| 9/30/2015 | | | 11.09 | | | | .63 | | | | (1.25 | ) | | | (.62 | ) |
| 9/30/20144,12 | | | 11.40 | | | | .06 | | | | (.31 | ) | | | (.25 | ) |
| Class R-3: | | | | | | | | | | | | | | | | |
| 3/31/20194,5 | | | 10.25 | | | | .30 | | | | (.12 | ) | | | .18 | |
| 9/30/2018 | | | 10.48 | | | | .58 | | | | (.25 | ) | | | .33 | |
| 9/30/2017 | | | 10.18 | | | | .57 | | | | .27 | | | | .84 | |
| 9/30/2016 | | | 9.83 | | | | .58 | | | | .34 | | | | .92 | |
| 9/30/2015 | | | 11.09 | | | | .60 | | | | (1.25 | ) | | | (.65 | ) |
| 9/30/2014 | | | 11.22 | | | | .64 | | | | (.13 | ) | | | .51 | |
| Class R-4: | | | | | | | | | | | | | | | | |
| 3/31/20194,5 | | | 10.25 | | | | .31 | | | | (.12 | ) | | | .19 | |
| 9/30/2018 | | | 10.48 | | | | .61 | | | | (.25 | ) | | | .36 | |
| 9/30/2017 | | | 10.18 | | | | .60 | | | | .27 | | | | .87 | |
| 9/30/2016 | | | 9.83 | | | | .61 | | | | .34 | | | | .95 | |
| 9/30/2015 | | | 11.09 | | | | .64 | | | | (1.25 | ) | | | (.61 | ) |
| 9/30/2014 | | | 11.22 | | | | .68 | | | | (.13 | ) | | | .55 | |
| Class R-5E: | | | | | | | | | | | | | | | | |
| 3/31/20194,5 | | | 10.25 | | | | .32 | | | | (.12 | ) | | | .20 | |
| 9/30/2018 | | | 10.48 | | | | .63 | | | | (.25 | ) | | | .38 | |
| 9/30/2017 | | | 10.18 | | | | .63 | | | | .27 | | | | .90 | |
| 9/30/20164,13 | | | 9.70 | | | | .53 | | | | .47 | | | | 1.00 | |
| Class R-5: | | | | | | | | | | | | | | | | |
| 3/31/20194,5 | | | 10.25 | | | | .33 | | | | (.12 | ) | | | .21 | |
| 9/30/2018 | | | 10.48 | | | | .64 | | | | (.25 | ) | | | .39 | |
| 9/30/2017 | | | 10.18 | | | | .63 | | | | .27 | | | | .90 | |
| 9/30/2016 | | | 9.83 | | | | .64 | | | | .34 | | | | .98 | |
| 9/30/2015 | | | 11.09 | | | | .67 | | | | (1.25 | ) | | | (.58 | ) |
| 9/30/2014 | | | 11.22 | | | | .71 | | | | (.13 | ) | | | .58 | |
| 38 | American High-Income Trust |
Dividends
(from net
investment
income) | | | Net asset
value, end
of period | | | Total
return2,3 | | | Net assets,
end of period
(in millions) | | | Ratio of
expenses to
average
net assets
before
reimbursements | | | Ratio of
expenses to
average
net assets
after
reimbursements3 | | | Ratio of
net income
to average
net assets3 | |
| | | | | | | | | | | | | | | | | | | | |
| $ | (.28 | ) | | $ | 10.13 | | | | 1.60 | %6 | | $ | 145 | | | | 1.49 | %7 | | | 1.49 | %7 | | | 5.47 | %7 |
| | (.51 | ) | | | 10.25 | | | | 2.80 | | | | 150 | | | | 1.46 | | | | 1.46 | | | | 5.14 | |
| | (.49 | ) | | | 10.48 | | | | 7.90 | | | | 166 | | | | 1.46 | | | | 1.46 | | | | 5.02 | |
| | (.52 | ) | | | 10.18 | | | | 9.27 | | | | 184 | | | | 1.52 | | | | 1.52 | | | | 5.47 | |
| | (.56 | ) | | | 9.83 | | | | (6.60 | ) | | | 183 | | | | 1.48 | | | | 1.48 | | | | 5.13 | |
| | (.59 | ) | | | 11.09 | | | | 4.06 | | | | 224 | | | | 1.50 | | | | 1.50 | | | | 5.15 | |
| | | | | | | | | | | | | | | | | | | | | | | | | | | |
| | (.29 | ) | | | 10.13 | | | | 1.76 | 6 | | | 8 | | | | 1.19 | 7 | | | 1.19 | 7 | | | 5.78 | 7 |
| | (.54 | ) | | | 10.25 | | | | 3.09 | | | | 7 | | | | 1.18 | | | | 1.18 | | | | 5.44 | |
| | (.52 | ) | | | 10.48 | | | | 8.22 | | | | 6 | | | | 1.16 | | | | 1.16 | | | | 5.31 | |
| | (.56 | ) | | | 10.18 | | | | 9.72 | | | | 3 | | | | 1.16 | | | | 1.16 | | | | 5.66 | |
| | (.64 | ) | | | 9.83 | | | | (5.94 | )8 | | | — | 9 | | | .79 | 8 | | | .79 | 8 | | | 5.76 | 8 |
| | (.06 | ) | | | 11.09 | | | | (2.20 | )6,8 | | | — | 9 | | | .04 | 6,8 | | | .04 | 6,8 | | | .51 | 6,8 |
| | | | | | | | | | | | | | | | | | | | | | | | | | | |
| | (.30 | ) | | | 10.13 | | | | 1.83 | 6 | | | 170 | | | | 1.04 | 7 | | | 1.04 | 7 | | | 5.93 | 7 |
| | (.56 | ) | | | 10.25 | | | | 3.26 | | | | 175 | | | | 1.01 | | | | 1.01 | | | | 5.60 | |
| | (.54 | ) | | | 10.48 | | | | 8.40 | | | | 190 | | | | 1.00 | | | | 1.00 | | | | 5.49 | |
| | (.57 | ) | | | 10.18 | | | | 9.78 | | | | 195 | | | | 1.06 | | | | 1.06 | | | | 5.95 | |
| | (.61 | ) | | | 9.83 | | | | (6.16 | ) | | | 209 | | | | 1.01 | | | | 1.01 | | | | 5.61 | |
| | (.64 | ) | | | 11.09 | | | | 4.57 | | | | 256 | | | | 1.01 | | | | 1.01 | | | | 5.65 | |
| | | | | | | | | | | | | | | | | | | | | | | | | | | |
| | (.31 | ) | | | 10.13 | | | | 1.99 | 6 | | | 137 | | | | .72 | 7 | | | .72 | 7 | | | 6.24 | 7 |
| | (.59 | ) | | | 10.25 | | | | 3.57 | | | | 138 | | | | .70 | | | | .70 | | | | 5.90 | |
| | (.57 | ) | | | 10.48 | | | | 8.73 | | | | 158 | | | | .69 | | | | .69 | | | | 5.79 | |
| | (.60 | ) | | | 10.18 | | | | 10.13 | | | | 159 | | | | .73 | | | | .73 | | | | 6.29 | |
| | (.65 | ) | | | 9.83 | | | | (5.86 | ) | | | 180 | | | | .69 | | | | .69 | | | | 5.93 | |
| | (.68 | ) | | | 11.09 | | | | 4.90 | | | | 230 | | | | .69 | | | | .69 | | | | 5.96 | |
| | | | | | | | | | | | | | | | | | | | | | | | | | | |
| | (.32 | ) | | | 10.13 | | | | 2.10 | 6 | | | 6 | | | | .51 | 7 | | | .51 | 7 | | | 6.48 | 7 |
| | (.61 | ) | | | 10.25 | | | | 3.80 | | | | 3 | | | | .48 | | | | .48 | | | | 6.22 | |
| | (.60 | ) | | | 10.48 | | | | 9.02 | | | | — | 9 | | | .59 | | | | .42 | | | | 6.06 | |
| | (.52 | ) | | | 10.18 | | | | 10.70 | 6 | | | — | 9 | | | .58 | 7 | | | .57 | 7 | | | 6.37 | 7 |
| | | | | | | | | | | | | | | | | | | | | | | | | | | |
| | (.33 | ) | | | 10.13 | | | | 2.14 | 6 | | | 79 | | | | .42 | 7 | | | .42 | 7 | | | 6.54 | 7 |
| | (.62 | ) | | | 10.25 | | | | 3.88 | | | | 84 | | | | .40 | | | | .40 | | | | 6.20 | |
| | (.60 | ) | | | 10.48 | | | | 9.05 | | | | 82 | | | | .40 | | | | .40 | | | | 6.08 | |
| | (.63 | ) | | | 10.18 | | | | 10.47 | | | | 76 | | | | .42 | | | | .42 | | | | 6.61 | |
| | (.68 | ) | | | 9.83 | | | | (5.58 | ) | | | 88 | | | | .39 | | | | .39 | | | | 6.23 | |
| | (.71 | ) | | | 11.09 | | | | 5.21 | | | | 111 | | | | .39 | | | | .39 | | | | 6.30 | |
See end of table for footnotes.
| American High-Income Trust | 39 |
Financial highlights (continued)
| | | | | | Income (loss) from investment operations1 |
| Period ended | | Net asset
value,
beginning
of period | | | Net
investment
income | | | Net (losses)
gains on
securities (both
realized and
unrealized) | | | Total from
investment
operations | |
| Class R-6: | | | | | | | | | | | | | | | | |
| 3/31/20194,5 | | $ | 10.25 | | | $ | .33 | | | $ | (.12 | ) | | $ | .21 | |
| 9/30/2018 | | | 10.48 | | | | .65 | | | | (.25 | ) | | | .40 | |
| 9/30/2017 | | | 10.18 | | | | .63 | | | | .27 | | | | .90 | |
| 9/30/2016 | | | 9.83 | | | | .64 | | | | .34 | | | | .98 | |
| 9/30/2015 | | | 11.09 | | | | .67 | | | | (1.25 | ) | | | (.58 | ) |
| 9/30/2014 | | | 11.22 | | | | .72 | | | | (.13 | ) | | | .59 | |
| | | Six months ended | | | | | | | | | | |
| | | March 31, | | Year ended September 30 |
| | | 20194,5,6 | | 2018 | | 2017 | | 2016 | | 2015 | | 2014 |
| Portfolio turnover rate for all share classes | | 22% | | 62% | | 73% | | 76% | | 49% | | 62% |
See notes to financial statements
| 40 | American High-Income Trust |
Dividends
(from net
investment
income) | | | Net asset
value, end
of period | | | Total
return2,3 | | | Net assets,
end of period
(in millions) | | | Ratio of
expenses to
average
net assets
before
reimbursements | | | Ratio of
expenses to
average
net assets
after
reimbursements3 | | | Ratio of
net income
to average
net assets3 | |
| | | | | | | | | | | | | | | | | | | | |
| $ | (.33 | ) | | $ | 10.13 | | | | 2.18 | %6 | | $ | 2,172 | | | | .37 | %7 | | | .37 | %7 | | | 6.60 | %7 |
| | (.63 | ) | | | 10.25 | | | | 3.94 | | | | 1,994 | | | | .35 | | | | .35 | | | | 6.26 | |
| | (.60 | ) | | | 10.48 | | | | 9.10 | | | | 1,776 | | | | .35 | | | | .35 | | | | 6.12 | |
| | (.63 | ) | | | 10.18 | | | | 10.54 | | | | 1,169 | | | | .36 | | | | .36 | | | | 6.62 | |
| | (.68 | ) | | | 9.83 | | | | (5.53 | ) | | | 1,046 | | | | .34 | | | | .34 | | | | 6.26 | |
| | (.72 | ) | | | 11.09 | | | | 5.26 | | | | 803 | | | | .34 | | | | .34 | | | | 6.29 | |
| 1 | Based on average shares outstanding. |
| 2 | Total returns exclude any applicable sales charges, including contingent deferred sales charges. |
| 3 | This column reflects the impact, if any, of certain reimbursements from CRMC. During some of the periods shown, CRMC paid a portion of the fund’s transfer agent fees for certain retirement plan share classes. |
| 4 | Based on operations for a period that is less than a full year. |
| 5 | Unaudited. |
| 6 | Not annualized. |
| 7 | Annualized. |
| 8 | All or a significant portion of assets in this class consisted of seed capital invested by CRMC and/or its affiliates. Fees for distribution services are not charged or accrued on these seed capital assets. If such fees were paid by the fund on seed capital assets, fund expenses would have been higher and net income and total return would have been lower. |
| 9 | Amount less than $1 million. |
| 10 | Class T and 529-T shares began investment operations on April 7, 2017. |
| 11 | Class F-3 shares began investment operations on January 27, 2017. |
| 12 | Class R-2E shares began investment operations on August 29, 2014. |
| 13 | Class R-5E shares began investment operations on November 20, 2015. |
| American High-Income Trust | 41 |
As a fund shareholder, you incur two types of costs: (1) transaction costs, such as initial sales charges on purchase payments and contingent deferred sales charges on redemptions (loads), and (2) ongoing costs, including management fees, distribution and service (12b-1) fees, and other expenses. This example is intended to help you understand your ongoing costs (in dollars) of investing in the fund so you can compare these costs with the ongoing costs of investing in other mutual funds. The example is based on an investment of $1,000 invested at the beginning of the period and held for the entire six-month period (October 1, 2018, through March 31, 2019).
Actual expenses:
The first line of each share class in the table on the following page provides information about actual account values and actual expenses. You may use the information in this line, together with the amount you invested, to estimate the expenses that you paid over the period. Simply divide your account value by $1,000 (for example, an $8,600 account value divided by $1,000 = 8.6), then multiply the result by the number in the first line under the heading titled “Expenses paid during period” to estimate the expenses you paid on your account during this period.
Hypothetical example for comparison purposes:
The second line of each share class in the table on the following page provides information about hypothetical account values and hypothetical expenses based on the actual expense ratio for the share class and an assumed rate of return of 5.00% per year before expenses, which is not the actual return of the share class. The hypothetical account values and expenses may not be used to estimate the actual ending account balance or expenses you paid for the period. You may use this information to compare the ongoing costs of investing in the fund and other funds. To do so, compare this 5.00% hypothetical example with the 5.00% hypothetical examples that appear in the shareholder reports of the other funds.
Notes:
Retirement plan participants may be subject to certain fees charged by the plan sponsor, and Class F-1, F-2, F-3 and 529-F-1 shareholders may be subject to fees charged by financial intermediaries, typically ranging from 0.75% to 1.50% of assets annually depending on services offered. You can estimate the impact of these fees by adding the amount of the fees to the total estimated expenses you paid on your account during the period as calculated above. In addition, your ending account value would be lower by the amount of these fees.
Note that the expenses shown in the table on the following page are meant to highlight your ongoing costs only and do not reflect any transactional costs, such as sales charges (loads). Therefore, the second line of each share class in the table is useful in comparing ongoing costs only and will not help you determine the relative total costs of owning different funds. In addition, if these transactional costs were included, your costs would have been higher.
| 42 | American High-Income Trust |
| | | Beginning
account value
10/1/2018 | | | Ending
account value
3/31/2019 | | | Expenses paid
during period* | | | Annualized
expense ratio | |
| Class A – actual return | | $ | 1,000.00 | | | $ | 1,019.88 | | | $ | 3.68 | | | | .73 | % |
| Class A – assumed 5% return | | | 1,000.00 | | | | 1,021.29 | | | | 3.68 | | | | .73 | |
| Class C – actual return | | | 1,000.00 | | | | 1,016.01 | | | | 7.54 | | | | 1.50 | |
| Class C – assumed 5% return | | | 1,000.00 | | | | 1,017.45 | | | | 7.54 | | | | 1.50 | |
| Class T – actual return | | | 1,000.00 | | | | 1,021.14 | | | | 2.42 | | | | .48 | |
| Class T – assumed 5% return | | | 1,000.00 | | | | 1,022.54 | | | | 2.42 | | | | .48 | |
| Class F-1 – actual return | | | 1,000.00 | | | | 1,019.74 | | | | 3.83 | | | | .76 | |
| Class F-1 – assumed 5% return | | | 1,000.00 | | | | 1,021.14 | | | | 3.83 | | | | .76 | |
| Class F-2 – actual return | | | 1,000.00 | | | | 1,021.20 | | | | 2.37 | | | | .47 | |
| Class F-2 – assumed 5% return | | | 1,000.00 | | | | 1,022.59 | | | | 2.37 | | | | .47 | |
| Class F-3 – actual return | | | 1,000.00 | | | | 1,021.69 | | | | 1.86 | | | | .37 | |
| Class F-3 – assumed 5% return | | | 1,000.00 | | | | 1,023.09 | | | | 1.87 | | | | .37 | |
| Class 529-A – actual return | | | 1,000.00 | | | | 1,019.56 | | | | 4.03 | | | | .80 | |
| Class 529-A – assumed 5% return | | | 1,000.00 | | | | 1,020.94 | | | | 4.03 | | | | .80 | |
| Class 529-C – actual return | | | 1,000.00 | | | | 1,015.84 | | | | 7.69 | | | | 1.53 | |
| Class 529-C – assumed 5% return | | | 1,000.00 | | | | 1,017.30 | | | | 7.70 | | | | 1.53 | |
| Class 529-E – actual return | | | 1,000.00 | | | | 1,018.66 | | | | 4.88 | | | | .97 | |
| Class 529-E – assumed 5% return | | | 1,000.00 | | | | 1,020.09 | | | | 4.89 | | | | .97 | |
| Class 529-T – actual return | | | 1,000.00 | | | | 1,020.88 | | | | 2.72 | | | | .54 | |
| Class 529-T – assumed 5% return | | | 1,000.00 | | | | 1,022.24 | | | | 2.72 | | | | .54 | |
| Class 529-F-1 – actual return | | | 1,000.00 | | | | 1,020.77 | | | | 2.82 | | | | .56 | |
| Class 529-F-1 – assumed 5% return | | | 1,000.00 | | | | 1,022.14 | | | | 2.82 | | | | .56 | |
| Class R-1 – actual return | | | 1,000.00 | | | | 1,015.96 | | | | 7.59 | | | | 1.51 | |
| Class R-1 – assumed 5% return | | | 1,000.00 | | | | 1,017.40 | | | | 7.59 | | | | 1.51 | |
| Class R-2 – actual return | | | 1,000.00 | | | | 1,016.04 | | | | 7.49 | | | | 1.49 | |
| Class R-2 – assumed 5% return | | | 1,000.00 | | | | 1,017.50 | | | | 7.49 | | | | 1.49 | |
| Class R-2E – actual return | | | 1,000.00 | | | | 1,017.56 | | | | 5.99 | | | | 1.19 | |
| Class R-2E – assumed 5% return | | | 1,000.00 | | | | 1,019.00 | | | | 5.99 | | | | 1.19 | |
| Class R-3 – actual return | | | 1,000.00 | | | | 1,018.35 | | | | 5.23 | | | | 1.04 | |
| Class R-3 – assumed 5% return | | | 1,000.00 | | | | 1,019.75 | | | | 5.24 | | | | 1.04 | |
| Class R-4 – actual return | | | 1,000.00 | | | | 1,019.92 | | | | 3.63 | | | | .72 | |
| Class R-4 – assumed 5% return | | | 1,000.00 | | | | 1,021.34 | | | | 3.63 | | | | .72 | |
| Class R-5E – actual return | | | 1,000.00 | | | | 1,021.01 | | | | 2.57 | | | | .51 | |
| Class R-5E – assumed 5% return | | | 1,000.00 | | | | 1,022.39 | | | | 2.57 | | | | .51 | |
| Class R-5 – actual return | | | 1,000.00 | | | | 1,021.45 | | | | 2.12 | | | | .42 | |
| Class R-5 – assumed 5% return | | | 1,000.00 | | | | 1,022.84 | | | | 2.12 | | | | .42 | |
| Class R-6 – actual return | | | 1,000.00 | | | | 1,021.75 | | | | 1.86 | | | | .37 | |
| Class R-6 – assumed 5% return | | | 1,000.00 | | | | 1,023.09 | | | | 1.87 | | | | .37 | |
| * | The “expenses paid during period” are equal to the “annualized expense ratio,” multiplied by the average account value over the period, multiplied by the number of days in the period, and divided by 365 (to reflect the one-half year period). |
| American High-Income Trust | 43 |
Approval of Investment Advisory and Service Agreement
American High-Income Trust’s board has approved the fund’s Investment Advisory and Service Agreement (the “agreement”) with Capital Research and Management Company (“CRMC”) for an additional one-year term through April 30, 2020. The board approved the agreement following the recommendation of the fund’s Contracts Committee (the “committee”), which is composed of all of the fund’s independent board members. The board and the committee determined in the exercise of their business judgment that the fund’s advisory fee structure was fair and reasonable in relation to the services provided, and that approving the agreement was in the best interests of the fund and its shareholders.
In reaching this decision, the board and the committee took into account information furnished to them throughout the year and otherwise provided to them, as well as information prepared specifically in connection with their review of the agreement, and were advised by their independent counsel with respect to the matters considered. They considered the following factors, among others, but did not identify any single issue or particular piece of information that, in isolation, was the controlling factor, and each board and committee member did not necessarily attribute the same weight to each factor.
1. Nature, extent and quality of services
The board and the committee considered the depth and quality of CRMC’s investment management process, including its global research capabilities; the experience, capability and integrity of its senior management and other personnel; the low turnover rates of its key personnel; the overall financial strength and stability of CRMC and the Capital Group organization; the resources and systems CRMC devotes to investment management, compliance, trading, portfolio accounting and other services; and the ongoing evolution of CRMC’s organizational structure designed to maintain and strengthen these qualities. The board and the committee also considered the nature, extent and quality of administrative, compliance and shareholder services provided by CRMC to the fund under the agreement and other agreements, as well as the benefits to fund shareholders from investing in a fund that is part of a large family of funds. The board and the committee concluded that the nature, extent and quality of the services provided by CRMC have benefited and should continue to benefit the fund and its shareholders.
2. Investment results
The board and the committee considered the investment results of the fund in light of its objectives of providing a high level of current income and, secondarily, capital appreciation. They compared the fund’s investment results with those of other funds (including funds that currently form the basis of the Lipper index for the category in which the fund is included), and data such as relevant market and fund indexes,
| 44 | American High-Income Trust |
over various periods through September 30, 2018. This report, including the letter to shareholders and related disclosures, contains certain information about the fund’s investment results. The board and the committee reviewed the fund’s investment results measured against the Lipper High Yield Funds Average and the Bloomberg Barclays U.S. Corporate High Yield 2% Issuer Capped Index. They reviewed the results for the one year, three-year, five-year, 10-year, 20-year and lifetime periods, and placed greater emphasis on longer-term periods. They noted that the investment results of the fund were mixed compared to the results of these indexes. The board and the committee concluded that the fund’s investment results have been satisfactory for renewal of the agreement and that CRMC’s record in managing the fund indicated that its continued management should benefit the fund and its shareholders.
3. Advisory fees and total expenses
The board and the committee compared the advisory fees and total expense levels of the fund to those of other relevant funds. They observed that the fund’s advisory fees and total expenses generally compared favorably to those of other similar funds included in the Lipper High Yields Funds category. The board and the committee also considered the breakpoint discounts in the fund’s advisory fee structure that reduce the level of fees charged by CRMC to the fund as fund assets increase. In addition, they reviewed information regarding the effective advisory fees charged to non-mutual fund clients by CRMC and its affiliates. They noted that, to the extent there were differences between the advisory fees paid by the fund and the advisory fees paid by those clients, the differences appropriately reflected the investment, operational, regulatory and market differences between advising the fund and the other clients. The board and the committee concluded that the fund’s cost structure was fair and reasonable in relation to the services provided, and that the fund’s shareholders receive reasonable value in return for the advisory fees and other amounts paid to CRMC by the fund.
4. Ancillary benefits
The board and the committee considered a variety of other benefits that CRMC and its affiliates receive as a result of CRMC’s relationship with the fund and other American Funds, including fees for administrative services provided to certain share classes; fees paid to CRMC’s affiliated transfer agent; sales charges and distribution fees received and retained by the fund’s principal underwriter, an affiliate of CRMC; and possible ancillary benefits to CRMC and its institutional management affiliates in managing other investment vehicles. The board and the committee reviewed CRMC’s portfolio trading practices, noting that through December 31, 2018 CRMC benefitted from research obtained with commissions from portfolio transactions made on behalf of the fund and since that time has undertaken to bear the cost of obtaining such research. The board and the committee took these ancillary benefits into account in evaluating the reasonableness of the advisory fees and other amounts paid to CRMC by the fund.
| American High-Income Trust | 45 |
5. Adviser financial information
The board and the committee reviewed information regarding CRMC’s costs of providing services to the American Funds, including personnel, systems and resources of investment, compliance, trading, accounting and other administrative operations. They considered CRMC’s costs and related cost allocation methodology as well as its track record of investing in technology, infrastructure and staff to maintain and expand services and capabilities, respond to industry and regulatory developments, and attract and retain qualified personnel. They noted information regarding the compensation structure for CRMC’s investment professionals. They reviewed information on the profitability of the investment adviser and its affiliates. The board and the committee also compared CRMC’s profitability and compensation data to the reported results and data of several large, publicly held investment management companies. The board and the committee noted the competitiveness and cyclicality of both the mutual fund industry and the capital markets, and the importance in that environment of CRMC’s long-term profitability for maintaining its independence, company culture and management continuity. They further considered the breakpoint discounts in the fund’s advisory fee structure and CRMC’s sharing of potential economies of scale, or efficiencies, through breakpoints and other fee reductions and costs voluntarily absorbed. The board and the committee concluded that the fund’s advisory fee structure reflected a reasonable sharing of benefits between CRMC and the fund’s shareholders.
| 46 | American High-Income Trust |
This page was intentionally left blank.
| American High-Income Trust | 47 |
This page was intentionally left blank.
| 48 | American High-Income Trust |
This page was intentionally left blank.
| American High-Income Trust | 49 |
This page was intentionally left blank.
| 50 | American High-Income Trust |
Results of special meeting of shareholders
Held November 28, 2018
Shares outstanding (all classes) on August 31, 2018 (record date)
1,596,101,299
Total shares voting on November 28, 2018
1,392,446,700 (87.2% of shares outstanding)
The proposal: to elect board members:
| | | Votes for | | Percent
of shares
voting for | | Votes
withheld | | Percent
of shares
withheld |
| William H. Baribault | | 1,348,312,313 | | | 96.8 | % | | | 44,134,387 | | | | 3.2 | % |
| James G. Ellis | | 1,349,485,355 | | | 96.9 | | | | 42,961,345 | | | | 3.1 | |
| Nariman Farvardin | | 1,350,506,209 | | | 97.0 | | | | 41,940,491 | | | | 3.0 | |
| Michael C. Gitlin | | 1,353,398,349 | | | 97.2 | | | | 39,048,351 | | | | 2.8 | |
| Mary Davis Holt | | 1,353,269,912 | | | 97.2 | | | | 39,176,788 | | | | 2.8 | |
| R. Clark Hooper | | 1,348,597,568 | | | 96.9 | | | | 43,849,132 | | | | 3.1 | |
| Merit E. Janow | | 1,350,773,982 | | | 97.0 | | | | 41,672,718 | | | | 3.0 | |
| Laurel B. Mitchell | | 1,354,272,427 | | | 97.3 | | | | 38,174,273 | | | | 2.7 | |
| Margaret Spellings | | 1,352,901,632 | | | 97.2 | | | | 39,545,068 | | | | 2.8 | |
| Alexandra Trower | | 1,354,029,383 | | | 97.2 | | | | 38,417,317 | | | | 2.8 | |
| Karl J. Zeile | | 1,353,240,098 | | | 97.2 | | | | 39,206,602 | | | | 2.8 | |
| American High-Income Trust | 51 |
Offices of the fund and of the investment adviser
Capital Research and Management Company
333 South Hope Street
Los Angeles, CA 90071-1406
6455 Irvine Center Drive
Irvine, CA 92618-4518
Transfer agent for shareholder accounts
American Funds Service Company
(Write to the address near you.)
P.O. Box 6007
Indianapolis, IN 46206-6007
P.O. Box 2280
Norfolk, VA 23501-2280
Custodian of assets
JPMorgan Chase Bank
270 Park Avenue
New York, NY 10017-2070
Counsel
Morgan, Lewis & Bockius LLP
One Federal Street
Boston, MA 02110-1726
Independent registered public accounting firm
Deloitte & Touche LLP
695 Town Center Drive
Suite 1000
Costa Mesa, CA 92626-7188
Principal underwriter
American Funds Distributors, Inc.
333 South Hope Street
Los Angeles, CA 90071-1406
| 52 | American High-Income Trust |
Investors should carefully consider investment objectives, risks, charges and expenses. This and other important information is contained in the fund prospectus and summary prospectus, which can be obtained from your financial professional and should be read carefully before investing. You may also call American Funds Service Company (AFS) at (800) 421-4225 or visit the American Funds website at americanfunds.com. Fund shares offered through American Funds Distributors, Inc.
“American Funds Proxy Voting Procedures and Principles” — which describes how we vote proxies relating to portfolio securities — is available on the American Funds website or upon request by calling AFS. The fund files its proxy voting record with the U.S. Securities and Exchange Commission (SEC) for the 12 months ended June 30 by August 31. The proxy voting record is available free of charge on the SEC website at sec.gov and on the American Funds website.
A complete March 31, 2019, portfolio of American High-Income Trust’s investments is available free of charge by calling AFS or visiting the SEC website (where it is part of Form N-CSR).
American High-Income Trust files a complete list of its portfolio holdings with the SEC for the first and third quarters of each fiscal year on Form N-PORT-EX. This filing is available free of charge on the SEC website. Additionally, the list of portfolio holdings is available by calling AFS.
This report is for the information of shareholders of American High-Income Trust, but it also may be used as sales literature when preceded or accompanied by the current prospectus or summary prospectus, which gives details about charges, expenses, investment objectives and operating policies of the fund. If used as sales material after June 30, 2019, this report must be accompanied by an American Funds statistical update for the most recently completed calendar quarter.
Bloomberg® is a trademark of Bloomberg Finance L.P. (collectively with its affiliates, “Bloomberg”). Barclays® is a trademark of Barclays Bank Plc (collectively with its affiliates, “Barclays”), used under license. Neither Bloomberg nor Barclays approves or endorses this material, guarantees the accuracy or completeness of any information herein and, to the maximum extent allowed by law, neither shall have any liability or responsibility for injury or damages arising in connection therewith.
The Capital Advantage®
Since 1931, Capital Group, home of American Funds, has helped investors pursue long-term investment success. Our consistent approach — in combination with The Capital SystemSM— has resulted in superior outcomes.
Aligned with investor success
We base our decisions on a long-term perspective, which we believe aligns our goals with the interests of our clients. Our portfolio managers average 27 years of investment experience, including 20 years at our company, reflecting a career commitment to our long-term approach.1
The Capital System
The Capital System combines individual accountability with teamwork. Funds using The Capital System are divided into portions that are managed independently by investment professionals with diverse backgrounds, ages and investment approaches. An extensive global research effort is the backbone of our system.
American Funds’ superior outcomes
Equity funds have beaten their Lipper peer indexes in 92% of 10-year periods and 99% of 20-year periods.2Fixed income funds have helped investors achieve diversification through attention to correlation between bonds and equities.3 Fund management fees have been among the lowest in the industry.4
| | 1 | Portfolio manager experience as of December 31, 2018. |
| | 2 | Based on Class F-2 share results for rolling periods through December 31, 2018. Periods covered are the shorter of the fund’s lifetime or since the comparable Lipper index inception date (except Capital Income Builder and SMALLCAP World Fund, for which the Lipper average was used). Expenses differ for each share class, so results will vary. |
| | 3 | Based on Class F-2 share results, as of December 31, 2018. Fourteen of our 15 American Funds fixed income funds that have been in existence for the three-year period showed a three-year correlation below 0.2. Standard & Poor’s 500 Composite Index was used as an equity market proxy. Correlation based on monthly total returns. Correlation is a statistical measure of how two securities move in relation to each other. A correlation ranges from –1 to 1. A positive correlation close to 1 implies that as one security moves, either up or down, the other security will move in “lockstep,” in the same direction. A negative correlation close to –1 indicates that the securities have moved in the opposite direction. |
| | 4 | On average, our management fees were in the lowest quintile 70% of the time, based on the 20-year period ended December 31, 2018, versus comparable Lipper categories, excluding funds of funds. |
Class F-2 shares were first offered on August 1, 2008. Class F-2 share results prior to the date of first sale are hypothetical based on Class A share results without a sales charge, adjusted for typical estimated expenses. Results for certain funds with an inception date after August 1, 2008, also include hypothetical returns because those funds’ Class F-2 shares sold after the funds’ date of first offering. Please see americanfunds.com for more information on specific expense adjustments and the actual dates of first sale.
All Capital Group trademarks mentioned are owned by The Capital Group Companies, Inc., an affiliated company or fund. All other company and product names mentioned are the property of their respective companies.

ITEM 2 – Code of Ethics
Not applicable for filing of semi-annual reports to shareholders.
ITEM 3 – Audit Committee Financial Expert
Not applicable for filing of semi-annual reports to shareholders.
ITEM 4 – Principal Accountant Fees and Services
Not applicable for filing of semi-annual reports to shareholders.
ITEM 5 – Audit Committee of Listed Registrants
Not applicable to this Registrant, insofar as the Registrant is not a listed issuer as defined in Rule 10A-3 under the Securities Exchange Act of 1934.
ITEM 6 – Schedule of Investments

American High-Income Trust®
Investment portfolio
March 31, 2019
unaudited
Bonds, notes & other debt instruments 91.15%
Corporate bonds & notes 90.90%
Communication services 14.43% | Principal amount
(000) | Value
(000) |
| Altice Finco SA 8.125% 20241 | $17,545 | $17,852 |
| Altice France SA, Term Loan B-13, (3-month USD-LIBOR + 4.00%) 6.484% 20262,3 | 9,052 | 8,679 |
| Altice NV 6.625% 20231 | 9,460 | 9,697 |
| Altice NV 7.50% 20261 | 9,000 | 8,933 |
| Altice NV, First Lien, 7.75% 20221 | 33,675 | 33,759 |
| Altice SA 7.625% 20251 | 21,425 | 18,854 |
| Cablevision Systems Corp. 5.125% 20211 | 6,850 | 6,876 |
| Cablevision Systems Corp. 6.75% 2021 | 44,150 | 47,296 |
| Cablevision Systems Corp. 5.50% 20271 | 2,700 | 2,764 |
| CBS Outdoor Americas Inc. 5.25% 2022 | 3,750 | 3,802 |
| CCO Holdings LLC and CCO Holdings Capital Corp. 4.00% 20231 | 27,375 | 27,417 |
| CCO Holdings LLC and CCO Holdings Capital Corp. 5.125% 20231 | 17,600 | 18,057 |
| CCO Holdings LLC and CCO Holdings Capital Corp. 5.875% 20241 | 3,835 | 4,018 |
| CCO Holdings LLC and CCO Holdings Capital Corp. 5.375% 20251 | 1,600 | 1,656 |
| CCO Holdings LLC and CCO Holdings Capital Corp. 5.50% 20261 | 11,000 | 11,385 |
| CCO Holdings LLC and CCO Holdings Capital Corp. 5.75% 20261 | 69,400 | 72,870 |
| CCO Holdings LLC and CCO Holdings Capital Corp. 5.125% 20271 | 62,990 | 63,541 |
| CCO Holdings LLC and CCO Holdings Capital Corp. 5.00% 20281 | 63,625 | 63,068 |
| CenturyLink, Inc. 6.75% 2023 | 60,675 | 63,481 |
| CenturyLink, Inc. 5.625% 2025 | 11,550 | 11,203 |
| CenturyLink, Inc. 7.65% 2042 | 7,825 | 6,906 |
| CenturyLink, Inc., Series T, 5.80% 2022 | 6,000 | 6,158 |
| Clear Channel Worldwide Holdings, Inc. 9.25% 20241 | 32,725 | 34,770 |
| CSC Holdings, LLC 7.75% 20251 | 1,500 | 1,613 |
| CSC Holdings, LLC 5.50% 20261 | 12,475 | 12,853 |
| Cumulus Media New Holdings Inc., Term Loan, (3-month USD-LIBOR + 4.50%) 7.00% 20222,3 | 49,953 | 49,196 |
| DISH DBS Corp. 7.875% 2019 | 6,000 | 6,090 |
| DISH DBS Corp. 5.125% 2020 | 2,000 | 2,018 |
| DISH DBS Corp. 6.75% 2021 | 11,000 | 11,368 |
| Frontier Communications Corp. 9.25% 2021 | 12,775 | 10,924 |
| Frontier Communications Corp. 10.50% 2022 | 131,757 | 101,123 |
| Frontier Communications Corp. 11.00% 2025 | 185,454 | 123,127 |
| Frontier Communications Corp. 8.50% 20261 | 51,775 | 48,215 |
| Frontier Communications Corp. 8.00% 20271 | 27,765 | 28,737 |
| Getty Images Inc. 9.75% 20271 | 11,775 | 11,878 |
| Getty Images Inc., Term Loan B, (3-month USD-LIBOR + 4.50%) 7.00% 20262,3 | 17,182 | 17,120 |
| Gogo Inc. 12.50% 20221 | 126,460 | 136,893 |
| Gray Television, Inc. 7.00% 20271 | 19,525 | 20,794 |
| iHeartCommunications, Inc. 9.00% 20194 | 19,325 | 13,817 |
| iHeartCommunications, Inc., Term Loan D, (3-month USD-LIBOR + 6.75%) 11.351% 20192,3,4 | 16,225 | 11,621 |
| Inmarsat PLC 4.875% 20221 | 48,055 | 49,026 |
| Inmarsat PLC 6.50% 20241 | 6,975 | 7,341 |
| Intelsat Jackson Holding Co. 5.50% 2023 | 66,875 | 59,686 |
| Intelsat Jackson Holding Co. 6.625% 20242 | 24,075 | 24,085 |
| Intelsat Jackson Holding Co. 8.00% 20241 | 10,250 | 10,711 |
| Intelsat Jackson Holding Co. 8.50% 20241 | 55,650 | 54,398 |
American High-Income Trust — Page 1 of 17
unaudited
Bonds, notes & other debt instruments (continued)
Corporate bonds & notes (continued)
Communication services (continued) | Principal amount
(000) | Value
(000) |
| Level 3 Communications, Inc. 5.25% 2026 | $11,425 | $11,425 |
| Liberty Global PLC 5.50% 20281 | 9,275 | 9,275 |
| Ligado Networks, Term Loan, (3-month USD-LIBOR + 8.75%) 11.52% 2020 (100% PIK)2,3,5 | 65,024 | 48,172 |
| Live Nation Entertainment, Inc. 4.875% 20241 | 3,900 | 3,934 |
| Live Nation Entertainment, Inc. 5.625% 20261 | 3,600 | 3,726 |
| Match Group, Inc. 6.375% 2024 | 12,845 | 13,551 |
| McGraw-Hill Global Education Holdings, LLC 7.875% 20241 | 4,950 | 4,028 |
| MDC Partners Inc. 6.50% 20241 | 136,458 | 113,601 |
| Meredith Corp. 6.875% 2026 | 126,769 | 134,058 |
| Neptune Finco Corp. (Altice NV) 6.625% 20251 | 10,600 | 11,262 |
| Neptune Finco Corp. (Altice NV) 10.875% 20251 | 2,098 | 2,427 |
| Nexstar Broadcasting, Inc. 5.625% 20241 | 7,000 | 7,123 |
| Numericable Group SA 7.375% 20261 | 21,300 | 20,927 |
| Sirius XM Radio Inc. 3.875% 20221 | 24,550 | 24,489 |
| Sirius XM Radio Inc. 4.625% 20231 | 7,475 | 7,596 |
| Sprint Corp. 7.25% 2021 | 33,035 | 34,769 |
| Sprint Corp. 11.50% 2021 | 78,780 | 91,582 |
| Sprint Corp. 7.875% 2023 | 16,670 | 17,545 |
| Sprint Corp. 6.875% 2028 | 75,850 | 73,100 |
| Sprint Corp. 8.75% 2032 | 8,925 | 9,439 |
| T-Mobile US, Inc. 4.00% 2022 | 7,025 | 7,122 |
| T-Mobile US, Inc. 6.375% 2025 | 20,375 | 21,267 |
| T-Mobile US, Inc. 6.50% 2026 | 9,775 | 10,459 |
| Trilogy International Partners, LLC 8.875% 20221 | 36,075 | 35,083 |
| Univision Communications Inc. 5.125% 20231 | 66,857 | 63,848 |
| Univision Communications Inc. 5.125% 20251 | 63,394 | 59,353 |
| Vodafone Group PLC 7.00% 2079 (5 year USD Swap + 4.873% on 4/4/2029)6 | 9,975 | 10,157 |
| Warner Music Group 5.00% 20231 | 19,875 | 20,297 |
| Warner Music Group 4.875% 20241 | 3,175 | 3,231 |
| Warner Music Group 5.50% 20261 | 8,275 | 8,513 |
| Wind Tre SpA 5.00% 20261 | 51,450 | 47,077 |
| Zayo Group Holdings, Inc. 6.00% 2023 | 7,000 | 7,123 |
| Zayo Group Holdings, Inc. 6.375% 2025 | 10,035 | 10,123 |
| Zayo Group Holdings, Inc. 5.75% 20271 | 11,975 | 11,979 |
| Ziggo Bond Finance BV 5.875% 20251 | 6,880 | 6,811 |
| Ziggo Bond Finance BV 5.50% 20271 | 48,427 | 48,064 |
| | | 2,368,212 |
| Energy 13.66% | | |
| American Energy (Permian Basin) (3-month USD-LIBOR + 6.50%) 9.233% 20191,3 | 6,750 | 2,700 |
| American Energy (Permian Basin) 7.125% 20201 | 54,047 | 21,078 |
| American Energy (Permian Basin) 7.375% 20211 | 49,175 | 19,178 |
| Antero Resources Corp. 5.375% 2024 | 21,110 | 21,380 |
| Ascent Resources Marcellus Holdings, Inc., Term Loan B, (3-month USD-LIBOR + 6.50%) 8.993% 20232,3,7 | 7,958 | 7,978 |
| Ascent Resources-Utica LLC 10.00% 20221 | 10,510 | 11,564 |
| Ascent Resources-Utica LLC 7.00% 20261 | 27,765 | 26,828 |
| Berry Petroleum Corp. 7.00% 20261 | 14,175 | 14,104 |
| Blackstone CQP Holdco LP 6.00% 20211,8 | 18,400 | 18,400 |
| Blackstone CQP Holdco LP 6.50% 20211,8 | 159,710 | 159,710 |
| Blue Racer Midstream LLC and Blue Racer Finance Corp. 6.125% 20221 | 30,225 | 30,829 |
| Bruin E&P Partners, LLC 8.875% 20231 | 9,660 | 9,249 |
| Calfrac Well Services Ltd. 8.50% 20261 | 7,900 | 6,162 |
| California Resources Corp., Term Loan B, (3-month USD-LIBOR + 4.75%) 7.246% 20222,3 | 20,525 | 20,217 |
| Carrizo Oil & Gas Inc. 6.25% 2023 | 15,325 | 15,134 |
American High-Income Trust — Page 2 of 17
unaudited
Bonds, notes & other debt instruments (continued)
Corporate bonds & notes (continued)
Energy (continued) | Principal amount
(000) | Value
(000) |
| Cheniere Energy Partners, LP 5.25% 2025 | $10,400 | $10,673 |
| Cheniere Energy, Inc. 7.00% 2024 | 15,255 | 17,258 |
| Cheniere Energy, Inc. 5.875% 2025 | 12,725 | 13,870 |
| Chesapeake Energy Corp. (3-month USD-LIBOR + 3.25%) 6.037% 20193 | 18,200 | 18,205 |
| Chesapeake Energy Corp. 4.875% 2022 | 28,871 | 28,582 |
| Chesapeake Energy Corp. 5.75% 2023 | 3,704 | 3,621 |
| Chesapeake Energy Corp. 8.00% 2025 | 21,200 | 21,730 |
| Chesapeake Energy Corp. 8.00% 2027 | 16,110 | 15,949 |
| Comstock Resources, Inc. 9.75% 20261 | 44,825 | 41,463 |
| CONSOL Energy Inc. 5.875% 2022 | 61,809 | 61,964 |
| Convey Park Energy LLC 7.50% 20251 | 23,535 | 21,939 |
| DCP Midstream Operating LP 4.95% 2022 | 23,053 | 23,658 |
| Denbury Resources Inc. 9.00% 20211 | 33,005 | 32,262 |
| Denbury Resources Inc. 7.50% 20241 | 19,605 | 16,836 |
| Diamond Offshore Drilling, Inc. 3.45% 2023 | 500 | 431 |
| Diamond Offshore Drilling, Inc. 7.875% 2025 | 29,050 | 28,178 |
| Diamond Offshore Drilling, Inc. 4.875% 2043 | 24,590 | 15,676 |
| Enbridge Energy Partners, LP 7.375% 2045 | 12,445 | 17,328 |
| Encino Acquisitions Partners LLC , Term Loan, (3-month USD-LIBOR + 6.75%) 9.249% 20252,3,9 | 8,775 | 8,512 |
| Energy Transfer Operating, LP 7.50% 2020 | 5,300 | 5,645 |
| Energy Transfer Operating, LP 5.875% 2024 | 18,500 | 20,266 |
| Energy Transfer Operating, LP 5.50% 2027 | 5,850 | 6,358 |
| Energy Transfer Partners, LP 4.75% 2026 | 3,400 | 3,556 |
| Ensco PLC 7.75% 2026 | 25,425 | 21,579 |
| Ensco PLC 5.75% 2044 | 33,070 | 21,413 |
| EP Energy Corp. 8.00% 20241 | 6,600 | 3,680 |
| EP Energy Corp. 7.75% 20261 | 12,785 | 10,484 |
| Extraction Oil & Gas, Inc. 7.375% 20241 | 19,850 | 16,674 |
| Extraction Oil & Gas, Inc. 5.625% 20261 | 31,580 | 24,396 |
| Genesis Energy, LP 6.75% 2022 | 27,524 | 28,281 |
| Genesis Energy, LP 6.50% 2025 | 22,140 | 21,642 |
| Hi-Crush Partners LP 9.50% 20261 | 6,750 | 5,231 |
| Indigo Natural Resources LLC 6.875% 20261 | 12,080 | 10,751 |
| Jonah Energy LLC 7.25% 20251 | 54,300 | 29,050 |
| Jones Energy, Inc. 9.25% 20231 | 15,600 | 8,619 |
| Kcad Holdings I Ltd. 7.25% 20211 | 14,630 | 12,655 |
| Kcad Holdings I Ltd. 9.625% 20231 | 10,580 | 8,900 |
| Laredo Petroleum, Inc. 5.625% 2022 | 5,940 | 5,457 |
| Magnolia Oil & Gas Operating LLC 6.00% 20261 | 4,479 | 4,546 |
| Matador Resources Co. 5.875% 2026 | 13,175 | 13,208 |
| McDermott International, Inc. 10.625% 20241 | 38,905 | 32,486 |
| McDermott International, Term Loan B, (3-month USD-LIBOR + 5.00%) 7.499% 20252,3 | 32,554 | 31,268 |
| Murphy Oil Corp. 6.875% 2024 | 7,150 | 7,574 |
| Murphy Oil Corp. 5.75% 2025 | 25,075 | 25,916 |
| Nabors Industries Inc. 5.50% 2023 | 11,000 | 10,555 |
| Nabors Industries Inc. 5.75% 2025 | 11,050 | 9,959 |
| Neptune Energy Group Holdings Ltd. 6.625% 20251 | 9,540 | 9,397 |
| NGL Energy Partners LP 7.50% 2023 | 5,605 | 5,827 |
| NGL Energy Partners LP 6.125% 2025 | 42,765 | 41,482 |
| NGPL PipeCo LLC 4.375% 20221 | 1,420 | 1,445 |
| NGPL PipeCo LLC 4.875% 20271 | 4,575 | 4,638 |
| NGPL PipeCo LLC 7.768% 20371 | 1,990 | 2,398 |
| Nine Energy Service, Inc. 8.75% 20231 | 8,620 | 8,943 |
| Noble Corp. PLC 7.95% 20256 | 14,895 | 12,959 |
American High-Income Trust — Page 3 of 17
unaudited
Bonds, notes & other debt instruments (continued)
Corporate bonds & notes (continued)
Energy (continued) | Principal amount
(000) | Value
(000) |
| Noble Corp. PLC 8.95% 20456 | $16,865 | $13,239 |
| Oasis Petroleum Inc. 6.875% 2022 | 24,755 | 25,064 |
| Oasis Petroleum Inc. 6.875% 2023 | 4,721 | 4,733 |
| Oasis Petroleum Inc. 6.25% 20261 | 11,740 | 11,212 |
| ONEOK, Inc. 7.50% 2023 | 9,475 | 10,976 |
| Pacific Drilling SA 8.375% 20231 | 16,050 | 16,334 |
| PDC Energy Inc. 6.125% 2024 | 4,950 | 4,962 |
| PDC Energy Inc. 5.75% 2026 | 33,363 | 32,696 |
| Peabody Energy Corp. 6.00% 20221 | 23,575 | 23,840 |
| Peabody Energy Corp. 6.375% 20251 | 825 | 806 |
| QEP Resources, Inc. 5.625% 2026 | 32,753 | 29,805 |
| QGOG Constellation SA 9.50% 2024 (5.26% PIK)1,4,5 | 91,001 | 34,126 |
| Range Resources Corp. 5.00% 2023 | 4,425 | 4,353 |
| Range Resources Corp. 4.875% 2025 | 9,250 | 8,626 |
| Sabine Pass Liquefaction, LLC 5.625% 20216 | 3,105 | 3,227 |
| Sabine Pass Liquefaction, LLC 5.625% 2025 | 1,800 | 1,981 |
| Sanchez Energy Corp. 7.25% 20231 | 25,450 | 20,614 |
| Seven Generations Energy Ltd. 5.375% 20251 | 8,525 | 8,365 |
| SM Energy Co. 6.125% 2022 | 9,052 | 9,097 |
| SM Energy Co. 5.625% 2025 | 16,620 | 15,451 |
| SM Energy Co. 6.75% 2026 | 4,120 | 3,971 |
| SM Energy Co. 6.625% 2027 | 7,050 | 6,733 |
| Southwestern Energy Co. 6.20% 20256 | 5,075 | 5,012 |
| Southwestern Energy Co. 7.50% 2026 | 29,375 | 30,109 |
| Southwestern Energy Co. 7.75% 2027 | 3,985 | 4,090 |
| Sunoco LP 4.875% 2023 | 32,705 | 33,307 |
| Sunoco LP 5.50% 2026 | 6,710 | 6,660 |
| Sunoco LP 6.00% 20271 | 7,125 | 7,161 |
| Tallgrass Energy Partners, LP 5.50% 20241 | 7,925 | 8,163 |
| Tapstone Energy Inc. 9.75% 20221 | 18,945 | 13,830 |
| Targa Resources Partners LP 6.75% 2024 | 1,000 | 1,051 |
| Targa Resources Partners LP 5.125% 2025 | 1,080 | 1,107 |
| Targa Resources Partners LP 6.50% 20271 | 14,955 | 16,170 |
| Targa Resources Partners LP 6.875% 20291 | 12,910 | 14,088 |
| Teekay Corp. 8.50% 2020 | 104,385 | 105,429 |
| Teekay Offshore Partners LP 8.50% 20231 | 27,825 | 27,408 |
| Transocean Guardian Ltd. 5.875% 20241 | 15,659 | 15,972 |
| Transocean Inc. 8.375% 20216 | 23,725 | 25,089 |
| Transocean Inc. 9.00% 20231 | 27,428 | 29,348 |
| Transocean Inc. 7.75% 20241 | 8,600 | 9,095 |
| Transocean Inc. 6.125% 20251 | 32,929 | 33,505 |
| Transocean Inc. 7.25% 20251 | 9,175 | 9,095 |
| Transocean Inc. 7.50% 20261 | 3,000 | 2,978 |
| Transocean Poseidon Ltd. 6.875% 20271 | 11,625 | 12,119 |
| Ultra Petroleum Corp. 11.00% 20245 | 53,610 | 31,898 |
| USA Compression Partners, LP 6.875% 2026 | 7,600 | 7,809 |
| USA Compression Partners, LP 6.875% 20271 | 19,400 | 19,812 |
| Vine Oil & Gas LP 8.75% 20231 | 40,765 | 32,612 |
| Vine Oil & Gas LP 9.75% 20231 | 16,025 | 13,301 |
| W&T Offshore, Inc. 9.75% 20231 | 23,809 | 23,839 |
| Weatherford International PLC 4.50% 2022 | 21,710 | 15,306 |
| Weatherford International PLC 8.25% 2023 | 23,175 | 16,512 |
| Weatherford International PLC 9.875% 2024 | 20,375 | 14,772 |
| Weatherford International PLC 9.875% 2025 | 21,350 | 15,212 |
American High-Income Trust — Page 4 of 17
unaudited
Bonds, notes & other debt instruments (continued)
Corporate bonds & notes (continued)
Energy (continued) | Principal amount
(000) | Value
(000) |
| Weatherford International PLC 6.50% 2036 | $31,390 | $17,892 |
| Weatherford International PLC 6.75% 2040 | 45,695 | 25,932 |
| Whiting Petroleum Corp. 6.25% 2023 | 6,647 | 6,713 |
| Whiting Petroleum Corp. 6.625% 2026 | 15,580 | 15,346 |
| WPX Energy Inc. 6.00% 2022 | 5,552 | 5,788 |
| WPX Energy Inc. 5.75% 2026 | 6,940 | 7,070 |
| | | 2,240,695 |
| Health care 13.36% | | |
| Auris Luxembourg III SARL, Term Loan, (3-month USD-LIBOR + 3.75%) 6.249% 20262,3 | 7,250 | 7,236 |
| Bausch Health Companies Inc. 5.75% 20271 | 8,110 | 8,333 |
| Centene Corp. 5.625% 2021 | 15,570 | 15,823 |
| Centene Corp. 4.75% 2022 | 58,125 | 59,288 |
| Centene Corp. 6.125% 2024 | 25,825 | 27,092 |
| Centene Corp. 4.75% 2025 | 36,490 | 37,311 |
| Centene Corp. 5.375% 20261 | 32,430 | 33,889 |
| Charles River Laboratories International, Inc. 5.50% 20261 | 7,465 | 7,764 |
| Community Health Systems Inc. 6.25% 2023 | 9,975 | 9,401 |
| Concordia International Corp. 8.00% 20247 | 5,062 | 4,784 |
| Concordia International Corp., Term Loan, (3-month USD-LIBOR + 5.50%) 7.993% 20242,3,7 | 5,836 | 5,531 |
| DaVita HealthCare Partners Inc. 5.125% 2024 | 16,840 | 16,672 |
| DaVita HealthCare Partners Inc. 5.00% 2025 | 14,900 | 14,334 |
| Eagle Holding Co. II LLC 7.625% 20221,5 | 10,700 | 10,820 |
| Endo International PLC 5.75% 20221 | 47,464 | 45,269 |
| Endo International PLC 6.00% 20231 | 42,135 | 32,655 |
| Endo International PLC 5.875% 20241 | 21,075 | 20,785 |
| Endo International PLC 6.00% 20251,6 | 21,060 | 15,374 |
| Envision Healthcare Corp. 8.75% 20261 | 29,470 | 26,339 |
| Envision Healthcare Corp., Term Loan, (3-month USD-LIBOR + 3.75%) 6.249% 20252,3 | 5,461 | 5,119 |
| HCA Inc. 6.50% 2020 | 8,375 | 8,621 |
| HCA Inc. 7.50% 2022 | 3,860 | 4,266 |
| HCA Inc. 5.875% 2023 | 16,750 | 17,902 |
| HCA Inc. 5.375% 2025 | 6,550 | 6,959 |
| HCA Inc. 5.375% 2026 | 9,900 | 10,445 |
| HCA Inc. 5.875% 2026 | 4,500 | 4,871 |
| HCA Inc. 5.625% 2028 | 26,000 | 27,560 |
| HCA Inc. 5.50% 2047 | 13,475 | 14,400 |
| HealthSouth Corp. 5.75% 2024 | 8,675 | 8,816 |
| HealthSouth Corp. 5.75% 2025 | 18,115 | 18,500 |
| IMS Health Holdings, Inc. 5.00% 20261 | 32,405 | 33,276 |
| inVentiv Health, Inc. 7.50% 20241 | 27,447 | 29,025 |
| Jaguar Holding Co. 6.375% 20231 | 27,655 | 28,243 |
| Kinetic Concepts, Inc. 7.875% 20211 | 29,411 | 30,145 |
| Kinetic Concepts, Inc. 12.50% 20211 | 94,530 | 102,565 |
| Mallinckrodt PLC 4.875% 20201 | 45,090 | 45,090 |
| Mallinckrodt PLC 5.75% 20221 | 5,345 | 5,051 |
| Mallinckrodt PLC 5.625% 20231 | 3,096 | 2,585 |
| Molina Healthcare, Inc. 5.375% 2022 | 109,511 | 114,095 |
| Molina Healthcare, Inc. 4.875% 20251 | 51,880 | 51,491 |
| Multiplan, Inc. 8.50% 20221,5 | 6,350 | 6,288 |
| Multiplan, Inc. 7.125% 20241 | 7,275 | 7,275 |
| NVA Holdings Inc. 6.875% 20261 | 20,375 | 20,248 |
| Owens & Minor, Inc. 3.875% 2021 | 30,435 | 24,348 |
| Owens & Minor, Inc., Term Loan B, (3-month USD-LIBOR + 4.50%) 6.989% 20252,3 | 12,786 | 9,765 |
American High-Income Trust — Page 5 of 17
unaudited
Bonds, notes & other debt instruments (continued)
Corporate bonds & notes (continued)
Health care (continued) | Principal amount
(000) | Value
(000) |
| Par Pharmaceutical Companies Inc. 7.50% 20271 | $62,725 | $63,744 |
| PAREXEL International Corp. 6.375% 20251 | 37,214 | 36,377 |
| Prestige Brands International Inc. 6.375% 20241 | 13,711 | 14,020 |
| Quintiles Transnational Corp. 4.875% 20231 | 27,126 | 27,739 |
| Rotech Healthcare Inc., Term Loan, (3-month USD-LIBOR + 11.00%) 13.41% 2023 (100% PIK)2,3,5,9,10 | 79,992 | 77,140 |
| Rotech Healthcare Inc., Term Loan A, (3-month USD-LIBOR + 3.25%) 5.752% 20232,3,9,10 | 16,951 | 16,951 |
| Sotera Health Topco, Inc. 8.125% 20211,5 | 1,585 | 1,569 |
| Sterigenics-Nordion Holdings, LLC 6.50% 20231 | 1,645 | 1,661 |
| Surgery Center Holdings 10.00% 20271 | 8,630 | 8,781 |
| Team Health Holdings, Inc. 6.375% 20251 | 32,913 | 26,865 |
| Teleflex Inc. 4.625% 2027 | 7,440 | 7,407 |
| Tenet Healthcare Corp. 4.75% 2020 | 14,010 | 14,238 |
| Tenet Healthcare Corp. 6.00% 2020 | 98,845 | 102,675 |
| Tenet Healthcare Corp. 4.375% 2021 | 34,620 | 35,395 |
| Tenet Healthcare Corp. 4.50% 2021 | 27,055 | 27,596 |
| Tenet Healthcare Corp. 8.125% 2022 | 40,385 | 43,600 |
| Tenet Healthcare Corp. 6.75% 2023 | 9,545 | 9,867 |
| Tenet Healthcare Corp. 4.625% 2024 | 52,461 | 52,789 |
| Tenet Healthcare Corp. 5.125% 2025 | 3,000 | 3,023 |
| Tenet Healthcare Corp. 6.25% 20271 | 12,250 | 12,725 |
| Teva Pharmaceutical Finance Co. BV 2.20% 2021 | 4,000 | 3,816 |
| Teva Pharmaceutical Finance Co. BV 2.80% 2023 | 29,757 | 26,577 |
| Teva Pharmaceutical Finance Co. BV 6.00% 2024 | 68,388 | 68,689 |
| Teva Pharmaceutical Finance Co. BV 3.15% 2026 | 22,985 | 18,815 |
| Teva Pharmaceutical Finance Co. BV 6.75% 2028 | 19,035 | 19,222 |
| Valeant Pharmaceuticals International, Inc. 5.625% 20211 | 21,103 | 21,109 |
| Valeant Pharmaceuticals International, Inc. 6.50% 20221 | 8,125 | 8,420 |
| Valeant Pharmaceuticals International, Inc. 5.875% 20231 | 78,720 | 79,802 |
| Valeant Pharmaceuticals International, Inc. 6.125% 20251 | 151,758 | 150,620 |
| Valeant Pharmaceuticals International, Inc. 9.00% 20251 | 55,500 | 60,498 |
| Valeant Pharmaceuticals International, Inc. 9.25% 20261 | 66,700 | 73,157 |
| Valeant Pharmaceuticals International, Inc. 8.50% 20271 | 13,360 | 14,195 |
Valeant Pharmaceuticals International, Inc., Term Loan B,
(3-month USD-LIBOR + 3.00%) 5.481% 20252,3 | 8,328 | 8,278 |
| Verscend Holding Corp 9.75% 20261 | 6,479 | 6,487 |
| Verscend Holding Corp., Term Loan B, (3-month USD-LIBOR + 4.50%) 6.999% 20252,3 | 7,686 | 7,638 |
| WellCare Health Plans, Inc. 5.375% 20261 | 4,085 | 4,284 |
| | | 2,191,418 |
| Materials 11.83% | | |
| AK Steel Holding Corp. 7.625% 2021 | 27,050 | 27,253 |
| AK Steel Holding Corp. 7.50% 2023 | 8,060 | 8,304 |
| AK Steel Holding Corp. 6.375% 2025 | 11,825 | 9,874 |
| AK Steel Holding Corp. 7.00% 2027 | 3,700 | 3,118 |
| ArcelorMittal 6.125% 2025 | 7,000 | 7,770 |
| Ardagh Group SA 7.125% 20235 | 3,300 | 3,304 |
| Ardagh Packaging Finance 6.00% 20251 | 48,620 | 48,742 |
| Axalta Coating Systems LLC 4.875% 20241 | 12,250 | 12,327 |
| Ball Corp. 4.375% 2020 | 8,175 | 8,318 |
| Ball Corp. 5.00% 2022 | 8,925 | 9,282 |
| Berry Plastics Corp. 5.50% 2022 | 6,800 | 6,928 |
| Blue Cube Spinco Inc. (Olin Corp.) 9.75% 2023 | 4,820 | 5,374 |
| Blue Cube Spinco Inc. (Olin Corp.) 10.00% 2025 | 4,260 | 4,895 |
| BWAY Parent Co. Inc. 5.50% 20241 | 28,725 | 28,626 |
American High-Income Trust — Page 6 of 17
unaudited
Bonds, notes & other debt instruments (continued)
Corporate bonds & notes (continued)
Materials (continued) | Principal amount
(000) | Value
(000) |
| BWAY Parent Co. Inc. 7.25% 20251 | $28,980 | $28,056 |
| Carlyle Group LP 8.75% 20231,5 | 14,995 | 14,658 |
| CF Industries, Inc. 4.50% 20261 | 345 | 350 |
| CF Industries, Inc. 4.95% 2043 | 20,560 | 17,707 |
| CF Industries, Inc. 5.375% 2044 | 16,593 | 15,017 |
| Chemours Co. 6.625% 2023 | 26,078 | 27,058 |
| Chemours Co. 7.00% 2025 | 7,005 | 7,390 |
| Cleveland-Cliffs Inc. 4.875% 2021 | 11,500 | 11,673 |
| Cleveland-Cliffs Inc. 4.875% 20241 | 50,875 | 50,621 |
| Cleveland-Cliffs Inc. 5.75% 2025 | 137,410 | 131,914 |
| Consolidated Energy Finance SA 6.875% 20251 | 19,475 | 19,718 |
| Consolidated Energy Finance SA 6.50% 20261 | 20,430 | 20,430 |
| Constellium NV 5.875% 20261 | 11,675 | 11,493 |
| Crown Holdings, Inc. 4.50% 2023 | 3,000 | 3,038 |
| Crown Holdings, Inc. 7.375% 2026 | 2,000 | 2,230 |
| CVR Partners, LP 9.25% 20231 | 29,600 | 31,117 |
| First Quantum Minerals Ltd. 7.00% 20211 | 20,930 | 21,322 |
| First Quantum Minerals Ltd. 7.25% 20221 | 34,150 | 34,491 |
| First Quantum Minerals Ltd. 7.25% 20231 | 57,125 | 55,982 |
| First Quantum Minerals Ltd. 6.50% 20241 | 44,998 | 42,467 |
| First Quantum Minerals Ltd. 7.50% 20251 | 109,700 | 105,860 |
| First Quantum Minerals Ltd. 6.875% 20261 | 56,000 | 52,150 |
| Freeport-McMoRan Inc. 3.55% 2022 | 56,165 | 55,674 |
| Freeport-McMoRan Inc. 6.875% 2023 | 7,950 | 8,457 |
| FXI Holdings, Inc. 7.875% 20241 | 70,055 | 65,326 |
| Greif, Inc. 6.50% 20271 | 6,955 | 7,129 |
| H.I.G. Capital, LLC 6.75% 20241 | 50,043 | 47,291 |
| Hexion Inc. 6.625% 2020 | 35,850 | 30,024 |
| Hexion Inc. 10.00% 2020 | 20,110 | 16,892 |
| Hexion Inc. 10.375% 20221 | 31,165 | 26,257 |
| INEOS Group Holdings SA 5.625% 20241 | 22,325 | 22,381 |
| LSB Industries, Inc. 9.625% 20231 | 69,610 | 72,408 |
| Neon Holdings, Inc. 10.125% 20261 | 47,990 | 49,070 |
| Nova Chemicals Corp. 4.875% 20241 | 23,075 | 22,758 |
| Nova Chemicals Corp. 5.25% 20271 | 59,395 | 58,504 |
| Novelis Corp. 6.25% 20241 | 15,940 | 16,339 |
| Novelis Corp. 5.875% 20261 | 26,675 | 26,608 |
| Olin Corp. 5.125% 2027 | 8,000 | 8,130 |
| Olin Corp. 5.00% 2030 | 11,230 | 11,048 |
| Owens-Illinois, Inc. 5.00% 20221 | 3,920 | 4,033 |
| Owens-Illinois, Inc. 5.875% 20231 | 22,970 | 24,145 |
| Owens-Illinois, Inc. 6.375% 20251 | 8,101 | 8,526 |
| Plastipak Holdings, Inc. 6.25% 20251 | 4,910 | 4,615 |
| Platform Specialty Products Corp. 5.875% 20251 | 25,020 | 25,204 |
| Rayonier Advanced Materials Inc. 5.50% 20241 | 25,785 | 24,302 |
| Reynolds Group Inc. 5.75% 2020 | 29,214 | 29,287 |
| Reynolds Group Inc. 7.00% 20241 | 11,700 | 12,074 |
| Ryerson Inc. 11.00% 20221 | 93,330 | 98,696 |
| S.P.C.M. SA 4.875% 20251 | 14,375 | 14,110 |
| Scotts Miracle-Gro Co. 5.25% 2026 | 5,685 | 5,614 |
| Sealed Air Corp. 4.875% 20221 | 8,250 | 8,545 |
| Sealed Air Corp. 5.25% 20231 | 4,410 | 4,597 |
| Standard Industries Inc. 6.00% 20251 | 5,375 | 5,655 |
| Starfruit US Holdco LLC 8.00% 20261 | 23,250 | 23,541 |
American High-Income Trust — Page 7 of 17
unaudited
Bonds, notes & other debt instruments (continued)
Corporate bonds & notes (continued)
Materials (continued) | Principal amount
(000) | Value
(000) |
| Starfruit US Holdco LLC, Term Loan B, (3-month USD-LIBOR + 3.25%) 5.74% 20252,3 | $4,245 | $4,192 |
| Summit Materials, Inc. 6.125% 2023 | 22,562 | 23,145 |
| Summit Materials, Inc. 6.50% 20271 | 10,025 | 10,125 |
| Teck Resources Ltd. 8.50% 20241 | 3,825 | 4,101 |
| TPC Group Inc., 8.75% 20201 | 6,988 | 6,918 |
| Tronox Ltd. 5.75% 20251 | 18,330 | 17,070 |
| Tronox Ltd. 6.50% 20261 | 47,863 | 45,860 |
| United States Steel Corp. 6.875% 2025 | 5,925 | 5,821 |
| Venator Materials Corp. 5.75% 20251 | 68,348 | 60,317 |
| Warrior Met Coal, Inc. 8.00% 20241 | 15,601 | 16,303 |
| Zekelman Industries Inc. 9.875% 20231 | 20,035 | 21,350 |
| | | 1,941,299 |
| Industrials 10.80% | | |
| ACCO Brands Corp. 5.25% 20241 | 9,035 | 8,877 |
| ADT Corp. 3.50% 2022 | 33,025 | 31,952 |
| Advanced Disposal Services, Inc. 5.625% 20241 | 15,000 | 15,375 |
| Allison Transmission Holdings, Inc. 5.00% 20241 | 42,936 | 42,990 |
| Allison Transmission Holdings, Inc. 4.75% 20271 | 4,000 | 3,840 |
| American Airlines, Inc., 5.50% 20191 | 21,150 | 21,518 |
| ARAMARK Corp. 5.125% 2024 | 24,475 | 25,240 |
| ARAMARK Corp. 5.00% 20281 | 7,470 | 7,458 |
| Ashtead Group PLC 4.125% 20251 | 6,770 | 6,685 |
| Associated Materials, LLC 9.00% 20241 | 82,390 | 81,360 |
| Avis Budget Group, Inc. 5.50% 2023 | 40,555 | 41,011 |
| Avolon Holdings Funding Ltd. 5.25% 20241 | 25,450 | 26,277 |
| Beacon Roofing Supply, Inc. 4.875% 20251 | 42,871 | 40,888 |
| Bohai Financial Investment Holding Co., Ltd. 5.25% 20221 | 43,725 | 44,923 |
| Bohai Financial Investment Holding Co., Ltd. 4.50% 20231 | 10,725 | 10,698 |
| Bohai Financial Investment Holding Co., Ltd. 5.125% 20231 | 15,000 | 15,300 |
| Bohai Financial Investment Holding Co., Ltd. 5.50% 20241 | 4,500 | 4,680 |
| Brand Energy 8.50% 20251 | 19,335 | 17,450 |
| Brookfield WEC Holdings Inc., Term Loan, (3-month USD-LIBOR + 3.75%) 6.249% 20252,3 | 9,451 | 9,453 |
| Brookfield WEC Holdings Inc., Term Loan, (3-month USD-LIBOR + 6.75%) 9.249% 20262,3 | 34,534 | 34,718 |
| Builders FirstSource, Inc. 5.625% 20241 | 98,633 | 97,523 |
| CD&R Waterworks Merger Sub, LLC 6.125% 20251 | 6,415 | 6,305 |
| Continental Airlines, Inc., Series 2001-1, Class A1, 6.703% 2022 | 586 | 624 |
| Continental Airlines, Inc., Series 2007-1, Class B, 6.903% 2022 | 865 | 894 |
| Continental Airlines, Inc., Series 2000-2, Class A1, 7.707% 20229 | 460 | 475 |
| Continental Airlines, Inc., Series 2000-1, Class A1, 8.048% 20229 | 94 | 96 |
| Continental Airlines, Inc., Series 2000-1, Class B, 8.388% 2022 | 1 | 1 |
| Covanta Holding Corp. 5.875% 2024 | 15,500 | 15,926 |
| Covanta Holding Corp. 5.875% 2025 | 7,750 | 7,915 |
| DAE Aviation Holdings, Inc. 10.00% 20231 | 150,175 | 161,438 |
| Deck Chassis Acquisition Inc. 10.00% 20231 | 92,560 | 98,229 |
| Delta Air Lines, Inc., Series 2002-1, Class G-1, MBIA insured, 6.718% 2024 | 2,076 | 2,212 |
| Dun & Bradstreet Corp. 6.875% 20261 | 38,095 | 39,024 |
| Dun & Bradstreet Corp. 10.25% 20271 | 57,147 | 58,861 |
| Dun & Bradstreet Corp., Term Loan B, (3-month USD-LIBOR + 5.00%) 7.49% 20262,3 | 24,730 | 24,555 |
| Euramax International, Inc. 12.00% 20201 | 52,646 | 53,633 |
| Hardwoods Acquisition Inc. 7.50% 20211 | 33,814 | 21,134 |
| HD Supply, Inc. 5.375% 20261 | 8,875 | 9,097 |
| HDTFS Inc. 5.875% 2020 | 25,000 | 25,025 |
| Hertz Global Holdings Inc. 7.625% 20221 | 55,192 | 56,627 |
American High-Income Trust — Page 8 of 17
unaudited
Bonds, notes & other debt instruments (continued)
Corporate bonds & notes (continued)
Industrials (continued) | Principal amount
(000) | Value
(000) |
| JELD-WEN Holding, Inc. 4.875% 20271 | $15,875 | $15,002 |
| KAR Auction Services, Inc. 5.125% 20251 | 17,160 | 17,053 |
| Kratos Defense & Security Solutions, Inc. 6.50% 20251 | 20,928 | 22,105 |
| LSC Communications, Inc. 8.75% 20231 | 94,823 | 100,749 |
| Multi-Color Corp. 4.875% 20251 | 44,280 | 45,830 |
| Navios Maritime Acquisition Corp. and Navios Acquisition Finance (US) Inc. 8.125% 20211 | 1,850 | 1,471 |
| Navistar International Corp. 6.625% 20251 | 8,155 | 8,328 |
| Navistar International Corp., Term Loan, (3-month USD-LIBOR + 4.75%) 6.00% 20242,3 | 5,318 | 5,312 |
| Pisces Parent LLC 8.00% 20261 | 105,946 | 95,539 |
| Pisces Parent LLC, Term Loan B, (3-month USD-LIBOR + 3.75%) 6.547% 20252,3,9 | 36,236 | 34,787 |
| PrimeSource Building Products Inc. 9.00% 20231 | 39,787 | 39,737 |
| R.R. Donnelley & Sons Co. 7.875% 2021 | 22,119 | 22,810 |
| R.R. Donnelley & Sons Co. 6.50% 2023 | 14,075 | 14,462 |
| R.R. Donnelley & Sons Co., Term Loan B, (3-month USD-LIBOR + 5.00%) 7.499% 20242,3 | 5,985 | 5,987 |
| Rexnord Corp. 4.875% 20251 | 22,105 | 21,939 |
| Sensata Technologies Holding BV 4.875% 20231 | 4,225 | 4,368 |
| Sensata Technologies Holding NV 6.25% 20261 | 7,000 | 7,455 |
| Standard Aero Holdings, Inc., Term Loan B, 6.25% 20222,3,9 | 5,761 | 5,765 |
| TransDigm Inc. 6.25% 20261 | 20,475 | 21,294 |
| United Air Lines, Inc., Series 2007-1, Class B, 7.336% 2021 | 2,121 | 2,150 |
| United Continental Holdings, Inc. 6.00% 2020 | 14,150 | 14,698 |
| United Rentals, Inc. 5.75% 2024 | 5,000 | 5,156 |
| United Rentals, Inc. 4.625% 2025 | 13,600 | 13,464 |
| United Rentals, Inc. 5.50% 2027 | 5,000 | 5,063 |
| United Rentals, Inc. 4.875% 2028 | 3,520 | 3,433 |
| Virgin Australia Holdings Ltd. 8.50% 20191 | 39,930 | 40,878 |
| Virgin Australia Holdings Ltd. 7.875% 20211 | 27,125 | 27,735 |
| | | 1,772,857 |
| Consumer discretionary 9.70% | | |
| American Axle & Manufacturing Holdings, Inc. 6.50% 2027 | 16,550 | 16,116 |
| Boyd Gaming Corp. 6.875% 2023 | 1,260 | 1,314 |
| Churchill Downs Inc. 4.75% 20281 | 13,725 | 13,125 |
| Cirsa Gaming Corp. SA 7.875% 20231 | 95,885 | 99,434 |
| CRC Escrow Issuer LLC 5.25% 20251 | 16,345 | 15,814 |
| Fertitta Entertainment, Inc. 6.75% 20241 | 12,050 | 12,140 |
| Fertitta Entertainment, Inc. 8.75% 20251 | 28,105 | 29,581 |
| Goodyear Tire & Rubber Co. 5.125% 2023 | 5,595 | 5,609 |
| Goodyear Tire & Rubber Co. 4.875% 2027 | 7,000 | 6,423 |
| Hanesbrands Inc. 4.625% 20241 | 21,110 | 21,273 |
| Hanesbrands Inc. 4.875% 20261 | 24,375 | 24,170 |
| Hilton Worldwide Holdings Inc. 4.25% 2024 | 4,275 | 4,278 |
| International Game Technology 6.50% 20251 | 9,100 | 9,509 |
| International Game Technology 6.25% 20271 | 10,825 | 11,116 |
| Lennar Corp. 8.375% 2021 | 18,725 | 20,317 |
| Levi Strauss & Co. 5.00% 2025 | 10,750 | 11,126 |
| Limited Brands, Inc. 6.625% 2021 | 6,750 | 7,121 |
| Limited Brands, Inc. 5.25% 2028 | 8,295 | 7,403 |
| Limited Brands, Inc. 6.875% 2035 | 2,810 | 2,441 |
| McGraw-Hill Global Education Holdings, LLC, Term Loan B, (3-month USD-LIBOR + 4.00%) 6.499% 20222,3 | 15,675 | 14,447 |
| Meritage Homes Corp. 5.125% 2027 | 13,375 | 13,003 |
| Merlin Entertainment 5.75% 20261 | 10,390 | 10,741 |
| MGM Growth Properties LLC 5.625% 2024 | 3,600 | 3,776 |
| MGM Resorts International 7.75% 2022 | 16,675 | 18,468 |
American High-Income Trust — Page 9 of 17
unaudited
Bonds, notes & other debt instruments (continued)
Corporate bonds & notes (continued)
Consumer discretionary (continued) | Principal amount
(000) | Value
(000) |
| MGM Resorts International 6.00% 2023 | $9,190 | $9,718 |
| MGM Resorts International 5.50% 2027 | 12,050 | 12,261 |
| Michaels Stores, Inc. 5.875% 20201 | 14,360 | 14,396 |
| Mohegan Tribal Gaming Authority, Term Loan B, (3-month USD-LIBOR + 4.50%) 6.499% 20232,3 | 9,572 | 9,027 |
| Neiman Marcus Group Ltd. Inc. 8.00% 20211 | 59,880 | 32,036 |
| Neiman Marcus Group Ltd. Inc. 9.50% 2021 (100% PIK)1,5 | 69,901 | 37,048 |
| Neiman Marcus Group Ltd. Inc., Term Loan B, (3-month USD-LIBOR + 3.25%) 5.733% 20202,3 | 49,771 | 46,360 |
| NMG Finco PLC 5.75% 20221 | 33,296 | 31,714 |
| Panther BF Aggregator 2, LP 6.25% 20261 | 15,970 | 16,329 |
| Panther BF Aggregator 2, LP 8.50% 20271 | 25,625 | 25,753 |
| Penn National Gaming, Inc. 5.625% 20271 | 3,750 | 3,656 |
| Petsmart, Inc. 7.125% 20231 | 143,774 | 107,830 |
| Petsmart, Inc. 5.875% 20251 | 153,500 | 129,324 |
| Petsmart, Inc. 8.875% 20251 | 82,085 | 61,769 |
| Petsmart, Inc., Term Loan B-2, (3-month USD-LIBOR + 3.00%) 5.49% 20222,3 | 48,687 | 43,788 |
| Sally Holdings LLC and Sally Capital Inc. 5.50% 2023 | 19,845 | 20,006 |
| Sally Holdings LLC and Sally Capital Inc. 5.625% 2025 | 77,835 | 77,640 |
| Sally Holdings LLC and Sally Capital Inc., Term Loan B2, 4.50% 20242,9 | 3,390 | 3,288 |
| Scientific Games Corp. 6.25% 2020 | 14,220 | 14,291 |
| Scientific Games Corp. 6.625% 2021 | 2,295 | 2,329 |
| Scientific Games Corp. 10.00% 2022 | 52,947 | 55,925 |
| Scientific Games Corp. 5.00% 20251 | 28,685 | 28,183 |
| Scientific Games Corp. 8.25% 20261 | 82,095 | 83,942 |
| Service Corp. International 5.375% 2024 | 2,345 | 2,412 |
| ServiceMaster Global Holdings, Inc. 5.125% 20241 | 12,000 | 12,075 |
| Six Flags Entertainment Corp. 4.875% 20241 | 42,475 | 41,918 |
| Sotheby’s 4.875% 20251 | 63,445 | 61,938 |
| Staples Inc. 8.50% 20251 | 8,855 | 9,696 |
| Stars Group Holdings BV, 7.00% 20261 | 14,125 | 14,761 |
| Uber Technologies, Inc. 7.50% 20231 | 45,025 | 47,051 |
| Uber Technologies, Inc. 8.00% 20261 | 63,775 | 68,080 |
| William Carter Co. 5.625% 20271 | 11,470 | 11,900 |
| Wyndham Worldwide Corp. 5.375% 20261 | 11,000 | 11,220 |
| Wynn Las Vegas, LLC and Wynn Capital Corp. 4.25% 20231 | 27,211 | 26,837 |
| Wynn Las Vegas, LLC and Wynn Capital Corp. 5.50% 20251 | 11,970 | 11,850 |
| Wynn Las Vegas, LLC and Wynn Capital Corp. 5.25% 20271 | 26,075 | 24,706 |
| ZF Friedrichshafen AG 4.75% 20251 | 2,341 | 2,277 |
| | | 1,592,079 |
| Information technology 7.08% | | |
| Alcatel-Lucent USA Inc. 6.45% 2029 | 16,200 | 15,916 |
| Almonde Inc., Term Loan-B, (3-month USD-LIBOR + 3.50%) 6.101% 20242,3 | 3,989 | 3,852 |
Almonde Inc., Term Loan, (3-month USD-LIBOR + 7.25%)
9.851% 20252,3 | 84,233 | 81,306 |
| Applied Systems, Inc., Term Loan, (3-month USD-LIBOR + 7.00%) 9.499% 20252,3 | 20,365 | 20,613 |
| Banff Merger Sub Inc. 9.75% 20261 | 14,253 | 13,861 |
| Blackboard Inc., Term Loan B4, (3-month USD-LIBOR + 5.00%) 7.78% 20212,3 | 42,766 | 42,107 |
| Camelot Finance SA 7.875% 20241 | 110,733 | 117,377 |
| CDW Corp. 5.00% 2025 | 10,500 | 10,802 |
| Colorado Buyer Inc., Term Loan, (3-month USD-LIBOR + 7.25%) 9.86% 20252,3 | 8,788 | 8,041 |
| CommScope Finance LLC 6.00% 20261 | 8,450 | 8,762 |
| CommScope Finance LLC 8.25% 20271 | 25,475 | 26,494 |
| CommScope Inc., Term Loan B, (3-month USD-LIBOR + 3.25%) 5.988% 20262,3 | 6,790 | 6,805 |
| CommScope Technologies LLC 5.50% 20241 | 3,000 | 2,949 |
American High-Income Trust — Page 10 of 17
unaudited
Bonds, notes & other debt instruments (continued)
Corporate bonds & notes (continued)
Information technology (continued) | Principal amount
(000) | Value
(000) |
| CommScope Technologies LLC 6.00% 20251 | $4,750 | $4,636 |
| CommScope Technologies LLC 5.00% 20271 | 13,650 | 12,137 |
| Dell Inc. 2.65% 2020 | 6,100 | 6,056 |
| Dell Inc. 7.125% 20241 | 18,025 | 19,114 |
| Diebold Nixdorf AG, Term Loan A, (3-month USD-LIBOR + 3.50%) 6.00% 20202,3 | 599 | 576 |
| Diebold Nixdorf AG, Term Loan A-DD, (3-month USD-LIBOR + 2.00%) 6.495% 20202,3 | 316 | 304 |
| Diebold Nixdorf AG, Term Loan A1, (3-month USD-LIBOR + 9.25%) 11.75% 20222,3 | 29,237 | 31,119 |
| Diebold Nixdorf AG, Term Loan B, (3-month USD-LIBOR + 2.75%) 5.25% 20232,3 | 7,578 | 7,123 |
| Diebold, Inc. 8.50% 2024 | 15,119 | 13,532 |
| Ellucian, Inc. 9.00% 20231 | 7,050 | 7,350 |
| Financial & Risk US Holdings, Inc. 6.25% 20261 | 23,080 | 23,455 |
| Financial & Risk US Holdings, Inc. 8.25% 20261 | 26,925 | 26,487 |
| Financial & Risk US Holdings, Inc., Term Loan B, (3-month USD-LIBOR + 3.75%) 6.249% 20252,3 | 7,207 | 7,005 |
| First Data Corp. 5.375% 20231 | 4,650 | 4,763 |
| First Data Corp. 5.00% 20241 | 5,500 | 5,635 |
| First Data Corp. 5.75% 20241 | 8,150 | 8,411 |
| Genesys Telecommunications Laboratories, Inc. 10.00% 20241 | 56,150 | 61,344 |
| Infor (US), Inc. 6.50% 2022 | 69,115 | 70,325 |
| Infor Software 7.125% 20211,5 | 67,151 | 67,578 |
| Informatica Corp. 7.125% 20231 | 14,250 | 14,588 |
| Internet Brands, Inc., Term Loan, (3-month USD-LIBOR + 3.75%) 6.236% 20242,3 | 5,110 | 5,047 |
| Internet Brands, Inc., Term Loan, (3-month USD-LIBOR + 7.50%) 9.986% 20252,3 | 41,290 | 40,774 |
| Kronos Inc., Term Loan B, (3-month USD-LIBOR + 3.00%) 5.736% 20232,3 | 11,068 | 10,965 |
Kronos Inc., Term Loan B, (3-month USD-LIBOR + 8.25%)
10.986% 20242,3 | 92,085 | 93,680 |
| McAfee, LLC, Term Loan, (3-month USD-LIBOR + 3.75%) 6.249% 20242,3 | 19,596 | 19,584 |
| McAfee, LLC, Term Loan, (3-month USD-LIBOR + 8.50%) 10.999% 20252,3 | 8,204 | 8,307 |
| Mitchell International, Inc., Term Loan B, (3-month USD-LIBOR + 7.25%) 9.749% 20252,3 | 10,167 | 9,912 |
| Qorvo, Inc. 5.50% 20261 | 18,125 | 18,761 |
| Solera Holdings, Inc. 10.50% 20241 | 11,633 | 12,667 |
| SS&C Technologies Holdings Inc. 5.50% 20271 | 11,325 | 11,459 |
| Tempo Acquisition LLC 6.75% 20251 | 12,125 | 12,277 |
| Unisys Corp. 10.75% 20221 | 77,660 | 85,911 |
| VeriSign, Inc. 4.625% 2023 | 4,600 | 4,675 |
| VeriSign, Inc. 5.25% 2025 | 3,000 | 3,154 |
| Veritas Holdings Ltd. 7.50% 20231 | 27,125 | 26,040 |
| Veritas Holdings Ltd. 10.50% 20241 | 10,652 | 9,587 |
| Vertafore Inc., Term Loan, (3-month USD-LIBOR + 7.25%) 9.749% 20262,3 | 28,550 | 28,291 |
| ViaSat, Inc. 5.625% 20271 | 10,740 | 10,956 |
| | | 1,162,470 |
| Financials 3.25% | | |
| Alliant Holdings Intermediate LLC 8.25% 20231 | 29,671 | 30,561 |
| Ally Financial Inc. 3.75% 2019 | 7,000 | 7,035 |
| Ally Financial Inc. 8.00% 2020 | 8,825 | 9,244 |
| Ally Financial Inc. 8.00% 2031 | 15,000 | 18,525 |
| Ally Financial Inc. 8.00% 2031 | 9,800 | 12,213 |
| Antero Resources Corp. 5.75% 20271 | 14,050 | 14,296 |
| CIT Group Inc. 4.125% 2021 | 22,435 | 22,772 |
| Compass Diversified Holdings 8.00% 20261 | 62,501 | 65,118 |
| Credit Acceptance Corp. 6.625% 20261 | 6,695 | 6,812 |
| Credit Suisse Group AG 3.869% 2049 (USD Semi Annual 30/360 (vs. 3M LIBOR) + 4.60% on 7/17/2023)1,6 | 2,295 | 2,362 |
| FS Energy and Power Fund 7.50% 20231 | 60,980 | 62,695 |
| General Motors Acceptance Corp. 7.50% 2020 | 13,225 | 14,052 |
American High-Income Trust — Page 11 of 17
unaudited
Bonds, notes & other debt instruments (continued)
Corporate bonds & notes (continued)
Financials (continued) | Principal amount
(000) | Value
(000) |
| HUB International Ltd. 7.00% 20261 | $64,366 | $63,883 |
| Hub International Ltd., Term Loan B, (3-month USD-LIBOR + 2.75%) 5.515% 20252,3 | 4,794 | 4,645 |
| Icahn Enterprises Finance Corp. 6.25% 2022 | 36,825 | 37,869 |
| iStar Financial Inc. 6.50% 2021 | 8,000 | 8,180 |
| Navient Corp. 4.875% 2019 | 13,859 | 13,885 |
| Navient Corp. 6.50% 2022 | 23,040 | 24,070 |
| Navient Corp. 5.50% 2023 | 45,240 | 45,466 |
| Navient Corp. 6.125% 2024 | 10,275 | 10,314 |
| Solenis International, LP, Term Loan, (3-month USD-LIBOR + 8.50%) 11.129% 20242,3,9 | 11,360 | 10,906 |
| Solenis International, LP, Term Loan, (3-month USD-LIBOR + 4.00%) 6.629% 20252,3 | 4,379 | 4,317 |
| Springleaf Finance Corp. 8.25% 2020 | 3,500 | 3,767 |
| Springleaf Finance Corp. 6.125% 2024 | 23,375 | 23,959 |
| Starwood Property Trust, Inc. 5.00% 2021 | 15,435 | 15,898 |
| | | 532,844 |
| Utilities 2.55% | | |
| AES Corp. 4.00% 2021 | 15,800 | 16,051 |
| AES Corp. 4.50% 2023 | 4,900 | 4,961 |
| AES Corp. 4.875% 2023 | 16,540 | 16,809 |
| AES Corp. 5.50% 2025 | 33,011 | 34,331 |
| AES Corp. 6.00% 2026 | 20,550 | 21,885 |
| AES Corp. 5.125% 2027 | 8,845 | 9,223 |
| AmeriGas Partners, LP 5.50% 2025 | 4,900 | 4,906 |
| AmeriGas Partners, LP 5.75% 2027 | 5,725 | 5,682 |
| Calpine Corp. 6.00% 20221 | 1,775 | 1,802 |
| Calpine Corp. 5.375% 2023 | 28,890 | 28,998 |
| Calpine Corp. 5.875% 20241 | 23,530 | 24,177 |
| Calpine Corp. 5.75% 2025 | 7,000 | 6,983 |
| Calpine Corp. 5.25% 20261 | 26,025 | 25,992 |
| Dynegy Finance Inc. 7.375% 2022 | 12,187 | 12,675 |
| Dynegy Finance Inc. 7.625% 2024 | 14,955 | 15,853 |
| Emera Inc. 6.75% 2076 (3-month USD-LIBOR + 5.44% on 6/15/2026)6 | 17,380 | 18,579 |
| Enel Società per Azioni 8.75% 20731,6 | 15,812 | 17,412 |
| NRG Energy, Inc. 7.25% 2026 | 5,000 | 5,520 |
| NRG Energy, Inc. 6.625% 2027 | 2,000 | 2,160 |
| Southern California Edison Co. 4.875% 2049 | 6,580 | 6,992 |
| Talen Energy Corp. 4.60% 2021 | 1,887 | 1,835 |
| Talen Energy Corp. 9.50% 20221 | 63,530 | 68,612 |
| Talen Energy Corp. 6.50% 2025 | 7,190 | 6,363 |
| Talen Energy Corp. 10.50% 20261 | 44,545 | 46,639 |
| TEX Operations Co. LLC, Term Loan B, (3-month USD-LIBOR + 2.00%) 4.499% 20232,3 | 8,482 | 8,401 |
| Vistra Operations Co. LLC 5.50% 20261 | 4,810 | 5,014 |
| | | 417,855 |
| Real estate 2.41% | | |
| Communications Sales & Leasing, Inc. 6.00% 20231 | 3,750 | 3,564 |
| Communications Sales & Leasing, Inc. 7.125% 20241 | 3,525 | 3,049 |
| Equinix, Inc. 5.75% 2025 | 5,450 | 5,671 |
| Equinix, Inc. 5.875% 2026 | 11,900 | 12,566 |
| Equinix, Inc. 5.375% 2027 | 41,580 | 43,659 |
| Five Point Holdings LLC 7.875% 20251 | 11,600 | 11,136 |
| Gaming and Leisure Properties, Inc. 4.375% 2021 | 3,500 | 3,559 |
| Gaming and Leisure Properties, Inc. 5.375% 2026 | 1,096 | 1,148 |
| Howard Hughes Corp. 5.375% 20251 | 75,685 | 75,685 |
American High-Income Trust — Page 12 of 17
unaudited
Bonds, notes & other debt instruments (continued)
Corporate bonds & notes (continued)
Real estate (continued) | Principal amount
(000) | Value
(000) |
| Iron Mountain Inc. 6.00% 2023 | $2,500 | $2,575 |
| Iron Mountain Inc. 5.75% 2024 | 53,200 | 53,865 |
| Iron Mountain Inc. 4.875% 20271 | 26,816 | 25,877 |
| Iron Mountain Inc. 5.25% 20281 | 28,754 | 28,035 |
| iStar Inc. 6.00% 2022 | 7,250 | 7,295 |
| Medical Properties Trust, Inc. 5.00% 2027 | 17,000 | 17,340 |
| Realogy Corp. 5.25% 20211 | 6,225 | 6,280 |
| Realogy Corp. 4.875% 20231 | 38,130 | 35,652 |
| Realogy Corp. 9.375% 20271 | 40,885 | 41,958 |
| SBA Communications Corp. 4.00% 2022 | 9,550 | 9,632 |
| SBA Communications Corp. 4.875% 2022 | 6,775 | 6,885 |
| | | 395,431 |
| Consumer staples 1.83% | | |
| Avon Products, Inc. 7.875% 20221 | 15,855 | 16,509 |
| B&G Foods, Inc. 4.625% 2021 | 11,050 | 11,064 |
| B&G Foods, Inc. 5.25% 2025 | 57,095 | 54,954 |
| Central Garden & Pet Co. 6.125% 2023 | 4,300 | 4,510 |
| Cott Beverages Inc. 5.50% 20251 | 21,125 | 21,389 |
| Darling Ingredients Inc. 5.375% 2022 | 9,250 | 9,423 |
| Darling Ingredients Inc. 5.25% 20271 | 3,630 | 3,691 |
| Energizer Holdings, Inc. 6.375% 20261 | 12,870 | 13,224 |
| Energizer Holdings, Inc. 7.75% 20271 | 12,860 | 13,744 |
| Energizer SpinCo Inc. 5.50% 20251 | 5,600 | 5,565 |
| First Quality Enterprises, Inc. 5.00% 20251 | 16,960 | 16,537 |
| First Quality Finance 4.625% 20211 | 8,575 | 8,596 |
| Lamb Weston Holdings, Inc. 4.625% 20241 | 12,690 | 12,849 |
| Post Holdings, Inc. 5.50% 20251 | 10,000 | 10,150 |
| Post Holdings, Inc. 8.00% 20251 | 8,400 | 9,009 |
| Post Holdings, Inc. 5.00% 20261 | 31,760 | 31,006 |
| Post Holdings, Inc. 5.625% 20281 | 24,460 | 24,368 |
| Prestige Brands International Inc. 5.375% 20211 | 9,714 | 9,823 |
| Spectrum Brands Inc. 6.625% 2022 | 1,750 | 1,795 |
| Spectrum Brands Inc. 6.125% 2024 | 4,750 | 4,821 |
| Spectrum Brands Inc. 5.75% 2025 | 3,000 | 3,037 |
| TreeHouse Foods, Inc. 4.875% 2022 | 2,000 | 2,032 |
| TreeHouse Foods, Inc. 6.00% 20241 | 10,975 | 11,428 |
| | | 299,524 |
| Total corporate bonds & notes | | 14,914,684 |
U.S. Treasury bonds & notes 0.24%
U.S. Treasury 0.24% | | |
| U.S. Treasury 3.125% 201911 | 40,000 | 40,034 |
Municipals 0.01%
Puerto Rico 0.01% | | |
| Aqueduct and Sewer Auth., Rev. Bonds, Series 2012-B, 4.90% 2020 | 1,780 | 1,715 |
| Total municipals | | 1,715 |
| Total bonds, notes & other debt instruments(cost: $15,355,395,000) | | 14,956,433 |
American High-Income Trust — Page 13 of 17
unaudited
Convertible bonds 0.59%
Communication services 0.32% | Principal amount
(000) | Value
(000) |
| DISH DBS Corp., convertible notes, 3.375% 2026 | $38,195 | $32,542 |
| Gogo Inc., convertible notes, 3.75% 2020 | 2,192 | 2,137 |
| Gogo Inc., convertible notes, 6.00% 20221 | 18,450 | 17,955 |
| | | 52,634 |
| Energy 0.11% | | |
| Chesapeake Energy Corp., convertible notes, 5.50% 2026 | 7,500 | 6,968 |
| Weatherford International PLC, convertible notes, 5.875% 2021 | 6,000 | 4,875 |
| Whiting Petroleum Corp., convertible notes, 1.25% 2020 | 5,500 | 5,330 |
| | | 17,173 |
| Health care 0.07% | | |
| Teva Pharmaceutical Finance Co. BV, Series C, convertible bonds, 0.25% 2026 | 11,910 | 11,040 |
| Industrials 0.06% | | |
| Fortive Corp., convertible notes, 0.875% 20221 | 9,850 | 10,378 |
| Information technology 0.03% | | |
| Euronet Worldwide, convertible notes, 0.75% 20491,8 | 4,915 | 5,306 |
| Total convertible bonds(cost: $102,067,000) | | 96,531 |
Convertible stocks 0.31%
Industrials 0.26% | Shares | |
| Associated Materials, LLC, 14.00% convertible preferred 20209,10 | 43,400 | 43,256 |
| Health care 0.04% | | |
| Danaher Corp., Series A, 4.75% cumulative convertible preferred 2022 | 5,424 | 5,711 |
| Utilities 0.01% | | |
| American Electric Power Co., Inc. 6.125% convertible preferred 2022 | 45,300 | 2,331 |
| Total convertible stocks(cost: $49,441,000) | | 51,298 |
Common stocks 1.03%
Health care 0.35% | | |
| Advanz Pharma Corp.7,8,12 | 2,244,779 | 39,014 |
| Advanz Pharma Corp.7,12 | 434,451 | 7,551 |
| Rotech Healthcare Inc.7,8,9,10,12 | 1,916,276 | 11,498 |
| | | 58,063 |
| Energy 0.29% | | |
| Ascent Resources - Utica, LLC, Class A7,8,9,10,12 | 90,532,504 | 19,917 |
| Tribune Resources, Inc.7,9,12 | 6,028,136 | 16,879 |
| White Star Petroleum Corp., Class A7,8,9,10,12 | 24,665,117 | 8,633 |
| Southwestern Energy Co.12 | 229,524 | 1,076 |
| Denbury Resources Inc.12 | 60,000 | 123 |
| Petroplus Holdings AG9,10,12 | 3,360,000 | —13 |
| | | 46,628 |
American High-Income Trust — Page 14 of 17
unaudited
Common stocks (continued)
Industrials 0.25% | Shares | Value
(000) |
| CEVA Logistics AG12 | 1,375,159 | $41,362 |
| NCI Building Systems, Inc.1,8,9,12 | 46,895 | 271 |
| | | 41,633 |
| Communication services 0.08% | | |
| Cumulus Media Inc., Class B9,12 | 376,995 | 6,790 |
| Cumulus Media Inc., Class A12 | 310,239 | 5,587 |
| Frontier Communications Corp.12 | 93,331 | 186 |
| Adelphia Recovery Trust, Series Arahova9,10,12 | 1,773,964 | 7 |
| Adelphia Recovery Trust, Series ACC-19,10,12 | 10,643,283 | 5 |
| | | 12,575 |
| Utilities 0.06% | | |
| Vistra Energy Corp. | 379,690 | 9,883 |
| Information technology 0.00% | | |
| Corporate Risk Holdings I, Inc.9,10,12 | 2,380,355 | 279 |
| Corporate Risk Holdings Corp.8,9,10,12 | 12,035 | 1 |
| | | 280 |
| Total common stocks(cost: $269,949,000) | | 169,062 |
Rights & warrants 0.01%
Energy 0.01% | | |
| Tribune Resources, Inc., Class A, warrants, expire 20237,9,10,12 | 2,032,968 | 498 |
| Tribune Resources, Inc., Class B, warrants, expire 20237,9,10,12 | 1,581,198 | 287 |
| Tribune Resources, Inc., Class C, warrants, expire 20237,9,10,12 | 1,480,250 | 208 |
| Ultra Petroleum Corp., warrants, expire 202512 | 1,053,850 | 158 |
| | | 1,151 |
| Industrials 0.00% | | |
| Associated Materials, LLC, warrants, expire 20239,10,12 | 616,536 | —13 |
| Communication services 0.00% | | |
| Liberman Broadcasting, Inc., warrants, expire 20228,9,10,12 | 10 | —13 |
| Total rights & warrants(cost: $572,000) | | 1,151 |
Short-term securities 5.58%
Money market investments 5.58% | | |
| Capital Group Central Cash Fund | 9,151,280 | 914,945 |
| Total short-term securities(cost: $915,041,000) | | 914,945 |
| Total investment securities 98.67%(cost: $16,692,465,000) | | 16,189,420 |
| Other assets less liabilities 1.33% | | 218,312 |
| Net assets 100.00% | | $16,407,732 |
American High-Income Trust — Page 15 of 17
unaudited
Swap contracts
Credit default swaps
Centrally cleared credit default swaps on credit indices — buy protection
| Receive | Pay/
Payment frequency | Expiration
date | Notional
(000) | Value at
3/31/2019
(000) | Upfront
payments
(000) | Unrealized
depreciation
at 3/31/2019
(000) |
| CDX.NA.HY.32 | 5.00%/Quarterly | 6/20/2024 | $69,600 | $(4,626) | $(4,216) | $(410) |
| CDX.NA.IG.32 | 1.00%/Quarterly | 6/20/2024 | 426,275 | (7,570) | (7,021) | (549) |
| | | | | | $(11,237) | $(959) |
| 1 | Acquired in a transaction exempt from registration under Rule 144A of the Securities Act of 1933. May be resold in the U.S. in transactions exempt from registration, normally to qualified institutional buyers. The total value of all such securities was $9,032,012,000, which represented 55.05% of the net assets of the fund. |
| 2 | Loan participations and assignments; may be subject to legal or contractual restrictions on resale. The total value of all such loans was $1,059,865,000, which represented 6.46% of the net assets of the fund. |
| 3 | Coupon rate may change periodically. |
| 4 | Scheduled interest and/or principal payment was not received. |
| 5 | Payment in kind; the issuer has the option of paying additional securities in lieu of cash. Most recent payment was 100% cash unless otherwise noted. |
| 6 | Step bond; coupon rate may change at a later date. |
| 7 | Represents an affiliated company as defined under the Investment Company Act of 1940. |
| 8 | Acquired through a private placement transaction exempt from registration under the Securities Act of 1933. May be subject to legal or contractual restrictions on resale. Further details on these holdings appear below. |
| 9 | Valued under fair value procedures adopted by authority of the board of trustees. The total value of all such securities was $266,449,000, which represented 1.62% of the net assets of the fund. |
| 10 | Value determined using significant unobservable inputs. |
| 11 | All or a portion of this security was pledged as collateral. The total value of pledged collateral was $7,029,000, which represented .04% of the net assets of the fund. |
| 12 | Security did not produce income during the last 12 months. |
| 13 | Amount less than one thousand. |
| Private placement securities | Acquisition
date(s) | Cost
(000) | Value
(000) | Percent
of net
assets |
| Blackstone CQP Holdco LP 6.50% 2021 | 3/6/2017-2/5/2018 | $159,710 | $159,710 | .97% |
| Blackstone CQP Holdco LP 6.00% 2021 | 8/9/2017 | 18,400 | 18,400 | .11 |
| Advanz Pharma Corp. | 8/31/2018 | 28,414 | 39,014 | .24 |
| Ascent Resources - Utica, LLC, Class A | 4/25/2016-11/15/2016 | 4,340 | 19,917 | .12 |
| Rotech Healthcare Inc. | 9/26/2013 | 41,128 | 11,498 | .07 |
| White Star Petroleum Corp., Class A | 6/30/2016 | 16,491 | 8,633 | .05 |
| Euronet Worldwide, convertible notes, 0.75% 2049 | 3/14/2019-3/19/2019 | 5,096 | 5,306 | .04 |
| NCI Building Systems, Inc. | 11/16/2018 | 990 | 271 | .00 |
| Corporate Risk Holdings Corp. | 8/31/2015 | — | 1 | .00 |
| Liberman Broadcasting, Inc., warrants, expire 2022 | 11/26/2014 | — | — | .00 |
| Total private placement securities | | $274,569 | $262,750 | 1.60% |
| Key to abbreviations and symbol |
| Auth. = Authority |
| LIBOR = London Interbank Offered Rate |
| Rev. = Revenue |
| USD/$ = U.S. dollars |
American High-Income Trust — Page 16 of 17
unaudited
Additional financial disclosures are included in the fund’s current shareholder report and should be read in conjunction with this report.
Investments are not FDIC-insured, nor are they deposits of or guaranteed by a bank or any other entity, so they may lose value.
Investors should carefully consider investment objectives, risks, charges and expenses. This and other important information is contained in the fund prospectus and summary prospectus, which can be obtained from your financial professional and should be read carefully before investing. You may also call American Funds Service Company (AFS) at (800) 421-4225 or visit the American Funds website at americanfunds.com. Fund shares offered through American Funds Distributors, Inc.
All Capital Group trademarks mentioned are owned by The Capital Group Companies, Inc., an affiliated company or fund. All other company and product names mentioned are the property of their respective companies.
© 2019 Capital Group. All rights reserved.
| MFGEFPX-021-0519O-S66072 | American High-Income Trust — Page 17 of 17 |
ITEM 7 – Disclosure of Proxy Voting Policies and Procedures for Closed-End Management Investment Companies
Not applicable to this Registrant, insofar as the Registrant is not a closed-end management investment company.
ITEM 8 – Portfolio Managers of Closed-End Management Investment Companies
Not applicable to this Registrant, insofar as the Registrant is not a closed-end management investment company.
ITEM 9 – Purchases of Equity Securities by Closed-End Management Investment Company and Affiliated Purchasers
Not applicable to this Registrant, insofar as the Registrant is not a closed-end management investment company.
ITEM 10 – Submission of Matters to a Vote of Security Holders
There have been no material changes to the procedures by which shareholders may recommend nominees to the Registrant’s board of trustees since the Registrant last submitted a proxy statement to its shareholders. The procedures are as follows. The Registrant has a nominating and governance committee comprised solely of persons who are not considered ‘‘interested persons’’ of the Registrant within the meaning of the Investment Company Act of 1940, as amended. The committee periodically reviews such issues as the board’s composition, responsibilities, committees, compensation and other relevant issues, and recommends any appropriate changes to the full board of trustees. While the committee normally is able to identify from its own resources an ample number of qualified candidates, it will consider shareholder suggestions of persons to be considered as nominees to fill future vacancies on the board. Such suggestions must be sent in writing to the nominating and governance committee of the Registrant, c/o the Registrant’s Secretary, and must be accompanied by complete biographical and occupational data on the prospective nominee, along with a written consent of the prospective nominee for consideration of his or her name by the nominating and governance committee.
ITEM 11 – Controls and Procedures
| (a) | The Registrant’s Principal Executive Officer and Principal Financial Officer have concluded, based on their evaluation of the Registrant’s disclosure controls and procedures (as such term is defined in Rule 30a-3 under the Investment Company Act of 1940), that such controls and procedures are adequate and reasonably designed to achieve the purposes described in paragraph (c) of such rule. |
| | |
| (b) | There were no changes in the Registrant’s internal controls over financial reporting (as defined in Rule 30a-3(d) under the Investment Company Act of 1940) that occurred during the Registrant’s semi-annual period covered by this report that has materially affected, or is reasonably likely to materially affect, the Registrant’s internal control over financial reporting. |
ITEM 12 – Exhibits
| (a)(1) | Not applicable for filing of semi-annual reports to shareholders. |
| | |
| (a)(2) | The certifications required by Rule 30a-2 of the Investment Company Act of 1940 and Sections 302 and 906 of the Sarbanes-Oxley Act of 2002 are attached as exhibits hereto. |
SIGNATURES
Pursuant to the requirements of the Securities Exchange Act of 1934 and the Investment Company Act of 1940, the Registrant has duly caused this report to be signed on its behalf by the undersigned, thereunto duly authorized.
| | AMERICAN HIGH-INCOME TRUST |
| | |
| | By__/s/ Kristine M. Nishiyama____________________ |
| | Kristine M. Nishiyama, Executive Vice President and Principal Executive Officer |
| | |
| | Date: May 31, 2019 |
Pursuant to the requirements of the Securities Exchange Act of 1934 and the Investment Company Act of 1940, this report has been signed below by the following persons on behalf of the Registrant and in the capacities and on the dates indicated.
| By__/s/ Kristine M. Nishiyama_________________ |
Kristine M. Nishiyama, Executive Vice President and Principal Executive Officer |
| |
| Date: May 31, 2019 |
| By ___/s/ Brian C. Janssen __________ |
Brian C. Janssen, Treasurer and Principal Financial Officer |
| |
| Date: May 31, 2019 |