
July 2022
Safe Harbor Statement Certain statements and information set forth in this presentation contains “forward-looking statements” and “forward-looking information” within the meaning of the Private Securities Litigation Reform Act of 1995. Except for statements of historical fact, certain information contained herein constitutes forward-looking statements which include management’s assessment of future plans and operations and are based on current internal expectations, estimates, projections, assumptions and beliefs, which may prove to be incorrect. Forward- looking statements are provided to allow potential investors the opportunity of management’s beliefs and opinions in respect of the future so that they may use such beliefs and opinions as one factor in evaluating an investment. Some of the forward-looking statements may be identified by words such as “may”, “plan”, “foresee”, “will”, “should”, “could”, “anticipate,” ”believe,” “expect,” “intend,” “potential,” “continue,” and similar expressions. While the Company’s management believes that these forward-looking statements are reasonable as and when made, these statements are not guarantees of future performance and undue reliance should not be placed on them. The Company’s forward-looking statements involve significant risks and uncertainties (some of which are beyond the Company’s control) and assumptions that could cause actual future results to differ materially from the Company’s historical experience and its present expectations or projections. For additional information regarding known material factors that could cause the Company’s results to differ from its projected results, please see its filings with the SEC, including its Annual Report on Form 10-K, Quarterly Reports on Form 10-Q, and Current Reports on Form 8-K. The reader is cautioned not to place undue reliance on forward-looking statements. The Company undertakes no obligation to publicly update or revise any forward- looking statement after they are made, whether as a result of new information, future events, or otherwise. 2
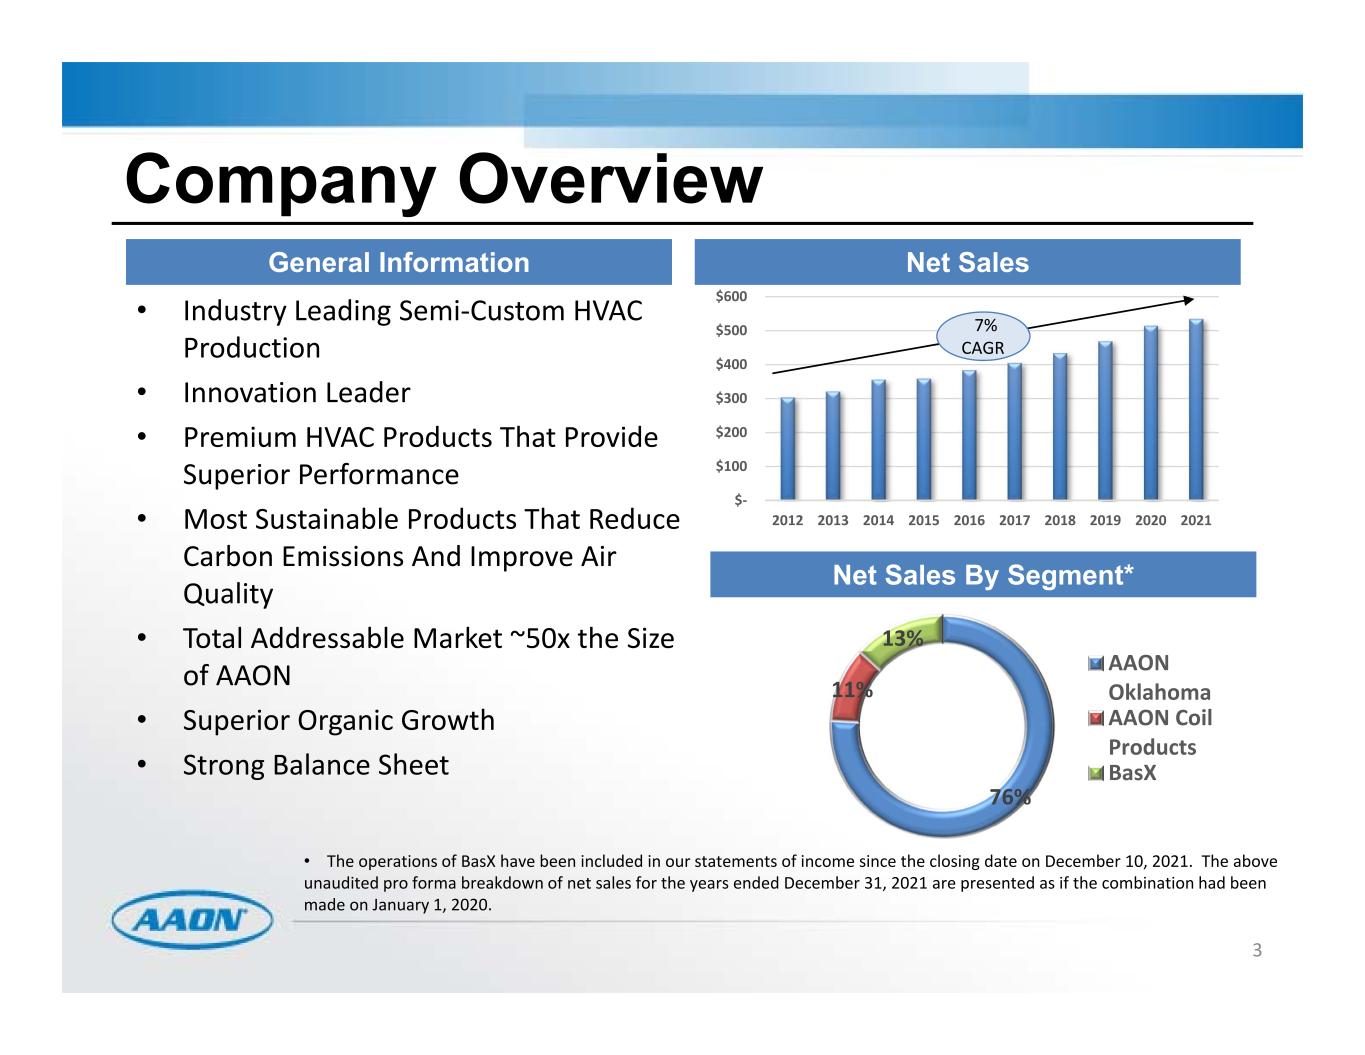
$‐ $100 $200 $300 $400 $500 $600 2021202020192018201720162015201420132012 • Industry Leading Semi‐Custom HVAC Production • Innovation Leader • Premium HVAC Products That Provide Superior Performance • Most Sustainable Products That Reduce Carbon Emissions And Improve Air Quality • Total Addressable Market ~50x the Size of AAON • Superior Organic Growth • Strong Balance Sheet 3 General Information Net Sales Company Overview 7% CAGR Net Sales By Segment* • The operations of BasX have been included in our statements of income since the closing date on December 10, 2021. The above unaudited pro forma breakdown of net sales for the years ended December 31, 2021 are presented as if the combination had been made on January 1, 2020. 76% 11% 13% AAON Oklahoma AAON Coil Products BasX
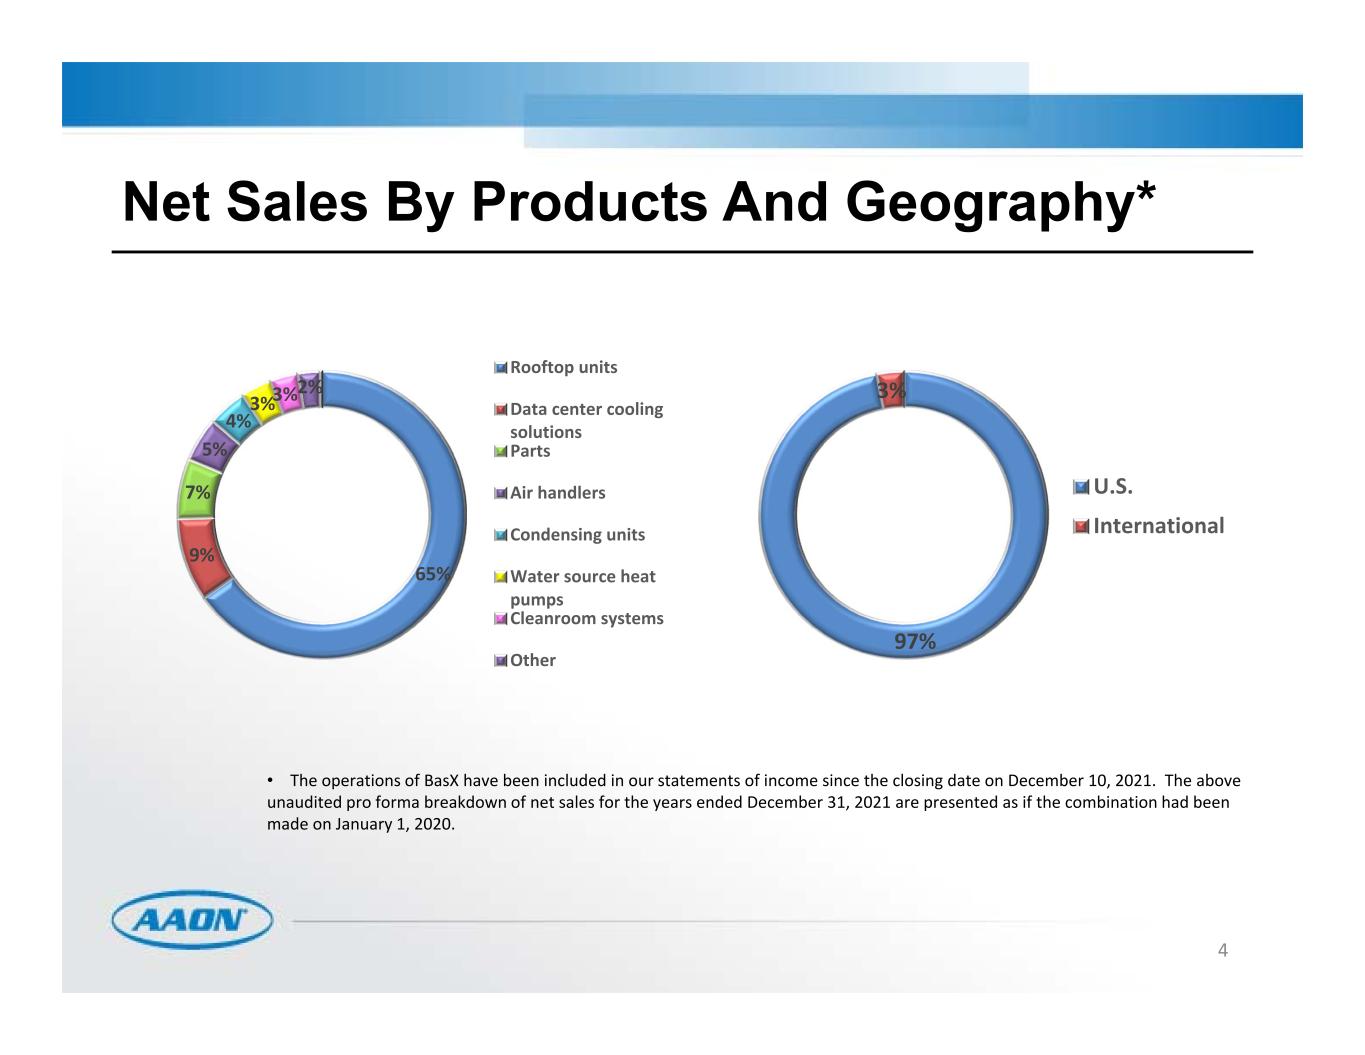
4 Net Sales By Products And Geography* 65% 9% 7% 5% 4% 3%3% 2% Rooftop units Data center cooling solutions Parts Air handlers Condensing units Water source heat pumps Cleanroom systems Other 97% 3% U.S. International • The operations of BasX have been included in our statements of income since the closing date on December 10, 2021. The above unaudited pro forma breakdown of net sales for the years ended December 31, 2021 are presented as if the combination had been made on January 1, 2020.
AAON offers the most semi-customized HVAC equipment for nonresidential buildings in the commercial HVAC industry Customization leads to: High performance Premium quality Energy efficiency Lowest cost of ownership Automated technologically-advanced production Proprietary software utilized to drive production of custom outputs Combining low unit costs of mass production processes with the flexibility of individual customization Modestly premium-priced equipment, but reasonable considering the benefits Delivery schedules competitive with standard equipment alternatives on the market 5 AAON Strategy - Customization
AAON has the highest quality products on the market Standardizing premium parts and components Premium designs Lowest cost of ownership Energy efficiency Maximizing equipment life span Ease of startup and serviceability Minimized maintenance AAON’s product portfolio is one of the most energy efficient Foam Insulated Panel Construction Direct Drive Backward Curved Plenum Fans Variable Capacity Compressors Advanced Control Sequences AHRI Certified Performance 6 AAON Strategy – Product Quality

In May 2020, Founder Norman Asbjornson stepped down as CEO, replaced by former President Gary Fields Since 2017, AAON began transitioning from an entrepreneurial led company to a structured team-oriented led enterprise New senior leadership and structure New Director of Investor Relations (2020) New CFO (2021) New V.P. of Administration (2021) New Director of Manufacturing (2022) New Executive Vice President of AAON Coil Products (2022) New Director of Marketing (2022) New CIO (2022) Higher efficiency while maintaining lean cost structure Overall, expect better execution and performance 7 Transition In Leadership And Culture
AAON sells a majority of its equipment through a network of independently owned sales representative organizations Approximately 64 independently managed sales representative firms 128 office locations One international sales organization, which utilizes 28 distributors Differentiation factor – most of our competition chooses to own and control the sales channel Competitive advantages: Independent sales channel attracts the best sales talent Compensation structure of independent sales channel is more attractive, providing better incentives to sell Independent sales channel is built on an engineered solutions‐based business model utilizing a portfolio of OEM’s equipment, as opposed to our competition that is restricted to selling only their equipment regardless of the best solution – this allows the independent sales channel to gain market share Transfers inventory management risk from AAON to the independent reps 8 AAON Strategy – Unique Sales Approach
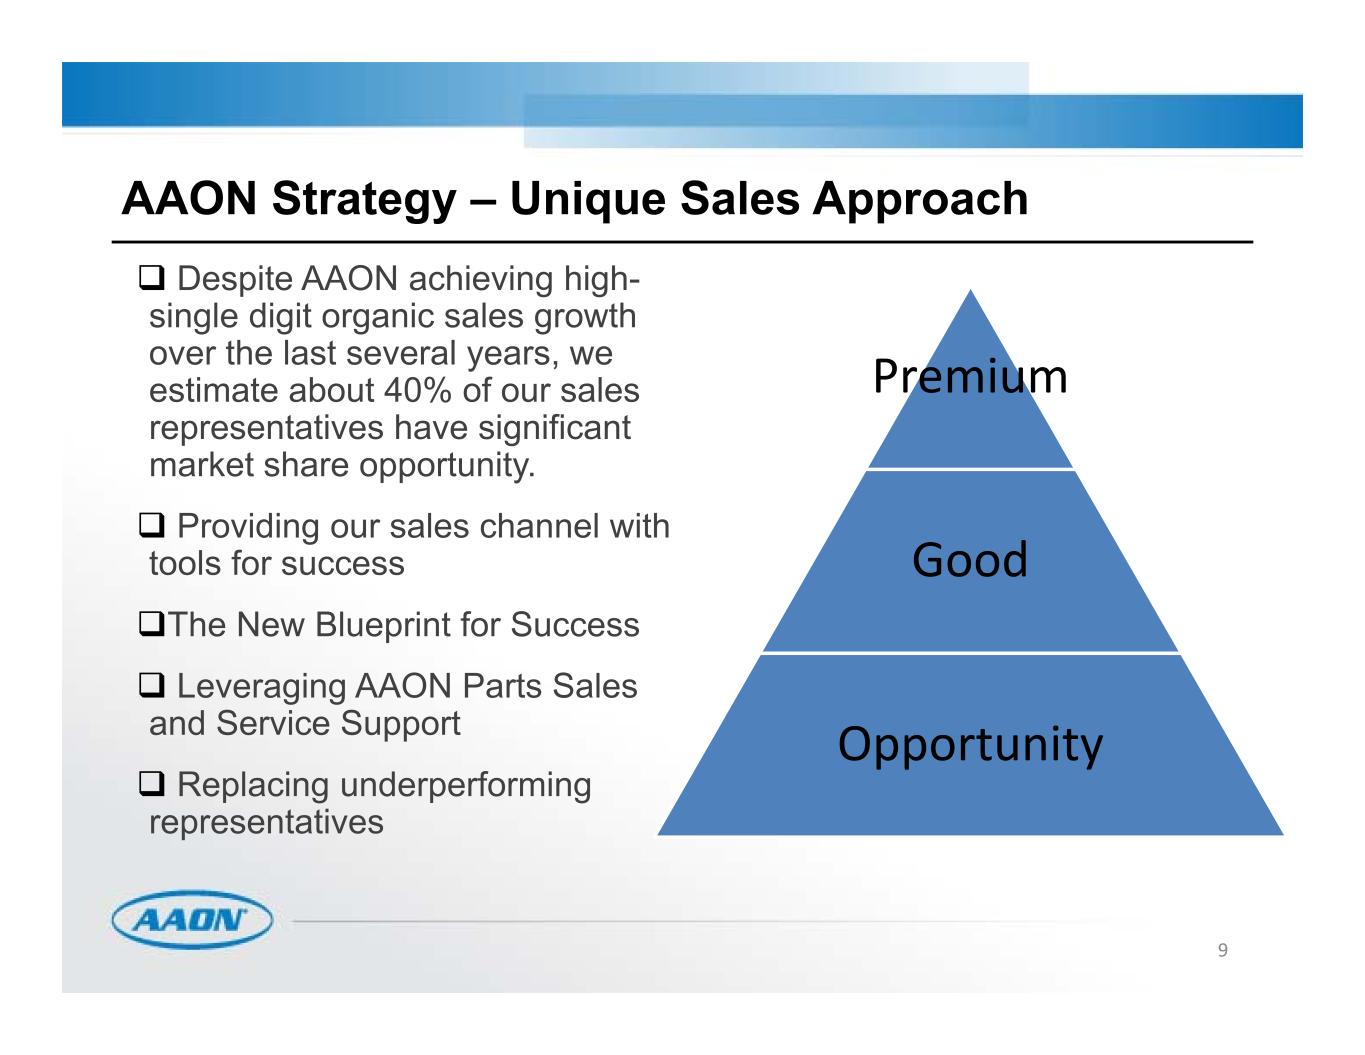
9 AAON Strategy – Unique Sales Approach Premium Good Opportunity Despite AAON achieving high- single digit organic sales growth over the last several years, we estimate about 40% of our sales representatives have significant market share opportunity. Providing our sales channel with tools for success The New Blueprint for Success Leveraging AAON Parts Sales and Service Support Replacing underperforming representatives
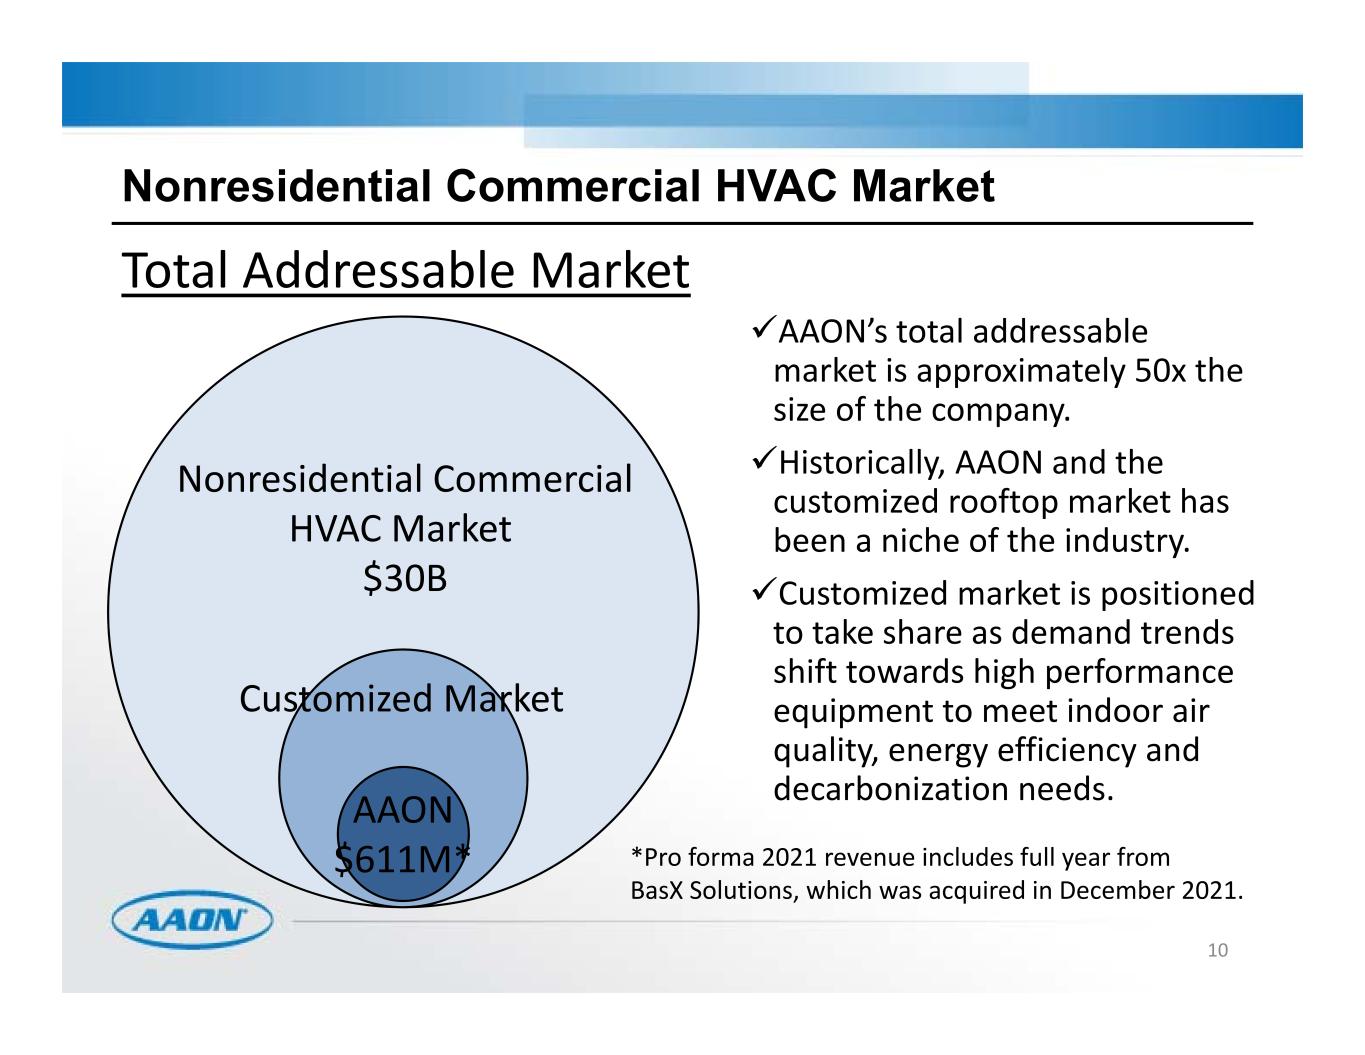
10 Nonresidential Commercial HVAC Market AAON $611M* Customized Market Nonresidential Commercial HVAC Market $30B Total Addressable Market AAON’s total addressable market is approximately 50x the size of the company. Historically, AAON and the customized rooftop market has been a niche of the industry. Customized market is positioned to take share as demand trends shift towards high performance equipment to meet indoor air quality, energy efficiency and decarbonization needs. *Pro forma 2021 revenue includes full year from BasX Solutions, which was acquired in December 2021.
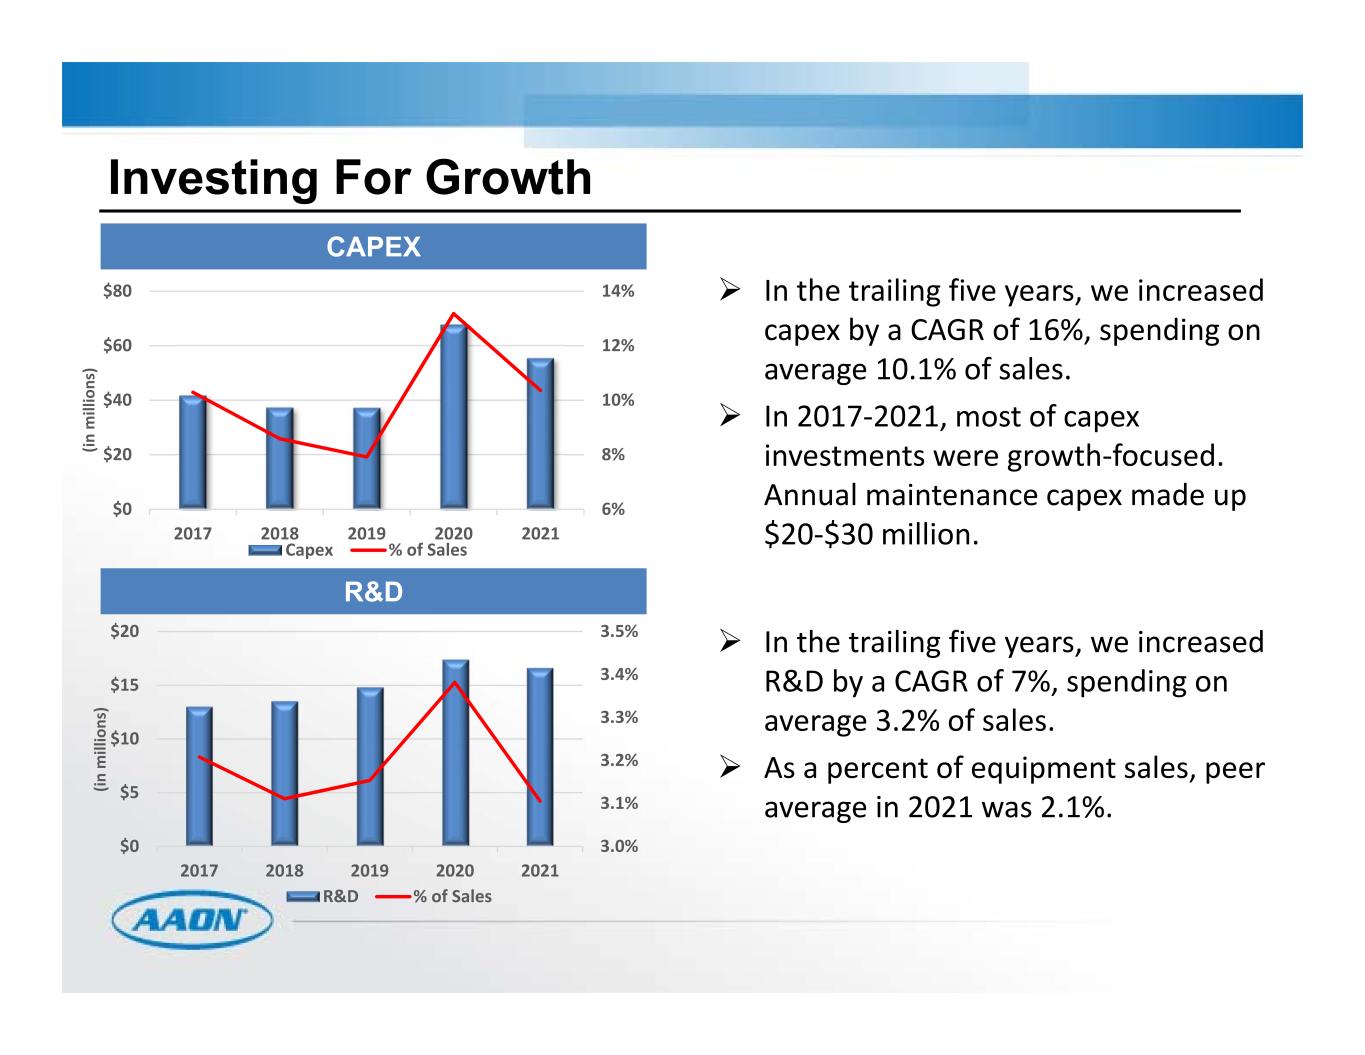
11 In the trailing five years, we increased capex by a CAGR of 16%, spending on average 10.1% of sales. In 2017‐2021, most of capex investments were growth‐focused. Annual maintenance capex made up $20‐$30 million. In the trailing five years, we increased R&D by a CAGR of 7%, spending on average 3.2% of sales. As a percent of equipment sales, peer average in 2021 was 2.1%. Investing For Growth CAPEX R&D 6% 8% 10% 12% 14% $0 $20 $40 $60 $80 2017 2018 2019 2020 2021 (in m ill io ns ) Capex % of Sales 3.0% 3.1% 3.2% 3.3% 3.4% 3.5% $0 $5 $10 $15 $20 2017 2018 2019 2020 2021 (in m ill io ns ) R&D % of Sales

12 Investing For Growth – New Products AAON’s latest generation of its RN D Series Rooftop Unit, which comes in sizes of 26‐70 tons, was introduced to the market in October 2021. The new D Series unit comes dramatically more energy efficient, with an average IEER of 38% higher, leading the market in all tonnage categories. Next Generation RN D Series with Variable Speed Compressors Next Generation Water‐Source Heat Pump AAON entered the $500 million‐ plus WSHP market in 2015 with an in‐house “EcoFit” model. By 2019, AAON captured 5% market share, growing at a 50%+ CAGR in 2017‐2019. In 2021, AAON introduced the next generation “ProFit” of its WSHP line that will target the replacement market (75% of market demand). AAON’s new RZ Series Rooftop Unit, which comes in sizes of 45‐250 tons, replaced the former RL Series with greater efficiency, higher capacity and quieter operation. In 2021, the RZ rooftop unit was recognized by readers of the building products trade publication Consulting‐Specifying Engineer as the most innovative product in the “HVAC: Air Movement, Compressors, Ect.” category. New RZ Series Rooftop Units

13 Investing For Growth – New Products Advancements In Low Ambient Air Sourced Heat Pump (ASHP) Technology ASHP’s are some of the most energy efficient HVAC systems on the market. However, down to a certain outdoor temperature ASHP’s historically are very inefficient or even inoperable when the outdoor temperature falls below 30oF. AAON has designed a new ASHP configuration that is operable down to 0oF outdoor temperature. In the 4th quarter of 2021, AAON introduced Cold Climate capable ASHP‐ powered rooftop units in the 2‐10 ton range and plans to introduce this new design in most of its portfolio of rooftop units. We think this is significant as the decarbonization secular trend accelerates. By the end of 2022, AAON expects to have a full offering of Cold Climate capable ASHP rooftop units, ASHP split systems and water sourced heat pumps, positioning it well for market trends.
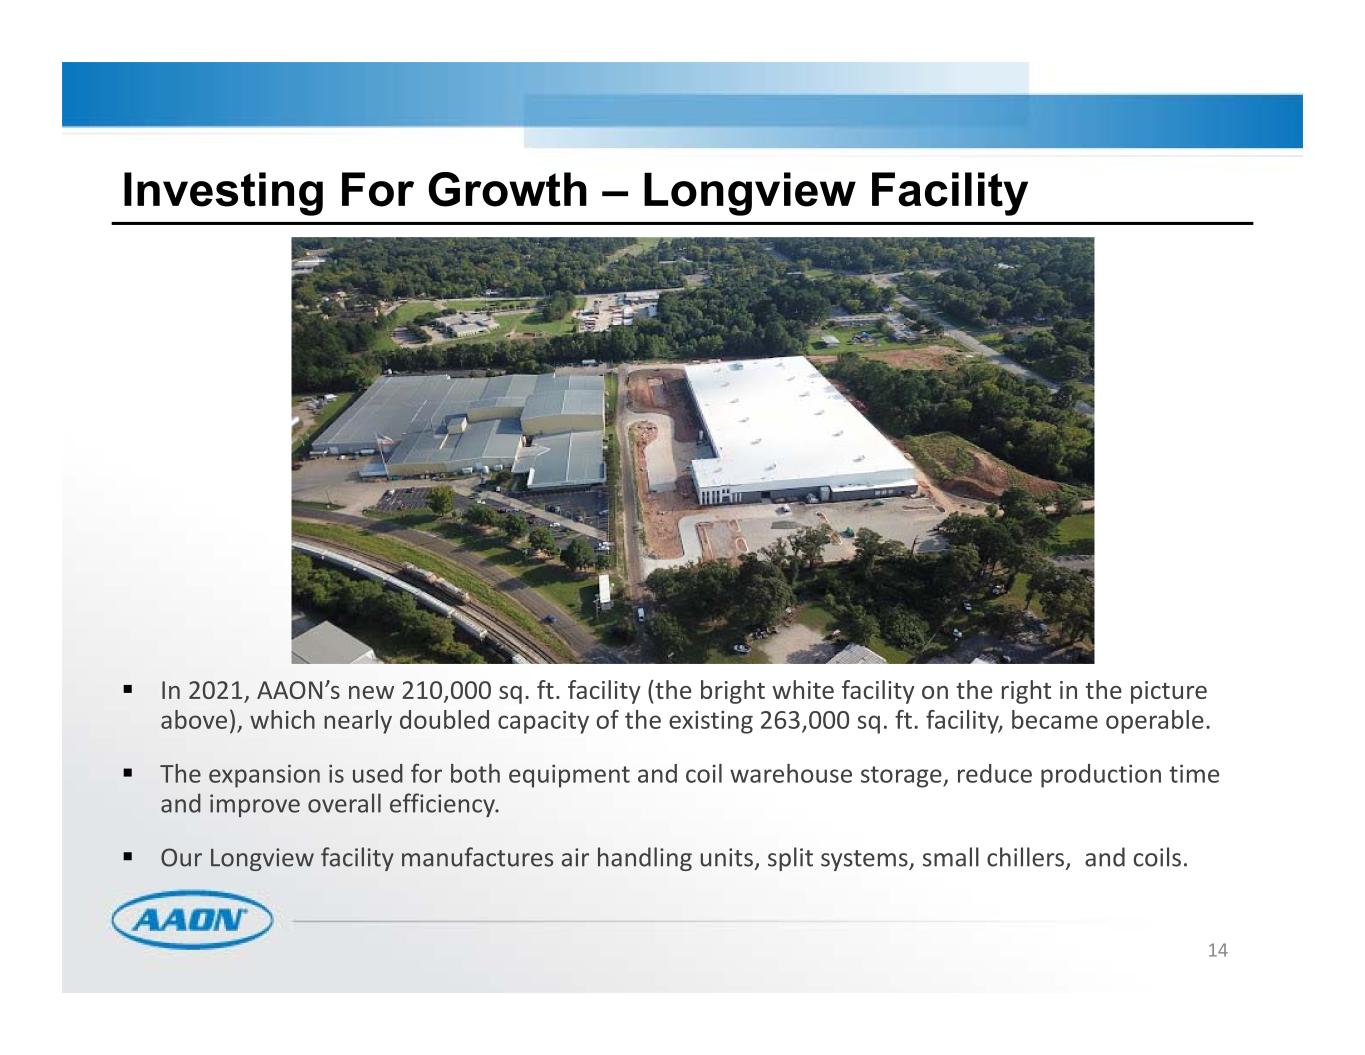
14 Investing For Growth – Longview Facility In 2021, AAON’s new 210,000 sq. ft. facility (the bright white facility on the right in the picture above), which nearly doubled capacity of the existing 263,000 sq. ft. facility, became operable. The expansion is used for both equipment and coil warehouse storage, reduce production time and improve overall efficiency. Our Longview facility manufactures air handling units, split systems, small chillers, and coils.
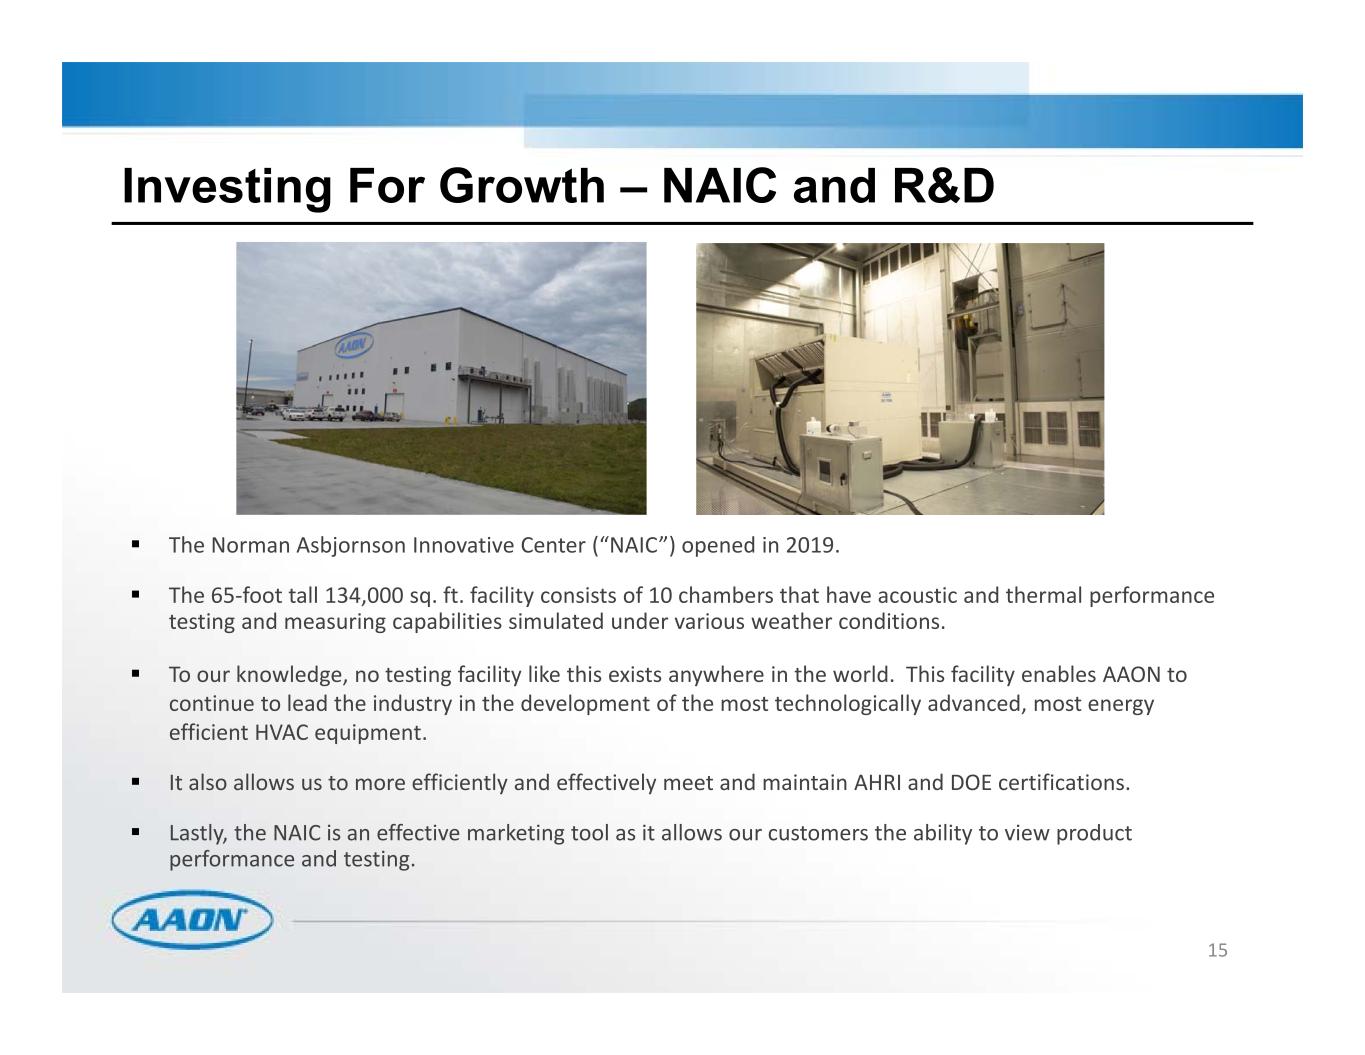
15 Investing For Growth – NAIC and R&D The Norman Asbjornson Innovative Center (“NAIC”) opened in 2019. The 65‐foot tall 134,000 sq. ft. facility consists of 10 chambers that have acoustic and thermal performance testing and measuring capabilities simulated under various weather conditions. To our knowledge, no testing facility like this exists anywhere in the world. This facility enables AAON to continue to lead the industry in the development of the most technologically advanced, most energy efficient HVAC equipment. It also allows us to more efficiently and effectively meet and maintain AHRI and DOE certifications. Lastly, the NAIC is an effective marketing tool as it allows our customers the ability to view product performance and testing.
16 Backlog

2018 2021 17 Acquisition of BasX Solutions BasX Solutions is an industry leader in designing, engineering and manufacturing high‐efficiency data center cooling solutions, cleanroom systems, custom HVAC systems and modular solutions SALES MIX Unitary Data Center Cooling Systems Cleanroom Plenum Systems 49% CAGR DESCRIPTION Data Centers Cleanroom Systems Commercial HVAC
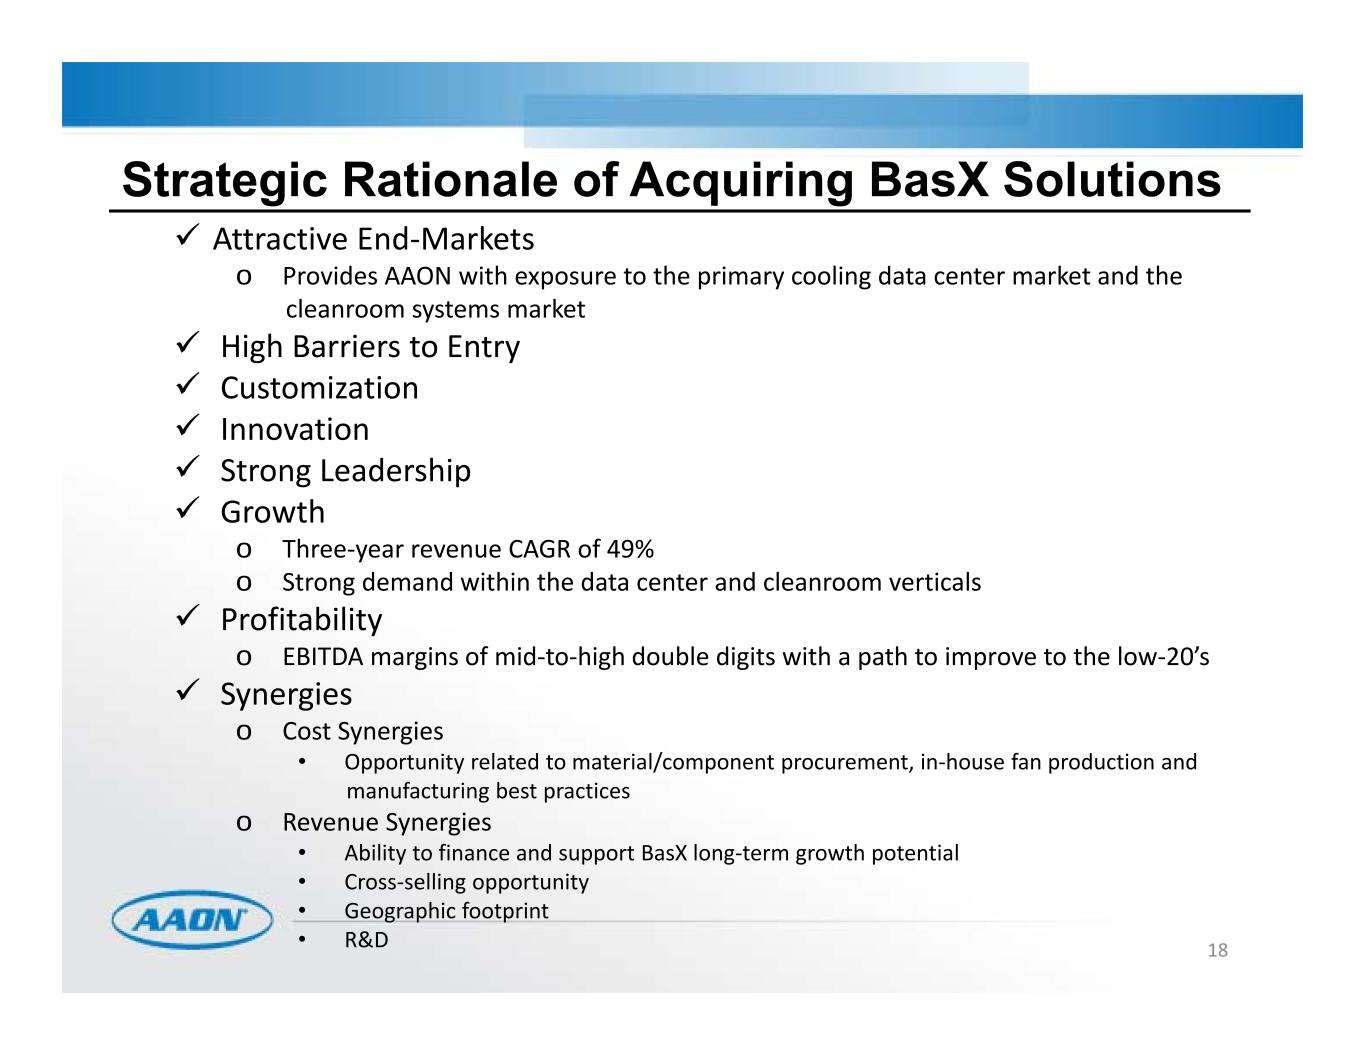
18 Strategic Rationale of Acquiring BasX Solutions Attractive End‐Markets o Provides AAON with exposure to the primary cooling data center market and the cleanroom systems market High Barriers to Entry Customization Innovation Strong Leadership Growth o Three‐year revenue CAGR of 49% o Strong demand within the data center and cleanroom verticals Profitability o EBITDA margins of mid‐to‐high double digits with a path to improve to the low‐20’s Synergies o Cost Synergies • Opportunity related to material/component procurement, in‐house fan production and manufacturing best practices o Revenue Synergies • Ability to finance and support BasX long‐term growth potential • Cross‐selling opportunity • Geographic footprint • R&D
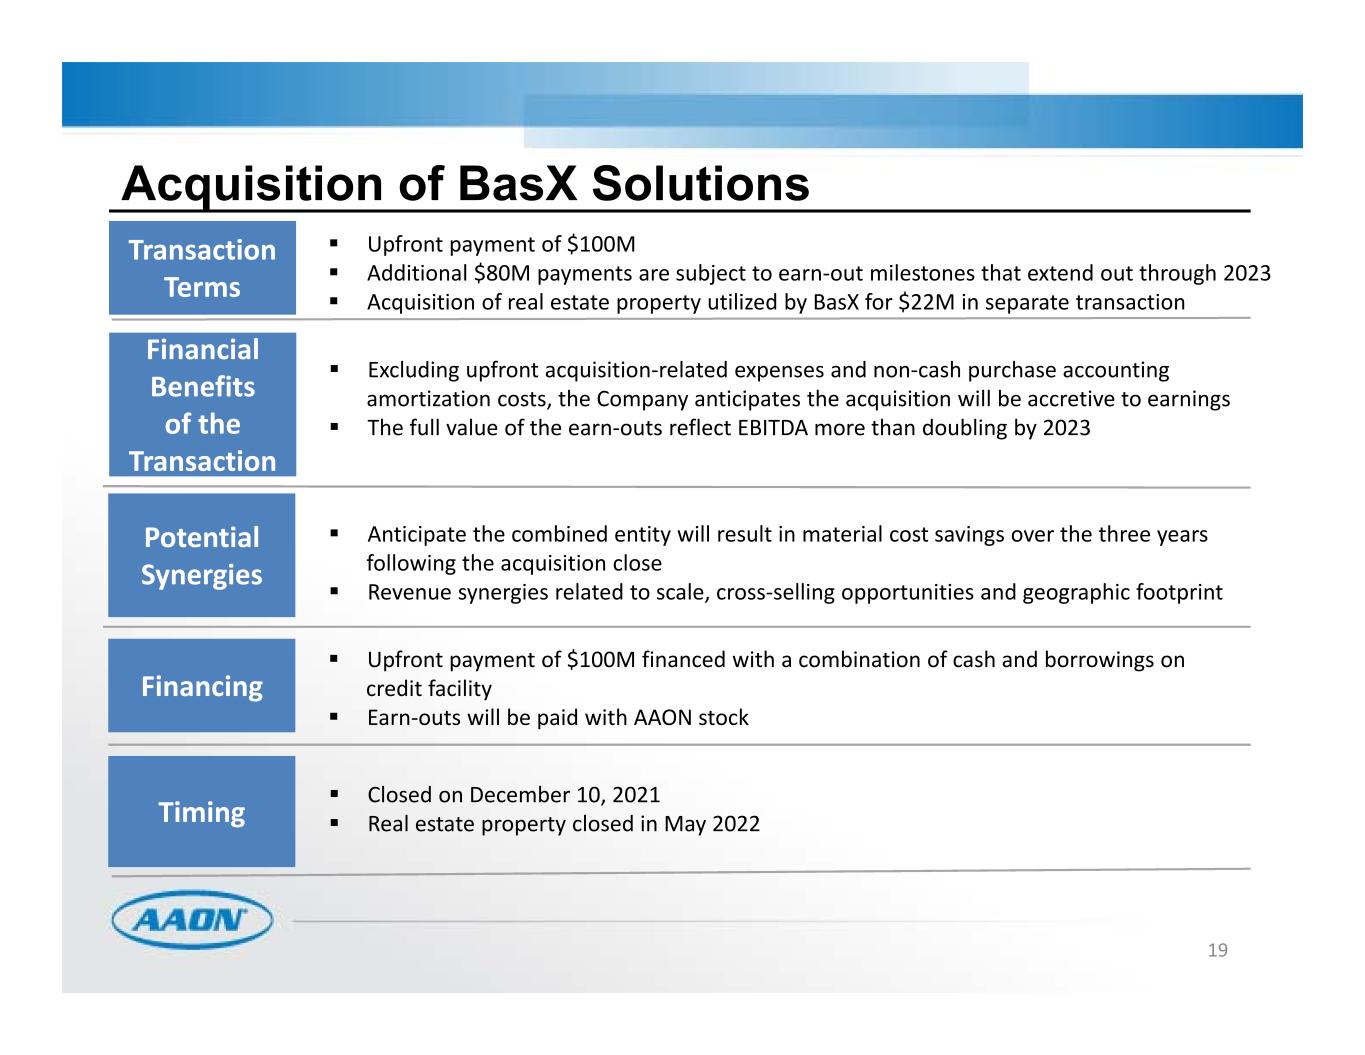
19 Acquisition of BasX Solutions Financial Benefits of the Transaction Potential Synergies Transaction Terms Financing Timing Upfront payment of $100M Additional $80M payments are subject to earn‐out milestones that extend out through 2023 Acquisition of real estate property utilized by BasX for $22M in separate transaction Excluding upfront acquisition‐related expenses and non‐cash purchase accounting amortization costs, the Company anticipates the acquisition will be accretive to earnings The full value of the earn‐outs reflect EBITDA more than doubling by 2023 Anticipate the combined entity will result in material cost savings over the three years following the acquisition close Revenue synergies related to scale, cross‐selling opportunities and geographic footprint Upfront payment of $100M financed with a combination of cash and borrowings on credit facility Earn‐outs will be paid with AAON stock Closed on December 10, 2021 Real estate property closed in May 2022
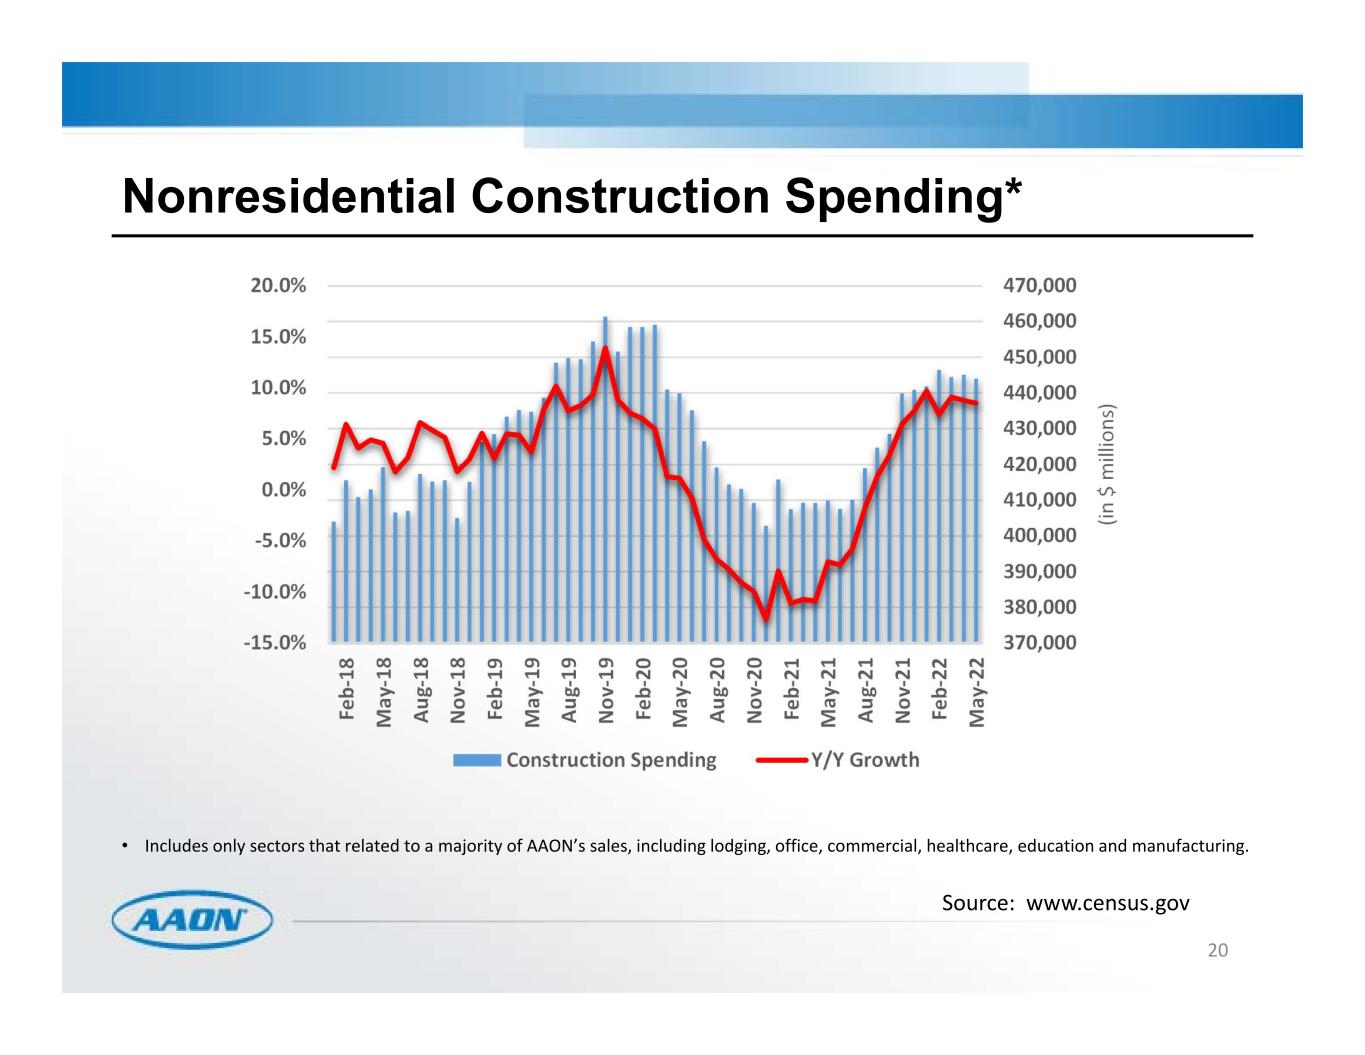
20 Nonresidential Construction Spending* Source: www.census.gov • Includes only sectors that related to a majority of AAON’s sales, including lodging, office, commercial, healthcare, education and manufacturing.

21 Nonresidential Construction Leading Indicators Source: www.aia.org, www.constructconnect.com, www.construction.com N on re sid en tia l C on st ru ct io n Pl an ni ng In di ca to rs N on re sid en tia l C on st ru ct io n St ar ts In di ca to rs
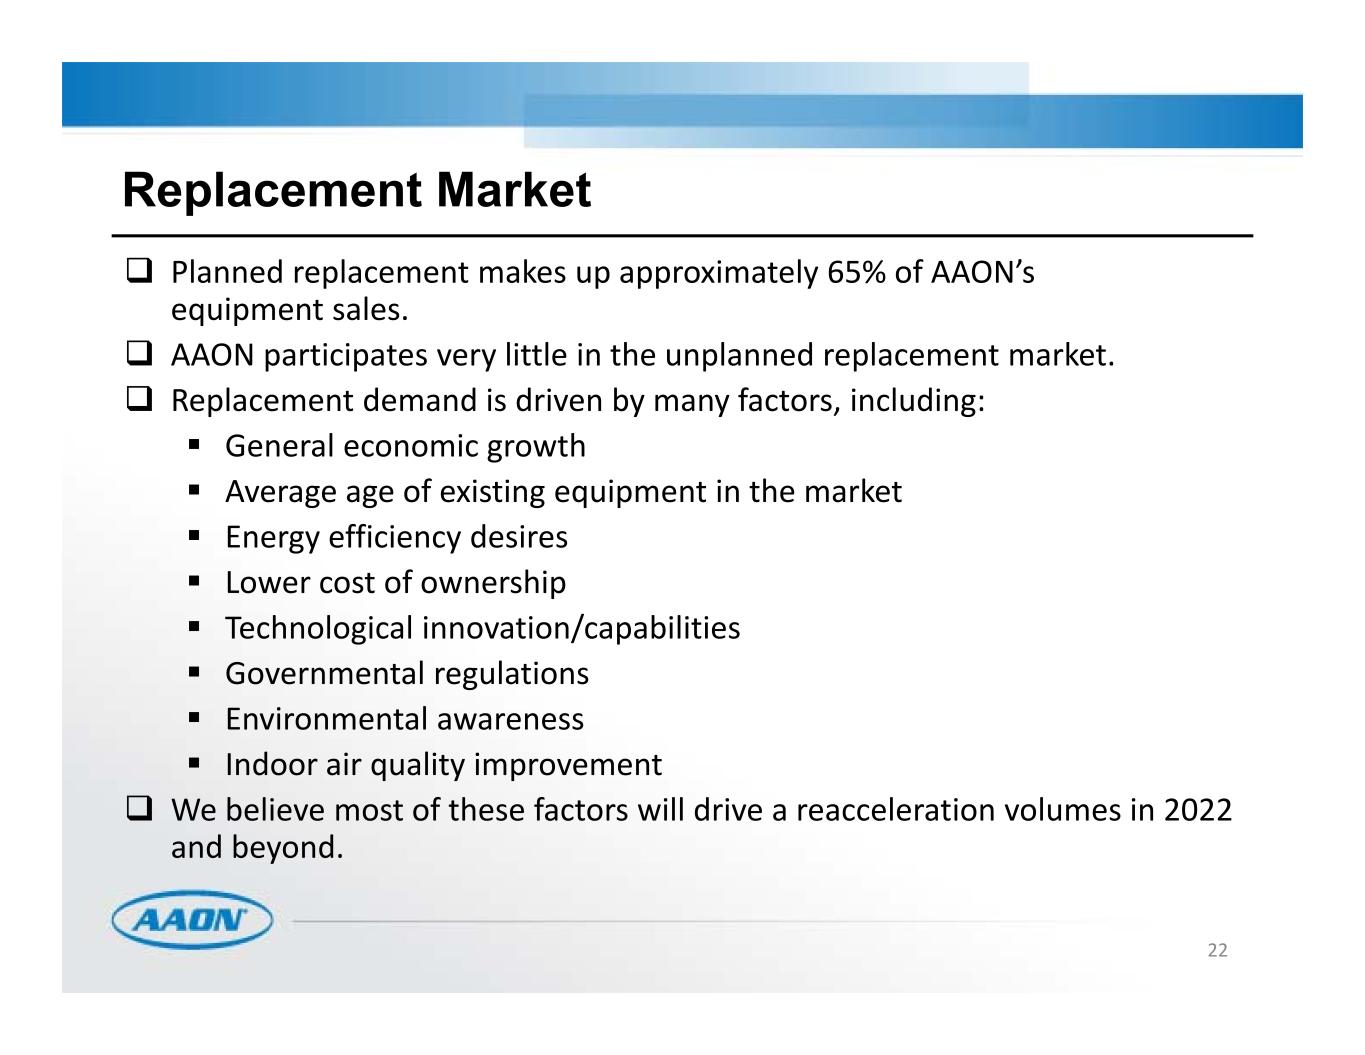
Planned replacement makes up approximately 65% of AAON’s equipment sales. AAON participates very little in the unplanned replacement market. Replacement demand is driven by many factors, including: General economic growth Average age of existing equipment in the market Energy efficiency desires Lower cost of ownership Technological innovation/capabilities Governmental regulations Environmental awareness Indoor air quality improvement We believe most of these factors will drive a reacceleration volumes in 2022 and beyond. 22 Replacement Market
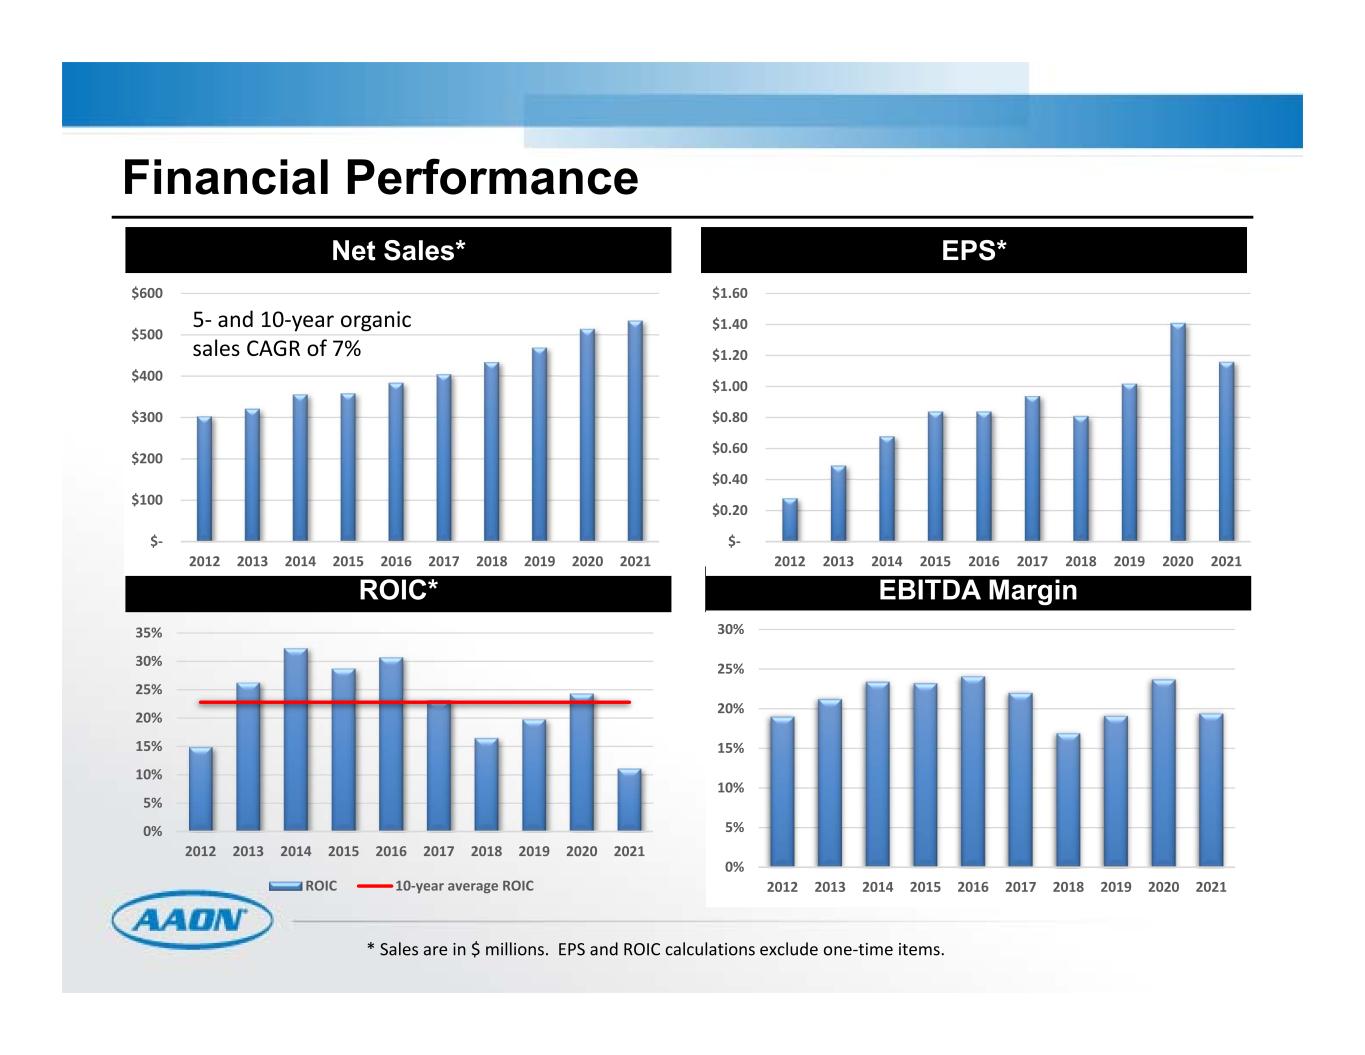
23 Financial Performance Net Sales* EPS* ROIC* EBITDA Margin * Sales are in $ millions. EPS and ROIC calculations exclude one‐time items. $‐ $100 $200 $300 $400 $500 $600 2021202020192018201720162015201420132012 5‐ and 10‐year organic sales CAGR of 7% $‐ $0.20 $0.40 $0.60 $0.80 $1.00 $1.20 $1.40 $1.60 2021202020192018201720162015201420132012 0% 5% 10% 15% 20% 25% 30% 35% 2021202020192018201720162015201420132012 ROIC 10‐year average ROIC 0% 5% 10% 15% 20% 25% 30% 2021202020192018201720162015201420132012
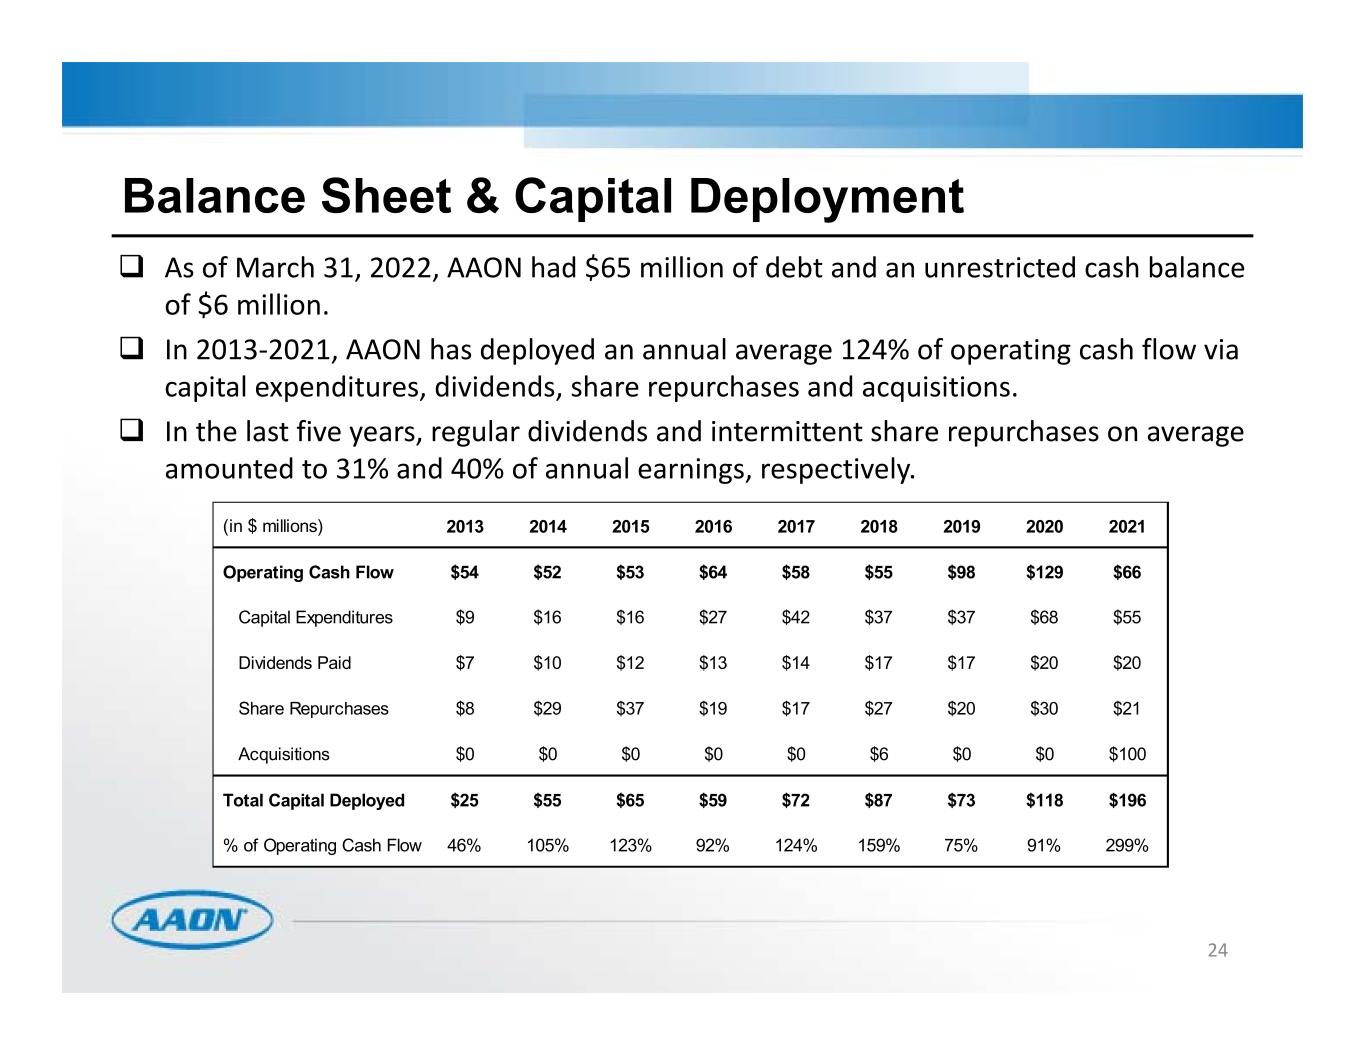
As of March 31, 2022, AAON had $65 million of debt and an unrestricted cash balance of $6 million. In 2013‐2021, AAON has deployed an annual average 124% of operating cash flow via capital expenditures, dividends, share repurchases and acquisitions. In the last five years, regular dividends and intermittent share repurchases on average amounted to 31% and 40% of annual earnings, respectively. 24 Balance Sheet & Capital Deployment (in $ millions) 2013 2014 2015 2016 2017 2018 2019 2020 2021 Operating Cash Flow $54 $52 $53 $64 $58 $55 $98 $129 $66 Capital Expenditures $9 $16 $16 $27 $42 $37 $37 $68 $55 Dividends Paid $7 $10 $12 $13 $14 $17 $17 $20 $20 Share Repurchases $8 $29 $37 $19 $17 $27 $20 $30 $21 Acquisitions $0 $0 $0 $0 $0 $6 $0 $0 $100 Total Capital Deployed $25 $55 $65 $59 $72 $87 $73 $118 $196 % of Operating Cash Flow 46% 105% 123% 92% 124% 159% 75% 91% 299%

25 How AAON Performance Stacks Up Against The Most Expensive Industrials In The Market ‐20.0% ‐10.0% 0.0% 10.0% 20.0% 30.0% 2021202020192018201720162015201420132012 Organic Sales Growth AAON LII AOS ROK AME ROP ZBRA XYL ‐80.0% ‐30.0% 20.0% 70.0% 120.0% 2021202020192018201720162015201420132012 Net Income Growth AAON LII AOS ROK AME ROP ZBRA XYL 0.0% 10.0% 20.0% 30.0% 40.0% 2021202020192018201720162015201420132012 EBITDA Margin AAON LII AOS ROK AME ROP ZBRA XYL 0% 10% 20% 30% 40% 2021202020192018201720162015201420132012 ROIC AAON LII AOS ROK AME ROP ZBRA XYL

26 How AAON Valuation Compares To The Most Expensive Industrials In The Market
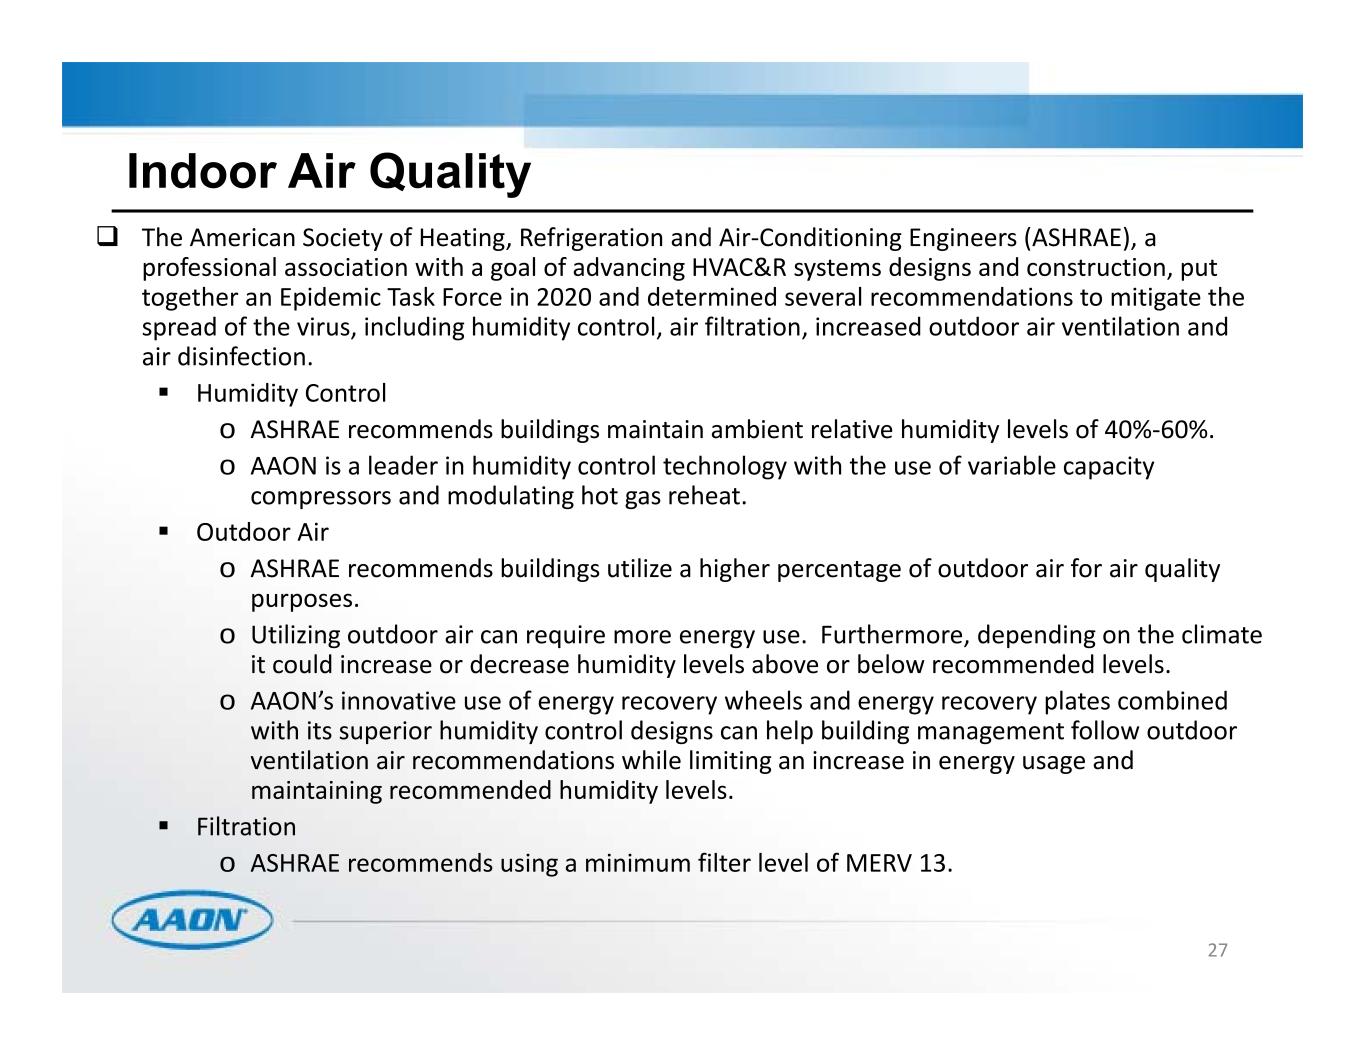
The American Society of Heating, Refrigeration and Air‐Conditioning Engineers (ASHRAE), a professional association with a goal of advancing HVAC&R systems designs and construction, put together an Epidemic Task Force in 2020 and determined several recommendations to mitigate the spread of the virus, including humidity control, air filtration, increased outdoor air ventilation and air disinfection. Humidity Control o ASHRAE recommends buildings maintain ambient relative humidity levels of 40%‐60%. o AAON is a leader in humidity control technology with the use of variable capacity compressors and modulating hot gas reheat. Outdoor Air o ASHRAE recommends buildings utilize a higher percentage of outdoor air for air quality purposes. o Utilizing outdoor air can require more energy use. Furthermore, depending on the climate it could increase or decrease humidity levels above or below recommended levels. o AAON’s innovative use of energy recovery wheels and energy recovery plates combined with its superior humidity control designs can help building management follow outdoor ventilation air recommendations while limiting an increase in energy usage and maintaining recommended humidity levels. Filtration o ASHRAE recommends using a minimum filter level of MERV 13. 27 Indoor Air Quality
Filtration ASHRAE now recommends using a minimum filter level of MERV 13 to mitigate infections aerosols. Prior to 2020, a vast majority of commercial buildings utilized filtration levels of MERV 4 to MERV 8. Standard packaged rooftop units in the market, particularly 40 tons and smaller, are not typically built to support this recommended level of filtration because it imposes an increased pressure drop. However, AAON standardizes a design that uses a backward curved plenum fan wheel, which can accommodate higher airflow and static pressure with very little reconfiguration. Thus, more often than not, in the 40 ton and smaller category, it is easier for existing buildings that use AAON equipment to retrofit its filtration to a higher MERV level compared to buildings that do not use AAON equipment. Air Disinfection ASHRAE supports using ultraviolet lighting and bipolar ionization technology. AAON units, including systems already installed, have capabilities of utilizing this technology. Ultraviolet Lighting for Air Disinfection ‐ ASHRAE states, “Ultraviolet energy inactivates viral, bacterial, and fungal organisms so they are unable to replicate and potentially cause disease.” Bipolar Ionization uses an electronic charge to create a plasma field filled with a high concentration of positive and negative ions. As these ions travel with the air stream, they attach to particles, pathogens and gas molecules. The ions help to agglomerate fine submicron particles together, which allows the HVAC filters to trap them more effectively. 28 Indoor Air Quality (continued)
According to the EIA, 13% of total energy consumption in the U.S. is generated from commercial buildings and 30% of commercial building energy usage is related to heating, ventilation and air‐conditioning. In the last decade, commercial building energy consumption was flat despite total square footage growing by over 11%. This is partially due to energy efficiency advancements in the HVAC industry. AAON is a leading designer and manufacturer of the most energy efficient HVAC equipment in the nonresidential HVAC industry. Many of the HVAC units AAON produces are uniquely designed with two‐stage compressors and high efficiency evaporator and condenser coils and variable speed fans, leading to an AHRI Certified performance of up to 19.15 SEER and 20.2 IEER, compared to the industry ASHRAE 90.1 minimum requirement of 12‐14 SEER/IEER. In 2020, Consulting‐Specifying Engineer recognized AAON’s RN Series Rooftop Unit as the “Most Valuable Product” amongst not only HVAC products, but all building product categories. The RN Series unit operates with an IEER of up to 22.5. 29 Sustainability - Environmental
AAON has an ongoing focus to reduce its own operational carbon footprint. In 2020, we invested in new overhead doors and a new HVAC system, replaced Metal Halide lighting with LED lighting, set goals around energy conservation, implemented lean manufacturing processes as well as many other initiatives to help reduce our energy usage. In 2020, our total energy usage per total revenue declined 2.9% compared to 2019. Of our total energy usage, 27% is derived from renewable power generation. In 2017, we created our internal GoGreen employee committee that has a goal of regularly identifying numerous waste streams that can be recycled, reused or reduced. AAON achieved Platinum level, the highest level, in the 2021 and 2020 Sustainable Tulsa Scor3card verification program. AAON participates in the non‐profit organization Sustainable Tulsa’s Scor3card, which is a sustainability tracking and assessment tool for organizations who want to track and improve their sustainability plans. 30 Sustainability – Environmental (continued)

At AAON, a diverse and inclusive workplace is integral to our business strategy and critical to our success. At the end of 2021, 69% of our total workforce were Black, Indigenous and people of Color and 28% were female. AAON employs individuals from over 32 countries. We have an inclusive ownership compensation structure throughout the entire organization. AAON has two team member resources groups: AAON Veterans Empowering Through Service (V.E.T.S.) Women’s Alliance and Resource Program (WARP) – helps unify core values and beliefs while fostering a supportive inclusive environment promoting advancement and success AAON supports Oklahoma Women in STEM, which celebrates women in STEM fields and inspires the next generation. AAON is involved in the Society of Women Engineers, a non‐profit service organization that helps provide a supportive environment for women to excel in engineering. AAON was named a 2020 Top Inclusive Workplace by the Tulsa Chamber’s Mosaic Diversity and Inclusion Index. 31 Sustainability – Diversity & Inclusion

Premium Product Offering Industry Leading Innovation Pricing Power Highly Efficient, Technologically‐Advanced Production Total Addressable Market Offers Share Gain Opportunity Strengthening Sales Channel Investing In Capacity And Growth More Efficient Leadership Structure Compelling ESG Story Long‐Term Secular Demand Superior Organic Growth Recovering End‐Markets Strong Margins And ROIC 32 Investment Thesis
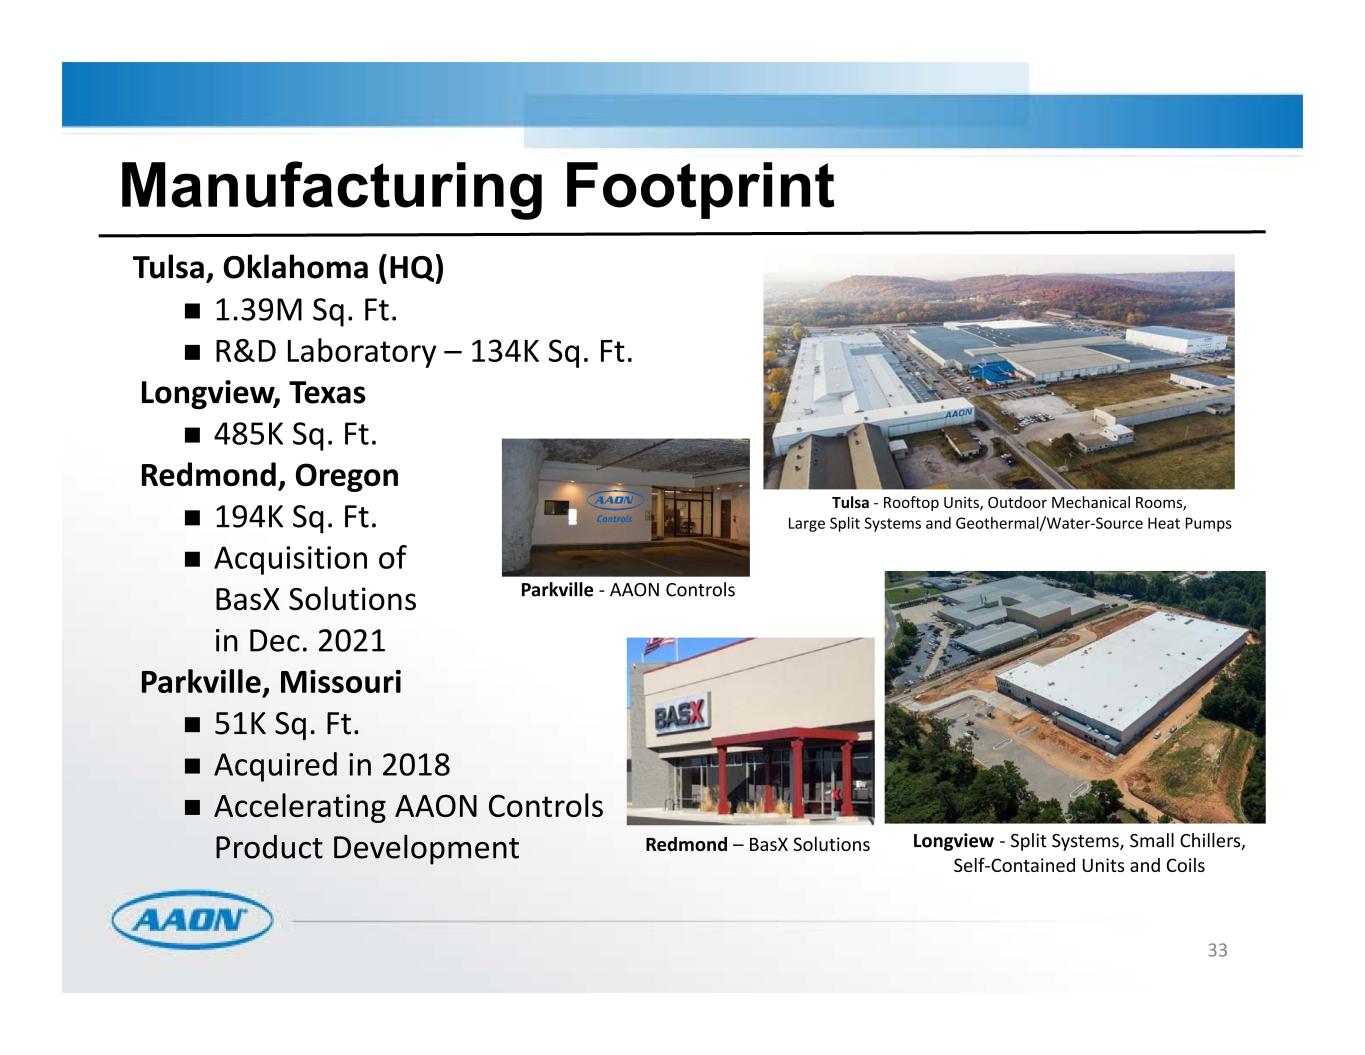
33 Tulsa, Oklahoma (HQ) 1.39M Sq. Ft. R&D Laboratory – 134K Sq. Ft. Longview, Texas 485K Sq. Ft. Redmond, Oregon 194K Sq. Ft. Acquisition of BasX Solutions in Dec. 2021 Parkville, Missouri 51K Sq. Ft. Acquired in 2018 Accelerating AAON Controls Product Development Tulsa ‐ Rooftop Units, Outdoor Mechanical Rooms, Large Split Systems and Geothermal/Water‐Source Heat Pumps Longview ‐ Split Systems, Small Chillers, Self‐Contained Units and Coils Redmond – BasX Solutions Manufacturing Footprint Parkville ‐ AAON Controls

34 APPENDIX
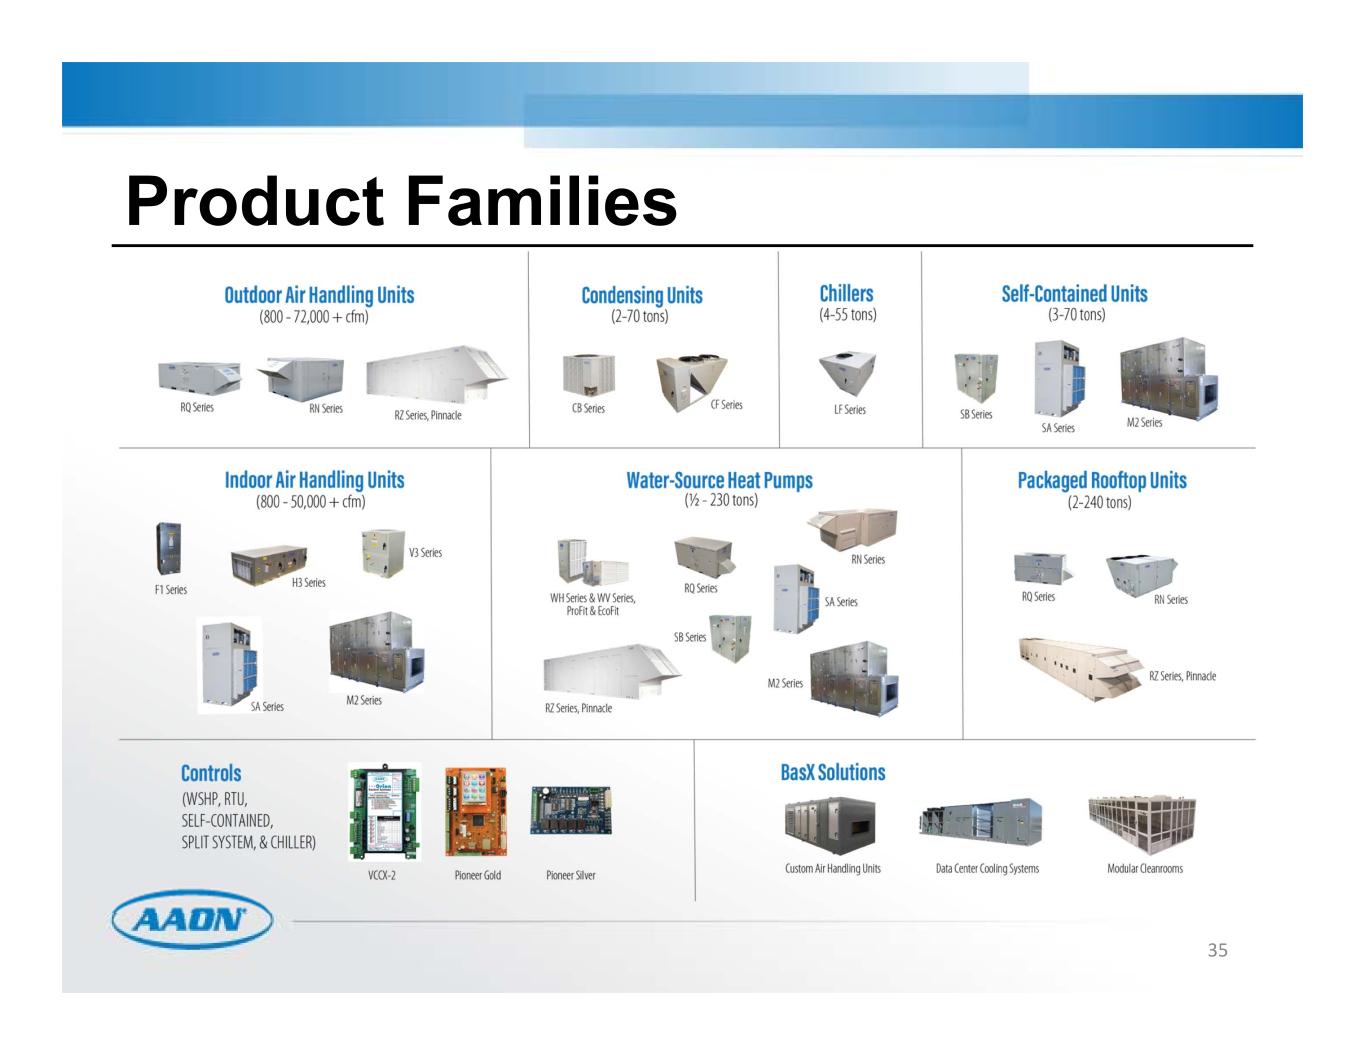
35 Product Families

Lodging Office Commercial Health Care Educational Religious Manufacturing Other May not add to 100% due to rounding 36 New vs Replacement* 35% New Construction 65% Replacement AAON Sales Breakout By Sector * Breakout is approximated.

Market Size (in $ billions) Rooftops $3.9 Cleanroom Systems $8.1 Datacenter Cooling Solutions $6.5 Chillers $0.8 Air Handling Units $2.7 Split Systems* $7.3 Geothermal/WSHP** $0.5 Total $29.7 37 Based on AHRI sales reporting * AHRI data includes both commercial and residential systems. Residential systems likely account for a large portion of this number ** AAON entered the mass produced geothermal/water‐source heat pump market in 2016. Units began shipping November 2016. AAON Total Addressable Market

38 AAON Strategy – Customization Example


