WASHINGTON, D. C. 20549
DWS Value Series, Inc.
MAY 31, 2013 Semiannual Report to Shareholders |
| |
| DWS Large Cap Value Fund |
|
Contents
8 Portfolio Management Team 17 Statement of Assets and Liabilities 19 Statement of Operations 20 Statement of Changes in Net Assets 27 Notes to Financial Statements 36 Information About Your Fund's Expenses 38 Summary of Management Fee Evaluation by Independent Fee Consultant 42 Account Management Resources |
This report must be preceded or accompanied by a prospectus. To obtain a summary prospectus, if available, or prospectus for any of our funds, refer to the Account Management Resources information provided in the back of this booklet. We advise you to consider the fund's objectives, risks, charges and expenses carefully before investing. The summary prospectus and prospectus contain this and other important information about the fund. Please read the prospectus carefully before you invest.
Investing in derivatives entails special risks relating to liquidity, leverage and credit that may reduce returns and/or increase volatility. The fund may lend securities to approved institutions. Stocks may decline in value. See the prospectus for details.
DWS Investments is part of the Deutsche Asset & Wealth Management division of Deutsche Bank AG.
NOT FDIC/NCUA INSURED NO BANK GUARANTEE MAY LOSE VALUE NOT A DEPOSIT NOT INSURED BY ANY FEDERAL GOVERNMENT AGENCY
Dear Investor:
The first half of 2013 brought welcome evidence that the U.S. economic recovery is gaining traction. Consumer confidence reached its highest level since 2007, U.S. stock market indexes marked a series of record highs and the housing market continues its recovery.
According to Asoka Wohrmann, co-chief investment officer for Deutsche Asset & Wealth Management, "The revival of the employment market, good asset performance with rising home and share prices, and an expansive monetary policy gives further growth momentum to the real economy. Accordingly, U.S. economic growth could accelerate in the coming months."
Nevertheless, concerns about the European and emerging-market economies persist. Closer to home, the outlook remains guarded when it comes to the eventual end of government intervention in the bond market and the full effects of reduced government spending on employment.
Where does this leave you? That depends on a variety of factors, including your overall portfolio allocation. Given the uncertainties in today's bond and stock markets, it may be time for a thoughtful evaluation of your strategy.
Talk with a trusted advisor to determine whether any adjustments may be in order, given your specific objectives and risk tolerance. We believe even the most sophisticated investor can benefit from the assistance of a trusted, objective financial professional.
Remember that Deutsche Asset & Wealth Management gives you access to Deutsche Bank's global network of economists, analysts and investment professionals. Insights are always at your fingertips at dws-investments.com.
Best regards,
Douglas Beck, CFA President, DWS Funds |
Performance Summary May 31, 2013 (Unaudited) | Class A | | 6-Month‡ | | | 1-Year | | | 5-Year | | | 10-Year | |
Average Annual Total Returns as of 5/31/13 | |
| Unadjusted for Sales Charge | | | 16.08 | % | | | 25.84 | % | | | 1.72 | % | | | 6.74 | % |
| Adjusted for the Maximum Sales Charge (max 5.75% load) | | | 9.41 | % | | | 18.60 | % | | | 0.52 | % | | | 6.11 | % |
Russell 1000® Value Index† | | | 19.35 | % | | | 32.71 | % | | | 4.73 | % | | | 8.02 | % |
Average Annual Total Returns as of 3/31/13 (most recent calendar quarter end) | |
| Unadjusted for Sales Charge | | | | | | | 11.51 | % | | | 2.85 | % | | | 8.01 | % |
| Adjusted for the Maximum Sales Charge (max 5.75% load) | | | | | | | 5.09 | % | | | 1.64 | % | | | 7.37 | % |
Russell 1000® Value Index† | | | | | | | 18.77 | % | | | 4.85 | % | | | 9.18 | % |
| Class B | | 6-Month‡ | | | 1-Year | | | 5-Year | | | 10-Year | |
Average Annual Total Returns as of 5/31/13 | |
| Unadjusted for Sales Charge | | | 15.56 | % | | | 24.82 | % | | | 0.89 | % | | | 5.87 | % |
| Adjusted for the Maximum Sales Charge (max 4.00% CDSC) | | | 11.56 | % | | | 21.82 | % | | | 0.70 | % | | | 5.87 | % |
Russell 1000® Value Index† | | | 19.35 | % | | | 32.71 | % | | | 4.73 | % | | | 8.02 | % |
Average Annual Total Returns as of 3/31/13 (most recent calendar quarter end) | |
| Unadjusted for Sales Charge | | | | | | | 10.63 | % | | | 2.02 | % | | | 7.13 | % |
| Adjusted for the Maximum Sales Charge (max 4.00% CDSC) | | | | | | | 7.63 | % | | | 1.84 | % | | | 7.13 | % |
Russell 1000® Value Index† | | | | | | | 18.77 | % | | | 4.85 | % | | | 9.18 | % |
| Class C | | 6-Month‡ | | | 1-Year | | | 5-Year | | | 10-Year | |
Average Annual Total Returns as of 5/31/13 | |
| Unadjusted for Sales Charge | | | 15.65 | % | | | 24.92 | % | | | 1.00 | % | | | 5.97 | % |
| Adjusted for the Maximum Sales Charge (max 1.00% CDSC) | | | 14.65 | % | | | 24.92 | % | | | 1.00 | % | | | 5.97 | % |
Russell 1000® Value Index† | | | 19.35 | % | | | 32.71 | % | | | 4.73 | % | | | 8.02 | % |
Average Annual Total Returns as of 3/31/13 (most recent calendar quarter end) | |
| Unadjusted for Sales Charge | | | | | | | 10.77 | % | | | 2.13 | % | | | 7.22 | % |
| Adjusted for the Maximum Sales Charge (max 1.00% CDSC) | | | | | | | 10.77 | % | | | 2.13 | % | | | 7.22 | % |
Russell 1000® Value Index† | | | | | | | 18.77 | % | | | 4.85 | % | | | 9.18 | % |
| Class R | | 6-Month‡ | | | 1-Year | | | 5-Year | | | 10-Year | |
Average Annual Total Returns as of 5/31/13 | |
| No Sales Charges | | | 15.89 | % | | | 25.36 | % | | | 1.45 | % | | | 6.46 | % |
Russell 1000® Value Index† | | | 19.35 | % | | | 32.71 | % | | | 4.73 | % | | | 8.02 | % |
Average Annual Total Returns as of 3/31/13 (most recent calendar quarter end) | |
| No Sales Charges | | | | | | | 11.09 | % | | | 2.58 | % | | | 7.72 | % |
Russell 1000® Value Index† | | | | | | | 18.77 | % | | | 4.85 | % | | | 9.18 | % |
| Class S | | 6-Month‡ | | | 1-Year | | | 5-Year | | | Life of Class* | |
Average Annual Total Returns as of 5/31/13 | |
| No Sales Charges | | | 16.26 | % | | | 26.24 | % | | | 2.04 | % | | | 5.27 | % |
Russell 1000® Value Index† | | | 19.35 | % | | | 32.71 | % | | | 4.73 | % | | | 5.53 | % |
Average Annual Total Returns as of 3/31/13 (most recent calendar quarter end) | |
| No Sales Charges | | | | | | | 11.87 | % | | | 3.19 | % | | | 4.88 | % |
Russell 1000® Value Index† | | | | | | | 18.77 | % | | | 4.85 | % | | | 5.13 | % |
| Institutional Class | | 6-Month‡ | | | 1-Year | | | 5-Year | | | 10-Year | |
Average Annual Total Returns as of 5/31/13 | |
| No Sales Charges | | | 16.26 | % | | | 26.15 | % | | | 2.08 | % | | | 7.14 | % |
Russell 1000® Value Index† | | | 19.35 | % | | | 32.71 | % | | | 4.73 | % | | | 8.02 | % |
Average Annual Total Returns as of 3/31/13 (most recent calendar quarter end) | |
| No Sales Charges | | | | | | | 11.87 | % | | | 3.22 | % | | | 8.41 | % |
Russell 1000® Value Index† | | | | | | | 18.77 | % | | | 4.85 | % | | | 9.18 | % |
Performance in the Average Annual Total Returns table(s) above and the Growth of an Assumed $10,000 Investment line graph that follows is historical and does not guarantee future results. Investment return and principal fluctuate, so your shares may be worth more or less when redeemed. Current performance may differ from performance data shown. Please visit www.dws-investments.com for the Fund's most recent month-end performance. Fund performance includes reinvestment of all distributions. Unadjusted returns do not reflect sales charges and would have been lower if they had.
The gross expense ratios of the Fund, as stated in the fee table of the prospectus dated March 1, 2013 are 1.00%, 1.80%, 1.70%, 1.33%, 0.69% and 0.69% for Class A, Class B, Class C, Class R, Class S and Institutional Class shares, respectively, and may differ from the expense ratios disclosed in the Financial Highlights tables in this report.
Index returns do not reflect any fees or expenses and it is not possible to invest directly into an index.
Performance figures do not reflect the deduction of taxes that a shareholder would pay on fund distributions or the redemption of fund shares.
The returns for Class R shares for periods prior to inception on March 1, 2011 are derived from the historical performance of Class A shares of DWS Large Cap Value Fund during such periods and have been adjusted to reflect higher total annual operating expenses of Class R. Any difference in expenses will affect performance.
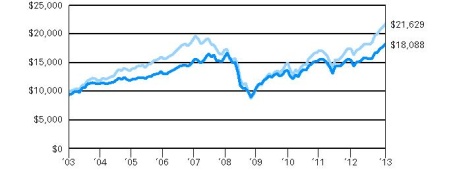
Growth of an Assumed $10,000 Investment (Adjusted for Maximum Sales Charge) |
|
|
| Yearly periods ended May 31 |
The Fund's growth of an assumed $10,000 investment is adjusted for the maximum sales charge of 5.75%. This results in a net initial investment of $9,425.
The growth of $10,000 is cumulative.
Performance of other share classes will vary based on the sales charges and the fee structure of those classes.
* Class S shares commenced operations on December 20, 2004. The performance shown for the index is for the time period of December 31, 2004 through May 31, 2013 (through March 31, 2013 for the most recent calendar quarter end returns), which is based on the performance period of the life of Class S.
† The Russell 1000® Value Index is an unmanaged index that consists of those stocks in the Russell 1000 Index with less-than-average growth orientation. The Russell 1000® Index is an unmanaged price-only index of the 1,000 largest capitalized companies that are domiciled in the U.S. and whose common stocks are traded.
‡ Total returns shown for periods less than one year are not annualized.
| | | Class A | | | Class B | | | Class C | | | Class R | | | Class S | | | Institutional Class | |
| Net Asset Value | |
| 5/31/13 | | $ | 21.05 | | | $ | 21.12 | | | $ | 21.09 | | | $ | 21.04 | | | $ | 21.06 | | | $ | 21.07 | |
| 11/30/12 | | $ | 18.31 | | | $ | 18.38 | | | $ | 18.35 | | | $ | 18.31 | | | $ | 18.32 | | | $ | 18.33 | |
Distribution Information as of 5/31/13 | |
| Income Dividends, Six Months | | $ | .19 | | | $ | .11 | | | $ | .12 | | | $ | .16 | | | $ | .22 | | | $ | .22 | |
Portfolio Management Team
Thomas Schuessler, PhD, Managing Director
Lead Portfolio Manager of the fund. Joined the fund in 2007.
• Joined Deutsche Asset & Wealth Management in 2001 after five years at Deutsche Bank where he managed various projects and worked in the office of the Chairman of the Management Board.
• US and Global Fund Management: Frankfurt.
• PhD, University of Heidelberg, studies in physics and economics at University of Heidelberg and University of Utah.
Peter Steffen, CFA, Vice President
Portfolio Manager of the fund. Joined the fund in 2011.
• Joined Deutsche Asset & Wealth Management in 2007.
• Portfolio manager and analyst for Global Equities: Frankfurt.
• US and Global Fund Management: Frankfurt.
• Master's Degree ("Diplom-Kaufmann") in Finance & Asset Management from International School of Management, Dortmund with educational exchanges at the Université de Neuchâtel (Switzerland) and the University of Colorado (USA).
Oliver Pfeil, PhD., Director
Portfolio Manager of the fund. Joined the fund in 2009.
• Joined Deutsche Asset & Wealth Management in 2006 after three years as Executive Assistant to the Management Board of Deutsche Bank. Previously, Research Fellow at the Swiss Institute of Banking and Finance at the University of St. Gallen (2000-2002); Visiting Scholar in Capital Markets Research at MIT Sloan School of Management (2002-2003).
• Portfolio manager for US and Global Value Equity: Frankfurt.
• US and Global Fund Management: Frankfurt.
• PhD in finance and accounting and Master's degree in Business Administration from the University of St. Gallen; CEMS Master in International Management from the University of St. Gallen & ESADE, Barcelona; completed bank training program ("Bankkaufmann") at Sal. Oppenheim jr. & Cie. KGaA, Cologne.
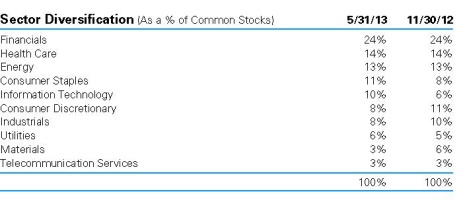
Portfolio Summary (Unaudited)

Ten Largest Equity Holdings at May 31, 2013 (24.2% of Net Assets) |
1. Exxon Mobil Corp. Explorer and producer of oil and gas | 3.5% |
2. Chevron Corp. Operator of petroleum exploration, delivery and refining facilities | 2.8% |
3. JPMorgan Chase & Co. Provider of global financial services | 2.6% |
4. General Electric Co. Globally diversified technology and financial services company | 2.6% |
5. Pfizer, Inc. Manufacturer of prescription pharmaceuticals and nonprescription self-medications | 2.4% |
6. AT&T, Inc. An integrated telecommunications company | 2.3% |
7. Merck & Co., Inc. A global pharmaceutical company | 2.1% |
8. Procter & Gamble Co. Manufacturer of diversified consumer products | 2.1% |
9. Johnson & Johnson Manufacturer of health care products and provider of related services | 1.9% |
10. PNC Financial Services Group, Inc. Provider of diversified financial services | 1.9% |
Portfolio holdings and characteristics are subject to change. For more complete details about the fund's investment portfolio, see page 10. A quarterly Fact Sheet is available on www.dws-investments.com or upon request. Please see the Account Management Resources section on page 42 for contact information. |
Investment Portfolio as of May 31, 2013 (Unaudited) | | | Shares | | | Value ($) | |
| | | | |
| Common Stocks 100.2% | |
| Consumer Discretionary 8.1% | |
| Automobiles 1.5% | |
| Ford Motor Co. | | | 1,500,000 | | | | 23,520,000 | |
| Diversified Consumer Services 0.7% | |
| DeVry, Inc. (a) | | | 150,000 | | | | 4,684,500 | |
| H&R Block, Inc. | | | 200,000 | | | | 5,854,000 | |
| | | | | | | | 10,538,500 | |
| Hotels, Restaurants & Leisure 0.4% | |
| Carnival Corp. | | | 200,000 | | | | 6,620,000 | |
| Household Durables 0.3% | |
| Jarden Corp.* | | | 100,000 | | | | 4,658,000 | |
| Leisure Equipment & Products 0.4% | |
| Hasbro, Inc. (a) | | | 150,000 | | | | 6,672,000 | |
| Media 4.0% | |
| Comcast Corp. "A" (a) | | | 650,000 | | | | 26,097,500 | |
| Meredith Corp. (a) | | | 125,000 | | | | 5,122,500 | |
| News Corp. "A" | | | 250,000 | | | | 8,027,500 | |
| Time Warner, Inc. | | | 150,000 | | | | 8,755,500 | |
| Walt Disney Co. (a) | | | 150,000 | | | | 9,462,000 | |
| Washington Post Co. "B" (a) | | | 10,000 | | | | 4,672,300 | |
| | | | | | | | 62,137,300 | |
| Specialty Retail 0.8% | |
| Lowe's Companies, Inc. (a) | | | 150,000 | | | | 6,316,500 | |
| Staples, Inc. (a) | | | 350,000 | | | | 5,250,000 | |
| | | | | | | | 11,566,500 | |
| Consumer Staples 10.6% | |
| Beverages 1.7% | |
| Beam, Inc. | | | 100,000 | | | | 6,484,000 | |
| PepsiCo, Inc. | | | 250,000 | | | | 20,192,500 | |
| | | | | | | | 26,676,500 | |
| Food & Staples Retailing 3.3% | |
| CVS Caremark Corp. | | | 300,000 | | | | 17,274,000 | |
| Sysco Corp. (a) | | | 150,000 | | | | 5,070,000 | |
| Wal-Mart Stores, Inc. | | | 250,000 | | | | 18,710,000 | |
| Walgreen Co. | | | 200,000 | | | | 9,552,000 | |
| | | | | | | | 50,606,000 | |
| Food Products 1.5% | |
| Ingredion, Inc. | | | 100,000 | | | | 6,812,000 | |
| Kellogg Co. | | | 250,000 | | | | 15,512,500 | |
| | | | | | | | 22,324,500 | |
| Household Products 2.1% | |
| Procter & Gamble Co. | | | 425,000 | | | | 32,623,000 | |
| Tobacco 2.0% | |
| Altria Group, Inc. | | | 450,000 | | | | 16,245,000 | |
| Philip Morris International, Inc. | | | 100,000 | | | | 9,091,000 | |
| Universal Corp. (a) | | | 100,000 | | | | 5,863,000 | |
| | | | | | | | 31,199,000 | |
| Energy 12.9% | |
| Energy Equipment & Services 1.4% | |
| Halliburton Co. | | | 300,000 | | | | 12,555,000 | |
| Helmerich & Payne, Inc. | | | 150,000 | | | | 9,261,000 | |
| | | | | | | | 21,816,000 | |
| Oil, Gas & Consumable Fuels 11.5% | |
| Anadarko Petroleum Corp. | | | 100,000 | | | | 8,747,000 | |
| Apache Corp. (a) | | | 150,000 | | | | 12,319,500 | |
| Chevron Corp. | | | 350,000 | | | | 42,962,500 | |
| ConocoPhillips | | | 150,000 | | | | 9,201,000 | |
| Exxon Mobil Corp. | | | 600,000 | | | | 54,282,000 | |
| Marathon Oil Corp. | | | 250,000 | | | | 8,597,500 | |
| Occidental Petroleum Corp. | | | 200,000 | | | | 18,414,000 | |
| Phillips 66 | | | 150,000 | | | | 9,985,500 | |
| Suncor Energy, Inc. (a) | | | 250,000 | | | | 7,577,500 | |
| Valero Energy Corp. (a) | | | 150,000 | | | | 6,094,500 | |
| | | | | | | | 178,181,000 | |
| Financials 24.2% | |
| Capital Markets 3.4% | |
| Ameriprise Financial, Inc. | | | 150,000 | | | | 12,228,000 | |
| Bank of New York Mellon Corp. | | | 250,000 | | | | 7,515,000 | |
| BlackRock, Inc. | | | 25,000 | | | | 6,980,000 | |
| Oaktree Capital Group LLC | | | 100,000 | | | | 5,215,000 | |
| The Goldman Sachs Group, Inc. | | | 125,000 | | | | 20,260,000 | |
| | | | | | | | 52,198,000 | |
| Commercial Banks 4.8% | |
| BankUnited, Inc. | | | 150,000 | | | | 3,687,000 | |
| Huntington Bancshares, Inc. | | | 750,000 | | | | 5,812,500 | |
| PNC Financial Services Group, Inc. | | | 400,000 | | | | 28,656,000 | |
| U.S. Bancorp. | | | 350,000 | | | | 12,271,000 | |
| Wells Fargo & Co. | | | 600,000 | | | | 24,330,000 | |
| | | | | | | | 74,756,500 | |
| Consumer Finance 1.7% | |
| American Express Co. (a) | | | 100,000 | | | | 7,571,000 | |
| Capital One Financial Corp. | | | 300,000 | | | | 18,279,000 | |
| | | | | | | | 25,850,000 | |
| Diversified Financial Services 6.4% | |
| Bank of America Corp. | | | 1,950,000 | | | | 26,637,000 | |
| Citigroup, Inc. | | | 350,000 | | | | 18,196,500 | |
| JPMorgan Chase & Co. | | | 750,000 | | | | 40,942,500 | |
| The NASDAQ OMX Group, Inc. | | | 400,000 | | | | 12,584,000 | |
| | | | | | | | 98,360,000 | |
| Insurance 7.4% | |
| ACE Ltd. | | | 75,000 | | | | 6,726,000 | |
| Alleghany Corp.* | | | 20,000 | | | | 7,800,000 | |
| Allstate Corp. | | | 150,000 | | | | 7,236,000 | |
| Aon PLC | | | 100,000 | | | | 6,367,000 | |
| Chubb Corp. | | | 75,000 | | | | 6,532,500 | |
| CNA Financial Corp. | | | 125,000 | | | | 4,271,250 | |
| Fidelity National Financial, Inc. "A" | | | 500,000 | | | | 13,155,000 | |
| HCC Insurance Holdings, Inc. | | | 150,000 | | | | 6,427,500 | |
| Lincoln National Corp. (a) | | | 250,000 | | | | 8,915,000 | |
| MetLife, Inc. | | | 400,000 | | | | 17,684,000 | |
| PartnerRe Ltd. | | | 100,000 | | | | 9,065,000 | |
| Principal Financial Group, Inc. | | | 50,000 | | | | 1,892,500 | |
| Prudential Financial, Inc. | | | 150,000 | | | | 10,345,500 | |
| Validus Holdings Ltd. | | | 200,000 | | | | 7,222,000 | |
| | | | | | | | 113,639,250 | |
| Thrifts & Mortgage Finance 0.5% | |
| Home Loan Servicing Solutions Ltd. | | | 200,000 | | | | 4,568,000 | |
| New York Community Bancorp., Inc. (a) | | | 300,000 | | | | 3,924,000 | |
| | | | | | | | 8,492,000 | |
| Health Care 14.2% | |
| Health Care Equipment & Supplies 2.4% | |
| Baxter International, Inc. | | | 75,000 | | | | 5,274,750 | |
| Becton, Dickinson & Co. | | | 50,000 | | | | 4,931,000 | |
| C.R. Bard, Inc. | | | 50,000 | | | | 5,154,500 | |
| Medtronic, Inc. | | | 250,000 | | | | 12,752,500 | |
| St. Jude Medical, Inc. | | | 200,000 | | | | 8,646,000 | |
| | | | | | | | 36,758,750 | |
| Health Care Providers & Services 3.1% | |
| Aetna, Inc. | | | 150,000 | | | | 9,057,000 | |
| HCA Holdings, Inc. | | | 150,000 | | | | 5,859,000 | |
| McKesson Corp. | | | 75,000 | | | | 8,539,500 | |
| Owens & Minor, Inc. (a) | | | 125,000 | | | | 4,272,500 | |
| Select Medical Holdings Corp. | | | 400,000 | | | | 3,160,000 | |
| UnitedHealth Group, Inc. | | | 150,000 | | | | 9,394,500 | |
| WellPoint, Inc. | | | 100,000 | | | | 7,697,000 | |
| | | | | | | | 47,979,500 | |
| Life Sciences Tools & Services 0.3% | |
| Agilent Technologies, Inc. | | | 100,000 | | | | 4,545,000 | |
| Pharmaceuticals 8.4% | |
| Bristol-Myers Squibb Co. | | | 200,000 | | | | 9,202,000 | |
| Eli Lilly & Co. | | | 150,000 | | | | 7,974,000 | |
| Forest Laboratories, Inc.* | | | 100,000 | | | | 3,975,000 | |
| Hospira, Inc.* (a) | | | 125,000 | | | | 4,335,000 | |
| Johnson & Johnson | | | 350,000 | | | | 29,463,000 | |
| Merck & Co., Inc. | | | 700,000 | | | | 32,690,000 | |
| Pfizer, Inc. | | | 1,350,000 | | | | 36,760,500 | |
| Teva Pharmaceutical Industries Ltd. (ADR) (a) | | | 150,000 | | | | 5,730,000 | |
| | | | | | | | 130,129,500 | |
| Industrials 8.0% | |
| Aerospace & Defense 2.9% | |
| Exelis, Inc. | | | 350,000 | | | | 4,252,500 | |
| Northrop Grumman Corp. | | | 100,000 | | | | 8,239,000 | |
| Raytheon Co. | | | 350,000 | | | | 23,324,000 | |
| United Technologies Corp. | | | 100,000 | | | | 9,490,000 | |
| | | | | | | | 45,305,500 | |
| Air Freight & Logistics 0.3% | |
| FedEx Corp. | | | 50,000 | | | | 4,817,000 | |
| Commercial Services & Supplies 0.6% | |
| Republic Services, Inc. | | | 250,000 | | | | 8,525,000 | |
| Industrial Conglomerates 3.1% | |
| Danaher Corp. | | | 100,000 | | | | 6,182,000 | |
| General Electric Co. | | | 1,750,000 | | | | 40,810,000 | |
| | | | | | | | 46,992,000 | |
| Machinery 0.6% | |
| AGCO Corp. | | | 100,000 | | | | 5,547,000 | |
| Stanley Black & Decker, Inc. | | | 50,000 | | | | 3,961,000 | |
| | | | | | | | 9,508,000 | |
| Road & Rail 0.5% | |
| Norfolk Southern Corp. | | | 100,000 | | | | 7,659,000 | |
| Information Technology 10.2% | |
| Communications Equipment 1.6% | |
| Cisco Systems, Inc. | | | 1,000,000 | | | | 24,080,000 | |
| Computers & Peripherals 2.5% | |
| Apple, Inc. | | | 10,000 | | | | 4,496,800 | |
| Dell, Inc. | | | 250,000 | | | | 3,337,500 | |
| EMC Corp.* (a) | | | 350,000 | | | | 8,666,000 | |
| Hewlett-Packard Co. | | | 300,000 | | | | 7,326,000 | |
| SanDisk Corp.* | | | 100,000 | | | | 5,902,000 | |
| Western Digital Corp. | | | 150,000 | | | | 9,498,000 | |
| | | | | | | | 39,226,300 | |
| Electronic Equipment, Instruments & Components 0.3% | |
| Corning, Inc. | | | 350,000 | | | | 5,379,500 | |
| IT Services 1.3% | |
| Booz Allen Hamilton Holding Corp. (a) | | | 200,000 | | | | 3,488,000 | |
| International Business Machines Corp. | | | 60,000 | | | | 12,481,200 | |
| Total System Services, Inc. | | | 200,000 | | | | 4,702,000 | |
| | | | | | | | 20,671,200 | |
| Office Electronics 0.3% | |
| Xerox Corp. | | | 500,000 | | | | 4,395,000 | |
| Semiconductors & Semiconductor Equipment 1.7% | |
| Broadcom Corp. "A" | | | 100,000 | | | | 3,591,000 | |
| Intel Corp. | | | 400,000 | | | | 9,712,000 | |
| Marvell Technology Group Ltd. | | | 400,000 | | | | 4,336,000 | |
| NVIDIA Corp. (a) | | | 300,000 | | | | 4,347,000 | |
| Texas Instruments, Inc. | | | 100,000 | | | | 3,589,000 | |
| | | | | | | | 25,575,000 | |
| Software 2.5% | |
| CA, Inc. | | | 200,000 | | | | 5,462,000 | |
| Microsoft Corp. | | �� | 600,000 | | | | 20,928,000 | |
| Oracle Corp. (a) | | | 350,000 | | | | 11,816,000 | |
| | | | | | | | 38,206,000 | |
| Materials 3.2% | |
| Chemicals 1.5% | |
| CF Industries Holdings, Inc. | | | 30,000 | | | | 5,728,800 | |
| LyondellBasell Industries NV "A" (a) | | | 100,000 | | | | 6,665,000 | |
| Praxair, Inc. | | | 40,000 | | | | 4,573,200 | |
| The Mosaic Co. | | | 100,000 | | | | 6,082,000 | |
| | | | | | | | 23,049,000 | |
| Containers & Packaging 0.4% | |
| Sonoco Products Co. | | | 200,000 | | | | 7,004,000 | |
| Metals & Mining 0.5% | |
| Constellium NV "A"* | | | 200,000 | | | | 2,940,000 | |
| Newmont Mining Corp. | | | 150,000 | | | | 5,142,000 | |
| | | | | | | | 8,082,000 | |
| Paper & Forest Products 0.8% | |
| International Paper Co. | | | 125,000 | | | | 5,768,750 | |
| Schweitzer-Mauduit International, Inc. | | | 125,000 | | | | 6,007,500 | |
| | | | | | | | 11,776,250 | |
| Telecommunication Services 2.9% | |
| Diversified Telecommunication Services | |
| AT&T, Inc. | | | 1,000,000 | | | | 34,990,000 | |
| CenturyLink, Inc. (a) | | | 300,000 | | | | 10,245,000 | |
| | | | | | | | 45,235,000 | |
| Utilities 5.9% | |
| Electric Utilities 3.8% | |
| American Electric Power Co., Inc. | | | 200,000 | | | | 9,164,000 | |
| Duke Energy Corp. | | | 125,000 | | | | 8,366,250 | |
| Exelon Corp. | | | 150,000 | | | | 4,701,000 | |
| FirstEnergy Corp. | | | 200,000 | | | | 7,802,000 | |
| NextEra Energy, Inc. | | | 100,000 | | | | 7,562,000 | |
| Pinnacle West Capital Corp. | | | 125,000 | | | | 7,060,000 | |
| PPL Corp. | | | 200,000 | | | | 5,940,000 | |
| Southern Co. (a) | | | 200,000 | | | | 8,780,000 | |
| | | | | | | | 59,375,250 | |
| Gas Utilities 0.4% | |
| UGI Corp. | | | 150,000 | | | | 5,728,500 | |
| Independent Power Producers & Energy Traders 0.3% | |
| AES Corp. | | | 350,000 | | | | 4,270,000 | |
| Multi-Utilities 1.4% | |
| Dominion Resources, Inc. | | | 150,000 | | | | 8,482,500 | |
| Public Service Enterprise Group, Inc. | | | 200,000 | | | | 6,608,000 | |
| Wisconsin Energy Corp. | | | 150,000 | | | | 6,121,500 | |
| | | | | | | | 21,212,000 | |
Total Common Stocks (Cost $1,286,009,987) | | | | 1,547,918,300 | |
| | |
| Securities Lending Collateral 7.9% | |
| Daily Assets Fund Institutional, 0.12% (b) (c) (Cost $121,036,562) | | | 121,036,562 | | | | 121,036,562 | |
| | |
| Cash Equivalents 0.0% | |
| Central Cash Management Fund, 0.07% (b) (Cost $444,577) | | | 444,577 | | | | 444,577 | |
| | | % of Net Assets | | | Value ($) | |
| | | | |
Total Investment Portfolio (Cost $1,407,491,126)† | | | 108.1 | | | | 1,669,399,439 | |
| Other Assets and Liabilities, Net | | | (8.1 | ) | | | (124,892,769 | ) |
| Net Assets | | | 100.0 | | | | 1,544,506,670 | |
* Non-income producing security.
† The cost for federal income tax purposes was $1,420,829,449. At May 31, 2013, net unrealized appreciation for all securities based on tax cost was $248,569,990. This consisted of aggregate gross unrealized appreciation for all securities in which there was an excess of value over tax cost of $276,439,791 and aggregate gross unrealized depreciation for all securities in which there was an excess of tax cost over value of $27,869,801.
(a) All or a portion of these securities were on loan (see Notes to Financial Statements). The value of securities loaned at May 31, 2013 amounted to $116,410,946, which is 7.5% of net assets.
(b) Affiliated fund managed by Deutsche Investment Management Americas Inc. The rate shown is the annualized seven-day yield at period end.
(c) Represents collateral held in connection with securities lending. Income earned by the Fund is net of borrower rebates.
ADR: American Depositary Receipt
Fair Value Measurements
Various inputs are used in determining the value of the Fund's investments. These inputs are summarized in three broad levels. Level 1 includes quoted prices in active markets for identical securities. Level 2 includes other significant observable inputs (including quoted prices for similar securities, interest rates, prepayment speeds and credit risk). Level 3 includes significant unobservable inputs (including the Fund's own assumptions in determining the fair value of investments). The inputs or methodology used for valuing securities are not necessarily an indication of the risk associated with investing in those securities.
The following is a summary of the inputs used as of May 31, 2013 in valuing the Fund's investments. For information on the Fund's policy regarding the valuation of investments, please refer to the Security Valuation section of Note A in the accompanying Notes to Financial Statements.
| Assets | | Level 1 | | | Level 2 | | | Level 3 | | | Total | |
| | |
| Common Stocks (d) | | $ | 1,547,918,300 | | | $ | — | | | $ | — | | | $ | 1,547,918,300 | |
| Short-Term Investments (d) | | | 121,481,139 | | | | — | | | | — | | | | 121,481,139 | |
| Total | | $ | 1,669,399,439 | | | $ | — | | | $ | — | | | $ | 1,669,399,439 | |
There have been no transfers between fair value measurement levels during the period ended May 31, 2013.
(d) See Investment Portfolio for additional detailed categorizations.
The accompanying notes are an integral part of the financial statements.
Statement of Assets and Liabilities | as of May 31, 2013 (Unaudited) | |
| Assets | |
Investments: Investments in non-affiliated securities, at value (cost $1,286,009,987) — including $116,410,946 of securities loaned | | $ | 1,547,918,300 | |
| Investment in Daily Assets Fund Institutional (cost $121,036,562)* | | | 121,036,562 | |
| Investment in Central Cash Management Fund (cost $444,577) | | | 444,577 | |
| Total investments in securities, at value (cost $1,407,491,126) | | | 1,669,399,439 | |
| Foreign currency, at value (cost $3,088) | | | 3,149 | |
| Receivable for investments sold | | | 6,282,068 | |
| Receivable for Fund shares sold | | | 815,525 | |
| Dividends receivable | | | 4,541,774 | |
| Interest receivable | | | 16,806 | |
| Foreign taxes recoverable | | | 18,146 | |
| Other assets | | | 42,673 | |
| Total assets | | | 1,681,119,580 | |
| Liabilities | |
| Payable upon return of securities loaned | | | 121,036,562 | |
| Payable for investments purchased | | | 5,589,595 | |
| Payable for Fund shares redeemed | | | 8,321,150 | |
| Accrued management fee | | | 560,911 | |
| Accrued Directors' fees | | | 13,488 | |
| Other accrued expenses and payables | | | 1,091,204 | |
| Total liabilities | | | 136,612,910 | |
| Net assets, at value | | $ | 1,544,506,670 | |
| Net Assets Consist of | |
| Undistributed net investment income | | | 15,639,806 | |
Net unrealized appreciation (depreciation) on: Investments | | | 261,908,313 | |
| Foreign currency | | | (54 | ) |
| Accumulated net realized gain (loss) | | | 17,335,498 | |
| Paid-in capital | | | 1,249,623,107 | |
| Net assets, at value | | $ | 1,544,506,670 | |
* Represents collateral on securities loaned.
The accompanying notes are an integral part of the financial statements.
Statement of Assets and Liabilities as of May 31, 2013 (Unaudited) (continued) | |
| Net Asset Value | |
Class A Net Asset Value, offering and redemption price (subject to contingent deferred sales charge) per share ($383,341,444 ÷ 18,210,744 shares of capital stock outstanding, $.01 par value, 420,000,000 shares authorized) | | $ | 21.05 | |
| Maximum offering price per share (100 ÷ 94.25 of $21.05) | | $ | 22.33 | |
Class B Net Asset Value and redemption price per share ($3,867,181 ÷ 183,062 shares of capital stock outstanding, $.01 par value, 320,000,000 shares authorized) | | $ | 21.12 | |
Class C Net Asset Value, offering and redemption price (subject to contingent deferred sales charge) per share ($35,920,702 ÷ 1,703,187 shares of capital stock outstanding, $.01 par value, 80,000,000 shares authorized) | | $ | 21.09 | |
Class R Net Asset Value, offering and redemption price per share ($1,255,664 ÷ 59,686 shares of capital stock outstanding, $.01 par value, 100,000,000 shares authorized) | | $ | 21.04 | |
Class S Net Asset Value, offering and redemption price per share ($978,852,783 ÷ 46,475,386 shares of capital stock outstanding, $.01 par value, 300,000,000 shares authorized) | | $ | 21.06 | |
Institutional Class Net Asset Value, offering and redemption price per share ($141,268,896 ÷ 6,704,450 shares of capital stock outstanding, $.01 par value, 80,000,000 shares authorized) | | $ | 21.07 | |
The accompanying notes are an integral part of the financial statements.
| for the six months ended May 31, 2013 (Unaudited) | |
| Investment Income | |
Income: Dividends (net of foreign taxes withheld of $71,571) | | $ | 19,794,554 | |
| Income distributions — Central Cash Management Fund | | | 8,634 | |
| Securities lending income, including income from Daily Assets Fund Institutional, net of borrower rebates | | | 40,854 | |
| Total income | | | 19,844,042 | |
Expenses: Management fee | | | 3,188,025 | |
| Administration fees | | | 750,648 | |
| Services to shareholders | | | 1,127,317 | |
| Distribution and service fees | | | 663,987 | |
| Custodian fee | | | 11,713 | |
| Professional fees | | | 50,837 | |
| Reports to shareholders | | | 50,991 | |
| Registration fees | | | 36,663 | |
| Directors' fees and expenses | | | 27,240 | |
| Other | | | 30,844 | |
| Total expenses | | | 5,938,265 | |
| Net investment income (loss) | | | 13,905,777 | |
| Realized and Unrealized Gain (Loss) | |
Net realized gain (loss) from: Investments | | | 98,077,675 | |
| Foreign currency | | | 278 | |
| | | | 98,077,953 | |
Change in net unrealized appreciation (depreciation) on: Investments | | | 112,937,868 | |
| Foreign currency | | | (84 | ) |
| | | | 112,937,784 | |
| Net gain (loss) | | | 211,015,737 | |
| Net increase (decrease) in net assets resulting from operations | | $ | 224,921,514 | |
The accompanying notes are an integral part of the financial statements.
Statement of Changes in Net Assets | Increase (Decrease) in Net Assets | | Six Months Ended May 31, 2013 (Unaudited) | | | Years Ended November 30, 2012 | |
Operations: Net investment income (loss) | | $ | 13,905,777 | | | $ | 31,035,853 | |
| Net realized gain (loss) | | | 98,077,953 | | | | 39,541,066 | |
| Change in net unrealized appreciation (depreciation) | | | 112,937,784 | | | | 55,612,199 | |
| Net increase (decrease) in net assets resulting from operations | | | 224,921,514 | | | | 126,189,118 | |
Distributions to shareholders from: Net investment income: Class A | | | (3,678,948 | ) | | | (7,317,218 | ) |
| Class B | | | (22,302 | ) | | | (53,359 | ) |
| Class C | | | (217,295 | ) | | | (429,215 | ) |
| Class R | | | (8,786 | ) | | | (9,649 | ) |
| Class S | | | (10,449,270 | ) | | | (20,084,736 | ) |
| Institutional Class | | | (1,517,356 | ) | | | (2,815,178 | ) |
| Total distributions | | | (15,893,957 | ) | | | (30,709,355 | ) |
Fund share transactions: Proceeds from shares sold | | | 49,915,652 | | | | 111,226,248 | |
| Reinvestment of distributions | | | 15,047,221 | | | | 28,843,174 | |
| Payments for shares redeemed | | | (179,202,253 | ) | | | (330,064,755 | ) |
| Net increase (decrease) in net assets from Fund share transactions | | | (114,239,380 | ) | | | (189,995,333 | ) |
| Increase (decrease) in net assets | | | 94,788,177 | | | | (94,515,570 | ) |
| Net assets at beginning of period | | | 1,449,718,493 | | | | 1,544,234,063 | |
| Net assets at end of period (including undistributed net investment income of $15,639,806 and $17,627,986, respectively) | | $ | 1,544,506,670 | | | $ | 1,449,718,493 | |
The accompanying notes are an integral part of the financial statements.
| | | | | | Years Ended November 30, | |
| Class A | | Six Months Ended 5/31/13 (Unaudited) | | | 2012 | | | 2011 | | | 2010 | | | 2009 | | | 2008 | |
| Selected Per Share Data | |
| Net asset value, beginning of period | | $ | 18.31 | | | $ | 17.21 | | | $ | 16.53 | | | $ | 15.95 | | | $ | 13.09 | | | $ | 24.51 | |
Income (loss) from investment operations: Net investment income (loss)a | | | .16 | | | | .33 | | | | .32 | | | | .30 | | | | .28 | | | | .26 | |
| Net realized and unrealized gain (loss) | | | 2.77 | | | | 1.10 | | | | .61 | | | | .57 | | | | 2.83 | | | | (7.24 | ) |
| Total from investment operations | | | 2.93 | | | | 1.43 | | | | .93 | | | | .87 | | | | 3.11 | | | | (6.98 | ) |
Less distributions from: Net investment income | | | (.19 | ) | | | (.33 | ) | | | (.25 | ) | | | (.29 | ) | | | (.25 | ) | | | (.28 | ) |
| Net realized gains | | | — | | | | — | | | | — | | | | — | | | | — | | | | (4.16 | ) |
| Total distributions | | | (.19 | ) | | | (.33 | ) | | | (.25 | ) | | | (.29 | ) | | | (.25 | ) | | | (4.44 | ) |
| Net asset value, end of period | | $ | 21.05 | | | $ | 18.31 | | | $ | 17.21 | | | $ | 16.53 | | | $ | 15.95 | | | $ | 13.09 | |
Total Return (%)b | | | 16.08 | ** | | | 8.35 | | | | 5.62 | | | | 5.54 | | | | 24.12 | | | | (34.81 | )c |
| Ratios to Average Net Assets and Supplemental Data | |
| Net assets, end of period ($ millions) | | | 383 | | | | 377 | | | | 415 | | | | 492 | | | | 469 | | | | 290 | |
| Ratio of expenses before expense reductions (%) | | | 1.01 | * | | | 1.00 | | | | 1.02 | | | | 1.03 | | | | 1.02 | | | | 1.03 | |
| Ratio of expenses after expense reductions (%) | | | 1.01 | * | | | 1.00 | | | | 1.02 | | | | 1.03 | | | | 1.02 | | | | 1.03 | |
| Ratio of net investment income (loss) (%) | | | 1.63 | * | | | 1.86 | | | | 1.84 | | | | 1.86 | | | | 2.05 | | | | 1.39 | |
| Portfolio turnover rate (%) | | | 51 | ** | | | 51 | | | | 34 | | | | 32 | | | | 81 | | | | 104 | |
a Based on average shares outstanding during the period. b Total return does not reflect the effect of any sales charge. c Total return would have been lower had certain expenses not been reduced. * Annualized ** Not annualized | |
| | | | | | Years Ended November 30, | |
| Class B | | Six Months Ended 5/31/13 (Unaudited) | | | 2012 | | | 2011 | | | 2010 | | | 2009 | | | 2008 | |
| Selected Per Share Data | |
| Net asset value, beginning of period | | $ | 18.38 | | | $ | 17.27 | | | $ | 16.57 | | | $ | 15.97 | | | $ | 13.11 | | | $ | 24.54 | |
Income (loss) from investment operations: Net investment income (loss)a | | | .08 | | | | .19 | | | | .19 | | | | .16 | | | | .16 | | | | .10 | |
| Net realized and unrealized gain (loss) | | | 2.77 | | | | 1.10 | | | | .61 | | | | .59 | | | | 2.83 | | | | (7.27 | ) |
| Total from investment operations | | | 2.85 | | | | 1.29 | | | | .80 | | | | .75 | | | | 2.99 | | | | (7.17 | ) |
Less distributions from: Net investment income | | | (.11 | ) | | | (.18 | ) | | | (.10 | ) | | | (.15 | ) | | | (.13 | ) | | | (.10 | ) |
| Net realized gains | | | — | | | | — | | | | — | | | | — | | | | — | | | | (4.16 | ) |
| Total distributions | | | (.11 | ) | | | (.18 | ) | | | (.10 | ) | | | (.15 | ) | | | (.13 | ) | | | (4.26 | ) |
| Net asset value, end of period | | $ | 21.12 | | | $ | 18.38 | | | $ | 17.27 | | | $ | 16.57 | | | $ | 15.97 | | | $ | 13.11 | |
Total Return (%)b | | | 15.56 | ** | | | 7.53 | | | | 4.83 | | | | 4.72 | | | | 23.12 | | | | (35.43 | )c |
| Ratios to Average Net Assets and Supplemental Data | |
| Net assets, end of period ($ millions) | | | 4 | | | | 4 | | | | 6 | | | | 10 | | | | 22 | | | | 17 | |
| Ratio of expenses before expense reductions (%) | | | 1.81 | * | | | 1.80 | | | | 1.77 | | | | 1.85 | | | | 1.87 | | | | 1.86 | |
| Ratio of expenses after expense reductions (%) | | | 1.81 | * | | | 1.80 | | | | 1.77 | | | | 1.85 | | | | 1.87 | | | | 1.86 | |
| Ratio of net investment income (loss) (%) | | | .83 | * | | | 1.05 | | | | 1.10 | | | | 1.03 | | | | 1.19 | | | | .56 | |
| Portfolio turnover rate (%) | | | 51 | ** | | | 51 | | | | 34 | | | | 32 | | | | 81 | | | | 104 | |
a Based on average shares outstanding during the period. b Total return does not reflect the effect of any sales charge. c Total return would have been lower had certain expenses not been reduced. * Annualized ** Not annualized | |
| | | | | | Years Ended November 30, | |
| Class C | | Six Months Ended 5/31/13 (Unaudited) | | | 2012 | | | 2011 | | | 2010 | | | 2009 | | | 2008 | |
| Selected Per Share Data | |
| Net asset value, beginning of period | | $ | 18.35 | | | $ | 17.24 | | | $ | 16.56 | | | $ | 15.96 | | | $ | 13.10 | | | $ | 24.52 | |
Income (loss) from investment operations: Net investment income (loss)a | | | .09 | | | | .21 | | | | .20 | | | | .19 | | | | .17 | | | | .12 | |
| Net realized and unrealized gain (loss) | | | 2.77 | | | | 1.10 | | | | .60 | | | | .58 | | | | 2.84 | | | | (7.25 | ) |
| Total from investment operations | | | 2.86 | | | | 1.31 | | | | .80 | | | | .77 | | | | 3.01 | | | | (7.13 | ) |
Less distributions from: Net investment income | | | (.12 | ) | | | (.20 | ) | | | (.12 | ) | | | (.17 | ) | | | (.15 | ) | | | (.13 | ) |
| Net realized gains | | | — | | | | — | | | | — | | | | — | | | | — | | | | (4.16 | ) |
| Total distributions | | | (.12 | ) | | | (.20 | ) | | | (.12 | ) | | | (.17 | ) | | | (.15 | ) | | | (4.29 | ) |
| Net asset value, end of period | | $ | 21.09 | | | $ | 18.35 | | | $ | 17.24 | | | $ | 16.56 | | | $ | 15.96 | | | $ | 13.10 | |
Total Return (%)b | | | 15.65 | ** | | | 7.65 | | | | 4.86 | | | | 4.85 | | | | 23.16 | | | | (35.29 | )c |
| Ratios to Average Net Assets and Supplemental Data | |
| Net assets, end of period ($ millions) | | | 36 | | | | 35 | | | | 39 | | | | 42 | | | | 42 | | | | 23 | |
| Ratio of expenses before expense reductions (%) | | | 1.70 | * | | | 1.70 | | | | 1.70 | | | | 1.73 | | | | 1.78 | | | | 1.79 | |
| Ratio of expenses after expense reductions (%) | | | 1.70 | * | | | 1.70 | | | | 1.70 | | | | 1.73 | | | | 1.78 | | | | 1.78 | |
| Ratio of net investment income (loss) (%) | | | .95 | * | | | 1.16 | | | | 1.16 | | | | 1.16 | | | | 1.28 | | | | .63 | |
| Portfolio turnover rate (%) | | | 51 | ** | | | 51 | | | | 34 | | | | 32 | | | | 81 | | | | 104 | |
a Based on average shares outstanding during the period. b Total return does not reflect the effect of any sales charge. c Total return would have been lower had certain expenses not been reduced. * Annualized ** Not annualized | |
| Class R | | Six Months Ended 5/31/13 (Unaudited) | | | Year Ended 11/30/12 | | | Period Ended 11/30/11a | |
| Selected Per Share Data | |
| Net asset value, beginning of period | | $ | 18.31 | | | $ | 17.22 | | | $ | 18.16 | |
Income (loss) from investment operations: Net investment income (loss)b | | | .13 | | | | .32 | | | | .22 | |
| Net realized and unrealized gain (loss) | | | 2.76 | | | | 1.06 | | | | (1.01 | ) |
| Total from investment operations | | | 2.89 | | | | 1.38 | | | | (.79 | ) |
Less distributions from: Net investment income | | | (.16 | ) | | | (.29 | ) | | | (.15 | ) |
| Total distributions | | | (.16 | ) | | | (.29 | ) | | | (.15 | ) |
| Net asset value, end of period | | $ | 21.04 | | | $ | 18.31 | | | $ | 17.22 | |
| Total Return (%) | | | 15.89 | ** | | | 8.05 | | | | (4.35 | )c** |
| Ratios to Average Net Assets and Supplemental Data | |
| Net assets, end of period ($ thousands) | | | 1,256 | | | | 941 | | | | 1 | |
| Ratio of expenses before expense reductions (%) | | | 1.32 | * | | | 1.33 | | | | 4.06 | * |
| Ratio of expenses after expense reductions (%) | | | 1.32 | * | | | 1.33 | | | | 1.26 | * |
| Ratio of net investment income (loss) (%) | | | 1.34 | * | | | 1.77 | | | | 1.66 | * |
| Portfolio turnover rate (%) | | | 51 | ** | | | 51 | | | | 34 | ** |
a For the period from March 1, 2011 (commencement of Class R shares) to November 30, 2011. b Based on average shares outstanding during the period. c Total return would have been lower had certain expenses not been reduced. * Annualized ** Not annualized | |
| | | | | | Years Ended November 30, | |
| Class S | | Six Months Ended 5/31/13 (Unaudited) | | | 2012 | | | 2011 | | | 2010 | | | 2009 | | | 2008 | |
| Selected Per Share Data | |
| Net asset value, beginning of period | | $ | 18.32 | | | $ | 17.22 | | | $ | 16.54 | | | $ | 15.95 | | | $ | 13.09 | | | $ | 24.52 | |
Income (loss) from investment operations: Net investment income (loss)a | | | .19 | | | | .39 | | | | .38 | | | | .35 | | | | .33 | | | | .32 | |
| Net realized and unrealized gain (loss) | | | 2.77 | | | | 1.09 | | | | .60 | | | | .58 | | | | 2.82 | | | | (7.24 | ) |
| Total from investment operations | | | 2.96 | | | | 1.48 | | | | .98 | | | | .93 | | | | 3.15 | | | | (6.92 | ) |
Less distributions from: Net investment income | | | (.22 | ) | | | (.38 | ) | | | (.30 | ) | | | (.34 | ) | | | (.29 | ) | | | (.35 | ) |
| Net realized gains | | | — | | | | — | | | | — | | | | — | | | | — | | | | (4.16 | ) |
| Total distributions | | | (.22 | ) | | | (.38 | ) | | | (.30 | ) | | | (.34 | ) | | | (.29 | ) | | | (4.51 | ) |
| Net asset value, end of period | | $ | 21.06 | | | $ | 18.32 | | | $ | 17.22 | | | $ | 16.54 | | | $ | 15.95 | | | $ | 13.09 | |
| Total Return (%) | | | 16.26 | ** | | | 8.71 | | | | 5.95 | | | | 5.92 | | | | 24.50 | | | | (34.61 | )b |
| Ratios to Average Net Assets and Supplemental Data | |
| Net assets, end of period ($ millions) | | | 979 | | | | 902 | | | | 955 | | | | 991 | | | | 976 | | | | 907 | |
| Ratio of expenses before expense reductions (%) | | | .68 | * | | | .69 | | | | .68 | | | | .70 | | | | .71 | | | | .72 | |
| Ratio of expenses after expense reductions (%) | | | .68 | * | | | .69 | | | | .68 | | | | .70 | | | | .71 | | | | .71 | |
| Ratio of net investment income (loss) (%) | | | 1.97 | * | | | 2.17 | | | | 2.18 | | | | 2.19 | | | | 2.36 | | | | 1.70 | |
| Portfolio turnover rate (%) | | | 51 | ** | | | 51 | | | | 34 | | | | 32 | | | | 81 | | | | 104 | |
a Based on average shares outstanding during the period. b Total return would have been lower had certain expenses not been reduced. * Annualized ** Not annualized | |
| | | | | | Years Ended November 30, | |
| Institutional Class | | Six Months Ended 5/31/13 (Unaudited) | | | 2012 | | | 2011 | | | 2010 | | | 2009 | | | 2008 | |
| Selected Per Share Data | |
| Net asset value, beginning of period | | $ | 18.33 | | | $ | 17.23 | | | $ | 16.55 | | | $ | 15.97 | | | $ | 13.12 | | | $ | 24.56 | |
Income (loss) from investment operations: Net investment income (loss)a | | | .19 | | | | .39 | | | | .38 | | | | .36 | | | | .34 | | | | .34 | |
| Net realized and unrealized gain (loss) | | | 2.77 | | | | 1.10 | | | | .60 | | | | .57 | | | | 2.82 | | | | (7.25 | ) |
| Total from investment operations | | | 2.96 | | | | 1.49 | | | | .98 | | | | .93 | | | | 3.16 | | | | (6.91 | ) |
Less distributions from: Net investment income | | | (.22 | ) | | | (.39 | ) | | | (.30 | ) | | | (.35 | ) | | | (.31 | ) | | | (.37 | ) |
| Net realized gains | | | — | | | | — | | | | — | | | | — | | | | — | | | | (4.16 | ) |
| Total distributions | | | (.22 | ) | | | (.39 | ) | | | (.30 | ) | | | (.35 | ) | | | (.31 | ) | | | (4.53 | ) |
| Net asset value, end of period | | $ | 21.07 | | | $ | 18.33 | | | $ | 17.23 | | | $ | 16.55 | | | $ | 15.97 | | | $ | 13.12 | |
| Total Return (%) | | | 16.26 | ** | | | 8.71 | | | | 5.98 | | | | 5.94 | | | | 24.53 | | | | (34.52 | )b |
| Ratios to Average Net Assets and Supplemental Data | |
| Net assets, end of period ($ millions) | | | 141 | | | | 131 | | | | 129 | | | | 104 | | | | 108 | | | | 52 | |
| Ratio of expenses before expense reductions (%) | | | .69 | * | | | .69 | | | | .68 | | | | .67 | | | | .63 | | | | .59 | |
| Ratio of expenses after expense reductions (%) | | | .69 | * | | | .69 | | | | .68 | | | | .67 | | | | .63 | | | | .59 | |
| Ratio of net investment income (loss) (%) | | | 1.95 | * | | | 2.17 | | | | 2.18 | | | | 2.22 | | | | 2.43 | | | | 1.83 | |
| Portfolio turnover rate (%) | | | 51 | ** | | | 51 | | | | 34 | | | | 32 | | | | 81 | | | | 104 | |
a Based on average shares outstanding during the period. b Total return would have been lower had certain expenses not been reduced. * Annualized ** Not annualized | |
Notes to Financial Statements (Unaudited)
A. Organization and Significant Accounting Policies
DWS Large Cap Value Fund (the "Fund") is a diversified series of DWS Value Series, Inc. (the "Corporation"), which is registered under the Investment Company Act of 1940, as amended (the "1940 Act"), as an open-end management investment company organized as a Maryland corporation.
The Fund offers multiple classes of shares which provide investors with different purchase options. Class A shares are offered to investors subject to an initial sales charge. Class B shares of the Fund are closed to new purchases, except exchanges or the reinvestment of dividends or other distributions. Class B shares were offered to investors without an initial sales charge and are subject to higher ongoing expenses than Class A shares and a contingent deferred sales charge payable upon certain redemptions. Class B shares automatically convert to Class A shares six years after issuance. Class C shares are offered to investors without an initial sales charge and are subject to higher ongoing expenses than Class A shares and a contingent deferred sales charge payable upon certain redemptions within one year of purchase. Class C shares do not automatically convert into another class. Class R shares are only available to participants in certain retirement plans and are offered to investors without an initial sales charge. Institutional Class shares are generally available only to qualified institutions, are not subject to initial or contingent deferred sales charges and generally have lower ongoing expenses than other classes. Class S shares are not subject to initial or contingent deferred sales charges and are only available to a limited group of investors.
Investment income, realized and unrealized gains and losses, and certain fund-level expenses and expense reductions, if any, are borne pro rata on the basis of relative net assets by the holders of all classes of shares, except that each class bears certain expenses unique to that class such as distribution and service fees, services to shareholders and certain other class-specific expenses. Differences in class-level expenses may result in payment of different per share dividends by class. All shares of the Fund have equal rights with respect to voting subject to class-specific arrangements.
The Fund's financial statements are prepared in accordance with accounting principles generally accepted in the United States of America which require the use of management estimates. Actual results could differ from those estimates. The policies described below are followed consistently by the Fund in the preparation of its financial statements.
Security Valuation. Investments are stated at value determined as of the close of regular trading on the New York Stock Exchange on each day the exchange is open for trading.
Various inputs are used in determining the value of the Fund's investments. These inputs are summarized in three broad levels. Level 1 includes quoted prices in active markets for identical securities. Level 2 includes other significant observable inputs (including quoted prices for similar securities, interest rates, prepayment speeds, and credit risk). Level 3 includes significant unobservable inputs (including the Fund's own assumptions in determining the fair value of investments). The inputs or methodology used for valuing securities are not necessarily an indication of the risk associated with investing in those securities.
Equity securities and exchange traded funds ("ETFs") are valued at the most recent sale price or official closing price reported on the exchange (U.S. or foreign) or over-the-counter market on which they trade and are categorized as Level 1 securities. Securities for which no sales are reported are valued at the calculated mean between the most recent bid and asked quotations on the relevant market or, if a mean cannot be determined, at the most recent bid quotation.
Investments in open-end investment companies are valued at their net asset value each business day and are categorized as Level 1.
Securities and other assets for which market quotations are not readily available or for which the above valuation procedures are deemed not to reflect fair value are valued in a manner that is intended to reflect their fair value as determined in accordance with procedures approved by the Board and are generally categorized as Level 3. In accordance with the Fund's valuation procedures, factors used in determining value may include, but are not limited to, the type of the security; the size of the holding; the initial cost of the security; the existence of any contractual restrictions on the security's disposition; the price and extent of public trading in similar securities of the issuer or of comparable companies; quotations or evaluated prices from broker-dealers and/or pricing services; information obtained from the issuer, analysts, and/or the appropriate stock exchange (for exchange-traded securities); an analysis of the company's or issuer's financial statements; an evaluation of the forces that influence the issuer and the market(s) in which the security is purchased and sold and with respect to debt securities; the maturity, coupon, creditworthiness, currency denomination and the movement of the market in which the security is normally traded. The value determined under these procedures may differ from published values for the same securities.
Disclosure about the classification of fair value measurements is included in a table following the Fund's Investment Portfolio.
New Accounting Pronouncement. In January 2013, Accounting Standard Update 2013-01 (ASU 2013-01), Clarifying the Scope of Disclosures about Offsetting Assets and Liabilities, replaced Accounting Standards Update 2011-11 (ASU 2011-11), Disclosures about Offsetting Assets and Liabilities. ASU 2013-01 is effective for fiscal years beginning on or after January 1, 2013, and interim periods within those annual periods. ASU 2011-11 was intended to enhance disclosure requirements on the offsetting of financial assets and liabilities. The ASU 2013-01 limits the scope of the new balance sheet offsetting disclosures to derivatives, repurchase agreements, and securities lending transactions to the extent that they are (1) offset in the financial statements or (2) subject to an enforceable master netting arrangement or similar agreement. Management is currently evaluating the application of ASU 2013-01 and its impact, if any, on the Fund's financial statements.
Foreign Currency Translations. The books and records of the Fund are maintained in U.S. dollars. Investment securities and other assets and liabilities denominated in a foreign currency are translated into U.S. dollars at the prevailing exchange rates at period end. Purchases and sales of investment securities, income and expenses are translated into U.S. dollars at the prevailing exchange rates on the respective dates of the transactions.
Net realized and unrealized gains and losses on foreign currency transactions represent net gains and losses between trade and settlement dates on securities transactions, the acquisition and disposition of foreign currencies, and the difference between the amount of net investment income accrued and the U.S. dollar amount actually received. That portion of both realized and unrealized gains and losses on investments that results from fluctuations in foreign currency exchange rates is not separately disclosed but is included with net realized and unrealized gain/appreciation and loss/depreciation on investments.
Securities Lending. The Fund lends securities to certain financial institutions. The Fund retains the benefits of owning the securities it has loaned and continues to receive interest and dividends generated by the securities and to participate in any changes in their market value. The Fund requires the borrowers of the securities to maintain collateral with the Fund consisting of either cash or liquid, unencumbered assets having a value at least equal to the value of the securities loaned. When the collateral falls below specified amounts, the lending agent will use its best effort to obtain additional collateral on the next business day to meet required amounts under the security lending agreement. The Fund may invest the cash collateral into a joint trading account in an affiliated money market fund pursuant to Exemptive Orders issued by the SEC. The Fund receives compensation for lending its securities either in the form of fees or by earning interest on invested cash collateral net of borrower rebates and fees paid to a lending agent. Either the Fund or the borrower may terminate the loan. There may be risks of delay and costs in recovery of securities or even loss of rights in the collateral should the borrower of the securities fail financially. The Fund is also subject to all investment risks associated with the reinvestment of any cash collateral received, including, but not limited to, interest rate, credit and liquidity risk associated with such investments.
Federal Income Taxes. The Fund's policy is to comply with the requirements of the Internal Revenue Code, as amended, which are applicable to regulated investment companies, and to distribute all of its taxable income to its shareholders.
Under the Regulated Investment Company Modernization Act of 2010, net capital losses incurred post-enactment may be carried forward indefinitely, and their character is retained as short-term and/or long-term. Previously, net capital losses were carried forward for eight years and treated as short-term losses. As a transition rule, the Act requires that post-enactment net capital losses be used before pre-enactment net capital losses.
At November 30, 2012, the Fund had a net tax basis capital loss carryforward of approximately $52,440,000 of pre-enactment losses, including approximately $9,245,000 inherited from its merger with an affiliated fund in fiscal year 2009, which may be applied against any realized net taxable capital gains of each succeeding year until fully utilized or until November 30, 2016 ($9,245,000) and November 30, 2017 ($43,195,000), the respective expiration dates, whichever occurs first, and which may be subject to certain limitations under Section 382-384 of Internal Revenue Code.
In addition, from November 1, 2012 through November 30, 2012, the Fund elects to defer qualified late year losses of approximately $13,782,000 of net long-term realized capital losses and approximately $1,182,000 of net short-term realized capital losses and treat them as arising in the fiscal year ending November 30, 2013.
The Fund has reviewed the tax positions for the open tax years as of November 30, 2012 and has determined that no provision for income tax is required in the Fund's financial statements. The Fund's federal tax returns for the prior three fiscal years remain open subject to examination by the Internal Revenue Service.
Distribution of Income and Gains. Distributions from net investment income of the Fund, if any, are declared and distributed to shareholders quarterly. Net realized gains from investment transactions, in excess of available capital loss carryforwards, would be taxable to the Fund if not distributed and, therefore, will be distributed to shareholders at least annually. The Fund may also make additional distributions for tax purposes if necessary.
The timing and characterization of certain income and capital gain distributions are determined annually in accordance with federal tax regulations which may differ from accounting principles generally accepted in the United States of America. These differences primarily relate to certain securities sold at a loss. As a result, net investment income (loss) and net realized gain (loss) on investment transactions for a reporting period may differ significantly from distributions during such period. Accordingly, the Fund may periodically make reclassifications among certain of its capital accounts without impacting the net asset value of the Fund.
The tax character of current year distributions will be determined at the end of the current fiscal year.
Expenses. Expenses of the Corporation arising in connection with a specific fund are allocated to that fund. Other Corporation expenses which cannot be directly attributed to a fund are apportioned among the funds in the Corporation based upon the relative net assets or other appropriate measures.
Contingencies. In the normal course of business, the Fund may enter into contracts with service providers that contain general indemnification clauses. The Fund's maximum exposure under these arrangements is unknown as this would involve future claims that may be made against the Fund that have not yet been made. However, based on experience, the Fund expects the risk of loss to be remote.
Other. Investment transactions are accounted for on a trade date plus one basis for daily net asset value calculations. However, for financial reporting purposes, investment transactions are reported on trade date. Interest income is recorded on the accrual basis. Dividend income is recorded on the ex-dividend date net of foreign withholding taxes. Certain dividends from foreign securities may be recorded subsequent to the ex-dividend date as soon as the Fund is informed of such dividends. Realized gains and losses from investment transactions are recorded on an identified cost basis and may include proceeds from litigation.
B. Purchases and Sales of Securities
During the six months ended May 31, 2013, purchases and sales of investment securities (excluding short-term investments) aggregated $749,610,672 and $783,933,756, respectively.
C. Related Parties
Management Agreement. Under the Investment Management Agreement with Deutsche Investment Management Americas Inc. ("DIMA" or the "Advisor") an indirect, wholly owned subsidiary of Deutsche Bank AG, the Advisor directs the investments of the Fund in accordance with its investment objectives, policies and restrictions. The Advisor determines the securities, instruments and other contracts relating to investments to be purchased, sold or entered into by the Fund.
Under the Investment Management Agreement with the Advisor, the Fund pays a monthly management fee based on the Fund's average daily net assets, computed and accrued daily and payable monthly, at the following annual rates:
| First $1.5 billion of the Fund's average daily net assets | | | .425 | % |
| Next $500 million of such net assets | | | .400 | % |
| Next $1 billion of such net assets | | | .375 | % |
| Next $1 billion of such net assets | | | .350 | % |
| Next $1 billion of such net assets | | | .325 | % |
| Over $5 billion of such net assets | | | .300 | % |
Accordingly, for the six months ended May 31, 2013, the fee pursuant to the Investment Management Agreement was equivalent to an annualized effective rate of 0.425% of the Fund's average daily net assets.
For the period from March 1, 2012 through February 28, 2013, the Advisor had contractually agreed to waive its fees and/or reimburse certain operating expenses of Class R shares to the extent necessary to maintain the operating expenses (excluding certain expenses such as extraordinary expenses, taxes, brokerage and interest) at 1.37%.
Administration Fee. Pursuant to an Administrative Services Agreement, DIMA provides most administrative services to the Fund. For all services provided under the Administrative Services Agreement, the Fund pays the Advisor an annual fee ("Administration Fee") of 0.10% of the Fund's average daily net assets, computed and accrued daily and payable monthly. For the six months ended May 31, 2013, the Administration Fee was $750,648, of which $132,265 is unpaid.
Service Provider Fees. DWS Investments Service Company ("DISC"), an affiliate of the Advisor, is the transfer agent, dividend-paying agent and shareholder service agent for the Fund. Pursuant to a sub-transfer agency agreement between DISC and DST Systems, Inc. ("DST"), DISC has delegated certain transfer agent, dividend-paying agent and shareholder service agent functions to DST. DISC compensates DST out of the shareholder servicing fee it receives from the Fund. For the six months ended May 31, 2013, the amounts charged to the Fund by DISC were as follows:
| Services to Shareholders | | Total Aggregated | | | Unpaid at May 31, 2013 | |
| Class A | | $ | 229,919 | | | $ | 115,228 | |
| Class B | | | 3,760 | | | | 1,983 | |
| Class C | | | 12,071 | | | | 6,221 | |
| Class R | | | 1,334 | | | | 777 | |
| Class S | | | 395,026 | | | | 202,047 | |
| Institutional Class | | | 81,662 | | | | 40,124 | |
| | | $ | 723,772 | | | $ | 366,380 | |
Distribution and Service Fees. Under the Fund's Class B, C and R 12b-1 Plans, DWS Investments Distributors, Inc. ("DIDI"), an affiliate of the Advisor, receives a fee ("Distribution Fee") of 0.75% of average daily net assets of each of Class B and C shares and 0.25% of average daily net assets of Class R shares. In accordance with the Fund's Underwriting and Distribution Services Agreement, DIDI enters into related selling group agreements with various firms at various rates for sales of Class B, C and R shares. For the six months ended May 31, 2013, the Distribution Fee was as follows:
| Distribution Fee | | Total Aggregated | | | Unpaid at May 31, 2013 | |
| Class B | | $ | 14,837 | | | $ | 2,492 | |
| Class C | | | 132,802 | | | | 22,988 | |
| Class R | | | 1,360 | | | | 262 | |
| | | $ | 148,999 | | | $ | 25,742 | |
In addition, DIDI provides information and administrative services for a fee ("Service Fee") to Class A, B, C and R shareholders at an annual rate of up to 0.25% of average daily net assets for each such class. DIDI in turn has various agreements with financial services firms that provide these services and pays these fees based upon the assets of shareholder accounts the firms service. For the six months ended May 31, 2013, the Service Fee was as follows:
| Service Fee | | Total Aggregated | | | Unpaid at May 31, 2013 | | | Annualized Effective Rate | |
| Class A | | $ | 464,612 | | | $ | 167,576 | | | | .24 | % |
| Class B | | | 4,880 | | | | 1,783 | | | | .25 | % |
| Class C | | | 44,136 | | | | 15,525 | | | | .25 | % |
| Class R | | | 1,360 | | | | 581 | | | | .25 | % |
| | | $ | 514,988 | | | $ | 185,465 | | | | | |
Underwriting Agreement and Contingent Deferred Sales Charge. DIDI is the principal underwriter for the Fund. Underwriting commissions paid in connection with the distribution of Class A shares for the six months ended May 31, 2013 aggregated $4,145.
In addition, DIDI receives any contingent deferred sales charge ("CDSC") from Class B share redemptions occurring within six years of purchase and Class C share redemptions occurring within one year of purchase. There is no such charge upon redemption of any share appreciation or reinvested dividends. The CDSC is based on declining rates, ranging from 4% to 1% for Class B and 1% for Class C, of the value of the shares redeemed. For the six months ended May 31, 2013, the CDSC for Class B and C shares aggregated $1,981 and $1,117, respectively. A deferred sales charge of up to 1% is assessed on certain redemptions of Class A shares. For the six months ended May 31, 2013, DIDI received $733 for Class A shares.
Typesetting and Filing Service Fees. Under an agreement with DIMA, DIMA is compensated for providing typesetting and certain regulatory filing services to the Fund. For the six months ended May 31, 2013, the amount charged to the Fund by DIMA included in the Statement of Operations under "reports to shareholders" aggregated $8,796, of which $5,510 is unpaid.
Directors' Fees and Expenses. The Fund paid retainer fees to each Director not affiliated with the Advisor, plus specified amounts to the Board Chairperson and Vice Chairperson and to each committee Chairperson.
Affiliated Cash Management Vehicles. The Fund may invest uninvested cash balances in Central Cash Management Fund and DWS Variable NAV Money Fund, affiliated money market funds which are managed by the Advisor. Each affiliated money market fund seeks to provide a high level of current income consistent with liquidity and the preservation of capital. Each affiliated money market fund is managed in accordance with Rule 2a-7 under the Investment Company Act of 1940, which governs the quality, maturity, diversity and liquidity of instruments in which a money market fund may invest. Central Cash Management Fund seeks to maintain a stable net asset value, and DWS Variable NAV Money Fund maintains a floating net asset value. The Fund indirectly bears its proportionate share of the expenses of each affiliated money market fund in which it invests. Central Cash Management Fund does not pay the Advisor an investment management fee. To the extent that DWS Variable NAV Money Fund pays an investment management fee to the Advisor, the Advisor will waive an amount of the investment management fee payable to the Advisor by the Fund equal to the amount of the investment management fee payable on the Fund's assets invested in DWS Variable NAV Money Fund.
Security Lending Fees. Effective December 27, 2012, Deutsche Bank AG serves as lending agent for the Fund. For the period from December 27, 2012 through May 31, 2013, the Fund incurred lending agent fees to Deutsche Bank AG for the amount of $4,350.
D. Line of Credit
The Fund and other affiliated funds (the "Participants") share in a $375 million revolving credit facility provided by a syndication of banks. The Fund may borrow for temporary or emergency purposes, including the meeting of redemption requests that otherwise might require the untimely disposition of securities. The Participants are charged an annual commitment fee which is allocated based on net assets, among each of the Participants. Interest is calculated at a rate per annum equal to the sum of the Federal Funds Rate plus 1.25 percent plus, if LIBOR exceeds the Federal Funds Rate, the amount of such excess. The Fund may borrow up to a maximum of 33 percent of its net assets under the agreement. The Fund had no outstanding loans at May 31, 2013.
E. Share Transactions
The following table summarizes share and dollar activity in the Fund:
| | | Six Months Ended May 31, 2013 | | | Year Ended November 30, 2012 | |
| | | Shares | | | Dollars | | | Shares | | | Dollars | |
| Shares sold | |
| Class A | | | 1,139,938 | | | $ | 22,507,292 | | | | 3,008,690 | | | $ | 53,935,353 | |
| Class B | | | 5,992 | | | | 116,887 | | | | 15,796 | | | | 283,060 | |
| Class C | | | 101,447 | | | | 1,984,487 | | | | 187,152 | | | | 3,382,885 | |
| Class R | | | 11,812 | | | | 234,253 | | | | 68,033 | | | | 1,224,497 | |
| Class S | | | 780,589 | | | | 15,349,463 | | | | 1,888,658 | | | | 33,721,535 | |
| Institutional Class | | | 488,239 | | | | 9,723,270 | | | | 1,051,846 | | | | 18,678,918 | |
| | | | | | | $ | 49,915,652 | | | | | | | $ | 111,226,248 | |
| Shares issued to shareholders in reinvestment of distributions | |
| Class A | | | 185,064 | | | $ | 3,547,691 | | | | 398,756 | | | $ | 7,062,605 | |
| Class B | | | 1,030 | | | | 19,827 | | | | 2,692 | | | | 47,845 | |
| Class C | | | 9,541 | | | | 183,320 | | | | 20,028 | | | | 356,190 | |
| Class R | | | 458 | | | | 8,786 | | | | 532 | | | | 9,649 | |
| Class S | | | 509,830 | | | | 9,775,027 | | | | 1,047,426 | | | | 18,560,447 | |
| Institutional Class | | | 78,875 | | | | 1,512,570 | | | | 158,031 | | | | 2,806,438 | |
| | | | | | | $ | 15,047,221 | | | | | | | $ | 28,843,174 | |
| Shares redeemed | |
| Class A | | | (3,687,426 | ) | | $ | (73,033,726 | ) | | | (6,971,866 | ) | | $ | (125,607,009 | ) |
| Class B | | | (47,359 | ) | | | (931,330 | ) | | | (142,958 | ) | | | (2,559,083 | ) |
| Class C | | | (314,149 | ) | | | (6,169,578 | ) | | | (571,056 | ) | | | (10,255,578 | ) |
| Class R | | | (3,978 | ) | | | (79,150 | ) | | | (17,227 | ) | | | (314,295 | ) |
| Class S | | | (4,020,882 | ) | | | (78,989,588 | ) | | | (9,155,468 | ) | | | (163,863,128 | ) |
| Institutional Class | | | (1,026,955 | ) | | | (19,998,881 | ) | | | (1,533,579 | ) | | | (27,465,662 | ) |
| | | | | | | $ | (179,202,253 | ) | | | | | | $ | (330,064,755 | ) |
| Net increase (decrease) | |
| Class A | | | (2,362,424 | ) | | $ | (46,978,743 | ) | | | (3,564,420 | ) | | $ | (64,609,051 | ) |
| Class B | | | (40,337 | ) | | | (794,616 | ) | | | (124,470 | ) | | | (2,228,178 | ) |
| Class C | | | (203,161 | ) | | | (4,001,771 | ) | | | (363,876 | ) | | | (6,516,503 | ) |
| Class R | | | 8,292 | | | | 163,889 | | | | 51,338 | | | | 919,851 | |
| Class S | | | (2,730,463 | ) | | | (53,865,098 | ) | | | (6,219,384 | ) | | | (111,581,146 | ) |
| Institutional Class | | | (459,841 | ) | | | (8,763,041 | ) | | | (323,702 | ) | | | (5,980,306 | ) |
| | | | | | | $ | (114,239,380 | ) | | | | | | $ | (189,995,333 | ) |
Information About Your Fund's Expenses
As an investor of the Fund, you incur two types of costs: ongoing expenses and transaction costs. Ongoing expenses include management fees, distribution and service (12b-1) fees and other Fund expenses. Examples of transaction costs include sales charges (loads) and account maintenance fees, which are not shown in this section. The following tables are intended to help you understand your ongoing expenses (in dollars) of investing in the Fund and to help you compare these expenses with the ongoing expenses of investing in other mutual funds. The example in the table is based on an investment of $1,000 invested at the beginning of the six-month period and held for the entire period (December 1, 2012 to May 31, 2013).
The tables illustrate your Fund's expenses in two ways:
•Actual Fund Return. This helps you estimate the actual dollar amount of ongoing expenses (but not transaction costs) paid on a $1,000 investment in the Fund using the Fund's actual return during the period. To estimate the expenses you paid over the period, simply divide your account value by $1,000 (for example, an $8,600 account value divided by $1,000 = 8.6), then multiply the result by the number in the "Expenses Paid per $1,000" line under the share class you hold.
•Hypothetical 5% Fund Return. This helps you to compare your Fund's ongoing expenses (but not transaction costs) with those of other mutual funds using the Fund's actual expense ratio and a hypothetical rate of return of 5% per year before expenses. Examples using a 5% hypothetical fund return may be found in the shareholder reports of other mutual funds. The hypothetical account values and expenses may not be used to estimate the actual ending account balance or expenses you paid for the period.
Please note that the expenses shown in these tables are meant to highlight your ongoing expenses only and do not reflect any transaction costs. The "Expenses Paid per $1,000" line of the tables is useful in comparing ongoing expenses only and will not help you determine the relative total expense of owning different funds. Subject to certain exceptions, an account maintenance fee of $20.00 assessed once per calendar year for Classes A, B, C and S shares may apply for accounts with balances less than $10,000. This fee is not included in these tables. If it was, the estimate of expenses paid for Classes A, B, C and S shares during the period would be higher, and account value during the period would be lower, by this amount.
Expenses and Value of a $1,000 Investment for the six months ended May 31, 2013 (Unaudited) | |
| Actual Fund Return | | Class A | | | Class B | | | Class C | | | Class R | | | Class S | | | Institutional Class | |
| Beginning Account Value 12/1/12 | | $ | 1,000.00 | | | $ | 1,000.00 | | | $ | 1,000.00 | | | $ | 1,000.00 | | | $ | 1,000.00 | | | $ | 1,000.00 | |
| Ending Account Value 5/31/13 | | $ | 1,160.80 | | | $ | 1,155.60 | | | $ | 1,156.50 | | | $ | 1,158.90 | | | $ | 1,162.60 | | | $ | 1,162.60 | |
| Expenses Paid per $1,000* | | $ | 5.44 | | | $ | 9.73 | | | $ | 9.14 | | | $ | 7.10 | | | $ | 3.67 | | | $ | 3.72 | |
| Hypothetical 5% Fund Return | | Class A | | | Class B | | | Class C | | | Class R | | | Class S | | | Institutional Class | |
| Beginning Account Value 12/1/12 | | $ | 1,000.00 | | | $ | 1,000.00 | | | $ | 1,000.00 | | | $ | 1,000.00 | | | $ | 1,000.00 | | | $ | 1,000.00 | |
| Ending Account Value 5/31/13 | | $ | 1,019.90 | | | $ | 1,015.91 | | | $ | 1,016.45 | | | $ | 1,018.35 | | | $ | 1,021.54 | | | $ | 1,021.49 | |
| Expenses Paid per $1,000* | | $ | 5.09 | | | $ | 9.10 | | | $ | 8.55 | | | $ | 6.64 | | | $ | 3.43 | | | $ | 3.48 | |
* Expenses are equal to the Fund's annualized expense ratio for each share class, multiplied by the average account value over the period, multiplied by 182 (the number of days in the most recent six-month period), then divided by 365.
| Annualized Expense Ratios | Class A | Class B | Class C | Class R | Class S | Institutional Class |
| DWS Large Cap Value Fund | 1.01% | 1.81% | 1.70% | 1.32% | .68% | .69% |
For more information, please refer to the Fund's prospectus.
For an analysis of the fees associated with an investment in the Fund or similar funds, please refer to http://apps.finra.org/fundanalyzer/1/fa.aspx.
Summary of Management Fee Evaluation by Independent Fee Consultant
September 17, 2012
Pursuant to an Order entered into by Deutsche Investment Management Americas and affiliates (collectively, "DeAM") with the Attorney General of New York, I, Thomas H. Mack, have been appointed the Independent Fee Consultant for the DWS Funds (formerly the DWS Scudder Funds). My duties include preparing an annual written evaluation of the management fees DeAM charges the Funds, considering among other factors the management fees charged by other mutual fund companies for like services, management fees DeAM charges other clients for like services, DeAM's costs of supplying services under the management agreements and related profit margins, possible economies of scale if a Fund grows larger, and the nature and quality of DeAM's services, including fund performance. This report summarizes my evaluation for 2012, including my qualifications, the evaluation process for each of the DWS Funds, consideration of certain complex-level factors, and my conclusions. I served in substantially the same capacity in 2007, 2008, 2009, 2010 and 2011.
Qualifications
For more than 35 years I have served in various professional capacities within the investment management business. I have held investment analysis and advisory positions, including securities analyst, portfolio strategist and director of investment policy with a large investment firm. I have also performed business management functions, including business development, financial management and marketing research and analysis.
Since 1991, I have been an independent consultant within the asset management industry. I have provided services to over 125 client organizations, including investment managers, mutual fund boards, product distributors and related organizations. Over the past ten years I have completed a number of assignments for mutual fund boards, specifically including assisting boards with management contract renewal.
I hold a Master of Business Administration degree, with highest honors, from Harvard University and Master of Science and Bachelor of Science (highest honors) degrees from the University of California at Berkeley. I am an independent director and audit committee financial expert for two closed-end mutual funds and have served in various leadership and financial oversight capacities with non-profit organizations.
Evaluation of Fees for each DWS Fund
My work focused primarily on evaluating, fund-by-fund, the fees charged to each of the 103 mutual fund portfolios in the DWS Fund family. For each Fund, I considered each of the key factors mentioned above, as well as any other relevant information. In doing so I worked closely with the Funds' Independent Directors in their annual contract renewal process, as well as in their approval of contracts for several new funds (documented separately).
In evaluating each Fund's fees, I reviewed comprehensive materials provided by or on behalf of DeAM, including expense information prepared by Lipper Analytical, comparative performance information, profitability data, manager histories, and other materials. I also accessed certain additional information from the Lipper and Morningstar databases and drew on my industry knowledge and experience.
To facilitate evaluating this considerable body of information, I prepared for each Fund a document summarizing the key data elements in each area as well as additional analytics discussed below. This made it possible to consider each key data element in the context of the others.
In the course of contract renewal, DeAM agreed to implement a number of fee and expense adjustments requested by the Independent Directors which will favorably impact future fees and expenses, and my evaluation includes the effects of these changes.
Fees and Expenses Compared with Other Funds
The competitive fee and expense evaluation for each fund focused on two primary comparisons:
The Fund's contractual management fee (the advisory fee plus the administration fee where applicable) compared with those of a group of typically 12-15 funds in the same Lipper investment category (e.g. Large Capitalization Growth) having similar distribution arrangements and being of similar size.
The Fund's total expenses compared with a broader universe of funds from the same Lipper investment category and having similar distribution arrangements.
These two comparisons provide a view of not only the level of the fee compared with funds of similar scale but also the total expense the Fund bears for all the services it receives, in comparison with the investment choices available in the Fund's investment category and distribution channel. The principal figure-of-merit used in these comparisons was the subject Fund's percentile ranking against peers.
DeAM's Fees for Similar Services to Others
DeAM provided management fee schedules for all of its US domiciled fund and non-fund investment management accounts in any of the investment categories where there is a DWS Fund. These similar products included the other DWS Funds, non-fund pooled accounts, institutional accounts and sub-advisory accounts. Using this information, I calculated for each Fund the fee that would be charged to each similar product, at the subject Fund's asset level.
Evaluating information regarding non-fund products is difficult because there are varying levels of services required for different types of accounts, with mutual funds generally requiring considerably more regulatory and administrative types of service as well as having more frequent cash flows than other types of accounts. Also, while mutual fund fees for similar fund products can be expected to be similar, there will be some differences due to different pricing conditions in different distribution channels (e.g. retail funds versus those used in variable insurance products), differences in underlying investment processes and other factors.
Costs and Profit Margins
DeAM provided a detailed profitability analysis for each Fund. After making some adjustments so that the presentation would be more comparable to the available industry figures, I reviewed profit margins from investment management alone, from investment management plus other fund services (excluding distribution) provided to the Funds by DeAM (principally shareholder services), and DeAM profits from all sources, including distribution. A later section comments on overall profitability.
Economies of Scale
Economies of scale — an expected decline in management cost per dollar of fund assets as fund assets grow — are very rarely quantified and documented because of inherent difficulties in collecting and analyzing relevant data. However, in virtually every investment category that I reviewed, larger funds tend to have lower fees and lower total expenses than smaller funds. To see how each DWS Fund compares with this industry observation, I reviewed:
The trend in Fund assets over the last five years and the accompanying trend in total expenses. This shows if the Fund has grown and, if so, whether total expense (management fees as well as other expenses) have declined as a percent of assets.
Whether the Fund has break-points in its management fee schedule, the extent of the fee reduction built into the schedule and the asset levels where the breaks take effect, and in the case of a sub-advised Fund how the Fund's break-points compare with those of the sub-advisory fee schedule.
How the Fund's contractual fee schedule compares with trends in the industry data. To accomplish this, I constructed a chart showing how actual latest-fiscal-year contractual fees of the Fund and of other similar funds relate to average fund assets, with the subject Fund's contractual fee schedule superimposed.
Quality of Service — Performance
The quality-of-service evaluation focused on investment performance, which is the principal result of the investment management service. Each Fund's performance was reviewed over the past 1, 3, 5 and 10 years, as applicable, and compared with that of other funds in the same investment category and with a suitable market index.
In addition, I calculated and reviewed risk-adjusted returns relative to an index of similar mutual funds' returns and a suitable market index. The risk-adjusted returns analysis provides a way of determining the extent to which the Fund's return comparisons are mainly the product of investment value-added (or lack thereof) or alternatively taking considerably more or less risk than is typical in its investment category.
I also received and considered the history of portfolio manager changes for each Fund, as this provided an important context for evaluating the performance results.
Complex-Level Considerations
While this evaluation was conducted mainly at the individual fund level, there are some issues relating to the reasonableness of fees that can alternatively be considered across the whole fund complex:
I reviewed DeAM's profitability analysis for all DWS Funds, with a view toward determining if the allocation procedures used were reasonable and how profit levels compared with public data for other investment managers.
I considered whether DeAM and affiliates receive any significant ancillary or "fallout" benefits that should be considered in interpreting the direct profitability results. These would be situations where serving as the investment manager of the Funds is beneficial to another part of the Deutsche Bank organization.
I considered how aggregated DWS Fund expenses had varied over the years, by asset class and in the context of trends in asset levels.
I considered how aggregated DWS Fund performance measures relative to appropriate peers had varied by asset class and over time.
I reviewed the structure of the DeAM organization, trends in staffing levels, and information on compensation of investment management and other professionals compared with industry data.
Findings
Based on the process and analysis discussed above, which included reviewing a wide range of information from management and external data sources and considering among other factors the fees DeAM charges other clients, the fees charged by other fund managers, DeAM's costs and profits associated with managing the Funds, economies of scale, possible fall-out benefits, and the nature and quality of services provided, in my opinion the management fees charged the DWS Funds are reasonable.
Thomas H. Mack
President, Thomas H. Mack & Co., Inc.
Account Management Resources | |
| For More Information | | The automated telephone system allows you to access personalized account information and obtain information on other DWS funds using either your voice or your telephone keypad. Certain account types within Classes A, B, C and S also have the ability to purchase, exchange or redeem shares using this system. For more information, contact your financial advisor. You may also access our automated telephone system or speak with a DWS Investments representative by calling: (800) 728-3337 |
| Web Site | | www.dws-investments.com View your account transactions and balances, trade shares, monitor your asset allocation, and change your address, 24 hours a day. Obtain prospectuses and applications, blank forms, interactive worksheets, news about DWS funds, subscription to fund updates by e-mail, retirement planning information, and more. |
| Written Correspondence | | DWS Investments PO Box 219151 Kansas City, MO 64121-9151 |
| Proxy Voting | | The fund's policies and procedures for voting proxies for portfolio securities and information about how the fund voted proxies related to its portfolio securities during the 12-month period ended June 30 are available on our Web site — www.dws-investments.com (click on "proxy voting"at the bottom of the page) — or on the SEC's Web site — www.sec.gov. To obtain a written copy of the fund's policies and procedures without charge, upon request, call us toll free at (800) 728-3337. |
| Portfolio Holdings | | Following the fund's fiscal first and third quarter-end, a complete portfolio holdings listing is filed with the SEC on Form N-Q. This form will be available on the SEC's Web site at www.sec.gov, and it also may be reviewed and copied at the SEC's Public Reference Room in Washington, D.C. Information on the operation of the SEC's Public Reference Room may be obtained by calling (800) SEC-0330. The fund's portfolio holdings are also posted on www.dws-investments.com from time to time. Please see the fund's current prospectus for more information. |
| Principal Underwriter | | If you have questions, comments or complaints, contact: DWS Investments Distributors, Inc. 222 South Riverside Plaza Chicago, IL 60606-5808 (800) 621-1148 |
| Investment Management | | Deutsche Investment Management Americas Inc. ("DIMA" or the "Advisor"), which is part of Deutsche Asset & Wealth Management, is the investment advisor for the fund. DIMA and its predecessors have more than 80 years of experience managing mutual funds and DIMA provides a full range of investment advisory services to both institutional and retail clients. DIMA is an indirect, wholly owned subsidiary of Deutsche Bank AG. Deutsche Bank AG is a major global banking institution engaged in a wide variety of financial services, including investment management, retail, private and commercial banking, investment banking and insurance. DWS Investments is the retail brand name in the U.S. for the asset management activities of Deutsche Bank AG and DIMA. As such, DWS is committed to delivering the investing expertise, insight and resources of this global investment platform to American investors. |
| | | Class A | Class B | Class C | Class S | Institutional Class |
| Nasdaq Symbol | | KDCAX | KDCBX | KDCCX | KDCSX | KDCIX |
| CUSIP Number | | 23338F 101 | 23338F 200 | 23338F 309 | 23338F 606 | 23338F 705 |
| Fund Number | | 086 | 286 | 386 | 2312 | 1486 |
| For shareholders of Class R |
| Automated Information Line | | DWS Investments Flex Plan Access (800) 728-3337 24-hour access to your retirement plan account. |
| Web Site | | www.dws-investments.com Click "Retirement Plans" to reallocate assets, process transactions and review your funds through our secure online account access. Obtain prospectuses and applications, blank forms, interactive worksheets, news about DWS funds, subscription to fund updates by e-mail, retirement planning information, and more. |
| For More Information | | (800) 728-3337 To speak with a service representative. |
| Written Correspondence | | DWS Investments Service Company 222 South Riverside Plaza Chicago, IL 60606-5806 |
| Nasdaq Symbol | | KDCQX |
| CUSIP Number | | 23338F 630 |
| Fund Number | | 1586 |
| FACTS | | What Does DWS Investments Do With Your Personal Information? |
| Why? | | Financial companies choose how they share your personal information. Federal law gives consumers the right to limit some but not all sharing. Federal law also requires us to tell you how we collect, share and protect your personal information. Please read this notice carefully to understand what we do. |
| What? | | The types of personal information we collect and share can include: • Social Security number • Account balances • Purchase and transaction history • Bank account information • Contact information such as mailing address, e-mail address and telephone number |
| How? | | All financial companies need to share customers' personal information to run their everyday business. In the section below, we list the reasons financial companies can share their customers' personal information, the reasons DWS Investments chooses to share and whether you can limit this sharing. |
| Reasons we can share your personal information | Does DWS Investments share? | Can you limit this sharing? |
For our everyday business purposes — such as to process your transactions, maintain your account(s), respond to court orders or legal investigations | Yes | No |
For our marketing purposes — to offer our products and services to you | Yes | No |
| For joint marketing with other financial companies | No | We do not share |
For our affiliates' everyday business purposes — information about your transactions and experiences | No | We do not share |
For our affiliates' everyday business purposes — information about your creditworthiness | No | We do not share |
| For non-affiliates to market to you | No | We do not share |
| Questions? | Call (800) 728-3337 or e-mail us at dws-investments.info@dws.com |
| Who we are |
| Who is providing this notice? | | DWS Investments Distributors, Inc.; Deutsche Investment Management Americas Inc.; DeAM Investor Services, Inc.; DWS Trust Company; the DWS Funds |
| What we do |
| How does DWS Investments protect my personal information? | | To protect your personal information from unauthorized access and use, we use security measures that comply with federal law. These measures include computer safeguards and secured files and buildings. |
| How does DWS Investments collect my personal information? | | We collect your personal information, for example. When you: • open an account • give us your contact information • provide bank account information for ACH or wire transactions • tell us where to send money • seek advice about your investments |
| Why can't I limit all sharing? | | Federal law gives you the right to limit only • sharing for affiliates' everyday business purposes — information about your creditworthiness • affiliates from using your information to market to you • sharing for nonaffiliates to market to you State laws and individual companies may give you additional rights to limit sharing. |
| Definitions |
| Affiliates | | Companies related by common ownership or control. They can be financial or non-financial companies. Our affiliates include financial companies with the DWS or Deutsche Bank ("DB") name, such as DB AG Frankfurt and DB Alex Brown. |
| Non-affiliates | | Companies not related by common ownership or control. They can be financial and non-financial companies. Non-affiliates we share with include account service providers, service quality monitoring services, mailing service providers and verification services to help in the fight against money laundering and fraud. |
| Joint marketing | | A formal agreement between non-affiliated financial companies that together market financial products or services to you. DWS Investments does not jointly market. |
Notes
Notes
Pursuant to the requirements of the Securities Exchange Act of 1934 and the Investment Company Act of 1940, the registrant has duly caused this report to be signed on its behalf by the undersigned, thereunto duly authorized.
Pursuant to the requirements of the Securities Exchange Act of 1934 and the Investment Company Act of 1940, this report has been signed below by the following persons on behalf of the registrant and in the capacities and on the dates indicated.