UNITED STATES
SECURITIES AND EXCHANGE COMMISSION
WASHINGTON, D. C. 20549
FORM N-CSR
Investment Company Act file number: 811-05385
Deutsche Value Series, Inc.
(Exact Name of Registrant as Specified in Charter)
345 Park Avenue
New York, NY 10154-0004
(Address of Principal Executive Offices) (Zip Code)
Registrant’s Telephone Number, including Area Code: (212) 250-3220
Paul Schubert
60 Wall Street
New York, NY 10005
(Name and Address of Agent for Service)
| Date of fiscal year end: | 11/30 |
| | |
| Date of reporting period: | 11/30/2015 |
| ITEM 1. | REPORT TO STOCKHOLDERS |

November 30, 2015
Annual Report
to Shareholders
Deutsche Mid Cap Value Fund

Contents
3 Letter to Shareholders 5 Portfolio Management Review 11 Performance Summary 14 Investment Portfolio 18 Statement of Assets and Liabilities 20 Statement of Operations 21 Statement of Changes in Net Assets 22 Financial Highlights 29 Notes to Financial Statements 40 Report of Independent Registered Public Accounting Firm 41 Information About Your Fund's Expenses 43 Tax Information 44 Advisory Agreement Board Considerations and Fee Evaluation 48 Board Members and Officers 53 Account Management Resources |
This report must be preceded or accompanied by a prospectus. To obtain a summary prospectus, if available, or prospectus for any of our funds, refer to the Account Management Resources information provided in the back of this booklet. We advise you to consider the fund's objectives, risks, charges and expenses carefully before investing. The summary prospectus and prospectus contain this and other important information about the fund. Please read the prospectus carefully before you invest.
Any fund that focuses in a particular segment of the market or region of the world will generally be more volatile than a fund that invests more broadly. Stocks of medium-sized companies involve greater risk than securities of larger, more-established companies. The fund may lend securities to approved institutions. Stocks may decline in value. See the prospectus for details.
Deutsche Asset & Wealth Management represents the asset management and wealth management activities conducted by Deutsche Bank AG or any of its subsidiaries, including the Advisor and DeAWM Distributors, Inc.
NOT FDIC/NCUA INSURED NO BANK GUARANTEE MAY LOSE VALUE NOT A DEPOSIT NOT INSURED BY ANY FEDERAL GOVERNMENT AGENCY
Letter to Shareholders
Dear Shareholder:
The global economy appears to be on track for continued, albeit modest, growth over the next year, with the U.S. leading Europe and Japan. Here at home, employment growth continues, although the pace has slowed in recent months. Housing data is positive and household finances are benefitting from lower levels of debt and debt service, gains in real income and lower energy prices.
Growth overseas, particularly in emerging economies, is a lingering concern. The stronger dollar and sluggish growth abroad have had a negative impact on U.S. exporters and manufacturers, and lower global energy prices have taken a toll on the domestic energy sector. Nevertheless, our economists see sufficient reason to expect the U.S. economy overall to maintain its moderate expansionary path.
For months, the most persistent question has been when the Federal Reserve Board would begin to tighten its monetary policy. That question was answered on December 16, when the Fed bumped short-term rates up by 0.25%. Based on financial data and guidance from the Fed itself, analysts agree that the tightening process is likely to be "low and slow."
As always, we encourage you to visit deutschefunds.com for timely information and insights about economic developments and your Deutsche fund investment. With frequent updates from our CIO Office and economists, we want to ensure that you are equipped to make informed decisions.
Thank you for your continued investment. We appreciate the opportunity to serve your investment needs.
Best regards,

 |
Brian Binder President, Deutsche Funds |
Assumptions, estimates and opinions contained in this document constitute our judgment as of the date of the document and are subject to change without notice. Any projections are based on a number of assumptions as to market conditions and there can be no guarantee that any projected results will be achieved. Past performance is not a guarantee of future results.
Portfolio Management Review (Unaudited)
Market Overview and Fund Performance
All performance information below is historical and does not guarantee future results. Returns shown are for Class A shares, unadjusted for sales charges. Investment return and principal fluctuate, so your shares may be worth more or less when redeemed. Current performance may differ from performance data shown. Please visit deutschefunds.com for the most recent month-end performance of all share classes. Fund performance includes reinvestment of all distributions. Unadjusted returns do not reflect sales charges and would have been lower if they had. Please refer to pages 11 through 13 for more complete performance information.
Investment Process In choosing stocks, we focus on individual security selection rather than industry selection. We use an active process that combines financial analysis with company visits to evaluate management and strategies. Company research lies at the heart of the investment process. We emphasize individual selection of stocks across all economic sectors, focusing on companies that we believe have strong management, identifiable catalysts (e.g., acquisitions or new products) and valuations that offer an attractive risk/reward trade-off. We utilize multiple sources for idea generation, as we believe quantitative screens by themselves are not robust enough to consistently source attractive investment ideas. |
Deutsche Mid Cap Value Fund returned 6.67% during the 12-month period ended November 30, 2015. The fund outperformed the –1.00% return of its benchmark, the Russell Midcap® Value Index, as well as the –0.85% average return of the funds in its peer group, Morningstar Mid-Cap Value funds. The fund also outpaced its peer group in the three-, five- and 10-year periods ended November 30, 2015.
The mid-cap value index finished the fund’s annual reporting period with a slightly negative return, as a strong first half was offset by weakness from mid-June onward. The initial gains in mid caps were fueled by concerns about slowing growth overseas, which led to a gravitation into stocks with higher sensitivity to the domestic economy. Since mid-sized companies typically earn a significant portion of their revenues in the United States, they were well positioned to benefit from this trend. This positive environment subsequently gave way to more challenging market conditions during the second half of the period, when questions about China’s growth outlook raised fears about the potential for a slowdown in global growth. The resulting "flight to quality" pressured higher-risk assets across the board, leading to a downturn in U.S. equities despite the continued strength in the domestic economy. The market staged an uneven recovery in the final two months of the period, however, enabling the index to close just short of the break-even mark for the year.
The general underperformance of value stocks also acted as a headwind to index performance. At a time of sluggish global economic conditions, investors gravitated to stocks seen as having the ability to deliver robust, organic earnings growth. As a result, the value style fell out of favor with investors.
| "The fund performed very well during the past 12 months, thanks to the effectiveness of our bottom-up, research-driven approach and focus on higher-quality, undervalued companies." |
Performance Attribution
Despite these potential challenges, the fund performed very well during the past 12 months, thanks to the effectiveness of our bottom-up, research-driven approach and focus on higher-quality, undervalued companies. The most notable aspect of the fund’s outperformance is that almost all of its excess returns came from individual stock selection. We believe this helps illustrate the potential effectiveness of our bottom-up, value-driven approach to stock selection.
Our investments outperformed the corresponding benchmark components in six of the eight sectors in which we held a position, with the strongest performance occurring in consumer discretionary, materials, financials and energy. In the sectors in which our holdings did underperform — industrials and health care — the shortfall was very slight. We are pleased with the broad-based nature of our performance, as it indicates that our stock selection process worked very well during the past year.
In the consumer discretionary sector, Expedia, Inc. finished the year as the largest contributor to performance. The stock was boosted by strong earnings gains and several acquisitions that were well received by the market. Newell-Rubbermaid, Inc. and the auto-components designer Visteon Corp. also made significant positive contributions within the consumer discretionary group.
Our performance in the materials sector stemmed from our preference for those with more attractive business models, and our avoidance of companies with above-average sensitivity to commodity prices. For example, Sealed Air Corp. was helped by a well-received management change and evidence that its product-rationalization strategy has begun to bear fruit. The chemical producer Celanese Corp. also delivered robust performance. The company has transitioned from a focus on commoditized chemicals to specialty products, which has led to higher profit margins and a healthy gain in its stock price.
The fund’s portfolio of financial stocks also delivered a return well in excess of the corresponding benchmark components, with First Republic Bank, CNO Financial Group, Inc. and the real estate investment trust Plum Creek Timber Company, Inc. leading the way.
Among individual stocks, Juniper Networks, Inc. — which outpaced the broader sector on the strength of improving earnings and rising new orders — was the top contributor to the fund’s results for the 12-months ended November 30, 2015. We also generated outperformance through our investment in BWX Technologies, Inc., which benefited from the successful spin-off of its power-generation business, as well as an earnings beat and a rising order backlog.
As would be expected in a period of outperformance for the fund, only a handful of holdings detracted from returns. The most significant detractors were the waste-services provider Covanta Holding Corp., the marine shipping company Kirby Corp. and the entertainment-technology developer Dolby Laboratories, Inc. However, the impact of these detractors was limited in relation to the contribution from the fund’s outperforming positions.
Outlook and Positioning
The fund closed the period with its largest overweights (relative to the benchmark) in the industrials, consumer discretionary and information technology sectors, as we have found all three to be home to an above-average number of individual stock opportunities. The utilities and financial sectors represent the fund’s largest underweights.
Consistent with our bottom-up approach, we did not make major shifts within the portfolio during the past year. Instead, we devoted our efforts to rotating the portfolio out of strong performers that had reached our target prices, such as Expedia and Juniper Networks, and redeploying the assets into stocks that we saw as offering greater upside. In this way, we were able to maintain an attractive valuation profile for the portfolio as a whole. In many cases, our purchases involved adding to existing holdings whose prices had fallen but where the underlying company fundamentals remained intact. We also added a number of new stocks to the portfolio during the course of the year, including ConAgra Foods, Inc. and Synchrony Financial.
While stocks experienced greater volatility in recent months than they did during the first half of the year, we believe the fund is well positioned for difficult market conditions by virtue of its focus on inexpensive stocks with strong management teams and sound underlying businesses. In addition, we believe volatility represents an opportunity in the sense that it can cause otherwise healthy companies to fall into value territory. We believe this patient, longer-term approach is the most prudent strategy for a potentially challenging environment.
| Ten Largest Equity Holdings at November 30, 2015 (30.1% of Net Assets) |
1. Visteon Corp. Supplies automotive systems, modules and components to vehicle manufacturers | 3.4% |
2. Synchrony Financial Consumer financial services company | 3.3% |
3. Harris Corp. International communications equipment company focused on product, system and service solutions | 3.3% |
4. Xylem, Inc. Designer, manufacturer, equipment and service provider for water and wastewater applications | 3.2% |
5. CNO Financial Group, Inc. Provides insurance product and services | 3.0% |
6. AerCap Holdings NV Integrated global aviation | 2.9% |
7. Celanese Corp. Produces chemicals and advanced materials | 2.9% |
8. Convergys Corp. Global company specializing in relationship management | 2.7% |
9. Newell Rubbermaid, Inc. Manufacturer and marketer of consumer products | 2.7% |
10. Plum Creek Timber Co., Inc. Manufacturer of forest products such as lumber and plywood | 2.7% |
Portfolio holdings and characteristics are subject to change. For more complete details about the fund's investment portfolio, see page 14. A quarterly Fact Sheet is available on deutschefunds.com or upon request. Please see the Account Management Resources section on page 53 for contact information. |
Portfolio Management Team
Richard Glass, CFA, Managing Director
Lead Portfolio Manager of the fund. Began managing the fund in 2013.
— Joined Deutsche Asset & Wealth Management in 2013 with 22 years of industry experience. Previously, he was lead portfolio manager and Managing Partner of Lockwell Investments, LLC, managing US Small Cap Value and US Small Mid Cap Value strategies. Prior to founding Lockwell in August of 2010, he was a Managing Director and portfolio manager for small- and mid-cap value strategies at Morgan Stanley Investment Management from November 2002 to July 2010. Before joining Morgan Stanley, he held positions with Neuberger Berman and with Wood, Struthers and Winthrop.
— BS in Economics, University of Pennsylvania.
Richard Hanlon, CFA, Director
Portfolio Manager of the fund. Began managing the fund in 2015.
— Joined Deutsche Asset & Wealth Management in 2013 with 23 years of industry experience. Previously, he founded Glenville Capital Management, where he served as Managing Partner. Prior to that, he worked as a Partner and Co-Head of the Equity Group at Silvercrest Asset Management Group. Before joining Silvercrest, he was Director of Research and a portfolio manager at DLJ Asset Management.
— BA in Economics, University at Albany, State University of New York.
The views expressed reflect those of the portfolio management team only through the end of the period of the report as stated on the cover. The management team's views are subject to change at any time based on market and other conditions and should not be construed as a recommendation. Past performance is no guarantee of future results. Current and future portfolio holdings are subject to risk.
Terms to Know
The Russell Midcap Value Index tracks the performance of those Russell Midcap Index companies with lower price-to-book ratios and lower forecasted growth values.
The Russell 1000 Value Index is an unmanaged index that consists of those stocks in the Russell 1000® Index with less-than-average growth orientation. The Russell 1000 Index is an unmanaged price-only index of the 1,000 largest capitalized companies that are domiciled in the U.S. and whose common stocks are traded.
The Russell 2000 Value Index tracks the performance of those Russell 2000 Index companies with lower price-to-book values and lower forecasted growth rates. Index and category returns assume reinvestment of all distributions. Index returns do not reflect fees or expenses and it is not possible to invest directly in an index.
Index returns do not reflect any fees or expenses and it is not possible to invest directly into an index.
The consumer discretionary sector consists of companies that produce goods and services that are not necessities in everyday life.
Overweight means the fund holds a higher weighting in a given sector or security than the benchmark. Underweight means the fund holds a lower weighting.
Performance Summary November 30, 2015 (Unaudited)
| Class A | 1-Year | 5-Year | 10-Year |
| Average Annual Total Returns as of 11/30/15 |
| Unadjusted for Sales Charge | 6.67% | 13.69% | 8.31% |
| Adjusted for the Maximum Sales Charge (max 5.75% load) | 0.54% | 12.35% | 7.67% |
| Russell Midcap® Value Index† | –1.00% | 13.59% | 8.05% |
| Class B | 1-Year | 5-Year | 10-Year |
| Average Annual Total Returns as of 11/30/15 |
| Unadjusted for Sales Charge | 5.86% | 12.83% | 7.52% |
| Adjusted for the Maximum Sales Charge (max 4.00% CDSC) | 2.86% | 12.70% | 7.52% |
| Russell Midcap® Value Index† | –1.00% | 13.59% | 8.05% |
| Class C | 1-Year | 5-Year | 10-Year |
| Average Annual Total Returns as of 11/30/15 |
| Unadjusted for Sales Charge | 5.87% | 12.85% | 7.52% |
| Adjusted for the Maximum Sales Charge (max 1.00% CDSC) | 5.87% | 12.85% | 7.52% |
| Russell Midcap® Value Index† | –1.00% | 13.59% | 8.05% |
| Class R | 1-Year | 5-Year | 10-Year |
| Average Annual Total Returns as of 11/30/15 |
| No Sales Charges | 6.42% | 13.44% | 8.02% |
| Russell Midcap® Value Index† | –1.00% | 13.59% | 8.05% |
| Class R6 | | 1-Year | Life of Class* |
| Average Annual Total Returns as of 11/30/15 |
| No Sales Charges | | 6.94% | 5.82% |
| Russell Midcap® Value Index† | | –1.00% | 0.20% |
| Class S | 1-Year | 5-Year | 10-Year |
| Average Annual Total Returns as of 11/30/15 |
| No Sales Charges | 6.94% | 13.98% | 8.64% |
| Russell Midcap® Value Index† | –1.00% | 13.59% | 8.05% |
| Institutional Class | 1-Year | 5-Year | 10-Year |
| Average Annual Total Returns as of 11/30/15 |
| No Sales Charges | 7.00% | 14.02% | 8.69% |
| Russell Midcap® Value Index† | –1.00% | 13.59% | 8.05% |
Performance in the Average Annual Total Returns table(s) above and the Growth of an Assumed $10,000 Investment line graph that follows is historical and does not guarantee future results. Investment return and principal fluctuate, so your shares may be worth more or less when redeemed. Current performance may differ from performance data shown. Please visit deutschefunds.com for the Fund's most recent month-end performance. Fund performance includes reinvestment of all distributions. Unadjusted returns do not reflect sales charges and would have been lower if they had.
The gross expense ratios of the Fund, as stated in the fee table of the prospectus dated March 1, 2015 are 1.28%, 2.17%, 2.04%, 1.59%, 0.91%, 1.05% and 1.00% for Class A, Class B, Class C, Class R, Class R6, Class S and Institutional Class shares, respectively, and may differ from the expense ratios disclosed in the Financial Highlights tables in this report.
Index returns do not reflect any fees or expenses and it is not possible to invest directly into an index.
Performance figures do not reflect the deduction of taxes that a shareholder would pay on fund distributions or the redemption of fund shares.
The returns for Class R shares for periods prior to inception on March 1, 2011 are derived from the historical performance of Class A shares of Deutsche Mid Cap Value Fund during such periods and have been adjusted to reflect higher total annual operating expenses of Class R. Any difference in expenses will affect performance.
| Growth of an Assumed $10,000 Investment (Adjusted for Maximum Sales Charge) |
■ Deutsche Mid Cap Value Fund — Class A ■ Russell Midcap Value Index† |
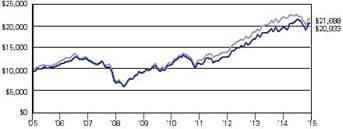 |
| Yearly periods ended November 30 |
The Fund's growth of an assumed $10,000 investment is adjusted for the maximum sales charge of 5.75%. This results in a net initial investment of $9,425.
The growth of $10,000 is cumulative.
Performance of other share classes will vary based on the sales charges and the fee structure of those classes.
* Class R6 shares commenced operations on August 25, 2014. The performance shown for the index is for the time period from August 31, 2014 through November 30, 2015, which is based on the performance period of the life of Class R6.
† Russell Midcap Value Index is an unmanaged index measuring the performance of those Russell Midcap companies with lower price-to-book ratios and lower forecasted growth values. The stocks are also members of the Russell 1000® Value Index.
| | Class A | Class B | Class C | Class R | Class R6 | Class S | Institutional Class |
| Net Asset Value |
| 11/30/15 | $ 18.42 | $ 18.09 | $ 18.06 | $ 18.40 | $ 18.41 | $ 18.43 | $ 18.44 |
| 11/30/14 | $ 17.96 | $ 17.78 | $ 17.75 | $ 17.98 | $ 17.97 | $ 17.97 | $ 17.97 |
| Distribution Information as of 11/30/15 |
| Income Dividends, Twelve Months | $ .00** | $ — | $ — | $ — | $ .06 | $ .05 | $ .05 |
| Capital Gain Distributions, Twelve Months | $ .69 | $ .69 | $ .69 | $ .69 | $ .69 | $ .69 | $ .69 |
** Amount is less than $.005.
Investment Portfolio as of November 30, 2015
| | Shares | Value ($) |
| | | |
| Common Stocks 95.1% |
| Consumer Discretionary 16.7% |
| Auto Components 5.1% |
| Tenneco, Inc.* | 104,050 | 5,606,214 |
| Visteon Corp.* | 93,294 | 11,186,883 |
| | 16,793,097 |
| Diversified Consumer Services 2.7% |
| Houghton Mifflin Harcourt Co.* | 440,087 | 8,696,119 |
| Household Durables 2.7% |
| Newell Rubbermaid, Inc. | 198,754 | 8,876,354 |
| Media 2.0% |
| TEGNA, Inc. | 236,000 | 6,667,000 |
| Specialty Retail 1.6% |
| Ross Stores, Inc. | 96,837 | 5,036,492 |
| Textiles, Apparel & Luxury Goods 2.6% |
| Hanesbrands, Inc. | 278,313 | 8,535,860 |
| Consumer Staples 1.9% |
| Food Products |
| ConAgra Foods, Inc. | 151,682 | 6,208,344 |
| Energy 5.6% |
| Energy Equipment & Services 2.1% |
| Oceaneering International, Inc. | 55,149 | 2,412,217 |
| Superior Energy Services, Inc. | 285,938 | 4,480,649 |
| | 6,892,866 |
| Oil, Gas & Consumable Fuels 3.5% |
| Cimarex Energy Co. | 47,638 | 5,669,875 |
| QEP Resources, Inc. | 360,315 | 5,692,977 |
| | 11,362,852 |
| Financials 24.1% |
| Banks 4.2% |
| First Republic Bank | 93,734 | 6,454,523 |
| KeyCorp | 543,870 | 7,130,136 |
| | 13,584,659 |
| Capital Markets 4.0% |
| Ameriprise Financial, Inc. | 65,737 | 7,424,994 |
| Lazard Ltd. "A" | 123,269 | 5,728,311 |
| | 13,153,305 |
| Consumer Finance 3.3% |
| Synchrony Financial* | 336,549 | 10,712,355 |
| Insurance 9.9% |
| Axis Capital Holdings Ltd. | 145,333 | 8,138,648 |
| CNO Financial Group, Inc. | 488,654 | 9,885,470 |
| Hartford Financial Services Group, Inc. | 156,107 | 7,124,724 |
| Reinsurance Group of America, Inc. | 79,240 | 7,280,571 |
| | 32,429,413 |
| Real Estate Investment Trusts 2.7% |
| Plum Creek Timber Co., Inc. (REIT) | 172,572 | 8,768,383 |
| Health Care 4.6% |
| Health Care Providers & Services 2.3% |
| HealthSouth Corp. | 208,316 | 7,330,640 |
| Life Sciences Tools & Services 2.3% |
| PerkinElmer, Inc. | 142,863 | 7,594,597 |
| Industrials 20.3% |
| Aerospace & Defense 1.5% |
| BWX Technologies, Inc. | 161,014 | 4,902,876 |
| Commercial Services & Supplies 5.2% |
| Covanta Holding Corp. | 507,480 | 8,195,802 |
| Pitney Bowes, Inc. | 404,420 | 8,735,472 |
| | 16,931,274 |
| Machinery 8.2% |
| Crane Co. | 163,376 | 8,498,820 |
| Stanley Black & Decker, Inc. | 71,912 | 7,849,914 |
| Xylem, Inc. | 278,678 | 10,400,263 |
| | 26,748,997 |
| Marine 1.3% |
| Kirby Corp.* | 65,229 | 4,213,793 |
| Road & Rail 1.2% |
| Ryder System, Inc. | 61,631 | 4,065,181 |
| Trading Companies & Distributors 2.9% |
| AerCap Holdings NV* | 211,704 | 9,619,830 |
| Information Technology 14.1% |
| Communications Equipment 3.3% |
| Harris Corp. | 127,761 | 10,620,772 |
| Electronic Equipment, Instruments & Components 8.1% |
| Belden, Inc. | 110,022 | 6,906,081 |
| Dolby Laboratories, Inc. "A" | 231,369 | 8,000,740 |
| Keysight Technologies, Inc.* | 149,214 | 4,597,283 |
| Zebra Technologies Corp. "A"* | 85,752 | 6,877,311 |
| | 26,381,415 |
| IT Services 2.7% |
| Convergys Corp. | 346,957 | 8,937,612 |
| Materials 7.8% |
| Chemicals 5.5% |
| Ashland, Inc. | 77,698 | 8,752,679 |
| Celanese Corp. "A" | 132,793 | 9,395,105 |
| | 18,147,784 |
| Containers & Packaging 2.3% |
| Sealed Air Corp. | 165,499 | 7,507,035 |
| Total Common Stocks (Cost $279,980,278) | 310,718,905 |
| |
| Cash Equivalents 4.9% |
| Central Cash Management Fund, 0.14% (a) (Cost $16,178,576) | 16,178,576 | 16,178,576 |
| | % of Net Assets | Value ($) |
| | |
| Total Investment Portfolio (Cost $296,158,854)† | 100.0 | 326,897,481 |
| Other Assets and Liabilities, Net | 0.0 | 5,206 |
| Net Assets | 100.0 | 326,902,687 |
* Non-income producing security.
† The cost for federal income tax purposes was $296,271,494. At November 30, 2015, net unrealized appreciation for all securities based on tax cost was $30,625,987. This consisted of aggregate gross unrealized appreciation for all securities in which there was an excess of value over tax cost of $43,280,654 and aggregate gross unrealized depreciation for all securities in which there was an excess of tax cost over value of $12,654,667.
(a) Affiliated fund managed by Deutsche Investment Management Americas Inc. The rate shown is the annualized seven-day yield at period end.
REIT: Real Estate Investment Trust
Fair Value Measurements
Various inputs are used in determining the value of the Fund's investments. These inputs are summarized in three broad levels. Level 1 includes quoted prices in active markets for identical securities. Level 2 includes other significant observable inputs (including quoted prices for similar securities, interest rates, prepayment speeds and credit risk). Level 3 includes significant unobservable inputs (including the Fund's own assumptions in determining the fair value of investments). The level assigned to the securities valuations may not be an indication of the risk or liquidity associated with investing in those securities.
The following is a summary of the inputs used as of November 30, 2015 in valuing the Fund's investments. For information on the Fund's policy regarding the valuation of investments, please refer to the Security Valuation section of Note A in the accompanying Notes to Financial Statements.
| Assets | Level 1 | Level 2 | Level 3 | Total |
| |
| Common Stocks (b) | $ 310,718,905 | $ — | $ — | $ 310,718,905 |
| Short-Term Investments | 16,178,576 | — | — | 16,178,576 |
| Total | $ 326,897,481 | $ — | $ — | $ 326,897,481 |
There have been no transfers between fair value measurement levels during the year ended November 30, 2015.
(b) See Investment Portfolio for additional detailed categorizations.
The accompanying notes are an integral part of the financial statements.
Statement of Assets and Liabilities
| as of November 30, 2015 |
| Assets |
Investments: Investments in non-affiliated securities, at value (cost $279,980,278) | $ 310,718,905 |
| Investment in Central Cash Management Fund (cost $16,178,576) | 16,178,576 |
| Total investments in securities, at value (cost $296,158,854) | 326,897,481 |
| Receivable for Fund shares sold | 2,085,969 |
| Dividends receivable | 527,985 |
| Interest receivable | 24,587 |
| Foreign taxes recoverable | 2,584 |
| Other assets | 39,209 |
| Total assets | 329,577,815 |
| Liabilities |
| Payable for Fund shares redeemed | 2,234,943 |
| Accrued management fee | 197,991 |
| Accrued Directors' fees | 4,887 |
| Other accrued expenses and payables | 237,307 |
| Total liabilities | 2,675,128 |
| Net assets, at value | $ 326,902,687 |
| Net Assets Consist of |
| Undistributed net investment income | 569,282 |
| Net unrealized appreciation (depreciation) on investments | 30,738,627 |
| Accumulated net realized gain (loss) | 25,243,284 |
| Paid-in capital | 270,351,494 |
| Net assets, at value | $ 326,902,687 |
The accompanying notes are an integral part of the financial statements.
| Statement of Assets and Liabilities as of November 30, 2015 (continued) |
| Net Asset Value |
Class A Net Asset Value and redemption price per share ($78,105,843 ÷ 4,241,052 shares of capital stock outstanding, $.01 par value, 75,000,000 shares authorized) | $ 18.42 |
| Maximum offering price per share (100 ÷ 94.25 of $18.42) | $ 19.54 |
Class B Net Asset Value, offering and redemption price (subject to contingent deferred sales charge) per share ($35,556 ÷ 1,965 shares of capital stock outstanding, $.01 par value, 75,000,000 shares authorized) | $ 18.09 |
Class C Net Asset Value, offering and redemption price (subject to contingent deferred sales charge) per share ($25,621,020 ÷ 1,418,313 shares of capital stock outstanding, $.01 par value, 75,000,000 shares authorized) | $ 18.06 |
Class R Net Asset Value, offering and redemption price per share ($18,499,265 ÷ 1,005,454 shares of capital stock outstanding, $.01 par value, 100,000,000 shares authorized) | $ 18.40 |
Class R6 Net Asset Value, offering and redemption price per share ($195,775 ÷ 10,632 shares of capital stock outstanding, $.01 par value, 50,000,000 shares authorized) | $ 18.41 |
Class S Net Asset Value, offering and redemption price per share ($175,358,361 ÷ 9,516,660 shares of capital stock outstanding, $.01 par value, 75,000,000 shares authorized) | $ 18.43 |
Institutional Class Net Asset Value, offering and redemption price per share ($29,086,867 ÷ 1,577,685 shares of capital stock outstanding, $.01 par value, 75,000,000 shares authorized) | $ 18.44 |
The accompanying notes are an integral part of the financial statements.
Statement of Operations
| for the year ended November 30, 2015 |
| Investment Income |
Income: Dividends | $ 3,513,180 |
| Income distributions — Central Cash Management Fund | 12,615 |
| Securities lending income, including income from Daily Assets Fund, net of borrower rebates | 44,750 |
| Total income | 3,570,545 |
Expenses: Management fee | 1,894,786 |
| Services to shareholders | 400,917 |
| Distribution and service fees | 420,507 |
| Custodian and accounting fees | 43,756 |
| Professional fees | 80,421 |
| Reports to shareholders | 46,737 |
| Registration fees | 93,023 |
| Directors' fees and expenses | 12,048 |
| Other | 14,970 |
| Total expenses before expense reductions | 3,007,165 |
| Expense reductions | (124,196) |
| Total expenses after expense reductions | 2,882,969 |
| Net investment income | 687,576 |
| Realized and Unrealized Gain (Loss) |
| Net realized gain (loss) from investments | 25,350,746 |
| Change in net unrealized appreciation (depreciation) on investments | (8,895,130) |
| Net gain (loss) | 16,455,616 |
| Net increase (decrease) in net assets resulting from operations | $ 17,143,192 |
The accompanying notes are an integral part of the financial statements.
Statement of Changes in Net Assets
| Increase (Decrease) in Net Assets | Years Ended November 30, |
| 2015 | 2014 |
Operations: Net investment income (loss) | $ 687,576 | $ 239,390 |
| Net realized gain (loss) | 25,350,746 | 13,773,967 |
| Change in net unrealized appreciation (depreciation) | (8,895,130) | 15,154,137 |
| Net increase (decrease) in net assets resulting from operations | 17,143,192 | 29,167,494 |
Distributions to shareholders from: Net investment income: Class A | (4,492) | (312,200) |
| Class B | — | (732) |
| Class C | — | (32,532) |
| Class R | — | (9,408) |
| Class R6 | (36) | — |
| Class S | (340,292) | (1,182,711) |
| Institutional Class | (17,875) | (63,044) |
Net realized gains: Class A | (2,055,262) | — |
| Class B | (8,367) | — |
| Class C | (730,901) | — |
| Class R | (468,982) | — |
| Class R6 | (385) | — |
| Class S | (5,163,726) | — |
| Institutional Class | (271,098) | — |
| Total distributions | (9,061,416) | (1,600,627) |
Fund share transactions: Proceeds from shares sold | 152,852,734 | 48,767,937 |
| Reinvestment of distributions | 8,730,968 | 1,536,559 |
| Payments for shares redeemed | (70,439,435) | (61,803,189) |
| Net increase (decrease) in net assets from Fund share transactions | 91,144,267 | (11,498,693) |
| Increase (decrease) in net assets | 99,226,043 | 16,068,174 |
| Net assets at beginning of period | 227,676,644 | 211,608,470 |
| Net assets at end of period (including undistributed net investment income of $569,282 and $229,283, respectively) | $ 326,902,687 | $ 227,676,644 |
The accompanying notes are an integral part of the financial statements.
Financial Highlights
| Class A | |
Years Ended November 30, |
| 2015 | 2014 | 2013 | 2012 | 2011 |
| Selected Per Share Data |
| Net asset value, beginning of period | $ 17.96 | $ 15.80 | $ 11.87 | $ 10.56 | $ 10.43 |
Income (loss) from investment operations: Net investment income (loss)a | .03 | .00* | .10 | .12 | .09 |
| Net realized and unrealized gain (loss) | 1.12 | 2.26 | 3.96 | 1.27 | .13 |
| Total from investment operations | 1.15 | 2.26 | 4.06 | 1.39 | .22 |
Less distributions from: Net investment income | (.00)* | (.10) | (.13) | (.08) | (.09) |
| Net realized gain | (.69) | — | — | — | — |
| Total distributions | (.69) | (.10) | (.13) | (.08) | (.09) |
| Net asset value, end of period | $ 18.42 | $ 17.96 | $ 15.80 | $ 11.87 | $ 10.56 |
| Total Return (%)b | 6.67c | 14.38c | 34.54c | 13.34c | 2.08 |
| Ratios to Average Net Assets and Supplemental Data |
| Net assets, end of period ($ millions) | 78 | 54 | 50 | 38 | 40 |
| Ratio of expenses before expense reductions (%) | 1.25 | 1.28 | 1.31 | 1.33 | 1.32 |
| Ratio of expenses after expense reductions (%) | 1.22 | 1.24 | 1.22 | 1.31 | 1.32 |
| Ratio of net investment income (loss) (%) | .19 | .01 | .68 | 1.03 | .81 |
| Portfolio turnover rate (%) | 34 | 34 | 98 | 28 | 47 |
a Based on average shares outstanding during period. b Total return does not reflect the effect of any sales charges. c Total return would have been lower had certain expenses not been reduced. * Amount is less than $.005. |
| Class B | |
Years Ended November 30, |
| 2015 | 2014 | 2013 | 2012 | 2011 |
| Selected Per Share Data |
| Net asset value, beginning of period | $ 17.78 | $ 15.69 | $ 11.78 | $ 10.48 | $ 10.35 |
Income (loss) from investment operations: Net investment income (loss)a | (.12) | (.13) | (.00)* | .02 | .00* |
| Net realized and unrealized gain (loss) | 1.12 | 2.25 | 3.94 | 1.28 | .14 |
| Total from investment operations | 1.00 | 2.12 | 3.94 | 1.30 | .14 |
Less distributions from: Net investment income | — | (.03) | (.03) | (.00)* | (.01) |
| Net realized gain | (.69) | — | — | — | — |
| Total distributions | (.69) | (.03) | (.03) | (.00)* | (.01) |
| Net asset value, end of period | $ 18.09 | $ 17.78 | $ 15.69 | $ 11.78 | $ 10.48 |
| Total Return (%)b,c | 5.86 | 13.52 | 33.53 | 12.44 | 1.33 |
| Ratios to Average Net Assets and Supplemental Data |
| Net assets, end of period ($ millions) | .04 | .2 | 1 | 1 | 2 |
| Ratio of expenses before expense reductions (%) | 2.34 | 2.17 | 2.16 | 2.19 | 2.15 |
| Ratio of expenses after expense reductions (%) | 1.97 | 1.97 | 1.96 | 2.11 | 2.12 |
| Ratio of net investment income (loss) (%) | (.65) | (.75) | (.03) | .20 | .01 |
| Portfolio turnover rate (%) | 34 | 34 | 98 | 28 | 47 |
a Based on average shares outstanding during the period. b Total return does not reflect the effect of any sales charges. c Total return would have been lower had certain expenses not been reduced. * Amount is less than $.005. |
| Class C | |
Years Ended November 30, |
| 2015 | 2014 | 2013 | 2012 | 2011 |
| Selected Per Share Data |
| Net asset value, beginning of period | $ 17.75 | $ 15.67 | $ 11.77 | $ 10.48 | $ 10.34 |
Income (loss) from investment operations: Net investment income (loss)a | (.10) | (.12) | (.01) | .03 | .01 |
| Net realized and unrealized gain (loss) | 1.10 | 2.23 | 3.95 | 1.27 | .14 |
| Total from investment operations | 1.00 | 2.11 | 3.94 | 1.30 | .15 |
Less distributions from: Net investment income | — | (.03) | (.04) | (.01) | (.01) |
| Net realized gain | (.69) | — | — | — | — |
| Total distributions | (.69) | (.03) | (.04) | (.01) | (.01) |
| Net asset value, end of period | $ 18.06 | $ 17.75 | $ 15.67 | $ 11.77 | $ 10.48 |
| Total Return (%)b | 5.87c | 13.48c | 33.57c | 12.42c | 1.45 |
| Ratios to Average Net Assets and Supplemental Data |
| Net assets, end of period ($ millions) | 26 | 19 | 17 | 13 | 16 |
| Ratio of expenses before expense reductions (%) | 2.00 | 2.04 | 2.06 | 2.08 | 2.05 |
| Ratio of expenses after expense reductions (%) | 1.97 | 1.99 | 1.97 | 2.07 | 2.05 |
| Ratio of net investment income (loss) (%) | (.57) | (.74) | (.07) | .27 | .08 |
| Portfolio turnover rate (%) | 34 | 34 | 98 | 28 | 47 |
a Based on average shares outstanding during the period. b Total return does not reflect the effect of any sales charges. c Total return would have been lower had certain expenses not been reduced. |
| Class R | |
Years Ended November 30, | Period Ended 11/30/11a |
| 2015 | 2014 | 2013 | 2012 |
| Selected Per Share Data |
| Net asset value, beginning of period | $ 17.98 | $ 15.82 | $ 11.87 | $ 10.55 | $ 11.66 |
Income (loss) from investment operations: Net investment income (loss)b | (.01) | (.03) | .05 | .11 | .05 |
| Net realized and unrealized gain (loss) | 1.12 | 2.25 | 3.99 | 1.26 | (1.16) |
| Total from investment operations | 1.11 | 2.22 | 4.04 | 1.37 | (1.11) |
Less distributions from: Net investment income | — | (.06) | (.09) | (.05) | — |
| Net realized gain | (.69) | — | — | — | — |
| Total distributions | (.69) | (.06) | (.09) | (.05) | — |
| Net asset value, end of period | $ 18.40 | $ 17.98 | $ 15.82 | $ 11.87 | $ 10.55 |
| Total Return (%)c | 6.42 | 14.08 | 34.30 | 13.08 | (9.52)** |
| Ratios to Average Net Assets and Supplemental Data |
| Net assets, end of period ($ thousands) | 18,499 | 11,991 | 1,043 | 229 | 1 |
| Ratio of expenses before expense reductions (%) | 1.64 | 1.59 | 1.61 | 1.64 | 6.24* |
| Ratio of expenses after expense reductions (%) | 1.47 | 1.48 | 1.47 | 1.59 | 1.57* |
| Ratio of net investment income (loss) (%) | (.06) | (.15) | .35 | .96 | .57* |
| Portfolio turnover rate (%) | 34 | 34 | 98 | 28 | 47d |
a For the period from March 1, 2011 (commencement of operations) to November 30, 2011. b Based on average shares outstanding during the period. c Total return would have been lower had certain expenses not been reduced. d Represents the Fund's portfolio turnover for the year ended November 30, 2011. * Annualized ** Not annualized |
| Class R6 | | Year Ended 11/30/15 | Period Ended 11/30/14a | |
| |
| Selected Per Share Data | |
| Net asset value, beginning of period | $ 17.97 | $ 17.89 | |
Income (loss) from investment operations: Net investment income (loss)b | .09 | .02 | |
| Net realized and unrealized gain (loss) | 1.10 | .06 | |
| Total from investment operations | 1.19 | .08 | |
Less distributions from: Net investment income | (.06) | — | |
| Net realized gain | (.69) | — | |
| Total distributions | (.75) | — | |
| Net asset value, end of period | $ 18.41 | $ 17.97 | |
| Total Return (%) | 6.94c | .45** | |
| Ratios to Average Net Assets and Supplemental Data | |
| Net assets, end of period ($ thousands) | 196 | 10 | |
| Ratio of expenses before expense reductions (%) | .97 | .91* | |
| Ratio of expenses after expense reductions (%) | .97 | .91* | |
| Ratio of net investment income (loss) (%) | .51 | .33* | |
| Portfolio turnover rate (%) | 34 | 34d | |
a For the period from August 25, 2014 (commencement of operations) to November 30, 2014. b Based on average shares outstanding during the period. c Total return would have been lower had certain expenses not been reduced. d Represents the Fund's portfolio turnover rate for the year ended November 30, 2014. * Annualized ** Not annualized | |
| Class S | |
Years Ended November 30, |
| 2015 | 2014 | 2013 | 2012 | 2011 |
| Selected Per Share Data |
| Net asset value, beginning of period | $ 17.97 | $ 15.81 | $ 11.87 | $ 10.57 | $ 10.44 |
Income (loss) from investment operations: Net investment income (loss)a | .08 | .04 | .13 | .15 | .12 |
| Net realized and unrealized gain (loss) | 1.12 | 2.26 | 3.97 | 1.26 | .13 |
| Total from investment operations | 1.20 | 2.30 | 4.10 | 1.41 | .25 |
Less distributions from: Net investment income | (.05) | (.14) | (.16) | (.11) | (.12) |
| Net realized gain | (.69) | — | — | — | — |
| Total distributions | (.74) | (.14) | (.16) | (.11) | (.12) |
| Net asset value, end of period | $ 18.43 | $ 17.97 | $ 15.81 | $ 11.87 | $ 10.57 |
| Total Return (%) | 6.94b | 14.65b | 34.95b | 13.56b | 2.38 |
| Ratios to Average Net Assets and Supplemental Data |
| Net assets, end of period ($ millions) | 175 | 135 | 136 | 121 | 104 |
| Ratio of expenses before expense reductions (%) | 1.02 | 1.05 | 1.08 | 1.10 | 1.08 |
| Ratio of expenses after expense reductions (%) | .97 | .99 | .97 | 1.07 | 1.08 |
| Ratio of net investment income (loss) (%) | .44 | .26 | .96 | 1.29 | 1.05 |
| Portfolio turnover rate (%) | 34 | 34 | 98 | 28 | 47 |
a Based on average shares outstanding during the period. b Total return would have been lower had certain expenses not been reduced. |
| Institutional Class | |
Years Ended November 30, |
| 2015 | 2014 | 2013 | 2012 | 2011 |
| Selected Per Share Data |
| Net asset value, beginning of period | $ 17.97 | $ 15.81 | $ 11.89 | $ 10.59 | $ 10.46 |
Income (loss) from investment operations: Net investment income (loss)a | .10 | .04 | .13 | .16 | .13 |
| Net realized and unrealized gain (loss) | 1.11 | 2.26 | 3.96 | 1.26 | .13 |
| Total from investment operations | 1.21 | 2.30 | 4.09 | 1.42 | .26 |
Less distributions from: Net investment income | (.05) | (.14) | (.17) | (.12) | (.13) |
| Net realized gain | (.69) | — | — | — | — |
| Total distributions | (.74) | (.14) | (.17) | (.12) | (.13) |
| Net asset value, end of period | $ 18.44 | $ 17.97 | $ 15.81 | $ 11.89 | $ 10.59 |
| Total Return (%) | 7.00 | 14.65b | 34.89b | 13.67b | 2.46 |
| Ratios to Average Net Assets and Supplemental Data |
| Net assets, end of period ($ millions) | 29 | 7 | 7 | 27 | 25 |
| Ratio of expenses before expense reductions (%) | .96 | 1.00 | .98 | .97 | .99 |
| Ratio of expenses after expense reductions (%) | .96 | .99 | .96 | .97 | .99 |
| Ratio of net investment income (loss) (%) | .54 | .26 | .99 | 1.39 | 1.14 |
| Portfolio turnover rate (%) | 34 | 34 | 98 | 28 | 47 |
a Based on average shares outstanding during the period. b Total return would have been lower had certain expenses not been reduced. |
Notes to Financial Statements
A. Organization and Significant Accounting Policies
Deutsche Mid Cap Value Fund (the "Fund") is a diversified series of Deutsche Value Series, Inc. (the "Corporation"), which is registered under the Investment Company Act of 1940, as amended (the "1940 Act"), as an open-end management investment company organized as a Maryland corporation.
The Fund offers multiple classes of shares which provide investors with different purchase options. Class A shares are subject to an initial sales charge. Class B shares are closed to new purchases, except exchanges and the reinvestment of dividends or other distributions. Class B shares were not subject to an initial sales charge and are subject to higher ongoing expenses than Class A shares and a contingent deferred sales charge payable upon certain redemptions. Class B shares automatically convert to Class A shares six years after issuance. On or about February 10, 2016, all remaining Class B shares will automatically convert to Class A shares. Class C shares are not subject to an initial sales charge but are subject to higher ongoing expenses than Class A shares and a contingent deferred sales charge payable upon certain redemptions within one year of purchase. Class C shares do not automatically convert into another class. Class R shares and Class R6 shares are not subject to initial or contingent deferred sales charges and are generally available only to certain retirement plans. Class S shares are not subject to initial or contingent deferred sales charges and are only available to a limited group of investors. Institutional Class shares are not subject to initial or contingent deferred sales charges and are generally available only to qualified institutions.
Investment income, realized and unrealized gains and losses, and certain fund-level expenses and expense reductions, if any, are borne pro rata on the basis of relative net assets by the holders of all classes of shares, except that each class bears certain expenses unique to that class such as distribution and service fees, services to shareholders and certain other class-specific expenses. Differences in class-level expenses may result in payment of different per share dividends by class. All shares of the Fund have equal rights with respect to voting subject to class-specific arrangements.
The Fund's financial statements are prepared in accordance with accounting principles generally accepted in the United States of America which require the use of management estimates. Actual results could differ from those estimates. The policies described below are followed consistently by the Fund in the preparation of its financial statements.
Security Valuation. Investments are stated at value determined as of the close of regular trading on the New York Stock Exchange on each day the exchange is open for trading.
Various inputs are used in determining the value of the Fund's investments. These inputs are summarized in three broad levels. Level 1 includes quoted prices in active markets for identical securities. Level 2 includes other significant observable inputs (including quoted prices for similar securities, interest rates, prepayment speeds and credit risk). Level 3 includes significant unobservable inputs (including the Fund's own assumptions in determining the fair value of investments). The level assigned to the securities valuations may not be an indication of the risk or liquidity associated with investing in those securities.
Equity securities are valued at the most recent sale price or official closing price reported on the exchange (U.S. or foreign) or over-the-counter market on which they trade. Securities for which no sales are reported are valued at the calculated mean between the most recent bid and asked quotations on the relevant market or, if a mean cannot be determined, at the most recent bid quotation. Equity securities are generally categorized as Level 1.
Investments in open-end investment companies are valued at their net asset value each business day and are categorized as Level 1.
Securities and other assets for which market quotations are not readily available or for which the above valuation procedures are deemed not to reflect fair value are valued in a manner that is intended to reflect their fair value as determined in accordance with procedures approved by the Board and are generally categorized as Level 3. In accordance with the Fund's valuation procedures, factors considered in determining value may include, but are not limited to, the type of the security; the size of the holding; the initial cost of the security; the existence of any contractual restrictions on the security's disposition; the price and extent of public trading in similar securities of the issuer or of comparable companies; quotations or evaluated prices from broker-dealers and/or pricing services; information obtained from the issuer, analysts, and/or the appropriate stock exchange (for exchange-traded securities); an analysis of the company's or issuer's financial statements; an evaluation of the forces that influence the issuer and the market(s) in which the security is purchased and sold; and with respect to debt securities, the maturity, coupon, creditworthiness, currency denomination and the movement of the market in which the security is normally traded. The value determined under these procedures may differ from published values for the same securities.
Disclosure about the classification of fair value measurements is included in a table following the Fund's Investment Portfolio.
Foreign Currency Translations. The books and records of the Fund are maintained in U.S. dollars. Investment securities and other assets and liabilities denominated in a foreign currency are translated into U.S. dollars at the prevailing exchange rates at period end. Purchases and sales of investment securities, income and expenses are translated into U.S. dollars at the prevailing exchange rates on the respective dates of the transactions.
Net realized and unrealized gains and losses on foreign currency transactions represent net gains and losses between trade and settlement dates on securities transactions, the acquisition and disposition of foreign currencies, and the difference between the amount of net investment income accrued and the U.S. dollar amount actually received. The portion of both realized and unrealized gains and losses on investments that results from fluctuations in foreign currency exchange rates is not separately disclosed but is included with net realized and unrealized gain/appreciation and loss/depreciation on investments.
Securities Lending. Brown Brothers Harriman & Co., as lending agent, lends securities of the Fund to certain financial institutions under the terms of the Security Lending Agreement. The Fund retains the benefits of owning the securities it has loaned and continues to receive interest and dividends generated by the securities and to participate in any changes in their market value. The Fund requires the borrowers of the securities to maintain collateral with the Fund consisting of either cash or liquid, unencumbered assets having a value at least equal to the value of the securities loaned. When the collateral falls below specified amounts, the lending agent will use its best effort to obtain additional collateral on the next business day to meet required amounts under the security lending agreement. The Fund may invest the cash collateral into a joint trading account in an affiliated money market fund pursuant to Exemptive Orders issued by the SEC. During the year ended November 30, 2015, the Fund invested the cash collateral in Daily Assets Fund, an affiliated money market fund managed by Deutsche Investment Management Americas Inc. Deutsche Investment Management Americas Inc. receives a management/administration fee (0.10% annualized effective rate as of November 30, 2015) on the cash collateral invested in Daily Assets Fund. The Fund receives compensation for lending its securities either in the form of fees or by earning interest on invested cash collateral net of borrower rebates and fees paid to a lending agent. Either the Fund or the borrower may terminate the loan. There may be risks of delay and costs in recovery of securities or even loss of rights in the collateral should the borrower of the securities fail financially. If the Fund is not able to recover securities lent, the Fund may sell the collateral and purchase a replacement investment in the market, incurring the risk that the value of the replacement security is greater than the value of the collateral. The Fund is also subject to all investment risks associated with the reinvestment of any cash collateral received, including, but not limited to, interest rate, credit and liquidity risk associated with such investments. As of November 30, 2015, the Fund had no securities on loan.
Federal Income Taxes. The Fund's policy is to comply with the requirements of the Internal Revenue Code, as amended, which are applicable to regulated investment companies, and to distribute all of its taxable income to its shareholders.
The Fund has reviewed the tax positions for the open tax years as of November 30, 2015 and has determined that no provision for income tax and/or uncertain tax provisions is required in the Fund's financial statements. The Fund's federal tax returns for the prior three fiscal years remain open subject to examination by the Internal Revenue Service.
Distribution of Income and Gains. Distributions from net investment income of the Fund, if any, are declared and distributed to shareholders annually. Net realized gains from investment transactions, in excess of available capital loss carryforwards, would be taxable to the Fund if not distributed, and, therefore, will be distributed to shareholders at least annually. The fund may also make additional distributions for tax purposes if necessary.
The timing and characterization of certain income and capital gain distributions are determined annually in accordance with federal tax regulations which may differ from accounting principles generally accepted in the United States of America. These differences primarily relate to securities sold at a loss, investments in limited partnerships, and income received from Real Estate Investment Trusts. As a result, net investment income (loss) and net realized gain (loss) on investment transactions for a reporting period may differ significantly from distributions during such period. Accordingly, the Fund may periodically make reclassifications among certain of its capital accounts without impacting the net asset value of the Fund.
At November 30, 2015, the Fund's components of distributable earnings (accumulated losses) on a tax basis were as follows:
| Undistributed ordinary income* | $ 2,189,105 |
| Undistributed long-term capital gains | $ 23,736,101 |
| Net unrealized appreciation (depreciation) on investments | $ 30,625,987 |
In addition, the tax character of distributions paid to shareholders by the Fund is summarized as follows:
| | Years Ended November 30, |
| | 2015 | 2014 |
| Distributions from ordinary income* | $ 2,710,432 | $ 1,600,627 |
| Distributions from long-term capital gains | $ 6,350,984 | $ — |
* For tax purposes, short-term capital gain distributions are considered ordinary income distributions.
Expenses. Expenses of the Corporation arising in connection with a specific fund are allocated to that fund. Other Corporation expenses which cannot be directly attributed to a fund are apportioned among the funds in the Corporation based upon the relative net assets or other appropriate measures.
Contingencies. In the normal course of business, the Fund may enter into contracts with service providers that contain general indemnification clauses. The Fund's maximum exposure under these arrangements is unknown as this would involve future claims that may be made against the Fund that have not yet been made. However, based on experience, the Fund expects the risk of loss to be remote.
Real Estate Investment Trusts. The Fund periodically recharacterizes distributions received from a Real Estate Investment Trust ("REIT") investment based on information provided by the REIT into the following categories: ordinary income, long-term and short-term capital gains, and return of capital. If information is not available timely from a REIT, the recharacterization will be estimated and a recharacterization will be made in the following year when such information becomes available. Distributions received from REITs in excess of income are recorded as either a reduction of cost of investments or realized gains. The Fund distinguishes between dividends received on a tax basis and a financial reporting basis and only distributions in excess of tax basis earnings and profits are reported in the financial statements as a tax return of capital.
Other. Investment transactions are accounted for on a trade date plus one basis for daily net asset valuation calculations. However, for financial reporting purposes, investment transactions are reported on trade date. Interest income is recorded on the accrual basis. Dividend income is recorded on the ex-dividend date net of foreign withholding taxes. Realized gains and losses from investment transactions are recorded on an identified cost basis. Proceeds from litigation payments, if any, are included in net realized gain (loss) from investments.
B. Purchases and Sales of Securities
During the year ended November 30, 2015, purchases and sales of investment securities (excluding short-term investments) aggregated $159,271,546 and $83,133,271, respectively.
C. Related Parties
Management Agreement. Under the Investment Management Agreement with Deutsche Investment Management Americas Inc. ("DIMA" or the "Advisor"), an indirect, wholly owned subsidiary of Deutsche Bank AG, the Advisor directs the investments of the Fund in accordance with its investment objectives, policies and restrictions. The Advisor determines the securities, instruments and other contracts relating to investments to be purchased, sold or entered into by the Fund. In addition to portfolio management services, the Advisor provides certain administrative services in accordance with the Investment Management Agreement.
Under the Investment Management Agreement with the Advisor, the Fund pays a monthly management fee based on the Fund's average daily net assets, computed and accrued daily and payable monthly, at the following annual rates:
| First $250 million of the Fund's average daily net assets | .750% |
| Next $250 million of such net assets | .720% |
| Next $2.0 billion of such net assets | .700% |
| Next $1.5 billion of such net assets | .680% |
| Over $4.0 billion of such assets | .660% |
Accordingly, for the year ended November 30, 2015, the fee pursuant to the Investment Management Agreement was equivalent to an annual rate (exclusive of any applicable waivers/reimbursements) of 0.75% of the Fund's average daily net assets.
For the period from December 1, 2014 through February 29, 2016, the Advisor has contractually agreed to waive its fees and/or reimburse certain operating expenses of the Fund to the extent necessary to maintain the operating expenses (excluding certain expenses such as extraordinary expenses, taxes, brokerage and interest) of each class as follows:
| Class A | 1.22% |
| Class B | 1.97% |
| Class C | 1.97% |
| Class R | 1.47% |
| Class R6 | .97% |
| Class S | .97% |
| Institutional Class | .97% |
For the year ended November 30, 2015, fees waived and/or expenses reimbursed for each class are as follows:
| Class A | $ 17,359 |
| Class B | 502 |
| Class C | 6,834 |
| Class R | 25,105 |
| Class R6 | 1 |
| Class S | 74,395 |
| | $ 124,196 |
Service Provider Fees. DeAWM Service Company ("DSC"), an affiliate of the Advisor, is the transfer agent, dividend-paying agent and shareholder service agent of the Fund. Pursuant to a sub-transfer agency agreement between DSC and DST Systems, Inc. ("DST"), DSC has delegated certain transfer agent, dividend-paying agent and shareholder service agent functions to DST. DSC compensates DST out of the shareholder servicing fee it receives from the Fund. For the year ended November 30, 2015, the amounts charged to the Fund by DSC were as follows:
| Services to Shareholders | Total Aggregated | Unpaid at November 30, 2015 |
| Class A | $ 36,355 | $ 8,507 |
| Class B | 581 | 146 |
| Class C | 5,245 | 1,043 |
| Class R | 943 | 247 |
| Class R6 | 45 | 23 |
| Class S | 123,670 | 29,082 |
| Institutional Class | 3,719 | 1,213 |
| | $ 170,558 | $ 40,261 |
Pursuant to a fund accounting agreement, DIMA is responsible for computing the daily net asset value per share and maintaining the portfolio and general accounting records of the Fund. DIMA has delegated certain fund accounting and record-keeping services to State Street Bank and Trust Company. The costs and expenses of such delegation are paid by DIMA. For the year ended November 30, 2015, the amount charged to the Fund for accounting services under the fund accounting agreement aggregated $37,979, of which $3,908 is unpaid.
Distribution and Service Fees. Under the Fund's Class B, C and R 12b-1 Plans, DeAWM Distributors, Inc. ("DDI"), an affiliate of the Advisor, receives a fee ("Distribution Fee") of 0.75% of average daily net assets of each of Class B and C shares, and 0.25% of the average daily net assets of Class R shares. In accordance with the Fund's Underwriting and Distribution Services Agreement, DDI enters into related selling group agreements with various firms at various rates for sales of Class B and C shares, respectively. For the year ended November 30, 2015, the Distribution Fee was as follows:
| Distribution Fee | Total Aggregated | Unpaid at November 30, 2015 |
| Class B | $ 1,012 | $ 27 |
| Class C | 151,380 | 15,184 |
| Class R | 36,022 | 3,726 |
| | $ 188,414 | $ 18,937 |
In addition, DDI provides information and administrative services for a fee ("Service Fee") to Class A, B, C and R shareholders at an annual rate of up to 0.25% of average daily net assets for each such class. DDI in turn has various agreements with financial services firms that provide these services and pays these fees based upon the assets of shareholder accounts the firms service. For the year ended November 30, 2015, the Service Fee was as follows:
| Service Fee | Total Aggregated | Unpaid at November 30, 2015 | Annual
Rate |
| Class A | $ 145,512 | $ 45,469 | .24% |
| Class B | 329 | 41 | .24% |
| Class C | 50,241 | 14,568 | .25% |
| Class R | 36,011 | 10,583 | .25% |
| | $ 232,093 | $ 70,661 | |
Underwriting and Contingent Deferred Sales Charge. DDI is the principal underwriter for the Fund. Underwriting commissions paid in connection with the distribution of Class A shares for the year ended November 30, 2015 aggregated $15,950.
In addition, DDI receives any contingent deferred sales charge ("CDSC") from Class B share redemptions occurring within six years of purchase and Class C share redemptions occurring within one year of purchase. There is no such charge upon redemption of any share appreciation or reinvested dividends. The CDSC is based on declining rates, ranging from 4% to 1% for Class B and 1% for Class C, of the value of the shares redeemed. For the year ended November 30, 2015, the CDSC for Class B and C shares aggregated $49 and $2,559, respectively. A deferred sales charge of up to 1% is assessed on certain redemptions of Class A shares. For the year ended November 30,2015, DDI received $997 for Class A shares.
Typesetting and Filing Service Fees. Under an agreement with DIMA, DIMA is compensated for providing typesetting and certain regulatory filing services to the Fund. For the year ended November 30, 2015, the amount charged to the Fund by DIMA included in the Statement of Operations under "Reports to shareholders" aggregated $23,377, of which $11,893 is unpaid.
Directors' Fees and Expenses. The Fund paid retainer fees to each Director not affiliated with the Advisor, plus specified amounts to the Board Chairperson and Vice Chairperson and to each committee Chairperson.
Affiliated Cash Management Vehicles. The Fund may invest uninvested cash balances in Central Cash Management Fund and Deutsche Variable NAV Money Fund, affiliated money market funds which are managed by the Advisor. Each affiliated money market fund seeks to provide a high level of current income consistent with liquidity and the preservation of capital. Each affiliated money market fund is managed in accordance with Rule 2a-7 under the 1940 Act, which governs the quality, maturity, diversity and liquidity of instruments in which a money market fund may invest. Central Cash Management Fund seeks to maintain a stable net asset value, and Deutsche Variable NAV Money Fund maintains a floating net asset value. The Fund indirectly bears its proportionate share of the expenses of each affiliated money market fund in which it invests. Central Cash Management Fund does not pay the Advisor an investment management fee. To the extent that Deutsche Variable NAV Money Fund pays an investment management fee to the Advisor, the Advisor will waive an amount of the investment management fee payable to the Advisor by the Fund equal to the amount of the investment management fee payable on the Fund's assets invested in Deutsche Variable NAV Money Fund.
D. Line of Credit
The Fund and other affiliated funds (the "Participants") share in a $400 million revolving credit facility provided by a syndication of banks. The Fund may borrow for temporary or emergency purposes, including the meeting of redemption requests that otherwise might require the untimely disposition of securities. The Participants are charged an annual commitment fee which is allocated based on net assets, among each of the Participants. Interest is calculated at a rate per annum equal to the sum of the Federal Funds Rate plus 1.25 percent plus if the one-month LIBOR exceeds the Federal Funds Rate, the amount of such excess. The Fund may borrow up to a maximum of 33 percent of its net assets under the agreement. The Fund had no outstanding loans at November 30, 2015.
E. Share Transactions
The following table summarizes share and dollar activity in the Fund:
| | Year Ended November 30, 2015 | Year Ended November 30, 2014 |
| | Shares | Dollars | Shares | Dollars |
| Shares sold |
| Class A | 2,089,627 | $ 38,194,111 | 684,013 | $ 11,676,178 |
| Class B | 384 | 6,353 | 404 | 7,058 |
| Class C | 576,113 | 10,135,197 | 220,472 | 3,658,494 |
| Class R | 455,136 | 8,236,475 | 641,828 | 10,945,569 |
| Class R6 | 10,049 | 177,594 | 559* | 10,000* |
| Class S | 3,921,464 | 70,514,114 | 1,269,675 | 21,584,519 |
| Institutional Class | 1,420,755 | 25,588,890 | 53,454 | 886,119 |
| | | $ 152,852,734 | | $ 48,767,937 |
| Shares issued to shareholders in reinvestment of distributions |
| Class A | 117,886 | $ 2,029,583 | 18,874 | $ 306,694 |
| Class B | 446 | 7,595 | 42 | 696 |
| Class C | 39,699 | 675,016 | 1,823 | 30,090 |
| Class R | 27,203 | 468,982 | 569 | 9,408 |
| Class R6 | 25 | 421 | — | — |
| Class S | 310,836 | 5,341,477 | 70,648 | 1,143,140 |
| Institutional Class | 12,097 | 207,894 | 2,875 | 46,531 |
| | | $ 8,730,968 | | $ 1,536,559 |
| Shares redeemed |
| Class A | (991,209) | $ (17,916,499) | (814,275) | $ (13,712,515) |
| Class B | (12,118) | (216,735) | (29,718) | (482,906) |
| Class C | (254,766) | (4,448,858) | (269,805) | (4,461,547) |
| Class R | (143,765) | (2,598,236) | (41,424) | (715,505) |
| Class R6 | (1) | (18) | — | — |
| Class S | (2,243,450) | (40,769,503) | (2,426,874) | (40,860,438) |
| Institutional Class | (251,665) | (4,489,586) | (92,740) | (1,570,278) |
| | | $ (70,439,435) | | $ (61,803,189) |
| Net increase (decrease) |
| Class A | 1,216,304 | $ 22,307,195 | (111,388) | $ (1,729,643) |
| Class B | (11,288) | (202,787) | (29,272) | (475,152) |
| Class C | 361,046 | 6,361,355 | (47,510) | (772,963) |
| Class R | 338,574 | 6,107,221 | 600,973 | 10,239,472 |
| Class R6 | 10,073 | 177,997 | 559* | 10,000* |
| Class S | 1,988,850 | 35,086,088 | (1,086,551) | (18,132,779) |
| Institutional Class | 1,181,187 | 21,307,198 | (36,411) | (637,628) |
| | | $ 91,144,267 | | $ (11,498,693) |
* For the period from August 25, 2014 (commencement of operations of Class R6) to November 30, 2014.
Report of Independent Registered Public Accounting Firm
To the Board of Directors of Deutsche Value Series, Inc. and Shareholders of Deutsche Mid Cap Value Fund:
We have audited the accompanying statement of assets and liabilities of Deutsche Mid Cap Value Fund (one of the funds constituting Deutsche Value Series, Inc. (the "Fund"), including the investment portfolio as of November 30, 2015, and the related statement of operations for the year then ended, the statements of changes in net assets for each of the two years in the period then ended, and the financial highlights for each of the periods indicated therein. These financial statements and financial highlights are the responsibility of the Fund's management. Our responsibility is to express an opinion on these financial statements and financial highlights based on our audits.
We conducted our audits in accordance with the standards of the Public Company Accounting Oversight Board (United States). Those standards require that we plan and perform the audit to obtain reasonable assurance about whether the financial statements and financial highlights are free of material misstatement. We were not engaged to perform an audit of the Fund's internal control over financial reporting. Our audits included consideration of internal control over financial reporting as a basis for designing audit procedures that are appropriate in the circumstances, but not for the purpose of expressing an opinion on the effectiveness of the Fund's internal control over financial reporting. Accordingly, we express no such opinion. An audit also includes examining, on a test basis, evidence supporting the amounts and disclosures in the financial statements and financial highlights, assessing the accounting principles used and significant estimates made by management, and evaluating the overall financial statement presentation. Our procedures included confirmation of securities owned as of November 30, 2015, by correspondence with the custodian and brokers. We believe that our audits provide a reasonable basis for our opinion.
In our opinion, the financial statements and financial highlights referred to above present fairly, in all material respects, the financial position of Deutsche Mid Cap Value Fund at November 30, 2015, the results of its operations for the year then ended, the changes in its net assets for each of the two years in the period then ended, and the financial highlights for each of the periods indicated therein, in conformity with U.S. generally accepted accounting principles.
| | |  |
Boston, Massachusetts
January 25, 2016 | | |
Information About Your Fund's Expenses
As an investor of the Fund, you incur two types of costs: ongoing expenses and transaction costs. Ongoing expenses include management fees, distribution and service (12b-1) fees and other Fund expenses. Examples of transaction costs include sales charges (loads) and account maintenance fees, which are not shown in this section. The following tables are intended to help you understand your ongoing expenses (in dollars) of investing in the Fund and to help you compare these expenses with the ongoing expenses of investing in other mutual funds. In the most recent six-month period, the Fund limited these expenses for Class A, Class B, Class C, Class R, Class R6 and Class S; had it not done so, expenses would have been higher. The example in the table is based on an investment of $1,000 invested at the beginning of the six-month period and held for the entire period (June 1, 2015 to November 30, 2015).
The tables illustrate your Fund's expenses in two ways:
— Actual Fund Return. This helps you estimate the actual dollar amount of ongoing expenses (but not transaction costs) paid on a $1,000 investment in the Fund using the Fund's actual return during the period. To estimate the expenses you paid over the period, simply divide your account value by $1,000 (for example, an $8,600 account value divided by $1,000 = 8.6), then multiply the result by the number in the "Expenses Paid per $1,000" line under the share class you hold.
— Hypothetical 5% Fund Return. This helps you to compare your Fund's ongoing expenses (but not transaction costs) with those of other mutual funds using the Fund's actual expense ratio and a hypothetical rate of return of 5% per year before expenses. Examples using a 5% hypothetical fund return may be found in the shareholder reports of other mutual funds. The hypothetical account values and expenses may not be used to estimate the actual ending account balance or expenses you paid for the period.
Please note that the expenses shown in these tables are meant to highlight your ongoing expenses only and do not reflect any transaction costs. The "Expenses Paid per $1,000" line of the tables is useful in comparing ongoing expenses only and will not help you determine the relative total expense of owning different funds. Subject to certain exceptions, an account maintenance fee of $20.00 assessed once per calendar year for Classes A, B, C and S shares may apply for accounts with balances less than $10,000. This fee is not included in these tables. If it was, the estimate of expenses paid for Classes A, B, C and S shares during the period would be higher, and account value during the period would be lower, by this amount.
Expenses and Value of a $1,000 Investment
for the six months ended November 30, 2015 (Unaudited) |
| Actual Fund Return | Class A | Class B | Class C | Class R | Class R6 | Class S | Institutional Class |
| Beginning Account Value 6/1/15 | $ 1,000.00 | $ 1,000.00 | $ 1,000.00 | $ 1,000.00 | $ 1,000.00 | $ 1,000.00 | $ 1,000.00 |
| Ending Account Value 11/30/15 | $ 974.60 | $ 970.50 | $ 970.40 | $ 973.00 | $ 975.60 | $ 975.60 | $ 975.70 |
| Expenses paid per $1,000* | $ 6.04 | $ 9.73 | $ 9.73 | $ 7.27 | $ 4.80 | $ 4.80 | $ 4.71 |
| Hypothetical 5% Fund Return | Class A | Class B | Class C | Class R | Class R6 | Class S | Institutional Class |
| Beginning Account Value 6/1/15 | $ 1,000.00 | $ 1,000.00 | $ 1,000.00 | $ 1,000.00 | $ 1,000.00 | $ 1,000.00 | $ 1,000.00 |
| Ending Account Value 11/30/15 | $ 1,018.95 | $ 1,015.19 | $ 1,015.19 | $ 1,017.70 | $ 1,020.21 | $ 1,020.21 | $ 1,020.31 |
| Expenses Paid per $1,000* | $ 6.17 | $ 9.95 | $ 9.95 | $ 7.44 | $ 4.91 | $ 4.91 | $ 4.81 |
** Expenses are equal to the Fund's annualized expense ratio for each share class, multiplied by the average account value over the period, multiplied by 183 (the number of days in the most recent six-month period), then divided by 365.
| Annualized Expense Ratios | Class A | Class B | Class C | Class R | Class R6 | Class S | Institutional Class |
| Deutsche Mid Cap Value Fund | 1.22% | 1.97% | 1.97% | 1.47% | .97% | .97% | .95% |
For more information, please refer to the Fund's prospectus.
For an analysis of the fees associated with an investment in the Fund or similar funds, please refer to http://apps.finra.org/fundanalyzer/1/fa.aspx.
Tax Information (Unaudited)
For corporate shareholders, 100% of the ordinary dividends (i.e., income dividends plus short-term capital gains) paid during the Fund's fiscal year ended November 30, 2015, qualified for the dividends received deduction.
The Fund paid distributions of $0.50 per share from net long-term capital
gains during its year ended November 30, 2015.
Pursuant to Section 852 of the Internal Revenue Code, the Fund designates $26,111,000 as capital gain dividends for its year ended November 30, 2015.
For federal income tax purposes, the Fund designates approximately $4,134,000, or the maximum amount allowable under tax law, as qualified dividend income.
Please contact a tax advisor if you have questions about federal or state income tax laws, or on how to prepare your tax returns. If you have specific questions about your account, please call (800) 728-3337.
Advisory Agreement Board Considerations and Fee Evaluation
The Board of Directors approved the renewal of Deutsche Mid Cap Value Fund’s investment management agreement (the "Agreement") with Deutsche Investment Management Americas Inc. ("DIMA") in September 2015.
In terms of the process that the Board followed prior to approving the Agreement, shareholders should know that:
— In September 2015, all of the Fund’s Directors were independent of DIMA and its affiliates.
— The Directors met frequently during the past year to discuss fund matters and dedicated a substantial amount of time to contract review matters. Over the course of several months, the Board’s Contract Committee reviewed comprehensive materials received from DIMA, independent third parties and independent counsel. These materials included an analysis of the Fund’s performance, fees and expenses, and profitability from a fee consultant retained by the Fund’s Independent Directors (the "Fee Consultant"). The Board also received extensive information throughout the year regarding performance of the Fund.
— The Independent Directors regularly meet privately with counsel to discuss contract review and other matters. In addition, the Independent Directors were advised by the Fee Consultant in the course of their review of the Fund’s contractual arrangements and considered a comprehensive report prepared by the Fee Consultant in connection with their deliberations.
— In connection with reviewing the Agreement, the Board also reviewed the terms of the Fund’s Rule 12b-1 plan, distribution agreement, transfer agency agreement and other material service agreements.
— Based on its evaluation of the information provided, the Contract Committee presented its findings and recommendations to the Board. The Board then reviewed the Contract Committee’s findings and recommendations.
In connection with the contract review process, the Contract Committee and the Board considered the factors discussed below, among others. The Board also considered that DIMA and its predecessors have managed the Fund since its inception, and the Board believes that a long-term relationship with a capable, conscientious advisor is in the best interests of the Fund. The Board considered, generally, that shareholders chose to invest or remain invested in the Fund knowing that DIMA managed the Fund. DIMA is part of Deutsche Bank AG’s ("Deutsche Bank") Asset and Wealth Management ("Deutsche AWM") division. Deutsche AWM is a global asset management business that offers a wide range of investing expertise and resources, including research capabilities in many countries throughout the world. Deutsche Bank has advised the Independent Directors that the U.S. asset management business continues to be a critical and integral part of Deutsche Bank, and that Deutsche Bank will continue to make significant investments in Deutsche AWM, including ongoing enhancements to Deutsche AWM’s investment platform. Deutsche Bank also has confirmed its commitment to maintaining strong legal and compliance groups within the Deutsche AWM division.
As part of the contract review process, the Board carefully considered the fees and expenses of each Deutsche fund overseen by the Board in light of the fund’s performance. In many cases, this led to the negotiation and implementation of expense caps. As part of these negotiations, the Board indicated that it would consider relaxing these caps in future years following sustained improvements in performance, among other considerations.
While shareholders may focus primarily on fund performance and fees, the Fund’s Board considers these and many other factors, including the quality and integrity of DIMA’s personnel and such other issues as back-office operations, fund valuations, and compliance policies and procedures.
Nature, Quality and Extent of Services. The Board considered the terms of the Agreement, including the scope of advisory services provided under the Agreement. The Board noted that, under the Agreement, DIMA provides portfolio management services and administrative services to the Fund. The Board considered the experience and skills of senior management and investment personnel, the resources made available to such personnel, the ability of DIMA to attract and retain high-quality personnel, and the organizational depth and stability of DIMA. The Board reviewed the Fund’s performance over short-term and long-term periods and compared those returns to various agreed-upon performance measures, including market index(es) and a peer universe compiled using information supplied by Morningstar Direct ("Morningstar"), an independent fund data service. The Board also noted that it has put into place a process of identifying "Focus Funds" (e.g., funds performing poorly relative to a peer universe), and receives additional reporting from DIMA regarding such funds and, where appropriate, DIMA’s plans to address underperformance. The Board believes this process is an effective manner of identifying and addressing underperforming funds. Based on the information provided, the Board noted that for the one-, three- and five-year periods ended December 31, 2014, the Fund’s performance (Class A shares) was in the 3rd quartile, 2nd quartile and 3rd quartile, respectively, of the applicable Morningstar universe (the 1st quartile being the best performers and the 4th quartile being the worst performers). The Board also observed that the Fund has underperformed its benchmark in the one-, three- and five-year periods ended December 31, 2014.
Fees and Expenses. The Board considered the Fund’s investment management fee schedule, operating expenses and total expense ratios, and comparative information provided by Lipper Inc. ("Lipper") and the Fee Consultant regarding investment management fee rates paid to other investment advisors by similar funds (1st quartile being the most favorable and 4th quartile being the least favorable). With respect to management fees paid to other investment advisors by similar funds, the Board noted that the contractual fee rates paid by the Fund were lower than the median (1st quartile) of the applicable Lipper peer group (based on Lipper data provided as of December 31, 2014). The Board noted that the Fund’s Class A shares total (net) operating expenses (excluding 12b-1 fees) were expected to be higher than the median (3rd quartile) of the applicable Lipper expense universe (based on Lipper data provided as of December 31, 2014, and analyzing Lipper expense universe Class A (net) expenses less any applicable 12b-1 fees) ("Lipper Universe Expenses"). The Board also reviewed data comparing each share class’s total (net) operating expenses to the applicable Lipper Universe Expenses. The Board noted that the expense limitations agreed to by DIMA were expected to help the Fund’s total (net) operating expenses remain competitive. The Board considered the Fund’s management fee rate as compared to fees charged by DIMA to a comparable Deutsche U.S. registered fund ("Deutsche Funds") and considered differences between the Fund and the comparable Deutsche Fund. The information requested by the Board as part of its review of fees and expenses also included information about institutional accounts (including any sub-advised funds and accounts) and funds offered primarily to European investors ("Deutsche Europe funds") managed by Deutsche AWM. The Board noted that DIMA indicated that Deutsche AWM does not manage any institutional accounts or Deutsche Europe funds comparable to the Fund.
On the basis of the information provided, the Board concluded that management fees were reasonable and appropriate in light of the nature, quality and extent of services provided by DIMA.
Profitability. The Board reviewed detailed information regarding revenues received by DIMA under the Agreement. The Board considered the estimated costs and pre-tax profits realized by DIMA from advising the Deutsche Funds, as well as estimates of the pre-tax profits attributable to managing the Fund in particular. The Board also received information regarding the estimated enterprise-wide profitability of DIMA and its affiliates with respect to all fund services in totality and by fund. The Board and the Fee Consultant reviewed DIMA’s methodology in allocating its costs to the management of the Fund. Based on the information provided, the Board concluded that the pre-tax profits realized by DIMA in connection with the management of the Fund were not unreasonable. The Board also reviewed certain publicly available information regarding the profitability of certain similar investment management firms. The Board noted that while information regarding the profitability of such firms is limited (and in some cases is not necessarily prepared on a comparable basis), DIMA and its affiliates’ overall profitability with respect to the Deutsche Funds (after taking into account distribution and other services provided to the funds by DIMA and its affiliates) was lower than the overall profitability levels of most comparable firms for which such data was available.
Economies of Scale. The Board considered whether there are economies of scale with respect to the management of the Fund and whether the Fund benefits from any economies of scale. The Board noted that the Fund’s investment management fee schedule includes fee breakpoints. The Board concluded that the Fund’s fee schedule represents an appropriate sharing between the Fund and DIMA of such economies of scale as may exist in the management of the Fund at current asset levels.
Other Benefits to DIMA and Its Affiliates. The Board also considered the character and amount of other incidental benefits received by DIMA and its affiliates, including any fees received by an affiliate of DIMA for distribution services. The Board also considered benefits to DIMA related to brokerage and soft-dollar allocations, including allocating brokerage to pay for research generated by parties other than the executing broker dealers, which pertain primarily to funds investing in equity securities, along with the incidental public relations benefits to DIMA related to Deutsche Funds advertising and cross-selling opportunities among DIMA products and services. The Board considered these benefits in reaching its conclusion that the Fund’s management fees were reasonable.
Compliance. The Board considered the significant attention and resources dedicated by DIMA to documenting and enhancing its compliance processes in recent years. The Board noted in particular (i) the experience and seniority of the individual serving as DIMA’s and the Fund’s chief compliance officer; (ii) the large number of DIMA compliance personnel; and (iii) the substantial commitment of resources by DIMA and its affiliates to compliance matters.
Based on all of the information considered and the conclusions reached, the Board unanimously determined that the continuation of the Agreement is in the best interests of the Fund. In making this determination, the Board did not give particular weight to any single factor identified above. The Board considered these factors over the course of numerous meetings, certain of which were in executive session with only the Independent Directors and counsel present. It is possible that individual Directors may have weighed these factors differently in reaching their individual decisions to approve the continuation of the Agreement.
Board Members and Officers
The following table presents certain information regarding the Board Members and Officers of the fund. Each Board Member's year of birth is set forth in parentheses after his or her name. Unless otherwise noted, (i) each Board Member has engaged in the principal occupation(s) noted in the table for at least the most recent five years, although not necessarily in the same capacity; and (ii) the address of each Independent Board Member is c/o Kenneth C. Froewiss, Chairman, Deutsche Mutual Funds, P.O. Box 390601, Cambridge, MA 02139. Except as otherwise noted below, the term of office for each Board Member is until the election and qualification of a successor, or until such Board Member sooner dies, resigns, is removed or as otherwise provided in the governing documents of the fund. Because the fund does not hold an annual meeting of shareholders, each Board Member will hold office for an indeterminate period. The Board Members may also serve in similar capacities with other funds in the fund complex.
| Independent Board Members |
| Name, Year of Birth, Position with the Fund and Length of Time Served1 | Business Experience and Directorships During the Past Five Years | Number of Funds in Deutsche Fund Complex Overseen | Other Directorships Held by Board Member |
Kenneth C. Froewiss (1945) Chairperson since 2013, and Board Member since 2001 | Retired Clinical Professor of Finance, NYU Stern School of Business (1997–2014); Member, Finance Committee, Association for Asian Studies (2002–present); Director, Mitsui Sumitomo Insurance Group (US) (2004–present); prior thereto, Managing Director, J.P. Morgan (investment banking firm) (until 1996) | 106 | — |
William McClayton (1944) Vice Chairperson since 2013, and Board Member since 2004 | Private equity investor (since October 2009); previously, Managing Director, Diamond Management & Technology Consultants, Inc. (global consulting firm) (2001–2009); Directorship: Board of Managers, YMCA of Metropolitan Chicago; formerly: Senior Partner, Arthur Andersen LLP (accounting) (1966–2001); Trustee, Ravinia Festival | 106 | — |
John W. Ballantine (1946) Board Member since 1999 | Retired; formerly, Executive Vice President and Chief Risk Management Officer, First Chicago NBD Corporation/The First National Bank of Chicago (1996–1998); Executive Vice President and Head of International Banking (1995–1996); former Directorships: Director and former Chairman of the Board, Healthways, Inc.2 (provider of disease and care management services) (2003–2014); Stockwell Capital Investments PLC (private equity); First Oak Brook Bancshares, Inc. and Oak Brook Bank; Prisma Energy International | 106 | Portland General Electric2 (utility company) (2003– present) |
Henry P. Becton, Jr. (1943) Board Member since 1990 | Vice Chair and former President, WGBH Educational Foundation. Directorships: Public Radio International; Public Radio Exchange (PRX); former Directorships: Belo Corporation2 (media company); The PBS Foundation; Association of Public Television Stations; Boston Museum of Science; American Public Television; Concord Academy; New England Aquarium; Mass. Corporation for Educational Telecommunications; Committee for Economic Development; Public Broadcasting Service; Connecticut College; North Bennett Street School (Boston) | 106 | Director, Becton Dickinson and Company2 (medical technology company) |
Dawn-Marie Driscoll (1946) Board Member since 1987 | Emeritus Executive Fellow, Center for Business Ethics, Bentley University; formerly: President, Driscoll Associates (consulting firm); Partner, Palmer & Dodge (law firm) (1988–1990); Vice President of Corporate Affairs and General Counsel, Filene's (retail) (1978–1988). Directorships: Director of ICI Mutual Insurance Company (since 2007); Advisory Board, Center for Business Ethics, Bentley University; Trustee and former Chairman of the Board, Southwest Florida Community Foundation (charitable organization); former Directorships: Sun Capital Advisers Trust (mutual funds) (2007–2012), Investment Company Institute (audit, executive, nominating committees) and Independent Directors Council (governance, executive committees) | 106 | — |
Keith R. Fox, CFA (1954) Board Member since 1996 | Managing General Partner, Exeter Capital Partners (a series of private investment funds) (since 1986). Directorships: Progressive International Corporation (kitchen goods importer and distributor); The Kennel Shop (retailer); former Chairman, National Association of Small Business Investment Companies; former Directorships: BoxTop Media Inc. (advertising); Sun Capital Advisers Trust (mutual funds) (2011–2012) | 106 | — |
Paul K. Freeman (1950) Board Member since 1993 | Consultant, World Bank/Inter-American Development Bank; Chair, Independent Directors Council; Investment Company Institute (executive and nominating committees); formerly, Chairman of Education Committee of Independent Directors Council; Project Leader, International Institute for Applied Systems Analysis (1998–2001); Chief Executive Officer, The Eric Group, Inc. (environmental insurance) (1986–1998); Directorships: Denver Zoo Foundation (December 2012–present); former Directorships: Prisma Energy International | 106 | — |
Richard J. Herring (1946) Board Member since 1990 | Jacob Safra Professor of International Banking and Professor, Finance Department, The Wharton School, University of Pennsylvania (since July 1972); Co-Director, Wharton Financial Institutions Center; Co-Chair, U.S. Shadow Financial Regulatory Committee; Executive Director, Financial Economists Roundtable; formerly: Vice Dean and Director, Wharton Undergraduate Division (July 1995–June 2000); Director, Lauder Institute of International Management Studies (July 2000–June 2006) | 106 | Director, Aberdeen Singapore and Japan Funds (since 2007); Independent Director of Barclays Bank Delaware (since September 2010) |
Rebecca W. Rimel (1951) Board Member since 1995 | President and Chief Executive Officer, The Pew Charitable Trusts (charitable organization) (1994 to present); formerly: Executive Vice President, The Glenmede Trust Company (investment trust and wealth management) (1983–2004); Board Member, Investor Education (charitable organization) (2004–2005); Trustee, Executive Committee, Philadelphia Chamber of Commerce (2001–2007); Director, Viasys Health Care2 (January 2007–June 2007); Trustee, Thomas Jefferson Foundation (charitable organization) (1994–2012) | 106 | Director, Becton Dickinson and Company2 (medical technology company) (2012– present); Director, BioTelemetry Inc.2 (health care) (2009– present) |
William N. Searcy, Jr. (1946) Board Member since 1993 | Private investor since October 2003; formerly: Pension & Savings Trust Officer, Sprint Corporation2 (telecommunications) (November 1989–September 2003); Trustee, Sun Capital Advisers Trust (mutual funds) (1998–2012) | 106 | — |
Jean Gleason Stromberg (1943) Board Member since 1997 | Retired. Formerly, Consultant (1997–2001); Director, Financial Markets U.S. Government Accountability Office (1996–1997); Partner, Norton Rose Fulbright, L.L.P. (law firm) (1978–1996). Directorships: The William and Flora Hewlett Foundation (charitable organization); former Directorships: Service Source, Inc. (nonprofit), Mutual Fund Directors Forum (2002–2004), American Bar Retirement Association (funding vehicle for retirement plans) (1987–1990 and 1994–1996) | 106 | — |
| Officers4 |
| Name, Year of Birth, Position with the Fund and Length of Time Served5 | Business Experience and Directorships During the Past Five Years |
Brian E. Binder8 (1972) President and Chief Executive Officer, 2013–present | Managing Director3 and Head of Fund Administration, Deutsche Asset & Wealth Management (2013–present); formerly: Head of Business Management and Consulting at Invesco, Ltd. (2010–2012); Chief Administrative Officer, Van Kampen Funds Inc. (2008–2010); and Chief Administrative Officer, Morgan Stanley Investment Management Americas Distribution (2003–2008) |
John Millette7 (1962) Vice President and Secretary, 1999–present | Director,3 Deutsche Asset & Wealth Management |
Melinda Morrow6 (1970) Vice President, 2012–present | Director,3 Deutsche Asset & Wealth Management |
Paul H. Schubert6 (1963) Chief Financial Officer, 2004–present Treasurer, 2005–present | Managing Director,3 Deutsche Asset & Wealth Management (since July 2004); formerly: Executive Director, Head of Mutual Fund Services and Treasurer for UBS Family of Funds (1998–2004); Vice President and Director of Mutual Fund Finance at UBS Global Asset Management (1994–1998) |
Caroline Pearson7 (1962) Chief Legal Officer, 2010–present | Managing Director,3 Deutsche Asset & Wealth Management; formerly: Assistant Secretary for DWS family of funds (1997–2010) |
Robert Kloby6 (1962) Chief Compliance Officer, 2006–present | Managing Director,3 Deutsche Asset & Wealth Management |
Wayne Salit6 (1967) Anti-Money Laundering Compliance Officer, 2014–present | Director,3 Deutsche Asset & Wealth Management; formerly: Managing Director, AML Compliance Officer at BNY Mellon (2011–2014); and Director, AML Compliance Officer at Deutsche Bank (2004–2011) |
Hepsen Uzcan6 (1974) Assistant Secretary, 2013–present | Director,3 Deutsche Asset & Wealth Management |
Paul Antosca7 (1957) Assistant Treasurer, 2007–present | Director,3 Deutsche Asset & Wealth Management |
Jack Clark7 (1967) Assistant Treasurer, 2007–present | Director,3 Deutsche Asset & Wealth Management |
Diane Kenneally7 (1966) Assistant Treasurer, 2007–present | Director,3 Deutsche Asset & Wealth Management |
1 The length of time served represents the year in which the Board Member joined the board of one or more Deutsche funds currently overseen by the Board.
2 A publicly held company with securities registered pursuant to Section 12 of the Securities Exchange Act of 1934.
3 Executive title, not a board directorship.
4 As a result of their respective positions held with the Advisor, these individuals are considered "interested persons" of the Advisor within the meaning of the 1940 Act. Interested persons receive no compensation from the fund.
5 The length of time served represents the year in which the officer was first elected in such capacity for one or more Deutsche funds.
6 Address: 60 Wall Street, New York, NY 10005.
7 Address: One Beacon Street, Boston, MA 02108.
8 Address: 222 South Riverside Plaza, Chicago, IL 60606.
The fund's Statement of Additional Information ("SAI") includes additional information about the Board Members. The SAI is available, without charge, upon request. If you would like to request a copy of the SAI, you may do so by calling the following toll-free number: (800) 728-3337.
Account Management Resources
| |
| For More Information | The automated telephone system allows you to access personalized account information and obtain information on other Deutsche funds using either your voice or your telephone keypad. Certain account types within Classes A, B, C and S also have the ability to purchase, exchange or redeem shares using this system. For more information, contact your financial advisor. You may also access our automated telephone system or speak with a Shareholder Service representative by calling: (800) 728-3337 |
| Web Site | deutschefunds.com View your account transactions and balances, trade shares, monitor your asset allocation, subscribe to fund and account updates by e-mail, and change your address, 24 hours a day. Obtain prospectuses and applications, blank forms, interactive worksheets, news about Deutsche funds, retirement planning information, and more. |
| Written Correspondence | Deutsche Asset & Wealth Management PO Box 219151
Kansas City, MO 64121-9151 |
| Proxy Voting | The fund's policies and procedures for voting proxies for portfolio securities and information about how the fund voted proxies related to its portfolio securities during the 12-month period ended June 30 are available on our Web site — deutschefunds.com (click on "proxy voting"at the bottom of the page) — or on the SEC's Web site — sec.gov. To obtain a written copy of the fund's policies and procedures without charge, upon request, call us toll free at (800) 728-3337. |
| Portfolio Holdings | Following the fund's fiscal first and third quarter-end, a complete portfolio holdings listing is filed with the SEC on Form N-Q. This form will be available on the SEC's Web site at sec.gov, and it also may be reviewed and copied at the SEC's Public Reference Room in Washington, D.C. Information on the operation of the SEC's Public Reference Room may be obtained by calling (800) SEC-0330. The fund's portfolio holdings are also posted on deutschefunds.com from time to time. Please see the fund's current prospectus for more information. |
| Principal Underwriter | If you have questions, comments or complaints, contact: DeAWM Distributors, Inc. 222 South Riverside Plaza
Chicago, IL 60606-5808 (800) 621-1148 |
| Investment Advisor | Deutsche Investment Management Americas Inc. ("DIMA" or the "Advisor"), which is part of Deutsche Asset & Wealth Management, is the investment advisor for the fund. DIMA and its predecessors have more than 80 years of experience managing mutual funds and DIMA provides a full range of investment advisory services to both institutional and retail clients. DIMA is an indirect, wholly owned subsidiary of Deutsche Bank AG. Deutsche Bank AG is a major global banking institution engaged in a wide variety of financial services, including investment management, retail, private and commercial banking, investment banking and insurance. Deutsche Asset & Wealth Management is the retail brand name in the U.S. for the wealth management and asset management activities of Deutsche Bank AG and DIMA. Deutsche Asset & Wealth Management is committed to delivering the investing expertise, insight and resources of this global investment platform to American investors. |
| | Class A | Class B | Class C | Class S | Institutional Class |
| Nasdaq Symbol | MIDVX | MIDYX | MIDZX | MIDTX | MIDIX |
| CUSIP Number | 25159G 852 | 25159G 860 | 25159G 878 | 25159G 886 | 25159G 704 |
| Fund Number | 417 | 617 | 717 | 2117 | 1417 |
| For shareholders of Class R and R6 |
| Automated Information Line | DeAWM Flex Plan Access (800) 728-3337 24-hour access to your retirement plan account. |
| Web Site | deutschefunds.com Click "Retirement Plans" to reallocate assets, process transactions, review your funds, and subscribe to fund updates by e-mail through our secure online account access. Obtain prospectuses and applications, blank forms, interactive worksheets, news about Deutsche funds, retirement planning information, and more. |
| For More Information | (800) 728-3337 To speak with a service representative. |
| Written Correspondence | DeAWM Service Company 222 South Riverside Plaza
Chicago, IL 60606-5806 |
| | Class R | Class R6 |
| Nasdaq Symbol | MIDQX | MIDUX |
| CUSIP Number | 25159G 605 | 25159G 720 |
| Fund Number | 1517 | 1617 |
Notes
Notes
Notes

| | |
| ITEM 2. | CODE OF ETHICS |
| | |
| | As of the end of the period covered by this report, the registrant has adopted a code of ethics, as defined in Item 2 of Form N-CSR, that applies to its Principal Executive Officer and Principal Financial Officer. There have been no amendments to, or waivers from, a provision of the code of ethics during the period covered by this report that would require disclosure under Item 2. A copy of the code of ethics is filed as an exhibit to this Form N-CSR. |
| | |
| ITEM 3. | AUDIT COMMITTEE FINANCIAL EXPERT |
| | |
| | The fund’s audit committee is comprised solely of trustees who are "independent" (as such term has been defined by the Securities and Exchange Commission ("SEC") in regulations implementing Section 407 of the Sarbanes-Oxley Act (the "Regulations")). The fund’s Board of Trustees has determined that there are several "audit committee financial experts" (as such term has been defined by the Regulations) serving on the fund’s audit committee including Mr. Paul K. Freeman, the chair of the fund’s audit committee. An “audit committee financial expert” is not an “expert” for any purpose, including for purposes of Section 11 of the Securities Act of 1933 and the designation or identification of a person as an “audit committee financial expert” does not impose on such person any duties, obligations or liability that are greater than the duties, obligations and liability imposed on such person as a member of the audit committee and board of directors in the absence of such designation or identification. |
| | |
| ITEM 4. | PRINCIPAL ACCOUNTANT FEES AND SERVICES |
| | |
Deutsche mid cap value fund
form n-csr disclosure re: AUDIT FEES
The following table shows the amount of fees that Ernst & Young LLP (“EY”), the Fund’s Independent Registered Public Accounting Firm, billed to the Fund during the Fund’s last two fiscal years. The Audit Committee approved in advance all audit services and non-audit services that EY provided to the Fund.
Services that the Fund’s Independent Registered Public Accounting Firm Billed to the Fund
Fiscal Year
Ended
November 30, | Audit Fees Billed to Fund | Audit-Related
Fees Billed to Fund | Tax Fees Billed to Fund | All
Other Fees Billed to Fund |
| 2015 | $57,516 | $0 | $5,451 | $0 |
| 2014 | $55,942 | $0 | $5,191 | $0 |
The above “Tax Fees” were billed for professional services rendered for tax return preparation.
Services that the Fund’s Independent Registered Public Accounting Firm Billed to the Adviser and Affiliated Fund Service Providers
The following table shows the amount of fees billed by EY to Deutsche Investment Management Americas, Inc. (“DIMA” or the “Adviser”), and any entity controlling, controlled by or under common control with DIMA (“Control Affiliate”) that provides ongoing services to the Fund (“Affiliated Fund Service Provider”), for engagements directly related to the Fund’s operations and financial reporting, during the Fund’s last two fiscal years.
Fiscal Year
Ended
November 30, | Audit-Related
Fees Billed to Adviser and Affiliated Fund Service Providers | Tax Fees Billed to Adviser and Affiliated Fund Service Providers | All
Other Fees Billed to Adviser and Affiliated Fund Service Providers |
| 2015 | $0 | $563,986 | $2,350,151 |
| 2014 | $0 | $274,022 | $7,431,158 |
The above “Tax Fees” were billed in connection with tax compliance services and agreed upon procedures. All other engagement fees were billed for services in connection with agreed upon procedures for DIMA and other related entities.
Non-Audit Services
The following table shows the amount of fees that EY billed during the Fund’s last two fiscal years for non-audit services. The Audit Committee pre-approved all non-audit services that EY provided to the Adviser and any Affiliated Fund Service Provider that related directly to the Fund’s operations and financial reporting. The Audit Committee requested and received information from EY about any non-audit services that EY rendered during the Fund’s last fiscal year to the Adviser and any Affiliated Fund Service Provider. The Committee considered this information in evaluating EY’s independence.
Fiscal Year
Ended
November 30, | Total
Non-Audit Fees Billed to Fund (A) | Total Non-Audit Fees billed to Adviser and Affiliated Fund Service Providers (engagements related directly to the operations and financial reporting of the Fund) (B) | Total Non-Audit Fees billed to Adviser and Affiliated Fund Service Providers (all other engagements) (C) | Total of (A), (B)
and (C) |
| 2015 | $5,451 | $2,914,137 | $880,336 | $3,799,924 |
| 2014 | $5,191 | $7,705,180 | $265,425 | $7,975,796 |
All other engagement fees were billed for services in connection with agreed upon procedures and tax compliance for DIMA and other related entities.
Audit Committee Pre-Approval Policies and Procedures. Generally, each Fund’s Audit Committee must pre approve (i) all services to be performed for a Fund by a Fund’s Independent Registered Public Accounting Firm and (ii) all non-audit services to be performed by a Fund’s Independent Registered Public Accounting Firm for the DIMA Entities with respect to operations and financial reporting of the Fund, except that the Chairperson or Vice Chairperson of each Fund’s Audit Committee may grant the pre-approval for non-audit services described in items (i) and (ii) above for non-prohibited services for engagements of less than $100,000. All such delegated pre approvals shall be presented to each Fund’s Audit Committee no later than the next Audit Committee meeting.
There were no amounts that were approved by the Audit Committee pursuant to the de minimis exception under Rule 2-01 of Regulation S-X.
According to the registrant’s principal Independent Registered Public Accounting Firm, substantially all of the principal Independent Registered Public Accounting Firm's hours spent on auditing the registrant's financial statements were attributed to work performed by full-time permanent employees of the principal Independent Registered Public Accounting Firm.
***
In connection with the audit of the 2014 and 2015 financial statements, the Fund entered into an engagement letter with EY. The terms of the engagement letter required by EY, and agreed to by the Audit Committee, include provisions in which the parties consent to the sole jurisdiction of federal courts in New York, Boston or the Northern District of Illinois, as well as a waiver of right to a trial by jury and, for the 2014 audit, an exclusion of punitive damages.
***
| | |
| ITEM 5. | AUDIT COMMITTEE OF LISTED REGISTRANTS |
| | |
| | Not applicable |
| | |
| ITEM 6. | SCHEDULE OF INVESTMENTS |
| | |
| | Not applicable |
| | |
| ITEM 7. | DISCLOSURE OF PROXY VOTING POLICIES AND PROCEDURES FOR CLOSED-END MANAGEMENT INVESTMENT COMPANIES |
| | |
| | Not applicable |
| | |
| ITEM 8. | PORTFOLIO MANAGERS OF CLOSED-END MANAGEMENT INVESTMENT COMPANIES |
| | |
| | Not applicable |
| | |
| ITEM 9. | PURCHASES OF EQUITY SECURITIES BY CLOSED-END MANAGEMENT INVESTMENT COMPANY AND AFFILIATED PURCHASERS |
| | |
| | Not applicable |
| | |
| ITEM 10. | SUBMISSION OF MATTERS TO A VOTE OF SECURITY HOLDERS |
| | |
| | There were no material changes to the procedures by which shareholders may recommend nominees to the Fund’s Board. The primary function of the Nominating and Governance Committee is to identify and recommend individuals for membership on the Board and oversee the administration of the Board Governance Guidelines. Shareholders may recommend candidates for Board positions by forwarding their correspondence by U.S. mail or courier service to Kenneth C. Froewiss, Independent Chairman, Deutsche Mutual Funds, P.O. Box 390601, Cambridge, MA 02139. |
| | |
| ITEM 11. | CONTROLS AND PROCEDURES |
| | |
| | (a) | The Chief Executive and Financial Officers concluded that the Registrant’s Disclosure Controls and Procedures are effective based on the evaluation of the Disclosure Controls and Procedures as of a date within 90 days of the filing date of this report. |
| | |
| | (b) | There have been no changes in the registrant’s internal control over financial reporting that occurred during the second fiscal quarter of the period covered by this report that has materially affected, or is reasonably likely to materially affect, the registrant’s internal controls over financial reporting. |
| | |
| ITEM 12. | EXHIBITS |
| | |
| | (a)(1) | Code of Ethics pursuant to Item 2 of Form N-CSR is filed and attached hereto as EX-99.CODE ETH. |
| | |
| | (a)(2) | Certification pursuant to Rule 30a-2(a) under the Investment Company Act of 1940 (17 CFR 270.30a-2(a)) is filed and attached hereto as Exhibit 99.CERT. |
| | |
| | (b) | Certification pursuant to Rule 30a-2(b) under the Investment Company Act of 1940 (17 CFR 270.30a-2(b)) is furnished and attached hereto as Exhibit 99.906CERT. |
SIGNATURES
Pursuant to the requirements of the Securities Exchange Act of 1934 and the Investment Company Act of 1940, the registrant has duly caused this report to be signed on its behalf by the undersigned, thereunto duly authorized.
| Registrant: | Deutsche Mid Cap Value Fund, a series of Deutsche Value Series, Inc. |
| | |
| | |
| By: | /s/Brian E. Binder Brian E. Binder President |
| | |
| Date: | January 29, 2016 |
Pursuant to the requirements of the Securities Exchange Act of 1934 and the Investment Company Act of 1940, this report has been signed below by the following persons on behalf of the registrant and in the capacities and on the dates indicated.
| By: | /s/Brian E. Binder Brian E. Binder President |
| | |
| Date: | January 29, 2016 |
| | |
| | |
| | |
| By: | /s/Paul Schubert Paul Schubert Chief Financial Officer and Treasurer |
| | |
| Date: | January 29, 2016 |