UNITED STATES
SECURITIES AND EXCHANGE COMMISSION
Washington, DC 20549
FORM N-CSR
CERTIFIED SHAREHOLDER REPORT OF REGISTERED MANAGEMENT INVESTMENT COMPANIES
Investment Company Act file number 811-05387
Franklin Mutual Series Funds
(Exact name of registrant as specified in charter)
101 John F. Kennedy Parkway, Short Hills, NJ 07078-2705
(Address of principal executive offices) (Zip code)
Craig S. Tyle, One Franklin Parkway, San Mateo, CA 94403-1906
(Name and address of agent for service)
Registrant's telephone number, including area code: (210) 912-2100
Date of fiscal year end: _12/31
Date of reporting period: 12/31/13_
Item 1. Reports to Stockholders.
|
| Contents | |||||||
| Shareholder Letter | 1 | Annual Report | Financial Statements | 33 | Board Members and Officers | 62 | |
| Mutual Beacon Fund | 6 | Notes to Financial Statements | 38 | Shareholder Information | 67 | ||
| Performance Summary | 13 | Report of Independent | |||||
| Registered Public | |||||||
| Your Fund’s Expenses | 18 | ||||||
| Accounting Firm | 60 | ||||||
| Financial Highlights and | |||||||
| Tax Information | 61 | ||||||
| Statement of Investments | 20 | ||||||
Annual Report
Mutual Beacon Fund
Your Fund’s Goals and Main Investments: Mutual Beacon Fund seeks capital
appreciation, with income as a secondary goal, by investing primarily in equity securities of companies
the Fund’s managers believe are at prices below their intrinsic value. The Fund may invest up to 35%
of its assets in foreign securities.
| Performance data represent past |
| performance, which does not |
| guarantee future results. Investment |
| return and principal value will |
| fluctuate, and you may have a gain |
| or loss when you sell your shares. |
| Current performance may differ |
| from figures shown. Please visit |
| franklintempleton.com or call |
| (800) 342-5236 for most recent |
| month-end performance. |
This annual report for Mutual Beacon Fund covers the fiscal year ended December 31, 2013.
Performance Overview
Mutual Beacon Fund – Class Z delivered a +29.11% cumulative total return for the 12 months ended December 31, 2013. In comparison, the Fund’s benchmark, the Standard & Poor’s 500 Index (S&P 500), which is a broad measure of U.S. stock performance, generated a +32.39% total return.1 You can find more of the Fund’s performance data in the Performance Summary beginning on page 13.
Economic and Market Overview
The 12 months under review were characterized by reinvigorated policy support and an economic recovery in developed markets. However, differences in global economic trends corresponded with increasingly divergent monetary policies, and growth in emerging market economies tended to slow. The central banks of key developed markets generally reaffirmed their accommodative monetary stances while some emerging market counterparts tightened policy rates as they sought to control inflation and currency depreciation.
In the U.S., economic growth and employment trends generally exceeded expectations, underpinned by consumer and business spending and rising inventories. Historically low mortgage rates and improving sentiment aided the housing market recovery, evidenced by increased new and existing home
1. Source: © 2014 Morningstar. All Rights Reserved. The information contained herein: (1) is proprietary to Morningstar and/or its content providers; (2) may not be copied or distributed; and (3) is not warranted to be accurate, complete or timely. Neither Morningstar nor its content providers are responsible for any damages or losses arising from any use of this information. The index is unmanaged and includes reinvested dividends. One cannot invest directly in an index, and an index is not representative of the Fund’s portfolio.
The dollar value, number of shares or principal amount, and names of all portfolio holdings are listed in the Fund’s Statement of Investments (SOI). The SOI begins on page 25.
6 | Annual Report
sales, rising home prices, low inventories and multi-year lows in new foreclosures. The U.S. Federal Reserve Board (Fed) expanded its asset purchase program to $85 billion per month from $40 billion early in the year. After encouraging economic and employment reports, the Fed announced in December it would reduce its monthly bond purchases by $10 billion beginning in January 2014; however, the Fed committed to keeping interest rates low. In October, the federal government temporarily shut down after Congress failed to authorize routine federal funding amid a disagreement over a new health care law. However, Congress subsequently agreed to fund the government through early 2014 and later passed a two-year budget deal that could ease automatic spending cuts and lower the risk of another shutdown.
Outside the U.S., the eurozone emerged from its longest recession on record during 2013’s second half and Japan’s growth moderated. The European Central Bank reduced its key interest rate to a record low and pledged to maintain systemic support following political turmoil in Greece, Spain, Portugal and Italy. Germany’s re-election of Chancellor Angela Merkel was largely perceived as a vote of support for ongoing eurozone reform measures. In Asia, the Bank of Japan set an explicit inflation target and pledged to double bond purchases in an unprecedented wave of policy reform. The U.S. dollar fell versus the euro but rose versus the Japanese yen in 2013.
Growth in many emerging markets moderated based on lower domestic demand, falling exports and weakening commodity prices. Political turmoil in certain emerging markets, the Fed’s potential tapering of its asset purchase program and the Chinese central bank’s effort to tighten liquidity to curb real estate and credit speculation led to a sell-off in emerging market equities and a sharp depreciation in regional currencies against the U.S. dollar. Central banks in Brazil, India and Indonesia raised interest rates in the second half of 2013 as they sought to curb inflation.
The stock market rally in developed markets accelerated during 2013 amid ongoing central bank commitments, continued corporate earnings strength and increasing signs of economic progress. Emerging market stocks rebounded toward period-end, although Latin American stocks trailed their emerging market peers. Oil prices rallied in the third quarter and rose for the year mainly owing to supply concerns related to geopolitical turmoil, but gold posted its largest annual price decline in more than three decades. Increasingly divergent economic and political circumstances during the period resulted in declining market correlations across regions and between asset classes, which many bottom-up investors perceived as more favorable.
Geographic Breakdown
Based on Total Net Assets as of 12/31/13

Annual Report | 7
| What is meant by “hedge”? |
| To hedge a position is to seek to reduce |
| the risk of adverse price movements in an |
| asset. Normally, a hedge is implemented |
| as an offsetting position in a related secu- |
| rity, such as a currency forward contract. |
| What is a currency forward |
| contract? |
| A currency forward contract, also called |
| a “currency forward,” is an agreement |
| between the Fund and a counterparty to |
| buy or sell a foreign currency at a spe- |
| cific exchange rate on a future date. |
Investment Strategy
At Mutual Series, we are committed to our distinctive value approach to investing, which we believe can generate above-average risk-adjusted returns over time for our shareholders. Our major investment strategy is investing in undervalued stocks. When selecting undervalued equities, we are always attracted to fundamentally strong companies with healthy balance sheets, high-quality assets, substantial free cash flow and shareholder-oriented management teams and whose stocks are trading at discounts to our assessment of the companies’ intrinsic or business value. We also look for asset-rich companies whose shares may be trading at depressed levels due to concerns over short-term earnings disappointments, litigation, management strategy or other perceived negatives. This strict value approach is not only intended to improve the likelihood of upside potential, but it is also intended to reduce the risk of substantial declines. While the vast majority of our undervalued equity investments are made in publicly traded companies globally, we may invest occasionally in privately held companies as well.
We complement this more traditional investment strategy with two others. One is distressed investing, a highly specialized field that has proven quite profitable during certain periods over the years. Distressed investing is complex and can take many forms. The most common distressed investment the Fund undertakes is the purchase of financially troubled or bankrupt companies’ debt at a substantial discount to face value. After the financially distressed company is reorganized, often in bankruptcy court, the old debt is typically replaced with new securities issued by the financially stronger company.
The other piece of our investment strategy is participating in arbitrage situations, another highly specialized field. When companies announce proposed mergers or takeovers, commonly referred to as “deals,” the target company may trade at a discount to the bid it ultimately accepts. One form of arbitrage involves purchasing the target company’s stock when it is trading below the value we believe it would receive in a deal. In keeping with our commitment to a relatively conservative investment approach, we typically focus our arbitrage efforts on announced deals, and eschew rumored deals or other situations we consider relatively risky.
In addition, it is our practice to hedge the Fund’s currency exposure when we deem it advantageous for our shareholders.
8 | Annual Report
Manager’s Discussion
In an environment of generally rising equity prices, many Fund holdings increased in value during the 12-month period. Three of the top contributors were U.K.-based mobile telephony operator Vodafone Group, software firm Microsoft and media company Twenty-First Century Fox.
Vodafone Group is a global mobile telecommunications company that provides a range of services, including voice and data communications. The company’s stock rallied in the second half of the year, driven largely by the long-anticipated sale of its 45% stake in Verizon Wireless to Verizon Communications at what we considered to be an attractive price. Vodafone said it planned to return two-thirds of the capital from the sale to shareholders and use the balance to invest in growth initiatives in its core markets and to reduce debt. Following the deal, we continued to view Vodafone as a potentially compelling stock, given that the economic environment in Europe has shown signs of stabilizing, the regulatory environment is easing and we believe the company may be close to monetizing its investments in data services.
Shares of global software firm Microsoft benefited from improved investor sentiment. In the first half of 2013, the company reported earnings that modestly beat expectations, generally reassuring the market of its status as a stable business with a reasonable future. The stock also rallied following chief executive officer (CEO) Steve Ballmer’s announcement that he would retire in 2014. At period-end, we remained optimistic about the company’s plans to shift toward a subscription model for its business software such as the Office suite. In our view, if implemented broadly, such a move may have the potential to generate greater revenues and higher profits.
Twenty-First Century Fox consists of the television and entertainment assets that were part of News Corporation prior to the media conglomerate’s June 2013 split. During the second half of the year, Twenty-First Century Fox reported quarterly earnings that were generally in line with expectations. However, shares benefited from the company’s newfound status as a stand-alone entity with attractive media assets and what we judged to be multiple near-term growth drivers. At period-end, we continued to believe Fox had the potential to benefit from growth in subscriber fees for its broadcast and cable networks in the U.S. and overseas, an inflection point in profitability from investments in the launch of a new U.S. sports network and the potential for an increase in its capital returns to shareholders.
Top 10 Sectors/Industries
Based on Equity Securities as of 12/31/13
| % of Total | |||
| Net Assets | |||
| Media | 10.2 | % | |
| Software | 7.9 | % | |
| Oil, Gas & Consumable Fuels | 7.1 | % | |
| Pharmaceuticals | 6.1 | % | |
| Insurance | 5.7 | % | |
| Tobacco | 5.0 | % | |
| Wireless Telecommunication Services | 4.1 | % | |
| Food & Staples Retailing | 3.6 | % | |
| Energy Equipment & Services | 3.5 | % | |
| Commercial Banks | 3.2 | % | |
| Top 10 Equity Holdings | |||
| 12/31/13 | |||
| Company | % of Total | ||
| Sector/Industry, Country | Net Assets | ||
| Vodafone Group PLC | 3.1 | % | |
| Wireless Telecommunication Services, | |||
| U.K. | |||
| Microsoft Corp. | 2.9 | % | |
| Software, U.S. | |||
| Twenty-First Century Fox Inc., B | 2.9 | % | |
| Media, U.S. | |||
| Medtronic Inc. | 2.7 | % | |
| Health Care Equipment & Supplies, U.S. | |||
| Apple Inc. | 2.4 | % | |
| Computers & Peripherals, U.S. | |||
| British American Tobacco PLC | 2.4 | % | |
| Tobacco, U.K. | |||
| Merck & Co. Inc. | 2.3 | % | |
| Pharmaceuticals, U.S. | |||
| Wells Fargo & Co. | 2.3 | % | |
| Commercial Banks, U.S. | |||
| WPX Energy Inc. | 2.2 | % | |
| Oil, Gas & Consumable Fuels, U.S. | |||
| Check Point Software Technologies Ltd. | 2.2 | % | |
| Software, Israel | |||
Annual Report | 9
| What is return on equity? |
| Return on equity is an amount, expressed |
| as a percentage, earned on a company’s |
| common stock investment for a given |
| period. Return on equity tells common |
| shareholders how effectually their |
| money is being employed. Comparing |
| percentages for current and prior peri- |
| ods also reveals trends, and comparison |
| with industry composites reveals how |
| well a company is holding its own |
| against its competitors. |
| What is a futures contract? |
| A futures contract, also called a |
| “future,” is an agreement between the |
| Fund and a counterparty made through |
| a U.S. or foreign futures exchange to |
| buy or sell a security at a specific price |
| on a future date. |
During the period under review, some of the Fund’s investments negatively affected performance. These included Australia-listed mining services company Boart Longyear, U.K.-headquartered RSA Insurance Group and Brazilian integrated energy firm Petroleo Brasileiro (Petrobras).
Boart Longyear is a global provider of mineral exploration drilling services and products. Declining commodity prices contributed to reduced demand for the company’s products and services during the year as mining companies sought to reduce expenses. At its annual general meeting in May, the company announced it anticipated a sizable decline in rig utilization rates and anticipated 2013 revenues and earnings to come in at the low end of consensus forecasts. By year-end, we exited our position in Boart Longyear as we believed demand would remain weak and significant uncertainty about management’s efforts to cut costs and fortify the balance sheet remained.
After cutting its dividend early in 2013, RSA Insurance Group suffered substantial weather-related losses, which precluded the company from achieving its annual return on equity target. RSA’s share price came under additional pressure in November when the company announced it would suspend the CEO, chief financial officer and claims director of its Irish unit amid an investigation into aggressive reserve accounting practices.
Although Petrobras possesses several exploration and production assets we feel are highly attractive, its refining and marketing (downstream) operations hurt results during the year and led the stock to decline. The Brazilian government regulates domestic fuel prices, and its reluctance to increase them continued to result in significant losses in Petrobras’s downstream business. Although the government did allow some modest price increases, recent protests against bus fare hikes, particularly in light of sluggish economic growth and a weakening Brazilian real, contributed to political pressure limiting the company’s ability to bring domestic prices in line with global prices.
During the year, the Fund held currency forwards and futures to hedge a portion of the currency risk of the portfolio’s non-U.S. dollar investments. The hedges had a minor negative impact on the Fund’s performance during the period.
10 | Annual Report
Thank you for your participation in Mutual Beacon Fund. We look forward to continuing to serve your investment needs.

Mutual Beacon Fund
CFA® is a trademark owned by CFA Institute.
The foregoing information reflects our analysis, opinions and portfolio holdings as of December 31, 2013, the end of the reporting period. The way we implement our main investment strategies and the resulting portfolio holdings may change depending on factors such as market and economic conditions. These opinions may not be relied upon as investment advice or an offer for a particular security. The information is not a complete analysis of every aspect of any market, country, industry, security or the Fund. Statements of fact are from sources considered reliable, but the investment manager makes no representation or warranty as to their completeness or accuracy. Although historical performance is no guarantee of future results, these insights may help you understand our investment management philosophy.
Annual Report | 11
| Christian Correa has been portfolio manager for Mutual Beacon Fund since 2007 and a |
| co-portfolio manager since December 2010. He joined Franklin Templeton Investments in |
| 2003 and serves as Director of Research for Franklin Mutual Advisers. Previously, he covered |
| merger arbitrage and special situations at Lehman Brothers Holdings Inc. |
| Mandana Hormozi has been a co-portfolio manager for Mutual Beacon Fund since 2010 and |
| was assistant portfolio manager for the Fund since 2009. Before that, she was assistant |
| portfolio manager for Mutual Global Discovery Fund since 2007. She has been an analyst for |
| Franklin Mutual Advisers since 2003, when she joined Franklin Templeton Investments. |
| Previously, she was a senior vice president in the equity research department at Lazard |
| Freres and an economic research analyst at Mitsubishi Bank. |
| Aman Gupta assumed assistant portfolio manager responsibilities for Mutual Beacon Fund |
| in December 2013 and has been an analyst for Franklin Mutual Advisers since 2010. |
| Previously, Mr. Gupta was a senior equity analyst and director at Evergreen Investments, |
| where he covered the health care industry with additional responsibilities in the consumer |
| and industrials sectors. |
12 | Annual Report
Performance Summary as of 12/31/13
Your dividend income will vary depending on dividends or interest paid by securities in the Fund’s portfolio, adjusted for operating expenses of each class. Capital gain distributions are net profits realized from the sale of portfolio securities. The performance table and graphs do not reflect any taxes that a shareholder would pay on Fund dividends, capital gain distributions, if any, or any realized gains on the sale of Fund shares. Total return reflects reinvestment of the Fund’s dividends and capital gain distributions, if any, and any unrealized gains or losses.
| Price and Distribution Information | ||||||||
| Class Z (Symbol: BEGRX) | Change | 12/31/13 | 12/31/12 | |||||
| Net Asset Value (NAV) | +$ | 3.55 | $ | 16.91 | $ | 13.36 | ||
| Distributions (1/1/13–12/31/13) | ||||||||
| Dividend Income | $ | 0.3231 | ||||||
| Class A (Symbol: TEBIX) | Change | 12/31/13 | 12/31/12 | |||||
| Net Asset Value (NAV) | +$ | 3.52 | $ | 16.80 | $ | 13.28 | ||
| Distributions (1/1/13–12/31/13) | ||||||||
| Dividend Income | $ | 0.2760 | ||||||
| Class C (Symbol: TEMEX) | Change | 12/31/13 | 12/31/12 | |||||
| Net Asset Value (NAV) | +$ | 3.49 | $ | 16.70 | $ | 13.21 | ||
| Distributions (1/1/13–12/31/13) | ||||||||
| Dividend Income | $ | 0.1655 | ||||||
| Class R (Symbol: n/a) | Change | 12/31/13 | 12/31/12 | |||||
| Net Asset Value (NAV) | +$ | 3.49 | $ | 16.68 | $ | 13.19 | ||
| Distributions (1/1/13–12/31/13) | ||||||||
| Dividend Income | $ | 0.2445 | ||||||
| Class R6 (Symbol: n/a) | Change | 12/31/13 | 5/1/13 | |||||
| Net Asset Value (NAV) | +$ | 2.11 | $ | 16.88 | $ | 14.77 | ||
| Distributions (5/1/13–12/31/13) | ||||||||
| Dividend Income | $ | 0.3399 | ||||||
Annual Report | 13
Performance Summary (continued)
Performance
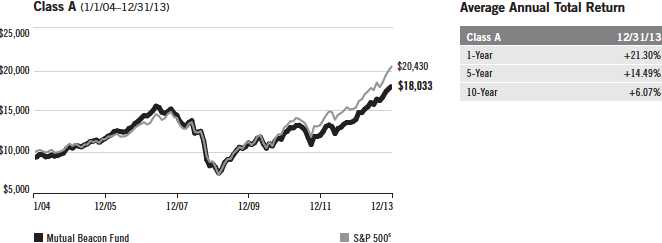
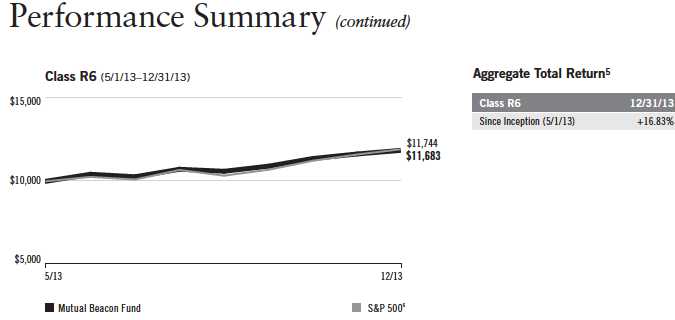
Cumulative total return excludes sales charges. Aggregate and average annual total returns and value of $10,000 investment include maximum sales charges. Class Z/R/R6: no sales charges; Class A: 5.75% maximum initial sales charge; Class C: 1% contingent deferred sales charge in first year only.
| Class Z | 1-Year | 5-Year | 10-Year | ||||||||
| Cumulative Total Return1 | + | 29.11 | % | + | 112.15 | % | + | 97.30 | % | ||
| Average Annual Total Return2 | + | 29.11 | % | + | 16.23 | % | + | 7.03 | % | ||
| Value of $10,000 Investment3 | $ | 12,911 | $ | 21,215 | $ | 19,730 | |||||
| Total Annual Operating Expenses4 | 0.84 | % | |||||||||
| Class A | 1-Year | 5-Year | 10-Year | ||||||||
| Cumulative Total Return1 | + | 28.70 | % | + | 108.74 | % | + | 91.28 | % | ||
| Average Annual Total Return2 | + | 21.30 | % | + | 14.49 | % | + | 6.07 | % | ||
| Value of $10,000 Investment3 | $ | 12,130 | $ | 19,671 | $ | 18,033 | |||||
| Total Annual Operating Expenses4 | 1.14 | % | |||||||||
| Class C | 1-Year | 5-Year | 10-Year | ||||||||
| Cumulative Total Return1 | + | 27.79 | % | + | 101.64 | % | + | 78.52 | % | ||
| Average Annual Total Return2 | + | 26.79 | % | + | 15.06 | % | + | 5.97 | % | ||
| Value of $10,000 Investment3 | $ | 12,679 | $ | 20,164 | $ | 17,852 | |||||
| Total Annual Operating Expenses4 | 1.84 | % | |||||||||
| Class R | 1-Year | 3-Year | Inception (10/30/09) | ||||||||
| Cumulative Total Return1 | + | 28.34 | % | + | 44.81 | % | + | 70.18 | % | ||
| Average Annual Total Return2 | + | 28.34 | % | + | 13.13 | % | + | 13.60 | % | ||
| Value of $10,000 Investment3 | $ | 12,834 | $ | 14,481 | $ | 17,018 | |||||
| Total Annual Operating Expenses4 | 1.34 | % | |||||||||
| Class R6 | Inception (5/1/13) | ||||||||||
| Cumulative Total Return1 | + | 16.83 | % | ||||||||
| Aggregate Total Return5 | + | 16.83 | % | ||||||||
| Value of $10,000 Investment3 | $ | 11,683 | |||||||||
| Total Annual Operating Expenses4 | 0.73 | % |
Performance data represent past performance, which does not guarantee future results. Investment return and principal value will fluctuate, and you may have a gain or loss when you sell your shares. Current performance may differ from figures shown. For most recent month-end performance, go to franklintempleton.com or call (800) 342-5236.
14 | Annual Report
Performance Summary (continued)
Total Return Index Comparison for a Hypothetical $10,000 Investment
Total return represents the change in value of an investment over the periods shown. It includes any applicable, maximum sales charge, Fund expenses, account fees and reinvested distributions. The unmanaged index includes reinvestment of any income or distributions. It differs from the Fund in composition and does not pay management fees or expenses. One cannot invest directly in an index.

| 1/04 | 12/05 | 12/07 | 12/09 | 12/11 | 12/13 |
| Mutual Beacon Fund | S&P 500 6 | ||||
Annual Report | 15

16 | Annual Report
Endnotes
All investments involve risks, including possible loss of principal. Value securities may not increase in price as anticipated or may decline further in value. The Fund’s investments in smaller company stocks and foreign securities involve special risks. Smaller company stocks have exhibited greater price volatility than larger company stocks, particularly over the short term. Foreign securities risks include currency fluctuations, and economic and political uncertainties. The Fund may also invest in companies engaged in mergers, reorganizations or liquidations, which involve special risks as pending deals may not be completed on time or on favorable terms, as well as lower rated bonds, which entail higher credit risk. The Fund is actively managed but there is no guarantee that the manager’s investment decisions will produce the desired results. The Fund’s prospectus also includes a description of the main investment risks.
| Class Z: | Shares are available to certain eligible investors as described in the prospectus. |
| Class C: | These shares have higher annual fees and expenses than Class A shares. |
| Class R: | Shares are available to certain eligible investors as described in the prospectus. These shares have |
| higher annual fees and expenses than Class A shares. | |
| Class R6: | Shares are available to certain eligible investors as described in the prospectus. |
1. Cumulative total return represents the change in value of an investment over the periods indicated.
2. Average annual total return represents the average annual change in value of an investment over the periods indicated.
3. These figures represent the value of a hypothetical $10,000 investment in the Fund over the periods indicated.
4. Figures are as stated in the Fund’s current prospectus. In periods of market volatility, assets may decline significantly, causing total annual Fund operating expenses to become higher than the figures shown.
5. Aggregate 5/1/1 total 3 return 5/31/1 represents 3 6/30/1 the3change 7/31/1 in3value 8/3of 1/1 an 3 investment 9/30/13 for 10/the 31/1 period 3 11/ indicated. 30/13 12/ Since 31/13Class R6 shares have existed for less than one year, average annual total return is not available.
6. Source: © 2014 Morningstar. The S&P 500 is a market capitalization-weighted index of 500 stocks designed to measure total U.S. equity market performance.
Annual Report | 17
Your Fund’s Expenses
As a Fund shareholder, you can incur two types of costs:
- Transaction costs, including sales charges (loads) on Fund purchases; and
- Ongoing Fund costs, including management fees, distribution and service (12b-1) fees, and other Fund expenses. All mutual funds have ongoing costs, sometimes referred to as operating expenses.
The following table shows ongoing costs of investing in the Fund and can help you understand these costs and compare them with those of other mutual funds. The table assumes a $1,000 investment held for the six months indicated.
Actual Fund Expenses
The first line (Actual) for each share class listed in the table provides actual account values and expenses. The “Ending Account Value” is derived from the Fund’s actual return, which includes the effect of Fund expenses.
You can estimate the expenses you paid during the period by following these steps. Of course, your account value and expenses will differ from those in this illustration:
| 1. | Divide your account value by $1,000. |
| If an account had an $8,600 value, then $8,600 ÷ $1,000 = 8.6. | |
| 2. | Multiply the result by the number under the heading “Expenses Paid During Period.” |
| If Expenses Paid During Period were $7.50, then 8.6 x $7.50 = $64.50. |
In this illustration, the estimated expenses paid this period are $64.50.
Hypothetical Example for Comparison with Other Funds
Information in the second line (Hypothetical) for each class in the table can help you compare ongoing costs of investing in the Fund with those of other mutual funds. This information may not be used to estimate the actual ending account balance or expenses you paid during the period. The hypothetical “Ending Account Value” is based on the actual expense ratio for each class and an assumed 5% annual rate of return before expenses, which does not represent the Fund’s actual return. The figure under the heading “Expenses Paid During Period” shows the hypothetical expenses your account would have incurred under this scenario. You can compare this figure with the 5% hypothetical examples that appear in shareholder reports of other funds.
18 | Annual Report
Your Fund’s Expenses (continued)
Please note that expenses shown in the table are meant to highlight ongoing costs and do not reflect any transaction costs, such as sales charges. Therefore, the second line for each class is useful in comparing ongoing costs only, and will not help you compare total costs of owning different funds. In addition, if transaction costs were included, your total costs would have been higher. Please refer to the Fund prospectus for additional information on operating expenses.
| Beginning Account | Ending Account | Expenses Paid During | ||||
| Class Z | Value 7/1/13 | Value 12/31/13 | Period* 7/1/13–12/31/13 | |||
| Actual | $ | 1,000 | $ | 1,140.10 | $ | 4.26 |
| Hypothetical (5% return before expenses) | $ | 1,000 | $ | 1,021.22 | $ | 4.02 |
| Class A | ||||||
| Actual | $ | 1,000 | $ | 1,138.60 | $ | 5.88 |
| Hypothetical (5% return before expenses) | $ | 1,000 | $ | 1,019.71 | $ | 5.55 |
| Class C | ||||||
| Actual | $ | 1,000 | $ | 1,134.40 | $ | 9.63 |
| Hypothetical (5% return before expenses) | $ | 1,000 | $ | 1,016.18 | $ | 9.10 |
| Class R | ||||||
| Actual | $ | 1,000 | $ | 1,136.90 | $ | 6.95 |
| Hypothetical (5% return before expenses) | $ | 1,000 | $ | 1,018.70 | $ | 6.56 |
| Class R6 | ||||||
| Actual | $ | 1,000 | $ | 1,140.50 | $ | 3.83 |
| Hypothetical (5% return before expenses) | $ | 1,000 | $ | 1,021.63 | $ | 3.62 |
*Expenses are calculated using the most recent six-month expense ratio, annualized for each class (Z: 0.79%; A: 1.09%; C: 1.79%; R: 1.29%; and R6: 0.71%), multiplied by the average account value over the period, multiplied by 184/365 to reflect the one-half year period.
Annual Report | 19
| Mutual Beacon Fund | |||||||||||||||
| Financial Highlights | |||||||||||||||
| Year Ended December 31, | |||||||||||||||
| Class Z | 2013 | 2012 | 2011 | 2010 | 2009 | ||||||||||
| Per share operating performance | |||||||||||||||
| (for a share outstanding throughout the year) | |||||||||||||||
| Net asset value, beginning of year | $ | 13.36 | $ | 11.68 | $ | 12.32 | $ | 11.49 | $ | 9.07 | |||||
| Income from investment operationsa: | |||||||||||||||
| Net investment incomeb | 0.31 | 0.24 | 0.28 | 0.36 | c | 0.08 | d | ||||||||
| Net realized and unrealized gains (losses) | 3.56 | 1.68 | (0.57 | ) | 0.91 | 2.61 | |||||||||
| Total from investment operations | 3.87 | 1.92 | (0.29 | ) | 1.27 | 2.69 | |||||||||
| Less distributions from net investment income | (0.32 | ) | (0.24 | ) | (0.35 | ) | (0.44 | ) | (0.27 | ) | |||||
| Net asset value, end of year | $ | 16.91 | $ | 13.36 | $ | 11.68 | $ | 12.32 | $ | 11.49 | |||||
| Total return | 29.11 | % | 16.44 | % | (2.15 | )% | 11.10 | % | 29.81 | % | |||||
| Ratios to average net assets | |||||||||||||||
| Expensese | 0.80 | %f | 0.84 | % | 0.84 | % | 0.88 | % | 1.41 | %f,g | |||||
| Expenses incurred in connection with securities sold short | —%h | 0.01 | % | —%h | 0.02 | % | 0.55 | % | |||||||
| Net investment income | 2.02 | % | 1.87 | % | 2.24 | % | 3.06 | %c | 0.79 | %d | |||||
| Supplemental data | |||||||||||||||
| Net assets, end of year (000’s) | $ | 2,876,322 | $ | 2,450,546 | $ | 2,423,177 $2,860,233 | $ | 2,833,233 | |||||||
| Portfolio turnover rate | 32.95 | % | 43.23 | % | 51.38 | % | 34.54 | % | 54.36 | % | |||||
aThe amount shown for a share outstanding throughout the period may not correlate with the Statement of Operations for the period due to the timing of sales and repurchases of
the Fund shares in relation to income earned and/or fluctuating market value of the investments of the Fund.
bBased on average daily shares outstanding.
cNet investment income per share includes approximately $0.18 per share received in the form of a special dividend paid in connection with a corporate real estate investment trust
(REIT) conversion. Excluding this non-recurring amount, the ratio of net investment income to average net assets would have been 1.53%.
dNet investment income per share includes approximately $(0.06) per share related to an adjustment for uncollectible interest. Excluding the effect of this adjustment, the ratio of
net investment income to average net assets would have been 1.35%.
eIncludes dividend and interest expense on securities sold short and borrowing fees, if any. See below for the ratios of such expenses to average net assets for the periods
presented. See Note 1(f).
fBenefit of expense reduction rounds to less than 0.01%.
gTotal expenses net of a one-time unaffiliated fee reimbursement are 1.30%.
hRounds to less than 0.01%.
20 | The accompanying notes are an integral part of these financial statements. | Annual Report
| Mutual Beacon Fund | |||||||||||||||
| Financial Highlights (continued) | |||||||||||||||
| Year Ended December 31, | |||||||||||||||
| Class A | 2013 | 2012 | 2011 | 2010 | 2009 | ||||||||||
| Per share operating performance | |||||||||||||||
| (for a share outstanding throughout the year) | |||||||||||||||
| Net asset value, beginning of year | $ | 13.28 | $ | 11.61 | $ | 12.24 | $ | 11.40 | $ | 8.99 | |||||
| Income from investment operationsa: | |||||||||||||||
| Net investment incomeb | 0.26 | 0.20 | 0.24 | 0.32 | c | 0.04 | d | ||||||||
| Net realized and unrealized gains (losses) | 3.54 | 1.67 | (0.56 | ) | 0.90 | 2.58 | |||||||||
| Total from investment operations | 3.80 | 1.87 | (0.32 | ) | 1.22 | 2.62 | |||||||||
| Less distributions from net investment income | (0.28 | ) | (0.20 | ) | (0.31 | ) | (0.38 | ) | (0.21 | ) | |||||
| Net asset value, end of year | $ | 16.80 | $ | 13.28 | $ | 11.61 | $ | 12.24 | $ | 11.40 | |||||
| Total returne | 28.70 | % | 16.10 | % | (2.50 | )% | 10.82 | % | 29.30 | % | |||||
| Ratios to average net assets | |||||||||||||||
| Expensesf | 1.10 | %g | 1.14 | % | 1.14 | % | 1.18 | % | 1.72 | %g,h | |||||
| Expenses incurred in connection with securities sold short | —%i | 0.01 | % | —%i | 0.02 | % | 0.55 | % | |||||||
| Net investment income | 1.72 | % | 1.57 | % | 1.94 | % | 2.76 | %c | 0.48 | %d | |||||
| Supplemental data | |||||||||||||||
| Net assets, end of year (000’s) | $ | 1,148,409 | $ | 983,981 | $ | 1,062,477 | $ | 1,327,189 | $ | 1,361,152 | |||||
| Portfolio turnover rate | 32.95 | % | 43.23 | % | 51.38 | % | 34.54 | % | 54.36 | % | |||||
aThe amount shown for a share outstanding throughout the period may not correlate with the Statement of Operations for the period due to the timing of sales and repurchases of
the Fund shares in relation to income earned and/or fluctuating market value of the investments of the Fund.
bBased on average daily shares outstanding.
cNet investment income per share includes approximately $0.18 per share received in the form of a special dividend paid in connection with a corporate REIT conversion. Excluding
this non-recurring amount, the ratio of net investment income to average net assets would have been 1.23%.
dNet investment income per share includes approximately $(0.06) per share related to an adjustment for uncollectible interest. Excluding the effect of this adjustment, the ratio of
net investment income to average net assets would have been 1.04%.
eTotal return does not reflect sales commissions or contingent deferred sales charges, if applicable.
fIncludes dividend and interest expense on securities sold short and borrowing fees, if any. See below for the ratios of such expenses to average net assets for the periods
presented. See Note 1(f).
gBenefit of expense reduction rounds to less than 0.01%.
hTotal expenses net of a one-time unaffiliated fee reimbursement are 1.61%.
iRounds to less than 0.01%.
Annual Report | The accompanying notes are an integral part of these financial statements. | 21
| Mutual Beacon Fund | |||||||||||||||
| Financial Highlights (continued) | |||||||||||||||
| Year Ended December 31, | |||||||||||||||
| Class C | 2013 | 2012 | 2011 | 2010 | 2009 | ||||||||||
| Per share operating performance | |||||||||||||||
| (for a share outstanding throughout the year) | |||||||||||||||
| Net asset value, beginning of year | $ | 13.21 | $ | 11.54 | $ | 12.16 | $ | 11.29 | $ | 8.84 | |||||
| Income from investment operationsa: | |||||||||||||||
| Net investment income (loss)b | 0.15 | 0.11 | 0.15 | 0.24 | c | (0.02 | )d | ||||||||
| Net realized and unrealized gains (losses) | 3.51 | 1.66 | (0.55 | ) | 0.88 | 2.54 | |||||||||
| Total from investment operations | 3.66 | 1.77 | (0.40 | ) | 1.12 | 2.52 | |||||||||
| Less distributions from net investment income | (0.17 | ) | (0.10 | ) | (0.22 | ) | (0.25 | ) | (0.07 | ) | |||||
| Net asset value, end of year | $ | 16.70 | $ | 13.21 | $ | 11.54 | $ | 12.16 | $ | 11.29 | |||||
| Total returne | 27.79 | % | 15.29 | % | (3.15 | )% | 9.96 | % | 28.51 | % | |||||
| Ratios to average net assets | |||||||||||||||
| Expensesf | 1.80 | %g | 1.84 | % | 1.84 | % | 1.88 | % | 2.41 | %g,h | |||||
| Expenses incurred in connection with securities sold short | —%i | 0.01 | % | —%i | 0.02 | % | 0.55 | % | |||||||
| Net investment income (loss) | 1.02 | % | 0.87 | % | 1.24 | % | 2.06 | %c | (0.21 | )%d | |||||
| Supplemental data | |||||||||||||||
| Net assets, end of year (000’s) | $ | 336,222 | $ | 295,958 | $ | 315,390 | $ | 400,949 | $ | 437,340 | |||||
| Portfolio turnover rate | 32.95 | % | 43.23 | % | 51.38 | % | 34.54 | % | 54.36 | % | |||||
aThe amount shown for a share outstanding throughout the period may not correlate with the Statement of Operations for the period due to the timing of sales and repurchases of
the Fund shares in relation to income earned and/or fluctuating market value of the investments of the Fund.
bBased on average daily shares outstanding.
cNet investment income per share includes approximately $0.18 per share received in the form of a special dividend paid in connection with a corporate REIT conversion. Excluding
this non-recurring amount, the ratio of net investment income to average net assets would have been 0.53%.
dNet investment income per share includes approximately $(0.06) per share related to an adjustment for uncollectible interest. Excluding the effect of this adjustment, the ratio of
net investment income to average net assets would have been 0.35%.
eTotal return does not reflect sales commissions or contingent deferred sales charges, if applicable.
fIncludes dividend and interest expense on securities sold short and borrowing fees, if any. See below for the ratios of such expenses to average net assets for the periods
presented. See Note 1(f).
gBenefit of expense reduction rounds to less than 0.01%.
hTotal expenses net of a one-time unaffiliated fee reimbursement are 2.30%.
iRounds to less than 0.01%.
22 | The accompanying notes are an integral part of these financial statements. | Annual Report
| Mutual Beacon Fund | |||||||||||||||
| Financial Highlights (continued) | |||||||||||||||
| Year Ended December 31, | |||||||||||||||
| Class R | 2013 | 2012 | 2011 | 2010 | 2009 | a | |||||||||
| Per share operating performance | |||||||||||||||
| (for a share outstanding throughout the year) | |||||||||||||||
| Net asset value, beginning of year | $ | 13.19 | $ | 11.52 | $ | 12.16 | $ | 11.38 | $ | 10.78 | |||||
| Income from investment operationsb: | |||||||||||||||
| Net investment incomec | 0.23 | 0.18 | 0.21 | 0.26 | d | 0.01 | |||||||||
| Net realized and unrealized gains (losses) | 3.50 | 1.66 | (0.55 | ) | 0.93 | 0.66 | |||||||||
| Total from investment operations | 3.73 | 1.84 | (0.34 | ) | 1.19 | 0.67 | |||||||||
| Less distributions from net investment income | (0.24 | ) | (0.17 | ) | (0.30 | ) | (0.41 | ) | (0.07 | ) | |||||
| Net asset value, end of year | $ | 16.68 | $ | 13.19 | $ | 11.52 | $ | 12.16 | $ | 11.38 | |||||
| Total returne | 28.34 | % | 15.95 | % | (2.69 | )% | 10.63 | % | 6.23 | % | |||||
| Ratios to average net assetsf | |||||||||||||||
| Expensesg | 1.30 | %h | 1.34 | % | 1.34 | % | 1.38 | % | 1.91 | %h,i | |||||
| Expenses incurred in connection with securities sold short | —%j | 0.01 | % | —%j | 0.02 | % | 0.55 | % | |||||||
| Net investment income | 1.52 | % | 1.37 | % | 1.74 | % | 2.56 | %d | 0.29 | % | |||||
| Supplemental data | |||||||||||||||
| Net assets, end of year (000’s) | $ | 1,956 | $ | 1,905 | $ | 2,039 | $ | 976 | $ | 34 | |||||
| Portfolio turnover rate | 32.95 | % | 43.23 | % | 51.38 | % | 34.54 | % | 54.36 | % | |||||
aFor the period October 30, 2009 (effective date) to December 31, 2009.
bThe amount shown for a share outstanding throughout the period may not correlate with the Statement of Operations for the period due to the timing of sales and repurchases of
the Fund shares in relation to income earned and/or fluctuating market value of the investments of the Fund.
cBased on average daily shares outstanding.
dNet investment income per share includes approximately $0.18 per share received in the form of a special dividend paid in connection with a corporate REIT conversion. Excluding
this non-recurring amount, the ratio of net investment income to average net assets would have been 1.03%.
eTotal return is not annualized for periods less than one year.
fRatios are annualized for periods less than one year.
gIncludes dividend and interest expense on securities sold short and borrowing fees, if any. See below for the ratios of such expenses to average net assets for the periods
presented. See Note 1(f).
hBenefit of expense reduction rounds to less than 0.01%.
iTotal expenses net of a one-time unaffiliated fee reimbursement are 1.80%.
jRounds to less than 0.01%.
Annual Report | The accompanying notes are an integral part of these financial statements. | 23
| Mutual Beacon Fund | ||||
| Financial Highlights (continued) | ||||
| Year Ended | Period Ended | |||
| Class R6 | December 31, 2013 | December 31 2013a | ||
| Per share operating performance | ||||
| (for a share outstanding throughout the period) | ||||
| Net asset value, beginning of period | $ | 14.77 | ||
| Income from investment operationsb: | ||||
| Net investment incomec | 0.24 | |||
| Net realized and unrealized gains (losses) | 2.21 | |||
| Total from investment operations | 2.45 | |||
| Less distributions from net investment income | (0.34 | ) | ||
| Net asset value, end of period | $ | 16.88 | ||
| Total returnd | 16.83 | % | ||
| Ratios to average net assetse | ||||
| Expenses before waiver, payments by affiliates and expense reductionf | 2.10 | % | ||
| Expenses net of waiver, payments by affiliates and expense reductionf | 0.71 | %g | ||
| Expenses incurred in connection with securities sold short | —%h | |||
| Net investment income | 2.11 | % | ||
| Supplemental data | ||||
| Net assets, end of period (000’s) | $ | 6 | ||
| Portfolio turnover rate | 32.95 | % | ||
aFor the period May 1, 2013 (effective date) to December 31, 2013.
bThe amount shown for a share outstanding throughout the period may not correlate with the Statement of Operations for the period due to the timing of sales and repurchases of
the Fund shares in relation to income earned and/or fluctuating market value of the investments of the Fund.
cBased on average daily shares outstanding.
dTotal return is not annualized for periods less than one year.
eRatios are annualized for periods less than one year.
fIncludes dividend and interest expense on securities sold short and borrowing fees, if any. See below for the ratios of such expenses to average net assets for the periods
presented. See Note 1(f).
gBenefit of expense reduction rounds to less than 0.01%.
hRounds to less than 0.01%.
24 | The accompanying notes are an integral part of these financial statements. | Annual Report
Mutual Beacon Fund
Statement of Investments, December 31, 2013
| Country | Shares | Value | ||
| Common Stocks and Other Equity Interests 84.2% | ||||
| Auto Components 0.3% | ||||
| a,bInternational Automotive Components Group Brazil LLC | Brazil | 2,846,329 | $ | 554,522 |
| a,b,cInternational Automotive Components Group North America, LLC | United States | 22,836,904 | 12,921,577 | |
| 13,476,099 | ||||
| Capital Markets 0.5% | ||||
| aChina Cinda Asset Management Co. Ltd., H | China | 1,979,063 | 1,230,159 | |
| Morgan Stanley | United States | 624,398 | 19,581,121 | |
| 20,811,280 | ||||
| Chemicals 0.4% | ||||
| a,d,eDow Corning Corp., Contingent Distribution | United States | 12,598,548 | — | |
| Tronox Ltd., A | United States | 851,461 | 19,643,205 | |
| 19,643,205 | ||||
| Commercial Banks 3.2% | ||||
| a,b,fFirst Southern Bancorp Inc. | United States | 1,065,450 | 5,135,682 | |
| SunTrust Banks Inc. | United States | 1,011,186 | 37,221,757 | |
| Wells Fargo & Co. | United States | 2,188,070 | 99,338,378 | |
| 141,695,817 | ||||
| Communications Equipment 1.1% | ||||
| Cisco Systems Inc. | United States | 2,094,362 | 47,018,427 | |
| Computers & Peripherals 3.0% | ||||
| Apple Inc. | United States | 185,640 | 104,164,460 | |
| SanDisk Corp. | United States | 371,025 | 26,172,104 | |
| 130,336,564 | ||||
| Consumer Finance 0.0%† | ||||
| aComdisco Holding Co. Inc. | United States | 1,223 | 6,604 | |
| Diversified Financial Services 3.1% | ||||
| aING Groep NV, IDR | Netherlands | 3,728,869 | 51,803,496 | |
| JPMorgan Chase & Co. | United States | 1,444,570 | 84,478,454 | |
| 136,281,950 | ||||
| Diversified Telecommunication Services 2.2% | ||||
| a,d,eGlobal Crossing Holdings Ltd., Contingent Distribution | United States | 60,632,757 | — | |
| TDC AS | Denmark | 6,263,530 | 60,745,940 | |
| Telenor ASA | Norway | 1,520,290 | 36,245,723 | |
| 96,991,663 | ||||
| Energy Equipment & Services 3.5% | ||||
| Fugro NV, IDR | Netherlands | 592,014 | 35,272,063 | |
| aRowan Cos. PLC | United States | 1,001,305 | 35,406,145 | |
| Transocean Ltd. | United States | 1,620,235 | 80,072,014 | |
| 150,750,222 |
Annual Report | 25
Mutual Beacon Fund
Statement of Investments, December 31, 2013 (continued)
| Country | Shares | Value | ||
| Common Stocks and Other Equity Interests (continued) | ||||
| Food & Staples Retailing 3.6% | ||||
| CVS Caremark Corp. | United States | 564,440 | $ | 40,396,971 |
| Tesco PLC | United Kingdom | 12,050,300 | 66,731,471 | |
| Walgreen Co. | United States | 897,779 | 51,568,426 | |
| 158,696,868 | ||||
| Health Care Equipment & Supplies 2.7% | ||||
| Medtronic Inc. | United States | 2,043,050 | 117,250,640 | |
| Health Care Providers & Services 2.3% | ||||
| Cigna Corp. | United States | 721,733 | 63,137,203 | |
| UnitedHealth Group Inc. | United States | 486,384 | 36,624,715 | |
| 99,761,918 | ||||
| Insurance 5.7% | ||||
| ACE Ltd. | United States | 417,424 | 43,215,907 | |
| American International Group Inc. | United States | 1,306,516 | 66,697,642 | |
| a,bOlympus Re Holdings Ltd. | United States | 106,700 | — | |
| RSA Insurance Group PLC | United Kingdom | 34,299,294 | 51,954,325 | |
| White Mountains Insurance Group Ltd. | United States | 146,141 | 88,134,714 | |
| 250,002,588 | ||||
| Internet Software & Services 0.6% | ||||
| aGoogle Inc., A | United States | 22,474 | 25,186,837 | |
| IT Services 0.4% | ||||
| fPolaris Financial Technology Ltd. | India | 7,108,509 | 15,598,717 | |
| Machinery 0.5% | ||||
| aCNH Industrial NV (EUR Traded) | Netherlands | 408,023 | 4,649,837 | |
| aCNH Industrial NV, special voting (EUR Traded) | Netherlands | 1,463,251 | 16,675,233 | |
| 21,325,070 | ||||
| Media 10.2% | ||||
| British Sky Broadcasting Group PLC | United Kingdom | 195,037 | 2,726,605 | |
| CBS Corp., B | United States | 709,201 | 45,204,472 | |
| Comcast Corp., Special A | United States | 731,577 | 36,491,061 | |
| Reed Elsevier PLC | United Kingdom | 3,983,176 | 59,279,223 | |
| RTL Group SA | Germany | 528,912 | 68,263,053 | |
| Time Warner Cable Inc. | United States | 424,034 | 57,456,607 | |
| aTribune Co., A | United States | 382,415 | 29,598,921 | |
| aTribune Co., B | United States | 234,472 | 18,077,791 | |
| Twenty-First Century Fox Inc., B | United States | 3,687,347 | 127,582,206 | |
| 444,679,939 | ||||
| Metals & Mining 2.9% | ||||
| Freeport-McMoRan Copper & Gold Inc., B | United States | 2,255,259 | 85,113,475 | |
| a,b,fPMG LLC | United States | 17,621 | 934,094 | |
| aThyssenKrupp AG | Germany | 1,603,543 | 39,018,360 | |
| 125,065,929 | ||||
| Office Electronics 1.9% | ||||
| Xerox Corp. | United States | 6,681,997 | 81,319,904 |
26 | Annual Report
Mutual Beacon Fund
Statement of Investments, December 31, 2013 (continued)
| Country | Shares | Value | ||
| Common Stocks and Other Equity Interests (continued) | ||||
| Oil, Gas & Consumable Fuels 7.1% | ||||
| Apache Corp. | United States | 823,010 | $ | 70,729,479 |
| BG Group PLC | United Kingdom | 1,888,700 | 40,587,110 | |
| CONSOL Energy Inc. | United States | 1,149,913 | 43,742,691 | |
| Marathon Oil Corp. | United States | 1,115,777 | 39,386,928 | |
| Petroleo Brasileiro SA, ADR | Brazil | 1,483,826 | 20,447,122 | |
| aWPX Energy Inc. | United States | 4,709,759 | 95,984,888 | |
| 310,878,218 | ||||
| Personal Products 0.9% | ||||
| Avon Products Inc. | United States | 2,187,955 | 37,676,585 | |
| Pharmaceuticals 6.1% | ||||
| aHospira Inc. | United States | 1,148,000 | 47,389,440 | |
| Merck & Co. Inc. | United States | 2,005,510 | 100,375,776 | |
| Novartis AG, ADR | Switzerland | 677,230 | 54,435,747 | |
| Teva Pharmaceutical Industries Ltd., ADR | Israel | 1,620,652 | 64,955,732 | |
| 267,156,695 | ||||
| Real Estate Management & Development 1.4% | ||||
| Brookfield Office Properties Inc. | United States | 551,389 | 10,614,238 | |
| eCanary Wharf Group PLC | United Kingdom | 10,069,634 | 52,039,512 | |
| 62,653,750 | ||||
| Semiconductors & Semiconductor Equipment 1.0% | ||||
| aON Semiconductor Corp. | United States | 5,183,381 | 42,711,059 | |
| Software 7.9% | ||||
| aCheck Point Software Technologies Ltd. | Israel | 1,475,194 | 95,179,517 | |
| Microsoft Corp. | United States | 3,409,670 | 127,623,948 | |
| Open Text Corp. | Canada | 604,097 | 55,552,760 | |
| Symantec Corp. | United States | 2,810,122 | 66,262,677 | |
| 344,618,902 | ||||
| Specialty Retail 2.6% | ||||
| aDufry AG | Switzerland | 488,180 | 85,700,340 | |
| Kingfisher PLC | United Kingdom | 4,256,823 | 27,109,966 | |
| 112,810,306 | ||||
| Tobacco 5.0% | ||||
| Altria Group Inc. | United States | 1,362,530 | 52,307,526 | |
| British American Tobacco PLC | United Kingdom | 1,926,205 | 103,247,445 | |
| Lorillard Inc. | United States | 1,276,635 | 64,699,862 | |
| 220,254,833 | ||||
| Wireless Telecommunication Services 4.1% | ||||
| Tele2 AB, B | Sweden | 3,789,690 | 42,917,046 | |
| Vodafone Group PLC | United Kingdom | 34,881,127 | 136,933,710 | |
| 179,850,756 | ||||
| Total Common Stocks and Other Equity Interests | ||||
| (Cost $2,559,000,989) | 3,674,511,345 |
Annual Report | 27
Mutual Beacon Fund
Statement of Investments, December 31, 2013 (continued)
| Country | Shares | Value | |||
| Convertible Preferred Stocks (Cost $1,821,000) 0.1% | |||||
| Commercial Banks 0.1% | |||||
| a,b,fFirst Southern Bancorp Inc., cvt. pfd., C | United States | 1,821 | $ | 3,399,518 | |
| Preferred Stocks 2.0% | |||||
| Automobiles 1.2% | |||||
| Porsche Automobile Holding SE, pfd. | Germany | 482,830 | 50,248,275 | ||
| Semiconductors & Semiconductor Equipment 0.8% | |||||
| Samsung Electronics Co. Ltd., pfd. | South Korea | 37,325 | 35,814,464 | ||
| Total Preferred Stocks (Cost $59,502,406) | 86,062,739 | ||||
| Principal Amount* | |||||
| Corporate Bonds, Notes and Senior Floating Rate | |||||
| Interests 6.1% | |||||
| gAmerican Airlines Inc., senior secured note, 144A, 7.50%, | |||||
| 3/15/16 | United States | 48,302,000 | 50,354,835 | ||
| h,iCaesars Entertainment Operating Co. Inc., Senior Tranche Term | |||||
| Loan, first lien, 1/28/18, | |||||
| B5, 4.488% | United States | 8,410,000 | 7,940,445 | ||
| B6, 5.488% | United States | 35,475,000 | 33,942,267 | ||
| Clear Channel Communications Inc., | |||||
| senior secured note, first lien, 9.00%, 12/15/19 | United States | 18,873,000 | 19,344,825 | ||
| h,i Tranche B Term Loan, 3.819%, 1/29/16 | United States | 226,261 | 219,784 | ||
| h,i Tranche C Term Loan, 3.819%, 1/29/16 | United States | 46,542 | 44,665 | ||
| h,i Tranche D Term Loan, 6.919%, 1/30/19 | United States | 15,813,482 | 15,141,409 | ||
| h,i Tranche E Term Loan, 7.669%, 7/30/19 | United States | 5,080,935 | 5,017,424 | ||
| h,iThe Great Atlantic & Pacific Tea Co. Inc., senior secured, First Lien | |||||
| Exit Term Loan, 11.00%, 3/13/17 | United States | 14,220,848 | 14,754,130 | ||
| h,iJC Penney Corp. Inc., Term Loan, 6.00%, 5/22/18 | United States | 18,115,888 | 17,725,889 | ||
| h,i,jKIK Custom Products Inc., Second Lien Term Loan, 9.50%, | |||||
| 11/17/19 | United States | 22,739,000 | 22,696,364 | ||
| NGPL PipeCo LLC, | |||||
| g secured note, 144A, 7.119%, 12/15/17 | United States | 8,028,000 | 7,305,480 | ||
| g,k senior secured note, 144A, 9.625%, 6/01/19 | United States | 11,912,000 | 11,703,540 | ||
| h,i Term Loan B, 6.75%, 9/15/17 | United States | 707,822 | 662,035 | ||
| h,iTexas Competitive Electric Holdings Co. LLC, Extended Term Loan, | |||||
| 4.668%, 10/10/17 | United States | 46,282,735 | 31,969,799 | ||
| Texas Competitive Electric Holdings Co. LLC/Texas Competitive | |||||
| Electric Holdings Finance Inc., | |||||
| senior note, A, 10.25%, 11/01/15 | United States | 24,392,000 | 1,707,440 | ||
| g senior secured note, 144A, 11.50%, 10/01/20 | United States | 28,306,000 | 20,946,440 | ||
| gWind Acquisition Finance SA, 144A, 11.75%, 7/15/17, | |||||
| senior secured note | Italy | 853,000 | 908,445 | ||
| third lien | Italy | 1,992,000 | EUR | 2,918,424 | |
| Total Corporate Bonds, Notes and Senior Floating Rate | |||||
| Interests (Cost $272,104,920) | 265,303,640 | ||||
28 | Annual Report
| Mutual Beacon Fund | ||||
| Statement of Investments, December 31, 2013 (continued) | ||||
| Country | Principal Amount* | Value | ||
| Corporate Notes in Reorganization 0.3% | ||||
| b,lBroadband Ventures III LLC, secured promissory note, 5.00%, | ||||
| 2/01/12 | United States | 10,848 | $ | — |
| h,lCengage Learning Acquisitions Inc., FRN, 2.70%, 7/03/14 | United States | 15,289,223 | 12,002,040 | |
| Total Corporate Notes in Reorganization | ||||
| (Cost $12,147,736) | 12,002,040 | |||
| Shares | ||||
| Companies in Liquidation 1.7% | ||||
| aAdelphia Recovery Trust | United States | 48,268,724 | 96,537 | |
| a,dAdelphia Recovery Trust, Arahova Contingent Value Vehicle, | ||||
| Contingent Distribution | United States | 6,161,087 | 3,081 | |
| a,b,c,fCB FIM Coinvestors LLC | United States | 15,831,950 | — | |
| a,d,eCentury Communications Corp., Contingent Distribution | United States | 16,986,000 | — | |
| a,bFIM Coinvestor Holdings I, LLC | United States | 19,805,560 | — | |
| a,mLehman Brothers Holdings Inc., Bankruptcy Claim | United States | 163,140,446 | 73,413,201 | |
| a,d,eTribune Litigation Trust, Contingent Distribution | United States | 496,443 | — | |
| Total Companies in Liquidation (Cost $77,636,913) | 73,512,819 | |||
| Counterparty | Notional Amount* | |||
| Options Purchased 0.3% | ||||
| Payer Swaptions - Over-the-Counter | ||||
| Interest Rate 0.1% | ||||
| Receive floating 6-month JPY LIBOR, pay fixed 3.00%, | ||||
| Expires 3/08/17 | UBSW | 5,500,000,000 | JPY | 522,060 |
| Receive floating 6-month JPY LIBOR, pay fixed 3.00%, | ||||
| Expires 3/14/17 | MSCS | 5,583,183,000 | JPY | 538,219 |
| Receive floating 6-month JPY LIBOR, pay fixed 3.00%, | ||||
| Expires 3/16/17 | MSCS | 5,107,000,000 | JPY | 497,473 |
| Receive floating 6-month JPY LIBOR, pay fixed 3.00%, | ||||
| Expires 6/15/17 | MSCS | 6,058,062,500 | JPY | 724,665 |
| 2,282,417 | ||||
| Puts - Over-the-Counter | ||||
| Currency Options 0.2% | ||||
| JPY/USD, June Strike Price 90 JPY, Expires 6/15/17 | BANT | 1,764,720,000 | JPY | 2,827,434 |
| JPY/USD, June Strike Price 95 JPY, Expires 6/15/17 | BANT | 2,393,646,600 | JPY | 2,846,147 |
| JPY/USD, June Strike Price 100 JPY, Expires 6/15/17 | BANT | 3,166,692,000 | JPY | 2,711,100 |
| 8,384,681 | ||||
| Total Options Purchased (Cost $10,808,994) | 10,667,098 | |||
| Total Investments before Short Term Investments | ||||
| (Cost $2,993,022,958) | 4,125,459,199 | |||
Annual Report | 29
Mutual Beacon Fund
Statement of Investments, December 31, 2013 (continued)
| Country | Principal Amount* | Value | ||||
| Short Term Investments 5.3% | ||||||
| U.S. Government and Agency Securities (Cost $232,871,666) | ||||||
| 5.3% | ||||||
| n,oU.S. Treasury Bills, 1/02/14 - 6/26/14 | United States | 232,900,000 | $ | 232,879,891 | ||
| Total Investments before Money Market Funds | ||||||
| (Cost $3,225,894,624) | 4,358,339,090 | |||||
| Shares | ||||||
| pInvestments from Cash Collateral Received for Loaned Securities | ||||||
| (Cost $1,698,820) 0.0%† | ||||||
| Money Market Funds 0.0%† | ||||||
| qBNY Mellon Overnight Government Fund, 0.017% | United States | 1,698,820 | 1,698,820 | |||
| Total Investments (Cost $3,227,593,444) 100.0% | 4,360,037,910 | |||||
| Securities Sold Short (0.6)% | (23,996,782 | ) | ||||
| Other Assets, less Liabilities 0.6% | 26,873,281 | |||||
| Net Assets 100.0% | $ | 4,362,914,409 | ||||
| rSecurities Sold Short (Proceeds $23,097,587) (0.6)% | ||||||
| Common Stocks (0.6)% | ||||||
| Diversified Telecommunication Services (0.6)% | ||||||
| Verizon Communications Inc. | United States | 488,335 | $ | (23,996,782 | ) | |
†Rounds to less than 0.1% of net assets.
*The principal/notional amount is stated in U.S. dollars unless otherwise indicated.
aNon-income producing.
bSee Note 9 regarding restricted securities.
cAt December 31, 2013, pursuant to the Fund’s policies and the requirements of applicable securities law, the Fund may be restricted from trading these securities for a limited
or extended period of time due to ownership limits and/or potential possession of material non-public information.
dContingent distributions represent the right to receive additional distributions, if any, during the reorganization of the underlying company. Shares represent total underlying
principal of debt securities.
eSecurity has been deemed illiquid because it may not be able to be sold within seven days. At December 31, 2013, the aggregate value of these securities was $52,039,512,
representing 1.19% of net assets.
fSee Note 11 regarding holdings of 5% voting securities.
gSecurity was purchased pursuant to Rule 144A under the Securities Act of 1933 and may be sold in transactions exempt from registration only to qualified institutional buyers or in
a public offering registered under the Securities Act of 1933. These securities have been deemed liquid under guidelines approved by the Trust’s Board of Trustees. At December 31,
2013, the aggregate value of these securities was $94,137,164, representing 2.16% of net assets.
hThe coupon rate shown represents the rate at period end.
iSee Note 1(h) regarding senior floating rate interests.
jA portion or all of the security purchased on a delayed delivery basis. See Note 1(c).
kA portion or all of the security is on loan at December 31, 2013. See Note 1(g).
lSee Note 8 regarding credit risk and defaulted securities.
mBankruptcy claims represent the right to receive distributions, if any, during the liquidation of the underlying pool of assets. Shares represent amount of allowed unsecured claims.
nThe security is traded on a discount basis with no stated coupon rate.
oSecurity or a portion of the security has been pledged as collateral for securities sold short, open futures and forward contracts. At December 31, 2013, the aggregate value of
these securities and/or cash pledged as collateral was $43,595,616, representing 1.00% of net assets.
pSee Note 1(g) regarding securities on loan.
qThe rate shown is the annualized seven-day yield at period end.
rSee Note 1(f) regarding securities sold short.
30 | Annual Report
Mutual Beacon Fund
Statement of Investments, December 31, 2013 (continued)
At December 31, 2013, the Fund had the following futures contracts outstanding. See Note 1(d).
| Futures Contracts | ||||||||||||||||
| Number of | Notional | Expiration | Unrealized | Unrealized | ||||||||||||
| Description | Type | Contracts | Value | Date | Appreciation | Depreciation | ||||||||||
| Currency Contracts | ||||||||||||||||
| EUR/USD | Short | 507 | $ | 87,381,450 | 3/17/14 | $ | — | $ | (375,958 | ) | ||||||
| GBP/USD | Short | 913 | 94,484,088 | 3/17/14 | — | (878,743 | ) | |||||||||
| Unrealized appreciation (depreciation) | — | (1,254,701 | ) | |||||||||||||
| Net unrealized appreciation (depreciation) | $ | (1,254,701 | ) | |||||||||||||
| At December 31, 2013, the Fund had the following forward exchange contracts outstanding. See Note 1(d). | ||||||||||||||||
| Forward Exchange Contracts | ||||||||||||||||
| Contract | Settlement | Unrealized | Unrealized | |||||||||||||
| Currency | Counterpartya Type | Quantity | Amount | Date | Appreciation | Depreciation | ||||||||||
| Euro | BANT | Buy | 541,221 | $ | 746,566 | 1/17/14 | $ | — | $ | (2,122 | ) | |||||
| Euro | SCBT | Buy | 3,937,869 | 5,331,126 | 1/17/14 | 85,367 | — | |||||||||
| Euro | BANT | Sell | 14,159,982 | 18,534,502 | 1/17/14 | — | (942,392 | ) | ||||||||
| Euro | BONY | Sell | 227,375 | 311,508 | 1/17/14 | — | (1,243 | ) | ||||||||
| Euro | BBU | Sell | 13,573,357 | 17,724,904 | 1/17/14 | — | (945,093 | ) | ||||||||
| Euro | HSBC | Sell | 586,748 | 802,337 | 1/17/14 | — | (4,728 | ) | ||||||||
| Euro | SCBT | Sell | 1,072,067 | 1,430,212 | 1/17/14 | — | (44,403 | ) | ||||||||
| Euro | SSBT | Sell | 248,258 | 339,602 | 1/17/14 | — | (1,874 | ) | ||||||||
| British Pound | BANT | Sell | 43,244,104 | 65,812,524 | 1/21/14 | — | (5,785,289 | ) | ||||||||
| British Pound | FBCO | Sell | 764,298 | 1,215,309 | 1/21/14 | — | (50,114 | ) | ||||||||
| British Pound | DBFX | Sell | 17,876,079 | 27,137,676 | 1/21/14 | — | (2,459,149 | ) | ||||||||
| British Pound | HSBC | Sell | 890,099 | 1,424,707 | 1/21/14 | — | (49,000 | ) | ||||||||
| British Pound | SCBT | Sell | 3,559,068 | 5,856,241 | 1/21/14 | — | (36,388 | ) | ||||||||
| South Korean Won | HSBC | Buy | 2,574,609,394 | 2,376,719 | 2/12/14 | 56,769 | (1,756 | ) | ||||||||
| Swiss Franc | BANT | Buy | 5,800,000 | 6,490,382 | 2/12/14 | 13,808 | — | |||||||||
| Swiss Franc | BONY | Buy | 353,427 | 398,680 | 2/12/14 | — | (2,342 | ) | ||||||||
| Swiss Franc | BBU | Buy | 8,730,407 | 9,761,777 | 2/12/14 | 28,606 | — | |||||||||
| Swiss Franc | FBCO | Buy | 394,608 | 424,378 | 2/12/14 | 18,140 | — | |||||||||
| South Korean Won | BANT | Sell | 4,864,815,741 | 4,330,212 | 2/12/14 | — | (264,634 | ) | ||||||||
| Swiss Franc | BANT | Sell | 61,166,916 | 66,874,550 | 2/12/14 | 26,930 | (1,745,693 | ) | ||||||||
| Swiss Franc | BBU | Sell | 9,614,174 | 10,621,754 | 2/12/14 | — | (159,696 | ) | ||||||||
| South Korean Won | FBCO | Sell | 12,421,576,282 | 11,171,477 | 2/12/14 | — | (560,771 | ) | ||||||||
| Swiss Franc | FBCO | Sell | 10,086,728 | 11,096,371 | 2/12/14 | — | (215,007 | ) | ||||||||
| South Korean Won | DBFX | Sell | 8,943,883,649 | 7,961,761 | 2/12/14 | — | (485,787 | ) | ||||||||
| South Korean Won | HSBC | Sell | 14,154,558,722 | 13,124,945 | 2/12/14 | 2,092 | (246,206 | ) | ||||||||
| Swiss Franc | HSBC | Sell | 1,619,857 | 1,731,786 | 2/12/14 | — | (84,741 | ) | ||||||||
| Swiss Franc | SCBT | Sell | 8,702,007 | 9,604,654 | 2/12/14 | — | (153,881 | ) | ||||||||
| Danish Krone | BONY | Buy | 4,222,816 | 762,684 | 2/14/14 | 16,191 | — | |||||||||
| Danish Krone | BANT | Sell | 290,319,238 | 52,419,014 | 2/14/14 | — | (1,128,796 | ) | ||||||||
| Danish Krone | BBU | Sell | 4,489,051 | 830,803 | 2/14/14 | 2,822 | — | |||||||||
| British Pound | BANT | Buy | 6,238,310 | 10,044,523 | 2/19/14 | 281,996 | — | |||||||||
| British Pound | BBU | Buy | 659,510 | 1,067,887 | 2/19/14 | 23,827 | — | |||||||||
| British Pound | SSBT | Buy | 439,185 | 707,324 | 2/19/14 | 19,675 | — | |||||||||
| British Pound | BANT | Sell | 39,435,881 | 62,065,915 | 2/19/14 | — | (3,213,841 | ) | ||||||||
| British Pound | BBU | Sell | 26,324,019 | 41,848,828 | 2/19/14 | — | (1,726,349 | ) | ||||||||
| Annual Report | 31 | ||||||||||||||||
| Mutual Beacon Fund | |||||||||||
| Statement of Investments, December 31, 2013 (continued) | |||||||||||
| Forward Exchange Contracts (continued) | |||||||||||
| Contract | Settlement | Unrealized | Unrealized | ||||||||
| Currency | Counterpartya Type | Quantity | Amount | Date | Appreciation | Depreciation | |||||
| Euro | BANT | Sell | 728,668 | $ | 969,492 | 2/28/14 | $ | — | $ | (32,790 | ) |
| Euro | BONY | Sell | 214,536 | 282,151 | 2/28/14 | — | (12,944 | ) | |||
| Euro | FBCO | Sell | 4,038,534 | 5,393,878 | 2/28/14 | — | (161,123 | ) | |||
| Euro | HSBC | Sell | 2,691,980 | 3,619,187 | 2/28/14 | — | (83,629 | ) | |||
| Euro | SCBT | Sell | 1,543,133 | 2,069,830 | 2/28/14 | — | (52,748 | ) | |||
| Euro | SSBT | Sell | 563,414 | 755,630 | 2/28/14 | — | (19,345 | ) | |||
| Euro | BANT | Buy | 5,813,231 | 7,953,049 | 4/16/14 | 43,580 | (540 | ) | |||
| Euro | BONY | Buy | 505,618 | 695,786 | 4/16/14 | — | (309 | ) | |||
| Euro | BBU | Buy | 291,110 | 400,073 | 4/16/14 | 348 | — | ||||
| Euro | HSBC | Buy | 533,598 | 733,011 | 4/16/14 | 1,301 | (349 | ) | |||
| Euro | SCBT | Buy | 4,999,520 | 6,850,213 | 4/16/14 | 29,009 | (2,391 | ) | |||
| Euro | SSBT | Buy | 237,981 | 327,315 | 4/16/14 | 28 | — | ||||
| Euro | BANT | Sell | 36,791,152 | 50,003,774 | 4/16/14 | — | (602,396 | ) | |||
| Euro | BONY | Sell | 176,497 | 241,529 | 4/16/14 | — | (1,242 | ) | |||
| Euro | BBU | Sell | 40,488,514 | 55,052,435 | 4/16/14 | — | (639,451 | ) | |||
| Euro | FBCO | Sell | 500,958 | 681,837 | 4/16/14 | — | (7,230 | ) | |||
| Euro | HSBC | Sell | 682,350 | 925,936 | 4/16/14 | — | (12,636 | ) | |||
| Euro | SCBT | Sell | 721,831 | 981,669 | 4/16/14 | — | (11,209 | ) | |||
| Euro | SSBT | Sell | 164,260 | 224,622 | 4/16/14 | — | (1,317 | ) | |||
| British Pound | BANT | Sell | 18,999,796 | 30,803,346 | 4/22/14 | — | (632,247 | ) | |||
| British Pound | BONY | Sell | 905,405 | 1,480,722 | 4/22/14 | — | (17,291 | ) | |||
| British Pound | FBCO | Sell | 16,180,906 | 26,083,620 | 4/22/14 | — | (688,055 | ) | |||
| British Pound | HSBC | Sell | 1,408,310 | 2,322,374 | 4/22/14 | — | (7,707 | ) | |||
| British Pound | SCBT | Sell | 28,316,585 | 45,646,335 | 4/22/14 | — | (1,204,097 | ) | |||
| Swedish Krona | BANT | Buy | 6,770,000 | 1,029,943 | 5/12/14 | 20,112 | — | ||||
| Swedish Krona | BANT | Sell | 183,884,300 | 27,853,856 | 5/12/14 | — | (667,350 | ) | |||
| Swedish Krona | BONY | Sell | 28,339,749 | 4,292,201 | 5/12/14 | — | (103,410 | ) | |||
| Swedish Krona | BBU | Sell | 66,351,160 | 10,113,506 | 5/12/14 | — | (177,830 | ) | |||
| Euro | BANT | Sell | 18,221,719 | 24,537,161 | 5/15/14 | 4,721 | (532,449 | ) | |||
| Euro | BONY | Sell | 851,806 | 1,175,359 | 5/15/14 | 3,657 | — | ||||
| Euro | BBU | Sell | 726,450 | 997,710 | 5/15/14 | 769 | (2,327 | ) | |||
| Euro | HSBC | Sell | 924,640 | 1,274,060 | 5/15/14 | 4,161 | (1,990 | ) | |||
| Euro | SCBT | Sell | 856,024 | 1,178,804 | 5/15/14 | 2,576 | (1,277 | ) | |||
| Euro | SSBT | Sell | 207,050 | 283,754 | 5/15/14 | — | (1,054 | ) | |||
| Euro | HSBC | Sell | 981,121 | 1,322,968 | 5/19/14 | — | (26,620 | ) | |||
| Euro | SCBT | Sell | 1,829,865 | 2,470,153 | 5/19/14 | — | (46,931 | ) | |||
| British Pound | BANT | Buy | 14,901,399 | 24,382,892 | 5/21/14 | 265,837 | — | ||||
| British Pound | BBU | Buy | 5,859,164 | 9,590,268 | 5/21/14 | 101,503 | — | ||||
| Norwegian Krone | BANT | Buy | 4,298,850 | 695,551 | 5/21/14 | 9,537 | — | ||||
| Norwegian Krone | BBU | Buy | 4,848,000 | 785,199 | 5/21/14 | 9,959 | — | ||||
| Norwegian Krone | BANT | Sell | 206,489,671 | 33,678,079 | 5/21/14 | — | (189,907 | ) | |||
| British Pound | BBU | Sell | 49,899,259 | 80,215,553 | 5/21/14 | — | (2,323,899 | ) | |||
| British Pound | HSBC | Sell | 35,228,605 | 56,647,597 | 5/21/14 | — | (1,624,807 | ) | |||
| Unrealized appreciation (depreciation) | 1,073,321 | (30,202,192 | ) | ||||||||
| Net unrealized appreciation (depreciation) | $ | (29,128,871 | ) | ||||||||
| aMay be comprised of multiple contracts using the same currency and settlement date. | |||||||||||
| See Abbreviations on page 59. | |||||||||||
| 32 | The accompanying notes are an integral part of these financial statements. | | Annual Report | ||||||||||
| Mutual Beacon Fund | |||
| Financial Statements | |||
| Statement of Assets and Liabilities | |||
| December 31, 2013 | |||
| Assets: | |||
| Investments in securities: | |||
| Cost - Unaffiliated issuers | $ | 3,177,718,840 | |
| Cost - Controlled affiliated issuers (Note 11) | 1,233,477 | ||
| Cost - Non-controlled affiliated issuers (Note 11) | 48,641,127 | ||
| Total cost of investments | $ | 3,227,593,444 | |
| Value - Unaffiliated issuers | $ | 4,334,969,899 | |
| Value - Controlled affiliated issuers (Note11) | 934,094 | ||
| Value - Non-controlled affiliated issuers (Note 11) | 24,133,917 | ||
| Total value of investments (includes securities loaned in the amount of $1,652,565) | 4,360,037,910 | ||
| Cash | 410,024 | ||
| Restricted Cash (Note 1e) | 2,524,000 | ||
| Foreign currency, at value (cost $26,916,355) | 26,886,684 | ||
| Receivables: | |||
| Investment securities sold | 2,273,858 | ||
| Capital shares sold | 1,183,833 | ||
| Dividends and interest | 18,936,694 | ||
| Due from brokers | 24,540,742 | ||
| Unrealized appreciation on forward exchange contracts | 1,073,321 | ||
| Other assets | 100 | ||
| Total assets | 4,437,867,166 | ||
| Liabilities: | |||
| Payables: | |||
| Investment securities purchased | 5,802,919 | ||
| Capital shares redeemed | 5,716,774 | ||
| Management fees | 2,187,506 | ||
| Administrative fees | 277,813 | ||
| Distribution fees | 1,120,658 | ||
| Transfer agent fees | 738,137 | ||
| Trustees’ fees and expenses | 212,894 | ||
| Variation margin | 173,763 | ||
| Securities sold short, at value (proceeds $23,097,587) | 23,996,782 | ||
| Due to brokers | 2,524,000 | ||
| Payable upon return of securities loaned | 1,698,820 | ||
| Unrealized depreciation on forward exchange contracts | 30,202,192 | ||
| Deferred tax | 8,455 | ||
| Accrued expenses and other liabilities | 292,044 | ||
| Total liabilities | 74,952,757 | ||
| Net assets, at value | $ | 4,362,914,409 | |
| Net assets consist of: | |||
| Paid-in capital | $ | 3,341,127,704 | |
| Undistributed net investment income | 34,607,622 | ||
| Net unrealized appreciation (depreciation) | 1,101,226,311 | ||
| Accumulated net realized gain (loss) | (114,047,228 | ) | |
| Net assets, at value | $ | 4,362,914,409 | |
Annual Report | The accompanying notes are an integral part of these financial statements. | 33
| Mutual Beacon Fund | |||
| Financial Statements (continued) | |||
| Statement of Assets and Liabilities (continued) | |||
| December 31, 2013 | |||
| Class Z: | |||
| Net assets, at value | $ | 2,876,321,624 | |
| Shares outstanding | 170,117,395 | ||
| Net asset value and maximum offering price per share | $ | 16.91 | |
| Class A: | |||
| Net assets, at value | $ | 1,148,408,828 | |
| Shares outstanding | 68,353,673 | ||
| Net asset value per sharea | $ | 16.80 | |
| Maximum offering price per share (net asset value per share ÷ 94.25%) | $ | 17.82 | |
| Class C: | |||
| Net assets, at value | $ | 336,222,103 | |
| Shares outstanding | 20,136,903 | ||
| Net asset value and maximum offering price per sharea | $ | 16.70 | |
| Class R: | |||
| Net assets, at value | $ | 1,956,132 | |
| Shares outstanding | 117,299 | ||
| Net asset value and maximum offering price per share | $ | 16.68 | |
| Class R6: | |||
| Net assets, at value | $ | 5,722 | |
| Shares outstanding | 339 | ||
| Net asset value and maximum offering price per share | $ | 16.88 | |
| aRedemption price is equal to net asset value less contingent deferred sales charges, if applicable. | |||
34 | The accompanying notes are an integral part of these financial statements. | Annual Report
| Mutual Beacon Fund | |||
| Financial Statements (continued) | |||
| Statement of Operations | |||
| for the year ended December 31, 2013 | |||
| Investment income: | |||
| Dividends: | |||
| Unaffiliated issuers | $ | 81,830,723 | |
| Non-controlled affiliated issuers (Note 11) | 588,715 | ||
| Interest | 32,805,759 | ||
| Income from securities loaned | 70,543 | ||
| Total investment income | 115,295,740 | ||
| Expenses: | |||
| Management fees (Note 3a) | 24,571,061 | ||
| Administrative fees (Note 3b) | 3,122,851 | ||
| Distribution fees: (Note 3c) | |||
| Class A | 3,215,366 | ||
| Class B | 1,651 | ||
| Class C | 3,175,836 | ||
| Class R | 9,194 | ||
| Transfer agent fees: (Note 3e) | |||
| Class Z | 2,812,603 | ||
| Class A | 1,114,869 | ||
| Class B | 194 | ||
| Class C | 330,560 | ||
| Class R | 1,912 | ||
| Class R6 | 51 | ||
| Custodian fees (Note 4) | 145,595 | ||
| Reports to shareholders | 238,334 | ||
| Registration and filing fees | 109,376 | ||
| Professional fees | 247,333 | ||
| Trustees’ fees and expenses | 116,288 | ||
| Dividends on securities sold short | 13,769 | ||
| Other | 68,118 | ||
| Total expenses | 39,294,961 | ||
| Expense reductions (Note 4) | (908 | ) | |
| Expenses waived/paid by affiliates (Note 3f) | (50 | ) | |
| Net expenses | 39,294,003 | ||
| Net investment income | 76,001,737 | ||
Annual Report | The accompanying notes are an integral part of these financial statements. | 35
| Mutual Beacon Fund | |||
| Financial Statements (continued) | |||
| Statement of Operations (continued) | |||
| for the year ended December 31, 2013 | |||
| Realized and unrealized gains (losses): | |||
| Net realized gain (loss) from: | |||
| Investments: | |||
| Unaffiliated issuers | $ | 382,188,964 | |
| Controlled affiliated issuers (Note 11) | 31,392 | ||
| Written options | 439,816 | ||
| Foreign currency transactions | (9,384,411 | ) | |
| Futures contracts | (6,876,999 | ) | |
| Net realized gain (loss) | 366,398,762 | ||
| Net change in unrealized appreciation (depreciation) on: | |||
| Investments | 599,618,776 | ||
| Translation of other assets and liabilities denominated in foreign currencies | (12,372,742 | ) | |
| Change in deferred taxes on unrealized appreciation | (8,455 | ) | |
| Net change in unrealized appreciation (depreciation) | 587,237,579 | ||
| Net realized and unrealized gain (loss) | 953,636,341 | ||
| Net increase (decrease) in net assets resulting from operations | $ | 1,029,638,078 | |
36 | The accompanying notes are an integral part of these financial statements. | Annual Report
| Mutual Beacon Fund | ||||||
| Financial Statements (continued) | ||||||
| Statements of Changes in Net Assets | ||||||
| Year Ended December 31, | ||||||
| 2013 | 2012 | |||||
| Increase (decrease) in net assets: | ||||||
| Operations: | ||||||
| Net investment income | $ | 76,001,737 | $ | 65,588,549 | ||
| Net realized gain (loss) from investments, written options, foreign currency transactions, | ||||||
| futures contracts and securities sold short | 366,398,762 | 327,115,629 | ||||
| Net change in unrealized appreciation (depreciation) on investments, translation of other | ||||||
| assets and liabilities denominated in foreign currencies and deferred taxes | 587,237,579 | 188,521,123 | ||||
| Net increase (decrease) in net assets resulting from operations | 1,029,638,078 | 581,225,301 | ||||
| Distributions to shareholders from: | ||||||
| Net investment income: | ||||||
| Class Z | (55,178,018 | ) | (44,549,983 | ) | ||
| Class A | (18,870,498 | ) | (15,179,473 | ) | ||
| Class B | — | (23,941 | ) | |||
| Class C | (3,387,637 | ) | (2,423,022 | ) | ||
| Class R | (27,980 | ) | (33,585 | ) | ||
| Class R6 | (115 | ) | — | |||
| Total distributions to shareholders | (77,464,248 | ) | (62,210,004 | ) | ||
| Capital share transactions: (Note 2) | ||||||
| Class Z | (202,452,718 | ) | (306,646,621 | ) | ||
| Class A | (84,966,969 | ) | (220,069,461 | ) | ||
| Class B | (1,429,101 | ) | (9,738,275 | ) | ||
| Class C | (33,769,334 | ) | (61,639,577 | ) | ||
| Class R | (387,734 | ) | (466,843 | ) | ||
| Class R6 | 5,000 | — | ||||
| Total capital share transactions | (323,000,856 | ) | (598,560,777 | ) | ||
| Net increase (decrease) in net assets | 629,172,974 | (79,545,480 | ) | |||
| Net assets: | ||||||
| Beginning of year | 3,733,741,435 | 3,813,286,915 | ||||
| End of year | $ | 4,362,914,409 | $ | 3,733,741,435 | ||
| Undistributed net investment income included in net assets: | ||||||
| End of year | $ | 34,607,622 | $ | 38,445,635 | ||
Annual Report | The accompanying notes are an integral part of these financial statements. | 37
Mutual Beacon Fund
Notes to Financial Statements
1. ORGANIZATION AND SIGNIFICANT ACCOUNTING POLICIES
Franklin Mutual Series Funds (Trust) is registered under the Investment Company Act of 1940, as amended, (1940 Act) as an open-end investment company, consisting of seven separate funds. The Mutual Beacon Fund (Fund) is included in this report. The financial statements of the remaining funds in the Trust are presented separately. The Fund offers five classes of shares: Class Z, Class A, Class C, Class R and Class R6. Effective May 1, 2013, the Fund began offering a new class of shares, Class R6. Effective March 22, 2013, all Class B shares were converted to Class A. Each class of shares differs by its initial sales load, contingent deferred sales charges, voting rights on matters affecting a single class, its exchange privilege and fees primarily due to differing arrangements for distribution and transfer agent fees.
The following summarizes the Fund’s significant accounting policies.
a. Financial Instrument Valuation
The Fund’s investments in financial instruments are carried at fair value daily. Fair value is the price that would be received to sell an asset or paid to transfer a liability in an orderly transaction between market participants on the measurement date. The Fund calculates the net asset value (NAV) per share at the close of the New York Stock Exchange (NYSE), generally at 4p.m. Eastern time (NYSE close) on each day the NYSE is open for trading. Under procedures approved by the Trust’s Board of Trustees (the Board), the Fund’s administrator, investment manager and other affiliates have formed the Valuation and Liquidity Oversight Committee (VLOC). The VLOC provides administration and oversight of the Fund’s valuation policies and procedures, which are approved annually by the Board. Among other things, these procedures allow the Fund to utilize independent pricing services, quotations from securities and financial instrument dealers, and other market sources to determine fair value.
Equity securities and derivative financial instruments (derivatives) listed on an exchange or on the NASDAQ National Market System are valued at the last quoted sale price or the official closing price of the day, respectively. Foreign equity securities are valued as of the close of trading on the foreign stock exchange on which the security is primarily traded or as of the NYSE close, whichever is earlier. The value is then converted into its U.S. dollar equivalent at the foreign exchange rate in effect at the NYSE close on the day that the value of the security is determined. Over-the-counter (OTC) securities are valued within the range of the most recent quoted bid and ask prices. Securities that trade in multiple markets or on multiple exchanges are valued according to the broadest and most representative market. Certain equity securities are valued based upon fundamental characteristics or relationships to similar securities. Investments in non-registered money market funds are valued at the closing net asset value.
Debt securities generally trade in the OTC market rather than on a securities exchange. The Fund’s pricing services use multiple valuation techniques to determine fair value. In instances where sufficient market activity exists, the pricing services may utilize a market-based approach through which quotes from market makers are used to determine fair value. In instances where
38 | Annual Report
Mutual Beacon Fund
Notes to Financial Statements (continued)
| 1. | ORGANIZATION AND SIGNIFICANT ACCOUNTING POLICIES (continued) |
| a. | Financial Instrument Valuation (continued) |
sufficient market activity may not exist or is limited, the pricing services also utilize proprietary valuation models which may consider market characteristics such as benchmark yield curves, credit spreads, estimated default rates, anticipated market interest rate volatility, coupon rates, anticipated timing of principal repayments, underlying collateral, and other unique security features in order to estimate the relevant cash flows, which are then discounted to calculate the fair value. Securities denominated in a foreign currency are converted into their U.S. dollar equivalent at the foreign exchange rate in effect at the NYSE close on the date that the values of the foreign debt securities are determined.
Certain derivatives trade in the OTC market. The Fund’s pricing services use various techniques including industry standard option pricing models and proprietary discounted cash flow models to determine the fair value of those instruments. The Fund’s net benefit or obligation under the derivative contract, as measured by the fair value of the contract, is included in net assets.
The Fund has procedures to determine the fair value of financial instruments for which market prices are not reliable or readily available. Under these procedures, the VLOC convenes on a regular basis to review such financial instruments and considers a number of factors, including significant unobservable valuation inputs, when arriving at fair value. The VLOC primarily employs a market-based approach which may use related or comparable assets or liabilities, recent transactions, market multiples, book values, and other relevant information for the investment to determine the fair value of the investment. An income-based valuation approach may also be used in which the anticipated future cash flows of the investment are discounted to calculate fair value. Discounts may also be applied due to the nature or duration of any restrictions on the disposition of the investments. Due to the inherent uncertainty of valuations of such investments, the fair values may differ significantly from the values that would have been used had an active market existed. The VLOC employs various methods for calibrating these valuation approaches including a regular review of key inputs and assumptions, transactional back-testing or disposition analysis, and reviews of any related market activity.
Trading in securities on foreign securities stock exchanges and OTC markets may be completed before the daily NYSE close. In addition, trading in certain foreign markets may not take place on every NYSE business day. Occasionally, events occur between the time at which trading in a foreign security is completed and the close of the NYSE that might call into question the reliability of the value of a portfolio security held by the Fund. As a result, differences may arise between the value of the Fund’s portfolio securities as determined at the foreign market close and the latest indications of value at the close of the NYSE. In order to minimize the potential for these differences, the VLOC monitors price movements following the close of trading in foreign stock markets through a series of country specific market proxies (such as baskets of American Depositary Receipts, futures contracts and exchange traded funds). These price movements are measured against established trigger thresholds for each specific market proxy to assist in determining if an
Annual Report | 39
Mutual Beacon Fund
Notes to Financial Statements (continued)
| 1. | ORGANIZATION AND SIGNIFICANT ACCOUNTING POLICIES (continued) |
| a. | Financial Instrument Valuation (continued) |
event has occurred that may call into question the reliability of the values of the foreign securities held by the Fund. If such an event occurs, the securities may be valued using fair value procedures, which may include the use of independent pricing services.
Also, when the last day of the reporting period is a non-business day, certain foreign markets may be open on those days that the NYSE is closed, which could result in differences between the value of the Fund’s portfolio securities on the last business day and the last calendar day of the reporting period. Any significant security valuation changes due to an open foreign market are adjusted and reflected by the Fund for financial reporting purposes.
b. Foreign Currency Translation
Portfolio securities and other assets and liabilities denominated in foreign currencies are translated into U.S. dollars based on the exchange rate of such currencies against U.S. dollars on the date of valuation. The Fund may enter into foreign currency exchange contracts to facilitate transactions denominated in a foreign currency. Purchases and sales of securities, income and expense items denominated in foreign currencies are translated into U.S. dollars at the exchange rate in effect on the transaction date. Portfolio securities and assets and liabilities denominated in foreign currencies contain risks that those currencies will decline in value relative to the U.S. dollar. Occasionally, events may impact the availability or reliability of foreign exchange rates used to convert the U.S. dollar equivalent value. If such an event occurs, the foreign exchange rate will be valued at fair value using procedures established and approved by the Board.
The Fund does not separately report the effect of changes in foreign exchange rates from changes in market prices on securities held. Such changes are included in net realized and unrealized gain or loss from investments on the Statement of Operations.
Realized foreign exchange gains or losses arise from sales of foreign currencies, currency gains or losses realized between the trade and settlement dates on securities transactions and the difference between the recorded amounts of dividends, interest, and foreign withholding taxes and the U.S. dollar equivalent of the amounts actually received or paid. Net unrealized foreign exchange gains and losses arise from changes in foreign exchange rates on foreign denominated assets and liabilities other than investments in securities held at the end of the reporting period.
c. Securities Purchased on a Delayed Delivery Basis
The Fund purchases securities on a delayed delivery basis, with payment and delivery scheduled for a future date. These transactions are subject to market fluctuations and are subject to the risk that the value at delivery may be more or less than the trade date purchase price. Although the Fund will generally purchase these securities with the intention of holding the securities, it may sell the securities before the settlement date. Sufficient assets have been segregated for these securities.
40 | Annual Report
Mutual Beacon Fund
Notes to Financial Statements (continued)
| 1. | ORGANIZATION AND SIGNIFICANT ACCOUNTING POLICIES (continued) |
| d. | Derivative Financial Instruments |
The Fund invested in derivatives in order to manage risk or gain exposure to various other investments or markets. Derivatives are financial contracts based on an underlying or notional amount, require no initial investment or an initial net investment that is smaller than would normally be required to have a similar response to changes in market factors, and require or permit net settlement. Derivatives contain various risks including the potential inability of the counterparty to fulfill their obligations under the terms of the contract, the potential for an illiquid secondary market, and/or the potential for market movements which expose the Fund to gains or losses in excess of the amounts shown on the Statement of Assets and Liabilities. Realized gain and loss and unrealized appreciation and depreciation on these contracts for the period are included in the Statement of Operations.
Derivative counterparty credit risk is managed through a formal evaluation of the creditworthi-ness of all potential counterparties. The Fund attempts to reduce its exposure to counterparty credit risk on OTC derivatives, whenever possible, by entering into International Swaps and Derivatives Association (ISDA) master agreements with certain counterparties. These agreements contain various provisions, including but not limited to collateral requirements, events of default, or early termination. Termination events applicable to the counterparty include certain deteriorations in the credit quality of the counterparty. Termination events applicable to the Fund include failure of the Fund to maintain certain net asset levels and/or limit the decline in net assets over various periods of time. In the event of default or early termination, the ISDA master agreement gives the non-defaulting party the right to net and close-out all transactions traded, whether or not arising under the ISDA agreement, to one net amount payable by one counterparty to the other. However, absent an event of default or early termination, OTC derivative assets and liabilities are presented gross and not offset in the Statement of Assets and Liabilities. Early termination by the counterparty may result in an immediate payment by the Fund of any net liability owed to that counterparty under the ISDA agreement.
Collateral requirements differ by type of derivative. Collateral or initial margin requirements are set by the broker or exchange clearing house for exchange traded and centrally cleared derivatives. Initial margin deposited is held at the exchange and can be in the form of cash and/or securities. For OTC derivatives traded under an ISDA master agreement, posting of collateral is required by either the Fund or the applicable counterparty if the total net exposure of all OTC derivatives with the applicable counterparty exceeds the minimum transfer amount, which typically ranges from $100,000 to $250,000, and can vary depending on the counterparty and the type of the agreement. Generally, collateral is determined at the close of fund business each day and any additional collateral required due to changes in derivative values may be delivered by the Fund or the counterparty within a few business days. Collateral pledged and/or received by the Fund for OTC derivatives, if any, is held in segregated accounts with the Fund’s custodian/ counterparty broker and can be in the form of cash and/or securities. Unrestricted cash may be invested according to the Fund’s investment objectives.
Annual Report | 41
Mutual Beacon Fund
Notes to Financial Statements (continued)
| 1. | ORGANIZATION AND SIGNIFICANT ACCOUNTING POLICIES (continued) |
| d. | Derivative Financial Instruments (continued) |
The Fund entered into exchange traded futures contracts primarily to manage exposure to certain foreign currencies. A futures contract is an agreement between the Fund and a counterparty to buy or sell an asset for a specified price on a future date. Required initial margins are pledged by the Fund, and the daily change in fair value is accounted for as a variation margin payable or receivable on the Statement of Assets and Liabilities.
The Fund entered into OTC forward exchange contracts primarily to manage exposure to certain foreign currencies. A forward exchange contract is an agreement between the Fund and a coun-terparty to buy or sell a foreign currency at a specific exchange rate on a future date.
The Fund purchased or wrote exchange traded and/or OTC option contracts primarily to manage and/or gain exposure to equity price, interest rate and foreign exchange rate risk. An option is a contract entitling the holder to purchase or sell a specific amount of shares or units of an asset or notional amount of a swap (swaption), at a specified price. Options purchased are recorded as an asset while options written are recorded as a liability. Upon exercise of an option, the acquisition cost or sales proceeds of the underlying investment is adjusted by any premium received or paid. Upon expiration of an option, any premium received or paid is recorded as a realized gain or loss. Upon closing an option other than through expiration or exercise, the difference between the premium and the cost to close the position is recorded as a realized gain or loss.
See Notes 7 and 10 regarding investment transactions and other derivative information, respectively.
e. Restricted Cash
At December 31, 2013, the Fund received restricted cash in connection with investments in certain derivative securities. Restricted cash is held in a segregated account with the Fund’s custodian/counterparty broker and is reflected in the Statement of Assets and Liabilities.
f. Securities Sold Short
The Fund is engaged in selling securities short, which obligates the Fund to replace a borrowed security with the same security at current market value. The Fund incurs a loss if the price of the security increases between the date of the short sale and the date on which the Fund replaces the borrowed security. The Fund realizes a gain if the price of the security declines between those dates. Gains are limited to the price at which the Fund sold the security short, while losses are potentially unlimited in size.
The Fund is required to establish a margin account with the broker lending the security sold short. While the short sale is outstanding, the broker retains the proceeds of the short sale to the extent necessary to meet margin requirements until the short position is closed out. A deposit must also be maintained with the Fund’s custodian/counterparty broker consisting of cash and/or securities having a value equal to a specified percentage of the value of the securities
42 | Annual Report
Mutual Beacon Fund
Notes to Financial Statements (continued)
| 1. | ORGANIZATION AND SIGNIFICANT ACCOUNTING POLICIES (continued) |
| f. | Securities Sold Short (continued) |
sold short. The Fund is obligated to pay fees for borrowing the securities sold short and is required to pay the counterparty any dividends or interest due on securities sold short. Such dividends or interest and any security borrowing fees are recorded as an expense to the Fund.
g. Securities Lending
The Fund participates in an agency based securities lending program. The Fund receives cash collateral against the loaned securities in an amount equal to at least 102% of the market value of the loaned securities. Collateral is maintained over the life of the loan in an amount not less than 100% of the market value of loaned securities, as determined at the close of fund business each day; any additional collateral required due to changes in security values is delivered to the Fund on the next business day. The collateral is invested in a non-registered money fund as indicated on the Statement of Investments. The Fund receives income from the investment of cash collateral, in addition to lending fees and rebates paid by the borrower. The Fund bears the market risk with respect to the collateral investment, securities loaned, and the risk that the agent may default on its obligations to the Fund. The securities lending agent has agreed to indemnify the Fund in the event of default by a third party borrower.
h. Senior Floating Rate Interests
The Fund invests in senior secured corporate loans that pay interest at rates which are periodically reset by reference to a base lending rate plus a spread. These base lending rates are generally the prime rate offered by a designated U.S. bank or the London InterBank Offered Rate (LIBOR). Senior secured corporate loans often require prepayment of principal from excess cash flows or at the discretion of the borrower. As a result, actual maturity may be substantially less than the stated maturity.
Senior secured corporate loans in which the Fund invests are generally readily marketable, but may be subject to certain restrictions on resale.
i. Income and Deferred Taxes
It is the Fund’s policy to qualify as a regulated investment company under the Internal Revenue Code. The Fund intends to distribute to shareholders substantially all of its taxable income and net realized gains to relieve it from federal income and excise taxes. As a result, no provision for U.S. federal income taxes is required.
The Fund may be subject to foreign taxation related to income received, capital gains on the sale of securities and certain foreign currency transactions in the foreign jurisdictions in which it invests. Foreign taxes, if any, are recorded based on the tax regulations and rates that exist in the foreign markets in which the Fund invests. When a capital gain tax is determined to apply the Fund records an estimated deferred tax liability in an amount that would be payable if the securities were disposed of on the valuation date.
Annual Report | 43
Mutual Beacon Fund
Notes to Financial Statements (continued)
| 1. | ORGANIZATION AND SIGNIFICANT ACCOUNTING POLICIES (continued) |
| i. | Income and Deferred Taxes (continued) |
The Fund recognizes the tax benefits of uncertain tax positions only when the position is “more likely than not” to be sustained upon examination by the tax authorities based on the technical merits of the tax position. As of December 31, 2013, and for all open tax years, the Fund has determined that no liability for unrecognized tax benefits is required in the Fund’s financial statements related to uncertain tax positions taken on a tax return (or expected to be taken on future tax returns). Open tax years are those that remain subject to examination and are based on each tax jurisdiction statute of limitation.
j. Security Transactions, Investment Income, Expenses and Distributions
Security transactions are accounted for on trade date. Realized gains and losses on security transactions are determined on a specific identification basis. Interest income and estimated expenses are accrued daily. Amortization of premium and accretion of discount on debt securities are included in interest income. Dividend income and dividends declared on securities sold short are recorded on the ex-dividend date except that certain dividends from foreign securities are recognized as soon as the Fund is notified of the ex-dividend date. Distributions to shareholders are recorded on the ex-dividend date and are determined according to income tax regulations (tax basis). Distributable earnings determined on a tax basis may differ from earnings recorded in accordance with accounting principles generally accepted in the United States of America. These differences may be permanent or temporary. Permanent differences are reclassified among capital accounts to reflect their tax character. These reclassifications have no impact on net assets or the results of operations. Temporary differences are not reclassified, as they may reverse in subsequent periods.
Common expenses incurred by the Trust are allocated among the funds based on the ratio of net assets of each fund to the combined net assets of the Trust. Fund specific expenses are charged directly to the fund that incurred the expense.
Realized and unrealized gains and losses and net investment income, not including class specific expenses, are allocated daily to each class of shares based upon the relative proportion of net assets of each class. Differences in per share distributions, by class, are generally due to differences in class specific expenses.
Distributions received by the Fund from certain securities may be a return of capital (ROC). Such distributions reduce the cost basis of the securities, and any distributions in excess of the cost basis are recognized as capital gains.
44 | Annual Report
Mutual Beacon Fund
Notes to Financial Statements (continued)
| 1. | ORGANIZATION AND SIGNIFICANT ACCOUNTING POLICIES (continued) |
| k. | Accounting Estimates |
The preparation of financial statements in accordance with accounting principles generally accepted in the United States of America requires management to make estimates and assumptions that affect the reported amounts of assets and liabilities at the date of the financial statements and the amounts of income and expenses during the reporting period. Actual results could differ from those estimates.
l. Guarantees and Indemnifications
Under the Trust’s organizational documents, its officers and trustees are indemnified by the Trust against certain liabilities arising out of the performance of their duties to the Trust. Additionally, in the normal course of business, the Trust, on behalf of the Fund, enters into contracts with service providers that contain general indemnification clauses. The Trust’s maximum exposure under these arrangements is unknown as this would involve future claims that may be made against the Trust that have not yet occurred. Currently, the Trust expects the risk of loss to be remote.
2. SHARES OF BENEFICIAL INTEREST
At December 31, 2013, there were an unlimited number of shares authorized (without par value). Transactions in the Fund’s shares were as follows:
| Year Ended December 31, | ||||||||||||
| 2013 | 2012 | |||||||||||
| Shares | Amount | Shares | Amount | |||||||||
| Class Z Shares: | ||||||||||||
| Shares sold | 5,766,527 | $ | 88,484,550 | 6,033,846 | $ | 77,047,538 | ||||||
| Shares issued in reinvestment of | ||||||||||||
| distributions | 3,192,842 | 51,701,130 | 3,100,559 | 41,435,724 | ||||||||
| Shares redeemed | (22,237,269 | ) | (342,638,398 | ) | (33,245,503 | ) | (425,129,883 | ) | ||||
| Net increase (decrease) | (13,277,900 | ) | $ | (202,452,718 | ) | (24,111,098 | ) | $ | (306,646,621 | ) | ||
| Class A Shares: | ||||||||||||
| Shares sold | 6,524,792 | $ | 99,232,404 | 6,494,698 | $ | 82,298,658 | ||||||
| Shares issued in reinvestment of | ||||||||||||
| distributions | 1,140,730 | 18,260,693 | 1,107,862 | 14,671,619 | ||||||||
| Shares redeemed | (13,397,621 | ) | (202,460,066 | ) | (25,052,269 | ) | (317,039,738 | ) | ||||
| Net increase (decrease) | (5,732,099 | ) | $ | (84,966,969 | ) | (17,449,709 | ) | $ | (220,069,461 | ) | ||
| Class B Sharesa: | ||||||||||||
| Shares sold | 8 | $ | 118 | 8,564 | $ | 106,832 | ||||||
| Shares issued in reinvestment of | ||||||||||||
| distributions | — | — | 1,674 | 21,631 | ||||||||
| Shares redeemed | (102,482 | ) | (1,429,219 | ) | (793,560 | ) | (9,866,738 | ) | ||||
| Net increase (decrease) | (102,474 | ) | $ | (1,429,101 | ) | (783,322 | ) | $ | (9,738,275 | ) | ||
Annual Report | 45
| Mutual Beacon Fund | ||||||||||
| Notes to Financial Statements (continued) | ||||||||||
| 2. SHARES OF BENEFICIAL INTEREST (continued) | ||||||||||
| Year Ended December 31, | ||||||||||
| 2013 | 2012 | |||||||||
| Shares | Amount | Shares | Amount | |||||||
| Class C Shares: | ||||||||||
| Shares sold | 1,182,680 | $ | 17,946,283 | 1,042,329 | $ | 13,107,853 | ||||
| Shares issued in reinvestment of | ||||||||||
| distributions | 204,523 | 3,174,069 | 173,772 | 2,256,012 | ||||||
| Shares redeemed | (3,662,772 | ) | (54,889,686 | ) | (6,134,184 | ) | (77,003,442 | ) | ||
| Net increase (decrease) | (2,275,569 | ) | $ | (33,769,334 | ) | (4,918,083 | ) | $ | (61,639,577 | ) |
| Class R Shares: | ||||||||||
| Shares sold | 18,668 | $ | 278,978 | 83,478 | $ | 1,032,374 | ||||
| Shares issued in reinvestment of | ||||||||||
| distributions | 1,768 | 27,980 | 2,566 | 33,585 | ||||||
| Shares redeemed | (47,578 | ) | (694,692 | ) | (118,562 | ) | (1,532,802 | ) | ||
| Net increase (decrease) | (27,142 | ) | $ | (387,734 | ) | (32,518 | ) | $ | (466,843 | ) |
| Class R6 Sharesb: | ||||||||||
| Shares sold | 339 | $ | 5,000 | |||||||
| aEffective March 22, 2013, all Class B shares were converted to Class A. | ||||||||||
| bFor the period May 1, 2013 (effective date) to December 31, 2013. | ||||||||||
3. TRANSACTIONS WITH AFFILIATES
Franklin Resources, Inc. is the holding company for various subsidiaries that together are referred to as Franklin Templeton Investments. Certain officers and trustees of the Fund are also officers and/or directors of the following subsidiaries:
| Subsidiary | Affiliation |
| Franklin Mutual Advisers, LLC (Franklin Mutual) | Investment manager |
| Franklin Templeton Services, LLC (FT Services) | Administrative manager |
| Franklin Templeton Distributors, Inc. (Distributors) | Principal underwriter |
| Franklin Templeton Investor Services, LLC (Investor Services) | Transfer agent |
a. Management Fees
The Fund pays an investment management fee to Franklin Mutual based on the average daily net assets of the Fund as follows:
| 0.600 | % | Up to and including $5 billion |
| 0.570 | % | Over $5 billion, up to and including $7 billion |
| 0.550 | % | Over $7 billion, up to and including $10 billion |
| 0.540 | % | In excess of $10 billion |
46 | Annual Report
Mutual Beacon Fund
Notes to Financial Statements (continued)
| 3. | TRANSACTIONS WITH AFFILIATES (continued) |
| b. | Administrative Fees |
The Fund pays its allocated share of an administrative fee to FT Services based on the Trust’s aggregate average daily net assets as follows:
| Annualized Fee Rate | Net Assets | |
| 0.150 | % | Up to and including $200 million |
| 0.135 | % | Over $200 million, up to and including $700 million |
| 0.100 | % | Over $700 million, up to and including $1.2 billion |
| 0.075 | % | In excess of $1.2 billion |
c. Distribution Fees
The Board has adopted distribution plans for each share class, with the exception of Class Z and Class R6 shares, pursuant to Rule 12b-1 under the 1940 Act. Distribution fees are not charged on shares held by affiliates. Under the Fund’s Class A reimbursement distribution plan, the Fund reimburses Distributors for costs incurred in connection with the servicing, sale and distribution of the Fund’s shares up to the maximum annual plan rate. Under the Class A reimbursement distribution plan, costs exceeding the maximum for the current plan year cannot be reimbursed in subsequent periods. In addition, under the Fund’s Class B, C and R compensation distribution plans, the Fund pays Distributors for costs incurred in connection with the servicing, sale and distribution of the Fund’s shares up to the maximum annual plan rate for each class. The plan year, for purposes of monitoring compliance with the maximum annual plan rates, is February 1 through January 31.
The maximum annual plan rates, based on the average daily net assets, for each class, are as follows:
| Class A | 0.35 | % |
| Class B | 1.00 | % |
| Class C | 1.00 | % |
| Class R | 0.50 | % |
The Board has set the current rate at 0.30% per year for Class A shares until further notice and approval by the Board.
d. Sales Charges/Underwriting Agreements
Front-end sales charges and contingent deferred sales charges (CDSC) do not represent expenses of the Fund. These charges are deducted from the proceeds of sales of Fund shares prior to investment or from redemption proceeds prior to remittance, as applicable. Distributors has advised the Fund of the following commission transactions related to the sales and redemptions of the Fund’s shares for the year:
| Sales charges retained net of commissions paid to unaffiliated | ||
| broker/dealers | $ | 255,480 |
| CDSC retained | $ | 8,835 |
Annual Report | 47
Mutual Beacon Fund
Notes to Financial Statements (continued)
| 3. | TRANSACTIONS WITH AFFILIATES (continued) |
| e. | Transfer Agent Fees |
Each class of shares, except for Class R6, pays transfer agent fees to Investor Services for its performance of shareholder servicing obligations and reimburses Investor Services for out of pocket expenses incurred, including shareholding servicing fees paid to third parties. These fees are allocated daily based upon their relative proportion of such classes’ aggregate net assets. Class R6 pays Investor Services transfer agent fees specific to that class.
For the year ended December 31, 2013, the Fund paid transfer agent fees of $4,260,189, of which $1,968,024 was retained by Investor Services.
f. Waiver and Expense Reimbursements
Investor Services has contractually agreed in advance to waive or limit its fees so that the Class R6 transfer agent fees do not exceed 0.01% until April 30, 2014.
4. EXPENSE OFFSET ARRANGEMENT
The Fund has entered into an arrangement with its custodian whereby credits realized as a result of uninvested cash balances are used to reduce a portion of the Fund’s custodian expenses. During the year ended December 31, 2013, the custodian fees were reduced as noted in the Statement of Operations.
5. INDEPENDENT TRUSTEES’ RETIREMENT PLAN
On January 1, 1993, the Trust adopted an Independent Trustees’ Retirement Plan (Plan). The Plan is an unfunded defined benefit plan that provides benefit payments to Trustees whose length of service and retirement age meets the eligibility requirements of the Plan. Benefits under the Plan are based on years of service and fees paid to each trustee at the time of retirement. Effective in December 1996, the Plan was closed to new participants.
During the year ended December 31, 2013, the Fund’s projected benefit obligation and benefit payments under the Plan were as follows:
| aProjected benefit obligation at December 31, 2013 | $ | 212,894 |
| bDecrease in projected benefit obligation | $ | 4,338 |
| Benefit payments made to retired trustees | $ | 4,934 |
aThe projected benefit obligation is included in accrued expenses and other liabilities in the Statement of Assets and Liabilities.
bThe decrease in projected benefit obligation is included in trustees’ fees and expenses in the Statement of Operations.
48 | Annual Report
Mutual Beacon Fund
Notes to Financial Statements (continued)
6. INCOME TAXES
For tax purposes, capital losses may be carried over to offset future capital gains. Capital loss carryforwards with no expiration, if any, must be fully utilized before those losses with expiration dates.
At December 31, 2013, the Fund had capital loss carryforwards of $139,540,058 expiring in 2017. During the year ended December 31, 2013, the Fund utilized $349,399,796 of capital loss carryforwards.
The tax character of distributions paid during the years ended December 31, 2013 and 2012, was as follows:
| 2013 | 2012 | |||
| Distributions paid from ordinary income | $ | 77,464,248 | $ | 62,210,004 |
At December 31, 2013, the cost of investments, net unrealized appreciation (depreciation) and undistributed ordinary income for income tax purposes were as follows:
| Cost of investments | $ | 3,238,470,783 | |
| Unrealized appreciation | $ | 1,251,189,634 | |
| Unrealized depreciation | (129,622,507 | ) | |
| Net unrealized appreciation (depreciation) | $ | 1,121,567,127 | |
| Distributable earnings - undistributed ordinary income | $ | 41,975,241 | |
Differences between income and/or capital gains as determined on a book basis and a tax basis are primarily due to differing treatments of foreign currency transactions, corporate actions and wash sales.
7. INVESTMENT TRANSACTIONS
Purchases and sales of investments (excluding short term securities and securities sold short) for the year ended December 31, 2013, aggregated $1,227,950,812 and $1,588,126,214, respectively.
Transactions in options written during the year ended December 31, 2013, were as follows:
| Number of | Premiums | ||||
| Contracts | Received | ||||
| Options outstanding at December 31, 2012 | 23,172 | $ | 704,427 | ||
| Options written | — | — | |||
| Options expired | (14,048 | ) | (221,256 | ) | |
| Options exercised | (2,100 | ) | (165,845 | ) | |
| Options closed | (7,024 | ) | (317,326 | ) | |
| Options outstanding at December 31, 2013 | — | $ | — |
Annual Report | 49
Mutual Beacon Fund
Notes to Financial Statements (continued)
7. INVESTMENT TRANSACTIONS (continued)
See Notes 1(d) and 10 regarding derivative financial instruments and other derivative information, respectively.
8. CREDIT RISK AND DEFAULTED SECURITIES
The Fund may purchase the pre-default or defaulted debt of distressed companies. Distressed companies are financially troubled and are about to be or are already involved in financial restructuring or bankruptcy. Risks associated with purchasing these securities include the possibility that the bankruptcy or other restructuring process takes longer than expected, or that distributions in restructuring are less than anticipated, either or both of which may result in unfavorable consequences to the Fund. If it becomes probable that the income on debt securities, including those of distressed companies, will not be collected, the Fund discontinues accruing income and recognizes an adjustment for uncollectible interest.
At December 31, 2013, the aggregate value of distressed company securities for which interest recognition has been discontinued was $12,002,040, representing 0.28% of the Fund’s net assets. For information as to specific securities, see the accompanying Statement of Investments.
9. RESTRICTED SECURITIES
The Fund invests in securities that are restricted under the Securities Act of 1933 (1933 Act) or which are subject to legal, contractual, or other agreed upon restrictions on resale. Restricted securities are often purchased in private placement transactions, and cannot be sold without prior registration unless the sale is pursuant to an exemption under the 1933 Act. Disposal of these securities may require greater effort and expense, and prompt sale at an acceptable price may be difficult. The Fund may have registration rights for restricted securities. The issuer generally incurs all registration costs.
50 | Annual Report
Mutual Beacon Fund
Notes to Financial Statements (continued)
9. RESTRICTED SECURITIES (continued)
At December 31, 2013, the Fund held investments in restricted securities, excluding certain securities exempt from registration under the 1933 Act deemed to be liquid, as follows:
| Principal | ||||||
| Amount/ | Acquisition | |||||
| Shares | Issuer | Dates | Cost | Value | ||
| 10,848 | Broadband Ventures III LLC, secured | |||||
| promissory note, 5.00%, 2/01/12 | 7/01/10 - 11/30/12 | $ | 10,848 | $ | — | |
| 15,831,950 | CB FIM Coinvestors LLC | 1/15/09 - 6/02/09 | — | — | ||
| 19,805,560 | FIM Coinvestor Holdings I, LLC | 11/20/06 - 6/02/09 | — | — | ||
| 1,065,450 | First Southern Bancorp Inc. | 1/27/10 - 7/07/10 | 22,480,995 | 5,135,682 | ||
| 1,821 | First Southern Bancorp Inc., cvt. | |||||
| pfd., C | 1/27/10 - 7/07/10 | 1,821,000 | 3,399,518 | |||
| 2,846,329 | International Automotive Components | |||||
| Group Brazil LLC | 4/13/06 - 12/26/08 | 1,890,264 | 554,522 | |||
| 22,836,904 | International Automotive Components | |||||
| Group North America, LLC | 1/12/06 - 3/18/13 | 18,692,218 | 12,921,577 | |||
| 106,700 | Olympus Re Holdings Ltd. | 12/19/01 | 9,995,768 | — | ||
| 17,621 | PMG LLC | 3/22/04 | 1,233,477 | 934,094 | ||
| Total Restricted Securities (Value is 0.53% of Net Assets) | $ | 56,124,570 | $ | 22,945,393 | ||
10. OTHER DERIVATIVE INFORMATION
At December 31, 2013, the Fund’s investments in derivative contracts are reflected on the Statement of Assets and Liabilities as follows:
| Asset Derivatives | Liability Derivatives | ||||||
| Derivative Contracts | |||||||
| Not Accounted for as | Statement of Assets and | Fair Value | Statement of Assets and | Fair Value | |||
| Hedging Instruments | Liabilities Location | Amount | Liabilities Location | Amount | |||
| Interest rate | |||||||
| contracts | Investments, at value | $ | 2,282,417 | ||||
| Foreign exchange | |||||||
| contracts | Investments, at value / | 9,458,002 | Unrealized depreciation | $ | 31,456,893 | a | |
| Unrealized appreciation | on forward exchange | ||||||
| on forward exchange | contracts / Net assets | ||||||
| contracts | consist of – net unrealized | ||||||
| appreciation (depreciation) | |||||||
aIncludes cumulative appreciation (depreciation) of futures contracts as reported in the Statement of Investments. Only current day’s variation margin is separately reported within the Statement of Assets and Liabilities.
Annual Report | 51
Mutual Beacon Fund
Notes to Financial Statements (continued)
10. OTHER DERIVATIVE INFORMATION (continued)
For the year ended December 31, 2013, the effect of derivative contracts on the Fund’s Statement of Operations was as follows:
| Change in | |||||||
| Unrealized | |||||||
| Derivative Contracts | Realized Gain | Appreciation | |||||
| Not Accounted for as | Statement of | (Loss) for | (Depreciation) | ||||
| Hedging Instruments | Operations Locations | the Year | for the Year | ||||
| Interest rate contracts | Net change in unrealized appreciation | $ | (1,503,307 | ) | |||
| (depreciation) on investments | |||||||
| Foreign exchange contracts | Net realized gain (loss) from foreign currency | $ | (17,237,881 | ) | (8,806,419 | ) | |
| transactions and futures contracts / | |||||||
| Net change in unrealized appreciation | |||||||
| (depreciation) on investments and | |||||||
| translation of other assets and liabilities | |||||||
| denominated in foreign currencies | |||||||
| Equity contracts | Net realized gain (loss) from investments and | (7,235,571 | ) | 5,938,413 | |||
| written options / Net change in unrealized | |||||||
| appreciation (depreciation) on investments | |||||||
For the year ended December 31, 2013, the average month end fair value of derivatives represented 0.82% of average month end net assets. The average month end number of open derivative contracts for the year was 156.
At December 31, 2013, the Fund’s OTC derivative assets and liabilities, are as follows:
| Gross and Net Amounts of Assets and Liabilities Presented | |||||
| in the Statement of Assets and Liabilities | |||||
| Assetsa | Liabilitiesa | ||||
| Derivatives | |||||
| Options Purchased | $ | 10,667,098 | $ | — | |
| Forward Exchange Contracts | 1,073,321 | 30,202,192 | |||
| Total | $ | 11,740,419 | $ | 30,202,192 | |
aAbsent an event of default or early termination, OTC derivative assets and liabilities are presented gross and not offset in the Statement of Assets and Liabilities.
52 | Annual Report
Mutual Beacon Fund
Notes to Financial Statements (continued)
10. OTHER DERIVATIVE INFORMATION (continued)
At December 31, 2013, Fund’s OTC derivative assets which may be offset against the Fund’s OTC derivative liabilities and collateral received from the counterparty, is as follows:
| Amounts Not Offset in the | |||||||||||||||
| Statement of Assets and Liabilities | |||||||||||||||
| Gross and | |||||||||||||||
| Net Amounts of | |||||||||||||||
| Assets Presented | Financial | Financial | |||||||||||||
| in the Statement | Instruments | Instruments | Cash | Net Amount | |||||||||||
| of Assets and | Available for | Collateral | Collateral | (Not less | |||||||||||
| Liabilities | Offset | Receiveda,b | Receivedb | than zero) | |||||||||||
| Counterparty | |||||||||||||||
| BANT | $ | 9,051,202 | $ | (9,051,202 | ) | $ | — | $ | — | $ | — | ||||
| BBU | 167,834 | (167,834 | ) | — | — | — | |||||||||
| BONY | 19,848 | (19,848 | ) | — | — | — | |||||||||
| DBFX | — | — | — | — | — | ||||||||||
| FBCO | 18,140 | (18,140 | ) | — | — | — | |||||||||
| HSBC | 64,323 | (64,323 | ) | — | — | — | |||||||||
| MSCS | 1,760,357 | — | — | (1,760,357 | ) | — | |||||||||
| SCBT | 116,952 | (116,952 | ) | — | — | — | |||||||||
| SSBT | 19,703 | (19,703 | ) | — | — | — | |||||||||
| UBSW | 522,060 | — | (522,060 | ) | — | — | |||||||||
| Total | $ | 11,740,419 | $ | (9,458,002 | ) | $ | (522,060 | ) | $ | (1,760,357 | ) | $ | — | ||
aAt December 31, 2013, the Fund received U.S. Treasury Bonds and Notes as collateral for derivatives.
bIn some instances, the collateral amounts disclosed in the table above were adjusted due to the requirement to limit the collateral amounts to avoid
the effect of overcollateralization. Actual collateral received and/or pledged may be more than the amounts disclosed herein.
Annual Report | 53
Mutual Beacon Fund
Notes to Financial Statements (continued)
10. OTHER DERIVATIVE INFORMATION (continued)
At December 31, 2013, the Fund’s OTC derivative liabilities which may be offset against the Fund’s OTC derivative assets and collateral pledged to the counterparty, is as follows:
| Amounts Not Offset in the | ||||||||||||
| Statement of Assets and Liabilities | ||||||||||||
| Gross and | ||||||||||||
| Net Amounts of | ||||||||||||
| Liabilities Presented | Financial | Financial | ||||||||||
| in the Statement | Instruments | Instruments | Cash | Net Amount | ||||||||
| of Assets and | Available for | Collateral | Collateral | (Not less | ||||||||
| Liabilities | Offset | Pledgeda | Pledged | than zero) | ||||||||
| Counterparty | ||||||||||||
| BANT | $ | 15,740,446 | $ | (9,051,202 | ) | $ | (5,138,830 | ) | $ | — | $ | 1,550,414 |
| BBU | 5,974,645 | (167,834 | ) | (4,870,313 | ) | — | 936,498 | |||||
| BONY | 138,781 | (19,848 | ) | — | — | 118,933 | ||||||
| DBFX | 2,944,936 | — | (2,801,620 | ) | — | 143,316 | ||||||
| FBCO | 1,682,300 | (18,140 | ) | (1,263,874 | ) | — | 400,286 | |||||
| HSBC | 2,144,169 | (64,323 | ) | (1,398,718 | ) | — | 681,128 | |||||
| MSCS | — | — | — | — | — | |||||||
| SCBT | 1,553,325 | (116,952 | ) | (1,008,849 | ) | — | 427,524 | |||||
| SSBT | 23,590 | (19,703 | ) | — | — | 3,887 | ||||||
| UBSW | — | — | — | — | — | |||||||
| Total | $ | 30,202,192 | $ | (9,458,002 | ) | $ | (16,482,204 | ) | $ | — | $ | 4,261,986 |
aSee the accompanying Statement of Investments for securities pledged as collateral for derivatives.
See Notes 1(d) and 7 regarding derivative financial instruments and investment transactions, respectively.
11. HOLDINGS OF 5% VOTING SECURITIES OF PORTFOLIO COMPANIES
The 1940 Act defines “affiliated companies” to include investments in portfolio companies in which a fund owns 5% or more of the outstanding voting securities. Investments in “affiliated companies” for the Fund for the year ended December 31, 2013, were as shown below.
| Number of | Number of | |||||||||
| Shares Held | Shares Held | Value at | Realized | |||||||
| at Beginning | Gross | Gross | at End | End of | Investment | Capital | ||||
| Name of Issuer | of Year | Additions | Reductions | of Year | Year | Income | Gain (Loss) | |||
| Controlled Affiliatesa | ||||||||||
| PMG LLC | 23,726 | — | 6,105 | 17,621 | $ | 934,094 | $ | — | $ | 31,392 |
| Non-Controlled Affiliates | ||||||||||
| CB FIM Coinvestors LLC | 15,831,950 | — | — | 15,831,950 | $ | — | $ | — | $ | — |
| First Southern Bancorp Inc. | 1,065,450 | — | — | 1,065,450 | 5,135,682 | — | — | |||
| First Southern Bancorp Inc., cvt. | ||||||||||
| pfd., C | 1,821 | — | — | 1,821 | 3,399,518 | — | — | |||
| Polaris Financial Technology Ltd. | 6,942,715 | 165,794 | — | 7,108,509 | 15,598,717 | 588,715 | — | |||
| Total Non-Controlled Affiliates | $ | 24,133,917 | $ | 588,715 | $ | — | ||||
| Total Affiliated Securities (Value is 0.57% of Net Assets) | $ | 25,068,011 | $ | 588,715 | $ | 31,392 | ||||
| aIssuer in which the Fund owns 25% or more of the outstanding voting securities. | ||||||||||
| 54 | Annual Report | ||||||||||
Mutual Beacon Fund
Notes to Financial Statements (continued)
12. CREDIT FACILITY
The Fund, together with other U.S. registered and foreign investment funds (collectively, Borrowers), managed by Franklin Templeton Investments, are borrowers in a joint syndicated senior unsecured credit facility totaling $1.5 billion (Global Credit Facility) which, after an extension of the original terms, matured on February 14, 2014. This Global Credit Facility provides a source of funds to the Borrowers for temporary and emergency purposes, including the ability to meet future unanticipated or unusually large redemption requests. Effective February 14, 2014, the Borrowers renewed the Global Credit Facility which matures on February 13, 2015.
Under the terms of the Global Credit Facility, the Fund shall, in addition to interest charged on any borrowings made by the Fund and other costs incurred by the Fund, pay its share of fees and expenses incurred in connection with the implementation and maintenance of the Global Credit Facility, based upon its relative share of the aggregate net assets of all of the Borrowers, including an annual commitment fee of 0.07% based upon the unused portion of the Global Credit Facility. These fees are reflected in other expenses on the Statement of Operations. During the year ended December 31, 2013, the Fund did not use the Global Credit Facility.
13. FAIR VALUE MEASUREMENTS
The Fund follows a fair value hierarchy that distinguishes between market data obtained from independent sources (observable inputs) and the Fund’s own market assumptions (unobservable inputs). These inputs are used in determining the value of the Fund’s financial instruments and are summarized in the following fair value hierarchy:
- Level 1 – quoted prices in active markets for identical financial instruments
- Level 2 – other significant observable inputs (including quoted prices for similar financial instruments, interest rates, prepayment speed, credit risk, etc.)
- Level 3 – significant unobservable inputs (including the Fund’s own assumptions in determining the fair value of financial instruments)
The input levels are not necessarily an indication of the risk or liquidity associated with financial instruments at that level.
For movements between the levels within the fair value hierarchy, the Fund has adopted a policy of recognizing the transfers as of the date of the underlying event which caused the movement.
Annual Report | 55
Mutual Beacon Fund
Notes to Financial Statements (continued)
13. FAIR VALUE MEASUREMENTS (continued)
A summary of inputs used as of December 31, 2013, in valuing the Fund’s assets and liabilities carried at fair value, is as follows:
| Level 1 | Level 2 | Level 3 | Total | |||||||
| Assets: | ||||||||||
| Investments in Securities: | ||||||||||
| Equity Investments:a | ||||||||||
| Auto Components | $ | — | $ | — | $ | 13,476,099 | $ | 13,476,099 | ||
| Commercial Banks | 136,560,135 | — | 8,535,200 | 145,095,335 | ||||||
| Machinery | 4,649,837 | 16,675,233 | — | 21,325,070 | ||||||
| Media | 426,602,148 | 18,077,791 | — | 444,679,939 | ||||||
| Metals & Mining | 124,131,835 | — | 934,094 | 125,065,929 | ||||||
| Real Estate Management & | ||||||||||
| Development | 10,614,238 | — | 52,039,512 | 62,653,750 | ||||||
| All Other Equity | ||||||||||
| Investmentsb | 2,951,677,480 | — | — c | 2,951,677,480 | ||||||
| Corporate Bonds, Notes and | ||||||||||
| Senior Floating Rate | ||||||||||
| Interests | — | 265,303,640 | — | 265,303,640 | ||||||
| Corporate Notes in | ||||||||||
| Reorganization | — | 12,002,040 | — c | 12,002,040 | ||||||
| Companies in Liquidation | 96,537 | 73,416,282 | — c | 73,512,819 | ||||||
| Options Purchased | — | 10,667,098 | — | 10,667,098 | ||||||
| Short Term Investments | 232,879,891 | 1,698,820 | — | 234,578,711 | ||||||
| Total Investments in | ||||||||||
| Securities | $ | 3,887,212,101 | $ | 397,840,904 | $ | 74,984,905 | $ | 4,360,037,910 | ||
| Forward Exchange Contracts | $ | — | $ | 1,073,321 | $ | — | $ | 1,073,321 | ||
| Liabilities: | ||||||||||
| Securities Sold Short | 23,996,782 | — | — | 23,996,782 | ||||||
| Futures Contracts | 1,254,701 | — | — | 1,254,701 | ||||||
| Forward Exchange Contracts | — | 30,202,192 | — | 30,202,192 | ||||||
| alncludes common, convertible preferred and preferred stocks as well as other equity investments. | ||||||||||
| bFor detailed categories, see the accompanying Statement of Investments. | ||||||||||
| cIncludes securities determined to have no value at December 31, 2013. | ||||||||||
56 | Annual Report
Mutual Beacon Fund
Notes to Financial Statements (continued)
13. FAIR VALUE MEASUREMENTS (continued)
A reconciliation of assets in which Level 3 inputs are used in determining fair value is presented when there are significant Level 3 investments at the end of the year. At December 31, 2013, the reconciliation of assets is as follows:
| Net Change | |||||||||||||||||||||||||||
| in Unrealized | |||||||||||||||||||||||||||
| Balance | Net | Net | Balance | Appreciation | |||||||||||||||||||||||
| at | Transfers | Transfers | Realized | Unrealized | at | (Depreciation) | |||||||||||||||||||||
| Beginning | Into | Out of | Cost Basis | Gain | Gain | End of | on Assets Held | ||||||||||||||||||||
| of Year | Purchases | Sales | Level 3 | Level 3a | Adjustmentsb | (Loss) | (Loss) | Year | at Year End | ||||||||||||||||||
| Assets: | |||||||||||||||||||||||||||
| Investments in Securities: | |||||||||||||||||||||||||||
| Equity Investments:c | |||||||||||||||||||||||||||
| Auto Components | $ | 9,090,582 | $ | 2,076,062 | $ | — | $ | — | $ | — | $ | — | $ | — | $ | 2,309,455 | $ | 13,476,099 | $ | 2,309,455 | |||||||
| Commercial Banks | 8,910,160 | — | — | — | — | — | — | (374,960 | ) | 8,535,200 | (374,960 | ) | |||||||||||||||
| Diversified | |||||||||||||||||||||||||||
| Telecommunication | |||||||||||||||||||||||||||
| Services | 800,511 | d | — | — | — | — | — | 1,708,371 | (2,508,882 | ) | —d | — | |||||||||||||||
| Insurance | —d | — | — | — | — | (25,936 | ) | — | 25,936 | —d | 25,936 | ||||||||||||||||
| Metals & Mining | 1,857,765 | — | (458,753 | ) | — | — | — | 31,392 | (496,310 | ) | 934,094 | (445,637 | ) | ||||||||||||||
| Real Estate Management & | |||||||||||||||||||||||||||
| Development | 50,398,206 | — | — | — | (14,158,652 | ) | — | — | 15,799,958 | 52,039,512 | 13,854,944 | ||||||||||||||||
| Corporate Notes in | |||||||||||||||||||||||||||
| Reorganization | —d | — | (1,205 | ) | — | — | — | — | 1,205 | —d | — | ||||||||||||||||
| Total | $ | 71,057,224 | $ | 2,076,062 | $ | (459,958 | ) | $ | — | $ | (14,158,652 | ) | $ | (25,936 | ) | $ | 1,739,763 | $ | 14,756,402 | $ | 74,984,905 | $ | 15,369,738 | ||||
| aThe investment was transferred out of Level 3 as a result of the removal of a significant unobservable valuation input. | |||||||||||||||||||||||||||
| bMay include accretion, amortization, partnership adjustments, and/or other cost basis adjustments. | |||||||||||||||||||||||||||
| cIncludes common and convertible preferred stocks as well as other equity investments. | |||||||||||||||||||||||||||
| dIncludes securities determined to have no value. | |||||||||||||||||||||||||||
Annual Report | 57
Mutual Beacon Fund
Notes to Financial Statements (continued)
13. FAIR VALUE MEASUREMENTS (continued)
Significant unobservable valuation inputs developed by the VLOC for material Level 3 investments and impact to fair value as a result of changes in unobservable valuation inputs as of December 31, 2013, are as follows:
| Impact to Fair | |||||||
| Fair Value at | Value if Input | ||||||
| Description | End of Year | Valuation Technique | Unobservable Inputs | Amount | Increases a | ||
| Assets: | |||||||
| Investments in Securities: | |||||||
| Equity Investments:b | |||||||
| Auto Components | $ | 12,921,577 | Market comparables | Discount for lack of marketability | 15 | % | Decrease |
| EV / EBITDA multiple | 5.1 | x | Increasec | ||||
| Commercial Banks | 8,535,200 | Market comparables | Discount for lack of marketability | 10 | % | Decrease c | |
| Price / tangible book multiple | 1.0 | x | Increasec | ||||
| Real Estate Management & | |||||||
| Development | 52,039,512 | Market comparables | Discount for lack of marketability | 8 | % | Decrease c | |
| All Other Investmentsd | 1,488,616 | ||||||
| Total | $ | 74,984,905 |
aRepresents the directional change in the fair value of the Level 3 investments that would result from a significant and reasonable increase in the corresponding input. A significant
and reasonable decrease in input would have the opposite effect. Significant impacts, if any, to fair value and/or net assets have been indicated.
bIncludes common and convertible preferred stocks.
cRepresents a significant impact to fair value but not net assets.
dIncludes fair value of immaterial investments developed using various valuation techniques and unobservable inputs. May also include investments with values derived using
prior transaction prices or third party pricing information without adjustment for which such inputs are also unobservable.
Abbreviations List
| EBITDA | - | Earnings before interest, taxes, depreciation and amortization |
| EV | - | Enterprise value |
14. NEW ACCOUNTING PRONOUNCEMENTS
In June 2013, the Financial Accounting Standards Board issued Accounting Standards Update (ASU) No. 2013-08, Investment Companies (Topic 946): Amendments to the Scope, Measurement, and Disclosure Requirements. The ASU modifies the criteria used in defining an investment company under U.S. Generally Accepted Accounting Principles and also sets forth certain measurement and disclosure requirements. Under the ASU, an entity that is registered under the 1940 Act automatically qualifies as an investment company. The ASU is effective for interim and annual reporting periods beginning after December 15, 2013. Management has reviewed the requirements and believes the adoption of this ASU will not have a material impact on the financial statements.
58 | Annual Report
Mutual Beacon Fund
Notes to Financial Statements (continued)
15. SUBSEQUENT EVENTS
The Fund has evaluated subsequent events through the issuance of the financial statements and determined that no events have occurred that require disclosure other than those already disclosed in the financial statements.
| ABBREVIATIONS | |||||||
| Counterparty | Currency | Selected Portfolio | |||||
| BANT | - | Bank of America N.A. | EUR | - Euro | ADR | - | American Depositary Receipt |
| BBU | - | Barclays Bank PLC | GBP | - British Pound | FRN | - | Floating Rate Note |
| BONY | - | Bank of New York Mellon | JPY | - Japanese Yen | IDR | - | International Depositary |
| DBFX | - | Deutsche Bank AG | USD | - United States Dollar | Receipt | ||
| FBCO | - | Credit Suisse Group AG | LIBOR | - | London InterBank Offered | ||
| HSBC | - | HSBC Bank USA, N.A. | Rate | ||||
| MSCS | - | Morgan Stanley Capital Services, | |||||
| LLC | |||||||
| SCBT | - | Standard Chartered Bank | |||||
| SSBT | - | State Street Bank and Trust Co., | |||||
| N.A. | |||||||
| UBSW - | UBS AG | ||||||
Annual Report | 59
Mutual Beacon Fund
Report of Independent Registered Public Accounting Firm
To the Board of Trustees of Franklin Mutual Series Funds and Shareholders of Mutual Beacon Fund:
We have audited the accompanying statement of assets and liabilities, including the statement of investments, of Mutual Beacon Fund (the “Fund”) (one of the funds constituting Franklin Mutual Series Funds), as of December 31, 2013, and the related statement of operations for the year then ended, the statements of changes in net assets for each of the two years in the period then ended, and the financial highlights for each of the periods indicated therein. These financial statements and financial highlights are the responsibility of the Fund’s management. Our responsibility is to express an opinion on these financial statements and financial highlights based on our audits.
We conducted our audits in accordance with the standards of the Public Company Accounting Oversight Board (United States). Those standards require that we plan and perform the audit to obtain reasonable assurance about whether the financial statements and financial highlights are free of material misstatement. We were not engaged to perform an audit of the Fund’s internal control over financial reporting. Our audits included consideration of internal control over financial reporting as a basis for designing audit procedures that are appropriate in the circumstances, but not for the purpose of expressing an opinion on the effectiveness of the Fund’s internal control over financial reporting. Accordingly, we express no such opinion.
An audit also includes examining, on a test basis, evidence supporting the amounts and disclosures in the financial statements and financial highlights, assessing the accounting principles used and significant estimates made by management, and evaluating the overall financial statement presentation. Our procedures included confirmation of securities owned as of December 31, 2013, by correspondence with the custodian and brokers, or by other appropriate auditing procedures where replies from the brokers were not received. We believe that our audits provide a reasonable basis for our opinion.
In our opinion, the financial statements and financial highlights referred to above present fairly, in all material respects, the financial position of Mutual Beacon Fund (one of the funds constituting Franklin Mutual Series Funds) at December 31, 2013, the results of its operations for the year then ended, the changes in its net assets for each of the two years in the period then ended, and the financial highlights for each of the periods indicated therein, in conformity with U.S. generally accepted accounting principles.

60 | Annual Report
Mutual Beacon Fund
Tax Information (unaudited)
Under Section 854(b)(1)(A) of the Internal Revenue Code (Code), the Fund hereby reports 51.34% of the ordinary income dividends as income qualifying for the dividends received deduction for the fiscal year ended December 31, 2013.
Under Section 854(b)(1)(B) of the Code, the Fund hereby reports the maximum amount allowable but no less than $78,198,632 as qualified dividends for purposes of the maximum rate under Section 1(h)(11) of the Code for the fiscal year ended December 31, 2013. Distributions, including qualified dividend income, paid during calendar year 2013 will be reported to shareholders on Form 1099-DIV by mid-February 2014. Shareholders are advised to check with their tax advisors for information on the treatment of these amounts on their individual income tax returns.
Under Section 871(k)(1)(C) of the Code, the Fund hereby reports the maximum amount allowable but no less than $23,613,904 as interest related dividends for purposes of the tax imposed under Section 871(a)(1)(A) of the Code for the fiscal year ended December 31, 2013.
Annual Report | 61
Mutual Beacon Fund
Board Members and Officers
The name, year of birth and address of the officers and board members, as well as their affiliations, positions held with the Fund, principal occupations during at least the past five years and number of portfolios overseen in the Franklin Templeton Investments fund complex are shown below. Generally, each board member serves until that person’s successor is elected and qualified.
| Independent Board Members | ||||
| Number of Portfolios in | ||||
| Name, Year of Birth | Length of | Fund Complex Overseen | Other Directorships Held | |
| and Address | Position | Time Served | by Board Member* | During at Least the Past 5 Years |
| Edward I. Altman, Ph.D. (1941) | Trustee | Since 1987 | 11 | None |
| c/o Franklin Mutual Advisers, LLC | ||||
| 101 John F. Kennedy Parkway | ||||
| Short Hills, NJ 07078-2789 | ||||
Principal Occupation During at Least the Past 5 Years:
Max L. Heine Professor of Finance and Director of The Credit and Debt Markets Research Program, Salomon Center, Stern School of Business, New York University; editor and author of numerous financial publications; financial consultant; an adviser to numerous financial publishing organizations; and formerly, Vice Director, Salomon Center, Stern School of Business, New York University.
| Ann Torre Bates (1958) | Trustee | Since 1995 | 38 | SLM Corporation (Sallie Mae), Ares |
| c/o Franklin Mutual Advisers, LLC | Capital Corporation (specialty finance | |||
| 101 John F. Kennedy Parkway | company), Allied Capital Corporation | |||
| Short Hills, NJ 07078-2789 | (financial services) (2003-2010) | |||
| and United Natural Foods, Inc., | ||||
| (October 2013). |
Principal Occupation During at Least the Past 5 Years:
Director of various companies; and formerly, Executive Vice President and Chief Financial Officer, NHP Incorporated (manager of multifamily housing) (1995-1997); and Vice President and Treasurer, US Airways, Inc. (until 1995).
| Burton J. Greenwald (1929) | Trustee | Since 2002 | 18 | Franklin Templeton Emerging Markets |
| c/o Franklin Mutual Advisers, LLC | Debt Opportunities Fund PLC and | |||
| 101 John F. Kennedy Parkway | Fiduciary International Ireland | |||
| Short Hills, NJ 07078-2789 | Limited. |
Principal Occupation During at Least the Past 5 Years:
Managing Director, B.J. Greenwald Associates (management consultants to the financial services industry); and formerly, Chairman, Fiduciary Trust International Funds; Executive Vice President, L.F Rothschild Fund Management, Inc.; President and Director, Merit Mutual Funds; President, Underwriting Division and Director, National Securities & Research Corporation; Governor, Investment Company Institute; and Chairman, ICI Public Information Committee.
62 | Annual Report
| Number of Portfolios in | ||||
| Name, Year of Birth | Length of | Fund Complex Overseen | Other Directorships Held | |
| and Address | Position | Time Served | by Board Member* | During at Least the Past 5 Years |
| Keith E. Mitchell (1954) | Trustee | Since 2009 | 11 | None |
| c/o Franklin Mutual Advisers, LLC | ||||
| 101 John F. Kennedy Parkway | ||||
| Short Hills, NJ 07078-2789 |
Principal Occupation During at Least the Past 5 Years:
Managing Member, Mitchell, Hartley & Bechtel Advisers, LLC (formerly, Mitchell Advisers, LLC) (advisory firm); director of various boards of asset management firms; and formerly, Managing Director, Putnam Lovell NBF.
| Charles Rubens II (1930) | Trustee | Since 1998 | 18 | None |
| c/o Franklin Mutual Advisers, LLC | ||||
| 101 John F. Kennedy Parkway | ||||
| Short Hills, NJ 07078-2789 |
Principal Occupation During at Least the Past 5 Years:
Private investor and president of non-profit organizations; and formerly, an executive of Time, Inc.; and Trustee of Colorado College.
| Jan Hopkins Trachtman (1947) | Trustee | Since 2009 | 11 | None |
| c/o Franklin Mutual Advisers, LLC | ||||
| 101 John F. Kennedy Parkway | ||||
| Short Hills, NJ 07078-2789 |
Principal Occupation During at Least the Past 5 Years:
President and Founder, The Jan Hopkins Group (communications consulting firm); President, Economic Club of New York; serves on Advisory Board of Knight Bagehot Fellowship; and formerly, Anchor/Correspondent, CNN Financial News (until 2003); Managing Director and Head of Client Communications, Citigroup Private Bank (until 2005); Off-Air Reporter, ABC News’ World News Tonight; and Editor, CBS Network News.
| Robert E. Wade (1946) | Trustee and | Trustee since | 45 | El Oro Ltd (investments). |
| c/o Franklin Mutual Advisers, LLC | Chairman of | 1993 and | ||
| 101 John F. Kennedy Parkway | the Board | Chairman of the | ||
| Short Hills, NJ 07078-2789 | Board since 2005 | |||
| Principal Occupation During at Least the Past 5 Years: | ||||
| Attorney at law engaged in private practice (1972-2008) and member of various boards. | ||||
| Interested Board Members and Officers | ||||
| Number of Portfolios in | ||||
| Name, Year of Birth | Length of | Fund Complex Overseen | Other Directorships Held | |
| and Address | Position | Time Served | by Board Member* | During at Least the Past 5 Years |
| **Gregory E. Johnson (1961) | Trustee | Since 2007 | 152 | None |
| One Franklin Parkway | ||||
| San Mateo, CA 94403-1906 | ||||
Principal Occupation During at Least the Past 5 Years:
Chairman of the Board, Member – Office of the Chairman, Director, President and Chief Executive Officer, Franklin Resources, Inc.; officer and/or director or trustee, as the case may be, of some of the other subsidiaries of Franklin Resources, Inc. and of 44 of the investment companies in Franklin Templeton Investments; and Chairman, Investment Company Institute.
Annual Report | 63
| Number of Portfolios in | |||||
| Name, Year of Birth | Length of | Fund Complex Overseen | Other Directorships Held | ||
| and Address | Position | Time Served | by Board Member* | During at Least the Past 5 Years | |
| **Peter A. Langerman (1955) | Trustee, | Trustee since | 11 | American International Group, Inc | |
| c/o Franklin Mutual Advisers, LLC | President and | 2007, President | (AIG) Credit Facility Trust | ||
| 101 John F. Kennedy Parkway | Chief Executive | and Chief | (2010–2011 | ). | |
| Short Hills, NJ 07078-2702 | Officer – | Executive Officer – | |||
| Investment | Investment | ||||
| Management | Management | ||||
| since 2005 |
Principal Occupation During at Least the Past 5 Years:
Chairman of the Board, Chief Executive Officer and President, Franklin Mutual Advisers, LLC; officer and/or director, as the case may be, of four of the investment companies in Franklin Templeton Investments.
| Alison E. Baur (1964) | Vice President | Since 2012 | Not Applicable | Not Applicable |
| One Franklin Parkway | ||||
| San Mateo, CA 94403-1906 |
Principal Occupation During at Least the Past 5 Years:
Deputy General Counsel, Franklin Templeton Investments; and officer of some of the other subsidiaries of Franklin Resources, Inc. and of 46 of the investment companies in Franklin Templeton Investments.
| Philippe Brugere-Trelat (1949) | Vice President | Since 2005 | Not Applicable | Not Applicable |
| 101 John F. Kennedy Parkway | ||||
| Short Hills, NJ 07078-2789 |
Principal Occupation During at Least the Past 5 Years:
Executive Vice President, Franklin Mutual Advisers, LLC; officer of three of the investment companies in Franklin Templeton Investments; and formerly, Portfolio Manager of Eurovest SA (French registered Investment Company, Sicav).
| Laura F. Fergerson (1962) | Chief Executive Since 2009 | Not Applicable | Not Applicable |
| One Franklin Parkway | Officer – | ||
| San Mateo, CA 94403-1906 | Finance and | ||
| Administration | |||
| Principal Occupation During at Least the Past 5 Years: | |||
Senior Vice President, Franklin Templeton Services, LLC; and officer of 46 of the investment companies in Franklin Templeton Investments.
| Aliya S. Gordon (1973) | Vice President | Since 2009 | Not Applicable | Not Applicable |
| One Franklin Parkway | ||||
| San Mateo, CA 94403-1906 |
Principal Occupation During at Least the Past 5 Years:
Senior Associate General Counsel, Franklin Templeton Investments; officer of 46 of the investment companies in Franklin Templeton Investments; and formerly, Litigation Associate, Steefel, Levitt & Weiss, LLP (2000-2004).
| Steven J. Gray (1955) | Secretary and | Secretary since | Not Applicable | Not Applicable |
| One Franklin Parkway | Vice President | 2005 and Vice | ||
| San Mateo, CA 94403-1906 | President since | |||
| 2009 |
Principal Occupation During at Least the Past 5 Years:
Senior Associate General Counsel, Franklin Templeton Investments; Vice President, Franklin Templeton Distributors, Inc.; and officer of 46 of the investment companies in Franklin Templeton Investments.
64 | Annual Report
| Number of Portfolios in | ||||
| Name, Year of Birth | Length of | Fund Complex Overseen | Other Directorships Held | |
| and Address | Position | Time Served | by Board Member* | During at Least the Past 5 Years |
| Selena L. Holmes (1965) | Vice President | Since 2012 | Not Applicable | Not Applicable |
| 100 Fountain Parkway | – AML | |||
| St. Petersburg, FL 33716-1205 | Compliance | |||
| Principal Occupation During at Least the Past 5 Years: | ||||
| Director, Global Compliance Monitoring; and officer of 46 of the investment companies in Franklin Templeton Investments. | ||||
| Robert Kubilis (1973) | Treasurer, | Since 2012 | Not Applicable | Not Applicable |
| 300 S.E. 2nd Street | Chief Financial | |||
| Fort Lauderdale, FL 33301-1923 | Officer and | |||
| Chief | ||||
| Accounting | ||||
| Officer | ||||
| Principal Occupation During at Least the Past 5 Years: | ||||
| Assistant Treasurer, Fund Accounting, Franklin Templeton Investments; and officer of five of the investment companies in Franklin Templeton | ||||
| Investments. | ||||
| Kimberly H. Novotny (1972) | Vice President | Since March 2013 | Not Applicable | Not Applicable |
| 300 S.E. 2nd Street | ||||
| Fort Lauderdale, FL 33301-1923 | ||||
| Principal Occupation During at Least the Past 5 Years: | ||||
| Associate General Counsel, Franklin Templeton Investments; Vice President and Secretary, Fiduciary Trust International of the South; Vice | ||||
| President, Templeton Investment Counsel, LLC; Assistant Secretary, Franklin Resources, Inc.; and officer of 46 of the investment companies | ||||
| in Franklin Templeton Investments. | ||||
| Robert C. Rosselot (1960) | Chief | Since March 2013 | Not Applicable | Not Applicable |
| 300 S.E. 2nd Street | Compliance | |||
| Fort Lauderdale, FL 33301-1923 | Officer | |||
| Principal Occupation During at Least the Past 5 Years: | ||||
| Director, Global Compliance, Franklin Templeton Investments; officer of 46 of the investment companies in Franklin Templeton Investments; | ||||
| and formerly, Senior Associate General Counsel, Franklin Templeton Investments (2007-2013); and Secretary and Vice President, Templeton | ||||
| Group of Funds (2004-2013). | ||||
| Karen L. Skidmore (1952) | Vice President | Since 2009 | Not Applicable | Not Applicable |
| One Franklin Parkway | ||||
| San Mateo, CA 94403-1906 | ||||
| Principal Occupation During at Least the Past 5 Years: | ||||
| Senior Associate General Counsel, Franklin Templeton Investments; and officer of 46 of the investment companies in Franklin Templeton | ||||
| Investments. | ||||
| Craig S. Tyle (1960) | Vice President | Since 2005 | Not Applicable | Not Applicable |
| One Franklin Parkway | ||||
| San Mateo, CA 94403-1906 | ||||
| Principal Occupation During at Least the Past 5 Years: | ||||
| General Counsel and Executive Vice President, Franklin Resources, Inc.; and officer of some of the other subsidiaries of Franklin Resources, | ||||
| Inc. and of 46 of the investment companies in Franklin Templeton Investments. | ||||
| Number of Portfolios in | ||||
| Name, Year of Birth | Length of | Fund Complex Overseen | Other Directorships Held | |
| and Address | Position | Time Served | by Board Member* | During at Least the Past 5 Years |
| Lori A. Weber (1964) | Vice President | Since 2011 | Not Applicable | Not Applicable |
| 300 S.E. 2nd Street | ||||
| Fort Lauderdale, FL 33301-1923 | ||||
| Principal Occupation During at Least the Past 5 Years: | ||||
| Senior Associate General Counsel, Franklin Templeton Investments; Assistant Secretary, Franklin Resources, Inc.; Vice President and | ||||
| Secretary, Templeton Investment Counsel, LLC; Vice President, Fiduciary Trust International of the South; and officer of 46 of the investment | ||||
| companies in Franklin Templeton Investments. | ||||
*We base the number of portfolios on each separate series of the U.S. registered investment companies within the Franklin Templeton Investments fund complex. These portfolios
have a common investment manager or affiliated investment managers.
**Gregory E. Johnson is considered to be an interested person of the Fund under the federal securities laws due to his position as an officer and director of Franklin Resources, Inc.,
which is the parent company of the Fund’s investment manager and distributor. Peter A. Langerman is considered to be an interested person of the Fund under the federal securities
laws due to his position as an officer of Franklin Mutual Advisers, LLC, which is an affiliate of the Fund’s investment manager.
Note 1: Officer information is current as of the date of this report. It is possible that after this date, information about officers may change.
The Fund’s Board has determined that certain of the members of the Audit Committee, including Ann Torre Bates, are audit committee financial experts, and “independent,”
under those provisions of the Sarbanes-Oxley Act of 2002, and the rules and form amendments adopted by the Securities and Exchange Commission, relating to audit
committee financial experts.
The Statement of Additional Information (SAI) includes additional information about the board members and is available, without charge, upon request. Shareholders may
call (800) DIAL BEN/342-5236 to request the SAI.
66 | Annual Report
Mutual Beacon Fund
Shareholder Information
Proxy Voting Policies and Procedures
The Fund’s investment manager has established Proxy Voting Policies and Procedures (Policies) that the Fund uses to determine how to vote proxies relating to portfolio securities. Shareholders may view the Fund’s complete Policies online at franklintempleton.com. Alternatively, shareholders may request copies of the Policies free of charge by calling the Proxy Group collect at (954) 527-7678 or by sending a written request to: Franklin Templeton Companies, LLC, 300 S.E. 2nd Street, Fort Lauderdale, FL 33301, Attention: Proxy Group. Copies of the Fund’s proxy voting records are also made available online at franklintempleton.com and posted on the U.S. Securities and Exchange Commission’s website at sec.gov and reflect the most recent 12-month period ended June 30.
Quarterly Statement of Investments
The Fund files a complete statement of investments with the U.S. Securities and Exchange Commission for the first and third quarters for each fiscal year on Form N-Q. Shareholders may view the filed Form N-Q by visiting the Commission’s website at sec.gov. The filed form may also be viewed and copied at the Commission’s Public Reference Room in Washington, DC. Information regarding the operations of the Public Reference Room may be obtained by calling (800) SEC-0330.
Householding of Reports and Prospectuses
You will receive the Fund’s financial reports every six months as well as an annual updated summary prospectus (prospectus available upon request). To reduce Fund expenses, we try to identify related shareholders in a household and send only one copy of the financial reports and summary prospectus. This process, called “householding,” will continue indefinitely unless you instruct us otherwise. If you prefer not to have these documents householded, please call us at (800) 632-2301. At any time you may view current prospectuses/summary prospectuses and financial reports on our website. If you choose, you may receive these documents through electronic delivery.
Annual Report | 67
This page intentionally left blank.
| Contents | |||||||
| Shareholder Letter | 1 | Annual Report | Financial Statements | 29 | Tax Information | 52 | |
| Mutual European Fund | 5 | Notes to Financial | Board Members | ||||
| Statements | 33 | and Officers | 54 | ||||
| Performance Summary | 11 | ||||||
| Report of Independent | Shareholder Information | 59 | |||||
| Your Fund’s Expenses | 16 | ||||||
| Registered Public | |||||||
| Financial Highlights and | Accounting Firm | 51 | |||||
| Statement of Investments | 18 | ||||||
Annual Report
Mutual European Fund
Your Fund’s Goals and Main Investments: Mutual European Fund seeks capital
appreciation, with income as a secondary goal, by investing at least 80% of its net assets in securities of European companies that the manager believes are available at market prices less than their intrinsic value. The Fund defines European companies as issuers organized under the laws of, or whose principal business operations are located in, or who earn at least 50% of their revenue from, European countries, as
defined in the prospectus.
| Performance data represent past |
| performance, which does not |
| guarantee future results. |
| Investment return and principal |
| value will fluctuate, and you may |
| have a gain or loss when you sell |
| your shares. Current performance |
| may differ from figures shown. |
| Please visit franklintempleton.com |
| or call (800) 342-5236 for most |
| recent month-end performance. |
We are pleased to bring you Mutual European Fund’s annual report for the fiscal year ended December 31, 2013.
Performance Overview
Mutual European Fund – Class Z delivered a +26.68% cumulative total return for the 12 months under review. For comparison, the Fund’s benchmark, the MSCI Europe Index, which tracks equity performance in Europe’s developed markets, posted a +21.55% total return in local currency terms.1 You can find more of the Fund’s performance data in the Performance Summary beginning on page 11.
Economic and Market Overview
The 12 months under review were characterized by reinvigorated policy support and an economic recovery in developed markets. However, differences in global economic trends corresponded with increasingly divergent monetary policies, and growth in emerging market economies tended to slow. The central banks of key developed markets generally reaffirmed their accommodative monetary stances while some emerging market counterparts tightened policy rates as they sought to control inflation and currency depreciation.
1. Source: © 2014 Morningstar. All Rights Reserved. The information contained herein: (1) is proprietary to Morningstar and/or its content providers; (2) may not be copied or distributed; and (3) is not warranted to be accurate, complete or timely. Neither Morningstar nor its content providers are responsible for any damages or losses arising from any use of this information. The unmanaged index is calculated in local currency and includes reinvested daily net dividends. One cannot invest directly in an index, and an index is not representative of the Fund’s portfolio.
The dollar value, number of shares or principal amount, and names of all portfolio holdings are listed in the Fund’s Statement of Investments (SOI). The SOI begins on page 23.
Annual Report | 5
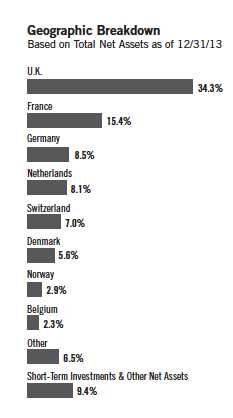
Outside the U.S., the eurozone emerged from its longest recession on record during 2013’s second half and Japan’s growth moderated. The European Central Bank reduced its key interest rate to a record low and pledged to maintain systemic support following political turmoil in Greece, Spain, Portugal and Italy. Germany’s re-election of Chancellor Angela Merkel was largely perceived as a vote of support for ongoing eurozone reform measures.
In Asia, the Bank of Japan set an explicit inflation target and pledged to double bond purchases in an unprecedented wave of policy reform. The U.S. dollar fell versus the euro but rose versus the Japanese yen in 2013.
Growth in many emerging markets moderated based on lower domestic demand, falling exports and weakening commodity prices. Political turmoil in certain emerging markets, the Fed’s potential tapering of its asset purchase program and the Chinese central bank’s effort to tighten liquidity to curb real estate and credit speculation led to a sell-off in emerging market equities and a sharp depreciation in regional currencies against the U.S. dollar. Central banks in Brazil, India and Indonesia raised interest rates in the second half of 2013 as they sought to curb inflation.
In the U.S., economic growth and employment trends generally exceeded expectations. The U.S. Federal Reserve Board (Fed) expanded its asset purchase program to $85 billion per month from $40 billion early in the year. After encouraging economic and employment reports, the Fed announced in December it would reduce its monthly bond purchases by $10 billion beginning in January 2014; however, the Fed committed to keeping interest rates low. In October, the federal government temporarily shut down after Congress failed to authorize routine federal funding amid a disagreement over a new health care law. However, Congress subsequently agreed to fund the government through early 2014 and later passed a two-year budget deal that could ease automatic spending cuts and lower the risk of another shutdown.
The stock market rally in developed markets accelerated during 2013 amid ongoing central bank commitments, continued corporate earnings strength and increasing signs of economic progress. Emerging market stocks rebounded toward period-end, although Latin American stocks trailed their emerging market peers. Oil prices rallied in the third quarter and rose for the year mainly owing to supply concerns related to geopolitical turmoil, but gold posted its largest annual price decline in more than three decades. Increasingly divergent economic and political circumstances during the period resulted in declining market correlations across regions and between asset classes, which many bottom-up investors perceived as more favorable.
6 | Annual Report
Investment Strategy
We follow a distinctive value investment approach, that combines investments in what we believe are undervalued common stocks with distressed debt investing and risk arbitrage. Our style aims to provide our shareholders with superior risk-adjusted results over time. We employ rigorous, fundamental analysis to find compelling situations. In our opinion, successful investing is as much about assessing risk and containing losses as it is about achieving profits. In choosing investments, we look at the market price of an individual company’s securities relative to our evaluation of its intrinsic value based on factors including book value, cash flow generation, long-term earnings potential and earnings multiples. We may invest in bankrupt or distressed companies if we believe the market overreacted to adverse developments or failed to appreciate positive changes.
In addition, it is our practice to hedge the Fund’s currency exposure when we deem it advantageous for our shareholders.
Manager’s Discussion
In an environment of generally rising equity prices, many Fund holdings increased in value and contributed to performance during the 12 months under review. Three of the top contributors to performance during the year under review were German retailer Metro, French aerospace manufacturer Safran and British-Spanish airline holding company International Consolidated Airlines Group.
Metro, which runs Europe’s largest self-service, wholesale superstore business as well as Germany’s largest department store chain, benefited from ongoing restructuring efforts led by a revamped management team. Management’s plans to create value by exiting non-core markets while improving profitability in Germany supported improved investor sentiment as quarterly operating profits exceeded consensus estimates. A rise in net cash flow from operations and proceeds from the disposal of various business units allowed Metro to significantly reduce its net debt. At period-end, the company was also considering a spin-off of its Russian operations, a move we believed could potentially unlock further value. Additionally, shares were positively affected by rising sentiment that European consumer spending is poised to grow.
Safran is a civil aerospace manufacturer with additional interests in defense and military/civil security. The company reported positive sales and earnings results during the year driven by better-than-expected growth in aftermarket engine parts sales for commercial aircraft. Safran’s largest profit driver is the CFM International joint venture with General Electric, which builds and maintains the CFM series of jet engines for short haul/narrow-bodied aircraft. In the wake
| What is meant by “hedge”? |
| To hedge a position is to seek to |
| reduce the risk of adverse price |
| movements in an asset. Normally, |
| a hedge is implemented as an |
| offsetting position in a related |
| security, such as a currency |
| forward contract. |
| What is a currency forward |
| contract? |
| A currency forward contract, also |
| called a “currency forward,” is an |
| agreement between the Fund and |
| a counterparty to buy or sell a |
| foreign currency at a specific |
| exchange rate on a future date. |
| Top 10 Sectors/Industries | ||
| Based on Equity Securities as of 12/31/13 | ||
| % of Total | ||
| Net Assets | ||
| Insurance | 18.3 | % |
| Oil, Gas & Consumable Fuels | 6.0 | % |
| Specialty Retail | 5.6 | % |
| Commercial Banks | 5.4 | % |
| Auto Components | 4.0 | % |
| Food & Staples Retailing | 3.8 | % |
| Wireless Telecommunication Services | 3.8 | % |
| Metals & Mining | 3.8 | % |
| Diversified Telecommunication Services | 3.6 | % |
| Marine | 3.4 | % |
Annual Report | 7
| What is return on invested |
| capital (ROIC)? |
| ROIC is a measure of how well a |
| company generates earnings from |
| capital invested in its business. |
| What is return on equity? |
| Return on equity is an amount, |
| expressed as a percentage, earned |
| on a company’s common stock |
| investment for a given period. Return |
| on equity tells common shareholders |
| how effectually their money is being |
| employed. Comparing percentages |
| for current and prior periods also |
| reveals trends, and comparison with |
| industry composites reveals how well |
| a company is holding its own against |
| its competitors. |
of the recent global economic slowdown, airplanes logged fewer miles and landing/takeoff cycles, the main drivers of regulatory maintenance, and airlines pulled back on engine maintenance work as they sought to reduce spending. However, we judged the trend as a deferral rather than a permanent reduction. The strength in 2013 aftermarket sales appears to have confirmed our assessment and at period-end we judged the trend as sustainable into 2014.
International Consolidated Airlines Group was formed from the 2011 merger of British Airways and Iberia. The company is a leading European long-haul carrier, with what we believe to be very strong positions in capacity-constrained North Atlantic routes and attractive mid-long haul routes to Africa, the Middle East and Latin America. Management has shown progress with improving the company’s return on invested capital (ROIC) through cost cutting initiatives, eliminating unprofitable routes and increasing margins on routes where the company has pricing power, namely, the North Atlantic. At period-end, we saw further upside potential as management’s efforts to improve ROIC in the company’s Iberia business were still in their early stages.
During the period under review, some of the Fund’s investments negatively affected performance. These included U.K.-based insurer RSA Insurance Group, transport company FirstGroup and metals and mining firm Anglo American.
After cutting its dividend early in 2013, RSA Insurance Group suffered substantial weather-related losses, which precluded the company from achieving its annual return on equity target. RSA’s share price came under additional pressure in November when the company announced it would suspend the chief executive officer (CEO), chief financial officer and claims director of its Irish unit amid an investigation into aggressive reserve accounting practices.
In May, FirstGroup announced a rights offering aimed at raising more than 600 million pounds to be used to pay down debt and finance an operational turnaround. Although we considered this in our initial investment analysis, the stock declined sharply after the announcement. We exercised our rights in the share offering at a heavily discounted price, materially bringing down our average cost. Since the rights offering, FirstGroup’s share price improved somewhat as management revealed measures to improve margins in the company’s under-performing U.K. bus and U.S. school bus operations. In addition, a recently completed U.K. government review of rail franchising proved favorable for incumbent operators such as FirstGroup. This development supported our view that the profit contribution from the company’s U.K rail division has potential to improve.
8 | Annual Report
The share price of Anglo American was negatively affected by declining prices for several of the commodities it produces. Uncertainty surrounding possible restructuring actions also weighed on the stock price. In January, the company appointed a new CEO, who was tasked with a mandate to improve operations and capital discipline. Despite the price decline during the year, at period-end, we maintained a favorable outlook for the stock as the new management team remained focused on improving operational performance and returns with the aim of increasing shareholder value.
During the year, the Fund held currency forwards to hedge a portion of the currency risk of the portfolio’s non-U.S. dollar investments. The hedges had a negative impact on the Fund’s performance during the period.
Thank you for your continued participation in Mutual European Fund.
We look forward to continuing to serve your investment needs.
Mutual European Fund
CFA® is a trademark owned by CFA Institute.
The foregoing information reflects our analysis, opinions and portfolio holdings as of December 31, 2013, the end
of the reporting period. The way we implement our main investment strategies and the resulting portfolio holdings
may change depending on factors such as market and economic conditions. These opinions may not be relied
upon as investment advice or an offer for a particular security. The information is not a complete analysis of
every aspect of any market, country, industry, security or the Fund. Statements of fact are from sources
considered reliable, but the investment manager makes no representation or warranty as to their completeness
or accuracy. Although historical performance is no guarantee of future results, these insights may help you
understand our investment management philosophy.
| Top 10 Equity Holdings | ||
| 12/31/13 | ||
| Company | % of Total | |
| Sector/Industry, Country | Net Assets | |
| A.P. Moller-Maersk AS, B | 3.4 | % |
| Marine, Denmark | ||
| Vodafone Group PLC | 2.9 | % |
| Wireless Telecommunication Services, | ||
| U.K. | ||
| International Consolidated | ||
| Airlines Group SA | 2.7 | % |
| Airlines, U.K. | ||
| Dufry AG | 2.7 | % |
| Specialty Retail, Switzerland | ||
| Safran SA | 2.7 | % |
| Aerospace & Defense, France | ||
| Delta Lloyd NV | 2.6 | % |
| Insurance, Netherlands | ||
| ING Groep NV, IDR | 2.6 | % |
| Diversified Financial Services, Netherlands | ||
| Metro AG | 2.5 | % |
| Food & Staples Retailing, Germany | ||
| Accor SA | 2.4 | % |
| Hotels, Restaurants & Leisure, France | ||
| Ageas | 2.3 | % |
| Insurance, Belgium | ||
Annual Report | 9
| Philippe Brugere-Trelat has been co-portfolio manager for Mutual European Fund since 2010 |
| and portfolio manager since 2005. He also has been co-portfolio manager for Mutual Global |
| Discovery Fund since 2009. He has been a member of the management team of the Mutual |
| Series Funds since 2004, when he rejoined Franklin Templeton Investments. Previously, he |
| was president and portfolio manager of Eurovest. Between 1984 and 1994, Mr. Brugere- |
| Trelat was employed at Heine Securities Corporation, the Fund’s former manager. |
| Katrina Dudley has been co-portfolio manager for Mutual European Fund since 2010 and was |
| assistant portfolio manager since 2007. She follows industrial companies (foreign and domes- |
| tic) including transportation, manufacturers, machinery, electrical equipment and general |
| industrial, as well as health care services companies. Prior to joining Franklin Templeton |
| Investments in 2002, Ms. Dudley was an investment analyst at Federated Investors, Inc., |
| responsible for the technology and health care sectors. From 1995 to 2001, Ms. Dudley was |
| a senior manager in the corporate finance division of Ernst & Young LLP, where she special- |
| ized in valuation and litigation consulting. |
10 | Annual Report
Performance Summary as of 12/31/13
Your dividend income will vary depending on dividends or interest paid by securities in the Fund’s portfolio, adjusted for operating expenses of each class. Capital gain distributions are net profits realized from the sale of portfolio securities. The performance table and graphs do not reflect any taxes that a shareholder would pay on Fund dividends, capital gain distributions, if any, or any realized gains on the sale of Fund shares. Total return reflects reinvestment of the Fund’s dividends and capital gain distributions, if any, and any unrealized gains or losses.
| Price and Distribution Information | ||||||||
| Class Z (Symbol: MEURX) | Change | 12/31/13 | 12/31/12 | |||||
| Net Asset Value (NAV) | +$ | 3.63 | $ | 24.76 | $ | 21.13 | ||
| Distributions (1/1/13–12/31/13) | ||||||||
| Dividend Income | $ | 0.4640 | ||||||
| Short-Term Capital Gain | $ | 0.1619 | ||||||
| Long-Term Capital Gain | $ | 1.3544 | ||||||
| Total | $ | 1.9803 | ||||||
| Class A (Symbol: TEMIX) | Change | 12/31/13 | 12/31/12 | |||||
| Net Asset Value (NAV) | +$ | 3.50 | $ | 24.21 | $ | 20.71 | ||
| Distributions (1/1/13–12/31/13) | ||||||||
| Dividend Income | $ | 0.3932 | ||||||
| Short-Term Capital Gain | $ | 0.1619 | ||||||
| Long-Term Capital Gain | $ | 1.3544 | ||||||
| Total | $ | 1.9095 | ||||||
| Class C (Symbol: TEURX) | Change | 12/31/13 | 12/31/12 | |||||
| Net Asset Value (NAV) | +$ | 3.46 | $ | 24.25 | $ | 20.79 | ||
| Distributions (1/1/13–12/31/13) | ||||||||
| Dividend Income | $ | 0.2774 | ||||||
| Short-Term Capital Gain | $ | 0.1619 | ||||||
| Long-Term Capital Gain | $ | 1.3544 | ||||||
| Total | $ | 1.7937 | ||||||
| Class R (Symbol: n/a) | Change | 12/31/13 | 12/31/12 | |||||
| Net Asset Value (NAV) | +$ | 3.40 | $ | 23.95 | $ | 20.55 | ||
| Distributions (1/1/13–12/31/13) | ||||||||
| Dividend Income | $ | 0.4114 | ||||||
| Short-Term Capital Gain | $ | 0.1619 | ||||||
| Long-Term Capital Gain | $ | 1.3544 | ||||||
| Total | $ | 1.9277 | ||||||
| Class R6 (Symbol: FMEUX) | Change | 12/31/13 | 5/1/13 | |||||
| Net Asset Value (NAV) | +$ | 2.21 | $ | 24.75 | $ | 22.54 | ||
| Distributions (5/1/13–12/31/13) | ||||||||
| Dividend Income | $ | 0.5022 | ||||||
| Short-Term Capital Gain | $ | 0.1619 | ||||||
| Long-Term Capital Gain | $ | 1.3544 | ||||||
| Total | $ | 2.0185 | ||||||
Annual Report | 11
Performance Summary (continued)
Performance
Cumulative total return excludes sales charges. Aggregate and average annual total returns and value of $10,000 investment include maximum sales charges. Class Z/R/R6: no sales charges; Class A: 5.75% maximum initial sales charge; Class C: 1% contingent deferred sales charge in first year only.
| Class Z | 1-Year | 5-Year | 10-Year | ||||||||
| Cumulative Total Return1 | + | 26.68 | % | + | 83.27 | % | + | 164.87 | % | ||
| Average Annual Total Return2 | + | 26.68 | % | + | 12.88 | % | + | 10.23 | % | ||
| Value of $10,000 Investment3 | $ | 12,668 | $ | 18,327 | $ | 26,487 | |||||
| Total Annual Operating Expenses4 | 1.13 | % | |||||||||
| Class A | 1-Year | 5-Year | 10-Year | ||||||||
| Cumulative Total Return1 | + | 26.30 | % | + | 80.57 | % | + | 157.03 | % | ||
| Average Annual Total Return2 | + | 19.06 | % | + | 11.22 | % | + | 9.25 | % | ||
| Value of $10,000 Investment3 | $ | 11,906 | $ | 17,019 | $ | 24,227 | |||||
| Total Annual Operating Expenses4 | 1.43 | % | |||||||||
| Class C | 1-Year | 5-Year | 10-Year | ||||||||
| Cumulative Total Return1 | + | 25.44 | % | + | 74.35 | % | + | 139.87 | % | ||
| Average Annual Total Return2 | + | 24.44 | % | + | 11.76 | % | + | 9.14 | % | ||
| Value of $10,000 Investment3 | $ | 12,444 | $ | 17,435 | $ | 23,987 | |||||
| Total Annual Operating Expenses4 | 2.13 | % | |||||||||
| Class R | 1-Year | 3-Year | Inception (10/30/09) | ||||||||
| Cumulative Total Return1 | + | 26.05 | % | + | 35.21 | % | + | 52.23 | % | ||
| Average Annual Total Return2 | + | 26.05 | % | + | 10.58 | % | + | 10.60 | % | ||
| Value of $10,000 Investment3 | $ | 12,605 | $ | 13,521 | $ | 15,223 | |||||
| Total Annual Operating Expenses4 | 1.63 | % | |||||||||
| Class R6 | Inception (5/1/13) | ||||||||||
| Cumulative Total Return1 | + | 18.99 | % | ||||||||
| Aggregate Total Return5 | + | 18.99 | % | ||||||||
| Value of $10,000 Investment3 | $ | 11,899 | |||||||||
| Total Annual Operating Expenses4 | 0.92 | % |
Performance data represent past performance, which does not guarantee future results. Investment return and principal value will fluctuate, and you may have a gain or loss when you sell your shares. Current performance may differ from figures shown. For most recent month-end performance, go to franklintempleton.com or call (800) 342-5236.
12 | Annual Report
Performance Summary (continued)
Total Return Index Comparison for a Hypothetical $10,000 Investment
Total return represents the change in value of an investment over the periods shown. It includes any applicable maximum sales charge, Fund expenses, account fees and reinvested distributions. The unmanaged index is calculated in local currency and includes reinvested daily net dividends. It differs from the Fund in composition and does not pay management fees or expenses. One cannot invest directly in an index.
| 1/04 | 12/05 | 12/07 | 12/09 | 12/11 | 12/13 |
| Mutual European Fund | MSCI Europe Index 6 | ||||
| 1/04 | 12/05 | 12/07 | 12/09 | 12/11 | 12/13 |
| Mutual European Fund | MSCI Europe Index 6 | ||||
Annual Report | 13
| 10/09 | 12/10 | 12/11 | 12/12 | 12/13 |
| Mutual European Fund | MSCI Europe Index 6 | |||
14 | Annual Report
| 5/13 | 12/13 |
| Mutual European Fund | MSCI Europe Index 6 |
Endnotes
All investments involve risks, including possible loss of principal. Value securities may not increase in price as
anticipated or may decline further in value. Special risks are associated with foreign investing, including currency
fluctuations, economic instability and political developments. Because the Fund invests its assets primarily in compa-
nies in a specific region, it is subject to greater risks of adverse developments in that region and/or the surrounding
regions than a fund that is more broadly diversified geographically. Political, social or economic disruptions in the
region, even in countries in which the Fund is not invested, may adversely affect the value of securities held by the
Fund. Current political uncertainty surrounding the European Union (EU) and its membership may increase market
volatility. The financial instability of some countries in the EU, including Greece, Italy and Spain, together with the risk
of that impacting other more stable countries may increase the economic risk of investing in companies in Europe.
The Fund’s investments in smaller company stocks carry an increased risk of price fluctuation, especially over the
short term. The Fund’s investments in companies engaged in mergers, reorganizations or liquidations also involve
special risks as pending deals may not be completed on time or on favorable terms. The Fund is actively managed but
there is no guarantee that the manager’s investment decisions will produce the desired results. The Fund’s prospec-
tus also includes a discussion of the main investment risks.
| Class Z: | Shares are available to certain eligible investors as described in the prospectus. |
| Class C: | These shares have higher annual fees and expenses than Class A shares. |
| Class R: | Shares are available to certain eligible investors as described in the prospectus. These shares have higher |
| annual fees and expenses than Class A shares. | |
| Class R6: | Shares are available to certain eligible investors as described in the prospectus. |
1. Cumulative total return represents the change in value of an investment over the periods indicated.
2. Average annual total return represents the average annual change in value of an investment over the periods indicated.
3. These figures represent the value of a hypothetical $10,000 investment in the Fund over the periods indicated.
4. Figures are as stated in the Fund’s current prospectus. In periods of market volatility, assets may decline significantly,
causing total annual Fund operating expenses to become higher than the figures shown.
5. Aggregate total return represents the change in value of an investment for the period indicated. Since Class R6 shares
have existed for less than one year, average annual total return is not available.
6. Source: © 2014 Morningstar. The MSCI Europe Index is a market capitalization-weighted index designed to measure
equity market performance of developed markets in Europe.
Annual Report | 15
Your Fund’s Expenses
As a Fund shareholder, you can incur two types of costs:
- Transaction costs, including sales charges (loads) on Fund purchases; and
- Ongoing Fund costs, including management fees, distribution and service (12b-1) fees, and other Fund expenses. All mutual funds have ongoing costs, sometimes referred to as operating expenses.
The following table shows ongoing costs of investing in the Fund and can help you understand these costs and compare them with those of other mutual funds. The table assumes a $1,000 investment held for the six months indicated.
Actual Fund Expenses
The first line (Actual) for each share class listed in the table provides actual account values and expenses. The “Ending Account Value” is derived from the Fund’s actual return, which includes the effect of Fund expenses.
You can estimate the expenses you paid during the period by following these steps. Of course, your account value and expenses will differ from those in this illustration:
| 1. | Divide your account value by $1,000. |
| If an account had an $8,600 value, then $8,600 ÷ $1,000 = 8.6. | |
| 2. | Multiply the result by the number under the heading “Expenses Paid During Period.” |
| If Expenses Paid During Period were $7.50, then 8.6 x $7.50 = $64.50. |
In this illustration, the estimated expenses paid this period are $64.50.
Hypothetical Example for Comparison with Other Funds
Information in the second line (Hypothetical) for each class in the table can help you compare ongoing costs of investing in the Fund with those of other mutual funds. This information may not be used to estimate the actual ending account balance or expenses you paid during the period. The hypothetical “Ending Account Value” is based on the actual expense ratio for each class and an assumed 5% annual rate of return before expenses, which does not represent the Fund’s actual return. The figure under the heading “Expenses Paid During Period” shows the hypothetical expenses your account would have incurred under this scenario. You can compare this figure with the 5% hypothetical examples that appear in shareholder reports of other funds.
16 | Annual Report
Your Fund’s Expenses (continued)
Please note that expenses shown in the table are meant to highlight ongoing costs and do not reflect any transaction costs, such as sales charges. Therefore, the second line for each class is useful in comparing ongoing costs only, and will not help you compare total costs of owning different funds. In addition, if transaction costs were included, your total costs would have been higher. Please refer to the Fund prospectus for additional information on operating expenses.
| Beginning Account | Ending Account | Expenses Paid During | ||||
| Class Z | Value 7/1/13 | Value 12/31/13 | Period* 7/1/13–12/31/13 | |||
| Actual | $ | 1,000 | $ | 1,191.30 | $ | 5.85 |
| Hypothetical (5% return before expenses) | $ | 1,000 | $ | 1,019.86 | $ | 5.40 |
| Class A | ||||||
| Actual | $ | 1,000 | $ | 1,189.50 | $ | 7.51 |
| Hypothetical (5% return before expenses) | $ | 1,000 | $ | 1,018.35 | $ | 6.92 |
| Class C | ||||||
| Actual | $ | 1,000 | $ | 1,185.40 | $ | 11.35 |
| Hypothetical (5% return before expenses) | $ | 1,000 | $ | 1,014.82 | $ | 10.46 |
| Class R | ||||||
| Actual | $ | 1,000 | $ | 1,188.30 | $ | 8.60 |
| Hypothetical (5% return before expenses) | $ | 1,000 | $ | 1,017.34 | $ | 7.93 |
| Class R6 | ||||||
| Actual | $ | 1,000 | $ | 1,192.50 | $ | 4.86 |
| Hypothetical (5% return before expenses) | $ | 1,000 | $ | 1,020.77 | $ | 4.48 |
*Expenses are calculated using the most recent six-month expense ratio, annualized for each class (Z: 1.06%; A: 1.36%; C: 2.06%; R: 1.56%; and R6: 0.88%), multiplied by the average account value over the period, multiplied by 184/365 to reflect the one-half year period.
Annual Report | 17
| Mutual European Fund | |||||||||||||||
| Financial Highlights | |||||||||||||||
| Year Ended December 31, | |||||||||||||||
| Class Z | 2013 | 2012 | 2011 | 2010 | 2009 | ||||||||||
| Per share operating performance | |||||||||||||||
| (for a share outstanding throughout the year) | |||||||||||||||
| Net asset value, beginning of year | $ | 21.13 | $ | 18.95 | $ | 21.47 | $ | 20.39 | $ | 17.25 | |||||
| Income from investment operationsa: | |||||||||||||||
| Net investment incomeb | 0.49 | 0.44 | 0.50 | 0.34 | 0.40 | ||||||||||
| Net realized and unrealized gains (losses) | 5.12 | 2.89 | (2.25 | ) | 1.40 | 3.52 | |||||||||
| Total from investment operations | 5.61 | 3.33 | (1.75 | ) | 1.74 | 3.92 | |||||||||
| Less distributions from: | |||||||||||||||
| Net investment income | (0.46 | ) | (0.68 | ) | (0.77 | ) | (0.66 | ) | (0.78 | ) | |||||
| Net realized gains | (1.52 | ) | (0.47 | ) | — | — | — | ||||||||
| Total distributions | (1.98 | ) | (1.15 | ) | (0.77 | ) | (0.66 | ) | (0.78 | ) | |||||
| Net asset value, end of year | $ | 24.76 | $ | 21.13 | $ | 18.95 | $ | 21.47 | $ | 20.39 | |||||
| Total return | 26.68 | % | 17.73 | % | (8.01 | )% | 8.61 | % | 23.01 | % | |||||
| Ratios to average net assets | |||||||||||||||
| Expenses before expense reductionc | 1.07 | % | 1.13 | % | 1.11 | % | 1.10 | % | 1.13 | % | |||||
| Expenses net of expense reductionc | 1.07 | %d | 1.13 | % | 1.11 | % | 1.10 | % | 1.12 | % | |||||
| Expenses incurred in connection with securities sold | |||||||||||||||
| short | —%e | —% | —% | —% | —% | ||||||||||
| Net investment income | 2.04 | % | 2.16 | % | 2.43 | % | 1.65 | % | 2.17 | % | |||||
| Supplemental data | |||||||||||||||
| Net assets, end of year (000’s) | $ | 1,399,294 | $ | 1,101,659 | $ | 964,069 | $ | 1,057,801 | $ | 1,017,962 | |||||
| Portfolio turnover rate | 39.05 | % | 41.69 | % | 32.60 | % | 35.44 | % | 58.83 | % | |||||
aThe amount shown for a share outstanding throughout the period may not correlate with the Statement of Operations for the period due to the timing of sales and repurchases of
the Fund shares in relation to income earned and/or fluctuating market value of the investments of the Fund.
bBased on average daily shares outstanding.
cIncludes dividend expense on securities sold short and borrowing fees, if any. See below for the ratios of such expenses to average net assets for the periods presented.
See Note 1(d).
dBenefit of expense reduction rounds to less than 0.01%.
eRounds to less than 0.01%.
18 | The accompanying notes are an integral part of these financial statements. | Annual Report
| Mutual European Fund | |||||||||||||||
| Financial Highlights (continued) | |||||||||||||||
| Year Ended December 31, | |||||||||||||||
| Class A | 2013 | 2012 | 2011 | 2010 | 2009 | ||||||||||
| Per share operating performance | |||||||||||||||
| (for a share outstanding throughout the year) | |||||||||||||||
| Net asset value, beginning of year | $ | 20.71 | $ | 18.59 | $ | 21.06 | $ | 20.02 | $ | 16.89 | |||||
| Income from investment operationsa: | |||||||||||||||
| Net investment incomeb | 0.42 | 0.37 | 0.44 | 0.27 | 0.34 | ||||||||||
| Net realized and unrealized gains (losses) | 4.99 | 2.84 | (2.20 | ) | 1.37 | 3.45 | |||||||||
| Total from investment operations | 5.41 | 3.21 | (1.76 | ) | 1.64 | 3.79 | |||||||||
| Less distributions from: | |||||||||||||||
| Net investment income | (0.39 | ) | (0.62 | ) | (0.71 | ) | (0.60 | ) | (0.66 | ) | |||||
| Net realized gains | (1.52 | ) | (0.47 | ) | — | — | — | ||||||||
| Total distributions | (1.91 | ) | (1.09 | ) | (0.71 | ) | (0.60 | ) | (0.66 | ) | |||||
| Net asset value, end of year | $ | 24.21 | $ | 20.71 | $ | 18.59 | $ | 21.06 | $ | 20.02 | |||||
| Total returnc | 26.30 | % | 17.37 | % | (8.27 | )% | 8.25 | % | 22.67 | % | |||||
| Ratios to average net assets | |||||||||||||||
| Expenses before expense reductiond | 1.37 | % | 1.43 | % | 1.41 | % | 1.40 | % | 1.43 | % | |||||
| Expenses net of expense reductiond | 1.37 | %e | 1.43 | % | 1.41 | % | 1.40 | % | 1.42 | % | |||||
| Expenses incurred in connection with securities sold short | —%f | —% | —% | —% | —% | ||||||||||
| Net investment income | 1.74 | % | 1.86 | % | 2.13 | % | 1.35 | % | 1.87 | % | |||||
| Supplemental data | |||||||||||||||
| Net assets, end of year (000’s) | $ | 839,655 | $ | 653,435 | $ | 593,825 | $ | 765,304 | $ | 807,932 | |||||
| Portfolio turnover rate | 39.05 | % | 41.69 | % | 32.60 | % | 35.44 | % | 58.83 | % | |||||
aThe amount shown for a share outstanding throughout the period may not correlate with the Statement of Operations for the period due to the timing of sales and repurchases of
the Fund shares in relation to income earned and/or fluctuating market value of the investments of the Fund.
bBased on average daily shares outstanding.
cTotal return does not reflect sales commissions or contingent deferred sales charges, if applicable.
dIncludes dividend expense on securities sold short and borrowing fees, if any. See below for the ratios of such expenses to average net assets for the periods presented.
See Note 1(d).
eBenefit of expense reduction rounds to less than 0.01%.
fRounds to less than 0.01%.
Annual Report | The accompanying notes are an integral part of these financial statements. | 19
| Mutual European Fund | |||||||||||||||
| Financial Highlights (continued) | |||||||||||||||
| Year Ended December 31, | |||||||||||||||
| Class C | 2013 | 2012 | 2011 | 2010 | 2009 | ||||||||||
| Per share operating performance | |||||||||||||||
| (for a share outstanding throughout the year) | |||||||||||||||
| Net asset value, beginning of year | $ | 20.79 | $ | 18.66 | $ | 21.10 | $ | 20.05 | $ | 16.76 | |||||
| Income from investment operationsa: | |||||||||||||||
| Net investment incomeb | 0.24 | 0.24 | 0.31 | 0.13 | 0.21 | ||||||||||
| Net realized and unrealized gains (losses) | 5.02 | 2.83 | (2.20 | ) | 1.36 | 3.42 | |||||||||
| Total from investment operations | 5.26 | 3.07 | (1.89 | ) | 1.49 | 3.63 | |||||||||
| Less distributions from: | |||||||||||||||
| Net investment income | (0.28 | ) | (0.47 | ) | (0.55 | ) | (0.44 | ) | (0.34 | ) | |||||
| Net realized gains | (1.52 | ) | (0.47 | ) | — | — | — | ||||||||
| Total distributions | (1.80 | ) | (0.94 | ) | (0.55 | ) | (0.44 | ) | (0.34 | ) | |||||
| Net asset value, end of year | $ | 24.25 | $ | 20.79 | $ | 18.66 | $ | 21.10 | $ | 20.05 | |||||
| Total returnc | 25.44 | % | 16.54 | % | (8.90 | )% | 7.52 | % | 21.76 | % | |||||
| Ratios to average net assets | |||||||||||||||
| Expenses before expense reductiond | 2.07 | % | 2.13 | % | 2.11 | % | 2.10 | % | 2.13 | % | |||||
| Expenses net of expense reductiond | 2.07 | %e | 2.13 | % | 2.11 | % | 2.10 | % | 2.12 | % | |||||
| Expenses incurred in connection with securities sold short | —%f | —% | —% | —% | —% | ||||||||||
| Net investment income | 1.04 | % | 1.16 | % | 1.43 | % | 0.65 | % | 1.17 | % | |||||
| Supplemental data | |||||||||||||||
| Net assets, end of year (000’s) | $ | 198,491 | $ | 122,438 | $ | 127,012 | $ | 171,750 | $ | 192,122 | |||||
| Portfolio turnover rate | 39.05 | % | 41.69 | % | 32.60 | % | 35.44 | % | 58.83 | % | |||||
aThe amount shown for a share outstanding throughout the period may not correlate with the Statement of Operations for the period due to the timing of sales and repurchases of
the Fund shares in relation to income earned and/or fluctuating market value of the investments of the Fund.
bBased on average daily shares outstanding.
cTotal return does not reflect sales commissions or contingent deferred sales charges, if applicable.
dIncludes dividend expense on securities sold short and borrowing fees, if any. See below for the ratios of such expenses to average net assets for the periods presented.
See Note 1(d).
eBenefit of expense reduction rounds to less than 0.01%.
fRounds to less than 0.01%.
20 | The accompanying notes are an integral part of these financial statements. | Annual Report
| Mutual European Fund | |||||||||||||||
| Financial Highlights (continued) | |||||||||||||||
| Year Ended December 31, | |||||||||||||||
| Class R | 2013 | 2012 | 2011 | 2010 | 2009 | a | |||||||||
| Per share operating performance | |||||||||||||||
| (for a share outstanding throughout the year) | |||||||||||||||
| Net asset value, beginning of year | $ | 20.55 | $ | 18.47 | $ | 21.00 | $ | 19.98 | $ | 19.36 | |||||
| Income from investment operationsb: | |||||||||||||||
| Net investment incomec | 0.31 | 0.33 | 0.16 | 0.19 | 0.02 | ||||||||||
| Net realized and unrealized gains (losses) | 5.02 | 2.81 | (1.97 | ) | 1.42 | 0.79 | |||||||||
| Total from investment operations | 5.33 | 3.14 | (1.81 | ) | 1.61 | 0.81 | |||||||||
| Less distributions from: | |||||||||||||||
| Net investment income | (0.41 | ) | (0.59 | ) | (0.72 | ) | (0.59 | ) | (0.19 | ) | |||||
| Net realized gains | (1.52 | ) | (0.47 | ) | — | — | — | ||||||||
| Total distributions | (1.93 | ) | (1.06 | ) | (0.72 | ) | (0.59 | ) | (0.19 | ) | |||||
| Net asset value, end of year | $ | 23.95 | $ | 20.55 | $ | 18.47 | $ | 21.00 | $ | 19.98 | |||||
| Total returnd | 26.05 | % | 17.16 | % | (8.45 | )% | 8.02 | % | 4.23 | % | |||||
| Ratios to average net assetse | |||||||||||||||
| Expenses before expense reductionf | 1.57 | % | 1.63 | % | 1.61 | % | 1.60 | % | 1.63 | % | |||||
| Expenses net of expense reductionf | 1.57 | %g | 1.63 | % | 1.61 | % | 1.60 | % | 1.62 | % | |||||
| Expenses incurred in connection with securities sold short | —%h | —% | —% | —% | —% | ||||||||||
| Net investment income | 1.54 | % | 1.66 | % | 1.93 | % | 1.15 | % | 1.67 | % | |||||
| Supplemental data | |||||||||||||||
| Net assets, end of year (000’s) | $ | 133 | $ | 46 | $ | 31 | $ | 21 | $ | 5 | |||||
| Portfolio turnover rate | 39.05 | % | 41.69 | % | 32.60 | % | 35.44 | % | 58.83 | % | |||||
aFor the period October 30, 2009 (effective date) to December 31, 2009.
bThe amount shown for a share outstanding throughout the period may not correlate with the Statement of Operations for the period due to the timing of sales and repurchases of
the Fund shares in relation to income earned and/or fluctuating market value of the investments of the Fund.
cBased on average daily shares outstanding.
dTotal return is not annualized for periods less than one year.
eRatios are annualized for periods less than one year.
fIncludes dividend expense on securities sold short and borrowing fees, if any. See below for the ratios of such expenses to average net assets for the periods presented.
See Note 1(d).
gBenefit of expense reduction rounds to less than 0.01%.
hRounds to less than 0.01%.
Annual Report | The accompanying notes are an integral part of these financial statements. | 21
| Mutual European Fund | |||
| Financial Highlights (continued) | |||
| Period Ended | |||
| December 31, | |||
| Class R6 | 2013 | a | |
| Per share operating performance | |||
| (for a share outstanding throughout the period) | |||
| Net asset value, beginning of period | $ | 22.54 | |
| Income from investment operationsb: | |||
| Net investment incomec | 0.28 | ||
| Net realized and unrealized gains (losses) | 3.95 | ||
| Total from investment operations | 4.23 | ||
| Less distributions from: | |||
| Net investment income | (0.50 | ) | |
| Net realized gains | (1.52 | ) | |
| Total distributions | (2.02 | ) | |
| Net asset value, end of period | $ | 24.75 | |
| Total returnd | 18.99 | % | |
| Ratios to average net assetse | |||
| Expensesf | 0.90 | %g | |
| Expenses incurred in connection with securities sold short | —%h | ||
| Net investment income | 2.21 | % | |
| Supplemental data | |||
| Net assets, end of period (000’s) | $ | 317,690 | |
| Portfolio turnover rate | 39.05 | % | |
aFor the period May 1, 2013 (effective date) to December 31, 2013.
bThe amount shown for a share outstanding throughout the period may not correlate with the Statement of Operations for the period due to the timing of sales and repurchases of
the Fund shares in relation to income earned and/or fluctuating market value of the investments of the Fund.
cBased on average daily shares outstanding.
dTotal return is not annualized for periods less than one year.
eRatios are annualized for periods less than one year.
fIncludes dividend expense on securities sold short and borrowing fees, if any. See below for the ratios of such expenses to average net assets for the periods presented.
See Note 1(d).
gBenefit of expense reduction rounds to less than 0.01%.
hRounds to less than 0.01%.
22 | The accompanying notes are an integral part of these financial statements. | Annual Report
Mutual European Fund
Statement of Investments, December 31, 2013
| Country | Shares | Value | ||
| Common Stocks 90.6% | ||||
| Aerospace & Defense 2.7% | ||||
| Safran SA | France | 1,054,339 | $ | 73,251,784 |
| Airlines 2.7% | ||||
| aInternational Consolidated Airlines Group SA | United Kingdom | 11,317,920 | 75,209,013 | |
| Auto Components 4.0% | ||||
| Continental AG | Germany | 68,756 | 15,075,076 | |
| Pirelli & C. SpA | Italy | 2,851,397 | 49,339,972 | |
| Valeo SA | France | 406,429 | 44,963,833 | |
| 109,378,881 | ||||
| Capital Markets 0.4% | ||||
| a,bAcquisition 1234 PLC | United Kingdom | 99,875 | 109,153 | |
| UBS AG | Switzerland | 555,452 | 10,535,562 | |
| 10,644,715 | ||||
| Commercial Banks 5.4% | ||||
| Barclays PLC | United Kingdom | 5,705,047 | 25,686,359 | |
| BNP Paribas SA | France | 780,500 | 60,818,176 | |
| HSBC Holdings PLC | United Kingdom | 4,683,760 | 51,370,794 | |
| Societe Generale | France | 197,400 | 11,463,730 | |
| 149,339,059 | ||||
| Construction & Engineering 1.4% | ||||
| FLSmidth & Co. AS | Denmark | 117,468 | 6,413,134 | |
| Vinci SA | France | 504,954 | 33,144,603 | |
| 39,557,737 | ||||
| Construction Materials 1.7% | ||||
| SA des Ciments Vicat | France | 630,670 | 46,844,273 | |
| Containers & Packaging 1.5% | ||||
| Rexam PLC | United Kingdom | 4,639,029 | 40,732,576 | |
| Diversified Financial Services 3.3% | ||||
| Deutsche Boerse AG | Germany | 208,394 | 17,256,085 | |
| aING Groep NV, IDR | Netherlands | 5,063,750 | 70,348,396 | |
| Oslo Bors VPS Holding ASA | Norway | 340,000 | 3,419,565 | |
| 91,024,046 | ||||
| Diversified Telecommunication Services 4.0% | ||||
| aHellenic Telecommunications Organization SA | Greece | 598,218 | 7,956,948 | |
| TDC AS | Denmark | 5,555,075 | 53,875,091 | |
| Telenor ASA | Norway | 1,147,612 | 27,360,587 | |
| Vivendi SA | France | 781,870 | 20,600,477 | |
| 109,793,103 | ||||
| Electrical Equipment 0.2% | ||||
| Alstom SA | France | 172,337 | 6,275,886 | |
| Energy Equipment & Services 1.0% | ||||
| aDeepOcean Group Holding BV | Netherlands | 915,467 | 26,548,543 |
Annual Report | 23
Mutual European Fund
Statement of Investments, December 31, 2013 (continued)
| Country | Shares | Value | ||
| Common Stocks (continued) | ||||
| Food & Staples Retailing 3.8% | ||||
| Koninklijke Ahold NV | Netherlands | 186,473 | $ | 3,347,241 |
| Metro AG | Germany | 1,423,416 | 68,918,383 | |
| Tesco PLC | United Kingdom | 5,939,249 | 32,890,038 | |
| 105,155,662 | ||||
| Hotels, Restaurants & Leisure 2.4% | ||||
| Accor SA | France | 1,395,346 | 65,831,932 | |
| Industrial Conglomerates 0.1% | ||||
| Siemens AG | Germany | 12,849 | 1,754,832 | |
| Insurance 18.3% | ||||
| ACE Ltd. | United States | 306,024 | 31,682,665 | |
| Aegon NV | Netherlands | 3,831,571 | 36,164,974 | |
| Ageas | Belgium | 1,488,339 | 63,361,155 | |
| Delta Lloyd NV | Netherlands | 2,844,765 | 70,590,052 | |
| Direct Line Insurance Group PLC | United Kingdom | 10,508,445 | 43,424,031 | |
| Lancashire Holdings Ltd. | United Kingdom | 3,972,161 | 53,294,205 | |
| a,cOlympus Re Holdings Ltd. | United States | 16,080 | — | |
| Resolution Ltd. | United Kingdom | 6,045,990 | 35,425,887 | |
| RSA Insurance Group PLC | United Kingdom | 23,378,035 | 35,411,517 | |
| aStorebrand ASA | Norway | 7,664,955 | 47,897,280 | |
| UNIQA Insurance Group AG | Austria | 2,769,359 | 35,346,060 | |
| Zurich Insurance Group AG | Switzerland | 176,900 | 51,262,429 | |
| 503,860,255 | ||||
| Machinery 1.6% | ||||
| aCNH Industrial NV (EUR Traded) | Netherlands | 614,093 | 6,998,214 | |
| aCNH Industrial NV, special voting (EUR Traded) | Netherlands | 833,461 | 9,498,136 | |
| KUKA AG | Germany | 588,778 | 27,575,872 | |
| 44,072,222 | ||||
| Marine 3.4% | ||||
| A.P. Moeller-Maersk AS, B | Denmark | 8,591 | 93,218,591 | |
| Media 3.4% | ||||
| Reed Elsevier PLC | United Kingdom | 4,156,832 | 61,863,642 | |
| RTL Group SA | Germany | 241,477 | 31,165,784 | |
| 93,029,426 | ||||
| Metals & Mining 3.8% | ||||
| Anglo American PLC | United Kingdom | 1,868,671 | 40,852,922 | |
| aThyssenKrupp AG | Germany | 2,165,065 | 52,681,647 | |
| Voestalpine AG | Austria | 232,588 | 11,174,973 | |
| 104,709,542 | ||||
| Multi-Utilities 1.1% | ||||
| GDF Suez | France | 1,328,614 | 31,241,257 | |
| Multiline Retail 1.4% | ||||
| Marks & Spencer Group PLC | United Kingdom | 5,304,795 | 38,018,061 |
24 | Annual Report
Mutual European Fund
Statement of Investments, December 31, 2013 (continued)
| Country | Shares | Value | |||
| Common Stocks (continued) | |||||
| Oil, Gas & Consumable Fuels 6.0% | |||||
| BG Group PLC | United Kingdom | 1,678,180 | $ | 36,063,152 | |
| BP PLC | United Kingdom | 3,801,931 | 30,732,057 | ||
| aCairn Energy PLC | United Kingdom | 10,636,947 | 47,530,625 | ||
| Royal Dutch Shell PLC, A | United Kingdom | 1,470,255 | 52,388,605 | ||
| 166,714,439 | |||||
| Pharmaceuticals 2.1% | |||||
| Novartis AG | Switzerland | 710,824 | 56,735,238 | ||
| Real Estate Management & Development 0.0%† | |||||
| bCanary Wharf Group PLC | United Kingdom | 192,100 | 992,766 | ||
| Road & Rail 2.7% | |||||
| c,dEuro Wagon LP | Jersey Islands | 16,127,149 | 16,886,505 | ||
| FirstGroup PLC | United Kingdom | 27,700,572 | 56,717,485 | ||
| 73,603,990 | |||||
| Software 0.7% | |||||
| SAP AG | Germany | 242,918 | 20,819,870 | ||
| Specialty Retail 5.6% | |||||
| aDufry AG | Switzerland | 418,957 | 73,548,194 | ||
| Kingfisher PLC | United Kingdom | 9,708,475 | 61,829,311 | ||
| WH Smith PLC | United Kingdom | 1,127,716 | 18,683,186 | ||
| 154,060,691 | |||||
| Tobacco 1.0% | |||||
| British American Tobacco PLC | United Kingdom | 526,173 | 28,203,653 | ||
| Trading Companies & Distributors 1.1% | |||||
| Rexel SA | France | 1,214,332 | 31,861,231 | ||
| Wireless Telecommunication Services 3.8% | |||||
| Tele2 AB, B | Sweden | 2,337,670 | 26,473,376 | ||
| Vodafone Group PLC | United Kingdom | 20,006,621 | 78,540,491 | ||
| 105,013,867 | |||||
| Total Common Stocks (Cost $1,847,152,405) | 2,497,497,141 | ||||
| Principal Amount* | |||||
| Corporate Bonds and Notes 0.3% | |||||
| e,fBaggot Securities Ltd., secured bond, 144A, 10.24%, Perpetual | Ireland | 4,212,000 | EUR | 6,120,945 | |
| fWind Acquisition Finance SA, 144A, 11.75%, 7/15/17, | |||||
| senior secured note | Italy | 313,000 | 333,345 | ||
| third lien | Italy | 915,000 | EUR | 1,340,541 | |
| Total Corporate Bonds and Notes (Cost $7,238,620) | 7,794,831 | ||||
Annual Report | 25
| Mutual European Fund | |||||
| Statement of Investments, December 31, 2013 (continued) | |||||
| Country | Principal Amount* | Value | |||
| Corporate Notes in Reorganization 0.1% | |||||
| f,g Glitnir Banki HF, senior note, 144A, | |||||
| 6.375%, 9/25/12 | Iceland | 5,000,000 | $ | 1,487,500 | |
| h FRN, 4.763%, 4/20/10 | Iceland | 5,000,000 | 1,487,500 | ||
| Total Corporate Notes in Reorganization | |||||
| (Cost $2,700,000) | 2,975,000 | ||||
| Total Investments before Short Term Investments | |||||
| (Cost $1,857,091,025) | 2,508,266,972 | ||||
| Short Term Investments 10.1% | |||||
| U.S. Government and Agency Securities 10.1% | |||||
| iU.S. Treasury Bills, | |||||
| 1/02/14 | United States | 30,200,000 | 30,200,000 | ||
| j 3/06/14 | United States | 40,000,000 | 39,996,320 | ||
| 3/27/14 | United States | 49,500,000 | 49,493,070 | ||
| 4/24/14 | United States | 41,000,000 | 40,992,825 | ||
| j 1/09/14 – 6/26/14 | United States | 115,500,000 | 115,481,159 | ||
| Total U.S. Government and Agency Securities | |||||
| (Cost $276,158,044) | 276,163,374 | ||||
| Total Investments (Cost $2,133,249,069) 101.1% | 2,784,430,346 | ||||
| Securities Sold Short (0.4)% | (10,966,721 | ) | |||
| Other Assets, less Liabilities (0.7)% | (18,202,111 | ) | |||
| Net Assets 100.0% | $ | 2,755,261,514 | |||
| Shares | |||||
| kSecurities Sold Short (Proceeds $10,578,559) (0.4)% | |||||
| Common Stocks (0.4)% | |||||
| Diversified Telecommunication Services (0.4)% | |||||
| Verizon Communications Inc. | United States | 223,173 | $ | (10,966,721 | ) |
†Rounds to less than 0.1% of net assets.
*The principal amount is stated in U.S. dollars unless otherwise indicated.
aNon-income producing.
bSecurity has been deemed illiquid because it may not be able to be sold within seven days. At December 31, 2013, the aggregate value of these securities was $1,101,919,
representing 0.04% of net assets.
cSee Note 10 regarding restricted securities.
dSee Note 12 regarding holdings of 5% voting securities.
ePerpetual security with no stated maturity date.
fSecurity was purchased pursuant to Rule 144A under the Securities Act of 1933 and may be sold in transactions exempt from registration only to qualified institutional buyers or in
a public offering registered under the Securities Act of 1933. These securities have been deemed liquid under guidelines approved by the Trust’s Board of Trustees. At December 31,
2013, the aggregate value of these securities was $10,769,831, representing 0.39% of net assets.
gSee Note 8 regarding credit risk and defaulted securities.
hThe coupon rate shown represents the rate at period end.
iThe security is traded on a discount basis with no stated coupon rate.
jSecurity or a portion of the security has been pledged as collateral for securities sold short, open futures and forward contracts. At December 31, 2013, the aggregate value of
these securities and/or cash pledged as collateral was $65,889,793, representing 2.39% of net assets.
kSee Note 1(d) regarding securities sold short.
26 | Annual Report
Mutual European Fund
Statement of Investments, December 31, 2013 (continued)
At December 31, 2013, the Fund had the following futures contracts outstanding. See Note 1(c).
| Futures Contracts | |||||||||||||
| Number of Notional | Expiration | Unrealized | Unrealized | ||||||||||
| Description | Type | Contracts Value | Date | Appreciation | Depreciation | ||||||||
| Currency Contracts | |||||||||||||
| EUR/USD | Short | 1,572 | $270,934,200 | 3/17/14 | $ | — | $ | (1,165,206 | ) | ||||
| GBP/USD | Short | 1,331 137,741,863 | 3/17/14 | — | (1,281,374 | ) | |||||||
| Unrealized appreciation (depreciation) | — | (2,446,580 | ) | ||||||||||
| Net unrealized appreciation (depreciation) | $ | (2,446,580 | ) | ||||||||||
| At December 31, 2013, the Fund had the following forward exchange contracts outstanding. See Note 1(c). | |||||||||||||
| Forward Exchange Contracts | |||||||||||||
| Settlement | Unrealized | Unrealized | |||||||||||
| Currency | Counterpartya | Type | Quantity | Contract Amount | Date | Appreciation | Depreciation | ||||||
| Euro | BANT | Sell | 66,185,342 | $ | 86,467,840 | 1/17/14 | $ | — | $ | (4,569,341 | ) | ||
| Euro | BONY | Sell | 445,595 | 610,474 | 1/17/14 | — | (2,437 | ) | |||||
| Euro | BBU | Sell | 66,185,944 | 86,429,576 | 1/17/14 | — | (4,608,432 | ) | |||||
| Euro | FBCO | Sell | 2,713,880 | 3,626,015 | 1/17/14 | — | (106,896 | ) | |||||
| Euro | SCBT | Sell | 1,289,768 | 1,728,521 | 1/17/14 | — | (45,540 | ) | |||||
| Euro | SSBT | Sell | 481,080 | 658,089 | 1/17/14 | — | (3,631 | ) | |||||
| British Pound | BANT | Sell | 52,951,326 | 81,601,085 | 1/21/14 | — | (6,068,649 | ) | |||||
| British Pound | BBU | Sell | 5,440,570 | 8,766,740 | 1/21/14 | — | (241,029 | ) | |||||
| British Pound | FBCO | Sell | 26,965,589 | 43,054,834 | 1/21/14 | — | (1,591,187 | ) | |||||
| British Pound | DBFX | Sell | 19,118,618 | 29,056,916 | 1/21/14 | — | (2,597,138 | ) | |||||
| British Pound | HSBC | Sell | 952,561 | 1,524,684 | 1/21/14 | — | (52,439 | ) | |||||
| British Pound | SCBT | Sell | 6,324,905 | 9,988,840 | 1/21/14 | — | (483,093 | ) | |||||
| Swiss Franc | BANT | Buy | 1,410,000 | 1,561,151 | 2/12/14 | 20,040 | — | ||||||
| Swiss Franc | BONY | Buy | 2,032,195 | 2,266,443 | 2/12/14 | 20,496 | (8,011 | ) | |||||
| Swiss Franc | BBU | Buy | 512,870 | 557,056 | 2/12/14 | 18,083 | — | ||||||
| Swiss Franc | FBCO | Buy | 9,073,622 | 9,941,957 | 2/12/14 | 233,312 | — | ||||||
| Swiss Franc | SCBT | Buy | 2,232,230 | 2,450,821 | 2/12/14 | 52,429 | — | ||||||
| Swiss Franc | BANT | Sell | 125,041,344 | 136,275,612 | 2/12/14 | — | (3,947,250 | ) | |||||
| Swiss Franc | BBU | Sell | 1,721,997 | 1,923,087 | 2/12/14 | — | (7,982 | ) | |||||
| Swiss Franc | FBCO | Sell | 4,494,173 | 4,866,332 | 2/12/14 | — | (173,487 | ) | |||||
| Swiss Franc | HSBC | Sell | 2,408,765 | 2,577,829 | 2/12/14 | — | (123,389 | ) | |||||
| Swiss Franc | SCBT | Sell | 4,890,351 | 5,370,950 | 2/12/14 | — | (113,148 | ) | |||||
| Danish Krone | BONY | Buy | 823,023 | 148,647 | 2/14/14 | 3,156 | — | ||||||
| Danish Krone | BANT | Sell | 307,002,512 | 55,499,255 | 2/14/14 | 1,782 | (1,127,477 | ) | |||||
| Danish Krone | BONY | Sell | 6,266,428 | 1,149,951 | 2/14/14 | 750 | (6,608 | ) | |||||
| Danish Krone | BBU | Sell | 6,542,471 | 1,209,758 | 2/14/14 | 3,229 | (195 | ) | |||||
| Danish Krone | SSBT | Sell | 1,574,493 | 290,687 | 2/14/14 | 281 | — | ||||||
| British Pound | BANT | Sell | 60,184,396 | 94,106,489 | 2/19/14 | — | (5,519,093 | ) | |||||
| British Pound | BBU | Sell | 27,721,970 | 43,320,677 | 2/19/14 | — | (2,568,583 | ) | |||||
| British Pound | FBCO | Sell | 11,282,331 | 17,803,606 | 2/19/14 | — | (872,477 | ) | |||||
| British Pound | DBFX | Sell | 2,204,604 | 3,421,960 | 2/19/14 | — | (227,407 | ) | |||||
| British Pound | HSBC | Sell | 7,323,292 | 11,630,359 | 2/19/14 | — | (492,172 | ) | |||||
| British Pound | SCBT | Sell | 13,733,148 | 22,002,075 | 2/19/14 | — | (730,942 | ) | |||||
| Annual Report | 27 | |||||||||||||
| Mutual European Fund | |||||||||||
| Statement of Investments, December 31, 2013 (continued) | |||||||||||
| Forward Exchange Contracts (continued) | |||||||||||
| Settlement | Unrealized | Unrealized | |||||||||
| Currency | Counterpartya | Type | Quantity | Contract Amount | Date | Appreciation | Depreciation | ||||
| British Pound | SSBT | Sell | 900,000 | $ | 1,397,970 | 2/19/14 | $ | — | $ | (91,835 | ) |
| Euro | BANT | Sell | 16,378,963 | 21,769,034 | 2/28/14 | — | (760,217 | ) | |||
| Euro | BONY | Sell | 366,686 | 482,253 | 2/28/14 | — | (22,124 | ) | |||
| Euro | BBU | Sell | 54,858,993 | 73,092,750 | 2/28/14 | — | (2,365,753 | ) | |||
| Euro | FBCO | Sell | 17,488,628 | 23,564,226 | 2/28/14 | — | (491,369 | ) | |||
| Euro | HSBC | Sell | 54,871,883 | 73,161,043 | 2/28/14 | — | (2,315,191 | ) | |||
| Euro | SCBT | Sell | 3,995,494 | 5,381,310 | 2/28/14 | — | (114,489 | ) | |||
| Euro | BANT | Buy | 7,216,826 | 9,882,499 | 4/16/14 | 45,723 | (1,490 | ) | |||
| Euro | BONY | Buy | 1,396,824 | 1,922,183 | 4/16/14 | — | (854 | ) | |||
| Euro | BBU | Buy | 1,088,965 | 1,491,255 | 4/16/14 | 6,614 | — | ||||
| Euro | HSBC | Buy | 1,913,099 | 2,619,659 | 4/16/14 | 12,770 | (965 | ) | |||
| Euro | SCBT | Buy | 2,093,544 | 2,877,979 | 4/16/14 | 2,893 | (1,206 | ) | |||
| Euro | SSBT | Buy | 657,448 | 904,241 | 4/16/14 | 78 | — | ||||
| Euro | BANT | Sell | 88,731,865 | 120,597,696 | 4/16/14 | — | (1,452,842 | ) | |||
| Euro | BBU | Sell | 97,649,059 | 132,773,914 | 4/16/14 | — | (1,542,211 | ) | |||
| British Pound | BANT | Sell | 29,207,426 | 47,236,891 | 4/22/14 | — | (1,087,458 | ) | |||
| British Pound | BONY | Sell | 1,919,671 | 3,076,022 | 4/22/14 | — | (100,116 | ) | |||
| British Pound | BBU | Sell | 1,155,603 | 1,892,074 | 4/22/14 | — | (19,898 | ) | |||
| British Pound | FBCO | Sell | 26,894,562 | 43,339,636 | 4/22/14 | — | (1,158,027 | ) | |||
| British Pound | HSBC | Sell | 2,323,967 | 3,817,986 | 4/22/14 | — | (27,070 | ) | |||
| British Pound | SCBT | Sell | 41,232,795 | 66,467,266 | 4/22/14 | — | (1,753,329 | ) | |||
| Swedish Krona | BANT | Buy | 4,170,000 | 634,396 | 5/12/14 | 12,388 | — | ||||
| Swedish Krona | BANT | Sell | 113,340,741 | 17,168,268 | 5/12/14 | — | (411,344 | ) | |||
| Swedish Krona | BONY | Sell | 17,606,928 | 2,666,743 | 5/12/14 | — | (64,163 | ) | |||
| Swedish Krona | BBU | Sell | 40,885,523 | 6,231,930 | 5/12/14 | — | (109,582 | ) | |||
| Euro | BANT | Sell | 73,626,932 | 99,188,951 | 5/15/14 | 14,550 | (2,103,136 | ) | |||
| Euro | BONY | Sell | 2,889,249 | 3,986,705 | 5/15/14 | 12,398 | — | ||||
| Euro | BBU | Sell | 1,706,561 | 2,345,102 | 5/15/14 | 2,203 | (4,561 | ) | |||
| Euro | HSBC | Sell | 3,043,746 | 4,191,915 | 5/15/14 | 12,929 | (7,839 | ) | |||
| Euro | SCBT | Sell | 2,354,891 | 3,244,674 | 5/15/14 | 7,906 | (2,502 | ) | |||
| Euro | SSBT | Sell | 405,762 | 556,081 | 5/15/14 | — | (2,065 | ) | |||
| British Pound | BANT | Buy | 4,039,114 | 6,594,958 | 5/21/14 | 86,228 | — | ||||
| British Pound | BBU | Buy | 2,998,165 | 4,893,924 | 5/21/14 | 65,407 | — | ||||
| British Pound | HSBC | Buy | 2,567,521 | 4,189,147 | 5/21/14 | 57,845 | — | ||||
| Norwegian Krone | BANT | Buy | 10,808,940 | 1,741,805 | 5/21/14 | 31,054 | — | ||||
| Norwegian Krone | BONY | Buy | 8,461,410 | 1,376,869 | 5/21/14 | 10,953 | — | ||||
| Norwegian Krone | BANT | Sell | 480,361,713 | 78,345,747 | 5/21/14 | — | (442,136 | ) | |||
| British Pound | BBU | Sell | 54,841,843 | 88,161,005 | 5/21/14 | — | (2,554,084 | ) | |||
| Norwegian Krone | BBU | Sell | 8,750,000 | 1,411,708 | 5/21/14 | — | (23,449 | ) | |||
| British Pound | HSBC | Sell | 38,718,042 | 62,258,612 | 5/21/14 | — | (1,785,746 | ) | |||
| Unrealized appreciation (depreciation) | 735,497 | (57,105,084 | ) | ||||||||
| Net unrealized appreciation (depreciation) | $ | (56,369,587 | ) | ||||||||
aMay be comprised of multiple contracts using the same currency and settlement date.
See Abbreviations on page 50.
28 | The accompanying notes are an integral part of these financial statements. | Annual Report
| Mutual European Fund | |||
| Financial Statements | |||
| Statement of Assets and Liabilities | |||
| December 31, 2013 | |||
| Assets: | |||
| Investments in securities: | |||
| Cost - Unaffiliated issuers | $ | 2,126,966,560 | |
| Cost - Controlled affiliated issuers (Note 12) | 6,282,509 | ||
| Total cost of investments | $ | 2,133,249,069 | |
| Value - Unaffiliated issuers | $ | 2,767,543,841 | |
| Value - Controlled affiliated issuers (Note 12) | 16,886,505 | ||
| Total value of investments | 2,784,430,346 | ||
| Cash | 11,898 | ||
| Foreign currency, at value (cost $16,651,902) | 16,637,558 | ||
| Receivables: | |||
| Investment securities sold | 1,142,806 | ||
| Capital shares sold | 13,390,252 | ||
| Dividends and interest | 6,563,063 | ||
| Due from brokers | 11,197,299 | ||
| Unrealized appreciation on forward exchange contracts | 735,497 | ||
| Other assets | 84 | ||
| Total assets | 2,834,108,803 | ||
| Liabilities: | |||
| Payables: | |||
| Investment securities purchased | 1,019,362 | ||
| Capital shares redeemed | 6,080,038 | ||
| Management fees | 1,746,304 | ||
| Administrative fees | 171,384 | ||
| Distribution fees | 707,714 | ||
| Transfer agent fees | 602,080 | ||
| Trustees’ fees and expenses | 88,937 | ||
| Variation margin | 107,563 | ||
| Securities sold short, at value (proceeds $10,578,559) | 10,966,721 | ||
| Unrealized depreciation on forward exchange contracts | 57,105,084 | ||
| Accrued expenses and other liabilities | 252,102 | ||
| Total liabilities | 78,847,289 | ||
| Net assets, at value | $ | 2,755,261,514 | |
| Net assets consist of: | |||
| Paid-in capital | $ | 2,142,670,107 | |
| Distributions in excess of net investment income | (2,733,259 | ) | |
| Net unrealized appreciation (depreciation) | 592,172,584 | ||
| Accumulated net realized gain (loss) | 23,152,082 | ||
| Net assets, at value | $ | 2,755,261,514 | |
Annual Report | The accompanying notes are an integral part of these financial statements. | 29
| Mutual European Fund | |||
| Financial Statements (continued) | |||
| Statement of Assets and Liabilities (continued) | |||
| December 31, 2013 | |||
| Class Z: | |||
| Net assets, at value | $ | 1,399,293,648 | |
| Shares outstanding | 56,511,479 | ||
| Net asset value and maximum offering price per share | $ | 24.76 | |
| Class A: | |||
| Net assets, at value | $ | 839,654,613 | |
| Shares outstanding | 34,685,810 | ||
| Net asset value per sharea | $ | 24.21 | |
| Maximum offering price per share (net asset value per share ÷ 94.25%) | $ | 25.69 | |
| Class C: | |||
| Net assets, at value | $ | 198,490,804 | |
| Shares outstanding | 8,186,369 | ||
| Net asset value and maximum offering price per sharea | $ | 24.25 | |
| Class R: | |||
| Net assets, at value | $ | 132,728 | |
| Shares outstanding | 5,543 | ||
| Net asset value and maximum offering price per share | $ | 23.95 | |
| Class R6: | |||
| Net assets, at value | $ | 317,689,721 | |
| Shares outstanding | 12,834,811 | ||
| Net asset value and maximum offering price per share | $ | 24.75 | |
| aRedemption price is equal to net asset value less contingent deferred sales charges, if applicable. | |||
30 | The accompanying notes are an integral part of these financial statements. | Annual Report
| Mutual European Fund | |||
| Financial Statements (continued) | |||
| Statement of Operations | |||
| for the year ended December 31, 2013 | |||
| Investment income: | |||
| Dividends: (net of foreign taxes of $5,343,418) | |||
| Unaffiliated issuers | $ | 67,537,481 | |
| Controlled affiliated issuers (Note 12) | 1,131,806 | ||
| Interest | 521,004 | ||
| Income from securities loaned | 541,205 | ||
| Total investment income | 69,731,496 | ||
| Expenses: | |||
| Management fees (Note 3a) | 17,501,449 | ||
| Administrative fees (Note 3b) | 1,708,438 | ||
| Distribution fees: (Note 3c) | |||
| Class A | 2,223,922 | ||
| Class B | 726 | ||
| Class C | 1,453,178 | ||
| Class R | 344 | ||
| Transfer agent fees: (Note 3e) | |||
| Class Z | 2,026,685 | ||
| Class A | 1,281,069 | ||
| Class B | 128 | ||
| Class C | 246,004 | ||
| Class R | 112 | ||
| Class R6 | 121 | ||
| Special servicing agreement fees (Note 13) | 130,953 | ||
| Custodian fees (Note 4) | 221,789 | ||
| Reports to shareholders | 118,363 | ||
| Registration and filing fees | 149,939 | ||
| Professional fees | 180,209 | ||
| Trustees’ fees and expenses | 55,582 | ||
| Dividends on securities sold short | 6,236 | ||
| Other | 52,239 | ||
| Total expenses | 27,357,486 | ||
| Expense reductions (Note 4) | (564 | ) | |
| Net expenses | 27,356,922 | ||
| Net investment income | 42,374,574 | ||
| Realized and unrealized gains (losses): | |||
| Net realized gain (loss) from: | |||
| Investments | 213,340,613 | ||
| Foreign currency transactions | (43,286,827 | ) | |
| Futures contracts | (16,266,291 | ) | |
| Net realized gain (loss) | 153,787,495 | ||
| Net change in unrealized appreciation (depreciation) on: | |||
| Investments | 347,463,978 | ||
| Translation of other assets and liabilities denominated in foreign currencies | (10,767,218 | ) | |
| Net change in unrealized appreciation (depreciation) | 336,696,760 | ||
| Net realized and unrealized gain (loss) | 490,484,255 | ||
| Net increase (decrease) in net assets resulting from operations | $ | 532,858,829 | |
Annual Report | The accompanying notes are an integral part of these financial statements. | 31
| Mutual European Fund | ||||||
| Financial Statements (continued) | ||||||
| Statements of Changes in Net Assets | ||||||
| Year Ended December 31, | ||||||
| 2013 | 2012 | |||||
| Increase (decrease) in net assets: | ||||||
| Operations: | ||||||
| Net investment income | $ | 42,374,574 | $ | 34,680,624 | ||
| Net realized gain (loss) from investments, foreign currency transactions | ||||||
| and futures contracts | 153,787,495 | 175,449,463 | ||||
| Net change in unrealized appreciation (depreciation) on investments and translation of | ||||||
| other assets and liabilities denominated in foreign currencies | 336,696,760 | 73,994,425 | ||||
| Net increase (decrease) in net assets resulting from operations | 532,858,829 | 284,124,512 | ||||
| Distributions to shareholders from: | ||||||
| Net investment income: | ||||||
| Class Z | (24,011,359 | ) | (34,243,460 | ) | ||
| Class A | (12,591,265 | ) | (18,593,208 | ) | ||
| Class B | — | (16,762 | ) | |||
| Class C | (2,058,127 | ) | (2,717,937 | ) | ||
| Class R | (1,998 | ) | (1,211 | ) | ||
| Class R6 | (5,884,957 | ) | — | |||
| Net realized gains: | ||||||
| Class Z | (78,739,802 | ) | (23,828,682 | ) | ||
| Class A | (48,335,077 | ) | (14,131,427 | ) | ||
| Class B | — | (16,218 | ) | |||
| Class C | (11,433,236 | ) | (2,702,029 | ) | ||
| Class R | (7,605 | ) | (1,014 | ) | ||
| Class R6 | (17,974,679 | ) | — | |||
| Total distributions to shareholders | (201,038,105 | ) | (96,251,948 | ) | ||
| Capital share transactions: (Note 2) | ||||||
| Class Z | 120,739,224 | 28,633,900 | ||||
| Class A | 73,155,449 | (5,833,466 | ) | |||
| Class B | (630,113 | ) | (3,131,339 | ) | ||
| Class C | 56,172,805 | (17,810,148 | ) | |||
| Class R | 80,985 | 11,045 | ||||
| Class R6 | 295,734,868 | — | ||||
| Total capital share transactions | 545,253,218 | 1,869,992 | ||||
| Net increase (decrease) in net assets | 877,073,942 | 189,742,556 | ||||
| Net assets: | ||||||
| Beginning of year | 1,878,187,572 | 1,688,445,016 | ||||
| End of year | $ | 2,755,261,514 | $ | 1,878,187,572 | ||
| Distributions in excess of net investment income included in net assets: | ||||||
| End of year | $ | (2,733,259 | ) | $ | (1,989,147 | ) |
32 | The accompanying notes are an integral part of these financial statements. | Annual Report
Mutual European Fund
Notes to Financial Statements
1. ORGANIZATION AND SIGNIFICANT ACCOUNTING POLICIES
Franklin Mutual Series Funds (Trust) is registered under the Investment Company Act of 1940, as amended, (1940 Act) as an open-end investment company, consisting of seven separate funds. The Mutual European Fund (Fund) is included in this report. The financial statements of the remaining funds in the Trust are presented separately. The Fund offers five classes of shares: Class Z, Class A, Class C, Class R and Class R6. Effective May 1, 2013, the Fund began offering a new class of shares, Class R6. Effective March 22, 2013, all Class B shares were converted to Class A. Each class of shares differs by its initial sales load, contingent deferred sales charges, voting rights on matters affecting a single class, its exchange privilege and fees primarily due to differing arrangements for distribution and transfer agent fees.
The following summarizes the Fund’s significant accounting policies.
a. Financial Instrument Valuation
The Fund’s investments in financial instruments are carried at fair value daily. Fair value is the price that would be received to sell an asset or paid to transfer a liability in an orderly transaction between market participants on the measurement date. The Fund calculates the net asset value (NAV) per share at the close of the New York Stock Exchange (NYSE), generally at 4p.m. Eastern time (NYSE close) on each day the NYSE is open for trading. Under procedures approved by the Trust’s Board of Trustees (the Board), the Fund’s administrator, investment manager and other affiliates have formed the Valuation and Liquidity Oversight Committee (VLOC). The VLOC provides administration and oversight of the Fund’s valuation policies and procedures, which are approved annually by the Board. Among other things, these procedures allow the Fund to utilize independent pricing services, quotations from securities and financial instrument dealers, and other market sources to determine fair value.
Equity securities and derivative financial instruments (derivatives) listed on an exchange or on the NASDAQ National Market System are valued at the last quoted sale price or the official closing price of the day, respectively. Foreign equity securities are valued as of the close of trading on the foreign stock exchange on which the security is primarily traded or as of the NYSE close, whichever is earlier. The value is then converted into its U.S. dollar equivalent at the foreign exchange rate in effect at the NYSE close on the day that the value of the security is determined. Over-the-counter (OTC) securities are valued within the range of the most recent quoted bid and ask prices. Securities that trade in multiple markets or on multiple exchanges are valued according to the broadest and most representative market. Certain equity securities are valued based upon fundamental characteristics or relationships to similar securities.
Debt securities generally trade in the OTC market rather than on a securities exchange. The Fund’s pricing services use multiple valuation techniques to determine fair value. In instances where sufficient market activity exists, the pricing services may utilize a market-based approach through which quotes from market makers are used to determine fair value. In instances where sufficient market activity may not exist or is limited, the pricing services also utilize proprietary
Annual Report | 33
Mutual European Fund
Notes to Financial Statements (continued)
| 1. | ORGANIZATION AND SIGNIFICANT ACCOUNTING POLICIES (continued) |
| a. | Financial Instrument Valuation (continued) |
valuation models which may consider market characteristics such as benchmark yield curves, credit spreads, estimated default rates, anticipated market interest rate volatility, coupon rates, anticipated timing of principal repayments, underlying collateral, and other unique security features in order to estimate the relevant cash flows, which are then discounted to calculate the fair value. Securities denominated in a foreign currency are converted into their U.S. dollar equivalent at the foreign exchange rate in effect at the NYSE close on the date that the values of the foreign debt securities are determined.
Certain derivatives trade in the OTC market. The Fund’s pricing services use various techniques including industry standard option pricing models and proprietary discounted cash flow models to determine the fair value of those instruments. The Fund’s net benefit or obligation under the derivative contract, as measured by the fair value of the contract, is included in net assets.
The Fund has procedures to determine the fair value of financial instruments for which market prices are not reliable or readily available. Under these procedures, the VLOC convenes on a regular basis to review such financial instruments and considers a number of factors, including significant unobservable valuation inputs, when arriving at fair value. The VLOC primarily employs a market-based approach which may use related or comparable assets or liabilities, recent transactions, market multiples, book values, and other relevant information for the investment to determine the fair value of the investment. An income-based valuation approach may also be used in which the anticipated future cash flows of the investment are discounted to calculate fair value. Discounts may also be applied due to the nature or duration of any restrictions on the disposition of the investments. Due to the inherent uncertainty of valuations of such investments, the fair values may differ significantly from the values that would have been used had an active market existed. The VLOC employs various methods for calibrating these valuation approaches including a regular review of key inputs and assumptions, transactional back-testing or disposition analysis, and reviews of any related market activity.
Trading in securities on foreign securities stock exchanges and OTC markets may be completed before the daily NYSE close. In addition, trading in certain foreign markets may not take place on every NYSE business day. Occasionally, events occur between the time at which trading in a foreign security is completed and the close of the NYSE that might call into question the reliability of the value of a portfolio security held by the Fund. As a result, differences may arise between the value of the Fund’s portfolio securities as determined at the foreign market close and the latest indications of value at the close of the NYSE. In order to minimize the potential for these differences, the VLOC monitors price movements following the close of trading in foreign stock markets through a series of country specific market proxies (such as baskets of American Depositary Receipts, futures contracts and exchange traded funds). These price movements are measured against established trigger thresholds for each specific market
34 | Annual Report
Mutual European Fund
Notes to Financial Statements (continued)
| 1. | ORGANIZATION AND SIGNIFICANT ACCOUNTING POLICIES (continued) |
| a. | Financial Instrument Valuation (continued) |
proxy to assist in determining if an event has occurred that may call into question the reliability of the values of the foreign securities held by the Fund. If such an event occurs, the securities may be valued using fair value procedures, which may include the use of independent pricing services.
Also, when the last day of the reporting period is a non-business day, certain foreign markets may be open on those days that the NYSE is closed, which could result in differences between the value of the Fund’s portfolio securities on the last business day and the last calendar day of the reporting period. Any significant security valuation changes due to an open foreign market are adjusted and reflected by the Fund for financial reporting purposes.
b. Foreign Currency Translation
Portfolio securities and other assets and liabilities denominated in foreign currencies are translated into U.S. dollars based on the exchange rate of such currencies against U.S. dollars on the date of valuation. The Fund may enter into foreign currency exchange contracts to facilitate transactions denominated in a foreign currency. Purchases and sales of securities, income and expense items denominated in foreign currencies are translated into U.S. dollars at the exchange rate in effect on the transaction date. Portfolio securities and assets and liabilities denominated in foreign currencies contain risks that those currencies will decline in value relative to the U.S. dollar. Occasionally, events may impact the availability or reliability of foreign exchange rates used to convert the U.S. dollar equivalent value. If such an event occurs, the foreign exchange rate will be valued at fair value using procedures established and approved by the Board.
The Fund do not separately report the effect of changes in foreign exchange rates from changes in market prices on securities held. Such changes are included in net realized and unrealized gain or loss from investments on the Statement of Operations.
Realized foreign exchange gains or losses arise from sales of foreign currencies, currency gains or losses realized between the trade and settlement dates on securities transactions and the difference between the recorded amounts of dividends, interest, and foreign withholding taxes and the U.S. dollar equivalent of the amounts actually received or paid. Net unrealized foreign exchange gains and losses arise from changes in foreign exchange rates on foreign denominated assets and liabilities other than investments in securities held at the end of the reporting period.
c. Derivative Financial Instruments
The Fund invested in derivatives in order to manage risk or gain exposure to various other investments or markets. Derivatives are financial contracts based on an underlying or notional amount, require no initial investment or an initial net investment that is smaller than would normally be required to have a similar response to changes in market factors, and require or
Annual Report | 35
Mutual European Fund
Notes to Financial Statements (continued)
| 1. | ORGANIZATION AND SIGNIFICANT ACCOUNTING POLICIES (continued) |
| c. | Derivative Financial Instruments (continued) |
permit net settlement. Derivatives contain various risks including the potential inability of the counterparty to fulfill their obligations under the terms of the contract, the potential for an illiquid secondary market, and/or the potential for market movements which expose the Fund to gains or losses in excess of the amounts shown on the Statement of Assets and Liabilities. Realized gain and loss and unrealized appreciation and depreciation on these contracts for the period are included in the Statement of Operations.
Derivative counterparty credit risk is managed through a formal evaluation of the creditworthiness of all potential counterparties. The Fund attempts to reduce its exposure to counterparty credit risk on OTC derivatives, whenever possible, by entering into International Swaps and Derivatives Association (ISDA) master agreements with certain counterparties. These agreements contain various provisions, including but not limited to collateral requirements, events of default, or early termination. Termination events applicable to the counterparty include certain deteriorations in the credit quality of the counterparty. Termination events applicable to the Fund include failure of the Fund to maintain certain net asset levels and/or limit the decline in net assets over various periods of time. In the event of default or early termination, the ISDA master agreement gives the non-defaulting party the right to net and close-out all transactions traded, whether or not arising under the ISDA agreement, to one net amount payable by one counterparty to the other. However, absent an event of default or early termination, OTC derivative assets and liabilities are presented gross and not offset in the Statement of Assets and Liabilities. Early termination by the counterparty may result in an immediate payment by the Fund of any net liability owed to that counterparty under the ISDA agreement.
Collateral requirements differ by type of derivative. Collateral or initial margin requirements are set by the broker or exchange clearing house for exchange traded and centrally cleared derivatives. Initial margin deposited is held at the exchange and can be in the form of cash and/or securities. For OTC derivatives traded under an ISDA master agreement, posting of collateral is required by either the Fund or the applicable counterparty if the total net exposure of all OTC derivatives with the applicable counterparty exceeds the minimum transfer amount, which typically ranges from $100,000 to $250,000, and can vary depending on the counterparty and the type of the agreement. Generally, collateral is determined at the close of fund business each day and any additional collateral required due to changes in derivative values may be delivered by the Fund or the counterparty within a few business days. Collateral pledged and/or received by the Fund for OTC derivatives, if any, is held in segregated accounts with the Fund’s custodian/counterparty broker and can be in the form of cash and/or securities. Unrestricted cash may be invested according to the Fund’s investment objectives.
36 | Annual Report
Mutual European Fund
Notes to Financial Statements (continued)
| 1. | ORGANIZATION AND SIGNIFICANT ACCOUNTING POLICIES (continued) |
| c. | Derivative Financial Instruments (continued) |
The Fund entered into exchange traded futures contracts primarily to manage exposure to certain foreign currencies. A futures contract is an agreement between the Fund and a counterparty to buy or sell an asset for a specified price on a future date. Required initial margins are pledged by the Fund, and the daily change in fair value is accounted for as a variation margin payable or receivable on the Statement of Assets and Liabilities.
The Fund entered into OTC forward exchange contracts primarily to manage exposure to certain foreign currencies. A forward exchange contract is an agreement between the Fund and a counterparty to buy or sell a foreign currency at a specific exchange rate on a future date.
The Fund purchased or wrote OTC option contracts primarily to manage exposure to equity price risk. An option is a contract entitling the holder to purchase or sell a specific amount of shares or units of an asset or notional amount of a swap (swaption), at a specified price. Options purchased are recorded as an asset while options written are recorded as a liability. Upon exercise of an option, the acquisition cost or sales proceeds of the underlying investment is adjusted by any premium received or paid. Upon expiration of an option, any premium received or paid is recorded as a realized gain or loss. Upon closing an option other than through expiration or exercise, the difference between the premium and the cost to close the position is recorded as a realized gain or loss.
See Notes 7 and 11 regarding investment transactions and other derivative information, respectively.
d. Securities Sold Short
The Fund is engaged in selling securities short, which obligates the Fund to replace a borrowed security with the same security at current market value. The Fund incurs a loss if the price of the security increases between the date of the short sale and the date on which the Fund replaces the borrowed security. The Fund realizes a gain if the price of the security declines between those dates. Gains are limited to the price at which the Fund sold the security short, while losses are potentially unlimited in size.
The Fund is required to establish a margin account with the broker lending the security sold short. While the short sale is outstanding, the broker retains the proceeds of the short sale to the extent necessary to meet margin requirements until the short position is closed out. A deposit must also be maintained with the Fund’s custodian/counterparty broker consisting of cash and/or securities having a value equal to a specified percentage of the value of the securities sold short.
Annual Report | 37
Mutual European Fund
Notes to Financial Statements (continued)
| 1. | ORGANIZATION AND SIGNIFICANT ACCOUNTING POLICIES (continued) |
| d. | Securities Sold Short (continued) |
The Fund is obligated to pay fees for borrowing the securities sold short and is required to pay the counterparty any dividends or interest due on securities sold short. Such dividends or interest and any security borrowing fees are recorded as an expense to the Fund.
e. Securities Lending
The Fund participates in an agency based securities lending program. The Fund receives cash collateral against the loaned securities in an amount equal to at least 102% of the market value of the loaned securities. Collateral is maintained over the life of the loan in an amount not less than 100% of the market value of loaned securities, as determined at the close of fund business each day; any additional collateral required due to changes in security values is delivered to the Fund on the next business day. The collateral is invested in a non-registered money fund. The Fund receives income from the investment of cash collateral, in addition to lending fees and rebates paid by the borrower. The Fund bears the market risk with respect to the collateral investment, securities loaned, and the risk that the agent may default on its obligations to the Fund. The securities lending agent has agreed to indemnify the Fund in the event of default by a third party borrower. At December 31, 2013, the Fund had no securities on loan.
f. Income and Deferred Taxes
It is the Fund’s policy to qualify as a regulated investment company under the Internal Revenue Code. The Fund intends to distribute to shareholders substantially all of its taxable income and net realized gains to relieve it from federal income and excise taxes. As a result, no provision for U.S. federal income taxes is required.
The Fund may be subject to foreign taxation related to income received, capital gains on the sale of securities and certain foreign currency transactions in the foreign jurisdictions in which it invests. Foreign taxes, if any, are recorded based on the tax regulations and rates that exist in the foreign markets in which the Fund invests. When a capital gain tax is determined to apply the Fund records an estimated deferred tax liability in an amount that would be payable if the securities were disposed of on the valuation date.
The Fund recognizes the tax benefits of uncertain tax positions only when the position is “more likely than not” to be sustained upon examination by the tax authorities based on the technical merits of the tax position. As of December 31, 2013, and for all open tax years, the Fund has determined that no liability for unrecognized tax benefits is required in the Fund’s financial statements related to uncertain tax positions taken on a tax return (or expected to be taken on future tax returns). Open tax years are those that remain subject to examination and are based on each tax jurisdiction statute of limitation.
38 | Annual Report
Mutual European Fund
Notes to Financial Statements (continued)
| 1. | ORGANIZATION AND SIGNIFICANT ACCOUNTING POLICIES (continued) |
| g. | Security Transactions, Investment Income, Expenses and Distributions |
Security transactions are accounted for on trade date. Realized gains and losses on security transactions are determined on a specific identification basis. Interest income and estimated expenses are accrued daily. Amortization of premium and accretion of discount on debt securities are included in interest income. Dividend income and dividends declared on securities sold short are recorded on the ex-dividend date except that certain dividends from foreign securities are recognized as soon as the Fund is notified of the ex-dividend date. Distributions to shareholders are recorded on the ex-dividend date and are determined according to income tax regulations (tax basis). Distributable earnings determined on a tax basis may differ from earnings recorded in accordance with accounting principles generally accepted in the United States of America. These differences may be permanent or temporary. Permanent differences are reclassified among capital accounts to reflect their tax character. These reclassifications have no impact on net assets or the results of operations. Temporary differences are not reclassified, as they may reverse in subsequent periods.
Common expenses incurred by the Trust are allocated among the funds based on the ratio of net assets of each fund to the combined net assets of the Trust. Fund specific expenses are charged directly to the fund that incurred the expense.
Realized and unrealized gains and losses and net investment income, not including class specific expenses, are allocated daily to each class of shares based upon the relative proportion of net assets of each class. Differences in per share distributions, by class, are generally due to differences in class specific expenses.
h. Accounting Estimates
The preparation of financial statements in accordance with accounting principles generally accepted in the United States of America requires management to make estimates and assumptions that affect the reported amounts of assets and liabilities at the date of the financial statements and the amounts of income and expenses during the reporting period. Actual results could differ from those estimates.
i. Guarantees and Indemnifications
Under the Trust’s organizational documents, its officers and trustees are indemnified by the Trust against certain liabilities arising out of the performance of their duties to the Trust. Additionally, in the normal course of business, the Trust, on behalf of the Fund, enters into contracts with service providers that contain general indemnification clauses. The Trust’s maximum exposure under these arrangements is unknown as this would involve future claims that may be made against the Trust that have not yet occurred. Currently, the Trust expects the risk of loss to be remote.
Annual Report | 39
Mutual European Fund
Notes to Financial Statements (continued)
2. SHARES OF BENEFICIAL INTEREST
At December 31, 2013, there were an unlimited number of shares authorized (without par value).
Transactions in the Fund’s shares were as follows:
| Year Ended December 31, | ||||||||||||
| 2013 | 2012 | |||||||||||
| Shares | Amount | Shares | Amount | |||||||||
| Class Z Shares: | ||||||||||||
| Shares sold | 20,746,802 | $ | 500,000,153 | 5,987,954 | $ | 122,427,609 | ||||||
| Shares issued in reinvestment of | ||||||||||||
| distributions | 3,970,748 | 96,496,979 | 2,622,257 | 55,401,510 | ||||||||
| Shares redeemeda | (20,331,016 | ) | (475,757,908 | ) | (7,365,879 | ) | (149,195,219 | ) | ||||
| Net increase (decrease) | 4,386,534 | $ | 120,739,224 | 1,244,332 | $ | 28,633,900 | ||||||
| Class A Shares: | ||||||||||||
| Shares sold | 13,679,102 | $ | 324,306,477 | 6,618,726 | $ | 132,551,979 | ||||||
| Shares issued in reinvestment of | ||||||||||||
| distributions | 2,057,291 | 48,885,214 | 928,602 | 19,210,403 | ||||||||
| Shares redeemed | (12,609,582 | ) | (300,036,242 | ) | (7,937,505 | ) | (157,595,848 | ) | ||||
| Net increase (decrease) | 3,126,811 | $ | 73,155,449 | (390,177 | ) | $ | (5,833,466 | ) | ||||
| Class B Sharesb: | ||||||||||||
| Shares sold | 151 | $ | 3,172 | 5,863 | $ | 118,713 | ||||||
| Shares issued in reinvestment of | ||||||||||||
| distributions | — | — | 1,403 | 28,810 | ||||||||
| Shares redeemed | (29,455 | ) | (633,285 | ) | (167,661 | ) | (3,278,862 | ) | ||||
| Net increase (decrease) | (29,304 | ) | $ | (630,113 | ) | (160,395 | ) | $ | (3,131,339 | ) | ||
| Class C Shares: | ||||||||||||
| Shares sold | 2,863,541 | $ | 68,880,536 | 547,006 | $ | 10,949,269 | ||||||
| Shares issued in reinvestment of | ||||||||||||
| distributions | 512,117 | 12,189,089 | 237,674 | 4,925,285 | ||||||||
| Shares redeemed | (1,079,321 | ) | (24,896,820 | ) | (1,702,604 | ) | (33,684,702 | ) | ||||
| Net increase (decrease) | 2,296,337 | $ | 56,172,805 | (917,924 | ) | $ | (17,810,148 | ) | ||||
| Class R Shares: | ||||||||||||
| Shares sold | 3,841 | $ | 93,844 | 698 | $ | 13,869 | ||||||
| Shares issued in reinvestment of | ||||||||||||
| distributions | 409 | 9,603 | 108 | 2,225 | ||||||||
| Shares redeemed | (937 | ) | (22,462 | ) | (277 | ) | (5,049 | ) | ||||
| Net increase (decrease) | 3,313 | $ | 80,985 | 529 | $ | 11,045 | ||||||
| Class R6 Sharesc: | ||||||||||||
| Shares solda | 12,899,801 | $ | 295,926,197 | |||||||||
| Shares issued in reinvestment of | ||||||||||||
| distributions | 982,194 | 23,859,636 | ||||||||||
| Shares redeemed | (1,047,184 | ) | (24,050,965 | ) | ||||||||
| Net increase (decrease) | 12,834,811 | $ | 295,734,868 | |||||||||
| aEffective May 1, 2013, a portion of Class Z shares were exchanged into Class R6. | ||||||||||||
| bEffective March 22, 2013, all Class B shares were converted to Class A. | ||||||||||||
| cFor the period May 1, 2013 (effective date) to December 31, 2013. | ||||||||||||
40 | Annual Report
Mutual European Fund
Notes to Financial Statements (continued)
3. TRANSACTIONS WITH AFFILIATES
Franklin Resources, Inc. is the holding company for various subsidiaries that together are referred to as Franklin Templeton Investments. Certain officers and trustees of the Fund are also officers and/or directors of the following subsidiaries:
| Subsidiary | Affiliation |
| Franklin Mutual Advisers, LLC (Franklin Mutual) | Investment manager |
| Franklin Templeton Services, LLC (FT Services) | Administrative manager |
| Franklin Templeton Distributors, Inc. (Distributors) | Principal underwriter |
| Franklin Templeton Investor Services, LLC (Investor Services) | Transfer agent |
a. Management Fees
The Fund pays an investment management fee to Franklin Mutual based on the average daily net assets of the Fund as follows:
| Annualized Fee Rate | Net Assets | |
| 0.800 | % | Up to and including $1 billion |
| 0.770 | % | Over $1 billion, up to and including $2 billion |
| 0.750 | % | Over $2 billion, up to and including $5 billion |
| 0.730 | % | In excess of $5 billion |
b. Administrative Fees
The Fund pays its allocated share of an administrative fee to FT Services based on the Trust’s aggregate average daily net assets as follows:
| Annualized Fee Rate | Net Assets | |
| 0.150 | % | Up to and including $200 million |
| 0.135 | % | Over $200 million, up to and including $700 million |
| 0.100 | % | Over $700 million, up to and including $1.2 billion |
| 0.075 | % | In excess of $1.2 billion |
c. Distribution Fees
The Board has adopted distribution plans for each share class, with the exception of Class Z and Class R6 shares, pursuant to Rule 12b-1 under the 1940 Act. Distribution fees are not charged on shares held by affiliates. Under the Fund’s Class A reimbursement distribution plan, the Fund reimburses Distributors for costs incurred in connection with the servicing, sale and distribution of the Fund’s shares up to the maximum annual plan rate. Under the Class A reimbursement distribution plan, costs exceeding the maximum for the current plan year cannot be reimbursed in subsequent periods. In addition, under the Fund’s Class B, C and R compensation distribution plans, the Fund pays Distributors for costs incurred in connection with the servicing, sale and distribution of the Fund’s shares up to the maximum annual plan rate for each class. The plan year, for purposes of monitoring compliance with the maximum annual plan rates, is February 1 through January 31.
Annual Report | 41
Mutual European Fund
Notes to Financial Statements (continued)
| 3. | TRANSACTIONS WITH AFFILIATES (continued) |
| c. | Distribution Fees (continued) |
The maximum annual plan rates, based on the average daily net assets, for each class, are as follows:
| Class A | 0.35 | % |
| Class B | 1.00 | % |
| Class C | 1.00 | % |
| Class R | 0.50 | % |
The Board has set the current rate at 0.30% per year for Class A shares until further notice and approval by the Board.
d. Sales Charges/Underwriting Agreements
Front-end sales charges and contingent deferred sales charges (CDSC) do not represent expenses of the Fund. These charges are deducted from the proceeds of sales of Fund shares prior to investment or from redemption proceeds prior to remittance, as applicable. Distributors has advised the Fund of the following commission transactions related to the sales and redemptions of the Fund’s shares for the year:
| Sales charges retained net of commissions paid to | ||
| unaffiliated broker/dealers | $ | 360,342 |
| CDSC retained | $ | 13,996 |
e. Transfer Agent Fees
Each class of shares, except for Class R6, pays transfer agent fees to Investor Services for its performance of shareholder servicing obligations and reimburses Investor Services for out of pocket expenses incurred, including shareholding servicing fees paid to third parties. These fees are allocated daily based upon their relative proportion of such classes’ aggregate net assets. Class R6 pays Investor Services transfer agent fees specific to that class.
For the year ended December 31, 2013, the Fund paid transfer agent fees of $3,554,119, of which $1,998,731 was retained by Investor Services.
f. Waiver and Expense Reimbursement
Investor Services has contractually agreed in advance to waive or limit its fees so that the Class R6 transfer agent fees do not exceed 0.01% until April 30, 2014. There were no expenses waived during the year ended December 31, 2013.
42 | Annual Report
Mutual European Fund
Notes to Financial Statements (continued)
4. EXPENSE OFFSET ARRANGEMENT
The Fund has entered into an arrangement with its custodian whereby credits realized as a result of uninvested cash balances are used to reduce a portion of the Fund’s custodian expenses. During the year ended December 31, 2013, the custodian fees were reduced as noted in the Statement of Operations.
5. INDEPENDENT TRUSTEES’ RETIREMENT PLAN
On January 1, 1993, the Trust adopted an Independent Trustees’ Retirement Plan (Plan). The Plan is an unfunded defined benefit plan that provides benefit payments to Trustees whose length of service and retirement age meets the eligibility requirements of the Plan. Benefits under the Plan are based on years of service and fees paid to each trustee at the time of retirement. Effective in December 1996, the Plan was closed to new participants.
During the year ended December 31, 2013, the Fund’s projected benefit obligation and benefit payments under the Plan were as follows:
| aProjected benefit obligation at December 31, 2013 | $ | 88,937 |
| bDecrease in projected benefit obligation | $ | 6,396 |
| Benefit payments made to retired trustees | $ | 2,612 |
aThe projected benefit obligation is included in accrued expenses and other liabilities in the Statement of Assets and Liabilities. bThe decrease in projected benefit obligation is included in trustees’ fees and expenses in the Statement of Operations.
6. INCOME TAXES
For tax purposes, the Fund may elect to defer any portion of a post-October capital loss to the first day of the following fiscal year. At December 31, 2013, the Fund deferred post-October capital losses of $25,671,875.
The tax character of distributions paid during the years ended December 31, 2013 and 2012, was as follows:
| 2013 | 2012 | |||
| Distributions paid from: | ||||
| Ordinary income | $ | 61,258,224 | $ | 55,573,974 |
| Long term capital gain | 139,779,881 | 40,677,974 | ||
| $ | 201,038,105 | $ | 96,251,948 |
Annual Report | 43
Mutual European Fund
Notes to Financial Statements (continued)
6. INCOME TAXES (continued)
At December 31, 2013, the cost of investments, net unrealized appreciation (depreciation) and undistributed ordinary income for income tax purposes were as follows:
| Cost of investments | $ | 2,146,116,536 | |
| Unrealized appreciation | 687,556,208 | ||
| Unrealized depreciation | (49,242,398 | ) | |
| Net unrealized appreciation (depreciation) | $ | 638,313,810 | |
| Distributable earnings - undistributed ordinary income | $ | 1,503,578 | |
Differences between income and/or capital gains as determined on a book basis and a tax basis are primarily due to differing treatments of foreign currency transactions, wash sales and corporate actions.
7. INVESTMENT TRANSACTIONS
Purchases and sales of investments (excluding short term securities and securities sold short) for the year ended December 31, 2013, aggregated $969,286,818 and $787,819,700, respectively.
Transactions in options written during the year ended December 31, 2013, were as follows:
| Number of | Premiums | ||||
| Contracts | Received | ||||
| Options outstanding at December 31, 2012 | — | $ | — | ||
| Options written | 271 | 37,940 | |||
| Options expired | — | — | |||
| Options exercised | (271) | (37,940 | ) | ||
| Options closed | — | — | |||
| Options outstanding at December 31, 2013 | — | $ | — | ||
See Note 1(c) regarding derivative financial instruments.
8. CREDIT RISK AND DEFAULTED SECURITIES
The Fund may purchase the pre-default or defaulted debt of distressed companies. Distressed companies are financially troubled and are about to be or are already involved in financial restructuring or bankruptcy. Risks associated with purchasing these securities include the possibility that the bankruptcy or other restructuring process takes longer than expected, or that distributions in restructuring are less than anticipated, either or both of which may result in unfavorable consequences to the Fund. If it becomes probable that the income on debt securities, including those of distressed companies, will not be collected, the Fund discontinues accruing income and recognizes an adjustment for uncollectible interest.
44 | Annual Report
Mutual European Fund
Notes to Financial Statements (continued)
8. CREDIT RISK AND DEFAULTED SECURITIES (continued)
At December 31, 2013, the aggregate value of distressed company securities for which interest recognition has been discontinued was $2,975,000, representing 0.11% of the Fund’s net assets. For information as to specific securities, see the accompanying Statement of Investments.
9. CONCENTRATION OF RISK
Investing in foreign securities may include certain risks and considerations not typically associated with investing in U.S. securities, such as fluctuating currency values and changing local and regional economic, political and social conditions, which may result in greater market volatility. In addition, certain foreign securities may not be as liquid as U.S. securities.
10. RESTRICTED SECURITIES
The Fund invests in securities that are restricted under the Securities Act of 1933 (1933 Act) or which are subject to legal, contractual, or other agreed upon restrictions on resale. Restricted securities are often purchased in private placement transactions, and cannot be sold without prior registration unless the sale is pursuant to an exemption under the 1933 Act. Disposal of these securities may require greater effort and expense, and prompt sale at an acceptable price may be difficult. The Fund may have registration rights for restricted securities. The issuer generally incurs all registration costs.
At December 31, 2013, the Fund held investments in restricted securities, excluding certain securities exempt from registration under the 1933 Act deemed to be liquid, as follows:
| Acquisition | ||||||
| Shares | Issuer | Dates | Cost | Value | ||
| 16,127,149 | Euro Wagon LP | 12/08/05 - 1/02/08 | $ | 6,282,509 | $ | 16,886,505 |
| 16,080 | Olympus Re Holdings Ltd. | 12/19/01 | 1,506,391 | — | ||
| Total Restricted Securities (Value is 0.61% of Net Assets) | $ | 7,788,900 | $ | 16,886,505 | ||
Annual Report | 45
Mutual European Fund
Notes to Financial Statements (continued)
11. OTHER DERIVATIVE INFORMATION
At December 31, 2013, the Fund’s investments in derivative contracts are reflected on the Statement of Assets and Liabilities as follows:
| Asset Derivatives | Liability Derivatives | ||||||
| Derivative Contracts | |||||||
| Not Accounted for as | Statement of Assets and | Fair Value | Statement of Assets and | Fair Value | |||
| Hedging Instruments | Liabilities Location | Amount | Liabilities Location | Amount | |||
| Foreign exchange | |||||||
| contracts | Unrealized appreciation on | $ | 735,497 | Unrealized depreciation on | $ | 59,551,664 | a |
| forward exchange contracts | forward exchange contracts / | ||||||
| Net assets consist of - net | |||||||
| unrealized appreciation | |||||||
| (depreciation) | |||||||
| aIncludes cumulative appreciation (depreciation) of futures contracts as reported in the Statement of Investments. Only current day’s variation | |||||||
| margin is separately reported within the Statement of Assets and Liabilities. | |||||||
| For the year ended December 31, 2013, the effect of derivative contracts on the Fund’s | |||||||
| Statement of Operations was as follows: | |||||||
| Change in | |||||||
| Unrealized | |||||||
| Derivative Contracts | Realized | Appreciation | |||||
| Not Accounted for as | Statement of | Gain (Loss) | (Depreciation) | ||||
| Hedging Instruments | Operations Locations | for the Year | for the Year | ||||
| Foreign exchange | |||||||
| contracts | Net realized gain (loss) from foreign currency $(60,308,849) | $ | (10,981,806 | ) | |||
| transactions and futures contracts / | |||||||
| Net change in unrealized appreciation | |||||||
| (depreciation) on translation of other | |||||||
| assets and liabilities denominated in foreign | |||||||
| currencies | |||||||
| For the year ended December 31, 2013, the average month end market value of derivatives repre- | |||||||
| sented 1.72% of average month end net assets. The average month end number of open derivative | |||||||
| contracts for the year was 180. | |||||||
| At December 31, 2013, the Fund’s OTC derivative assets and liabilities are as follows: | |||||||
| Gross and Net Amounts of Assets and Liabilities Presented | |||||||
| in the Statement of Assets and Liabilities | |||||||
| Assetsa | Liabilitiesa | ||||||
| Derivatives | |||||||
| Forward Exchange Contracts | $ | 735,497 | $ | 57,105,084 | |||
| aAbsent an event of default or early termination, OTC derivative assets and liabilities are presented gross and not offset in the Statement of Assets | |||||||
| and Liabilities. | |||||||
46 | Annual Report
Mutual European Fund
Notes to Financial Statements (continued)
11. OTHER DERIVATIVE INFORMATION (continued)
At December 31, 2013, the Fund’s OTC derivative assets which may be offset against the Fund’s OTC derivative liabilities and collateral received from the counterparty, is as follows:
| Amounts Not Offset in the | ||||||||||||
| Statement of Assets and Liabilities | ||||||||||||
| Gross and | ||||||||||||
| Net Amounts of | ||||||||||||
| Assets Presented | Financial | Financial | ||||||||||
| in the Statement | Instruments Instruments | Cash | Net Amount | |||||||||
| of Assets and | Available for | Collateral | Collateral | (Not less | ||||||||
| Liabilities | Offset | Received | Received | than zero) | ||||||||
| Counterparty | ||||||||||||
| BANT | $ | 211,765 | $ | (211,765 | ) | $ | — | $ | — | $ | — | |
| BBU | 95,536 | (95,536 | ) | — | — | — | ||||||
| BONY | 47,753 | (47,753 | ) | — | — | — | ||||||
| DBFX | — | — | — | — | — | |||||||
| FBCO | 233,312 | (233,312 | ) | — | — | — | ||||||
| HSBC | 83,544 | (83,544 | ) | — | — | — | ||||||
| SCBT | 63,228 | (63,228 | ) | — | — | — | ||||||
| SSBT | 359 | (359 | ) | — | — | — | ||||||
| Total | $ | 735,497 | $ | (735,497 | ) | $ | — | $ | — | $ | — | |
| At December 31, 2013, the Fund’s OTC derivative liabilities which may be offset against the | ||||||||||||
| Fund's OTC derivative assets and collateral pledged to the counterparty, is as follows: | ||||||||||||
| Amounts Not Offset in the | ||||||||||||
| Statement of Assets and Liabilities | ||||||||||||
| Gross and | ||||||||||||
| Net Amounts of | ||||||||||||
| Liabilities Presented | Financial | Financial | ||||||||||
| in the Statement | Instruments | Instruments | Cash | Net Amount | ||||||||
| of Assets and | Available for | Collateral | Collateral | (Not less | ||||||||
| Liabilities | Offset | Pledgeda,b | Pledged | than zero) | ||||||||
| Counterparty | ||||||||||||
| BANT | $ | 27,490,433 | $ | (211,765 | ) | $ | (24,503,049 | ) | — | $ | 2,775,619 | |
| BBU | 14,045,759 | (95,536 | ) | (12,489,383 | ) | — | 1,460,840 | |||||
| BONY | 204,313 | (47,753 | ) | (156,560 | ) | — | — | |||||
| DBFX | 2,824,545 | — | (2,645,015 | ) | — | 179,530 | ||||||
| FBCO | 4,393,443 | (233,312 | ) | (3,152,685 | ) | — | 1,007,446 | |||||
| HSBC | 4,804,811 | (83,544 | ) | (3,459,644 | ) | — | 1,261,623 | |||||
| SCBT | 3,244,249 | (63,228 | ) | (2,632,444 | ) | — | 548,577 | |||||
| SSBT | 97,531 | (359 | ) | — | — | 97,172 | ||||||
| Total | $ | 57,105,084 | $ | (735,497 | ) | $ | (49,038,780 | ) | $ | — | $ | 7,330,807 |
aSee the accompanying Statement of Investments for securities pledged as collateral for derivatives.
bIn some instances, the collateral amounts disclosed in the table above were adjusted due to the requirement to limit the collateral amounts to avoid
the effect of overcollateralization. Actual collateral received and/or pledged may be more than the amounts disclosed herein.
See Notes 1(c) and 7 regarding derivative financial instruments and investment transactions,
respectively.
Annual Report | 47
Mutual European Fund
Notes to Financial Statements (continued)
12. HOLDINGS OF 5% VOTING SECURITIES OF PORTFOLIO COMPANIES
The 1940 Act defines “affiliated companies” to include investments in portfolio companies in which a fund owns 5% or more of the outstanding voting securities. Investments in “affiliated companies” for the Fund for the year ended December 31, 2013, were as shown below.
| Number of Shares | Number of Shares | Value at | Realized | ||||||
| Held at Beginning | Gross | Gross | Held at End | End of | Investment | Capital | |||
| Name of Issuer | of Year | Additions | Reductions | of Year | Year | Income | Gain (Loss) | ||
| Controlled Affiliatesa | |||||||||
| Euro Wagon LP | |||||||||
| (Value is 0.61% of Net Assets) | 16,127,149 | — | — | 16,127,149 | $ | 16,886,505 | $ | 1,131,806 | $ — |
| aIssuer in which the Fund owns 25% or more of the outstanding voting securities. | |||||||||
13. SPECIAL SERVICING AGREEMENT
The Fund, which is an eligible underlying investment of one or more of the Franklin Templeton Fund Allocator Series Funds (Allocator Funds), participated in a Special Servicing Agreement (SSA) with the Allocator Funds and certain service providers of the Fund and the Allocator Funds. Under the SSA, the Fund may pay a portion of the Allocator Funds’ expenses (other than any asset allocation, administrative, and distribution fees) to the extent such payments are less than the amount of the benefits realized or expected to be realized by the Fund (e.g., due to reduced costs associated with servicing accounts) from the investment in the Fund by the Allocator Funds. The Allocator Funds are either managed by Franklin Advisers, Inc. or administered by FT Services, affiliates of Franklin Mutual. For the year ended December 31, 2013, the Fund was held by one or more of the Allocator Funds and the amount of expenses borne by the Fund is noted in the Statement of Operations. At December 31, 2013, 11.44% of the Fund’s outstanding shares were held by one or more of the Allocator Funds. Effective May 1, 2013, the SSA was discontinued until further notice.
14. CREDIT FACILITY
The Fund, together with other U.S. registered and foreign investment funds (collectively, Borrowers), managed by Franklin Templeton Investments, are borrowers in a joint syndicated senior unsecured credit facility totaling $1.5 billion (Global Credit Facility) which, after an extension of the original terms, matured on February 14, 2014. This Global Credit Facility provides a source of funds to the Borrowers for temporary and emergency purposes, including the ability to meet future unanticipated or unusually large redemption requests. Effective February 14, 2014, the Borrowers renewed the Global Credit Facility which matures on February 13, 2015.
Under the terms of the Global Credit Facility, the Fund shall, in addition to interest charged on any borrowings made by the Fund and other costs incurred by the Fund, pay its share of fees and expenses incurred in connection with the implementation and maintenance of the Global
48 | Annual Report
Mutual European Fund
Notes to Financial Statements (continued)
14. CREDIT FACILITY (continued)
Credit Facility, based upon its relative share of the aggregate net assets of all of the Borrowers, including an annual commitment fee of 0.07% based upon the unused portion of the Global Credit Facility. These fees are reflected in other expenses on the Statement of Operations. During the year ended December 31, 2013, the Fund did not use the Global Credit Facility.
15. FAIR VALUE MEASUREMENTS
The Fund follows a fair value hierarchy that distinguishes between market data obtained from independent sources (observable inputs) and the Fund’s own market assumptions (unobservable inputs). These inputs are used in determining the value of the Fund’s financial instruments and are summarized in the following fair value hierarchy:
- Level 1 – quoted prices in active markets for identical financial instruments
- Level 2 – other significant observable inputs (including quoted prices for similar financial instruments, interest rates, prepayment speed, credit risk, etc.)
- Level 3 – significant unobservable inputs (including the Fund’s own assumptions in determining the fair value of financial instruments)
The input levels are not necessarily an indication of the risk or liquidity associated with financial instruments at that level.
For movements between the levels within the fair value hierarchy, the Fund has adopted a policy of recognizing the transfers as of the date of the underlying event which caused the movement.
A summary of inputs used as of December 31, 2013, in valuing the Fund’s assets and liabilities carried at fair value, is as follows:
| Level 1 | Level 2 | Level 3 | Total | |||||
| Assets: | ||||||||
| Investments in Securities: | ||||||||
| Equity Investments:a | ||||||||
| Capital Markets | $ | 10,535,562 | $ | — | $ | 109,153 | $ | 10,644,715 |
| Energy Equipment & Services | — | 26,548,543 | — | 26,548,543 | ||||
| Machinery | 34,574,086 | 9,498,136 | — | 44,072,222 | ||||
| Real Estate Management | ||||||||
| & Development | — | — | 992,766 | 992,766 | ||||
| Road & Rail | 56,717,485 | — | 16,886,505 | 73,603,990 | ||||
| All Other Equity Investmentsb | 2,341,634,905 | — | —c | 2,341,634,905 | ||||
| Corporate Bonds and Notes | — | 7,794,831 | — | 7,794,831 | ||||
| Corporate Notes in Reorganization | — | 2,975,000 | — | 2,975,000 | ||||
| Short Term Investments | 276,163,374 | — | — | 276,163,374 | ||||
| Total Investments in Securities | $ | 2,719,625,412 | $ | 46,816,510 | $ | 17,988,424 | $ | 2,784,430,346 |
| Forward Exchange Contracts | $ | — | $ | 735,497 | $ | — | $ | 735,497 |
Annual Report | 49
| Mutual European Fund | ||||||||
| Notes to Financial Statements | ||||||||
| 15. FAIR VALUE MEASUREMENTS (continued) | ||||||||
| Level 1 | Level 2 | Level 3 | Total | |||||
| Liabilities: | ||||||||
| Securities Sold Short | $ | 10,966,721 | $ | — | $ | — | $ | 10,966,721 |
| Futures Contracts | 2,446,580 | — | — | 2,446,580 | ||||
| Forward Exchange Contracts | — | 57,105,084 | — | 57,105,084 | ||||
aIncludes common stocks.
bFor detailed categories, see the accompanying Statement of Investments.
cIncludes securities determined to have no value at December 31, 2013.
A reconciliation of assets in which Level 3 inputs are used in determining fair value is presented when there are significant Level 3 investments at the end of the year.
16. NEW ACCOUNTING PRONOUNCEMENTS
In June 2013, the Financial Accounting Standards Board issued Accounting Standards Update (ASU) No. 2013-08, Investment Companies (Topic 946): Amendments to the Scope, Measurement, and Disclosure Requirements. The ASU modifies the criteria used in defining an investment company under U.S. Generally Accepted Accounting Principles and also sets forth certain measurement and disclosure requirements. Under the ASU, an entity that is registered under the 1940 Act automatically qualifies as an investment company. The ASU is effective for interim and annual reporting periods beginning after December 15, 2013. Management has reviewed the requirements and believes the adoption of this ASU will not have a material impact on the financial statements.
17. SUBSEQUENT EVENTS
The Fund has evaluated subsequent events through the issuance of the financial statements and determined that no events have occurred that require disclosure other than those already disclosed in the financial statements.
| ABBREVIATIONS | |||||
| Counterparty | Currency | Selected Portfolio | |||
| BANT - | Bankof America N.A. | EUR - Euro | FRN | - Floating Rate Note | |
| BBU | - | Barclays Bank PLC | GBP - British Pound | IDR | -InternationalDepositary Receipt |
| BONY - | Bankof New York Mellon | USD -UnitedStates Dollar | |||
| DBFX | - | Deutsche Bank AG | |||
| FBCO | - | Credit Suisse Group AG | |||
| HSBC - | HSBC Bank USA, N.A. | ||||
| SCBT | - | Standard Chartered Bank | |||
| SSBT | - | State Street Bank and Trust Co., N.A. | |||
50 | Annual Report
Mutual European Fund
Report of Independent Registered Public Accounting Firm
To the Board of Trustees of Franklin Mutual Series Funds and Shareholders of the Mutual European Fund:
We have audited the accompanying statement of assets and liabilities, including the statement of investments, of Mutual European Fund (the “Fund”) (one of the funds constituting Franklin Mutual Series Funds), as of December 31, 2013, and the related statement of operations for the year then ended, the statements of changes in net assets for each of the two years in the period then ended, and the financial highlights for each of the periods indicated therein. These financial statements and financial highlights are the responsibility of the Fund’s management. Our responsibility is to express an opinion on these financial statements and financial highlights based on our audits.
We conducted our audits in accordance with the standards of the Public Company Accounting Oversight Board (United States). Those standards require that we plan and perform the audit to obtain reasonable assurance about whether the financial statements and financial highlights are free of material misstatement. We were not engaged to perform an audit of the Fund’s internal control over financial reporting. Our audits included consideration of internal control over financial reporting as a basis for designing audit procedures that are appropriate in the circumstances, but not for the purpose of expressing an opinion on the effectiveness of the Fund’s internal control over financial reporting. Accordingly, we express no such opinion.
An audit also includes examining, on a test basis, evidence supporting the amounts and disclosures in the financial statements and financial highlights, assessing the accounting principles used and significant estimates made by management, and evaluating the overall financial statement presentation. Our procedures included confirmation of securities owned as of December 31, 2013, by correspondence with the custodian and brokers, or by other appropriate auditing procedures where replies from the brokers were not received. We believe that our audits provide a reasonable basis for our opinion.
In our opinion, the financial statements and financial highlights referred to above present fairly, in all material respects, the financial position of Mutual European Fund (one of the funds constituting Franklin Mutual Series Funds) at December 31, 2013, the results of its operations for the year then ended, the changes in its net assets for each of the two years in the period then ended, and the financial highlights for each of the periods indicated therein, in conformity with U.S. generally accepted accounting principles.

Boston, Massachusetts
February 19, 2014
Annual Report | 51
Mutual European Fund
Tax Information (unaudited)
Under Section 852(b)(3)(C) of the Internal Revenue Code (Code), the Fund hereby reports the maximum amount allowable but no less than $139,779,881 as a long term capital gain dividend for the fiscal year ended December 31, 2013.
Under Section 871(k)(2)(C) of the Code, the Fund hereby reports the maximum amount allowable but no less than $16,701,723 as a short term capital gain dividend for purposes of the tax imposed under Section 871(a)(1)(A) of the Code for the fiscal year ended December 31, 2013.
Under Section 854(b)(1)(B) of the Code, the Fund hereby reports the maximum amount allowable but no less than $58,538,839 as qualified dividends for purposes of the maximum rate under Section 1(h)(11) of the Code for the fiscal year ended December 31, 2013. Distributions, including qualified dividend income, paid during calendar year 2013 will be reported to shareholders on Form 1099-DIV by mid-February 2014. Shareholders are advised to check with their tax advisors for information on the treatment of these amounts on their individual income tax returns.
At December 31, 2013, more than 50% of the Fund’s total assets were invested in securities of foreign issuers. In most instances, foreign taxes were withheld from income paid to the Fund on these investments. As shown in the table below, the Fund hereby reports to shareholders the foreign source income and foreign taxes paid, pursuant to Section 853 of the Code. This written statement will allow shareholders of record on December 19, 2013, to treat their proportionate share of foreign taxes paid by the Fund as having been paid directly by them. The shareholder shall consider these amounts as foreign taxes paid in the tax year in which they receive the Fund distribution.
The following table provides a detailed analysis of foreign tax paid, foreign source income, and foreign qualified dividends as reported by the Fund, to Class Z, Class A, Class C, Class R and Class R6 shareholders of record.
| Foreign Tax | Foreign Source | Foreign Qualified | ||||
| Class | Paid Per Share | Income Per Share | Dividends Per Share | |||
| Class Z | $ | 0.0467 | $ | 0.5235 | $ | 0.4185 |
| Class A | $ | 0.0467 | $ | 0.4683 | $ | 0.3744 |
| Class C | $ | 0.0467 | $ | 0.3785 | $ | 0.3025 |
| Class R | $ | 0.0467 | $ | 0.4833 | $ | 0.3864 |
| Class R6 | $ | 0.0467 | $ | 0.5540 | $ | 0.4429 |
Foreign Tax Paid Per Share (Column 1) is the amount per share available to you, as a tax credit (assuming you held your shares in the Fund for a minimum of 16 days during the 31-day period beginning 15 days before the ex-dividend date of the Fund’s distribution to which the foreign taxes relate), or, as a tax deduction.
52 | Annual Report
Mutual European Fund
Tax Information (unaudited) (continued)
Foreign Source Income Per Share (Column 2) is the amount per share of income dividends attributable to foreign securities held by the Fund, plus any foreign taxes withheld on these dividends. The amounts reported include foreign source qualified dividends that have not been adjusted for the rate differential applicable to such dividend income.1
Foreign Qualified Dividends Per Share (Column 3) is the amount per share of foreign source qualified dividends plus any foreign taxes withheld on these dividends. These amounts represent the portion of the Foreign Source Income reported to you in column 2 that were derived from qualified foreign securities held by the Fund.1
By mid-February 2014, shareholders will receive Form 1099-DIV which will include their share of taxes paid and foreign source income distributed during the calendar year 2013. The Foreign Source Income reported on Form 1099-DIV has not been adjusted for the rate differential on foreign source qualified dividend income. Shareholders are advised to check with their tax advisors for information on the treatment of these amounts on their 2013 individual income tax returns.
1 Qualified dividends are taxed at reduced long term capital gains tax rates. In determining the amount of foreign tax credit that may be applied against the U.S. tax liability of individuals receiving foreign source qualified dividends, adjustments may be required to the foreign tax credit limitation calculation to reflect the rate differential applicable to such dividend income. The rules however permit certain individuals to elect not to apply the rate differential adjustments for capital gains and/or dividends for any taxable year. Please consult your tax advisor and the instructions to Form 1116 for more information.
Annual Report | 53
Mutual European Fund
Board Members and Officers
The name, year of birth and address of the officers and board members, as well as their affiliations, positions held with the Fund, principal occupations during at least the past five years and number of portfolios overseen in the Franklin Templeton Investments fund complex are shown below. Generally, each board member serves until that person’s successor is elected and qualified.
| Independent Board Members | ||||
| Number of Portfolios in | ||||
| Name, Year of Birth | Length of | Fund Complex Overseen | Other Directorships Held | |
| and Address | Position | Time Served | by Board Member* | During at Least the Past 5 Years |
| Edward I. Altman, Ph.D. (1941) | Trustee | Since 1987 | 11 | None |
| c/o Franklin Mutual Advisers, LLC | ||||
| 101 John F. Kennedy Parkway | ||||
| Short Hills, NJ 07078-2789 | ||||
| Principal Occupation During at Least the Past 5 Years: | ||||
| Max L. Heine Professor of Finance and Director of The Credit and Debt Markets Research Program, Salomon Center, Stern School of | ||||
| Business, New York University; editor and author of numerous financial publications; financial consultant; an adviser to numerous financial | ||||
| publishing organizations; and formerly, Vice Director, Salomon Center, Stern School of Business, New York University. | ||||
| Ann Torre Bates (1958) | Trustee | Since 1995 | 38 | SLM Corporation (Sallie Mae), Ares |
| c/o Franklin Mutual Advisers, LLC | Capital Corporation (specialty finance | |||
| 101 John F. Kennedy Parkway | company), Allied Capital Corporation | |||
| Short Hills, NJ 07078-2789 | (financial services) (2003-2010) | |||
| and United Natural Foods, Inc., | ||||
| (October 2013). | ||||
| Principal Occupation During at Least the Past 5 Years: | ||||
| Director of various companies; and formerly, Executive Vice President and Chief Financial Officer, NHP Incorporated (manager of multifamily | ||||
| housing) (1995-1997); and Vice President and Treasurer, US Airways, Inc. (until 1995). | ||||
| Burton J. Greenwald (1929) | Trustee | Since 2002 | 18 | Franklin Templeton Emerging Markets |
| c/o Franklin Mutual Advisers, LLC | Debt Opportunities Fund PLC and | |||
| 101 John F. Kennedy Parkway | Fiduciary International Ireland | |||
| Short Hills, NJ 07078-2789 | Limited. | |||
| Principal Occupation During at Least the Past 5 Years: | ||||
| Managing Director, B.J. Greenwald Associates (management consultants to the financial services industry); and formerly, Chairman, | ||||
| Fiduciary Trust International Funds; Executive Vice President, L.F Rothschild Fund Management, Inc.; President and Director, Merit Mutual | ||||
| Funds; President, Underwriting Division and Director, National Securities & Research Corporation; Governor, Investment Company Institute; | ||||
| and Chairman, ICI Public Information Committee. | ||||
54 | Annual Report
| Number of Portfolios in | |||||
| Name, Year of Birth | Length of | Fund Complex Overseen | Other Directorships Held | ||
| and Address | Position | Time Served | by Board Member* | During at Least the Past 5 Years | |
| Keith E. Mitchell (1954) | Trustee | Since 2009 | 11 | None | |
| c/o Franklin Mutual Advisers, LLC | |||||
| 101 John F. Kennedy Parkway | |||||
| Short Hills, NJ 07078-2789 | |||||
| Principal Occupation During at Least the Past 5 Years: | |||||
| Managing Member, Mitchell, Hartley & Bechtel Advisers, LLC (formerly, Mitchell Advisers, LLC) (advisory firm); director of various boards of | |||||
| asset management firms; and formerly, Managing Director, Putnam Lovell NBF. | |||||
| Charles Rubens II (1930) | Trustee | Since 1998 | 18 | None | |
| c/o Franklin Mutual Advisers, LLC | |||||
| 101 John F. Kennedy Parkway | |||||
| Short Hills, NJ 07078-2789 | |||||
| Principal Occupation During at Least the Past 5 Years: | |||||
| Private investor and president of non-profit organizations; and formerly, an executive of Time, Inc.; and Trustee of Colorado College. | |||||
| Jan Hopkins Trachtman (1947) | Trustee | Since 2009 | 11 | None | |
| c/o Franklin Mutual Advisers, LLC | |||||
| 101 John F. Kennedy Parkway | |||||
| Short Hills, NJ 07078-2789 | |||||
| Principal Occupation During at Least the Past 5 Years: | |||||
| President and Founder, The Jan Hopkins Group (communications consulting firm); President, Economic Club of New York; serves on | |||||
| Advisory Board of Knight Bagehot Fellowship; and formerly, Anchor/Correspondent, CNN Financial News (until 2003); Managing Director | |||||
| and Head of Client Communications, Citigroup Private Bank (until 2005); Off-Air Reporter, ABC News’ World News Tonight; and Editor, CBS | |||||
| Network News. | |||||
| Robert E. Wade (1946) | Trustee and | Trustee since | 45 | El Oro Ltd (investments). | |
| c/o Franklin Mutual Advisers, LLC | Chairman of | 1993 and | |||
| 101 John F. Kennedy Parkway | the Board | Chairman of the | |||
| Short Hills, NJ 07078-2789 | Board since 2005 | ||||
| Principal Occupation During at Least the Past 5 Years: | |||||
| Attorney at law engaged in private practice (1972-2008) and member of various boards. | |||||
| Interested Board Members and Officers | |||||
| Number of Portfolios in | |||||
| Name, Year of Birth | Length of | Fund Complex Overseen | Other Directorships Held | ||
| and Address | Position | Time Served | by Board Member* | During at Least the Past 5 Years | |
| **Gregory E. Johnson (1961) | Trustee | Since 2007 | 152 | None | |
| One Franklin Parkway | |||||
| San Mateo, CA 94403-1906 | |||||
| Principal Occupation During at Least the Past 5 Years: | |||||
| Chairman of the Board, Member – Office of the Chairman, Director, President and Chief Executive Officer, Franklin Resources, Inc.; officer | |||||
| and/or director or trustee, as the case may be, of some of the other subsidiaries of Franklin Resources, Inc. and of 44 of the investment | |||||
| companies in Franklin Templeton Investments; and Chairman, Investment Company Institute. | |||||
Annual Report | 55
| Number of Portfolios in | |||||
| Name, Year of Birth | Length of | Fund Complex Overseen | Other Directorships Held | ||
| and Address | Position | Time Served | by Board Member* | During at Least the Past 5 Years | |
| **Peter A. Langerman (1955) | Trustee, | Trustee since | 11 | American International Group, Inc. | |
| c/o Franklin Mutual Advisers, LLC | President and | 2007, President | (AIG) Credit Facility Trust | ||
| 101 John F. Kennedy Parkway | Chief Executive | and Chief | (2010–2011 | ). | |
| Short Hills, NJ 07078-2702 | Officer – | Executive Officer – | |||
| Investment | Investment | ||||
| Management | Management | ||||
| since 2005 | |||||
| Principal Occupation During at Least the Past 5 Years: | |||||
| Chairman of the Board, Chief Executive Officer and President, Franklin Mutual Advisers, LLC; officer and/or director, as the case may be, of | |||||
| four of the investment companies in Franklin Templeton Investments. | |||||
| Alison E. Baur (1964) | Vice President | Since 2012 | Not Applicable | Not Applicable | |
| One Franklin Parkway | |||||
| San Mateo, CA 94403-1906 | |||||
| Principal Occupation During at Least the Past 5 Years: | |||||
| Deputy General Counsel, Franklin Templeton Investments; and officer of some of the other subsidiaries of Franklin Resources, Inc. and of 46 | |||||
| of the investment companies in Franklin Templeton Investments. | |||||
| Philippe Brugere-Trelat (1949) | Vice President | Since 2005 | Not Applicable | Not Applicable | |
| 101 John F. Kennedy Parkway | |||||
| Short Hills, NJ 07078-2789 | |||||
| Principal Occupation During at Least the Past 5 Years: | |||||
| Executive Vice President, Franklin Mutual Advisers, LLC; officer of three of the investment companies in Franklin Templeton Investments; | |||||
| and formerly, Portfolio Manager of Eurovest SA (French registered Investment Company, Sicav). | |||||
| Laura F. Fergerson (1962) | Chief Executive | Since 2009 | Not Applicable | Not Applicable | |
| One Franklin Parkway | Officer – | ||||
| San Mateo, CA 94403-1906 | Finance and | ||||
| Administration | |||||
| Principal Occupation During at Least the Past 5 Years: | |||||
| Senior Vice President, Franklin Templeton Services, LLC; and officer of 46 of the investment companies in Franklin Templeton Investments. | |||||
| Aliya S. Gordon (1973) | Vice President | Since 2009 | Not Applicable | Not Applicable | |
| One Franklin Parkway | |||||
| San Mateo, CA 94403-1906 | |||||
| Principal Occupation During at Least the Past 5 Years: | |||||
| Senior Associate General Counsel, Franklin Templeton Investments; officer of 46 of the investment companies in Franklin Templeton | |||||
| Investments; and formerly, Litigation Associate, Steefel, Levitt & Weiss, LLP (2000-2004). | |||||
| Steven J. Gray (1955) | Secretary and | Secretary since | Not Applicable | Not Applicable | |
| One Franklin Parkway | Vice President | 2005 and Vice | |||
| San Mateo, CA 94403-1906 | President since | ||||
| 2009 | |||||
| Principal Occupation During at Least the Past 5 Years: | |||||
| Senior Associate General Counsel, Franklin Templeton Investments; Vice President, Franklin Templeton Distributors, Inc.; and officer of 46 of | |||||
| the investment companies in Franklin Templeton Investments. | |||||
56 | Annual Report
| Number of Portfolios in | ||||
| Name, Year of Birth | Length of | Fund Complex Overseen | Other Directorships Held | |
| and Address | Position | Time Served | by Board Member* | During at Least the Past 5 Years |
| Selena L. Holmes (1965) | Vice President | Since 2012 | Not Applicable | Not Applicable |
| 100 Fountain Parkway | – AML | |||
| St. Petersburg, FL 33716-1205 | Compliance | |||
| Principal Occupation During at Least the Past 5 Years: | ||||
| Director, Global Compliance Monitoring; and officer of 46 of the investment companies in Franklin Templeton Investments. | ||||
| Robert Kubilis (1973) | Treasurer, | Since 2012 | Not Applicable | Not Applicable |
| 300 S.E. 2nd Street | Chief Financial | |||
| Fort Lauderdale, FL 33301-1923 | Officer and | |||
| Chief | ||||
| Accounting | ||||
| Officer | ||||
| Principal Occupation During at Least the Past 5 Years: | ||||
| Assistant Treasurer, Fund Accounting, Franklin Templeton Investments; and officer of five of the investment companies in Franklin Templeton | ||||
| Investments. | ||||
| Kimberly H. Novotny (1972) | Vice President | Since March 2013 | Not Applicable | Not Applicable |
| 300 S.E. 2nd Street | ||||
| Fort Lauderdale, FL 33301-1923 | ||||
| Principal Occupation During at Least the Past 5 Years: | ||||
| Associate General Counsel, Franklin Templeton Investments; Vice President and Secretary, Fiduciary Trust International of the South; Vice | ||||
| President, Templeton Investment Counsel, LLC; Assistant Secretary, Franklin Resources, Inc.; and officer of 46 of the investment companies | ||||
| in Franklin Templeton Investments. | ||||
| Robert C. Rosselot (1960) | Chief | Since March 2013 | Not Applicable | Not Applicable |
| 300 S.E. 2nd Street | Compliance | |||
| Fort Lauderdale, FL 33301-1923 | Officer | |||
| Principal Occupation During at Least the Past 5 Years: | ||||
| Director, Global Compliance, Franklin Templeton Investments; officer of 46 of the investment companies in Franklin Templeton Investments; | ||||
| and formerly, Senior Associate General Counsel, Franklin Templeton Investments (2007-2013); and Secretary and Vice President, Templeton | ||||
| Group of Funds (2004-2013). | ||||
| Karen L. Skidmore (1952) | Vice President | Since 2009 | Not Applicable | Not Applicable |
| One Franklin Parkway | ||||
| San Mateo, CA 94403-1906 | ||||
| Principal Occupation During at Least the Past 5 Years: | ||||
| Senior Associate General Counsel, Franklin Templeton Investments; and officer of 46 of the investment companies in Franklin Templeton | ||||
| Investments. | ||||
| Craig S. Tyle (1960) | Vice President | Since 2005 | Not Applicable | Not Applicable |
| One Franklin Parkway | ||||
| San Mateo, CA 94403-1906 | ||||
| Principal Occupation During at Least the Past 5 Years: | ||||
| General Counsel and Executive Vice President, Franklin Resources, Inc.; and officer of some of the other subsidiaries of Franklin Resources, | ||||
| Inc. and of 46 of the investment companies in Franklin Templeton Investments. | ||||
Annual Report | 57
| Number of Portfolios in | ||||
| Name, Year of Birth | Length of | Fund Complex Overseen | Other Directorships Held | |
| and Address | Position | Time Served | by Board Member* | During at Least the Past 5 Years |
| Lori A. Weber (1964) | Vice President | Since 2011 | Not Applicable | Not Applicable |
| 300 S.E. 2nd Street | ||||
| Fort Lauderdale, FL 33301-1923 | ||||
| Principal Occupation During at Least the Past 5 Years: | ||||
| Senior Associate General Counsel, Franklin Templeton Investments; Assistant Secretary, Franklin Resources, Inc.; Vice President and | ||||
| Secretary, Templeton Investment Counsel, LLC; Vice President, Fiduciary Trust International of the South; and officer of 46 of the investment | ||||
| companies in Franklin Templeton Investments. | ||||
*We base the number of portfolios on each separate series of the U.S. registered investment companies within the Franklin Templeton Investments fund complex. These portfolios have a common investment manager or affiliated investment managers.
**Gregory E. Johnson is considered to be an interested person of the Fund under the federal securities laws due to his position as an officer and director of Franklin Resources, Inc., which is the parent company of the Fund’s investment manager and distributor. Peter A. Langerman is considered to be an interested person of the Fund under the federal securities laws due to his position as an officer of Franklin Mutual Advisers, LLC, which is an affiliate of the Fund’s investment manager.
Note 1: Officer information is current as of the date of this report. It is possible that after this date, information about officers may change.
The Fund’s Board has determined that certain of the members of the Audit Committee, including Ann Torre Bates, are audit committee financial experts, and “independent,” under those provisions of the Sarbanes-Oxley Act of 2002, and the rules and form amendments adopted by the Securities and Exchange Commission, relating to audit committee financial experts.
The Statement of Additional Information (SAI) includes additional information about the board members and is available, without charge, upon request. Shareholders may call (800) DIAL BEN/342-5236 to request the SAI.
58 | Annual Report
Mutual European Fund
Shareholder Information
Proxy Voting Policies and Procedures
The Fund’s investment manager has established Proxy Voting Policies and Procedures (Policies) that the Fund uses to determine how to vote proxies relating to portfolio securities. Shareholders may view the Fund’s complete Policies online at franklintempleton.com. Alternatively, shareholders may request copies of the Policies free of charge by calling the Proxy Group collect at (954) 527-7678 or by sending a written request to: Franklin Templeton Companies, LLC, 300 S.E. 2nd Street, Fort Lauderdale, FL 33301, Attention: Proxy Group. Copies of the Fund’s proxy voting records are also made available online at franklintempleton.com and posted on the U.S. Securities and Exchange Commission’s website at sec.gov and reflect the most recent 12-month period ended June 30.
Quarterly Statement of Investments
The Fund files a complete statement of investments with the U.S. Securities and Exchange Commission for the first and third quarters for each fiscal year on Form N-Q. Shareholders may view the filed Form N-Q by visiting the Commission’s website at sec.gov. The filed form may also be viewed and copied at the Commission’s Public Reference Room in Washington, DC. Information regarding the operations of the Public Reference Room may be obtained by calling (800) SEC-0330.
Householding of Reports and Prospectuses
You will receive the Fund’s financial reports every six months as well as an annual updated summary prospectus (prospectus available upon request). To reduce Fund expenses, we try to identify related shareholders in a household and send only one copy of the financial reports and summary prospectus. This process, called “householding,” will continue indefinitely unless you instruct us otherwise. If you prefer not to have these documents householded, please call us at (800) 632-2301. At any time you may view current prospectuses/summary prospectuses and financial reports on our website. If you choose, you may receive these documents through electronic delivery.
Annual Report | 59
This page intentionally left blank.
| Contents | |||||||
| Shareholder Letter | 1 | Annual Report | Financial Highlights and | Report of Independent | |||
| Statement of Investments | 19 | Registered Public | |||||
| Mutual Financial | |||||||
| Accounting Firm | 50 | ||||||
| Services Fund | 6 | Financial Statements | 28 | ||||
| Tax Information | 51 | ||||||
| Performance Summary | 12 | Notes to Financial | |||||
| Statements | 32 | Board Members and Officers | 53 | ||||
| Your Fund’s Expenses | 17 | ||||||
| Shareholder Information | 58 | ||||||
Annual Report
Mutual Financial Services Fund
Your Fund’s Goals and Main Investments: Mutual Financial Services Fund seeks capital appreciation, with income as a secondary goal, by investing at least 80% of its net assets in securities of financial services companies that the manager believes are available at market prices less than their intrinsic value. The Fund concentrates its investments in securities of issuers such as banks, savings and loan organizations, credit card companies, brokerage firms, finance companies, subprime lending institutions, investment advisors, investment companies and insurance companies.
| Performance data represent past |
| performance, which does not |
| guarantee future results. Investment |
| return and principal value will |
| fluctuate, and you may have a |
| gain or loss when you sell your |
| shares. Current performance may |
| differ from figures shown. Please |
| visit franklintempleton.com |
| or call (800) 342-5236 for most |
| recent month-end performance. |
6 | Annual Report
This annual report for Mutual Financial Services Fund covers the fiscal year ended December 31, 2013.
Performance Overview
Mutual Financial Services Fund – Class Z posted a +25.67% cumulative total return for the 12 months under review. For comparison, the Fund’s narrow benchmark, the Standard & Poor’s 500 (S&P 500) Financials Index, which tracks financials stocks in the S&P 500 Index, generated a +35.63% total return.1 For the same period, the Fund’s broad benchmark, the S&P 500 Index, which is a broad measure of U.S. stock performance, posted a +32.39% total return.1 You can find more of the Fund’s performance data in the Performance Summary beginning on page 12.
Economic and Market Overview
The 12 months under review were characterized by reinvigorated policy support and an economic recovery in developed markets. However, differences in global economic trends corresponded with increasingly divergent monetary policies, and growth in emerging market economies tended to slow. The central banks of key developed markets generally reaffirmed their accommodative monetary stances while some emerging market counterparts tightened policy rates as they sought to control inflation and currency depreciation.
1. Source: © 2014 Morningstar. All Rights Reserved. The information contained herein: (1) is proprietary to Morningstar and/or its content providers; (2) may not be copied or distributed; and (3) is not warranted to be accurate, complete or timely. Neither Morningstar nor its content providers are responsible for any damages or losses arising from any use of this information. The indexes are unmanaged and include reinvested dividends. One cannot invest directly in an index, and an index is not representative of the Fund’s portfolio.
The dollar value, number of shares or principal amount, and names of all portfolio holdings are listed in the Fund’s Statement of Investments (SOI). The SOI begins on page 23.
In the U.S., economic growth and employment trends generally exceeded expectations, underpinned by consumer and business spending and rising inventories. Historically low mortgage rates and improving sentiment aided the housing market recovery, evidenced by increased new and existing home sales, rising home prices, low inventories and multi-year lows in new foreclosures. The U.S. Federal Reserve Board (Fed) expanded its asset purchase program to $85 billion per month from $40 billion early in the year. After encouraging economic and employment reports, the Fed announced in December it would reduce its monthly bond purchases by $10 billion beginning in January 2014; however, the Fed committed to keeping interest rates low. In October, the federal government temporarily shut down after Congress failed to authorize routine federal funding amid a disagreement over a new health care law. However, Congress subsequently agreed to fund the government through early 2014 and later passed a two-year budget deal that could ease automatic spending cuts and lower the risk of another shutdown.
Outside the U.S., the eurozone emerged from its longest recession on record during 2013’s second half and Japan’s growth moderated. The European Central Bank reduced its key interest rate to a record low and pledged to maintain systemic support following political turmoil in Greece, Spain, Portugal and Italy. Germany’s re-election of Chancellor Angela Merkel was largely perceived as a vote of support for ongoing eurozone reform measures. In Asia, the Bank of Japan set an explicit inflation target and pledged to double bond purchases in an unprecedented wave of policy reform. The U.S. dollar fell versus the euro but rose versus the Japanese yen in 2013.
Growth in many emerging markets moderated based on lower domestic demand, falling exports and weakening commodity prices. Political turmoil in certain emerging markets, the Fed’s potential tapering of its asset purchase program and the Chinese central bank’s effort to tighten liquidity to curb real estate and credit speculation led to a sell-off in emerging market equities and a sharp depreciation in regional currencies against the U.S. dollar. Central banks in Brazil, India and Indonesia raised interest rates in the second half of 2013 as they sought to curb inflation.
The stock market rally in developed markets accelerated during 2013 amid ongoing central bank commitments, continued corporate earnings strength and increasing signs of economic progress. Emerging market stocks rebounded toward period-end, although Latin American stocks trailed their emerging market peers. Oil prices rallied in the third quarter and rose for the year mainly owing to supply concerns related to geopolitical turmoil, but gold posted its largest annual price decline in more than three decades. Increasingly divergent economic and political circumstances during the period resulted in declining market correlations across regions and between asset classes, which many bottom-up investors perceived as more favorable.

Annual Report | 7
| What is return on equity? |
| Return on equity is an amount, |
| expressed as a percentage, earned on a |
| company’s common stock investment for |
| a given period. Return on equity tells |
| common shareholders how effectually |
| their money is being employed. |
| Comparing percentages for current and |
| prior periods also reveals trends, and |
| comparison with industry composites |
| reveals how well a company is holding |
| its own against its competitors. |
| What is meant by “hedge”? |
| To hedge a position is to seek to |
| reduce the risk of adverse price |
| movements in an asset. Normally, a |
| hedge is implemented as an offsetting |
| position in a related security, such as |
| a currency forward contract. |
| What is a currency forward |
| contract? |
| A currency forward contract, also |
| called a “currency forward,” is an |
| agreement between the Fund and a |
| counterparty to buy or sell a foreign |
| currency at a specific exchange rate |
| on a future date. |
Investment Strategy
We strive to provide investors with superior risk-adjusted returns over time through our distinctive, value investment style, which includes investments in undervalued common stocks, distressed debt and risk arbitrage. Rigorous fundamental analysis drives our investment process. We attempt to determine each investment’s intrinsic value as well as the price at which we would be willing to commit shareholder funds. While valuation remains our key consideration, we utilize numerous fundamental factors such as return on equity, financial leverage and long-term earnings power. We also consider factors such as management quality and competitive position. As always, our approach to investing is as much about assessing risk and containing losses as it is about achieving profits. In addition, it is our practice to hedge the Fund’s currency exposure when we deem it advantageous for our shareholders.
Manager’s Discussion
In an environment of generally rising equity prices, many Fund investments increased in value during the 12-month period. Three of the top contributors were insurers CNO Financial Group, Protector Forsikring and MetLife.
CNO Financial is a diversified life insurance company with a focus on serving the less affluent senior and middle-income U.S. markets. CNO stock performed well during the period as restructuring efforts led to an increase in profitability. CNO Financial completed a debt recapitalization plan, lowering its interest costs and improving its capital structure. Amid these efforts, CNO Financial generated significant cash flow, which was used to create shareholder value throughout the year through dividends, buybacks and a debt restructuring.
Norwegian insurer Protector Forsikring reported impressive growth in premiums and improved underwriting margins, which drove earnings forecasts higher and supported the stock’s positive performance during the year. The company’s strong Nordic franchise has allowed it to increase prices, resulting in improved underwriting margins and a higher return on equity. Strong operational performance, in our view, also contributed further stability to the firm’s attractive dividend payment moving into 2014.
MetLife shares appreciated during the period under review owing to solid quarterly results and a dividend increase. In the first half of the year, the U.S.-based life insurer reported better-than-expected earnings and an improvement in margins. In April, the company raised its quarterly dividend 49%, representing the company’s first increase since 2007. Efforts to rationalize capital allocation policies by shifting from capital-intensive to more capital-efficient businesses drove operational results while diversifying the company’s risk
8 | Annual Report
profile. At period-end, the company’s balance sheet remained strong and significant excess capital presented the potential for increased returns to shareholders, in our view.
During the period under review, some of the Fund’s investments negatively affected performance. These included U.K.-headquartered RSA Insurance Group, U.S. bank holding company Bond Street Holdings and U.K.-based F&C Asset Management.
After cutting its dividend early in 2013, RSA Insurance Group suffered substantial weather-related losses, which precluded the company from achieving its annual return on equity target. RSA’s share price came under additional pressure in November when the company announced it would suspend the chief executive officer, chief financial officer and claims director of its Irish unit amid an investigation into aggressive reserve accounting practices.
Although our investment in Bond Street Holdings declined in value for the period, the group reported positive operating results during the year, led by solid loan growth in its portfolio of Floridian community and commercial banks. However, its net interest margin (NIM) came under pressure as the persistently low interest rate environment meant new loans came in at lower yields while older, higher yielding loans have gradually run off the balance sheet. NIM is a profitability measure relating the difference between interest income earned on a bank’s assets and interest paid on its liabilities. The Miami-based holding company has been able to reduce costs, primarily in integration, professional and credit-related expenses and at period-end, we believed the company continued to make progress toward reaching a healthy level of profitability.
F&C Asset Management was under pressure in 2013 as investor focus shifted away from its ongoing corporate restructuring toward management’s ability to retain key institutional asset management mandates that are up for renewal over the next few years. Investors wanted to see further evidence that the company’s organic asset gathering efforts can be successful. Although redemptions will hurt future revenues and create some uncertainty regarding F&C’s prospects, the amount of outflows by key institutional customers has so far been modest, in our view. In addition, at period-end, we believed F&C’s organic asset gathering prospects were gaining positive momentum.
During the year, the Fund held currency forwards and futures to hedge a portion of the currency risk of the portfolio’s non-U.S. dollar investments. The hedges had a positive impact on the Fund’s performance during the period.
What is a futures contract?
A futures contract, also called a “future,” is an agreement between the Fund and a counterparty made through a U.S. or foreign futures exchange to buy or sell an asset at a specific price on a future date.
Annual Report | 9
| Top 10 Equity Holdings | ||
| 12/31/13 | ||
| Company | % of Total | |
| Sector/Industry, Country | Net Assets | |
| ACE Ltd. | 3.3 | % |
| Insurance, U.S. | ||
| Protector Forsikring ASA | 3.3 | % |
| Insurance, Norway | ||
| PartnerRe Ltd. | 2.7 | % |
| Insurance, Bermuda | ||
| CNO Financial Group Inc. | 2.7 | % |
| Insurance, U.S. | ||
| ING Groep NV, IDR | 2.6 | % |
| Diversified Financial Services, Netherlands | ||
| Resolution Ltd. | 2.6 | % |
| Insurance, U.K. | ||
| Catlin Group Ltd. | 2.5 | % |
| Insurance, U.K. | ||
| Hana Financial Group Inc. | 2.3 | % |
| Commercial Banks, South Korea | ||
| MetLife Inc. | 2.2 | % |
| Insurance, U.S. | ||
| Oslo Bors VPS Holding ASA | 2.1 | % |
| Diversified Financial Services, Norway |
Thank you for your continued participation in Mutual Financial Services Fund.
We look forward to continuing to serve your investment needs.

Mutual Financial Services Fund
CFA® is a trademark owned by CFA Institute.
The foregoing information reflects our analysis, opinions and portfolio holdings as of December 31, 2013, the end of the reporting period. The way we implement our main investment strategies and the resulting portfolio holdings may change depending on factors such as market and economic conditions. These opinions may not be relied upon as investment advice or an offer for a particular security. The information is not a complete analysis of every aspect of any market, country, industry, security or the Fund. Statements of fact are from sources considered reliable, but the investment manager makes no representation or warranty as to their completeness or accuracy. Although historical performance is no guarantee of future results, these insights may help you understand our investment management philosophy.
10 | Annual Report
| Andrew Sleeman has been portfolio manager for Mutual Financial Services Fund since |
| 2009. He has also been a co-portfolio manager for Mutual International Fund since 2009. |
| Mr. Sleeman joined Franklin Templeton Investments in 2007. Previously, he was with |
| Fox-Pitt, Kelton, a financials specialist firm, where he focused on international financial |
| equities. Prior to that, he worked in international equities at BNP Paribas. Mr. Sleeman also |
| worked in Australia in the fixed income division of JP Morgan Investment Management. |
| Richard Cetlin has been assistant portfolio manager for Mutual Financial Services Fund |
| since 2010 with primary coverage of European banks. Prior to joining Franklin Templeton |
| Investments in 2010, Mr. Cetlin was a consultant for Asian Century Quest, a hedge fund |
| focused on the Asia-Pacific region. In this role, he focused on the analysis of banking, |
| insurance and real estate stocks in China and banking stocks in Hong Kong and |
| South Korea. Prior to that, Mr. Cetlin worked for 14 years at AllianceBernstein where he |
| was a senior vice president and senior analyst for U.S. banking and specialty finance. |
| Andrew Dinnhaupt assumed assistant portfolio manager responsibilities for Mutual Financial |
| Services Fund in December 2013 and has been an analyst for Franklin Mutual Advisers |
| since 2011, specializing in the global insurance industry. Previously, Mr. Dinnhaupt was a |
| portfolio manager and senior analyst covering the global financial services sector for RBC |
| Capital Markets. Prior to RBC, Mr. Dinnhaupt worked at several hedge funds where he was |
| responsible for analyzing and managing portfolios in the financial services sector. Before |
| that, he worked at Mitchell Hutchins Asset Management where he covered the financial |
| services industry and managed the PaineWebber Financial Services Fund. |
Annual Report | 11
Performance Summary as of 12/31/13
Your dividend income will vary depending on dividends or interest paid by securities in the Fund’s portfolio, adjusted for operating expenses of each class. Capital gain distributions are net profits realized from the sale of portfolio securities. The performance table and graphs do not reflect any taxes that a shareholder would pay on Fund dividends, capital gain distributions, if any, or any realized gains on the sale of Fund shares. Total return reflects reinvestment of the Fund’s dividends and capital gain distributions, if any, and any unrealized gains or losses.
| Price and Distribution Information | ||||||||
| Class Z (Symbol: TEFAX) | Change | 12/31/13 | 12/31/12 | |||||
| Net Asset Value (NAV) | +$ | 3.31 | $ | 16.90 | $ | 13.59 | ||
| Distributions (1/1/13–12/31/13) | ||||||||
| Dividend Income | $ | 0.1748 | ||||||
| Class A (Symbol: TFSIX) | Change | 12/31/13 | 12/31/12 | |||||
| Net Asset Value (NAV) | +$ | 3.32 | $ | 16.96 | $ | 13.64 | ||
| Distributions (1/1/13–12/31/13) | ||||||||
| Dividend Income | $ | 0.1300 | ||||||
| Class C (Symbol: TMFSX) | Change | 12/31/13 | 12/31/12 | |||||
| Net Asset Value (NAV) | +$ | 3.31 | $ | 16.92 | $ | 13.61 | ||
| Distributions (1/1/13–12/31/13) | ||||||||
| Dividend Income | $ | 0.0225 | ||||||
| Class R6 (Symbol: n/a) | Change | 12/31/13 | 5/1/13 | |||||
| Net Asset Value (NAV) | +$ | 1.99 | $ | 16.88 | $ | 14.89 | ||
| Distributions (5/1/13–12/31/13) | ||||||||
| Dividend Income | $ | 0.2072 | ||||||
12 | Annual Report
Performance Summary (continued)
Performance
Cumulative total return excludes sales charges. Aggregate and average annual total returns and value of $10,000 investment include maximum sales charges. Class Z/R6: no sales charges; Class A: 5.75% maximum initial sales charge; Class C: 1% contingent deferred sales charge in first year only.
| Class Z | 1-Year | 5-Year | 10-Year | ||||||||
| Cumulative Total Return1 | + | 25.67 | % | + | 77.26 | % | + | 53.21 | % | ||
| Average Annual Total Return2 | + | 25.67 | % | + | 12.13 | % | + | 4.36 | % | ||
| Value of $10,000 Investment3 | $ | 12,567 | $ | 17,726 | $ | 15,321 | |||||
| Total Annual Operating Expenses4 | 1.24 | % | |||||||||
| Class A | 1-Year | 5-Year | 10-Year | ||||||||
| Cumulative Total Return1 | + | 25.32 | % | + | 74.64 | % | + | 48.64 | % | ||
| Average Annual Total Return2 | + | 18.13 | % | + | 10.48 | % | + | 3.43 | % | ||
| Value of $10,000 Investment3 | $ | 11,813 | $ | 16,461 | $ | 14,006 | |||||
| Total Annual Operating Expenses4 | 1.54 | % | |||||||||
| Class C | 1-Year | 5-Year | 10-Year | ||||||||
| Cumulative Total Return1 | + | 24.50 | % | + | 68.53 | % | + | 38.70 | % | ||
| Average Annual Total Return2 | + | 23.50 | % | + | 11.00 | % | + | 3.33 | % | ||
| Value of $10,000 Investment3 | $ | 12,350 | $ | 16,853 | $ | 13,870 | |||||
| Total Annual Operating Expenses4 | 2.24 | % | |||||||||
| Class R6 | Inception (5/1/13) | ||||||||||
| Cumulative Total Return1 | + | 14.86 | % | ||||||||
| Aggregate Total Return5 | + | 14.86 | % | ||||||||
| Value of $10,000 Investment3 | $ | 11,486 | |||||||||
| Total Annual Operating Expenses4 | 0.99 | % |
Performance data represent past performance, which does not guarantee future results. Investment return and principal value will fluctuate, and you may have a gain or loss when you sell your shares. Current performance may differ from figures shown. For most recent month-end performance, go to franklintempleton.com or call (800) 342-5236.
Annual Report | 13
Performance Summary (continued)
Total Return Index Comparison for a Hypothetical $10,000 Investment
Total return represents the change in value of an investment over the periods shown. It includes any applicable maximum sales charge, Fund expenses, account fees and reinvested distributions. The unmanaged indexes include reinvestment of any income or distributions. They differ from the Fund in composition and do not pay management fees or expenses. One cannot invest directly in an index.
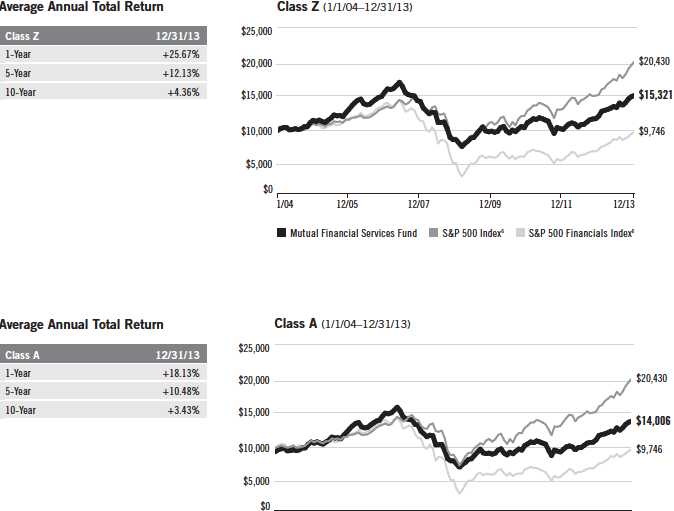
| 1/04 | 12/05 | 12/07 | 12/09 | 12/11 | 12/13 |
| Mutual Financial Services Fund | S&P 500 Index 6 | S&P 500 Financials Index6 | |||
14 | Annual Report
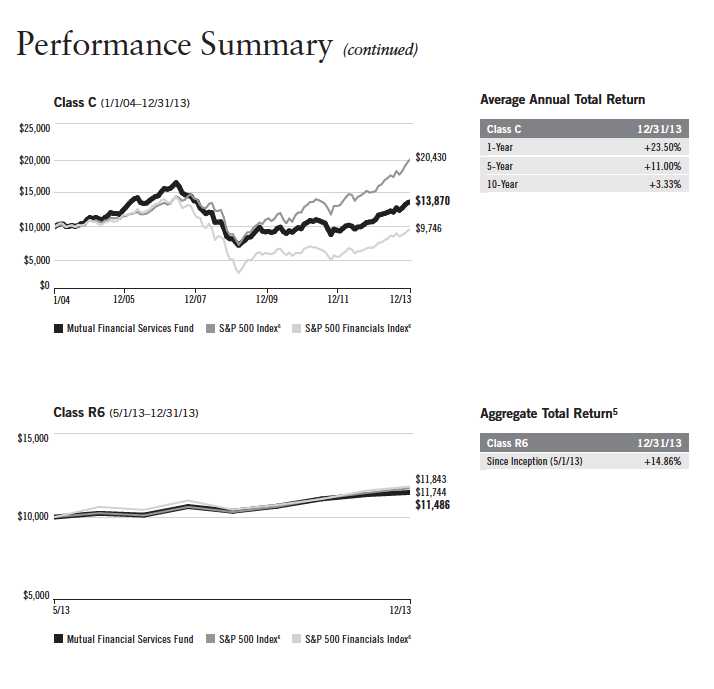
Annual Report | 15
Performance Summary (continued)
Endnotes
All investments involve risks, including possible loss of principal. Value securities may not increase in price as anticipated or may decline further in value. Investing in a single-sector fund involves special risks, including greater sensitivity to economic, political or regulatory developments impacting the sector. In addition, the Fund invests in foreign securities whose risks include currency fluctuations, and economic and political uncertainties. The Fund’s investments in smaller company stocks carry an increased risk of price fluctuation, particularly over the short term. The Fund may also invest in companies engaged in mergers, reorganizations or liquidations, which involve special risks as pending deals may not be completed on time or on favorable terms, as well as lower rated bonds, which entail higher credit risk. The Fund is actively managed but there is no guarantee that the manager’s investment decisions will produce the desired results. The Fund’s prospectus also includes a description of the main investment risks.
Class Z: Shares are available to certain eligible investors as described in the prospectus.
Class C: These shares have higher annual fees and expenses than Class A shares.
Class R6: Shares are available to certain eligible investors as described in the prospectus.
1. Cumulative total return represents the change in value of an investment over the periods indicated.
2. Average annual total return represents the average annual change in value of an investment over the periods indicated.
3. These figures represent the value of a hypothetical $10,000 investment in the Fund over the periods indicated.
4. Figures are as stated in the Fund’s current prospectus. In periods of market volatility, assets may decline significantly, causing total annual Fund
operating expenses to become higher than the figures shown.
5. Aggregate total return represents the change in value of an investment for the period indicated. Since Class R6 shares have existed for less than
one year, average annual total return is not available.
6. Source: © 2014 Morningstar. The S&P 500 Index is a market capitalization-weighted index of 500 stocks designed to measure total U.S. equity
market performance. The S&P 500 Financials Index is market capitalization weighted and consists of all financial stocks in the S&P 500 Index.
16 | Annual Report
Your Fund’s Expenses
As a Fund shareholder, you can incur two types of costs:
- Transaction costs, including sales charges (loads) on Fund purchases; and
- Ongoing Fund costs, including management fees, distribution and service (12b-1) fees, and other Fund expenses. All mutual funds have ongoing costs, sometimes referred to as operating expenses.
The following table shows ongoing costs of investing in the Fund and can help you understand these costs and compare them with those of other mutual funds. The table assumes a $1,000 investment held for the six months indicated.
Actual Fund Expenses
The first line (Actual) for each share class listed in the table provides actual account values and expenses. The “Ending Account Value” is derived from the Fund’s actual return, which includes the effect of Fund expenses.
You can estimate the expenses you paid during the period by following these steps. Of course, your account value and expenses will differ from those in this illustration:
| 1. | Divide your account value by $1,000. |
| If an account had an $8,600 value, then $8,600 ÷ $1,000 = 8.6. | |
| 2. | Multiply the result by the number under the heading “Expenses Paid During Period.” |
| If Expenses Paid During Period were $7.50, then 8.6 x $7.50 = $64.50. |
In this illustration, the estimated expenses paid this period are $64.50.
Hypothetical Example for Comparison with Other Funds
Information in the second line (Hypothetical) for each class in the table can help you compare ongoing costs of investing in the Fund with those of other mutual funds. This information may not be used to estimate the actual ending account balance or expenses you paid during the period. The hypothetical “Ending Account Value” is based on the actual expense ratio for each class and an assumed 5% annual rate of return before expenses, which does not represent the Fund’s actual return. The figure under the heading “Expenses Paid During Period” shows the hypothetical expenses your account would have incurred under this scenario. You can compare this figure with the 5% hypothetical examples that appear in shareholder reports of other funds.
Annual Report | 17
Your Fund’s Expenses (continued)
Please note that expenses shown in the table are meant to highlight ongoing costs and do not reflect any transaction costs, such as sales charges. Therefore, the second line for each class is useful in comparing ongoing costs only, and will not help you compare total costs of owning different funds. In addition, if transaction costs were included, your total costs would have been higher. Please refer to the Fund prospectus for additional information on operating expenses.
| Beginning Account | Ending Account | Expenses Paid During | ||||
| Class Z | Value 7/1/13 | Value 12/31/13 | Period* 7/1/13–12/31/13 | |||
| Actual | $ | 1,000 | $ | 1,134.80 | $ | 6.13 |
| Hypothetical (5% return before expenses) | $ | 1,000 | $ | 1,019.46 | $ | 5.80 |
| Class A | ||||||
| Actual | $ | 1,000 | $ | 1,133.50 | $ | 7.74 |
| Hypothetical (5% return before expenses) | $ | 1,000 | $ | 1,017.95 | $ | 7.32 |
| Class C | ||||||
| Actual | $ | 1,000 | $ | 1,129.60 | $ | 11.49 |
| Hypothetical (5% return before expenses) | $ | 1,000 | $ | 1,014.42 | $ | 10.87 |
| Class R6 | ||||||
| Actual | $ | 1,000 | $ | 1,135.60 | $ | 5.17 |
| Hypothetical (5% return before expenses) | $ | 1,000 | $ | 1,020.37 | $ | 4.89 |
*Expenses are calculated using the most recent six-month expense ratio, annualized for each class (Z: 1.14%; A: 1.44%; C: 2.14%; and R6: 0.96%), multiplied by the average account value over the period, multiplied by 184/365 to reflect the one-half year period.
18 | Annual Report
| Mutual Financial Services Fund | |||||||||||||||
| Financial Highlights | |||||||||||||||
| Year Ended December 31, | |||||||||||||||
| Class Z | 2013 | 2012 | 2011 | 2010 | 2009 | ||||||||||
| Per share operating performance | |||||||||||||||
| (for a share outstanding throughout the year) | |||||||||||||||
| Net asset value, beginning of year | $ | 13.59 | $ | 11.53 | $ | 13.01 | $ | 12.05 | $ | 10.80 | |||||
| Income from investment operationsa: | |||||||||||||||
| Net investment incomeb | 0.24 | 0.20 | 0.28 | 0.26 | 0.15 | c | |||||||||
| Net realized and unrealized gains (losses) | 3.24 | 2.09 | (1.48 | ) | 1.27 | 1.44 | |||||||||
| Total from investment operations | 3.48 | 2.29 | (1.20 | ) | 1.53 | 1.59 | |||||||||
| Less distributions from net investment income | (0.17 | ) | (0.23 | ) | (0.28 | ) | (0.57 | ) | (0.34 | ) | |||||
| Net asset value, end of year | $ | 16.90 | $ | 13.59 | $ | 11.53 | $ | 13.01 | $ | 12.05 | |||||
| Total return | 25.67 | % | 19.98 | % | (9.26 | )% | 12.84 | % | 14.82 | % | |||||
| Ratios to average net assets | |||||||||||||||
| Expenses before expense reductiond | 1.16 | % | 1.24 | % | 1.24 | % | 1.28 | % | 1.26 | % | |||||
| Expenses net of expense reductiond | 1.16 | %e | 1.24 | % | 1.24 | % | 1.28 | % | 1.25 | % | |||||
| Expenses incurred in connection with securities sold short | —% | —% | —% | —% | —%f | ||||||||||
| Net investment income | 1.51 | % | 1.56 | % | 2.22 | % | 2.07 | % | 1.24 | %c | |||||
| Supplemental data | |||||||||||||||
| Net assets, end of year (000’s) | $ | 105,279 | $ | 86,519 | $ | 80,105 | $ | 97,487 | $ | 99,610 | |||||
| Portfolio turnover rate | 25.73 | % | 12.65 | % | 23.58 | % | 35.37 | % | 81.29 | % | |||||
aThe amount shown for a share outstanding throughout the period may not correlate with the Statement of Operations for the period due to the timing of sales and repurchases of
the Fund shares in relation to income earned and/or fluctuating market value of the investments of the Fund.
bBased on average daily shares outstanding.
cNet investment income per share includes approximately $(0.09) per share related to an adjustment for uncollectible interest. Excluding the effect of this adjustment, the ratio of
net investment income to average net assets would have been 2.09%.
dIncludes dividend expense on securities sold short and borrowing fees, if any. See below for the ratios of such expenses to average net assets for the periods presented.
eBenefit of expense reduction rounds to less than 0.01%.
fRounds to less than 0.01%.
Annual Report | The accompanying notes are an integral part of these financial statements. | 19
| Mutual Financial Services Fund | |||||||||||||||
| Financial Highlights (continued) | |||||||||||||||
| Year Ended December 31, | |||||||||||||||
| Class A | 2013 | 2012 | 2011 | 2010 | 2009 | ||||||||||
| Per share operating performance | |||||||||||||||
| (for a share outstanding throughout the year) | |||||||||||||||
| Net asset value, beginning of year | $ | 13.64 | $ | 11.57 | $ | 13.05 | $ | 12.09 | $ | 10.83 | |||||
| Income from investment operationsa: | |||||||||||||||
| Net investment incomeb | 0.19 | 0.16 | 0.25 | 0.22 | 0.11 | c | |||||||||
| Net realized and unrealized gains (losses) | 3.26 | 2.10 | (1.49 | ) | 1.27 | 1.46 | |||||||||
| Total from investment operations | 3.45 | 2.26 | (1.24 | ) | 1.49 | 1.57 | |||||||||
| Less distributions from net investment income | (0.13 | ) | (0.19 | ) | (0.24 | ) | (0.53 | ) | (0.31 | ) | |||||
| Net asset value, end of year | $ | 16.96 | $ | 13.64 | $ | 11.57 | $ | 13.05 | $ | 12.09 | |||||
| Total returnd | 25.32 | % | 19.55 | % | (9.49 | )% | 12.45 | % | 14.53 | % | |||||
| Ratios to average net assets | |||||||||||||||
| Expenses before expense reductione | 1.46 | % | 1.54 | % | 1.54 | % | 1.58 | % | 1.55 | % | |||||
| Expenses net of expense reductione | 1.46 | %f | 1.54 | % | 1.54 | % | 1.58 | % | 1.54 | % | |||||
| Expenses incurred in connection with securities sold short | —% | —% | —% | —% | —%g | ||||||||||
| Net investment income | 1.21 | % | 1.26 | % | 1.92 | % | 1.77 | % | 0.95 | %c | |||||
| Supplemental data | |||||||||||||||
| Net assets, end of year (000’s) | $ | 240,529 | $ | 184,681 | $ | 173,167 | $ | 226,172 | $ | 245,251 | |||||
| Portfolio turnover rate | 25.73 | % | 12.65 | % | 23.58 | % | 35.37 | % | 81.29 | % | |||||
aThe amount shown for a share outstanding throughout the period may not correlate with the Statement of Operations for the period due to the timing of sales and repurchases of
the Fund shares in relation to income earned and/or fluctuating market value of the investments of the Fund.
bBased on average daily shares outstanding.
cNet investment income per share includes approximately $(0.09) per share related to an adjustment for uncollectible interest. Excluding the effect of this adjustment, the ratio of
net investment income to average net assets would have been 1.80%.
dTotal return does not reflect sales commissions or contingent deferred sales charges, if applicable.
eIncludes dividend expense on securities sold short and borrowing fees, if any. See below for the ratios of such expenses to average net assets for the periods presented.
fBenefit of expense reduction rounds to less than 0.01%.
gRounds to less than 0.01%.
20 | The accompanying notes are an integral part of these financial statements. | Annual Report
| Mutual Financial Services Fund | |||||||||||||||
| Financial Highlights (continued) | |||||||||||||||
| Year Ended December 31, | |||||||||||||||
| Class C | 2013 | 2012 | 2011 | 2010 | 2009 | ||||||||||
| Per share operating performance | |||||||||||||||
| (for a share outstanding throughout the year) | |||||||||||||||
| Net asset value, beginning of year | $ | 13.61 | $ | 11.55 | $ | 13.01 | $ | 12.05 | $ | 10.80 | |||||
| Income from investment operationsa: | |||||||||||||||
| Net investment incomeb | 0.08 | 0.07 | 0.16 | 0.13 | 0.03 | c | |||||||||
| Net realized and unrealized gains (losses) | 3.25 | 2.08 | (1.48 | ) | 1.26 | 1.44 | |||||||||
| Total from investment operations | 3.33 | 2.15 | (1.32 | ) | 1.39 | 1.47 | |||||||||
| Less distributions from net investment income | (0.02 | ) | (0.09 | ) | (0.14 | ) | (0.43 | ) | (0.22 | ) | |||||
| Net asset value, end of year | $ | 16.92 | $ | 13.61 | $ | 11.55 | $ | 13.01 | $ | 12.05 | |||||
| Total returnd | 24.50 | % | 18.67 | % | (10.13 | )% | 11.69 | % | 13.64 | % | |||||
| Ratios to average net assets | |||||||||||||||
| Expenses before expense reductione | 2.16 | % | 2.24 | % | 2.24 | % | 2.28 | % | 2.26 | % | |||||
| Expenses net of expense reductione | 2.16 | %f | 2.24 | % | 2.24 | % | 2.28 | % | 2.25 | % | |||||
| Expenses incurred in connection with securities sold short | —% | —% | —% | —% | —%g | ||||||||||
| Net investment income | 0.51 | % | 0.56 | % | 1.22 | % | 1.07 | % | 0.24 | %c | |||||
| Supplemental data | |||||||||||||||
| Net assets, end of year (000’s) | $ | 86,370 | $ | 69,046 | $ | 68,324 | $ | 89,989 | $ | 97,404 | |||||
| Portfolio turnover rate | 25.73 | % | 12.65 | % | 23.58 | % | 35.37 | % | 81.29 | % | |||||
aThe amount shown for a share outstanding throughout the period may not correlate with the Statement of Operations for the period due to the timing of sales and repurchases of
the Fund shares in relation to income earned and/or fluctuating market value of the investments of the Fund.
bBased on average daily shares outstanding.
cNet investment income per share includes approximately $(0.09) per share related to an adjustment for uncollectible interest. Excluding the effect of this adjustment, the ratio of
net investment income to average net assets would have been 1.09%.
dTotal return does not reflect sales commissions or contingent deferred sales charges, if applicable.
eIncludes dividend expense on securities sold short and borrowing fees, if any. See below for the ratios of such expenses to average net assets for the periods presented.
fBenefit of expense reduction rounds to less than 0.01%.
gRounds to less than 0.01%.
Annual Report | The accompanying notes are an integral part of these financial statements. | 21
| Mutual Financial Services Fund | |||
| Financial Highlights (continued) | |||
| Period Ended | |||
| December 31, | |||
| Class R6 | 2013 | a | |
| Per share operating performance | |||
| (for a share outstanding throughout the period) | |||
| Net asset value, beginning of period | $ | 14.89 | |
| Income from investment operationsb: | |||
| Net investment incomec | 0.13 | ||
| Net realized and unrealized gains (losses) | 2.07 | ||
| Total from investment operations | 2.20 | ||
| Less distributions from net investment income | (0.21 | ) | |
| Net asset value, end of period | $ | 16.88 | |
| Total returnd | 14.86 | % | |
| Ratios to average net assetse | |||
| Expenses before waiver, payment by affiliates and expense reduction | 2.18 | % | |
| Expenses net of waiver, payment by affiliates and expense reduction | 0.97 | %f | |
| Net investment income | 1.70 | % | |
| Supplemental data | |||
| Net assets, end of period (000’s) | $ | 6 | |
| Portfolio turnover rate | 25.73 | % | |
aFor the May 1, 2013 (effective date) to December 31, 2013.
bThe amount shown for a share outstanding throughout the period may not correlate with the Statement of Operations for the period due to the timing of sales and repurchases of
the Fund shares in relation to income earned and/or fluctuating market value of the investments of the Fund.
cBased on average daily shares outstanding.
dTotal return is not annualized for periods less than one year.
eRatios are annualized for periods less than one year.
fBenefit of expense reduction rounds to less than 0.01%.
22 | The accompanying notes are an integral part of these financial statements. | Annual Report
Mutual Financial Services Fund
Statement of Investments, December 31, 2013
| Country | Shares/Units/Warrants | Value | ||
| Common Stocks and Other Equity Interests 90.3% | ||||
| Capital Markets 3.8% | ||||
| a,bAcquisition 1234 PLC | United Kingdom | 18,057 | $ | 19,734 |
| aChina Cinda Asset Management Co. Ltd., H | China | 195,507 | 121,525 | |
| China Everbright Ltd. | Hong Kong | 3,014,000 | 4,773,053 | |
| F&C Asset Management PLC | United Kingdom | 1,163,275 | 1,769,276 | |
| Morgan Stanley | United States | 184,390 | 5,782,470 | |
| Sun Hung Kai & Co. Ltd. | Hong Kong | 7,457,704 | 4,154,737 | |
| 16,620,795 | ||||
| Commercial Banks 23.5% | ||||
| a,cAB&T Financial Corp. | United States | 226,100 | 122,094 | |
| Aozora Bank Ltd. | Japan | 2,950,341 | 8,349,493 | |
| a,dThe Bankshares Inc. | United States | 456,903 | 2,178,966 | |
| Barclays PLC | United Kingdom | 888,492 | 4,000,339 | |
| BB&T Corp. | United States | 85,130 | 3,177,052 | |
| a,eBond Street Holdings LLC, A, 144A | United States | 286,469 | 4,297,035 | |
| aCapital Bank Financial Corp., A | United States | 42,649 | 970,265 | |
| a,eCapital Bank Financial Corp., B, 144A, non-voting | United States | 153,021 | 3,481,228 | |
| CIT Group Inc. | United States | 138,480 | 7,218,962 | |
| Columbia Banking System Inc. | United States | 178,332 | 4,905,913 | |
| a,dColumbia Banking System Inc., wts., C, 10/23/16 | United States | 8,117 | 1,535,525 | |
| a,dFirst Southern Bancorp Inc. | United States | 110,792 | 534,040 | |
| Guaranty Bancorp | United States | 266,761 | 3,747,992 | |
| Hana Financial Group Inc. | South Korea | 243,313 | 10,117,636 | |
| HSBC Holdings PLC | United Kingdom | 561,180 | 6,154,940 | |
| KB Financial Group Inc. | South Korea | 178,863 | 7,158,078 | |
| PNC Financial Services Group Inc. | United States | 78,520 | 6,091,582 | |
| Southern National Bancorp of Virginia Inc. | United States | 547,560 | 5,481,076 | |
| State Bank Financial Corp. | United States | 137,860 | 2,507,673 | |
| SunTrust Banks Inc. | United States | 209,110 | 7,697,339 | |
| Wells Fargo & Co. | United States | 186,280 | 8,457,112 | |
| Woori Finance Holdings Co. Ltd. | South Korea | 262,880 | 3,311,756 | |
| 101,496,096 | ||||
| Consumer Finance 1.1% | ||||
| aComdisco Holding Co. Inc. | United States | 103 | 556 | |
| Samsung Card Co. Ltd. | South Korea | 130,850 | 4,635,477 | |
| 4,636,033 | ||||
| Diversified Financial Services 9.6% | ||||
| Citigroup Inc. | United States | 65,609 | 3,418,885 | |
| Deutsche Boerse AG | Germany | 33,107 | 2,741,428 | |
| First Pacific Co. Ltd. | Hong Kong | 7,714,902 | 8,775,131 | |
| aING Groep NV, IDR | Netherlands | 802,283 | 11,145,756 | |
| JPMorgan Chase & Co. | United States | 108,420 | 6,340,402 | |
| Oslo Bors VPS Holding ASA | Norway | 911,000 | 9,162,421 | |
| 41,584,023 | ||||
| Industrial Conglomerates 0.9% | ||||
| Shanghai Industrial Holdings Ltd. | China | 1,039,000 | 3,805,296 |
Annual Report | 23
Mutual Financial Services Fund
Statement of Investments, December 31, 2013 (continued)
| Country | Shares/Units/Warrants | Value | ||
| Common Stocks and Other Equity Interests (continued) | ||||
| Insurance 49.6% | ||||
| ACE Ltd. | United States | 139,770 | $ | 14,470,388 |
| Aegon NV | Netherlands | 637,658 | 6,018,650 | |
| Ageas | Belgium | 208,183 | 8,862,709 | |
| aAlleghany Corp. | United States | 12,747 | 5,098,290 | |
| American International Group Inc. | United States | 154,888 | 7,907,032 | |
| Argo Group International Holdings Ltd. | United States | 105,712 | 4,914,551 | |
| Catlin Group Ltd. | United Kingdom | 1,109,668 | 10,671,277 | |
| China Pacific Insurance (Group) Co. Ltd., H | China | 1,561,940 | 6,123,399 | |
| CNO Financial Group Inc. | United States | 654,910 | 11,585,358 | |
| Delta Lloyd NV | Netherlands | 318,343 | 7,899,369 | |
| Direct Line Insurance Group PLC | United Kingdom | 2,119,159 | 8,756,998 | |
| aEnstar Group Ltd. | United States | 65,199 | 9,056,793 | |
| a,dImagine Group Holdings Ltd. | Bermuda | 68,631 | 501,418 | |
| Korean Reinsurance Co. | South Korea | 600,118 | 6,508,656 | |
| Lancashire Holdings Ltd. | United Kingdom | 431,280 | 5,786,454 | |
| Maiden Holdings Ltd. | United States | 496,740 | 5,429,368 | |
| MetLife Inc. | United States | 177,140 | 9,551,389 | |
| a,dOlympus Re Holdings Ltd. | United States | 7,480 | — | |
| PartnerRe Ltd. | Bermuda | 112,420 | 11,852,441 | |
| PICC Property and Casualty Co. Ltd., H | China | 2,116,029 | 3,138,153 | |
| cProtector Forsikring ASA | Norway | 4,479,410 | 14,180,256 | |
| RenaissanceRe Holdings Ltd. | United States | 42,200 | 4,107,748 | |
| Resolution Ltd. | United Kingdom | 1,898,597 | 11,124,643 | |
| RSA Insurance Group PLC | United Kingdom | 3,892,653 | 5,896,336 | |
| aStorebrand ASA | Norway | 1,200,174 | 7,499,727 | |
| UNIQA Insurance Group AG | Austria | 564,365 | 7,203,139 | |
| Validus Holdings Ltd. | Bermuda | 119,914 | 4,831,335 | |
| White Mountains Insurance Group Ltd. | United States | 12,068 | 7,277,969 | |
| Zurich Insurance Group AG | Switzerland | 28,050 | 8,128,384 | |
| 214,382,230 | ||||
| Real Estate Management & Development 0.6% | ||||
| aDolphin Capital Investors Ltd. | Virgin Islands (British) | 3,979,650 | 2,586,537 | |
| Thrifts & Mortgage Finance 1.2% | ||||
| Cape Bancorp Inc. | United States | 264,663 | 2,688,976 | |
| Westfield Financial Inc. | United States | 319,620 | 2,384,365 | |
| 5,073,341 | ||||
| Total Common Stocks and Other Equity Interests | ||||
| (Cost $306,650,783) | 390,184,351 | |||
| Convertible Preferred Stocks 0.1% | ||||
| Commercial Banks 0.1% | ||||
| Columbia Banking System Inc., cvt. pfd., B | United States | 1,224 | 392,483 | |
| a,dFirst Southern Bancorp Inc., cvt. pfd., C | United States | 190 | 354,700 | |
| Total Convertible Preferred Stocks | ||||
| (Cost $312,400) | 747,183 | |||
24 | Annual Report
| Mutual Financial Services Fund | |||||
| Statement of Investments, December 31, 2013 (continued) | |||||
| Country | Shares/Units/Warrants | Value | |||
| Preferred Stocks 1.1% | |||||
| Diversified Financial Services 1.1% | |||||
| a,dHightower Holding LLC, pfd., A | United States | 3,000,000 | $ | 2,859,000 | |
| a,dHightower Holding LLC, pfd., A, Series 2 | United States | 968,000 | 1,841,233 | ||
| Total Preferred Stocks (Cost $4,782,324) | 4,700,233 | ||||
| Principal Amount* | |||||
| Corporate Bonds (Cost $1,158,755) 0.3% | |||||
| e,fBaggot Securities Ltd., secured bond, 144A, 10.24%, Perpetual | Ireland | 816,000 EUR | 1,185,824 | ||
| Shares | |||||
| Companies in Liquidation 0.8% | |||||
| a,dFIM Coinvestor Holdings I, LLC | United States | 4,357,178 | — | ||
| a,gLehman Brothers Holdings Inc., Bankruptcy Claim | United States | 7,766,103 | 3,494,746 | ||
| Total Companies in Liquidation (Cost $3,483,802) | 3,494,746 | ||||
| Total Investments before Short Term Investments | |||||
| (Cost $316,388,064) | 400,312,337 | ||||
| Principal Amount* | |||||
| Short Term Investments 7.2% | |||||
| U.S. Government and Agency Securities 7.2% | |||||
| hU.S. Treasury Bills, | |||||
| 1/02/14 | United States | 12,100,000 | 12,100,000 | ||
| i1/09/14 - 4/24/14 | United States | 13,000,000 | 12,998,821 | ||
| 6/26/14 | United States | 6,000,000 | 5,997,666 | ||
| Total U.S. Government and Agency Securities | |||||
| (Cost $31,096,035) | 31,096,487 | ||||
| Total Investments (Cost $347,484,099) 99.8% | 431,408,824 | ||||
| Other Assets, less Liabilities 0.2% | 774,895 | ||||
| Net Assets 100.0% | $ | 432,183,719 | |||
*The principal amount is stated in U.S. dollars unless otherwise indicated.
aNon-income producing.
bSecurity has been deemed illiquid because it may not be able to be sold within seven days. At December 31, 2013, the value of this security was $19,734, representing less than
0.01% of net assets.
cSee Note 10 regarding holdings of 5% voting securities.
dSee Note 8 regarding restricted securities.
eSecurity was purchased pursuant to Rule 144A under the Securities Act of 1933 and may be sold in transactions exempt from registration only to qualified institutional buyers or in
a public offering registered under the Securities Act of 1933. These securities have been deemed liquid under guidelines approved by the Trust’s Board of Trustees. At December 31,
2013, the aggregate value of these securities was $8,964,087, representing 2.07% of net assets.
fPerpetual security with no stated maturity date.
gBankruptcy claims represent the right to receive distributions, if any, during the liquidation of the underlying pool of assets. Shares represent amount of allowed unsecured claims.
hThe security is traded on a discount basis with no stated coupon rate.
iSecurity or a portion of the security has been pledged as collateral for open futures and forward contracts. At December 31, 2013, the aggregate value of these securities and/or
cash pledged as collateral was $3,557,045, representing 0.82% of net assets.
Annual Report | 25
Mutual Financial Services Fund
Statement of Investments, December 31, 2013 (continued)
At December 31, 2013, the Fund had the following futures contracts outstanding. See Note 1(c).
| Futures Contracts | ||||||||||||
| Number of | Notional | Expiration | Unrealized | Unrealized | ||||||||
| Description | Type | Contracts | Value | Date | Appreciation | Depreciation | ||||||
| Currency Contracts | ||||||||||||
| EUR/USD | Short | 47 | $ | 8,100,450 | 3/17/14 | $ | — | $ | (34,571 | ) | ||
| GBP/USD | Short | 93 | 9,624,338 | 3/17/14 | — | (89,156 | ) | |||||
| Unrealized appreciation (depreciation) | — | (123,727 | ) | |||||||||
| Net unrealized appreciation (depreciation) | $ | (123,727 | ) | |||||||||
| At December 31, 2013, the Fund had the following forward exchange contracts outstanding. See Note 1(c). | ||||||||||||
| Forward Exchange Contracts | ||||||||||||
| Settlement | Unrealized | Unrealized | ||||||||||
| Currency | Counterpartya Type | Quantity | Contract Amount | Date | Appreciation Depreciation | |||||||
| Euro | BANT | Sell | 2,082,256 | $ | 2,720,363 | 1/17/14 | $ | — | $ | (143,756 | ) | |
| Euro | BBU | Sell | 2,082,272 | 2,719,156 | 1/17/14 | — | (144,986 | ) | ||||
| Euro | FBCO | Sell | 239,515 | 320,125 | 1/17/14 | — | (9,325 | ) | ||||
| Euro | DBFX | Sell | 131,394 | 173,450 | 1/17/14 | — | (7,282 | ) | ||||
| Euro | SCBT | Sell | 63,611 | 84,360 | 1/17/14 | — | (3,135 | ) | ||||
| British Pound | BANT | Sell | 2,981,970 | 4,540,279 | 1/21/14 | — | (396,869 | ) | ||||
| British Pound | FBCO | Sell | 1,004,216 | 1,606,055 | 1/21/14 | — | (56,591 | ) | ||||
| British Pound | DBFX | Sell | 1,575,519 | 2,391,795 | 1/21/14 | — | (216,739 | ) | ||||
| British Pound | HSBC | Sell | 142,796 | 229,079 | 1/21/14 | — | (7,343 | ) | ||||
| British Pound | SCBT | Sell | 37,518 | 59,882 | 1/21/14 | — | (2,236 | ) | ||||
| British Pound | SSBT | Sell | 940,000 | 1,517,329 | 1/21/14 | — | (38,997 | ) | ||||
| Japanese Yen | BONY | Buy | 29,200,000 | 299,038 | 1/22/14 | — | (21,704 | ) | ||||
| Japanese Yen | FBCO | Buy | 58,946,490 | 601,409 | 1/22/14 | — | (41,551 | ) | ||||
| Japanese Yen | DBFX | Buy | 12,000,000 | 124,660 | 1/22/14 | — | (10,687 | ) | ||||
| Japanese Yen | HSBC | Buy | 29,599,765 | 300,667 | 1/22/14 | — | (19,536 | ) | ||||
| Japanese Yen | BONY | Sell | 38,300,000 | 385,859 | 1/22/14 | 22,096 | — | |||||
| Japanese Yen | FBCO | Sell | 932,293,434 | 9,277,659 | 1/22/14 | 422,978 | — | |||||
| South Korean Won | BANT | Buy | 766,773,929 | 716,933 | 2/12/14 | 7,289 | — | |||||
| South Korean Won | FBCO | Buy | 703,434,120 | 655,699 | 2/12/14 | 8,698 | — | |||||
| South Korean Won | HSBC | Buy | 2,492,813,398 | 2,295,135 | 2/12/14 | 60,251 | (909 | ) | ||||
| Swiss Franc | BBU | Buy | 67,560 | 73,381 | 2/12/14 | 2,382 | — | |||||
| Swiss Franc | FBCO | Buy | 2,888,873 | 3,195,987 | 2/12/14 | 43,629 | — | |||||
| South Korean Won | BANT | Sell | 6,024,622,910 | 5,365,014 | 2/12/14 | — | (325,276 | ) | ||||
| Swiss Franc | BANT | Sell | 2,765,865 | 3,013,707 | 2/12/14 | — | (87,966 | ) | ||||
| South Korean Won | FBCO | Sell | 14,155,766,283 | 12,658,937 | 2/12/14 | — | (711,264 | ) | ||||
| Swiss Franc | FBCO | Sell | 139,843 | 150,171 | 2/12/14 | — | (6,650 | ) | ||||
| South Korean Won | DBFX | Sell | 11,237,045,759 | 10,006,130 | 2/12/14 | — | (607,322 | ) | ||||
| South Korean Won | HSBC | Sell | 6,009,070,166 | 5,515,738 | 2/12/14 | 3,764 | (163,626 | ) | ||||
| Swiss Franc | HSBC | Sell | 16,827 | 17,962 | 2/12/14 | — | (908 | ) | ||||
| Swiss Franc | SCBT | Sell | 33,898 | 36,522 | 2/12/14 | — | (1,492 | ) | ||||
| British Pound | BANT | Sell | 4,174,249 | 6,487,873 | 2/19/14 | — | (421,924 | ) | ||||
| British Pound | BBU | Sell | 2,127,777 | 3,311,827 | 2/19/14 | — | (210,365 | ) | ||||
| Euro | SCBT | Buy | 823,379 | 1,128,038 | 2/28/14 | 4,519 | — | |||||
| 26 | Annual Report | ||||||||||||
| Mutual Financial Services Fund | ||||||||||||
| Statement of Investments, December 31, 2013 (continued) | ||||||||||||
| Forward Exchange Contracts (continued) | ||||||||||||
| Settlement | Unrealized | Unrealized | ||||||||||
| Currency | Counterpartya Type | Quantity | Contract Amount | Date | Appreciation Depreciation | |||||||
| Euro | BANT | Sell | 175,548 | $ | 231,680 | 2/28/14 | $ | — | $ | (9,786 | ) | |
| Euro | BONY | Sell | 78,222 | 102,875 | 2/28/14 | — | (4,719 | ) | ||||
| Euro | BBU | Sell | 1,190,458 | 1,586,136 | 2/28/14 | — | (51,338 | ) | ||||
| Euro | FBCO | Sell | 4,692,559 | 6,350,868 | 2/28/14 | — | (103,744 | ) | ||||
| Euro | HSBC | Sell | 1,287,960 | 1,718,679 | 2/28/14 | — | (52,909 | ) | ||||
| Euro | SCBT | Sell | 48,757 | 64,764 | 2/28/14 | — | (2,301 | ) | ||||
| Euro | BANT | Buy | 121,607 | 167,242 | 4/16/14 | 99 | (70 | ) | ||||
| Euro | BONY | Buy | 65,978 | 90,793 | 4/16/14 | — | (40 | ) | ||||
| Euro | BBU | Buy | 30,753 | 42,274 | 4/16/14 | 27 | — | |||||
| Euro | HSBC | Buy | 160,215 | 220,477 | 4/16/14 | 41 | (143 | ) | ||||
| Euro | SCBT | Buy | 121,572 | 167,048 | 4/16/14 | 231 | (57 | ) | ||||
| Euro | SSBT | Buy | 72,763 | 100,114 | 4/16/14 | 4 | (32 | ) | ||||
| Euro | BANT | Sell | 1,648,947 | 2,241,125 | 4/16/14 | — | (26,999 | ) | ||||
| Euro | BBU | Sell | 1,814,660 | 2,467,403 | 4/16/14 | — | (28,660 | ) | ||||
| British Pound | BANT | Sell | 2,148,823 | 3,478,289 | 4/22/14 | — | (76,987 | ) | ||||
| British Pound | FBCO | Sell | 1,707,959 | 2,753,230 | 4/22/14 | — | (72,627 | ) | ||||
| British Pound | HSBC | Sell | 105,914 | 174,657 | 4/22/14 | — | (580 | ) | ||||
| British Pound | SCBT | Sell | 2,988,927 | 4,818,150 | 4/22/14 | — | (127,097 | ) | ||||
| Euro | BANT | Sell | 7,291,010 | 9,811,241 | 5/15/14 | — | (217,909 | ) | ||||
| Euro | BONY | Sell | 400,000 | 541,696 | 5/19/14 | — | (8,527 | ) | ||||
| Euro | SCBT | Sell | 232,558 | 313,932 | 5/19/14 | — | (5,964 | ) | ||||
| British Pound | BANT | Buy | 2,106,559 | 3,458,392 | 5/21/14 | 26,113 | — | |||||
| British Pound | BBU | Buy | 282,961 | 461,605 | 5/21/14 | 6,447 | — | |||||
| British Pound | HSBC | Buy | 198,592 | 323,725 | 5/21/14 | 4,770 | — | |||||
| Norwegian Krone | BANT | Buy | 1,374,782 | 222,439 | 5/21/14 | 3,050 | — | |||||
| Norwegian Krone | BONY | Buy | 325,000 | 52,670 | 5/21/14 | 636 | — | |||||
| Norwegian Krone | BBU | Buy | 5,318,900 | 854,740 | 5/21/14 | 17,653 | — | |||||
| Norwegian Krone | BANT | Sell | 188,650,175 | 30,768,474 | 5/21/14 | — | (173,517 | ) | ||||
| British Pound | BBU | Sell | 4,056,465 | 6,520,970 | 5/21/14 | — | (188,917 | ) | ||||
| British Pound | HSBC | Sell | 2,863,841 | 4,605,056 | 5/21/14 | — | (132,084 | ) | ||||
| Unrealized appreciation (depreciation) | 634,677 | (4,943,446 | ) | |||||||||
| Net unrealized appreciation (depreciation) | $ | (4,308,769 | ) | |||||||||
| aMay be comprised of multiple contracts using the same currency and settlement date. | ||||||||||||
| See Abbreviations on page 49. | ||||||||||||
Annual Report | The accompanying notes are an integral part of these financial statements. | 27
| Mutual Financial Services Fund | |||
| Financial Statements | |||
| Statement of Assets and Liabilities | |||
| December 31, 2013 | |||
| Assets: | |||
| Investments in securities: | |||
| Cost - Unaffiliated issuers | $ | 335,208,177 | |
| Cost - Non-controlled affiliated issuers (Note 10) | 12,275,922 | ||
| Total cost of investments | $ | 347,484,099 | |
| Value - Unaffiliated issuers | $ | 417,106,474 | |
| Value - Non-controlled affiliated issuers (Note 10) | 14,302,350 | ||
| Total value of investments | 431,408,824 | ||
| Cash | 38,610 | ||
| Foreign currency, at value (cost $6,016,261) | 6,009,642 | ||
| Receivables: | |||
| Capital shares sold | 449,278 | ||
| Dividends and interest | 378,567 | ||
| Unrealized appreciation on forward exchange contracts | 634,677 | ||
| Other assets | 150,862 | ||
| Total assets | 439,070,460 | ||
| Liabilities: | |||
| Payables: | |||
| Capital shares redeemed | 1,058,407 | ||
| Management fees | 288,964 | ||
| Administrative fees | 27,524 | ||
| Distribution fees | 260,437 | ||
| Transfer agent fees | 133,464 | ||
| Trustees’ fees and expenses | 22,791 | ||
| Variation margin | 18,513 | ||
| Unrealized depreciation on forward exchange contracts | 4,943,446 | ||
| Accrued expenses and other liabilities | 133,195 | ||
| Total liabilities | 6,886,741 | ||
| Net assets, at value | $ | 432,183,719 | |
| Net assets consist of: | |||
| Paid-in capital | $ | 562,611,056 | |
| Undistributed net investment income | 1,155,140 | ||
| Net unrealized appreciation (depreciation) | 79,488,676 | ||
| Accumulated net realized gain (loss) | (211,071,153 | ) | |
| Net assets, at value | $ | 432,183,719 | |
28 | The accompanying notes are an integral part of these financial statements. | Annual Report
| Mutual Financial Services Fund | |||
| Financial Statements (continued) | |||
| Statement of Assets and Liabilities (continued) | |||
| December 31, 2013 | |||
| Class Z: | |||
| Net assets, at value | $ | 105,279,196 | |
| Shares outstanding | 6,230,577 | ||
| Net asset value and maximum offering price per share | $ | 16.90 | |
| Class A: | |||
| Net assets, at value | $ | 240,528,945 | |
| Shares outstanding | 14,186,173 | ||
| Net asset value per sharea | $ | 16.96 | |
| Maximum offering price per share (net asset value per share ÷ 94.25%) | $ | 17.99 | |
| Class C: | |||
| Net assets, at value | $ | 86,369,907 | |
| Shares outstanding | 5,105,334 | ||
| Net asset value and maximum offering price per sharea | $ | 16.92 | |
| Class R6: | |||
| Net assets, at value | $ | 5,671 | |
| Shares outstanding | 336 | ||
| Net asset value and maximum offering price per share | $ | 16.88 | |
| aRedemption price is equal to net asset value less contingent deferred sales charges, if applicable. | |||
Annual Report | The accompanying notes are an integral part of these financial statements. | 29
| Mutual Financial Services Fund | |||
| Financial Statements (continued) | |||
| Statement of Operations | |||
| for the year ended December 31, 2013 | |||
| Investment income: | |||
| Dividends: (net of foreign taxes of $741,191) | |||
| Unaffiliated issuers | $ | 9,329,195 | |
| Non-controlled affiliated issuers (Note 10) | 686,027 | ||
| Interest | 404,754 | ||
| Income from securities loaned | 85,529 | ||
| Total investment income | 10,505,505 | ||
| Expenses: | |||
| Management fees (Note 3a) | 3,142,524 | ||
| Administrative fees (Note 3b) | 299,545 | ||
| Distribution fees: (Note 3c) | |||
| Class A | 645,477 | ||
| Class B | 470 | ||
| Class C | 786,074 | ||
| Transfer agent fees: (Note 3e) | |||
| Class Z | 198,349 | ||
| Class A | 437,246 | ||
| Class B | 102 | ||
| Class C | 158,782 | ||
| Class R6 | 44 | ||
| Custodian fees (Note 4) | 34,390 | ||
| Reports to shareholders | 80,573 | ||
| Registration and filing fees | 74,195 | ||
| Professional fees | 106,872 | ||
| Trustees’ fees and expenses | 10,626 | ||
| Other | 16,068 | ||
| Total expenses | 5,991,337 | ||
| Expense reductions (Note 4) | (219 | ) | |
| Expenses waived/paid by affiliates (Note 3f) | (43 | ) | |
| Net expenses | 5,991,075 | ||
| Net investment income | 4,514,430 | ||
| Realized and unrealized gains (losses): | |||
| Net realized gain (loss) from: | |||
| Investments | 10,024,642 | ||
| Foreign currency transactions | 1,025,499 | ||
| Futures contracts | (470,825 | ) | |
| Net realized gain (loss) | 10,579,316 | ||
| Net change in unrealized appreciation (depreciation) on: | |||
| Investments | 73,855,058 | ||
| Translation of other assets and liabilities denominated in foreign currencies | (1,982,190 | ) | |
| Net change in unrealized appreciation (depreciation) | 71,872,868 | ||
| Net realized and unrealized gain (loss) | 82,452,184 | ||
| Net increase (decrease) in net assets resulting from operations | $ | 86,966,614 | |
30 | The accompanying notes are an integral part of these financial statements. | Annual Report
| Mutual Financial Services Fund | ||||||
| Financial Statements (continued) | ||||||
| Statements of Changes in Net Assets | ||||||
| Year Ended December 31, | ||||||
| 2013 | 2012 | |||||
| Increase (decrease) in net assets: | ||||||
| Operations: | ||||||
| Net investment income | $ | 4,514,430 | $ | 4,005,426 | ||
| Net realized gain (loss) from investments, foreign currency transactions and futures contracts | 10,579,316 | 14,653,384 | ||||
| Net change in unrealized appreciation (depreciation) on investments and translation | ||||||
| of other assets and liabilities denominated in foreign currencies | 71,872,868 | 40,432,930 | ||||
| Net increase (decrease) in net assets resulting from operations | 86,966,614 | 59,091,740 | ||||
| Distributions to shareholders from: | ||||||
| Net investment income: | ||||||
| Class Z | (1,085,169 | ) | (1,463,197 | ) | ||
| Class A | (1,840,120 | ) | (2,589,323 | ) | ||
| Class B | — | (2,287 | ) | |||
| Class C | (118,179 | ) | (490,530 | ) | ||
| Class R6 | (70 | ) | — | |||
| Total distributions to shareholders | (3,043,538 | ) | (4,545,337 | ) | ||
| Capital share transactions: (Note 2) | ||||||
| Class Z | (2,248,625 | ) | (7,268,399 | ) | ||
| Class A | 9,777,938 | (17,774,465 | ) | |||
| Class B | (374,083 | ) | (1,633,368 | ) | ||
| Class C | 503,579 | (10,673,792 | ) | |||
| Class R6 | 5,000 | — | ||||
| Total capital share transactions | 7,663,809 | (37,350,024 | ) | |||
| Net increase (decrease) in net assets | 91,586,885 | 17,196,379 | ||||
| Net assets: | ||||||
| Beginning of year | 340,596,834 | 323,400,455 | ||||
| End of year | $ | 432,183,719 | $ | 340,596,834 | ||
| Undistributed net investment income included in net assets: | ||||||
| End of year | $ | 1,155,140 | $ | 1,566,225 | ||
Annual Report | The accompanying notes are an integral part of these financial statements. | 31
Mutual Financial Services Fund
Notes to Financial Statements
1. ORGANIZATION AND SIGNIFICANT ACCOUNTING POLICIES
Franklin Mutual Series Funds (Trust) is registered under the Investment Company Act of 1940, as amended, (1940 Act) as an open-end investment company, consisting of seven separate funds. The Mutual Financial Services Fund (Fund) is included in this report. The financial statements of the remaining funds in the Trust are presented separately. The Fund offers four classes of shares: Class Z, Class A, Class C and Class R6. Effective May 1, 2013, the Fund began offering a new class of shares, Class R6. Effective March 22, 2013, all Class B shares were converted to Class A. Each class of shares differs by its initial sales load, contingent deferred sales charges, voting rights on matters affecting a single class, its exchange privilege and fees primarily due to differing arrangements for distribution and transfer agent fees.
The following summarizes the Fund’s significant accounting policies.
a. Financial Instrument Valuation
The Fund’s investments in financial instruments are carried at fair value daily. Fair value is the price that would be received to sell an asset or paid to transfer a liability in an orderly transaction between market participants on the measurement date. The Fund calculates the net asset value (NAV) per share at the close of the New York Stock Exchange (NYSE), generally at 4p.m. Eastern time (NYSE close) on each day the NYSE is open for trading. Under procedures approved by the Trust’s Board of Trustees (the Board), the Fund’s administrator, investment manager and other affiliates have formed the Valuation and Liquidity Oversight Committee (VLOC). The VLOC provides administration and oversight of the Fund’s valuation policies and procedures, which are approved annually by the Board. Among other things, these procedures allow the Fund to utilize independent pricing services, quotations from securities and financial instrument dealers, and other market sources to determine fair value.
Equity securities and derivative financial instruments (derivatives) listed on an exchange or on the NASDAQ National Market System are valued at the last quoted sale price or the official closing price of the day, respectively. Foreign equity securities are valued as of the close of trading on the foreign stock exchange on which the security is primarily traded or as of the NYSE close, whichever is earlier. The value is then converted into its U.S. dollar equivalent at the foreign exchange rate in effect at the NYSE close on the day that the value of the security is determined. Over-the-counter (OTC) securities are valued within the range of the most recent quoted bid and ask prices. Securities that trade in multiple markets or on multiple exchanges are valued according to the broadest and most representative market. Certain equity securities are valued based upon fundamental characteristics or relationships to similar securities.
Debt securities generally trade in the OTC market rather than on a securities exchange. The Fund’s pricing services use multiple valuation techniques to determine fair value. In instances where sufficient market activity exists, the pricing services may utilize a market-based approach through which quotes from market makers are used to determine fair value. In instances where sufficient market activity may not exist or is limited, the pricing services also utilize proprietary valuation models which may consider market characteristics such as benchmark yield curves,
32 | Annual Report
Mutual Financial Services Fund
Notes to Financial Statements (continued)
| 1. | ORGANIZATION AND SIGNIFICANT ACCOUNTING POLICIES (continued) |
| a. | Financial Instrument Valuation (continued) |
credit spreads, estimated default rates, anticipated market interest rate volatility, coupon rates, anticipated timing of principal repayments, underlying collateral, and other unique security features in order to estimate the relevant cash flows, which are then discounted to calculate the fair value. Securities denominated in a foreign currency are converted into their U.S. dollar equivalent at the foreign exchange rate in effect at the NYSE close on the date that the values of the foreign debt securities are determined.
Certain derivatives trade in the OTC market. The Fund’s pricing services use various techniques including industry standard option pricing models and proprietary discounted cash flow models to determine the fair value of those instruments. The Fund’s net benefit or obligation under the derivative contract, as measured by the fair value of the contract, is included in net assets.
The Fund has procedures to determine the fair value of financial instruments for which market prices are not reliable or readily available. Under these procedures, the VLOC convenes on a regular basis to review such financial instruments and considers a number of factors, including significant unobservable valuation inputs, when arriving at fair value. The VLOC primarily employs a market-based approach which may use related or comparable assets or liabilities, recent transactions, market multiples, book values, and other relevant information for the investment to determine the fair value of the investment. An income-based valuation approach may also be used in which the anticipated future cash flows of the investment are discounted to calculate fair value. Discounts may also be applied due to the nature or duration of any restrictions on the disposition of the investments. Due to the inherent uncertainty of valuations of such investments, the fair values may differ significantly from the values that would have been used had an active market existed. The VLOC employs various methods for calibrating these valuation approaches including a regular review of key inputs and assumptions, transactional back-testing or disposition analysis, and reviews of any related market activity.
Trading in securities on foreign securities stock exchanges and OTC markets may be completed before the daily NYSE close. In addition, trading in certain foreign markets may not take place on every NYSE business day. Occasionally, events occur between the time at which trading in a foreign security is completed and the close of the NYSE that might call into question the reliability of the value of a portfolio security held by the Fund. As a result, differences may arise between the value of the Fund’s portfolio securities as determined at the foreign market close and the latest indications of value at the close of the NYSE. In order to minimize the potential for these differences, the VLOC monitors price movements following the close of trading in foreign stock markets through a series of country specific market proxies (such as baskets of American Depositary Receipts, futures contracts and exchange traded funds). These price movements are measured against established trigger thresholds for each specific market proxy to assist in determining if an event has occurred that may call into question the reliability of the values of the foreign securities held by the Fund. If such an event occurs, the securities may be valued using fair value procedures, which may include the use of independent pricing services.
Annual Report | 33
Mutual Financial Services Fund
Notes to Financial Statements (continued)
| 1. | ORGANIZATION AND SIGNIFICANT ACCOUNTING POLICIES (continued) |
| a. | Financial Instrument Valuation (continued) |
Also, when the last day of the reporting period is a non-business day, certain foreign markets may be open on those days that the NYSE is closed, which could result in differences between the value of the Fund’s portfolio securities on the last business day and the last calendar day of the reporting period. Any significant security valuation changes due to an open foreign market are adjusted and reflected by the Fund for financial reporting purposes.
b. Foreign Currency Translation
Portfolio securities and other assets and liabilities denominated in foreign currencies are translated into U.S. dollars based on the exchange rate of such currencies against U.S. dollars on the date of valuation. The Fund may enter into foreign currency exchange contracts to facilitate transactions denominated in a foreign currency. Purchases and sales of securities, income and expense items denominated in foreign currencies are translated into U.S. dollars at the exchange rate in effect on the transaction date. Portfolio securities and assets and liabilities denominated in foreign currencies contain risks that those currencies will decline in value relative to the U.S. dollar. Occasionally, events may impact the availability or reliability of foreign exchange rates used to convert the U.S. dollar equivalent value. If such an event occurs, the foreign exchange rate will be valued at fair value using procedures established and approved by the Board.
The Funds does not separately report the effect of changes in foreign exchange rates from changes in market prices on securities held. Such changes are included in net realized and unrealized gain or loss from investments on the Statement of Operations.
Realized foreign exchange gains or losses arise from sales of foreign currencies, currency gains or losses realized between the trade and settlement dates on securities transactions and the difference between the recorded amounts of dividends, interest, and foreign withholding taxes and the U.S. dollar equivalent of the amounts actually received or paid. Net unrealized foreign exchange gains and losses arise from changes in foreign exchange rates on foreign denominated assets and liabilities other than investments in securities held at the end of the reporting period.
c. Derivative Financial Instruments
The Fund invested in derivatives in order to manage risk or gain exposure to various other investments or markets. Derivatives are financial contracts based on an underlying or notional amount, require no initial investment or an initial net investment that is smaller than would normally be required to have a similar response to changes in market factors, and require or permit net settlement. Derivatives contain various risks including the potential inability of the counterparty to fulfill their obligations under the terms of the contract, the potential for an illiquid secondary market, and/or the potential for market movements which expose the Fund to gains or losses in excess of the amounts shown on the Statement of Assets and Liabilities. Realized gain and loss and unrealized appreciation and depreciation on these contracts for the period are included in the Statement of Operations.
34 | Annual Report
Mutual Financial Services Fund
Notes to Financial Statements (continued)
| 1. | ORGANIZATION AND SIGNIFICANT ACCOUNTING POLICIES (continued) |
| c. | Derivative Financial Instruments (continued) |
Derivative counterparty credit risk is managed through a formal evaluation of the creditworthi-ness of all potential counterparties. The Fund attempts to reduce its exposure to counterparty credit risk on OTC derivatives, whenever possible, by entering into International Swaps and Derivatives Association (ISDA) master agreements with certain counterparties. These agreements contain various provisions, including but not limited to collateral requirements, events of default, or early termination. Termination events applicable to the counterparty include certain deteriorations in the credit quality of the counterparty. Termination events applicable to the Fund include failure of the Fund to maintain certain net asset levels and/or limit the decline in net assets over various periods of time. In the event of default or early termination, the ISDA master agreement gives the non-defaulting party the right to net and close-out all transactions traded, whether or not arising under the ISDA agreement, to one net amount payable by one counterparty to the other. However, absent an event of default or early termination, OTC derivative assets and liabilities are presented gross and not offset in the Statement of Assets and Liabilities. Early termination by the counterparty may result in an immediate payment by the Fund of any net liability owed to that counterparty under the ISDA agreement.
Collateral requirements differ by type of derivative. Collateral or initial margin requirements are set by the broker or exchange clearing house for exchange traded and centrally cleared derivatives. Initial margin deposited is held at the exchange and can be in the form of cash and/or securities. For OTC derivatives traded under an ISDA master agreement, posting of collateral is required by either the Fund or the applicable counterparty if the total net exposure of all OTC derivatives with the applicable counterparty exceeds the minimum transfer amount, which typically ranges from $100,000 to $250,000, and can vary depending on the counterparty and the type of the agreement. Generally, collateral is determined at the close of fund business each day and any additional collateral required due to changes in derivative values may be delivered by the Fund or the counterparty within a few business days. Collateral pledged and/or received by the Fund for OTC derivatives, if any, is held in segregated accounts with the Fund’s custodian/counterparty broker and can be in the form of cash and/or securities. Unrestricted cash may be invested according to the Fund’s investment objectives.
The Fund entered into exchange traded futures contracts primarily to manage exposure to certain foreign currencies. A futures contract is an agreement between the Fund and a coun-terparty to buy or sell an asset for a specified price on a future date. Required initial margins are pledged by the Fund, and the daily change in fair value is accounted for as a variation margin payable or receivable on the Statement of Assets and Liabilities.
The Fund entered into OTC forward exchange contracts primarily to manage exposure to certain foreign currencies. A forward exchange contract is an agreement between the Fund and a counter-party to buy or sell a foreign currency at a specific exchange rate on a future date.
See Note 9 regarding other derivative information.
Annual Report | 35
Mutual Financial Services Fund
Notes to Financial Statements (continued)
| 1. | ORGANIZATION AND SIGNIFICANT ACCOUNTING POLICIES (continued) |
| d. | Securities Lending |
The Fund participates in an agency based securities lending program. The Fund receives cash collateral against the loaned securities in an amount equal to at least 102% of the market value of the loaned securities. Collateral is maintained over the life of the loan in an amount not less than 100% of the market value of loaned securities, as determined at the close of fund business each day; any additional collateral required due to changes in security values is delivered to the Fund on the next business day. The collateral is invested in a non-registered money fund. The Fund receives income from the investment of cash collateral, in addition to lending fees and rebates paid by the borrower. The Fund bears the market risk with respect to the collateral investment, securities loaned, and the risk that the agent may default on its obligations to the Fund. The securities lending agent has agreed to indemnify the Fund in the event of default by a third party borrower. At December 31, 2013, the Fund had no securities on loan.
e. Income and Deferred Taxes
It is the Fund’s policy to qualify as a regulated investment company under the Internal Revenue Code. The Fund intends to distribute to shareholders substantially all of its taxable income and net realized gains to relieve it from federal income and excise taxes. As a result, no provision for U.S. federal income taxes is required.
The Fund may be subject to foreign taxation related to income received, capital gains on the sale of securities and certain foreign currency transactions in the foreign jurisdictions in which it invests. Foreign taxes, if any, are recorded based on the tax regulations and rates that exist in the foreign markets in which the Fund invests. When a capital gain tax is determined to apply the Fund records an estimated deferred tax liability in an amount that would be payable if the securities were disposed of on the valuation date.
The Fund recognizes the tax benefits of uncertain tax positions only when the position is “more likely than not” to be sustained upon examination by the tax authorities based on the technical merits of the tax position. As of December 31, 2013, and for all open tax years, the Fund has determined that no liability for unrecognized tax benefits is required in the Fund’s financial statements related to uncertain tax positions taken on a tax return (or expected to be taken on future tax returns). Open tax years are those that remain subject to examination and are based on each tax jurisdiction statute of limitation.
f. Security Transactions, Investment Income, Expenses and Distributions
Security transactions are accounted for on trade date. Realized gains and losses on security transactions are determined on a specific identification basis. Interest income and estimated expenses are accrued daily. Amortization of premium and accretion of discount on debt securities are included
36 | Annual Report
Mutual Financial Services Fund
Notes to Financial Statements (continued)
| 1. | ORGANIZATION AND SIGNIFICANT ACCOUNTING POLICIES (continued) |
| f. | Security Transactions, Investment Income, Expenses and Distributions (continued) |
in interest income. Dividend income is recorded on the ex-dividend date except that certain dividends from foreign securities are recognized as soon as the Fund is notified of the ex-dividend date. Distributions to shareholders are recorded on the ex-dividend date and are determined according to income tax regulations (tax basis). Distributable earnings determined on a tax basis may differ from earnings recorded in accordance with accounting principles generally accepted in the United States of America. These differences may be permanent or temporary. Permanent differences are reclassified among capital accounts to reflect their tax character. These reclassifications have no impact on net assets or the results of operations. Temporary differences are not reclassified, as they may reverse in subsequent periods.
Common expenses incurred by the Trust are allocated among the funds based on the ratio of net assets of each fund to the combined net assets of the Trust. Fund specific expenses are charged directly to the fund that incurred the expense.
Realized and unrealized gains and losses and net investment income, not including class specific expenses, are allocated daily to each class of shares based upon the relative proportion of net assets of each class. Differences in per share distributions, by class, are generally due to differences in class specific expenses.
Distributions received by the Fund from certain securities may be a return of capital (ROC). Such distributions reduce the cost basis of the securities, and any distributions in excess of the cost basis are recognized as capital gains.
g. Accounting Estimates
The preparation of financial statements in accordance with accounting principles generally accepted in the United States of America requires management to make estimates and assumptions that affect the reported amounts of assets and liabilities at the date of the financial statements and the amounts of income and expenses during the reporting period. Actual results could differ from those estimates.
h. Guarantees and Indemnifications
Under the Trust’s organizational documents, its officers and trustees are indemnified by the Trust against certain liabilities arising out of the performance of their duties to the Trust. Additionally, in the normal course of business, the Trust, on behalf of the Fund, enters into contracts with service providers that contain general indemnification clauses. The Trust’s maximum exposure under these arrangements is unknown as this would involve future claims that may be made against the Trust that have not yet occurred. Currently, the Trust expects the risk of loss to be remote.
Annual Report | 37
Mutual Financial Services Fund
Notes to Financial Statements (continued)
2. SHARES OF BENEFICIAL INTEREST
At December 31, 2013, there were an unlimited number of shares authorized (without par value).
Transactions in the Fund’s shares were as follows:
| Year Ended December 31, | ||||||||||||
| 2013 | 2012 | |||||||||||
| Shares | Amount | Shares | Amount | |||||||||
| Class Z Shares: | ||||||||||||
| Shares sold | 688,935 | $ | 10,392,063 | 1,024,689 | $ | 13,275,422 | ||||||
| Shares issued in reinvestment | ||||||||||||
| of distributions | 57,352 | 946,286 | 96,383 | 1,304,659 | ||||||||
| Shares redeemed | (883,206 | ) | (13,586,974 | ) | (1,703,585 | ) | (21,848,480 | ) | ||||
| Net increase (decrease) | (136,919 | ) | $ | (2,248,625 | ) | (582,513 | ) | $ | (7,268,399 | ) | ||
| Class A Shares: | ||||||||||||
| Shares sold | 3,661,594 | $ | 56,607,499 | 2,053,865 | $ | 26,219,145 | ||||||
| Shares issued in reinvestment | ||||||||||||
| of distributions | 107,325 | 1,772,519 | 183,716 | 2,490,728 | ||||||||
| Shares redeemed | (3,124,833 | ) | (48,602,080 | ) | (3,664,473 | ) | (46,484,338 | ) | ||||
| Net increase (decrease) | 644,086 | $ | 9,777,938 | (1,426,892 | ) | $ | (17,774,465 | ) | ||||
| Class B Sharesa: | ||||||||||||
| Shares sold | 54 | $ | 759 | 2,961 | $ | 36,601 | ||||||
| Shares issued in reinvestment | ||||||||||||
| of distributions | — | — | 166 | 2,141 | ||||||||
| Shares redeemed | (25,977 | ) | (374,842 | ) | (134,684 | ) | (1,672,110 | ) | ||||
| Net increase (decrease) | (25,923 | ) | $ | (374,083 | ) | (131,557 | ) | $ | (1,633,368 | ) | ||
| Class C Shares: | ||||||||||||
| Shares sold | 1,115,744 | $ | 17,176,940 | 393,032 | $ | 4,966,381 | ||||||
| Shares issued in reinvestment | ||||||||||||
| of distributions | 7,101 | 111,402 | 34,214 | 457,649 | ||||||||
| Shares redeemed | (1,088,960 | ) | (16,784,763 | ) | (1,271,876 | ) | (16,097,822 | ) | ||||
| Net increase (decrease) | 33,885 | $ | 503,579 | (844,630 | ) | $ | (10,673,792 | ) | ||||
| Class R6 Sharesb: | ||||||||||||
| Shares sold | 336 | $ | 5,000 | |||||||||
| aEffective March 22, 2013, all Class B shares were converted to Class A. | ||||||||||||
| bFor the period May 1, 2013 (effective date) to December 31, 2013. | ||||||||||||
3. TRANSACTIONS WITH AFFILIATES
Franklin Resources, Inc. is the holding company for various subsidiaries that together are referred to as Franklin Templeton Investments. Certain officers and trustees of the Fund are also officers and/or directors of the following subsidiaries:
| Subsidiary | Affiliation |
| Franklin Mutual Advisers, LLC (Franklin Mutual) | Investment manager |
| Franklin Templeton Services, LLC (FT Services) | Administrative manager |
| Franklin Templeton Distributors, Inc. (Distributors) | Principal underwriter |
| Franklin Templeton Investor Services, LLC (Investor Services) | Transfer agent |
| | Annual Report | |
Mutual Financial Services Fund
Notes to Financial Statements (continued)
| 3. | TRANSACTIONS WITH AFFILIATES (continued) |
| a. | Management Fees |
The Fund pays an investment management fee to Franklin Mutual based on the average daily net assets of the Fund as follows:
| Annualized Fee Rate | Net Assets | |
| 0.800 | % | Up to and including $1 billion |
| 0.770 | % | Over $1 billion, up to and including $2 billion |
| 0.750 | % | Over $2 billion, up to and including $5 billion |
| 0.730 | % | In excess of $5 billion |
b. Administrative Fees
The Fund pays its allocated share of an administrative fee to FT Services based on the Trust’s aggregate average daily net assets as follows:
| Annualized Fee Rate | Net Assets | |
| 0.150 | % | Up to and including $200 million |
| 0.135 | % | Over $200 million, up to and including $700 million |
| 0.100 | % | Over $700 million, up to and including $1.2 billion |
| 0.075 | % | In excess of $1.2 billion |
c. Distribution Fees
The Board has adopted distribution plans for each share class, with the exception of Class Z and Class R6 shares, pursuant to Rule 12b-1 under the 1940 Act. Distribution fees are not charged on shares held by affiliates. Under the Fund’s Class A reimbursement distribution plan, the Fund reimburses Distributors for costs incurred in connection with the servicing, sale and distribution of the Fund’s shares up to the maximum annual plan rate. Under the Class A reimbursement distribution plan, costs exceeding the maximum for the current plan year cannot be reimbursed in subsequent periods. In addition, under the Fund’s Class B and C compensation distribution plans, the Fund pays Distributors for costs incurred in connection with the servicing, sale and distribution of the Fund’s shares up to the maximum annual plan rate for each class. The plan year, for purposes of monitoring compliance with the maximum annual plan rates, is February 1 through January 31.
The maximum annual plan rates, based on the average daily net assets, for each class, are as follows:
| Class A | 0.35 | % |
| Class B | 1.00 | % |
| Class C | 1.00 | % |
The Board has set the current rate at 0.30% per year for Class A shares until further notice and approval by the Board.
Annual Report | 39
Mutual Financial Services Fund
Notes to Financial Statements (continued)
| 3. | TRANSACTIONS WITH AFFILIATES (continued) |
| d. | Sales Charges/Underwriting Agreements |
Front-end sales charges and contingent deferred sales charges (CDSC) do not represent expenses of the Fund. These charges are deducted from the proceeds of sales of Fund shares prior to investment or from redemption proceeds prior to remittance, as applicable. Distributors has advised the Fund of the following commission transactions related to the sales and redemptions of the Fund’s shares for the year:
| Sales charges retained net of commissions paid to | ||
| unaffiliated broker/dealers | $ | 84,242 |
| CDSC retained | $ | 5,405 |
e. Transfer Agent Fees
Each class of shares, except for Class R6, pays transfer agent fees to Investor Services for its performance of shareholder servicing obligations and reimburses Investor Services for out of pocket expenses incurred, including shareholding servicing fees paid to third parties. These fees are allocated daily based upon their relative proportion of such classes’ aggregate net assets. Class R6 pays Investor Services transfer agent fees specific to that class.
For the year ended December 31, 2013, the Fund paid transfer agent fees of $794,523, of which $438,183 was retained by Investor Services.
f. Waiver and Expense Reimbursements
Investor Services has contractually agreed in advance to waive or limit its fees so that the Class R6 transfer agent fees of the Fund do not exceed 0.01% until April 30, 2014.
4. EXPENSE OFFSET ARRANGEMENT
The Fund has entered into an arrangement with its custodian whereby credits realized as a result of uninvested cash balances are used to reduce a portion of the Fund’s custodian expenses. During the year ended December 31, 2013, the custodian fees were reduced as noted in the Statement of Operations.
5. INDEPENDENT TRUSTEES’ RETIREMENT PLAN
On January 1, 1993, the Trust adopted an Independent Trustees’ Retirement Plan (Plan). The Plan is an unfunded defined benefit plan that provides benefit payments to Trustees whose length of service and retirement age meets the eligibility requirements of the Plan. Benefits under the Plan are based on years of service and fees paid to each trustee at the time of retirement. Effective in December 1996, the Plan was closed to new participants.
40 | Annual Report
Mutual Financial Services Fund
Notes to Financial Statements (continued)
5. INDEPENDENT TRUSTEES’ RETIREMENT PLAN (continued)
During the year ended December 31, 2013, the Fund’s projected benefit obligation and benefit payments under the Plan were as follows:
| aProjected benefit obligation at December 31, 2013 | $ | 22,791 | ||||||
| bDecrease in projected benefit obligation | $ | 656 | ||||||
| Benefit payments made to retired trustees | $ | 468 | ||||||
| aThe projected benefit obligation is included in accrued expenses and other liabilities in the Statement of Assets and Liabilities. | ||||||||
| bThe decrease in projected benefit obligation is included in trustees’ fees and expenses in the Statement of Operations. | ||||||||
| 6. INCOME TAXES | ||||||||
| For tax purposes, capital losses may be carried over to offset future capital gains. Capital | ||||||||
| loss carryforwards with no expiration, if any, must be fully utilized before those losses with | ||||||||
| expiration dates. | ||||||||
| At December 31, 2013, capital loss carryforwards were as follows: | ||||||||
| Capital loss carryforwards subject to expiration: | ||||||||
| 2016 | $ | 105,848,544 | ||||||
| 2017 | 73,527,713 | |||||||
| 2018 | 31,091,133 | |||||||
| Capital loss carryforwards not subject to expiration: | ||||||||
| Short term | 3,334,336 | |||||||
| Long term | 1,454,330 | |||||||
| Total capital loss carryforwards | $ | 215,256,056 | ||||||
| During the year ended December 31, 2013, the Fund utilized $9,458,122 of capital loss | ||||||||
| carryforwards. | ||||||||
| The tax character of distributions paid during the years ended December 31, 2013 and 2012, | ||||||||
| was as follows: | ||||||||
| 2013 | 2012 | |||||||
| Distributions paid from ordinary | ||||||||
| income | $ | 3,043,538 | $ | 4,545,337 | ||||
| At December 31, 2013, the cost of investments, net unrealized appreciation (depreciation) and | ||||||||
| undistributed ordinary income for income tax purposes were as follows: | ||||||||
| Cost of investments | $ | 347,991,428 | ||||||
| Unrealized appreciation | $ | 119,588,802 | ||||||
| Unrealized depreciation | (36,171,406) | |||||||
| Net unrealized appreciation (depreciation) | $ | 83,417,396 | ||||||
| Distributable earnings – undistributed ordinary income | $ | 1,286,493 | ||||||
Annual Report | 41
Mutual Financial Services Fund
Notes to Financial Statements (continued)
6. INCOME TAXES (continued)
Differences between income and/or capital gains as determined on a book basis and a tax basis are primarily due to differing treatments of foreign currency transactions and passive foreign investment company shares.
7. INVESTMENT TRANSACTIONS
Purchases and sales of investments (excluding short term securities) for the year ended December 31, 2013, aggregated $97,248,809 and $91,708,923, respectively.
8. RESTRICTED SECURITIES
The Fund invests in securities that are restricted under the Securities Act of 1933 (1933 Act) or which are subject to legal, contractual, or other agreed upon restrictions on resale. Restricted securities are often purchased in private placement transactions, and cannot be sold without prior registration unless the sale is pursuant to an exemption under the 1933 Act. Disposal of these securities may require greater effort and expense, and prompt sale at an acceptable price may be difficult. The Fund may have registration rights for restricted securities. The issuer generally incurs all registration costs.
At December 31, 2013, the Fund held investments in restricted securities, excluding certain securities exempt from registration under the 1933 Act deemed to be liquid, as follows:
| Acquisition | ||||||
| Shares/Warrants | Issuer | Dates | Cost | Value | ||
| 456,903 | The Bankshares Inc. | 3/22/07 | $ | 4,569,030 | $ | 2,178,966 |
| 8,117 | aColumbia Banking System Inc., | |||||
| wts., C, 10/23/16 | 10/23/09 | — | 1,535,525 | |||
| 4,357,178 | FIM Coinvestor Holdings I, LLC | 11/20/06 - 6/02/09 | — | — | ||
| 110,792 | First Southern Bancorp Inc. | 1/27/10 - 7/07/10 | 2,337,711 | 534,040 | ||
| 190 | First Southern Bancorp Inc., | |||||
| cvt. pfd., C | 1/27/10 - 7/07/10 | 190,000 | 354,700 | |||
| 3,000,000 | Hightower Holding LLC, pfd., A | 3/31/08 - 1/05/10 | 2,362,324 | 2,859,000 | ||
| 968,000 | Hightower Holding LLC, pfd., A, | |||||
| Series 2 | 6/10/10 - 5/10/12 | 2,420,000 | 1,841,233 | |||
| 68,631 | Imagine Group Holdings Ltd. | 8/31/04 | 702,884 | 501,418 | ||
| 7,480 | Olympus Re Holdings Ltd. | 12/19/01 | 700,734 | — | ||
| Total Restricted Securities (Value is 2.27% of Net Assets) | $ | 13,282,683 | $ | 9,804,882 | ||
aThe Fund also invests in unrestricted securities or other investments in the issuer, valued at $5,298,396 as of December 31, 2013.
42 | Annual Report
Mutual Financial Services Fund
Notes to Financial Statements (continued)
9. OTHER DERIVATIVE INFORMATION
At December 31, 2013, the Fund’s investments in derivative contracts are reflected on the Statement of Assets and Liabilities as follows:
| Asset Derivatives | Liability Derivatives | ||||||
| Derivative Contracts | |||||||
| Not Accounted for as | Statement of Assets and | Fair Value | Statement of Assets and | Fair Value | |||
| Hedging Instruments | Liabilities Location | Amount | Liabilities Location | Amount | |||
| Foreign exchange | |||||||
| contracts | Unrealized appreciation on | $ | 634,677 | Unrealized depreciation on | $ | 5,067,173 | a |
| forward exchange contracts | forward exchange contracts / | ||||||
| Net assets consist of - net | |||||||
| unrealized appreciation | |||||||
| (depreciation) | |||||||
aIncludes cumulative appreciation (depreciation) of futures contracts as reported in the Statement of Investments. Only current day’s variation margin is separately reported within the Statement of Assets and Liabilities.
For the year ended December 31, 2013, the effect of derivative contracts on the Fund’s Statement of Operations was as follows:
| Realized | Change in | |||||
| Derivative Contracts | Statement of | Gain (Loss) | Unrealized Appreciation | |||
| Not Accounted for as | Operations | for the | (Depreciation) for | |||
| Hedging Instruments | Locations | Year | the Year | |||
| Foreign exchange contracts | Net realized gain (loss) from foreign | $ | 1,635,632 | $ | (1,989,732 | ) |
| currency transactions and futures | ||||||
| contracts / Net change in | ||||||
| unrealized appreciation | ||||||
| (depreciation) on translation | ||||||
| of other assets and liabilities | ||||||
| denominated in foreign currencies | ||||||
For the year ended December 31, 2013, the average month end fair value of derivatives represented 0.97% of average month end net assets. The average month end number of open derivative contracts for the year was 121.
At December 31, 2013, the Fund’s OTC derivative assets and liabilities are as follows:and Net
| Gross and Net Amounts of Assets and Liabilities Presented | ||||
| in the Statement of Assets and Liabilities | ||||
| Assetsa | Liabilitiesa | |||
| Derivatives | ||||
| Forward Exchange Contracts | $ | 634,677 | $ | 4,943,446 |
aAbsent an event of default or early termination, OTC derivative assets and liabilities are presented gross and not offset in the Statement of Assets
and Liabilities.
Annual Report | 43
Mutual Financial Services Fund
Notes to Financial Statements (continued)
9. OTHER DERIVATIVE INFORMATION (continued)
At December 31, 2013, the Fund’s OTC derivative assets which may be offset against the Fund’s OTC derivative liabilities and collateral received from the counterparty, is as follows:
| Amounts Not Offset in the | ||||||||||||
| Statement of Assets and Liabilities | ||||||||||||
| Gross and | ||||||||||||
| Net Amounts of | ||||||||||||
| Assets Presented | Financial | Financial | ||||||||||
| in the Statement | Instruments | Instruments | Cash | Net Amount | ||||||||
| of Assets and | Available for | Collateral | Collateral | (Not less | ||||||||
| Liabilities | Offset | Received | Received | than zero) | ||||||||
| Counterparty | ||||||||||||
| BANT | $ | 36,551 | $ | (36,551 | ) | $ | — | $ | — | $ | — | |
| BBU | 26,509 | (26,509 | ) | — | — | — | ||||||
| BONY | 22,732 | (22,732 | ) | — | — | — | ||||||
| DBFX | — | — | — | — | — | |||||||
| FBCO | 475,305 | (475,305 | ) | — | — | — | ||||||
| HSBC | 68,826 | (68,826 | ) | — | — | — | ||||||
| SCBT | 4,750 | (4,750 | ) | — | — | — | ||||||
| SSBT | 4 | (4 | ) | — | — | — | ||||||
| Total | $ | 634,677 | $ | (634,677 | ) | $ | — | $ | — | $ | — | |
| At December 31, 2013, the Fund’s OTC derivative liabilities which may be offset against the | ||||||||||||
| Fund’s OTC derivative assets and collateral pledged to the counterparty, is as follows: | ||||||||||||
| Amounts Not Offset in the | ||||||||||||
| Statement of Assets and Liabilities | ||||||||||||
| Gross and | ||||||||||||
| Net Amounts of | ||||||||||||
| Liabilities Presented | Financial | Financial | ||||||||||
| in the Statement | Instruments | Instruments | Cash | Net Amount | ||||||||
| of Assets and | Available for | Collateral | Collateral | (Not less | ||||||||
| Liabilities | Offset | Pledgeda,b | Pledged | than zero) | ||||||||
| Counterparty | ||||||||||||
| BANT | $ | 1,881,059 | $ | (36,551 | ) | $ | (1,267,709 | ) | $ | — | $ | 576,799 |
| BBU | 624,266 | (26,509 | ) | (300,000 | ) | — | 297,757 | |||||
| BONY | 34,990 | (22,732 | ) | — | — | 12,258 | ||||||
| DBFX | 842,030 | — | (837,475 | ) | — | 4,555 | ||||||
| FBCO | 1,001,752 | (475,305 | ) | (526,447 | ) | — | — | |||||
| HSBC | 378,038 | (68,826 | ) | (259,948 | ) | — | 49,264 | |||||
| SCBT | 142,282 | (4,750 | ) | — | — | 137,532 | ||||||
| SSBT | 39,029 | (4 | ) | — | — | 39,025 | ||||||
| Total | $ | 4,943,446 | $ | (634,677 | ) | $ | (3,191,579 | ) | $ | — | $ | 1,117,190 |
aIn some instances, the collateral amounts disclosed in the table above were adjusted due to the requirement to limit collateral amounts to avoid the
effect of overcollateralization. Actual collateral received and/or pledged may be more than the amounts disclosed herein.
bSee the accompanying Statement of Investments for securities pledged as collateral for derivatives.
See Note 1(c) regarding derivative financial instruments.
44 | Annual Report
Mutual Financial Services Fund
Notes to Financial Statements (continued)
10. HOLDINGS OF 5% VOTING SECURITIES OF PORTFOLIO COMPANIES
The 1940 Act defines “affiliated companies” to include investments in portfolio companies in which a fund owns 5% or more of the outstanding voting securities. Investments in “affiliated companies” for the Fund for the year ended December 31, 2013, were as shown below.
| Number of Shares | Number of Shares | Value at | ||||||||
| Held at Beginning | Gross | Gross | Held at End | End of | Investment | Realized Capital | ||||
| Name of Issuer | of Year | Additions | Reductions | of Year | Year | Income | Gain (Loss) | |||
| Non-Controlled Affiliates | ||||||||||
| AB&T Financial Corp. | 226,100 | — | — | 226,100 | $ | 122,094 | $ | — | $ | — |
| Protector Forsikring ASA | 4,479,410 | — | — | 4,479,410 | 14,180,256 | 686,027 | — | |||
| Total Affiliated Securities (Value is 3.31% of Net Assets) | $ | 14,302,350 | $ | 686,027 | $ | — | ||||
11. CREDIT FACILITY
The Fund, together with other U.S. registered and foreign investment funds (collectively, Borrowers), managed by Franklin Templeton Investments, are borrowers in a joint syndicated senior unsecured credit facility totaling $1.5 billion (Global Credit Facility) which, after an extension of the original terms, matured on February 14, 2014. This Global Credit Facility provides a source of funds to the Borrowers for temporary and emergency purposes, including the ability to meet future unanticipated or unusually large redemption requests. Effective February 14, 2014, the Borrowers renewed the Global Credit Facility which matures on February 13, 2015.
Under the terms of the Global Credit Facility, the Fund shall, in addition to interest charged on any borrowings made by the Fund and other costs incurred by the Fund, pay its share of fees and expenses incurred in connection with the implementation and maintenance of the Global Credit Facility, based upon its relative share of the aggregate net assets of all of the Borrowers, including an annual commitment fee of 0.07% based upon the unused portion of the Global Credit Facility. These fees are reflected in other expenses on the Statement of Operations. During the year ended December 31, 2013, the Fund did not use the Global Credit Facility.
12. FAIR VALUE MEASUREMENTS
The Fund follows a fair value hierarchy that distinguishes between market data obtained from independent sources (observable inputs) and the Fund’s own market assumptions (unobservable inputs). These inputs are used in determining the value of the Fund’s financial instruments and are summarized in the following fair value hierarchy:
- Level 1 – quoted prices in active markets for identical financial instruments
- Level 2 – other significant observable inputs (including quoted prices for similar financial instruments, interest rates, prepayment speed, credit risk, etc.)
- Level 3 – significant unobservable inputs (including the Fund’s own assumptions in determining the fair value of financial instruments)
Annual Report | 45
Mutual Financial Services Fund
Notes to Financial Statements (continued)
12. FAIR VALUE MEASUREMENTS (continued)
The input levels are not necessarily an indication of the risk or liquidity associated with financial instruments at that level.
For movements between the levels within the fair value hierarchy, the Fund has adopted a policy of recognizing the transfers as of the date of the underlying event which caused the movement.
A summary of inputs used as of December 31, 2013, in valuing the Fund’s assets and liabilities carried at fair value, is as follows:
| Level 1 | Level 2 | Level 3 | Total | ||||||
| Assets: | |||||||||
| Investments in Securities: | |||||||||
| Equity Investments:a | |||||||||
| Capital Markets | $ | 16,601,061 | $ | — | $ | 19,734 | $ | 16,620,795 | |
| Commercial Banks | 89,469,302 | 3,873,711 | 8,900,266 | 102,243,279 | |||||
| Diversified Financial Services | 41,584,023 | — | 4,700,233 | 46,284,256 | |||||
| Insurance | 213,880,812 | — | 501,418 | b | 214,382,230 | ||||
| All Other Equity Investmentsc | 16,101,207 | — | — | 16,101,207 | |||||
| Corporate Bonds | — | 1,185,824 | — | 1,185,824 | |||||
| Companies in Liquidation | — | 3,494,746 | —b | 3,494,746 | |||||
| Short Term Investments | 31,096,487 | — | — | 31,096,487 | |||||
| Total Investments in Securities | $ | 408,732,892 | $ | 8,554,281 | $ | 14,121,651 | $ | 431,408,824 | |
| Forward Exchange Contracts | $ | — | $ | 634,677 | $ | — | $ | 634,677 | |
| Liabilities: | |||||||||
| Futures Contracts | 123,727 | — | — | 123,727 | |||||
| Forward Exchange Contracts | — | 4,943,446 | — | 4,943,446 | |||||
alncludes common, convertible preferred and preferred stocks as well as other equity investments.
bIncludes securities determined to have no value at December 31, 2013.
cFor detailed categories, see the accompanying Statement of Investments.
46 | Annual Report
Mutual Financial Services Fund
Notes to Financial Statements (continued)
| 12. | FAIR VALUE MEASUREMENTS (continued) |
| A | reconciliation of assets in which Level 3 inputs are used in determining fair value is presented |
when there are significant Level 3 investments at the end of the year. At December 31, 2013, the reconciliation of assets is as follows:
| Net Change | |||||||||||||||||||||||||||||||
| in Unrealized | |||||||||||||||||||||||||||||||
| Balance | Net | Net | Balance | Appreciation | |||||||||||||||||||||||||||
| at | Transfers | Transfers | Realized | Unrealized | at | (Depreciation) | |||||||||||||||||||||||||
| Beginning | Into | Out of | Cost Basis | Gain | Gain | End of | on Assets Held | ||||||||||||||||||||||||
| of Year | Purchases | Sales | Level 3 | Level 3a | Adjustmentsb | (Loss) | (Loss) | Year | at Year End | ||||||||||||||||||||||
| Assets: | |||||||||||||||||||||||||||||||
| Investments in Securities: | |||||||||||||||||||||||||||||||
| Equity Investments:c | |||||||||||||||||||||||||||||||
| Capital Markets | $ | — | $ | 28,059 | $ | — | $ | — | $ | — | $ | — | $ | — | $ | (8,325 | ) | $ | 19,734 | $ | (8,325 | ) | |||||||||
| Commercial Banks | 10,856,078 | — | — | — | (3,344,000 | ) | — | — | 1,388,188 | 8,900,266 | 2,063,047 | ||||||||||||||||||||
| Diversified Financial | |||||||||||||||||||||||||||||||
| Services | 5,154,639 | — | — | — | — | — | — | (454,406 | ) | 4,700,233 | (454,406 | ) | |||||||||||||||||||
| Insurance | 792,077 | d | — | — | — | — | (1,818 | ) | — | (288,841 | ) | 501,418 | d | (288,841 | ) | ||||||||||||||||
| Real Estate Management & | |||||||||||||||||||||||||||||||
| Development | 159,657 | — | (130,745 | ) | — | — | — | (9,706,180 | ) | 9,677,268 | — | — | |||||||||||||||||||
| Total | $ | 16,962,451 | $ | 28,059 | $ | (130,745 | ) | $ | — | $ | (3,344,000 | ) | $ | (1,818 | ) | $ | (9,706,180 | ) | $ | 10,313,884 | $ | 14,121,651 | $ | 1,311,475 | |||||||
| aThe investments were transferred out of Level 3 as a result of the availability of a broker quote. | |||||||||||||||||||||||||||||||
| bMay include accretion, amortization, partnership adjustments, and/or other cost basis adjustments. | |||||||||||||||||||||||||||||||
| cIncludes common, convertible preferred and preferred stocks as well as other equity investments. | |||||||||||||||||||||||||||||||
| dIncludes securities determined to have no value. | |||||||||||||||||||||||||||||||
Annual Report | 47
Mutual Financial Services Fund
Notes to Financial Statements (continued)
12. FAIR VALUE MEASUREMENTS (continued)
Significant unobservable valuation inputs developed by the VLOC for material Level 3 investments and impact to fair value as a result of changes in unobservable valuation inputs as of December 31, 2013, are as follows:
| Impact to Fair | |||||||
| Fair Value at | Amount/ | Value if Input | |||||
| Description | End of Year | Valuation Technique | Unobservable Inputs | Range | Increases a | ||
| Assets: | |||||||
| Investments in Securities: | |||||||
| Equity Investments:b | |||||||
| Commercial Banks | $ | 4,603,231 | Market comparables | Discount for lack of | |||
| marketability | 10 | % | Decreasec | ||||
| Price / tangible book | |||||||
| multiple | 1.0x -1.4x | Increase c | |||||
| Option pricing model | Stock price volatility | 26.7 | % | Increase | |||
| Diversified Financial | |||||||
| Services | 4,700,233 | Discounted cash flow | |||||
| model | Cost of equity | 17 | % | Decrease | |||
| Long-term revenue | |||||||
| growth rate | 6.2% - 34.9% | Increase d | |||||
| Adjusted EBITDA margin | 10.6% - 23.3% | Increase | |||||
| Insurance | 501,418 | Market comparables | Discount for lack of | ||||
| marketability | 14 | % | Decreasec | ||||
| Price / book multiple | 1.0 | x | Increase | ||||
| All Other Investmentse | 4,316,769 | ||||||
| Total | $ | 14,121,651 | |||||
aRepresents the directional change in the fair value of the Level 3 investments that would result from a significant and reasonable increase in the corresponding input. A significant
and reasonable decrease in input would have the opposite effect. Significant impacts, if any, to fair value and/or net assets have been indicated.
bIncludes common, convertible preferred and preferred stocks.
cRepresents a significant impact to fair value but not net assets.
dRepresents a significant impact to fair value and net assets.
eIncludes fair value of immaterial investments developed using various valuation techniques and unobservable inputs. May also include investments with values derived using
prior transaction prices or third party pricing information without adjustment for which such inputs are also unobservable.
Abbreviations List
EBITDA - Earnings before interest, taxes, depreciation and amortization
13. NEW ACCOUNTING PRONOUNCEMENTS
In June 2013, the Financial Accounting Standards Board issued Accounting Standards Update (ASU) No. 2013-08, Investment Companies (Topic 946): Amendments to the Scope, Measurement, and Disclosure Requirements. The ASU modifies the criteria used in defining an investment company under U.S. Generally Accepted Accounting Principles and also sets forth certain measurement
48 | Annual Report
Mutual Financial Services Fund
Notes to Financial Statements (continued)
13. NEW ACCOUNTING PRONOUNCEMENTS (continued)
and disclosure requirements. Under the ASU, an entity that is registered under the 1940 Act automatically qualifies as an investment company. The ASU is effective for interim and annual reporting periods beginning after December 15, 2013. Management has reviewed the requirements and believes the adoption of this ASU will not have a material impact on the financial statements.
14. SUBSEQUENT EVENTS
The Fund has evaluated subsequent events through the issuance of the financial statements and determined that no events have occurred that require disclosure other than those already disclosed in the financial statements.
| ABBREVIATIONS | |||||
| Counterparty | Currency | Selected Portfolio | |||
| BANT | - | Bankof America N.A. | EUR | - Euro | IDR -InternationalDepositary |
| BBU | - | Barclays Bank PLC | GBP | - British Pound | Receipt |
| BONY | - | Bankof New York Mellon | USD | -UnitedStates Dollar | |
| DBFX | - | Deutsche Bank AG | |||
| FBCO | - | Credit Suisse Group AG | |||
| HSBC | - | HSBC Bank USA, N.A. | |||
| SCBT | - | Standard Chartered Bank | |||
| SSBT | - | State Street Bank and Trust Co., N.A. | |||
Annual Report | 49
Mutual Financial Services Fund
Report of Independent Registered Public Accounting Firm
To the Board of Trustees of Franklin Mutual Series Funds and Shareholders of the Mutual Financial Services Fund:
We have audited the accompanying statement of assets and and liabilities, including the statement of investments, of Mutual Financial Services Fund (the “Fund”) (one of the funds constituting Franklin Mutual Series Funds), as of December 31, 2013, and the related statement of operations for the year then ended, the statements of changes in net assets for each of the two years in the period then ended, and the financial highlights for each of the periods indicated therein. These financial statements and financial highlights are the responsibility of the Fund’s management. Our responsibility is to express an opinion on these financial statements and financial highlights based on our audits.
We conducted our audits in accordance with the standards of the Public Company Accounting Oversight Board (United States). Those standards require that we plan and perform the audit to obtain reasonable assurance about whether the financial statements and financial highlights are free of material misstatement. We were not engaged to perform an audit of the Fund’s internal control over financial reporting. Our audits included consideration of internal control over financial reporting as a basis for designing audit procedures that are appropriate in the circumstances, but not for the purpose of expressing an opinion on the effectiveness of the Fund’s internal control over financial reporting. Accordingly, we express no such opinion. An audit also includes examining, on a test basis, evidence supporting the amounts and disclosures in the financial statements and financial highlights, assessing the accounting principles used and significant estimates made by management, and evaluating the overall financial statement presentation. Our procedures included confirmation of securities owned as of December 31, 2013, by correspondence with the custodian and brokers, or by other appropriate auditing procedures where replies from the brokers were not received. We believe that our audits provide a reasonable basis for our opinion.
In our opinion, the financial statements and financial highlights referred to above present fairly, in all material respects, the financial position of Mutual Financial Services Fund (one of the funds constituting Franklin Mutual Series Funds) at December 31, 2013, the results of its operations for the year then ended, the changes in its net assets for each of the two years in the period then ended, and the financial highlights for each of the periods indicated therein, in conformity with U.S. generally accepted accounting principles.

Boston, Massachusetts
February 19, 2014
50 | Annual Report
Mutual Financial Services Fund
Tax Information (unaudited)
Under Section 854(b)(1)(A) of the Internal Revenue Code (Code), the Fund hereby reports 42.59% of the ordinary income dividends as income qualifying for the dividends received deduction for the fiscal year ended December 31, 2013.
Under Section 854(b)(1)(B) of the Code, the Fund hereby reports the maximum amount allowable but no less than $7,308,579 as qualified dividends for purposes of the maximum rate under Section 1(h)(11) of the Code for the fiscal year ended December 31, 2013. Distributions, including qualified dividend income, paid during calendar year 2013 will be reported to shareholders on Form 1099-DIV by mid-February 2014. Shareholders are advised to check with their tax advisors for information on the treatment of these amounts on their individual income tax returns.
At December 31, 2013, more than 50% of the Fund’s total assets were invested in securities of foreign issuers. In most instances, foreign taxes were withheld from income paid to the Fund on these investments. As shown in the table below, the Fund hereby reports to shareholders the foreign source income and foreign taxes paid, pursuant to Section 853 of the Code. This written statement will allow shareholders of record on December 19, 2013, to treat their proportionate share of foreign taxes paid by the Fund as having been paid directly by them. The shareholder shall consider these amounts as foreign taxes paid in the tax year in which they receive the Fund distribution.
The following table provides a detailed analysis of foreign tax paid, foreign source income and foreign qualified dividends as reported by the Fund, to Class Z, Class A, Class C and Class R6 shareholders of record.
| Foreign Tax Paid | Foreign Source Income | Foreign Source Qualified | ||||
| Class | Per Share | Per Share | Dividends Per Share | |||
| Class Z | $ | 0.0263 | $ | 0.2295 | $ | 0.1378 |
| Class A | $ | 0.0263 | $ | 0.1923 | $ | 0.1154 |
| Class C | $ | 0.0263 | $ | 0.1032 | $ | 0.0618 |
| Class R6 | $ | 0.0263 | $ | 0.1460 | $ | 0.0861 |
Foreign Tax Paid Per Share (Column 1) is the amount per share available to you, as a tax credit (assuming you held your shares in the Fund for a minimum of 16 days during the 31-day period beginning 15 days before the ex-dividend date of the Fund’s distribution to which the foreign taxes relate), or, as a tax deduction.
Annual Report | 51
Mutual Financial Services Fund
Tax Information (unaudited) (continued)
Foreign Source Income Per Share (Column 2) is the amount per share of income dividends attributable to foreign securities held by the Fund, plus any foreign taxes withheld on these dividends. The amounts reported include foreign source qualified dividends that have not been adjusted for the rate differential applicable to such dividend income.1
Foreign Qualified Dividends Per Share (Column 3) is the amount per share of foreign source qualified dividends plus any foreign taxes withheld on these dividends. These amounts represent the portion of the Foreign Source Income reported to you in column 2 that were derived from qualified foreign securities held by the Fund.1
By mid-February 2014, shareholders will receive Form 1099-DIV which will include their share of taxes paid and foreign source income distributed during the calendar year 2013. The Foreign Source Income reported on Form 1099-DIV has not been adjusted for the rate differential on foreign source qualified dividend income. Shareholders are advised to check with their tax advisors for information on the treatment of these amounts on their 2013 individual income tax returns.
1Qualified dividends are taxed at reduced long term capital gains tax rates. In determining the amount of foreign tax credit that may be applied against the U.S. tax liability of individuals receiving foreign source qualified dividends, adjustments may be required to the foreign tax credit limitation calculation to reflect the rate differential applicable to such dividend income. The rules however permit certain individuals to elect not to apply the rate differential adjustments for capital gains and/or dividends for any taxable year. Please consult your tax advisor and the instructions to Form 1116 for more information.
52 | Annual Report
Mutual Financial Services Fund
Board Members and Officers
The name, year of birth and address of the officers and board members, as well as their affiliations, positions held with the Fund, principal occupations during at least the past five years and number of portfolios overseen in the Franklin Templeton Investments fund complex are shown below. Generally, each board member serves until that person’s successor is elected and qualified.
| Independent Board Members | ||||
| Number of Portfolios in | ||||
| Name, Year of Birth | Length of | Fund Complex Overseen | Other Directorships Held | |
| and Address | Position | Time Served | by Board Member* | During at Least the Past 5 Years |
| Edward I. Altman, Ph.D. (1941) | Trustee | Since 1987 | 11 | None |
| c/o Franklin Mutual Advisers, LLC | ||||
| 101 John F. Kennedy Parkway | ||||
| Short Hills, NJ 07078-2789 | ||||
Principal Occupation During at Least the Past 5 Years:
Max L. Heine Professor of Finance and Director of The Credit and Debt Markets Research Program, Salomon Center, Stern School of Business, New York University; editor and author of numerous financial publications; financial consultant; an adviser to numerous financial publishing organizations; and formerly, Vice Director, Salomon Center, Stern School of Business, New York University.
| Ann Torre Bates (1958) | Trustee | Since 1995 | 38 | SLM Corporation (Sallie Mae), Ares |
| c/o Franklin Mutual Advisers, LLC | Capital Corporation (specialty finance | |||
| 101 John F. Kennedy Parkway | company), Allied Capital Corporation | |||
| Short Hills, NJ 07078-2789 | (financial services) (2003-2010) | |||
| and United Natural Foods, Inc., | ||||
| (October 2013). |
Principal Occupation During at Least the Past 5 Years:
Director of various companies; and formerly, Executive Vice President and Chief Financial Officer, NHP Incorporated (manager of multifamily housing) (1995-1997); and Vice President and Treasurer, US Airways, Inc. (until 1995).
| Burton J. Greenwald (1929) | Trustee | Since 2002 | 18 | Franklin Templeton Emerging Markets |
| c/o Franklin Mutual Advisers, LLC | Debt Opportunities Fund PLC and | |||
| 101 John F. Kennedy Parkway | Fiduciary International Ireland | |||
| Short Hills, NJ 07078-2789 | Limited. |
Principal Occupation During at Least the Past 5 Years:
Managing Director, B.J. Greenwald Associates (management consultants to the financial services industry); and formerly, Chairman, Fiduciary Trust International Funds; Executive Vice President, L.F Rothschild Fund Management, Inc.; President and Director, Merit Mutual Funds; President, Underwriting Division and Director, National Securities & Research Corporation; Governor, Investment Company Institute; and Chairman, ICI Public Information Committee.
Annual Report | 53
| Number of Portfolios in | |||||
| Name, Year of Birth | Length of | Fund Complex Overseen | Other Directorships Held | ||
| and Address | Position | Time Served | by Board Member* | During at Least the Past 5 Years | |
| Keith E. Mitchell (1954) | Trustee | Since 2009 | 11 | None | |
| c/o Franklin Mutual Advisers, LLC | |||||
| 101 John F. Kennedy Parkway | |||||
| Short Hills, NJ 07078-2789 | |||||
| Principal Occupation During at Least the Past 5 Years: | |||||
| Managing Member, Mitchell, Hartley & Bechtel Advisers, LLC (formerly, Mitchell Advisers, LLC) (advisory firm); director of various boards of | |||||
| asset management firms; and formerly, Managing Director, Putnam Lovell NBF. | |||||
| Charles Rubens II (1930) | Trustee | Since 1998 | 18 | None | |
| c/o Franklin Mutual Advisers, LLC | |||||
| 101 John F. Kennedy Parkway | |||||
| Short Hills, NJ 07078-2789 | |||||
| Principal Occupation During at Least the Past 5 Years: | |||||
| Private investor and president of non-profit organizations; and formerly, an executive of Time, Inc.; and Trustee of Colorado College. | |||||
| Jan Hopkins Trachtman (1947) | Trustee | Since 2009 | 11 | None | |
| c/o Franklin Mutual Advisers, LLC | |||||
| 101 John F. Kennedy Parkway | |||||
| Short Hills, NJ 07078-2789 | |||||
| Principal Occupation During at Least the Past 5 Years: | |||||
| President and Founder, The Jan Hopkins Group (communications consulting firm); President, Economic Club of New York; serves on | |||||
| Advisory Board of Knight Bagehot Fellowship; and formerly, Anchor/Correspondent, CNN Financial News (until 2003); Managing Director | |||||
| and Head of Client Communications, Citigroup Private Bank (until 2005); Off-Air Reporter, ABC News’ World News Tonight; and Editor, CBS | |||||
| Network News. | |||||
| Robert E. Wade (1946) | Trustee and | Trustee since | 45 | El Oro Ltd (investments). | |
| c/o Franklin Mutual Advisers, LLC | Chairman of | 1993 and | |||
| 101 John F. Kennedy Parkway | the Board | Chairman of the | |||
| Short Hills, NJ 07078-2789 | Board since 2005 | ||||
| Principal Occupation During at Least the Past 5 Years: | |||||
| Attorney at law engaged in private practice (1972-2008) and member of various boards. | |||||
| Interested Board Members and Officers | |||||
| Number of Portfolios in | |||||
| Name, Year of Birth | Length of | Fund Complex Overseen | Other Directorships Held | ||
| and Address | Position | Time Served | by Board Member* | During at Least the Past 5 Years | |
| **Gregory E. Johnson (1961) | Trustee | Since 2007 | 152 | None | |
| One Franklin Parkway | |||||
| San Mateo, CA 94403-1906 | |||||
| Principal Occupation During at Least the Past 5 Years: | |||||
| Chairman of the Board, Member – Office of the Chairman, Director, President and Chief Executive Officer, Franklin Resources, Inc.; officer | |||||
| and/or director or trustee, as the case may be, of some of the other subsidiaries of Franklin Resources, Inc. and of 44 of the investment | |||||
| companies in Franklin Templeton Investments; and Chairman, Investment Company Institute. | |||||
54 | Annual Report
| Number of Portfolios in | |||||
| Name, Year of Birth | Length of | Fund Complex Overseen | Other Directorships Held | ||
| and Address | Position | Time Served | by Board Member* | During at Least the Past 5 Years | |
| **Peter A. Langerman (1955) | Trustee, | Trustee since | 11 | American International Group, Inc. | |
| c/o Franklin Mutual Advisers, LLC | President and | 2007, President | (AIG) Credit Facility Trust | ||
| 101 John F. Kennedy Parkway | Chief Executive | and Chief | (2010–2011 | ). | |
| Short Hills, NJ 07078-2702 | Officer – | Executive Officer – | |||
| Investment | Investment | ||||
| Management | Management | ||||
| since 2005 | |||||
| Principal Occupation During at Least the Past 5 Years: | |||||
| Chairman of the Board, Chief Executive Officer and President, Franklin Mutual Advisers, LLC; officer and/or director, as the case may be, of | |||||
| four of the investment companies in Franklin Templeton Investments. | |||||
| Alison E. Baur (1964) | Vice President | Since 2012 | Not Applicable | Not Applicable | |
| One Franklin Parkway | |||||
| San Mateo, CA 94403-1906 | |||||
| Principal Occupation During at Least the Past 5 Years: | |||||
| Deputy General Counsel, Franklin Templeton Investments; and officer of some of the other subsidiaries of Franklin Resources, Inc. and of 46 | |||||
| of the investment companies in Franklin Templeton Investments. | |||||
| Philippe Brugere-Trelat (1949) | Vice President | Since 2005 | Not Applicable | Not Applicable | |
| 101 John F. Kennedy Parkway | |||||
| Short Hills, NJ 07078-2789 | |||||
| Principal Occupation During at Least the Past 5 Years: | |||||
| Executive Vice President, Franklin Mutual Advisers, LLC; officer of three of the investment companies in Franklin Templeton Investments; | |||||
| and formerly, Portfolio Manager of Eurovest SA (French registered Investment Company, Sicav). | |||||
| Laura F. Fergerson (1962) | Chief Executive | Since 2009 | Not Applicable | Not Applicable | |
| One Franklin Parkway | Officer – | ||||
| San Mateo, CA 94403-1906 | Finance and | ||||
| Administration | |||||
| Principal Occupation During at Least the Past 5 Years: | |||||
| Senior Vice President, Franklin Templeton Services, LLC; and officer of 46 of the investment companies in Franklin Templeton Investments. | |||||
| Aliya S. Gordon (1973) | Vice President | Since 2009 | Not Applicable | Not Applicable | |
| One Franklin Parkway | |||||
| San Mateo, CA 94403-1906 | |||||
| Principal Occupation During at Least the Past 5 Years: | |||||
| Senior Associate General Counsel, Franklin Templeton Investments; officer of 46 of the investment companies in Franklin Templeton | |||||
| Investments; and formerly, Litigation Associate, Steefel, Levitt & Weiss, LLP (2000-2004). | |||||
| Steven J. Gray (1955) | Secretary and | Secretary since | Not Applicable | Not Applicable | |
| One Franklin Parkway | Vice President | 2005 and Vice | |||
| San Mateo, CA 94403-1906 | President since | ||||
| 2009 | |||||
| Principal Occupation During at Least the Past 5 Years: | |||||
| Senior Associate General Counsel, Franklin Templeton Investments; Vice President, Franklin Templeton Distributors, Inc.; and officer of 46 of | |||||
| the investment companies in Franklin Templeton Investments. | |||||
Annual Report | 55
| Number of Portfolios in | ||||
| Name, Year of Birth | Length of | Fund Complex Overseen | Other Directorships Held | |
| and Address | Position | Time Served | by Board Member* | During at Least the Past 5 Years |
| Selena L. Holmes (1965) | Vice President | Since 2012 | Not Applicable | Not Applicable |
| 100 Fountain Parkway | – AML | |||
| St. Petersburg, FL 33716-1205 | Compliance | |||
| Principal Occupation During at Least the Past 5 Years: | ||||
| Director, Global Compliance Monitoring; and officer of 46 of the investment companies in Franklin Templeton Investments. | ||||
| Robert Kubilis (1973) | Treasurer, | Since 2012 | Not Applicable | Not Applicable |
| 300 S.E. 2nd Street | Chief Financial | |||
| Fort Lauderdale, FL 33301-1923 | Officer and | |||
| Chief | ||||
| Accounting | ||||
| Officer | ||||
| Principal Occupation During at Least the Past 5 Years: | ||||
| Assistant Treasurer, Fund Accounting, Franklin Templeton Investments; and officer of five of the investment companies in Franklin Templeton | ||||
| Investments. | ||||
| Kimberly H. Novotny (1972) | Vice President | Since March 2013 | Not Applicable | Not Applicable |
| 300 S.E. 2nd Street | ||||
| Fort Lauderdale, FL 33301-1923 | ||||
| Principal Occupation During at Least the Past 5 Years: | ||||
| Associate General Counsel, Franklin Templeton Investments; Vice President and Secretary, Fiduciary Trust International of the South; Vice | ||||
| President, Templeton Investment Counsel, LLC; Assistant Secretary, Franklin Resources, Inc.; and officer of 46 of the investment companies | ||||
| in Franklin Templeton Investments. | ||||
| Robert C. Rosselot (1960) | Chief | Since March 2013 | Not Applicable | Not Applicable |
| 300 S.E. 2nd Street | Compliance | |||
| Fort Lauderdale, FL 33301-1923 | Officer | |||
| Principal Occupation During at Least the Past 5 Years: | ||||
| Director, Global Compliance, Franklin Templeton Investments; officer of 46 of the investment companies in Franklin Templeton Investments; | ||||
| and formerly, Senior Associate General Counsel, Franklin Templeton Investments (2007-2013); and Secretary and Vice President, Templeton | ||||
| Group of Funds (2004-2013). | ||||
| Karen L. Skidmore (1952) | Vice President | Since 2009 | Not Applicable | Not Applicable |
| One Franklin Parkway | ||||
| San Mateo, CA 94403-1906 | ||||
| Principal Occupation During at Least the Past 5 Years: | ||||
| Senior Associate General Counsel, Franklin Templeton Investments; and officer of 46 of the investment companies in Franklin Templeton | ||||
| Investments. | ||||
| Craig S. Tyle (1960) | Vice President | Since 2005 | Not Applicable | Not Applicable |
| One Franklin Parkway | ||||
| San Mateo, CA 94403-1906 | ||||
| Principal Occupation During at Least the Past 5 Years: | ||||
| General Counsel and Executive Vice President, Franklin Resources, Inc.; and officer of some of the other subsidiaries of Franklin Resources, | ||||
| Inc. and of 46 of the investment companies in Franklin Templeton Investments. | ||||
56 | Annual Report
| Number of Portfolios in | ||||
| Name, Year of Birth | Length of | Fund Complex Overseen | Other Directorships Held | |
| and Address | Position | Time Served | by Board Member* | During at Least the Past 5 Years |
| Lori A. Weber (1964) | Vice President | Since 2011 | Not Applicable | Not Applicable |
| 300 S.E. 2nd Street | ||||
| Fort Lauderdale, FL 33301-1923 | ||||
| Principal Occupation During at Least the Past 5 Years: | ||||
| Senior Associate General Counsel, Franklin Templeton Investments; Assistant Secretary, Franklin Resources, Inc.; Vice President and | ||||
| Secretary, Templeton Investment Counsel, LLC; Vice President, Fiduciary Trust International of the South; and officer of 46 of the investment | ||||
| companies in Franklin Templeton Investments. | ||||
*We base the number of portfolios on each separate series of the U.S. registered investment companies within the Franklin Templeton Investments fund complex. These portfolios
have a common investment manager or affiliated investment managers.
**Gregory E. Johnson is considered to be an interested person of the Fund under the federal securities laws due to his position as an officer and director of Franklin Resources, Inc.,
which is the parent company of the Fund’s investment manager and distributor. Peter A. Langerman is considered to be an interested person of the Fund under the federal securities
laws due to his position as an officer of Franklin Mutual Advisers, LLC, which is an affiliate of the Fund’s investment manager.
Note 1: Officer information is current as of the date of this report. It is possible that after this date, information about officers may change.
The Fund’s Board has determined that certain of the members of the Audit Committee, including Ann Torre Bates, are audit committee financial experts, and “independent,”
under those provisions of the Sarbanes-Oxley Act of 2002, and the rules and form amendments adopted by the Securities and Exchange Commission, relating to audit committee
financial experts.
The Statement of Additional Information (SAI) includes additional information about the board members and is available, without charge, upon request. Shareholders may
call (800) DIAL BEN/342-5236 to request the SAI.
Annual Report | 57
Mutual Financial Services Fund
Shareholder Information
Proxy Voting Policies and Procedures
The Fund’s investment manager has established Proxy Voting Policies and Procedures (Policies) that the Fund uses to determine how to vote proxies relating to portfolio securities. Shareholders may view the Fund’s complete Policies online at franklintempleton.com. Alternatively, shareholders may request copies of the Policies free of charge by calling the Proxy Group collect at (954) 527-7678 or by sending a written request to: Franklin Templeton Companies, LLC, 300 S.E. 2nd Street, Fort Lauderdale, FL 33301, Attention: Proxy Group. Copies of the Fund’s proxy voting records are also made available online at franklintempleton.com and posted on the U.S. Securities and Exchange Commission’s website at sec.gov and reflect the most recent 12-month period ended June 30.
Quarterly Statement of Investments
The Fund files a complete statement of investments with the U.S. Securities and Exchange Commission for the first and third quarters for each fiscal year on Form N-Q. Shareholders may view the filed Form N-Q by visiting the Commission’s website at sec.gov. The filed form may also be viewed and copied at the Commission’s Public Reference Room in Washington, DC. Information regarding the operations of the Public Reference Room may be obtained by calling (800) SEC-0330.
Householding of Reports and Prospectuses
You will receive the Fund’s financial reports every six months as well as an annual updated summary prospectus (prospectus available upon request). To reduce Fund expenses, we try to identify related shareholders in a household and send only one copy of the financial reports and summary prospectus. This process, called “householding,” will continue indefinitely unless you instruct us otherwise. If you prefer not to have these documents householded, please call us at (800) 632-2301. At any time you may view current prospectuses/summary prospectuses and financial reports on our website. If you choose, you may receive these documents through electronic delivery.
58 | Annual Report
This page intentionally left blank.
This page intentionally left blank.

| Contents | |||||||
| Shareholder Letter | 1 | Annual Report | Financial Statements | 34 | Board Members and Officers | 58 | |
| Mutual Global Discovery Fund | 6 | Notes to Financial Statements | 38 | Shareholder Information | 63 | ||
| Performance Summary | 13 | Report of Independent | |||||
| Registered Public | |||||||
| Your Fund’s Expenses | 18 | ||||||
| Accounting Firm | 56 | ||||||
| Financial Highlights and | |||||||
| Tax Information | 57 | ||||||
| Statement of Investments | 20 | ||||||
Annual Report
Mutual Global Discovery Fund
Your Fund’s Goal and Main Investments: Mutual Global Discovery Fund seeks capital appreciation by investing primarily in equity securities of companies of any nation the Fund’s managers believe are at prices below their intrinsic value. The Fund may invest up to 100% of its assets in foreign securities.
| Performance data represent past |
| performance, which does not |
| guarantee future results. |
| Investment return and principal |
| value will fluctuate, and you may |
| have a gain or loss when you sell |
| your shares. Current performance |
| may differ from figures shown. |
| Please visit franklintempleton.com |
| or call (800) 342-5236 for most |
| recent month-end performance. |
This annual report for Mutual Global Discovery Fund covers the fiscal year ended December 31, 2013.
Performance Overview
Mutual Global Discovery Fund – Class Z delivered a +25.64% total return for the 12 months ended December 31, 2013. For comparison, the MSCI World Index, which tracks stock performance in global developed markets, generated a total return of +27.36% and the Standard & Poor’s 500 Index (S&P 500), which is a broad measure of U.S. stock performance, posted a +32.39% total return.1 You can find more of the Fund’s performance data in the Performance Summary beginning on page 13.
Economic and Market Overview
The 12 months under review were characterized by reinvigorated policy support and an economic recovery in developed markets. However, differences in global economic trends corresponded with increasingly divergent monetary policies, and growth in emerging market economies tended to slow. The central banks of key developed markets generally reaffirmed their accommodative monetary stances while some emerging market counterparts tightened policy rates as they sought to control inflation and currency depreciation.
In the U.S., economic growth and employment trends generally exceeded expectations. The U.S. Federal Reserve Board (Fed) expanded its asset purchase program to $85 billion per month from $40 billion early in the year. After encouraging economic and employment reports, the Fed announced in
1. Source: © 2014 Morningstar. All Rights Reserved. The information contained herein: (1) is proprietary to Morningstar and/or its content providers; (2) may not be copied or distributed; and (3) is not warranted to be accurate, complete or timely. Neither Morningstar nor its content providers are responsible for any damages or losses arising from any use of this information. The indexes are unmanaged and include reinvested dividends. One cannot invest directly in an index, and an index is not representative of the Fund’s portfolio.
The dollar value, number of shares or principal amount, and names of all portfolio holdings are listed in the Fund’s Statement of Investments (SOI). The SOI begins on page 25.
6 | Annual Report
December it would reduce its monthly bond purchases by $10 billion beginning in January 2014; however, the Fed committed to keeping interest rates low. In October, the federal government temporarily shut down after Congress failed to authorize routine federal funding amid a disagreement over a new health care law. However, Congress subsequently agreed to fund the government through early 2014 and later passed a two-year budget deal that could ease automatic spending cuts and lower the risk of another shutdown.
Outside the U.S., the eurozone emerged from its longest recession on record during 2013’s second half and Japan’s growth moderated. The European Central Bank reduced its key interest rate to a record low and pledged to maintain systemic support following political turmoil in Greece, Spain, Portugal and Italy. Germany’s re-election of Chancellor Angela Merkel was largely perceived as a vote of support for ongoing eurozone reform measures. In Asia, the Bank of Japan set an explicit inflation target and pledged to double bond purchases in an unprecedented wave of policy reform. The U.S. dollar fell versus the euro but rose versus the Japanese yen in 2013.
Growth in many emerging markets moderated based on lower domestic demand, falling exports and weakening commodity prices. Political turmoil in certain emerging markets, the Fed’s potential tapering of its asset purchase program and the Chinese central bank’s effort to tighten liquidity to curb real estate and credit speculation led to a sell-off in emerging market equities and a sharp depreciation in regional currencies against the U.S. dollar. Central banks in Brazil, India and Indonesia raised interest rates in the second half of 2013 as they sought to curb inflation.
The stock market rally in developed markets accelerated during 2013 amid ongoing central bank commitments, continued corporate earnings strength and increasing signs of economic progress. Emerging market stocks rebounded toward period-end, although Latin American stocks trailed their emerging market peers. Oil prices rallied in the third quarter and rose for the year mainly owing to supply concerns related to geopolitical turmoil, but gold posted its largest annual price decline in more than three decades. Increasingly divergent economic and political circumstances during the period resulted in declining market correlations across regions and between asset classes, which many bottom-up investors perceived as more favorable.
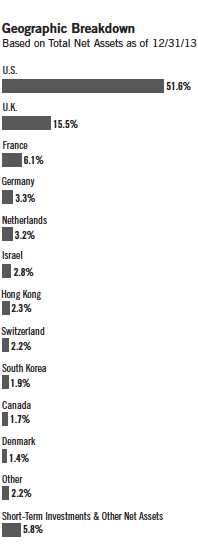
Annual Report | 7
| Top 10 Sectors/Industries | ||
| Based on Equity Securities as of 12/31/13 | ||
| % of Total | ||
| Net Assets | ||
| Insurance | 9.0 | % |
| Oil, Gas & Consumable Fuels | 8.3 | % |
| Commercial Banks | 8.3 | % |
| Food & Staples Retailing | 5.7 | % |
| Pharmaceuticals | 5.4 | % |
| Diversified Financial Services | 4.9 | % |
| Tobacco | 4.8 | % |
| Media | 4.7 | % |
| Software | 4.2 | % |
| Computers & Peripherals | 3.0 | % |
| What is meant by “hedge”? |
| To hedge a position is to seek to reduce |
| the risk of adverse price movements |
| in an asset. Normally, a hedge is imple- |
| mented as an offsetting position in a |
| related security, such as a currency |
| forward contract. |
| What is a currency forward |
| contract? |
| A currency forward contract, also called |
| a “currency forward,” is an agreement |
| between the Fund and a counterparty |
| to buy or sell a foreign currency at a |
| specific exchange rate on a future date. |
Investment Strategy
At Mutual Series, we are committed to our distinctive value approach to investing, which we believe can generate above-average risk-adjusted returns over time for our shareholders. Our major investment strategy is investing in undervalued stocks. When selecting undervalued equities, we are always attracted to fundamentally strong companies with healthy balance sheets, high-quality assets, substantial free cash flow and shareholder-oriented management teams and whose stocks are trading at discounts to our assessment of the companies’ intrinsic or business value. We also look for asset-rich companies whose shares may be trading at depressed levels due to concerns over short-term earnings disappointments, litigation, management strategy or other perceived negatives. This strict value approach is not only intended to improve the likelihood of upside potential, but it is also intended to reduce the risk of substantial declines. While the vast majority of our undervalued equity investments are made in publicly traded companies globally, we may invest occasionally in privately held companies as well.
We complement this more traditional investment strategy with two others. One is distressed investing, a highly specialized field that has proven quite profitable during certain periods over the years. Distressed investing is complex and can take many forms. The most common distressed investment the Fund undertakes is the purchase of financially troubled or bankrupt companies’ debt at a substantial discount to face value. After the financially distressed company is reorganized, often in bankruptcy court, the old debt is typically replaced with new securities issued by the financially stronger company.
The other piece of our investment strategy is participating in arbitrage situations, another highly specialized field. When companies announce proposed mergers or takeovers, commonly referred to as “deals,” the target company may trade at a discount to the bid it ultimately accepts. One form of arbitrage involves purchasing the target company’s stock when it is trading below the value we believe it would receive in a deal. In keeping with our commitment to a relatively conservative investment approach, we typically focus our arbi-trage efforts on announced deals, and eschew rumored deals or other situations we consider relatively risky.
In addition, it is our practice to hedge the Fund’s currency exposure when we deem it advantageous for our shareholders.
8 | Annual Report
Manager’s Discussion
In an environment of generally rising equity prices, many Fund investments increased in value during the year. Three of the top contributors were U.K.-based mobile telephony operator Vodafone Group, U.S.-based managed health care company Cigna and Germany-based retailer Metro.
Vodafone Group is a global mobile telecommunications company that provides a range of services, including voice and data communications. The company’s stock rallied in the second half of the year, driven largely by the long-anticipated sale of its 45% stake in Verizon Wireless to Verizon Communications at what we considered to be an attractive price. Vodafone said it planned to return two-thirds of the capital from the sale to shareholders and use the balance to invest in growth initiatives in its core markets and to reduce debt. Following the deal, we continued to view Vodafone as a potentially compelling stock, given that the economic environment in Europe has shown signs of stabilizing, the regulatory environment is easing and we believe the company may be close to monetizing its investments in data services.
Shares of Cigna benefited from improved investor sentiment early in the period following the company’s divestiture of its legacy run-off insurance business. Partially as a result of the divestiture, three major independent credit rating agencies issued positive outlooks for the company’s debt. Additionally, operational performance also improved as Cigna reported strong results in its core businesses. In October, Cigna increased its outlook for fiscal year 2013 consolidated adjusted income from operations. In our assessment, the outlook was among the more favorable in the managed care industry, owing to the company’s low exposure to potentially negative elements of upcoming health care reforms.
Metro, which runs Europe’s largest self-service, wholesale superstore business as well as Germany’s largest department store chain, benefited from ongoing restructuring efforts led by a revamped management team. Management’s plans to create value by exiting non-core markets while improving profitability in Germany supported improved investor sentiment as quarterly operating profits exceeded consensus estimates. A rise in net cash flow from operations and proceeds from the disposal of various business units allowed Metro to significantly reduce its net debt. At period-end, the company was also considering a spin-off of its Russian operations, a move we believed could potentially unlock further value. Additionally, shares were positively affected by rising sentiment that European consumer spending is poised to grow.
| Top 10 Equity Holdings | ||
| 12/31/13 | ||
| Company | % of Total | |
| Sector/Industry, Country | Net Assets | |
| Vodafone Group PLC | 2.3 | % |
| Wireless Telecommunication Services, U.K. | ||
| Apple Inc. | 2.2 | % |
| Computers & Peripherals, U.S. | ||
| ACE Ltd. | 2.0 | % |
| Insurance, U.S. | ||
| Merck & Co. Inc. | 2.0 | % |
| Pharmaceuticals, U.S. | ||
| Microsoft Corp. | 1.8 | % |
| Software, U.S. | ||
| American International Group Inc. | 1.8 | % |
| Insurance, U.S. | ||
| ING Groep NV, IDR | 1.7 | % |
| Diversified Financial Services, | ||
| Netherlands | ||
| Cigna Corp. | 1.6 | % |
| Health Care Providers & Services, U.S. | ||
| Medtronic Inc. | 1.6 | % |
| Health Care Equipment & Supplies, U.S. | ||
| Royal Dutch Shell PLC, A | 1.6 | % |
| Oil, Gas & Consumable Fuels, U.K. | ||
Annual Report | 9
| What is a futures contract? |
| A futures contract, also called a |
| “future,” is an agreement between the |
| Fund and a counterparty made through |
| a U.S. or foreign futures exchange to |
| buy or sell an asset at a specific price on |
| a future date. |
During the 12 months under review, some of the Fund’s investments negatively affected performance. Key detractors included Brazilian integrated energy firm Petroleo Brasileiro (Petrobras), Hong Kong-based conglomerate Jardine Matheson Holdings and U.K.-based metals and mining company Anglo American.
Although Petrobras possesses several exploration and production assets we feel are highly attractive, its refining and marketing (downstream) operations hurt results during the year and led the stock to decline. The Brazilian government regulates domestic fuel prices, and its reluctance to increase them continued to result in significant losses in Petrobras’s downstream business. Although the government did allow some modest price increases, recent protests against bus fare hikes, particularly in light of sluggish economic growth and a weakening Brazilian real, contributed to political pressure limiting the company’s ability to bring domestic prices in line with global prices.
Exposure to emerging markets in Asia negatively affected Jardine Matheson Holdings. A growing belief that the Fed was close to winding down its quantitative easing program, which the central bank confirmed in December, contributed to capital outflows from those markets during the year. Operationally, strong performance at the company’s Hong Kong Land business was offset by weak results for Indonesian automotive producer and distributor Astra International, which struggled amid poor demand for heavy machinery and a weakening Indonesian rupiah. We saw the recent headwinds as a cyclical issue for emerging markets, and at period-end we remained confident in our investment thesis given Jardine Matheson’s cash generation ability and robust balance sheet.
The share price of Anglo American was negatively affected by declining prices for several of the commodities it produces. Uncertainty surrounding possible restructuring actions also weighed on the stock price. In January, the company appointed a new chief executive officer, who was tasked with a mandate to improve operations and capital discipline. Despite the price decline during the year, at period-end, we maintained a favorable outlook for the stock as the new management team remained focused on improving operational performance and returns with the aim of increasing shareholder value.
During the year, the Fund held currency forwards and futures to hedge a portion of the currency risk of the portfolio’s non-U.S. dollar investments. The hedges had a negative impact on the Fund’s performance during the period.
10 | Annual Report
Thank you for your participation in Mutual Global Discovery Fund. We look forward to continuing to serve your investment needs.
Mutual Global Discovery Fund
CFA® is a trademark owned by CFA Institute.
The foregoing information reflects our analysis, opinions and portfolio holdings as of December 31, 2013, the end of the reporting period. The way we implement our main investment strategies and the resulting portfolio holdings may change depending on factors such as market and economic conditions. These opinions may not be relied upon as investment advice or an offer for a particular security. The information is not a complete analysis of every aspect of any market, country, industry, security or the Fund. Statements of fact are from sources considered reliable, but the investment manager makes no representation or warranty as to their completeness or accuracy. Although historical performance is no guarantee of future results, these insights may help you understand our investment management philosophy.
Annual Report | 11
| Peter Langerman has been co-portfolio manager for Mutual Global Discovery Fund since |
| 2009. He has been portfolio manager for Mutual Shares Fund since 2005. He joined |
| Franklin Templeton Investments in 1996, serving in various capacities, including President |
| and Chief Executive Officer of Franklin Mutual Advisers and member of the management |
| team of the Funds, including Mutual Shares Fund. From 2002 to 2005, he served as direc- |
| tor of New Jersey’s Division of Investment, overseeing employee pension funds. Between |
| 1986 and 1996, Mr. Langerman was employed at Heine Securities Corporation, the Fund’s |
| former manager. |
| Philippe Brugere-Trelat has been co-portfolio manager for Mutual Global Discovery Fund |
| since 2009. He has been lead portfolio manager for Mutual European Fund since 2005 |
| and co-portfolio manager for Mutual International Fund since 2009. He has been a |
| member of the management team of the Mutual Series Funds since 2004, when he |
| rejoined Franklin Templeton Investments. Previously, he was president and portfolio |
| manager of Eurovest. Between 1984 and 1994, Mr. Brugere-Trelat was employed at |
| Heine Securities Corporation, the Fund’s former manager. |
| Timothy Rankin assumed co-portfolio manager responsibility for Mutual Global Discovery |
| Fund in December 2013. He has been assistant portfolio manager since 2010. Mr. Rankin |
| had previously worked at Mutual Series from 1997 through 2004. Prior to 2010, he was |
| managing director of Blue Harbour Group, LLC, a private investment firm focused on |
| small- and mid-cap North American companies. Prior to his original employment with |
| Mutual Series, Mr. Rankin was an equity analyst at Glickenhaus & Co. |
12 | Annual Report
Performance Summary as of 12/31/13
Your dividend income will vary depending on dividends or interest paid by securities in the Fund’s portfolio, adjusted for operating expenses of each class. Capital gain distributions are net profits realized from the sale of portfolio securities. The performance table and graphs do not reflect any taxes that a shareholder would pay on Fund dividends, capital gain distributions, if any, or any realized gains on the sale of Fund shares. Total return reflects reinvestment of the Fund’s dividends and capital gain distributions, if any, and any unrealized gains or losses.
| Price and Distribution Information | ||||||||
| Class Z (Symbol: MDISX) | Change | 12/31/13 | 12/31/12 | |||||
| Net Asset Value (NAV) | +$ | 5.08 | $ | 33.73 | $ | 28.65 | ||
| Distributions (1/1/13–12/31/13) | ||||||||
| Dividend Income | $ | 0.5723 | ||||||
| Short-Term Capital Gain | $ | 0.2057 | ||||||
| Long-Term Capital Gain | $ | 1.4349 | ||||||
| Total | $ | 2.2129 | ||||||
| Class A (Symbol: TEDIX) | Change | 12/31/13 | 12/31/12 | |||||
| Net Asset Value (NAV) | +$ | 4.97 | $ | 33.24 | $ | 28.27 | ||
| Distributions (1/1/13–12/31/13) | ||||||||
| Dividend Income | $ | 0.4826 | ||||||
| Short-Term Capital Gain | $ | 0.2057 | ||||||
| Long-Term Capital Gain | $ | 1.4349 | ||||||
| Total | $ | 2.1232 | ||||||
| Class C (Symbol: TEDSX) | Change | 12/31/13 | 12/31/12 | |||||
| Net Asset Value (NAV) | +$ | 4.89 | $ | 32.94 | $ | 28.05 | ||
| Distributions (1/1/13–12/31/13) | ||||||||
| Dividend Income | $ | 0.2681 | ||||||
| Short-Term Capital Gain | $ | 0.2057 | ||||||
| Long-Term Capital Gain | $ | 1.4349 | ||||||
| Total | $ | 1.9087 | ||||||
| Class R (Symbol: TEDRX) | Change | 12/31/13 | 12/31/12 | |||||
| Net Asset Value (NAV) | +$ | 4.90 | $ | 32.88 | $ | 27.98 | ||
| Distributions (1/1/13–12/31/13) | ||||||||
| Dividend Income | $ | 0.4112 | ||||||
| Short-Term Capital Gain | $ | 0.2057 | ||||||
| Long-Term Capital Gain | $ | 1.4349 | ||||||
| Total | $ | 2.0518 | ||||||
| Class R6 (Symbol: n/a) | Change | 12/31/13 | 5/1/13 | |||||
| Net Asset Value (NAV) | +$ | 2.31 | $ | 33.73 | $ | 31.42 | ||
| Distributions (5/1/13–12/31/13) | ||||||||
| Dividend Income | $ | 0.6186 | ||||||
| Short-Term Capital Gain | $ | 0.2057 | ||||||
| Long-Term Capital Gain | $ | 1.4349 | ||||||
| Total | $ | 2.2592 | ||||||
Annual Report | 13
Performance Summary (continued)
Performance
Cumulative total return excludes sales charges. Aggregate and average annual total returns and value of $10,000 investment include maximum sales charges. Class Z/R/R6: no sales charges; Class A: 5.75% maximum initial sales charge; Class C: 1% contingent deferred sales charge in first year only.
| Class Z | 1-Year | 5-Year | 10-Year | ||||||||
| Cumulative Total Return1 | + | 25.64 | % | + | 87.73 | % | + | 161.69 | % | ||
| Average Annual Total Return2 | + | 25.64 | % | + | 13.42 | % | + | 10.10 | % | ||
| Value of $10,000 Investment3 | $ | 12,564 | $ | 18,773 | $ | 26,169 | |||||
| Total Annual Operating Expenses4 | 1.02 | % | |||||||||
| Class A | 1-Year | 5-Year | 10-Year | ||||||||
| Cumulative Total Return1 | + | 25.26 | % | + | 84.94 | % | + | 153.71 | % | ||
| Average Annual Total Return2 | + | 18.08 | % | + | 11.75 | % | + | 9.11 | % | ||
| Value of $10,000 Investment3 | $ | 11,808 | $ | 17,431 | $ | 23,913 | |||||
| Total Annual Operating Expenses4 | 1.32 | % | |||||||||
| Class C | 1-Year | 5-Year | 10-Year | ||||||||
| Cumulative Total Return1 | + | 24.39 | % | + | 78.58 | % | + | 136.81 | % | ||
| Average Annual Total Return2 | + | 23.39 | % | + | 12.30 | % | + | 9.00 | % | ||
| Value of $10,000 Investment3 | $ | 12,339 | $ | 17,858 | $ | 23,681 | |||||
| Total Annual Operating Expenses4 | 2.02 | % | |||||||||
| Class R | 1-Year | 5-Year | 10-Year | ||||||||
| Cumulative Total Return1 | + | 25.02 | % | + | 83.18 | % | + | 149.06 | % | ||
| Average Annual Total Return2 | + | 25.02 | % | + | 12.87 | % | + | 9.55 | % | ||
| Value of $10,000 Investment3 | $ | 12,502 | $ | 18,318 | $ | 24,906 | |||||
| Total Annual Operating Expenses4 | 1.52 | % | |||||||||
| Class R6 | Inception (5/1/13) | ||||||||||
| Cumulative Total Return1 | + | 14.71 | % | ||||||||
| Aggregate Total Return5 | + | 14.71 | % | ||||||||
| Value of $10,000 Investment3 | $ | 11,471 | |||||||||
| Total Annual Operating Expenses4 | 0.86 | % |
Performance data represent past performance, which does not guarantee future results. Investment return and principal value will fluctuate, and you may have a gain or loss when you sell your shares. Current performance may differ from figures shown. For most recent month-end performance, go to franklintempleton.com or call (800) 342-5236.
14 | Annual Report
Performance Summary (continued)
Total Return Index Comparison for a Hypothetical $10,000 Investment
Total return represents the change in value of an investment over the periods shown. It includes any applicable maximum sales charge, Fund expenses, account fees and reinvested distributions. The unmanaged indexes include reinvestment of any income or distributions. They differ from the Fund in composition and do not pay management fees or expenses. One cannot invest directly in an index.
| 1/04 | 12/05 | 12/07 | 12/09 | 12/11 | 12/13 |
| Mutual Global Discovery Fund | S&P 500 6 | MSCI World Index 6 | |||
| 1/04 | 12/05 | 12/07 | 12/09 | 12/11 | 12/13 |
| Mutual Global Discovery Fund | S&P 500 6 | MSCI World Index 6 | |||
Annual Report | 15
| 1/04 | 12/05 | 12/07 | 12/09 | 12/11 | 12/13 |
| Mutual Global Discovery Fund | S&P 500 6 | MSCI World Index 6 | |||
16 | Annual Report
Endnotes
All investments involve risks, including possible loss of principal. Value securities may not increase in price as anticipated or may decline further in value. The Fund’s investments in foreign securities involve certain risks including currency fluctuations, and economic and political uncertainties. Smaller company stocks have exhibited greater price volatility than larger company stocks, particularly over the short term. The Fund’s investments in companies engaged in mergers, reorganizations or liquidations also involve special risks as pending deals may not be completed on time or on favorable terms. The Fund may invest in lower rated bonds, which entail higher credit risk. The Fund is actively managed but there is no guarantee that the manager’s investment decisions will produce the desired results. The Fund’s prospectus also includes a description of the main investment risks.
| Class Z: | Shares are available to certain eligible investors as described in the prospectus. |
| Class C: | These shares have higher annual fees and expenses than Class A shares. |
| Class R: | Shares are available to certain eligible investors as described in the prospectus. These shares have higher |
| annual fees and expenses than Class A shares. | |
| Class R6: | Shares are available to certain eligible investors as described in the prospectus. |
1. Cumulative total return represents the change in value of an investment over the periods indicated.
2. Average annual total return represents the average annual change in value of an investment over the periods indicated. 3. These figures represent the value of a hypothetical $10,000 investment in the Fund over the periods indicated.
4. Figures are as stated in the Fund’s current prospectus. In periods of market volatility, assets may decline significantly, causing total annual Fund operating expenses to become higher than the figures shown.
5. Aggregate total return represents the change in value of an investment for the period indicated. Since Class R6 shares have existed for less than one year, average annual total return is not available.
6. Source: © 2014 Morningstar. The S&P 500 is a market capitalization-weighted index of 500 stocks designed to measure total U.S. equity market performance. The MSCI World Index is a free float-adjusted, market capitalization-weighted index designed to measure equity market performance in global developed markets.
Annual Report | 17
Your Fund’s Expenses
As a Fund shareholder, you can incur two types of costs:
- Transaction costs, including sales charges (loads) on Fund purchases; and
- Ongoing Fund costs, including management fees, distribution and service (12b-1) fees, and other Fund expenses. All mutual funds have ongoing costs, sometimes referred to as operating expenses.
The following table shows ongoing costs of investing in the Fund and can help you understand these costs and compare them with those of other mutual funds. The table assumes a $1,000 investment held for the six months indicated.
Actual Fund Expenses
The first line (Actual) for each share class listed in the table provides actual account values and expenses. The “Ending Account Value” is derived from the Fund’s actual return, which includes the effect of Fund expenses.
You can estimate the expenses you paid during the period by following these steps. Of course, your account value and expenses will differ from those in this illustration:
| 1. | Divide your account value by $1,000. |
| If an account had an $8,600 value, then $8,600 ÷ $1,000 = 8.6. | |
| 2. | Multiply the result by the number under the heading “Expenses Paid During Period.” |
| If Expenses Paid During Period were $7.50, then 8.6 x $7.50 = $64.50. |
In this illustration, the estimated expenses paid this period are $64.50.
Hypothetical Example for Comparison with Other Funds
Information in the second line (Hypothetical) for each class in the table can help you compare ongoing costs of investing in the Fund with those of other mutual funds. This information may not be used to estimate the actual ending account balance or expenses you paid during the period. The hypothetical “Ending Account Value” is based on the Fund’s actual expense ratio for each class and an assumed 5% annual rate of return before expenses, which does not represent the Fund’s actual return. The figure under the heading “Expenses Paid During Period” shows the hypothetical expenses your account would have incurred under this scenario. You can compare this figure with the 5% hypothetical examples that appear in shareholder reports of other funds.
18 | Annual Report
Your Fund’s Expenses (continued)
Please note that expenses shown in the table are meant to highlight ongoing costs and do not reflect any transaction costs, such as sales charges. Therefore, the second line for each class is useful in comparing ongoing costs only, and will not help you compare total costs of owning different funds. In addition, if transaction costs were included, your total costs would have been higher. Please refer to the Fund prospectus for additional information on operating expenses.
| Beginning Account | Ending Account | Expenses Paid During | ||||
| Class Z | Value 7/1/13 | Value 12/31/13 | Period* 7/1/13–12/31/13 | |||
| Actual | $ | 1,000 | $ | 1,137.60 | $ | 5.23 |
| Hypothetical (5% return before expenses) | $ | 1,000 | $ | 1,020.32 | $ | 4.94 |
| Class A | ||||||
| Actual | $ | 1,000 | $ | 1,136.10 | $ | 6.84 |
| Hypothetical (5% return before expenses) | $ | 1,000 | $ | 1,018.80 | $ | 6.46 |
| Class C | ||||||
| Actual | $ | 1,000 | $ | 1,132.10 | $ | 10.59 |
| Hypothetical (5% return before expenses) | $ | 1,000 | $ | 1,015.27 | $ | 10.01 |
| Class R | ||||||
| Actual | $ | 1,000 | $ | 1,135.00 | $ | 7.91 |
| Hypothetical (5% return before expenses) | $ | 1,000 | $ | 1,017.80 | $ | 7.48 |
| Class R6 | ||||||
| Actual | $ | 1,000 | $ | 1,139.50 | $ | 4.48 |
| Hypothetical (5% return before expenses) | $ | 1,000 | $ | 1,021.02 | $ | 4.23 |
*Expenses are calculated using the most recent six-month expense ratio, annualized for each class (Z: 0.97%; A: 1.27%; C: 1.97%; R: 1.47%; and R6: 0.83%) multiplied by the average account value over the period, multiplied by 184/365 to reflect the one-half year period.
Annual Report | 19
| Mutual Global Discovery Fund | |||||||||||||||
| Financial Highlights | |||||||||||||||
| Year Ended December 31, | |||||||||||||||
| Class Z | 2013 | 2012 | 2011 | 2010 | 2009 | ||||||||||
| Per share operating performance | |||||||||||||||
| (for a share outstanding throughout the year) | |||||||||||||||
| Net asset value, beginning of year | $ | 28.65 | $ | 27.47 | $ | 29.54 | $ | 27.03 | $ | 22.54 | |||||
| Income from investment operationsa: | |||||||||||||||
| Net investment incomeb | 0.55 | 0.56 | 0.61 | 0.53 | c | 0.18 | d | ||||||||
| Net realized and unrealized gains (losses) | 6.74 | 3.21 | (1.46 | ) | 2.55 | 4.62 | |||||||||
| Total from investment operations | 7.29 | 3.77 | (0.85 | ) | 3.08 | 4.80 | |||||||||
| Less distributions from: | |||||||||||||||
| Net investment income | (0.57 | ) | (0.57 | ) | (0.55 | ) | (0.57 | ) | (0.30 | ) | |||||
| Net realized gains | (1.64 | ) | (2.02 | ) | (0.67 | ) | — | (0.01 | ) | ||||||
| Total distributions | (2.21 | ) | (2.59 | ) | (1.22 | ) | (0.57 | ) | (0.31 | ) | |||||
| Net asset value, end of year | $ | 33.73 | $ | 28.65 | $ | 27.47 | $ | 29.54 | $ | 27.03 | |||||
| Total return | 25.64 | % | 13.64 | % | (2.68 | )% | 11.37 | % | 21.31 | % | |||||
| Ratios to average net assets | |||||||||||||||
| Expensese | 0.98 | %f | 1.02 | % | 1.01 | % | 1.04 | % | 1.12 | %f | |||||
| Expenses incurred in connection with securities sold | |||||||||||||||
| short | —%g | —%g | —%g | 0.02 | % | 0.09 | % | ||||||||
| Net investment income | 1.68 | % | 1.89 | % | 2.11 | % | 1.89 | %c | 0.75 | %d | |||||
| Supplemental data | |||||||||||||||
| Net assets, end of year (000’s) | $ | 9,529,245 | $ | 7,417,041 | $ | 7,159,033 | $ | 7,210,122 | $ | 5,897,681 | |||||
| Portfolio turnover rate | 23.57 | % | 24.65 | % | 33.60 | % | 37.76 | % | 37.26 | % | |||||
aThe amount shown for a share outstanding throughout the period may not correlate with the Statement of Operations for the period due to the timing of sales and repurchases of
the Fund shares in relation to income earned and/or fluctuating market value of the investments of the Fund.
bBased on average daily shares outstanding.
cNet investment income per share includes approximately $0.05 per share received in the form of a special dividend paid in connection with a corporate real estate investment trust
(REIT) conversion. Excluding this non-recurring amount, the ratio of net investment income to average net assets would have been 1.71%.
dNet investment income per share includes approximately $(0.05) per share related to an adjustment for uncollectible interest. Excluding the effect of this adjustment, the ratio of
net investment income to average net assets would have been 0.95%.
eIncludes dividend expense on securities sold short and borrowing fees, if any. See below for the ratios of such expenses to average net assets for the periods presented.
See Note 1(e).
fBenefit of expense reduction rounds to less than 0.01%.
gRounds to less than 0.01%.
20 | The accompanying notes are an integral part of these financial statements. | Annual Report
| Mutual Global Discovery Fund | |||||||||||||||
| Financial Highlights (continued) | |||||||||||||||
| Year Ended December 31, | |||||||||||||||
| Class A | 2013 | 2012 | 2011 | 2010 | 2009 | ||||||||||
| Per share operating performance | |||||||||||||||
| (for a share outstanding throughout the year) | |||||||||||||||
| Net asset value, beginning of year | $ | 28.27 | $ | 27.14 | $ | 29.19 | $ | 26.72 | $ | 22.30 | |||||
| Income from investment operationsa: | |||||||||||||||
| Net investment incomeb | 0.44 | 0.46 | 0.52 | 0.44 | c | 0.11 | d | ||||||||
| Net realized and unrealized gains (losses) | 6.65 | 3.17 | (1.44 | ) | 2.52 | 4.55 | |||||||||
| Total from investment operations | 7.09 | 3.63 | (0.92 | ) | 2.96 | 4.66 | |||||||||
| Less distributions from: | |||||||||||||||
| Net investment income | (0.48 | ) | (0.48 | ) | (0.46 | ) | (0.49 | ) | (0.23 | ) | |||||
| Net realized gains | (1.64 | ) | (2.02 | ) | (0.67 | ) | — | (0.01 | ) | ||||||
| Total distributions | (2.12 | ) | (2.50 | ) | (1.13 | ) | (0.49 | ) | (0.24 | ) | |||||
| Net asset value, end of year | $ | 33.24 | $ | 28.27 | $ | 27.14 | $ | 29.19 | $ | 26.72 | |||||
| Total returne | 25.26 | % | 13.34 | % | (2.99 | )% | 11.08 | % | 20.89 | % | |||||
| Ratios to average net assets | |||||||||||||||
| Expensesf | 1.28 | %g | 1.32 | % | 1.31 | % | 1.34 | % | 1.42 | %g | |||||
| Expenses incurred in connection with securities sold | |||||||||||||||
| short | —%h | —%h | —%h | 0.02 | % | 0.09 | % | ||||||||
| Net investment income | 1.38 | % | 1.59 | % | 1.81 | % | 1.59 | %c | 0.45 | %d | |||||
| Supplemental data | |||||||||||||||
| Net assets, end of year (000’s) | $ | 10,785,375 | $ | 7,977,279 | $ | 7,617,500 | $ | 8,122,714 | $ | 7,259,737 | |||||
| Portfolio turnover rate | 23.57 | % | 24.65 | % | 33.60 | % | 37.76 | % | 37.26 | % | |||||
aThe amount shown for a share outstanding throughout the period may not correlate with the Statement of Operations for the period due to the timing of sales and repurchases of
the Fund shares in relation to income earned and/or fluctuating market value of the investments of the Fund.
bBased on average daily shares outstanding.
cNet investment income per share includes approximately $0.05 per share received in the form of a special dividend paid in connection with a corporate REIT conversion. Excluding
this non-recurring amount, the ratio of net investment income to average net assets would have been 1.41%.
dNet investment income per share includes approximately $(0.05) per share related to an adjustment for uncollectible interest. Excluding the effect of this adjustment, the ratio of
net investment income to average net assets would have been 0.65%.
eTotal return does not reflect sales commissions or contingent deferred sales charges, if applicable.
fIncludes dividend expense on securities sold short and borrowing fees, if any. See below for the ratios of such expenses to average net assets for the periods presented.
See Note 1(e).
gBenefit of expense reduction rounds to less than 0.01%.
hRounds to less than 0.01%.
Annual Report | The accompanying notes are an integral part of these financial statements. | 21
| Mutual Global Discovery Fund | |||||||||||||||
| Financial Highlights (continued) | |||||||||||||||
| Year Ended December 31, | |||||||||||||||
| Class C | 2013 | 2012 | 2011 | 2010 | 2009 | ||||||||||
| Per share operating performance | |||||||||||||||
| (for a share outstanding throughout the year) | |||||||||||||||
| Net asset value, beginning of year | $ | 28.05 | $ | 26.95 | $ | 28.97 | $ | 26.53 | $ | 22.16 | |||||
| Income from investment operationsa: | |||||||||||||||
| Net investment income (loss)b | 0.22 | 0.25 | 0.32 | 0.24 | c | (0.06 | )d | ||||||||
| Net realized and unrealized gains (losses) | 6.58 | 3.14 | (1.42 | ) | 2.49 | 4.51 | |||||||||
| Total from investment operations | 6.80 | 3.39 | (1.10 | ) | 2.73 | 4.45 | |||||||||
| Less distributions from: | |||||||||||||||
| Net investment income | (0.27 | ) | (0.27 | ) | (0.25 | ) | (0.29 | ) | (0.07 | ) | |||||
| Net realized gains | (1.64 | ) | (2.02 | ) | (0.67 | ) | — | (0.01 | ) | ||||||
| Total distributions | (1.91 | ) | (2.29 | ) | (0.92 | ) | (0.29 | ) | (0.08 | ) | |||||
| Net asset value, end of year | $ | 32.94 | $ | 28.05 | $ | 26.95 | $ | 28.97 | $ | 26.53 | |||||
| Total returne | 24.39 | % | 12.53 | % | (3.64 | )% | 10.26 | % | 20.07 | % | |||||
| Ratios to average net assets | |||||||||||||||
| Expensesf | 1.98 | %g | 2.02 | % | 2.01 | % | 2.04 | % | 2.12 | %g | |||||
| Expenses incurred in connection with securities sold | |||||||||||||||
| short | —%h | —%h | —%h | 0.02 | % | 0.09 | % | ||||||||
| Net investment income (loss) | 0.68 | % | 0.89 | % | 1.11 | % | 0.89 | %c | (0.25 | )%d | |||||
| Supplemental data | |||||||||||||||
| Net assets, end of year (000’s) | $ | 2,894,908 | $ | 2,222,484 | $ | 2,268,995 | $ | 2,587,189 | $ | 2,460,205 | |||||
| Portfolio turnover rate | 23.57 | % | 24.65 | % | 33.60 | % | 37.76 | % | 37.26 | % | |||||
aThe amount shown for a share outstanding throughout the period may not correlate with the Statement of Operations for the period due to the timing of sales and repurchases of
the Fund shares in relation to income earned and/or fluctuating market value of the investments of the Fund.
bBased on average daily shares outstanding.
cNet investment income per share includes approximately $0.05 per share received in the form of a special dividend paid in connection with a corporate REIT conversion. Excluding
this non-recurring amount, the ratio of net investment income to average net assets would have been 0.71%.
dNet investment income per share includes approximately $(0.05) per share related to an adjustment for uncollectible interest. Excluding the effect of this adjustment, the ratio of
net investment income to average net assets would have been (0.05)%.
eTotal return does not reflect sales commissions or contingent deferred sales charges, if applicable.
fIncludes dividend expense on securities sold short and security borrowing fees, if any. See below for the ratios of such expenses to average net assets for the periods presented.
See Note 1(e).
gBenefit of expense reduction rounds to less than 0.01%.
hRounds to less than 0.01%.
22 | The accompanying notes are an integral part of these financial statements. | Annual Report
| Mutual Global Discovery Fund | |||||||||||||||
| Financial Highlights (continued) | |||||||||||||||
| June 30, 2003 | Year Ended December 31, | ||||||||||||||
| Class R | 2013 | 2012 | 2011 | 2010 | 2009 | ||||||||||
| Per share operating performance | |||||||||||||||
| (for a share outstanding throughout the year) | |||||||||||||||
| Net asset value, beginning of year | $ | 27.98 | $ | 26.89 | $ | 28.93 | $ | 26.50 | $ | 22.12 | |||||
| Income from investment operationsa: | |||||||||||||||
| Net investment incomeb | 0.37 | 0.39 | 0.46 | 0.38 | c | 0.06 | d | ||||||||
| Net realized and unrealized gains (losses) | 6.58 | 3.14 | (1.42 | ) | 2.49 | 4.52 | |||||||||
| Total from investment operations | 6.95 | 3.53 | (0.96 | ) | 2.87 | 4.58 | |||||||||
| Less distributions from: | |||||||||||||||
| Net investment income | (0.41 | ) | (0.42 | ) | (0.41 | ) | (0.44 | ) | (0.19 | ) | |||||
| Net realized gains | (1.64 | ) | (2.02 | ) | (0.67 | ) | — | (0.01 | ) | ||||||
| Total distributions | (2.05 | ) | (2.44 | ) | (1.08 | ) | (0.44 | ) | (0.20 | ) | |||||
| Net asset value, end of year | $ | 32.88 | $ | 27.98 | $ | 26.89 | $ | 28.93 | $ | 26.50 | |||||
| Total return | 25.02 | % | 13.09 | % | (3.17 | )% | 10.84 | % | 20.72 | % | |||||
| Ratios to average net assets | |||||||||||||||
| Expensese | 1.48 | %f | 1.52 | % | 1.51 | % | 1.54 | % | 1.62 | %f | |||||
| Expenses incurred in connection with securities sold short | —%g | —%g | —%g | 0.02 | % | 0.09 | % | ||||||||
| Net investment income | 1.18 | % | 1.39 | % | 1.61 | % | 1.39 | %c | 0.25 | %d | |||||
| Supplemental data | |||||||||||||||
| Net assets, end of year (000’s) | $ | 539,613 | $ | 458,142 | $ | 434,893 | $ | 422,042 | $ | 335,702 | |||||
| Portfolio turnover rate | 23.57 | % | 24.65 | % | 33.60 | % | 37.76 | % | 37.26 | % | |||||
aThe amount shown for a share outstanding throughout the period may not correlate with the Statement of Operations for the period due to the timing of sales and repurchases of
the Fund shares in relation to income earned and/or fluctuating market value of the investments of the Fund.
bBased on average daily shares outstanding.
cNet investment income per share includes approximately $0.05 per share received in the form of a special dividend paid in connection with a corporate REIT conversion. Excluding
this non-recurring amount, the ratio of net investment income to average net assets would have been 1.21%.
dNet investment income per share includes approximately $(0.05) per share related to an adjustment for uncollectible interest. Excluding the effect of this adjustment, the ratio of
net investment income to average net assets would have been 0.45%.
eIncludes dividend expense on securities sold short and borrowing fees, if any. See below for the ratios of such expenses to average net assets for the periods presented.
See Note 1(e).
fBenefit of expense reduction rounds to less than 0.01%.
gRounds to less than 0.01%.
Annual Report | The accompanying notes are an integral part of these financial statements. | 23
| Mutual Global Discovery Fund | |||
| Financial Highlights (continued) | |||
| Period Ended | |||
| December 31, | |||
| Class R6 | 2013 | a | |
| Per share operating performance | |||
| (for a share outstanding throughout the period) | |||
| Net asset value, beginning of period | $ | 31.42 | |
| Income from investment operationsb: | |||
| Net investment incomec | 0.40 | ||
| Net realized and unrealized gains (losses) | 4.17 | ||
| Total from investment operations | 4.57 | ||
| Less distributions from: | |||
| Net investment income | (0.62 | ) | |
| Net realized gains | (1.64 | ) | |
| Total distributions | (2.26 | ) | |
| Net asset value, end of period | $ | 33.73 | |
| Total returnd | 14.71 | % | |
| Ratios to average net assetse | |||
| Expensesf | 0.84 | %g | |
| Expenses incurred in connection with securities sold short | —%h | ||
| Net investment income | 1.83 | % | |
| Supplemental data | |||
| Net assets, end of period (000’s) | $ | 10,535 | |
| Portfolio turnover rate | 23.57 | % | |
aFor the period May 1, 2013 (effective date) to December 31, 2013.
bThe amount shown for a share outstanding throughout the period may not correlate with the Statement of Operations for the period due to the timing of sales and repurchases of the
Fund shares in relation to income earned and/or fluctuating market value of the investments of the Fund.
cBased on average daily shares outstanding.
dTotal return is not annualized for periods less than one year.
eRatios are annualized for periods less than one year.
fIncludes dividend expense on securities sold short and borrowing fees, if any. See below for the ratios of such expenses to average net assets for the periods presented.
See Note 1(e).
gBenefit of expense reduction rounds to less than 0.01%.
hRounds to less than 0.01%.
24 | The accompanying notes are an integral part of these financial statements. | Annual Report
Mutual Global Discovery Fund
Statement of Investments, December 31, 2013
| Country | Shares/Units | Value | ||
| Common Stocks and Other Equity Interests 88.8% | ||||
| Aerospace & Defense 1.0% | ||||
| Safran SA | France | 3,248,169 | $ | 225,671,417 |
| Auto Components 0.1% | ||||
| a,bInternational Automotive Components Group Brazil LLC | Brazil | 3,819,425 | 744,101 | |
| a,b,c,dInternational Automotive Components Group North America, LLC | United States | 35,491,081 | 20,081,563 | |
| 20,825,664 | ||||
| Automobiles 0.7% | ||||
| aGeneral Motors Co. | United States | 3,781,830 | 154,563,392 | |
| Beverages 1.3% | ||||
| Coca-Cola Enterprises Inc. | United Kingdom | 4,983,592 | 219,925,915 | |
| Dr. Pepper Snapple Group Inc. | United States | 2,024,518 | 98,634,517 | |
| 318,560,432 | ||||
| Capital Markets 0.8% | ||||
| a,eAcquisition 1234 PLC | United Kingdom | 380,709 | 416,075 | |
| aChina Cinda Asset Management Co. Ltd., H | China | 10,656,123 | 6,623,703 | |
| Morgan Stanley | United States | 3,927,680 | 123,172,045 | |
| UBS AG | Switzerland | 3,502,629 | 66,436,279 | |
| 196,648,102 | ||||
| Chemicals 0.0% | ||||
| a,e,fDow Corning Corp., Contingent Distribution | United States | 11,430,153 | — | |
| Commercial Banks 8.3% | ||||
| Barclays PLC | United Kingdom | 32,880,693 | 148,041,773 | |
| BNP Paribas SA | France | 3,078,332 | 239,870,004 | |
| aCapital Bank Financial Corp., A | United States | 866,477 | 19,712,352 | |
| a,gCapital Bank Financial Corp., B, 144A, non-voting | United States | 2,980,444 | 67,805,101 | |
| CIT Group Inc. | United States | 2,806,874 | 146,322,341 | |
| HSBC Holdings PLC | United Kingdom | 22,629,178 | 248,193,513 | |
| KB Financial Group Inc. | South Korea | 5,228,599 | 209,247,965 | |
| PNC Financial Services Group Inc. | United States | 3,118,000 | 241,894,440 | |
| Societe Generale | France | 1,938,479 | 112,574,467 | |
| SunTrust Banks Inc. | United States | 5,298,164 | 195,025,417 | |
| Wells Fargo & Co. | United States | 7,620,708 | 345,980,143 | |
| 1,974,667,516 | ||||
| Communications Equipment 0.7% | ||||
| Cisco Systems Inc. | United States | 7,847,650 | 176,179,742 | |
| Computers & Peripherals 3.0% | ||||
| Apple Inc. | United States | 911,570 | 511,491,043 | |
| Hewlett-Packard Co. | United States | 7,194,829 | 201,311,315 | |
| 712,802,358 | ||||
| Construction & Engineering 0.9% | ||||
| Vinci SA | France | 3,281,974 | 215,425,020 | |
| Consumer Finance 0.0%† | ||||
| aComdisco Holding Co. Inc. | United States | 929 | 5,017 |
Annual Report | 25
Mutual Global Discovery Fund
Statement of Investments, December 31, 2013 (continued)
| Country | Shares/Units | Value | ||||
| Common Stocks and Other Equity Interests (continued) | ||||||
| Diversified Financial Services 4.9% | ||||||
| Citigroup Inc. | United States | 5,809,671 | $ | 302,741,956 | ||
| Deutsche Boerse AG | Germany | 2,019,535 | 167,227,788 | |||
| aING Groep NV, IDR | Netherlands | 29,029,616 | 403,295,370 | |||
| JPMorgan Chase & Co. | United States | 4,857,660 | 284,075,957 | |||
| 1,157,341,071 | ||||||
| Diversified Telecommunication Services 0.7% | ||||||
| a,e,fGlobal Crossing Holdings Ltd., Contingent Distribution | United States | 45,658,716 | — | |||
| Vivendi SA | France | 6,446,782 | 169,857,885 | |||
| 169,857,885 | ||||||
| Electric Utilities 0.6% | ||||||
| Exelon Corp. | United States | 5,081,970 | 139,195,158 | |||
| Electrical Equipment 0.1% | ||||||
| Alstom SA | France | 957,588 | 34,871,870 | |||
| Energy Equipment & Services 1.9% | ||||||
| Baker Hughes Inc. | United States | 3,760,487 | 207,804,511 | |||
| Ensco PLC, A | United States | 1,364,410 | 78,016,964 | |||
| Transocean Ltd. | United States | 3,123,804 | 154,378,394 | |||
| 440,199,869 | ||||||
| Food & Staples Retailing 5.7% | ||||||
| CVS Caremark Corp. | United States | 4,391,768 | 314,318,836 | |||
| Empire Co. Ltd., A | Canada | 2,240,171 | 153,077,824 | |||
| Koninklijke Ahold NV | Netherlands | 2,461,963 | 44,192,911 | |||
| Metro AG | Germany | 7,814,516 | 378,360,090 | |||
| Tesco PLC | United Kingdom | 40,774,854 | 225,800,686 | |||
| Walgreen Co. | United States | 3,965,744 | 227,792,335 | |||
| 1,343,542,682 | ||||||
| Health Care Equipment & Supplies 2.0% | ||||||
| Medtronic Inc. | United States | 6,763,400 | 388,151,526 | |||
| Stryker Corp. | United States | 1,155,371 | 86,814,577 | |||
| 474,966,103 | ||||||
| Health Care Providers & Services 2.2% | ||||||
| Cigna Corp. | United States | 4,470,307 | 391,062,456 | |||
| UnitedHealth Group Inc. | United States | 227,665 | 17,143,175 | |||
| WellPoint Inc. | United States | 1,230,834 | 113,716,753 | |||
| 521,922,384 | ||||||
| Hotels, Restaurants & Leisure 1.2% | ||||||
| Accor SA | France | 6,094,334 | 287,528,530 | |||
| Independent Power Producers & Energy Traders 0.8% | ||||||
| NRG Energy Inc. | United States | 6,590,837 | 189,288,839 | |||
| Industrial Conglomerates 2.3% | ||||||
| Jardine Matheson Holdings Ltd. | Hong Kong | 4,224,266 | 220,971,355 | |||
| Jardine Strategic Holdings Ltd. | Hong Kong | 9,774,205 | 312,774,560 | |||
| Siemens AG | Germany | 113,787 | 15,540,276 | |||
| 549,286,191 | ||||||
| 26 | | | Annual Report | ||||
| Mutual Global Discovery Fund | ||||
| Statement of Investments, December 31, 2013 (continued) | ||||
| Country | Shares/Units | Value | ||
| Common Stocks and Other Equity Interests (continued) | ||||
| Insurance 9.0% | ||||
| ACE Ltd. | United States | 4,552,150 | $ | 471,284,089 |
| Aegon NV | Netherlands | 17,745,624 | 167,495,275 | |
| aAlleghany Corp. | United States | 81,228 | 32,487,951 | |
| American International Group Inc. | United States | 8,245,065 | 420,910,568 | |
| China Pacific Insurance (Group) Co. Ltd., H | China | 31,982,226 | 125,382,485 | |
| E-L Financial Corp. Ltd. | Canada | 177,619 | 122,911,044 | |
| a,b,dImagine Group Holdings Ltd. | Bermuda | 566,317 | 4,137,512 | |
| MetLife Inc. | United States | 3,265,940 | 176,099,485 | |
| a,bOlympus Re Holdings Ltd. | United States | 47,160 | — | |
| PartnerRe Ltd. | Bermuda | 1,813,630 | 191,211,011 | |
| PICC Property and Casualty Co. Ltd., H | China | 38,664,422 | 57,340,828 | |
| RSA Insurance Group PLC | United Kingdom | 25,243,283 | 38,236,872 | |
| White Mountains Insurance Group Ltd. | United States | 172,815 | 104,221,270 | |
| Zurich Insurance Group AG | Switzerland | 813,000 | 235,592,736 | |
| 2,147,311,126 | ||||
| Machinery 1.6% | ||||
| Caterpillar Inc. | United States | 1,460,991 | 132,672,593 | |
| aCNH Industrial NV (EUR Traded) | Netherlands | 6,237,616 | 71,083,977 | |
| aCNH Industrial NV, special voting (EUR Traded) | Netherlands | 7,338,645 | 83,631,322 | |
| Stanley Black & Decker Inc. | United States | 1,116,076 | 90,056,173 | |
| 377,444,065 | ||||
| Marine 1.4% | ||||
| AP Moeller-Maersk AS, B | Denmark | 30,011 | 325,641,152 | |
| Media 4.7% | ||||
| British Sky Broadcasting Group PLC | United Kingdom | 1,297,984 | 18,145,733 | |
| CBS Corp., B | United States | 3,788,202 | 241,459,996 | |
| Comcast Corp., Special A | United States | 1,094,160 | 54,576,701 | |
| Daekyo Co. Ltd. | South Korea | 1,840,893 | 12,729,185 | |
| Reed Elsevier PLC | United Kingdom | 21,794,590 | 324,355,834 | |
| Time Warner Cable Inc. | United States | 1,411,309 | 191,232,370 | |
| aTribune Co., A | United States | 989,868 | 76,615,783 | |
| aTribune Co., B | United States | 606,923 | 46,793,763 | |
| Twenty-First Century Fox Inc., B | United States | 4,401,800 | 152,302,280 | |
| 1,118,211,645 | ||||
| Metals & Mining 2.5% | ||||
| Anglo American PLC | United Kingdom | 11,349,431 | 248,121,486 | |
| Freeport-McMoRan Copper & Gold Inc., B | United States | 3,621,030 | 136,657,672 | |
| aThyssenKrupp AG | Germany | 8,967,041 | 218,191,365 | |
| 602,970,523 | ||||
| Multi-Utilities 0.7% | ||||
| GDF Suez | France | 6,868,819 | 161,514,586 | |
| Multiline Retail 0.6% | ||||
| Kohl’s Corp. | United States | 2,501,430 | 141,956,152 | |
| Office Electronics 1.0% | ||||
| Xerox Corp. | United States | 19,612,707 | 238,686,644 | |
Annual Report | 27
| Mutual Global Discovery Fund | ||||
| Statement of Investments, December 31, 2013 (continued) | ||||
| Country | Shares/Units | Value | ||
| Common Stocks and Other Equity Interests (continued) | ||||
| Oil, Gas & Consumable Fuels 8.3% | ||||
| Apache Corp. | United States | 4,036,842 | $ | 346,926,201 |
| BG Group PLC | United Kingdom | 10,853,884 | 233,243,914 | |
| BP PLC | United Kingdom | 31,838,677 | 257,360,810 | |
| CONSOL Energy Inc. | United States | 5,089,470 | 193,603,439 | |
| Marathon Oil Corp. | United States | 5,814,486 | 205,251,356 | |
| Murphy Oil Corp. | United States | 1,168,040 | 75,782,435 | |
| Petroleo Brasileiro SA, ADR | Brazil | 9,729,240 | 134,068,927 | |
| Royal Dutch Shell PLC, A | United Kingdom | 10,641,154 | 379,169,064 | |
| Talisman Energy Inc. (CAD Traded) | Canada | 886,182 | 10,303,957 | |
| Talisman Energy Inc. (USD Traded) | Canada | 10,083,637 | 117,474,371 | |
| aWPX Energy Inc. | United States | 1,329,727 | 27,099,836 | |
| 1,980,284,310 | ||||
| Paper & Forest Products 0.2% | ||||
| a,c,dNewPage Holdings Inc. | United States | 583,268 | 52,494,120 | |
| Personal Products 0.6% | ||||
| Avon Products Inc. | United States | 8,495,894 | 146,299,295 | |
| Pharmaceuticals 5.4% | ||||
| Eli Lilly & Co. | United States | 2,886,400 | 147,206,400 | |
| aHospira Inc. | United States | 2,150,184 | 88,759,595 | |
| Merck & Co. Inc. | United States | 9,354,960 | 468,215,748 | |
| Novartis AG, ADR | Switzerland | 2,692,791 | 216,446,541 | |
| Teva Pharmaceutical Industries Ltd., ADR | Israel | 8,737,113 | 350,183,489 | |
| 1,270,811,773 | ||||
| Real Estate Management & Development 0.4% | ||||
| Brookfield Office Properties Inc. | United States | 2,936,506 | 56,527,741 | |
| eCanary Wharf Group PLC | United Kingdom | 5,400,183 | 27,907,954 | |
| Great Eagle Holdings Ltd. | Hong Kong | 2,554,659 | 8,746,858 | |
| Swire Pacific Ltd., B | Hong Kong | 2,744,405 | 6,193,567 | |
| 99,376,120 | ||||
| Semiconductors & Semiconductor Equipment 0.9% | ||||
| Samsung Electronics Co. Ltd. | South Korea | 127,599 | 165,825,218 | |
| aSK Hynix Semiconductor Inc. | South Korea | 1,679,983 | 58,560,112 | |
| 224,385,330 | ||||
| Software 4.2% | ||||
| aCheck Point Software Technologies Ltd. | Israel | 4,768,670 | 307,674,588 | |
| Microsoft Corp. | United States | 11,367,680 | 425,492,262 | |
| Symantec Corp. | United States | 10,762,015 | 253,768,314 | |
| 986,935,164 | ||||
| Specialty Retail 0.9% | ||||
| Kingfisher PLC | United Kingdom | 32,521,663 | 207,117,184 | |
| Tobacco 4.8% | ||||
| Altria Group Inc. | United States | 4,246,046 | 163,005,706 | |
| British American Tobacco PLC | United Kingdom | 6,977,821 | 374,021,555 | |
| Imperial Tobacco Group PLC | United Kingdom | 4,677,039 | 181,032,570 | |
28 | Annual Report
| Mutual Global Discovery Fund | |||||
| Statement of Investments, December 31, 2013 (continued) | |||||
| Country | Shares/Units | Value | |||
| Common Stocks and Other Equity Interests (continued) | |||||
| Tobacco (continued) | |||||
| Lorillard Inc. | United States | 5,914,641 | $ | 299,754,006 | |
| Philip Morris International Inc. | United States | 1,484,505 | 129,344,921 | ||
| 1,147,158,758 | |||||
| Wireless Telecommunication Services 2.4% | |||||
| Vodafone Group PLC | United Kingdom | 142,156,667 | 558,067,973 | ||
| Total Common Stocks and Other Equity Interests | |||||
| (Cost $15,334,147,235) | 21,090,015,162 | ||||
| Preferred Stocks (Cost $7,620,000) 0.0%† | |||||
| Diversified Financial Services 0.0%† | |||||
| a,bHightower Holding LLC, pfd., A, Series 2 | United States | 3,048,000 | 5,797,601 | ||
| Principal Amount* | |||||
| Corporate Bonds, Notes and Senior Floating Rate | |||||
| Interests 4.5% | |||||
| gAmerican Airlines Inc., senior secured note, 144A, 7.50%, | |||||
| 3/15/16 | United States | 108,963,000 | 113,593,928 | ||
| Avaya Inc., | |||||
| g senior note, 144A, 10.50%, 3/01/21 | United States | 74,335,000 | 72,104,950 | ||
| g senior secured note, 144A, 7.00%, 4/01/19 | United States | 51,741,000 | 50,964,885 | ||
| h,i Tranche B-3 Term Loan, 4.736%, 10/26/17 | United States | 79,668,827 | 77,909,500 | ||
| h,i Tranche B-5 Term Loan, 8.00%, 3/31/18 | United States | 19,762,041 | 20,046,120 | ||
| h,iCaesars Entertainment Operating Co. Inc., | |||||
| Senior Tranche Term Loan, first lien, 1/28/18, | |||||
| B5, 4.488% | United States | 14,078,000 | 13,291,983 | ||
| B6, 5.488% | United States | 67,114,000 | 64,214,273 | ||
| Clear Channel Communications Inc., | |||||
| senior secured note, first lien, 9.00%, 12/15/19 | United States | 95,618,000 | 98,008,450 | ||
| h,i Tranche B Term Loan, 3.819%, 1/29/16 | United States | 1,832,300 | 1,779,850 | ||
| h,i Tranche C Term Loan, 3.819%, 1/29/16 | United States | 210,609 | 202,119 | ||
| h,i Tranche D Term Loan, 6.919%, 1/30/19 | United States | 117,978,997 | 112,964,890 | ||
| h,i Tranche E Term Loan, 7.669%, 7/30/19 | United States | 37,921,652 | 37,447,631 | ||
| h,iJC Penney Corp. Inc., Term Loan, 6.00%, 5/22/18 | United States | 96,058,526 | 93,990,578 | ||
| NGPL PipeCo LLC, | |||||
| g secured note, 144A, 7.119%, 12/15/17 | United States | 42,312,000 | 38,503,920 | ||
| g,j senior secured note, 144A, 9.625%, 6/01/19 | United States | 62,806,000 | 61,706,895 | ||
| h,i Term Loan B, 6.75%, 9/15/17 | United States | 3,728,916 | 3,487,703 | ||
| h,iTexas Competitive Electric Holdings Co. LLC, | |||||
| Extended Term Loan, 4.668%, 10/10/17 | United States | 142,325,613 | 98,311,417 | ||
| Texas Competitive Electric Holdings Co. LLC/Texas Competitive | |||||
| Electric Holdings Finance Inc., | |||||
| senior note, A, 10.25%, 11/01/15 | United States | 85,292,000 | 5,970,440 | ||
| g senior secured note, 144A, 11.50%, 10/01/20 | United States | 118,132,000 | 87,417,680 | ||
| gWind Acquisition Finance SA, 144A, 11.75%, 7/15/17, | |||||
| senior secured note | Italy | 3,970,000 | 4,228,050 | ||
| third lien | Italy | 9,316,000 | EUR | 13,648,615 | |
| Total Corporate Bonds, Notes and Senior Floating | |||||
| Rate Interests (Cost $1,084,341,603) | 1,069,793,877 | ||||
| Annual Report | 29 | |||||
| Mutual Global Discovery Fund | |||||
| Statement of Investments, December 31, 2013 (continued) | |||||
| Country | Principal Amount* | Value | |||
| Corporate Notes in Reorganization 0.2% | |||||
| b,kBroadband Ventures III LLC, secured promissory note, | |||||
| 5.00%, 2/01/12 | United States | 8,893 | $ | — | |
| h,kCengage Learning Acquisitions Inc., FRN, 2.70%, 7/03/14 | United States | 76,347,562 | 59,932,837 | ||
| Total Corporate Notes in Reorganization | |||||
| (Cost $60,614,521) | 59,932,837 | ||||
| Shares | |||||
| Companies in Liquidation 1.1% | |||||
| aAdelphia Recovery Trust | United States | 45,477,593 | 90,955 | ||
| a,fAdelphia Recovery Trust, Arahova Contingent Value Vehicle | United States | 5,538,790 | 2,769 | ||
| a,e,fCentury Communications Corp., Contingent Distribution | United States | 15,282,000 | — | ||
| a,bFIM Coinvestor Holdings I, LLC | United States | 30,279,560 | — | ||
| a,lLehman Brothers Holdings Inc., Bankruptcy Claim | United States | 587,363,521 | 264,313,585 | ||
| a,e,fNewPage Corp. Litigation Trust, Contingent Distribution | United States | 145,817,000 | — | ||
| a,e,fTribune Litigation Trust, Contingent Distribution | United States | 1,285,023 | — | ||
| Total Companies in Liquidation | |||||
| (Cost $264,824,881) | 264,407,309 | ||||
| Total Investments before Short Term Investments | |||||
| (Cost $16,751,548,240) | 22,489,946,786 | ||||
| Principal Amount* | |||||
| Short Term Investments 5.8% | |||||
| U.S. Government and Agency Securities | |||||
| (Cost $1,368,930,578) 5.8% | |||||
| m,nU.S. Treasury Bills, 1/02/14 – 6/26/14 | United States | 1,369,090,000 | 1,368,981,704 | ||
| Total Investments before Money Market Funds | |||||
| (Cost $18,120,478,818) | 23,858,928,490 | ||||
| Shares | |||||
| o Investments from Cash Collateral Received | |||||
| for Loaned Securities (Cost $8,680,467) 0.0%† | |||||
| Money Market Funds 0.0%† | |||||
| pBNY Mellon Overnight Government Fund, 0.017% | United States | 8,680,467 | 8,680,467 | ||
| Total Investments (Cost $18,129,159,285) 100.4% | 23,867,608,957 | ||||
| Securities Sold Short (0.4)% | (97,798,084 | ) | |||
| Other Assets, less Liabilities (0.0)%† | (10,135,428 | ) | |||
| Net Assets 100.0% | $ | 23,759,675,445 | |||
| qSecurities Sold Short (Proceeds $94,135,090) (0.4)% | |||||
| Common Stocks (0.4)% | |||||
| Diversified Telecommunication Services (0.4)% | |||||
| Verizon Communications Inc. | United States | 1,990,193 | $ | (97,798,084 | ) |
30 | Annual Report
Mutual Global Discovery Fund
Statement of Investments, December 31, 2013 (continued)
†Rounds to less than 0.1% of net assets.
*The principal amount is stated in U.S. dollars unless otherwise indicated.
aNon-income producing.
bSee Note 10 regarding restricted securities.
cAt December 31, 2013, pursuant to the Fund's policies and the requirements of applicable securities law, the Fund may be restricted from trading this security for a limited or
extended period of time due to ownership limits and/or potential possession of material non-public information.
dSee Note 12 regarding holdings of 5% voting securities.
eSecurity has been deemed illiquid because it may not be able to be sold within seven days. At December 31, 2013, the aggregate value of these securities was $28,324,029,
representing 0.12% of net assets.
fContingent distributions represent the right to receive additional distributions, if any, during the reorganization of the underlying company. Shares represent total underlying
principal of debt securities.
gSecurity was purchased pursuant to Rule 144A under the Securities Act of 1933 and may be sold in transactions exempt from registration only to qualified institutional buyers or in
a public offering registered under the Securities Act of 1933. These securities have been deemed liquid under guidelines approved by the Trust's Board of Trustees. At December 31,
2013, the aggregate value of these securities was $509,974,024, representing 2.15% of net assets.
hThe coupon rate shown represents the rate at period end.
iSee Note 1(g) regarding senior floating rate interests.
jA portion or all of the security is on loan at December 31, 2013. See Note 1(f).
kSee Note 8 regarding credit risk and defaulted securities.
lBankruptcy claims represent the right to receive distributions, if any, during the liquidation of the underlying pool of assets. Shares represent amount of allowed unsecured claims.
mThe security is traded on a discount basis with no stated coupon rate.
nSecurity or a portion of the security has been pledged as collateral for securities sold short, open futures and forward contracts. At December 31, 2013, the aggregate value of
these securities and/or cash pledged as collateral was $285,753,190, representing 1.20% of net assets.
oSee Note 1(f) regarding securities on loan.
pThe rate shown is the annualized seven-day yield at period end.
qSee Note 1(e) regarding securities sold short.
At December 31, 2013, the Fund had the following futures contracts outstanding. See Note 1(c).
| Futures Contracts | ||||||||||
| Number of | Notional | Expiration | Unrealized | Unrealized | ||||||
| Description | Type | Contracts | Value | Date | Appreciation | Depreciation | ||||
| Currency Contracts | ||||||||||
| EUR/USD | Short | 4,557 | $ | 785,398,950 | 3/17/14 | $ | — | $ | (3,378,355 | ) |
| GBP/USD | Short | 4,381 | 453,378,738 | 3/17/14 | — | (4,217,228 | ) | |||
| Unrealized appreciation (depreciation) | — | (7,595,583 | ) | |||||||
| Net unrealized appreciation (depreciation) | $ | (7,595,583 | ) |
Annual Report | 31
Mutual Global Discovery Fund
Statement of Investments, December 31, 2013 (continued)
At December 31, 2013, the Fund had the following forward exchange contracts outstanding. See Note 1(c).
| Forward Exchange Contracts | |||||||||||
| Contract | Settlement | Unrealized | Unrealized | ||||||||
| Currency | Counterpartya Type | Quantity | Amount | Date | Appreciation | Depreciation | |||||
| Euro | BANT | Buy | 18,566,580 | $ | 25,051,146 | 1/17/14 | $ | 486,972 | $ | — | |
| Euro | HSBC | Buy | 12,806,395 | 17,528,131 | 1/17/14 | 86,919 | — | ||||
| Euro | SCBT | Buy | 16,356,847 | 22,070,818 | 1/17/14 | 427,838 | — | ||||
| Euro | BANT | Sell | 175,343,528 | 229,887,186 | 1/17/14 | 4,534 | (11,300,365 | ) | |||
| Euro | BONY | Sell | 2,904,789 | 3,979,619 | 1/17/14 | — | (15,885 | ) | |||
| Euro | BBU | Sell | 150,724,387 | 196,824,947 | 1/17/14 | — | (10,494,722 | ) | |||
| Euro | FBCO | Sell | 41,443,162 | 54,879,093 | 1/17/14 | — | (2,125,502 | ) | |||
| Euro | DBFX | Sell | 52,555,795 | 69,675,931 | 1/17/14 | — | (2,613,964 | ) | |||
| Euro | HSBC | Sell | 19,764,015 | 26,319,833 | 1/17/14 | — | (865,344 | ) | |||
| Euro | SCBT | Sell | 31,408,796 | 41,757,086 | 1/17/14 | — | (1,445,354 | ) | |||
| Euro | SSBT | Sell | 2,202,946 | 3,013,498 | 1/17/14 | — | (16,629 | ) | |||
| British Pound | BANT | Sell | 224,572,637 | 344,003,509 | 1/21/14 | — | (27,813,871 | ) | |||
| British Pound | BBU | Sell | 8,956,579 | 14,454,924 | 1/21/14 | — | (374,184 | ) | |||
| British Pound | FBCO | Sell | 45,781,424 | 73,284,410 | 1/21/14 | — | (2,514,358 | ) | |||
| British Pound | DBFX | Sell | 86,168,762 | 130,812,798 | 1/21/14 | — | (11,853,930 | ) | |||
| British Pound | HSBC | Sell | 7,623,171 | 12,218,315 | 1/21/14 | — | (403,114 | ) | |||
| British Pound | SCBT | Sell | 4,281,769 | 6,849,363 | 1/21/14 | — | (239,818 | ) | |||
| South Korean Won | BANT | Buy | 10,059,700,787 | 9,416,772 | 2/12/14 | 84,672 | — | ||||
| South Korean Won | FBCO | Buy | 1,970,072,300 | 1,818,081 | 2/12/14 | 42,664 | — | ||||
| South Korean Won | HSBC | Buy | 12,706,994,106 | 11,781,215 | 2/12/14 | 220,612 | — | ||||
| Swiss Franc | BANT | Buy | 20,045,277 | 22,435,765 | 2/12/14 | 65,380 | (22,131 | ) | |||
| Swiss Franc | BONY | Buy | 2,197,943 | 2,424,611 | 2/12/14 | 41,799 | (1,610 | ) | |||
| Swiss Franc | BBU | Buy | 1,139,163 | 1,237,306 | 2/12/14 | 40,165 | — | ||||
| Swiss Franc | FBCO | Buy | 59,512,002 | 65,733,385 | 2/12/14 | 1,004,087 | — | ||||
| Swiss Franc | HSBC | Buy | 3,000,000 | 3,333,810 | 2/12/14 | 30,426 | — | ||||
| Swiss Franc | SCBT | Buy | 19,904,420 | 21,869,814 | 2/12/14 | 453,475 | (2,234 | ) | |||
| Swiss Franc | SSBT | Buy | 376,514 | 411,037 | 2/12/14 | 11,190 | — | ||||
| South Korean Won | BANT | Sell | 118,309,310,248 | 107,914,231 | 2/12/14 | 152,524 | (3,982,096 | ) | |||
| Swiss Franc | BANT | Sell | 154,932,155 | 168,821,466 | 2/12/14 | — | (4,921,310 | ) | |||
| Swiss Franc | BBU | Sell | 850,000 | 952,565 | 2/12/14 | — | (636 | ) | |||
| South Korean Won | FBCO | Sell | 158,276,493,229 | 142,081,078 | 2/12/14 | — | (7,411,952 | ) | |||
| Swiss Franc | FBCO | Sell | 6,199,673 | 6,658,165 | 2/12/14 | — | (294,222 | ) | |||
| South Korean Won | DBFX | Sell | 112,046,361,402 | 99,753,017 | 2/12/14 | — | (6,075,396 | ) | |||
| South Korean Won | HSBC | Sell | 83,982,670,713 | 76,383,137 | 2/12/14 | — | (2,938,964 | ) | |||
| Swiss Franc | HSBC | Sell | 673,143 | 718,563 | 2/12/14 | — | (36,307 | ) | |||
| Swiss Franc | SCBT | Sell | 1,638,418 | 1,765,251 | 2/12/14 | — | (72,090 | ) | |||
| British Pound | BANT | Buy | 14,762,669 | 23,782,254 | 2/19/14 | 654,969 | — | ||||
| British Pound | BBU | Buy | 4,389,074 | 7,106,837 | 2/19/14 | 158,569 | — | ||||
| British Pound | BANT | Sell | 208,638,550 | 324,833,792 | 2/19/14 | — | (20,533,756 | ) | |||
| British Pound | BBU | Sell | 110,572,612 | 172,617,249 | 2/19/14 | — | (10,417,918 | ) | |||
| British Pound | FBCO | Sell | 10,670,153 | 16,749,487 | 2/19/14 | — | (913,235 | ) | |||
| British Pound | HSBC | Sell | 16,595,050 | 25,905,306 | 2/19/14 | — | (1,565,130 | ) | |||
| British Pound | SCBT | Sell | 10,478,877 | 16,429,202 | 2/19/14 | — | (916,893 | ) | |||
| Euro | BANT | Sell | 36,614,693 | 48,710,382 | 2/28/14 | — | (1,653,101 | ) | |||
32 | Annual Report
| Mutual Global Discovery Fund | |||||||||||
| Statement of Investments, December 31, 2013 (continued) | |||||||||||
| Forward Exchange Contracts (continued) | |||||||||||
| Contract | Settlement | Unrealized | Unrealized | ||||||||
| Currency | Counterpartya Type | Quantity | Amount | Date | Appreciation | Depreciation | |||||
| Euro | BONY | Sell | 17,590,873 | $ | 23,426,159 | 2/28/14 | $ | — | $ | (770,074 | ) |
| Euro | BBU | Sell | 153,242,222 | 204,176,106 | 2/28/14 | — | (6,608,457 | ) | |||
| Euro | FBCO | Sell | 39,929,011 | 53,446,508 | 2/28/14 | — | (1,475,817 | ) | |||
| Euro | HSBC | Sell | 186,220,067 | 248,679,928 | 2/28/14 | — | (7,465,636 | ) | |||
| Euro | SCBT | Sell | 29,589,830 | 39,663,776 | 2/28/14 | — | (1,037,013 | ) | |||
| Euro | SSBT | Sell | 11,595,725 | 15,507,339 | 2/28/14 | — | (442,572 | ) | |||
| Canadian Dollar | HSBC | Buy | 2,083,726 | 1,942,542 | 3/18/14 | 15,570 | — | ||||
| Canadian Dollar | SCBT | Buy | 9,960,000 | 9,332,659 | 3/18/14 | 26,920 | — | ||||
| Canadian Dollar | BANT | Sell | 17,956,403 | 17,325,507 | 3/18/14 | 451,575 | — | ||||
| Canadian Dollar | HSBC | Sell | 2,219,285 | 2,145,231 | 3/18/14 | 59,732 | — | ||||
| Canadian Dollar | SCBT | Sell | 276,756,610 | 266,575,707 | 3/18/14 | 6,565,984 | (63,086 | ) | |||
| Euro | BANT | Buy | 32,895,031 | 45,003,170 | 4/16/14 | 248,679 | (4,786 | ) | |||
| Euro | BONY | Buy | 4,485,132 | 6,172,035 | 4/16/14 | — | (2,743 | ) | |||
| Euro | BBU | Buy | 8,504,643 | 11,597,426 | 4/16/14 | 100,697 | — | ||||
| Euro | HSBC | Buy | 14,978,370 | 20,548,845 | 4/16/14 | 64,067 | (10,189 | ) | |||
| Euro | SCBT | Buy | 6,861,220 | 9,431,968 | 4/16/14 | 9,609 | (3,981 | ) | |||
| Euro | SSBT | Buy | 5,145,648 | 7,079,922 | 4/16/14 | 250 | (2,342 | ) | |||
| Euro | BANT | Sell | 179,115,806 | 243,440,770 | 4/16/14 | — | (2,932,735 | ) | |||
| Euro | BONY | Sell | 5,170,711 | 7,078,877 | 4/16/14 | — | (33,428 | ) | |||
| Euro | BBU | Sell | 197,116,221 | 268,019,911 | 4/16/14 | — | (3,113,135 | ) | |||
| Euro | FBCO | Sell | 16,197,357 | 22,132,613 | 4/16/14 | — | (146,825 | ) | |||
| Euro | HSBC | Sell | 23,016,407 | 31,394,481 | 4/16/14 | 575 | (265,125 | ) | |||
| Euro | SCBT | Sell | 14,048,522 | 19,111,262 | 4/16/14 | — | (212,458 | ) | |||
| Euro | SSBT | Sell | 6,954,816 | 9,519,334 | 4/16/14 | — | (47,004 | ) | |||
| British Pound | BANT | Sell | 88,738,114 | 143,562,212 | 4/22/14 | — | (3,257,011 | ) | |||
| British Pound | BONY | Sell | 3,506,757 | 5,735,038 | 4/22/14 | — | (66,971 | ) | |||
| British Pound | BBU | Sell | 3,923,986 | 6,424,759 | 4/22/14 | — | (67,566 | ) | |||
| British Pound | FBCO | Sell | 82,424,134 | 132,859,310 | 4/22/14 | — | (3,513,290 | ) | |||
| British Pound | HSBC | Sell | 7,829,200 | 12,821,599 | 4/22/14 | — | (131,990 | ) | |||
| British Pound | SCBT | Sell | 140,841,628 | 227,036,704 | 4/22/14 | — | (5,988,963 | ) | |||
| Euro | BANT | Sell | 274,893,266 | 369,981,612 | 5/15/14 | 41,109 | (8,188,973 | ) | |||
| Euro | BONY | Sell | 8,005,105 | 11,045,794 | 5/15/14 | 34,370 | — | ||||
| Euro | BBU | Sell | 7,631,615 | 10,473,699 | 5/15/14 | 5,762 | (29,732 | ) | |||
| Euro | HSBC | Sell | 9,898,616 | 13,623,871 | 5/15/14 | 36,823 | (28,995 | ) | |||
| Euro | SCBT | Sell | 8,221,340 | 11,314,797 | 5/15/14 | 22,242 | (16,311 | ) | |||
| Euro | SSBT | Sell | 2,645,124 | 3,625,037 | 5/15/14 | — | (13,463 | ) | |||
| British Pound | BANT | Buy | 15,980,142 | 26,115,227 | 5/21/14 | 317,874 | — | ||||
| British Pound | BBU | Buy | 15,783,181 | 25,771,635 | 5/21/14 | 335,669 | — | ||||
| British Pound | HSBC | Buy | 12,574,650 | 20,527,690 | 5/21/14 | 272,313 | — | ||||
| British Pound | BBU | Sell | 206,083,953 | 331,290,259 | 5/21/14 | — | (9,597,697 | ) | |||
| British Pound | HSBC | Sell | 145,494,146 | 233,954,587 | 5/21/14 | — | (6,710,449 | ) | |||
| Unrealized appreciation (depreciation) | 12,576,615 | (196,084,838 | ) | ||||||||
| Net unrealized appreciation (depreciation) | $ | (183,508,223 | ) | ||||||||
aMay be comprised of multiple contracts using the same currency and settlement date.
See Abbreviations on page 55.
Annual Report | The accompanying notes are an integral part of these financial statements. | 33
| Mutual Global Discovery Fund | |||
| Financial Statements | |||
| Statement of Assets and Liabilities | |||
| December 31, 2013 | |||
| Assets: | |||
| Investments in securities: | |||
| Cost - Unaffiliated issuers | $ | 17,968,548,929 | |
| Cost - Non-controlled affiliated issuers (Note 12) | 160,610,356 | ||
| Total cost of investments | $ | 18,129,159,285 | |
| Value - Unaffiliated issuers | $ | 23,790,895,762 | |
| Value - Non-controlled affiliated issuers (Note 12) | 76,713,195 | ||
| Total value of investments (includes securities loaned in the amount of $8,653,860) | 23,867,608,957 | ||
| Cash | 1,614,660 | ||
| Restricted Cash (Note 1d) | 920,000 | ||
| Foreign currency, at value (cost $28,793,511) | 28,820,047 | ||
| Receivables: | |||
| Investment securities sold | 14,544,633 | ||
| Capital shares sold | 39,835,170 | ||
| Dividends and interest | 73,746,415 | ||
| Due from brokers | 99,863,600 | ||
| Unrealized appreciation on forward exchange contracts | 12,576,615 | ||
| Other assets | 1,050,584 | ||
| Total assets | 24,140,580,681 | ||
| Liabilities: | |||
| Payables: | |||
| Investment securities purchased | 3,445,641 | ||
| Capital shares redeemed | 38,978,332 | ||
| Management fees | 14,384,586 | ||
| Administrative fees | 1,501,124 | ||
| Distribution fees | 10,432,179 | ||
| Transfer agent fees | 6,185,699 | ||
| Trustees’ fees and expenses | 728,384 | ||
| Variation margin | 462,063 | ||
| Securities sold short, at value (proceeds $94,135,090) | 97,798,084 | ||
| Payable upon return of securities loaned | 8,680,467 | ||
| Due to brokers | 920,000 | ||
| Unrealized depreciation on forward exchange contracts | 196,084,838 | ||
| Accrued expenses and other liabilities | 1,303,839 | ||
| Total liabilities | 380,905,236 | ||
| Net assets, at value | $ | 23,759,675,445 | |
| Net assets consist of: | |||
| Paid-in capital | $ | 18,004,811,583 | |
| Distributions in excess of net investment income | (10,673,520 | ) | |
| Net unrealized appreciation (depreciation) | 5,544,258,700 | ||
| Accumulated net realized gain (loss) | 221,278,682 | ||
| Net assets, at value | $ | 23,759,675,445 | |
34 | The accompanying notes are an integral part of these financial statements. | Annual Report
| Mutual Global Discovery Fund | |||
| Financial Statements (continued) | |||
| Statement of Assets and Liabilities (continued) | |||
| December 31, 2013 | |||
| Class Z: | |||
| Net assets, at value | $ | 9,529,245,134 | |
| Shares outstanding | 282,556,092 | ||
| Net asset value and maximum offering price per share | $ | 33.73 | |
| Class A: | |||
| Net assets, at value | $ | 10,785,374,624 | |
| Shares outstanding | 324,469,656 | ||
| Net asset value per sharea | $ | 33.24 | |
| Maximum offering price per share (net asset value per share ÷ 94.25%) | $ | 35.27 | |
| Class C: | |||
| Net assets, at value | $ | 2,894,907,546 | |
| Shares outstanding | 87,882,045 | ||
| Net asset value and maximum offering price per sharea | $ | 32.94 | |
| Class R: | |||
| Net assets, at value | $ | 539,613,046 | |
| Shares outstanding | 16,411,887 | ||
| Net asset value and maximum offering price per share | $ | 32.88 | |
| Class R6: | |||
| Net assets, at value | $ | 10,535,095 | |
| Shares outstanding | 312,315 | ||
| Net asset value and maximum offering price per share | $ | 33.73 | |
| aRedemption price is equal to net asset value less contingent deferred sales charges, if applicable. | |||
Annual Report | The accompanying notes are an integral part of these financial statements. | 35
| Mutual Global Discovery Fund | |||
| Financial Statements (continued) | |||
| Statement of Operations | |||
| for the year ended December 31, 2013 | |||
| Investment income: | |||
| Dividends (net of foreign taxes of $17,038,810) | $ | 451,237,763 | |
| Interest | 109,361,257 | ||
| Income from securities loaned | 400,212 | ||
| Total investment income | 560,999,232 | ||
| Expenses: | |||
| Management fees (Note 3a) | 155,237,515 | ||
| Administrative fees (Note 3b) | 16,058,288 | ||
| Distribution fees: (Note 3c) | |||
| Class A | 28,160,823 | ||
| Class B | 8,482 | ||
| Class C | 25,535,999 | ||
| Class R | 2,512,616 | ||
| Transfer agent fees: (Note 3e) | |||
| Class Z | 12,688,008 | ||
| Class A | 13,763,645 | ||
| Class B | 1,298 | ||
| Class C | 3,747,773 | ||
| Class R | 740,920 | ||
| Class R6 | 158 | ||
| Custodian fees (Note 4) | 1,014,896 | ||
| Reports to shareholders | 1,727,587 | ||
| Registration and filing fees | 340,656 | ||
| Professional fees | 382,637 | ||
| Trustees’ fees and expenses | 563,901 | ||
| Dividends on securities sold short | 56,419 | ||
| Other | 241,808 | ||
| Total expenses | 262,783,429 | ||
| Expense reductions (Note 4) | (3,754 | ) | |
| Net expenses | 262,779,675 | ||
| Net investment income | 298,219,557 | ||
| Realized and unrealized gains (losses): | |||
| Net realized gain (loss) from: | |||
| Investments | 1,335,800,236 | ||
| Written options | 760,734 | ||
| Foreign currency transactions | (123,001,812 | ) | |
| Futures contracts | (52,495,529 | ) | |
| Securities sold short | (3,598 | ) | |
| Net realized gain (loss) | 1,161,060,031 | ||
| Net change in unrealized appreciation (depreciation) on: | |||
| Investments | 3,272,612,306 | ||
| Translation of other assets and liabilities denominated in foreign currencies | (44,451,145 | ) | |
| Net change in unrealized appreciation (depreciation) | 3,228,161,161 | ||
| Net realized and unrealized gain (loss) | 4,389,221,192 | ||
| Net increase (decrease) in net assets resulting from operations | $ | 4,687,440,749 | |
36 | The accompanying notes are an integral part of these financial statements. | Annual Report
| Mutual Global Discovery Fund | ||||||
| Financial Statements (continued) | ||||||
| Statements of Changes in Net Assets | ||||||
| Year Ended December 31, | ||||||
| 2013 | 2012 | |||||
| Increase (decrease) in net assets: | ||||||
| Operations: | ||||||
| Net investment income | $ | 298,219,557 | $ | 291,955,293 | ||
| Net realized gain (loss) from investments, written options, foreign currency transactions, | ||||||
| futures contracts and securities sold short | 1,161,060,031 | 1,451,964,919 | ||||
| Net change in unrealized appreciation (depreciation) on investments and translation of | ||||||
| other assets and liabilities denominated in foreign currencies | 3,228,161,161 | 470,701,010 | ||||
| Net increase (decrease) in net assets resulting from operations | 4,687,440,749 | 2,214,621,222 | ||||
| Distributions to shareholders from: | ||||||
| Net investment income: | ||||||
| Class Z | (153,169,921 | ) | (139,002,935 | ) | ||
| Class A | (147,576,057 | ) | (128,442,097 | ) | ||
| Class C | (22,295,610 | ) | (20,244,527 | ) | ||
| Class R | (6,426,289 | ) | (6,559,914 | ) | ||
| Class R6 | (175,736 | ) | — | |||
| Net realized gains: | ||||||
| Class Z | (439,026,091 | ) | (489,534,243 | ) | ||
| Class A | (501,321,480 | ) | (536,717,158 | ) | ||
| Class B | — | (790,263 | ) | |||
| Class C | (136,541,361 | ) | (151,736,225 | ) | ||
| Class R | (25,642,292 | ) | (31,523,552 | ) | ||
| Class R6 | (455,197 | ) | — | |||
| Total distributions to shareholders | (1,432,630,034 | ) | (1,504,550,914 | ) | ||
| Capital share transactions: (Note 2) | ||||||
| Class Z | 763,820,861 | (25,440,581 | ) | |||
| Class A | 1,372,830,037 | 48,452,407 | ||||
| Class B | (7,791,204 | ) | (40,766,815 | ) | ||
| Class C | 280,891,544 | (141,067,734 | ) | |||
| Class R | 2,361,667 | 4,979,898 | ||||
| Class R6 | 10,407,188 | — | ||||
| Total capital share transactions | 2,422,520,093 | (153,842,825 | ) | |||
| Net increase (decrease) in net assets | 5,677,330,808 | 556,227,483 | ||||
| Net assets: | ||||||
| Beginning of year | 18,082,344,637 | 17,526,117,154 | ||||
| End of year | $ | 23,759,675,445 | $ | 18,082,344,637 | ||
| Undistributed net investment income (distributions in excess of net investment income) | ||||||
| included in net assets: | ||||||
| End of year | $ | (10,673,520 | ) | $ | 3,624,898 | |
Annual Report | The accompanying notes are an integral part of these financial statements. | 37
Mutual Global Discovery Fund
Notes to Financial Statements
1. ORGANIZATION AND SIGNIFICANT ACCOUNTING POLICIES
Franklin Mutual Series Funds (Trust) is registered under the Investment Company Act of 1940, as amended, (1940 Act) as an open-end investment company, consisting of seven separate funds. The Mutual Global Discovery Fund (Fund) is included in this report. The financial statements of the remaining funds in the Trust are presented separately. The Fund offers five classes of shares: Class Z, Class A, Class C, Class R and Class R6. Effective May 1, 2013, the Fund began offering a new class of shares, Class R6. Effective March 22, 2013, all Class B shares were converted to Class A. Each class of shares differs by its initial sales load, contingent deferred sales charges, voting rights on matters affecting a single class, its exchange privilege and fees primarily due to differing arrangements for distribution and transfer agent fees.
The following summarizes the Fund’s significant accounting policies.
a. Financial Instrument Valuation
The Fund’s investments in financial instruments are carried at fair value daily. Fair value is the price that would be received to sell an asset or paid to transfer a liability in an orderly transaction between market participants on the measurement date. The Fund calculates the net asset value (NAV) per share at the close of the New York Stock Exchange (NYSE), generally at 4p.m. Eastern time (NYSE close) on each day the NYSE is open for trading. Under procedures approved by the Trust’s Board of Trustees (the Board), the Fund’s administrator, investment manager and other affiliates have formed the Valuation and Liquidity Oversight Committee (VLOC). The VLOC provides administration and oversight of the Fund’s valuation policies and procedures, which are approved annually by the Board. Among other things, these procedures allow the Fund to utilize independent pricing services, quotations from securities and financial instrument dealers, and other market sources to determine fair value.
Equity securities and derivative financial instruments (derivatives) listed on an exchange or on the NASDAQ National Market System are valued at the last quoted sale price or the official closing price of the day, respectively. Foreign equity securities are valued as of the close of trading on the foreign stock exchange on which the security is primarily traded or as of the NYSE close, whichever is earlier. The value is then converted into its U.S. dollar equivalent at the foreign exchange rate in effect at the NYSE close on the day that the value of the security is determined. Over-the-counter (OTC) securities are valued within the range of the most recent quoted bid and ask prices. Securities that trade in multiple markets or on multiple exchanges are valued according to the broadest and most representative market. Certain equity securities are valued based upon fundamental characteristics or relationships to similar securities. Investments in non-registered money market funds are valued at the closing net asset value.
Debt securities generally trade in the OTC market rather than on a securities exchange. The Fund’s pricing services use multiple valuation techniques to determine fair value. In instances where sufficient market activity exists, the pricing services may utilize a market-based approach through which quotes from market makers are used to determine fair value. In instances where
38 | Annual Report
Mutual Global Discovery Fund
Notes to Financial Statements (continued)
| 1. | ORGANIZATION AND SIGNIFICANT ACCOUNTING POLICIES (continued) |
| a. | Financial Instrument Valuation (continued) |
sufficient market activity may not exist or is limited, the pricing services also utilize proprietary valuation models which may consider market characteristics such as benchmark yield curves, credit spreads, estimated default rates, anticipated market interest rate volatility, coupon rates, anticipated timing of principal repayments, underlying collateral, and other unique security features in order to estimate the relevant cash flows, which are then discounted to calculate the fair value. Securities denominated in a foreign currency are converted into their U.S. dollar equivalent at the foreign exchange rate in effect at the NYSE close on the date that the values of the foreign debt securities are determined.
Certain derivatives trade in the OTC market. The Fund’s pricing services use various techniques including industry standard option pricing models and proprietary discounted cash flow models to determine the fair value of those instruments. The Fund’s net benefit or obligation under the derivative contract, as measured by the fair value of the contract, is included in net assets.
The Fund has procedures to determine the fair value of financial instruments for which market prices are not reliable or readily available. Under these procedures, the VLOC convenes on a regular basis to review such financial instruments and considers a number of factors, including significant unobservable valuation inputs, when arriving at fair value. The VLOC primarily employs a market-based approach which may use related or comparable assets or liabilities, recent transactions, market multiples, book values, and other relevant information for the investment to determine the fair value of the investment. An income-based valuation approach may also be used in which the anticipated future cash flows of the investment are discounted to calculate fair value. Discounts may also be applied due to the nature or duration of any restrictions on the disposition of the investments. Due to the inherent uncertainty of valuations of such investments, the fair values may differ significantly from the values that would have been used had an active market existed. The VLOC employs various methods for calibrating these valuation approaches including a regular review of key inputs and assumptions, transactional back-testing or disposition analysis, and reviews of any related market activity.
Trading in securities on foreign securities stock exchanges and OTC markets may be completed before the daily NYSE close. In addition, trading in certain foreign markets may not take place on every NYSE business day. Occasionally, events occur between the time at which trading in a foreign security is completed and the close of the NYSE that might call into question the reliability of the value of a portfolio security held by the Fund. As a result, differences may arise between the value of the Fund’s portfolio securities as determined at the foreign market close and the latest indications of value at the close of the NYSE. In order to minimize the potential for these differences, the VLOC monitors price movements following the close of trading in foreign stock markets through a series of country specific market proxies (such as baskets of American Depositary Receipts, futures contracts and exchange traded funds). These price
Annual Report | 39
Mutual Global Discovery Fund
Notes to Financial Statements (continued)
| 1. | ORGANIZATION AND SIGNIFICANT ACCOUNTING POLICIES (continued) |
| a. | Financial Instrument Valuation (continued) |
movements are measured against established trigger thresholds for each specific market proxy to assist in determining if an event has occurred that may call into question the reliability of the values of the foreign securities held by the Fund. If such an event occurs, the securities may be valued using fair value procedures, which may include the use of independent pricing services.
Also, when the last day of the reporting period is a non-business day, certain foreign markets may be open on those days that the NYSE is closed, which could result in differences between the value of the Fund’s portfolio securities on the last business day and the last calendar day of the reporting period. Any significant security valuation changes due to an open foreign market are adjusted and reflected by the Fund for financial reporting purposes.
b. Foreign Currency Translation
Portfolio securities and other assets and liabilities denominated in foreign currencies are translated into U.S. dollars based on the exchange rate of such currencies against U.S. dollars on the date of valuation. The Fund may enter into foreign currency exchange contracts to facilitate transactions denominated in a foreign currency. Purchases and sales of securities, income and expense items denominated in foreign currencies are translated into U.S. dollars at the exchange rate in effect on the transaction date. Portfolio securities and assets and liabilities denominated in foreign currencies contain risks that those currencies will decline in value relative to the U.S. dollar. Occasionally, events may impact the availability or reliability of foreign exchange rates used to convert the U.S. dollar equivalent value. If such an event occurs, the foreign exchange rate will be valued at fair value using procedures established and approved by the Board.
The Fund does not separately report the effect of changes in foreign exchange rates from changes in market prices on securities held. Such changes are included in net realized and unrealized gain or loss from investments on the Statement of Operations.
Realized foreign exchange gains or losses arise from sales of foreign currencies, currency gains or losses realized between the trade and settlement dates on securities transactions and the difference between the recorded amounts of dividends, interest, and foreign withholding taxes and the U.S. dollar equivalent of the amounts actually received or paid. Net unrealized foreign exchange gains and losses arise from changes in foreign exchange rates on foreign denominated assets and liabilities other than investments in securities held at the end of the reporting period.
c. Derivative Financial Instruments
The Fund invested in derivatives in order to manage risk or gain exposure to various other investments or markets. Derivatives are financial contracts based on an underlying or notional amount, require no initial investment or an initial net investment that is smaller than would normally be required to have a similar response to changes in market factors, and require or permit net settlement. Derivatives contain various risks including the potential inability of the
40 | Annual Report
Mutual Global Discovery Fund
Notes to Financial Statements (continued)
| 1. | ORGANIZATION AND SIGNIFICANT ACCOUNTING POLICIES (continued) |
| c. | Derivative Financial Instruments (continued) |
counterparty to fulfill their obligations under the terms of the contract, the potential for an illiquid secondary market, and/or the potential for market movements which expose the Fund to gains or losses in excess of the amounts shown on the Statement of Assets and Liabilities. Realized gain and loss and unrealized appreciation and depreciation on these contracts for the period are included in the Statement of Operations.
Derivative counterparty credit risk is managed through a formal evaluation of the creditwor-thiness of all potential counterparties. The Fund attempts to reduce its exposure to counterparty credit risk on OTC derivatives, whenever possible, by entering into International Swaps and Derivatives Association (ISDA) master agreements with certain counterparties. These agreements contain various provisions, including but not limited to collateral requirements, events of default, or early termination. Termination events applicable to the counterparty include certain deteriorations in the credit quality of the counterparty. Termination events applicable to the Fund include failure of the Fund to maintain certain net asset levels and/or limit the decline in net assets over various periods of time. In the event of default or early termination, the ISDA master agreement gives the non-defaulting party the right to net and close-out all transactions traded, whether or not arising under the ISDA agreement, to one net amount payable by one counterparty to the other. However, absent an event of default or early termination, OTC derivative assets and liabilities are presented gross and not offset in the Statement of Assets and Liabilities. Early termination by the counterparty may result in an immediate payment by the Fund of any net liability owed to that counterparty under the ISDA agreement. At December 31, 2013, the Fund had OTC derivatives in a net liability position of $182,997,653 and the aggregate value of collateral pledged for such contracts was $168,931,762.
Collateral requirements differ by type of derivative. Collateral or initial margin requirements are set by the broker or exchange clearing house for exchange traded and centrally cleared derivatives. Initial margin deposited is held at the exchange and can be in the form of cash and/or securities. For OTC derivatives traded under an ISDA master agreement, posting of collateral is required by either the Fund or the applicable counterparty if the total net exposure of all OTC derivatives with the applicable counterparty exceeds the minimum transfer amount, which typically ranges from $100,000 to $250,000, and can vary depending on the counterparty and the type of the agreement. Generally, collateral is determined at the close of fund business each day and any additional collateral required due to changes in derivative values may be delivered by the Fund or the counterparty within a few business days. Collateral pledged and/or received by the Fund for OTC derivatives, if any, is held in segregated accounts with the Fund’s custodian/counterparty broker and can be in the form of cash and/or securities. Unrestricted cash may be invested according to the Fund’s investment objectives.
The Fund entered into exchange traded futures contracts primarily to manage exposure to certain foreign currencies. A futures contract is an agreement between the Fund and a counterparty
Annual Report | 41
Mutual Global Discovery Fund
Notes to Financial Statements (continued)
| 1. | ORGANIZATION AND SIGNIFICANT ACCOUNTING POLICIES (continued) |
| c. | Derivative Financial Instruments (continued) |
to buy or sell an asset for a specified price on a future date. Required initial margins are pledged by the Fund, and the daily change in fair value is accounted for as a variation margin payable or receivable on the Statement of Assets and Liabilities.
The Fund entered into OTC forward exchange contracts primarily to manage exposure to certain foreign currencies. A forward exchange contract is an agreement between the Fund and a counterparty to buy or sell a foreign currency at a specific exchange rate on a future date.
The Fund purchased or wrote exchange traded option contracts primarily to manage exposure to equity price risk. An option is a contract entitling the holder to purchase or sell a specific amount of shares or units of an asset or notional amount of a swap (swaption), at a specified price. Options purchased are recorded as an asset while options written are recorded as a liability. Upon exercise of an option, the acquisition cost or sales proceeds of the underlying investment is adjusted by any premium received or paid. Upon expiration of an option, any premium received or paid is recorded as a realized gain or loss. Upon closing an option other than through expiration or exercise, the difference between the premium and the cost to close the position is recorded as a realized gain or loss.
See Notes 7 and 11 regarding investment transactions and other derivative information, respectively.
d. Restricted Cash
At December 31, 2013, the Fund received restricted cash in connection with investments in certain derivative securities. Restricted cash is held in a segregated account with the Fund’s custodian/ counterparty broker and is reflected in the Statement of Assets and Liabilities.
e. Securities Sold Short
The Fund is engaged in selling securities short, which obligates the Fund to replace a borrowed security with the same security at current market value. The Fund incurs a loss if the price of the security increases between the date of the short sale and the date on which the Fund replaces the borrowed security. The Fund realizes a gain if the price of the security declines between those dates. Gains are limited to the price at which the Fund sold the security short, while losses are potentially unlimited in size.
The Fund is required to establish a margin account with the broker lending the security sold short. While the short sale is outstanding, the broker retains the proceeds of the short sale to the extent necessary to meet margin requirements until the short position is closed out. A deposit must also be maintained with the Fund’s custodian/counterparty broker consisting of cash and/or securities having a value equal to a specified percentage of the value of the securities sold short. The Fund is obligated to pay fees for borrowing the securities sold short and is required to pay the counterparty any dividends or interest due on securities sold short. Such dividends or interest and any security borrowing fees are recorded as an expense to the Fund.
42 | Annual Report
Mutual Global Discovery Fund
Notes to Financial Statements (continued)
| 1. | ORGANIZATION AND SIGNIFICANT ACCOUNTING POLICIES (continued) |
| f. | Securities Lending |
The Fund participates in an agency based securities lending program. The Fund receives cash collateral against the loaned securities in an amount equal to at least 102% of the market value of the loaned securities. Collateral is maintained over the life of the loan in an amount not less than 100% of the market value of loaned securities, as determined at the close of fund business each day; any additional collateral required due to changes in security values is delivered to the Fund on the next business day. The collateral is invested in a non-registered money fund as indicated on the Statement of Investments. The Fund receives income from the investment of cash collateral, in addition to lending fees and rebates paid by the borrower. The Fund bears the market risk with respect to the collateral investment, securities loaned, and the risk that the agent may default on its obligations to the Fund. The securities lending agent has agreed to indemnify the Fund in the event of default by a third party borrower.
g. Senior Floating Rate Interests
The Fund invests in senior secured corporate loans that pay interest at rates which are periodically reset by reference to a base lending rate plus a spread. These base lending rates are generally the prime rate offered by a designated U.S. bank or the London InterBank Offered Rate (LIBOR). Senior secured corporate loans often require prepayment of principal from excess cash flows or at the discretion of the borrower. As a result, actual maturity may be substantially less than the stated maturity.
Senior secured corporate loans in which the Fund invests are generally readily marketable, but may be subject to certain restrictions on resale.
h. Income and Deferred Taxes
It is the Fund’s policy to qualify as a regulated investment company under the Internal Revenue Code. The Fund intends to distribute to shareholders substantially all of its taxable income and net realized gains to relieve it from federal income and excise taxes. As a result, no provision for U.S. federal income taxes is required.
The Fund may be subject to foreign taxation related to income received, capital gains on the sale of securities and certain foreign currency transactions in the foreign jurisdictions in which it invests. Foreign taxes, if any, are recorded based on the tax regulations and rates that exist in the foreign markets in which the Fund invests. When a capital gain tax is determined to apply the Fund records an estimated deferred tax liability in an amount that would be payable if the securities were disposed of on the valuation date.
The Fund recognizes the tax benefits of uncertain tax positions only when the position is “more likely than not” to be sustained upon examination by the tax authorities based on the technical merits of the tax position. As of December 31, 2013, and for all open tax years, the Fund has determined that no liability for unrecognized tax benefits is required in the Fund’s financial
Annual Report | 43
Mutual Global Discovery Fund
Notes to Financial Statements (continued)
| 1. | ORGANIZATION AND SIGNIFICANT ACCOUNTING POLICIES (continued) |
| h. | Income and Deferred Taxes (continued) |
statements related to uncertain tax positions taken on a tax return (or expected to be taken on future tax returns). Open tax years are those that remain subject to examination and are based on each tax jurisdiction statute of limitation.
i. Security Transactions, Investment Income, Expenses and Distributions
Security transactions are accounted for on trade date. Realized gains and losses on security transactions are determined on a specific identification basis. Interest income and estimated expenses are accrued daily. Amortization of premium and accretion of discount on debt securities are included in interest income. Dividend income and dividends declared on securities sold short are recorded on the ex-dividend date except that certain dividends from foreign securities are recognized as soon as the Fund is notified of the ex-dividend date. Distributions to shareholders are recorded on the ex-dividend date and are determined according to income tax regulations (tax basis). Distributable earnings determined on a tax basis may differ from earnings recorded in accordance with accounting principles generally accepted in the United States of America. These differences may be permanent or temporary. Permanent differences are reclassified among capital accounts to reflect their tax character. These reclassifications have no impact on net assets or the results of operations. Temporary differences are not reclassified, as they may reverse in subsequent periods.
Common expenses incurred by the Trust are allocated among the funds based on the ratio of net assets of each fund to the combined net assets of the Trust. Fund specific expenses are charged directly to the fund that incurred the expense.
Realized and unrealized gains and losses and net investment income, not including class specific expenses, are allocated daily to each class of shares based upon the relative proportion of net assets of each class. Differences in per share distributions, by class, are generally due to differences in class specific expenses.
Distributions received by the Fund from certain securities may be a return of capital (ROC). Such distributions reduce the cost basis of the securities, and any distributions in excess of the cost basis are recognized as capital gains.
j. Accounting Estimates
The preparation of financial statements in accordance with accounting principles generally accepted in the United States of America requires management to make estimates and assumptions that affect the reported amounts of assets and liabilities at the date of the financial statements and the amounts of income and expenses during the reporting period. Actual results could differ from those estimates.
44 | Annual Report
Mutual Global Discovery Fund
Notes to Financial Statements (continued)
| 1. | ORGANIZATION AND SIGNIFICANT ACCOUNTING POLICIES (continued) |
| k. | Guarantees and Indemnifications |
Under the Trust’s organizational documents, its officers and trustees are indemnified by the Trust against certain liabilities arising out of the performance of their duties to the Trust. Additionally, in the normal course of business, the Trust, on behalf of the Fund, enters into contracts with service providers that contain general indemnification clauses. The Trust’s maximum exposure under these arrangements is unknown as this would involve future claims that may be made against the Trust that have not yet occurred. Currently, the Trust expects the risk of loss to be remote.
2. SHARES OF BENEFICIAL INTEREST
At December 31, 2013, there were an unlimited number of shares authorized (without par value). Transactions in the Fund’s shares were as follows:
| Year Ended December 31, | ||||||||||||
| 2013 | 2012 | |||||||||||
| Shares | Amount | Shares | Amount | |||||||||
| Class Z Shares: | ||||||||||||
| Shares sold | 39,277,044 | $ | 1,262,484,145 | 35,838,283 | $ | 1,045,037,865 | ||||||
| Shares issued in reinvestment | ||||||||||||
| of distributions | 16,798,038 | 556,566,980 | 20,207,742 | 588,402,069 | ||||||||
| Shares redeemed | (32,446,005 | ) | (1,055,230,264 | ) | (57,727,689 | ) | (1,658,880,515 | ) | ||||
| Net increase (decrease) | 23,629,077 | $ | 763,820,861 | (1,681,664 | ) | $ | (25,440,581 | ) | ||||
| Class A Shares: | ||||||||||||
| Shares sold | 67,514,512 | $ | 2,161,156,184 | 45,025,798 | $ | 1,299,390,618 | ||||||
| Shares issued in reinvestment | ||||||||||||
| of distributions | 19,281,960 | 629,578,265 | 22,347,099 | 642,432,714 | ||||||||
| Shares redeemed | (44,501,012 | ) | (1,417,904,412 | ) | (65,832,868 | ) | (1,893,370,925 | ) | ||||
| Net increase (decrease) | 42,295,460 | $ | 1,372,830,037 | 1,540,029 | $ | 48,452,407 | ||||||
| Class B Sharesa: | ||||||||||||
| Shares sold | 327 | $ | 9,532 | 27,155 | $ | 767,214 | ||||||
| Shares issued in reinvestment | ||||||||||||
| of distributions | — | — | 24,515 | 703,980 | ||||||||
| Shares redeemed | (263,544 | ) | (7,800,736 | ) | (1,492,359 | ) | (42,238,009 | ) | ||||
| Net increase (decrease) | (263,217 | ) | $ | (7,791,204 | ) | (1,440,689 | ) | $ | (40,766,815 | ) | ||
| Class C Shares: | ||||||||||||
| Shares sold | 14,796,292 | $ | 470,219,996 | 6,835,643 | $ | 195,370,937 | ||||||
| Shares issued in reinvestment | ||||||||||||
| of distributions | 4,473,813 | 144,765,096 | 5,472,763 | 156,094,260 | ||||||||
| Shares redeemed | (10,615,918 | ) | (334,093,548 | ) | (17,268,421 | ) | (492,532,931 | ) | ||||
| Net increase (decrease) | 8,654,187 | $ | 280,891,544 | (4,960,015 | ) | $ | (141,067,734 | ) | ||||
Annual Report | 45
Mutual Global Discovery Fund
Notes to Financial Statements (continued)
| 2. SHARES OF BENEFICIAL INTEREST (continued) | ||||||||||
| Year Ended December 31, | ||||||||||
| 2013 | 2012 | |||||||||
| Shares | Amount | Shares | Amount | |||||||
| Class R Shares: | ||||||||||
| Shares sold | 3,025,023 | $ | 95,077,806 | 3,364,735 | $ | 95,615,574 | ||||
| Shares issued in reinvestment | ||||||||||
| of distributions | 971,774 | 31,386,222 | 1,309,620 | 37,260,903 | ||||||
| Shares redeemed | (3,957,937 | ) | (124,102,361 | ) | (4,475,164 | ) | (127,896,579 | ) | ||
| Net increase (decrease) | 38,860 | $ | 2,361,667 | 199,191 | $ | 4,979,898 | ||||
| Class R6 Sharesb: | ||||||||||
| Shares sold | 306,934 | $ | 10,243,048 | |||||||
| Shares issued in reinvestment | ||||||||||
| of distributions | 19,028 | 630,574 | ||||||||
| Shares redeemed | (13,647 | ) | (466,434 | ) | ||||||
| Net increase (decrease) | 312,315 | $ | 10,407,188 | |||||||
| aEffective March 22, 2013, all Class B shares were converted to Class A. | ||||||||||
| bFor the period May 1, 2013 (effective date) to December 31, 2013. | ||||||||||
| 3. TRANSACTIONS WITH AFFILIATES | ||||||||||
| Franklin Resources, Inc. is the holding company for various subsidiaries that together are | ||||||||||
| referred to as Franklin Templeton Investments. Certain officers and trustees of the Fund are also | ||||||||||
| officers and/or directors of the following subsidiaries: | ||||||||||
| Subsidiary | Affiliation | |||||||||
| Franklin Mutual Advisers, LLC (Franklin Mutual) | Investment manager | |||||||||
| Franklin Templeton Services, LLC (FT Services) | Administrative manager | |||||||||
| Franklin Templeton Distributors, Inc. (Distributors) | Principal underwriter | |||||||||
| Franklin Templeton Investor Services, LLC (Investor Services) Transfer agent | ||||||||||
a. Management Fees
The Fund pays an investment management fee to Franklin Mutual based on the average daily net assets of the Fund as follows:
| Annualized Fee Rate | Net Assets | |
| 0.800 | % | Up to and including $4 billion |
| 0.770 | % | Over $4 billion, up to and including $7 billion |
| 0.750 | % | Over $7 billion, up to and including $10 billion |
| 0.730 | % | Over $10 billion, up to and including $13 billion |
| 0.710 | % | Over $13 billion, up to and including $16 billion |
| 0.690 | % | Over $16 billion, up to and including $19 billion |
| 0.670 | % | Over $19 billion, up to and including $22 billion |
| 0.650 | % | In excess of $22 billion |
46 | Annual Report
Mutual Global Discovery Fund
Notes to Financial Statements (continued)
| 3. | TRANSACTIONS WITH AFFILIATES (continued) |
| b. | Administrative Fees |
The Fund pays its allocated share of an administrative fee to FT Services based on the Trust’s aggregate average daily net assets as follows:
| Annualized Fee Rate | Net Assets | |
| 0.150 | % | Up to and including $200 million |
| 0.135 | % | Over $200 million, up to and including $700 million |
| 0.100 | % | Over $700 million, up to and including $1.2 billion |
| 0.075 | % | In excess of $1.2 billion |
c. Distribution Fees
The Board has adopted distribution plans for each share class, with the exception of Class Z and Class R6 shares, pursuant to Rule 12b-1 under the 1940 Act. Distribution fees are not charged on shares held by affiliates. Under the Fund’s Class A reimbursement distribution plan, the Fund reimburses Distributors for costs incurred in connection with the servicing, sale and distribution of the Fund’s shares up to the maximum annual plan rate. Under the Class A reimbursement distribution plan, costs exceeding the maximum for the current plan year cannot be reimbursed in subsequent periods. In addition, under the Fund’s Class B, C and R compensation distribution plans, the Fund pays Distributors for costs incurred in connection with the servicing, sale and distribution of the Fund’s shares up to the maximum annual plan rate for each class. The plan year, for purposes of monitoring compliance with the maximum annual plan rates, is February 1 through January 31.
The maximum annual plan rates, based on the average daily net assets, for each class, are as follows:
| Class A | 0.35 | % |
| Class B | 1.00 | % |
| Class C | 1.00 | % |
| Class R | 0.50 | % |
The Board has set the current rate at 0.30% per year for Class A shares until further notice and approval by the Board.
d. Sales Charges/Underwriting Agreements
Front-end sales charges and contingent deferred sales charges (CDSC) do not represent expenses of the Fund. These charges are deducted from the proceeds of sales of Fund shares prior to investment or from redemption proceeds prior to remittance, as applicable. Distributors has advised the Fund of the following commission transactions related to the sales and redemptions of the Fund’s shares for the year:
| Sales charges retained net of commissions paid to | ||
| unaffiliated broker/dealers | $ | 6,812,314 |
| CDSC retained | $ | 134,912 |
Annual Report | 47
Mutual Global Discovery Fund
Notes to Financial Statements (continued)
| 3. | TRANSACTIONS WITH AFFILIATES (continued) |
| e. | Transfer Agent Fees |
Each class of shares, except for Class R6, pays transfer agent fees to Investor Services for its performance of shareholder servicing obligations and reimburses Investor Services for out of pocket expenses incurred, including shareholding servicing fees paid to third parties. These fees are allocated daily based upon their relative proportion of such classes’ aggregate net assets. Class R6 pays Investor Services transfer agent fees specific to that class.
For the year ended December 31, 2013, the Fund paid transfer agent fees of $30,941,802, of which $11,864,917 was retained by Investor Services.
f. Waiver and Expense Reimbursements
Investor Services has contractually agreed in advance to waive or limit its fees so that the Class R6 transfer agent fees do not exceed 0.01% until April 30, 2014. There were no expenses waived during the year ended December 31, 2013.
4. EXPENSE OFFSET ARRANGEMENT
The Fund has entered into an arrangement with its custodian whereby credits realized as a result of uninvested cash balances are used to reduce a portion of the Fund’s custodian expenses. During the year ended December 31, 2013, the custodian fees were reduced as noted in the Statement of Operations.
5. INDEPENDENT TRUSTEES’ RETIREMENT PLAN
On January 1, 1993, the Trust adopted an Independent Trustees’ Retirement Plan (Plan). The Plan is an unfunded defined benefit plan that provides benefit payments to Trustees whose length of service and retirement age meets the eligibility requirements of the Plan. Benefits under the Plan are based on years of service and fees paid to each trustee at the time of retirement. Effective in December 1996, the Plan was closed to new participants.
During the year ended December 31, 2013, the Fund’s projected benefit obligation and benefit payments under the Plan were as follows:
| aProjected benefit obligation at December 31, 2013 | $ | 728,384 |
| bDecrease in projected benefit obligation | $ | 38,112 |
| Benefit payments made to retired trustees | $ | 24,958 |
aThe projected benefit obligation is included in accrued expenses and other liabilities in the Statement of Assets and Liabilities.
bThe decrease in projected benefit obligation is included in trustees’ fees and expenses in the Statement of Operations.
48 | Annual Report
Mutual Global Discovery Fund
Notes to Financial Statements (continued)
6. INCOME TAXES
For tax purposes, the Fund may elect to defer any portion of a post-October capital loss to the first day of the following fiscal year. At December 31, 2013, the Fund deferred post-October capital losses of $31,051,851.
The tax character of distributions paid during the years ended December 31, 2013 and 2012 was as follows:
| 2013 | 2012 | |||
| Distributions paid from: | ||||
| Ordinary income | $ | 467,985,037 | $ | 448,496,118 |
| Long term capital gain | 964,644,997 | 1,056,054,796 | ||
| $ | 1,432,630,034 | $ | 1,504,550,914 |
At December 31, 2013, the cost of investments, net unrealized appreciation (depreciation), undistributed ordinary income and undistributed long term capital gains for income tax purposes were as follows:
| Cost of investments | $ | 18,166,090,684 | |
| Unrealized appreciation | $ | 6,329,219,143 | |
| Unrealized depreciation | (627,700,870 | ) | |
| Net unrealized appreciation (depreciation) | $ | 5,701,518,273 | |
| Undistributed ordinary income | $ | 16,843,288 | |
| Undistributed long term capital gains | 118,733,201 | ||
| Distributable earnings | $ | 135,576,489 | |
Differences between income and/or capital gains as determined on a book basis and a tax basis are primarily due to differing treatments of foreign currency transactions and corporate actions.
7. INVESTMENT TRANSACTIONS
Purchases and sales of investments (excluding short term securities and securities sold short) for the year ended December 31, 2013, aggregated $5,705,743,398 and $4,544,910,754, respectively.
Transactions in options written during the year ended December 31, 2013, were as follows:
| Number of | Premiums | ||||
| Contracts | Received | ||||
| Options outstanding at December 31, 2012 | — | $ | — | ||
| Options written | 2,934 | 825,861 | |||
| Options expired | (2,712 | ) | (594,484 | ) | |
| Options exercised | — | — | |||
| Options closed | (222 | ) | (231,377 | ) | |
| Options outstanding at December 31, 2013 | — | $ | — |
Annual Report | 49
Mutual Global Discovery Fund
Notes to Financial Statements (continued)
7. INVESTMENT TRANSACTIONS (continued)
See Notes 1(c) and 11 regarding derivative financial instruments and other derivative information, respectively.
8. CREDIT RISK AND DEFAULTED SECURITIES
The Fund may purchase the pre-default or defaulted debt of distressed companies. Distressed companies are financially troubled and are about to be or are already involved in financial restructuring or bankruptcy. Risks associated with purchasing these securities include the possibility that the bankruptcy or other restructuring process takes longer than expected, or that distributions in restructuring are less than anticipated, either or both of which may result in unfavorable consequences to the Fund. If it becomes probable that the income on debt securities, including those of distressed companies, will not be collected, the Fund discontinues accruing income and recognizes an adjustment for uncollectible interest.
At December 31, 2013, the aggregate value of distressed company securities for which interest recognition has been discontinued was $59,932,837, representing 0.25% of the Fund’s net assets. For information as to specific securities, see the accompanying Statement of Investments.
9. CONCENTRATION OF RISK
Investing in foreign securities may include certain risks and considerations not typically associated with investing in U.S. securities, such as fluctuating currency values and changing local and regional economic, political and social conditions, which may result in greater market volatility. In addition, certain foreign securities may not be as liquid as U.S. securities.
10. RESTRICTED SECURITIES
The Fund invests in securities that are restricted under the Securities Act of 1933 (1933 Act) or which are subject to legal, contractual, or other agreed upon restrictions on resale. Restricted securities are often purchased in private placement transactions, and cannot be sold without prior registration unless the sale is pursuant to an exemption under the 1933 Act. Disposal of these securities may require greater effort and expense, and prompt sale at an acceptable price may be difficult. The Fund may have registration rights for restricted securities. The issuer generally incurs all registration costs.
50 | Annual Report
Mutual Global Discovery Fund
Notes to Financial Statements (continued)
10. RESTRICTED SECURITIES (continued)
At December 31, 2013, the Fund held investments in restricted securities, excluding certain securities exempt from registration under the 1933 Act deemed to be liquid, as follows:
| Principal | ||||||
| Amount/Units | Acquisition | |||||
| Shares | Issuer | Dates | Cost | Value | ||
| 8,893 | Broadband Ventures III LLC, secured | |||||
| promissory note, 5.00%, 2/01/12 | 7/01/10 - 11/30/12 | $ | 8,893 | $ | — | |
| 30,279,560 | FIM Coinvestor Holdings I, LLC | 11/20/06 - 6/02/09 | — | — | ||
| 3,048,000 | Hightower Holding LLC, pfd., A, | |||||
| Series 2 | 6/10/10 - 5/10/12 | 7,620,000 | 5,797,601 | |||
| 566,317 | Imagine Group Holdings Ltd. | 8/31/04 | 5,799,936 | 4,137,512 | ||
| 3,819,425 | International Automotive | |||||
| Components Group Brazil LLC | 4/13/06 - 12/26/08 | 2,536,498 | 744,101 | |||
| 35,491,081 | International Automotive Components | |||||
| Group North America, LLC | 1/12/06 - 3/18/13 | 29,095,371 | 20,081,563 | |||
| 47,160 | Olympus Re Holdings Ltd. | 12/19/01 | 4,417,998 | — | ||
| Total Restricted Securities (Value is 0.13% of Net Assets) | $ | 49,478,696 | $ | 30,760,777 | ||
11. OTHER DERIVATIVE INFORMATION
At December 31, 2013, the Fund’s investments in derivative contracts are reflected on the Statement of Assets and Liabilities as follows:
| Asset Derivatives | Liability Derivatives | ||||||
| Derivative Contracts | |||||||
| Not Accounted for as | Statement of Assets and | Fair Value | Statement of Assets and | Fair Value | |||
| Hedging Instruments | Liabilities Location | Amount | Liabilities Location | Amount | |||
| Foreign exchange | |||||||
| contracts | Unrealized appreciation on | $ | 12,576,615 | Unrealized depreciation on | $ | 203,680,421 | a |
| forward exchange contracts | forward exchange contracts / | ||||||
| Net assets consist of - net | |||||||
| unrealized appreciation | |||||||
| (depreciation) | |||||||
aIncludes cumulative appreciation (depreciation) of futures contracts as reported in the Statement of Investments. Only current day’s variation margin is separately reported within the Statement of Assets and Liabilities.
Annual Report | 51
Mutual Global Discovery Fund
Notes to Financial Statements (continued)
11. OTHER DERIVATIVE INFORMATION (continued)
For the year ended December 31, 2013, the effect of derivative contracts on the Fund’s Statement of Operations was as follows:
| Change in | |||||||
| Unrealized | |||||||
| Appreciation | |||||||
| Derivative Contracts | Realized Gain | (Depreciation) | |||||
| Not Accounted for as | Statement of | (Loss) for the | for the | ||||
| Hedging Instruments | Operations Locations | Year | Year | ||||
| Foreign exchange | |||||||
| contracts | Net realized gain (loss) from foreign currency | $ | (176,199,027 | ) | $ | (45,268,435 | ) |
| transactions and futures contracts / Net | |||||||
| change in unrealized appreciation (depreciation) | |||||||
| on translation of other assets and liabilities | |||||||
| denominated in foreign currencies | |||||||
| Equity contracts | Net realized gain (loss) from written options | 760,734 | |||||
For the year ended December 31 2013, the average month end fair value of derivatives represented 0.61% of average month end net assets. The average month end number of open derivative contracts for the year was 203.
See Notes 1(c) and 7 regarding derivative financial instruments and investment transactions, respectively.
12. HOLDINGS OF 5% VOTING SECURITIES OF PORTFOLIO COMPANIES
The 1940 Act defines “affiliated companies” to include investments in portfolio companies in which a fund owns 5% or more of the outstanding voting securities. Investments in “affiliated companies” for the Fund for the year ended December 31, 2013, were as shown below.
| Number of | Number of | |||||||||
| Shares Held | Shares Held | Value | Realized | |||||||
| Name of Issuer | at Beginning | Gross | Gross | at End | at End | Investment | Capital | |||
| of Year | Additions | Reductions | of Year | of Year | Income | Gain (Loss) | ||||
| Non-Controlled Affiliates | ||||||||||
| Imagine Group Holdings Ltd. | 566,317 | — | — | 566,317 | $ | 4,137,512 | $ | — | $ | — |
| International Automotive | ||||||||||
| Components Group North | ||||||||||
| America, LLC | 26,272,706 | 9,218,375 | — | 35,491,081 | 20,081,563 | — | — | |||
| NewPage Holdings Inc. | 583,268 | — | — | 583,268 | 52,494,120 | — | — | |||
| Total Affiliated Securities (Value is 0.32% of Net Assets) | $ | 76,713,195 | $ | — | $ | — | ||||
52 | Annual Report
Mutual Global Discovery Fund
Notes to Financial Statements (continued)
13. CREDIT FACILITY
The Fund, together with other U.S. registered and foreign investment funds (collectively, Borrowers), managed by Franklin Templeton Investments, are borrowers in a joint syndicated senior unsecured credit facility totaling $1.5 billion (Global Credit Facility) which, after an extension of the original terms, matured on February 14, 2014. This Global Credit Facility provides a source of funds to the Borrowers for temporary and emergency purposes, including the ability to meet future unanticipated or unusually large redemption requests. Effective February 14, 2014, the Borrowers renewed the Global Credit Facility which matures on February 13, 2015.
Under the terms of the Global Credit Facility, the Fund shall, in addition to interest charged on any borrowings made by the Fund and other costs incurred by the Fund, pay its share of fees and expenses incurred in connection with the implementation and maintenance of the Global Credit Facility, based upon its relative share of the aggregate net assets of all of the Borrowers, including an annual commitment fee of 0.07% based upon the unused portion of the Global Credit Facility. These fees are reflected in other expenses on the Statement of Operations. During the year ended December 31, 2013, the Fund did not use the Global Credit Facility.
14. FAIR VALUE MEASUREMENTS
The Fund follows a fair value hierarchy that distinguishes between market data obtained from independent sources (observable inputs) and the Fund’s own market assumptions (unobservable inputs). These inputs are used in determining the value of the Fund’s financial instruments and are summarized in the following fair value hierarchy:
- Level 1 – quoted prices in active markets for identical financial instruments
- Level 2 – other significant observable inputs (including quoted prices for similar financial instruments, interest rates, prepayment speed, credit risk, etc.)
- Level 3 – significant unobservable inputs (including the Fund’s own assumptions in determining the fair value of financial instruments)
The input levels are not necessarily an indication of the risk or liquidity associated with financial instruments at that level.
For movements between the levels within the fair value hierarchy, the Fund has adopted a policy of recognizing the transfers as of the date of the underlying event which caused the movement.
Annual Report | 53
Mutual Global Discovery Fund
Notes to Financial Statements (continued)
| 14. | FAIR VALUE MEASUREMENTS (continued) |
| A | summary of inputs used as of December 31, 2013, in valuing the Fund’s assets and liabilities |
carried at fair value, is as follows:
| Level 1 | Level 2 | Level 3 | Total | ||||||
| Assets: | |||||||||
| Investments in Securities: | |||||||||
| Equity Investments:a | |||||||||
| Auto Components | $ | — | $ | — | $ | 20,825,664 | $ | 20,825,664 | |
| Capital Markets | 196,232,027 | — | 416,075 | 196,648,102 | |||||
| Commercial Banks | 1,906,862,415 | 67,805,101 | — | 1,974,667,516 | |||||
| Diversified Financial Services | 1,157,341,071 | — | 5,797,601 | 1,163,138,672 | |||||
| Insurance | 2,143,173,614 | — | 4,137,512 | b | 2,147,311,126 | ||||
| Machinery | 293,812,743 | 83,631,322 | — | 377,444,065 | |||||
| Media | 1,071,417,882 | 46,793,763 | — | 1,118,211,645 | |||||
| Paper & Forest Products | — | 52,494,120 | — | 52,494,120 | |||||
| Real Estate Management & | |||||||||
| Development | 71,468,166 | — | 27,907,954 | 99,376,120 | |||||
| All Other Equity | |||||||||
| Investmentsc | 13,945,695,733 | — | —b | 13,945,695,733 | |||||
| Corporate Bonds, Notes and | |||||||||
| Senior Floating Rate Interests | — | 1,069,793,877 | — | 1,069,793,877 | |||||
| Corporate Notes in | |||||||||
| Reorganization | — | 59,932,837 | — b | 59,932,837 | |||||
| Companies in Liquidation | 90,955 | 264,316,354 | —b | 264,407,309 | |||||
| Short Term Investments | 1,368,981,704 | 8,680,467 | — | 1,377,662,171 | |||||
| Total Investments in | |||||||||
| Securities | $ | 22,155,076,310 | $ | 1,653,447,841 | $ | 59,084,806 | $ | 23,867,608,957 | |
| Forward Exchange Contracts | $ | — | $ | 12,576,615 | $ | — | $ | 12,576,615 | |
| Liabilities: | |||||||||
| Securities Sold Short | 97,798,084 | — | — | 97,798,084 | |||||
| Futures Contracts | 7,595,583 | — | — | 7,595,583 | |||||
| Forward Exchange Contracts | — | 196,084,838 | — | 196,084,838 | |||||
aIncludes common and preferred stocks as well as other equity investments.
bIncludes securities determined to have no value at December 31, 2013.
cFor detailed categories, see the accompanying Statement of Investments.
A reconciliation of assets in which Level 3 inputs are used in determining fair value is presented
when there are significant Level 3 investments at the end of the year.
54 | Annual Report
Mutual Global Discovery Fund
Notes to Financial Statements (continued)
15. NEW ACCOUNTING PRONOUNCEMENTS
In June 2013, the Financial Accounting Standards Board issued Accounting Standards Update (ASU) No. 2013-08, Investment Companies (Topic 946): Amendments to the Scope, Measurement, and Disclosure Requirements. The ASU modifies the criteria used in defining an investment company under U.S. Generally Accepted Accounting Principles and also sets forth certain measurement and disclosure requirements. Under the ASU, an entity that is registered under the 1940 Act automatically qualifies as an investment company. The ASU is effective for interim and annual reporting periods beginning after December 15, 2013. Management has reviewed the requirements and believes the adoption of this ASU will not have a material impact on the financial statements.
16. SUBSEQUENT EVENTS
The Fund has evaluated subsequent events through the issuance of the financial statements and determined that no events have occurred that require disclosure other than those already disclosed in the financial statements.
| ABBREVIATIONS | |||||||
| Counterparty | Currency | Selected Portfolio | |||||
| BANT | - | Bankof America N.A. | CAD | - | CanadianDollar | ADR | - American Depositary Receipt |
| BBU | - | Barclays Bank PLC | EUR | - | Euro | FRN | - Floating Rate Note |
| BONY - | Bankof New York Mellon | GBP | - | British Pound | IDR | -InternationalDepositary Receipt | |
| DBFX | - | Deutsche Bank AG | USD | - | UnitedStates Dollar | ||
| FBCO | - | Credit Suisse Group AG | |||||
| HSBC | - | HSBC Bank USA, N.A. | |||||
| SCBT | - | Standard Chartered Bank | |||||
| SSBT | - | State Street Bank and Trust | |||||
| Co., N.A. | |||||||
Annual Report | 55
Mutual Global Discovery Fund
Report of Independent Registered Public Accounting Firm
To the Board of Trustees of Franklin Mutual Series Funds and Shareholders of the Mutual Global Discovery Fund:
We have audited the accompanying statement of assets and liabilities, including the statement of investments, of Mutual Global Discovery Fund (the “Fund”) (one of the funds constituting Franklin Mutual Series Funds), as of December 31, 2013, and the related statement of operations for the year then ended, the statements of changes in net assets for each of the two years in the period then ended, and the financial highlights for each of the periods presented therein. These financial statements and financial highlights are the responsibility of the Fund’s management. Our responsibility is to express an opinion on these financial statements and financial highlights based on our audits.
We conducted our audits in accordance with the standards of the Public Company Accounting Oversight Board (United States). Those standards require that we plan and perform the audit to obtain reasonable assurance about whether the financial statements and financial highlights are free of material misstatement. We were not engaged to perform an audit of the Fund’s internal control over financial reporting. Our audits included consideration of internal control over financial reporting as a basis for designing audit procedures that are appropriate in the circumstances, but not for the purpose of expressing an opinion on the effectiveness of the Fund’s internal control over financial reporting. Accordingly, we express no such opinion. An audit also includes examining, on a test basis, evidence supporting the amounts and disclosures in the financial statements and financial highlights, assessing the accounting principles used and significant estimates made by management, and evaluating the overall financial statement presentation. Our procedures included confirmation of securities owned as of December 31, 2013, by correspondence with the custodian and brokers, or by other appropriate auditing procedures where replies from the brokers were not received. We believe that our audits provide a reasonable basis for our opinion.
In our opinion, the financial statements and financial highlights referred to above present fairly, in all material respects, the financial position of Mutual Global Discovery Fund (one of the funds constituting Franklin Mutual Series Funds) at December 31, 2013, the results of its operations for the year then ended, the changes in its net assets for each of the two years in the period then ended, and the financial highlights for each of the periods indicated therein, in conformity with U.S. generally accepted accounting principles.

Boston, Massachusetts
February 19, 2014
56 | Annual Report
Mutual Global Discovery Fund
Tax Information (unaudited)
Under Section 852(b)(3)(C) of the Internal Revenue Code (Code), the Fund hereby reports the maximum amount allowable but no less than $964,644,997 as a long term capital gain dividend for the fiscal year ended December 31, 2013.
Under Section 871(k)(2)(C) of the Code, the Fund hereby reports the maximum amount allowable but no less than $138,304,237 as a short term capital gain dividend for purposes of the tax imposed under Section 871(a)(1)(A) of the Code for the fiscal year ended December 31, 2013.
Under Section 854(b)(1)(A) of the Code, the Fund hereby reports 40.47% of the ordinary income dividends as income qualifying for the dividends received deduction for the fiscal year ended December 31, 2013.
Under Section 854(b)(1)(B) of the Code, the Fund hereby reports the maximum amount allowable but no less than $431,332,158 as qualified dividends for purposes of the maximum rate under Section 1(h)(11) of the Code for the fiscal year ended December 31, 2013. Distributions, including qualified dividend income, paid during calendar year 2013 will be reported to shareholders on Form 1099-DIV by mid-February 2014. Shareholders are advised to check with their tax advisors for information on the treatment of these amounts on their individual income tax returns.
Under Section 871(k)(1)(C) of the Code, the Fund hereby reports the maximum amount allowable but no less than $74,689,354 as interest related dividends for purposes of the tax imposed under Section 871(a)(1)(A) of the Code for the fiscal year ended December 31, 2013.
Annual Report | 57
Mutual Global Discovery Fund
Board Members and Officers
The name, year of birth and address of the officers and board members, as well as their affiliations, positions held with the Fund, principal occupations during at least the past five years and number of portfolios overseen in the Franklin Templeton Investments fund complex are shown below. Generally, each board member serves until that person’s successor is elected and qualified.
| Independent Board Members | ||||
| Number of Portfolios in | ||||
| Name, Year of Birth | Length of | Fund Complex Overseen | Other Directorships Held | |
| and Address | Position | Time Served | by Board Member* | During at Least the Past 5 Years |
| Edward I. Altman, Ph.D. (1941) | Trustee | Since 1987 | 11 | None |
| c/o Franklin Mutual Advisers, LLC | ||||
| 101 John F. Kennedy Parkway | ||||
| Short Hills, NJ 07078-2789 | ||||
Principal Occupation During at Least the Past 5 Years:
Max L. Heine Professor of Finance and Director of The Credit and Debt Markets Research Program, Salomon Center, Stern School of Business, New York University; editor and author of numerous financial publications; financial consultant; an adviser to numerous financial publishing organizations; and formerly, Vice Director, Salomon Center, Stern School of Business, New York University.
| Ann Torre Bates (1958) | Trustee | Since 1995 | 38 | SLM Corporation (Sallie Mae), Ares |
| c/o Franklin Mutual Advisers, LLC | Capital Corporation (specialty finance | |||
| 101 John F. Kennedy Parkway | company), Allied Capital Corporation | |||
| Short Hills, NJ 07078-2789 | (financial services) (2003-2010) | |||
| and United Natural Foods, Inc., | ||||
| (October 2013). |
Principal Occupation During at Least the Past 5 Years:
Director of various companies; and formerly, Executive Vice President and Chief Financial Officer, NHP Incorporated (manager of multifamily housing) (1995-1997); and Vice President and Treasurer, US Airways, Inc. (until 1995).
| Burton J. Greenwald (1929) | Trustee | Since 2002 | 18 | Franklin Templeton Emerging Markets |
| c/o Franklin Mutual Advisers, LLC | Debt Opportunities Fund PLC and | |||
| 101 John F. Kennedy Parkway | Fiduciary International Ireland | |||
| Short Hills, NJ 07078-2789 | Limited. |
Principal Occupation During at Least the Past 5 Years:
Managing Director, B.J. Greenwald Associates (management consultants to the financial services industry); and formerly, Chairman, Fiduciary Trust International Funds; Executive Vice President, L.F Rothschild Fund Management, Inc.; President and Director, Merit Mutual Funds; President, Underwriting Division and Director, National Securities & Research Corporation; Governor, Investment Company Institute; and Chairman, ICI Public Information Committee.
58 | Annual Report
| Number of Portfolios in | |||||
| Name, Year of Birth | Length of | Fund Complex Overseen | Other Directorships Held | ||
| and Address | Position | Time Served | by Board Member* | During at Least the Past 5 Years | |
| Keith E. Mitchell (1954) | Trustee | Since 2009 | 11 | None | |
| c/o Franklin Mutual Advisers, LLC | |||||
| 101 John F. Kennedy Parkway | |||||
| Short Hills, NJ 07078-2789 | |||||
| Principal Occupation During at Least the Past 5 Years: | |||||
| Managing Member, Mitchell, Hartley & Bechtel Advisers, LLC (formerly, Mitchell Advisers, LLC) (advisory firm); director of various boards of | |||||
| asset management firms; and formerly, Managing Director, Putnam Lovell NBF. | |||||
| Charles Rubens II (1930) | Trustee | Since 1998 | 18 | None | |
| c/o Franklin Mutual Advisers, LLC | |||||
| 101 John F. Kennedy Parkway | |||||
| Short Hills, NJ 07078-2789 | |||||
| Principal Occupation During at Least the Past 5 Years: | |||||
| Private investor and president of non-profit organizations; and formerly, an executive of Time, Inc.; and Trustee of Colorado College. | |||||
| Jan Hopkins Trachtman (1947) | Trustee | Since 2009 | 11 | None | |
| c/o Franklin Mutual Advisers, LLC | |||||
| 101 John F. Kennedy Parkway | |||||
| Short Hills, NJ 07078-2789 | |||||
| Principal Occupation During at Least the Past 5 Years: | |||||
| President and Founder, The Jan Hopkins Group (communications consulting firm); President, Economic Club of New York; serves on | |||||
| Advisory Board of Knight Bagehot Fellowship; and formerly, Anchor/Correspondent, CNN Financial News (until 2003); Managing Director | |||||
| and Head of Client Communications, Citigroup Private Bank (until 2005); Off-Air Reporter, ABC News’ World News Tonight; and Editor, CBS | |||||
| Network News. | |||||
| Robert E. Wade (1946) | Trustee and | Trustee since | 45 | El Oro Ltd (investments). | |
| c/o Franklin Mutual Advisers, LLC | Chairman of | 1993 and | |||
| 101 John F. Kennedy Parkway | the Board | Chairman of the | |||
| Short Hills, NJ 07078-2789 | Board since 2005 | ||||
| Principal Occupation During at Least the Past 5 Years: | |||||
| Attorney at law engaged in private practice (1972-2008) and member of various boards. | |||||
| Interested Board Members and Officers | |||||
| Number of Portfolios in | |||||
| Name, Year of Birth | Length of | Fund Complex Overseen | Other Directorships Held | ||
| and Address | Position | Time Served | by Board Member* | During at Least the Past 5 Years | |
| **Gregory E. Johnson (1961) | Trustee | Since 2007 | 152 | None | |
| One Franklin Parkway | |||||
| San Mateo, CA 94403-1906 | |||||
Principal Occupation During at Least the Past 5 Years:
Chairman of the Board, Member – Office of the Chairman, Director, President and Chief Executive Officer, Franklin Resources, Inc.; officer and/or director or trustee, as the case may be, of some of the other subsidiaries of Franklin Resources, Inc. and of 44 of the investment companies in Franklin Templeton Investments; and Chairman, Investment Company Institute.
Annual Report | 59
| Number of Portfolios in | |||||
| Name, Year of Birth | Length of | Fund Complex Overseen | Other Directorships Held | ||
| and Address | Position | Time Served | by Board Member* | During at Least the Past 5 Years | |
| **Peter A. Langerman (1955) | Trustee, | Trustee since | 11 | American International Group, Inc. | |
| c/o Franklin Mutual Advisers, LLC | President and | 2007, President | (AIG) Credit Facility Trust | ||
| 101 John F. Kennedy Parkway | Chief Executive | and Chief | (2010–2011) | ||
| Short Hills, NJ 07078-2702 | Officer – | Executive Officer – | |||
| Investment | Investment | ||||
| Management | Management | ||||
| since 2005 | |||||
| Principal Occupation During at Least the Past 5 Years: | |||||
| Chairman of the Board, Chief Executive Officer and President, Franklin Mutual Advisers, LLC; officer and/or director, as the case may be, of | |||||
| four of the investment companies in Franklin Templeton Investments. | |||||
| Alison E. Baur (1964) | Vice President | Since 2012 | Not Applicable | Not Applicable | |
| One Franklin Parkway | |||||
| San Mateo, CA 94403-1906 | |||||
| Principal Occupation During at Least the Past 5 Years: | |||||
| Deputy General Counsel, Franklin Templeton Investments; and officer of some of the other subsidiaries of Franklin Resources, Inc. and of 46 | |||||
| of the investment companies in Franklin Templeton Investments. | |||||
| Philippe Brugere-Trelat (1949) | Vice President | Since 2005 | Not Applicable | Not Applicable | |
| 101 John F. Kennedy Parkway | |||||
| Short Hills, NJ 07078-2789 | |||||
| Principal Occupation During at Least the Past 5 Years: | |||||
| Executive Vice President, Franklin Mutual Advisers, LLC; officer of three of the investment companies in Franklin Templeton Investments; | |||||
| and formerly, Portfolio Manager of Eurovest SA (French registered Investment Company, Sicav). | |||||
| Laura F. Fergerson (1962) | Chief Executive | Since 2009 | Not Applicable | Not Applicable | |
| One Franklin Parkway | Officer – | ||||
| San Mateo, CA 94403-1906 | Finance and | ||||
| Administration | |||||
| Principal Occupation During at Least the Past 5 Years: | |||||
| Senior Vice President, Franklin Templeton Services, LLC; and officer of 46 of the investment companies in Franklin Templeton Investments. | |||||
| Aliya S. Gordon (1973) | Vice President | Since 2009 | Not Applicable | Not Applicable | |
| One Franklin Parkway | |||||
| San Mateo, CA 94403-1906 | |||||
| Principal Occupation During at Least the Past 5 Years: | |||||
| Senior Associate General Counsel, Franklin Templeton Investments; officer of 46 of the investment companies in Franklin Templeton | |||||
| Investments; and formerly, Litigation Associate, Steefel, Levitt & Weiss, LLP (2000-2004). | |||||
| Steven J. Gray (1955) | Secretary and | Secretary since | Not Applicable | Not Applicable | |
| One Franklin Parkway | Vice President | 2005 and Vice | |||
| San Mateo, CA 94403-1906 | President since | ||||
| 2009 | |||||
Principal Occupation During at Least the Past 5 Years:
Senior Associate General Counsel, Franklin Templeton Investments; Vice President, Franklin Templeton Distributors, Inc.; and officer of 46 of the investment companies in Franklin Templeton Investments.
60 | Annual Report
| Number of Portfolios in | ||||
| Name, Year of Birth | Length of | Fund Complex Overseen | Other Directorships Held | |
| and Address | Position | Time Served | by Board Member* | During at Least the Past 5 Years |
| Selena L. Holmes (1965) | Vice President | Since 2012 | Not Applicable | Not Applicable |
| 100 Fountain Parkway | – AML | |||
| St. Petersburg, FL 33716-1205 | Compliance | |||
| Principal Occupation During at Least the Past 5 Years: | ||||
| Director, Global Compliance Monitoring; and officer of 46 of the investment companies in Franklin Templeton Investments. | ||||
| Robert Kubilis (1973) | Treasurer, | Since 2012 | Not Applicable | Not Applicable |
| 300 S.E. 2nd Street | Chief Financial | |||
| Fort Lauderdale, FL 33301-1923 | Officer and | |||
| Chief | ||||
| Accounting | ||||
| Officer | ||||
| Principal Occupation During at Least the Past 5 Years: | ||||
| Assistant Treasurer, Fund Accounting, Franklin Templeton Investments; and officer of five of the investment companies in Franklin Templeton | ||||
| Investments. | ||||
| Kimberly H. Novotny (1972) | Vice President | Since March 2013 | Not Applicable | Not Applicable |
| 300 S.E. 2nd Street | ||||
| Fort Lauderdale, FL 33301-1923 | ||||
| Principal Occupation During at Least the Past 5 Years: | ||||
| Associate General Counsel, Franklin Templeton Investments; Vice President and Secretary, Fiduciary Trust International of the South; Vice | ||||
| President, Templeton Investment Counsel, LLC; Assistant Secretary, Franklin Resources, Inc.; and officer of 46 of the investment companies | ||||
| in Franklin Templeton Investments. | ||||
| Robert C. Rosselot (1960) | Chief | Since March 2013 | Not Applicable | Not Applicable |
| 300 S.E. 2nd Street | Compliance | |||
| Fort Lauderdale, FL 33301-1923 | Officer | |||
| Principal Occupation During at Least the Past 5 Years: | ||||
| Director, Global Compliance, Franklin Templeton Investments; officer of 46 of the investment companies in Franklin Templeton Investments; | ||||
| and formerly, Senior Associate General Counsel, Franklin Templeton Investments (2007-2013); and Secretary and Vice President, Templeton | ||||
| Group of Funds (2004-2013). | ||||
| Karen L. Skidmore (1952) | Vice President | Since 2009 | Not Applicable | Not Applicable |
| One Franklin Parkway | ||||
| San Mateo, CA 94403-1906 | ||||
| Principal Occupation During at Least the Past 5 Years: | ||||
| Senior Associate General Counsel, Franklin Templeton Investments; and officer of 46 of the investment companies in Franklin Templeton | ||||
| Investments. | ||||
| Craig S. Tyle (1960) | Vice President | Since 2005 | Not Applicable | Not Applicable |
| One Franklin Parkway | ||||
| San Mateo, CA 94403-1906 | ||||
Principal Occupation During at Least the Past 5 Years:
General Counsel and Executive Vice President, Franklin Resources, Inc.; and officer of some of the other subsidiaries of Franklin Resources, Inc. and of 46 of the investment companies in Franklin Templeton Investments.
Annual Report | 61
| Number of Portfolios in | ||||
| Name, Year of Birth | Length of | Fund Complex Overseen | Other Directorships Held | |
| and Address | Position | Time Served | by Board Member* | During at Least the Past 5 Years |
| Lori A. Weber (1964) | Vice President | Since 2011 | Not Applicable | Not Applicable |
| 300 S.E. 2nd Street | ||||
| Fort Lauderdale, FL 33301-1923 | ||||
Principal Occupation During at Least the Past 5 Years:
Senior Associate General Counsel, Franklin Templeton Investments; Assistant Secretary, Franklin Resources, Inc.; Vice President and
Secretary, Templeton Investment Counsel, LLC; Vice President, Fiduciary Trust International of the South; and officer of 46 of the investment
companies in Franklin Templeton Investments.
*We base the number of portfolios on each separate series of the U.S. registered investment companies within the Franklin Templeton Investments fund complex. These portfolios
have a common investment manager or affiliated investment managers.
**Gregory E. Johnson is considered to be an interested person of the Fund under the federal securities laws due to his position as an officer and director of Franklin Resources, Inc.,
which is the parent company of the Fund’s investment manager and distributor. Peter A. Langerman is considered to be an interested person of the Fund under the federal securities
laws due to his position as an officer of Franklin Mutual Advisers, LLC, which is an affiliate of the Fund’s investment manager.
Note 1: Officer information is current as of the date of this report. It is possible that after this date, information about officers may change.
The Fund’s Board has determined that certain of the members of the Audit Committee, including Ann Torre Bates, are audit committee financial experts, and “independent,”
under those provisions of the Sarbanes-Oxley Act of 2002, and the rules and form amendments adopted by the Securities and Exchange Commission, relating to audit
committee financial experts.
The Statement of Additional Information (SAI) includes additional information about the board members and is available, without charge, upon request. Shareholders may
call (800) DIAL BEN/342-5236 to request the SAI.
62 | Annual Report
Mutual Global Discovery Fund
Shareholder Information
Proxy Voting Policies and Procedures
The Fund’s investment manager has established Proxy Voting Policies and Procedures (Policies) that the Fund uses to determine how to vote proxies relating to portfolio securities. Shareholders may view the Fund’s complete Policies online at franklintempleton.com. Alternatively, shareholders may request copies of the Policies free of charge by calling the Proxy Group collect at (954) 527-7678 or by sending a written request to: Franklin Templeton Companies, LLC, 300 S.E. 2nd Street, Fort Lauderdale, FL 33301, Attention: Proxy Group. Copies of the Fund’s proxy voting records are also made available online at franklintempleton.com and posted on the U.S. Securities and Exchange Commission’s website at sec.gov and reflect the most recent 12-month period ended June 30.
Quarterly Statement of Investments
The Fund files a complete statement of investments with the U.S. Securities and Exchange Commission for the first and third quarters for each fiscal year on Form N-Q. Shareholders may view the filed Form N-Q by visiting the Commission’s website at sec.gov. The filed form may also be viewed and copied at the Commission’s Public Reference Room in Washington, DC. Information regarding the operations of the Public Reference Room may be obtained by calling (800) SEC-0330.
Householding of Reports and Prospectuses
You will receive the Fund’s financial reports every six months as well as an annual updated summary prospectus (prospectus available upon request). To reduce Fund expenses, we try to identify related shareholders in a household and send only one copy of the financial reports and summary prospectus. This process, called “householding,” will continue indefinitely unless you instruct us otherwise. If you prefer not to have these documents householded, please call us at (800) 632-2301. At any time you may view current prospectuses/summary prospectuses and financial reports on our website. If you choose, you may receive these documents through electronic delivery.
Annual Report | 63
This page intentionally left blank.
| Contents | |||||||
| Shareholder Letter | 1 | Annual Report | Financial Statements | 30 | Tax Information | 50 | |
| Mutual International Fund | 5 | Notes to Financial | Board Members and Officers | 52 | |||
| Statements | 34 | ||||||
| Performance Summary | 12 | Shareholder Information | 57 | ||||
| Report of Independent | |||||||
| Your Fund’s Expenses | 17 | ||||||
| Registered Public | |||||||
| Financial Highlights and | Accounting Firm | 49 | |||||
| Statement of Investments | 19 | ||||||
Annual Report
Mutual International Fund
Your Fund’s Goals and Main Investments: Mutual International Fund seeks capital appreciation, which may occasionally be short term, with income as a secondary goal. The Fund normally invests at least 80% of its net assets in securities of non-U.S. issuers that the manager believes are available at prices less than their intrinsic value. The Fund invests, to a lesser extent, in risk arbitrage securities and distressed companies.
| Performance data represent past |
| performance, which does not |
| guarantee future results. |
| Investment return and principal |
| value will fluctuate, and you may |
| have a gain or loss when you sell |
| your shares. Current performance |
| may differ from figures shown. |
| Please visit franklintempleton.com |
| or call (800) 342-5236 for most |
| recent month-end performance. |
This annual report for Mutual International Fund covers the fiscal year ended December 31, 2013.
Performance Overview
Mutual International Fund – Class Z posted a +19.71% cumulative total return for the 12 months under review. In comparison, the Fund’s benchmark, the MSCI Europe, Australasia, Far East (EAFE) Index Net Return (Local Currency), which measures equity performance in global developed markets outside the U.S. and Canada, generated a +26.93% total return.1 You can find more of the Fund’s performance data in the Performance Summary beginning on page 12.
Economic and Market Overview
The 12 months under review were characterized by reinvigorated policy support and an economic recovery in developed markets. However, differences in global economic trends corresponded with increasingly divergent monetary policies, and growth in emerging market economies tended to slow. The central banks of key developed markets generally reaffirmed their accommodative monetary stances while some emerging market counterparts tightened policy rates as they sought to control inflation and currency depreciation.
1. Source: © 2014 Morningstar. All Rights Reserved. The information contained herein: (1) is proprietary to Morningstar and/or its content providers; (2) may not be copied or distributed; and (3) is not warranted to be accurate, complete or timely. Neither Morningstar nor its content providers are responsible for any damages or losses arising from any use of this information. The unmanaged index is calculated in local currency and includes reinvested daily net dividends. One cannot invest directly in an index, and an index is not representative of the Fund’s portfolio.
The dollar value, number of shares or principal amount, and names of all portfolio holdings are listed in the Fund’s Statement of Investments (SOI). The SOI begins on page 24.
Annual Report | 5

Outside the U.S., the eurozone emerged from its longest recession on record during 2013’s second half and Japan’s growth moderated. The European Central Bank reduced its key interest rate to a record low and pledged to maintain systemic support following political turmoil in Greece, Spain, Portugal and Italy. Germany’s re-election of Chancellor Angela Merkel was largely perceived as a vote of support for ongoing eurozone reform measures. In Asia, the Bank of Japan set an explicit inflation target and pledged to double bond purchases in an unprecedented wave of policy reform. The U.S. dollar fell versus the euro but rose versus the Japanese yen in 2013.
Growth in many emerging markets moderated based on lower domestic demand, falling exports and weakening commodity prices. Political turmoil in certain emerging markets, the Fed’s potential tapering of its asset purchase program and the Chinese central bank’s effort to tighten liquidity to curb real estate and credit speculation led to a sell-off in emerging market equities and a sharp depreciation in regional currencies against the U.S. dollar. Central banks in Brazil, India and Indonesia raised interest rates in the second half of 2013 as they sought to curb inflation.
In the U.S., economic growth and employment trends generally exceeded expectations. The U.S. Federal Reserve Board (Fed) expanded its asset purchase program to $85 billion per month from $40 billion early in the year. After encouraging economic and employment reports, the Fed announced in December it would reduce its monthly bond purchases by $10 billion beginning in January 2014; however, the Fed committed to keeping interest rates low. In October, the federal government temporarily shut down after Congress failed to authorize routine federal funding amid a disagreement over a new health care law. However, Congress subsequently agreed to fund the government through early 2014 and later passed a two-year budget deal that could ease automatic spending cuts and lower the risk of another shutdown.
The stock market rally in developed markets accelerated during 2013 amid ongoing central bank commitments, continued corporate earnings strength and increasing signs of economic progress. Emerging market stocks rebounded toward period-end, although Latin American stocks trailed their emerging market peers. Oil prices rallied in the third quarter and rose for the year mainly owing to supply concerns related to geopolitical turmoil, but gold posted its largest annual price decline in more than three decades. Increasingly divergent economic and political circumstances during the period resulted in declining market correlations across regions and between asset classes, which many bottom-up investors perceived as more favorable.
6 | Annual Report
Investment Strategy
At Mutual Series, we are committed to our distinctive value approach to investing, which we believe can generate above-average risk-adjusted returns over time for our shareholders. Our major investment strategy is investing in undervalued stocks in Asia and Europe. We have the ability to invest in emerging markets, although this is unlikely to be a significant focus of our strategy. When selecting undervalued equities, we are always attracted to fundamentally strong companies with healthy balance sheets, high-quality assets, substantial free cash flow and shareholder-oriented management teams and whose stocks are trading at discounts to our assessment of the companies’ intrinsic or business value. We also look for asset-rich companies whose shares may be trading at depressed levels due to concerns over short-term earnings disappointments, litigation, management strategy or other perceived negatives. This strict value approach is not only intended to improve the likelihood of upside potential, but it is also intended to reduce the risk of substantial declines. While the vast majority of our undervalued equity investments are made in publicly traded companies internationally, we may invest occasionally in privately held companies as well.
We complement this more traditional investment strategy with two others. One is distressed investing, a highly specialized field that has proven quite profitable during certain periods over the years. Distressed investing is complex and can take many forms. The most common distressed investment the Fund undertakes is the purchase of financially troubled or bankrupt companies’ debt at a substantial discount to face value. After the financially distressed company is reorganized, the old debt is typically replaced with new securities issued by the financially stronger company.
The other piece of our investment strategy is participating in arbitrage situations, another highly specialized field. When companies announce proposed mergers or takeovers, commonly referred to as “deals,” the target company may trade at a discount to the bid it ultimately accepts. One form of arbitrage involves purchasing the target company’s stock when it is trading below the value we believe it would receive in a deal. In keeping with our commitment to a relatively conservative investment approach, we typically focus our arbitrage efforts on announced deals, and eschew rumored deals or other situations we consider relatively risky.
In addition, it is our practice to hedge the Fund’s currency exposure when we deem it advantageous for our shareholders.
| Top 10 Sectors/Industries | ||
| Based on Equity Securities as of 12/31/13 | ||
| % of Total | ||
| Net Assets | ||
| Insurance | 19.4 | % |
| Commercial Banks | 6.5 | % |
| Specialty Retail | 5.8 | % |
| Hotels, Restaurants & Leisure | 5.5 | % |
| Media | 5.4 | % |
| Oil, Gas & Consumable Fuels | 4.9 | % |
| Auto Components | 4.1 | % |
| Diversified Financial Services | 4.0 | % |
| Food & Staples Retailing | 3.8 | % |
| Multiline Retail | 3.5 | % |
| What is meant by “hedge”? |
| To hedge a position is to seek to |
| reduce the risk of adverse price |
| movements in an asset. Normally, a |
| hedge is implemented as an offsetting |
| position in a related security, such as |
| a currency forward contract. |
| What is a currency forward |
| contract? |
| A currency forward contract, also |
| called a “currency forward,” is an |
| agreement between the Fund and a |
| counterparty to buy or sell a foreign |
| currency at a specific exchange rate |
| on a future date. |
Annual Report | 7
| Top 10 Equity Holdings | ||
| 12/31/13 | ||
| Company | % of Total | |
| Sector/Industry, Country | Net Assets | |
| Dufry AG | 1.9 | % |
| Specialty Retail, Switzerland | ||
| International Consolidated | ||
| Airlines Group SA | 1.8 | % |
| Airlines, U.K. | ||
| ING Groep NV, IDR | 1.6 | % |
| Diversified Financial Services, | ||
| Netherlands | ||
| UNIQA Insurance Group AG | 1.6 | % |
| Insurance, Austria | ||
| Direct Line Insurance Group PLC | 1.6 | % |
| Insurance, U.K. | ||
| Samsung Electronics Co. Ltd., ord. & pfd. 1.5% | ||
| Semiconductors & Semiconductor | ||
| Equipment, South Korea | ||
| Hana Financial Group Inc. | 1.5 | % |
| Commercial Banks, South Korea | ||
| Hyundai Motor Co., 2nd pfd. | 1.5 | % |
| Automobiles, South Korea | ||
| A.P. Moeller-Maersk AS, B | 1.5 | % |
| Marine, Denmark | ||
| Metro AG | 1.5 | % |
| Food & Staples Retailing, Germany | ||
| What is return on invested | ||
| capital (ROIC)? | ||
| ROIC is a measure of how well a | ||
| company generates earnings from | ||
| capital invested in its business. | ||
Manager’s Discussion
In an environment of generally rising equity prices, many Fund holdings increased in value during the 12 months under review. Three particularly strong performers were Chinese media advertising firm Sinomedia Holding, British-Spanish airline holding company International Consolidated Airlines Group and German retailer Metro.
Sinomedia Holding is a Beijing-based company that provides nationwide advertising coverage and campaign planning for advertisers. The company reported that a major private equity shareholder completed its gradual exit, with the final stake sold in May. We believe this investor’s exit eliminated what had been a drag on the stock. The company also reported better-than-expected results for the first half of the year, attributable to solid cost control and a recovery in advertising. In our assessment at year-end, Sinomedia continued to trade at an attractive valuation with considerable cash on the balance sheet and a dividend yield near 5%.
International Consolidated Airlines Group was formed from the 2011 merger of British Airways and Iberia. The company is a leading European long-haul carrier, with what we believe to be very strong positions in capacity-constrained North Atlantic routes and attractive mid-long haul routes to Africa, the Middle East and Latin America. Management has shown progress with improving the company’s return on invested capital (ROIC) through cost cutting initiatives, eliminating unprofitable routes and increasing margins on routes where the company has pricing power, namely, the North Atlantic. At period-end, we saw further upside potential as management’s efforts to improve ROIC in the company’s Iberia business were still in their early stages.
Metro, which runs Europe’s largest self-service, wholesale superstore business as well as Germany’s largest department store chain, benefited from ongoing restructuring efforts led by a revamped management team. Management’s plans to create value by exiting non-core markets while improving profitability in Germany supported improved investor sentiment as quarterly operating profits exceeded consensus estimates. A rise in net cash flow from operations and proceeds from the disposal of various business units allowed Metro to significantly reduce its net debt. At period-end, the company was also considering a spin-off of its Russian operations, a move we believed could potentially unlock further value. Additionally, shares were positively affected by rising sentiment that European consumer spending is poised to grow.
8 | Annual Report
During the period under review, some of the Fund’s holdings negatively affected performance. These included Australia-listed mining services company Boart Longyear, automobile dealer China Zheng Tong Auto Services Holdings and U.K.-based RSA Insurance Group.
Boart Longyear is a global provider of mineral exploration drilling services and products. Declining commodity prices contributed to reduced demand for the company’s products and services during the year as mining companies sought to reduce expenses. At its annual general meeting in May, the company announced it anticipated a sizable decline in rig utilization rates and anticipated 2013 revenues and earnings to come in at the low end of consensus forecasts. By year-end, we exited our position in Boart Longyear as we believed demand would remain weak and significant uncertainty remained about management’s efforts to cut costs and fortify the balance sheet.
China Zheng Tong Auto Services is an investment holding company that operates automobile dealerships primarily located in China’s inland cities. In the first half of 2013, the company announced fiscal year results that fell short of market expectations owing to disappointing vehicle sales numbers. The stock came under further pressure later in 2013 based on comments from China’s Dealers Association that it expected vehicle production would be in overcapacity for a few years. Although new sales matter for China Zheng Tong, we have always viewed the higher margin after-sales service revenues as the greatest source of potential value for this company, aided by growth in demand for luxury cars as China’s wealth effect has spread inland.
After cutting its dividend early in 2013, RSA Insurance Group suffered substantial weather-related losses, which precluded the company from achieving its annual return on equity target. RSA’s share price came under additional pressure in November when the company announced it would suspend the chief executive officer, chief financial officer and claims director of its Irish unit amid an investigation into aggressive reserve accounting practices.
During the year, the Fund held currency forwards to hedge a portion of the currency risk of the portfolio’s non-U.S. dollar investments. The hedges had a minor negative impact on the Fund’s performance during the period.
| What is return on equity? |
| Return on equity is an amount, |
| expressed as a percentage, earned |
| on a company’s common stock |
| investment for a given period. Return |
| on equity tells common shareholders |
| how effectually their money is being |
| employed. Comparing percentages |
| for current and prior periods also |
| reveals trends, and comparison with |
| industry composites reveals how well |
| a company is holding its own against |
| its competitors. |
Annual Report | 9
Thank you for your continued participation in Mutual International Fund.
We look forward to continuing to serve your investment needs.

Mutual International Fund
CFA® is a trademark owned by CFA Institute.
The foregoing information reflects our analysis, opinions and portfolio holdings as of December 31, 2013, the end of the reporting period. The way we implement our main investment strategies and the resulting portfolio holdings may change depending on factors such as market and economic conditions. These opinions may not be relied upon as investment advice or an offer for a particular security. The information is not a complete analysis of every aspect of any market, country, industry, security or the Fund. Statements of fact are from sources considered reliable, but the investment manager makes no representation or warranty as to their completeness or accuracy. Although historical performance is no guarantee of future results, these insights may help you understand our investment management philosophy.
10 | Annual Report
Philippe Brugere-Trelat has been co-portfolio manager for Mutual International Fund since 2009. Mr. Brugere-Trelat has also served as lead portfolio manager for Mutual European Fund since 2005 and as co-portfolio manager for Mutual Global Discovery Fund since 2009. He has been a member of the management team of the Mutual Series Funds since 2004, when he rejoined Franklin Templeton Investments. Previously, he was president and portfolio manager of Eurovest. Between 1984 and 1994, Mr. Brugere-Trelat was employed at Heine Securities Corporation, the Fund’s former manager.
Andrew Sleeman has been co-portfolio manager for Mutual International Fund since 2009. He has also served as lead portfolio manager for Mutual Financial Services Fund since 2009. Mr. Sleeman joined Franklin Templeton Investments in 2007. Previously, he was with Fox-Pitt, Kelton, a financials specialist firm, where he focused on international financial equities. Prior to that, he worked in international equities at BNP Paribas. Mr. Sleeman also worked in Australia in the fixed income division of JP Morgan Investment Management.
Annual Report | 11
Performance Summary as of 12/31/13
Your dividend income will vary depending on dividends or interest paid by securities in the Fund’s portfolio, adjusted for operating expenses of each class. Capital gain distributions are net profits realized from the sale of portfolio securities. The performance table and graphs do not reflect any taxes that a shareholder would pay on Fund dividends, capital gain distributions, if any, or any realized gains on the sale of Fund shares. Total return reflects reinvestment of the Fund’s dividends and capital gain distributions, if any, and any unrealized gains or losses.
| Price and Distribution Information | ||||||||
| Class Z (Symbol: FMIZX) | Change | 12/31/13 | 12/31/12 | |||||
| Net Asset Value (NAV) | +$ | 2.32 | $ | 15.90 | $ | 13.58 | ||
| Distributions (1/1/13–12/31/13) | ||||||||
| Dividend Income | $ | 0.2449 | ||||||
| Short-Term Capital Gain | $ | 0.0684 | ||||||
| Long-Term Capital Gain | $ | 0.0340 | ||||||
| Total | $ | 0.3473 | ||||||
| Class A (Symbol: FMIAX) | Change | 12/31/13 | 12/31/12 | |||||
| Net Asset Value (NAV) | +$ | 2.30 | $ | 15.84 | $ | 13.54 | ||
| Distributions (1/1/13–12/31/13) | ||||||||
| Dividend Income | $ | 0.2084 | ||||||
| Short-Term Capital Gain | $ | 0.0684 | ||||||
| Long-Term Capital Gain | $ | 0.0340 | ||||||
| Total | $ | 0.3108 | ||||||
| Class C (Symbol: FCMIX) | Change | 12/31/13 | 12/31/12 | |||||
| Net Asset Value (NAV) | +$ | 2.27 | $ | 15.68 | $ | 13.41 | ||
| Distributions (1/1/13–12/31/13) | ||||||||
| Dividend Income | $ | 0.1075 | ||||||
| Short-Term Capital Gain | $ | 0.0684 | ||||||
| Long-Term Capital Gain | $ | 0.0340 | ||||||
| Total | $ | 0.2099 | ||||||
| Class R (Symbol: FRMIX) | Change | 12/31/13 | 12/31/12 | |||||
| Net Asset Value (NAV) | +$ | 2.29 | $ | 15.83 | $ | 13.54 | ||
| Distributions (1/1/13–12/31/13) | ||||||||
| Dividend Income | $ | 0.1894 | ||||||
| Short-Term Capital Gain | $ | 0.0684 | ||||||
| Long-Term Capital Gain | $ | 0.0340 | ||||||
| Total | $ | 0.2918 | ||||||
| Class R6 (Symbol: n/a) | Change | 12/31/13 | 5/1/13 | |||||
| Net Asset Value (NAV) | +$ | 1.61 | $ | 15.87 | $ | 14.26 | ||
| Distributions (5/1/13–12/31/13) | ||||||||
| Dividend Income | $ | 0.2674 | ||||||
| Short-Term Capital Gain | $ | 0.0684 | ||||||
| Long-Term Capital Gain | $ | 0.0340 | ||||||
| Total | $ | 0.3698 | ||||||
| 12 | Annual Report | ||||||||
Performance Summary (continued)
Performance1
Cumulative total return excludes sales charges. Aggregate and average annual total returns and value of $10,000 investment include maximum sales charges. Class Z/R/R6: no sales charges; Class A: 5.75% maximum initial sales charge; Class C: 1% contingent deferred sales charge in first year only.
| Class Z | 1-Year | 3-Year | Inception (5/1/09) | ||||||
| Cumulative Total Return2 | + | 19.71 | % | + | 23.80 | % | + | 82.94 | % |
| Average Annual Total Return3 | + | 19.71 | % | + | 7.38 | % | + | 13.81 | % |
| Value of $10,000 Investment4 | $ | 11,971 | $ | 12,380 | $ | 18,294 | |||
| Total Annual Operating Expenses5 | 1.17% (with waiver) | 1.75% (without waiver) | |||||||
| Class A | 1-Year | 3-Year | Inception (5/1/09) | ||||||
| Cumulative Total Return2 | + | 19.34 | % | + | 22.67 | % | + | 80.42 | % |
| Average Annual Total Return3 | + | 12.45 | % | + | 4.96 | % | + | 12.04 | % |
| Value of $10,000 Investment4 | $ | 11,245 | $ | 11,563 | $ | 17,005 | |||
| Total Annual Operating Expenses5 | 1.47% (with waiver) | 2.05% (without waiver) | |||||||
| Class C | 1-Year | 3-Year | Inception (5/1/09) | ||||||
| Cumulative Total Return2 | + | 18.54 | % | + | 20.12 | % | + | 74.50 | % |
| Average Annual Total Return3 | + | 17.54 | % | + | 6.30 | % | + | 12.67 | % |
| Value of $10,000 Investment4 | $ | 11,754 | $ | 12,012 | $ | 17,450 | |||
| Total Annual Operating Expenses5 | 2.17% (with waiver) | 2.75% (without waiver) | |||||||
| Class R | 1-Year | 3-Year | Inception (5/1/09) | ||||||
| Cumulative Total Return2 | + | 19.13 | % | + | 21.93 | % | + | 78.62 | % |
| Average Annual Total Return3 | + | 19.13 | % | + | 6.83 | % | + | 13.23 | % |
| Value of $10,000 Investment4 | $ | 11,913 | $ | 12,193 | $ | 17,862 | |||
| Total Annual Operating Expenses5 | 1.67% (with waiver) | 2.25% (without waiver) | |||||||
| Class R6 | Inception (5/1/13) | ||||||||
| Cumulative Total Return2 | + | 14.09 | % | ||||||
| Aggregate Total Return6 | + | 14.09 | % | ||||||
| Value of $10,000 Investment4 | $ | 11,409 | |||||||
| Total Annual Operating Expenses5 | 1.00% (with waiver) | 1.58% (without waiver) | |||||||
Performance data represent past performance, which does not guarantee future results. Investment return and principal value will fluctuate, and you may have a gain or loss when you sell your shares. Current performance may differ from figures shown. For most recent month-end performance, go to franklintempleton.com or call (800) 342-5236.
Annual Report | 13
Performance Summary (continued)
Total Return Index Comparison for a Hypothetical $10,000 Investment1
Total return represents the change in value of an investment over the periods shown. It includes any applicable maximum sales charge, Fund expenses, account fees and reinvested distributions. The unmanaged index is calculated in local currency and includes reinvested daily net dividends. It differs from the Fund in composition and does not pay management fees or expenses. One cannot invest directly in an index.

14 | Annual Report

Annual Report | 15

Endnotes
All investments involve risks, including possible loss of principal. Value securities may not increase in price as anticipated or may decline further in value. Special risks are associated with foreign investing, including currency fluctuations, economic instability and political developments; investments in emerging markets involve heightened risks related to the same factors. Because the Fund invests its assets primarily in companies in a specific region, it is subject to greater risks of adverse developments in that region and/or the surrounding regions than a fund that is more broadly diversified geographically. Political, social or economic disruptions in the region, even in countries in which the Fund is not invested, may adversely affect the value of securities held by the Fund. Current political uncertainty surrounding the European Union (EU) and its membership may increase market volatility. The financial instability of some countries in the EU, including Greece, Italy and Spain, together with the risk of that impacting other more stable countries, may increase the economic risk of investing in companies in Europe. The Fund’s investments in companies engaged in mergers, reorganizations or liquidations also involve special risks as pending deals may not be completed on time or on favorable terms. The Fund is actively managed but there is no guarantee that the manager’s investment decisions will produce the desired results. The Fund’s prospectus also includes a description of the main investment risks.
| Class Z: | Shares are available to certain eligible investors as described in the prospectus. |
| Class C: | These shares have higher annual fees and expenses than Class A shares. |
| Class R: | Shares are available to certain eligible investors as described in the prospectus. These shares have |
| higher annual fees and expenses than Class A shares. | |
| Class R6: | Shares are available to certain eligible investors as described in the prospectus. |
1. The Fund has an expense reduction contractually guaranteed through at least 4/30/14. Fund investment results
reflect the expense reduction, to the extent applicable; without this reduction, the results would have been lower.
2. Cumulative total return represents the change in value of an investment over the periods indicated.
3. Average annual total return represents the average annual change in value of an investment over the periods indicated.
4. These figures represent the value of a hypothetical $10,000 investment in the Fund over the periods indicated.
5. Figures are as stated in the Fund’s current prospectus. In periods of market volatility, assets may decline
significantly, causing total annual Fund operating expenses to become higher than the figures shown.
6. Aggregate total return represents the change in value of an investment for the period indicated. Since Class R6
shares have existed for less than one year, average annual total return is not available.
7. Source: © 2014 Morningstar. The MSCI EAFE Index Net Return (Local Currency) is a free float-adjusted, market
capitalization-weighted index designed to measure equity market performance of global developed markets excluding
the U.S. and Canada.
16 | Annual Report
Your Fund’s Expenses
As a Fund shareholder, you can incur two types of costs:
- Transaction costs, including sales charges (loads) on Fund purchases; and
- Ongoing Fund costs, including management fees, distribution and service (12b-1) fees, and other
Fund expenses. All mutual funds have ongoing costs, sometimes referred to as operating expenses.
The following table shows ongoing costs of investing in the Fund and can help you understand these costs and compare them with those of other mutual funds. The table assumes a $1,000 investment held for the six months indicated.
Actual Fund Expenses
The first line (Actual) for each share class listed in the table provides actual account values and expenses. The “Ending Account Value” is derived from the Fund’s actual return, which includes the effect of Fund expenses.
You can estimate the expenses you paid during the period by following these steps. Of course, your account value and expenses will differ from those in this illustration:
| 1. | Divide your account value by $1,000. |
| If an account had an $8,600 value, then $8,600 ÷ $1,000 = 8.6. | |
| 2. | Multiply the result by the number under the heading “Expenses Paid During Period.” |
| If Expenses Paid During Period were $7.50, then 8.6 x $7.50 = $64.50. |
In this illustration, the estimated expenses paid this period are $64.50.
Hypothetical Example for Comparison with Other Funds
Information in the second line (Hypothetical) for each class in the table can help you compare ongoing costs of investing in the Fund with those of other mutual funds. This information may not be used to estimate the actual ending account balance or expenses you paid during the period. The hypothetical “Ending Account Value” is based on the actual expense ratio for each class and an assumed 5% annual rate of return before expenses, which does not represent the Fund’s actual return. The figure under the heading “Expenses Paid During Period” shows the hypothetical expenses your account would have incurred under this scenario. You can compare this figure with the 5% hypothetical examples that appear in shareholder reports of other funds.
Annual Report | 17
Your Fund’s Expenses (continued)
Please note that expenses shown in the table are meant to highlight ongoing costs and do not reflect any transaction costs, such as sales charges. Therefore, the second line for each class is useful in comparing ongoing costs only, and will not help you compare total costs of owning different funds. In addition, if transaction costs were included, your total costs would have been higher. Please refer to the Fund prospectus for additional information on operating expenses.
| Beginning Account | Ending Account | Expenses Paid During | ||||
| Class Z | Value 7/1/13 | Value 12/31/13 | Period* 7/1/13–12/31/13 | |||
| Actual | $ | 1,000 | $ | 1,167.00 | $ | 6.39 |
| Hypothetical (5% return before expenses) | $ | 1,000 | $ | 1,019.31 | $ | 5.96 |
| Class A | ||||||
| Actual | $ | 1,000 | $ | 1,165.00 | $ | 8.02 |
| Hypothetical (5% return before expenses) | $ | 1,000 | $ | 1,017.80 | $ | 7.48 |
| Class C | ||||||
| Actual | $ | 1,000 | $ | 1,161.10 | $ | 11.82 |
| Hypothetical (5% return before expenses) | $ | 1,000 | $ | 1,014.27 | $ | 11.02 |
| Class R | ||||||
| Actual | $ | 1,000 | $ | 1,163.80 | $ | 9.11 |
| Hypothetical (5% return before expenses) | $ | 1,000 | $ | 1,016.79 | $ | 8.49 |
| Class R6 | ||||||
| Actual | $ | 1,000 | $ | 1,167.90 | $ | 5.46 |
| Hypothetical (5% return before expenses) | $ | 1,000 | $ | 1,020.16 | $ | 5.09 |
*Expenses are calculated using the most recent six-month expense ratio, net of expense waivers, annualized for each class (Z: 1.17%; A: 1.47%; C: 2.17%; R: 1.67%; and R6: 1.00%), multiplied by the average account value over the period, multiplied by 184/365 to reflect the one-half year period.
18 | Annual Report
| Mutual International Fund | |||||||||||||||
| Financial Highlights | |||||||||||||||
| Year Ended December 31, | |||||||||||||||
| Class Z | 2013 | 2012 | 2011 | 2010 | 2009 | a | |||||||||
| Per share operating performance | |||||||||||||||
| (for a share outstanding throughout the year) | |||||||||||||||
| Net asset value, beginning of year | $ | 13.58 | $ | 11.83 | $ | 13.81 | $ | 12.59 | $ | 10.00 | |||||
| Income from investment operationsb: | |||||||||||||||
| Net investment incomec | 0.24 | 0.24 | 0.28 | 0.22 | 0.14 | ||||||||||
| Net realized and unrealized gains (losses) | 2.42 | 1.68 | (1.81 | ) | 1.66 | 2.68 | |||||||||
| Total from investment operations | 2.66 | 1.92 | (1.53 | ) | 1.88 | 2.82 | |||||||||
| Less distributions from: | |||||||||||||||
| Net investment income | (0.24 | ) | (0.15 | ) | (0.30 | ) | (0.49 | ) | (0.17 | ) | |||||
| Net realized gains | (0.10 | ) | (0.02 | ) | (0.15 | ) | (0.17 | ) | (0.06 | ) | |||||
| Total distributions | (0.34 | ) | (0.17 | ) | (0.45 | ) | (0.66 | ) | (0.23 | ) | |||||
| Net asset value, end of year | $ | 15.90 | $ | 13.58 | $ | 11.83 | $ | 13.81 | $ | 12.59 | |||||
| Total returnd | 19.71 | % | 16.30 | % | (11.08 | )% | 15.20 | % | 28.27 | % | |||||
| Ratios to average net assetse | |||||||||||||||
| Expenses before waiver, payments by affiliates and | |||||||||||||||
| expense reductionf | 1.49 | % | 1.75 | % | 1.80 | % | 2.77 | % | 4.42 | % | |||||
| Expenses net of waiver, payments by affiliates and | |||||||||||||||
| expense reductionf | 1.17 | %g | 1.17 | % | 1.17 | % | 1.17 | % | 1.17 | %g | |||||
| Expenses incurred in connection with securities sold short | —% | —% | —% | —% | 0.01 | % | |||||||||
| Net investment income | 1.64 | % | 1.70 | % | 2.12 | % | 1.70 | % | 1.91 | % | |||||
| Supplemental data | |||||||||||||||
| Net assets, end of year (000’s) | $ | 14,732 | $ | 10,354 | $ | 6,977 | $ | 7,968 | $ | 4,320 | |||||
| Portfolio turnover rate | 41.47 | % | 27.97 | % | 41.26 | % | 38.43 | % | 33.93 | % | |||||
aFor the period May 1, 2009 (commencement of operations) to December 31, 2009.
bThe amount shown for a share outstanding throughout the period may not correlate with the Statement of Operations for the period due to the timing of sales and repurchases of
the Fund shares in relation to income earned and/or fluctuating market value of the investments of the Fund.
cBased on average daily shares outstanding.
dTotal return is not annualized for periods less than one year.
eRatios are annualized for periods less than one year.
fIncludes dividend expense on securities sold short and borrowing fees, if any. See below for the ratios of such expenses to average net assets for the periods presented.
gBenefit of expense reduction rounds to less than 0.01%.
Annual Report | The accompanying notes are an integral part of these financial statements. | 19
| Mutual International Fund | |||||||||||||||
| Financial Highlights (continued) | |||||||||||||||
| Year Ended December 31, | |||||||||||||||
| Class A | 2013 | 2012 | 2011 | 2010 | 2009 | a | |||||||||
| Per share operating performance | |||||||||||||||
| (for a share outstanding throughout the year) | |||||||||||||||
| Net asset value, beginning of year | $ | 13.54 | $ | 11.81 | $ | 13.78 | $ | 12.58 | $ | 10.00 | |||||
| Income from investment operationsb: | |||||||||||||||
| Net investment incomec | 0.20 | 0.18 | 0.24 | 0.18 | 0.13 | ||||||||||
| Net realized and unrealized gains (losses) | 2.41 | 1.70 | (1.80 | ) | 1.66 | 2.67 | |||||||||
| Total from investment operations | 2.61 | 1.88 | (1.56 | ) | 1.84 | 2.80 | |||||||||
| Less distributions from: | |||||||||||||||
| Net investment income | (0.21 | ) | (0.13 | ) | (0.26 | ) | (0.47 | ) | (0.16 | ) | |||||
| Net realized gains | (0.10 | ) | (0.02 | ) | (0.15 | ) | (0.17 | ) | (0.06 | ) | |||||
| Total distributions | (0.31 | ) | (0.15 | ) | (0.41 | ) | (0.64 | ) | (0.22 | ) | |||||
| Net asset value, end of year | $ | 15.84 | $ | 13.54 | $ | 11.81 | $ | 13.78 | $ | 12.58 | |||||
| Total returnd | 19.34 | % | 16.01 | % | (11.39 | )% | 14.86 | % | 28.05 | % | |||||
| Ratios to average net assetse | |||||||||||||||
| Expenses before waiver, payments by affiliates and | |||||||||||||||
| expense reductionf | 1.79 | % | 2.05 | % | 2.11 | % | 3.05 | % | 4.70 | % | |||||
| Expenses net of waiver, payments by affiliates and | |||||||||||||||
| expense reductionf | 1.47 | %g | 1.47 | % | 1.48 | % | 1.45 | % | 1.45 | %g | |||||
| Expenses incurred in connection with securities sold short | —% | —% | —% | —% | 0.01 | % | |||||||||
| Net investment income | 1.34 | % | 1.40 | % | 1.81 | % | 1.42 | % | 1.63 | % | |||||
| Supplemental data | |||||||||||||||
| Net assets, end of year (000’s) | $ | 35,319 | $ | 18,221 | $ | 9,212 | $ | 8,144 | $ | 4,784 | |||||
| Portfolio turnover rate | 41.47 | % | 27.97 | % | 41.26 | % | 38.43 | % | 33.93 | % | |||||
aFor the period May 1, 2009 (commencement of operations) to December 31, 2009.
bThe amount shown for a share outstanding throughout the period may not correlate with the Statement of Operations for the period due to the timing of sales and repurchases of
the Fund shares in relation to income earned and/or fluctuating market value of the investments of the Fund.
cBased on average daily shares outstanding.
dTotal return does not reflect sales commissions or contingent deferred sales charges, if applicable, and is not annualized for periods less than one year.
eRatios are annualized for periods less than one year.
fIncludes dividend expense on securities sold short and borrowing fees, if any. See below for the ratios of such expenses to average net assets for the periods presented.
gBenefit of expense reduction rounds to less than 0.01%.
20 | The accompanying notes are an integral part of these financial statements. | Annual Report
| Mutual International Fund | |||||||||||||||
| Financial Highlights (continued) | |||||||||||||||
| Year Ended December 31, | |||||||||||||||
| Class C | 2013 | 2012 | 2011 | 2010 | 2009 | a | |||||||||
| Per share operating performance | |||||||||||||||
| (for a share outstanding throughout the year) | |||||||||||||||
| Net asset value, beginning of year | $ | 13.41 | $ | 11.74 | $ | 13.71 | $ | 12.54 | $ | 10.00 | |||||
| Income from investment operationsb: | |||||||||||||||
| Net investment incomec | 0.10 | 0.05 | 0.14 | 0.09 | 0.08 | ||||||||||
| Net realized and unrealized gains (losses) | 2.38 | 1.72 | (1.78 | ) | 1.64 | 2.66 | |||||||||
| Total from investment operations | 2.48 | 1.77 | (1.64 | ) | 1.73 | 2.74 | |||||||||
| Less distributions from: | |||||||||||||||
| Net investment income | (0.11 | ) | (0.08 | ) | (0.18 | ) | (0.39 | ) | (0.14 | ) | |||||
| Net realized gains | (0.10 | ) | (0.02 | ) | (0.15 | ) | (0.17 | ) | (0.06 | ) | |||||
| Total distributions | (0.21 | ) | (0.10 | ) | (0.33 | ) | (0.56 | ) | (0.20 | ) | |||||
| Net asset value, end of year | $ | 15.68 | $ | 13.41 | $ | 11.74 | $ | 13.71 | $ | 12.54 | |||||
| Total returnd | 18.54 | % | 15.14 | % | (11.98 | )% | 14.02 | % | 27.41 | % | |||||
| Ratios to average net assetse | |||||||||||||||
| Expenses before waiver, payments by affiliates and | |||||||||||||||
| expense reductionf | 2.49 | % | 2.75 | % | 2.80 | % | 3.77 | % | 5.42 | % | |||||
| Expenses net of waiver, payments by affiliates and | |||||||||||||||
| expense reductionf | 2.17 | %g | 2.17 | % | 2.17 | % | 2.17 | % | 2.17 | %g | |||||
| Expenses incurred in connection with securities sold short | —% | —% | —% | —% | 0.01 | % | |||||||||
| Net investment income | 0.64 | % | 0.70 | % | 1.12 | % | 0.70 | % | 0.91 | % | |||||
| Supplemental data | |||||||||||||||
| Net assets, end of year (000’s) | $ | 14,198 | $ | 10,503 | $ | 2,667 | $ | 2,103 | $ | 999 | |||||
| Portfolio turnover rate | 41.47 | % | 27.97 | % | 41.26 | % | 38.43 | % | 33.93 | % | |||||
aFor the period May 1, 2009 (commencement of operations) to December 31, 2009.
bThe amount shown for a share outstanding throughout the period may not correlate with the Statement of Operations for the period due to the timing of sales and repurchases of
the Fund shares in relation to income earned and/or fluctuating market value of the investments of the Fund.
cBased on average daily shares outstanding.
dTotal return does not reflect sales commissions or contingent deferred sales charges, if applicable, and is not annualized for periods less than one year.
eRatios are annualized for periods less than one year.
fIncludes dividend expense on securities sold short and borrowing fees, if any. See below for the ratios of such expenses to average net assets for the periods presented.
gBenefit of expense reduction rounds to less than 0.01%.
Annual Report | The accompanying notes are an integral part of these financial statements. | 21
| Mutual International Fund | |||||||||||||||
| Financial Highlights (continued) | |||||||||||||||
| Year Ended December 31, | |||||||||||||||
| Class R | 2013 | 2012 | 2011 | 2010 | 2009 | a | |||||||||
| Per share operating performance | |||||||||||||||
| (for a share outstanding throughout the year) | |||||||||||||||
| Net asset value, beginning of year | $ | 13.54 | $ | 11.82 | $ | 13.78 | $ | 12.58 | $ | 10.00 | |||||
| Income from investment operationsb: | |||||||||||||||
| Net investment incomec | 0.15 | 0.11 | 0.21 | 0.16 | 0.11 | ||||||||||
| Net realized and unrealized gains (losses) | 2.43 | 1.73 | (1.79 | ) | 1.64 | 2.68 | |||||||||
| Total from investment operations | 2.58 | 1.84 | (1.58 | ) | 1.80 | 2.79 | |||||||||
| Less distributions from: | |||||||||||||||
| Net investment income | (0.19 | ) | (0.10 | ) | (0.23 | ) | (0.43 | ) | (0.15 | ) | |||||
| Net realized gains | (0.10 | ) | (0.02 | ) | (0.15 | ) | (0.17 | ) | (0.06 | ) | |||||
| Total distributions | (0.29 | ) | (0.12 | ) | (0.38 | ) | (0.60 | ) | (0.21 | ) | |||||
| Net asset value, end of year | $ | 15.83 | $ | 13.54 | $ | 11.82 | $ | 13.78 | $ | 12.58 | |||||
| Total returnd | 19.13 | % | 15.70 | % | (11.53 | )% | 14.54 | % | 27.89 | % | |||||
| Ratios to average net assetse | |||||||||||||||
| Expenses before waiver, payments by affiliates and | |||||||||||||||
| expense reductionf | 1.99 | % | 2.25 | % | 2.30 | % | 3.27 | % | 4.92 | % | |||||
| Expenses net of waiver, payments by affiliates and | |||||||||||||||
| expense reductionf | 1.67 | %g | 1.67 | % | 1.67 | % | 1.67 | % | 1.67 | %g | |||||
| Expenses incurred in connection with securities sold short | —% | —% | —% | —% | 0.01 | % | |||||||||
| Net investment income | 1.14 | % | 1.20 | % | 1.62 | % | 1.20 | % | 1.41 | % | |||||
| Supplemental data | |||||||||||||||
| Net assets, end of year (000’s) | $ | 90 | $ | 42 | $ | 12 | $ | 14 | $ | 13 | |||||
| Portfolio turnover rate | 41.47 | % | 27.97 | % | 41.26 | % | 38.43 | % | 33.93 | % | |||||
aFor the period May 1, 2009 (commencement of operations) to December 31, 2009.
bThe amount shown for a share outstanding throughout the period may not correlate with the Statement of Operations for the period due to the timing of sales and repurchases of
the Fund shares in relation to income earned and/or fluctuating market value of the investments of the Fund.
cBased on average daily shares outstanding.
dTotal return is not annualized for periods less than one year.
eRatios are annualized for periods less than one year.
fIncludes dividend expense on securities sold short and borrowing fees, if any. See below for the ratios of such expenses to average net assets for the periods presented.
gBenefit of expense reduction rounds to less than 0.01%.
22 | The accompanying notes are an integral part of these financial statements. | Annual Report
| Mutual International Fund | |||
| Financial Highlights (continued) | |||
| Period Ended | |||
| December 31, | |||
| Class R6 | 2013 | a | |
| Per share operating performance | |||
| (for a share outstanding throughout the period) | |||
| Net asset value, beginning of period | $ | 14.26 | |
| Income from investment operationsb: | |||
| Net investment incomec | 0.15 | ||
| Net realized and unrealized gains (losses) | 1.83 | ||
| Total from investment operations | 1.98 | ||
| Less distributions from: | |||
| Net investment income | (0.27 | ) | |
| Net realized gains | (0.10 | ) | |
| Total distributions | (0.37 | ) | |
| Net asset value, end of period | $ | 15.87 | |
| Total returnd | 14.09 | % | |
| Ratios to average net assetse | |||
| Expenses before waiver, payments by affiliates and expense reduction | 2.89 | % | |
| Expenses net of waiver, payments by affiliates and expense reduction | 1.00 | %f | |
| Net investment income | 1.81 | % | |
| Supplemental data | |||
| Net assets, end of period (000’s) | $ | 6 | |
| Portfolio turnover rate | 41.47 | % | |
aFor the period May 1, 2013 (effective date) to December 31, 2013.
bThe amount shown for a share outstanding throughout the period may not correlate with the Statement of Operations for the period due to the timing of sales and repurchases of
the Fund shares in relation to income earned and/or fluctuating market value of the investments of the Fund.
cBased on average daily shares outstanding.
dTotal return is not annualized for periods less than one year.
eRatios are annualized for periods less than one year.
fBenefit of expense reduction rounds to less than 0.01%.
Annual Report | The accompanying notes are an integral part of these financial statements. | 23
Mutual International Fund
Statement of Investments, December 31, 2013
| Country | Shares | Value | ||
| Common Stocks 92.0% | ||||
| Aerospace & Defense 1.2% | ||||
| Safran SA | France | 11,505 | $ | 799,327 |
| Airlines 1.8% | ||||
| aInternational Consolidated Airlines Group SA | United Kingdom | 172,820 | 1,148,410 | |
| Auto Components 4.1% | ||||
| Chaowei Power Holdings Ltd. | China | 1,093,000 | 576,499 | |
| Pirelli & C. SpA | Italy | 48,082 | 832,001 | |
| Valeo SA | France | 5,069 | 560,790 | |
| Xinyi Glass Holdings Ltd. | Hong Kong | 768,000 | 678,432 | |
| 2,647,722 | ||||
| Capital Markets 2.0% | ||||
| a,bAcquisition 1234 PLC | United Kingdom | 2,282 | 2,494 | |
| aChina Cinda Asset Management Co. Ltd., H | China | 28,259 | 17,565 | |
| China Everbright Ltd. | Hong Kong | 436,000 | 690,462 | |
| Sun Hung Kai & Co. Ltd. | Hong Kong | 1,089,748 | 607,106 | |
| 1,317,627 | ||||
| Chemicals 0.9% | ||||
| Huabao International Holdings Ltd. | Hong Kong | 1,038,615 | 575,941 | |
| Commercial Banks 6.5% | ||||
| Aozora Bank Ltd. | Japan | 255,926 | 724,273 | |
| Barclays PLC | United Kingdom | 125,677 | 565,847 | |
| Hana Financial Group Inc. | South Korea | 23,386 | 972,455 | |
| HSBC Holdings PLC | United Kingdom | 64,690 | 709,511 | |
| KB Financial Group Inc. | South Korea | 17,663 | 706,871 | |
| Woori Finance Holdings Co. Ltd. | South Korea | 37,480 | 472,172 | |
| 4,151,129 | ||||
| Construction & Engineering 1.2% | ||||
| FLSmidth & Co. AS | Denmark | 2,700 | 147,406 | |
| Sinopec Engineering Group Co. Ltd. | China | 404,000 | 603,315 | |
| 750,721 | ||||
| Construction Materials 0.9% | ||||
| SA des Ciments Vicat | France | 7,577 | 562,797 | |
| Consumer Finance 0.7% | ||||
| Samsung Card Co. Ltd. | South Korea | 13,590 | 481,438 | |
| Containers & Packaging 0.7% | ||||
| Rexam PLC | United Kingdom | 48,813 | 428,598 | |
| Diversified Financial Services 4.0% | ||||
| Deutsche Boerse AG | Germany | 4,861 | 402,515 | |
| First Pacific Co. Ltd. | Hong Kong | 560,859 | 637,936 | |
| aING Groep NV, IDR | Netherlands | 73,653 | 1,023,228 | |
| Metro Pacific Investments Corp. | Philippines | 5,359,000 | 521,416 | |
| 2,585,095 |
24 | Annual Report
Mutual International Fund
Statement of Investments, December 31, 2013 (continued)
| Country | Shares | Value | ||
| Common Stocks (continued) | ||||
| Diversified Telecommunication Services 1.9% | ||||
| aHellenic Telecommunications Organization SA | Greece | 13,700 | $ | 182,225 |
| TDC AS | Denmark | 59,831 | 580,262 | |
| Vivendi SA | France | 17,264 | 454,867 | |
| 1,217,354 | ||||
| Food & Staples Retailing 3.8% | ||||
| China Resources Enterprise Ltd. | China | 176,000 | 584,446 | |
| Empire Co. Ltd., A | Canada | 4,555 | 311,257 | |
| Metro AG | Germany | 19,696 | 953,633 | |
| Tesco PLC | United Kingdom | 103,232 | 571,673 | |
| 2,421,009 | ||||
| Hotels, Restaurants & Leisure 5.5% | ||||
| Accor SA | France | 16,932 | 798,846 | |
| Genting Malaysia Bhd. | Malaysia | 463,300 | 618,958 | |
| Kuoni Reisen Holding AG, B | Switzerland | 1,389 | 627,117 | |
| Mandarin Oriental International Ltd. | Hong Kong | 476,361 | 795,523 | |
| REXLot Holdings Ltd. | Hong Kong | 4,928,968 | 667,421 | |
| 3,507,865 | ||||
| Industrial Conglomerates 1.3% | ||||
| Jardine Matheson Holdings Ltd. | Hong Kong | 5,400 | 282,474 | |
| Jardine Strategic Holdings Ltd. | Hong Kong | 9,200 | 294,400 | |
| Shanghai Industrial Holdings Ltd. | China | 68,350 | 250,329 | |
| Siemens AG | Germany | 283 | 38,650 | |
| 865,853 | ||||
| Insurance 19.4% | ||||
| ACE Ltd. | United States | 6,567 | 679,881 | |
| Aegon NV | Netherlands | 97,367 | 919,016 | |
| Ageas | Belgium | 19,404 | 826,062 | |
| Catlin Group Ltd. | United Kingdom | 56,166 | 540,128 | |
| China Pacific Insurance (Group) Co. Ltd., H | China | 167,645 | 657,232 | |
| Delta Lloyd NV | Netherlands | 33,742 | 837,275 | |
| Direct Line Insurance Group PLC | United Kingdom | 242,238 | 1,001,000 | |
| Great Eastern Holdings Ltd. | Singapore | 52,853 | 746,426 | |
| Korean Reinsurance Co. | South Korea | 66,075 | 716,620 | |
| Lancashire Holdings Ltd. | United Kingdom | 67,684 | 908,111 | |
| PICC Property and Casualty Co. Ltd., H | China | 289,802 | 429,788 | |
| Resolution Ltd. | United Kingdom | 162,304 | 951,004 | |
| RSA Insurance Group PLC | United Kingdom | 393,240 | 595,654 | |
| aStorebrand ASA | Norway | 135,269 | 845,278 | |
| UNIQA Insurance Group AG | Austria | 79,537 | 1,015,152 | |
| Zurich Insurance Group AG | Switzerland | 2,890 | 837,470 | |
| 12,506,097 | ||||
| Internet & Catalog Retail 1.2% | ||||
| GS Home Shopping Inc. | South Korea | 2,726 | 792,967 |
Annual Report | 25
Mutual International Fund
Statement of Investments, December 31, 2013 (continued)
| Country | Shares | Value | ||
| Common Stocks (continued) | ||||
| Machinery 1.8% | ||||
| aCNH Industrial NV (EUR Traded) | Netherlands | 28,377 | $ | 323,385 |
| aCNH Industrial NV, special voting (EUR Traded) | Netherlands | 16,517 | 188,228 | |
| KUKA AG | Germany | 13,205 | 618,466 | |
| 1,130,079 | ||||
| Marine 1.5% | ||||
| A.P. Moeller-Maersk AS, B | Denmark | 88 | 954,864 | |
| Media 5.4% | ||||
| aNine Entertainment Co. Holdings Ltd. | Australia | 375,885 | 661,001 | |
| Reed Elsevier PLC | United Kingdom | 33,489 | 498,397 | |
| RTL Group SA | Germany | 4,470 | 576,912 | |
| Seven West Media Ltd. | Australia | 400,878 | 840,933 | |
| Sinomedia Holding Ltd. | China | 1,244,346 | 882,589 | |
| 3,459,832 | ||||
| Metals & Mining 2.4% | ||||
| Anglo American PLC | United Kingdom | 29,531 | 645,607 | |
| aThyssenKrupp AG | Germany | 27,329 | 664,985 | |
| Voestalpine AG | Austria | 4,971 | 238,838 | |
| 1,549,430 | ||||
| Multi-Utilities 0.6% | ||||
| GDF Suez | France | 16,635 | 391,158 | |
| Multiline Retail 3.5% | ||||
| Hyundai Department Store Co. Ltd. | South Korea | 3,522 | 537,111 | |
| Marks & Spencer Group PLC | United Kingdom | 61,707 | 442,238 | |
| New World Department Store China | China | 1,151,000 | 647,167 | |
| Springland International Holdings Ltd. | China | 1,216,556 | 625,979 | |
| 2,252,495 | ||||
| Oil, Gas & Consumable Fuels 4.9% | ||||
| BG Group PLC | United Kingdom | 33,059 | 710,420 | |
| BP PLC | United Kingdom | 64,478 | 521,193 | |
| aCairn Energy PLC | United Kingdom | 161,720 | 722,637 | |
| Petroleo Brasileiro SA, ADR | Brazil | 30,743 | 423,639 | |
| Royal Dutch Shell PLC, A | United Kingdom | 22,484 | 801,157 | |
| 3,179,046 | ||||
| Pharmaceuticals 2.0% | ||||
| Novartis AG | Switzerland | 7,319 | 584,175 | |
| Teva Pharmaceutical Industries Ltd., ADR | Israel | 17,640 | 707,011 | |
| 1,291,186 | ||||
| Road & Rail 1.4% | ||||
| FirstGroup PLC | United Kingdom | 432,277 | 885,096 |
26 | Annual Report
| Mutual International Fund | |||||
| Statement of Investments, December 31, 2013 (continued) | |||||
| Country | Shares | Value | |||
| Common Stocks (continued) | |||||
| Semiconductors & Semiconductor Equipment 1.9% | |||||
| Samsung Electronics Co. Ltd. | South Korea | 340 | $ | 441,857 | |
| aSK Hynix Semiconductor Inc. | South Korea | 22,740 | 792,661 | ||
| 1,234,518 | |||||
| Specialty Retail 5.8% | |||||
| Baoxin Auto Group Ltd. | China | 799,500 | 778,431 | ||
| aChina ZhengTong Auto Services Holdings Ltd. | China | 700,500 | 448,972 | ||
| aDufry AG | Switzerland | 6,864 | 1,204,980 | ||
| Kingfisher PLC | United Kingdom | 132,792 | 845,698 | ||
| WH Smith PLC | United Kingdom | 26,021 | 431,097 | ||
| 3,709,178 | |||||
| Tobacco 0.3% | |||||
| British American Tobacco PLC | United Kingdom | 4,129 | 221,321 | ||
| Trading Companies & Distributors 1.1% | |||||
| Rexel SA | France | 26,179 | 686,876 | ||
| Wireless Telecommunication Services 2.3% | |||||
| Tele2 AB, B | Sweden | 54,420 | 616,289 | ||
| Vodafone Group PLC | United Kingdom | 217,281 | 852,986 | ||
| 1,469,275 | |||||
| Total Common Stocks (Cost $48,273,957) | 59,174,304 | ||||
| Preferred Stocks 2.3% | |||||
| Automobiles 1.5% | |||||
| Hyundai Motor Co., 2nd pfd. | South Korea | 7,852 | 970,599 | ||
| Semiconductors & Semiconductor Equipment 0.8% | |||||
| Samsung Electronics Co. Ltd., pfd. | South Korea | 563 | 540,216 | ||
| Total Preferred Stocks (Cost $1,066,063) | 1,510,815 | ||||
| Principal Amount* | |||||
| Corporate Bonds (Cost $142,004) 0.2% | |||||
| c,dBaggot Securities Ltd., secured bond, 144A, 10.24%, Perpetual | Ireland | 100,000 EUR | 145,321 | ||
| Total Investments before Short Term Investments | |||||
| (Cost $49,482,024) | 60,830,440 | ||||
| Short Term Investments 5.5% | |||||
| U.S. Government and Agency Securities 5.5% | |||||
| eU.S. Treasury Bills, | |||||
| 1/02/14 | United States | 1,800,000 | 1,800,000 | ||
| f3/27/14 | United States | 890,000 | 889,876 | ||
| f4/03/14 | United States | 800,000 | 799,866 | ||
| Total U.S. Government and Agency Securities | |||||
| (Cost $3,489,704) | 3,489,742 | ||||
| Total Investments (Cost $52,971,728) 100.0% | 64,320,182 | ||||
| Other Assets, less Liabilities 0.0%† | 24,076 | ||||
| Net Assets 100.0% | $ | 64,344,258 | |||
Annual Report | 27
Mutual International Fund
Statement of Investments, December 31, 2013 (continued)
*The principal amount is stated in U.S. dollars unless otherwise indicated.
†Rounds to less than 0.1% of net assets.
aNon-income producing.
bSecurity has been deemed illiquid because it may not be able to be sold within seven days. At December 31, 2013, the value of this security was $2,494, representing less than
0.01% of net assets.
cPerpetual security with no stated maturity date.
dSecurity was purchased pursuant to Rule 144A under the Securities Act of 1933 and may be sold in transactions exempt from registration only to qualified institutional buyers or
in a public offering registered under the Securities Act of 1933. This security has been deemed liquid under guidelines approved by the Trust’s Board of Trustees.
eThe security is traded on a discount basis with no stated coupon rate.
fSecurity or a portion of the security has been pledged as collateral for open forward contracts. At December 31, 2013, the aggregate value of these securities and/or cash pledged
as collateral was $1,407,839, representing 2.19% of net assets.
At December 31, 2013, the Fund had the following forward exchange contracts outstanding. See Note 1(c).
| Forward Exchange Contracts | |||||||||||
| Settlement | Unrealized | Unrealized | |||||||||
| Currency | Counterpartya | Type | Quantity | Contract Amount | Date | Appreciation Depreciation | |||||
| Euro | BANT | Buy | 265,755 | $ | 362,591 | 1/17/14 | $ | 2,964 | $ | (13 | ) |
| Euro | BONY | Buy | 11,054 | 15,212 | 1/17/14 | — | (7 | ) | |||
| Euro | BBU | Buy | 23,867 | 32,681 | 1/17/14 | 148 | — | ||||
| Euro | HSBC | Buy | 145,152 | 199,197 | 1/17/14 | 468 | (9 | ) | |||
| Euro | SSBT | Buy | 5,484 | 7,543 | 1/17/14 | — | — | ||||
| Euro | BANT | Sell | 2,527,660 | 3,307,054 | 1/17/14 | — | (169,714 | ) | |||
| Euro | BONY | Sell | 71,063 | 94,763 | 1/17/14 | — | (2,983 | ) | |||
| Euro | BBU | Sell | 2,339,193 | 3,054,659 | 1/17/14 | — | (162,875 | ) | |||
| Euro | FBCO | Sell | 878,872 | 1,182,637 | 1/17/14 | — | (26,241 | ) | |||
| Euro | DBFX | Sell | 353,317 | 466,745 | 1/17/14 | — | (19,239 | ) | |||
| Euro | HSBC | Sell | 102,973 | 139,471 | 1/17/14 | — | (2,167 | ) | |||
| Euro | SCBT | Sell | 426,990 | 579,471 | 1/17/14 | — | (7,849 | ) | |||
| Euro | SSBT | Sell | 185,295 | 248,135 | 1/17/14 | — | (6,736 | ) | |||
| Japanese Yen | BONY | Buy | 2,533,600 | 25,947 | 1/22/14 | — | (1,883 | ) | |||
| Japanese Yen | FBCO | Buy | 4,579,730 | 46,722 | 1/22/14 | — | (3,225 | ) | |||
| Japanese Yen | DBFX | Buy | 1,040,000 | 10,804 | 1/22/14 | — | (926 | ) | |||
| Japanese Yen | HSBC | Buy | 2,568,524 | 26,090 | 1/22/14 | — | (1,695 | ) | |||
| Japanese Yen | BONY | Sell | 3,300,000 | 33,246 | 1/22/14 | 1,904 | — | ||||
| Japanese Yen | FBCO | Sell | 80,360,764 | 799,705 | 1/22/14 | 36,459 | — | ||||
| South Korean Won | FBCO | Buy | 106,689,502 | 99,357 | 2/12/14 | 1,412 | — | ||||
| South Korean Won | HSBC | Buy | 119,239,668 | 105,498 | 2/12/14 | 7,124 | — | ||||
| Swiss Franc | BONY | Buy | 5,164 | 5,704 | 2/12/14 | 87 | — | ||||
| Swiss Franc | FBCO | Buy | 232,149 | 251,312 | 2/12/14 | 9,022 | — | ||||
| Swiss Franc | SCBT | Buy | 16,088 | 17,657 | 2/12/14 | 384 | — | ||||
| South Korean Won | BANT | Sell | 1,104,653,270 | 983,643 | 2/12/14 | — | (59,708 | ) | |||
| Swiss Franc | BANT | Sell | 1,680,134 | 1,833,503 | 2/12/14 | 548 | (51,167 | ) | |||
28 | Annual Report
| Mutual International Fund | ||||||||||||
| Statement of Investments, December 31, 2013 (continued) | ||||||||||||
| Forward Exchange Contracts (continued) | ||||||||||||
| Settlement | Unrealized | Unrealized | ||||||||||
| Currency | Counterpartya | Type | Quantity | Contract Amount | Date | Appreciation Depreciation | ||||||
| Swiss Franc | BONY | Sell | 136,000 | $ | 147,924 | 2/12/14 | $ | — | $ | (4,588 | ) | |
| South Korean Won | FBCO | Sell | 3,489,154,218 | 3,154,805 | 2/12/14 | — | (140,721 | ) | ||||
| Swiss Franc | FBCO | Sell | 384,716 | 415,151 | 2/12/14 | — | (16,274 | ) | ||||
| South Korean Won | DBFX | Sell | 2,042,785,328 | 1,818,963 | 2/12/14 | — | (110,459 | ) | ||||
| South Korean Won | HSBC | Sell | 1,427,802,954 | 1,313,556 | 2/12/14 | 635 | (35,647 | ) | ||||
| Swiss Franc | HSBC | Sell | 44,828 | 47,968 | 2/12/14 | — | (2,302 | ) | ||||
| Swiss Franc | SCBT | Sell | 112,322 | 124,497 | 2/12/14 | — | (1,463 | ) | ||||
| Danish Krone | BANT | Sell | 3,476,331 | 629,449 | 2/14/14 | 104 | (11,846 | ) | ||||
| Danish Krone | BONY | Sell | 278,500 | 50,578 | 2/14/14 | — | (790 | ) | ||||
| Danish Krone | BBU | Sell | 89,781 | 16,616 | 2/14/14 | 56 | — | |||||
| British Pound | BANT | Buy | 148,235 | 241,655 | 2/19/14 | 3,724 | — | |||||
| British Pound | BBU | Buy | 22,449 | 36,638 | 2/19/14 | 523 | — | |||||
| British Pound | HSBC | Buy | 31,853 | 51,961 | 2/19/14 | 766 | — | |||||
| British Pound | SSBT | Buy | 7,852 | 12,842 | 2/19/14 | 155 | — | |||||
| British Pound | BANT | Sell | 6,762,671 | 10,529,555 | 2/19/14 | — | (664,959 | ) | ||||
| British Pound | FBCO | Sell | 921,543 | 1,458,087 | 2/19/14 | — | (67,379 | ) | ||||
| British Pound | HSBC | Sell | 202,106 | 323,257 | 2/19/14 | — | (11,297 | ) | ||||
| British Pound | SCBT | Sell | 384,229 | 615,135 | 2/19/14 | — | (20,895 | ) | ||||
| Australian Dollar | HSBC | Buy | 434,059 | 387,594 | 3/14/14 | — | (1,977 | ) | ||||
| Australian Dollar | HSBC | Sell | 1,627,777 | 1,498,921 | 3/14/14 | 52,808 | — | |||||
| Australian Dollar | SCBT | Sell | 488,800 | 441,660 | 3/14/14 | 7,411 | — | |||||
| Canadian Dollar | HSBC | Buy | 1,500 | 1,411 | 3/18/14 | — | (1 | ) | ||||
| Canadian Dollar | SCBT | Buy | 37,710 | 35,596 | 3/18/14 | — | (159 | ) | ||||
| Canadian Dollar | BANT | Sell | 47,462 | 45,794 | 3/18/14 | 1,193 | — | |||||
| Canadian Dollar | HSBC | Sell | 2,942 | 2,844 | 3/18/14 | 79 | — | |||||
| Canadian Dollar | SCBT | Sell | 313,497 | 302,830 | 3/18/14 | 8,231 | — | |||||
| Philippine Peso | BONY | Buy | 5,127,800 | 117,275 | 3/20/14 | — | (1,742 | ) | ||||
| Philippine Peso | BONY | Sell | 28,278,680 | 661,706 | 3/20/14 | 24,566 | — | |||||
| Swedish Krona | BANT | Sell | 2,314,131 | 349,420 | 5/12/14 | — | (9,511 | ) | ||||
| Swedish Krona | BONY | Sell | 661,200 | 100,156 | 5/12/14 | — | (2,399 | ) | ||||
| Swedish Krona | BBU | Sell | 901,932 | 137,740 | 5/12/14 | — | (2,153 | ) | ||||
| Euro | BANT | Sell | 3,053,930 | 4,107,539 | 5/15/14 | — | (93,295 | ) | ||||
| Euro | BONY | Sell | 100,000 | 135,424 | 5/19/14 | — | (2,132 | ) | ||||
| Norwegian Krone | BANT | Buy | 167,380 | 26,976 | 5/21/14 | 478 | — | |||||
| Norwegian Krone | BONY | Buy | 153,400 | 24,962 | 5/21/14 | 200 | — | |||||
| Norwegian Krone | BANT | Sell | 5,111,499 | 833,741 | 5/21/14 | — | (4,636 | ) | ||||
| Norwegian Krone | BBU | Sell | 241,280 | 38,928 | 5/21/14 | — | (647 | ) | ||||
| Unrealized appreciation (depreciation) | 161,449 | (1,723,709 | ) | |||||||||
| Net unrealized appreciation (depreciation) | $ | (1,562,260 | ) | |||||||||
| aMay be comprised of multiple contracts using the same currency and settlement date. | ||||||||||||
| See Abbreviations on page 48. | ||||||||||||
Annual Report | The accompanying notes are an integral part of these financial statements. | 29
| Mutual International Fund | |||
| Financial Statements | |||
| Statement of Assets and Liabilities | |||
| December 31, 2013 | |||
| Assets: | |||
| Investments in securities: | |||
| Cost | $ | 52,971,728 | |
| Value | $ | 64,320,182 | |
| Cash | 16,540 | ||
| Foreign currency, at value (cost $1,333,926) | 1,332,618 | ||
| Receivables: | |||
| Investment securities sold | 277,654 | ||
| Capital shares sold | 107,939 | ||
| Dividends and interest | 76,117 | ||
| Unrealized appreciation on forward exchange contracts | 161,449 | ||
| Total assets | 66,292,499 | ||
| Liabilities: | |||
| Payables: | |||
| Capital shares redeemed | 57,276 | ||
| Management fees | 26,950 | ||
| Distribution fees | 40,016 | ||
| Transfer agent fees | 11,854 | ||
| Unrealized depreciation on forward exchange contracts | 1,723,709 | ||
| Accrued expenses and other liabilities | 88,436 | ||
| Total liabilities | 1,948,241 | ||
| Net assets, at value | $ | 64,344,258 | |
| Net assets consist of: | |||
| Paid-in capital | $ | 53,709,908 | |
| Distributions in excess of net investment income | (233,787 | ) | |
| Net unrealized appreciation (depreciation) | 9,786,727 | ||
| Accumulated net realized gain (loss) | 1,081,410 | ||
| Net assets, at value | $ | 64,344,258 | |
30 | The accompanying notes are an integral part of these financial statements. | Annual Report
| Mutual International Fund | |||
| Financial Statements (continued) | |||
| Statement of Assets and Liabilities (continued) | |||
| December 31, 2013 | |||
| Class Z: | |||
| Net assets, at value | $ | 14,731,683 | |
| Shares outstanding | 926,747 | ||
| Net asset value and maximum offering price per share | $ | 15.90 | |
| Class A: | |||
| Net assets, at value | $ | 35,318,933 | |
| Shares outstanding | 2,229,954 | ||
| Net asset value per sharea | $ | 15.84 | |
| Maximum offering price per share (net asset value per share ÷ 94.25%) | $ | 16.81 | |
| Class C: | |||
| Net assets, at value | $ | 14,198,167 | |
| Shares outstanding | 905,658 | ||
| Net asset value and maximum offering price per sharea | $ | 15.68 | |
| Class R: | |||
| Net assets, at value | $ | 89,904 | |
| Shares outstanding | 5,681 | ||
| Net asset value and maximum offering price per share | $ | 15.83 | |
| Class R6: | |||
| Net assets, at value | $ | 5,571 | |
| Shares outstanding | 351 | ||
| Net asset value and maximum offering price per share | $ | 15.87 | |
| aRedemption price is equal to net asset value less contingent deferred sales charges, if applicable. | |||
Annual Report | The accompanying notes are an integral part of these financial statements. | 31
| Mutual International Fund | |||
| Financial Statements (continued) | |||
| Statement of Operations | |||
| for the year ended December 31, 2013 | |||
| Investment income: | |||
| Dividends (net of foreign taxes of $74,910) | $ | 1,444,286 | |
| Interest | 1,935 | ||
| Income from securities loaned | 7,592 | ||
| Total investment income | 1,453,813 | ||
| Expenses: | |||
| Management fees (Note 3a) | 413,334 | ||
| Administrative fees (Note 3b) | 39,398 | ||
| Distribution fees: (Note 3c) | |||
| Class A | 81,963 | ||
| Class C | 122,021 | ||
| Class R | 333 | ||
| Transfer agent fees: (Note 3e) | |||
| Class Z | 20,370 | ||
| Class A | 45,590 | ||
| Class C | 20,580 | ||
| Class R | 113 | ||
| Class R6 | 56 | ||
| Custodian fees (Note 4) | 12,490 | ||
| Reports to shareholders | 29,780 | ||
| Registration and filing fees | 74,278 | ||
| Professional fees | 91,871 | ||
| Trustees’ fees and expenses | 306 | ||
| Other | 23,171 | ||
| Total expenses | 975,654 | ||
| Expense reductions (Note 4) | (107 | ) | |
| Expenses waived/paid by affiliates (Note 3f) | (167,198 | ) | |
| Net expenses | 808,349 | ||
| Net investment income | 645,464 | ||
| Realized and unrealized gains (losses): | |||
| Net realized gain (loss) from: | |||
| Investments | 1,150,091 | ||
| Foreign currency transactions | 244,281 | ||
| Net realized gain (loss) | 1,394,372 | ||
| Net change in unrealized appreciation (depreciation) on: | |||
| Investments | 8,009,722 | ||
| Translation of other assets and liabilities denominated in foreign currencies | (866,395 | ) | |
| Net change in unrealized appreciation (depreciation) | 7,143,327 | ||
| Net realized and unrealized gain (loss) | 8,537,699 | ||
| Net increase (decrease) in net assets resulting from operations | $ | 9,183,163 | |
32 | The accompanying notes are an integral part of these financial statements. | Annual Report
| Mutual International Fund | ||||||
| Financial Statements (continued) | ||||||
| Statements of Changes in Net Assets | ||||||
| Year Ended December 31, | ||||||
| 2013 | 20122012 | |||||
| Increase (decrease) in net assets: | ||||||
| Operations: | ||||||
| Net investment income | $ | 645,464 | $ | 351,980 | ||
| Net realized gain (loss) from investments and foreign currency transactions | 1,394,372 | 661,985 | ||||
| Net change in unrealized appreciation (depreciation) on investments and translation of other | ||||||
| assets and liabilities denominated in foreign currencies | 7,143,327 | 2,943,747 | ||||
| Net increase (decrease) in net assets resulting from operations | 9,183,163 | 3,957,712 | ||||
| Distributions to shareholders from: | ||||||
| Net investment income: | ||||||
| Class Z | (218,779 | ) | (115,170 | ) | ||
| Class A | (447,845 | ) | (158,607 | ) | ||
| Class C | (94,563 | ) | (64,828 | ) | ||
| Class R | (1,045 | ) | (304 | ) | ||
| Class R6 | (94 | ) | — | |||
| Net realized gains: | ||||||
| Class Z | (92,660 | ) | (14,604 | ) | ||
| Class A | (222,263 | ) | (24,295 | ) | ||
| Class C | (91,241 | ) | (15,726 | ) | ||
| Class R | (585 | ) | (60 | ) | ||
| Class R6 | (36 | ) | — | |||
| Total distributions to shareholders | (1,169,111 | ) | (393,594 | ) | ||
| Capital share transactions: (Note 2) | ||||||
| Class Z | 2,483,765 | 2,221,368 | ||||
| Class A | 12,890,819 | 7,357,121 | ||||
| Class C | 1,795,889 | 7,084,634 | ||||
| Class R | 35,105 | 23,912 | ||||
| Class R6 | 5,000 | — | ||||
| Total capital share transactions | 17,210,578 | 16,687,035 | ||||
| Net increase (decrease) in net assets | 25,224,630 | 20,251,153 | ||||
| Net assets: | ||||||
| Beginning of year | 39,119,628 | 18,868,475 | ||||
| End of year | $ | 64,344,258 | $ | 39,119,628 | ||
| Distributions in excess of net investment income included in net assets: | ||||||
| End of year | $ | (233,787 | ) | $ | (72,211 | ) |
Annual Report | The accompanying notes are an integral part of these financial statements. | 33
Mutual International Fund
Notes to Financial Statements
1. ORGANIZATION AND SIGNIFICANT ACCOUNTING POLICIES
Franklin Mutual Series Funds (Trust) is registered under the Investment Company Act of 1940, as amended, (1940 Act) as an open-end investment company, consisting of seven separate funds. The Mutual International Fund (Fund) is included in this report. The financial statements of the remaining funds in the Trust are presented separately. The Fund offers five classes of shares: Class Z, Class A, Class C, Class R and Class R6. Effective May 1, 2013, the Fund began offering a new class of shares, Class R6. Each class of shares differs by its initial sales load, contingent deferred sales charges, voting rights on matters affecting a single class, its exchange privilege and fees primarily due to differing arrangements for distribution and transfer agent fees.
The following summarizes the Fund’s significant accounting policies.
a. Financial Instrument Valuation
The Fund’s investments in financial instruments are carried at fair value daily. Fair value is the price that would be received to sell an asset or paid to transfer a liability in an orderly transaction between market participants on the measurement date. The Fund calculates the net asset value (NAV) per share at the close of the New York Stock Exchange (NYSE), generally at 4p.m. Eastern time (NYSE close) on each day the NYSE is open for trading. Under procedures approved by the Trust’s Board of Trustees (the Board), the Fund’s administrator, investment manager and other affiliates have formed the Valuation and Liquidity Oversight Committee (VLOC). The VLOC provides administration and oversight of the Fund’s valuation policies and procedures, which are approved annually by the Board. Among other things, these procedures allow the Fund to utilize independent pricing services, quotations from securities and financial instrument dealers, and other market sources to determine fair value.
Equity securities and derivative financial instruments (derivatives) listed on an exchange or on the NASDAQ National Market System are valued at the last quoted sale price or the official closing price of the day, respectively. Foreign equity securities are valued as of the close of trading on the foreign stock exchange on which the security is primarily traded or as of the NYSE close, whichever is earlier. The value is then converted into its U.S. dollar equivalent at the foreign exchange rate in effect at the NYSE close on the day that the value of the security is determined. Over-the-counter (OTC) securities are valued within the range of the most recent quoted bid and ask prices. Securities that trade in multiple markets or on multiple exchanges are valued according to the broadest and most representative market. Certain equity securities are valued based upon fundamental characteristics or relationships to similar securities.
Debt securities generally trade in the OTC market rather than on a securities exchange. The Fund’s pricing services use multiple valuation techniques to determine fair value. In instances where sufficient market activity exists, the pricing services may utilize a market-based approach through which quotes from market makers are used to determine fair value. In instances where sufficient market activity may not exist or is limited, the pricing services also utilize proprietary valuation models which may consider market characteristics such as benchmark yield curves,
34 | Annual Report
Mutual International Fund
Notes to Financial Statements (continued)
| 1. | ORGANIZATION AND SIGNIFICANT ACCOUNTING POLICIES (continued) |
| a. | Financial Instrument Valuation (continued) |
credit spreads, estimated default rates, anticipated market interest rate volatility, coupon rates, anticipated timing of principal repayments, underlying collateral, and other unique security features in order to estimate the relevant cash flows, which are then discounted to calculate the fair value. Securities denominated in a foreign currency are converted into their U.S. dollar equivalent at the foreign exchange rate in effect at the NYSE close on the date that the values of the foreign debt securities are determined.
Certain derivatives trade in the OTC market. The Fund’s pricing services use various techniques including industry standard option pricing models and proprietary discounted cash flow models to determine the fair value of those instruments. The Fund’s net benefit or obligation under the derivative contract, as measured by the fair value of the contract, is included in net assets.
The Fund has procedures to determine the fair value of financial instruments for which market prices are not reliable or readily available. Under these procedures, the VLOC convenes on a regular basis to review such financial instruments and considers a number of factors, including significant unobservable valuation inputs, when arriving at fair value. The VLOC primarily employs a market-based approach which may use related or comparable assets or liabilities, recent transactions, market multiples, book values, and other relevant information for the investment to determine the fair value of the investment. An income-based valuation approach may also be used in which the anticipated future cash flows of the investment are discounted to calculate fair value. Discounts may also be applied due to the nature or duration of any restrictions on the disposition of the investments. Due to the inherent uncertainty of valuations of such investments, the fair values may differ significantly from the values that would have been used had an active market existed. The VLOC employs various methods for calibrating these valuation approaches including a regular review of key inputs and assumptions, transactional back-testing or disposition analysis, and reviews of any related market activity.
Trading in securities on foreign securities stock exchanges and OTC markets may be completed before the daily NYSE close. In addition, trading in certain foreign markets may not take place on every NYSE business day. Occasionally, events occur between the time at which trading in a foreign security is completed and the close of the NYSE that might call into question the reliability of the value of a portfolio security held by the Fund. As a result, differences may arise between the value of the Fund’s portfolio securities as determined at the foreign market close and the latest indications of value at the close of the NYSE. In order to minimize the potential for these differences, the VLOC monitors price movements following the close of trading in foreign stock markets through a series of country specific market proxies (such as baskets of American Depositary Receipts, futures contracts and exchange traded funds). These price movements are measured against established trigger thresholds for each specific market proxy to assist in determining if an event has occurred that may call into question the reliability of the values of the foreign securities held by the Fund. If such an event occurs, the securities may be valued using fair value procedures, which may include the use of independent pricing services.
Annual Report | 35
Mutual International Fund
Notes to Financial Statements (continued)
| 1. | ORGANIZATION AND SIGNIFICANT ACCOUNTING POLICIES (continued) |
| a. | Financial Instrument Valuation (continued) |
Also, when the last day of the reporting period is a non-business day, certain foreign markets may be open on those days that the NYSE is closed, which could result in differences between the value of the Fund’s portfolio securities on the last business day and the last calendar day of the reporting period. Any significant security valuation changes due to an open foreign market are adjusted and reflected by the Fund for financial reporting purposes.
b. Foreign Currency Translation
Portfolio securities and other assets and liabilities denominated in foreign currencies are translated into U.S. dollars based on the exchange rate of such currencies against U.S. dollars on the date of valuation. The Fund may enter into foreign currency exchange contracts to facilitate transactions denominated in a foreign currency. Purchases and sales of securities, income and expense items denominated in foreign currencies are translated into U.S. dollars at the exchange rate in effect on the transaction date. Portfolio securities and assets and liabilities denominated in foreign currencies contain risks that those currencies will decline in value relative to the U.S. dollar. Occasionally, events may impact the availability or reliability of foreign exchange rates used to convert the U.S. dollar equivalent value. If such an event occurs, the foreign exchange rate will be valued at fair value using procedures established and approved by the Board.
The Fund does not separately report the effect of changes in foreign exchange rates from changes in market prices on securities held. Such changes are included in net realized and unrealized gain or loss from investments on the Statement of Operations.
Realized foreign exchange gains or losses arise from sales of foreign currencies, currency gains or losses realized between the trade and settlement dates on securities transactions and the difference between the recorded amounts of dividends, interest, and foreign withholding taxes and the U.S. dollar equivalent of the amounts actually received or paid. Net unrealized foreign exchange gains and losses arise from changes in foreign exchange rates on foreign denominated assets and liabilities other than investments in securities held at the end of the reporting period.
c. Derivative Financial Instruments
The Fund invested in derivatives in order to manage risk or gain exposure to various other investments or markets. Derivatives are financial contracts based on an underlying or notional amount, require no initial investment or an initial net investment that is smaller than would normally be required to have a similar response to changes in market factors, and require or permit net settlement. Derivatives contain various risks including the potential inability of the counter-party to fulfill their obligations under the terms of the contract, the potential for an illiquid secondary market, and/or the potential for market movements which expose the Fund to gains or losses in excess of the amounts shown on the Statement of Assets and Liabilities. Realized gain and loss and unrealized appreciation and depreciation on these contracts for the period are included in the Statement of Operations.
36 | Annual Report
Mutual International Fund
Notes to Financial Statements (continued)
| 1. | ORGANIZATION AND SIGNIFICANT ACCOUNTING POLICIES (continued) |
| c. | Derivative Financial Instruments (continued) |
Derivative counterparty credit risk is managed through a formal evaluation of the creditworthiness of all potential counterparties. The Fund attempts to reduce its exposure to counterparty credit risk on OTC derivatives, whenever possible, by entering into International Swaps and Derivatives Association (ISDA) master agreements with certain counterparties. These agreements contain various provisions, including but not limited to collateral requirements, events of default, or early termination. Termination events applicable to the counterparty include certain deteriorations in the credit quality of the counterparty. Termination events applicable to the Fund include failure of the Fund to maintain certain net asset levels and/or limit the decline in net assets over various periods of time. In the event of default or early termination, the ISDA master agreement gives the non-defaulting party the right to net and close-out all transactions traded, whether or not arising under the ISDA agreement, to one net amount payable by one counterparty to the other. However, absent an event of default or early termination, OTC derivative assets and liabilities are presented gross and not offset in the Statement of Assets and Liabilities. Early termination by the counterparty may result in an immediate payment by the Fund of any net liability owed to that counterparty under the ISDA agreement.
Collateral requirements differ by type of derivative. Collateral terms are contract specific for OTC derivatives. For OTC derivatives traded under an ISDA master agreement, posting of collateral is required by either the fund or the applicable counterparty if the total net exposure of all OTC derivatives with the applicable counterparty exceeds the minimum transfer amount, which typically ranges from $100,000 to $250,000, and can vary depending on the counterparty and the type of the agreement. Generally, collateral is determined at the close of fund business each day and any additional collateral required due to changes in derivative values may be delivered by the fund or the counterparty within a few business days. Collateral pledged and/or received by the fund, if any, is held in segregated accounts with the fund’s custodian/counterparty broker and can be in the form of cash and/or securities. Unrestricted cash may be invested according to the Fund’s investment objectives.
The Fund entered into OTC forward exchange contracts primarily to manage exposure to certain foreign currencies. A forward exchange contract is an agreement between the Fund and a counterparty to buy or sell a foreign currency at a specific exchange rate on a future date.
See Note 8 regarding other derivative information.
d. Securities Lending
The Fund participates in an agency based securities lending program. The Fund receives cash collateral against the loaned securities in an amount equal to at least 102% of the market value of the loaned securities. Collateral is maintained over the life of the loan in an amount not less than 100% of the market value of loaned securities, as determined at the close of fund business
Annual Report | 37
Mutual International Fund
Notes to Financial Statements (continued)
| 1. | ORGANIZATION AND SIGNIFICANT ACCOUNTING POLICIES (continued) |
| d. | Securities Lending (continued) |
each day; any additional collateral required due to changes in security values is delivered to the Fund on the next business day. The collateral is invested in a non-registered money fund. The Fund receives income from the investment of cash collateral, in addition to lending fees and rebates paid by the borrower. The Fund bears the market risk with respect to the collateral investment, securities loaned, and the risk that the agent may default on its obligations to the Fund. The securities lending agent has agreed to indemnify the Fund in the event of default by a third party borrower. At December 31, 2013, the Fund had no securities on loan.
e. Income and Deferred Taxes
It is the Fund’s policy to qualify as a regulated investment company under the Internal Revenue Code. The Fund intends to distribute to shareholders substantially all of its taxable income and net realized gains to relieve it from federal income and excise taxes. As a result, no provision for U.S. federal income taxes is required.
The Fund may be subject to foreign taxation related to income received, capital gains on the sale of securities and certain foreign currency transactions in the foreign jurisdictions in which it invests. Foreign taxes, if any, are recorded based on the tax regulations and rates that exist in the foreign markets in which the Fund invests. When a capital gain tax is determined to apply the Fund records an estimated deferred tax liability in an amount that would be payable if the securities were disposed of on the valuation date.
The Fund recognizes the tax benefits of uncertain tax positions only when the position is “more likely than not” to be sustained upon examination by the tax authorities based on the technical merits of the tax position. As of December 31, 2013, and for all open tax years, the Fund has determined that no liability for unrecognized tax benefits is required in the Fund’s financial statements related to uncertain tax positions taken on a tax return (or expected to be taken on future tax returns). Open tax years are those that remain subject to examination and are based on each tax jurisdiction statute of limitation.
f. Security Transactions, Investment Income, Expenses and Distributions
Security transactions are accounted for on trade date. Realized gains and losses on security transactions are determined on a specific identification basis. Interest income and estimated expenses are accrued daily. Amortization of premium and accretion of discount on debt securities are included in interest income. Dividend income is recorded on the ex-dividend date except that certain dividends from foreign securities are recognized as soon as the Fund is notified of the ex-dividend date. Distributions to shareholders are recorded on the ex-dividend date and are determined according to income tax regulations (tax basis). Distributable earnings determined on a tax basis may differ from earnings recorded in accordance with accounting principles generally accepted in the United States of America. These differences may be permanent or temporary. Permanent differences are reclassified among capital accounts to reflect their tax character. These reclassifications have no
38 | Annual Report
Mutual International Fund
Notes to Financial Statements (continued)
| 1. | ORGANIZATION AND SIGNIFICANT ACCOUNTING POLICIES (continued) |
| f. | Security Transactions, Investment Income, Expenses and Distributions (continued) |
impact on net assets or the results of operations. Temporary differences are not reclassified, as they may reverse in subsequent periods.
Common expenses incurred by the Trust are allocated among the funds based on the ratio of net assets of each fund to the combined net assets of the Trust. Fund specific expenses are charged directly to the fund that incurred the expense.
Realized and unrealized gains and losses and net investment income, not including class specific expenses, are allocated daily to each class of shares based upon the relative proportion of net assets of each class. Differences in per share distributions, by class, are generally due to differences in class specific expenses.
g. Accounting Estimates
The preparation of financial statements in accordance with accounting principles generally accepted in the United States of America requires management to make estimates and assumptions that affect the reported amounts of assets and liabilities at the date of the financial statements and the amounts of income and expenses during the reporting period. Actual results could differ from those estimates.
h. Guarantees and Indemnifications
Under the Trust’s organizational documents, its officers and trustees are indemnified by the Trust against certain liabilities arising out of the performance of their duties to the Trust. Additionally, in the normal course of business, the Trust, on behalf of the Fund, enters into contracts with service providers that contain general indemnification clauses. The Trust’s maximum exposure under these arrangements is unknown as this would involve future claims that may be made against the Trust that have not yet occurred. Currently, the Trust expects the risk of loss to be remote.
2. SHARES OF BENEFICIAL INTEREST
At December 31, 2013, there were an unlimited number of shares authorized (without par value). Transactions in the Fund’s shares were as follows:
| Year Ended December 31, | ||||||||||
| 2013 | 2012 | |||||||||
| Shares | Amount | Shares | Amount | |||||||
| Class Z Shares: | ||||||||||
| Shares sold | 532,453 | $ | 7,747,736 | 255,752 | $ | 3,273,550 | ||||
| Shares issued in reinvestment | ||||||||||
| of distributions | 19,629 | 304,656 | 9,504 | 127,333 | ||||||
| Shares redeemed | (387,998 | ) | (5,568,627 | ) | (92,397 | ) | (1,179,515 | ) | ||
| Net increase (decrease) | 164,084 | $ | 2,483,765 | 172,859 | $ | 2,221,368 | ||||
Annual Report | 39
| Mutual International Fund | ||||||||||||
| Notes to Financial Statements (continued) | ||||||||||||
| 2. SHARES OF BENEFICIAL INTEREST (continued) | ||||||||||||
| Year Ended December 31, | ||||||||||||
| 2013 | 2012 | |||||||||||
| Shares | Amount | Shares | Amount | |||||||||
| Class A Shares: | ||||||||||||
| Shares sold | 1,274,923 | $ | 18,493,067 | 968,430 | $ | 12,495,160 | ||||||
| Shares issued in reinvestment | ||||||||||||
| of distributions | 42,070 | 650,456 | 13,636 | 181,926 | ||||||||
| Shares redeemed | (432,923 | ) | (6,252,704 | ) | (416,449 | ) | (5,319,965 | ) | ||||
| Net increase (decrease) | 884,070 | $ | 12,890,819 | 565,617 | $ | 7,357,121 | ||||||
| Class C Shares: | ||||||||||||
| Shares sold | 260,176 | $ | 3,760,594 | 611,983 | $ | 7,797,495 | ||||||
| Shares issued in reinvestment | ||||||||||||
| of distributions | 12,115 | 185,013 | 6,112 | 80,306 | ||||||||
| Shares redeemed | (149,858 | ) | (2,149,718 | ) | (62,050 | ) | (793,167 | ) | ||||
| Net increase (decrease) | 122,433 | $ | 1,795,889 | 556,045 | $ | 7,084,634 | ||||||
| Class R Shares: | ||||||||||||
| Shares sold | 10,728 | $ | 158,252 | 10,604 | $ | 137,476 | ||||||
| Shares issued in reinvestment | ||||||||||||
| of distributions | 106 | 1,631 | 27 | 364 | ||||||||
| Shares redeemed | (8,221 | ) | (124,778 | ) | (8,563 | ) | (113,928 | ) | ||||
| Net increase (decrease) | 2,613 | $ | 35,105 | 2,068 | $ | 23,912 | ||||||
| Class R6 Sharesa: | ||||||||||||
| Shares sold | 351 | $ | 5,000 | |||||||||
| aFor the period May 1, 2013 (effective date) to December 31, 2013. | ||||||||||||
3. TRANSACTIONS WITH AFFILIATES
Franklin Resources, Inc. is the holding company for various subsidiaries that together are referred to as Franklin Templeton Investments. Certain officers and trustees of the Fund are also officers and/or directors of the following subsidiaries:
| Subsidiary | Affiliation |
| Franklin Mutual Advisers, LLC (Franklin Mutual) | Investment manager |
| Franklin Templeton Services, LLC (FT Services) | Administrative manager |
| Franklin Templeton Distributors, Inc. (Distributors) | Principal underwriter |
| Franklin Templeton Investor Services, LLC (Investor Services) | Transfer agent |
a. Management Fees
The Fund pays an investment management fee to Franklin Mutual of 0.80% per year of the average daily net assets of the Fund.
40 | Annual Report
Mutual International Fund
Notes to Financial Statements (continued)
| 3. | TRANSACTIONS WITH AFFILIATES (continued) |
| b. | Administrative Fees |
The Fund pays its allocated share of an administrative fee to FT Services based on the Trust’s aggregate average daily net assets as follows:
| Annualized Fee Rate | Net Assets | |
| 0.150 | % | Up to and including $200 million |
| 0.135 | % | Over $200 million, up to and including $700 million |
| 0.100 | % | Over $700 million, up to and including $1.2 billion |
| 0.075 | % | In excess of $1.2 billion |
c. Distribution Fees
The Board has adopted distribution plans for each share class, with the exception of Class Z and Class R6 shares, pursuant to Rule 12b-1 under the 1940 Act. Distribution fees are not charged on shares held by affiliates. Under the Fund’s Class A reimbursement distribution plan, the Fund reimburses Distributors for costs incurred in connection with the servicing, sale and distribution of the Fund’s shares up to the maximum annual plan rate. Under the Class A reimbursement distribution plan, costs exceeding the maximum for the current plan year cannot be reimbursed in subsequent periods. In addition, under the Fund’s Class C and R compensation distribution plans, the Fund pays Distributors for costs incurred in connection with the servicing, sale and distribution of the Fund’s shares up to the maximum annual plan rate for each class. The plan year, for purposes of monitoring compliance with the maximum annual plan rates, is February 1 through January 31.
The maximum annual plan rates, based on the average daily net assets, for each class, are as follows:
| Class A | 0.35 | % |
| Class C | 1.00 | % |
| Class R | 0.50 | % |
The Board has set the current rate at 0.30% per year for Class A shares until further notice and approval by the Board.
d. Sales Charges/Underwriting Agreements
Front-end sales charges and contingent deferred sales charges (CDSC) do not represent expenses of the Fund. These charges are deducted from the proceeds of sales of Fund shares prior to investment or from redemption proceeds prior to remittance, as applicable. Distributors has advised the Fund of the following commission transactions related to the sales and redemptions of the Fund’s shares for the year:
| Sales charges retained net of commissions paid to | ||
| unaffiliated broker/dealers | $ | 38,226 |
| CDSC retained | $ | 714 |
Annual Report | 41
Mutual International Fund
Notes to Financial Statements (continued)
| 3. | TRANSACTIONS WITH AFFILIATES (continued) |
| e. | Transfer Agent Fees |
Each class of shares, except for Class R6, pays transfer agent fees to Investor Services for its performance of shareholder servicing obligations and reimburses Investor Services for out of pocket expenses incurred, including shareholding servicing fees paid to third parties. These fees are allocated daily based upon their relative proportion of such classes’ aggregate net assets. Class R6 pays Investor Services transfer agent fees specific to that class.
For the year ended December 31, 2013, the Fund paid transfer agent fees of $86,709, of which $57,422 was retained by Investor Services.
f. Waiver and Expense Reimbursements
FT Services and Franklin Mutual have contractually agreed in advance to waive or limit their respective fees and to assume as their own expense certain expenses otherwise payable by the Fund so that the expenses (excluding distribution fees and acquired fund fees and expenses) for Class Z, Class A, Class C and Class R of the Fund do not exceed 1.17%, and Class R6 does not exceed 1.00% based on the average net assets of each class (other than certain non-routine expenses or costs, including those relating to litigation, indemnification, reorganizations, and liquidations) until April 30, 2014.
4. EXPENSE OFFSET ARRANGEMENT
The Fund has entered into an arrangement with its custodian whereby credits realized as a result of uninvested cash balances are used to reduce a portion of the Fund’s custodian expenses. During the year ended December 31, 2013, the custodian fees were reduced as noted in the Statement of Operations.
5. INCOME TAXES
For tax purposes, capital losses may be carried over to offset future capital gains, if any.
During the year ended December 31, 2013, the Fund utilized $645,221 of capital loss carryforwards.
For tax purposes, the Fund may elect to defer any portion of a post-October capital loss to the first day of the following fiscal year. At December 31, 2013, the Fund deferred post-October capital losses of $491,186.
42 | Annual Report
Mutual International Fund
Notes to Financial Statements (continued)
5. INCOME TAXES (continued)
The tax character of distributions paid during the years ended December 31, 2013 and 2012, was as follows:
| 2013 | 2012 | |||
| Distributions paid from: | ||||
| Ordinary income | $ | 1,034,231 | $ | 339,172 |
| Long term capital gain | 134,880 | 54,422 | ||
| $ | 1,169,111 | $ | 393,594 |
At December 31, 2013, the cost of investments, net unrealized appreciation (depreciation) and undistributed ordinary income for income tax purposes were as follows:
| Cost of investments | $ | 53,251,286 | |
| Unrealized appreciation | $ | 11,990,679 | |
| Unrealized depreciation | (921,783 | ) | |
| Net unrealized appreciation (depreciation) | $ | 11,068,896 | |
| Distributable earnings – undistributed ordinary income | $ | 46,400 | |
Differences between income and/or capital gains as determined on a book basis and a tax basis are primarily due to differing treatment of foreign currency transactions.
6. INVESTMENT TRANSACTIONS
Purchases and sales of investments (excluding short term securities) for the year ended December 31, 2013, aggregated $35,081,756 and $19,478,860 respectively.
7. CONCENTRATION OF RISK
Investing in foreign securities may include certain risks and considerations not typically associated with investing in U.S. securities, such as fluctuating currency values and changing local and regional economic, political and social conditions, which may result in greater market volatility. In addition, certain foreign securities may not be as liquid as U.S. securities.
Annual Report | 43
Mutual International Fund
Notes to Financial Statements (continued)
8. OTHER DERIVATIVE INFORMATION
At December 31, 2013, the Fund’s investments in derivative contracts are reflected on the Statement of Assets and Liabilities as follows:
| Asset Derivatives | Liability Derivatives | |||||||||
| Derivative Contracts | ||||||||||
| Not Accounted for as | Statement of Assets and | Fair Value | Statement of Assets and | Fair Value | ||||||
| Hedging Instruments | Liabilities Location | Amount | Liabilities Location | Amount | ||||||
| Foreign exchange | ||||||||||
| contracts | Unrealized appreciation on | $ | 161,449 | Unrealized depreciation on | $ | 1,723,709 | ||||
| forward exchange contracts | forward exchange contracts | |||||||||
| For the year ended December 31, 2013, the effect of derivative contracts on the Fund’s | ||||||||||
| Statement of Operations was as follows: | ||||||||||
| Change in | ||||||||||
| Unrealized | ||||||||||
| Derivative Contracts | Realized | Appreciation | ||||||||
| Not Accounted for as | Statement of | Gain (Loss) | (Depreciation) | |||||||
| Hedging Instruments | Operations Locations | for the Year | for the Year | |||||||
| Foreign exchange | ||||||||||
| contracts | Net realized gain (loss) from foreign currency | $ | 297,963 | $ | (867,920 | ) | ||||
| transactions / Net change in unrealized | ||||||||||
| appreciation (depreciation) on translation | ||||||||||
| of other assets and liabilities denominated | ||||||||||
| in foreign currencies | ||||||||||
| For the year ended December 31, 2013, the average month end market value of derivatives | ||||||||||
| represented 1.98% of average month end net assets. The average month end number of open | ||||||||||
| derivative contracts for the year was 127. | ||||||||||
| At December 31, 2013, the Fund’s OTC derivative assets and liabilities are as follows: | ||||||||||
| Gross and Net Amounts of Assets and Liabilities Presented | ||||||||||
| in the Statement of Assets and Liabilities | ||||||||||
| Assetsa | Liabilitiesa | |||||||||
| Derivatives | ||||||||||
| Forward Exchange Contracts | $ | 161,449 | $ | 1,723,709 | ||||||
| aAbsent an event of default or early termination, OTC derivative assets and liabilities are presented gross and not offset in the Statement of Assets | ||||||||||
| and Liabilities. | ||||||||||
44 | Annual Report
Mutual International Fund
Notes to Financial Statements (continued)
8. OTHER DERIVATIVE INFORMATION (continued)
At December 31, 2013, the Fund’s OTC derivative assets which may be offset against the Fund’s OTC derivative liabilities and collateral received from the counterparty, is as follows:
| Amounts Not Offset in the | |||||||||||||
| Statement of Assets and Liabilities | |||||||||||||
| Gross and | |||||||||||||
| Net Amounts of | |||||||||||||
| Assets Presented | Financial | Financial | |||||||||||
| in the Statement | Instruments | Instruments | Cash | Net Amount | |||||||||
| of Assets and | Available | Collateral | Collateral | (Not less | |||||||||
| Liabilities | for Offset | Received | Received | than zero) | |||||||||
| Counterparty | |||||||||||||
| BANT | $ | 9,011 | $ | (9,011 | ) | $ | — | $ | — | $ | — | ||
| BBU | 727 | (727 | ) | — | — | — | |||||||
| BONY | 26,757 | (16,524 | ) | — | — | 10,233 | |||||||
| DBFX | — | — | — | — | — | ||||||||
| FBCO | 46,893 | (46,893 | ) | — | — | — | |||||||
| HSBC | 61,880 | (55,095 | ) | — | — | 6,785 | |||||||
| SCBT | 16,026 | (16,026 | ) | — | — | — | |||||||
| SSBT | 155 | (155 | ) | — | — | — | |||||||
| Total | $ | 161,449 | $ | (144,431 | ) | $ | — | $ | — | $ | 17,018 | ||
| At December 31, 2013, the Fund’s OTC derivative liabilities which may be offset against the | |||||||||||||
| Fund’s OTC derivative assets and collateral pledged to the counterparty, is as follows: | |||||||||||||
| Amounts Not Offset in the | |||||||||||||
| Statement of Assets and Liabilities | |||||||||||||
| Gross and | |||||||||||||
| Net Amounts of | |||||||||||||
| Liabilities Presented | Financial | Financial | |||||||||||
| in the Statement | Instruments | Instruments | Cash | Net Amount | |||||||||
| of Assets and | Available | Collateral | Collateral | (Not less | |||||||||
| Liabilities | for Offset | Pledgeda,b | Pledged | than zero) | |||||||||
| Counterparty | |||||||||||||
| BANT | $ | 1,064,849 | $ | (9,011 | ) | $ | (985,457 | ) | $ | — | $ | 70,381 | |
| BBU | 165,675 | (727 | ) | — | — | 164,948 | |||||||
| BONY | 16,524 | (16,524 | ) | — | — | — | |||||||
| DBFX | 130,624 | — | (99,990 | ) | — | 30,634 | |||||||
| FBCO | 253,840 | (46,893 | ) | (206,947 | ) | — | — | ||||||
| HSBC | 55,095 | (55,095 | ) | — | — | — | |||||||
| SCBT | 30,366 | (16,026 | ) | — | — | 14,340 | |||||||
| SSBT | 6,736 | (155 | ) | — | — | 6,581 | |||||||
| Total | $ | 1,723,709 | $ | (144,431 | ) | $ | (1,292,394 | ) | $ | — | $ | 286,884 | |
aSee the accompanying Statement of Investments for securities pledged as collateral for derivatives.
bIn some instances, the collateral amounts disclosed in the table above were adjusted due to the requirement to limit the collateral amounts to avoid
the effect of overcollateralization. Actual collateral received and/or pledged may be more than the amounts disclosed herein.
See Note 1(c) regarding derivative financial instruments.
Annual Report | 45
Mutual International Fund
Notes to Financial Statements (continued)
9. CREDIT FACILITY
The Fund, together with other U.S. registered and foreign investment funds (collectively, Borrowers), managed by Franklin Templeton Investments, are borrowers in a joint syndicated senior unsecured credit facility totaling $1.5 billion (Global Credit Facility) which, after an extension of the original terms, matured on February 14, 2014. This Global Credit Facility provides a source of funds to the Borrowers for temporary and emergency purposes, including the ability to meet future unanticipated or unusually large redemption requests. Effective February 14, 2014, the Borrowers renewed the Global Credit Facility which matures on February 13, 2015.
Under the terms of the Global Credit Facility, the Fund shall, in addition to interest charged on any borrowings made by the Fund and other costs incurred by the Fund, pay its share of fees and expenses incurred in connection with the implementation and maintenance of the Global Credit Facility, based upon its relative share of the aggregate net assets of all of the Borrowers, including an annual commitment fee of 0.07% based upon the unused portion of the Global Credit Facility. These fees are reflected in other expenses on the Statement of Operations. During the year ended December 31, 2013, the Fund did not use the Global Credit Facility.
10. FAIR VALUE MEASUREMENTS
The Fund follows a fair value hierarchy that distinguishes between market data obtained from independent sources (observable inputs) and the Fund’s own market assumptions (unobservable inputs). These inputs are used in determining the value of the Fund’s financial instruments and are summarized in the following fair value hierarchy:
- Level 1 – quoted prices in active markets for identical financial instruments
- Level 2 – other significant observable inputs (including quoted prices for similar financial instruments, interest rates, prepayment speed, credit risk, etc.)
- Level 3 – significant unobservable inputs (including the Fund’s own assumptions in determining the fair value of financial instruments)
The input levels are not necessarily an indication of the risk or liquidity associated with financial instruments at that level.
For movements between the levels within the fair value hierarchy, the Fund has adopted a policy of recognizing the transfers as of the date of the underlying event which caused the movement.
46 | Annual Report
Mutual International Fund
Notes to Financial Statements (continued)
10. FAIR VALUE MEASUREMENTS (continued)
A summary of inputs used as of December 31, 2013, in valuing the Fund’s assets and liabilities carried at fair value, is as follows:
| Level 1 | Level 2 | Level 3 | Total | |||||
| Assets: | ||||||||
| Investments in Securities: | ||||||||
| Equity Investments:a | ||||||||
| Capital Markets | $ | 1,315,133 | $ | — | $ | 2,494 | $ | 1,317,627 |
| Machinery | 941,851 | 188,228 | — | 1,130,079 | ||||
| All Other Equity Investmentsb | 58,237,413 | — | — | 58,237,413 | ||||
| Corporate Bonds | — | 145,321 | — | 145,321 | ||||
| Short Term Investments | 3,489,742 | — | — | 3,489,742 | ||||
| Total Investments in Securities | $ | 63,984,139 | $ | 333,549 | $ | 2,494 | $ | 64,320,182 |
| Forward Exchange Contracts | $ | — | $ | 161,449 | $ | — | $ | 161,449 |
| Liabilities: | ||||||||
| Forward Exchange Contracts | — | 1,723,709 | — | 1,723,709 | ||||
| aIncludes common and preferred stocks. | ||||||||
| bFor detailed categories, see the accompanying Statement of Investments. | ||||||||
A reconciliation of assets in which Level 3 inputs are used in determining fair value is presented when there are significant Level 3 investments at the end of the year.
11. NEW ACCOUNTING PRONOUNCEMENTS
In June 2013, the Financial Accounting Standards Board issued Accounting Standards Update (ASU) No. 2013-08, Investment Companies (Topic 946): Amendments to the Scope, Measurement, and Disclosure Requirements. The ASU modifies the criteria used in defining an investment company under U.S. Generally Accepted Accounting Principles and also sets forth certain measurement and disclosure requirements. Under the ASU, an entity that is registered under the 1940 Act automatically qualifies as an investment company. The ASU is effective for interim and annual reporting periods beginning after December 15, 2013. Management has reviewed the requirements and believes the adoption of this ASU will not have a material impact on the financial statements.
Annual Report | 47
Mutual International Fund
Notes to Financial Statements (continued)
12. SUBSEQUENT EVENTS
The Fund has evaluated subsequent events through the issuance of the financial statements and determined that no events have occurred that require disclosure other than those already disclosed in the financial statements.
| ABBREVIATIONS | |||||
| Counterparty | Currency | Selected Portfolio | |||
| BANT - | Bank of America N.A. | EUR - Euro | ADR | - American Depositary Receipt | |
| BBU | - | Barclays Bank PLC | IDR | - International Depositary Receipt | |
| BONY - | Bank of New York Mellon | ||||
| DBFX | - | Deutsche Bank AG | |||
| FBCO | - | Credit Suisse Group AG | |||
| HSBC - | HSBC Bank USA, N.A. | ||||
| SCBT | - | Standard Chartered Bank | |||
| SSBT | - | State Street Bank and Trust Co., N.A. | |||
48 | Annual Report
Mutual International Fund
Report of Independent Registered Public Accounting Firm
To the Board of Trustees of Franklin Mutual Series Funds and Shareholders of the Mutual International Fund:
We have audited the accompanying statement of assets and liabilities, including the statement of investments, of Mutual International Fund (the “Fund”) (one of the funds constituting Franklin Mutual Series Funds), as of December 31, 2013, and the related statement of operations for the year then ended, the statements of changes in net assets for each of the two years in the period then ended, and the financial highlights for each of the periods indicated therein. These financial statements and financial highlights are the responsibility of the Fund’s management. Our responsibility is to express an opinion on these financial statements and financial highlights based on our audits.
We conducted our audits in accordance with the standards of the Public Company Accounting Oversight Board (United States). Those standards require that we plan and perform the audit to obtain reasonable assurance about whether the financial statements and financial highlights are free of material misstatement. We were not engaged to perform an audit of the Fund’s internal control over financial reporting. Our audits included consideration of internal control over financial reporting as a basis for designing audit procedures that are appropriate in the circumstances, but not for the purpose of expressing an opinion on the effectiveness of the Fund’s internal control over financial reporting. Accordingly, we express no such opinion. An audit also includes examining, on a test basis, evidence supporting the amounts and disclosures in the financial statements and financial highlights, assessing the accounting principles used and significant estimates made by management, and evaluating the overall financial statement presentation. Our procedures included confirmation of securities owned as of December 31, 2013, by correspondence with the custodian and brokers, or by other appropriate auditing procedures where replies from the brokers were not received. We believe that our audits provide a reasonable basis for our opinion.
In our opinion, the financial statements and financial highlights referred to above present fairly, in all material respects, the financial position of Mutual International Fund (one of the funds constituting Franklin Mutual Series Funds) at December 31, 2013, the results of its operations for the year then ended, the changes in its net assets for each of the two years in the period then ended, and the financial highlights for each of the periods indicated therein, and the financial highlights for each of the five years in the period then ended, in conformity with U.S. generally accepted accounting principles.
![]()
Boston, Massachusetts
February 19, 2014
Annual Report | 49
Mutual International Fund
Tax Information (unaudited)
Under Section 852(b)(3)(C) of the Internal Revenue Code (Code), the Fund hereby reports the maximum amount allowable but no less than $134,880 as a long term capital gain dividend for the fiscal year ended December 31, 2013.
Under Section 871(k)(2)(C) of the Code, the Fund hereby reports the maximum amount allowable but no less than $271,626 as a short term capital gain dividend for purposes of the tax imposed under Section 871(a)(1)(A) of the Code for the fiscal year ended December 31, 2013.
Under Section 854(b)(1)(B) of the Code, the Fund hereby reports the maximum amount allowable but no less than $876,288 as qualified dividends for purposes of the maximum rate under Section 1(h)(11) of the Code for the fiscal year ended December 31, 2013. Distributions, including qualified dividend income, paid during calendar year 2013 will be reported to shareholders on Form 1099-DIV by mid-February 2014. Shareholders are advised to check with their tax advisors for information on the treatment of these amounts on their individual income tax returns.
At December 31, 2013, more than 50% of the Fund’s total assets were invested in securities of foreign issuers. In most instances, foreign taxes were withheld from income paid to the Fund on these investments. As shown in the table below, the Fund hereby reports to shareholders the foreign source income and foreign taxes paid, pursuant to Section 853 of the Code. This written statement will allow shareholders of record on December 19, 2013, to treat their proportionate share of foreign taxes paid by the Fund as having been paid directly by them. The shareholder shall consider these amounts as foreign taxes paid in the tax year in which they receive the Fund distribution.
The following table provides a detailed analysis of foreign tax paid, foreign source income, and foreign qualified dividends as reported by the Fund, to Class Z, Class A, Class C, Class R and Class R6 shareholders of record.
| Foreign Tax Paid | Foreign Source Income | Foreign Qualified Dividends | ||||
| Class | Per Share | Per Share | Per Share | |||
| Class Z | $ | 0.0172 | $ | 0.2823 | $ | 0.1505 |
| Class A | $ | 0.0172 | $ | 0.2514 | $ | 0.1338 |
| Class C | $ | 0.0172 | $ | 0.1648 | $ | 0.0880 |
| Class R | $ | 0.0172 | $ | 0.2353 | $ | 0.1254 |
| Class R6 | $ | 0.0172 | $ | 0.1703 | $ | 0.0927 |
Foreign Tax Paid Per Share (Column 1) is the amount per share available to you, as a tax credit (assuming you held your shares in the Fund for a minimum of 16 days during the 31-day period beginning 15 days before the ex-dividend date of the Fund’s distribution to which the foreign taxes relate), or, as a tax deduction.
50 | Annual Report
Mutual International Fund
Tax Information (unaudited) (continued)
Foreign Source Income Per Share (Column 2) is the amount per share of income dividends attributable to foreign securities held by the Fund, plus any foreign taxes withheld on these dividends. The amounts reported include foreign source qualified dividends that have not been adjusted for the rate differential applicable to such dividend income.1
Foreign Qualified Dividends Per Share (Column 3) is the amount per share of foreign source qualified dividends plus any foreign taxes withheld on these dividends. These amounts represent the portion of the Foreign Source Income reported to you in column 2 that were derived from qualified foreign securities held by the Fund.1
By mid-February 2014, shareholders will receive Form 1099-DIV which will include their share of taxes paid and foreign source income distributed during the calendar year 2013. The Foreign Source Income reported on Form 1099-DIV has not been adjusted for the rate differential on foreign source qualified dividend income. Shareholders are advised to check with their tax advisors for information on the treatment of these amounts on their 2013 individual income tax returns.
1Qualified dividends are taxed at reduced long term capital gains tax rates. In determining the amount of foreign tax credit that may be applied against the U.S. tax liability of individuals receiving foreign source qualified dividends, adjustments may be required to the foreign tax credit limitation calculation to reflect the rate differential applicable to such dividend income. The rules however permit certain individuals to elect not to apply the rate differential adjustments for capital gains and/or dividends for any taxable year. Please consult your tax advisor and the instructions to Form 1116 for more information.
Annual Report | 51
Mutual International Fund
Board Members and Officers
The name, year of birth and address of the officers and board members, as well as their affiliations, positions held with the Fund, principal occupations during at least the past five years and number of portfolios overseen in the Franklin Templeton Investments fund complex are shown below. Generally, each board member serves until that person’s successor is elected and qualified.
| Independent Board Members | ||||
| Number of Portfolios in | ||||
| Name, Year of Birth | Length of | Fund Complex Overseen | Other Directorships Held | |
| and Address | Position | Time Served | by Board Member* | During at Least the Past 5 Years |
| Edward I. Altman, Ph.D. (1941) | Trustee | Since 1987 | 11 | None |
| c/o Franklin Mutual Advisers, LLC | ||||
| 101 John F. Kennedy Parkway | ||||
| Short Hills, NJ 07078-2789 | ||||
| Principal Occupation During at Least the Past 5 Years: | ||||
| Max L. Heine Professor of Finance and Director of The Credit and Debt Markets Research Program, Salomon Center, Stern School of | ||||
| Business, New York University; editor and author of numerous financial publications; financial consultant; an adviser to numerous financial | ||||
| publishing organizations; and formerly, Vice Director, Salomon Center, Stern School of Business, New York University. | ||||
| Ann Torre Bates (1958) | Trustee | Since 1995 | 38 | SLM Corporation (Sallie Mae), Ares |
| c/o Franklin Mutual Advisers, LLC | Capital Corporation (specialty finance | |||
| 101 John F. Kennedy Parkway | company), Allied Capital Corporation | |||
| Short Hills, NJ 07078-2789 | (financial services) (2003-2010) | |||
| and United Natural Foods, Inc., | ||||
| (October 2013). | ||||
| Principal Occupation During at Least the Past 5 Years: | ||||
| Director of various companies; and formerly, Executive Vice President and Chief Financial Officer, NHP Incorporated (manager of multifamily | ||||
| housing) (1995-1997); and Vice President and Treasurer, US Airways, Inc. (until 1995). | ||||
| Burton J. Greenwald (1929) | Trustee | Since 2002 | 18 | Franklin Templeton Emerging Markets |
| c/o Franklin Mutual Advisers, LLC | Debt Opportunities Fund PLC and | |||
| 101 John F. Kennedy Parkway | Fiduciary International Ireland | |||
| Short Hills, NJ 07078-2789 | Limited. | |||
| Principal Occupation During at Least the Past 5 Years: | ||||
| Managing Director, B.J. Greenwald Associates (management consultants to the financial services industry); and formerly, Chairman, | ||||
| Fiduciary Trust International Funds; Executive Vice President, L.F Rothschild Fund Management, Inc.; President and Director, Merit Mutual | ||||
| Funds; President, Underwriting Division and Director, National Securities & Research Corporation; Governor, Investment Company Institute; | ||||
| and Chairman, ICI Public Information Committee. | ||||
52 | Annual Report
| Number of Portfolios in | |||||
| Name, Year of Birth | Length of | Fund Complex Overseen | Other Directorships Held | ||
| and Address | Position | Time Served | by Board Member* | During at Least the Past 5 Years | |
| Keith E. Mitchell (1954) | Trustee | Since 2009 | 11 | None | |
| c/o Franklin Mutual Advisers, LLC | |||||
| 101 John F. Kennedy Parkway | |||||
| Short Hills, NJ 07078-2789 | |||||
| Principal Occupation During at Least the Past 5 Years: | |||||
| Managing Member, Mitchell, Hartley & Bechtel Advisers, LLC (formerly, Mitchell Advisers, LLC) (advisory firm); director of various boards of | |||||
| asset management firms; and formerly, Managing Director, Putnam Lovell NBF. | |||||
| Charles Rubens II (1930) | Trustee | Since 1998 | 18 | None | |
| c/o Franklin Mutual Advisers, LLC | |||||
| 101 John F. Kennedy Parkway | |||||
| Short Hills, NJ 07078-2789 | |||||
| Principal Occupation During at Least the Past 5 Years: | |||||
| Private investor and president of non-profit organizations; and formerly, an executive of Time, Inc.; and Trustee of Colorado College. | |||||
| Jan Hopkins Trachtman (1947) | Trustee | Since 2009 | 11 | None | |
| c/o Franklin Mutual Advisers, LLC | |||||
| 101 John F. Kennedy Parkway | |||||
| Short Hills, NJ 07078-2789 | |||||
| Principal Occupation During at Least the Past 5 Years: | |||||
| President and Founder, The Jan Hopkins Group (communications consulting firm); President, Economic Club of New York; serves on | |||||
| Advisory Board of Knight Bagehot Fellowship; and formerly, Anchor/Correspondent, CNN Financial News (until 2003); Managing Director | |||||
| and Head of Client Communications, Citigroup Private Bank (until 2005); Off-Air Reporter, ABC News’ World News Tonight; and Editor, CBS | |||||
| Network News. | |||||
| Robert E. Wade (1946) | Trustee and | Trustee since | 45 | El Oro Ltd (investments). | |
| c/o Franklin Mutual Advisers, LLC | Chairman of | 1993 and | |||
| 101 John F. Kennedy Parkway | the Board | Chairman of the | |||
| Short Hills, NJ 07078-2789 | Board since 2005 | ||||
| Principal Occupation During at Least the Past 5 Years: | |||||
| Attorney at law engaged in private practice (1972-2008) and member of various boards. | |||||
| Interested Board Members and Officers | |||||
| Number of Portfolios in | |||||
| Name, Year of Birth | Length of | Fund Complex Overseen | Other Directorships Held | ||
| and Address | Position | Time Served | by Board Member* | During at Least the Past 5 Years | |
| **Gregory E. Johnson (1961) | Trustee | Since 2007 | 152 | None | |
| One Franklin Parkway | |||||
| San Mateo, CA 94403-1906 | |||||
| Principal Occupation During at Least the Past 5 Years: | |||||
| Chairman of the Board, Member – Office of the Chairman, Director, President and Chief Executive Officer, Franklin Resources, Inc.; officer | |||||
| and/or director or trustee, as the case may be, of some of the other subsidiaries of Franklin Resources, Inc. and of 44 of the investment | |||||
| companies in Franklin Templeton Investments; and Chairman, Investment Company Institute. | |||||
Annual Report | 53
| Number of Portfolios in | |||||
| Name, Year of Birth | Length of | Fund Complex Overseen | Other Directorships Held | ||
| and Address | Position | Time Served | by Board Member* | During at Least the Past 5 Years | |
| **Peter A. Langerman (1955) | Trustee, | Trustee since | 11 | American International Group, Inc. | |
| c/o Franklin Mutual Advisers, LLC | President and | 2007, President | (AIG) Credit Facility Trust | ||
| 101 John F. Kennedy Parkway | Chief Executive | and Chief | (2010–2011 | ). | |
| Short Hills, NJ 07078-2702 | Officer – | Executive Officer – | |||
| Investment | Investment | ||||
| Management | Management | ||||
| since 2005 | |||||
| Principal Occupation During at Least the Past 5 Years: | |||||
| Chairman of the Board, Chief Executive Officer and President, Franklin Mutual Advisers, LLC; officer and/or director, as the case may be, of | |||||
| four of the investment companies in Franklin Templeton Investments. | |||||
| Alison E. Baur (1964) | Vice President | Since 2012 | Not Applicable | Not Applicable | |
| One Franklin Parkway | |||||
| San Mateo, CA 94403-1906 | |||||
| Principal Occupation During at Least the Past 5 Years: | |||||
| Deputy General Counsel, Franklin Templeton Investments; and officer of some of the other subsidiaries of Franklin Resources, Inc. and of 46 | |||||
| of the investment companies in Franklin Templeton Investments. | |||||
| Philippe Brugere-Trelat (1949) | Vice President | Since 2005 | Not Applicable | Not Applicable | |
| 101 John F. Kennedy Parkway | |||||
| Short Hills, NJ 07078-2789 | |||||
| Principal Occupation During at Least the Past 5 Years: | |||||
| Executive Vice President, Franklin Mutual Advisers, LLC; officer of three of the investment companies in Franklin Templeton Investments; | |||||
| and formerly, Portfolio Manager of Eurovest SA (French registered Investment Company, Sicav). | |||||
| Laura F. Fergerson (1962) | Chief Executive | Since 2009 | Not Applicable | Not Applicable | |
| One Franklin Parkway | Officer – | ||||
| San Mateo, CA 94403-1906 | Finance and | ||||
| Administration | |||||
| Principal Occupation During at Least the Past 5 Years: | |||||
| Senior Vice President, Franklin Templeton Services, LLC; and officer of 46 of the investment companies in Franklin Templeton Investments. | |||||
| Aliya S. Gordon (1973) | Vice President | Since 2009 | Not Applicable | Not Applicable | |
| One Franklin Parkway | |||||
| San Mateo, CA 94403-1906 | |||||
| Principal Occupation During at Least the Past 5 Years: | |||||
| Senior Associate General Counsel, Franklin Templeton Investments; officer of 46 of the investment companies in Franklin Templeton | |||||
| Investments; and formerly, Litigation Associate, Steefel, Levitt & Weiss, LLP (2000-2004). | |||||
| Steven J. Gray (1955) | Secretary and | Secretary since | Not Applicable | Not Applicable | |
| One Franklin Parkway | Vice President | 2005 and Vice | |||
| San Mateo, CA 94403-1906 | President since | ||||
| 2009 | |||||
| Principal Occupation During at Least the Past 5 Years: | |||||
| Senior Associate General Counsel, Franklin Templeton Investments; Vice President, Franklin Templeton Distributors, Inc.; and officer of 46 of | |||||
| the investment companies in Franklin Templeton Investments. | |||||
54 | Annual Report
| Number of Portfolios in | ||||
| Name, Year of Birth | Length of | Fund Complex Overseen | Other Directorships Held | |
| and Address | Position | Time Served | by Board Member* | During at Least the Past 5 Years |
| Selena L. Holmes (1965) | Vice President | Since 2012 | Not Applicable | Not Applicable |
| 100 Fountain Parkway | – AML | |||
| St. Petersburg, FL 33716-1205 | Compliance | |||
| Principal Occupation During at Least the Past 5 Years: | ||||
| Director, Global Compliance Monitoring; and officer of 46 of the investment companies in Franklin Templeton Investments. | ||||
| Robert Kubilis (1973) | Treasurer, | Since 2012 | Not Applicable | Not Applicable |
| 300 S.E. 2nd Street | Chief Financial | |||
| Fort Lauderdale, FL 33301-1923 | Officer and | |||
| Chief | ||||
| Accounting | ||||
| Officer | ||||
| Principal Occupation During at Least the Past 5 Years: | ||||
| Assistant Treasurer, Fund Accounting, Franklin Templeton Investments; and officer of five of the investment companies in Franklin Templeton | ||||
| Investments. | ||||
| Kimberly H. Novotny (1972) | Vice President | Since March 2013 | Not Applicable | Not Applicable |
| 300 S.E. 2nd Street | ||||
| Fort Lauderdale, FL 33301-1923 | ||||
| Principal Occupation During at Least the Past 5 Years: | ||||
| Associate General Counsel, Franklin Templeton Investments; Vice President and Secretary, Fiduciary Trust International of the South; Vice | ||||
| President, Templeton Investment Counsel, LLC; Assistant Secretary, Franklin Resources, Inc.; and officer of 46 of the investment companies | ||||
| in Franklin Templeton Investments. | ||||
| Robert C. Rosselot (1960) | Chief | Since March 2013 | Not Applicable | Not Applicable |
| 300 S.E. 2nd Street | Compliance | |||
| Fort Lauderdale, FL 33301-1923 | Officer | |||
| Principal Occupation During at Least the Past 5 Years: | ||||
| Director, Global Compliance, Franklin Templeton Investments; officer of 46 of the investment companies in Franklin Templeton Investments; | ||||
| and formerly, Senior Associate General Counsel, Franklin Templeton Investments (2007-2013); and Secretary and Vice President, Templeton | ||||
| Group of Funds (2004-2013). | ||||
| Karen L. Skidmore (1952) | Vice President | Since 2009 | Not Applicable | Not Applicable |
| One Franklin Parkway | ||||
| San Mateo, CA 94403-1906 | ||||
| Principal Occupation During at Least the Past 5 Years: | ||||
| Senior Associate General Counsel, Franklin Templeton Investments; and officer of 46 of the investment companies in Franklin Templeton | ||||
| Investments. | ||||
| Craig S. Tyle (1960) | Vice President | Since 2005 | Not Applicable | Not Applicable |
| One Franklin Parkway | ||||
| San Mateo, CA 94403-1906 | ||||
| Principal Occupation During at Least the Past 5 Years: | ||||
| General Counsel and Executive Vice President, Franklin Resources, Inc.; and officer of some of the other subsidiaries of Franklin Resources, | ||||
| Inc. and of 46 of the investment companies in Franklin Templeton Investments. | ||||
Annual Report | 55
| Number of Portfolios in | ||||
| Name, Year of Birth | Length of | Fund Complex Overseen | Other Directorships Held | |
| and Address | Position | Time Served | by Board Member* | During at Least the Past 5 Years |
| Lori A. Weber (1964) | Vice President | Since 2011 | Not Applicable | Not Applicable |
| 300 S.E. 2nd Street | ||||
| Fort Lauderdale, FL 33301-1923 | ||||
| Principal Occupation During at Least the Past 5 Years: | ||||
| Senior Associate General Counsel, Franklin Templeton Investments; Assistant Secretary, Franklin Resources, Inc.; Vice President and | ||||
| Secretary, Templeton Investment Counsel, LLC; Vice President, Fiduciary Trust International of the South; and officer of 46 of the investment | ||||
| companies in Franklin Templeton Investments. | ||||
*We base the number of portfolios on each separate series of the U.S. registered investment companies within the Franklin Templeton Investments fund complex. These portfolios
have a common investment manager or affiliated investment managers.
**Gregory E. Johnson is considered to be an interested person of the Fund under the federal securities laws due to his position as an officer and director of Franklin Resources, Inc.,
which is the parent company of the Fund’s investment manager and distributor. Peter A. Langerman is considered to be an interested person of the Fund under the federal securities
laws due to his position as an officer of Franklin Mutual Advisers, LLC, which is an affiliate of the Fund’s investment manager.
Note 1: Officer information is current as of the date of this report. It is possible that after this date, information about officers may change.
The Fund’s Board has determined that certain of the members of the Audit Committee, including Ann Torre Bates, are audit committee financial experts, and “independent,”
under those provisions of the Sarbanes-Oxley Act of 2002, and the rules and form amendments adopted by the Securities and Exchange Commission, relating to audit committee
financial experts.
The Statement of Additional Information (SAI) includes additional information about the board members and is available, without charge, upon request. Shareholders may
call (800) DIAL BEN/342-5236 to request the SAI.
56 | Annual Report
Mutual International Fund
Shareholder Information
Proxy Voting Policies and Procedures
The Fund’s investment manager has established Proxy Voting Policies and Procedures (Policies) that the Fund uses to determine how to vote proxies relating to portfolio securities. Shareholders may view the Fund’s complete Policies online at franklintempleton.com. Alternatively, shareholders may request copies of the Policies free of charge by calling the Proxy Group collect at (954) 527-7678 or by sending a written request to: Franklin Templeton Companies, LLC, 300 S.E. 2nd Street, Fort Lauderdale, FL 33301, Attention: Proxy Group. Copies of the Fund’s proxy voting records are also made available online at franklintempleton.com and posted on the U.S. Securities and Exchange Commission’s website at sec.gov and reflect the most recent 12-month period ended June 30.
Quarterly Statement of Investments
The Fund files a complete statement of investments with the U.S. Securities and Exchange Commission for the first and third quarters for each fiscal year on Form N-Q. Shareholders may view the filed Form N-Q by visiting the Commission’s website at sec.gov. The filed form may also be viewed and copied at the Commission’s Public Reference Room in Washington, DC. Information regarding the operations of the Public Reference Room may be obtained by calling (800) SEC-0330.
Householding of Reports and Prospectuses
You will receive the Fund’s financial reports every six months as well as an annual updated summary prospectus (prospectus available upon request). To reduce Fund expenses, we try to identify related shareholders in a household and send only one copy of the financial reports and summary prospectus. This process, called “householding,” will continue indefinitely unless you instruct us otherwise. If you prefer not to have these documents householded, please call us at (800) 632-2301. At any time you may view current prospectuses/summary prospectuses and financial reports on our website. If you choose, you may receive these documents through electronic delivery.
Annual Report | 57
This page intentionally left blank.
This page intentionally left blank.
This page intentionally left blank.
| Contents | |||||||
| Shareholder Letter | 1 | Annual Report | Financial Statements | 33 | Board Members and Officers | 59 | |
| Mutual Quest Fund | 6 | Notes to Financial Statements | 38 | Shareholder Information | 64 | ||
| Performance Summary | 12 | Report of Independent | |||||
| Registered Public | |||||||
| Your Fund’s Expenses | 17 | ||||||
| Accounting Firm | 57 | ||||||
| Financial Highlights and | |||||||
| Tax Information | 58 | ||||||
| Statement of Investments | 19 | ||||||
Annual Report
Mutual Quest Fund
Your Fund’s Goals and Main Investments: Mutual Quest Fund seeks capital
appreciation, with income as a secondary goal, by investing primarily in equity securities of companies
the Fund’s managers believe are at prices below their intrinsic value. The Fund may invest up to 50%
of its assets in foreign securities.
| Performance data represent past |
| performance, which does not |
| guarantee future results. Investment |
| return and principal value will |
| fluctuate, and you may have a gain |
| or loss when you sell your shares. |
| Current performance may differ |
| from figures shown. Please visit |
| franklintempleton.com or call |
| (800) 342-5236 for most recent |
| month-end performance. |
This annual report for Mutual Quest Fund covers the fiscal year ended December 31, 2013.
Performance Overview
Mutual Quest Fund – Class Z delivered a +25.97% cumulative total return for the 12 months ended December 31, 2013. For comparison, the Fund’s benchmark, the Standard & Poor’s 500 Index (S&P 500), which is a broad measure of U.S. stock performance, generated a +32.39% total return.1 You can find more of the Fund’s performance data in the Performance Summary beginning on page 12.
Economic and Market Overview
The 12 months under review were characterized by reinvigorated policy support and an economic recovery in developed markets. However, differences in global economic trends corresponded with increasingly divergent monetary policies, and growth in emerging market economies tended to slow. The central banks of key developed markets generally reaffirmed their accommodative monetary stances while some emerging market counterparts tightened policy rates as they sought to control inflation and currency depreciation.
In the U.S., economic growth and employment trends generally exceeded expectations, underpinned by consumer and business spending and rising inventories. Historically low mortgage rates and improving sentiment aided the housing
1. Source: © 2014 Morningstar. All Rights Reserved. The information contained herein: (1) is proprietary to Morningstar and/or its content providers; (2) may not be copied or distributed; and (3) is not warranted to be accurate, complete or timely. Neither Morningstar nor its content providers are responsible for any damages or losses arising from any use of this information. The index is unmanaged and includes reinvested dividends. One cannot invest directly in an index, and an index is not representative of the Fund’s portfolio.
The dollar value, number of shares or principal amount, and names of all portfolio holdings are listed in the Fund’s Statement of Investments (SOI). The SOI begins on page 24.
6 | Annual Report
market recovery, evidenced by increased new and existing home sales, rising home prices, low inventories and multi-year lows in new foreclosures. The U.S. Federal Reserve Board (Fed) expanded its asset purchase program to $85 billion per month from $40 billion early in the year. After encouraging economic and employment reports, the Fed announced in December it would reduce its monthly bond purchases by $10 billion beginning in January 2014; however, the Fed committed to keeping interest rates low. In October, the federal government temporarily shut down after Congress failed to authorize routine federal funding amid a disagreement over a new health care law. However, Congress subsequently agreed to fund the government through early 2014 and later passed a two-year budget deal that could ease automatic spending cuts and lower the risk of another shutdown.
Outside the U.S., the eurozone emerged from its longest recession on record during the second half of 2013 and Japan’s growth moderated. The European Central Bank reduced its key interest rate to a record low and pledged to maintain systemic support following political turmoil in Greece, Spain, Portugal and Italy. Germany’s re-election of Chancellor Angela Merkel was largely perceived as a vote of support for ongoing eurozone reform measures. In Asia, the Bank of Japan set an explicit inflation target and pledged to double bond purchases in an unprecedented wave of policy reform. The U.S. dollar fell versus the euro but rose versus the Japanese yen in 2013.
Growth in many emerging markets moderated based on lower domestic demand, falling exports and weakening commodity prices. Political turmoil in certain emerging markets, the Fed’s potential tapering of its asset purchase program and the Chinese central bank’s effort to tighten liquidity to curb real estate and credit speculation led to a sell-off in emerging market equities and a sharp depreciation in regional currencies against the U.S. dollar. Central banks in Brazil, India and Indonesia raised interest rates in the second half of 2013 as they sought to curb inflation.
The stock market rally in developed markets accelerated during 2013 amid ongoing central bank commitments, continued corporate earnings strength and increasing signs of economic progress. Emerging market stocks rebounded toward period-end, although Latin American stocks trailed their emerging market peers. Oil prices rallied in the third quarter and rose for the year mainly owing to supply concerns related to geopolitical turmoil, but gold posted its largest annual price decline in more than three decades. Increasingly divergent economic and political circumstances during the period resulted in declining market correlations across regions and between asset classes, which many bottom-up investors perceived as more favorable.
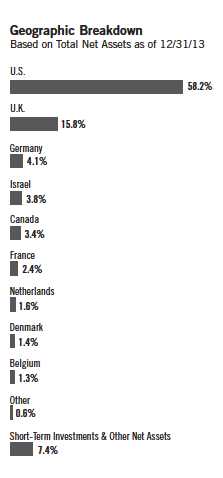
Annual Report | 7
Top 10 Sectors/Industries
Based on Equity Securities as of 12/31/13
| % of Total | ||
| Net Assets | ||
| Oil, Gas & Consumable Fuels | 8.6 | % |
| Insurance | 8.1 | % |
| Tobacco | 7.7 | % |
| Media | 5.5 | % |
| Commercial Banks | 4.9 | % |
| Software | 4.2 | % |
| Energy Equipment & Services | 3.3 | % |
| Wireless Telecommunication Services | 3.3 | % |
| Metals & Mining | 2.6 | % |
| Pharmaceuticals | 2.6 | % |
| What is meant by “hedge”? |
| To hedge a position is to seek to reduce |
| the risk of adverse price movements |
| in an asset. Normally, a hedge is |
| implemented as an offsetting position in |
| a related security, such as a currency |
| forward contract. |
| What is a currency |
| forward contract? |
| A currency forward contract, also called |
| a “currency forward,” is an agreement |
| between the Fund and a counterparty |
| to buy or sell a foreign currency at a |
| specific exchange rate on a future date. |
Investment Strategy
At Mutual Series, we are committed to our distinctive value approach to investing, which we believe can generate above-average risk-adjusted returns over time for our shareholders. Our major investment strategy is investing in undervalued stocks. When selecting undervalued equities, we are always attracted to fundamentally strong companies with healthy balance sheets, high-quality assets, substantial free cash flow and shareholder-oriented management teams and whose stocks are trading at discounts to our assessment of the companies’ intrinsic or business value. We also look for asset rich companies whose shares may be trading at depressed levels due to concerns over short-term earnings disappointments, litigation, management strategy or other perceived negatives. This strict value approach is not only intended to improve the likelihood of upside potential, but it is also intended to reduce the risk of substantial declines. While the vast majority of our undervalued equity investments are made in publicly traded companies globally, we may invest occasionally in privately held companies as well.
We complement this more traditional investment strategy with two others. One is distressed investing, a highly specialized field that has proven quite profitable during certain periods over the years. Distressed investing is complex and can take many forms. The most common distressed investment the Fund undertakes is the purchase of financially troubled or bankrupt companies’ debt at a substantial discount to face value. After the financially distressed company is reorganized, often in bankruptcy court, the old debt is typically replaced with new securities issued by the financially stronger company.
The other piece of our investment strategy is participating in arbitrage situations, another highly specialized field. When companies announce proposed mergers or takeovers, commonly referred to as “deals,” the target company may trade at a discount to the bid it ultimately accepts. One form of arbitrage involves purchasing the target company’s stock when it is trading below the value we believe it would receive in a deal. In keeping with our commitment to a relatively conservative investment approach, we typically focus our arbitrage efforts on announced deals, and eschew rumored deals or other situations we consider relatively risky.
In addition, it is our practice to hedge the Fund’s currency exposure when we deem it advantageous for our shareholders.
8 | Annual Report
Manager’s Discussion
In an environment of generally rising equity prices, many Fund holdings increased in value during the 12-month period. Three of the top contributors were U.K.-based mobile telephony operator Vodafone Group and insurers MetLife and American International Group (AIG).
Vodafone Group is a global mobile telecommunications company that provides a range of services, including voice and data communications. The company’s stock rallied in the second half of the year, driven largely by the long-anticipated sale of its 45% stake in Verizon Wireless to Verizon Communications at what we considered to be an attractive price. Vodafone said it planned to return two-thirds of the capital from the sale to shareholders and use the balance to invest in growth initiatives in its core markets and to reduce debt. Following the deal, we continued to view Vodafone as a potentially compelling stock, given that the economic environment in Europe has shown signs of stabilizing, the regulatory environment is easing and we believe the company may be close to monetizing its investments in data services.
MetLife shares appreciated during the period under review owing to solid quarterly results and a dividend increase. In the first half of the year, the U.S.-based life insurer reported better-than-expected earnings and an improvement in margins. In April, the company raised its quarterly dividend 49%, representing the company’s first increase since 2007. Efforts to rationalize capital allocation policies by shifting from capital-intensive to more capital-efficient businesses drove operational results while diversifying the company’s risk profile. At period-end, the company’s balance sheet remained strong and significant excess capital presented the potential for increased returns to shareholders, in our view.
Strong performance in its life and property and casualty segments and a general improvement in expense management helped AIG produce quarterly earnings results that topped consensus estimates. In May, independent credit rating agency Standard & Poor’s upgraded its rating for AIG’s property and casualty insurance business, supporting the stock’s performance. In the second half of 2013, continued operational improvements led to a reinstatement of the company’s dividend and the announcement of a $1 billion stock buyback plan.
During the period under review, some of the Fund’s investments negatively affected performance. These included U.K.-headquartered RSA Insurance Group, specialty telecommunications company Sorenson Communications and German engineering and steel conglomerate ThyssenKrupp.
| Top 10 Equity Holdings | ||
| 12/31/13 | ||
| Company | % of Total | |
| Sector/Industry, Country | Net Assets | |
| Vodafone Group PLC | 3.2 | % |
| Wireless Telecommunication Services, U.K. | ||
| Royal Dutch Shell PLC, A | 3.0 | % |
| Oil, Gas & Consumable Fuels, U.K. | ||
| Imperial Tobacco Group PLC | 2.8 | % |
| Tobacco, U.K. | ||
| Apple Inc. | 2.5 | % |
| Computers & Peripherals, U.S. | ||
| Apache Corp. | 2.4 | % |
| Oil, Gas & Consumable Fuels, U.S. | ||
| Tribune Co., A | 2.4 | % |
| Media, U.S. | ||
| Transocean Ltd. | 2.4 | % |
| Energy Equipment & Services, U.S. | ||
| British American Tobacco PLC | 2.4 | % |
| Tobacco, U.K. | ||
| Spirit Realty Capital Inc. | 2.3 | % |
| Real Estate Investment Trusts, U.S. | ||
| CIT Group Inc. | 2.3 | % |
| Commercial Banks, U.S. | ||
Annual Report | 9
| What is return on equity? |
| Return on equity is an amount, |
| expressed as a percentage, earned on |
| a company’s common stock investment |
| for a given period. Return on equity tells |
| common shareholders how effectually |
| their money is being employed. |
| Comparing percentages for current and |
| prior periods also reveals trends, and |
| comparison with industry composites |
| reveals how well a company is holding |
| its own against its competitors. |
| What is a futures contract? |
| A futures contract, also called a “future,” |
| is an agreement between the Fund and |
| a counterparty made through a U.S. or |
| foreign futures exchange to buy or sell |
| an asset at a specific price on a future |
| date. |
After cutting its dividend early in 2013, RSA Insurance Group suffered substantial weather-related losses, which precluded the company from achieving its annual return on equity target. RSA’s share price came under additional pressure in November when the company announced it would suspend the chief executive officer, chief financial officer and claims director of its Irish unit amid an investigation into aggressive reserve accounting practices.
We held a debt position in Sorenson Communications, the largest U.S. company providing videophones, applications and video relay services to the hearing impaired. The company’s systems allow users to place and receive calls through a professional American Sign Language interpreter, providing deaf and hard-of-hearing individuals the functional equivalent of a voice telephone. Our investment in Sorenson debt declined following the Federal Communications Commission’s July announcement that it would cut reimbursement rates for telecommunications relay services.
Amid a difficult operating environment, ThyssenKrupp stock was negatively affected by slow progress on the sale of its Steel Americas operations and capital raising efforts undertaken to address the company’s low book value of equity. The announcement of an asset swap with Outokumpu, a Finnish stainless steel producer, also weighed on shares. The swap was announced in an effort to win regulatory approval for a previous transaction involving the sale of ThyssenKrupp’s stainless steel division to Outokumpu. The market reacted negatively to the news as the asset swap would extend the timeline for the completion of ThyssenKrupp’s restructuring efforts.
During the year, the Fund held currency forwards and futures to hedge a portion of the currency risk of the portfolio’s non-U.S. dollar investments. The hedges had a minor negative impact on the Fund’s performance during the period.
10 | Annual Report
Thank you for your participation in Mutual Quest Fund. We look forward to continuing to serve your investment needs.

Mutual Quest Fund
CFA® is a trademark owned by CFA Institute.
The foregoing information reflects our analysis, opinions and portfolio holdings as of December 31, 2013, the end of the reporting period. The way we implement our main investment strategies and the resulting portfolio holdings may change depending on factors such as market and economic conditions. These opinions may not be relied upon as investment advice or an offer for a particular security. The information is not a complete analysis of every aspect of any market, country, industry, security or the Fund. Statements of fact are from sources considered reliable, but the investment manager makes no representation or warranty as to their completeness or accuracy. Although historical performance is no guarantee of future results, these insights may help you understand our investment management philosophy.
Shawn Tumulty has been a portfolio manager for Mutual Quest Fund since 2003 and a co-portfolio manager since 2010. He joined Franklin Templeton Investments in 2000. Prior to joining Franklin Templeton Investments, Mr. Tumulty was an analyst and portfolio manager at Hamilton Partners Limited.
Keith Luh has been a co-portfolio manager for Mutual Quest Fund since 2010. He is also a research analyst specializing in distressed securities, merger and capital structure arbitrage, and event-driven situations. Prior to joining Mutual Series in 2005, Mr. Luh was an analyst in global investment research at Putnam Investments, where he also helped manage a best ideas research fund. Previously, he worked in the investment banking group at Volpe Brown Whelan and Co., LLC, and the derivative products trading group at BNP. Mr. Luh is also Adjunct Professor in Finance and Economics at the Graduate School of Business, Columbia University and the Gabelli School of Business, Fordham University.
Annual Report | 11
Performance Summary as of 12/31/13
Your dividend income will vary depending on dividends or interest paid by securities in the Fund’s portfolio, adjusted for operating expenses of each class. Capital gain distributions are net profits realized from the sale of portfolio securities. The performance table and graphs do not reflect any taxes that a shareholder would pay on Fund dividends, capital gain distributions, if any, or any realized gains on the sale of Fund shares. Total return reflects reinvestment of the Fund’s dividends and capital gain distributions, if any, and any unrealized gains or losses.
| Price and Distribution Information | ||||||||
| Class Z (Symbol: MQIFX) | Change | 12/31/13 | 12/31/12 | |||||
| Net Asset Value (NAV) | +$ | 1.63 | $ | 18.18 | $ | 16.55 | ||
| Distributions (1/1/13–12/31/13) | ||||||||
| Dividend Income | $ | 0.5635 | ||||||
| Short-Term Capital Gain | $ | 1.1055 | ||||||
| Long-Term Capital Gain | $ | 0.9280 | ||||||
| Total | $ | 2.5970 | ||||||
| Class A (Symbol: TEQIX) | Change | 12/31/13 | 12/31/12 | |||||
| Net Asset Value (NAV) | +$ | 1.59 | $ | 18.00 | $ | 16.41 | ||
| Distributions (1/1/13–12/31/13) | ||||||||
| Dividend Income | $ | 0.5094 | ||||||
| Short-Term Capital Gain | $ | 1.1055 | ||||||
| Long-Term Capital Gain | $ | 0.9280 | ||||||
| Total | $ | 2.5429 | ||||||
| Class C (Symbol: TEMQX) | Change | 12/31/13 | 12/31/12 | |||||
| Net Asset Value (NAV) | +$ | 1.52 | $ | 17.76 | $ | 16.24 | ||
| Distributions (1/1/13–12/31/13) | ||||||||
| Dividend Income | $ | 0.3857 | ||||||
| Short-Term Capital Gain | $ | 1.1055 | ||||||
| Long-Term Capital Gain | $ | 0.9280 | ||||||
| Total | $ | 2.4192 | ||||||
| Class R (Symbol: n/a) | Change | 12/31/13 | 12/31/12 | |||||
| Net Asset Value (NAV) | +$ | 1.51 | $ | 17.84 | $ | 16.33 | ||
| Distributions (1/1/13–12/31/13) | ||||||||
| Dividend Income | $ | 0.5248 | ||||||
| Short-Term Capital Gain | $ | 1.1055 | ||||||
| Long-Term Capital Gain | $ | 0.9280 | ||||||
| Total | $ | 2.5583 | ||||||
| Class R6 (Symbol: n/a) | Change | 12/31/13 | 5/1/13 | |||||
| Net Asset Value (NAV) | +$ | 0.03 | $ | 18.19 | $ | 18.16 | ||
| Distributions (5/1/13–12/31/13) | ||||||||
| Dividend Income | $ | 0.5785 | ||||||
| Short-Term Capital Gain | $ | 1.1055 | ||||||
| Long-Term Capital Gain | $ | 0.9280 | ||||||
| Total | $ | 2.6120 | ||||||
| 12 | Annual Report | ||||||||
Performance Summary (continued)
Performance
Cumulative total return excludes sales charges. Aggregate and average annual total return and value of $10,000 investment include maximum sales charges. Class Z/R/R6: no sales charges; Class A: 5.75% maximum initial sales charge; Class C: 1% contingent deferred sales charge in first year only.
| Class Z | 1-Year | 5-Year | 10-Year | ||||||||
| Cumulative Total Return1 | + | 25.97 | % | + | 84.95 | % | + | 133.25 | % | ||
| Average Annual Total Return2 | + | 25.97 | % | + | 13.09 | % | + | 8.84 | % | ||
| Value of $10,000 Investment3 | $ | 12,597 | $ | 18,495 | $ | 23,325 | |||||
| Total Annual Operating Expenses4 | 0.90 | % | |||||||||
| Class A | 1-Year | 5-Year | 10-Year | ||||||||
| Cumulative Total Return1 | + | 25.61 | % | + | 82.20 | % | + | 126.08 | % | ||
| Average Annual Total Return2 | + | 18.40 | % | + | 11.43 | % | + | 7.86 | % | ||
| Value of $10,000 Investment3 | $ | 11,840 | $ | 17,178 | $ | 21,303 | |||||
| Total Annual Operating Expenses4 | 1.20 | % | |||||||||
| Class C | 1-Year | 5-Year | 10-Year | ||||||||
| Cumulative Total Return1 | + | 24.74 | % | + | 75.90 | % | + | 111.08 | % | ||
| Average Annual Total Return2 | + | 23.74 | % | + | 11.96 | % | + | 7.76 | % | ||
| Value of $10,000 Investment3 | $ | 12,374 | $ | 17,590 | $ | 21,108 | |||||
| Total Annual Operating Expenses4 | 1.90 | % | |||||||||
| Class R | 1-Year | 3-Year | Inception (5/1/09) | ||||||||
| Cumulative Total Return1 | + | 25.34 | % | + | 37.13 | % | + | 78.77 | % | ||
| Average Annual Total Return2 | + | 25.34 | % | + | 12.36 | % | + | 13.25 | % | ||
| Value of $10,000 Investment3 | $ | 12,534 | $ | 13,713 | $ | 17,877 | |||||
| Total Annual Operating Expenses4 | 1.40 | % | |||||||||
| Class R6 | Inception (5/1/13) | ||||||||||
| Cumulative Total Return1 | + | 14.83 | % | ||||||||
| Aggregate Total Return5 | + | 14.83 | % | ||||||||
| Value of $10,000 Investment3 | $ | 11,483 | |||||||||
| Total Annual Operating Expenses4 | 0.82 | % |
Performance data represent past performance, which does not guarantee future results. Investment return and principal value will fluctuate, and you may have a gain or loss when you sell your shares. Current performance may differ from figures shown. For most recent month-end performance, go to franklintempleton.com or call (800) 342-5236.
Annual Report | 13
Performance Summary (continued)
Total Return Index Comparison for a Hypothetical $10,000 Investment
Total return represents the change in value of an investment over the periods shown. It includes any applicable maximum sales charge, Fund expenses, account fees and reinvested distributions. The unmanaged index includes reinvestment of any income or distributions. It differs from the Fund in composition and does not pay management fees or expenses. One cannot invest directly in an index.
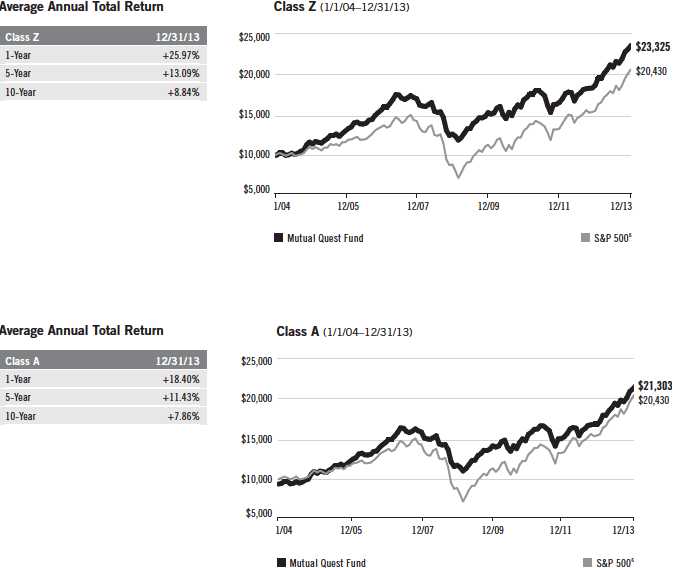
14 | Annual Report

Annual Report | 15
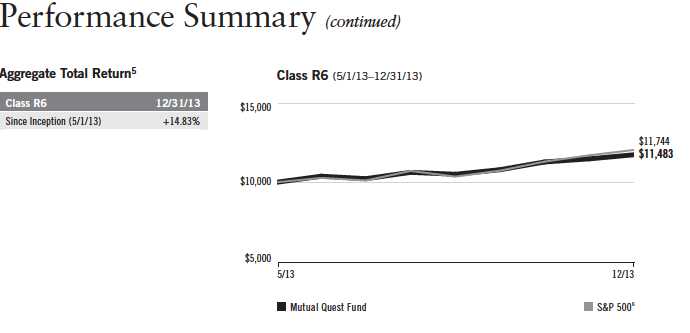
Endnotes
All investments involve risks, including possible loss of principal. Value securities may not increase in price as anticipated or may decline further in value. The Fund’s investments in smaller company stocks and foreign securities involve special risks. Smaller company stocks have exhibited greater price volatility than larger company stocks, particularly over the short term. Foreign securities risks include currency fluctuations, and economic and political uncertainties. The Fund may also invest in companies engaged in mergers, reorganizations or liquidations, which involve special risks as pending deals may not be completed on time or on favorable terms, as well as lower rated bonds, which entail higher credit risk. The Fund is actively managed but there is no guarantee that the manager’s investment decisions will produce the desired results. The Fund’s prospectus also includes a description of the main investment risks.
| Class Z: | Shares are available to certain eligible investors as described in the prospectus. |
| Class C: | These shares have higher annual fees and expenses than Class A shares. |
| Class R: | Shares are available to certain eligible investors as described in the prospectus. These shares have |
| higher annual fees and expenses than Class A shares. | |
| Class R6: | Shares are available to certain eligible investors as described in the prospectus. |
1. Cumulative total return represents the change in value of an investment over the periods indicated.
2. Average annual total return represents the average annual change in value of an investment over the periods indicated.
3. These figures represent the value of a hypothetical $10,000 investment in the Fund over the periods indicated.
4. Figures are as stated in the Fund’s current prospectus. In periods of market volatility, assets may decline significantly, causing total annual Fund operating expenses to become higher than the figures shown.
5. Aggregate total return represents the change in value of an investment for the period indicated. Since Class R6 shares have existed for less than one year, average annual total return is not available.
6. Source: © 2014 Morningstar. The S&P 500 is a market capitalization-weighted index of 500 stocks designed to measure total U.S. equity market performance.
16 | Annual Report
Your Fund’s Expenses
As a Fund shareholder, you can incur two types of costs:
- Transaction costs, including sales charges (loads) on Fund purchases; and
- Ongoing Fund costs, including management fees, distribution and service (12b-1) fees, and other Fund expenses. All mutual funds have ongoing costs, sometimes referred to as operating expenses.
The following table shows ongoing costs of investing in the Fund and can help you understand these costs and compare them with those of other mutual funds. The table assumes a $1,000 investment held for the six months indicated.
Actual Fund Expenses
The first line (Actual) for each share class listed in the table provides actual account values and expenses. The “Ending Account Value” is derived from the Fund’s actual return, which includes the effect of Fund expenses.
You can estimate the expenses you paid during the period by following these steps. Of course, your account value and expenses will differ from those in this illustration:
| 1. | Divide your account value by $1,000. |
| If an account had an $8,600 value, then $8,600 ÷ $1,000 = 8.6. | |
| 2. | Multiply the result by the number under the heading “Expenses Paid During Period.” |
| If Expenses Paid During Period were $7.50, then 8.6 x $7.50 = $64.50. |
In this illustration, the estimated expenses paid this period are $64.50.
Hypothetical Example for Comparison with Other Funds
Information in the second line (Hypothetical) for each class in the table can help you compare ongoing costs of investing in the Fund with those of other mutual funds. This information may not be used to estimate the actual ending account balance or expenses you paid during the period. The hypothetical “Ending Account Value” is based on the actual expense ratio for each class and an assumed 5% annual rate of return before expenses, which does not represent the Fund’s actual return. The figure under the heading “Expenses Paid During Period” shows the hypothetical expenses your account would have incurred under this scenario. You can compare this figure with the 5% hypothetical examples that appear in shareholder reports of other funds.
Annual Report | 17
Your Fund’s Expenses (continued)
Please note that expenses shown in the table are meant to highlight ongoing costs and do not reflect any transaction costs, such as sales charges. Therefore, the second line for each class is useful in comparing ongoing costs only, and will not help you compare total costs of owning different funds. In addition, if transaction costs were included, your total costs would have been higher. Please refer to the Fund prospectus for additional information on operating expenses.
| Beginning Account | Ending Account | Expenses Paid During | ||||
| Class Z | Value 7/1/13 | Value 12/31/13 | Period* 7/1/13–12/31/13 | |||
| Actual | $ | 1,000 | $ | 1,126.30 | $ | 4.45 |
| Hypothetical (5% return before expenses) | $ | 1,000 | $ | 1,021.02 | $ | 4.23 |
| Class A | ||||||
| Actual | $ | 1,000 | $ | 1,125.10 | $ | 6.05 |
| Hypothetical (5% return before expenses) | $ | 1,000 | $ | 1,019.51 | $ | 5.75 |
| Class C | ||||||
| Actual | $ | 1,000 | $ | 1,121.00 | $ | 9.78 |
| Hypothetical (5% return before expenses) | $ | 1,000 | $ | 1,015.98 | $ | 9.30 |
| Class R | ||||||
| Actual | $ | 1,000 | $ | 1,124.00 | $ | 7.12 |
| Hypothetical (5% return before expenses) | $ | 1,000 | $ | 1,018.50 | $ | 6.77 |
| Class R6 | ||||||
| Actual | $ | 1,000 | $ | 1,126.60 | $ | 4.02 |
| Hypothetical (5% return before expenses) | $ | 1,000 | $ | 1,021.42 | $ | 3.82 |
*Expenses are calculated using the most recent six-month expense ratio, annualized for each class (Z: 0.83%; A: 1.13%; C: 1.83%; R: 1.33%; and R6: 0.75%) multiplied by the average account value over the period, multiplied by 184/365 to reflect the one-half year period.
18 | Annual Report
| Mutual Quest Fund | |||||||||||||||
| Financial Highlights | |||||||||||||||
| Year Ended December 31, | |||||||||||||||
| Class Z | 2013 | 2012 | 2011 | 2010 | 2009 | ||||||||||
| Per share operating performance | |||||||||||||||
| (for a share outstanding throughout the year) | |||||||||||||||
| Net asset value, beginning of year | $ | 16.55 | $ | 16.24 | $ | 17.70 | $ | 17.24 | $ | 14.59 | |||||
| Income from investment operationsa: | |||||||||||||||
| Net investment incomeb | 0.54 | 0.43 | 0.51 | 0.41 | c | 0.16 | d | ||||||||
| Net realized and unrealized gains (losses) | 3.68 | 1.61 | (0.88 | ) | 1.34 | 2.84 | |||||||||
| Total from investment operations | 4.22 | 2.04 | (0.37 | ) | 1.75 | 3.00 | |||||||||
| Less distributions from: | |||||||||||||||
| Net investment income | (0.56 | ) | (0.43 | ) | (0.52 | ) | (0.45 | ) | (0.33 | ) | |||||
| Net realized gains | (2.03 | ) | (1.30 | ) | (0.57 | ) | (0.84 | ) | (0.02 | ) | |||||
| Total distributions | (2.59 | ) | (1.73 | ) | (1.09 | ) | (1.29 | ) | (0.35 | ) | |||||
| Net asset value, end of year | $ | 18.18 | $ | 16.55 | $ | 16.24 | $ | 17.70 | $ | 17.24 | |||||
| Total return | 25.97 | % | 12.57 | % | (1.83 | )% | 10.16 | % | 20.61 | % | |||||
| Ratios to average net assets | |||||||||||||||
| Expensese | 0.84 | %f | 0.90 | % | 0.86 | % | 0.83 | % | 0.90 | %f | |||||
| Expenses incurred in connection with securities sold | |||||||||||||||
| short | 0.07 | % | 0.11 | % | 0.06 | % | 0.02 | % | 0.09 | % | |||||
| Net investment income | 2.93 | % | 2.48 | % | 2.90 | % | 2.33 | %c | 1.00 | %d | |||||
| Supplemental data | |||||||||||||||
| Net assets, end of year (000’s) | $ | 4,270,828 | $ | 3,582,856 | $ | 3,413,759 | $ | 3,701,894 | $ | 3,584,302 | |||||
| Portfolio turnover rate | 63.41 | % | 65.21 | % | 107.25 | % | 49.13 | % | 37.10 | % | |||||
aThe amount shown for a share outstanding throughout the period may not correlate with the Statement of Operations for the period due to the timing of sales and repurchases of
the Fund shares in relation to income earned and/or fluctuating market value of the investments of the Fund.
bBased on average daily shares outstanding.
cNet investment income per share includes approximately $0.06 per share received in the form of a special dividend paid in connection with a corporate real estate investment trust
(REIT) conversion. Excluding this non-recurring amount, the ratio of net investment income to average net assets would have been 1.97%.
dNet investment income per share includes approximately $(0.05) per share related to an adjustment for uncollectible interest. Excluding the effect of this adjustment, the ratio of
net investment income to average net assets would have been 1.34%.
eIncludes dividend and interest expense on securities sold short and borrowing fees, if any. See below for the ratios of such expenses to average net assets for the periods
presented. See Note 1(e).
fBenefit of expense reduction rounds to less than 0.01%.
Annual Report | The accompanying notes are an integral part of these financial statements. | 19
Mutual Quest Fund
Financial Highlights (continued)
| Year Ended December 31, | |||||||||||||||
| Class A | 2013 | 2012 | 2011 | 2010 | 2009 | ||||||||||
| Per share operating performance | |||||||||||||||
| (for a share outstanding throughout the year) | |||||||||||||||
| Net asset value, beginning of year | $ | 16.41 | $ | 16.12 | $ | 17.57 | $ | 17.12 | $ | 14.50 | |||||
| Income from investment operationsa: | |||||||||||||||
| Net investment incomeb | 0.48 | 0.37 | 0.45 | 0.35 | c | 0.11 | d | ||||||||
| Net realized and unrealized gains (losses) | 3.65 | 1.60 | (0.86 | ) | 1.34 | 2.82 | |||||||||
| Total from investment operations | 4.13 | 1.97 | (0.41 | ) | 1.69 | 2.93 | |||||||||
| Less distributions from: | |||||||||||||||
| Net investment income | (0.51 | ) | (0.38 | ) | (0.47 | ) | (0.40 | ) | (0.29 | ) | |||||
| Net realized gains | (2.03 | ) | (1.30 | ) | (0.57 | ) | (0.84 | ) | (0.02 | ) | |||||
| Total distributions | (2.54 | ) | (1.68 | ) | (1.04 | ) | (1.24 | ) | (0.31 | ) | |||||
| Net asset value, end of year | $ | 18.00 | $ | 16.41 | $ | 16.12 | $ | 17.57 | $ | 17.12 | |||||
| Total returne | 25.61 | % | 12.21 | % | (2.10 | )% | 9.86 | % | 20.20 | % | |||||
| Ratios to average net assets | |||||||||||||||
| Expensesf | 1.14 | %g | 1.20 | % | 1.16 | % | 1.13 | % | 1.21 | %g | |||||
| Expenses incurred in connection with securities sold | |||||||||||||||
| short | 0.07 | % | 0.11 | % | 0.06 | % | 0.02 | % | 0.09 | % | |||||
| Net investment income | 2.63 | % | 2.18 | % | 2.60 | % | 2.03 | %c | 0.69 | %d | |||||
| Supplemental data | |||||||||||||||
| Net assets, end of year (000’s) | $ | 1,371,789 | $ | 1,101,808 | $ | 1,093,539 | $ | 1,194,746 | $ | 1,101,463 | |||||
| Portfolio turnover rate | 63.41 | % | 65.21 | % | 107.25 | % | 49.13 | % | 37.10 | % | |||||
aThe amount shown for a share outstanding throughout the period may not correlate with the Statement of Operations for the period due to the timing of sales and repurchases of
the Fund shares in relation to income earned and/or fluctuating market value of the investments of the Fund.
bBased on average daily shares outstanding.
cNet investment income per share includes approximately $0.06 per share received in the form of a special dividend paid in connection with a corporate REIT conversion. Excluding
this non-recurring amount, the ratio of net investment income to average net assets would have been 1.67%.
dNet investment income per share includes approximately $(0.05) per share related to an adjustment for uncollectible interest. Excluding the effect of this adjustment, the ratio of
net investment income to average net assets would have been 1.03%.
eTotal return does not reflect sales commissions or contingent deferred sales charges, if applicable.
fIncludes dividend and interest expense on securities sold short and borrowing fees, if any. See below for the ratios of such expenses to average net assets for the periods presented.
See Note 1(e).
gBenefit of expense reduction rounds to less than 0.01%.
20 | The accompanying notes are an integral part of these financial statements. | Annual Report
| Mutual Quest Fund | |||||||||||||||
| Financial Highlights (continued) | |||||||||||||||
| Year Ended December 31, | |||||||||||||||
| Class C | 2013 | 2012 | 2011 | 2010 | 2009 | ||||||||||
| Per share operating performance | |||||||||||||||
| (for a share outstanding throughout the year) | |||||||||||||||
| Net asset value, beginning of year | $ | 16.24 | $ | 15.96 | $ | 17.39 | $ | 16.97 | $ | 14.38 | |||||
| Income from investment operationsa: | |||||||||||||||
| Net investment incomeb | 0.35 | 0.25 | 0.33 | 0.23 | c | —d,e | |||||||||
| Net realized and unrealized gains (losses) | 3.59 | 1.59 | (0.85 | ) | 1.30 | 2.79 | |||||||||
| Total from investment operations | 3.94 | 1.84 | (0.52 | ) | 1.53 | 2.79 | |||||||||
| Less distributions from: | |||||||||||||||
| Net investment income | (0.39 | ) | (0.26 | ) | (0.34 | ) | (0.27 | ) | (0.18 | ) | |||||
| Net realized gains | (2.03 | ) | (1.30 | ) | (0.57 | ) | (0.84 | ) | (0.02 | ) | |||||
| Total distributions | (2.42 | ) | (1.56 | ) | (0.91 | ) | (1.11 | ) | (0.20 | ) | |||||
| Net asset value, end of year | $ | 17.76 | $ | 16.24 | $ | 15.96 | $ | 17.39 | $ | 16.97 | |||||
| Total returnf | 24.74 | % | 11.42 | % | (2.82 | )% | 9.08 | % | 19.39 | % | |||||
| Ratios to average net assets | |||||||||||||||
| Expensesg | 1.84 | %h | 1.90 | % | 1.86 | % | 1.83 | % | 1.90 | %h | |||||
| Expenses incurred in connection with securities sold short | 0.07 | % | 0.11 | % | 0.06 | % | 0.02 | % | 0.09 | % | |||||
| Net investment income | 1.93 | % | 1.48 | % | 1.90 | % | 1.33 | %c | —%e,i | ||||||
| Supplemental data | |||||||||||||||
| Net assets, end of year (000’s) | $ | 406,304 | $ | 333,908 | $ | 338,983 | $ | 392,134 | $ | 388,875 | |||||
| Portfolio turnover rate | 63.41 | % | 65.21 | % | 107.25 | % | 49.13 | % | 37.10 | % | |||||
aThe amount shown for a share outstanding throughout the period may not correlate with the Statement of Operations for the period due to the timing of sales and repurchases of
the Fund shares in relation to income earned and/or fluctuating market value of the investments of the Fund.
bBased on average daily shares outstanding.
cNet investment income per share includes approximately $0.06 per share received in the form of a special dividend paid in connection with a corporate REIT conversion. Excluding
this non-recurring amount, the ratio of net investment income to average net assets would have been 0.97%.
dAmount rounds to less than $0.01 per share.
eNet investment income per share includes approximately $(0.05) per share related to an adjustment for uncollectible interest. Excluding the effect of adjustment, the ratio of net
investment income to average net assets would have been 0.34%.
fTotal return does not reflect sales commissions or contingent deferred sales charges, if applicable.
gIncludes dividend and interest expense on securities sold short and borrowing fees, if any. See below for the ratios of such expenses to average net assets for the periods presented.
See Note 1(e).
hBenefit of expense reduction rounds to less than 0.01%.
iRounds to less than 0.01%.
Annual Report | The accompanying notes are an integral part of these financial statements. | 21
| Mutual Quest Fund | |||||||||||||||
| Financial Highlights (continued) | |||||||||||||||
| Year Ended December 31, | |||||||||||||||
| Class R | 2013 | 2012 | 2011 | 2010 | 2009 | a | |||||||||
| Per share operating performance | |||||||||||||||
| (for a share outstanding throughout the year) | |||||||||||||||
| Net asset value, beginning of year | $ | 16.33 | $ | 16.05 | $ | 17.50 | $ | 17.07 | $ | 14.64 | |||||
| Income from investment operationsb: | |||||||||||||||
| Net investment incomec | 0.50 | 0.33 | 0.41 | 0.32 | d | 0.05 | |||||||||
| Net realized and unrealized gains (losses) | 3.56 | 1.60 | (0.85 | ) | 1.33 | 2.71 | |||||||||
| Total from investment operations | 4.06 | 1.93 | (0.44 | ) | 1.65 | 2.76 | |||||||||
| Less distributions from: | |||||||||||||||
| Net investment income | (0.52 | ) | (0.35 | ) | (0.44 | ) | (0.38 | ) | (0.31 | ) | |||||
| Net realized gains | (2.03 | ) | (1.30 | ) | (0.57 | ) | (0.84 | ) | (0.02 | ) | |||||
| Total distributions | (2.55 | ) | (1.65 | ) | (1.01 | ) | (1.22 | ) | (0.33 | ) | |||||
| Net asset value, end of year | $ | 17.84 | $ | 16.33 | $ | 16.05 | $ | 17.50 | $ | 17.07 | |||||
| Total returne | 25.34 | % | 11.99 | % | (2.31 | )% | 9.65 | % | 18.89 | % | |||||
| Ratios to average net assetsf | |||||||||||||||
| Expensesg | 1.34 | %h | 1.40 | % | 1.36 | % | 1.33 | % | 1.40 | %h | |||||
| Expenses incurred in connection with securities sold short | 0.07 | % | 0.11 | % | 0.06 | % | 0.02 | % | 0.09 | % | |||||
| Net investment income | 2.43 | % | 1.98 | % | 2.40 | % | 1.83 | %d | 0.50 | % | |||||
| Supplemental data | |||||||||||||||
| Net assets, end of year (000’s) | $ | 853 | $ | 212 | $ | 193 | $ | 204 | $ | 99 | |||||
| Portfolio turnover rate | 63.41 | % | 65.21 | % | 107.25 | % | 49.13 | % | 37.10 | % | |||||
aFor the period May 1, 2009 (effective date) to December 31, 2009.
bThe amount shown for a share outstanding throughout the period may not correlate with the Statement of Operations for the period due to the timing of sales and repurchases of
the Fund shares in relation to income earned and/or fluctuating market value of the investments of the Fund.
cBased on average daily shares outstanding.
dNet investment income per share includes approximately $0.06 per share received in the form of a special dividend paid in connection with a corporate REIT conversion. Excluding
this non-recurring amount, the ratio of net investment income to average net assets would have been 1.47%.
eTotal return is not annualized for periods less than one year.
fRatios are annualized for periods less than one year.
gIncludes dividend and interest expense on securities sold short and borrowing fees, if any. See below for the ratios of such expenses to average net assets for the periods presented.
See Note 1(e).
hBenefit of expense reduction rounds to less than 0.01%.
22 | The accompanying notes are an integral part of these financial statements. | Annual Report
| Mutual Quest Fund | ||||
| Financial Highlights (continued) | ||||
| Year Ended | Period Ended | |||
| Class R6 | December 31, 2013 | December 31 2013a | ||
| Per share operating performance | ||||
| (for a share outstanding throughout the period) | ||||
| Net asset value, beginning of period | $ | 18.16 | ||
| Income from investment operationsb: | ||||
| Net investment incomec | 0.36 | |||
| Net realized and unrealized gains (losses) | 2.28 | |||
| Total from investment operations | 2.64 | |||
| Less distributions from: | ||||
| Net investment income | (0.58 | ) | ||
| Net realized gains | (2.03 | ) | ||
| Total distributions | (2.61 | ) | ||
| Net asset value, end of period | $ | 18.19 | ||
| Total returnd | 14.83 | % | ||
| Ratios to average net assetse | ||||
| Expenses before waiver, payments by affiliates and expense reductionf | 2.00 | % | ||
| Expenses net of waiver, payments by affiliates and expense reductionf | 0.77 | %g | ||
| Expenses incurred in connection with securities sold short | 0.07 | % | ||
| Net investment income | 3.00 | % | ||
| Supplemental data | ||||
| Net assets, end of period (000’s) | $ | 5 | ||
| Portfolio turnover rate | 63.41 | % | ||
aFor the period May 1, 2013 (effective date) to December 31, 2013.
bThe amount shown for a share outstanding throughout the period may not correlate with the Statement of Operations for the period due to the timing of sales and repurchases of
the Fund shares in relation to income earned and/or fluctuating market value of the investments of the Fund.
cBased on average daily shares outstanding.
dTotal return is not annualized for periods less than one year.
eRatios are annualized for periods less than one year.
fIncludes interest expense on securities sold short and borrowing fees, if any. See below for the ratios of such expenses to average net assets for the period presented. See Note 1(e).
gBenefit of expense reduction rounds to less than 0.01%.
Annual Report | The accompanying notes are an integral part of these financial statements. | 23
Mutual Quest Fund
Statement of Investments, December 31, 2013
| Country | Shares/Warrants | Value | ||
| Common Stocks and Other Equity Interests 71.1% | ||||
| Auto Components 0.2% | ||||
| a,b International Automotive Components Group Brazil LLC | Brazil | 2,363,058 | $ | 460,371 |
| a,b,c International Automotive Components Group North America, LLC | United States | 18,661,349 | 10,558,964 | |
| 11,019,335 | ||||
| Automobiles 1.6% | ||||
| a,d,e General Motors Co. | United States | 1,786,908 | 73,030,930 | |
| a General Motors Co., wts., 7/10/16 | United States | 490,011 | 15,268,743 | |
| a General Motors Co., wts., 7/10/19 | United States | 484,626 | 11,209,399 | |
| 99,509,072 | ||||
| Capital Markets 0.0%† | ||||
| a China Cinda Asset Management Co. Ltd., H | China | 2,727,387 | 1,695,307 | |
| Chemicals 0.0% | ||||
| a,f,g Dow Corning Corp., Contingent Distribution | United States | 12,089,194 | — | |
| Commercial Banks 4.9% | ||||
| BB&T Corp. | United States | 1,050,707 | 39,212,385 | |
| CIT Group Inc. | United States | 2,645,447 | 137,907,152 | |
| Guaranty Bancorp | United States | 347,127 | 4,877,134 | |
| PNC Financial Services Group Inc. | United States | 376,558 | 29,213,370 | |
| SunTrust Banks Inc. | United States | 1,495,657 | 55,055,134 | |
| Wells Fargo & Co. | United States | 634,914 | 28,825,096 | |
| 295,090,271 | ||||
| Computers & Peripherals 2.5% | ||||
| Apple Inc. | United States | 271,440 | 152,307,699 | |
| Construction & Engineering 2.2% | ||||
| Vinci SA | France | 2,007,750 | 131,786,414 | |
| Consumer Finance 0.0%† | ||||
| a Comdisco Holding Co. Inc. | United States | 997 | 5,384 | |
| Diversified Financial Services 1.0% | ||||
| Capmark Financial Group Inc. | United States | 4,885,536 | 19,542,144 | |
| Deutsche Boerse AG | Germany | 470,260 | 38,939,924 | |
| 58,482,068 | ||||
| Diversified Telecommunication Services 1.5% | ||||
| a,f,g Global Crossing Holdings Ltd., Contingent Distribution | United States | 49,411,586 | — | |
| TDC AS | Denmark | 8,437,906 | 81,833,811 | |
| Telenor ASA | Norway | 372,076 | 8,870,783 | |
| 90,704,594 | ||||
| Electric Utilities 2.4% | ||||
| Entergy Corp. | United States | 739,049 | 46,759,630 | |
| Exelon Corp. | United States | 3,599,987 | 98,603,644 | |
| 145,363,274 | ||||
| Energy Equipment & Services 3.3% | ||||
| Fugro NV, IDR | Netherlands | 414,106 | 24,672,344 | |
| a Rowan Cos. PLC | United States | 962,370 | 34,029,404 | |
| Transocean Ltd. | United States | 2,903,098 | 143,471,103 | |
| 202,172,851 | ||||
| 24 | Annual Report | ||||
Mutual Quest Fund
Statement of Investments, December 31, 2013 (continued)
| Country | Shares/Warrants | Value | ||
| Common Stocks and Other Equity Interests (continued) | ||||
| Food & Staples Retailing 0.3% | ||||
| Metro AG | Germany | 423,534 | $ | 20,506,499 |
| Health Care Equipment & Supplies 1.6% | ||||
| Medtronic Inc. | United States | 1,681,862 | 96,522,060 | |
| Health Care Providers & Services 0.5% | ||||
| WellPoint Inc. | United States | 314,120 | 29,021,547 | |
| Independent Power Producers & Energy Traders 0.9% | ||||
| NRG Energy Inc. | United States | 1,920,171 | 55,147,311 | |
| Insurance 8.1% | ||||
| Aegon NV | Netherlands | 7,676,795 | 72,458,815 | |
| Ageas | Belgium | 1,781,081 | 75,823,686 | |
| American International Group Inc. | United States | 1,953,436 | 99,722,908 | |
| a,b,h Imagine Group Holdings Ltd. | Bermuda | 350,236 | 2,558,824 | |
| MetLife Inc. | United States | 1,075,331 | 57,981,848 | |
| a,b Olympus Re Holdings Ltd. | United States | 97,300 | — | |
| RSA Insurance Group PLC | United Kingdom | 51,042,567 | 77,315,939 | |
| White Mountains Insurance Group Ltd. | United States | 171,770 | 103,591,052 | |
| 489,453,072 | ||||
| Leisure Equipment & Products 0.5% | ||||
| a,b Eastman Kodak Co. | United States | 869,627 | 28,675,515 | |
| a Eastman Kodak Co., wts., 9/03/18 | United States | 38,301 | 747,636 | |
| a Eastman Kodak Co., wts., 9/03/18 | United States | 38,301 | 700,142 | |
| 30,123,293 | ||||
| Media 5.5% | ||||
| CBS Corp., B | United States | 745,740 | 47,533,468 | |
| Comcast Corp., Special A | United States | 645,504 | 32,197,740 | |
| RTL Group SA | Germany | 831,935 | 107,372,158 | |
| a Tribune Co., A | United States | 1,152,442 | 89,199,011 | |
| a Tribune Co., B | United States | 706,604 | 54,479,168 | |
| 330,781,545 | ||||
| Metals & Mining 2.6% | ||||
| Freeport-McMoRan Copper & Gold Inc., B | United States | 2,018,617 | 76,182,605 | |
| a ThyssenKrupp AG | Germany | 3,241,059 | 78,863,372 | |
| 155,045,977 | ||||
| Multi-Utilities 0.2% | ||||
| GDF Suez | France | 591,467 | 13,907,856 | |
| Multiline Retail 0.6% | ||||
| Kohl’s Corp. | United States | 642,200 | 36,444,850 | |
| Oil, Gas & Consumable Fuels 8.6% | ||||
| Apache Corp. | United States | 1,672,070 | 143,697,696 | |
| BG Group PLC | United Kingdom | 1,601,310 | 34,411,259 | |
| BP PLC | United Kingdom | 13,712,227 | 110,839,714 | |
| CONSOL Energy Inc. | United States | 743,531 | 28,283,919 | |
| Royal Dutch Shell PLC, A | United Kingdom | 5,168,694 | 184,172,587 | |
| a WPX Energy Inc. | United States | 991,269 | 20,202,062 | |
| 521,607,237 | ||||
| Annual Report | 25 |
Mutual Quest Fund
Statement of Investments, December 31, 2013 (continued)
| Country | Shares/Warrants | Value | ||
| Common Stocks and Other Equity Interests (continued) | ||||
| Paper & Forest Products 0.3% | ||||
| Domtar Corp. | United States | 198,808 | $ | 18,755,547 |
| Pharmaceuticals 2.6% | ||||
| a Hospira Inc. | United States | 652,451 | 26,933,177 | |
| Novartis AG | Switzerland | 194,910 | 15,556,967 | |
| Teva Pharmaceutical Industries Ltd., ADR | Israel | 2,789,874 | 111,818,150 | |
| 154,308,294 | ||||
| Real Estate Investment Trusts (REITs) 2.3% | ||||
| Spirit Realty Capital Inc. | United States | 14,148,165 | 139,076,462 | |
| Real Estate Management & Development 0.7% | ||||
| g Canary Wharf Group PLC | United Kingdom | 8,298,072 | 42,884,142 | |
| Semiconductors & Semiconductor Equipment 1.0% | ||||
| Altera Corp. | United States | 204,357 | 6,647,733 | |
| a ON Semiconductor Corp. | United States | 3,208,509 | 26,438,114 | |
| a Spansion Inc., A | United States | 1,920,005 | 26,668,870 | |
| 59,754,717 | ||||
| Software 4.2% | ||||
| a Check Point Software Technologies Ltd. | Israel | 1,796,746 | 115,926,052 | |
| Microsoft Corp. | United States | 2,470,111 | 92,456,255 | |
| Symantec Corp. | United States | 1,932,746 | 45,574,150 | |
| 253,956,457 | ||||
| Tobacco 7.7% | ||||
| Altria Group Inc. | United States | 2,026,480 | 77,796,567 | |
| British American Tobacco PLC | United Kingdom | 2,658,418 | 142,495,148 | |
| Imperial Tobacco Group PLC | United Kingdom | 4,386,398 | 169,782,827 | |
| Lorillard Inc. | United States | 938,574 | 47,566,930 | |
| Philip Morris International Inc. | United States | 298,690 | 26,024,860 | |
| 463,666,332 | ||||
| Wireless Telecommunication Services 3.3% | ||||
| a T-Mobile U.S. Inc. | United States | 248,578 | 8,362,164 | |
| Vodafone Group PLC | United Kingdom | 48,843,260 | 191,745,204 | |
| 200,107,368 | ||||
| Total Common Stocks and Other Equity Interests | ||||
| (Cost $3,184,755,184) | 4,299,206,835 | |||
| Preferred Stocks (Cost $5,798,234) 0.1% | ||||
| Semiconductors & Semiconductor Equipment 0.1% | ||||
| Samsung Electronics Co. Ltd., pfd. | South Korea | 6,316 | 6,060,393 | |
| Corporate Bonds, Notes and Senior Floating Rate | ||||
| Interests 14.5% | ||||
| i American Airlines Inc., senior secured note, 144A, 7.50%, | ||||
| 3/15/16 | United States | 62,380,200 | 65,031,359 |
26 | Annual Report
| Mutual Quest Fund | |||||
| Statement of Investments, December 31, 2013 (continued) | |||||
| Country | Principal Amount* | Value | |||
| Corporate Bonds, Notes and Senior Floating Rate | |||||
| Interests (continued) | |||||
| Avaya Inc., | |||||
| i senior note, 144A, 10.50%, 3/01/21 | United States | 19,943,000 | $ | 19,344,710 | |
| i senior secured note, 144A, 7.00%, 4/01/19 | United States | 14,003,000 | 13,792,955 | ||
| j,k Tranche B-3 Term Loan, 4.736%, 10/26/17 | United States | 21,277,852 | 20,807,974 | ||
| j,k Tranche B-5 Term Loan, 8.00%, 3/31/18 | United States | 5,189,570 | 5,264,170 | ||
| j,k Caesars Entertainment Operating Co. Inc., Senior Tranche Term | |||||
| Loan, first lien, 1/28/18, | |||||
| B5, 4.488% | United States | 7,586,000 | 7,162,451 | ||
| B6, 5.488% | United States | 36,163,000 | 34,600,541 | ||
| CDW LLC/Finance Corp., senior sub. note, 12.535%, 10/12/17 | United States | 11,279,000 | 11,842,950 | ||
| Clear Channel Communications Inc., | |||||
| senior secured note, first lien, 9.00%, 12/15/19 | United States | 37,367,000 | 38,301,175 | ||
| j,k Tranche B Term Loan, 3.819%, 1/29/16 | United States | 676,455 | 657,091 | ||
| j,k Tranche C Term Loan, 3.819%, 1/29/16 | United States | 108,007 | 103,653 | ||
| j,k Tranche D Term Loan, 6.919%, 1/30/19 | United States | 45,389,937 | 43,460,865 | ||
| j,k Tranche E Term Loan, 7.669%, 7/30/19 | United States | 14,586,689 | 14,404,355 | ||
| j,k Eastman Kodak Co., | |||||
| First Lien Term Loan, 7.25%, 9/03/19 | United States | 14,771,770 | 14,736,613 | ||
| Second Lien Term Loan, 10.75%, 9/03/20 | United States | 39,590,000 | 39,886,925 | ||
| j,k Gatehouse Media Intermediate Holdco Inc., Term Loan, | |||||
| 11.165%, 11/15/19 | United States | 50,000,000 | 49,482,000 | ||
| j,k JC Penney Corp. Inc., Term Loan, 6.00%, 5/22/18 | United States | 24,873,950 | 24,338,464 | ||
| j,k Lee Enterprises Inc., | |||||
| First Lien Extended Term Loan, 7.50%, 12/31/15 | United States | 17,007,509 | 16,911,705 | ||
| Second Lien Term Loan, 15.00%, 4/03/17 | United States | 41,437,970 | 43,095,488 | ||
| j,k Moxie Liberty LLC, Construction B-1 Term Loan, 7.50%, | |||||
| 8/21/20 | United States | 42,552,000 | 43,509,420 | ||
| j,k,l Moxie Patriot LLC, Construction B-1 Term Loan, 6.75%, | |||||
| 12/18/20 | United States | 24,748,000 | 25,366,700 | ||
| NGPL PipeCo LLC, | |||||
| i secured note, 144A, 7.119%, 12/15/17 | United States | 11,037,000 | 10,043,670 | ||
| i,m senior secured note, 144A, 9.625%, 6/01/19 | United States | 16,383,000 | 16,096,298 | ||
| j,k Term Loan B, 6.75%, 9/15/17 | United States | 972,761 | 909,836 | ||
| Sorenson Communications Inc., | |||||
| j,k First Lien Term Loan, 9.50%, 10/31/14 | United States | 68,719,708 | 69,868,632 | ||
| i senior secured note, 144A, 10.50%, 2/01/15 | United States | 188,203,000 | 141,152,250 | ||
| j,k Texas Competitive Electric Holdings Co. LLC, Extended Term Loan, | |||||
| 4.668%, 10/10/17 | United States | 101,650,473 | 70,215,064 | ||
| Texas Competitive Electric Holdings Co. LLC/Texas Competitive | |||||
| Electric Holdings Finance Inc., | |||||
| senior note, A, 10.25%, 11/01/15 | United States | 53,359,000 | 3,735,130 | ||
| i senior secured note, 144A, 11.50%, 10/01/20 | United States | 39,724,000 | 29,395,760 | ||
| i Wind Acquisition Finance SA, 144A, 11.75%, 7/15/17, | |||||
| senior secured note | Italy | 1,118,000 | 1,190,670 | ||
| third lien | Italy | 2,610,000 | EUR | 3,823,839 | |
| Total Corporate Bonds, Notes and Senior Floating Rate | |||||
| Interests (Cost $893,666,896) | 878,532,713 | ||||
Annual Report | 27
| Mutual Quest Fund | |||||||
| Statement of Investments, December 31, 2013 (continued) | |||||||
| Country | Principal Amount* | Value | |||||
| Corporate Bonds and Notes in Reorganization 3.2% | |||||||
| b,n Broadband Ventures III LLC, secured promissory note, 5.00%, | |||||||
| 2/01/12 | United States | 9,272 | $ | — | |||
| j,n Cengage Learning Acquisitions Inc., FRN, 2.70%, 7/03/14 | United States | 20,598,549 | 16,169,861 | ||||
| n Nortel Networks Corp., cvt., senior note, | |||||||
| 1.75%, 4/15/12 | Canada | 76,472,000 | 75,401,622 | ||||
| 2.125%, 4/15/14 | Canada | 12,797,000 | 12,741,013 | ||||
| n Nortel Networks Ltd., senior note, | |||||||
| 10.125%, 7/15/13 | Canada | 44,307,000 | 51,783,806 | ||||
| 10.75%, 7/15/16 | Canada | 20,475,000 | 24,058,125 | ||||
| n Northern Telecom Ltd., 6.875%, 9/01/23 | Canada | 20,544,000 | 10,631,520 | ||||
| j,k,n Vertis Inc., senior secured Term Loan, 11.75%, 12/23/15 | United States | 75,168,887 | 1,338,758 | ||||
| Total Corporate Bonds and Notes in Reorganization | |||||||
| (Cost $222,419,818) | 192,124,705 | ||||||
| Shares | |||||||
| Companies in Liquidation 3.4% | |||||||
| a Adelphia Recovery Trust | United States | 38,254,708 | 76,509 | ||||
| a,f Adelphia Recovery Trust, Arahova Contingent Value Vehicle, | |||||||
| Contingent Distribution | United States | 4,899,492 | 2,450 | ||||
| a,f,g Century Communications Corp., Contingent Distribution | United States | 13,497,000 | — | ||||
| a,b FIM Coinvestor Holdings I, LLC | United States | 16,133,491 | — | ||||
| a,h,i KGen Power Corp., 144A | United States | 5,377,461 | 2,957,604 | ||||
| a,o Lehman Brothers Holdings Inc., Bankruptcy Claim | United States | 454,066,643 | 204,329,989 | ||||
| a,f,g Tribune Litigation Trust, Contingent Distribution | United States | 1,496,073 | — | ||||
| Total Companies in Liquidation (Cost $204,135,934) | 207,366,552 | ||||||
| Principal Amount* | |||||||
| Asset-Backed Securities 0.5% | |||||||
| Diversified Financial Services 0.5% | |||||||
| Master Asset Vehicle, 2009-2, | |||||||
| j A2, FRN, 0.775%, 1/22/17 | Canada | 8,500,000 | CAD | 7,162,359 | |||
| B, zero cpn., 7/15/56 | Canada | 29,000,000 | CAD | 23,634,939 | |||
| Total Asset-Backed Securities (Cost $27,036,547) | 30,797,298 | ||||||
| Municipal Bonds (Cost $46,389,752) 0.7% | |||||||
| New Jersey EDA Energy Facility Revenue, ARC Energy Partners, | |||||||
| Series B, 12.00%, 12/01/30 | United States | 45,225,000 | 41,913,625 | ||||
| Counterparty | Number of Contracts | ||||||
| Options Purchased (Cost $1,651,098) 0.0%† | |||||||
| Calls – Exchange-Traded | |||||||
| Energy Equipment & Services 0.0%† | |||||||
| Transocean Ltd., January Strike Price $60, Expires 1/17/15 | United States | 3,500 | 481,250 | ||||
| Total Investments before Short Term Investments | |||||||
| (Cost $4,585,853,463) | 5,656,483,371 | ||||||
28 | Annual Report
Mutual Quest Fund
Statement of Investments, December 31, 2013 (continued)
| Country | Principal Amount* | Value | |||||
| Short Term Investments 6.0% | |||||||
| U.S. Government and Agency Securities 6.0% | |||||||
| e,p U.S. Treasury Bills, | |||||||
| 4/24/14 | United States | 64,000,000 | $ | 63,988,800 | |||
| 1/02/14 - 6/26/14 | United States | 295,500,000 | 295,483,886 | ||||
| Total U.S. Government and Agency Securities | |||||||
| (Cost $359,454,805) | 359,472,686 | ||||||
| Total Investments before Money Market Funds | |||||||
| (Cost $4,945,308,268) | 6,015,956,057 | ||||||
| Shares | |||||||
| q Investments from Cash Collateral Received for Loaned | |||||||
| Securities (Cost $2,210,890) 0.0%† | |||||||
| Money Market Funds 0.0%† | |||||||
| r BNY Mellon Overnight Government Fund, 0.017% | United States | 2,210,890 | 2,210,890 | ||||
| Total Investments (Cost $4,947,519,158) 99.5% | 6,018,166,947 | ||||||
| Options Written (0.0)%† | (3,031,500 | ) | |||||
| Securities Sold Short (0.9)% | (52,521,046 | ) | |||||
| Other Assets, less Liabilities 1.4% | 87,164,272 | ||||||
| Net Assets 100.0% | $ | 6,049,778,673 | |||||
| Number of Contracts | |||||||
| s Options Written (0.0)%† | |||||||
| Calls – Exchange-Traded | |||||||
| Automobiles (0.0)%† | |||||||
| General Motors Co., January Strike Price $40, Expires 1/18/14 | United States | 3,000 | $ | (474,000 | ) | ||
| Puts – Exchange-Traded | |||||||
| Automobiles (0.0)%† | |||||||
| General Motors Co., January Strike Price $32, Expires 1/17/15 | United States | 2,000 | (346,000 | ) | |||
| General Motors Co., January Strike Price $35, Expires 1/17/15 | United States | 2,000 | (516,000 | ) | |||
| (862,000 | ) | ||||||
| Energy Equipment & Services (0.0)%† | |||||||
| Transocean Ltd., January Strike Price $52.50, Expires 1/18/14 | United States | 5,000 | (1,662,500 | ) | |||
| Pharmaceuticals (0.0)%† | |||||||
| Teva Pharmaceutical Industries Ltd., ADR, January Strike Price | |||||||
| $37.50, Expires 1/18/14 | Israel | 3,000 | (33,000 | ) | |||
| (2,557,500 | ) | ||||||
| Total Options Written | |||||||
| (Premiums Received $5,365,918) | $ | (3,031,500 | ) | ||||
Annual Report | 29
| Mutual Quest Fund | |||||
| Statement of Investments, December 31, 2013 (continued) | |||||
| Country | Principal Amount* | Value | |||
| t Securities Sold Short (0.9)% | |||||
| Corporate Notes (0.9)% | |||||
| NRG Energy Inc., senior note, 7.875%, 5/15/21 | United States | 20,000,000 | $ | (22,250,000 | ) |
| Texas Industries Inc., senior note, 9.25%, 8/15/20 | United States | 14,821,000 | (16,580,994 | ) | |
| Vulcan Materials Co., senior note, | |||||
| 6.50%, 12/01/16 | United States | 8,256,000 | (9,288,000 | ) | |
| 7.00%, 6/15/18 | United States | 3,853,000 | (4,402,052 | ) | |
| Total Securities Sold Short (Proceeds $48,840,114) | $ | (52,521,046 | ) | ||
†Rounds to less than 0.1% of net assets.
*The principal amount is stated in U.S. dollars unless otherwise indicated.
aNon-income producing.
bSee Note 9 regarding restricted securities.
cAt December 31, 2013, pursuant to the Fund’s policies and the requirements of applicable securities law, the Fund may be restricted from trading these securities for a limited or
extended period of time due to ownership limits and/or potential possession of material non-public information.
dA portion or all of the security is held in connection with written option contracts open at year end.
eSecurity or a portion of the security has been pledged as collateral for securities sold short, open futures, forward and written options contracts. At December 31, 2013, the
aggregate value of these securities and/or cash pledged as collateral was $123,641,260, representing 2.04% of net assets.
fContingent distributions represent the right to receive additional distributions, if any, during the reorganization of the underlying company. Shares represent total underlying
principal of debt securities.
gSecurity has been deemed illiquid because it may not be able to be sold within seven days. At December 31, 2013, the aggregate value of these securities was $42,884,142,
representing 0.71% of net assets.
hSee Note 11 regarding holdings of 5% voting securities.
iSecurity was purchased pursuant to Rule 144A under the Securities Act of 1933 and may be sold in transactions exempt from registration only to qualified institutional buyers or in
a public offering registered under the Securities Act of 1933. These securities have been deemed liquid under guidelines approved by the Trust’s Board of Trustees. At December 31,
2013, the aggregate value of these securities was $302,829,115, representing 5.01% of net assets.
jThe coupon rate shown represents the rate at period end.
kSee Note 1(g) regarding senior floating rate interests.
lSecurity purchased on a when-issued basis. See Note 1(c).
mA portion or all of the security is on loan at December 31, 2013. See Note 1(f).
nSee Note 8 regarding credit risk and defaulted securities.
oBankruptcy claims represent the right to receive distributions, if any, during the liquidation of the underlying pool of assets. Shares represent amount of allowed unsecured claims.
pThe security is traded on a discount basis with no stated coupon rate.
qSee Note 1(f) regarding securities on loan.
rThe rate shown is the annualized seven-day yield at period end.
sSee Note 1(d) regarding written options.
tSee Note 1(e) regarding securities sold short.
30 | Annual Report
Mutual Quest Fund
Statement of Investments, December 31, 2013 (continued)
At December 31, 2013, the Fund had the following futures contracts outstanding. See Note 1(d).
| Futures Contracts | |||||||||||||
| Number of | Notional | Expiration | Unrealized | Unrealized | |||||||||
| Description | Type | Contracts | Value | Date | Appreciation | Depreciation | |||||||
| Currency Contracts | |||||||||||||
| EUR/USD | Short | 800 | $ | 137,880,000 | 3/17/14 | $ | — | $ | (593,246 | ) | |||
| GBP/USD | Short | 961 | 99,451,488 | 3/17/14 | — | (925,170 | ) | ||||||
| Unrealized appreciation (depreciation) | — | (1,518,416 | ) | ||||||||||
| Net unrealized appreciation (depreciation) | $ | (1,518,416 | ) | ||||||||||
| At December 31, 2013, the Fund had the following forward exchange contracts outstanding. See Note 1(d). | |||||||||||||
| Forward Exchange Contracts | |||||||||||||
| Contract | Settlement | Unrealized | Unrealized | ||||||||||
| Currency | Counterpartya Type | Quantity | Amount | Date | Appreciation | Depreciation | |||||||
| Euro | BANT | Sell | 18,268,973 | $ | 24,150,457 | 1/17/14 | $ | — | $ | (978,306 | ) | ||
| Euro | BBU | Sell | 11,466,129 | 14,973,159 | 1/17/14 | — | (798,370 | ) | |||||
| Euro | DBFX | Sell | 4,474,779 | 5,915,676 | 1/17/14 | — | (239,331 | ) | |||||
| Euro | FBCO | Sell | 6,317,192 | 8,411,498 | 1/17/14 | — | (277,727 | ) | |||||
| Euro | HSBC | Sell | 893,018 | 1,186,107 | 1/17/14 | — | (42,230 | ) | |||||
| Euro | SSBT | Sell | 100,000 | 133,864 | 1/17/14 | — | (3,685 | ) | |||||
| British Pound | BANT | Sell | 52,036,171 | 79,335,956 | 1/21/14 | — | (6,818,587 | ) | |||||
| British Pound | DBFX | Sell | 24,178,155 | 36,704,857 | 1/21/14 | — | (3,326,103 | ) | |||||
| British Pound | FBCO | Sell | 2,659,173 | 4,246,480 | 1/21/14 | — | (156,223 | ) | |||||
| British Pound | SCBT | Sell | 486,016 | 775,720 | 1/21/14 | — | (28,960 | ) | |||||
| Swiss Franc | BANT | Sell | 11,332,914 | 12,350,986 | 2/12/14 | — | (357,880 | ) | |||||
| Swiss Franc | BBU | Sell | 150,000 | 168,100 | 2/12/14 | — | (112 | ) | |||||
| Swiss Franc | BONY | Buy | 326,435 | 365,197 | 2/12/14 | 2,162 | (1,291 | ) | |||||
| Swiss Franc | FBCO | Buy | 336,189 | 369,754 | 2/12/14 | 7,252 | — | ||||||
| Swiss Franc | FBCO | Sell | 527,646 | 570,080 | 2/12/14 | — | (21,629 | ) | |||||
| South Korean Won | HSBC | Buy | 189,480,000 | 179,262 | 2/12/14 | — | (297 | ) | |||||
| South Korean Won | HSBC | Sell | 6,587,588,000 | 6,114,374 | 2/12/14 | 373 | (108,012 | ) | |||||
| Swiss Franc | HSBC | Sell | 120,605 | 128,743 | 2/12/14 | — | (6,505 | ) | |||||
| Swiss Franc | SCBT | Buy | 430,505 | 480,013 | 2/12/14 | 3,416 | (655 | ) | |||||
| Swiss Franc | SCBT | Sell | 477,249 | 529,264 | 2/12/14 | — | (5,929 | ) | |||||
| Danish Krone | BANT | Sell | 434,315,679 | 78,419,139 | 2/14/14 | — | (1,688,034 | ) | |||||
| Danish Krone | BBU | Sell | 6,683,698 | 1,236,973 | 2/14/14 | 4,201 | — | ||||||
| Danish Krone | BONY | Buy | 6,054,161 | 1,093,444 | 2/14/14 | 23,213 | — | ||||||
| British Pound | BANT | Sell | 48,610,224 | 75,597,768 | 2/19/14 | — | (4,868,636 | ) | |||||
| British Pound | BBU | Sell | 23,609,852 | 36,703,876 | 2/19/14 | — | (2,378,435 | ) | |||||
| British Pound | SCBT | Sell | 6,821,523 | 11,047,057 | 2/19/14 | — | (244,877 | ) | |||||
| Euro | BANT | Sell | 12,437,597 | 16,620,864 | 2/28/14 | — | (487,040 | ) | |||||
| Euro | BBU | Sell | 31,697,145 | 42,232,483 | 2/28/14 | — | (1,366,916 | ) | |||||
| Euro | BONY | Sell | 30,610 | 40,257 | 2/28/14 | — | (1,847 | ) | |||||
| Euro | FBCO | Sell | 7,666,877 | 10,339,683 | 2/28/14 | — | (206,101 | ) | |||||
| Euro | HSBC | Sell | 34,662,482 | 46,253,835 | 2/28/14 | — | (1,424,383 | ) | |||||
| Euro | SCBT | Buy | 9,657,402 | 13,230,697 | 2/28/14 | 53,052 | — | ||||||
| Euro | SCBT | Sell | 9,990,850 | 13,568,690 | 2/28/14 | — | (173,717 | ) | |||||
| Canadian Dollar | SCBT | Sell | 29,333,799 | 28,313,088 | 3/18/14 | 747,627 | — | ||||||
| Euro | BANT | Buy | 1,430,151 | 1,968,241 | 4/16/14 | — | (1,071 | ) | |||||
| Euro | BANT | Sell | 64,928,306 | 88,245,684 | 4/16/14 | — | (1,063,097 | ) | |||||
| Annual Report | 31 | |||||||||||||
| Mutual Quest Fund | |||||||||||
| Statement of Investments, December 31, 2013 (continued) | |||||||||||
| Forward Exchange Contracts (continued) | |||||||||||
| Contract | Settlement | Unrealized | Unrealized | ||||||||
| Currency | Counterpartya Type | Quantity | Amount | Date | Appreciation | Depreciation | |||||
| Euro | BBU | Buy | 559,462 | $ | 768,395 | 4/16/14 | $ | 1,144 | $ | — | |
| Euro | BBU | Sell | 71,453,339 | 97,155,463 | 4/16/14 | — | (1,128,491 | ) | |||
| Euro | BONY | Buy | 1,003,358 | 1,380,731 | 4/16/14 | — | (614 | ) | |||
| Euro | BONY | Sell | 156,863 | 214,975 | 4/16/14 | — | (790 | ) | |||
| Euro | FBCO | Sell | 1,101,411 | 1,513,762 | 4/16/14 | — | (1,227 | ) | |||
| Euro | HSBC | Buy | 2,673,559 | 3,670,404 | 4/16/14 | 9,277 | (2,205 | ) | |||
| Euro | HSBC | Sell | 1,474,642 | 2,026,028 | 4/16/14 | 102 | (2,442 | ) | |||
| Euro | SCBT | Buy | 3,076,859 | 4,232,473 | 4/16/14 | 2,983 | (3,241 | ) | |||
| Euro | SSBT | Buy | 1,119,446 | 1,540,240 | 4/16/14 | 56 | (499 | ) | |||
| Euro | SSBT | Sell | 373,231 | 511,315 | 4/16/14 | — | (2,063 | ) | |||
| British Pound | BANT | Sell | 28,333,750 | 45,926,409 | 4/22/14 | — | (952,423 | ) | |||
| British Pound | FBCO | Sell | 19,499,621 | 31,433,389 | 4/22/14 | — | (829,176 | ) | |||
| British Pound | HSBC | Sell | 370,131 | 593,253 | 4/22/14 | — | (19,137 | ) | |||
| British Pound | SCBT | Sell | 34,124,336 | 55,008,430 | 4/22/14 | — | (1,451,058 | ) | |||
| Euro | BANT | Sell | 30,720,652 | 41,302,995 | 5/15/14 | — | (954,803 | ) | |||
| Euro | BANT | Sell | 706,413 | 950,795 | 5/19/14 | — | (20,916 | ) | |||
| Euro | HSBC | Sell | 3,994,567 | 5,386,374 | 5/19/14 | — | (108,382 | ) | |||
| Euro | SCBT | Sell | 2,906,977 | 3,924,157 | 5/19/14 | — | (74,556 | ) | |||
| British Pound | BANT | Buy | 12,877,458 | 21,057,585 | 5/21/14 | 243,299 | — | ||||
| Norwegian Krone | BANT | Buy | 25,684,048 | 4,197,684 | 5/21/14 | 14,958 | — | ||||
| British Pound | BANT | Sell | 1,705,260 | 2,765,222 | 5/21/14 | — | (55,485 | ) | |||
| Norwegian Krone | BANT | Sell | 108,784,909 | 17,742,633 | 5/21/14 | — | (100,031 | ) | |||
| British Pound | BBU | Buy | 442,158 | 721,513 | 5/21/14 | 9,870 | — | ||||
| Norwegian Krone | BBU | Buy | 34,679,000 | 5,676,615 | 5/21/14 | 11,359 | — | ||||
| British Pound | BBU | Sell | 47,903,184 | 77,006,763 | 5/21/14 | — | (2,230,937 | ) | |||
| British Pound | HSBC | Sell | 33,819,386 | 54,381,573 | 5/21/14 | — | (1,559,810 | ) | |||
| Unrealized appreciation (depreciation) | 1,134,344 | (36,574,272 | ) | ||||||||
| Net unrealized appreciation (depreciation) | $ | (35,439,928 | ) | ||||||||
| aMay be comprised of multiple contracts using the same currency and settlement date. | |||||||||||
| See Abbreviations on page 56. | |||||||||||
32 | The accompanying notes are an integral part of these financial statements. | Annual Report
| Mutual Quest Fund | |||
| Financial Statements | |||
| Statement of Assets and Liabilities | |||
| December 31, 2013 | |||
| Assets: | |||
| Investments in securities: | |||
| Cost - Unaffiliated issuers | $ | 4,943,932,216 | |
| Cost - Non-controlled affiliated issuers (Note 11) | 3,586,942 | ||
| Total cost of investments | $ | 4,947,519,158 | |
| Value - Unaffiliated issuers | $ | 6,012,650,519 | |
| Value - Non-controlled affiliated issuers (Note 11) | 5,516,428 | ||
| Total value of investments (includes securities loaned in the amount of $2,150,693) | 6,018,166,947 | ||
| Cash | 1,363,218 | ||
| Foreign currency, at value (cost $38,211,706) | 38,146,945 | ||
| Receivables: | |||
| Investment securities sold | 29,708,778 | ||
| Capital shares sold | 4,364,088 | ||
| Dividends and interest | 38,014,720 | ||
| Due from brokers | 54,138,078 | ||
| Unrealized appreciation on forward exchange contracts | 1,134,344 | ||
| Other assets | 5,705 | ||
| Total assets | 6,185,042,823 | ||
| Liabilities: | |||
| Payables: | |||
| Investment securities purchased | 27,975,303 | ||
| Capital shares redeemed | 6,766,899 | ||
| Management fees | 2,993,877 | ||
| Administrative fees | 383,203 | ||
| Distribution fees | 1,345,837 | ||
| Transfer agent fees | 736,452 | ||
| Trustees’ fees and expenses | 238,467 | ||
| Variation margin | 136,289 | ||
| Options written, at value (premiums received $5,365,918) | 3,031,500 | ||
| Securities sold short, at value (proceeds $48,840,114) | 52,521,046 | ||
| Payable upon return of securities loaned | 2,210,890 | ||
| Unrealized depreciation on forward exchange contracts | 36,574,272 | ||
| Accrued expenses and other liabilities | 350,115 | ||
| Total liabilities | 135,264,150 | ||
| Net assets, at value | $ | 6,049,778,673 | |
| Net assets consist of: | |||
| Paid-in capital | $ | 5,021,138,886 | |
| Distributions in excess of net investment income | (5,986,981 | ) | |
| Net unrealized appreciation (depreciation) | 1,032,515,038 | ||
| Accumulated net realized gain (loss) | 2,111,730 | ||
| Net assets, at value | $ | 6,049,778,673 | |
Annual Report | The accompanying notes are an integral part of these financial statements. | 33
| Mutual Quest Fund | |||
| Financial Statements (continued) | |||
| Statement of Assets and Liabilities (continued) | |||
| December 31, 2013 | |||
| Class Z: | |||
| Net assets, at value | $ | 4,270,828,170 | |
| Shares outstanding | 234,913,228 | ||
| Net asset value and maximum offering price per share | $ | 18.18 | |
| Class A: | |||
| Net assets, at value | $ | 1,371,788,834 | |
| Shares outstanding | 76,223,126 | ||
| Net asset value per sharea | $ | 18.00 | |
| Maximum offering price per share (net asset value per share ÷ 94.25%) | $ | 19.10 | |
| Class C: | |||
| Net assets, at value | $ | 406,304,092 | |
| Shares outstanding | 22,876,872 | ||
| Net asset value and maximum offering price per sharea | $ | 17.76 | |
| Class R: | |||
| Net assets, at value | $ | 852,574 | |
| Shares outstanding | 47,795 | ||
| Net asset value and maximum offering price per share | $ | 17.84 | |
| Class R6: | |||
| Net assets, at value | $ | 5,003 | |
| Shares outstanding | 275 | ||
| Net asset value and maximum offering price per share | $ | 18.19 | |
| aRedemption price is equal to net asset value less contingent deferred sales charges, if applicable. | |||
34 | The accompanying notes are an integral part of these financial statements. | Annual Report
| Mutual Quest Fund | |||
| Financial Statements (continued) | |||
| Statement of Operations | |||
| for the year ended December 31, 2013 | |||
| Investment income: | |||
| Dividends | $ | 112,516,518 | |
| Interest | 97,955,427 | ||
| Income from securities loaned | 130,417 | ||
| Total investment income | 210,602,362 | ||
| Expenses: | |||
| Management fees (Note 3a) | 33,293,499 | ||
| Administrative fees (Note 3b) | 4,253,432 | ||
| Distribution fees: (Note 3c) | |||
| Class A | 3,740,627 | ||
| Class B | 1,187 | ||
| Class C | 3,695,343 | ||
| Class R | 1,857 | ||
| Transfer agent fees: (Note 3e) | |||
| Class Z | 3,215,270 | ||
| Class A | 1,009,394 | ||
| Class B | 100 | ||
| Class C | 299,044 | ||
| Class R | 274 | ||
| Class R6 | 44 | ||
| Custodian fees (Note 4) | 181,052 | ||
| Reports to shareholders | 292,200 | ||
| Registration and filing fees | 150,974 | ||
| Professional fees | 279,861 | ||
| Trustees’ fees and expenses | 155,574 | ||
| Interest on securities sold short | 3,844,952 | ||
| Other | 78,489 | ||
| Total expenses | 54,493,173 | ||
| Expense reductions (Note 4) | (2,866 | ) | |
| Expenses waived/paid by affiliates (Note 3f) | (43 | ) | |
| Net expenses | 54,490,264 | ||
| Net investment income | 156,112,098 | ||
Annual Report | The accompanying notes are an integral part of these financial statements. | 35
| Mutual Quest Fund | |||
| Financial Statements (continued) | |||
| Statement of Operations (continued) | |||
| for the year ended December 31, 2013 | |||
| Realized and unrealized gains (losses): | |||
| Net realized gain (loss) from: | |||
| Investments: | |||
| Unaffiliated issuers | $ | 498,833,418 | |
| Non-controlled affiliated issuers (Note 11) | (8,685,108 | ) | |
| Written options | 17,667,214 | ||
| Foreign currency transactions | (15,949,943 | ) | |
| Futures contracts | (7,981,684 | ) | |
| Securities sold short | (865,159 | ) | |
| Net realized gain (loss) | 483,018,738 | ||
| Net change in unrealized appreciation (depreciation) on: | |||
| Investments | 643,847,317 | ||
| Translation of other assets and liabilities denominated in foreign currencies | (13,181,828 | ) | |
| Net change in unrealized appreciation (depreciation) | 630,665,489 | ||
| Net realized and unrealized gain (loss) | 1,113,684,227 | ||
| Net increase (decrease) in net assets resulting from operations | $ | 1,269,796,325 | |
36 | The accompanying notes are an integral part of these financial statements. | Annual Report
| Mutual Quest Fund | ||||||
| Financial Statements (continued) | ||||||
| Statements of Changes in Net Assets | ||||||
| Year Ended December 31, | ||||||
| 2013 | 2012 | |||||
| Increase (decrease) in net assets: | ||||||
| Operations: | ||||||
| Net investment income | $ | 156,112,098 | $ | 117,375,302 | ||
| Net realized gain (loss) from investments, written options, foreign currency transactions, | ||||||
| futures contracts and securities sold short | 483,018,738 | 463,982,335 | ||||
| Net change in unrealized appreciation (depreciation) on investments and translation of | ||||||
| other assets and liabilities denominated in foreign currencies | 630,665,489 | 2,687,835 | ||||
| Net increase (decrease) in net assets resulting from operations | 1,269,796,325 | 584,045,472 | ||||
| Distributions to shareholders from: | ||||||
| Net investment income: | ||||||
| Class Z | (119,200,085 | ) | (86,884,671 | ) | ||
| Class A | (34,924,178 | ) | (23,626,019 | ) | ||
| Class C | (7,984,041 | ) | (4,903,811 | ) | ||
| Class R | (20,663 | ) | (4,061 | ) | ||
| Class R6 | (159 | ) | — | |||
| Net realized gains: | ||||||
| Class Z | (429,707,917 | ) | (261,883,836 | ) | ||
| Class A | (138,766,536 | ) | (81,468,806 | ) | ||
| Class B | — | (119,634 | ) | |||
| Class C | (41,877,771 | ) | (25,106,344 | ) | ||
| Class R | (71,953 | ) | (15,734 | ) | ||
| Class R6 | (560 | ) | — | |||
| Total distributions to shareholders | (772,553,863 | ) | (484,012,916 | ) | ||
| Capital share transactions: (Note 2) | ||||||
| Class Z | 329,356,966 | 99,292,533 | ||||
| Class A | 162,496,969 | (14,699,365 | ) | |||
| Class B | (990,999 | ) | (6,323,745 | ) | ||
| Class C | 41,284,507 | (11,976,468 | ) | |||
| Class R | 651,940 | 16,981 | ||||
| Class R6 | 5,000 | — | ||||
| Total capital share transactions | 532,804,383 | 66,309,936 | ||||
| Net increase (decrease) in net assets | 1,030,046,845 | 166,342,492 | ||||
| Net assets: | ||||||
| Beginning of year | 5,019,731,828 | 4,853,389,336 | ||||
| End of year | $ | 6,049,778,673 | $ | 5,019,731,828 | ||
| Undistributed net investment income (distributions in excess of net investment income) | ||||||
| included in net assets: | ||||||
| End of year | $ | (5,986,981 | ) | $ | 1,981,649 | |
Annual Report | The accompanying notes are an integral part of these financial statements. | 37
Mutual Quest Fund
Notes to Financial Statements
1. ORGANIZATION AND SIGNIFICANT ACCOUNTING POLICIES
Franklin Mutual Series Funds (Trust) is registered under the Investment Company Act of 1940, as amended, (1940 Act) as an open-end investment company, consisting of seven separate funds. The Mutual Quest Fund (Fund) is included in this report. The financial statements of the remaining funds in the Trust are presented separately. The Fund offers five classes of shares: Class Z, Class A, Class C, Class R and Class R6. Effective May 1, 2013, the Fund began offering a new class of shares, Class R6. Effective March 22, 2013, all Class B shares were converted to Class A. Each class of shares differs by its initial sales load, contingent deferred sales charges, voting rights on matters affecting a single class, its exchange privilege and fees primarily due to differing arrangements for distribution and transfer agent fees.
The following summarizes the Fund’s significant accounting policies.
a. Financial Instrument Valuation
The Fund’s investments in financial instruments are carried at fair value daily. Fair value is the price that would be received to sell an asset or paid to transfer a liability in an orderly transaction between market participants on the measurement date. The Fund calculates the net asset value (NAV) per share at the close of the New York Stock Exchange (NYSE), generally at 4p.m. Eastern time (NYSE close) on each day the NYSE is open for trading. Under procedures approved by the Trust’s Board of Trustees (the Board), the Fund’s administrator, investment manager and other affiliates have formed the Valuation and Liquidity Oversight Committee (VLOC). The VLOC provides administration and oversight of the Fund’s valuation policies and procedures, which are approved annually by the Board. Among other things, these procedures allow the Fund to utilize independent pricing services, quotations from securities and financial instrument dealers, and other market sources to determine fair value.
Equity securities and derivative financial instruments (derivatives) listed on an exchange or on the NASDAQ National Market System are valued at the last quoted sale price or the official closing price of the day, respectively. Foreign equity securities are valued as of the close of trading on the foreign stock exchange on which the security is primarily traded or as of the NYSE close, whichever is earlier. The value is then converted into its U.S. dollar equivalent at the foreign exchange rate in effect at the NYSE close on the day that the value of the security is determined. Over-the-counter (OTC) securities are valued within the range of the most recent quoted bid and ask prices. Securities that trade in multiple markets or on multiple exchanges are valued according to the broadest and most representative market. Certain equity securities are valued based upon fundamental characteristics or relationships to similar securities. Investments in non-registered money market funds are valued at the closing net asset value.
Debt securities generally trade in the OTC market rather than on a securities exchange. The Fund’s pricing services use multiple valuation techniques to determine fair value. In instances where sufficient market activity exists, the pricing services may utilize a market-based approach through which quotes from market makers are used to determine fair value. In instances where sufficient market activity may not exist or is limited, the pricing services also utilize proprietary valuation models which may consider market characteristics such as benchmark yield curves,
38 | Annual Report
Mutual Quest Fund
Notes to Financial Statements (continued)
| 1. | ORGANIZATION AND SIGNIFICANT ACCOUNTING POLICIES (continued) |
| a. | Financial Instrument Valuation (continued) |
credit spreads, estimated default rates, anticipated market interest rate volatility, coupon rates, anticipated timing of principal repayments, underlying collateral, and other unique security features in order to estimate the relevant cash flows, which are then discounted to calculate the fair value. Securities denominated in a foreign currency are converted into their U.S. dollar equivalent at the foreign exchange rate in effect at the NYSE close on the date that the values of the foreign debt securities are determined.
Certain derivatives trade in the OTC market. The Fund’s pricing services use various techniques including industry standard option pricing models and proprietary discounted cash flow models to determine the fair value of those instruments. The Fund’s net benefit or obligation under the derivative contract, as measured by the fair value of the contract, is included in net assets.
The Fund has procedures to determine the fair value of financial instruments for which market prices are not reliable or readily available. Under these procedures, the VLOC convenes on a regular basis to review such financial instruments and considers a number of factors, including significant unobservable valuation inputs, when arriving at fair value. The VLOC primarily employs a market-based approach which may use related or comparable assets or liabilities, recent transactions, market multiples, book values, and other relevant information for the investment to determine the fair value of the investment. An income-based valuation approach may also be used in which the anticipated future cash flows of the investment are discounted to calculate fair value. Discounts may also be applied due to the nature or duration of any restrictions on the disposition of the investments. Due to the inherent uncertainty of valuations of such investments, the fair values may differ significantly from the values that would have been used had an active market existed. The VLOC employs various methods for calibrating these valuation approaches including a regular review of key inputs and assumptions, transactional back-testing or disposition analysis, and reviews of any related market activity.
Trading in securities on foreign securities stock exchanges and OTC markets may be completed before the daily NYSE close. In addition, trading in certain foreign markets may not take place on every NYSE business day. Occasionally, events occur between the time at which trading in a foreign security is completed and the close of the NYSE that might call into question the reliability of the value of a portfolio security held by the Fund. As a result, differences may arise between the value of the Fund’s portfolio securities as determined at the foreign market close and the latest indications of value at the close of the NYSE. In order to minimize the potential for these differences, the VLOC monitors price movements following the close of trading in foreign stock markets through a series of country specific market proxies (such as baskets of American Depositary Receipts, futures contracts and exchange traded funds). These price movements are measured against established trigger thresholds for each specific market proxy to assist in determining if an event has occurred that may call into question the reliability of the values of the foreign securities held by the Fund. If such an event occurs, the securities may be valued using fair value procedures, which may include the use of independent pricing services.
Annual Report | 39
Mutual Quest Fund
Notes to Financial Statements (continued)
| 1. | ORGANIZATION AND SIGNIFICANT ACCOUNTING POLICIES (continued) |
| a. | Financial Instrument Valuation (continued) |
Also, when the last day of the reporting period is a non-business day, certain foreign markets may be open on those days that the NYSE is closed, which could result in differences between the value of the Fund’s portfolio securities on the last business day and the last calendar day of the reporting period. Any significant security valuation changes due to an open foreign market are adjusted and reflected by the Fund for financial reporting purposes.
b. Foreign Currency Translation
Portfolio securities and other assets and liabilities denominated in foreign currencies are translated into U.S. dollars based on the exchange rate of such currencies against U.S. dollars on the date of valuation. The Fund may enter into foreign currency exchange contracts to facilitate transactions denominated in a foreign currency. Purchases and sales of securities, income and expense items denominated in foreign currencies are translated into U.S. dollars at the exchange rate in effect on the transaction date. Portfolio securities and assets and liabilities denominated in foreign currencies contain risks that those currencies will decline in value relative to the U.S. dollar. Occasionally, events may impact the availability or reliability of foreign exchange rates used to convert the U.S. dollar equivalent value. If such an event occurs, the foreign exchange rate will be valued at fair value using procedures established and approved by the Board.
The Funds do not separately report the effect of changes in foreign exchange rates from changes in market prices on securities held. Such changes are included in net realized and unrealized gain or loss from investments on the Statement of Operations.
Realized foreign exchange gains or losses arise from sales of foreign currencies, currency gains or losses realized between the trade and settlement dates on securities transactions and the difference between the recorded amounts of dividends, interest, and foreign withholding taxes and the U.S. dollar equivalent of the amounts actually received or paid. Net unrealized foreign exchange gains and losses arise from changes in foreign exchange rates on foreign denominated assets and liabilities other than investments in securities held at the end of the reporting period.
c. Securities Purchased on a When-Issued Basis
The Fund purchases securities on a when-issued basis, with payment and delivery scheduled for a future date. These transactions are subject to market fluctuations and are subject to the risk that the value at delivery may be more or less than the trade date purchase price. Although the Fund will generally purchase these securities with the intention of holding the securities, it may sell the securities before the settlement date. Sufficient assets have been segregated for these securities.
d. Derivative Financial Instruments
The Fund invested in derivatives in order to manage risk or gain exposure to various other investments or markets. Derivatives are financial contracts based on an underlying or notional amount, require no initial investment or an initial net investment that is smaller than would normally be
40 | Annual Report
Mutual Quest Fund
Notes to Financial Statements (continued)
| 1. | ORGANIZATION AND SIGNIFICANT ACCOUNTING POLICIES (continued) |
| d. | Derivative Financial Instruments (continued) |
required to have a similar response to changes in market factors, and require or permit net settlement. Derivatives contain various risks including the potential inability of the counterparty to fulfill their obligations under the terms of the contract, the potential for an illiquid secondary market, and/or the potential for market movements which expose the Fund to gains or losses in excess of the amounts shown on the Statement of Assets and Liabilities. Realized gain and loss and unrealized appreciation and depreciation on these contracts for the period are included in the Statement of Operations.
Derivative counterparty credit risk is managed through a formal evaluation of the creditworthiness of all potential counterparties. The Fund attempts to reduce its exposure to counterparty credit risk on OTC derivatives, whenever possible, by entering into International Swaps and Derivatives Association (ISDA) master agreements with certain counterparties. These agreements contain various provisions, including but not limited to collateral requirements, events of default, or early termination. Termination events applicable to the counterparty include certain deteriorations in the credit quality of the counterparty. Termination events applicable to the Fund include failure of the Fund to maintain certain net asset levels and/or limit the decline in net assets over various periods of time. In the event of default or early termination, the ISDA master agreement gives the non-defaulting party the right to net and close-out all transactions traded, whether or not arising under the ISDA agreement, to one net amount payable by one counterparty to the other. However, absent an event of default or early termination, OTC derivative assets and liabilities are presented gross and not offset in the Statement of Assets and Liabilities. Early termination by the counterparty may result in an immediate payment by the Fund of any net liability owed to that counterparty under the ISDA agreement. At December 31, 2013, the Fund had OTC derivatives in a net liability position of $35,454,570 and the aggregate value of collateral pledged for such contracts was $30,761,376.
Collateral requirements differ by type of derivative. Collateral or initial margin requirements are set by the broker or exchange clearing house for exchange traded and centrally cleared derivatives. Initial margin deposited is held at the exchange and can be in the form of cash and/or securities. For OTC derivatives traded under an ISDA master agreement, posting of collateral is required by either the Fund or the applicable counterparty if the total net exposure of all OTC derivatives with the applicable counterparty exceeds the minimum transfer amount, which typically ranges from $100,000 to $250,000, and can vary depending on the counterparty and the type of the agreement. Generally, collateral is determined at the close of fund business each day and any additional collateral required due to changes in derivative values may be delivered by the Fund or the coun-terparty within a few business days. Collateral pledged and/or received by the Fund for OTC derivatives, if any, is held in segregated accounts with the Fund’s custodian/counterparty broker and can be in the form of cash and/or securities. Unrestricted cash may be invested according to the Fund’s investment objectives.
Annual Report | 41
Mutual Quest Fund
Notes to Financial Statements (continued)
| 1. | ORGANIZATION AND SIGNIFICANT ACCOUNTING POLICIES (continued) |
| d. | Derivative Financial Instruments (continued) |
The Fund entered into exchange traded futures contracts primarily to manage exposure to certain foreign currencies. A futures contract is an agreement between the Fund and a counterparty to buy or sell an asset for a specified price on a future date. Required initial margins are pledged by the Fund, and the daily change in fair value is accounted for as a variation margin payable or receivable on the Statement of Assets and Liabilities.
The Fund entered into OTC forward exchange contracts primarily to manage exposure to certain foreign currencies. A forward exchange contract is an agreement between the Fund and a counter-party to buy or sell a foreign currency at a specific exchange rate on a future date.
The Fund purchased or wrote exchange traded and/or OTC option contracts primarily to manage exposure to equity price risk. An option is a contract entitling the holder to purchase or sell a specific amount of shares or units of an asset or notional amount of a swap (swaption), at a specified price. Options purchased are recorded as an asset while options written are recorded as a liability. Upon exercise of an option, the acquisition cost or sales proceeds of the underlying investment is adjusted by any premium received or paid. Upon expiration of an option, any premium received or paid is recorded as a realized gain or loss. Upon closing an option other than through expiration or exercise, the difference between the premium and the cost to close the position is recorded as a realized gain or loss.
See Notes 7 and 10 regarding investment transactions and other derivative information, respectively.
e. Securities Sold Short
The Fund is engaged in selling securities short, which obligates the Fund to replace a borrowed security with the same security at current market value. The Fund incurs a loss if the price of the security increases between the date of the short sale and the date on which the Fund replaces the borrowed security. The Fund realizes a gain if the price of the security declines between those dates. Gains are limited to the price at which the Fund sold the security short, while losses are potentially unlimited in size.
The Fund is required to establish a margin account with the broker lending the security sold short. While the short sale is outstanding, the broker retains the proceeds of the short sale to the extent necessary to meet margin requirements until the short position is closed out. A deposit must also be maintained with the Fund’s custodian/counterparty broker consisting of cash and/or securities having a value equal to a specified percentage of the value of the securities sold short. The Fund is obligated to pay fees for borrowing the securities sold short and is required to pay the counterparty any dividends or interest due on securities sold short. Such dividends or interest and any security borrowing fees are recorded as an expense to the Fund.
42 | Annual Report
Mutual Quest Fund
Notes to Financial Statements (continued)
| 1. | ORGANIZATION AND SIGNIFICANT ACCOUNTING POLICIES (continued) |
| f. | Securities Lending |
The Fund participates in an agency based securities lending program. The Fund receives cash collateral against the loaned securities in an amount equal to at least 102% of the market value of the loaned securities. Collateral is maintained over the life of the loan in an amount not less than 100% of the market value of loaned securities, as determined at the close of fund business each day; any additional collateral required due to changes in security values is delivered to the Fund on the next business day. The collateral is invested in a non-registered money fund as indicated on the Statement of Investments. The Fund receives income from the investment of cash collateral, in addition to lending fees and rebates paid by the borrower. The Fund bears the market risk with respect to the collateral investment, securities loaned, and the risk that the agent may default on its obligations to the Fund. The securities lending agent has agreed to indemnify the Fund in the event of default by a third party borrower.
g. Senior Floating Rate Interests
The Fund invests in senior secured corporate loans that pay interest at rates which are periodically reset by reference to a base lending rate plus a spread. These base lending rates are generally the prime rate offered by a designated U.S. bank or the London InterBank Offered Rate (LIBOR). Senior secured corporate loans often require prepayment of principal from excess cash flows or at the discretion of the borrower. As a result, actual maturity may be substantially less than the stated maturity.
Senior secured corporate loans in which the Fund invests are generally readily marketable, but may be subject to certain restrictions on resale.
h. Income and Deferred Taxes
It is the Fund’s policy to qualify as a regulated investment company under the Internal Revenue Code. The Fund intends to distribute to shareholders substantially all of its taxable income and net realized gains to relieve it from federal income and excise taxes. As a result, no provision for U.S. federal income taxes is required.
The Fund may be subject to foreign taxation related to income received, capital gains on the sale of securities and certain foreign currency transactions in the foreign jurisdictions in which it invests. Foreign taxes, if any, are recorded based on the tax regulations and rates that exist in the foreign markets in which the Fund invests. When a capital gain tax is determined to apply the Fund records an estimated deferred tax liability in an amount that would be payable if the securities were disposed of on the valuation date.
The Fund recognizes the tax benefits of uncertain tax positions only when the position is “more likely than not” to be sustained upon examination by the tax authorities based on the technical merits of the tax position. As of December 31, 2013, and for all open tax years, the Fund has
Annual Report | 43
Mutual Quest Fund
Notes to Financial Statements (continued)
| 1. | ORGANIZATION AND SIGNIFICANT ACCOUNTING POLICIES (continued) |
| h. | Income and Deferred Taxes (continued) |
determined that no liability for unrecognized tax benefits is required in the Fund’s financial statements related to uncertain tax positions taken on a tax return (or expected to be taken on future tax returns). Open tax years are those that remain subject to examination and are based on each tax jurisdiction statute of limitation.
i. Security Transactions, Investment Income, Expenses and Distributions
Security transactions are accounted for on trade date. Realized gains and losses on security transactions are determined on a specific identification basis. Interest income and estimated expenses are accrued daily. Amortization of premium and accretion of discount on debt securities are included in interest income. Dividend income and dividends on securities sold short are recorded on the ex-dividend date except that certain dividends from foreign securities are recognized as soon as the Fund is notified of the ex-dividend date. Distributions to shareholders are recorded on the ex-dividend date and are determined according to income tax regulations (tax basis). Distributable earnings determined on a tax basis may differ from earnings recorded in accordance with accounting principles generally accepted in the United States of America. These differences may be permanent or temporary. Permanent differences are reclassified among capital accounts to reflect their tax character. These reclassifications have no impact on net assets or the results of operations. Temporary differences are not reclassified, as they may reverse in subsequent periods.
Common expenses incurred by the Trust are allocated among the funds based on the ratio of net assets of each fund to the combined net assets of the Trust. Fund specific expenses are charged directly to the fund that incurred the expense.
Realized and unrealized gains and losses and net investment income, not including class specific expenses, are allocated daily to each class of shares based upon the relative proportion of net assets of each class. Differences in per share distributions, by class, are generally due to differences in class specific expenses.
Distributions received by the Fund from certain securities may be a return of capital (ROC). Such distributions reduce the cost basis of the securities, and any distributions in excess of the cost basis are recognized as capital gains.
j. Accounting Estimates
The preparation of financial statements in accordance with accounting principles generally accepted in the United States of America requires management to make estimates and assumptions that affect the reported amounts of assets and liabilities at the date of the financial statements and the amounts of income and expenses during the reporting period. Actual results could differ from those estimates.
44 | Annual Report
Mutual Quest Fund
Notes to Financial Statements (continued)
| 1. | ORGANIZATION AND SIGNIFICANT ACCOUNTING POLICIES (continued) |
| k. | Guarantees and Indemnifications |
Under the Trust’s organizational documents, its officers and trustees are indemnified by the Trust against certain liabilities arising out of the performance of their duties to the Trust. Additionally, in the normal course of business, the Trust, on behalf of the Fund, enters into contracts with service providers that contain general indemnification clauses. The Trust’s maximum exposure under these arrangements is unknown as this would involve future claims that may be made against the Trust that have not yet occurred. Currently, the Trust expects the risk of loss to be remote.
2. SHARES OF BENEFICIAL INTEREST
At December 31, 2013, there were an unlimited number of shares authorized (without par value).
Transactions in the Fund’s shares were as follows:
| Year Ended December 31, | ||||||||||||
| 2013 | 2012 | |||||||||||
| Shares | Amount | Shares | Amount | |||||||||
| Class Z Shares: | ||||||||||||
| Shares sold | 11,698,858 | $ | 217,333,009 | 9,807,945 | $ | 168,953,685 | ||||||
| Shares issued in reinvestment of | ||||||||||||
| distributions | 29,082,475 | 524,878,902 | 19,782,561 | 332,370,140 | ||||||||
| Shares redeemed | (22,293,224 | ) | (412,854,945 | ) | (23,313,362 | ) | (402,031,292 | ) | ||||
| Net increase (decrease) | 18,488,109 | $ | 329,356,966 | 6,277,144 | $ | 99,292,533 | ||||||
| Class A Shares: | ||||||||||||
| Shares sold | 12,521,572 | $ | 230,284,598 | 8,770,043 | $ | 149,858,561 | ||||||
| Shares issued in reinvestment of | ||||||||||||
| distributions | 9,440,266 | 168,652,419 | 6,123,013 | 102,021,441 | ||||||||
| Shares redeemed | (12,865,192 | ) | (236,440,048 | ) | (15,603,877 | ) | (266,579,367 | ) | ||||
| Net increase (decrease) | 9,096,646 | $ | 162,496,969 | (710,821 | ) | $ | (14,699,365 | ) | ||||
| Class B Sharesa: | ||||||||||||
| Shares sold | 619 | $ | 10,718 | 3,030 | $ | 51,346 | ||||||
| Shares issued in reinvestment of | ||||||||||||
| distributions | — | — | 6,505 | 109,113 | ||||||||
| Shares redeemed | (58,326 | ) | (1,001,717 | ) | (386,598 | ) | (6,484,204 | ) | ||||
| Net increase (decrease) | (57,707 | ) | $ | (990,999 | ) | (377,063 | ) | $ | (6,323,745 | ) | ||
| Class C Shares: | ||||||||||||
| Shares sold | 2,814,368 | $ | 51,317,041 | 1,740,897 | $ | 29,377,738 | ||||||
| Shares issued in reinvestment of | ||||||||||||
| distributions | 2,705,655 | 47,704,834 | 1,725,746 | 28,458,374 | ||||||||
| Shares redeemed | (3,207,256 | ) | (57,737,368 | ) | (4,137,143 | ) | (69,812,580 | ) | ||||
| Net increase (decrease) | 2,312,767 | $ | 41,284,507 | (670,500 | ) | $ | (11,976,468 | ) | ||||
| Class R Shares: | ||||||||||||
| Shares sold | 33,864 | $ | 637,240 | 6,047 | $ | 102,759 | ||||||
| Shares issued in reinvestment of | ||||||||||||
| distributions | 5,249 | 92,616 | 1,193 | 19,794 | ||||||||
| Shares redeemed | (4,282 | ) | (77,916 | ) | (6,316 | ) | (105,572 | ) | ||||
| Net increase (decrease) | 34,831 | $ | 651,940 | 924 | $ | 16,981 | ||||||
Annual Report | 45
| Mutual Quest Fund | |||
| Notes to Financial Statements (continued) | |||
| 2. SHARES OF BENEFICIAL INTEREST (continued) | |||
| Year Ended December 31, | |||
| 2013 | |||
| Shares | Amount | ||
| Class R6 Sharesb: | |||
| Shares sold | 275 | $ | 5,000 |
| aEffective March 22, 2013, all Class B shares were converted to Class A. | |||
| bFor the period May 1, 2013 (effective date) to December 31, 2013. | |||
| 3. TRANSACTIONS WITH AFFILIATES | |||
| Franklin Resources, Inc. is the holding company for various subsidiaries that together are referred | |||
| to as Franklin Templeton Investments. Certain officers and trustees of the Fund are also officers | |||
| and/or directors of the following subsidiaries: | |||
| Subsidiary | Affiliation | ||
| Franklin Mutual Advisers, LLC (Franklin Mutual) | Investment manager | ||
| Franklin Templeton Services, LLC (FT Services) | Administrative manager | ||
| Franklin Templeton Distributors, Inc. (Distributors) | Principal underwriter | ||
| Franklin Templeton Investor Services, LLC (Investor Services) | Transfer agent | ||
a. Management Fees
The Fund pays an investment management fee to Franklin Mutual based on the average daily net assets of the Fund as follows:
| Annualized Fee Rate | Net Assets | |
| 0.600 | % | Up to and including $5 billion |
| 0.570 | % | Over $5 billion, up to and including $7 billion |
| 0.550 | % | Over $7 billion, up to and including $10 billion |
| 0.540 | % | In excess of $10 billion |
b. Administrative Fees
The Fund pays its allocated share of an administrative fee to FT Services based on the Trust’s aggregate average daily net assets as follows:
| Annualized Fee Rate | Net Assets | |
| 0.150 | % | Up to and including $200 million |
| 0.135 | % | Over $200 million, up to and including $700 million |
| 0.100 | % | Over $700 million, up to and including $1.2 billion |
| 0.075 | % | In excess of $1.2 billion |
46 | Annual Report
Mutual Quest Fund
Notes to Financial Statements (continued)
| 3. | TRANSACTIONS WITH AFFILIATES (continued) |
| c. | Distribution Fees |
The Board has adopted distribution plans for each share class, with the exception of Class Z and Class R6 shares, pursuant to Rule 12b-1 under the 1940 Act. Distribution fees are not charged on shares held by affiliates. Under the Fund’s Class A reimbursement distribution plan, the Fund reimburses Distributors for costs incurred in connection with the servicing, sale and distribution of the Fund’s shares up to the maximum annual plan rate. Under the Class A reimbursement distribution plan, costs exceeding the maximum for the current plan year cannot be reimbursed in subsequent periods. In addition, under the Fund’s Class B, C and R compensation distribution plans, the Fund pays Distributors for costs incurred in connection with the servicing, sale and distribution of the Fund’s shares up to the maximum annual plan rate for each class. The plan year, for purposes of monitoring compliance with the maximum annual plan rates, is February 1 through January 31.
The maximum annual plan rates, based on the average daily net assets, for each class, are as follows:
| Class A | 0.35 | % |
| Class B | 1.00 | % |
| Class C | 1.00 | % |
| Class R | 0.50 | % |
The Board has set the current rate at 0.30% per year for Class A shares until further notice and approval by the Board.
d. Sales Charges/Underwriting Agreements
Front-end sales charges and contingent deferred sales charges (CDSC) do not represent expenses of the Fund. These charges are deducted from the proceeds of sales of Fund shares prior to investment or from redemption proceeds prior to remittance, as applicable. Distributors has advised the Fund of the following commission transactions related to the sales and redemptions of the Fund’s shares for the year:
| Sales charges retained net of commissions paid to unaffiliated | ||
| broker/dealers | $ | 607,804 |
| CDSC retained | $ | 18,522 |
e. Transfer Agent Fees
Each class of shares, except for Class R6, pays transfer agent fees to Investor Services for its performance of shareholder servicing obligations and reimburses Investor Services for out of pocket expenses incurred, including shareholding servicing fees paid to third parties. These fees are allocated daily based upon their relative proportion of such classes’ aggregate net assets. Class R6 pays Investor Services transfer agent fees specific to that class.
For the year ended December 31, 2013, the Fund paid transfer agent fees of $4,524,126, of which $2,531,303 was retained by Investor Services.
Annual Report | 47
Mutual Quest Fund
Notes to Financial Statements (continued)
| 3. | TRANSACTIONS WITH AFFILIATES (continued) |
| f. | Waiver and Expense Reimbursements |
Investor Services has contractually agreed in advance to waive or limit its fees so that the Class R6 transfer agent fees of the Fund do not exceed 0.01% until April 30, 2014.
4. EXPENSE OFFSET ARRANGEMENT
The Fund has entered into an arrangement with its custodian whereby credits realized as a result of uninvested cash balances are used to reduce a portion of the Fund’s custodian expenses. During the year ended December 31, 2013, the custodian fees were reduced as noted in the Statement of Operations.
5. INDEPENDENT TRUSTEES’ RETIREMENT PLAN
On January 1, 1993, the Trust adopted an Independent Trustees’ Retirement Plan (Plan). The Plan is an unfunded defined benefit plan that provides benefit payments to Trustees whose length of service and retirement age meets the eligibility requirements of the Plan. Benefits under the Plan are based on years of service and fees paid to each trustee at the time of retirement. Effective in December 1996, the Plan was closed to new participants.
During the year ended December 31, 2013, the Fund’s projected benefit obligation and benefit payments under the Plan were as follows:
| aProjected benefit obligation at December 31, 2013 | $ | 238,467 |
| bDecrease in projected benefit obligation | $ | 7,403 |
| Benefit payments made to retired trustees | $ | 6,697 |
aThe projected benefit obligation is included in accrued expenses and other liabilities in the Statement of Assets and Liabilities. bThe decrease in projected benefit obligation is included in trustees’ fees and expenses in the Statement of Operations.
6. INCOME TAXES
For tax purposes, the Fund may elect to defer any portion of a post-October capital loss to the first day of the following fiscal year. At December 31, 2013, the Fund deferred post-October capital losses of $9,371,000.
The tax character of distributions paid during the years ended December 31, 2013 and 2012, was as follows:
| 2013 | 2012 | |||
| Distributions paid from: | ||||
| Ordinary income | $ | 494,364,532 | $ | 300,332,766 |
| Long term capital gain | 278,189,331 | 183,680,150 | ||
| $ | 772,553,863 | $ | 484,012,916 | |
| 48 | Annual Report |
Mutual Quest Fund
Notes to Financial Statements (continued)
6. INCOME TAXES (continued)
At December 31, 2013, the cost of investments, net unrealized appreciation (depreciation), undistributed ordinary income and undistributed long term capital gains for income tax purposes were as follows:
| Cost of investments | $ | 4,981,594,688 | |
| Unrealized appreciation | $ | 1,228,044,078 | |
| Unrealized depreciation | (191,471,819 | ) | |
| Net unrealized appreciation (depreciation) | $ | 1,036,572,259 | |
| Undistributed ordinary income | $ | 10,174,376 | |
| Undistributed long term capital gains | 1,908,076 | ||
| Distributable earnings | $ | 12,082,452 | |
Differences between income and/or capital gains as determined on a book basis and a tax basis are primarily due to differing treatments of foreign currency transactions, bond discounts and premiums, tax straddles and wash sales.
7. INVESTMENT TRANSACTIONS
Purchases and sales of investments (excluding short term securities and securities sold short) for the year ended December 31, 2013, aggregated $3,149,341,528 and $3,088,941,850, respectively.
Transactions in options written during the year ended December 31, 2013, were as follows:
| Number of | Premiums | ||||
| Contracts | Received | ||||
| Options outstanding at December 31, 2012 | 34,733 | $ | 2,437,366 | ||
| Options written | 172,785 | 35,414,543 | |||
| Options expired | (39,213 | ) | (2,592,017 | ) | |
| Options exercised | (24,650 | ) | (4,326,078 | ) | |
| Options closed | (128,655 | ) | (25,567,896 | ) | |
| Options outstanding at December 31, 2013 | 15,000 | $ | 5,365,918 |
See Notes 1(d) and 10 regarding derivative financial instruments and other derivative information, respectively.
Annual Report | 49
Mutual Quest Fund
Notes to Financial Statements (continued)
8. CREDIT RISK AND DEFAULTED SECURITIES
The Fund may purchase the pre-default or defaulted debt of distressed companies. Distressed companies are financially troubled and are about to be or are already involved in financial restructuring or bankruptcy. Risks associated with purchasing these securities include the possibility that the bankruptcy or other restructuring process takes longer than expected, or that distributions in restructuring are less than anticipated, either or both of which may result in unfavorable consequences to the Fund. If it becomes probable that the income on debt securities, including those of distressed companies, will not be collected, the Fund discontinues accruing income and recognizes an adjustment for uncollectible interest.
At December 31, 2013, the aggregate value of distressed company securities for which interest recognition has been discontinued was $192,124,705, representing 3.18% of the Fund’s net assets. For information as to specific securities, see the accompanying Statement of Investments.
9. RESTRICTED SECURITIES
The Fund invests in securities that are restricted under the Securities Act of 1933 (1933 Act) or which are subject to legal, contractual, or other agreed upon restrictions on resale. Restricted securities are often purchased in private placement transactions, and cannot be sold without prior registration unless the sale is pursuant to an exemption under the 1933 Act. Disposal of these securities may require greater effort and expense, and prompt sale at an acceptable price may be difficult. The Fund may have registration rights for restricted securities. The issuer generally incurs all registration costs.
At December 31, 2013, the Fund held investments in restricted securities, excluding certain securities exempt from registration under the 1933 Act deemed to be liquid, as follows:
| Principal Amount/ | Acquisition | |||||
| Shares | Issuer | Dates | Cost | Value | ||
| 9,272 | Broadband Ventures III LLC, secured | |||||
| promissory note, 5.00%, 2/01/12 | 7/01/10 - 11/30/12 | $ | 9,272 | $ | — | |
| 869,627 | a Eastman Kodak Co. | 9/03/13 | 10,383,346 | 28,675,515 | ||
| 16,133,491 | FIM Coinvestor Holdings I, LLC | 11/20/06 - 6/02/09 | — | — | ||
| 350,236 | Imagine Group Holdings Ltd. | 8/31/04 | 3,586,942 | 2,558,824 | ||
| 2,363,058 | International Automotive Components | |||||
| Group Brazil LLC | 4/13/06 - 12/26/08 | 1,569,318 | 460,371 | |||
| 18,661,349 | International Automotive Components | |||||
| Group North America, LLC | 1/02/06 - 3/18/13 | 15,279,344 | 10,558,964 | |||
| 97,300 | Olympus Re Holdings Ltd. | 12/19/01 | 9,115,166 | — | ||
| Total Restricted Securities | ||||||
| (Value is 0.70% of Net Assets) | $ | 39,943,388 | $ | 42,253,674 | ||
aThe Fund also invests in unrestricted securities or other investments in the issuer, valued at $56,071,316 as of December 31, 2013.
50 | Annual Report
Mutual Quest Fund
Notes to Financial Statements (continued)
10. OTHER DERIVATIVE INFORMATION
At December 31, 2013, the Fund’s investments in derivative contracts are reflected on the Statement of Assets and Liabilities as follows:
| Asset Derivatives | Liability Derivatives | ||||||
| Derivative Contracts | |||||||
| Not Accounted for as | Statement of Assets and | Fair Value | Statement of Assets and | Fair Value | |||
| Hedging Instruments | Liabilities Location | Amount | Liabilities Location | Amount | |||
| Foreign exchange | |||||||
| contracts | Unrealized appreciation on | $ | 1,134,344 | Unrealized depreciation on | $ | 38,092,688 | a |
| forward exchange contracts | forward exchange contracts / | ||||||
| Net assets consist of – net | |||||||
| unrealized appreciation | |||||||
| (depreciation) | |||||||
| Equity contracts | Investments, at value | 481,250 | Options written, at value | 3,031,500 | |||
aIncludes cumulative appreciation (depreciation) of futures contracts as reported in the Statement of Investments. Only current day’s variation margin is separately reported within the Statement of Assets and Liabilities.
For the year ended December 31, 2013, the effect of derivative contracts on the Fund’s Statement of Operations was as follows:
| Derivative Contracts | Realized Gain | Change in Unrealized | |||||
| Not Accounted for as | Statement of Operations | (Loss) for the | Appreciation (Depreciation) | ||||
| Hedging Instruments | Locations | Year | for the Year | ||||
| Foreign exchange | |||||||
| contracts | Net realized gain (loss) from foreign | $ | (23,738,661 | ) | $ | (13,277,687 | ) |
| currency transactions and futures | |||||||
| contracts / Net change in unrealized | |||||||
| appreciation (depreciation) on translation | |||||||
| of other assets and liabilities denominated | |||||||
| in foreign currencies | |||||||
| Equity contracts | Net realized gain (loss) from investments | 2,466,413 | (13,195,683 | ) | |||
| and written options / Net change in unrealized | |||||||
| appreciation (depreciation) on investments | |||||||
For the year ended December 31, 2013, the average month end fair value of derivatives represented 0.60% of average month end net assets. The average month end number of open derivative contracts for the year was 140.
See Notes 1(d) and 7 regarding derivative financial instruments and investment transactions, respectively.
Annual Report | 51
Mutual Quest Fund
Notes to Financial Statements (continued)
11. HOLDINGS OF 5% VOTING SECURITIES OF PORTFOLIO COMPANIES
The 1940 Act defines “affiliated companies” to include investments in portfolio companies in which a fund owns 5% or more of the outstanding voting securities. Investments in “affiliated companies” for the Fund for the year ended December 31, 2013, were as shown below.
| Number of | Number of | ||||||||||
| Shares | Shares | Value at | Realized | ||||||||
| Held at Beginning | Gross | Gross | Held at End | End of | Investment | Capital | |||||
| Name of Issuer | of Year | Additions | Reductions | of Year | Year | Income | Gain (Loss) | ||||
| Non-Controlled Affiliates | |||||||||||
| Imagine Group Holdings Ltd. | 350,236 | — | — | 350,236 | $ | 2,558,824 | $ | — | $ | — | |
| KGen Power Corp., 144A | 5,377,461 | — | — | 5,377,461 | 2,957,604 | — | 2,321,297 | ||||
| White River Capital Inc. | 549,751 | — | 549,751 | — | — | — | (11,006,405) | ||||
| Total Affiliated Securities (Value is 0.09% of Net Assets) | $ | 5,516,428 | $ | — | $ | (8,685,108) | |||||
12. CREDIT FACILITY
The Fund, together with other U.S. registered and foreign investment funds (collectively, Borrowers), managed by Franklin Templeton Investments, are borrowers in a joint syndicated senior unsecured credit facility totaling $1.5 billion (Global Credit Facility) which, after an extension of the original terms, matured on February 14, 2014. This Global Credit Facility provides a source of funds to the Borrowers for temporary and emergency purposes, including the ability to meet future unanticipated or unusually large redemption requests. Effective February 14, 2014, the Borrowers renewed the Global Credit Facility which matures on February 13, 2015.
Under the terms of the Global Credit Facility, the Fund shall, in addition to interest charged on any borrowings made by the Fund and other costs incurred by the Fund, pay its share of fees and expenses incurred in connection with the implementation and maintenance of the Global Credit Facility, based upon its relative share of the aggregate net assets of all of the Borrowers, including an annual commitment fee of 0.07% based upon the unused portion of the Global Credit Facility. These fees are reflected in other expenses on the Statement of Operations. During the year ended December 31, 2013, the Fund did not use the Global Credit Facility.
13. FAIR VALUE MEASUREMENTS
The Fund follows a fair value hierarchy that distinguishes between market data obtained from independent sources (observable inputs) and the Fund’s own market assumptions (unobservable inputs). These inputs are used in determining the value of the Fund’s financial instruments and are summarized in the following fair value hierarchy:
- Level 1 – quoted prices in active markets for identical financial instruments
- Level 2 – other significant observable inputs (including quoted prices for similar financial instruments, interest rates, prepayment speed, credit risk, etc.)
- Level 3 – significant unobservable inputs (including the Fund’s own assumptions in deter- mining the fair value of financial instruments)
52 | Annual Report
Mutual Quest Fund
Notes to Financial Statements (continued)
13. FAIR VALUE MEASUREMENTS (continued)
The input levels are not necessarily an indication of the risk or liquidity associated with financial instruments at that level.
For movements between the levels within the fair value hierarchy, the Fund has adopted a policy of recognizing the transfers as of the date of the underlying event which caused the movement.
A summary of inputs used as of December 31, 2013, in valuing the Fund’s assets and liabilities carried at fair value, is as follows:
| Level 1 | Level 2 | Level 3 | Total | |||||||
| Assets: | ||||||||||
| Investments in Securities: | ||||||||||
| Equity Investments:a | ||||||||||
| Auto Components | $ | — | $ | — | $ | 11,019,335 | $ | 11,019,335 | ||
| Insurance | 486,894,248 | — | 2,558,824 | b | 489,453,072 | |||||
| Leisure Equipment & | ||||||||||
| Products | 1,447,778 | — | 28,675,515 | 30,123,293 | ||||||
| Media | 276,302,377 | 54,479,168 | — | 330,781,545 | ||||||
| Real Estate Management & | ||||||||||
| Development | — | — | 42,884,142 | 42,884,142 | ||||||
| All Other Equity | ||||||||||
| Investmentsc | 3,401,005,841 | — | — b | 3,401,005,841 | ||||||
| Corporate Bonds, Notes and | ||||||||||
| Senior Floating Rate | ||||||||||
| Interests | — | 878,532,713 | — | 878,532,713 | ||||||
| Corporate Bonds and Notes in | ||||||||||
| Reorganization | — | 192,124,705 | — b | 192,124,705 | ||||||
| Companies in Liquidation | 76,509 | 207,290,043 | — b | 207,366,552 | ||||||
| Asset-Backed Securities | — | 30,797,298 | — | 30,797,298 | ||||||
| Municipal Bonds | — | 41,913,625 | — | 41,913,625 | ||||||
| Options Purchased | 481,250 | — | — | 481,250 | ||||||
| Short Term Investments | 359,472,686 | 2,210,890 | — | 361,683,576 | ||||||
| Total Investments in | ||||||||||
| Securities | $ | 4,525,680,689 | $ | 1,407,348,442 | $ | 85,137,816 | $ | 6,018,166,947 | ||
| Forward Exchange Contracts | $ | — | $ | 1,134,344 | $ | — | $ | 1,134,344 | ||
| Liabilities: | ||||||||||
| Options Written | 3,031,500 | — | — | 3,031,500 | ||||||
| Securities Sold Short | — | 52,521,046 | — | 52,521,046 | ||||||
| Futures Contracts | 1,518,416 | — | — | 1,518,416 | ||||||
| Forward Exchange Contracts | — | 36,574,272 | — | 36,574,272 | ||||||
| aIncludes common and preferred stocks as well as other equity investments. | ||||||||||
| bIncludes securities determined to have no value at December 31, 2013. | ||||||||||
| cFor detailed categories, see the accompanying Statement of Investments. | ||||||||||
Annual Report | 53
Mutual Quest Fund
Notes to Financial Statements (continued)
13. FAIR VALUE MEASUREMENTS (continued)
A reconciliation of assets in which Level 3 inputs are used in determining fair value is presented when there are significant Level 3 investments at the end of the year. At December 31, 2013, the reconciliation of assets, is as follows:
| Net Change | |||||||||||||||||||||||||||
| in Unrealized | |||||||||||||||||||||||||||
| Balance | Net | Net | Balance | Appreciation | |||||||||||||||||||||||
| at | Transfers | Transfers | Realized | Unrealized | at | (Depreciation) | |||||||||||||||||||||
| Beginning | Into | Out of | Cost Basis | Gain | Gain | End of | on Assets Held | ||||||||||||||||||||
| of Year | Purchases | Sales | Level 3 | Level 3a | Adjustmentsb | (Loss) | (Loss) | Year | at Year End | ||||||||||||||||||
| Assets: | |||||||||||||||||||||||||||
| Investments in Securities: | |||||||||||||||||||||||||||
| Equity Investments:c | |||||||||||||||||||||||||||
| Auto Components | $ | 7,434,274 | $ | 1,696,470 | $ | — | $ | — | $ | — | $ | — | $ | — | $ | 1,888,591 | $ | 11,019,335 | $ | 1,888,591 | |||||||
| Diversified Telecommunication | |||||||||||||||||||||||||||
| Services | 643,554 | d | — | — | — | — | — | 1,373,490 | (2,017,044 | ) | —d | — | |||||||||||||||
| Insurance | 4,042,109 | d | — | — | — | — | (23,651 | ) | — | (1,459,634 | ) | 2,558,824 | d | (1,459,634 | ) | ||||||||||||
| Leisure Equipment & | |||||||||||||||||||||||||||
| Products | — | 10,383,346 | — | — | — | — | — | 18,292,169 | 28,675,515 | 18,292,169 | |||||||||||||||||
| Real Estate Management & | |||||||||||||||||||||||||||
| Development | 46,535,906 | — | — | — | (17,468,951 | ) | — | — | 13,817,187 | 42,884,142 | 11,417,427 | ||||||||||||||||
| Corporate Bonds, Notes and | |||||||||||||||||||||||||||
| Senior Floating Rate | |||||||||||||||||||||||||||
| Interests | 6,736,506 | — | (6,506,784 | ) | — | — | 29,836 | 608,568 | (868,126 | ) | — | — | |||||||||||||||
| Corporate Bonds and Notes in | |||||||||||||||||||||||||||
| Reorganization | —d | — | (1,030 | ) | — | — | — | — | 1,030 | —d | — | ||||||||||||||||
| Total | $ | 65,392,349 | $ | 12,079,816 | $ | (6,507,814 | ) | $ | — | $ | (17,468,951 | ) | $ | 6,185 | $ | 1,982,058 | $ | 29,654,173 | $ | 85,137,816 | $ | 30,138,553 |
aThe investments were transferred out of Level 3 as a result of the removal of a significant unobservable valuation input.
bMay include accretion, amortization, partnership adjustments, and/or other cost basis adjustments.
cIncludes common stocks as well as other equity investments.
dIncludes securities determined to have no value.
54 | Annual Report
Mutual Quest Fund
Notes to Financial Statements (continued)
13. FAIR VALUE MEASUREMENTS (continued)
Significant unobservable valuation inputs developed by the VLOC for material Level 3 investments and impact to fair value as a result of changes in unobservable valuation inputs as of December 31, 2013, are as follows:
| Impact to Fair | |||||||
| Fair Value at | Value if Input | ||||||
| Description | End of Year | Valuation Technique | Unobservable Inputs | Amount | Increases a | ||
| Assets: | |||||||
| Investments in Securities: | |||||||
| Equity Investments: | |||||||
| Auto Components. | $ | 10,558,964 | Market comparables | Discount for lack of marketability | 15 | % | Decrease |
| EV / EBITDA multiple | 5.1 | x | Increase b | ||||
| Leisure Equipment & | |||||||
| Products | 28,675,515 | Market comparables | Discount for lack of marketability | 5 | % | Decrease b | |
| Real Estate Management & | |||||||
| Development | 42,884,142 | Market comparables | Discount for lack of marketability | 8 | % | Decrease b | |
| All Other Investmentsc | 3,019,195 | ||||||
| Total | $ | 85,137,816 |
aRepresents the directional change in the fair value of the Level 3 investments that would result from a significant and reasonable increase in the corresponding input. A significant
and reasonable decrease in input would have the opposite effect. Significant impacts, if any, to fair value and/or net assets have been indicated.
bRepresents a significant impact to fair value but not net assets.
cIncludes fair value of immaterial investments developed using various valuation techniques and unobservable inputs. May also include investments with values derived using
prior transaction prices or third party pricing information without adjustment for which such inputs are also unobservable.
Abbreviations List
| EBITDA | - | Earnings before interest, taxes, depreciation and amortization |
| EV | - | Enterprise value |
14. NEW ACCOUNTING PRONOUNCEMENTS
In June 2013, the Financial Accounting Standards Board issued Accounting Standards Update (ASU) No. 2013-08, Investment Companies (Topic 946): Amendments to the Scope, Measurement, and Disclosure Requirements. The ASU modifies the criteria used in defining an investment company under U.S. Generally Accepted Accounting Principles and also sets forth certain measurement and disclosure requirements. Under the ASU, an entity that is registered under the 1940 Act automatically qualifies as an investment company. The ASU is effective for interim and annual reporting periods beginning after December 15, 2013. Management has reviewed the requirements and believes the adoption of this ASU will not have a material impact on the financial statements.
Annual Report | 55
Mutual Quest Fund
Notes to Financial Statements (continued)
15. SUBSEQUENT EVENTS
The Fund has evaluated subsequent events through the issuance of the financial statements and determined that no events have occurred that require disclosure other than those already disclosed in the financial statements.
| ABBREVIATIONS | |||||
| Counterparty | Currency | Selected Portfolio | |||
| BANT | - Bank of America N.A. | CAD | - Canadian Dollar | ADR | - American Depositary Receipt |
| BBU | - Barclays Bank PLC | EUR | - Euro | EDA | - Economic Development Authority |
| BONY | - Bank of New York Mellon | GBP | - British Pound | FRN | - Floating Rate Note |
| DBFX | - Deutsche Bank AG | USD | - United States Dollar | IDR | - International Depositary Receipt |
| FBCO | - Credit Suisse Group AG | ||||
| HSBC | - HSBC Bank USA, N.A. | ||||
| SCBT | - Standard Chartered Bank | ||||
| SSBT | - State Street Bank and Trust | ||||
| Co., N.A. | |||||
56 | Annual Report
Mutual Quest Fund
Report of Independent Registered Public Accounting Firm
To the Board of Trustees of Franklin Mutual Series Funds and Shareholders of the Mutual Quest Fund:
We have audited the accompanying statement of assets and liabilities, including the statement of investments, of Mutual Quest Fund (the “Fund”) (one of the funds constituting Franklin Mutual Series Funds), as of December 31, 2013, and the related statement of operations for the year then ended, the statements of changes in net assets for each of the two years in the period then ended, and the financial highlights for each of the periods indicated therein. These financial statements and financial highlights are the responsibility of the Fund’s management. Our responsibility is to express an opinion on these financial statements and financial highlights based on our audits.
We conducted our audits in accordance with the standards of the Public Company Accounting Oversight Board (United States). Those standards require that we plan and perform the audit to obtain reasonable assurance about whether the financial statements and financial highlights are free of material misstatement. We were not engaged to perform an audit of the Fund’s internal control over financial reporting. Our audits included consideration of internal control over financial reporting as a basis for designing audit procedures that are appropriate in the circumstances, but not for the purpose of expressing an opinion on the effectiveness of the Fund’s internal control over financial reporting. Accordingly, we express no such opinion. An audit also includes examining, on a test basis, evidence supporting the amounts and disclosures in the financial statements and financial highlights, assessing the accounting principles used and significant estimates made by management, and evaluating the overall financial statement presentation. Our procedures included confirmation of securities owned as of December 31, 2013, by correspondence with the custodian and brokers, or by other appropriate auditing procedures where replies from the brokers were not received. We believe that our audits provide a reasonable basis for our opinion.
In our opinion, the financial statements and financial highlights referred to above present fairly, in all material respects, the financial position of Mutual Quest Fund (one of the funds constituting Franklin Mutual Series Funds) at December 31, 2013, the results of its operations for the year then ended, the changes in its net assets for each of the two years in the period then ended, and the financial highlights for each of the periods indicated therein, in conformity with U.S. generally accepted accounting principles.

Annual Report | 57
Mutual Quest Fund
Tax Information (unaudited)
Under Section 852(b)(3)(C) of the Internal Revenue Code (Code), the Fund hereby reports the maximum amount allowable but no less than $278,189,331 as a long term capital gain dividend for the fiscal year ended December 31, 2013.
Under Section 871(k)(2)(C) of the Code, the Fund hereby reports the maximum amount allowable but no less than $332,208,014 as a short term capital gain dividend for purposes of the tax imposed under Section 871(a)(1)(A) of the Code for the fiscal year ended December 31, 2013.
Under Section 854(b)(1)(A) of the Code, the Fund hereby reports 7.80% of the ordinary income dividends as income qualifying for the dividends received deduction for the fiscal year ended December 31, 2013.
Under Section 854(b)(1)(B) of the Code, the Fund hereby reports the maximum amount allowable but no less than $101,341,015 as qualified dividends for purposes of the maximum rate under Section 1(h)(11) of the Code for the fiscal year ended December 31, 2013. Distributions, including qualified dividend income, paid during calendar year 2013 will be reported to shareholders on Form 1099-DIV by mid-February 2014. Shareholders are advised to check with their tax advisors for information on the treatment of these amounts on their individual income tax returns.
Under Section 871(k)(1)(C) of the Code, the Fund hereby reports the maximum amount allowable but no less than $85,837,183 as interest related dividends for purposes of the tax imposed under Section 871(a)(1)(A) of the Code for the fiscal year ended December 31, 2013.
58 | Annual Report
Mutual Quest Fund
Board Members and Officers
The name, year of birth and address of the officers and board members, as well as their affiliations, positions held with the Fund, principal occupations during at least the past five years and number of portfolios overseen in the Franklin Templeton Investments fund complex are shown below. Generally, each board member serves until that person’s successor is elected and qualified.
| Independent Board Members | ||||
| Number of Portfolios in | ||||
| Name, Year of Birth | Length of | Fund Complex Overseen | Other Directorships Held | |
| and Address | Position | Time Served | by Board Member* | During at Least the Past 5 Years |
| Edward I. Altman, Ph.D. (1941) | Trustee | Since 1987 | 11 | None |
| c/o Franklin Mutual Advisers, LLC | ||||
| 101 John F. Kennedy Parkway | ||||
| Short Hills, NJ 07078-2789 | ||||
| Principal Occupation During at Least the Past 5 Years: | ||||
| Max L. Heine Professor of Finance and Director of The Credit and Debt Markets Research Program, Salomon Center, Stern School of | ||||
| Business, New York University; editor and author of numerous financial publications; financial consultant; an adviser to numerous financial | ||||
| publishing organizations; and formerly, Vice Director, Salomon Center, Stern School of Business, New York University. | ||||
| Ann Torre Bates (1958) | Trustee | Since 1995 | 38 | SLM Corporation (Sallie Mae), Ares |
| c/o Franklin Mutual Advisers, LLC | Capital Corporation (specialty finance | |||
| 101 John F. Kennedy Parkway | company), Allied Capital Corporation | |||
| Short Hills, NJ 07078-2789 | (financial services) (2003-2010) | |||
| and United Natural Foods, Inc., | ||||
| (October 2013). | ||||
| Principal Occupation During at Least the Past 5 Years: | ||||
| Director of various companies; and formerly, Executive Vice President and Chief Financial Officer, NHP Incorporated (manager of multifamily | ||||
| housing) (1995-1997); and Vice President and Treasurer, US Airways, Inc. (until 1995). | ||||
| Burton J. Greenwald (1929) | Trustee | Since 2002 | 18 | Franklin Templeton Emerging Markets |
| c/o Franklin Mutual Advisers, LLC | Debt Opportunities Fund PLC and | |||
| 101 John F. Kennedy Parkway | Fiduciary International Ireland | |||
| Short Hills, NJ 07078-2789 | Limited. | |||
| Principal Occupation During at Least the Past 5 Years: | ||||
| Managing Director, B.J. Greenwald Associates (management consultants to the financial services industry); and formerly, Chairman, | ||||
| Fiduciary Trust International Funds; Executive Vice President, L.F Rothschild Fund Management, Inc.; President and Director, Merit Mutual | ||||
| Funds; President, Underwriting Division and Director, National Securities & Research Corporation; Governor, Investment Company Institute; | ||||
| and Chairman, ICI Public Information Committee. | ||||
Annual Report | 59
| Number of Portfolios in | |||||
| Name, Year of Birth | Length of | Fund Complex Overseen | Other Directorships Held | ||
| and Address | Position | Time Served | by Board Member* | During at Least the Past 5 Years | |
| Keith E. Mitchell (1954) | Trustee | Since 2009 | 11 | None | |
| c/o Franklin Mutual Advisers, LLC | |||||
| 101 John F. Kennedy Parkway | |||||
| Short Hills, NJ 07078-2789 | |||||
| Principal Occupation During at Least the Past 5 Years: | |||||
| Managing Member, Mitchell, Hartley & Bechtel Advisers, LLC (formerly, Mitchell Advisers, LLC) (advisory firm); director of various boards of | |||||
| asset management firms; and formerly, Managing Director, Putnam Lovell NBF. | |||||
| Charles Rubens II (1930) | Trustee | Since 1998 | 18 | None | |
| c/o Franklin Mutual Advisers, LLC | |||||
| 101 John F. Kennedy Parkway | |||||
| Short Hills, NJ 07078-2789 | |||||
| Principal Occupation During at Least the Past 5 Years: | |||||
| Private investor and president of non-profit organizations; and formerly, an executive of Time, Inc.; and Trustee of Colorado College. | |||||
| Jan Hopkins Trachtman (1947) | Trustee | Since 2009 | 11 | None | |
| c/o Franklin Mutual Advisers, LLC | |||||
| 101 John F. Kennedy Parkway | |||||
| Short Hills, NJ 07078-2789 | |||||
| Principal Occupation During at Least the Past 5 Years: | |||||
| President and Founder, The Jan Hopkins Group (communications consulting firm); President, Economic Club of New York; serves on | |||||
| Advisory Board of Knight Bagehot Fellowship; and formerly, Anchor/Correspondent, CNN Financial News (until 2003); Managing Director | |||||
| and Head of Client Communications, Citigroup Private Bank (until 2005); Off-Air Reporter, ABC News’ World News Tonight; and Editor, CBS | |||||
| Network News. | |||||
| Robert E. Wade (1946) | Trustee and | Trustee since | 45 | El Oro Ltd (investments). | |
| c/o Franklin Mutual Advisers, LLC | Chairman of | 1993 and | |||
| 101 John F. Kennedy Parkway | the Board | Chairman of the | |||
| Short Hills, NJ 07078-2789 | Board since 2005 | ||||
| Principal Occupation During at Least the Past 5 Years: | |||||
| Attorney at law engaged in private practice (1972-2008) and member of various boards. | |||||
| Interested Board Members and Officers | |||||
| Number of Portfolios in | |||||
| Name, Year of Birth | Length of | Fund Complex Overseen | Other Directorships Held | ||
| and Address | Position | Time Served | by Board Member* | During at Least the Past 5 Years | |
| **Gregory E. Johnson (1961) | Trustee | Since 2007 | 152 | None | |
| One Franklin Parkway | |||||
| San Mateo, CA 94403-1906 | |||||
| Principal Occupation During at Least the Past 5 Years: | |||||
| Chairman of the Board, Member – Office of the Chairman, Director, President and Chief Executive Officer, Franklin Resources, Inc.; officer | |||||
| and/or director or trustee, as the case may be, of some of the other subsidiaries of Franklin Resources, Inc. and of 44 of the investment | |||||
| companies in Franklin Templeton Investments; and Chairman, Investment Company Institute. | |||||
60 | Annual Report
| Number of Portfolios in | |||||
| Name, Year of Birth | Length of | Fund Complex Overseen | Other Directorships Held | ||
| and Address | Position | Time Served | by Board Member* | During at Least the Past 5 Years | |
| **Peter A. Langerman (1955) | Trustee, | Trustee since | 11 | American International Group, Inc. | |
| c/o Franklin Mutual Advisers, LLC | President and | 2007, President | (AIG) Credit Facility Trust | ||
| 101 John F. Kennedy Parkway | Chief Executive | and Chief | (2010–2011 | ). | |
| Short Hills, NJ 07078-2702 | Officer – | Executive Officer – | |||
| Investment | Investment | ||||
| Management | Management | ||||
| since 2005 | |||||
| Principal Occupation During at Least the Past 5 Years: | |||||
| Chairman of the Board, Chief Executive Officer and President, Franklin Mutual Advisers, LLC; officer and/or director, as the case may be, of | |||||
| four of the investment companies in Franklin Templeton Investments. | |||||
| Alison E. Baur (1964) | Vice President | Since 2012 | Not Applicable | Not Applicable | |
| One Franklin Parkway | |||||
| San Mateo, CA 94403-1906 | |||||
| Principal Occupation During at Least the Past 5 Years: | |||||
| Deputy General Counsel, Franklin Templeton Investments; and officer of some of the other subsidiaries of Franklin Resources, Inc. and of 46 | |||||
| of the investment companies in Franklin Templeton Investments. | |||||
| Philippe Brugere-Trelat (1949) | Vice President | Since 2005 | Not Applicable | Not Applicable | |
| 101 John F. Kennedy Parkway | |||||
| Short Hills, NJ 07078-2789 | |||||
| Principal Occupation During at Least the Past 5 Years: | |||||
| Executive Vice President, Franklin Mutual Advisers, LLC; officer of three of the investment companies in Franklin Templeton Investments; | |||||
| and formerly, Portfolio Manager of Eurovest SA (French registered Investment Company, Sicav). | |||||
| Laura F. Fergerson (1962) | Chief Executive | Since 2009 | Not Applicable | Not Applicable | |
| One Franklin Parkway | Officer – | ||||
| San Mateo, CA 94403-1906 | Finance and | ||||
| Administration | |||||
| Principal Occupation During at Least the Past 5 Years: | |||||
| Senior Vice President, Franklin Templeton Services, LLC; and officer of 46 of the investment companies in Franklin Templeton Investments. | |||||
| Aliya S. Gordon (1973) | Vice President | Since 2009 | Not Applicable | Not Applicable | |
| One Franklin Parkway | |||||
| San Mateo, CA 94403-1906 | |||||
| Principal Occupation During at Least the Past 5 Years: | |||||
| Senior Associate General Counsel, Franklin Templeton Investments; officer of 46 of the investment companies in Franklin Templeton | |||||
| Investments; and formerly, Litigation Associate, Steefel, Levitt & Weiss, LLP (2000-2004). | |||||
| Steven J. Gray (1955) | Secretary and | Secretary since | Not Applicable | Not Applicable | |
| One Franklin Parkway | Vice President | 2005 and Vice | |||
| San Mateo, CA 94403-1906 | President since | ||||
| 2009 | |||||
| Principal Occupation During at Least the Past 5 Years: | |||||
| Senior Associate General Counsel, Franklin Templeton Investments; Vice President, Franklin Templeton Distributors, Inc.; and officer of 46 of | |||||
| the investment companies in Franklin Templeton Investments. | |||||
Annual Report | 61
| Number of Portfolios in | ||||
| Name, Year of Birth | Length of | Fund Complex Overseen | Other Directorships Held | |
| and Address | Position | Time Served | by Board Member* | During at Least the Past 5 Years |
| Selena L. Holmes (1965) | Vice President | Since 2012 | Not Applicable | Not Applicable |
| 100 Fountain Parkway | – AML | |||
| St. Petersburg, FL 33716-1205 | Compliance | |||
Principal Occupation During at Least the Past 5 Years:
Director, Global Compliance Monitoring; and officer of 46 of the investment companies in Franklin Templeton Investments.
| Robert Kubilis (1973) | Treasurer, | Since 2012 | Not Applicable | Not Applicable |
| 300 S.E. 2nd Street | Chief Financial | |||
| Fort Lauderdale, FL 33301-1923 | Officer and | |||
| Chief | ||||
| Accounting | ||||
| Officer |
Principal Occupation During at Least the Past 5 Years:
Assistant Treasurer, Fund Accounting, Franklin Templeton Investments; and officer of five of the investment companies in Franklin Templeton Investments.
| Kimberly H. Novotny (1972) | Vice President | Since March 2013 | Not Applicable | Not Applicable |
| 300 S.E. 2nd Street | ||||
| Fort Lauderdale, FL 33301-1923 |
Principal Occupation During at Least the Past 5 Years:
Associate General Counsel, Franklin Templeton Investments; Vice President and Secretary, Fiduciary Trust International of the South; Vice President, Templeton Investment Counsel, LLC; Assistant Secretary, Franklin Resources, Inc.; and officer of 46 of the investment companies in Franklin Templeton Investments.
| Robert C. Rosselot (1960) | Chief | Since March 2013 | Not Applicable | Not Applicable |
| 300 S.E. 2nd Street | Compliance | |||
| Fort Lauderdale, FL 33301-1923 | Officer |
Principal Occupation During at Least the Past 5 Years:
Director, Global Compliance, Franklin Templeton Investments; officer of 46 of the investment companies in Franklin Templeton Investments; and formerly, Senior Associate General Counsel, Franklin Templeton Investments (2007-2013); and Secretary and Vice President, Templeton Group of Funds (2004-2013).
| Karen L. Skidmore (1952) | Vice President | Since 2009 | Not Applicable | Not Applicable |
| One Franklin Parkway | ||||
| San Mateo, CA 94403-1906 |
Principal Occupation During at Least the Past 5 Years:
Senior Associate General Counsel, Franklin Templeton Investments; and officer of 46 of the investment companies in Franklin Templeton Investments.
| Craig S. Tyle (1960) | Vice President | Since 2005 | Not Applicable | Not Applicable |
| One Franklin Parkway | ||||
| San Mateo, CA 94403-1906 |
Principal Occupation During at Least the Past 5 Years:
General Counsel and Executive Vice President, Franklin Resources, Inc.; and officer of some of the other subsidiaries of Franklin Resources, Inc. and of 46 of the investment companies in Franklin Templeton Investments.
62 | Annual Report
| Number of Portfolios in | ||||
| Name, Year of Birth | Length of | Fund Complex Overseen | Other Directorships Held | |
| and Address | Position | Time Served | by Board Member* | During at Least the Past 5 Years |
| Lori A. Weber (1964) | Vice President | Since 2011 | Not Applicable | Not Applicable |
| 300 S.E. 2nd Street | ||||
| Fort Lauderdale, FL 33301-1923 |
Principal Occupation During at Least the Past 5 Years:
Senior Associate General Counsel, Franklin Templeton Investments; Assistant Secretary, Franklin Resources, Inc.; Vice President and Secretary, Templeton Investment Counsel, LLC; Vice President, Fiduciary Trust International of the South; and officer of 46 of the investment companies in Franklin Templeton Investments.
*We base the number of portfolios on each separate series of the U.S. registered investment companies within the Franklin Templeton Investments fund complex. These portfolios have a common investment manager or affiliated investment managers.
**Gregory E. Johnson is considered to be an interested person of the Fund under the federal securities laws due to his position as an officer and director of Franklin Resources, Inc., which is the parent company of the Fund’s investment manager and distributor. Peter A. Langerman is considered to be an interested person of the Fund under the federal securities laws due to his position as an officer of Franklin Mutual Advisers, LLC, which is an affiliate of the Fund’s investment manager.
Note 1: Officer information is current as of the date of this report. It is possible that after this date, information about officers may change.
The Fund’s Board has determined that certain of the members of the Audit Committee, including Ann Torre Bates, are audit committee financial experts, and “independent,” under those provisions of the Sarbanes-Oxley Act of 2002, and the rules and form amendments adopted by the Securities and Exchange Commission, relating to audit committee financial experts.
The Statement of Additional Information (SAI) includes additional information about the board members and is available, without charge, upon request. Shareholders may call (800) DIAL BEN/342-5236 to request the SAI.
Annual Report | 63
Mutual Quest Fund
Shareholder Information
Proxy Voting Policies and Procedures
The Fund’s investment manager has established Proxy Voting Policies and Procedures (Policies) that the Fund uses to determine how to vote proxies relating to portfolio securities. Shareholders may view the Fund’s complete Policies online at franklintempleton.com. Alternatively, shareholders may request copies of the Policies free of charge by calling the Proxy Group collect at (954) 527-7678 or by sending a written request to: Franklin Templeton Companies, LLC, 300 S.E. 2nd Street, Fort Lauderdale, FL 33301, Attention: Proxy Group. Copies of the Fund’s proxy voting records are also made available online at franklintempleton.com and posted on the U.S. Securities and Exchange Commission’s website at sec.gov and reflect the most recent 12-month period ended June 30.
Quarterly Statement of Investments
The Fund files a complete statement of investments with the U.S. Securities and Exchange Commission for the first and third quarters for each fiscal year on Form N-Q. Shareholders may view the filed Form N-Q by visiting the Commission’s website at sec.gov. The filed form may also be viewed and copied at the Commission’s Public Reference Room in Washington, DC. Information regarding the operations of the Public Reference Room may be obtained by calling (800) SEC-0330.
Householding of Reports and Prospectuses
You will receive the Fund’s financial reports every six months as well as an annual updated summary prospectus (prospectus available upon request). To reduce Fund expenses, we try to identify related shareholders in a household and send only one copy of the financial reports and summary prospectus. This process, called “householding,” will continue indefinitely unless you instruct us otherwise. If you prefer not to have these documents householded, please call us at (800) 632-2301. At any time you may view current prospectuses/summary prospectuses and financial reports on our website. If you choose, you may receive these documents through electronic delivery.
64 | Annual Report
| Contents | |||||||
| Shareholder Letter | 1 | Annual Report | Financial Statements | 34 | Board Members and Officers | 58 | |
| Mutual Shares Fund | 6 | Notes to Financial Statements | 38 | Shareholder Information | 63 | ||
| Performance Summary | 13 | Report of Independent | |||||
| Registered Public | |||||||
| Your Fund’s Expenses | 18 | ||||||
| Accounting Firm | 56 | ||||||
| Financial Highlights and | |||||||
| Tax Information | 57 | ||||||
| Statement of Investments | 20 | ||||||
Annual Report
Mutual Shares Fund
Your Fund’s Goals and Main Investments: Mutual Shares Fund seeks capital appreciation, with income as a secondary goal, by investing primarily in equity securities of companies the Fund’s managers believe are at prices below their intrinsic value. The Fund may invest up to 35% of its assets in foreign securities.
| Performance data represent past |
| performance, which does not |
| guarantee future results. |
| Investment return and principal |
| value will fluctuate, and you may |
| have a gain or loss when you sell |
| your shares. Current performance |
| may differ from figures shown. |
| Please visit franklintempleton.com |
| or call (800) 342-5236 for most |
| recent month-end performance. |
This annual report for Mutual Shares Fund covers the fiscal year ended December 31, 2013.
Performance Overview
Mutual Shares Fund – Class Z delivered a +28.10% cumulative total return for the 12 months ended December 31, 2013. For comparison, the Fund’s benchmark, the Standard & Poor’s 500 Index (S&P 500), which is a broad measure of U.S. stock performance, generated a +32.39% total return.1 You can find more of the Fund’s performance data in the Performance Summary beginning on page 13.
Economic and Market Overview
The 12 months under review were characterized by reinvigorated policy support and an economic recovery in developed markets. However, differences in global economic trends corresponded with increasingly divergent monetary policies, and growth in emerging market economies tended to slow. The central banks of key developed markets generally reaffirmed their accommodative monetary stances while some emerging market counterparts tightened policy rates as they sought to control inflation and currency depreciation.
In the U.S., economic growth and employment trends generally exceeded expectations, underpinned by consumer and business spending and rising inventories. Historically low mortgage rates and improving sentiment aided
1. Source: © 2014 Morningstar. All Rights Reserved. The information contained herein: (1) is proprietary to Morningstar and/or its content providers; (2) may not be copied or distributed; and (3) is not warranted to be accurate, complete or timely. Neither Morningstar nor its content providers are responsible for any damages or losses arising from any use of this information. The index is unmanaged and includes reinvested dividends. One cannot invest directly in an index, and an index is not representative of the Fund’s portfolio.
The dollar value, number of shares or principal amount, and names of all portfolio holdings are listed in the Fund’s Statement of Investments (SOI). The SOI begins on page 25.
6 | Annual Report
the housing market recovery, evidenced by increased new and existing home sales, rising home prices, low inventories and multi-year lows in new foreclosures. The U.S. Federal Reserve Board (Fed) expanded its asset purchase program to $85 billion per month from $40 billion early in the year. After encouraging economic and employment reports, the Fed announced in December it would reduce its monthly bond purchases by $10 billion beginning in January 2014; however, the Fed committed to keeping interest rates low. In October, the federal government temporarily shut down after Congress failed to authorize routine federal funding amid a disagreement over a new health care law. However, Congress subsequently agreed to fund the government through early 2014 and later passed a two-year budget deal that could ease automatic spending cuts and lower the risk of another shutdown.
Outside the U.S., the eurozone emerged from its longest recession on record during 2013’s second half and Japan’s growth moderated. The European Central Bank reduced its key interest rate to a record low and pledged to maintain systemic support following political turmoil in Greece, Spain, Portugal and Italy. Germany’s re-election of Chancellor Angela Merkel was largely perceived as a vote of support for ongoing eurozone reform measures. In Asia, the Bank of Japan set an explicit inflation target and pledged to double bond purchases in an unprecedented wave of policy reform. The U.S. dollar fell versus the euro but rose versus the Japanese yen in 2013.
Growth in many emerging markets moderated based on lower domestic demand, falling exports and weakening commodity prices. Political turmoil in certain emerging markets, the Fed’s potential tapering of its asset purchase program and the Chinese central bank’s effort to tighten liquidity to curb real estate and credit speculation led to a sell-off in emerging market equities and a sharp depreciation in regional currencies against the U.S. dollar. Central banks in Brazil, India and Indonesia raised interest rates in the second half of 2013 as they sought to curb inflation.
The stock market rally in developed markets accelerated during 2013 amid ongoing central bank commitments, continued corporate earnings strength and increasing signs of economic progress. Emerging market stocks rebounded toward period-end, although Latin American stocks trailed their emerging market peers. Oil prices rallied in the third quarter and rose for the year mainly owing to supply concerns related to geopolitical turmoil, but gold posted its largest annual price decline in more than three decades. Increasingly divergent economic and political circumstances during the period resulted in declining market correlations across regions and between asset classes, which many bottom-up investors perceived as more favorable.
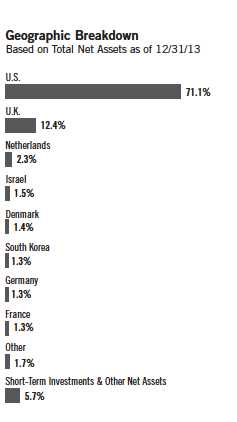
Annual Report | 7
| What is meant by “hedge”? |
| To hedge a position is to seek to |
| reduce the risk of adverse price |
| movements in an asset. Normally, |
| a hedge is implemented as an |
| offsetting position in a related security, |
| such as a currency forward contract. |
| What is a currency forward |
| contract? |
| A currency forward contract, also |
| called a “currency forward,” is an |
| agreement between the Fund and a |
| counterparty to buy or sell a foreign |
| currency at a specific exchange rate |
| on a future date. |
Investment Strategy
At Mutual Series, we are committed to our distinctive value approach to investing, which we believe can generate above-average risk-adjusted returns over time for our shareholders. Our major investment strategy is investing in undervalued stocks. When selecting undervalued equities, we are always attracted to fundamentally strong companies with healthy balance sheets, high-quality assets, substantial free cash flow and shareholder-oriented management teams and whose stocks are trading at discounts to our assessment of the companies’ intrinsic or business value. We also look for asset-rich companies whose shares may be trading at depressed levels due to concerns over short-term earnings disappointments, litigation, management strategy or other perceived negatives. This strict value approach is not only intended to improve the likelihood of upside potential, but it is also intended to reduce the risk of substantial declines. While the vast majority of our undervalued equity investments are made in publicly traded companies globally, we may invest occasionally in privately held companies as well.
We complement this more traditional investment strategy with two others. One is distressed investing, a highly specialized field that has proven quite profitable during certain periods over the years. Distressed investing is complex and can take many forms. The most common distressed investment the Fund undertakes is the purchase of financially troubled or bankrupt companies’ debt at a substantial discount to face value. After the financially distressed company is reorganized, often in bankruptcy court, the old debt is typically replaced with new securities issued by the financially stronger company.
The other piece of our investment strategy is participating in arbitrage situations, another highly specialized field. When companies announce proposed mergers or takeovers, commonly referred to as “deals,” the target company may trade at a discount to the bid it ultimately accepts. One form of arbitrage involves purchasing the target company’s stock when it is trading below the value we believe it would receive in a deal. In keeping with our commitment to a relatively conservative investment approach, we typically focus our arbitrage efforts on announced deals, and eschew rumored deals or other situations we consider relatively risky.
In addition, it is our practice to hedge the Fund’s currency exposure when we deem it advantageous for our shareholders.
8 | Annual Report
Manager’s Discussion
In an environment of generally rising equity prices, many Fund holdings increased in value during the 12-month period. Three of the top contributors were U.K.-based mobile telephony operator Vodafone Group, software firm Microsoft and managed health care services company Cigna.
Vodafone Group is a global mobile telecommunications company that provides a range of services, including voice and data communications. The company’s stock rallied in the second half of the year, driven largely by the long-anticipated sale of its 45% stake in Verizon Wireless to Verizon Communications at what we considered to be an attractive price. Vodafone said it planned to return two-thirds of the capital from the sale to shareholders and use the balance to invest in growth initiatives in its core markets and to reduce debt. Following the deal, we continued to view Vodafone as a potentially compelling stock, given that the economic environment in Europe has shown signs of stabilizing, the regulatory environment is easing and we believe the company may be close to monetizing its investments in data services.
Shares of global software firm Microsoft benefited from improved investor sentiment. In the first half of 2013, the company reported earnings that modestly beat expectations, generally reassuring the market of its status as a stable business with a reasonable future. The stock also rallied following chief executive officer (CEO) Steve Ballmer’s announcement that he would retire in 2014. At period-end, we remained optimistic about the company’s plans to shift toward a subscription model for its business software such as the Office suite. In our view, if implemented broadly, such a move may have the potential to generate greater revenues and higher profits.
Shares of Cigna also benefited from improved investor sentiment early in the period following the company’s divestiture of its legacy run-off insurance business. Partially as a result of the divestiture, three major independent credit rating agencies issued positive outlooks for the company’s debt. Additionally, operational performance also improved as Cigna reported strong results in its core businesses. In October, Cigna increased its outlook for fiscal year 2013 consolidated adjusted income from operations. In our assessment, the outlook was among the more favorable in the managed care industry, owing to the company’s low exposure to potentially negative elements of upcoming health care reforms.
Top 10 Sectors/Industries
Based on Equity Securities as of 12/31/13
| % of Total | ||
| Net Assets | ||
| Insurance | 9.3 | % |
| Oil, Gas & Consumable Fuels | 8.9 | % |
| Media | 6.6 | % |
| Commercial Banks | 5.5 | % |
| Pharmaceuticals | 5.3 | % |
| Tobacco | 5.0 | % |
| Food & Staples Retailing | 4.9 | % |
| Diversified Financial Services | 3.9 | % |
| Software | 3.8 | % |
| Computers & Peripherals | 3.2 | % |
Annual Report | 9
| Top 10 Equity Holdings | |||
| 12/31/13 | |||
| Company | % of Total | ||
| Sector/Industry, Country | Net Assets | ||
| Merck & Co. Inc. | 2.8 | % | |
| Pharmaceuticals, U.S. | |||
| Microsoft Corp. | 2.5 | % | |
| Software, U.S. | |||
| White Mountains Insurance Group Ltd. | 2.4 | % | |
| Insurance, U.S. | |||
| Vodafone Group PLC | 2.3 | % | |
| Wireless Telecommunication Services, | |||
| U.K. | |||
| Apple Inc. | 2.3 | % | |
| Computers & Peripherals, U.S. | |||
| American International Group Inc. | 2.1 | % | |
| Insurance, U.S. | |||
| Medtronic Inc. | 1.9 | % | |
| Health Care Equipment & Supplies, U.S. | |||
| Cigna Corp. | 1.9 | % | |
| Health Care Providers & Services, U.S. | |||
| Twenty-First Century Fox Inc., B | 1.8 | % | |
| Media, U.S. | |||
| PNC Financial Services Group Inc. | 1.7 | % | |
| Commercial Banks, U.S. | |||
| What is a futures contract? |
| A futures contract, also called a |
| “future,” is an agreement between |
| the Fund and a counterparty made |
| through a U.S. or foreign futures |
| exchange to buy or sell an asset at |
| a specific price on a future date. |
During the period under review, some of the Fund’s investments negatively affected performance. These included Brazilian integrated energy firm Petroleo Brasileiro (Petrobras), U.K.-based metals and mining company Anglo American and Netherlands-incorporated heavy equipment manufacturer CNH Industrial.
Although Petrobras possesses several exploration and production assets we feel are highly attractive, its refining and marketing (downstream) operations hurt results during the year and led the stock to decline. The Brazilian government regulates domestic fuel prices, and its reluctance to increase them continued to result in significant losses in Petrobras’s downstream business. Although the government did allow some modest price increases, recent protests against bus fare hikes, particularly in light of sluggish economic growth and a weakening Brazilian real, contributed to political pressure limiting the company’s ability to bring domestic prices in line with global prices.
The share price of Anglo American was negatively affected by declining prices for several of the commodities it produces. Uncertainty surrounding possible restructuring actions also weighed on the stock price. In January, the company appointed a new CEO, who was tasked with a mandate to improve operations and capital discipline. Despite the price decline during the year, at period-end, we maintained a favorable outlook for the stock as the new management team remained focused on improving operational performance and returns with the aim of increasing shareholder value.
CNH Industrial was formed from the integration of Fiat Industrial and CNH Global. Late in the year, the manufacturer of heavy machinery reported quarterly earnings that missed consensus estimates. Although operating performance improved in the company’s agricultural segment, declining agricultural commodity prices contributed to an unenthusiastic market outlook for agricultural equipment makers and weighed on the stock price. At period-end, our investment thesis remained intact and we believed CNH Industrial was one of Europe’s more attractively priced capital goods stocks, given upside potential from the restructuring of its European truck business, lower financial expenses and a lower tax rate following the company’s recent reorganization.
During the year, the Fund held currency forwards and futures to hedge a portion of the currency risk of the portfolio’s non-U.S. dollar investments. The hedges had a minor negative impact on the Fund’s performance during the period.
10 | Annual Report
Thank you for your participation in Mutual Shares Fund. We look forward to continuing to serve your investment needs.


F. David Segal, CFA
Co-Portfolio Manager

Debbie A. Turner, CFA
Assistant Portfolio Manager
Mutual Shares Fund
CFA® is a trademark owned by CFA Institute.
The foregoing information reflects our analysis, opinions and portfolio holdings as of December 31, 2013, the end of the reporting period. The way we implement our main investment strategies and the resulting portfolio holdings may change depending on factors such as market and economic conditions. These opinions may not be relied upon as investment advice or an offer for a particular security. The information is not a complete analysis of every aspect of any market, country, industry, security or the Fund. Statements of fact are from sources considered reliable, but the investment manager makes no representation or warranty as to their completeness or accuracy. Although historical performance is no guarantee of future results, these insights may help you understand our investment management philosophy.
Annual Report | 11
| Peter Langerman has been portfolio manager for Mutual Shares Fund since 2005. He has |
| been co-portfolio manager of Mutual Global Discovery Fund since 2009. He joined Franklin |
| Templeton Investments in 1996, serving in various capacities, including President and |
| Chief Executive Officer of Franklin Mutual Advisers and member of the management team of |
| the Funds, including Mutual Shares Fund. From 2002 to 2005, he served as director of |
| New Jersey’s Division of Investment, overseeing employee pension funds. Between 1986 |
| and 1996, Mr. Langerman was employed at Heine Securities Corporation, the Fund’s |
| former manager. |
| F. David Segal has been portfolio manager for Mutual Shares Fund since 2005. He joined |
| Franklin Templeton Investments in 2002. Previously, he was an analyst in the Structured |
| Finance Group of MetLife for the period 1999 to 2002. |
| Debbie Turner has been assistant portfolio manager for Mutual Shares Fund since 2001. She |
| joined Franklin Templeton Investments in 1996. Between 1993 and 1996, Ms. Turner was |
| employed at Heine Securities Corporation, the Fund’s former manager. |
12 | Annual Report
Performance Summary as of 12/31/13
Your dividend income will vary depending on dividends or interest paid by securities in the Fund’s portfolio, adjusted for operating expenses of each class. Capital gain distributions are net profits realized from the sale of portfolio securities. The performance table and graphs do not reflect any taxes that a shareholder would pay on Fund dividends, capital gain distributions, if any, or any realized gains on the sale of Fund shares. Total return reflects reinvestment of the Fund’s dividends and capital gain distributions, if any, and any unrealized gains or losses.
| Price and Distribution Information | ||||||||
| Class Z (Symbol: MUTHX) | Change | 12/31/13 | 12/31/12 | |||||
| Net Asset Value (NAV) | +$ | 5.86 | $ | 28.34 | $ | 22.48 | ||
| Distributions (1/1/13–12/31/13) | ||||||||
| Dividend Income | $ | 0.4413 | ||||||
| Class A (Symbol: TESIX) | Change | 12/31/13 | 12/31/12 | |||||
| Net Asset Value (NAV) | +$ | 5.80 | $ | 28.12 | $ | 22.32 | ||
| Distributions (1/1/13–12/31/13) | ||||||||
| Dividend Income | $ | 0.3649 | ||||||
| Class C (Symbol: TEMTX) | Change | 12/31/13 | 12/31/12 | |||||
| Net Asset Value (NAV) | +$ | 5.75 | $ | 27.88 | $ | 22.13 | ||
| Distributions (1/1/13–12/31/13) | ||||||||
| Dividend Income | $ | 0.1845 | ||||||
| Class R (Symbol: TESRX) | Change | 12/31/13 | 12/31/12 | |||||
| Net Asset Value (NAV) | +$ | 5.78 | $ | 27.98 | $ | 22.20 | ||
| Distributions (1/1/13–12/31/13) | ||||||||
| Dividend Income | $ | 0.2941 | ||||||
| Class R6 (Symbol: FMSHX) | Change | 12/31/13 | 5/1/13 | |||||
| Net Asset Value (NAV) | +$ | 3.42 | $ | 28.33 | $ | 24.91 | ||
| Distributions (5/1/13–12/31/13) | ||||||||
| Dividend Income | $ | 0.4746 | ||||||
Annual Report | 13
Performance Summary (continued)
Performance
Cumulative total return excludes sales charges. Aggregate and average annual total returns and value of $10,000 investment include maximum sales charges. Class Z/R/R6: no sales charges; Class A: 5.75% maximum initial sales charge; Class C: 1% contingent deferred sales charge in first year only.
| Class Z | 1-Year | 5-Year | 10-Year | ||||||||
| Cumulative Total Return1 | + | 28.10 | % | + | 108.15 | % | + | 98.63 | % | ||
| Average Annual Total Return2 | + | 28.10 | % | + | 15.79 | % | + | 7.10 | % | ||
| Value of $10,000 Investment3 | $ | 12,810 | $ | 20,815 | $ | 19,863 | |||||
| Total Annual Operating Expenses4 | 0.82 | % | |||||||||
| Class A | 1-Year | 5-Year | 10-Year | ||||||||
| Cumulative Total Return1 | + | 27.74 | % | + | 105.04 | % | + | 92.46 | % | ||
| Average Annual Total Return2 | + | 20.40 | % | + | 14.08 | % | + | 6.14 | % | ||
| Value of $10,000 Investment3 | $ | 12,040 | $ | 19,324 | $ | 18,143 | |||||
| Total Annual Operating Expenses4 | 1.12 | % | |||||||||
| Class C | 1-Year | 5-Year | 10-Year | ||||||||
| Cumulative Total Return1 | + | 26.82 | % | + | 97.98 | % | + | 79.79 | % | ||
| Average Annual Total Return2 | + | 25.82 | % | + | 14.64 | % | + | 6.04 | % | ||
| Value of $10,000 Investment3 | $ | 12,582 | $ | 19,798 | $ | 17,979 | |||||
| Total Annual Operating Expenses4 | 1.82 | % | |||||||||
| Class R | 1-Year | 5-Year | 10-Year | ||||||||
| Cumulative Total Return1 | + | 27.47 | % | + | 102.93 | % | + | 88.97 | % | ||
| Average Annual Total Return2 | + | 27.47 | % | + | 15.20 | % | + | 6.57 | % | ||
| Value of $10,000 Investment3 | $ | 12,747 | $ | 20,293 | $ | 18,897 | |||||
| Total Annual Operating Expenses4 | 1.32 | % | |||||||||
| Class R6 | Inception (5/1/13) | ||||||||||
| Cumulative Total Return1 | + | 15.70 | % | ||||||||
| Aggregate Total Return5 | + | 15.70 | % | ||||||||
| Value of $10,000 Investment3 | $ | 11,570 | |||||||||
| Total Annual Operating Expenses4 | 0.68 | % |
Performance data represent past performance, which does not guarantee future results. Investment return and principal value will fluctuate, and you may have a gain or loss when you sell your shares. Current performance may differ from figures shown. For most recent month-end performance, go to franklintempleton.com or call (800) 342-5236.
14 | Annual Report
Performance Summary (continued)
Total Return Index Comparison for a Hypothetical $10,000 Investment
Total return represents the change in value of an investment over the periods shown. It includes any applicable maximum sales charge, Fund expenses, account fees and reinvested distributions. The unmanaged index includes reinvestment of any income or distributions. It differs from the Fund in composition and does not pay management fees or expenses. One cannot invest directly in an index.

| 1/04 | 12/05 | 12/07 | 12/09 | 12/11 | 12/13 |
| Mutual Shares Fund | S&P 500 6 | ||||
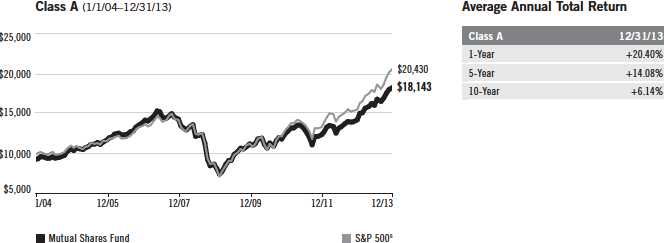
Annual Report | 15
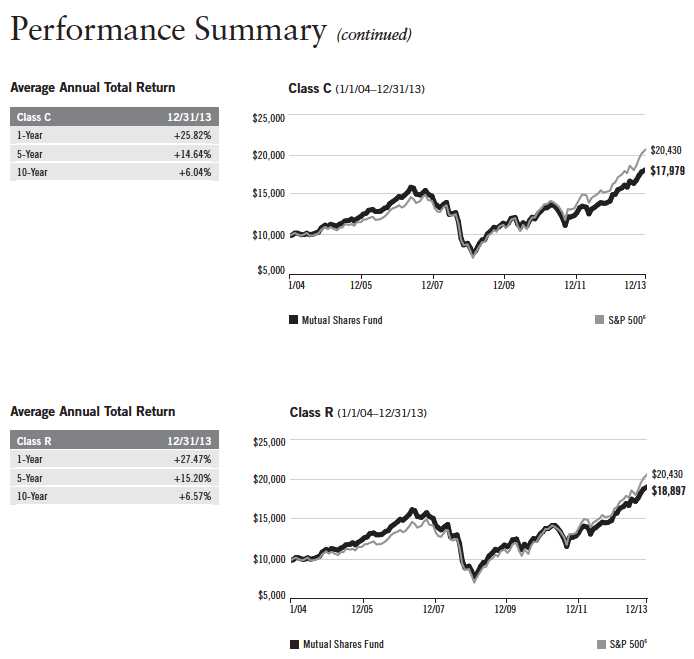
16 | Annual Report
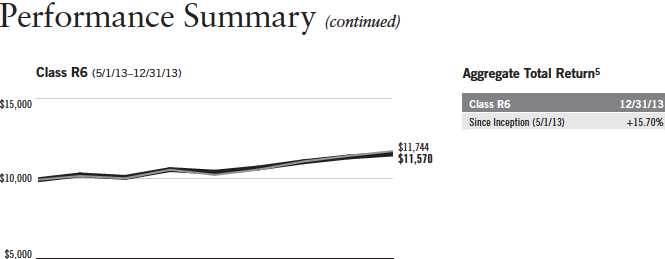
| 5/13 | 12/13 |
| Mutual Shares Fund | S&P 500 6 |
Endnotes
All investments involve risks, including possible loss of principal. Value securities may not increase in price as anticipated or may decline further in value. The Fund’s investments in foreign securities involve special risks including currency fluctuations, and economic and political uncertainties. The Fund may also invest in companies engaged in mergers, reorganizations or liquidations, which involve special risks as pending deals may not be completed on time or on favorable terms, as well as lower rated bonds, which entail higher credit risk. The Fund is actively managed but there is no guarantee that the manager’s investment decisions will produce the desired results. The Fund’s prospectus also includes a description of the main investment risks.
Class Z: Class C: Class R: | Shares are available to certain eligible investors as described in the prospectus. These shares have higher annual fees and expenses than Class A shares. Shares are available to certain eligible investors as described in the prospectus. These shares have higher annual fees and expenses than Class A shares. |
Class R6: | Shares are available to certain eligible investors as described in the prospectus. |
1. Cumulative total return represents the change in value of an investment over the periods indicated.
2. Average annual total return represents the average annual change in value of an investment over the periods indicated.
3. These figures represent the value of a hypothetical $10,000 investment in the Fund over the periods indicated.
4. Figures are as stated in the Fund’s current prospectus. In periods of market volatility, assets may decline significantly, causing total annual Fund operating expenses to become higher than the figures shown.
5. Aggregate total return represents the change in value of an investment for the period indicated. Since Class R6 shares have existed for less than one year, average annual total return is not available.
6. Source: © 2014 Morningstar. The S&P 500 is a market capitalization-weighted index of 500 stocks designed to measure total U.S. equity market performance.
Annual Report | 17
Your Fund’s Expenses
As a Fund shareholder, you can incur two types of costs:
- Transaction costs, including sales charges (loads) on Fund purchases; and
- Ongoing Fund costs, including management fees, distribution and service (12b-1) fees, and other Fund expenses. All mutual funds have ongoing costs, sometimes referred to as operating expenses.
The following table shows ongoing costs of investing in the Fund and can help you understand these costs and compare them with those of other mutual funds. The table assumes a $1,000 investment held for the six months indicated.
Actual Fund Expenses
The first line (Actual) for each share class listed in the table provides actual account values and expenses. The “Ending Account Value” is derived from the Fund’s actual return, which includes the effect of Fund expenses.
You can estimate the expenses you paid during the period by following these steps. Of course, your account value and expenses will differ from those in this illustration:
1. Divide your account value by $1,000.
If an account had an $8,600 value, then $8,600 ÷ $1,000 = 8.6.
| 2. | Multiply the result by the number under the heading “Expenses Paid During Period.” |
| If Expenses Paid During Period were $7.50, then 8.6 x $7.50 = $64.50. |
In this illustration, the estimated expenses paid this period are $64.50.
Hypothetical Example for Comparison with Other Funds
Information in the second line (Hypothetical) for each class in the table can help you compare ongoing costs of investing in the Fund with those of other mutual funds. This information may not be used to estimate the actual ending account balance or expenses you paid during the period. The hypothetical “Ending Account Value” is based on the actual expense ratio for each class and an assumed 5% annual rate of return before expenses, which does not represent the Fund’s actual return. The figure under the heading “Expenses Paid During Period” shows the hypothetical expenses your account would have incurred under this scenario. You can compare this figure with the 5% hypothetical examples that appear in shareholder reports of other funds.
18 | Annual Report
Your Fund’s Expenses (continued)
Please note that expenses shown in the table are meant to highlight ongoing costs and do not reflect any transaction costs, such as sales charges. Therefore, the second line for each class is useful in comparing ongoing costs only, and will not help you compare total costs of owning different funds. In addition, if transaction costs were included, your total costs would have been higher. Please refer to the Fund prospectus for additional information on operating expenses.
| Beginning Account | Ending Account | Expenses Paid During | ||||
| Class Z | Value 7/1/13 | Value 12/31/13 | Period* 7/1/13–12/31/13 | |||
| Actual | $ | 1,000 | $ | 1,138.70 | $ | 4.26 |
| Hypothetical (5% return before expenses) | $ | 1,000 | $ | 1,021.22 | $ | 4.02 |
| Class A | ||||||
| Actual | $ | 1,000 | $ | 1,136.80 | $ | 5.87 |
| Hypothetical (5% return before expenses) | $ | 1,000 | $ | 1,019.71 | $ | 5.55 |
| Class C | ||||||
| Actual | $ | 1,000 | $ | 1,133.00 | $ | 9.62 |
| Hypothetical (5% return before expenses) | $ | 1,000 | $ | 1,016.18 | $ | 9.10 |
| Class R | ||||||
| Actual | $ | 1,000 | $ | 1,135.60 | $ | 6.94 |
| Hypothetical (5% return before expenses) | $ | 1,000 | $ | 1,018.70 | $ | 6.56 |
| Class R6 | ||||||
| Actual | $ | 1,000 | $ | 1,139.60 | $ | 3.56 |
| Hypothetical (5% return before expenses) | $ | 1,000 | $ | 1,021.88 | $ | 3.36 |
*Expenses are calculated using the most recent expense ratio, annualized for each class (Z: 0.79%; A: 1.09%; C: 1.79%; R: 1.29%; and R6: 0.66%) multiplied by the average account value over the period, multiplied by 184/365 to reflect the one-half year period.
Annual Report | 19
| Mutual Shares Fund | |||||||||||||||
| Financial Highlights | |||||||||||||||
| Year Ended December 31, | |||||||||||||||
| Class Z | 2013 | 2012 | 2011 | 2010 | 2009 | ||||||||||
| Per share operating performance | |||||||||||||||
| (for a share outstanding throughout the year) | |||||||||||||||
| Net asset value, beginning of year | $ | 22.48 | $ | 19.96 | $ | 20.80 | $ | 19.19 | $ | 15.32 | |||||
| Income from investment operationsa: | |||||||||||||||
| Net investment incomeb | 0.47 | 0.39 | 0.47 | c | 0.56 | d | 0.24 | e | |||||||
| Net realized and unrealized gains (losses) | 5.83 | 2.62 | (0.80 | ) | 1.68 | 4.06 | |||||||||
| Total from investment operations | 6.30 | 3.01 | (0.33 | ) | 2.24 | 4.30 | |||||||||
| Less distributions from net investment income | (0.44 | ) | (0.49 | ) | (0.51 | ) | (0.63 | ) | (0.43 | ) | |||||
| Net asset value, end of year | $ | 28.34 | $ | 22.48 | $ | 19.96 | $ | 20.80 | $ | 19.19 | |||||
| Total return | 28.10 | % | 15.14 | % | (1.50 | )% | 11.75 | % | 28.20 | % | |||||
| Ratios to average net assets | |||||||||||||||
| Expenses before waiver and payments by affiliatesf | 0.79 | %g | 0.82 | % | 0.86 | % | 0.85 | % | 0.90 | %g | |||||
| Expenses net of waiver and payments by affiliatesf | 0.79 | %g | 0.82 | % | 0.86 | % | 0.85 | %h | 0.88 | %g | |||||
| Expenses incurred in connection with securities | |||||||||||||||
| sold short | —%i | —%i | —%i | 0.02 | % | 0.05 | % | ||||||||
| Net investment income | 1.85 | % | 1.82 | % | 2.24 | %c | 2.83 | %d | 1.48 | %e | |||||
| Supplemental data | |||||||||||||||
| Net assets, end of year (000’s) | $ | 7,025,908 | $ | 7,575,308 | $ | 7,540,502 | $ | 8,635,954 | $ | 8,472,347 | |||||
| Portfolio turnover rate | 24.29 | % | 21.57 | % | 29.44 | % | 28.25 | % | 47.87 | % | |||||
aThe amount shown for a share outstanding throughout the period may not correlate with the Statement of Operations for the period due to the timing of sales and repurchases of
the Fund shares in relation to income earned and/or fluctuating market value of the investments of the Fund.
bBased on average daily shares outstanding.
cNet investment income per share includes approximately $0.08 per share related to interest income received that had previously been deemed uncollectible. Excluding this amount,
the ratio of net investment income to average net assets would have been 1.87%.
dNet investment income per share includes approximately $0.21 per share received in the form of a special dividend paid in connection with a corporate real estate investment trust
(REIT) conversion. Excluding this non-recurring amount, the ratio of net investment income to average net assets would have been 1.73%.
eNet investment income per share includes approximately $(0.08) per share related to an adjustment for uncollectible interest. Excluding the effect of this adjustment, the ratio of
net investment income to average net assets would have been 1.95%.
fIncludes dividend expense on securities sold short and borrowing fees, if any. See below for the ratios of such expenses to average net assets for the periods presented. See Note 1(d).
gBenefit of expense reduction rounds to less than 0.01%.
hBenefit of waiver and payment by affiliate rounds to less than 0.01%.
iRounds to less than 0.01%.
20 | The accompanying notes are an integral part of these financial statements. | Annual Report
| Mutual Shares Fund | |||||||||||||||
| Financial Highlights (continued) | |||||||||||||||
| Year Ended December 31, | |||||||||||||||
| Class A | 2013 | 2012 | 2011 | 2010 | 2009 | ||||||||||
| Per share operating performance | |||||||||||||||
| (for a share outstanding throughout the year) | |||||||||||||||
| Net asset value, beginning of year | $ | 22.32 | $ | 19.81 | $ | 20.64 | $ | 19.06 | $ | 15.22 | |||||
| Income from investment operationsa: | |||||||||||||||
| Net investment incomeb | 0.40 | 0.33 | 0.40 | c | 0.49 | d | 0.19 | e | |||||||
| Net realized and unrealized gains (losses) | 5.76 | 2.60 | (0.79 | ) | 1.66 | 4.02 | |||||||||
| Total from investment operations | 6.16 | 2.93 | (0.39 | ) | 2.15 | 4.21 | |||||||||
| Less distributions from net investment income | (0.36 | ) | (0.42 | ) | (0.44 | ) | (0.57 | ) | (0.37 | ) | |||||
| Net asset value, end of year | $ | 28.12 | $ | 22.32 | $ | 19.81 | $ | 20.64 | $ | 19.06 | |||||
| Total returnf | 27.74 | % | 14.75 | % | (1.79 | )% | 11.41 | % | 27.84 | % | |||||
| Ratios to average net assets | |||||||||||||||
| Expenses before waiver and payments by affiliatesg | 1.09 | %h | 1.12 | % | 1.16 | % | 1.15 | % | 1.20 | %h | |||||
| Expenses net of waiver and payments by affiliatesg | 1.09 | %h | 1.12 | % | 1.16 | % | 1.15 | %i | 1.18 | %h | |||||
| Expenses incurred in connection with securities | |||||||||||||||
| sold short | —%j | —%j | —%j | 0.02 | % | 0.05 | % | ||||||||
| Net investment income | 1.55 | % | 1.52 | % | 1.94 | %c | 2.53 | %d | 1.18 | %e | |||||
| Supplemental data | |||||||||||||||
| Net assets, end of year (000’s) | $ | 5,477,733 | $ | 4,633,895 | $ | 4,681,967 | $ | 5,368,887 | $ | 5,100,309 | |||||
| Portfolio turnover rate | 24.29 | % | 21.57 | % | 29.44 | % | 28.25 | % | 47.87 | % | |||||
aThe amount shown for a share outstanding throughout the period may not correlate with the Statement of Operations for the period due to the timing of sales and repurchases of
the Fund shares in relation to income earned and/or fluctuating market value of the investments of the Fund.
bBased on average daily shares outstanding.
cNet investment income per share includes approximately $0.08 per share related to interest income received that had previously been deemed uncollectible. Excluding this amount,
the ratio of net investment income to average net assets would have been 1.57%.
dNet investment income per share includes approximately $0.21 per share received in the form of a special dividend paid in connection with a corporate REIT conversion. Excluding
this non-recurring amount, the ratio of net investment income to average net assets would have been 1.43%.
eNet investment income per share includes approximately $(0.08) per share related to an adjustment for uncollectible interest. Excluding the effect of this adjustment, the ratio of
net investment income to average net assets would have been 1.65%.
fTotal return does not reflect sales commissions or contingent deferred sales charges, if applicable.
gIncludes dividend expense on securities sold short and borrowing fees, if any. See below for the ratios of such expenses to average net assets for the periods presented. See Note 1(d).
hBenefit of expense reduction rounds to less than 0.01%.
iBenefit of waiver and payment by affiliate rounds to less than 0.01%.
jRounds to less than 0.01%.
Annual Report | The accompanying notes are an integral part of these financial statements. | 21
| Mutual Shares Fund | |||||||||||||||
| Financial Highlights (continued) | |||||||||||||||
| Year Ended December 31, | |||||||||||||||
| Class C | 2013 | 2012 | 2011 | 2010 | 2009 | ||||||||||
| Per share operating performance | |||||||||||||||
| (for a share outstanding throughout the year) | |||||||||||||||
| Net asset value, beginning of year | $ | 22.13 | $ | 19.65 | $ | 20.46 | $ | 18.89 | $ | 15.10 | |||||
| Income from investment operationsa: | |||||||||||||||
| Net investment incomeb | 0.22 | 0.17 | 0.25 | c | 0.35 | d | 0.08 | e | |||||||
| Net realized and unrealized gains (losses) | 5.71 | 2.57 | (0.77 | ) | 1.65 | 3.96 | |||||||||
| Total from investment operations | 5.93 | 2.74 | (0.52 | ) | 2.00 | 4.04 | |||||||||
| Less distributions from net investment income | (0.18 | ) | (0.26 | ) | (0.29 | ) | (0.43 | ) | (0.25 | ) | |||||
| Net asset value, end of year | $ | 27.88 | $ | 22.13 | $ | 19.65 | $ | 20.46 | $ | 18.89 | |||||
| Total returnf | 26.82 | % | 13.97 | % | (2.44 | )% | 10.62 | % | 26.92 | % | |||||
| Ratios to average net assets | |||||||||||||||
| Expenses before waiver and payments by affiliatesg | 1.79 | %h | 1.82 | % | 1.86 | % | 1.85 | % | 1.90 | %h | |||||
| Expenses net of waiver and payments by affiliatesg | 1.79 | %h | 1.82 | % | 1.86 | % | 1.85 | %i | 1.88 | %h | |||||
| Expenses incurred in connection with securities | |||||||||||||||
| sold short | —%j | —%j | —%j | 0.02 | % | 0.05 | % | ||||||||
| Net investment income | 0.85 | % | 0.82 | % | 1.24 | %c | 1.83 | %d | 0.48 | %e | |||||
| Supplemental data | |||||||||||||||
| Net assets, end of year (000’s) | $ | 1,236,603 | $ | 1,043,695 | $ | 1,065,446 | $ | 1,292,711 | $ | 1,355,155 | |||||
| Portfolio turnover rate | 24.29 | % | 21.57 | % | 29.44 | % | 28.25 | % | 47.87 | % | |||||
aThe amount shown for a share outstanding throughout the period may not correlate with the Statement of Operations for the period due to the timing of sales and repurchases of
the Fund shares in relation to income earned and/or fluctuating market value of the investments of the Fund.
bBased on average daily shares outstanding.
cNet investment income per share includes approximately $0.08 per share related to interest income received that had previously been deemed uncollectible. Excluding this amount,
the ratio of net investment income to average net assets would have been 0.87%.
dNet investment income per share includes approximately $0.21 per share received in the form of a special dividend paid in connection with a corporate REIT conversion. Excluding
this non-recurring amount, the ratio of net investment income to average net assets would have been 0.73%.
eNet investment income per share includes approximately $(0.08) per share related to an adjustment for uncollectible interest. Excluding the effect of this adjustment, the ratio of
net investment income to average net assets would have been 0.95%.
fTotal return does not reflect sales commissions or contingent deferred sales charges, if applicable.
gIncludes dividend expense on securities sold short and borrowing fees, if any. See below for the ratios of such expenses to average net assets for the periods presented. See Note 1(d).
hBenefit of expense reduction rounds to less than 0.01%.
iBenefit of waiver and payments by affiliates rounds to less than 0.01%.
jRounds to less than 0.01%.
22 | The accompanying notes are an integral part of these financial statements. | Annual Report
| Mutual Shares Fund | |||||||||||||||
| Financial Highlights (continued) | |||||||||||||||
| Year Ended December 31, | |||||||||||||||
| Class R | 2013 | 2012 | 2011 | 2010 | 2009 | ||||||||||
| Per share operating performance | |||||||||||||||
| (for a share outstanding throughout the year) | |||||||||||||||
| Net asset value, beginning of year | $ | 22.20 | $ | 19.70 | $ | 20.52 | $ | 18.95 | $ | 15.15 | |||||
| Income from investment operationsa: | |||||||||||||||
| Net investment incomeb | 0.34 | 0.28 | 0.36 | c | 0.45 | d | 0.16 | e | |||||||
| Net realized and unrealized gains (losses) | 5.73 | 2.59 | (0.78 | ) | 1.66 | 3.99 | |||||||||
| Total from investment operations | 6.07 | 2.87 | (0.42 | ) | 2.11 | 4.15 | |||||||||
| Less distributions from net investment income | (0.29 | ) | (0.37 | ) | (0.40 | ) | (0.54 | ) | (0.35 | ) | |||||
| Net asset value, end of year | $ | 27.98 | $ | 22.20 | $ | 19.70 | $ | 20.52 | $ | 18.95 | |||||
| Total return | 27.47 | % | 14.52 | % | (1.94 | )% | 11.18 | % | 27.51 | % | |||||
| Ratios to average net assets | |||||||||||||||
| Expenses before waiver and payments by affiliatesf | 1.29 | %g | 1.32 | % | 1.36 | % | 1.35 | % | 1.40 | %g | |||||
| Expenses net of waiver and payments by affiliatesf | 1.29 | %g | 1.32 | % | 1.36 | % | 1.35 | %h | 1.38 | %g | |||||
| Expenses incurred in connection with securities | |||||||||||||||
| sold short | —%i | —%i | —%i | 0.02 | % | 0.05 | % | ||||||||
| Net investment income | 1.35 | % | 1.32 | % | 1.74 | %c | 2.33 | %d | 0.98 | %e | |||||
| Supplemental data | |||||||||||||||
| Net assets, end of year (000’s) | $ | 192,658 | $ | 191,304 | $ | 218,757 | $ | 259,834 | $ | 227,649 | |||||
| Portfolio turnover rate | 24.29 | % | 21.57 | % | 29.44 | % | 28.25 | % | 47.87 | % | |||||
aThe amount shown for a share outstanding throughout the period may not correlate with the Statement of Operations for the period due to the timing of sales and repurchases of
the Fund shares in relation to income earned and/or fluctuating market value of the investments of the Fund.
bBased on average daily shares outstanding.
cNet investment income per share includes approximately $0.08 per share related to interest income received that had previously been deemed uncollectible. Excluding this amount,
the ratio of net investment income to average net assets would have been 1.37%.
dNet investment income per share includes approximately $0.21 per share received in the form of a special dividend paid in connection with a corporate REIT conversion. Excluding
this non-recurring amount, the ratio of net investment income to average net assets would have been 1.23%.
eNet investment income per share includes approximately $(0.08) per share related to an adjustment for uncollectible interest. Excluding the effect of this adjustment, the ratio of
net investment income to average net assets would have been 1.45%.
fIncludes dividend expense on securities sold short and borrowing fees, if any. See below for the ratios of such expenses to average net assets for the periods presented.
See Note 1(d).
gBenefit of expense reduction rounds to less than 0.01%.
hBenefit of waiver and payments by affiliates rounds to less than 0.01%.
iRounds to less than 0.01%.
Annual Report | The accompanying notes are an integral part of these financial statements. | 23
| Mutual Shares Fund | |||
| Financial Highlights (continued) | |||
| Period Ended | |||
| December 31, | |||
| Class R6 | 2013 | a | |
| Per share operating performance | |||
| (for a share outstanding throughout the period) | |||
| Net asset value, beginning of period | $ | 24.91 | |
| Income from investment operationsb: | |||
| Net investment incomec | 0.38 | ||
| Net realized and unrealized gains (losses) | 3.51 | ||
| Total from investment operations | 3.89 | ||
| Less distributions from net investment income | (0.47 | ) | |
| Net asset value, end of period | $ | 28.33 | |
| Total returnd | 15.70 | % | |
| Ratios to average net assetse | |||
| Expenses | 0.67 | %f | |
| Expenses incurred in connection with securities sold short | —%g | ||
| Net investment income | 1.97 | % | |
| Supplemental data | |||
| Net assets, end of period (000’s) | $ | 2,221,889 | |
| Portfolio turnover rate | 24.29 | % | |
aFor the period May 1, 2013 (effective date) to December 31, 2013.
bThe amount shown for a share outstanding throughout the period may not correlate with the Statement of Operations for the period due to the timing of sales and repurchases of
the Fund shares in relation to income earned and/or fluctuating market value of the investments of the Fund.
cBased on average daily shares outstanding.
dTotal return is not annualized for periods less than one year.
eRatios are annualized for periods less than one year.
fBenefit of expense reduction rounds to less than 0.01%.
gRounds to less than 0.01%.
24 | The accompanying notes are an integral part of these financial statements. | Annual Report
| Mutual Shares Fund | ||||
| Statement of Investments, December 31, 2013 | ||||
| Country | Shares/Warrants | Value | ||
| Common Stocks and Other Equity Interests 87.9% | ||||
| Aerospace & Defense 1.0% | ||||
| Huntington Ingalls Industries Inc. | United States | 1,861,796 | $ | 167,580,258 |
| Auto Components 0.2% | ||||
| a,b,c International Automotive Components Group Brazil LLC | Brazil | 7,234,813 | 1,409,486 | |
| a,b,c,d International Automotive Components Group North America, LLC | United States | 63,079,866 | 35,691,850 | |
| 37,101,336 | ||||
| Automobiles 1.1% | ||||
| a General Motors Co. | United States | 4,526,480 | 184,997,238 | |
| Beverages 1.6% | ||||
| Coca-Cola Enterprises Inc. | United Kingdom | 2,695,770 | 118,964,330 | |
| Dr. Pepper Snapple Group Inc. | United States | 1,856,030 | 90,425,781 | |
| Pernod Ricard SA | France | 460,092 | 52,406,848 | |
| 261,796,959 | ||||
| Capital Markets 0.6% | ||||
| a China Cinda Asset Management Co. Ltd., H | China | 7,303,705 | 4,539,885 | |
| Morgan Stanley | United States | 2,859,090 | 89,661,062 | |
| 94,200,947 | ||||
| Chemicals 0.0% | ||||
| a,e,f Dow Corning Corp., Contingent Distribution | United States | 12,630,547 | — | |
| Commercial Banks 5.5% | ||||
| a,c,g Bond Street Holdings LLC, A, 144A | United States | 1,647,570 | 24,713,550 | |
| CIT Group Inc. | United States | 2,102,356 | 109,595,818 | |
| Columbia Banking System Inc. | United States | 1,102,002 | 30,316,075 | |
| a,b Columbia Banking System Inc., wts., C, 10/23/16 | United States | 50,163 | 9,489,536 | |
| a,b First Southern Bancorp Inc. | United States | 453,016 | 2,183,628 | |
| c Guaranty Bancorp | United States | 1,146,366 | 16,106,442 | |
| KB Financial Group Inc. | South Korea | 2,463,869 | 98,603,770 | |
| PNC Financial Services Group Inc. | United States | 3,438,533 | 266,761,390 | |
| Societe Generale | France | 1,242,184 | 72,138,105 | |
| State Bank Financial Corp. | United States | 1,467,000 | 26,684,730 | |
| SunTrust Banks Inc. | United States | 3,703,850 | 136,338,719 | |
| Wells Fargo & Co. | United States | 2,093,160 | 95,029,464 | |
| 887,961,227 | ||||
| Communications Equipment 1.1% | ||||
| Cisco Systems Inc. | United States | 8,126,460 | 182,439,027 | |
| Computers & Peripherals 3.2% | ||||
| Apple Inc. | United States | 665,640 | 373,497,260 | |
| Hewlett-Packard Co. | United States | 5,176,960 | 144,851,341 | |
| 518,348,601 | ||||
| Consumer Finance 0.0%† | ||||
| a Comdisco Holding Co. Inc. | United States | 2,122 | 11,459 | |
| Containers & Packaging 0.8% | ||||
| MeadWestvaco Corp. | United States | 3,299,455 | 121,848,873 | |
Annual Report | 25
| Mutual Shares Fund | ||||
| Statement of Investments, December 31, 2013 (continued) | ||||
| Country | Shares/Warrants | Value | ||
| Common Stocks and Other Equity Interests (continued) | ||||
| Diversified Financial Services 3.9% | ||||
| Citigroup Inc. | United States | 3,362,406 | $ | 175,214,977 |
| Deutsche Boerse AG | Germany | 1,166,539 | 96,595,373 | |
| a ING Groep NV, IDR | Netherlands | 10,399,861 | 144,480,581 | |
| JPMorgan Chase & Co. | United States | 3,550,940 | 207,658,971 | |
| 623,949,902 | ||||
| Diversified Telecommunication Services 0.0% | ||||
| a,e,f Global Crossing Holdings Ltd., Contingent Distribution | United States | 105,649,309 | — | |
| Electric Utilities 0.8% | ||||
| Entergy Corp. | United States | 821,510 | 51,976,938 | |
| Exelon Corp. | United States | 2,855,950 | 78,224,470 | |
| 130,201,408 | ||||
| Electronic Equipment, Instruments & Components 0.5% | ||||
| TE Connectivity Ltd. | United States | 1,450,344 | 79,928,458 | |
| Energy Equipment & Services 2.4% | ||||
| Baker Hughes Inc. | United States | 3,257,098 | 179,987,236 | |
| Ensco PLC, A | United States | 1,076,335 | 61,544,835 | |
| Transocean Ltd. | United States | 3,071,412 | 151,789,181 | |
| 393,321,252 | ||||
| Food & Staples Retailing 4.9% | ||||
| CVS Caremark Corp. | United States | 3,550,136 | 254,083,234 | |
| The Kroger Co. | United States | 5,353,096 | 211,607,885 | |
| Tesco PLC | United Kingdom | 27,985,723 | 154,977,758 | |
| Walgreen Co. | United States | 2,996,962 | 172,145,497 | |
| 792,814,374 | ||||
| Health Care Equipment & Supplies 2.3% | ||||
| Medtronic Inc. | United States | 5,371,395 | 308,264,359 | |
| Stryker Corp. | United States | 865,772 | 65,054,108 | |
| 373,318,467 | ||||
| Health Care Providers & Services 2.6% | ||||
| Cigna Corp. | United States | 3,430,230 | 300,076,521 | |
| UnitedHealth Group Inc. | United States | 165,968 | 12,497,390 | |
| WellPoint Inc. | United States | 1,223,884 | 113,074,643 | |
| 425,648,554 | ||||
| Independent Power Producers & Energy Traders 0.8% | ||||
| NRG Energy Inc. | United States | 4,399,652 | 126,358,005 | |
| Insurance 9.3% | ||||
| ACE Ltd. | United States | 2,345,100 | 242,788,203 | |
| Aegon NV | Netherlands | 12,658,878 | 119,483,105 | |
| a Alleghany Corp. | United States | 377,389 | 150,940,504 | |
| American International Group Inc. | United States | 6,686,309 | 341,336,075 | |
| MetLife Inc. | United States | 2,895,970 | 156,150,702 | |
| a,b Olympus Re Holdings Ltd. | United States | 202,380 | — | |
26 | Annual Report
| Mutual Shares Fund | ||||
| Statement of Investments, December 31, 2013 (continued) | ||||
| Country | Shares/Warrants | Value | ||
| Common Stocks and Other Equity Interests (continued) | ||||
| Insurance (continued) | ||||
| c White Mountains Insurance Group Ltd. | United States | 655,346 | $ | 395,226,066 |
| Zurich Insurance Group AG | Switzerland | 352,340 | 102,101,777 | |
| 1,508,026,432 | ||||
| Machinery 2.0% | ||||
| Caterpillar Inc. | United States | 1,065,086 | 96,720,460 | |
| a CNH Industrial NV (EUR Traded) | Netherlands | 4,150,523 | 47,299,430 | |
| a CNH Industrial NV, special voting (EUR Traded) | Netherlands | 5,296,616 | 60,360,325 | |
| a,c Federal Signal Corp. | United States | 3,360,800 | 49,235,720 | |
| Stanley Black & Decker Inc. | United States | 926,153 | 74,731,286 | |
| 328,347,221 | ||||
| Marine 1.4% | ||||
| A.P. Moeller-Maersk AS, B | Denmark | 20,138 | 218,511,929 | |
| Media 6.6% | ||||
| British Sky Broadcasting Group PLC | United Kingdom | 1,100,532 | 15,385,367 | |
| CBS Corp., B | United States | 2,616,369 | 166,767,360 | |
| Comcast Corp., Special A | United States | 846,676 | 42,232,199 | |
| Reed Elsevier PLC | United Kingdom | 16,852,410 | 250,804,328 | |
| Time Warner Cable Inc. | United States | 1,469,924 | 199,174,702 | |
| a Tribune Co., A | United States | 766,463 | 59,324,236 | |
| a Tribune Co., B | United States | 469,946 | 36,232,837 | |
| Twenty-First Century Fox Inc., B | United States | 8,524,052 | 294,932,199 | |
| 1,064,853,228 | ||||
| Metals & Mining 2.7% | ||||
| Anglo American PLC | United Kingdom | 4,301,023 | 94,029,050 | |
| Freeport-McMoRan Copper & Gold Inc., B | United States | 5,933,533 | 223,931,536 | |
| a ThyssenKrupp AG | Germany | 4,544,107 | 110,569,909 | |
| 428,530,495 | ||||
| Multi-Utilities 0.5% | ||||
| GDF Suez | France | 3,256,408 | 76,571,735 | |
| Multiline Retail 0.8% | ||||
| Kohl’s Corp. | United States | 2,129,900 | 120,871,825 | |
| Office Electronics 1.4% | ||||
| Xerox Corp. | United States | 18,652,685 | 227,003,176 | |
| Oil, Gas & Consumable Fuels 8.9% | ||||
| Apache Corp. | United States | 2,845,910 | 244,577,505 | |
| BG Group PLC | United Kingdom | 6,265,349 | 134,638,856 | |
| BP PLC | United Kingdom | 15,851,497 | 128,132,023 | |
| CONSOL Energy Inc. | United States | 3,898,850 | 148,312,254 | |
| Marathon Oil Corp. | United States | 6,926,623 | 244,509,792 | |
| Murphy Oil Corp. | United States | 1,576,220 | 102,265,154 | |
| Petroleo Brasileiro SA, ADR | Brazil | 4,479,680 | 61,729,990 | |
| Royal Dutch Shell PLC, A | United Kingdom | 7,150,467 | 254,787,768 | |
| Talisman Energy Inc. (CAD Traded) | Canada | 614,645 | 7,146,699 | |
| Talisman Energy Inc. (USD Traded) | Canada | 6,976,171 | 81,272,392 | |
| a WPX Energy Inc. | United States | 1,130,869 | 23,047,110 | |
| 1,430,419,543 | ||||
| Annual Report | 27 | ||||
| Mutual Shares Fund | ||||
| Statement of Investments, December 31, 2013 (continued) | ||||
| Country | Shares/Warrants | Value | ||
| Common Stocks and Other Equity Interests (continued) | ||||
| Paper & Forest Products 1.6% | ||||
| Domtar Corp. | United States | 548,278 | $ | 51,724,546 |
| International Paper Co. | United States | 4,310,260 | 211,332,048 | |
| 263,056,594 | ||||
| Personal Products 0.7% | ||||
| Avon Products Inc. | United States | 6,320,485 | 108,838,752 | |
| Pharmaceuticals 5.3% | ||||
| Eli Lilly & Co. | United States | 1,856,440 | 94,678,440 | |
| a Hospira Inc. | United States | 1,653,558 | 68,258,874 | |
| Merck & Co. Inc. | United States | 8,897,690 | 445,329,385 | |
| Teva Pharmaceutical Industries Ltd., ADR | Israel | 6,224,949 | 249,495,956 | |
| 857,762,655 | ||||
| Real Estate Investment Trusts (REITs) 0.7% | ||||
| c Alexander’s Inc. | United States | 326,675 | 107,802,750 | |
| Real Estate Management & Development 0.9% | ||||
| Brookfield Office Properties Inc. | United States | 2,027,464 | 39,028,682 | |
| f Canary Wharf Group PLC | United Kingdom | 14,262,931 | 73,710,322 | |
| a Forestar Group Inc. | United States | 1,431,256 | 30,442,815 | |
| 143,181,819 | ||||
| Semiconductors & Semiconductor Equipment 0.7% | ||||
| Samsung Electronics Co. Ltd. | South Korea | 88,806 | 115,410,578 | |
| Software 3.8% | ||||
| Microsoft Corp. | United States | 10,929,980 | 409,109,152 | |
| Symantec Corp. | United States | 8,447,347 | 199,188,442 | |
| 608,297,594 | ||||
| Tobacco 5.0% | ||||
| Altria Group Inc. | United States | 3,982,209 | 152,877,004 | |
| British American Tobacco PLC | United Kingdom | 4,864,275 | 260,732,354 | |
| Imperial Tobacco Group PLC | United Kingdom | 3,810,199 | 147,480,087 | |
| Lorillard Inc. | United States | 3,265,821 | 165,511,808 | |
| Philip Morris International Inc. | United States | 944,754 | 82,316,416 | |
| 808,917,669 | ||||
| Wireless Telecommunication Services 2.3% | ||||
| Vodafone Group PLC | United Kingdom | 95,429,428 | 374,629,686 | |
| Total Common Stocks and Other Equity Interests | ||||
| (Cost $10,014,519,614) | 14,192,860,026 | |||
| Convertible Preferred Stocks 0.0%† | ||||
| Commercial Banks 0.0%† | ||||
| Columbia Banking System Inc., cvt. pfd., B | United States | 7,558 | 2,423,523 | |
| a,b First Southern Bancorp Inc., cvt. pfd., C | United States | 774 | 1,444,935 | |
| Total Convertible Preferred Stocks | ||||
| (Cost $1,529,800) | 3,868,458 | |||
28 | Annual Report
| Mutual Shares Fund | |||||
| Statement of Investments, December 31, 2013 (continued) | |||||
| Country | Principal Amount* | Value | |||
| Corporate Bonds, Notes and Senior Floating Rate Interests 5.3% | |||||
| g American Airlines Inc., senior secured note, 144A, 7.50%, | |||||
| 3/15/16 | United States | 82,024,300 | $ | 85,510,333 | |
| Avaya Inc., | |||||
| g senior note, 144A, 10.50%, 3/01/21 | United States | 53,569,000 | 51,961,930 | ||
| g senior secured note, 144A, 7.00%, 4/01/19 | United States | 37,416,000 | 36,854,760 | ||
| h,i Tranche B-3 Term Loan, 4.736%, 10/26/17 | United States | 57,171,509 | 55,908,991 | ||
| h,i Tranche B-5 Term Loan, 8.00%, 3/31/18 | United States | 13,949,882 | 14,150,411 | ||
| h,i Caesars Entertainment Operating Co. Inc., Senior Tranche | |||||
| Term Loan, first lien, 1/28/18, | |||||
| B5, 4.488% | United States | 10,094,000 | 9,530,422 | ||
| B6, 5.488% | United States | 48,124,000 | 46,044,754 | ||
| Clear Channel Communications Inc., | |||||
| senior secured note, first lien, 9.00%, 12/15/19 | United States | 74,295,000 | 76,152,375 | ||
| h,i Tranche B Term Loan, 3.819%, 1/29/16 | United States | 1,461,648 | 1,419,808 | ||
| h,i Tranche C Term Loan, 3.819%, 1/29/16 | United States | 176,373 | 169,263 | ||
| h,i Tranche D Term Loan, 6.919%, 1/30/19 | United States | 94,620,527 | 90,599,154 | ||
| h,i Tranche E Term Loan, 7.669%, 7/30/19 | United States | 30,412,812 | 30,032,652 | ||
| h,i JC Penney Corp. Inc., Term Loan, 6.00%, 5/22/18 | United States | 66,745,248 | 65,308,357 | ||
| NGPL PipeCo LLC, | |||||
| g secured note, 144A, 7.119%, 12/15/17 | United States | 29,468,000 | 26,815,880 | ||
| g,j senior secured note, 144A, 9.625%, 6/01/19 | United States | 43,741,000 | 42,975,532 | ||
| h,i Term Loan B, 6.75%, 9/15/17 | United States | 2,596,994 | 2,429,002 | ||
| h,i Texas Competitive Electric Holdings Co. LLC, Extended | |||||
| Term Loan, 4.668%, 10/10/17 | United States | 194,177,556 | 134,128,147 | ||
| Texas Competitive Electric Holdings Co. LLC/Texas Competitive | |||||
| Electric Holdings Finance Inc., | |||||
| senior note, A, 10.25%, 11/01/15 | United States | 98,536,000 | 6,897,520 | ||
| g senior secured note, 144A, 11.50%, 10/01/20 | United States | 98,672,000 | 73,017,280 | ||
| g Wind Acquisition Finance SA, 144A, 11.75%, 7/15/17, | |||||
| senior secured note | Italy | 3,027,000 | 3,223,755 | ||
| third lien | Italy | 7,079,000 | EUR | 10,371,248 | |
| Total Corporate Bonds, Notes and Senior Floating | |||||
| Rate Interests (Cost $895,526,589) | 863,501,574 | ||||
| Corporate Notes in Reorganization 0.3% | |||||
| b,k Broadband Ventures III LLC, secured promissory note, | |||||
| 5.00%, 2/01/12 | United States | 19,594 | — | ||
| h,k Cengage Learning Acquisitions Inc., FRN, 2.70%, 7/03/14 | United States | 55,618,381 | 43,660,429 | ||
| Total Corporate Notes in Reorganization | |||||
| (Cost $44,170,332) | 43,660,429 | ||||
Annual Report | 29
| Mutual Shares Fund | ||||||
| Statement of Investments, December 31, 2013 (continued) | ||||||
| Country | Shares | Value | ||||
| Companies in Liquidation 1.2% | ||||||
| a Adelphia Recovery Trust | United States | 99,967,609 | $ | 199,935 | ||
| a,e Adelphia Recovery Trust, Arahova Contingent Value Vehicle, | ||||||
| Contingent Distribution | United States | 12,005,115 | 6,003 | |||
| a,b,c,d CB FIM Coinvestors LLC | United States | 43,105,703 | — | |||
| a,e,f Century Communications Corp., Contingent Distribution | United States | 33,138,000 | — | |||
| a,b FIM Coinvestor Holdings I, LLC | United States | 53,924,666 | — | |||
| a,l Lehman Brothers Holdings Inc., Bankruptcy Claim | United States | 420,480,670 | 189,216,301 | |||
| a,e,f Tribune Litigation Trust, Contingent Distribution | United States | 995,004 | — | |||
| a,e,f Tropicana Litigation Trust, Contingent Distribution | United States | 76,355,000 | — | |||
| Principal Amount* | ||||||
| f,k Peregrine Investments Holdings Ltd., | ||||||
| 6.70%, 1/15/98 | Hong Kong | 95,000,000 | JPY | — | ||
| 6.70%, 6/30/00 | Hong Kong | 250,000,000 | JPY | — | ||
| zero cpn., 1/22/98 | Hong Kong | 500,000 | — | |||
| f,k PIV Investment Finance (Cayman) Ltd., 4.50%, 12/01/00 | Hong Kong | 22,710,000 | — | |||
| Total Companies in Liquidation | ||||||
| (Cost $197,146,905) | 189,422,239 | |||||
| Total Investments before Short Term Investments | ||||||
| (Cost $11,152,893,240) | 15,293,312,726 | |||||
| Short Term Investments 5.6% | ||||||
| U.S. Government and Agency Securities (Cost $899,108,417) 5.6% | ||||||
| m,n U.S. Treasury Bills, 1/02/14 - 6/26/14 | United States | 899,200,000 | 899,140,780 | |||
| Total Investments before Money Market Funds | ||||||
| (Cost $12,052,001,657) | 16,192,453,506 | |||||
| Shares | ||||||
| o Investments from Cash Collateral Received for Loaned | ||||||
| Securities (Cost $7,268,970) 0.0%† | ||||||
| Money Market Funds 0.0%† | ||||||
| p BNY Mellon Overnight Government Fund, 0.017% | United States | 7,268,970 | 7,268,970 | |||
| Total Investments (Cost $12,059,270,627) 100.3% | 16,199,722,476 | |||||
| Securities Sold Short (0.4)% | (65,651,581 | ) | ||||
| Other Assets, less Liabilities 0.1% | 20,720,076 | |||||
| Net Assets 100.0% | $ | 16,154,790,971 | ||||
| q Securities Sold Short (Proceeds $63,192,623) (0.4)% | ||||||
| Common Stocks (0.4)% | ||||||
| Diversified Telecommunication Services (0.4)% | ||||||
| Verizon Communications Inc. | United States | 1,336,011 | $ | (65,651,581 | ) | |
30 | Annual Report
Mutual Shares Fund
Statement of Investments, December 31, 2013 (continued)
†Rounds to less than 0.1% of net assets.
*The principal amount is stated in U.S. dollars unless otherwise indicated.
aNon-income producing.
bSee Note 9 regarding restricted securities.
cSee Note 11 regarding holdings of 5% voting securities.
dAt December 31, 2013, pursuant to the Fund’s policies and the requirements of applicable securities law, the Fund may be restricted from trading these securities for a limited or
extended period of time due to ownership limits and/or potential possession of material non-public information.
eContingent distributions represent the right to receive additional distributions, if any, during the reorganization of the underlying company. Shares represent total underlying
principal of debt securities.
fSecurity has been deemed illiquid because it may not be able to be sold within seven days. At December 31, 2013, the aggregate value of these securities was $73,710,322,
representing 0.46% of net assets.
gSecurity was purchased pursuant to Rule 144A under the Securities Act of 1933 and may be sold in transactions exempt from registration only to qualified institutional buyers or in
a public offering registered under the Securities Act of 1933. These securities have been deemed liquid under guidelines approved by the Trust’s Board of Trustees. At December 31,
2013, the aggregate value of these securities was $355,444,268, representing 2.20% of net assets.
hThe coupon rate shown represents the rate at period end.
See Note 1(f) regarding senior floating rate interests.
A portion or all of the security is on loan at December 31, 2013. See Note 1(e).
kSee Note 8 regarding credit risk and defaulted securities.
Bankruptcy claims represent the right to receive distributions, if any, during the liquidation of the underlying pool of assets. Shares represent amount of allowed unsecured claims.
mThe security is traded on a discount basis with no stated coupon rate.
nSecurity or a portion of the security has been pledged as collateral for securities sold short, open futures and forward contracts. At December 31, 2013, the aggregate value of
these securities and/or cash pledged as collateral was $143,526,451, representing 0.89% of net assets.
oSee Note 1(e) regarding securities on loan.
pThe rate shown is the annualized seven-day yield at period end.
qSee Note 1(d) regarding securities sold short.
At December 31, 2013, the Fund had the following futures contracts outstanding. See Note 1(c).
| Futures Contracts | ||||||||||
| Number of | Unrealized | Unrealized | ||||||||
| Description | Type | Contracts | Notional Value | Expiration Date | Appreciation | Depreciation | ||||
| Currency Contracts | ||||||||||
| EUR/USD | Short | 1,188 | $ | 204,751,800 | 3/17/14 | $ | — | $ | (880,588 | ) |
| GBP/USD | Short | 2,433 | 251,785,088 | 3/17/14 | — | (2,342,357 | ) | |||
| Unrealized appreciation (depreciation) | — | (3,222,945 | ) | |||||||
| Net unrealized appreciation (depreciation) | $ | (3,222,945 | ) |
Annual Report | 31
Mutual Shares Fund
Statement of Investments, December 31, 2013 (continued)
At December 31, 2013, the Fund had the following forward exchange contracts outstanding. See Note 1(c).
| Forward Exchange Contracts | |||||||||||||
| Settlement | Unrealized | Unrealized | |||||||||||
| Currency | Counterparty a Type | Quantity | Contract Amount | Date | Appreciation | Depreciation | |||||||
| Euro | HSBC | Buy | 195,000 | $ | 265,223 | 1/17/14 | $ | 2,997 | $ | — | |||
| Euro | BANT | Sell | 46,765,811 | 61,536,077 | 1/17/14 | 1,210 | (2,790,971 | ) | |||||
| Euro | BONY | Sell | 994,958 | 1,363,112 | 1/17/14 | — | (5,441 | ) | |||||
| Euro | BBU | Sell | 35,250,878 | 46,032,711 | 1/17/14 | — | (2,454,468 | ) | |||||
| Euro | FBCO | Sell | 9,271,112 | 12,398,655 | 1/17/14 | — | (353,653 | ) | |||||
| Euro | DBFX | Sell | 8,128,918 | 10,720,079 | 1/17/14 | — | (461,155 | ) | |||||
| Euro | HSBC | Sell | 4,088,382 | 5,590,528 | 1/17/14 | — | (32,996 | ) | |||||
| Euro | SCBT | Sell | 392,122 | 514,910 | 1/17/14 | — | (24,448 | ) | |||||
| Euro | SSBT | Sell | 1,200,486 | 1,642,193 | 1/17/14 | — | (9,062 | ) | |||||
| British Pound | BANT | Sell | 96,451,871 | 147,657,577 | 1/21/14 | — | (12,034,548 | ) | |||||
| British Pound | BBU | Sell | 6,055,184 | 9,772,395 | 1/21/14 | — | (252,971 | ) | |||||
| British Pound | FBCO | Sell | 25,008,158 | 40,059,605 | 1/21/14 | — | (1,345,564 | ) | |||||
| British Pound | DBFX | Sell | 43,538,858 | 66,096,340 | 1/21/14 | — | (5,989,486 | ) | |||||
| British Pound | HSBC | Sell | 7,021,717 | 11,254,786 | 1/21/14 | — | (370,836 | ) | |||||
| British Pound | SCBT | Sell | 2,759,354 | 4,414,091 | 1/21/14 | — | (154,479 | ) | |||||
| South Korean Won | BANT | Buy | 4,912,319,480 | 4,599,735 | 2/12/14 | 39,978 | — | ||||||
| South Korean Won | FBCO | Buy | 842,323,000 | 777,338 | 2/12/14 | 18,241 | — | ||||||
| South Korean Won | HSBC | Buy | 11,898,586,074 | 11,099,163 | 2/12/14 | 144,717 | (5,599 | ) | |||||
| South Korean Won | BANT | Sell | 42,427,730,506 | 37,762,315 | 2/12/14 | — | (2,310,913 | ) | |||||
| South Korean Won | FBCO | Sell | 91,300,963,602 | 82,011,877 | 2/12/14 | — | (4,222,393 | ) | |||||
| South Korean Won | DBFX | Sell | 63,067,674,825 | 56,145,024 | 2/12/14 | — | (3,422,746 | ) | |||||
| South Korean Won | HSBC | Sell | 42,911,766,985 | 38,744,025 | 2/12/14 | — | (1,786,379 | ) | |||||
| British Pound | BANT | Buy | 10,268,236 | 16,580,177 | 2/19/14 | 417,235 | — | ||||||
| British Pound | BBU | Buy | 3,721,411 | 6,025,749 | 2/19/14 | 134,447 | — | ||||||
| British Pound | BANT | Sell | 99,843,735 | 155,373,071 | 2/19/14 | — | (9,902,166 | ) | |||||
| British Pound | BBU | Sell | 54,025,180 | 84,350,514 | 2/19/14 | — | (5,079,478 | ) | |||||
| British Pound | FBCO | Sell | 2,611,468 | 4,139,712 | 2/19/14 | — | (183,153 | ) | |||||
| British Pound | HSBC | Sell | 8,422,876 | 13,349,442 | 2/19/14 | — | (593,274 | ) | |||||
| British Pound | SCBT | Sell | 3,978,699 | 6,381,535 | 2/19/14 | — | (204,561 | ) | |||||
| Euro | BANT | Sell | 11,449,156 | 15,295,348 | 2/28/14 | — | (452,958 | ) | |||||
| Euro | BONY | Sell | 573,978 | 754,876 | 2/28/14 | — | (34,631 | ) | |||||
| Euro | BBU | Sell | 22,091,680 | 29,434,403 | 2/28/14 | — | (952,687 | ) | |||||
| Euro | FBCO | Sell | 16,033,901 | 21,465,194 | 2/28/14 | — | (589,424 | ) | |||||
| Euro | HSBC | Sell | 32,310,453 | 43,230,242 | 2/28/14 | — | (1,212,762 | ) | |||||
| Euro | SCBT | Sell | 6,435,906 | 8,665,091 | 2/28/14 | — | (187,494 | ) | |||||
| Euro | SSBT | Sell | 1,433,399 | 1,922,423 | 2/28/14 | — | (49,216 | ) | |||||
| Euro | BANT | Buy | 3,489,574 | 4,798,310 | 4/16/14 | 3,479 | (1,885 | ) | |||||
| Euro | BONY | Buy | 1,766,544 | 2,430,959 | 4/16/14 | — | (1,080 | ) | |||||
| Euro | BBU | Buy | 3,628,578 | 4,987,041 | 4/16/14 | 4,062 | — | ||||||
| Euro | HSBC | Buy | 4,254,522 | 5,841,329 | 4/16/14 | 13,710 | (2,951 | ) | |||||
| Euro | SCBT | Buy | 2,458,576 | 3,380,422 | 4/16/14 | 2,870 | (1,525 | ) | |||||
| Euro | SSBT | Buy | 1,572,142 | 2,162,952 | 4/16/14 | 98 | (572 | ) | |||||
| Euro | BANT | Sell | 56,975,964 | 77,437,457 | 4/16/14 | — | (932,890 | ) | |||||
| Euro | BONY | Sell | 989,222 | 1,354,177 | 4/16/14 | — | (6,496 | ) | |||||
| Euro | BBU | Sell | 62,701,819 | 85,255,977 | 4/16/14 | — | (990,275 | ) | |||||
| 32 | | | Annual Report | |||||||||||
| Mutual Shares Fund | |||||||||||
| Statement of Investments, December 31, 2013 (continued) | |||||||||||
| Forward Exchange Contracts (continued) | |||||||||||
| Settlement | Unrealized | Unrealized | |||||||||
| Currency | Counterpartya Type | Quantity | Contract Amount | Date | Appreciation | Depreciation | |||||
| Euro | FBCO | Sell | 3,685,448 | $ | 5,033,177 | 4/16/14 | $ | — | $ | (36,151 | ) |
| Euro | HSBC | Sell | 5,173,879 | 7,051,917 | 4/16/14 | 128 | (64,873 | ) | |||
| Euro | SCBT | Sell | 3,429,540 | 4,662,258 | 4/16/14 | — | (55,069 | ) | |||
| Euro | SSBT | Sell | 1,257,448 | 1,720,912 | 4/16/14 | — | (8,705 | ) | |||
| British Pound | BANT | Sell | 44,312,279 | 71,698,720 | 4/22/14 | — | (1,616,950 | ) | |||
| British Pound | BBU | Sell | 296,953 | 486,203 | 4/22/14 | — | (5,113 | ) | |||
| British Pound | FBCO | Sell | 42,302,061 | 68,185,257 | 4/22/14 | — | (1,804,463 | ) | |||
| British Pound | HSBC | Sell | 1,432,766 | 2,296,466 | 4/22/14 | — | (74,078 | ) | |||
| British Pound | SCBT | Sell | 71,733,488 | 115,634,383 | 4/22/14 | — | (3,050,300 | ) | |||
| Euro | BANT | Sell | 89,981,817 | 121,116,240 | 5/15/14 | 11,093 | (2,669,355 | ) | |||
| Euro | BONY | Sell | 2,216,379 | 3,058,250 | 5/15/14 | 9,510 | — | ||||
| Euro | BBU | Sell | 2,503,393 | 3,435,060 | 5/15/14 | 1,701 | (10,184 | ) | |||
| Euro | HSBC | Sell | 3,104,728 | 4,270,346 | 5/15/14 | 9,844 | (10,207 | ) | |||
| Euro | SCBT | Sell | 2,454,384 | 3,376,574 | 5/15/14 | 6,032 | (5,587 | ) | |||
| Euro | SSBT | Sell | 906,017 | 1,241,660 | 5/15/14 | — | (4,612 | ) | |||
| Euro | BANT | Sell | 2,903,773 | 3,922,169 | 5/19/14 | — | (72,137 | ) | |||
| British Pound | BANT | Buy | 6,743,899 | 11,020,971 | 5/21/14 | 134,259 | — | ||||
| British Pound | BBU | Buy | 7,627,228 | 12,456,750 | 5/21/14 | 159,615 | — | ||||
| British Pound | HSBC | Buy | 6,697,809 | 10,936,067 | 5/21/14 | 142,926 | — | ||||
| British Pound | BBU | Sell | 144,166,309 | 231,754,551 | 5/21/14 | — | (6,714,082 | ) | |||
| British Pound | HSBC | Sell | 101,780,627 | 163,663,248 | 5/21/14 | — | (4,694,304 | ) | |||
| Unrealized appreciation (depreciation) | 1,258,152 | (80,303,756 | ) | ||||||||
| Net unrealized appreciation (depreciation) | $ | (79,045,604 | ) | ||||||||
| aMay be comprised of multiple contracts using the same currency and settlement date. | |||||||||||
| See Abbreviations on page 55. | |||||||||||
Annual Report | The accompanying notes are an integral part of these financial statements. | 33
| Mutual Shares Fund | |||
| Financial Statements | |||
| Statement of Assets and Liabilities | |||
| December 31, 2013 | |||
| Assets: | |||
| Investments in securities: | |||
| Cost - Unaffiliated issuers | $ | 11,745,185,278 | |
| Cost - Non-controlled affiliated issuers (Note 11) | 314,085,349 | ||
| Total cost of investments | $ | 12,059,270,627 | |
| Value - Unaffiliated issuers | $ | 15,569,536,612 | |
| Value - Non-controlled affiliated issuers (Note 11) | 630,185,864 | ||
| Total value of investments (includes securities loaned in the amount of $7,071,053) | 16,199,722,476 | ||
| Cash | 1,244,961 | ||
| Foreign currency, at value (cost $4,954,592) | 4,964,884 | ||
| Receivables: | |||
| Investment securities sold | 5,680,163 | ||
| Capital shares sold | 12,747,495 | ||
| Dividends and interest | 51,682,622 | ||
| Due from brokers | 67,053,725 | ||
| Unrealized appreciation on forward exchange contracts | 1,258,152 | ||
| Other assets | 891 | ||
| Total assets | 16,344,355,369 | ||
| Liabilities: | |||
| Payables: | |||
| Investment securities purchased | 114,760 | ||
| Capital shares redeemed | 17,613,756 | ||
| Management fees | 7,695,277 | ||
| Administrative fees | 1,028,088 | ||
| Distribution fees | 4,891,113 | ||
| Transfer agent fees | 3,088,073 | ||
| Trustees’ fees and expenses | �� | 708,584 | |
| Variation margin | 491,588 | ||
| Securities sold short, at value (proceeds $63,192,623) | 65,651,581 | ||
| Payable upon return of securities loaned | 7,268,970 | ||
| Unrealized depreciation on forward exchange contracts | 80,303,756 | ||
| Accrued expenses and other liabilities | 708,852 | ||
| Total liabilities | 189,564,398 | ||
| Net assets, at value | $ | 16,154,790,971 | |
| Net assets consist of: | |||
| Paid-in capital | $ | 12,541,202,188 | |
| Undistributed net investment income | 69,030,288 | ||
| Net unrealized appreciation (depreciation) | 4,055,974,652 | ||
| Accumulated net realized gain (loss) | (511,416,157 | ) | |
| Net assets, at value | $ | 16,154,790,971 | |
34 | The accompanying notes are an integral part of these financial statements. | Annual Report
| Mutual Shares Fund | ||
| Financial Statements (continued) | ||
| Statement of Assets and Liabilities (continued) | ||
| December 31, 2013 | ||
| Class Z: | ||
| Net assets, at value | $ | 7,025,907,555 |
| Shares outstanding | 247,915,072 | |
| Net asset value and maximum offering price per share | $ | 28.34 |
| Class A: | ||
| Net assets, at value | $ | 5,477,733,431 |
| Shares outstanding | 194,790,899 | |
| Net asset value per sharea | $ | 28.12 |
| Maximum offering price per share (net asset value per share ÷ 94.25%) | $ | 29.84 |
| Class C: | ||
| Net assets, at value | $ | 1,236,603,041 |
| Shares outstanding | 44,361,827 | |
| Net asset value and maximum offering price per sharea | $ | 27.88 |
| Class R: | ||
| Net assets, at value | $ | 192,657,945 |
| Shares outstanding | 6,884,793 | |
| Net asset value and maximum offering price per share | $ | 27.98 |
| Class R6: | ||
| Net assets, at value | $ | 2,221,888,999 |
| Shares outstanding | 78,428,864 | |
| Net asset value and maximum offering price per share | $ | 28.33 |
| aRedemption price is equal to net asset value less contingent deferred sales charges, if applicable. | ||
Annual Report | The accompanying notes are an integral part of these financial statements. | 35
| Mutual Shares Fund | ||||
| Financial Statements (continued) | ||||
| Statement of Operations | ||||
| for the year ended December 31, 2013 | ||||
| Investment income: | ||||
| Dividends: | ||||
| Unaffiliated issuers | $ | 295,260,956 | ||
| Non-controlled affiliated issuers (Note 11) | 4,411,990 | |||
| Interest | 96,211,682 | |||
| Income from securities loaned | 311,049 | |||
| Total investment income | 396,195,677 | |||
| Expenses: | ||||
| Management fees (Note 3a) | 85,749,525 | |||
| Administrative fees (Note 3b) | 11,414,546 | |||
| Distribution fees: (Note 3c) | ||||
| Class A | 15,292,423 | |||
| Class B | 10,195 | |||
| Class C | 11,499,348 | |||
| Class R | 1,005,696 | |||
| Transfer agent fees: (Note 3e) | ||||
| Class Z | 8,662,354 | |||
| Class A | 6,201,738 | |||
| Class B | 1,192 | |||
| Class C | 1,395,138 | |||
| Class R | 246,382 | |||
| Class R6 | 198 | |||
| Special servicing agreement fees (Note 12) | 984,416 | |||
| Custodian fees (Note 4) | 385,534 | |||
| Reports to shareholders | 856,673 | |||
| Registration and filing fees | 162,703 | |||
| Professional fees | 338,897 | |||
| Trustees’ fees and expenses | 418,970 | |||
| Dividends on securities sold short | 37,857 | |||
| Other | 189,446 | |||
| Total expenses | 144,853,231 | |||
| Expense reductions (Note 4) | (2,098 | ) | ||
| Net expenses | 144,851,133 | |||
| Net investment income | 251,344,544 | |||
| Realized and unrealized gains (losses): | ||||
| Net realized gain (loss) from: | ||||
| Investments: | ||||
| Unaffiliated issuers | 1,024,730,510 | |||
| Non-controlled affiliated issuers (Note 11) | 12,627,215 | |||
| Written options | 123,525 | |||
| Foreign currency transactions | (26,418,346 | ) | ||
| Futures contracts | (17,316,891 | ) | ||
| Securities sold short | (14,897 | ) | ||
| Net realized gain (loss) | 993,731,116 | |||
| Net change in unrealized appreciation (depreciation) on: | ||||
| Investments | 2,439,906,549 | |||
| Translation of other assets and liabilities denominated in foreign currencies | (43,531,458 | ) | ||
| Net change in unrealized appreciation (depreciation) | 2,396,375,091 | |||
| Net realized and unrealized gain (loss) | 3,390,106,207 | |||
| Net increase (decrease) in net assets resulting from operations | $ | 3,641,450,751 | ||
| 36 | The accompanying notes are an integral part of these financial statements. | | Annual Report | |||
| Mutual Shares Fund | ||||||
| Financial Statements (continued) | ||||||
| Statements of Changes in Net Assets | ||||||
| Year Ended December 31, | ||||||
| 2013 | 2012 | |||||
| Increase (decrease) in net assets: | ||||||
| Operations: | ||||||
| Net investment income | $ | 251,344,544 | $ | 222,806,229 | ||
| Net realized gain (loss) from investments, written options, foreign currency transactions, | ||||||
| futures contracts and securities sold short | 993,731,116 | 793,699,975 | ||||
| Net change in unrealized appreciation (depreciation) on investments and translation of | ||||||
| other assets and liabilities denominated in foreign currencies | 2,396,375,091 | 876,473,376 | ||||
| Net increase (decrease) in net assets resulting from operations | 3,641,450,751 | 1,892,979,580 | ||||
| Distributions to shareholders from: | ||||||
| Net investment income: | ||||||
| Class Z | (108,650,856 | ) | (165,072,302 | ) | ||
| Class A | (70,929,517 | ) | (88,508,981 | ) | ||
| Class B | — | (145,525 | ) | |||
| Class C | (8,234,548 | ) | (12,672,606 | ) | ||
| Class R | (2,105,976 | ) | (3,308,030 | ) | ||
| Class R6 | (36,946,169 | ) | — | |||
| Total distributions to shareholders | (226,867,066 | ) | (269,707,444 | ) | ||
| Capital share transactions: (Note 2) | ||||||
| Class Z | (2,214,251,239 | ) | (867,334,139 | ) | ||
| Class A | (322,542,799 | ) | (612,652,990 | ) | ||
| Class B | (8,747,313 | ) | (51,688,861 | ) | ||
| Class C | (69,514,789 | ) | (148,736,649 | ) | ||
| Class R | (45,098,562 | ) | (52,522,594 | ) | ||
| Class R6 | 1,947,873,302 | — | ||||
| Total capital share transactions | (712,281,400 | ) | (1,732,935,233 | ) | ||
| Net increase (decrease) in net assets | 2,702,302,285 | (109,663,097 | ) | |||
| Net assets: | ||||||
| Beginning of year | 13,452,488,686 | 13,562,151,783 | ||||
| End of year | $ | 16,154,790,971 | $ | 13,452,488,686 | ||
| Undistributed net investment income included in net assets: | ||||||
| End of year | $ | 69,030,288 | $ | 50,267,365 | ||
Annual Report | The accompanying notes are an integral part of these financial statements. | 37
Mutual Shares Fund
Notes to Financial Statements
1. ORGANIZATION AND SIGNIFICANT ACCOUNTING POLICIES
Franklin Mutual Series Funds (Trust) is registered under the Investment Company Act of 1940, as amended, (1940 Act) as an open-end investment company, consisting of seven separate funds. The Mutual Shares Fund (Fund) is included in this report. The financial statements of the remaining funds in the Trust are presented separately. The Fund offers five classes of shares: Class Z, Class A, Class C, Class R and Class R6. Effective May 1, 2013, the Fund began offering a new class of shares, Class R6. Effective March 22, 2013, all Class B shares were converted to Class A. Each class of shares differs by its initial sales load, contingent deferred sales charges, voting rights on matters affecting a single class, its exchange privilege and fees primarily due to differing arrangements for distribution and transfer agent fees
The following summarizes the Fund’s significant accounting policies.
a. Financial Instrument Valuation
The Fund’s investments in financial instruments are carried at fair value daily. Fair value is the price that would be received to sell an asset or paid to transfer a liability in an orderly transaction between market participants on the measurement date. The Fund calculates the net asset value (NAV) per share at the close of the New York Stock Exchange (NYSE), generally at 4p.m. Eastern time (NYSE close) on each day the NYSE is open for trading. Under procedures approved by the Trust’s Board of Trustees (the Board), the Fund’s administrator, investment manager and other affiliates have formed the Valuation and Liquidity Oversight Committee (VLOC). The VLOC provides administration and oversight of the Fund’s valuation policies and procedures, which are approved annually by the Board. Among other things, these procedures allow the Fund to utilize independent pricing services, quotations from securities and financial instrument dealers, and other market sources to determine fair value.
Equity securities and derivative financial instruments (derivatives) listed on an exchange or on the NASDAQ National Market System are valued at the last quoted sale price or the official closing price of the day, respectively. Foreign equity securities are valued as of the close of trading on the foreign stock exchange on which the security is primarily traded or as of the NYSE close, whichever is earlier. The value is then converted into its U.S. dollar equivalent at the foreign exchange rate in effect at the NYSE close on the day that the value of the security is determined. Over-the-counter (OTC) securities are valued within the range of the most recent quoted bid and ask prices. Securities that trade in multiple markets or on multiple exchanges are valued according to the broadest and most representative market. Certain equity securities are valued based upon fundamental characteristics or relationships to similar securities. Investments in non-registered money market funds are valued at the closing net asset value.
Debt securities generally trade in the OTC market rather than on a securities exchange. The Fund’s pricing services use multiple valuation techniques to determine fair value. In instances where sufficient market activity exists, the pricing services may utilize a market-based approach through which quotes from market makers are used to determine fair value. In instances where sufficient market activity may not exist or is limited, the pricing services also utilize proprietary
38 | Annual Report
Mutual Shares Fund
Notes to Financial Statements (continued)
| 1. | ORGANIZATION AND SIGNIFICANT ACCOUNTING POLICIES (continued) |
| a. | Financial Instrument Valuation (continued) |
valuation models which may consider market characteristics such as benchmark yield curves, credit spreads, estimated default rates, anticipated market interest rate volatility, coupon rates, anticipated timing of principal repayments, underlying collateral, and other unique security features in order to estimate the relevant cash flows, which are then discounted to calculate the fair value. Securities denominated in a foreign currency are converted into their U.S. dollar equivalent at the foreign exchange rate in effect at the NYSE close on the date that the values of the foreign debt securities are determined.
Certain derivatives trade in the OTC market. The Fund’s pricing services use various techniques including industry standard option pricing models and proprietary discounted cash flow models to determine the fair value of those instruments. The Fund’s net benefit or obligation under the derivative contract, as measured by the fair value of the contract, is included in net assets.
The Fund has procedures to determine the fair value of financial instruments for which market prices are not reliable or readily available. Under these procedures, the VLOC convenes on a regular basis to review such financial instruments and considers a number of factors, including significant unobservable valuation inputs, when arriving at fair value. The VLOC primarily employs a market-based approach which may use related or comparable assets or liabilities, recent transactions, market multiples, book values, and other relevant information for the investment to determine the fair value of the investment. An income-based valuation approach may also be used in which the anticipated future cash flows of the investment are discounted to calculate fair value. Discounts may also be applied due to the nature or duration of any restrictions on the disposition of the investments. Due to the inherent uncertainty of valuations of such investments, the fair values may differ significantly from the values that would have been used had an active market existed. The VLOC employs various methods for calibrating these valuation approaches including a regular review of key inputs and assumptions, transactional back-testing or disposition analysis, and reviews of any related market activity.
Trading in securities on foreign securities stock exchanges and OTC markets may be completed before the daily NYSE close. In addition, trading in certain foreign markets may not take place on every NYSE business day. Occasionally, events occur between the time at which trading in a foreign security is completed and the close of the NYSE that might call into question the reliability of the value of a portfolio security held by the Fund. As a result, differences may arise between the value of the Fund’s portfolio securities as determined at the foreign market close and the latest indications of value at the close of the NYSE. In order to minimize the potential for these differences, the VLOC monitors price movements following the close of trading in foreign stock markets through a series of country specific market proxies (such as baskets of American Depositary Receipts, futures contracts and exchange traded funds). These price movements are measured against established trigger thresholds for each specific market proxy to assist in determining if an event has occurred that may call into question the reliability of the values of the foreign securities held by the Fund. If such an event occurs, the securities may be valued using fair value procedures, which may include the use of independent pricing services.
Annual Report | 39
Mutual Shares Fund
Notes to Financial Statements (continued)
| 1. | ORGANIZATION AND SIGNIFICANT ACCOUNTING POLICIES (continued) |
| a. | Financial Instrument Valuation (continued) |
Also, when the last day of the reporting period is a non-business day, certain foreign markets may be open on those days that the NYSE is closed, which could result in differences between the value of the Fund’s portfolio securities on the last business day and the last calendar day of the reporting period. Any significant security valuation changes due to an open foreign market are adjusted and reflected by the Fund for financial reporting purposes.
b. Foreign Currency Translation
Portfolio securities and other assets and liabilities denominated in foreign currencies are translated into U.S. dollars based on the exchange rate of such currencies against U.S. dollars on the date of valuation. The Fund may enter into foreign currency exchange contracts to facilitate transactions denominated in a foreign currency. Purchases and sales of securities, income and expense items denominated in foreign currencies are translated into U.S. dollars at the exchange rate in effect on the transaction date. Portfolio securities and assets and liabilities denominated in foreign currencies contain risks that those currencies will decline in value relative to the U.S. dollar. Occasionally, events may impact the availability or reliability of foreign exchange rates used to convert the U.S. dollar equivalent value. If such an event occurs, the foreign exchange rate will be valued at fair value using procedures established and approved by the Board.
The Funds do not separately report the effect of changes in foreign exchange rates from changes in market prices on securities held. Such changes are included in net realized and unrealized gain or loss from investments on the Statement of Operations.
Realized foreign exchange gains or losses arise from sales of foreign currencies, currency gains or losses realized between the trade and settlement dates on securities transactions and the difference between the recorded amounts of dividends, interest, and foreign withholding taxes and the U.S. dollar equivalent of the amounts actually received or paid. Net unrealized foreign exchange gains and losses arise from changes in foreign exchange rates on foreign denominated assets and liabilities other than investments in securities held at the end of the reporting period.
c. Derivative Financial Instruments
The Fund invested in derivatives in order to manage risk or gain exposure to various other investments or markets. Derivatives are financial contracts based on an underlying or notional amount, require no initial investment or an initial net investment that is smaller than would normally be required to have a similar response to changes in market factors, and require or permit net settlement. Derivatives contain various risks including the potential inability of the counter-party to fulfill their obligations under the terms of the contract, the potential for an illiquid secondary market, and/or the potential for market movements which expose the Fund to gains or losses in excess of the amounts shown on the Statement of Assets and Liabilities. Realized gain and loss and unrealized appreciation and depreciation on these contracts for the period are included in the Statement of Operations.
40 | Annual Report
Mutual Shares Fund
Notes to Financial Statements (continued)
| 1. | ORGANIZATION AND SIGNIFICANT ACCOUNTING POLICIES (continued) |
| c. | Derivative Financial Instruments (continued) |
Derivative counterparty credit risk is managed through a formal evaluation of the creditworthiness of all potential counterparties. The Fund attempts to reduce its exposure to counterparty credit risk on OTC derivatives, whenever possible, by entering into International Swaps and Derivatives Association (ISDA) master agreements with certain counterparties. These agreements contain various provisions, including but not limited to collateral requirements, events of default, or early termination. Termination events applicable to the counterparty include certain deteriorations in the credit quality of the counterparty. Termination events applicable to the Fund include failure of the Fund to maintain certain net asset levels and/or limit the decline in net assets over various periods of time. In the event of default or early termination, the ISDA master agreement gives the non-defaulting party the right to net and close-out all transactions traded, whether or not arising under the ISDA agreement, to one net amount payable by one counterparty to the other. However, absent an event of default or early termination, OTC derivative assets and liabilities are presented gross and not offset in the Statement of Assets and Liabilities. Early termination by the counterparty may result in an immediate payment by the Fund of any net liability owed to that counterparty under the ISDA agreement. At December 31, 2013, the Fund had OTC derivatives in a net liability position of $78,973,535 and the aggregate value of collateral pledged for such contracts was $70,069,905.
Collateral requirements differ by type of derivative. Collateral or initial margin requirements are set by the broker or exchange clearing house for exchange traded and centrally cleared derivatives. Initial margin deposited is held at the exchange and can be in the form of cash and/or securities. For OTC derivatives traded under an ISDA master agreement, posting of collateral is required by either the Fund or the applicable counterparty if the total net exposure of all OTC derivatives with the applicable counterparty exceeds the minimum transfer amount, which typically ranges from $100,000 to $250,000, and can vary depending on the counterparty and the type of the agreement. Generally, collateral is determined at the close of fund business each day and any additional collateral required due to changes in derivative values may be delivered by the Fund or the counterparty within a few business days. Collateral pledged and/or received by the Fund for OTC derivatives, if any, is held in segregated accounts with the Fund’s custodian/counterparty broker and can be in the form of cash and/or securities. Unrestricted cash may be invested according to the Fund’s investment objectives.
The Fund entered into exchange traded futures contracts primarily to manage exposure to certain foreign currencies. A futures contract is an agreement between the Fund and a counterparty to buy or sell an asset for a specified price on a future date. Required initial margins are pledged by the Fund, and the daily change in fair value is accounted for as a variation margin payable or receivable on the Statement of Assets and Liabilities.
The Fund entered into OTC forward exchange contracts primarily to manage exposure to certain foreign currencies. A forward exchange contract is an agreement between the Fund and a coun-terparty to buy or sell a foreign currency at a specific exchange rate on a future date.
Annual Report | 41
Mutual Shares Fund
Notes to Financial Statements (continued)
| 1. | ORGANIZATION AND SIGNIFICANT ACCOUNTING POLICIES (continued) |
| c. | Derivative Financial Instruments (continued) |
The Fund purchased or wrote exchange traded option contracts primarily to manage exposure to equity price risk. An option is a contract entitling the holder to purchase or sell a specific amount of shares or units of an asset or notional amount of a swap (swaption), at a specified price. Options purchased are recorded as an asset while options written are recorded as a liability. Upon exercise of an option, the acquisition cost or sales proceeds of the underlying investment is adjusted by any premium received or paid. Upon expiration of an option, any premium received or paid is recorded as a realized gain or loss. Upon closing an option other than through expiration or exercise, the difference between the premium and the cost to close the position is recorded as a realized gain or loss.
See Notes 7 and 10 regarding investment transactions and other derivative information, respectively.
d. Securities Sold Short
The Fund is engaged in selling securities short, which obligates the Fund to replace a borrowed security with the same security at current market value. The Fund incurs a loss if the price of the security increases between the date of the short sale and the date on which the Fund replaces the borrowed security. The Fund realizes a gain if the price of the security declines between those dates. Gains are limited to the price at which the Fund sold the security short, while losses are potentially unlimited in size.
The Fund is required to establish a margin account with the broker lending the security sold short. While the short sale is outstanding, the broker retains the proceeds of the short sale to the extent necessary to meet margin requirements until the short position is closed out. A deposit must also be maintained with the Fund’s custodian/counterparty broker consisting of cash and/or securities having a value equal to a specified percentage of the value of the securities sold short. The Fund is obligated to pay fees for borrowing the securities sold short and is required to pay the counterparty any dividends or interest due on securities sold short. Such dividends or interest and any security borrowing fees are recorded as an expense to the Fund.
e. Securities Lending
The Fund participates in an agency based securities lending program. The Fund receives cash collateral against the loaned securities in an amount equal to at least 102% of the market value of the loaned securities. Collateral is maintained over the life of the loan in an amount not less than 100% of the market value of loaned securities, as determined at the close of fund business each day; any additional collateral required due to changes in security values is delivered to the Fund on the next business day. The collateral is invested in a non-registered money fund as indicated on the Statement of Investments. The Fund receives income from the investment of cash collateral, in addition to lending fees and rebates paid by the borrower. The Fund bears the market risk with respect to the collateral investment, securities loaned, and the risk that the agent may default on its obligations to the Fund. The securities lending agent has agreed to indemnify the Fund in the event of default by a third party borrower.
42 | Annual Report
Mutual Shares Fund
Notes to Financial Statements (continued)
| 1. | ORGANIZATION AND SIGNIFICANT ACCOUNTING POLICIES (continued) |
| f. | Senior Floating Rate Interests |
The Fund invests in senior secured corporate loans that pay interest at rates which are periodically reset by reference to a base lending rate plus a spread. These base lending rates are generally the prime rate offered by a designated U.S. bank or the London InterBank Offered Rate (LIBOR). Senior secured corporate loans often require prepayment of principal from excess cash flows or at the discretion of the borrower. As a result, actual maturity may be substantially less than the stated maturity.
Senior secured corporate loans in which the Fund invests are generally readily marketable, but may be subject to certain restrictions on resale.
g. Income and Deferred Taxes
It is the Fund’s policy to qualify as a regulated investment company under the Internal Revenue Code. The Fund intends to distribute to shareholders substantially all of its taxable income and net realized gains to relieve it from federal income and excise taxes. As a result, no provision for U.S. federal income taxes is required.
The Fund may be subject to foreign taxation related to income received, capital gains on the sale of securities and certain foreign currency transactions in the foreign jurisdictions in which it invests. Foreign taxes, if any, are recorded based on the tax regulations and rates that exist in the foreign markets in which the Fund invests. When a capital gain tax is determined to apply the Fund records an estimated deferred tax liability in an amount that would be payable if the securities were disposed of on the valuation date.
The Fund recognizes the tax benefits of uncertain tax positions only when the position is “more likely than not” to be sustained upon examination by the tax authorities based on the technical merits of the tax position. As of December 31, 2013, and for all open tax years, the Fund has determined that no liability for unrecognized tax benefits is required in the Fund’s financial statements related to uncertain tax positions taken on a tax return (or expected to be taken on future tax returns). Open tax years are those that remain subject to examination and are based on each tax jurisdiction statute of limitation.
h. Security Transactions, Investment Income, Expenses and Distributions
Security transactions are accounted for on trade date. Realized gains and losses on security transactions are determined on a specific identification basis. Interest income and estimated expenses are accrued daily. Amortization of premium and accretion of discount on debt securities are included in interest income. Dividend income and dividends declared on securities sold short are recorded on the ex-dividend date except that certain dividends from foreign securities are recognized as soon as the Fund is notified of the ex-dividend date. Distributions to shareholders are recorded on the ex-dividend date and are determined according to income tax regulations (tax basis). Distributable earnings determined on a tax basis may differ from earnings recorded in accordance with accounting principles generally accepted in the United States of America. These differences may be permanent
Annual Report | 43
Mutual Shares Fund
Notes to Financial Statements (continued)
| 1. | ORGANIZATION AND SIGNIFICANT ACCOUNTING POLICIES (continued) |
| h. | Security Transactions, Investment Income, Expenses and Distributions (continued) |
or temporary. Permanent differences are reclassified among capital accounts to reflect their tax character. These reclassifications have no impact on net assets or the results of operations. Temporary differences are not reclassified, as they may reverse in subsequent periods.
Common expenses incurred by the Trust are allocated among the funds based on the ratio of net assets of each fund to the combined net assets of the Trust. Fund specific expenses are charged directly to the fund that incurred the expense.
Realized and unrealized gains and losses and net investment income, not including class specific expenses, are allocated daily to each class of shares based upon the relative proportion of net assets of each class. Differences in per share distributions, by class, are generally due to differences in class specific expenses.
Distributions received by the Fund from certain securities may be a return of capital (ROC). Such distributions reduce the cost basis of the securities, and any distributions in excess of the cost basis are recognized as capital gains.
i. Accounting Estimates
The preparation of financial statements in accordance with accounting principles generally accepted in the United States of America requires management to make estimates and assumptions that affect the reported amounts of assets and liabilities at the date of the financial statements and the amounts of income and expenses during the reporting period. Actual results could differ from those estimates.
j. Guarantees and Indemnifications
Under the Trust’s organizational documents, its officers and trustees are indemnified by the Trust against certain liabilities arising out of the performance of their duties to the Trust. Additionally, in the normal course of business, the Trust, on behalf of the Fund, enters into contracts with service providers that contain general indemnification clauses. The Trust’s maximum exposure under these arrangements is unknown as this would involve future claims that may be made against the Trust that have not yet occurred. Currently, the Trust expects the risk of loss to be remote.
44 | Annual Report
Mutual Shares Fund
Notes to Financial Statements (continued)
2. SHARES OF BENEFICIAL INTEREST
At December 31, 2013, there were an unlimited number of shares authorized (without par value). Transactions in the Fund’s shares were as follows:
| Year Ended December 31, | |||||||||||
| 2013 | 2012 | ||||||||||
| Shares | Amount | Shares | Amount | ||||||||
| Class Z Shares: | |||||||||||
| Shares sold | 23,777,445 | $ | 610,905,219 | 18,042,723 | $ | 390,428,745 | |||||
| Shares issued in reinvestment | |||||||||||
| of distributions | 3,583,743 | 98,456,406 | 6,722,684 | 152,103,923 | |||||||
| Shares redeemeda | (116,412,728 | ) | (2,923,612,864 | ) | (65,666,075 | ) | (1,409,866,807 | ) | |||
| Net increase (decrease) | (89,051,540 | ) | $ | (2,214,251,239 | ) | (40,900,668 | ) | $ | (867,334,139 | ) | |
| Class A Shares: | |||||||||||
| Shares sold | 19,131,649 | $ | 488,767,639 | 19,317,648 | $ | 413,524,340 | |||||
| Shares issued in reinvestment | |||||||||||
| of distributions | 2,409,509 | 65,436,121 | 3,634,576 | 81,513,903 | |||||||
| Shares redeemed | (34,406,256 | ) | (876,746,559 | ) | (51,623,600 | ) | (1,107,691,233 | ) | |||
| Net increase (decrease) | (12,865,098 | ) | $ | (322,542,799 | ) | (28,671,376 | ) | $ | (612,652,990 | ) | |
| Class B Sharesb: | |||||||||||
| Shares sold | 561 | $ | 13,200 | 15,688 | $ | 330,652 | |||||
| Shares issued in reinvestment | |||||||||||
| of distributions | — | — | 5,699 | 124,922 | |||||||
| Shares redeemed | (373,830 | ) | (8,760,513 | ) | (2,477,059 | ) | (52,144,435 | ) | |||
| Net increase (decrease) | (373,269 | ) | $ | (8,747,313 | ) | (2,455,672 | ) | $ | (51,688,861 | ) | |
| Class C Shares: | |||||||||||
| Shares sold | 3,626,063 | $ | 91,651,237 | 3,007,472 | $ | 64,043,529 | |||||
| Shares issued in reinvestment | |||||||||||
| of distributions | 293,487 | 7,744,860 | 532,311 | 11,776,943 | |||||||
| Shares redeemed | (6,713,803 | ) | (168,910,886 | ) | (10,599,333 | ) | (224,557,121 | ) | |||
| Net increase (decrease) | (2,794,253 | ) | $ | (69,514,789 | ) | (7,059,550 | ) | $ | (148,736,649 | ) | |
| Class R Shares: | |||||||||||
| Shares sold | 1,292,806 | $ | 32,376,979 | 1,390,782 | $ | 29,530,926 | |||||
| Shares issued in reinvestment | |||||||||||
| of distributions | 78,123 | 2,098,501 | 148,057 | 3,297,636 | |||||||
| Shares redeemed | (3,105,285 | ) | (79,574,042 | ) | (4,023,769 | ) | (85,351,156 | ) | |||
| Net increase (decrease) | (1,734,356 | ) | $ | (45,098,562 | ) | (2,484,930 | ) | $ | (52,522,594 | ) | |
| Class R6 Sharesc: | |||||||||||
| Shares solda | 82,984,840 | $ | 2,067,192,481 | ||||||||
| Shares issued in reinvestment | |||||||||||
| of distributions | 1,344,162 | 36,946,169 | |||||||||
| Shares redeemed | (5,900,138 | ) | (156,265,348 | ) | |||||||
| Net increase (decrease) | 78,428,864 | $ | 1,947,873,302 | ||||||||
| aEffective May 1, 2013, a portion of Class Z shares were exchanged into Class R6. | |||||||||||
| bEffective March 22, 2013, all Class B shares were converted to Class A. | |||||||||||
| cFor the period May 1, 2013 (effective date) to December 31, 2013. | |||||||||||
Annual Report | 45
Mutual Shares Fund
Notes to Financial Statements (continued)
3. TRANSACTIONS WITH AFFILIATES
Franklin Resources, Inc. is the holding company for various subsidiaries that together are referred to as Franklin Templeton Investments. Certain officers and trustees of the Fund are also officers and/or directors of the following subsidiaries:
| Subsidiary | Affiliation |
| Franklin Mutual Advisers, LLC (Franklin Mutual) | Investment manager |
| Franklin Templeton Services, LLC (FT Services) | Administrative manager |
| Franklin Templeton Distributors, Inc. (Distributors) | Principal underwriter |
| Franklin Templeton Investor Services, LLC (Investor Services) | Transfer agent |
a. Management Fees
The Fund pays an investment management fee to Franklin Mutual based on the average daily net assets of the Fund as follows:
| Annualized Fee Rate | Net Assets | |
| 0.600 | % | Up to and including $5 billion |
| 0.570 | % | Over $5 billion, up to and including $10 billion |
| 0.550 | % | Over $10 billion, up to and including $15 billion |
| 0.520 | % | Over $15 billion, up to and including $20 billion |
| 0.510 | % | Over $20 billion, up to and including $25 billion |
| 0.490 | % | Over $25 billion, up to and including $30 billion |
| 0.480 | % | Over $30 billion, up to and including $35 billion |
| 0.470 | % | In excess of $35 billion |
b. Administrative Fees
The Fund pays its allocated share of an administrative fee to FT Services based on the Trust’s aggregate average daily net assets as follows:
| Annualized Fee Rate | Net Assets | |
| 0.150 | % | Up to and including $200 million |
| 0.135 | % | Over $200 million, up to and including $700 million |
| 0.100 | % | Over $700 million, up to and including $1.2 billion |
| 0.075 | % | In excess of $1.2 billion |
c. Distribution Fees
The Board has adopted distribution plans for each share class, with the exception of Class Z and Class R6 shares, pursuant to Rule 12b-1 under the 1940 Act. Distribution fees are not charged on shares held by affiliates. Under the Fund’s Class A reimbursement distribution plan, the Fund reimburses Distributors for costs incurred in connection with the servicing, sale and distribution of the Fund’s shares up to the maximum annual plan rate. Under the Class A reimbursement distribution plan, costs exceeding the maximum for the current plan year cannot be reimbursed in subsequent periods. In addition, under the Fund’s Class B, C and R compensation distribution plans, the Fund pays Distributors for costs incurred in connection with the servicing, sale and distribution of the Fund’s shares up to the maximum annual plan rate for each class. The plan year, for purposes of monitoring compliance with the maximum annual plan rates, is February 1 through January 31.
46 | Annual Report
Mutual Shares Fund
Notes to Financial Statements (continued)
| 3. | TRANSACTIONS WITH AFFILIATES (continued) |
| c. | Distribution Fees (continued) |
The maximum annual plan rates, based on the average daily net assets, for each class, are as follows:
| Class A | 0.35 | % |
| Class B | 1.00 | % |
| Class C | 1.00 | % |
| Class R | 0.50 | % |
The Board has set the current rate at 0.30% per year for Class A shares until further notice and approval by the Board.
d. Sales Charges/Underwriting Agreements
Front-end sales charges and contingent deferred sales charges (CDSC) do not represent expenses of the Fund. These charges are deducted from the proceeds of sales of Fund shares prior to investment or from redemption proceeds prior to remittance, as applicable. Distributors has advised the Fund of the following commission transactions related to the sales and redemptions of the Fund’s shares for the year:
| Sales charges retained net of commissions | ||
| paid to unaffiliated broker/dealers | $ | 1,408,677 |
| CDSC retained | $ | 38,162 |
e. Transfer Agent Fees
Each class of shares, except for Class R6, pays transfer agent fees to Investor Services for its performance of shareholder servicing obligations and reimburses Investor Services for out of pocket expenses incurred, including shareholding servicing fees paid to third parties. These fees are allocated daily based upon their relative proportion of such classes’ aggregate net assets. Class R6 pays Investor Services transfer agent fees specific to that class.
For the year ended December 31, 2013, the Fund paid transfer agent fees of $16,507,002, of which $7,926,677 was retained by Investor Services.
f. Waiver and Expense Reimbursements
Investor Services has contractually agreed in advance to waive or limit its fees so that the Class R6 transfer agent fees do not exceed 0.01% until April 30, 2014. There were no expenses waived during the period ended December 31, 2013.
4. EXPENSE OFFSET ARRANGEMENT
The Fund has entered into an arrangement with its custodian whereby credits realized as a result of uninvested cash balances are used to reduce a portion of the Fund’s custodian expenses. During the year ended December 31, 2013, the custodian fees were reduced as noted in the Statement of Operations.
Annual Report | 47
Mutual Shares Fund
Notes to Financial Statements (continued)
5. INDEPENDENT TRUSTEES’ RETIREMENT PLAN
On January 1, 1993, the Trust adopted an Independent Trustees’ Retirement Plan (Plan). The Plan is an unfunded defined benefit plan that provides benefit payments to Trustees whose length of service and retirement age meets the eligibility requirements of the Plan. Benefits under the Plan are based on years of service and fees paid to each trustee at the time of retirement. Effective in December 1996, the Plan was closed to new participants.
During the year ended December 31, 2013, the Fund’s projected benefit obligation and benefit payments under the Plan were as follows:
| aProjected benefit obligation at December 31, 2013 | $ | 708,584 |
| bDecrease in projected benefit obligation | $ | 18,293 |
| Benefit payments made to retired trustees | $ | 17,956 |
aThe projected benefit obligation is included in accrued expenses and other liabilities in the Statement of Assets and Liabilities.
bThe decrease in projected benefit obligation is included in trustees’ fees and expenses in the Statement of Operations.
6. INCOME TAXES
For tax purposes, capital losses may be carried over to offset future capital gains, if any. Capital loss carryforwards with no expiration, if any, must be fully utilized before those losses with expiration dates.
At December 31, 2013, the Fund had capital loss carryforwards of $579,853,821 expiring in 2017. During the year ended December 31, 2013, the Fund utilized $958,590,330 of capital loss carryforwards.
For tax purposes, the Fund may elect to defer any portion of a post-October capital loss to the first day of the following fiscal year. At December 31, 2013, the Fund deferred post-October capital losses of $11,110,804.
The tax character of distributions paid during the years ended December 31, 2013 and 2012, was as follows:
| 2013 | 2012 | |||
| Distributions paid from ordinary income | $ | 226,867,066 | $ | 269,707,444 |
At December 31, 2013, the cost of investments, net unrealized appreciation (depreciation) and undistributed ordinary income for income tax purposes were as follows:
| Cost of investments | $ | 12,101,716,751 | |
| Unrealized appreciation | $ | 4,724,559,331 | |
| Unrealized depreciation | (626,553,606 | ) | |
| Net unrealized appreciation (depreciation) | $ | 4,098,005,725 | |
| Distributable earnings – undistributed ordinary income | $ | 109,585,365 | |
48 | Annual Report
Mutual Shares Fund
Notes to Financial Statements (continued)
6. INCOME TAXES (continued)
Differences between income and/or capital gains as determined on a book basis and a tax basis are primarily due to differing treatments of foreign currency transactions, bonds discounts and premiums, corporate actions and defaulted securities.
7. INVESTMENT TRANSACTIONS
Purchases and sales of investments (excluding short term securities and securities sold short) for the year ended December 31, 2013, aggregated $3,286,292,241 and $3,716,456,499, respectively.
Transactions in options written during the year ended December 31, 2013, were as follows:
| Number of | Premiums | ||||
| Contracts | Received | ||||
| Options outstanding at December 31, 2012 | — | $ | — | ||
| Options written | 1,143 | 386,313 | |||
| Options expired | — | — | |||
| Options exercised | (978 | ) | (214,382 | ) | |
| Options closed | (165 | ) | (171,931 | ) | |
| Options outstanding at December 31, 2013 | — | $ | — |
See Notes 1(c) and 10 regarding derivative financial instruments and other derivative information, respectively.
8. CREDIT RISK AND DEFAULTED SECURITIES
The Fund may purchase the pre-default or defaulted debt of distressed companies. Distressed companies are financially troubled and are about to be or are already involved in financial restructuring or bankruptcy. Risks associated with purchasing these securities include the possibility that the bankruptcy or other restructuring process takes longer than expected, or that distributions in restructuring are less than anticipated, either or both of which may result in unfavorable consequences to the Fund. If it becomes probable that the income on debt securities, including those of distressed companies, will not be collected, the Fund discontinues accruing income and recognizes an adjustment for uncollectible interest.
At December 31, 2013, the aggregate value of distressed company securities for which interest recognition has been discontinued was $43,660,429, representing 0.27% of the Fund’s net assets. For information as to specific securities, see the accompanying Statement of Investments.
Annual Report | 49
Mutual Shares Fund
Notes to Financial Statements (continued)
9. RESTRICTED SECURITIES
The Fund invests in securities that are restricted under the Securities Act of 1933 (1933 Act) or which are subject to legal, contractual, or other agreed upon restrictions on resale. Restricted securities are often purchased in private placement transactions, and cannot be sold without prior registration unless the sale is pursuant to an exemption under the 1933 Act. Disposal of these securities may require greater effort and expense, and prompt sale at an acceptable price may be difficult. The Fund may have registration rights for restricted securities. The issuer generally incurs all registration costs.
At December 31, 2013, the Fund held investments in restricted securities, excluding certain securities exempt from registration under the 1933 Act deemed to be liquid, as follows:
| Principal Amount | ||||||||
| Shares/ | Acquisition | |||||||
| Warrants | Issuer | Dates | Cost | Value | ||||
| 19,594 | Broadband Ventures III LLC, | |||||||
| secured promissory note, 5.00%, | ||||||||
| 2/01/12 | 7/01/10 - 11/30/12 | $ | 19,594 | $ | — | |||
| 43,105,703 | CB FIM Coinvestors LLC | 1/15/09 - 6/02/09 | — | — | ||||
| 50,163 | aColumbia Banking System Inc., wts., C, | |||||||
| 10/23/16 | 10/23/09 | — | 9,489,536 | |||||
| 53,924,666 | FIM Coinvestor Holdings I, LLC | 11/20/06 - 6/02/09 | — | — | ||||
| 453,016 | First Southern Bancorp Inc. | 1/27/10 - 7/07/10 | 9,558,638 | 2,183,628 | ||||
| 774 | First Southern Bancorp Inc., | |||||||
| cvt. pfd., C | 1/27/10 - 7/07/10 | 774,000 | 1,444,935 | |||||
| 7,234,813 | International Automotive Components | |||||||
| Group Brazil LLC | 4/13/06 - 12/26/08 | 4,804,678 | 1,409,486 | |||||
| 63,079,866 | International Automotive Components | |||||||
| Group North America, LLC | 1/12/06 - 3/18/13 | 51,662,536 | 35,691,850 | |||||
| 202,380 | Olympus Re Holdings Ltd. | 12/19/01 | 18,959,171 | — | ||||
| Total Restricted Securities | ||||||||
| (Value is 0.31% of Net Assets) | $ | 85,778,617 | $ | 50,219,435 | ||||
| aThe Fund also invests in unrestricted securities or other investments in the issuer, valued at $32,739,598 as of December 31, 2013. | ||||||||
10. OTHER DERIVATIVE INFORMATION
At December 31, 2013, the Fund’s investments in derivative contracts are reflected on the Statement of Assets and Liabilities as follows:
| Asset Derivatives | Liability Derivatives | ||||||
| Derivative Contracts | |||||||
| Not Accounted for as | Statement of Assets and | Fair Value | Statement of Assets and | Fair Value | |||
| Hedging Instruments | Liabilities Location | Amount | Liabilities Location | Amount | |||
| Foreign exchange | |||||||
| contracts | Unrealized appreciation on | $ | 1,258,152 | Unrealized depreciation on | $ | 83,526,701 | a |
| forward exchange contracts | forward exchange contracts / | ||||||
| Net assets consist of - net | |||||||
| unrealized appreciation | |||||||
| (depreciation) | |||||||
aIncludes cumulative appreciation (depreciation) of futures contracts as reported in the Statement of Investments. Only current day’s variation margin is separately reported within the Statement of Assets and Liabilities.
50 | Annual Report
Mutual Shares Fund
Notes to Financial Statements (continued)
10. OTHER DERIVATIVE INFORMATION (continued)
For the year ended December 31, 2013, the effect of derivative contracts on the Fund’s Statement of Operations was as follows:
| Change in | |||||||
| Unrealized | |||||||
| Derivative Contracts | Appreciation | ||||||
| Not Accounted for as | Statement of | Realized Gain (Loss) | (Depreciation) | ||||
| Hedging Instruments | Operations Locations | for the Year | for the Year | ||||
| Foreign exchange | |||||||
| contracts | et realized gain (loss) from foreign currency | $ | (44,464,659) | $ | (43,884,820 | ) | |
| ansactions and futures contracts / Net change | |||||||
| in unrealized appreciation (depreciation) on | |||||||
| translation of other assets and liabilities | |||||||
| denominated in foreign currencies | |||||||
| Equity contracts | Net realized gain (loss) from written options | 123,525 | |||||
For the year ended December 31, 2013, the average month end fair value of derivatives represented 0.33% of average month end net assets. The average month end number of open derivative contracts for the year was 128.
See Notes 1(c) and 7 regarding derivative financial instruments and investment transactions, respectively.
11. HOLDINGS OF 5% VOTING SECURITIES OF PORTFOLIO COMPANIES
The 1940 Act defines “affiliated companies” to include investments in portfolio companies in which a fund owns 5% or more of the outstanding voting securities. Investments in “affiliated companies” for the Fund for the year ended December 31, 2013, were as shown below.
| Number of | Number of | |||||||||||
| Shares/Warrants | Shares/Warrants | Value at | Realized | |||||||||
| Held at Beginning | Gross | Gross | Held at the | End of | Investment | Capital | ||||||
| Name of Issuer | of Year | Additions | Reductions | End of the Year | Year | Income | Gain (Loss) | |||||
| Controlled Affiliatesa | ||||||||||||
| CB FIM Coinvestors LLC | 43,105,703 | — | — | 43,105,703 | $ | — | $ | — | $ | — | ||
| Non-Controlled Affiliates | ||||||||||||
| Alexander’s Inc. | 326,675 | — | — | 326,675 | $ | 107,802,750 | $ | 3,593,425 | $ | — | ||
| Bond Street Holdings LLC, | ||||||||||||
| A, 144A | 1,647,570 | — | — | 1,647,570 | 24,713,550 | — | — | |||||
| Federal Signal Corp. | 3,360,800 | — | — | 3,360,800 | 49,235,720 | — | — | |||||
| Guaranty Bancorp | 5,731,834 | — | 4,585,468 | b | 1,146,366 | 16,106,442 | 85,978 | — | ||||
| International Automotive | ||||||||||||
| Components Group Brazil | ||||||||||||
| LLC | 7,234,813 | — | — | 7,234,813 | 1,409,486 | — | — | |||||
| International Automotive | ||||||||||||
| Components Group North | ||||||||||||
| America, LLC | 46,695,640 | 16,384,226 | — | 63,079,866 | 35,691,850 | — | — | |||||
Annual Report | 51
Mutual Shares Fund
Notes to Financial Statements (continued)
11. HOLDINGS OF 5% VOTING SECURITIES OF PORTFOLIO COMPANIES (continued)
| Number of | Number of | |||||||||
| Shares/Warrants | Shares/Warrants | Value at | Realized | |||||||
| Held at Beginning | Gross | Gross | Held at the | End of | Investment | Capital | ||||
| Name of Issuer | of Year | Additions | Reductions | End of the Year | Year | Income | Gain (Loss) | |||
| Non-Controlled Affiliates (continued) | ||||||||||
| West Coast Bancorp | 1,469,240 | — | 1,469,240 | — | $ | — | $ | 73,462 | $ | 12,627,215 |
| West Coast Bancorp, cvt. | ||||||||||
| pfd., B | 7,558 | — | 7,558 | — | — | 3,779 | — | |||
| West Coast Bancorp, wts., | ||||||||||
| C, 10/23/16 | 43,036 | — | 43,036 | — | — | — | — | |||
| White Mountains Insurance | ||||||||||
| Group Ltd. | 655,346 | — | — | 655,346 | 395,226,066 | 655,346 | — | |||
| Total Non-Controlled Affiliates | $ | 630,185,864 | $ | 4,411,990 | $ | 12,627,215 | ||||
| Total Affiliated Securities (Value is 3.90% of Net Assets) | $ | 630,185,864 | $ | 4,411,990 | $ | 12,627,215 | ||||
aIssuer in which the Fund owns 25% or more of the outstanding voting securities.
bReflects a 1:5 reverse stock split during the current year. Balance as of May 21, 2013, was 5,731,834.
12. SPECIAL SERVICING AGREEMENT
The Fund, which is an eligible underlying investment of one or more of the Franklin Templeton Fund Allocator Series Funds (Allocator Funds), participates in a Special Servicing Agreement (SSA) with the Allocator Funds and certain service providers of the Fund and the Allocator Funds. Under the SSA, the Fund may pay a portion of the Allocator Funds’ expenses (other than any asset allocation, administrative, and distribution fees) to the extent such payments are less than the amount of the benefits realized or expected to be realized by the Fund (e.g., due to reduced costs associated with servicing accounts) from the investment in the Fund by the Allocator Funds. The Allocator Funds are either managed by Franklin Advisers, Inc. or administered by FT Services, affiliates of Franklin Mutual. For the year ended December 31, 2013, the Fund was held by one or more of the Allocator Funds and the amount of expenses borne by the Fund is noted in the Statement of Operations. At December 31, 2013, 13.70% of the Fund’s outstanding shares were held by one or more of the Allocator Funds. Effective May 1, 2013, the SSA was discontinued until further notice.
13. CREDIT FACILITY
The Fund, together with other U.S. registered and foreign investment funds (collectively, Borrowers), managed by Franklin Templeton Investments, are borrowers in a joint syndicated senior unsecured credit facility totaling $1.5 billion (Global Credit Facility) which, after an extension of the original terms, matured on February 14, 2014. This Global Credit Facility provides a source of funds to the Borrowers for temporary and emergency purposes, including the ability to meet future unanticipated or unusually large redemption requests. Effective February 14, 2014, the Borrowers renewed the Global Credit Facility which matures on February 13, 2015.
52 | Annual Report
Mutual Shares Fund
Notes to Financial Statements (continued)
13. CREDIT FACILITY (continued)
Under the terms of the Global Credit Facility, the Fund shall, in addition to interest charged on any borrowings made by the Fund and other costs incurred by the Fund, pay its share of fees and expenses incurred in connection with the implementation and maintenance of the Global Credit Facility, based upon its relative share of the aggregate net assets of all of the Borrowers, including an annual commitment fee of 0.07% based upon the unused portion of the Global Credit Facility. These fees are reflected in other expenses on the Statement of Operations. During the year ended December 31, 2013, the Fund did not use the Global Credit Facility.
14. FAIR VALUE MEASUREMENTS
The Fund follows a fair value hierarchy that distinguishes between market data obtained from independent sources (observable inputs) and the Fund’s own market assumptions (unobservable inputs). These inputs are used in determining the value of the Fund’s financial instruments and are summarized in the following fair value hierarchy:
- Level 1 – quoted prices in active markets for identical financial instruments
- Level 2 – other significant observable inputs (including quoted prices for similar financial instruments, interest rates, prepayment speed, credit risk, etc.)
- Level 3 – significant unobservable inputs (including the Fund’s own assumptions in deter- mining the fair value of financial instruments)
The input levels are not necessarily an indication of the risk or liquidity associated with financial instruments at that level.
For movements between the levels within the fair value hierarchy, the Fund has adopted a policy of recognizing the transfers as of the date of the underlying event which caused the movement.
A summary of inputs used as of December 31, 2013, in valuing the Fund’s assets and liabilities carried at fair value, is as follows:
| Level 1 | Level 2 | Level 3 | Total | |||||
| Assets: | ||||||||
| Investments in Securities: | ||||||||
| Equity Investments:a | ||||||||
| Auto Components | $ | — | $ | — | $ | 37,101,336 | $ | 37,101,336 |
| Commercial Banks | 851,574,513 | 2,423,523 | 37,831,649 | 891,829,685 | ||||
| Machinery | 267,986,896 | 60,360,325 | — | 328,347,221 | ||||
| Media | 1,028,620,391 | 36,232,837 | — | 1,064,853,228 | ||||
| Real Estate Management & | ||||||||
| Development | 69,471,497 | — | 73,710,322 | 143,181,819 | ||||
| All Other Equity Investmentsb | 11,731,415,195 | — | —c | 11,731,415,195 |
Annual Report | 53
| Mutual Shares Fund | |||||||||
| Notes to Financial Statements (continued) | |||||||||
| 14. FAIR VALUE MEASUREMENTS (continued) | |||||||||
| Level 1 | Level 2 | Level 3 | Total | ||||||
| Assets: (continued) | |||||||||
| Investments in Securities: (continued) | |||||||||
| Corporate Bonds, Notes and | |||||||||
| Senior Floating Rate | |||||||||
| Interests | $ | — | $ | 863,501,574 | $ | — | $ | 863,501,574 | |
| Corporate Notes in | |||||||||
| Reorganization | — | 43,660,429 | — c | 43,660,429 | |||||
| Companies in Liquidation | 199,935 | 189,222,304 | —c | 189,422,239 | |||||
| Short Term Investments | 899,140,780 | 7,268,970 | — | 906,409,750 | |||||
| Total Investments in Securities | $ | 14,848,409,207 | $ | 1,202,669,962 | $ | 148,643,307 | $ | 16,199,722,476 | |
| Forward Exchange Contracts | $ | — | $ | 1,258,152 | $ | — | $ | 1,258,152 | |
| Liabilities: | |||||||||
| Securities Sold Short | 65,651,581 | — | — | 65,651,581 | |||||
| Futures Contracts | 3,222,945 | — | — | 3,222,945 | |||||
| Forward Exchange Contracts | — | 80,303,756 | — | 80,303,756 | |||||
alncludes common and convertible preferred stocks as well as other equity investments.
bFor detailed categories, see the accompanying Statement of Investments.
cIncludes securities determined to have no value at December 31, 2013.
A reconciliation of assets in which Level 3 inputs are used in determining fair value is presented
when there are significant Level 3 investments at the end of the year.
15. NEW ACCOUNTING PRONOUNCEMENTS
In June 2013, the Financial Accounting Standards Board issued Accounting Standards Update (ASU) No. 2013-08, Investment Companies (Topic 946): Amendments to the Scope, Measurement, and Disclosure Requirements. The ASU modifies the criteria used in defining an investment company under U.S. Generally Accepted Accounting Principles and also sets forth certain measurement and disclosure requirements. Under the ASU, an entity that is registered under the 1940 Act automatically qualifies as an investment company. The ASU is effective for interim and annual reporting periods beginning after December 15, 2013. Management has reviewed the requirements and believes the adoption of this ASU will not have a material impact on the financial statements.
16. SUBSEQUENT EVENTS
The Fund has evaluated subsequent events through the issuance of the financial statements and determined that no events have occurred that require disclosure other than those already disclosed in the financial statements.
54 | Annual Report
| Mutual Shares Fund | |||||
| Notes to Financial Statements (continued) | |||||
| ABBREVIATIONS | |||||
| Counterparty | Currency | Selected Portfolio | |||
| BANT | -Bankof America N.A. | CAD | -CanadianDollar | ADR | - American Depositary Receipt |
| BBU | - Barclays Bank PLC | EUR | - Euro | FRN | - Floating Rate Note |
| BONY | -Bankof New York Mellon | GBP | - British Pound | IDR | -InternationalDepositary Receipt |
| DBFX | - Deutsche Bank AG | JPY | - Japanese Yen | ||
| FBCO | - Credit Suisse Group AG | USD | -UnitedStates Dollar | ||
| HSBC | - HSBC Bank USA, N.A. | ||||
| SCBT | - Standard Chartered Bank | ||||
| SSBT | - State Street Bank and | ||||
| Trust Co., N.A. | |||||
Annual Report | 55
Mutual Shares Fund
Report of Independent Registered Public Accounting Firm
To the Board of Trustees of Franklin Mutual Series Funds and Shareholders of the Mutual Shares Fund:
We have audited the accompanying statement of assets and liabilities, including the statement of investments, of Mutual Shares Fund (the “Fund”) (one of the funds constituting Franklin Mutual Series Funds), as of December 31, 2013, and the related statement of operations for the year then ended, the statements of changes in net assets for each of the two years in the period then ended, and the financial highlights for each of the periods indicated therein. These financial statements and financial highlights are the responsibility of the Fund’s management. Our responsibility is to express an opinion on these financial statements and financial highlights based on our audits.
We conducted our audits in accordance with the standards of the Public Company Accounting Oversight Board (United States). Those standards require that we plan and perform the audit to obtain reasonable assurance about whether the financial statements and financial highlights are free of material misstatement. We were not engaged to perform an audit of the Fund’s internal control over financial reporting. Our audits included consideration of internal control over financial reporting as a basis for designing audit procedures that are appropriate in the circumstances, but not for the purpose of expressing an opinion on the effectiveness of the Fund’s internal control over financial reporting. Accordingly, we express no such opinion. An audit also includes examining, on a test basis, evidence supporting the amounts and disclosures in the financial statements and financial highlights, assessing the accounting principles used and significant estimates made by management, and evaluating the overall financial statement presentation. Our procedures included confirmation of securities owned as of December 31, 2013, by correspondence with the custodian and brokers, or by other appropriate auditing procedures where replies from the brokers were not received. We believe that our audits provide a reasonable basis for our opinion.
In our opinion, the financial statements and financial highlights referred to above present fairly, in all material respects, the financial position of the Mutual Shares Fund (one of the Funds constituting Franklin Mutual Series Funds) at December 31, 2013, the results of its operations for the year then ended, the changes in its net assets for each of the two years in the period then ended, and the financial highlights for each of the periods indicated therein, in conformity with U.S. generally accepted accounting principles.

56 | Annual Report
Mutual Shares Fund
Tax Information (unaudited)
Under Section 854(b)(1)(A) of the Internal Revenue Code (Code), the Fund hereby reports 82.77% of the ordinary income dividends as income qualifying for the dividends received deduction for the fiscal year ended December 31, 2013.
Under Section 854(b)(1)(B) of the Code, the Fund hereby reports the maximum amount allowable but no less than $285,384,209 as qualified dividends for purposes of the maximum rate under Section 1(h)(11) of the Code for the fiscal year ended December 31, 2013. Distributions, including qualified dividend income, paid during calendar year 2013 will be reported to shareholders on Form 1099-DIV by mid-February 2014. Shareholders are advised to check with their tax advisors for information on the treatment of these amounts on their individual income tax returns.
Annual Report | 57
Mutual Shares Fund
Board Members and Officers
The name, year of birth and address of the officers and board members, as well as their affiliations, positions held with the Fund, principal occupations during at least the past five years and number of portfolios overseen in the Franklin Templeton Investments fund complex are shown below. Generally, each board member serves until that person’s successor is elected and qualified.
| Independent Board Members | ||||
| Number of Portfolios in | ||||
| Name, Year of Birth | Length of | Fund Complex Overseen | Other Directorships Held | |
| and Address | Position | Time Served | by Board Member* | During at Least the Past 5 Years |
| Edward I. Altman, Ph.D. (1941) | Trustee | Since 1987 | 11 | None |
| c/o Franklin Mutual Advisers, LLC | ||||
| 101 John F. Kennedy Parkway | ||||
| Short Hills, NJ 07078-2789 | ||||
| Principal Occupation During at Least the Past 5 Years: | ||||
| Max L. Heine Professor of Finance and Director of The Credit and Debt Markets Research Program, Salomon Center, Stern School of | ||||
| Business, New York University; editor and author of numerous financial publications; financial consultant; an adviser to numerous financial | ||||
| publishing organizations; and formerly, Vice Director, Salomon Center, Stern School of Business, New York University. | ||||
| Ann Torre Bates (1958) | Trustee | Since 1995 | 38 | SLM Corporation (Sallie Mae), Ares |
| c/o Franklin Mutual Advisers, LLC | Capital Corporation (specialty finance | |||
| 101 John F. Kennedy Parkway | company), Allied Capital Corporation | |||
| Short Hills, NJ 07078-2789 | (financial services) (2003-2010) | |||
| and United Natural Foods, Inc., | ||||
| (October 2013). | ||||
| Principal Occupation During at Least the Past 5 Years: | ||||
| Director of various companies; and formerly, Executive Vice President and Chief Financial Officer, NHP Incorporated (manager of multifamily | ||||
| housing) (1995-1997); and Vice President and Treasurer, US Airways, Inc. (until 1995). | ||||
| Burton J. Greenwald (1929) | Trustee | Since 2002 | 18 | Franklin Templeton Emerging Markets |
| c/o Franklin Mutual Advisers, LLC | Debt Opportunities Fund PLC and | |||
| 101 John F. Kennedy Parkway | Fiduciary International Ireland | |||
| Short Hills, NJ 07078-2789 | Limited. | |||
| Principal Occupation During at Least the Past 5 Years: | ||||
| Managing Director, B.J. Greenwald Associates (management consultants to the financial services industry); and formerly, Chairman, | ||||
| Fiduciary Trust International Funds; Executive Vice President, L.F Rothschild Fund Management, Inc.; President and Director, Merit Mutual | ||||
| Funds; President, Underwriting Division and Director, National Securities & Research Corporation; Governor, Investment Company Institute; | ||||
| and Chairman, ICI Public Information Committee. | ||||
58 | Annual Report
| Number of Portfolios in | |||||
| Name, Year of Birth | Length of | Fund Complex Overseen | Other Directorships Held | ||
| and Address | Position | Time Served | by Board Member* | During at Least the Past 5 Years | |
| Keith E. Mitchell (1954) | Trustee | Since 2009 | 11 | None | |
| c/o Franklin Mutual Advisers, LLC | |||||
| 101 John F. Kennedy Parkway | |||||
| Short Hills, NJ 07078-2789 | |||||
| Principal Occupation During at Least the Past 5 Years: | |||||
| Managing Member, Mitchell, Hartley & Bechtel Advisers, LLC (formerly, Mitchell Advisers, LLC) (advisory firm); director of various boards of | |||||
| asset management firms; and formerly, Managing Director, Putnam Lovell NBF. | |||||
| Charles Rubens II (1930) | Trustee | Since 1998 | 18 | None | |
| c/o Franklin Mutual Advisers, LLC | |||||
| 101 John F. Kennedy Parkway | |||||
| Short Hills, NJ 07078-2789 | |||||
| Principal Occupation During at Least the Past 5 Years: | |||||
| Private investor and president of non-profit organizations; and formerly, an executive of Time, Inc.; and Trustee of Colorado College. | |||||
| Jan Hopkins Trachtman (1947) | Trustee | Since 2009 | 11 | None | |
| c/o Franklin Mutual Advisers, LLC | |||||
| 101 John F. Kennedy Parkway | |||||
| Short Hills, NJ 07078-2789 | |||||
| Principal Occupation During at Least the Past 5 Years: | |||||
| President and Founder, The Jan Hopkins Group (communications consulting firm); President, Economic Club of New York; serves on | |||||
| Advisory Board of Knight Bagehot Fellowship; and formerly, Anchor/Correspondent, CNN Financial News (until 2003); Managing Director | |||||
| and Head of Client Communications, Citigroup Private Bank (until 2005); Off-Air Reporter, ABC News’ World News Tonight; and Editor, CBS | |||||
| Network News. | |||||
| Robert E. Wade (1946) | Trustee and | Trustee since | 45 | El Oro Ltd (investments). | |
| c/o Franklin Mutual Advisers, LLC | Chairman of | 1993 and | |||
| 101 John F. Kennedy Parkway | the Board | Chairman of the | |||
| Short Hills, NJ 07078-2789 | Board since 2005 | ||||
| Principal Occupation During at Least the Past 5 Years: | |||||
| Attorney at law engaged in private practice (1972-2008) and member of various boards. | |||||
| Interested Board Members and Officers | |||||
| Number of Portfolios in | |||||
| Name, Year of Birth | Length of | Fund Complex Overseen | Other Directorships Held | ||
| and Address | Position | Time Served | by Board Member* | During at Least the Past 5 Years | |
| **Gregory E. Johnson (1961) | Trustee | Since 2007 | 152 | None | |
| One Franklin Parkway | |||||
| San Mateo, CA 94403-1906 | |||||
| Principal Occupation During at Least the Past 5 Years: | |||||
| Chairman of the Board, Member – Office of the Chairman, Director, President and Chief Executive Officer, Franklin Resources, Inc.; officer | |||||
| and/or director or trustee, as the case may be, of some of the other subsidiaries of Franklin Resources, Inc. and of 44 of the investment | |||||
| companies in Franklin Templeton Investments; and Chairman, Investment Company Institute. | |||||
Annual Report | 59
| Number of Portfolios in | |||||
| Name, Year of Birth | Length of | Fund Complex Overseen | Other Directorships Held | ||
| and Address | Position | Time Served | by Board Member* | During at Least the Past 5 Years | |
| **Peter A. Langerman (1955) | Trustee, | Trustee since | 11 | American International Group, Inc. | |
| c/o Franklin Mutual Advisers, LLC | President and | 2007, President | (AIG) Credit Facility Trust | ||
| 101 John F. Kennedy Parkway | Chief Executive | and Chief | (2010–2011). | ||
| Short Hills, NJ 07078-2702 | Officer – | Executive Officer – | |||
| Investment | Investment | ||||
| Management | Management | ||||
| since 2005 | |||||
| Principal Occupation During at Least the Past 5 Years: | |||||
| Chairman of the Board, Chief Executive Officer and President, Franklin Mutual Advisers, LLC; officer and/or director, as the case may be, of | |||||
| four of the investment companies in Franklin Templeton Investments. | |||||
| Alison E. Baur (1964) | Vice President | Since 2012 | Not Applicable | Not Applicable | |
| One Franklin Parkway | |||||
| San Mateo, CA 94403-1906 | |||||
| Principal Occupation During at Least the Past 5 Years: | |||||
| Deputy General Counsel, Franklin Templeton Investments; and officer of some of the other subsidiaries of Franklin Resources, Inc. and of 46 | |||||
| of the investment companies in Franklin Templeton Investments. | |||||
| Philippe Brugere-Trelat (1949) | Vice President | Since 2005 | Not Applicable | Not Applicable | |
| 101 John F. Kennedy Parkway | |||||
| Short Hills, NJ 07078-2789 | |||||
| Principal Occupation During at Least the Past 5 Years: | |||||
| Executive Vice President, Franklin Mutual Advisers, LLC; officer of three of the investment companies in Franklin Templeton Investments; | |||||
| and formerly, Portfolio Manager of Eurovest SA (French registered Investment Company, Sicav). | |||||
| Laura F. Fergerson (1962) | Chief Executive | Since 2009 | Not Applicable | Not Applicable | |
| One Franklin Parkway | Officer – | ||||
| San Mateo, CA 94403-1906 | Finance and | ||||
| Administration | |||||
| Principal Occupation During at Least the Past 5 Years: | |||||
| Senior Vice President, Franklin Templeton Services, LLC; and officer of 46 of the investment companies in Franklin Templeton Investments. | |||||
| Aliya S. Gordon (1973) | Vice President | Since 2009 | Not Applicable | Not Applicable | |
| One Franklin Parkway | |||||
| San Mateo, CA 94403-1906 | |||||
| Principal Occupation During at Least the Past 5 Years: | |||||
| Senior Associate General Counsel, Franklin Templeton Investments; officer of 46 of the investment companies in Franklin Templeton | |||||
| Investments; and formerly, Litigation Associate, Steefel, Levitt & Weiss, LLP (2000-2004). | |||||
| Steven J. Gray (1955) | Secretary and | Secretary since | Not Applicable | Not Applicable | |
| One Franklin Parkway | Vice President | 2005 and Vice | |||
| San Mateo, CA 94403-1906 | President since | ||||
| 2009 | |||||
| Principal Occupation During at Least the Past 5 Years: | |||||
| Senior Associate General Counsel, Franklin Templeton Investments; Vice President, Franklin Templeton Distributors, Inc.; and officer of 46 of | |||||
| the investment companies in Franklin Templeton Investments. | |||||
60 | Annual Report
| Number of Portfolios in | ||||
| Name, Year of Birth | Length of | Fund Complex Overseen | Other Directorships Held | |
| and Address | Position | Time Served | by Board Member* | During at Least the Past 5 Years |
| Selena L. Holmes (1965) | Vice President | Since 2012 | Not Applicable | Not Applicable |
| 100 Fountain Parkway | – AML | |||
| St. Petersburg, FL 33716-1205 | Compliance | |||
| Principal Occupation During at Least the Past 5 Years: | ||||
| Director, Global Compliance Monitoring; and officer of 46 of the investment companies in Franklin Templeton Investments. | ||||
| Robert Kubilis (1973) | Treasurer, | Since 2012 | Not Applicable | Not Applicable |
| 300 S.E. 2nd Street | Chief Financial | |||
| Fort Lauderdale, FL 33301-1923 | Officer and | |||
| Chief | ||||
| Accounting | ||||
| Officer | ||||
| Principal Occupation During at Least the Past 5 Years: | ||||
| Assistant Treasurer, Fund Accounting, Franklin Templeton Investments; and officer of five of the investment companies in Franklin Templeton | ||||
| Investments. | ||||
| Kimberly H. Novotny (1972) | Vice President | Since March 2013 | Not Applicable | Not Applicable |
| 300 S.E. 2nd Street | ||||
| Fort Lauderdale, FL 33301-1923 | ||||
| Principal Occupation During at Least the Past 5 Years: | ||||
| Associate General Counsel, Franklin Templeton Investments; Vice President and Secretary, Fiduciary Trust International of the South; Vice | ||||
| President, Templeton Investment Counsel, LLC; Assistant Secretary, Franklin Resources, Inc.; and officer of 46 of the investment companies | ||||
| in Franklin Templeton Investments. | ||||
| Robert C. Rosselot (1960) | Chief | Since March 2013 | Not Applicable | Not Applicable |
| 300 S.E. 2nd Street | Compliance | |||
| Fort Lauderdale, FL 33301-1923 | Officer | |||
| Principal Occupation During at Least the Past 5 Years: | ||||
| Director, Global Compliance, Franklin Templeton Investments; officer of 46 of the investment companies in Franklin Templeton Investments; | ||||
| and formerly, Senior Associate General Counsel, Franklin Templeton Investments (2007-2013); and Secretary and Vice President, Templeton | ||||
| Group of Funds (2004-2013). | ||||
| Karen L. Skidmore (1952) | Vice President | Since 2009 | Not Applicable | Not Applicable |
| One Franklin Parkway | ||||
| San Mateo, CA 94403-1906 | ||||
| Principal Occupation During at Least the Past 5 Years: | ||||
| Senior Associate General Counsel, Franklin Templeton Investments; and officer of 46 of the investment companies in Franklin Templeton | ||||
| Investments. | ||||
| Craig S. Tyle (1960) | Vice President | Since 2005 | Not Applicable | Not Applicable |
| One Franklin Parkway | ||||
| San Mateo, CA 94403-1906 | ||||
| Principal Occupation During at Least the Past 5 Years: | ||||
| General Counsel and Executive Vice President, Franklin Resources, Inc.; and officer of some of the other subsidiaries of Franklin Resources, | ||||
| Inc. and of 46 of the investment companies in Franklin Templeton Investments. | ||||
Annual Report | 61
| Number of Portfolios in | ||||
| Name, Year of Birth | Length of | Fund Complex Overseen | Other Directorships Held | |
| and Address | Position | Time Served | by Board Member* | During at Least the Past 5 Years |
| Lori A. Weber (1964) | Vice President | Since 2011 | Not Applicable | Not Applicable |
| 300 S.E. 2nd Street | ||||
| Fort Lauderdale, FL 33301-1923 |
Principal Occupation During at Least the Past 5 Years:
Senior Associate General Counsel, Franklin Templeton Investments; Assistant Secretary, Franklin Resources, Inc.; Vice President and Secretary, Templeton Investment Counsel, LLC; Vice President, Fiduciary Trust International of the South; and officer of 46 of the investment companies in Franklin Templeton Investments.
*We base the number of portfolios on each separate series of the U.S. registered investment companies within the Franklin Templeton Investments fund complex. These portfolios have a common investment manager or affiliated investment managers.
**Gregory E. Johnson is considered to be an interested person of the Fund under the federal securities laws due to his position as an officer and director of Franklin Resources, Inc., which is the parent company of the Fund’s investment manager and distributor. Peter A. Langerman is considered to be an interested person of the Fund under the federal securities laws due to his position as an officer of Franklin Mutual Advisers, LLC, which is an affiliate of the Fund’s investment manager.
Note 1: Officer information is current as of the date of this report. It is possible that after this date, information about officers may change.
The Fund’s Board has determined that certain of the members of the Audit Committee, including Ann Torre Bates, are audit committee financial experts, and “independent,” under those provisions of the Sarbanes-Oxley Act of 2002, and the rules and form amendments adopted by the Securities and Exchange Commission, relating to audit committee financial experts.
The Statement of Additional Information (SAI) includes additional information about the board members and is available, without charge, upon request. Shareholders may call (800) DIAL BEN/342-5236 to request the SAI.
62 | Annual Report
Mutual Shares Fund
Shareholder Information
Proxy Voting Policies and Procedures
The Fund’s investment manager has established Proxy Voting Policies and Procedures (Policies) that the Fund uses to determine how to vote proxies relating to portfolio securities. Shareholders may view the Fund’s complete Policies online at franklintempleton.com. Alternatively, shareholders may request copies of the Policies free of charge by calling the Proxy Group collect at (954) 527-7678 or by sending a written request to: Franklin Templeton Companies, LLC, 300 S.E. 2nd Street, Fort Lauderdale, FL 33301, Attention: Proxy Group. Copies of the Fund’s proxy voting records are also made available online at franklintempleton.com and posted on the U.S. Securities and Exchange Commission’s website at sec.gov and reflect the most recent 12-month period ended June 30.
Quarterly Statement of Investments
The Fund files a complete statement of investments with the U.S. Securities and Exchange Commission for the first and third quarters for each fiscal year on Form N-Q. Shareholders may view the filed Form N-Q by visiting the Commission’s website at sec.gov. The filed form may also be viewed and copied at the Commission’s Public Reference Room in Washington, DC. Information regarding the operations of the Public Reference Room may be obtained by calling (800) SEC-0330.
Householding of Reports and Prospectuses
You will receive the Fund’s financial reports every six months as well as an annual updated summary prospectus (prospectus available upon request). To reduce Fund expenses, we try to identify related shareholders in a household and send only one copy of the financial reports and summary prospectus. This process, called “householding,” will continue indefinitely unless you instruct us otherwise. If you prefer not to have these documents householded, please call us at (800) 632-2301. At any time you may view current prospectuses/summary prospectuses and financial reports on our website. If you choose, you may receive these documents through electronic delivery.
Annual Report | 63
This page intentionally left blank.

Item 2. Code of Ethics.
(a) The Registrant has adopted a code of ethics that applies to its principal executive officers and principal financial and accounting officer.
(c) N/A
(d) N/A
(f) Pursuant to Item 12(a)(1), the Registrant is attaching as an exhibit a copy of its code of ethics that applies to its principal executive officers and principal financial and accounting officer.
Item 3. Audit Committee Financial Expert.
(a)(1) The registrant has an audit committee financial expert serving on its audit committee.
(2) The audit committee financial expert is Ann Torre Bates, and she is “independent” as defined under the relevant Securities and Exchange Commission Rules and Releases.
Item 4. Principal Accountant Fees and Services.
(a) Audit Fees
The aggregate fees paid to the principal accountant for professional services rendered by the principal accountant for the audit of the registrant’s annual financial statements or for services that are normally provided by the principal accountant in connection with statutory and regulatory filings or engagements were $528,870 for the fiscal year ended December 31, 2013 and $528,965 for the fiscal year ended December 31, 2012.
(b) Audit-Related Fees
There were no fees paid to the principal accountant for assurance and related services rendered by the principal accountant to the registrant that are reasonably related to the performance of the audit of the registrant's financial statements and are not reported under paragraph (a) of Item 4.
There were no fees paid to the principal accountant for assurance and related services rendered by the principal accountant to the registrant's investment adviser and any entity controlling, controlled by or under common control with the investment adviser that provides ongoing services to the registrant that are reasonably related to the performance of the audit of their financial statements.
(c) Tax Fees
The aggregate fees paid to the principal accountant for professional services rendered by the principal accountant to the registrant for tax compliance, tax advice and tax planning were $3,281 the fiscal year ended December 31, 2013 and $5,834 for the fiscal year ended December 31, 2012. The services for which these fees were paid included identifying passive foreign investment company to manage exposure to tax liabilities.
|
The aggregate fees paid to the principal accountant for professional services rendered by the principal accountant to the registrant’s investment adviser and any entity controlling, controlled by or under common control with the investment adviser that provides ongoing services to the registrant for tax compliance, tax advice and tax planning were $6,417 for the fiscal year ended December 31, 2013 and $0 for the fiscal year ended December 31, 2012. The services for which these fees were paid included technical tax consultation for withholding tax report to foreign governments, and application of local country tax laws.
(d) All Other Fees
There were no fees paid to the principal accountant for products and services rendered by the principal accountant to the registrant not reported in paragraphs (a)-(c) of Item 4.
There were no fees paid to the principal accountant for products and services rendered by the principal accountant to the registrant’s investment adviser and any entity controlling, controlled by or under common control with the investment adviser that provides ongoing services to the registrant other than services reported in paragraphs (a)-(c) of Item 4.
(e) (1) The registrant’s audit committee is directly responsible for approving the services to be provided by the auditors, including:
(i) pre-approval of all audit and audit related services;
(ii) pre-approval of all non-audit related services to be provided to the Fund by the auditors;
(iii) pre-approval of all non-audit related services to be provided to the registrant by the auditors to the registrant’s investment adviser or to any entity that controls, is controlled by or is under common control with the registrant’s investment adviser and that provides ongoing services to the registrant where the non-audit services relate directly to the operations or financial reporting of the registrant; and
(iv) establishment by the audit committee, if deemed necessary or appropriate, as an alternative to committee pre-approval of services to be provided by the auditors, as required by paragraphs (ii) and (iii) above, of policies and procedures to permit such services to be pre-approved by other means, such as through establishment of guidelines or by action of a designated member or members of the committee; provided the policies and procedures are detailed as to the particular service and the committee is informed of each service and such policies and procedures do not include delegation of audit committee responsibilities, as contemplated under the Securities Exchange Act of 1934, to management; subject, in the case of (ii) through (iv), to any waivers, exceptions or exemptions that may be available under applicable law or rules.
|
(e) (2) None of the services provided to the registrant described in paragraphs (b)-(d) of Item 4 were approved by the audit committee pursuant to paragraph (c)(7)(i)(C) of Rule 2-01 of regulation S-X.
(f) No disclosures are required by this Item 4(f).
(g) The aggregate non-audit fees paid to the principal accountant for services rendered by the principal accountant to the registrant and the registrant’s investment adviser and any entity controlling, controlled by or under common control with the investment adviser that provides ongoing services to the registrant were $9,698 for the fiscal year ended December 31, 2013 and $5,834 for the fiscal year ended December 31, 2012.
(h) The registrant’s audit committee of the board has considered whether the provision of non-audit services that were rendered to the registrant’s investment adviser (not including any sub-adviser whose role is primarily portfolio management and is subcontracted with or overseen by another investment adviser), and any entity controlling, controlled by, or under common control with the investment adviser that provides ongoing services to the registrant that were not pre-approved pursuant to paragraph (c)(7)(ii) of Rule 2-01 of Regulation S-X is compatible with maintaining the principal accountant’s independence.
Item 5. Audit Committee of Listed Registrants. N/A
Item 6. Schedule of Investments. N/A
Item 7. Disclosure of Proxy Voting Policies and Procedures for
Closed-End Management Investment Companies. N/A
Item 8. Portfolio Managers of Closed-End Management Investment Companies. N/A
Item 9. Purchases of Equity Securities by Closed-End Management Investment Company and Affiliated Purchasers. N/A
Item 10. Submission of Matters to a Vote of Security Holders.
There have been no changes to the procedures by which shareholders may recommend nominees to the Registrant's board of trustees that would require disclosure herein.
Item 11. Controls and Procedures.
(a) Evaluation of Disclosure Controls and Procedures. The Registrant maintains disclosure controls and procedures that are designed to ensure that information required to be disclosed in the Registrant’s filings under the Securities Exchange Act of 1934 and the Investment Company Act of 1940 is recorded, processed, summarized and reported within the periods specified in the rules and forms of the Securities and Exchange Commission. Such information is accumulated and communicated to the Registrant’s management, including its principal executive officer and principal financial officer, as appropriate, to allow timely decisions regarding required disclosure. The Registrant’s management, including the principal executive officer and the principal financial officer, recognizes that any set of controls and procedures, no matter how well designed and operated, can provide only reasonable assurance of achieving the desired control objectives.
|
Within 90 days prior to the filing date of this Shareholder Report on Form N-CSR, the Registrant had carried out an evaluation, under the supervision and with the participation of the Registrant’s management, including the Registrant’s principal executive officer and the Registrant’s principal financial officer, of the effectiveness of the design and operation of the Registrant’s disclosure controls and procedures. Based on such evaluation, the Registrant’s principal executive officer and principal financial officer concluded that the Registrant’s disclosure controls and procedures are effective.
(b) Changes in Internal Controls. There have been no changes in the Registrant’s internal controls or in other factors that could materially affect the internal controls over financial reporting subsequent to the date of their evaluation in connection with the preparation of this Shareholder Report on Form N-CSR.
|
Item 12. Exhibits.
(a)(1) Code of Ethics
(a)(2) Certifications pursuant to Section 302 of the Sarbanes-Oxley Act of 2002 of Laura F. Fergerson, Chief Executive Officer - Finance and Administration, and Robert G. Kubilis, Chief Financial Officer and Chief Accounting Officer
(b) Certifications pursuant to Section 906 of the Sarbanes-Oxley Act of 2002 of Laura F. Fergerson, Chief Executive Officer - Finance and Administration, and Robert G. Kubilis, Chief Financial Officer and Chief Accounting Officer
SIGNATURES
Pursuant to the requirements of the Securities Exchange Act of 1934 and the Investment Company Act of 1940, the registrant has duly caused this report to be signed on its behalf by the undersigned, thereunto duly authorized.
FRANKLIN MUTUAL SERIES FUNDS
By /s/ Laura F. Fergerson
Laura F. Fergerson
Chief Executive Officer –
Finance and Administration
Date February 27, 2014
Pursuant to the requirements of the Securities Exchange Act of 1934 and the Investment Company Act of 1940, this report has been signed below by the following persons on behalf of the registrant and in the capacities and on the dates indicated.
By /s/ Laura F. Fergerson
Laura F. Fergerson
Chief Executive Officer –
Finance and Administration
Date February 27, 2014
By /s/ Robert G. Kubilis
Robert G. Kubilis
Chief Financial Officer and
Chief Accounting Officer
Date: February 27, 2014
|