UNITED STATES
SECURITIES AND EXCHANGE COMMISSION
Washington, DC 20549
FORM N-CSR
CERTIFIED SHAREHOLDER REPORT OF REGISTERED
MANAGEMENT INVESTMENT COMPANIES
Investment Company Act file number 811-05387
Franklin Mutual Series Funds
(Exact name of registrant as specified in charter)
101 John F. Kennedy Parkway,
Short Hills, NJ 07078-2705
(Address of principal executive offices) (Zip code)
Craig S. Tyle, One Franklin Parkway,
San Mateo, CA 94403-1906
(Name and address of agent for service)
Registrant’s telephone number, including area code: (210) 912-2100
Date of fiscal year end: 12/31
Date of reporting period: 12/31/17
| Item 1. | Reports to Stockholders. |
 | Annual Report and Shareholder Letter
December 31, 2017 |

Sign up for electronic delivery at franklintempleton.com/edelivery
Franklin Templeton Investments
Gain From Our Perspective®
At Franklin Templeton Investments, we’re dedicated to one goal: delivering exceptional asset management for our clients. By bringing together multiple, world-class investment teams in a single firm, we’re able to offer specialized expertise across styles and asset classes, all supported by the strength and resources of one of the world’s largest asset managers. This has helped us to become a trusted partner to individual and institutional investors across the globe.
Dear Franklin Mutual Beacon Fund Shareholder:
Securities markets benefited from a confluence of positive economic, financial and political trends during 2017. The global economy entered a synchronized pace of modest and steady growth, corporate earnings strengthened in the US, Europe and Japan, and US equity market volatility remained at historically low levels. A number of political risks identified at the start of 2017, such as the success of far-right parties in Europe, Brexit negotiations and the Trump administration’s ability to enact its policy agenda, also dissipated or became less immediate for investors as the year progressed. For the year ended December 31, 2017, US stocks, as measured by the Standard & Poor’s® 500 Index (S&P 500®), produced a +21.83% total return.1 Stocks in global developed markets, as measured by the MSCI World Index, returned +23.07%, and investment-grade bonds, as measured by the Bloomberg Barclays US Aggregate Bond Index, posted a +3.54% total return.1
In many equity markets, the trend of growth stocks outpacing value stocks continued. The Russell 1000® Growth Index returned +30.21%, while the Russell 1000® Value Index returned +13.66%.1 The difference in performance has been driven in large part by a rally in internet and software stocks, which dominated the S&P 500 Growth Index. In addition, the S&P 500 Value Index has components that we believe are facing disruption from new technology (e.g., the rapid market share shift to online retailing from traditional bricks and mortar retailers that are often labeled as value stocks). Exacerbating the disruption is the reality that many new technology companies are able to innovate without the need to show immediate profits.
1. Source: Morningstar. Frank Russell Company is the source and owner of the trademarks, service marks and copyrights related to the Russell Indexes. Russell® is a trademark of Frank Russell Company.
See www.franklintempletondatasources.com for additional data provider information.
We do not know how long these trends will continue, but historically, periods of strong performance by growth stocks have eventually been followed by relatively weaker performance. Given that unemployment has continued to decline in most developed markets and the US Federal Reserve has taken its first steps toward monetary normalization, value-oriented stocks may become more attractive to investors, particularly within cyclical sectors of the equity markets such as industrials, consumer discretionary and financials.
A stellar 2017 for equity markets also pushed up common valuation metrics, such as price-to-earnings. Valuation is a critical factor in our analysis and we always ask ourselves if current and potential investments represent an attractive balance of risk and reward. We remain committed to our long-term perspective and disciplined investment approach as we conduct a rigorous, fundamental analysis of securities with a regular emphasis on investment risk management.
Although the investment landscape appears favorable as we enter 2018, it is worth remembering that securities markets are dynamic and constantly evolving. Therefore, we believe active, professional investment management serves investors well. We also recognize the important role of financial advisors in today’s markets and encourage investors to continue to seek their advice. Amid changing markets and economic conditions, we are confident investors with a well-diversified portfolio and a patient, long-term outlook should be well positioned for the years ahead.
| Not FDIC Insured | | | May Lose Value | | | No Bank Guarantee |
franklintempleton.com |
Not part of the annual report |
|
1 |
|
On the following pages, the Fund’s portfolio management team reviews investment decisions that pertain to performance during the past 12 months in light of the economic environment and other factors. Please remember all securities markets fluctuate, as do mutual fund share prices.
We thank you for investing with Franklin Templeton, welcome your questions and comments, and look forward to continuing to serve your investment needs in the years ahead.
Sincerely,

Peter A. Langerman
Chairman, President and Chief Executive Officer
Franklin Mutual Advisers, LLC
This letter reflects our analysis and opinions as of December 31, 2017, unless otherwise indicated. The information is not a complete analysis of every aspect of any market, country, industry, security or fund. Statements of fact are from sources considered reliable.
Annual Report
Visit franklintempleton.com for fund updates, to access your account, or to find helpful financial planning tools.
2 |
Not part of the annual report | franklintempleton.com |
Annual Report
This annual report for Franklin Mutual Beacon Fund covers the fiscal year ended December 31, 2017.
Your Fund’s Goal and Main Investments
The Fund seeks capital appreciation, which may occasionally be short term, with income as a secondary goal. Under normal market conditions, the Fund invests primarily in equity securities of US and foreign companies that the investment manager believes are available at market prices less than their intrinsic value. The equity securities in which the Fund invests are primarily common stock, with a current focus on mid- and large-cap companies. To a lesser extent, the Fund also invests in merger arbitrage securities and the debt and equity of distressed companies. The Fund may invest a substantial portion, potentially up to 100% of its assets in foreign securities, which may include sovereign debt and participations in foreign government debt. The Geographic Composition bar chart on this page lists the leading countries where the Fund invests.
Performance Overview
The Fund’s Class Z shares delivered a +14.39% cumulative total return for the 12 months ended December 31, 2017. In comparison, the Fund’s benchmark, the MSCI World Index (USD), which tracks stock performance in global developed markets, generated a +23.07% total return.1 You can find more of the Fund’s performance data in the Performance Summary beginning on page 10.
Performance data represent past performance, which does not guarantee future results. Investment return and principal value will fluctuate, and you may have a gain or loss when you sell your shares. Current performance may differ from figures shown. For most recent month-end performance, go to franklintempleton.com or call (800) 342-5236.
Economic and Market Overview
The global economy grew moderately during the 12-month period under review. In this environment, global developed and emerging market stocks generated a +24.62% total return, as
Geographic Composition*
Based on Total Net Assets as of 12/31/17
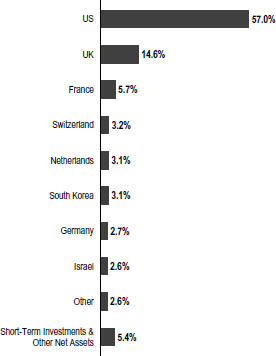
*Figures are stated as a percentage of total and may not equal 100% or may be negative due to rounding, use of any derivatives, unsettled trades or other factors. The Fund held 38.5% of total net assets in foreign securities.
measured by the MSCI All Country World Index.1 Global markets were aided by price gains in oil and other commodities, generally upbeat economic data across regions, the European Central Bank’s (ECB’s) extension of its monetary easing program, and investor optimism about pro-growth and pro-business policies in the US. The prospect for reforms in the European Union (EU) with Emmanuel Macron’s election as France’s president, encouraging corporate earnings reports and the passage of the US tax reform bill also supported global stocks.
1. Source: Morningstar.
The index is unmanaged and includes reinvestment of any income or distributions. It does not reflect any fees, expenses or sales charges. One cannot invest directly in an index, and an index is not representative of the Fund’s portfolio.
The dollar value, number of shares or principal amount, and names of all portfolio holdings are listed in the Fund’s Statement of Investments (SOI). The SOI begins on page 19.
franklintempleton.com | Annual Report | 3 |
FRANKLIN MUTUAL BEACON FUND
However, global markets reflected investor concerns about the terms of the UK’s exit from the EU, political uncertainty in the US and the EU, and geopolitical tensions in the Korean peninsula and other regions. Other concerns included the health of European banks, global oil oversupply despite a pact by major oil-producing countries to extend production cuts, and comments from key central bankers around the world about potentially raising interest rates.
After strengthening in 2017’s second and third quarters, the US economy moderated in the fourth quarter. The economy grew faster in 2017 than in 2016, however, largely due to growth in consumer spending, business investment and exports. The unemployment rate decreased from 4.7% in December 2016, as reported at the beginning of the 12-month period, to 4.1% at period-end.2 Annual inflation, as measured by the Consumer Price Index, was 2.1% in December 2016, as reported at the beginning of the 12-month period, and while it varied over the 12-month period, remained unchanged at period-end.2 The US Federal Reserve (Fed) raised its target range for the federal funds rate 0.25% three times during the period, amid signs of a growing US economy, strengthening labor market and improving business spending. At its December meeting, the Fed confirmed that the monthly balance sheet reduction would increase from US$10 billion to US$20 billion beginning in January 2018.
In Europe, the UK’s economic growth moderated in 2017 compared to 2016, largely due to slower growth in the services sector. In November, the Bank of England raised its key policy rate 0.25%, its first increase in a decade. The eurozone’s growth accelerated in 2017’s second and third quarters, but moderated in the fourth quarter. However, the eurozone’s 2017 economic growth rate of 2.5% was the fastest in a decade.3 The bloc’s annual inflation rate, while low, ended higher than in December 2016. The ECB kept its benchmark interest rate unchanged during the period. However, at its October meeting, the ECB extended the time frame for its massive bond-buying program from December 2017 to at least September 2018, while reducing the amount of monthly bond purchases in half beginning in January 2018.
In Asia, Japan’s quarterly gross domestic product (GDP) grew for the seventh consecutive quarter, although third-quarter 2017 growth was lower than the previous quarter. The Bank of Japan left its benchmark interest rate unchanged during the period and continued its monetary stimulus measures.
In emerging markets, Brazil’s quarterly GDP grew for the third consecutive quarter, although third-quarter 2017 growth slowed from the previous quarter. The country’s central bank cut its benchmark interest rate several times during the period to spur economic growth. Russia’s GDP grew in 2017’s first three quarters compared to the prior-year periods, amid the Bank of Russia’s continued policy support. China’s GDP grew faster in 2017 than in 2016, supported by solid growth in industrial production, services, fixed-asset investment, retail sales, and imports and exports. The People’s Bank of China left its benchmark interest rate unchanged during the period. Overall, emerging market stocks, as measured by the MSCI Emerging Markets Index, produced a substantial +37.75% total return during the period.1
Investment Strategy
At Franklin Mutual Series, we are committed to our distinctive value approach to investing, which we believe can generate above-average risk-adjusted returns over time for our shareholders. Our major investment strategy is investing in undervalued stocks. When selecting undervalued equities, we are attracted to what we believe are fundamentally strong companies with healthy balance sheets, high-quality assets, substantial free cash flow and shareholder-oriented management teams and whose stocks are trading at discounts to our assessment of the companies’ intrinsic or business value. We also look for asset-rich companies whose shares may be trading at depressed levels due to concerns over short-term earnings disappointments, litigation, management strategy or other perceived negatives. This strict value approach is not only intended to improve the likelihood of upside potential, but also reduces the risk of substantial declines, in our opinion. While the vast majority of our undervalued equity investments are made in publicly traded companies globally, we may invest occasionally in privately held companies as well.
We complement this more traditional investment strategy with two others. One is distressed investing, a highly specialized field that has proven quite profitable during certain periods over the years. Distressed investing is complex and can take many forms. The most common distressed investment the Fund undertakes is the purchase of financially troubled or bankrupt companies’ debt at a substantial discount to face value. After the financially distressed company is reorganized, often in bankruptcy court, the old debt is typically replaced with new securities issued by the financially stronger company.
2. Source: Bureau of Labor Statistics.
3. Source: Eurostat.
| 4 |
Annual Report | franklintempleton.com |
FRANKLIN MUTUAL BEACON FUND
The other piece of our investment strategy is participating in arbitrage situations, another highly specialized field. When companies announce proposed mergers or takeovers, commonly referred to as “deals,” the target company may trade at a discount to the bid it ultimately accepts. One form of arbitrage involves purchasing the target company’s stock when it is trading below the value we believe it would receive in a deal. In keeping with our commitment to a relatively conservative investment approach, we typically focus our arbitrage efforts on announced deals, and avoid rumored deals or other situations we consider relatively risky.
In addition, it is our practice to hedge the Fund’s currency exposure when we deem it advantageous for our shareholders.
What is meant by “hedge”? To hedge an investment is to take a position intended to offset potential losses/gains that may be incurred by a companion financial instrument. |
Manager’s Discussion
In 2017, an improving economic and political backdrop helped drive most equity markets higher. The positive performances were broad based, spanning across most regions and sectors, and complemented by minimal volatility. Global markets were aided by generally upbeat economic data, improved corporate earnings in the US, Europe and Japan, as well as improved industrial commodity prices, most notably crude oil. In addition, the most significant political risks identified by investors heading into 2017 failed to materialize.
In the US, markets began 2017 rallying as investors hoped that a Republican sweep of US elections in November 2016 would lead to a general loosening in regulations and tax reform, including lower corporate tax rates. Although the Trump administration’s policy agenda was hindered by political gridlock, efforts to loosen federal regulations yielded some results and tax reform legislation was finally passed in late December. Improving economic activity and corporate earnings appeared to be the most meaningful equity market catalysts during much of 2017. However, the modest level of economic growth and low interest rates pushed investors to keep favoring growth stocks. During the period, the Russell 1000® Growth Index generated a total return of +30.21%, while the Russell
1000® Value Index posted a total return of +13.66%.4 Within the Russell 1000® Growth Index, stocks with the largest weightings were technology firms that dominated the headlines: Apple,5 Alphabet (a.k.a. Google),5 Microsoft, Amazon.com5 and Facebook.5
European equity markets started 2017 slowly, but positive political events and improved economic data fueled strong performances during the period. Elections in Europe produced outcomes generally regarded as positive economically as far-right parties largely failed to gain political power in national elections. Investors were particularly encouraged by the presidential election outcome in France. The reform-minded, centrist candidate, Emmanuel Macron, won the French presidential election in May and quickly began to push his agenda, most notably labor decrees giving employers in France greater freedom in negotiating contracts directly with workers. Amid all the positive events, the UK remained the most significant outlier. In the UK, a June 2017 snap election resulting in no party having a majority in Parliament appeared to make a “hard Brexit,” in which the UK leaves the European Union (EU) in March 2019 without a negotiated deal, even more likely than before. Although the UK and EU appeared to make some progress late in the year, the snap election results left the Conservative Party in a precarious position and with the risk of another election in the near future.
As value investors, we seek to invest prudently in securities that we believe represent good value, but adjust our views accordingly as the world around us changes. The media industry is a recent example of this approach. The Top 10 Sectors/Industries table on page 6 lists media and other leading industries in which the Fund currently invests. The media industry became a significant area of investment interest in the latter stages of the year due to significant structural changes. Since the 1980s, most Americans received their TV entertainment as part of a bundle from a cable provider. Disparate networks were combined and sold as packages, with annual price increases justified by the inclusion of more networks. Consumers rarely had the option to unbundle cable packages and most markets had no direct competition. However, the growth of fixed and mobile broadband connectivity ushered in the opportunity to bypass traditional distributors through the delivery of film and TV content over the internet and the launch of direct-to-consumer offerings by
4. Source: Morningstar. Frank Russell Company is the source and owner of the trademarks, service marks and copyrights related to the Russell Indexes. Russell® is a trademark of Frank Russell Company.
5. Not a Fund holding.
See www.franklintempletondatasources.com for additional data provider information.
franklintempleton.com | Annual Report | 5 |
FRANKLIN MUTUAL BEACON FUND
TV networks. The growing popularity of new digital options has driven cable providers to roll out lower-priced packages with fewer channels. This evolution has begun to create winners and losers among networks and new opportunities for investors.
Pay TV subscription among US households peaked in 2009 at close to 100 million homes. Initially, the decline in subscribers was moderate, but has accelerated since 2015, reaching a pace of more than 2% per year in 2017. At first, media companies benefited from digital distribution by using it as an additional outlet for selling content. With the cannibalization of traditional platforms accelerating, media companies have begun to respond. The necessity for greater scale in content development and direct access to consumers is driving investment and merger decisions in the industry. From our standpoint, we are looking for networks with the most attractive content relative to the price they have been charging and may be able to charge in the future.
The Fund initiated a position in Walt Disney in the latter half of 2017. We believe Disney is well positioned to benefit from the evolution toward a more direct-to-consumer distribution model. In our view, Disney has one of the best intellectual property (IP) portfolios in all of media with a stable of globally recognized proprietary characters upon which to build a strong direct-to-consumer franchise. If Disney is successful in its bid to acquire the bulk of Twenty-First Century Fox’s5 content assets, the deal would further strengthen its IP portfolio and its content development scale. As it has done with its own IP, Disney would likely be able to leverage Fox’s content into attractions at its theme parks as well as consumer products. The acquisition would offer potential cost synergies that would likely offset some of the investments in the direct-to-consumer service. Under the leadership of chief executive officer Bob Iger, Disney has been effective in integrating acquired companies and navigating through a changing media landscape. Iger’s commitment to remain at the helm through 2021 strengthens our belief that the company should be able to execute on this opportunity.
Merger and acquisition activity remained healthy in 2017, although the pace of activity appeared to decelerate slightly compared to 2016 due to less favorable political and regulatory conditions in the US, the UK and China. In the US, several key regulatory agencies remain short of members, including the Federal Communications Commission and the Federal Trade Commission. Many large deals continued to wind their way through prolonged regulatory reviews, including Bayer’s5 acquisition of Monsanto, AT&T’s acquisition of Time Warner,5 and Twenty-First Century Fox’s5 offer for Sky.
Top 10 Sectors/Industries
Based on Equity Securities as of 12/31/17
| % of Total Net Assets | |||
Media | 12.1% | |||
Pharmaceuticals | 11.2% | |||
Banks | 10.6% | |||
Software | 7.6% | |||
Oil, Gas & Consumable Fuels | 5.9% | |||
Health Care Equipment & Supplies | 4.2% | |||
Wireless Telecommunication Services | 3.5% | |||
IT Services | 3.5% | |||
Consumer Finance | 3.5% | |||
Communications Equipment | 3.4% | |||
Credit spreads narrowed in 2017 for higher quality and high yield credit, albeit with some minor bouts of volatility. The broad-based decrease in yield differentials between bonds with the same maturity but different credit quality provided the Fund with the opportunity to exit a number of opportunities that presented themselves in early 2016, including several bond offerings related to leveraged acquisitions, as prices improved, yield premium over Treasuries shrank, and the risk-adjusted returns were no longer mispriced. As the year progressed and investors became more willing buyers of credit, mispriced risk became more difficult to find, in our opinion. In times when the credit markets fluctuate and value is difficult to identify, we believe our industry specific expertise, deep fundamental analysis with a focus on cash flow, and intensive credit and covenant review combine seamlessly and provide us with different ways of looking at the same ideas others may disregard.
Fund Performance
Turning to Fund performance, top positive contributors included US-based aerospace and oilfield services provider KLX, South Korea-based Samsung Electronics and US-based multinational industrial technology company Sensata Technologies. Samsung Electronics and Sensata Technologies are listed among the Fund’s largest positions in the Top 10 Equity Holdings table on page 7.
KLX provides logistics support to aerospace and oil and gas firms. The stock price rose as market fundamentals and KLX’s operational performance remained positive. In December, KLX posted better-than-expected quarterly results and announced a new share buyback plan. Within its aerospace solutions group, KLX gained market share. Management also stated its belief that an upturn in military and business jet demand may begin in 2018, as new business jets are slated to enter the market and the
| 6 |
Annual Report | franklintempleton.com |
FRANKLIN MUTUAL BEACON FUND
Top 10 Equity Holdings
12/31/17
Company Sector/Industry, Country | % of Total Net Assets | |||
Vodafone Group PLC | 3.6% | |||
Wireless Telecommunication Services, UK | ||||
Capital One Financial Corp. | 3.5% | |||
Consumer Finance, US | ||||
JPMorgan Chase & Co. | 3.4% | |||
Banks, US | ||||
Medtronic PLC | 3.2% | |||
Health Care Equipment & Supplies, US | ||||
Sensata Technologies Holding NV | 3.2% | |||
Electrical Equipment, US | ||||
Royal Dutch Shell PLC | 3.2% | |||
Oil, Gas & Consumable Fuels, UK | ||||
Novartis AG | 3.2% | |||
Pharmaceuticals, Switzerland | ||||
Koninklijke KPN NV | 3.1% | |||
Diversified Telecommunication Services, Netherlands | ||||
Samsung Electronics Co. Ltd. | 3.1% | |||
Technology Hardware, Storage & Peripherals, | ||||
Societe Generale SA | 3.0% | |||
Banks, France | ||||
US military refocuses money on its aircraft. KLX saw increased demand within its energy solutions group, while its cost cutting efforts positively impacted the operating margin. The company also announced that it retained advisers to review strategic alternatives, with a focus on maximizing shareholder value.
Samsung Electronics is a low cost provider of dynamic random-access memory and flash memory products, smartphones, consumer electronics and other goods. For investors, Samsung’s solid operating results outweighed both the conviction of Samsung vice chairman Jay Y. Lee for his involvement in a government bribery scandal and escalating tensions between North Korea and the international community. Samsung reported strong sales in its core businesses, including memory chips and OLED (organic light-emitting diode) displays. Sales of its newest generation of smartphones during 2017 exceeded market expectations. Shareholder-friendly actions also boosted shares of Samsung, including a plan to cancel existing treasury shares held by the company and the announcement of significant dividend increases in 2017 and 2018.
Sensata Technologies is a multinational industrial technology company specializing in sensors and controls. Sensata was able to improve its operational performance during the period.
Quarterly results released in July 2017 showed stronger demand from non-auto markets, such as heavy vehicles, HVAC (heating, ventilation, and air conditioning) and industrials, which boosted organic growth and contributed to an increase in the operating margin. At the same time, management raised its full-year 2017 revenue guidance. In December 2017, investors also reacted positively to management’s three-year outlook for revenues that implied a re-acceleration in Sensata’s core business and its reiteration of solid margin expansion.
During the period under review, Fund investments that detracted from performance included US-based industrials company General Electric (GE), Israel-based pharmaceutical services provider Teva Pharmaceuticals and US-based drugstore chain Rite Aid.
The stock price of GE, an industrials company with a wide range of business units, declined as investors became more discouraged about the company’s poor cash flow generation, significantly underfunded pension liability, bloated cost structure, and increased competition and overcapacity in the power market. Intensifying pressure by activist investors led to chief executive officer (CEO) Jeffrey Immelt’s resignation in June 2017 and the promotion of John Flannery to CEO. However, GE’s stock price continued to slide after the company lowered its 2017 earnings guidance in October, which heightened investor concerns about a potential dividend cut. A dividend cut of 50%, larger than most investors had speculated, was announced in November, along with the incoming CEO’s plan for portfolio optimization and significant cost reductions. These negative events have not altered our view that GE has well-positioned businesses. If GE delivers on its plan to improve free cash flow generation and reduce overhead expenses, we believe there is upside potential for its stock price.
Teva Pharmaceutical Industries experienced a challenging year. In January 2017, Teva provided lower earnings guidance and a US federal court invalidated four patents for the company’s top-selling multiple sclerosis drug Copaxone. The resignations of Teva’s chief executive officer (CEO) and chief financial officer in the first half of 2017 further hindered Teva’s stock price. In the second half of the year, weak operating results, a dividend cut and a debt rating downgrade escalated investor concerns. The company managed to ease investor anxiety later in 2017, in our view, with the appointment of Kare Schultz, a well-regarded industry veteran as the new CEO, as well as the divestiture of certain non-core assets and amendment to certain debt instruments. We were also encouraged by the details of a restructuring plan announced by the new CEO in December.
franklintempleton.com | Annual Report | 7 |
FRANKLIN MUTUAL BEACON FUND
Shares of Rite Aid steadily declined during the period as a deal to be acquired by Walgreens Boots Alliance fell apart. The transaction was mired in antitrust review by the Federal Trade Commission (FTC) and in June 2017, Walgreens terminated the merger agreement. Rite Aid subsequently agreed to sell a significant number of its stores and related distribution assets to Walgreens. The new agreement was approved by the FTC in September 2017, but investors were skeptical of Rite Aid’s ability to successfully compete against larger industry peers and potential new competitors, such as Amazon.com.
During the period, the Fund held currency forwards and futures seeking to hedge most of the currency risk of the portfolio’s non-US dollar investments. The currency forwards and futures had a negative impact on the Fund’s performance because of the depreciation of the US dollar versus the hedged currencies.
What is a currency forward?
A currency forward is an agreement between the Fund and a counterparty to buy or sell a foreign currency in exchange for another currency at a specific exchange rate on a future date.
What is a future?
A future is an agreement between the Fund and a counterparty made through a US or foreign futures exchange to buy or sell an underlying instrument or asset at a specific price on a future date.
Thank you for your participation in Franklin Mutual Beacon Fund. We look forward to continuing to serve your investment needs.
 |
Christian Correa, CFA Co-Portfolio Manager | |
 |
Mandana Hormozi Co-Portfolio Manager | |
 |
Aman Gupta, CFA Assistant Portfolio Manager | |


The foregoing information reflects our analysis, opinions and portfolio holdings as of December 31, 2017, the end of the reporting period. The way we implement our main investment strategies and the resulting portfolio holdings may change depending on factors such as market and economic conditions. These opinions may not be relied upon as investment advice or an offer for a particular security. The information is not a complete analysis of every aspect of any market, country, industry, security or the Fund. Statements of fact are from sources considered reliable, but the investment manager makes no representation or warranty as to their completeness or accuracy. Although historical performance is no guarantee of future results, these insights may help you understand our investment management philosophy.
CFA® is a trademark owned by CFA Institute.
8 |
Annual Report |
franklintempleton.com |
FRANKLIN MUTUAL BEACON FUND
Christian Correa has been portfolio manager for Franklin Mutual Beacon Fund since 2007 and a co-portfolio manager since December 2010. He joined Franklin Templeton Investments in 2003 and serves as Director of Research for Franklin Mutual Advisers. Previously, he covered merger arbitrage and special situations at Lehman Brothers Holdings Inc.
Mandana Hormozi has been a co-portfolio manager for Franklin Mutual Beacon Fund since 2010 and was assistant portfolio manager for the Fund since 2009. Before that, she was assistant portfolio manager for Franklin Mutual Global Discovery Fund since 2007. She has been an analyst for Franklin Mutual Advisers since 2003, when she joined Franklin Templeton Investments. Previously, she was a senior vice president in the equity research department at Lazard Freres. Also, she was an economic research analyst at Mitsubishi Bank.
Aman Gupta has been assistant portfolio manager for Franklin Mutual Beacon Fund since December 2013 and has been an analyst for Franklin Mutual Advisers since 2010. Previously, Mr. Gupta was a senior equity analyst and director at Evergreen Investments, where he covered the health care industry with additional responsibilities in the consumer and industrials sectors.
franklintempleton.com | Annual Report | 9 |
FRANKLIN MUTUAL BEACON FUND
Performance Summary as of December 31, 2017
The performance table and graphs do not reflect any taxes that a shareholder would pay on Fund dividends, capital gain distributions, if any, or any realized gains on the sale of Fund shares. Total return reflects reinvestment of the Fund’s dividends and capital gain distributions, if any, and any unrealized gains or losses. Your dividend income will vary depending on dividends or interest paid by securities in the Fund’s portfolio, adjusted for operating expenses of each class. Capital gain distributions are net profits realized from the sale of portfolio securities.
Performance as of 12/31/17
Cumulative total return excludes sales charges. Average annual total return includes maximum sales charges. Sales charges will vary depending on the size of the investment and the class of share purchased. The maximum is 5.75% and the minimum is 0%. Class A: 5.75% maximum initial sales charge. For other share classes, visit franklintempleton.com.
| Share Class | | Cumulative Total Return1 | | | Average Annual Total Return2 | | ||
Z | ||||||||
1-Year | +14.39% | +14.39% | ||||||
5-Year | +75.60% | +11.92% | ||||||
10-Year | +72.06% | +5.58% | ||||||
A | ||||||||
1-Year | +14.09% | +7.51% | ||||||
5-Year | +73.21% | +10.30% | ||||||
10-Year | +67.22% | +4.66% | ||||||
Performance data represent past performance, which does not guarantee future results. Investment return and principal value will fluctuate, and you may have a gain or loss when you sell your shares. Current performance may differ from figures shown. For most recent month-end performance, go to franklintempleton.com or call (800) 342-5236.
See page 12 for Performance Summary footnotes.
| 10 |
Annual Report | franklintempleton.com |
FRANKLIN MUTUAL BEACON FUND
PERFORMANCE SUMMARY
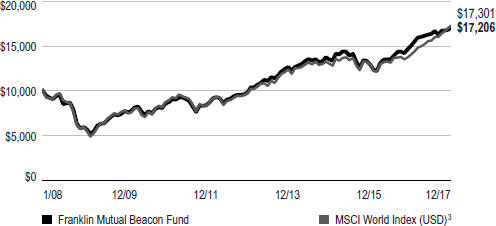
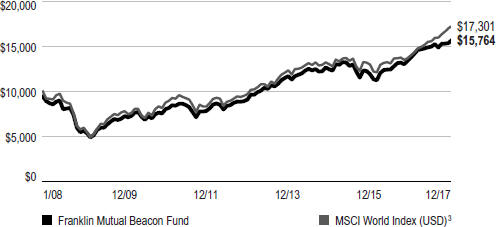
Total Return Index Comparison for a Hypothetical $10,000 Investment
Total return represents the change in value of an investment over the periods shown. It includes any applicable maximum sales charge, Fund expenses, account fees and reinvested distributions. The unmanaged index includes reinvestment of any income or distributions. It differs from the Fund in composition and does not pay management fees or expenses. One cannot invest directly in an index.
Class Z (1/1/08–12/31/17)
Class A (1/1/08–12/31/17)
See page 12 for Performance Summary footnotes.
franklintempleton.com |
Annual Report |
|
11 |
|
FRANKLIN MUTUAL BEACON FUND
PERFORMANCE SUMMARY
Distributions (1/1/17–12/31/17)
| Share Class | Net Investment Income | Short-Term Capital Gain | Long-Term Capital Gain | Total | ||||||||||||||||
| Z | $ | 0.3070 | $ | 0.0463 | $ | 0.5232 | $ | 0.8765 | ||||||||||||
| A | $ | 0.2642 | $ | 0.0463 | $ | 0.5232 | $ | 0.8337 | ||||||||||||
| C | $ | 0.1316 | $ | 0.0463 | $ | 0.5232 | $ | 0.7011 | ||||||||||||
| R | $ | 0.2115 | $ | 0.0463 | $ | 0.5232 | $ | 0.7810 | ||||||||||||
| R6 | $ | 0.3203 | $ | 0.0463 | $ | 0.5232 | $ | 0.8898 | ||||||||||||
Total Annual Operating Expenses4
| Share Class | ||||
Z | 0.80% | |||
A | 1.05% | |||
Each class of shares is available to certain eligible investors and has different annual fees and expenses, as described in the prospectus.
All investments involve risks, including possible loss of principal. Value securities may not increase in price as anticipated or may decline further in value. Special risks are associated with foreign investing, including currency fluctuations, economic instability and political developments. Because the Fund may invest its assets in companies in a specific region, including Europe, it is subject to greater risks of adverse developments in that region and/or the surrounding regions than a fund that is more broadly diversified geographically. Current political and financial uncertainty surrounding the European Union may increase market volatility and the economic risk of investing in companies in Europe. Smaller company stocks have exhibited greater price volatility than larger company stocks, particularly over the short term. The Fund’s investments in companies engaged in mergers, reorganizations or liquidations also involve special risks as pending deals may not be completed on time or on favorable terms. The Fund may invest in lower rated bonds, which entail higher credit risk. The Fund is actively managed but there is no guarantee that the manager’s investment decisions will produce the desired results. The Fund’s prospectus also includes a description of the main investment risks.
1. Cumulative total return represents the change in value of an investment over the periods indicated.
2. Average annual total return represents the average annual change in value of an investment over the periods indicated. Return for less than one year, if any, has not been annualized.
3. Source: Morningstar. The MSCI World Index (USD) is a free float-adjusted, market capitalization-weighted index designed to measure equity market performance in global developed markets.
4. Figures are as stated in the Fund’s current prospectus and may differ from the expense ratios disclosed in the Your Fund’s Expenses and Financial Highlights sections in this report. In periods of market volatility, assets may decline significantly, causing total annual Fund operating expenses to become higher than the figures shown.
See www.franklintempletondatasources.com for additional data provider information.
12 |
Annual Report |
franklintempleton.com |
FRANKLIN MUTUAL BEACON FUND
As a Fund shareholder, you can incur two types of costs: (1) transaction costs, including sales charges (loads) on Fund purchases and redemptions; and (2) ongoing Fund costs, including management fees, distribution and service (12b-1) fees, and other Fund expenses. All mutual funds have ongoing costs, sometimes referred to as operating expenses. The table below shows ongoing costs of investing in the Fund and can help you understand these costs and compare them with those of other mutual funds. The table assumes a $1,000 investment held for the six months indicated.
Actual Fund Expenses
The table below provides information about actual account values and actual expenses in the columns under the heading “Actual.” In these columns the Fund’s actual return, which includes the effect of Fund expenses, is used to calculate the “Ending Account Value” for each class of shares. You can estimate the expenses you paid during the period by following these steps (of course, your account value and expenses will differ from those in this illustration): Divide your account value by $1,000 (if your account had an $8,600 value, then $8,600 ÷ $1,000 = 8.6). Then multiply the result by the number in the row for your class of shares under the headings “Actual” and “Expenses Paid During Period” (if Actual Expenses Paid During Period were $7.50, then 8.6 x $7.50 = $64.50). In this illustration, the actual expenses paid this period are $64.50.
Hypothetical Example for Comparison with Other Funds
Under the heading “Hypothetical” in the table, information is provided about hypothetical account values and hypothetical expenses based on the Fund’s actual expense ratio and an assumed rate of return of 5% per year before expenses, which is not the Fund’s actual return. This information may not be used to estimate the actual ending account balance or expenses you paid for the period, but it can help you compare ongoing costs of investing in the Fund with those of other funds. To do so, compare this 5% hypothetical example for the class of shares you hold with the 5% hypothetical examples that appear in the shareholder reports of other funds.
Please note that expenses shown in the table are meant to highlight ongoing costs and do not reflect any transactional costs. Therefore, information under the heading “Hypothetical” is useful in comparing ongoing costs only, and will not help you compare total costs of owning different funds. In addition, if transactional costs were included, your total costs would have been higher.
Actual (actual return after expenses) | Hypothetical (5% annual return before expenses) | |||||||||||||||||
Share Class | Beginning Account Value 7/1/17 | Ending Account Value 12/31/17 | Expenses Paid During 7/1/17–12/31/171,2 | Ending Value 12/31/17 | Expenses Paid During 7/1/17–12/31/171,2 | Net Annualized Expense Ratio2 | ||||||||||||
| Z | $1,000 | $1,051.80 | $4.14 | $1,021.17 | $4.08 | 0.80% | ||||||||||||
| A | $1,000 | $1,050.30 | $5.43 | $1,019.91 | $5.35 | 1.05% | ||||||||||||
| C | $1,000 | $1,046.30 | $9.28 | $1,016.13 | $9.15 | 1.80% | ||||||||||||
| R | $1,000 | $1,048.90 | $6.71 | $1,018.65 | $6.61 | 1.30% | ||||||||||||
| R6 | $1,000 | $1,051.40 | $3.77 | $1,021.53 | $3.72 | 0.73% | ||||||||||||
1. Expenses are equal to the annualized expense ratio for the six-month period as indicated above—in the far right column—multiplied by the simple average account value over the period indicated, and then multiplied by 184/365 to reflect the one-half year period.
2. Reflects expenses after fee waivers and expense reimbursements. Does not include acquired fund fees and expenses.
franklintempleton.com |
Annual Report |
|
13 |
|
FRANKLIN MUTUAL BEACON FUND
| Year Ended December 31, | ||||||||||||||||||||
| 2017 | 2016 | 2015 | 2014 | 2013 | ||||||||||||||||
Class Z | ||||||||||||||||||||
| Per share operating performance | ||||||||||||||||||||
(for a share outstanding throughout the year) | ||||||||||||||||||||
Net asset value, beginning of year | $15.30 | $14.30 | $16.59 | $16.91 | $13.36 | |||||||||||||||
Income from investment operationsa: | ||||||||||||||||||||
Net investment incomeb | 0.29 | 0.37c | 0.29 | 0.54d | 0.31 | |||||||||||||||
Net realized and unrealized gains (losses) | 1.90 | 1.93 | (0.99) | 0.62 | 3.56 | |||||||||||||||
Total from investment operations | 2.19 | 2.30 | (0.70) | 1.16 | 3.87 | |||||||||||||||
Less distributions from: | ||||||||||||||||||||
Net investment income | (0.31) | (0.37) | (0.37) | (0.69) | (0.32) | |||||||||||||||
Net realized gains | (0.57) | (0.93) | (1.22) | (0.79) | — | |||||||||||||||
Total distributions | (0.88) | (1.30) | (1.59) | (1.48) | (0.32) | |||||||||||||||
Net asset value, end of year | $16.61 | $15.30 | $14.30 | $16.59 | $16.91 | |||||||||||||||
Total return | 14.39% | 16.11% | (4.14)% | 6.82% | 29.11% | |||||||||||||||
Ratios to average net assets | ||||||||||||||||||||
Expensese,f | 0.78% | 0.80% | 0.84%g | 0.83% | 0.80% | |||||||||||||||
Expenses incurred in connection with securities sold short | —% | 0.01% | 0.04% | 0.04% | —%h | |||||||||||||||
Net investment income | 1.78% | 2.48%c | 1.73% | 3.14%d | 2.02% | |||||||||||||||
| Supplemental data | ||||||||||||||||||||
Net assets, end of year (000’s) | $2,700,327 | $2,564,120 | $2,420,165 | $2,774,929 | $2,876,322 | |||||||||||||||
Portfolio turnover rate | 24.80% | 30.94% | 35.80% | 40.06% | 32.95% | |||||||||||||||
aThe amount shown for a share outstanding throughout the period may not correlate with the Statement of Operations for the period due to the timing of sales and repurchases of the Fund’s shares in relation to income earned and/or fluctuating fair value of the investments of the Fund.
bBased on average daily shares outstanding.
cNet investment income per share includes approximately $0.10 per share related to income received in the form of special dividends in connection with certain Fund holdings. Excluding this amount, the ratio of net investment income to average net assets would have been 1.81%.
dNet investment income per share includes approximately $0.24 per share related to income received in the form of a special dividend in connection with certain Fund holdings. Excluding this amount, the ratio of net investment income to average net assets would have been 1.74%.
eBenefit of expense reduction rounds to less than 0.01%.
fIncludes dividend and/or interest expense on securities sold short and security borrowing fees, if any. See below for the ratios of such expenses to average net assets for the periods presented. See Note 1(d).
gBenefit of waiver and payments by affiliates rounds to less than 0.01%.
hRounds to less than 0.01%.
14 |
Annual Report |
The accompanying notes are an integral part of these financial statements. |
franklintempleton.com |
FRANKLIN MUTUAL BEACON FUND
FINANCIAL HIGHLIGHTS
| Year Ended December 31, | ||||||||||||||||||||
| 2017 | 2016 | 2015 | 2014 | 2013 | ||||||||||||||||
Class A | ||||||||||||||||||||
| Per share operating performance | ||||||||||||||||||||
(for a share outstanding throughout the year) | ||||||||||||||||||||
Net asset value, beginning of year | $15.18 | $14.20 | $16.47 | $16.80 | $13.28 | |||||||||||||||
Income from investment operationsa: | ||||||||||||||||||||
Net investment incomeb | 0.25 | 0.33c | 0.24 | 0.49d | 0.26 | |||||||||||||||
Net realized and unrealized gains (losses) | 1.87 | 1.91 | (0.97) | 0.60 | 3.54 | |||||||||||||||
Total from investment operations | 2.12 | 2.24 | (0.73) | 1.09 | 3.80 | |||||||||||||||
Less distributions from: | ||||||||||||||||||||
Net investment income | (0.26) | (0.33) | (0.32) | (0.63) | (0.28) | |||||||||||||||
Net realized gains | (0.57) | (0.93) | (1.22) | (0.79) | — | |||||||||||||||
Total distributions | (0.83) | (1.26) | (1.54) | (1.42) | (0.28) | |||||||||||||||
Net asset value, end of year | $16.47 | $15.18 | $14.20 | $16.47 | $16.80 | |||||||||||||||
Total returne | 14.09% | 15.80% | (4.33)% | 6.48% | 28.70% | |||||||||||||||
| Ratios to average net assets | ||||||||||||||||||||
Expensesf,g | 1.03% | 1.05% | 1.12%h | 1.13% | 1.10% | |||||||||||||||
Expenses incurred in connection with securities sold short | —% | 0.01% | 0.04% | 0.04% | —%i | |||||||||||||||
Net investment income | 1.53% | 2.23%c | 1.45% | 2.84%d | 1.72% | |||||||||||||||
| Supplemental data | ||||||||||||||||||||
Net assets, end of year (000’s) | $983,048 | $992,306 | $1,019,568 | $1,101,706 | $1,148,409 | |||||||||||||||
Portfolio turnover rate | 24.80% | 30.94% | 35.80% | 40.06% | 32.95% | |||||||||||||||
aThe amount shown for a share outstanding throughout the period may not correlate with the Statement of Operations for the period due to the timing of sales and repurchases of the Fund’s shares in relation to income earned and/or fluctuating fair value of the investments of the Fund.
bBased on average daily shares outstanding.
cNet investment income per share includes approximately $0.10 per share related to income received in the form of special dividends in connection with certain Fund holdings. Excluding this amount, the ratio of net investment income to average net assets would have been 1.56%.
dNet investment income per share includes approximately $0.24 per share related to income received in the form of a special dividend in connection with certain Fund holdings. Excluding this amount, the ratio of net investment income to average net assets would have been 1.44%.
eTotal return does not reflect sales commissions or contingent deferred sales charges, if applicable.
fBenefit of expense reduction rounds to less than 0.01%.
gIncludes dividend and/or interest expense on securities sold short and security borrowing fees, if any. See below for the ratios of such expenses to average net assets for the periods presented. See Note 1(d).
hBenefit of waiver and payments by affiliates rounds to less than 0.01%.
iRounds to less than 0.01%.
franklintempleton.com |
The accompanying notes are an integral part of these financial statements. | |
Annual Report |
15 |
FRANKLIN MUTUAL BEACON FUND
FINANCIAL HIGHLIGHTS
| Year Ended December 31, | ||||||||||||||||||||
| 2017 | 2016 | 2015 | 2014 | 2013 | ||||||||||||||||
Class C | ||||||||||||||||||||
| Per share operating performance | ||||||||||||||||||||
(for a share outstanding throughout the year) | ||||||||||||||||||||
Net asset value, beginning of year | $15.06 | $14.10 | $16.36 | $16.70 | $13.21 | |||||||||||||||
Income from investment operationsa: | ||||||||||||||||||||
Net investment incomeb | 0.12 | 0.22c | 0.12 | 0.37d | 0.15 | |||||||||||||||
Net realized and unrealized gains (losses) | 1.86 | 1.88 | (0.96) | 0.59 | 3.51 | |||||||||||||||
Total from investment operations | 1.98 | 2.10 | (0.84) | 0.96 | 3.66 | |||||||||||||||
Less distributions from: | ||||||||||||||||||||
Net investment income | (0.13) | (0.21) | (0.20) | (0.51) | (0.17) | |||||||||||||||
Net realized gains | (0.57) | (0.93) | (1.22) | (0.79) | — | |||||||||||||||
Total distributions | (0.70) | (1.14) | (1.42) | (1.30) | (0.17) | |||||||||||||||
Net asset value, end of year | $16.34 | $15.06 | $14.10 | $16.36 | $16.70 | |||||||||||||||
Total returne | 13.25% | 14.94% | (5.06)% | 5.78% | 27.79% | |||||||||||||||
| Ratios to average net assets | ||||||||||||||||||||
Expensesf,g | 1.78% | 1.80% | 1.84%h | 1.83% | 1.80% | |||||||||||||||
Expenses incurred in connection with securities sold short | —% | 0.01% | 0.04% | 0.04% | —%i | |||||||||||||||
Net investment income | 0.78% | 1.48%c | 0.73% | 2.14%d | 1.02% | |||||||||||||||
| Supplemental data | ||||||||||||||||||||
Net assets, end of year (000’s) | $260,113 | $275,138 | $285,333 | $320,832 | $336,222 | |||||||||||||||
Portfolio turnover rate | 24.80% | 30.94% | 35.80% | 40.06% | 32.95% | |||||||||||||||
aThe amount shown for a share outstanding throughout the period may not correlate with the Statement of Operations for the period due to the timing of sales and repurchases of the Fund’s shares in relation to income earned and/or fluctuating fair value of the investments of the Fund.
bBased on average daily shares outstanding.
cNet investment income per share includes approximately $0.10 per share related to income received in the form of special dividends in connection with certain Fund holdings. Excluding this amount, the ratio of net investment income to average net assets would have been 0.81%.
dNet investment income per share includes approximately $0.24 per share related to income received in the form of a special dividend in connection with certain Fund holdings. Excluding this amount, the ratio of net investment income to average net assets would have been 0.74%.
eTotal return does not reflect sales commissions or contingent deferred sales charges, if applicable.
fBenefit of expense reduction rounds to less than 0.01%.
gIncludes dividend and/or interest expense on securities sold short and security borrowing fees, if any. See below for the ratios of such expenses to average net assets for the periods presented. See Note 1(d).
hBenefit of waiver and payments by affiliates rounds to less than 0.01%.
iRounds to less than 0.01%.
16 |
Annual Report | The accompanying notes are an integral part of these financial statements. |
franklintempleton.com |
FRANKLIN MUTUAL BEACON FUND
FINANCIAL HIGHLIGHTS
| Year Ended December 31, | ||||||||||||||||||||
| 2017 | 2016 | 2015 | 2014 | 2013 | ||||||||||||||||
Class R | ||||||||||||||||||||
| Per share operating performance | ||||||||||||||||||||
(for a share outstanding throughout the year) | ||||||||||||||||||||
Net asset value, beginning of year | $15.01 | $14.05 | $16.33 | $16.68 | $13.19 | |||||||||||||||
Income from investment operationsa: | ||||||||||||||||||||
Net investment incomeb | 0.21 | 0.30c | 0.20 | 0.44d | 0.23 | |||||||||||||||
Net realized and unrealized gains (losses) | 1.84 | 1.89 | (0.97) | 0.61 | 3.50 | |||||||||||||||
Total from investment operations | 2.05 | 2.19 | (0.77) | 1.05 | 3.73 | |||||||||||||||
Less distributions from: | ||||||||||||||||||||
Net investment income | (0.21) | (0.30) | (0.29) | (0.61) | (0.24) | |||||||||||||||
Net realized gains | (0.57) | (0.93) | (1.22) | (0.79) | — | |||||||||||||||
Total distributions | (0.78) | (1.23) | (1.51) | (1.40) | (0.24) | |||||||||||||||
Net asset value, end of year | $16.28 | $15.01 | $14.05 | $16.33 | $16.68 | |||||||||||||||
Total return | 13.76% | 15.58% | (4.61)% | 6.31% | 28.34% | |||||||||||||||
| Ratios to average net assets | ||||||||||||||||||||
Expensese,f | 1.28% | 1.30% | 1.34%g | 1.33% | 1.30% | |||||||||||||||
Expenses incurred in connection with securities sold short | —% | 0.01% | 0.04% | 0.04% | —%h | |||||||||||||||
Net investment income | 1.28% | 1.98%c | 1.23% | 2.64%d | 1.52% | |||||||||||||||
| Supplemental data | ||||||||||||||||||||
Net assets, end of year (000’s) | $1,601 | $2,035 | $2,343 | $2,246 | $1,956 | |||||||||||||||
Portfolio turnover rate | 24.80% | 30.94% | 35.80% | 40.06% | 32.95% | |||||||||||||||
aThe amount shown for a share outstanding throughout the period may not correlate with the Statement of Operations for the period due to the timing of sales and repurchases of the Fund’s shares in relation to income earned and/or fluctuating fair value of the investments of the Fund.
bBased on average daily shares outstanding.
cNet investment income per share includes approximately $0.10 per share related to income received in the form of special dividends in connection with certain Fund holdings. Excluding this amount, the ratio of net investment income to average net assets would have been 1.31%.
dNet investment income per share includes approximately $0.24 per share related to income received in the form of a special dividend in connection with certain Fund holdings. Excluding this amount, the ratio of net investment income to average net assets would have been 1.24%.
eBenefit of expense reduction rounds to less than 0.01%.
fIncludes dividend and/or interest expense on securities sold short and security borrowing fees, if any. See below for the ratios of such expenses to average net assets for the periods presented. See Note 1(d).
gBenefit of waiver and payments by affiliates rounds to less than 0.01%.
hRounds to less than 0.01%.
franklintempleton.com |
The accompanying notes are an integral part of these financial statements. | |
Annual Report |
17 |
FRANKLIN MUTUAL BEACON FUND
FINANCIAL HIGHLIGHTS
| Year Ended December 31, | ||||||||||||||||||||
| 2017 | 2016 | 2015 | 2014 | 2013a | ||||||||||||||||
Class R6 | ||||||||||||||||||||
| Per share operating performance | ||||||||||||||||||||
(for a share outstanding throughout the year) | ||||||||||||||||||||
Net asset value, beginning of year | $15.30 | $14.30 | $16.58 | $16.88 | $14.77 | |||||||||||||||
Income from investment operationsb: | ||||||||||||||||||||
Net investment incomec | 0.37 | 0.38d | 0.30 | 0.56e | 0.24 | |||||||||||||||
Net realized and unrealized gains (losses) | 1.82 | 1.93 | (0.98) | 0.63 | 2.21 | |||||||||||||||
Total from investment operations | 2.19 | 2.31 | (0.68) | 1.19 | 2.45 | |||||||||||||||
Less distributions from: | ||||||||||||||||||||
Net investment income | (0.32) | (0.38) | (0.38) | (0.70) | (0.34) | |||||||||||||||
Net realized gains | (0.57) | (0.93) | (1.22) | (0.79) | — | |||||||||||||||
Total distributions | (0.89) | (1.31) | (1.60) | (1.49) | (0.34) | |||||||||||||||
Net asset value, end of year | $16.60 | $15.30 | $14.30 | $16.58 | $16.88 | |||||||||||||||
Total returnf | 14.42% | 16.20% | (3.98)% | 6.91% | 16.83% | |||||||||||||||
| Ratios to average net assetsg | ||||||||||||||||||||
Expenses before waiver and payments by affiliatesh | 0.72% | 0.71% | 0.74% | 0.74% | 2.10% | |||||||||||||||
Expenses net of waiver and payments by affiliatesh,i | 0.71% | 0.71% | 0.74%j | 0.74% | 0.71% | |||||||||||||||
Expenses incurred in connection with securities sold short | —% | 0.01% | 0.04% | 0.04% | —%k | |||||||||||||||
Net investment income | 1.85% | 2.57%d | 1.83% | 3.23%e | 2.11% | |||||||||||||||
| Supplemental data | ||||||||||||||||||||
Net assets, end of year (000’s) | $106,845 | $604 | $48,844 | $50,868 | $6 | |||||||||||||||
Portfolio turnover rate | 24.80% | 30.94% | 35.80% | 40.06% | 32.95% | |||||||||||||||
aFor the period May 1, 2013 (effective date) to December 31, 2013.
bThe amount shown for a share outstanding throughout the period may not correlate with the Statement of Operations for the period due to the timing of sales and repurchases of the Fund’s shares in relation to income earned and/or fluctuating fair value of the investments of the Fund.
cBased on average daily shares outstanding.
dNet investment income per share includes approximately $0.10 per share related to income received in the form of special dividends in connection with certain Fund holdings. Excluding this amount, the ratio of net investment income to average net assets would have been 1.90%.
eNet investment income per share includes approximately $0.24 per share related to income received in the form of a special dividend in connection with certain Fund holdings. Excluding this amount, the ratio of net investment income to average net assets would have been 1.83%.
fTotal return is not annualized for periods less than one year.
gRatios are annualized for periods less than one year.
hIncludes dividend and/or interest expense on securities sold short and security borrowing fees, if any. See below for the ratios of such expenses to average net assets for the periods presented. See Note 1(d).
iBenefit of expense reduction rounds to less than 0.01%.
jBenefit of waiver and payments by affiliates rounds to less than 0.01%.
kRounds to less than 0.01%.
18 |
Annual Report | The accompanying notes are an integral part of these financial statements. |
franklintempleton.com |
FRANKLIN MUTUAL BEACON FUND
Statement of Investments, December 31, 2017
| Country | Shares | Value | ||||||||||||||
|
| |||||||||||||||
Common Stocks and Other Equity Interests 86.9% | ||||||||||||||||
Aerospace & Defense 3.0% | ||||||||||||||||
BAE Systems PLC | United Kingdom | 95,912 | $ | 742,175 | ||||||||||||
| a | KLX Inc. | United States | 1,749,664 | 119,414,568 | ||||||||||||
|
| |||||||||||||||
| 120,156,743 | ||||||||||||||||
|
| |||||||||||||||
Auto Components 0.4% | ||||||||||||||||
| a,b,c | International Automotive Components Group Brazil LLC | Brazil | 2,846,329 | 97,586 | ||||||||||||
| a,b,c | International Automotive Components Group North America LLC | United States | 22,836,904 | 15,044,382 | ||||||||||||
|
| |||||||||||||||
| 15,141,968 | ||||||||||||||||
|
| |||||||||||||||
Banks 10.6% | ||||||||||||||||
JPMorgan Chase & Co. | United States | 1,270,500 | 135,867,270 | |||||||||||||
Societe Generale SA | France | 2,374,988 | 122,671,438 | |||||||||||||
| a | Standard Chartered PLC | United Kingdom | 4,695,355 | 49,464,910 | ||||||||||||
Wells Fargo & Co. | United States | 2,016,650 | 122,350,156 | |||||||||||||
|
| |||||||||||||||
| 430,353,774 | ||||||||||||||||
|
| |||||||||||||||
Chemicals 1.0% | ||||||||||||||||
| a,b,d | Dow Corning Corp., Contingent Distribution | United States | 12,598,548 | — | ||||||||||||
Monsanto Co. | United States | 349,920 | 40,863,658 | |||||||||||||
|
| |||||||||||||||
| 40,863,658 | ||||||||||||||||
|
| |||||||||||||||
Communications Equipment 3.4% | ||||||||||||||||
Cisco Systems Inc. | United States | 2,338,442 | 89,562,329 | |||||||||||||
Nokia OYJ, ADR | Finland | 10,448,063 | 48,687,973 | |||||||||||||
|
| |||||||||||||||
| 138,250,302 | ||||||||||||||||
|
| |||||||||||||||
Consumer Finance 3.5% | ||||||||||||||||
Capital One Financial Corp. | United States | 1,419,398 | 141,343,653 | |||||||||||||
|
| |||||||||||||||
Diversified Telecommunication Services 3.1% | ||||||||||||||||
Koninklijke KPN NV | Netherlands | 36,081,711 | 125,889,760 | |||||||||||||
|
| |||||||||||||||
Electrical Equipment 3.2% | ||||||||||||||||
| a | Sensata Technologies Holding NV | United States | 2,557,686 | 130,723,331 | ||||||||||||
|
| |||||||||||||||
Food & Staples Retailing 0.9% | ||||||||||||||||
| a | Rite Aid Corp. | United States | 6,467,611 | 12,741,194 | ||||||||||||
Walgreens Boots Alliance Inc. | United States | 306,751 | 22,276,257 | |||||||||||||
|
| |||||||||||||||
| 35,017,451 | ||||||||||||||||
|
| |||||||||||||||
Health Care Equipment & Supplies 4.2% | ||||||||||||||||
Medtronic PLC | United States | 1,622,190 | 130,991,843 | |||||||||||||
Stryker Corp. | United States | 255,186 | 39,513,000 | |||||||||||||
|
| |||||||||||||||
| 170,504,843 | ||||||||||||||||
|
| |||||||||||||||
Hotels, Restaurants & Leisure 2.8% | ||||||||||||||||
Accor SA | France | 2,090,746 | 107,864,519 | |||||||||||||
| a | Caesars Entertainment Corp. | United States | 384,369 | 4,862,268 | ||||||||||||
|
| |||||||||||||||
| 112,726,787 | ||||||||||||||||
|
| |||||||||||||||
Independent Power & Renewable Electricity Producers 0.6% | ||||||||||||||||
| a | Vistra Energy Corp. | United States | 1,256,451 | 23,018,182 | ||||||||||||
|
| |||||||||||||||
Industrial Conglomerates 1.7% | ||||||||||||||||
General Electric Co. | United States | 4,061,400 | 70,871,430 | |||||||||||||
|
| |||||||||||||||
Internet Software & Services 1.3% | ||||||||||||||||
| a | Baidu Inc., ADR | China | 226,547 | 53,059,573 | ||||||||||||
|
| |||||||||||||||
franklintempleton.com |
Annual Report |
|
19 |
|
FRANKLIN MUTUAL BEACON FUND
STATEMENT OF INVESTMENTS
| Country | Shares | Value | ||||||||||||||
|
| |||||||||||||||
Common Stocks and Other Equity Interests (continued) | ||||||||||||||||
IT Services 3.5% | ||||||||||||||||
Cognizant Technology Solutions Corp., A | United States | 1,437,830 | $ | 102,114,686 | ||||||||||||
Infosys Ltd. | India | 2,464,285 | 40,224,126 | |||||||||||||
|
| |||||||||||||||
| 142,338,812 | ||||||||||||||||
|
| |||||||||||||||
Media 12.1% | ||||||||||||||||
| a | Charter Communications Inc., A | United States | 270,187 | 90,772,024 | ||||||||||||
Comcast Corp., A | United States | 1,983,900 | 79,455,195 | |||||||||||||
| a | DISH Network Corp., A | United States | 801,941 | 38,292,683 | ||||||||||||
Sky PLC | United Kingdom | 4,390,865 | 60,007,994 | |||||||||||||
Time Warner Inc. | United States | 1,243,455 | 113,738,829 | |||||||||||||
The Walt Disney Co. | United States | 994,700 | 106,940,197 | |||||||||||||
|
| |||||||||||||||
| 489,206,922 | ||||||||||||||||
|
| |||||||||||||||
Metals & Mining 0.2% | ||||||||||||||||
Warrior Met Coal Inc. | United States | 301,445 | 7,581,342 | |||||||||||||
|
| |||||||||||||||
Oil, Gas & Consumable Fuels 5.9% | ||||||||||||||||
Royal Dutch Shell PLC, B | United Kingdom | 3,819,043 | 129,374,048 | |||||||||||||
The Williams Cos. Inc. | United States | 3,549,332 | 108,219,133 | |||||||||||||
|
| |||||||||||||||
| 237,593,181 | ||||||||||||||||
|
| |||||||||||||||
Pharmaceuticals 11.2% | ||||||||||||||||
Eli Lilly & Co. | United States | 1,203,639 | 101,659,350 | |||||||||||||
GlaxoSmithKline PLC | United Kingdom | 4,971,907 | 88,796,775 | |||||||||||||
Merck & Co. Inc. | United States | 1,980,177 | 111,424,560 | |||||||||||||
Novartis AG, ADR | Switzerland | 1,534,190 | 128,810,592 | |||||||||||||
Teva Pharmaceutical Industries Ltd., ADR | Israel | 1,165,025 | 22,077,224 | |||||||||||||
|
| |||||||||||||||
| 452,768,501 | ||||||||||||||||
|
| |||||||||||||||
Real Estate Management & Development 0.2% | ||||||||||||||||
| a | VICI Properties Inc. | United States | 467,797 | 9,589,839 | ||||||||||||
|
| |||||||||||||||
Software 7.6% | ||||||||||||||||
CA Inc. | United States | 1,248,866 | 41,562,261 | |||||||||||||
| a | Check Point Software Technologies Ltd. | Israel | 816,412 | 84,596,611 | ||||||||||||
Microsoft Corp. | United States | 1,172,844 | 100,325,076 | |||||||||||||
Symantec Corp. | United States | 2,955,337 | 82,926,756 | |||||||||||||
|
| |||||||||||||||
| 309,410,704 | ||||||||||||||||
|
| |||||||||||||||
Tobacco 3.0% | ||||||||||||||||
British American Tobacco PLC | United Kingdom | 1,808,426 | 122,549,040 | |||||||||||||
|
| |||||||||||||||
Wireless Telecommunication Services 3.5% | ||||||||||||||||
Vodafone Group PLC | United Kingdom | 45,462,324 | 144,277,301 | |||||||||||||
|
| |||||||||||||||
Total Common Stocks and Other Equity Interests (Cost $2,701,581,590) | 3,523,237,097 | |||||||||||||||
|
| |||||||||||||||
Management Investment Companies (Cost $40,343,454) 1.1% | ||||||||||||||||
Diversified Financial Services 1.1% | ||||||||||||||||
| a | Altaba Inc. | United States | 615,600 | 42,999,660 | ||||||||||||
|
| |||||||||||||||
Preferred Stocks 5.8% | ||||||||||||||||
Automobiles 2.7% | ||||||||||||||||
| e | Porsche Automobil Holding SE, 1.447%, pfd | Germany | 1,324,222 | 110,866,579 | ||||||||||||
|
| |||||||||||||||
20 |
Annual Report |
franklintempleton.com |
FRANKLIN MUTUAL BEACON FUND
STATEMENT OF INVESTMENTS
| Country | Shares | Value | ||||||||||||
Preferred Stocks (continued) | ||||||||||||||
| Technology Hardware, Storage & Peripherals 3.1% | ||||||||||||||
e | Samsung Electronics Co. Ltd., 2.323%, pfd | South Korea | 62,971 | $ | 123,301,923 | |||||||||
|
| |||||||||||||
| Total Preferred Stocks (Cost $116,661,045) | 234,168,502 | |||||||||||||
|
| |||||||||||||
| Principal Amount | ||||||||||||||
Corporate Notes and Senior Floating Rate Interests 1.8% |
| |||||||||||||
f,g | Cumulus Media Holdings Inc., Term Loans, 4.82%, (LIBOR + 3.25%), 12/23/20 | United States | $ | 14,384,460 | 12,424,577 | |||||||||
| Frontier Communications Corp., | ||||||||||||||
senior note, 10.50%, 9/15/22 | United States | 16,691,000 | 12,664,296 | |||||||||||
senior note, 11.00%, 9/15/25 | United States | 23,907,000 | 17,691,180 | |||||||||||
| iHeartCommunications Inc., | ||||||||||||||
senior secured note, first lien, 9.00%, 12/15/19 | United States | 18,873,000 | 14,107,568 | |||||||||||
f,g Tranche D Term Loan, 8.443%, (LIBOR + 6.75%), 1/30/19 | United States | 15,813,483 | 11,932,585 | |||||||||||
f,g Tranche E Term Loan, 9.193%, (LIBOR + 7.50%), 7/30/19 | United States | 5,080,935 | 3,821,285 | |||||||||||
|
| |||||||||||||
| Total Corporate Notes and Senior Floating Rate Interests (Cost $87,470,061) | 72,641,491 | |||||||||||||
|
| |||||||||||||
| Corporate Notes in Reorganization (Cost $10,848) 0.0% | ||||||||||||||
b,c,h | Broadband Ventures III LLC, secured promissory note, 5.00%, 2/01/12 | United States | 10,848 | — | ||||||||||
|
| |||||||||||||
| Shares | ||||||||||||||
| Companies in Liquidation 0.1% | ||||||||||||||
a,b,c,i | CB FIM Coinvestors LLC | United States | 15,831,950 | — | ||||||||||
a,b,c | FIM Coinvestor Holdings I, LLC | United States | 19,805,560 | — | ||||||||||
a,j | Lehman Brothers Holdings Inc., Bankruptcy Claim | United States | 163,140,446 | 3,621,718 | ||||||||||
a,b,d | Tribune Media, Litigation Trust, Contingent Distribution | United States | 502,320 | — | ||||||||||
a,b,d | Vistra Energy Corp., Litigation Trust, Contingent Distribution | United States | 74,588,735 | 865,229 | ||||||||||
a | Vistra Energy Corp., Litigation Trust, TRA | United States | 1,256,451 | 1,099,395 | ||||||||||
|
| |||||||||||||
| Total Companies in Liquidation (Cost $16,631,637) | 5,586,342 | |||||||||||||
|
| |||||||||||||
| Total Investments before Short Term Investments (Cost $2,962,698,635) | 3,878,633,092 | |||||||||||||
|
| |||||||||||||
| Principal Amount | ||||||||||||||
| Short Term Investments 4.2% | ||||||||||||||
| U.S. Government and Agency Securities 4.2% | ||||||||||||||
k | FHLB, 1/02/18 - 1/03/18 | United States | $ | 39,100,000 | 39,098,992 | |||||||||
k | U.S. Treasury Bill, | |||||||||||||
1/02/18 - 3/29/18 | United States | 56,350,000 | 56,337,344 | |||||||||||
l 1/11/18 - 6/21/18 | United States | 73,000,000 | 72,768,692 | |||||||||||
|
| |||||||||||||
| Total U.S. Government and Agency Securities (Cost $168,207,640) | 168,205,028 | |||||||||||||
|
| |||||||||||||
| Total Investments (Cost $3,130,906,275) 99.9% | 4,046,838,120 | |||||||||||||
| Securities Sold Short (1.1)% | (44,515,112 | ) | ||||||||||||
| Other Assets, less Liabilities 1.2% | 49,611,540 | |||||||||||||
|
| |||||||||||||
| Net Assets 100.0% | $ | 4,051,934,548 | ||||||||||||
|
| |||||||||||||
franklintempleton.com |
Annual Report |
|
21 |
|
FRANKLIN MUTUAL BEACON FUND
STATEMENT OF INVESTMENTS
| Country | Shares | Value | ||||||||||||
m | Securities Sold Short (1.1)% | |||||||||||||
Common Stocks (1.1)% | ||||||||||||||
Diversified Telecommunication Services (0.2)% | ||||||||||||||
AT&T Inc. | United States | 162,085 | $ | (6,301,865 | ) | |||||||||
|
| |||||||||||||
Internet Software & Services (0.9)% | ||||||||||||||
Alibaba Group Holding Ltd., ADR | China | 221,616 | (38,213,247 | ) | ||||||||||
|
| |||||||||||||
Total Securities Sold Short (Proceeds $ 45,087,545) | $ | (44,515,112 | ) | |||||||||||
|
| |||||||||||||
aNon-income producing.
bFair valued using significant unobservable inputs. See Note 14 regarding fair value measurements.
cSee Note 10 regarding restricted securities.
dContingent distributions represent the right to receive additional distributions, if any, during the reorganization of the underlying company. Shares represent total underlying principal of debt securities.
eVariable rate security. The rate shown represents the yield at period end.
fThe coupon rate shown represents the rate at period end.
gSee Note 1(e) regarding senior floating rate interests.
hSee Note 8 regarding credit risk and defaulted securities.
iSee Note 12 regarding holdings of 5% voting securities.
jBankruptcy claims represent the right to receive distributions, if any, during the liquidation of the underlying pool of assets. Shares represent amount of allowed unsecured claims.
kThe security was issued on a discount basis with no stated coupon rate.
lA portion or all of the security has been segregated as collateral for securities sold short and open forward exchange contracts. At December 31, 2017, the aggregate value of these securities pledged amounted to $38,374,408, representing 0.9% of net assets.
mSee Note 1(d) regarding securities sold short.
At December 31, 2017, the Fund had the following futures contracts outstanding. See Note 1(c).
Futures Contracts
| Description | Type | Number of Contracts | Notional Amount* | Expiration Date | Value/ Unrealized Appreciation (Depreciation) | |||||||||||||||
| Currency Contracts | ||||||||||||||||||||
EUR/USD | Short | 1,210 | $ | 182,641,938 | 3/19/18 | $ | (3,241,837 | ) | ||||||||||||
GBP/USD | Short | 1,648 | 139,637,100 | 3/19/18 | (997,760 | ) | ||||||||||||||
|
| |||||||||||||||||||
Total Futures Contracts | $ | (4,239,597 | ) | |||||||||||||||||
|
| |||||||||||||||||||
*As of period end.
22 |
Annual Report |
franklintempleton.com |
FRANKLIN MUTUAL BEACON FUND
STATEMENT OF INVESTMENTS
At December 31, 2017, the Fund had the following forward exchange contracts outstanding. See Note 1(c).
Forward Exchange Contracts
| Currency | Counterpartya | Type | Quantity | Contract Amount | Settlement Date | Unrealized Appreciation | Unrealized Depreciation | |||||||||||||||||||||
| ||||||||||||||||||||||||||||
| OTC Forward Exchange Contracts | ||||||||||||||||||||||||||||
Euro | BOFA | Buy | 15,334,903 | $ | 18,127,473 | 1/12/18 | $ | 287,594 | $ | — | ||||||||||||||||||
Euro | BOFA | Sell | 555,062 | 642,690 | 1/12/18 | — | (23,862 | ) | ||||||||||||||||||||
Euro | HSBK | Buy | 158,289 | 190,383 | 1/12/18 | — | (300 | ) | ||||||||||||||||||||
Euro | HSBK | Buy | 10,488,243 | 12,437,341 | 1/12/18 | 157,568 | — | |||||||||||||||||||||
Euro | HSBK | Sell | 29,660,238 | 34,145,292 | 1/12/18 | — | (1,472,494 | ) | ||||||||||||||||||||
Euro | SSBT | Buy | 4,847,203 | 5,748,523 | 1/12/18 | 72,287 | — | |||||||||||||||||||||
Euro | SSBT | Sell | 2,874,423 | 3,317,961 | 1/12/18 | — | (133,818 | ) | ||||||||||||||||||||
Euro | UBSW | Buy | 6,404,349 | 7,610,373 | 1/12/18 | 80,352 | — | |||||||||||||||||||||
Euro | UBSW | Sell | 30,333,798 | 34,910,434 | 1/12/18 | — | (1,516,202 | ) | ||||||||||||||||||||
British Pound | BOFA | Sell | 5,690,000 | 7,433,194 | 1/16/18 | — | (255,777 | ) | ||||||||||||||||||||
British Pound | BONY | Sell | 16,705,883 | 21,604,231 | 1/16/18 | — | (970,646 | ) | ||||||||||||||||||||
British Pound | SSBT | Sell | 269,170 | 351,111 | 1/16/18 | — | (12,622 | ) | ||||||||||||||||||||
British Pound | UBSW | Sell | 16,705,788 | 21,583,878 | 1/16/18 | — | (990,871 | ) | ||||||||||||||||||||
Euro | HSBK | Sell | 5,651,452 | 6,642,943 | 1/26/18 | — | (149,658 | ) | ||||||||||||||||||||
Euro | UBSW | Sell | 7,364,251 | 8,665,337 | 1/26/18 | — | (185,913 | ) | ||||||||||||||||||||
South Korean Won | HSBK | Buy | 12,468,258,000 | 11,450,474 | 2/09/18 | 238,591 | — | |||||||||||||||||||||
South Korean Won | HSBK | Sell | 51,774,093,481 | 46,125,656 | 2/09/18 | — | (2,412,860 | ) | ||||||||||||||||||||
South Korean Won | UBSW | Buy | 8,731,865,474 | 7,969,212 | 2/09/18 | 216,963 | — | |||||||||||||||||||||
South Korean Won | UBSW | Sell | 35,198,612,171 | 31,397,084 | 2/09/18 | — | (1,601,821 | ) | ||||||||||||||||||||
British Pound | BOFA | Sell | 1,079,352 | 1,434,810 | 2/14/18 | — | (25,056 | ) | ||||||||||||||||||||
British Pound | HSBK | Sell | 11,528,722 | 15,322,824 | 2/14/18 | — | (270,221 | ) | ||||||||||||||||||||
Euro | BONY | Sell | 20,649,603 | 24,404,341 | 2/20/18 | — | (449,292 | ) | ||||||||||||||||||||
Euro | SSBT | Sell | 20,649,603 | 24,399,571 | 2/20/18 | — | (454,062 | ) | ||||||||||||||||||||
Euro | SSBT | Sell | 82,223 | 97,695 | 4/10/18 | — | (1,582 | ) | ||||||||||||||||||||
Euro | BOFA | Sell | 19,029,546 | 22,702,533 | 4/18/18 | — | (286,316 | ) | ||||||||||||||||||||
Euro | SSBT | Sell | 19,029,545 | 22,701,962 | 4/18/18 | — | (286,886 | ) | ||||||||||||||||||||
Euro | UBSW | Sell | 19,029,545 | 22,705,863 | 4/18/18 | — | (282,985 | ) | ||||||||||||||||||||
British Pound | BOFA | Sell | 15,521,664 | 20,663,890 | 4/24/18 | — | (381,179 | ) | ||||||||||||||||||||
British Pound | SSBT | Sell | 4,643,589 | 6,136,574 | 4/24/18 | — | (159,440 | ) | ||||||||||||||||||||
British Pound | UBSW | Sell | 1,105,243 | 1,465,806 | 4/24/18 | — | (32,739 | ) | ||||||||||||||||||||
Euro | HSBK | Sell | 36,254,033 | 42,785,088 | 5/07/18 | — | (1,067,683 | ) | ||||||||||||||||||||
Euro | UBSW | Sell | 36,254,032 | 42,777,402 | 5/07/18 | — | (1,075,369 | ) | ||||||||||||||||||||
South Korean Won | HSBK | Sell | 27,279,529,318 | 24,327,385 | 5/11/18 | — | (1,274,429 | ) | ||||||||||||||||||||
South Korean Won | UBSW | Sell | 34,716,047,504 | 30,955,141 | 5/11/18 | — | (1,625,839 | ) | ||||||||||||||||||||
Euro | BOFA | Sell | 32,752,274 | 39,031,540 | 5/21/18 | — | (622,670 | ) | ||||||||||||||||||||
Euro | SSBT | Sell | 7,092,419 | 8,474,221 | 5/21/18 | — | (112,794 | ) | ||||||||||||||||||||
Euro | UBSW | Sell | 32,752,275 | 39,024,991 | 5/21/18 | — | (629,221 | ) | ||||||||||||||||||||
British Pound | BOFA | Sell | 4,804,025 | 6,462,929 | 5/24/18 | — | (57,752 | ) | ||||||||||||||||||||
British Pound | HSBK | Sell | 2,244,120 | 2,998,991 | 5/24/18 | — | (47,036 | ) | ||||||||||||||||||||
British Pound | SSBT | Sell | 35,402,352 | 47,217,356 | 5/24/18 | — | (835,570 | ) | ||||||||||||||||||||
British Pound | UBSW | Sell | 500,822 | 676,886 | 5/24/18 | — | (2,898 | ) | ||||||||||||||||||||
|
| |||||||||||||||||||||||||||
Total Forward Exchange Contracts |
| $ | 1,053,355 | $ | (19,707,863 | ) | ||||||||||||||||||||||
|
| |||||||||||||||||||||||||||
Net unrealized appreciation (depreciation) |
| $ | (18,654,508 | ) | ||||||||||||||||||||||||
|
| |||||||||||||||||||||||||||
aMay be comprised of multiple contracts with the same counterparty, currency and settlement date.
See Note 11 regarding other derivative information.
See Abbreviations on page 39.
franklintempleton.com |
The accompanying notes are an integral part of these financial statements. | |
Annual Report |
23 |
FRANKLIN MUTUAL BEACON FUND
Statement of Assets and Liabilities
December 31, 2017
Assets: | ||||
Investments in securities: | ||||
Cost - Unaffiliated issuers | $ | 3,130,906,275 | ||
|
| |||
Value - Unaffiliated issuers | $ | 4,046,838,120 | ||
Cash | 431,791 | |||
Receivables: | ||||
Investment securities sold | 13,131,077 | |||
Capital shares sold | 1,583,232 | |||
Dividends and interest | 10,998,890 | |||
European Union tax reclaims | 2,670,046 | |||
Deposits with brokers for: | ||||
Securities sold short | 45,564,833 | |||
Futures contracts | 5,746,440 | |||
Unrealized appreciation on OTC forward exchange contracts | 1,053,355 | |||
Other assets | 456 | |||
|
| |||
Total assets | 4,128,018,240 | |||
|
| |||
Liabilities: | ||||
Payables: | ||||
Capital shares redeemed | 5,083,119 | |||
Management fees | 2,303,623 | |||
Distribution fees | 837,419 | |||
Transfer agent fees | 536,684 | |||
Trustees’ fees and expenses | 220,923 | |||
Variation margin on futures contracts | 1,831,900 | |||
Securities sold short, at value (proceeds $45,087,545) | 44,515,112 | |||
Unrealized depreciation on OTC forward exchange contracts | 19,707,863 | |||
Deferred tax | 672,158 | |||
Accrued expenses and other liabilities | 374,891 | |||
|
| |||
Total liabilities | 76,083,692 | |||
|
| |||
Net assets, at value | $ | 4,051,934,548 | ||
|
| |||
Net assets consist of: | ||||
Paid-in capital | $ | 3,118,955,229 | ||
Undistributed net investment income | 1,171,624 | |||
Net unrealized appreciation (depreciation) | 893,139,062 | |||
Accumulated net realized gain (loss) | 38,668,633 | |||
|
| |||
Net assets, at value | $ | 4,051,934,548 | ||
|
|
24 |
Annual Report | The accompanying notes are an integral part of these financial statements. |
franklintempleton.com |
FRANKLIN MUTUAL BEACON FUND
FINANCIAL STATEMENTS
Statement of Assets and Liabilities (continued)
December 31, 2017
| Class Z: | ||||
Net assets, at value | $ | 2,700,327,142 | ||
|
| |||
Shares outstanding | 162,585,505 | |||
|
| |||
Net asset value and maximum offering price per share | $16.61 | |||
|
| |||
| Class A: | ||||
Net assets, at value | $ | 983,047,774 | ||
|
| |||
Shares outstanding | 59,698,482 | |||
|
| |||
Net asset value per sharea | $16.47 | |||
|
| |||
Maximum offering price per share (net asset value per share ÷ 94.25%) | $17.47 | |||
|
| |||
| Class C: | ||||
Net assets, at value | $ | 260,113,388 | ||
|
| |||
Shares outstanding | 15,918,769 | |||
|
| |||
Net asset value and maximum offering price per sharea | $16.34 | |||
|
| |||
| Class R: | ||||
Net assets, at value | $ | 1,601,196 | ||
|
| |||
Shares outstanding | 98,337 | |||
|
| |||
Net asset value and maximum offering price per share | $16.28 | |||
|
| |||
| Class R6: | ||||
Net assets, at value | $ | 106,845,048 | ||
|
| |||
Shares outstanding | 6,435,154 | |||
|
| |||
Net asset value and maximum offering price per share | $16.60 | |||
|
|
aRedemption price is equal to net asset value less contingent deferred sales charges, if applicable.
franklintempleton.com |
The accompanying notes are an integral part of these financial statements. | |
Annual Report |
25 |
FRANKLIN MUTUAL BEACON FUND
FINANCIAL STATEMENTS
Statement of Operations
for the year ended December 31, 2017
Investment income: | ||||
Dividends: (net of foreign taxes)* | ||||
Unaffiliated issuers | $ 90,600,735 | |||
Interest: | ||||
Unaffiliated issuers | 11,625,187 | |||
Other income (Note 1f) | 633,525 | |||
|
| |||
Total investment income | 102,859,447 | |||
|
| |||
Expenses: | ||||
Management fees (Note 3a) | 27,127,489 | |||
Distribution fees: (Note 3c) | ||||
Class A | 2,490,203 | |||
Class C | 2,726,175 | |||
Class R | 10,223 | |||
Transfer agent fees: (Note 3e) | ||||
Class Z | 2,303,767 | |||
Class A | 841,363 | |||
Class C | 230,279 | |||
Class R | 1,728 | |||
Class R6 | 5,201 | |||
Custodian fees (Note 4) | 172,078 | |||
Reports to shareholders | 204,120 | |||
Registration and filing fees | 137,871 | |||
Professional fees | 411,173 | |||
Trustees’ fees and expenses | 122,412 | |||
Other | 132,743 | |||
|
| |||
Total expenses | 36,916,825 | |||
Expense reductions (Note 4) | (11,324 | ) | ||
Expenses waived/paid by affiliates (Note 3f) | (2,949 | ) | ||
|
| |||
Net expenses | 36,902,552 | |||
|
| |||
Net investment income | 65,956,895 | |||
|
| |||
Realized and unrealized gains (losses): | ||||
Net realized gain (loss) from: | ||||
Investments: | ||||
Unaffiliated issuers | 232,105,445 | |||
Written options | 1,995,812 | |||
Foreign currency transactions | 757,843 | |||
Forward exchange contracts | (31,591,522 | ) | ||
Futures contracts | (21,551,515 | ) | ||
Securities sold short | 1,431,571 | |||
|
| |||
Net realized gain (loss) | 183,147,634 | |||
|
| |||
Net change in unrealized appreciation (depreciation) on: | ||||
Investments: | ||||
Unaffiliated issuers | 332,425,939 | |||
Translation of other assets and liabilities denominated in foreign currencies | 417,962 | |||
Forward exchange contracts | (41,340,957 | ) | ||
Written options | (542,578 | ) | ||
Futures contracts | (7,668,447 | ) | ||
Securities sold short | (1,483,428 | ) | ||
Change in deferred taxes on unrealized appreciation | (672,158 | ) | ||
|
| |||
Net change in unrealized appreciation (depreciation) | 281,136,333 | |||
|
| |||
Net realized and unrealized gain (loss) | 464,283,967 | |||
|
| |||
Net increase (decrease) in net assets resulting from operations | $530,240,862 | |||
|
| |||
*Foreign taxes withheld on dividends | $ 4,895,526 | |||
26 |
Annual Report | The accompanying notes are an integral part of these financial statements. |
franklintempleton.com |
FRANKLIN MUTUAL BEACON FUND
FINANCIAL STATEMENTS
Statements of Changes in Net Assets
| Year Ended December 31, | ||||||||
|
| |||||||
| 2017 | 2016 | |||||||
| ||||||||
Increase (decrease) in net assets: | ||||||||
Operations: | ||||||||
Net investment income | $ | 65,956,895 | $ | 86,695,303 | ||||
Net realized gain (loss) | 183,147,634 | 238,903,177 | ||||||
Net change in unrealized appreciation (depreciation) | 281,136,333 | 224,718,936 | ||||||
|
| |||||||
Net increase (decrease) in net assets resulting from operations | 530,240,862 | 550,317,416 | ||||||
|
| |||||||
Distributions to shareholders from: | ||||||||
Net investment income: | ||||||||
Class Z | (48,496,718 | ) | (58,200,382 | ) | ||||
Class A | (15,320,414 | ) | (20,284,242 | ) | ||||
Class C | (2,055,677 | ) | (3,677,329 | ) | ||||
Class R | (23,201 | ) | (37,485 | ) | ||||
Class R6 | (1,872,829 | ) | (1,152,424 | ) | ||||
Net realized gains: | ||||||||
Class Z | (91,365,841 | ) | (146,912,444 | ) | ||||
Class A | (33,271,239 | ) | (57,880,823 | ) | ||||
Class C | (8,974,316 | ) | (16,247,924 | ) | ||||
Class R | (65,148 | ) | (118,154 | ) | ||||
Class R6 | (2,256,073 | ) | (2,834,009 | ) | ||||
|
| |||||||
Total distributions to shareholders | (203,701,456 | ) | (307,345,216 | ) | ||||
|
| |||||||
Capital share transactions: (Note 2) | ||||||||
Class Z | (86,429,444 | ) | (13,134,883 | ) | ||||
Class A | (92,158,566 | ) | (92,115,190 | ) | ||||
Class C | (38,165,096 | ) | (27,695,808 | ) | ||||
Class R | (607,336 | ) | (406,764 | ) | ||||
Class R6 | 108,551,501 | (51,666,995 | ) | |||||
|
| |||||||
Total capital share transactions | (108,808,941 | ) | (185,019,640 | ) | ||||
|
| |||||||
Net increase (decrease) in net assets | 217,730,465 | 57,952,560 | ||||||
Net assets: | ||||||||
Beginning of year | 3,834,204,083 | 3,776,251,523 | ||||||
|
| |||||||
End of year | $ | 4,051,934,548 | $ | 3,834,204,083 | ||||
|
| |||||||
Undistributed net investment income included in net assets: | ||||||||
End of year | $ | 1,171,624 | $ | — | ||||
|
| |||||||
Distributions in excess of net investment income included in net assets: | ||||||||
End of year | $ | — | $ | (1,675,194) | ||||
|
| |||||||
franklintempleton.com |
The accompanying notes are an integral part of these financial statements. | |
Annual Report |
27 |
FRANKLIN MUTUAL BEACON FUND
1. Organization and Significant Accounting Policies
Franklin Mutual Series Funds (Trust) is registered under the Investment Company Act of 1940 (1940 Act) as an open-end management investment company, consisting of seven separate funds and applies the specialized accounting and reporting guidance in U.S. Generally Accepted Accounting Principles (U.S. GAAP). Franklin Mutual Beacon Fund (Fund) is included in this report. The Fund offers five classes of shares: Class Z, Class A, Class C, Class R and Class R6. Each class of shares may differ by its initial sales load, contingent deferred sales charges, voting rights on matters affecting a single class, its exchange privilege and fees due to differing arrangements for distribution and transfer agent fees.
The following summarizes the Fund’s significant accounting policies.
a. Financial Instrument Valuation
The Fund’s investments in financial instruments are carried at fair value daily. Fair value is the price that would be received to sell an asset or paid to transfer a liability in an orderly transaction between market participants on the measurement date. The Fund calculates the net asset value (NAV) per share as of 4 p.m. Eastern time each day the New York Stock Exchange (NYSE) is open for trading. Under compliance policies and procedures approved by the Trust’s Board of Trustees (the Board), the Fund’s administrator has responsibility for oversight of valuation, including leading the cross-functional Valuation Committee (VC). The VC provides administration and oversight of the Fund’s valuation policies and procedures, which are approved annually by the Board. Among other things, these procedures allow the Fund to utilize independent pricing services, quotations from securities and financial instrument dealers, and other market sources to determine fair value.
Equity securities and derivative financial instruments listed on an exchange or on the NASDAQ National Market System are valued at the last quoted sale price or the official closing price of the day, respectively. Foreign equity securities are valued as of the close of trading on the foreign stock exchange on which the security is primarily traded, or as of 4 p.m. Eastern time. The value is then converted into its U.S. dollar equivalent at the foreign exchange rate in effect at 4 p.m. Eastern time on the day that the value of the security is determined. Over-the-counter (OTC) securities are valued within the range of the most recent
quoted bid and ask prices. Securities that trade in multiple markets or on multiple exchanges are valued according to the broadest and most representative market. Certain equity securities are valued based upon fundamental characteristics or relationships to similar securities.
Debt securities generally trade in the OTC market rather than on a securities exchange. The Fund’s pricing services use multiple valuation techniques to determine fair value. In instances where sufficient market activity exists, the pricing services may utilize a market-based approach through which quotes from market makers are used to determine fair value. In instances where sufficient market activity may not exist or is limited, the pricing services also utilize proprietary valuation models which may consider market characteristics such as benchmark yield curves, credit spreads, estimated default rates, anticipated market interest rate volatility, coupon rates, anticipated timing of principal repayments, underlying collateral, and other unique security features in order to estimate the relevant cash flows, which are then discounted to calculate the fair value.
Certain derivative financial instruments trade in the OTC market. The Fund’s pricing services use various techniques including industry standard option pricing models and proprietary discounted cash flow models to determine the fair value of those instruments. The Fund’s net benefit or obligation under the derivative contract, as measured by the fair value of the contract, is included in net assets.
The Fund has procedures to determine the fair value of financial instruments for which market prices are not reliable or readily available. Under these procedures, the VC convenes on a regular basis to review such financial instruments and considers a number of factors, including significant unobservable valuation inputs, when arriving at fair value. The VC primarily employs a market-based approach which may use related or comparable assets or liabilities, recent transactions, market multiples, book values, and other relevant information for the investment to determine the fair value of the investment. An income-based valuation approach may also be used in which the anticipated future cash flows of the investment are discounted to calculate fair value. Discounts may also be applied due to the nature or duration of any restrictions on the disposition of the investments. Due to the inherent uncertainty of valuations of such investments, the fair values may differ significantly from the values that would have been used had an active market existed. The VC employs various methods for calibrating these
28 |
Annual Report |
franklintempleton.com |
FRANKLIN MUTUAL BEACON FUND
NOTES TO FINANCIAL STATEMENTS
valuation approaches including a regular review of key inputs and assumptions, transactional back-testing or disposition analysis, and reviews of any related market activity.
Trading in securities on foreign securities stock exchanges and OTC markets may be completed before 4 p.m. Eastern time. In addition, trading in certain foreign markets may not take place on every Fund’s business day. Occasionally, events occur between the time at which trading in a foreign security is completed and 4 p.m. Eastern time that might call into question the reliability of the value of a portfolio security held by the Fund. As a result, differences may arise between the value of the Fund’s portfolio securities as determined at the foreign market close and the latest indications of value at 4 p.m. Eastern time. In order to minimize the potential for these differences, the VC monitors price movements following the close of trading in foreign stock markets through a series of country specific market proxies (such as baskets of American Depositary Receipts, futures contracts and exchange traded funds). These price movements are measured against established trigger thresholds for each specific market proxy to assist in determining if an event has occurred that may call into question the reliability of the values of the foreign securities held by the Fund. If such an event occurs, the securities may be valued using fair value procedures, which may include the use of independent pricing services.
When the last day of the reporting period is a non-business day, certain foreign markets may be open on those days that the Fund’s NAV is not calculated, which could result in differences between the value of the Fund’s portfolio securities on the last business day and the last calendar day of the reporting period. Any significant security valuation changes due to an open foreign market are adjusted and reflected by the Fund for financial reporting purposes.
b. Foreign Currency Translation
Portfolio securities and other assets and liabilities denominated in foreign currencies are translated into U.S. dollars based on the exchange rate of such currencies against U.S. dollars on the date of valuation. The Fund may enter into foreign currency exchange contracts to facilitate transactions denominated in a foreign currency. Purchases and sales of securities, income and expense items denominated in foreign currencies are translated into U.S. dollars at the exchange rate in effect on the transaction date. Portfolio securities and assets and liabilities denominated in foreign currencies contain risks that those currencies will
decline in value relative to the U.S. dollar. Occasionally, events may impact the availability or reliability of foreign exchange rates used to convert the U.S. dollar equivalent value. If such an event occurs, the foreign exchange rate will be valued at fair value using procedures established and approved by the Board.
The Fund does not separately report the effect of changes in foreign exchange rates from changes in market prices on securities held. Such changes are included in net realized and unrealized gain or loss from investments in the Statement of Operations.
Realized foreign exchange gains or losses arise from sales of foreign currencies, currency gains or losses realized between the trade and settlement dates on securities transactions and the difference between the recorded amounts of dividends, interest, and foreign withholding taxes and the U.S. dollar equivalent of the amounts actually received or paid. Net unrealized foreign exchange gains and losses arise from changes in foreign exchange rates on foreign denominated assets and liabilities other than investments in securities held at the end of the reporting period.
c. Derivative Financial Instruments
The Fund invested in derivative financial instruments in order to manage risk or gain exposure to various other investments or markets. Derivatives are financial contracts based on an underlying or notional amount, require no initial investment or an initial net investment that is smaller than would normally be required to have a similar response to changes in market factors, and require or permit net settlement. Derivatives contain various risks including the potential inability of the counterparty to fulfill their obligations under the terms of the contract, the potential for an illiquid secondary market, and/or the potential for market movements which expose the Fund to gains or losses in excess of the amounts shown in the Statement of Assets and Liabilities. Realized gain and loss and unrealized appreciation and depreciation on these contracts for the period are included in the Statement of Operations.
Derivative counterparty credit risk is managed through a formal evaluation of the creditworthiness of all potential counter-parties. The Fund attempts to reduce its exposure to counterparty credit risk on OTC derivatives, whenever possible, by entering into International Swaps and Derivatives Association (ISDA) master agreements with certain counterparties. These agreements contain various provisions,
franklintempleton.com |
Annual Report |
|
29 |
|
FRANKLIN MUTUAL BEACON FUND
NOTES TO FINANCIAL STATEMENTS
1. Organization and Significant Accounting Policies (continued)
c. Derivative Financial Instruments (continued)
including but not limited to collateral requirements, events of default, or early termination. Termination events applicable to the counterparty include certain deteriorations in the credit quality of the counterparty. Termination events applicable to the Fund include failure of the Fund to maintain certain net asset levels and/or limit the decline in net assets over various periods of time. In the event of default or early termination, the ISDA master agreement gives the non-defaulting party the right to net and close-out all transactions traded, whether or not arising under the ISDA agreement, to one net amount payable by one counterparty to the other. However, absent an event of default or early termination, OTC derivative assets and liabilities are presented gross and not offset in the Statement of Assets and Liabilities. Early termination by the counterparty may result in an immediate payment by the Fund of any net liability owed to that counterparty under the ISDA agreement. At December 31, 2017, the Fund had OTC derivatives in a net liability position of $18,654,508 and the aggregate value of collateral pledged for such contracts was $16,110,440.
Collateral requirements differ by type of derivative. Collateral or initial margin requirements are set by the broker or exchange clearing house for exchange traded and centrally cleared derivatives. Initial margin deposited is held at the exchange and can be in the form of cash and/or securities. For OTC derivatives traded under an ISDA master agreement, posting of collateral is required by either the Fund or the applicable counterparty if the total net exposure of all OTC derivatives with the applicable counterparty exceeds the minimum transfer amount, which typically ranges from $100,000 to $250,000, and can vary depending on the counterparty and the type of the agreement. Generally, collateral is determined at the close of Fund business each day and any additional collateral required due to changes in derivative values may be delivered by the Fund or the counterparty the next business day, or within a few business days. Collateral pledged and/or received by the Fund for OTC derivatives, if any, is held in segregated accounts with the Fund’s custodian/counterparty broker and can be in the form of cash and/or securities. Unrestricted cash may be invested according to the Fund’s investment objectives. To the extent that the amounts due to the Fund from its counterparties are not subject to collateralization or are not fully collateralized, the Fund bears the risk of loss from counterparty non-performance.
The Fund entered into exchange traded futures contracts primarily to manage exposure to certain foreign currencies. A futures contract is an agreement between the Fund and a counterparty to buy or sell an asset at a specified price on a future date. Required initial margins are pledged by the Fund, and the daily change in fair value is accounted for as a variation margin payable or receivable in the Statement of Assets and Liabilities.
The Fund entered into OTC forward exchange contracts primarily to manage exposure to certain foreign currencies. A forward exchange contract is an agreement between the Fund and a counterparty to buy or sell a foreign currency at a specific exchange rate on a future date.
The Fund purchased or wrote exchange traded and/or OTC option contracts primarily to manage exposure to equity price risk. An option is a contract entitling the holder to purchase or sell a specific amount of shares or units of an asset or notional amount of a swap (swaption), at a specified price. When an option is purchased or written, an amount equal to the premium paid or received is recorded as an asset or liability, respectively. Upon exercise of an option, the acquisition cost or sales proceeds of the underlying investment is adjusted by any premium received or paid. Upon expiration of an option, any premium received or paid is recorded as a realized gain or loss. Upon closing an option other than through expiration or exercise, the difference between the premium received or paid and the cost to close the position is recorded as a realized gain or loss.
See Note 11 regarding other derivative information.
d. Securities Sold Short
The Fund is engaged in selling securities short, which obligates the Fund to replace a borrowed security with the same security at current fair value. The Fund incurs a loss if the price of the security increases between the date of the short sale and the date on which the Fund replaces the borrowed security. The Fund realizes a gain if the price of the security declines between those dates. Gains are limited to the price at which the Fund sold the security short, while losses are potentially unlimited in size.
The Fund is required to establish a margin account with the broker lending the security sold short. While the short sale is outstanding, the broker retains the proceeds of the short sale to the extent necessary to meet margin requirements until the short position is closed out. A deposit must also be maintained with
30 |
Annual Report |
franklintempleton.com |
FRANKLIN MUTUAL BEACON FUND
NOTES TO FINANCIAL STATEMENTS
the Fund’s custodian/counterparty broker consisting of cash and/or securities having a value equal to a specified percentage of the value of the securities sold short. The Fund is obligated to pay fees for borrowing the securities sold short and is required to pay the counterparty any dividends and/or interest due on securities sold short. Such dividends and/or interest and any security borrowing fees are recorded as an expense to the Fund.
e. Senior Floating Rate Interests
The Fund invests in senior secured corporate loans that pay interest at rates which are periodically reset by reference to a base lending rate plus a spread. These base lending rates are generally the prime rate offered by a designated U.S. bank or the London InterBank Offered Rate (LIBOR). Senior secured corporate loans often require prepayment of principal from excess cash flows or at the discretion of the borrower. As a result, actual maturity may be substantially less than the stated maturity. Senior secured corporate loans in which the Fund invests are generally readily marketable, but may be subject to certain restrictions on resale.
f. Income and Deferred Taxes
It is the Fund’s policy to qualify as a regulated investment company under the Internal Revenue Code. The Fund intends to distribute to shareholders substantially all of its taxable income and net realized gains to relieve it from federal income and excise taxes. As a result, no provision for U.S. federal income taxes is required.
The Fund may be subject to foreign taxation related to income received, capital gains on the sale of securities and certain foreign currency transactions in the foreign jurisdictions in which it invests. Foreign taxes, if any, are recorded based on the tax regulations and rates that exist in the foreign markets in which the Fund invests. When a capital gain tax is determined to apply, the Fund records an estimated deferred tax liability in an amount that would be payable if the securities were disposed of on the valuation date.
As a result of several court cases, in certain countries across the European Union, the Fund filed additional tax reclaims for previously withheld taxes on dividends earned in those countries (EU reclaims). These additional filings are subject to various administrative proceedings by the local jurisdictions’ tax authorities within the European Union, as well as a number of related judicial proceedings. Income recognized, if any, for EU reclaims is reflected as other income in the Statement of
Operations and any related receivable, if any, is reflected as European Union tax reclaims in the Statement of Assets and Liabilities. When uncertainty exists as to the ultimate resolution of these proceedings, the likelihood of receipt of these EU reclaims, and the potential timing of payment, no amounts are reflected in the financial statements. For U.S. income tax purposes, EU reclaims received by the Fund, if any, reduce the amounts of foreign taxes Fund shareholders can use as tax credits in their individual income tax returns.
The Fund may recognize an income tax liability related to its uncertain tax positions under U.S. GAAP when the uncertain tax position has a less than 50% probability that it will be sustained upon examination by the tax authorities based on its technical merits. As of December 31, 2017, the Fund has determined that no tax liability is required in its financial statements related to uncertain tax positions for any open tax years (or expected to be taken in future tax years). Open tax years are those that remain subject to examination and are based on the statute of limitations in each jurisdiction in which the Fund invests.
g. Security Transactions, Investment Income, Expenses and Distributions
Security transactions are accounted for on trade date. Realized gains and losses on security transactions are determined on a specific identification basis. Interest income and estimated expenses are accrued daily. Amortization of premium and accretion of discount on debt securities are included in interest income. Dividend income is recorded on the ex-dividend date except for certain dividends from securities where the dividend rate is not available. In such cases, the dividend is recorded as soon as the information is received by the Fund. Distributions to shareholders are recorded on the ex-dividend date. Distributable earnings are determined according to income tax regulations (tax basis) and may differ from earnings recorded in accordance with U.S. GAAP. These differences may be permanent or temporary. Permanent differences are reclassified among capital accounts to reflect their tax character. These reclassifications have no impact on net assets or the results of operations. Temporary differences are not reclassified, as they may reverse in subsequent periods.
Common expenses incurred by the Trust are allocated among the Funds based on the ratio of net assets of each Fund to the combined net assets of the Trust. Fund specific expenses are charged directly to the Fund that incurred the expense.
franklintempleton.com |
Annual Report |
|
31 |
|
FRANKLIN MUTUAL BEACON FUND
NOTES TO FINANCIAL STATEMENTS
1. Organization and Significant Accounting Policies (continued)
g. Security Transactions, Investment Income, Expenses and Distributions (continued)
Realized and unrealized gains and losses and net investment income, excluding class specific expenses, are allocated daily to each class of shares based upon the relative proportion of net assets of each class. Differences in per share distributions by class are generally due to differences in class specific expenses.
h. Accounting Estimates
The preparation of financial statements in accordance with U.S. GAAP requires management to make estimates and assumptions that affect the reported amounts of assets and liabilities at the date of the financial statements and the amounts of income and expenses during the reporting period. Actual results could differ from those estimates.
i. Guarantees and Indemnifications
Under the Trust’s organizational documents, its officers and trustees are indemnified by the Trust against certain liabilities arising out of the performance of their duties to the Trust. Additionally, in the normal course of business, the Trust, on behalf of the Fund, enters into contracts with service providers that contain general indemnification clauses. The Trust’s maximum exposure under these arrangements is unknown as this would involve future claims that may be made against the Trust that have not yet occurred. Currently, the Trust expects the risk of loss to be remote.
2. Shares of Beneficial Interest
At December 31, 2017, there were an unlimited number of shares authorized (without par value). Transactions in the Fund’s shares were as follows:
| Year Ended December 31, | ||||||||||||||||
| 2017 | 2016 | |||||||||||||||
| Shares | Amount | Shares | Amount | |||||||||||||
| Class Z Shares: | ||||||||||||||||
Shares sold | 12,158,938 | $ | 199,279,041 | 9,149,715 | $ | 140,197,196 | ||||||||||
Shares issued in reinvestment of distributions | 7,927,106 | 130,651,385 | 12,432,394 | 192,053,179 | ||||||||||||
Shares redeemed | (25,064,661 | ) | (416,359,870 | ) | (23,237,873 | ) | (345,385,258 | ) | ||||||||
Net increase (decrease) | (4,978,617 | ) | $ | (86,429,444 | ) | (1,655,764 | ) | $ | (13,134,883 | ) | ||||||
| Class A Shares: | ||||||||||||||||
Shares sold | 5,808,494 | $ | 94,712,185 | 5,078,134 | $ | 75,827,729 | ||||||||||
Shares issued in reinvestment of distributions | 2,889,127 | 47,191,652 | 4,985,244 | 76,408,846 | ||||||||||||
Shares redeemed | (14,375,309 | ) | (234,062,403 | ) | (16,508,824 | ) | (244,351,765 | ) | ||||||||
Net increase (decrease) | (5,677,688 | ) | $ | (92,158,566 | ) | (6,445,446 | ) | $ | (92,115,190 | ) | ||||||
| Class C Shares: | ||||||||||||||||
Shares sold | 1,150,062 | $ | 18,503,214 | 884,730 | $ | 13,160,013 | ||||||||||
Shares issued in reinvestment of distributions | 672,846 | 10,882,501 | 1,245,164 | 18,929,994 | ||||||||||||
Shares redeemed | (4,170,647 | ) | (67,550,811 | ) | (4,098,752 | ) | (59,785,815 | ) | ||||||||
Net increase (decrease) | (2,347,739 | ) | $ | (38,165,096 | ) | (1,968,858 | ) | $ | (27,695,808 | ) | ||||||
| Class R Shares: | ||||||||||||||||
Shares sold | 32,014 | $ | 516,552 | 29,412 | $ | 419,666 | ||||||||||
Shares issued in reinvestment of distributions | 5,476 | 88,349 | 10,270 | 155,639 | ||||||||||||
Shares redeemed | (74,775 | ) | (1,212,237 | ) | (70,761 | ) | (982,069 | ) | ||||||||
Net increase (decrease) | (37,285 | ) | $ | (607,336 | ) | (31,079 | ) | $ | (406,764 | ) | ||||||
32 |
Annual Report |
franklintempleton.com |
FRANKLIN MUTUAL BEACON FUND
NOTES TO FINANCIAL STATEMENTS
| Year Ended December 31, | ||||||||||||||||
| 2017 | 2016 | |||||||||||||||
| Shares | Amount | Shares | Amount | |||||||||||||
| Class R6 Shares: | ||||||||||||||||
Shares sold | 6,649,392 | $ | 112,866,490 | 618,690 | $ | 9,392,683 | ||||||||||
Shares issued in reinvestment of distributions | 249,808 | 4,128,902 | 3,324 | 51,412 | ||||||||||||
Shares redeemed | (503,515 | ) | (8,443,891 | ) | (3,998,311 | ) | (61,111,090 | ) | ||||||||
Net increase (decrease) | 6,395,685 | $ | 108,551,501 | (3,376,297 | ) | $ | (51,666,995 | ) | ||||||||
3. Transactions with Affiliates
Franklin Resources, Inc. is the holding company for various subsidiaries that together are referred to as Franklin Templeton Investments. Certain officers and trustees of the Fund are also officers and/or directors of the following subsidiaries:
| Subsidiary | Affiliation | |
Franklin Mutual Advisers, LLC (Franklin Mutual) | Investment manager | |
Franklin Templeton Services, LLC (FT Services) | Administrative manager | |
Franklin Templeton Distributors, Inc. (Distributors) | Principal underwriter | |
Franklin Templeton Investor Services, LLC (Investor Services) | Transfer agent | |
a. Management Fees
The Fund pays an investment management fee to Franklin Mutual based on the average daily net assets of the Fund as follows:
| Annualized Fee Rate | Net Assets | |||
0.675% | Up to and including $5 billion | |||
0.645% | Over $5 billion, up to and including $7 billion | |||
0.625% | Over $7 billion, up to and including $10 billion | |||
0.615% | In excess of $10 billion |
For the year ended December 31, 2017, the gross effective investment management fee rate was 0.675% of the Fund’s average daily net assets.
b. Administrative Fees
Under an agreement with Franklin Mutual, FT Services provides administrative services to the Fund. The fee is paid by Franklin Mutual based on the Fund’s average daily net assets, and is not an additional expense of the Fund.
c. Distribution Fees
The Board has adopted distribution plans for each share class, with the exception of Class Z and Class R6 shares, pursuant to Rule 12b-1 under the 1940 Act. Under the Fund’s Class A reimbursement distribution plan, the Fund reimburses Distributors for costs incurred in connection with the servicing, sale and distribution of the Fund’s shares up to the maximum annual plan rate. Under the Class A reimbursement distribution plan, costs exceeding the maximum for the current plan year cannot be reimbursed in subsequent periods. In addition, under the Fund’s Class C and R compensation distribution plans, the Fund pays Distributors for costs incurred in connection with the servicing, sale and distribution of the Fund’s shares up to the maximum annual plan rate for each class. The plan year, for purposes of monitoring compliance with the maximum annual plan rates, is February 1 through January 31.
franklintempleton.com |
Annual Report |
|
33 |
|
FRANKLIN MUTUAL BEACON FUND
NOTES TO FINANCIAL STATEMENTS
3. Transactions with Affiliates (continued)
c. Distribution Fees (continued)
The maximum annual plan rates, based on the average daily net assets, for each class, are as follows:
Class A | 0.35 | % | ||
Class C | 1.00 | % | ||
Class R | 0.50 | % |
The Board has set the current rate at 0.25% per year for Class A shares until further notice and approval by the Board.
d. Sales Charges/Underwriting Agreements
Front-end sales charges and contingent deferred sales charges (CDSC) do not represent expenses of the Fund. These charges are deducted from the proceeds of sales of Fund shares prior to investment or from redemption proceeds prior to remittance, as applicable. Distributors has advised the Fund of the following commission transactions related to the sales and redemptions of the Fund’s shares for the year:
Sales charges retained net of commissions paid to unaffiliated brokers/dealers | $ | 157,001 | ||
CDSC retained | $ | 9,728 |
e. Transfer Agent Fees
Each class of shares pays transfer agent fees to Investor Services for its performance of shareholder servicing obligations. Effective November 1, 2017, the fees are based on an annualized asset based fee of 0.02% plus a transaction based fee. Prior to November 1, 2017, the fees were account based fees that varied based on fund or account type. In addition, each class reimburses Investor Services for out of pocket expenses incurred and, except for Class R6, reimburses shareholder servicing fees paid to third parties. These fees are allocated daily based upon their relative proportion of such classes’ aggregate net assets. Class R6 pays Investor Services transfer agent fees specific to that class.
For the year ended December 31, 2017, the Fund paid transfer agent fees of $3,382,338, of which $1,394,464 was retained by Investor Services.
f. Waiver and Expense Reimbursements
Investor Services has voluntarily agreed in advance to waive or limit its fees so that the Class R6 transfer agent fees do not exceed 0.02%. Investor Services may discontinue this waiver in the future.
4. Expense Offset Arrangement
The Fund has entered into an arrangement with its custodian whereby credits realized as a result of uninvested cash balances are used to reduce a portion of the Fund’s custodian expenses. During the year ended December 31, 2017, the custodian fees were reduced as noted in the Statement of Operations.
5. Independent Trustees’ Retirement Plan
On January 1, 1993, the Trust adopted an Independent Trustees’ Retirement Plan (Plan). The Plan is an unfunded defined benefit plan that provides benefit payments to Trustees whose length of service and retirement age meets the eligibility requirements of the Plan. Benefits under the Plan are based on years of service and fees paid to each trustee at the time of retirement. Effective in December 1996, the Plan was closed to new participants.
34 |
Annual Report |
franklintempleton.com |
FRANKLIN MUTUAL BEACON FUND
NOTES TO FINANCIAL STATEMENTS
During the year ended December 31, 2017, the Fund’s projected benefit obligation and benefit payments under the Plan were as follows:
aProjected benefit obligation at December 31, 2017 | $ | 220,923 | ||
bIncrease in projected benefit obligation | $ | 3,154 | ||
Benefit payments made to retired trustees | $ | (3,931 | ) |
aThe projected benefit obligation is included in trustees’ fees and expenses in the Statement of Assets and Liabilities.
bThe increase in projected benefit obligation is included in trustees’ fees and expenses in the Statement of Operations.
6. Income Taxes
For tax purposes, the Fund may elect to defer any portion of a post-October capital loss to the first day of the following fiscal year. At December 31, 2017, the Fund deferred post-October capital losses of $2,417,876.
The tax character of distributions paid during the years ended December 31, 2017 and 2016, was as follows:
| 2017 | 2016 | |||||||
Distributions paid from: | ||||||||
Ordinary income | $ | 78,895,649 | $ | 128,829,823 | ||||
Long term capital gain | 124,805,807 | 178,515,393 | ||||||
| $ | 203,701,456 | $ | 307,345,216 | |||||
At December 31, 2017, the cost of investments, net unrealized appreciation (depreciation), undistributed ordinary income and undistributed long term capital gains for income tax purposes were as follows:
Cost of investments | $ | 3,066,638,016 | ||
Unrealized appreciation | $ | 1,099,066,075 | ||
Unrealized depreciation | (186,265,154 | ) | ||
Net unrealized appreciation (depreciation) | $ | 912,800,921 | ||
Undistributed ordinary income | $ | 2,125,174 | ||
Undistributed long term capital gains | 20,272,368 | |||
Distributable earnings | $ | 22,397,542 | ||
Differences between income and/or capital gains as determined on a book basis and a tax basis are primarily due to differing treatment of foreign currency transactions.
The Fund utilized a tax accounting practice to treat a portion of the proceeds from capital shares redeemed as a distribution from realized capital gains.
7. Investment Transactions
Purchases and sales of investments (excluding short term securities and securities sold short) for the year ended December 31, 2017, aggregated $946,579,875 and $1,294,619,527, respectively.
franklintempleton.com |
Annual Report |
|
35 |
|
FRANKLIN MUTUAL BEACON FUND
NOTES TO FINANCIAL STATEMENTS
8. Credit Risk and Defaulted Securities
The Fund may purchase the pre-default or defaulted debt of distressed companies. Distressed companies are financially troubled and could be or are already involved in financial restructuring or bankruptcy. Risks associated with purchasing these securities include the possibility that the bankruptcy or other restructuring process takes longer than expected, or that distributions in restructuring are less than anticipated, either or both of which may result in unfavorable consequences to the Fund. If it becomes probable that the income on debt securities, including those of distressed companies, will not be collected, the Fund discontinues accruing income and recognizes an adjustment for uncollectible interest.
At December 31, 2017, the aggregate long value of distressed company securities for which interest recognition has been discontinued represents less than 0.1% of the Fund’s net assets. For information as to specific securities, see the accompanying Statement of Investments.
9. Concentration of Risk
Investing in foreign securities may include certain risks and considerations not typically associated with investing in U.S. securities, such as fluctuating currency values and changing local and regional economic, political and social conditions, which may result in greater market volatility. In addition, certain foreign securities may not be as liquid as U.S. securities.
10. Restricted Securities
The Fund invests in securities that are restricted under the Securities Act of 1933 (1933 Act). Restricted securities are often purchased in private placement transactions, and cannot be sold without prior registration unless the sale is pursuant to an exemption under the 1933 Act. Disposal of these securities may require greater effort and expense, and prompt sale at an acceptable price may be difficult. The Fund may have registration rights for restricted securities. The issuer generally incurs all registration costs.
At December 31, 2017, investments in restricted securities, excluding securities exempt from registration under the 1933 Act deemed to be liquid, were as follows:
| Principal Amount/ Shares | Issuer | Acquisition Date | Cost | Value | ||||||||||
| 10,848 | Broadband Ventures III LLC, secured promissory note, 5.00%, 2/01/12 | 7/01/10 - 11/30/12 | $ | 10,848 | $ | — | ||||||||
| 15,831,950 | CB FIM Coinvestors LLC | 1/15/09 - 6/02/09 | — | — | ||||||||||
| 19,805,560 | FIM Coinvestor Holdings I, LLC | 11/20/06 - 6/02/09 | — | — | ||||||||||
| 2,846,329 | International Automotive Components Group Brazil LLC | 4/13/06 - 12/26/08 | 1,890,264 | 97,586 | ||||||||||
| 22,836,904 | International Automotive Components Group North America LLC | 1/12/06 - 3/18/13 | 18,692,218 | 15,044,382 | ||||||||||
|
|
| ||||||||||||
| Total Restricted Securities (Value is 0.4% of Net Assets) | $ | 20,593,330 | $ | 15,141,968 | ||||||||||
|
|
| ||||||||||||
36 |
Annual Report |
franklintempleton.com |
FRANKLIN MUTUAL BEACON FUND
NOTES TO FINANCIAL STATEMENTS
11. Other Derivative Information
At December 31, 2017, the Fund’s investments in derivative contracts are reflected in the Statement of Assets and Liabilities as follows:
| Asset Derivatives | Liability Derivatives | |||||||||||
Derivative Contracts Not Accounted for as Hedging Instruments | Statement of Assets and Liabilities Location | Fair Value | Statement of Assets and Liabilities Location | Fair Value | ||||||||
Foreign exchange contracts | Variation margin on futures contracts | $ | — | Variation margin on futures contracts | $ | 4,239,597 | a | |||||
Unrealized appreciation on OTC forward exchange contracts | 1,053,355 | Unrealized depreciation on OTC forward exchange contracts | 19,707,863 | |||||||||
|
|
|
| |||||||||
Totals | $ | 1,053,355 | $ | 23,947,460 | ||||||||
|
|
|
| |||||||||
aThis amount reflects the cumulative appreciation (depreciation) of futures contracts as reported in the Statement of Investments. Only the variation margin receivable/ payable at year end is separately reported within the Statement of Assets and Liabilities. Prior variation margin movements were recorded to cash upon receipt or payment.
For the year ended December 31, 2017, the effect of derivative contracts in the Fund’s Statement of Operations was as follows:
Derivative Contracts Not Accounted for as Hedging Instruments | Statement of Operations Location | Net Realized Gain (Loss) for the Year | Statement of Operations Location | Net Change in Unrealized Appreciation (Depreciation) for the Year | ||||||||
Net realized gain (loss) from: | Net change in unrealized appreciation (depreciation) on: | |||||||||||
Foreign exchange contracts | Forward exchange contracts | $(31,591,522 | ) | Forward exchange contracts | $(41,340,957 | ) | ||||||
Futures contracts | (21,551,515 | ) | Futures contracts | (7,668,447 | ) | |||||||
Equity contracts | Written options | 1,995,812 | Written options | (542,578 | ) | |||||||
|
|
|
| |||||||||
Totals | $(51,147,225 | ) | $(49,551,982 | ) | ||||||||
|
|
|
| |||||||||
For the year ended December 31, 2017, the average month end notional amount of futures contracts and options represented $295,318,652 and $210,287, respectively. The average month end contract value of forward exchange contracts was $720,385,969.
See Note 1(c) regarding derivative financial instruments.
12. Holdings of 5% Voting Securities of Portfolio Companies
The 1940 Act defines “affiliated companies” to include investments in portfolio companies in which a fund owns 5% or more of the outstanding voting securities. During the year ended December 31, 2017, investments in “affiliated companies” were as follows:
| Name of Issuer | Number of Shares Held at Beginning of Year | Gross Additions | Gross Reductions | Number of Shares Held at End of Year | Value at End of Year | Dividend Income | Realized Gain (Loss) | Net Change in Unrealized Appreciation (Depreciation) | ||||||||||||||||||||||||
| Non-Controlled Affiliates | ||||||||||||||||||||||||||||||||
CB FIM Coinvestors LLC (Value is —% of Net Assets) | 15,831,950 | — | — | 15,831,950 | $— | $— | $— | $— | ||||||||||||||||||||||||
|
| |||||||||||||||||||||||||||||||
franklintempleton.com |
Annual Report |
|
37 |
|
FRANKLIN MUTUAL BEACON FUND
NOTES TO FINANCIAL STATEMENTS
13. Credit Facility
The Fund, together with other U.S. registered and foreign investment funds (collectively, Borrowers), managed by Franklin Templeton Investments, are borrowers in a joint syndicated senior unsecured credit facility totaling $2 billion (Global Credit Facility) which matured on February 9, 2018. This Global Credit Facility provides a source of funds to the Borrowers for temporary and emergency purposes, including the ability to meet future unanticipated or unusually large redemption requests. Effective February 9, 2018, the Borrowers renewed the Global Credit Facility for a one year term, maturing February 8, 2019, for a total of $2 billion.
Under the terms of the Global Credit Facility, the Fund shall, in addition to interest charged on any borrowings made by the Fund and other costs incurred by the Fund, pay its share of fees and expenses incurred in connection with the implementation and maintenance of the Global Credit Facility, based upon its relative share of the aggregate net assets of all of the Borrowers, including an annual commitment fee of 0.15% based upon the unused portion of the Global Credit Facility. These fees are reflected in other expenses in the Statement of Operations. During the year ended December 31, 2017, the Fund did not use the Global Credit Facility.
14. Fair Value Measurements
The Fund follows a fair value hierarchy that distinguishes between market data obtained from independent sources (observable inputs) and the Fund’s own market assumptions (unobservable inputs). These inputs are used in determining the value of the Fund’s financial instruments and are summarized in the following fair value hierarchy:
| • | Level 1 – quoted prices in active markets for identical financial instruments |
| • | Level 2 – other significant observable inputs (including quoted prices for similar financial instruments, interest rates, prepayment speed, credit risk, etc.) |
| • | Level 3 – significant unobservable inputs (including the Fund’s own assumptions in determining the fair value of financial instruments) |
The input levels are not necessarily an indication of the risk or liquidity associated with financial instruments at that level.
For movements between the levels within the fair value hierarchy, the Fund has adopted a policy of recognizing the transfers as of the date of the underlying event which caused the movement.
A summary of inputs used as of December 31, 2017, in valuing the Fund’s assets and liabilities carried at fair value, is as follows:
| Level 1 | Level 2 | Level 3 | Total | |||||||||||||
| Assets: | ||||||||||||||||
Investments in Securities:a | ||||||||||||||||
Equity Investments:b | ||||||||||||||||
Auto Components | $ | — | $ | — | $ | 15,141,968 | $ | 15,141,968 | ||||||||
All Other Equity Investments | 3,785,263,291 | — | — | c | 3,785,263,291 | |||||||||||
Corporate Notes and Senior Floating Rate Interests | — | 72,641,491 | — | 72,641,491 | ||||||||||||
Corporate Notes in Reorganization | — | — | — | c | — | |||||||||||
Companies in Liquidation | — | 4,721,113 | 865,229 | c | 5,586,342 | |||||||||||
Short Term Investments | 129,106,036 | 39,098,992 | — | 168,205,028 | ||||||||||||
|
| |||||||||||||||
Total Investments in Securities | $ | 3,914,369,327 | $ | 116,461,596 | $ | 16,007,197 | $ | 4,046,838,120 | ||||||||
|
| |||||||||||||||
Other Financial Instruments: | ||||||||||||||||
Forward Exchange Contracts | $ | — | $ | 1,053,355 | $ | — | $ | 1,053,355 | ||||||||
|
| |||||||||||||||
| 38 |
Annual Report | franklintempleton.com |
FRANKLIN MUTUAL BEACON FUND
NOTES TO FINANCIAL STATEMENTS
| Level 1 | Level 2 | Level 3 | Total | |||||||||||||
| Liabilities: | ||||||||||||||||
Other Financial Instruments: | ||||||||||||||||
Securities Sold Short | $ | 44,515,112 | $ | — | $ | — | $ | 44,515,112 | ||||||||
Futures Contracts | 4,239,597 | — | — | 4,239,597 | ||||||||||||
Forward Exchange Contracts | — | 19,707,863 | — | 19,707,863 | ||||||||||||
Total Other Financial Instruments | $ | 48,754,709 | $ | 19,707,863 | $ | — | $ | 68,462,572 | ||||||||
aFor detailed categories, see the accompanying Statement of Investments.
bIncludes common, preferred stocks and management investment companies as well as other equity investments.
cIncludes securities determined to have no value at December 31, 2017.
A reconciliation of assets in which Level 3 inputs are used in determining fair value is presented when there are significant Level 3 financial instruments at the beginning and/or end of the year.
15. Subsequent Events
The Fund has evaluated subsequent events through the issuance of the financial statements and determined that no events have occurred that require disclosure other than those already disclosed in the financial statements.
Abbreviations
| Counterparty | Currency | Selected Portfolio | ||||||||
| BOFA | Bank of America N.A. | EUR | Euro | ADR | American Depositary Receipt | |||||
| BONY | The Bank of New York Mellon Corp. | GBP | British Pound | FHLB | Federal Home Loan Bank | |||||
| HSBK | HSBC Bank PLC | USD | United States Dollar | LIBOR | London InterBank Offered Rate | |||||
| SSBT | State Street Bank and Trust Co., N.A. | TRA | Tax Receivable Agreement Right | |||||||
| UBSW | UBS AG | |||||||||
franklintempleton.com |
Annual Report |
|
39 |
|
FRANKLIN MUTUAL BEACON FUND
Report of Independent Registered Public Accounting Firm
To the Board of Trustees of Franklin Mutual Series Funds and Shareholders of Franklin Mutual Beacon Fund:
Opinion on the Financial Statements
We have audited the accompanying statement of assets and liabilities of Franklin Mutual Beacon Fund (the “Fund”) (one of the funds constituting Franklin Mutual Series Funds), including the schedule of investments, as of December 31, 2017, and the related statement of operations for the year then ended, the statements of changes in net assets for each of the two years in the period then ended, the financial highlights for each of the periods indicated therein and the related notes (collectively referred to as the “financial statements”). In our opinion, the financial statements present fairly, in all material respects, the financial position of Franklin Mutual Beacon Fund (one of the funds constituting Franklin Mutual Series Funds) at December 31, 2017, the results of its operations for the year then ended, the changes in its net assets for each of the two years in the period then ended and its financial highlights for each of the periods indicated therein, in conformity with U.S. generally accepted accounting principles.
Basis for Opinion
These financial statements are the responsibility of the Fund’s management. Our responsibility is to express an opinion on the Fund’s financial statements based on our audits. We are a public accounting firm registered with the Public Company Accounting Oversight Board (United States) (“PCAOB”) and are required to be independent with respect to the Fund in accordance with the U.S. federal securities laws and the applicable rules and regulations of the Securities and Exchange Commission and the PCAOB.
We conducted our audits in accordance with the standards of the PCAOB. Those standards require that we plan and perform the audit to obtain reasonable assurance about whether the financial statements are free of material misstatement, whether due to error or fraud. The Fund is not required to have, nor were we engaged to perform, an audit of the Fund’s internal control over financial reporting. As part of our audits, we are required to obtain an understanding of internal control over financial reporting, but not for the purpose of expressing an opinion on the effectiveness of the Fund’s internal control over financial reporting. Accordingly, we express no such opinion.
Our audits included performing procedures to assess the risks of material misstatement of the financial statements, whether due to error or fraud, and performing procedures that respond to those risks. Such procedures included examining, on a test basis, evidence regarding the amounts and disclosures in the financial statements. Our procedures included confirmation of securities owned as of December 31, 2017, by correspondence with the custodian and brokers. Our audits also included evaluating the accounting principles used and significant estimates made by management, as well as evaluating the overall presentation of the financial statements. We believe that our audits provide a reasonable basis for our opinion.

We have served as the auditor of one or more Franklin investment companies since 1987.
Boston, MA
February 26, 2018
| 40 |
Annual Report | franklintempleton.com |
FRANKLIN MUTUAL BEACON FUND
Under Section 852(b)(3)(C) of the Internal Revenue Code (Code), the Fund hereby reports the maximum amount allowable but no less than $136,812,624 as a long term capital gain dividend for the fiscal year ended December 31, 2017.
Under Section 871(k)(2)(C) of the Code, the Fund hereby reports the maximum amount allowable but no less than $11,109,607 as a short term capital gain dividend for purposes of the tax imposed under Section 871(a)(1)(A) of the Code for the fiscal year ended December 31, 2017.
Under Section 854(b)(1)(A) of the Code, the Fund hereby reports 50.10% of the ordinary income dividends as income qualifying for the dividends received deduction for the fiscal year ended December 31, 2017.
Under Section 854(b)(1)(B) of the Code, the Fund hereby reports the maximum amount allowable but no less than $85,239,900 as qualified dividends for purposes of the maximum rate under Section 1(h)(11) of the Code for the fiscal year ended December 31, 2017. Distributions, including qualified dividend income, paid during calendar year 2017 will be reported to shareholders on Form 1099-DIV by mid-February 2018. Shareholders are advised to check with their tax advisors for information on the treatment of these amounts on their individual income tax returns.
Under Section 871(k)(1)(C) of the Code, the Fund hereby reports the maximum amount allowable but no less than $6,728,252 as interest related dividends for purposes of the tax imposed under Section 871(a)(1)(A) of the Code for the fiscal year ended December 31, 2017.
franklintempleton.com |
Annual Report |
|
41 |
|
FRANKLIN MUTUAL SERIES FUNDS
The name, year of birth and address of the officers and board members, as well as their affiliations, positions held with the Trust, principal occupations during at least the past five years and number of US registered portfolios overseen in the Franklin Templeton Investments fund complex, are shown below. Generally, each board member serves until that person’s successor is elected and qualified.
Independent Board Members
| Name, Year of Birth and Address | Position | Length of Time Served | Number of Portfolios in by Board Member* | Other Directorships Held During at Least the Past 5 Years | ||||
Edward I. Altman, Ph.D. (1941) c/o Franklin Mutual Advisers, LLC Short Hills, NJ 07078-2789 | Trustee | Since 1987 | 14 | None | ||||
Principal Occupation During at Least the Past 5 Years: Max L. Heine Professor of Finance, Emeritus and Director of The Credit and Debt Markets Research Program, Salomon Center, Stern School of Business, New York University; editor and author of numerous financial publications; financial consultant; an adviser to numerous financial and publishing organizations; and formerly, Vice Director, Salomon Center, Stern School of Business, New York University. | ||||||||
Ann Torre Bates (1958) c/o Franklin Mutual Advisers, LLC 101 John F. Kennedy Parkway Short Hills, NJ 07078-2789 | Trustee | Since 1995 | 40 | Ares Capital Corporation (specialty finance company) (2010-present), United Natural Foods, Inc. (distributor of natural, organic and specialty foods) (2013-present), Allied Capital Corporation (financial services) (2003-2010), SLM Corporation (Sallie Mae) (1997-2014) and Navient Corporation (loan management, servicing and asset recovery) (2014-2016). | ||||
Principal Occupation During at Least the Past 5 Years: Director of various companies; and formerly, Executive Vice President and Chief Financial Officer, NHP Incorporated (manager of multifamily housing) (1995-1997); and Vice President and Treasurer, US Airways, Inc. (until 1995). | ||||||||
Burton J. Greenwald (1929) c/o Franklin Mutual Advisers, LLC 101 John F. Kennedy Parkway Short Hills, NJ 07078-2789 | Trustee and Vice Chairman | Trustee since 2002 and Vice Chairman since 2015 | 14 | Franklin Templeton Emerging Markets Debt Opportunities Fund PLC (1999-present) and Fiduciary International Ireland Limited (1999-2015). | ||||
Principal Occupation During at Least the Past 5 Years: Managing Director, B. J. Greenwald Associates (management consultants to the financial services industry); and formerly, Chairman, Fiduciary Trust International Funds; Executive Vice President, L.F. Rothschild Fund Management, Inc.; President and Director, Merit Mutual Funds; President, Underwriting Division and Director, National Securities & Research Corporation; Governor, Investment Company Institute; and Chairman, ICI Public Information Committee. | ||||||||
Jan Hopkins Trachtman (1947) c/o Franklin Mutual Advisers, LLC 101 John F. Kennedy Parkway Short Hills, NJ 07078-2789 | Trustee | Since 2009 | 14 | None | ||||
Principal Occupation During at Least the Past 5 Years: President and Founder, The Jan Hopkins Group (communications and consulting firm); serves on Advisory Board of Knight Bagehot Fellowship; and formerly, President, Economic Club of New York (2007-2015); Anchor/Correspondent, CNN Financial News (until 2003); Managing Director and Head of Client Communications, Citigroup Private Bank (until 2005); Off-Air reporter, ABC News’ World News Tonight; and Editor, CBS Network News. | ||||||||
Keith Mitchell (1954) c/o Franklin Mutual Advisers, LLC 101 John F. Kennedy Parkway Short Hills, NJ 07078-2789 | Trustee | Since 2009 | 14 | None | ||||
Principal Occupation During at Least the Past 5 Years: Director of various boards of asset management firms; and formerly, Managing Member, Mitchell, Hartley & Bechtel Advisers, LLC (formerly, Mitchell Advisers, LLC) (advisory firm) (2003-2015) and Managing Director, Putman Lovell NBF. | ||||||||
42 |
Annual Report |
franklintempleton.com |
FRANKLIN MUTUAL SERIES FUNDS
Independent Board Members (continued)
| Name, Year of Birth and Address | Position | Length of Time Served | Number of Portfolios in Fund Complex Overseen by Board Member* | Other Directorships Held During at Least the Past 5 Years | ||||
| David W. Niemiec (1949) c/o Franklin Mutual Advisers, LLC 101 John F. Kennedy Parkway Short Hills, NJ 07078-2789 | Trustee | Since 2015 | 40 | Hess Midstream Partners LP (oil and gas midstream infrastructure) (2017-present). | ||||
Principal Occupation During at Least the Past 5 Years: Advisor, Saratoga Partners (private equity fund); and formerly, Managing Director, Saratoga Partners (1998-2001) and SBC Warburg Dillon Read (investment banking) (1997-1998); Vice Chairman, Dillon, Read & Co. Inc. (investment banking) (1991-1997); and Chief Financial Officer, Dillon, Read & Co. Inc. (1982-1997). | ||||||||
| Charles Rubens II (1930) c/o Franklin Mutual Advisers, LLC 101 John F. Kennedy Parkway Short Hills, NJ 07078-2789 | Trustee | Since 1998 | 14 | None | ||||
Principal Occupation During at Least the Past 5 Years: Private investor and president of non-profit organizations; and formerly, an executive of Time, Inc.; and Trustee of Colorado College. | ||||||||
| Robert E. Wade (1946) c/o Franklin Mutual Advisers, LLC 101 John F. Kennedy Parkway Short Hills, NJ 07078-2789 | Trustee and Chairman of the Board | Trustee since 1993 and Chairman of the Board since 2005 | 40 | El Oro Ltd (investments) (2003-present). | ||||
Principal Occupation During at Least the Past 5 Years: Attorney at law engaged in private practice as a sole practitioner (1972-2008) and member of various boards. | ||||||||
| Gregory H. Williams (1943) c/o Franklin Mutual Advisers, LLC 101 John F. Kennedy Parkway Short Hills, NJ 07078-2789 | Trustee | Since 2015 | 14 | None | ||||
| Principal Occupation During at Least the Past 5 Years: Private investor; Consultant; and formerly, President, University of Cincinnati (2009-2012); President, The City College of New York (2001-2009); Dean, College of Law, Ohio State University (1993-2001); and Associate Vice President, Academic Affairs and Professor of Law, University of Iowa (1977-1993). | ||||||||
Interested Board Members and Officers
| Name, Year of Birth and Address | Position | Length of Time Served | Number of Portfolios in Fund Complex Overseen by Board Member* | Other Directorships Held During at Least the Past 5 Years | ||||
| **Gregory E. Johnson (1961) One Franklin Parkway San Mateo, CA 94403-1906 | Trustee | Since 2007 | 153 | None | ||||
Principal Occupation During at Least the Past 5 Years: Chairman of the Board, Member – Office of the Chairman, Director and Chief Executive Officer, Franklin Resources, Inc.; officer and/or director or trustee, as the case may be, of some of the other subsidiaries of Franklin Resources, Inc. and of 43 of the investment companies in Franklin Templeton Investments; Vice Chairman, Investment Company Institute; and formerly, President, Franklin Resources, Inc. (1994-2015). | ||||||||
| **Peter A. Langerman (1955) c/o Franklin Mutual Advisers, LLC 101 John F. Kennedy Parkway Short Hills, NJ 07078-2789 | Trustee, President, and Chief Executive Officer – Investment Management | Trustee since 2007, President, and Chief Executive Officer – Investment Management since 2005 | 7 | American International Group, Inc. (AIG) Credit Facility Trust (2010-2011). | ||||
Principal Occupation During at Least the Past 5 Years: Chairman of the Board, Chief Executive Officer and President, Franklin Mutual Advisers, LLC; President and Chief Investment Officer, Franklin Advisory Services, LLC; and officer and/or director, as the case may be, of three of the investment companies in Franklin Templeton Investments. | ||||||||
franklintempleton.com |
Annual Report |
|
43 |
|
FRANKLIN MUTUAL SERIES FUNDS
Interested Board Members and Officers (continued)
| Name, Year of Birth and Address | Position | Length of Time Served | Number of Portfolios in Fund Complex Overseen by Board Member* | Other Directorships Held During at Least the Past 5 Years | ||||
| Alison E. Baur (1964) One Franklin Parkway San Mateo, CA 94403-1906 | Vice President | Since 2012 | Not Applicable | Not Applicable | ||||
Principal Occupation During at Least the Past 5 Years: Deputy General Counsel, Franklin Templeton Investments; and officer of some of the other subsidiaries of Franklin Resources, Inc. and of 45 of the investment companies in Franklin Templeton Investments. | ||||||||
| Philippe Brugere-Trelat (1949) 101 John F. Kennedy Parkway Short Hills NJ 07078-2789 | Vice President | Since 2005 | Not Applicable | Not Applicable | ||||
Principal Occupation During at Least the Past 5 Years: Executive Vice President, Franklin Mutual Advisers, LLC; officer of one of the investment companies in Franklin Templeton Investments; and formerly, Portfolio Manager of Eurovest SA (French registered investment company, SICAV). | ||||||||
| Aliya S. Gordon (1973) One Franklin Parkway San Mateo, CA 94403-1906 | Vice President | Since 2009 | Not Applicable | Not Applicable | ||||
Principal Occupation During at Least the Past 5 Years: Senior Associate General Counsel, Franklin Templeton Investments; and officer of 45 of the investment companies in Franklin Templeton Investments. | ||||||||
| Steven J. Gray (1955) One Franklin Parkway San Mateo, CA 94403-1906 | Vice President and Secretary | Vice President since 2009 and Secretary since 2005 | Not Applicable | Not Applicable | ||||
Principal Occupation During at Least the Past 5 Years: Senior Associate General Counsel, Franklin Templeton Investments; Vice President, Franklin Templeton Distributors, Inc. and FASA, LLC; and officer of 45 of the investment companies in Franklin Templeton Investments. | ||||||||
| Matthew T. Hinkle (1971) One Franklin Parkway San Mateo, CA 94403-1906 | Chief Executive Officer – Finance and Administration | Since June 2017 | Not Applicable | Not Applicable | ||||
Principal Occupation During at Least the Past 5 Years: Senior Vice President, Franklin Templeton Services, LLC; officer of 45 of the investment companies in Franklin Templeton Investments; and formerly, Vice President, Global Tax (2012-April 2017) and Treasurer/Assistant Treasurer, Franklin Templeton Investments (2009-2017). | ||||||||
| Robert G. Kubilis (1973) 300 S.E. 2nd Street Fort Lauderdale, FL 33301-1923 | Chief Financial Officer, Chief Accounting Officer and Treasurer | Since 2012 | Not Applicable | Not Applicable | ||||
Principal Occupation During at Least the Past 5 Years: Treasurer, U.S. Fund Administration & Reporting, Franklin Templeton Investments; and officer of 17 of the investment companies in Franklin Templeton Investments. | ||||||||
| Robert Lim (1948) One Franklin Parkway San Mateo, CA 94403-1906 | Vice President –AML Compliance | Since 2016 | Not Applicable | Not Applicable | ||||
Principal Occupation During at Least the Past 5 Years: Vice President, Franklin Templeton Companies, LLC; Chief Compliance Officer, Franklin Templeton Distributors, Inc. and Franklin Templeton Investor Services, LLC; and officer of 45 of the investment companies in Franklin Templeton Investments. | ||||||||
44 |
Annual Report |
franklintempleton.com |
FRANKLIN MUTUAL SERIES FUNDS
Interested Board Members and Officers (continued)
| Name, Year of Birth and Address | Position | Length of Time Served | Number of Portfolios in Fund Complex Overseen by Board Member* | Other Directorships Held During at Least the Past 5 Years | ||||
| Kimberly H. Novotny (1972) 300 S.E. 2nd Street Fort Lauderdale, FL 33301-1923 | Vice President | Since 2013 | Not Applicable | Not Applicable | ||||
Principal Occupation During at Least the Past 5 Years: Associate General Counsel, Franklin Templeton Investments; Vice President and Corporate Secretary, Fiduciary Trust International of the South; Vice President, Templeton Investment Counsel, LLC; Assistant Secretary, Franklin Resources, Inc.; and officer of 45 of the investment companies in Franklin Templeton Investments. | ||||||||
| Robert C. Rosselot (1960) 300 S.E. 2nd Street Fort Lauderdale, FL 33301-1923 | Chief Compliance Officer | Since 2013 | Not Applicable | Not Applicable | ||||
Principal Occupation During at Least the Past 5 Years: Director, Global Compliance, Franklin Templeton Investments; Vice President, Franklin Templeton Companies, LLC; officer of 45 of the investment companies in Franklin Templeton Investments; and formerly, Senior Associate General Counsel, Franklin Templeton Investments (2007-2013); and Secretary and Vice President, Templeton Group of Funds (2004-2013). | ||||||||
| Karen L. Skidmore (1952) One Franklin Parkway San Mateo, CA 94403-1906 | Vice President | Since 2009 | Not Applicable | Not Applicable | ||||
Principal Occupation During at Least the Past 5 Years: Senior Associate General Counsel, Franklin Templeton Investments; and officer of 45 of the investment companies in Franklin Templeton Investments. | ||||||||
| Navid J. Tofigh (1972) One Franklin Parkway San Mateo, CA 94403-1906 | Vice President | Since 2015 | Not Applicable | Not Applicable | ||||
Principal Occupation During at Least the Past 5 Years: Associate General Counsel, Franklin Templeton Investments; and officer of 45 of the investment companies in Franklin Templeton Investments. | ||||||||
| Craig S. Tyle (1960) One Franklin Parkway San Mateo, CA 94403-1906 | Vice President | Since 2005 | Not Applicable | Not Applicable | ||||
Principal Occupation During at Least the Past 5 Years: General Counsel and Executive Vice President, Franklin Resources, Inc.; and officer of some of the other subsidiaries of Franklin Resources, Inc. and of 45 of the investment companies in Franklin Templeton Investments. | ||||||||
| Lori A. Weber (1964) 300 S.E. 2nd Street Fort Lauderdale, FL 33301-1923 | Vice President | Since 2011 | Not Applicable | Not Applicable | ||||
Principal Occupation During at Least the Past 5 Years: Senior Associate General Counsel, Franklin Templeton Investments; Assistant Secretary, Franklin Resources, Inc.; Vice President and Secretary, Templeton Investment Counsel, LLC; and officer of 45 of the investment companies in Franklin Templeton Investments. | ||||||||
*We base the number of portfolios on each separate series of the US registered investment companies within the Franklin Templeton Investments fund complex. These portfolios have a common investment manager or affiliated investment managers.
**Gregory E. Johnson is considered to be an interested person of the Fund under the federal securities laws due to his position as an officer and director of Franklin Resources, Inc. (Resources), which is the parent company of the Fund’s investment manager and distributor. Peter A. Langerman is considered to be an interested person of the Fund under the federal securities laws due to his position as an officer of Franklin Mutual Advisors, LLC, which is an affiliate of the Fund’s investment manager.
Note 1: Officer information is current as of the date of this report. It is possible that after this date, information about officers may change.
The Sarbanes-Oxley Act of 2002 and Rules adopted by the U.S. Securities and Exchange Commission require the Fund to disclose whether the Fund’s Audit Committee includes at least one member who is an audit committee financial expert within the meaning of such Act and Rules. The Fund’s Board has determined that there is at least one such financial expert on the Audit Committee and has designated each of Edward I. Altman, Ph.D., Ann Torre Bates and David W. Niemiec as an audit committee financial expert. The Board believes that Messrs. Altman and Niemiec and Ms. Bates qualify as such an expert in view of their extensive business background and experience. Mr. Altman has served as a member of the Fund Audit Committee since 1996. He currently serves as a Max L. Hines Professor of Finance, Emeritus and Director of The Credit and Debt Markets Research Program, Salomon Center, Stern School of Business, New York University. Ms. Bates has served as a member of the Fund Audit Committee since 1996. She currently serves as a director of Ares Capital Corporation (2010-present) and United Natural Foods, Inc. (2013-present) and was formerly a director of Navient Corporation from 2014 to 2016, SLM Corporation from 1997 to 2014 and Allied
franklintempleton.com |
Annual Report |
|
45 |
|
FRANKLIN MUTUAL SERIES FUNDS
Interested Board Members and Officers (continued)
Capital Corporation from 2003 to 2010, Executive Vice President and Chief Financial Officer of NHP Incorporated from 1995 to 1997 and Vice President and Treasurer of US Airways, Inc. until 1995. Mr. Niemiec has served as a member of the Fund Audit Committee since 2015, currently serves as an Advisor to Saratoga Partners and was formerly its Managing Director from 1998 to 2001 and serves as a director of Hess Midstream Partners LP (2017-present). Mr. Niemiec was formerly a director of Emeritus Corporation from 1999 to 2010 and OSI Pharmaceuticals, Inc. from 2006 to 2010, Managing Director of SBC Warburg Dillon Read from 1997 to 1998, and was Vice Chairman from 1991 to 1997 and Chief Financial Officer from 1982 to 1997 of Dillon, Read & Co. Inc. As a result of such background and experience, the Board believes that Messrs. Altman and Niemiec and Ms. Bates have each acquired an understanding of generally accepted accounting principles and financial statements, the general application of such principles in connection with the accounting estimates, accruals and reserves, and analyzing and evaluating financial statements that present a breadth and level of complexity of accounting issues generally comparable to those of the Fund, as well as an understanding of internal controls and procedures for financial reporting and an understanding of audit committee functions. Messrs. Altman and Niemiec and Ms. Bates are independent Board members as that term is defined under the applicable U.S. Securities and Exchange Commission Rules and Releases.
The Statement of Additional Information (SAI) includes additional information about the board members and is available, without charge, upon request. Shareholders may call (800) DIAL BEN/342-5236 to request the SAI.
46 |
Annual Report |
franklintempleton.com |
FRANKLIN MUTUAL SERIES FUNDS
FRANKLIN MUTUAL BEACON FUND
Proxy Voting Policies and Procedures
The Fund’s investment manager has established Proxy Voting Policies and Procedures (Policies) that the Fund uses to determine how to vote proxies relating to portfolio securities. Shareholders may view the Fund’s complete Policies online at franklintempleton.com. Alternatively, shareholders may request copies of the Policies free of charge by calling the Proxy Group collect at (954) 527-7678 or by sending a written request to: Franklin Templeton Companies, LLC, 300 S.E. 2nd Street, Fort Lauderdale, FL 33301, Attention: Proxy Group. Copies of the Fund’s proxy voting records are also made available online at franklintempleton.com and posted on the US Securities and Exchange Commission’s website at sec.gov and reflect the most recent 12-month period ended June 30.
Quarterly Statement of Investments
The Trust, on behalf of the Fund, files a complete statement of investments with the US Securities and Exchange Commission for the first and third quarters for each fiscal year on Form N-Q. Shareholders may view the filed Form N-Q by visiting the Commission’s website at sec.gov. The filed form may also be viewed and copied at the Commission’s Public Reference Room in Washington, DC. Information regarding the operations of the Public Reference Room may be obtained by calling (800) SEC-0330.
Householding of Reports and Prospectuses
You will receive the Fund’s financial reports every six months as well as an annual updated summary prospectus (prospectus available upon request). To reduce Fund expenses, we try to identify related shareholders in a household and send only one copy of the financial reports and summary prospectus. This process, called “householding,” will continue indefinitely unless you instruct us otherwise. If you prefer not to have these documents householded, please call us at (800) 632-2301. At any time you may view current prospectuses/summary prospectuses and financial reports on our website. If you choose, you may receive these documents through electronic delivery.
franklintempleton.com |
Annual Report |
|
47 |
|
This page intentionally left blank.
 | Annual Report and Shareholder Letter Franklin Mutual Beacon Fund
Investment Manager Franklin Mutual Advisers, LLC
Distributor Franklin Templeton Distributors, Inc. (800) DIAL BEN® / 342-5236 franklintempleton.com
Shareholder Services (800) 632-2301 - (Class A, C, R & R6) (800) 448-FUND - (Class Z) |
Authorized for distribution only when accompanied or preceded by a summary prospectus and/or prospectus. Investors should carefully consider a fund’s investment goals, risks, charges and expenses before investing. A prospectus contains this and other information; please read it carefully before investing.
To help ensure we provide you with quality service, all calls to and from our service areas are monitored and/or recorded.
| © 2018 Franklin Templeton Investments. All rights reserved. | 476 A 02/18 |
| Annual Report and Shareholder Letter
December 31, 2017 |


Sign up for electronic delivery at franklintempleton.com/edelivery
Franklin Templeton Investments
Gain From Our Perspective®
At Franklin Templeton Investments, we’re dedicated to one goal: delivering exceptional asset management for our clients. By bringing together multiple, world-class investment teams in a single firm, we’re able to offer specialized expertise across styles and asset classes, all supported by the strength and resources of one of the world’s largest asset managers. This has helped us to become a trusted partner to individual and institutional investors across the globe.
Dear Franklin Mutual Global Discovery Fund Shareholder:
Securities markets benefited from a confluence of positive economic, financial and political trends during 2017. The global economy entered a synchronized pace of modest and steady growth, corporate earnings strengthened in the US, Europe and Japan, and US equity market volatility remained at historically low levels. A number of political risks identified at the start of 2017, such as the success of far-right parties in Europe, Brexit negotiations and the Trump administration’s ability to enact its policy agenda, also dissipated or became less immediate for investors as the year progressed. For the year ended December 31, 2017, US stocks, as measured by the Standard & Poor’s® 500 Index (S&P 500®), produced a +21.83% total return.1 Stocks in global developed markets, as measured by the MSCI World Index, returned +23.07%, and investment-grade bonds, as measured by the Bloomberg Barclays US Aggregate Bond Index, posted a +3.54% total return.1
In many equity markets, the trend of growth stocks outpacing value stocks continued. The Russell 1000® Growth Index returned +30.21%, while the Russell 1000® Value Index returned +13.66%.1 The difference in performance has been driven in large part by a rally in internet and software stocks, which dominated the S&P 500 Growth Index. In addition, the S&P 500 Value Index has components that we believe are facing disruption from new technology (e.g., the rapid market share shift to online retailing from traditional bricks and mortar retailers that are often labeled as value stocks). Exacerbating the disruption is the reality that many new technology companies are able to innovate without the need to show immediate profits.
1. Source: Morningstar. Frank Russell Company is the source and owner of the trademarks, service marks and copyrights related to the Russell Indexes. Russell® is a trademark of Frank Russell Company.
See www.franklintempletondatasources.com for additional data provider information.
We do not know how long these trends will continue, but historically, periods of strong performance by growth stocks have eventually been followed by relatively weaker performance. Given that unemployment has continued to decline in most developed markets and the US Federal Reserve has taken its first steps toward monetary normalization, value-oriented stocks may become more attractive to investors, particularly within cyclical sectors of the equity markets such as industrials, consumer discretionary and financials.
A stellar 2017 for equity markets also pushed up common valuation metrics, such as price-to-earnings. Valuation is a critical factor in our analysis and we always ask ourselves if current and potential investments represent an attractive balance of risk and reward. We remain committed to our long-term perspective and disciplined investment approach as we conduct a rigorous, fundamental analysis of securities with a regular emphasis on investment risk management.
Although the investment landscape appears favorable as we enter 2018, it is worth remembering that securities markets are dynamic and constantly evolving. Therefore, we believe active, professional investment management serves investors well. We also recognize the important role of financial advisors in today’s markets and encourage investors to continue to seek their advice. Amid changing markets and economic conditions, we are confident investors with a well-diversified portfolio and a patient, long-term outlook should be well positioned for the years ahead.
| Not FDIC Insured | | | May Lose Value | | | No Bank Guarantee |
| franklintempleton.com | Not part of the annual report | 1 |
On the following pages, the Fund’s portfolio management team reviews investment decisions that pertain to performance during the past 12 months in light of the economic environment and other factors. Please remember all securities markets fluctuate, as do mutual fund share prices.
We thank you for investing with Franklin Templeton, welcome your questions and comments, and look forward to continuing to serve your investment needs in the years ahead.
Sincerely,
Peter A. Langerman
Chairman, President and Chief Executive Officer
Franklin Mutual Advisers, LLC
This letter reflects our analysis and opinions as of December 31, 2017, unless otherwise indicated. The information is not a complete analysis of every aspect of any market, country, industry, security or fund. Statements of fact are from sources considered reliable.
Annual Report
Visit franklintempleton.com for fund updates, to access your account, or to find helpful financial planning tools.
| 2 | Not part of the annual report | franklintempleton.com |
Annual Report
Franklin Mutual Global Discovery Fund
This annual report for Franklin Mutual Global Discovery Fund covers the fiscal year ended December 31, 2017.
Your Fund’s Goal and Main Investments
The Fund seeks capital appreciation. Under normal market conditions, the Fund invests primarily in equity securities of US and foreign companies that the investment manager believes are available at market prices less than their intrinsic value. The equity securities in which the Fund invests are primarily common stock, with a current focus on mid- and large cap companies. To a lesser extent, the Fund also invests in merger arbitrage securities and the debt and equity of distressed companies. The Fund may invest a substantial portion, potentially up to 100% of its assets in foreign securities, which may include sovereign debt and participations in foreign government debt. The Geographic Composition bar chart on this page lists the leading countries where the Fund invests.
Performance Overview
The Fund’s Class Z shares delivered a +9.84% cumulative total return for the 12 months ended December 31, 2017. For comparison, the Fund’s benchmark, the MSCI World Index (USD), which tracks stock performance in global developed markets, posted a +23.07% total return.1 You can find more of the Fund’s performance data in the Performance Summary beginning on page 10.
Performance data represent past performance, which does not guarantee future results. Investment return and principal value will fluctuate, and you may have a gain or loss when you sell your shares. Current performance may differ from figures shown. For most recent month-end performance, go to franklintempleton.com or call (800) 342-5236.
Economic and Market Overview
The global economy grew moderately during the 12-month period under review. In this environment, global developed and emerging market stocks generated a +24.62% total return, as measured by the MSCI All Country World Index.1 Global
Geographic Composition*
Based on Total Net Assets as of 12/31/17
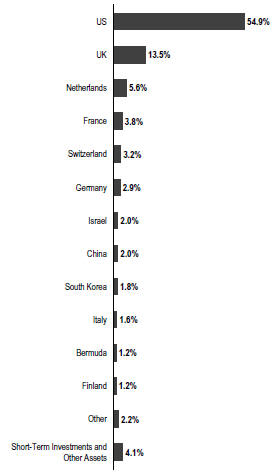
*Figures are stated as a percentage of total and may not equal 100% or may be negative due to rounding, use of any derivatives, unsettled trades or other factors.
markets were aided by price gains in oil and other commodities, generally upbeat economic data across regions, the European Central Bank’s (ECB’s) extension of its monetary
1. Source: Morningstar.
The index is unmanaged and includes reinvestment of any income or distributions. It does not reflect any fees, expenses or sales charges. One cannot invest directly in an index, and an index is not representative of the Fund’s portfolio.
The dollar value, number of shares or principal amount, and names of all portfolio holdings are listed in the Fund’s Statement of Investments (SOI). The SOI begins on page 19.
| franklintempleton.com | Annual Report | 3 |
FRANKLIN MUTUAL GLOBAL DISCOVERY FUND
easing program, and investor optimism about pro-growth and pro-business policies in the US. The prospect for reforms in the European Union (EU) with Emmanuel Macron’s election as France’s president, encouraging corporate earnings reports and the passage of the US tax reform bill also supported global stocks.
However, global markets reflected investor concerns about the terms of the UK’s exit from the EU, political uncertainty in the US and the EU, and geopolitical tensions in the Korean peninsula and other regions. Other concerns included the health of European banks, global oil oversupply despite a pact by major oil-producing countries to extend production cuts, and comments from key central bankers around the world about potentially raising interest rates.
After strengthening in 2017’s second and third quarters, the US economy moderated in the fourth quarter. The economy grew faster in 2017 than in 2016, however, largely due to growth in consumer spending, business investment and exports. The unemployment rate decreased from 4.7% in December 2016, as reported at the beginning of the 12-month period, to 4.1% at period-end.2 Annual inflation, as measured by the Consumer Price Index, was 2.1% in December 2016, as reported at the beginning of the 12-month period, and while it varied over the 12-month period, remained unchanged at period-end.2 The US Federal Reserve (Fed) raised its target range for the federal funds rate 0.25% three times during the period, amid signs of a growing US economy, strengthening labor market and improving business spending. At its December meeting, the Fed confirmed that the monthly balance sheet reduction would increase from US$10 billion to US$20 billion beginning in January 2018.
In Europe, the UK’s economic growth moderated in 2017 compared to 2016, largely due to slower growth in the services sector. In November, the Bank of England raised its key policy rate 0.25%, its first increase in a decade. The eurozone’s growth accelerated in 2017’s second and third quarters, but moderated in the fourth quarter. However, the eurozone’s 2017 economic growth rate of 2.5% was the fastest in a decade.3 The bloc’s annual inflation rate, while low, ended higher than in December 2016. The ECB kept its benchmark interest rate unchanged during the period. However, at its October meeting, the ECB extended the time frame for its massive bond-buying program from December 2017 to at least September 2018,
while reducing the amount of monthly bond purchases in half beginning in January 2018.
In Asia, Japan’s quarterly gross domestic product (GDP) grew for the seventh consecutive quarter, although third-quarter 2017 growth was lower than the previous quarter. The Bank of Japan left its benchmark interest rate unchanged during the period and continued its monetary stimulus measures.
In emerging markets, Brazil’s quarterly GDP grew for the third consecutive quarter, although third-quarter 2017 growth slowed from the previous quarter. The country’s central bank cut its benchmark interest rate several times during the period to spur economic growth. Russia’s GDP grew in 2017’s first three quarters compared to the prior-year periods, amid the Bank of Russia’s continued policy support. China’s GDP grew faster in 2017 than in 2016, supported by solid growth in industrial production, services, fixed-asset investment, retail sales, and imports and exports. The People’s Bank of China left its benchmark interest rate unchanged during the period. Overall, emerging market stocks, as measured by the MSCI Emerging Markets Index, produced a substantial +37.75% total return during the period.1
Investment Strategy
At Franklin Mutual Series, we are committed to our distinctive value approach to investing, which we believe can generate above-average risk-adjusted returns over time for our shareholders. Our major investment strategy is investing in undervalued stocks. When selecting undervalued equities, we are attracted to what we believe are fundamentally strong companies with healthy balance sheets, high-quality assets, substantial free cash flow and shareholder-oriented management teams and whose stocks are trading at discounts to our assessment of the companies’ intrinsic or business value. We also look for asset-rich companies whose shares may be trading at depressed levels due to concerns over short-term earnings disappointments, litigation, management strategy or other perceived negatives. This strict value approach is not only intended to improve the likelihood of upside potential, but also reduces the risk of substantial declines, in our opinion. While the vast majority of our undervalued equity investments are made in publicly traded companies globally, we may invest occasionally in privately held companies as well.
We complement this more traditional investment strategy with two others. One is distressed investing, a highly specialized
2. Source: Bureau of Labor Statistics.
3. Source: Eurostat.
| 4 | Annual Report | franklintempleton.com |
FRANKLIN MUTUAL GLOBAL DISCOVERY FUND
field that has proven quite profitable during certain periods over the years. Distressed investing is complex and can take many forms. The most common distressed investment the Fund undertakes is the purchase of financially troubled or bankrupt companies’ debt at a substantial discount to face value. After the financially distressed company is reorganized, often in bankruptcy court, the old debt is typically replaced with new securities issued by the financially stronger company.
The other piece of our investment strategy is participating in arbitrage situations, another highly specialized field. When companies announce proposed mergers or takeovers, commonly referred to as “deals,” the target company may trade at a discount to the bid it ultimately accepts. One form of arbitrage involves purchasing the target company’s stock when it is trading below the value we believe it would receive in a deal. In keeping with our commitment to a relatively conservative investment approach, we typically focus our arbitrage efforts on announced deals, and avoid rumored deals or other situations we consider relatively risky.
In addition, it is our practice to hedge the Fund’s currency exposure when we deem it advantageous for our shareholders.
What is meant by “hedge”?
To hedge an investment is to take a position intended to offset potential losses/gains that may be incurred by a companion financial instrument. |
Manager’s Discussion
In 2017, an improving economic and political backdrop helped drive most equity markets higher. The positive performances were broad based, spanning across most regions and sectors, and complemented by minimal volatility. Global markets were aided by generally upbeat economic data, improved corporate earnings in the US, Europe and Japan, as well as improved industrial commodity prices, most notably crude oil. In addition, the most significant political risks identified by investors heading into 2017 failed to materialize.
In the US, markets began 2017 rallying as investors hoped that a Republican sweep of US elections in November 2016 would lead to a general loosening in regulations and tax reform, including lower corporate tax rates. Although the Trump administration’s policy agenda was hindered by political
gridlock, efforts to loosen federal regulations yielded some results and tax reform legislation was finally passed in late December. Improving economic activity and corporate earnings appeared to be the most meaningful equity market catalysts during much of 2017. However, the modest level of economic growth and low interest rates pushed investors to keep favoring growth stocks. During the period, the Russell 1000® Growth Index generated a total return of +30.21%, while the Russell 1000® Value Index posted a total return of +13.66%.4 Within the Russell 1000® Growth Index, stocks with the largest weightings were technology firms that dominated the headlines: Apple,5 Alphabet (a.k.a. Google),5 Microsoft, Amazon.com5 and Facebook.5
European equity markets started 2017 slowly, but positive political events and improved economic data fueled strong performances during the period. Elections in Europe produced outcomes the markets viewed as generally positive, with far-right parties largely failing to gain political power in national elections. Investors were particularly encouraged by the presidential election outcome in France. The reform-minded, centrist candidate, Emmanuel Macron, won the French presidential election in May and quickly began to push his agenda, most notably labor decrees giving employers in France greater freedom in negotiating contracts directly with workers. Amid all the positive events, the UK remained the most significant outlier. In the UK, a June 2017 snap election resulting in no party having a majority in Parliament appeared to make a “hard Brexit,” in which the UK leaves the European Union (EU) in March 2019 without a negotiated deal, even more likely than before. Although the UK and EU appeared to make some progress late in the year, the snap election results left the Conservative Party in a precarious position and with the risk of another election in the near future.
As value investors, we seek to invest prudently in securities that we believe represent good value, but adjust our views accordingly as the world around us changes. The media industry is a recent example of this approach. The Top 10 Sectors/Industries table on page 6 lists media and other leading industries in which the Fund currently invests. The media industry became a significant area of investment interest in the latter stages of the year due to significant structural changes. Since the 1980s, most Americans received their TV entertainment as part of a bundle from a cable provider.
4. Source: Morningstar. Frank Russell Company is the source and owner of the trademarks, service marks and copyrights related to the Russell Indexes. Russell® is a trademark of Frank Russell Company.
5. Not a Fund holding.
See www.franklintempletondatasources.com for additional data provider information.
| franklintempleton.com | Annual Report | 5 |
FRANKLIN MUTUAL GLOBAL DISCOVERY FUND
Disparate networks were combined and sold as packages, with annual price increases justified by the inclusion of more networks. Consumers rarely had the option to unbundle cable packages and most markets had no direct competition. However, the growth of fixed and mobile broadband connectivity ushered in the opportunity to bypass traditional distributors through the delivery of film and TV content over the internet and the launch of direct-to-consumer offerings by TV networks. The growing popularity of new digital options has driven cable providers to roll out lower-priced packages with fewer channels. This evolution has begun to create winners and losers among networks and new opportunities for investors.
Pay TV subscription among US households peaked in 2009 at close to 100 million homes. Initially, the decline in subscribers was moderate, but has accelerated since 2015, reaching a pace of more than 2% per year in 2017. At first, media companies benefited from digital distribution by using it as an additional outlet for selling content. With the cannibalization of traditional platforms accelerating, media companies have begun to respond. The necessity for greater scale in content development and direct access to consumers is driving investment and merger decisions in the industry. From our standpoint, we are looking for networks with the most attractive content relative to the price they have been charging and may be able to charge in the future.
The Fund initiated a position in Walt Disney in the latter half of 2017. Walt Disney is listed among the Fund’s largest positions in the Top 10 Equity Holdings table on page 7. We believe Disney is well positioned to benefit from the evolution toward a more direct-to-consumer distribution model. In our view, Disney has one of the best intellectual property (IP) portfolios in all of media with a stable of globally recognized proprietary characters upon which to build a strong direct-to-consumer franchise. If Disney is successful in its bid to acquire the bulk of Twenty-First Century Fox’s5 content assets, the deal would further strengthen its IP portfolio and its content development scale. As it has done with its own IP, Disney would likely be able to leverage Fox’s content into attractions at its theme parks as well as consumer products. The acquisition would offer potential cost synergies that would likely offset some of the investments in the direct-to-consumer service. Under the leadership of chief executive officer Bob Iger, Disney has been effective in integrating acquired companies and navigating through a changing media landscape. Iger’s commitment to remain at the helm through 2021 strengthens our belief that the company should be able to execute on this opportunity.
Top 10 Sectors/Industries
Based on Equity Securities as of 12/31/17
| % of Total Net Assets | |||
Banks | 12.0% | |||
Insurance | 10.1% | |||
Oil, Gas & Consumable Fuels | 8.3% | |||
Pharmaceuticals | 7.9% | |||
Media | 7.4% | |||
Software | 5.4% | |||
Health Care Equipment & Supplies | 5.3% | |||
Tobacco | 3.5% | |||
Automobiles | 2.7% | |||
Technology Hardware, Storage & Peripherals | 2.5% | |||
Merger and acquisition activity remained healthy in 2017, although the pace of activity appeared to decelerate slightly compared to 2016 due to less favorable political and regulatory conditions in the US, the UK and China. In the US, several key regulatory agencies remain short of members, including the Federal Communications Commission and the Federal Trade Commission. Many large deals continued to wind their way through prolonged regulatory reviews, including Bayer’s5 acquisition of Monsanto, AT&T’s acquisition of Time Warner, and Twenty-First Century Fox’s offer for Sky.
Credit spreads narrowed in 2017 for higher quality and high yield credit, albeit with some minor bouts of volatility. The broad-based decrease in yield differentials between bonds with the same maturity but different credit quality provided the Fund with the opportunity to exit a number of opportunities that presented themselves in early 2016, including several bond offerings related to leveraged acquisitions, as prices improved, yield premium over Treasuries shrank, and the risk-adjusted returns were no longer mispriced. As the year progressed and investors became more willing buyers of credit, mispriced risk became more difficult to find, in our opinion. In times when the credit markets fluctuate and value is difficult to identify, we believe our industry specific expertise, deep fundamental analysis with a focus on cash flow, and intensive credit and covenant review combine seamlessly and provide us with different ways of looking at the same ideas others may disregard.
Fund Performance
Turning to Fund performance, top positive contributors included multinational software company Microsoft, South Korea-based Samsung Electronics and construction and mining equipment manufacturer Caterpillar.
| 6 | Annual Report | franklintempleton.com |
FRANKLIN MUTUAL GLOBAL DISCOVERY FUND
| Top 10 Equity Holdings | ||||
| 12/31/17 | ||||
Company Sector/Industry, Country | % of Total Net Assets | |||
Medtronic PLC | 2.3% | |||
| Health Care Equipment & Supplies, US | ||||
Royal Dutch Shell PLC | 2.3% | |||
| Oil, Gas & Consumable Fuels, UK | ||||
British American Tobacco PLC | 2.3% | |||
| Tobacco, UK | ||||
Novartis AG | 2.3% | |||
| Pharmaceuticals, Switzerland | ||||
NN Group NV | 2.2% | |||
| Insurance, Netherlands | ||||
Time Warner Inc. | 2.2% | |||
| Media, US | ||||
Eli Lilly & Co. | 2.1% | |||
| Pharmaceuticals, US | ||||
Merck & Co. Inc. | 2.0% | |||
| Pharmaceuticals, US | ||||
Koninklijke Philips NV | 1.9% | |||
| Health Care Equipment & Supplies, Netherlands | ||||
The Walt Disney Co. | 1.9% | |||
| Media, US | ||||
Microsoft continued to reap the rewards of its rapidly growing cloud business and from shifting Microsoft Office software clients to its subscription-based services. Microsoft reported solid quarterly results, including an improvement in operating margins and upward guidance to 2018 operating margins. Microsoft also announced a reorganization of its commercial field sales teams in July 2017 as part of its increased focus on cloud computing.
Samsung Electronics is a low cost provider of dynamic random-access memory and flash memory products, smartphones, consumer electronics and other goods. For investors, Samsung’s solid operating results outweighed both the conviction of Samsung vice chairman Jay Y. Lee for his involvement in a government bribery scandal and escalating tensions between North Korea and the international community. Samsung reported strong sales in its core businesses, including memory chips and OLED (organic light-emitting diode) displays. Sales of its newest generation of smartphones during 2017 exceeded market expectations. Shareholder-friendly actions also boosted shares of Samsung, including a plan to cancel existing treasury shares held by the company and the announcement of significant dividend increases in 2017 and 2018.
Caterpillar raised its 2017 revenue and earnings guidance on multiple occasions during the year as demand generally
improved across all of its divisions. Improved global economic conditions and a rebound in Chinese construction activity were significant catalysts for the increased demand. In September, Caterpillar’s new chief executive officer, Jim Umpleby, hosted an investor day at which he outlined his vision for the company. In particular, the company highlighted significant new growth opportunities in each of its business units, as well as margin targets that exceeded analyst expectations.
During the period under review, Fund investments that detracted from performance included US-based energy services company Baker Hughes, Israel-based pharmaceutical services provider Teva Pharmaceuticals and US-based industrials company General Electric (GE).
Baker Hughes is a US-based energy services company, majority owned by GE following the completed merger between Baker Hughes and GE’s oil-and-gas business in July 2017. Baker Hughes’ stock price slid lower in 2017 as the environment for long-cycle oil field service projects remained challenging and the newly combined company posted weaker-than-expected operating results. Toward year-end, we saw reasons for optimism as oil prices gained and Baker Hughes announced a $3 billion share repurchase program.
Teva Pharmaceutical Industries experienced a challenging year. In January 2017, Teva provided lower earnings guidance and a US federal court invalidated four patents for the company’s top-selling multiple sclerosis drug Copaxone. The resignations of Teva’s chief executive officer (CEO) and chief financial officer in the first half of 2017 further hindered Teva’s stock price. In the second half of the year, weak operating results, a dividend cut and a debt rating downgrade escalated investor concerns. The company managed to ease investor anxiety later in 2017, in our view, with the appointment of Kare Schultz, a well-regarded industry veteran as the new CEO, as well as the divestiture of certain non-core assets and amendment to certain debt instruments. We were also encouraged by the details of a restructuring plan announced by the new CEO in December.
The stock price of GE, an industrials company with a wide range of business units, declined as investors became more discouraged about the company’s poor cash flow generation, significantly underfunded pension liability, bloated cost structure, and increased competition and overcapacity in the power market. Intensifying pressure by activist investors led to chief executive officer (CEO) Jeffrey Immelt’s resignation in June 2017 and the promotion of John Flannery to CEO. However, GE’s stock price continued to slide after the company lowered its 2017 earnings guidance in October, which heightened investor concerns about a potential dividend cut. A
| franklintempleton.com | Annual Report | 7 |
FRANKLIN MUTUAL GLOBAL DISCOVERY FUND
dividend cut of 50%, larger than most investors had speculated, was announced in November, along with the incoming CEO’s plan for portfolio optimization and significant cost reductions. These negative events have not altered our view that GE has well-positioned businesses. If GE delivers on its plan to improve free cash flow generation and reduce overhead expenses, we believe there is upside potential for its stock price.
During the period, the Fund held currency forwards and futures seeking to hedge most of the currency risk of the portfolio’s non-US dollar investments. The currency forwards and futures had a negative impact on the Fund’s performance because of the depreciation of the US dollar versus the hedged currencies.
What is a currency forward?
A currency forward is an agreement between the Fund and a
|
What is a future?
A future is an agreement between the Fund and a
|
Philippe Brugere-Trelat, Executive Vice President and Portfolio Manager with Franklin Mutual Series, has decided to retire in 2018. We are grateful for Mr. Brugere-Trelat’s many years of service to the firm. In preparation for Mr. Brugere-Trelat’s retirement, Christian Correa, director of research and portfolio manager for Franklin Mutual Advisers will be added as a co-lead portfolio manager for Franklin Mutual Global Discovery Fund effective January 1, 2018, joining current co-lead portfolio managers Peter Langerman, Timothy Rankin and Philippe Brugere-Trelat. Effective May 1, 2018, Mr. Brugere-Trelat will step down as portfolio manager and remain with the firm in a consulting capacity until later in 2018 when he will officially retire.
Thank you for your participation in Franklin Mutual Global Discovery Fund. We look forward to continuing to serve your investment needs.
 |
Peter A. Langerman Co-Portfolio Manager | |
 |
Philippe Brugere-Trelat Co-Portfolio Manager | |
 |
Timothy Rankin, CFA Co-Portfolio Manager | |


The foregoing information reflects our analysis, opinions and portfolio holdings as of December 31, 2017, the end of the reporting period. The way we implement our main investment strategies and the resulting portfolio holdings may change depending on factors such as market and economic conditions. These opinions may not be relied upon as investment advice or an offer for a particular security. The information is not a complete analysis of every aspect of any market, country, industry, security or the Fund. Statements of fact are from sources considered reliable, but the investment manager makes no representation or warranty as to their completeness or accuracy. Although historical performance is no guarantee of future results, these insights may help you understand our investment management philosophy.
CFA® is a trademark owned by CFA Institute.
| 8 |
Annual Report | franklintempleton.com |
FRANKLIN MUTUAL GLOBAL DISCOVERY FUND
Peter Langerman has been portfolio manager for Franklin
|
Philippe Brugere-Trelat has been portfolio manager for
|
Timothy Rankin rejoined the Franklin Mutual Series
|
| franklintempleton.com | Annual Report | 9 |
FRANKLIN MUTUAL GLOBAL DISCOVERY FUND
Performance Summary as of December 31, 2017
The performance table and graphs do not reflect any taxes that a shareholder would pay on Fund dividends, capital gain distributions, if any, or any realized gains on the sale of Fund shares. Total return reflects reinvestment of the Fund’s dividends and capital gain distributions, if any, and any unrealized gains or losses. Your dividend income will vary depending on dividends or interest paid by securities in the Fund’s portfolio, adjusted for operating expenses of each class. Capital gain distributions are net profits realized from the sale of portfolio securities.
Performance as of 12/31/17
Cumulative total return excludes sales charges. Average annual total return includes maximum sales charges. Sales charges will vary depending on the size of the investment and the class of share purchased. The maximum is 5.75% and the minimum is 0%. Class A: 5.75% maximum initial sales charge. For other share classes, visit franklintempleton.com.
| Share Class | | Cumulative Total Return1 | | | Average Annual Total Return2 | | ||
Z | ||||||||
1-Year | +9.84% | +9.84% | ||||||
5-Year | +58.54% | +9.65% | ||||||
10-Year | +73.98% | +5.69% | ||||||
A | ||||||||
1-Year | +9.57% | +3.25% | ||||||
5-Year | +56.33% | +8.06% | ||||||
10-Year | +69.11% | +4.77% | ||||||
Performance data represent past performance, which does not guarantee future results. Investment return and principal value will fluctuate, and you may have a gain or loss when you sell your shares. Current performance may differ from figures shown. For most recent month-end performance, go to franklintempleton.com or call (800) 342-5236.
See page 12 for Performance Summary footnotes.
| 10 |
Annual Report | franklintempleton.com |
FRANKLIN MUTUAL GLOBAL DISCOVERY FUND
PERFORMANCE SUMMARY
Total Return Index Comparison for a Hypothetical $10,000 Investment
Total return represents the change in value of an investment over the periods shown. It includes any applicable maximum sales charge, Fund expenses, account fees and reinvested distributions. The unmanaged index includes reinvestment of any income or distributions. It differs from the Fund in composition and does not pay management fees or expenses. One cannot invest directly in an index.
Class Z (1/1/08–12/31/17)
Class A (1/1/08–12/31/17)
See page 12 for Performance Summary footnotes.
franklintempleton.com |
Annual Report |
|
11 |
|
FRANKLIN MUTUAL GLOBAL DISCOVERY FUND
PERFORMANCE SUMMARY
Distributions (1/1/17–12/31/17)
| Share Class | Net Investment Income | Short-Term Capital Gain | Long-Term Capital Gain | Total | ||||||||||||
| Z | $0.7946 | $0.0964 | $0.8664 | $1.7574 | ||||||||||||
| A | $0.7158 | $0.0964 | $0.8664 | $1.6786 | ||||||||||||
| C | $0.4552 | $0.0964 | $0.8664 | $1.4180 | ||||||||||||
| R | $0.6294 | $0.0964 | $0.8664 | $1.5922 | ||||||||||||
| R6 | $0.8466 | $0.0964 | $0.8664 | $1.8094 | ||||||||||||
Total Annual Operating Expenses4
| Share Class | ||||
Z | 0.99% | |||
A | 1.24% | |||
Each class of shares is available to certain eligible investors and has different annual fees and expenses, as described in the prospectus.
All investments involve risks, including possible loss of principal. Value securities may not increase in price as anticipated or may decline further in value. Special risks are associated with foreign investing, including currency fluctuations, economic instability and political developments. Because the Fund may invest its assets in companies in a specific region, including Europe, it is subject to greater risks of adverse developments in that region and/or the surrounding regions than a fund that is more broadly diversified geographically. Current political and financial uncertainty surrounding the European Union may increase market volatility and the economic risk of investing in companies in Europe. Smaller company stocks have exhibited greater price volatility than larger company stocks, particularly over the short term. The Fund’s investments in companies engaged in mergers, reorganizations or liquidations also involve special risks as pending deals may not be completed on time or on favorable terms. The Fund may invest in lower rated bonds, which entail higher credit risk. The Fund is actively managed but there is no guarantee that the manager’s investment decisions will produce the desired results. The Fund’s prospectus also includes a description of the main investment risks.
1. Cumulative total return represents the change in value of an investment over the periods indicated.
2. Average annual total return represents the average annual change in value of an investment over the periods indicated. Return for less than one year, if any, has not been annualized.
3. Source: Morningstar. The MSCI World Index (USD) is a free float-adjusted, market capitalization-weighted index designed to measure equity market performance in global developed markets.
4. Figures are as stated in the Fund’s current prospectus and may differ from the expense ratios disclosed in the Your Fund’s Expenses and Financial Highlights sections in this report. In periods of market volatility, assets may decline significantly, causing total annual Fund operating expenses to become higher than the figures shown.
See www.franklintempletondatasources.com for additional data provider information.
12 |
Annual Report |
franklintempleton.com |
FRANKLIN MUTUAL GLOBAL DISCOVERY FUND
As a Fund shareholder, you can incur two types of costs: (1) transaction costs, including sales charges (loads) on Fund purchases and redemptions; and (2) ongoing Fund costs, including management fees, distribution and service (12b-1) fees, and other Fund expenses. All mutual funds have ongoing costs, sometimes referred to as operating expenses. The table below shows ongoing costs of investing in the Fund and can help you understand these costs and compare them with those of other mutual funds. The table assumes a $1,000 investment held for the six months indicated.
Actual Fund Expenses
The table below provides information about actual account values and actual expenses in the columns under the heading “Actual.” In these columns the Fund’s actual return, which includes the effect of Fund expenses, is used to calculate the “Ending Account Value” for each class of shares. You can estimate the expenses you paid during the period by following these steps (of course, your account value and expenses will differ from those in this illustration): Divide your account value by $1,000 (if your account had an $8,600 value, then $8,600 ÷ $1,000 = 8.6). Then multiply the result by the number in the row for your class of shares under the headings “Actual” and “Expenses Paid During Period” (if Actual Expenses Paid During Period were $7.50, then 8.6 x $7.50 = $64.50). In this illustration, the actual expenses paid this period are $64.50.
Hypothetical Example for Comparison with Other Funds
Under the heading “Hypothetical” in the table, information is provided about hypothetical account values and hypothetical expenses based on the Fund’s actual expense ratio and an assumed rate of return of 5% per year before expenses, which is not the Fund’s actual return. This information may not be used to estimate the actual ending account balance or expenses you paid for the period, but it can help you compare ongoing costs of investing in the Fund with those of other funds. To do so, compare this 5% hypothetical example for the class of shares you hold with the 5% hypothetical examples that appear in the shareholder reports of other funds.
Please note that expenses shown in the table are meant to highlight ongoing costs and do not reflect any transactional costs. Therefore, information under the heading “Hypothetical” is useful in comparing ongoing costs only, and will not help you compare total costs of owning different funds. In addition, if transactional costs were included, your total costs would have been higher.
| Actual (actual return after expenses) | Hypothetical (5% annual return before expenses) | |||||||||||||||||
Share Class | Beginning Account Value 7/1/17 | Ending Account Value 12/31/17 | Expenses Paid During 7/1/17–12/31/171 | Ending Account Value 12/31/17 | Expenses Paid During 7/1/17–12/31/171 | Annualized Expense Ratio | ||||||||||||
|
|
|
| |||||||||||||||
| Z | $1,000 | $1,029.60 | $ 4.91 | $1,020.37 | $4.89 | 0.96% | ||||||||||||
| A | $1,000 | $1,028.10 | $ 6.19 | $1,019.11 | $6.16 | 1.21% | ||||||||||||
| C | $1,000 | $1,024.40 | $10.00 | $1,015.32 | $9.96 | 1.96% | ||||||||||||
| R | $1,000 | $1,027.00 | $ 7.46 | $1,017.85 | $7.43 | 1.46% | ||||||||||||
| R6 | $1,000 | $1,029.90 | $ 4.30 | $1,020.97 | $4.28 | 0.84% | ||||||||||||
1. Expenses are equal to the annualized expense ratio for the six-month period as indicated above—in the far right column—multiplied by the simple average account value over the period indicated, and then multiplied by 184/365 to reflect the one-half year period.
franklintempleton.com |
Annual Report |
|
13 |
|
FRANKLIN MUTUAL GLOBAL DISCOVERY FUND
| Year Ended December 31, | ||||||||||||||||||||
| 2017 | 2016 | 2015 | 2014 | 2013 | ||||||||||||||||
Class Z | ||||||||||||||||||||
| Per share operating performance | ||||||||||||||||||||
(for a share outstanding throughout the year) | ||||||||||||||||||||
Net asset value, beginning of year | $31.12 | $29.35 | $33.32 | $33.73 | $28.65 | |||||||||||||||
Income from investment operationsa: | ||||||||||||||||||||
Net investment incomeb | 0.76 | c | 0.67 | d | 0.53 | 0.82 | e | 0.55 | ||||||||||||
Net realized and unrealized gains (losses) | 2.29 | 3.08 | (1.71 | ) | 0.97 | 6.74 | ||||||||||||||
Total from investment operations | 3.05 | 3.75 | (1.18 | ) | 1.79 | 7.29 | ||||||||||||||
Less distributions from: | ||||||||||||||||||||
Net investment income | (0.79 | ) | (0.69 | ) | (0.55 | ) | (0.82 | ) | (0.57 | ) | ||||||||||
Net realized gains | (0.96 | ) | (1.29 | ) | (2.24 | ) | (1.38 | ) | (1.64 | ) | ||||||||||
Total distributions | (1.75 | ) | (1.98 | ) | (2.79 | ) | (2.20 | ) | (2.21 | ) | ||||||||||
Net asset value, end of year | $32.42 | $31.12 | $29.35 | $33.32 | $33.73 | |||||||||||||||
Total return | 9.84% | 12.86% | (3.36)% | 5.33% | 25.64% | |||||||||||||||
Ratios to average net assets | ||||||||||||||||||||
Expensesf,g | 0.96% | 0.99% | h | 0.99% | h | 0.99% | 0.98% | |||||||||||||
Expenses incurred in connection with securities sold short | —% | 0.01% | 0.02% | 0.03% | —% | i | ||||||||||||||
Net investment income | 2.30% | c | 2.27% | d | 1.56% | 2.38% | e | 1.68% | ||||||||||||
| Supplemental data | ||||||||||||||||||||
Net assets, end of year (000’s) | $7,175,981 | $8,354,865 | $9,132,752 | $10,375,518 | $9,529,245 | |||||||||||||||
Portfolio turnover rate | 17.50% | 17.01% | 21.79% | 23.66% | 23.57% | |||||||||||||||
aThe amount shown for a share outstanding throughout the period may not correlate with the Statement of Operations for the period due to the timing of sales and repurchases of the Fund’s shares in relation to income earned and/or fluctuating fair value of the investments of the Fund.
bBased on average daily shares outstanding.
cNet investment income per share includes approximately $0.20 per share related to income received in the form of special dividends in connection with certain Fund holdings. Excluding this amount, the ratio of net investment income to average net assets would have been 1.68%.
dNet investment income per share includes approximately $0.10 per share related to income received in the form of special dividends in connection with certain Fund holdings. Excluding this amount, the ratio of net investment income to average net assets would have been 1.94%.
eNet investment income per share includes approximately $0.34 per share related to income received in the form of special dividends in connection with certain Fund holdings. Excluding this amount, the ratio of net investment income to average net assets would have been 1.40%.
fIncludes dividend and/or interest expense on securities sold short and security borrowing fees, if any. See below for the ratios of such expenses to average net assets for the periods presented. See Note 1(d).
gBenefit of expense reduction rounds to less than 0.01%.
hBenefit of waiver and payments by affiliates rounds to less than 0.01%.
iRounds to less than 0.01%.
14 |
Annual Report | The accompanying notes are an integral part of these financial statements. |
franklintempleton.com |
FRANKLIN MUTUAL GLOBAL DISCOVERY FUND
FINANCIAL HIGHLIGHTS
| Year Ended December 31, | ||||||||||||||||||||
| 2017 | 2016 | 2015 | 2014 | 2013 | ||||||||||||||||
Class A | ||||||||||||||||||||
| Per share operating performance | ||||||||||||||||||||
(for a share outstanding throughout the year) | ||||||||||||||||||||
Net asset value, beginning of year | $30.57 | $28.86 | $32.81 | $33.24 | $28.27 | |||||||||||||||
Income from investment operationsa: | ||||||||||||||||||||
Net investment incomeb | 0.66 | c | 0.59 | d | 0.42 | 0.71 | e | 0.44 | ||||||||||||
Net realized and unrealized gains (losses) | 2.25 | 3.01 | (1.67 | ) | 0.96 | 6.65 | ||||||||||||||
Total from investment operations | 2.91 | 3.60 | (1.25 | ) | 1.67 | 7.09 | ||||||||||||||
Less distributions from: | ||||||||||||||||||||
Net investment income | (0.72 | ) | (0.60 | ) | (0.46 | ) | (0.72 | ) | (0.48 | ) | ||||||||||
Net realized gains | (0.96 | ) | (1.29 | ) | (2.24 | ) | (1.38 | ) | (1.64 | ) | ||||||||||
Total distributions | (1.68 | ) | (1.89 | ) | (2.70 | ) | (2.10 | ) | (2.12 | ) | ||||||||||
Net asset value, end of year | $31.80 | $30.57 | $28.86 | $32.81 | $33.24 | |||||||||||||||
Total returnf | 9.57% | 12.56% | (3.63)% | 5.01% | 25.26% | |||||||||||||||
| Ratios to average net assets | ||||||||||||||||||||
Expensesg,h | 1.21% | 1.24% | i | 1.27% | i | 1.29% | 1.28% | |||||||||||||
Expenses incurred in connection with securities sold short | —% | 0.01% | 0.02% | 0.03% | —% | j | ||||||||||||||
Net investment income | 2.05% | c | 2.02% | d | 1.28% | 2.08% | e | 1.38% | ||||||||||||
| Supplemental data | ||||||||||||||||||||
Net assets, end of year (000’s) | $9,589,033 | $10,498,722 | $11,274,721 | $11,573,196 | $10,785,375 | |||||||||||||||
Portfolio turnover rate | 17.50% | 17.01% | 21.79% | 23.66% | 23.57% | |||||||||||||||
aThe amount shown for a share outstanding throughout the period may not correlate with the Statement of Operations for the period due to the timing of sales and repurchases of the Fund’s shares in relation to income earned and/or fluctuating fair value of the investments of the Fund.
bBased on average daily shares outstanding.
cNet investment income per share includes approximately $0.20 per share related to income received in the form of special dividends in connection with certain Fund holdings. Excluding this amount, the ratio of net investment income to average net assets would have been 1.43%.
dNet investment income per share includes approximately $0.10 per share related to income received in the form of special dividends in connection with certain Fund holdings. Excluding this amount, the ratio of net investment income to average net assets would have been 1.69%.
eNet investment income per share includes approximately $0.34 per share related to income received in the form of special dividends in connection with certain Fund holdings. Excluding this amount, the ratio of net investment income to average net assets would have been 1.10%.
fTotal return does not reflect sales commissions or contingent deferred sales charges, if applicable.
gIncludes dividend and/or interest expense on securities sold short and security borrowing fees, if any. See below for the ratios of such expenses to average net assets for the periods presented. See Note 1(d).
hBenefit of expense reduction rounds to less than 0.01%.
iBenefit of waiver and payments by affiliates rounds to less than 0.01%.
jRounds to less than 0.01%.
franklintempleton.com |
The accompanying notes are an integral part of these financial statements. | |
Annual Report |
15 |
FRANKLIN MUTUAL GLOBAL DISCOVERY FUND
FINANCIAL HIGHLIGHTS
| Year Ended December 31, | ||||||||||||||||||||
| 2017 | 2016 | 2015 | 2014 | 2013 | ||||||||||||||||
Class C | ||||||||||||||||||||
| Per share operating performance | ||||||||||||||||||||
(for a share outstanding throughout the year) | ||||||||||||||||||||
Net asset value, beginning of year | $30.22 | $28.55 | $32.49 | $32.94 | $28.05 | |||||||||||||||
Income from investment operationsa: | ||||||||||||||||||||
Net investment incomeb | 0.41 | c | 0.36 | d | 0.18 | 0.47 | e | 0.22 | ||||||||||||
Net realized and unrealized gains (losses) | 2.23 | 2.97 | (1.64 | ) | 0.95 | 6.58 | ||||||||||||||
Total from investment operations | 2.64 | 3.33 | (1.46 | ) | 1.42 | 6.80 | ||||||||||||||
Less distributions from: | ||||||||||||||||||||
Net investment income | (0.46 | ) | (0.37 | ) | (0.24 | ) | (0.49 | ) | (0.27 | ) | ||||||||||
Net realized gains | (0.96 | ) | (1.29 | ) | (2.24 | ) | (1.38 | ) | (1.64 | ) | ||||||||||
Total distributions | (1.42 | ) | (1.66 | ) | (2.48 | ) | (1.87 | ) | (1.91 | ) | ||||||||||
Net asset value, end of year | $31.44 | $30.22 | $28.55 | $32.49 | $32.94 | |||||||||||||||
Total returnf | 8.78% | 11.70% | (4.33)% | 4.28% | 24.39% | |||||||||||||||
| Ratios to average net assets | ||||||||||||||||||||
Expensesg,h | 1.96% | 1.99% | i | 1.99% | i | 1.99% | 1.98% | |||||||||||||
Expenses incurred in connection with securities sold short | —% | 0.01% | 0.02% | 0.03% | —% | j | ||||||||||||||
Net investment income | 1.30% | c | 1.27% | d | 0.56% | 1.38% | e | 0.68% | ||||||||||||
| Supplemental data | ||||||||||||||||||||
Net assets, end of year (000’s) | $2,438,507 | $2,758,563 | $2,983,216 | $3,077,691 | $2,894,908 | |||||||||||||||
Portfolio turnover rate | 17.50% | 17.01% | 21.79% | 23.66% | 23.57% | |||||||||||||||
aThe amount shown for a share outstanding throughout the period may not correlate with the Statement of Operations for the period due to the timing of sales and repurchases of the Fund’s shares in relation to income earned and/or fluctuating fair value of the investments of the Fund.
bBased on average daily shares outstanding.
cNet investment income per share includes approximately $0.20 per share related to income received in the form of special dividends in connection with certain Fund holdings. Excluding this amount, the ratio of net investment income to average net assets would have been 0.68%.
dNet investment income per share includes approximately $0.10 per share related to income received in the form of special dividends in connection with certain Fund holdings. Excluding this amount, the ratio of net investment income to average net assets would have been 0.94%.
eNet investment income per share includes approximately $0.34 per share related to income received in the form of special dividends in connection with certain Fund holdings. Excluding this amount, the ratio of net investment income to average net assets would have been 0.40%.
fTotal return does not reflect sales commissions or contingent deferred sales charges, if applicable.
gIncludes dividend and/or interest expense on securities sold short and security borrowing fees, if any. See below for the ratios of such expenses to average net assets for the periods presented. See Note 1(d).
hBenefit of expense reduction rounds to less than 0.01%.
iBenefit of waiver and payments by affiliates rounds to less than 0.01%.
jRounds to less than 0.01%.
16 |
Annual Report | The accompanying notes are an integral part of these financial statements. |
franklintempleton.com |
FRANKLIN MUTUAL GLOBAL DISCOVERY FUND
FINANCIAL HIGHLIGHTS
| Year Ended December 31, | ||||||||||||||||||||
| 2017 | 2016 | 2015 | 2014 | 2013 | ||||||||||||||||
Class R | ||||||||||||||||||||
| Per share operating performance | ||||||||||||||||||||
(for a share outstanding throughout the year) | ||||||||||||||||||||
Net asset value, beginning of year | $30.17 | $28.51 | $32.43 | $32.88 | $27.98 | |||||||||||||||
Income from investment operationsa: | ||||||||||||||||||||
Net investment incomeb | 0.57 | c | 0.50 | d | 0.35 | 0.65 | e | 0.37 | ||||||||||||
Net realized and unrealized gains (losses) | 2.22 | 2.98 | (1.64 | ) | 0.93 | 6.58 | ||||||||||||||
Total from investment operations | 2.79 | 3.48 | (1.29 | ) | 1.58 | 6.95 | ||||||||||||||
Less distributions from: | ||||||||||||||||||||
Net investment income | (0.63 | ) | (0.53 | ) | (0.39 | ) | (0.65 | ) | (0.41 | ) | ||||||||||
Net realized gains | (0.96 | ) | (1.29 | ) | (2.24 | ) | (1.38 | ) | (1.64 | ) | ||||||||||
Total distributions | (1.59 | ) | (1.82 | ) | (2.63 | ) | (2.03 | ) | (2.05 | ) | ||||||||||
Net asset value, end of year | $31.37 | $30.17 | $28.51 | $32.43 | $32.88 | |||||||||||||||
Total return | 9.31% | 12.28% | (3.82)% | 4.77% | 25.02% | |||||||||||||||
| Ratios to average net assets | ||||||||||||||||||||
Expensesf,g | 1.46% | 1.49% | h | 1.49%h | 1.49% | 1.48% | ||||||||||||||
Expenses incurred in connection with securities sold short | —% | 0.01% | 0.02% | 0.03% | —% | i | ||||||||||||||
Net investment income | 1.80% | c | 1.77% | d | 1.06% | 1.88% | e | 1.18% | ||||||||||||
| Supplemental data | ||||||||||||||||||||
Net assets, end of year (000’s) | $398,692 | $444,813 | $468,425 | $528,439 | $539,613 | |||||||||||||||
Portfolio turnover rate | 17.50% | 17.01% | 21.79% | 23.66% | 23.57% | |||||||||||||||
aThe amount shown for a share outstanding throughout the period may not correlate with the Statement of Operations for the period due to the timing of sales and repurchases of the Fund’s shares in relation to income earned and/or fluctuating fair value of the investments of the Fund.
bBased on average daily shares outstanding.
cNet investment income per share includes approximately $0.20 per share related to income received in the form of special dividends in connection with certain Fund holdings. Excluding this amount, the ratio of net investment income to average net assets would have been 1.18%.
dNet investment income per share includes approximately $0.10 per share related to income received in the form of special dividends in connection with certain Fund holdings. Excluding this amount, the ratio of net investment income to average net assets would have been 1.44%.
eNet investment income per share includes approximately $0.34 per share related to income received in the form of special dividends in connection with certain Fund holdings. Excluding this amount, the ratio of net investment income to average net assets would have been 0.90%.
fIncludes dividend and/or interest expense on securities sold short and security borrowing fees, if any. See below for the ratios of such expenses to average net assets for the periods presented. See Note 1(d).
gBenefit of expense reduction rounds to less than 0.01%.
hBenefit of waiver and payments by affiliates rounds to less than 0.01%.
iRounds to less than 0.01%.
franklintempleton.com |
The accompanying notes are an integral part of these financial statements. | |
Annual Report |
17 |
FRANKLIN MUTUAL GLOBAL DISCOVERY FUND
FINANCIAL HIGHLIGHTS
| Year Ended December 31, | ||||||||||||||||||||
| 2017 | 2016 | 2015 | 2014 | 2013a | ||||||||||||||||
Class R6 | ||||||||||||||||||||
| Per share operating performance | ||||||||||||||||||||
(for a share outstanding throughout the year) | ||||||||||||||||||||
Net asset value, beginning of year | $31.13 | $29.35 | $33.33 | $33.73 | $31.42 | |||||||||||||||
Income from investment operationsb: | ||||||||||||||||||||
Net investment incomec | 0.75 | d | 0.61 | e | 0.55 | 0.85 | f | 0.40 | ||||||||||||
Net realized and unrealized gains (losses) | 2.34 | 3.19 | (1.69 | ) | 1.00 | 4.17 | ||||||||||||||
Total from investment operations | 3.09 | 3.80 | (1.14 | ) | 1.85 | 4.57 | ||||||||||||||
Less distributions from: | ||||||||||||||||||||
Net investment income | (0.85 | ) | (0.73 | ) | (0.60 | ) | (0.87 | ) | (0.62 | ) | ||||||||||
Net realized gains | (0.96 | ) | (1.29 | ) | (2.24 | ) | (1.38 | ) | (1.64 | ) | ||||||||||
Total distributions | (1.81 | ) | (2.02 | ) | (2.84 | ) | (2.25 | ) | (2.26 | ) | ||||||||||
Net asset value, end of year. | $32.41 | $31.13 | $29.35 | $33.33 | $33.73 | |||||||||||||||
Total returng | 9.98% | 13.02% | (3.23)% | 5.46% | 14.71% | |||||||||||||||
| Ratios to average net assetsh | ||||||||||||||||||||
Expensesi,j | 0.84% | 0.85% | k | 0.84% | k | 0.85% | 0.84% | |||||||||||||
Expenses incurred in connection with securities sold short | —% | 0.01% | 0.02% | 0.03% | —% | l | ||||||||||||||
Net investment income | 2.42% | d | 2.41% | e | 1.71% | 2.52% | f | 1.83% | ||||||||||||
| Supplemental data | ||||||||||||||||||||
Net assets, end of year (000’s) | $2,221,338 | $528,617 | $229,765 | $137,922 | $10,535 | |||||||||||||||
Portfolio turnover rate | 17.50% | 17.01% | 21.79% | 23.66% | 23.57% | |||||||||||||||
aFor the period May 1, 2013 (effective date) to December 31, 2013.
bThe amount shown for a share outstanding throughout the period may not correlate with the Statement of Operations for the period due to the timing of sales and repurchases of the Fund’s shares in relation to income earned and/or fluctuating fair value of the investments of the Fund.
cBased on average daily shares outstanding.
dNet investment income per share includes approximately $0.20 per share related to income received in the form of special dividends in connection with certain Fund holdings. Excluding this amount, the ratio of net investment income to average net assets would have been 1.80%.
eNet investment income per share includes approximately $0.10 per share related to income received in the form of special dividends in connection with certain Fund holdings. Excluding this amount, the ratio of net investment income to average net assets would have been 2.08%.
fNet investment income per share includes approximately $0.34 per share related to income received in the form of special dividends in connection with certain Fund holdings. Excluding this amount, the ratio of net investment income to average net assets would have been 1.54%.
gTotal return is not annualized for periods less than one year.
hRatios are annualized for periods less than one year.
iIncludes dividend and/or interest expense on securities sold short and security borrowing fees, if any. See below for the ratios of such expenses to average net assets for the periods presented. See Note 1(d).
jBenefit of expense reduction rounds to less than 0.01%.
kBenefit of waiver and payments by affiliates rounds to less than 0.01%.
lRounds to less than 0.01%.
18 |
Annual Report | The accompanying notes are an integral part of these financial statements. |
franklintempleton.com |
FRANKLIN MUTUAL GLOBAL DISCOVERY FUND
Statement of Investments, December 31, 2017
| Country | Shares/ Units/ Warrants | Value | ||||||||||||||
|
| |||||||||||||||
Common Stocks and Other Equity Interests 91.9% | ||||||||||||||||
Aerospace & Defense 0.1% | ||||||||||||||||
BAE Systems PLC | United Kingdom | 1,590,636 | $ | 12,308,466 | ||||||||||||
|
| |||||||||||||||
Auto Components 0.1% | ||||||||||||||||
| a,b,c | International Automotive Components Group Brazil LLC | Brazil | 3,819,425 | 130,949 | ||||||||||||
| a,b,c,d | International Automotive Components Group North America LLC | United States | 35,491,081 | 23,380,637 | ||||||||||||
|
| |||||||||||||||
| 23,511,586 | ||||||||||||||||
|
| |||||||||||||||
Automobiles 1.0% | ||||||||||||||||
General Motors Co. | United States | 5,350,852 | 219,331,423 | |||||||||||||
|
| |||||||||||||||
Banks 12.0% | ||||||||||||||||
Barclays PLC | United Kingdom | 36,257,633 | 99,446,130 | |||||||||||||
BNP Paribas SA | France | 2,309,793 | 172,512,789 | |||||||||||||
CIT Group Inc. | United States | 3,769,060 | 185,550,824 | |||||||||||||
Citigroup Inc. | United States | 4,720,240 | 351,233,058 | |||||||||||||
Citizens Financial Group Inc. | United States | 9,225,010 | 387,265,920 | |||||||||||||
First Horizon National Corp. | United States | 7,743,203 | 154,786,628 | |||||||||||||
HSBC Holdings PLC | United Kingdom | 16,067,494 | 166,404,627 | |||||||||||||
JPMorgan Chase & Co. | United States | 2,948,319 | 315,293,234 | |||||||||||||
Societe Generale SA | France | 5,157,188 | 266,375,943 | |||||||||||||
| a | Standard Chartered PLC | United Kingdom | 12,656,750 | 133,337,097 | ||||||||||||
| a | Unicaja Banco SA | Spain | 32,636,630 | 51,452,864 | ||||||||||||
Wells Fargo & Co. | United States | 5,713,404 | 346,632,221 | |||||||||||||
|
| |||||||||||||||
| 2,630,291,335 | ||||||||||||||||
|
| |||||||||||||||
Beverages 0.8% | ||||||||||||||||
PepsiCo Inc. | United States | 1,395,272 | 167,321,018 | |||||||||||||
|
| |||||||||||||||
Building Products 0.7% | ||||||||||||||||
Johnson Controls International PLC | United States | 4,191,600 | 159,741,876 | |||||||||||||
|
| |||||||||||||||
Capital Markets 0.4% | ||||||||||||||||
| a | Guotai Junan Securities Co. Ltd. | China | 41,520,689 | 92,470,736 | ||||||||||||
|
| |||||||||||||||
Chemicals 1.1% | ||||||||||||||||
| a,b,e | Dow Corning Corp., Contingent Distribution | United States | 11,430,153 | — | ||||||||||||
Monsanto Co. | United States | 2,149,530 | 251,022,113 | |||||||||||||
|
| |||||||||||||||
| 251,022,113 | ||||||||||||||||
|
| |||||||||||||||
Communications Equipment 2.5% | ||||||||||||||||
Cisco Systems Inc. | United States | 7,416,030 | 284,033,949 | |||||||||||||
Nokia OYJ, A | Finland | 28,555,604 | 133,412,395 | |||||||||||||
Nokia OYJ, ADR | Finland | 25,474,246 | 118,709,986 | |||||||||||||
|
| |||||||||||||||
| 536,156,330 | ||||||||||||||||
|
| |||||||||||||||
Construction Materials 0.9% | ||||||||||||||||
LafargeHolcim Ltd., B | Switzerland | 3,691,245 | 208,173,565 | |||||||||||||
|
| |||||||||||||||
Consumer Finance 1.6% | ||||||||||||||||
Ally Financial Inc. | United States | 4,641,368 | 135,342,291 | |||||||||||||
Capital One Financial Corp. | United States | 2,190,465 | 218,126,505 | |||||||||||||
|
| |||||||||||||||
| 353,468,796 | ||||||||||||||||
|
| |||||||||||||||
Containers & Packaging 0.8% | ||||||||||||||||
International Paper Co. | United States | 2,848,948 | 165,068,047 | |||||||||||||
|
| |||||||||||||||
franklintempleton.com |
Annual Report |
|
19 |
|
FRANKLIN MUTUAL GLOBAL DISCOVERY FUND
STATEMENT OF INVESTMENTS
| Country | Shares/ Units/ | Value | ||||||||||||||
|
| |||||||||||||||
Common Stocks and Other Equity Interests (continued) | ||||||||||||||||
Diversified Financial Services 0.8% | ||||||||||||||||
| a,b,c | Hightower Holding LLC, B, Series II | United States | 2,491,917 | $ | 5,927,772 | |||||||||||
Voya Financial Inc. | United States | 3,426,353 | 169,501,683 | |||||||||||||
|
| |||||||||||||||
| 175,429,455 | ||||||||||||||||
|
| |||||||||||||||
Diversified Telecommunication Services 2.0% | ||||||||||||||||
China Telecom Corp. Ltd., H | China | 229,081,897 | 109,074,750 | |||||||||||||
Koninklijke KPN NV | Netherlands | 95,635,204 | 333,673,004 | |||||||||||||
|
| |||||||||||||||
| 442,747,754 | ||||||||||||||||
|
| |||||||||||||||
Electric Utilities 2.1% | ||||||||||||||||
Enel SpA | Italy | 57,664,238 | 354,921,905 | |||||||||||||
PG&E Corp. | United States | 2,569,864 | 115,207,003 | |||||||||||||
|
| |||||||||||||||
| 470,128,908 | ||||||||||||||||
|
| |||||||||||||||
Energy Equipment & Services 0.8% | ||||||||||||||||
Baker Hughes a GE Co., A | United States | 5,382,143 | 170,291,005 | |||||||||||||
|
| |||||||||||||||
Food & Staples Retailing 2.3% | ||||||||||||||||
CVS Health Corp. | United States | 3,061,866 | 221,985,285 | |||||||||||||
| a | METRO AG | Germany | 2,324,311 | 46,431,996 | ||||||||||||
| a | Rite Aid Corp. | United States | 13,959,587 | 27,500,386 | ||||||||||||
Walgreens Boots Alliance Inc. | United States | 2,833,972 | 205,803,047 | |||||||||||||
|
| |||||||||||||||
| 501,720,714 | ||||||||||||||||
|
| |||||||||||||||
Health Care Equipment & Supplies 5.3% | ||||||||||||||||
Koninklijke Philips NV | Netherlands | 11,117,357 | 420,699,622 | |||||||||||||
Medtronic PLC | United States | 6,236,184 | 503,571,858 | |||||||||||||
Stryker Corp. | United States | 1,490,802 | 230,835,782 | |||||||||||||
|
| |||||||||||||||
| 1,155,107,262 | ||||||||||||||||
|
| |||||||||||||||
Hotels, Restaurants & Leisure 2.4% | ||||||||||||||||
Accor SA | France | 7,758,692 | 400,281,805 | |||||||||||||
| a | Caesars Entertainment Corp. | United States | 906,511 | 11,467,364 | ||||||||||||
Sands China Ltd. | Hong Kong | 21,300,300 | 110,006,861 | |||||||||||||
|
| |||||||||||||||
| 521,756,030 | ||||||||||||||||
|
| |||||||||||||||
Independent Power & Renewable Electricity Producers 0.4% | ||||||||||||||||
| a | Vistra Energy Corp. | United States | 4,396,159 | 80,537,615 | ||||||||||||
|
| |||||||||||||||
Industrial Conglomerates 1.5% | ||||||||||||||||
General Electric Co. | United States | 18,356,200 | 320,315,690 | |||||||||||||
|
| |||||||||||||||
Insurance 10.1% | ||||||||||||||||
| a | Alleghany Corp. | United States | 76,761 | 45,756,465 | ||||||||||||
American International Group Inc. | United States | 5,102,618 | 304,013,980 | |||||||||||||
| a | Brighthouse Financial Inc. | United States | 349,187 | 20,476,326 | ||||||||||||
China Pacific Insurance Group Co. Ltd., H | China | 44,491,587 | 213,834,784 | |||||||||||||
Chubb Ltd. | United States | 1,651,098 | 241,274,951 | |||||||||||||
The Hartford Financial Services Group Inc. | United States | 3,295,287 | 185,458,752 | |||||||||||||
MetLife Inc. | United States | 3,841,066 | 194,204,297 | |||||||||||||
NN Group NV | Netherlands | 11,287,329 | 489,156,475 | |||||||||||||
RSA Insurance Group PLC | United Kingdom | 17,857,312 | 152,529,951 | |||||||||||||
T&D Holdings Inc. | Japan | 6,611,212 | 113,056,800 | |||||||||||||
XL Group Ltd. | Bermuda | 7,184,954 | 252,622,983 | |||||||||||||
|
| |||||||||||||||
| 2,212,385,764 | ||||||||||||||||
|
| |||||||||||||||
20 |
Annual Report |
franklintempleton.com |
FRANKLIN MUTUAL GLOBAL DISCOVERY FUND
STATEMENT OF INVESTMENTS
| Country | Shares/ Units/ Warrants | Value | ||||||||||||||
|
| |||||||||||||||
Common Stocks and Other Equity Interests (continued) | ||||||||||||||||
IT Services 1.8% | ||||||||||||||||
Cognizant Technology Solutions Corp., A | United States | 4,311,090 | $ | 306,173,612 | ||||||||||||
DXC Technology Co. | United States | 862,421 | 81,843,753 | |||||||||||||
|
| |||||||||||||||
| 388,017,365 | ||||||||||||||||
|
| |||||||||||||||
Machinery 1.8% | ||||||||||||||||
Caterpillar Inc. | United States | 1,330,608 | 209,677,209 | |||||||||||||
CNH Industrial NV | United Kingdom | 5,804,196 | 77,786,481 | |||||||||||||
CNH Industrial NV, special voting | United Kingdom | 7,338,645 | 98,350,808 | |||||||||||||
|
| |||||||||||||||
| 385,814,498 | ||||||||||||||||
|
| |||||||||||||||
Media 7.4% | ||||||||||||||||
| a | Charter Communications Inc., A | United States | 840,665 | 282,429,813 | ||||||||||||
| a | DISH Network Corp., A | United States | 4,143,726 | 197,862,917 | ||||||||||||
Sky PLC | United Kingdom | 17,665,468 | 241,426,075 | |||||||||||||
Time Warner Inc. | United States | 5,178,666 | 473,692,579 | |||||||||||||
The Walt Disney Co. | United States | 3,912,400 | 420,622,124 | |||||||||||||
|
| |||||||||||||||
| 1,616,033,508 | ||||||||||||||||
|
| |||||||||||||||
Metals & Mining 1.3% | ||||||||||||||||
| a | Freeport-McMoRan Inc. | United States | 6,099,862 | 115,653,383 | ||||||||||||
thyssenkrupp AG | Germany | 4,205,590 | 122,185,673 | |||||||||||||
Warrior Met Coal Inc. | United States | 1,788,865 | 44,989,955 | |||||||||||||
|
| |||||||||||||||
| 282,829,011 | ||||||||||||||||
|
| |||||||||||||||
Multi-Utilities 0.4% | ||||||||||||||||
innogy SE | Germany | 2,114,859 | 82,909,805 | |||||||||||||
|
| |||||||||||||||
Oil, Gas & Consumable Fuels 8.3% | ||||||||||||||||
Anadarko Petroleum Corp. | United States | 2,074,000 | 111,249,360 | |||||||||||||
BP PLC | United Kingdom | 30,087,550 | 212,382,065 | |||||||||||||
Crescent Point Energy Corp. | Canada | 16,701,800 | 127,279,647 | |||||||||||||
JXTG Holdings Inc. | Japan | 13,174,642 | 84,997,690 | |||||||||||||
Kinder Morgan Inc. | United States | 13,160,358 | 237,807,669 | |||||||||||||
Marathon Oil Corp. | United States | 12,762,064 | 216,061,744 | |||||||||||||
Plains All American Pipeline LP | United States | 5,573,200 | 115,030,848 | |||||||||||||
Royal Dutch Shell PLC, A (EUR Traded) | United Kingdom | 8,880,928 | 296,058,566 | |||||||||||||
Royal Dutch Shell PLC, A (GBP Traded) | United Kingdom | 6,164,658 | 206,461,550 | |||||||||||||
The Williams Cos. Inc. | United States | 6,364,035 | 194,039,427 | |||||||||||||
|
| |||||||||||||||
| 1,801,368,566 | ||||||||||||||||
|
| |||||||||||||||
Pharmaceuticals 7.9% | ||||||||||||||||
Eli Lilly & Co. | United States | 5,532,056 | 467,237,450 | |||||||||||||
GlaxoSmithKline PLC | United Kingdom | 13,777,842 | 246,068,145 | |||||||||||||
Merck & Co. Inc. | United States | 7,603,328 | 427,839,267 | |||||||||||||
Novartis AG, ADR | Switzerland | 5,849,662 | 491,137,621 | |||||||||||||
Teva Pharmaceutical Industries Ltd., ADR | Israel | 4,852,226 | 91,949,683 | |||||||||||||
|
| |||||||||||||||
| 1,724,232,166 | ||||||||||||||||
|
| |||||||||||||||
Real Estate Management & Development 0.1% | ||||||||||||||||
| a | VICI Properties Inc. | United States | 1,103,270 | 22,617,035 | ||||||||||||
|
| |||||||||||||||
Software 5.4% | ||||||||||||||||
| a | Avaya Holdings Corp. | United States | 4,558,155 | 79,995,620 | ||||||||||||
| a,b | Avaya Holdings Corp., wts., 12/15/22 | United States | 401,411 | 682,837 | ||||||||||||
| a | Check Point Software Technologies Ltd. | Israel | 3,379,372 | 350,170,527 | ||||||||||||
| a | Dell Technologies Inc., V | United States | 1,105,751 | 89,875,441 | ||||||||||||
franklintempleton.com | Annual Report |
|
21 |
|
FRANKLIN MUTUAL GLOBAL DISCOVERY FUND
STATEMENT OF INVESTMENTS
| Country | Shares/ Units/ Warrants | Value | ||||||||||||
| ||||||||||||||
Common Stocks and Other Equity Interests (continued) | ||||||||||||||
Software (continued) | ||||||||||||||
Microsoft Corp. | United States | 4,462,975 | $ | 381,762,881 | ||||||||||
Symantec Corp. | United States | 9,568,159 | 268,482,542 | |||||||||||
|
| |||||||||||||
| 1,170,969,848 | ||||||||||||||
|
| |||||||||||||
Specialty Retail 0.5% | ||||||||||||||
Kingfisher PLC | United Kingdom | 24,744,829 | 112,848,043 | |||||||||||
|
| |||||||||||||
Technology Hardware, Storage & Peripherals 2.5% | ||||||||||||||
Hewlett Packard Enterprise Co. | United States | 10,039,360 | 144,165,209 | |||||||||||
Lenovo Group Ltd. | China | 41,391,101 | 23,363,402 | |||||||||||
Samsung Electronics Co. Ltd. | South Korea | 162,773 | 388,565,972 | |||||||||||
|
| |||||||||||||
| 556,094,583 | ||||||||||||||
|
| |||||||||||||
Tobacco 3.5% | ||||||||||||||
Altria Group Inc. | United States | 2,606,727 | 186,146,375 | |||||||||||
British American Tobacco PLC | United Kingdom | 5,233,602 | 354,658,085 | |||||||||||
British American Tobacco PLC, ADR | United Kingdom | 2,178,905 | 145,964,846 | |||||||||||
Imperial Brands PLC | United Kingdom | 1,937,431 | 82,835,342 | |||||||||||
|
| |||||||||||||
| 769,604,648 | ||||||||||||||
|
| |||||||||||||
Wireless Telecommunication Services 1.3% | ||||||||||||||
Vodafone Group PLC | United Kingdom | 89,319,132 | 283,459,405 | |||||||||||
|
| |||||||||||||
Total Common Stocks and Other Equity Interests (Cost $15,452,032,673) | 20,066,083,969 | |||||||||||||
|
| |||||||||||||
Management Investment Companies (Cost $112,851,576) 0.6% | ||||||||||||||
Diversified Financial Services 0.6% | ||||||||||||||
a | Altaba Inc. | United States | 1,722,000 | 120,281,700 | ||||||||||
|
| |||||||||||||
Preferred Stocks (Cost $391,187,079) 1.7% | ||||||||||||||
Automobiles 1.7% | ||||||||||||||
f | Volkswagen AG, 1.238%, pfd. | Germany | 1,896,164 | 378,676,695 | ||||||||||
|
| |||||||||||||
| Principal Amount | ||||||||||||||
Corporate Notes and Senior Floating Rate Interests 2.2% |
| |||||||||||||
g,h | Belk Inc., Closing Date Term Loan, 6.099%, (LIBOR + 4.75%), 12/12/22 | United States | $ | 33,559,402 | 27,553,679 | |||||||||
g,h | Cumulus Media Holdings Inc., Term Loans, 4.82%, (LIBOR + 3.25%), 12/23/20 | United States | 80,932,238 | 69,905,220 | ||||||||||
| Frontier Communications Corp., | ||||||||||||||
senior note, 10.50%, 9/15/22 | United States | 117,895,000 | 89,452,831 | |||||||||||
senior note, 11.00%, 9/15/25 | United States | 133,179,000 | 98,552,460 | |||||||||||
| iHeartCommunications Inc., | ||||||||||||||
senior secured note, first lien, 9.00%, 12/15/19 | United States | 95,618,000 | 71,474,455 | |||||||||||
g,h Tranche D Term Loan, 8.443%, (LIBOR + 6.75%), 1/30/19 | United States | 117,978,997 | 89,024,946 | |||||||||||
g,h Tranche E Term Loan, 9.193%, (LIBOR + 7.50%), 7/30/19 | United States | 37,921,652 | 28,520,230 | |||||||||||
|
| |||||||||||||
Total Corporate Notes and Senior Floating Rate Interests (Cost $567,869,245) | 474,483,821 | |||||||||||||
|
| |||||||||||||
Corporate Notes in Reorganization (Cost $8,893) 0.0% | ||||||||||||||
b,c,i | Broadband Ventures III LLC, secured promissory note, 5.00%, 2/01/12 | United States | 8,893 | — | ||||||||||
|
| |||||||||||||
22 |
Annual Report |
franklintempleton.com |
FRANKLIN MUTUAL GLOBAL DISCOVERY FUND
STATEMENT OF INVESTMENTS
| Country | Shares | Value | ||||||||||||||
|
| |||||||||||||||
| Companies in Liquidation 0.1% | ||||||||||||||||
| a,b,e | Avaya Holdings Corp., Contingent Distribution | United States | 123,916,000 | $ | — | |||||||||||
| a,b,e | Avaya Inc., Contingent Distribution | United States | 168,607,600 | — | ||||||||||||
| a,b,c | FIM Coinvestor Holdings I, LLC | United States | 30,279,560 | — | ||||||||||||
| a,j | Lehman Brothers Holdings Inc., Bankruptcy Claim | United States | 587,363,521 | 13,039,470 | ||||||||||||
| a,b,e | NewPage Corp., Litigation Trust, Contingent Distribution | United States | 145,817,000 | — | ||||||||||||
| a,b,e | Tribune Media, Litigation Trust, Contingent Distribution | United States | 1,300,238 | — | ||||||||||||
| a,b,e | Vistra Energy Corp., Litigation Trust, Contingent Distribution | United States | 260,457,613 | 3,021,308 | ||||||||||||
| a | Vistra Energy Corp., Litigation Trust, TRA | United States | 4,396,159 | 3,846,640 | ||||||||||||
|
| |||||||||||||||
| Total Companies in Liquidation (Cost $58,023,230) | 19,907,418 | |||||||||||||||
|
| |||||||||||||||
| Total Investments before Short Term Investments (Cost $16,581,972,696) | 21,059,433,603 | |||||||||||||||
|
| |||||||||||||||
| Principal Amount | ||||||||||||||||
| Short Term Investments 3.6% | ||||||||||||||||
| U.S. Government and Agency Securities 3.6% | ||||||||||||||||
| k | FHLB, 1/02/18 | United States | $ | 2,400,000 | 2,400,000 | |||||||||||
| k | U.S. Treasury Bill, | |||||||||||||||
| 1/02/18 - 2/22/18 | United States | 620,700,000 | 620,449,787 | |||||||||||||
| l4/05/18 - 5/10/18 | United States | 167,000,000 | 166,248,845 | |||||||||||||
|
| |||||||||||||||
| Total U.S. Government and Agency Securities (Cost $789,137,815) | 789,098,632 | |||||||||||||||
|
| |||||||||||||||
| Total Investments (Cost $17,371,110,511) 100.1% | 21,848,532,235 | |||||||||||||||
| Securities Sold Short (0.6)% | (136,950,389 | ) | ||||||||||||||
| Other Assets, less Liabilities 0.5% | 111,969,225 | |||||||||||||||
|
| |||||||||||||||
| Net Assets 100.0% | $ | 21,823,551,071 | ||||||||||||||
|
| |||||||||||||||
| Shares | ||||||||||||||||
| m | Securities Sold Short (0.6)% | |||||||||||||||
| Common Stocks (0.6)% | ||||||||||||||||
| Diversified Telecommunication Services (0.1)% | ||||||||||||||||
| AT&T Inc. | United States | 773,086 | (30,057,584 | ) | ||||||||||||
|
| |||||||||||||||
| Internet Software & Services (0.5)% | ||||||||||||||||
| Alibaba Group Holding Ltd., ADR | China | 619,920 | (106,892,805 | ) | ||||||||||||
|
| |||||||||||||||
| Total Securities Sold Short (Proceeds $138,351,504) | $ | (136,950,389 | ) | |||||||||||||
|
| |||||||||||||||
franklintempleton.com |
Annual Report |
|
23 |
|
FRANKLIN MUTUAL GLOBAL DISCOVERY FUND
STATEMENT OF INVESTMENTS
aNon-income producing.
bFair valued using significant unobservable inputs. See Note 14 regarding fair value measurements.
cSee Note 10 regarding restricted securities.
dSee Note 12 regarding holdings of 5% voting securities.
eContingent distributions represent the right to receive additional distributions, if any, during the reorganization of the underlying company. Shares represent total underlying principal of debt securities.
fVariable rate security. The rate shown represents the yield at period end.
gThe coupon rate shown represents the rate at period end.
hSee Note 1(e) regarding senior floating rate interests.
iSee Note 8 regarding credit risk and defaulted securities.
jBankruptcy claims represent the right to receive distribution, if any during the liquidation of the underlying pool of assets. Shares represent amount of allowed unsecured claims.
kThe security was issued on a discount basis with no stated coupon rate.
lA portion or all of the security has been segregated as collateral for securities sold short and open forward exchange contracts. At December 31, 2017, the aggregate value of these securities pledged amounted to $158,372,967, representing 0.7% of net assets.
mSee Note 1(d) regarding securities sold short.
At December 31, 2017, the Fund had the following futures contracts outstanding. See Note 1(c).
Futures Contracts
| Description | Type | Number of Contracts | Notional Amount* | Expiration Date | Value/ Appreciation | |||||||||||||||
| Currency Contracts | ||||||||||||||||||||
EUR/USD | Short | 8,972 | $1,354,267,325 | 3/19/18 | $(24,144,770 | ) | ||||||||||||||
GBP/USD | Short | 9,023 | 764,530,069 | 3/19/18 | (4,784,272 | ) | ||||||||||||||
Total Futures Contracts | $(28,929,042 | ) | ||||||||||||||||||
*As of period end.
24 |
Annual Report |
franklintempleton.com |
FRANKLIN MUTUAL GLOBAL DISCOVERY FUND
STATEMENT OF INVESTMENTS
At December 31, 2017, the Fund had the following forward exchange contracts outstanding. See Note 1(c).
Forward Exchange Contracts
| Currency | Counterpartya | Type | Quantity | Contract Amount | Settlement Date | Unrealized Appreciation | Unrealized Depreciation | |||||||||||||||||||
| OTC Forward Exchange Contracts | ||||||||||||||||||||||||||
Euro | BOFA | Sell | 3,225,503 | $ | 3,734,713 | 1/12/18 | $ | — | $ | (138,663 | ) | |||||||||||||||
Euro | HSBK | Buy | 11,607,253 | 13,794,772 | 1/12/18 | 143,909 | — | |||||||||||||||||||
Euro | HSBK | Buy | 14,813,411 | 17,816,889 | 1/12/18 | — | (28,061 | ) | ||||||||||||||||||
Euro | HSBK | Sell | 180,066,458 | 207,295,336 | 1/12/18 | — | (8,939,221 | ) | ||||||||||||||||||
Euro | SSBT | Buy | 28,598,259 | 33,879,124 | 1/12/18 | 463,376 | — | |||||||||||||||||||
Euro | SSBT | Sell | 13,928,023 | 16,232,216 | 1/12/18 | — | (493,386 | ) | ||||||||||||||||||
Euro | UBSW | Buy | 12,418,599 | 14,771,641 | 1/12/18 | 141,355 | — | |||||||||||||||||||
Euro | UBSW | Sell | 183,610,277 | 211,291,512 | 1/12/18 | — | (9,198,675 | ) | ||||||||||||||||||
British Pound | BOFA | Buy | 1,930,266 | 2,589,145 | 1/16/18 | 19,250 | — | |||||||||||||||||||
British Pound | BOFA | Buy | 2,060,000 | 2,787,454 | 1/16/18 | — | (3,749 | ) | ||||||||||||||||||
British Pound | BOFA | Sell | 22,615,685 | 29,592,923 | 1/16/18 | — | (967,947 | ) | ||||||||||||||||||
British Pound | BONY | Sell | 146,718,967 | 189,738,582 | 1/16/18 | — | (8,524,671 | ) | ||||||||||||||||||
British Pound | SSBT | Buy | 78,150 | 104,579 | 1/16/18 | 1,026 | — | |||||||||||||||||||
British Pound | SSBT | Sell | 1,449,617 | 1,890,910 | 1/16/18 | — | (67,977 | ) | ||||||||||||||||||
British Pound | UBSW | Buy | 3,399,397 | 4,604,337 | 1/16/18 | — | (10,688 | ) | ||||||||||||||||||
British Pound | UBSW | Buy | 7,583,834 | 10,200,620 | 1/16/18 | 47,513 | — | |||||||||||||||||||
British Pound | UBSW | Sell | 146,718,134 | 189,559,829 | 1/16/18 | — | (8,702,299 | ) | ||||||||||||||||||
Euro | BOFA | Sell | 4,839,350 | 5,853,012 | 1/26/18 | 36,494 | — | |||||||||||||||||||
Euro | BONY | Sell | 1,000,000 | 1,198,700 | 1/26/18 | — | (3,221 | ) | ||||||||||||||||||
Euro | BONY | Sell | 1,000,000 | 1,204,025 | 1/26/18 | 2,104 | — | |||||||||||||||||||
Euro | HSBK | Sell | 160,857,394 | 189,183,200 | 1/26/18 | — | (4,154,720 | ) | ||||||||||||||||||
Euro | SSBT | Sell | 504,113 | 607,115 | 1/26/18 | 1,211 | — | |||||||||||||||||||
Euro | SSBT | Sell | 7,382,209 | 8,810,639 | 1/26/18 | — | (62,196 | ) | ||||||||||||||||||
Euro | UBSW | Sell | 154,120,245 | 181,154,672 | 1/26/18 | — | (4,085,725 | ) | ||||||||||||||||||
South Korean Won | HSBK | Buy | 37,972,775,965 | 34,867,564 | 2/09/18 | 732,136 | — | |||||||||||||||||||
South Korean Won | HSBK | Sell | 73,046,652,947 | 65,109,672 | 2/09/18 | — | (3,371,992 | ) | ||||||||||||||||||
South Korean Won | UBSW | Sell | 190,936,125,366 | 170,431,255 | 2/09/18 | — | (8,572,482 | ) | ||||||||||||||||||
British Pound | BONY | Sell | 93,367,335 | 122,083,206 | 2/14/18 | — | (4,199,753 | ) | ||||||||||||||||||
British Pound | HSBK | Sell | 43,149,973 | 57,350,629 | 2/14/18 | — | (1,011,391 | ) | ||||||||||||||||||
British Pound | UBSW | Sell | 93,367,337 | 122,082,928 | 2/14/18 | — | (4,200,034 | ) | ||||||||||||||||||
Euro | BONY | Sell | 138,420,941 | 163,590,159 | 2/20/18 | — | (3,011,749 | ) | ||||||||||||||||||
Euro | SSBT | Sell | 138,420,941 | 163,558,184 | 2/20/18 | — | (3,043,724 | ) | ||||||||||||||||||
Japanese Yen | UBSW | Sell | 96,738,860 | 857,570 | 2/20/18 | — | (3,115 | ) | ||||||||||||||||||
Japanese Yen | UBSW | Sell | 12,443,048,392 | 111,045,788 | 2/20/18 | 340,088 | — | |||||||||||||||||||
Euro | BOFA | Sell | 3,556,440 | 4,263,318 | 4/10/18 | — | (30,782 | ) | ||||||||||||||||||
Euro | HSBK | Sell | 185,511,145 | 219,789,894 | 4/10/18 | — | (4,199,078 | ) | ||||||||||||||||||
Euro | UBSW | Sell | 188,928,115 | 223,917,290 | 4/10/18 | — | (4,197,384 | ) | ||||||||||||||||||
Euro | BOFA | Sell | 138,062,118 | 164,710,177 | 4/18/18 | — | (2,077,261 | ) | ||||||||||||||||||
Euro | SSBT | Sell | 138,062,118 | 164,706,036 | 4/18/18 | — | (2,081,403 | ) | ||||||||||||||||||
Euro | UBSW | Sell | 138,062,118 | 164,734,339 | 4/18/18 | — | (2,053,100 | ) | ||||||||||||||||||
British Pound | BOFA | Sell | 59,017,275 | 78,528,805 | 4/24/18 | — | (1,489,839 | ) | ||||||||||||||||||
British Pound | UBSW | Sell | 11,352,995 | 15,032,841 | 4/24/18 | — | (360,131 | ) | ||||||||||||||||||
Euro | HSBK | Sell | 122,952,210 | 145,101,682 | 5/07/18 | — | (3,620,950 | ) | ||||||||||||||||||
Euro | UBSW | Sell | 122,952,209 | 145,075,615 | 5/07/18 | — | (3,647,016 | ) | ||||||||||||||||||
South Korean Won | HSBK | Sell | 91,905,791,119 | 81,918,885 | 5/11/18 | — | (4,334,617 | ) | ||||||||||||||||||
South Korean Won | UBSW | Sell | 94,469,602,033 | 84,255,871 | 5/11/18 | — | (4,403,767 | ) | ||||||||||||||||||
Euro | BOFA | Sell | 72,538,066 | 86,561,422 | 5/21/18 | — | (1,262,699 | ) | ||||||||||||||||||
Euro | UBSW | Sell | 69,388,066 | 82,731,764 | 5/21/18 | — | (1,278,554 | ) | ||||||||||||||||||
British Pound | BOFA | Sell | 3,186,040 | 4,291,284 | 5/24/18 | — | (33,244 | ) | ||||||||||||||||||
franklintempleton.com |
Annual Report |
|
25 |
|
FRANKLIN MUTUAL GLOBAL DISCOVERY FUND
STATEMENT OF INVESTMENTS
Forward Exchange Contracts (continued)
| Currency | Counterpartya | Type | Quantity | Contract Amount | Settlement Date | Unrealized Appreciation | Unrealized Depreciation | |||||||||||||||||||
| OTC Forward Exchange Contracts (continued) | ||||||||||||||||||||||||||
British Pound | HSBK | Sell | 1,619,407 | $ | 2,200,143 | 5/24/18 | $ | 2,061 | $ | — | ||||||||||||||||
British Pound | HSBK | Sell | 20,675,997 | 27,711,095 | 5/24/18 | — | (353,204 | ) | ||||||||||||||||||
British Pound | SSBT | Sell | 132,504,765 | 176,726,242 | 5/24/18 | — | (3,127,392 | ) | ||||||||||||||||||
Total Forward Exchange Contracts |
| $ | 1,930,523 | $ | (111,345,860 | ) | ||||||||||||||||||||
Net unrealized appreciation (depreciation) |
| $ | (109,415,337 | ) | ||||||||||||||||||||||
aMay be comprised of multiple contracts with the same counterparty, currency and settlement date.
See Note 11 regarding other derivative information.
See Abbreviations on page 42.
26 |
Annual Report | The accompanying notes are an integral part of these financial statements. |
franklintempleton.com |
FRANKLIN MUTUAL GLOBAL DISCOVERY FUND
Statement of Assets and Liabilities | ||||
December 31, 2017 | ||||
Assets: | ||||
Investments in securities: | ||||
Cost - Unaffiliated issuers | $ | 17,342,015,140 | ||
Cost - Non-controlled affiliates (Note 12) | 29,095,371 | |||
Value - Unaffiliated issuers | $ | 21,825,151,598 | ||
Value - Non-controlled affiliates (Note 12) | 23,380,637 | |||
Cash | 3,562,979 | |||
Foreign currency, at value (cost $22,928,206) | 22,992,085 | |||
Receivables: | ||||
Investment securities sold | 22,138,867 | |||
Capital shares sold | 27,341,398 | |||
Dividends and interest | 52,473,163 | |||
European Union tax reclaims | 6,526,149 | |||
Deposits with brokers for: | ||||
Securities sold short | 140,151,137 | |||
Futures contracts | 36,656,640 | |||
Unrealized appreciation on OTC forward exchange contracts | 1,930,523 | |||
Other assets | 502,680 | |||
Total assets | 22,162,807,856 | |||
Liabilities: | ||||
Payables: | ||||
Capital shares redeemed | 48,821,903 | |||
Management fees | 15,002,525 | |||
Distribution fees | 8,446,520 | |||
Transfer agent fees | 4,384,960 | |||
Trustees’ fees and expenses | 778,610 | |||
Variation margin on futures contracts | 12,024,913 | |||
Securities sold short, at value (proceeds $138,351,504) | 136,950,389 | |||
Unrealized depreciation on OTC forward exchange contracts | 111,345,860 | |||
Accrued expenses and other liabilities | 1,501,105 | |||
Total liabilities | 339,256,785 | |||
Net assets, at value | $ | 21,823,551,071 | ||
Net assets consist of: | ||||
Paid-in capital | $ | 17,528,395,496 | ||
Undistributed net investment income | 7,087,401 | |||
Net unrealized appreciation (depreciation) | 4,341,209,695 | |||
Accumulated net realized gain (loss) | (53,141,521 | ) | ||
Net assets, at value | $ | 21,823,551,071 | ||
franklintempleton.com |
The accompanying notes are an integral part of these financial statements. | |
Annual Report |
27 |
FRANKLIN MUTUAL GLOBAL DISCOVERY FUND
FINANCIAL STATEMENTS
Statement of Assets and Liabilities (continued)
December 31, 2017
| Class Z: | ||||
Net assets, at value | $7,175,981,310 | |||
Shares outstanding | 221,351,272 | |||
Net asset value and maximum offering price per share | $32.42 | |||
| Class A: | ||||
Net assets, at value | $9,589,033,149 | |||
Shares outstanding | 301,535,528 | |||
Net asset value per sharea | $31.80 | |||
Maximum offering price per share (net asset value per share ÷ 94.25%) | $33.74 | |||
| Class C: | ||||
Net assets, at value | $2,438,506,635 | |||
Shares outstanding | 77,570,650 | |||
Net asset value and maximum offering price per sharea | $31.44 | |||
| Class R: | ||||
Net assets, at value | $ 398,691,929 | |||
Shares outstanding | 12,710,477 | |||
Net asset value and maximum offering price per share | $31.37 | |||
| Class R6: | ||||
Net assets, at value | $2,221,338,048 | |||
Shares outstanding | 68,528,721 | |||
Net asset value and maximum offering price per share | $32.41 |
aRedemption price is equal to net asset value less contingent deferred sales charges, if applicable.
28 |
Annual Report | The accompanying notes are an integral part of these financial statements. |
franklintempleton.com |
FRANKLIN MUTUAL GLOBAL DISCOVERY FUND
FINANCIAL STATEMENTS
Statement of Operations
for the year ended December 31, 2017
Investment income: | ||||
Dividends: (net of foreign taxes)* | ||||
Unaffiliated issuers | $ | 644,383,143 | ||
Interest: | ||||
Unaffiliated issuers | 87,280,572 | |||
Other income (Note 1f) | 2,540,168 | |||
|
| |||
Total investment income | 734,203,883 | |||
|
| |||
Expenses: | ||||
Management fees (Note 3a) | 181,746,674 | |||
Distribution fees: (Note 3c) | ||||
Class A | 25,156,234 | |||
Class C | 26,285,180 | |||
Class R | 2,138,351 | |||
Transfer agent fees: (Note 3e) | ||||
Class Z | 11,213,906 | |||
Class A | 13,297,857 | |||
Class C | 3,473,850 | |||
Class R | 565,903 | |||
Class R6 | 91,837 | |||
Custodian fees (Note 4) | 1,080,186 | |||
Reports to shareholders | 1,789,151 | |||
Registration and filing fees | 410,362 | |||
Professional fees | 1,361,644 | |||
Trustees’ fees and expenses | 696,605 | |||
Other | 429,545 | |||
|
| |||
Total expenses | 269,737,285 | |||
Expense reductions (Note 4) | (116,989 | ) | ||
|
| |||
Net expenses | 269,620,296 | |||
|
| |||
Net investment income | 464,583,587 | |||
|
| |||
Realized and unrealized gains (losses): | ||||
Net realized gain (loss) from: | ||||
Investments: | ||||
Unaffiliated issuers | 963,570,555 | |||
Foreign currency transactions | 4,860,010 | |||
Forward exchange contracts | (145,628,588 | ) | ||
Futures contracts | (155,446,868 | ) | ||
Securities sold short | (1,910,663 | ) | ||
|
| |||
Net realized gain (loss) | 665,444,446 | |||
|
| |||
Net change in unrealized appreciation (depreciation) on: | ||||
Investments: | ||||
Unaffiliated issuers | 1,295,324,981 | |||
Non-controlled affiliates (Note 12) | (3,021,178 | ) | ||
Translation of other assets and liabilities denominated in foreign currencies | 1,381,212 | |||
Forward exchange contracts | (303,918,308 | ) | ||
Futures contracts | (49,863,315 | ) | ||
Securities sold short | 923,558 | |||
|
| |||
Net change in unrealized appreciation (depreciation) | 940,826,950 | |||
|
| |||
Net realized and unrealized gain (loss) | 1,606,271,396 | |||
|
| |||
Net increase (decrease) in net assets resulting from operations | $ | 2,070,854,983 | ||
|
| |||
*Foreign taxes withheld on dividends. | $ | 29,560,436 | ||
franklintempleton.com |
The accompanying notes are an integral part of these financial statements. | |
Annual Report |
29 |
FRANKLIN MUTUAL GLOBAL DISCOVERY FUND
FINANCIAL STATEMENTS
Statements of Changes in Net Assets
| Year Ended December 31, | ||||||||
|
| |||||||
| 2017 | 2016 | |||||||
| ||||||||
Increase (decrease) in net assets: | ||||||||
Operations: | ||||||||
Net investment income | $ | 464,583,587 | $ | 448,677,966 | ||||
Net realized gain (loss) | 665,444,446 | 976,195,241 | ||||||
Net change in unrealized appreciation (depreciation) | 940,826,950 | 1,145,149,281 | ||||||
|
| |||||||
Net increase (decrease) in net assets resulting from operations | 2,070,854,983 | 2,570,022,488 | ||||||
|
| |||||||
Distributions to shareholders from: | ||||||||
Net investment income: | ||||||||
Class Z | (172,580,188 | ) | (176,437,033 | ) | ||||
Class A | (209,942,027 | ) | (200,541,522 | ) | ||||
Class C | (34,634,111 | ) | (33,021,201 | ) | ||||
Class R | (7,828,860 | ) | (7,618,889 | ) | ||||
Class R6 | (54,145,296 | ) | (10,674,922 | ) | ||||
Net realized gains: | ||||||||
Class Z | (233,398,813 | ) | (326,765,440 | ) | ||||
Class A | (286,608,599 | ) | (435,628,779 | ) | ||||
Class C | (74,606,964 | ) | (116,244,017 | ) | ||||
Class R | (12,124,955 | ) | (18,594,896 | ) | ||||
Class R6 | (40,494,896 | ) | (18,722,984 | ) | ||||
|
| |||||||
Total distributions to shareholders | (1,126,364,709 | ) | (1,344,249,683 | ) | ||||
|
| |||||||
Capital share transactions: (Note 2) | ||||||||
Class Z | (1,590,803,172 | ) | (1,201,294,226 | ) | ||||
Class A | (1,344,720,248 | ) | (1,372,576,556 | ) | ||||
Class C | (436,509,197 | ) | (376,018,782 | ) | ||||
Class R | (64,928,952 | ) | (47,755,202 | ) | ||||
Class R6 | 1,730,442,445 | 268,573,248 | ||||||
|
| |||||||
Total capital share transactions | (1,706,519,124 | ) | (2,729,071,518 | ) | ||||
|
| |||||||
Net increase (decrease) in net assets | (762,028,850 | ) | (1,503,298,713 | ) | ||||
Net assets: | ||||||||
Beginning of year | 22,585,579,921 | 24,088,878,634 | ||||||
|
| |||||||
End of year | $ | 21,823,551,071 | $ | 22,585,579,921 | ||||
|
| |||||||
Undistributed net investment income included in net assets: | ||||||||
End of year | $ | 7,087,401 | $ | — | ||||
|
| |||||||
Distributions in excess of net investment income included in net assets: | ||||||||
End of year | $ | — | $ | (18,974,209) | ||||
|
| |||||||
30 |
Annual Report | The accompanying notes are an integral part of these financial statements. |
franklintempleton.com |
FRANKLIN MUTUAL GLOBAL DISCOVERY FUND
1. Organization and Significant Accounting Policies
Franklin Mutual Series Funds (Trust) is registered under the Investment Company Act of 1940 (1940 Act) as an open-end management investment company, consisting of seven separate funds and applies the specialized accounting and reporting guidance in U.S. Generally Accepted Accounting Principles (U.S. GAAP). Franklin Mutual Global Discovery Fund (Fund) is included in this report. The Fund offers five classes of shares: Class Z, Class A, Class C, Class R and Class R6. Each class of shares may differ by its initial sales load, contingent deferred sales charges, voting rights on matters affecting a single class, its exchange privilege and fees due to differing arrangements for distribution and transfer agent fees.
The following summarizes the Fund’s significant accounting policies.
a. Financial Instrument Valuation
The Fund’s investments in financial instruments are carried at fair value daily. Fair value is the price that would be received to sell an asset or paid to transfer a liability in an orderly transaction between market participants on the measurement date. The Fund calculates the net asset value (NAV) per share as of 4 p.m. Eastern time each day the New York Stock Exchange (NYSE) is open for trading. Under compliance policies and procedures approved by the Trust’s Board of Trustees (the Board), the Fund’s administrator has responsibility for oversight of valuation, including leading the cross-functional Valuation Committee (VC). The VC provides administration and oversight of the Fund’s valuation policies and procedures, which are approved annually by the Board. Among other things, these procedures allow the Fund to utilize independent pricing services, quotations from securities and financial instrument dealers, and other market sources to determine fair value.
Equity securities and derivative financial instruments listed on an exchange or on the NASDAQ National Market System are valued at the last quoted sale price or the official closing price of the day, respectively. Foreign equity securities are valued as of the close of trading on the foreign stock exchange on which the security is primarily traded, or as of 4 p.m. Eastern time. The value is then converted into its U.S. dollar equivalent at the foreign exchange rate in effect at 4 p.m. Eastern time on the day that the value of the security is determined. Over-the-counter (OTC) securities are valued within the range of the most recent
quoted bid and ask prices. Securities that trade in multiple markets or on multiple exchanges are valued according to the broadest and most representative market. Certain equity securities are valued based upon fundamental characteristics or relationships to similar securities.
Debt securities generally trade in the OTC market rather than on a securities exchange. The Fund’s pricing services use multiple valuation techniques to determine fair value. In instances where sufficient market activity exists, the pricing services may utilize a market-based approach through which quotes from market makers are used to determine fair value. In instances where sufficient market activity may not exist or is limited, the pricing services also utilize proprietary valuation models which may consider market characteristics such as benchmark yield curves, credit spreads, estimated default rates, anticipated market interest rate volatility, coupon rates, anticipated timing of principal repayments, underlying collateral, and other unique security features in order to estimate the relevant cash flows, which are then discounted to calculate the fair value.
Certain derivative financial instruments trade in the OTC market. The Fund’s pricing services use various techniques including industry standard option pricing models and proprietary discounted cash flow models to determine the fair value of those instruments. The Fund’s net benefit or obligation under the derivative contract, as measured by the fair value of the contract, is included in net assets.
The Fund has procedures to determine the fair value of financial instruments for which market prices are not reliable or readily available. Under these procedures, the VC convenes on a regular basis to review such financial instruments and considers a number of factors, including significant unobservable valuation inputs, when arriving at fair value. The VC primarily employs a market-based approach which may use related or comparable assets or liabilities, recent transactions, market multiples, book values, and other relevant information for the investment to determine the fair value of the investment. An income-based valuation approach may also be used in which the anticipated future cash flows of the investment are discounted to calculate fair value. Discounts may also be applied due to the nature or duration of any restrictions on the disposition of the investments. Due to the inherent uncertainty of valuations of such investments, the fair values may differ significantly from the values that would have been used had an active market existed. The VC employs various methods for calibrating these
franklintempleton.com |
Annual Report |
|
31 |
|
FRANKLIN MUTUAL GLOBAL DISCOVERY FUND
NOTES TO FINANCIAL STATEMENTS
1. Organization and Significant Accounting Policies (continued)
a. Financial Instrument Valuation (continued)
valuation approaches including a regular review of key inputs and assumptions, transactional back-testing or disposition analysis, and reviews of any related market activity.
Trading in securities on foreign securities stock exchanges and OTC markets may be completed before 4 p.m. Eastern time. In addition, trading in certain foreign markets may not take place on every Fund’s business day. Occasionally, events occur between the time at which trading in a foreign security is completed and 4 p.m. Eastern time that might call into question the reliability of the value of a portfolio security held by the Fund. As a result, differences may arise between the value of the Fund’s portfolio securities as determined at the foreign market close and the latest indications of value at 4 p.m. Eastern time. In order to minimize the potential for these differences, the VC monitors price movements following the close of trading in foreign stock markets through a series of country specific market proxies (such as baskets of American Depositary Receipts, futures contracts and exchange traded funds). These price movements are measured against established trigger thresholds for each specific market proxy to assist in determining if an event has occurred that may call into question the reliability of the values of the foreign securities held by the Fund. If such an event occurs, the securities may be valued using fair value procedures, which may include the use of independent pricing services.
When the last day of the reporting period is a non-business day, certain foreign markets may be open on those days that the Fund’s NAV is not calculated, which could result in differences between the value of the Fund’s portfolio securities on the last business day and the last calendar day of the reporting period. Any significant security valuation changes due to an open foreign market are adjusted and reflected by the Fund for financial reporting purposes.
b. Foreign Currency Translation
Portfolio securities and other assets and liabilities denominated in foreign currencies are translated into U.S. dollars based on the exchange rate of such currencies against U.S. dollars on the date of valuation. The Fund may enter into foreign currency exchange contracts to facilitate transactions denominated in a foreign currency. Purchases and sales of securities, income and
expense items denominated in foreign currencies are translated into U.S. dollars at the exchange rate in effect on the transaction date. Portfolio securities and assets and liabilities denominated in foreign currencies contain risks that those currencies will decline in value relative to the U.S. dollar. Occasionally, events may impact the availability or reliability of foreign exchange rates used to convert the U.S. dollar equivalent value. If such an event occurs, the foreign exchange rate will be valued at fair value using procedures established and approved by the Board.
The Fund does not separately report the effect of changes in foreign exchange rates from changes in market prices on securities held. Such changes are included in net realized and unrealized gain or loss from investments in the Statement of Operations.
Realized foreign exchange gains or losses arise from sales of foreign currencies, currency gains or losses realized between the trade and settlement dates on securities transactions and the difference between the recorded amounts of dividends, interest, and foreign withholding taxes and the U.S. dollar equivalent of the amounts actually received or paid. Net unrealized foreign exchange gains and losses arise from changes in foreign exchange rates on foreign denominated assets and liabilities other than investments in securities held at the end of the reporting period.
c. Derivative Financial Instruments
The Fund invested in derivative financial instruments in order to manage risk or gain exposure to various other investments or markets. Derivatives are financial contracts based on an underlying or notional amount, require no initial investment or an initial net investment that is smaller than would normally be required to have a similar response to changes in market factors, and require or permit net settlement. Derivatives contain various risks including the potential inability of the counterparty to fulfill their obligations under the terms of the contract, the potential for an illiquid secondary market, and/or the potential for market movements which expose the Fund to gains or losses in excess of the amounts shown in the Statement of Assets and Liabilities. Realized gain and loss and unrealized appreciation and depreciation on these contracts for the period are included in the Statement of Operations.
Derivative counterparty credit risk is managed through a formal evaluation of the creditworthiness of all potential counterparties. The Fund attempts to reduce its exposure to
32 |
Annual Report |
franklintempleton.com |
FRANKLIN MUTUAL GLOBAL DISCOVERY FUND
NOTES TO FINANCIAL STATEMENTS
counterparty credit risk on OTC derivatives, whenever possible, by entering into International Swaps and Derivatives Association (ISDA) master agreements with certain counterparties. These agreements contain various provisions, including but not limited to collateral requirements, events of default, or early termination. Termination events applicable to the counterparty include certain deteriorations in the credit quality of the counterparty. Termination events applicable to the Fund include failure of the Fund to maintain certain net asset levels and/or limit the decline in net assets over various periods of time. In the event of default or early termination, the ISDA master agreement gives the non-defaulting party the right to net and close-out all transactions traded, whether or not arising under the ISDA agreement, to one net amount payable by one counterparty to the other. However, absent an event of default or early termination, OTC derivative assets and liabilities are presented gross and not offset in the Statement of Assets and Liabilities. Early termination by the counterparty may result in an immediate payment by the Fund of any net liability owed to that counterparty under the ISDA agreement. At December 31, 2017, the Fund had OTC derivatives in a net liability position of $109,415,337 and the aggregate value of collateral pledged for such contracts was $91,716,527.
Collateral requirements differ by type of derivative. Collateral or initial margin requirements are set by the broker or exchange clearing house for exchange traded and centrally cleared derivatives. Initial margin deposited is held at the exchange and can be in the form of cash and/or securities. For OTC derivatives traded under an ISDA master agreement, posting of collateral is required by either the Fund or the applicable counterparty if the total net exposure of all OTC derivatives with the applicable counterparty exceeds the minimum transfer amount, which typically ranges from $100,000 to $250,000, and can vary depending on the counterparty and the type of the agreement. Generally, collateral is determined at the close of Fund business each day and any additional collateral required due to changes in derivative values may be delivered by the Fund or the counterparty the next business day, or within a few business days. Collateral pledged and/or received by the Fund for OTC derivatives, if any, is held in segregated accounts with the Fund’s custodian/counterparty broker and can be in the form of cash and/or securities. Unrestricted cash may be invested according to the Fund’s investment objectives. To the extent that the amounts due to the Fund from its counterparties are not subject to collateralization or are not fully collateralized, the Fund bears the risk of loss from counterparty non-performance.
The Fund entered into exchange traded futures contracts primarily to manage exposure to certain foreign currencies. A futures contract is an agreement between the Fund and a counterparty to buy or sell an asset at a specified price on a future date. Required initial margins are pledged by the Fund, and the daily change in fair value is accounted for as a variation margin payable or receivable in the Statement of Assets and Liabilities.
The Fund entered into OTC forward exchange contracts primarily to manage exposure to certain foreign currencies. A forward exchange contract is an agreement between the Fund and a counterparty to buy or sell a foreign currency at a specific exchange rate on a future date.
See Note 11 regarding other derivative information.
d. Securities Sold Short
The Fund is engaged in selling securities short, which obligates the Fund to replace a borrowed security with the same security at current fair value. The Fund incurs a loss if the price of the security increases between the date of the short sale and the date on which the Fund replaces the borrowed security. The Fund realizes a gain if the price of the security declines between those dates. Gains are limited to the price at which the Fund sold the security short, while losses are potentially unlimited in size.
The Fund is required to establish a margin account with the broker lending the security sold short. While the short sale is outstanding, the broker retains the proceeds of the short sale to the extent necessary to meet margin requirements until the short position is closed out. A deposit must also be maintained with the Fund’s custodian/counterparty broker consisting of cash and/or securities having a value equal to a specified percentage of the value of the securities sold short. The Fund is obligated to pay fees for borrowing the securities sold short and is required to pay the counterparty any dividends and/or interest due on securities sold short. Such dividends and/or interest and any security borrowing fees are recorded as an expense to the Fund.
e. Senior Floating Rate Interests
The Fund invests in senior secured corporate loans that pay interest at rates which are periodically reset by reference to a base lending rate plus a spread. These base lending rates are generally the prime rate offered by a designated U.S. bank or the London InterBank Offered Rate (LIBOR). Senior secured corporate loans often require prepayment of principal from
franklintempleton.com |
Annual Report |
|
33 |
|
FRANKLIN MUTUAL GLOBAL DISCOVERY FUND
NOTES TO FINANCIAL STATEMENTS
1. Organization and Significant Accounting Policies (continued)
e. Senior Floating Rate Interests (continued)
excess cash flows or at the discretion of the borrower. As a result, actual maturity may be substantially less than the stated maturity. Senior secured corporate loans in which the Fund invests are generally readily marketable, but may be subject to certain restrictions on resale.
f. Income and Deferred Taxes
It is the Fund’s policy to qualify as a regulated investment company under the Internal Revenue Code. The Fund intends to distribute to shareholders substantially all of its taxable income and net realized gains to relieve it from federal income and excise taxes. As a result, no provision for U.S. federal income taxes is required.
The Fund may be subject to foreign taxation related to income received, capital gains on the sale of securities and certain foreign currency transactions in the foreign jurisdictions in which it invests. Foreign taxes, if any, are recorded based on the tax regulations and rates that exist in the foreign markets in which the Fund invests. When a capital gain tax is determined to apply, the Fund records an estimated deferred tax liability in an amount that would be payable if the securities were disposed of on the valuation date.
As a result of several court cases, in certain countries across the European Union, the Fund filed additional tax reclaims for previously withheld taxes on dividends earned in those countries (EU reclaims). These additional filings are subject to various administrative proceedings by the local jurisdictions’ tax authorities within the European Union, as well as a number of related judicial proceedings. Income recognized, if any, for EU reclaims is reflected as other income in the Statement of Operations and any related receivable, if any, is reflected as European Union tax reclaims in the Statement of Assets and Liabilities. When uncertainty exists as to the ultimate resolution of these proceedings, the likelihood of receipt of these EU reclaims, and the potential timing of payment, no amounts are reflected in the financial statements. For U.S. income tax purposes, EU reclaims received by the Fund, if any, reduce the amounts of foreign taxes Fund shareholders can use as tax credits in their individual income tax returns.
The Fund may recognize an income tax liability related to its uncertain tax positions under U.S. GAAP when the uncertain tax position has a less than 50% probability that it will be sustained upon examination by the tax authorities based on its technical merits. As of December 31, 2017, the Fund has determined that no tax liability is required in its financial statements related to uncertain tax positions for any open tax years (or expected to be taken in future tax years). Open tax years are those that remain subject to examination and are based on the statute of limitations in each jurisdiction in which the Fund invests.
g. Security Transactions, Investment Income, Expenses and Distributions
Security transactions are accounted for on trade date. Realized gains and losses on security transactions are determined on a specific identification basis. Interest income and estimated expenses are accrued daily. Amortization of premium and accretion of discount on debt securities are included in interest income. Dividend income is recorded on the ex-dividend date except for certain dividends from securities where the dividend rate is not available. In such cases, the dividend is recorded as soon as the information is received by the Fund. Distributions to shareholders are recorded on the ex-dividend date. Distributable earnings are determined according to income tax regulations (tax basis) and may differ from earnings recorded in accordance with U.S. GAAP. These differences may be permanent or temporary. Permanent differences are reclassified among capital accounts to reflect their tax character. These reclassifications have no impact on net assets or the results of operations. Temporary differences are not reclassified, as they may reverse in subsequent periods.
Common expenses incurred by the Trust are allocated among the Funds based on the ratio of net assets of each Fund to the combined net assets of the Trust. Fund specific expenses are charged directly to the Fund that incurred the expense.
Realized and unrealized gains and losses and net investment income, excluding class specific expenses, are allocated daily to each class of shares based upon the relative proportion of net assets of each class. Differences in per share distributions by class are generally due to differences in class specific expenses.
34 |
Annual Report |
franklintempleton.com |
FRANKLIN MUTUAL GLOBAL DISCOVERY FUND
NOTES TO FINANCIAL STATEMENTS
h. Accounting Estimates
The preparation of financial statements in accordance with U.S. GAAP requires management to make estimates and assumptions that affect the reported amounts of assets and liabilities at the date of the financial statements and the amounts of income and expenses during the reporting period. Actual results could differ from those estimates.
i. Guarantees and Indemnifications
Under the Trust’s organizational documents, its officers and trustees are indemnified by the Trust against certain liabilities arising out of the performance of their duties to the Trust.
Additionally, in the normal course of business, the Trust, on behalf of the Fund, enters into contracts with service providers that contain general indemnification clauses. The Trust’s maximum exposure under these arrangements is unknown as this would involve future claims that may be made against the Trust that have not yet occurred. Currently, the Trust expects the risk of loss to be remote.
2. Shares of Beneficial Interest
At December 31, 2017, there were an unlimited number of shares authorized (without par value). Transactions in the Fund’s shares were as follows:
| Year Ended December 31, | ||||||||||||||||
| 2017 | 2016 | |||||||||||||||
| Shares | Amount | Shares | Amount | |||||||||||||
| Class Z Shares: | ||||||||||||||||
Shares sold | 68,835,996 | $ | 2,244,877,670 | 55,397,128 | $ | 1,662,439,998 | ||||||||||
Shares issued in reinvestment of distributions | 11,449,535 | 372,018,771 | 15,044,678 | 468,213,378 | ||||||||||||
Shares redeemed | (127,366,615 | ) | (4,207,699,613 | ) | (113,174,673 | ) | (3,331,947,602 | ) | ||||||||
Net increase (decrease) | (47,081,084 | ) | $ | (1,590,803,172 | ) | (42,732,867 | ) | $ | (1,201,294,226 | ) | ||||||
| Class A Shares: | ||||||||||||||||
Shares sold | 31,207,860 | $ | 1,003,437,365 | 35,127,143 | $ | 1,014,171,059 | ||||||||||
Shares issued in reinvestment of distributions | 15,223,548 | 484,999,519 | 20,440,282 | 624,283,614 | ||||||||||||
Shares redeemed | (88,369,392 | ) | (2,833,157,132 | ) | (102,820,657 | ) | (3,011,031,229 | ) | ||||||||
Net increase (decrease) | (41,937,984 | ) | $ | (1,344,720,248 | ) | (47,253,232 | ) | $ | (1,372,576,556 | ) | ||||||
| Class C Shares: | ||||||||||||||||
Shares sold | 6,673,104 | $ | 211,439,458 | 7,120,197 | $ | 203,328,360 | ||||||||||
Shares issued in reinvestment of distributions | 3,370,430 | 105,965,772 | 4,628,208 | 139,510,899 | ||||||||||||
Shares redeemed | (23,753,704 | ) | (753,914,427 | ) | (24,940,702 | ) | (718,858,041 | ) | ||||||||
Net increase (decrease) | (13,710,170 | ) | $ | (436,509,197 | ) | (13,192,297 | ) | $ | (376,018,782 | ) | ||||||
| Class R Shares: | ||||||||||||||||
Shares sold | 1,801,733 | $ | 57,024,664 | 1,951,411 | $ | 55,809,510 | ||||||||||
Shares issued in reinvestment of distributions | 615,390 | 19,331,426 | 844,579 | 25,450,207 | ||||||||||||
Shares redeemed | (4,451,909 | ) | (141,285,042 | ) | (4,482,315 | ) | (129,014,919 | ) | ||||||||
Net increase (decrease) | (2,034,786 | ) | $ | (64,928,952 | ) | (1,686,325 | ) | $ | (47,755,202 | ) | ||||||
| Class R6 Shares: | ||||||||||||||||
Shares sold | 54,624,980 | $ | 1,832,959,818 | 11,717,779 | $ | 343,905,697 | ||||||||||
Shares issued in reinvestment of distributions | 2,637,145 | 85,609,397 | 728,048 | 22,663,432 | ||||||||||||
Shares redeemed | (5,716,616 | ) | (188,126,770 | ) | (3,290,558 | ) | (97,995,881 | ) | ||||||||
Net increase (decrease) | 51,545,509 | $ | 1,730,442,445 | 9,155,269 | $ | 268,573,248 | ||||||||||
franklintempleton.com |
Annual Report |
|
35 |
|
FRANKLIN MUTUAL GLOBAL DISCOVERY FUND
NOTES TO FINANCIAL STATEMENTS
3. Transactions with Affiliates
Franklin Resources, Inc. is the holding company for various subsidiaries that together are referred to as Franklin Templeton Investments. Certain officers and trustees of the Fund are also officers and/or directors of the following subsidiaries:
| Subsidiary | Affiliation | |
| Franklin Mutual Advisers, LLC (Franklin Mutual) | Investment manager | |
| Franklin Templeton Services, LLC (FT Services) | Administrative manager | |
| Franklin Templeton Distributors, Inc. (Distributors) | Principal underwriter | |
| Franklin Templeton Investor Services, LLC (Investor Services) | Transfer agent |
a. Management Fees
The Fund pays an investment management fee to Franklin Mutual based on the average daily net assets of the Fund as follows:
| Annualized Fee Rate | Net Assets | |||
0.875% | Up to and including $4 billion | |||
0.845% | Over $4 billion, up to and including $7 billion | |||
0.825% | Over $7 billion, up to and including $10 billion | |||
0.805% | Over $10 billion, up to and including $13 billion | |||
0.785% | Over $13 billion, up to and including $16 billion | |||
0.765% | Over $16 billion, up to and including $19 billion | |||
0.745% | Over $19 billion, up to and including $22 billion | |||
0.725% | Over $22 billion, up to and including $25 billion | |||
0.705% | Over $25 billion, up to and including $28 billion | |||
0.685% | In excess of $28 billion | |||
For the year ended December 31, 2017, the gross effective investment management fee rate was 0.808% of the Fund’s average daily net assets.
b. Administrative Fees
Under an agreement with Franklin Mutual, FT Services provides administrative services to the Fund. The fee is paid by Franklin Mutual based on the Fund’s average daily net assets, and is not an additional expense of the Fund.
c. Distribution Fees
The Board has adopted distribution plans for each share class, with the exception of Class Z and Class R6 shares, pursuant to Rule 12b-1 under the 1940 Act. Under the Fund’s Class A reimbursement distribution plan, the Fund reimburses Distributors for costs incurred in connection with the servicing, sale and distribution of the Fund’s shares up to the maximum annual plan rate. Under the Class A reimbursement distribution plan, costs exceeding the maximum for the current plan year cannot be reimbursed in subsequent periods. In addition, under the Fund’s Class C and R compensation distribution plans, the Fund pays Distributors for costs incurred in connection with the servicing, sale and distribution of the Fund’s shares up to the maximum annual plan rate for each class. The plan year, for purposes of monitoring compliance with the maximum annual plan rates, is February 1 through January 31.
36 |
Annual Report |
franklintempleton.com |
FRANKLIN MUTUAL GLOBAL DISCOVERY FUND
NOTES TO FINANCIAL STATEMENTS
The maximum annual plan rates, based on the average daily net assets, for each class, are as follows:
Class A | 0.35 | % | ||
Class C | 1.00 | % | ||
Class R | 0.50 | % |
The Board has set the current rate at 0.25% per year for Class A shares until further notice and approval by the Board.
d. Sales Charges/Underwriting Agreements
Front-end sales charges and contingent deferred sales charges (CDSC) do not represent expenses of the Fund. These charges are deducted from the proceeds of sales of Fund shares prior to investment or from redemption proceeds prior to remittance, as applicable. Distributors has advised the Fund of the following commission transactions related to the sales and redemptions of the Fund’s shares for the year:
Sales charges retained net of commissions paid to unaffiliated brokers/dealers | $ | 2,304,034 | ||
CDSC retained | $ | 141,150 |
e. Transfer Agent Fees
Each class of shares pays transfer agent fees to Investor Services for its performance of shareholder servicing obligations. Effective November 1, 2017, the fees are based on an annualized asset based fee of 0.02% plus a transaction based fee. Prior to November 1, 2017, the fees were account based fees that varied based on fund or account type. In addition, each class reimburses Investor Services for out of pocket expenses incurred and, except for Class R6, reimburses shareholder servicing fees paid to third parties. These fees are allocated daily based upon their relative proportion of such classes’ aggregate net assets. Class R6 pays Investor Services transfer agent fees specific to that class.
For the year ended December 31, 2017, the Fund paid transfer agent fees of $28,643,353, of which $9,984,977 was retained by Investor Services.
4. Expense Offset Arrangement
The Fund has entered into an arrangement with its custodian whereby credits realized as a result of uninvested cash balances are used to reduce a portion of the Fund’s custodian expenses. During the year ended December 31, 2017, the custodian fees were reduced as noted in the Statement of Operations.
5. Independent Trustees’ Retirement Plan
On January 1, 1993, the Trust adopted an Independent Trustees’ Retirement Plan (Plan). The Plan is an unfunded defined benefit plan that provides benefit payments to Trustees whose length of service and retirement age meets the eligibility requirements of the Plan. Benefits under the Plan are based on years of service and fees paid to each trustee at the time of retirement. Effective in December 1996, the Plan was closed to new participants.
During the year ended December 31, 2017, the Fund’s projected benefit obligation and benefit payments under the Plan were as follows:
aProjected benefit obligation at December 31, 2017 | $ | 778,610 | ||
bIncrease in projected benefit obligation | $ | 17,318 |
franklintempleton.com |
Annual Report |
|
37 |
|
FRANKLIN MUTUAL GLOBAL DISCOVERY FUND
NOTES TO FINANCIAL STATEMENTS
5. Independent Trustees’ Retirement Plan (continued)
Benefit payments made to retired trustees | $ | (22,171 | ) |
aThe projected benefit obligation is included in trustees’ fees and expenses in the Statement of Assets and Liabilities.
bThe increase in projected benefit obligation is included in trustees’ fees and expenses in the Statement of Operations.
6. Income Taxes
For tax purposes, the Fund may elect to defer any portion of a post-October capital loss to the first day of the following fiscal year. At December 31, 2017, the Fund deferred post-October capital losses of $145,031,524.
The tax character of distributions paid during the years ended December 31, 2017 and 2016, was as follows:
| 2017 | 2016 | |||||||
|
| |||||||
Distributions paid from: | ||||||||
Ordinary income | $ | 544,846,066 | $ | 487,383,893 | ||||
Long term capital gain | 581,518,643 | 856,865,790 | ||||||
|
| |||||||
| $ | 1,126,364,709 | $ | 1,344,249,683 | |||||
|
| |||||||
At December 31, 2017, the cost of investments, net unrealized appreciation (depreciation) and undistributed ordinary income for income tax purposes were as follows:
Cost of investments | $ | 17,147,589,962 | ||
Unrealized appreciation | $ | 5,762,362,196 | ||
Unrealized depreciation | (1,336,651,524 | ) | ||
Net unrealized appreciation (depreciation) | $ | 4,425,710,672 | ||
Distributable earnings - undistributed ordinary income | $ | 14,339,473 | ||
Differences between income and/or capital gains as determined on a book basis and a tax basis are primarily due to differing treatment of foreign currency transactions.
The Fund utilized a tax accounting practice to treat a portion of the proceeds from capital shares redeemed as a distribution from realized capital gains.
7. Investment Transactions
Purchases and sales of investments (excluding short term securities and securities sold short) for the year ended December 31, 2017, aggregated $3,770,159,266 and $6,025,790,713, respectively.
8. Credit Risk and Defaulted Securities
The Fund may purchase the pre-default or defaulted debt of distressed companies. Distressed companies are financially troubled and could be or are already involved in financial restructuring or bankruptcy. Risks associated with purchasing these securities include the possibility that the bankruptcy or other restructuring process takes longer than expected, or that distributions in restructuring are less than anticipated, either or both of which may result in unfavorable consequences to the Fund. If it becomes probable that the income on debt securities, including those of distressed companies, will not be collected, the Fund discontinues accruing income and recognizes an adjustment for uncollectible interest.
38 |
Annual Report |
franklintempleton.com |
FRANKLIN MUTUAL GLOBAL DISCOVERY FUND
NOTES TO FINANCIAL STATEMENTS
At December 31, 2017, the aggregate long value of distressed company securities for which interest recognition has been discontinued represents less than 0.1% of the Fund’s net assets. For information as to specific securities, see the accompanying Statement of Investments.
9. Concentration of Risk
Investing in foreign securities may include certain risks and considerations not typically associated with investing in U.S. securities, such as fluctuating currency values and changing local and regional economic, political and social conditions, which may result in greater market volatility. In addition, certain foreign securities may not be as liquid as U.S. securities.
10. Restricted Securities
The Fund invests in securities that are restricted under the Securities Act of 1933 (1933 Act). Restricted securities are often purchased in private placement transactions, and cannot be sold without prior registration unless the sale is pursuant to an exemption under the 1933 Act. Disposal of these securities may require greater effort and expense, and prompt sale at an acceptable price may be difficult. The Fund may have registration rights for restricted securities. The issuer generally incurs all registration costs.
At December 31, 2017, investments in restricted securities, excluding securities exempt from registration under the 1933 Act deemed to be liquid, were as follows:
| Principal Amount/ Shares | Issuer | Acquisition Date | Cost | Value | ||||||||||||
| 8,893 | Broadband Ventures III LLC, secured promissory note, 5.00%, 2/01/12 | 7/01/10 - 11/30/12 | $ | 8,893 | $ | — | ||||||||||
| 30,279,560 | FIM Coinvestor Holdings I, LLC | 11/20/06 - 6/02/09 | — | — | ||||||||||||
| 2,491,917 | Hightower Holding LLC, B, Series II | 6/10/10 - 5/10/12 | 7,620,000 | 5,927,772 | ||||||||||||
| 3,819,425 | International Automotive Components Group Brazil LLC | 4/13/06 - 12/26/08 | 2,536,498 | 130,949 | ||||||||||||
| 35,491,081 | International Automotive Components Group North America LLC | 1/12/06 - 3/18/13 | 29,095,371 | 23,380,637 | ||||||||||||
|
| |||||||||||||||
Total Restricted Securities (Value is 0.1% of Net Assets) | $ | 39,260,762 | $ | 29,439,358 | ||||||||||||
|
| |||||||||||||||
11. Other Derivative Information
At December 31, 2017, the Fund’s investments in derivative contracts are reflected in the Statement of Assets and Liabilities as follows:
| Asset Derivatives | Liability Derivatives | |||||||||||
| Derivative Contracts Not Accounted for as Hedging Instruments | Statement of Assets and Liabilities Location | Fair Value | Statement of Assets and Liabilities Location | Fair Value | ||||||||
Foreign exchange contracts | Variation margin on futures contracts | $ | - | Variation margin on futures contracts | $ | 28,929,042 | a | |||||
Unrealized appreciation on OTC forward exchange contracts | 1,930,523 | Unrealized depreciation on OTC forward exchange contracts | 111,345,860 | |||||||||
|
|
|
| |||||||||
Totals | $ | 1,930,523 | $ | 140,274,902 | ||||||||
|
|
|
| |||||||||
aThis amount reflects the cumulative appreciation (depreciation) of futures contracts as reported in the Statement of Investments. Only the variation margin receivable/payable at year end is separately reported within the Statement of Assets and Liabilities. Prior variation margin movements were recorded to cash upon receipt or payment.
franklintempleton.com |
Annual Report |
|
39 |
|
FRANKLIN MUTUAL GLOBAL DISCOVERY FUND
NOTES TO FINANCIAL STATEMENTS
11. Other Derivative Information (continued)
For the year ended December 31, 2017, the effect of derivative contracts in the Fund’s Statement of Operations was as follows:
| Derivative Contracts Not Accounted for as Hedging Instruments | Statement of Operations Location | Net Realized Gain (Loss) for the Year | Statement of Operations Location | Net Change in Unrealized Appreciation (Depreciation) for the Year | ||||||||
Net realized gain (loss) from: | Net change in unrealized appreciation (depreciation) on: | |||||||||||
Foreign exchange contracts | Forward exchange contracts | $ | (145,628,588) | Forward exchange contracts | $ | (303,918,308) | ||||||
Futures contracts | (155,446,868) | Futures contracts | (49,863,315) | |||||||||
|
|
|
| |||||||||
Totals | $ | (301,075,456) | $ | (353,781,623) | ||||||||
|
|
|
| |||||||||
For the year ended December 31, 2017, the average month end notional amount of futures contracts represented $2,047,965,764. The average month end contract value of forward exchange contracts was $4,610,451,970.
See Note 1(c) regarding derivative financial instruments.
12. Holdings of 5% Voting Securities of Portfolio Companies
The 1940 Act defines “affiliated companies” to include investments in portfolio companies in which a fund owns 5% or more of the outstanding voting securities. During the year ended December 31, 2017, investments in “affiliated companies” were as follows:
| Name of Issuer | Number of Shares Held at Beginning of Year | Gross Additions | Gross Reductions | Number of Shares Held at End of Year | Value at End of Year | Dividend Income | Realized Gain (Loss) | Net Change in Unrealized Appreciation (Depreciation) | ||||||||||||||||||||||||
| Non-Controlled Affiliates | ||||||||||||||||||||||||||||||||
International Automotive Components Group North America LLC (Value is 0.1% of Net Assets) | 35,491,081 | — | — | 35,491,081 | $23,380,637 | $— | $— | $(3,021,178 | ) | |||||||||||||||||||||||
|
| |||||||||||||||||||||||||||||||
13. Credit Facility
The Fund, together with other U.S. registered and foreign investment funds (collectively, Borrowers), managed by Franklin Templeton Investments, are borrowers in a joint syndicated senior unsecured credit facility totaling $2 billion (Global Credit Facility) which matured on February 9, 2018. This Global Credit Facility provides a source of funds to the Borrowers for temporary and emergency purposes, including the ability to meet future unanticipated or unusually large redemption requests. Effective February 9, 2018, the Borrowers renewed the Global Credit Facility for a one year term, maturing February 8, 2019, for a total of $2 billion.
Under the terms of the Global Credit Facility, the Fund shall, in addition to interest charged on any borrowings made by the Fund and other costs incurred by the Fund, pay its share of fees and expenses incurred in connection with the implementation and maintenance of the Global Credit Facility, based upon its relative share of the aggregate net assets of all of the Borrowers, including an annual commitment fee of 0.15% based upon the unused portion of the Global Credit Facility. These fees are reflected in other expenses in the Statement of Operations. During the year ended December 31, 2017, the Fund did not use the Global Credit Facility.
| 40 |
Annual Report | franklintempleton.com |
FRANKLIN MUTUAL GLOBAL DISCOVERY FUND
NOTES TO FINANCIAL STATEMENTS
14. Fair Value Measurements
The Fund follows a fair value hierarchy that distinguishes between market data obtained from independent sources (observable inputs) and the Fund’s own market assumptions (unobservable inputs). These inputs are used in determining the value of the Fund’s financial instruments and are summarized in the following fair value hierarchy:
| • | Level 1 – quoted prices in active markets for identical financial instruments |
| • | Level 2 – other significant observable inputs (including quoted prices for similar financial instruments, interest rates, prepayment speed, credit risk, etc.) |
| • | Level 3 – significant unobservable inputs (including the Fund’s own assumptions in determining the fair value of financial instruments) |
The input levels are not necessarily an indication of the risk or liquidity associated with financial instruments at that level.
For movements between the levels within the fair value hierarchy, the Fund has adopted a policy of recognizing the transfers as of the date of the underlying event which caused the movement.
A summary of inputs used as of December 31, 2017, in valuing the Fund’s assets and liabilities carried at fair value, is as follows:
| Level 1 | Level 2 | Level 3 | Total | |||||||||||||
| Assets: | ||||||||||||||||
Investments in Securities:a | ||||||||||||||||
Equity Investments: | ||||||||||||||||
Auto Components | $ | — | $ | — | $ | 23,511,586 | $ | 23,511,586 | ||||||||
Diversified Financial Services | 289,783,383 | — | 5,927,772 | 295,711,155 | ||||||||||||
Machinery | 287,463,690 | 98,350,808 | — | 385,814,498 | ||||||||||||
Software | 1,170,287,011 | — | 682,837 | 1,170,969,848 | ||||||||||||
All Other Equity Investmentsb | 18,689,035,277 | — | — | c | 18,689,035,277 | |||||||||||
Corporate Notes and Senior Floating Rate Interests | — | 474,483,821 | — | 474,483,821 | ||||||||||||
Corporate Notes in Reorganization | — | — | — | c | — | |||||||||||
Companies in Liquidation | — | 16,886,110 | 3,021,308c | 19,907,418 | ||||||||||||
Short Term Investments | 786,698,632 | 2,400,000 | — | 789,098,632 | ||||||||||||
Total Investments in Securities | $ | 21,223,267,993 | $ | 592,120,739 | $ | 33,143,503 | $ | 21,848,532,235 | ||||||||
Other Financial Instruments: | ||||||||||||||||
Forward Exchange Contracts | $ | — | $ | 1,930,523 | $ | — | $ | 1,930,523 | ||||||||
| Liabilities: | ||||||||||||||||
Other Financial Instruments: | ||||||||||||||||
Securities Sold Short | $ | 136,950,389 | $ | — | $ | — | $ | 136,950,389 | ||||||||
Futures Contracts | 28,929,042 | — | — | 28,929,042 | ||||||||||||
Forward Exchange Contracts | — | 111,345,860 | — | 111,345,860 | ||||||||||||
Total Other Financial Instruments | $ | 165,879,431 | $ | 111,345,860 | $ | — | $ | 277,225,291 | ||||||||
aFor detailed categories, see the accompanying Statement of Investments.
bIncludes common, preferred stocks and management investment companies as well as other equity investments.
cIncludes securities determined to have no value at December 31, 2017.
A reconciliation of assets in which Level 3 inputs are used in determining fair value is presented when there are significant Level 3 financial instruments at the beginning and/or end of the year.
| franklintempleton.com | Annual Report | 41 |
FRANKLIN MUTUAL GLOBAL DISCOVERY FUND
NOTES TO FINANCIAL STATEMENTS
15. Subsequent Events
The Fund has evaluated subsequent events through the issuance of the financial statements and determined that no events have occurred that require disclosure other than those already disclosed in the financial statements.
Abbreviations
| Counterparty | Currency | Selected Portfolio | ||||||||
| BOFA | Bank of America N.A. | EUR | Euro | ADR | American Depositary Receipt | |||||
| BONY | The Bank of New York Mellon Corp. | GBP | British Pound | FHLB | Federal Home Loan Bank | |||||
| HSBK | HSBC Bank PLC | USD | United States Dollar | LIBOR | London InterBank Offered Rate | |||||
| SSBT | State Street Bank and Trust Co., N.A. | TRA | Tax Receivable Agreement Right | |||||||
| UBSW | UBS AG | |||||||||
42 |
Annual Report |
franklintempleton.com |
FRANKLIN MUTUAL GLOBAL DISCOVERY FUND
Report of Independent Registered Public Accounting Firm
To the Board of Trustees of Franklin Mutual Series Funds and Shareholders of Franklin Mutual Global Discovery Fund:
Opinion on the Financial Statements
We have audited the accompanying statement of assets and liabilities of Franklin Mutual Global Discovery Fund (the “Fund”) (one of the funds constituting Franklin Mutual Series Funds), including the schedule of investments, as of December 31, 2017, and the related statement of operations for the year then ended, the statements of changes in net assets for each of the two years in the period then ended, the financial highlights for each of the periods indicated therein and the related notes (collectively referred to as the “financial statements”). In our opinion, the financial statements present fairly, in all material respects, the financial position of Franklin Mutual Global Discovery Fund (one of the funds constituting Franklin Mutual Series Funds) at December 31, 2017, the results of its operations for the year then ended, the changes in its net assets for each of the two years in the period then ended and its financial highlights for each of the periods indicated therein, in conformity with U.S. generally accepted accounting principles.
Basis for Opinion
These financial statements are the responsibility of the Fund’s management. Our responsibility is to express an opinion on the Fund’s financial statements based on our audits. We are a public accounting firm registered with the Public Company Accounting Oversight Board (United States) (“PCAOB”) and are required to be independent with respect to the Fund in accordance with the U.S. federal securities laws and the applicable rules and regulations of the Securities and Exchange Commission and the PCAOB.
We conducted our audits in accordance with the standards of the PCAOB. Those standards require that we plan and perform the audit to obtain reasonable assurance about whether the financial statements are free of material misstatement, whether due to error or fraud. The Fund is not required to have, nor were we engaged to perform, an audit of the Fund’s internal control over financial reporting. As part of our audits, we are required to obtain an understanding of internal control over financial reporting, but not for the purpose of expressing an opinion on the effectiveness of the Fund’s internal control over financial reporting. Accordingly, we express no such opinion.
Our audits included performing procedures to assess the risks of material misstatement of the financial statements, whether due to error or fraud, and performing procedures that respond to those risks. Such procedures included examining, on a test basis, evidence regarding the amounts and disclosures in the financial statements. Our procedures included confirmation of securities owned as of December 31, 2017, by correspondence with the custodian and brokers. Our audits also included evaluating the accounting principles used and significant estimates made by management, as well as evaluating the overall presentation of the financial statements. We believe that our audits provide a reasonable basis for our opinion.
We have served as the auditor of one or more Franklin investment companies since 1987.
Boston, MA
February 26, 2018
franklintempleton.com | Annual Report | 43 |
FRANKLIN MUTUAL GLOBAL DISCOVERY FUND
Under Section 852(b)(3)(C) of the Internal Revenue Code (Code), the Fund hereby reports the maximum amount allowable but no less than $684,666,052 as a long term capital gain dividend for the fiscal year ended December 31, 2017.
Under Section 871(k)(2)(C) of the Code, the Fund hereby reports the maximum amount allowable but no less than $65,715,584 as a short term capital gain dividend for purposes of the tax imposed under Section 871(a)(1)(A) of the Code for the fiscal year ended December 31, 2017.
Under Section 854(b)(1)(A) of the Code, the Fund hereby reports 60.59% of the ordinary income dividends as income qualifying for the dividends received deduction for the fiscal year ended December 31, 2017.
Under Section 854(b)(1)(B) of the Code, the Fund hereby reports the maximum amount allowable but no less than $615,643,534 as qualified dividends for purposes of the maximum rate under Section 1(h)(11) of the Code for the fiscal year ended December 31, 2017. Distributions, including qualified dividend income, paid during calendar year 2017 will be reported to shareholders on Form 1099-DIV by mid-February 2018. Shareholders are advised to check with their tax advisors for information on the treatment of these amounts on their individual income tax returns.
Under Section 871(k)(1)(C) of the Code, the Fund hereby reports the maximum amount allowable but no less than $45,041,378 as interest related dividends for purposes of the tax imposed under Section 871(a)(1)(A) of the Code for the fiscal year ended December 31, 2017.
| 44 |
Annual Report | franklintempleton.com |
FRANKLIN MUTUAL SERIES FUNDS
The name, year of birth and address of the officers and board members, as well as their affiliations, positions held with the Trust, principal occupations during at least the past five years and number of US registered portfolios overseen in the Franklin Templeton Investments fund complex, are shown below. Generally, each board member serves until that person’s successor is elected and qualified.
Independent Board Members
Name, Year of Birth and Address | Position | Length of Time Served | Number of Portfolios in Fund Complex Overseen by Board Member* | Other Directorships Held During at Least the Past 5 Years | ||||
Edward I. Altman, Ph.D. (1941) c/o Franklin Mutual Advisers, LLC 101 John F. Kennedy Parkway Short Hills, NJ 07078-2789 | Trustee | Since 1987 | 14 | None | ||||
Principal Occupation During at Least the Past 5 Years: Max L. Heine Professor of Finance, Emeritus and Director of The Credit and Debt Markets Research Program, Salomon Center, Stern School of Business, New York University; editor and author of numerous financial publications; financial consultant; an adviser to numerous financial and publishing organizations; and formerly, Vice Director, Salomon Center, Stern School of Business, New York University. | ||||||||
Ann Torre Bates (1958) c/o Franklin Mutual Advisers, LLC 101 John F. Kennedy Parkway Short Hills, NJ 07078-2789 | Trustee | Since 1995 | 40 | Ares Capital Corporation (specialty finance company) (2010-present), United Natural Foods, Inc. (distributor of natural, organic and specialty foods) (2013-present), Allied Capital Corporation (financial services) (2003-2010), SLM Corporation (Sallie Mae) (1997-2014) and Navient Corporation (loan management, servicing and asset recovery) (2014-2016). | ||||
Principal Occupation During at Least the Past 5 Years: Director of various companies; and formerly, Executive Vice President and Chief Financial Officer, NHP Incorporated (manager of multifamily housing) (1995-1997); and Vice President and Treasurer, US Airways, Inc. (until 1995). | ||||||||
Burton J. Greenwald (1929) c/o Franklin Mutual Advisers, LLC 101 John F. Kennedy Parkway Short Hills, NJ 07078-2789 | Trustee and Vice Chairman | Trustee since 2002 and Vice Chairman since 2015 | 14 | Franklin Templeton Emerging Markets Debt Opportunities Fund PLC (1999-present) and Fiduciary International Ireland Limited (1999-2015). | ||||
Principal Occupation During at Least the Past 5 Years: Managing Director, B. J. Greenwald Associates (management consultants to the financial services industry); and formerly, Chairman, Fiduciary Trust International Funds; Executive Vice President, L.F. Rothschild Fund Management, Inc.; President and Director, Merit Mutual Funds; President, Underwriting Division and Director, National Securities & Research Corporation; Governor, Investment Company Institute; and Chairman, ICI Public Information Committee. | ||||||||
Jan Hopkins Trachtman (1947) c/o Franklin Mutual Advisers, LLC 101 John F. Kennedy Parkway Short Hills, NJ 07078-2789 | Trustee | Since 2009 | 14 | None | ||||
Principal Occupation During at Least the Past 5 Years: President and Founder, The Jan Hopkins Group (communications and consulting firm); serves on Advisory Board of Knight Bagehot Fellowship; and formerly, President, Economic Club of New York (2007-2015); Anchor/Correspondent, CNN Financial News (until 2003); Managing Director and Head of Client Communications, Citigroup Private Bank (until 2005); Off-Air reporter, ABC News’ World News Tonight; and Editor, CBS Network News. | ||||||||
Keith Mitchell (1954) c/o Franklin Mutual Advisers, LLC 101 John F. Kennedy Parkway Short Hills, NJ 07078-2789. | Trustee | Since 2009 | 14 | None | ||||
Principal Occupation During at Least the Past 5 Years: Director of various boards of asset management firms; and formerly, Managing Member, Mitchell, Hartley & Bechtel Advisers, LLC (formerly, Mitchell Advisers, LLC) (advisory firm) (2003-2015) and Managing Director, Putman Lovell NBF. | ||||||||
franklintempleton.com | Annual Report | 45 |
FRANKLIN MUTUAL SERIES FUNDS
Independent Board Members (continued)
Name, Year of Birth | Position | Length of Time Served | Number of Portfolios in Fund Complex Overseen by Board Member* | Other Directorships Held During at Least the Past 5 Years | ||||
David W. Niemiec (1949) c/o Franklin Mutual Advisers, LLC 101 John F. Kennedy Parkway Short Hills, NJ 07078-2789 | Trustee | Since 2015 | 40 | Hess Midstream Partners LP (oil and gas midstream infrastructure) (2017-present). | ||||
Principal Occupation During at Least the Past 5 Years: Advisor, Saratoga Partners (private equity fund); and formerly, Managing Director, Saratoga Partners (1998-2001) and SBC Warburg Dillon Read (investment banking) (1997-1998); Vice Chairman, Dillon, Read & Co. Inc. (investment banking) (1991-1997); and Chief Financial Officer, Dillon, Read & Co. Inc. (1982-1997). | ||||||||
Charles Rubens II (1930) c/o Franklin Mutual Advisers, LLC 101 John F. Kennedy Parkway Short Hills, NJ 07078-2789 | Trustee | Since 1998 | 14 | None | ||||
Principal Occupation During at Least the Past 5 Years: Private investor and president of non-profit organizations; and formerly, an executive of Time, Inc.; and Trustee of Colorado College. | ||||||||
Robert E. Wade (1946) c/o Franklin Mutual Advisers, LLC 101 John F. Kennedy Parkway Short Hills, NJ 07078-2789 | Trustee and Chairman of the Board | Trustee since 1993 and Chairman of the Board since 2005 | 40 | El Oro Ltd (investments) (2003-present). | ||||
Principal Occupation During at Least the Past 5 Years: Attorney at law engaged in private practice as a sole practitioner (1972-2008) and member of various boards. | ||||||||
Gregory H. Williams (1943) c/o Franklin Mutual Advisers, LLC 101 John F. Kennedy Parkway Short Hills, NJ 07078-2789 | Trustee | Since 2015 | 14 | None | ||||
Principal Occupation During at Least the Past 5 Years: Private investor; Consultant; and formerly, President, University of Cincinnati (2009-2012); President, The City College of New York (2001-2009); Dean, College of Law, Ohio State University (1993-2001); and Associate Vice President, Academic Affairs and Professor of Law, University of Iowa (1977-1993). | ||||||||
Interested Board Members and Officers
| ||||||||
Name, Year of Birth and Address | Position | Length of Time Served | Number of Portfolios in Fund Complex Overseen by Board Member* | Other Directorships Held During at Least the Past 5 Years | ||||
**Gregory E. Johnson (1961) One Franklin Parkway San Mateo, CA 94403-1906 | Trustee | Since 2007 | 153 | None | ||||
Principal Occupation During at Least the Past 5 Years: Chairman of the Board, Member – Office of the Chairman, Director and Chief Executive Officer, Franklin Resources, Inc.; officer and/or director or trustee, as the case may be, of some of the other subsidiaries of Franklin Resources, Inc. and of 43 of the investment companies in Franklin Templeton Investments; Vice Chairman, Investment Company Institute; and formerly, President, Franklin Resources, Inc. (1994-2015). | ||||||||
**Peter A. Langerman (1955) c/o Franklin Mutual Advisers, LLC 101 John F. Kennedy Parkway Short Hills, NJ 07078-2789 | Trustee, President, and Chief Executive Officer – Investment Management | Trustee since 2007, President, and Chief Executive Officer – Investment Management since 2005 | 7 | American International Group, Inc. (AIG) Credit Facility Trust (2010-2011). | ||||
Principal Occupation During at Least the Past 5 Years: Chairman of the Board, Chief Executive Officer and President, Franklin Mutual Advisers, LLC; President and Chief Investment Officer, Franklin Advisory Services, LLC; and officer and/or director, as the case may be, of three of the investment companies in Franklin Templeton Investments. | ||||||||
46 |
Annual Report |
franklintempleton.com |
FRANKLIN MUTUAL SERIES FUNDS
Interested Board Members and Officers (continued)
Name, Year of Birth and Address | Position | Length of Time Served | Number of Portfolios in Fund Complex Overseen by Board Member* | Other Directorships Held During at Least the Past 5 Years | ||||
Alison E. Baur (1964) One Franklin Parkway San Mateo, CA 94403-1906 | Vice President | Since 2012 | Not Applicable | Not Applicable | ||||
Principal Occupation During at Least the Past 5 Years: Deputy General Counsel, Franklin Templeton Investments; and officer of some of the other subsidiaries of Franklin Resources, Inc. and of 45 of the investment companies in Franklin Templeton Investments. | ||||||||
Philippe Brugere-Trelat (1949) 101 John F. Kennedy Parkway Short Hills NJ 07078-2789 | Vice President | Since 2005 | Not Applicable | Not Applicable | ||||
Principal Occupation During at Least the Past 5 Years: Executive Vice President, Franklin Mutual Advisers, LLC; officer of one of the investment companies in Franklin Templeton Investments; and formerly, Portfolio Manager of Eurovest SA (French registered investment company, SICAV). | ||||||||
Aliya S. Gordon (1973) One Franklin Parkway San Mateo, CA 94403-1906 | Vice President | Since 2009 | Not Applicable | Not Applicable | ||||
Principal Occupation During at Least the Past 5 Years: Senior Associate General Counsel, Franklin Templeton Investments; and officer of 45 of the investment companies in Franklin Templeton Investments. | ||||||||
Steven J. Gray (1955) One Franklin Parkway San Mateo, CA 94403-1906 | Vice President and Secretary | Vice President since 2009 and Secretary since 2005 | Not Applicable | Not Applicable | ||||
Principal Occupation During at Least the Past 5 Years: Senior Associate General Counsel, Franklin Templeton Investments; Vice President, Franklin Templeton Distributors, Inc. and FASA, LLC; and officer of 45 of the investment companies in Franklin Templeton Investments. | ||||||||
Matthew T. Hinkle (1971) One Franklin Parkway San Mateo, CA 94403-1906 | Chief Executive Officer – Finance and Administration | Since June 2017 | Not Applicable | Not Applicable | ||||
Principal Occupation During at Least the Past 5 Years: Senior Vice President, Franklin Templeton Services, LLC; officer of 45 of the investment companies in Franklin Templeton Investments; and formerly, Vice President, Global Tax (2012-April 2017) and Treasurer/Assistant Treasurer, Franklin Templeton Investments (2009-2017). | ||||||||
Robert G. Kubilis (1973) 300 S.E. 2nd Street Fort Lauderdale, FL 33301-1923 | Chief Financial Officer, Chief Accounting Officer and Treasurer | Since 2012 | Not Applicable | Not Applicable | ||||
Principal Occupation During at Least the Past 5 Years: Treasurer, U.S. Fund Administration & Reporting, Franklin Templeton Investments; and officer of 17 of the investment companies in Franklin Templeton Investments. | ||||||||
Robert Lim (1948) One Franklin Parkway San Mateo, CA 94403-1906 | Vice President –AML Compliance | Since 2016 | Not Applicable | Not Applicable | ||||
Principal Occupation During at Least the Past 5 Years: Vice President, Franklin Templeton Companies, LLC; Chief Compliance Officer, Franklin Templeton Distributors, Inc. and Franklin Templeton Investor Services, LLC; and officer of 45 of the investment companies in Franklin Templeton Investments. | ||||||||
franklintempleton.com | Annual Report | 47 |
FRANKLIN MUTUAL SERIES FUNDS
Interested Board Members and Officers (continued)
Name, Year of Birth and Address | Position | Length of Time Served | Number of Portfolios in Fund Complex Overseen by Board Member* | Other Directorships Held During at Least the Past 5 Years | ||||
Kimberly H. Novotny (1972) 300 S.E. 2nd Street Fort Lauderdale, FL 33301-1923 | Vice President | Since 2013 | Not Applicable | Not Applicable | ||||
Principal Occupation During at Least the Past 5 Years: Associate General Counsel, Franklin Templeton Investments; Vice President and Corporate Secretary, Fiduciary Trust International of the South; Vice President, Templeton Investment Counsel, LLC; Assistant Secretary, Franklin Resources, Inc.; and officer of 45 of the investment companies in Franklin Templeton Investments.
| ||||||||
Robert C. Rosselot (1960) 300 S.E. 2nd Street Fort Lauderdale, FL 33301-1923 | Chief Compliance Officer | Since 2013 | Not Applicable | Not Applicable | ||||
Principal Occupation During at Least the Past 5 Years: Director, Global Compliance, Franklin Templeton Investments; Vice President, Franklin Templeton Companies, LLC; officer of 45 of the investment companies in Franklin Templeton Investments; and formerly, Senior Associate General Counsel, Franklin Templeton Investments (2007-2013); and Secretary and Vice President, Templeton Group of Funds (2004-2013).
| ||||||||
Karen L. Skidmore (1952) One Franklin Parkway San Mateo, CA 94403-1906 | Vice President | Since 2009 | Not Applicable | Not Applicable | ||||
Principal Occupation During at Least the Past 5 Years: Senior Associate General Counsel, Franklin Templeton Investments; and officer of 45 of the investment companies in Franklin Templeton Investments.
| ||||||||
Navid J. Tofigh (1972) One Franklin Parkway San Mateo, CA 94403-1906 | Vice President | Since 2015 | Not Applicable | Not Applicable | ||||
Principal Occupation During at Least the Past 5 Years: Associate General Counsel, Franklin Templeton Investments; and officer of 45 of the investment companies in Franklin Templeton Investments.
| ||||||||
Craig S. Tyle (1960) One Franklin Parkway San Mateo, CA 94403-1906 | Vice President | Since 2005 | Not Applicable | Not Applicable | ||||
Principal Occupation During at Least the Past 5 Years: General Counsel and Executive Vice President, Franklin Resources, Inc.; and officer of some of the other subsidiaries of Franklin Resources, Inc. and of 45 of the investment companies in Franklin Templeton Investments.
| ||||||||
Lori A. Weber (1964) 300 S.E. 2nd Street Fort Lauderdale, FL 33301-1923 | Vice President | Since 2011 | Not Applicable | Not Applicable | ||||
Principal Occupation During at Least the Past 5 Years: Senior Associate General Counsel, Franklin Templeton Investments; Assistant Secretary, Franklin Resources, Inc.; Vice President and Secretary, Templeton Investment Counsel, LLC; and officer of 45 of the investment companies in Franklin Templeton Investments.
| ||||||||
*We base the number of portfolios on each separate series of the US registered investment companies within the Franklin Templeton Investments fund complex. These portfolios have a common investment manager or affiliated investment managers.
**Gregory E. Johnson is considered to be an interested person of the Fund under the federal securities laws due to his position as an officer and director of Franklin Resources, Inc. (Resources), which is the parent company of the Fund’s investment manager and distributor. Peter A. Langerman is considered to be an interested person of the Fund under the federal securities laws due to his position as an officer of Franklin Mutual Advisors, LLC, which is an affiliate of the Fund’s investment manager.
Note 1: Officer information is current as of the date of this report. It is possible that after this date, information about officers may change.
The Sarbanes-Oxley Act of 2002 and Rules adopted by the U.S. Securities and Exchange Commission require the Fund to disclose whether the Fund’s Audit Committee includes at least one member who is an audit committee financial expert within the meaning of such Act and Rules. The Fund’s Board has determined that there is at least one such financial expert on the Audit Committee and has designated each of Edward I. Altman, Ph.D., Ann Torre Bates and David W. Niemiec as an audit committee financial expert. The Board believes that Messrs. Altman and Niemiec and Ms. Bates qualify as such an expert in view of their extensive business background and experience. Mr. Altman has served as a member of the Fund Audit Committee since 1996. He currently serves as a Max L. Hines Professor of Finance, Emeritus and Director of The Credit and Debt Markets Research Program, Salomon Center, Stern School of Business, New York University. Ms. Bates has served as a member of the Fund Audit Committee since 1996. She currently serves as a director of Ares Capital Corporation (2010-present) and United Natural Foods, Inc. (2013-present) and was formerly a director of Navient Corporation from 2014 to 2016, SLM Corporation from 1997 to 2014 and Allied
48 |
Annual Report |
franklintempleton.com |
FRANKLIN MUTUAL SERIES FUNDS
Interested Board Members and Officers (continued)
Capital Corporation from 2003 to 2010, Executive Vice President and Chief Financial Officer of NHP Incorporated from 1995 to 1997 and Vice President and Treasurer of US Airways, Inc. until 1995. Mr. Niemiec has served as a member of the Fund Audit Committee since 2015, currently serves as an Advisor to Saratoga Partners and was formerly its Managing Director from 1998 to 2001 and serves as a director of Hess Midstream Partners LP (2017-present). Mr. Niemiec was formerly a director of Emeritus Corporation from 1999 to 2010 and OSI Pharmaceuticals, Inc. from 2006 to 2010, Managing Director of SBC Warburg Dillon Read from 1997 to 1998, and was Vice Chairman from 1991 to 1997 and Chief Financial Officer from 1982 to 1997 of Dillon, Read & Co. Inc. As a result of such background and experience, the Board believes that Messrs. Altman and Niemiec and Ms. Bates have each acquired an understanding of generally accepted accounting principles and financial statements, the general application of such principles in connection with the accounting estimates, accruals and reserves, and analyzing and evaluating financial statements that present a breadth and level of complexity of accounting issues generally comparable to those of the Fund, as well as an understanding of internal controls and procedures for financial reporting and an understanding of audit committee functions. Messrs. Altman and Niemiec and Ms. Bates are independent Board members as that term is defined under the applicable U.S. Securities and Exchange Commission Rules and Releases.
The Statement of Additional Information (SAI) includes additional information about the board members and is available, without charge, upon request. Shareholders may call (800) DIAL BEN/342-5236 to request the SAI.
franklintempleton.com | Annual Report | 49 |
FRANKLIN MUTUAL SERIES FUNDS
FRANKLIN MUTUAL GLOBAL DISCOVERY FUND
Proxy Voting Policies and Procedures
The Fund’s investment manager has established Proxy Voting Policies and Procedures (Policies) that the Fund uses to determine how to vote proxies relating to portfolio securities. Shareholders may view the Fund’s complete Policies online at franklintempleton.com. Alternatively, shareholders may request copies of the Policies free of charge by calling the Proxy Group collect at (954) 527-7678 or by sending a written request to: Franklin Templeton Companies, LLC, 300 S.E. 2nd Street, Fort Lauderdale, FL 33301, Attention: Proxy Group. Copies of the Fund’s proxy voting records are also made available online at franklintempleton.com and posted on the US Securities and Exchange Commission’s website at sec.gov and reflect the most recent 12-month period ended June 30.
Quarterly Statement of Investments
The Trust, on behalf of the Fund, files a complete statement of investments with the US Securities and Exchange Commission for the first and third quarters for each fiscal year on Form N-Q. Shareholders may view the filed Form N-Q by visiting the Commission’s website at sec.gov. The filed form may also be viewed and copied at the Commission’s Public Reference Room in Washington, DC. Information regarding the operations of the Public Reference Room may be obtained by calling (800) SEC-0330.
Householding of Reports and Prospectuses
You will receive the Fund’s financial reports every six months as well as an annual updated summary prospectus (prospectus available upon request). To reduce Fund expenses, we try to identify related shareholders in a household and send only one copy of the financial reports and summary prospectus. This process, called “householding,” will continue indefinitely unless you instruct us otherwise. If you prefer not to have these documents householded, please call us at (800) 632-2301. At any time you may view current prospectuses/summary prospectuses and financial reports on our website. If you choose, you may receive these documents through electronic delivery.
50 |
Annual Report |
franklintempleton.com |
This page intentionally left blank.
This page intentionally left blank.
 | Annual Report and Shareholder Letter Franklin Mutual Global Discovery Fund
Investment Manager Franklin Mutual Advisers, LLC
Distributor Franklin Templeton Distributors, Inc. (800) DIAL BEN® / 342-5236 franklintempleton.com
Shareholder Services (800) 632-2301 - (Class A, C, R & R6) (800) 448-FUND - (Class Z) |
Authorized for distribution only when accompanied or preceded by a summary prospectus and/or prospectus. Investors should carefully consider a fund’s investment goals, risks, charges and expenses before investing. A prospectus contains this and other information; please read it carefully before investing.
To help ensure we provide you with quality service, all calls to and from our service areas are monitored and/or recorded.
© 2018 Franklin Templeton Investments. All rights reserved. | 477 A 02/18 |
| Annual Report and Shareholder Letter
December 31, 2017 |

Sign up for electronic delivery at franklintempleton.com/edelivery
Franklin Templeton Investments
Gain From Our Perspective®
At Franklin Templeton Investments, we’re dedicated to one goal: delivering exceptional asset management for our clients. By bringing together multiple, world-class investment teams in a single firm, we’re able to offer specialized expertise across styles and asset classes, all supported by the strength and resources of one of the world’s largest asset managers. This has helped us to become a trusted partner to individual and institutional investors across the globe.
Dear Franklin Mutual European Fund Shareholder:
Securities markets benefited from a confluence of positive economic, financial and political trends during 2017. The global economy entered a synchronized pace of modest and steady growth, corporate earnings strengthened in the US, Europe and Japan, and US equity market volatility remained at historically low levels. A number of political risks identified at the start of 2017, such as the success of far-right parties in Europe, Brexit negotiations and the Trump administration’s ability to enact its policy agenda, also dissipated or became less immediate for investors as the year progressed. Stocks in global developed markets, as measured by the MSCI World Index, delivered a +23.07% total return.1
In European equity markets, growth stocks outperformed value stocks during the period. The MSCI All Country (AC) Europe Growth Index returned +15.24% in local currency terms and +27.66% in US dollar terms, while the MSCI AC Europe Value Index returned +10.90% in local currency terms and +23.11% in US dollar terms.1 We do not know how long these trends will continue, but historically, periods of strong performance by growth stocks have eventually been followed by relatively weaker performance. A strengthening European economy—including lower unemployment, rising wages and increased capital investment—has the potential to increase the attractiveness of more “value” oriented stocks, particularly within cyclical sectors such as industrials, consumer discretionary and financial services.
A stellar 2017 for equity markets also pushed up common valuation metrics, such as price-to-earnings. Valuation is a critical factor in our analysis and we always ask ourselves if current and potential investments represent an attractive balance of risk and reward. We remain committed to our long-term perspective and disciplined investment approach as we conduct a rigorous, fundamental analysis of securities with a regular emphasis on investment risk management.
Although the investment landscape appears favorable as we enter 2018, it is worth remembering that securities markets are dynamic and constantly evolving. Therefore, we believe active, professional investment management serves investors well. We also recognize the important role of financial advisors in today’s markets and encourage investors to continue to seek their advice. Amid changing markets and economic conditions, we are confident investors with a well-diversified portfolio and a patient, long-term outlook will be well positioned for the years ahead.
On the following pages, the Fund’s portfolio management team reviews investment decisions that pertain to performance during the past 12 months in light of the economic environment and other factors. Please remember all securities markets fluctuate, as do mutual fund share prices.
1. Source: Morningstar.
See www.franklintempletondatasources.com for additional data provider information.
| Not FDIC Insured | | | May Lose Value | | | No Bank Guarantee |
franklintempleton.com |
Not part of the annual report |
|
1 |
|
We thank you for investing with Franklin Templeton, welcome your questions and comments, and look forward to continuing to serve your investment needs in the years ahead.
Sincerely,
Peter A. Langerman
Chairman, President and Chief Executive Officer
Franklin Mutual Advisers, LLC
This letter reflects our analysis and opinions as of December 31, 2017, unless otherwise indicated. The information is not a complete analysis of every aspect of any market, country, industry, security or fund. Statements of fact are from sources considered reliable.
Annual Report
| 3 | ||||
| 9 | ||||
| 12 | ||||
| 13 | ||||
| 23 | ||||
| 27 | ||||
| Report of Independent Registered Public Accounting Firm | 39 | |||
| 40 | ||||
| 41 | ||||
|
| 46
|
| ||
Visit franklintempleton.com for fund updates, to access your account, or to find helpful financial planning tools.
| 2 | Not part of the annual report | franklintempleton.com |
Annual Report
This annual report for Franklin Mutual European Fund covers the fiscal year ended December 31, 2017.
Your Fund’s Goal and Main Investments
The Fund seeks capital appreciation, which may occasionally be short term, with income as a secondary goal, by investing at least 80% of its net assets in securities of European companies that the investment manager believes are available at market prices less than their intrinsic value. The equity securities in which the Fund invests are primarily common stock, with a focus on mid- and large cap companies. To a lesser extent, the Fund also invests in merger arbitrage securities and the debt and equity of distressed companies. The Geographic Composition bar chart on this page lists the leading European countries where the Fund invests.
Performance Overview
The Fund’s Class Z shares generated a +10.45% cumulative total return for the 12 months ended December 31, 2017. For comparison, the Fund’s benchmark, the MSCI Europe Index, which tracks equity performance in Europe’s developed markets, produced a +13.06% total return in local currency terms.1 Also for comparison, the MSCI Europe Index posted a +26.24% total return in US dollar terms.1 You can find more of the Fund’s performance data in the Performance Summary beginning on page 9.
Performance data represent past performance, which does not guarantee future results. Investment return and principal value will fluctuate, and you may have a gain or loss when you sell your shares. Current performance may differ from figures shown. For most recent month-end performance, go to franklintempleton.com or call (800) 342-5236.
Economic and Market Overview
The global economy grew moderately during the 12-month period under review. In this environment, global developed and emerging market stocks generated a +24.62% total return, as measured by the MSCI All Country World Index.1 Global markets were aided by price gains in oil and other
Geographic Composition*
Based on Total Net Assets as of 12/31/17
*Figures are stated as a percentage of total and may not equal 100% or may be negative due to rounding, use of any derivatives, unsettled trades or other factors.
commodities, generally upbeat economic data across regions, the European Central Bank’s (ECB’s) extension of its monetary easing program, and investor optimism about pro-growth and pro-business policies in the US. The prospect for reforms in the European Union (EU) with Emmanuel Macron’s election as France’s president, encouraging corporate earnings reports and the passage of the US tax reform bill also supported global stocks.
However, global markets reflected investor concerns about the terms of the UK’s exit from the EU, political uncertainty in the US and the EU, and geopolitical tensions in the Korean peninsula and other regions. Other concerns included the health
1. Source: Morningstar.
The index is unmanaged and includes reinvestment of any income or distributions. It does not reflect any fees, expenses or sales charges. One cannot invest directly in an index, and an index is not representative of the Fund’s portfolio.
The dollar value, number of shares or principal amount, and names of all portfolio holdings are listed in the Fund’s Statement of Investments (SOI). The SOI begins on page 18.
| franklintempleton.com | Annual Report | 3 |
FRANKLIN MUTUAL EUROPEAN FUND
of European banks, global oil oversupply despite a pact by major oil-producing countries to extend production cuts, and comments from key central bankers around the world about potentially raising interest rates.
In Europe, the UK’s economic growth moderated in 2017 compared to 2016, largely due to slower growth in the services sector. In November, the Bank of England raised its key policy rate 0.25%, its first increase in a decade. The eurozone’s growth accelerated in 2017’s second and third quarters, but moderated in the fourth quarter. However, the eurozone’s 2017 economic growth rate of 2.5% was the fastest in a decade.2 The bloc’s annual inflation rate, while low, ended higher than in December 2016. The ECB kept its benchmark interest rate unchanged during the period. However, at its October meeting, the ECB extended the time frame for its massive bond-buying program from December 2017 to at least September 2018, while reducing the amount of monthly bond purchases in half beginning in January 2018.
Investment Strategy
We follow a distinctive value investment approach that combines investments in what we believe are undervalued common stocks with distressed debt investing and risk arbitrage. Our style aims to provide our shareholders with superior risk-adjusted results over time. We employ rigorous, fundamental analysis to find compelling situations. In our opinion, successful investing is as much about assessing risk and containing losses as it is about achieving profits. In choosing investments, we look at the market price of an individual company’s securities relative to our evaluation of its intrinsic value based on factors including book value, cash flow generation, long-term earnings potential and earnings multiples. We may invest in bankrupt or distressed companies if we believe the market overreacted to adverse developments or failed to appreciate positive changes.
In addition, it is our practice to hedge the Fund’s currency exposure when we deem it advantageous for our shareholders.
What is meant by “hedge”?
To hedge an investment is to take a position intended to offset potential losses/gains that may be incurred by a companion financial instrument. |
Manager’s Discussion
In 2017, an improving economic and political backdrop helped drive most equity markets higher. The positive performances were broad based, spanning across most regions and sectors, and complemented by minimal volatility. Global markets were aided by generally upbeat economic data, improved corporate earnings in the US, Europe and Japan, as well as improved industrial commodity prices, most notably crude oil. In addition, the most significant political risks identified by investors heading into 2017 failed to materialize.
European equity markets started 2017 slowly, but positive political events and improved economic data fueled strong performances during the period. Elections in Europe produced outcomes generally regarded as positive economically as far-right parties largely failed to gain political power in national elections. Investors were particularly encouraged by the presidential election outcome in France. The reform-minded, centrist candidate, Emmanuel Macron, won the French presidential election in May and quickly began to push his agenda, most notably labor decrees giving employers in France greater freedom in negotiating contracts directly with workers. Amid all the positive events, the UK remained the most significant outlier. In the UK, a June 2017 snap election resulting in no party having a majority in Parliament appeared to make a “hard Brexit,” in which the UK leaves the European Union (EU) in March 2019 without a negotiated deal, even more likely than before. Although the UK and EU appeared to make some progress late in the year, the snap election results left the Conservative Party in a precarious position and with the risk of another election in the near future.
As value investors, we managed to benefit from steady economic growth despite underlying market turbulence. In all market environments, we seek to invest prudently in securities that we believe represent good value, and then we adjust our views as the world around us changes.
As the European economy grew stronger, the Fund’s exposure to the consumer discretionary sector increased as well.3 In particular, the Fund’s investments in the automotive industry grew. The Top 10 Sectors/Industries table on page 5 lists automobiles and other leading industries in which the Fund currently invests. Automobiles were a particularly attractive opportunity due to the confluence of several favorable factors: value enhancing restructuring opportunities, improving competitiveness, a strong pipeline of new products expected to
2. Source: Eurostat.
3. The consumer discretionary sector comprises auto components; automobiles; hotels, restaurants and leisure; household durables; media; and specialty retail in the SOI.
| 4 | Annual Report | franklintempleton.com | |||
FRANKLIN MUTUAL EUROPEAN FUND
come to market over the next several years, a consumer preference shift towards higher-margin CUVs (crossover utility vehicles), solid balance sheets, strong free-cash flow, attractive valuations and a generally positive global economic environment.
The Fund initiated a position in automaker Peugeot in the first half of 2017. Peugeot acquired General Motors’4 European business (Opel Vauxhall) in 2017, making Peugeot the second largest automaker in Europe. The global automotive industry has always been competitive, but accelerating innovation has increased the required research and development costs and put pressure on automakers to become ever more efficient. The scale that this combination gave Peugeot should allow it to increase margins and cash flow through improved product development, more efficient vehicle production, maximizing the value of the industrial base and better powertrain performance.
Another investment in the automotive industry was Volkswagen, the largest European automaker. The company has always possessed the necessary scale to compete globally, but it was hampered by the diesel-emissions scandal of 2015. Volkswagen showed signs of moving past the scandal, as operational results improved in 2017. Investors were particularly encouraged by the underlying improvement in free-cash flow and an ongoing cycle of new product releases. Volkswagen also moved to position itself for the future with an aggressive program of innovation in autonomous driving and electric vehicles.
Merger and acquisition (M&A) activity remained healthy in 2017, although the pace of activity appeared to decelerate slightly compared to 2016 due to less favorable political and regulatory conditions in the US, the UK and China. With a number of large cross-border deals dominating the European M&A headlines, US regulatory issues appeared to be a broader consideration. Many large deals involving European corporates continued to wind their way through prolonged regulatory reviews, including Twenty-First Century Fox’s4 offer for Sky.
With an improving economic backdrop and continuing low interest-rate environment in Europe, we continued to see very limited activity in the distressed debt market. As long as these conditions continue, we do not expect the investment landscape in distressed markets to change.
Top 10 Sectors/Industries
Based on Equity Securities as of 12/31/17
| % of Total Net Assets | |||
Insurance | 15.5% | |||
Oil, Gas & Consumable Fuels | 9.3% | |||
Banks | 8.0% | |||
Pharmaceuticals | 6.8% | |||
Automobiles | 5.9% | |||
Diversified Telecommunication Services | 4.8% | |||
Auto Components | 4.0% | |||
Trading Companies & Distributors | 3.9% | |||
Electric Utilities | 3.8% | |||
Hotels, Restaurants & Leisure | 3.7% | |||
Fund Performance
Turning to Fund performance, top positive contributors included Italy-based Enel, Germany-based Volkswagen and France-based Accor. These positive contributors are listed among the Fund’s largest positions in the Top 10 Equity Holdings table on page 6.
Enel is a multinational electric and natural gas utility that has a large presence in Europe. A combination of generally positive earnings results, the announcement of a €2billion stock buyback program in March 2017 and consistent confirmation of full-year 2017 guidance helped drive the stock price higher. We believe the results show in part that Enel is successfully implementing its strategic plan, which includes cutting costs, a focused increase in capital investments in its network and renewable energy capacity, and sales of non-core assets. Shares of Enel and other European utilities received a boost from investors favoring more defensive and eurozone-oriented stocks due to a strengthening euro and the European Central Bank’s initial steps to gradually scale back its quantitative easing program.
Operational results improved in 2017 for Volkswagen, a global automaker, with investors particularly encouraged by the underlying trend in free cash flow and liquidity. In October 2017, Volkswagen raised its 2018 guidance moderately as it is in a positive new product cycle. Volkswagen’s strategy update in November 2017 provided further support to the stock price; management expressed confidence in hitting its long-term financial targets, its intention to raise the dividend payout ratio and its plan to launch 80 electrified models by 2025. We
4. Not a Fund holding.
See www.franklintempletondatasources.com for additional data provider information.
| franklintempleton.com | Annual Report | 5 |
FRANKLIN MUTUAL EUROPEAN FUND
Top 10 Equity Holdings
12/31/17
Company Sector/Industry, Country | % of Total Net Assets | |||
Enel SpA | 3.8% | |||
Electric Utilities, Italy | ||||
Royal Dutch Shell PLC | 3.8% | |||
Oil, Gas & Consumable Fuels, UK | ||||
Accor SA | 3.7% | |||
Hotels, Restaurants & Leisure, France | ||||
NN Group NV | 3.6% | |||
Insurance, Netherlands | ||||
Volkswagen AG | 3.5% | |||
Automobiles, Germany | ||||
Koninklijke Philips NV | 3.5% | |||
Health Care Equipment & Supplies, Netherlands | ||||
Novartis AG | 3.4% | |||
Pharmaceuticals, Switzerland | ||||
Vodafone Group PLC | 3.2% | |||
Wireless Telecommunication Services, UK | ||||
BP PLC | 3.0% | |||
Oil, Gas & Consumable Fuels, UK | ||||
Koninklijke KPN NV | 3.0% | |||
Diversified Telecommunication Services, Netherlands | ||||
believe Volkswagen has been taking the steps needed to move past its emissions-related transgressions.
Accor, a hotel operator, benefited from an improving European economy. The company reported generally solid demand in France and the rest of Europe, as well as improvement in revenue per available room, a key performance metric for the industry. In October, Accor agreed to acquire Mantra Group, an Australian hotel operator. In our view, the acquisition was financially and strategically attractive as it consolidated Accor’s leadership in the Australia/New Zealand market, which has seen strong tourism growth. In December, Accor’s management stated it was close to selling a stake in AccorInvest, its hotel property company. The planned sale is part of Accor’s restructuring efforts to become a predominantly assetlight hotel management company.
During the period under review, Fund investments that detracted from performance included Germany-based Kloeckner, UK-based GlaxoSmithKline and France-based Carrefour.
Kloeckner is a global multi-metal distributor. In March 2017, investors focused on Kloeckner’s updated full-year earnings guidance figures that did not match management’s prior upbeat tone. Given the positive tailwind from steel price increases in 2016 and the more favorable global economic backdrop, the guidance appeared conservative to us. The lack of an infrastructure stimulus proposal by the Trump administration may have led to additional downward pressure on shares of Kloeckner and other companies that would likely benefit from such a program. Following the company’s recent capital markets day presentation, in which the company provided an update to the market on its “Kloeckner.i” strategy, we were encouraged that its business appears to be well positioned for the digital transition in the steel distribution market.
Shares of pharmaceutical company GlaxoSmithKline dropped in the second half of the period. Glaxo reported decent quarterly results in July 2017, but investors were disappointed by management not raising its 2020 outlook and reducing its 2017 earnings growth guidance. In addition, the July 2017 strategy update by Glaxo’s new chief executive officer, Emma Walmsley, was met with some skepticism due to the company’s operating history and company culture. Shares of Glaxo fell further in October 2017 as investors became concerned about limited growth in 2018 from the effect of generic competition on its largest product Advair, and a future dividend cut given Glaxo’s potential interest in Pfizer’s4 consumer-health business.
Food retailer Carrefour reported positive year-over-year sales growth during 2017, but earnings and margins came under continued pressure. In August 2017, management pointed to a number of factors pressuring the company’s operating performance, most notably competition in France from low-price retailers. Additional drags on operating results included: new investments to upgrade its digital platform, an area where Carrefour has lagged peers after putting off such spending for a number of years; integration costs of acquisitions outside of France; and a slower-than-expected economic recovery in Argentina, where it has a material presence.
| 6 | Annual Report |
franklintempleton.com |
FRANKLIN MUTUAL EUROPEAN FUND
During the period, the Fund held currency forwards and futures seeking to hedge most of the currency risk of the portfolio’s non-US dollar investments. The currency forwards and futures had a negative impact on the Fund’s performance because of the depreciation of the US dollar versus the hedged currencies.
What is a currency forward?
A currency forward is an agreement between the Fund and a counterparty to buy or sell a foreign currency in exchange for another currency at a specific exchange rate on a future date.
What is a future?
A future is an agreement between the Fund and a counterparty made through a US or foreign futures exchange to buy or sell an underlying instrument or asset at a specific price on a future date.
Philippe Brugere-Trelat, Executive Vice President and Portfolio Manager with Franklin Mutual Series, has decided to retire in 2018. We are grateful for Mr. Brugere-Trelat’s many years of service to the firm. In preparation for Mr. Brugere-Trelat’s retirement, Mandana Hormozi, portfolio manager and research analyst for Franklin Mutual Advisers will be added as a co-lead portfolio manager for Franklin Mutual European Fund effective January 1, 2018, joining current co-lead portfolio managers Katrina Dudley and Philippe Brugere-Trelat. Effective May 1, 2018, Mr. Brugere-Trelat will step down as portfolio manager and remain with the firm in a consulting capacity until later in 2018 when he will officially retire.
Thank you for your participation in Franklin Mutual European Fund. We look forward to continuing to serve your investment needs.

The foregoing information reflects our analysis, opinions and portfolio holdings as of December 31, 2017, the end of the reporting period. The way we implement our main investment strategies and the resulting portfolio holdings may change depending on factors such as market and economic conditions. These opinions may not be relied upon as investment advice or an offer for a particular security. The information is not a complete analysis of every aspect of any market, country, industry, security or the Fund. Statements of fact are from sources considered reliable, but the investment manager makes no representation or warranty as to their completeness or accuracy. Although historical performance is no guarantee of future results, these insights may help you understand our investment management philosophy.
Philippe Brugere-Trelat has been co-portfolio manager for Franklin Mutual European Fund since 2010 and portfolio manager since 2005. He also has been portfolio manager for Franklin Mutual Global Discovery Fund since 2009. He has been a member of the management team of the Franklin Mutual Series Funds since 2004, when he rejoined Franklin Templeton Investments. Previously, he was president and portfolio manager of Eurovest. Between 1984 and 1994, Mr. Brugere-Trelat was employed at Heine Securities Corporation, the Fund’s former manager.
CFA® is a trademark owned by CFA Institute.
franklintempleton.com | Annual Report | 7 |
FRANKLIN MUTUAL EUROPEAN FUND
Katrina Dudley has been co-portfolio manager for Franklin Mutual European Fund since 2010 and was assistant portfolio manager since 2007. She follows industrial companies (foreign and domestic) including transportation, manufacturers, machinery, electrical equipment and general industrial. Prior to joining Franklin Templeton Investments in 2002, Ms. Dudley was an investment analyst at Federated Investors, Inc., responsible for the technology and health care sectors. From 1995 to 2001, Ms. Dudley was a senior manager in the corporate finance division of Ernst & Young LLP, where she specialized in valuation and litigation consulting.
| 8 |
Annual Report | franklintempleton.com |
FRANKLIN MUTUAL EUROPEAN FUND
Performance Summary as of December 31, 2017
The performance table and graphs do not reflect any taxes that a shareholder would pay on Fund dividends, capital gain distributions, if any, or any realized gains on the sale of Fund shares. Total return reflects reinvestment of the Fund’s dividends and capital gain distributions, if any, and any unrealized gains or losses. Your dividend income will vary depending on dividends or interest paid by securities in the Fund’s portfolio, adjusted for operating expenses of each class. Capital gain distributions are net profits realized from the sale of portfolio securities.
Performance as of 12/31/17
Cumulative total return excludes sales charges. Average annual total return includes maximum sales charges. Sales charges will vary depending on the size of the investment and the class of share purchased. The maximum is 5.75% and the minimum is 0%. Class A: 5.75% maximum initial sales charge. For other share classes, visit franklintempleton.com.
| Share Class | | Cumulative Total Return1 | | | Average Annual Total Return2 | | ||
Z | ||||||||
1-Year | +10.45% | +10.45% | ||||||
5-Year | +38.67% | +6.76% | ||||||
10-Year | +35.48% | +3.08% | ||||||
A | ||||||||
1-Year | +10.14% | +3.80% | ||||||
5-Year | +36.72% | +5.21% | ||||||
10-Year | +31.58% | +2.18% | ||||||
Performance data represent past performance, which does not guarantee future results. Investment return and principal value will fluctuate, and you may have a gain or loss when you sell your shares. Current performance may differ from figures shown. For most recent month-end performance, go to franklintempleton.com or call (800) 342-5236.
See page 11 for Performance Summary footnotes.
franklintempleton.com | Annual Report | 9 |
FRANKLIN MUTUAL EUROPEAN FUND
PERFORMANCE SUMMARY
Total Return Index Comparison for a Hypothetical $10,000 Investment
Total return represents the change in value of an investment over the periods shown. It includes any applicable maximum sales charge, Fund expenses, account fees and reinvested distributions. The unmanaged indexes include reinvestment of any income or distributions. They differ from the Fund in composition and do not pay management fees or expenses. One cannot invest directly in an index.
Class Z (1/1/08–12/31/17)
Class A (1/1/08–12/31/17)
See page 11 for Performance Summary footnotes.
10 |
Annual Report |
franklintempleton.com |
FRANKLIN MUTUAL EUROPEAN FUND
PERFORMANCE SUMMARY
Distributions (1/1/17–12/31/17)
| Share Class | Net Investment Income | |||
| Z | $0.2748 | |||
| A | $0.2204 | |||
| C | $0.0697 | |||
| R | $0.1988 | |||
| R6 | $0.3066 | |||
Total Annual Operating Expenses4
| Share Class |
| |||
| Z | 1.06 | % | ||
| A | 1.31 | % | ||
Each class of shares is available to certain eligible investors and has different annual fees and expenses, as described in the prospectus.
All investments involve risks, including possible loss of principal. Value securities may not increase in price as anticipated or may decline further in value. Special risks are associated with foreign investing, including currency fluctuations, economic instability and political developments. Because the Fund may invest its assets in companies in a specific region, including Europe, it is subject to greater risks of adverse developments in that region and/or the surrounding regions than a fund that is more broadly diversified geographically. Current political and financial uncertainty surrounding the European Union may increase market volatility and the economic risk of investing in companies in Europe. The Fund’s investments in smaller company stocks carry an increased risk of price fluctuation, especially over the short term. The Fund’s investments in companies engaged in mergers, reorganizations or liquidations also involve special risks as pending deals may not be completed on time or on favorable terms. The Fund is actively managed but there is no guarantee that the manager’s investment decisions will produce the desired results. The Fund’s prospectus also includes a description of the main investment risks.
1. Cumulative total return represents the change in value of an investment over the periods indicated.
2. Average annual total return represents the average annual change in value of an investment over the periods indicated. Return for less than one year, if any, has not been annualized.
3. Source: Morningstar. The MSCI Europe Index (Local Currency and US Dollar) is a market capitalization-weighted index designed to measure equity market performance of developed markets in Europe.
4. Figures are as stated in the Fund’s current prospectus and may differ from the expense ratios disclosed in the Your Fund’s Expenses and Financial Highlights sections in this report. In periods of market volatility, assets may decline significantly, causing total annual Fund operating expenses to become higher than the figures shown.
See www.franklintempletondatasources.com for additional data provider information.
franklintempleton.com |
Annual Report |
|
11 |
|
FRANKLIN MUTUAL EUROPEAN FUND
As a Fund shareholder, you can incur two types of costs: (1) transaction costs, including sales charges (loads) on Fund purchases and redemptions; and (2) ongoing Fund costs, including management fees, distribution and service (12b-1) fees, and other Fund expenses. All mutual funds have ongoing costs, sometimes referred to as operating expenses. The table below shows ongoing costs of investing in the Fund and can help you understand these costs and compare them with those of other mutual funds. The table assumes a $1,000 investment held for the six months indicated.
Actual Fund Expenses
The table below provides information about actual account values and actual expenses in the columns under the heading “Actual.” In these columns the Fund’s actual return, which includes the effect of Fund expenses, is used to calculate the “Ending Account Value” for each class of shares. You can estimate the expenses you paid during the period by following these steps (of course, your account value and expenses will differ from those in this illustration): Divide your account value by $1,000 (if your account had an $8,600 value, then $8,600 ÷ $1,000 = 8.6). Then multiply the result by the number in the row for your class of shares under the headings “Actual” and “Expenses Paid During Period” (if Actual Expenses Paid During Period were $7.50, then 8.6 x $7.50 = $64.50). In this illustration, the actual expenses paid this period are $64.50.
Hypothetical Example for Comparison with Other Funds
Under the heading “Hypothetical” in the table, information is provided about hypothetical account values and hypothetical expenses based on the Fund’s actual expense ratio and an assumed rate of return of 5% per year before expenses, which is not the Fund’s actual return. This information may not be used to estimate the actual ending account balance or expenses you paid for the period, but it can help you compare ongoing costs of investing in the Fund with those of other funds. To do so, compare this 5% hypothetical example for the class of shares you hold with the 5% hypothetical examples that appear in the shareholder reports of other funds.
Please note that expenses shown in the table are meant to highlight ongoing costs and do not reflect any transactional costs. Therefore, information under the heading “Hypothetical” is useful in comparing ongoing costs only, and will not help you compare total costs of owning different funds. In addition, if transactional costs were included, your total costs would have been higher.
Actual (actual return after expenses) | Hypothetical (5% annual return before expenses) | ||||||||||||||||||||||||||||||||||||||||||||
Share Class | Beginning Account Value 7/1/17 | Ending Account Value 12/31/17 | Expenses Paid During Period 7/1/17–12/31/171 | Ending Account Value 12/31/17 | Expenses Paid During Period 7/1/17–12/31/171 | Annualized Expense Ratio | |||||||||||||||||||||||||||||||||||||||
| Z | $1,000 | $1,030.50 | $ 5.22 | $1,020.06 | $ 5.19 | 1.02% | |||||||||||||||||||||||||||||||||||||||
| A | $1,000 | $1,029.20 | $ 6.50 | $1,018.80 | $ 6.46 | 1.27% | |||||||||||||||||||||||||||||||||||||||
| C | $1,000 | $1,025.10 | $10.31 | $1,015.02 | $10.26 | 2.02% | |||||||||||||||||||||||||||||||||||||||
| R | $1,000 | $1,028.10 | $ 7.77 | $1,017.54 | $ 7.73 | 1.52% | |||||||||||||||||||||||||||||||||||||||
| R6 | $1,000 | $1,031.00 | $ 4.56 | $1,020.72 | $ 4.53 | 0.89% | |||||||||||||||||||||||||||||||||||||||
1. Expenses are equal to the annualized expense ratio for the six-month period as indicated above—in the far right column—multiplied by the simple average account value over the period indicated, and then multiplied by 184/365 to reflect the one-half year period.
12 |
Annual Report |
franklintempleton.com |
FRANKLIN MUTUAL EUROPEAN FUND
| Year Ended December 31, | ||||||||||||||||||||
| 2017 | 2016 | 2015 | 2014 | 2013 | ||||||||||||||||
Class Z | ||||||||||||||||||||
| Per share operating performance | ||||||||||||||||||||
(for a share outstanding throughout the year) | ||||||||||||||||||||
Net asset value, beginning of year | $19.20 | $19.48 | $20.86 | $24.76 | $21.13 | |||||||||||||||
Income from investment operationsa: | ||||||||||||||||||||
Net investment incomeb | 0.35 | 0.63c | 0.42 | 0.73d | 0.49 | |||||||||||||||
Net realized and unrealized gains (losses) | 1.65 | (0.17) | (0.27) | (1.73) | 5.12 | |||||||||||||||
Total from investment operations | 2.00 | 0.46 | 0.15 | (1.00) | 5.61 | |||||||||||||||
Less distributions from: | ||||||||||||||||||||
Net investment income | (0.27) | (0.47) | (0.46) | (0.67) | (0.46) | |||||||||||||||
Net realized gains | — | (0.27) | (1.07) | (2.23) | (1.52) | |||||||||||||||
Total distributions | (0.27) | (0.74) | (1.53) | (2.90) | (1.98) | |||||||||||||||
Net asset value, end of year | $20.93 | $19.20 | $19.48 | $20.86 | $24.76 | |||||||||||||||
Total return | 10.45% | 2.40% | 0.82% | (4.00)% | 26.68% | |||||||||||||||
Ratios to average net assets | ||||||||||||||||||||
Expensese | 1.04%f | 1.06%f, | g | 1.05% | 1.04%f | 1.07%f | ||||||||||||||
Expenses incurred in connection with securities sold short | —% | —% | —%h | 0.01% | —%h | |||||||||||||||
Net investment income | 1.75% | 3.42%c | 1.93% | 2.93%d | 2.04% | |||||||||||||||
| Supplemental data | ||||||||||||||||||||
Net assets, end of year (000’s) | $1,328,622 | $1,175,972 | $1,355,780 | $1,128,769 | $1,399,294 | |||||||||||||||
Portfolio turnover rate | 17.33% | 16.43% | 32.59% | 54.05% | 39.05% | |||||||||||||||
aThe amount shown for a share outstanding throughout the period may not correlate with the Statement of Operations for the period due to the timing of sales and repurchases of the Fund’s shares in relation to income earned and/or fluctuating fair value of the investments of the Fund.
bBased on average daily shares outstanding.
cNet investment income per share includes approximately $0.17 per share related to a nonrecurring distribution. The amount, although initially recorded as dividend income, is subject to recharacterization once the issuer provides information regarding the actual composition of the distribution. Excluding this amount, the ratio of net investment income to average net assets would have been 2.50%.
dNet investment income per share includes approximately $0.29 per share related to income received in the form of a special dividend in connection with certain Fund holdings. Excluding this amount, the ratio of net investment income to average net assets would have been 1.74%.
eIncludes dividend and/or interest expense on securities sold short and security borrowing fees, if any. See below for the ratios of such expenses to average net assets for the periods presented. See Note 1(d).
fBenefit of expense reduction rounds to less than 0.01%.
gBenefit of waiver and payments by affiliates rounds to less than 0.01%.
hRounds to less than 0.01%.
franklintempleton.com |
The accompanying notes are an integral part of these financial statements. | |
Annual Report |
13 |
FRANKLIN MUTUAL EUROPEAN FUND
FINANCIAL HIGHLIGHTS
| Year Ended December 31, | ||||||||||||||||||||
| 2017 | 2016 | 2015 | 2014 | 2013 | ||||||||||||||||
Class A | ||||||||||||||||||||
| Per share operating performance | ||||||||||||||||||||
(for a share outstanding throughout the year) | ||||||||||||||||||||
Net asset value, beginning of year | $18.66 | $18.95 | $20.33 | $24.21 | $20.71 | |||||||||||||||
Income from investment operationsa: | ||||||||||||||||||||
Net investment incomeb | 0.31 | 0.57 | c | 0.35 | 0.61 | d | 0.42 | |||||||||||||
Net realized and unrealized gains (losses) | 1.58 | (0.18 | ) | (0.26 | ) | (1.66 | ) | 4.99 | ||||||||||||
Total from investment operations | 1.89 | 0.39 | 0.09 | (1.05 | ) | 5.41 | ||||||||||||||
Less distributions from: | ||||||||||||||||||||
Net investment income | (0.22 | ) | (0.41 | ) | (0.40 | ) | (0.60 | ) | (0.39 | ) | ||||||||||
Net realized gains | — | (0.27 | ) | (1.07 | ) | (2.23 | ) | (1.52 | ) | |||||||||||
Total distributions | (0.22 | ) | (0.68 | ) | (1.47 | ) | (2.83 | ) | (1.91 | ) | ||||||||||
Net asset value, end of year | $20.33 | $18.66 | $18.95 | $20.33 | $24.21 | |||||||||||||||
Total returne | 10.14% | 2.12% | 0.57% | (4.31)% | 26.30% | |||||||||||||||
Ratios to average net assets | ||||||||||||||||||||
Expensesf | 1.29% | g | 1.31% | g,h | 1.33% | 1.34% | g | 1.37% | g | |||||||||||
Expenses incurred in connection with securities sold short | —% | —% | —% | i | 0.01% | —% | i | |||||||||||||
Net investment income | 1.50% | 3.17% | c | 1.65% | 2.63% | d | 1.74% | |||||||||||||
| Supplemental data | ||||||||||||||||||||
Net assets, end of year (000’s) | $714,915 | $769,297 | $1,033,307 | $843,836 | $839,655 | |||||||||||||||
Portfolio turnover rate | 17.33% | 16.43% | 32.59% | 54.05% | 39.05% | |||||||||||||||
aThe amount shown for a share outstanding throughout the period may not correlate with the Statement of Operations for the period due to the timing of sales and repurchases of the Fund’s shares in relation to income earned and/or fluctuating fair value of the investments of the Fund.
bBased on average daily shares outstanding.
cNet investment income per share includes approximately $0.17 per share related to a nonrecurring distribution. The amount, although initially recorded as dividend income, is subject to recharacterization once the issuer provides information regarding the actual composition of the distribution. Excluding this amount, the ratio of net investment income to average net assets would have been 2.25%.
dNet investment income per share includes approximately $0.29 per share related to income received in the form of a special dividend in connection with certain Fund holdings. Excluding this amount, the ratio of net investment income to average net assets would have been 1.44%.
eTotal return does not reflect sales commissions or contingent deferred sales charges, if applicable.
fIncludes dividend and/or interest expense on securities sold short and security borrowing fees, if any. See below for the ratios of such expenses to average net assets for the periods presented. See Note 1(d).
gBenefit of expense reduction rounds to less than 0.01%.
hBenefit of waiver and payments by affiliates rounds to less than 0.01%.
iRounds to less than 0.01%.
14 |
Annual Report | The accompanying notes are an integral part of these financial statements. |
franklintempleton.com |
FRANKLIN MUTUAL EUROPEAN FUND
FINANCIAL HIGHLIGHTS
| Year Ended December 31, | ||||||||||||||||||||
| 2017 | 2016 | 2015 | 2014 | 2013 | ||||||||||||||||
Class C | ||||||||||||||||||||
| Per share operating performance | ||||||||||||||||||||
(for a share outstanding throughout the year) | ||||||||||||||||||||
Net asset value, beginning of year | $18.70 | $18.97 | $20.37 | $24.25 | $20.79 | |||||||||||||||
Income from investment operationsa: | ||||||||||||||||||||
Net investment incomeb | 0.15 | 0.44 | c | 0.19 | 0.43 | d | 0.24 | |||||||||||||
Net realized and unrealized gains (losses) | 1.60 | (0.19 | ) | (0.25 | ) | (1.64 | ) | 5.02 | ||||||||||||
Total from investment operations | 1.75 | 0.25 | (0.06 | ) | (1.21 | ) | 5.26 | |||||||||||||
Less distributions from: | ||||||||||||||||||||
Net investment income | (0.07 | ) | (0.25 | ) | (0.27 | ) | (0.44 | ) | (0.28 | ) | ||||||||||
Net realized gains | — | (0.27 | ) | (1.07 | ) | (2.23 | ) | (1.52 | ) | |||||||||||
Total distributions | (0.07 | ) | (0.52 | ) | (1.34 | ) | (2.67 | ) | (1.80 | ) | ||||||||||
Net asset value, end of year | $20.38 | $18.70 | $18.97 | $20.37 | $24.25 | |||||||||||||||
Total returne | 9.37% | 1.32% | (0.16)% | (4.97)% | 25.44% | |||||||||||||||
Ratios to average net assets | ||||||||||||||||||||
Expensesf | 2.04% | g | 2.06% | g,h | 2.05% | 2.04% | g | 2.07% | g | |||||||||||
Expenses incurred in connection with securities sold short | —% | —% | —% | i | 0.01% | —% | i | |||||||||||||
Net investment income | 0.75% | 2.42% | c | 0.93% | 1.93% | d | 1.04% | |||||||||||||
| Supplemental data | ||||||||||||||||||||
Net assets, end of year (000’s) | $179,123 | $209,196 | $291,752 | $216,258 | $198,491 | |||||||||||||||
Portfolio turnover rate | 17.33% | 16.43% | 32.59% | 54.05% | 39.05% | |||||||||||||||
aThe amount shown for a share outstanding throughout the period may not correlate with the Statement of Operations for the period due to the timing of sales and repurchases of the Fund’s shares in relation to income earned and/or fluctuating fair value of the investments of the Fund.
bBased on average daily shares outstanding.
cNet investment income per share includes approximately $0.17 per share related to a nonrecurring distribution. The amount, although initially recorded as dividend income, is subject to recharacterization once the issuer provides information regarding the actual composition of the distribution. Excluding this amount, the ratio of net investment income to average net assets would have been 1.50%.
dNet investment income per share includes approximately $0.29 per share related to income received in the form of a special dividend in connection with certain Fund holdings. Excluding this amount, the ratio of net investment income to average net assets would have been 0.74%.
eTotal return does not reflect sales commissions or contingent deferred sales charges, if applicable.
fIncludes dividend and/or interest expense on securities sold short and security borrowing fees, if any. See below for the ratios of such expenses to average net assets for the periods presented. See Note 1(d).
gBenefit of expense reduction rounds to less than 0.01%.
hBenefit of waiver and payments by affiliates rounds to less than 0.01%.
iRounds to less than 0.01%.
franklintempleton.com |
The accompanying notes are an integral part of these financial statements. | |
Annual Report |
15 |
FRANKLIN MUTUAL EUROPEAN FUND
FINANCIAL HIGHLIGHTS
| Year Ended December 31, | ||||||||||||||||||||
| 2017 | 2016 | 2015 | 2014 | 2013 | ||||||||||||||||
Class R | ||||||||||||||||||||
| Per share operating performance | ||||||||||||||||||||
(for a share outstanding throughout the year) | ||||||||||||||||||||
Net asset value, beginning of year | $18.35 | $18.62 | $20.04 | $23.95 | $20.55 | |||||||||||||||
Income from investment operationsa: | ||||||||||||||||||||
Net investment incomeb | 0.22 | 0.52 | c | 0.27 | 0.41 | d | 0.31 | |||||||||||||
Net realized and unrealized gains (losses) | 1.60 | (0.18 | ) | (0.23 | ) | (1.49 | ) | 5.02 | ||||||||||||
Total from investment operations | 1.82 | 0.34 | 0.04 | (1.08 | ) | 5.33 | ||||||||||||||
Less distributions from: | ||||||||||||||||||||
Net investment income | (0.20 | ) | (0.34 | ) | (0.39 | ) | (0.60 | ) | (0.41 | ) | ||||||||||
Net realized gains | — | (0.27 | ) | (1.07 | ) | (2.23 | ) | (1.52 | ) | |||||||||||
Total distributions | (0.20 | ) | (0.61 | ) | (1.46 | ) | (2.83 | ) | (1.93 | ) | ||||||||||
Net asset value, end of year | $19.97 | $18.35 | $18.62 | $20.04 | $23.95 | |||||||||||||||
Total return | 9.92% | 1.86% | 0.37% | (4.52)% | 26.05% | |||||||||||||||
Ratios to average net assets | ||||||||||||||||||||
Expensese | 1.54% | f | 1.56% | f,g | 1.55% | 1.54% | f | 1.57%f | ||||||||||||
Expenses incurred in connection with securities sold short | —% | —% | —% | h | 0.01% | —% | h | |||||||||||||
Net investment income | 1.25% | 2.92% | c | 1.43% | 2.43% | d | 1.54% | |||||||||||||
| Supplemental data | ||||||||||||||||||||
Net assets, end of year (000’s) | $821 | $626 | $997 | $421 | $133 | |||||||||||||||
Portfolio turnover rate | 17.33% | 16.43% | 32.59% | 54.05% | 39.05% | |||||||||||||||
aThe amount shown for a share outstanding throughout the period may not correlate with the Statement of Operations for the period due to the timing of sales and repurchases of the Fund’s shares in relation to income earned and/or fluctuating fair value of the investments of the Fund.
bBased on average daily shares outstanding.
cNet investment income per share includes approximately $0.17 per share related to a nonrecurring distribution. The amount, although initially recorded as dividend income, is subject to recharacterization once the issuer provides information regarding the actual composition of the distribution. Excluding this amount, the ratio of net investment income to average net assets would have been 2.00%.
dNet investment income per share includes approximately $0.29 per share related to income received in the form of a special dividend in connection with certain Fund holdings. Excluding this amount, the ratio of net investment income to average net assets would have been 1.24%.
eIncludes dividend and/or interest expense on securities sold short and security borrowing fees, if any. See below for the ratios of such expenses to average net assets for the periods presented. See Note 1(d).
fBenefit of expense reduction rounds to less than 0.01%.
gBenefit of waiver and payments by affiliates rounds to less than 0.01%.
hRounds to less than 0.01%.
16 |
Annual Report | The accompanying notes are an integral part of these financial statements. |
franklintempleton.com |
FRANKLIN MUTUAL EUROPEAN FUND
FINANCIAL HIGHLIGHTS
| Year Ended December 31, | ||||||||||||||||||||
| 2017 | 2016 | 2015 | 2014 | 2013a | ||||||||||||||||
Class R6 | ||||||||||||||||||||
| Per share operating performance | ||||||||||||||||||||
(for a share outstanding throughout the year) | ||||||||||||||||||||
Net asset value, beginning of year | $19.19 | $19.47 | $20.85 | $24.75 | $22.54 | |||||||||||||||
Income from investment operationsb: | ||||||||||||||||||||
Net investment incomec | 0.41 | 0.66 | d | 0.46 | 0.75 | e | 0.28 | |||||||||||||
Net realized and unrealized gains (losses) | 1.62 | (0.17 | ) | (0.28 | ) | (1.71 | ) | 3.95 | ||||||||||||
Total from investment operations | 2.03 | 0.49 | 0.18 | (0.96 | ) | 4.23 | ||||||||||||||
Less distributions from: | ||||||||||||||||||||
Net investment income | (0.31 | ) | (0.50 | ) | (0.49 | ) | (0.71 | ) | (0.50 | ) | ||||||||||
Net realized gains | — | (0.27 | ) | (1.07 | ) | (2.23 | ) | (1.52 | ) | |||||||||||
Total distributions | (0.31 | ) | (0.77 | ) | (1.56 | ) | (2.94 | ) | (2.02 | ) | ||||||||||
Net asset value, end of year | $20.91 | $19.19 | $19.47 | $20.85 | $24.75 | |||||||||||||||
Total returnf | 10.63% | 2.53% | 0.98% | (3.88)% | 18.99% | |||||||||||||||
Ratios to average net assetsg | ||||||||||||||||||||
Expensesh | 0.88% | i | 0.89% | i,j | 0.89% | 0.89%i | 0.90% | i | ||||||||||||
Expenses incurred in connection with securities sold short | —% | —% | —% | k | 0.01% | —% | k | |||||||||||||
Net investment income | 1.91% | 3.59% | d | 2.09% | 3.08% | e | 2.21% | |||||||||||||
| Supplemental data | ||||||||||||||||||||
Net assets, end of year (000’s) | $294,660 | $311,784 | $373,904 | $334,396 | $317,690 | |||||||||||||||
Portfolio turnover rate | 17.33% | 16.43% | 32.59% | 54.05% | 39.05% | |||||||||||||||
aFor the period May 1, 2013 (effective date) to December 31, 2013.
bThe amount shown for a share outstanding throughout the period may not correlate with the Statement of Operations for the period due to the timing of sales and repurchases of the Fund’s shares in relation to income earned and/or fluctuating fair value of the investments of the Fund.
cBased on average daily shares outstanding.
dNet investment income per share includes approximately $0.17 per share related to a nonrecurring distribution. The amount, although initially recorded as dividend income, is subject to recharacterization once the issuer provides information regarding the actual composition of the distribution. Excluding this amount, the ratio of net investment income to average net assets would have been 2.67%.
eNet investment income per share includes approximately $0.29 per share related to income received in the form of a special dividend in connection with certain Fund holdings. Excluding this amount, the ratio of net investment income to average net assets would have been 1.89%.
fTotal return is not annualized for periods less than one year.
gRatios are annualized for periods less than one year.
hIncludes dividend and/or interest expense on securities sold short and security borrowing fees, if any. See below for the ratios of such expenses to average net assets for the periods presented. See Note 1(d).
iBenefit of expense reduction rounds to less than 0.01%.
jBenefit of waiver and payments by affiliates rounds to less than 0.01%.
kRounds to less than 0.01%.
franklintempleton.com |
The accompanying notes are an integral part of these financial statements. | |
Annual Report |
17 |
FRANKLIN MUTUAL EUROPEAN FUND
Statement of Investments, December 31, 2017
| Country | Shares | Value | ||||||||||||||
Common Stocks 85.9% | ||||||||||||||||
| Auto Components 1.8% | ||||||||||||||||
Cie Generale des Etablissements Michelin, B | France | 314,218 | $ | 45,070,204 | ||||||||||||
|
| |||||||||||||||
| Automobiles 2.4% | ||||||||||||||||
Peugeot SA | France | 2,409,341 | 49,012,285 | |||||||||||||
Renault SA | France | 108,240 | 10,897,086 | |||||||||||||
|
| |||||||||||||||
| 59,909,371 | ||||||||||||||||
|
| |||||||||||||||
| Banks 8.0% | ||||||||||||||||
AIB Group PLC | Ireland | 5,022,410 | 33,142,383 | |||||||||||||
BNP Paribas SA | France | 344,956 | 25,763,920 | |||||||||||||
HSBC Holdings PLC | United Kingdom | 2,732,076 | 28,295,021 | |||||||||||||
Societe Generale SA | France | 1,017,419 | 52,551,108 | |||||||||||||
| a | Standard Chartered PLC | United Kingdom | 5,207,966 | 54,865,196 | ||||||||||||
| a | Unicaja Banco SA | Spain | 3,808,700 | 6,004,558 | ||||||||||||
|
| |||||||||||||||
| 200,622,186 | ||||||||||||||||
|
| |||||||||||||||
| Capital Markets 0.8% | ||||||||||||||||
Credit Suisse Group AG | Switzerland | 872,476 | 15,580,728 | |||||||||||||
Oslo Bors VPS Holding ASA | Norway | 340,000 | 5,156,536 | |||||||||||||
|
| |||||||||||||||
| 20,737,264 | ||||||||||||||||
|
| |||||||||||||||
| Commercial Services & Supplies 1.2% | ||||||||||||||||
G4S PLC | United Kingdom | 8,137,683 | 29,342,056 | |||||||||||||
|
| |||||||||||||||
| Communications Equipment 2.2% | ||||||||||||||||
Nokia OYJ, A | Finland | 5,254,934 | 24,551,165 | |||||||||||||
Nokia OYJ, ADR | Finland | 6,476,564 | 30,180,788 | |||||||||||||
|
| |||||||||||||||
| 54,731,953 | ||||||||||||||||
|
| |||||||||||||||
| Construction & Engineering 0.4% | ||||||||||||||||
FLSmidth & Co. AS | Denmark | 193,655 | 11,275,995 | |||||||||||||
|
| |||||||||||||||
| Construction Materials 2.9% | ||||||||||||||||
HeidelbergCement AG | Germany | 48,487 | 5,250,267 | |||||||||||||
LafargeHolcim Ltd., B | Switzerland | 1,216,211 | 68,590,131 | |||||||||||||
|
| |||||||||||||||
| 73,840,398 | ||||||||||||||||
|
| |||||||||||||||
| Diversified Telecommunication Services 4.8% | ||||||||||||||||
Hellenic Telecommunications Organization SA | Greece | 3,445,216 | 47,536,059 | |||||||||||||
Koninklijke KPN NV | Netherlands | 21,300,825 | 74,318,975 | |||||||||||||
|
| |||||||||||||||
| 121,855,034 | ||||||||||||||||
|
| |||||||||||||||
| Electric Utilities 3.8% | ||||||||||||||||
Enel SpA | Italy | 15,739,968 | 96,879,099 | |||||||||||||
|
| |||||||||||||||
| Food & Staples Retailing 2.0% | ||||||||||||||||
Carrefour SA | France | 1,567,550 | 33,928,669 | |||||||||||||
| a | METRO AG | Germany | 759,860 | 15,179,473 | ||||||||||||
|
| |||||||||||||||
| 49,108,142 | ||||||||||||||||
|
| |||||||||||||||
| Health Care Equipment & Supplies 3.5% | ||||||||||||||||
Koninklijke Philips NV | Netherlands | 2,333,465 | 88,302,269 | |||||||||||||
|
| |||||||||||||||
| Hotels, Restaurants & Leisure 3.7% | ||||||||||||||||
Accor SA | France | 1,810,220 | 93,391,789 | |||||||||||||
|
| |||||||||||||||
| Household Durables 0.3% | ||||||||||||||||
| a,b | Neinor Homes SA, 144A | Spain | 334,815 | 7,351,312 | ||||||||||||
|
| |||||||||||||||
18 |
Annual Report |
franklintempleton.com |
FRANKLIN MUTUAL EUROPEAN FUND
STATEMENT OF INVESTMENTS
| Country | Shares | Value | ||||||||||||||
Common Stocks (continued) | ||||||||||||||||
| Insurance 15.5% | ||||||||||||||||
Ageas | Belgium | 1,192,769 | $ | 58,266,598 | ||||||||||||
ASR Nederland NV | Netherlands | 962,392 | 39,611,228 | |||||||||||||
Direct Line Insurance Group PLC | United Kingdom | 11,324,835 | 58,375,762 | |||||||||||||
Lancashire Holdings Ltd. | United Kingdom | 3,612,800 | 33,274,138 | |||||||||||||
NN Group NV | Netherlands | 2,111,854 | 91,520,949 | |||||||||||||
RSA Insurance Group PLC | United Kingdom | 8,123,460 | 69,387,316 | |||||||||||||
XL Group Ltd. | Bermuda | 1,127,818 | 39,654,081 | |||||||||||||
|
| |||||||||||||||
| 390,090,072 | ||||||||||||||||
|
| |||||||||||||||
| IT Services 0.4% | ||||||||||||||||
Capgemini SE | France | 87,396 | 10,369,381 | |||||||||||||
|
| |||||||||||||||
| Machinery 2.9% | ||||||||||||||||
CNH Industrial NV | United Kingdom | 2,999,447 | 40,197,889 | |||||||||||||
CNH Industrial NV, special voting | United Kingdom | 833,461 | 11,169,850 | |||||||||||||
| a | Vossloh AG | Germany | 366,097 | 20,556,582 | ||||||||||||
|
| |||||||||||||||
| 71,924,321 | ||||||||||||||||
|
| |||||||||||||||
| Marine 1.0% | ||||||||||||||||
A.P. Moeller-Maersk AS, B | Denmark | 13,740 | 24,003,481 | |||||||||||||
|
| |||||||||||||||
| Media 1.2% | ||||||||||||||||
Sky PLC | United Kingdom | 2,284,938 | 31,227,229 | |||||||||||||
|
| |||||||||||||||
| Metals & Mining 1.0% | ||||||||||||||||
thyssenkrupp AG | Germany | 859,109 | 24,959,830 | |||||||||||||
|
| |||||||||||||||
| Multi-Utilities 1.0% | ||||||||||||||||
innogy SE | Germany | 644,199 | 25,254,834 | |||||||||||||
|
| |||||||||||||||
| Oil, Gas & Consumable Fuels 9.3% | ||||||||||||||||
BP PLC | United Kingdom | 10,819,016 | 76,369,294 | |||||||||||||
| a | Cairn Energy PLC | United Kingdom | 9,565,171 | 27,617,156 | ||||||||||||
Repsol SA | Spain | 485,520 | 8,589,360 | |||||||||||||
Royal Dutch Shell PLC, A (EUR Traded) | United Kingdom | 1,241,414 | 41,384,329 | |||||||||||||
Royal Dutch Shell PLC, A (GBP Traded) | United Kingdom | 1,603,748 | 53,711,382 | |||||||||||||
Total SA | France | 488,727 | 26,999,622 | |||||||||||||
|
| |||||||||||||||
| 234,671,143 | ||||||||||||||||
|
| |||||||||||||||
| Pharmaceuticals 6.8% | ||||||||||||||||
GlaxoSmithKline PLC | United Kingdom | 2,554,947 | 45,630,591 | |||||||||||||
Novartis AG | Switzerland | 1,011,384 | 85,531,936 | |||||||||||||
Sanofi | France | 450,899 | 38,870,034 | |||||||||||||
|
| |||||||||||||||
| 170,032,561 | ||||||||||||||||
|
| |||||||||||||||
| Road & Rail 0.0% | ||||||||||||||||
| a,c,d,e | Euro Wagon LP | Jersey Islands | 16,127,149 | — | ||||||||||||
|
| |||||||||||||||
| Specialty Retail 1.5% | ||||||||||||||||
| a | Dufry AG | Switzerland | 13,909 | 2,068,470 | ||||||||||||
Hornbach Holding AG & Co. KGaA | Germany | 213,786 | 18,986,164 | |||||||||||||
Kingfisher PLC | United Kingdom | 3,905,428 | 17,810,586 | |||||||||||||
|
| |||||||||||||||
| 38,865,220 | ||||||||||||||||
|
| |||||||||||||||
| Tobacco 0.4% | ||||||||||||||||
Imperial Brands PLC | United Kingdom | 241,805 | 10,338,433 | |||||||||||||
|
| |||||||||||||||
franklintempleton.com |
Annual Report |
|
19 |
|
FRANKLIN MUTUAL EUROPEAN FUND
STATEMENT OF INVESTMENTS
| Country | Shares | Value | ||||||||||||||
| Common Stocks (continued) | ||||||||||||||||
| Trading Companies & Distributors 3.9% | ||||||||||||||||
| Kloeckner & Co. SE | Germany | 3,031,653 | $ | 37,428,614 | ||||||||||||
| Rexel SA | France | 3,311,972 | 60,082,408 | |||||||||||||
|
| |||||||||||||||
| 97,511,022 | ||||||||||||||||
|
| |||||||||||||||
| Wireless Telecommunication Services 3.2% | ||||||||||||||||
| Vodafone Group PLC | United Kingdom | 25,502,548 | 80,933,803 | |||||||||||||
|
| |||||||||||||||
| Total Common Stocks (Cost $1,914,083,403) | 2,162,598,402 | |||||||||||||||
|
| |||||||||||||||
| Preferred Stocks 5.7% | ||||||||||||||||
| Auto Components 2.2% | ||||||||||||||||
| f | Schaeffler AG, 3.382%, pfd | Germany | 3,156,455 | 55,992,494 | ||||||||||||
|
| |||||||||||||||
| Automobiles 3.5% | ||||||||||||||||
| f | Volkswagen AG, 1.238%, pfd | Germany | 446,068 | 89,082,778 | ||||||||||||
|
| |||||||||||||||
| Total Preferred Stocks (Cost $116,912,951) | 145,075,272 | |||||||||||||||
|
| |||||||||||||||
Total Investments before Short Term Investments (Cost $2,030,996,354) | 2,307,673,674 | |||||||||||||||
|
| |||||||||||||||
| Principal Amount | ||||||||||||||||
| Short Term Investments 8.7% | ||||||||||||||||
| U.S. Government and Agency Securities 8.7% | ||||||||||||||||
| g | U.S. Treasury Bill, | |||||||||||||||
1/02/18 - 5/03/18 | United States | $ | 185,200,000 | 184,826,783 | ||||||||||||
h3/15/18 - 5/10/18 | United States | 34,000,000 | 33,875,247 | |||||||||||||
|
| |||||||||||||||
Total U.S. Government and Agency Securities (Cost $218,740,949) | 218,702,030 | |||||||||||||||
|
| |||||||||||||||
| Total Investments (Cost $2,249,737,303) 100.3% | 2,526,375,704 | |||||||||||||||
| Other Assets, less Liabilities (0.3)% | (8,234,993 | ) | ||||||||||||||
|
| |||||||||||||||
| Net Assets 100.0% | $ | 2,518,140,711 | ||||||||||||||
|
| |||||||||||||||
aNon-income producing.
bSecurity was purchased pursuant to Rule 144A under the Securities Act of 1933 and may be sold in transactions exempt from registration only to qualified institutional buyers or in a public offering registered under the Securities Act of 1933. This security has been deemed liquid under guidelines approved by the Trust’s Board of Trustees.
cSee Note 11 regarding holdings of 5% voting securities.
dFair valued using significant unobservable inputs. See Note 13 regarding fair value measurements.
eSee Note 9 regarding restricted securities.
fVariable rate security. The rate shown represents the yield at period end.
gThe security was issued on a discount basis with no stated coupon rate.
hA portion or all of the security has been segregated as collateral for open forward exchange contracts. At December 31, 2017, the aggregate value of these securities pledged amounted to $20,421,389, representing 0.8% of net assets.
20 |
Annual Report |
franklintempleton.com |
FRANKLIN MUTUAL EUROPEAN FUND
STATEMENT OF INVESTMENTS
At December 31, 2017, the Fund had the following futures contracts outstanding. See Note 1(c).
Futures Contracts
| Description | Type | Number of Contracts | Notional Amount* | Expiration Date | Value/ Unrealized Appreciation (Depreciation) | |||||||||||||||
| ||||||||||||||||||||
| Currency Contracts | ||||||||||||||||||||
EUR/USD | Short | 3,558 | $ | 537,057,862 | 3/19/18 | $ | (9,580,955 | ) | ||||||||||||
GBP/USD | Short | 2,194 | 185,900,363 | 3/19/18 | (1,252,672 | ) | ||||||||||||||
|
| |||||||||||||||||||
Total Futures Contracts | $ | (10,833,627 | ) | |||||||||||||||||
|
| |||||||||||||||||||
*As of period end.
At December 31, 2017, the Fund had the following forward exchange contracts outstanding. See Note 1(c).
Forward Exchange Contracts
| Currency | Counterpartya | Type | Quantity | Contract Amount | Settlement Date | Unrealized Appreciation | Unrealized Depreciation | |||||||||||||||||||||
| ||||||||||||||||||||||||||||
| OTC Forward Exchange Contracts | ||||||||||||||||||||||||||||
Euro | BOFA | Sell | 121,706 | $ | 140,920 | 1/12/18 | $ | — | $ | (5,232 | ) | |||||||||||||||||
Euro | HSBK | Buy | 2,000,657 | 2,377,639 | 1/12/18 | 24,870 | — | |||||||||||||||||||||
Euro | HSBK | Sell | 17,147,969 | 19,737,590 | 1/12/18 | — | (854,715 | ) | ||||||||||||||||||||
Euro | SSBT | Buy | 4,165,404 | 4,923,088 | 1/12/18 | 78,978 | — | |||||||||||||||||||||
Euro | SSBT | Sell | 781,615 | 905,595 | 1/12/18 | — | (33,014 | ) | ||||||||||||||||||||
Euro | UBSW | Buy | 1,099,330 | 1,303,907 | 1/12/18 | 16,234 | — | |||||||||||||||||||||
Euro | UBSW | Sell | 17,808,336 | 20,493,911 | 1/12/18 | — | (891,404 | ) | ||||||||||||||||||||
British Pound | BOFA | Buy | 205,089 | 273,952 | 1/16/18 | 3,187 | — | |||||||||||||||||||||
British Pound | BOFA | Buy | 273,135 | 369,588 | 1/16/18 | — | (497 | ) | ||||||||||||||||||||
British Pound | BOFA | Sell | 800,000 | 1,045,089 | 1/16/18 | — | (35,962 | ) | ||||||||||||||||||||
British Pound | BONY | Sell | 20,342,297 | 26,306,883 | 1/16/18 | — | (1,181,929 | ) | ||||||||||||||||||||
British Pound | SSBT | Buy | 2,476,000 | 3,313,351 | 1/16/18 | 32,500 | — | |||||||||||||||||||||
British Pound | SSBT | Sell | 472,871 | 618,874 | 1/16/18 | — | (20,123 | ) | ||||||||||||||||||||
British Pound | UBSW | Buy | 299,776 | 406,033 | 1/16/18 | — | (942 | ) | ||||||||||||||||||||
British Pound | UBSW | Buy | 836,138 | 1,124,646 | 1/16/18 | 5,238 | — | |||||||||||||||||||||
British Pound | UBSW | Sell | 20,342,182 | 26,282,099 | 1/16/18 | — | (1,206,557 | ) | ||||||||||||||||||||
Norwegian Krone | HSBK | Sell | 595,000 | 72,049 | 1/25/18 | — | (495 | ) | ||||||||||||||||||||
Norwegian Krone | SSBT | Buy | 244,399 | 29,566 | 1/25/18 | 232 | — | |||||||||||||||||||||
Norwegian Krone | SSBT | Sell | 951,320 | 114,661 | 1/25/18 | — | (1,325 | ) | ||||||||||||||||||||
Norwegian Krone | SSBT | Sell | 37,398,864 | 4,690,807 | 1/25/18 | 131,065 | — | |||||||||||||||||||||
Norwegian Krone | UBSW | Sell | 680,000 | 83,082 | 1/25/18 | 175 | — | |||||||||||||||||||||
Norwegian Krone | UBSW | Sell | 1,674,215 | 200,421 | 1/25/18 | — | (3,702 | ) | ||||||||||||||||||||
Euro | BOFA | Sell | 5,381,488 | 6,492,845 | 1/26/18 | 24,720 | — | |||||||||||||||||||||
Euro | BONY | Sell | 390,335 | 469,973 | 1/26/18 | 821 | — | |||||||||||||||||||||
Euro | BONY | Sell | 13,406,197 | 16,068,868 | 1/26/18 | — | (44,325 | ) | ||||||||||||||||||||
Euro | HSBK | Sell | 68,970,074 | 81,330,730 | 1/26/18 | — | (1,565,868 | ) | ||||||||||||||||||||
Euro | SSBT | Sell | 2,412,487 | 2,893,703 | 1/26/18 | — | (5,916 | ) | ||||||||||||||||||||
Euro | SSBT | Sell | 4,335,103 | 5,217,003 | 1/26/18 | 6,551 | — | |||||||||||||||||||||
Euro | UBSW | Sell | 57,770,074 | 67,898,901 | 1/26/18 | — | (1,536,178 | ) | ||||||||||||||||||||
British Pound | BOFA | Sell | 2,455,015 | 3,264,185 | 2/14/18 | — | (56,318 | ) | ||||||||||||||||||||
British Pound | BONY | Sell | 38,061,746 | 49,767,940 | 2/14/18 | — | (1,712,054 | ) | ||||||||||||||||||||
British Pound | HSBK | Sell | 6,473,077 | 8,599,960 | 2/14/18 | — | (155,130 | ) | ||||||||||||||||||||
franklintempleton.com | Annual Report |
|
21 |
|
FRANKLIN MUTUAL EUROPEAN FUND
STATEMENT OF INVESTMENTS
Forward Exchange Contracts (continued)
| Currency | Counterpartya | Type | Quantity | Contract Amount | Settlement Date | Unrealized Appreciation | Unrealized Depreciation | |||||||||||||||||||||
| ||||||||||||||||||||||||||||
OTC Forward Exchange Contracts (continued) |
| |||||||||||||||||||||||||||
British Pound | UBSW | Sell | 38,061,745 | $ | 49,767,825 | 2/14/18 | $ — | $ | (1,712,168 | ) | ||||||||||||||||||
Euro | BONY | Sell | 78,841,408 | 93,177,220 | 2/20/18 | — | (1,715,423 | ) | ||||||||||||||||||||
Euro | SSBT | Sell | 78,841,408 | 93,159,008 | 2/20/18 | — | (1,733,636 | ) | ||||||||||||||||||||
Swiss Franc | BOFA | Sell | 14,997,942 | 15,224,693 | 3/05/18 | — | (239,941 | ) | ||||||||||||||||||||
Euro | HSBK | Sell | 54,121,678 | 64,122,282 | 4/10/18 | — | (1,225,054 | ) | ||||||||||||||||||||
Euro | UBSW | Sell | 54,121,678 | 64,133,647 | 4/10/18 | — | (1,213,688 | ) | ||||||||||||||||||||
Euro | BOFA | Sell | 32,200,756 | 38,415,984 | 4/18/18 | — | (484,487 | ) | ||||||||||||||||||||
Euro | SSBT | Sell | 32,200,755 | 38,415,018 | 4/18/18 | — | (485,454 | ) | ||||||||||||||||||||
Euro | UBSW | Sell | 32,200,756 | 38,421,620 | 4/18/18 | — | (478,852 | ) | ||||||||||||||||||||
British Pound | BOFA | Sell | 40,074,643 | 53,087,998 | 4/24/18 | — | (1,247,256 | ) | ||||||||||||||||||||
British Pound | UBSW | Sell | 39,042,293 | 51,702,108 | 4/24/18 | — | (1,233,432 | ) | ||||||||||||||||||||
Euro | HSBK | Sell | 44,418,188 | 52,419,991 | 5/07/18 | — | (1,308,118 | ) | ||||||||||||||||||||
Euro | UBSW | Sell | 44,418,188 | 52,410,574 | 5/07/18 | — | (1,317,535 | ) | ||||||||||||||||||||
Euro | BOFA | Sell | 68,574,884 | 81,729,305 | 5/21/18 | — | (1,296,467 | ) | ||||||||||||||||||||
Euro | UBSW | Sell | 64,367,297 | 76,745,529 | 5/21/18 | — | (1,185,986 | ) | ||||||||||||||||||||
British Pound | HSBK | Sell | 1,548,565 | 2,103,896 | 5/24/18 | 1,971 | — | |||||||||||||||||||||
British Pound | SSBT | Sell | 10,535,860 | 14,052,045 | 5/24/18 | — | (248,669 | ) | ||||||||||||||||||||
|
| |||||||||||||||||||||||||||
Total Forward Exchange Contracts | $ 326,542 | $ | (26,437,852 | ) | ||||||||||||||||||||||||
|
| |||||||||||||||||||||||||||
Net unrealized appreciation (depreciation) |
| $ | (26,111,310 | ) | ||||||||||||||||||||||||
|
| |||||||||||||||||||||||||||
aMay be comprised of multiple contracts with the same counterparty, currency and settlement date.
See Note 10 regarding other derivative information.
See Abbreviations on page 38.
22 |
Annual Report | The accompanying notes are an integral part of these financial statements. |
franklintempleton.com |
FRANKLIN MUTUAL EUROPEAN FUND
Statement of Assets and Liabilities
December 31, 2017
Assets: | ||||
Investments in securities: | ||||
Cost - Unaffiliated issuers | $ | 2,243,454,794 | ||
Cost - Controlled affiliates (Note 11) | 6,282,509 | |||
|
| |||
Value - Unaffiliated issuers | $ | 2,526,375,704 | ||
Value - Controlled affiliates (Note 11) | — | |||
Cash | 154,228 | |||
Foreign currency, at value (cost $2,993,356) | 3,005,224 | |||
Receivables: | ||||
Investment securities sold | 889,478 | |||
Capital shares sold | 2,695,794 | |||
Dividends and interest | 8,282,358 | |||
European Union tax reclaims | 2,989,872 | |||
Deposits with brokers for: | ||||
Futures contracts | 11,990,160 | |||
Unrealized appreciation on OTC forward exchange contracts | 326,542 | |||
Other assets | 287 | |||
|
| |||
Total assets | 2,556,709,647 | |||
|
| |||
Liabilities: | ||||
Payables: | ||||
Investment securities purchased | 343,178 | |||
Capital shares redeemed | 4,314,460 | |||
Management fees | 1,840,190 | |||
Distribution fees | 610,049 | |||
Transfer agent fees | 507,198 | |||
Trustees’ fees and expenses | 94,720 | |||
Variation margin on futures contracts. | 4,093,875 | |||
Unrealized depreciation on OTC forward exchange contracts | 26,437,852 | |||
Accrued expenses and other liabilities | 327,414 | |||
|
| |||
Total liabilities | 38,568,936 | |||
|
| |||
Net assets, at value | $ | 2,518,140,711 | ||
|
| |||
Net assets consist of: | ||||
Paid-in capital | $ | 2,471,669,291 | ||
Undistributed net investment income | 21,175,134 | |||
Net unrealized appreciation (depreciation) | 240,049,804 | |||
Accumulated net realized gain (loss) | (214,753,518 | ) | ||
|
| |||
Net assets, at value | $ | 2,518,140,711 | ||
|
|
franklintempleton.com |
The accompanying notes are an integral part of these financial statements. | |
Annual Report |
23 |
FRANKLIN MUTUAL EUROPEAN FUND
FINANCIAL STATEMENTS
Statement of Assets and Liabilities (continued)
December 31, 2017
| Class Z: | ||||
Net assets, at value | $1,328,621,844 | |||
|
| |||
Shares outstanding | 63,488,937 | |||
|
| |||
Net asset value and maximum offering price per share | $20.93 | |||
|
| |||
| Class A: | ||||
Net assets, at value | $ 714,915,022 | |||
|
| |||
Shares outstanding | 35,162,533 | |||
|
| |||
Net asset value per sharea | $20.33 | |||
|
| |||
Maximum offering price per share (net asset value per share ÷ 94.25%) | $21.57 | |||
|
| |||
| Class C: | ||||
Net assets, at value | $ 179,122,984 | |||
|
| |||
Shares outstanding | 8,789,733 | |||
|
| |||
Net asset value and maximum offering price per sharea | $20.38 | |||
|
| |||
| Class R: | ||||
Net assets, at value | $ 820,789 | |||
|
| |||
Shares outstanding | 41,111 | |||
|
| |||
Net asset value and maximum offering price per share | $19.97 | |||
|
| |||
| Class R6: | ||||
Net assets, at value | $ 294,660,072 | |||
|
| |||
Shares outstanding | 14,091,658 | |||
|
| |||
Net asset value and maximum offering price per share | $20.91 | |||
|
|
aRedemption price is equal to net asset value less contingent deferred sales charges, if applicable.
24 |
Annual Report | The accompanying notes are an integral part of these financial statements. |
franklintempleton.com |
FRANKLIN MUTUAL EUROPEAN FUND
FINANCIAL STATEMENTS
Statement of Operations
for the year ended December 31, 2017
Investment income: | ||||
Dividends: (net of foreign taxes)* | ||||
Unaffiliated issuers | $ | 68,928,653 | ||
Interest: | ||||
Unaffiliated issuers | 2,381,635 | |||
Other income (Note 1e) | 550,416 | |||
|
| |||
Total investment income | 71,860,704 | |||
|
| |||
Expenses: | ||||
Management fees (Note 3a) | 21,928,101 | |||
Distribution fees: (Note 3c) | ||||
Class A | 1,868,293 | |||
Class C | 1,959,571 | |||
Class R | 3,383 | |||
Transfer agent fees: (Note 3e) | ||||
Class Z | 2,039,253 | |||
Class A | 1,172,070 | |||
Class C | 307,337 | |||
Class R | 1,062 | |||
Class R6 | 12,587 | |||
Custodian fees (Note 4) | 266,926 | |||
Reports to shareholders | 140,200 | |||
Registration and filing fees | 114,933 | |||
Professional fees | 159,195 | |||
Trustees’ fees and expenses | 78,682 | |||
Other | 86,674 | |||
|
| |||
Total expenses | 30,138,267 | |||
Expense reductions (Note 4) | (31,645 | ) | ||
|
| |||
Net expenses | 30,106,622 | |||
|
| |||
Net investment income | 41,754,082 | |||
|
| |||
Realized and unrealized gains (losses): | ||||
Net realized gain (loss) from: | ||||
Investments: | ||||
Unaffiliated issuers | 80,334,263 | |||
Foreign currency transactions | 870,468 | |||
Forward exchange contracts | (62,447,783 | ) | ||
Futures contracts | (55,698,381 | ) | ||
|
| |||
Net realized gain (loss) | (36,941,433 | ) | ||
|
| |||
Net change in unrealized appreciation (depreciation) on: | ||||
Investments: | ||||
Unaffiliated issuers | 336,586,998 | |||
Translation of other assets and liabilities denominated in foreign currencies | 916,931 | |||
Forward exchange contracts | (75,466,518 | ) | ||
Futures contracts | (16,983,478 | ) | ||
|
| |||
Net change in unrealized appreciation (depreciation) | 245,053,933 | |||
|
| |||
Net realized and unrealized gain (loss) | 208,112,500 | |||
|
| |||
Net increase (decrease) in net assets resulting from operations | $ | 249,866,582 | ||
|
| |||
*Foreign taxes withheld on dividends | $ | 7,169,851 | ||
franklintempleton.com |
The accompanying notes are an integral part of these financial statements. | |
Annual Report |
25 |
FRANKLIN MUTUAL EUROPEAN FUND
FINANCIAL STATEMENTS
Statements of Changes in Net Assets
| Year Ended December 31, | ||||||||
|
| |||||||
| 2017 | 2016 | |||||||
| ||||||||
Increase (decrease) in net assets: | ||||||||
Operations: | ||||||||
Net investment income | $ | 41,754,082 | $ | 86,670,906 | ||||
Net realized gain (loss) | (36,941,433 | ) | (142,742,912 | ) | ||||
Net change in unrealized appreciation (depreciation) | 245,053,933 | 80,746,396 | ||||||
|
| |||||||
Net increase (decrease) in net assets resulting from operations | 249,866,582 | 24,674,390 | ||||||
|
| |||||||
Distributions to shareholders from: | ||||||||
Net investment income: | ||||||||
Class Z | (17,540,243 | ) | (28,255,499 | ) | ||||
Class A | (7,669,484 | ) | (16,888,293 | ) | ||||
Class C | (661,962 | ) | (2,839,954 | ) | ||||
Class R | (7,585 | ) | (11,461 | ) | ||||
Class R6 | (4,427,392 | ) | (7,900,715 | ) | ||||
Net realized gains: | ||||||||
Class Z | — | (16,457,536 | ) | |||||
Class A | — | (12,347,412 | ) | |||||
Class C | — | (3,328,152 | ) | |||||
Class R | — | (12,030 | ) | |||||
Class R6 | — | (4,582,657 | ) | |||||
|
| |||||||
Total distributions to shareholders | (30,306,666 | ) | (92,623,709 | ) | ||||
|
| |||||||
Capital share transactions: (Note 2) | ||||||||
Class Z | 43,359,185 | (153,067,905 | ) | |||||
Class A | (118,591,024 | ) | (238,121,733 | ) | ||||
Class C | (47,346,696 | ) | (74,322,720 | ) | ||||
Class R | 141,266 | (342,532 | ) | |||||
Class R6 | (45,857,168 | ) | (55,061,378 | ) | ||||
|
| |||||||
Total capital share transactions | (168,294,437 | ) | (520,916,268 | ) | ||||
|
| |||||||
Net increase (decrease) in net assets | 51,265,479 | (588,865,587 | ) | |||||
Net assets: | ||||||||
Beginning of year | 2,466,875,232 | 3,055,740,819 | ||||||
|
| |||||||
End of year | $ | 2,518,140,711 | $ | 2,466,875,232 | ||||
|
| |||||||
Undistributed net investment income included in net assets: | ||||||||
End of year | $ | 21,175,134 | $ | 33,336,341 | ||||
|
| |||||||
| 26 | Annual Report | The accompanying notes are an integral part of these financial statements. | franklintempleton.com | ||
FRANKLIN MUTUAL EUROPEAN FUND
1. Organization and Significant Accounting Policies
Franklin Mutual Series Funds (Trust) is registered under the Investment Company Act of 1940 (1940 Act) as an open-end management investment company, consisting of seven separate funds and applies the specialized accounting and reporting guidance in U.S. Generally Accepted Accounting Principles (U.S. GAAP). Franklin Mutual European Fund (Fund) is included in this report. The Fund offers five classes of shares: Class Z, Class A, Class C, Class R and Class R6. Each class of shares may differ by its initial sales load, contingent deferred sales charges, voting rights on matters affecting a single class, its exchange privilege and fees due to differing arrangements for distribution and transfer agent fees.
The following summarizes the Fund’s significant accounting policies.
a. Financial Instrument Valuation
The Fund’s investments in financial instruments are carried at fair value daily. Fair value is the price that would be received to sell an asset or paid to transfer a liability in an orderly transaction between market participants on the measurement date. The Fund calculates the net asset value (NAV) per share as of 4 p.m. Eastern time each day the New York Stock Exchange (NYSE) is open for trading. Under compliance policies and procedures approved by the Trust’s Board of Trustees (the Board), the Fund’s administrator has responsibility for oversight of valuation, including leading the cross-functional Valuation Committee (VC). The VC provides administration and oversight of the Fund’s valuation policies and procedures, which are approved annually by the Board. Among other things, these procedures allow the Fund to utilize independent pricing services, quotations from securities and financial instrument dealers, and other market sources to determine fair value.
Equity securities and derivative financial instruments listed on an exchange or on the NASDAQ National Market System are valued at the last quoted sale price or the official closing price of the day, respectively. Foreign equity securities are valued as of the close of trading on the foreign stock exchange on which the security is primarily traded, or as of 4 p.m. Eastern time. The value is then converted into its U.S. dollar equivalent at the foreign exchange rate in effect at 4 p.m. Eastern time on the day that the value of the security is determined. Over-the-counter (OTC) securities are valued within the range of the most recent
quoted bid and ask prices. Securities that trade in multiple markets or on multiple exchanges are valued according to the broadest and most representative market. Certain equity securities are valued based upon fundamental characteristics or relationships to similar securities.
Debt securities generally trade in the OTC market rather than on a securities exchange. The Fund’s pricing services use multiple valuation techniques to determine fair value. In instances where sufficient market activity exists, the pricing services may utilize a market-based approach through which quotes from market makers are used to determine fair value. In instances where sufficient market activity may not exist or is limited, the pricing services also utilize proprietary valuation models which may consider market characteristics such as benchmark yield curves, credit spreads, estimated default rates, anticipated market interest rate volatility, coupon rates, anticipated timing of principal repayments, underlying collateral, and other unique security features in order to estimate the relevant cash flows, which are then discounted to calculate the fair value.
Certain derivative financial instruments trade in the OTC market. The Fund’s pricing services use various techniques including industry standard option pricing models and proprietary discounted cash flow models to determine the fair value of those instruments. The Fund’s net benefit or obligation under the derivative contract, as measured by the fair value of the contract, is included in net assets.
The Fund has procedures to determine the fair value of financial instruments for which market prices are not reliable or readily available. Under these procedures, the VC convenes on a regular basis to review such financial instruments and considers a number of factors, including significant unobservable valuation inputs, when arriving at fair value. The VC primarily employs a market-based approach which may use related or comparable assets or liabilities, recent transactions, market multiples, book values, and other relevant information for the investment to determine the fair value of the investment. An income-based valuation approach may also be used in which the anticipated future cash flows of the investment are discounted to calculate fair value. Discounts may also be applied due to the nature or duration of any restrictions on the disposition of the investments. Due to the inherent uncertainty of valuations of such investments, the fair values may differ significantly from the values that would have been used had an active market existed. The VC employs various methods for calibrating these
franklintempleton.com |
Annual Report |
27 |
FRANKLIN MUTUAL EUROPEAN FUND
NOTES TO FINANCIAL STATEMENTS
1. Organization and Significant Accounting Policies
(continued)
a. Financial Instrument Valuation (continued)
valuation approaches including a regular review of key inputs and assumptions, transactional back-testing or disposition analysis, and reviews of any related market activity.
Trading in securities on foreign securities stock exchanges and OTC markets may be completed before 4 p.m. Eastern time. In addition, trading in certain foreign markets may not take place on every Fund’s business day. Occasionally, events occur between the time at which trading in a foreign security is completed and 4 p.m. Eastern time that might call into question the reliability of the value of a portfolio security held by the Fund. As a result, differences may arise between the value of the Fund’s portfolio securities as determined at the foreign market close and the latest indications of value at 4 p.m. Eastern time. In order to minimize the potential for these differences, the VC monitors price movements following the close of trading in foreign stock markets through a series of country specific market proxies (such as baskets of American Depositary Receipts, futures contracts and exchange traded funds). These price movements are measured against established trigger thresholds for each specific market proxy to assist in determining if an event has occurred that may call into question the reliability of the values of the foreign securities held by the Fund. If such an event occurs, the securities may be valued using fair value procedures, which may include the use of independent pricing services.
When the last day of the reporting period is a non-business day, certain foreign markets may be open on those days that the Fund’s NAV is not calculated, which could result in differences between the value of the Fund’s portfolio securities on the last business day and the last calendar day of the reporting period. Any significant security valuation changes due to an open foreign market are adjusted and reflected by the Fund for financial reporting purposes.
b. Foreign Currency Translation
Portfolio securities and other assets and liabilities denominated in foreign currencies are translated into U.S. dollars based on the exchange rate of such currencies against U.S. dollars on the date of valuation. The Fund may enter into foreign currency exchange contracts to facilitate transactions denominated in a foreign currency. Purchases and sales of securities, income and
expense items denominated in foreign currencies are translated into U.S. dollars at the exchange rate in effect on the transaction date. Portfolio securities and assets and liabilities denominated in foreign currencies contain risks that those currencies will decline in value relative to the U.S. dollar. Occasionally, events may impact the availability or reliability of foreign exchange rates used to convert the U.S. dollar equivalent value. If such an event occurs, the foreign exchange rate will be valued at fair value using procedures established and approved by the Board.
The Fund does not separately report the effect of changes in foreign exchange rates from changes in market prices on securities held. Such changes are included in net realized and unrealized gain or loss from investments in the Statement of Operations.
Realized foreign exchange gains or losses arise from sales of foreign currencies, currency gains or losses realized between the trade and settlement dates on securities transactions and the difference between the recorded amounts of dividends, interest, and foreign withholding taxes and the U.S. dollar equivalent of the amounts actually received or paid. Net unrealized foreign exchange gains and losses arise from changes in foreign exchange rates on foreign denominated assets and liabilities other than investments in securities held at the end of the reporting period.
c. Derivative Financial Instruments
The Fund invested in derivative financial instruments in order to manage risk or gain exposure to various other investments or markets. Derivatives are financial contracts based on an underlying or notional amount, require no initial investment or an initial net investment that is smaller than would normally be required to have a similar response to changes in market factors, and require or permit net settlement. Derivatives contain various risks including the potential inability of the counterparty to fulfill their obligations under the terms of the contract, the potential for an illiquid secondary market, and/or the potential for market movements which expose the Fund to gains or losses in excess of the amounts shown in the Statement of Assets and Liabilities. Realized gain and loss and unrealized appreciation and depreciation on these contracts for the period are included in the Statement of Operations.
Derivative counterparty credit risk is managed through a formal evaluation of the creditworthiness of all potential counter-parties. The Fund attempts to reduce its exposure to
28 |
Annual Report |
franklintempleton.com |
FRANKLIN MUTUAL EUROPEAN FUND
NOTES TO FINANCIAL STATEMENTS
counterparty credit risk on OTC derivatives, whenever possible, by entering into International Swaps and Derivatives Association (ISDA) master agreements with certain counterparties. These agreements contain various provisions, including but not limited to collateral requirements, events of default, or early termination. Termination events applicable to the counterparty include certain deteriorations in the credit quality of the counterparty. Termination events applicable to the Fund include failure of the Fund to maintain certain net asset levels and/or limit the decline in net assets over various periods of time. In the event of default or early termination, the ISDA master agreement gives the non-defaulting party the right to net and close-out all transactions traded, whether or not arising under the ISDA agreement, to one net amount payable by one counterparty to the other. However, absent an event of default or early termination, OTC derivative assets and liabilities are presented gross and not offset in the Statement of Assets and Liabilities. Early termination by the counterparty may result in an immediate payment by the Fund of any net liability owed to that counterparty under the ISDA agreement.
Collateral requirements differ by type of derivative. Collateral or initial margin requirements are set by the broker or exchange clearing house for exchange traded and centrally cleared derivatives. Initial margin deposited is held at the exchange and can be in the form of cash and/or securities. For OTC derivatives traded under an ISDA master agreement, posting of collateral is required by either the Fund or the applicable counterparty if the total net exposure of all OTC derivatives with the applicable counterparty exceeds the minimum transfer amount, which typically ranges from $100,000 to $250,000, and can vary depending on the counterparty and the type of the agreement. Generally, collateral is determined at the close of Fund business each day and any additional collateral required due to changes in derivative values may be delivered by the Fund or the counterparty the next business day, or within a few business days. Collateral pledged and/or received by the Fund for OTC derivatives, if any, is held in segregated accounts with the Fund’s custodian/counterparty broker and can be in the form of cash and/or securities. Unrestricted cash may be invested according to the Fund’s investment objectives. To the extent that the amounts due to the Fund from its counterparties are not subject to collateralization or are not fully collateralized, the Fund bears the risk of loss from counterparty non-performance.
The Fund entered into exchange traded futures contracts primarily to manage exposure to certain foreign currencies. A futures contract is an agreement between the Fund and a counterparty to buy or sell an asset at a specified price on a future date. Required initial margins are pledged by the Fund, and the daily change in fair value is accounted for as a variation margin payable or receivable in the Statement of Assets and Liabilities.
The Fund entered into OTC forward exchange contracts primarily to manage exposure to certain foreign currencies. A forward exchange contract is an agreement between the Fund and a counterparty to buy or sell a foreign currency at a specific exchange rate on a future date.
See Note 10 regarding other derivative information.
d. Securities Sold Short
The Fund is engaged in selling securities short, which obligates the Fund to replace a borrowed security with the same security at current fair value. The Fund incurs a loss if the price of the security increases between the date of the short sale and the date on which the Fund replaces the borrowed security. The Fund realizes a gain if the price of the security declines between those dates. Gains are limited to the price at which the Fund sold the security short, while losses are potentially unlimited in size.
The Fund is required to establish a margin account with the broker lending the security sold short. While the short sale is outstanding, the broker retains the proceeds of the short sale to the extent necessary to meet margin requirements until the short position is closed out. A deposit must also be maintained with the Fund’s custodian/counterparty broker consisting of cash and/or securities having a value equal to a specified percentage of the value of the securities sold short. The Fund is obligated to pay fees for borrowing the securities sold short and is required to pay the counterparty any dividends and/or interest due on securities sold short. Such dividends and/or interest and any security borrowing fees are recorded as an expense to the Fund. At December 31, 2017, the Fund had no securities sold short.
e. Income and Deferred Taxes
It is the Fund’s policy to qualify as a regulated investment company under the Internal Revenue Code. The Fund intends to distribute to shareholders substantially all of its taxable income
franklintempleton.com |
Annual Report |
29 |
FRANKLIN MUTUAL EUROPEAN FUND
NOTES TO FINANCIAL STATEMENTS
1. Organization and Significant Accounting Policies
(continued)
e. Income and Deferred Taxes (continued)
and net realized gains to relieve it from federal income and excise taxes. As a result, no provision for U.S. federal income taxes is required.
The Fund may be subject to foreign taxation related to income received, capital gains on the sale of securities and certain foreign currency transactions in the foreign jurisdictions in which it invests. Foreign taxes, if any, are recorded based on the tax regulations and rates that exist in the foreign markets in which the Fund invests. When a capital gain tax is determined to apply, the Fund records an estimated deferred tax liability in an amount that would be payable if the securities were disposed of on the valuation date.
As a result of several court cases, in certain countries across the European Union, the Fund filed additional tax reclaims for previously withheld taxes on dividends earned in those countries (EU reclaims). These additional filings are subject to various administrative proceedings by the local jurisdictions’ tax authorities within the European Union, as well as a number of related judicial proceedings. Income recognized, if any, for EU reclaims is reflected as other income in the Statement of Operations and any related receivable, if any, is reflected as European Union tax reclaims in the Statement of Assets and Liabilities. When uncertainty exists as to the ultimate resolution of these proceedings, the likelihood of receipt of these EU reclaims, and the potential timing of payment, no amounts are reflected in the financial statements. For U.S. income tax purposes, EU reclaims received by the Fund, if any, reduce the amounts of foreign taxes Fund shareholders can use as tax credits in their individual income tax returns.
The Fund may recognize an income tax liability related to its uncertain tax positions under U.S. GAAP when the uncertain tax position has a less than 50% probability that it will be sustained upon examination by the tax authorities based on its technical merits. As of December 31, 2017, the Fund has determined that no tax liability is required in its financial statements related to uncertain tax positions for any open tax years (or expected to be taken in future tax years). Open tax years are those that remain subject to examination and are based on the statute of limitations in each jurisdiction in which the Fund invests.
f. Security Transactions, Investment Income, Expenses and Distributions
Security transactions are accounted for on trade date. Realized gains and losses on security transactions are determined on a specific identification basis. Interest income and estimated expenses are accrued daily. Amortization of premium and accretion of discount on debt securities are included in interest income. Dividend income is recorded on the ex-dividend date except for certain dividends from securities where the dividend rate is not available. In such cases, the dividend is recorded as soon as the information is received by the Fund. Distributions to shareholders are recorded on the ex-dividend date. Distributable earnings are determined according to income tax regulations (tax basis) and may differ from earnings recorded in accordance with U.S. GAAP. These differences may be permanent or temporary. Permanent differences are reclassified among capital accounts to reflect their tax character. These reclassifications have no impact on net assets or the results of operations. Temporary differences are not reclassified, as they may reverse in subsequent periods.
Common expenses incurred by the Trust are allocated among the Funds based on the ratio of net assets of each Fund to the combined net assets of the Trust. Fund specific expenses are charged directly to the Fund that incurred the expense.
Realized and unrealized gains and losses and net investment income, excluding class specific expenses, are allocated daily to each class of shares based upon the relative proportion of net assets of each class. Differences in per share distributions by class are generally due to differences in class specific expenses.
g. Accounting Estimates
The preparation of financial statements in accordance with U.S. GAAP requires management to make estimates and assumptions that affect the reported amounts of assets and liabilities at the date of the financial statements and the amounts of income and expenses during the reporting period. Actual results could differ from those estimates.
h. Guarantees and Indemnifications
Under the Trust’s organizational documents, its officers and trustees are indemnified by the Trust against certain liabilities arising out of the performance of their duties to the Trust. Additionally, in the normal course of business, the Trust, on behalf of the Fund, enters into contracts with service providers that contain general indemnification clauses. The Trust’s
30 |
Annual Report |
franklintempleton.com |
FRANKLIN MUTUAL EUROPEAN FUND
NOTES TO FINANCIAL STATEMENTS
maximum exposure under these arrangements is unknown as this would involve future claims that may be made against the Trust that have not yet occurred. Currently, the Trust expects the risk of loss to be remote.
2. Shares of Beneficial Interest
At December 31, 2017, there were an unlimited number of shares authorized (without par value). Transactions in the Fund’s shares were as follows:
| Year Ended December 31, | ||||||||||||||||
| 2017 | 2016 | |||||||||||||||
Shares |
Amount |
Shares |
Amount | |||||||||||||
Class Z Shares: | ||||||||||||||||
Shares sold | 17,236,906 | $ | 350,944,087 | 15,887,532 | $ | 289,620,406 | ||||||||||
Shares issued in reinvestment of distributions | 789,963 | 16,435,905 | 2,149,123 | 40,692,946 | ||||||||||||
Shares redeemed
|
| (15,782,895
| )
|
| (324,020,807
| )
|
| (26,381,377
| )
|
| (483,381,257
| )
| ||||
Net increase (decrease)
|
| 2,243,974
|
| $
| 43,359,185
|
|
| (8,344,722
| )
| $
| (153,067,905
| )
| ||||
| Class A Shares: | ||||||||||||||||
Shares sold | 15,602,529 | $ | 310,200,219 | 8,051,045 | $ | 142,359,812 | ||||||||||
Shares issued in reinvestment of distributions | 287,521 | 5,802,513 | 1,310,378 | 24,063,648 | ||||||||||||
Shares redeemed
|
| (21,954,991
| )
|
| (434,593,756
| )
|
| (22,672,948
| )
|
| (404,545,193
| )
| ||||
Net increase (decrease)
|
| (6,064,941
| )
| $
| (118,591,024
| )
|
| (13,311,525
| )
| $
| (238,121,733
| )
| ||||
| Class C Shares: | ||||||||||||||||
Shares sold | 1,180,124 | $ | 23,513,530 | 1,157,702 | $ | 20,444,715 | ||||||||||
Shares issued in reinvestment of distributions | 32,119 | 639,507 | 316,883 | 5,796,600 | ||||||||||||
Shares redeemed
|
| (3,606,833
| )
|
| (71,499,733
| )
|
| (5,665,889
| )
|
| (100,564,035
| )
| ||||
Net increase (decrease)
|
| (2,394,590
| )
| $
| (47,346,696
| )
|
| (4,191,304
| )
| $
| (74,322,720
| )
| ||||
| Class R Shares: | ||||||||||||||||
Shares sold | 16,679 | $ | 329,815 | 8,245 | $ | 141,919 | ||||||||||
Shares issued in reinvestment of distributions | 382 | 7,585 | 1,306 | 23,491 | ||||||||||||
Shares redeemed
|
| (10,067
| )
|
| (196,134
| )
|
| (28,993
| )
|
| (507,942
| )
| ||||
Net increase (decrease)
|
| 6,994
|
| $
| 141,266
|
|
| (19,442
| )
| $
| (342,532
| )
| ||||
| Class R6 Shares: | ||||||||||||||||
Shares sold | 3,235,565 | $ | 65,830,080 | 4,455,100 | $ | 81,890,311 | ||||||||||
Shares issued in reinvestment of distributions | 185,294 | 3,853,120 | 577,663 | 10,934,416 | ||||||||||||
Shares redeemed
|
| (5,580,242
| )
|
| (115,540,368
| )
|
| (7,987,118
| )
|
| (147,886,105
| )
| ||||
Net increase (decrease)
|
| (2,159,383
| )
| $
| (45,857,168
| )
|
| (2,954,355
| )
| $
| (55,061,378
| )
| ||||
franklintempleton.com |
Annual Report |
31 |
FRANKLIN MUTUAL EUROPEAN FUND
NOTES TO FINANCIAL STATEMENTS
3. Transactions with Affiliates
Franklin Resources, Inc. is the holding company for various subsidiaries that together are referred to as Franklin Templeton Investments. Certain officers and trustees of the Fund are also officers and/or directors of the following subsidiaries:
| Subsidiary | Affiliation | |||
Franklin Mutual Advisers, LLC (Franklin Mutual) | Investment manager | |||
Franklin Templeton Services, LLC (FT Services) | Administrative manager | |||
Franklin Templeton Distributors, Inc. (Distributors) | Principal underwriter | |||
Franklin Templeton Investor Services, LLC (Investor Services) | Transfer agent |
a. Management Fees
The Fund pays an investment management fee to Franklin Mutual based on the average daily net assets of the Fund as follows:
| Annualized Fee Rate | Net Assets | |||
0.875% | Up to and including $1 billion | |||
0.845% | Over $1 billion, up to and including $2 billion | |||
0.825% | Over $2 billion, up to and including $5 billion | |||
0.805% | In excess of $5 billion |
For the year ended December 31, 2017, the gross effective investment management fee rate was 0.852% of the Fund’s average daily net assets.
b. Administrative Fees
Under an agreement with Franklin Mutual, FT Services provides administrative services to the Fund. The fee is paid by Franklin Mutual based on the Fund’s average daily net assets, and is not an additional expense of the Fund.
c. Distribution Fees
The Board has adopted distribution plans for each share class, with the exception of Class Z and Class R6 shares, pursuant to Rule 12b-1 under the 1940 Act. Under the Fund’s Class A reimbursement distribution plan, the Fund reimburses Distributors for costs incurred in connection with the servicing, sale and distribution of the Fund’s shares up to the maximum annual plan rate. Under the Class A reimbursement distribution plan, costs exceeding the maximum for the current plan year cannot be reimbursed in subsequent periods. In addition, under the Fund’s Class C and R compensation distribution plans, the Fund pays Distributors for costs incurred in connection with the servicing, sale and distribution of the Fund’s shares up to the maximum annual plan rate for each class. The plan year, for purposes of monitoring compliance with the maximum annual plan rates, is February 1 through January 31.
The maximum annual plan rates, based on the average daily net assets, for each class, are as follows:
Class A | 0.35 | % | ||
Class C | 1.00 | % | ||
Class R | 0.50 | % |
The Board has set the current rate at 0.25% per year for Class A shares until further notice and approval by the Board.
32 |
Annual Report |
franklintempleton.com |
FRANKLIN MUTUAL EUROPEAN FUND
NOTES TO FINANCIAL STATEMENTS
d. Sales Charges/Underwriting Agreements
Front-end sales charges and contingent deferred sales charges (CDSC) do not represent expenses of the Fund. These charges are deducted from the proceeds of sales of Fund shares prior to investment or from redemption proceeds prior to remittance, as applicable. Distributors has advised the Fund of the following commission transactions related to the sales and redemptions of the Fund’s shares for the year:
Sales charges retained net of commissions paid to unaffiliated brokers/dealers | $ | 133,400 | ||
CDSC retained | $ | 102,489 |
e. Transfer Agent Fees
Each class of shares pays transfer agent fees to Investor Services for its performance of shareholder servicing obligations. Effective November 1, 2017, the fees are based on an annualized asset based fee of 0.02% plus a transaction based fee. Prior to November 1, 2017, the fees were account based fees that varied based on fund or account type. In addition, each class reimburses Investor Services for out of pocket expenses incurred and, except for Class R6, reimburses shareholder servicing fees paid to third parties. These fees are allocated daily based upon their relative proportion of such classes’ aggregate net assets. Class R6 pays Investor Services transfer agent fees specific to that class.
For the year ended December 31, 2017, the Fund paid transfer agent fees of $3,532,309, of which $1,703,684 was retained by Investor Services.
f. Other Affiliated Transactions
At December 31, 2017, one or more of the funds in Franklin Fund Allocator Series owned 9.5% of the Fund’s outstanding shares.
4. Expense Offset Arrangement
The Fund has entered into an arrangement with its custodian whereby credits realized as a result of uninvested cash balances are used to reduce a portion of the Fund’s custodian expenses. During the year ended December 31, 2017, the custodian fees were reduced as noted in the Statement of Operations.
5. Independent Trustees’ Retirement Plan
On January 1, 1993, the Trust adopted an Independent Trustees’ Retirement Plan (Plan). The Plan is an unfunded defined benefit plan that provides benefit payments to Trustees whose length of service and retirement age meets the eligibility requirements of the Plan. Benefits under the Plan are based on years of service and fees paid to each trustee at the time of retirement. Effective in December 1996, the Plan was closed to new participants.
During the year ended December 31, 2017, the Fund’s projected benefit obligation and benefit payments under the Plan were as follows:
aProjected benefit obligation at December 31, 2017 | $ | 94,720 | ||
bIncrease in projected benefit obligation | $ | 2,070 | ||
Benefit payments made to retired trustees | $ | (2,515 | ) |
aThe projected benefit obligation is included in trustees’ fees and expenses in the Statement of Assets and Liabilities.
bThe increase in projected benefit obligation is included in trustees’ fees and expenses in the Statement of Operations.
6. Income Taxes
For tax purposes, capital losses may be carried over to offset future capital gains, if any.
franklintempleton.com |
Annual Report |
33 |
FRANKLIN MUTUAL EUROPEAN FUND
NOTES TO FINANCIAL STATEMENTS
6. Income Taxes (continued)
At December 31, 2017, the capital loss carryforwards were as follows:
Capital loss carryforwards: | ||||
Short term | $ | 82,846,650 | ||
Long term | 171,281,334 | |||
Total capital loss carryforwards | $ | 254,127,984 | ||
The tax character of distributions paid during the years ended December 31, 2017 and 2016, was as follows:
| 2017 | 2016 | |||||||
Distributions paid from: | ||||||||
Ordinary income | $ | 30,306,666 | $ | 55,897,868 | ||||
Long term capital gain | — | 36,725,841 | ||||||
| $ | 30,306,666 | $ | 92,623,709 | |||||
At December 31, 2017, the cost of investments, net unrealized appreciation (depreciation) and undistributed ordinary income for income tax purposes were as follows:
Cost of investments. | $ | 2,211,141,232 | ||
Unrealized appreciation | $ | 419,903,400 | ||
Unrealized depreciation | (141,593,701 | ) | ||
Net unrealized appreciation (depreciation) | $ | 278,309,699 | ||
Distributable earnings - undistributed ordinary income | $ | 19,148,688 | ||
Differences between income and/or capital gains as determined on a book basis and a tax basis are primarily due to differing treatment of foreign currency transactions.
7. Investment Transactions
Purchases and sales of investments (excluding short term securities) for the year ended December 31, 2017, aggregated $400,536,972 and $663,994,913, respectively.
8. Concentration of Risk
Investing in foreign securities may include certain risks and considerations not typically associated with investing in U.S. securities, such as fluctuating currency values and changing local and regional economic, political and social conditions, which may result in greater market volatility. In addition, certain foreign securities may not be as liquid as U.S. securities.
9. Restricted Securities
The Fund invests in securities that are restricted under the Securities Act of 1933 (1933 Act). Restricted securities are often purchased in private placement transactions, and cannot be sold without prior registration unless the sale is pursuant to an exemption under the 1933 Act. Disposal of these securities may require greater effort and expense, and prompt sale at an acceptable price may be difficult. The Fund may have registration rights for restricted securities. The issuer generally incurs all registration costs.
At December 31, 2017, investments in restricted securities, excluding securities exempt from registration under the 1933 Act deemed to be liquid, were as follows:
| Shares | Issuer | Acquisition Date | Cost | Value | ||||||||||
| 16,127,149 | Euro Wagon LP (Value is —% of Net Assets) | 12/08/05 - 1/02/08 | $ | 6,282,509 | $ | — | ||||||||
34 |
Annual Report |
franklintempleton.com |
FRANKLIN MUTUAL EUROPEAN FUND
NOTES TO FINANCIAL STATEMENTS
10. Other Derivative Information
At December 31, 2017, the Fund’s investments in derivative contracts are reflected in the Statement of Assets and Liabilities as follows:
| Asset Derivatives | Liability Derivatives | |||||||||||
| Derivative Contracts Not Accounted for as Hedging Instruments | Statement of Assets and Liabilities Location | Fair Value | Statement of Assets and Liabilities Location | Fair Value | ||||||||
Foreign exchange contracts | Variation margin on futures | $ — | Variation margin on futures contracts | $10,833,627 | a | |||||||
Unrealized appreciation on OTC forward exchange contracts | 326,542 | Unrealized depreciation on OTC forward exchange contracts | 26,437,852 | |||||||||
Totals | $326,542 | $37,271,479 | ||||||||||
| aThis amount reflects the cumulative appreciation (depreciation) of futures contracts as reported in the Statement of Investments. Only the variation margin receivable/ payable at year end is separately reported within the Statement of Assets and Liabilities. Prior variation margin movements were recorded to cash upon receipt or payment. | ||||||||||||
| For the year ended December 31, 2017, the effect of derivative contracts in the Fund’s Statement of Operations was as follows: | ||||||||||||
| Derivative Contracts Not Accounted for as Hedging Instruments | Statement of Operations Location | Net Realized Gain (Loss) for the Year | Statement of Operations Location | Net Change in Unrealized | ||||||||
| Net realized gain (loss) from: | Net change in unrealized appreciation (depreciation) on: | |||||||||||
Foreign exchange contracts | Forward exchange contracts | $ (62,447,783) | Forward exchange contracts | $(75,466,518) | ||||||||
| Futures contracts | (55,698,381) | Futures contracts | (16,983,478) | |||||||||
Totals | $(118,146,164) | $(92,449,996) | ||||||||||
For the year ended December 31, 2017, the average month end notional amount of futures contracts represented $706,352,421. The average month end contract value of forward exchange contracts was $1,345,624,459.
At December 31, 2017, the Fund’s OTC derivative assets and liabilities are as follows:
| Gross Amounts of Assets and Liabilities Presented in the Statement of Assets and Liabilities | ||||||||
| Assetsa | Liabilitiesa | |||||||
Derivatives | ||||||||
Forward exchange contracts | $326,542 | $26,437,852 | ||||||
aAbsent an event of default or early termination, OTC derivative assets and liabilities are presented gross and not offset in the Statement of Assets and Liabilities.
franklintempleton.com |
Annual Report |
35 |
FRANKLIN MUTUAL EUROPEAN FUND
NOTES TO FINANCIAL STATEMENTS
10. Other Derivative Information (continued)
At December 31, 2017, the Fund’s OTC derivative assets, which may be offset against the Fund’s OTC derivative liabilities and collateral received from the counterparty, are as follows:
Amounts Not Offset in the Statement of Assets and Liabilities | ||||||||||||||||||||
Gross Amounts of | Financial Instruments Available for Offset | Financial Instruments Collateral Received | Cash Collateral Received | Net Amount (Not less than zero) | ||||||||||||||||
Counterparty | ||||||||||||||||||||
BOFA | $ 27,907 | $ (27,907 | ) | $ — | $ — | $ — | ||||||||||||||
BONY | 821 | (821 | ) | — | — | — | ||||||||||||||
HSBK | 26,841 | (26,841 | ) | — | — | — | ||||||||||||||
SSBT | 249,326 | (249,326 | ) | — | — | — | ||||||||||||||
UBSW | 21,647 | (21,647 | ) | — | — | — | ||||||||||||||
Total | $326,542 | $(326,542 | ) | $ — | $ — | $ — | ||||||||||||||
| At December 31, 2017, the Fund’s OTC derivative liabilities, which may be offset against the Fund’s OTC derivative assets and collateral pledged to the counterparty, are as follows: | ||||||||||||||||||||
Amounts Not Offset in the Statement of Assets and Liabilities | ||||||||||||||||||||
| Gross Amounts of Liabilities Presented in the Statement of Assets and Liabilities | Financial Instruments Available for Offset | Financial Instruments Collateral Pledgeda | Cash Collateral Pledged | Net Amount (Not less than zero) | ||||||||||||||||
Counterparty | ||||||||||||||||||||
BOFA | $ 3,366,160 | $ (27,907 | ) | $ (2,426,723 | ) | $ — | $ 911,530 | |||||||||||||
BONY | 4,653,731 | (821 | ) | (3,782,041 | ) | — | 870,869 | |||||||||||||
HSBK. | 5,109,380 | (26,841 | ) | (4,070,471 | ) | — | 1,012,068 | |||||||||||||
SSBT | 2,528,137 | (249,326 | ) | (1,570,936 | ) | — | 707,875 | |||||||||||||
UBSW | 10,780,444 | (21,647 | ) | (8,571,218 | ) | — | 2,187,579 | |||||||||||||
Total | $26,437,852 | $(326,542 | ) | $(20,421,389 | ) | $ — | $5,689,921 | |||||||||||||
aSee the accompanying Statement of Investments for securities pledged as collateral for derivatives.
See Note 1(c) regarding derivative financial instruments.
See Abbreviations on page 38.
11. Holdings of 5% Voting Securities of Portfolio Companies
The 1940 Act defines “affiliated companies” to include investments in portfolio companies in which a fund owns 5% or more of the outstanding voting securities. During the year ended December 31, 2017, investments in “affiliated companies” were as follows:
| Name of Issuer | Number of Shares Held at Beginning of Year | Gross Additions | Gross Reductions | Number of at End of Year | Value at End of Year | Dividend Income | Realized Gain (Loss) | Net Change in Unrealized Appreciation (Depreciation) | ||||||||||||||||||||||||
Controlled Affiliatesa | ||||||||||||||||||||||||||||||||
Euro Wagon LP (Value is —% of Net Assets) | 16,127,149 | — | — | 16,127,149 | $— | $— | $— | $— | ||||||||||||||||||||||||
aIssuer in which the Fund owns 25% or more of the outstanding voting securities.
36 |
Annual Report |
franklintempleton.com |
FRANKLIN MUTUAL EUROPEAN FUND
NOTES TO FINANCIAL STATEMENTS
12. Credit Facility
The Fund, together with other U.S. registered and foreign investment funds (collectively, Borrowers), managed by Franklin Templeton Investments, are borrowers in a joint syndicated senior unsecured credit facility totaling $2 billion (Global Credit Facility) which matured on February 9, 2018. This Global Credit Facility provides a source of funds to the Borrowers for temporary and emergency purposes, including the ability to meet future unanticipated or unusually large redemption requests. Effective February 9, 2018, the Borrowers renewed the Global Credit Facility for a one year term, maturing February 8, 2019, for a total of $2 billion.
Under the terms of the Global Credit Facility, the Fund shall, in addition to interest charged on any borrowings made by the Fund and other costs incurred by the Fund, pay its share of fees and expenses incurred in connection with the implementation and maintenance of the Global Credit Facility, based upon its relative share of the aggregate net assets of all of the Borrowers, including an annual commitment fee of 0.15% based upon the unused portion of the Global Credit Facility. These fees are reflected in other expenses in the Statement of Operations. During the year ended December 31, 2017, the Fund did not use the Global Credit Facility.
13. Fair Value Measurements
The Fund follows a fair value hierarchy that distinguishes between market data obtained from independent sources (observable inputs) and the Fund’s own market assumptions (unobservable inputs). These inputs are used in determining the value of the Fund’s financial instruments and are summarized in the following fair value hierarchy:
| • | Level 1 – quoted prices in active markets for identical financial instruments |
| • | Level 2 – other significant observable inputs (including quoted prices for similar financial instruments, interest rates, prepayment speed, credit risk, etc.) |
| • | Level 3 – significant unobservable inputs (including the Fund’s own assumptions in determining the fair value of financial instruments) |
The input levels are not necessarily an indication of the risk or liquidity associated with financial instruments at that level.
For movements between the levels within the fair value hierarchy, the Fund has adopted a policy of recognizing the transfers as of the date of the underlying event which caused the movement.
A summary of inputs used as of December 31, 2017, in valuing the Fund’s assets and liabilities carried at fair value, is as follows:
| Level 1 | Level 2 | Level 3 | Total | |||||||||||||
| Assets: | ||||||||||||||||
Investments in Securities:a | ||||||||||||||||
Equity Investments:b | ||||||||||||||||
Machinery | $ | 60,754,471 | $ | 11,169,850 | $ | — | $ | 71,924,321 | ||||||||
All Other Equity Investments | 2,235,749,353 | — | — | c | 2,235,749,353 | |||||||||||
Short Term Investments | 218,702,030 | — | — | 218,702,030 | ||||||||||||
Total Investments in Securities | $ | 2,515,205,854 | $ | 11,169,850 | $ | — | $ | 2,526,375,704 | ||||||||
Other Financial Instruments: | ||||||||||||||||
Forward Exchange Contracts | $ | — | $ | 326,542 | $ | — | $ | 326,542 | ||||||||
| Liabilities: | ||||||||||||||||
Other Financial Instruments: | ||||||||||||||||
Futures Contracts | $ | 10,833,627 | $ | — | $ | — | $ | 10,833,627 | ||||||||
Forward Exchange Contracts | — | 26,437,852 | — | 26,437,852 | ||||||||||||
Total Other Financial Instruments | $ | 10,833,627 | $ | 26,437,852 | $ | — | $ | 37,271,479 | ||||||||
aFor detailed categories, see the accompanying Statement of Investments.
bIncludes common and preferred stocks.
cIncludes securities determined to have no value at December 31, 2017.
franklintempleton.com |
Annual Report |
37 |
FRANKLIN MUTUAL EUROPEAN FUND
NOTES TO FINANCIAL STATEMENTS
13. Fair Value Measurements (continued)
A reconciliation of assets in which Level 3 inputs are used in determining fair value is presented when there are significant Level 3 financial instruments at the beginning and/or end of the year.
14. Subsequent Events
The Fund has evaluated subsequent events through the issuance of the financial statements and determined that no events have occurred that require disclosure other than those already disclosed in the financial statements.
Abbreviations
| Counterparty | Currency | Selected Portfolio | ||||||||
BOFA | Bank of America N.A. | EUR | Euro | ADR | American Depositary Receipt | |||||
BONY | The Bank of New York Mellon Corp. | GBP | British Pound | |||||||
HSBK | HSBC Bank PLC | USD | United States Dollar | |||||||
SSBT | State Street Bank and Trust Co., N.A. | |||||||||
UBSW | UBS AG | |||||||||
38 |
Annual Report |
franklintempleton.com |
FRANKLIN MUTUAL EUROPEAN FUND
Report of Independent Registered Public Accounting Firm
To the Board of Trustees of Franklin Mutual Series Funds and Shareholders of Franklin Mutual European Fund:
Opinion on the Financial Statements
We have audited the accompanying statement of assets and liabilities of Franklin Mutual European Fund (the “Fund”) (one of the funds constituting Franklin Mutual Series Funds), including the schedule of investments, as of December 31, 2017, and the related statement of operations for the year then ended, the statements of changes in net assets for each of the two years in the period then ended, the financial highlights for each of the periods indicated therein and the related notes (collectively referred to as the “financial statements”). In our opinion, the financial statements present fairly, in all material respects, the financial position of Franklin Mutual European Fund (one of the funds constituting Franklin Mutual Series Funds) at December 31, 2017, the results of its operations for the year then ended, the changes in its net assets for each of the two years in the period then ended and its financial highlights for each of the periods indicated therein, in conformity with U.S. generally accepted accounting principles.
Basis for Opinion
These financial statements are the responsibility of the Fund’s management. Our responsibility is to express an opinion on the Fund’s financial statements based on our audits. We are a public accounting firm registered with the Public Company Accounting Oversight Board (United States) (“PCAOB”) and are required to be independent with respect to the Fund in accordance with the U.S. federal securities laws and the applicable rules and regulations of the Securities and Exchange Commission and the PCAOB.
We conducted our audits in accordance with the standards of the PCAOB. Those standards require that we plan and perform the audit to obtain reasonable assurance about whether the financial statements are free of material misstatement, whether due to error or fraud. The Fund is not required to have, nor were we engaged to perform, an audit of the Fund’s internal control over financial reporting. As part of our audits, we are required to obtain an understanding of internal control over financial reporting, but not for the purpose of expressing an opinion on the effectiveness of the Fund’s internal control over financial reporting. Accordingly, we express no such opinion.
Our audits included performing procedures to assess the risks of material misstatement of the financial statements, whether due to error or fraud, and performing procedures that respond to those risks. Such procedures included examining, on a test basis, evidence regarding the amounts and disclosures in the financial statements. Our procedures included confirmation of securities owned as of December 31, 2017, by correspondence with the custodian and brokers or by other appropriate auditing procedures where replies from others were not received. Our audits also included evaluating the accounting principles used and significant estimates made by management, as well as evaluating the overall presentation of the financial statements. We believe that our audits provide a reasonable basis for our opinion.
We have served as the auditor of one or more Franklin investment companies since 1987.
Boston, MA
February 26, 2018
franklintempleton.com |
Annual Report |
39 |
FRANKLIN MUTUAL EUROPEAN FUND
Under Section 854(b)(1)(B) of the Internal Revenue Code (Code), the Fund hereby reports the maximum amount allowable but no less than $70,971,977 as qualified dividends for purposes of the maximum rate under Section 1(h)(11) of the Code for the fiscal year ended December 31, 2017. Distributions, including qualified dividend income, paid during calendar year 2017 will be reported to shareholders on Form 1099-DIV by mid-February 2018. Shareholders are advised to check with their tax advisors for information on the treatment of these amounts on their individual income tax returns.
At December 31, 2017, more than 50% of the Fund’s total assets were invested in securities of foreign issuers. In most instances, foreign taxes were withheld from income paid to the Fund on these investments. As shown in the table below, the Fund hereby reports to shareholders the foreign source income and foreign taxes paid, pursuant to Section 853 of the Code. This written statement will allow shareholders of record on December 21, 2017, to treat their proportionate share of foreign taxes paid by the Fund as having been paid directly by them. The shareholder shall consider these amounts as foreign taxes paid in the tax year in which they receive the Fund distribution.
The following table provides a detailed analysis of foreign tax paid, foreign source income and foreign source qualified dividends as reported by the Fund, to Class Z, Class A, Class C, Class R and Class R6 shareholders of record.
| Class | Foreign Tax Paid Per Share | Foreign Source Income Per Share | Foreign Source Qualified Dividends Per Share | |||
Class Z | $0.0547 | $0.4131 | $0.3851 | |||
Class A | $0.0547 | $0.3605 | $0.3360 | |||
Class C | $0.0547 | $0.1971 | $0.1836 | |||
Class R | $0.0547 | $0.3399 | $0.3169 | |||
Class R6 | $0.0547 | $0.4438 | $0.4137 |
Foreign Tax Paid Per Share (Column 1) is the amount per share available to you, as a tax credit (assuming you held your shares in the Fund for a minimum of 16 days during the 31-day period beginning 15 days before the ex-dividend date of the Fund’s distribution to which the foreign taxes relate), or, as a tax deduction.
Foreign Source Income Per Share (Column 2) is the amount per share of income dividends attributable to foreign securities held by the Fund, plus any foreign taxes withheld on these dividends. The amounts reported include foreign source qualified dividends that have not been adjusted for the rate differential applicable to such dividend income.1
Foreign Source Qualified Dividends Per Share (Column 3) is the amount per share of foreign source qualified dividends, plus any foreign taxes withheld on these dividends. These amounts represent the portion of the Foreign Source Income reported to you in column 2 that were derived from qualified foreign securities held by the Fund.1
By mid-February 2018, shareholders will receive Form 1099-DIV which will include their share of taxes paid and foreign source income distributed during the calendar year 2017. The Foreign Source Income reported on Form 1099-DIV has not been adjusted for the rate differential on foreign source qualified dividend income. Shareholders are advised to check with their tax advisors for information on the treatment of these amounts on their 2017 individual income tax returns.
1. Qualified dividends are taxed at reduced long term capital gains tax rates. In determining the amount of foreign tax credit that may be applied against the U.S. tax liability of individuals receiving foreign source qualified dividends, adjustments may be required to the foreign tax credit limitation calculation to reflect the rate differential applicable to such dividend income. The rules however permit certain individuals to elect not to apply the rate differential adjustments for capital gains and/or dividends for any taxable year. Please consult your tax advisor and the instructions to Form 1116 for more information.
40 |
Annual Report |
franklintempleton.com |
FRANKLIN MUTUAL SERIES FUNDS
The name, year of birth and address of the officers and board members, as well as their affiliations, positions held with the Trust, principal occupations during at least the past five years and number of US registered portfolios overseen in the Franklin Templeton Investments fund complex, are shown below. Generally, each board member serves until that person’s successor is elected and qualified.
Independent Board Members
| Name, Year of Birth and Address | Position | Length of Time Served | Number of Portfolios in by Board Member* | Other Directorships Held During at Least the Past 5 Years | ||||
Edward I. Altman, Ph.D. (1941) c/o Franklin Mutual Advisers, LLC Short Hills, NJ 07078-2789 | Trustee | Since 1987 | 14 | None | ||||
Principal Occupation During at Least the Past 5 Years: Max L. Heine Professor of Finance, Emeritus and Director of The Credit and Debt Markets Research Program, Salomon Center, Stern School of Business, New York University; editor and author of numerous financial publications; financial consultant; an adviser to numerous financial and publishing organizations; and formerly, Vice Director, Salomon Center, Stern School of Business, New York University. | ||||||||
Ann Torre Bates (1958) c/o Franklin Mutual Advisers, LLC 101 John F. Kennedy Parkway Short Hills, NJ 07078-2789 | Trustee | Since 1995 | 40 | Ares Capital Corporation (specialty finance company) (2010-present), United Natural Foods, Inc. (distributor of natural, organic and specialty foods) (2013-present), Allied Capital Corporation (financial services) (2003-2010), SLM Corporation (Sallie Mae) (1997-2014) and Navient Corporation (loan management, servicing and asset recovery) (2014-2016). | ||||
Principal Occupation During at Least the Past 5 Years: Director of various companies; and formerly, Executive Vice President and Chief Financial Officer, NHP Incorporated (manager of multifamily housing) (1995-1997); and Vice President and Treasurer, US Airways, Inc. (until 1995). | ||||||||
Burton J. Greenwald (1929) c/o Franklin Mutual Advisers, LLC 101 John F. Kennedy Parkway Short Hills, NJ 07078-2789 | Trustee and Vice Chairman | Trustee since 2002 and Vice Chairman since 2015 | 14 | Franklin Templeton Emerging Markets Debt Opportunities Fund PLC (1999-present) and Fiduciary International Ireland Limited (1999-2015). | ||||
Principal Occupation During at Least the Past 5 Years: Managing Director, B. J. Greenwald Associates (management consultants to the financial services industry); and formerly, Chairman, Fiduciary Trust International Funds; Executive Vice President, L.F. Rothschild Fund Management, Inc.; President and Director, Merit Mutual Funds; President, Underwriting Division and Director, National Securities & Research Corporation; Governor, Investment Company Institute; and Chairman, ICI Public Information Committee. | ||||||||
Jan Hopkins Trachtman (1947) c/o Franklin Mutual Advisers, LLC 101 John F. Kennedy Parkway Short Hills, NJ 07078-2789 | Trustee | Since 2009 | 14 | None | ||||
Principal Occupation During at Least the Past 5 Years: President and Founder, The Jan Hopkins Group (communications and consulting firm); serves on Advisory Board of Knight Bagehot Fellowship; and formerly, President, Economic Club of New York (2007-2015); Anchor/Correspondent, CNN Financial News (until 2003); Managing Director and Head of Client Communications, Citigroup Private Bank (until 2005); Off-Air reporter, ABC News’ World News Tonight; and Editor, CBS Network News. | ||||||||
Keith Mitchell (1954) c/o Franklin Mutual Advisers, LLC 101 John F. Kennedy Parkway Short Hills, NJ 07078-2789 | Trustee | Since 2009 | 14 | None | ||||
Principal Occupation During at Least the Past 5 Years: Director of various boards of asset management firms; and formerly, Managing Member, Mitchell, Hartley & Bechtel Advisers, LLC (formerly, Mitchell Advisers, LLC) (advisory firm) (2003-2015) and Managing Director, Putman Lovell NBF. | ||||||||
franklintempleton.com |
Annual Report |
41 |
FRANKLIN MUTUAL SERIES FUNDS
Independent Board Members (continued)
| Name, Year of Birth and Address | Position | Length of Time Served | Number of Portfolios in Fund Complex Overseen by Board Member* | Other Directorships Held During at Least the Past 5 Years | ||||
| David W. Niemiec (1949) c/o Franklin Mutual Advisers, LLC 101 John F. Kennedy Parkway Short Hills, NJ 07078-2789 | Trustee | Since 2015 | 40 | Hess Midstream Partners LP (oil and gas midstream infrastructure) (2017-present). | ||||
Principal Occupation During at Least the Past 5 Years: Advisor, Saratoga Partners (private equity fund); and formerly, Managing Director, Saratoga Partners (1998-2001) and SBC Warburg Dillon Read (investment banking) (1997-1998); Vice Chairman, Dillon, Read & Co. Inc. (investment banking) (1991-1997); and Chief Financial Officer, Dillon, Read & Co. Inc. (1982-1997). | ||||||||
| Charles Rubens II (1930) c/o Franklin Mutual Advisers, LLC 101 John F. Kennedy Parkway Short Hills, NJ 07078-2789 | Trustee | Since 1998 | 14 | None | ||||
Principal Occupation During at Least the Past 5 Years: Private investor and president of non-profit organizations; and formerly, an executive of Time, Inc.; and Trustee of Colorado College. | ||||||||
| Robert E. Wade (1946) c/o Franklin Mutual Advisers, LLC 101 John F. Kennedy Parkway Short Hills, NJ 07078-2789 | Trustee and Chairman of the Board | Trustee since 1993 and Chairman of the Board since 2005 | 40 | El Oro Ltd (investments) (2003-present). | ||||
Principal Occupation During at Least the Past 5 Years: Attorney at law engaged in private practice as a sole practitioner (1972-2008) and member of various boards. | ||||||||
| Gregory H. Williams (1943) c/o Franklin Mutual Advisers, LLC 101 John F. Kennedy Parkway Short Hills, NJ 07078-2789 | Trustee | Since 2015 | 14 | None | ||||
| Principal Occupation During at Least the Past 5 Years: Private investor; Consultant; and formerly, President, University of Cincinnati (2009-2012); President, The City College of New York (2001-2009); Dean, College of Law, Ohio State University (1993-2001); and Associate Vice President, Academic Affairs and Professor of Law, University of Iowa (1977-1993). | ||||||||
Interested Board Members and Officers
| Name, Year of Birth and Address | Position | Length of Time Served | Number of Portfolios in Fund Complex Overseen | Other Directorships Held During at Least the Past 5 Years | ||||
| **Gregory E. Johnson (1961) One Franklin Parkway San Mateo, CA 94403-1906 | Trustee | Since 2007 | 153 | None | ||||
Principal Occupation During at Least the Past 5 Years: Chairman of the Board, Member – Office of the Chairman, Director and Chief Executive Officer, Franklin Resources, Inc.; officer and/or director or trustee, as the case may be, of some of the other subsidiaries of Franklin Resources, Inc. and of 43 of the investment companies in Franklin Templeton Investments; Vice Chairman, Investment Company Institute; and formerly, President, Franklin Resources, Inc. (1994-2015). | ||||||||
| **Peter A. Langerman (1955) c/o Franklin Mutual Advisers, LLC 101 John F. Kennedy Parkway Short Hills, NJ 07078-2789 | Trustee, President, and Chief Executive Officer – Investment Management | Trustee since 2007, President, and Chief Executive Officer – Investment Management since 2005 | 7 | American International Group, Inc. (AIG) Credit Facility Trust (2010-2011). | ||||
Principal Occupation During at Least the Past 5 Years: Chairman of the Board, Chief Executive Officer and President, Franklin Mutual Advisers, LLC; President and Chief Investment Officer, Franklin Advisory Services, LLC; and officer and/or director, as the case may be, of three of the investment companies in Franklin Templeton Investments. | ||||||||
42 |
Annual Report |
franklintempleton.com |
FRANKLIN MUTUAL SERIES FUNDS
Interested Board Members and Officers (continued)
| Name, Year of Birth and Address | Position | Length of Time Served | Number of Portfolios in Fund Complex Overseen by Board Member* | Other Directorships Held During at Least the Past 5 Years | ||||
| Alison E. Baur (1964) One Franklin Parkway San Mateo, CA 94403-1906 | Vice President | Since 2012 | Not Applicable | Not Applicable | ||||
Principal Occupation During at Least the Past 5 Years: Deputy General Counsel, Franklin Templeton Investments; and officer of some of the other subsidiaries of Franklin Resources, Inc. and of 45 of the investment companies in Franklin Templeton Investments. | ||||||||
| Philippe Brugere-Trelat (1949) 101 John F. Kennedy Parkway Short Hills NJ 07078-2789 | Vice President | Since 2005 | Not Applicable | Not Applicable | ||||
Principal Occupation During at Least the Past 5 Years: Executive Vice President, Franklin Mutual Advisers, LLC; officer of one of the investment companies in Franklin Templeton Investments; and formerly, Portfolio Manager of Eurovest SA (French registered investment company, SICAV). | ||||||||
| Aliya S. Gordon (1973) One Franklin Parkway San Mateo, CA 94403-1906 | Vice President | Since 2009 | Not Applicable | Not Applicable | ||||
Principal Occupation During at Least the Past 5 Years: Senior Associate General Counsel, Franklin Templeton Investments; and officer of 45 of the investment companies in Franklin Templeton Investments. | ||||||||
| Steven J. Gray (1955) One Franklin Parkway San Mateo, CA 94403-1906 | Vice President and Secretary | Vice President since 2009 and Secretary since 2005 | Not Applicable | Not Applicable | ||||
Principal Occupation During at Least the Past 5 Years: Senior Associate General Counsel, Franklin Templeton Investments; Vice President, Franklin Templeton Distributors, Inc. and FASA, LLC; and officer of 45 of the investment companies in Franklin Templeton Investments. | ||||||||
| Matthew T. Hinkle (1971) One Franklin Parkway San Mateo, CA 94403-1906 | Chief Executive Officer – Finance and Administration | Since June 2017 | Not Applicable | Not Applicable | ||||
Principal Occupation During at Least the Past 5 Years: Senior Vice President, Franklin Templeton Services, LLC; officer of 45 of the investment companies in Franklin Templeton Investments; and formerly, Vice President, Global Tax (2012-April 2017) and Treasurer/Assistant Treasurer, Franklin Templeton Investments (2009-2017). | ||||||||
| Robert G. Kubilis (1973) 300 S.E. 2nd Street Fort Lauderdale, FL 33301-1923 | Chief Financial Officer, Chief Accounting Officer and Treasurer | Since 2012 | Not Applicable | Not Applicable | ||||
Principal Occupation During at Least the Past 5 Years: Treasurer, U.S. Fund Administration & Reporting, Franklin Templeton Investments; and officer of 17 of the investment companies in Franklin Templeton Investments. | ||||||||
| Robert Lim (1948) One Franklin Parkway San Mateo, CA 94403-1906 | Vice President –AML Compliance | Since 2016 | Not Applicable | Not Applicable | ||||
Principal Occupation During at Least the Past 5 Years: Vice President, Franklin Templeton Companies, LLC; Chief Compliance Officer, Franklin Templeton Distributors, Inc. and Franklin Templeton Investor Services, LLC; and officer of 45 of the investment companies in Franklin Templeton Investments. | ||||||||
franklintempleton.com |
Annual Report |
43 |
FRANKLIN MUTUAL SERIES FUNDS
Interested Board Members and Officers (continued)
| Name, Year of Birth and Address | Position | Length of Time Served | Number of Portfolios in Fund Complex Overseen by Board Member* | Other Directorships Held During at Least the Past 5 Years | ||||
| Kimberly H. Novotny (1972) 300 S.E. 2nd Street Fort Lauderdale, FL 33301-1923 | Vice President | Since 2013 | Not Applicable | Not Applicable | ||||
Principal Occupation During at Least the Past 5 Years: Associate General Counsel, Franklin Templeton Investments; Vice President and Corporate Secretary, Fiduciary Trust International of the South; Vice President, Templeton Investment Counsel, LLC; Assistant Secretary, Franklin Resources, Inc.; and officer of 45 of the investment companies in Franklin Templeton Investments. | ||||||||
| Robert C. Rosselot (1960) 300 S.E. 2nd Street Fort Lauderdale, FL 33301-1923 | Chief Compliance Officer | Since 2013 | Not Applicable | Not Applicable | ||||
Principal Occupation During at Least the Past 5 Years: Director, Global Compliance, Franklin Templeton Investments; Vice President, Franklin Templeton Companies, LLC; officer of 45 of the investment companies in Franklin Templeton Investments; and formerly, Senior Associate General Counsel, Franklin Templeton Investments (2007-2013); and Secretary and Vice President, Templeton Group of Funds (2004-2013). | ||||||||
| Karen L. Skidmore (1952) One Franklin Parkway San Mateo, CA 94403-1906 | Vice President | Since 2009 | Not Applicable | Not Applicable | ||||
Principal Occupation During at Least the Past 5 Years: Senior Associate General Counsel, Franklin Templeton Investments; and officer of 45 of the investment companies in Franklin Templeton Investments. | ||||||||
| Navid J. Tofigh (1972) One Franklin Parkway San Mateo, CA 94403-1906 | Vice President | Since 2015 | Not Applicable | Not Applicable | ||||
Principal Occupation During at Least the Past 5 Years: Associate General Counsel, Franklin Templeton Investments; and officer of 45 of the investment companies in Franklin Templeton Investments. | ||||||||
| Craig S. Tyle (1960) One Franklin Parkway San Mateo, CA 94403-1906 | Vice President | Since 2005 | Not Applicable | Not Applicable | ||||
Principal Occupation During at Least the Past 5 Years: General Counsel and Executive Vice President, Franklin Resources, Inc.; and officer of some of the other subsidiaries of Franklin Resources, Inc. and of 45 of the investment companies in Franklin Templeton Investments. | ||||||||
| Lori A. Weber (1964) 300 S.E. 2nd Street Fort Lauderdale, FL 33301-1923 | Vice President | Since 2011 | Not Applicable | Not Applicable | ||||
Principal Occupation During at Least the Past 5 Years: Senior Associate General Counsel, Franklin Templeton Investments; Assistant Secretary, Franklin Resources, Inc.; Vice President and Secretary, Templeton Investment Counsel, LLC; and officer of 45 of the investment companies in Franklin Templeton Investments. | ||||||||
*We base the number of portfolios on each separate series of the US registered investment companies within the Franklin Templeton Investments fund complex. These portfolios have a common investment manager or affiliated investment managers.
**Gregory E. Johnson is considered to be an interested person of the Fund under the federal securities laws due to his position as an officer and director of Franklin Resources, Inc. (Resources), which is the parent company of the Fund’s investment manager and distributor. Peter A. Langerman is considered to be an interested person of the Fund under the federal securities laws due to his position as an officer of Franklin Mutual Advisors, LLC, which is an affiliate of the Fund’s investment manager.
Note 1: Officer information is current as of the date of this report. It is possible that after this date, information about officers may change.
The Sarbanes-Oxley Act of 2002 and Rules adopted by the U.S. Securities and Exchange Commission require the Fund to disclose whether the Fund’s Audit Committee includes at least one member who is an audit committee financial expert within the meaning of such Act and Rules. The Fund’s Board has determined that there is at least one such financial expert on the Audit Committee and has designated each of Edward I. Altman, Ph.D., Ann Torre Bates and David W. Niemiec as an audit committee financial expert. The Board believes that Messrs. Altman and Niemiec and Ms. Bates qualify as such an expert in view of their extensive business background and experience. Mr. Altman has served as a member of the Fund Audit Committee since 1996. He currently serves as a Max L. Hines Professor of Finance, Emeritus and Director of The Credit and Debt Markets Research Program, Salomon Center, Stern School of Business, New York University. Ms. Bates has served as a member of the Fund Audit Committee since 1996. She currently serves as a director of Ares Capital Corporation (2010-present) and United Natural Foods, Inc. (2013-present) and was formerly a director of Navient Corporation from 2014 to 2016, SLM Corporation from 1997 to 2014 and Allied
44 |
Annual Report |
franklintempleton.com |
FRANKLIN MUTUAL SERIES FUNDS
Interested Board Members and Officers (continued)
Capital Corporation from 2003 to 2010, Executive Vice President and Chief Financial Officer of NHP Incorporated from 1995 to 1997 and Vice President and Treasurer of US Airways, Inc. until 1995. Mr. Niemiec has served as a member of the Fund Audit Committee since 2015, currently serves as an Advisor to Saratoga Partners and was formerly its Managing Director from 1998 to 2001 and serves as a director of Hess Midstream Partners LP (2017-present). Mr. Niemiec was formerly a director of Emeritus Corporation from 1999 to 2010 and OSI Pharmaceuticals, Inc. from 2006 to 2010, Managing Director of SBC Warburg Dillon Read from 1997 to 1998, and was Vice Chairman from 1991 to 1997 and Chief Financial Officer from 1982 to 1997 of Dillon, Read & Co. Inc. As a result of such background and experience, the Board believes that Messrs. Altman and Niemiec and Ms. Bates have each acquired an understanding of generally accepted accounting principles and financial statements, the general application of such principles in connection with the accounting estimates, accruals and reserves, and analyzing and evaluating financial statements that present a breadth and level of complexity of accounting issues generally comparable to those of the Fund, as well as an understanding of internal controls and procedures for financial reporting and an understanding of audit committee functions. Messrs. Altman and Niemiec and Ms. Bates are independent Board members as that term is defined under the applicable U.S. Securities and Exchange Commission Rules and Releases.
The Statement of Additional Information (SAI) includes additional information about the board members and is available, without charge, upon request. Shareholders may call (800) DIAL BEN/342-5236 to request the SAI.
franklintempleton.com |
Annual Report |
45 |
FRANKLIN MUTUAL SERIES FUNDS
FRANKLIN MUTUAL EUROPEAN FUND
Proxy Voting Policies and Procedures
The Fund’s investment manager has established Proxy Voting Policies and Procedures (Policies) that the Fund uses to determine how to vote proxies relating to portfolio securities. Shareholders may view the Fund’s complete Policies online at franklintempleton.com. Alternatively, shareholders may request copies of the Policies free of charge by calling the Proxy Group collect at (954) 527-7678 or by sending a written request to: Franklin Templeton Companies, LLC, 300 S.E. 2nd Street, Fort Lauderdale, FL 33301, Attention: Proxy Group. Copies of the Fund’s proxy voting records are also made available online at franklintempleton.com and posted on the US Securities and Exchange Commission’s website at sec.gov and reflect the most recent 12-month period ended June 30.
Quarterly Statement of Investments
The Trust, on behalf of the Fund, files a complete statement of investments with the US Securities and Exchange Commission for the first and third quarters for each fiscal year on Form N-Q. Shareholders may view the filed Form N-Q by visiting the Commission’s website at sec.gov. The filed form may also be viewed and copied at the Commission’s Public Reference Room in Washington, DC. Information regarding the operations of the Public Reference Room may be obtained by calling (800) SEC-0330.
Householding of Reports and Prospectuses
You will receive the Fund’s financial reports every six months as well as an annual updated summary prospectus (prospectus available upon request). To reduce Fund expenses, we try to identify related shareholders in a household and send only one copy of the financial reports and summary prospectus. This process, called “householding,” will continue indefinitely unless you instruct us otherwise. If you prefer not to have these documents householded, please call us at (800) 632-2301. At any time you may view current prospectuses/summary prospectuses and financial reports on our website. If you choose, you may receive these documents through electronic delivery.
46 |
Annual Report |
franklintempleton.com |
This page intentionally left blank.
This page intentionally left blank.
| Annual Report and Shareholder Letter Franklin Mutual European Fund
Investment Manager Franklin Mutual Advisers, LLC
Distributor Franklin Templeton Distributors, Inc. (800) DIAL BEN® / 342-5236 franklintempleton.com
Shareholder Services (800) 632-2301 - (Class A, C, R & R6) (800) 448-FUND - (Class Z) |
Authorized for distribution only when accompanied or preceded by a summary prospectus and/or prospectus. Investors should carefully consider a fund’s investment goals, risks, charges and expenses before investing. A prospectus contains this and other information; please read it carefully before investing.
To help ensure we provide you with quality service, all calls to and from our service areas are monitored and/or recorded.
| © 2018 Franklin Templeton Investments. All rights reserved. | 478 A 02/18 |
| Annual Report and Shareholder Letter
December 31, 2017 |
Sign up for electronic delivery at franklintempleton.com/edelivery
Franklin Templeton Investments
Gain From Our Perspective®
At Franklin Templeton Investments, we’re dedicated to one goal: delivering exceptional asset management for our clients. By bringing together multiple, world-class investment teams in a single firm, we’re able to offer specialized expertise across styles and asset classes, all supported by the strength and resources of one of the world’s largest asset managers. This has helped us to become a trusted partner to individual and institutional investors across the globe.
Dear Franklin Mutual Quest Fund Shareholder:
Securities markets benefited from a confluence of positive economic, financial and political trends during 2017. The global economy entered a synchronized pace of modest and steady growth, corporate earnings strengthened in the US, Europe and Japan, and US equity market volatility remained at historically low levels. A number of political risks identified at the start of 2017, such as the success of far-right parties in Europe, Brexit negotiations and the Trump administration’s ability to enact its policy agenda, also dissipated or became less immediate for investors as the year progressed. For the year ended December 31, 2017, US stocks, as measured by the Standard & Poor’s® 500 Index (S&P 500®), produced a +21.83% total return.1 Stocks in global developed markets, as measured by the MSCI World Index, returned +23.07%, and investment-grade bonds, as measured by the Bloomberg Barclays US Aggregate Bond Index, posted a +3.54% total return.1
In many equity markets, the trend of growth stocks outpacing value stocks continued. The Russell 1000® Growth Index returned +30.21%, while the Russell 1000® Value Index returned +13.66%.1 The difference in performance has been driven in large part by a rally in internet and software stocks, which dominated the S&P 500 Growth Index. In addition, the S&P 500 Value Index has components that we believe are facing disruption from new technology (e.g., the rapid market share shift to online retailing from traditional bricks and mortar retailers that are often labeled as value stocks). Exacerbating the disruption is the reality that many new technology companies are able to innovate without the need to show immediate profits.
We do not know how long these trends will continue, but historically, periods of strong performance by growth stocks have eventually been followed by relatively weaker performance. Given that unemployment has continued to decline in most developed markets and the US Federal Reserve has taken its first steps toward monetary normalization, value-oriented stocks may become more attractive to investors, particularly within cyclical sectors of the equity markets such as industrials, consumer discretionary and financials.
A stellar 2017 for equity markets also pushed up common valuation metrics, such as price-to-earnings. Valuation is a critical factor in our analysis and we always ask ourselves if current and potential investments represent an attractive balance of risk and reward. We remain committed to our long-term perspective and disciplined investment approach as we conduct a rigorous, fundamental analysis of securities with a regular emphasis on investment risk management.
Although the investment landscape appears favorable as we enter 2018, it is worth remembering that securities markets are dynamic and constantly evolving. Therefore, we believe active, professional investment management serves investors well. We also recognize the important role of financial advisors in today’s markets and encourage investors to continue to seek their advice. Amid changing markets and economic conditions, we are confident investors with a well-diversified portfolio and a patient, long-term outlook should be well positioned for the years ahead.
1. Source: Morningstar. Frank Russell Company is the source and owner of the trademarks, service marks and copyrights related to the Russell Indexes. Russell® is a trademark of Frank Russell Company.
See www.franklintempletondatasources.com for additional data provider information.
| Not FDIC Insured | | | May Lose Value | | | No Bank Guarantee |
| franklintempleton.com | Not part of the annual report | 1 |
On the following pages, the Fund’s portfolio management team reviews investment decisions that pertain to performance during the past 12 months in light of the economic environment and other factors. Please remember all securities markets fluctuate, as do mutual fund share prices.
We thank you for investing with Franklin Templeton, welcome your questions and comments, and look forward to continuing to serve your investment needs in the years ahead.
Sincerely,
Peter A. Langerman
Chairman, President and Chief Executive Officer
Franklin Mutual Advisers, LLC
This letter reflects our analysis and opinions as of December 31, 2017, unless otherwise indicated. The information is not a complete analysis of every aspect of any market, country, industry, security or fund. Statements of fact are from sources considered reliable.
Annual Report
Visit franklintempleton.com for fund updates, to access your account, or to find helpful financial planning tools.
| 2 | Not part of the annual report | franklintempleton.com |
Annual Report
This annual report for Franklin Mutual Quest Fund covers the fiscal year ended December 31, 2017.
Your Fund’s Goal and Main Investments
The Fund seeks capital appreciation, which may occasionally be short term, with income as a secondary goal. Under normal market conditions, the Fund invests substantially to primarily in equity securities of US and foreign companies that the investment manager believes are available at market prices less than their intrinsic value. The equity securities in which the Fund invests are primarily common stock, with a current focus on mid- and large-cap companies. To a lesser extent, the Fund also invests in merger arbitrage securities and the debt and equity of distressed companies. The Fund may invest a substantial portion, potentially up to 100% of its assets in foreign securities, which may include sovereign debt and participations in foreign government debt. The Geographic Composition bar chart on this page lists the leading countries where the Fund invests.
Performance Overview
The Fund’s Class Z shares delivered a +7.25% cumulative total return for the 12 months ended December 31, 2017. In comparison, the Fund’s benchmark, the MSCI World Index (USD), which tracks stock performance in global developed markets, generated a total return of +23.07%.1 Also for comparison, the Fund’s secondary benchmark, the Bloomberg Barclays US Corporate High Yield Index, which measures the US corporate market of non-investment grade, fixed-rate corporate bonds, defined as the middle or lower ratings of Moody’s, Fitch and Standard & Poor’s (Ba1/BB+/BB+), produced a +7.50% total return.1 You can find more of the Fund’s performance data in the Performance Summary beginning on page 10.
Geographic Composition*
Based on Total Net Assets as of 12/31/17
*Figures are stated as a percentage of total and may not equal 100% or may be negative due to rounding, use of any derivatives, unsettled trades or other factors.
Performance data represent past performance, which does not guarantee future results. Investment return and principal value will fluctuate, and you may have a gain or loss when you sell your shares. Current performance may differ from figures shown. For most recent month-end performance, go to franklintempleton.com or call (800) 342-5236.
Economic and Market Overview
The global economy grew moderately during the 12-month period under review. In this environment, global developed and emerging market stocks generated a +24.62% total return, as measured by the MSCI All Country World Index.1 Global markets were aided by price gains in oil and other commodities, generally upbeat economic data across regions, the European Central Bank’s (ECB’s) extension of its monetary easing program, and investor optimism about pro-growth and pro-business policies in the US. The prospect for reforms in the European Union (EU) with Emmanuel Macron’s election as
1. Source: Morningstar.
The indexes are unmanaged and include reinvestment of any income or distributions. They do not reflect any fees, expenses or sales charges. One cannot invest directly in an index, and an index is not representative of the Fund’s portfolio.
The dollar value, number of shares or principal amount, and names of all portfolio holdings are listed in the Fund’s Statement of Investments (SOI). The SOI begins on page 19.
| franklintempleton.com | Annual Report | 3 | ||||
FRANKLIN MUTUAL QUEST FUND
France’s president, encouraging corporate earnings reports and the passage of the US tax reform bill also supported global stocks.
However, global markets reflected investor concerns about the terms of the UK’s exit from the EU, political uncertainty in the US and the EU, and geopolitical tensions in the Korean peninsula and other regions. Other concerns included the health of European banks, global oil oversupply despite a pact by major oil-producing countries to extend production cuts, and comments from key central bankers around the world about potentially raising interest rates.
After strengthening in 2017’s second and third quarters, the US economy moderated in the fourth quarter. The economy grew faster in 2017 than in 2016, however, largely due to growth in consumer spending, business investment and exports. The unemployment rate decreased from 4.7% in December 2016, as reported at the beginning of the 12-month period, to 4.1% at period-end.2 Annual inflation, as measured by the Consumer Price Index, was 2.1% in December 2016, as reported at the beginning of the 12-month period, and while it varied over the 12-month period, remained unchanged at period-end.2 The US Federal Reserve (Fed) raised its target range for the federal funds rate 0.25% three times during the period, amid signs of a growing US economy, strengthening labor market and improving business spending. At its December meeting, the Fed confirmed that the monthly balance sheet reduction would increase from US$10 billion to US$20 billion beginning in January 2018.
In Europe, the UK’s economic growth moderated in 2017 compared to 2016, largely due to slower growth in the services sector. In November, the Bank of England raised its key policy rate 0.25%, its first increase in a decade. The eurozone’s growth accelerated in 2017’s second and third quarters, but moderated in the fourth quarter. However, the eurozone’s 2017 economic growth rate of 2.5% was the fastest in a decade.3 The bloc’s annual inflation rate, while low, ended higher than in December 2016. The ECB kept its benchmark interest rate unchanged during the period. However, at its October meeting, the ECB extended the time frame for its massive bond-buying program from December 2017 to at least September 2018, while reducing the amount of monthly bond purchases in half beginning in January 2018.
In Asia, Japan’s quarterly gross domestic product (GDP) grew for the seventh consecutive quarter, although third-quarter 2017 growth was lower than the previous quarter. The Bank of Japan left its benchmark interest rate unchanged during the period and continued its monetary stimulus measures.
In emerging markets, Brazil’s quarterly GDP grew for the third consecutive quarter, although third-quarter 2017 growth slowed from the previous quarter. The country’s central bank cut its benchmark interest rate several times during the period to spur economic growth. Russia’s GDP grew in 2017’s first three quarters compared to the prior-year periods, amid the Bank of Russia’s continued policy support. China’s GDP grew faster in 2017 than in 2016, supported by solid growth in industrial production, services, fixed-asset investment, retail sales, and imports and exports. The People’s Bank of China left its benchmark interest rate unchanged during the period. Overall, emerging market stocks, as measured by the MSCI Emerging Markets Index, produced a substantial +37.75% total return during the period.1
Investment Strategy
At Franklin Mutual Series, we are committed to our distinctive value approach to investing, which we believe can generate above-average risk-adjusted returns over time for our shareholders. Our major investment strategy is investing in undervalued stocks. When selecting undervalued equities, we are attracted to what we believe are fundamentally strong companies with healthy balance sheets, high-quality assets, substantial free cash flow and shareholder-oriented management teams and whose stocks are trading at discounts to our assessment of the companies’ intrinsic or business value. We also look for asset-rich companies whose shares may be trading at depressed levels due to concerns over short-term earnings disappointments, litigation, management strategy or other perceived negatives. This strict value approach is not only intended to improve the likelihood of upside potential, but also reduces the risk of substantial declines, in our opinion. While the vast majority of our undervalued equity investments are made in publicly traded companies globally, we may invest occasionally in privately held companies as well.
We complement this more traditional investment strategy with two others. One is distressed investing, a highly specialized field that has proven quite profitable during certain periods over the years. Distressed investing is complex and can take many forms. The most common distressed investment the Fund
2. Source: Bureau of Labor Statistics.
3. Source: Eurostat.
| 4 | Annual Report | franklintempleton.com | ||
FRANKLIN MUTUAL QUEST FUND
undertakes is the purchase of financially troubled or bankrupt companies’ debt at a substantial discount to face value. After the financially distressed company is reorganized, often in bankruptcy court, the old debt is typically replaced with new securities issued by the financially stronger company.
The other piece of our investment strategy is participating in arbitrage situations, another highly specialized field. When companies announce proposed mergers or takeovers, commonly referred to as “deals,” the target company may trade at a discount to the bid it ultimately accepts. One form of arbitrage involves purchasing the target company’s stock when it is trading below the value we believe it would receive in a deal. In keeping with our commitment to a relatively conservative investment approach, we typically focus our arbitrage efforts on announced deals, and avoid rumored deals or other situations we consider relatively risky. The current percentages of the Fund’s assets devoted to these investment strategies are listed in the Asset Allocation bar chart on this page.
In addition, it is our practice to hedge the Fund’s currency exposure when we deem it advantageous for our shareholders.
What is meant by “hedge”?
To hedge an investment is to take a position intended to offset potential losses/gains that may be incurred by a companion financial instrument.
| ||
Manager’s Discussion
In 2017, an improving economic and political backdrop helped drive most equity markets higher. The positive performances were broad based, spanning across most regions and sectors, and complemented by minimal volatility. Global markets were aided by generally upbeat economic data, improved corporate earnings in the US, Europe and Japan, as well as improved industrial commodity prices, most notably crude oil. In addition, the most significant political risks identified by investors heading into 2017 failed to materialize.
In the US, markets began 2017 rallying as investors hoped that a Republican sweep of US elections in November 2016 would lead to a general loosening in regulations and tax reform, including lower corporate tax rates. Although the Trump administration’s policy agenda was hindered by political
Asset Allocation*
Based on Total Net Assets as of 12/31/17

*Figures are stated as a percentage of total and may not equal 100% or may be negative due to rounding, use of any derivatives, unsettled trades or other factors.
gridlock, efforts to loosen federal regulations yielded some results and tax reform legislation was finally passed in late December. Improving economic activity and corporate earnings appeared to be the most meaningful equity market catalysts during much of 2017. However, the modest level of economic growth and low interest rates pushed investors to keep favoring growth stocks. During the period, the Russell 1000® Growth Index generated a total return of +30.21%, while the Russell 1000® Value Index posted a total return of +13.66%.4 Within the Russell 1000® Growth Index, stocks with the largest weightings were technology firms that dominated the headlines: Apple,5 Alphabet (a.k.a. Google),5 Microsoft,5 Amazon.com5 and Facebook.5
European equity markets started 2017 slowly, but positive political events and improved economic data fueled strong performances during the period. Elections in Europe produced outcomes generally regarded as positive economically as far-right parties largely failed to gain political power in national elections. Investors were particularly encouraged by the presidential election outcome in France. The reform-minded, centrist candidate, Emmanuel Macron, won the French presidential election in May and quickly began to push his agenda, most notably labor decrees giving employers in France greater freedom in negotiating contracts directly with workers. Amid all the positive events, the UK remained the most significant outlier. In the UK, a June 2017 snap election resulting in no party having a majority in Parliament appeared to make a “hard Brexit,” in which the UK leaves the European Union (EU) in March 2019 without a negotiated deal, even more likely than before. Although the UK and EU appeared to
4. Source: Morningstar. Frank Russell Company is the source and owner of the trademarks, service marks and copyrights related to the Russell Indexes. Russell® is a trademark of Frank Russell Company.
5. Not a Fund holding.
See www.franklintempletondatasources.com for additional data provider information.
| franklintempleton.com | Annual Report | 5 | ||||
FRANKLIN MUTUAL QUEST FUND
make some progress late in the year, the snap election results left the Conservative Party in a precarious position and with the risk of another election in the near future.
As value investors, we seek to invest prudently in securities that we believe represent good value, but adjust our views accordingly as the world around us changes. The media industry is a recent example of this approach. The Top 10 Sectors/Industries table on this page lists media and other leading industries in which the Fund currently invests. The media industry became a significant area of investment interest in the latter stages of the year due to significant structural changes. Since the 1980s, most Americans received their TV entertainment as part of a bundle from a cable provider. Disparate networks were combined and sold as packages, with annual price increases justified by the inclusion of more networks. Consumers rarely had the option to unbundle cable packages and most markets had no direct competition. However, the growth of fixed and mobile broadband connectivity ushered in the opportunity to bypass traditional distributors through the delivery of film and TV content over the internet and the launch of direct-to-consumer offerings by TV networks. The growing popularity of new digital options has driven cable providers to roll out lower-priced packages with fewer channels. This evolution has begun to create winners and losers among networks and new opportunities for investors.
Pay TV subscription among US households peaked in 2009 at close to 100 million homes. Initially, the decline in subscribers was moderate, but has accelerated since 2015, reaching a pace of more than 2% per year in 2017. At first, media companies benefited from digital distribution by using it as an additional outlet for selling content. With the cannibalization of traditional platforms accelerating, media companies have begun to respond. The necessity for greater scale in content development and direct access to consumers is driving investment and merger decisions in the industry. From our standpoint, we are looking for networks with the most attractive content relative to the price they have been charging and may be able to charge in the future.
The Fund initiated a position in Walt Disney in the latter half of 2017. We believe Disney is well positioned to benefit from the evolution toward a more direct-to-consumer distribution model. In our view, Disney has one of the best intellectual property (IP) portfolios in all of media with a stable of globally recognized proprietary characters upon which to build a strong direct-to-consumer franchise. If Disney is successful in its bid to acquire the bulk of Twenty-First Century Fox’s5 content assets, the deal would further strengthen its IP portfolio and its
| Top 10 Sectors/Industries | ||||
| Based on Equity Securities as of 12/31/17 | ||||
| % of Total Net Assets | ||||
| Pharmaceuticals | 8.0% | |||
| Media | 7.9% | |||
| Oil, Gas & Consumable Fuels | 6.7% | |||
| Insurance | 5.1% | |||
| Banks | 5.0% | |||
| Communications Equipment | 3.1% | |||
| Consumer Finance | 3.0% | |||
| Wireless Telecommunication Services | 2.9% | |||
| Software | 2.7% | |||
| Equity Real Estate Investment Trusts (REITs) | 2.5% | |||
content development scale. As it has done with its own IP, Disney would likely be able to leverage Fox’s content into attractions at its theme parks as well as consumer products. The acquisition would offer potential cost synergies that would likely offset some of the investments in the direct-to-consumer service. Under the leadership of chief executive officer Bob Iger, Disney has been effective in integrating acquired companies and navigating through a changing media landscape. Iger’s commitment to remain at the helm through 2021 strengthens our belief that the company should be able to execute on this opportunity.
Merger and acquisition activity remained healthy in 2017, although the pace of activity appeared to decelerate slightly compared to 2016 due to less favorable political and regulatory conditions in the US, the UK and China. In the US, several key regulatory agencies remain short of members, including the Federal Communications Commission and the Federal Trade Commission. Many large deals continued to wind their way through prolonged regulatory reviews, including AT&T’s5 acquisition of Time Warner, and Twenty-First Century Fox’s offer for Sky.
Credit spreads narrowed in 2017 for higher quality and high yield credit, albeit with some minor bouts of volatility. The broad-based decrease in yield differentials between bonds with the same maturity but different credit quality provided the Fund with the opportunity to exit a number of opportunities that presented themselves in early 2016, including several bond offerings related to leveraged acquisitions, as prices improved, yield premium over Treasuries shrank, and the risk-adjusted returns were no longer mispriced. As the year progressed and investors became more willing buyers of credit, mispriced risk became more difficult to find, in our opinion. In times when the credit markets fluctuate and value is difficult to identify, we believe our industry specific expertise, deep fundamental
| 6 |
Annual Report | franklintempleton.com |
FRANKLIN MUTUAL QUEST FUND
analysis with a focus on cash flow, and intensive credit and covenant review combine seamlessly and provide us with different ways of looking at the same ideas others may disregard.
Fund Performance
Turning to Fund performance, top positive contributors included US-based companies NRG Energy and Ally Financial and Netherlands-based ASR Nederland. ASR Nederland is listed among the Fund’s largest positions in the Top 10 Equity Holdings table on this page.
NRG Energy is an integrated wholesale power generation and retail electricity company that includes solar and renewable energy businesses. Shares of NRG began to rally in January 2017 after hedge fund management firm Elliott Associates and private equity firm Bluescape Energy Partners announced a combined stake in NRG. In a filing with the US Securities and Exchange Commission, the two investors stated their belief in “numerous opportunities to significantly increase shareholder value.” Shares of NRG rose further in July 2017 in reaction to the NRG Board of Directors’ transformation plan. The plan includes a reduction in debt by several billion through significant cost reduction and margin improvement goals, asset sales of up to $4 billion, including renewable energy assets and contracted power plants, and restructuring that includes the bankruptcy filing of subsidiary GenOn. If successfully executed, the transformation plan could turn NRG into a more focused energy provider with a considerably stronger balance sheet, in our view.
The stock price of Ally Financial, a US-based bank and auto finance company, rose steadily from the middle of 2017 due to improved financial performance, stable to improving auto prices, favorable decisions by the US Federal Reserve (Fed), as well as the passage of a major US tax reform bill. Ally’s quarterly results showed improved lending spreads, positive management of expenses and credit, and a good rate of deposit growth. In June, shares of Ally rose in response to the Fed’s Comprehensive Capital Analysis and Review (CCAR) results. As part of CCAR, the Fed evaluated banks’ capital distribution plans, including dividends and stock repurchases. Ally was approved to raise its dividend by more than investors had expected, as well as to increase its share buyback plan. In August, the Fed released Ally Bank from the capital, liquidity, and business plan commitments connected to its application for membership in the Federal Reserve System.
Shares of insurer ASR Nederland steadily rose during most of the period, aided by a series of solid quarterly results. Operating results were aided by ASR Nederland’s efforts to
| Top 10 Equity Holdings | ||||
| 12/31/17 | ||||
Company Sector/Industry, Country | % of Total Net Assets | |||
Sorenson Communications LLC | 3.1% | |||
| Communications Equipment, US | ||||
Vodafone Group PLC | 2.9% | |||
| Wireless Telecommunication Services, UK | ||||
Royal Dutch Shell PLC | 2.5% | |||
| Oil, Gas & Consumable Fuels, UK | ||||
Time Warner Inc. | 2.4% | |||
| Media, US | ||||
ASR Nederland NV | 2.2% | |||
| Insurance, Netherlands | ||||
Novartis AG | 2.2% | |||
| Pharmaceuticals, Switzerland | ||||
CIT Group Inc. | 2.0% | |||
| Banks, US | ||||
Voya Financial Inc. | 1.9% | |||
| Diversified Financial Services, US | ||||
Medtronic PLC | 1.9% | |||
| Health Care Equipment & Supplies, US | ||||
BP PLC | 1.9% | |||
| Oil, Gas & Consumable Fuels, UK | ||||
increase the investment risk of its portfolio by shifting invested premiums from traditional fixed income securities to equities and other assets with higher historical returns. In February 2017, ASR Nederland announced it would increase its dividend and repurchase shares on offer from the Dutch government, shares the government had acquired during the 2008 financial crisis. The company announced an additional share buyback plan in May 2017. In our view, the buybacks demonstrated ASR Nederland’s strong capital position.
During the period under review, Fund investments that detracted from performance included US-based companies Eastman Kodak and Avaya and Israel-based pharmaceutical services provider Teva Pharmaceuticals.
Shares of Eastman Kodak, a digital commercial imaging company, retreated in March due to weak results, particularly lower revenues. Earnings guidance for full year 2017 was also met with disappointment as was Kodak’s announcement in April that it would not sell its inkjet business. The stock price dropped further in November on another set of disappointing quarterly results and a downward revision to 2017 earnings guidance. Eastman Kodak has been dealing with a number of challenges, including weakness in the commercial print business and problems with vendors in its film business.
Avaya is a communications company that was chiefly a hardware maker but is transitioning into a software and services
franklintempleton.com | Annual Report | 7 |
FRANKLIN MUTUAL QUEST FUND
provider. As we anticipated, the company filed for Chapter 11 bankruptcy in January 2017 to restructure and reduce its debt load. Avaya then emerged from bankruptcy in December with significantly less debt.
Teva Pharmaceutical Industries experienced a challenging year. In January 2017, Teva provided lower earnings guidance and a US federal court invalidated four patents for the company’s top-selling multiple sclerosis drug Copaxone. The resignations of Teva’s chief executive officer (CEO) and chief financial officer in the first half of 2017 further hindered Teva’s stock price. In the second half of the year, weak operating results, a dividend cut and a debt rating downgrade escalated investor concerns. The company managed to ease investor anxiety later in 2017, in our view, with the appointment of Kare Schultz, a well-regarded industry veteran as the new CEO, as well as the divestiture of certain non-core assets and amendment to certain debt instruments. We were also encouraged by the details of a restructuring plan announced by the new CEO in December.
During the period, the Fund held currency forwards and futures seeking to hedge most of the currency risk of the portfolio’s non-US dollar investments. The currency forwards and futures had a negative impact on the Fund’s performance because of the depreciation of the US dollar versus the hedged currencies.
What is a currency forward?
A currency forward is an agreement between the Fund and a counterparty to buy or sell a foreign currency in exchange for another currency at a specific exchange rate on a future date.
What is a future?
A future is an agreement between the Fund and a counterparty made through a US or foreign futures exchange to buy or sell an underlying instrument or asset at a specific price on a future date.
Thank you for your participation in Franklin Mutual Quest Fund. We look forward to continuing to serve your investment needs.
 |
Shawn M. Tumulty Co-Portfolio Manager | |
 |
Keith Luh, CFA Co-Portfolio Manager | |


The foregoing information reflects our analysis, opinions and portfolio holdings as of December 31, 2017, the end of the reporting period. The way we implement our main investment strategies and the resulting portfolio holdings may change depending on factors such as market and economic conditions. These opinions may not be relied upon as investment advice or an offer for a particular security. The information is not a complete analysis of every aspect of any market, country, industry, security or the Fund. Statements of fact are from sources considered reliable, but the investment manager makes no representation or warranty as to their completeness or accuracy. Although historical performance is no guarantee of future results, these insights may help you understand our investment management philosophy.
Shawn Tumulty has been a portfolio manager for Franklin Mutual Quest Fund since 2003 and a co-portfolio manager since 2010. He joined Franklin Templeton Investments in 2000. Prior to joining Franklin Templeton Investments, Mr. Tumulty was an analyst and portfolio manager at Hamilton Partners Limited.
CFA® is a trademark owned by CFA Institute.
| 8 |
Annual Report | franklintempleton.com |
FRANKLIN MUTUAL QUEST FUND
Keith Luh has been a co-portfolio manager for Franklin Mutual Quest Fund since 2010. He is also head of cross asset investing for Franklin Mutual Series with a value and event-driven focus across equity and fixed income investments, globally. Prior to joining in 2005, Mr. Luh was a senior analyst in global investment research at Putnam Investments, where he also helped manage a best-ideas research fund. Previously, he worked in the investment banking group at Volpe Brown Whelan and Co., LLC, and the derivative products trading group at BNP. Mr. Luh is also Adjunct Professor in Finance and Economics at the Graduate School of Business, Columbia University.
| franklintempleton.com | Annual Report | 9 |
FRANKLIN MUTUAL QUEST FUND
Performance Summary as of December 31, 2017
The performance table and graphs do not reflect any taxes that a shareholder would pay on Fund dividends, capital gain distributions, if any, or any realized gains on the sale of Fund shares. Total return reflects reinvestment of the Fund’s dividends and capital gain distributions, if any, and any unrealized gains or losses. Your dividend income will vary depending on dividends or interest paid by securities in the Fund’s portfolio, adjusted for operating expenses of each class. Capital gain distributions are net profits realized from the sale of portfolio securities.
Performance as of 12/31/17
Cumulative total return excludes sales charges. Average annual total return includes maximum sales charges. Sales charges will vary depending on the size of the investment and the class of share purchased. The maximum is 5.75% and the minimum is 0%. Class A: 5.75% maximum initial sales charge. For other share classes, visit franklintempleton.com.
| Share Class | | Cumulative Total Return1 | | | Average Annual Total Return2 | | ||
Z | ||||||||
1-Year | +7.25%3 | +7.25%3 | ||||||
5-Year | +53.46% | +8.94% | ||||||
10-Year | +68.22% | +5.34% | ||||||
A | ||||||||
1-Year | +6.95%3 | +0.83% | ||||||
5-Year | +51.34% | +7.36% | ||||||
10-Year | +63.43% | +4.42% | ||||||
Performance data represent past performance, which does not guarantee future results. Investment return and principal value will fluctuate, and you may have a gain or loss when you sell your shares. Current performance may differ from figures shown. For most recent month-end performance, go to franklintempleton.com or call (800) 342-5236.
See page 12 for Performance Summary footnotes.
| 10 |
Annual Report | franklintempleton.com |
FRANKLIN MUTUAL QUEST FUND
PERFORMANCE SUMMARY
Total Return Index Comparison for a Hypothetical $10,000 Investment
Total return represents the change in value of an investment over the periods shown. It includes any applicable maximum sales charge, Fund expenses, account fees and reinvested distributions. The unmanaged indexes include reinvestment of any income or distributions. They differ from the Fund in composition and do not pay management fees or expenses. One cannot invest directly in an index.
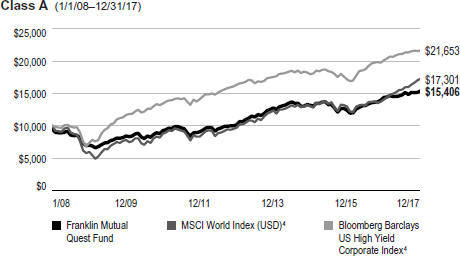
See page 12 for Performance Summary footnotes.
franklintempleton.com |
Annual Report |
|
11 |
|
FRANKLIN MUTUAL QUEST FUND
PERFORMANCE SUMMARY
Distributions (1/1/17–12/31/17)
| Share Class | Net Investment Income | Short-Term Capital Gain | Long-Term Capital Gain | Total | ||||||||||||||||||||||||
Z | $0.6257 | $0.0961 | $0.0376 | $0.7594 | ||||||||||||||||||||||||
A | $0.5843 | $0.0961 | $0.0376 | $0.7180 | ||||||||||||||||||||||||
C | $0.4598 | $0.0961 | $0.0376 | $0.5935 | ||||||||||||||||||||||||
R | $0.5688 | $0.0961 | $0.0376 | $0.7025 | ||||||||||||||||||||||||
R6 | $0.6387 | $0.0961 | $0.0376 | $0.7724 | ||||||||||||||||||||||||
Total Annual Operating Expenses5
| Share Class | ||||
Z | 0.79 | % | ||
A | 1.04 | % | ||
Each class of shares is available to certain eligible investors and has different annual fees and expenses, as described in the prospectus.
All investments involve risks, including possible loss of principal. Value securities may not increase in price as anticipated or may decline further in value. Special risks are associated with foreign investing, including currency fluctuations, economic instability and political developments. Because the Fund may invest its assets in companies in a specific region, including Europe, it is subject to greater risks of adverse developments in that region and/or the surrounding regions than a fund that is more broadly diversified geographically. Current political and financial uncertainty surrounding the European Union may increase market volatility and the economic risk of investing in companies in Europe. Smaller company stocks have exhibited greater price volatility than larger company stocks, particularly over the short term. The Fund’s investments in companies engaged in mergers, reorganizations or liquidations also involve special risks as pending deals may not be completed on time or on favorable terms. The Fund may invest in lower rated bonds, which entail higher credit risk. The Fund is actively managed but there is no guarantee that the manager’s investment decisions will produce the desired results. The Fund’s prospectus also includes a description of the main investment risks.
1. Cumulative total return represents the change in value of an investment over the periods indicated.
2. Average annual total return represents the average annual change in value of an investment over the periods indicated. Return for less than one year, if any, has not been annualized.
3. Total return information is based on net asset values calculated for shareholder transactions. Certain adjustments were made to the net assets of the Fund at 12/31/17 for financial reporting purposes, and as a result, the total returns based on those net asset values differ from the adjusted total returns reported in the Financial Highlights.
4. Source: Morningstar. The MSCI World Index (USD) is a free float-adjusted, market capitalization-weighted index designed to measure equity market performance in global developed markets. The Bloomberg Barclays US Corporate High Yield Index measures the US corporate market of non-investment grade, fixed-rate corporate bonds, defined as the middle or lower ratings of Moody’s, Fitch and Standard & Poor’s (Ba1/BB+/BB+).
5. Figures are as stated in the Fund’s current prospectus and may differ from the expense ratios disclosed in the Your Fund’s Expenses and Financial Highlights sections in this report. In periods of market volatility, assets may decline significantly, causing total annual Fund operating expenses to become higher than the figures shown.
See www.franklintempletondatasources.com for additional data provider information.
12 |
Annual Report |
franklintempleton.com |
FRANKLIN MUTUAL QUEST FUND
As a Fund shareholder, you can incur two types of costs: (1) transaction costs, including sales charges (loads) on Fund purchases and redemptions; and (2) ongoing Fund costs, including management fees, distribution and service (12b-1) fees, and other Fund expenses. All mutual funds have ongoing costs, sometimes referred to as operating expenses. The table below shows ongoing costs of investing in the Fund and can help you understand these costs and compare them with those of other mutual funds. The table assumes a $1,000 investment held for the six months indicated.
Actual Fund Expenses
The table below provides information about actual account values and actual expenses in the columns under the heading “Actual.” In these columns the Fund’s actual return, which includes the effect of Fund expenses, is used to calculate the “Ending Account Value” for each class of shares. You can estimate the expenses you paid during the period by following these steps (of course, your account value and expenses will differ from those in this illustration): Divide your account value by $1,000 (if your account had an $8,600 value, then $8,600 ÷ $1,000 = 8.6). Then multiply the result by the number in the row for your class of shares under the headings “Actual” and “Expenses Paid During Period” (if Actual Expenses Paid During Period were $7.50, then 8.6 x $7.50 = $64.50). In this illustration, the actual expenses paid this period are $64.50.
Hypothetical Example for Comparison with Other Funds
Under the heading “Hypothetical” in the table, information is provided about hypothetical account values and hypothetical expenses based on the Fund’s actual expense ratio and an assumed rate of return of 5% per year before expenses, which is not the Fund’s actual return. This information may not be used to estimate the actual ending account balance or expenses you paid for the period, but it can help you compare ongoing costs of investing in the Fund with those of other funds. To do so, compare this 5% hypothetical example for the class of shares you hold with the 5% hypothetical examples that appear in the shareholder reports of other funds.
Please note that expenses shown in the table are meant to highlight ongoing costs and do not reflect any transactional costs. Therefore, information under the heading “Hypothetical” is useful in comparing ongoing costs only, and will not help you compare total costs of owning different funds. In addition, if transactional costs were included, your total costs would have been higher.
Actual (actual return after expenses) | Hypothetical (5% annual return before expenses) | |||||||||||||||||||
Share Class | Beginning Account Value 7/1/17 | Ending Account Value 12/31/17 | Expenses Paid During Period 7/1/17–12/31/171 | Ending Account Value 12/31/17 | Expenses Paid During 7/1/17–12/31/171 | Annualized Expense Ratio | ||||||||||||||
| Z | $1,000 | $1,042.30 | $4.12 | $1,021.17 | $4.08 | 0.80% | ||||||||||||||
| A | $1,000 | $1,040.90 | $5.40 | $1,019.91 | $5.35 | 1.05% | ||||||||||||||
| C | $1,000 | $1,036.90 | $9.24 | $1,016.13 | $9.15 | 1.80% | ||||||||||||||
| R | $1,000 | $1,039.80 | $6.68 | $1,018.65 | $6.61 | 1.30% | ||||||||||||||
| R6 | $1,000 | $1,042.50 | $3.76 | $1,021.53 | $3.72 | 0.73% | ||||||||||||||
1. Expenses are equal to the annualized expense ratio for the six-month period as indicated above—in the far right column—multiplied by the simple average account value over the period indicated, and then multiplied by 184/365 to reflect the one-half year period.
franklintempleton.com |
Annual Report |
|
13 |
|
FRANKLIN MUTUAL QUEST FUND
| Year Ended December 31, | ||||||||||||||||||||
| 2017 | 2016 | 2015 | 2014 | 2013 | ||||||||||||||||
Class Z | ||||||||||||||||||||
| Per share operating performance | ||||||||||||||||||||
(for a share outstanding throughout the year) | ||||||||||||||||||||
Net asset value, beginning of year | $15.52 | $14.47 | $16.21 | $18.18 | $16.55 | |||||||||||||||
Income from investment operationsa: | ||||||||||||||||||||
Net investment incomeb | 0.58 | 0.87 | c | 0.54 | 0.78 | d | 0.54 | |||||||||||||
Net realized and unrealized gains (losses) | 0.49 | 1.47 | (1.45 | ) | (0.16 | ) | 3.68 | |||||||||||||
Total from investment operations | 1.07 | 2.34 | (0.91 | ) | 0.62 | 4.22 | ||||||||||||||
Less distributions from: | ||||||||||||||||||||
Net investment income | (0.63 | ) | (1.01 | ) | (0.68 | ) | (0.85 | ) | (0.56 | ) | ||||||||||
Net realized gains | (0.13 | ) | (0.28 | ) | (0.15 | ) | (1.74 | ) | (2.03 | ) | ||||||||||
Total distributions | (0.76 | ) | (1.29 | ) | (0.83 | ) | (2.59 | ) | (2.59 | ) | ||||||||||
Net asset value, end of year | $15.83 | $15.52 | $14.47 | $16.21 | $18.18 | |||||||||||||||
Total return | 6.92% | 16.26% | (5.55)% | 3.44% | 25.97% | |||||||||||||||
Ratios to average net assets | ||||||||||||||||||||
Expensese,f | 0.79% | 0.79% | g | 0.82% | g | 0.81% | 0.84% | |||||||||||||
Expenses incurred in connection with securities sold short | —% | 0.01% | 0.03% | 0.04% | 0.07% | |||||||||||||||
Net investment income | 3.65% | 5.74% | c | 3.35% | 4.18% | d | 2.93% | |||||||||||||
| Supplemental data | ||||||||||||||||||||
Net assets, end of year (000’s) | $3,667,351 | $3,683,095 | $3,577,696 | $4,116,651 | $4,270,828 | |||||||||||||||
Portfolio turnover rate | 32.90% | 44.04% | 30.51% | 65.77% | 63.41% | |||||||||||||||
aThe amount shown for a share outstanding throughout the period may not correlate with the Statement of Operations for the period due to the timing of sales and repurchases of the Fund’s shares in relation to income earned and/or fluctuating fair value of the investments of the Fund.
bBased on average daily shares outstanding.
cNet investment income per share includes approximately $0.05 per share related to income received in the form of special dividends in connection with certain Fund holdings. Excluding this amount, the ratio of net investment income to average net assets would have been 5.42%.
dNet investment income per share includes approximately $0.27 per share related to income received in the form of special dividends in connection with certain Fund holdings. Excluding this amount, the ratio of net investment income to average net assets would have been 2.73%.
eIncludes dividend and/or interest expense on securities sold short and security borrowing fees, if any. See below for the ratios of such expenses to average net assets for the periods presented. See Note 1(d).
fBenefit of expense reduction rounds to less than 0.01%.
gBenefit of waiver and payments by affiliates rounds to less than 0.01%.
14 |
Annual Report | The accompanying notes are an integral part of these financial statements. |
franklintempleton.com |
FRANKLIN MUTUAL QUEST FUND
FINANCIAL HIGHLIGHTS
| Year Ended December 31, | ||||||||||||||||||||
| 2017 | 2016 | 2015 | 2014 | 2013 | ||||||||||||||||
Class A | ||||||||||||||||||||
| Per share operating performance | ||||||||||||||||||||
(for a share outstanding throughout the year) | ||||||||||||||||||||
Net asset value, beginning of year | $ | 15.32 | $ | 14.29 | $ | 16.02 | $ | 18.00 | $ | 16.41 | ||||||||||
Income from investment operationsa: | ||||||||||||||||||||
Net investment incomeb | 0.53 | 0.83 | c | 0.49 | 0.71 | d | 0.48 | |||||||||||||
Net realized and unrealized gains (losses) | 0.46 | 1.45 | (1.43 | ) | (0.15 | ) | 3.65 | |||||||||||||
Total from investment operations | 0.99 | 2.28 | (0.94 | ) | 0.56 | 4.13 | ||||||||||||||
Less distributions from: | ||||||||||||||||||||
Net investment income | (0.58 | ) | (0.97 | ) | (0.64 | ) | (0.80 | ) | (0.51 | ) | ||||||||||
Net realized gains | (0.13 | ) | (0.28 | ) | (0.15 | ) | (1.74 | ) | (2.03 | ) | ||||||||||
Total distributions | (0.71 | ) | (1.25 | ) | (0.79 | ) | (2.54 | ) | (2.54 | ) | ||||||||||
Net asset value, end of year | $ | 15.60 | $ | 15.32 | $ | 14.29 | $ | 16.02 | $ | 18.00 | ||||||||||
Total returne | 6.54% | 16.04% | (5.85)% | 3.11% | 25.61% | |||||||||||||||
| Ratios to average net assets | ||||||||||||||||||||
Expensesf,g | 1.04% | 1.04% | h | 1.10% | h | 1.11% | 1.14% | |||||||||||||
Expenses incurred in connection with securities sold short | —% | 0.01% | 0.03% | 0.04% | 0.07% | |||||||||||||||
Net investment income | 3.40% | 5.49% | c | 3.07% | 3.88% | d | 2.63% | |||||||||||||
| Supplemental data | ||||||||||||||||||||
Net assets, end of year (000’s) | $ | 1,153,870 | $ | 1,216,085 | $ | 1,203,508 | $ | 1,394,138 | $ | 1,371,789 | ||||||||||
Portfolio turnover rate | 32.90% | 44.04% | 30.51% | 65.77% | 63.41% | |||||||||||||||
aThe amount shown for a share outstanding throughout the period may not correlate with the Statement of Operations for the period due to the timing of sales and repurchases of the Fund’s shares in relation to income earned and/or fluctuating fair value of the investments of the Fund.
bBased on average daily shares outstanding.
cNet investment income per share includes approximately $0.05 per share related to income received in the form of special dividends in connection with certain Fund holdings. Excluding this amount, the ratio of net investment income to average net assets would have been 5.17%.
dNet investment income per share includes approximately $0.27 per share related to income received in the form of special dividends in connection with certain Fund holdings. Excluding this amount, the ratio of net investment income to average net assets would have been 2.43%.
eTotal return does not reflect sales commissions or contingent deferred sales charges, if applicable.
fIncludes dividend and/or interest expense on securities sold short and security borrowing fees, if any. See below for the ratios of such expenses to average net assets for the periods presented. See Note 1(d).
gBenefit of expense reduction rounds to less than 0.01%.
hBenefit of waiver and payments by affiliates rounds to less than 0.01%.
franklintempleton.com |
The accompanying notes are an integral part of these financial statements. | |
Annual Report |
15 |
FRANKLIN MUTUAL QUEST FUND
FINANCIAL HIGHLIGHTS
| Year Ended December 31, | ||||||||||||||||||||
| 2017 | 2016 | 2015 | 2014 | 2013 | ||||||||||||||||
Class C | ||||||||||||||||||||
| Per share operating performance | ||||||||||||||||||||
(for a share outstanding throughout the year) | ||||||||||||||||||||
Net asset value, beginning of year | $15.06 | $14.08 | $15.78 | $17.76 | $16.24 | |||||||||||||||
Income from investment operationsa: | ||||||||||||||||||||
Net investment incomeb | 0.41 | 0.70 | c | 0.36 | 0.57 | d | 0.35 | |||||||||||||
Net realized and unrealized gains (losses) | 0.47 | 1.41 | (1.39 | ) | (0.14 | ) | 3.59 | |||||||||||||
Total from investment operations | 0.88 | 2.11 | (1.03 | ) | 0.43 | 3.94 | ||||||||||||||
Less distributions from: | ||||||||||||||||||||
Net investment income | (0.46 | ) | (0.85 | ) | (0.52 | ) | (0.67 | ) | (0.39 | ) | ||||||||||
Net realized gains | (0.13 | ) | (0.28 | ) | (0.15 | ) | (1.74 | ) | (2.03 | ) | ||||||||||
Total distributions | (0.59 | ) | (1.13 | ) | (0.67 | ) | (2.41 | ) | (2.42 | ) | ||||||||||
Net asset value, end of year | $15.35 | $15.06 | $14.08 | $15.78 | $17.76 | |||||||||||||||
Total returne | 5.89% | 15.10% | (6.49)% | 2.42% | 24.74% | |||||||||||||||
| Ratios to average net assets | ||||||||||||||||||||
Expensesf,g | 1.79% | 1.79% | h | 1.82% | h | 1.81% | 1.84% | |||||||||||||
Expenses incurred in connection with securities sold short | —% | 0.01% | 0.03% | 0.04% | 0.07% | |||||||||||||||
Net investment income | 2.65% | 4.74% | c | 2.35% | 3.18% | d | 1.93% | |||||||||||||
| Supplemental data | ||||||||||||||||||||
Net assets, end of year (000’s) | $309,160 | $343,624 | $337,974 | $397,963 | $406,304 | |||||||||||||||
Portfolio turnover rate | 32.90% | 44.04% | 30.51% | 65.77% | 63.41% | |||||||||||||||
aThe amount shown for a share outstanding throughout the period may not correlate with the Statement of Operations for the period due to the timing of sales and repurchases of the Fund’s shares in relation to income earned and/or fluctuating fair value of the investments of the Fund.
bBased on average daily shares outstanding.
cNet investment income per share includes approximately $0.05 per share related to income received in the form of special dividends in connection with certain Fund holdings. Excluding this amount, the ratio of net investment income to average net assets would have been 4.42%.
dNet investment income per share includes approximately $0.27 per share related to income received in the form of special dividends in connection with certain Fund holdings. Excluding this amount, the ratio of net investment income to average net assets would have been 1.73%.
eTotal return does not reflect sales commissions or contingent deferred sales charges, if applicable.
fIncludes dividend and/or interest expense on securities sold short and security borrowing fees, if any. See below for the ratios of such expenses to average net assets for the periods presented. See Note 1(d).
gBenefit of expense reduction rounds to less than 0.01%.
hBenefit of waiver and payments by affiliates rounds to less than 0.01%.
16 |
Annual Report | |
The accompanying notes are an integral part of these financial statements. |
franklintempleton.com |
FRANKLIN MUTUAL QUEST FUND
FINANCIAL HIGHLIGHTS
| Year Ended December 31, | ||||||||||||||||||||||||
|
| |||||||||||||||||||||||
| 2017 | 2016 | 2015 | 2014 | 2013 | ||||||||||||||||||||
| ||||||||||||||||||||||||
| Class R | ||||||||||||||||||||||||
| Per share operating performance (for a share outstanding throughout the year) | ||||||||||||||||||||||||
Net asset value, beginning of year | $15.14 | $14.14 | $15.87 | $17.84 | $16.33 | |||||||||||||||||||
|
| |||||||||||||||||||||||
Income from investment operationsa: | ||||||||||||||||||||||||
Net investment incomeb | 0.50 | 0.78 | c | 0.44 | 0.65 | d | 0.50 | |||||||||||||||||
Net realized and unrealized gains (losses) | 0.46 | 1.43 | (1.40 | ) | (0.13 | ) | 3.56 | |||||||||||||||||
|
| |||||||||||||||||||||||
Total from investment operations | 0.96 | 2.21 | (0.96 | ) | 0.52 | 4.06 | ||||||||||||||||||
|
| |||||||||||||||||||||||
Less distributions from: | ||||||||||||||||||||||||
Net investment income | (0.57 | ) | (0.93 | ) | (0.62 | ) | (0.75 | ) | (0.52 | ) | ||||||||||||||
Net realized gains | (0.13 | ) | (0.28 | ) | (0.15 | ) | (1.74 | ) | (2.03 | ) | ||||||||||||||
|
| |||||||||||||||||||||||
Total distributions | (0.70 | ) | (1.21 | ) | (0.77 | ) | (2.49 | ) | (2.55 | ) | ||||||||||||||
|
| |||||||||||||||||||||||
Net asset value, end of year | $15.40 | $15.14 | $14.14 | $15.87 | $17.84 | |||||||||||||||||||
|
| |||||||||||||||||||||||
Total return | 6.38% | 15.69% | (6.03)% | 2.94% | 25.34% | |||||||||||||||||||
| Ratios to average net assets | ||||||||||||||||||||||||
Expensese,f | 1.29% | 1.29% | g | 1.32% | g | 1.31% | 1.34% | |||||||||||||||||
Expenses incurred in connection with securities sold short | —% | 0.01% | 0.03% | 0.04% | 0.07% | |||||||||||||||||||
Net investment income | 3.15% | 5.24% | c | 2.85% | 3.68% | d | 2.43% | |||||||||||||||||
| Supplemental data | ||||||||||||||||||||||||
Net assets, end of year (000’s) | $1,774 | $880 | $898 | $675 | $853 | |||||||||||||||||||
Portfolio turnover rate | 32.90% | 44.04% | 30.51% | 65.77% | 63.41% | |||||||||||||||||||
aThe amount shown for a share outstanding throughout the period may not correlate with the Statement of Operations for the period due to the timing of sales and repurchases of the Fund’s shares in relation to income earned and/or fluctuating fair value of the investments of the Fund.
bBased on average daily shares outstanding.
cNet investment income per share includes approximately $0.05 per share related to income received in the form of special dividends in connection with certain Fund holdings. Excluding this amount, the ratio of net investment income to average net assets would have been 4.92%.
dNet investment income per share includes approximately $0.27 per share related to income received in the form of special dividends in connection with certain Fund holdings. Excluding this amount, the ratio of net investment income to average net assets would have been 2.23%.
eIncludes dividend and/or interest expense on securities sold short and security borrowing fees, if any. See below for the ratios of such expenses to average net assets for the periods presented. See Note 1(d).
fBenefit of expense reduction rounds to less than 0.01%.
gBenefit of waiver and payments by affiliates rounds to less than 0.01%.
franklintempleton.com |
The accompanying notes are an integral part of these financial statements. | |
Annual Report |
17 |
FRANKLIN MUTUAL QUEST FUND
FINANCIAL HIGHLIGHTS
| Year Ended December 31, | ||||||||||||||||||||||||
|
| |||||||||||||||||||||||
| 2017 | 2016 | 2015 | 2014 | 2013a | ||||||||||||||||||||
| ||||||||||||||||||||||||
| Class R6 | ||||||||||||||||||||||||
| Per share operating performance (for a share outstanding throughout the year) | ||||||||||||||||||||||||
Net asset value, beginning of year | $15.51 | $14.45 | $16.19 | $18.19 | $18.16 | |||||||||||||||||||
|
| |||||||||||||||||||||||
Income from investment operationsb: | ||||||||||||||||||||||||
Net investment incomec | 0.64 | 0.88 | d | 0.55 | 0.51 | e | 0.36 | |||||||||||||||||
Net realized and unrealized gains (losses) | 0.43 | 1.48 | (1.44 | ) | 0.10 | 2.28 | ||||||||||||||||||
|
| |||||||||||||||||||||||
Total from investment operations | 1.07 | 2.36 | (0.89 | ) | 0.61 | 2.64 | ||||||||||||||||||
|
| |||||||||||||||||||||||
Less distributions from: | ||||||||||||||||||||||||
Net investment income | (0.64 | ) | (1.02 | ) | (0.70 | ) | (0.87 | ) | (0.58 | ) | ||||||||||||||
Net realized gains | (0.13 | ) | (0.28 | ) | (0.15 | ) | (1.74 | ) | (2.03 | ) | ||||||||||||||
|
| |||||||||||||||||||||||
Total distributions | (0.77 | ) | (1.30 | ) | (0.85 | ) | (2.61 | ) | (2.61 | ) | ||||||||||||||
|
| |||||||||||||||||||||||
Net asset value, end of year | $15.81 | $15.51 | $14.45 | $16.19 | $18.19 | |||||||||||||||||||
|
| |||||||||||||||||||||||
Total returnf | 6.94% | 16.44% | (5.54)% | 3.53% | 14.83% | |||||||||||||||||||
| Ratios to average net assetsg | ||||||||||||||||||||||||
Expenses before waiver and payments by affiliatesh | 0.72% | 0.71% | 0.74% | 0.74% | 2.00% | |||||||||||||||||||
Expenses net of waiver and payments by affiliatesh,i | 0.72% | 0.71% | j | 0.74% | j | 0.74% | 0.77% | |||||||||||||||||
Expenses incurred in connection with securities sold short | —% | 0.01% | 0.03% | 0.04% | 0.07% | |||||||||||||||||||
Net investment income | 3.72% | 5.82% | d | 3.43% | 4.25% | e | 3.00% | |||||||||||||||||
| Supplemental data | ||||||||||||||||||||||||
Net assets, end of year (000’s) | $123,863 | $52,277 | $41,408 | $44,340 | $5 | |||||||||||||||||||
Portfolio turnover rate | 32.90% | 44.04% | 30.51% | 65.77% | 63.41% | |||||||||||||||||||
aFor the period May 1, 2013 (effective date) to December 31, 2013.
bThe amount shown for a share outstanding throughout the period may not correlate with the Statement of Operations for the period due to the timing of sales and repurchases of the Fund’s shares in relation to income earned and/or fluctuating fair value of the investments of the Fund.
cBased on average daily shares outstanding.
dNet investment income per share includes approximately $0.05 per share related to income received in the form of special dividends in connection with certain Fund holdings. Excluding this amount, the ratio of net investment income to average net assets would have been 5.50%.
eNet investment income per share includes approximately $0.27 per share related to income received in the form of special dividends in connection with certain Fund holdings. Excluding this amount, the ratio of net investment income to average net assets would have been 2.80%.
fTotal return is not annualized for periods less than one year.
gRatios are annualized for periods less than one year.
hIncludes dividend and/or interest expense on securities sold short and security borrowing fees, if any. See below for the ratios of such expenses to average net assets for the periods presented. See Note 1(d).
iBenefit of expense reduction rounds to less than 0.01%.
jBenefit of waiver and payments by affiliates rounds to less than 0.01%.
18 |
Annual Report | The accompanying notes are an integral part of these financial statements. |
franklintempleton.com |
FRANKLIN MUTUAL QUEST FUND
Statement of Investments, December 31, 2017
| Country | Shares/ Warrants | Value | ||||||||||||
Common Stocks and Other Equity Interests 61.1% | ||||||||||||||
| Auto Components 1.0% | ||||||||||||||
The Goodyear Tire & Rubber Co. | United States | 1,291,372 | $ | 41,724,229 | ||||||||||
| a,b,c | International Automotive Components Group Brazil LLC | Brazil | 2,548,299 | 87,369 | ||||||||||
| a,b,c | International Automotive Components Group North America LLC | United States | 19,924,658 | 13,125,867 | ||||||||||
|
| |||||||||||||
| 54,937,465 | ||||||||||||||
|
| |||||||||||||
| Automobiles 1.6% | ||||||||||||||
Peugeot SA | France | 4,111,080 | 83,630,098 | |||||||||||
|
| |||||||||||||
| Banks 5.0% | ||||||||||||||
BB&T Corp. | United States | 429,077 | 21,333,708 | |||||||||||
CIT Group Inc. | United States | 2,118,508 | 104,294,149 | |||||||||||
Citizens Financial Group Inc. | United States | 780,750 | 32,775,885 | |||||||||||
Guaranty Bancorp | United States | 347,127 | 9,598,062 | |||||||||||
SunTrust Banks Inc. | United States | 711,267 | 45,940,735 | |||||||||||
Wells Fargo & Co. | United States | 822,224 | 49,884,330 | |||||||||||
|
| |||||||||||||
| 263,826,869 | ||||||||||||||
|
| |||||||||||||
| Chemicals 0.3% | ||||||||||||||
| d | Advanced Emissions Solutions Inc. | United States | 1,724,209 | 16,655,859 | ||||||||||
| a,b,e | Dow Corning Corp., Contingent Distribution | United States | 12,089,194 | — | ||||||||||
|
| |||||||||||||
| 16,655,859 | ||||||||||||||
|
| |||||||||||||
| Communications Equipment 3.1% | ||||||||||||||
| a,b,c | Sorenson Communications LLC, Membership Interests | United States | 224,279 | 160,414,954 | ||||||||||
|
| |||||||||||||
| Consumer Finance 3.0% | ||||||||||||||
Ally Financial Inc. | United States | 2,646,824 | 77,181,388 | |||||||||||
Capital One Financial Corp. | United States | 826,100 | 82,263,038 | |||||||||||
|
| |||||||||||||
| 159,444,426 | ||||||||||||||
|
| |||||||||||||
| Diversified Consumer Services 0.2% | ||||||||||||||
| a,b | Affinion Group Inc., wts., 11/10/22 | United States | 549,716 | 10,164,359 | ||||||||||
|
| |||||||||||||
| Diversified Financial Services 1.9% | ||||||||||||||
Voya Financial Inc. | United States | 2,043,200 | 101,077,104 | |||||||||||
|
| |||||||||||||
| Diversified Telecommunication Services 1.8% | ||||||||||||||
Koninklijke KPN NV | Netherlands | 27,104,180 | 94,566,988 | |||||||||||
|
| |||||||||||||
| Electric Utilities 0.5% | ||||||||||||||
PG&E Corp. | United States | 616,122 | 27,620,749 | |||||||||||
|
| |||||||||||||
| Energy Equipment & Services 0.0%† | ||||||||||||||
| a | GulfMark Offshore Inc. | United States | 158 | 4,501 | ||||||||||
| a | GulfMark Offshore Inc., wts., 11/14/24 | United States | 1,712 | 1,233 | ||||||||||
|
| |||||||||||||
| 5,734 | ||||||||||||||
|
| |||||||||||||
| Equity Real Estate Investment Trusts (REITs) 2.5% | ||||||||||||||
Forest City Realty Trust Inc., A | United States | 2,481,030 | 59,792,823 | |||||||||||
JBG SMITH Properties | United States | 581 | 20,178 | |||||||||||
Vornado Realty Trust | United States | 907,163 | 70,922,004 | |||||||||||
|
| |||||||||||||
| 130,735,005 | ||||||||||||||
|
| |||||||||||||
| Food & Staples Retailing 0.3% | ||||||||||||||
| a | Rite Aid Corp. | United States | 8,181,200 | 16,116,964 | ||||||||||
|
| |||||||||||||
| Health Care Equipment & Supplies 1.9% | ||||||||||||||
Medtronic PLC | United States | 1,245,243 | 100,553,372 | |||||||||||
|
| |||||||||||||
| Hotels, Restaurants & Leisure 0.1% | ||||||||||||||
| a | Caesars Entertainment Corp. | United States | 412,211 | 5,214,469 | ||||||||||
|
| |||||||||||||
franklintempleton.com | Annual Report | 19 |
FRANKLIN MUTUAL QUEST FUND
STATEMENT OF INVESTMENTS
| Country | Shares/ Warrants | Value | ||||||||||||
Common Stocks and Other Equity Interests (continued) |
| |||||||||||||
| Independent Power & Renewable Electricity Producers 1.5% | ||||||||||||||
NRG Energy Inc. | United States | 1,182,781 | $ | 33,685,603 | ||||||||||
| a | Vistra Energy Corp. | United States | 2,433,367 | 44,579,283 | ||||||||||
|
| |||||||||||||
| 78,264,886 | ||||||||||||||
|
| |||||||||||||
| Industrial Conglomerates 1.2% | ||||||||||||||
General Electric Co. | United States | 3,526,100 | 61,530,445 | |||||||||||
|
| |||||||||||||
| Insurance 5.1% | ||||||||||||||
Ageas | Belgium | 917,290 | 44,809,488 | |||||||||||
American International Group Inc. | United States | 395,586 | 23,569,014 | |||||||||||
ASR Nederland NV | Netherlands | 2,800,648 | 115,272,267 | |||||||||||
The Hartford Financial Services Group Inc. | United States | 1,115,390 | 62,774,149 | |||||||||||
RSA Insurance Group PLC | United Kingdom | 2,630,267 | 22,466,679 | |||||||||||
|
| |||||||||||||
| 268,891,597 | ||||||||||||||
|
| |||||||||||||
| Internet Software & Services 1.1% | ||||||||||||||
| a | Baidu Inc., ADR | China | 244,769 | 57,327,348 | ||||||||||
|
| |||||||||||||
| IT Services 0.9% | ||||||||||||||
Infosys Ltd. | India | 2,433,411 | 39,720,174 | |||||||||||
Infosys Ltd., ADR | India | 357,900 | 5,805,138 | |||||||||||
|
| |||||||||||||
| 45,525,312 | ||||||||||||||
|
| |||||||||||||
| Media 7.9% | ||||||||||||||
Comcast Corp., A | United States | 1,865,300 | 74,705,265 | |||||||||||
| a,d | Lee Enterprises Inc./IA | United States | 4,824,268 | 11,337,030 | ||||||||||
| a,b,c,d | Lee Enterprises Inc., wts., 12/31/22 | United States | 1,110,000 | 488,722 | ||||||||||
| d | New Media Investment Group Inc. | United States | 4,932,482 | 82,767,048 | ||||||||||
Sky PLC | United Kingdom | 4,686,424 | 64,047,268 | |||||||||||
Time Warner Inc. | United States | 1,361,220 | 124,510,793 | |||||||||||
The Walt Disney Co. | United States | 543,800 | 58,463,938 | |||||||||||
|
| |||||||||||||
| 416,320,064 | ||||||||||||||
|
| |||||||||||||
| Metals & Mining 0.2% | ||||||||||||||
Warrior Met Coal Inc. | United States | 431,052 | 10,840,958 | |||||||||||
|
| |||||||||||||
| Oil, Gas & Consumable Fuels 6.7% | ||||||||||||||
BP PLC | United Kingdom | 13,916,288 | 98,232,325 | |||||||||||
Crescent Point Energy Corp. | Canada | 8,512,600 | 64,872,093 | |||||||||||
JXTG Holdings Inc. | Japan | 2,447,555 | 15,790,677 | |||||||||||
Kinder Morgan Inc. | United States | 2,458,870 | 44,431,781 | |||||||||||
Royal Dutch Shell PLC, A (EUR Traded) | United Kingdom | 3,899,615 | 129,999,300 | |||||||||||
|
| |||||||||||||
| 353,326,176 | ||||||||||||||
|
| |||||||||||||
| Pharmaceuticals 7.3% | ||||||||||||||
Eli Lilly & Co. | United States | 715,947 | 60,468,884 | |||||||||||
GlaxoSmithKline PLC | United Kingdom | 4,394,234 | 78,479,707 | |||||||||||
Merck & Co. Inc. | United States | 1,314,970 | 73,993,362 | |||||||||||
Novartis AG, ADR | Switzerland | 1,362,606 | 114,404,400 | |||||||||||
Teva Pharmaceutical Industries Ltd., ADR | Israel | 2,905,868 | 55,066,198 | |||||||||||
|
| |||||||||||||
| 382,412,551 | ||||||||||||||
|
| |||||||||||||
| Real Estate Management & Development 0.2% | ||||||||||||||
| a | VICI Properties Inc. | United States | 501,682 | 10,284,481 | ||||||||||
|
| |||||||||||||
| 20 |
Annual Report | franklintempleton.com |
FRANKLIN MUTUAL QUEST FUND
STATEMENT OF INVESTMENTS
| Country | Shares/ Warrants | Value | ||||||||||||
Common Stocks and Other Equity Interests (continued) |
| |||||||||||||
| Software 2.7% | ||||||||||||||
| a | Avaya Holdings Corp. | United States | 1,596,593 | $ | 28,020,207 | |||||||||
| a,b | Avaya Holdings Corp., wts., 12/15/22 | United States | 338,090 | 575,122 | ||||||||||
| a | Check Point Software Technologies Ltd. | Israel | 846,738 | 87,738,992 | ||||||||||
Symantec Corp. | United States | 861,457 | 24,172,483 | |||||||||||
|
| |||||||||||||
| 140,506,804 | ||||||||||||||
|
| |||||||||||||
| Technology Hardware, Storage & Peripherals 0.2% | ||||||||||||||
| a,d | Eastman Kodak Co. | United States | 2,613,836 | 8,102,892 | ||||||||||
| a,d | Eastman Kodak Co., wts., 9/03/18 | United States | 48,582 | 340 | ||||||||||
| a,d | Eastman Kodak Co., wts., 9/03/18 | United States | 48,582 | 490 | ||||||||||
|
| |||||||||||||
| 8,103,722 | ||||||||||||||
|
| |||||||||||||
| Wireless Telecommunication Services 2.9% | ||||||||||||||
Vodafone Group PLC | United Kingdom | 47,816,110 | 151,747,176 | |||||||||||
|
| |||||||||||||
Total Common Stocks and Other Equity Interests | 3,210,045,935 | |||||||||||||
|
| |||||||||||||
Convertible Preferred Stocks (Cost $86,875,212) 0.7% | ||||||||||||||
| Pharmaceuticals 0.7% | ||||||||||||||
Teva Pharmaceutical Industries Ltd., 7.00%, cvt. pfd | Israel | 104,000 | 36,901,280 | |||||||||||
|
| |||||||||||||
Preferred Stocks 1.5% | ||||||||||||||
| Automobiles 0.6% | ||||||||||||||
| f | Volkswagen AG, 1.238%, pfd | Germany | 160,282 | 32,009,393 | ||||||||||
|
| |||||||||||||
| Technology Hardware, Storage & Peripherals 0.9% | ||||||||||||||
| f | Samsung Electronics Co. Ltd., 2.323%, pfd | South Korea | 23,596 | 46,202,731 | ||||||||||
|
| |||||||||||||
Total Preferred Stocks (Cost $44,082,899) | 78,212,124 | |||||||||||||
|
| |||||||||||||
| Principal Amount* | ||||||||||||||
Corporate Bonds, Notes and Senior Floating Rate Interests 22.1% |
| |||||||||||||
Affinion Group Inc., | ||||||||||||||
g,h senior note., 144A, PIK, 14.00%, 11/10/22 | United States | $ | 85,643,583 | 75,637,902 | ||||||||||
i,j Term Loans, 9.16%, (LIBOR + 7.75%), 5/10/22 | United States | 74,437,500 | 77,042,812 | |||||||||||
| j | Belk Inc., | |||||||||||||
i Closing Date Term Loan, 6.099%, (LIBOR + 4.75%), 12/12/22 | United States | 7,186,238 | 5,900,203 | |||||||||||
second lien Term Loan, 10.50%, 12/12/22 | United States | 25,000,000 | 21,156,250 | |||||||||||
| i,j | Bluestem Brands Inc., Initial Term Loan, 8.88% - 9.069%, (LIBOR + 7.50%), 11/09/20 | United States | 68,561,957 | 48,336,180 | ||||||||||
| i,j | Cumulus Media Holdings Inc., Term Loans, 4.82%, (LIBOR + 3.25%), 12/23/20 | United States | 19,175,110 | 16,562,501 | ||||||||||
| d,i,j | Eastman Kodak Co., Term Loan, 7.819%, (LIBOR + 6.25%), 9/03/19 | United States | 37,302,241 | 32,359,694 | ||||||||||
Frontier Communications Corp., | ||||||||||||||
senior note, 8.50%, 4/15/20 | United States | 59,469,000 | 49,507,943 | |||||||||||
senior note, 10.50%, 9/15/22 | United States | 77,063,000 | 58,471,551 | |||||||||||
senior note, 11.00%, 9/15/25 | United States | 41,812,000 | 30,940,880 | |||||||||||
iHeartCommunications Inc., | ||||||||||||||
senior secured note, first lien, 9.00%, 12/15/19 | United States | 72,867,000 | 54,468,083 | |||||||||||
i,j Tranche D Term Loan, 8.443%, (LIBOR + 6.75%), 1/30/19 | United States | 46,662,631 | 35,210,828 | |||||||||||
i,j Tranche E Term Loan, 9.193%, (LIBOR + 7.50%), 7/30/19 | United States | 14,995,598 | 11,277,934 | |||||||||||
franklintempleton.com | Annual Report | 21 |
FRANKLIN MUTUAL QUEST FUND
STATEMENT OF INVESTMENTS
| Country | Principal Amount* | Value | ||||||||||||
Corporate Bonds, Notes and Senior Floating Rate Interests (continued) |
| |||||||||||||
| d | Lee Enterprises Inc., | |||||||||||||
j Second Lien Term Loan, 12.00%, 12/15/22 | United States | $ | 56,941,414 | $ | 59,219,071 | |||||||||
g senior secured note, first lien, 144A, 9.50%, 3/15/22 | United States | 99,050,000 | 103,012,000 | |||||||||||
| d,i,j | New Media Holdings II LLC, Fourth Amendment Replacement Term Loans, 7.819%, (LIBOR + 6.25%), 7/14/22 | United States | 111,005,571 | 112,046,248 | ||||||||||
| g | Rite Aid Corp., senior note, 144A, 6.125%, 4/01/23 | United States | 75,000,000 | 67,968,750 | ||||||||||
Sorenson Communications LLC, | ||||||||||||||
i,j Initial Term Loan, 8.00%, (LIBOR + 5.75%), 4/30/20 | United States | 140,628,141 | 141,682,852 | |||||||||||
g,hsecured note, second lien, 144A, PIK, 9.00%, 10/31/20 | United States | 96,671,937 | 97,396,977 | |||||||||||
| g,h | Sorenson Holdings LLC/Finance Corp., senior note, 144A, PIK, 13.85%, 10/31/21 | United States | 20,117,561 | 19,011,095 | ||||||||||
| i,j | Toys R US-Delaware Inc., (DIP), 10.319%, (LIBOR + 8.75%), 1/18/19 | United States | 41,186,602 | 42,216,267 | ||||||||||
|
| |||||||||||||
Total Corporate Bonds, Notes and Senior Floating Rate Interests |
| 1,159,426,021 | ||||||||||||
|
| |||||||||||||
| Corporate Notes and Senior Floating Rate Interests in Reorganization 0.8% | ||||||||||||||
| b,c,k | Broadband Ventures III LLC, secured promissory note, 5.00%, 2/01/12 | United States | 9,272 | — | ||||||||||
| b,c,k | Sunshine Oilsands Ltd., secured note, 144A, 10.00%, 8/01/17 | Canada | 17,873,000 | 8,657,697 | ||||||||||
| i,j,k | Toys R US-Delaware Inc., Term B-4 Loan, 6.125%, (LIBOR + 3.875%), 4/24/20 | United States | 73,423,169 | 36,344,469 | ||||||||||
|
| |||||||||||||
| Total Corporate Notes and Senior Floating Rate Interests in Reorganization (Cost $88,740,013) | 45,002,166 | |||||||||||||
|
| |||||||||||||
| Shares | ||||||||||||||
| Companies in Liquidation 0.3% | ||||||||||||||
| a,b,e | Avaya Holdings Corp., Contingent Distribution | United States | 82,902,380 | — | ||||||||||
| a,b,e | Avaya Inc., Contingent Distribution | United States | 60,987,608 | — | ||||||||||
| a,b,c | CB FIM Coinvestors LLC | United States | 1,439,821 | — | ||||||||||
| a,b,c | FIM Coinvestor Holdings I, LLC | United States | 17,934,688 | — | ||||||||||
| a,l | Lehman Brothers Holdings Inc., Bankruptcy Claim | United States | 459,471,220 | 10,200,261 | ||||||||||
| a,b,e | NewPage Corp., Litigation Trust, Contingent Distribution | United States | 723,000 | — | ||||||||||
| a,e | Nortel Networks Corp., Contingent Distribution | Canada | 31,192,000 | 1,676,570 | ||||||||||
| a,e | Nortel Networks Ltd., Contingent Distribution | Canada | 20,912,000 | 575,080 | ||||||||||
| a,b,e | Tribune Media, Litigation Trust, Contingent Distribution | United States | 1,534,137 | — | ||||||||||
| a,b,e | Vistra Energy Corp., Litigation Trust, Contingent Distribution | United States | 144,840,133 | 1,680,146 | ||||||||||
| a | Vistra Energy Corp., Litigation Trust, TRA | United States | 2,433,367 | 2,129,196 | ||||||||||
|
| |||||||||||||
Total Companies in Liquidation (Cost $46,138,364) | 16,261,253 | |||||||||||||
|
| |||||||||||||
| Number of Contracts | Notional Amount* | |||||||||||||
Options Purchased (Cost $82,287) 0.0%† | ||||||||||||||
| Calls - Exchange-Traded | ||||||||||||||
Time Warner Inc., March Strike Price $92.50, Expires 3/16/18 | 300 | $ | 30,000 | 69,000 | ||||||||||
|
| |||||||||||||
Total Investments before Short Term Investments | 4,545,917,779 | |||||||||||||
|
| |||||||||||||
| 22 |
Annual Report | franklintempleton.com |
FRANKLIN MUTUAL QUEST FUND
STATEMENT OF INVESTMENTS
| Country | Principal Amount* | Value | ||||||||||||
Short Term Investments 13.1% | ||||||||||||||
U.S. Government and Agency Securities 13.1% | ||||||||||||||
| m | FHLB, 1/02/18 | United States | $ | 41,400,000 | $ | 41,400,000 | ||||||||
| m | U.S. Treasury Bill, | |||||||||||||
1/02/18 | United States | 59,820,000 | 59,820,000 | |||||||||||
1/25/18 | United States | 75,000,000 | 74,941,302 | |||||||||||
3/22/18 | United States | 66,000,000 | 65,804,475 | |||||||||||
1/04/18 - 4/19/18 | United States | 372,300,000 | 371,509,013 | |||||||||||
n 4/26/18 - 5/03/18 | United States | 75,000,000 | 74,667,262 | |||||||||||
|
| |||||||||||||
Total U.S. Government and Agency Securities | 688,142,052 | |||||||||||||
|
| |||||||||||||
Total Investments (Cost $4,956,373,738) 99.6% | 5,234,059,831 | |||||||||||||
Options Written (0.0)%† | (241,000 | ) | ||||||||||||
Other Assets, less Liabilities 0.4% | 22,199,370 | |||||||||||||
|
| |||||||||||||
Net Assets 100.0% | $ | 5,256,018,201 | ||||||||||||
|
| |||||||||||||
| Number of Contracts | Notional Amount* | |||||||||||||
| o | Options Written (0.0)%† | |||||||||||||
Puts - Exchange-Traded | ||||||||||||||
Time Warner Inc., January Strike Price $87.50, Expires 1/19/18 | 2,750 | $ | 275,000 | (33,000 | ) | |||||||||
Time Warner Inc., June Strike Price $80, Expires 6/15/18 | 500 | 50,000 | (59,000 | ) | ||||||||||
Time Warner Inc., June Strike Price $85, Expires 6/15/18 | 500 | 50,000 | (138,500 | ) | ||||||||||
Time Warner Inc., March Strike Price $80, Expires 3/16/18 | 750 | 75,000 | (10,500 | ) | ||||||||||
|
| |||||||||||||
Total Options Written (Premiums Received $1,554,697) | $ | (241,000 | ) | |||||||||||
|
| |||||||||||||
†Rounds to less than 0.1% of net assets.
*The principal/notional amount is stated in U.S. dollars unless otherwise indicated.
aNon-income producing.
bFair valued using significant unobservable inputs. See Note 14 regarding fair value measurements.
cSee Note 10 regarding restricted securities.
dSee Note 12 regarding holdings of 5% voting securities.
eContingent distributions represent the right to receive additional distributions, if any, during the reorganization of the underlying company. Shares represent total underlying principal of debt securities.
fVariable rate security. The rate shown represents the yield at period end.
gSecurity was purchased pursuant to Rule 144A under the Securities Act of 1933 and may be sold in transactions exempt from registration only to qualified institutional buyers or in a public offering registered under the Securities Act of 1933. These securities have been deemed liquid under guidelines approved by the Trust’s Board of Trustees. At December 31, 2017, the aggregate value of these securities was $363,026,724, representing 6.9% of net assets.
hIncome may be received in additional securities and/or cash.
I The coupon rate shown represents the rate at period end.
jSee Note 1(e) regarding senior floating rate interests.
kSee Note 8 regarding credit risk and defaulted securities.
lBankruptcy claims represent the right to receive distributions, if any, during the liquidation of the underlying pool of assets. Shares represent amount of allowed unsecured claims.
mThe security was issued on a discount basis with no stated coupon rate.
nA portion or all of the security has been segregated as collateral for open forward exchange contracts and open written options. At December 31, 2017, the aggregate value of these securities pledged amounted to $15,276,623, representing 0.3% of net assets.
oSee Note 1(c) regarding written options.
franklintempleton.com | Annual Report | 23 |
FRANKLIN MUTUAL QUEST FUND
STATEMENT OF INVESTMENTS
At December 31, 2017, the Fund had the following futures contracts outstanding. See Note 1(c).
Futures Contracts
| Description | Type | Number of Contracts | Notional Amount* | Expiration Date | Value/ Unrealized Appreciation (Depreciation) | |||||||||||||||
| Currency Contracts | ||||||||||||||||||||
EUR/USD | Short | 814 | $ | 122,868,212 | 3/19/18 | $ | (2,170,917 | ) | ||||||||||||
GBP/USD | Short | 955 | 80,918,344 | 3/19/18 | (327,387 | ) | ||||||||||||||
|
| |||||||||||||||||||
Total Futures Contracts | $ | (2,498,304 | ) | |||||||||||||||||
|
| |||||||||||||||||||
*As of period end.
At December 31, 2017, the Fund had the following forward exchange contracts outstanding. See Note 1(c).
Forward Exchange Contracts
| Currency | Counterpartya | Type | Quantity | Contract Amount | Settlement Date | Unrealized Appreciation | Unrealized Depreciation | |||||||||||||||||||||
| OTC Forward Exchange Contracts | ||||||||||||||||||||||||||||
Euro | BOFA | Buy | 1,884,427 | $ | 2,227,007 | 1/12/18 | $ | 35,925 | $ | — | ||||||||||||||||||
Euro | BOFA | Sell | 198,557 | 229,903 | 1/12/18 | — | (8,536 | ) | ||||||||||||||||||||
Euro | HSBK | Buy | 556,455 | 669,279 | 1/12/18 | — | (1,054 | ) | ||||||||||||||||||||
Euro | HSBK | Buy | 1,907,966 | 2,255,508 | 1/12/18 | 35,691 | — | |||||||||||||||||||||
Euro | HSBK | Sell | 16,607,635 | 19,116,122 | 1/12/18 | — | (827,318 | ) | ||||||||||||||||||||
Euro | SSBT | Buy | 962,804 | 1,140,323 | 1/12/18 | 15,869 | — | |||||||||||||||||||||
Euro | SSBT | Sell | 5,204,896 | 6,020,839 | 1/12/18 | — | (229,512 | ) | ||||||||||||||||||||
Euro | UBSW | Buy | 318,457 | 378,188 | 1/12/18 | 4,234 | — | |||||||||||||||||||||
Euro | UBSW | Sell | 24,606,115 | 28,342,352 | 1/12/18 | — | (1,206,139 | ) | ||||||||||||||||||||
Euro | BOFA | Sell | 46,889 | 56,539 | 1/26/18 | 183 | — | |||||||||||||||||||||
Euro | BONY | Sell | 1,488,213 | 1,778,072 | 1/26/18 | — | (10,642 | ) | ||||||||||||||||||||
Euro | HSBK | Sell | 10,604,296 | 12,483,856 | 1/26/18 | — | (261,673 | ) | ||||||||||||||||||||
Euro | SSBT | Sell | 590,320 | 707,092 | 1/26/18 | — | (2,427 | ) | ||||||||||||||||||||
Euro | SSBT | Sell | 723,265 | 871,045 | 1/26/18 | 1,738 | — | |||||||||||||||||||||
Euro | UBSW | Sell | 6,073,045 | 7,137,832 | 1/26/18 | — | (161,490 | ) | ||||||||||||||||||||
South Korean Won | HSBK | Buy | 5,184,995,568 | 4,762,323 | 2/09/18 | 98,641 | �� | — | ||||||||||||||||||||
South Korean Won | HSBK | Sell | 21,315,648,512 | 18,981,808 | 2/09/18 | — | (1,001,737 | ) | ||||||||||||||||||||
British Pound | BOFA | Sell | 990,000 | 1,344,707 | 2/14/18 | 5,693 | — | |||||||||||||||||||||
British Pound | BOFA | Sell | 1,832,329 | 2,434,196 | 2/14/18 | — | (44,100 | ) | ||||||||||||||||||||
British Pound | BONY | Sell | 4,683,882 | 6,348,815 | 2/14/18 | 13,682 | — | |||||||||||||||||||||
British Pound | BONY | Sell | 4,897,483 | 6,403,743 | 2/14/18 | — | (220,294 | ) | ||||||||||||||||||||
British Pound | HSBK | Sell | 14,463,880 | 19,223,943 | 2/14/18 | — | (339,019 | ) | ||||||||||||||||||||
British Pound | UBSW | Sell | 4,897,483 | 6,403,728 | 2/14/18 | — | (220,308 | ) | ||||||||||||||||||||
Euro | BONY | Sell | 43,228,928 | 51,089,288 | 2/20/18 | — | (940,571 | ) | ||||||||||||||||||||
Euro | HSBK | Sell | 961,597 | 1,137,165 | 2/20/18 | — | (20,202 | ) | ||||||||||||||||||||
Euro | SSBT | Sell | 43,228,928 | 51,079,301 | 2/20/18 | — | (950,557 | ) | ||||||||||||||||||||
Euro | HSBK | Sell | 4,510,583 | 5,329,255 | 4/10/18 | — | (116,892 | ) | ||||||||||||||||||||
Euro | SSBT | Sell | 2,765,000 | 3,285,315 | 4/10/18 | — | (53,188 | ) | ||||||||||||||||||||
Euro | UBSW | Sell | 6,953,239 | 8,200,290 | 4/10/18 | — | (195,156 | ) | ||||||||||||||||||||
Euro | BOFA | Sell | 2,737,169 | 3,265,484 | 4/18/18 | — | (41,183 | ) | ||||||||||||||||||||
Euro | SSBT | Sell | 2,737,170 | 3,265,403 | 4/18/18 | — | (41,265 | ) | ||||||||||||||||||||
Euro | UBSW | Sell | 2,737,170 | 3,265,964 | 4/18/18 | — | (40,704 | ) | ||||||||||||||||||||
| 24 |
Annual Report | franklintempleton.com |
FRANKLIN MUTUAL QUEST FUND
STATEMENT OF INVESTMENTS
Forward Exchange Contracts (continued)
| Currency | Counterpartya | Type | Quantity | Contract Amount | Settlement Date | Unrealized Appreciation | Unrealized Depreciation | |||||||||||||||||||||
| OTC Forward Exchange Contracts (continued) | ||||||||||||||||||||||||||||
British Pound | BOFA | Sell | 19,885,025 | $ | 26,458,194 | 4/24/18 | $ | — | $ | (502,941 | ) | |||||||||||||||||
British Pound | SSBT | Sell | 3,871,613 | 5,112,411 | 4/24/18 | — | (136,919 | ) | ||||||||||||||||||||
British Pound | UBSW | Sell | 5,153,536 | 6,826,504 | 4/24/18 | — | (160,924 | ) | ||||||||||||||||||||
Euro | HSBK | Sell | 14,888,813 | 17,570,988 | 5/07/18 | — | (438,476 | ) | ||||||||||||||||||||
Euro | UBSW | Sell | 14,888,812 | 17,567,830 | 5/07/18 | — | (441,633 | ) | ||||||||||||||||||||
South Korean Won | HSBK | Sell | 20,419,930,753 | 18,184,221 | 5/11/18 | — | (979,866 | ) | ||||||||||||||||||||
South Korean Won | UBSW | Sell | 11,325,700,303 | 10,101,293 | 5/11/18 | — | (527,867 | ) | ||||||||||||||||||||
Euro | BOFA | Sell | 10,023,949 | 11,945,741 | 5/21/18 | — | (190,570 | ) | ||||||||||||||||||||
Euro | UBSW | Sell | 10,023,949 | 11,943,736 | 5/21/18 | — | (192,575 | ) | ||||||||||||||||||||
British Pound | BOFA | Sell | 3,660,553 | 4,938,211 | 5/24/18 | — | (30,395 | ) | ||||||||||||||||||||
British Pound | HSBK | Sell | 243,409 | 330,698 | 5/24/18 | 310 | — | |||||||||||||||||||||
British Pound | HSBK | Sell | 3,090,310 | 4,153,326 | 5/24/18 | — | (41,266 | ) | ||||||||||||||||||||
British Pound | SSBT | Sell | 44,415,623 | 59,238,671 | 5/24/18 | — | (1,048,302 | ) | ||||||||||||||||||||
|
| |||||||||||||||||||||||||||
Total Forward Exchange Contracts |
| $ | 211,966 | $ | (11,625,701 | ) | ||||||||||||||||||||||
|
| |||||||||||||||||||||||||||
Net unrealized appreciation (depreciation) |
| $ | (11,413,735 | ) | ||||||||||||||||||||||||
|
| |||||||||||||||||||||||||||
aMay be comprised of multiple contracts with the same counterparty, currency and settlement date.
See Note 11 regarding other derivative information.
See Abbreviations on page 44.
franklintempleton.com |
The accompanying notes are an integral part of these financial statements. | |
Annual Report |
25 |
FRANKLIN MUTUAL QUEST FUND
Statement of Assets and Liabilities
December 31, 2017
Assets: | ||||
Investments in securities: | ||||
Cost - Unaffiliated issuers | $ | 4,483,098,861 | ||
Cost - Non-controlled affiliates (Note 12) | 473,274,877 | |||
|
| |||
Value - Unaffiliated issuers | $ | 4,808,070,437 | ||
Value - Non-controlled affiliates (Note 12) | 425,989,394 | |||
Cash | 6,968,744 | |||
Foreign currency, at value (cost $2,952,747) | 2,966,476 | |||
Receivables: | ||||
Investment securities sold | 7,662,837 | |||
Capital shares sold | 3,904,297 | |||
Dividends and interest | 23,489,531 | |||
European Union tax reclaims | 732,481 | |||
Deposits with brokers for: | ||||
Futures contracts | 3,500,100 | |||
Unrealized appreciation on OTC forward exchange contracts | 211,966 | |||
Other assets | 622 | |||
|
| |||
Total assets | 5,283,496,885 | |||
|
| |||
Liabilities: | ||||
Payables: | ||||
Capital shares redeemed | 8,550,861 | |||
Management fees | 3,008,102 | |||
Distribution fees | 1,016,539 | |||
Transfer agent fees | 614,506 | |||
Trustees’ fees and expenses | 249,567 | |||
Variation margin on futures contracts | 1,157,463 | |||
Options written, at value (premiums received $1,554,697) | 241,000 | |||
Unrealized depreciation on OTC forward exchange contracts | 11,625,701 | |||
Deferred tax | 680,769 | |||
Accrued expenses and other liabilities | 334,176 | |||
|
| |||
Total liabilities | 27,478,684 | |||
|
| |||
Net assets, at value | $ | 5,256,018,201 | ||
|
| |||
Net assets consist of: | ||||
Paid-in capital | $ | 5,054,329,619 | ||
Distributions in excess of net investment income | (4,820,394 | ) | ||
Net unrealized appreciation (depreciation) | 264,605,826 | |||
Accumulated net realized gain (loss) | (58,096,850 | ) | ||
|
| |||
Net assets, at value | $ | 5,256,018,201 | ||
|
|
26 |
Annual Report | The accompanying notes are an integral part of these financial statements. |
franklintempleton.com |
FRANKLIN MUTUAL QUEST FUND
FINANCIAL STATEMENTS
Statement of Assets and Liabilities (continued)
December 31, 2017
| Class Z: | ||||
Net assets, at value | $ | 3,667,350,701 | ||
|
| |||
Shares outstanding | 231,655,302 | |||
|
| |||
Net asset value and maximum offering price per share | $15.83 | |||
|
| |||
| Class A: | ||||
Net assets, at value | $ | 1,153,870,027 | ||
|
| |||
Shares outstanding | 73,989,419 | |||
|
| |||
Net asset value per sharea | $15.60 | |||
|
| |||
Maximum offering price per share (net asset value per share ÷ 94.25%) | $16.55 | |||
|
| |||
| Class C: | ||||
Net assets, at value | $ | 309,160,372 | ||
|
| |||
Shares outstanding | 20,145,248 | |||
|
| |||
Net asset value and maximum offering price per sharea | $15.35 | |||
|
| |||
| Class R: | ||||
Net assets, at value | $ | 1,774,482 | ||
|
| |||
Shares outstanding | 115,210 | |||
|
| |||
Net asset value and maximum offering price per share | $15.40 | |||
|
| |||
| Class R6: | ||||
Net assets, at value | $ | 123,862,619 | ||
|
| |||
Shares outstanding | 7,832,141 | |||
|
| |||
Net asset value and maximum offering price per share | $15.81 | |||
|
|
aRedemption price is equal to net asset value less contingent deferred sales charges, if applicable.
franklintempleton.com |
The accompanying notes are an integral part of these financial statements. | Annual Report |
27 |
FRANKLIN MUTUAL QUEST FUND
FINANCIAL STATEMENTS
Statement of Operations
for the year ended December 31, 2017
Investment income: | ||||
Dividends: (net of foreign taxes)* | ||||
Unaffiliated issuers | $ | 74,819,213 | ||
Non-controlled affiliates (Note 12) | 8,297,281 | |||
Interest: | ||||
Unaffiliated issuers | 131,386,153 | |||
Non-controlled affiliates (Note 12) | 22,730,275 | |||
|
| |||
Total investment income | 237,232,922 | |||
|
| |||
Expenses: | ||||
Management fees (Note 3a) | 35,964,097 | |||
Distribution fees: (Note 3c) | ||||
Class A | 2,991,168 | |||
Class C | 3,298,299 | |||
Class R | 6,714 | |||
Transfer agent fees: (Note 3e) | ||||
Class Z | 3,118,192 | |||
Class A | 993,614 | |||
Class C | 273,921 | |||
Class R | 1,115 | |||
Class R6 | 7,632 | |||
Custodian fees (Note 4) | 146,113 | |||
Reports to shareholders | 270,101 | |||
Registration and filing fees | 193,874 | |||
Professional fees | 850,164 | |||
Trustees’ fees and expenses | 164,116 | |||
Other | 138,522 | |||
|
| |||
Total expenses | 48,417,642 | |||
Expense reductions (Note 4) | (11,994 | ) | ||
|
| |||
Net expenses | 48,405,648 | |||
|
| |||
Net investment income | 188,827,274 | |||
|
| |||
Realized and unrealized gains (losses): | ||||
Net realized gain (loss) from: | ||||
Investments: | ||||
Unaffiliated issuers | 80,951,666 | |||
Non-controlled affiliates (Note 12) | (11,433,358 | ) | ||
Foreign currency transactions | 894,517 | |||
Forward exchange contracts | (21,211,216 | ) | ||
Futures contracts | (14,718,212 | ) | ||
Securities sold short | 3,216,360 | |||
|
| |||
Net realized gain (loss) | 37,699,757 | |||
|
| |||
Net change in unrealized appreciation (depreciation) on: | ||||
Investments: | ||||
Unaffiliated issuers | 177,917,984 | |||
Non-controlled affiliates (Note 12) | (29,950,000 | ) | ||
Translation of other assets and liabilities denominated in foreign currencies | 412,404 | |||
Forward exchange contracts | (18,597,720 | ) | ||
Written options | 1,313,697 | |||
Futures contracts | (4,474,166 | ) | ||
Securities sold short | (3,624,223 | ) | ||
Change in deferred taxes on unrealized appreciation | (680,769 | ) | ||
|
| |||
Net change in unrealized appreciation (depreciation) | 122,317,207 | |||
|
| |||
Net realized and unrealized gain (loss) | 160,016,964 | |||
|
| |||
Net increase (decrease) in net assets resulting from operations | $ | 348,844,238 | ||
|
| |||
*Foreign taxes withheld on dividends | $ | 5,782,997 | ||
28 |
Annual Report | The accompanying notes are an integral part of these financial statements. |
franklintempleton.com |
FRANKLIN MUTUAL QUEST FUND
FINANCIAL STATEMENTS
Statements of Changes in Net Assets
| Year Ended December 31, | ||||||||
| 2017 | 2016 | |||||||
Increase (decrease) in net assets: | ||||||||
Operations: | ||||||||
Net investment income | $ | 188,827,274 | $ | 280,468,001 | ||||
Net realized gain (loss) | 37,699,757 | 221,052,860 | ||||||
Net change in unrealized appreciation (depreciation) | 122,317,207 | 243,294,468 | ||||||
|
| |||||||
Net increase (decrease) in net assets resulting from operations | 348,844,238 | 744,815,329 | ||||||
|
| |||||||
Distributions to shareholders from: | ||||||||
Net investment income: | ||||||||
Class Z | (141,121,394 | ) | (222,278,713 | ) | ||||
Class A | (42,192,676 | ) | (72,209,924 | ) | ||||
Class C | (9,158,365 | ) | (18,316,353 | ) | ||||
Class R | (62,381 | ) | (51,119 | ) | ||||
Class R6 | (4,613,009 | ) | (3,177,032 | ) | ||||
Net realized gains: | ||||||||
Class Z | (31,454,610 | ) | (61,002,060 | ) | ||||
Class A | (9,969,480 | ) | (20,589,851 | ) | ||||
Class C | (2,773,577 | ) | (5,930,239 | ) | ||||
Class R | (12,207 | ) | (15,198 | ) | ||||
Class R6 | (303,983 | ) | (865,361 | ) | ||||
|
| |||||||
Total distributions to shareholders | (241,661,682 | ) | (404,435,850 | ) | ||||
|
| |||||||
Capital share transactions: (Note 2) | ||||||||
Class Z | (94,442,773 | ) | (125,329,991 | ) | ||||
Class A | (85,348,310 | ) | (71,220,397 | ) | ||||
Class C | (41,119,296 | ) | (17,124,219 | ) | ||||
Class R | 879,482 | (83,695 | ) | |||||
Class R6 | 72,905,275 | 7,856,691 | ||||||
|
| |||||||
Total capital share transactions | (147,125,622 | ) | (205,901,611 | ) | ||||
|
| |||||||
Net increase (decrease) in net assets | (39,943,066 | ) | 134,477,868 | |||||
Net assets: | ||||||||
Beginning of year | 5,295,961,267 | 5,161,483,399 | ||||||
|
| |||||||
End of year | $ | 5,256,018,201 | $ | 5,295,961,267 | ||||
|
| |||||||
Distributions in excess of net investment income included in net assets: | ||||||||
End of year | $ | (4,820,394 | ) | $ | (49,871,151 | ) | ||
|
| |||||||
franklintempleton.com |
The accompanying notes are an integral part of these financial statements. | Annual Report |
29 |
FRANKLIN MUTUAL QUEST FUND
1. Organization and Significant Accounting Policies
Franklin Mutual Series Funds (Trust) is registered under the Investment Company Act of 1940 (1940 Act) as an open-end management investment company, consisting of seven separate funds and applies the specialized accounting and reporting guidance in U.S. Generally Accepted Accounting Principles (U.S. GAAP). Franklin Mutual Quest Fund (Fund) is included in this report. The Fund offers five classes of shares: Class Z, Class A, Class C, Class R and Class R6. Each class of shares may differ by its initial sales load, contingent deferred sales charges, voting rights on matters affecting a single class, its exchange privilege and fees due to differing arrangements for distribution and transfer agent fees.
The following summarizes the Fund’s significant accounting policies.
a. Financial Instrument Valuation
The Fund’s investments in financial instruments are carried at fair value daily. Fair value is the price that would be received to sell an asset or paid to transfer a liability in an orderly transaction between market participants on the measurement date. The Fund calculates the net asset value (NAV) per share as of 4 p.m. Eastern time each day the New York Stock Exchange (NYSE) is open for trading. Under compliance policies and procedures approved by the Trust’s Board of Trustees (the Board), the Fund’s administrator has responsibility for oversight of valuation, including leading the cross-functional Valuation Committee (VC). The VC provides administration and oversight of the Fund’s valuation policies and procedures, which are approved annually by the Board. Among other things, these procedures allow the Fund to utilize independent pricing services, quotations from securities and financial instrument dealers, and other market sources to determine fair value.
Equity securities and derivative financial instruments listed on an exchange or on the NASDAQ National Market System are valued at the last quoted sale price or the official closing price of the day, respectively. Foreign equity securities are valued as of the close of trading on the foreign stock exchange on which the security is primarily traded, or as of 4 p.m. Eastern time. The value is then converted into its U.S. dollar equivalent at the foreign exchange rate in effect at 4 p.m. Eastern time on the day that the value of the security is determined. Over-the-counter (OTC) securities are valued within the range of the most recent
quoted bid and ask prices. Securities that trade in multiple markets or on multiple exchanges are valued according to the broadest and most representative market. Certain equity securities are valued based upon fundamental characteristics or relationships to similar securities.
Debt securities generally trade in the OTC market rather than on a securities exchange. The Fund’s pricing services use multiple valuation techniques to determine fair value. In instances where sufficient market activity exists, the pricing services may utilize a market-based approach through which quotes from market makers are used to determine fair value. In instances where sufficient market activity may not exist or is limited, the pricing services also utilize proprietary valuation models which may consider market characteristics such as benchmark yield curves, credit spreads, estimated default rates, anticipated market interest rate volatility, coupon rates, anticipated timing of principal repayments, underlying collateral, and other unique security features in order to estimate the relevant cash flows, which are then discounted to calculate the fair value.
Certain derivative financial instruments trade in the OTC market. The Fund’s pricing services use various techniques including industry standard option pricing models and proprietary discounted cash flow models to determine the fair value of those instruments. The Fund’s net benefit or obligation under the derivative contract, as measured by the fair value of the contract, is included in net assets.
The Fund has procedures to determine the fair value of financial instruments for which market prices are not reliable or readily available. Under these procedures, the VC convenes on a regular basis to review such financial instruments and considers a number of factors, including significant unobservable valuation inputs, when arriving at fair value. The VC primarily employs a market-based approach which may use related or comparable assets or liabilities, recent transactions, market multiples, book values, and other relevant information for the investment to determine the fair value of the investment. An income-based valuation approach may also be used in which the anticipated future cash flows of the investment are discounted to calculate fair value. Discounts may also be applied due to the nature or duration of any restrictions on the disposition of the investments. Due to the inherent uncertainty of valuations of such investments, the fair values may differ significantly from the values that would have been used had an active market existed. The VC employs various methods for calibrating these
30 |
Annual Report |
franklintempleton.com |
FRANKLIN MUTUAL QUEST FUND
NOTES TO FINANCIAL STATEMENTS
valuation approaches including a regular review of key inputs and assumptions, transactional back-testing or disposition analysis, and reviews of any related market activity.
Trading in securities on foreign securities stock exchanges and OTC markets may be completed before 4 p.m. Eastern time. In addition, trading in certain foreign markets may not take place on every Fund’s business day. Occasionally, events occur between the time at which trading in a foreign security is completed and 4 p.m. Eastern time that might call into question the reliability of the value of a portfolio security held by the Fund. As a result, differences may arise between the value of the Fund’s portfolio securities as determined at the foreign market close and the latest indications of value at 4 p.m. Eastern time. In order to minimize the potential for these differences, the VC monitors price movements following the close of trading in foreign stock markets through a series of country specific market proxies (such as baskets of American Depositary Receipts, futures contracts and exchange traded funds). These price movements are measured against established trigger thresholds for each specific market proxy to assist in determining if an event has occurred that may call into question the reliability of the values of the foreign securities held by the Fund. If such an event occurs, the securities may be valued using fair value procedures, which may include the use of independent pricing services.
When the last day of the reporting period is a non-business day, certain foreign markets may be open on those days that the Fund’s NAV is not calculated, which could result in differences between the value of the Fund’s portfolio securities on the last business day and the last calendar day of the reporting period. Any significant security valuation changes due to an open foreign market are adjusted and reflected by the Fund for financial reporting purposes.
b. Foreign Currency Translation
Portfolio securities and other assets and liabilities denominated in foreign currencies are translated into U.S. dollars based on the exchange rate of such currencies against U.S. dollars on the date of valuation. The Fund may enter into foreign currency exchange contracts to facilitate transactions denominated in a foreign currency. Purchases and sales of securities, income and expense items denominated in foreign currencies are translated into U.S. dollars at the exchange rate in effect on the transaction date. Portfolio securities and assets and liabilities denominated in foreign currencies contain risks that those currencies will
decline in value relative to the U.S. dollar. Occasionally, events may impact the availability or reliability of foreign exchange rates used to convert the U.S. dollar equivalent value. If such an event occurs, the foreign exchange rate will be valued at fair value using procedures established and approved by the Board.
The Fund does not separately report the effect of changes in foreign exchange rates from changes in market prices on securities held. Such changes are included in net realized and unrealized gain or loss from investments in the Statement of Operations.
Realized foreign exchange gains or losses arise from sales of foreign currencies, currency gains or losses realized between the trade and settlement dates on securities transactions and the difference between the recorded amounts of dividends, interest, and foreign withholding taxes and the U.S. dollar equivalent of the amounts actually received or paid. Net unrealized foreign exchange gains and losses arise from changes in foreign exchange rates on foreign denominated assets and liabilities other than investments in securities held at the end of the reporting period.
c. Derivative Financial Instruments
The Fund invested in derivative financial instruments in order to manage risk or gain exposure to various other investments or markets. Derivatives are financial contracts based on an underlying or notional amount, require no initial investment or an initial net investment that is smaller than would normally be required to have a similar response to changes in market factors, and require or permit net settlement. Derivatives contain various risks including the potential inability of the counterparty to fulfill their obligations under the terms of the contract, the potential for an illiquid secondary market, and/or the potential for market movements which expose the Fund to gains or losses in excess of the amounts shown in the Statement of Assets and Liabilities. Realized gain and loss and unrealized appreciation and depreciation on these contracts for the period are included in the Statement of Operations.
Derivative counterparty credit risk is managed through a formal evaluation of the creditworthiness of all potential counter-parties. The Fund attempts to reduce its exposure to counterparty credit risk on OTC derivatives, whenever possible, by entering into International Swaps and Derivatives Association (ISDA) master agreements with certain counterparties. These agreements contain various provisions,
franklintempleton.com |
Annual Report |
|
31 |
|
FRANKLIN MUTUAL QUEST FUND
NOTES TO FINANCIAL STATEMENTS
1. Organization and Significant Accounting Policies (continued)
c. Derivative Financial Instruments (continued)
including but not limited to collateral requirements, events of default, or early termination. Termination events applicable to the counterparty include certain deteriorations in the credit quality of the counterparty. Termination events applicable to the Fund include failure of the Fund to maintain certain net asset levels and/or limit the decline in net assets over various periods of time. In the event of default or early termination, the ISDA master agreement gives the non-defaulting party the right to net and close-out all transactions traded, whether or not arising under the ISDA agreement, to one net amount payable by one counterparty to the other. However, absent an event of default or early termination, OTC derivative assets and liabilities are presented gross and not offset in the Statement of Assets and Liabilities. Early termination by the counterparty may result in an immediate payment by the Fund of any net liability owed to that counterparty under the ISDA agreement. At December 31, 2017, the Fund had OTC derivatives in a net liability position of $11,413,735 and the aggregate value of collateral pledged for such contracts was $9,377,361.
Collateral requirements differ by type of derivative. Collateral or initial margin requirements are set by the broker or exchange clearing house for exchange traded and centrally cleared derivatives. Initial margin deposited is held at the exchange and can be in the form of cash and/or securities. For OTC derivatives traded under an ISDA master agreement, posting of collateral is required by either the Fund or the applicable counterparty if the total net exposure of all OTC derivatives with the applicable counterparty exceeds the minimum transfer amount, which typically ranges from $100,000 to $250,000, and can vary depending on the counterparty and the type of the agreement. Generally, collateral is determined at the close of Fund business each day and any additional collateral required due to changes in derivative values may be delivered by the Fund or the counterparty the next business day, or within a few business days. Collateral pledged and/or received by the Fund for OTC derivatives, if any, is held in segregated accounts with the Fund’s custodian/counterparty broker and can be in the form of cash and/or securities. Unrestricted cash may be invested according to the Fund’s investment objectives. To the extent that the amounts due to the Fund from its counterparties are not subject to collateralization or are not fully collateralized, the Fund bears the risk of loss from counterparty non-performance.
The Fund entered into exchange traded futures contracts primarily to manage exposure to certain foreign currencies. A futures contract is an agreement between the Fund and a counterparty to buy or sell an asset at a specified price on a future date. Required initial margins are pledged by the Fund, and the daily change in fair value is accounted for as a variation margin payable or receivable in the Statement of Assets and Liabilities.
The Fund entered into OTC forward exchange contracts primarily to manage exposure to certain foreign currencies. A forward exchange contract is an agreement between the Fund and a counterparty to buy or sell a foreign currency at a specific exchange rate on a future date.
The Fund purchased or wrote exchange traded option contracts primarily to manage exposure to equity price risk. An option is a contract entitling the holder to purchase or sell a specific amount of shares or units of an asset or notional amount of a swap (swaption), at a specified price. When an option is purchased or written, an amount equal to the premium paid or received is recorded as an asset or liability, respectively. Upon exercise of an option, the acquisition cost or sales proceeds of the underlying investment is adjusted by any premium received or paid. Upon expiration of an option, any premium received or paid is recorded as a realized gain or loss. Upon closing an option other than through expiration or exercise, the difference between the premium received or paid and the cost to close the position is recorded as a realized gain or loss.
See Note 11 regarding other derivative information.
d. Securities Sold Short
The Fund is engaged in selling securities short, which obligates the Fund to replace a borrowed security with the same security at current fair value. The Fund incurs a loss if the price of the security increases between the date of the short sale and the date on which the Fund replaces the borrowed security. The Fund realizes a gain if the price of the security declines between those dates. Gains are limited to the price at which the Fund sold the security short, while losses are potentially unlimited in size.
The Fund is required to establish a margin account with the broker lending the security sold short. While the short sale is outstanding, the broker retains the proceeds of the short sale to the extent necessary to meet margin requirements until the short position is closed out. A deposit must also be maintained with the Fund’s custodian/counterparty broker consisting of cash
32 |
Annual Report |
franklintempleton.com |
FRANKLIN MUTUAL QUEST FUND
NOTES TO FINANCIAL STATEMENTS
and/or securities having a value equal to a specified percentage of the value of the securities sold short. The Fund is obligated to pay fees for borrowing the securities sold short and is required to pay the counterparty any dividends and/or interest due on securities sold short. Such dividends and/or interest and any security borrowing fees are recorded as an expense to the Fund. At December 31, 2017, the Fund had no securities sold short.
e. Senior Floating Rate Interests
The Fund invests in senior secured corporate loans that pay interest at rates which are periodically reset by reference to a base lending rate plus a spread. These base lending rates are generally the prime rate offered by a designated U.S. bank or the London InterBank Offered Rate (LIBOR). Senior secured corporate loans often require prepayment of principal from excess cash flows or at the discretion of the borrower. As a result, actual maturity may be substantially less than the stated maturity. Senior secured corporate loans in which the Fund invests are generally readily marketable, but may be subject to certain restrictions on resale.
f. Income and Deferred Taxes
It is the Fund’s policy to qualify as a regulated investment company under the Internal Revenue Code. The Fund intends to distribute to shareholders substantially all of its taxable income and net realized gains to relieve it from federal income and excise taxes. As a result, no provision for U.S. federal income taxes is required.
The Fund may be subject to foreign taxation related to income received, capital gains on the sale of securities and certain foreign currency transactions in the foreign jurisdictions in which it invests. Foreign taxes, if any, are recorded based on the tax regulations and rates that exist in the foreign markets in which the Fund invests. When a capital gain tax is determined to apply, the Fund records an estimated deferred tax liability in an amount that would be payable if the securities were disposed of on the valuation date.
As a result of several court cases, in certain countries across the European Union, the Fund filed additional tax reclaims for previously withheld taxes on dividends earned in those countries (EU reclaims). These additional filings are subject to various administrative proceedings by the local jurisdictions’ tax authorities within the European Union, as well as a number of related judicial proceedings. Income recognized, if any, for EU reclaims is reflected as other income in the Statement of
Operations and any related receivable, if any, is reflected as European Union tax reclaims in the Statement of Assets and Liabilities. When uncertainty exists as to the ultimate resolution of these proceedings, the likelihood of receipt of these EU reclaims, and the potential timing of payment, no amounts are reflected in the financial statements. For U.S. income tax purposes, EU reclaims received by the Fund, if any, reduce the amounts of foreign taxes Fund shareholders can use as tax credits in their individual income tax returns.
The Fund may recognize an income tax liability related to its uncertain tax positions under U.S. GAAP when the uncertain tax position has a less than 50% probability that it will be sustained upon examination by the tax authorities based on its technical merits. As of December 31, 2017, the Fund has determined that no tax liability is required in its financial statements related to uncertain tax positions for any open tax years (or expected to be taken in future tax years). Open tax years are those that remain subject to examination and are based on the statute of limitations in each jurisdiction in which the Fund invests.
g. Security Transactions, Investment Income, Expenses and Distributions
Security transactions are accounted for on trade date. Realized gains and losses on security transactions are determined on a specific identification basis. Interest income and estimated expenses are accrued daily. Amortization of premium and accretion of discount on debt securities are included in interest income. Dividend income is recorded on the ex-dividend date except for certain dividends from securities where the dividend rate is not available. In such cases, the dividend is recorded as soon as the information is received by the Fund. Distributions to shareholders are recorded on the ex-dividend date. Distributable earnings are determined according to income tax regulations (tax basis) and may differ from earnings recorded in accordance with U.S. GAAP. These differences may be permanent or temporary. Permanent differences are reclassified among capital accounts to reflect their tax character. These reclassifications have no impact on net assets or the results of operations. Temporary differences are not reclassified, as they may reverse in subsequent periods.
Common expenses incurred by the Trust are allocated among the Funds based on the ratio of net assets of each Fund to the combined net assets of the Trust. Fund specific expenses are charged directly to the Fund that incurred the expense.
franklintempleton.com |
Annual Report |
|
33 |
|
FRANKLIN MUTUAL QUEST FUND
NOTES TO FINANCIAL STATEMENTS
1. Organization and Significant Accounting Policies (continued)
g. Security Transactions, Investment Income, Expenses and Distributions (continued)
Realized and unrealized gains and losses and net investment income, excluding class specific expenses, are allocated daily to each class of shares based upon the relative proportion of net assets of each class. Differences in per share distributions by class are generally due to differences in class specific expenses.
h. Accounting Estimates
The preparation of financial statements in accordance with U.S. GAAP requires management to make estimates and assumptions that affect the reported amounts of assets and liabilities at the date of the financial statements and the amounts of income and expenses during the reporting period. Actual results could differ from those estimates.
i. Guarantees and Indemnifications
Under the Trust’s organizational documents, its officers and trustees are indemnified by the Trust against certain liabilities arising out of the performance of their duties to the Trust. Additionally, in the normal course of business, the Trust, on behalf of the Fund, enters into contracts with service providers that contain general indemnification clauses. The Trust’s maximum exposure under these arrangements is unknown as this would involve future claims that may be made against the Trust that have not yet occurred. Currently, the Trust expects the risk of loss to be remote.
2. Shares of Beneficial Interest
At December 31, 2017, there were an unlimited number of shares authorized (without par value). Transactions in the Fund’s shares were as follows:
| Year Ended December 31, | ||||||||||||||||
|
| |||||||||||||||
| 2017 | 2016 | |||||||||||||||
|
| |||||||||||||||
| Shares | Amount | Shares | Amount | |||||||||||||
| ||||||||||||||||
| Class Z Shares: | ||||||||||||||||
Shares sold | 27,728,870 | $ | 439,840,070 | 19,828,497 | $ | 304,660,334 | ||||||||||
Shares issued in reinvestment of distributions | 10,319,549 | 163,868,714 | 17,429,676 | 268,009,103 | ||||||||||||
Shares redeemed | (43,674,171 | ) | (698,151,557 | ) | (47,272,331 | ) | (697,999,428 | ) | ||||||||
|
| |||||||||||||||
Net increase (decrease) | (5,625,752 | ) | $ | (94,442,773 | ) | (10,014,158 | ) | $ | (125,329,991 | ) | ||||||
|
| |||||||||||||||
| Class A Shares: | ||||||||||||||||
Shares sold | 13,056,163 | $ | 204,059,076 | 10,500,328 | $ | 158,786,624 | ||||||||||
Shares issued in reinvestment of distributions | 3,269,611 | 51,185,442 | 6,003,992 | 91,123,764 | ||||||||||||
Shares redeemed | (21,720,286 | ) | (340,592,828 | ) | (21,323,796 | ) | (321,130,785 | ) | ||||||||
|
| |||||||||||||||
Net increase (decrease) | (5,394,512 | ) | $ | (85,348,310 | ) | (4,819,476 | ) | $ | (71,220,397 | ) | ||||||
|
| |||||||||||||||
| Class C Shares: | ||||||||||||||||
Shares sold | 3,143,553 | $ | 48,265,137 | 2,376,846 | $ | 35,487,953 | ||||||||||
Shares issued in reinvestment of distributions | 767,506 | 11,797,949 | 1,572,193 | 23,466,576 | ||||||||||||
Shares redeemed | (6,578,117 | ) | (101,182,382 | ) | (5,145,604 | ) | (76,078,748 | ) | ||||||||
|
| |||||||||||||||
Net increase (decrease) | (2,667,058 | ) | $ | (41,119,296 | ) | (1,196,565 | ) | $ | (17,124,219 | ) | ||||||
|
| |||||||||||||||
| Class R Shares: | ||||||||||||||||
Shares sold | 93,915 | $ | 1,451,999 | 17,052 | $ | 252,213 | ||||||||||
Shares issued in reinvestment of distributions | 4,829 | 74,588 | 4,419 | 66,317 | ||||||||||||
Shares redeemed | (41,676 | ) | (647,105 | ) | (26,855 | ) | (402,225 | ) | ||||||||
|
| |||||||||||||||
Net increase (decrease) | 57,068 | $ | 879,482 | (5,384 | ) | $ | (83,695 | ) | ||||||||
|
| |||||||||||||||
34 |
Annual Report |
franklintempleton.com |
FRANKLIN MUTUAL QUEST FUND
NOTES TO FINANCIAL STATEMENTS
| Year Ended December 31, | ||||||||||||||||||||
| 2017 | 2016 | |||||||||||||||||||
| Shares | Amount | Shares | Amount | |||||||||||||||||
| Class R6 Shares: | ||||||||||||||||||||
Shares sold | 6,529,553 | $ | 105,932,665 | 745,561 | $ | 11,522,145 | ||||||||||||||
Shares issued in reinvestment of distributions | 310,142 | 4,916,992 | 250,829 | 3,854,293 | ||||||||||||||||
Shares redeemed | (2,378,788 | ) | (37,944,382 | ) | (490,186 | ) | (7,519,747 | ) | ||||||||||||
Net increase (decrease) | 4,460,907 | $ | 72,905,275 | 506,204 | $ | 7,856,691 | ||||||||||||||
3. Transactions with Affiliates
Franklin Resources, Inc. is the holding company for various subsidiaries that together are referred to as Franklin Templeton Investments. Certain officers and trustees of the Fund are also officers and/or directors of the following subsidiaries:
| Subsidiary | Affiliation | |
Franklin Mutual Advisers, LLC (Franklin Mutual) | Investment manager | |
Franklin Templeton Services, LLC (FT Services) | Administrative manager | |
Franklin Templeton Distributors, Inc. (Distributors) | Principal underwriter | |
Franklin Templeton Investor Services, LLC (Investor Services) | Transfer agent |
a. Management Fees
The Fund pays an investment management fee to Franklin Mutual based on the average daily net assets of the Fund as follows:
| Annualized Fee Rate | Net Assets | |
0.675% | Up to and including $5 billion | |
0.645% | Over $5 billion, up to and including $7 billion | |
0.625% | Over $7 billion, up to and including $10 billion | |
0.615% | In excess of $10 billion |
For the year ended December 31, 2017, the gross effective investment management fee rate was 0.673% of the Fund’s average daily net assets.
b. Administrative Fees
Under an agreement with Franklin Mutual, FT Services provides administrative services to the Fund. The fee is paid by Franklin Mutual based on the Fund’s average daily net assets, and is not an additional expense of the Fund.
c. Distribution Fees
The Board has adopted distribution plans for each share class, with the exception of Class Z and Class R6 shares, pursuant to Rule 12b-1 under the 1940 Act. Under the Fund’s Class A reimbursement distribution plan, the Fund reimburses Distributors for costs incurred in connection with the servicing, sale and distribution of the Fund’s shares up to the maximum annual plan rate. Under the Class A reimbursement distribution plan, costs exceeding the maximum for the current plan year cannot be reimbursed in subsequent periods. In addition, under the Fund’s Class C and R compensation distribution plans, the Fund pays Distributors for costs incurred in connection with the servicing, sale and distribution of the Fund’s shares up to the maximum annual plan rate for each class. The plan year, for purposes of monitoring compliance with the maximum annual plan rates, is February 1 through January 31.
| franklintempleton.com | Annual Report | 35 |
FRANKLIN MUTUAL QUEST FUND
NOTES TO FINANCIAL STATEMENTS
3. Transactions with Affiliates (continued)
c. Distribution Fees (continued)
The maximum annual plan rates, based on the average daily net assets, for each class, are as follows:
Class A | 0.35% | |||
Class C | 1.00% | |||
Class R | 0.50% |
The Board has set the current rate at 0.25% per year for Class A shares until further notice and approval by the Board.
d. Sales Charges/Underwriting Agreements
Front-end sales charges and contingent deferred sales charges (CDSC) do not represent expenses of the Fund. These charges are deducted from the proceeds of sales of Fund shares prior to investment or from redemption proceeds prior to remittance, as applicable. Distributors has advised the Fund of the following commission transactions related to the sales and redemptions of the Fund’s shares for the year:
Sales charges retained net of commissions paid to | $ | 394,847 | ||
CDSC retained | $ | 25,543 |
e. Transfer Agent Fees
Each class of shares pays transfer agent fees to Investor Services for its performance of shareholder servicing obligations. Effective November 1, 2017, the fees are based on an annualized asset based fee of 0.02% plus a transaction based fee. Prior to November 1, 2017, the fees were account based fees that varied based on fund or account type. In addition, each class reimburses Investor Services for out of pocket expenses incurred and, except for Class R6, reimburses shareholder servicing fees paid to third parties. These fees are allocated daily based upon their relative proportion of such classes’ aggregate net assets. Class R6 pays Investor Services transfer agent fees specific to that class.
For the year ended December 31, 2017, the Fund paid transfer agent fees of $4,394,474, of which $2,084,366 was retained by Investor Services.
4. Expense Offset Arrangement
The Fund has entered into an arrangement with its custodian whereby credits realized as a result of uninvested cash balances are used to reduce a portion of the Fund’s custodian expenses. During the year ended December 31, 2017, the custodian fees were reduced as noted in the Statement of Operations.
5. Independent Trustees’ Retirement Plan
On January 1, 1993, the Trust adopted an Independent Trustees’ Retirement Plan (Plan). The Plan is an unfunded defined benefit plan that provides benefit payments to Trustees whose length of service and retirement age meets the eligibility requirements of the Plan. Benefits under the Plan are based on years of service and fees paid to each trustee at the time of retirement. Effective in December 1996, the Plan was closed to new participants.
During the year ended December 31, 2017, the Fund’s projected benefit obligation and benefit payments under the Plan were as follows:
aProjected benefit obligation at December 31, 2017 | $ | 249,567 |
| 36 |
Annual Report | franklintempleton.com |
FRANKLIN MUTUAL QUEST FUND
NOTES TO FINANCIAL STATEMENTS
bIncrease in projected benefit obligation | $ | 4,167 | ||
Benefit payments made to retired trustees | $ | (5,253 | ) |
aThe projected benefit obligation is included in trustees’ fees and expenses in the Statement of Assets and Liabilities.
bThe increase in projected benefit obligation is included in trustees’ fees and expenses in the Statement of Operations.
6. Income Taxes
For tax purposes, capital losses may be carried over to offset future capital gains. Capital loss carryforwards with no expiration, if any, must be fully utilized before those losses with expiration dates.
At December 31, 2017, capital loss carryforwards were as follows:
Capital loss carryforwards subject to expiration: | ||||
2018 | $ | 18,751,585 | ||
Capital loss carryforwards not subject to expiration: | ||||
Short term | 9,021,376 | |||
Long term | 38,510,337 | |||
|
| |||
Total capital loss carryforwards | $ | 66,283,298a | ||
|
|
aIncludes $21,379,658 from the acquired Franklin Mutual Recovery Fund, which may be carried over to offset future capital gains, subject to certain limitations.
On December 31, 2017, the Fund had expired capital loss carryforwards of $73,758,943, which were reclassified to paid-in-capital.
The tax character of distributions paid during the years ended December 31, 2017 and 2016, was as follows:
| 2017 | 2016 | |||||||
Distributions paid from: | ||||||||
Ordinary income | $ | 229,143,200 | $ | 355,255,859 | ||||
Long term capital gain | 12,518,482 | 49,179,991 | ||||||
| $ | 241,661,682 | $ | 404,435,850 | |||||
At December 31, 2017, the cost of investments, net unrealized appreciation (depreciation) and undistributed ordinary income for income tax purposes were as follows:
Cost of investments | $ | 4,972,287,449 | ||
|
| |||
Unrealized appreciation | $ | 734,072,949 | ||
Unrealized depreciation | (486,447,358 | ) | ||
|
| |||
Net unrealized appreciation (depreciation) | $ | 247,625,591 | ||
|
| |||
Distributable earnings - undistributed ordinary income | $ | 25,469,105 | ||
|
|
Differences between income and/or capital gains as determined on a book basis and a tax basis are primarily due to differing treatments of foreign currency transactions, bond discounts and premiums and defaulted securities.
7. Investment Transactions
Purchases and sales of investments (excluding short term securities and securities sold short) for the year ended December 31, 2017, aggregated $1,646,337,980 and $1,442,724,176, respectively.
| franklintempleton.com | Annual Report | 37 |
FRANKLIN MUTUAL QUEST FUND
NOTES TO FINANCIAL STATEMENTS
8. Credit Risk and Defaulted Securities
The Fund may purchase the pre-default or defaulted debt of distressed companies. Distressed companies are financially troubled and could be or are already involved in financial restructuring or bankruptcy. Risks associated with purchasing these securities include the possibility that the bankruptcy or other restructuring process takes longer than expected, or that distributions in restructuring are less than anticipated, either or both of which may result in unfavorable consequences to the Fund. If it becomes probable that the income on debt securities, including those of distressed companies, will not be collected, the Fund discontinues accruing income and recognizes an adjustment for uncollectible interest.
At December 31, 2017, the aggregate long value of distressed company securities for which interest recognition has been discontinued was $45,002,166, representing 0.8% of the Fund’s net assets. For information as to specific securities, see the accompanying Statement of Investments.
9. Concentration of Risk
Investing in foreign securities may include certain risks and considerations not typically associated with investing in U.S. securities, such as fluctuating currency values and changing local and regional economic, political and social conditions, which may result in greater market volatility. In addition, certain foreign securities may not be as liquid as U.S. securities.
10. Restricted Securities
The Fund invests in securities that are restricted under the Securities Act of 1933 (1933 Act). Restricted securities are often purchased in private placement transactions, and cannot be sold without prior registration unless the sale is pursuant to an exemption under the 1933 Act. Disposal of these securities may require greater effort and expense, and prompt sale at an acceptable price may be difficult. The Fund may have registration rights for restricted securities. The issuer generally incurs all registration costs.
At December 31, 2017, investments in restricted securities, excluding securities exempt from registration under the 1933 Act deemed to be liquid, were as follows:
| Principal Amount/ Shares/ Warrants | Issuer | Acquisition Date | Cost | Value | ||||||||||||
| 9,272 | Broadband Ventures III LLC, secured promissory note, 5.00%, 2/01/12 | 7/01/10 - 11/30/12 | $ | 9,272 | $ | — | ||||||||||
| 1,439,821 | CB FIM Coinvestors LLC | 1/15/09 - 6/02/09 | — | — | ||||||||||||
| 17,934,688 | FIM Coinvestor Holdings I, LLC | 11/20/06 - 6/02/09 | — | — | ||||||||||||
| 2,548,299 | International Automotive Components Group Brazil LLC | 4/13/06 - 12/26/08 | 1,692,334 | 87,369 | ||||||||||||
| 19,924,658 | International Automotive Components Group North America LLC | 1/02/06 - 3/18/13 | 16,305,945 | 13,125,867 | ||||||||||||
| 1,110,000 | a Lee Enterprises Inc., wts., 12/31/22 | 3/31/14 | 1,490,026 | 488,722 | ||||||||||||
| 224,279 | b Sorenson Communications LLC, Membership Interests | 4/30/14 | — | 160,414,954 | ||||||||||||
| 17,873,000 | Sunshine Oilsands Ltd., secured note, 144A, 10.00%, 8/01/17 | 8/04/14 | 17,706,373 | 8,657,697 | ||||||||||||
|
| |||||||||||||||
| Total Restricted Securities (Value is 3.5% of Net Assets) | $ | 37,203,950 | $ | 182,774,609 | ||||||||||||
|
| |||||||||||||||
aThe Fund also invests in unrestricted securities or other investments in the issuer, valued at $173,568,101 as of December 31, 2017.
bThe Fund also invests in unrestricted securities or other investments in the issuer, valued at $258,090,924 as of December 31, 2017.
| 38 |
Annual Report | franklintempleton.com |
FRANKLIN MUTUAL QUEST FUND
NOTES TO FINANCIAL STATEMENTS
11. Other Derivative Information
At December 31, 2017, the Fund’s investments in derivative contracts are reflected in the Statement of Assets and Liabilities as follows:
| Asset Derivatives | Liability Derivatives | |||||||||||
| Derivative Contracts Not Accounted for as Hedging Instruments | Statement of Assets and Liabilities Location | Fair Value | Statement of Assets and Liabilities Location | Fair Value | ||||||||
Foreign exchange contracts | Variation margin on futures contracts | $ | — | Variation margin on futures contracts | $ | 2,498,304 | a | |||||
Unrealized appreciation on OTC forward exchange contracts | 211,966 | Unrealized depreciation on OTC forward exchange contracts | 11,625,701 | |||||||||
Equity contracts | Investments in securities, at value | 69,000 | b | Options written, at value | 241,000 | |||||||
|
|
|
| |||||||||
Totals | $ | 280,966 | $ | 14,365,005 | ||||||||
|
|
|
| |||||||||
aThis amount reflects the cumulative appreciation (depreciation) of futures contracts as reported in the Statement of Investments. Only the variation margin receivable/ payable at year end is separately reported within the Statement of Assets and Liabilities. Prior variation margin movements were recorded to cash upon receipt or payment.
bPurchased option contracts are included in investments in securities, at value in the Statement of Assets and Liabilities.
For the year ended December 31, 2017, the effect of derivative contracts in the Fund’s Statement of Operations was as follows:
| Derivative Contracts Not Accounted for as Hedging Instruments | Statement of Operations Location | Net Realized Gain (Loss) for the Year | Statement of Operations Location | Net Change in Unrealized Appreciation (Depreciation) for the Year | ||||||||
| Net realized gain (loss) from: | Net change in unrealized appreciation (depreciation) on: | |||||||||||
Foreign exchange contracts | Forward exchange contracts | $ | (21,211,216 | ) | Forward exchange contracts | $ | (18,597,720 | ) | ||||
Futures contracts | (14,718,212 | ) | Futures contracts | (4,474,166 | ) | |||||||
Equity contracts | Investments | — | Investments | (13,287 | )a | |||||||
Written options | — | Written options | 1,313,697 | |||||||||
|
|
|
| |||||||||
Totals | $ | (35,929,428 | ) | $ | (21,771,476 | ) | ||||||
|
|
|
| |||||||||
aPurchased option contracts are included in net change in unrealized appreciation (depreciation) on investments in the Statement of Operations.
For the year ended December 31, 2017, the average month end notional amount of futures contracts and options represented $193,075,647 and $71,538, respectively. The average month end contract value of forward exchange contracts was $380,722,254.
See Note 1(c) regarding derivative financial instruments.
| franklintempleton.com | Annual Report | 39 |
FRANKLIN MUTUAL QUEST FUND
NOTES TO FINANCIAL STATEMENTS
12. Holdings of 5% Voting Securities of Portfolio Companies
The 1940 Act defines “affiliated companies” to include investments in portfolio companies in which a fund owns 5% or more of the outstanding voting securities. During the year ended December 31, 2017, investments in “affiliated companies” were as follows:
| Name of Issuer | Number of Shares/ Warrants/ Principal amount Held at Beginning of Year | Gross Additions | Gross Reductions | Number of Shares/ Warrants/ Principal amount Held at End of Year | Value at End of Year | Investment Income | Realized Gain (Loss) | Net Change in Unrealized Appreciation (Depreciation) | ||||||||||||||||||||||||
| Non-Controlled Affiliates | ||||||||||||||||||||||||||||||||
| Dividends | ||||||||||||||||||||||||||||||||
Advanced Emissions Solutions Inc. | 1,724,209 | — | — | 1,724,209 | $ | 16,655,859 | $ | 1,293,157 | $ | — | $ | 724,168 | ||||||||||||||||||||
Eastman Kodak Co. | 3,072,827 | — | (458,991 | ) | 2,613,836 | 8,102,892 | — | (11,585,214 | ) | (26,295,520 | ) | |||||||||||||||||||||
Eastman Kodak Co., wts., 9/03/18 | 48,582 | — | — | 48,582 | 340 | — | — | (189,130 | ) | |||||||||||||||||||||||
Eastman Kodak Co., wts., 9/03/18 | 48,582 | — | — | 48,582 | 490 | — | — | (145,255 | ) | |||||||||||||||||||||||
Lee Enterprises Inc./IA | 4,824,268 | — | — | 4,824,268 | 11,337,030 | — | — | (2,653,347 | ) | |||||||||||||||||||||||
Lee Enterprises Inc., wts., 12/31/22 | 1,110,000 | — | — | 1,110,000 | 488,722 | — | — | (1,347,116 | ) | |||||||||||||||||||||||
New Media Investment Group Inc. | 4,660,772 | 271,710 | — | 4,932,482 | 82,767,048 | 7,004,124 | — | 9,873,158 | ||||||||||||||||||||||||
| $ | 119,352,381 | $ | 8,297,281 | $ | (11,585,214 | ) | $ | (20,033,042 | ) | |||||||||||||||||||||||
| Interest | ||||||||||||||||||||||||||||||||
Eastman Kodak Co., Term Loan, 7.819%, (LIBOR + 6.25%), 9/03/19 | 37,968,616 | — | (666,375 | ) | 37,302,241 | $ | 32,359,694 | $ | 2,402,042 | $ | 15,131 | $ | (5,984,946 | ) | ||||||||||||||||||
Lee Enterprises Inc., Second Lien Term Loan, 12.00%, 12/15/22 | 65,604,374 | — | (8,662,960 | ) | 56,941,414 | 59,219,071 | 3,819,956 | 122,143 | (2,257,994 | ) | ||||||||||||||||||||||
Lee Enterprises Inc., senior secured note, first lien, 144A, 9.50%, 3/15/22 | 99,050,000 | — | — | 99,050,000 | 103,012,000 | 9,383,612 | — | (2,644,866 | ) | |||||||||||||||||||||||
New Media Holdings II LLC, Fourth Amendment Replacement Term Loans, 7.819%, (LIBOR + 6.25%), 7/14/22 | 112,135,512 | — | (1,129,941 | ) | 111,005,571 | 112,046,248 | 7,124,665 | 14,582 | 970,848 | |||||||||||||||||||||||
| $ | 306,637,013 | $ | 22,730,275 | $ | 151,856 | $ | (9,916,958 | ) | ||||||||||||||||||||||||
Total Affiliated Securities (Value is 8.1% of Net Assets) |
| $ | 425,989,394 | $ | 31,027,556 | $ | (11,433,358 | ) | $ | (29,950,000 | ) | |||||||||||||||||||||
13. Credit Facility
The Fund, together with other U.S. registered and foreign investment funds (collectively, Borrowers), managed by Franklin Templeton Investments, are borrowers in a joint syndicated senior unsecured credit facility totaling $2 billion (Global Credit Facility) which matured on February 9, 2018. This Global Credit Facility provides a source of funds to the Borrowers for temporary and emergency purposes, including the ability to meet future unanticipated or unusually large redemption requests. Effective February 9, 2018, the Borrowers renewed the Global Credit Facility for a one year term, maturing February 8, 2019, for a total of $2 billion.
Under the terms of the Global Credit Facility, the Fund shall, in addition to interest charged on any borrowings made by the Fund and other costs incurred by the Fund, pay its share of fees and expenses incurred in connection with the implementation and maintenance of the Global Credit Facility, based upon its relative share of the aggregate net assets of all of the Borrowers, including an annual commitment fee of 0.15% based upon the unused portion of the Global Credit Facility. These fees are reflected in other expenses in the Statement of Operations. During the year ended December 31, 2017, the Fund did not use the Global Credit Facility.
| 40 |
Annual Report | franklintempleton.com |
FRANKLIN MUTUAL QUEST FUND
NOTES TO FINANCIAL STATEMENTS
14. Fair Value Measurements
The Fund follows a fair value hierarchy that distinguishes between market data obtained from independent sources (observable inputs) and the Fund’s own market assumptions (unobservable inputs). These inputs are used in determining the value of the Fund’s financial instruments and are summarized in the following fair value hierarchy:
| • | Level 1 – quoted prices in active markets for identical financial instruments |
| • | Level 2 – other significant observable inputs (including quoted prices for similar financial instruments, interest rates, prepayment speed, credit risk, etc.) |
| • | Level 3 – significant unobservable inputs (including the Fund’s own assumptions in determining the fair value of financial instruments) |
The input levels are not necessarily an indication of the risk or liquidity associated with financial instruments at that level.
For movements between the levels within the fair value hierarchy, the Fund has adopted a policy of recognizing the transfers as of the date of the underlying event which caused the movement.
A summary of inputs used as of December 31, 2017, in valuing the Fund’s assets and liabilities carried at fair value, is as follows:
| Level 1 | Level 2 | Level 3 | Total | |||||||||||||
| ||||||||||||||||
| Assets: | ||||||||||||||||
Investments in Securities:a | ||||||||||||||||
Equity Investments:b | ||||||||||||||||
Auto Components | $ | 41,724,229 | $ | — | $ | 13,213,236 | $ | 54,937,465 | ||||||||
Communications Equipment | — | — | 160,414,954 | 160,414,954 | ||||||||||||
Diversified Consumer Services | — | — | 10,164,359 | 10,164,359 | ||||||||||||
Media | 415,831,342 | — | 488,722 | 416,320,064 | ||||||||||||
Software | 139,931,682 | — | 575,122 | 140,506,804 | ||||||||||||
All Other Equity Investments | 2,542,815,693 | — | — | c | 2,542,815,693 | |||||||||||
Corporate Bonds, Notes and Senior Floating Rate Interests | — | 1,159,426,021 | — | 1,159,426,021 | ||||||||||||
Corporate Notes and Senior Floating Rate Interests in Reorganization | — | 36,344,469 | 8,657,697 | c | 45,002,166 | |||||||||||
Companies in Liquidation | — | 14,581,107 | 1,680,146 | c | 16,261,253 | |||||||||||
Options Purchased | 69,000 | — | — | 69,000 | ||||||||||||
Short Term Investments | 646,742,052 | 41,400,000 | — | 688,142,052 | ||||||||||||
|
| |||||||||||||||
Total Investments in Securities | $ | 3,787,113,998 | $ | 1,251,751,597 | $ | 195,194,236 | $ | 5,234,059,831 | ||||||||
|
| |||||||||||||||
Other Financial Instruments: | ||||||||||||||||
Forward Exchange Contracts | $ | — | $ | 211,966 | $ | — | $ | 211,966 | ||||||||
|
| |||||||||||||||
| Liabilities: | ||||||||||||||||
Other Financial Instruments: | ||||||||||||||||
Options Written | $ | 241,000 | $ | — | $ | — | $ | 241,000 | ||||||||
Futures Contracts | 2,498,304 | — | — | 2,498,304 | ||||||||||||
Forward Exchange Contracts | — | 11,625,701 | — | 11,625,701 | ||||||||||||
|
| |||||||||||||||
Total Other Financial Instruments | $ | 2,739,304 | $ | 11,625,701 | $ | — | $ | 14,365,005 | ||||||||
|
| |||||||||||||||
aFor detailed categories, see the accompanying Statement of Investments.
bIncludes common, preferred and convertible preferred stocks as well as other equity investments.
cIncludes securities determined to have no value at December 31, 2017.
| franklintempleton.com | Annual Report | 41 |
FRANKLIN MUTUAL QUEST FUND
NOTES TO FINANCIAL STATEMENTS
14. Fair Value Measurements (continued)
A reconciliation of assets in which Level 3 inputs are used in determining fair value is presented when there are significant Level 3 financial instruments at the beginning and/or end of the year. At December 31, 2017, the reconciliation of assets, is as follows:
| Balance at Beginning of Year | Purchases | Sales | Transfer Into Level 3a | Transfer Out of Level 3b | Cost Basis Adjustmentsc | Net Realized Gain (Loss) | Net Unrealized Appreciation (Depreciation) | Balance at End of Year | Net Change in Unrealized Appreciation (Depreciation) on Assets Held at | |||||||||||||||||||||||||||||||
| Assets: | ||||||||||||||||||||||||||||||||||||||||
Investments in Securities: | ||||||||||||||||||||||||||||||||||||||||
Equity Investments:d |
| |||||||||||||||||||||||||||||||||||||||
Auto Components | $ | 14,884,656 | $ | – | $ | – | $ | – | $ | – | $ | – | $ | – | $ | (1,671,420 | ) | $ | 13,213,236 | $ | (1,671,420 | ) | ||||||||||||||||||
Communications Equipment | 150,861,922 | – | – | – | – | – | – | 9,553,032 | 160,414,954 | 9,553,032 | ||||||||||||||||||||||||||||||
Diversified Consumer Services | – | 6,591,095 | – | – | – | – | – | 3,573,264 | 10,164,359 | 3,573,264 | ||||||||||||||||||||||||||||||
Media | 1,835,838 | – | – | – | – | – | – | (1,347,116 | ) | 488,722 | (1,347,116 | ) | ||||||||||||||||||||||||||||
Software | – | – | – | 613,592 | – | – | – | (38,470 | ) | 575,122 | (38,470 | ) | ||||||||||||||||||||||||||||
Oil, Gas & Consumable Fuels | 15,939,950 | – | – | – | (14,713,800 | ) | – | – | (1,226,150 | ) | – | – | ||||||||||||||||||||||||||||
Corporate Notes and Senior Floating Rate Interests in Reorganization | – | e | – | – | 9,740,785 | – | – | – | (1,083,088 | ) | 8,657,697e | (1,083,088 | ) | |||||||||||||||||||||||||||
Companies in Liquidation | 1,680,146 | e | – | (107 | ) | – | – | (282,530 | ) | 177,890 | 104,747 | 1,680,146e | – | |||||||||||||||||||||||||||
Total | $ | 185,202,512 | $ | 6,591,095 | $ | (107 | ) | $ | 10,354,377 | $ | (14,713,800 | ) | $ | (282,530 | ) | $ | 177,890 | $ | 7,864,799 | $ | 195,194,236 | $ | 8,986,202 | |||||||||||||||||
aThe investments were transferred into Level 3 as a result of their value being determined using a significant unobservable valuation input. May include amounts related to a corporate action.
bThe investments were transferred out of Level 3 as a result of the removal of a significant unobservable valuation input.
cMay include accretion, amortization, partnership adjustments, and/or other cost basis adjustments.
dIncludes common stocks as well as other equity investments.
eIncludes securities determined to have no value.
| 42 |
Annual Report | franklintempleton.com |
FRANKLIN MUTUAL QUEST FUND
NOTES TO FINANCIAL STATEMENTS
Significant unobservable valuation inputs for material Level 3 financial instruments and impact to fair value as a result of changes in unobservable valuation inputs as of December 31, 2017, are as follows:
| Description | Fair Value at End of Year | Valuation Technique | Unobservable Inputs | Amount/ Weighting | Impact to Fair Value if Input Increasesa | |||||||||
Assets: | ||||||||||||||
Investments in Securities: | ||||||||||||||
Equity Investments: | ||||||||||||||
Auto | Market comparables/ | |||||||||||||
Components | $13,125,867 | Discounted cash flow | EV / EBITDA multiple | 4.1x | Increase | |||||||||
3 Yr Forward EBITDA growth rate | 1.01% | Increase | ||||||||||||
Discount for lack of marketability | 10% | Decrease | ||||||||||||
Discount rate | 10% | Decreaseb | ||||||||||||
Communications Equipment | 160,414,954 | Market transaction | Transaction price weighting | 50% | Increasec | |||||||||
Market comparables | EV / EBITDA multiple | 6.1x | Increaseb | |||||||||||
Discount for lack of marketability | 15% | Decreasec | ||||||||||||
Diversified | ||||||||||||||
Consumer Services | 10,164,359 | Market comparablesd | EV / Last 12 months EBITDA multiple | 11.7x | Increasec | |||||||||
EV / Last 12 months Net Sales multiple | 2.4x | Increasec | ||||||||||||
EV / Total Assets multiple | 1.5x | Increasec | ||||||||||||
Discount for lack of marketability | 4.2% - 19.9% | Decreasec | ||||||||||||
Corporate Notes | 8,657,697 | Market comparables | Discount for lack of marketability | 15.5% | Decreaseb | |||||||||
EV / Revenue multiple | 4.0x | Increaseb | ||||||||||||
All Other Investmentse | 2,831,359 | |||||||||||||
Total | $195,194,236 | |||||||||||||
aRepresents the directional change in the fair value of the Level 3 financial instruments that would result from a significant and reasonable increase in the corresponding input. A significant and reasonable decrease in the input would have the opposite effect. Significant impacts, if any, to fair value and/or net assets have been indicated.
bRepresents a significant impact to fair value but not net assets.
cRepresents a significant impact to fair value and net assets.
dFair value of warrants with $0.01 strike price derived from underlying equity valuation categorized as Level 3, therefore, significant unobservable inputs presented for warrants and underlying equity.
eIncludes fair value of immaterial financial instruments developed using various valuation techniques and unobservable inputs. May also include financial instruments with values derived using prior transaction prices or third party pricing information without adjustment for which such inputs are unobservable.
Abbreviations List
EBITDA - Earnings before interest, taxes, depreciation and amortization
EV - Enterprise value
15. Subsequent Events
The Fund has evaluated subsequent events through the issuance of the financial statements and determined that no events have occurred that require disclosure other than those already disclosed in the financial statements.
franklintempleton.com |
Annual Report |
|
43 |
|
FRANKLIN MUTUAL QUEST FUND
NOTES TO FINANCIAL STATEMENTS
| Abbreviations | ||||||||||
| Counterparty | Currency | Selected Portfolio | ||||||||
| BOFA | Bank of America N.A. | EUR | Euro | ADR | American Depositary Receipt | |||||
| BONY | The Bank of New York Mellon Corp. | GBP | British Pound | DIP | Debtor-In-Possession | |||||
| HSBK | HSBC Bank PLC | USD | United States Dollar | FHLB | Federal Home Loan Bank | |||||
| SSBT | State Street Bank and Trust Co., N.A. | LIBOR | London InterBank Offered Rate | |||||||
| UBSW | UBS AG | PIK | Payment-In-Kind | |||||||
| TRA | Tax Receivable Agreement Right | |||||||||
44 |
Annual Report |
franklintempleton.com |
FRANKLIN MUTUAL QUEST FUND
Report of Independent Registered Public Accounting Firm
To the Board of Trustees of Franklin Mutual Series Funds and Shareholders of Franklin Mutual Quest Fund:
Opinion on the Financial Statements
We have audited the accompanying statement of assets and liabilities of Franklin Mutual Quest Fund (the “Fund”) (one of the funds constituting Franklin Mutual Series Funds), including the schedule of investments, as of December 31, 2017, and the related statement of operations for the year then ended, the statements of changes in net assets for each of the two years in the period then ended, the financial highlights for each of the periods indicated therein and the related notes (collectively referred to as the “financial statements”). In our opinion, the financial statements present fairly, in all material respects, the financial position of Franklin Mutual Quest Fund (one of the funds constituting Franklin Mutual Series Funds) at December 31, 2017, the results of its operations for the year then ended, the changes in its net assets for each of the two years in the period then ended and its financial highlights for each of the periods indicated therein, in conformity with U.S. generally accepted accounting principles.
Basis for Opinion
These financial statements are the responsibility of the Fund’s management. Our responsibility is to express an opinion on the Fund’s financial statements based on our audits. We are a public accounting firm registered with the Public Company Accounting Oversight Board (United States) (“PCAOB”) and are required to be independent with respect to the Fund in accordance with the U.S. federal securities laws and the applicable rules and regulations of the Securities and Exchange Commission and the PCAOB.
We conducted our audits in accordance with the standards of the PCAOB. Those standards require that we plan and perform the audit to obtain reasonable assurance about whether the financial statements are free of material misstatement, whether due to error or fraud. The Fund is not required to have, nor were we engaged to perform, an audit of the Fund’s internal control over financial reporting. As part of our audits, we are required to obtain an understanding of internal control over financial reporting, but not for the purpose of expressing an opinion on the effectiveness of the Fund’s internal control over financial reporting. Accordingly, we express no such opinion.
Our audits included performing procedures to assess the risks of material misstatement of the financial statements, whether due to error or fraud, and performing procedures that respond to those risks. Such procedures included examining, on a test basis, evidence regarding the amounts and disclosures in the financial statements. Our procedures included confirmation of securities owned as of December 31, 2017, by correspondence with the custodian and brokers. Our audits also included evaluating the accounting principles used and significant estimates made by management, as well as evaluating the overall presentation of the financial statements. We believe that our audits provide a reasonable basis for our opinion.

We have served as the auditor of one or more Franklin investment companies since 1987.
Boston, MA
February 26, 2018
franklintempleton.com |
Annual Report |
|
45 |
|
FRANKLIN MUTUAL QUEST FUND
Under Section 852(b)(3)(C) of the Internal Revenue Code (Code), the Fund hereby reports the maximum amount allowable but no less than $12,518,482 as a long term capital gain dividend for the fiscal year ended December 31, 2017.
Under Section 871(k)(2)(C) of the Code, the Fund hereby reports the maximum amount allowable but no less than $32,242,806 as a short term capital gain dividend for purposes of the tax imposed under Section 871(a)(1)(A) of the Code for the fiscal year ended December 31, 2017.
Under Section 854(b)(1)(A) of the Code, the Fund hereby reports 12.77% of the ordinary income dividends as income qualifying for the dividends received deduction for the fiscal year ended December 31, 2017.
Under Section 854(b)(1)(B) of the Code, the Fund hereby reports the maximum amount allowable but no less than $81,414,327 as qualified dividends for purposes of the maximum rate under Section 1(h)(11) of the Code for the fiscal year ended December 31, 2017. Distributions, including qualified dividend income, paid during calendar year 2017 will be reported to shareholders on Form 1099-DIV by mid-February 2018. Shareholders are advised to check with their tax advisors for information on the treatment of these amounts on their individual income tax returns.
Under Section 871(k)(1)(C) of the Code, the Fund hereby reports the maximum amount allowable but no less than $116,434,243 as interest related dividends for purposes of the tax imposed under Section 871(a)(1)(A) of the Code for the fiscal year ended December 31, 2017.
46 |
Annual Report |
franklintempleton.com |
FRANKLIN MUTUAL SERIES FUNDS
The name, year of birth and address of the officers and board members, as well as their affiliations, positions held with the Trust, principal occupations during at least the past five years and number of US registered portfolios overseen in the Franklin Templeton Investments fund complex, are shown below. Generally, each board member serves until that person’s successor is elected and qualified.
Independent Board Members
Name, Year of Birth and Address | Position | Length of Time Served | Number of Portfolios in Fund Complex Overseen by Board Member* | Other Directorships Held During at Least the Past 5 Years | ||||
Edward I. Altman, Ph.D. (1941) c/o Franklin Mutual Advisers, LLC 101 John F. Kennedy Parkway Short Hills, NJ 07078-2789 | Trustee | Since 1987 | 14 | None | ||||
Principal Occupation During at Least the Past 5 Years: Max L. Heine Professor of Finance, Emeritus and Director of The Credit and Debt Markets Research Program, Salomon Center, Stern School of Business, New York University; editor and author of numerous financial publications; financial consultant; an adviser to numerous financial and publishing organizations; and formerly, Vice Director, Salomon Center, Stern School of Business, New York University.
| ||||||||
Ann Torre Bates (1958) c/o Franklin Mutual Advisers, LLC 101 John F. Kennedy Parkway Short Hills, NJ 07078-2789 | Trustee | Since 1995 | 40 | Ares Capital Corporation (specialty finance company) (2010-present), United Natural Foods, Inc. (distributor of natural, organic and specialty foods) (2013-present), Allied Capital Corporation (financial services) (2003-2010), SLM Corporation (Sallie Mae) (1997-2014) and Navient Corporation (loan management, servicing and asset recovery) (2014-2016). | ||||
Principal Occupation During at Least the Past 5 Years: Director of various companies; and formerly, Executive Vice President and Chief Financial Officer, NHP Incorporated (manager of multifamily housing) (1995-1997); and Vice President and Treasurer, US Airways, Inc. (until 1995).
| ||||||||
Burton J. Greenwald (1929) c/o Franklin Mutual Advisers, LLC 101 John F. Kennedy Parkway Short Hills, NJ 07078-2789 | Trustee and Vice Chairman | Trustee since 2002 and Vice Chairman since 2015 | 14 | Franklin Templeton Emerging Markets Debt Opportunities Fund PLC (1999-present) and Fiduciary International Ireland Limited (1999-2015). | ||||
Principal Occupation During at Least the Past 5 Years: Managing Director, B. J. Greenwald Associates (management consultants to the financial services industry); and formerly, Chairman, Fiduciary Trust International Funds; Executive Vice President, L.F. Rothschild Fund Management, Inc.; President and Director, Merit Mutual Funds; President, Underwriting Division and Director, National Securities & Research Corporation; Governor, Investment Company Institute; and Chairman, ICI Public Information Committee.
| ||||||||
Jan Hopkins Trachtman (1947) c/o Franklin Mutual Advisers, LLC 101 John F. Kennedy Parkway Short Hills, NJ 07078-2789
| Trustee | Since 2009 | 14 | None | ||||
Principal Occupation During at Least the Past 5 Years: President and Founder, The Jan Hopkins Group (communications and consulting firm); serves on Advisory Board of Knight Bagehot Fellowship; and formerly, President, Economic Club of New York (2007-2015); Anchor/Correspondent, CNN Financial News (until 2003); Managing Director and Head of Client Communications, Citigroup Private Bank (until 2005); Off-Air reporter, ABC News’ World News Tonight; and Editor, CBS Network News. | ||||||||
Keith Mitchell (1954) c/o Franklin Mutual Advisers, LLC 101 John F. Kennedy Parkway Short Hills, NJ 07078-2789 | Trustee | Since 2009 | 14 | None | ||||
Principal Occupation During at Least the Past 5 Years: Director of various boards of asset management firms; and formerly, Managing Member, Mitchell, Hartley & Bechtel Advisers, LLC (formerly, Mitchell Advisers, LLC) (advisory firm) (2003-2015) and Managing Director, Putman Lovell NBF. | ||||||||
franklintempleton.com |
Annual Report |
|
47 |
|
FRANKLIN MUTUAL SERIES FUNDS
Independent Board Members (continued)
Name, Year of Birth and Address | Position | Length of Time Served | Number of Portfolios in Fund Complex Overseen by Board Member* | Other Directorships Held During at Least the Past 5 Years | ||||
David W. Niemiec (1949) c/o Franklin Mutual Advisers, LLC 101 John F. Kennedy Parkway Short Hills, NJ 07078-2789 | Trustee | Since 2015 | 40 | Hess Midstream Partners LP (oil and gas midstream infrastructure) (2017-present). | ||||
Principal Occupation During at Least the Past 5 Years: Advisor, Saratoga Partners (private equity fund); and formerly, Managing Director, Saratoga Partners (1998-2001) and SBC Warburg Dillon Read (investment banking) (1997-1998); Vice Chairman, Dillon, Read & Co. Inc. (investment banking) (1991-1997); and Chief Financial Officer, Dillon, Read & Co. Inc. (1982-1997).
| ||||||||
Charles Rubens II (1930) c/o Franklin Mutual Advisers, LLC 101 John F. Kennedy Parkway Short Hills, NJ 07078-2789 | Trustee | Since 1998 | 14 | None | ||||
Principal Occupation During at Least the Past 5 Years: Private investor and president of non-profit organizations; and formerly, an executive of Time, Inc.; and Trustee of Colorado College.
| ||||||||
Robert E. Wade (1946) c/o Franklin Mutual Advisers, LLC 101 John F. Kennedy Parkway Short Hills, NJ 07078-2789 | Trustee and Chairman of the Board | Trustee since 1993 and Chairman of the Board since 2005 | 40 | El Oro Ltd (investments) (2003-present). | ||||
Principal Occupation During at Least the Past 5 Years: Attorney at law engaged in private practice as a sole practitioner (1972-2008) and member of various boards.
| ||||||||
Gregory H. Williams (1943) c/o Franklin Mutual Advisers, LLC 101 John F. Kennedy Parkway Short Hills, NJ 07078-2789 | Trustee | Since 2015 | 14 | None | ||||
Principal Occupation During at Least the Past 5 Years: Private investor; Consultant; and formerly, President, University of Cincinnati (2009-2012); President, The City College of New York (2001-2009); Dean, College of Law, Ohio State University (1993-2001); and Associate Vice President, Academic Affairs and Professor of Law, University of Iowa (1977-1993). | ||||||||
| Interested Board Members and Officers | ||||||||
Name, Year of Birth and Address | Position | Length of Time Served | Number of Portfolios in Fund Complex Overseen by Board Member* | Other Directorships Held During at Least the Past 5 Years | ||||
**Gregory E. Johnson (1961) One Franklin Parkway San Mateo, CA 94403-1906 | Trustee | Since 2007 | 153 | None | ||||
Principal Occupation During at Least the Past 5 Years: Chairman of the Board, Member – Office of the Chairman, Director and Chief Executive Officer, Franklin Resources, Inc.; officer and/or director or trustee, as the case may be, of some of the other subsidiaries of Franklin Resources, Inc. and of 43 of the investment companies in Franklin Templeton Investments; Vice Chairman, Investment Company Institute; and formerly, President, Franklin Resources, Inc. (1994-2015).
| ||||||||
**Peter A. Langerman (1955) c/o Franklin Mutual Advisers, LLC 101 John F. Kennedy Parkway Short Hills, NJ 07078-2789 | Trustee, President, and Chief Executive Officer – Investment Management | Trustee since 2007, President, and Chief Executive Officer – Investment Management since 2005 | 7 | American International Group, Inc. (AIG) Credit Facility Trust (2010-2011). | ||||
Principal Occupation During at Least the Past 5 Years: Chairman of the Board, Chief Executive Officer and President, Franklin Mutual Advisers, LLC; President and Chief Investment Officer, Franklin Advisory Services, LLC; and officer and/or director, as the case may be, of three of the investment companies in Franklin Templeton Investments.
| ||||||||
48 |
Annual Report |
franklintempleton.com |
FRANKLIN MUTUAL SERIES FUNDS
Interested Board Members and Officers (continued)
Name, Year of Birth and Address | Position | Length of Time Served | Number of Portfolios in Fund Complex Overseen by Board Member* | Other Directorships Held During at Least the Past 5 Years | ||||
Alison E. Baur (1964) One Franklin Parkway San Mateo, CA 94403-1906 | Vice President | Since 2012 | Not Applicable | Not Applicable | ||||
Principal Occupation During at Least the Past 5 Years: Deputy General Counsel, Franklin Templeton Investments; and officer of some of the other subsidiaries of Franklin Resources, Inc. and of 45 of the investment companies in Franklin Templeton Investments.
| ||||||||
Philippe Brugere-Trelat (1949) 101 John F. Kennedy Parkway Short Hills NJ 07078-2789 | Vice President | Since 2005 | Not Applicable | Not Applicable | ||||
Principal Occupation During at Least the Past 5 Years: Executive Vice President, Franklin Mutual Advisers, LLC; officer of one of the investment companies in Franklin Templeton Investments; and formerly, Portfolio Manager of Eurovest SA (French registered investment company, SICAV). | ||||||||
Aliya S. Gordon (1973) One Franklin Parkway San Mateo, CA 94403-1906 | Vice President | Since 2009 | Not Applicable | Not Applicable | ||||
Principal Occupation During at Least the Past 5 Years: Senior Associate General Counsel, Franklin Templeton Investments; and officer of 45 of the investment companies in Franklin Templeton Investments. | ||||||||
Steven J. Gray (1955) One Franklin Parkway San Mateo, CA 94403-1906 | Vice President and Secretary | Vice President since 2009 and Secretary since 2005 | Not Applicable | Not Applicable | ||||
Principal Occupation During at Least the Past 5 Years: Senior Associate General Counsel, Franklin Templeton Investments; Vice President, Franklin Templeton Distributors, Inc. and FASA, LLC; and officer of 45 of the investment companies in Franklin Templeton Investments. | ||||||||
Matthew T. Hinkle (1971) One Franklin Parkway San Mateo, CA 94403-1906 | Chief Executive Officer – Finance and Administration | Since June 2017 | Not Applicable | Not Applicable | ||||
Principal Occupation During at Least the Past 5 Years: Senior Vice President, Franklin Templeton Services, LLC; officer of 45 of the investment companies in Franklin Templeton Investments; and formerly, Vice President, Global Tax (2012-April 2017) and Treasurer/Assistant Treasurer, Franklin Templeton Investments (2009-2017). | ||||||||
Robert G. Kubilis (1973) 300 S.E. 2nd Street Fort Lauderdale, FL 33301-1923 | Chief Financial Officer, Chief Accounting Officer and Treasurer | Since 2012 | Not Applicable | Not Applicable | ||||
Principal Occupation During at Least the Past 5 Years: Treasurer, U.S. Fund Administration & Reporting, Franklin Templeton Investments; and officer of 17 of the investment companies in Franklin Templeton Investments. | ||||||||
Robert Lim (1948) One Franklin Parkway San Mateo, CA 94403-1906 | Vice President – AML Compliance | Since 2016 | Not Applicable | Not Applicable | ||||
Principal Occupation During at Least the Past 5 Years: Vice President, Franklin Templeton Companies, LLC; Chief Compliance Officer, Franklin Templeton Distributors, Inc. and Franklin Templeton Investor Services, LLC; and officer of 45 of the investment companies in Franklin Templeton Investments. | ||||||||
franklintempleton.com |
Annual Report |
|
49 |
|
FRANKLIN MUTUAL SERIES FUNDS
Interested Board Members and Officers (continued)
Name, Year of Birth and Address | Position | Length of Time Served | Number of Portfolios in Fund Complex Overseen by Board Member* | Other Directorships Held During at Least the Past 5 Years | ||||
Kimberly H. Novotny (1972) 300 S.E. 2nd Street Fort Lauderdale, FL 33301-1923 |
Vice President |
Since 2013 |
Not Applicable |
Not Applicable | ||||
Principal Occupation During at Least the Past 5 Years: Associate General Counsel, Franklin Templeton Investments; Vice President and Corporate Secretary, Fiduciary Trust International of the South; Vice President, Templeton Investment Counsel, LLC; Assistant Secretary, Franklin Resources, Inc.; and officer of 45 of the investment companies in Franklin Templeton Investments. | ||||||||
Robert C. Rosselot (1960) 300 S.E. 2nd Street Fort Lauderdale, FL 33301-1923 | Chief Compliance Officer | Since 2013 | Not Applicable | Not Applicable | ||||
Principal Occupation During at Least the Past 5 Years: Director, Global Compliance, Franklin Templeton Investments; Vice President, Franklin Templeton Companies, LLC; officer of 45 of the investment companies in Franklin Templeton Investments; and formerly, Senior Associate General Counsel, Franklin Templeton Investments (2007-2013); and Secretary and Vice President, Templeton Group of Funds (2004-2013). | ||||||||
Karen L. Skidmore (1952) One Franklin Parkway San Mateo, CA 94403-1906 | Vice President | Since 2009 | Not Applicable | Not Applicable | ||||
Principal Occupation During at Least the Past 5 Years: Senior Associate General Counsel, Franklin Templeton Investments; and officer of 45 of the investment companies in Franklin Templeton Investments. | ||||||||
Navid J. Tofigh (1972) One Franklin Parkway San Mateo, CA 94403-1906 | Vice President | Since 2015 | Not Applicable | Not Applicable | ||||
Principal Occupation During at Least the Past 5 Years: Associate General Counsel, Franklin Templeton Investments; and officer of 45 of the investment companies in Franklin Templeton Investments. | ||||||||
Craig S. Tyle (1960) One Franklin Parkway San Mateo, CA 94403-1906 | Vice President | Since 2005 | Not Applicable | Not Applicable | ||||
Principal Occupation During at Least the Past 5 Years: General Counsel and Executive Vice President, Franklin Resources, Inc.; and officer of some of the other subsidiaries of Franklin Resources, Inc. and of 45 of the investment companies in Franklin Templeton Investments. | ||||||||
Lori A. Weber (1964) 300 S.E. 2nd Street Fort Lauderdale, FL 33301-1923 | Vice President | Since 2011 | Not Applicable | Not Applicable | ||||
Principal Occupation During at Least the Past 5 Years: Senior Associate General Counsel, Franklin Templeton Investments; Assistant Secretary, Franklin Resources, Inc.; Vice President and Secretary, Templeton Investment Counsel, LLC; and officer of 45 of the investment companies in Franklin Templeton Investments. | ||||||||
*We base the number of portfolios on each separate series of the US registered investment companies within the Franklin Templeton Investments fund complex. These portfolios have a common investment manager or affiliated investment managers.
**Gregory E. Johnson is considered to be an interested person of the Fund under the federal securities laws due to his position as an officer and director of Franklin Resources, Inc. (Resources), which is the parent company of the Fund’s investment manager and distributor. Peter A. Langerman is considered to be an interested person of the Fund under the federal securities laws due to his position as an officer of Franklin Mutual Advisors, LLC, which is an affiliate of the Fund’s investment manager.
Note 1: Officer information is current as of the date of this report. It is possible that after this date, information about officers may change.
The Sarbanes-Oxley Act of 2002 and Rules adopted by the U.S. Securities and Exchange Commission require the Fund to disclose whether the Fund’s Audit Committee includes at least one member who is an audit committee financial expert within the meaning of such Act and Rules. The Fund’s Board has determined that there is at least one such financial expert on the Audit Committee and has designated each of Edward I. Altman, Ph.D., Ann Torre Bates and David W. Niemiec as an audit committee financial expert. The Board believes that Messrs. Altman and Niemiec and Ms. Bates qualify as such an expert in view of their extensive business background and experience. Mr. Altman has served as a member of the Fund Audit Committee since 1996. He currently serves as a Max L. Hines Professor of Finance, Emeritus and Director of The Credit and Debt Markets Research Program, Salomon Center, Stern School of Business, New York University. Ms. Bates has served as a member of the Fund Audit Committee since 1996. She currently serves as a director of Ares Capital Corporation (2010-present) and United Natural Foods, Inc. (2013-present) and was formerly a director of Navient Corporation from 2014 to 2016, SLM Corporation from 1997 to 2014 and Allied
50 |
Annual Report |
franklintempleton.com |
FRANKLIN MUTUAL SERIES FUNDS
Interested Board Members and Officers (continued)
Capital Corporation from 2003 to 2010, Executive Vice President and Chief Financial Officer of NHP Incorporated from 1995 to 1997 and Vice President and Treasurer of US Airways, Inc. until 1995. Mr. Niemiec has served as a member of the Fund Audit Committee since 2015, currently serves as an Advisor to Saratoga Partners and was formerly its Managing Director from 1998 to 2001 and serves as a director of Hess Midstream Partners LP (2017-present). Mr. Niemiec was formerly a director of Emeritus Corporation from 1999 to 2010 and OSI Pharmaceuticals, Inc. from 2006 to 2010, Managing Director of SBC Warburg Dillon Read from 1997 to 1998, and was Vice Chairman from 1991 to 1997 and Chief Financial Officer from 1982 to 1997 of Dillon, Read & Co. Inc. As a result of such background and experience, the Board believes that Messrs. Altman and Niemiec and Ms. Bates have each acquired an understanding of generally accepted accounting principles and financial statements, the general application of such principles in connection with the accounting estimates, accruals and reserves, and analyzing and evaluating financial statements that present a breadth and level of complexity of accounting issues generally comparable to those of the Fund, as well as an understanding of internal controls and procedures for financial reporting and an understanding of audit committee functions. Messrs. Altman and Niemiec and Ms. Bates are independent Board members as that term is defined under the applicable U.S. Securities and Exchange Commission Rules and Releases.
The Statement of Additional Information (SAI) includes additional information about the board members and is available, without charge, upon request. Shareholders may call (800) DIAL BEN/342-5236 to request the SAI.
franklintempleton.com |
Annual Report |
|
51 |
|
FRANKLIN MUTUAL SERIES FUNDS
FRANKLIN MUTUAL QUEST FUND
Proxy Voting Policies and Procedures
The Fund’s investment manager has established Proxy Voting Policies and Procedures (Policies) that the Fund uses to determine how to vote proxies relating to portfolio securities. Shareholders may view the Fund’s complete Policies online at franklintempleton.com. Alternatively, shareholders may request copies of the Policies free of charge by calling the Proxy Group collect at (954) 527-7678 or by sending a written request to: Franklin Templeton Companies, LLC, 300 S.E. 2nd Street, Fort Lauderdale, FL 33301, Attention: Proxy Group. Copies of the Fund’s proxy voting records are also made available online at franklintempleton.com and posted on the US Securities and Exchange Commission’s website at sec.gov and reflect the most recent 12-month period ended June 30.
Quarterly Statement of Investments
The Trust, on behalf of the Fund, files a complete statement of investments with the US Securities and Exchange Commission for the first and third quarters for each fiscal year on Form N-Q. Shareholders may view the filed Form N-Q by visiting the Commission’s website at sec.gov. The filed form may also be viewed and copied at the Commission’s Public Reference Room in Washington, DC. Information regarding the operations of the Public Reference Room may be obtained by calling (800) SEC-0330.
Householding of Reports and Prospectuses
You will receive the Fund’s financial reports every six months as well as an annual updated summary prospectus (prospectus available upon request). To reduce Fund expenses, we try to identify related shareholders in a household and send only one copy of the financial reports and summary prospectus. This process, called “householding,” will continue indefinitely unless you instruct us otherwise. If you prefer not to have these documents householded, please call us at (800) 632-2301. At any time you may view current prospectuses/summary prospectuses and financial reports on our website. If you choose, you may receive these documents through electronic delivery.
52 |
Annual Report |
franklintempleton.com |
 | Annual Report and Shareholder Letter Franklin Mutual Quest Fund
Investment Manager Franklin Mutual Advisers, LLC
Distributor Franklin Templeton Distributors, Inc. (800) DIAL BEN® / 342-5236 franklintempleton.com
Shareholder Services (800) 632-2301 - (Class A, C, R & R6) (800) 448-FUND - (Class Z) |
Authorized for distribution only when accompanied or preceded by a summary prospectus and/or prospectus. Investors should carefully consider a fund’s investment goals, risks, charges and expenses before investing. A prospectus contains this and other information; please read it carefully before investing.
To help ensure we provide you with quality service, all calls to and from our service areas are monitored and/or recorded.
| © 2018 Franklin Templeton Investments. All rights reserved. | 475 A 02/18 |
| Annual Report and Shareholder Letter
December 31, 2017 |
Sign up for electronic delivery at franklintempleton.com/edelivery
Franklin Templeton Investments
Gain From Our Perspective®
At Franklin Templeton Investments, we’re dedicated to one goal: delivering exceptional asset management for our clients. By bringing together multiple, world-class investment teams in a single firm, we’re able to offer specialized expertise across styles and asset classes, all supported by the strength and resources of one of the world’s largest asset managers. This has helped us to become a trusted partner to individual and institutional investors across the globe.
Dear Franklin Mutual Shares Fund Shareholder:
Securities markets benefited from a confluence of positive economic, financial and political trends during 2017. The global economy entered a synchronized pace of modest and steady growth, corporate earnings strengthened in the US, Europe and Japan, and US equity market volatility remained at historically low levels. A number of political risks identified at the start of 2017, such as the success of far-right parties in Europe, Brexit negotiations and the Trump administration’s ability to enact its policy agenda, also dissipated or became less immediate for investors as the year progressed. For the year ended December 31, 2017, US stocks, as measured by the Standard & Poor’s® 500 Index (S&P 500®), produced a +21.83% total return.1 Stocks in global developed markets, as measured by the MSCI World Index, returned +23.07%, and investment-grade bonds, as measured by the Bloomberg Barclays US Aggregate Bond Index, posted a +3.54% total return.1
In many equity markets, the trend of growth stocks outpacing value stocks continued. The Russell 1000® Growth Index returned +30.21%, while the Russell 1000® Value Index returned +13.66%.1 The difference in performance has been driven in large part by a rally in internet and software stocks, which dominated the S&P 500 Growth Index. In addition, the S&P 500 Value Index has components that we believe are facing disruption from new technology (e.g., the rapid market share shift to online retailing from traditional bricks and mortar retailers that are often labeled as value stocks). Exacerbating the disruption is the reality that many new technology companies are able to innovate without the need to show immediate profits.
We do not know how long these trends will continue, but historically, periods of strong performance by growth stocks have eventually been followed by relatively weaker performance. Given that unemployment has continued to decline in most developed markets and the US Federal Reserve has taken its first steps toward monetary normalization, value-oriented stocks may become more attractive to investors, particularly within cyclical sectors of the equity markets such as industrials, consumer discretionary and financials.
A stellar 2017 for equity markets also pushed up common valuation metrics, such as price-to-earnings. Valuation is a critical factor in our analysis and we always ask ourselves if current and potential investments represent an attractive balance of risk and reward. We remain committed to our long-term perspective and disciplined investment approach as we conduct a rigorous, fundamental analysis of securities with a regular emphasis on investment risk management.
Although the investment landscape appears favorable as we enter 2018, it is worth remembering that securities markets are dynamic and constantly evolving. Therefore, we believe active, professional investment management serves investors well. We also recognize the important role of financial advisors in today’s markets and encourage investors to continue to seek their advice. Amid changing markets and economic conditions, we are confident investors with a well-diversified portfolio and a patient, long-term outlook should be well positioned for the years ahead.
1. Source: Morningstar. Frank Russell Company is the source and owner of the trademarks, service marks and copyrights related to the Russell Indexes. Russell® is a trademark of Frank Russell Company.
See www.franklintempletondatasources.com for additional data provider information.
Not FDIC Insured | May Lose Value | No Bank Guarantee
|
franklintempleton.com |
Not part of the annual report |
|
1 |
|
On the following pages, the Fund’s portfolio management team reviews investment decisions that pertain to performance during the past 12 months in light of the economic environment and other factors. Please remember all securities markets fluctuate, as do mutual fund share prices.
We thank you for investing with Franklin Templeton, welcome your questions and comments, and look forward to continuing to serve your investment needs in the years ahead.
Sincerely,
Peter A. Langerman
Chairman, President and Chief Executive Officer
Franklin Mutual Advisers, LLC
This letter reflects our analysis and opinions as of December 31, 2017, unless otherwise indicated. The information is not a complete analysis of every aspect of any market, country, industry, security or fund. Statements of fact are from sources considered reliable.
Annual Report
Visit franklintempleton.com for fund updates, to access your account, or to find helpful financial planning tools.
| 2 | Not part of the annual report | franklintempleton.com |
Annual Report
This annual report for Franklin Mutual Shares Fund covers the fiscal year ended December 31, 2017.
Your Fund’s Goal and Main Investments
The Fund seeks capital appreciation, which may occasionally be short term, with income as a secondary goal. Under normal market conditions, the Fund invests primarily in equity securities, primarily common stock, of US and foreign companies that the investment manager believes are available at market prices less than their intrinsic value. To a lesser extent, the Fund also invests in merger arbitrage securities and the debt and equity of distressed companies. The Fund may invest up to 35% of its assets in foreign securities, which may include sovereign debt and participations in foreign government debt. The Geographic Composition bar chart on this page lists the leading countries where the Fund invests.
Performance Overview
The Fund’s Class Z shares delivered a cumulative total return of +8.49% for the 12 months ended December 31, 2017. For comparison, the Fund’s benchmark, the Standard & Poor’s 500 Index (S&P 500), which is a broad measure of US stock performance, generated a total return of +21.83%.1 You can find more of the Fund’s performance data in the Performance Summary beginning on page 9.
Performance data represent past performance, which does not guarantee future results. Investment return and principal value will fluctuate, and you may have a gain or loss when you sell your shares. Current performance may differ from figures shown. For most recent month-end performance, go to franklintempleton.com or call (800) 342-5236.
Economic and Market Overview
The global economy grew moderately during the 12-month period under review. In this environment, global developed and emerging market stocks generated a +24.62% total return, as measured by the MSCI All Country World Index.1 Global markets were aided by price gains in oil and other commodities, generally upbeat economic data across regions,
Geographic Composition*
Based on Total Net Assets as of 12/31/17
*Figures are stated as a percentage of total and may not equal 100% or may be negative due to rounding, use of any derivatives, unsettled trades or other factors.
the European Central Bank’s (ECB’s) extension of its monetary easing program, and investor optimism about pro-growth and pro-business policies in the US. The prospect for reforms in the European Union (EU) with Emmanuel Macron’s election as France’s president, encouraging corporate earnings reports and the passage of the US tax reform bill also supported global stocks.
However, global markets reflected investor concerns about the terms of the UK’s exit from the EU, political uncertainty in the US and the EU, and geopolitical tensions in the Korean peninsula and other regions. Other concerns included the health of European banks, global oil oversupply despite a pact by major oil-producing countries to extend production cuts, and comments from key central bankers around the world about potentially raising interest rates.
After strengthening in 2017’s second and third quarters, the US economy moderated in the fourth quarter. The economy grew faster in 2017 than in 2016, however, largely due to growth in consumer spending, business investment and exports. The unemployment rate decreased from 4.7% in December 2016, as reported at the beginning of the 12-month period, to 4.1% at
1. Source: Morningstar.
The index is unmanaged and includes reinvestment of any income or distributions. It does not reflect any fees, expenses or sales charges. One cannot invest directly in an index, and an index is not representative of the Fund’s portfolio.
The dollar value, number of shares or principal amount, and names of all portfolio holdings are listed in the Fund’s Statement of Investments (SOI). The SOI begins on page 18.
| franklintempleton.com | Annual Report | 3 |
FRANKLIN MUTUAL SHARES FUND
period-end.2 Annual inflation, as measured by the Consumer Price Index, was 2.1% in December 2016, as reported at the beginning of the 12-month period, and while it varied over the 12-month period, remained unchanged at period-end.2 The US Federal Reserve (Fed) raised its target range for the federal funds rate 0.25% three times during the period, amid signs of a growing US economy, strengthening labor market and improving business spending. At its December meeting, the Fed confirmed that the monthly balance sheet reduction would increase from US$10 billion to US$20 billion beginning in January 2018.
In Europe, the UK’s economic growth moderated in 2017 compared to 2016, largely due to slower growth in the services sector. In November, the Bank of England raised its key policy rate 0.25%, its first increase in a decade. The eurozone’s growth accelerated in 2017’s second and third quarters, but moderated in the fourth quarter. However, the eurozone’s 2017 economic growth rate of 2.5% was the fastest in a decade.3 The bloc’s annual inflation rate, while low, ended higher than in December 2016. The ECB kept its benchmark interest rate unchanged during the period. However, at its October meeting, the ECB extended the time frame for its massive bond-buying program from December 2017 to at least September 2018, while reducing the amount of monthly bond purchases in half beginning in January 2018.
In Asia, Japan’s quarterly gross domestic product (GDP) grew for the seventh consecutive quarter, although third-quarter 2017 growth was lower than the previous quarter. The Bank of Japan left its benchmark interest rate unchanged during the period and continued its monetary stimulus measures.
In emerging markets, Brazil’s quarterly GDP grew for the third consecutive quarter, although third-quarter 2017 growth slowed from the previous quarter. The country’s central bank cut its benchmark interest rate several times during the period to spur economic growth. Russia’s GDP grew in 2017’s first three quarters compared to the prior-year periods, amid the Bank of Russia’s continued policy support. China’s GDP grew faster in 2017 than in 2016, supported by solid growth in industrial production, services, fixed-asset investment, retail sales, and imports and exports. The People’s Bank of China left its benchmark interest rate unchanged during the period. Overall, emerging market stocks, as measured by the MSCI Emerging Markets Index, produced a substantial +37.75% total return during the period.1
Investment Strategy
At Franklin Mutual Series, we are committed to our distinctive value approach to investing, which we believe can generate above-average risk-adjusted returns over time for our shareholders. Our major investment strategy is investing in undervalued stocks. When selecting undervalued equities, we are attracted to what we believe are fundamentally strong companies with healthy balance sheets, high-quality assets, substantial free cash flow and shareholder-oriented management teams and whose stocks are trading at discounts to our assessment of the companies’ intrinsic or business value. We also look for asset-rich companies whose shares may be trading at depressed levels due to concerns over short-term earnings disappointments, litigation, management strategy or other perceived negatives. This strict value approach is not only intended to improve the likelihood of upside potential, but also reduces the risk of substantial declines, in our opinion. While the vast majority of our undervalued equity investments are made in publicly traded companies globally, we may invest occasionally in privately held companies as well.
We complement this more traditional investment strategy with two others. One is distressed investing, a highly specialized field that has proven quite profitable during certain periods over the years. Distressed investing is complex and can take many forms. The most common distressed investment the Fund undertakes is the purchase of financially troubled or bankrupt companies’ debt at a substantial discount to face value. After the financially distressed company is reorganized, often in bankruptcy court, the old debt is typically replaced with new securities issued by the financially stronger company.
The other piece of our investment strategy is participating in arbitrage situations, another highly specialized field. When companies announce proposed mergers or takeovers, commonly referred to as “deals,” the target company may trade at a discount to the bid it ultimately accepts. One form of arbitrage involves purchasing the target company’s stock when it is trading below the value we believe it would receive in a deal. In keeping with our commitment to a relatively conservative investment approach, we typically focus our arbitrage efforts on announced deals, and avoid rumored deals or other situations we consider relatively risky.
In addition, it is our practice to hedge the Fund’s currency exposure when we deem it advantageous for our shareholders.
2. Source: Bureau of Labor Statistics.
3. Source: Eurostat.
| 4 | Annual Report | franklintempleton.com |
FRANKLIN MUTUAL SHARES FUND
What is meant by “hedge”?
To hedge an investment is to take a position intended to offset potential losses/gains that may be incurred by a companion financial instrument.
|
Manager’s Discussion
In 2017, an improving economic and political backdrop helped drive most equity markets higher. The positive performances were broad based, spanning across most regions and sectors, and complemented by minimal volatility. Global markets were aided by generally upbeat economic data, improved corporate earnings in the US, Europe and Japan, as well as improved industrial commodity prices, most notably crude oil. In addition, the most significant political risks identified by investors heading into 2017 failed to materialize.
In the US, markets began 2017 rallying as investors hoped that a Republican sweep of US elections in November 2016 would lead to a general loosening in regulations and tax reform, including lower corporate tax rates. Although the Trump administration’s policy agenda was hindered by political gridlock, efforts to loosen federal regulations yielded some results and tax reform legislation was finally passed in late December. Improving economic activity and corporate earnings appeared to be the most meaningful equity market catalysts during much of 2017. However, the modest level of economic growth and low interest rates pushed investors to keep favoring growth stocks. During the period, the Russell 1000® Growth Index generated a total return of +30.21%, while the Russell 1000® Value Index posted a total return of +13.66%.4 Within the Russell 1000® Growth Index, stocks with the largest weightings were technology firms that dominated the headlines: Apple,5 Alphabet (a.k.a. Google),5 Microsoft, Amazon.com5 and Facebook.5
European equity markets started 2017 slowly, but positive political events and improved economic data fueled strong performances during the period. Elections in Europe produced generally positive outcomes as far-right parties largely failed to gain political power in national elections. Investors were particularly encouraged by the presidential election outcome in France. The reform-minded, centrist candidate, Emmanuel Macron, won the French presidential election in May and quickly began to push his agenda, most notably labor decrees giving employers in France greater freedom in negotiating
Top 10 Sectors/Industries
Based on Equity Securities as of 12/31/17
| % of Total Net Assets | ||||
Banks | 10.2% | |||
Oil, Gas & Consumable Fuels | 8.5% | |||
Media | 7.9% | |||
Insurance | 7.8% | |||
Pharmaceuticals | 7.4% | |||
Software | 6.0% | |||
Health Care Equipment & Supplies | 4.4% | |||
Tobacco | 4.2% | |||
Food & Staples Retailing | 4.1% | |||
Communications Equipment | 2.8% | |||
contracts directly with workers. Amid all the positive events, the UK remained the most significant outlier. In the UK, a June 2017 snap election resulting in no party having a majority in Parliament appeared to make a “hard Brexit,” in which the UK leaves the European Union (EU) in March 2019 without a negotiated deal, even more likely than before. Although the UK and EU appeared to make some progress late in the year, the snap election results left the Conservative Party in a precarious position and with the risk of another election in the near future.
As value investors, we seek to invest prudently in securities that we believe represent good value, but adjust our views accordingly as the world around us changes. The media industry is a recent example of this approach. The Top 10 Sectors/Industries table on this page lists media and other leading industries in which the Fund currently invests. The media industry became a significant area of investment interest in the latter stages of the year due to significant structural changes. Since the 1980s, most Americans received their TV entertainment as part of a bundle from a cable provider. Disparate networks were combined and sold as packages, with annual price increases justified by the inclusion of more networks. Consumers rarely had the option to unbundle cable packages and most markets had no direct competition. However, the growth of fixed and mobile broadband connectivity ushered in the opportunity to bypass traditional distributors through the delivery of film and TV content over the internet and the launch of direct-to-consumer offerings by TV networks. The growing popularity of new digital options has driven cable providers to roll out lower-priced packages
4. Source: Morningstar. Frank Russell Company is the source and owner of the trademarks, service marks and copyrights related to the Russell Indexes. Russell® is a trademark of Frank Russell Company.
5. Not a Fund holding.
| franklintempleton.com | Annual Report | 5 |
FRANKLIN MUTUAL SHARES FUND
with fewer channels. This evolution has begun to create winners and losers among networks and new opportunities for investors.
Pay TV subscription among US households peaked in 2009 at close to 100 million homes. Initially, the decline in subscribers was moderate, but has accelerated since 2015, reaching a pace of more than 2% per year in 2017. At first, media companies benefited from digital distribution by using it as an additional outlet for selling content. With the cannibalization of traditional platforms accelerating, media companies have begun to respond. The necessity for greater scale in content development and direct access to consumers is driving investment and merger decisions in the industry. From our standpoint, we are looking for networks with the most attractive content relative to the price they have been charging and may be able to charge in the future.
The Fund initiated a position in Walt Disney in the latter half of 2017. We believe Disney is well positioned to benefit from the evolution toward a more direct-to-consumer distribution model. In our view, Disney has one of the best intellectual property (IP) portfolios in all of media with a stable of globally recognized proprietary characters upon which to build a strong direct-to-consumer franchise. If Disney is successful in its bid to acquire the bulk of Twenty-First Century Fox’s5 content assets, the deal would further strengthen its IP portfolio and its content development scale. As it has done with its own IP, Disney would likely be able to leverage Fox’s content into attractions at its theme parks as well as consumer products. The acquisition would offer potential cost synergies that would likely offset some of the investments in the direct-to-consumer service. Under the leadership of chief executive officer Bob Iger, Disney has been effective in integrating acquired companies and navigating through a changing media landscape. Iger’s commitment to remain at the helm through 2021 strengthens our belief that the company should be able to execute on this opportunity.
Merger and acquisition activity remained healthy in 2017, although the pace of activity appeared to decelerate slightly compared to 2016 due to less favorable political and regulatory conditions in the US, the UK and China. In the US, several key regulatory agencies remain short of members, including the Federal Communications Commission and the Federal Trade Commission. Many large deals continued to wind their way through prolonged regulatory reviews, including Bayer’s5 acquisition of Monsanto, AT&T’s acquisition of Time Warner, and Twenty-First Century Fox’s offer for Sky.
| Top 10 Equity Holdings | ||||
| 12/31/17 | ||||
Company Sector/Industry, Country | % of Total Net Assets | |||
Medtronic PLC | 3.0% | |||
Health Care Equipment & Supplies, US | ||||
Merck & Co. Inc. | 2.8% | |||
Pharmaceuticals, US | ||||
British American Tobacco PLC | 2.6% | |||
Tobacco, UK | ||||
Eli Lilly & Co. | 2.5% | |||
Pharmaceuticals, US | ||||
Microsoft Corp. | 2.4% | |||
Software, US | ||||
Royal Dutch Shell PLC | 2.2% | |||
Oil, Gas & Consumable Fuels, UK | ||||
Time Warner Inc. | 2.2% | |||
Media, US | ||||
Novartis AG | 2.1% | |||
Pharmaceuticals, Switzerland | ||||
Cisco Systems Inc. | 2.0% | |||
Communications Equipment, US | ||||
American International Group Inc. | 2.0% | |||
Insurance, US | ||||
Credit spreads narrowed in 2017 for higher quality and high yield credit, albeit with some minor bouts of volatility. The broad-based decrease in yield differentials between bonds with the same maturity but different credit quality provided the Fund with the opportunity to exit a number of opportunities that presented themselves in early 2016, including several bond offerings related to leveraged acquisitions, as prices improved, yield premium over Treasuries shrank, and the risk-adjusted returns were no longer mispriced. As the year progressed and investors became more willing buyers of credit, mispriced risk became more difficult to find, in our opinion. In times when the credit markets fluctuate and value is difficult to identify, we believe our industry specific expertise, deep fundamental analysis with a focus on cash flow, and intensive credit and covenant review combine seamlessly and provide us with different ways of looking at the same ideas others may disregard.
Fund Performance
Turning to Fund performance, top positive contributors included multinational software company Microsoft, construction and mining equipment manufacturer Caterpillar and South Korea-based Samsung Electronics. Microsoft is listed among the Fund’s largest positions in the Top 10 Equity Holdings table on this page.
| 6 | Annual Report | franklintempleton.com |
FRANKLIN MUTUAL SHARES FUND
Microsoft continued to reap the rewards of its rapidly growing cloud business and from shifting Microsoft Office software clients to its subscription-based services. Microsoft reported solid quarterly results, including an improvement in operating margins and upward guidance to 2018 operating margins. Microsoft also announced a reorganization of its commercial field sales teams in July 2017 as part of its increased focus on cloud computing.
Caterpillar raised its 2017 revenue and earnings guidance on multiple occasions during the year as demand generally improved across all of its divisions. Improved global economic conditions and a rebound in Chinese construction activity were significant catalysts for the increased demand. In September, Caterpillar’s new chief executive officer, Jim Umpleby, hosted an investor day at which he outlined his vision for the company. In particular, the company highlighted significant new growth opportunities in each of its business units, as well as margin targets that exceeded analyst expectations.
Samsung Electronics is a low cost provider of dynamic random-access memory and flash memory products, smartphones, consumer electronics and other goods. For investors, Samsung’s solid operating results outweighed both the conviction of Samsung vice chairman Jay Y. Lee for his involvement in a government bribery scandal and escalating tensions between North Korea and the international community. Samsung reported strong sales in its core businesses, including memory chips and OLED (organic light-emitting diode) displays. Sales of its newest generation of smartphones during 2017 exceeded market expectations. Shareholder-friendly actions also boosted shares of Samsung, including a plan to cancel existing treasury shares held by the company and the announcement of significant dividend increases in 2017 and 2018.
During the period under review, Fund investments that detracted from performance included US-based energy services company Baker Hughes, Israel-based pharmaceutical services provider Teva Pharmaceuticals6 and US-based industrials company General Electric (GE).
Baker Hughes is an energy services company, majority owned by GE following the completed merger between Baker Hughes and GE’s oil-and-gas business in July 2017. Baker Hughes’ stock price slid lower in 2017 as the environment for long-cycle oil field service projects remained challenging and
the newly combined company posted weaker-than-expected operating results. Toward year-end, we saw reasons for optimism as oil prices gained and Baker Hughes announced a $3 billion share repurchase program.
Teva Pharmaceutical Industries experienced a challenging year. In January 2017, Teva provided lower earnings guidance and a US federal court invalidated four patents for the company’s top-selling multiple sclerosis drug Copaxone. The resignations of Teva’s chief executive officer (CEO) and chief financial officer in the first half of 2017 further hindered Teva’s stock price. In the second half of the year, weak operating results, a dividend cut and a debt rating downgrade escalated investor concerns.
The stock price of GE, an industrials company with a wide range of business units, declined as investors became more discouraged about the company’s poor cash flow generation, significantly underfunded pension liability, bloated cost structure, and increased competition and overcapacity in the power market. Intensifying pressure by activist investors led to chief executive officer (CEO) Jeffrey Immelt’s resignation in June 2017 and the promotion of John Flannery to CEO. However, GE’s stock price continued to slide after the company lowered its 2017 earnings guidance in October, which heightened investor concerns about a potential dividend cut. A dividend cut of 50%, larger than most investors had speculated, was announced in November, along with the incoming CEO’s plan for portfolio optimization and significant cost reductions. These negative events have not altered our view that GE has well-positioned businesses. If GE delivers on its plan to improve free cash flow generation and reduce overhead expenses, we believe there is upside potential for its stock price.
During the period, the Fund held currency forwards and futures seeking to hedge most of the currency risk of the portfolio’s non-US dollar investments. The currency forwards and futures had a negative impact on the Fund’s performance because of the depreciation of the US dollar versus the hedged currencies.
What is a currency forward?
A currency forward is an agreement between the Fund and a counterparty to buy or sell a foreign currency in exchange for another currency at a specific exchange rate on a future date.
6. Not held at period-end.
See www.franklintempletondatasources.com for additional data provider information.
| franklintempleton.com | Annual Report | 7 |
FRANKLIN MUTUAL SHARES FUND
What is a future?
A future is an agreement between the Fund and a counterparty made through a US or foreign futures exchange to buy or sell an underlying instrument or asset at a specific price on a future date.
Thank you for your participation in Franklin Mutual Shares Fund. We look forward to continuing to serve your investment needs.
 |
Peter A. Langerman Co-Portfolio Manager | |
 |
F. David Segal, CFA Co-Portfolio Manager | |
 |
Debbie A. Turner, CFA Assistant Portfolio Manager | |


The foregoing information reflects our analysis, opinions and portfolio holdings as of December 31, 2017, the end of the reporting period. The way we implement our main investment strategies and the resulting portfolio holdings may change depending on factors such as market and economic conditions. These opinions may not be relied upon as investment advice or an offer for a particular security. The information is not a complete analysis of every aspect of any market, country, industry, security or the Fund. Statements of fact are from sources considered reliable, but the investment manager makes no representation or warranty as to their completeness or accuracy. Although historical performance is no guarantee of future results, these insights may help you understand our investment management philosophy.
CFA® is a trademark owned by CFA Institute.
Peter Langerman has been portfolio manager for Franklin Mutual Shares Fund since 2005. He has been portfolio manager of Franklin Mutual Global Discovery Fund since 2009. He joined Franklin Templeton Investments in 1996, serving in various capacities, including President and Chief Executive Officer of Franklin Mutual Advisers and member of the management team of the Funds, including Franklin Mutual Shares Fund. From 2002 to 2005, he served as director of New Jersey’s Division of Investment, overseeing employee pension funds. Between 1986 and 1996, Mr. Langerman was employed at Heine Securities Corporation, the Fund’s former manager.
F. David Segal has been portfolio manager for Franklin Mutual Shares Fund since 2005. He joined Franklin Templeton Investments in 2002. Previously, he was an analyst in the Structured Finance Group of MetLife for the period 1999 to 2002.
Debbie Turner has been assistant portfolio manager for Franklin Mutual Shares Fund since 2001. She joined Franklin Templeton Investments in 1996. Between 1993 and 1996, Ms. Turner was employed at Heine Securities Corporation, the Fund’s former manager.
| 8 | Annual Report | franklintempleton.com |
FRANKLIN MUTUAL SHARES FUND
Performance Summary as of December 31, 2017
The performance table and graphs do not reflect any taxes that a shareholder would pay on Fund dividends, capital gain distributions, if any, or any realized gains on the sale of Fund shares. Total return reflects reinvestment of the Fund’s dividends and capital gain distributions, if any, and any unrealized gains or losses. Your dividend income will vary depending on dividends or interest paid by securities in the Fund’s portfolio, adjusted for operating expenses of each class. Capital gain distributions are net profits realized from the sale of portfolio securities.
Performance as of 12/31/17
Cumulative total return excludes sales charges. Average annual total return includes maximum sales charges. Sales charges will vary depending on the size of the investment and the class of share purchased. The maximum is 5.75% and the minimum is 0%. Class A: 5.75% maximum initial sales charge. For other share classes, visit franklintempleton.com.
| Share Class | | Cumulative Total Return1 |
| | Average Annual Total Return2 | | ||
Z | ||||||||
1-Year | +8.49% | +8.49% | ||||||
5-Year | +66.69% | +10.76% | ||||||
10-Year | +68.14% | +5.33% | ||||||
A | ||||||||
1-Year | +8.21% | +1.97% | ||||||
5-Year | +64.44% | +9.16% | ||||||
10-Year | +63.38% | +4.41% | ||||||
Performance data represent past performance, which does not guarantee future results. Investment return and principal value will fluctuate, and you may have a gain or loss when you sell your shares. Current performance may differ from figures shown. For most recent month-end performance, go to franklintempleton.com or call (800) 342-5236.
See page 11 for Performance Summary footnotes.
franklintempleton.com |
Annual Report |
|
9 |
|
FRANKLIN MUTUAL SHARES FUND
PERFORMANCE SUMMARY
Total Return Index Comparison for a Hypothetical $10,000 Investment
Total return represents the change in value of an investment over the periods shown. It includes any applicable maximum sales charge, Fund expenses, account fees and reinvested distributions. The unmanaged index includes reinvestment of any income or distributions. It differs from the Fund in composition and does not pay management fees or expenses. One cannot invest directly in an index.
Class Z (1/1/08–12/31/17)
Class A (1/1/08–12/31/17)
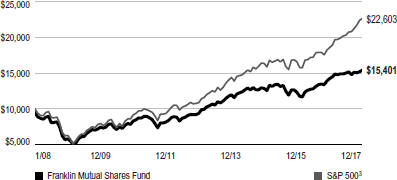
See page 11 for Performance Summary footnotes.
10 |
Annual Report |
franklintempleton.com |
FRANKLIN MUTUAL SHARES FUND
PERFORMANCE SUMMARY
Distributions (1/1/17–12/31/17)
| Share Class | Net Investment Income | Short-Term Capital Gain | Long-Term Capital Gain | Total | ||||||||||||
| Z | $0.6778 | $0.0599 | $1.2339 | $1.9716 | ||||||||||||
| A | $0.6070 | $0.0599 | $1.2339 | $1.9008 | ||||||||||||
| C | $0.3726 | $0.0599 | $1.2339 | $1.6664 | ||||||||||||
| R | $0.5260 | $0.0599 | $1.2339 | $1.8198 | ||||||||||||
| R6 | $0.7183 | $0.0599 | $1.2339 | $2.0121 | ||||||||||||
Total Annual Operating Expenses4
| Share Class | ||||
Z | 0.80% | |||
A | 1.05% | |||
Each class of shares is available to certain eligible investors and has different annual fees and expenses, as described in the prospectus.
All investments involve risks, including possible loss of principal. Value securities may not increase in price as anticipated or may decline further in value. Special risks are associated with foreign investing, including currency fluctuations, economic instability and political developments. The Fund’s investments in companies engaged in mergers, reorganizations or liquidations also involve special risks as pending deals may not be completed on time or on favorable terms. The Fund may invest in lower rated bonds, which entail higher credit risk. The Fund is actively managed but there is no guarantee that the manager’s investment decisions will produce the desired results. The Fund’s prospectus also includes a description of the main investment risks.
1. Cumulative total return represents the change in value of an investment over the periods indicated.
2. Average annual total return represents the average annual change in value of an investment over the periods indicated. Return for less than one year, if any, has not been annualized.
3. Source: Morningstar. The S&P 500 is a market capitalization-weighted index of 500 stocks designed to measure total US equity market performance.
4. Figures are as stated in the Fund’s current prospectus and may differ from the expense ratios disclosed in the Your Fund’s Expenses and Financial Highlights sections in this report. In periods of market volatility, assets may decline significantly, causing total annual Fund operating expenses to become higher than the figures shown.
See www.franklintempletondatasources.com for additional data provider information.
franklintempleton.com |
Annual Report |
|
11 |
|
FRANKLIN MUTUAL SHARES FUND
As a Fund shareholder, you can incur two types of costs: (1) transaction costs, including sales charges (loads) on Fund purchases and redemptions; and (2) ongoing Fund costs, including management fees, distribution and service (12b-1) fees, and other Fund expenses. All mutual funds have ongoing costs, sometimes referred to as operating expenses. The table below shows ongoing costs of investing in the Fund and can help you understand these costs and compare them with those of other mutual funds. The table assumes a $1,000 investment held for the six months indicated.
Actual Fund Expenses
The table below provides information about actual account values and actual expenses in the columns under the heading “Actual.” In these columns the Fund’s actual return, which includes the effect of Fund expenses, is used to calculate the “Ending Account Value” for each class of shares. You can estimate the expenses you paid during the period by following these steps (of course, your account value and expenses will differ from those in this illustration): Divide your account value by $1,000 (if your account had an $8,600 value, then $8,600 ÷ $1,000 = 8.6). Then multiply the result by the number in the row for your class of shares under the headings “Actual” and “Expenses Paid During Period” (if Actual Expenses Paid During Period were $7.50, then 8.6 x $7.50 = $64.50). In this illustration, the actual expenses paid this period are $64.50.
Hypothetical Example for Comparison with Other Funds
Under the heading “Hypothetical” in the table, information is provided about hypothetical account values and hypothetical expenses based on the Fund’s actual expense ratio and an assumed rate of return of 5% per year before expenses, which is not the Fund’s actual return. This information may not be used to estimate the actual ending account balance or expenses you paid for the period, but it can help you compare ongoing costs of investing in the Fund with those of other funds. To do so, compare this 5% hypothetical example for the class of shares you hold with the 5% hypothetical examples that appear in the shareholder reports of other funds.
Please note that expenses shown in the table are meant to highlight ongoing costs and do not reflect any transactional costs. Therefore, information under the heading “Hypothetical” is useful in comparing ongoing costs only, and will not help you compare total costs of owning different funds. In addition, if transactional costs were included, your total costs would have been higher.
Actual (actual return after expenses) | Hypothetical (5% annual return before expenses) | |||||||||||||||||
Share Class | Beginning Account Value 7/1/17 | Ending Account Value 12/31/17 | Expenses Paid During Period 7/1/17–12/31/171 | Ending Account Value 12/31/17 | Expenses Period 7/1/17–12/31/171 | Annualized Expense Ratio | ||||||||||||
| Z | $1,000 | $1,028.80 | $4.04 | $1,021.22 | $4.02 | 0.79% | ||||||||||||
| A | $1,000 | $1,027.30 | $5.31 | $1,019.96 | $5.30 | 1.04% | ||||||||||||
| C | $1,000 | $1,023.40 | $9.13 | $1,016.18 | $9.10 | 1.79% | ||||||||||||
| R | $1,000 | $1,026.10 | $6.59 | $1,018.70 | $6.56 | 1.29% | ||||||||||||
| R6 | $1,000 | $1,029.20 | $3.48 | $1,021.78 | $3.47 | 0.68% | ||||||||||||
1. Expenses are equal to the annualized expense ratio for the six-month period as indicated above—in the far right column—multiplied by the simple average account value over the period indicated, and then multiplied by 184/365 to reflect the one-half year period.
12 |
Annual Report |
franklintempleton.com |
FRANKLIN MUTUAL SHARES FUND
| Year Ended December 31, | ||||||||||||||||||||
| 2017 | 2016 | 2015 | 2014 | 2013 | ||||||||||||||||
Class Z | ||||||||||||||||||||
| Per share operating performance | ||||||||||||||||||||
(for a share outstanding throughout the year) | ||||||||||||||||||||
Net asset value, beginning of year | $28.22 | $26.00 | $29.52 | $28.34 | $22.48 | |||||||||||||||
Income from investment operationsa: | ||||||||||||||||||||
Net investment incomeb | 0.65c | 0.63d | 0.54 | 0.78e | 0.47 | |||||||||||||||
Net realized and unrealized gains (losses) | 1.73 | 3.48 | (1.71) | 1.38 | 5.83 | |||||||||||||||
Total from investment operations | 2.38 | 4.11 | (1.17) | 2.16 | 6.30 | |||||||||||||||
Less distributions from: | ||||||||||||||||||||
Net investment income | (0.68) | (0.64) | (0.59) | (0.98) | (0.44) | |||||||||||||||
Net realized gains | (1.29) | (1.25) | (1.76) | — | — | |||||||||||||||
Total distributions | (1.97) | (1.89) | (2.35) | (0.98) | (0.44) | |||||||||||||||
Net asset value, end of year | $28.63 | $28.22 | $26.00 | $29.52 | $28.34 | |||||||||||||||
Total return | 8.49% | 15.88% | (3.81)% | 7.60% | 28.10% | |||||||||||||||
Ratios to average net assets | ||||||||||||||||||||
Expensesf,g | 0.78% | 0.80%h | 0.81%h | 0.80% | 0.79% | |||||||||||||||
Expenses incurred in connection with securities sold short | —% | 0.01% | 0.02% | 0.03% | —%i | |||||||||||||||
Net investment income | 2.23%c | 2.33%d | 1.82% | 2.67%e | 1.85% | |||||||||||||||
| Supplemental data | ||||||||||||||||||||
Net assets, end of year (000’s) | $6,229,996 | $7,681,881 | $6,770,056 | $7,363,765 | $7,025,908 | |||||||||||||||
Portfolio turnover rate | 18.15% | 20.56% | 19.99% | 19.24% | 24.29% | |||||||||||||||
aThe amount shown for a share outstanding throughout the period may not correlate with the Statement of Operations for the period due to the timing of sales and repurchases of the Fund’s shares in relation to income earned and/or fluctuating fair value of the investments of the Fund.
bBased on average daily shares outstanding.
cNet investment income per share includes approximately $0.16 per share related to income received in the form of special dividends in connection with certain Fund holdings. Excluding this amount, the ratio of net investment income to average net assets would have been 1.69%.
dNet investment income per share includes approximately $0.10 per share related to income received in the form of special dividends in connection with certain Fund holdings. Excluding this amount, the ratio of net investment income to average net assets would have been 1.96%.
eNet investment income per share includes approximately $0.29 per share related to income received in the form of a special dividend in connection with certain Fund holdings. Excluding this amount, the ratio of net investment income to average net assets would have been 1.66%.
fIncludes dividend and/or interest expense on securities sold short and security borrowing fees, if any. See below for the ratios of such expenses to average net assets for the periods presented. See Note 1(d).
gBenefit of expense reduction rounds to less than 0.01%.
hBenefit of waiver and payments by affiliates rounds to less than 0.01%.
iRounds to less than 0.01%.
franklintempleton.com |
The accompanying notes are an integral part of these financial statements. | |
Annual Report |
13 |
FRANKLIN MUTUAL SHARES FUND
FINANCIAL HIGHLIGHTS
| Year Ended December 31, | ||||||||||||||||||||
| 2017 | 2016 | 2015 | 2014 | 2013 | ||||||||||||||||
Class A | ||||||||||||||||||||
| Per share operating performance | ||||||||||||||||||||
(for a share outstanding throughout the year) | ||||||||||||||||||||
Net asset value, beginning of year | $27.97 | $25.78 | $29.29 | $28.12 | $22.32 | |||||||||||||||
Income from investment operationsa: | ||||||||||||||||||||
Net investment incomeb | 0.58c | 0.56d | 0.45 | 0.69e | 0.40 | |||||||||||||||
Net realized and unrealized gains (losses) | 1.70 | 3.45 | (1.69) | 1.37 | 5.76 | |||||||||||||||
Total from investment operations | 2.28 | 4.01 | (1.24) | 2.06 | 6.16 | |||||||||||||||
Less distributions from: | ||||||||||||||||||||
Net investment income | (0.61) | (0.57) | (0.51) | (0.89) | (0.36) | |||||||||||||||
Net realized gains | (1.29) | (1.25) | (1.76) | — | — | |||||||||||||||
Total distributions | (1.90) | (1.82) | (2.27) | (0.89) | (0.36) | |||||||||||||||
Net asset value, end of year | $28.35 | $27.97 | $25.78 | $29.29 | $28.12 | |||||||||||||||
Total returnf | 8.21% | 15.61% | (4.10)% | 7.30% | 27.74% | |||||||||||||||
Ratios to average net assets | ||||||||||||||||||||
Expensesg,h | 1.03% | 1.05%i | 1.09%i | 1.10% | 1.09% | |||||||||||||||
Expenses incurred in connection with securities sold short | —% | 0.01% | 0.02% | 0.03% | —%j | |||||||||||||||
Net investment income | 1.98%c | 2.08%d | 1.54% | 2.37%e | 1.55% | |||||||||||||||
| Supplemental data | ||||||||||||||||||||
Net assets, end of year (000’s) | $4,386,829 | $4,737,576 | $4,819,868 | $5,392,130 | $5,477,733 | |||||||||||||||
Portfolio turnover rate | 18.15% | 20.56% | 19.99% | 19.24% | 24.29% | |||||||||||||||
aThe amount shown for a share outstanding throughout the period may not correlate with the Statement of Operations for the period due to the timing of sales and repurchases of the Fund’s shares in relation to income earned and/or fluctuating fair value of the investments of the Fund.
bBased on average daily shares outstanding.
cNet investment income per share includes approximately $0.16 per share related to income received in the form of special dividends in connection with certain Fund holdings. Excluding this amount, the ratio of net investment income to average net assets would have been 1.44%.
dNet investment income per share includes approximately $0.10 per share related to income received in the form of special dividends in connection with certain Fund holdings. Excluding this amount, the ratio of net investment income to average net assets would have been 1.71%.
eNet investment income per share includes approximately $0.29 per share related to income received in the form of a special dividend in connection with certain Fund holdings. Excluding this amount, the ratio of net investment income to average net assets would have been 1.36%.
fTotal return does not reflect sales commissions or contingent deferred sales charges, if applicable.
gIncludes dividend and/or interest expense on securities sold short and security borrowing fees, if any. See below for the ratios of such expenses to average net assets for the periods presented. See Note 1(d).
hBenefit of expense reduction rounds to less than 0.01%.
iBenefit of waiver and payments by affiliates rounds to less than 0.01%.
jRounds to less than 0.01%.
14 |
Annual Report | The accompanying notes are an integral part of these financial statements. |
franklintempleton.com |
FRANKLIN MUTUAL SHARES FUND
FINANCIAL HIGHLIGHTS
| Year Ended December 31, | ||||||||||||||||||||
| 2017 | 2016 | 2015 | 2014 | 2013 | ||||||||||||||||
Class C | ||||||||||||||||||||
| Per share operating performance | ||||||||||||||||||||
(for a share outstanding throughout the year) | ||||||||||||||||||||
Net asset value, beginning of year | $27.68 | $25.54 | $29.02 | $27.88 | $22.13 | |||||||||||||||
Income from investment operationsa: | ||||||||||||||||||||
Net investment incomeb | 0.35c | 0.35d | 0.24 | 0.48e | 0.22 | |||||||||||||||
Net realized and unrealized gains (losses) | 1.67 | 3.40 | (1.67) | 1.34 | 5.71 | |||||||||||||||
Total from investment operations | 2.02 | 3.75 | (1.43) | 1.82 | 5.93 | |||||||||||||||
Less distributions from: | ||||||||||||||||||||
Net investment income | (0.37) | (0.36) | (0.29) | (0.68) | (0.18) | |||||||||||||||
Net realized gains | (1.29) | (1.25) | (1.76) | — | — | |||||||||||||||
Total distributions | (1.66) | (1.61) | (2.05) | (0.68) | (0.18) | |||||||||||||||
Net asset value, end of year | $28.04 | $27.68 | $25.54 | $29.02 | $27.88 | |||||||||||||||
Total returnf | 7.37% | 14.77% | (4.79)% | 6.56% | 26.82% | |||||||||||||||
| Ratios to average net assets | ||||||||||||||||||||
Expensesg,h | 1.78% | 1.80%i | 1.81%i | 1.80% | 1.79% | |||||||||||||||
Expenses incurred in connection with securities sold short | —% | 0.01% | 0.02% | 0.03% | —%j | |||||||||||||||
Net investment income | 1.23%c | 1.33%d | 0.82% | 1.67%e | 0.85% | |||||||||||||||
| Supplemental data | ||||||||||||||||||||
Net assets, end of year (000’s) | $995,665 | $1,114,760 | $1,101,302 | $1,240,845 | $1,236,603 | |||||||||||||||
Portfolio turnover rate | 18.15% | 20.56% | 19.99% | 19.24% | 24.29% | |||||||||||||||
aThe amount shown for a share outstanding throughout the period may not correlate with the Statement of Operations for the period due to the timing of sales and repurchases of the Fund’s shares in relation to income earned and/or fluctuating fair value of the investments of the Fund.
bBased on average daily shares outstanding.
cNet investment income per share includes approximately $0.16 per share related to income received in the form of special dividends in connection with certain Fund holdings. Excluding this amount, the ratio of net investment income to average net assets would have been 0.69%.
dNet investment income per share includes approximately $0.10 per share related to income received in the form of special dividends in connection with certain Fund holdings. Excluding this amount, the ratio of net investment income to average net assets would have been 0.96%.
eNet investment income per share includes approximately $0.29 per share related to income received in the form of a special dividend in connection with certain Fund holdings. Excluding this amount, the ratio of net investment income to average net assets would have been 0.66%.
fTotal return does not reflect sales commissions or contingent deferred sales charges, if applicable.
gIncludes dividend and/or interest expense on securities sold short and security borrowing fees, if any. See below for the ratios of such expenses to average net assets for the periods presented. See Note 1(d).
hBenefit of expense reduction rounds to less than 0.01%.
iBenefit of waiver and payments by affiliates rounds to less than 0.01%.
jRounds to less than 0.01%.
franklintempleton.com |
The accompanying notes are an integral part of these financial statements. | |
Annual Report |
15 |
FRANKLIN MUTUAL SHARES FUND
FINANCIAL HIGHLIGHTS
| Year Ended December 31, | ||||||||||||||||||||
| 2017 | 2016 | 2015 | 2014 | 2013 | ||||||||||||||||
Class R | ||||||||||||||||||||
| Per share operating performance | ||||||||||||||||||||
(for a share outstanding throughout the year) | ||||||||||||||||||||
Net asset value, beginning of year | $27.83 | $25.66 | $29.14 | $27.98 | $22.20 | |||||||||||||||
Income from investment operationsa: | ||||||||||||||||||||
Net investment incomeb | 0.50c | 0.49d | 0.38 | 0.64e | 0.34 | |||||||||||||||
Net realized and unrealized gains (losses) | 1.70 | 3.42 | (1.67) | 1.34 | 5.73 | |||||||||||||||
Total from investment operations | 2.20 | 3.91 | (1.29) | 1.98 | 6.07 | |||||||||||||||
Less distributions from: | ||||||||||||||||||||
Net investment income | (0.53) | (0.49) | (0.43) | (0.82) | (0.29) | |||||||||||||||
Net realized gains | (1.29) | (1.25) | (1.76) | — | — | |||||||||||||||
Total distributions | (1.82) | (1.74) | (2.19) | (0.82) | (0.29) | |||||||||||||||
Net asset value, end of year | $28.21 | $27.83 | $25.66 | $29.14 | $27.98 | |||||||||||||||
Total return | 7.96% | 15.31% | (4.32)% | 7.10% | 27.47% | |||||||||||||||
| Ratios to average net assets | ||||||||||||||||||||
Expensesf,g | 1.28% | 1.30%h | 1.31%h | 1.30% | 1.29% | |||||||||||||||
Expenses incurred in connection with securities sold short | —% | 0.01% | 0.02% | 0.03% | —%i | |||||||||||||||
Net investment income | 1.73%c | 1.83%d | 1.32% | 2.17%e | 1.35% | |||||||||||||||
| Supplemental data | ||||||||||||||||||||
Net assets, end of year (000’s) | $107,660 | $123,013 | $134,050 | $172,938 | $192,658 | |||||||||||||||
Portfolio turnover rate | 18.15% | 20.56% | 19.99% | 19.24% | 24.29% | |||||||||||||||
aThe amount shown for a share outstanding throughout the period may not correlate with the Statement of Operations for the period due to the timing of sales and repurchases of the Fund’s shares in relation to income earned and/or fluctuating fair value of the investments of the Fund.
bBased on average daily shares outstanding.
cNet investment income per share includes approximately $0.16 per share related to income received in the form of special dividends in connection with certain Fund holdings. Excluding this amount, the ratio of net investment income to average net assets would have been 1.19%.
dNet investment income per share includes approximately $0.10 per share related to income received in the form of special dividends in connection with certain Fund holdings. Excluding this amount, the ratio of net investment income to average net assets would have been 1.46%.
eNet investment income per share includes approximately $0.29 per share related to income received in the form of a special dividend in connection with certain Fund holdings. Excluding this amount, the ratio of net investment income to average net assets would have been 1.16%.
fIncludes dividend and/or interest expense on securities sold short and security borrowing fees, if any. See below for the ratios of such expenses to average net assets for the periods presented. See Note 1(d).
gBenefit of expense reduction rounds to less than 0.01%.
hBenefit of waiver and payments by affiliates rounds to less than 0.01%.
iRounds to less than 0.01%.
16 |
Annual Report | The accompanying notes are an integral part of these financial statements. |
franklintempleton.com |
FRANKLIN MUTUAL SHARES FUND
FINANCIAL HIGHLIGHTS
| Year Ended December 31, | ||||||||||||||||||||
| 2017 | 2016 | 2015 | 2014 | 2013a | ||||||||||||||||
Class R6 | ||||||||||||||||||||
| Per share operating performance | ||||||||||||||||||||
(for a share outstanding throughout the year) | ||||||||||||||||||||
Net asset value, beginning of year | $28.21 | $25.98 | $29.51 | $28.33 | $24.91 | |||||||||||||||
Income from investment operationsb: | ||||||||||||||||||||
Net investment incomec | 0.70d | 0.66e | 0.57 | 0.82f | 0.38 | |||||||||||||||
Net realized and unrealized gains (losses) | 1.71 | 3.49 | (1.71) | 1.37 | 3.51 | |||||||||||||||
Total from investment operations | 2.41 | 4.15 | (1.14) | 2.19 | 3.89 | |||||||||||||||
Less distributions from: | ||||||||||||||||||||
Net investment income | (0.72) | (0.67) | (0.63) | (1.01) | (0.47) | |||||||||||||||
Net realized gains | (1.29) | (1.25) | (1.76) | — | — | |||||||||||||||
Total distributions | (2.01) | (1.92) | (2.39) | (1.01) | (0.47) | |||||||||||||||
Net asset value, end of year | $28.61 | $28.21 | $25.98 | $29.51 | $28.33 | |||||||||||||||
Total returng | 8.61% | 16.05% | (3.71)% | 7.72% | 15.70% | |||||||||||||||
| Ratios to average net assetsh | ||||||||||||||||||||
Expensesi,j | 0.67% | 0.68%k | 0.69%k | 0.69% | 0.67% | |||||||||||||||
Expenses incurred in connection with securities sold short | —% | 0.01% | 0.02% | 0.03% | —%l | |||||||||||||||
Net investment income | 2.34%d | 2.45%e | 1.94% | 2.78%f | 1.97% | |||||||||||||||
| Supplemental data | ||||||||||||||||||||
Net assets, end of year (000’s) | $3,741,430 | $1,896,497 | $1,923,466 | $2,249,991 | $2,221,889 | |||||||||||||||
Portfolio turnover rate | 18.15% | 20.56% | 19.99% | 19.24% | 24.29% | |||||||||||||||
aFor the period May 1, 2013 (effective date) to December 31, 2013.
bThe amount shown for a share outstanding throughout the period may not correlate with the Statement of Operations for the period due to the timing of sales and repurchases of the Fund’s shares in relation to income earned and/or fluctuating fair value of the investments of the Fund.
cBased on average daily shares outstanding.
dNet investment income per share includes approximately $0.16 per share related to income received in the form of special dividends in connection with certain Fund holdings. Excluding this amount, the ratio of net investment income to average net assets would have been 1.80%.
eNet investment income per share includes approximately $0.10 per share related to income received in the form of special dividends in connection with certain Fund holdings. Excluding this amount, the ratio of net investment income to average net assets would have been 2.08%.
fNet investment income per share includes approximately $0.29 per share related to income received in the form of a special dividend in connection with certain Fund holdings. Excluding this amount, the ratio of net investment income to average net assets would have been 1.77%.
gTotal return is not annualized for periods less than one year.
hRatios are annualized for periods less than one year.
iIncludes dividend and/or interest expense on securities sold short and security borrowing fees, if any. See below for the ratios of such expenses to average net assets for the periods presented. See Note 1(d).
jBenefit of expense reduction rounds to less than 0.01%.
kBenefit of waiver and payments by affiliates rounds to less than 0.01%.
lRounds to less than 0.01%.
franklintempleton.com |
The accompanying notes are an integral part of these financial statements. | |
Annual Report |
17 |
FRANKLIN MUTUAL SHARES FUND
Statement of Investments, December 31, 2017
| Country | Shares/ Units/ Warrants | Value | ||||||||||||
| Common Stocks and Other Equity Interests 91.0% | ||||||||||||||
| Aerospace & Defense 0.1% | ||||||||||||||
BAE Systems PLC | United Kingdom | 1,122,145 | $ | 8,683,246 | ||||||||||
|
| |||||||||||||
| Auto Components 0.8% | ||||||||||||||
The Goodyear Tire & Rubber Co. | United States | 2,382,274 | 76,971,273 | |||||||||||
a,b,c,d | International Automotive Components Group Brazil LLC | Brazil | 7,234,813 | 248,046 | ||||||||||
a,b,c,d | International Automotive Components Group North America LLC | United States | 63,079,866 | 41,555,438 | ||||||||||
|
| |||||||||||||
| 118,774,757 | ||||||||||||||
|
| |||||||||||||
| Automobiles 1.2% | ||||||||||||||
General Motors Co | United States | 4,507,470 | 184,761,195 | |||||||||||
|
| |||||||||||||
| Banks 10.2% | ||||||||||||||
Barclays PLC | United Kingdom | 38,190,870 | 104,748,543 | |||||||||||
CIT Group Inc. | United States | 2,759,673 | 135,858,702 | |||||||||||
Citigroup Inc. | United States | 3,362,406 | 250,196,630 | |||||||||||
Citizens Financial Group Inc. | United States | 6,757,671 | 283,687,029 | |||||||||||
Columbia Banking System Inc. | United States | 88,096 | 3,826,890 | |||||||||||
a | FCB Financial Holdings Inc., A | United States | 1,647,570 | 83,696,556 | ||||||||||
Guaranty Bancorp | United States | 1,146,366 | 31,697,020 | |||||||||||
JPMorgan Chase & Co. | United States | 2,748,790 | 293,955,603 | |||||||||||
PNC Financial Services Group Inc. | United States | 1,361,933 | 196,513,312 | |||||||||||
State Bank Financial Corp. | United States | 1,467,000 | 43,775,280 | |||||||||||
Wells Fargo & Co. | United States | 2,531,930 | 153,612,193 | |||||||||||
|
| |||||||||||||
| 1,581,567,758 | ||||||||||||||
|
| |||||||||||||
| Beverages 0.9% | ||||||||||||||
PepsiCo Inc. | United States | 1,185,449 | 142,159,044 | |||||||||||
|
| |||||||||||||
| Building Products 0.7% | ||||||||||||||
Johnson Controls International PLC | United States | 2,901,100 | 110,560,921 | |||||||||||
|
| |||||||||||||
| Chemicals 1.1% | ||||||||||||||
a,c,e | Dow Corning Corp., Contingent Distribution | United States | 12,630,547 | — | ||||||||||
Monsanto Co. | United States | 1,483,490 | 173,241,962 | |||||||||||
|
| |||||||||||||
| 173,241,962 | ||||||||||||||
|
| |||||||||||||
| Communications Equipment 2.8% | ||||||||||||||
Cisco Systems Inc. | United States | 8,126,460 | 311,243,418 | |||||||||||
Nokia OYJ, A. | Finland | 13,670,039 | 63,866,716 | |||||||||||
Nokia OYJ, ADR | Finland | 10,897,776 | 50,783,636 | |||||||||||
|
| |||||||||||||
| 425,893,770 | ||||||||||||||
|
| |||||||||||||
| Construction & Engineering 0.6% | ||||||||||||||
Fluor Corp. | United States | 1,928,727 | 99,618,750 | |||||||||||
|
| |||||||||||||
| Construction Materials 0.7% | ||||||||||||||
LafargeHolcim Ltd., B. | Switzerland | 1,946,175 | 109,757,599 | |||||||||||
|
| |||||||||||||
| Consumer Finance 1.7% | ||||||||||||||
Ally Financial Inc. | United States | 3,254,500 | 94,901,220 | |||||||||||
Capital One Financial Corp. | United States | 1,609,205 | 160,244,634 | |||||||||||
|
| |||||||||||||
| 255,145,854 | ||||||||||||||
|
| |||||||||||||
| Containers & Packaging 2.2% | ||||||||||||||
International Paper Co. | United States | 3,276,637 | 189,848,348 | |||||||||||
WestRock Co. | United States | 2,383,939 | 150,688,784 | |||||||||||
|
| |||||||||||||
| 340,537,132 | ||||||||||||||
|
| |||||||||||||
18 |
Annual Report |
franklintempleton.com |
FRANKLIN MUTUAL SHARES FUND
STATEMENT OF INVESTMENTS
| Country | Shares/ Units/ Warrants | Value | ||||||||||||
| Common Stocks and Other Equity Interests (continued) | ||||||||||||||
| Diversified Financial Services 1.1% | ||||||||||||||
Voya Financial Inc. | United States | 3,413,030 | $ | 168,842,594 | ||||||||||
|
| |||||||||||||
| Diversified Telecommunication Services 0.7% | ||||||||||||||
Koninklijke KPN NV | Netherlands | 30,410,640 | 106,103,288 | |||||||||||
|
| |||||||||||||
| Electric Utilities 0.5% | ||||||||||||||
PG&E Corp. | United States | 1,822,271 | 81,692,409 | |||||||||||
|
| |||||||||||||
| Electrical Equipment 1.3% | ||||||||||||||
a | Sensata Technologies Holding NV | United States | 4,067,870 | 207,908,836 | ||||||||||
|
| |||||||||||||
| Energy Equipment & Services 0.7% | ||||||||||||||
Baker Hughes a GE Co., A | United States | 3,663,252 | 115,905,293 | |||||||||||
a | GulfMark Offshore Inc. | United States | 464 | 13,219 | ||||||||||
a | GulfMark Offshore Inc., wts., 11/14/24 | United States | 5,020 | 3,615 | ||||||||||
|
| |||||||||||||
| 115,922,127 | ||||||||||||||
|
| |||||||||||||
| Equity Real Estate Investment Trusts (REITs) 2.0% | ||||||||||||||
b | Alexander’s Inc. | United States | 326,675 | 129,314,299 | ||||||||||
JBG SMITH Properties. | United States | 719,061 | 24,972,988 | |||||||||||
Vornado Realty Trust | United States | 2,036,522 | 159,215,290 | |||||||||||
|
| |||||||||||||
| 313,502,577 | ||||||||||||||
|
| |||||||||||||
| Food & Staples Retailing 4.1% | ||||||||||||||
CVS Health Corp. | United States | 3,015,915 | 218,653,837 | |||||||||||
The Kroger Co. | United States | 8,225,486 | 225,789,591 | |||||||||||
a | Rite Aid Corp. | United States | 8,729,840 | 17,197,785 | ||||||||||
Walgreens Boots Alliance Inc. | United States | 2,283,129 | 165,800,828 | |||||||||||
|
| |||||||||||||
| 627,442,041 | ||||||||||||||
|
| |||||||||||||
| Health Care Equipment & Supplies 4.4% | ||||||||||||||
Medtronic PLC | United States | 5,756,394 | 464,828,815 | |||||||||||
Stryker Corp. | United States | 1,438,552 | 222,745,392 | |||||||||||
|
| |||||||||||||
| 687,574,207 | ||||||||||||||
|
| |||||||||||||
| Hotels, Restaurants & Leisure 0.1% | ||||||||||||||
a | Caesars Entertainment Corp. | United States | 631,368 | 7,986,805 | ||||||||||
|
| |||||||||||||
| Household Products 0.6% | ||||||||||||||
Energizer Holdings Inc. | United States | 1,787,933 | 85,785,025 | |||||||||||
|
| |||||||||||||
| Independent Power & Renewable Electricity Producers 0.6% | ||||||||||||||
a | Vistra Energy Corp. | United States | 4,927,428 | 90,270,481 | ||||||||||
|
| |||||||||||||
| Industrial Conglomerates 1.4% | ||||||||||||||
General Electric Co. | United States | 12,824,100 | 223,780,545 | |||||||||||
|
| |||||||||||||
| Insurance 7.8% | ||||||||||||||
a | Alleghany Corp. | United States | 377,389 | 224,957,809 | ||||||||||
American International Group Inc. | United States | 5,079,039 | 302,609,144 | |||||||||||
a | Brighthouse Financial Inc. | United States | 322,902 | 18,934,973 | ||||||||||
Chubb Ltd. | United States | 1,169,358 | 170,878,284 | |||||||||||
The Hartford Financial Services Group Inc. | United States | 2,286,099 | 128,661,652 | |||||||||||
MetLife Inc. | United States | 3,551,930 | 179,585,581 | |||||||||||
XL Group Ltd. | Bermuda | 5,164,055 | 181,568,174 | |||||||||||
|
| |||||||||||||
| 1,207,195,617 | ||||||||||||||
|
| |||||||||||||
franklintempleton.com |
Annual Report |
|
19 |
|
FRANKLIN MUTUAL SHARES FUND
STATEMENT OF INVESTMENTS
| Country | Shares/ Units/ Warrants | Value | ||||||||||||
| Common Stocks and Other Equity Interests (continued) | ||||||||||||||
| IT Services 1.8% | ||||||||||||||
Cognizant Technology Solutions Corp., A | United States | 2,992,250 | $ | 212,509,595 | ||||||||||
DXC Technology Co. | United States | 643,537 | 61,071,661 | |||||||||||
|
| |||||||||||||
| 273,581,256 | ||||||||||||||
|
| |||||||||||||
| Machinery 1.9% | ||||||||||||||
Caterpillar Inc. | United States | 1,058,961 | 166,871,074 | |||||||||||
CNH Industrial NV | United Kingdom | 4,351,332 | 58,315,537 | |||||||||||
CNH Industrial NV, special voting | United Kingdom | 5,296,616 | 70,984,012 | |||||||||||
|
| |||||||||||||
| 296,170,623 | ||||||||||||||
|
| |||||||||||||
| Media 7.9% | ||||||||||||||
a | Charter Communications Inc., A | United States | 865,529 | 290,783,123 | ||||||||||
a | DISH Network Corp., A. | United States | 2,879,437 | 137,493,117 | ||||||||||
Sky PLC | United Kingdom | 12,335,183 | 168,579,447 | |||||||||||
Time Warner Inc. | United States | 3,673,058 | 335,974,615 | |||||||||||
The Walt Disney Co. | United States | 2,716,200 | 292,018,662 | |||||||||||
|
| |||||||||||||
| 1,224,848,964 | ||||||||||||||
|
| |||||||||||||
| Metals & Mining 0.9% | ||||||||||||||
thyssenkrupp AG | Germany | 3,973,743 | 115,449,785 | |||||||||||
Warrior Met Coal Inc. | United States | 1,156,279 | 29,080,417 | |||||||||||
|
| |||||||||||||
| 144,530,202 | ||||||||||||||
|
| |||||||||||||
| Oil, Gas & Consumable Fuels 8.5% | ||||||||||||||
Anadarko Petroleum Corp. | United States | 3,948,180 | 211,780,375 | |||||||||||
BP PLC. | United Kingdom | 15,851,497 | 111,892,583 | |||||||||||
Kinder Morgan Inc. | United States | 11,533,040 | 208,402,033 | |||||||||||
Marathon Oil Corp. | United States | 10,059,014 | 170,299,107 | |||||||||||
Plains All American Pipeline LP | United States | 3,862,400 | 79,719,936 | |||||||||||
Royal Dutch Shell PLC, A (EUR Traded) | United Kingdom | 6,445,120 | 214,857,387 | |||||||||||
Royal Dutch Shell PLC, A (GBP Traded) | United Kingdom | 3,716,893 | 124,483,060 | |||||||||||
The Williams Cos. Inc. | United States | 6,351,184 | 193,647,600 | |||||||||||
|
| |||||||||||||
| 1,315,082,081 | ||||||||||||||
|
| |||||||||||||
| Pharmaceuticals 7.4% | ||||||||||||||
Eli Lilly & Co. | United States | 4,632,255 | 391,240,257 | |||||||||||
Merck & Co. Inc. | United States | 7,597,210 | 427,495,007 | |||||||||||
Novartis AG, ADR | Switzerland | 3,798,680 | 318,937,173 | |||||||||||
|
| |||||||||||||
| 1,137,672,437 | ||||||||||||||
|
| |||||||||||||
| Professional Services 1.0% | ||||||||||||||
RELX PLC | United Kingdom | 6,306,172 | 148,096,198 | |||||||||||
|
| |||||||||||||
| Real Estate Management & Development 0.1% | ||||||||||||||
a | VICI Properties Inc. | United States | 768,407 | 15,752,343 | ||||||||||
|
| |||||||||||||
| Software 6.0% | ||||||||||||||
a | Avaya Holdings Corp. | United States | 3,089,269 | 54,216,671 | ||||||||||
a,c | Avaya Holdings Corp., wts., 12/15/22 | United States | 276,741 | 470,762 | ||||||||||
CA Inc. | United States | 5,174,940 | 172,222,003 | |||||||||||
a | Dell Technologies Inc., V | United States | 720,878 | 58,592,964 | ||||||||||
Microsoft Corp. | United States | 4,372,085 | 373,988,151 | |||||||||||
Symantec Corp. | United States | 9,445,251 | 265,033,743 | |||||||||||
|
| |||||||||||||
| 924,524,294 | ||||||||||||||
|
| |||||||||||||
20 |
Annual Report |
franklintempleton.com |
FRANKLIN MUTUAL SHARES FUND
STATEMENT OF INVESTMENTS
| Country | Shares/ Units/ Warrants | Value | ||||||||||||
| ||||||||||||||
Common Stocks and Other Equity Interests (continued) | ||||||||||||||
Technology Hardware, Storage & Peripherals 2.4% | ||||||||||||||
Hewlett Packard Enterprise Co. | United States | 7,491,354 | $ | 107,575,843 | ||||||||||
Samsung Electronics Co. Ltd. | South Korea | 110,421 | 263,593,122 | |||||||||||
|
| |||||||||||||
| 371,168,965 | ||||||||||||||
|
| |||||||||||||
Tobacco 4.2% | ||||||||||||||
Altria Group Inc. | United States | 2,351,460 | 167,917,758 | |||||||||||
British American Tobacco PLC | United Kingdom | 4,377,848 | 296,667,417 | |||||||||||
British American Tobacco PLC, ADR | United Kingdom | 1,655,688 | 110,914,539 | |||||||||||
Imperial Brands PLC. | United Kingdom | 1,751,865 | 74,901,422 | |||||||||||
|
| |||||||||||||
| 650,401,136 | ||||||||||||||
|
| |||||||||||||
Wireless Telecommunication Services 0.6% | ||||||||||||||
Vodafone Group PLC | United Kingdom | 29,287,025 | 92,944,059 | |||||||||||
|
| |||||||||||||
Total Common Stocks and Other Equity Interests | 14,069,481,098 | |||||||||||||
|
| |||||||||||||
Management Investment Companies (Cost $78,163,804) 0.5% | ||||||||||||||
Diversified Financial Services 0.5% | ||||||||||||||
a | Altaba Inc. | United States | 1,192,700 | 83,310,095 | ||||||||||
|
| |||||||||||||
| Principal Amount | ||||||||||||||
Corporate Notes and Senior Floating Rate Interests 2.5% | ||||||||||||||
f,g | Belk Inc., Closing Date Term Loan, 6.099%, (LIBOR + 4.75%), 12/12/22 | United States | $ | 20,592,390 | 16,907,217 | |||||||||
f,g | Cumulus Media Holdings Inc., Term Loans, 4.82%, (LIBOR + 3.25%), 12/23/20 | United States | 56,795,526 | 49,057,136 | ||||||||||
Frontier Communications Corp., | ||||||||||||||
senior note, 10.50%, 9/15/22 | United States | 82,365,000 | 62,494,444 | |||||||||||
senior note, 11.00%, 9/15/25 | United States | 93,006,000 | 68,824,440 | |||||||||||
iHeartCommunications Inc., | ||||||||||||||
senior secured note, first lien, 9.00%, 12/15/19 | United States | 74,295,000 | 55,535,512 | |||||||||||
f,g Tranche D Term Loan, 8.443%, (LIBOR + 6.75%), 1/30/19 | United States | 94,620,527 | 71,399,041 | |||||||||||
f,g Tranche E Term Loan, 9.193%, (LIBOR + 7.50%), 7/30/19 | United States | 30,412,812 | 22,872,959 | |||||||||||
f,g | Toys R US-Delaware Inc., (DIP), 10.319%, (LIBOR + 8.75%), 1/18/19 | United States | 42,205,955 | 43,261,104 | ||||||||||
|
| |||||||||||||
Total Corporate Notes and Senior Floating Rate Interests | 390,351,853 | |||||||||||||
|
| |||||||||||||
Corporate Notes and Senior Floating Rate Interests in Reorganization 0.3% | ||||||||||||||
c,d,h | Broadband Ventures III LLC, secured promissory note, 5.00%, 2/01/12 | United States | 19,594 | — | ||||||||||
f,g,h | Toys R US-Delaware Inc., Term B-4 Loan, 6.125%, (LIBOR + 3.875%), 4/24/20 | United States | 77,193,103 | 38,210,586 | ||||||||||
|
| |||||||||||||
Total Corporate Notes and Senior Floating Rate Interests in Reorganization (Cost $73,753,961) | 38,210,586 | |||||||||||||
|
| |||||||||||||
| Shares | ||||||||||||||
Companies in Liquidation 0.1% | ||||||||||||||
a,c,e | Avaya Holdings Corp., Contingent Distribution | United States | 67,859,000 | — | ||||||||||
a,c,e | Avaya Inc., Contingent Distribution | United States | 131,491,378 | — | ||||||||||
a,b,c,d | CB FIM Coinvestors LLC | United States | 43,105,703 | — | ||||||||||
a,c,d | FIM Coinvestor Holdings I, LLC | United States | 53,924,666 | — | ||||||||||
franklintempleton.com | Annual Report | 21 |
FRANKLIN MUTUAL SHARES FUND
STATEMENT OF INVESTMENTS
| Country | Shares | Value | ||||||||||||
| ||||||||||||||
Companies in Liquidation (continued) | ||||||||||||||
| a,i | Lehman Brothers Holdings Inc., Bankruptcy Claim | United States | 420,480,670 | $ | 9,334,671 | |||||||||
| a,c,e | Tribune Media, Litigation Trust, Contingent Distribution | United States | 1,006,784 | — | ||||||||||
| a,c,e | Vistra Energy Corp., Litigation Trust, Contingent Distribution | United States | 292,849,556 | 3,397,055 | ||||||||||
| a | Vistra Energy Corp., Litigation Trust, TRA | United States | 4,927,428 | 4,311,499 | ||||||||||
|
| |||||||||||||
Total Companies in Liquidation (Cost $52,431,683) | 17,043,225 | |||||||||||||
|
| |||||||||||||
Total Investments before Short Term Investments | 14,598,396,857 | |||||||||||||
|
| |||||||||||||
| Principal Amount | ||||||||||||||
Short Term Investments 5.5% | ||||||||||||||
U.S. Government and Agency Securities 5.5% | ||||||||||||||
| j | FHLB, 1/02/18 | United States | $ | 4,300,000 | 4,300,000 | |||||||||
| j | U.S. Treasury Bill, | |||||||||||||
1/02/18 - 5/03/18 | United States | 745,530,000 | 744,121,767 | |||||||||||
k4/19/18 - 5/10/18 | United States | 100,000,000 | 99,540,986 | |||||||||||
|
| |||||||||||||
Total U.S. Government and Agency Securities | 847,962,753 | |||||||||||||
|
| |||||||||||||
Total Investments (Cost $11,608,802,657) 99.9% | 15,446,359,610 | |||||||||||||
Securities Sold Short (0.6)% | (95,444,797 | ) | ||||||||||||
Other Assets, less Liabilities 0.7% | 110,664,825 | |||||||||||||
|
| |||||||||||||
Net Assets 100.0% | $ | 15,461,579,638 | ||||||||||||
|
| |||||||||||||
| Shares | ||||||||||||||
| l | Securities Sold Short (0.6)% | |||||||||||||
Common Stocks (0.6)% | ||||||||||||||
Diversified Telecommunication Services (0.1)% | ||||||||||||||
AT&T Inc. | United States | 550,622 | (21,408,183 | ) | ||||||||||
|
| |||||||||||||
Internet Software & Services (0.5)% | ||||||||||||||
Alibaba Group Holding Ltd., ADR | China | 429,372 | (74,036,614 | ) | ||||||||||
|
| |||||||||||||
Total Securities Sold Short (Proceeds $96,405,190) | $ | (95,444,797 | ) | |||||||||||
|
| |||||||||||||
| 22 |
Annual Report | franklintempleton.com |
FRANKLIN MUTUAL SHARES FUND
STATEMENT OF INVESTMENTS
aNon-income producing.
bSee Note 11 regarding holdings of 5% voting securities.
cFair valued using significant unobservable inputs. See Note 13 regarding fair value measurements.
dSee Note 9 regarding restricted securities.
eContingent distributions represent the right to receive additional distributions, if any, during the reorganization of the underlying company. Shares represent total underlying principal of debt securities.
fThe coupon rate shown represents the rate at period end.
gSee Note 1(e) regarding senior floating rate interests.
hSee Note 8 regarding credit risk and defaulted securities.
iBankruptcy claims represent the right to receive distributions, if any, during the liquidation of the underlying pool of assets. Shares represent the amount of allowed unsecured claims.
jThe security was issued on a discount basis with no stated coupon rate.
kA portion or all of the security has been segregated as collateral for securities sold short and open forward exchange contracts. At December 31, 2017, the aggregate value of these securities pledged amounted to $74,221,903, representing 0.5% of net assets.
lSee Note 1(d) regarding securities sold short.
At December 31, 2017, the Fund had the following futures contracts outstanding. See Note 1(c).
| Futures Contracts | ||||||||||||||||||||
| Description | Type | Number of Contracts | Notional Amount* | Expiration Date | Value/ Unrealized Appreciation (Depreciation) | |||||||||||||||
| ||||||||||||||||||||
| Currency Contracts | ||||||||||||||||||||
EUR/USD | Short | 1,549 | $233,811,869 | 3/19/18 | $(4,168,699) | |||||||||||||||
GBP/USD | Short | 3,891 | 329,689,294 | 3/19/18 | (2,334,760) | |||||||||||||||
|
| |||||||||||||||||||
Total Futures Contracts | $(6,503,459) | |||||||||||||||||||
|
| |||||||||||||||||||
*As of period end.
At December 31, 2017, the Fund had the following forward exchange contracts outstanding. See Note 1(c).
| Forward Exchange Contracts | ||||||||||||||||||||||||||||
| Currency | Counterpartya | Type | Quantity | Contract Amount | Settlement Date | Unrealized Appreciation | Unrealized Depreciation | |||||||||||||||||||||
| ||||||||||||||||||||||||||||
| OTC Forward Exchange Contracts | ||||||||||||||||||||||||||||
Euro | BOFA | Buy | 3,461,170 | $ | 4,087,056 | 1/12/18 | $ | 69,324 | $ | — | ||||||||||||||||||
Euro | HSBK | Buy | 4,744,587 | 5,608,762 | 1/12/18 | 88,822 | — | |||||||||||||||||||||
Euro | HSBK | Sell | 29,348,872 | 33,790,694 | 1/12/18 | — | (1,453,184 | ) | ||||||||||||||||||||
Euro | SSBT | Sell | 1,521,428 | 1,763,251 | 1/12/18 | — | (63,770 | ) | ||||||||||||||||||||
Euro | UBSW | Sell | 30,509,230 | 35,118,092 | 1/12/18 | — | (1,519,214 | ) | ||||||||||||||||||||
British Pound | BONY | Sell | 3,616,066 | 4,676,337 | 1/16/18 | — | (210,101 | ) | ||||||||||||||||||||
British Pound | SSBT | Sell | 1,787,109 | 2,338,893 | 1/16/18 | — | (76,050 | ) | ||||||||||||||||||||
British Pound | UBSW | Sell | 3,616,046 | 4,671,931 | 1/16/18 | — | (214,479 | ) | ||||||||||||||||||||
Euro | HSBK | Sell | 36,507,824 | 42,912,757 | 1/26/18 | — | (966,773 | ) | ||||||||||||||||||||
Euro | UBSW | Sell | 36,507,825 | 42,908,742 | 1/26/18 | — | (970,789 | ) | ||||||||||||||||||||
South Korean Won | HSBK | Buy | 25,759,750,664 | 23,653,255 | 2/09/18 | 496,661 | — | |||||||||||||||||||||
South Korean Won | HSBK | Sell | 76,804,255,977 | 68,376,863 | 2/09/18 | — | (3,627,577 | ) | ||||||||||||||||||||
South Korean Won | UBSW | Sell | 58,884,911,177 | 52,515,469 | 2/09/18 | — | (2,689,480 | ) | ||||||||||||||||||||
British Pound | BONY | Sell | 4,492,042 | 5,873,605 | 2/14/18 | — | (202,056 | ) | ||||||||||||||||||||
British Pound | HSBK | Sell | 23,479,061 | 31,206,020 | 2/14/18 | — | (550,325 | ) | ||||||||||||||||||||
franklintempleton.com | Annual Report | 23 |
FRANKLIN MUTUAL SHARES FUND
STATEMENT OF INVESTMENTS
| Forward Exchange Contracts (continued) | ||||||||||||||||||||||||||||
| Currency | Counterpartya | Type | Quantity | Contract Amount | Settlement Date | Unrealized Appreciation | Unrealized Depreciation | |||||||||||||||||||||
| OTC Forward Exchange Contracts (continued) | ||||||||||||||||||||||||||||
British Pound | UBSW | Sell | 4,492,041 | $ | 5,873,591 | 2/14/18 | $ | — | $ | (202,070 | ) | |||||||||||||||||
Euro | BONY | Sell | 19,323,179 | 22,836,732 | 2/20/18 | — | (420,432 | ) | ||||||||||||||||||||
Euro | SSBT | Sell | 19,323,179 | 22,832,268 | 2/20/18 | — | (424,895 | ) | ||||||||||||||||||||
Euro | HSBK | Sell | 17,330,559 | 20,532,900 | 4/10/18 | — | (392,280 | ) | ||||||||||||||||||||
Euro | UBSW | Sell | 17,330,559 | 20,536,539 | 4/10/18 | — | (388,641 | ) | ||||||||||||||||||||
Euro | BOFA | Sell | 9,350,050 | 11,154,750 | 4/18/18 | — | (140,679 | ) | ||||||||||||||||||||
Euro | SSBT | Sell | 9,350,050 | 11,154,469 | 4/18/18 | — | (140,960 | ) | ||||||||||||||||||||
Euro | UBSW | Sell | 9,350,050 | 11,156,386 | 4/18/18 | — | (139,043 | ) | ||||||||||||||||||||
British Pound | BOFA | Sell | 109,616,137 | 145,362,940 | 4/24/18 | — | (3,260,233 | ) | ||||||||||||||||||||
British Pound | UBSW | Sell | 80,692,824 | 106,848,759 | 4/24/18 | — | (2,558,705 | ) | ||||||||||||||||||||
Euro | BOFA | Sell | 516,406 | 606,129 | 5/07/18 | — | (18,514 | ) | ||||||||||||||||||||
Euro | HSBK | Sell | 15,677,300 | 18,501,519 | 5/07/18 | — | (461,697 | ) | ||||||||||||||||||||
Euro | UBSW | Sell | 15,677,300 | 18,498,195 | 5/07/18 | — | (465,021 | ) | ||||||||||||||||||||
South Korean Won | HSBK | Sell | 105,695,642,489 | 94,124,776 | 5/11/18 | — | (5,070,490 | ) | ||||||||||||||||||||
South Korean Won | UBSW | Sell | 64,126,544,521 | 57,193,331 | 5/11/18 | — | (2,989,375 | ) | ||||||||||||||||||||
Euro | BOFA | Sell | 31,164,010 | 37,138,774 | 5/21/18 | — | (592,475 | ) | ||||||||||||||||||||
Euro | HSBK | Sell | 1,260,000 | 1,527,545 | 5/21/18 | 2,023 | — | |||||||||||||||||||||
Euro | UBSW | Sell | 31,164,009 | 37,132,540 | 5/21/18 | — | (598,708 | ) | ||||||||||||||||||||
British Pound | BOFA | Sell | 13,051,218 | 17,567,462 | 5/24/18 | — | (147,441 | ) | ||||||||||||||||||||
British Pound | HSBK | Sell | 780,341 | 1,060,179 | 5/24/18 | 993 | — | |||||||||||||||||||||
British Pound | HSBK | Sell | 10,553,820 | 14,185,022 | 5/24/18 | — | (140,069 | ) | ||||||||||||||||||||
British Pound | SSBT | Sell | 72,099,408 | 96,161,503 | 5/24/18 | — | (1,701,698 | ) | ||||||||||||||||||||
|
| |||||||||||||||||||||||||||
Total Forward Exchange Contracts |
| $ | 657,823 | $ | (32,797,224 | ) | ||||||||||||||||||||||
|
| |||||||||||||||||||||||||||
Net unrealized appreciation (depreciation) |
| $ | (32,139,401 | ) | ||||||||||||||||||||||||
|
| |||||||||||||||||||||||||||
aMay be comprised of multiple contracts with the same counterparty, currency and settlement date.
See Note 10 regarding other derivative information.
See Abbreviations on page 41.
24 |
Annual Report | The accompanying notes are an integral part of these financial statements. |
franklintempleton.com |
FRANKLIN MUTUAL SHARES FUND
Statement of Assets and Liabilities
December 31, 2017
Assets: | ||||
Investments in securities: | ||||
Cost - Unaffiliated issuers | $ | 11,539,623,754 | ||
Cost - Non-controlled affiliates (Note 11) | 69,178,903 | |||
|
| |||
Value - Unaffiliated issuers | $ | 15,275,241,827 | ||
Value - Non-controlled affiliates (Note 11) | 171,117,783 | |||
Cash | 2,983,341 | |||
Foreign currency, at value (cost $7,084,718) | 7,111,113 | |||
Receivables: | ||||
Investment securities sold | 10,307,930 | |||
Capital shares sold | 7,918,047 | |||
Dividends and interest | 33,552,123 | |||
European Union tax reclaims | 5,715,475 | |||
Deposits with brokers for: | ||||
Securities sold short | 97,671,827 | |||
Futures contracts | 10,737,480 | |||
Unrealized appreciation on OTC forward exchange contracts | 657,823 | |||
Other assets | 1,822 | |||
|
| |||
Total assets | 15,623,016,591 | |||
|
| |||
Liabilities: | ||||
Payables: | ||||
Capital shares redeemed | 14,380,239 | |||
Management fees | 8,454,955 | |||
Distribution fees | 3,575,944 | |||
Transfer agent fees | 2,131,354 | |||
Trustees’ fees and expenses | 739,370 | |||
Variation margin on futures contracts | 3,213,512 | |||
Securities sold short, at value (proceeds $96,405,190) | 95,444,797 | |||
Unrealized depreciation on OTC forward exchange contracts | 32,797,224 | |||
Accrued expenses and other liabilities | 699,558 | |||
|
| |||
Total liabilities | 161,436,953 | |||
|
| |||
Net assets, at value | $ | 15,461,579,638 | ||
|
| |||
Net assets consist of: | ||||
Paid-in capital | $ | 11,655,882,575 | ||
Undistributed net investment income | 2,054,424 | |||
Net unrealized appreciation (depreciation) | 3,800,152,990 | |||
Accumulated net realized gain (loss) | 3,489,649 | |||
|
| |||
Net assets, at value | $ | 15,461,579,638 | ||
|
|
franklintempleton.com |
The accompanying notes are an integral part of these financial statements. | |
Annual Report |
25 |
FRANKLIN MUTUAL SHARES FUND
FINANCIAL STATEMENTS
Statement of Assets and Liabilities (continued)
December 31, 2017
| Class Z: | ||||
Net assets, at value | $ | 6,229,996,034 | ||
|
| |||
Shares outstanding | 217,608,562 | |||
|
| |||
Net asset value and maximum offering price per share | $28.63 | |||
|
| |||
| Class A: | ||||
Net assets, at value | $ | 4,386,829,076 | ||
|
| |||
Shares outstanding | 154,736,261 | |||
|
| |||
Net asset value per sharea | $28.35 | |||
|
| |||
Maximum offering price per share (net asset value per share ÷ 94.25%) | $30.08 | |||
|
| |||
| Class C: | ||||
Net assets, at value | $ | 995,664,589 | ||
|
| |||
Shares outstanding | 35,503,033 | |||
|
| |||
Net asset value and maximum offering price per sharea | $28.04 | |||
|
| |||
| Class R: | ||||
Net assets, at value | $ | 107,659,584 | ||
|
| |||
Shares outstanding | 3,816,362 | |||
|
| |||
Net asset value and maximum offering price per share | $28.21 | |||
|
| |||
| Class R6: | ||||
Net assets, at value | $ | 3,741,430,355 | ||
|
| |||
Shares outstanding | 130,782,011 | |||
|
| |||
Net asset value and maximum offering price per share | $28.61 | |||
|
| |||
a Redemption price is equal to net asset value less contingent deferred sales charges, if applicable.
26 |
Annual Report | The accompanying notes are an integral part of these financial statements. |
franklintempleton.com |
FRANKLIN MUTUAL SHARES FUND
FINANCIAL STATEMENTS
Statement of Operations
for the year ended December 31, 2017
Investment income: | ||||
Dividends: (net of foreign taxes)* | ||||
Unaffiliated issuers | $ | 388,806,643 | ||
Non-controlled affiliates (Note 11) | 6,528,380 | |||
Interest: | ||||
Unaffiliated issuers | 75,431,662 | |||
Other income (Note 1f) | 1,148,425 | |||
|
| |||
Total investment income | 471,915,110 | |||
|
| |||
Expenses: | ||||
Management fees (Note 3a) | 101,321,939 | |||
Distribution fees: (Note 3c) | ||||
Class A | 11,498,862 | |||
Class C | 10,655,171 | |||
Class R | 582,910 | |||
Transfer agent fees: (Note 3e) | ||||
Class Z | 8,726,204 | |||
Class A | 5,196,408 | |||
Class C | 1,203,857 | |||
Class R | 132,036 | |||
Class R6 | 121,269 | |||
Custodian fees (Note 4) | 396,486 | |||
Reports to shareholders | 761,735 | |||
Registration and filing fees | 225,457 | |||
Professional fees | 969,353 | |||
Trustees’ fees and expenses | 483,137 | |||
Other | 307,417 | |||
|
| |||
Total expenses | 142,582,241 | |||
Expense reductions (Note 4) | (33,395 | ) | ||
|
| |||
Net expenses | 142,548,846 | |||
|
| |||
Net investment income | 329,366,264 | |||
|
| |||
Realized and unrealized gains (losses): | ||||
Net realized gain (loss) from: | ||||
Investments: | ||||
Unaffiliated issuers | 390,638,973 | |||
Non-controlled affiliates (Note 11) | 247,989,930 | |||
Foreign currency transactions | 2,198,840 | |||
Forward exchange contracts | (38,370,101 | ) | ||
Futures contracts | (35,950,853 | ) | ||
Securities sold short | (1,211,075 | ) | ||
|
| |||
Net realized gain (loss) | 565,295,714 | |||
|
| |||
Net change in unrealized appreciation (depreciation) on: | ||||
Investments: | ||||
Unaffiliated issuers | 685,759,756 | |||
Non-controlled affiliates (Note 11) | (238,547,821 | ) | ||
Translation of other assets and liabilities denominated in foreign currencies | 751,000 | |||
Forward exchange contracts | (72,989,757 | ) | ||
Futures contracts | (14,221,830 | ) | ||
Securities sold short | 671,262 | |||
|
| |||
Net change in unrealized appreciation (depreciation) | 361,422,610 | |||
|
| |||
Net realized and unrealized gain (loss) | 926,718,324 | |||
|
|
franklintempleton.com |
The accompanying notes are an integral part of these financial statements. | |
Annual Report |
27 |
FRANKLIN MUTUAL SHARES FUND
FINANCIAL STATEMENTS
Statement of Operations (continued)
for the year ended December 31, 2017
Net increase (decrease) in net assets resulting from operations | $ | 1,256,084,588 | ||
|
|
*Foreign taxes withheld on dividends | $ | 7,988,005 |
28 |
Annual Report | The accompanying notes are an integral part of these financial statements. |
franklintempleton.com |
FRANKLIN MUTUAL SHARES FUND
FINANCIAL STATEMENTS
Statements of Changes in Net Assets
| Year Ended December 31, | ||||||||
| 2017 | 2016 | |||||||
Increase (decrease) in net assets: | ||||||||
Operations: | ||||||||
Net investment income | $ | 329,366,264 | $ | 323,716,322 | ||||
Net realized gain (loss) | 565,295,714 | 721,946,200 | ||||||
Net change in unrealized appreciation (depreciation) | 361,422,610 | 1,146,276,539 | ||||||
|
| |||||||
Net increase (decrease) in net assets resulting from operations | 1,256,084,588 | 2,191,939,061 | ||||||
|
| |||||||
Distributions to shareholders from: | ||||||||
Net investment income: | ||||||||
Class Z | (143,391,184 | ) | (167,480,237 | ) | ||||
Class A | (90,135,244 | ) | (92,382,149 | ) | ||||
Class C | (12,762,513 | ) | (14,151,029 | ) | ||||
Class R | (1,950,214 | ) | (2,106,830 | ) | ||||
Class R6 | (87,386,307 | ) | (43,103,381 | ) | ||||
Net realized gains: | ||||||||
Class Z | (296,748,998 | ) | (326,344,607 | ) | ||||
Class A | (194,072,656 | ) | (206,689,642 | ) | ||||
Class C | (44,764,663 | ) | (48,998,625 | ) | ||||
Class R | (4,865,346 | ) | (5,470,579 | ) | ||||
Class R6 | (134,490,114 | ) | (81,063,435 | ) | ||||
|
| |||||||
Total distributions to shareholders | (1,010,567,239 | ) | (987,790,514 | ) | ||||
|
| |||||||
Capital share transactions: (Note 2) | ||||||||
Class Z | (1,618,916,627 | ) | 336,119,152 | |||||
Class A | (431,662,396 | ) | (462,728,047 | ) | ||||
Class C | (138,671,413 | ) | (71,596,143 | ) | ||||
Class R | (17,540,464 | ) | (21,431,476 | ) | ||||
Class R6 | 1,869,126,723 | (179,527,859 | ) | |||||
|
| |||||||
Total capital share transactions | (337,664,177 | ) | (399,164,373 | ) | ||||
|
| |||||||
Net increase (decrease) in net assets | (92,146,828 | ) | 804,984,174 | |||||
Net assets: | ||||||||
Beginning of year | 15,553,726,466 | 14,748,742,292 | ||||||
|
| |||||||
End of year | $ | 15,461,579,638 | $ | 15,553,726,466 | ||||
|
| |||||||
Undistributed net investment income included in net assets: | ||||||||
End of year | $ | 2,054,424 | $ | — | ||||
|
| |||||||
Distributions in excess of net investment income included in net assets: | ||||||||
End of year | $ | — | $ | (14,961,309 | ) | |||
|
| |||||||
franklintempleton.com |
The accompanying notes are an integral part of these financial statements. | |
Annual Report |
29 |
FRANKLIN MUTUALSHARES FUND
1. Organization and Significant Accounting Policies
Franklin Mutual Series Funds (Trust) is registered under the Investment Company Act of 1940 (1940 Act) as an open-end management investment company, consisting of seven separate funds and applies the specialized accounting and reporting guidance in U.S. Generally Accepted Accounting Principles (U.S. GAAP). Franklin Mutual Shares Fund (Fund) is included in this report. The Fund offers five classes of shares: Class Z, Class A, Class C, Class R and Class R6. Each class of shares may differ by its initial sales load, contingent deferred sales charges, voting rights on matters affecting a single class, its exchange privilege and fees due to differing arrangements for distribution and transfer agent fees.
The following summarizes the Fund’s significant accounting policies.
a. Financial Instrument Valuation
The Fund’s investments in financial instruments are carried at fair value daily. Fair value is the price that would be received to sell an asset or paid to transfer a liability in an orderly transaction between market participants on the measurement date. The Fund calculates the net asset value (NAV) per share as of 4 p.m. Eastern time each day the New York Stock Exchange (NYSE) is open for trading. Under compliance policies and procedures approved by the Trust’s Board of Trustees (the Board), the Fund’s administrator has responsibility for oversight of valuation, including leading the cross-functional Valuation Committee (VC). The VC provides administration and oversight of the Fund’s valuation policies and procedures, which are approved annually by the Board. Among other things, these procedures allow the Fund to utilize independent pricing services, quotations from securities and financial instrument dealers, and other market sources to determine fair value.
Equity securities and derivative financial instruments listed on an exchange or on the NASDAQ National Market System are valued at the last quoted sale price or the official closing price of the day, respectively. Foreign equity securities are valued as of the close of trading on the foreign stock exchange on which the security is primarily traded, or as of 4 p.m. Eastern time. The value is then converted into its U.S. dollar equivalent at the foreign exchange rate in effect at 4 p.m. Eastern time on the day that the value of the security is determined. Over-the-counter (OTC) securities are valued within the range of the most recent
quoted bid and ask prices. Securities that trade in multiple markets or on multiple exchanges are valued according to the broadest and most representative market. Certain equity securities are valued based upon fundamental characteristics or relationships to similar securities.
Debt securities generally trade in the OTC market rather than on a securities exchange. The Fund’s pricing services use multiple valuation techniques to determine fair value. In instances where sufficient market activity exists, the pricing services may utilize a market-based approach through which quotes from market makers are used to determine fair value. In instances where sufficient market activity may not exist or is limited, the pricing services also utilize proprietary valuation models which may consider market characteristics such as benchmark yield curves, credit spreads, estimated default rates, anticipated market interest rate volatility, coupon rates, anticipated timing of principal repayments, underlying collateral, and other unique security features in order to estimate the relevant cash flows, which are then discounted to calculate the fair value.
Certain derivative financial instruments trade in the OTC market. The Fund’s pricing services use various techniques including industry standard option pricing models and proprietary discounted cash flow models to determine the fair value of those instruments. The Fund’s net benefit or obligation under the derivative contract, as measured by the fair value of the contract, is included in net assets.
The Fund has procedures to determine the fair value of financial instruments for which market prices are not reliable or readily available. Under these procedures, the VC convenes on a regular basis to review such financial instruments and considers a number of factors, including significant unobservable valuation inputs, when arriving at fair value. The VC primarily employs a market-based approach which may use related or comparable assets or liabilities, recent transactions, market multiples, book values, and other relevant information for the investment to determine the fair value of the investment. An income-based valuation approach may also be used in which the anticipated future cash flows of the investment are discounted to calculate fair value. Discounts may also be applied due to the nature or duration of any restrictions on the disposition of the investments. Due to the inherent uncertainty of valuations of such investments, the fair values may differ significantly from the values that would have been used had an active market existed. The VC employs various methods for calibrating these
30 |
Annual Report |
franklintempleton.com |
FRANKLIN MUTUAL SHARES FUND
NOTES TO FINANCIAL STATEMENTS
valuation approaches including a regular review of key inputs and assumptions, transactional back-testing or disposition analysis, and reviews of any related market activity.
Trading in securities on foreign securities stock exchanges and OTC markets may be completed before 4 p.m. Eastern time. In addition, trading in certain foreign markets may not take place on every Fund’s business day. Occasionally, events occur between the time at which trading in a foreign security is completed and 4 p.m. Eastern time that might call into question the reliability of the value of a portfolio security held by the Fund. As a result, differences may arise between the value of the Fund’s portfolio securities as determined at the foreign market close and the latest indications of value at 4 p.m. Eastern time. In order to minimize the potential for these differences, the VC monitors price movements following the close of trading in foreign stock markets through a series of country specific market proxies (such as baskets of American Depositary Receipts, futures contracts and exchange traded funds). These price movements are measured against established trigger thresholds for each specific market proxy to assist in determining if an event has occurred that may call into question the reliability of the values of the foreign securities held by the Fund. If such an event occurs, the securities may be valued using fair value procedures, which may include the use of independent pricing services.
When the last day of the reporting period is a non-business day, certain foreign markets may be open on those days that the Fund’s NAV is not calculated, which could result in differences between the value of the Fund’s portfolio securities on the last business day and the last calendar day of the reporting period. Any significant security valuation changes due to an open foreign market are adjusted and reflected by the Fund for financial reporting purposes.
b. Foreign Currency Translation
Portfolio securities and other assets and liabilities denominated in foreign currencies are translated into U.S. dollars based on the exchange rate of such currencies against U.S. dollars on the date of valuation. The Fund may enter into foreign currency exchange contracts to facilitate transactions denominated in a foreign currency. Purchases and sales of securities, income and expense items denominated in foreign currencies are translated into U.S. dollars at the exchange rate in effect on the transaction date. Portfolio securities and assets and liabilities denominated in foreign currencies contain risks that those currencies will
decline in value relative to the U.S. dollar. Occasionally, events may impact the availability or reliability of foreign exchange rates used to convert the U.S. dollar equivalent value. If such an event occurs, the foreign exchange rate will be valued at fair value using procedures established and approved by the Board.
The Fund does not separately report the effect of changes in foreign exchange rates from changes in market prices on securities held. Such changes are included in net realized and unrealized gain or loss from investments in the Statement of Operations.
Realized foreign exchange gains or losses arise from sales of foreign currencies, currency gains or losses realized between the trade and settlement dates on securities transactions and the difference between the recorded amounts of dividends, interest, and foreign withholding taxes and the U.S. dollar equivalent of the amounts actually received or paid. Net unrealized foreign exchange gains and losses arise from changes in foreign exchange rates on foreign denominated assets and liabilities other than investments in securities held at the end of the reporting period.
c. Derivative Financial Instruments
The Fund invested in derivative financial instruments in order to manage risk or gain exposure to various other investments or markets. Derivatives are financial contracts based on an underlying or notional amount, require no initial investment or an initial net investment that is smaller than would normally be required to have a similar response to changes in market factors, and require or permit net settlement. Derivatives contain various risks including the potential inability of the counterparty to fulfill their obligations under the terms of the contract, the potential for an illiquid secondary market, and/or the potential for market movements which expose the Fund to gains or losses in excess of the amounts shown in the Statement of Assets and Liabilities. Realized gain and loss and unrealized appreciation and depreciation on these contracts for the period are included in the Statement of Operations.
Derivative counterparty credit risk is managed through a formal evaluation of the creditworthiness of all potential counter-parties. The Fund attempts to reduce its exposure to counterparty credit risk on OTC derivatives, whenever possible, by entering into International Swaps and Derivatives Association (ISDA) master agreements with certain counterparties. These agreements contain various provisions,
franklintempleton.com |
Annual Report |
|
31 |
|
FRANKLIN MUTUAL SHARES FUND
NOTES TO FINANCIAL STATEMENTS
1. Organization and Significant Accounting
Policies (continued)
c. Derivative Financial Instruments (continued)
including but not limited to collateral requirements, events of default, or early termination. Termination events applicable to the counterparty include certain deteriorations in the credit quality of the counterparty. Termination events applicable to the Fund include failure of the Fund to maintain certain net asset levels and/or limit the decline in net assets over various periods of time. In the event of default or early termination, the ISDA master agreement gives the non-defaulting party the right to net and close-out all transactions traded, whether or not arising under the ISDA agreement, to one net amount payable by one counterparty to the other. However, absent an event of default or early termination, OTC derivative assets and liabilities are presented gross and not offset in the Statement of Assets and Liabilities. Early termination by the counterparty may result in an immediate payment by the Fund of any net liability owed to that counterparty under the ISDA agreement. At December 31, 2017, the Fund had OTC derivatives in a net liability position of $32,139,401 and the aggregate value of collateral pledged for such contracts was $27,578,600.
Collateral requirements differ by type of derivative. Collateral or initial margin requirements are set by the broker or exchange clearing house for exchange traded and centrally cleared derivatives. Initial margin deposited is held at the exchange and can be in the form of cash and/or securities. For OTC derivatives traded under an ISDA master agreement, posting of collateral is required by either the Fund or the applicable counterparty if the total net exposure of all OTC derivatives with the applicable counterparty exceeds the minimum transfer amount, which typically ranges from $100,000 to $250,000, and can vary depending on the counterparty and the type of the agreement. Generally, collateral is determined at the close of Fund business each day and any additional collateral required due to changes in derivative values may be delivered by the Fund or the counterparty the next business day, or within a few business days. Collateral pledged and/or received by the Fund for OTC derivatives, if any, is held in segregated accounts with the Fund’s custodian/counterparty broker and can be in the form of cash and/or securities. Unrestricted cash may be invested according to the Fund’s investment objectives. To the extent that the amounts due to the Fund from its counterparties are not subject to collateralization or are not fully collateralized, the Fund bears the risk of loss from counterparty non-performance.
The Fund entered into exchange traded futures contracts primarily to manage exposure to certain foreign currencies. A futures contract is an agreement between the Fund and a counterparty to buy or sell an asset at a specified price on a future date. Required initial margins are pledged by the Fund, and the daily change in fair value is accounted for as a variation margin payable or receivable in the Statement of Assets and Liabilities.
The Fund entered into OTC forward exchange contracts primarily to manage exposure to certain foreign currencies. A forward exchange contract is an agreement between the Fund and a counterparty to buy or sell a foreign currency at a specific exchange rate on a future date.
See Note 10 regarding other derivative information.
d. Securities Sold Short
The Fund is engaged in selling securities short, which obligates the Fund to replace a borrowed security with the same security at current fair value. The Fund incurs a loss if the price of the security increases between the date of the short sale and the date on which the Fund replaces the borrowed security. The Fund realizes a gain if the price of the security declines between those dates. Gains are limited to the price at which the Fund sold the security short, while losses are potentially unlimited in size.
The Fund is required to establish a margin account with the broker lending the security sold short. While the short sale is outstanding, the broker retains the proceeds of the short sale to the extent necessary to meet margin requirements until the short position is closed out. A deposit must also be maintained with the Fund’s custodian/counterparty broker consisting of cash and/or securities having a value equal to a specified percentage of the value of the securities sold short. The Fund is obligated to pay fees for borrowing the securities sold short and is required to pay the counterparty any dividends and/or interest due on securities sold short. Such dividends and/or interest and any security borrowing fees are recorded as an expense to the Fund.
e. Senior Floating Rate Interests
The Fund invests in senior secured corporate loans that pay interest at rates which are periodically reset by reference to a base lending rate plus a spread. These base lending rates are generally the prime rate offered by a designated U.S. bank or the London InterBank Offered Rate (LIBOR). Senior secured corporate loans often require prepayment of principal from
32 |
Annual Rep.ort |
franklintempleton.com |
FRANKLIN MUTUAL SHARES FUND
NOTES TO FINANCIAL STATEMENTS
excess cash flows or at the discretion of the borrower. As a result, actual maturity may be substantially less than the stated maturity. Senior secured corporate loans in which the Fund invests are generally readily marketable, but may be subject to certain restrictions on resale.
f. Income and Deferred Taxes
It is the Fund’s policy to qualify as a regulated investment company under the Internal Revenue Code. The Fund intends to distribute to shareholders substantially all of its taxable income and net realized gains to relieve it from federal income and excise taxes. As a result, no provision for U.S. federal income taxes is required.
The Fund may be subject to foreign taxation related to income received, capital gains on the sale of securities and certain foreign currency transactions in the foreign jurisdictions in which it invests. Foreign taxes, if any, are recorded based on the tax regulations and rates that exist in the foreign markets in which the Fund invests. When a capital gain tax is determined to apply, the Fund records an estimated deferred tax liability in an amount that would be payable if the securities were disposed of on the valuation date.
As a result of several court cases, in certain countries across the European Union, the Fund filed additional tax reclaims for previously withheld taxes on dividends earned in those countries (EU reclaims). These additional filings are subject to various administrative proceedings by the local jurisdictions’ tax authorities within the European Union, as well as a number of related judicial proceedings. Income recognized, if any, for EU reclaims is reflected as other income in the Statement of Operations and any related receivable, if any, is reflected as European Union tax reclaims in the Statement of Assets and Liabilities. When uncertainty exists as to the ultimate resolution of these proceedings, the likelihood of receipt of these EU reclaims, and the potential timing of payment, no amounts are reflected in the financial statements. For U.S. income tax purposes, EU reclaims received by the Fund, if any, reduce the amounts of foreign taxes Fund shareholders can use as tax credits in their individual income tax returns.
The Fund may recognize an income tax liability related to its uncertain tax positions under U.S. GAAP when the uncertain tax position has a less than 50% probability that it will be sustained upon examination by the tax authorities based on its technical merits. As of December 31, 2017, the Fund has
determined that no tax liability is required in its financial statements related to uncertain tax positions for any open tax years (or expected to be taken in future tax years). Open tax years are those that remain subject to examination and are based on the statute of limitations in each jurisdiction in which the Fund invests.
g. Security Transactions, Investment Income, Expenses and Distributions
Security transactions are accounted for on trade date. Realized gains and losses on security transactions are determined on a specific identification basis. Interest income and estimated expenses are accrued daily. Amortization of premium and accretion of discount on debt securities are included in interest income. Dividend income is recorded on the ex-dividend date except for certain dividends from securities where the dividend rate is not available. In such cases, the dividend is recorded as soon as the information is received by the Fund. Distributions to shareholders are recorded on the ex-dividend date. Distributable earnings are determined according to income tax regulations (tax basis) and may differ from earnings recorded in accordance with U.S. GAAP. These differences may be permanent or temporary. Permanent differences are reclassified among capital accounts to reflect their tax character. These reclassifications have no impact on net assets or the results of operations. Temporary differences are not reclassified, as they may reverse in subsequent periods.
Common expenses incurred by the Trust are allocated among the Funds based on the ratio of net assets of each Fund to the combined net assets of the Trust. Fund specific expenses are charged directly to the Fund that incurred the expense.
Realized and unrealized gains and losses and net investment income, excluding class specific expenses, are allocated daily to each class of shares based upon the relative proportion of net assets of each class. Differences in per share distributions by class are generally due to differences in class specific expenses.
h. Accounting Estimates
The preparation of financial statements in accordance with U.S. GAAP requires management to make estimates and assumptions that affect the reported amounts of assets and liabilities at the date of the financial statements and the amounts of income and expenses during the reporting period. Actual results could differ from those estimates.
franklintempleton.com |
Annual Report |
|
33 |
|
FRANKLIN MUTUAL SHARES FUND
NOTES TO FINANCIAL STATEMENTS
1. Organization and Significant Accounting
Policies (continued)
i. Guarantees and Indemnifications
Under the Trust’s organizational documents, its officers and trustees are indemnified by the Trust against certain liabilities arising out of the performance of their duties to the Trust. Additionally, in the normal course of business, the Trust, on
behalf of the Fund, enters into contracts with service providers that contain general indemnification clauses. The Trust’s maximum exposure under these arrangements is unknown as this would involve future claims that may be made against the Trust that have not yet occurred. Currently, the Trust expects the risk of loss to be remote.
2. Shares of Beneficial Interest
At December 31, 2017, there were an unlimited number of shares authorized (without par value). Transactions in the Fund’s shares were as follows:
| Year Ended December 31, | ||||||||||||||||
| 2017 | 2016 | |||||||||||||||
| Shares | Amount | Shares | Amount | |||||||||||||
Class Z Shares: | ||||||||||||||||
Shares sold | 23,691,795 | $ | 696,267,462 | 32,376,662 | $ | 873,776,950 | ||||||||||
Shares issued in reinvestment of distributions | 13,747,109 | 395,547,594 | 15,952,237 | 451,923,049 | ||||||||||||
Shares redeemed | (92,023,346 | ) | (2,710,731,683 | ) | (36,561,397 | ) | (989,580,847 | ) | ||||||||
Net increase (decrease) | (54,584,442 | ) | $ | (1,618,916,627 | ) | 11,767,502 | $ | 336,119,152 | ||||||||
Class A Shares: | ||||||||||||||||
Shares sold | 17,964,808 | $ | 522,017,079 | 11,507,397 | $ | 308,371,612 | ||||||||||
Shares issued in reinvestment of distributions | 9,145,140 | 260,399,623 | 9,838,985 | 276,122,225 | ||||||||||||
Shares redeemed | (41,761,357 | ) | (1,214,079,098 | ) | (38,936,274 | ) | (1,047,221,884 | ) | ||||||||
Net increase (decrease) | (14,651,409 | ) | $ | (431,662,396 | ) | (17,589,892 | ) | $ | (462,728,047 | ) | ||||||
Class C Shares: | ||||||||||||||||
Shares sold | 2,533,117 | $ | 72,481,356 | 2,625,989 | $ | 69,812,879 | ||||||||||
Shares issued in reinvestment of distributions | 2,024,489 | 56,971,259 | 2,168,641 | 60,145,452 | ||||||||||||
Shares redeemed | (9,333,970 | ) | (268,124,028 | ) | (7,636,941 | ) | (201,554,474 | ) | ||||||||
Net increase (decrease) | (4,776,364 | ) | $ | (138,671,413 | ) | (2,842,311 | ) | $ | (71,596,143 | ) | ||||||
Class R Shares: | ||||||||||||||||
Shares sold | 622,054 | $ | 17,981,440 | 580,804 | $ | 15,418,202 | ||||||||||
Shares issued in reinvestment of distributions | 239,266 | 6,777,153 | 270,055 | 7,536,986 | ||||||||||||
Shares redeemed | (1,464,599 | ) | (42,299,057 | ) | (1,655,748 | ) | (44,386,664 | ) | ||||||||
Net increase (decrease) | (603,279 | ) | $ | (17,540,464 | ) | (804,889 | ) | $ | (21,431,476 | ) | ||||||
Class R6 Shares: | ||||||||||||||||
Shares sold | 63,378,950 | $ | 1,870,087,713 | 430,006 | $ | 11,589,179 | ||||||||||
Shares issued in reinvestment of distributions | 7,729,991 | 221,874,105 | 4,383,823 | 124,166,816 | ||||||||||||
Shares redeemed | (7,551,970 | ) | (222,835,095 | ) | (11,616,080 | ) | (315,283,854 | ) | ||||||||
Net increase (decrease) | 63,556,971 | $ | 1,869,126,723 | (6,802,251 | ) | $ | (179,527,859 | ) | ||||||||
34 |
Annual Report |
franklintempleton.com |
FRANKLIN MUTUAL SHARES FUND
NOTES TO FINANCIAL STATEMENTS
3. Transactions with Affiliates
Franklin Resources, Inc. is the holding company for various subsidiaries that together are referred to as Franklin Templeton Investments. Certain officers and trustees of the Fund are also officers and/or directors of the following subsidiaries:
| Subsidiary | Affiliation | |
Franklin Mutual Advisers, LLC (Franklin Mutual) | Investment manager | |
Franklin Templeton Services, LLC (FT Services) | Administrative manager | |
Franklin Templeton Distributors, Inc. (Distributors) | Principal underwriter | |
Franklin Templeton Investor Services, LLC (Investor Services) | Transfer agent |
a. Management Fees
The Fund pays an investment management fee to Franklin Mutual based on the average daily net assets of the Fund as follows:
| Annualized Fee Rate | Net Assets | |
0.675% | Up to and including $5 billion | |
0.645% | Over $5 billion, up to and including $10 billion | |
0.625% | Over $10 billion, up to and including $15 billion | |
0.595% | Over $15 billion, up to and including $20 billion | |
0.585% | Over $20 billion, up to and including $25 billion | |
0.565% | Over $25 billion, up to and including $30 billion | |
0.555% | Over $30 billion, up to and including $35 billion | |
0.545% | In excess of $35 billion |
For the year ended December 31, 2017, the gross effective investment management fee rate was 0.646% of the Fund’s average daily net assets.
b. Administrative Fees
Under an agreement with Franklin Mutual, FT Services provides administrative services to the Fund. The fee is paid by Franklin Mutual based on the Fund’s average daily net assets, and is not an additional expense of the Fund.
c. Distribution Fees
The Board has adopted distribution plans for each share class, with the exception of Class Z and Class R6 shares, pursuant to Rule 12b-1 under the 1940 Act. Under the Fund’s Class A reimbursement distribution plan, the Fund reimburses Distributors for costs incurred in connection with the servicing, sale and distribution of the Fund’s shares up to the maximum annual plan rate. Under the Class A reimbursement distribution plan, costs exceeding the maximum for the current plan year cannot be reimbursed in subsequent periods. In addition, under the Fund’s Class C and R compensation distribution plans, the Fund pays Distributors for costs incurred in connection with the servicing, sale and distribution of the Fund’s shares up to the maximum annual plan rate for each class. The plan year, for purposes of monitoring compliance with the maximum annual plan rates, is February 1 through January 31.
The maximum annual plan rates, based on the average daily net assets, for each class, are as follows:
Class A | 0.35% | |||
Class C | 1.00% | |||
Class R | 0.50% |
The Board has set the current rate at 0.25% per year for Class A shares until further notice and approval by the Board.
| franklintempleton.com | Annual Report | 35 |
FRANKLIN MUTUAL SHARES FUND
NOTES TO FINANCIAL STATEMENTS
3. Transactions with Affiliates (continued)
d. Sales Charges/Underwriting Agreements
Front-end sales charges and contingent deferred sales charges (CDSC) do not represent expenses of the Fund. These charges are deducted from the proceeds of sales of Fund shares prior to investment or from redemption proceeds prior to remittance, as applicable. Distributors has advised the Fund of the following commission transactions related to the sales and redemptions of the Fund’s shares for the year:
Sales charges retained net of commissions paid to unaffiliated brokers/dealers | $ | 575,075 | ||
CDSC retained | $ | 43,139 |
e. Transfer Agent Fees
Each class of shares pays transfer agent fees to Investor Services for its performance of shareholder servicing obligations. Effective November 1, 2017, the fees are based on an annualized asset based fee of 0.02% plus a transaction based fee. Prior to November 1, 2017, the fees were account based fees that varied based on fund or account type. In addition, each class reimburses Investor Services for out of pocket expenses incurred and, except for Class R6, reimburses shareholder servicing fees paid to third parties. These fees are allocated daily based upon their relative proportion of such classes’ aggregate net assets. Class R6 pays Investor Services transfer agent fees specific to that class.
For the year ended December 31, 2017, the Fund paid transfer agent fees of $15,379,774, of which $6,537,890 was retained by Investor Services.
f. Other Affiliated Transactions
At December 31, 2017, one or more of the funds in Franklin Fund Allocator Series owned 11.4% of the Fund’s outstanding shares.
4. Expense Offset Arrangement
The Fund has entered into an arrangement with its custodian whereby credits realized as a result of uninvested cash balances are used to reduce a portion of the Fund’s custodian expenses. During the year ended December 31, 2017, the custodian fees were reduced as noted in the Statement of Operations.
5. Independent Trustees’ Retirement Plan
On January 1, 1993, the Trust adopted an Independent Trustees’ Retirement Plan (Plan). The Plan is an unfunded defined benefit plan that provides benefit payments to Trustees whose length of service and retirement age meets the eligibility requirements of the Plan. Benefits under the Plan are based on years of service and fees paid to each trustee at the time of retirement. Effective in December 1996, the Plan was closed to new participants.
During the year ended December 31, 2017, the Fund’s projected benefit obligation and benefit payments under the Plan were as follows:
aProjected benefit obligation at December 31, 2017 | $ | 739,370 | ||
bIncrease in projected benefit obligation | $ | 12,076 | ||
Benefit payments made to retired trustees | $ | (15,434 | ) |
aThe projected benefit obligation is included in trustees’ fees and expenses in the Statement of Assets and Liabilities.
bThe increase in projected benefit obligation is included in trustees’ fees and expenses in the Statement of Operations.
| 36 |
Annual Report | franklintempleton.com |
FRANKLIN MUTUAL SHARES FUND
NOTES TO FINANCIAL STATEMENTS
6. Income Taxes
For tax purposes, the Fund may elect to defer any portion of a post-October capital loss to the first day of the following fiscal year. At December 31, 2017, the Fund deferred post-October capital losses of $26,175,568.
The tax character of distributions paid during the years ended December 31, 2017 and 2016, was as follows:
| 2017 | 2016 | |||||||
|
| |||||||
Distributions paid from: | ||||||||
Ordinary income | $ | 367,181,482 | $ | 432,682,240 | ||||
Long term capital gain | 643,385,757 | 555,108,274 | ||||||
|
| |||||||
| $ | 1,010,567,239 | $ | 987,790,514 | |||||
|
| |||||||
At December 31, 2017, the cost of investments, net unrealized appreciation (depreciation) and undistributed ordinary income for income tax purposes were as follows:
Cost of investments | $ | 11,489,806,663 | ||
|
| |||
Unrealized appreciation | $ | 4,670,744,750 | ||
Unrealized depreciation | (848,260,376 | ) | ||
|
| |||
Net unrealized appreciation (depreciation) | $ | 3,822,484,374 | ||
|
| |||
Distributable earnings - undistributed ordinary income | $ | 11,249,400 | ||
|
| |||
Differences between income and/or capital gains as determined on a book basis and a tax basis are primarily due to differing treatments of defaulted securities and foreign currency transactions.
The Fund utilized a tax accounting practice to treat a portion of the proceeds from capital shares redeemed as a distribution from realized capital gains.
7. Investment Transactions
Purchases and sales of investments (excluding short term securities and securities sold short) for the year ended December 31, 2017, aggregated $2,629,902,593 and $3,201,641,264, respectively.
8. Credit Risk and Defaulted Securities
The Fund may purchase the pre-default or defaulted debt of distressed companies. Distressed companies are financially troubled and could be or are already involved in financial restructuring or bankruptcy. Risks associated with purchasing these securities include the possibility that the bankruptcy or other restructuring process takes longer than expected, or that distributions in restructuring are less than anticipated, either or both of which may result in unfavorable consequences to the Fund. If it becomes probable that the income on debt securities, including those of distressed companies, will not be collected, the Fund discontinues accruing income and recognizes an adjustment for uncollectible interest.
At December 31, 2017, the aggregate long value of distressed company securities for which interest recognition has been discontinued was $38,210,586, representing 0.3% of the Fund’s net assets. For information as to specific securities, see the accompanying Statement of Investments.
| franklintempleton.com | Annual Report | 37 |
FRANKLIN MUTUAL SHARES FUND
NOTES TO FINANCIAL STATEMENTS
9. Restricted Securities
The Fund invests in securities that are restricted under the Securities Act of 1933 (1933 Act). Restricted securities are often purchased in private placement transactions, and cannot be sold without prior registration unless the sale is pursuant to an exemption under the 1933 Act. Disposal of these securities may require greater effort and expense, and prompt sale at an acceptable price may be difficult. The Fund may have registration rights for restricted securities. The issuer generally incurs all registration costs.
At December 31, 2017, investments in restricted securities, excluding securities exempt from registration under the 1933 Act deemed to be liquid, were as follows:
| Principal Amount/ Shares | Issuer | Acquisition Date | Cost | Value | ||||||||||||
| 19,594 | Broadband Ventures III LLC, secured promissory note, 5.00%, 2/01/12 | 7/01/10 - 11/30/12 | $ | 19,594 | $ | — | ||||||||||
| 43,105,703 | CB FIM Coinvestors LLC. | 1/15/09 - 6/02/09 | — | — | ||||||||||||
| 53,924,666 | FIM Coinvestor Holdings I, LLC | 11/20/06 - 6/02/09 | — | — | ||||||||||||
| 7,234,813 | International Automotive Components Group Brazil LLC | 4/13/06 - 12/26/08 | 4,804,678 | 248,046 | ||||||||||||
| 63,079,866 | International Automotive Components Group North America LLC | 1/12/06 - 3/18/13 | 51,662,536 | 41,555,438 | ||||||||||||
|
| |||||||||||||||
| Total Restricted Securities (Value is 0.3% of Net Assets) | $ | 56,486,808 | $ | 41,803,484 | ||||||||||||
|
| |||||||||||||||
10. Other Derivative Information
At December 31, 2017, the Fund’s investments in derivative contracts are reflected in the Statement of Assets and Liabilities as follows:
| Asset Derivatives | Liability Derivatives | |||||||||||
| Derivative Contracts Not Accounted for as Hedging Instruments | Statement of Assets and Liabilities Location | Fair Value | Statement of Assets and Liabilities Location | Fair Value | ||||||||
Foreign exchange contracts | Variation margin on futures contracts | $ | — | Variation margin on futures contracts | $ | 6,503,459 | a | |||||
Unrealized appreciation on OTC forward exchange contracts | $ | 657,823 | Unrealized depreciation on OTC forward exchange contracts | 32,797,224 | ||||||||
|
|
|
| |||||||||
Totals | $ | 657,823 | $ | 39,300,683 | ||||||||
|
|
|
| |||||||||
aThis amount reflects the cumulative appreciation (depreciation) of futures contracts as reported in the Statement of Investments. Only the variation margin receivable/ payable at year end is separately reported within the Statement of Assets and Liabilities. Prior variation margin movements were recorded to cash upon receipt or payment.
For the year ended December 31, 2017, the effect of derivative contracts in the Fund’s Statement of Operations was as follows:
| Derivative Contracts Not Accounted for as Hedging Instruments | Statement of Operations Location | Net Realized Gain (Loss) for the Year | Statement of Operations Location | Net Change in Unrealized Appreciation (Depreciation) for the Year | ||||||||
Net realized gain (loss) from: | Net change in unrealized appreciation (depreciation) on: | |||||||||||
Foreign exchange contracts | Forward exchange contracts | $(38,370,101 | ) | Forward exchange contracts | $ | (72,989,757 | ) | |||||
Futures contracts | (35,950,853 | ) | Futures contracts | (14,221,830 | ) | |||||||
|
|
|
| |||||||||
Totals | $(74,320,954 | ) | $ | (87,211,587 | ) | |||||||
|
|
|
| |||||||||
For the year ended December 31, 2017, the average month end notional amount of futures contracts represented $535,703,439. The average month end contract value of forward exchange contracts was $1,163,127,706.
See Note 1(c) regarding derivative financial instruments.
| 38 |
Annual Report | franklintempleton.com |
FRANKLIN MUTUAL SHARES FUND
NOTES TO FINANCIAL STATEMENTS
11. Holdings of 5% Voting Securities of Portfolio Companies
The 1940 Act defines “affiliated companies” to include investments in portfolio companies in which a fund owns 5% or more of the outstanding voting securities. During the year ended December 31, 2017, investments in “affiliated companies” were as follows:
| Name of Issuer | Number of Shares Held at Beginning of Year | Gross Additions | Gross Reductions | Number of Shares Held at End of Year | Value at End of Year | Dividend Income | Realized Gain (Loss) | Net Change in Unrealized Appreciation (Depreciation) | ||||||||||||||||||||||||
| Controlled Affiliatesa | ||||||||||||||||||||||||||||||||
CB FIM Coinvestors LLC | 43,105,703 | — | — | 43,105,703 | $ | — | $ | — | $ | — | $ | — | ||||||||||||||||||||
|
| |||||||||||||||||||||||||||||||
| Non-Controlled Affiliates | ||||||||||||||||||||||||||||||||
Alexander’s Inc. | 326,675 | — | — | 326,675 | $ | 129,314,299 | $ | 5,553,475 | $ | 122,830 | b | $ | (10,133,458 | ) | ||||||||||||||||||
Federal Signal Corp | 3,288,138 | — | (3,288,138 | ) | — | — | 682,944 | 6,918,028 | 8,231,206 | |||||||||||||||||||||||
International Automotive Components Group Brazil LLC | 7,234,813 | — | — | 7,234,813 | 248,046 | — | — | 70,026 | ||||||||||||||||||||||||
International Automotive Components Group North America LLC | 63,079,866 | — | — | 63,079,866 | 41,555,438 | — | — | (5,369,674 | ) | |||||||||||||||||||||||
White Mountains Insurance Group Ltd. | 297,806 | — | (297,806 | ) | — | — | 291,961 | 240,949,072 | (231,345,921 | ) | ||||||||||||||||||||||
|
| |||||||||||||||||||||||||||||||
Total Non-Controlled Affiliates |
| $ | 171,117,783 | $ | 6,528,380 | $ | 247,989,930 | $ | (238,547,821 | ) | ||||||||||||||||||||||
|
| |||||||||||||||||||||||||||||||
| Total Affiliated Securities (Value is 1.1% of Net Assets) | $ | 171,117,783 | $ | 6,528,380 | $ | 247,989,930 | $ | (238,547,821 | ) | |||||||||||||||||||||||
|
| |||||||||||||||||||||||||||||||
aIssuer in which the Fund owns 25% or more of the outstanding voting securities.
bRealized gain distributions from REITs.
12. Credit Facility
The Fund, together with other U.S. registered and foreign investment funds (collectively, Borrowers), managed by Franklin Templeton Investments, are borrowers in a joint syndicated senior unsecured credit facility totaling $2 billion (Global Credit Facility) which matured on February 9, 2018. This Global Credit Facility provides a source of funds to the Borrowers for temporary and emergency purposes, including the ability to meet future unanticipated or unusually large redemption requests. Effective February 9, 2018, the Borrowers renewed the Global Credit Facility for a one year term, maturing February 8, 2019, for a total of $2 billion.
Under the terms of the Global Credit Facility, the Fund shall, in addition to interest charged on any borrowings made by the Fund and other costs incurred by the Fund, pay its share of fees and expenses incurred in connection with the implementation and maintenance of the Global Credit Facility, based upon its relative share of the aggregate net assets of all of the Borrowers, including an annual commitment fee of 0.15% based upon the unused portion of the Global Credit Facility. These fees are reflected in other expenses in the Statement of Operations. During the year ended December 31, 2017, the Fund did not use the Global Credit Facility.
13. Fair Value Measurements
The Fund follows a fair value hierarchy that distinguishes between market data obtained from independent sources (observable inputs) and the Fund’s own market assumptions (unobservable inputs). These inputs are used in determining the value of the Fund’s financial instruments and are summarized in the following fair value hierarchy:
| • | Level 1 – quoted prices in active markets for identical financial instruments |
| • | Level 2 – other significant observable inputs (including quoted prices for similar financial instruments, interest rates, prepayment speed, credit risk, etc.) |
| franklintempleton.com | Annual Report | 39 |
FRANKLIN MUTUAL SHARES FUND
NOTES TO FINANCIAL STATEMENTS
13. Fair Value Measurements (continued)
| • | Level 3 – significant unobservable inputs (including the Fund’s own assumptions in determining the fair value of financial instruments) |
The input levels are not necessarily an indication of the risk or liquidity associated with financial instruments at that level.
For movements between the levels within the fair value hierarchy, the Fund has adopted a policy of recognizing the transfers as of the date of the underlying event which caused the movement.
A summary of inputs used as of December 31, 2017, in valuing the Fund’s assets and liabilities carried at fair value, is as follows:
| Level 1 | Level 2 | Level 3 | Total | |||||||||||||
| Assets: | ||||||||||||||||
Investments in Securities:a | ||||||||||||||||
Equity Investments:b | ||||||||||||||||
Auto Components | $ | 76,971,273 | $ | — | $ | 41,803,484 | $ | 118,774,757 | ||||||||
Machinery | 225,186,611 | 70,984,012 | — | 296,170,623 | ||||||||||||
Software | 924,053,532 | — | 470,762 | 924,524,294 | ||||||||||||
All Other Equity Investments | 12,813,321,519 | — | —c | 12,813,321,519 | ||||||||||||
Corporate Notes and Senior Floating Rate Interests | — | 390,351,853 | — | 390,351,853 | ||||||||||||
Corporate Notes and Senior Floating Rate Interests in Reorganization | — | 38,210,586 | —c | 38,210,586 | ||||||||||||
Companies in Liquidation | — | 13,646,170 | 3,397,055c | 17,043,225 | ||||||||||||
Short Term Investments | 843,662,753 | 4,300,000 | — | 847,962,753 | ||||||||||||
Total Investments in Securities | $ | 14,883,195,688 | $ | 517,492,621 | $ | 45,671,301 | $ | 15,446,359,610 | ||||||||
Other Financial Instruments: | ||||||||||||||||
Forward Exchange Contracts | $ | — | $ | 657,823 | $ | — | $ | 657,823 | ||||||||
| Liabilities: | ||||||||||||||||
Other Financial Instruments: | ||||||||||||||||
Securities Sold Short | $ | 95,444,797 | $ | — | $ | — | $ | 95,444,797 | ||||||||
Futures Contracts | 6,503,459 | — | — | 6,503,459 | ||||||||||||
Forward Exchange Contracts | — | 32,797,224 | — | 32,797,224 | ||||||||||||
Total Other Financial Instruments | $ | 101,948,256 | $ | 32,797,224 | $ | — | $ | 134,745,480 | ||||||||
aFor detailed categories, see the accompanying Statement of Investments.
bIncludes common stocks and management investment companies as well as other equity investments.
cIncludes securities determined to have no value at December 31, 2017.
A reconciliation of assets in which Level 3 inputs are used in determining fair value is presented when there are significant Level 3 financial instruments at the beginning and/or end of the year.
14. Subsequent Events
The Fund has evaluated subsequent events through the issuance of the financial statements and determined that no events have occurred that require disclosure other than those already disclosed in the financial statements.
40 |
Annual Report |
franklintempleton.com |
FRANKLIN MUTUAL SHARES FUND
NOTES TO FINANCIAL STATEMENTS
Abbreviations
| Counterparty | Currency | Selected Portfolio | ||||||||
| BOFA | Bank of America N.A. | EUR | Euro | ADR | American Depositary Receipt | |||||
| BONY | The Bank of New York Mellon Corp. | GBP | British Pound | DIP | Debtor-In-Possession | |||||
| HSBK | HSBC Bank PLC | USD | United States Dollar | FHLB | Federal Home Loan Bank | |||||
| SSBT | State Street Bank and Trust Co., N.A. | LIBOR | London InterBank Offered Rate | |||||||
| UBSW | UBS AG | TRA | Tax Receivable Agreement Right | |||||||
| franklintempleton.com | Annual Report | 41 | ||||
FRANKLIN MUTUAL SHARES FUND
Report of Independent Registered Public Accounting Firm
To the Board of Trustees of Franklin Mutual Series Funds and Shareholders of Franklin Mutual Shares Fund:
Opinion on the Financial Statements
We have audited the accompanying statement of assets and liabilities of Franklin Mutual Shares Fund (the “Fund”) (one of the funds constituting Franklin Mutual Series Funds), including the schedule of investments, as of December 31, 2017, and the related statement of operations for the year then ended, the statements of changes in net assets for each of the two years in the period then ended, the financial highlights for each of the periods indicated therein and the related notes (collectively referred to as the “financial statements”). In our opinion, the financial statements present fairly, in all material respects, the financial position of Franklin Mutual Shares Fund (one of the funds constituting Franklin Mutual Series Funds) at December 31, 2017, the results of its operations for the year then ended, the changes in its net assets for each of the two years in the period then ended and its financial highlights for each of the periods indicated therein, in conformity with U.S. generally accepted accounting principles.
Basis for Opinion
These financial statements are the responsibility of the Fund’s management. Our responsibility is to express an opinion on the Fund’s financial statements based on our audits. We are a public accounting firm registered with the Public Company Accounting Oversight Board (United States) (“PCAOB”) and are required to be independent with respect to the Fund in accordance with the U.S. federal securities laws and the applicable rules and regulations of the Securities and Exchange Commission and the PCAOB.
We conducted our audits in accordance with the standards of the PCAOB. Those standards require that we plan and perform the audit to obtain reasonable assurance about whether the financial statements are free of material misstatement, whether due to error or fraud. The Fund is not required to have, nor were we engaged to perform, an audit of the Fund’s internal control over financial reporting. As part of our audits, we are required to obtain an understanding of internal control over financial reporting, but not for the purpose of expressing an opinion on the effectiveness of the Fund’s internal control over financial reporting. Accordingly, we express no such opinion.
Our audits included performing procedures to assess the risks of material misstatement of the financial statements, whether due to error or fraud, and performing procedures that respond to those risks. Such procedures included examining, on a test basis, evidence regarding the amounts and disclosures in the financial statements. Our procedures included confirmation of securities owned as of December 31, 2017, by correspondence with the custodian. Our audits also included evaluating the accounting principles used and significant estimates made by management, as well as evaluating the overall presentation of the financial statements. We believe that our audits provide a reasonable basis for our opinion.
We have served as the auditor of one or more Franklin investment companies since 1987.
Boston, MA
February 26, 2018
42 |
Annual Report |
franklintempleton.com |
FRANKLIN MUTUAL SHARES FUND
Under Section 852(b)(3)(C) of the Internal Revenue Code (Code), the Fund hereby reports the maximum amount allowable but no less than $675,911,960 as a long term capital gain dividend for the fiscal year ended December 31, 2017.
Under Section 871(k)(2)(C) of the Code, the Fund hereby reports the maximum amount allowable but no less than $31,519,416 as a short term capital gain dividend for purposes of the tax imposed under Section 871(a)(1)(A) of the Code for the fiscal year ended December 31, 2017.
Under Section 854(b)(1)(A) of the Code, the Fund hereby reports 75.03% of the ordinary income dividends as income qualifying for the dividends received deduction for the fiscal year ended December 31, 2017.
Under Section 854(b)(1)(B) of the Code, the Fund hereby reports the maximum amount allowable but no less than $374,597,076 as qualified dividends for purposes of the maximum rate under Section 1(h)(11) of the Code for the fiscal year ended December 31, 2017. Distributions, including qualified dividend income, paid during calendar year 2017 will be reported to shareholders on Form 1099-DIV by mid-February 2018. Shareholders are advised to check with their tax advisors for information on the treatment of these amounts on their individual income tax returns.
franklintempleton.com |
Annual Report |
|
43 |
|
FRANKLIN MUTUAL SERIES FUNDS
The name, year of birth and address of the officers and board members, as well as their affiliations, positions held with the Trust, principal occupations during at least the past five years and number of US registered portfolios overseen in the Franklin Templeton Investments fund complex, are shown below. Generally, each board member serves until that person’s successor is elected and qualified.
Independent Board Members
Name, Year of Birth and Address | Position | Length of Time Served | Number of Portfolios in Fund Complex Overseen by Board Member* | Other Directorships Held During at Least the Past 5 Years | ||||
Edward I. Altman, Ph.D. (1941) c/o Franklin Mutual Advisers, LLC 101 John F. Kennedy Parkway Short Hills, NJ 07078-2789 | Trustee | Since 1987 | 14 | None | ||||
Principal Occupation During at Least the Past 5 Years: Max L. Heine Professor of Finance, Emeritus and Director of The Credit and Debt Markets Research Program, Salomon Center, Stern School of Business, New York University; editor and author of numerous financial publications; financial consultant; an adviser to numerous financial and publishing organizations; and formerly, Vice Director, Salomon Center, Stern School of Business, New York University. | ||||||||
Ann Torre Bates (1958) c/o Franklin Mutual Advisers, LLC 101 John F. Kennedy Parkway Short Hills, NJ 07078-2789 | Trustee | Since 1995 | 40 | Ares Capital Corporation (specialty finance company) (2010-present), United Natural Foods, Inc. (distributor of natural, organic and specialty foods) (2013-present), Allied Capital Corporation (financial services) (2003-2010), SLM Corporation (Sallie Mae) (1997-2014) and Navient Corporation (loan management, servicing and asset recovery) (2014-2016). | ||||
Principal Occupation During at Least the Past 5 Years: Director of various companies; and formerly, Executive Vice President and Chief Financial Officer, NHP Incorporated (manager of multifamily housing) (1995-1997); and Vice President and Treasurer, US Airways, Inc. (until 1995). | ||||||||
Burton J. Greenwald (1929) c/o Franklin Mutual Advisers, LLC 101 John F. Kennedy Parkway Short Hills, NJ 07078-2789 | Trustee and Vice Chairman | Trustee since 2002 and Vice Chairman since 2015 | 14 | Franklin Templeton Emerging Markets Debt Opportunities Fund PLC (1999-present) and Fiduciary International Ireland Limited (1999-2015). | ||||
Principal Occupation During at Least the Past 5 Years: Managing Director, B. J. Greenwald Associates (management consultants to the financial services industry); and formerly, Chairman, Fiduciary Trust International Funds; Executive Vice President, L.F. Rothschild Fund Management, Inc.; President and Director, Merit Mutual Funds; President, Underwriting Division and Director, National Securities & Research Corporation; Governor, Investment Company Institute; and Chairman, ICI Public Information Committee. | ||||||||
Jan Hopkins Trachtman (1947) c/o Franklin Mutual Advisers, LLC 101 John F. Kennedy Parkway Short Hills, NJ 07078-2789 | Trustee | Since 2009 | 14 | None | ||||
Principal Occupation During at Least the Past 5 Years: President and Founder, The Jan Hopkins Group (communications and consulting firm); serves on Advisory Board of Knight Bagehot Fellowship; and formerly, President, Economic Club of New York (2007-2015); Anchor/Correspondent, CNN Financial News (until 2003); Managing Director and Head of Client Communications, Citigroup Private Bank (until 2005); Off-Air reporter, ABC News’ World News Tonight; and Editor, CBS Network News. | ||||||||
Keith Mitchell (1954) c/o Franklin Mutual Advisers, LLC 101 John F. Kennedy Parkway Short Hills, NJ 07078-2789 | Trustee | Since 2009 | 14 | None | ||||
Principal Occupation During at Least the Past 5 Years: Director of various boards of asset management firms; and formerly, Managing Member, Mitchell, Hartley & Bechtel Advisers, LLC (formerly, Mitchell Advisers, LLC) (advisory firm) (2003-2015) and Managing Director, Putman Lovell NBF. | ||||||||
| 44 |
Annual Report | franklintempleton.com |
FRANKLIN MUTUAL SERIES FUNDS
Independent Board Members (continued)
Name, Year of Birth and Address | Position | Length of Time Served | Number of Portfolios in Fund Complex Overseen by Board Member* | Other Directorships Held During at Least the Past 5 Years | ||||
David W. Niemiec (1949) c/o Franklin Mutual Advisers, LLC 101 John F. Kennedy Parkway Short Hills, NJ 07078-2789 | Trustee | Since 2015 | 40 | Hess Midstream Partners LP (oil and gas midstream infrastructure) (2017-present). | ||||
Principal Occupation During at Least the Past 5 Years: Advisor, Saratoga Partners (private equity fund); and formerly, Managing Director, Saratoga Partners (1998-2001) and SBC Warburg Dillon Read (investment banking) (1997-1998); Vice Chairman, Dillon, Read & Co. Inc. (investment banking) (1991-1997); and Chief Financial Officer, Dillon, Read & Co. Inc. (1982-1997). | ||||||||
Charles Rubens II (1930) c/o Franklin Mutual Advisers, LLC 101 John F. Kennedy Parkway Short Hills, NJ 07078-2789 | Trustee | Since 1998 | 14 | None | ||||
Principal Occupation During at Least the Past 5 Years: Private investor and president of non-profit organizations; and formerly, an executive of Time, Inc.; and Trustee of Colorado College. | ||||||||
Robert E. Wade (1946) c/o Franklin Mutual Advisers, LLC 101 John F. Kennedy Parkway Short Hills, NJ 07078-2789 | Trustee and Chairman of the Board | Trustee since 1993 and Chairman of the Board since 2005 | 40 | El Oro Ltd (investments) (2003-present). | ||||
Principal Occupation During at Least the Past 5 Years: Attorney at law engaged in private practice as a sole practitioner (1972-2008) and member of various boards. | ||||||||
Gregory H. Williams (1943) c/o Franklin Mutual Advisers, LLC 101 John F. Kennedy Parkway Short Hills, NJ 07078-2789 | Trustee | Since 2015 | 14 | None | ||||
Principal Occupation During at Least the Past 5 Years: Private investor; Consultant; and formerly, President, University of Cincinnati (2009-2012); President, The City College of New York (2001-2009); Dean, College of Law, Ohio State University (1993-2001); and Associate Vice President, Academic Affairs and Professor of Law, University of Iowa (1977-1993). | ||||||||
Interested Board Members and Officers
Name, Year of Birth and Address | Position | Length of Time Served | Number of Portfolios in Fund Complex Overseen by Board Member* | Other Directorships Held During at Least the Past 5 Years | ||||
**Gregory E. Johnson (1961) One Franklin Parkway San Mateo, CA 94403-1906 | Trustee | Since 2007 | 153 | None | ||||
Principal Occupation During at Least the Past 5 Years: Chairman of the Board, Member – Office of the Chairman, Director and Chief Executive Officer, Franklin Resources, Inc.; officer and/or director or trustee, as the case may be, of some of the other subsidiaries of Franklin Resources, Inc. and of 43 of the investment companies in Franklin Templeton Investments; Vice Chairman, Investment Company Institute; and formerly, President, Franklin Resources, Inc. (1994-2015). | ||||||||
**Peter A. Langerman (1955) c/o Franklin Mutual Advisers, LLC 101 John F. Kennedy Parkway Short Hills, NJ 07078-2789 | Trustee, President, and Chief Executive Officer – Investment Management | Trustee since 2007, President, and Chief Executive Officer – Investment Management since 2005 | 7 | American International Group, Inc. (AIG) Credit Facility Trust (2010-2011). | ||||
Principal Occupation During at Least the Past 5 Years: Chairman of the Board, Chief Executive Officer and President, Franklin Mutual Advisers, LLC; President and Chief Investment Officer, Franklin Advisory Services, LLC; and officer and/or director, as the case may be, of three of the investment companies in Franklin Templeton Invstments. | ||||||||
| franklintempleton.com |
Annual Report | 45 |
FRANKLIN MUTUAL SERIES FUNDS
Interested Board Members and Officers (continued)
Name, Year of Birth and Address | Position | Length of Time Served | Number of Portfolios in Fund Complex Overseen by Board Member* | Other Directorships Held During at Least the Past 5 Years | ||||
Alison E. Baur (1964) One Franklin Parkway San Mateo, CA 94403-1906 | Vice President | Since 2012 | Not Applicable | Not Applicable | ||||
Principal Occupation During at Least the Past 5 Years: Deputy General Counsel, Franklin Templeton Investments; and officer of some of the other subsidiaries of Franklin Resources, Inc. and of 45 of the investment companies in Franklin Templeton Investments. | ||||||||
Philippe Brugere-Trelat (1949) 101 John F. Kennedy Parkway Short Hills NJ 07078-2789 | Vice President | Since 2005 | Not Applicable | Not Applicable | ||||
Principal Occupation During at Least the Past 5 Years: Executive Vice President, Franklin Mutual Advisers, LLC; officer of one of the investment companies in Franklin Templeton Investments; and formerly, Portfolio Manager of Eurovest SA (French registered investment company, SICAV). | ||||||||
Aliya S. Gordon (1973) One Franklin Parkway San Mateo, CA 94403-1906 | Vice President | Since 2009 | Not Applicable | Not Applicable | ||||
Principal Occupation During at Least the Past 5 Years: Senior Associate General Counsel, Franklin Templeton Investments; and officer of 45 of the investment companies in Franklin Templeton Investments. | ||||||||
Steven J. Gray (1955) One Franklin Parkway San Mateo, CA 94403-1906 | Vice President and Secretary | Vice President since 2009 and Secretary since 2005 | Not Applicable | Not Applicable | ||||
Principal Occupation During at Least the Past 5 Years: Senior Associate General Counsel, Franklin Templeton Investments; Vice President, Franklin Templeton Distributors, Inc. and FASA, LLC; and officer of 45 of the investment companies in Franklin Templeton Investments. | ||||||||
Matthew T. Hinkle (1971) One Franklin Parkway San Mateo, CA 94403-1906 | Chief Executive Officer – Finance and Administration | Since June 2017 | Not Applicable | Not Applicable | ||||
Principal Occupation During at Least the Past 5 Years: Senior Vice President, Franklin Templeton Services, LLC; officer of 45 of the investment companies in Franklin Templeton Investments; and formerly, Vice President, Global Tax (2012-April 2017) and Treasurer/Assistant Treasurer, Franklin Templeton Investments (2009-2017). | ||||||||
Robert G. Kubilis (1973) 300 S.E. 2nd Street Fort Lauderdale, FL 33301-1923 | Chief Financial Officer, Chief Accounting Officer and Treasurer | Since 2012 | Not Applicable | Not Applicable | ||||
Principal Occupation During at Least the Past 5 Years: Treasurer, U.S. Fund Administration & Reporting, Franklin Templeton Investments; and officer of 17 of the investment companies in Franklin Templeton Investments. | ||||||||
Robert Lim (1948) One Franklin Parkway San Mateo, CA 94403-1906 | Vice President – AML Compliance | Since 2016 | Not Applicable | Not Applicable | ||||
Principal Occupation During at Least the Past 5 Years: Vice President, Franklin Templeton Companies, LLC; Chief Compliance Officer, Franklin Templeton Distributors, Inc. and Franklin Templeton Investor Services, LLC; and officer of 45 of the investment companies in Franklin Templeton Investments. | ||||||||
| 46 |
Annual Report | franklintempleton.com |
FRANKLIN MUTUAL SERIES FUNDS
Interested Board Members and Officers (continued)
Name, Year of Birth and Address | Position | Length of Time Served | Number of Portfolios in Fund Complex Overseen by Board Member* | Other Directorships Held During at Least the Past 5 Years | ||||
Kimberly H. Novotny (1972) 300 S.E. 2nd Street Fort Lauderdale, FL 33301-1923 | Vice President | Since 2013 | Not Applicable | Not Applicable | ||||
Principal Occupation During at Least the Past 5 Years: Associate General Counsel, Franklin Templeton Investments; Vice President and Corporate Secretary, Fiduciary Trust International of the South; Vice President, Templeton Investment Counsel, LLC; Assistant Secretary, Franklin Resources, Inc.; and officer of 45 of the investment companies in Franklin Templeton Investments. | ||||||||
Robert C. Rosselot (1960) 300 S.E. 2nd Street Fort Lauderdale, FL 33301-1923 | Chief Compliance Officer | Since 2013 | Not Applicable | Not Applicable | ||||
Principal Occupation During at Least the Past 5 Years: Director, Global Compliance, Franklin Templeton Investments; Vice President, Franklin Templeton Companies, LLC; officer of 45 of the investment companies in Franklin Templeton Investments; and formerly, Senior Associate General Counsel, Franklin Templeton Investments (2007-2013); and Secretary and Vice President, Templeton Group of Funds (2004-2013). | ||||||||
Karen L. Skidmore (1952) One Franklin Parkway San Mateo, CA 94403-1906 | Vice President | Since 2009 | Not Applicable | Not Applicable | ||||
Principal Occupation During at Least the Past 5 Years: Senior Associate General Counsel, Franklin Templeton Investments; and officer of 45 of the investment companies in Franklin Templeton Investments. | ||||||||
Navid J. Tofigh (1972) One Franklin Parkway San Mateo, CA 94403-1906 | Vice President | Since 2015 | Not Applicable | Not Applicable | ||||
Principal Occupation During at Least the Past 5 Years: Associate General Counsel, Franklin Templeton Investments; and officer of 45 of the investment companies in Franklin Templeton Investments. | ||||||||
Craig S. Tyle (1960) One Franklin Parkway San Mateo, CA 94403-1906 | Vice President | Since 2005 | Not Applicable | Not Applicable | ||||
Principal Occupation During at Least the Past 5 Years: General Counsel and Executive Vice President, Franklin Resources, Inc.; and officer of some of the other subsidiaries of Franklin Resources, Inc. and of 45 of the investment companies in Franklin Templeton Investments. | ||||||||
Lori A. Weber (1964) 300 S.E. 2nd Street Fort Lauderdale, FL 33301-1923 | Vice President | Since 2011 | Not Applicable | Not Applicable | ||||
Principal Occupation During at Least the Past 5 Years: Senior Associate General Counsel, Franklin Templeton Investments; Assistant Secretary, Franklin Resources, Inc.; Vice President and Secretary, Templeton Investment Counsel, LLC; and officer of 45 of the investment companies in Franklin Templeton Investments. | ||||||||
*We base the number of portfolios on each separate series of the US registered investment companies within the Franklin Templeton Investments fund complex. These portfolios have a common investment manager or affiliated investment managers.
**Gregory E. Johnson is considered to be an interested person of the Fund under the federal securities laws due to his position as an officer and director of Franklin Resources, Inc. (Resources), which is the parent company of the Fund’s investment manager and distributor. Peter A. Langerman is considered to be an interested person of the Fund under the federal securities laws due to his position as an officer of Franklin Mutual Advisors, LLC, which is an affiliate of the Fund’s investment manager.
Note 1: Officer information is current as of the date of this report. It is possible that after this date, information about officers may change.
The Sarbanes-Oxley Act of 2002 and Rules adopted by the U.S. Securities and Exchange Commission require the Fund to disclose whether the Fund’s Audit Committee includes at least one member who is an audit committee financial expert within the meaning of such Act and Rules. The Fund’s Board has determined that there is at least one such financial expert on the Audit Committee and has designated each of Ann Torre Bates and David W. Niemiec as an audit committee financial expert. The Board believes that Ms. Bates and Mr. Niemiec qualify as such an expert in view of their extensive business background and experience. Ms. Bates has served as a member of the Fund Audit Committee since 2008. She currently serves as a director of Navient Corporation (2014-present), Ares Capital Corporation (2010-present) and United Natural Foods, Inc. (2013-present) and was formerly a director of SLM Corporation from 1997 to 2014 and Allied Capital Corporation from 2003 to 2010, Executive Vice President and Chief Financial Officer of NHP Incorporated from 1995 to 1997 and Vice President and Treasurer of US Airways, Inc. until 1995. Mr. Niemiec has served as a member of the Fund Audit Committee since 2013, currently serves as an Advisor to Saratoga Partners
| franklintempleton.com |
Annual Report | 47 |
FRANKLIN MUTUAL SERIES FUND
Interested Board Members and Officers (continued)
and was formerly its Managing Director from 1998 to 2001. Mr. Niemiec was formerly a director of Emeritus Corporation from 1999 to 2010 and OSI Pharmaceuticals, Inc. from 2006 to 2010, Managing Director of SBC Warburg Dillon Read from 1997 to 1998, and was Vice Chairman from 1991 to 1997 and Chief Financial Officer from 1982 to 1997 of Dillon, Read & Co. Inc. As a result of such background and experience, the Board believes that Ms. Bates and Mr. Niemiec have each acquired an understanding of generally accepted accounting principles and financial statements, the general application of such principles in connection with the accounting estimates, accruals and reserves, and analyzing and evaluating financial statements that present a breadth and level of complexity of accounting issues generally comparable to those of the Fund, as well as an understanding of internal controls and procedures for financial reporting and an understanding of audit committee functions. Ms. Bates and Mr. Niemiec are independent Board members as that term is defined under the applicable U.S. Securities and Exchange Commission Rules and Releases.
The Statement of Additional Information (SAI) includes additional information about the board members and is available, without charge, upon request. Shareholders may call (800) DIAL BEN/342-5236 to request the SAI.
| 48 | Annual Report | franklintempleton.com | ||
FRANKLIN MUTUAL SERIES FUNDS
FRANKLIN MUTUAL SHARES FUND
Proxy Voting Policies and Procedures
The Fund’s investment manager has established Proxy Voting Policies and Procedures (Policies) that the Fund uses to determine how to vote proxies relating to portfolio securities. Shareholders may view the Fund’s complete Policies online at franklintempleton.com. Alternatively, shareholders may request copies of the Policies free of charge by calling the Proxy Group collect at (954) 527-7678 or by sending a written request to: Franklin Templeton Companies, LLC, 300 S.E. 2nd Street, Fort Lauderdale, FL 33301, Attention: Proxy Group. Copies of the Fund’s proxy voting records are also made available online at franklintempleton.com and posted on the US Securities and Exchange Commission’s website at sec.gov and reflect the most recent 12-month period ended June 30.
Quarterly Statement of Investments
The Trust, on behalf of the Fund, files a complete statement of investments with the US Securities and Exchange Commission for the first and third quarters for each fiscal year on Form N-Q. Shareholders may view the filed Form N-Q by visiting the Commission’s website at sec.gov. The filed form may also be viewed and copied at the Commission’s Public Reference Room in Washington, DC. Information regarding the operations of the Public Reference Room may be obtained by calling (800) SEC-0330.
Householding of Reports and Prospectuses
You will receive the Fund’s financial reports every six months as well as an annual updated summary prospectus (prospectus available upon request). To reduce Fund expenses, we try to identify related shareholders in a household and send only one copy of the financial reports and summary prospectus. This process, called “householding,” will continue indefinitely unless you instruct us otherwise. If you prefer not to have these documents householded, please call us at (800) 632-2301. At any time you may view current prospectuses/summary prospectuses and financial reports on our website. If you choose, you may receive these documents through electronic delivery.
| franklintempleton.com | Annual Report | 49 |
This page intentionally left blank.
This page intentionally left blank.
This page intentionally left blank.
| Annual Report and Shareholder Letter Franklin Mutual Shares Fund
Investment Manager Franklin Mutual Advisers, LLC
Distributor Franklin Templeton Distributors, Inc. (800) DIAL BEN® / 342-5236 franklintempleton.com
Shareholder Services (800) 632-2301 - (Class A, C, R & R6) (800) 448-FUND - (Class Z) |
Authorized for distribution only when accompanied or preceded by a summary prospectus and/or prospectus. Investors should carefully consider a fund’s investment goals, risks, charges and expenses before investing. A prospectus contains this and other information; please read it carefully before investing.
To help ensure we provide you with quality service, all calls to and from our service areas are monitored and/or recorded.
| © 2018 Franklin Templeton Investments. All rights reserved. | 474 A 02/18 |
| Annual Report and Shareholder Letter
December 31, 2017 |

Sign up for electronic delivery at franklintempleton.com/edelivery
Franklin Templeton Investments
Gain From Our Perspective®
At Franklin Templeton Investments, we’re dedicated to one goal: delivering exceptional asset management for our clients. By bringing together multiple, world-class investment teams in a single firm, we’re able to offer specialized expertise across styles and asset classes, all supported by the strength and resources of one of the world’s largest asset managers. This has helped us to become a trusted partner to individual and institutional investors across the globe.
Dear Franklin Mutual Financial Services Fund Shareholder:
Securities markets benefited from a confluence of positive economic, financial and political trends during 2017. The global economy entered a synchronized pace of modest and steady growth, corporate earnings strengthened in the US, Europe and Japan, and US equity market volatility remained at historically low levels. A number of political risks identified at the start of 2017, such as the success of far-right parties in Europe, Brexit negotiations and the Trump administration’s ability to enact its policy agenda, also dissipated or became less immediate for investors as the year progressed. For the year ended December 31, 2017, US stocks, as measured by the Standard & Poor’s® 500 Index (S&P 500®), produced a +21.83% total return.1 Stocks in global developed markets, as measured by the MSCI World Index, returned +23.07%, and investment-grade bonds, as measured by the Bloomberg Barclays US Aggregate Bond Index, posted a +3.54% total return.1
A stellar 2017 for equity markets also pushed up common valuation metrics, such as price-to-earnings. Valuation is a critical factor in our analysis and we always ask ourselves if current and potential investments represent an attractive balance of risk and reward. We remain committed to our long-term perspective and disciplined investment approach as we conduct a rigorous, fundamental analysis of securities with a regular emphasis on investment risk management.
Although the investment landscape appears favorable as we enter 2018, it is worth remembering that securities markets are dynamic and constantly evolving. Therefore, we believe active, professional investment management serves investors well. We also recognize the important role of financial advisors in
1. Source: Morningstar.
See www.franklintempletondatasources.com for additional data provider information.
today’s markets and encourage investors to continue to seek their advice. Amid changing markets and economic conditions, we are confident investors with a well-diversified portfolio and a patient, long-term outlook should be well positioned for the years ahead.
On the following pages, the Fund’s portfolio management team reviews investment decisions that pertain to performance during the past 12 months in light of the economic environment and other factors. Please remember all securities markets fluctuate, as do mutual fund share prices.
We thank you for investing with Franklin Templeton, welcome your questions and comments, and look forward to continuing to serve your investment needs in the years ahead.
Sincerely,

Peter A. Langerman
Chairman, President and Chief Executive Officer
Franklin Mutual Advisers, LLC
This letter reflects our analysis and opinions as of December 31, 2017, unless otherwise indicated. The information is not a complete analysis of every aspect of any market, country, industry, security or fund. Statements of fact are from sources considered reliable.
| Not FDIC Insured | | | May Lose Value | | | No Bank Guarantee |
| franklintempleton.com | Not part of the annual report | 1 |
Annual Report | ||||
| 3 | ||||
| 9 | ||||
| 12 | ||||
| 13 | ||||
| 22 | ||||
| 26 | ||||
| 39 | ||||
| 40 | ||||
| 41 | ||||
| 46 | ||||
Visit franklintempleton.com for fund updates, to access your account, or to find helpful financial planning tools.
2 |
Annual Report |
franklintempleton.com |
Annual Report
Franklin Mutual Financial Services Fund
This annual report for Franklin Mutual Financial Services Fund covers the fiscal year ended December 31, 2017.
Your Fund’s Goal and Main Investments
The Fund seeks capital appreciation, which may occasionally be short term, with income as a secondary goal. Under normal market conditions, the Fund invests at least 80% of its net assets in securities of financial services companies that the investment manager believes are available at market prices less than their intrinsic value. The equity securities in which the Fund invests are primarily common stock with a current focus on mid- and large cap companies. To a lesser extent, the Fund also invests in merger arbitrage securities and the debt and equity of distressed companies. The Fund may invest in foreign securities without limit. The Geographic Composition bar chart on this page lists the leading countries where the Fund invests.
Performance Overview
The Fund’s Class Z shares delivered a cumulative total return of +13.61% for the 12 months ended December 31, 2017. For comparison, the Fund’s primary benchmark, the MSCI World Financials Index (USD), which captures large and midcap representation across 23 developed markets countries, generated a +23.41% total return, while its secondary benchmark, the Standard & Poor’s 500 (S&P 500®) Financials Index, which tracks financials stocks in the S&P 500 Index, posted a +22.18% total return.1 You can find more of the Fund’s performance data in the Performance Summary beginning on page 9.
Performance data represent past performance, which does not guarantee future results. Investment return and principal value will fluctuate, and you may have a gain or loss when you sell your shares. Current performance may differ from figures shown. For most recent month-end performance, go to franklintempleton.com or call (800) 342-5236.
Economic and Market Overview
The global economy grew moderately during the 12-month period under review. In this environment, global developed and
Geographic Composition*
Based on Total Net Assets as of 12/31/17
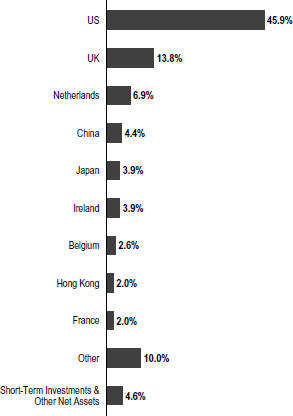
*Figures are stated as a percentage of total and may not equal 100% or may be negative due to rounding, use of any derivatives, unsettled trades or other factors.
emerging market stocks generated a +24.62% total return, as measured by the MSCI All Country World Index.1 Global markets were aided by price gains in oil and other commodities, generally upbeat economic data across regions, the European Central Bank’s (ECB’s) extension of its monetary easing program, and investor optimism about pro-growth and pro-business policies in the US. The prospect for reforms in the European Union (EU) with Emmanuel Macron’s election as
1. Source: Morningstar.
The indexes are unmanaged and include reinvestment of any income or distributions. They do not reflect any fees, expenses or sales charges. One cannot invest directly in an index, and an index is not representative of the Fund’s portfolio.
The dollar value, number of shares or principal amount, and names of all portfolio holdings are listed in the Fund’s Statement of Investments (SOI).
The SOI begins on page 17.
| franklintempleton.com | Annual Report | 3 | ||||
FRANKLIN MUTUAL FINANCIAL SERVICES FUND
France’s president, encouraging corporate earnings reports and the passage of the US tax reform bill also supported global stocks.
However, global markets reflected investor concerns about the terms of the UK’s exit from the EU, political uncertainty in the US and the EU, and geopolitical tensions in the Korean peninsula and other regions. Other concerns included the health of European banks, global oil oversupply despite a pact by major oil-producing countries to extend production cuts, and comments from key central bankers around the world about potentially raising interest rates.
After strengthening in 2017’s second and third quarters, the US economy moderated in the fourth quarter. The economy grew faster in 2017 than in 2016, however, largely due to growth in consumer spending, business investment and exports. The unemployment rate decreased from 4.7% in December 2016, as reported at the beginning of the 12-month period, to 4.1% at period-end.2 Annual inflation, as measured by the Consumer Price Index, was 2.1% in December 2016, as reported at the beginning of the 12-month period, and while it varied over the 12-month period, remained unchanged at period-end.2 The US Federal Reserve (Fed) raised its target range for the federal funds rate 0.25% three times during the period, amid signs of a growing US economy, strengthening labor market and improving business spending. At its December meeting, the Fed confirmed that the monthly balance sheet reduction would increase from US$10 billion to US$20 billion beginning in January 2018.
In Europe, the UK’s economic growth moderated in 2017 compared to 2016, largely due to slower growth in the services sector. In November, the Bank of England raised its key policy rate 0.25%, its first increase in a decade. The eurozone’s growth accelerated in 2017’s second and third quarters, but moderated in the fourth quarter. However, the eurozone’s 2017 economic growth rate of 2.5% was the fastest in a decade.3 The bloc’s annual inflation rate, while low, ended higher than in December 2016. The ECB kept its benchmark interest rate unchanged during the period. However, at its October meeting, the ECB extended the time frame for its massive bond-buying program from December 2017 to at least September 2018, while reducing the amount of monthly bond purchases in half beginning in January 2018.
In Asia, Japan’s quarterly gross domestic product (GDP) grew for the seventh consecutive quarter, although third-quarter 2017 growth was lower than the previous quarter. The Bank of Japan left its benchmark interest rate unchanged during the period and continued its monetary stimulus measures.
In emerging markets, Brazil’s quarterly GDP grew for the third consecutive quarter, although third-quarter 2017 growth slowed from the previous quarter. The country’s central bank cut its benchmark interest rate several times during the period to spur economic growth. Russia’s GDP grew in 2017’s first three quarters compared to the prior-year periods, amid the Bank of Russia’s continued policy support. China’s GDP grew faster in 2017 than in 2016, supported by solid growth in industrial production, services, fixed-asset investment, retail sales, and imports and exports. The People’s Bank of China left its benchmark interest rate unchanged during the period. Overall, emerging market stocks, as measured by the MSCI Emerging Markets Index, produced a substantial +37.75% total return during the period.1
Investment Strategy
We strive to provide investors with superior risk-adjusted returns over time through our distinctive, value investment style, which includes investments in undervalued common stocks, distressed debt and merger arbitrage. Rigorous fundamental analysis drives our investment process. We attempt to determine each investment’s intrinsic value as well as the price at which we would be willing to commit shareholder funds. While valuation remains our key consideration, we utilize numerous fundamental factors such as return on equity, financial leverage and long-term earnings power. We also consider factors such as management quality and competitive position. As always, our approach to investing is as much about assessing risk and containing losses as it is about achieving profits.
In addition, it is our practice to hedge the Fund’s currency exposure when we deem it advantageous for our shareholders.
What is meant by “hedge”?
To hedge an investment is to take a position intended to offset potential losses/gains that may be incurred by a companion financial instrument.
|
2. Source: Bureau of Labor Statistics.
3. Source: Eurostat.
4 |
Annual Report |
franklintempleton.com |
FRANKLIN MUTUAL FINANCIAL SERVICES FUND
What is return on equity?
Return on equity is a measure of profitability, expressed as a percentage, calculated by dividing a company’s net income by total shareholder equity for a given period. Return on equity tells common shareholders how effectually their money is being employed. Comparing percentages for current and prior periods also reveals trends, and comparison with industry composites reveals how well a company is holding its own against its competitors.
|
Manager’s Discussion
In 2017, an improving economic and political backdrop helped drive most equity markets higher. The positive performances were broad based, spanning across most regions and sectors, and complemented by minimal volatility. Global markets were aided by generally upbeat economic data, improved corporate earnings in the US, Europe and Japan, as well as improved industrial commodity prices, most notably crude oil. In addition, the most significant political risks identified by investors heading into 2017 failed to materialize.
In the US, markets began 2017 rallying as investors hoped that a Republican sweep of US elections in November 2016 would lead to a general loosening in regulations and tax reform, including lower corporate tax rates. Although the Trump administration’s policy agenda was hindered by political gridlock, efforts to loosen federal regulations yielded some results and tax reform legislation was finally passed in late December. Improving economic activity and corporate earnings appeared to be the most meaningful equity market catalysts during much of 2017.
European equity markets started 2017 slowly, but positive political events and improved economic data fueled strong performances during the period. Elections in Europe produced outcomes generally regarded as positive economically as far-right parties largely failed to gain political power in national elections. Investors were particularly encouraged by the presidential election outcome in France. The reform-minded, centrist candidate, Emmanuel Macron, won the French presidential election in May and quickly began to push his agenda, most notably labor decrees giving employers in France greater freedom in negotiating contracts directly with workers. Amid all the positive events, the UK remained the most significant outlier. In the UK, a June 2017 snap election resulting in no party having a majority in Parliament appeared to make a “hard Brexit,” in which the UK leaves the European
Union (EU) in March 2019 without a negotiated deal, even more likely than before. Although the UK and EU appeared to make some progress late in the year, the snap election results left the Conservative Party in a precarious position and with the risk of another election in the near future.
While inflation remains generally subdued in developed markets, economic conditions, particularly tighter labor markets, may lead to gradual price level increases, providing major central banks with justification to incrementally move away from their expansive monetary policies. We concur with the general investor view that monetary policy is not likely to change significantly when Federal Reserve (Fed) Governor Jerome Powell assumes his role as the next Fed Chair in February 2018, although some loosening in financial regulation is possible. At the same time, the ECB’s caution in scaling back its quantitative easing program means monetary policy will likely remain relatively accommodative in 2018. In Asia, we believe that the Bank of Japan has not been following through with as much quantitative easing as planned, and China has been tightening.
If the constructive backdrop as of period-end persists, it is likely to be a tailwind for equity markets. However, we are also highly cognizant of elevated levels of overall equity market valuations, such as price-to-earnings, price-to-book or price-to-sales, relative to most historical benchmarks. Elevated valuation levels may raise the overall risk profile of equity markets, particularly should the backdrop change due to some geopolitical event, greater-than-expected interest rate hikes, or other unexpected factors.
Within the US financials sector, we believe companies moved toward being fully valued in 2017, particularly regional banks.4 The Portfolio Composition bar chart on page 6 lists banks, insurance and other leading industries in which the Fund currently invests. At this point, we believe merger and acquisition activity will likely be an increasingly important catalyst of individual stock price performance. We also think larger banks have better operating leverage that may positively impact return metrics.
Although returns at foreign banks have been under pressure from a combination of low interest rates, anemic credit growth and greater regulatory capital and liquidity requirements, we think more investment opportunities are likely to be found abroad. We believe the regulatory and rate cycles are turning, which will likely create opportunities among European banks.
4. The financials sector comprises banks, capital markets, consumer finance, diversified financial services, insurance, and thrifts and mortgage finance in the SOI.
| franklintempleton.com |
Annual Report | 5 |
FRANKLIN MUTUAL FINANCIAL SERVICES FUND
Some European banks have recently adjusted their business models, a process that took place in the US more than five years ago, which gives investors greater clarity on future opportunities. However, the uncertainty of Brexit negotiations still hangs over the UK.
In China, efforts to rein in the financial system due to the rapid growth in debt and to shift the economy’s leading driver of growth from capital investment toward domestic consumption, have picked up steam. As part of the process, more bankruptcies among state-owned enterprises, local government financing vehicles and small banks are possible, in our view. Although the current environment for China’s lenders is filled with uncertainty, we believe China will be in much better shape in time. At the same time, life insurers are likely to benefit from tighter liquidity conditions which may help foster higher investment returns. Demand for life insurance has been growing at a rapid pace in China as the quality of life has been improving and consumers have been looking to create a stronger safety net given the trends in mortality and morbidity.
Although the Japanese banking industry is challenged by very low margins, the life insurance industry has survived a period of negative interest rates, and we believe would benefit meaningfully if rates at the long end of the yield curve were allowed to move higher. We see this as more likely than a move in overnight rates.
Fund Performance
Turning to Fund performance, top positive contributors included Netherlands-based insurer ASR Nederland, Japan-based real estate asset management company Kenedix and India-based Indiabulls Housing Finance. ASR Nederland is listed among the Fund’s largest positions in the Top 10 Equity Holdings table on page 7.
Shares of ASR Nederland steadily rose during most of the period, aided by a series of solid quarterly results. Operating results were aided by ASR Nederland’s efforts to increase the investment risk of its portfolio by shifting invested insurance policy premiums from traditional fixed income securities to equities and other assets with higher historical returns. In February 2017, ASR Nederland announced it would increase its dividend and repurchase shares on offer from the Dutch government, shares the government had acquired during the 2008 financial crisis. The company announced an additional
Portfolio Composition*
Based on Total Net Assets as of 12/31/17
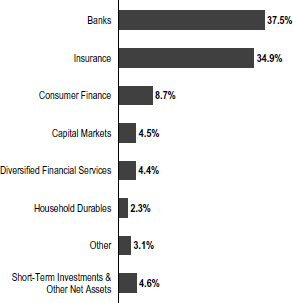
*Figures are stated as a percentage of total and may not equal 100% or may be negative due to rounding, use of any derivatives, unsettled trades or other factors.
share buyback plan in May 2017. In our view, the buybacks demonstrated ASR Nederland’s strong capital position.
The stock price of Kenedix began to rally in April 2017 on activist investor Elliott Management’s5 disclosure that it joined the shareholder register. The addition of Elliott Management led to a positive shift in investor perception. The real estate sector in Japan came under some temporary pressure in the middle of 2017 as Japan’s Financial Services Agency (FSA) raised concerns about whether the structure of Japanese real estate investment trust (REIT) funds served investors’ best interests.6 The FSA’s statements led to significant investment outflows from REIT mutual funds, which put downward pressure on shares of Kenedix and its peers. We subsequently exited the position when the stock price rallied to our target. The stock price appreciated as Japan’s property market remained healthy and Kenedix became the target of takeover speculation when ARA Asset Management5 acquired over 20% of the shares.
Indiabulls Housing Finance is India’s third largest mortgage financing company. We initiated a position when investors were concerned about the impact on Indiabulls of the Indian
5. Not a Fund holding.
6. The real estate sector comprises equity REITs and real estate management and development in the SOI.
See www.franklintempletondatasources.com for additional data provider information.
| 6 |
Annual Report | franklintempleton.com |
FRANKLIN MUTUAL FINANCIAL SERVICES FUND
| Top 10 Equity Holdings | ||||
| 12/31/17 | ||||
Company Sector/Industry, Country | % of Total Net Assets | |||
NN Group NV | 3.9% | |||
| Insurance, Netherlands | ||||
Capital One Financial Corp. | 3.6% | |||
| Consumer Finance, US | ||||
Citizens Financial Group Inc. | 3.5% | |||
| Banks, US | ||||
The Hartford Financial Services Group Inc. | 3.4% | |||
| Insurance, US | ||||
Direct Line Insurance Group PLC | 3.2% | |||
| Insurance, UK | ||||
Wells Fargo & Co. | 3.2% | |||
| Banks, US | ||||
American International Group Inc. | 3.1% | |||
| Insurance, US | ||||
Voya Financial Inc. | 3.1% | |||
| Diversified Financial Services, US | ||||
ASR Nederland NV | 3.0% | |||
| Insurance, Netherlands | ||||
SunTrust Banks Inc. | 2.9% | |||
| Banks, US | ||||
government’s 2016 recall of 500- and 1,000-rupee notes, despite the company’s business being essentially cashless. Indiabulls has continued to execute well in a favorable environment as the government has created effective interest rates of well below 3% for borrowers in the affordable housing segment, the company’s area of focus. Investors also reacted positively to credit rating upgrades in 2017 as they help reduce the company’s cost of borrowing and boost profitability.
During the period under review, Fund investments that detracted from performance included Japan-based residential developer Takara Leben and China-based consumer finance companies Qudian and PPDAI Group.
Takara Leben is a midsized condominium developer in Japan that has been rapidly expanding its solar farm capacity. The stock price dropped in the first quarter of 2017 after investors reacted sharply to a small downward adjustment to fiscal year revenue guidance due to a delay in the sales of solar power plants. We believe Takara has not been utilizing its cost advantage in the residential real estate market to the fullest extent. In our view, Takara has also failed to accelerate the completion of units in a favorable market environment. Moreover, we do not believe it has been selling solar assets at full value. Consequently, we exited the position by period-end.
Qudian, China’s largest online microlender, went public in the US in October 2017. A number of subsequent events, which we
believe were misunderstood by the market, drove the share price down. China’s government suspended regulatory approvals of new internet microlending licenses, elevating a barrier to entry and improving the position of this established low cost leader, in our view. Alipay,5 a Chinese internet payments platform, announced an interest rate cap of 24%; the rate cap effectively takes Alipay out of the market for customers underwritten by Qudian who would not qualify for loans at 24%. Subsequently, China’s government prohibited unlicensed lending and capped borrowing costs to 36%, the same cap level implemented by Qudian in April 2017. Although it is possible Qudian could see a short-term increase in bad debts from a credit crunch in the unsecured consumer credit market, we see the regulatory changes as a long-term positive move. Qudian is among the most established microlenders with strong brand recognition and operational performance.
PPDAI Group, one of China’s largest online consumer credit platforms, went public in the US in November 2017. PPDAI facilitates person-to-person (P2P) lending between investors and borrowers, unlike online microlender Qudian that lends directly to consumers. In our view, few investors have yet made the important distinction between PPDAI and Qudian. PPDAI’s customers make P2P loans at rates above the 36% cap, requiring adjustments to comply with China’s new lending rules. Nonetheless, we view PPDAI as a well-organized, low-cost provider of consumer credit services that generates significant free cash flow. We believe it is highly likely, given its technology and industry practices, that PPDAI will be one of the P2P lending platforms given a license by the Chinese government at the beginning of 2018, which could position it well for any upcoming industry consolidation, in our view.
During the period, the Fund held currency forwards and futures seeking to hedge most of the currency risk of the portfolio’s non-US dollar investments. The currency forwards and futures had a negative impact on the Fund’s performance because of the depreciation of the US dollar versus the hedged currencies.
What is a currency forward?
A currency forward is an agreement between the Fund and a counterparty to buy or sell a foreign currency in exchange for another currency at a specific exchange rate on a future date.
|
| franklintempleton.com | Annual Report | 7 |
FRANKLIN MUTUAL FINANCIAL SERVICES FUND
What is a future?
A future is an agreement between the Fund and a counterparty made through a US or foreign futures exchange to buy or sell an underlying instrument or asset at a specific price on a future date.
|
Thank you for your participation in Franklin Mutual Financial Services Fund. We look forward to continuing to serve your investment needs.
 |
Andrew Sleeman, CFA Portfolio Manager | |
 |
Andrew B. Dinnhaupt, CFA Assistant Portfolio Manager | |
 |
Richard Cetlin Assistant Portfolio Manager | |


The foregoing information reflects our analysis, opinions and portfolio holdings as of December 31, 2017, the end of the reporting period. The way we implement our main investment strategies and the resulting portfolio holdings may change depending on factors such as market and economic conditions. These opinions may not be relied upon as investment advice or an offer for a particular security. The information is not a complete analysis of every aspect of any market, country, industry, security or the Fund. Statements of fact are from sources considered reliable, but the investment manager makes no representation or warranty as to their completeness or accuracy. Although historical performance is no guarantee of future results, these insights may help you understand our investment management philosophy.
CFA® is a trademark owned by CFA Institute.
Andrew Sleeman has been portfolio manager for Franklin Mutual Financial Services Fund since 2009. He has also been a co-portfolio manager for Franklin Mutual International Fund since 2009. Mr. Sleeman joined Franklin Templeton Investments in 2007. Previously, he was with Fox-Pitt, Kelton, a financials specialist firm, where he focused on international financial equities. Prior to that, he worked in international equities at BNP Paribas. Mr. Sleeman also worked in Australia in the fixed income division of JP Morgan Investment Management.
|
Andrew Dinnhaupt has been assistant portfolio manager for Franklin Mutual Financial Services Fund since December 2013 and has been an analyst for Franklin Mutual Advisers since 2011, specializing in the global insurance industry. Previously, Mr. Dinnhaupt was a portfolio manager and senior analyst covering the global financial services sector for RBC Capital Markets. Prior to RBC, Mr. Dinnhaupt worked at several hedge funds where he was responsible for analyzing and managing portfolios in the financial services sector. Before that, he worked at Mitchell Hutchins Asset Management where he covered the financial services industry.
|
Richard Cetlin has been assistant portfolio manager for Franklin Mutual Financial Services Fund since 2010 with primary coverage of European banks. Prior to joining Franklin Templeton Investments in 2010, Mr. Cetlin was a consultant for Asian Century Quest, a hedge fund focused on the Asia-Pacific region. In this role, he focused on the analysis of banking, insurance and real estate stocks in China and banking stocks in Hong Kong and Korea. Prior to that, Mr. Cetlin worked for 14 years at AllianceBernstein where he was a senior vice president and senior analyst for U.S. banking and specialty finance.
|
8 |
Annual Report |
franklintempleton.com |
FRANKLIN MUTUAL FINANCIAL SERVICES FUND
Performance Summary as of December 31, 2017
The performance table and graphs do not reflect any taxes that a shareholder would pay on Fund dividends, capital gain distributions, if any, or any realized gains on the sale of Fund shares. Total return reflects reinvestment of the Fund’s dividends and capital gain distributions, if any, and any unrealized gains or losses. Your dividend income will vary depending on dividends or interest paid by securities in the Fund’s portfolio, adjusted for operating expenses of each class. Capital gain distributions are net profits realized from the sale of portfolio securities.
Performance as of 12/31/17
Cumulative total return excludes sales charges. Average annual total return includes maximum sales charges. Sales charges will vary depending on the size of the investment and the class of share purchased. The maximum is 5.75% and the minimum is 0%. Class A: 5.75% maximum initial sales charge. For other share classes, visit franklintempleton.com.
| Share Class | Cumulative Total Return1 | Average Annual Total Return2 | ||||||||||
| ||||||||||||
Z
| ||||||||||||
1-Year
| +13.61%3 | +13.61%3 | ||||||||||
5-Year
| +92.33% | +13.98% | ||||||||||
10-Year
| +62.55% | +4.98% | ||||||||||
A
| ||||||||||||
1-Year
| +13.35%3 | +6.81% | ||||||||||
5-Year
| +89.64% | +12.32% | ||||||||||
10-Year
| +57.96% | +4.06% | ||||||||||
Performance data represent past performance, which does not guarantee future results. Investment return and principal value will fluctuate, and you may have a gain or loss when you sell your shares. Current performance may differ from figures shown. For most recent month-end performance, go to franklintempleton.com or call (800) 342-5236.
See page 11 for Performance Summary footnotes.
franklintempleton.com |
Annual Report |
|
9 |
|
FRANKLIN MUTUAL FINANCIAL SERVICES FUND
PERFORMANCE SUMMARY
Total Return Index Comparison for a Hypothetical $10,000 Investment
Total return represents the change in value of an investment over the periods shown. It includes any applicable maximum sales charge, Fund expenses, account fees and reinvested distributions. The unmanaged indexes include reinvestment of any income or distributions. They differ from the Fund in composition and do not pay management fees or expenses. One cannot invest directly in an index.
Class Z (1/1/08–12/31/17)
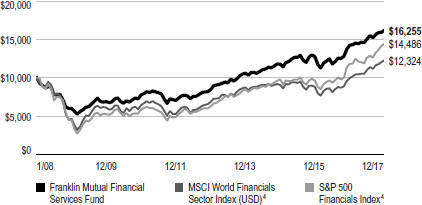
Class A (1/1/08–12/31/17)
See page 11 for Performance Summary footnotes.
| 10 | Annual Report | franklintempleton.com | ||
FRANKLIN MUTUAL FINANCIAL SERVICES FUND
PERFORMANCE SUMMARY
Distributions (1/1/17–12/31/17)
| Share Class | Net Investment Income | |||
| Z | $0.4891 | |||
| A | $0.4284 | |||
| C | $0.2514 | |||
| R6 | $0.5213 | |||
Total Annual Operating Expenses5
| Share Class |
| |||
| Z | 1.13 | % | ||
| A | 1.38 | % | ||
Each class of shares is available to certain eligible investors and has different annual fees and expenses, as described in the prospectus.
All investments involve risks, including possible loss of principal. Value securities may not increase in price as anticipated or may decline further in value. Special risks are associated with foreign investing, including currency fluctuations, economic instability and political developments. Investing in a single-sector fund involves special risks, including greater sensitivity to economic, political or regulatory developments impacting the sector. Because the Fund may invest its assets in companies in a specific region, including Europe, it is subject to greater risks of adverse developments in that region and/or the surrounding regions than a fund that is more broadly diversified geographically. Current political and financial uncertainty surrounding the European Union may increase market volatility and the economic risk of investing in companies in Europe. Smaller company stocks have exhibited greater price volatility than larger company stocks, particularly over the short term. The Fund’s investments in companies engaged in mergers, reorganizations or liquidations also involve special risks as pending deals may not be completed on time or on favorable terms. The Fund may invest in lower rated bonds, which entail higher credit risk. The Fund is actively managed but there is no guarantee that the manager’s investment decisions will produce the desired results. The Fund’s prospectus also includes a description of the main investment risks.
1. Cumulative total return represents the change in value of an investment over the periods indicated.
2. Average annual total return represents the average annual change in value of an investment over the periods indicated. Return for less than one year, if any, has not been annualized.
3. Total return information is based on net asset values calculated for shareholder transactions. Certain adjustments were made to the net assets of the Fund at 12/31/16 for financial reporting purposes, and as a result, the total returns based on those net asset values differ from the adjusted total returns reported in the Financial Highlights.
4. Source: Morningstar. The MSCI World Financials Index (USD) captures large and midcap representation across 23 developed markets countries. The S&P 500 Financials Index is market capitalization-weighted and consists of all financial stocks in the S&P 500. The S&P 500 is a market capitalization-weighted index of 500 stocks designed to measure total US equity market performance.
5. Figures are as stated in the Fund’s current prospectus and may differ from the expense ratios disclosed in the Your Fund’s Expenses and Financial Highlights sections in this report. In periods of market volatility, assets may decline significantly, causing total annual Fund operating expenses to become higher than the figures shown.
See www.franklintempletondatasources.com for additional data provider information.
franklintempleton.com | Annual Report |
|
11 |
| ||
FRANKLIN MUTUAL FINANCIAL SERVICES FUND
As a Fund shareholder, you can incur two types of costs: (1) transaction costs, including sales charges (loads) on Fund purchases and redemptions; and (2) ongoing Fund costs, including management fees, distribution and service (12b-1) fees, and other Fund expenses. All mutual funds have ongoing costs, sometimes referred to as operating expenses. The table below shows ongoing costs of investing in the Fund and can help you understand these costs and compare them with those of other mutual funds. The table assumes a $1,000 investment held for the six months indicated.
Actual Fund Expenses
The table below provides information about actual account values and actual expenses in the columns under the heading “Actual.” In these columns the Fund’s actual return, which includes the effect of Fund expenses, is used to calculate the “Ending Account Value” for each class of shares. You can estimate the expenses you paid during the period by following these steps (of course, your account value and expenses will differ from those in this illustration): Divide your account value by $1,000 (if your account had an $8,600 value, then $8,600 ÷ $1,000 = 8.6). Then multiply the result by the number in the row for your class of shares under the headings “Actual” and “Expenses Paid During Period” (if Actual Expenses Paid During Period were $7.50, then 8.6 x $7.50 = $64.50). In this illustration, the actual expenses paid this period are $64.50.
Hypothetical Example for Comparison with Other Funds
Under the heading “Hypothetical” in the table, information is provided about hypothetical account values and hypothetical expenses based on the Fund’s actual expense ratio and an assumed rate of return of 5% per year before expenses, which is not the Fund’s actual return. This information may not be used to estimate the actual ending account balance or expenses you paid for the period, but it can help you compare ongoing costs of investing in the Fund with those of other funds. To do so, compare this 5% hypothetical example for the class of shares you hold with the 5% hypothetical examples that appear in the shareholder reports of other funds.
Please note that expenses shown in the table are meant to highlight ongoing costs and do not reflect any transactional costs. Therefore, information under the heading “Hypothetical” is useful in comparing ongoing costs only, and will not help you compare total costs of owning different funds. In addition, if transactional costs were included, your total costs would have been higher.
| Actual (actual return after expenses) | Hypothetical (5% annual return before expenses) | |||||||||||||||||
| Share Class | Beginning Account Value 7/1/17 | Ending Account Value 12/31/17 | Expenses Paid During Period 7/1/17–12/31/171,2 | Ending Account Value 12/31/17 | Expenses Paid During Period 7/1/17–12/31/171,2 | Net Annualized Expense Ratio2 | ||||||||||||
| Z | $1,000 | $1,076.50 | $ 5.70 | $1,019.71 | $ 5.55 | 1.09% | ||||||||||||
| A | $1,000 | $1,075.10 | $ 7.01 | $1,018.45 | $ 6.82 | 1.34% | ||||||||||||
| C | $1,000 | $1,071.00 | $10.91 | $1,014.67 | $10.61 | 2.09% | ||||||||||||
| R6 | $1,000 | $1,077.40 | $ 5.03 | $1,020.37 | $ 4.89 | 0.96% | ||||||||||||
1. Expenses are equal to the annualized expense ratio for the six-month period as indicated above—in the far right column—multiplied by the simple average account value over the period indicated, and then multiplied by 184/365 to reflect the one-half year period.
2. Reflects expenses after fee waivers and expense reimbursements. Does not include acquired fund fees and expenses.
12 |
Annual Report |
franklintempleton.com |
FRANKLIN MUTUAL FINANCIAL SERVICES FUND
| Year Ended December 31, | ||||||||||||||||||||||||
|
| |||||||||||||||||||||||
| 2017 | 2016 | 2015 | 2014 | 2013 | ||||||||||||||||||||
| ||||||||||||||||||||||||
| Class Z | ||||||||||||||||||||||||
| Per share operating performance (for a share outstanding throughout the year) | ||||||||||||||||||||||||
Net asset value, beginning of year | $21.65 | $19.63 | $18.40 | $16.90 | $13.59 | |||||||||||||||||||
|
| |||||||||||||||||||||||
Income from investment operationsa: | ||||||||||||||||||||||||
Net investment incomeb | 0.22 | 0.31 | c | 0.30 | d | 0.25 | 0.24 | |||||||||||||||||
Net realized and unrealized gains (losses) | 2.76 | 2.00 | 1.23 | 1.62 | 3.24 | |||||||||||||||||||
|
| |||||||||||||||||||||||
Total from investment operations | 2.98 | 2.31 | 1.53 | 1.87 | 3.48 | |||||||||||||||||||
|
| |||||||||||||||||||||||
Less distributions from net investment income | (0.49 | ) | (0.29 | ) | (0.30 | ) | (0.37 | ) | (0.17 | ) | ||||||||||||||
|
| |||||||||||||||||||||||
Net asset value, end of year | $24.14 | $21.65 | $19.63 | $18.40 | $16.90 | |||||||||||||||||||
|
| |||||||||||||||||||||||
Total return | 13.77% | 11.79% | 8.34% | 11.07% | 25.67% | |||||||||||||||||||
| Ratios to average net assets | ||||||||||||||||||||||||
Expensese | 1.09% | 1.13% | f | 1.13% | 1.14% | 1.16% | ||||||||||||||||||
Net investment income | 0.95% | 1.64% | c | 1.53% | d | 1.44% | 1.51% | |||||||||||||||||
| Supplemental data | ||||||||||||||||||||||||
Net assets, end of year (000’s) | $210,825 | $162,687 | $178,157 | $112,156 | $105,279 | |||||||||||||||||||
Portfolio turnover rate | 67.89% | 34.58% | 25.43% | 33.69% | 25.73% | |||||||||||||||||||
aThe amount shown for a share outstanding throughout the period may not correlate with the Statement of Operations for the period due to the timing of sales and repurchases of the Fund’s shares in relation to income earned and/or fluctuating fair value of the investments of the Fund.
bBased on average daily shares outstanding.
cNet investment income per share includes approximately $0.05 per share related to income received in the form of special dividends in connection with certain Fund holdings. Excluding this amount, the ratio of net investment income to average net assets would have been 1.38%.
dNet investment income per share includes approximately $0.14 per share related to income received in the form of special dividends in connection with certain Fund holdings. Excluding this amount, the ratio of net investment income to average net assets would have been 0.81%.
eBenefit of expense reduction rounds to less than 0.01%.
fBenefit of waiver and payments by affiliates rounds to less than 0.01%.
franklintempleton.com |
The accompanying notes are an integral part of these financial statements. | |
Annual Report |
13 |
FRANKLIN MUTUAL FINANCIAL SERVICES FUND
FINANCIAL HIGHLIGHTS
| Year Ended December 31, | ||||||||||||||||||||||||
|
| |||||||||||||||||||||||
| 2017 | 2016 | 2015 | 2014 | 2013 | ||||||||||||||||||||
| ||||||||||||||||||||||||
| Class A | ||||||||||||||||||||||||
| Per share operating performance (for a share outstanding throughout the year) | ||||||||||||||||||||||||
Net asset value, beginning of year | $21.70 | $19.69 | $18.46 | $16.96 | $13.64 | |||||||||||||||||||
|
| |||||||||||||||||||||||
Income from investment operationsa: | ||||||||||||||||||||||||
Net investment incomeb | 0.16 | 0.26 | c | 0.25 | d | 0.20 | 0.19 | |||||||||||||||||
Net realized and unrealized gains (losses) | 2.78 | 1.99 | 1.23 | 1.61 | 3.26 | |||||||||||||||||||
|
| |||||||||||||||||||||||
Total from investment operations | 2.94 | 2.25 | 1.48 | 1.81 | 3.45 | |||||||||||||||||||
|
| |||||||||||||||||||||||
Less distributions from net investment income | (0.43 | ) | (0.24 | ) | (0.25 | ) | (0.31 | ) | (0.13 | ) | ||||||||||||||
|
| |||||||||||||||||||||||
Net asset value, end of year | $24.21 | $21.70 | $19.69 | $18.46 | $16.96 | |||||||||||||||||||
|
| |||||||||||||||||||||||
Total returne | 13.55% | 11.46% | 8.05% | 10.71% | 25.32% | |||||||||||||||||||
| Ratios to average net assets | ||||||||||||||||||||||||
Expensesf | 1.34% | 1.38% | g | 1.41% | 1.44% | 1.46% | ||||||||||||||||||
Net investment income | 0.70% | 1.39% | c | 1.25% | d | 1.14% | 1.21% | |||||||||||||||||
| Supplemental data | ||||||||||||||||||||||||
Net assets, end of year (000’s) | $368,850 | $346,008 | $360,278 | $255,242 | $240,529 | |||||||||||||||||||
Portfolio turnover rate | 67.89% | 34.58% | 25.43% | 33.69% | 25.73% | |||||||||||||||||||
aThe amount shown for a share outstanding throughout the period may not correlate with the Statement of Operations for the period due to the timing of sales and repurchases of the Fund’s shares in relation to income earned and/or fluctuating fair value of the investments of the Fund.
bBased on average daily shares outstanding.
cNet investment income per share includes approximately $0.05 per share related to income received in the form of special dividends in connection with certain Fund holdings. Excluding this amount, the ratio of net investment income to average net assets would have been 1.13%.
dNet investment income per share includes approximately $0.14 per share related to income received in the form of special dividends in connection with certain Fund holdings. Excluding this amount, the ratio of net investment income to average net assets would have been 0.53%.
eTotal return does not reflect sales commissions or contingent deferred sales charges, if applicable.
fBenefit of expense reduction rounds to less than 0.01%.
gBenefit of waiver and payments by affiliates rounds to less than 0.01%.
14 |
Annual Report | The accompanying notes are an integral part of these financial statements. |
franklintempleton.com |
FRANKLIN MUTUAL FINANCIAL SERVICES FUND
FINANCIAL HIGHLIGHTS
| Year Ended December 31, | ||||||||||||||||||||||||
|
| |||||||||||||||||||||||
| 2017 | 2016 | 2015 | 2014 | 2013 | ||||||||||||||||||||
| ||||||||||||||||||||||||
| Class C | ||||||||||||||||||||||||
| Per share operating performance (for a share outstanding throughout the year) | ||||||||||||||||||||||||
Net asset value, beginning of year | $21.60 | $19.61 | $18.41 | $16.92 | $13.61 | |||||||||||||||||||
|
| |||||||||||||||||||||||
Income from investment operationsa: | ||||||||||||||||||||||||
Net investment income (loss)b | (0.01 | ) | 0.12 | c | 0.10 | d | 0.08 | 0.08 | ||||||||||||||||
Net realized and unrealized gains (losses) | 2.74 | 1.96 | 1.24 | 1.60 | 3.25 | |||||||||||||||||||
|
| |||||||||||||||||||||||
Total from investment operations | 2.73 | 2.08 | 1.34 | 1.68 | 3.33 | |||||||||||||||||||
|
| |||||||||||||||||||||||
Less distributions from net investment income | (0.25 | ) | (0.09 | ) | (0.14 | ) | (0.19 | ) | (0.02 | ) | ||||||||||||||
|
| |||||||||||||||||||||||
Net asset value, end of year | $24.08 | $21.60 | $19.61 | $18.41 | $16.92 | |||||||||||||||||||
|
| |||||||||||||||||||||||
Total returne | 12.66% | 10.64% | 7.30% | 9.93% | 24.50% | |||||||||||||||||||
| Ratios to average net assets | ||||||||||||||||||||||||
Expensesf | 2.09% | 2.13% | g | 2.13% | 2.14% | 2.16% | ||||||||||||||||||
Net investment income (loss) | (0.05)% | 0.64% | c | 0.53% | d | 0.44% | 0.51% | |||||||||||||||||
| Supplemental data | ||||||||||||||||||||||||
Net assets, end of year (000’s) | $134,117 | $128,766 | $132,975 | $89,341 | $86,370 | |||||||||||||||||||
Portfolio turnover rate | 67.89% | 34.58% | 25.43% | 33.69% | 25.73% | |||||||||||||||||||
aThe amount shown for a share outstanding throughout the period may not correlate with the Statement of Operations for the period due to the timing of sales and repurchases of the Fund’s shares in relation to income earned and/or fluctuating fair value of the investments of the Fund.
bBased on average daily shares outstanding.
cNet investment income per share includes approximately $0.05 per share related to income received in the form of special dividends in connection with certain Fund holdings. Excluding this amount, the ratio of net investment income to average net assets would have been 0.38%.
dNet investment income per share includes approximately $0.14 per share related to income received in the form of special dividends in connection with certain Fund holdings. Excluding this amount, the ratio of net investment income to average net assets would have been (0.19)%.
eTotal return does not reflect sales commissions or contingent deferred sales charges, if applicable.
fBenefit of expense reduction rounds to less than 0.01%.
gBenefit of waiver and payments by affiliates rounds to less than 0.01%.
franklintempleton.com |
The accompanying notes are an integral part of these financial statements. | |
Annual Report |
15 |
FRANKLIN MUTUAL FINANCIAL SERVICES FUND
FINANCIAL HIGHLIGHTS
| Year Ended December 31, | ||||||||||||||||||||||||
|
| |||||||||||||||||||||||
| 2017 | 2016 | 2015 | 2014 | 2013a | ||||||||||||||||||||
| ||||||||||||||||||||||||
| Class R6 | ||||||||||||||||||||||||
| Per share operating performance (for a share outstanding throughout the year) | ||||||||||||||||||||||||
Net asset value, beginning of year | $21.79 | $19.76 | $18.52 | $16.88 | $14.89 | |||||||||||||||||||
|
| |||||||||||||||||||||||
Income from investment operationsb: | ||||||||||||||||||||||||
Net investment incomec | 0.25 | 0.32 | d | 0.07 | e | 0.25 | 0.13 | |||||||||||||||||
Net realized and unrealized gains (losses) | 2.78 | 2.03 | 1.49 | 1.66 | 2.07 | |||||||||||||||||||
|
| |||||||||||||||||||||||
Total from investment operations | 3.03 | 2.35 | 1.56 | 1.91 | 2.20 | |||||||||||||||||||
|
| |||||||||||||||||||||||
Less distributions from net investment income | (0.52 | ) | (0.32 | ) | (0.32 | ) | (0.27 | ) | (0.21 | ) | ||||||||||||||
|
| |||||||||||||||||||||||
Net asset value, end of year | $24.30 | $21.79 | $19.76 | $18.52 | $16.88 | |||||||||||||||||||
|
| |||||||||||||||||||||||
Total returnf | 13.92% | 11.93% | 8.55% | 11.23% | 14.86% | |||||||||||||||||||
| Ratios to average net assetsg | ||||||||||||||||||||||||
Expenses before waiver and payments by affiliates | 0.97% | 0.99% | 1.16% | 2.61% | 2.18% | |||||||||||||||||||
Expenses net of waiver and payments by affiliatesh | 0.95% | 0.96% | 0.96% | 0.97% | 0.97% | |||||||||||||||||||
Net investment income | 1.09% | 1.81% | d | 1.70% | e | 1.61% | 1.70% | |||||||||||||||||
| Supplemental data | ||||||||||||||||||||||||
Net assets, end of year (000’s) | $4,523 | $2,601 | $1,421 | $12 | $6 | |||||||||||||||||||
Portfolio turnover rate | 67.89% | 34.58% | 25.43% | 33.69% | 25.73% | |||||||||||||||||||
aFor the period May 1, 2013 (effective date) to December 31, 2013.
bThe amount shown for a share outstanding throughout the period may not correlate with the Statement of Operations for the period due to the timing of sales and repurchases of the Fund’s shares in relation to income earned and/or fluctuating fair value of the investments of the Fund.
cBased on average daily shares outstanding.
dNet investment income per share includes approximately $0.05 per share related to income received in the form of special dividends in connection with certain Fund holdings. Excluding this amount, the ratio of net investment income to average net assets would have been 1.55%.
eNet investment income per share includes approximately $0.14 per share related to income received in the form of special dividends in connection with certain Fund holdings. Excluding this amount, the ratio of net investment income to average net assets would have been 0.98%.
fTotal return is not annualized for periods less than one year.
gRatios are annualized for periods less than one year.
hBenefit of expense reduction rounds to less than 0.01%.
16 |
Annual Report | The accompanying notes are an integral part of these financial statements. |
franklintempleton.com |
FRANKLIN MUTUAL FINANCIAL SERVICES FUND
Statement of Investments, December 31, 2017
| Country | Shares/ Units | Value | ||||||||||||
| Common Stocks and Other Equity Interests 95.4% | ||||||||||||||
| Banks 37.5% | ||||||||||||||
a,b | AB&T Financial Corp. | United States | 226,100 | $ | 128,877 | |||||||||
AIB Group PLC | Ireland | 1,254,659 | 8,279,370 | |||||||||||
Barclays PLC | United Kingdom | 5,856,542 | 16,063,112 | |||||||||||
BB&T Corp. | United States | 144,100 | 7,164,652 | |||||||||||
CIT Group Inc. | United States | 419,311 | 20,642,680 | |||||||||||
Citigroup Inc. | United States | 243,810 | 18,141,902 | |||||||||||
Citizens Financial Group Inc. | United States | 600,000 | 25,188,000 | |||||||||||
a | FCB Financial Holdings Inc., A | United States | 224,087 | 11,383,620 | ||||||||||
First Horizon National Corp. | United States | 425,229 | 8,500,328 | |||||||||||
Guaranty Bancorp | United States | 266,761 | 7,375,942 | |||||||||||
HSBC Holdings PLC | United Kingdom | 1,604,742 | 16,619,673 | |||||||||||
JPMorgan Chase & Co. | United States | 172,980 | 18,498,481 | |||||||||||
Shinsei Bank Ltd. | Japan | 1,134,000 | 19,613,666 | |||||||||||
Societe Generale SA | France | 269,809 | 13,936,011 | |||||||||||
Southern National Bancorp of Virginia Inc. | United States | 547,560 | 8,777,387 | |||||||||||
a | Standard Chartered PLC | United Kingdom | 1,219,301 | 12,845,166 | ||||||||||
State Bank Financial Corp. | United States | 416,160 | 12,418,214 | |||||||||||
SunTrust Banks Inc. | United States | 325,420 | 21,018,878 | |||||||||||
Wells Fargo & Co. | United States | 374,670 | 22,731,229 | |||||||||||
|
| |||||||||||||
| 269,327,188 | ||||||||||||||
|
| |||||||||||||
| Capital Markets 4.5% | ||||||||||||||
Credit Suisse Group AG | Switzerland | 631,414 | 11,275,828 | |||||||||||
a | Guotai Junan Securities Co. Ltd. | China | 3,217,063 | 7,164,722 | ||||||||||
Oslo Bors VPS Holding ASA | Norway | 911,000 | 13,816,482 | |||||||||||
|
| |||||||||||||
| 32,257,032 | ||||||||||||||
|
| |||||||||||||
| Consumer Finance 8.7% | ||||||||||||||
Ally Financial Inc. | United States | 265,200 | 7,733,232 | |||||||||||
Capital One Financial Corp. | United States | 262,010 | 26,090,956 | |||||||||||
c | Hoist Finance AB, 144A | Sweden | 850,396 | 9,563,223 | ||||||||||
a | PPDAI Group Inc., ADR | China | 851,710 | 6,055,658 | ||||||||||
a | Qudian Inc., ADR | China | 340,647 | 4,271,714 | ||||||||||
Sun Hung Kai & Co. Ltd. | Hong Kong | 14,145,704 | 9,034,739 | |||||||||||
|
| |||||||||||||
| 62,749,522 | ||||||||||||||
|
| |||||||||||||
| Diversified Financial Services 4.4% | ||||||||||||||
First Pacific Co. Ltd. | Hong Kong | 7,786,902 | 5,282,398 | |||||||||||
a,d,e | Hightower Holding LLC, B, I | United States | 1,815,233 | 2,222,571 | ||||||||||
a,d,e | Hightower Holding LLC, B, Series II | United States | 791,396 | 1,882,573 | ||||||||||
Voya Financial Inc. | United States | 449,050 | 22,214,503 | |||||||||||
|
| |||||||||||||
| 31,602,045 | ||||||||||||||
|
| |||||||||||||
| Equity Real Estate Investment Trusts (REITs) 1.6% | ||||||||||||||
Hibernia REIT PLC | Ireland | 6,309,142 | 11,536,237 | |||||||||||
|
| |||||||||||||
| Household Durables 2.3% | ||||||||||||||
a | Cairn Homes PLC | Ireland | 3,444,859 | 8,080,293 | ||||||||||
a,c | Neinor Homes SA, 144A | Spain | 380,000 | 8,343,409 | ||||||||||
|
| |||||||||||||
| 16,423,702 | ||||||||||||||
|
| |||||||||||||
| Insurance 34.9% | ||||||||||||||
Ageas | Belgium | 383,978 | 18,757,271 | |||||||||||
a | Alleghany Corp. | United States | 34,937 | 20,825,596 | ||||||||||
American International Group Inc. | United States | 375,458 | 22,369,788 | |||||||||||
ASR Nederland NV | Netherlands | 525,829 | 21,642,670 | |||||||||||
franklintempleton.com |
Annual Report |
|
17 |
|
FRANKLIN MUTUAL FINANCIAL SERVICES FUND
STATEMENT OF INVESTMENTS
| Country | Shares/ Units | Value | ||||||||||||
| Common Stocks and Other Equity Interests (continued) | ||||||||||||||
| Insurance (continued) | ||||||||||||||
a | Brighthouse Financial Inc. | United States | 17,970 | $ | 1,053,761 | |||||||||
China Pacific Insurance Group Co. Ltd., H | China | 2,979,740 | 14,321,181 | |||||||||||
Chubb Ltd. | United States | 64,950 | 9,491,144 | |||||||||||
Direct Line Insurance Group PLC | United Kingdom | 4,411,555 | 22,740,100 | |||||||||||
The Hartford Financial Services Group Inc. | United States | 439,772 | 24,750,368 | |||||||||||
Korean Reinsurance Co. | South Korea | 474,730 | 4,892,404 | |||||||||||
Lancashire Holdings Ltd. | United Kingdom | 1,184,720 | 10,911,353 | |||||||||||
MetLife Inc. | United States | 197,670 | 9,994,195 | |||||||||||
NN Group NV | Netherlands | 643,498 | 27,887,130 | |||||||||||
RSA Insurance Group PLC | United Kingdom | 1,347,824 | 11,512,569 | |||||||||||
a | Sabre Insurance Group PLC | United Kingdom | 2,280,794 | 8,377,867 | ||||||||||
T&D Holdings Inc. | Japan | 504,169 | 8,621,677 | |||||||||||
XL Group Ltd. | Bermuda | 361,012 | 12,693,182 | |||||||||||
|
| |||||||||||||
| 250,842,256 | ||||||||||||||
|
| |||||||||||||
| Real Estate Management & Development 0.1% | ||||||||||||||
a | Dolphin Capital Investors Ltd. | Greece | 3,979,650 | 369,484 | ||||||||||
|
| |||||||||||||
| Thrifts & Mortgage Finance 1.4% | ||||||||||||||
Indiabulls Housing Finance Ltd. | India | 515,498 | 9,662,358 | |||||||||||
|
| |||||||||||||
| Total Common Stocks and Other Equity Interests (Cost $612,954,257) | 684,769,824 | |||||||||||||
|
| |||||||||||||
| Companies in Liquidation 0.0%† | ||||||||||||||
a,d,e | FIM Coinvestor Holdings I, LLC | United States | 4,357,178 | — | ||||||||||
a,f | Lehman Brothers Holdings Inc., Bankruptcy Claim | United States | 7,766,103 | 172,408 | ||||||||||
|
| |||||||||||||
Total Companies in Liquidation (Cost $455,021) | 172,408 | |||||||||||||
|
| |||||||||||||
Total Investments before Short Term Investments | 684,942,232 | |||||||||||||
|
| |||||||||||||
| Principal Amount | ||||||||||||||
| Short Term Investments 5.0% | ||||||||||||||
| U.S. Government and Agency Securities 5.0% | ||||||||||||||
g | FHLB, 1/02/18 | United States | $ | 4,500,000 | 4,500,000 | |||||||||
g | U.S. Treasury Bill, | United States | 25,610,000 | 25,569,136 | ||||||||||
h4/12/18 - 4/19/18 | United States | 6,000,000 | 5,976,064 | |||||||||||
|
| |||||||||||||
| Total U.S. Government and Agency Securities (Cost $36,051,000) | 36,045,200 | |||||||||||||
|
| |||||||||||||
Total Investments (Cost $649,460,278) 100.4% | 720,987,432 | |||||||||||||
Other Assets, less Liabilities (0.4)% | (2,671,101 | ) | ||||||||||||
|
| |||||||||||||
Net Assets 100.0% | $ | 718,316,331 | ||||||||||||
|
| |||||||||||||
18 |
Annual Report |
franklintempleton.com |
FRANKLIN MUTUAL FINANCIAL SERVICES FUND
STATEMENT OF INVESTMENTS
†Rounds to less than 0.1% of net assets.
aNon-income producing.
bSee Note 11 regarding holdings of 5% voting securities.
cSecurity was purchased pursuant to Rule 144A under the Securities Act of 1933 and may be sold in transactions exempt from registration only to qualified institutional buyers or in a public offering registered under the Securities Act of 1933. These securities have been deemed liquid under guidelines approved by the Trust’s Board of Trustees. At December 31, 2017, the aggregate value of these securities was $17,906,632, representing 2.5% of net assets.
dFair valued using significant unobservable inputs. See Note 13 regarding fair value measurements.
eSee Note 9 regarding restricted securities.
fBankruptcy claims represent the right to receive distributions, if any, during the liquidation of the underlying pool of assets. Shares represent amount of allowed unsecured claims.
gThe security was issued on a discount basis with no stated coupon rate.
hA portion or all of the security has been segregated as collateral for open forward exchange contracts. At December 31, 2017, the aggregate value of these securities pledged amounted to $2,626,462, representing 0.4% of net assets.
At December 31, 2017, the Fund had the following futures contracts outstanding. See Note 1(c).
Futures Contracts
| Description | Type | Number of Contracts | Notional Amount* | Expiration Date | Value/ Unrealized Appreciation (Depreciation) | |||||||||||||||
Currency Contracts | ||||||||||||||||||||
EUR/USD | Short | 163 | $ | 24,603,831 | 3/19/18 | $ | (436,161 | ) | ||||||||||||
GBP/USD | Short | 166 | 14,065,388 | 3/19/18 | (92,021 | ) | ||||||||||||||
Total Futures Contracts | $ | (528,182 | ) | |||||||||||||||||
*As of period end.
At December 31, 2017, the Fund had the following forward exchange contracts outstanding. See Note 1(c).
Forward Exchange Contracts
| Currency | Counterpartya | Type | Quantity | Contract Amount | Settlement Date | Unrealized Appreciation | Unrealized Depreciation | |||||||||||||||||||||
OTC Forward Exchange Contracts | ||||||||||||||||||||||||||||
Euro | BOFA | Buy | 2,255,817 | $ | 2,661,413 | 1/12/18 | $ | 47,507 | $ | — | ||||||||||||||||||
Euro | HSBK | Buy | 560,838 | 674,550 | 1/12/18 | — | (1,062 | ) | ||||||||||||||||||||
Euro | HSBK | Buy | 742,504 | 882,570 | 1/12/18 | 9,072 | — | |||||||||||||||||||||
Euro | HSBK | Sell | 4,521,972 | 5,203,997 | 1/12/18 | — | (226,256 | ) | ||||||||||||||||||||
Euro | SSBT | Buy | 453,653 | 539,677 | 1/12/18 | 5,097 | — | |||||||||||||||||||||
Euro | SSBT | Sell | 703,213 | 824,157 | 1/12/18 | — | (20,303 | ) | ||||||||||||||||||||
Euro | UBSW | Buy | 513,386 | 611,526 | 1/12/18 | 4,978 | — | |||||||||||||||||||||
Euro | UBSW | Sell | 4,076,868 | 4,691,312 | 1/12/18 | — | (204,434 | ) | ||||||||||||||||||||
British Pound | BOFA | Buy | 44,758 | 59,787 | 1/16/18 | 696 | — | |||||||||||||||||||||
British Pound | BOFA | Sell | 1,000,000 | 1,292,495 | 1/16/18 | — | (58,818 | ) | ||||||||||||||||||||
British Pound | BONY | Sell | 2,793,255 | 3,612,268 | 1/16/18 | — | (162,294 | ) | ||||||||||||||||||||
British Pound | SSBT | Buy | 316,400 | 423,402 | 1/16/18 | 4,153 | — | |||||||||||||||||||||
British Pound | UBSW | Sell | 2,793,238 | 3,608,863 | 1/16/18 | — | (165,675 | ) | ||||||||||||||||||||
Norwegian Krone | HSBK | Sell | 1,595,000 | 193,140 | 1/25/18 | — | (1,326 | ) | ||||||||||||||||||||
Norwegian Krone | SSBT | Buy | 655,601 | 79,310 | 1/25/18 | 622 | — | |||||||||||||||||||||
Norwegian Krone | SSBT | Sell | 2,548,680 | 307,189 | 1/25/18 | — | (3,551 | ) | ||||||||||||||||||||
Norwegian Krone | SSBT | Sell | 100,208,531 | 12,568,800 | 1/25/18 | 351,184 | — | |||||||||||||||||||||
franklintempleton.com |
Annual Report |
|
19 |
|
FRANKLIN MUTUAL FINANCIAL SERVICES FUND
STATEMENT OF INVESTMENTS
Forward Exchange Contracts (continued)
| Currency | Counterpartya | Type | Quantity | Contract Amount | Settlement Date | Unrealized Appreciation | Unrealized Depreciation | |||||||||||||||||||||
OTC Forward Exchange Contracts (continued) | ||||||||||||||||||||||||||||
Norwegian Krone | UBSW | Sell | 1,835,000 | $ | 224,200 | 1/25/18 | $ | 473 | $ | — | ||||||||||||||||||
Norwegian Krone | UBSW | Sell | 4,485,390 | 536,948 | 1/25/18 | — | (9,920 | ) | ||||||||||||||||||||
Euro | BOFA | Sell | 17,140 | 20,321 | 1/26/18 | — | (280 | ) | ||||||||||||||||||||
Euro | HSBK | Sell | 4,618,125 | 5,436,213 | 1/26/18 | — | (114,409 | ) | ||||||||||||||||||||
Euro | SSBT | Sell | 329,905 | 397,312 | 1/26/18 | 793 | — | |||||||||||||||||||||
Euro | SSBT | Sell | 1,325,476 | 1,565,058 | 1/26/18 | — | (28,061 | ) | ||||||||||||||||||||
Euro | UBSW | Sell | 4,818,766 | 5,668,849 | 1/26/18 | — | (122,928 | ) | ||||||||||||||||||||
Swedish Krona | SSBT | Buy | 1,630,000 | 194,697 | 1/29/18 | 4,404 | — | |||||||||||||||||||||
Swedish Krona | SSBT | Sell | 2,056,260 | 244,720 | 1/29/18 | — | (6,448 | ) | ||||||||||||||||||||
Swedish Krona | SSBT | Sell | 2,780,000 | 340,290 | 1/29/18 | 719 | — | |||||||||||||||||||||
Swedish Krona | UBSW | Sell | 1,667,839 | 200,123 | 1/29/18 | — | (3,600 | ) | ||||||||||||||||||||
Swedish Krona | UBSW | Sell | 71,220,665 | 8,719,357 | 1/29/18 | 19,900 | — | |||||||||||||||||||||
South Korean Won | HSBK | Buy | 142,419,000 | 131,099 | 2/09/18 | 2,420 | — | |||||||||||||||||||||
South Korean Won | HSBK | Sell | 2,267,993,818 | 2,026,985 | 2/09/18 | — | (99,272 | ) | ||||||||||||||||||||
South Korean Won | UBSW | Sell | 2,201,986,346 | 1,966,937 | 2/09/18 | — | (97,438 | ) | ||||||||||||||||||||
British Pound | BOFA | Sell | 3,819,213 | 5,060,792 | 2/14/18 | — | (104,841 | ) | ||||||||||||||||||||
British Pound | BONY | Sell | 9,315,732 | 12,163,421 | 2/14/18 | — | (436,469 | ) | ||||||||||||||||||||
British Pound | HSBK | Sell | 2,517,583 | 3,346,120 | 2/14/18 | — | (59,010 | ) | ||||||||||||||||||||
British Pound | SSBT | Sell | 1,175,099 | 1,557,963 | 2/14/18 | — | (31,404 | ) | ||||||||||||||||||||
British Pound | UBSW | Sell | 7,615,732 | 9,957,989 | 2/14/18 | — | (342,586 | ) | ||||||||||||||||||||
Euro | BOFA | Sell | 19,362 | 23,081 | 2/20/18 | — | (222 | ) | ||||||||||||||||||||
Euro | BONY | Sell | 7,775,735 | 9,192,823 | 2/20/18 | — | (165,966 | ) | ||||||||||||||||||||
Euro | HSBK | Sell | 630,773 | 765,885 | 2/20/18 | 6,694 | — | |||||||||||||||||||||
Euro | HSBK | Sell | 1,488,403 | 1,760,156 | 2/20/18 | — | (31,270 | ) | ||||||||||||||||||||
Euro | SSBT | Sell | 7,599,837 | 8,979,967 | 2/20/18 | — | (167,112 | ) | ||||||||||||||||||||
Japanese Yen | UBSW | Buy | 66,304,178 | 590,423 | 2/20/18 | — | (515 | ) | ||||||||||||||||||||
Japanese Yen | UBSW | Sell | 3,248,003,841 | 28,986,447 | 2/20/18 | 88,983 | — | |||||||||||||||||||||
Swiss Franc | UBSW | Sell | 10,839,622 | 11,050,239 | 3/05/18 | — | (126,681 | ) | ||||||||||||||||||||
Euro | HSBK | Sell | 2,081,485 | 2,461,009 | 4/10/18 | — | (52,207 | ) | ||||||||||||||||||||
Euro | SSBT | Sell | 284,000 | 337,443 | 4/10/18 | — | (5,463 | ) | ||||||||||||||||||||
Euro | UBSW | Sell | 2,278,194 | 2,692,307 | 4/10/18 | — | (58,418 | ) | ||||||||||||||||||||
Euro | BOFA | Sell | 2,716,206 | 3,240,475 | 4/18/18 | — | (40,868 | ) | ||||||||||||||||||||
Euro | SSBT | Sell | 2,716,207 | 3,240,394 | 4/18/18 | — | (40,949 | ) | ||||||||||||||||||||
Euro | UBSW | Sell | 2,716,207 | 3,240,951 | 4/18/18 | — | (40,392 | ) | ||||||||||||||||||||
British Pound | BOFA | Sell | 4,631,493 | 6,158,644 | 4/24/18 | — | (120,972 | ) | ||||||||||||||||||||
British Pound | HSBK | Sell | 443,933 | 588,114 | 4/24/18 | — | (13,794 | ) | ||||||||||||||||||||
British Pound | UBSW | Sell | 385,913 | 511,000 | 4/24/18 | — | (12,242 | ) | ||||||||||||||||||||
Euro | HSBK | Sell | 4,361,103 | 5,145,444 | 5/07/18 | — | (129,734 | ) | ||||||||||||||||||||
Euro | SSBT | Sell | 1,065,617 | 1,252,083 | 5/07/18 | — | (36,884 | ) | ||||||||||||||||||||
Euro | UBSW | Sell | 3,938,972 | 4,647,731 | 5/07/18 | — | (116,838 | ) | ||||||||||||||||||||
South Korean Won | HSBK | Sell | 158,868,021 | 141,291 | 5/11/18 | — | (7,806 | ) | ||||||||||||||||||||
South Korean Won | UBSW | Sell | 640,654,815 | 570,282 | 5/11/18 | — | (30,972 | ) | ||||||||||||||||||||
Euro | BOFA | Sell | 12,463,453 | 14,862,024 | 5/21/18 | — | (227,870 | ) | ||||||||||||||||||||
Euro | SSBT | Sell | 742,329 | 886,955 | 5/21/18 | — | (11,806 | ) | ||||||||||||||||||||
Euro | UBSW | Sell | 10,383,442 | 12,400,335 | 5/21/18 | — | (171,226 | ) | ||||||||||||||||||||
British Pound | BOFA | Sell | 2,658,079 | 3,586,288 | 5/24/18 | — | (21,621 | ) | ||||||||||||||||||||
British Pound | HSBK | Sell | 229,263 | 308,980 | 5/24/18 | — | (2,207 | ) | ||||||||||||||||||||
British Pound | HSBK | Sell | 229,516 | 311,823 | 5/24/18 | 292 | — | |||||||||||||||||||||
British Pound | SSBT | Sell | 7,730,985 | 10,311,086 | 5/24/18 | — | (182,468 | ) | ||||||||||||||||||||
British Pound | UBSW | Sell | 1,356,202 | 1,844,640 | 5/24/18 | 3,816 | — | |||||||||||||||||||||
20 |
Annual Report |
franklintempleton.com |
FRANKLIN MUTUAL FINANCIAL SERVICES FUND
STATEMENT OF INVESTMENTS
Forward Exchange Contracts (continued)
| Currency | Counterpartya | Type | Quantity | Contract Amount | Settlement Date | Unrealized Appreciation | Unrealized Depreciation | |||||||||||||||||
OTC Forward Exchange Contracts (continued) | ||||||||||||||||||||||||
British Pound | UBSW | Sell | 5,616,909 | $ | 7,580,462 | 5/24/18 | $ | — | $ | (43,577 | ) | |||||||||||||
Total Forward Exchange Contracts | $ | 551,803 | $ | (4,160,465 | ) | |||||||||||||||||||
Net unrealized appreciation (depreciation) | $ | (3,608,662 | ) | |||||||||||||||||||||
aMay be comprised of multiple contracts with the same counterparty, currency and settlement date.
See Note 10 regarding other derivative information.
See Abbreviations on page 38.
franklintempleton.com |
The accompanying notes are an integral part of these financial statements. | |
Annual Report |
21 |
FRANKLIN MUTUAL FINANCIAL SERVICES FUND
Statement of Assets and Liabilities
December 31, 2017
Assets: | ||||
Investments in securities: | ||||
Cost - Unaffiliated issuers | $ | 647,233,523 | ||
Cost - Non-controlled affiliates (Note 11) | 2,226,755 | |||
|
| |||
Value - Unaffiliated issuers | $ | 720,858,555 | ||
Value - Non-controlled affiliates (Note 11) | 128,877 | |||
Cash | 4,514 | |||
Receivables: | ||||
Investment securities sold | 843,732 | |||
Capital shares sold | 1,046,147 | |||
Dividends and interest | 643,030 | |||
European Union tax reclaims | 946,913 | |||
Deposits with brokers for: | ||||
Futures contracts | 665,880 | |||
Unrealized appreciation on OTC forward exchange contracts | 551,803 | |||
Other assets | 92,097 | |||
|
| |||
Total assets | 725,781,548 | |||
|
| |||
Liabilities: | ||||
Payables: | ||||
Capital shares redeemed | 1,206,208 | |||
Management fees | 528,339 | |||
Distribution fees | 370,773 | |||
Transfer agent fees | 142,043 | |||
Trustees’ fees and expenses | 23, 907 | |||
Variation margin on futures contracts | 219,475 | |||
Unrealized depreciation on OTC forward exchange contracts | 4,160,465 | |||
Deferred tax | 646,818 | |||
Accrued expenses and other liabilities | 167,189 | |||
|
| |||
Total liabilities | 7,465,217 | |||
|
| |||
Net assets, at value | $ | 718,316,331 | ||
|
| |||
Net assets consist of: | ||||
Paid-in capital | $ | 666,652,909 | ||
Distributions in excess of net investment income | (6,913,596 | ) | ||
Net unrealized appreciation (depreciation) | 66,788,100 | |||
Accumulated net realized gain (loss) | (8,211,082 | ) | ||
|
| |||
Net assets, at value | $ | 718,316,331 | ||
|
|
22 |
Annual Report | The accompanying notes are an integral part of these financial statements. |
franklintempleton.com |
FRANKLIN MUTUAL FINANCIAL SERVICES FUND
FINANCIAL STATEMENTS
Statement of Assets and Liabilities (continued)
December 31, 2017
| Class Z: | ||||
Net assets, at value | $210,825,321 | |||
|
| |||
Shares outstanding | 8,732,924 | |||
|
| |||
Net asset value and maximum offering price per share | $24.14 | |||
|
| |||
| Class A: | ||||
Net assets, at value | $368,850,300 | |||
|
| |||
Shares outstanding | 15,238,465 | |||
|
| |||
Net asset value per sharea | $24.21 | |||
|
| |||
Maximum offering price per share (net asset value per share ÷ 94.25%) | $25.69 | |||
|
| |||
| Class C: | ||||
Net assets, at value | $134,117,380 | |||
|
| |||
Shares outstanding | 5,569,716 | |||
|
| |||
Net asset value and maximum offering price per sharea | $24.08 | |||
|
| |||
| Class R6: | ||||
Net assets, at value | $ 4,523,330 | |||
|
| |||
Shares outstanding | 186,133 | |||
|
| |||
Net asset value and maximum offering price per share | $24.30 | |||
|
|
aRedemption price is equal to net asset value less contingent deferred sales charges, if applicable.
franklintempleton.com |
The accompanying notes are an integral part of these financial statements. | |
Annual Report |
23 |
FRANKLIN MUTUAL FINANCIAL SERVICES FUND
FINANCIAL STATEMENTS
Statement of Operations
for the year ended December 31, 2017
Investment income: | ||||
Dividends: (net of foreign taxes)* | ||||
Unaffiliated issuers | $ | 13,419,025 | ||
Interest: | ||||
Unaffiliated issuers | 407,618 | |||
|
| |||
Total investment income | 13,826,643 | |||
|
| |||
Expenses: | ||||
Management fees (Note 3a) | 5,933,250 | |||
Distribution fees: (Note 3c) | ||||
Class A | 880,728 | |||
Class C | 1,305,562 | |||
Transfer agent fees: (Note 3e) | ||||
Class Z | 288,037 | |||
Class A | 528,897 | |||
Class C | 196,008 | |||
Class R6 | 1,181 | |||
Custodian fees (Note 4) | 52,487 | |||
Reports to shareholders | 86,577 | |||
Registration and filing fees | 82,289 | |||
Professional fees | 148,629 | |||
Trustees’ fees and expenses | 19,994 | |||
Other | 52,693 | |||
|
| |||
Total expenses | 9,576,332 | |||
Expense reductions (Note 4) | (1,459 | ) | ||
Expenses waived/paid by affiliates (Note 3f) | (704 | ) | ||
|
| |||
Net expenses | 9,574,169 | |||
|
| |||
Net investment income | 4,252,474 | |||
|
| |||
Realized and unrealized gains (losses): | ||||
Net realized gain (loss) from: | ||||
Investments:# | ||||
Unaffiliated issuers | 96,915,069 | |||
Foreign currency transactions | (52,217 | ) | ||
Forward exchange contracts | (5,884,179 | ) | ||
Futures contracts | (2,653,053 | ) | ||
|
| |||
Net realized gain (loss) | 88,325,620 | |||
|
| |||
Net change in unrealized appreciation (depreciation) on: | ||||
Investments: | ||||
Unaffiliated issuers | 4,606,745 | |||
Non-controlled affiliates (Note 11) | 4,852 | |||
Translation of other assets and liabilities denominated in foreign currencies | 126,774 | |||
Forward exchange contracts | (10,356,443 | ) | ||
Futures contracts | (852,946 | ) | ||
Change in deferred taxes on unrealized appreciation | (646,818 | ) | ||
|
| |||
Net change in unrealized appreciation (depreciation) | (7,117,836 | ) | ||
|
| |||
Net realized and unrealized gain (loss) | 81,207,784 | |||
|
| |||
Net increase (decrease) in net assets resulting from operations | $ | 85,460,258 | ||
|
| |||
*Foreign taxes withheld on dividends | $ | 860,199 | ||
#Net of foreign taxes | $ | 257,560 | ||
24 |
Annual Report | The accompanying notes are an integral part of these financial statements. |
franklintempleton.com |
FRANKLIN MUTUAL FINANCIAL SERVICES FUND
FINANCIAL STATEMENTS
Statements of Changes in Net Assets
| Year Ended December 31, | ||||||||
|
| |||||||
| 2017 | 2016 | |||||||
Increase (decrease) in net assets: | ||||||||
Operations: | ||||||||
Net investment income | $ | 4,252,474 | $ | 7,432,945 | ||||
Net realized gain (loss) | 88,325,620 | 31,236,601 | ||||||
Net change in unrealized appreciation (depreciation) | (7,117,836 | ) | 13,082,760 | |||||
|
| |||||||
Net increase (decrease) in net assets resulting from operations | 85,460,258 | 51,752,306 | ||||||
|
| |||||||
Distributions to shareholders from: | ||||||||
Net investment income: | ||||||||
Class Z | (4,211,056 | ) | (2,125,014 | ) | ||||
Class A | (6,418,111 | ) | (3,742,491 | ) | ||||
Class C | (1,393,532 | ) | (542,259 | ) | ||||
Class R6 | (93,577 | ) | (37,208 | ) | ||||
|
| |||||||
Total distributions to shareholders | (12,116,276 | ) | (6,446,972 | ) | ||||
|
| |||||||
Capital share transactions: (Note 2) | ||||||||
Class Z | 27,417,572 | (26,302,473 | ) | |||||
Class A | (15,335,232 | ) | (38,310,153 | ) | ||||
Class C | (8,715,929 | ) | (14,415,335 | ) | ||||
Class R6 | 1,544,299 | 953,365 | ||||||
|
| |||||||
Total capital share transactions | 4,910,710 | (78,074,596 | ) | |||||
|
| |||||||
Net increase (decrease) in net assets | 78,254,692 | (32,769,262 | ) | |||||
Net assets: | ||||||||
Beginning of year | 640,061,639 | 672,830,901 | ||||||
|
| |||||||
End of year | $ | 718,316,331 | $ | 640,061,639 | ||||
|
| |||||||
Distributions in excess of net investment income included in net assets: | ||||||||
End of year | $ | (6,913,596 | ) | $ | (198,732 | ) | ||
|
| |||||||
franklintempleton.com |
The accompanying notes are an integral part of these financial statements. | |
Annual Report |
25 |
FRANKLIN MUTUAL FINANCIAL SERVICES FUND
1. Organization and Significant Accounting Policies
Franklin Mutual Series Funds (Trust) is registered under the Investment Company Act of 1940 (1940 Act) as an open-end management investment company, consisting of seven separate funds and applies the specialized accounting and reporting guidance in U.S. Generally Accepted Accounting Principles (U.S. GAAP). Franklin Mutual Financial Services Fund (Fund) is included in this report. The Fund offers four classes of shares: Class Z, Class A, Class C and Class R6. Each class of shares may differ by its initial sales load, contingent deferred sales charges, voting rights on matters affecting a single class, its exchange privilege and fees due to differing arrangements for distribution and transfer agent fees.
The following summarizes the Fund’s significant accounting policies.
a. Financial Instrument Valuation
The Fund’s investments in financial instruments are carried at fair value daily. Fair value is the price that would be received to sell an asset or paid to transfer a liability in an orderly transaction between market participants on the measurement date. The Fund calculates the net asset value (NAV) per share as of 4 p.m. Eastern time each day the New York Stock Exchange (NYSE) is open for trading. Under compliance policies and procedures approved by the Trust’s Board of Trustees (the Board), the Fund’s administrator has responsibility for oversight of valuation, including leading the cross-functional Valuation Committee (VC). The VC provides administration and oversight of the Fund’s valuation policies and procedures, which are approved annually by the Board. Among other things, these procedures allow the Fund to utilize independent pricing services, quotations from securities and financial instrument dealers, and other market sources to determine fair value.
Equity securities and derivative financial instruments listed on an exchange or on the NASDAQ National Market System are valued at the last quoted sale price or the official closing price of the day, respectively. Foreign equity securities are valued as of the close of trading on the foreign stock exchange on which the security is primarily traded, or as of 4 p.m. Eastern time. The value is then converted into its U.S. dollar equivalent at the foreign exchange rate in effect at 4 p.m. Eastern time on the day that the value of the security is determined. Over-the-counter (OTC) securities are valued within the range of the most recent
quoted bid and ask prices. Securities that trade in multiple markets or on multiple exchanges are valued according to the broadest and most representative market. Certain equity securities are valued based upon fundamental characteristics or relationships to similar securities.
Debt securities generally trade in the OTC market rather than on a securities exchange. The Fund’s pricing services use multiple valuation techniques to determine fair value. In instances where sufficient market activity exists, the pricing services may utilize a market-based approach through which quotes from market makers are used to determine fair value. In instances where sufficient market activity may not exist or is limited, the pricing services also utilize proprietary valuation models which may consider market characteristics such as benchmark yield curves, credit spreads, estimated default rates, anticipated market interest rate volatility, coupon rates, anticipated timing of principal repayments, underlying collateral, and other unique security features in order to estimate the relevant cash flows, which are then discounted to calculate the fair value.
Certain derivative financial instruments trade in the OTC market. The Fund’s pricing services use various techniques including industry standard option pricing models and proprietary discounted cash flow models to determine the fair value of those instruments. The Fund’s net benefit or obligation under the derivative contract, as measured by the fair value of the contract, is included in net assets.
The Fund has procedures to determine the fair value of financial instruments for which market prices are not reliable or readily available. Under these procedures, the VC convenes on a regular basis to review such financial instruments and considers a number of factors, including significant unobservable valuation inputs, when arriving at fair value. The VC primarily employs a market-based approach which may use related or comparable assets or liabilities, recent transactions, market multiples, book values, and other relevant information for the investment to determine the fair value of the investment. An income-based valuation approach may also be used in which the anticipated future cash flows of the investment are discounted to calculate fair value. Discounts may also be applied due to the nature or duration of any restrictions on the disposition of the investments. Due to the inherent uncertainty of valuations of such investments, the fair values may differ significantly from the values that would have been used had an active market existed. The VC employs various methods for calibrating these
26 |
Annual Report |
franklintempleton.com |
FRANKLIN MUTUAL FINANCIAL SERVICES FUND
NOTES TO FINANCIAL STATEMENTS
valuation approaches including a regular review of key inputs and assumptions, transactional back-testing or disposition analysis, and reviews of any related market activity.
Trading in securities on foreign securities stock exchanges and OTC markets may be completed before 4 p.m. Eastern time. In addition, trading in certain foreign markets may not take place on every Fund’s business day. Occasionally, events occur between the time at which trading in a foreign security is completed and 4 p.m. Eastern time that might call into question the reliability of the value of a portfolio security held by the Fund. As a result, differences may arise between the value of the Fund’s portfolio securities as determined at the foreign market close and the latest indications of value at 4 p.m. Eastern time. In order to minimize the potential for these differences, the VC monitors price movements following the close of trading in foreign stock markets through a series of country specific market proxies (such as baskets of American Depositary Receipts, futures contracts and exchange traded funds). These price movements are measured against established trigger thresholds for each specific market proxy to assist in determining if an event has occurred that may call into question the reliability of the values of the foreign securities held by the Fund. If such an event occurs, the securities may be valued using fair value procedures, which may include the use of independent pricing services.
When the last day of the reporting period is a non-business day, certain foreign markets may be open on those days that the Fund’s NAV is not calculated, which could result in differences between the value of the Fund’s portfolio securities on the last business day and the last calendar day of the reporting period. Any significant security valuation changes due to an open foreign market are adjusted and reflected by the Fund for financial reporting purposes.
b. Foreign Currency Translation
Portfolio securities and other assets and liabilities denominated in foreign currencies are translated into U.S. dollars based on the exchange rate of such currencies against U.S. dollars on the date of valuation. The Fund may enter into foreign currency exchange contracts to facilitate transactions denominated in a foreign currency. Purchases and sales of securities, income and expense items denominated in foreign currencies are translated into U.S. dollars at the exchange rate in effect on the transaction date. Portfolio securities and assets and liabilities denominated in foreign currencies contain risks that those currencies will
decline in value relative to the U.S. dollar. Occasionally, events may impact the availability or reliability of foreign exchange rates used to convert the U.S. dollar equivalent value. If such an event occurs, the foreign exchange rate will be valued at fair value using procedures established and approved by the Board.
The Fund does not separately report the effect of changes in foreign exchange rates from changes in market prices on securities held. Such changes are included in net realized and unrealized gain or loss from investments in the Statement of Operations.
Realized foreign exchange gains or losses arise from sales of foreign currencies, currency gains or losses realized between the trade and settlement dates on securities transactions and the difference between the recorded amounts of dividends, interest, and foreign withholding taxes and the U.S. dollar equivalent of the amounts actually received or paid. Net unrealized foreign exchange gains and losses arise from changes in foreign exchange rates on foreign denominated assets and liabilities other than investments in securities held at the end of the reporting period.
c. Derivative Financial Instruments
The Fund invested in derivative financial instruments in order to manage risk or gain exposure to various other investments or markets. Derivatives are financial contracts based on an underlying or notional amount, require no initial investment or an initial net investment that is smaller than would normally be required to have a similar response to changes in market factors, and require or permit net settlement. Derivatives contain various risks including the potential inability of the counterparty to fulfill their obligations under the terms of the contract, the potential for an illiquid secondary market, and/or the potential for market movements which expose the Fund to gains or losses in excess of the amounts shown in the Statement of Assets and Liabilities. Realized gain and loss and unrealized appreciation and depreciation on these contracts for the period are included in the Statement of Operations.
Derivative counterparty credit risk is managed through a formal evaluation of the creditworthiness of all potential counter-parties. The Fund attempts to reduce its exposure to counterparty credit risk on OTC derivatives, whenever possible, by entering into International Swaps and Derivatives Association (ISDA) master agreements with certain counterparties. These agreements contain various provisions,
franklintempleton.com |
Annual Report |
27 |
FRANKLIN MUTUAL FINANCIAL SERVICES FUND
NOTES TO FINANCIAL STATEMENTS
1. Organization and Significant Accounting Policies (continued)
c. Derivative Financial Instruments (continued)
including but not limited to collateral requirements, events of default, or early termination. Termination events applicable to the counterparty include certain deteriorations in the credit quality of the counterparty. Termination events applicable to the Fund include failure of the Fund to maintain certain net asset levels and/or limit the decline in net assets over various periods of time. In the event of default or early termination, the ISDA master agreement gives the non-defaulting party the right to net and close-out all transactions traded, whether or not arising under the ISDA agreement, to one net amount payable by one counterparty to the other. However, absent an event of default or early termination, OTC derivative assets and liabilities are presented gross and not offset in the Statement of Assets and Liabilities. Early termination by the counterparty may result in an immediate payment by the Fund of any net liability owed to that counterparty under the ISDA agreement.
Collateral requirements differ by type of derivative. Collateral or initial margin requirements are set by the broker or exchange clearing house for exchange traded and centrally cleared derivatives. Initial margin deposited is held at the exchange and can be in the form of cash and/or securities. For OTC derivatives traded under an ISDA master agreement, posting of collateral is required by either the Fund or the applicable counterparty if the total net exposure of all OTC derivatives with the applicable counterparty exceeds the minimum transfer amount, which typically ranges from $100,000 to $250,000, and can vary depending on the counterparty and the type of the agreement. Generally, collateral is determined at the close of Fund business each day and any additional collateral required due to changes in derivative values may be delivered by the Fund or the counterparty the next business day, or within a few business days. Collateral pledged and/or received by the Fund for OTC derivatives, if any, is held in segregated accounts with the Fund’s custodian/counterparty broker and can be in the form of cash and/or securities. Unrestricted cash may be invested according to the Fund’s investment objectives. To the extent that the amounts due to the Fund from its counterparties are not subject to collateralization or are not fully collateralized, the Fund bears the risk of loss from counterparty non-performance.
The Fund entered into exchange traded futures contracts primarily to manage exposure to certain foreign currencies. A futures contract is an agreement between the Fund and a counterparty to buy or sell an asset at a specified price on a future date. Required initial margins are pledged by the Fund, and the daily change in fair value is accounted for as a variation margin payable or receivable in the Statement of Assets and Liabilities.
The Fund entered into OTC forward exchange contracts primarily to manage exposure to certain foreign currencies. A forward exchange contract is an agreement between the Fund and a counterparty to buy or sell a foreign currency at a specific exchange rate on a future date.
The Fund purchased or wrote OTC option contracts primarily to manage exposure to foreign exchange rate risk. An option is a contract entitling the holder to purchase or sell a specific amount of shares or units of an asset or notional amount of a swap (swaption), at a specified price. When an option is purchased or written, an amount equal to the premium paid or received is recorded as an asset or liability, respectively. Upon exercise of an option, the acquisition cost or sales proceeds of the underlying investment is adjusted by any premium received or paid. Upon expiration of an option, any premium received or paid is recorded as a realized gain or loss. Upon closing an option other than through expiration or exercise, the difference between the premium received or paid and the cost to close the position is recorded as a realized gain or loss.
See Note 10 regarding other derivative information.
d. Income and Deferred Taxes
It is the Fund’s policy to qualify as a regulated investment company under the Internal Revenue Code. The Fund intends to distribute to shareholders substantially all of its taxable income and net realized gains to relieve it from federal income and excise taxes. As a result, no provision for U.S. federal income taxes is required.
The Fund may be subject to foreign taxation related to income received, capital gains on the sale of securities and certain foreign currency transactions in the foreign jurisdictions in which it invests. Foreign taxes, if any, are recorded based on the tax regulations and rates that exist in the foreign markets in which the Fund invests. When a capital gain tax is determined
28 |
Annual Report |
franklintempleton.com |
FRANKLIN MUTUAL FINANCIAL SERVICES FUND
NOTES TO FINANCIAL STATEMENTS
to apply, the Fund records an estimated deferred tax liability in an amount that would be payable if the securities were disposed of on the valuation date.
As a result of several court cases, in certain countries across the European Union, the Fund filed additional tax reclaims for previously withheld taxes on dividends earned in those countries (EU reclaims). These additional filings are subject to various administrative proceedings by the local jurisdictions’ tax authorities within the European Union, as well as a number of related judicial proceedings. Income recognized, if any, for EU reclaims is reflected as other income in the Statement of Operations and any related receivable, if any, is reflected as European Union tax reclaims in the Statement of Assets and Liabilities. When uncertainty exists as to the ultimate resolution of these proceedings, the likelihood of receipt of these EU reclaims, and the potential timing of payment, no amounts are reflected in the financial statements. For U.S. income tax purposes, EU reclaims received by the Fund, if any, reduce the amounts of foreign taxes Fund shareholders can use as tax credits in their individual income tax returns.
The Fund may recognize an income tax liability related to its uncertain tax positions under U.S. GAAP when the uncertain tax position has a less than 50% probability that it will be sustained upon examination by the tax authorities based on its technical merits. As of December 31, 2017, the Fund has determined that no tax liability is required in its financial statements related to uncertain tax positions for any open tax years (or expected to be taken in future tax years). Open tax years are those that remain subject to examination and are based on the statute of limitations in each jurisdiction in which the Fund invests.
e. Security Transactions, Investment Income, Expenses and Distributions
Security transactions are accounted for on trade date. Realized gains and losses on security transactions are determined on a specific identification basis. Interest income and estimated expenses are accrued daily. Amortization of premium and accretion of discount on debt securities are included in interest income. Dividend income is recorded on the ex-dividend date except for certain dividends from securities where the dividend
rate is not available. In such cases, the dividend is recorded as soon as the information is received by the Fund. Distributions to shareholders are recorded on the ex-dividend date. Distributable earnings are determined according to income tax regulations (tax basis) and may differ from earnings recorded in accordance with U.S. GAAP. These differences may be permanent or temporary. Permanent differences are reclassified among capital accounts to reflect their tax character. These reclassifications have no impact on net assets or the results of operations. Temporary differences are not reclassified, as they may reverse in subsequent periods.
Common expenses incurred by the Trust are allocated among the Funds based on the ratio of net assets of each Fund to the combined net assets of the Trust. Fund specific expenses are charged directly to the Fund that incurred the expense.
Realized and unrealized gains and losses and net investment income, excluding class specific expenses, are allocated daily to each class of shares based upon the relative proportion of net assets of each class. Differences in per share distributions by class are generally due to differences in class specific expenses.
f. Accounting Estimates
The preparation of financial statements in accordance with U.S. GAAP requires management to make estimates and assumptions that affect the reported amounts of assets and liabilities at the date of the financial statements and the amounts of income and expenses during the reporting period. Actual results could differ from those estimates.
g. Guarantees and Indemnifications
Under the Trust’s organizational documents, its officers and trustees are indemnified by the Trust against certain liabilities arising out of the performance of their duties to the Trust. Additionally, in the normal course of business, the Trust, on behalf of the Fund, enters into contracts with service providers that contain general indemnification clauses. The Trust’s maximum exposure under these arrangements is unknown as this would involve future claims that may be made against the Trust that have not yet occurred. Currently, the Trust expects the risk of loss to be remote.
franklintempleton.com |
Annual Report |
29 |
FRANKLIN MUTUAL FINANCIAL SERVICES FUND
NOTES TO FINANCIAL STATEMENTS
2. Shares of Beneficial Interest
At December 31, 2017, there were an unlimited number of shares authorized (without par value). Transactions in the Fund’s shares were as follows:
| Year Ended December 31, | ||||||||||||||||
| 2017 | 2016 | |||||||||||||||
| Shares | Amount | Shares | Amount | |||||||||||||
| Class Z Shares: | ||||||||||||||||
| Shares sold | 2,575,987 | $ 58,323,294 | 1,862,217 | $ 35,847,321 | ||||||||||||
| Shares issued in reinvestment of distributions | 156,102 | 3,762,873 | 90,302 | 1,927,186 | ||||||||||||
| Shares redeemed | (1,515,027 | ) | (34,668,595 | ) | (3,510,389 | ) | (64,076,980 | ) | ||||||||
|
| |||||||||||||||
| Net increase (decrease) | 1,217,062 | $ 27,417,572 | (1,557,870 | ) | $ (26,302,473 | ) | ||||||||||
|
| |||||||||||||||
| Class A Shares: | ||||||||||||||||
| Shares sold | 3,502,833 | $ 79,651,690 | 5,020,628 | $ 98,395,643 | ||||||||||||
| Shares issued in reinvestment of distributions | 257,411 | 6,217,199 | 170,054 | 3,626,102 | ||||||||||||
| Shares redeemed | (4,464,692 | ) | (101,204,121 | ) | (7,543,324 | ) | (140,331,898 | ) | ||||||||
|
| |||||||||||||||
| Net increase (decrease) | (704,448 | ) | $ (15,335,232 | ) | (2,352,642 | ) | $ (38,310,153 | ) | ||||||||
|
| |||||||||||||||
| Class C Shares: | ||||||||||||||||
| Shares sold | 998,768 | $ 22,519,991 | 1,138,253 | $ 22,312,026 | ||||||||||||
| Shares issued in reinvestment of distributions | 56,775 | 1,357,536 | 25,584 | 520,576 | ||||||||||||
| Shares redeemed | (1,447,619 | ) | (32,593,456 | ) | (1,982,746 | ) | (37,247,937 | ) | ||||||||
|
| |||||||||||||||
| Net increase (decrease) | (392,076 | ) | $ (8,715,929 | ) | (818,909 | ) | $ (14,415,335 | ) | ||||||||
|
| |||||||||||||||
| Class R6 Shares: | ||||||||||||||||
| Shares sold | 109,161 | $ 2,521,815 | 72,872 | $ 1,425,313 | ||||||||||||
| Shares issued in reinvestment of distributions | 3,853 | 93,577 | 1,726 | 37,208 | ||||||||||||
| Shares redeemed | (46,239 | ) | (1,071,093 | ) | (27,167 | ) | (509,156 | ) | ||||||||
|
| |||||||||||||||
| Net increase (decrease) | 66,775 | $ 1,544,299 | 47,431 | $ 953,365 | ||||||||||||
|
| |||||||||||||||
3. Transactions with Affiliates
Franklin Resources, Inc. is the holding company for various subsidiaries that together are referred to as Franklin Templeton Investments. Certain officers and trustees of the Fund are also officers and/or directors of the following subsidiaries:
| Subsidiary | Affiliation | |
| Franklin Mutual Advisers, LLC (Franklin Mutual) | Investment manager | |
| Franklin Templeton Services, LLC (FT Services) | Administrative manager | |
| Franklin Templeton Distributors, Inc. (Distributors) | Principal underwriter | |
| Franklin Templeton Investor Services, LLC (Investor Services) | Transfer agent |
30 |
Annual Report |
franklintempleton.com |
FRANKLIN MUTUAL FINANCIAL SERVICES FUND
NOTES TO FINANCIAL STATEMENTS
a. Management Fees
The Fund pays an investment management fee to Franklin Mutual based on the average daily net assets of the Fund as follows:
| Annualized Fee Rate | Net Assets | |||
0.875% | Up to and including $1 billion | |||
0.845% | Over $1 billion, up to and including $2 billion | |||
0.825% | Over $2 billion, up to and including $5 billion | |||
0.805% | In excess of $5 billion | |||
For the year ended December 31, 2017, the gross effective investment management fee rate was 0.875% of the Fund’s average daily net assets.
b. Administrative Fees
Under an agreement with Franklin Mutual, FT Services provides administrative services to the Fund. The fee is paid by Franklin Mutual based on the Fund’s average daily net assets, and is not an additional expense of the Fund.
c. Distribution Fees
The Board has adopted distribution plans for each share class, with the exception of Class Z and Class R6 shares, pursuant to Rule 12b-1 under the 1940 Act. Under the Fund’s Class A reimbursement distribution plan, the Fund reimburses Distributors for costs incurred in connection with the servicing, sale and distribution of the Fund’s shares up to the maximum annual plan rate. Under the Class A reimbursement distribution plan, costs exceeding the maximum for the current plan year cannot be reimbursed in subsequent periods. In addition, under the Fund’s Class C compensation distribution plan, the Fund pays Distributors for costs incurred in connection with the servicing, sale and distribution of the Fund’s shares up to the maximum annual plan rate. The plan year, for purposes of monitoring compliance with the maximum annual plan rates, is February 1 through January 31.
The maximum annual plan rates, based on the average daily net assets, for each class, are as follows:
Class A | 0.35 | % | ||
Class C | 1.00 | % |
The Board has set the current rate at 0.25% per year for Class A shares until further notice and approval by the Board.
d. Sales Charges/Underwriting Agreements
Front-end sales charges and contingent deferred sales charges (CDSC) do not represent expenses of the Fund. These charges are deducted from the proceeds of sales of Fund shares prior to investment or from redemption proceeds prior to remittance, as applicable. Distributors has advised the Fund of the following commission transactions related to the sales and redemptions of the Fund’s shares for the year:
Sales charges retained net of commissions paid to unaffiliated brokers/dealers | $ | 149,336 | ||
CDSC retained | $ | 12,167 |
e. Transfer Agent Fees
Each class of shares pays transfer agent fees to Investor Services for its performance of shareholder servicing obligations. Effective November 1, 2017, the fees are based on an annualized asset based fee of 0.02% plus a transaction based fee. Prior to November 1, 2017, the fees were account based fees that varied based on fund or account type. In addition, each class reimburses Investor
franklintempleton.com |
Annual Report |
31 |
FRANKLIN MUTUAL FINANCIAL SERVICES FUND
NOTES TO FINANCIAL STATEMENTS
3. Transactions with Affiliates (continued)
e. Distribution Fees (continued)
Services for out of pocket expenses incurred and, except for Class R6, reimburses shareholder servicing fees paid to third parties. These fees are allocated daily based upon their relative proportion of such classes’ aggregate net assets. Class R6 pays Investor Services transfer agent fees specific to that class.
For the year ended December 31, 2017, the Fund paid transfer agent fees of $1,014,123, of which $445,422 was retained by Investor Services.
f. Waiver and Expense Reimbursements
Investor Services has contractually agreed in advance to waive or limit its fees so that the Class R6 transfer agent fees do not exceed 0.01% until April 30, 2018.
4. Expense Offset Arrangement
The Fund has entered into an arrangement with its custodian whereby credits realized as a result of uninvested cash balances are used to reduce a portion of the Fund’s custodian expenses. During the year ended December 31, 2017, the custodian fees were reduced as noted in the Statement of Operations.
5. Independent Trustees’ Retirement Plan
On January 1, 1993, the Trust adopted an Independent Trustees’ Retirement Plan (Plan). The Plan is an unfunded defined benefit plan that provides benefit payments to Trustees whose length of service and retirement age meets the eligibility requirements of the Plan. Benefits under the Plan are based on years of service and fees paid to each trustee at the time of retirement. Effective in December 1996, the Plan was closed to new participants.
During the year ended December 31, 2017, the Fund’s projected benefit obligation and benefit payments under the Plan were as follows:
aProjected benefit obligation at December 31, 2017 | $ | 23,907 | ||
bIncrease in projected benefit obligation | $ | 553 | ||
Benefit payments made to retired trustees | $ | (655 | ) | |
aThe projected benefit obligation is included in trustees’ fees and expenses in the Statement of Assets and Liabilities.
bThe increase in projected benefit obligation is included in trustees’ fees and expenses in the Statement of Operations.
6. Income Taxes
For tax purposes, capital losses may be carried over to offset future capital gains. Capital loss carryforwards with no expiration, if any, must be fully utilized before those losses with expiration dates.
At December 31, 2017, the Fund had capital loss carryforwards of $7,872,501 expiring in 2018.
During the year ended December 31, 2017, the Fund utilized $71,306,492 of capital loss carryforwards.
The tax character of distributions paid during the years ended December 31, 2017 and 2016, was as follows:
| 2017 | 2016 | |||||||
Distributions paid from ordinary income | $ | 12,116,276 | $ | 6,446,972 | ||||
32 |
Annual Report |
franklintempleton.com |
FRANKLIN MUTUAL FINANCIAL SERVICES FUND
NOTES TO FINANCIAL STATEMENTS
At December 31, 2017, the cost of investments, net unrealized appreciation (depreciation) and undistributed ordinary income for income tax purposes were as follows:
Cost of investments | $ | 658,736,293 | ||
Unrealized appreciation |
$ |
113,318,564 |
| |
Unrealized depreciation | (55,203,112 | ) | ||
Net unrealized appreciation (depreciation) | $ | 58,115,452 | ||
Distributable earnings - undistributed ordinary income | $ | 1,347,999 | ||
Differences between income and/or capital gains as determined on a book basis and a tax basis are primarily due to differing treatment of foreign currency transactions.
7. Investment Transactions
Purchases and sales of investments (excluding short term securities) for the year ended December 31, 2017, aggregated $451,668,163 and $426,835,018, respectively.
8. Concentration of Risk
Investing in foreign securities may include certain risks and considerations not typically associated with investing in U.S. securities, such as fluctuating currency values and changing local and regional economic, political and social conditions, which may result in greater market volatility. In addition, certain foreign securities may not be as liquid as U.S. securities.
9. Restricted Securities
The Fund invests in securities that are restricted under the Securities Act of 1933 (1933 Act). Restricted securities are often purchased in private placement transactions, and cannot be sold without prior registration unless the sale is pursuant to an exemption under the 1933 Act. Disposal of these securities may require greater effort and expense, and prompt sale at an acceptable price may be difficult. The Fund may have registration rights for restricted securities. The issuer generally incurs all registration costs.
At December 31, 2017, investments in restricted securities, excluding securities exempt from registration under the 1933 Act deemed to be liquid, were as follows:
| Shares/ Units | Issuer | Acquisition Date | Cost | Value | ||||||||||
4,357,178 | FIM Coinvestor Holdings I, LLC | 11/20/06 - 6/02/09 | $ | — | $ | — | ||||||||
1,815,233 | Hightower Holding LLC, B, I | 3/31/08 - 1/05/10 | 2,362,324 | 2,222,571 | ||||||||||
791,396 | Hightower Holding LLC, B, Series II | 6/10/10 - 5/10/12 | 2,420,000 | 1,882,573 | ||||||||||
|
| |||||||||||||
| Total Restricted Securities (Value is 0.6% of Net Assets) | $ | 4,782,324 | $ | 4,105,144 | ||||||||||
|
| |||||||||||||
franklintempleton.com |
Annual Report |
33 |
FRANKLIN MUTUAL FINANCIAL SERVICES FUND
NOTES TO FINANCIAL STATEMENTS
10. Other Derivative Information
At December 31, 2017, the Fund’s investments in derivative contracts are reflected in the Statement of Assets and Liabilities as follows:
| Asset Derivatives | Liability Derivatives | |||||||||||
Derivative Contracts Not Accounted for as Hedging Instruments | Statement of Assets and Liabilities Location | Fair Value | Statement of Assets and Liabilities Location | Fair Value | ||||||||
Foreign exchange contracts | Variation margin on futures contracts | $ | — | Variation margin on futures contracts | $ | 528,182 | a | |||||
| Unrealized appreciation on OTC forward exchange contracts | 551,803 | Unrealized depreciation on OTC forward exchange contracts | 4,160,465 | |||||||||
|
|
|
| |||||||||
Totals | $ | 551,803 | $ | 4,688,647 | ||||||||
|
|
|
| |||||||||
aThis amount reflects the cumulative appreciation (depreciation) of futures contracts as reported in the Statement of Investments. Only the variation margin receivable/ payable at year end is separately reported within the Statement of Assets and Liabilities. Prior variation margin movements were recorded to cash upon receipt or payment.
For the year ended December 31, 2017, the effect of derivative contracts in the Fund’s Statement of Operations was as follows:
| Derivative Contracts Not Accounted for as Hedging Instruments | Statement of Operations Location | Net Realized Gain (Loss) for the Year | Statement of Operations Location | Net Change in Unrealized Appreciation (Depreciation) for the Year | ||||||||
| Net realized gain (loss) from: | Net change in unrealized | |||||||||||
| appreciation (depreciation) on: | ||||||||||||
Foreign exchange contracts | Investments | $ (85,868 | )a | Investments | $ — | |||||||
| Forward exchange contracts | (5,884,179 | ) | Forward exchange contracts | (10,356,443 | ) | |||||||
| Futures contracts | (2,653,053 | ) | Futures contracts | (852,946 | ) | |||||||
|
|
|
| |||||||||
Totals | $(8,623,100 | ) | $(11,209,389 | ) | ||||||||
|
|
|
| |||||||||
aPurchased option contracts are included in net realized gain (loss) from investments in the Statement of Operations.
For the year ended December 31, 2017, the average month end notional amount of futures contracts and options represented $34,836,724 and $3,735,692, respectively. The average month end contract value of forward exchange contracts was $217,075,717.
At December 31, 2017, the Fund’s OTC derivative assets and liabilities are as follows:
| Gross Amounts of Assets and Liabilities Presented in the Statement of Assets and Liabilities | ||||||||
| Assetsa | Liabilitiesa | |||||||
| Derivatives | ||||||||
Forward exchange contracts | $551,803 | $4,160,465 | ||||||
|
| |||||||
aAbsent an event of default or early termination, OTC derivative assets and liabilities are presented gross and not offset in the Statement of Assets and Liabilities.
34 |
Annual Report |
franklintempleton.com |
FRANKLIN MUTUAL FINANCIAL SERVICES FUND
NOTES TO FINANCIAL STATEMENTS
At December 31, 2017, the Fund’s OTC derivative assets, which may be offset against the Fund’s OTC derivative liabilities and collateral received from the counterparty, are as follows:
| Amounts Not Offset in the Statement of Assets and Liabilities | ||||||||||||||||||||
|
| |||||||||||||||||||
| Gross Amounts of Assets Presented in the Statement of Assets and Liabilities | Financial Instruments Available for Offset | Financial Instruments Collateral Receiveda | Cash Collateral Received | Net Amount (Not less than zero) | ||||||||||||||||
| ||||||||||||||||||||
Counterparty | ||||||||||||||||||||
BOFA | $ 48,203 | $ (48,203 | ) | $ — | $ — | $ — | ||||||||||||||
BONY | — | — | — | — | — | |||||||||||||||
HSBK | 18,478 | (18,478 | ) | — | — | — | ||||||||||||||
SSBT | 366,972 | (366,972 | ) | — | — | — | ||||||||||||||
UBSW | 118,150 | (118,150 | ) | — | — | — | ||||||||||||||
|
| |||||||||||||||||||
Total | $551,803 | $(551,803 | ) | $ — | $ — | $ — | ||||||||||||||
|
| |||||||||||||||||||
At December 31, 2017, the Fund’s OTC derivative liabilities, which may be offset against the Fund’s OTC derivative assets and collateral pledged to the counterparty, are as follows:
|
| |||||||||||||||||||
| Amounts Not Offset in the Statement of Assets and Liabilities | ||||||||||||||||||||
|
| |||||||||||||||||||
| Gross Amounts of Liabilities Presented in the Statement of Assets and Liabilities | Financial Instruments Available for Offset | Financial Instruments Collateral Pledgedb | Cash Collateral Pledged | Net Amount (Not less than zero) | ||||||||||||||||
| ||||||||||||||||||||
Counterparty | ||||||||||||||||||||
BOFA | $ 575,492 | $ (48,203 | ) | $ (382,415 | ) | $ — | $144,874 | |||||||||||||
BONY | 764,729 | — | (651,453 | ) | — | 113,276 | ||||||||||||||
HSBK | 738,353 | (18,478 | ) | (608,650 | ) | — | 111,225 | |||||||||||||
SSBT | 534,449 | (366,972 | ) | — | — | 167,477 | ||||||||||||||
UBSW | 1,547,442 | (118,150 | ) | (983,944 | ) | — | 445,348 | |||||||||||||
|
| |||||||||||||||||||
Total | $4,160,465 | $(551,803 | ) | $(2,626,462 | ) | $ — | $982,200 | |||||||||||||
|
| |||||||||||||||||||
aIn some instances, the collateral amounts disclosed in the table above were adjusted due to the requirement to limit collateral amounts to avoid the effect of overcollateralization. Actual collateral received and/or pledged may be more than the amounts disclosed herein.
bSee the accompanying Statement of Investments for securities pledged as collateral for derivatives.
See Note 1(c) regarding derivative financial instruments.
See Abbreviations on page 38.
franklintempleton.com |
Annual Report |
35 |
FRANKLIN MUTUAL FINANCIAL SERVICES FUND
NOTES TO FINANCIAL STATEMENTS
11. Holdings of 5% Voting Securities of Portfolio Companies
The 1940 Act defines “affiliated companies” to include investments in portfolio companies in which a fund owns 5% or more of the outstanding voting securities. During the year ended December 31, 2017, investments in “affiliated companies” were as follows:
| Name of Issuer | Number of Shares Held at Beginning of Year | Gross Additions | Gross Reductions | Number of Shares Held at End of Year | Value at End of Year | Dividend Income | Realized Gain (Loss) | Net Change in Unrealized Appreciation (Depreciation) | ||||||||||||||||||||||||
| ||||||||||||||||||||||||||||||||
Non-Controlled Affiliates | ||||||||||||||||||||||||||||||||
AB&T Financial Corp. (Value is —%a of Net Assets) | 226,100 | — | — | 226,100 | $128,877 | $— | $— | $4,852 | ||||||||||||||||||||||||
|
| |||||||||||||||||||||||||||||||
aRounds to less than 0.1% of net assets.
12. Credit Facility
The Fund, together with other U.S. registered and foreign investment funds (collectively, Borrowers), managed by Franklin Templeton Investments, are borrowers in a joint syndicated senior unsecured credit facility totaling $2 billion (Global Credit Facility) which matured on February 9, 2018. This Global Credit Facility provides a source of funds to the Borrowers for temporary and emergency purposes, including the ability to meet future unanticipated or unusually large redemption requests. Effective February 9, 2018, the Borrowers renewed the Global Credit Facility for a one year term, maturing February 8, 2019, for a total of $2 billion.
Under the terms of the Global Credit Facility, the Fund shall, in addition to interest charged on any borrowings made by the Fund and other costs incurred by the Fund, pay its share of fees and expenses incurred in connection with the implementation and maintenance of the Global Credit Facility, based upon its relative share of the aggregate net assets of all of the Borrowers, including an annual commitment fee of 0.15% based upon the unused portion of the Global Credit Facility. These fees are reflected in other expenses in the Statement of Operations. During the year ended December 31, 2017, the Fund did not use the Global Credit Facility.
13. Fair Value Measurements
The Fund follows a fair value hierarchy that distinguishes between market data obtained from independent sources (observable inputs) and the Fund’s own market assumptions (unobservable inputs). These inputs are used in determining the value of the Fund’s financial instruments and are summarized in the following fair value hierarchy:
| • | Level 1 – quoted prices in active markets for identical financial instruments |
| • | Level 2 – other significant observable inputs (including quoted prices for similar financial instruments, interest rates, prepayment speed, credit risk, etc.) |
| • | Level 3 – significant unobservable inputs (including the Fund’s own assumptions in determining the fair value of financial instruments) |
The input levels are not necessarily an indication of the risk or liquidity associated with financial instruments at that level.
For movements between the levels within the fair value hierarchy, the Fund has adopted a policy of recognizing the transfers as of the date of the underlying event which caused the movement.
36 |
Annual Report |
franklintempleton.com |
FRANKLIN MUTUAL FINANCIAL SERVICES FUND
NOTES TO FINANCIAL STATEMENTS
A summary of inputs used as of December 31, 2017, in valuing the Fund’s assets and liabilities carried at fair value, is as follows:
| Level 1 | Level 2 | Level 3 | Total | |||||||||||||
| Assets: | ||||||||||||||||
Investments in Securities:a | ||||||||||||||||
Equity Investments:b | ||||||||||||||||
Diversified Financial Services | $ | 27,496,901 | $ | — | $ | 4,105,144 | $ | 31,602,045 | ||||||||
All Other Equity Investments | 653,167,779 | — | — | 653,167,779 | ||||||||||||
Companies in Liquidation | — | 172,408 | — | c | 172,408 | |||||||||||
Short Term Investments | 31,545,200 | 4,500,000 | — | 36,045,200 | ||||||||||||
|
| |||||||||||||||
Total Investments in Securities | $ | 712,209,880 | $ | 4,672,408 | $ | 4,105,144 | $ | 720,987,432 | ||||||||
|
| |||||||||||||||
Other Financial Instruments: | ||||||||||||||||
Forward Exchange Contracts | $ | — | $ | 551,803 | $ | — | $ | 551,803 | ||||||||
| Liabilities: |
|
| ||||||||||||||
Other Financial Instruments: | ||||||||||||||||
Futures Contracts | $ | 528,182 | $ | — | $ | — | $ | 528,182 | ||||||||
Forward Exchange Contracts | — | 4,160,465 | — | 4,160,465 | ||||||||||||
|
| |||||||||||||||
Total Other Financial Instruments | $ | 528,182 | $ | 4,160,465 | $ | — | $ | 4,688,647 | ||||||||
|
| |||||||||||||||
aFor detailed categories, see the accompanying Statement of Investments.
bIncludes common stocks as well as other equity investments.
cIncludes securities determined to have no value at December 31, 2017.
A reconciliation of assets in which Level 3 inputs are used in determining fair value is presented when there are significant Level 3 financial instruments at the beginning and/or end of the year. At December 31, 2017, the reconciliation of assets, is as follows:
| Balance at Beginning of Year | Purchases (Sales) | Transfer Into (Out of) Level 3 | Cost Basis Adjustmentsa | Net Realized Gain (Loss) | Net Unrealized Appreciation (Depreciation) | Balance at End of Year | Net Change in Unrealized Appreciation (Depreciation) on Assets Held at Year End | |||||||||||||||||||||||||
| ||||||||||||||||||||||||||||||||
| Assets: | ||||||||||||||||||||||||||||||||
Investments in Securities: | ||||||||||||||||||||||||||||||||
Equity Investments:b | ||||||||||||||||||||||||||||||||
Diversified Financial Services | $5,615,411 | $ — | $ — | $ — | $ — | $(1,510,267 | ) | $4,105,144 | $(1,510,267 | ) | ||||||||||||||||||||||
Companies in Liquidation | — | c | — | — | (68,325 | ) | 68,325 | — | — | c | — | |||||||||||||||||||||
|
| |||||||||||||||||||||||||||||||
Total | $5,615,411 | $ — | $ — | $(68,325 | ) | $68,325 | $(1,510,267 | ) | $4,105,144 | $(1,510,267 | ) | |||||||||||||||||||||
|
| |||||||||||||||||||||||||||||||
aMay include accretion, amortization, partnership adjustments, and/or other cost basis adjustments.
bIncludes common stocks as well as other equity investments.
cIncludes securities determined to have no value.
franklintempleton.com |
Annual Report |
37 |
FRANKLIN MUTUAL FINANCIAL SERVICES FUND
NOTES TO FINANCIAL STATEMENTS
13. Fair Value Measurements (continued)
Significant unobservable valuation inputs for material Level 3 financial instruments and impact to fair value as a result of changes in unobservable valuation inputs as of December 31, 2017, are as follows:
| Description | Fair Value at End of Year | Valuation Technique | Unobservable Inputs | Amount | Impact to Fair Value if Input Increasesa | |||||||||||||||
| Assets: | ||||||||||||||||||||
Investments in Securities: | ||||||||||||||||||||
Equity Investments: | ||||||||||||||||||||
Diversified Financial Services | $ | 4,105,144 | Market transaction | Transaction price weighting | 100% | Increase | ||||||||||||||
|
| |||||||||||||||||||
| Discount for deal uncertainty | 5% | Decrease | b | |||||||||||||||||
| ||||||||||||||||||||
aRepresents the directional change in the fair value of the Level 3 financial instruments that would result from a significant and reasonable increase in the corresponding input. A significant and reasonable decrease in the input would have the opposite effect. Significant impacts, if any, to fair value and/or net assets have been indicated.
bRepresents a significant impact to fair value but not net assets.
14. Subsequent Events
The Fund has evaluated subsequent events through the issuance of the financial statements and determined that no events have occurred that require disclosure other than those already disclosed in the financial statements.
Abbreviations
| Counterparty | Currency | Selected Portfolio | ||||||||
| BOFA | Bank of America N.A. | EUR | Euro | ADR | American Depositary Receipt | |||||
| BONY | The Bank of New York Mellon Corp. | GBP | British Pound | FHLB | Federal Home Loan Bank | |||||
| HSBK | HSBC Bank PLC | USD | United States Dollar | |||||||
| SSBT | State Street Bank and Trust Co., N.A. | |||||||||
| UBSW | UBS AG | |||||||||
38 |
Annual Report |
franklintempleton.com |
FRANKLIN MUTUAL FINANCIAL SERVICES FUND
Report of Independent Registered Public Accounting Firm
To the Board of Trustees of Franklin Mutual Series Funds and Shareholders of Franklin Mutual Financial Services Fund:
Opinion on the Financial Statements
We have audited the accompanying statement of assets and liabilities of Franklin Mutual Financial Services Fund (the “Fund”) (one of the funds constituting Franklin Mutual Series Funds), including the schedule of investments, as of December 31, 2017, and the related statement of operations for the year then ended, the statements of changes in net assets for each of the two years in the period then ended, the financial highlights for each of the periods indicated therein and the related notes (collectively referred to as the “financial statements”). In our opinion, the financial statements present fairly, in all material respects, the financial position of Franklin Mutual Financial Services Fund (one of the funds constituting Franklin Mutual Series Funds) at December 31, 2017, the results of its operations for the year then ended, the changes in its net assets for each of the two years in the period then ended and its financial highlights for each of the periods indicated therein, in conformity with U.S. generally accepted accounting principles.
Basis for Opinion
These financial statements are the responsibility of the Fund’s management. Our responsibility is to express an opinion on the Fund’s financial statements based on our audits. We are a public accounting firm registered with the Public Company Accounting Oversight Board (United States) (“PCAOB”) and are required to be independent with respect to the Fund in accordance with the U.S. federal securities laws and the applicable rules and regulations of the Securities and Exchange Commission and the PCAOB.
We conducted our audits in accordance with the standards of the PCAOB. Those standards require that we plan and perform the audit to obtain reasonable assurance about whether the financial statements are free of material misstatement, whether due to error or fraud. The Fund is not required to have, nor were we engaged to perform, an audit of the Fund’s internal control over financial reporting. As part of our audits, we are required to obtain an understanding of internal control over financial reporting, but not for the purpose of expressing an opinion on the effectiveness of the Fund’s internal control over financial reporting. Accordingly, we express no such opinion.
Our audits included performing procedures to assess the risks of material misstatement of the financial statements, whether due to error or fraud, and performing procedures that respond to those risks. Such procedures included examining, on a test basis, evidence regarding the amounts and disclosures in the financial statements. Our procedures included confirmation of securities owned as of December 31, 2017, by correspondence with the custodian and brokers. Our audits also included evaluating the accounting principles used and significant estimates made by management, as well as evaluating the overall presentation of the financial statements. We believe that our audits provide a reasonable basis for our opinion.
We have served as the auditor of one or more Franklin investment companies since 1987.
Boston, MA
February 26, 2018
franklintempleton.com |
Annual Report |
39 |
FRANKLIN MUTUAL FINANCIAL SERVICES FUND
Under Section 854(b)(1)(A) of the Internal Revenue Code (Code), the Fund hereby reports 38.08% of the ordinary income dividends as income qualifying for the dividends received deduction for the fiscal year ended December 31, 2017.
Under Section 854(b)(1)(B) of the Code, the Fund hereby reports the maximum amount allowable but no less than $12,447,494 as qualified dividends for purposes of the maximum rate under Section 1(h)(11) of the Code for the fiscal year ended December 31, 2017. Distributions, including qualified dividend income, paid during calendar year 2017 will be reported to shareholders on Form 1099-DIV by mid-February 2018. Shareholders are advised to check with their tax advisors for information on the treatment of these amounts on their individual income tax returns.
40 |
Annual Report |
franklintempleton.com |
FRANKLIN MUTUAL SERIES FUNDS
The name, year of birth and address of the officers and board members, as well as their affiliations, positions held with the Trust, principal occupations during at least the past five years and number of US registered portfolios overseen in the Franklin Templeton Investments fund complex, are shown below. Generally, each board member serves until that person’s successor is elected and qualified.
Independent Board Members
| Name, Year of Birth and Address | Position | Length of Time Served | Number of Portfolios in Fund Complex Overseen by Board Member* | Other Directorships Held During at Least the Past 5 Years | ||||
Edward I. Altman, Ph.D. (1941) 101 John F. Kennedy Parkway Short Hills, NJ 07078-2789 | Trustee | Since 1987 | 14 | None | ||||
| Principal Occupation During at Least the Past 5 Years: | ||||||||
| Max L. Heine Professor of Finance, Emeritus and Director of The Credit and Debt Markets Research Program, Salomon Center, Stern School of Business, New York University; editor and author of numerous financial publications; financial consultant; an adviser to numerous financial and publishing organizations; and formerly, Vice Director, Salomon Center, Stern School of Business, New York University. | ||||||||
Ann Torre Bates (1958) 101 John F. Kennedy Parkway Short Hills, NJ 07078-2789 | Trustee | Since 1995 | 40 | Ares Capital Corporation (specialty finance company) (2010-present), United Natural Foods, Inc. (distributor of natural, organic and specialty foods) (2013-present), Allied Capital Corporation (financial services) (2003-2010), SLM Corporation (Sallie Mae) (1997-2014) and Navient Corporation (loan management, servicing and asset recovery) (2014-2016). | ||||
| Principal Occupation During at Least the Past 5 Years: | ||||||||
| Director of various companies; and formerly, Executive Vice President and Chief Financial Officer, NHP Incorporated (manager of multifamily housing) (1995-1997); and Vice President and Treasurer, US Airways, Inc. (until 1995). | ||||||||
Burton J. Greenwald (1929) 101 John F. Kennedy Parkway Short Hills, NJ 07078-2789 | Trustee and Vice Chairman | Trustee since 2002 and Vice Chairman since 2015 | 14 | Franklin Templeton Emerging Markets Debt Opportunities Fund PLC (1999-present) and Fiduciary International Ireland Limited (1999-2015). | ||||
| Principal Occupation During at Least the Past 5 Years: | ||||||||
| Managing Director, B. J. Greenwald Associates (management consultants to the financial services industry); and formerly, Chairman, Fiduciary Trust International Funds; Executive Vice President, L.F. Rothschild Fund Management, Inc.; President and Director, Merit Mutual Funds; President, Underwriting Division and Director, National Securities & Research Corporation; Governor, Investment Company Institute; and Chairman, ICI Public Information Committee. | ||||||||
Jan Hopkins Trachtman (1947) 101 John F. Kennedy Parkway Short Hills, NJ 07078-2789 | Trustee | Since 2009 | 14 | None | ||||
| Principal Occupation During at Least the Past 5 Years: | ||||||||
| President and Founder, The Jan Hopkins Group (communications and consulting firm); serves on Advisory Board of Knight Bagehot Fellowship; and formerly, President, Economic Club of New York (2007-2015); Anchor/Correspondent, CNN Financial News (until 2003); Managing Director and Head of Client Communications, Citigroup Private Bank (until 2005); Off-Air reporter, ABC News’ World News Tonight; and Editor, CBS Network News. | ||||||||
Keith Mitchell (1954) 101 John F. Kennedy Parkway Short Hills, NJ 07078-2789 | Trustee | Since 2009 | 14 | None | ||||
| Principal Occupation During at Least the Past 5 Years: | ||||||||
| Director of various boards of asset management firms; and formerly, Managing Member, Mitchell, Hartley & Bechtel Advisers, LLC (formerly, Mitchell Advisers, LLC) (advisory firm) (2003-2015) and Managing Director, Putman Lovell NBF. | ||||||||
franklintempleton.com |
Annual Report |
41 |
FRANKLIN MUTUAL SERIES FUNDS
Independent Board Members (continued)
| Name, Year of Birth and Address | Position | Length of Time Served | Number of Portfolios in Fund Complex Overseen by Board Member* | Other Directorships Held During at Least the Past 5 Years | ||||
David W. Niemiec (1949) c/o Franklin Mutual Advisers, LLC 101 John F. Kennedy Parkway Short Hills, NJ 07078-2789 | Trustee | Since 2015 | 40 | Hess Midstream Partners LP (oil and gas midstream infrastructure) (2017-present). | ||||
| Principal Occupation During at Least the Past 5 Years: | ||||||||
| Advisor, Saratoga Partners (private equity fund); and formerly, Managing Director, Saratoga Partners (1998-2001) and SBC Warburg Dillon Read (investment banking) (1997-1998); Vice Chairman, Dillon, Read & Co. Inc. (investment banking) (1991-1997); and Chief Financial Officer, Dillon, Read & Co. Inc. (1982-1997). | ||||||||
Charles Rubens II (1930) c/o Franklin Mutual Advisers, LLC 101 John F. Kennedy Parkway Short Hills, NJ 07078-2789 | Trustee | Since 1998 | 14 | None | ||||
| Principal Occupation During at Least the Past 5 Years: | ||||||||
| Private investor and president of non-profit organizations; and formerly, an executive of Time, Inc.; and Trustee of Colorado College. | ||||||||
Robert E. Wade (1946) c/o Franklin Mutual Advisers, LLC 101 John F. Kennedy Parkway Short Hills, NJ 07078-2789 | Trustee and Chairman of the Board | Trustee since 1993 and Chairman of the Board since 2005 | 40 | El Oro Ltd (investments) (2003-present). | ||||
| Principal Occupation During at Least the Past 5 Years: | ||||||||
| Attorney at law engaged in private practice as a sole practitioner (1972-2008) and member of various boards. | ||||||||
Gregory H. Williams (1943) c/o Franklin Mutual Advisers, LLC 101 John F. Kennedy Parkway Short Hills, NJ 07078-2789 | Trustee | Since 2015 | 14 | None | ||||
| Principal Occupation During at Least the Past 5 Years: | ||||||||
| Private investor; Consultant; and formerly, President, University of Cincinnati (2009-2012); President, The City College of New York (2001-2009); Dean, College of Law, Ohio State University (1993-2001); and Associate Vice President, Academic Affairs and Professor of Law, University of Iowa (1977-1993). | ||||||||
Interested Board Members and Officers
| Name, Year of Birth and Address | Position | Length of Time Served | Number of Portfolios in Fund Complex Overseen by Board Member* | Other Directorships Held During at Least the Past 5 Years | ||||
**Gregory E. Johnson (1961) One Franklin Parkway San Mateo, CA 94403-1906 | Trustee | Since 2007 | 153 | None | ||||
| Principal Occupation During at Least the Past 5 Years: | ||||||||
| Chairman of the Board, Member – Office of the Chairman, Director and Chief Executive Officer, Franklin Resources, Inc.; officer and/or director or trustee, as the case may be, of some of the other subsidiaries of Franklin Resources, Inc. and of 43 of the investment companies in Franklin Templeton Investments; Vice Chairman, Investment Company Institute; and formerly, President, Franklin Resources, Inc. (1994-2015). | ||||||||
**Peter A. Langerman (1955) c/o Franklin Mutual Advisers, LLC 101 John F. Kennedy Parkway Short Hills, NJ 07078-2789 | Trustee, President, and Chief Executive Officer – Investment Management | Trustee since 2007, President, and Chief Executive Officer – Investment Management since 2005 | 7 | American International Group, Inc. (AIG) Credit Facility Trust (2010-2011). | ||||
| Principal Occupation During at Least the Past 5 Years: | ||||||||
| Chairman of the Board, Chief Executive Officer and President, Franklin Mutual Advisers, LLC; President and Chief Investment Officer, Franklin Advisory Services, LLC; and officer and/or director, as the case may be, of three of the investment companies in Franklin Templeton Investments. | ||||||||
42 |
Annual Report |
franklintempleton.com |
FRANKLIN MUTUAL SERIES FUNDS
Interested Board Members and Officers (continued)
| Name, Year of Birth and Address | Position | Length of Time Served | Number of Portfolios in Fund Complex Overseen by Board Member* | Other Directorships Held During at Least the Past 5 Years | ||||
Alison E. Baur (1964) One Franklin Parkway San Mateo, CA 94403-1906 | Vice President | Since 2012 | Not Applicable | Not Applicable | ||||
| Principal Occupation During at Least the Past 5 Years: | ||||||||
| Deputy General Counsel, Franklin Templeton Investments; and officer of some of the other subsidiaries of Franklin Resources, Inc. and of 45 of the investment companies in Franklin Templeton Investments. | ||||||||
Philippe Brugere-Trelat (1949) 101 John F. Kennedy Parkway Short Hills NJ 07078-2789 | Vice President | Since 2005 | Not Applicable | Not Applicable | ||||
| Principal Occupation During at Least the Past 5 Years: | ||||||||
| Executive Vice President, Franklin Mutual Advisers, LLC; officer of one of the investment companies in Franklin Templeton Investments; and formerly, Portfolio Manager of Eurovest SA (French registered investment company, SICAV). | ||||||||
Aliya S. Gordon (1973) One Franklin Parkway San Mateo, CA 94403-1906 | Vice President | Since 2009 | Not Applicable | Not Applicable | ||||
| Principal Occupation During at Least the Past 5 Years: | ||||||||
| Senior Associate General Counsel, Franklin Templeton Investments; and officer of 45 of the investment companies in Franklin Templeton Investments. | ||||||||
Steven J. Gray (1955) One Franklin Parkway San Mateo, CA 94403-1906 | Vice President and Secretary | Vice President since 2009 and Secretary since 2005 | Not Applicable | Not Applicable | ||||
| Principal Occupation During at Least the Past 5 Years: | ||||||||
| Senior Associate General Counsel, Franklin Templeton Investments; Vice President, Franklin Templeton Distributors, Inc. and FASA, LLC; and officer of 45 of the investment companies in Franklin Templeton Investments. | ||||||||
Matthew T. Hinkle (1971) One Franklin Parkway San Mateo, CA 94403-1906 | Chief Executive Officer – Finance and Administration | Since June 2017 | Not Applicable | Not Applicable | ||||
| Principal Occupation During at Least the Past 5 Years: | ||||||||
| Senior Vice President, Franklin Templeton Services, LLC; officer of 45 of the investment companies in Franklin Templeton Investments; and formerly, Vice President, Global Tax (2012-April 2017) and Treasurer/Assistant Treasurer, Franklin Templeton Investments (2009-2017). | ||||||||
Robert G. Kubilis (1973) 300 S.E. 2nd Street Fort Lauderdale, FL 33301-1923 | Chief Financial Officer, Chief Accounting Officer and Treasurer | Since 2012 | Not Applicable | Not Applicable | ||||
| Principal Occupation During at Least the Past 5 Years: | ||||||||
| Treasurer, U.S. Fund Administration & Reporting, Franklin Templeton Investments; and officer of 17 of the investment companies in Franklin Templeton Investments. | ||||||||
Robert Lim (1948) One Franklin Parkway San Mateo, CA 94403-1906 | Vice President – AML Compliance | Since 2016 | Not Applicable | Not Applicable | ||||
| Principal Occupation During at Least the Past 5 Years: | ||||||||
| Vice President, Franklin Templeton Companies, LLC; Chief Compliance Officer, Franklin Templeton Distributors, Inc. and Franklin Templeton Investor Services, LLC; and officer of 45 of the investment companies in Franklin Templeton Investments. | ||||||||
franklintempleton.com |
Annual Report |
43 |
FRANKLIN MUTUAL SERIES FUNDS
Interested Board Members and Officers (continued)
| Name, Year of Birth and Address | Position | Length of Time Served | Number of Portfolios in Fund Complex Overseen | Other Directorships Held During at Least the Past 5 Years | ||||
Kimberly H. Novotny (1972) 300 S.E. 2nd Street Fort Lauderdale, FL 33301-1923 | Vice President | Since 2013 | Not Applicable | Not Applicable | ||||
| Principal Occupation During at Least the Past 5 Years: | ||||||||
| Associate General Counsel, Franklin Templeton Investments; Vice President and Corporate Secretary, Fiduciary Trust International of the South; Vice President, Templeton Investment Counsel, LLC; Assistant Secretary, Franklin Resources, Inc.; and officer of 45 of the investment companies in Franklin Templeton Investments. | ||||||||
Robert C. Rosselot (1960) 300 S.E. 2nd Street Fort Lauderdale, FL 33301-1923 | Chief Compliance Officer | Since 2013 | Not Applicable | Not Applicable | ||||
| Principal Occupation During at Least the Past 5 Years: | ||||||||
| Director, Global Compliance, Franklin Templeton Investments; Vice President, Franklin Templeton Companies, LLC; officer of 45 of the investment companies in Franklin Templeton Investments; and formerly, Senior Associate General Counsel, Franklin Templeton Investments (2007-2013); and Secretary and Vice President, Templeton Group of Funds (2004-2013). | ||||||||
Karen L. Skidmore (1952) One Franklin Parkway San Mateo, CA 94403-1906 | Vice President | Since 2009 | Not Applicable | Not Applicable | ||||
| Principal Occupation During at Least the Past 5 Years: | ||||||||
| Senior Associate General Counsel, Franklin Templeton Investments; and officer of 45 of the investment companies in Franklin Templeton Investments. | ||||||||
Navid J. Tofigh (1972) One Franklin Parkway San Mateo, CA 94403-1906 | Vice President | Since 2015 | Not Applicable | Not Applicable | ||||
| Principal Occupation During at Least the Past 5 Years: | ||||||||
| Associate General Counsel, Franklin Templeton Investments; and officer of 45 of the investment companies in Franklin Templeton Investments. | ||||||||
Craig S. Tyle (1960) One Franklin Parkway San Mateo, CA 94403-1906 | Vice President | Since 2005 | Not Applicable | Not Applicable | ||||
| Principal Occupation During at Least the Past 5 Years: | ||||||||
| General Counsel and Executive Vice President, Franklin Resources, Inc.; and officer of some of the other subsidiaries of Franklin Resources, Inc. and of 45 of the investment companies in Franklin Templeton Investments. | ||||||||
Lori A. Weber (1964) 300 S.E. 2nd Street Fort Lauderdale, FL 33301-1923 | Vice President | Since 2011 | Not Applicable | Not Applicable | ||||
| Principal Occupation During at Least the Past 5 Years: | ||||||||
| Senior Associate General Counsel, Franklin Templeton Investments; Assistant Secretary, Franklin Resources, Inc.; Vice President and Secretary, Templeton Investment Counsel, LLC; and officer of 45 of the investment companies in Franklin Templeton Investments. | ||||||||
*We base the number of portfolios on each separate series of the US registered investment companies within the Franklin Templeton Investments fund complex. These portfolios have a common investment manager or affiliated investment managers.
**Gregory E. Johnson is considered to be an interested person of the Fund under the federal securities laws due to his position as an officer and director of Franklin Resources, Inc. (Resources), which is the parent company of the Fund’s investment manager and distributor. Peter A. Langerman is considered to be an interested person of the Fund under the federal securities laws due to his position as an officer of Franklin Mutual Advisors, LLC, which is an affiliate of the Fund’s investment manager.
Note 1: Officer information is current as of the date of this report. It is possible that after this date, information about officers may change.
The Sarbanes-Oxley Act of 2002 and Rules adopted by the U.S. Securities and Exchange Commission require the Fund to disclose whether the Fund’s Audit Committee includes at least one member who is an audit committee financial expert within the meaning of such Act and Rules. The Fund’s Board has determined that there is at least one such financial expert on the Audit Committee and has designated each of Edward I. Altman, Ph.D., Ann Torre Bates and David W. Niemiec as an audit committee financial expert. The Board believes that Messrs. Altman and Niemiec and Ms. Bates qualify as such an expert in view of their extensive business background and experience. Mr. Altman has served as a member of the Fund Audit Committee since 1996. He currently serves as a Max L. Hines Professor of Finance, Emeritus and Director of The Credit and Debt Markets Research Program, Salomon Center, Stern School of Business, New York University. Ms. Bates has served as a member of the Fund Audit Committee since 1996. She currently serves as a director of Ares Capital Corporation (2010-present) and United Natural Foods, Inc. (2013-present) and was formerly a director of Navient Corporation from 2014 to 2016, SLM Corporation from 1997 to 2014 and Allied
44 |
Annual Report |
franklintempleton.com |
FRANKLIN MUTUAL SERIES FUNDS
Interested Board Members and Officers (continued)
Capital Corporation from 2003 to 2010, Executive Vice President and Chief Financial Officer of NHP Incorporated from 1995 to 1997 and Vice President and Treasurer of US Airways, Inc. until 1995. Mr. Niemiec has served as a member of the Fund Audit Committee since 2015, currently serves as an Advisor to Saratoga Partners and was formerly its Managing Director from 1998 to 2001 and serves as a director of Hess Midstream Partners LP (2017-present). Mr. Niemiec was formerly a director of Emeritus Corporation from 1999 to 2010 and OSI Pharmaceuticals, Inc. from 2006 to 2010, Managing Director of SBC Warburg Dillon Read from 1997 to 1998, and was Vice Chairman from 1991 to 1997 and Chief Financial Officer from 1982 to 1997 of Dillon, Read & Co. Inc. As a result of such background and experience, the Board believes that Messrs. Altman and Niemiec and Ms. Bates have each acquired an understanding of generally accepted accounting principles and financial statements, the general application of such principles in connection with the accounting estimates, accruals and reserves, and analyzing and evaluating financial statements that present a breadth and level of complexity of accounting issues generally comparable to those of the Fund, as well as an understanding of internal controls and procedures for financial reporting and an understanding of audit committee functions. Messrs. Altman and Niemiec and Ms. Bates are independent Board members as that term is defined under the applicable U.S. Securities and Exchange Commission Rules and Releases.
The Statement of Additional Information (SAI) includes additional information about the board members and is available, without charge, upon request. Shareholders may call (800) DIAL BEN/342-5236 to request the SAI.
franklintempleton.com |
Annual Report |
45 |
FRANKLIN MUTUAL SERIES FUNDS
FRANKLIN MUTUAL FINANCIAL SERVICES FUND
Proxy Voting Policies and Procedures
The Fund’s investment manager has established Proxy Voting Policies and Procedures (Policies) that the Fund uses to determine how to vote proxies relating to portfolio securities. Shareholders may view the Fund’s complete Policies online at franklintempleton.com. Alternatively, shareholders may request copies of the Policies free of charge by calling the Proxy Group collect at (954) 527-7678 or by sending a written request to: Franklin Templeton Companies, LLC, 300 S.E. 2nd Street, Fort Lauderdale, FL 33301, Attention: Proxy Group. Copies of the Fund’s proxy voting records are also made available online at franklintempleton.com and posted on the US Securities and Exchange Commission’s website at sec.gov and reflect the most recent 12-month period ended June 30.
Quarterly Statement of Investments
The Trust, on behalf of the Fund, files a complete statement of investments with the US Securities and Exchange Commission for the first and third quarters for each fiscal year on Form N-Q. Shareholders may view the filed Form N-Q by visiting the Commission’s website at sec.gov. The filed form may also be viewed and copied at the Commission’s Public Reference Room in Washington, DC. Information regarding the operations of the Public Reference Room may be obtained by calling (800) SEC-0330.
Householding of Reports and Prospectuses
You will receive the Fund’s financial reports every six months as well as an annual updated summary prospectus (prospectus available upon request). To reduce Fund expenses, we try to identify related shareholders in a household and send only one copy of the financial reports and summary prospectus. This process, called “householding,” will continue indefinitely unless you instruct us otherwise. If you prefer not to have these documents householded, please call us at (800) 632-2301. At any time you may view current prospectuses/summary prospectuses and financial reports on our website. If you choose, you may receive these documents through electronic delivery.
46 |
Annual Report |
franklintempleton.com |
This page intentionally left blank.
This page intentionally left blank.
 | Annual Report and Shareholder Letter | |||
| Franklin Mutual Financial Services Fund | ||||
| Investment Manager | ||||
Franklin Mutual Advisers, LLC
| ||||
| Distributor | ||||
| Franklin Templeton Distributors, Inc. | ||||
| (800) DIAL BEN® / 342-5236 | ||||
franklintempleton.com
| ||||
| Shareholder Services | ||||
| (800) 632-2301 - (Class A, C & R6) | ||||
| (800) 448-FUND - (Class Z) |
Authorized for distribution only when accompanied or preceded by a summary prospectus and/or prospectus. Investors should carefully consider a fund’s investment goals, risks, charges and expenses before investing. A prospectus contains this and other information; please read it carefully before investing.
To help ensure we provide you with quality service, all calls to and from our service areas are monitored and/or recorded.
| ©2018 Franklin Templeton Investments. All rights reserved. | 479 A 02/18 |
| Annual Report and Shareholder Letter
December 31, 2017 |
Franklin Templeton Investments
Gain From Our Perspective®
At Franklin Templeton Investments, we’re dedicated to one goal: delivering exceptional asset management for our clients. By bringing together multiple, world-class investment teams in a single firm, we’re able to offer specialized expertise across styles and asset classes, all supported by the strength and resources of one of the world’s largest asset managers. This has helped us to become a trusted partner to individual and institutional investors across the globe.
Dear Franklin Mutual International Fund Shareholder:
Securities markets benefited from a confluence of positive economic, financial and political trends during 2017. The global economy entered a synchronized pace of modest and steady growth, corporate earnings strengthened in the US, Europe and Japan, and US equity market volatility remained at historically low levels. A number of political risks identified at the start of 2017, such as the success of far-right parties in Europe, Brexit negotiations and the Trump administration’s ability to enact its policy agenda, also dissipated or became less immediate for investors as the year progressed. For the year ended December 31, 2017, international stocks, as measured by the MSCI All Country World Index (ACWI) ex USA Net Return (Local Currency), produced a +18.24% total return.1 Stocks in global developed markets, as measured by the MSCI World Index, returned +23.07% and investment-grade bonds, as measured by the Bloomberg Barclays US Aggregate Bond Index, posted a +3.54% total return.1
In many equity markets, the trend of growth stocks outpacing value stocks continued. The MSCI World Growth Index returned +28.49%, while the MSCI World Value Index returned +17.95%.1 The difference in performance was driven in part by a rally in information technology stocks. In addition, MSCI World Value Index has components that we believe are facing disruption from new technology (e.g., the rapid market share shift to online retailing from traditional bricks and mortar retailers that are often labeled as value stocks). Exacerbating the disruption is the reality that many new technology companies are able to innovate without the need to show immediate profits.
We do not know how long these trends will continue, but historically, periods of strong performance by growth stocks
1. Source: Morningstar.
See www.franklintempletondatasources.com for additional data provider information.
have eventually been followed by relatively weaker performance. Given that unemployment has continued to decline in most developed markets and the US Federal Reserve has taken its first steps toward monetary normalization, value-oriented stocks may become more attractive to investors, particularly within cyclical sectors of the equity markets such as industrials, consumer discretionary and financials.
A stellar 2017 for equity markets also pushed up common valuation metrics, such as price-to-earnings. Valuation is a critical factor in our analysis and we always ask ourselves if current and potential investments represent an attractive balance of risk and reward. We remain committed to our long-term perspective and disciplined investment approach as we conduct a rigorous, fundamental analysis of securities with a regular emphasis on investment risk management.
Although the investment landscape appears favorable as we enter 2018, it is worth remembering that securities markets are dynamic and constantly evolving. Therefore, we believe active, professional investment management serves investors well. We also recognize the important role of financial advisors in today’s markets and encourage investors to continue to seek their advice. Amid changing markets and economic conditions, we are confident investors with a well-diversified portfolio and a patient, long-term outlook should be well positioned for the years ahead.
On the following pages, the Fund’s portfolio management team reviews investment decisions that pertain to performance during the past 12 months in light of the economic environment and other factors. Please remember all securities markets fluctuate, as do mutual fund share prices.
| Not FDIC Insured | | | May Lose Value | | | No Bank Guarantee |
franklintempleton.com | Not part of the annual report | 1 |
We thank you for investing with Franklin Templeton, welcome your questions and comments, and look forward to continuing to serve your investment needs in the years ahead.
Sincerely,
| Peter A. Langerman |
| Chairman, President and Chief Executive Officer |
| Franklin Mutual Advisers, LLC |
This letter reflects our analysis and opinions as of December 31, 2017, unless otherwise indicated. The information is not a complete analysis of every aspect of any market, country, industry, security or fund. Statements of fact are from sources considered reliable.
Annual Report
|
Franklin Mutual International Fund
| 3 | |||
| 10 | |||
| 13 | |||
Financial Highlights and Statement of Investments
| 14 | |||
| 24 | |||
| 28 | |||
Report of Independent Registered Public Accounting Firm
| 40 | |||
| 41 | |||
| 42 | |||
| 47 |
Visit franklintempleton.com for fund updates, to access your account, or to find helpful financial planning tools.
2 |
Not part of the annual report |
franklintempleton.com |
Annual Report
Franklin Mutual International Fund
This annual report for Franklin Mutual International Fund covers the fiscal year ended December 31, 2017.
Your Fund’s Goal and Main Investments
The Fund seeks capital appreciation, which may occasionally be short term, with income as a secondary goal. Under normal market conditions, the Fund invests at least 80% of its net assets in securities of non-US issuers, primarily Asian and European companies. The investment manager focuses the Fund’s investments on securities believed to be available at market prices less than their intrinsic value. The equity securities in which the Fund invests are primarily common stocks, with a current focus on mid- and large-cap companies. To a lesser extent, the Fund also invests in merger arbitrage securities and the debt and equity of distressed companies. The Geographic Composition bar chart on page 4 lists the leading countries where the Fund invests.
Performance Overview
The Fund’s Class Z shares delivered a +13.99% cumulative total return for the 12 months ended December 31, 2017. In comparison, the Fund’s benchmark, the MSCI All Country World Index (ACWI) ex USA Net Return (Local Currency), which is a free float-adjusted,1 market capitalization-weighted index designed to measure equity market performance in global developed and emerging markets, generated a +18.24% total return.2 Also for comparison, the Fund’s secondary benchmark, the MSCI ACWI ex USA Net Return (US dollar) posted a +27.19% total return.2 You can find more of the Fund’s performance data in the Performance Summary beginning on page 10.
Performance data represent past performance, which does not guarantee future results. Investment return and principal value will fluctuate, and you may have a gain or loss when you sell your shares. Current performance may differ from figures shown. For most recent month-end performance, go to franklintempleton.com or call (800) 342-5236.
Economic and Market Overview
The global economy grew moderately during the 12-month period under review. In this environment, global developed and emerging market stocks generated a +24.62% total return, as measured by the MSCI All Country World Index.2 Global markets were aided by price gains in oil and other commodities, generally upbeat economic data across regions, the European Central Bank’s (ECB’s) extension of its monetary easing program, and investor optimism about pro-growth and pro-business policies in the US. The prospect for reforms in the European Union (EU) with Emmanuel Macron’s election as France’s president, encouraging corporate earnings reports and the passage of the US tax reform bill also supported global stocks.
However, global markets reflected investor concerns about the terms of the UK’s exit from the EU, political uncertainty in the US and the EU, and geopolitical tensions in the Korean peninsula and other regions. Other concerns included the health of European banks, global oil oversupply despite a pact by major oil-producing countries to extend production cuts, and comments from key central bankers around the world about potentially raising interest rates.
After strengthening in 2017’s second and third quarters, the US economy moderated in the fourth quarter. The economy grew faster in 2017 than in 2016, however, largely due to growth in consumer spending, business investment and exports. The unemployment rate decreased from 4.7% in December 2016, as reported at the beginning of the 12-month period, to 4.1% at
1. A “free float-adjusted” index means that companies with larger proportions of their shares being actively traded, rather than being held by company insiders, governments or cross held by other companies, receive higher weightings within the index.
2. Source: Morningstar.
The indexes are unmanaged and include reinvestment of any income or distributions. They do not reflect any fees, expenses or sales charges. One cannot invest directly in an index, and an index is not representative of the Fund’s portfolio.
The dollar value, number of shares or principal amount, and names of all portfolio holdings are listed in the Fund’s Statement of Investments (SOI). The SOI begins on page 19.
franklintempleton.com | Annual Report | 3 |
FRANKLIN MUTUAL INTERNATIONAL FUND
period-end.3 Annual inflation, as measured by the Consumer Price Index, was 2.1% in December 2016, as reported at the beginning of the 12-month period, and while it varied over the 12-month period, remained unchanged at period-end.3 The US Federal Reserve (Fed) raised its target range for the federal funds rate 0.25% three times during the period, amid signs of a growing US economy, strengthening labor market and improving business spending. At its December meeting, the Fed confirmed that the monthly balance sheet reduction would increase from US$10 billion to US$20 billion beginning in January 2018.
In Europe, the UK’s economic growth moderated in 2017 compared to 2016, largely due to slower growth in the services sector. In November, the Bank of England raised its key policy rate 0.25%, its first increase in a decade. The eurozone’s growth accelerated in 2017’s second and third quarters, but moderated in the fourth quarter. However, the eurozone’s 2017 economic growth rate of 2.5% was the fastest in a decade.4 The bloc’s annual inflation rate, while low, ended higher than in December 2016. The ECB kept its benchmark interest rate unchanged during the period. However, at its October meeting, the ECB extended the time frame for its massive bond-buying program from December 2017 to at least September 2018, while reducing the amount of monthly bond purchases in half beginning in January 2018.
In Asia, Japan’s quarterly gross domestic product (GDP) grew for the seventh consecutive quarter, although third-quarter 2017 growth was lower than the previous quarter. The Bank of Japan left its benchmark interest rate unchanged during the period and continued its monetary stimulus measures.
In emerging markets, Brazil’s quarterly GDP grew for the third consecutive quarter, although third-quarter 2017 growth slowed from the previous quarter. The country’s central bank cut its benchmark interest rate several times during the period to spur economic growth. Russia’s GDP grew in 2017’s first three quarters compared to the prior-year periods, amid the Bank of Russia’s continued policy support. China’s GDP grew faster in 2017 than in 2016, supported by solid growth in industrial production, services, fixed-asset investment, retail sales, and imports and exports. The People’s Bank of China left its benchmark interest rate unchanged during the period. Overall, emerging market stocks, as measured by the MSCI Emerging Markets Index, produced a substantial +37.75% total return during the period.2
Geographic Composition*
Based on Total Net Assets as of 12/31/17
*Figures are stated as a percentage of total and may not equal 100% or may be negative due to rounding, use of any derivatives, unsettled trades or other factors.
Investment Strategy
At Franklin Mutual Series, we are committed to our distinctive value approach to investing, which we believe can generate above-average risk-adjusted returns over time for our shareholders. Our major investment strategy is investing in undervalued stocks in Asia and Europe. We have the ability to invest in emerging markets, although this is unlikely to be a significant focus of our strategy. When selecting undervalued equities, we are attracted to what we believe are fundamentally
3. Source: Bureau of Labor Statistics.
4. Source: Eurostat.
4 | Annual Report | franklintempleton.com |
FRANKLIN MUTUAL INTERNATIONAL FUND
strong companies with healthy balance sheets, high-quality assets, substantial free cash flow and shareholder-oriented management teams and whose stocks are trading at discounts to our assessment of the companies’ intrinsic or business value. We also look for asset-rich companies whose shares may be trading at depressed levels due to concerns over short-term earnings disappointments, litigation, management strategy or other perceived negatives. This strict value approach is not only intended to improve the likelihood of upside potential, but also reduces the risk of substantial declines, in our opinion. While the vast majority of our undervalued equity investments are made in publicly traded companies internationally, we may invest occasionally in privately held companies as well.
We complement this more traditional investment strategy with two others. One is distressed investing, a highly specialized field that has proven quite profitable during certain periods over the years. Distressed investing is complex and can take many forms. The most common distressed investment the Fund undertakes is the purchase of financially troubled or bankrupt companies’ debt at a substantial discount to face value. After the financially distressed company is reorganized, the old debt is typically replaced with new securities issued by the financially stronger company.
The other piece of our investment strategy is participating in arbitrage situations, another highly specialized field. When companies announce proposed mergers or takeovers, commonly referred to as “deals,” the target company may trade at a discount to the bid it ultimately accepts. One form of arbitrage involves purchasing the target company’s stock when it is trading below the value we believe it would receive in a deal. In keeping with our commitment to a relatively conservative investment approach, we typically focus our arbitrage efforts on announced deals, and avoid rumored deals or other situations we consider relatively risky.
In addition, it is our practice to hedge the Fund’s currency exposure when we deem it advantageous for our shareholders.
What is meant by “hedge”?
To hedge an investment is to take a position intended to offset potential losses/gains that may be incurred by a companion financial instrument.
Manager’s Discussion
In 2017, an improving economic and political backdrop helped drive most equity markets higher. The positive performances were broad based, spanning across most regions and sectors, and complemented by minimal volatility. Global markets were
aided by generally upbeat economic data, improved corporate earnings in the US, Europe and Japan, as well as improved industrial commodity prices, most notably crude oil. In addition, the most significant political risks identified by investors heading into 2017 failed to materialize.
In the US, markets began 2017 rallying as investors hoped that a Republican sweep of US elections in November 2016 would lead to a general loosening in regulations and tax reform, including lower corporate tax rates. Although the Trump administration’s policy agenda was hindered by political gridlock, efforts to loosen federal regulations yielded some results and tax reform legislation was finally passed in late December. Improving economic activity and corporate earnings appeared to be the most meaningful equity market catalysts during much of 2017.
European equity markets started 2017 slowly, but positive political events and improved economic data fueled strong performances during the period. Elections in Europe produced outcomes generally regarded as positive economically as far-right parties largely failed to gain political power in national elections. Investors were particularly encouraged by the presidential election outcome in France. The reform-minded, centrist candidate, Emmanuel Macron, won the French presidential election in May and quickly began to push his agenda, most notably labor decrees giving employers in France greater freedom in negotiating contracts directly with workers. Amid all the positive events, the UK remained the most significant outlier. In the UK, a June 2017 snap election resulting in no party having a majority in Parliament appeared to make a “hard Brexit,” in which the UK leaves the European Union (EU) in March 2019 without a negotiated deal, even more likely than before. Although the UK and EU appeared to make some progress late in the year, the snap election results left the Conservative Party in a precarious position and with the risk of another election in the near future.
While inflation remains generally subdued in developed markets, economic conditions, particularly tighter labor markets, may lead to gradual price level increases, providing major central banks with justification to incrementally move away from their expansive monetary policies. We concur with the general investor view that monetary policy is not likely to change significantly when Federal Reserve (Fed) Governor Jerome Powell assumes his role as the next Fed Chair in February 2018, although some loosening in financial regulation is possible. At the same time, the ECB’s caution in scaling back its quantitative easing program means monetary policy will likely remain relatively accommodative in 2018. In Asia, we believe that the Bank of Japan has not been following through
franklintempleton.com | Annual Report | 5 |
FRANKLIN MUTUAL INTERNATIONAL FUND
with as much quantitative easing as planned, and China has been tightening.
If the constructive backdrop as of period-end persists, it is likely to be a tailwind for equity markets. However, we are also highly cognizant of elevated levels of overall equity market valuations, such as price-to-earnings, price-to-book or price-to-sales, relative to most historical benchmarks. Elevated valuation levels may raise the overall risk profile of equity markets, particularly should the backdrop change due to some geopolitical event, greater-than-expected interest rate hikes, or other unexpected factors.
The Fund’s financials sector exposure increased significantly during the year, due to a combination of performance among the Fund’s sector positions and our investments in the sector.5 The Top Ten Sectors/Industries table on this page lists insurance, banks and other leading industries in which the Fund currently invests.
Although returns at foreign banks have been under pressure from a combination of low interest rates, anemic credit growth and greater regulatory capital and liquidity requirements, we think more investment opportunities are likely to be found abroad. We believe the regulatory and rate cycles are turning, which will likely create opportunities among European banks. Some European banks have recently adjusted their business models, a process that took place in the US more than five years ago, which gives investors greater clarity on future opportunities. However, the uncertainty of Brexit negotiations still hangs over the UK.
In China, efforts to rein in the financial system due to the rapid growth in debt and to shift the economy’s leading driver of growth from capital investment toward domestic consumption, have picked up steam. As part of the process, more bankruptcies among state-owned enterprises, local government financing vehicles and small banks are possible, in our view. Although the current environment for China’s lenders is filled with uncertainty, we believe China will be in much better shape in time. At the same time, life insurers are likely to benefit from tighter liquidity conditions which may help foster higher investment returns. Demand for life insurance has been growing at a rapid pace in China as the quality of life has been improving and consumers have been looking to create a stronger safety net given the trends in mortality and morbidity.
Although the Japanese banking industry is challenged by very low margins, the life insurance industry has survived a period
Top 10 Sectors/Industries
Based on Equity Securities as of 12/31/17
| % of Total Net Assets | ||||
| Insurance | 17.0 | % | ||
| Banks | 9.6 | % | ||
| Oil, Gas & Consumable Fuels | 6.5 | % | ||
| Pharmaceuticals | 4.8 | % | ||
| Auto Components | 4.6 | % | ||
| Automobiles | 4.3 | % | ||
| Diversified Telecommunication Services | 4.0 | % | ||
| Hotels, Restaurants & Leisure | 3.8 | % | ||
| Internet Software & Services | 2.9 | % | ||
| IT Services | 2.9 | % | ||
of negative interest rates, and we believe would benefit meaningfully if rates at the long end of the yield curve were allowed to move higher. We see this as more likely than a move in overnight rates.
Fund Performance
Turning to Fund performance, top positive contributors included Netherlands-based insurer ASR Nederland, India-based mortgage finance company Indiabulls Housing Finance and South Korea-based Samsung Electronics. ASR Nederland is listed among the Fund’s largest positions in the Top 10 Equity Holdings table on page 7.
Shares of ASR Nederland steadily rose during most of the period, aided by a series of solid quarterly results. Operating results were aided by ASR Nederland’s efforts to increase the investment risk of its portfolio by shifting invested insurance policy premiums from traditional fixed income securities to equities and other assets with higher historical returns. In February 2017, ASR Nederland announced it would increase its dividend and repurchase shares on offer from the Dutch government, shares the government had acquired during the 2008 financial crisis. The company announced an additional share buyback plan in May 2017. In our view, the buybacks demonstrated ASR Nederland’s strong capital position.
Indiabulls Housing Finance is India’s third largest mortgage financing company. We initiated a position when investors were concerned about the impact on Indiabulls of the Indian government’s 2016 recall of 500- and 1,000-rupee notes, despite the company’s business being essentially cashless. Indiabulls has continued to execute well in a favorable environment as the government has created effective interest
5. The financials sector comprises banks, capital markets, consumer finance, diversified financial services, insurance, and thrifts and mortgage finance in the SOI.
6 | Annual Report | franklintempleton.com |
FRANKLIN MUTUAL INTERNATIONAL FUND
| Top 10 Equity Holdings | ||||
| 12/31/17 | ||||
Company Sector/Industry, Country | % of Total Net Assets | |||
China Longyuan Power Group Corp. | 2.8% | |||
| Independent Power & Renewable Electricity Producers, China | ||||
Volkswagen AG | 2.7% | |||
| Automobiles, Germany | ||||
Coca-Cola Bottlers Japan Holdings Inc. | 2.7% | |||
| Beverages, Japan | ||||
ASR Nederland NV | 2.7% | |||
| Insurance, Netherlands | ||||
Enel SpA | 2.5% | |||
| Electric Utilities, Italy | ||||
Accor SA | 2.5% | |||
| Hotels, Restaurants & Leisure, France | ||||
Koninklijke Philips NV | 2.2% | |||
| Health Care Equipment & Supplies, Netherlands | ||||
Metro Pacific Investments Corp. | 2.2% | |||
| Diversified Financial Services, Philippines | ||||
Novartis AG | 2.1% | |||
| Pharmaceuticals, Switzerland | ||||
NN Group NV | 2.1% | |||
| Insurance, Netherlands | ||||
rates of well below 3% for borrowers in the affordable housing segment, the company’s area of focus. Investors also reacted positively to credit rating upgrades in 2017 as they help reduce the company’s cost of borrowing and boost profitability.
Samsung Electronics is a low cost provider of dynamic random-access memory and flash memory products, smartphones, consumer electronics and other goods. For investors, Samsung’s solid operating results outweighed both the conviction of Samsung vice chairman Jay Y. Lee for his involvement in a government bribery scandal and escalating tensions between North Korea and the international community. Samsung reported strong sales in its core businesses, including memory chips and OLED (organic light-emitting diode) displays. Sales of its newest generation of smartphones during 2017 exceeded market expectations. Shareholder- friendly actions also boosted shares of Samsung, including a plan to cancel existing treasury shares held by the company and the announcement of significant dividend increases in 2017 and 2018.
During the period under review, Fund investments that detracted from performance included Israel-based
pharmaceutical services provider Teva Pharmaceuticals,6 Japan-based residential developer Takara Leben and China-based consumer finance company Qudian.
Teva Pharmaceutical Industries experienced a challenging year. In January 2017, Teva provided lower earnings guidance and a US federal court invalidated four patents for the company’s top-selling multiple sclerosis drug Copaxone. The resignations of Teva’s chief executive officer (CEO) and chief financial officer in the first half of 2017 further hindered Teva’s stock price. In the second half of the year, weak operating results, a dividend cut and a debt rating downgrade escalated investor concerns.
Takara Leben is a midsized condominium developer in Japan that has been rapidly expanding its solar farm capacity. The stock price dropped in the first quarter of 2017 after investors reacted sharply to a small downward adjustment to fiscal year revenue guidance due to a delay in the sales of solar power plants. We believe Takara has not been utilizing its cost advantage in the residential real estate market to the fullest extent. In our view, Takara has also failed to accelerate the completion of units in a favorable market environment. Moreover, we do not believe it has been selling solar assets at full value. Consequently, we exited the position by period-end.
Qudian, China’s largest online microlender, went public in the US in October 2017. A number of subsequent events, which we believe were misunderstood by the market, drove the share price down. China’s government suspended regulatory approvals of new internet microlending licenses, elevating a barrier to entry and improving the position of this established low cost leader, in our view. Alipay, a Chinese internet payments platform, announced an interest rate cap of 24%; the rate cap effectively takes Alipay out of the market for customers underwritten by Qudian who would not qualify for loans at 24%. Subsequently, China’s government prohibited unlicensed lending and capped borrowing costs to 36%, the same cap level implemented by Qudian in April 2017. Although it is possible Qudian could see a short-term increase in bad debts from a credit crunch in the unsecured consumer credit market, we see the regulatory changes as a long-term positive move. Qudian is among the most established microlenders with strong brand recognition and operational performance.
6. Not held at period-end.
See www.franklintempletondatasources.com for additional data provider information.
franklintempleton.com | Annual Report | 7 |
FRANKLIN MUTUAL INTERNATIONAL FUND
During the period, the Fund held currency forwards and futures seeking to hedge most of the currency risk of the portfolio’s non-US dollar investments. The currency forwards and futures had a negative impact on the Fund’s performance because of the depreciation of the US dollar versus the hedged currencies.
What is a currency forward?
A currency forward is an agreement between the Fund and a counterparty to buy or sell a foreign currency in exchange for another currency at a specific exchange rate on a future date.
What is a future?
A future is an agreement between the Fund and a counterparty made through a US or foreign futures exchange to buy or sell an underlying instrument or asset at a specific price on a future date.
Philippe Brugere-Trelat, Executive Vice President and Portfolio Manager with Franklin Mutual Series, has decided to retire in 2018. We are grateful for Mr. Brugere-Trelat’s many years of service to the firm. In preparation for Mr. Brugere-Trelat’s retirement, Timothy Rankin, portfolio manager and research analyst for Franklin Mutual Advisers will be added as a co-lead portfolio manager for Franklin Mutual International Fund effective January 1, 2018, joining current co-lead portfolio managers Andrew Sleeman and Philippe Brugere-Trelat. Effective May 1, 2018, Mr. Brugere-Trelat will step down as portfolio manager and remain with the firm in a consulting capacity until later in 2018 when he will officially retire.
Thank you for your participation in Franklin Mutual International Fund. We look forward to continuing to serve your investment needs.


The foregoing information reflects our analysis, opinions and portfolio holdings as of December 31, 2017, the end of the reporting period. The way we implement our main investment strategies and the resulting portfolio holdings may change depending on factors such as market and economic conditions. These opinions may not be relied upon as investment advice or an offer for a particular security. The information is not a complete analysis of every aspect of any market, country, industry, security or the Fund. Statements of fact are from sources considered reliable, but the investment manager makes no representation or warranty as to their completeness or accuracy. Although historical performance is no guarantee of future results, these insights may help you understand our investment management philosophy.
CFA® is a trademark owned by CFA Institute.
| 8 |
Annual Report | franklintempleton.com |
FRANKLIN MUTUAL INTERNATIONAL FUND
Philippe Brugere-Trelat has been a co-portfolio manager for Franklin Mutual International Fund since 2009. Mr. Brugere-Trelat has also served as lead portfolio manager for Franklin Mutual European Fund since 2005 and as portfolio manager for Franklin Mutual Global Discovery Fund since 2009. He has been a member of the management team of the Franklin Mutual Series Funds since 2004, when he rejoined Franklin Templeton Investments. Previously, he was president and portfolio manager of Eurovest. Between 1984 and 1994, Mr. Brugere-Trelat was employed at Heine Securities Corporation, the Fund’s former manager.
Andrew Sleeman has been a co-portfolio manager for Franklin Mutual International Fund since 2009. He has also served as lead portfolio manager for Franklin Mutual Financial Services Fund since 2009. Mr. Sleeman joined Franklin Templeton Investments in 2007. Previously, he was with Fox-Pitt, Kelton, a financials specialist firm, where he focused on international financial equities. Prior to that, he worked in international equities at BNP Paribas. Mr. Sleeman also worked in Australia in the fixed income division of JP Morgan Investment Management.
franklintempleton.com | Annual Report | 9 |
FRANKLIN MUTUAL INTERNATIONAL FUND
Performance Summary as of December 31, 2017
The performance table and graphs do not reflect any taxes that a shareholder would pay on Fund dividends, capital gain distributions, if any, or any realized gains on the sale of Fund shares. Total return reflects reinvestment of the Fund’s dividends and capital gain distributions, if any, and any unrealized gains or losses. Your dividend income will vary depending on dividends or interest paid by securities in the Fund’s portfolio, adjusted for operating expenses of each class. Capital gain distributions are net profits realized from the sale of portfolio securities.
Performance as of 12/31/171
Cumulative total return excludes sales charges. Average annual total return includes maximum sales charges. Sales charges will vary depending on the size of the investment and the class of share purchased. The maximum is 5.75% and the minimum is 0%. Class A: 5.75% maximum initial sales charge. For other share classes, visit franklintempleton.com.
| Share Class | | Cumulative Total Return | 2 | | Average Annual Total Return | 3 | ||
Z | ||||||||
1-Year | +13.99% | +13.99% | ||||||
5-Year | +38.91% | +6.79% | ||||||
Since Inception (5/1/09) | +112.29% | +9.07% | ||||||
A | ||||||||
1-Year | +13.67% | +7.13% | ||||||
5-Year | +36.99% | +5.24% | ||||||
Since Inception (5/1/09) | +107.10% | +8.02% | ||||||
Performance data represent past performance, which does not guarantee future results. Investment return and principal value will fluctuate, and you may have a gain or loss when you sell your shares. Current performance may differ from figures shown. For most recent month-end performance, go to franklintempleton.com or call (800) 342-5236.
See page 12 for Performance Summary footnotes.
10 | Annual Report | franklintempleton.com |
FRANKLIN MUTUAL INTERNATIONAL FUND
PERFORMANCE SUMMARY
Total Return Index Comparison for a Hypothetical $10,000 Investment1
Total return represents the change in value of an investment over the periods shown. It includes any applicable maximum sales charge, Fund expenses, account fees and reinvested distributions. The unmanaged indexes include reinvestment of any income or distributions. They differ from the Fund in composition and do not pay management fees or expenses. One cannot invest directly in an index.
Class Z (5/1/09–12/31/17)
Class A (5/1/09–12/31/17)
See page 12 for Performance Summary footnotes.
franklintempleton.com | Annual Report | 11 |
FRANKLIN MUTUAL INTERNATIONAL FUND
PERFORMANCE SUMMARY
Distributions (1/1/17–12/31/17)
| Share Class | Net Investment Income | |||
Z | $0.3501 | |||
A | $0.3059 | |||
C | $0.1892 | |||
R | $0.2940 | |||
R6 | $0.3684 | |||
Total Annual Operating Expenses5
| Share Class | With Waiver | Without Waiver | ||||||
Z | 0.97% | 1.22% | ||||||
A | 1.22% | 1.47% | ||||||
Each class of shares is available to certain eligible investors and has different annual fees and expenses, as described in the prospectus.
All investments involve risks, including possible loss of principal. Value securities may not increase in price as anticipated or may decline further in value. Special risks are associated with foreign investing, including currency fluctuations, economic instability and political developments; investments in emerging markets involve heightened risks related to the same factors. Because the Fund may invest its assets in companies in a specific region, including Europe, it is subject to greater risks of adverse developments in that region and/or the surrounding regions than a fund that is more broadly diversified geographically. Current political and financial uncertainty surrounding the European Union may increase market volatility and the economic risk of investing in companies in Europe. Smaller company stocks have exhibited greater price volatility than larger company stocks, particularly over the short term. The Fund’s investments in companies engaged in mergers, reorganizations or liquidations also involve special risks as pending deals may not be completed on time or on favorable terms. The Fund may invest in lower rated bonds, which entail higher credit risk. The Fund is actively managed but there is no guarantee that the manager’s investment decisions will produce the desired results. The Fund’s prospectus also includes a description of the main investment risks.
1. The Fund has an expense reduction contractually guaranteed through 4/30/19. Fund investment results reflect the expense reduction; without this reduction, the results would have been lower.
2. Cumulative total return represents the change in value of an investment over the periods indicated.
3. Average annual total return represents the average annual change in value of an investment over the periods indicated. Return for less than one year, if any, has not been annualized.
4. Source: Morningstar. the MSCI ACWI ex USA Net Return (Local Currency and US dollar) is a free float-adjusted, market capitalization-weighted index designed to measure equity market performance in global developed and emerging markets.
5. Figures are as stated in the Fund’s current prospectus and may differ from the expense ratios disclosed in the Your Fund’s Expenses and Financial Highlights sections in this report. In periods of market volatility, assets may decline significantly, causing total annual Fund operating expenses to become higher than the figures shown.
See www.franklintempletondatasources.com for additional data provider information.
12 | Annual Report | franklintempleton.com |
FRANKLIN MUTUAL INTERNATIONAL FUND
As a Fund shareholder, you can incur two types of costs: (1) transaction costs, including sales charges (loads) on Fund purchases and redemptions; and (2) ongoing Fund costs, including management fees, distribution and service (12b-1) fees, and other Fund expenses. All mutual funds have ongoing costs, sometimes referred to as operating expenses. The table below shows ongoing costs of investing in the Fund and can help you understand these costs and compare them with those of other mutual funds. The table assumes a $1,000 investment held for the six months indicated.
Actual Fund Expenses
The table below provides information about actual account values and actual expenses in the columns under the heading “Actual.” In these columns the Fund’s actual return, which includes the effect of Fund expenses, is used to calculate the “Ending Account Value” for each class of shares. You can estimate the expenses you paid during the period by following these steps (of course, your account value and expenses will differ from those in this illustration): Divide your account value by $1,000 (if your account had an $8,600 value, then $8,600 ÷ $1,000 = 8.6). Then multiply the result by the number in the row for your class of shares under the headings “Actual” and “Expenses Paid During Period” (if Actual Expenses Paid During Period were $7.50, then 8.6 x $7.50 = $64.50). In this illustration, the actual expenses paid this period are $64.50.
Hypothetical Example for Comparison with Other Funds
Under the heading “Hypothetical” in the table, information is provided about hypothetical account values and hypothetical expenses based on the Fund’s actual expense ratio and an assumed rate of return of 5% per year before expenses, which is not the Fund’s actual return. This information may not be used to estimate the actual ending account balance or expenses you paid for the period, but it can help you compare ongoing costs of investing in the Fund with those of other funds. To do so, compare this 5% hypothetical example for the class of shares you hold with the 5% hypothetical examples that appear in the shareholder reports of other funds.
Please note that expenses shown in the table are meant to highlight ongoing costs and do not reflect any transactional costs. Therefore, information under the heading “Hypothetical” is useful in comparing ongoing costs only, and will not help you compare total costs of owning different funds. In addition, if transactional costs were included, your total costs would have been higher.
| Actual (actual return after expenses) | Hypothetical (5% annual return before expenses) | |||||||||||||||||
| Share Class | Beginning Account Value 7/1/17 | Ending Account Value 12/31/17 | Expenses Paid During 7/1/17–12/31/171,2 | Ending Account Value 12/31/17 | Expenses Paid During Period 7/1/17–12/31/171,2 | Net Annualized Expense Ratio2 | ||||||||||||
| Z | $1,000 | $1,047.00 | $ 5.93 | $1,019.41 | $ 5.85 | 1.15% | ||||||||||||
| A | $1,000 | $1,045.00 | $ 7.22 | $1,018.15 | $ 7.12 | 1.40% | ||||||||||||
| C | $1,000 | $1,041.30 | $11.06 | $1,014.37 | $10.92 | 2.15% | ||||||||||||
| R | $1,000 | $1,044.50 | $ 8.30 | $1,017.09 | $ 8.19 | 1.61% | ||||||||||||
| R6 | $1,000 | $1,047.40 | $ 5.26 | $1,020.06 | $ 5.19 | 1.02% | ||||||||||||
1. Expenses are equal to the annualized expense ratio for the six-month period as indicated above—in the far right column—multiplied by the simple average account value over the period indicated, and then multiplied by 184/365 to reflect the one-half year period.
2. Reflects expenses after fee waivers and expense reimbursements. Does not include acquired fund fees and expenses.
franklintempleton.com |
Annual Report |
13 |
FRANKLIN MUTUAL INTERNATIONAL FUND
| Year Ended December 31, | ||||||||||||||||||||
| 2017 | 2016 | 2015 | 2014 | 2013 | ||||||||||||||||
Class Z | ||||||||||||||||||||
| Per share operating performance | ||||||||||||||||||||
(for a share outstanding throughout the year) | ||||||||||||||||||||
Net asset value, beginning of year | $14.32 | $14.17 | $14.59 | $15.90 | $13.58 | |||||||||||||||
Income from investment operationsa: | ||||||||||||||||||||
Net investment incomeb | 0.21 | 0.27 | c | 0.18 | d | 0.30 | e | 0.24 | ||||||||||||
Net realized and unrealized gains (losses) | 1.78 | 0.20 | (0.17 | ) | (0.57 | ) | 2.42 | |||||||||||||
Total from investment operations | 1.99 | 0.47 | 0.01 | (0.27 | ) | 2.66 | ||||||||||||||
Less distributions from: | ||||||||||||||||||||
Net investment income | (0.35 | ) | (0.27 | ) | (0.16 | ) | (0.43 | ) | (0.24 | ) | ||||||||||
Net realized gains | — | (0.05 | ) | (0.27 | ) | (0.61 | ) | (0.10 | ) | |||||||||||
Total distributions | (0.35 | ) | (0.32 | ) | (0.43 | ) | (1.04 | ) | (0.34 | ) | ||||||||||
Net asset value, end of year. | $15.96 | $14.32 | $14.17 | $14.59 | $15.90 | |||||||||||||||
Total return | 13.99% | 3.34% | 0.15% | (1.63)% | 19.71% | |||||||||||||||
Ratios to average net assets | ||||||||||||||||||||
Expenses before waiver and payments by affiliatesf | 1.17% | 1.22% | 1.24% | 1.39% | 1.49% | |||||||||||||||
Expenses net of waiver and payments by affiliatesf,g | 1.16% | 1.17% | 1.15% | 1.16% | 1.17% | |||||||||||||||
Expenses incurred in connection with securities sold short | —% | —% | —% | —% | h | —% | ||||||||||||||
Net investment income | 1.41% | 2.07% | c | 1.26% | d | 1.78% | e | 1.64% | ||||||||||||
Supplemental data | ||||||||||||||||||||
Net assets, end of year (000’s) | $86,274 | $40,875 | $49,963 | $19,940 | $14,732 | |||||||||||||||
Portfolio turnover rate | 38.77% | 24.87% | 28.64% | 54.78% | 41.47% | |||||||||||||||
aThe amount shown for a share outstanding throughout the period may not correlate with the Statement of Operations for the period due to the timing of sales and repurchases of the Fund’s shares in relation to income earned and/or fluctuating fair value of the investments of the Fund.
bBased on average daily shares outstanding.
cNet investment income per share includes approximately $0.06 per share related to income received in the form of special dividends in connection with certain Fund holdings. Excluding this amount, the ratio of net investment income to average net assets would have been 1.63%.
dNet investment income per share includes approximately $0.08 per share related to income received in the form of special dividends in connection with certain Fund holdings. Excluding this amount, the ratio of net investment income to average net assets would have been 0.71%.
eNet investment income per share includes approximately $0.08 per share related to income received in the form of special dividends in connection with certain Fund holdings. Excluding this amount, the ratio of net investment income to average net assets would have been 1.27%.
fIncludes dividend and/or interest expense on securities sold short and security borrowing fees, if any. See below for the ratios of such expenses to average net assets for the periods presented. See Note 1(d).
gBenefit of expense reduction rounds to less than 0.01%.
hRounds to less than 0.01%.
| 14 |
Annual Report | The accompanying notes are an integral part of these financial statements. | franklintempleton.com |
FRANKLIN MUTUAL INTERNATIONAL FUND
FINANCIAL HIGHLIGHTS
| Year Ended December 31, | ||||||||||||||||||||
| 2017 | 2016 | 2015 | 2014 | 2013 | ||||||||||||||||
Class A | ||||||||||||||||||||
| Per share operating performance | ||||||||||||||||||||
(for a share outstanding throughout the year) | ||||||||||||||||||||
Net asset value, beginning of year | $14.25 | $14.10 | $14.54 | $15.84 | $13.54 | |||||||||||||||
Income from investment operationsa: | ||||||||||||||||||||
Net investment incomeb | 0.18 | 0.24 | c | 0.15 | d | 0.26 | e | 0.20 | ||||||||||||
Net realized and unrealized gains (losses) | 1.78 | 0.19 | (0.19 | ) | (0.57 | ) | 2.41 | |||||||||||||
Total from investment operations | 1.96 | 0.43 | (0.04 | ) | (0.31 | ) | 2.61 | |||||||||||||
Less distributions from: | ||||||||||||||||||||
Net investment income | (0.31 | ) | (0.23 | ) | (0.13 | ) | (0.38 | ) | (0.21 | ) | ||||||||||
Net realized gains | — | (0.05 | ) | (0.27 | ) | (0.61 | ) | (0.10 | ) | |||||||||||
Total distributions | (0.31 | ) | (0.28 | ) | (0.40 | ) | (0.99 | ) | (0.31 | ) | ||||||||||
Net asset value, end of year | $15.90 | $14.25 | $14.10 | $14.54 | $15.84 | |||||||||||||||
Total returnf | 13.67% | 3.14% | (0.20)% | (1.89)% | 19.34% | |||||||||||||||
Ratios to average net assets | ||||||||||||||||||||
Expenses before waiver and payments by affiliatesg | 1.42% | 1.47% | 1.52% | 1.69% | 1.79% | |||||||||||||||
Expenses net of waiver and payments by affiliatesg,h | 1.41% | 1.42% | 1.43% | 1.46% | 1.47% | |||||||||||||||
Expenses incurred in connection with securities sold short | —% | —% | —% | —% | i | —% | ||||||||||||||
Net investment income | 1.16% | 1.82% | c | 0.98% | d | 1.48% | e | 1.34% | ||||||||||||
Supplemental data | ||||||||||||||||||||
Net assets, end of year (000’s) | $82,965 | $82,626 | $110,591 | $39,810 | $35,319 | |||||||||||||||
Portfolio turnover rate | 38.77% | 24.87% | 28.64% | 54.78% | 41.47% | |||||||||||||||
aThe amount shown for a share outstanding throughout the period may not correlate with the Statement of Operations for the period due to the timing of sales and repurchases of the Fund’s shares in relation to income earned and/or fluctuating fair value of the investments of the Fund.
bBased on average daily shares outstanding.
cNet investment income per share includes approximately $0.06 per share related to income received in the form of special dividends in connection with certain Fund holdings. Excluding this amount, the ratio of net investment income to average net assets would have been 1.38%.
dNet investment income per share includes approximately $0.08 per share related to income received in the form of special dividends in connection with certain Fund holdings. Excluding this amount, the ratio of net investment income to average net assets would have been 0.43%.
eNet investment income per share includes approximately $0.08 per share related to income received in the form of special dividends in connection with certain Fund holdings. Excluding this amount, the ratio of net investment income to average net assets would have been 0.97%.
fTotal return does not reflect sales commissions or contingent deferred sales charges, if applicable.
gIncludes dividend and/or interest expense on securities sold short and security borrowing fees, if any. See below for the ratios of such expenses to average net assets for the periods presented. See Note 1(d).
hBenefit of expense reduction rounds to less than 0.01%.
iRounds to less than 0.01%.
| franklintempleton.com |
The accompanying notes are an integral part of these financial statements. | Annual Report | 15 |
FRANKLIN MUTUAL INTERNATIONAL FUND
FINANCIAL HIGHLIGHTS
| Year Ended December 31, | ||||||||||||||||||||
| 2017 | 2016 | 2015 | 2014 | 2013 | ||||||||||||||||
Class C | ||||||||||||||||||||
| Per share operating performance | ||||||||||||||||||||
(for a share outstanding throughout the year) | ||||||||||||||||||||
Net asset value, beginning of year | $14.08 | $13.92 | $14.38 | $15.68 | $13.41 | |||||||||||||||
Income from investment operationsa: | ||||||||||||||||||||
Net investment incomeb | 0.08 | 0.15 | c | 0.04 | d | 0.15 | e | 0.10 | ||||||||||||
Net realized and unrealized gains (losses) | 1.72 | 0.18 | (0.18 | ) | (0.56 | ) | 2.38 | |||||||||||||
Total from investment operations | 1.80 | 0.33 | (0.14 | ) | (0.41 | ) | 2.48 | |||||||||||||
Less distributions from: | ||||||||||||||||||||
Net investment income | (0.19 | ) | (0.12 | ) | (0.05 | ) | (0.28 | ) | (0.11 | ) | ||||||||||
Net realized gains | — | (0.05 | ) | (0.27 | ) | (0.61 | ) | (0.10 | ) | |||||||||||
Total distributions | (0.19 | ) | (0.17 | ) | (0.32 | ) | (0.89 | ) | (0.21 | ) | ||||||||||
Net asset value, end of year | $15.69 | $14.08 | $13.92 | $14.38 | $15.68 | |||||||||||||||
Total returnf | 12.79% | 2.44% | (0.93)% | (2.58)% | 18.54% | |||||||||||||||
Ratios to average net assets | ||||||||||||||||||||
Expenses before waiver and payments by affiliatesg | 2.17% | 2.22% | 2.24% | 2.39% | 2.49% | |||||||||||||||
Expenses net of waiver and payments by affiliatesg,h | 2.16% | 2.17% | 2.15% | 2.16% | 2.17% | |||||||||||||||
Expenses incurred in connection with securities sold short | —% | —% | —% | —% | i | —% | ||||||||||||||
Net investment income | 0.41% | 1.07% | c | 0.26% | d | 0.78% | e | 0.64% | ||||||||||||
Supplemental data | ||||||||||||||||||||
Net assets, end of year (000’s) | $29,109 | $25,860 | $34,611 | $14,794 | $14,198 | |||||||||||||||
Portfolio turnover rate | 38.77% | 24.87% | 28.64% | 54.78% | 41.47% | |||||||||||||||
aThe amount shown for a share outstanding throughout the period may not correlate with the Statement of Operations for the period due to the timing of sales and repurchases of the Fund’s shares in relation to income earned and/or fluctuating fair value of the investments of the Fund.
bBased on average daily shares outstanding.
cNet investment income per share includes approximately $0.06 per share related to income received in the form of special dividends in connection with certain Fund holdings. Excluding this amount, the ratio of net investment income to average net assets would have been 0.63%.
dNet investment income per share includes approximately $0.08 per share related to income received in the form of special dividends in connection with certain Fund holdings. Excluding this amount, the ratio of net investment income to average net assets would have been (0.29)%.
eNet investment income per share includes approximately $0.08 per share related to income received in the form of special dividends in connection with certain Fund holdings. Excluding this amount, the ratio of net investment income to average net assets would have been 0.27%.
fTotal return does not reflect sales commissions or contingent deferred sales charges, if applicable.
gIncludes dividend and/or interest expense on securities sold short and security borrowing fees, if any. See below for the ratios of such expenses to average net assets for the periods presented. See Note 1(d).
hBenefit of expense reduction rounds to less than 0.01%.
iRounds to less than 0.01%.
| 16 |
Annual Report | The accompanying notes are an integral part of these financial statements. | franklintempleton.com |
FRANKLIN MUTUAL INTERNATIONAL FUND
FINANCIAL HIGHLIGHTS
| Year Ended December 31, | ||||||||||||||||||||
| 2017 | 2016 | 2015 | 2014 | 2013 | ||||||||||||||||
Class R | ||||||||||||||||||||
| Per share operating performance | ||||||||||||||||||||
(for a share outstanding throughout the year) | ||||||||||||||||||||
Net asset value, beginning of year | $14.19 | $14.05 | $14.51 | $15.83 | $13.54 | |||||||||||||||
Income from investment operationsa: | ||||||||||||||||||||
Net investment incomeb | 0.10 | 0.20 | c | 0.04 | d | 0.18 | e | 0.15 | ||||||||||||
Net realized and unrealized gains (losses) | 1.80 | 0.20 | (0.10 | ) | (0.52 | ) | 2.43 | |||||||||||||
Total from investment operations | 1.90 | 0.40 | (0.06 | ) | (0.34 | ) | 2.58 | |||||||||||||
Less distributions from: | ||||||||||||||||||||
Net investment income | (0.29 | ) | (0.21 | ) | (0.13 | ) | (0.37 | ) | (0.19 | ) | ||||||||||
Net realized gains | — | (0.05 | ) | (0.27 | ) | (0.61 | ) | (0.10 | ) | |||||||||||
Total distributions | (0.29 | ) | (0.26 | ) | (0.40 | ) | (0.98 | ) | (0.29 | ) | ||||||||||
Net asset value, end of year | $15.80 | $14.19 | $14.05 | $14.51 | $15.83 | |||||||||||||||
Total return | 13.43% | 2.90% | (0.38)% | (2.13)% | 19.13% | |||||||||||||||
Ratios to average net assets | ||||||||||||||||||||
Expenses before waiver and payments by affiliatesf | 1.64% | 1.72% | 1.74% | 1.89% | 1.99% | |||||||||||||||
Expenses net of waiver and payments by affiliatesf,g | 1.63% | 1.67% | 1.65% | 1.66% | 1.67% | |||||||||||||||
Expenses incurred in connection with securities sold short | —% | —% | —% | —% | h | —% | ||||||||||||||
Net investment income | 0.94% | 1.57% | c | 0.76% | d | 1.28% | e | 1.14% | ||||||||||||
Supplemental data | ||||||||||||||||||||
Net assets, end of year (000’s) | $1,867 | $694 | $662 | $112 | $90 | |||||||||||||||
Portfolio turnover rate | 38.77% | 24.87% | 28.64% | 54.78% | 41.47% | |||||||||||||||
aThe amount shown for a share outstanding throughout the period may not correlate with the Statement of Operations for the period due to the timing of sales and repurchases of the Fund’s shares in relation to income earned and/or fluctuating fair value of the investments of the Fund.
bBased on average daily shares outstanding.
cNet investment income per share includes approximately $0.06 per share related to income received in the form of special dividends in connection with certain Fund holdings. Excluding this amount, the ratio of net investment income to average net assets would have been 1.13%.
dNet investment income per share includes approximately $0.08 per share related to income received in the form of special dividends in connection with certain Fund holdings. Excluding this amount, the ratio of net investment income to average net assets would have been 0.21%.
eNet investment income per share includes approximately $0.08 per share related to income received in the form of special dividends in connection with certain Fund holdings. Excluding this amount, the ratio of net investment income to average net assets would have been 0.77%.
fIncludes dividend and/or interest expense on securities sold short and security borrowing fees, if any. See below for the ratios of such expenses to average net assets for the periods presented. See Note 1(d).
gBenefit of expense reduction rounds to less than 0.01%.
hRounds to less than 0.01%.
| franklintempleton.com |
The accompanying notes are an integral part of these financial statements. | Annual Report | 17 |
FRANKLIN MUTUAL INTERNATIONAL FUND
FINANCIAL HIGHLIGHTS
| Year Ended December 31, | ||||||||||||||||||||
| 2017 | 2016 | 2015 | 2014 | 2013a | ||||||||||||||||
Class R6 | ||||||||||||||||||||
| Per share operating performance | ||||||||||||||||||||
(for a share outstanding throughout the year) | ||||||||||||||||||||
Net asset value, beginning of year | $14.32 | $14.17 | $14.59 | $15.87 | $14.26 | |||||||||||||||
Income from investment operationsb: | ||||||||||||||||||||
Net investment incomec | 0.24 | 0.33 | d | 0.22 | e | — | f,g | 0.15 | ||||||||||||
Net realized and unrealized gains (losses) | 1.78 | 0.17 | (0.20 | ) | (0.22 | ) | 1.83 | |||||||||||||
Total from investment operations | 2.02 | 0.50 | 0.02 | (0.22 | ) | 1.98 | ||||||||||||||
Less distributions from: | ||||||||||||||||||||
Net investment income | (0.37 | ) | (0.30 | ) | (0.17 | ) | (0.45 | ) | (0.27 | ) | ||||||||||
Net realized gains | — | (0.05 | ) | (0.27 | ) | (0.61 | ) | (0.10 | ) | |||||||||||
Total distributions | (0.37 | ) | (0.35 | ) | (0.44 | ) | (1.06 | ) | (0.37 | ) | ||||||||||
Net asset value, end of year | $15.97 | $14.32 | $14.17 | $14.59 | $15.87 | |||||||||||||||
Total returnh | 14.11% | 3.58% | 0.23% | (1.46)% | 14.09% | |||||||||||||||
Ratios to average net assetsi | ||||||||||||||||||||
Expenses before waiver and payments by affiliatesj | 1.03% | 1.06% | 1.06% | 1.24% | 2.89% | |||||||||||||||
Expenses net of waiver and payments by affiliatesj,k | 1.01% | 1.00% | 1.02% | 1.00% | 1.00% | |||||||||||||||
Expenses incurred in connection with securities sold short | —% | —% | —% | —% | l | —% | ||||||||||||||
Net investment income | 1.56% | 2.24% | d | 1.39% | e | 1.94% | f | 1.81% | ||||||||||||
Supplemental data | ||||||||||||||||||||
Net assets, end of year (000’s) | $25,697 | $16,687 | $23,793 | $19,398 | $6 | |||||||||||||||
Portfolio turnover rate | 38.77% | 24.87% | 28.64% | 54.78% | 41.47% | |||||||||||||||
aFor the period May 1, 2013 (commencement of operations) to December 31, 2013.
bThe amount shown for a share outstanding throughout the period may not correlate with the Statement of Operations for the period due to the timing of sales and repurchases of the Fund’s shares in relation to income earned and/or fluctuating fair value of the investments of the Fund.
cBased on average daily shares outstanding.
dNet investment income per share includes approximately $0.06 per share related to income received in the form of special dividends in connection with certain Fund holdings. Excluding this amount, the ratio of net investment income to average net assets would have been 1.80%.
eNet investment income per share includes approximately $0.08 per share related to income received in the form of special dividends in connection with certain Fund holdings. Excluding this amount, the ratio of net investment income to average net assets would have been 0.84%.
fNet investment income per share includes approximately $0.08 per share related to income received in the form of special dividends in connection with certain Fund holdings. Excluding this amount, the ratio of net investment income to average net assets would have been 1.42%.
gAmount rounds to less than $0.01 per share.
hTotal return is not annualized for periods less than one year.
iRatios are annualized for periods less than one year.
jIncludes dividend and/or interest expense on securities sold short and security borrowing fees, if any. See below for the ratios of such expenses to average net assets for the periods presented. See Note 1(d).
kBenefit of expense reduction rounds to less than 0.01%.
lRounds to less than 0.01%.
| 18 |
Annual Report | The accompanying notes are an integral part of these financial statements. | franklintempleton.com |
FRANKLIN MUTUAL INTERNATIONAL FUND
Statement of Investments, December 31, 2017
| Country | Shares | Value | ||||||||||
Common Stocks 90.8% | ||||||||||||
Auto Components 3.0% | ||||||||||||
Cie Generale des Etablissements Michelin, B | France | 20,766 | $ | 2,978,594 | ||||||||
Toyo Tire & Rubber Co. Ltd. | Japan | 189,100 | 3,906,685 | |||||||||
|
| |||||||||||
| 6,885,279 | ||||||||||||
|
| |||||||||||
Automobiles 1.6% | ||||||||||||
Peugeot SA | France | 176,908 | 3,598,770 | |||||||||
|
| |||||||||||
Banks 9.6% | ||||||||||||
AIB Group PLC | Ireland | 370,005 | 2,441,626 | |||||||||
Barclays PLC | United Kingdom | 1,504,914 | 4,127,624 | |||||||||
HSBC Holdings PLC | United Kingdom | 388,429 | 4,022,804 | |||||||||
Shinsei Bank Ltd. | Japan | 223,800 | 3,870,843 | |||||||||
Societe Generale SA | France | 65,741 | 3,395,614 | |||||||||
aStandard Chartered PLC | United Kingdom | 366,605 | 3,862,135 | |||||||||
|
| |||||||||||
| 21,720,646 | ||||||||||||
|
| |||||||||||
Beverages 2.7% | ||||||||||||
Coca-Cola Bottlers Japan Holdings Inc. | Japan | 165,515 | 6,044,232 | |||||||||
|
| |||||||||||
Capital Markets 2.2% | ||||||||||||
Credit Suisse Group AG | Switzerland | 171,599 | 3,064,425 | |||||||||
aGuotai Junan Securities Co. Ltd. | China | 852,864 | 1,899,414 | |||||||||
|
| |||||||||||
| 4,963,839 | ||||||||||||
|
| |||||||||||
Communications Equipment 1.2% | ||||||||||||
Nokia OYJ, A | Finland | 356,803 | 1,666,991 | |||||||||
Nokia OYJ, ADR | Finland | 227,640 | 1,060,803 | |||||||||
|
| |||||||||||
| 2,727,794 | ||||||||||||
|
| |||||||||||
Construction Materials 1.4% | ||||||||||||
LafargeHolcim Ltd., B | Switzerland | 57,170 | 3,224,192 | |||||||||
|
| |||||||||||
Consumer Finance 2.6% | ||||||||||||
bHoist Finance AB, 144A | Sweden | 240,641 | 2,706,155 | |||||||||
aQudian Inc., ADR | China | 110,432 | 1,384,817 | |||||||||
Sun Hung Kai & Co. Ltd. | Hong Kong | 2,877,748 | 1,837,993 | |||||||||
|
| |||||||||||
| 5,928,965 | ||||||||||||
|
| |||||||||||
Diversified Financial Services 2.2% | ||||||||||||
Metro Pacific Investments Corp. | Philippines | 36,164,200 | 4,953,059 | |||||||||
|
| |||||||||||
Diversified Telecommunication Services 4.0% | ||||||||||||
China Telecom Corp. Ltd., H | China | 4,038,538 | 1,922,904 | |||||||||
Hellenic Telecommunications Organization SA | Greece | 269,294 | 3,715,638 | |||||||||
Koninklijke KPN NV | Netherlands | 969,692 | 3,383,274 | |||||||||
|
| |||||||||||
| 9,021,816 | ||||||||||||
|
| |||||||||||
Electric Utilities 2.5% | ||||||||||||
Enel SpA | Italy | 931,370 | 5,732,558 | |||||||||
|
| |||||||||||
Equity Real Estate Investment Trusts (REITs) 1.4% | ||||||||||||
Hibernia REIT PLC | Ireland | 1,741,347 | 3,184,045 | |||||||||
|
| |||||||||||
Food & Staples Retailing 0.5% | ||||||||||||
Carrefour SA | France | 51,600 | 1,116,851 | |||||||||
|
| |||||||||||
Health Care Equipment & Supplies 2.2% | ||||||||||||
Koninklijke Philips NV | Netherlands | 133,508 | 5,052,169 | |||||||||
|
| |||||||||||
franklintempleton.com |
Annual Report |
19 |
FRANKLIN MUTUAL INTERNATIONAL FUND
STATEMENT OF INVESTMENTS
| Country | Shares | Value | ||||||||||
| ||||||||||||
Common Stocks (continued) | ||||||||||||
Hotels, Restaurants & Leisure 3.8% | ||||||||||||
Accor SA | France | 110,379 | $ | 5,694,607 | ||||||||
Sands China Ltd. | Hong Kong | 546,000 | 2,819,855 | |||||||||
|
| |||||||||||
| 8,514,462 | ||||||||||||
|
| |||||||||||
Household Durables 2.5% | ||||||||||||
aCairn Homes PLC | Ireland | 1,056,000 | 2,476,963 | |||||||||
a,bNeinor Homes SA, 144A | Spain | 139,204 | 3,056,411 | |||||||||
|
| |||||||||||
| 5,533,374 | ||||||||||||
|
| |||||||||||
Independent Power & Renewable Electricity Producers 2.8% | ||||||||||||
China Longyuan Power Group Corp. | China | 9,019,000 | 6,418,354 | |||||||||
|
| |||||||||||
Insurance 17.0% | ||||||||||||
Ageas | Belgium | 89,259 | 4,360,290 | |||||||||
ASR Nederland NV | Netherlands | 145,680 | 5,996,064 | |||||||||
China Pacific Insurance Group Co. Ltd., H | China | 879,045 | 4,224,852 | |||||||||
Direct Line Insurance Group PLC | United Kingdom | 839,181 | 4,325,699 | |||||||||
Lancashire Holdings Ltd. | United Kingdom | 388,658 | 3,579,567 | |||||||||
NN Group NV | Netherlands | 110,515 | 4,789,364 | |||||||||
RSA Insurance Group PLC | United Kingdom | 389,405 | 3,326,140 | |||||||||
aSabre Insurance Group PLC | United Kingdom | 719,206 | 2,641,805 | |||||||||
T&D Holdings Inc. | Japan | 162,633 | 2,781,149 | |||||||||
XL Group Ltd. | Bermuda | 68,774 | 2,418,094 | |||||||||
|
| |||||||||||
| 38,443,024 | ||||||||||||
|
| |||||||||||
Internet Software & Services 2.9% | ||||||||||||
aBaidu Inc., ADR | China | 13,631 | 3,192,516 | |||||||||
Yahoo Japan Corp. | Japan | 734,600 | 3,370,353 | |||||||||
|
| |||||||||||
| 6,562,869 | ||||||||||||
|
| |||||||||||
IT Services 2.9% | ||||||||||||
Cognizant Technology Solutions Corp., A | United States | 44,480 | 3,158,970 | |||||||||
Infosys Ltd. | India | 204,636 | 3,340,240 | |||||||||
|
| |||||||||||
| 6,499,210 | ||||||||||||
|
| |||||||||||
Media 1.7% | ||||||||||||
Clear Media Ltd. | Hong Kong | 2,283,000 | 2,270,479 | |||||||||
Sky PLC | United Kingdom | 117,011 | 1,599,137 | |||||||||
|
| |||||||||||
| 3,869,616 | ||||||||||||
|
| |||||||||||
Metals & Mining 0.8% | ||||||||||||
thyssenkrupp AG | Germany | 58,392 | 1,696,472 | |||||||||
|
| |||||||||||
Multi-Utilities 0.8% | ||||||||||||
innogy SE | Germany | 43,342 | 1,699,157 | |||||||||
|
| |||||||||||
Oil, Gas & Consumable Fuels 6.5% | ||||||||||||
BP PLC | United Kingdom | 566,355 | 3,997,788 | |||||||||
Crescent Point Energy Corp. | Canada | 371,100 | 2,828,047 | |||||||||
JXTG Holdings Inc. | Japan | 597,808 | 3,856,826 | |||||||||
Royal Dutch Shell PLC, B | United Kingdom | 117,500 | 3,980,434 | |||||||||
|
| |||||||||||
| 14,663,095 | ||||||||||||
|
| |||||||||||
Pharmaceuticals 4.8% | ||||||||||||
GlaxoSmithKline PLC | United Kingdom | 181,719 | 3,245,447 | |||||||||
Novartis AG | Switzerland | 57,144 | 4,832,622 | |||||||||
Sanofi | France | 31,929 | 2,752,460 | |||||||||
|
| |||||||||||
| 10,830,529 | ||||||||||||
|
| |||||||||||
20 |
Annual Report |
franklintempleton.com |
FRANKLIN MUTUAL INTERNATIONAL FUND
STATEMENT OF INVESTMENTS
| Country | Shares | Value | ||||||||||
| ||||||||||||
Common Stocks (continued) | ||||||||||||
Specialty Retail 1.2% | ||||||||||||
Hornbach Holding AG & Co. KGaA | Germany | 31,290 | $ | 2,778,840 | ||||||||
|
| |||||||||||
Technology Hardware, Storage & Peripherals 1.5% | ||||||||||||
Samsung Electronics Co. Ltd. | South Korea | 1,424 | 3,399,323 | |||||||||
|
| |||||||||||
Thrifts & Mortgage Finance 1.2% | ||||||||||||
Indiabulls Housing Finance Ltd. | India | 139,156 | 2,608,303 | |||||||||
|
| |||||||||||
Trading Companies & Distributors 1.4% | ||||||||||||
Rexel SA | France | 180,233 | 3,269,603 | |||||||||
|
| |||||||||||
Wireless Telecommunication Services 1.9% | ||||||||||||
Vodafone Group PLC | United Kingdom | 1,324,860 | 4,204,519 | |||||||||
|
| |||||||||||
Total Common Stocks (Cost $181,732,164) | 205,144,965 | |||||||||||
|
| |||||||||||
Preferred Stocks 4.3% | ||||||||||||
| Auto Components 1.6% | ||||||||||||
c Schaeffler AG, 3.382%, pfd | Germany | 195,008 | 3,459,255 | |||||||||
|
| |||||||||||
| Automobiles 2.7% | ||||||||||||
c Volkswagen AG, 1.238%, pfd | Germany | 30,491 | 6,089,258 | |||||||||
|
| |||||||||||
Total Preferred Stocks (Cost $8,031,664) | 9,548,513 | |||||||||||
|
| |||||||||||
Total Investments before Short Term Investments | 214,693,478 | |||||||||||
|
| |||||||||||
| Principal Amount | ||||||||||||
Short Term Investments 5.8% | ||||||||||||
U.S. Government and Agency Securities 5.8% | ||||||||||||
d FHLB, 1/02/18 | United States | $ | 2,800,000 | 2,800,000 | ||||||||
d U.S. Treasury Bill, | ||||||||||||
1/04/18 | United States | 3,000,000 | 2,999,812 | |||||||||
1/02/18 - 1/11/18 | United States | 2,370,000 | 2,369,707 | |||||||||
1/25/18 | United States | 3,000,000 | 2,997,652 | |||||||||
e 4/05/18 - 4/12/18 | United States | 2,000,000 | 1,992,578 | |||||||||
|
| |||||||||||
Total U.S. Government and Agency Securities | 13,159,749 | |||||||||||
|
| |||||||||||
Total Investments (Cost $202,923,958) 100.9% | 227,853,227 | |||||||||||
Other Assets, less Liabilities (0.9)% | (1,941,871 | ) | ||||||||||
|
| |||||||||||
Net Assets 100.0% | $ | 225,911,356 | ||||||||||
|
| |||||||||||
aNon-income producing.
bSecurity was purchased pursuant to Rule 144A under the Securities Act of 1933 and may be sold in transactions exempt from registration only to qualified institutional buyers or in a public offering registered under the Securities Act of 1933. These securities have been deemed liquid under guidelines approved by the Trust’s Board of Trustees. At December 31, 2017, the aggregate value of these securities was $5,762,566, representing 2.6% of net assets.
cVariable rate security. The rate shown represents the yield at period end.
dThe security was issued on a discount basis with no stated coupon rate.
eA portion or all of the security has been segregated as collateral for open forward exchange contracts. At December 31, 2017, the aggregate value of these securities pledged amounted to $1,742,544, representing 0.8% of net assets.
franklintempleton.com |
Annual Report |
21 |
FRANKLIN MUTUAL INTERNATIONAL FUND
STATEMENT OF INVESTMENTS
At December 31, 2017, the Fund had the following futures contracts outstanding. See Note 1(c).
Futures Contracts
| Description | Type | Number of Contracts | Notional Amount* | Expiration Date | Value/ Unrealized | |||||||||||||||
| Currency Contracts | ||||||||||||||||||||
EUR/USD | Short | 137 | $ | 20,679,294 | 3/19/18 | $ | (364,565 | ) | ||||||||||||
GBP/USD | Short | 68 | 5,761,725 | 3/19/18 | (17,391 | ) | ||||||||||||||
|
| |||||||||||||||||||
Total Futures Contracts | $ | (381,956 | ) | |||||||||||||||||
|
| |||||||||||||||||||
*As of period end.
At December 31, 2017, the Fund had the following forward exchange contracts outstanding. See Note 1(c).
Forward Exchange Contracts
| Currency | Counterpartya | Type | Quantity | Contract Amount | Settlement Date | Unrealized Appreciation | Unrealized Depreciation | |||||||||||||||||||||
| OTC Forward Exchange Contracts | ||||||||||||||||||||||||||||
Euro | BOFA | Buy | 1,047,973 | $ | 1,236,399 | 1/12/18 | $ | 22,070 | $ | — | ||||||||||||||||||
Euro | HSBK | Buy | 83,067 | 98,826 | 1/12/18 | 926 | — | |||||||||||||||||||||
Euro | HSBK | Sell | 11,257,885 | 12,957,150 | 1/12/18 | — | (561,990 | ) | ||||||||||||||||||||
Euro | SSBT | Buy | 724,881 | 857,566 | 1/12/18 | 12,914 | — | |||||||||||||||||||||
Euro | UBSW | Buy | 55,070 | 65,335 | 1/12/18 | 797 | — | |||||||||||||||||||||
Euro | UBSW | Sell | 11,258,190 | 12,952,154 | 1/12/18 | — | (567,353 | ) | ||||||||||||||||||||
South Korean Won | HSBK | Buy | 3,012,767,516 | 2,699,512 | 1/12/18 | 123,792 | — | |||||||||||||||||||||
South Korean Won | HSBK | Sell | 3,849,925,032 | 3,423,360 | 1/12/18 | — | (184,456 | ) | ||||||||||||||||||||
South Korean Won | UBSW | Sell | 2,770,546,484 | 2,466,169 | 1/12/18 | — | (130,147 | ) | ||||||||||||||||||||
British Pound | BOFA | Buy | 13,395 | 17,893 | 1/16/18 | 208 | — | |||||||||||||||||||||
British Pound | BOFA | Buy | 54,489 | 73,730 | 1/16/18 | — | (99 | ) | ||||||||||||||||||||
British Pound | BOFA | Sell | 2,421,419 | 3,172,433 | 1/16/18 | — | (99,662 | ) | ||||||||||||||||||||
British Pound | BONY | Sell | 1,219,618 | 1,577,223 | 1/16/18 | — | (70,862 | ) | ||||||||||||||||||||
British Pound | SSBT | Buy | 59,450 | 79,555 | 1/16/18 | 780 | — | |||||||||||||||||||||
British Pound | SSBT | Sell | 33,487 | 43,826 | 1/16/18 | — | (1,425 | ) | ||||||||||||||||||||
British Pound | UBSW | Buy | 59,797 | 80,992 | 1/16/18 | — | (188 | ) | ||||||||||||||||||||
British Pound | UBSW | Buy | 150,000 | 201,757 | 1/16/18 | 940 | — | |||||||||||||||||||||
British Pound | UBSW | Sell | 1,219,612 | 1,575,739 | 1/16/18 | — | (72,339 | ) | ||||||||||||||||||||
Euro | BOFA | Sell | 14,999 | 18,086 | 1/26/18 | 58 | — | |||||||||||||||||||||
Euro | BOFA | Sell | 5,192,849 | 6,105,530 | 1/26/18 | — | (135,866 | ) | ||||||||||||||||||||
Euro | BONY | Sell | 131,973 | 157,116 | 1/26/18 | — | (1,505 | ) | ||||||||||||||||||||
Euro | HSBK | Sell | 1,543,407 | 1,813,740 | 1/26/18 | — | (41,313 | ) | ||||||||||||||||||||
Euro | SSBT | Sell | 587,590 | 707,649 | 1/26/18 | 1,412 | — | |||||||||||||||||||||
Euro | SSBT | Sell | 730,807 | 872,062 | 1/26/18 | — | (6,311 | ) | ||||||||||||||||||||
Euro | UBSW | Sell | 1,164,457 | 1,368,621 | 1/26/18 | — | (30,964 | ) | ||||||||||||||||||||
Swedish Krona | SSBT | Buy | 461,000 | 55,065 | 1/29/18 | 1,246 | — | |||||||||||||||||||||
Swedish Krona | SSBT | Sell | 581,620 | 69,220 | 1/29/18 | — | (1,825 | ) | ||||||||||||||||||||
Swedish Krona | SSBT | Sell | 786,000 | 96,211 | 1/29/18 | 203 | — | |||||||||||||||||||||
Swedish Krona | UBSW | Sell | 863,980 | 103,669 | 1/29/18 | — | (1,865 | ) | ||||||||||||||||||||
Swedish Krona | UBSW | Sell | 19,761,661 | 2,419,368 | 1/29/18 | 5,522 | — | |||||||||||||||||||||
Philippine Peso | BONY | Sell | 8,000,000 | 160,578 | 2/08/18 | 488 | — | |||||||||||||||||||||
Philippine Peso | BONY | Sell | 232,781,028 | 4,581,795 | 2/08/18 | — | (76,434 | ) | ||||||||||||||||||||
22 |
Annual Report |
franklintempleton.com |
FRANKLIN MUTUAL INTERNATIONAL FUND
STATEMENT OF INVESTMENTS
Forward Exchange Contracts (continued)
| Currency | Counterpartya | Type | Quantity | Contract Amount | Settlement Date | Unrealized Appreciation | Unrealized Depreciation | |||||||||||||||||||||
OTC Forward Exchange Contracts (continued) |
| |||||||||||||||||||||||||||
British Pound | BOFA | Sell | 2,340,204 | $ | 3,109,736 | 2/14/18 | $ | — | $ | (55,481 | ) | |||||||||||||||||
British Pound | BONY | Sell | 1,262,018 | 1,650,162 | 2/14/18 | — | (56,767 | ) | ||||||||||||||||||||
British Pound | HSBK | Sell | 1,612,704 | 2,143,240 | 2/14/18 | — | (38,005 | ) | ||||||||||||||||||||
British Pound | SSBT | Sell | 856,000 | 1,134,396 | 2/14/18 | — | (23,377 | ) | ||||||||||||||||||||
British Pound | UBSW | Sell | 1,262,017 | 1,650,157 | 2/14/18 | — | (56,771 | ) | ||||||||||||||||||||
Euro | BONY | Sell | 2,218,045 | 2,622,370 | 2/20/18 | — | (47,245 | ) | ||||||||||||||||||||
Euro | HSBK | Sell | 198,951 | 241,566 | 2/20/18 | 2,111 | — | |||||||||||||||||||||
Euro | SSBT | Sell | 2,162,566 | 2,555,288 | 2/20/18 | — | (47,552 | ) | ||||||||||||||||||||
Japanese Yen | UBSW | Buy | 15,627,122 | 139,157 | 2/20/18 | — | (123 | ) | ||||||||||||||||||||
Japanese Yen | UBSW | Buy | 22,690,584 | 201,296 | 2/20/18 | 582 | — | |||||||||||||||||||||
Japanese Yen | UBSW | Sell | 1,848,780,122 | 16,499,231 | 2/20/18 | 50,650 | — | |||||||||||||||||||||
Swiss Franc | UBSW | Sell | 2,946,040 | 3,006,054 | 3/05/18 | — | (31,660 | ) | ||||||||||||||||||||
Euro | BOFA | Sell | 723,464 | 859,848 | 4/10/18 | — | (13,674 | ) | ||||||||||||||||||||
Euro | HSBK | Sell | 338,000 | 400,456 | 4/10/18 | — | (7,651 | ) | ||||||||||||||||||||
Euro | UBSW | Sell | 338,000 | 400,527 | 4/10/18 | — | (7,580 | ) | ||||||||||||||||||||
Euro | BOFA | Sell | 34,144 | 40,734 | 4/18/18 | — | (514 | ) | ||||||||||||||||||||
Euro | SSBT | Sell | 34,144 | 40,733 | 4/18/18 | — | (515 | ) | ||||||||||||||||||||
Euro | UBSW | Sell | 34,143 | 40,738 | 4/18/18 | — | (508 | ) | ||||||||||||||||||||
British Pound | BOFA | Sell | 3,513,813 | 4,666,418 | 4/24/18 | — | (97,789 | ) | ||||||||||||||||||||
British Pound | HSBK | Sell | 2,695,364 | 3,570,765 | 4/24/18 | — | (83,748 | ) | ||||||||||||||||||||
British Pound | UBSW | Sell | 1,597,184 | 2,115,151 | 4/24/18 | — | (50,392 | ) | ||||||||||||||||||||
Euro | HSBK | Sell | 3,210,021 | 3,788,297 | 5/07/18 | — | (94,535 | ) | ||||||||||||||||||||
Euro | UBSW | Sell | 3,210,023 | 3,787,619 | 5/07/18 | — | (95,216 | ) | ||||||||||||||||||||
Euro | BOFA | Sell | 6,624,836 | 7,899,116 | 5/21/18 | — | (121,782 | ) | ||||||||||||||||||||
Euro | SSBT | Sell | 935,918 | 1,118,261 | 5/21/18 | — | (14,884 | ) | ||||||||||||||||||||
Euro | UBSW | Sell | 6,738,835 | 8,032,044 | 5/21/18 | — | (126,875 | ) | ||||||||||||||||||||
British Pound | BOFA | Sell | 477,304 | 643,982 | 5/24/18 | — | (3,880 | ) | ||||||||||||||||||||
British Pound | HSBK | Sell | 270,681 | 364,655 | 5/24/18 | — | (2,750 | ) | ||||||||||||||||||||
British Pound | HSBK | Sell | 284,308 | 386,264 | 5/24/18 | 362 | — | |||||||||||||||||||||
British Pound | SSBT | Sell | 4,390,606 | 5,855,904 | 5/24/18 | — | (103,628 | ) | ||||||||||||||||||||
British Pound | UBSW | Sell | 1,568,400 | 2,116,344 | 5/24/18 | — | (12,503 | ) | ||||||||||||||||||||
|
| |||||||||||||||||||||||||||
Total Forward Exchange Contracts | $ | 225,061 | $ | (3,180,009 | ) | |||||||||||||||||||||||
|
| |||||||||||||||||||||||||||
Net unrealized appreciation (depreciation) |
| $ | (2,954,948 | ) | ||||||||||||||||||||||||
|
| |||||||||||||||||||||||||||
aMay be comprised of multiple contracts with the same counterparty, currency and settlement date.
See Note 9 regarding other derivative information.
See Abbreviations on page 39.
franklintempleton.com |
The accompanying notes are an integral part of these financial statements. | Annual Report |
|
23 |
|
FRANKLIN MUTUAL INTERNATIONAL FUND
Statement of Assets and Liabilities
December 31, 2017
Assets: | ||||
Investments in securities: | ||||
Cost - Unaffiliated issuers | $ | 202,923,958 | ||
|
| |||
Value - Unaffiliated issuers | $ | 227,853,227 | ||
Cash | 37,848 | |||
Foreign currency, at value (cost $701,359) | 703,750 | |||
Receivables: | ||||
Investment securities sold | 204,992 | |||
Capital shares sold | 376,893 | |||
Dividends and interest | 488,386 | |||
Deposits with brokers for: | ||||
Futures contracts | 417,030 | |||
Unrealized appreciation on OTC forward exchange contracts | 225,061 | |||
Other assets | 20 | |||
|
| |||
Total assets | 230,307,207 | |||
|
| |||
Liabilities: | ||||
Payables: | ||||
Capital shares redeemed | 439,504 | |||
Management fees | 166,724 | |||
Distribution fees | 85,143 | |||
Transfer agent fees | 39,409 | |||
Trustees’ fees and expenses | 315 | |||
Variation margin on futures contracts | 149,600 | |||
Unrealized depreciation on OTC forward exchange contracts | 3,180,009 | |||
Deferred tax | 244,572 | |||
Accrued expenses and other liabilities | 90,575 | |||
|
| |||
Total liabilities | 4,395,851 | |||
|
| |||
Net assets, at value | $ | 225,911,356 | ||
|
| |||
Net assets consist of: | ||||
Paid-in capital | $ | 217,570,664 | ||
Distributions in excess of net investment income | (2,125,110 | ) | ||
Net unrealized appreciation (depreciation) | 21,368,636 | |||
Accumulated net realized gain (loss) | (10,902,834 | ) | ||
|
| |||
Net assets, at value | $ | 225,911,356 | ||
|
|
24 |
Annual Report | The accompanying notes are an integral part of these financial statements. | franklintempleton.com |
FRANKLIN MUTUAL INTERNATIONAL FUND
FINANCIAL STATEMENTS
Statement of Assets and Liabilities (continued)
December 31, 2017
| Class Z: | ||||
Net assets, at value | $ | 86,274,337 | ||
|
| |||
Shares outstanding | 5,404,749 | |||
|
| |||
Net asset value and maximum offering price per share | $15.96 | |||
|
| |||
| Class A: | ||||
Net assets, at value | $ | 82,964,516 | ||
|
| |||
Shares outstanding | 5,219,318 | |||
|
| |||
Net asset value per sharea | $15.90 | |||
|
| |||
Maximum offering price per share (net asset value per share ÷ 94.25%) | $16.87 | |||
|
| |||
| Class C: | ||||
Net assets, at value | $ | 29,109,395 | ||
|
| |||
Shares outstanding | 1,855,174 | |||
|
| |||
Net asset value and maximum offering price per sharea | $15.69 | |||
|
| |||
| Class R: | ||||
Net assets, at value | $ | 1,866,583 | ||
|
| |||
Shares outstanding | 118,167 | |||
|
| |||
Net asset value and maximum offering price per share | $15.80 | |||
|
| |||
| Class R6: | ||||
Net assets, at value | $ | 25,696,525 | ||
|
| |||
Shares outstanding | 1,608,859 | |||
|
| |||
Net asset value and maximum offering price per share | $15.97 | |||
|
|
aRedemption price is equal to net asset value less contingent deferred sales charges, if applicable.
franklintempleton.com |
The accompanying notes are an integral part of these financial statements. | Annual Report |
|
25 |
|
FRANKLIN MUTUAL INTERNATIONAL FUND
FINANCIAL STATEMENTS
Statement of Operations
for the year ended December 31, 2017
Investment income: | ||||
Dividends: (net of foreign taxes)* | ||||
Unaffiliated issuers | $ | 4,925,761 | ||
Interest: | ||||
Unaffiliated issuers | 133,048 | |||
|
| |||
Total investment income | 5,058,809 | |||
|
| |||
Expenses: | ||||
Management fees (Note 3a) | 1,722,703 | |||
Distribution fees: (Note 3c) | ||||
Class A | 200,344 | |||
Class C | 285,261 | |||
Class R | 6,820 | |||
Transfer agent fees: (Note 3e) | ||||
Class Z | 106,640 | |||
Class A | 128,309 | |||
Class C | 45,657 | |||
Class R | 2,323 | |||
Class R6 | 3,568 | |||
Custodian fees (Note 4) | 33,867 | |||
Reports to shareholders | 37,089 | |||
Registration and filing fees | 84,260 | |||
Professional fees | 90,239 | |||
Trustees’ fees and expenses | 5,677 | |||
Other | 20,804 | |||
|
| |||
Total expenses | 2,773,561 | |||
Expense reductions (Note 4) | (595 | ) | ||
Expenses waived/paid by affiliates (Note 3f) | (33,185 | ) | ||
|
| |||
Net expenses | 2,739,781 | |||
|
| |||
Net investment income | 2,319,028 | |||
|
| |||
Realized and unrealized gains (losses): | ||||
Net realized gain (loss) from: | ||||
Investments:# | ||||
Unaffiliated issuers | 3,442,564 | |||
Foreign currency transactions | 17,757 | |||
Forward exchange contracts | (2,733,458 | ) | ||
Futures contracts | (2,009,534 | ) | ||
|
| |||
Net realized gain (loss) | (1,282,671 | ) | ||
|
| |||
Net change in unrealized appreciation (depreciation) on: | ||||
Investments: | ||||
Unaffiliated issuers | 30,599,277 | |||
Translation of other assets and liabilities denominated in foreign currencies | 30,806 | |||
Forward exchange contracts | (7,052,674 | ) | ||
Futures contracts | (553,890 | ) | ||
Change in deferred taxes on unrealized appreciation | (244,572 | ) | ||
|
| |||
Net change in unrealized appreciation (depreciation) | 22,778,947 | |||
|
| |||
Net realized and unrealized gain (loss) | 21,496,276 | |||
|
| |||
Net increase (decrease) in net assets resulting from operations | $23,815,304 | |||
|
| |||
*Foreign taxes withheld on dividends | $ 461,691 | |||
#Net of foreign taxes | $ 61,084 | |||
| 26 |
Annual Report | The accompanying notes are an integral part of these financial statements. | franklintempleton.com |
FRANKLIN MUTUAL INTERNATIONAL FUND
FINANCIAL STATEMENTS
Statements of Changes in Net Assets
| Year Ended December 31, | ||||||||
|
| |||||||
| 2017 | 2016 | |||||||
| ||||||||
Increase (decrease) in net assets: | ||||||||
Operations: | ||||||||
Net investment income | $ | 2,319,028 | $ | 3,170,309 | ||||
Net realized gain (loss) | (1,282,671 | ) | (7,943,873 | ) | ||||
Net change in unrealized appreciation (depreciation) | 22,778,947 | 6,339,210 | ||||||
|
| |||||||
Net increase (decrease) in net assets resulting from operations | 23,815,304 | 1,565,646 | ||||||
|
| |||||||
Distributions to shareholders from: | ||||||||
Net investment income: | ||||||||
Class Z | (1,857,997 | ) | (752,123 | ) | ||||
Class A | (1,574,566 | ) | (1,359,676 | ) | ||||
Class C | (348,684 | ) | (229,216 | ) | ||||
Class R | (35,346 | ) | (10,051 | ) | ||||
Class��R6 | (569,536 | ) | (334,768 | ) | ||||
Net realized gains: | ||||||||
Class Z | — | (154,704 | ) | |||||
Class A | — | (335,389 | ) | |||||
Class C | — | (106,625 | ) | |||||
Class R | — | (2,628 | ) | |||||
Class R6 | — | (63,007 | ) | |||||
|
| |||||||
Total distributions to shareholders | (4,386,129 | ) | (3,348,187 | ) | ||||
|
| |||||||
Capital share transactions: (Note 2) | ||||||||
Class Z | 39,322,326 | (8,767,720 | ) | |||||
Class A | (7,963,782 | ) | (27,056,442 | ) | ||||
Class C | 226,100 | (8,521,550 | ) | |||||
Class R | 1,060,015 | 24,758 | ||||||
Class R6 | 7,095,104 | (6,772,837 | ) | |||||
|
| |||||||
Total capital share transactions | 39,739,763 | (51,093,791 | ) | |||||
|
| |||||||
Net increase (decrease) in net assets | 59,168,938 | (52,876,332 | ) | |||||
Net assets: | ||||||||
Beginning of year | 166,742,418 | 219,618,750 | ||||||
|
| |||||||
End of year | $ | 225,911,356 | $ | 166,742,418 | ||||
|
| |||||||
Distributions in excess of net investment income included in net assets: | ||||||||
End of year | $ | (2,125,110 | ) | $ | (315,020 | ) | ||
|
| |||||||
franklintempleton.com |
The accompanying notes are an integral part of these financial statements. | Annual Report |
|
27 |
|
FRANKLIN MUTUAL INTERNATIONAL FUND
1. Organization and Significant Accounting Policies
Franklin Mutual Series Funds (Trust) is registered under the Investment Company Act of 1940 (1940 Act) as an open-end management investment company, consisting of seven separate funds and applies the specialized accounting and reporting guidance in U.S. Generally Accepted Accounting Principles (U.S. GAAP). Franklin Mutual International Fund (Fund) is included in this report. The Fund offers five classes of shares: Class Z, Class A, Class C, Class R and Class R6. Each class of shares may differ by its initial sales load, contingent deferred sales charges, voting rights on matters affecting a single class, its exchange privilege and fees due to differing arrangements for distribution and transfer agent fees.
The following summarizes the Fund’s significant accounting policies.
a. Financial Instrument Valuation
The Fund’s investments in financial instruments are carried at fair value daily. Fair value is the price that would be received to sell an asset or paid to transfer a liability in an orderly transaction between market participants on the measurement date. The Fund calculates the net asset value (NAV) per share as of 4 p.m. Eastern time each day the New York Stock Exchange (NYSE) is open for trading. Under compliance policies and procedures approved by the Trust’s Board of Trustees (the Board), the Fund’s administrator has responsibility for oversight of valuation, including leading the cross-functional Valuation Committee (VC). The VC provides administration and oversight of the Fund’s valuation policies and procedures, which are approved annually by the Board. Among other things, these procedures allow the Fund to utilize independent pricing services, quotations from securities and financial instrument dealers, and other market sources to determine fair value.
Equity securities and derivative financial instruments listed on an exchange or on the NASDAQ National Market System are valued at the last quoted sale price or the official closing price of the day, respectively. Foreign equity securities are valued as of the close of trading on the foreign stock exchange on which the security is primarily traded, or as of 4 p.m. Eastern time. The value is then converted into its U.S. dollar equivalent at the foreign exchange rate in effect at 4 p.m. Eastern time on the day that the value of the security is determined. Over-the-counter (OTC) securities are valued within the range of the most recent
quoted bid and ask prices. Securities that trade in multiple markets or on multiple exchanges are valued according to the broadest and most representative market. Certain equity securities are valued based upon fundamental characteristics or relationships to similar securities.
Debt securities generally trade in the OTC market rather than on a securities exchange. The Fund’s pricing services use multiple valuation techniques to determine fair value. In instances where sufficient market activity exists, the pricing services may utilize a market-based approach through which quotes from market makers are used to determine fair value. In instances where sufficient market activity may not exist or is limited, the pricing services also utilize proprietary valuation models which may consider market characteristics such as benchmark yield curves, credit spreads, estimated default rates, anticipated market interest rate volatility, coupon rates, anticipated timing of principal repayments, underlying collateral, and other unique security features in order to estimate the relevant cash flows, which are then discounted to calculate the fair value.
Certain derivative financial instruments trade in the OTC market. The Fund’s pricing services use various techniques including industry standard option pricing models and proprietary discounted cash flow models to determine the fair value of those instruments. The Fund’s net benefit or obligation under the derivative contract, as measured by the fair value of the contract, is included in net assets.
The Fund has procedures to determine the fair value of financial instruments for which market prices are not reliable or readily available. Under these procedures, the VC convenes on a regular basis to review such financial instruments and considers a number of factors, including significant unobservable valuation inputs, when arriving at fair value. The VC primarily employs a market-based approach which may use related or comparable assets or liabilities, recent transactions, market multiples, book values, and other relevant information for the investment to determine the fair value of the investment. An income-based valuation approach may also be used in which the anticipated future cash flows of the investment are discounted to calculate fair value. Discounts may also be applied due to the nature or duration of any restrictions on the disposition of the investments. Due to the inherent uncertainty of valuations of such investments, the fair values may differ significantly from the values that would have been used had an active market existed. The VC employs various methods for calibrating these
| 28 |
Annual Report | franklintempleton.com |
FRANKLIN MUTUAL INTERNATIONAL FUND
NOTES TO FINANCIAL STATEMENTS
valuation approaches including a regular review of key inputs and assumptions, transactional back-testing or disposition analysis, and reviews of any related market activity.
Trading in securities on foreign securities stock exchanges and OTC markets may be completed before 4 p.m. Eastern time. In addition, trading in certain foreign markets may not take place on every Fund’s business day. Occasionally, events occur between the time at which trading in a foreign security is completed and 4 p.m. Eastern time that might call into question the reliability of the value of a portfolio security held by the Fund. As a result, differences may arise between the value of the Fund’s portfolio securities as determined at the foreign market close and the latest indications of value at 4 p.m. Eastern time. In order to minimize the potential for these differences, the VC monitors price movements following the close of trading in foreign stock markets through a series of country specific market proxies (such as baskets of American Depositary Receipts, futures contracts and exchange traded funds). These price movements are measured against established trigger thresholds for each specific market proxy to assist in determining if an event has occurred that may call into question the reliability of the values of the foreign securities held by the Fund. If such an event occurs, the securities may be valued using fair value procedures, which may include the use of independent pricing services.
When the last day of the reporting period is a non-business day, certain foreign markets may be open on those days that the Fund’s NAV is not calculated, which could result in differences between the value of the Fund’s portfolio securities on the last business day and the last calendar day of the reporting period. Any significant security valuation changes due to an open foreign market are adjusted and reflected by the Fund for financial reporting purposes.
b. Foreign Currency Translation
Portfolio securities and other assets and liabilities denominated in foreign currencies are translated into U.S. dollars based on the exchange rate of such currencies against U.S. dollars on the date of valuation. The Fund may enter into foreign currency exchange contracts to facilitate transactions denominated in a foreign currency. Purchases and sales of securities, income and expense items denominated in foreign currencies are translated into U.S. dollars at the exchange rate in effect on the transaction date. Portfolio securities and assets and liabilities denominated in foreign currencies contain risks that those currencies will
decline in value relative to the U.S. dollar. Occasionally, events may impact the availability or reliability of foreign exchange rates used to convert the U.S. dollar equivalent value. If such an event occurs, the foreign exchange rate will be valued at fair value using procedures established and approved by the Board.
The Fund does not separately report the effect of changes in foreign exchange rates from changes in market prices on securities held. Such changes are included in net realized and unrealized gain or loss from investments in the Statement of Operations.
Realized foreign exchange gains or losses arise from sales of foreign currencies, currency gains or losses realized between the trade and settlement dates on securities transactions and the difference between the recorded amounts of dividends, interest, and foreign withholding taxes and the U.S. dollar equivalent of the amounts actually received or paid. Net unrealized foreign exchange gains and losses arise from changes in foreign exchange rates on foreign denominated assets and liabilities other than investments in securities held at the end of the reporting period.
c. Derivative Financial Instruments
The Fund invested in derivative financial instruments in order to manage risk or gain exposure to various other investments or markets. Derivatives are financial contracts based on an underlying or notional amount, require no initial investment or an initial net investment that is smaller than would normally be required to have a similar response to changes in market factors, and require or permit net settlement. Derivatives contain various risks including the potential inability of the counterparty to fulfill their obligations under the terms of the contract, the potential for an illiquid secondary market, and/or the potential for market movements which expose the Fund to gains or losses in excess of the amounts shown in the Statement of Assets and Liabilities. Realized gain and loss and unrealized appreciation and depreciation on these contracts for the period are included in the Statement of Operations.
Derivative counterparty credit risk is managed through a formal evaluation of the creditworthiness of all potential counter-parties. The Fund attempts to reduce its exposure to counterparty credit risk on OTC derivatives, whenever possible, by entering into International Swaps and Derivatives Association (ISDA) master agreements with certain counterparties. These agreements contain various provisions,
| franklintempleton.com |
Annual Report | 29 |
FRANKLIN MUTUAL INTERNATIONAL FUND
NOTES TO FINANCIAL STATEMENTS
1. Organization and Significant Accounting
Policies (continued)
c. Derivative Financial Instruments (continued)
including but not limited to collateral requirements, events of default, or early termination. Termination events applicable to the counterparty include certain deteriorations in the credit quality of the counterparty. Termination events applicable to the Fund include failure of the Fund to maintain certain net asset levels and/or limit the decline in net assets over various periods of time. In the event of default or early termination, the ISDA master agreement gives the non-defaulting party the right to net and close-out all transactions traded, whether or not arising under the ISDA agreement, to one net amount payable by one counterparty to the other. However, absent an event of default or early termination, OTC derivative assets and liabilities are presented gross and not offset in the Statement of Assets and Liabilities. Early termination by the counterparty may result in an immediate payment by the Fund of any net liability owed to that counterparty under the ISDA agreement.
Collateral requirements differ by type of derivative. Collateral or initial margin requirements are set by the broker or exchange clearing house for exchange traded and centrally cleared derivatives. Initial margin deposited is held at the exchange and can be in the form of cash and/or securities. For OTC derivatives traded under an ISDA master agreement, posting of collateral is required by either the Fund or the applicable counterparty if the total net exposure of all OTC derivatives with the applicable counterparty exceeds the minimum transfer amount, which typically ranges from $100,000 to $250,000, and can vary depending on the counterparty and the type of the agreement. Generally, collateral is determined at the close of Fund business each day and any additional collateral required due to changes in derivative values may be delivered by the Fund or the counterparty the next business day, or within a few business days. Collateral pledged and/or received by the Fund for OTC derivatives, if any, is held in segregated accounts with the Fund’s custodian/counterparty broker and can be in the form of cash and/or securities. Unrestricted cash may be invested according to the Fund’s investment objectives. To the extent that the amounts due to the Fund from its counterparties are not subject to collateralization or are not fully collateralized, the Fund bears the risk of loss from counterparty non-performance.
The Fund entered into exchange traded futures contracts primarily to manage exposure to certain foreign currencies. A futures contract is an agreement between the Fund and a counterparty to buy or sell an asset at a specified price on a future date. Required initial margins are pledged by the Fund, and the daily change in fair value is accounted for as a variation margin payable or receivable in the Statement of Assets and Liabilities.
The Fund entered into OTC forward exchange contracts primarily to manage exposure to certain foreign currencies. A forward exchange contract is an agreement between the Fund and a counterparty to buy or sell a foreign currency at a specific exchange rate on a future date.
The Fund purchased or wrote OTC option contracts primarily to manage exposure to foreign exchange rate risk. An option is a contract entitling the holder to purchase or sell a specific amount of shares or units of an asset or notional amount of a swap (swaption), at a specified price. When an option is purchased or written, an amount equal to the premium paid or received is recorded as an asset or liability, respectively. Upon exercise of an option, the acquisition cost or sales proceeds of the underlying investment is adjusted by any premium received or paid. Upon expiration of an option, any premium received or paid is recorded as a realized gain or loss. Upon closing an option other than through expiration or exercise, the difference between the premium received or paid and the cost to close the position is recorded as a realized gain or loss.
See Note 9 regarding other derivative information.
d. Securities Sold Short
The Fund is engaged in selling securities short, which obligates the Fund to replace a borrowed security with the same security at current fair value. The Fund incurs a loss if the price of the security increases between the date of the short sale and the date on which the Fund replaces the borrowed security. The Fund realizes a gain if the price of the security declines between those dates. Gains are limited to the price at which the Fund sold the security short, while losses are potentially unlimited in size.
The Fund is required to establish a margin account with the broker lending the security sold short. While the short sale is outstanding, the broker retains the proceeds of the short sale to the extent necessary to meet margin requirements until the short position is closed out. A deposit must also be maintained with the Fund’s custodian/counterparty broker consisting of cash
| 30 |
Annual Report | franklintempleton.com |
FRANKLIN MUTUAL INTERNATIONAL FUND
NOTES TO FINANCIAL STATEMENTS
and/or securities having a value equal to a specified percentage of the value of the securities sold short. The Fund is obligated to pay fees for borrowing the securities sold short and is required to pay the counterparty any dividends and/or interest due on securities sold short. Such dividends and/or interest and any security borrowing fees are recorded as an expense to the Fund. At December 31, 2017, the Fund had no securities sold short.
e. Income and Deferred Taxes
It is the Fund’s policy to qualify as a regulated investment company under the Internal Revenue Code. The Fund intends to distribute to shareholders substantially all of its taxable income and net realized gains to relieve it from federal income and excise taxes. As a result, no provision for U.S. federal income taxes is required.
The Fund may be subject to foreign taxation related to income received, capital gains on the sale of securities and certain foreign currency transactions in the foreign jurisdictions in which it invests. Foreign taxes, if any, are recorded based on the tax regulations and rates that exist in the foreign markets in which the Fund invests. When a capital gain tax is determined to apply, the Fund records an estimated deferred tax liability in an amount that would be payable if the securities were disposed of on the valuation date.
The Fund may recognize an income tax liability related to its uncertain tax positions under U.S. GAAP when the uncertain tax position has a less than 50% probability that it will be sustained upon examination by the tax authorities based on its technical merits. As of December 31, 2017, the Fund has determined that no tax liability is required in its financial statements related to uncertain tax positions for any open tax years (or expected to be taken in future tax years). Open tax years are those that remain subject to examination and are based on the statute of limitations in each jurisdiction in which the Fund invests.
f. Security Transactions, Investment Income, Expenses and Distributions
Security transactions are accounted for on trade date. Realized gains and losses on security transactions are determined on a specific identification basis. Interest income and estimated expenses are accrued daily. Amortization of premium and accretion of discount on debt securities are included in interest
income. Dividend income is recorded on the ex-dividend date except for certain dividends from securities where the dividend rate is not available. In such cases, the dividend is recorded as soon as the information is received by the Fund. Distributions to shareholders are recorded on the ex-dividend date. Distributable earnings are determined according to income tax regulations (tax basis) and may differ from earnings recorded in accordance with U.S. GAAP. These differences may be permanent or temporary. Permanent differences are reclassified among capital accounts to reflect their tax character. These reclassifications have no impact on net assets or the results of operations. Temporary differences are not reclassified, as they may reverse in subsequent periods.
Common expenses incurred by the Trust are allocated among the Funds based on the ratio of net assets of each Fund to the combined net assets of the Trust. Fund specific expenses are charged directly to the Fund that incurred the expense.
Realized and unrealized gains and losses and net investment income, excluding class specific expenses, are allocated daily to each class of shares based upon the relative proportion of net assets of each class. Differences in per share distributions by class are generally due to differences in class specific expenses.
g. Accounting Estimates
The preparation of financial statements in accordance with U.S. GAAP requires management to make estimates and assumptions that affect the reported amounts of assets and liabilities at the date of the financial statements and the amounts of income and expenses during the reporting period. Actual results could differ from those estimates.
h. Guarantees and Indemnifications
Under the Trust’s organizational documents, its officers and trustees are indemnified by the Trust against certain liabilities arising out of the performance of their duties to the Trust. Additionally, in the normal course of business, the Trust, on behalf of the Fund, enters into contracts with service providers that contain general indemnification clauses. The Trust’s maximum exposure under these arrangements is unknown as this would involve future claims that may be made against the Trust that have not yet occurred. Currently, the Trust expects the risk of loss to be remote.
| franklintempleton.com |
Annual Report | 31 |
FRANKLIN MUTUAL INTERNATIONAL FUND
NOTES TO FINANCIAL STATEMENTS
2. Shares of Beneficial Interest
At December 31, 2017, there were an unlimited number of shares authorized (without par value). Transactions in the Fund’s shares were as follows:
Year Ended December 31,
| ||||||||||||||||
2017
| 2016
| |||||||||||||||
Shares
| Amount
| Shares
| Amount
| |||||||||||||
| Class Z Shares: | ||||||||||||||||
Shares sold | 3,534,237 | $ | 54,797,744 | 1,418,415 | $ | 19,343,369 | ||||||||||
Shares issued in reinvestment of distributions | 114,066 | 1,815,700 | 60,850 | 863,079 | ||||||||||||
Shares redeemed | (1,098,953 | ) | (17,291,118 | ) | (2,150,864 | ) | (28,974,168 | ) | ||||||||
Net increase (decrease) | 2,549,350 | $ | 39,322,326 | (671,599 | ) | $ | (8,767,720 | ) | ||||||||
| Class A Shares: | ||||||||||||||||
Shares sold | 1,959,536 | $ | 30,501,176 | 1,936,625 | $ | 26,120,034 | ||||||||||
Shares issued in reinvestment of distributions | 98,350 | 1,558,023 | 118,659 | 1,674,269 | ||||||||||||
Shares redeemed | (2,635,900 | ) | (40,022,981 | ) | (4,099,974 | ) | (54,850,745 | ) | ||||||||
Net increase (decrease) | (578,014 | ) | $ | (7,963,782 | ) | (2,044,690 | ) | $ | (27,056,442 | ) | ||||||
| Class C Shares: | ||||||||||||||||
Shares sold | 572,952 | $ | 8,653,851 | 363,847 | $ | 4,831,729 | ||||||||||
Shares issued in reinvestment of distributions | 22,302 | 348,313 | 24,173 | 335,241 | ||||||||||||
Shares redeemed | (577,334 | ) | (8,776,064 | ) | (1,036,433 | ) | (13,688,520 | ) | ||||||||
Net increase (decrease) | 17,920 | $ | 226,100 | (648,413 | ) | $ | (8,521,550 | ) | ||||||||
| Class R Shares: | ||||||||||||||||
Shares sold | 113,248 | $ | 1,751,799 | 28,370 | $ | 379,915 | ||||||||||
Shares issued in reinvestment of distributions | 2,245 | 35,346 | 903 | 12,679 | ||||||||||||
Shares redeemed | (46,246 | ) | (727,130 | ) | (27,458 | ) | (367,836 | ) | ||||||||
Net increase (decrease) | 69,247 | $ | 1,060,015 | 1,815 | $ | 24,758 | ||||||||||
| Class R6 Shares: | ||||||||||||||||
Shares sold | 685,257 | $ | 10,863,178 | 371,903 | $ | 5,022,728 | ||||||||||
Shares issued in reinvestment of distributions | 35,752 | 569,536 | 28,018 | 397,775 | ||||||||||||
Shares redeemed | (277,679 | ) | (4,337,610 | ) | (913,622 | ) | (12,193,340 | ) | ||||||||
Net increase (decrease) | 443,330 | $ | 7,095,104 | (513,701 | ) | $ | (6,772,837 | ) | ||||||||
3. Transactions with Affiliates
Franklin Resources, Inc. is the holding company for various subsidiaries that together are referred to as Franklin Templeton Investments. Certain officers and trustees of the Fund are also officers and/or directors of the following subsidiaries:
| Subsidiary | Affiliation | |
| Franklin Mutual Advisers, LLC (Franklin Mutual) | Investment manager | |
| Franklin Templeton Services, LLC (FT Services) | Administrative manager | |
| Franklin Templeton Distributors, Inc. (Distributors) | Principal underwriter | |
| Franklin Templeton Investor Services, LLC (Investor Services) | Transfer agent |
a. Management Fees
The Fund pays an investment management fee to Franklin Mutual of 0.875% per year of the average daily net assets of the Fund.
| 32 |
Annual Report | franklintempleton.com |
FRANKLIN MUTUAL INTERNATIONAL FUND
NOTES TO FINANCIAL STATEMENTS
b. Administrative Fees
Under an agreement with Franklin Mutual, FT Services provides administrative services to the Fund. The fee is paid by Franklin Mutual based on the Fund’s average daily net assets, and is not an additional expense of the Fund.
c. Distribution Fees
The Board has adopted distribution plans for each share class, with the exception of Class Z and Class R6 shares, pursuant to Rule 12b-1 under the 1940 Act. Under the Fund’s Class A reimbursement distribution plan, the Fund reimburses Distributors for costs incurred in connection with the servicing, sale and distribution of the Fund’s shares up to the maximum annual plan rate. Under the Class A reimbursement distribution plan, costs exceeding the maximum for the current plan year cannot be reimbursed in subsequent periods. In addition, under the Fund’s Class C and R compensation distribution plans, the Fund pays Distributors for costs incurred in connection with the servicing, sale and distribution of the Fund’s shares up to the maximum annual plan rate for each class. The plan year, for purposes of monitoring compliance with the maximum annual plan rates, is February 1 through January 31.
The maximum annual plan rates, based on the average daily net assets, for each class, are as follows:
Class A | 0.35 | % | ||
Class C | 1.00 | % | ||
Class R | 0.50 | % |
The Board has set the current rate at 0.25% per year for Class A shares until further notice and approval by the Board.
d. Sales Charges/Underwriting Agreements
Front-end sales charges and contingent deferred sales charges (CDSC) do not represent expenses of the Fund. These charges are deducted from the proceeds of sales of Fund shares prior to investment or from redemption proceeds prior to remittance, as applicable. Distributors has advised the Fund of the following commission transactions related to the sales and redemptions of the Fund’s shares for the year:
Sales charges retained net of commissions paid to unaffiliated brokers/dealers | $ | 38,060 | ||
CDSC retained | $ | 22,947 |
e. Transfer Agent Fees
Each class of shares pays transfer agent fees to Investor Services for its performance of shareholder servicing obligations. Effective November 1, 2017, the fees are based on an annualized asset based fee of 0.02% plus a transaction based fee. Prior to November 1, 2017, the fees were account based fees that varied based on fund or account type. In addition, each class reimburses Investor Services for out of pocket expenses incurred and, except for Class R6, reimburses shareholder servicing fees paid to third parties. These fees are allocated daily based upon their relative proportion of such classes’ aggregate net assets. Class R6 pays Investor Services transfer agent fees specific to that class.
For the year ended December 31, 2017, the Fund paid transfer agent fees of $286,497, of which $134,543 was retained by Investor Services.
f. Waiver and Expense Reimbursements
Franklin Mutual and Investor Services have contractually agreed in advance to waive or limit their respective fees and to assume as their own expense certain expenses otherwise payable by the Fund so that the expenses (excluding distribution fees, acquired fund fees and expenses) for each class of the Fund do not exceed 1.17% and Class R6 does not exceed 1.01% based on the average net assets of each class (other than certain non-routine expenses or costs, including those relating to litigation, indemnification,
| franklintempleton.com | Annual Report | 33 |
FRANKLIN MUTUAL INTERNATIONAL FUND
NOTES TO FINANCIAL STATEMENTS
3. Transactions with Affiliates (continued)
f. Waiver and Expense Reimbursements (continued)
reorganizations, and liquidations). Effective February 1, 2018, the expenses for each class of the Fund will be limited to 0.97% and Class R6 will be limited to 0.81% until April 30, 2018. Total expenses waived or paid are not subject to recapture subsequent to the Fund’s fiscal year end. Prior to May 1, 2017, expenses for Class R6 were limited to 0.99%.
g. Other Affiliated Transactions
At December 31, 2017, one or more of the funds in Franklin Fund Allocator Series owned 7.2% of the Fund’s outstanding shares.
4. Expense Offset Arrangement
The Fund has entered into an arrangement with its custodian whereby credits realized as a result of uninvested cash balances are used to reduce a portion of the Fund’s custodian expenses. During the year ended December 31, 2017, the custodian fees were reduced as noted in the Statement of Operations.
5. Independent Trustees’ Retirement Plan
On January 1, 1993, the Trust adopted an Independent Trustees’ Retirement Plan (Plan). The Plan is an unfunded defined benefit plan that provides benefit payments to Trustees whose length of service and retirement age meets the eligibility requirements of the Plan. Benefits under the Plan are based on years of service and fees paid to each trustee at the time of retirement. Effective in December 1996, the Plan was closed to new participants.
During the year ended December 31, 2017, the Fund’s projected benefit obligation and benefit payments under the Plan were as follows:
aProjected benefit obligation at December 31, 2017. | $ | 315 | ||
bIncrease in projected benefit obligation | $ | 179 | ||
Benefit payments made to retired trustees | $ | (186 | ) | |
aThe projected benefit obligation is included in trustees’ fees and expenses in the Statement of Assets and Liabilities.
bThe increase in projected benefit obligation is included in trustees’ fees and expenses in the Statement of Operations.
| 34 |
Annual Report | franklintempleton.com |
FRANKLIN MUTUAL INTERNATIONAL FUND
NOTES TO FINANCIAL STATEMENTS
6. Income Taxes
For tax purposes, capital losses may be carried over to offset future capital gains, if any.
At December 31, 2017, the capital loss carryforwards were as follows:
Capital loss carryforwards: | ||||
Short term | $ 5,601,773 | |||
Long term | 8,348,899 | |||
|
| |||
Total capital loss carryforwards | $13,950,672 | |||
|
|
The tax character of distributions paid during the years ended December 31, 2017 and 2016, was as follows:
| 2017 | 2016 | |||||||
|
| |||||||
| Distributions paid from: | ||||||||
Ordinary income | $ | 4,386,129 | $ | 2,686,549 | ||||
Long term capital gain | — | 661,638 | ||||||
|
| |||||||
| $ | 4,386,129 | $ | 3,348,187 | |||||
|
| |||||||
At December 31, 2017, the cost of investments, net unrealized appreciation (depreciation) and undistributed ordinary income for income tax purposes were as follows:
Cost of investments | $202,264,562 | |||
|
| |||
Unrealized appreciation | $ 35,213,926 | |||
Unrealized depreciation | (12,961,440 | ) | ||
Net unrealized appreciation (depreciation) | $ 22,252,486 | |||
|
| |||
Distributable earnings - undistributed ordinary income | $ 324,818 | |||
|
| |||
Differences between income and/or capital gains as determined on a book basis and a tax basis are primarily due to differing treatment of foreign currency transactions.
7. Investment Transactions
Purchases and sales of investments (excluding short term securities) for the year ended December 31, 2017, aggregated $98,486,087 and $70,870,916, respectively.
8. Concentration of Risk
Investing in foreign securities may include certain risks and considerations not typically associated with investing in U.S. securities, such as fluctuating currency values and changing local and regional economic, political and social conditions, which may result in greater market volatility. In addition, certain foreign securities may not be as liquid as U.S. securities.
| franklintempleton.com | Annual Report | 35 |
FRANKLIN MUTUAL INTERNATIONAL FUND
NOTES TO FINANCIAL STATEMENTS
9. Other Derivative Information
At December 31, 2017, the Fund’s investments in derivative contracts are reflected in the Statement of Assets and Liabilities as follows:
| Asset Derivatives | Liability Derivatives | |||||||||||
Derivative Contracts Not Accounted for as Hedging Instruments | Statement of Assets and Liabilities Location | Fair Value | Statement of Assets and Liabilities Location | Fair Value | ||||||||
Foreign exchange contracts | Variation margin on futures contracts | $ | — | Variation margin on futures contracts | $ | 381,956 | a | |||||
Unrealized appreciation on OTC forward exchange contracts | 225,061 | Unrealized depreciation on OTC forward exchange contracts | 3,180,009 | |||||||||
|
|
|
| |||||||||
Totals | $ | 225,061 | $ | 3,561,965 | ||||||||
|
|
|
| |||||||||
aThis amount reflects the cumulative appreciation (depreciation) of futures contracts as reported in the Statement of Investments. Only the variation margin receivable/ payable at year end is separately reported within the Statement of Assets and Liabilities. Prior variation margin movements were recorded to cash upon receipt or payment.
For the year ended December 31, 2017, the effect of derivative contracts in the Fund’s Statement of Operations was as follows:
Derivative Contracts Not Accounted for as Hedging Instruments | Statement of Operations Location | Net Realized Gain (Loss) for the Year | Statement of Operations Location | Net Change in Unrealized Appreciation (Depreciation) for the Year | ||||||||
Net realized gain (loss) from: | Net change in unrealized appreciation (depreciation) on: | |||||||||||
Foreign exchange contracts | Investments | $ (22,342) | a | Investments | $ — | |||||||
Forward exchange contracts | (2,733,458) | Forward exchange contracts | (7,052,674) | |||||||||
Futures contracts | (2,009,534) | Futures contracts | (553,890) | |||||||||
|
|
|
| |||||||||
Totals | $(4,765,334) | $(7,606,564) | ||||||||||
|
|
|
| |||||||||
aPurchased option contracts are included in net realized gain (loss) from investments in the Statement of Operations.
For the year ended December 31, 2017, the average month end notional amount of futures contracts and options represented $24,301,150, and $972,000, respectively. The average month end contract value of forward exchange contracts was $116,300,811.
At December 31, 2017, the Fund’s OTC derivative assets and liabilities are as follows:
| Gross Amounts of Assets and Liabilities Presented in the Statement of Assets and Liabilities | ||||||||
| Assetsa | Liabilitiesa | |||||||
| Derivatives | ||||||||
Forward exchange contracts | $225,061 | $3,180,009 | ||||||
|
| |||||||
aAbsent an event of default or early termination, OTC derivative assets and liabilities are presented gross and not offset in the Statement of Assets and Liabilities.
| 36 |
Annual Report | franklintempleton.com |
FRANKLIN MUTUAL INTERNATIONAL FUND
NOTES TO FINANCIAL STATEMENTS
At December 31, 2017, the Fund’s OTC derivative assets, which may be offset against the Fund’s OTC derivative liabilities and collateral received from the counterparty, are as follows:
| Amounts Not Offset in the Statement of Assets and Liabilities | ||||||||||||||||||||
| Gross Amounts of Assets Presented in the Statement of Assets and Liabilities | Financial Offset | Financial Instruments Collateral Received | Cash Collateral Received | Net Amount (Not less than zero) | ||||||||||||||||
| Counterparty | ||||||||||||||||||||
BOFA | $ 22,336 | $ (22,336 | ) | $ — | $ — | $ — | ||||||||||||||
BONY | 488 | (488 | ) | — | — | — | ||||||||||||||
HSBK | 127,191 | (127,191 | ) | — | — | — | ||||||||||||||
SSBT | 16,555 | (16,555 | ) | — | — | — | ||||||||||||||
UBSW | 58,491 | (58,491 | ) | — | — | — | ||||||||||||||
|
| |||||||||||||||||||
Total | $225,061 | $(225,061 | ) | $ — | $ — | $ — | ||||||||||||||
|
| |||||||||||||||||||
At December 31, 2017, the Fund’s OTC derivative liabilities, which may be offset against the Fund’s OTC derivative assets and collateral pledged to the counterparty, are as follows:
| Amounts Not Offset in the Statement of Assets and Liabilities | ||||||||||||||||||||
| Gross Amounts of Liabilities Presented in the Statement of Assets and Liabilities | Financial Instruments Available for Offset | Financial Instruments Collateral Pledgeda | Cash Collateral Pledged | Net Amount (Not less than zero) | ||||||||||||||||
| Counterparty | ||||||||||||||||||||
BOFA | $ 528,747 | $ (22,336 | ) | $(300,864 | ) | $ — | $205,547 | |||||||||||||
BONY. | 252,813 | (488 | ) | (128,539 | ) | — | 123,786 | |||||||||||||
HSBK | 1,014,448 | (127,191 | ) | (496,104 | ) | — | 391,153 | |||||||||||||
SSBT | 199,517 | (16,555 | ) | — | — | 182,962 | ||||||||||||||
UBSW | 1,184,484 | (58,491 | ) | (817,037 | ) | — | 308,956 | |||||||||||||
|
| |||||||||||||||||||
Total | $3,180,009 | $(225,061 | ) | $(1,742,544 | ) | $ — | $1,212,404 | |||||||||||||
|
| |||||||||||||||||||
aSee the accompanying Statement of Investments for securities pledged as collateral for derivatives.
See Note 1(c) regarding derivative financial instruments.
See Abbreviations on page 39.
10. Credit Facility
The Fund, together with other U.S. registered and foreign investment funds (collectively, Borrowers), managed by Franklin Templeton Investments, are borrowers in a joint syndicated senior unsecured credit facility totaling $2 billion (Global Credit Facility) which matured on February 9, 2018. This Global Credit Facility provides a source of funds to the Borrowers for temporary and emergency purposes, including the ability to meet future unanticipated or unusually large redemption requests. Effective February 9, 2018, the Borrowers renewed the Global Credit Facility for a one year term, maturing February 8, 2019, for a total of $2 billion.
franklintempleton.com | Annual Report | 37 |
FRANKLIN MUTUAL INTERNATIONAL FUND
NOTES TO FINANCIAL STATEMENTS
10. Credit Facility (continued)
Under the terms of the Global Credit Facility, the Fund shall, in addition to interest charged on any borrowings made by the Fund and other costs incurred by the Fund, pay its share of fees and expenses incurred in connection with the implementation and maintenance of the Global Credit Facility, based upon its relative share of the aggregate net assets of all of the Borrowers, including an annual commitment fee of 0.15% based upon the unused portion of the Global Credit Facility. These fees are reflected in other expenses in the Statement of Operations. During the year ended December 31, 2017, the Fund did not use the Global Credit Facility.
11. Fair Value Measurements
The Fund follows a fair value hierarchy that distinguishes between market data obtained from independent sources (observable inputs) and the Fund’s own market assumptions (unobservable inputs). These inputs are used in determining the value of the Fund’s financial instruments and are summarized in the following fair value hierarchy:
| • | Level 1 – quoted prices in active markets for identical financial instruments |
| • | Level 2 – other significant observable inputs (including quoted prices for similar financial instruments, interest rates, prepayment speed, credit risk, etc.) |
| • | Level 3 – significant unobservable inputs (including the Fund’s own assumptions in determining the fair value of financial instruments) |
The input levels are not necessarily an indication of the risk or liquidity associated with financial instruments at that level.
For movements between the levels within the fair value hierarchy, the Fund has adopted a policy of recognizing the transfers as of the date of the underlying event which caused the movement.
A summary of inputs used as of December 31, 2017, in valuing the Fund’s assets and liabilities carried at fair value, is as follows:
| Level 1 | Level 2 | Level 3 | Total | |||||||||||||
| Assets: | ||||||||||||||||
Investments in Securities:a | ||||||||||||||||
Equity Investmentsb | $ | 214,693,478 | $ | — | $ | — | $ | 214,693,478 | ||||||||
Short Term Investments | 10,359,749 | 2,800,000 | — | 13,159,749 | ||||||||||||
|
| |||||||||||||||
Total Investments in Securities | $ | 225,053,227 | $ | 2,800,000 | $ | — | $ | 227,853,227 | ||||||||
|
| |||||||||||||||
Other Financial Instruments: | ||||||||||||||||
Forward Exchange Contracts | $ | — | $ | 225,061 | $ | — | $ | 225,061 | ||||||||
|
| |||||||||||||||
| Liabilities: | ||||||||||||||||
Other Financial Instruments: | ||||||||||||||||
Futures Contracts | $ | 381,956 | $ | — | $ | — | $ | 381,956 | ||||||||
Forward Exchange Contracts | — | 3,180,009 | — | 3,180,009 | ||||||||||||
|
| |||||||||||||||
Total Other Financial Instruments | $ | 381,956 | $ | 3,180,009 | $ | — | $ | 3,561,965 | ||||||||
|
| |||||||||||||||
aFor detailed categories, see the accompanying Statement of Investments.
bIncludes common and preferred stocks.
12. Subsequent Events
The Fund has evaluated subsequent events through the issuance of the financial statements and determined that no events have occurred that require disclosure other than those already disclosed in the financial statements.
| 38 |
Annual Report | franklintempleton.com |
FRANKLIN MUTUAL INTERNATIONAL FUND
NOTES TO FINANCIAL STATEMENTS
Abbreviations
| Counterparty | Currency | Selected Portfolio | ||||||||
BOFA |
Bank of America N.A. |
EUR |
Euro |
ADR |
American Depositary Receipt | |||||
| BONY | The Bank of New York Mellon Corp. | GBP | British Pound | FHLB | Federal Home Loan Bank | |||||
| HSBK | HSBC Bank PLC | USD | United States Dollar | REIT | Real Estate Investment Trust | |||||
| SSBT | State Street Bank and Trust Co., N.A. | |||||||||
| UBSW | UBS AG | |||||||||
| franklintempleton.com | Annual Report | 39 |
FRANKLIN MUTUAL INTERNATIONAL FUND
Report of Independent Registered Public Accounting Firm
To the Board of Trustees of Franklin Mutual Series Funds and Shareholders of Franklin Mutual International Fund:
Opinion on the Financial Statements
We have audited the accompanying statement of assets and liabilities of Franklin Mutual International Fund (the “Fund”) (one of the funds constituting Franklin Mutual Series Funds), including the schedule of investments, as of December 31, 2017, and the related statement of operations for the year then ended, the statements of changes in net assets for each of the two years in the period then ended, the financial highlights for each of the periods indicated therein and the related notes (collectively referred to as the “financial statements”). In our opinion, the financial statements present fairly, in all material respects, the financial position of Franklin Mutual International Fund (one of the funds constituting Franklin Mutual Series Funds) at December 31, 2017, the results of its operations for the year then ended, the changes in its net assets for each of the two years in the period then ended and its financial highlights for each of the periods indicated therein, in conformity with U.S. generally accepted accounting principles.
Basis for Opinion
These financial statements are the responsibility of the Fund’s management. Our responsibility is to express an opinion on the Fund’s financial statements based on our audits. We are a public accounting firm registered with the Public Company Accounting Oversight Board (United States) (“PCAOB”) and are required to be independent with respect to the Fund in accordance with the U.S. federal securities laws and the applicable rules and regulations of the Securities and Exchange Commission and the PCAOB.
We conducted our audits in accordance with the standards of the PCAOB. Those standards require that we plan and perform the audit to obtain reasonable assurance about whether the financial statements are free of material misstatement, whether due to error or fraud. The Fund is not required to have, nor were we engaged to perform, an audit of the Fund’s internal control over financial reporting. As part of our audits, we are required to obtain an understanding of internal control over financial reporting, but not for the purpose of expressing an opinion on the effectiveness of the Fund’s internal control over financial reporting. Accordingly, we express no such opinion.
Our audits included performing procedures to assess the risks of material misstatement of the financial statements, whether due to error or fraud, and performing procedures that respond to those risks. Such procedures included examining, on a test basis, evidence regarding the amounts and disclosures in the financial statements. Our procedures included confirmation of securities owned as of December 31, 2017, by correspondence with the custodian and brokers. Our audits also included evaluating the accounting principles used and significant estimates made by management, as well as evaluating the overall presentation of the financial statements. We believe that our audits provide a reasonable basis for our opinion.
We have served as the auditor of one or more Franklin investment companies since 1987.
Boston, MA
February 26, 2018
40 |
Annual Report |
franklintempleton.com |
FRANKLIN MUTUAL INTERNATIONAL FUND
Under Section 854(b)(1)(B) of the Internal Revenue Code (Code), the Fund hereby reports the maximum amount allowable but no less than $4,285,106 as qualified dividends for purposes of the maximum rate under Section 1(h)(11) of the Code for the fiscal year ended December 31, 2017. Distributions, including qualified dividend income, paid during calendar year 2017 will be reported to shareholders on Form 1099-DIV by mid-February 2018. Shareholders are advised to check with their tax advisors for information on the treatment of these amounts on their individual income tax returns.
At December 31, 2017, more than 50% of the Fund’s total assets were invested in securities of foreign issuers. In most instances, foreign taxes were withheld from income paid to the Fund on these investments. As shown in the table below, the Fund hereby reports to shareholders the foreign source income and foreign taxes paid, pursuant to Section 853 of the Code. This written statement will allow shareholders of record on December 21, 2017, to treat their proportionate share of foreign taxes paid by the Fund as having been paid directly by them. The shareholder shall consider these amounts as foreign taxes paid in the tax year in which they receive the Fund distribution.
The following table provides a detailed analysis of foreign tax paid, foreign source income and foreign source qualified dividends as reported by the Fund, to Class Z, Class A, Class C, Class R and Class R6 shareholders of record.
| Class | Foreign Tax Paid Per Share | Foreign Source Income Per Share | Foreign Source Qualified Dividends Per Share | |||||||||
Class Z | $0.0313 | $0.2694 | $0.2150 | |||||||||
Class A | $0.0313 | $0.2383 | $0.1903 | |||||||||
Class C | $0.0313 | $0.1560 | $0.1245 | |||||||||
Class R | $0.0313 | $0.2302 | $0.1837 | |||||||||
Class R6 | $0.0313 | $0.2826 | $0.2255 | |||||||||
Foreign Tax Paid Per Share (Column 1) is the amount per share available to you, as a tax credit (assuming you held your shares in the Fund for a minimum of 16 days during the 31-day period beginning 15 days before the ex-dividend date of the Fund’s distribution to which the foreign taxes relate), or, as a tax deduction.
Foreign Source Income Per Share (Column 2) is the amount per share of income dividends attributable to foreign securities held by the Fund, plus any foreign taxes withheld on these dividends. The amounts reported include foreign source qualified dividends that have not been adjusted for the rate differential applicable to such dividend income.1
Foreign Source Qualified Dividends Per Share (Column 3) is the amount per share of foreign source qualified dividends, plus any foreign taxes withheld on these dividends. These amounts represent the portion of the Foreign Source Income reported to you in column 2 that were derived from qualified foreign securities held by the Fund.1
By mid-February 2018, shareholders will receive Form 1099-DIV which will include their share of taxes paid and foreign source income distributed during the calendar year 2017. The Foreign Source Income reported on Form 1099-DIV has not been adjusted for the rate differential on foreign source qualified dividend income. Shareholders are advised to check with their tax advisors for information on the treatment of these amounts on their 2017 individual income tax returns.
1Qualified dividends are taxed at reduced long term capital gains tax rates. In determining the amount of foreign tax credit that may be applied against the U.S. tax liability of individuals receiving foreign source qualified dividends, adjustments may be required to the foreign tax credit limitation calculation to reflect the rate differential applicable to such dividend income. The rules however permit certain individuals to elect not to apply the rate differential adjustments for capital gains and/or dividends for any taxable year. Please consult your tax advisor and the instructions to Form 1116 for more information.
franklintempleton.com |
Annual Report |
41 |
FRANKLIN MUTUAL SERIES FUNDS
The name, year of birth and address of the officers and board members, as well as their affiliations, positions held with the Trust, principal occupations during at least the past five years and number of US registered portfolios overseen in the Franklin Templeton Investments fund complex, are shown below. Generally, each board member serves until that person’s successor is elected and qualified.
Independent Board Members
| Name,Year of Birth and Address | Position | Length of Time Served | Number of Portfolios in Fund Complex Overseen by Board Member* | Other Directorships Held During at Least the Past 5 Years | ||||
Edward I. Altman, Ph.D. (1941) c/o Franklin Mutual Advisers, LLC 101 John F. Kennedy Parkway Short Hills, NJ 07078-2789 | Trustee | Since 1987 | 14 | None | ||||
| Principal Occupation During at Least the Past 5 Years: | ||||||||
| Max L. Heine Professor of Finance, Emeritus and Director of The Credit and Debt Markets Research Program, Salomon Center, Stern School of Business, New York University; editor and author of numerous financial publications; financial consultant; an adviser to numerous financial and publishing organizations; and formerly, Vice Director, Salomon Center, Stern School of Business, New York University. | ||||||||
Ann Torre Bates (1958) c/o Franklin Mutual Advisers, LLC 101 John F. Kennedy Parkway Short Hills, NJ 07078-2789 | Trustee | Since 1995 | 40 | Ares Capital Corporation (specialty finance company) (2010-present), United Natural Foods, Inc. (distributor of natural, organic and specialty foods) (2013-present), Allied Capital Corporation (financial services) (2003-2010), SLM Corporation (Sallie Mae) (1997-2014) and Navient Corporation (loan management, servicing and asset recovery) (2014-2016). | ||||
| Principal Occupation During at Least the Past 5 Years: | ||||||||
| Director of various companies; and formerly, Executive Vice President and Chief Financial Officer, NHP Incorporated (manager of multifamily housing) (1995-1997); and Vice President and Treasurer, US Airways, Inc. (until 1995). | ||||||||
Burton J. Greenwald (1929) c/o Franklin Mutual Advisers, LLC 101 John F. Kennedy Parkway Short Hills, NJ 07078-2789 | Trustee and Vice Chairman | Trustee since 2002 and Vice Chairman since 2015 | 14 | Franklin Templeton Emerging Markets Debt Opportunities Fund PLC (1999-present) and Fiduciary International Ireland Limited (1999-2015). | ||||
| Principal Occupation During at Least the Past 5 Years: | ||||||||
| Managing Director, B. J. Greenwald Associates (management consultants to the financial services industry); and formerly, Chairman, Fiduciary Trust International Funds; Executive Vice President, L.F. Rothschild Fund Management, Inc.; President and Director, Merit Mutual Funds; President, Underwriting Division and Director, National Securities & Research Corporation; Governor, Investment Company Institute; and Chairman, ICI Public Information Committee. | ||||||||
Jan Hopkins Trachtman (1947) c/o Franklin Mutual Advisers, LLC 101 John F. Kennedy Parkway Short Hills, NJ 07078-2789 | Trustee | Since 2009 | 14 | None | ||||
| Principal Occupation During at Least the Past 5 Years: | ||||||||
| President and Founder, The Jan Hopkins Group (communications and consulting firm); serves on Advisory Board of Knight Bagehot Fellowship; and formerly, President, Economic Club of New York (2007-2015); Anchor/Correspondent, CNN Financial News (until 2003); Managing Director and Head of Client Communications, Citigroup Private Bank (until 2005); Off-Air reporter, ABC News’ World News Tonight; and Editor, CBS Network News. | ||||||||
Keith Mitchell (1954) c/o Franklin Mutual Advisers, LLC 101 John F. Kennedy Parkway Short Hills, NJ 07078-2789 | Trustee | Since 2009 | 14 | None | ||||
| Principal Occupation During at Least the Past 5 Years: | ||||||||
| Director of various boards of asset management firms; and formerly, Managing Member, Mitchell, Hartley & Bechtel Advisers, LLC (formerly, Mitchell Advisers, LLC) (advisory firm) (2003-2015) and Managing Director, Putman Lovell NBF. | ||||||||
| 42 |
Annual Report | franklintempleton.com |
FRANKLIN MUTUAL SERIES FUNDS
Independent Board Members (continued)
| Name, Year of Birth and Address | Position | Length of Time Served | Number of Portfolios in Fund Complex Overseen by Board Member* | Other Directorships Held During at Least the Past 5 Years | ||||
David W. Niemiec (1949) c/o Franklin Mutual Advisers, LLC 101 John F. Kennedy Parkway Short Hills, NJ 07078-2789 | Trustee | Since 2015 | 40 | Hess Midstream Partners LP (oil and gas midstream infrastructure) (2017-present). | ||||
| Principal Occupation During at Least the Past 5 Years: | ||||||||
| Advisor, Saratoga Partners (private equity fund); and formerly, Managing Director, Saratoga Partners (1998-2001) and SBC Warburg Dillon Read (investment banking) (1997-1998); Vice Chairman, Dillon, Read & Co. Inc. (investment banking) (1991-1997); and Chief Financial Officer, Dillon, Read & Co. Inc. (1982-1997). | ||||||||
Charles Rubens II (1930) c/o Franklin Mutual Advisers, LLC 101 John F. Kennedy Parkway Short Hills, NJ 07078-2789 | Trustee | Since 1998 | 14 | None | ||||
| Principal Occupation During at Least the Past 5 Years: | ||||||||
| Private investor and president of non-profit organizations; and formerly, an executive of Time, Inc.; and Trustee of Colorado College. | ||||||||
Robert E. Wade (1946) c/o Franklin Mutual Advisers, LLC 101 John F. Kennedy Parkway Short Hills, NJ 07078-2789 | Trustee and Chairman of the Board | Trustee since 1993 and Chairman of the Board since 2005 | 40 | El Oro Ltd (investments) (2003-present). | ||||
| Principal Occupation During at Least the Past 5 Years: | ||||||||
| Attorney at law engaged in private practice as a sole practitioner (1972-2008) and member of various boards. | ||||||||
Gregory H. Williams (1943) c/o Franklin Mutual Advisers, LLC 101 John F. Kennedy Parkway Short Hills, NJ 07078-2789 | Trustee | Since 2015 | 14 | None | ||||
| Principal Occupation During at Least the Past 5 Years: | ||||||||
| Private investor; Consultant; and formerly, President, University of Cincinnati (2009-2012); President, The City College of New York (2001-2009); Dean, College of Law, Ohio State University (1993-2001); and Associate Vice President, Academic Affairs and Professor of Law, University of Iowa (1977-1993). | ||||||||
Interested Board Members and Officers
| Name, Year of Birth and Address | Position | Length of Time Served | Number of Portfolios in Fund Complex Overseen by Board Member* | Other Directorships Held During at Least the Past 5 Years | ||||
**Gregory E. Johnson (1961) One Franklin Parkway San Mateo, CA 94403-1906 | Trustee | Since 2007 | 153 | None | ||||
| Principal Occupation During at Least the Past 5 Years: | ||||||||
| Chairman of the Board, Member – Office of the Chairman, Director and Chief Executive Officer, Franklin Resources, Inc.; officer and/or director or trustee, as the case may be, of some of the other subsidiaries of Franklin Resources, Inc. and of 43 of the investment companies in Franklin Templeton Investments; Vice Chairman, Investment Company Institute; and formerly, President, Franklin Resources, Inc. (1994-2015). | ||||||||
**Peter A. Langerman (1955) c/o Franklin Mutual Advisers, LLC 101 John F. Kennedy Parkway Short Hills, NJ 07078-2789 | Trustee, President, and Chief Executive Officer – Investment Management | Trustee since 2007, President, and Chief Executive Officer – Investment Management since 2005 | 7 | American International Group, Inc. (AIG) Credit Facility Trust (2010-2011). | ||||
| Principal Occupation During at Least the Past 5 Years: | ||||||||
| Chairman of the Board, Chief Executive Officer and President, Franklin Mutual Advisers, LLC; President and Chief Investment Officer, Franklin Advisory Services, LLC; and officer and/or director, as the case may be, of three of the investment companies in Franklin Templeton Investments. | ||||||||
franklintempleton.com | Annual Report | 43 |
FRANKLIN MUTUAL SERIES FUNDS
Interested Board Members and Officers (continued)
| Name, Year of Birth and Address | Position | Length of Time Served | Number of Portfolios in Fund Complex Overseen by Board Member* | Other Directorships Held During at Least the Past 5 Years | ||||
Alison E. Baur (1964) One Franklin Parkway San Mateo, CA 94403-1906 | Vice President | Since 2012 | Not Applicable | Not Applicable | ||||
| Principal Occupation During at Least the Past 5 Years: | ||||||||
| Deputy General Counsel, Franklin Templeton Investments; and officer of some of the other subsidiaries of Franklin Resources, Inc. and of 45 of the investment companies in Franklin Templeton Investments. | ||||||||
Philippe Brugere-Trelat (1949) 101 John F. Kennedy Parkway Short Hills NJ 07078-2789 | Vice President | Since 2005 | Not Applicable | Not Applicable | ||||
| Principal Occupation During at Least the Past 5 Years: | ||||||||
| Executive Vice President, Franklin Mutual Advisers, LLC; officer of one of the investment companies in Franklin Templeton Investments; and formerly, Portfolio Manager of Eurovest SA (French registered investment company, SICAV). | ||||||||
Aliya S. Gordon (1973) One Franklin Parkway San Mateo, CA 94403-1906 | Vice President | Since 2009 | Not Applicable | Not Applicable | ||||
| Principal Occupation During at Least the Past 5 Years: | ||||||||
| Senior Associate General Counsel, Franklin Templeton Investments; and officer of 45 of the investment companies in Franklin Templeton Investments. | ||||||||
Steven J. Gray (1955) One Franklin Parkway San Mateo, CA 94403-1906 | Vice President and Secretary | Vice President since 2009 and Secretary since 2005 | Not Applicable | Not Applicable | ||||
| Principal Occupation During at Least the Past 5 Years: | ||||||||
| Senior Associate General Counsel, Franklin Templeton Investments; Vice President, Franklin Templeton Distributors, Inc. and FASA, LLC; and officer of 45 of the investment companies in Franklin Templeton Investments. | ||||||||
Matthew T. Hinkle (1971) One Franklin Parkway San Mateo, CA 94403-1906 | Chief Executive Officer – Finance and Administration | Since June 2017 | Not Applicable | Not Applicable | ||||
| Principal Occupation During at Least the Past 5 Years: | ||||||||
| Senior Vice President, Franklin Templeton Services, LLC; officer of 45 of the investment companies in Franklin Templeton Investments; and formerly, Vice President, Global Tax (2012-April 2017) and Treasurer/Assistant Treasurer, Franklin Templeton Investments (2009-2017). | ||||||||
Robert G. Kubilis (1973) 300 S.E. 2nd Street Fort Lauderdale, FL 33301-1923 | Chief Financial Officer, Chief Accounting Officer and Treasurer | Since 2012 | Not Applicable | Not Applicable | ||||
| Principal Occupation During at Least the Past 5 Years: | ||||||||
| Treasurer, U.S. Fund Administration & Reporting, Franklin Templeton Investments; and officer of 17 of the investment companies in Franklin Templeton Investments. | ||||||||
Robert Lim (1948) One Franklin Parkway San Mateo, CA 94403-1906 | Vice President – AML Compliance | Since 2016 | Not Applicable | Not Applicable | ||||
| Principal Occupation During at Least the Past 5 Years: | ||||||||
| Vice President, Franklin Templeton Companies, LLC; Chief Compliance Officer, Franklin Templeton Distributors, Inc. and Franklin Templeton Investor Services, LLC; and officer of 45 of the investment companies in Franklin Templeton Investments. | ||||||||
| 44 |
Annual Report | franklintempleton.com |
FRANKLIN MUTUAL SERIES FUNDS
Interested Board Members and Officers (continued)
| Name, Year of Birth and Address | Position | Length of Time Served | Number of Portfolios in Fund Complex Overseen by Board Member* | Other Directorships Held During at Least the Past 5 Years | ||||
Kimberly H. Novotny (1972) 300 S.E. 2nd Street Fort Lauderdale, FL 33301-1923 | Vice President | Since 2013 | Not Applicable | Not Applicable | ||||
| Principal Occupation During at Least the Past 5 Years: | ||||||||
Associate General Counsel, Franklin Templeton Investments; Vice President and Corporate Secretary, Fiduciary Trust International of the South; Vice President, Templeton Investment Counsel, LLC; Assistant Secretary, Franklin Resources, Inc.; and officer of 45 of the investment companies in Franklin Templeton Investments.
| ||||||||
Robert C. Rosselot (1960) 300 S.E. 2nd Street Fort Lauderdale, FL 33301-1923 | Chief Compliance Officer | Since 2013 | Not Applicable | Not Applicable | ||||
| Principal Occupation During at Least the Past 5 Years: | ||||||||
Director, Global Compliance, Franklin Templeton Investments; Vice President, Franklin Templeton Companies, LLC; officer of 45 of the investment companies in Franklin Templeton Investments; and formerly, Senior Associate General Counsel, Franklin Templeton Investments (2007-2013); and Secretary and Vice President, Templeton Group of Funds (2004-2013).
| ||||||||
Karen L. Skidmore (1952) One Franklin Parkway San Mateo, CA 94403-1906 | Vice President | Since 2009 | Not Applicable | Not Applicable | ||||
| Principal Occupation During at Least the Past 5 Years: | ||||||||
Senior Associate General Counsel, Franklin Templeton Investments; and officer of 45 of the investment companies in Franklin Templeton Investments.
| ||||||||
Navid J. Tofigh (1972) One Franklin Parkway San Mateo, CA 94403-1906 | Vice President | Since 2015 | Not Applicable | Not Applicable | ||||
| Principal Occupation During at Least the Past 5 Years: | ||||||||
Associate General Counsel, Franklin Templeton Investments; and officer of 45 of the investment companies in Franklin Templeton Investments.
| ||||||||
Craig S. Tyle (1960) One Franklin Parkway San Mateo, CA 94403-1906 | Vice President | Since 2005 | Not Applicable | Not Applicable | ||||
| Principal Occupation During at Least the Past 5 Years: | ||||||||
General Counsel and Executive Vice President, Franklin Resources, Inc.; and officer of some of the other subsidiaries of Franklin Resources, Inc. and of 45 of the investment companies in Franklin Templeton Investments.
| ||||||||
Lori A. Weber (1964) 300 S.E. 2nd Street Fort Lauderdale, FL 33301-1923 | Vice President | Since 2011 | Not Applicable | Not Applicable | ||||
| Principal Occupation During at Least the Past 5 Years: | ||||||||
Senior Associate General Counsel, Franklin Templeton Investments; Assistant Secretary, Franklin Resources, Inc.; Vice President and Secretary, Templeton Investment Counsel, LLC; and officer of 45 of the investment companies in Franklin Templeton Investments.
| ||||||||
*We base the number of portfolios on each separate series of the US registered investment companies within the Franklin Templeton Investments fund complex. These portfolios have a common investment manager or affiliated investment managers.
**Gregory E. Johnson is considered to be an interested person of the Fund under the federal securities laws due to his position as an officer and director of Franklin Resources, Inc. (Resources), which is the parent company of the Fund’s investment manager and distributor. Peter A. Langerman is considered to be an interested person of the Fund under the federal securities laws due to his position as an officer of Franklin Mutual Advisors, LLC, which is an affiliate of the Fund’s investment manager.
Note 1: Officer information is current as of the date of this report. It is possible that after this date, information about officers may change.
The Sarbanes-Oxley Act of 2002 and Rules adopted by the U.S. Securities and Exchange Commission require the Fund to disclose whether the Fund’s Audit Committee includes at least one member who is an audit committee financial expert within the meaning of such Act and Rules. The Fund’s Board has determined that there is at least one such financial expert on the Audit Committee and has designated each of Edward I. Altman, Ph.D., Ann Torre Bates and David W. Niemiec as an audit committee financial expert. The Board believes that Messrs. Altman and Niemiec and Ms. Bates qualify as such an expert in view of their extensive business background and experience. Mr. Altman has served as a member of the Fund Audit Committee since 1996. He currently serves as a Max L. Hines Professor of Finance, Emeritus and Director of The Credit and Debt Markets Research Program, Salomon Center, Stern School of Business, New York University. Ms. Bates has served as a member of the Fund Audit Committee since 1996. She currently serves as a director of Ares Capital Corporation (2010-present) and United Natural Foods, Inc. (2013-present) and was formerly a director of Navient Corporation from 2014 to 2016, SLM Corporation from 1997 to 2014 and Allied
franklintempleton.com | Annual Report | 45 |
FRANKLIN MUTUAL SERIES FUNDS
Interested Board Members and Officers (continued)
Capital Corporation from 2003 to 2010, Executive Vice President and Chief Financial Officer of NHP Incorporated from 1995 to 1997 and Vice President and Treasurer of US Airways, Inc. until 1995. Mr. Niemiec has served as a member of the Fund Audit Committee since 2015, currently serves as an Advisor to Saratoga Partners and was formerly its Managing Director from 1998 to 2001 and serves as a director of Hess Midstream Partners LP (2017-present). Mr. Niemiec was formerly a director of Emeritus Corporation from 1999 to 2010 and OSI Pharmaceuticals, Inc. from 2006 to 2010, Managing Director of SBC Warburg Dillon Read from 1997 to 1998, and was Vice Chairman from 1991 to 1997 and Chief Financial Officer from 1982 to 1997 of Dillon, Read & Co. Inc. As a result of such background and experience, the Board believes that Messrs. Altman and Niemiec and Ms. Bates have each acquired an understanding of generally accepted accounting principles and financial statements, the general application of such principles in connection with the accounting estimates, accruals and reserves, and analyzing and evaluating financial statements that present a breadth and level of complexity of accounting issues generally comparable to those of the Fund, as well as an understanding of internal controls and procedures for financial reporting and an understanding of audit committee functions. Messrs. Altman and Niemiec and Ms. Bates are independent Board members as that term is defined under the applicable U.S. Securities and Exchange Commission Rules and Releases.
The Statement of Additional Information (SAI) includes additional information about the board members and is available, without charge, upon request. Shareholders may call (800) DIAL BEN/342-5236 to request the SAI.
| 46 |
Annual Report | franklintempleton.com |
FRANKLIN MUTUAL SERIES FUNDS
FRANKLIN MUTUAL INTERNATIONAL FUND
Proxy Voting Policies and Procedures
The Fund’s investment manager has established Proxy Voting Policies and Procedures (Policies) that the Fund uses to determine how to vote proxies relating to portfolio securities. Shareholders may view the Fund’s complete Policies online at franklintempleton.com. Alternatively, shareholders may request copies of the Policies free of charge by calling the Proxy Group collect at (954) 527-7678 or by sending a written request to: Franklin Templeton Companies, LLC, 300 S.E. 2nd Street, Fort Lauderdale, FL 33301, Attention: Proxy Group. Copies of the Fund’s proxy voting records are also made available online at franklintempleton.com and posted on the US Securities and Exchange Commission’s website at sec.gov and reflect the most recent 12-month period ended June 30.
Quarterly Statement of Investments
The Trust, on behalf of the Fund, files a complete statement of investments with the US Securities and Exchange Commission for the first and third quarters for each fiscal year on Form N-Q. Shareholders may view the filed Form N-Q by visiting the Commission’s website at sec.gov. The filed form may also be viewed and copied at the Commission’s Public Reference Room in Washington, DC. Information regarding the operations of the Public Reference Room may be obtained by calling (800) SEC-0330.
Householding of Reports and Prospectuses
You will receive the Fund’s financial reports every six months as well as an annual updated summary prospectus (prospectus available upon request). To reduce Fund expenses, we try to identify related shareholders in a household and send only one copy of the financial reports and summary prospectus. This process, called “householding,” will continue indefinitely unless you instruct us otherwise. If you prefer not to have these documents householded, please call us at (800) 632-2301. At any time you may view current prospectuses/summary prospectuses and financial reports on our website. If you choose, you may receive these documents through electronic delivery.
| franklintempleton.com |
Annual Report | 47 |
This page intentionally left blank.
 | Annual Report and Shareholder Letter Franklin Mutual International Fund
Investment Manager Franklin Mutual Advisers, LLC
Distributor Franklin Templeton Distributors, Inc. (800) DIAL BEN® / 342-5236 franklintempleton.com
Shareholder Services (800) 632-2301 - (Class A, C, R & R6) (800) 448-FUND - (Class Z) |
Authorized for distribution only when accompanied or preceded by a summary prospectus and/or prospectus. Investors should carefully consider a fund’s investment goals, risks, charges and expenses before investing. A prospectus contains this and other information; please read it carefully before investing.
To help ensure we provide you with quality service, all calls to and from our service areas are monitored and/or recorded.
© 2018 Franklin Templeton Investments. All rights reserved. | 373 A 02/18 |
| Item 2. | Code of Ethics. |
(a) The Registrant has adopted a code of ethics that applies to its principal executive officers and principal financial and accounting officer.
(c) N/A
(d) N/A
(f) Pursuant to Item 12(a)(1), the Registrant is attaching as an exhibit a copy of its code of ethics that applies to its principal executive officers and principal financial and accounting officer.
| Item 3. | Audit Committee Financial Expert. |
(a) (1) The registrant has an audit committee financial expert serving on its audit committee.
(2) The audit committee financial expert is Ann Torre Bates, and she is “independent” as defined under the relevant Securities and Exchange Commission Rules and Releases.
| Item 4. | Principal Accountant Fees and Services. |
(a) Audit Fees
The aggregate fees paid to the principal accountant for professional services rendered by the principal accountant for the audit of the registrant’s annual financial statements or for services that are normally provided by the principal accountant in connection with statutory and regulatory filings or engagements were $557,692 for the fiscal year ended December 31, 2017 and $546,756 for the fiscal year ended December 31, 2016.
(b) Audit-Related Fees
There were no fees paid to the principal accountant for assurance and related services rendered by the principal accountant to the registrant that are reasonably related to the performance of the audit of the registrant’s financial statements and are not reported under paragraph (a) of Item 4.
There were no fees paid to the principal accountant for assurance and related services rendered by the principal accountant to the registrant’s investment adviser and any entity controlling, controlled by or under common control with the investment adviser that provides ongoing services to the registrant that are reasonably related to the performance of the audit of their financial statements.
(c) Tax Fees
The aggregate fees paid to the principal accountant for professional services rendered by the principal accountant to the registrant for tax compliance, tax advice and tax planning were $4,544 the fiscal year ended December 31, 2017 and $5,504 for the fiscal year ended December 31, 2016. The services for which these fees were paid included identifying passive foreign investment company to manage exposure to tax liabilities.
The aggregate fees paid to the principal accountant for professional services rendered by the principal accountant to the registrant’s investment adviser and any entity controlling, controlled by or under common control with the investment adviser that provides ongoing services to the registrant for tax compliance, tax advice and tax planning were $70,000 for the fiscal year ended December 31, 2017 and $74,500 for the fiscal year ended December 31, 2016. The services for which these fees were paid included technical tax consultation for withholding tax report to foreign governments, application of local country tax laws and tax advice.
(d) All Other Fees
There were no fees paid to the principal accountant for products and services rendered by the principal accountant to the registrant not reported in paragraphs (a)-(c) of Item 4.
There were no fees paid to the principal accountant for products and services rendered by the principal accountant to the registrant’s investment adviser and any entity controlling, controlled by or under common control with the investment adviser that provides ongoing services to the registrant other than services reported in paragraphs (a)-(c) of Item 4.
(e) (1) The registrant’s audit committee is directly responsible for approving the services to be provided by the auditors, including:
(i) pre-approval of all audit and audit related services;
(ii) pre-approval of all non-audit related services to be provided to the Fund by the auditors;
(iii) pre-approval of all non-audit related services to be provided to the registrant by the auditors to the registrant’s investment adviser or to any entity that controls, is controlled by or is under common control with the registrant’s investment adviser and that provides ongoing services to the registrant where the non-audit services relate directly to the operations or financial reporting of the registrant; and
(iv) establishment by the audit committee, if deemed necessary or appropriate, as an alternative to committee pre-approval of services to be provided by the auditors, as required by paragraphs (ii) and (iii) above, of policies and procedures to permit such services to be pre-approved by other means, such as through establishment of guidelines or by action of a designated member or members of the committee; provided the policies and procedures are detailed as to the particular service and the committee is informed of each service and such policies and procedures do not include delegation of audit committee responsibilities, as contemplated under the Securities Exchange Act of 1934, to management; subject, in the case of (ii) through (iv), to any waivers, exceptions or exemptions that may be available under applicable law or rules.
(e) (2) None of the services provided to the registrant described in paragraphs (b)-(d) of Item 4 were approved by the audit committee pursuant to paragraph (c)(7)(i)(C) of Rule 2-01 of regulation S-X.
(f) No disclosures are required by this Item 4(f).
(g) The aggregate non-audit fees paid to the principal accountant for services rendered by the principal accountant to the registrant and the registrant’s investment adviser and any entity controlling, controlled by or under common control with the investment adviser that provides ongoing services to the registrant were $74,544 for the fiscal year ended December 31, 2017 and $80,004 for the fiscal year ended December 31, 2016.
(h) The registrant’s audit committee of the board has considered whether the provision of non-audit services that were rendered to the registrant’s investment adviser (not including any sub-adviser whose role is primarily portfolio management and is subcontracted with or overseen by another investment adviser), and any entity controlling, controlled by, or under common control with the investment adviser that provides ongoing services to the registrant that were not pre-approved pursuant to paragraph (c)(7)(ii) of Rule 2-01 of Regulation S-X is compatible with maintaining the principal accountant’s independence.
| Item 5. | Audit Committee of Listed Registrants. N/A |
| Item 6. | Schedule of Investments. N/A |
| Item 7. | Disclosure of Proxy Voting Policies and Procedures for Closed-End Management Investment Companies. N/A |
| Item 8. | Portfolio Managers of Closed-End Management Investment Companies. N/A |
| Item 9. | Purchases of Equity Securities by Closed-End Management Investment Company and Affiliated Purchasers. N/A |
| Item 10. | Submission of Matters to a Vote of Security Holders. |
There have been no changes to the procedures by which shareholders may recommend nominees to the Registrant’s board of trustees that would require disclosure herein.
| Item 11. | Controls and Procedures. |
(a) Evaluation of Disclosure Controls and Procedures. The Registrant maintains disclosure controls and procedures that are designed to ensure that information required to be disclosed in the Registrant’s filings under the Securities Exchange Act of 1934 and the Investment Company Act of 1940 is recorded, processed, summarized and reported within the periods specified in the rules and forms of the Securities and Exchange Commission. Such information is accumulated and communicated to the Registrant’s management, including its principal executive officer and principal financial officer, as appropriate, to
allow timely decisions regarding required disclosure. The Registrant’s management, including the principal executive officer and the principal financial officer, recognizes that any set of controls and procedures, no matter how well designed and operated, can provide only reasonable assurance of achieving the desired control objectives.
Within 90 days prior to the filing date of this Shareholder Report on Form N-CSR, the Registrant had carried out an evaluation, under the supervision and with the participation of the Registrant’s management, including the Registrant’s principal executive officer and the Registrant’s principal financial officer, of the effectiveness of the design and operation of the Registrant’s disclosure controls and procedures. Based on such evaluation, the Registrant’s principal executive officer and principal financial officer concluded that the Registrant’s disclosure controls and procedures were ineffective due to a material weakness determination for the Franklin Mutual Quest Fund as a result of inaccurate financial data contained in two valuation models used to determine the fair value of management appraised investments. The impact of these errors was immaterial to previously issued financial statements and no changes to prior year reported amounts have been recorded. After December 31, 2017 and prior to the issuance of the Franklin Mutual Quest Fund’s annual report as of and for the period then ended, the error was corrected and the Registrant’s controls were enhanced to ensure proper valuation of such financial instruments.
(b) Changes in Internal Controls. Other than the enhancements to controls noted above, there have been no changes in the Registrant’s internal controls or in other factors that could materially affect the internal controls over financial reporting subsequent to the date of their evaluation in connection with the preparation of this Shareholder Report on Form N-CSR.
| Item 12. | Exhibits. |
(a) (1) Code of Ethics
(a) (2) Certifications pursuant to Section 302 of the Sarbanes-Oxley Act of 2002 of Matthew T. Hinkle, Chief Executive Officer - Finance and Administration, and Robert G. Kubilis, Chief Financial Officer and Chief Accounting Officer
(b) Certifications pursuant to Section 906 of the Sarbanes-Oxley Act of 2002 of Matthew T. Hinkle, Chief Executive Officer - Finance and Administration, and Robert G. Kubilis, Chief Financial Officer and Chief Accounting Officer
SIGNATURES
Pursuant to the requirements of the Securities Exchange Act of 1934 and the Investment Company Act of 1940, the registrant has duly caused this report to be signed on its behalf by the undersigned, thereunto duly authorized.
FRANKLIN MUTUAL SERIES FUNDS
| By | /s/MATTHEW T. HINKLE | |
| Matthew T. Hinkle | ||
| Chief Executive Officer – | ||
| Finance and Administration | ||
| Date | February 26, 2018 | |
Pursuant to the requirements of the Securities Exchange Act of 1934 and the Investment Company Act of 1940, this report has been signed below by the following persons on behalf of the registrant and in the capacities and on the dates indicated.
| By | /s/MATTHEW T. HINKLE | |
| Matthew T. Hinkle | ||
| Chief Executive Officer – | ||
| Finance and Administration | ||
| Date | February 26, 2018 | |
| By | /s/ROBERT G. KUBILIS | |
| Robert G. Kubilis | ||
| Chief Financial Officer and | ||
| Chief Accounting Officer | ||
| Date: | February 26, 2018 | |