| UNITED STATES |
| SECURITIES AND EXCHANGE COMMISSION |
| Washington, D.C. 20549 |
| |
| FORM N-CSR |
| |
| CERTIFIED SHAREHOLDER REPORT |
| OF |
| REGISTERED MANAGEMENT INVESTMENT COMPANIES |
| |
| Investment Company Act file number: 811-05379 |
| |
| Name of Registrant: Royce Focus Trust, Inc. |
| |
| Address of Registrant: 745 Fifth Avenue |
| New York, NY 10151 |
| |
| Name and address of agent for service: | | John E. Denneen, Esquire |
| | | 745 Fifth Avenue |
| | | New York, NY 10151 |
| Registrant’s telephone number, including area code: (212) 508-4500 |
| Date of fiscal year end: December 31 |
| Date of reporting period: January 1, 2012 – December 31, 2012 |
| |
Item 1. Reports to Shareholders.
ANNUAL
REVIEW AND REPORT
TO STOCKHOLDERS
| |
Royce Value Trust
Royce Micro-Cap Trust
Royce Focus Trust |
| | | |
| |
| | |
| |
www.roycefunds.com |
 |
| A Few Words on Closed-End Funds |
|
Royce & Associates, LLC manages three closed-end funds: Royce Value Trust, the first small-cap value closed-end fund offering; Royce Micro-Cap Trust, the only micro-cap closed-end fund; and Royce Focus Trust, a closed-end fund that invests in a limited number of primarily small-cap companies. |
| |
| A closed-end fund is an investment company whose shares are listed and traded on a stock exchange. Like all investment companies, including open-end mutual funds, the assets of a closed-end fund are professionally managed in accordance with the investment objectives and policies approved by the Fund’s Board of Directors. A closed-end fund raises cash for investment by issuing a fixed number of shares through initial and other public offerings that may include shelf offerings and periodic rights offerings. Proceeds from the offerings are invested in an actively managed portfolio of securities. Investors wanting to buy or sell shares of a publicly traded closed-end fund after the offerings must do so on a stock exchange, as with any publicly traded stock. This is in contrast to open-end mutual funds, in which the fund sells and redeems its shares on a continuous basis. |
| A Closed-End Fund Offers Several Distinct Advantages Not Available from an Open-End Fund Structure |
| | |
| • | Since a closed-end fund does not issue redeemable securities or offer its securities on a continuous basis, it does not need to liquidate securities or hold uninvested assets to meet investor demands for cash redemptions, as an open-end fund must. |
| | |
| • | In a closed-end fund, not having to meet investor redemption requests or invest at inopportune times is ideal for value managers who attempt to buy stocks when prices are depressed and sell securities when prices are high. |
| | |
| • | A closed-end fund may invest more freely in less liquid portfolio securities because it is not subject to potential stockholder redemption demands. This is particularly beneficial for Royce-managed closed-end funds, which invest in small- and micro-cap securities. |
| | |
| • | The fixed capital structure allows permanent leverage to be employed as a means to enhance capital appreciation potential. |
| | |
| • | Unlike Royce’s open-end funds, our closed-end funds are able to distribute capital gains on a quarterly basis. Each of the Funds has adopted a quarterly distribution policy for its common stock. Please see page 16-18 for more details. |
| | |
| • | We believe that the closed-end fund structure is very suitable for the long-term investor who understands the benefits of a stable pool of capital. |
| Why Dividend Reinvestment Is Important |
| A very important component of an investor’s total return comes from the reinvestment of distributions. By reinvesting distributions, our investors can maintain an undiluted investment in a Fund. To get a fair idea of the impact of reinvested distributions, please see the charts on pages 11, 13, and 15. For additional information on the Funds’ Distribution Reinvestment and Cash Purchase Options and the benefits for stockholders, please see page 18 or visit our website at www.roycefunds.com. |
| This page is not part of the 2012 Annual Report to Stockholders |
| Table of Contents | |
|
| | |
| Annual Review | |
|
| | |
| Performance Table | 2 |
| | |
| Letter to Our Stockholders | 3 |
| | |
| 2012: In Quotes | 63 |
| | |
| Postscript: The Lessons of 40 years | 64 |
|
| | |
| Annual Report to Stockholders | 9 |
| | |
| | |
| |
| | |
| For 40 years, we have used a value approach to invest in small-cap securities. We focus primarily on the quality of a company’s balance sheet, its ability to generate free cash flow, and other measures of profitability or sound financial condition. We then use these factors to assess the company’s current worth, basing the assessment on either what we believe a knowledgeable buyer might pay to acquire the entire company or what we think the value of the company should be in the stock market. |
| | |
| | |
| | |
|
| This page is not part of the 2012 Annual Report to Stockholders | 1 |
| NAV Average Annual Total Returns | | Through December 31, 2012 |
| | | Royce | | Royce | | Royce | | Russell | | Russell | | Russell |
| | | Value Trust | | Micro-Cap Trust | | Focus Trust | | 2000 Index | | Microcap Index | | 2500 Index |
|
| One-Year | | | 15.41 | % | | | 17.34 | % | | | 11.42 | % | | | 16.35 | % | | | 19.75 | % | | | 17.88 | % |
|
| Five-Year | | | 1.23 | | | | 2.15 | | | | 1.38 | | | | 3.56 | | | | 1.46 | | | | 4.34 | |
|
| 10-Year | | | 9.48 | | | | 10.45 | | | | 12.19 | | | | 9.72 | | | | 8.42 | | | | 10.49 | |
|
| 15-Year | | | 8.14 | | | | 8.60 | | | | 9.17 | | | | 5.89 | | | | n.a. | | | | 7.43 | |
|
| 20-Year | | | 10.06 | | | | n.a. | | | | n.a. | | | | 8.43 | | | | n.a. | | | | 9.89 | |
|
| 25-Year | | | 11.15 | | | | n.a. | | | | n.a. | | | | 9.74 | | | | n.a. | | | | 11.14 | |
|
| Since Inception | | | 10.33 | | | | 10.42 | | | | 10.04 | | | | n.a. | | | | n.a. | | | | n.a. | |
|
| Inception Date | | 11/26/86 | | 12/14/93 | | 11/1/961 | | | n.a. | | | | n.a. | | | | n.a. | |
|
| 1 Date Royce & Associates, LLC assumed investment management responsibility for the Fund. |
Important Performance and Risk Information
All performance information in this Review and Report reflects past performance, is presented on a total return basis, and reflects the reinvestment of distributions. Past performance is no guarantee of future results. Investment return and principal value of an investment will fluctuate, so that shares may be worth more or less than their original cost when sold. Current performance may be higher or lower than performance quoted. Current month-end performance may be obtained at www.roycefunds.com. Certain immaterial adjustments were made to the net assets of Royce Micro-Cap Trust at 12/31/12 for financial reporting purposes, and as a result the net asset value originally calculated on that date and the total return based on that net asset value differs from the adjusted net asset value and total return reported in the Financial Highlights. All indexes referenced are unmanaged and capitalization-weighted. Each indexes’s returns include net reinvested dividends and/or interest income. Russell Investment Group is the source and owner of the trademarks, service marks and copyrights related to the Russell Indexes. Russell® is a trademark of Russell Investment Group. The Russell 2000 Index is an index of domestic small-cap stocks that measures the performance of the 2,000 smallest publicly traded U.S. companies in the Russell 3000 Index. The Russell Microcap Index includes 1,000 of the smallest securities in the small-cap Russell 2000 Index, along with the next smallest eligible securities as determined by Russell. The Russell 2500 Index is an index of the 2,500 smallest publicly traded U.S. companies in the Russell 3000 Index. |
| 2 | This page is not part of the 2012 Annual Report to Stockholders |
| Letter to Our Stockholders |
|
| |
 |
| |
| |
Men can do nothing without the make-believe of a beginning.
– George Eliot |
See a Little Light | | |
When seeing out one year and ushering in another, it is important to remember that the calendar, useful though it may be, provides only one way of tracking time. Some people, for example, choose to look to spring for a new beginning, while others, more habituated to the rhythms of the school year, prefer the arrival of fall. The stock market, in all its caprice and unpredictability, most often eschews 12-month spans in favor of its own irregularly paced seasons. So we find ourselves, as we look back on 2012 and peer ahead to 2013, at one of those curious, familiar junctures when the calendar compels a shift that the market seems to have anticipated months before. From our perspective as active small-cap managers, the recent market cycle change was something of a watershed. In fact, it seems very likely to us that the 2012 small-cap low on June 4 signaled the end of the closely correlated, range-bound cycle of the last few years, a cycle that created ample disappointments for those of us committed to high quality, risk management, and long-term absolute returns. It is not yet clear that this June low will prove as auspicious as it looks to us at this writing. Suffice it to say that major market inflection points seldom do any of us the favor of announcing their arrival. | | From our perspective as active small-
cap managers, the recent market cycle
change was something of a watershed.
In fact, it seems very likely to us that the
2012 small-cap low on June 4 signaled
the end of the closely correlated, range-
bound cycle of the last few years, a cycle
that created ample disappointments for
those of us committed to high quality,
risk management, and long-term
absolute returns. |
| This page is not part of the 2012 Annual Report to Stockholders | 3 |
| |

Charles M. Royce, President
One of the most interesting recent
developments in the equity markets,
particularly in the small-cap space,
has been the persistent disparity
in performance between high- and
low-quality companies. Over longer
periods of time, higher-quality
companies have differentiated
themselves from a performance
standpoint, especially compared
to the lower quality segments of
the market. While the aftermath
of the financial crisis altered this
script, there are signs that the
dynamic is changing.
Historically, lower-quality companies
have tended to demonstrate their
most robust outperformance when
markets are in the initial recovery
phase following a recession or bear
market low. However, once economies
and markets move from recovery to
expansion, the rate of change in these
inputs begins to slow while leadership
tends to rotate back to higher-
quality companies, whose business
fundamentals are more compelling.
Continued on page 6...
| | | Letter to Our Stockholders
It is equally important to emphasize that our new-found sanguine attitude is contingent on seeing in 2013 more of what we saw in the second half of 2012, particularly in last year’s closing months. During this period, investors were looking more closely at companies that possess sustainable quality in the form of strong balance sheets, high returns on invested capital, steady earnings, and reasonable dividends while paying a bit less attention to high-yield instruments, copiously leveraged stocks, and explosive growth surprises. We want to stress the extremely cautious nature of our optimism. The resurgence of quality off the June low was not decisive and has been thus far short lived. However, in our view, it did mark a subtle and significant shift that grew more pronounced in the fourth quarter, most notably in October and November when share prices went wobbly from the impact of Hurricane Sandy and the aftermath of the elections, which included periods of recurrent anxiety over the then-looming fiscal cliff.
Quality shone through in this more uncertain period. Throughout most of our first 35 years of managing portfolios, this resilience would have been unexceptional, and hardly worth mentioning, because quality companies have historically defended well. However, since the spring of 2010—and even more dramatically since the April 2011 small-cap high—little of what worked historically has enjoyed success. This has made the last five years—the last three particularly—among the most frustrating periods of our 40 years in business. With retrospective clarity, perhaps we should have suspected that something was amiss, or at least historically aberrant, when stocks rebounded so quickly and dynamically from the March 2009 bottom. Considering that the recession which began in 2007 was made far worse by the global financial crisis in the fall of 2008, the market’s surge may have been too much too soon, welcome though it was.
In any event, investors soon became more than a little wary, shuffling in and out of stocks with little regard for business fundamentals and too much for macro headlines, nearly all of them negative. Unable to establish any clear direction, the market sputtered as it rose and wheezed as it stumbled. It often seemed as though many of the investors who were frantically shoving money in and pulling it out again weeks, days, or hours later were the same people decrying the mercurial nature of asset prices and questioning whether equities were any longer a viable investment option. Along the way, results for passive investment approaches began to outpace those of an ever-larger number of active managers. So it is with a large measure of relief that we bid a tentative and hopeful good-bye to all that as we look ahead to better, more stable days.
The Wall of Worry
An old adage has it that “the market climbs a wall of worry” during those times when stocks behave bullishly in the face of negative news or perceptions. It seems clear to us that in 2012, the market scaled just such a wall. Consider the following: For the most part, the bearish second quarter eroded, but did not undo, the gains achieved in the first. The year’s final six months found many investors still behaving coolly toward equities and a host of large-scale economic and fiscal issues yet to be fully worked through. As the year closed, a fiscal cliff deal had yet to be reached, various European nations continued to flirt with financial peril, and China was still growing |
| |
| |
| | | | |
| 4 | This page is not part of the 2012 Annual Report to Stockholders |
| | |
| | | |
at a slower pace than in previous boom years. In addition, there was a typically contentious presidential election preceded by a disastrous hurricane that swept through the world’s financial capital. Yet the market ultimately shrugged off most of these concerns.
Share prices did not skyrocket following the June 4 small-cap low. July, in fact, saw a downturn for most stocks. But August and September were highly rewarding months that enabled equities to rally decisively enough to post impressive third-quarter results. For the quarter, the small-cap Russell 2000 Index gained 5.3% while the large-cap S&P 500 and Russell 1000 Indexes were up 6.4% and 6.3%, respectively, and the more tech-oriented Nasdaq Composite climbed 6.2%. Following the strong third quarter, equities took a bit of breather in October, before rallying again in November and December, which repeated to some degree the third quarter’s pattern, though with far more modest or slightly negative results. For the fourth quarter, the Russell 2000 was up 1.9%, the Russell 1000 rose 0.1%, the S&P 500 was off 0.4%, and the Nasdaq Composite fell 3.1%.
The end result was a strong calendar year, especially compared to 2011, with each major equity index posting double-digit returns. In 2012, the Russell 2000 gained 16.3%, the S&P 500 rose 16.0%, the Russell 1000 was up 16.4%, and the Nasdaq Composite increased 15.9%. Three-year returns for the major indexes were also strong, with each again posting double-digit average annual total returns. For the three-year period ended December 31, 2012, the Russell 2000 led with a gain of 12.2%. The Russell 2000, Russell 1000, and S&P 500 each finished the year within 2.5% of their respective highs established during 2012’s third quarter, while the Nasdaq Composite remained 40.2% below its peak from March 10, 2000.
Non-U.S. equities also enjoyed a strong second half after starting the year with generally lower gains when stacked against their domestic cousins. The Russell Global ex-U.S. Small Cap Index climbed 8.3% in the third quarter, while the Russell Global ex-U.S. Large Cap Index rose 7.7%. In contrast to the domestic indexes, these strong third-quarter performances were followed by consistently positive results in the fourth quarter. The Russell Global ex-U.S. Small Cap Index was up 4.8% versus a gain of 5.8% for the Russell Global ex-U.S. Large Cap Index. For the full year small-caps were the leaders, with the Russell Global ex-U.S. Small Cap Index gaining 18.8% while the Russell Global ex-U.S. Large Cap Index was up 17.0%. So while the perception persists that non-U.S. markets are a mess—a perception based on the uncertain debt and currency situations in Europe and slower-than-desired growth in developing countries—the reality is that stocks across the globe finished the year with highly attractive results.
Shifting back stateside finds that micro-cap stocks enjoyed a very strong year. After finishing the first half with an enviable 13.0% return, the Russell Microcap Index climbed 5.9% in the third quarter and was essentially flat in the fourth, up 0.04%, which gave the index a 19.7% increase in 2012. Mid-cap stocks also experienced robust results for the calendar year—the Russell Midcap Index was up 17.3% in 2012. | | An old adage has it that “the market
climbs a wall of worry” during those
times when stocks behave bullishly
in the face of negative news or
perceptions. It seems clear to us
that in 2012 the market scaled just
such a wall. |
| This page is not part of the 2012 Annual Report to Stockholders | 5 |
| | However, the four rounds of QE
have created an extended tailwind
for low-quality companies. Highly
levered businesses—a low-quality
attribute from our standpoint—have
benefited from the sharp drop in the
cost of capital that has accompanied
the Fed’s bond buying programs.
Access to capital has simultaneously
improved, allowing weaker companies
to stave off potential financing
challenges. This is particularly
relevant in the smaller company space
where financing is often tenuous.
Interestingly, companies with large
net cash positions have also lagged
as that cash has been viewed as an
unproductive asset that generates
little or no return, even though it
provides a healthy margin of safety
and is often the result of profitability.
Even allowing for strong second-half
results, high-quality small-caps look
highly attractive to us relative to
both their lower-quality counterparts
and their high-quality peers in the
large-cap space.
The drop in market volatility back
to pre-crisis levels, as measured
by the VIX, has contributed to the
relative strength of low-quality
companies. Investors’ appetite for
riskier assets tends to correlate with
sharp moves—both up and down—in
volatility. As the more violent swings
in the market dissipated, investors
were increasingly willing to embrace
the added risk associated with
lower quality enterprises.
Continued on page 8...
| |
| |
| |
| Letter to Our Stockholders |
|
| |
| Good-Bye to All That (We Hope) |
Calendar-year results for our closed-end funds fell a bit short of our expectations on a relative basis, even as all three of the portfolios finished the year with both solid second-half performances and more-than-respectable absolute returns. Certainly some holdings drew a benefit from the market’s suddenly renewed affection for quality characteristics. Results as a whole therefore left us frustrated yet hopeful, for the reasons outlined above.
We have previously discussed the reasons for recent performance disappointments, but they are worth recapping for what we would like to think will be the last time, at least for a while. Beginning with 2007’s recession and moving through the global financial crisis into the early days of June 2012, the markets were highly volatile, closely correlated, and frequently disappointing. This pattern could first be seen emerging in the spring of 2010 and was cast in harder material by the small-cap high on April 29, 2011. So while the one- and three-year numbers for the major domestic indexes were strong through the end of 2012, investors continue to be leery of the market, most probably owing to its lack of a sustainable course, bullish or bearish, especially in the roughly 13-month period between the April 2011 high and the 2012 low in early June. More importantly, this cycle of high correlation often proved difficult for our closed-end portfolios. |
2012 NAV TOTAL RETURNS FOR THE ROYCE FUNDS VS.
RUSSELL 2000, RUSSELL MICROCAP AND THE RUSSELL 2500 as of 12/31/12
 |
| 1 | Certain immaterial adjustments were made to the net assets of Royce Micro-Cap Trust at 12/31/12 for financial reporting purposes, and as a result the net asset value originally calculated on that date and the total return based on that net asset value differs from the adjusted net asset value and total return reported in the Financial Highlights. |
Throughout this time, we remained patient and disciplined, resolutely searching for companies that met our standards for quality and attractive valuation while investors grew more interested in other matters. On the one hand, they sought safety in fixed income instruments, utilities, or high-yielding vehicles such as REITs and MLPs; on the other hand they looked |
| 6 | This page is not part of the 2012 Annual Report to Stockholders |
| | |
| | | |
for fast, dramatic growth, which most often came from highly leveraged companies in which we take no interest. For our part, we continued to see many companies across several sector and industry groups that answered to our preferred combination of quality and value. However, many of the largest company, industry and/or sector weightings in some portfolios have fared poorest, including those in the Energy, Materials, and Information Technology sectors. While all of this has been frustrating, none of it has changed the way in which we invest or construct portfolios. As we said in our Semiannual Review and Report, patience and discipline are not virtues to which we pay lip service. Our investment horizon will remain squarely focused on the long term, as it has for 40 years.
New Cycle, New Balance
The recent era of low rates and ample liquidity has not changed our view of the importance of strong balance sheets, high returns on invested capital, cash flow, or dividends. Many small-cap companies that possess any number of these characteristics underperformed the Russell 2000 in 2010, 2011, and the first half of 2012, which definitely hampered the effectiveness of our disciplined approach. This can be seen in the Funds’ three-, five-year, and in the case of Royce Value Trust, even 10-year, results. We did not enjoy watching certain portfolio favorites languish. But not once did we consider changing our core principles. We knew that we were in a highly anomalous market, one that we may not see again for more than a generation. So we stayed patient and consistent while we waited for the cycle to shift.
Our contention is that quality stocks underperformed through much of the recent cycle of correlation owing to both the zero-interest-rate policies that the Fed has implemented over the last few years and the related rounds of quantitative easing. With interest rates so low, companies were finding it very easy to restructure debt or take on more of it. The price companies were paying to do so was miniscule, so investors acted accordingly by rewarding a number of fast-growing, highly leveraged businesses while often ignoring those with strong balance sheets. In an environment where the cost of debt has been virtually nil, low-debt companies lost their traditional advantage. (Our Sidebar, piece provides some more details.) However, we also suspect that we have reached a stage where this advantage is diminishing because rates have been historically low for a few years now and monetary stimulus no longer has the same dramatic impact it had with the first two or three rounds of quantitative easing. In addition to their stalwart second-half returns, we think this is a good sign for high-quality small-cap stocks.
A Quality Cycle?
As correlation continues to abate, we expect to see more opportunities for quality stocks to flourish. This is ultimately why we were not surprised by the market’s strength in the second half, even with ample ongoing uncertainty. We feel confident that the market has entered a cycle | | We did not enjoy watching certain
portfolio favorites languish. But not
once did we consider changing our
core principles. We knew that we
were in a highly anomalous market,
one that we may not see again for
more than a generation. So we stayed
patient and consistent while we
waited for the cycle to shift. |
| This page is not part of the 2012 Annual Report to Stockholders | 7 |
| | The current preference for passive
strategies and ETFs at the expense of
active management has also played
a role. Within small-cap, active
managers, especially those with a
long-term orientation, tend to have
a quality bias in their portfolios,
while passive index vehicles,
especially those meant to replicate
the Russell 2000, have no bias other
than market cap and therefore have
a higher weighting in lower-quality
companies. Persistent redemptions
of actively managed funds combined
with modest inflows to ETFs have
further distorted the low quality/high
performance differential.
The key question, then, is when will
this change? It is our view that it may
already have begun. Interest rates,
while at historic lows, cannot fall
much lower. In fact, each successive
round of quantitative easing is
exerting less and less pressure on
rates while at the same time raising
the specter of increased inflation
down the road. While liquidity should
remain abundant, the rate of change
in the cost of capital has clearly
peaked. By the same token, the rate
of decline in market volatility has
significantly slowed with the VIX now
back to its long-run averages. And
while the global economy continues to
grow, GDP statistics are anything but
robust. Low-quality companies have
had an extended moment in the sun,
but it is our strong belief that we are
entering a new era for quality.
| |
| |
| |
| Letter to Our Stockholders |
|
| |

in which stock picking matters. Our optimism, cautious as it is, is bolstered by the fact that in the years ahead earnings growth can accelerate for small caps and should be robust as the economy continues to improve. While many companies are hesitant about capital expenditures, those issues have more to do with timing. That is, businesses were not willing to start spending until the President and Congress struck a deal. Yet our meetings with management teams have convinced us that there is no question about their willingness to invest.
In this context, it is worth mentioning that the tax and stimulus deal that was struck early in January still left important matters such as infrastructure spending, entitlements, and the next debt ceiling increase unresolved. So there will be opportunities for political intransigence to potentially affect the markets in 2013, and it will be interesting to see how investors respond to additional rounds of fiscal gridlock. Our thought is that greater levels of attention to business fundamentals will remain high. We believe that equities will continue their positive performance into 2013, that quality-oriented companies and active management approaches, especially within the small-cap universe, will continue their resurgence, and that non-U.S. small-caps will continue to surprise on the upside. We are very happy to say that it looks like a new, more historically typical cycle has begun. |
| | | | | | |
| | Sincerely | | | | |
| | | | | | |
| |  | |  | |  |
| | Charles M. Royce | | W. Whitney George | | Jack E. Fockler, Jr. |
| | President | | Vice President | | Vice President |
| | | | | | |
| | January 31, 2013 |
| 8 | This page is not part of the 2012 Annual Report to Stockholders |
| Table of Contents | |
|
| | |
| Annual Report to Stockholders | |
|
| Managers’ Discussions of Fund Performance | |
| | |
| Royce Value Trust | 10 |
| | |
| Royce Micro-Cap Trust | 12 |
| | |
| Royce Focus Trust | 14 |
|
| History Since Inception | 16 |
| | |
| Distribution Reinvestment and Cash Purchase Options | 18 |
| | |
| Schedules of Investments and Other Financial Statements | |
| | |
| Royce Value Trust | 19 |
| | |
| Royce Micro-Cap Trust | 35 |
| | |
| Royce Focus Trust | 50 |
| | |
| Directors and Officers | 60 |
| | |
| Notes to Performance and Other Important Information | 61 |
| | |
| | |
| |
| | |
| The Royce Funds 2012 Annual Report to Stockholders | 9 |
AVERAGE ANNUAL NAV TOTAL RETURNS
Through 12/31/12 |
|
| July-December 20121 | | 10.87 | % | |
|
| One-Year | | | | | 15.41 | | |
|
| Three-Year | | | | | 10.58 | | |
|
| Five-Year | | | | | 1.23 | | |
|
| 10-Year | | | | | 9.48 | | |
|
| 15-Year | | | | | 8.14 | | |
|
| 20-Year | | | | | 10.06 | | |
|
| 25-Year | | | | | 11.15 | | |
|
| Since Inception (11/26/86) | | | | | 10.33 | | |
|
| 1 Not annualized | |
| | | | |
| CALENDAR YEAR NAV TOTAL RETURNS | |
|
| Year | | RVT | | | Year | | | RVT | | |
|
| 2012 | | 15.4 | % | | 2004 | | | 21.4 | % | |
|
| 2011 | | -10.1 | | | 2003 | | | 40.8 | | |
|
| 2010 | | 30.3 | | | 2002 | | | -15.6 | | |
|
| 2009 | | 44.6 | | | 2001 | | | 15.2 | | |
|
| 2008 | | -45.6 | | | 2000 | | | 16.6 | | |
|
| 2007 | | 5.0 | | | 1999 | | | 11.7 | | |
|
| 2006 | | 19.5 | | | 1998 | | | 3.3 | | |
|
| 2005 | | 8.4 | | | 1997 | | | 27.5 | | |
|
| | | | | | | | | | | |
| TOP 10 POSITIONS % of Net Assets | |
|
| HEICO Corporation | | 1.1 | % | |
|
| Carter’s | | 1.0 | | |
|
| Mohawk Industries | | 1.0 | | |
|
| Coherent | | 1.0 | | |
|
| Lincoln Electric Holdings | | 1.0 | | |
|
| Advisory Board (The) | | 1.0 | | |
|
| Nordson Corporation | | 1.0 | | |
|
| Reliance Steel & Aluminum | | 0.9 | | |
|
| PAREXEL International | | 0.9 | | |
|
| E-L Financial | | 0.8 | | |
|
| | | | | | | | | | | |
| PORTFOLIO SECTOR BREAKDOWN % of Net Assets | |
|
| Industrials | | 27.8 | % | |
|
| Information Technology | | 19.6 | | |
|
| Financials | | 17.8 | | |
|
| Consumer Discretionary | | 13.9 | | |
|
| Materials | | 8.1 | | |
|
| Health Care | | 6.5 | | |
|
| Energy | | 5.1 | | |
|
| Consumer Staples | | 2.1 | | |
|
| Telecommunication Services | | 0.7 | | |
|
| Diversified Investment Companies | | 0.4 | | |
|
| Miscellaneous | | 3.8 | | |
|
| Preferred Stock | | 0.1 | | |
|
| Borrowings Under Revolving Credit Agreement Less Cash and Cash Equivalents | | -5.9 | | |
|
| |
| |
| |
 |
| |
Manager’s Discussion
Strong results in the final six months of 2012 helped Royce Value Trust (RVT) to enjoy a strong year on an absolute basis even as it came up a bit short on a relative scale. RVT gained 15.4% on an NAV (net asset value) basis and 16.2% on a market price basis in 2012 compared to gains of 16.3% for both of its unleveraged small-cap benchmarks, the Russell 2000 and S&P SmallCap 600 Indexes.
The Fund enjoyed full participation in the rally that enlivened the year’s first quarter, up 13.9% on an NAV basis and 14.7% on a market price basis versus 12.4% for the Russell 2000 and 12.0% for the S&P SmallCap 600. This relative advantage was lost, however, once stock prices began to decline following a small-cap high on March 26. Investors once again shifted from bullish to bearish based on a now-familiar set of macro headlines concerning European debt and the pace of global economic growth, particularly in the U.S. and China. RVT fell hard in the second quarter, down 8.6% on an NAV basis and 8.9% on a market price basis versus respective declines of 3.5% and 3.6% for the Russell 2000 and S&P SmallCap 600.
Small-cap stocks reached their low for the year on June 4, 2012, though it would not be until July and August that the presence of a rally began to be felt. Though not as dynamic as the first quarter’s bull run, the third quarter was the year’s second shift into an up phase. The Fund once more did well as share prices climbed, gaining 5.1% on an NAV basis and 6.3% based on market price while the Russell 2000 was up 5.3% and the S&P SmallCap 600 rose 5.4%. For stocks as a whole, the fourth quarter was a more mixed period. Investors did their best to make sense of the effects of Hurricane Sandy, the elections, the looming fiscal cliff, and another round of quantitative easing announced by the Fed in mid-December. This muted the performance of RVT’s benchmarks—the Russell 2000 was up 1.9% in the fourth quarter while the S&P SmallCap 600 rose 2.2%. The Fund handily outpaced each benchmark for the same period, up 5.5% on an NAV basis and 4.6% on a market price basis. This gave the Fund an NAV advantage for the second half and from the 2012 small-cap low on June 4 through the end of December. For this period, RVT gained 17.4% on an NAV basis (+15.6% based on market price) versus respective gains of 16.3% and 15.8% for the Russell 2000 and S&P SmallCap 600.
Longer-term relative results were mixed, with some key pockets of strength. From the small-cap trough on March 9, 2009 through December 31, 2012, RVT was up 187.2% on an NAV basis and 207.0% on a market price basis versus a gain of 160.9% for the Russell 2000 and 174.6% for the S&P SmallCap 600. On an NAV basis, the Fund outperformed both benchmarks for |
GOOD IDEAS THAT WORKED
Top Contributors to 2012 Performance1 |
|
| Nordson Corporation | | 0.45% |
|
| Mohawk Industries | | 0.44 |
|
| MAXIMUS | | 0.36 |
|
| Carter’s | | 0.34 |
|
| PAREXEL International | | 0.31 |
|
| 1 Includes dividends | | |
| | | |
Important Performance and Risk Information
All performance information reflects past performance, is presented on a total return basis, and reflects the reinvestment of distributions. Past performance is no guarantee of future results. Current performance may be higher or lower than performance quoted. Returns as of the most recent month-end may be obtained at www.roycefunds.com. The market price of the Fund’s shares will fluctuate, so that shares may be worth more or less than their original cost when sold. The Fund invests primarily in securities of small-and micro-cap companies, which may involve considerably more risk than investing in a more diversified portfolio of larger-cap companies. Regarding the two “Good Ideas” tables shown above, the sum of all contributors to, and all detractors from, performance for all securities in the portfolio would approximate the Fund’s performance for 2012. |
| 10 | The Royce Funds 2012 Annual Report to Stockholders |
Performance and Portfolio Review
the 15-, 25-year, and since inception (11/26/86) periods ended December 31, 2012. (The Fund also beat the Russell 2000 on both an NAV and market price basis for the 15-, 20-, 25-year, and since inception periods.) RVT’s NAV average annual total return since inception was 10.3%.
Nordson Corporation, part of the machinery group in the top-performing Industrials sector, was the Fund’s top contributor in 2012. The company has what we think is a highly attractive niche business making customized systems that apply adhesives, sealants, and coatings to consumer and industrial products during the manufacturing process. The company announced a 20% increase in its fiscal fourth quarter dividend in July, which not only excited investors, but also marked the 49th consecutive year in which it increased its dividend. We trimmed our position in August. The recovery in the housing industry spurred the rapidly rising stock price of Mohawk Industries in 2012, which in turn led us to take gains in February, May, November, and December. This conservatively capitalized company produces floor coverings for the residential and commercial markets. In addition to its robust earnings growth, investors seemed to like its aggressive attempts to capture market share by acquiring smaller competitors.
Shares of PMFG, a business we have owned since 1990, fell nearly 80% between its early February high and its 2012 low in late November, driven in large part by issuing a secondary offering priced at a sizable discount to its stock. As a manufacturer of custom products primarily for the natural gas industry, the company was also adversely affected by declining gas prices, increased expenses, and project delays, all of which hurt earnings. Fond of its growing business and attractive valuation, we increased our stake between February and September. Major Drilling Group International provides contract drilling services for the metals industry. Although the firm continued to operate profitably, revenue and earnings were hurt as precious metals miners pared back development projects. This in turn seemed to spark fears of a possible decrease in demand for its services. We added to our stake in 2012 before reducing it somewhat in early January 2013. |
GOOD IDEAS AT THE TIME
Top Detractors from 2012 Performance1 |
|
|
| PMFG | -0.31% |
|
| Major Drilling Group International | -0.19 |
|
| GrafTech International | -0.15 |
|
| ADTRAN | -0.14 |
|
| Sapient Corporation | -0.13 |
|
| 1 Net of dividends |
| |
| MARKET PRICE PERFORMANCE HISTORY SINCE INCEPTION (11/26/86) through 12/31/12 |
|
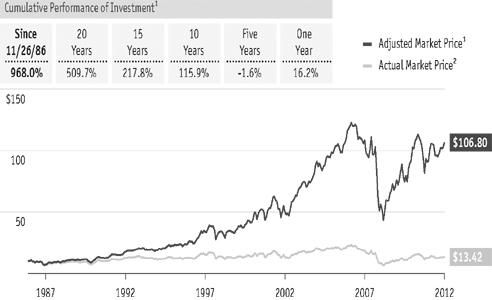 |
1 Reflects the cumulative total return of an investment made by a stockholder who purchased one share at inception ($10.00 IPO), reinvested all annual distributions and fully participated in primary subscriptions of the Fund’s rights offerings. |
2 Reflects the actual market price of one share as it traded on the NYSE. |
| |
| FUND INFORMATION AND PORTFOLIO DIAGNOSTICS |
|
| Fund Total Net Assets | $1,082 million |
|
| Number of Holdings | 478 |
|
| Turnover Rate | 25% |
|
| Symbol | |
| Market Price | RVT |
| NAV | XRVTX |
|
| Net Leverage1 | 6% |
|
| Average Market Capitalization2 | $1,430 million |
|
| Weighted Average P/E Ratio3,4 | 15.2x |
|
| Weighted Average P/B Ratio3 | 1.6x |
|
| U.S. Investments (% of Net Assets) | 79.6% |
|
| Non-U.S. Investments (% of Net Assets) | 26.3% |
|
1 Net leverage is the percentage, in excess of 100%, of the total value of equity type investments, divided by net assets. |
2 Geometric Average. This weighted calculation uses each portfolio holding’s market cap in a way designed to not skew the effect of very large or small holdings; instead, it aims to better identify the portfolio’s center, which Royce believes offers a more accurate measure of average market cap than a simple mean or median. |
3 Harmonic Average. This weighted calculation evaluates a portfolio as if it were a single stock and measures it overall. It compares the total market value of the portfolio to the portfolio’s share in the earnings or book value, as the case may be, of its underlying stocks. |
4 The Fund’s P/E ratio calculation excludes companies with zero or negative earnings (10% of portfolio holdings as of 12/31/12). |
| |
DOWN MARKET PERFORMANCE COMPARISON
All Down Periods of 7.5% or Greater
Over the Last 7 Years, in Percentages (%) |

|
| |
|
| The Royce Funds 2012 Annual Report to Stockholders | 11 |
AVERAGE ANNUAL NAV TOTAL RETURNS
Through 12/31/12 |
|
| July-December 20121 | | 10.20 | % | |
|
| One-Year | | | | | 17.34 | | |
|
| Three-Year | | | | | 11.65 | | |
|
| Five-Year | | | | | 2.15 | | |
|
| 10-Year | | | | | 10.45 | | |
|
| 15-Year | | | | | 8.60 | | |
|
| Since Inception (12/14/93) | | | | | 10.42 | | |
|
| 1 Not annualized | |
| | | | |
| CALENDAR YEAR NAV TOTAL RETURNS | |
|
| Year | | RMT | | | Year | | | RMT | | |
|
| 2012 | | 17.3 | % | | 2004 | | | 18.7 | % | |
|
| 2011 | | -7.7 | | | 2003 | | | 55.5 | | |
|
| 2010 | | 28.5 | | | 2002 | | | -13.8 | | |
|
| 2009 | | 46.5 | | | 2001 | | | 23.4 | | |
|
| 2008 | | -45.5 | | | 2000 | | | 10.9 | | |
|
| 2007 | | 0.6 | | | 1999 | | | 12.7 | | |
|
| 2006 | | 22.5 | | | 1998 | | | -4.1 | | |
|
| 2005 | | 6.8 | | | 1997 | | | 27.1 | | |
|
| | | | | | | | | | | |
| TOP 10 POSITIONS % of Net Assets | |
|
| Kennedy-Wilson Holdings | | 2.0 | % | |
|
| Integrated Electrical Services | | 1.6 | | |
|
| Quaker Chemical | | 1.3 | | |
|
| Virtus Investment Partners | | 1.3 | | |
|
| Seneca Foods | | 1.3 | | |
|
| Tennant Company | | 1.3 | | |
|
| Advisory Board (The) | | 1.2 | | |
|
| America’s Car-Mart | | 1.2 | | |
|
| Flexsteel Industries | | 1.2 | | |
|
| Sapient Corporation | | 1.2 | | |
|
| | | | | | | | | | | |
| PORTFOLIO SECTOR BREAKDOWN % of Net Assets | |
|
| Industrials | | 27.7 | % | |
|
| Information Technology | | 24.6 | | |
|
| Financials | | 17.8 | | |
|
| Consumer Discretionary | | 10.4 | | |
|
| Materials | | 9.2 | | |
|
| Health Care | | 7.7 | | |
|
| Energy | | 4.1 | | |
|
| Consumer Staples | | 3.2 | | |
|
| Utilities | | 0.1 | | |
|
| Miscellaneous | | 4.5 | | |
|
| Preferred Stock | | 0.4 | | |
|
| Borrowings Under Revolving Credit Agreement Less Cash and Cash Equivalents | | -9.7 | | |
|
| |
| |
| |
|
| |
Manager’s Discussion
The strong year for micro-cap stocks was reflected in the calendar-year results for Royce Micro-Cap Trust (RMT). The Fund was up 17.3% on an NAV (net asset value) basis and 14.0% on a market price basis in 2012 compared to 16.3% for its unleveraged small-cap benchmark, the Russell 2000 Index, and 19.8% for the unleveraged Russell Microcap Index.
Stocks as a whole took off fast in 2012, building on a rally that began in early October 2011 and making for a pleasant and bullish opening quarter. The Fund gained 11.4% on an NAV basis and 8.8% on a market price basis compared to a 12.4% increase for its benchmark and a gain of 15.3% for the microcap index. The rally lost steam after small-caps reached a first-half high on March 26, derailed for the third straight year by the same three concerns: sovereign debt in Europe and the pace of economic growth in the U.S. and China. These anxieties drove share prices down through most of the second quarter, with May seeing the largest losses. RMT fell 4.4% on an NAV basis and 3.8% based on its market price in the second quarter. That same period saw the Russell 2000 lose 3.5% while the Russell Microcap lost 2.0%.
Although the third quarter saw a resumption of bullish behavior, it was a more moderately paced run than what the market enjoyed during the first quarter. After reaching a 2012 low on June 4, share prices crept upward. For the third quarter, the Fund rose 6.8% on an NAV basis and 7.3% on a market price basis compared to a 5.3% increase for the Russell 2000 and a gain of 5.9% for the unleveraged Russell Microcap. The fourth quarter was a bit more volatile as investors tried to sort out the ramifications of Hurricane Sandy, the aftermath of the elections, the potential effects of the fiscal cliff, and a fourth round of quantitative easing. The Russell 2000 was up 1.9% and the Russell Microcap gained 0.04% while the Fund climbed 3.2% on an NAV basis and 1.4% based on market price for the year’s final quarter.
The Fund’s strong year helped it to build on previous relative advantages over longer-term time frames. From the small-cap trough on March 9, 2009 through December 31, 2012, RMT gained 197.8% on an NAV basis and 214.7% on a market price basis versus a gain of 160.9% for the Russell 2000 and 160.4% for the Russell Microcap. On both an NAV and market price basis, the Fund was ahead of each index for the 10-year period ended December 31, 2012 while it also outperformed the Russell 2000 for the 15-year and since inception (12/14/93) periods as well. (Data for the Russell Microcap only goes back to 2000.) RMT’s NAV average annual total return since inception was 10.4%.
Eight of the Fund’s nine equity sectors made positive contributions in 2012 while net losses for Energy—the portfolio’s lone detractor—were relatively modest. Financials and Industrials led |
GOOD IDEAS THAT WORKED
Top Contributors to 2012 Performance1 |
|
| Integrated Electrical Services | | 0.91% |
|
| Celsion Corporation | | 0.90 |
|
| Acadia Pharmaceuticals | | 0.78 |
|
| Kennedy-Wilson Holdings | | 0.66 |
|
| Virtus Investment Partners | | 0.59 |
|
| 1 Includes dividends | | |
| | | |
Important Performance and Risk Information
All performance information reflects past performance, is presented on a total return basis, and reflects the reinvestment of distributions. Past performance is no guarantee of future results. Current performance may be higher or lower than performance quoted. Returns as of the most recent month-end may be obtained at www.roycefunds.com. Certain immaterial adjustments were made to the net assets of Royce Micro-Cap Trust at 12/31/12 for financial reporting purposes, and as a result the net asset value originally calculated on that date and the total return based on that net asset value differs from the adjusted net asset value and total return reported in the Financial Highlights. The market price of the Fund’s shares will fluctuate, so that shares may be worth more or less than their original cost when sold. The Fund normally invests in micro-cap companies, which may involve considerably more risk than investing in a more diversified portfolio of larger-cap companies. Regarding the two “Good Ideas” tables shown above, the sum of all contributors to, and all detractors from, performance for all securities in the portfolio would approximate the Fund’s performance for 2012. |
| 12 | The Royce Funds 2012 Annual Report to Stockholders |
Performance and Portfolio Review
by a sizable margin while Consumer Discretionary, Health Care, and Information Technology also posted notable net gains. In fact, RMT’s underweight in Health Care did not stop the sector from making a meaningful positive impact—two of the Fund’s top three contributors hailed from that sector. Cancer drug developer Celsion Corporation made progress toward FDA approval for its liver cancer treatment ThermoDox, which helped its shares to soar and led us to begin reducing our position in July. During November and December we sold our position in Acadia Pharmaceuticals. Its price shot up late in November after the company announced the success of its drug Pimavanserin in treating psychosis in patients with Parkinson’s disease.
We also trimmed our stake in top contributor Integrated Electrical Services in October as its price rose. The company provides electrical contracting and maintenance services to the commercial, industrial, residential, and power line markets and also offers data communication services that include the installation of wiring for computer networks and fiber optic telecommunications systems. Its ongoing progress back to profitability seemed to attract investors, especially in the second half.
The stock price of PMFG, a business we have owned since 1994 in RMT’s portfolio, fell nearly 80% between its early February high and its 2012 low in late November, driven in large part by issuing a secondary offering priced at a sizable discount to its stock. As a manufacturer of custom products primarily for the natural gas industry, the company was also affected by declining gas prices, increased expenses, and project delays, all of which hurt earnings. Still believing in its niche business and increasingly attractive valuation, we increased our stake between February and June. Tough times for the energy industry, disappointing earnings, and insider selling back in March all helped to drive investors away from Dawson Geophysical. The company acquires and processes three-dimensional seismic data used to analyze subsurface geological conditions for potential oil and natural gas reserves. Its margins remained solid, and it boasts what we think is a highly attractive niche business, so we were happy to hold our shares throughout 2012. |
GOOD IDEAS AT THE TIME
Top Detractors from 2012 Performance1 |
|
|
| PMFG | -0.47% |
|
| Dawson Geophysical | -0.28 |
|
| Chelsea Therapeutics International | -0.25 |
|
| Sapient Corporation | -0.24 |
|
| ChinaCast Education | -0.22 |
|
| 1 Net of dividends |
| |
| MARKET PRICE PERFORMANCE HISTORY SINCE INCEPTION (12/14/93) through 12/31/12 |
|
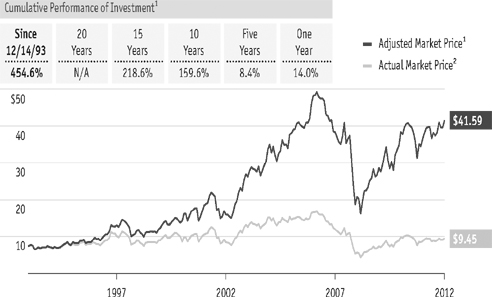 |
1 Reflects the cumulative total return of an investment made by a stockholder who purchased one share at inception ($7.50 IPO), reinvested distributions and fully participated in the primary subscription of the 1994 rights offering. |
2 Reflects the actual market price of one share as it traded on the NYSE and, prior to 12/1/03, on the Nasdaq. |
| |
| FUND INFORMATION AND PORTFOLIO DIAGNOSTICS |
|
| Fund Total Net Assets | $319 million |
|
| Number of Holdings | 332 |
|
| Turnover Rate | 28% |
|
| Symbol | |
| Market Price | RMT |
| NAV | XOTCX |
|
| Net Leverage1 | 10% |
|
| Average Market Capitalization2 | $350 million |
|
| Weighted Average P/E Ratio3,4 | 15.6 |
|
| Weighted Average P/B Ratio3 | 1.4x |
|
| U.S. Investments (% of Net Assets) | 96.6% |
|
| Non-U.S. Investments (% of Net Assets) | 13.1% |
|
1 Net leverage is the percentage, in excess of 100%, of the total value of equity type investments, divided by net assets. |
2 Geometric Average. This weighted calculation uses each portfolio holding’s market cap in a way designed to not skew the effect of very large or small holdings; instead, it aims to better identify the portfolio’s center, which Royce believes offers a more accurate measure of average market cap than a simple mean or median. |
3 Harmonic Average. This weighted calculation evaluates a portfolio as if it were a single stock and measures it overall. It compares the total market value of the portfolio to the portfolio’s share in the earnings or book value, as the case may be, of its underlying stocks. |
4 The Fund’s P/E ratio calculation excludes companies with zero or negative earnings (25% of portfolio holdings as of 12/31/12). |
| |
DOWN MARKET PERFORMANCE COMPARISON
All Down Periods of 7.5% or Greater
Over the Last 7 Years, in Percentages (%) |
|
| |
|
| The Royce Funds 2012 Annual Report to Stockholders | 13 |
AVERAGE ANNUAL NAV TOTAL RETURNS
Through 12/31/12 |
|
| July-December 20121 | | 11.50 | % | |
|
| One-Year | | | | | 11.42 | | |
|
| Three-Year | | | | | 6.69 | | |
|
| Five-Year | | | | | 1.38 | | |
|
| 10-Year | | | | | 12.19 | | |
|
| 15-Year | | | | | 9.17 | | |
|
| Since Inception (11/1/96)2 | | | | | 10.04 | | |
|
| 1 Not annualized | |
2 Royce & Associates assumed investment management responsibility for the Fund on 11/1/96. |
| | | | |
| CALENDAR YEAR NAV TOTAL RETURNS | |
|
| Year | | FUND | | | Year | | | FUND | | |
|
| 2012 | | 11.4 | % | | 2004 | | | 29.3 | % | |
|
| 2011 | | -10.5 | | | 2003 | | | 54.3 | | |
|
| 2010 | | 21.8 | | | 2002 | | | -12.5 | | |
|
| 2009 | | 54.0 | | | 2001 | | | 10.0 | | |
|
| 2008 | | -42.7 | | | 2000 | | | 20.9 | | |
|
| 2007 | | 12.2 | | | 1999 | | | 8.7 | | |
|
| 2006 | | 15.8 | | | 1998 | | | -6.8 | | |
|
| 2005 | | 13.3 | | | 1997 | | | 20.5 | | |
|
| | | | | | | | | | | |
| TOP 10 POSITIONS % of Net Assets | |
|
| Western Digital | | 3.9 | % | |
|
| Analog Devices | | 3.3 | | |
|
| Berkshire Hathaway Cl. B | | 3.3 | | |
|
| Microsoft Corporation | | 3.3 | | |
|
| Mosaic Company (The) | | 3.1 | | |
|
| Franklin Resources | | 3.1 | | |
|
| Helmerich & Payne | | 2.9 | | |
|
| Exxon Mobil | | 2.9 | | |
|
| Buckle (The) | | 2.7 | | |
|
| Apple | | 2.6 | | |
|
| | | | | | | | | | | |
| PORTFOLIO SECTOR BREAKDOWN % of Net Assets | |
|
| Materials | | 29.6 | % | |
|
| Information Technology | | 18.1 | | |
|
| Financials | | 15.9 | | |
|
| Energy | | 13.1 | | |
|
| Consumer Discretionary | | 7.5 | | |
|
| Industrials | | 7.0 | | |
|
| Consumer Staples | | 4.9 | | |
|
| Health Care | | 2.0 | | |
|
| Cash and Cash Equivalents | | 1.9 | | |
|
| |
| |
| |
 |
| |
Manager’s Discussion
We were very pleased with the strong second half turned in by Royce Focus Trust (FUND), even if it was not quite strong enough to give the Fund an advantage over its new benchmark for the calendar year. In 2012, FUND rose 11.4% on an NAV (net asset value) basis and 12.1% on a market price basis versus 17.9% for its new unleveraged benchmark, the Russell 2500 Index, and 16.3% for the similarly unleveraged Russell 2000 Index.
The year began on a positive note by extending the rally that began off the October 3, 2011 small-cap low. In the bullish first quarter of 2012, the Fund rose 11.0% on an NAV basis and 12.0% on a market price basis. While by each measure these were strong absolute showings, the Fund lagged both the Russell 2500, which was up 13.0%, and the Russell 2000, which rose 12.4%. Any hopes that the nearly six-month bull phase might keep running based on the slowly improving U.S. economy were dashed following an early small-cap high on March 26, 2012. Driving investors away from stocks was another round of macro worries, including anxiety over European debt and currency issues and the strength of the U.S. and Chinese economies. The effect on stock prices was predictably negative, hitting many of the Fund’s most heavily weighted, economically sensitive sectors hardest. The Fund fell 10.0% on an NAV basis and 8.3% on a market price basis in the second quarter, while for the same period the Russell 2500 lost 4.1% and the Russell 2000 fell 3.5%.
Following the June 4, 2012 small-cap low, the market shook loose of the bear. The Fund’s relative results also began to improve substantially. For the third quarter, FUND climbed 10.1% on an NAV basis and 8.4% on a market price basis, in both cases beating the Russell 2500 (+5.6%) and the Russell 2000 (+5.3%). For most small-cap and mid-cap stocks the fourth quarter was slightly rockier, particularly from mid-September through mid-November. The Fund gave up some ground to both indexes in the fourth quarter, gaining 1.3% in NAV and 0.7% in market price while the Russell 2500 rose 3.1% and the Russell 2000 was up 1.9%. Yet FUND outpaced both indexes for the second half of 2012 on both an NAV (+11.5%) and market price (+9.2%) basis. The Russell 2500 was up 8.8% during this same period, while the Russell 2000 increased 7.2%.
During the most recent full market cycle period that ran from the previous small-cap peak on July 13, 2007 through the small-cap peak on April 29, 2011, the Fund increased 10.2% on an NAV basis versus 9.2% for its new benchmark and 6.6% for the Russell 2000. On an NAV and market price basis, FUND beat both indexes for the 10-year, 15-year, and |
GOOD IDEAS THAT WORKED
Top Contributors to 2012 Performance1 |
|
| Westlake Chemical | | 1.68% |
|
| Western Digital | | 1.25 |
|
| Franklin Resources | | 1.02 |
|
| Stella-Jones | | 0.85 |
|
| Analog Devices | | 0.76 |
|
| 1 Includes dividends | | |
| | | |
Important Performance and Risk Information
All performance information reflects past performance, is presented on a total return basis, and reflects the reinvestment of distributions. Past performance is no guarantee of future results. Current performance may be higher or lower than performance quoted. Returns as of the most recent month-end may be obtained at www.roycefunds.com. The market price of the Fund’s shares will fluctuate, so that shares may be worth more or less than their original cost when sold. The Fund normally invests primarily in small-cap companies, which may involve considerably more risk than investing in a more diversified portfolio of larger-cap companies. Regarding the two “Good Ideas” tables shown above, the sum of all contributors to, and all detractors from, performance for all securities in the portfolio would approximate the Fund’s performance for 2012. |
| 14 | The Royce Funds 2012 Annual Report to Stockholders |
Performance and Portfolio Review
since inception of Royce’s management (11/1/96) periods ended December 31, 2012. The Fund’s average annual NAV total return for the since inception of our management period was 10.0%.
Westlake Chemical manufactures basic chemicals, vinyls, polymers, fabricated building products, plastics, and high-end plastic films used to wrap food. Natural gas is a feedstock for much of what it produces, which gave it a huge cost advantage thanks to slumping gas prices. A founder-controlled business with conservative and intelligent management, we think its ongoing prospects remain very strong, especially in light of the fact that it has yet to see much benefit from the reviving housing industry. We did, however, take gains in August as its stock price was climbing. Top holding Western Digital makes hard drives and related products. Its stock was quite volatile in 2012, though it was relatively more stable in the second half. After announcing in April that its disk prices were lower than they had been at the beginning of the year, its shares tumbled. The company bought back shares in the aftermath, which is nearly always a positive sign to us. The firm’s earnings then surprised on the upside for the next two quarters, giving a boost to its stock price. Liking its ongoing prospects as a leader in its field, we were happy to hold a large position at the end of 2012.
Major Drilling Group International provides contract drilling services for the metals industry. Although the firm continued to operate profitably, revenue and earnings were hurt as precious metals miners pared back development projects. This in turn seemed to spark fears of a possible decrease in demand for its services. This looked to us like a case of guilt by association, so we built our position in June, August, and September. We have owned shares of steel and scrap metal recycler Schnitzer Steel Industries since 2004. Demand for recycled metals slackened amid the slow pace of growth in the U.S. Excess capacity, lower-than-normal spring scrap flows, and margins compressed from increases in raw materials and transport costs have all driven investors to keep selling while we continued to hold our shares in anticipation of a rebound in global industrial activity that we think will spark demand. |
GOOD IDEAS AT THE TIME
Top Detractors from 2012 Performance1 |
|
|
| Major Drilling Group International | -0.75% |
|
| Schnitzer Steel Industries Cl. A | -0.60 |
|
| Sprott | -0.55 |
|
| Trican Well Service | -0.53 |
|
| Newmont Mining | -0.48 |
|
| 1 Net of dividends |
| |
| MARKET PRICE PERFORMANCE HISTORY SINCE INCEPTION (11/1/96)3 through 12/31/12 |
|
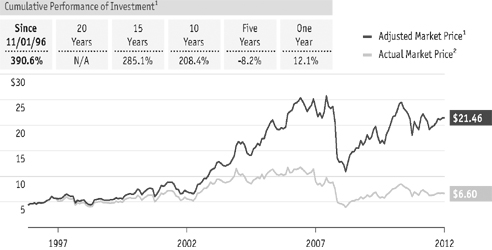 |
1 Reflects the cumulative total return experience of a continuous common stockholder who reinvested all distributions and fully participated in the primary subscription of the 2005 rights offering. |
2 Reflects the actual market price of one share as it traded on Nasdaq. |
3 Royce & Associates assumed investment management responsibility for the Fund on 11/1/96. |
| |
| FUND INFORMATION AND PORTFOLIO DIAGNOSTICS |
|
| Fund Total Net Assets | $164 million |
|
| Number of Holdings | 52 |
|
| Turnover Rate | 16% |
|
| Symbol | |
| Market Price | FUND |
| NAV | XFUNX |
|
| Average Market Capitalization1 | $5,492 million |
|
| Weighted Average P/E Ratio2,3 | 14.1x |
|
| Weighted Average P/B Ratio2 | 1.8x |
|
| U.S. Investments (% of Net Assets) | 71.4% |
|
| Non-U.S. Investments (% of Net Assets) | 26.7% |
|
1 Geometric Average. This weighted calculation uses each portfolio holding’s market cap in a way designed to not skew the effect of very large or small holdings; instead, it aims to better identify the portfolio’s center, which Royce believes offers a more accurate measure of average market cap than a simple mean or median. |
2 Harmonic Average. This weighted calculation evaluates a portfolio as if it were a single stock and measures it overall. It compares the total market value of the portfolio to the portfolio’s share in the earnings, or book value, as the case may be, of its underlying stocks. |
3 The Fund’s P/E ratio calculation excludes companies with zero or negative earnings (8% of portfolio holdings as of 12/31/12). |
| |
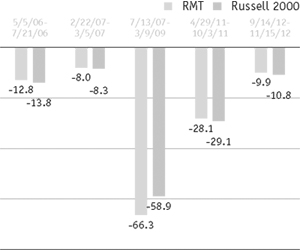
DOWN MARKET PERFORMANCE COMPARISON
All Down Periods of 7.5% or Greater
Over the Last 7 Years, in Percentages(%) |

|
| |
|
| The Royce Funds 2012 Annual Report to Stockholders | 15 |
History Since Inception
The following table details the share accumulations by an initial investor in the Funds who reinvested all distributions and participated fully in primary subscriptions for each of the rights offerings. Full participation in distribution reinvestments and rights offerings can maximize the returns available to a long-term investor. This table should be read in conjunction with the Performance and Portfolio Reviews of the Funds. |
| | | | Amount | | | Purchase | | | | | | NAV | | | Market |
History | | | Invested | | | Price1 | | | Shares | | | Value2 | | | Value2 |
| Royce Value Trust |
| 11/26/86 | | | Initial Purchase | | | $ | 10,000 | | | $ | 10.000 | | | | 1,000 | | | $ | 9,280 | | | $ | 10,000 |
| 10/15/87 | | | Distribution $0.30 | | | | | | | | 7.000 | | | | 42 | | | | | | | | |
| 12/31/87 | | | Distribution $0.22 | | | | | | | | 7.125 | | | | 32 | | | | 8,578 | | | | 7,250 |
| 12/27/88 | | | Distribution $0.51 | | | | | | | | 8.625 | | | | 63 | | | | 10,529 | | | | 9,238 |
| 9/22/89 | | | Rights Offering | | | | 405 | | | | 9.000 | | | | 45 | | | | | | | | |
| 12/29/89 | | | Distribution $0.52 | | | | | | | | 9.125 | | | | 67 | | | | 12,942 | | | | 11,866 |
| 9/24/90 | | | Rights Offering | | | | 457 | | | | 7.375 | | | | 62 | | | | | | | | |
| 12/31/90 | | | Distribution $0.32 | | | | | | | | 8.000 | | | | 52 | | | | 11,713 | | | | 11,074 |
| 9/23/91 | | | Rights Offering | | | | 638 | | | | 9.375 | | | | 68 | | | | | | | | |
| 12/31/91 | | | Distribution $0.61 | | | | | | | | 10.625 | | | | 82 | | | | 17,919 | | | | 15,697 |
| 9/25/92 | | | Rights Offering | | | | 825 | | | | 11.000 | | | | 75 | | | | | | | | |
| 12/31/92 | | | Distribution $0.90 | | | | | | | | 12.500 | | | | 114 | | | | 21,999 | | | | 20,874 |
| 9/27/93 | | | Rights Offering | | | | 1,469 | | | | 13.000 | | | | 113 | | | | | | | | |
| 12/31/93 | | | Distribution $1.15 | | | | | | | | 13.000 | | | | 160 | | | | 26,603 | | | | 25,428 |
| 10/28/94 | | | Rights Offering | | | | 1,103 | | | | 11.250 | | | | 98 | | | | | | | | |
| 12/19/94 | | | Distribution $1.05 | | | | | | | | 11.375 | | | | 191 | | | | 27,939 | | | | 24,905 |
| 11/3/95 | | | Rights Offering | | | | 1,425 | | | | 12.500 | | | | 114 | | | | | | | | |
| 12/7/95 | | | Distribution $1.29 | | | | | | | | 12.125 | | | | 253 | | | | 35,676 | | | | 31,243 |
| 12/6/96 | | | Distribution $1.15 | | | | | | | | 12.250 | | | | 247 | | | | 41,213 | | | | 36,335 |
| 1997 | | | Annual distribution total $1.21 | | | | | | | | 15.374 | | | | 230 | | | | 52,556 | | | | 46,814 |
| 1998 | | | Annual distribution total $1.54 | | | | | | | | 14.311 | | | | 347 | | | | 54,313 | | | | 47,506 |
| 1999 | | | Annual distribution total $1.37 | | | | | | | | 12.616 | | | | 391 | | | | 60,653 | | | | 50,239 |
| 2000 | | | Annual distribution total $1.48 | | | | | | | | 13.972 | | | | 424 | | | | 70,711 | | | | 61,648 |
| 2001 | | | Annual distribution total $1.49 | | | | | | | | 15.072 | | | | 437 | | | | 81,478 | | | | 73,994 |
| 2002 | | | Annual distribution total $1.51 | | | | | | | | 14.903 | | | | 494 | | | | 68,770 | | | | 68,927 |
| 1/28/03 | | | Rights Offering | | | | 5,600 | | | | 10.770 | | | | 520 | | | | | | | | |
| 2003 | | | Annual distribution total $1.30 | | | | | | | | 14.582 | | | | 516 | | | | 106,216 | | | | 107,339 |
| 2004 | | | Annual distribution total $1.55 | | | | | | | | 17.604 | | | | 568 | | | | 128,955 | | | | 139,094 |
| 2005 | | | Annual distribution total $1.61 | | | | | | | | 18.739 | | | | 604 | | | | 139,808 | | | | 148,773 |
| 2006 | | | Annual distribution total $1.78 | | | | | | | | 19.696 | | | | 693 | | | | 167,063 | | | | 179,945 |
| 2007 | | | Annual distribution total $1.85 | | | | | | | | 19.687 | | | | 787 | | | | 175,469 | | | | 165,158 |
| 2008 | | | Annual distribution total $1.723 | | | | | | | | 12.307 | | | | 1,294 | | | | 95,415 | | | | 85,435 |
| 3/11/09 | | | Distribution $0.323 | | | | | | | | 6.071 | | | | 537 | | | | 137,966 | | | | 115,669 |
| 12/2/10 | | | Distribution $0.03 | | | | | | | | 13.850 | | | | 23 | | | | 179,730 | | | | 156,203 |
| 2011 | | | Annual distribution total $0.783 | | | | | | | | 13.043 | | | | 656 | | | | 161,638 | | | | 139,866 |
| 2012 | | | Annual distribution total $0.80 | | | | | | | | 13.063 | | | | 714 | | | | | | | | |
| |
| 12/31/12 | | | | | | $ | 21,922 | | | | | | | | 12,113 | | | $ | 186,540 | | | $ | 162,556 |
| |
|
1 The purchase price used for annual distribution totals is a weighted average of the distribution reinvestment prices for the year. | 2 Other than for initial purchase, values are stated as of December 31 of the year indicated, after reinvestment of distributions. |
3 Includes a return of capital. |
| 16 | The Royce Funds 2012 Annual Report to Stockholders |
The following table details the share accumulations by an initial investor in the Funds who reinvested all distributions and participated fully in primary subscriptions for each of the rights offerings. Full participation in distribution reinvestments and rights offerings can maximize the returns available to a long-term investor. This table should be read in conjunction with the Performance and Portfolio Reviews of the Funds. |
| | | | Amount | | | Purchase | | | | | | NAV | | | Market |
History | | | Invested | | | Price1 | | | Shares | | | Value2 | | | Value2 |
| Royce Micro-Cap Trust |
| 12/14/93 | | | Initial Purchase | | | $ | 7,500 | | | $ | 7.500 | | | | 1,000 | | | $ | 7,250 | | | $ | 7,500 |
| 10/28/94 | | | Rights Offering | | | | 1,400 | | | | 7.000 | | | | 200 | | | | | | | | |
| 12/19/94 | | | Distribution $0.05 | | | | | | | | 6.750 | | | | 9 | | | | 9,163 | | | | 8,462 |
| 12/7/95 | | | Distribution $0.36 | | | | | | | | 7.500 | | | | 58 | | | | 11,264 | | | | 10,136 |
| 12/6/96 | | | Distribution $0.80 | | | | | | | | 7.625 | | | | 133 | | | | 13,132 | | | | 11,550 |
| 12/5/97 | | | Distribution $1.00 | | | | | | | | 10.000 | | | | 140 | | | | 16,694 | | | | 15,593 |
| 12/7/98 | | | Distribution $0.29 | | | | | | | | 8.625 | | | | 52 | | | | 16,016 | | | | 14,129 |
| 12/6/99 | | | Distribution $0.27 | | | | | | | | 8.781 | | | | 49 | | | | 18,051 | | | | 14,769 |
| 12/6/00 | | | Distribution $1.72 | | | | | | | | 8.469 | | | | 333 | | | | 20,016 | | | | 17,026 |
| 12/6/01 | | | Distribution $0.57 | | | | | | | | 9.880 | | | | 114 | | | | 24,701 | | | | 21,924 |
| 2002 | | | Annual distribution total $0.80 | | | | | | | | 9.518 | | | | 180 | | | | 21,297 | | | | 19,142 |
| 2003 | | | Annual distribution total $0.92 | | | | | | | | 10.004 | | | | 217 | | | | 33,125 | | | | 31,311 |
| 2004 | | | Annual distribution total $1.33 | | | | | | | | 13.350 | | | | 257 | | | | 39,320 | | | | 41,788 |
| 2005 | | | Annual distribution total $1.85 | | | | | | | | 13.848 | | | | 383 | | | | 41,969 | | | | 45,500 |
| 2006 | | | Annual distribution total $1.55 | | | | | | | | 14.246 | | | | 354 | | | | 51,385 | | | | 57,647 |
| 2007 | | | Annual distribution total $1.35 | | | | | | | | 13.584 | | | | 357 | | | | 51,709 | | | | 45,802 |
| 2008 | | | Annual distribution total $1.193 | | | | | | | | 8.237 | | | | 578 | | | | 28,205 | | | | 24,807 |
| 3/11/09 | | | Distribution $0.223 | | | | | | | | 4.260 | | | | 228 | | | | 41,314 | | | | 34,212 |
| 12/2/10 | | | Distribution $0.08 | | | | | | | | 9.400 | | | | 40 | | | | 53,094 | | | | 45,884 |
| 2011 | | | Annual distribution total $0.533 | | | | | | | | 8.773 | | | | 289 | | | | 49,014 | | | | 43,596 |
| 2012 | | | Annual distribution total $0.51 | | | | | | | | 9.084 | | | | 285 | | | | | | | | |
| |
|
| 12/31/12 | | | | | | $ | 8,900 | | | | | | | | 5,256 | | | $ | 57,501 | | | $ | 49,669 |
| |
|
| Royce Focus Trust |
| 10/31/96 | | | Initial Purchase | | | $ | 4,375 | | | $ | 4.375 | | | | 1,000 | | | $ | 5,280 | | | $ | 4,375 |
| 12/31/96 | | | | | | | | | | | | | | | | | | | 5,520 | | | | 4,594 |
| 12/5/97 | | | Distribution $0.53 | | | | | | | | 5.250 | | | | 101 | | | | 6,650 | | | | 5,574 |
| 12/31/98 | | | | | | | | | | | | | | | | | | | 6,199 | | | | 5,367 |
| 12/6/99 | | | Distribution $0.145 | | | | | | | | 4.750 | | | | 34 | | | | 6,742 | | | | 5,356 |
| 12/6/00 | | | Distribution $0.34 | | | | | | | | 5.563 | | | | 69 | | | | 8,151 | | | | 6,848 |
| 12/6/01 | | | Distribution $0.14 | | | | | | | | 6.010 | | | | 28 | | | | 8,969 | | | | 8,193 |
| 12/6/02 | | | Distribution $0.09 | | | | | | | | 5.640 | | | | 19 | | | | 7,844 | | | | 6,956 |
| 12/8/03 | | | Distribution $0.62 | | | | | | | | 8.250 | | | | 94 | | | | 12,105 | | | | 11,406 |
| 2004 | | | Annual distribution total $1.74 | | | | | | | | 9.325 | | | | 259 | | | | 15,639 | | | | 16,794 |
| 5/6/05 | | | Rights offering | | | | 2,669 | | | | 8.340 | | | | 320 | | | | | | | | |
| 2005 | | | Annual distribution total $1.21 | | | | | | | | 9.470 | | | | 249 | | | | 21,208 | | | | 20,709 |
| 2006 | | | Annual distribution total $1.57 | | | | | | | | 9.860 | | | | 357 | | | | 24,668 | | | | 27,020 |
| 2007 | | | Annual distribution total $2.01 | | | | | | | | 9.159 | | | | 573 | | | | 27,679 | | | | 27,834 |
| 2008 | | | Annual distribution total $0.473 | | | | | | | | 6.535 | | | | 228 | | | | 15,856 | | | | 15,323 |
| 3/11/09 | | | Distribution $0.093 | | | | | | | | 3.830 | | | | 78 | | | | 24,408 | | | | 21,579 |
| 12/31/10 | | | | | | | | | | | | | | | | | | | 29,726 | | | | 25,806 |
| 2011 | | | Annual distribution total $0.413 | | | | | | | | 6.894 | | | | 207 | | | | 26,614 | | | | 22,784 |
| 2012 | | | Annual distribution total $0.46 | | | | | | | | 6.686 | | | | 255 | | | | | | | | |
| |
|
| 12/31/12 | | | | | | $ | 7,044 | | | | | | | | 3,871 | | | $ | 29,652 | | | $ | 25,549 |
| |
|
1 The purchase price used for annual distribution totals is a weighted average of the distribution reinvestment prices for the year. | 2 Other than for initial purchase, values are stated as of December 31 of the year indicated, after reinvestment of distributions. |
3 Includes a return of capital. |
| The Royce Funds 2012 Annual Report to Stockholders | 17 |
Distribution Reinvestment and Cash Purchase Options
Why should I reinvest my distributions?
By reinvesting distributions, a stockholder can maintain an undiluted investment in the Fund. The regular reinvestment of distributions has a significant impact on stockholder returns. In contrast, the stockholder who takes distributions in cash is penalized when shares are issued below net asset value to other stockholders.
How does the reinvestment of distributions from the Royce closed-end funds work?
The Funds automatically issue shares in payment of distributions unless you indicate otherwise. The shares are generally issued at the lower of the market price or net asset value on the valuation date.
How does this apply to registered stockholders?
If your shares are registered directly with a Fund, your distributions are automatically reinvested unless you have otherwise instructed the Funds’ transfer agent, Computershare, in writing. A registered stockholder also has the option to receive the distribution in the form of a stock certificate or in cash if Computershare is properly notified.
What if my shares are held by a brokerage firm or a bank?
If your shares are held by a brokerage firm, bank, or other intermediary as the stockholder of record, you should contact your brokerage firm or bank to be certain that it is automatically reinvesting distributions on your behalf. If they are unable to reinvest distributions on your behalf, you should have your shares registered in your name in order to participate.
What other features are available for registered stockholders?
The Distribution Reinvestment and Cash Purchase Plans also allow registered stockholders to make optional cash purchases of shares of a Fund’s common stock directly through Computershare on a monthly basis, and to deposit certificates representing your Fund shares with Computershare for safekeeping. The Funds’ investment adviser is absorbing all commissions on optional cash purchases under the Plans through December 31, 2012.
How do the Plans work for registered stockholders?
Computershare maintains the accounts for registered stockholders in the Plans and sends written confirmation of all transactions in the account. Shares in the account of each participant will be held by Computershare in non-certificated form in the name of the participant, and each participant will be able to vote those shares at a stockholder meeting or by proxy. A participant may also send other stock certificates held by them to Computershare to be held in non-certificated form. There is no service fee charged to participants for reinvesting distributions. If a participant elects to sell shares from a Plan account, Computershare will deduct a $2.50 fee plus brokerage commissions from the sale transaction. If a nominee is the registered owner of your shares, the nominee will maintain the accounts on your behalf.
How can I get more information on the Plans?
You can call an Investor Services Representative at (800) 221-4268 or you can request a copy of the Plan for your Fund from Computershare. All correspondence (including notifications) should be directed to: [Name of Fund] Distribution Reinvestment and Cash Purchase Plan, c/o Computershare, PO Box 43010, Providence, RI 02940-3010, telephone (800) 426-5523.
|
| 18 | The Royce Funds 2012 Annual Report to Stockholders |
| Royce Value Trust | December 31, 2012 |
|
| |
| Schedule of Investments |
| | | SHARES | | | VALUE |
| | | | | | | |
COMMON STOCKS – 105.8% | | | | | | |
| | | | | | | |
Consumer Discretionary – 13.9% | | | | | | |
Auto Components - 0.4% | | | | | | |
China XD Plastics 1 | | 109,700 | | | $ | 421,248 |
Drew Industries | | 46,591 | | | | 1,502,560 |
Gentex Corporation 2 | | 97,700 | | | | 1,838,714 |
Minth Group | | 717,600 | | | | 829,971 |
| | | | | |
|
| | | | | | | 4,592,493 |
| | | | | |
|
Automobiles - 0.6% | | | | | | |
Thor Industries 2 | | 77,500 | | | | 2,900,825 |
Winnebago Industries 1 | | 222,500 | | | | 3,811,425 |
| | | | | |
|
| | | | | | | 6,712,250 |
| | | | | |
|
Distributors - 0.9% | | | | | | |
LKQ Corporation 1 | | 368,000 | | | | 7,764,800 |
Weyco Group | | 97,992 | | | | 2,289,093 |
| | | | | |
|
| | | | | | | 10,053,893 |
| | | | | |
|
Diversified Consumer Services - 1.4% | | | | | | |
†Career Education 1 | | 28,900 | | | | 101,728 |
MegaStudy | | 39,150 | | | | 2,885,627 |
Regis Corporation 2,3 | | 233,800 | | | | 3,955,896 |
Sotheby’s 2 | | 206,500 | | | | 6,942,530 |
Universal Technical Institute | | 110,432 | | | | 1,108,737 |
| | | | | |
|
| | | | | | | 14,994,518 |
| | | | | |
|
Hotels, Restaurants & Leisure - 0.4% | | | | | | |
CEC Entertainment | | 64,100 | | | | 2,127,479 |
†Lotto24 1 | | 30,900 | | | | 139,462 |
†WMS Industries 1,2 | | 120,000 | | | | 2,100,000 |
| | | | | |
|
| | | | | | | 4,366,941 |
| | | | | |
|
Household Durables - 2.7% | | | | | | |
Blyth | | 34,200 | | | | 531,810 |
Desarrolladora Homex ADR 1 | | 14,100 | | | | 175,968 |
Ekornes | | 125,000 | | | | 2,084,504 |
Ethan Allen Interiors | | 345,800 | | | | 8,890,518 |
Hanssem | | 39,100 | | | | 678,880 |
Harman International Industries 2,3 | | 121,400 | | | | 5,419,296 |
Mohawk Industries 1,2,3 | | 122,900 | | | | 11,118,763 |
| | | | | |
|
| | | | | | | 28,899,739 |
| | | | | |
|
Internet & Catalog Retail - 0.5% | | | | | | |
Manutan International | | 53,900 | | | | 2,391,200 |
Takkt | | 190,000 | | | | 2,645,215 |
| | | | | |
|
| | | | | | | 5,036,415 |
| | | | | |
|
Leisure Equipment & Products - 0.4% | | | | | | |
Beneteau | | 180,000 | | | | 1,954,824 |
Shimano | | 38,000 | | | | 2,422,972 |
| | | | | |
|
| | | | | | | 4,377,796 |
| | | | | |
|
Media - 1.0% | | | | | | |
Morningstar 2 | | 98,900 | | | | 6,213,887 |
Pico Far East Holdings | | 11,679,000 | | | | 3,489,994 |
Television Broadcasts | | 135,000 | | | | 1,013,340 |
| | | | | |
|
| | | | | | | 10,717,221 |
| | | | | |
|
Multiline Retail - 0.5% | | | | | | |
Dollar Tree 1 | | 22,000 | | | | 892,320 |
New World Department Store China | | 7,215,700 | | | | 4,697,120 |
| | | | | |
|
| | | | | | | 5,589,440 |
| | | | | |
|
Specialty Retail - 1.7% | | | | | | |
Ascena Retail Group 1,2 | | 89,900 | | | | 1,662,251 |
Christopher & Banks 1 | | 43,700 | | | | 238,165 |
Dickson Concepts (International) | | 934,300 | | | | 497,189 |
Dover Saddlery 1 | | 17,821 | | | | 58,809 |
GameStop Corporation Cl. A 2 | | 32,400 | | | | 812,916 |
Guess? 2 | | 32,400 | | | | 795,096 |
Lewis Group | | 350,000 | | | | 2,854,939 |
L’Occitane International | | 100,000 | | | | 317,989 |
Luk Fook Holdings (International) | | 231,200 | | | | 741,939 |
Men’s Wearhouse (The) 2 | | 44,700 | | | | 1,392,852 |
Oriental Watch Holdings | | 407,600 | | | | 143,513 |
OSIM International | | 1,400,000 | | | | 1,990,669 |
Sa Sa International Holdings | | 800,000 | | | | 661,711 |
Stein Mart | | 167,800 | | | | 1,265,212 |
Systemax | | 194,000 | | | | 1,872,100 |
TravelCenters of America LLC 1 | | 27,600 | | | | 129,720 |
USS | | 12,000 | | | | 1,243,854 |
West Marine 1 | | 131,100 | | | | 1,409,325 |
Wet Seal (The) Cl. A 1 | | 75,200 | | | | 207,552 |
| | | | | |
|
| | | | | | | 18,295,801 |
| | | | | |
|
Textiles, Apparel & Luxury Goods - 3.4% | | | | | | |
Anta Sports Products | | 1,713,200 | | | | 1,531,566 |
Carter’s 1,2,3 | | 204,100 | | | | 11,358,165 |
Columbia Sportswear 2,3 | | 31,197 | | | | 1,664,672 |
Daphne International Holdings | | 1,660,100 | | | | 2,299,653 |
Gildan Activewear | | 20,000 | | | | 731,600 |
Grendene | | 250,000 | | | | 2,025,886 |
J.G. Boswell Company 4 | | 2,292 | | | | 1,870,249 |
K-Swiss Cl. A 1 | | 163,600 | | | | 549,696 |
Pacific Textiles Holdings | | 5,571,000 | | | | 5,040,501 |
PVH | | 4,600 | | | | 510,646 |
Stella International Holdings | | 633,700 | | | | 1,717,839 |
Texwinca Holdings | | 1,830,300 | | | | 1,748,086 |
Van de Velde | | 30,000 | | | | 1,356,683 |
Wolverine World Wide 2 | | 100,000 | | | | 4,098,000 |
| | | | | |
|
| | | | | | | 36,503,242 |
| | | | | |
|
Total (Cost $115,105,364) | | | | | | 150,139,749 |
| | | | | |
|
| | | | | | | |
Consumer Staples – 2.1% | | | | | | |
Beverages - 0.0% | | | | | | |
MGP Ingredients | | 127,400 | | | | 435,708 |
| | | | | |
|
Food & Staples Retailing - 0.3% | | | | | | |
FamilyMart | | 76,000 | | | | 3,128,478 |
| | | | | |
|
Food Products - 1.8% | | | | | | |
Alico | | 27,000 | | | | 989,010 |
Cal-Maine Foods | | 28,248 | | | | 1,136,135 |
First Resources | | 307,100 | | | | 511,588 |
Industrias Bachoco ADR | | 3,000 | | | | 83,760 |
Origin Agritech 1 | | 76,800 | | | | 106,752 |
Seneca Foods Cl. A 1 | | 110,000 | | | | 3,344,000 |
Seneca Foods Cl. B 1 | | 13,251 | | | | 397,398 |
Super Group | | 590,000 | | | | 1,570,516 |
Tootsie Roll Industries | | 322,058 | | | | 8,347,743 |
Waterloo Investment Holdings 1,5 | | 598,676 | | | | 87,526 |
| THE ACCOMPANYING NOTES ARE AN INTEGRAL PART OF THESE FINANCIAL STATEMENTS. | | 2012 Annual Report to Stockholders | 19 |
| Royce Value Trust | |
|
| |
| Schedule of Investments |
| | | SHARES | | | VALUE |
| | | | | | | |
| Consumer Staples (continued) | | | | | | |
| Food Products (continued) | | | | | | |
Westway Group | | 380,000 | | | $ | 2,534,600 |
| | | | | |
|
| | | | | | | 19,109,028 |
| | | | | |
|
Total (Cost $18,927,929) | | | | | | 22,673,214 |
| | | | | |
|
Diversified Investment Companies – 0.4% | | | | | | |
Closed-End Funds - 0.4% | | | | | | |
Central Fund of Canada Cl. A 2,3 | | 226,000 | | | | 4,752,780 |
| | | | | |
|
Total (Cost $2,031,251) | | | | | | 4,752,780 |
| | | | | |
|
Energy – 5.1% | | | | | | |
Energy Equipment & Services - 4.4% | | | | | | |
Cal Dive International 1 | | 456,250 | | | | 789,312 |
CARBO Ceramics 2,3 | | 8,000 | | | | 626,720 |
Ensign Energy Services | | 225,100 | | | | 3,478,222 |
Heckmann Corporation 1,2,3 | | 50,000 | | | | 201,500 |
Helmerich & Payne 2,3 | | 125,100 | | | | 7,006,851 |
ION Geophysical 1 | | 361,500 | | | | 2,353,365 |
Oil States International 1,2,3 | | 103,823 | | | | 7,427,497 |
Pason Systems | | 105,800 | | | | 1,824,138 |
SEACOR Holdings 2 | | 92,866 | | | | 7,782,171 |
ShawCor Cl. A | | 54,300 | | | | 2,128,438 |
Steel Excel 1,4 | | 156,880 | | | | 3,890,624 |
†Superior Energy Services 1,2 | | 77,600 | | | | 1,607,872 |
TETRA Technologies 1,2 | | 68,000 | | | | 516,120 |
TGS-NOPEC Geophysical | | 40,000 | | | | 1,310,812 |
Tidewater | | 36,000 | | | | 1,608,480 |
Trican Well Service | | 263,000 | | | | 3,468,945 |
Unit Corporation 1 | | 34,000 | | | | 1,531,700 |
| | | | | |
|
| | | | | | | 47,552,767 |
| | | | | |
|
Oil, Gas & Consumable Fuels - 0.7% | | | | | | |
†Africa Oil 1 | | 74,800 | | | | 525,638 |
Bill Barrett 1,2 | | 50,000 | | | | 889,500 |
Cimarex Energy 2 | | 61,300 | | | | 3,538,849 |
†Green Plains Renewable Energy 1 | | 82,000 | | | | 648,620 |
Resolute Energy 1,2 | | 201,134 | | | | 1,635,219 |
†VAALCO Energy 1,2 | | 33,300 | | | | 288,045 |
| | | | | |
|
| | | | | | | 7,525,871 |
| | | | | |
|
Total (Cost $47,035,152) | | | | | | 55,078,638 |
| | | | | |
|
Financials – 17.8% | | | | | | |
Capital Markets - 9.0% | | | | | | |
Affiliated Managers Group 1,2,3 | | 42,200 | | | | 5,492,330 |
AllianceBernstein Holding L.P. 2 | | 514,600 | | | | 8,969,478 |
AP Alternative Assets L.P. 1 | | 233,200 | | | | 3,458,733 |
Artio Global Investors Cl. A | | 433,000 | | | | 822,700 |
ASA Gold and Precious Metals | | 117,501 | | | | 2,529,797 |
Ashmore Group | | 831,000 | | | | 4,805,107 |
Cowen Group 1 | | 1,274,458 | | | | 3,122,422 |
Dubai Investments | | 8,900,000 | | | | 2,073,850 |
Eaton Vance 2 | | 85,300 | | | | 2,716,805 |
Egyptian Financial Group-Hermes Holding Company 1 | | 51,625 | | | | 89,451 |
FBR & Co. 1 | | 576,200 | | | | 2,229,894 |
Federated Investors Cl. B 2,3 | | 224,700 | | | | 4,545,681 |
GAMCO Investors Cl. A | | 80,575 | | | | 4,276,115 |
GFI Group 2 | | 166,247 | | | | 538,640 |
GIMV | | 35,000 | | | | 1,759,934 |
Gleacher & Company 1 | | 200,000 | | | | 150,000 |
Jupiter Fund Management | | 75,000 | | | | 348,103 |
KKR & Co. L.P. | | 415,000 | | | | 6,320,450 |
Lazard Cl. A | | 206,100 | | | | 6,150,024 |
MVC Capital | | 254,200 | | | | 3,088,530 |
Oppenheimer Holdings Cl. A | | 75,000 | | | | 1,295,250 |
Paris Orleans | | 226,496 | | | | 5,171,501 |
Partners Group Holding | | 11,200 | | | | 2,586,881 |
Reinet Investments 1 | | 164,948 | | | | 3,008,098 |
Reinet Investments DR 1 | | 500,000 | | | | 930,652 |
SEI Investments | | 323,100 | | | | 7,541,154 |
Sprott | | 370,600 | | | | 1,475,396 |
Value Partners Group | | 7,071,900 | | | | 4,747,299 |
VZ Holding | | 5,984 | | | | 754,759 |
Waddell & Reed Financial Cl. A 2 | | 139,300 | | | | 4,850,426 |
Westwood Holdings Group | | 23,460 | | | | 959,514 |
| | | | | |
|
| | | | | | | 96,808,974 |
| | | | | |
|
Commercial Banks - 1.8% | | | | | | |
Bank of N.T. Butterfield & Son 1 | | 1,784,161 | | | | 2,230,201 |
BCB Holdings 1 | | 598,676 | | | | 211,523 |
Farmers & Merchants Bank of Long Beach | | 1,200 | | | | 5,172,000 |
Fauquier Bankshares | | 160,800 | | | | 1,913,520 |
†First Citizens BancShares Cl. A | | 45,527 | | | | 7,443,665 |
Mechanics Bank | | 200 | | | | 2,150,000 |
| | | | | |
|
| | | | | | | 19,120,909 |
| | | | | |
|
Diversified Financial Services - 1.3% | | | | | | |
Banca Finnat Euramerica | | 1,060,000 | | | | 376,952 |
Leucadia National | | 38,300 | | | | 911,157 |
PICO Holdings 1 | | 67,500 | | | | 1,368,225 |
RHJ International 1 | | 622,500 | | | | 3,272,454 |
†Sofina | | 89,000 | | | | 8,061,573 |
| | | | | |
|
| | | | | | | 13,990,361 |
| | | | | |
|
Insurance - 3.1% | | | | | | |
Alleghany Corporation 1,2 | | 8,999 | | | | 3,018,444 |
Argo Group International Holdings 2 | | 18,200 | | | | 611,338 |
E-L Financial | | 20,900 | | | | 9,139,942 |
Erie Indemnity Cl. A 2 | | 50,000 | | | | 3,461,000 |
Independence Holding | | 349,423 | | | | 3,326,507 |
Platinum Underwriters Holdings | | 161,900 | | | | 7,447,400 |
Primerica | | 170,000 | | | | 5,101,700 |
ProAssurance Corporation | | 44,000 | | | | 1,856,360 |
| | | | | |
|
| | | | | | | 33,962,691 |
| | | | | |
|
Real Estate Investment Trusts (REITs) - 0.0% | | | | | | |
Vestin Realty Mortgage II 1 | | 214,230 | | | | 314,918 |
| | | | | |
|
Real Estate Management & Development - 2.2% | | | | | | |
CBRE Group Cl. A 1,2 | | 24,200 | | | | 481,580 |
Consolidated-Tomoka Land | | 63,564 | | | | 1,971,120 |
E-House China Holdings ADR | | 585,161 | | | | 2,399,160 |
Forestar Group 1,2 | | 222,000 | | | | 3,847,260 |
| 20 | 2012 Annual Report to Stockholders | | THE ACCOMPANYING NOTES ARE AN INTEGRAL PART OF THESE FINANCIAL STATEMENTS. |
| | | SHARES | | | VALUE |
| | | | | | | |
| Financials (continued) | | | | | | |
| Real Estate Management & Development (continued) | | | | | | |
Kennedy-Wilson Holdings | | 191,000 | | | $ | 2,670,180 |
Midland Holdings | | 2,398,600 | | | | 1,164,775 |
St. Joe Company (The) 1,2,3 | | 167,000 | | | | 3,854,360 |
Tejon Ranch 1 | | 279,900 | | | | 7,859,592 |
| | | | | |
|
| | | | | | | 24,248,027 |
| | | | | |
|
Thrifts & Mortgage Finance - 0.4% | | | | | | |
CFS Bancorp | | 150,000 | | | | 936,000 |
Kearny Financial | | 70,862 | | | | 690,904 |
Timberland Bancorp 1,6 | | 444,200 | | | | 3,082,748 |
| | | | | |
|
| | | | | | | 4,709,652 |
| | | | | |
|
Total (Cost $200,748,625) | | | | | | 193,155,532 |
| | | | | |
|
| | | | | | | |
Health Care – 6.5% | | | | | | |
Biotechnology - 0.1% | | | | | | |
Green Cross | | 5,000 | | | | 647,779 |
| | | | | |
|
Health Care Equipment & Supplies - 2.2% | | | | | | |
Allied Healthcare Products 1 | | 140,512 | | | | 369,547 |
Analogic Corporation 2 | | 40,135 | | | | 2,982,030 |
Atrion Corporation | | 15,750 | | | | 3,087,000 |
bioMerieux | | 17,000 | | | | 1,643,232 |
Carl Zeiss Meditec | | 55,000 | | | | 1,580,183 |
CONMED Corporation | | 81,500 | | | | 2,277,925 |
DiaSorin | | 50,000 | | | | 2,005,590 |
DynaVox Cl. A 1 | | 55,000 | | | | 20,350 |
IDEXX Laboratories 1,2 | | 40,201 | | | | 3,730,653 |
Kossan Rubber Industries | | 647,568 | | | | 711,365 |
Nihon Kohden | | 25,100 | | | | 761,049 |
Straumann Holding | | 10,000 | | | | 1,235,985 |
Top Glove | | 375,000 | | | | 691,512 |
Urologix 1 | | 142,648 | | | | 97,001 |
Young Innovations | | 66,447 | | | | 2,618,676 |
| | | | | |
|
| | | | | | | 23,812,098 |
| | | | | |
|
Health Care Providers & Services - 0.9% | | | | | | |
†Accretive Health 1 | | 160,000 | | | | 1,849,600 |
Landauer 2 | | 75,500 | | | | 4,621,355 |
MWI Veterinary Supply 1,2 | | 10,000 | | | | 1,100,000 |
VCA Antech 1,2 | | 82,500 | | | | 1,736,625 |
WellCare Health Plans 1 | | 15,400 | | | | 749,826 |
| | | | | |
|
| | | | | | | 10,057,406 |
| | | | | |
|
Life Sciences Tools & Services - 1.9% | | | | | | |
Bio-Rad Laboratories Cl. A 1 | | 21,388 | | | | 2,246,809 |
EPS Corporation | | 612 | | | | 1,568,052 |
Furiex Pharmaceuticals 1 | | 8,333 | | | | 160,494 |
ICON ADR 1 | | 43,963 | | | | 1,220,413 |
Luminex Corporation 1 | | 20,000 | | | | 335,200 |
PAREXEL International 1 | | 312,400 | | | | 9,243,916 |
PerkinElmer 2,3 | | 185,800 | | | | 5,897,292 |
| | | | | |
|
| | | | | | | 20,672,176 |
| | | | | |
|
Pharmaceuticals - 1.4% | | | | | | |
Adcock Ingram Holdings | | 300,000 | | | | 1,911,099 |
Almirall | | 200,000 | | | | 1,964,882 |
Boiron | | 55,000 | | | | 1,897,321 |
Kalbe Farma | | 4,000,000 | | | | 441,704 |
Recordati | | 300,000 | | | | 2,748,609 |
Santen Pharmaceutical | | 61,000 | | | | 2,335,482 |
Vetoquinol | | 50,000 | | | | 1,753,108 |
Virbac | | 10,000 | | | | 1,977,333 |
| | | | | |
|
| | | | | | | 15,029,538 |
| | | | | |
|
Total (Cost $43,447,204) | | | | | | 70,218,997 |
| | | | | |
|
| | | | | | | |
Industrials – 27.8% | | | | | | |
Aerospace & Defense - 1.8% | | | | | | |
AeroVironment 1 | | 13,000 | | | | 282,620 |
Alliant Techsystems 2 | | 8,000 | | | | 495,680 |
Cubic Corporation | | 11,800 | | | | 566,046 |
Ducommun 1 | | 117,200 | | | | 1,895,124 |
HEICO Corporation 2,3 | | 210,351 | | | | 9,415,311 |
HEICO Corporation Cl. A | | 64,647 | | | | 2,067,411 |
Hexcel Corporation 1 | | 47,500 | | | | 1,280,600 |
Moog Cl. A 1 | | 25,000 | | | | 1,025,750 |
National Presto Industries | | 3,000 | | | | 207,300 |
Teledyne Technologies 1 | | 43,630 | | | | 2,839,004 |
| | | | | |
|
| | | | | | | 20,074,846 |
| | | | | |
|
Air Freight & Logistics - 1.4% | | | | | | |
Forward Air | | 209,750 | | | | 7,343,348 |
Hub Group Cl. A 1,2,3 | | 149,400 | | | | 5,019,840 |
UTi Worldwide | | 175,000 | | | | 2,345,000 |
| | | | | |
|
| | | | | | | 14,708,188 |
| | | | | |
|
Building Products - 1.4% | | | | | | |
American Woodmark 1 | | 123,335 | | | | 3,431,180 |
Apogee Enterprises 2 | | 78,400 | | | | 1,879,248 |
Burnham Holdings Cl. B 4 | | 36,000 | | | | 507,600 |
Simpson Manufacturing | | 275,300 | | | | 9,027,087 |
| | | | | |
|
| | | | | | | 14,845,115 |
| | | | | |
|
Commercial Services & Supplies - 2.5% | | | | | | |
Brink’s Company (The) | | 206,320 | | | | 5,886,309 |
CompX International Cl. A | | 185,300 | | | | 2,581,229 |
Copart 1 | | 149,780 | | | | 4,418,510 |
Kimball International Cl. B | | 286,180 | | | | 3,322,550 |
Moshi Moshi Hotline | | 23,900 | | | | 304,623 |
Ritchie Bros. Auctioneers 2,3 | | 297,800 | | | | 6,221,042 |
Sykes Enterprises 1 | | 68,649 | | | | 1,044,838 |
Tetra Tech 1 | | 119,900 | | | | 3,171,355 |
TMS International Cl. A 1 | | 45,500 | | | | 569,660 |
| | | | | |
|
| | | | | | | 27,520,116 |
| | | | | |
|
Construction & Engineering - 1.8% | | | | | | |
EMCOR Group | | 199,400 | | | | 6,901,234 |
Integrated Electrical Services 1 | | 266,349 | | | | 1,241,186 |
Jacobs Engineering Group 1,2 | | 81,400 | | | | 3,465,198 |
KBR | | 180,000 | | | | 5,385,600 |
†MYR Group 1,2 | | 25,900 | | | | 576,275 |
Raubex Group | | 750,000 | | | | 1,500,104 |
| | | | | |
|
| | | | | | | 19,069,597 |
| | | | | |
|
Electrical Equipment - 3.1% | | | | | | |
AZZ | | 53,099 | | | | 2,040,594 |
Belden | | 57,800 | | | | 2,600,422 |
| THE ACCOMPANYING NOTES ARE AN INTEGRAL PART OF THESE FINANCIAL STATEMENTS. | | 2012 Annual Report to Stockholders | 21 |
| Royce Value Trust | |
|
| |
| Schedule of Investments |
| | | SHARES | | | VALUE |
| | | | | | | |
| Industrials (continued) | | | | | | |
| Electrical Equipment (continued) | | | | | | |
Elektrobudowa | | 16,392 | | | $ | 556,257 |
Franklin Electric | | 104,600 | | | | 6,502,982 |
GrafTech International 1 | | 590,587 | | | | 5,545,612 |
†Hubbell Cl. B 2 | | 7,000 | | | | 592,410 |
Powell Industries 1 | | 92,400 | | | | 3,837,372 |
Preformed Line Products | | 91,600 | | | | 5,442,872 |
Regal-Beloit | | 100,000 | | | | 7,047,000 |
| | | | | |
|
| | | | | | | 34,165,521 |
| | | | | |
|
Industrial Conglomerates - 0.5% | | | | | | |
†Carlisle Companies 2 | | 10,400 | | | | 611,104 |
Raven Industries 2 | | 199,000 | | | | 5,245,640 |
| | | | | |
|
| | | | | | | 5,856,744 |
| | | | | |
|
Machinery - 10.1% | | | | | | |
Armstrong Industrial | | 1,514,500 | | | | 326,656 |
Astec Industries | | 46,500 | | | | 1,549,845 |
Burckhardt Compression Holding | | 14,400 | | | | 4,722,953 |
Chen Hsong Holdings | | 1,615,000 | | | | 493,456 |
CLARCOR 2 | | 92,500 | | | | 4,419,650 |
Columbus McKinnon 1 | | 110,800 | | | | 1,830,416 |
Donaldson Company 2,3 | | 185,600 | | | | 6,095,104 |
EVA Precision Industrial Holdings | | 3,476,000 | | | | 576,067 |
FAG Bearings India | | 29,500 | | | | 923,579 |
Gardner Denver | | 10,300 | | | | 705,550 |
Graco | | 116,376 | | | | 5,992,200 |
IDEX Corporation | | 67,400 | | | | 3,136,122 |
Kennametal 2,3 | | 213,300 | | | | 8,532,000 |
Lincoln Electric Holdings | | 223,060 | | | | 10,858,561 |
NN 1 | | 197,100 | | | | 1,805,436 |
Nordson Corporation | | 169,996 | | | | 10,730,148 |
Pfeiffer Vacuum Technology | | 17,000 | | | | 2,058,527 |
PMFG 1 | | 388,352 | | | | 3,530,120 |
Rational | | 7,000 | | | | 2,015,989 |
RBC Bearings 1 | | 47,000 | | | | 2,353,290 |
Rotork | | 30,000 | | | | 1,244,131 |
Semperit AG Holding | | 84,000 | | | | 3,462,134 |
Spirax-Sarco Engineering | | 65,000 | | | | 2,443,806 |
Sun Hydraulics | | 8,600 | | | | 224,288 |
Timken Company (The) | | 9,400 | | | | 449,602 |
Valmont Industries | | 44,500 | | | | 6,076,475 |
WABCO Holdings 1 | | 103,800 | | | | 6,766,722 |
Wabtec Corporation | | 87,725 | | | | 7,679,446 |
Woodward 2,3 | | 208,400 | | | | 7,946,292 |
| | | | | |
|
| | | | | | | 108,948,565 |
| | | | | |
|
Marine - 0.5% | | | | | | |
Kirby Corporation 1,2 | | 80,000 | | | | 4,951,200 |
| | | | | |
|
Professional Services - 2.8% | | | | | | |
Advisory Board (The) 1,2,3 | | 231,200 | | | | 10,817,848 |
CRA International 1 | | 64,187 | | | | 1,268,977 |
FTI Consulting 1,2 | | 7,850 | | | | 259,050 |
JobStreet Corporation | | 723,400 | | | | 520,431 |
ManpowerGroup | | 78,600 | | | | 3,335,784 |
Michael Page International | | 325,000 | | | | 2,099,068 |
On Assignment 1 | | 375,400 | | | | 7,613,112 |
Robert Half International | | 136,100 | | | | 4,330,702 |
| | | | | |
|
| | | | | | | 30,244,972 |
| | | | | |
|
Road & Rail - 1.2% | | | | | | |
Frozen Food Express Industries 1 | | 286,635 | | | | 255,105 |
Landstar System 2 | | 99,400 | | | | 5,214,524 |
Patriot Transportation Holding 1 | | 212,958 | | | | 6,054,396 |
Universal Truckload Services | | 55,000 | | | | 1,003,750 |
| | | | | |
|
| | | | | | | 12,527,775 |
| | | | | |
|
Trading Companies & Distributors - 0.6% | | | | | | |
AerCap Holdings 1 | | 45,000 | | | | 617,400 |
Lawson Products | | 161,431 | | | | 1,598,167 |
MSC Industrial Direct Cl. A 2 | | 59,548 | | | | 4,488,728 |
| | | | | |
|
| | | | | | | 6,704,295 |
| | | | | |
|
Transportation Infrastructure - 0.1% | | | | | | |
Wesco Aircraft Holdings 1 | | 68,400 | | | | 903,564 |
| | | | | |
|
Total (Cost $167,135,935) | | | | | | 300,520,498 |
| | | | | |
|
| | | | | | | |
Information Technology – 19.6% | | | | | | |
Communications Equipment - 1.6% | | | | | | |
AAC Technologies Holdings | | 177,600 | | | | 625,662 |
†Acme Packet 1,2,3 | | 121,000 | | | | 2,676,520 |
ADTRAN 2,3 | | 187,700 | | | | 3,667,658 |
Bel Fuse Cl. A | | 36,672 | | | | 631,125 |
Cogo Group 1 | | 87,715 | | | | 190,342 |
Comba Telecom Systems Holdings | | 997,728 | | | | 367,811 |
Comtech Telecommunications 2 | | 30,000 | | | | 761,400 |
EVS Broadcast Equipment | | 35,000 | | | | 2,064,860 |
Globecomm Systems 1 | | 183,700 | | | | 2,075,810 |
Sonus Networks 1 | | 1,124,000 | | | | 1,910,800 |
Tellabs | | 700,000 | | | | 1,596,000 |
VTech Holdings | | 47,050 | | | | 528,645 |
| | | | | |
|
| | | | | | | 17,096,633 |
| | | | | |
|
Computers & Peripherals - 0.9% | | | | | | |
Asustek Computer | | 50,000 | | | | 564,587 |
Catcher Technology | | 84,600 | | | | 423,410 |
China Digital TV Holding Co. ADR | | 5,000 | | | | 8,400 |
Diebold | | 151,600 | | | | 4,640,476 |
Foxconn Technology | | 85,155 | | | | 268,152 |
Intermec 1 | | 23,000 | | | | 226,780 |
Intevac 1 | | 57,450 | | | | 262,547 |
QLogic Corporation 1 | | 24,100 | | | | 234,493 |
†Seagate Technology 2 | | 10,400 | | | | 316,992 |
Simplo Technology | | 104,630 | | | | 528,489 |
SMART Technologies Cl. A 1 | | 75,000 | | | | 118,500 |
†STEC 1 | | 375,500 | | | | 1,851,215 |
Western Digital 2 | | 10,400 | | | | 441,896 |
| | | | | |
|
| | | | | | | 9,885,937 |
| | | | | |
|
Electronic Equipment, Instruments & Components - 8.7% | | | | | | |
Agilysys 1 | | 165,125 | | | | 1,382,096 |
Anixter International 2 | | 61,795 | | | | 3,953,644 |
Benchmark Electronics 1,2 | | 165,200 | | | | 2,745,624 |
Broadway Industrial Group | | 945,600 | | | | 241,287 |
Chroma Ate | | 269,982 | | | | 601,004 |
| 22 | 2012 Annual Report to Stockholders | | THE ACCOMPANYING NOTES ARE AN INTEGRAL PART OF THESE FINANCIAL STATEMENTS. |
| | | SHARES | | | VALUE |
| | | | | | | |
| Information Technology (continued) | | | | | | |
| Electronic Equipment, Instruments & Components (continued) | | | | | | |
Cognex Corporation | | 179,900 | | | $ | 6,623,918 |
Coherent | | 219,500 | | | | 11,111,090 |
Dolby Laboratories Cl. A 2 | | 149,600 | | | | 4,387,768 |
DTS 1 | | 207,000 | | | | 3,456,900 |
†FARO Technologies 1,2 | | 32,300 | | | | 1,152,464 |
FEI Company 2 | | 93,200 | | | | 5,168,872 |
FLIR Systems | | 246,000 | | | | 5,488,260 |
Hana Microelectronics | | 708,100 | | | | 529,108 |
Hollysys Automation Technologies 1 | | 63,927 | | | | 758,813 |
Inficon Holding | | 1,100 | | | | 263,804 |
IPG Photonics 2 | | 64,420 | | | | 4,293,593 |
Molex 2 | | 72,600 | | | | 1,984,158 |
National Instruments | | 251,850 | | | | 6,500,249 |
Newport Corporation 1 | | 523,500 | | | | 7,041,075 |
Perceptron | | 357,700 | | | | 2,110,430 |
Plexus Corporation 1 | | 176,100 | | | | 4,543,380 |
Richardson Electronics | | 333,912 | | | | 3,779,884 |
Rofin-Sinar Technologies 1 | | 305,400 | | | | 6,621,072 |
Tech Data 1,2,3 | | 91,300 | | | | 4,156,889 |
TTM Technologies 1,2 | | 211,400 | | | | 1,944,880 |
Vaisala Cl. A | | 161,680 | | | | 3,396,064 |
| | | | | |
|
| | | | | | | 94,236,326 |
| | | | | |
|
Internet Software & Services - 0.9% | | | | | | |
Active Network 1 | | 21,500 | | | | 105,565 |
Perficient 1 | | 10,000 | | | | 117,800 |
RealNetworks 1 | | 61,350 | | | | 463,806 |
ValueClick 1 | | 145,000 | | | | 2,814,450 |
VistaPrint 1,2,3 | | 187,000 | | | | 6,144,820 |
| | | | | |
|
| | | | | | | 9,646,441 |
| | | | | |
|
IT Services - 2.5% | | | | | | |
Convergys Corporation | | 121,000 | | | | 1,985,610 |
CSE Global | | 1,792,100 | | | | 1,154,241 |
eClerx Services | | 35,900 | | | | 449,784 |
Forrester Research 2 | | 20,100 | | | | 538,680 |
Hackett Group | | 655,000 | | | | 2,803,400 |
ManTech International Cl. A | | 35,400 | | | | 918,276 |
MAXIMUS | | 94,200 | | | | 5,955,324 |
MoneyGram International 1,2 | | 164,962 | | | | 2,192,345 |
NeuStar Cl. A 1 | | 39,287 | | | | 1,647,304 |
Sapient Corporation 1 | | 706,602 | | | | 7,461,717 |
Unisys Corporation 1 | | 94,000 | | | | 1,626,200 |
| | | | | |
|
| | | | | | | 26,732,881 |
| | | | | |
|
Office Electronics - 0.1% | | | | | | |
Zebra Technologies Cl. A 1,2 | | 23,058 | | | | 905,718 |
| | | | | |
|
Semiconductors & Semiconductor Equipment - 3.3% | | | | | | |
Aixtron ADR | | 88,258 | | | | 1,054,683 |
Analog Devices 2 | | 11,200 | | | | 471,072 |
ASM Pacific Technology | | 15,000 | | | | 184,128 |
ATMI 1 | | 92,215 | | | | 1,925,449 |
BE Semiconductor Industries 4 | | 58,000 | | | | 429,200 |
Cabot Microelectronics | | 35,209 | | | | 1,250,272 |
Diodes 1 | | 252,450 | | | | 4,380,008 |
Exar Corporation 1 | | 157,576 | | | | 1,402,426 |
Integrated Silicon Solution 1 | | 180,200 | | | | 1,621,800 |
International Rectifier 1 | | 330,000 | | | | 5,850,900 |
Intersil Corporation Cl. A 2 | | 190,000 | | | | 1,575,100 |
Miraial | | 26,170 | | | | 492,972 |
Nanometrics 1,2 | | 159,400 | | | | 2,298,548 |
Power Integrations 2 | | 49,000 | | | | 1,646,890 |
RDA Microelectronics ADR | | 94,800 | | | | 1,019,100 |
Teradyne 1,2,3 | | 287,200 | | | | 4,850,808 |
TriQuint Semiconductor 1 | | 670,000 | | | | 3,242,800 |
Veeco Instruments 1,2 | | 88,000 | | | | 2,597,760 |
| | | | | |
|
| | | | | | | 36,293,916 |
| | | | | |
|
Software - 1.6% | | | | | | |
ACI Worldwide 1,2,3 | | 131,150 | | | | 5,729,943 |
ANSYS 1,2,3 | | 105,600 | | | | 7,111,104 |
Aspen Technology 1 | | 42,100 | | | | 1,163,644 |
Blackbaud 2 | | 31,400 | | | | 716,862 |
Majesco Entertainment 1 | | 36,255 | | | | 38,068 |
SimCorp | | 10,000 | | | | 2,238,521 |
| | | | | |
|
| | | | | | | 16,998,142 |
| | | | | |
|
Total (Cost $184,774,858) | | | | | | 211,795,994 |
| | | | | |
|
Materials – 8.1% | | | | | | |
Chemicals - 1.7% | | | | | | |
Cabot Corporation 2,3 | | 67,200 | | | | 2,673,888 |
Hawkins | | 86,178 | | | | 3,329,918 |
Huchems Fine Chemical | | 40,056 | | | | 968,496 |
Intrepid Potash 2 | | 131,766 | | | | 2,805,298 |
KMG Chemicals | | 33,274 | | | | 584,624 |
LSB Industries 1 | | 49,849 | | | | 1,765,652 |
Minerals Technologies 2 | | 57,860 | | | | 2,309,771 |
Mosaic Company (The) 2 | | 16,000 | | | | 906,080 |
Victrex | | 85,000 | | | | 2,293,983 |
†W.R. Grace & Co. 1,2 | | 17,200 | | | | 1,156,356 |
| | | | | |
|
| | | | | | | 18,794,066 |
| | | | | |
|
Construction Materials - 0.9% | | | | | | |
Ash Grove Cement Cl. B 4 | | 50,518 | | | | 7,628,218 |
†Cemex ADR 1,2 | | 30,000 | | | | 296,100 |
Mardin Cimento Sanayii | | 500,000 | | | | 1,496,783 |
| | | | | |
|
| | | | | | | 9,421,101 |
| | | | | |
|
Containers & Packaging - 1.1% | | | | | | |
Greif Cl. A 2 | | 90,844 | | | | 4,042,558 |
Mayr-Melnhof Karton | | 70,000 | | | | 7,508,986 |
| | | | | |
|
| | | | | | | 11,551,544 |
| | | | | |
|
Metals & Mining - 4.4% | | | | | | |
Allied Nevada Gold 1,2 | | 23,600 | | | | 711,068 |
AuRico Gold 1 | | 258,300 | | | | 2,112,894 |
Central Steel & Wire 4 | | 6,062 | | | | 4,032,745 |
Cliffs Natural Resources | | 22,300 | | | | 859,888 |
Endeavour Mining 1 | | 300,000 | | | | 624,309 |
Fresnillo | | 25,000 | | | | 775,720 |
Globe Specialty Metals | | 45,600 | | | | 627,000 |
Hecla Mining | | 300,000 | | | | 1,749,000 |
Hochschild Mining | | 250,000 | | | | 1,942,513 |
Kimber Resources 1 | | 560,000 | | | | 212,800 |
| THE ACCOMPANYING NOTES ARE AN INTEGRAL PART OF THESE FINANCIAL STATEMENTS. | | 2012 Annual Report to Stockholders | 23 |
| Royce Value Trust | December 31, 2012 |
|
| |
| Schedule of Investments |
| | | SHARES | | | VALUE |
| | | | | | | |
| Materials (continued) | | | | | | | |
| Metals & Mining (continued) | | | | | | | |
Maharashtra Seamless | | 330,000 | | | $ | 1,627,119 | |
Major Drilling Group International | | 399,600 | | | | 3,936,946 | |
Medusa Mining | | 250,000 | | | | 1,441,982 | |
†Pretium Resources 1 | | 39,000 | | | | 515,190 | |
Randgold Resources ADR | | 33,000 | | | | 3,275,250 | |
Reliance Steel & Aluminum 2,3 | | 160,720 | | | | 9,980,712 | |
Schnitzer Steel Industries Cl. A 2 | | 100,000 | | | | 3,033,000 | |
Silvercorp Metals 2 | | 116,500 | | | | 596,480 | |
Sims Metal Management ADR | | 219,167 | | | | 2,160,987 | |
Synalloy Corporation | | 178,800 | | | | 2,345,856 | |
Worthington Industries | | 185,000 | | | | 4,808,150 | |
| | | | | |
| |
| | | | | | | 47,369,609 | |
| | | | | |
| |
| Paper & Forest Products - 0.0% | | | | | | | |
Qunxing Paper Holdings 5 | | 3,296,000 | | | | 175,541 | |
| | | | | |
| |
| Total (Cost $70,926,378) | | | | | | 87,311,861 | |
| | | | | |
| |
| Telecommunication Services – 0.7% | | | | | | | |
| Wireless Telecommunication Services - 0.7% | | | | | | | |
Telephone and Data Systems | | 338,270 | | | | 7,489,298 | |
| | | | | |
| |
| Total (Cost $8,279,046) | | | | | | 7,489,298 | |
| | | | | |
| |
| Miscellaneous 7 – 3.8% | | | | | | | |
| Total (Cost $41,383,240) | | | | | | 41,610,785 | |
| | | | | |
| |
| TOTAL COMMON STOCKS | | | | | | | |
(Cost $899,794,982) | | | | | | 1,144,747,346 | |
| | | | | |
| |
| PREFERRED STOCK – 0.1% | | | | | | | |
Seneca Foods Conv. 1,5 | | | | | | | |
(Cost $796,469) | | 55,000 | | | | 1,504,800 | |
| | | | | |
| |
| REPURCHASE AGREEMENT – 6.9% | | | | | | | |
| Fixed Income Clearing Corporation, | | | | | | | |
0.10% dated 12/31/12, due 1/2/13, |
maturity value $74,647,415 (collateralized |
by obligations of various U.S. Government |
Agencies, 0.25% due 9/6/13, valued at $76,140,056) |
(Cost $74,647,000) | | | | | | 74,647,000 | |
| | | | | |
| |
| TOTAL INVESTMENTS – 112.8% | | | | | | | |
(Cost $975,238,451) | | | | | | 1,220,899,146 | |
| | | | | | | | |
| LIABILITIES LESS CASH | | | | | | | |
AND OTHER ASSETS – (12.8)% | | | | | | (138,472,650 | ) |
| | | | | |
| |
| NET ASSETS – 100.0% | | | | | $ | 1,082,426,496 | |
| | | | | |
| |
|
| † | New additions in 2012. |
| 1 | Non-income producing. |
| 2 | All or a portion of these securities were pledged as collateral in connection with the revolving credit agreement at December 31, 2012. Total market value of pledged securities at December 31, 2012, was $343,415,150. |
| 3 | At December 31, 2012, a portion of these securities were rehypothecated in connection with the Fund’s revolving credit agreement in the aggregate amount of $146,902,041. |
| 4 | These securities are defined as Level 2 securities due to fair value being based on quoted prices for similar securities. See Notes to Financial Statements. |
| 5 | Securities for which market quotations are not readily available represent 0.2% of net assets. These securities have been valued at their fair value under procedures approved by the Fund’s Board of Directors. These securities are defined as Level 3 securities due to the use of significant unobservable inputs in the determination of fair value. See Notes to Financial Statements. |
| 6 | At December 31, 2012, the Fund owned 5% or more of the Company’s outstanding voting securities thereby making the Company an Affiliated Company as that term is defined in the Investment Company Act of 1940. See Notes to Financial Statements. |
| 7 | Includes securities first acquired in 2012 and less than 1% of net assets. |
| | |
| | Bold indicates the Fund’s 20 largest equity holdings in terms of December 31, 2012, market value. |
| | |
| | TAX INFORMATION: The cost of total investments for Federal income tax purposes was $971,980,024. At December 31, 2012, net unrealized appreciation for all securities was $248,919,122, consisting of aggregate gross unrealized appreciation of $342,393,387 and aggregate gross unrealized depreciation of $93,474,265. The primary difference between book and tax basis cost is the timing of the recognition of losses on securities sold. |
|
| 24 | 2012 Annual Report to Stockholders | | THE ACCOMPANYING NOTES ARE AN INTEGRAL PART OF THESE FINANCIAL STATEMENTS. |
| Royce Value Trust | December 31, 2012 |
|
| |
| Statement of Assets and Liabilities |
| ASSETS: | | | | | |
| Investments at value | | | | | |
Non-Affiliated Companies (cost $895,158,885) | | | $ | 1,143,169,398 | |
Affiliated Companies (cost $5,432,566) | | | | 3,082,748 | |
| |
| Total investments at value | | | | 1,146,252,146 | |
| Repurchase agreements (at cost and value) | | | | 74,647,000 | |
| Cash and foreign currency | | | | 591,935 | |
| Receivable for investments sold | | | | 10,598,415 | |
| Receivable for dividends and interest | | | | 961,580 | |
| Prepaid expenses and other assets | | | | 472,346 | |
| |
Total Assets | | | | 1,233,523,422 | |
| |
| LIABILITIES: | | | | | |
| Revolving credit agreement | | | | 150,000,000 | |
| Payable for investments purchased | | | | 343,091 | |
| Payable for investment advisory fee | | | | 476,587 | |
| Payable for interest expense | | | | 21,000 | |
| Accrued expenses | | | | 256,248 | |
| |
Total Liabilities | | | | 151,096,926 | |
| |
Net Assets | | | $ | 1,082,426,496 | |
| |
| ANALYSIS OF NET ASSETS: | | | | | |
| Paid-in capital - $0.001 par value per share; 70,275,231 shares outstanding (150,000,000 shares authorized) | | | $ | 820,368,882 | |
| Undistributed net investment income (loss) | | | | 2,818,184 | |
| Accumulated net realized gain (loss) on investments and foreign currency | | | | 13,591,177 | |
| Net unrealized appreciation (depreciation) on investments and foreign currency | | | | 245,648,253 | |
| |
Net Assets (net asset value per share - $15.40) | | | $ | 1,082,426,496 | |
| |
Investments at identified cost | | | $ | 900,591,451 | |
| THE ACCOMPANYING NOTES ARE AN INTEGRAL PART OF THESE FINANCIAL STATEMENTS. | | 2012 Annual Report to Stockholders | 25 |
| Royce Value Trust | Year Ended December 31, 2012 |
|
| |
| Statement of Operations |
| INVESTMENT INCOME: | | | | | |
| Income: | | | | | |
Dividends 1 | | | $ | 22,870,207 | |
Interest | | | | 105,418 | |
Rehypothecation income | | | | 38,430 | |
Securities lending | | | | 526,743 | |
| |
| Total income | | | | 23,540,798 | |
| |
| Expenses: | | | | | |
Investment advisory fees | | | | 5,838,929 | |
Stockholder reports | | | | 403,494 | |
Custody and transfer agent fees | | | | 345,803 | |
Interest expense | | | | 252,048 | |
Administrative and office facilities | | | | 149,691 | |
Professional fees | | | | 145,456 | |
Directors’ fees | | | | 129,647 | |
Other expenses | | | | 118,684 | |
| |
Total expenses | | | | 7,383,752 | |
Compensating balance credits | | | | (71 | ) |
Fees waived by investment adviser | | | | (50,000 | ) |
| |
Net expenses | | | | 7,333,681 | |
| |
Net investment income (loss) | | | | 16,207,117 | |
| |
REALIZED AND UNREALIZED GAIN (LOSS) ON INVESTMENTS AND FOREIGN CURRENCY: | | | | | |
Net realized gain (loss): | | | | | |
Investments | | | | 63,037,316 | |
Foreign currency transactions | | | | (139,763 | ) |
Net change in unrealized appreciation (depreciation): | | | | | |
Investments and foreign currency translations | | | | 75,703,358 | |
Other assets and liabilities denominated in foreign currency | | | | (476 | ) |
| |
Net realized and unrealized gain (loss) on investments and foreign currency | | | | 138,600,435 | |
| |
NET INCREASE (DECREASE) IN NET ASSETS FROM INVESTMENT OPERATIONS | | | | 154,807,552 | |
| |
DISTRIBUTIONS TO PREFERRED STOCKHOLDERS | | | | (11,357,495 | ) |
| |
NET INCREASE (DECREASE) IN NET ASSETS APPLICABLE TO COMMON STOCKHOLDERS | | | | | |
FROM INVESTMENT OPERATIONS | | | $ | 143,450,057 | |
| 1 Net of foreign withholding tax of $620,073. |
| 26 | 2012 Annual Report to Stockholders | | THE ACCOMPANYING NOTES ARE AN INTEGRAL PART OF THESE FINANCIAL STATEMENTS. |
| Royce Value Trust | |
|
| |
| Statement of Changes in Net Assets Applicable to Common Stockholders |
| | | Year ended | | Year ended |
| | | 12/31/12 | | 12/31/11 |
INVESTMENT OPERATIONS: | | | | | | | | | | |
Net investment income (loss) | | | $ | 16,207,117 | | | | $ | 6,739,838 | |
Net realized gain (loss) on investments and foreign currency | | | | 62,897,553 | | | | | 35,713,778 | |
Net change in unrealized appreciation (depreciation) on investments and foreign currency | | | | 75,702,882 | | | | | (143,670,265 | ) |
| |
Net increase (decrease) in net assets from investment operations | | | | 154,807,552 | | | | | (101,216,649 | ) |
| |
DISTRIBUTIONS TO PREFERRED STOCKHOLDERS: | | | | | | | | | | |
Net investment income | | | | (2,356,525 | ) | | | | (2,024,508 | ) |
Net realized gain on investments and foreign currency | | | | (9,000,970 | ) | | | | (10,955,492 | ) |
| |
Total distributions to Preferred Stockholders | | | | (11,357,495 | ) | | | | (12,980,000 | ) |
| |
NET INCREASE (DECREASE) IN NET ASSETS APPLICABLE TO COMMON STOCKHOLDERS | | | | | | | | | | |
FROM INVESTMENT OPERATIONS | | | | 143,450,057 | | | | | (114,196,649 | ) |
| |
DISTRIBUTIONS TO COMMON STOCKHOLDERS: | | | | | | | | | | |
Net investment income | | | | (11,444,608 | ) | | | | (5,275,650 | ) |
Net realized gain on investments and foreign currency | | | | (43,713,673 | ) | | | | (28,548,829 | ) |
Return of capital | | | | – | | | | | (18,288,444 | ) |
| |
Total distributions to Common Stockholders | | | | (55,158,281 | ) | | | | (52,112,923 | ) |
| |
CAPITAL STOCK TRANSACTIONS: | | | | | | | | | | |
Reinvestment of distributions to Common Stockholders | | | | 27,494,847 | | | | | 27,070,308 | |
| |
Total capital stock transactions | | | | 27,494,847 | | | | | 27,070,308 | |
| |
NET INCREASE (DECREASE) IN NET ASSETS APPLICABLE TO COMMON STOCKHOLDERS | | | | 115,786,623 | | | | | (139,239,264 | ) |
| |
NET ASSETS APPLICABLE TO COMMON STOCKHOLDERS: | | | | | | | | | | |
Beginning of year | | | | 966,639,873 | | | | | 1,105,879,137 | |
| |
End of year (including undistributed net investment income (loss) of $2,818,184 at 12/31/12 and | | | | | | | | | | |
$2,529,467 at 12/31/11) | | | $ | 1,082,426,496 | | | | $ | 966,639,873 | |
| THE ACCOMPANYING NOTES ARE AN INTEGRAL PART OF THESE FINANCIAL STATEMENTS. | | 2012 Annual Report to Stockholders | 27 |
| Royce Value Trust | |
|
| |
| Statement of Cash Flows |
| CASH FLOWS FROM OPERATING ACTIVITIES: | | | | | |
Net increase (decrease) in net assets from investment operations | | | $ | 154,807,552 | |
Adjustments to reconcile net increase (decrease) in net assets from operations to net cash provided by operating activities: | | | | | |
Purchases of long-term investments | | | | (297,587,829 | ) |
Proceeds from sales and maturities of long-term investments | | | | 381,488,198 | |
Net purchases, sales and maturities of short-term investments | | | | 9,436,000 | |
Net (increase) decrease in dividends and interest receivable and other assets | | | | 228,801 | |
Net increase (decrease) in interest expense payable, accrued expenses and other liabilities | | | | (28,453 | ) |
Net change in unrealized appreciation (depreciation) on investments | | | | (75,703,358 | ) |
Net realized gain on investments and foreign currency | | | | (62,897,553 | ) |
| |
Cash provided by operating activities | | | | 109,743,358 | |
| |
CASH FLOW FROM FINANCING ACTIVITIES: | | | | | |
Net increase (decrease) in revolving credit agreement | | | | 150,000,000 | |
Liquidation of Preferred Stock | | | | (220,000,000 | ) |
Distributions paid to Preferred Stockholders | | | | (11,645,944 | ) |
Distributions paid to Common Stockholders | | | | (55,158,281 | ) |
Reinvestment of distributions to Common Stockholders | | | | 27,494,847 | |
| |
Cash used for financing activities | | | | (109,309,378 | ) |
| |
INCREASE (DECREASE) IN CASH: | | | | 433,980 | |
| |
Cash and foreign currency at beginning of year | | | | 157,955 | |
| |
Cash and foreign currency at end of year | | | $ | 591,935 | |
| 28 | 2012 Annual Report to Stockholders | | THE ACCOMPANYING NOTES ARE AN INTEGRAL PART OF THESE FINANCIAL STATEMENTS. |
| Royce Value Trust | |
|
| |
| Financial Highlights |
This table is presented to show selected data for a share of Common Stock outstanding throughout each period, and to assist stockholders in evaluating the Fund’s performance for the periods presented.
| | | Years ended December 31, |
| | | |
| | | 2012 | | 2011 | | 2010 | | 2009 | | 2008 |
| |
| NET ASSET VALUE, BEGINNING OF PERIOD | | | $ | 14.18 | | | | $ | 16.73 | | | | $ | 12.87 | | | | $ | 9.37 | | | | $ | 19.74 | |
| |
| INVESTMENT OPERATIONS: | | | | | | | | | | | | | | | | | | | | | | | | | |
Net investment income (loss) | | | | 0.23 | | | | | 0.10 | | | | | 0.24 | | | | | 0.17 | | | | | 0.14 | |
Net realized and unrealized gain (loss) on investments and foreign currency | | | | 2.02 | | | | | (1.62 | ) | | | | 3.85 | | | | | 3.87 | | | | | (8.50 | ) |
| |
Total investment operations | | | | 2.25 | | | | | (1.52 | ) | | | | 4.09 | | | | | 4.04 | | | | | (8.36 | ) |
| |
| DISTRIBUTIONS TO PREFERRED STOCKHOLDERS: | | | | | | | | | | | | | | | | | | | | | | | | | |
Net investment income | | | | (0.04 | ) | | | | (0.03 | ) | | | | (0.20 | ) | | | | (0.18 | ) | | | | (0.01 | ) |
Net realized gain on investments and foreign currency | | | | (0.13 | ) | | | | (0.16 | ) | | | | – | | | | | – | | | | | (0.20 | ) |
Return of capital | | | | – | | | | | – | | | | | – | | | | | (0.02 | ) | | | | – | |
| |
Total distributions to Preferred Stockholders | | | | (0.17 | ) | | | | (0.19 | ) | | | | (0.20 | ) | | | | (0.20 | ) | | | | (0.21 | ) |
| |
NET INCREASE (DECREASE) IN NET ASSETS APPLICABLE TO COMMON STOCKHOLDERS FROM INVESTMENT OPERATIONS | | | | 2.08 | | | | | (1.71 | ) | | | | 3.89 | | | | | 3.84 | | | | | (8.57 | ) |
| |
| DISTRIBUTIONS TO COMMON STOCKHOLDERS: | | | | | | | | | | | | | | | | | | | | | | | | | |
Net investment income | | | | (0.17 | ) | | | | (0.08 | ) | | | | (0.03 | ) | | | | – | | | | | (0.06 | ) |
Net realized gain on investments and foreign currency | | | | (0.63 | ) | | | | (0.43 | ) | | | | – | | | | | – | | | | | (1.18 | ) |
Return of capital | | | | – | | | | | (0.27 | ) | | | | – | | | | | (0.32 | ) | | | | (0.48 | ) |
| |
Total distributions to Common Stockholders | | | | (0.80 | ) | | | | (0.78 | ) | | | | (0.03 | ) | | | | (0.32 | ) | | | | (1.72 | ) |
| |
| CAPITAL STOCK TRANSACTIONS: | | | | | | | | | | | | | | | | | | | | | | | | | |
Effect of reinvestment of distributions by Common Stockholders | | | | (0.06 | ) | | | | (0.06 | ) | | | | (0.00 | ) | | | | (0.02 | ) | | | | (0.08 | ) |
| |
Total capital stock transactions | | | | (0.06 | ) | | | | (0.06 | ) | | | | (0.00 | ) | | | | (0.02 | ) | | | | (0.08 | ) |
| |
| NET ASSET VALUE, END OF PERIOD | | | $ | 15.40 | | | | $ | 14.18 | | | | $ | 16.73 | | | | $ | 12.87 | | | | $ | 9.37 | |
| |
| MARKET VALUE, END OF PERIOD | | | $ | 13.42 | | | | $ | 12.27 | | | | $ | 14.54 | | | | $ | 10.79 | | | | $ | 8.39 | |
| |
| TOTAL RETURN:1 | | | | | | | | | | | | | | | | | | | | | | | | | |
| Market Value | | | | 16.22 | % | | | | (10.46 | )% | | | | 35.05 | % | | | | 35.39 | % | | | | (48.27 | )% |
| Net Asset Value | | | | 15.41 | % | | | | (10.06 | )% | | | | 30.27 | % | | | | 44.59 | % | | | | (45.62 | )% |
RATIOS BASED ON AVERAGE NET ASSETS APPLICABLE TO | | | | | | | | | | | | | | | | | | | | | | | | | |
COMMON STOCKHOLDERS: | | | | | | | | | | | | | | | | | | | | | | | | | |
Investment advisory fee expense 2 | | | | 0.56 | % | | | | 0.86 | % | | | | 0.11 | % | | | | 0.00 | % | | | | 1.27 | % |
Other operating expenses | | | | 0.15 | % | | | | 0.12 | % | | | | 0.12 | % | | | | 0.16 | % | | | | 0.12 | % |
Total expenses (net) 3 | | | | 0.71 | % | | | | 0.98 | % | | | | 0.23 | % | | | | 0.16 | % | | | | 1.39 | % |
Expenses net of fee waivers and excluding interest expense | | | | 0.68 | % | | | | 0.98 | % | | | | 0.23 | % | | | | 0.16 | % | | | | 1.39 | % |
Expenses prior to fee waivers and balance credits | | | | 0.71 | % | | | | 0.98 | % | | | | 0.23 | % | | | | 0.16 | % | | | | 1.39 | % |
Expenses prior to fee waivers | | | | 0.71 | % | | | | 0.98 | % | | | | 0.23 | % | | | | 0.16 | % | | | | 1.39 | % |
Net investment income (loss) | | | | 1.57 | % | | | | 0.63 | % | | | | 1.69 | % | | | | 1.66 | % | | | | 0.94 | % |
SUPPLEMENTAL DATA: | | | | | | | | | | | | | | | | | | | | | | | | | |
Net Assets Applicable to Common Stockholders, | | | | | | | | | | | | | | | | | | | | | | | | | |
End of Period (in thousands) | | | $ | 1,082,426 | | | | $ | 966,640 | | | | $ | 1,105,879 | | | | $ | 849,777 | | | | $ | 603,234 | |
| Liquidation Value of Preferred Stock, | | | | | | | | | | | | | | | | | | | | | | | | | |
End of Period (in thousands) | | | | | | | | $ | 220,000 | | | | $ | 220,000 | | | | $ | 220,000 | | | | $ | 220,000 | |
Portfolio Turnover Rate | | | | 25 | % | | | | 26 | % | | | | 30 | % | | | | 31 | % | | | | 25 | % |
PREFERRED STOCK: | | | | | | | | | | | | | | | | | | | | | | | | | |
Total shares outstanding | | | | | | | | | 8,800,000 | | | | | 8,800,000 | | | | | 8,800,000 | | | | | 8,800,000 | |
Asset coverage per share | | | | | | | | $ | 134.88 | | | | $ | 150.67 | | | | $ | 121.57 | | | | $ | 93.55 | |
Liquidation preference per share | | | | | | | | $ | 25.00 | | | | $ | 25.00 | | | | $ | 25.00 | | | | $ | 25.00 | |
Average month-end market value per share | | | | | | | | $ | 25.37 | | | | $ | 25.06 | | | | $ | 23.18 | | | | $ | 22.51 | |
REVOLVING CREDIT AGREEMENT: | | | | | | | | | | | | | | | | | | | | | | | | | |
Asset coverage | | | | 822 | % | | | | | | | | | | | | | | | | | | | | |
Asset coverage per $1,000 | | | $ | 8,216 | | | | | | | | | | | | | | | | | | | | | |
| 1 | The Market Value Total Return is calculated assuming a purchase of Common Stock on the opening of the first business day and a sale on the closing of the last business day of each period. Dividends and distributions are assumed for the purposes of this calculation to be reinvested at prices obtained under the Fund’s Distribution Reinvestment and Cash Purchase Plan. Net Asset Value Total Return is calculated on the same basis, except that the Fund’s net asset value is used on the purchase and sale dates instead of market value. |
| 2 | The investment advisory fee is calculated based on average net assets over a rolling 60-month basis, while the above ratios of investment advisory fee expenses are based on the average net assets applicable to Common Stockholders over a 12-month basis. |
| 3 | Expense ratios based on total average net assets including liquidation value of Preferred Stock were 0.60%, 0.82%, 0.18%, 0.12% and 1.13% for the years ended December 31, 2012, 2011, 2010, 2009 and 2008, respectively. |
| THE ACCOMPANYING NOTES ARE AN INTEGRAL PART OF THESE FINANCIAL STATEMENTS. | | 2012 Annual Report to Stockholders | 29 |
| Royce Value Trust | |
|
| |
| Notes to Financial Statements |
Summary of Significant Accounting Policies:
Royce Value Trust, Inc. (the "Fund"), was incorporated under the laws of the State of Maryland on July 1, 1986, as a diversified closed-end investment company. The Fund commenced operations on November 26, 1986.
The preparation of financial statements in conformity with accounting principles generally accepted in the United States of America requires management to make estimates and assumptions that affect the reported amounts of assets and liabilities and the disclosure of contingent assets and liabilities at the date of the financial statements and the reported amounts of income and expenses during the reporting period. Actual results could differ from those estimates.
Valuation of Investments:
Securities are valued as of the close of trading on the New York Stock Exchange (NYSE) (generally 4:00 p.m. Eastern time) on the valuation date. Securities that trade on an exchange, and securities traded on Nasdaq’s Electronic Bulletin Board, are valued at their last reported sales price or Nasdaq official closing price taken from the primary market in which each security trades or, if no sale is reported for such day, at their bid price. Other over-the-counter securities for which market quotations are readily available are valued at their highest bid price, except in the case of some bonds and other fixed income securities which may be valued by reference to other securities with comparable ratings, interest rates and maturities, using established independent pricing services. The Fund values its non-U.S. dollar denominated securities in U.S. dollars daily at the prevailing foreign currency exchange rates as quoted by a major bank. Securities for which market quotations are not readily available are valued at their fair value in accordance with the provisions of the 1940 Act, under procedures approved by the Fund’s Board of Directors, and are reported as Level 3 securities. As a general principle, the fair value of a security is the amount which the Fund might reasonably expect to receive for the security upon its current sale. However, in light of the judgment involved in fair valuations, there can be no assurance that a fair value assigned to a particular security will be the amount which the Fund might be able to receive upon its current sale. In addition, if, between the time trading ends on a particular security and the close of the customary trading session on the NYSE, events occur that are significant and may make the closing price unreliable, the Fund may fair value the security. The Fund uses an independent pricing service to provide fair value estimates for relevant non-U.S. equity securities on days when the U.S. market volatility exceeds a certain threshold. This pricing service uses proprietary correlations it has developed between the movement of prices of non-U.S. equity securities and indices of U.S.-traded securities, futures contracts and other indications to estimate the fair value of relevant non-U.S. securities. When fair value pricing is employed, the prices of securities used by the Fund may differ from quoted or published prices for the same security. Investments in money market funds are valued at net asset value per share.
Various inputs are used in determining the value of the Fund’s investments, as noted above. These inputs are summarized in the three broad levels below:
Level 1 – quoted prices in active markets for identical securities.
Level 2 – other significant observable inputs (including quoted prices for similar securities, foreign securities that may be fair valued and repurchase agreements). The table below includes all Level 2 securities. Level 2 securities with values based on quoted prices for similar securities are noted in the Schedule of Investments.
Level 3 – significant unobservable inputs (including last trade price before trading was suspended, or at a discount thereto for lack of marketability or otherwise, market price information regarding other securities, information received from the company and/or published documents, including SEC filings and financial statements, or other publicly available information).
The inputs or methodology used for valuing securities are not necessarily an indication of the risk associated with investing in those securities.
The following is a summary of the inputs used to value the Fund’s investments as of December 31, 2012. For a detailed breakout of common stocks by sector classification, please refer to the Schedule of Investments.
| | | Level 1 | | Level 2 | | Level 3 | | Total |
| Common Stocks | | | $ | 892,590,687 | | | | $ | 251,893,592 | | | | $ | 263,067 | | | | $ | 1,144,747,346 | |
| Preferred Stocks | | | | – | | | | | – | | | | | 1,504,800 | | | | | 1,504,800 | |
| Cash Equivalents | | | | – | | | | | 74,647,000 | | | | | – | | | | | 74,647,000 | |
For the year ended December 31, 2012, certain securities have transferred in and out of Level 1 and Level 2 measurements as a result of the fair value pricing procedures for international equities. The Fund recognizes transfers between levels as of the end of the reporting period. At December 31, 2012, securities valued at $1,328,435 were transferred from Level 2 to Level 1 within the fair value hierarchy.
Level 3 Reconciliation:
| | | | | | | | | | | | | Realized and Unrealized | | | | | |
| | | Balance as of 12/31/11 | | Sales | | Gain (Loss) 1 | | Balance as of 12/31/12 |
| Common Stocks | | | $ | 1,701,029 | | | | $ | 456,781 | | | | $ | (981,181 | ) | | | $ | 263,067 | |
| Preferred Stocks | | | | 1,278,090 | | | | | – | | | | | 226,710 | | | | | 1,504,800 | |
| 1 | The net change in unrealized appreciation (depreciation) is included in the accompanying Statement of Operations. Change in unrealized appreciation (depreciation) includes net unrealized appreciation (depreciation) resulting from changes in investment values during the reporting period and the reversal of previously recorded unrealized appreciation (depreciation) when gains or losses are realized. Net realized gain (loss) from investments and foreign currency transactions is included in the accompanying Statement of Operations. |
| 30 | 2012 Annual Report to Stockholders | | |
| Royce Value Trust | |
|
| |
| Notes to Financial Statements (continued) |
Repurchase Agreements:
The Fund may enter into repurchase agreements with institutions that the Fund’s investment adviser has determined are creditworthy. The Fund restricts repurchase agreements to maturities of no more than seven days. Securities pledged as collateral for repurchase agreements, which are held until maturity of the repurchase agreements, are marked-to-market daily and maintained at a value at least equal to the principal amount of the repurchase agreement (including accrued interest). Repurchase agreements could involve certain risks in the event of default or insolvency of the counter-party, including possible delays or restrictions upon the ability of the Fund to dispose of its underlying securities.
Foreign Currency:
Net realized foreign exchange gains or losses arise from sales and maturities of short-term securities, sales of foreign currencies, expiration of currency forward contracts, currency gains or losses realized between the trade and settlement dates on securities transactions, and the difference between the amounts of dividends, interest, and foreign withholding taxes recorded on the Fund’s books and the U.S. dollar equivalent of the amounts actually received or paid. Net unrealized foreign exchange gains and losses arise from changes in the value of assets and liabilities, including investments in securities at the end of the reporting period, as a result of changes in foreign currency exchange rates.
Securities Lending:
The Fund loans securities through a lending agent to qualified institutional investors for the purpose of realizing additional income. Collateral for the Fund on all securities loaned is accepted in cash and cash equivalents and invested temporarily by the custodian. The collateral maintained is at least 100% of the current market value of the loaned securities. The market value of the loaned securities is determined at the close of business of the Fund and any additional required collateral is delivered to the Fund on the next business day. The Fund retains the risk of any loss on the securities on loan as well as incurring the potential loss on investments purchased with cash collateral received for securities lending. The Fund’s securities lending income consists of the income earned on investing cash collateral, plus any premium payments received for lending certain securities, less any rebates paid to borrowers and lending agent fees associated with the loan. The lending agent is not affiliated with Royce.
Taxes:
As a qualified regulated investment company under Subchapter M of the Internal Revenue Code, the Fund is not subject to income taxes to the extent that it distributes substantially all of its taxable income for its fiscal year. The Schedule of Investments includes information regarding income taxes under the caption “Tax Information”.
Distributions:
The Fund pays quarterly distributions on the Fund’s Common Stock at the annual rate of 5% of the rolling average of the prior four calendar quarter-end NAVs of the Fund’s Common Stock, with the fourth quarter distribution being the greater of 1.25% of the rolling average or the distribution required by IRS regulations. Prior to November 15, 2012, distributions to Preferred Stockholders were accrued daily and paid quarterly. Distributions to Common Stockholders are recorded on ex-dividend date. Distributable capital gains and/or net investment income were first allocated to Preferred Stockholder distributions, with any excess allocable to Common Stockholders. If capital gains and/or net investment income are allocated to both Preferred and Common Stockholders, the tax character of such allocations is proportional. To the extent that distributions are not paid from long-term capital gains, net investment income or net short-term capital gains, they will represent a return of capital. Distributions are determined in accordance with income tax regulations that may differ from accounting principles generally accepted in the United States of America. Permanent book and tax differences relating to stockholder distributions will result in reclassifications within the capital accounts. Undistributed net investment income may include temporary book and tax basis differences, which will reverse in a subsequent period. Any taxable income or gain remaining undistributed at fiscal year end is distributed in the following year.
Investment Transactions and Related Investment Income:
Investment transactions are accounted for on the trade date. Dividend income is recorded on the ex-dividend date. Non-cash dividend income is recorded at the fair market value of the securities received. Interest income is recorded on an accrual basis. Premium and discounts on debt securities are amortized using the effective yield-to-maturity method. Realized gains and losses from investment transactions are determined on the basis of identified cost for book and tax purposes.
Expenses:
The Fund incurs direct and indirect expenses. Expenses directly attributable to the Fund are charged to the Fund’s operations, while expenses applicable to more than one of the Royce Funds are allocated equitably. Certain personnel, occupancy costs and other administrative expenses related to the Royce Funds are allocated by Royce & Associates, LLC (“Royce”) under an administration agreement and are included in administrative and office facilities and professional fees. The Fund has adopted a deferred fee agreement that allows the Directors to defer the receipt of all or a portion of directors’ fees otherwise payable. The deferred fees are invested in certain Royce Funds until distributed in accordance with the agreement.
| | 2012 Annual Report to Stockholders | 31 |
| Royce Value Trust | |
|
| |
| Notes to Financial Statements (continued) |
Compensating Balance Credits:
The Fund has an arrangement with its custodian bank, whereby a portion of the custodian’s fee is paid indirectly by credits earned on the Fund’s cash on deposit with the bank. This deposit arrangement is an alternative to purchasing overnight investments. Conversely, the Fund pays interest to the custodian on any cash overdrafts, to the extent they are not offset by credits earned on positive cash balances.
Capital Stock:
The Fund issued 2,103,737 and 2,076,969 shares of Common Stock as reinvestment of distributions by Common Stockholders for the years ended December 31, 2012 and December 31, 2011, respectively.
On November 15, 2012, the Fund redeemed all (8,800,000 shares) of its then outstanding 5.90% Cumulative Preferred Stock at the redemption price of $25.00 per share plus accumulated and unpaid dividends through the redemption date of $0.217153 per share.
Borrowings:
The Fund entered into a $150,000,000 revolving credit agreement (the credit agreement) with BNP Paribas Prime Brokerage Inc. (BNPP) on November 14, 2012. The Fund pays a commitment fee of 0.50% per annum on the unused portion of the credit agreement. The credit agreement has a 360-day rolling term that resets daily; however, if the Fund exceeds certain net asset value triggers, the credit agreement may convert to a 60-day rolling term that resets daily. The Fund is required to pledge portfolio securities as collateral in an amount up to two times the loan balance outstanding and has granted a security interest in the securities pledged to, and in favor of, BNPP as security for the loan balance outstanding. If the Fund fails to meet certain requirements, or maintain other financial covenants required under the credit agreement, the Fund may be required to repay immediately, in part or in full, the loan balance outstanding under the credit agreement necessitating the sale of portfolio securities at potentially inopportune times. The credit agreement also permits, subject to certain conditions, BNPP to rehypothecate portfolio securities pledged by the Fund up to the amount of the loan balance outstanding. The Fund continues to receive payments in lieu of dividends and interest on rehypothecated securities. The Fund also has the right under the credit agreement to recall the rehypothecated securities from BNPP on demand. If BNPP fails to deliver the recalled security in a timely manner, the Fund will be compensated by BNPP for any fees or losses related to the failed delivery or, in the event a recalled security will not be returned by BNPP, the Fund, upon notice to BNPP, may reduce the loan balance outstanding by the amount of the recalled security failed to be returned. The Fund will receive a portion of the fees earned by BNPP in connection with the rehypothecation of portfolio securities.
As of December 31, 2012, the Fund has outstanding borrowings of $150,000,000. During the period ended December 31, 2012, for which borrowings were outstanding, the Fund borrowed an average daily balance of $150,000,000 at a weighted average borrowing cost of 1.26%. As of December 31, 2012, the aggregate value of rehypothecated securities was $146,902,041. During the period ended December 31, 2012, the Fund earned $38,430 in fees from rehypothecated securities.
Investment Advisory Agreement:
As compensation for its services under the Investment Advisory Agreement, Royce receives a fee comprised of a Basic Fee (“Basic Fee”) and an adjustment to the Basic Fee based on the investment performance of the Fund in relation to the investment record of the S&P SmallCap 600 Index (“S&P 600").
The Basic Fee is a monthly fee equal to 1/12 of 1% (1% on an annualized basis) of the average of the Fund’s month-end net assets applicable to Common Stockholders, plus the liquidation value of outstanding Preferred Stock, for the rolling 60-month period ending with such month (the "performance period"). The Basic Fee for each month is increased or decreased at the rate of 1/12 of .05% for each percentage point that the investment performance of the Fund exceeds, or is exceeded by, the percentage change in the investment record of the S&P 600 for the performance period by more than two percentage points. The performance period for each such month is a rolling 60-month period ending with such month. The maximum increase or decrease in the Basic Fee for any month may not exceed 1/12 of .5%. Accordingly, for each month, the maximum monthly fee rate as adjusted for performance is 1/12 of 1.5% and is payable if the investment performance of the Fund exceeds the percentage change in the investment record of the S&P 600 by 12 or more percentage points for the performance period, and the minimum monthly fee rate as adjusted for performance is 1/12 of .5% and is payable if the percentage change in the investment record of the S&P 600 exceeds the investment performance of the Fund by 12 or more percentage points for the performance period.
Notwithstanding the foregoing, Royce is not entitled to receive any fee for any month when the investment performance of the Fund for the rolling 36-month period ending with such month is negative. In the event that the Fund’s investment performance for such a performance period is less than zero, Royce will not be required to refund to the Fund any fee earned in respect of any prior performance period.
Royce has voluntarily committed to waive the portion of its investment advisory fee attributable to an issue of the Fund’s Preferred Stock for any month in which the Fund’s average annual NAV total return since issuance of the Preferred Stock fails to exceed the applicable Preferred Stock’s dividend rate.
| 32 | 2012 Annual Report to Stockholders | | |
| Royce Value Trust | |
|
| |
| Notes to Financial Statements (continued) |
Investment Advisory Agreement (continued):
For the twelve rolling 60-month periods in 2012, the Fund’s investment performance ranged from 12% to 24% below the investment performance of the S&P 600. Accordingly, the net investment advisory fee consisted of a Basic Fee of $11,677,855 and a net downward adjustment of $5,838,926 for the performance of the Fund relative to that of the S&P 600. Additionally, Royce voluntarily waived a portion of its investment advisory fee ($50,000) attributable to issues of the Fund’s Preferred Stock for those months in which the Fund’s average annual NAV total return failed to exceed the applicable Preferred Stock’s dividend rate. For the year ended December 31, 2012, the Fund accrued and paid Royce investment advisory fees totaling $5,788,929.
Purchases and Sales of Investment Securities:
For the year ended December 31, 2012, the costs of purchases and proceeds from sales of investment securities, other than short-term securities and collateral received for securities loaned, amounted to $291,365,428 and $391,096,851, respectively.
| Distributions to Stockholders: |
| | The tax character of distributions paid to common stockholders | | The tax character of distributions paid to preferred stockholders |
| | during 2012 and 2011 was as follows: | | during 2012 and 2011 was as follows: |
| | | | |
| | Distributions paid from: | | 2012 | | 2011 | | Distributions paid from: | | 2012 | | 2011 |
| | Ordinary income | | | $ | 17,311,826 | | | | $ | 6,285,946 | | | Ordinary income | | | $ | 3,655,160 | | | | $ | 2,412,205 | |
| | Long-term capital gain | | | | 37,846,455 | | | | | 27,538,533 | | | Long-term capital gain | | | | 7,990,784 | | | | | 10,567,795 | |
| | | | |
| | Return of capital | | | | – | | | | | 18,288,444 | | | | | | $ | 11,645,944 | | | | $ | 12,980,000 | |
| | | | | | |
| | | | | $ | 55,158,281 | | | | $ | 52,112,923 | | | | | | | | | | | | | |
| | | | |
| | As of December 31, 2012, the tax basis components of distributable earnings included in stockholders’ equity were as follows: |
| | |
| | Net unrealized appreciation (depreciation) | | | $ | 248,906,706 | |
| | Undistributed ordinary income | | | | 2,542,673 | |
| | Undistributed capital gains | | | | 10,608,235 | |
| | | | | |
| | | | | $ | 262,057,614 | |
| | |
The difference between book and tax basis unrealized appreciation (depreciation) is attributable primarily to the tax deferral on wash sales, partnership investments and the unrealized gains on Passive Foreign Investment Companies.
For financial reporting purposes, capital accounts and distributions to stockholders are adjusted to reflect the tax character of permanent book/tax differences. These differences are primarily due to differing treatments of income and gains on various investment securities and foreign currency transactions held by the Fund, timing differences and different characterization of distributions made by the Fund. For the year ended December 31, 2012, the Fund recorded the following permanent reclassifications. Results of operations and net assets were not affected by these reclassifications.
| |
| | Undistributed Net | | Accumulated Net | | | Paid-in | |
| | Investment Income | | Realized Gain (Loss) | | | Capital | |
| | $(2,057,417) | | $2,101,976 | | | $(44,559) | |
| |
Management has analyzed the Fund’s tax positions taken on federal income tax returns for all open tax years (2009-2012) and has concluded that as of December 31, 2012, no provision for income tax is required in the Fund’s financial statements.
Transactions in Affiliated Companies:
An “Affiliated Company” as defined in the Investment Company Act of 1940, is a company in which a fund owns 5% or more of the company’s outstanding voting securities at any time during the period. The Fund effected the following transactions in shares of such companies for year ended December 31, 2012:
| | | Shares | | Market Value | | Cost of | | Cost of | | Realized | | Dividend | | Shares | | Market Value |
| Affiliated Company | | 12/31/11 | | 12/31/11 | | Purchases | | Sales | | Gain (Loss) | | Income | | 12/31/12 | | 12/31/12 |
| Timberland Bancorp | | 444,200 | | $1,710,170 | | – | | – | | – | | – | | 444,200 | | $3,082,748 |
| | | | | $1,710,170 | | | | | | | | | | | | $3,082,748 |
| | 2012 Annual Report to Stockholders | 33 |
| Royce Value Trust | |
|
| |
| Report of Independent Registered Public Accounting Firm |
To the Board of Directors and Stockholders of
Royce Value Trust, Inc.
New York, New York
We have audited the accompanying statement of assets and liabilities of Royce Value Trust, Inc., (“Fund”) including the schedule of investments, as of December 31, 2012, and the related statement of operations and statement of cash flows for the year then ended, the statements of changes in net assets for each of the two years in the period then ended and the financial highlights for each of the five years in the period then ended. These financial statements and financial highlights are the responsibility of the Fund’s management. Our responsibility is to express an opinion on these financial statements and financial highlights based on our audits.
We conducted our audits in accordance with the standards of the Public Company Accounting Oversight Board (United States). Those standards require that we plan and perform the audit to obtain reasonable assurance about whether the financial statements and financial highlights are free of material misstatement. The Fund is not required to have, nor were we engaged to perform, an audit of its internal control over financial reporting. Our audits included consideration of internal control over financial reporting as a basis for designing audit procedures that are appropriate in the circumstances, but not for the purpose of expressing an opinion on the effectiveness of the Fund’s internal control over financial reporting. Accordingly, we express no such opinion. An audit includes examining, on a test basis, evidence supporting the amounts and disclosures in the financial statements. Our procedures included confirmation of securities owned as of December 31, 2012, by correspondence with the custodian and brokers or by other appropriate auditing procedures where replies from brokers were not received. An audit also includes assessing the accounting principles used and significant estimates made by management, as well as evaluating the overall financial statement presentation. We believe that our audits provide a reasonable basis for our opinion.
In our opinion, the financial statements and financial highlights referred to above present fairly, in all material respects, the financial position of Royce Value Trust, Inc. at December 31, 2012, the results of its operations and its cash flows for the year then ended, the changes in its net assets for each of the two years in the period then ended and the financial highlights for each of the five years in the period then ended, in conformity with accounting principles generally accepted in the United States of America.
TAIT, WELLER, & BAKER LLP
Philadelphia, Pennsylvania
February 25, 2013
| 34 | 2012 Annual Report to Stockholders | |
| Royce Micro-Cap Trust | December 31, 2012 |
|
| |
| Schedule of Investments |
| | | SHARES | | | VALUE |
| | | | | | | |
| COMMON STOCKS – 109.3% | | | | | | |
| | | | | | | |
| Consumer Discretionary – 10.4% | | | | | | |
Auto Components - 1.7% | | | | | | |
China XD Plastics 1 | | 102,400 | | | $ | 393,216 |
China Zenix Auto International ADR | | 50,000 | | | | 149,500 |
Drew Industries 2 | | 109,900 | | | | 3,544,275 |
Fuel Systems Solutions 1 | | 76,000 | | | | 1,117,200 |
Spartan Motors | | 41,000 | | | | 202,130 |
| | | | | |
|
| | | | | | | 5,406,321 |
| | | | | |
|
Distributors - 0.4% | | | | | | |
Weyco Group | | 48,000 | | | | 1,121,280 |
| | | | | |
|
Diversified Consumer Services - 0.1% | | | | | | |
Lincoln Educational Services | | 64,000 | | | | 357,760 |
Spectrum Group International 1,3 | | 6,925 | | | | 11,773 |
| | | | | |
|
| | | | | | | 369,533 |
| | | | | |
|
Household Durables - 3.1% | | | | | | |
Cavco Industries 1 | | 3,091 | | | | 154,488 |
Ethan Allen Interiors 2 | | 81,600 | | | | 2,097,936 |
Flexsteel Industries | | 172,500 | | | | 3,700,125 |
Koss Corporation | | 73,400 | | | | 353,054 |
Natuzzi ADR 1 | | 409,800 | | | | 786,816 |
Skullcandy 1 | | 29,700 | | | | 231,363 |
Universal Electronics 1 | | 137,400 | | | | 2,658,690 |
| | | | | |
|
| | | | | | | 9,982,472 |
| | | | | |
|
Internet & Catalog Retail - 0.1% | | | | | | |
Geeknet 1 | | 1,500 | | | | 24,150 |
U.S. Auto Parts Network 1 | | 140,900 | | | | 257,847 |
| | | | | |
|
| | | | | | | 281,997 |
| | | | | |
|
Leisure Equipment & Products - 0.1% | | | | | | |
Leapfrog Enterprises Cl. A 1,2 | | 32,800 | | | | 283,064 |
Sturm, Ruger & Co. 2 | | 3,200 | | | | 145,280 |
| | | | | |
|
| | | | | | | 428,344 |
| | | | | |
|
Media - 0.6% | | | | | | |
Rentrak Corporation 1 | | 101,400 | | | | 1,976,286 |
| | | | | |
|
Specialty Retail - 2.7% | | | | | | |
America’s Car-Mart 1,2,4 | | 92,800 | | | | 3,760,256 |
Lewis Group | | 57,000 | | | | 464,947 |
Oriental Watch Holdings | | 372,400 | | | | 131,119 |
Shoe Carnival 2 | | 30,728 | | | | 629,617 |
†Stage Stores 2 | | 14,600 | | | | 361,788 |
Stein Mart 2 | | 178,900 | | | | 1,348,906 |
Systemax 2 | | 84,000 | | | | 810,600 |
West Marine 1 | | 86,000 | | | | 924,500 |
Wet Seal (The) Cl. A 1 | | 87,679 | | | | 241,994 |
| | | | | |
|
| | | | | | | 8,673,727 |
| | | | | |
|
Textiles, Apparel & Luxury Goods - 1.6% | | | | | | |
G-III Apparel Group 1,2 | | 8,100 | | | | 277,263 |
J.G. Boswell Company 3 | | 2,490 | | | | 2,031,815 |
K-Swiss Cl. A 1 | | 72,400 | | | | 243,264 |
Marimekko | | 25,300 | | | | 477,940 |
Movado Group 2 | | 49,274 | | | | 1,511,726 |
True Religion Apparel 2 | | 19,300 | | | | 490,606 |
| | | | | |
|
| | | | | | | 5,032,614 |
| | | | | |
|
Total (Cost $24,563,431) | | | | | | 33,272,574 |
| | | | | |
|
Consumer Staples – 3.2% | | | | | | |
Food & Staples Retailing - 0.5% | | | | | | |
Arden Group Cl. A | | 16,000 | | | | 1,439,520 |
| | | | | |
|
Food Products - 2.5% | | | | | | |
Asian Citrus Holdings | | 1,060,000 | | | | 504,296 |
Calavo Growers 2 | | 26,200 | | | | 660,502 |
Farmer Bros. 1 | | 41,400 | | | | 597,402 |
Griffin Land & Nurseries | | 70,274 | | | | 1,897,398 |
Origin Agritech 1 | | 121,488 | | | | 168,868 |
Seneca Foods Cl. A 1,2 | | 51,400 | | | | 1,562,560 |
Seneca Foods Cl. B 1 | | 42,500 | | | | 1,274,575 |
Waterloo Investment Holdings 1,5 | | 806,207 | | | | 117,867 |
Westway Group | | 195,000 | | | | 1,300,650 |
| | | | | |
|
| | | | | | | 8,084,118 |
| | | | | |
|
Personal Products - 0.2% | | | | | | |
Inter Parfums 2 | | 33,900 | | | | 659,694 |
| | | | | |
|
Total (Cost $8,520,373) | | | | | | 10,183,332 |
| | | | | |
|
Energy – 4.1% | | | | | | |
Energy Equipment & Services - 3.0% | | | | | | |
Dawson Geophysical 1 | | 53,213 | | | | 1,403,759 |
Geospace Technologies 1,2 | | 14,260 | | | | 1,267,286 |
Global Geophysical Services 1 | | 35,000 | | | | 134,750 |
Gulf Island Fabrication | | 29,116 | | | | 699,658 |
Heckmann Corporation 1,2,4 | | 200,000 | | | | 806,000 |
Lamprell | | 202,400 | | | | 308,768 |
†Matrix Service 1,2 | | 50,600 | | | | 581,900 |
North American Energy Partners 1 | | 50,000 | | | | 170,000 |
Pason Systems | | 139,200 | | | | 2,400,000 |
Pioneer Energy Services 1,2 | | 57,500 | | | | 417,450 |
Tesco Corporation 1,2 | | 50,000 | | | | 569,500 |
Willbros Group 1 | | 131,100 | | | | 702,696 |
| | | | | |
|
| | | | | | | 9,461,767 |
| | | | | |
|
Oil, Gas & Consumable Fuels - 1.1% | | | | | | |
Approach Resources 1,2 | | 12,000 | | | | 300,120 |
†Resolute Energy 1,2 | | 102,100 | | | | 830,073 |
Sprott Resource | | 172,600 | | | | 754,811 |
VAALCO Energy 1,2 | | 88,600 | | | | 766,390 |
Warren Resources 1 | | 290,000 | | | | 814,900 |
| | | | | |
|
| | | | | | | 3,466,294 |
| | | | | |
|
Total (Cost $10,191,829) | | | | | | 12,928,061 |
| | | | | |
|
Financials – 17.8% | | | | | | |
Capital Markets - 6.3% | | | | | | |
ASA Gold and Precious Metals | | 45,000 | | | | 968,850 |
Cowen Group 1 | | 600,600 | | | | 1,471,470 |
Diamond Hill Investment Group | | 34,479 | | | | 2,339,745 |
Duff & Phelps Cl. A 2 | | 93,000 | | | | 1,452,660 |
FBR & Co. 1 | | 215,000 | | | | 832,050 |
| THE ACCOMPANYING NOTES ARE AN INTEGRAL PART OF THESE FINANCIAL STATEMENTS. | | 2012 Annual Report to Stockholders | 35 |
| Royce Micro-Cap Trust | |
|
| |
| Schedule of Investments |
| | | SHARES | | | VALUE |
| | | | | | | |
| Financials (continued) | | | | | | |
| Capital Markets (continued) | | | | | | |
Fiera Capital | | 78,000 | | | $ | 584,196 |
INTL FCStone 1,2 | | 26,310 | | | | 458,057 |
JZ Capital Partners | | 373,999 | | | | 2,685,432 |
MVC Capital | | 151,200 | | | | 1,837,080 |
NGP Capital Resources | | 170,752 | | | | 1,232,829 |
Queen City Investments 3 | | 948 | | | | 949,934 |
U.S. Global Investors Cl. A | | 91,500 | | | | 366,915 |
Urbana Corporation 1 | | 237,600 | | | | 226,923 |
Virtus Investment Partners 1,2,4 | | 35,000 | | | | 4,232,900 |
Westwood Holdings Group 2 | | 8,800 | | | | 359,920 |
| | | | | |
|
| | | | | | | 19,998,961 |
| | | | | |
|
Commercial Banks - 1.6% | | | | | | |
BCB Holdings 1 | | 806,207 | | | | 284,847 |
Chemung Financial | | 40,000 | | | | 1,200,000 |
Fauquier Bankshares | | 140,200 | | | | 1,668,380 |
First Bancorp | | 40,200 | | | | 662,094 |
Peapack-Gladstone Financial | | 88,868 | | | | 1,251,262 |
| | | | | |
|
| | | | | | | 5,066,583 |
| | | | | |
|
Consumer Finance - 0.2% | | | | | | |
†Regional Management 1 | | 51,400 | | | | 850,670 |
| | | | | |
|
Diversified Financial Services - 1.3% | | | | | | |
Banca Finnat Euramerica | | 1,310,000 | | | | 465,855 |
Bolsa Mexicana de Valores | | 300,000 | | | | 756,597 |
GAIN Capital Holdings | | 25,000 | | | | 102,250 |
PICO Holdings 1,2 | | 45,700 | | | | 926,339 |
RHJ International 1 | | 348,000 | | | | 1,829,420 |
| | | | | |
|
| | | | | | | 4,080,461 |
| | | | | |
|
Insurance - 2.6% | | | | | | |
Hallmark Financial Services 1 | | 138,000 | | | | 1,295,820 |
Independence Holding | | 105,380 | | | | 1,003,218 |
†National Western Life Insurance Company
Cl. A 2 | | 14,033 | | | | 2,213,565 |
State Auto Financial 2 | | 139,264 | | | | 2,080,604 |
United Fire Group 2 | | 73,603 | | | | 1,607,490 |
| | | | | |
|
| | | | | | | 8,200,697 |
| | | | | |
|
Real Estate Investment Trusts (REITs) - 0.5% | | |
BRT Realty Trust 1 | | 228,681 | | | | 1,495,574 |
| | | | | |
|
Real Estate Management & Development - 4.4% | | |
Consolidated-Tomoka Land | | 62,750 | | | | 1,945,877 |
Forestar Group 1,2,4 | | 143,000 | | | | 2,478,190 |
Kennedy-Wilson Holdings | | 465,358 | | | | 6,505,705 |
Tejon Ranch 1,2,4 | | 112,162 | | | | 3,149,509 |
ZipRealty 1 | | 25,000 | | | | 70,000 |
| | | | | |
|
| | | | | | | 14,149,281 |
| | | | | |
|
Thrifts & Mortgage Finance - 0.9% | | | | | | |
Alliance Bancorp, Inc. of Pennsylvania | | 41,344 | | | | 525,069 |
BofI Holding 1,2,4 | | 85,562 | | | | 2,384,613 |
| | | | | |
|
| | | | | | | 2,909,682 |
| | | | | |
|
Total (Cost $46,331,468) | | | | | | 56,751,909 |
| | | | | |
|
Health Care – 7.7% | | | | | | |
Biotechnology - 1.0% | | | | | | |
Celsion Corporation 1 | | 220,000 | | | | 1,801,800 |
†Chelsea Therapeutics International 1 | | 710,000 | | | | 539,600 |
Halozyme Therapeutics 1 | | 81,622 | | | | 547,684 |
3SBio ADR 1 | | 15,000 | | | | 204,600 |
| | | | | |
|
| | | | | | | 3,093,684 |
| | | | | |
|
Health Care Equipment & Supplies - 4.2% | | | | | | |
Allied Healthcare Products 1 | | 180,029 | | | | 473,476 |
AngioDynamics 1,2 | | 170,000 | | | | 1,868,300 |
Atrion Corporation | | 7,557 | | | | 1,481,172 |
CryoLife | | 50,573 | | | | 315,070 |
DynaVox Cl. A 1 | | 20,000 | | | | 7,400 |
Exactech 1 | | 111,000 | | | | 1,881,450 |
†Invacare Corporation 2 | | 42,500 | | | | 692,750 |
Medical Action Industries 1 | | 125,250 | | | | 336,923 |
STRATEC Biomedical | | 14,000 | | | | 698,939 |
Syneron Medical 1 | | 69,200 | | | | 599,964 |
Theragenics Corporation 1 | | 202,377 | | | | 321,779 |
†Trinity Biotech ADR | | 49,100 | | | | 708,022 |
Utah Medical Products | | 42,300 | | | | 1,524,915 |
Young Innovations | | 61,450 | | | | 2,421,745 |
| | | | | |
|
| | | | | | | 13,331,905 |
| | | | | |
|
Health Care Providers & Services - 1.7% | | | | | | |
CorVel Corporation 1,2 | | 20,000 | | | | 896,600 |
Cross Country Healthcare 1 | | 323,200 | | | | 1,551,360 |
Gentiva Health Services 1,2 | | 23,000 | | | | 231,150 |
PDI 1 | | 65,383 | | | | 496,911 |
PharMerica Corporation 1,2 | | 40,000 | | | | 569,600 |
Psychemedics Corporation | | 67,300 | | | | 723,475 |
U.S. Physical Therapy | | 35,857 | | | | 987,501 |
| | | | | |
|
| | | | | | | 5,456,597 |
| | | | | |
|
Life Sciences Tools & Services - 0.3% | | | | | | |
Affymetrix 1 | | 150,000 | | | | 475,500 |
Furiex Pharmaceuticals 1 | | 23,758 | | | | 457,579 |
| | | | | |
|
| | | | | | | 933,079 |
| | | | | |
|
Pharmaceuticals - 0.5% | | | | | | |
Hi-Tech Pharmacal 2 | | 44,500 | | | | 1,556,610 |
| | | | | |
|
Total (Cost $21,099,889) | | | | | | 24,371,875 |
| | | | | |
|
| | | | | | | |
Industrials – 27.7% | | | | | | |
Aerospace & Defense - 2.4% | | | | | | |
AeroVironment 1 | | 24,900 | | | | 541,326 |
Astronics Corporation 1 | | 40,844 | | | | 934,511 |
CPI Aerostructures 1 | | 33,935 | | | | 339,689 |
Ducommun 1 | | 78,700 | | | | 1,272,579 |
HEICO Corporation 2 | | 65,625 | | | | 2,937,375 |
Innovative Solutions and Support | | 177,090 | | | | 609,189 |
Kratos Defense & Security Solutions 1 | | 72,324 | | | | 363,790 |
SIFCO Industries | | 45,800 | | | | 721,350 |
| | | | | |
|
| | | | | | | 7,719,809 |
| | | | | |
|
Air Freight & Logistics - 0.6% | | | | | | |
Forward Air 2 | | 50,700 | | | | 1,775,007 |
Pacer International 1 | | 35,000 | | | | 136,500 |
| | | | | |
|
| | | | | | | 1,911,507 |
| | | | | |
|
| 36 | 2012 Annual Report to Stockholders | | THE ACCOMPANYING NOTES ARE AN INTEGRAL PART OF THESE FINANCIAL STATEMENTS. |
| | | SHARES | | | VALUE |
| | | | | | | |
| Industrials (continued) | | | | | | |
| Building Products - 4.0% | | | | | | |
AAON 2 | | 109,500 | | | $ | 2,285,265 |
American Woodmark 1,2 | | 72,000 | | | | 2,003,040 |
Apogee Enterprises | | 57,900 | | | | 1,387,863 |
Burnham Holdings Cl. A 3 | | 121,000 | | | | 1,706,100 |
Griffon Corporation 2 | | 89,500 | | | | 1,025,670 |
Trex Company 1,2,4 | | 90,000 | | | | 3,350,700 |
WaterFurnace Renewable Energy | | 58,300 | | | | 846,338 |
| | | | | |
|
| | | | | | | 12,604,976 |
| | | | | |
|
Commercial Services & Supplies - 2.2% | | | | | | |
Acorn Energy | | 60,000 | | | | 468,600 |
CompX International Cl. A | | 107,500 | | | | 1,497,475 |
Heritage-Crystal Clean 1 | | 113,301 | | | | 1,700,648 |
Interface 2 | | 27,000 | | | | 434,160 |
Team 1,2,4 | | 73,240 | | | | 2,786,050 |
| | | | | |
|
| | | | | | | 6,886,933 |
| | | | | |
|
Construction & Engineering - 2.8% | | | | | | |
Comfort Systems USA 2 | | 11,696 | | | | 142,223 |
Integrated Electrical Services 1,6 | | 1,099,679 | | | | 5,124,504 |
Layne Christensen 1,2 | | 30,300 | | | | 735,381 |
MYR Group 1,2 | | 102,600 | | | | 2,282,850 |
Pike Electric 2 | | 55,900 | | | | 533,845 |
| | | | | |
|
| | | | | | | 8,818,803 |
| | | | | |
|
Electrical Equipment - 2.0% | | | | | | |
AZZ | | 16,494 | | | | 633,864 |
Deswell Industries | | 544,371 | | | | 1,301,047 |
Encore Wire 2 | | 15,000 | | | | 454,650 |
Global Power Equipment Group | | 36,000 | | | | 617,400 |
Jinpan International | | 35,000 | | | | 201,950 |
LSI Industries | | 79,812 | | | | 559,482 |
Orion Energy Systems 1 | | 100,000 | | | | 166,000 |
Powell Industries 1,2 | | 36,000 | | | | 1,495,080 |
Preformed Line Products | | 16,000 | | | | 950,720 |
| | | | | |
|
| | | | | | | 6,380,193 |
| | | | | |
|
Industrial Conglomerates - 1.1% | | | | | | |
Raven Industries 2 | | 116,800 | | | | 3,078,848 |
†Standex International 2 | | 10,400 | | | | 533,416 |
| | | | | |
|
| | | | | | | 3,612,264 |
| | | | | |
|
Machinery - 6.0% | | | | | | |
Alamo Group | | 11,900 | | | | 388,416 |
Armstrong Industrial | | 585,500 | | | | 126,284 |
CIRCOR International 2 | | 14,000 | | | | 554,260 |
Columbus McKinnon 1 | | 5,150 | | | | 85,078 |
Eastern Company (The) | | 39,750 | | | | 628,845 |
FAG Bearings India | | 27,200 | | | | 851,571 |
Flow International 1 | | 82,534 | | | | 288,869 |
Foster (L.B.) Company 2 | | 59,200 | | | | 2,571,648 |
Graham Corporation | | 43,900 | | | | 856,050 |
Hurco Companies 1 | | 52,666 | | | | 1,211,318 |
Kadant 1 | | 15,500 | | | | 410,905 |
NN 1 | | 164,300 | | | | 1,504,988 |
PMFG 1 | | 223,245 | | | | 2,029,297 |
Semperit AG Holding | | 12,500 | | | | 515,199 |
Sun Hydraulics 2 | | 122,387 | | | | 3,191,853 |
Tennant Company 2 | | 92,300 | | | | 4,056,585 |
| | | | | |
|
| | | | | | | 19,271,166 |
| | | | | |
|
Professional Services - 3.7% | | | | | | |
Advisory Board (The) 1,2,4 | | 82,800 | | | | 3,874,212 |
CBIZ 1 | | 47,000 | | | | 277,770 |
Exponent 1,2,4 | | 58,400 | | | | 3,260,472 |
GP Strategies 1,2 | | 13,785 | | | | 284,660 |
Heidrick & Struggles International | | 150,600 | | | | 2,298,156 |
JobStreet Corporation | | 50,000 | | | | 35,971 |
Kforce 2 | | 60,000 | | | | 859,800 |
On Assignment 1,2 | | 41,100 | | | | 833,508 |
| | | | | |
|
| | | | | | | 11,724,549 |
| | | | | |
|
Road & Rail - 1.9% | | | | | | |
Frozen Food Express Industries 1 | | 157,000 | | | | 139,730 |
Marten Transport | | 15,500 | | | | 285,045 |
Patriot Transportation Holding 1 | | 111,681 | | | | 3,175,091 |
Universal Truckload Services | | 134,200 | | | | 2,449,150 |
| | | | | |
|
| | | | | | | 6,049,016 |
| | | | | |
|
Trading Companies & Distributors - 0.6% | | | | | | |
Aceto Corporation | | 72,219 | | | | 725,079 |
Houston Wire & Cable | | 67,375 | | | | 826,691 |
Lawson Products | | 50,269 | | | | 497,663 |
| | | | | |
|
| | | | | | | 2,049,433 |
| | | | | |
|
Transportation Infrastructure - 0.4% | | | | | | |
Touax | | 47,000 | | | | 1,345,598 |
| | | | | |
|
Total (Cost $56,080,612) | | | | | | 88,374,247 |
| | | | | |
|
Information Technology – 24.6% | | | | | | |
Communications Equipment - 1.2% | | | | | | |
Bel Fuse Cl. A | | 67,705 | | | | 1,165,203 |
ClearOne 1 | | 25,000 | | | | 101,000 |
Cogo Group 1 | | 48,035 | | | | 104,236 |
Extreme Networks 1 | | 245,000 | | | | 891,800 |
Globecomm Systems 1 | | 49,200 | | | | 555,960 |
Oplink Communications 1 | | 40,351 | | | | 628,668 |
PC-Tel | | 44,100 | | | | 317,520 |
| | | | | |
|
| | | | | | | 3,764,387 |
| | | | | |
|
Computers & Peripherals - 1.3% | | | | | | |
Intevac 1 | | 180,000 | | | | 822,600 |
Rimage Corporation | | 79,200 | | | | 529,056 |
STEC 1 | | 228,900 | | | | 1,128,477 |
Super Micro Computer 1,2 | | 101,254 | | | | 1,032,791 |
TransAct Technologies | | 78,600 | | | | 567,492 |
| | | | | |
|
| | | | | | | 4,080,416 |
| | | | | |
|
Electronic Equipment, Instruments & Components - 8.8% | | | | | | |
Agilysys 1 | | 232,000 | | | | 1,941,840 |
Broadway Industrial Group | | 886,800 | | | | 226,283 |
Checkpoint Systems 1,2 | | 60,300 | | | | 647,622 |
Diploma | | 50,000 | | | | 449,615 |
Domino Printing Sciences | | 80,000 | | | | 759,714 |
DTS 1 | | 96,000 | | | | 1,603,200 |
Frequency Electronics | | 34,600 | | | | 284,066 |
Hana Microelectronics | | 646,900 | | | | 483,379 |
| THE ACCOMPANYING NOTES ARE AN INTEGRAL PART OF THESE FINANCIAL STATEMENTS. | | 2012 Annual Report to Stockholders | 37 |
| Royce Micro-Cap Trust | |
|
| |
| Schedule of Investments |
| | | SHARES | | | VALUE |
| | | | | | | |
| Information Technology (continued) | | | | | | |
Electronic Equipment, Instruments & Components (continued) |
Hollysys Automation Technologies 1 | | 244,300 | | | $ | 2,899,841 |
Inficon Holding | | 3,600 | | | | 863,357 |
Maxwell Technologies 1 | | 232,594 | | | | 1,928,204 |
Mercury Systems 1 | | 71,956 | | | | 661,995 |
Mesa Laboratories | | 51,389 | | | | 2,575,103 |
Methode Electronics 2 | | 118,613 | | | | 1,189,689 |
Newport Corporation 1,2 | | 80,900 | | | | 1,088,105 |
†Parametric Sound 1 | | 75,000 | | | | 514,500 |
Park Electrochemical 2 | | 14,200 | | | | 365,366 |
Pulse Electronics 1 | | 286,200 | | | | 88,865 |
Richardson Electronics | | 300,900 | | | | 3,406,188 |
Rogers Corporation 1,2,4 | | 58,400 | | | | 2,900,144 |
TTM Technologies 1,2 | | 114,400 | | | | 1,052,480 |
†Vishay Precision Group 1 | | 144,000 | | | | 1,903,680 |
Zygo Corporation 1,2 | | 15,100 | | | | 237,070 |
| | | | | |
|
| | | | | | | 28,070,306 |
| | | | | |
|
Internet Software & Services - 2.4% | | | | | | |
Bitauto Holdings ADR 1 | | 50,000 | | | | 365,000 |
†comScore 1 | | 155,000 | | | | 2,135,900 |
Marchex Cl. B | | 95,000 | | | | 390,450 |
RealNetworks 1 | | 254,000 | | | | 1,920,240 |
Stamps.com 1,2 | | 25,000 | | | | 630,000 |
Support.com 1 | | 387,500 | | | | 1,619,750 |
WebMediaBrands 1 | | 75,000 | | | | 150,000 |
World Energy Solutions 1 | | 72,920 | | | | 317,202 |
| | | | | |
|
| | | | | | | 7,528,542 |
| | | | | |
|
IT Services - 4.8% | | | | | | |
Cass Information Systems 2 | | 29,150 | | | | 1,230,130 |
Computer Task Group 1,2,4 | | 193,400 | | | | 3,525,682 |
CSE Global | | 1,332,800 | | | | 858,419 |
eClerx Services | | 25,100 | | | | 314,473 |
Forrester Research 2 | | 54,900 | | | | 1,471,320 |
†Higher One Holdings 1 | | 144,000 | | | | 1,517,760 |
Innodata 1 | | 233,832 | | | | 883,885 |
Official Payments Holdings 1 | | 333,414 | | | | 1,880,455 |
Sapient Corporation 1,2,4 | | 350,000 | | | | 3,696,000 |
| | | | | |
|
| | | | | | | 15,378,124 |
| | | | | |
|
Semiconductors & Semiconductor Equipment - 4.1% | | | | | | |
Advanced Energy Industries 1,2 | | 64,500 | | | | 890,745 |
Alpha & Omega Semiconductor 1 | | 184,800 | | | | 1,552,320 |
Amtech Systems 1 | | 107,800 | | | | 347,116 |
AXT 1 | | 66,200 | | | | 186,022 |
Exar Corporation 1,2,4 | | 341,208 | | | | 3,036,751 |
GSI Technology 1 | | 34,471 | | | | 216,133 |
Integrated Silicon Solution 1 | | 53,700 | | | | 483,300 |
LTX-Credence Corporation 1 | | 72,200 | | | | 473,632 |
Miraial | | 22,030 | | | | 414,986 |
MoSys 1 | | 442,275 | | | | 1,539,117 |
Photronics 1 | | 220,700 | | | | 1,315,372 |
RDA Microelectronics ADR | | 86,300 | | | | 927,725 |
Rubicon Technology 1 | | 76,899 | | | | 469,853 |
Rudolph Technologies 1,2 | | 34,800 | | | | 468,060 |
†Silicon Motion Technology ADR 1 | | 62,000 | | | | 881,640 |
| | | | | |
|
| | | | | | | 13,202,772 |
| | | | | |
|
| Software - 2.0% | | | | | | |
ACI Worldwide 1,2 | | 69,600 | | | | 3,040,824 |
Actuate Corporation 1 | | 139,500 | | | | 781,200 |
American Software Cl. A | | 113,496 | | | | 880,729 |
BSQUARE Corporation 1 | | 193,875 | | | | 571,931 |
Pegasystems 2 | | 49,000 | | | | 1,111,320 |
| | | | | |
|
| | | | | | | 6,386,004 |
| | | | | |
|
Total (Cost $64,232,547) | | | | | | 78,410,551 |
| | | | | |
|
Materials – 9.2% | | | | | | |
Chemicals - 3.1% | | | | | | |
Balchem Corporation 2 | | 63,375 | | | | 2,306,850 |
Hawkins 2 | | 29,697 | | | | 1,147,492 |
Landec Corporation 1 | | 75,610 | | | | 717,539 |
†OM Group 1,2 | | 10,200 | | | | 226,440 |
Quaker Chemical 2,4 | | 79,000 | | | | 4,254,940 |
Zoltek Companies 1 | | 135,633 | | | | 1,051,156 |
| | | | | |
|
| | | | | | | 9,704,417 |
| | | | | |
|
Construction Materials - 0.7% | | | | | | |
Ash Grove Cement 3 | | 8,000 | | | | 1,208,000 |
Monarch Cement | | 52,303 | | | | 1,056,521 |
| | | | | |
|
| | | | | | | 2,264,521 |
| | | | | |
|
Metals & Mining - 5.2% | | | | | | |
AuRico Gold 1 | | 91,250 | | | | 746,425 |
Aurizon Mines 1 | | 97,000 | | | | 337,560 |
Central Steel & Wire 3 | | 1,088 | | | | 723,792 |
†Comstock Mining 1 | | 375,000 | | | | 855,000 |
Endeavour Mining 1 | | 642,400 | | | | 1,336,853 |
Geodrill 1 | | 177,700 | | | | 192,939 |
Golden Star Resources 1,2,4 | | 640,000 | | | | 1,177,600 |
Haynes International 2 | | 24,401 | | | | 1,265,680 |
Horsehead Holding Corporation 1,2 | | 67,888 | | | | 693,136 |
Kingsrose Mining | | 224,000 | | | | 197,905 |
MAG Silver 1 | | 74,750 | | | | 769,178 |
Materion Corporation | | 50,000 | | | | 1,289,000 |
Midway Gold 1 | | 345,000 | | | | 479,550 |
RTI International Metals 1,2 | | 96,000 | | | | 2,645,760 |
Scorpio Mining 1 | | 136,000 | | | | 140,826 |
Seabridge Gold 1,2 | | 16,700 | | | | 300,099 |
Synalloy Corporation | | 58,200 | | | | 763,584 |
Universal Stainless & Alloy Products 1 | | 25,000 | | | | 919,250 |
Victoria Gold 1 | | 1,000,000 | | | | 231,225 |
Vista Gold 1 | | 528,000 | | | | 1,425,600 |
| | | | | |
|
| | | | | | | 16,490,962 |
| | | | | |
|
Paper & Forest Products - 0.2% | | | | | | |
Pope Resources L.P. | | 12,205 | | | | 676,157 |
Qunxing Paper Holdings 5 | | 1,500,000 | | | | 79,888 |
| | | | | |
|
| | | | | | | 756,045 |
| | | | | |
|
Total (Cost $24,539,262) | | | | | | 29,215,945 |
| | | | | |
|
Utilities – 0.1% | | | | | | |
Independent Power Producers & Energy Traders - 0.1% | | | | | | |
Alterra Power 1 | | 450,000 | | | | 194,531 |
| 38 | 2012 Annual Report to Stockholders | | THE ACCOMPANYING NOTES ARE AN INTEGRAL PART OF THESE FINANCIAL STATEMENTS. |
| | | SHARES | | | VALUE |
| | | | | | | |
| Utilities (continued) | | | | | | | |
Independent Power Producers & Energy Traders (continued) | | | | | | | |
China Hydroelectric ADS 1 | | 73,100 | | | $ | 125,732 | |
| | | | | |
| |
| Total (Cost $754,614) | | | | | | 320,263 | |
| | | | | |
| |
| Miscellaneous 7 – 4.5% | | | | | | | |
| Total (Cost $15,303,348) | | | | | | 14,462,215 | |
| | | | | |
| |
| TOTAL COMMON STOCKS | | | | | | | |
(Cost $271,617,373) | | | | | | 348,290,972 | |
| | | | | |
| |
| PREFERRED STOCK – 0.4% | | | | | | | |
Seneca Foods Conv. 1,3 | | | | | | | |
(Cost $578,719) | | 45,409 | | | | 1,319,132 | |
| | | | | |
| |
| REPURCHASE AGREEMENT – 4.0% | | | | | | | |
| Fixed Income Clearing Corporation, | | | | | | | |
0.10% dated 12/31/12, due 1/2/13, | | | | | | | |
maturity value $12,675,070 (collateralized | | | | | | | |
by obligations of various U.S. Government | | | | | | | |
Agencies, 0.30% due 12/4/13, valued at | | | | | | | |
$12,932,500) | | | | | | | |
(Cost $12,675,000) | | | | | | 12,675,000 | |
| | | | | |
| |
| TOTAL INVESTMENTS – 113.7% | | | | | | | |
(Cost $284,871,092) | | | | | | 362,285,104 | |
| LIABILITIES LESS CASH | | | | | | | |
AND OTHER ASSETS – (13.7)% | | | | | | (43,740,144 | ) |
| | | | | |
| |
| NET ASSETS – 100.0% | | | | | $ | 318,544,960 | |
| | | | | |
| |
| † | New additions in 2012. |
| 1 | Non-income producing. |
| 2 | All or a portion of these securities were pledged as collateral in connection with the revolving credit agreement at December 31, 2012. Total market value of pledged securities at December 31, 2012, was $132,970,059. |
| 3 | These securities are defined as Level 2 securities due to fair value being based on quoted prices for similar securities. See Notes to Financial Statements. |
| 4 | At December 31, 2012, a portion of these securities were rehypothecated in connection with the Fund’s revolving credit agreement in the aggregate amount of $44,527,150. |
| 5 | Securities for which market quotations are not readily available represent 0.1% of net assets. These securities have been valued at their fair value under procedures approved by the Fund’s Board of Directors. These securities are defined as Level 3 securities due to the use of significant unobservable inputs in the determination of fair value. See Notes to Financial Statements. |
| 6 | At December 31, 2012, the Fund owned 5% or more of the Company’s outstanding voting securities thereby making the Company an Affiliated Company as that term is defined in the Investment Company Act of 1940. See Notes to Financial Statements. |
| 7 | Includes securities first acquired in 2012 and less than 1% of net assets. |
| | |
| | Bold indicates the Fund’s 20 largest equity holdings in terms of December 31, 2012, market value. |
| | |
| | TAX INFORMATION: The cost of total investments for Federal income tax purposes was $287,897,762. At December 31, 2012, net unrealized appreciation for all securities was $74,387,342, consisting of aggregate gross unrealized appreciation of $103,226,024 and aggregate gross unrealized depreciation of $28,838,682. The primary difference between book and tax basis cost is the timing of the recognition of losses on securities sold. |
| THE ACCOMPANYING NOTES ARE AN INTEGRAL PART OF THESE FINANCIAL STATEMENTS. | | 2012 Annual Report to Stockholders | 39 |
| Royce Micro-Cap Trust | December 31, 2012 |
|
| |
| Statement of Assets and Liabilities |
| ASSETS: | | | | | |
| Investments at value | | | | | |
Non-Affiliated Companies (cost $270,116,086) | | | $ | 344,485,600 | |
Affiliated Companies (cost $2,080,006) | | | | 5,124,504 | |
| |
Total investments at value | | | | 349,610,104 | |
Repurchase agreements (at cost and value) | | | | 12,675,000 | |
Cash and foreign currency | | | | 162,100 | |
Receivable for investments sold | | | | 1,339,713 | |
Receivable for dividends and interest | | | | 120,858 | |
Prepaid expenses and other assets | | | | 36,767 | |
| |
Total Assets | | | | 363,944,542 | |
| |
| LIABILITIES: | | | | | |
Revolving credit agreement | | | | 45,000,000 | |
Payable for investments purchased | | | | 13,081 | |
Payable for investment advisory fee | | | | 273,522 | |
Payable for interest expense | | | | 6,300 | |
Accrued expenses | | | | 106,679 | |
| |
Total Liabilities | | | | 45,399,582 | |
| |
Net Assets | | | $ | 318,544,960 | |
| |
| ANALYSIS OF NET ASSETS: | | | | | |
Paid-in capital - $0.001 par value per share; 29,137,296 shares outstanding (150,000,000 shares authorized) | | | $ | 234,278,217 | |
Undistributed net investment income (loss) | | | | (471,326 | ) |
Accumulated net realized gain (loss) on investments and foreign currency | | | | 7,336,912 | |
Net unrealized appreciation (depreciation) on investments and foreign currency | | | | 77,401,157 | |
| |
Net Assets (net asset value per share - $10.93) | | | $ | 318,544,960 | |
| |
Investments at identified cost | | | $ | 272,196,092 | |
| 40 | 2012 Annual Report to Stockholders | | THE ACCOMPANYING NOTES ARE AN INTEGRAL PART OF THESE FINANCIAL STATEMENTS. |
| Royce Micro-Cap Trust | Year Ended December 31, 2012 |
|
| |
| Statement of Operations |
| INVESTMENT INCOME: | | | | | |
| Income: | | | | | |
Dividends 1 | | | $ | 7,822,698 | |
Interest | | | | 20,911 | |
Rehypothecation income | | | | 10,611 | |
Securities lending | | | | 394,938 | |
| |
| Total income | | | | 8,249,158 | |
| |
| Expenses: | | | | | |
Investment advisory fees | | | | 3,383,702 | |
Stockholder reports | | | | 121,800 | |
Custody and transfer agent fees | | | | 108,816 | |
Professional fees | | | | 75,942 | |
Interest expense | | | | 75,614 | |
Directors’ fees | | | | 64,886 | |
Administrative and office facilities | | | | 42,327 | |
Other expenses | | | | 55,502 | |
| |
Total expenses | | | | 3,928,589 | |
Compensating balance credits | | | | (49 | ) |
Fees waived by investment adviser | | | | (51,666 | ) |
| |
Net expenses | | | | 3,876,874 | |
| |
Net investment income (loss) | | | | 4,372,284 | |
| |
REALIZED AND UNREALIZED GAIN (LOSS) ON INVESTMENTS AND FOREIGN CURRENCY: | | | | | |
Net realized gain (loss): | | | | | |
Investments in Non-Affiliated Companies | | | | 23,207,343 | |
Investments in Affiliated Companies | | | | 86,514 | |
Foreign currency transactions | | | | (17,645 | ) |
Net change in unrealized appreciation (depreciation): | | | | | |
Investments and foreign currency translations | | | | 22,078,562 | |
Other assets and liabilities denominated in foreign currency | | | | (11,386 | ) |
| |
Net realized and unrealized gain (loss) on investments and foreign currency | | | | 45,343,388 | |
| |
NET INCREASE (DECREASE) IN NET ASSETS FROM INVESTMENT OPERATIONS | | | | 49,715,672 | |
| |
DISTRIBUTIONS TO PREFERRED STOCKHOLDERS | | | | (3,150,000 | ) |
| |
NET INCREASE (DECREASE) IN NET ASSETS APPLICABLE TO COMMON STOCKHOLDERS FROM INVESTMENT OPERATIONS | | | $ | 46,565,672 | |
| 1 Net of foreign withholding tax of $46,983. |
| THE ACCOMPANYING NOTES ARE AN INTEGRAL PART OF THESE FINANCIAL STATEMENTS. | | 2012 Annual Report to Stockholders | 41 |
| Royce Micro-Cap Trust | |
|
| |
| Statement of Changes in Net Assets Applicable to Common Stockholders |
| | | Year ended | | Year ended |
| | | 12/31/12 | | 12/31/11 |
INVESTMENT OPERATIONS: | | | | | | | | | | |
Net investment income (loss) | | | $ | 4,372,284 | | | | $ | 1,181,694 | |
Net realized gain (loss) on investments and foreign currency | | | | 23,276,212 | | | | | 5,899,117 | |
Net change in unrealized appreciation (depreciation) on investments and foreign currency | | | | 22,067,176 | | | | | (28,491,445 | ) |
| |
Net increase (decrease) in net assets from investment operations | | | | 49,715,672 | | | | | (21,410,634 | ) |
| |
DISTRIBUTIONS TO PREFERRED STOCKHOLDERS: | | | | | | | | | | |
Net investment income | | | | (514,703 | ) | | | | (660,851 | ) |
Net realized gain on investments and foreign currency | | | | (2,635,297 | ) | | | | (2,939,149 | ) |
| |
Total distributions to Preferred Stockholders | | | | (3,150,000 | ) | | | | (3,600,000 | ) |
| |
NET INCREASE (DECREASE) IN NET ASSETS APPLICABLE TO COMMON STOCKHOLDERS FROM INVESTMENT OPERATIONS | | | | 46,565,672 | | | | | (25,010,634 | ) |
| |
DISTRIBUTIONS TO COMMON STOCKHOLDERS: | | | | | | | | | | |
Net investment income | | | | (2,385,531 | ) | | | | (1,505,199 | ) |
Net realized gain on investments and foreign currency | | | | (12,213,998 | ) | | | | (6,694,405 | ) |
Return of capital | | | | – | | | | | (6,511,252 | ) |
| |
Total distributions to Common Stockholders | | | | (14,599,529 | ) | | | | (14,710,856 | ) |
| |
CAPITAL STOCK TRANSACTIONS: | | | | | | | | | | |
Reinvestment of distributions to Common Stockholders | | | | 7,286,598 | | | | | 7,734,894 | |
| |
Total capital stock transactions | | | | 7,286,598 | | | | | 7,734,894 | |
| |
NET INCREASE (DECREASE) IN NET ASSETS APPLICABLE TO COMMON STOCKHOLDERS | | | | 39,252,741 | | | | | (31,986,596 | ) |
| |
NET ASSETS APPLICABLE TO COMMON STOCKHOLDERS: | | | | | | | | | | |
Beginning of year | | | | 279,292,219 | | | | | 311,278,815 | |
| |
End of year (including undistributed net investment income (loss) of $(471,326) at 12/31/12 and $(1,994,992) at 12/31/11) | | | $ | 318,544,960 | | | | $ | 279,292,219 | |
| 42 | 2012 Annual Report to Stockholders | | THE ACCOMPANYING NOTES ARE AN INTEGRAL PART OF THESE FINANCIAL STATEMENTS. |
| Royce Micro-Cap Trust | |
|
| |
| Statement of Cash Flows |
| CASH FLOWS FROM OPERATING ACTIVITIES: | | | | | |
Net increase (decrease) in net assets from investment operations | | | $ | 49,715,672 | |
Adjustments to reconcile net increase (decrease) in net assets from operations to net cash provided by operating activities: | | | | | |
Purchases of long-term investments | | | | (104,788,249 | ) |
Proceeds from sales and maturities of long-term investments | | | | 90,541,227 | |
Net purchases, sales and maturities of short-term investments | | | | 35,331,000 | |
Net (increase) decrease in dividends and interest receivable and other assets | | | | 326,586 | |
Net increase (decrease) in interest expense payable, accrued expenses and other liabilities | | | | (95,227 | ) |
Net change in unrealized appreciation (depreciation) on investments | | | | (22,078,562 | ) |
Net realized gain on investments and foreign currency | | | | (23,276,212 | ) |
| |
Cash provided by operating activities | | | | 25,676,235 | |
| |
CASH FLOW FROM FINANCING ACTIVITIES: | | | | | |
Net increase (decrease) in revolving credit agreement | | | | 45,000,000 | |
Liquidation of Preferred Stock | | | | (60,000,000 | ) |
Distributions paid to Preferred Stockholders | | | | (3,230,000 | ) |
Distributions paid to Common Stockholders | | | | (14,599,529 | ) |
Reinvestment of distributions to Common Stockholders | | | | 7,286,598 | |
| |
Cash used for financing activities | | | | (25,542,931 | ) |
| |
INCREASE (DECREASE) IN CASH: | | | | 133,304 | |
| |
Cash and foreign currency at beginning of year | | | | 28,796 | |
| |
Cash and foreign currency at end of year | | | $ | 162,100 | |
| THE ACCOMPANYING NOTES ARE AN INTEGRAL PART OF THESE FINANCIAL STATEMENTS. | | 2012 Annual Report to Stockholders | 43 |
| Royce Micro-Cap Trust | |
|
| |
| Financial Highlights |
This table is presented to show selected data for a share of Common Stock outstanding throughout each period, and to assist stockholders in evaluating the Fund’s performance for the periods presented.
| | | Years ended December 31, |
| | | |
| | | 2012 | | 2011 | | 2010 | | 2009 | | 2008 |
| |
| NET ASSET VALUE, BEGINNING OF PERIOD | | | $ | 9.86 | | | | $ | 11.34 | | | | $ | 8.90 | | | | $ | 6.39 | | | | $ | 13.48 | |
| |
| INVESTMENT OPERATIONS: | | | | | | | | | | | | | | | | | | | | | | | | | |
Net investment income (loss) | | | | 0.15 | | | | | 0.04 | | | | | 0.08 | | | | | 0.00 | | | | | 0.02 | |
Net realized and unrealized gain (loss) on investments and | | | | | | | | | | | | | | | | | | | | | | | | | |
foreign currency | | | | 1.58 | | | | | (0.82 | ) | | | | 2.58 | | | | | 2.88 | | | | | (5.70 | ) |
| |
Total investment operations | | | | 1.73 | | | | | (0.78 | ) | | | | 2.66 | | | | | 2.88 | | | | | (5.68 | ) |
| |
| DISTRIBUTIONS TO PREFERRED STOCKHOLDERS: | | | | | | | | | | | | | | | | | | | | | | | | | |
Net investment income | | | | (0.02 | ) | | | | (0.02 | ) | | | | (0.10 | ) | | | | (0.04 | ) | | | | (0.01 | ) |
Net realized gain on investments and foreign currency | | | | (0.09 | ) | | | | (0.11 | ) | | | | (0.03 | ) | | | | – | | | | | (0.13 | ) |
Return of capital | | | | – | | | | | – | | | | | – | | | | | (0.09 | ) | | | | – | |
| |
Total distributions to Preferred Stockholders | | | | (0.11 | ) | | | | (0.13 | ) | | | | (0.13 | ) | | | | (0.13 | ) | | | | (0.14 | ) |
| |
NET INCREASE (DECREASE) IN NET ASSETS APPLICABLE TO COMMON STOCKHOLDERS FROM INVESTMENT OPERATIONS | | | | 1.62 | | | | | (0.91 | ) | | | | 2.53 | | | | | 2.75 | | | | | (5.82 | ) |
| |
| DISTRIBUTIONS TO COMMON STOCKHOLDERS: | | | | | | | | | | | | | | | | | | | | | | | | | |
Net investment income | | | | (0.08 | ) | | | | (0.05 | ) | | | | (0.06 | ) | | | | – | | | | | (0.09 | ) |
Net realized gain on investments and foreign currency | | | | (0.43 | ) | | | | (0.24 | ) | | | | (0.02 | ) | | | | – | | | | | (0.83 | ) |
Return of capital | | | | – | | | | | (0.24 | ) | | | | – | | | | | (0.22 | ) | | | | (0.27 | ) |
| |
Total distributions to Common Stockholders | | | | (0.51 | ) | | | | (0.53 | ) | | | | (0.08 | ) | | | | (0.22 | ) | | | | (1.19 | ) |
| |
| CAPITAL STOCK TRANSACTIONS: | | | | | | | | | | | | | | | | | | | | | | | | | |
Effect of reinvestment of distributions by Common Stockholders | | | | (0.04 | ) | | | | (0.04 | ) | | | | (0.01 | ) | | | | (0.02 | ) | | | | (0.08 | ) |
| |
Total capital stock transactions | | | | (0.04 | ) | | | | (0.04 | ) | | | | (0.01 | ) | | | | (0.02 | ) | | | | (0.08 | ) |
| |
| NET ASSET VALUE, END OF PERIOD | | | $ | 10.93 | | | | $ | 9.86 | | | | $ | 11.34 | | | | $ | 8.90 | | | | $ | 6.39 | |
| |
| MARKET VALUE, END OF PERIOD | | | $ | 9.45 | | | | $ | 8.77 | | | | $ | 9.80 | | | | $ | 7.37 | | | | $ | 5.62 | |
| |
| TOTAL RETURN:1 | | | | | | | | | | | | | | | | | | | | | | | | | |
| Market Value | | | | 13.95 | % | | | | (4.99 | )% | | | | 34.10 | % | | | | 37.91 | % | | | | (45.84 | )% |
| Net Asset Value | | | | 17.23 | % | | | | (7.69 | )% | | | | 28.50 | % | | | | 46.47 | % | | | | (45.45 | )% |
RATIOS BASED ON AVERAGE NET ASSETS APPLICABLE TO | | | | | | | | | | | | | | | | | | | | | | | | | |
COMMON STOCKHOLDERS: | | | | | | | | | | | | | | | | | | | | | | | | | |
Investment advisory fee expense2 | | | | 1.12 | % | | | | 0.97 | % | | | | 0.97 | % | | | | 1.38 | % | | | | 1.39 | % |
Other operating expenses | | | | 0.18 | % | | | | 0.15 | % | | | | 0.15 | % | | | | 0.21 | % | | | | 0.16 | % |
Total expenses (net)3 | | | | 1.30 | % | | | | 1.12 | % | | | | 1.12 | % | | | | 1.59 | % | | | | 1.55 | % |
Expenses net of fee waivers and excluding interest expense | | | | 1.27 | % | | | | 1.12 | % | | | | 1.12 | % | | | | 1.59 | % | | | | 1.55 | % |
Expenses prior to fee waivers and balance credits | | | | 1.32 | % | | | | 1.15 | % | | | | 1.17 | % | | | | 1.74 | % | | | | 1.58 | % |
Expenses prior to fee waivers | | | | 1.32 | % | | | | 1.15 | % | | | | 1.17 | % | | | | 1.74 | % | | | | 1.58 | % |
Net investment income (loss) | | | | 1.46 | % | | | | 0.40 | % | | | | 0.84 | % | | | | 0.02 | % | | | | 0.15 | % |
SUPPLEMENTAL DATA: | | | | | | | | | | | | | | | | | | | | | | | | | |
Net Assets Applicable to Common Stockholders, | | | | | | | | | | | | | | | | | | | | | | | | | |
End of Period (in thousands) | | | $ | 318,545 | | | | $ | 279,292 | | | | $ | 311,279 | | | | $ | 243,156 | | | | $ | 169,854 | |
| Liquidation Value of Preferred Stock, | | | | | | | | | | | | | | | | | | | | | | | | | |
End of Period (in thousands) | | | | | | | | $ | 60,000 | | | | $ | 60,000 | | | | $ | 60,000 | | | | $ | 60,000 | |
| Portfolio Turnover Rate | | | | 28 | % | | | | 30 | % | | | | 27 | % | | | | 30 | % | | | | 42 | % |
| PREFERRED STOCK: | | | | | | | | | | | | | | | | | | | | | | | | | |
| Total shares outstanding | | | | | | | | | 2,400,000 | | | | | 2,400,000 | | | | | 2,400,000 | | | | | 2,400,000 | |
| Asset coverage per share | | | | | | | | $ | 141.37 | | | | $ | 154.70 | | | | $ | 126.32 | | | | $ | 95.77 | |
| Liquidation preference per share | | | | | | | | $ | 25.00 | | | | $ | 25.00 | | | | $ | 25.00 | | | | $ | 25.00 | |
| Average month-end market value per share | | | | | | | | $ | 25.41 | | | | $ | 25.11 | | | | $ | 23.47 | | | | $ | 23.08 | |
| REVOLVING CREDIT AGREEMENT: | | | | | | | | | | | | | | | | | | | | | | | | | |
| Asset coverage | | | | 808 | % | | | | | | | | | | | | | | | | | | | | |
| Asset coverage per $1,000 | | | $ | 8,079 | | | | | | | | | | | | | | | | | | | | | |
| 1 | The Market Value Total Return is calculated assuming a purchase of Common Stock on the opening of the first business day and a sale on the closing of the last business day of each period. Dividends and distributions are assumed for the purposes of this calculation to be reinvested at prices obtained under the Fund’s Distribution Reinvestment and Cash Purchase Plan. Net Asset Value Total Return is calculated on the same basis, except that the Fund’s net asset value is used on the purchase and sale dates instead of market value. |
| 2 | The investment advisory fee is calculated based on average net assets over a rolling 36-month basis, while the above ratios of investment advisory fee expenses are based on the average net assets applicable to Common Stockholders over a 12-month basis. |
| 3 | Expense ratios based on total average net assets including liquidation value of Preferred Stock were 1.10%, 0.93%, 0.91%, 1.21% and 1.26% for the years ended December 31, 2012, 2011, 2010, 2009 and 2008, respectively. |
| 44 | 2012 Annual Report to Stockholders | | THE ACCOMPANYING NOTES ARE AN INTEGRAL PART OF THESE FINANCIAL STATEMENTS. |
| Royce Micro-Cap Trust | |
|
| |
| Notes to Financial Statements |
Summary of Significant Accounting Policies:
Royce Micro-Cap Trust, Inc. (the “Fund”), was incorporated under the laws of the State of Maryland on September 9, 1993, as a diversified closed-end investment company. The Fund commenced operations on December 14, 1993.
The preparation of financial statements in conformity with accounting principles generally accepted in the United States of America requires management to make estimates and assumptions that affect the reported amounts of assets and liabilities and the disclosure of contingent assets and liabilities at the date of the financial statements and the reported amounts of income and expenses during the reporting period. Actual results could differ from those estimates.
Valuation of Investments:
Securities are valued as of the close of trading on the New York Stock Exchange (NYSE) (generally 4:00 p.m. Eastern time) on the valuation date. Securities that trade on an exchange, and securities traded on Nasdaq’s Electronic Bulletin Board, are valued at their last reported sales price or Nasdaq official closing price taken from the primary market in which each security trades or, if no sale is reported for such day, at their bid price. Other over-the-counter securities for which market quotations are readily available are valued at their highest bid price, except in the case of some bonds and other fixed income securities which may be valued by reference to other securities with comparable ratings, interest rates and maturities, using established independent pricing services. The Fund values its non-U.S. dollar denominated securities in U.S. dollars daily at the prevailing foreign currency exchange rates as quoted by a major bank. Securities for which market quotations are not readily available are valued at their fair value in accordance with the provisions of the 1940 Act, under procedures approved by the Fund’s Board of Directors, and are reported as Level 3 securities. As a general principle, the fair value of a security is the amount which the Fund might reasonably expect to receive for the security upon its current sale. However, in light of the judgment involved in fair valuations, there can be no assurance that a fair value assigned to a particular security will be the amount which the Fund might be able to receive upon its current sale. In addition, if, between the time trading ends on a particular security and the close of the customary trading session on the NYSE, events occur that are significant and may make the closing price unreliable, the Fund may fair value the security. The Fund uses an independent pricing service to provide fair value estimates for relevant non-U.S. equity securities on days when the U.S. market volatility exceeds a certain threshold. This pricing service uses proprietary correlations it has developed between the movement of prices of non-U.S. equity securities and indices of U.S.-traded securities, futures contracts and other indications to estimate the fair value of relevant non-U.S. securities. When fair value pricing is employed, the prices of securities used by the Fund may differ from quoted or published prices for the same security. Investments in money market funds are valued at net asset value per share.
Various inputs are used in determining the value of the Fund’s investments, as noted above. These inputs are summarized in the three broad levels below:
Level 1 – quoted prices in active markets for identical securities.
Level 2 – other significant observable inputs (including quoted prices for similar securities, foreign securities that may be fair valued and repurchase agreements). The table below includes all Level 2 securities. Level 2 securities with values based on quoted prices for similar securities are noted in the Schedule of Investments.
Level 3 – significant unobservable inputs (including last trade price before trading was suspended, or at a discount thereto for lack of marketability or otherwise, market price information regarding other securities, information received from the company and/or published documents, including SEC filings and financial statements, or other publicly available information).
The inputs or methodology used for valuing securities are not necessarily an indication of the risk associated with investing in those securities.
The following is a summary of the inputs used to value the Fund’s investments as of December 31, 2012. For a detailed breakout of common stocks by sector classification, please refer to the Schedule of Investments.
| | | Level 1 | | Level 2 | | Level 3 | | Total |
| Common Stocks | | | $ | 316,082,440 | | | | $ | 32,010,777 | | | | $ | 197,755 | | | | $ | 348,290,972 | |
| Preferred Stocks | | | | – | | | | | 1,319,132 | | | | | – | | | | | 1,319,132 | |
| Cash Equivalents | | | | – | | | | | 12,675,000 | | | | | – | | | | | 12,675,000 | |
| | | | | | | | | | | | | | | | | | | | | |
For the year ended December 31, 2012, certain securities have transferred in and out of Level 1 and Level 2 measurements as a result of the fair value pricing procedures for international equities. The Fund recognizes transfers between levels as of the end of the reporting period. At December 31, 2012, securities valued at $2,755,554 were transferred from Level 2 to Level 1 within the fair value hierarchy.
Level 3 Reconciliation:
| | | | | | | Realized and Unrealized | | |
| | | Balance as of 12/31/11 | | Sales | | Gain (Loss)1 | | Balance as of 12/31/12 |
| Common Stocks | | $347,895 | | $0 | | $(150,140) | | $197,755 |
| 1 | The net change in unrealized appreciation (depreciation) is included in the accompanying Statement of Operations. Change in unrealized appreciation (depreciation) includes net unrealized appreciation (depreciation) resulting from changes in investment values during the reporting period and the reversal of previously recorded unrealized appreciation (depreciation) when gains or losses are realized. Net realized gain (loss) from investments and foreign currency transactions is included in the accompanying Statement of Operations. |
| 2012 Annual Report to Stockholders | 45 |
| Royce Micro-Cap Trust | |
|
| |
| Notes to Financial Statements (continued) |
Repurchase Agreements:
The Fund may enter into repurchase agreements with institutions that the Fund’s investment adviser has determined are creditworthy. The Fund restricts repurchase agreements to maturities of no more than seven days. Securities pledged as collateral for repurchase agreements, which are held until maturity of the repurchase agreements, are marked-to-market daily and maintained at a value at least equal to the principal amount of the repurchase agreement (including accrued interest). Repurchase agreements could involve certain risks in the event of default or insolvency of the counter-party, including possible delays or restrictions upon the ability of the Fund to dispose of its underlying securities.
Foreign Currency:
Net realized foreign exchange gains or losses arise from sales and maturities of short-term securities, sales of foreign currencies, expiration of currency forward contracts, currency gains or losses realized between the trade and settlement dates on securities transactions, and the difference between the amounts of dividends, interest, and foreign withholding taxes recorded on the Fund’s books and the U.S. dollar equivalent of the amounts actually received or paid. Net unrealized foreign exchange gains and losses arise from changes in the value of assets and liabilities, including investments in securities at the end of the reporting period, as a result of changes in foreign currency exchange rates.
Securities Lending:
The Fund loans securities through a lending agent to qualified institutional investors for the purpose of realizing additional income. Collateral for the Fund on all securities loaned is accepted in cash and cash equivalents and invested temporarily by the custodian. The collateral maintained is at least 100% of the current market value of the loaned securities. The market value of the loaned securities is determined at the close of business of the Fund and any additional required collateral is delivered to the Fund on the next business day. The Fund retains the risk of any loss on the securities on loan as well as incurring the potential loss on investments purchased with cash collateral received for securities lending. The Fund’s securities lending income consists of the income earned on investing cash collateral, plus any premium payments received for lending certain securities, less any rebates paid to borrowers and lending agent fees associated with the loan. The lending agent is not affiliated with Royce.
Taxes:
As a qualified regulated investment company under Subchapter M of the Internal Revenue Code, the Fund is not subject to income taxes to the extent that it distributes substantially all of its taxable income for its fiscal year. The Schedule of Investments includes information regarding income taxes under the caption “Tax Information”.
Distributions:
The Fund pays quarterly distributions on the Fund’s Common Stock at the annual rate of 5% of the rolling average of the prior four calendar quarter-end NAVs of the Fund’s Common Stock, with the fourth quarter distribution being the greater of 1.25% of the rolling average or the distribution required by IRS regulations. Prior to November 15, 2012, distributions to Preferred Stockholders were accrued daily and paid quarterly. Distributions to Common Stockholders are recorded on ex-dividend date. Distributable capital gains and/or net investment income were first allocated to Preferred Stockholder distributions, with any excess allocable to Common Stockholders. If capital gains and/or net investment income are allocated to both Preferred and Common Stockholders, the tax character of such allocations is proportional. To the extent that distributions are not paid from long-term capital gains, net investment income or net short-term capital gains, they will represent a return of capital. Distributions are determined in accordance with income tax regulations that may differ from accounting principles generally accepted in the United States of America. Permanent book and tax differences relating to stockholder distributions will result in reclassifications within the capital accounts. Undistributed net investment income may include temporary book and tax basis differences, which will reverse in a subsequent period. Any taxable income or gain remaining undistributed at fiscal year end is distributed in the following year.
Investment Transactions and Related Investment Income:
Investment transactions are accounted for on the trade date. Dividend income is recorded on the ex-dividend date. Non-cash dividend income is recorded at the fair market value of the securities received. Interest income is recorded on an accrual basis. Premium and discounts on debt securities are amortized using the effective yield-to-maturity method. Realized gains and losses from investment transactions are determined on the basis of identified cost for book and tax purposes.
Expenses:
The Fund incurs direct and indirect expenses. Expenses directly attributable to the Fund are charged to the Fund’s operations, while expenses applicable to more than one of the Royce Funds are allocated equitably. Certain personnel, occupancy costs and other administrative expenses related to the Royce Funds are allocated by Royce & Associates, LLC (“Royce”) under an administration agreement and are included in administrative and office facilities and professional fees. The Fund has adopted a deferred fee agreement that allows the Directors to defer the receipt of all or a portion of directors’ fees otherwise payable. The deferred fees are invested in certain Royce Funds until distributed in accordance with the agreement.
| 46 | 2012 Annual Report to Stockholders |
| Royce Micro-Cap Trust | |
|
| |
| Notes to Financial Statements (continued) |
Compensating Balance Credits:
The Fund has an arrangement with its custodian bank, whereby a portion of the custodian’s fee is paid indirectly by credits earned on the Fund’s cash on deposit with the bank. This deposit arrangement is an alternative to purchasing overnight investments. Conversely, the Fund pays interest to the custodian on any cash overdrafts, to the extent they are not offset by credits earned on positive cash balances.
Capital Stock:
The Fund issued 804,089 and 881,817 shares of Common Stock as reinvestment of distributions by Common Stockholders for the years ended December 31, 2012 and December 31, 2011, respectively.
On November 15, 2012, the Fund redeemed all (2,400,000 shares) of its then outstanding 6.00% Cumulative Preferred Stock at the redemption price of $25.00 per share plus accumulated and unpaid dividends through the redemption date of $0.220833 per share.
Borrowings:
The Fund entered into a $45,000,000 revolving credit agreement (the credit agreement) with BNP Paribas Prime Brokerage Inc. (BNPP) on November 14, 2012. The Fund pays a commitment fee of 0.50% per annum on the unused portion of the credit agreement. The credit agreement has a 360-day rolling term that resets daily; however, if the Fund exceeds certain net asset value triggers, the credit agreement may convert to a 60-day rolling term that resets daily. The Fund is required to pledge portfolio securities as collateral in an amount up to two times the loan balance outstanding and has granted a security interest in the securities pledged to, and in favor of, BNPP as security for the loan balance outstanding. If the Fund fails to meet certain requirements, or maintain other financial covenants required under the credit agreement, the Fund may be required to repay immediately, in part or in full, the loan balance outstanding under the credit agreement necessitating the sale of portfolio securities at potentially inopportune times. The credit agreement also permits, subject to certain conditions, BNPP to rehypothecate portfolio securities pledged by the Fund up to the amount of the loan balance outstanding. The Fund continues to receive payments in lieu of dividends and interest on rehypothecated securities. The Fund also has the right under the credit agreement to recall the rehypothecated securities from BNPP on demand. If BNPP fails to deliver the recalled security in a timely manner, the Fund will be compensated by BNPP for any fees or losses related to the failed delivery or, in the event a recalled security will not be returned by BNPP, the Fund, upon notice to BNPP, may reduce the loan balance outstanding by the amount of the recalled security failed to be returned. The Fund will receive a portion of the fees earned by BNPP in connection with the rehypothecation of portfolio securities.
As of December 31, 2012, the Fund has outstanding borrowings of $45,000,000. During the period ended December 31, 2012, for which borrowings were outstanding, the Fund borrowed an average daily balance of $45,000,000 at a weighted average borrowing cost of 1.26%. As of December 31, 2012, the aggregate value of rehypothecated securities was $44,527,150. During the period ended December 31, 2012, the Fund earned $10,611 in fees from rehypothecated securities.
Investment Advisory Agreement:
As compensation for its services under the Investment Advisory Agreement, Royce receives a fee comprised of a Basic Fee (“Basic Fee”) and an adjustment to the Basic Fee based on the investment performance of the Fund in relation to the investment record of the Russell 2000.
The Basic Fee is a monthly fee equal to 1/12 of 1% (1% on an annualized basis) of the average of the Fund’s month-end net assets applicable to Common Stockholders, plus the liquidation value of outstanding Preferred Stock, for the rolling 36-month period ending with such month (the “performance period”). The Basic Fee for each month is increased or decreased at the rate of 1/12 of .05% for each percentage point that the investment performance of the Fund exceeds, or is exceeded by, the percentage change in the investment record of the Russell 2000 for the performance period by more than two percentage points. The performance period for each such month is a rolling 36-month period ending with such month. The maximum increase or decrease in the Basic Fee for any month may not exceed 1/12 of .5%. Accordingly, for each month, the maximum monthly fee rate as adjusted for performance is 1/12 of 1.5% and is payable if the investment performance of the Fund exceeds the percentage change in the investment record of the Russell 2000 by 12 or more percentage points for the performance period, and the minimum monthly fee rate as adjusted for performance is 1/12 of .5% and is payable if the percentage change in the investment record of the Russell 2000 exceeds the investment performance of the Fund by 12 or more percentage points for the performance period.
Royce has voluntarily committed to waive the portion of its investment advisory fee attributable to an issue of the Fund’s Preferred Stock for any month in which the Fund’s average annual NAV total return since issuance of the Preferred Stock fails to exceed the applicable Preferred Stock’s dividend rate.
For the twelve rolling 36-month periods in 2012, the Fund’s investment performance ranged from 25% above to 9% below the investment performance of the Russell 2000. Accordingly, the net investment advisory fee consisted of a Basic Fee of $3,352,647 and a net upward adjustment of $31,055 for the performance of the Fund relative to that of the Russell 2000. Additionally, Royce voluntarily waived a portion of its investment advisory fee ($51,666) attributable to issues of the Fund’s Preferred Stock for those months in which the Fund’s average annual NAV total return failed to exceed the applicable Preferred Stock’s dividend rate. For the year ended December 31, 2012, the Fund accrued and paid Royce investment advisory fees totaling $3,332,036.
| 2012 Annual Report to Stockholders | 47 |
| Royce Micro-Cap Trust | |
|
| |
| Notes to Financial Statements (continued) |
Purchases and Sales of Investment Securities:
For the year ended December 31, 2012, the costs of purchases and proceeds from sales of investment securities, other than short-term securities and collateral received for securities loaned, amounted to $102,670,073 and $89,015,662, respectively.
| Distributions to Stockholders: |
| | The tax character of distributions paid to common stockholders | | The tax character of distributions paid to preferred stockholders |
| | during 2012 and 2011 was as follows: | | during 2012 and 2011 was as follows: |
| | | | |
| | Distributions paid from: | | 2012 | | 2011 | | Distributions paid from: | | 2012 | | 2011 |
| | Ordinary income | | | $ | 6,023,066 | | | | $ | 1,505,199 | | | Ordinary income | | | $ | 1,332,543 | | | | $ | 660,851 | |
| | Long-term capital gain | | | | 8,576,463 | | | | | 6,694,405 | | | Long-term capital gain | | | | 1,897,457 | | | | | 2,939,149 | |
| | | | |
| | Return of capital | | | | – | | | | | 6,511,252 | | | | | | $ | 3,230,000 | | | | $ | 3,600,000 | |
| | | | | | |
| | | | | $ | 14,599,529 | | | | $ | 14,710,856 | | | | | | | | | | | | | |
| | | | |
| | As of December 31, 2012, tax basis components of distributable earnings included in stockholders’ equity were as follows: |
| | |
| | Net unrealized appreciation (depreciation) | | | $ | 74,374,486 | |
| | Undistributed ordinary income | | | | 3,893,463 | |
| | Undistributed capital gains | | | | 5,998,792 | |
| | | | |
| | | | | $ | 84,266,741 | |
| | |
The difference between book and tax basis unrealized appreciation (depreciation) is attributable primarily to the tax deferral on wash sales, partnership investments and the unrealized gains on Passive Foreign Investment Companies.
For financial reporting purposes, capital accounts and distributions to stockholders are adjusted to reflect the tax character of permanent book/tax differences. These differences are primarily due to differing treatments of income and gains on various investment securities and foreign currency transactions held by the Fund, timing differences and different characterization of distributions made by the Fund. For the year ended December 31, 2012, the Fund recorded the following permanent reclassifications. Results of operations and net assets were not affected by these reclassifications.
| |
| | Undistributed Net | | | Accumulated Net | | | Paid-in | |
| | Investment Income | | | Realized Gain (Loss) | | | Capital | |
| | $64,688 | | | $203,869 | | | $(268,557) | |
| |
Management has analyzed the Fund’s tax positions taken on federal income tax returns for all open tax years (2009-2012) and has concluded that as of December 31, 2012, no provision for income tax is required in the Fund’s financial statements.
Transactions in Affiliated Companies:
An “Affiliated Company” as defined in the Investment Company Act of 1940, is a company in which a fund owns 5% or more of the company’s outstanding voting securities at any time during the period. The Fund effected the following transactions in shares of such companies for the year ended December 31, 2012:
| | | Shares | | Market Value | | Cost of | | Cost of | | Realized | | Dividend | | Shares | | Market Value |
| Affiliated Company | | 12/31/11 | | 12/31/11 | | Purchases | | Sales | | Gain (Loss) | | Income | | 12/31/12 | | 12/31/12 |
| Integrated Electrical Services | | 1,122,500 | | $2,155,200 | | – | | $42,219 | | $86,514 | | – | | 1,099,679 | | $5,124,504 |
| | | | | $2,155,200 | | | | | | $86,514 | | | | | | $5,124,504 |
| 48 | 2012 Annual Report to Stockholders |
| Royce Micro-Cap Trust | |
|
| |
| Report of Independent Registered Public Accounting Firm |
To the Board of Directors and Stockholders of
Royce Micro-Cap Trust, Inc.
New York, New York
We have audited the accompanying statement of assets and liabilities of Royce Micro-Cap Trust, Inc., (“Fund”) including the schedule of investments, as of December 31, 2012, and the related statement of operations and statement of cash flows for the year then ended, the statements of changes in net assets for each of the two years in the period then ended and the financial highlights for each of the five years in the period then ended. These financial statements and financial highlights are the responsibility of the Fund’s management. Our responsibility is to express an opinion on these financial statements and financial highlights based on our audits.
We conducted our audits in accordance with the standards of the Public Company Accounting Oversight Board (United States). Those standards require that we plan and perform the audit to obtain reasonable assurance about whether the financial statements and financial highlights are free of material misstatement. The Fund is not required to have, nor were we engaged to perform, an audit of its internal control over financial reporting. Our audits included consideration of internal control over financial reporting as a basis for designing audit procedures that are appropriate in the circumstances, but not for the purpose of expressing an opinion on the effectiveness of the Fund’s internal control over financial reporting. Accordingly, we express no such opinion. An audit includes examining, on a test basis, evidence supporting the amounts and disclosures in the financial statements. Our procedures included confirmation of securities owned as of December 31, 2012, by correspondence with the custodian and brokers. An audit also includes assessing the accounting principles used and significant estimates made by management, as well as evaluating the overall financial statement presentation. We believe that our audits provide a reasonable basis for our opinion.
In our opinion, the financial statements and financial highlights referred to above present fairly, in all material respects, the financial position of Royce Micro-Cap Trust, Inc. at December 31, 2012, the results of its operations and its cash flows for the year then ended, the changes in its net assets for each of the two years in the period then ended and the financial highlights for each of the five years in the period then ended, in conformity with accounting principles generally accepted in the United States of America.
TAIT, WELLER, & BAKER LLP
Philadelphia, Pennsylvania
February 25, 2013
| | | 2012 Annual Report to Stockholders | 49 |
| Royce Focus Trust | |
|
| |
| Schedule of Investments |
| | | SHARES | | | VALUE |
| | | | | | | |
| COMMON STOCKS – 98.1% | | | | | | |
| | | | | | | |
| Consumer Discretionary – 7.5% | | | | | | |
| Automobiles - 1.4% | | | | | | |
Thor Industries | | 60,000 | | | $ | 2,245,800 |
| | | | | |
|
Household Durables - 1.2% | | | | | | |
†Garmin | | 50,000 | | | | 2,041,000 |
| | | | | |
|
Specialty Retail - 4.9% | | | | | | |
Buckle (The) | | 100,000 | | | | 4,464,000 |
GameStop Corporation Cl. A | | 140,000 | | | | 3,512,600 |
| | | | | |
|
| | | | | | | 7,976,600 |
| | | | | |
|
Total (Cost $10,203,058) | | | | | | 12,263,400 |
| | | | | |
|
Consumer Staples – 4.9% | | | | | | |
Food Products - 3.6% | | | | | | |
Cal-Maine Foods | | 45,000 | | | | 1,809,900 |
Industrias Bachoco ADR | | 85,000 | | | | 2,373,200 |
Sanderson Farms | | 35,000 | | | | 1,664,250 |
| | | | | |
|
| | | | | | | 5,847,350 |
| | | | | |
|
Personal Products - 1.3% | | | | | | |
Nu Skin Enterprises Cl. A | | 60,000 | | | | 2,223,000 |
| | | | | |
|
Total (Cost $7,810,948) | | | | | | 8,070,350 |
| | | | | |
|
Energy – 13.1% | | | | | | |
Energy Equipment & Services - 10.2% | | | | | | |
†C&J Energy Services 1 | | 100,000 | | | | 2,144,000 |
Helmerich & Payne | | 85,000 | | | | 4,760,850 |
Pason Systems | | 230,000 | | | | 3,965,517 |
Trican Well Service | | 270,000 | | | | 3,561,275 |
Unit Corporation 1 | | 50,000 | | | | 2,252,500 |
| | | | | |
|
| | | | | | | 16,684,142 |
| | | | | |
|
Oil, Gas & Consumable Fuels - 2.9% | | | | | | |
Exxon Mobil | | 55,000 | | | | 4,760,250 |
| | | | | |
|
Total (Cost $17,198,092) | | | | | | 21,444,392 |
| | | | | |
|
Financials – 15.9% | | | | | | |
Capital Markets - 10.6% | | | | | | |
Affiliated Managers Group 1 | | 15,000 | | | | 1,952,250 |
Ashmore Group | | 550,000 | | | | 3,180,275 |
Franklin Resources | | 40,000 | | | | 5,028,000 |
Partners Group Holding | | 10,000 | | | | 2,309,715 |
Sprott | | 500,000 | | | | 1,990,550 |
Value Partners Group | | 4,300,000 | | | | 2,886,549 |
| | | | | |
|
| | | | | | | 17,347,339 |
| | | | | |
|
Insurance - 3.3% | | | | | | |
Berkshire Hathaway Cl. B 1 | | 60,000 | | | | 5,382,000 |
| | | | | |
|
Real Estate Management & Development - 2.0% | | |
Kennedy-Wilson Holdings | | 240,000 | | | | 3,355,200 |
| | | | | |
|
Total (Cost $20,907,636) | | | | | | 26,084,539 |
| | | | | |
|
| Health Care – 2.0% | | | | | | |
| Biotechnology - 2.0% | | | | | | |
Myriad Genetics 1 | | 120,000 | | | | 3,270,000 |
| | | | | |
|
Total (Cost $2,915,704) | | | | | | 3,270,000 |
| | | | | |
|
Industrials – 7.0% | | | | | | |
Construction & Engineering - 1.3% | | | | | | |
Jacobs Engineering Group 1 | | 50,000 | | | | 2,128,500 |
| | | | | |
|
Electrical Equipment - 0.9% | | | | | | |
GrafTech International 1 | | 150,000 | | | | 1,408,500 |
| | | | | |
|
Machinery - 3.2% | | | | | | |
Lincoln Electric Holdings | | 50,000 | | | | 2,434,000 |
Semperit AG Holding | | 70,000 | | | | 2,885,112 |
| | | | | |
|
| | | | | | | 5,319,112 |
| | | | | |
|
Road & Rail - 1.6% | | | | | | |
Patriot Transportation Holding 1 | | 90,000 | | | | 2,558,700 |
| | | | | |
|
Total (Cost $9,325,718) | | | | | | 11,414,812 |
| | | | | |
|
Information Technology – 18.1% | | | | | | |
Computers & Peripherals - 8.3% | | | | | | |
Apple | | 8,000 | | | | 4,264,240 |
SanDisk Corporation 1 | | 70,000 | | | | 3,049,200 |
Western Digital | | 150,000 | | | | 6,373,500 |
| | | | | |
|
| | | | | | | 13,686,940 |
| | | | | |
|
Semiconductors & Semiconductor Equipment - 6.5% | | | | | | |
Analog Devices | | 130,000 | | | | 5,467,800 |
MKS Instruments | | 130,000 | | | | 3,351,400 |
Veeco Instruments 1,2 | | 60,000 | | | | 1,771,200 |
| | | | | |
|
| | | | | | | 10,590,400 |
| | | | | |
|
Software - 3.3% | | | | | | |
Microsoft Corporation | | 200,000 | | | | 5,346,000 |
| | | | | |
|
Total (Cost $25,489,342) | | | | | | 29,623,340 |
| | | | | |
|
Materials – 29.6% | | | | | | |
Chemicals - 7.1% | | | | | | |
LSB Industries 1 | | 70,000 | | | | 2,479,400 |
Mosaic Company (The) | | 90,000 | | | | 5,096,700 |
Westlake Chemical | | 50,000 | | | | 3,965,000 |
| | | | | |
|
| | | | | | | 11,541,100 |
| | | | | |
|
Metals & Mining - 20.6% | | | | | | |
Alamos Gold | | 120,000 | | | | 2,105,158 |
Allied Nevada Gold 1 | | 120,000 | | | | 3,615,600 |
Endeavour Mining 1 | | 450,000 | | | | 936,463 |
Fresnillo | | 60,000 | | | | 1,861,729 |
Globe Specialty Metals | | 200,000 | | | | 2,750,000 |
Major Drilling Group International | | 250,000 | | | | 2,463,054 |
Newmont Mining | | 75,000 | | | | 3,483,000 |
Nucor Corporation | | 50,000 | | | | 2,159,000 |
Pan American Silver | | 160,000 | | | | 2,996,800 |
†Pretium Resources 1 | | 200,000 | | | | 2,642,000 |
Reliance Steel & Aluminum | | 65,000 | | | | 4,036,500 |
Schnitzer Steel Industries Cl. A | | 75,000 | | | | 2,274,750 |
Seabridge Gold 1 | | 135,000 | | | | 2,425,950 |
| | | | | |
|
| | | | | | | 33,750,004 |
| | | | | |
|
| 50 | 2012 Annual Report to Stockholders | | THE ACCOMPANYING NOTES ARE AN INTEGRAL PART OF THESE FINANCIAL STATEMENTS. |
| | | SHARES | | | VALUE |
| | | | | | | |
| Materials (continued) | | | | | | | |
| Paper & Forest Products - 1.9% | | | | | | | |
†Stella-Jones | | 40,000 | | | $ | 3,081,532 | |
| | | | | |
| |
| Total (Cost $41,754,576) | | | | | | 48,372,636 | |
| | | | | |
| |
| TOTAL COMMON STOCKS | | | | | | | |
(Cost $135,605,074) | | | | | | 160,543,469 | |
| | | | | |
| |
| REPURCHASE AGREEMENT – 1.9% | | | | | | | |
| Fixed Income Clearing Corporation, | | | | | | | |
0.10% dated 12/31/12, due 1/2/13, | | | | | | | |
maturity value $3,054,017 (collateralized | | | | |
by obligations of various U.S. Government | | | | |
Agencies, 4.50% due 1/15/14, valued at $3,116,060) | | | | |
(Cost $3,054,000) | | | | | | 3,054,000 | |
| | | | | |
| |
| COLLATERAL RECEIVED FOR SECURITIES | | | | | | | |
LOANED – 0.8% | | | | | | | |
| Money Market Funds | | | | | | | |
Federated Government Obligations Fund | | | | | | | |
(7 day yield-0.0107%) | | | | | | | |
(Cost $1,293,175) | | | | | | 1,293,175 | |
| | | | | |
| |
| TOTAL INVESTMENTS – 100.8% | | | | | | | |
(Cost $139,952,249) | | | | | | 164,890,644 | |
| | | | | | | | |
| LIABILITIES LESS CASH | | | | | | | |
AND OTHER ASSETS – (0.8)% | | | | | | (1,302,500 | ) |
| | | | | |
| |
| NET ASSETS – 100.0% | | | | | $ | 163,588,144 | |
| | | | | |
| |
| |
| † | New additions in 2012. |
| 1 | Non-income producing. |
| 2 | All or a portion of these securities were on loan at December 31, 2012. Total market value of loaned securities at December 31, 2012, was $1,326,460. |
| | Bold indicates the Fund’s 20 largest equity holdings in terms of December 31, 2012, market value. |
| |
TAX INFORMATION: The cost of total investments for Federal income tax purposes was $139,160,769. At December 31, 2012, net unrealized appreciation for all securities was $25,729,875, consisting of aggregate gross unrealized appreciation of $30,896,609 and aggregate gross unrealized depreciation of $5,166,734. The primary difference between book and tax basis cost is the timing of the recognition of investments in publicly traded partnerships.
|
| |
| THE ACCOMPANYING NOTES ARE AN INTEGRAL PART OF THESE FINANCIAL STATEMENTS. | | 2012 Annual Report to Stockholders | 51 |
| Royce Focus Trust | December 31, 2012 |
|
| |
| Statement of Assets and Liabilities |
| ASSETS: | | | | |
Total investments at value (including collateral on loaned securities) | | | $ | 161,836,644 |
Repurchase agreements (at cost and value) | | | | 3,054,000 |
Cash and foreign currency | | | | 23,417 |
Receivable for dividends and interest | | | | 149,390 |
Prepaid expenses and other assets | | | | 29,118 |
| |
Total Assets | | | | 165,092,569 |
| |
| LIABILITIES: | | | | |
| Payable for collateral on loaned securities | | | | 1,293,175 |
| Payable for investment advisory fee | | | | 136,759 |
| Accrued expenses | | | | 74,491 |
| |
Total Liabilities | | | | 1,504,425 |
| |
Net Assets | | | $ | 163,588,144 |
| |
| ANALYSIS OF NET ASSETS: | | | | |
Paid-in capital - $0.001 par value per share; 21,364,100 shares outstanding (150,000,000 shares authorized) | | | $ | 137,342,409 |
Undistributed net investment income (loss) | | | | 22,426 |
Accumulated net realized gain (loss) on investments and foreign currency | | | | 1,286,751 |
Net unrealized appreciation (depreciation) on investments and foreign currency | | | | 24,936,558 |
| |
Net Assets (net asset value per share - $7.66) | | | $ | 163,588,144 |
| |
Investments at identified cost (including $1,293,175 of collateral on loaned securities) | | | $ | 136,898,249 |
Market value of loaned securities | | | | 1,326,460 |
| 52 | 2012 Annual Report to Stockholders | | THE ACCOMPANYING NOTES ARE AN INTEGRAL PART OF THESE FINANCIAL STATEMENTS. |
| Royce Focus Trust | Year Ended December 31, 2012 |
|
| |
| Statement of Operations |
| INVESTMENT INCOME: | | | | | |
| Income: | | | | | |
Dividends1 | | | $ | 3,175,890 | |
Interest | | | | 73,975 | |
Securities lending | | | | 41,215 | |
| |
| Total income | | | | 3,291,080 | |
| |
| Expenses: | | | | | |
Investment advisory fees | | | | 1,806,797 | |
Stockholder reports | | | | 79,227 | |
Custody and transfer agent fees | | | | 62,180 | |
Professional fees | | | | 45,716 | |
Directors’ fees | | | | 39,975 | |
Administrative and office facilities | | | | 22,042 | |
Other expenses | | | | 55,853 | |
| |
| Total expenses | | | | 2,111,790 | |
| Compensating balance credits | | | | (19 | ) |
| |
| Net expenses | | | | 2,111,771 | |
| |
| Net investment income (loss) | | | | 1,179,309 | |
| |
| REALIZED AND UNREALIZED GAIN (LOSS) ON INVESTMENTS AND FOREIGN CURRENCY: | | | | | |
| Net realized gain (loss): | | | | | |
Investments | | | | 10,388,753 | |
Foreign currency transactions | | | | (3,082 | ) |
| Net change in unrealized appreciation (depreciation): | | | | | |
Investments and foreign currency translations | | | | 6,238,135 | |
Other assets and liabilities denominated in foreign currency | | | | 191 | |
| |
Net realized and unrealized gain (loss) on investments and foreign currency | | | | 16,623,997 | |
| |
NET INCREASE (DECREASE) IN NET ASSETS FROM INVESTMENT OPERATIONS | | | | 17,803,306 | |
| |
DISTRIBUTIONS TO PREFERRED STOCKHOLDERS | | | | (1,312,510 | ) |
| |
NET INCREASE (DECREASE) IN NET ASSETS APPLICABLE TO COMMON STOCKHOLDERS FROM INVESTMENT OPERATIONS | | | $ | 16,490,796 | |
| 1 Net of foreign withholding tax of $71,762. |
| THE ACCOMPANYING NOTES ARE AN INTEGRAL PART OF THESE FINANCIAL STATEMENTS. | | 2012 Annual Report to Stockholders | 53 |
| Royce Focus Trust | |
|
| |
| Statement of Changes in Net Assets Applicable to Common Stockholders |
| | | Year ended | | Year ended |
| | | 12/31/12 | | 12/31/11 |
| INVESTMENT OPERATIONS: | | | | | | | | | | |
Net investment income (loss) | | | $ | 1,179,309 | | | | $ | 449,951 | |
Net realized gain (loss) on investments and foreign currency | | | | 10,385,671 | | | | | 7,961,607 | |
Net change in unrealized appreciation (depreciation) on investments and foreign currency | | | | 6,238,326 | | | | | (25,251,663 | ) |
| |
Net increase (decrease) in net assets from investment operations | | | | 17,803,306 | | | | | (16,840,105 | ) |
| |
DISTRIBUTIONS TO PREFERRED STOCKHOLDERS: | | | | | | | | | | |
Net investment income | | | | (119,929 | ) | | | | – | |
Net realized gain on investments and foreign currency | | | | (1,192,581 | ) | | | | (1,500,000 | ) |
| |
Total distributions to Preferred Stockholders | | | | (1,312,510 | ) | | | | (1,500,000 | ) |
| |
NET INCREASE (DECREASE) IN NET ASSETS APPLICABLE TO COMMON STOCKHOLDERS FROM INVESTMENT OPERATIONS | | | | 16,490,796 | | | | | (18,340,105 | ) |
| |
DISTRIBUTIONS TO COMMON STOCKHOLDERS: | | | | | | | | | | |
Net investment income | | | | (874,175 | ) | | | | – | |
Net realized gain on investments and foreign currency | | | | (8,693,633 | ) | | | | (5,749,656 | ) |
Return of capital | | | | – | | | | | (2,456,896 | ) |
| |
Total distributions to Common Stockholders | | | | (9,567,808 | ) | | | | (8,206,552 | ) |
| |
CAPITAL STOCK TRANSACTIONS: | | | | | | | | | | |
Reinvestment of distributions to Common Stockholders | | | | 5,809,237 | | | | | 5,111,803 | |
| |
Total capital stock transactions | | | | 5,809,237 | | | | | 5,111,803 | |
| |
NET INCREASE (DECREASE) IN NET ASSETS APPLICABLE TO COMMON STOCKHOLDERS | | | | 12,732,225 | | | | | (21,434,854 | ) |
| |
NET ASSETS APPLICABLE TO COMMON STOCKHOLDERS: | | | | | | | | | | |
Beginning of year | | | | 150,855,919 | | | | | 172,290,773 | |
| |
End of year (including undistributed net investment income (loss) of $22,426 at 12/31/12 and $(156,651) at 12/31/11) | | | $ | 163,588,144 | | | | $ | 150,855,919 | |
| 54 | 2012 Annual Report to Stockholders | | THE ACCOMPANYING NOTES ARE AN INTEGRAL PART OF THESE FINANCIAL STATEMENTS. |
| Royce Focus Trust | |
|
| |
| Financial Highlights |
This table is presented to show selected data for a share of Common Stock outstanding throughout each period, and to assist stockholders in evaluating the Fund’s performance for the periods presented.
| | | Years ended December 31, |
| | | |
| | | 2012 | | 2011 | | 2010 | | 2009 | | 2008 |
| |
| NET ASSET VALUE, BEGINNING OF PERIOD | | | $ | 7.36 | | | | $ | 8.72 | | | | $ | 7.16 | | | | $ | 4.76 | | | | $ | 8.92 | |
| |
| INVESTMENT OPERATIONS: | | | | | | | | | | | | | | | | | | | | | | | | | |
Net investment income (loss) | | | | 0.06 | | | | | 0.02 | | | | | (0.01 | ) | | | | 0.03 | | | | | 0.07 | |
Net realized and unrealized gain (loss) on investments and | | | | | | | | | | | | | | | | | | | | | | | | | |
foreign currency | | | | 0.81 | | | | | (0.86 | ) | | | | 1.65 | | | | | 2.54 | | | | | (3.67 | ) |
| |
Total investment operations | | | | 0.87 | | | | | (0.84 | ) | | | | 1.64 | | | | | 2.57 | | | | | (3.60 | ) |
| |
| DISTRIBUTIONS TO PREFERRED STOCKHOLDERS: | | | | | | | | | | | | | | | | | | | | | | | | | |
Net investment income | | | | (0.01 | ) | | | | – | | | | | (0.05 | ) | | | | (0.08 | ) | | | | (0.01 | ) |
Net realized gain on investments and foreign currency | | | | (0.06 | ) | | | | (0.07 | ) | | | | (0.03 | ) | | | | – | | | | | (0.07 | ) |
| |
Total distributions to Preferred Stockholders | | | | (0.07 | ) | | | | (0.07 | ) | | | | (0.08 | ) | | | | (0.08 | ) | | | | (0.08 | ) |
| |
NET INCREASE (DECREASE) IN NET ASSETS APPLICABLE TO COMMON STOCKHOLDERS FROM INVESTMENT OPERATIONS | | | | 0.80 | | | | | (0.91 | ) | | | | 1.56 | | | | | 2.49 | | | | | (3.68 | ) |
| |
| DISTRIBUTIONS TO COMMON STOCKHOLDERS: | | | | | | | | | | | | | | | | | | | | | | | | | |
Net investment income | | | | (0.04 | ) | | | | – | | | | | – | | | | | (0.00 | ) | | | | (0.07 | ) |
Net realized gain on investments and foreign currency | | | | (0.42 | ) | | | | (0.29 | ) | | | | – | | | | | – | | | | | (0.37 | ) |
Return of capital | | | | – | | | | | (0.12 | ) | | | | – | | | | | (0.09 | ) | | | | (0.03 | ) |
| |
Total distributions to Common Stockholders | | | | (0.46 | ) | | | | (0.41 | ) | | | | – | | | | | (0.09 | ) | | | | (0.47 | ) |
| |
| CAPITAL STOCK TRANSACTIONS: | | | | | | | | | | | | | | | | | | | | | | | | | |
Effect of reinvestment of distributions by Common Stockholders | | | | (0.04 | ) | | | | (0.04 | ) | | | | – | | | | | (0.00 | ) | | | | (0.01 | ) |
| |
Total capital stock transactions | | | | (0.04 | ) | | | | (0.04 | ) | | | | – | | | | | (0.00 | ) | | | | (0.01 | ) |
| |
| NET ASSET VALUE, END OF PERIOD | | | $ | 7.66 | | | | $ | 7.36 | | | | $ | 8.72 | | | | $ | 7.16 | | | | $ | 4.76 | |
| |
| MARKET VALUE, END OF PERIOD | | | $ | 6.60 | | | | $ | 6.30 | | | | $ | 7.57 | | | | $ | 6.33 | | | | $ | 4.60 | |
| |
| TOTAL RETURN: 1 | | | | | | | | | | | | | | | | | | | | | | | | | |
| Market Value | | | | 12.14 | % | | | | (11.75 | )% | | | | 19.59 | % | | | | 40.84 | % | | | | (44.94 | )% |
| Net Asset Value | | | | 11.42 | % | | | | (10.51 | )% | | | | 21.79 | % | | | | 53.95 | % | | | | (42.71 | )% |
| RATIOS BASED ON AVERAGE NET ASSETS APPLICABLE TO | | | | | | | | | | | | | | | | | | | | | | | | | |
COMMON STOCKHOLDERS: | | | | | | | | | | | | | | | | | | | | | | | | | |
Investment advisory fee expense | | | | 1.14 | % | | | | 1.15 | % | | | | 1.17 | % | | | | 1.16 | % | | | | 1.13 | % |
Other operating expenses | | | | 0.19 | % | | | | 0.18 | % | | | | 0.20 | % | | | | 0.26 | % | | | | 0.21 | % |
| Total expenses (net) 2 | | | | 1.33 | % | | | | 1.33 | % | | | | 1.37 | % | | | | 1.42 | % | | | | 1.34 | % |
| Expenses prior to fee waivers and balance credits | | | | 1.33 | % | | | | 1.33 | % | | | | 1.37 | % | | | | 1.48 | % | | | | 1.39 | % |
| Expenses prior to fee waivers | | | | 1.33 | % | | | | 1.33 | % | | | | 1.37 | % | | | | 1.48 | % | | | | 1.39 | % |
| Net investment income (loss) | | | | 0.74 | % | | | | 0.27 | % | | | | (0.15 | )% | | | | 0.49 | % | | | | 0.72 | % |
| SUPPLEMENTAL DATA: | | | | | | | | | | | | | | | | | | | | | | | | | |
| Net Assets Applicable to Common Stockholders, | | | | | | | | | | | | | | | | | | | | | | | | | |
End of Period (in thousands) | | | $ | 163,588 | | | | $ | 150,856 | | | | $ | 172,291 | | | | $ | 141,497 | | | | $ | 92,550 | |
| Liquidation Value of Preferred Stock, | | | | | | | | | | | | | | | | | | | | | | | | | |
End of Period (in thousands) | | | | | | | | $ | 25,000 | | | | $ | 25,000 | | | | $ | 25,000 | | | | $ | 25,000 | |
| Portfolio Turnover Rate | | | | 16 | % | | | | 33 | % | | | | 36 | % | | | | 46 | % | | | | 51 | % |
| PREFERRED STOCK: | | | | | | | | | | | | | | | | | | | | | | | | | |
| Total shares outstanding | | | | | | | | | 1,000,000 | | | | | 1,000,000 | | | | | 1,000,000 | | | | | 1,000,000 | |
| Asset coverage per share | | | | | | | | $ | 175.86 | | | | $ | 197.29 | | | | $ | 166.48 | | | | $ | 117.55 | |
| Liquidation preference per share | | | | | | | | $ | 25.00 | | | | $ | 25.00 | | | | $ | 25.00 | | | | $ | 25.00 | |
| Average month-end market value per share | | | | | | | | $ | 25.65 | | | | $ | 25.38 | | | | $ | 23.56 | | | | $ | 22.89 | |
| |
| 1 | The Market Value Total Return is calculated assuming a purchase of Common Stock on the opening of the first business day and a sale on the closing of the last business day of each period. Dividends and distributions are assumed for the purposes of this calculation to be reinvested at prices obtained under the Fund’s Distribution Reinvestment and Cash Purchase Plan. Net Asset Value Total Return is calculated on the same basis, except that the Fund’s net asset value is used on the purchase and sale dates instead of market value. |
| 2 | Expense ratios based on total average net assets including liquidation value of Preferred Stock were 1.17%, 1.16%, 1.17%, 1.16% and 1.14% for the years ended December 31, 2012, 2011, 2010, 2009 and 2008, respectively. |
| THE ACCOMPANYING NOTES ARE AN INTEGRAL PART OF THESE FINANCIAL STATEMENTS. | | 2012 Annual Report to Stockholders | 55 |
| Royce Focus Trust | |
|
| |
| Notes to Financial Statements |
Summary of Significant Accounting Policies:
Royce Focus Trust, Inc. (the “Fund”), is a diversified closed-end investment company incorporated under the laws of the State of Maryland. The Fund commenced operations on March 2, 1988, and Royce & Associates, LLC (“Royce”) assumed investment management responsibility for the Fund on November 1, 1996.
The preparation of financial statements in conformity with accounting principles generally accepted in the United States of America requires management to make estimates and assumptions that affect the reported amounts of assets and liabilities and the disclosure of contingent assets and liabilities at the date of the financial statements and the reported amounts of income and expenses during the reporting period. Actual results could differ from those estimates.
At December 31, 2012, officers, employees of Royce, Fund directors, the Royce retirement plans and other affiliates owned 25% of the Fund.
Valuation of Investments:
Securities are valued as of the close of trading on the New York Stock Exchange (NYSE) (generally 4:00 p.m. Eastern time) on the valuation date. Securities that trade on an exchange, and securities traded on Nasdaq’s Electronic Bulletin Board, are valued at their last reported sales price or Nasdaq official closing price taken from the primary market in which each security trades or, if no sale is reported for such day, at their bid price. Other over-the-counter securities for which market quotations are readily available are valued at their highest bid price, except in the case of some bonds and other fixed income securities which may be valued by reference to other securities with comparable ratings, interest rates and maturities, using established independent pricing services. The Fund values its non-U.S. dollar denominated securities in U.S. dollars daily at the prevailing foreign currency exchange rates as quoted by a major bank. Securities for which market quotations are not readily available are valued at their fair value in accordance with the provisions of the 1940 Act, under procedures approved by the Fund’s Board of Directors, and are reported as Level 3 securities. As a general principle, the fair value of a security is the amount which the Fund might reasonably expect to receive for the security upon its current sale. However, in light of the judgment involved in fair valuations, there can be no assurance that a fair value assigned to a particular security will be the amount which the Fund might be able to receive upon its current sale. In addition, if, between the time trading ends on a particular security and the close of the customary trading session on the NYSE, events occur that are significant and may make the closing price unreliable, the Fund may fair value the security. The Fund uses an independent pricing service to provide fair value estimates for relevant non-U.S. equity securities on days when the U.S. market volatility exceeds a certain threshold. This pricing service uses proprietary correlations it has developed between the movement of prices of non-U.S. equity securities and indices of U.S.-traded securities, futures contracts and other indications to estimate the fair value of relevant non-U.S. securities. When fair value pricing is employed, the prices of securities used by the Fund may differ from quoted or published prices for the same security. Investments in money market funds are valued at net asset value per share.
Various inputs are used in determining the value of the Fund’s investments, as noted above. These inputs are summarized in the three broad levels below:
Level 1 – quoted prices in active markets for identical securities.
Level 2 – other significant observable inputs (including quoted prices for similar securities, foreign securities that may be fair valued and repurchase agreements). The table below includes all Level 2 securities. Any Level 2 securities with values based on quoted prices for similar securities would be noted in the Schedule of Investments.
Level 3 – significant unobservable inputs (including last trade price before trading was suspended, or at a discount thereto for lack of marketability or otherwise, market price information regarding other securities, information received from the company and/or published documents, including SEC filings and financial statements, or other publicly available information).
The inputs or methodology used for valuing securities are not necessarily an indication of the risk associated with investing in those securities.
The following is a summary of the inputs used to value the Fund’s investments as of December 31, 2012. For a detailed breakout of common stocks by sector classification, please refer to the Schedule of Investments.
| | | Level 1 | | Level 2 | | Level 3 | | Total |
| Common Stocks | | | $ | 126,674,540 | | | | $ | 33,868,929 | | | | $ | – | | | | $ | 160,543,469 | |
| Cash Equivalents | | | | 1,293,175 | | | | | 3,054,000 | | | | | – | | | | | 4,347,175 | |
| | | | | | | | | | | | | | | | | | | | | |
Repurchase Agreements:
The Fund may enter into repurchase agreements with institutions that the Fund’s investment adviser has determined are creditworthy. The Fund restricts repurchase agreements to maturities of no more than seven days. Securities pledged as collateral for repurchase agreements, which are held until maturity of the repurchase agreements, are marked-to-market daily and maintained at a value at least equal to the principal amount of the repurchase agreement (including accrued interest). Repurchase agreements could involve certain risks in the event of default or insolvency of the counter-party, including possible delays or restrictions upon the ability of the Fund to dispose of its underlying securities.
| 56 | 2012 Annual Report to Stockholders |
| Royce Focus Trust |
|
| |
| Notes to Financial Statements (continued) |
Foreign Currency:
Net realized foreign exchange gains or losses arise from sales and maturities of short-term securities, sales of foreign currencies, expiration of currency forward contracts, currency gains or losses realized between the trade and settlement dates on securities transactions, and the difference between the amounts of dividends, interest, and foreign withholding taxes recorded on the Fund’s books and the U.S. dollar equivalent of the amounts actually received or paid. Net unrealized foreign exchange gains and losses arise from changes in the value of assets and liabilities, including investments in securities at the end of the reporting period, as a result of changes in foreign currency exchange rates.
Securities Lending:
The Fund loans securities through a lending agent to qualified institutional investors for the purpose of realizing additional income. Collateral for the Fund on all securities loaned is accepted in cash and cash equivalents and invested temporarily by the custodian. The collateral maintained is at least 100% of the current market value of the loaned securities. The market value of the loaned securities is determined at the close of business of the Fund and any additional required collateral is delivered to the Fund on the next business day. The Fund retains the risk of any loss on the securities on loan as well as incurring the potential loss on investments purchased with cash collateral received for securities lending. The Fund’s securities lending income consists of the income earned on investing cash collateral, plus any premium payments received for lending certain securities, less any rebates paid to borrowers and lending agent fees associated with the loan. The lending agent is not affiliated with Royce.
Taxes:
As a qualified regulated investment company under Subchapter M of the Internal Revenue Code, the Fund is not subject to income taxes to the extent that it distributes substantially all of its taxable income for its fiscal year. The Schedule of Investments includes information regarding income taxes under the caption “Tax Information”.
Distributions:
The Fund pays quarterly distributions on the Fund’s Common Stock at the annual rate of 5% of the rolling average of the prior four calendar quarter-end NAVs of the Fund’s Common Stock, with the fourth quarter distribution being the greater of 1.25% of the rolling average or the distribution required by IRS regulations. Prior to November 15, 2012, distributions to Preferred Stockholders were accrued daily and paid quarterly. Distributions to Common Stockholders are recorded on ex-dividend date. Distributable capital gains and/or net investment income were first allocated to Preferred Stockholder distributions, with any excess allocable to Common Stockholders. If capital gains and/or net investment income are allocated to both Preferred and Common Stockholders, the tax character of such allocations is proportional. To the extent that distributions are not paid from long-term capital gains, net investment income or net short-term capital gains, they will represent a return of capital. Distributions are determined in accordance with income tax regulations that may differ from accounting principles generally accepted in the United States of America. Permanent book and tax differences relating to stockholder distributions will result in reclassifications within the capital accounts. Undistributed net investment income may include temporary book and tax basis differences, which will reverse in a subsequent period. Any taxable income or gain remaining undistributed at fiscal year end is distributed in the following year.
Investment Transactions and Related Investment Income:
Investment transactions are accounted for on the trade date. Dividend income is recorded on the ex-dividend date. Non-cash dividend income is recorded at the fair market value of the securities received. Interest income is recorded on an accrual basis. Premium and discounts on debt securities are amortized using the effective yield-to-maturity method. Realized gains and losses from investment transactions are determined on the basis of identified cost for book and tax purposes.
Expenses:
The Fund incurs direct and indirect expenses. Expenses directly attributable to the Fund are charged to the Fund’s operations, while expenses applicable to more than one of the Royce Funds are allocated equitably. Certain personnel, occupancy costs and other administrative expenses related to the Royce Funds are allocated by Royce under an administration agreement and are included in administrative and office facilities and professional fees. The Fund has adopted a deferred fee agreement that allows the Directors to defer the receipt of all or a portion of directors’ fees otherwise payable. The deferred fees are invested in certain Royce Funds until distributed in accordance with the agreement.
Compensating Balance Credits:
The Fund has an arrangement with its custodian bank, whereby a portion of the custodian’s fee is paid indirectly by credits earned on the Fund’s cash on deposit with the bank. This deposit arrangement is an alternative to purchasing overnight investments. Conversely, the Fund pays interest to the custodian on any cash overdrafts, to the extent they are not offset by credits earned on positive cash balances.
Capital Stock:
The Fund issued 869,648 and 735,388 shares of Common Stock as reinvestment of distributions by Common Stockholders for the years ended December 31, 2012 and December 31, 2011, respectively.
On November 15, 2012, the Fund redeemed all (1,000,000 shares) of its then outstanding 6.00% Cumulative Preferred Stock at the redemption price of $25.00 per share plus accumulated and unpaid dividends through the redemption date of $0.220833 per share.
| 2012 Annual Report to Stockholders | 57 |
| Royce Focus Trust |
|
| |
| Notes to Financial Statements (continued) |
Investment Advisory Agreement:
The Investment Advisory Agreement between Royce and the Fund provides for fees to be paid at an annual rate of 1.0% of the Fund’s average daily net assets applicable to Common Stockholders plus the liquidation value of Preferred Stock. Prior to November 15, 2012, Royce had voluntarily committed to waive the portion of its investment advisory fee attributable to an issue of the Fund’s Preferred Stock for any month in which the Fund’s average annual NAV total return since issuance of the Preferred Stock fails to exceed the applicable Preferred Stock’s dividend rate. For the year ended December 31, 2012, the Fund accrued and paid Royce investment advisory fees totaling $1,806,797.
Purchases and Sales of Investment Securities:
For the year ended December 31, 2012, the costs of purchases and proceeds from sales of investment securities, other than short-term securities and collateral received for securities loaned, amounted to $25,145,991 and $36,025,011, respectively.
Distributions to Stockholders:
| | The tax character of distributions paid to common stockholders | | The tax character of distributions paid to preferred stockholders |
| | during 2012 and 2011 was as follows: | | during 2012 and 2011 was as follows: |
| | | | |
| | Distributions paid from: | | 2012 | | 2011 | | Distributions paid from: | | 2012 | | 2011 |
| | Ordinary income | | | $ | 1,960,249 | | | | $ | 561,089 | �� | | Ordinary income | | | $ | 275,745 | | | | $ | 146,380 | |
| | Long-term capital gain | | | | 7,607,559 | | | | | 5,188,567 | | | Long-term capital gain | | | | 1,070,098 | | | | | 1,353,620 | |
| | | | | | |
| | Return of capital | | | | – | | | | | 2,456,896 | | | | | | $ | 1,345,843 | | | | $ | 1,500,000 | |
| | | | | | |
| | | | | $ | 9,567,808 | | | | $ | 8,206,552 | | | | | | | | | | | | | |
| | | | |
| | As of December 31, 2012, the tax basis components of distributable earnings included in stockholders’ equity were as follows: |
| | |
| | Net unrealized appreciation (depreciation) | | | $ | 25,728,039 | |
| | Post October loss* | | | | (42 | ) |
| | Undistributed ordinary income | | | | 104,482 | |
| | Undistributed capital gains | | | | 413,256 | |
| | | | |
| | | | | $ | 26,245,735 | |
| | |
* Under the current tax law, capital losses, foreign currency losses and losses realized on Passive Foreign Investment Companies after October 31 may be deferred and treated as occurring on the first day of the following fiscal year. As of December 31, 2012, the Fund had $42 of post October currency losses.
The difference between book and tax basis unrealized appreciation (depreciation) is attributable primarily to partnership investments.
For financial reporting purposes, capital accounts and distributions to stockholders are adjusted to reflect the tax character of permanent book/tax differences. These differences are primarily due to differing treatments of income and gains on various investment securities and foreign currency transactions held by the Fund, timing differences and different characterization of distributions made by the Fund. For the year ended December 31, 2012, the Fund recorded the following permanent reclassifications. Results of operations and net assets were not affected by these reclassifications.
| |
| | Undistributed Net | | | | Accumulated Net | |
| | Investment Income | | | | Realized Gain (Loss) | |
| | $(3,082) | | | | $3,082 | |
| |
Management has analyzed the Fund’s tax positions taken on federal income tax returns for all open tax years (2009-2012) and has concluded that as of December 31, 2012, no provision for income tax is required in the Fund’s financial statements.
| 58 | 2012 Annual Report to Stockholders |
| Royce Focus Trust |
|
| |
| Report of Independent Registered Public Accounting Firm |
To the Board of Directors and Stockholders of
Royce Focus Trust, Inc.
New York, New York
We have audited the accompanying statement of assets and liabilities of Royce Focus Trust, Inc., (“Fund”) including the schedule of investments, as of December 31, 2012, and the related statement of operations for the year then ended, the statements of changes in net assets for each of the two years in the period then ended and the financial highlights for each of the five years in the period then ended. These financial statements and financial highlights are the responsibility of the Fund’s management. Our responsibility is to express an opinion on these financial statements and financial highlights based on our audits.
We conducted our audits in accordance with the standards of the Public Company Accounting Oversight Board (United States). Those standards require that we plan and perform the audit to obtain reasonable assurance about whether the financial statements and financial highlights are free of material misstatement. The Fund is not required to have, nor were we engaged to perform, an audit of its internal control over financial reporting. Our audits included consideration of internal control over financial reporting as a basis for designing audit procedures that are appropriate in the circumstances, but not for the purpose of expressing an opinion on the effectiveness of the Fund’s internal control over financial reporting. Accordingly, we express no such opinion. An audit includes examining, on a test basis, evidence supporting the amounts and disclosures in the financial statements. Our procedures included confirmation of securities owned as of December 31, 2012, by correspondence with the custodian. An audit also includes assessing the accounting principles used and significant estimates made by management, as well as evaluating the overall financial statement presentation. We believe that our audits provide a reasonable basis for our opinion.
In our opinion, the financial statements and financial highlights referred to above present fairly, in all material respects, the financial position of Royce Focus Trust, Inc. at December 31, 2012, the results of its operations for the year then ended, the changes in its net assets for each of the two years in the period then ended and the financial highlights for each of the five years in the period then ended, in conformity with accounting principles generally accepted in the United States of America.
TAIT, WELLER, & BAKER LLP
Philadelphia, Pennsylvania
February 25, 2013
| | | 2012 Annual Report to Stockholders | 59 |
All Directors and Officers may be reached c/o The Royce Funds,745 Fifth Avenue, New York, NY 10151
Charles M. Royce, Director1, President
Age: 73 | Number of Funds Overseen: 34 | Tenure: Since 1982
Non-Royce Directorships: Director of TICC Capital Corp.
Principal Occupation(s) During Past Five Years: President, Co-Chief Investment Officer and Member of Board of Managers of Royce & Associates, LLC (“Royce”), The Royce Funds’ investment adviser.
Patricia W. Chadwick, Director
Age: 64 | Number of Funds Overseen: 34 | Tenure: Since 2009
Non-Royce Directorships: Trustee of ING Mutual Funds and Director of Wisconsin Energy Corp.
Principal Occupation(s) During Past 5 Years: Consultant and President of Ravengate Partners LLC (since 2000).
Richard M. Galkin, Director
Age: 74 | Number of Funds Overseen: 34 | Tenure: Since 1982
Non-Royce Directorships: None
Principal Occupation(s) During Past Five Years: Private investor. Mr. Galkin’s prior business experience includes having served as President of Richard M. Galkin Associates, Inc., telecommunications consultants, President of Manhattan Cable Television (a subsidiary of Time, Inc.), President of Haverhills Inc. (another Time, Inc. subsidiary), President of Rhode Island Cable Television and Senior Vice President of Satellite Television Corp. (a subsidiary of Comsat).
Stephen L. Isaacs, Director
Age: 73 | Number of Funds Overseen: 34 | Tenure: Since 1989
Non-Royce Directorships: None
Principal Occupation(s) During Past Five Years: President of The Center for Health and Social Policy (since September 1996); Attorney and President of Health Policy Associates, Inc., consultants. Mr. Isaacs’s prior business experience includes having served as Director of Columbia University Development Law and Policy Program and Professor at Columbia University (until August 1996).
Arthur S. Mehlman, Director
Age: 70 | Number of Funds Overseen: 48 | Tenure: Since 2004
Non-Royce Directorships: Director/Trustee of registered investment companies
constituting the 14 Legg Mason Funds.
Principal Occupation(s) During Past Five Years: Director of The League for People with Disabilities, Inc.; Director of University of Maryland Foundation (non-profits). Formerly: Director of Municipal Mortgage & Equity, LLC (from October 2004 to April 1, 2011); Director of University of Maryland College Park Foundation (non-profit) (from 1998 to 2005); Partner, KPMG LLP (international accounting firm) (from 1972 to 2002); Director of Maryland Business Roundtable for Education (from July 1984 to June 2002).
David L. Meister, Director
Age: 73 | Number of Funds Overseen: 34 | Tenure: Since 1982
Non-Royce Directorships: None
Principal Occupation(s) During Past Five Years: Consultant. Chairman and Chief Executive Officer of The Tennis Channel (from June 2000 to March 2005). Mr. Meister’s prior business experience includes having served as Chief Executive Officer of Seniorlife.com, a consultant to the communications industry, President of Financial News Network, Senior Vice President of HBO, President of Time-Life Films and Head of Broadcasting for Major League Baseball.
G. Peter O’Brien, Director
Age: 67 | Number of Funds Overseen: 48 | Tenure: Since 2001
Non-Royce Directorships: Director/Trustee of registered investment companies constituting the 14 Legg Mason Funds; Director of TICC Capital Corp.
Principal Occupation(s) During Past Five Years: Trustee Emeritus of Colgate University (since 2005); Board Member of Hill House, Inc. (since 1999); Formerly: Trustee of Colgate University (from 1996 to 2005), President of Hill House, Inc. (from 2001 to 2005) and Managing Director/Equity Capital Markets Group of Merrill Lynch & Co. (from 1971 to 1999).
John D. Diederich, Vice President and Treasurer
Age: 61 | Tenure: Since 2001
Principal Occupation(s) During Past Five Years: Chief Operating Officer, Managing Director and member of the Board of Managers of Royce; Chief Financial Officer of Royce; Director of Administration of The Royce Funds; and President of Royce Fund Services, Inc. (“RFS”), having been employed by Royce since April 1993.
Jack E. Fockler, Jr., Vice President
Age: 54 | Tenure: Since 1995
Principal Occupation(s) During Past Five Years: Managing Director and Vice President of Royce, and Vice President of RFS, having been employed by Royce since October 1989.
W. Whitney George, Vice President
Age: 54 | Tenure: Since 1995
Principal Occupation(s) During Past Five Years: Co-Chief Investment Officer, Managing Director and Vice President of Royce, having been employed by Royce since October 1991.
Daniel A. O’Byrne, Vice President and Assistant Secretary
Age: 50 | Tenure: Since 1994
Principal Occupation(s) During Past Five Years: Principal and Vice President of Royce, having been employed by Royce since October 1986.
John E. Denneen, Secretary and Chief Legal Officer
Age: 45 | Tenure: 1996-2001 and Since April 2002
Principal Occupation(s) During Past Five Years: General Counsel, Principal, Chief Legal and Compliance Officer and Secretary of Royce; Secretary and Chief Legal Officer of The Royce Funds.
Lisa Curcio, Chief Compliance Officer
Age: 53 | Tenure: Since 2004
Principal Occupation(s) During Past Five Years: Chief Compliance Officer of The Royce Funds (since October 2004) and Compliance Officer of Royce (since June 2004).
1 Interested Director.Directors will hold office until their successors have been duly elected and qualified or until their earlier resignation or removal.
| 60 | The Royce Funds 2012 Annual Report to Stockholders |
| Notes to Performance and Other Important Information |
|
The thoughts expressed in this Review and Report concerning recent market movements and future prospects for small company stocks are solely the opinion of Royce at December 31, 2012, and, of course, historical market trends are not necessarily indicative of future market movements. Statements regarding the future prospects for particular securities held in the Funds’ portfolios and Royce’s investment intentions with respect to those securities reflect Royce’s opinions as of December 31, 2012 and are subject to change at any time without notice. There can be no assurance that securities mentioned in this Review and Report will be included in any Royce-managed portfolio in the future. Investments in securities of micro-cap, small-cap and/or mid-cap companies may involve considerably more risk than investments in securities of larger-cap companies. All publicly released material information is always disclosed by the Funds on the website at www.roycefunds.com.
Sector weightings are determined using the Global Industry Classification Standard (“GICS”). GICS was developed by, and is the exclusive property of, Standard & Poor’s Financial Services LLC (“S&P”) and MSCI Inc. (“MSCI”). GICS is the trademark of S&P and MSCI. “Global Industry Classification Standard (GICS)” and “GICS Direct” are service marks of S&P and MSCI.
All indexes referred to are unmanaged and capitalization weighted. Each index’s returns include net reinvested dividends and/or interest income. Russell Investment Group is the source and owner of the trademarks, service marks, and copyrights related to the Russell Indexes. Russell® is a trademark of Russell Investment Group. The Russell 2000 Index is an index of domestic small-cap stocks. It measures the performance of the 2,000 smallest publicly traded U.S. companies in the Russell 3000 Index. The Russell 2500 is an index of 2,500 smallest publicly traded U.S. companies in the Russell 3000 Index. The Russell Microcap Index includes 1,000 of the smallest securities in the Russell 2000 Index along with the next smallest eligible securities as determined by Russell. The Russell 1000 Index is an index of domestic large-cap stocks. It measures the performance of the 1,000 largest publicly traded companies in the Russell 3000 Index. The Russell Midcap Index measures the performance of the midcap segment of the U.S. equity universe. It includes approximately 800 of the smallest securities in the Russell 1000 Index. The Russell Global ex-U.S. Large Cap Index is an index of global large-cap stocks, excluding the United States. The Russell Global ex-U.S. Small Cap Index is an index of global small-cap stocks, excluding the United States. The S&P 500 and SmallCap 600 are indexes of U.S. large- and small-cap stocks, respectively, selected by Standard & Poor’s based on market size, liquidity, and industry grouping, among other factors. The Nasdaq Composite is an index of the more than 3,000 common equities listed on the Nasdaq stock exchange. Returns for the market indexes used in this report were based on information supplied to Royce by Russell Investments.
Forward-Looking Statements
This material contains forward-looking statements within the meaning of the Securities Exchange Act of 1934, as amended (the “Exchange Act”), that involve risks and uncertainties, including, among others, statements as to:
| • | the Funds’ future operating results |
| • | the prospects of the Funds’ portfolio companies |
| • | the impact of investments that the Funds have made or may make |
| • | the dependence of the Funds’ future success on the general economy and its impact on the companies and industries in which the Funds invest, and |
| • | the ability of the Funds’ portfolio companies to achieve their objectives. |
This Review and Report uses words such as “anticipates,” “believes,” “expects,” “future,” “intends,” and similar expressions to identify forward-looking statements. Actual results may differ materially from those projected in the forward-looking statements for any reason.
The Royce Funds have based the forward-looking statements included in this Review and Report on information available to us on the date of the report, and we assume no obligation to update any such forward-looking statements. Although The Royce Funds undertake no obligation to revise or update any forward-looking statements, whether as a result of new information, future events or otherwise, you are advised to consult any additional disclosures that we may make through future stockholder communications or reports.Authorized Share Transactions
Royce Value Trust, Royce Micro-Cap Trust and Royce Focus Trust may each repurchase up to 5% of the issued and outstanding shares of its respective common stock during the year ending December 31, 2013. Any such repurchases would take place at then prevailing prices in the open market or in other transactions. Common stock repurchases would be effected at a price per share that is less than the share’s then current net asset value.
Royce Value Trust, Royce Micro-Cap Trust and Royce Focus Trust are also authorized to offer their common stockholders an opportunity to subscribe for additional shares of their common stock through rights offerings at a price per share that may be less than the share’s then current net asset value. The timing and terms of any such offerings are within each Board’s discretion.
Annual Certifications
As required, the Funds have submitted to the New York Stock Exchange (“NYSE”) for Royce Value Trust and Royce Micro-Cap Trust and to Nasdaq for Royce Focus Trust, respectively, the annual certification of the Funds’ Chief Executive Officer that he is not aware of any violation of the NYSE’s or Nasdaq’s Corporate Governance listing standards. The Funds also have included the certification of the Funds’ Chief Executive Officer and Chief Financial Officer required by section 302 of the Sarbanes-Oxley Act of 2002 as exhibits to the Funds’ form N-CSR for the period ended December 31, 2012, filed with the Securities and Exchange Commission.
Proxy Voting
A copy of the policies and procedures that The Royce Funds use to determine how to vote proxies relating to portfolio securities and information regarding how each of The Royce Funds voted proxies relating to portfolio securities during the most recent 12-month period ended June 30 is available, without charge, on The Royce Funds’ website at www.roycefunds.com, by calling (800) 221-4268 (toll-free) and on the website of the Securities and Exchange Commission (“SEC”), at www.sec.gov.
Form N-Q Filing
The Funds file their complete schedules of investments with the SEC for the first and third quarters of each fiscal year on Form N-Q. The Funds’ Forms N-Q are available on the SEC’s website at www.sec.gov. The Royce Funds’ holdings are also on the Funds’ website approximately 15 to 20 days after each calendar quarter end and remain available until the next quarter’s holdings are posted. The Funds’ Forms N-Q may also be reviewed and copied at the SEC’s Public Reference Room in Washington, D.C. To find out more about this public service, call the SEC at (800) 732-0330. The Funds’ complete schedules of investments are updated quarterly, and are available at www.roycefunds.com.
| The Royce Funds 2012 Annual Report to Stockholders | 61 |
| Notes to Performance and Other Important Information |
|
Royce Value Trust, Inc.
At the 2012 Annual Meeting of Stockholders held on September 20, 2012, the Fund’s stockholders elected four Directors, consisting of:
| | | VOTES FOR | | VOTES WITHHELD | |
| |
Charles M. Royce* | | 65,337,507 | | 4,224,750 | |
| |
G. Peter O’Brien* | | 65,272,582 | | 4,289,675 | |
| |
Patricia W. Chadwick** | | 8,101,914 | | 94,645 | |
| |
David L. Meister** | | 8,046,066 | | 150,493 | |
| |
| * | Common Stock and Preferred Stock voting together as a single class |
| ** | Preferred Stock voting as a separate class |
Royce Micro-Cap Trust, Inc.
At the 2012 Annual Meeting of Stockholders held on September 20, 2012, the Fund’s stockholders elected four Directors, consisting of:
| | | VOTES FOR | | VOTES WITHHELD | |
| |
Charles M. Royce* | | 25,694,436 | | 559,772 | |
| |
G. Peter O’Brien* | | 25,681,753 | | 572,455 | |
| |
Patricia W. Chadwick** | | 2,151,603 | | 35,923 | |
| |
David L. Meister** | | 2,148,112 | | 39,414 | |
| |
| * | Common Stock and Preferred Stock voting together as a single class |
| ** | Preferred Stock voting as a separate class |
Royce Focus Trust, Inc.
At the 2012 Annual Meeting of Stockholders held on September 20, 2012, the Fund’s stockholders elected four Directors, consisting of:
| | | VOTES FOR | | VOTES WITHHELD | |
| |
Charles M. Royce* | | 17,738,928 | | 203,236 | |
| |
G. Peter O’Brien* | | 17,700,904 | | 241,260 | |
| |
Stephen L. Isaacs** | | 873,774 | | 12,148 | |
| |
David L. Meister** | | 874,275 | | 11,647 | |
| |
| * | Common Stock and Preferred Stock voting together as a single class |
| ** | Preferred Stock voting as a separate class |
| 62 | The Royce Funds 2012 Annual Report to Stockholders |
History has shown that lousy economic conditions, or even dismal corporate results, don’t necessarily lead to disappointing stock market returns in any given year—or decade, for that matter.
– Paul J. Lim, nytimes.com, December 15, 2012
|
| |
Points To Ponder
Bonds are thought to be lower-risk investments; we believe that, at today’s prices, long-term bonds are very risky.
– Bill Nygren, Oakmark Funds, Morningstar Advisor, October 12, 2012
Our national wealth didn’t come from politicians of any ilk, level, office or ideology. It came from the long-term, much defiled 1% of the population and their dedicated followers via the marvelous magic of capitalism.
– Ken Fisher, Forbes, November 19, 2012
Profit margins are probably the most mean-reverting series in finance, and if profit margins do not mean-revert, then something has gone badly wrong with capitalism. If high profits do not attract competition, there is something wrong with the system and it is not functioning properly.
– Jeremy Grantham
Individual and institutional investors are insuring that they will lose money on Treasuries [after inflation] over the next 10 years when they by-pass the chance to make money in equities.
– Noah Blackstein, Barron’s, July 14, 2012
It is important to recognize that results in the short term reflect a lot of randomness. Even skillful managers will slump, and unskillful managers will shine. But over the long haul, good process wins.
– Michael Mauboussin, Daily News & Analysis, June 4, 2012
The market always does what it’s supposed to do only never when it’s supposed to do it.
– Arnold Van De Berg
Do not trust financial market risk models. Despite the predilection of some analysts to model the financial markets using sophisticated mathematics, the markets are governed by behavioral science, not physical science.
– Seth Klarman
In Absolute Agreement
Whenever you find yourself on the side of the majority, it is time to pause and reflect.
– Mark Twain
To preserve independence, we must not let our rulers load us with perpetual debt. We must make our election between economy and liberty, or profusion and servitude.
– Thomas Jefferson
It’s never as good as you think it is when it’s great, and never as bad as you think it is when it’s bad.
– Preston Athey, Barron’s, June 16, 2012
Leverage reduces the investor’s critical asset: patience.
–Jeremy Grantham, GMO Letter, February 2012
We don’t have to be smarter than the rest. We have to be more disciplined than the rest.
– Warren Buffett, 2002
Cocktail Conversation
A decade ago, jewelry accounted for more than 90% of global gold demand...Jewelry accounted for just 43% of global demand in the 2012 first half.
– The Wall Street Journal, November 12, 2012
The one who follows the crowd will usually get no further than the crowd. The one who walks alone is likely to find himself in places no one has ever been.
– Albert Einstein
Timeless Tidbits
The key to happiness is good health and a bad memory.
– Ingrid Bergman
The things that will destroy America are prosperity at any price, peace at any price, safety first instead of duty first and love of soft living and the get-rich-quick theory of life.
– Theodore Roosevelt
You can’t live a perfect day without doing something for someone who will never be able to repay you.
– John Wooden
|
| |
| The thoughts expressed above represent solely the opinions of the persons quoted and, of course, there can be no assurance of future market trends or performance. |
| This page is not part of the 2012 Annual Report to Stockholders | 63 |
November 2012 marked the 40th anniversary of Chuck Royce’s management of Royce Pennsylvania Mutual Fund. Forty years is a long time to do anything, of course, so this happy and momentous event has naturally focused our attention on what we have learned from managing portfolios with a small-cap value orientation. More precisely, we thought about what the most significant lessons have been over four full decades in the mutual fund business. Ultimately, three ideas made it to the top of our list.
The first is the importance of managing risk. Chuck’s formative years running the Fund coincided with the severe bear market of 1973-4, precipitated by the fall of the “Nifty Fifty,” a group of well known large-cap stocks that had previously been thought to be almost impervious to major market corrections (it would not be the last time a group of stocks earned and lost that kind of lofty reputation). Chuck’s portfolio shed value as dramatically as most others. The bear market recalled to him one of the central lessons of value investing, one that became integral to his own burgeoning approach—capital preservation is as critical to building strong returns as capital appreciation.
As the Fund began to recover from the bear market near the end of 1974, Chuck began to concentrate his efforts on finding what he thought were well-managed companies with the financial strength to withstand adversity. A set of criteria soon emerged that he wanted in each portfolio holding. This list included a strong balance sheet, high returns on capital, and the ability to generate free cash flow. He reasoned that companies with these attributes had what it took to better hold their value during difficult periods for the company, its industry, or the economy as a whole.
The second lesson in some ways grew out of the first. Chuck saw that small-caps, especially in the first two-and-a-half decades of his history with the Fund, were often vulnerable and volatile. Yet within the large and diverse small-cap universe were many conservatively capitalized, effectively managed businesses that performed very well, notably over full market cycle periods. These lengthier spans tended to smooth out some of the inherent volatility to which nearly every company in the asset class was subject to some degree. There was also a benefit to be drawn from seeing how a company performed in both up and down markets, an observation he quickly extended to his own approach. Many styles did well in up markets; others held up in downturns. Chuck wanted an approach that could potentially excel through both up and down phases—through full market cycles, in other words. He decided that an approach that did better in down phases while remaining competitive on the upside would work best in trying to meet that objective. This is how the firm’s emphasis on long-term returns became crucial.
From this came the importance of patience and absolute returns. Stressing long-term results has often meant that our Funds were out of sync with their benchmarks over short- and/or intermediate-term periods. It also meant that, even when the Funds outpaced their respective benchmarks over market cycle and other long-term performance periods, we still care most about absolute returns. We thoroughly enjoy outperforming our small-cap benchmarks, but we learned early in our tenure that one cannot eat from the table of relative results. Given the choice, we would much prefer doubling our investors’—and our own—money every five to seven years or so to the occasional victory over a small-cap index.
Anniversaries nearly always lead to a look behind, a gaze through life’s rear-view mirror. As we engage in a review of what has mattered over the years, what pleases us most about our long-term record are the lives that our investments have helped to make better. Close behind is the realization that so much of what was important then remains important now—because it still works.

The thoughts in this essay concerning the stock market are solely those of Royce & Associates and, of course, there can be no assurance with regard to future market movements.
| 64 | This page is not part of the 2012 Annual Report to Stockholders |
| |
| | | |
| | | |
| | | | |
| | | |
| | | |
| | |
| | |
| |  | |
| | |
| | |
| | |
| | |
| | |
| | |
| | |
| | |
| | |
| | About The Royce Funds
Wealth Of Experience
With approximately $35 billion in total assets under management, Royce & Associates is committed to the same small-company investing principles that have served us well for 40 years. Charles M. Royce, our President and Co-Chief Investment Officer, enjoys one of the longest tenures of any active mutual fund manager. Royce’s investment staff also includes Co-Chief Investment Officer W. Whitney George, 18 Portfolio Managers, four assistant portfolio managers and analysts, and eight traders.
Multiple Funds, Common Focus
Our goal is to offer both individual and institutional investors the best available smaller-cap portfolios. Unlike a lot of mutual fund groups with broad product offerings, we have chosen to concentrate on smaller-company investing by providing investors with a range of funds that take full advantage of this large and diverse sector.
Consistent Discipline
Our approach emphasizes paying close attention to risk and maintaining the same discipline, regardless of market movements and trends. The price we pay for a security must be significantly below our appraisal of its current worth. This requires a thorough analysis of the financial and business dynamics of an enterprise, as though we were purchasing the entire company.
Co-Ownership Of Funds
It is important that our employees and shareholders share a common financial goal; our officers, employees and their families currently have approximately $147 million invested in The Royce Funds. | | |
| | |
| | | | | | | | | | | | | | | |
| | | | | | | | | | | | | | | |
| | | | | | | | | | | | | | | |
| | Contact Us | |
| | General Information
Additional Report Copies
and Prospectus Inquiries
(800) 221-4268 | | RIA/BD Services
Fund Materials and
Performance Updates
(800) 33-ROYCE (337-6923) | | Broker/Dealer Services
Fund Materials and
Performance Updates
(800) 59-ROYCE (597-6923) | | Computershare
Transfer Agent
and Registrar
(800) 426-5523 | | | | | |  | |
| | | | | | | | | | | | | | | | | |
| | | | | | | | | | | | | | | | | |
Item 2. Code(s) of Ethics. As of the end of the period covered by this report, the Registrant had adopted a code of ethics, as defined in Item 2 of Form N-CSR, applicable to its principal executive officer, principal financial officer, principal accounting officer or controller, or persons performing similar functions. A copy of this code of ethics is filed as an exhibit to this Form N-CSR. No substantive amendments were approved or waivers were granted to this code of ethics during the period covered by this report.
Item 3. Audit Committee Financial Expert.
| (a)(1) | | The Board of Directors of the Registrant has determined that it has an audit committee financial expert. |
| | | |
| (a)(2) | | Arthur S. Mehlman and Patricia W. Chadwick were designated by the Board of Directors as the Registrant’s Audit Committee Financial Experts, effective April 15, 2004 and April 8, 2010, respectively. Mr. Mehlman and Ms. Chadwick are “independent” as defined under Item 3 of Form N-CSR. |
Item 4. Principal Accountant Fees and Services.
| (a) | | Audit Fees: |
| | | Year ended December 31, 2012 - $29,000 |
| | | Year ended December 31, 2011 - $27,500 |
| | | |
| (b) | | Audit-Related Fees: |
| | | Year ended December 31, 2012 - $1,500 – Not Applicable |
| | | Year ended December 31, 2011 - $1,500 – Preparation of reports to rating agency for Preferred Stock |
| | | |
| (c) | | Tax Fees: |
| | | Year ended December 31, 2012 - $7,100 - Preparation of tax returns |
| | | Year ended December 31, 2011 - $6,900 - Preparation of tax returns |
| | | |
| (d) | | All Other Fees: |
| | | Year ended December 31, 2012 - $0 |
| | | Year ended December 31, 2011 - $0 |
(e)(1) Annual Pre-Approval: On an annual basis, the Registrant’s independent auditor submits to the Audit Committee a schedule of proposed audit, audit-related, tax and other non-audit services to be rendered to the Registrant and/or investment adviser(s) for the following year that require pre-approval by the Audit Committee. This schedule provides a description of each type of service that is expected to require pre-approval and the maximum fees that can be paid for each such service without further Audit Committee approval. The Audit Committee then reviews and determines whether to approve the types of scheduled services and the projected fees for them. Any subsequent revision to already pre-approved services or fees (including fee increases) are presented for consideration at the next regularly scheduled Audit Committee meeting, as needed.
If subsequent to the annual pre-approval of services and fees by the Audit Committee, the Registrant or one of its affiliates determines that it would like to engage the Registrant’s independent auditor to perform a service not already pre-approved, the request is to be submitted to the Registrant’s Chief Financial Officer, and if he or she determines that the service fits within the independence guidelines (e.g., it is not a prohibited service), he or she will then arrange for a discussion of the proposed service and fee to be included on the agenda for the next regularly scheduled Audit Committee meeting so that pre-approval can be considered.
Interim Pre-Approval: If, in the judgment of the Registrant’s Chief Financial Officer, a proposed engagement needs to commence before the next regularly scheduled Audit Committee meeting, he or she shall submit a written summary of the proposed engagement to all members of the Audit Committee, outlining the services, the estimated maximum cost, the category of the services (e.g., audit, audit-related, tax or other) and the rationale for engaging the Registrant’s independent auditor to perform the services. To the extent the proposed engagement involves audit, audit-related or tax services, any individual member of the Audit Committee who is an independent Board member is authorized to pre-approve the engagement. To the extent the proposed engagement
2
involves non-audit services other than audit-related or tax, the Chairman of the Audit Committee is authorized to pre-approve the engagement. The Registrant’s Chief Financial Officer will arrange for this interim review and coordinate with the appropriate member(s) of the Committee. The independent auditor may not commence the engagement under consideration until the Registrant’s Chief Financial Officer has informed the auditor in writing that pre-approval has been obtained from the Audit Committee or an individual member who is an independent Board member. The member of the Audit Committee who pre-approves any engagements in between regularly scheduled Audit Committee meetings is to report, for informational purposes only, any pre-approval decisions to the Audit Committee at its next regularly scheduled meeting.
| (e)(2) | | Not Applicable |
| | | |
| (f) | | Not Applicable |
| | | |
| (g) | | Year ended December 31, 2012 - $7,100 |
| | | Year ended December 31, 2011 - $8,400 |
| | | |
| (h) | | No such services were rendered during 2012 or 2011. |
Item 5. Audit Committee of Listed Registrants. The Registrant has a separately designated standing audit committee established in accordance with Section 3(a)(58)(A) of the Securities Exchange Act of 1934. Patricia W. Chadwick, Richard M. Galkin, Stephen L. Isaacs, William L. Koke, Arthur S. Mehlman, David L. Meister and G. Peter O’Brien are members of the Registrant’s audit committee.
Item 6. Investments.
(a) See Item 1.
(b) Not applicable.
Item 7. Disclosure of Proxy Voting Policies and Procedures for Closed-End Management Investment Companies.
| | June 5, 2003, as amended |
| | through October 22, 2009 |
| Royce & Associates Proxy Voting Guidelines and Procedures |
These procedures apply to Royce & Associates, LLC (“Royce”) and all funds and other client accounts for which it is responsible for voting proxies, including all open and closed-end registered investment companies (“The Royce Funds”), limited partnerships, limited liability companies, separate accounts, other accounts for which it acts as investment adviser and any accounts for which it acts as sub-adviser that have delegated proxy voting authority to Royce. Such authority is determined at the inception of each client account and generally: (i) is specifically authorized in the applicable investment management agreement or other written instrument or (ii) where not specifically authorized, is granted to Royce where general investment discretion is given to it in the applicable investment management agreement. The Boards of Trustees/Directors of The Royce Funds (the “Boards”) have delegated all proxy voting decisions to Royce subject to these policies and procedures. Notwithstanding the above, from time to time the Boards may reserve voting authority for specific securities.
Receipt of Proxy Material. Under the continuous oversight of the Head of Administration, an Administrative Assistant designated by him is responsible for monitoring receipt of all proxies and ensuring that proxies are received for all securities for which Royce has proxy voting responsibility. All proxy materials are logged in upon receipt by Royce’s Librarian.
Voting of Proxies. Once proxy material has been logged in by Royce’s Librarian, it is then promptly reviewed by the designated Administrative Assistant to evaluate the issues presented. Regularly recurring matters are usually voted as recommended by the issuer’s board of directors or “management.” The Head of Administration or his designee, in consultation with the Chief Investment Officer, develops and updates a list of matters Royce treats as
3
“regularly recurring” and is responsible for ensuring that the designated Administrative Assistant has an up-to-date list of these matters at all times, including instructions from Royce’s Chief Investment Officer on how to vote on those matters on behalf of Royce clients. Examples of “regularly recurring” matters include non-contested elections of directors and non-contested approval of independent auditors. Non-“regularly recurring” matters are brought to the attention of the portfolio manager(s) for the account(s) involved by the designated Administrative Assistant, and, after giving some consideration to advisories from Glass Lewis & Co., an independent third party research firm, the portfolio manager directs that such matters be voted in a way that he or she believes should better protect or enhance the value of the investment. If the portfolio manager determines that information concerning any proxy requires analysis, is missing or incomplete, he or she then gives the proxy to an analyst or another portfolio manager for review and analysis.
| a. | | From time to time, it is possible that one Royce portfolio manager will decide (i) to vote shares held in client accounts he or she manages differently from the vote of another Royce portfolio manager whose client accounts hold the same security or (ii) to abstain from voting on behalf of client accounts he or she manages when another Royce portfolio manager is casting votes on behalf of other Royce client accounts. |
| | | |
| | | The designated Administrative Assistant reviews all proxy votes collected from Royce’s portfolio managers prior to such votes being cast. If any difference exists among the voting instructions given by Royce’s portfolio managers, as described above, the designated Administrative Assistant then presents these proposed votes to the Head of Administration, or his designee, and the Chief Investment Officer. The Chief Investment Officer, after consulting with the relevant portfolio managers, either reconciles the votes or authorizes the casting of differing votes by different portfolio managers. The Head of Administration, or his designee, maintains a log of all votes for which different portfolio managers have cast differing votes, that describes the rationale for allowing such differing votes and contains the initials of both the Chief Investment Officer and Head of Administration, or his designee, allowing such differing votes. The Head of Administration, or his designee, performs a weekly review of all votes cast by Royce to confirm that any conflicting votes were properly handled in accordance with the above-described procedures. |
| | | |
| b. | | There are many circumstances that might cause Royce to vote against an issuer’s board of directors or “management” proposal. These would include, among others, excessive compensation, unusual management stock options, preferential voting and poison pills. The portfolio managers decide these issues on a case-by-case basis as described above. |
| | | |
| c. | | A portfolio manager may, on occasion, determine to abstain from voting a proxy or a specific proxy item when he or she concludes that the potential benefit of voting is outweighed by the cost, when it is not in the client account’s best interest to vote. |
| | | |
| d. | | When a client has authorized Royce to vote proxies on its behalf, Royce will generally not accept instructions from the clients regarding how to vote proxies. |
| | | |
| e. | | If a security is on loan under The Royce Funds’ Securities Lending Program with State Street Bank and Trust Company (“Loaned Securities”), the Head of Administration, or his designee, will recall the Loaned Securities and request that they be delivered within the customary settlement period after the notice, to permit the exercise of their voting rights if the number of shares of the security on loan would have a material effect on The Royce Funds’ voting power at the up-coming stockholder meeting. A material effect is defined as any case where the Loaned Securities are 1% or more of a class of a company’s outstanding equity securities. Monthly, the Head of Administration or his designee will review the summary of this activity by State Street. A quarterly report detailing any exceptions that occur in recalling Loaned Securities will be given to the Boards. |
Custodian banks are authorized to release all proxy ballots held for Royce client account portfolios to Glass Lewis & Co. for voting, utilizing the Viewpoint proxy voting platform. Substantially all portfolio companies utilize Broadridge to collect their proxy votes.
4
Under the continuous oversight of the Head of Administration, or his designee, the designated Administrative Assistant is responsible for voting all proxies in a timely manner. Votes are returned to Broadridge using Viewpoint as ballots are received, generally two weeks before the scheduled meeting date. The issuer can thus see that the shares were voted, but the actual vote cast is not released to the company until 4:00 pm on the day before the meeting. If proxies must be mailed, they go out at least ten business days before the meeting date.
Conflicts of Interest. The designated Administrative Assistant reviews reports generated by Royce’s portfolio management system (“Quest PMS”) that set forth by record date, any security held in a Royce client account which is issued by a (i) public company that is, or a known affiliate of which is, a separate account client of Royce (including sub-advisory relationships), (ii) public company, or a known affiliate of a public company, that has invested in a privately-offered pooled vehicle managed by Royce or (iii) public company, or a known affiliate of a public company, by which the spouse of a Royce employee or an immediate family member of a Royce employee living in the household of such employee is employed, for the purpose of identifying any potential proxy votes that could present a conflict of interest for Royce. The Head of Administration, or his designee, develops and updates the list of such public companies or their known affiliates which is used by Quest PMS to generate these daily reports. This list also contains information regarding the source of any potential conflict relating to such companies. Potential conflicts identified on the “conflicts reports” are brought to the attention of the Head of Administration or his designee by the designated Administrative Assistant. An R&A Compliance Officer then reviews them to determine if business or personal relationships exist between Royce, its officers, managers or employees and the company that could present a material conflict of interest. Any such identified material conflicts are voted by Royce in accordance with the recommendation given by an independent third party research firm (Glass Lewis & Co.). The Head of Administration or his designee maintains a log of all such conflicts identified, the analysis of the conflict and the vote ultimately cast. Each entry in this log is signed by the Chief Investment Officer before the relevant votes are cast.
Recordkeeping. A record of the issues and how they are voted is stored in the Viewpoint system. Copies of all physically executed proxy cards, all proxy statements (with it being permissible to rely on proxy statements filed and available on Edgar) and any other documents created or reviewed that are material to making a decision on how to vote proxies are retained in the Company File maintained by Royce’s Librarian in an easily accessible place for a period of not less than six years from the end of the fiscal year during which the last entry was made on such record, the first two years at Royce’s office. In addition, copies of each written client request for information on how Royce voted proxies on behalf of that client, and a copy of any written response by Royce to any (written or oral) client request for information on how Royce voted proxies on behalf of that client will be maintained by Royce’s Head of Administration and/or Royce’s Director of Alternative Investments, or their designee (depending on who received such request) for a period of not less than six years from the end of the fiscal year during which the last entry was made on such record, the first two years at Royce’s office. Royce’s Compliance Department shall maintain a copy of any proxy voting policies and procedures in effect at any time within the last five years.
Disclosure. Royce’s proxy voting procedures will be disclosed to clients upon commencement of a client account. Thereafter, proxy voting records and procedures are generally disclosed to those clients for which Royce has authority to vote proxies as set forth below:
| | - | The Royce Funds – proxy voting records are disclosed annually on Form N-PX (with such voting records also available at www.roycefunds.com). Proxy voting procedures are available in the Statement of Additional Information for the open-end funds, in the annual report on Form N-CSR for the closed-end funds and at www.roycefunds.com. |
| | - | Limited Liability Company and Limited Partnership Accounts – proxy voting records are disclosed to members/partners upon request and proxy voting procedures (along with a summary thereof) are provided to members/partners annually (and are available at www.roycefunds.com). |
| | - | Separate Accounts – proxy voting records and procedures are disclosed to separate account clients annually. |
Item 8. Portfolio Managers of Closed-End Management Investment Companies.
(a)(1) Portfolio Managers of Closed-End Management Investment Companies (information as of December 31, 2012)
5
| Name | Title | Length of Service | Principal Occupation(s) During Past 5 Years |
| W. Whitney George | Vice President and Portfolio Manager of the Registrant | Since July 2002 | Co-Chief Investment Officer, Managing Director and Vice President of Royce & Associates, LLC (“Royce”), investment adviser to the Registrant; Vice President of the Registrant, Royce Value Trust, Inc., Royce Micro-Cap Trust, Inc., Royce Focus Trust, Inc., The Royce Fund and Royce Capital Fund (collectively, “The Royce Funds”). |
(a)(2) Other Accounts Managed by Portfolio Manager and Potential Conflicts of Interest (information as of December 31, 2012)
Other Accounts
| Type of Account | Number of
Accounts Managed | Total
Assets Managed | Number of Accounts
Managed for which
Advisory Fee is
Performance-Based | Value of Managed
Accounts for which
Advisory Fee is
Performance Based |
| Registered investment companies | 11 | $14,544,212,176 | - | - |
| Private pooled investment vehicles | 5 | $1,116,163,365 | 1 | $104,617,204 |
| Other accounts* | 2 | $39,529,545 | - | - |
*Other accounts include all other accounts managed by the Portfolio Manager in either a professional or personal capacity except for personal accounts subject to pre-approval and reporting requirements under the Registrant’s Rule 17j-1 Code of Ethics.
Conflicts of Interest
The fact that the Portfolio Manager has day-to-day management responsibility for more than one client account may create actual, potential or only apparent conflicts of interest. For example, the Portfolio Manager may have an opportunity to purchase securities of limited availability. In this circumstance, the Portfolio Manager is expected to review each account’s investment guidelines, restrictions, tax considerations, cash balances, liquidity needs and other factors to determine the suitability of the investment for each account and to ensure that his managed accounts are treated equitably. The Portfolio Manager may also decide to purchase or sell the same security for multiple managed accounts at approximately the same time. To address any conflicts that this situation may create, the Portfolio Manager will generally combine managed account orders (i.e., enter a “bunched” order) in an effort to obtain best execution or a more favorable commission rate. In addition, if orders to buy or sell a security for multiple accounts managed by common Portfolio Managers on the same day are executed at different prices or commission rates, the transactions will generally be allocated by Royce & Associates, LLC (“Royce”) to each of such managed accounts at the weighted average execution price and commission. In circumstances where a pre-allocated bunched order is not completely filled, each account will normally receive a pro-rated portion of the securities based upon the account’s level of participation in the order. Royce may under certain circumstances allocate securities in a manner other than pro-rata if it determines that the allocation is fair and equitable under the circumstances and does not discriminate against any account.
As described below, there is a revenue-based component of the Portfolio Manager’s Performance-Related Variable Compensation and the Portfolio Manager also receives Firm-Related Variable Compensation based on revenues (adjusted for certain imputed expenses) generated by Royce. In addition, the Portfolio Manager receives variable compensation based on Royce’s retained pre-tax profits from operations. As a result, the Portfolio Manager may receive a greater relative benefit from activities that increase the value to Royce of The Royce Funds and/or other Royce client accounts, including, but not limited to, increases in sales of the Registrant’s shares and assets under management.
Also, as described above, the Portfolio Manager generally manages more than one client account, including, among others, registered investment company accounts, separate accounts and private pooled accounts managed on behalf of institutions (e.g., pension funds, endowments and foundations) and for high-net-worth individuals. The appearance of a conflict of interest may arise where Royce has an incentive, such as a performance-based management fee (or any other variation in the level of fees payable by The Royce Funds or other Royce client accounts to Royce), which relates to the management of one or more of The Royce Funds or accounts with respect to which the Portfolio Manager has day-to-day management responsibilities. One registered investment company
6
account, Royce Global Select Fund, for which the Portfolio Manager serves as Assistant Portfolio Manager, pays Royce a performance-based fee.
Finally, conflicts of interest may arise when the Portfolio Manager personally buys, holds or sells securities held or to be purchased or sold for the Registrant or other Royce client account or personally buys, holds or sells the shares of one or more of The Royce Funds. To address this, Royce has adopted a written Code of Ethics designed to prevent and detect personal trading activities that may interfere or conflict with client interests (including Registrant’s stockholders’ interests). Royce generally does not permit its Portfolio Managers to purchase small- or micro-cap securities in their personal investment portfolios.
Royce and The Royce Funds have adopted certain compliance procedures which are designed to address the above-described types of conflicts. However, there is no guarantee that such procedures will detect each and every situation in which a conflict arises.
(a)(3) Description of Portfolio Manager Compensation Structure (information as of December 31, 2012)
Royce seeks to maintain a compensation program that is competitively positioned to attract and retain high-caliber investment professionals. The Portfolio Manager, receives from Royce a base salary, Performance-Related Variable Compensation, Firm-Related Variable Compensation based primarily on registered investment company and other client account revenues generated by Royce and a benefits package. Portfolio Manager compensation is reviewed and may be modified from time to time as appropriate to reflect changes in the market, as well as to adjust the factors used to determine variable compensation. Except as described below, the Portfolio Manager’s compensation consists of the following elements:
| | - | BASE SALARY. The Portfolio Manager is paid a base salary. In setting the base salary, Royce seeks to be competitive in light of the Portfolio Manager’s experience and responsibilities. |
| | | |
| | - | PERFORMANCE-RELATED VARIABLE COMPENSATION. The Portfolio Manager receives quarterly Performance-Related Variable Compensation that is either asset-based, or revenue-based and therefore in part based on the value of the net assets of the account for which he is being compensated, determined with reference to each of the registered investment company and other client accounts he is managing. The Performance-Related Variable Compensation applicable to the registered investment company accounts managed by the Portfolio Manager is subject to downward adjustment or elimination based on a combination of 3-year, 5-year and 10-year risk-adjusted pre-tax returns of such accounts relative to all small-cap objective funds with three years of history tracked by Morningstar (as of December 31, 2012 there were 374 such Funds tracked by Morningstar), 5-year absolute returns of such accounts relative to 5-year U.S. Treasury Notes and absolute returns over the prior full market cycle and current cycle to date vs. the accounts’ benchmark. The Performance-Related Variable Compensation applicable to non-registered investment company accounts managed by the Portfolio Manager is not subject to performance-related adjustment. |
Payment of the Performance-Related Variable Compensation may be deferred, and any amounts deferred are forfeitable, if the Portfolio Manager is terminated by Royce with or without cause or resigns. The amount of the deferred Performance-Related Variable Compensation will appreciate or depreciate during the deferral period, based on the total return performance of one or more Royce-managed registered investment company accounts selected by the Portfolio Manager at the beginning of the deferral period. The amount deferred will depend on the Portfolio Manager’s total direct, indirect beneficial and deferred unvested investments in the Royce registered investment company account for which he or she is receiving portfolio management compensation.
| | - | FIRM-RELATED VARIABLE COMPENSATION. The Portfolio Manager receives quarterly variable compensation based on Royce’s net revenues. |
| | | |
| | - | BENEFIT PACKAGE. The Portfolio Manager also receives benefits standard for all Royce employees, including health care and other insurance benefits, and participation in Royce’s 401(k) Plan and Money |
7
| | | Purchase Pension Plan. From time to time, on a purely discretionary basis, the Portfolio Manager may also receive options to acquire stock in Royce’s parent company, Legg Mason, Inc. Those options typically represent a relatively small portion of the Portfolio Managers’ overall compensation. |
The Portfolio Manager, in addition to the above-described compensation, also receives variable compensation based on Royce’s retained pre-tax operating profit. This variable compensation, along with the Performance-Related Variable Compensation and Firm-Related Variable Compensation, generally represents the most significant element of the Portfolio Manager’s compensation.
(a)(4) Dollar Range of Equity Securities in Registrant Beneficially Owned by Portfolio Manager (information as of December 31, 2012)
The following table shows the dollar range of the Registrant’s shares owned beneficially and of record by the Portfolio Manager, including investments by his immediately family members sharing the same household and amounts invested through retirement and deferred compensation plans.
| Dollar Range of Registrant’s Shares Beneficially Owned |
| Over $1,000,000 |
(b) Not Applicable.
Item 9. Purchases of Equity Securities by Closed-End Management Investment Company and Affiliated Purchasers. Not Applicable.
Item 10. Submission of Matters to a Vote of Security Holders. Not Applicable.
Item 11. Controls and Procedures.
(a) Disclosure Controls and Procedures. The Principal Executive and Financial Officers concluded that the Registrant’s Disclosure Controls and Procedures are effective based on their evaluation of the Disclosure Controls and Procedures as of a date within 90 days of the filing date of this report.
(b) Internal Control over Financial Reporting. There were no significant changes in Registrant’s internal control over financial reporting or in other factors that could significantly affect this control subsequent to the date of the evaluation, including any corrective actions with regard to significant deficiencies and material weaknesses during the second fiscal quarter of the period covered by this report.
Item 12. Exhibits. Attached hereto.
(a)(1) The Registrant’s code of ethics pursuant to Item 2 of Form N-CSR.
(a)(2) Separate certifications by the Registrant’s Principal Executive Officer and Principal Financial Officer as required by Rule 30a-2(a) under the Investment Company Act of 1940.
(a)(3) Not Applicable
(b) Separate certifications by the Registrant’s Principal Executive Officer and Principal Financial Officer, pursuant to Section 906 of the Sarbanes-Oxley Act of 2002 and required by Rule 30a-2(b) under the Investment Company Act of 1940.
8
Pursuant to the requirements of the Securities Exchange Act of 1934 and the Investment Company Act of 1940, the registrant has duly caused this report to be signed on its behalf by the undersigned, thereunto duly authorized.
ROYCE FOCUS TRUST, INC.
| BY: | /s/ Charles M. Royce | |
| | Charles M. Royce | |
| | President | |
| | | |
| Date: | March 4, 2013 | |
Pursuant to the requirements of the Securities Exchange Act of 1934 and the Investment Company Act of 1940, this report has been signed below by the following persons on behalf of the registrant and in the capacities and on the dates indicated.
| ROYCE FOCUS TRUST, INC. | ROYCE FOCUS TRUST, INC. |
| | | | | | |
| BY: | /s/ Charles M. Royce | | BY: | /s/ John D. Diederich | |
| | Charles M. Royce | | | John D. Diederich | |
| | President | | | Chief Financial Officer |
| | | | | | |
| Date: | March 4, 2013 | | Date: | March 4, 2013 | |
9