UNITED STATES
SECURITIES AND EXCHANGE COMMISSION
WASHINGTON, D.C. 20549
FORM N-CSR
CERTIFIED SHAREHOLDER REPORT OF
REGISTERED MANAGEMENT INVESTMENT COMPANIES
Investment Company Act file number: 811-05379
SPROTT FOCUS TRUST, INC.
(Exact name of registrant as specified in charter)
Royal Bank Plaza, South Tower
200 Bay Street, Suite 2600
Toronto, Ontario, Canada M5J 2J1
(Address of principal executive offices)
The Prentice-Hall Corporation System, MA
7 St. Paul Street, Suite 820
Baltimore, MD 21202
(Name and address of agent for service)
Registrant’s telephone number, including area code: (760) 444-5297
Date of fiscal year end: December 31, 2020
Date of reporting period: January 1, 2020 – December 31, 2020
Item 1. Reports to Shareholders.
| | | | | | |
| |  | | Annual Report |
| | |
| | | | December 31, 2020 |
| | |
| | | |  |

Beginning September 1, 2021, as permitted by regulations adopted by the Securities and Exchange Commission, paper copies of Sprott Focus Trust’s (“the Fund”) semi-annual and annual financial reports will no longer be sent by mail, unless you specifically request paper copies of the reports. Instead, the reports will be made available on www.sprottfocustrust.com and you will be notified by mail each time a report is posted and provided with a website link to access the report.
If you have already elected to receive shareholder reports electronically, you will not be affected by this change and you need not take any action. You may elect to receive shareholder reports and other communications from the Fund electronically at any time by contacting your financial intermediary (such as a broker-dealer or bank) or, if you are a direct investor and your shares are held with our transfer agent, Computershare, you may log into your Investor Center account at www.computershare.com/investor and go to “Communication Preferences”. You may also call Computershare at 1.800.426.5523.
You may elect to receive all future reports in paper form at no cost to you. If you invest through a financial intermediary, you can contact your financial intermediary to request that you continue to receive paper copies of your shareholder reports; if you invest directly with the Fund, you can call Computershare at 1.800.426.5523. Your election to receive reports in paper form will apply to all funds held in your account with your financial intermediary or, if you invest directly, to all closed-end funds you hold.
Table of Contents
Managed Distribution Policy
The Board of Directors of Sprott Focus Trust, Inc. (the “Fund”) has authorized a managed distribution policy (“MDP”). Under the MDP, the Fund pays quarterly distributions at an annual rate of 6% of the rolling average of the prior four quarter-end net asset values, with the fourth quarter distribution being the greater of this annualized rate or the distribution required by IRS regulations. With each distribution, the Fund will issue a notice to its stockholders and an accompanying press release that provides detailed information regarding the amount and composition of the distribution (including whether any portion of the distribution represents a return of capital) and other information required by the Fund’s MDP. You should not draw any conclusions about the Fund’s investment performance from the amount of distributions or from the terms of the Fund’s MDP. The Fund’s Board of Directors may amend or terminate the MDP at any time without prior notice to stockholders.
Performance
NAV Average Annual Total Returns
As of December 31, 2020 (%)
| | | | | | | | | | | | | | | | | | | | | | | | | | | | | | | | |
| FUND | | 1 YR | | | 3 YR | | | 5 YR | | | 10 YR | | | 15 YR | | | 20 YR | | | SINCE INCEPTION | | | INCEPTION DATE | |
Sprott Focus Trust | | | 6.80 | | | | 5.55 | | | | 11.70 | | | | 6.35 | | | | 6.54 | | | | 9.04 | | | | 9.37 | | | | 11/1/1996 | 1 |
| | | | | | | | |
| INDEX | | | | | | | | | | | | | | | | | | | | | | | | |
Russell 3000 TR2 | | | 20.89 | | | | 14.49 | | | | 15.43 | | | | 13.79 | | | | 9.98 | | | | 7.82 | | | | 9.38 | | | | | |
| 1 | Royce & Associates, LLC served as investment adviser of the Fund from November 1, 1996 to March 6, 2015. After the close of business on March 6, 2015, Sprott Asset Management LP and Sprott Asset Management USA Inc. became the investment adviser and investment sub-adviser, respectively, of the Fund. |
| 2 | Russell Investment Group is the source and owner of the trademarks, service marks, and copyrights related to the Russell Indexes. Russell® is a trademark of Russell Investment Group. The Russell 3000 Total Return index measures the performance of the largest 3,000 U.S. companies. The performance of an index does not represent exactly any particular investment, as you cannot invest directly in an index. |
Growth of $10,000 (as of December 31, 2020)
Comparison of Change in Value of $10,000 Investment in the Fund and the Underlying Index
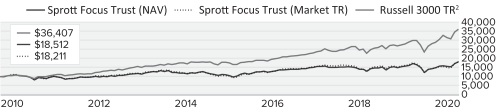
This chart assumes an initial gross investment of $10,000 made on 12/31/2010. Returns shown do not reflect the deduction of taxes that a shareholder would pay on fund distributions or the redemption of fund shares. Returns shown include the reinvestment of all dividends and other distributions. Past performance is not predictive of future performance. Investment return and principal value will fluctuate so that your shares, when redeemed, may be worth more or less than their original cost.
The Russell 3000 Index is a capitalization-weighted index measuring the performance of the largest 3,000 U.S. companies representing approximately 98% of the investable U.S. equity market. The Russell 3000 Index is constructed to provide a comprehensive, unbiased and stable barometer of the broad market and is completely reconstituted annually to ensure new and growing equities are reflected. Returns include the reinvestment of all dividends. The performance of an index does not represent exactly any particular investment, as you cannot invest directly in an index.
Important Performance and Risk Information
All performance information reflects past performance, is presented on a total return basis, net of the Fund’s investment advisory fee and reflects the reinvestment of distributions. Past performance is no guarantee of future results. Current performance may be higher or lower than performance quoted. Returns as of the most recent month-end may be obtained at www.sprottfocustrust.com. The market price of the Fund’s shares will fluctuate, so shares may be worth more or less than their original cost when sold.
The Fund is a closed-end registered investment company whose shares of common stock may trade at a discount to their net asset value. Shares of the Fund’s common stock are also subject to the market risks of investing in the underlying portfolio securities held by the Fund.
The Fund’s shares of common stock trade on the Nasdaq Select Market. Closed-end funds, unlike open-end funds, are not continuously offered. After the initial public offering, shares of closed-end funds are sold on the open market through a stock exchange. For additional information, contact your financial advisor or call 203.656.2430. Investment policies, management fees and other matters of interest to prospective investors may be found in the closed-end fund prospectus used in its initial public offering, as revised by subsequent stockholder reports.
2020 Annual Report to Stockholders | 1
| | |
| | MANAGER’S DISCUSSION |
| Sprott Focus Trust | | |

W. Whitney George
DEAR FELLOW SHAREHOLDERS,
We start this letter by wishing all of you a safe and healthy New Year, and we hope that the COVID-19 crisis will be lessening by the time you receive this letter. It’s hard to know where to begin to describe the events of 2020. We will start with the year’s end results. For 2020, Sprott Focus Trust’s (FUND) total return based on net asset value (NAV) was 6.80%. FUND’s market price appreciation, reflecting the re-investment of dividends, was less at 2.86% due to a widening of the market price trading discount to NAV. We will discuss more on this later. Our benchmark Russell 3000 Total Return Index was up 20.89%. With the Russell 3000’s ever increasing weighting in mega-capitalization technology names, we find this comparison less and less relevant.
We seem to have completed a full market cycle in just one year in 2020, starting with a historic bear market in the spring followed by a rapid bull market for the remainder of the year. FUND’s performance was trailing as we entered the late February/early March crash. We recovered in the second and third quarters of the year, performing more in line with the market. Our strategy began to outperform during the fall, a welcome development that has continued into the New Year. It has been quite the ride and we find ourselves once again in the same place we were this time last year, gently selling individual positions into a bull market. FUND’s portfolio in aggregate is slightly cheaper in absolute terms and massively less expensive relative to its benchmarks, and the portfolio’s cash position, having been fully deployed last spring, is once again rising.
Equity markets in 2020 were dominated by one factor: The liquidity of U.S. dollars. The global economy has functioned on a U.S. dollar standard for 50 years as of this year, and last March this system broke. The scramble for scarce dollars in March caused a worldwide margin call that required the liquidation of virtually every other available asset. The moment the U.S. Federal Reserve (Fed) stepped in to provide the “whatever it takes” dollars to the global system, the crisis passed. Massive amounts of capital were printed and flooded the system in response to the COVID-19 global pandemic. With most developed economies in lockdown, this capital had nowhere to go other than the fixed income and equity markets. While the crisis did pass, the underlying conditions that caused it remain with us (i.e., massive debt levels and the inability to service them at free-market interest rates). As we have observed for years, the most likely way out of the current global financial mess is the significant debasement of those currencies in which the debt is denominated (mostly the U.S. dollar). We believe that we hit the tipping point in 2020.
In September, we wrote an article titled 2020 vs. 1968: This Too Shall Pass, which can be found on Sprott’s website under the Insights blog menu tab (https://sprott.com/insights/2020-vs-1968-this-too-shall-pass/). In 1968, our economy and society had reached another tipping point due to the massive debts built up from President Lyndon Johnson’s Great Society government expansion and the escalating Vietnam War. Like 2020, 1968 was characterized by political and social unrest and even a global pandemic, the Hong Kong flu. What followed was more than a decade of higher inflation, higher interest rates and slow growth punctuated by recessions.
In the 1970s, we experienced stagflation, a time in which good inflation (stocks and bonds) suffered and bad inflation (food and energy) were constantly on the rise. We guess that the economic adjustments required back then to put our fiscal house in order will take significantly less than a decade this time around. Given the speed at which information travels and markets react, we are prepared for massive volatility, rapid rotations and significant changes in the global financial system.
Activity
FUND’s annual portfolio turnover for 2020 was generally consistent with the last few years at 35%, although slightly higher than implied by our historic three- to five-year holding period. Heightened volatility can create short-term trading opportunities in existing positions, driving portfolio turnover higher, which was the case in 2020.
We established two new positions since our semi-annual letter despite the strong recovery in equity markets during the second half of 2020. Vishay Intertechnology is one of the world’s largest manufacturers of discrete semiconductors and passive electronic components. From humble roots in 1962, Vishay has grown through dozens of acquisitions of other electronic component manufacturers to become a global provider of products that help bring modern technology to life, every day and for everyone. Vishay’s products span almost every sector, including automotive, industrial, consumer, telecom, medical and more. Electric vehicles, factory automation, 5G wireless networks and the Internet of Things realm of connectivity are strong growth areas for Vishay. We believe that Vishay’s net cash balance sheet, strong free cash flow generation and commitment to maintaining a prudent capital structure lend confidence that the company’s record of value-creating capital allocation should continue in the years ahead. Much has been written recently about the proliferation of special-purpose acquisition companies (SPACs). These are non-operating companies formed to raise capital for the intended purpose of acquiring an existing company, referred to colloquially as “blank check companies.” In the closing days of 2020, Sprott Focus Trust
2 | 2020 Annual Report to Stockholders
participated in one such acquisition that was faltering due to
insufficient capital and fears of COVID-19 related business risk. AerSale Corp., a global leader in aviation aftermarket products and services, agreed to combine with Monocle Acquisition Corp. before the COVID-19 pandemic struck. The sudden arrest of global travel put this transaction on hold and eventually at risk of failure. In need of additional capital, very attractive terms were devised to attract outside investors and on December 22, 2020, the deal was consummated with Sprott Focus Trust participating. AerSale management has a long history of success in the lucrative aftermarket aerospace industry, having previously founded California-based AeroTurbine, Inc., which it ultimately sold to Dutch aircraft leasing and asset management company AerCap Holdings N.V. The December transaction gives AerSale significantly greater financial resources to expand its asset purchase program, to expand passenger-to-freighter conversions and to bring innovative AerAware technology to market. You should be aware that statements above about Vishay Intertechnology and AerSale Corporation only reflect our views and are subject to risks and uncertainties. Actual events or results concerning these companies may differ substantially.
In total, we sold eight of FUND’s portfolio positions in 2020. We discussed five of these in detail in the semi-annual report, namely Apple, Amgen, Birchcliff Energy, Pretium Resources and Stelco Holdings. In the second half of 2020, shares in Exxon Mobil Corporation, Lam Research and MAG Silver were liquidated. We sold Exxon Mobile in favor of redeploying proceeds towards higher-quality oilfield services companies already in FUND’s portfolio, specifically Pason Systems and Helmerich & Payne. Notional exposure to the energy industry was maintained, although both Pason’s and Helmerich & Payne’s net cash balance sheets mitigate financial leverage while preserving operating leverage in a recovery. Lam Research shares were sold following tremendous price appreciation exceeding our estimate of fair business value. Lam’s leading position within the semiconductor equipment industry will continue to serve it well in the current growing demand environment. Finally, we sold shares in MAG Silver from our precious metals miners’ basket following significant price appreciation.
Top Contributors to Performance
Year-to-date through 12/31/2020 (%)1
| | | | |
Artisan Partners Asset Management, Inc. | | | 3.21 | |
Westlake Chemical Corporation | | | 1.97 | |
Seabridge Gold Inc. | | | 1.43 | |
Kirkland Lake Gold Ltd. | | | 1.28 | |
Fresnillo plc | | | 1.28 | |
Top Detractors from Performance
Year-to-date through 12/31/2020 (%)1
| | | | |
Pason Systems Inc. | | | -2.73 | |
Helmerich & Payne, Inc. | | | -2.02 | |
Kennedy-Wilson Holdings, Inc. | | | -1.61 | |
Exxon Mobil Corporation | | | -1.38 | |
Biogen Inc. | | | -0.66 | |
Figure 1
Figure 1 lists our top five performance contributors and detractors for the full year. Artisan Partners Asset Management was the largest contributor to portfolio performance. Consistent with shares of most other asset managers, Artisan Partners suffered a short but sharp decline during the early days of the COVID-19 crisis. Its recovery was equally sharp and our decision to buy more shares during the March swoon helped the position contribute more than 3.21% of the FUND’s 6.80% NAV return for the year. Our strategy of staying focused on the long term helps to ease the burden of difficult decisions during extremely volatile periods such as we had in 2020. Westlake Chemical Corporation contributed 1.97% to 2020 performance as PVC (polyvinyl chloride) prices strengthened from a combination of pent-up construction demand, low-interest rates and a potential post-COVID-19 infrastructure package. Similar to our report to you at mid-year, the remaining three of the top five contributors to FUND’s performance in 2020 were components of our basket of precious metals producers. Seabridge Gold, Kirkland Lake Gold and Fresnillo plc together contributed nearly 4% to FUND’s annual performance. Equities of gold and silver miners benefited from resilient and rising spot prices, inexpensive valuations, prodigious free cash flow generation and value-enhancing capital allocation — all of which are still present across many gold and silver miners today.
Three of the five largest detractors from FUND’s performance during the 12-month period were concentrated in the energy patch. Pason Systems and Helmerich & Payne were repeat offenders from our semi-annual report, while Exxon Mobil joined the energy sector’s suffering. Together, the three detracted 6.13% from 2020 performance. Interestingly, and hopefully a sign of good things to come in 2021, both Pason and Helmerich & Payne were among the five best-performing positions for FUND during the fourth quarter of 2020, while we sold Exxon Mobil for tax-loss purposes. Kennedy-Wilson Holdings detracted 1.61% during the year as sentiment toward office real estate values soured and investors contemplated potential demand destruction resulting from the success of work-from-home. Finally, shares in Biogen fell after results from an important Advisory Committee review of its Aducanumab Alzheimer’s drug revealed challenges with clinical trial data; it detracted 0.66% from FUND’s 2020 performance.
Positioning
The Fund had 37 investments at year-end 2020, down from 43 investments at the end of 2019. This is not surprising to us, given the strength in the recovery of markets and our disciplined approach to security selection. It is slightly disappointing, however, since we tend to find better opportunities when markets are under pressure. FUND’s cash position, which had been building as the year progressed, stood at 1.15% at year-end due to the AerSale Corp. purchase in December.
2020 Annual Report to Stockholders | 3
Once again, Materials was our largest sector exposure (27.1%) at the end of 2020, comprised of precious metals miners that we believe have very attractive investment characteristics. The defensive role that bonds have traditionally played in portfolios seems to have largely run its course as rates are near zero, offering very little upside and potentially great downside from here. This might lend further support for other defensive assets such as gold and silver, underpinning the valuation of gold mining stocks. Bountiful free cash flow should drive further dividend increases and share buybacks in the future.
Top 10 Positions
(% of Net Assets)
| | | | |
Western Digital Corporation | | | 5.0 | |
AerSale Corp. | | | 4.9 | |
Berkshire Hathaway Inc. | | | 4.8 | |
Artisan Partners Asset Management, Inc. | | | 4.8 | |
Kennedy-Wilson Holdings, Inc. | | | 4.4 | |
Federated Hermes, Inc. | | | 4.4 | |
Helmerich & Payne, Inc. | | | 4.4 | |
Pason Systems Inc. | | | 4.4 | |
Westlake Chemical Corporation | | | 4.4 | |
Biogen Inc. | | | 4.0 | |
Portfolio Sector Breakdown
(% of Net Assets)
| | | | |
Materials | | | 27.1 | |
Financial Services | | | 20.2 | |
Energy | | | 9.5 | |
Industrials | | | 8.7 | |
Technology | | | 8.0 | |
Real Estate | | | 8.0 | |
Consumer Staples | | | 7.1 | |
Consumer Discretionary | | | 6.2 | |
Health Care | | | 4.0 | |
Cash and Cash Equivalents | | | 1.2 | |
Figure 2
Portfolio Diagnostics
| | | | |
Fund Net Assets | | | $242.9 million | |
Total Equity Holdings | | | 37 | |
2020 Annual Turnover Rate | | | 35% | |
Net Asset Value | | | $8.08 | |
Market Price | | | $6.90 | |
Average Market Capitalization1 | | | $3.13 billion | |
Weighted Average P/E Ratio2,3 | | | 17.2x | |
Weighted Average P/B Ratio2 | | | 1.8x | |
Weighted Average Yield | | | 2.4% | |
Weighted Average ROIC | | | 16.06% | |
Weighted Average Leverage Ratio | | | 2.08x | |
Holdings ³75% of Total Investments | | | 21 | |
U.S. Investments (% of Net Assets) | | | 70.34% | |
Non-U.S. Investments (% of Net Assets) | | | 29.66% | |
Figure 3
| 1 | Geometric Average. This weighted calculation uses each portfolio holding’s market cap in a way designed to not skew the effect of very large or small holdings; instead, it aims to better identify the portfolio’s center, which Sprott believes offers a more accurate measure of average market cap than a simple mean or median. |
| 2 | Harmonic Average. This weighted calculation evaluates a portfolio as if it were a single stock and measures it overall. It compares the total market value of the portfolio to the portfolio’s share in the earnings or book value, as the case may be, of its underlying stocks. |
| 3 | The Fund’s P/E ratio calculation excludes companies with zero or negative earnings (21.6% of holdings as of 12/31/2020). |
Outlook
As we write this letter, markets are setting new all-time highs daily. The unimaginable monetary and fiscal stimulus created in 2020 is driving the bull market and is expected to continue, if not expand, in 2021. With short-term rates at 0%, and expected to remain there for years, we are hearing the very dangerous explanation of “TINA” (there is no alternative). Even with low inflation, investors are faced with negative real returns (interest after adjusting for inflation) in fixed income markets. It should come as no surprise that speculative bubbles are now resurfacing. Legendary value investor Jeremy Grantham gives many examples in his annual letter, Waiting for the Last Dance (available at https://www.gmo.com/americas/research-library/waiting-for-the-last-dance/). But we were most intrigued by his discussion about the popularity of SPACs. Grantham writes that in 2020 there were 480 IPOs (initial public offerings), of which 248 were SPACs — which have no business, just the hope of acquiring one someday. As mentioned, we did participate in one SPAC, but only after the acquisition was identified following the return of its cash. By comparison, Grantham points out there were 406 IPOs in 2000 at the height of the dot.com bubble. There are many other examples of euphoric speculation but we need to be mindful that these conditions can persist for longer than one might expect. Remember Alan Greenspan’s warning of “irrational exuberance” in late 1996 and three-and-a-half years before the dot.com peak? Our focus will remain
4 | 2020 Annual Report to Stockholders
on FUND’s portfolio and the valuations of its individual holdings. While our cash position is starting to build again and the number of holdings is starting to shrink, we are comfortable with the current aggregate valuations.
As value managers, we are always asking ourselves, what could go wrong? Firstly, the COVID-19 pandemic has accelerated many changes that were already in place and created some new ones. Perhaps the expected U.S. economic recovery will not unfold as predicted or resemble what we have seen in the past. The U.S. consumer may continue to choose to save more of their stimulus checks rather than spending them. Or worse, yet, be forced to pay more for essentials like food and energy as the depreciating U.S. dollar drives up the cost of commodities. There is also the possibility that many of the changes we have been forced to make during the COVID pandemic will become permanent. The way we sleep, the way we travel, learn and even work have been altered, and in some cases, permanently. This will cause some dramatic restructuring in our economy with some unexpected outcomes, many of them negative. Finally, we must contend with the policy changes that come with our new federal leadership under President Biden. New spending priorities, regulations and tax policies could create challenges for corporations and investors once we move beyond the COVID-19 crisis. Reversing the Trump corporate tax rates would create an immediate reduction in corporate profitability. This, in turn, would likely be met with unwelcome cost cutting and restructuring, perhaps impacting employment. High taxes on investment returns for individuals would increase the cost of capital for new growth initiatives. Past experience has taught us that there is always a higher cost to meet and comply with new regulations. These are all considerations that could derail a U.S. economic expansion before it begins, and we don’t believe this potential outcome has been priced into the current market.
On the flip side, as long-term investors who have repeatedly learned that markets cannot be timed, we find much to make us optimistic. Last fall, we witnessed some mean reversion in the historic spread between growth and value investing styles. As the markets started to look forward to an economic recovery due to the arrival of COVID-19 vaccines, cyclical sectors like industrials, financials and energy came into focus. FUND’s portfolio, which tends to favor hard asset themes, began to outperform — a welcome development. Active management assisted in the sorting process as investors began to assess the pandemic lockdown’s longer-term effects and the ramifications of our November election results. Merger and acquisition activity picked up the pace, unlocking value in some of our favorite sectors like asset management. Also, there is perhaps a glimmer of hope that politicians can agree on some badly needed infrastructure investment that would benefit our industrial and materials holdings. Finally, while precious metals paused in the fourth quarter of 2020, the fundamentals of
precious metals miners have never been brighter. Repeated results from our gold and silver mining stocks are strong and improving on all metrics, including balance sheets, revenue growth, operating margins and free cash flow. Based on all the previously discussed macroeconomic conditions, we would expect the mining sector to be discovered by a much wider audience in 2021.
As promised earlier in this letter, we will now discuss the unfortunate widening of FUND’s trading discount to net asset value in 2020. After several years of progress towards narrowing this spread, the market volatility and FUND’s weaker performance earlier in the year set us back. Our continued investment coupled with attractive portfolio metrics (strong balance sheets and high returns of capital) and reasonable valuations (relatively low price-to-book and price-to-earnings ratios) were not enough to attract new investors. In November, we announced a share repurchase plan. While the plan is somewhat limited by volumes on a daily basis, we expect that it will have a significant long-term benefit. Further, we are permitted to buy large blocks of stock should they be presented. We hope that as all of our shareholders become aware of this initiative, it will improve liquidity and the value proposition that FUND offers.
This year we would like to thank Basia Dworak for her herculean accomplishments under extreme circumstances. Basia is the Office Manager of our Darien, CT office, the Executive Assistant to the President of Sprott and supports all those associated with the management of Sprott Focus Trust. Despite having two small children requiring homeschooling for nearly a year now, Basia kept us all functioning at 100% through COVID. Additionally, she headed our Connecticut COVID-19 Committee and managed an office move at the beginning of November. This crisis has been difficult for many, but none more so than working parents with children at home. Thank you, Basia.
I would also like to thank my investment partner, Matt Haynes, for his continued support and insights, as well as his heavy assistance on this letter. A big thanks also to the entire Sprott team for its expertise and efforts in helping manage FUND during a global pandemic as if it were a normal year. From trading to administration and accounting, we have been fully supported and encouraged and are proud to be part of Sprott.
Finally, thank you to our shareholders for your continued support and patience. We look forward to hearing from you at any time. Our office number is 203.656.2430. Please don’t be shy.
Sincerely,
W. Whitney George
Senior Portfolio Manager
2020 Annual Report to Stockholders | 5
(This page intentionally left blank)
6 | 2020 Annual Report to Stockholders
| | |
| PERFORMANCE AND PORTFOLIO REVIEW | | SYMBOLS MARKET PRICE: FUND NAV: XFUNX |
Average Annual Total Return (%) Through 12/31/2020
| | | | | | | | | | | | | | | | | | | | | | | | | | | | |
| | | 1 YR | | | 3 YR | | | 5 YR | | | 10 YR | | | 15 YR | | | 20 YR | | | SINCE
INCEPTION
(11/1/1996)1 | |
FUND (NAV) | | | 6.80 | | | | 5.55 | | | | 11.70 | | | | 6.35 | | | | 6.54 | | | | 9.04 | | | | 9.37 | |
Relative Returns: Monthly Rolling Average Annual Return Periods1
15 Years through 12/31/2020
On a monthly rolling basis, the Fund outperformed the Russell 3000 in 58% of all 10-year periods; 55% of all 5-year periods; and 48% of all 3-year and 1-year periods.
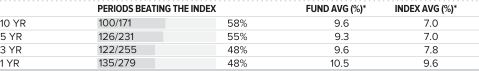
| * | Average of monthly rolling average annual total returns over the specified periods. |
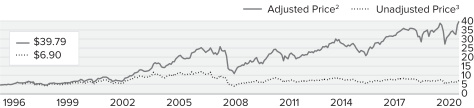
Market Price Performance History (%) Since Inception (11/1/1996)1
Cumulative Performance of Investment2
| | | | | | | | | | | | | | | | | | | | | | | | | | | | | | | | | | | | | | | | |
| Description | | 1 MO | | | QTD | | | YTD | | | 1 YR | | | 3 YR | | | 5 YR | | | 10 YR | | | 15 YR | | | 20 YR | | | SINCE INCEPTION | |
Sprott Focus Trust (MKT TR) | | | 5.09 | | | | 19.57 | | | | 2.86 | | | | 2.86 | | | | 13.23 | | | | 75.90 | | | | 82.11 | | | | 127.02 | | | | 474.04 | | | | 798.41 | |
Sprott Focus Trust (MKT Price) | | | 1.92 | | | | 15.97 | | | | (6.25 | ) | | | (6.25 | ) | | | (12.88 | ) | | | 18.97 | | | | (8.85 | ) | | | (27.60 | ) | | | 21.32 | | | | 57.71 | |
| 1 | Royce & Associates, LLC served as investment adviser of the Fund from November 1, 1996 to March 6, 2015. After the close of business on March 6, 2015, Sprott Asset Management LP and Sprott Asset Management USA, Inc. became the investment adviser and investment sub-adviser, respectively, of the Fund. |
| 2 | Reflects the cumulative performance experience of a continuous common stockholder who reinvested all distributions and fully participated in the primary subscription of the Fund’s 2005 rights offering. |
| 3 | Reflects the actual month-end market price movement of one share as it has traded on Nasdaq. |
| | | | |
Calendar Year Total Returns (%) | |
| YEAR | | FUND
(NAV) | |
2020 | | | 6.8 | |
2019 | | | 32.7 | |
2018 | | | -17.0 | |
2017 | | | 18.5 | |
2016 | | | 24.8 | |
2015 | | | -11.1 | |
2014 | | | 0.3 | |
2013 | | | 19.7 | |
2012 | | | 11.4 | |
2011 | | | -10.5 | |
2010 | | | 21.8 | |
2009 | | | 54.0 | |
2008 | | | -42.7 | |
2007 | | | 12.2 | |
2006 | | | 15.8 | |
2005 | | | 13.7 | |
2004 | | | 29.3 | |
2003 | | | 54.3 | |
2002 | | | -12.5 | |
2001 | | | 10.0 | |
2000 | | | 20.9 | |
1999 | | | 8.7 | |
Important Performance and Risk Information
All performance information reflects past performance, is presented on a total return basis, and reflects the reinvestment of distributions. Past performance is no guarantee of future results. Current performance may be higher or lower than performance quoted. Returns as of the most recent month-end may be obtained at www.sprottfocustrust.com. The market price of the Fund’s shares will fluctuate, so shares may be worth more or less than their original cost when sold. The Fund normally invests primarily in small-/mid-cap companies, which may involve considerably more risk than investing in larger-cap companies. The Fund also generally invests a significant portion of its assets in a limited number of stocks, which may involve considerably more risk than a broadly diversified portfolio because a decline in the value of any one of these stocks would cause the Fund’s overall value to decline to a greater degree. Regarding the “Top Contributors” and “Top Detractors” tables shown on page 3, the sum of all contributors to, and all detractors from, performance for all securities in the portfolio would approximate the Fund’s performance for 2020 to date.
| | |
| | 2020 Annual Report to Stockholders | 7 |
History Since Inception
The following table details the share accumulations by an initial investor in the Funds who reinvested all distributions and participated fully in primary subscriptions for each of the rights offerings. Full participation in distribution reinvestments and rights offerings can maximize the returns available to a long-term investor. This table should be read in conjunction with the Performance and Portfolio Reviews of the Funds.
| | | | | | | | | | | | | | | | | | | | | | |
| HISTORY | | | | AMOUNT REINVESTED | | | PURCHASE PRICE1 | | | SHARES | | | NAV VALUE2 | | | MARKET VALUE2 | |
| 10/31/96 | | Initial Purchase | | $ | 4,375 | | | $ | 4.375 | | | | 1,000 | | | $ | 5,280 | | | $ | 4,375 | |
| 12/31/96 | | | | | | | | | | | | | | | | | 5,520 | | | | 4,594 | |
| 12/5/97 | | Distribution $0.53 | | | | | | | 5.250 | | | | 101 | | | | 6,650 | | | | 5,574 | |
| 12/31/98 | | | | | | | | | | | | | | | | | 6,199 | | | | 5,367 | |
| 12/6/99 | | Distribution $0.145 | | | | | | | 4.750 | | | | 34 | | | | 6,742 | | | | 5,356 | |
| 12/6/00 | | Distribution $0.34 | | | | | | | 5.563 | | | | 69 | | | | 8,151 | | | | 6,848 | |
| 12/6/01 | | Distribution $0.145 | | | | | | | 6.010 | | | | 28 | | | | 8,969 | | | | 8,193 | |
| 12/6/02 | | Distribution $0.09 | | | | | | | 5.640 | | | | 19 | | | | 7,844 | | | | 6,956 | |
| 12/8/03 | | Distribution $0.62 | | | | | | | 8.250 | | | | 94 | | | | 12,105 | | | | 11,406 | |
| 2004 | | Annual distribution total $1.74 | | | | | | | 9.325 | | | | 259 | | | | 15,639 | | | | 16,794 | |
| 5/6/05 | | Rights offering | | | 2,669 | | | | 8.340 | | | | 320 | | | | | | | | | |
| 2005 | | Annual distribution total $1.21 | | | | | | | 9.470 | | | | 249 | | | | 21,208 | | | | 20,709 | |
| 2006 | | Annual distribution total $1.57 | | | | | | | 9.860 | | | | 357 | | | | 24,668 | | | | 27,020 | |
| 2007 | | Annual distribution total $2.01 | | | | | | | 9.159 | | | | 573 | | | | 27,679 | | | | 27,834 | |
| 2008 | | Annual distribution total $0.473 | | | | | | | 6.535 | | | | 228 | | | | 15,856 | | | | 15,323 | |
| 3/11/09 | | Distribution $0.093 | | | | | | | 3.830 | | | | 78 | | | | 24,408 | | | | 21,579 | |
| 12/31/10 | | | | | | | | | | | | | | | | | 29,726 | | | | 25,806 | |
| 2011 | | Annual distribution total $0.413 | | | | | | | 6.894 | | | | 207 | | | | 26,614 | | | | 22,784 | |
| 2012 | | Annual distribution total $0.46 | | | | | | | 6.686 | | | | 255 | | | | 29,652 | | | | 25,549 | |
| 2013 | | Annual distribution total $0.40 | | | | | | | 7.222 | | | | 219 | | | | 35,501 | | | | 31,166 | |
| 2014 | | Annual distribution total $0.42 | | | | | | | 7.890 | | | | 222 | | | | 35,617 | | | | 31,348 | |
| 2015 | | Annual distribution total $0.44 | | | | | | | 6.655 | | | | 296 | | | | 31,657 | | | | 26,726 | |
| 2016 | | Annual distribution total $0.40 | | | | | | | 6.609 | | | | 287 | | | | 36,709 | | | | 31,423 | |
| 2017 | | Annual distribution total $0.52 | | | | | | | 7.603 | | | | 345 | | | | 46,794 | | | | 41,502 | |
| 2018 | | Annual distribution total $0.69 | | | | | | | 6.782 | | | | 565 | | | | 38,836 | | | | 33,669 | |
| 2019 | | Annual distribution total $0.46 | | | | | | | 6.870 | | | | 403 | | | | 51,523 | | | | 45,688 | |
| 2020 | | Annual distribution total $0.55 | | | | | | | 6.038 | | | | 603 | | | | 55,033 | | | | 46,996 | |
| 12/31/2020 | | | | $ | 7,044 | | | | | | |
| 6,811
|
| | | | | | | | |
| 1The | purchase price used for annual distribution totals is a weighted average of the distribution reinvestment prices for the year. |
| 2Values | are stated as of December 31 of the year indicated, after reinvestment of distributions. |
| 3Includes | a return of capital. |
8 | 2020 Annual Report to Stockholders
Distribution Reinvestment and Cash Purchase Options
Why should I reinvest my distributions?
By reinvesting distributions, a stockholder can maintain an undiluted investment in the Fund. The regular reinvestment of distributions has a significant impact on stockholder returns. In contrast, the stockholder who takes distributions in cash is penalized when shares are issued below net asset value to other stockholders.
How does the reinvestment of distributions from the Fund work?
The Fund automatically issues shares in payment of distributions unless you indicate otherwise. The shares are generally issued at the lower of the market price or net asset value on the valuation date.
How does this apply to registered stockholders?
If your shares are registered directly with the Fund, your distributions are automatically reinvested unless you have otherwise instructed the Fund’s transfer agent, Computershare, in writing, in which case you will receive your distribution in cash. A registered stockholder also may have the option to receive the distribution in the form of a stock certificate.
What if my shares are held by a brokerage firm or a bank?
If your shares are held by a brokerage firm, bank, or other intermediary as the stockholder of record, you should contact your brokerage firm or bank to be certain that it is automatically reinvesting distributions on your behalf. If they are unable to reinvest distributions on behalf, you should have your shares registered in your name in order to participate.
What other features are available for registered stockholders?
The Distribution Reinvestment and Cash Purchase Plan also allows registered stockholders to make optional cash purchases of shares of the Fund’s common stock directly through Computershare on a monthly basis, and to deposit certificates representing your FUND shares with Computershare for safekeeping. Plan participants are subject to a $0.75 service fee for each voluntary cash purchase under the Plans.
How does the Plan work for registered stockholders?
Computershare maintains the accounts for registered stockholders in the Plan and sends written confirmation of all transactions in the account. Shares in the account of each participant will be held by Computershare in non-certificated form in the name of the participant, and each participant will be able to vote those shares at a stockholder meeting or by proxy. A participant may also send stock certificates for FUND held by them to Computershare to be held in non-certificated form. There is no service fee charged to participants for reinvesting distributions. If a participant elects to sell shares from a Plan account, Computershare will deduct a $2.50 service fee from the sale transaction. If a nominee is the registered owner of your shares, the nominee will maintain the accounts on your behalf.
How can I get more information on the Plan?
You can call an Investor Services Representative at (203) 656-2430 or you can request a copy of the Plan for your Fund from Computershare. All correspondence (including notifications) should be directed to: Sprott Focus Trust Distribution Reinvestment and Cash Purchase Plan, c/o Computershare, PO Box 30170, College Station, TX 77842-3170, telephone (800) 426-5523 (from 9:00 A.M. to 5:00 P.M.).
2020 Annual Report to Stockholders | 9
| | |
| Sprott Focus Trust | | December 31, 2020 |
| | | | | | | | |
| Schedule of Investments | |
| Common Stocks – 98.8% | |
| | | SHARES | | | VALUE | |
|
CONSUMER DISCRETIONARY – 6.2% | |
AUTO COMPONENTS – 0.7% | |
Gentex Corp. | | | 50,000 | | | $ | 1,696,500 | |
| | | | | | | | |
AUTOMOBILES – 1.5% | |
Thor Industries, Inc.1 | | | 40,000 | | | | 3,719,600 | |
| | | | | | | | |
SPECIALTY RETAIL – 4.0% | |
Buckle, Inc. (The) | | | 330,000 | | | | 9,636,000 | |
Total (Cost $9,104,380) | | | | | | | 15,052,100 | |
|
CONSUMER STAPLES – 7.1% | |
FOOD PRODUCTS – 7.1% | |
Cal-Maine Foods, Inc.2 | | | 200,000 | | | | 7,508,000 | |
Industrias Bachoco SAB de CV | | | 70,000 | | | | 3,161,200 | |
Sanderson Farms, Inc. | | | 50,000 | | | | 6,610,000 | |
| | | | | | | | |
| | | | | | | 17,279,200 | |
Total (Cost $14,463,732) | | | | | | | 17,279,200 | |
|
ENERGY – 9.5% | |
ENERGY EQUIPMENT & SERVICES – 9.5% | |
Helmerich & Payne, Inc. | | | 460,000 | | | | 10,653,600 | |
Pason Systems, Inc.1 | | | 1,720,000 | | | | 10,647,812 | |
Smart Sand, Inc.1,2 | | | 1,000,000 | | | | 1,720,000 | |
| | | | | | | | |
| | | | | | | 23,021,412 | |
Total (Cost $33,956,900) | | | | | | | 23,021,412 | |
|
FINANCIALS – 20.2% | |
CAPITAL MARKETS – 15.5% | |
Artisan Partners Asset Management, Inc. | | | 230,000 | | | | 11,578,200 | |
Ashmore Group plc1 | | | 700,000 | | | | 4,131,614 | |
Federated Hermes, Inc. | | | 370,000 | | | | 10,689,300 | |
Franklin Resources, Inc. | | | 280,000 | | | | 6,997,200 | |
Value Partners Group Ltd. | | | 8,000,000 | | | | 4,247,541 | |
| | | | | | | | |
| | | | | | | 37,643,855 | |
| | | | | | | | |
DIVERSIFIED FINANCIAL SERVICES – 4.7% | |
Berkshire Hathaway, Inc.2 | | | 50,000 | | | | 11,593,500 | |
Total (Cost $39,508,771) | | | | | | | 49,237,355 | |
|
HEALTH CARE – 4.0% | |
BIOTECHNOLOGY – 4.0% | |
Biogen, Inc.2 | | | 40,000 | | | | 9,794,400 | |
Total (Cost $9,139,256) | | | | | | | 9,794,400 | |
|
INDUSTRIALS – 8.7% | |
AEROSPACE & DEFENSE – 4.9% | |
AerSale Corp.2,3,4 | | | 1,500,000 | | | | 12,000,000 | |
| | | | | | | | |
CONSTRUCTION & ENGINEERING – 2.3% | |
Arcosa, Inc. | | | 100,000 | | | | 5,493,000 | |
| | | | | | | | |
MARINE – 1.5% | |
Clarkson plc | | | 100,000 | | | | 3,694,094 | |
Total (Cost $17,780,663) | | | | | | | 21,187,094 | |
|
INFORMATION TECHNOLOGY – 8.0% | |
ELECTRONIC EQUIPMENT, INSTRUMENTS & COMPONENTS – 1.3% | |
Vishay Intertechnology, Inc. | | | 150,000 | | | | 3,106,500 | |
| | | | | | | | |
| | | | | | | | |
| Schedule of Investments | |
| | |
| | | SHARES | | | VALUE | |
SEMICONDUCTORS & SEMICONDUCTOR EQUIPMENT – 1.7% | |
Cirrus Logic, Inc.2 | | | 50,000 | | | $ | 4,110,000 | |
| | | | | | | | |
TECHNOLOGY HARDWARE, STORAGE & PERIPHERALS – 5.0% | |
Western Digital Corp. | | | 220,000 | | | | 12,185,800 | |
Total (Cost $12,622,651) | | | | | | | 19,402,300 | |
|
MATERIALS – 27.1% | |
CHEMICALS – 4.4% | |
Westlake Chemical Corp. | | | 130,000 | | | | 10,608,000 | |
| | | | | | | | |
METALS & MINING – 22.7% | |
Agnico Eagle Mines Ltd. | | | 50,000 | | | | 3,525,500 | |
Barrick Gold Corp. | | | 270,000 | | | | 6,150,600 | |
Centamin plc | | | 2,000,000 | | | | 3,348,531 | |
Fresnillo plc | | | 200,000 | | | | 3,093,932 | |
Gemfields Group Ltd.1,2 | | | 16,000,000 | | | | 1,472,909 | |
Hochschild Mining plc | | | 2,000,000 | | | | 5,702,424 | |
Kirkland Lake Gold Ltd. | | | 155,000 | | | | 6,396,850 | |
Major Drilling Group International, Inc.2 | | | 1,000,000 | | | | 6,041,323 | |
Pan American Silver Corp.1 | | | 120,000 | | | | 4,141,200 | |
Reliance Steel & Aluminum Co. | | | 75,000 | | | | 8,981,250 | |
Seabridge Gold, Inc.1,2 | | | 300,000 | | | | 6,321,000 | |
| | | | | | | | |
| | | | | | | 55,175,519 | |
Total (Cost $43,381,841) | | | | | | | 65,783,519 | |
|
REAL ESTATE – 8.0% | |
REAL ESTATE MANAGEMENT & DEVELOPMENT – 8.0% | |
FRP Holdings, Inc.2 | | | 100,000 | | | | 4,555,000 | |
Kennedy-Wilson Holdings, Inc. | | | 600,000 | | | | 10,734,000 | |
Marcus & Millichap, Inc.2 | | | 110,000 | | | | 4,095,300 | |
| | | | | | | | |
| | | | | | | 19,384,300 | |
Total (Cost $14,392,885) | | | | | | | 19,384,300 | |
| | |
TOTAL COMMON STOCKS | | | | | | | | |
(Cost $194,351,079) | | | | 240,141,680 | |
|
REPURCHASE AGREEMENT – 1.1% | |
| Fixed Income Clearing Corporation, 0.0% dated 12/31/20, due 01/04/21, maturity value $2,646,122 (collateralized by obligations of a U.S. Treasury Note, 0.125%, due 12/31/22, valued at $2,699,100) | | | | | | | 2,646,122 | |
Total (Cost $2,646,122) | | | | | | | 2,646,122 | |
|
SECURITIES LENDING COLLATERAL – 1.7% | |
| State Street Navigator Securities Lending Government Money Market Portfolio, 0.08%5 | | | 4,088,849 | | | | 4,088,849 | |
Total (Cost $4,088,849) | | | | | | | 4,088,849 | |
| | |
TOTAL INVESTMENTS – 101.6% | | | | | | | | |
(Cost $201,086,050) | | | | 246,876,651 | |
| |
LIABILITIES LESS CASH AND OTHER ASSETS – (1.6)% | | | | (3,975,677 | ) |
| | | | | | | | |
| | | | | | | |
NET ASSETS – 100.0% | | | | | | $ | 242,900,974 | |
| 1 | Security (or a portion of the security) is on loan. As of December 31, 2020, the market value of securities loaned was $10,749,517. The loaned securities were secured with cash collateral of $4,088,849 and non-cash collateral with a value of $7,275,915. The non-cash collateral received consists of U.S. Treasury securities, and is held for the benefit of the Fund at the Fund’s custodian. The Fund cannot repledge or resell this collateral. Collateral is calculated based on prior day’s prices. |
| 4 | Fair-valued by management in accordance with procedures approved by the Fund’s Board of Directors. |
| 5 | Represents an investment of securities lending cash collateral. The rate shown is the annualized one-day yield at December 31, 2020. |
| | |
10 | 2020 Annual Report to Stockholders | | THE ACCOMPANYING NOTES ARE AN INTEGRAL PART OF THESE FINANCIAL STATEMENTS |
| | |
| Sprott Focus Trust | | December 31, 2020 |
Statement of Assets and Liabilities
| | | | |
ASSETS: | |
Investments at value | | $ | 244,230,529 | |
Repurchase agreements (at cost and value) | | | 2,646,122 | |
Foreign currencies at value | | | 73,427 | |
Receivable for dividends and interest | | | 251,503 | |
Receivable for securities lending income | | | 2,478 | |
Prepaid expenses and other assets | | | 3,041 | |
Total Assets | | | 247,207,100 | |
LIABILITIES: | |
Obligation to return securities lending collateral | | | 4,088,849 | |
Payable for investments purchased | | | 128 | |
Payable for investment advisory fee | | | 3,630 | |
Fund shares redeemed | | | 57,207 | |
Audit fees | | | 37,200 | |
Administration fees | | | 13,241 | |
Accrued expenses | | | 105,871 | |
Total Liabilities | | | 4,306,126 | |
Net Assets | | $ | 242,900,974 | |
ANALYSIS OF NET ASSETS: | | | | |
Paid-in capital - $0.001 par value per share; 30,077,838 shares outstanding (150,000,000 shares authorized) | | $ | 196,080,470 | |
Distributable earnings | | | 46,820,504 | |
Net Assets (net asset value per share $8.08) | | $ | 242,900,974 | |
Investments (excluding repurchase agreements) at identified cost | | $ | 198,439,928 | |
Foreign currencies at cost | | $ | 73,102 | |
Market value of securities on loan | | $ | 10,749,517 | |
| | |
| THE ACCOMPANYING NOTES ARE AN INTEGRAL PART OF THESE FINANCIAL STATEMENTS | | 2020 Annual Report to Stockholders | 11 |
| | |
| Sprott Focus Trust | | December 31, 2020 |
Statement of Operations
| | | | |
INVESTMENT INCOME: | |
|
INCOME: | |
Dividends | | $ | 6,817,332 | |
Foreign withholding tax | | | (100,118 | ) |
Interest | | | 3,892 | |
Securities lending | | | 44,888 | |
Other income | | | 3,425 | |
Total Income | | | 6,769,419 | |
EXPENSES: | |
Investment advisory fees | | | 2,104,145 | |
Stockholders reports | | | 72,840 | |
Custody and transfer agent fees | | | 91,190 | |
Directors’ fees | | | 14,748 | |
Audit fees | | | 34,437 | |
Legal fees | | | 67,533 | |
Administrative and office facilities | | | 41,577 | |
Other expenses | | | 53,893 | |
Total expenses | | | 2,480,363 | |
Custody credit | | | (114 | ) |
Net expenses | | | 2,480,249 | |
Net Investment Income (loss) | | | 4,289,170 | |
REALIZED AND UNREALIZED GAIN (LOSS) ON INVESTMENTS AND FOREIGN CURRENCY: | |
NET REALIZED GAIN (LOSS): | |
Investments | | | 11,252,588 | |
Foreign currency transactions | | | (15,111 | ) |
NET CHANGE IN UNREALIZED APPRECIATION (DEPRECIATION): | |
Investments and foreign currency translations | | | (2,109,428 | ) |
Other assets and liabilities denominated in foreign currency | | | 3,444 | |
Net realized and unrealized gain (loss) on investments and foreign currency | | | 9,131,493 | |
NET INCREASE (DECREASE) IN NET ASSETS FROM INVESTMENT OPERATIONS | | $ | 13,420,663 | |
| | |
12 | 2020 Annual Report to Stockholders | | THE ACCOMPANYING NOTES ARE AN INTEGRAL PART OF THESE FINANCIAL STATEMENTS |
| | |
| Sprott Focus Trust | | December 31, 2020 |
Statement of Changes
| | | | | | | | |
| | | YEAR ENDED
DEC. 31, 2020 | | | YEAR ENDED
DEC. 31, 2019 | |
| | | | | | | |
INVESTMENT OPERATIONS: | | | | | | | | |
Net investment income (loss) | | $ | 4,289,170 | | | $ | 3,284,572 | |
Net realized gain (loss) on investments and foreign currency | | | 11,237,477 | | | | 11,802,191 | |
Net change in unrealized appreciation (depreciation) on investments and foreign currency | | | (2,105,984 | ) | | | 43,121,715 | |
Net increase (decrease) in net assets from investment operations | | | 13,420,663 | | | | 58,208,478 | |
DISTRIBUTIONS: | | | | | | | | |
Total Distributions | | | (15,908,592 | ) | | | (12,800,963 | ) |
CAPITAL SHARE TRANSACTIONS: | | | | | | | | |
Reinvestment of distributions | | | 10,661,537 | | | | 8,166,065 | |
Shares redeemed | | | (595,076 | ) | | | — | |
Total capital stock transactions | | | 10,066,461 | | | | 8,166,065 | |
Net increase (decrease) in Net Assets | | | 7,578,532 | | | | 53,573,580 | |
NET ASSETS | | | | | | | | |
Beginning of period | | | 235,322,442 | | | | 181,748,862 | |
End of period | | $ | 242,900,974 | | | $ | 235,322,442 | |
| | |
| THE ACCOMPANYING NOTES ARE AN INTEGRAL PART OF THESE FINANCIAL STATEMENTS | | 2020 Annual Report to Stockholders | 13 |
| | |
| Sprott Focus Trust | | December 31, 2020 |
Financial Highlights
This table is presented to show selected data for a share of Common Stock outstanding throughout each period, and to assist stockholders in evaluating the Fund’s performance for the periods presented.
| | | | | | | | | | | | | | | | | | | | |
| | | YEAR ENDED
DEC. 31, 2020 | | | YEAR ENDED
DEC. 31, 2019 | | | YEAR ENDED
DEC. 31, 2018 | | | YEAR ENDED
DEC. 31, 2017 | | | YEAR ENDED
DEC. 31, 2016 | |
Net Asset Value, Beginning of Period | | $ | 8.30 | | | $ | 6.69 | | | $ | 8.93 | | | $ | 8.07 | | | $ | 6.87 | |
INVESTMENT OPERATIONS: | |
Net investment income (loss)1 | | | 0.15 | | | | 0.12 | | | | 0.17 | | | | 0.09 | | | | 0.14 | |
Net realized and unrealized gain (loss) on investments and foreign currency | | | 0.24 | | | | 1.99 | | | | (1.67 | ) | | | 1.33 | | | | 1.50 | |
Total investment operations | | | 0.39 | | | | 2.11 | | | | (1.50 | ) | | | 1.42 | | | | 1.64 | |
DISTRIBUTIONS TO COMMON STOCKHOLDERS: | |
Net investment income | | | (0.33 | ) | | | (0.07 | ) | | | (0.24 | ) | | | (0.09 | ) | | | (0.10 | ) |
Net realized gain on investments and foreign currency | | | (0.22 | ) | | | (0.39 | ) | | | (0.45 | ) | | | (0.43 | ) | | | (0.30 | ) |
Total distributions to Common Stockholders | | | (0.55 | ) | | | (0.46 | ) | | | (0.69 | ) | | | (0.52 | ) | | | (0.40 | ) |
CAPITAL STOCK TRANSACTIONS: | |
Effect of reinvestment of distributions by Common Stockholders | | | (0.06 | ) | | | (0.04 | ) | | | (0.05 | ) | | | (0.04 | ) | | | (0.04 | ) |
Total capital stock transactions | | | (0.06 | ) | | | (0.04 | ) | | | (0.05 | ) | | | (0.04 | ) | | | (0.04 | ) |
Net Asset Value, End of Period | | $ | 8.08 | | | $ | 8.30 | | | $ | 6.69 | | | $ | 8.93 | | | $ | 8.07 | |
Market Value, End of Period | | $ | 6.90 | | | $ | 7.36 | | | $ | 5.78 | | | $ | 7.92 | | | $ | 6.94 | |
TOTAL RETURN:2 | |
Net Asset Value | | | 6.80 | % | | | 32.67 | % | | | (17.01 | )% | | | 18.46 | % | | | 24.83 | % |
Market Value | | | 2.86 | % | | | 36.17 | % | | | (19.15 | )% | | | 22.17 | % | | | 27.16 | % |
RATIOS BASED ON AVERAGE NET ASSETS APPLICABLE TO COMMON STOCKHOLDERS: | | | | | | | | | | | | | | | | | | | | |
Investment advisory fee expense | | | 1.00 | % | | | 1.00 | % | | | 1.00 | % | | | 1.00 | % | | | 1.00 | % |
Other operating expenses | | | 0.18 | % | | | 0.11 | % | | | 0.24 | % | | | 0.26 | % | | | 0.28 | % |
Net expenses | | | 1.18 | % | | | 1.11 | % | | | 1.20 | % | | | 1.20 | % | | | 1.20 | % |
Expenses prior to balance credits | | | 1.18 | % | | | 1.11 | % | | | 1.24 | % | | | 1.26 | % | | | 1.28 | % |
Net investment income (loss) | | | 2.04 | % | | | 1.57 | % | | | 2.00 | % | | | 1.11 | % | | | 1.82 | % |
SUPPLEMENTAL DATA: | |
Net Assets Applicable to Common Stockholders, End of Period (in thousands) | | $ | 242,901 | | | $ | 235,322 | | | $ | 181,749 | | | $ | 227,992 | | | $ | 197,306 | |
Portfolio turnover rate | | | 35 | % | | | 30 | % | | | 31 | % | | | 29 | % | | | 35 | % |
| 1 | Calculated using average shares outstanding during the period. |
| 2 | The Market Value Total Return is calculated assuming a purchase of Common Stock on the opening of the first business day and a sale on the closing of the last business day of each period. Dividends and distributions are assumed for the purposes of this calculation to be reinvested at prices obtained under the Fund’s Distribution Reinvestment and Cash Purchase Plan. Net Asset Value Total Return is calculated on the same basis, except that the Fund’s net asset value is used on the purchase and sale dates instead of market value. |
| | |
14 | 2020 Annual Report to Stockholders | | THE ACCOMPANYING NOTES ARE AN INTEGRAL PART OF THESE FINANCIAL STATEMENTS |
Sprott Focus Trust
Notes to Financial Statements
Organization:
Sprott Focus Trust, Inc. (the “Fund”) is a diversified closed-end investment company incorporated under the laws of the State of Maryland. The Fund commenced operations on March 2, 1988, and Sprott Asset Management LP and Sprott Asset Management USA Inc. (collectively, “Sprott”) assumed investment management responsibility for the Fund after the close of business on March 6, 2015. Royce & Associates, LLC was the Fund’s previous investment manager.
Summary of Significant Accounting Policies:
The preparation of financial statements in conformity with accounting principles generally accepted in the United States of America requires management to make estimates and assumptions that affect the reported amounts of assets and liabilities and the disclosure of contingent assets and liabilities at the date of the financial statements and the reported amounts of income and expenses during the reporting period. Actual results could differ from those estimates.
The Fund is an investment company and accordingly follows the investment company accounting and reporting guidance of the Financial Accounting Standards Board (FASB) Accounting Standard Codification Topic 946 “Financial Services- Investment Companies” and Accounting Standards Update 2013-08.
At December 31, 2020, officers, employees of Sprott, Fund directors, and other affiliates owned 44% of the Fund.
USE OF ESTIMATES:
The preparation of financial statements requires management to make estimates and assumptions that affect the reported amounts of assets and liabilities at the date of the financial statements and the reported amounts of income and expenses for the period. Actual results could differ from these estimates.
VALUATION OF INVESTMENTS:
Securities are valued as of the close of trading on the New York Stock Exchange (NYSE) (generally 4:00 p.m. Eastern time) on the valuation date. Securities that trade on an exchange, and securities traded on Nasdaq’s Electronic Bulletin Board, are valued at their last reported sales price or Nasdaq official closing price taken from the primary market in which each security trades or, if no sale is reported for such day, at their highest bid price. Other over-the-counter securities for which market quotations are readily available are valued at their highest bid price, except in the case of some bonds and other fixed income securities which may be valued by reference to other securities with comparable ratings, interest rates and maturities, using established independent pricing services. The Fund values its non-U.S. dollar denominated securities in U.S. dollars daily at the prevailing foreign currency exchange rates as quoted by a major bank. Securities for which market quotations are not readily available are valued at their fair value in accordance with the provisions of the Investment Company Act of 1940 (the “1940 Act”), under procedures approved by the Fund’s Board of Directors, and are reported as Level 3 securities. As a general principle, the fair value of a security is the amount which the Fund might reasonably expect to receive for the security upon its current sale. However, in light of the judgment involved in fair valuations, there can be no assurance that a fair value assigned to a particular security will be the amount which the Fund might be able to receive upon its current sale. In addition, if, between the time trading ends on a particular security and the close of the customary trading session on the NYSE, events occur that are significant and may make the closing price unreliable, the Fund may fair value the security. The Fund uses an independent pricing service to provide fair value estimates for relevant non-U.S. equity securities on days when the U.S. market volatility exceeds a certain threshold. This pricing service uses proprietary correlations it has developed between the movement of prices of non-U.S. equity securities and indices of U.S.-traded securities, futures contracts and other indications to estimate the fair value of relevant non-U.S. securities. When fair value pricing is employed, the prices of securities used by the Fund may differ from quoted or published prices for the same security. Investments in money market funds are valued at net asset value per share.
Various inputs are used in determining the value of the Fund’s investments, as noted above. These inputs are summarized in the three broad levels below:
| Level 1 – | quoted prices in active markets for identical securities. |
| Level 2 – | other significant observable inputs (including quoted prices for similar securities, foreign securities that may be fair valued and repurchase agreements). |
2020 Annual Report to Stockholders | 15
Sprott Focus Trust
Notes to Financial Statements (continued)
| Level 3 – | significant unobservable inputs (including last trade price before trading was suspended, or at a discount thereto for lack of marketability or otherwise, market price information regarding other securities, information received from the company and/or published documents, including SEC filings and financial statements, or other publicly available information). |
The inputs or methodology used for valuing securities are not necessarily an indication of the risk associated with investing in those securities.
The following is a summary of the Fund’s investments as of December 31, 2020 based on the inputs used to value them. For a detailed breakout of common stocks by sector classification, please refer to the Schedule of Investments.
| | | | | | | | | | | | | | | | |
| | | Level 1 | | | Level 2 | | | Level 3 | | | Total | |
Common Stocks | | $ | 202,450,635 | | | $ | 25,691,045 | | | $ | 12,000,000 | | | $ | 240,141,680 | |
Cash Equivalents | | | — | | | | 2,646,122 | | | | — | | | | 2,646,122 | |
Securities Lending Collateral | | | 4,088,849 | | | | — | | | | — | | | | 4,088,849 | |
Total | | $ | 206,539,484 | | | $ | 28,337,167 | | | $ | 12,000,000 | | | $ | 246,876,651 | |
On December 31, 2020, foreign common stocks in the Fund were valued at the last reported sale price or official closing price as the Fund’s fair value pricing procedures did not require the use of the independent statistical fair value pricing service. There were no transfers between levels for investments held at the end of the period.
The following is a reconciliation of investments as of December 31, 2020 for which significant unobservable inputs were used in determining fair value:
| | | | |
| | | Common
Stocks | |
Balance as of December 31, 2019 | | $ | — | |
Purchases | | | 12,000,000 | |
Sales | | | — | |
Realized gain (loss) | | | — | |
Change in unrealized appreciation (depreciation) | | | — | |
Transfers into Level 3 | | | — | |
Transfers out of Level 3 | | | — | |
Balance as of December 31, 2020 | | | 12,000,000 | |
Net change in unrealized appreciation (depreciation) from investments still held as of October 31, 2020 | | | — | |
| | | | | | | | | | | | | | | | |
| Quantitative Disclosure About Significant Unobservable Inputs | |
| Asset Class | | Fair Value
At 12/31/2020 | | | Valuation
Technique | | | Unobservable
Input | | | Range | |
| Common Stock | | $ | 12,000,000 | | | | Vendor pricing | | | | Cost | | | $ | 8.00 | |
COMMON STOCK:
The Fund invests a significant amount of assets in common stock. The value of common stock held by the Fund will fluctuate, sometimes rapidly and unpredictably, due to general market and economic conditions, perceptions regarding the industries in which the issuers of common stock held by the Fund participate or factors relating to specific companies in which the Fund invests.
REPURCHASE AGREEMENTS:
The Fund may enter into repurchase agreements with institutions that the Fund’s investment adviser has determined are creditworthy. The Fund restricts repurchase agreements to maturities of no more than seven days. Securities pledged as collateral for repurchase agreements, which are held until maturity of the repurchase agreements, are marked-to-market daily and maintained at a value at least equal to the principal amount of the repurchase agreement (including accrued interest). Repurchase agreements could involve certain risks in the event of default or insolvency of the counter-party, including possible delays or restrictions upon the ability of the Fund to dispose of its underlying securities. The maturity associated with these securities is considered continuous.
16 | 2020 Annual Report to Stockholders
Sprott Focus Trust
Notes to Financial Statements (continued)
FOREIGN CURRENCY:
Net realized foreign exchange gains or losses arise from sales and maturities of short-term securities, sales of foreign currencies, expiration of currency forward contracts, currency gains or losses realized between the trade and settlement dates on securities transactions, and the difference between the amounts of dividends, interest, and foreign withholding taxes recorded on the Fund’s books and the U.S. dollar equivalent of the amounts actually received or paid. Net unrealized foreign exchange gains and losses arise from changes in the value of assets and liabilities, including investments in securities at the end of the reporting period, as a result of changes in foreign currency exchange rates.
TAXES:
As a qualified regulated investment company under Subchapter M of the Internal Revenue Code, the Fund is not subject to income taxes to the extent that it distributes substantially all of its taxable income for its fiscal year.
The cost of total investments for Federal income tax purposes was $200,633,008. At December 31, 2020, net unrealized appreciation for all securities was $46,243,643, consisting of aggregate gross unrealized appreciation of $59,845,593 and aggregate gross unrealized depreciation of $(13,601,950).
DISTRIBUTIONS:
The Fund pays quarterly distributions on the Fund’s Common Stock at the annual rate of 6% of the rolling average of the prior four calendar quarter-end NAVs of the Fund’s Common Stock, with the fourth quarter distribution being the greater of 1.5% of the rolling average or the distribution required by IRS regulations. Distributions are recorded on ex-dividend date and to the extent that distributions are not paid from long-term capital gains, net investment income or net short-term capital gains, they will represent a return of capital. Distributions are determined in accordance with income tax regulations that may differ from accounting principles generally accepted in the United States of America. Permanent book and tax differences relating to stockholder distributions will result in reclassifications within the capital accounts. Undistributed net investment income may include temporary book and tax basis differences, which will reverse in a subsequent period. Any taxable income or gain remaining undistributed at fiscal year end is distributed in the following year.
INVESTMENT TRANSACTIONS AND RELATED INVESTMENT INCOME:
Investment transactions are accounted for on the trade date. Dividend income is recorded on the ex-dividend date. Non- cash dividend income is recorded at the fair market value of the securities received. Interest income is recorded on an accrual basis. Premium and discounts on debt securities are amortized using the effective yield-to-maturity method. Realized gains and losses from investment transactions are determined on the basis of identified cost for book and tax purposes.
EXPENSES:
The Fund incurs direct and indirect expenses. Expenses directly attributable to the Fund are charged to the Fund’s operations, while expenses applicable to more than one fund managed by Sprott are allocated equitably.
COMPENSATING BALANCE CREDITS:
The Fund has an arrangement with its custodian bank, whereby a portion of the custodian’s fee is paid indirectly by credits earned on the Fund’s cash on deposit with the bank. This deposit arrangement is an alternative to purchasing overnight investments. Conversely, the Fund pays interest to the custodian on any cash overdrafts, to the extent they are not offset by credits earned on positive cash balances. The amount of credits earned on the Fund’s cash on deposit amounted to $114 for the year ended December 31, 2020.
CAPITAL STOCK:
The Fund issued 1,819,470 and 1,190,322 shares of Common Stock as reinvestments of distributions for the years ended December 31, 2020 and December 31, 2019, respectively.
On November 20 2020, as part of its evaluation of options to enhance shareholder value, The Board of Trustees (the “Board”) authorized Sprott to repurchase up to $50 million in aggregate purchase price of the currently outstanding shares of the Fund’s common stock through 2021. Under this share repurchase program, the Fund may purchase up to 5% of its outstanding common shares as of November 20, 2020, in the open market, between now and December 31, 2021. The Fund will retire immediately all such common shares that it repurchases in connection with the share repurchase program.
2020 Annual Report to Stockholders | 17
Sprott Focus Trust
Notes to Financial Statements (continued)
The following table summarizes the Fund’s share repurchases under its share repurchase program for the period ended December 31, 2020:
| | | | |
Dollar amount repurchased | | $ | 595,076 | |
Shares repurchased | | | 86,159 | |
Average price per share (including commission) | | | $6.90 | |
Weighted average discount to NAV | | | 13.77% | |
INVESTMENT ADVISORY AGREEMENT:
The Investment Advisory Agreement between Sprott and the Fund provides for fees to be paid at an annual rate of 1.0% of the Fund’s average daily net assets. The Fund accrued and paid investment advisory fees totaling $2,104,145 to Sprott for the year ended December 31, 2020. Sprott did not reimburse any of the Fund’s operating expenses for the year ended December 31, 2020.
PURCHASES AND SALES OF INVESTMENT SECURITIES:
For the year December 31, 2020, the costs of purchases and proceeds from sales of investment securities, other than short-term securities, amounted to $80,074,439 and $69,602,613, respectively.
DISTRIBUTIONS TO STOCKHOLDERS:
The tax character of distributions paid to common stockholders during 2020 and 2019 were as follows:
| | | | | | | | |
| DISTRIBUTIONS PAID FROM INCOME: | | 2020 | | | 2019 | |
Ordinary Income | | $ | 5,068,891 | | | $ | 2,059,306 | |
Long-term capital gain | | | 10,839,701 | | | | 10,741,657 | |
| | | $ | 15,908,592 | | | $ | 12,800,963 | |
As of December 31, 2020, the tax basis components of distributable earnings included in stockholder’s equity were as follows:
| | | | |
Net unrealized appreciation (depreciation) | | $ | 46,243,840 | |
Post October loss* | | | — | |
Undistributed ordinary income | | | 576,664 | |
| | | $ | 46,820,504 | |
| * | Under current tax law, capital losses and foreign currency losses after October 31 may be deferred and treated as occurring on the first day of the following fiscal year. As of December 31, 2020, the Fund did not have any post October capital or currency losses. |
The difference between book and tax basis unrealized appreciation (depreciation) is attributable primarily to attributable primarily to deferral of losses on wash sales, the realization for tax purposes of unrealized gains on investments in passive foreign investment companies, and non-REIT return of capital basis adjustments. For financial reporting purposes, capital accounts and distributions to stockholders are adjusted to reflect the tax character of permanent book/tax differences. Any permanent differences resulting from different book and tax treatment are reclassified at year-end and have no impact on net income, NAV or NAV per share to the fund. For the year ended December 31, 2020 there were no permanent differences requiring a reclassification between total distributable earnings/ (losses) and paid-in capital.
Management has analyzed the Fund’s tax positions taken on federal income tax returns for all open tax years (2017-2020) and has concluded that as of December 31, 2020, no provision for income tax is required in the Fund’s financial statements.
Lending of Portfolio Securities:
The Fund, using State Street Bank and Trust Company (“State Street”) as its lending agent, may loan securities to qualified brokers and dealers in exchange for negotiated lenders’ fees. The Fund receives cash collateral, which may be invested by the lending agent in short-term instruments, in an amount at least equal to 102% (for loans of U.S. securities) or 105% (for loans of non-U.S. securities) of the market value of the loaned securities at the inception of each loan. The market value of the loaned securities is determined at the close of business of the Fund and any additional required collateral is delivered to the Fund on the next business day. As of December 31, 2020, the cash collateral received by the Fund was invested in the State Street Navigator Securities Lending Government Money Market Portfolio, which is a 1940 Act
18 | 2020 Annual Report to Stockholders
Sprott Focus Trust
Notes to Financial Statements (continued)
registered money market fund. To the extent that advisory or other fees paid by the State Street Navigator Securities Lending Government Money Market Portfolio are for the same or similar services as fees paid by the Fund, there will be a layering of fees, which would increase expenses and decrease returns. Information regarding the value of the securities loaned and the value of the collateral at period end is included in the Schedule of Investments. The Fund could experience a delay in recovering its securities, a possible loss of income or value and record realized gain or loss on securities deemed sold due to a borrower’s inability to return securities on loan. These loans involve the risk of delay in receiving additional collateral in the event that the collateral decreases below the value of the securities loaned and the risks of the loss of rights in the collateral should the borrower of the securities experience financial difficulties.
As of December 31, 2020, the Fund had outstanding loans of securities to certain approved brokers for which the Fund received collateral:
| | | | | | | | | | | | |
Market Value of Loaned
Securities | | Market Value of Cash
Collateral | | | Market Value of Non Cash
Collateral | | | Total Collateral | |
| $10,749,517 | | $ | 4,088,849 | | | $ | 7,275,915 | | | $ | 11,364,764 | |
The following table presents financial instruments that are subject to enforceable netting arrangements as of December 31, 2020.
Gross Amounts Not Offset in the Statement of Assets and Liabilities
| | | | | | | | | | | | |
Gross Asset Amounts
Presented in
Statement of Assets and Liabilities(a) | | Financial
Instrument | | | Collateral
Received(b) | | | Net Amount
(not less than $0) | |
| $10,749,517 | | | — | | | $ | (10,749,517 | ) | | | — | |
| (a) | Represents market value of loaned securities at year end. |
| (b) | The actual collateral received is greater than the amount shown here due to collateral requirements of the security lending agreement. |
All securities on loan are classified as Common Stock in the Fund’s Schedule of Investments as of December 31, 2020, with a contractual maturity of overnight and continuous.
Other information regarding the Fund is available in the Fund’s most recent Report to Stockholders. This information is available through Sprott Asset Management’s website (www.sprottfocustrust.com) and on the Securities and Exchange Commission’s website (www.sec.gov).
2020 Annual Report to Stockholders | 19
Report of Independent Registered Public Accounting Firm
To the Shareholders and Board of Directors of
Sprott Focus Trust, Inc.
Opinion on the Financial Statements
We have audited the accompanying statement of assets and liabilities of Sprott Focus Trust Inc., (the “Fund”), including the schedule of investments, as of December 31, 2020, the related statement of operations for the year then ended, the statements of changes in net assets for each of the two years in the period then ended, and financial highlights for each of the five years in the period then ended, and the related notes (collectively referred to as the “financial statements”). In our opinion, the financial statements present fairly, in all material respects, the financial position of the Fund as of December 31, 2020, the results of its operations for the year then ended, the changes in its net assets for each of the two years in the period then ended, and the financial highlights for each of the five years in the period then ended, in conformity with accounting principles generally accepted in the United States of America.
Basis for Opinion
These financial statements are the responsibility of the Fund’s management. Our responsibility is to express an opinion on the Fund’s financial statements based on our audits. We are a public accounting firm registered with the Public Company Accounting Oversight Board (United States) (“PCAOB”) and are required to be independent with respect to the Fund in accordance with the U.S. federal securities laws and the applicable rules and regulations of the Securities and Exchange Commission and the PCAOB. We have served as the Fund’s auditor since 1998.
We conducted our audits in accordance with the standards of the PCAOB. Those standards require that we plan and perform the audit to obtain reasonable assurance about whether the financial statements are free of material misstatement, whether due to error or fraud. The Fund is not required to have, nor were we engaged to perform, an audit of its internal control over financial reporting. As part of our audits we are required to obtain an understanding of internal control over financial reporting, but not for the purpose of expressing an opinion on the effectiveness of the Fund’s internal control over financial reporting. Accordingly, we express no such opinion.
Our audits included performing procedures to assess the risks of material misstatement of the financial statements, whether due to error or fraud, and performing procedures that respond to those risks. Such procedures included examining, on a test basis, evidence regarding the amounts and disclosures in the financial statements. Our audits also included evaluating the accounting principles used and significant estimates made by management, as well as evaluating the overall presentation of the financial statements. Our procedures included confirmation of securities owned as of December 31, 2020 by correspondence with the custodian. We believe that our audits provide a reasonable basis for our opinion.
TAIT, WELLER & BAKER LLP
Philadelphia, Pennsylvania
February 26, 2021
20 | 2020 Annual Report to Stockholders
Fund’s Portfolio Management, Investment Objectives and Policies and Principal Risks (unaudited)
The following information in this annual report is a summary of certain changes since April 27, 2005. This information may not reflect all of the changes that have occurred since you purchased shares of the Fund.
Portfolio Management
W. Whitney George is the portfolio manager of the Fund. He has served as the portfolio manager of the Fund since 2000.
Royce & Associates, LLC served as investment adviser of the Fund from November 1, 1996 to March 6, 2015. After the close of business on March 6, 2015, Sprott Asset Management LP and Sprott Asset Management USA Inc. (the “Sub-Adviser”) became the investment adviser and investment sub-adviser, respectively, of the Fund.
Investment Objectives and Policies
The Fund’s primary investment goal is long-term capital growth.
The Fund normally invests at least 65% of its assets in equity securities. The Sub-Adviser uses a value approach to invest the Fund’s assets in a limited number of domestic and foreign companies. While the Fund is not restricted as to stock market capitalization, the Sub-Adviser focuses the Fund’s investments primarily in small-cap companies (companies with stock market capitalizations between $500 million and $2.5 billion) and micro-cap companies (companies with stock market capitalizations below $500 million) with significant business activities in the United States. Stock market capitalization is calculated by multiplying the total number of common shares issued and outstanding by the per share market price of the common stock.
The Fund may invest up to 35% of its assets in direct obligations of the U.S. Government or its agencies and in the non-convertible preferred stocks and debt securities of domestic and foreign companies.
The Sub-Adviser invests the Fund’s assets primarily in a limited number of companies selected using a value approach. While it does not limit the stock market capitalizations of the companies in which the Fund may invest, the Sub-Adviser has historically focused on small-cap and micro-cap equity securities.
The Sub-Adviser uses a value method in managing the Fund’s assets. In selecting equity securities for the Fund, the Sub-Adviser evaluates the quality of a company’s balance sheet, the level of its cash flows and various measures of a company’s profitability. The Sub-Adviser then uses these factors to assess the company’s current worth, basing this assessment on either what it believes a knowledgeable buyer might pay to acquire the entire company or what it thinks the value of the company should be in the stock market. This analysis takes a number of factors into consideration, including the company’s future growth prospects and current financial condition.
The Sub-Adviser invests in the equity securities of companies that are trading significantly below its estimate of the company’s “current worth” in an attempt to reduce the risk of overpaying for such companies. The Sub-Adviser’s value approach strives to reduce some of the other risks of investing in small-cap companies (for the Fund’s portfolio taken as a whole) by evaluating various other risk factors. The Sub-Adviser attempts to lessen financial risk by buying companies with strong balance sheets. While no assurance can be given that this risk-averse value approach will be successful, the Sub-Adviser believes that it can reduce some of the risks of investing in the securities of small-cap companies, which are inherently fragile in nature and whose securities have substantially greater market price volatility. Although the Sub-Adviser’s approach to security selection seeks to reduce downside risk to the Fund’s portfolio, especially during periods of broad small-cap market declines, it may also potentially have the effect of limiting gains in strong small-cap up markets.
Principal Risks
Equity Securities Risk. The price of equity securities may rise or fall because of changes in the broad market or changes in a company’s financial condition, sometimes rapidly or unpredictably. A stock or stocks selected for the Fund’s portfolio may fail to perform as expected. A value stock may decrease in price or may not increase in price as anticipated by the portfolio
2020 Annual Report to Stockholders | 21
managers if other investors fail to recognize the company’s value or the factors that the portfolio managers believe will cause the stock price to increase do not occur.
Fixed Income Securities. Up to 35% of the Fund’s assets may be invested in direct obligations of the U.S. Government or its agencies and in non-convertible preferred stocks and debt securities of various domestic and foreign issuers, including up to 5% of its assets in below investment-grade debt securities, also known as high-yield/high-risk securities. There are no limits on the maturity or duration of the fixed income securities in which the Fund may invest.
Two of the main risks of investing in fixed income securities are credit risk and interest rate risk. Below investment-grade debt securities are primarily speculative and may entail substantial risk of loss of principal and non-payment of interest, but may also produce above-average returns for the Fund. Debt securities rated C or D may be in default as to the payment of interest or repayment of principal. As of the date of this Prospectus, interest rates are near historical lows, which makes it more likely that they will increase in the future, which could, in turn, result in a decline in the market value of the fixed income securities held by the Fund.
Foreign Investments. The Fund invests a portion of its assets in securities of foreign issuers. In most instances, investments will be made in companies principally based, or whose securities are traded in, the United States or the other developed countries of North America, Europe, Asia, Australia and New Zealand and not in emerging markets countries.
Foreign investments involve certain risks which typically are not present in securities of domestic issuers. There may be less information available about a foreign company than a domestic company; foreign companies may not be subject to accounting, auditing and reporting standards and requirements comparable to those applicable to domestic companies; and foreign markets, brokers and issuers are generally subject to less extensive government regulation than their domestic counterparts. Foreign securities may be less liquid and may be subject to greater price volatility than domestic securities. Foreign investments also may be subject to local economic and political risks which might adversely affect the Fund’s ability to realize on its investment in such securities. No assurance can be given that the Sub-Adviser will be able to anticipate these potential events or counter their effects.
The Fund does not expect to purchase or sell foreign currencies to hedge against declines in the U.S. dollar or to lock in the value of the foreign securities it purchases, and its foreign investments may be adversely affected by changes in foreign currency rates. Consequently, the risks associated with such investments may be greater than if the Fund did engage in foreign currency transactions for hedging purposes.
Income earned or received by the Fund from sources within foreign countries may be subject to withholding and other taxes imposed by such countries.
Limited Number of Portfolio Holdings. The Fund generally invests a significant portion of its assets in a limited number of stocks, which may involve considerably more risk than a broadly diversified portfolio because a decline in the value of any one of these stocks would cause the Fund’s overall value to decline to a greater degree.
Sector Risk. To the extent the Fund focuses its investments in securities of issuers in one or more sectors (such as the financial services or materials sectors), the Fund will be subject, to a greater extent than if its investments were diversified across different sectors, to the risks of volatile economic cycles and/or conditions and developments that may be particular to that sector, such as: adverse economic, business, political, environmental or other developments.
Securities Lending. The Fund may lend up to 25% of its assets to brokers, dealers and other financial institutions. Securities lending allows the Fund to retain ownership of the securities loaned and, at the same time, to earn additional income. Since there may be delays in the recovery of loaned securities or even a loss of rights in collateral supplied should the borrower fail financially, loans will be made only to parties that participate in a global securities lending program organized and monitored by the Fund’s custodian and who are deemed by it to be of good standing. Furthermore, such loans will be made only if, in the Sub-Adviser’s judgment, the consideration to be earned from such loans would justify the risk.
Share Price Discount. The Fund is a closed-end registered investment company whose shares of common stock may trade at a discount to their net asset value. Shares of the Fund’s common stock are also subject to the market risks of investing in the underlying portfolio securities held by the Fund.
22 | 2020 Annual Report to Stockholders
Small/Mid-Cap Companies. The Fund normally invests primarily in small/mid cap companies, which may involve considerably more risk than investing in larger-cap companies. Investments in securities of micro-cap, small-cap and/or mid-cap companies may involve considerably more risk than investments in securities of larger-cap companies.
Warrants, Rights or Options. The Fund may invest up to 5% of its assets in warrants, rights or options. A warrant, right or call option entitles the holder to purchase a given security within a specified period for a specified price and does not represent an ownership interest in the underlying security. A put option gives the holder the right to sell a particular security at a specified price during the term of the option. These securities have no voting rights, pay no dividends and have no liquidation rights. In addition, market prices of warrants, rights or call options do not necessarily move parallel to the market prices of the underlying securities; market prices of put options tend to move inversely to the market prices of the underlying securities.
2020 Annual Report to Stockholders | 23
Disclosure Regarding Results of Stockholder Meeting
At the annual meeting of stockholders of Sprott Focus Trust, Inc., held on September 9, 2020, stockholders of record as of the close of business on July 31, 2020, voted to approve the following proposal:
Proposal 1: To elect two Directors to the Fund’s Board of Directors: Barbara Connolly Keady and Peyton Tansill Muldoon.
| | | | | | | | | | | | | | | | |
| | | FOR | | | AGAINST | | | ABSTAIN | | | BROKER
NON-VOTES | |
Barbara Connolly Keady | | | 21,797,220 | | | | 970,166 | | | | 0 | | | | 0 | |
Peyton Tansill Muldoon | | | 21,800,625 | | | | 966,671 | | | | 0 | | | | 0 | |
The Director terms of W. Whitney George, Michael W. Clark, and James R. Pierce expire in 2021, 2022 and 2021, respectively.
24 | 2020 Annual Report to Stockholders
Directors and Officers
All Directors and Officers may be reached c/o Sprott Asset Management LP, 200 Bay Street, Suite 2600, Toronto, Ontario, Canada M5J2J1.
W. Whitney George, Director1, Senior Portfolio Manager
Year of Birth: 1958 | Number of Funds Overseen: 1 | Tenure: Director since 2013; Term expires 2021 | Other Directorships: None
Principal Occupation(s) During Past Five Years: President of Sprott Inc. since January 2019; Executive Vice President of Sprott Inc. from January 2016 to January 2019; Chief Investment Officer of Sprott Asset Management, LP, a registered investment adviser, since April 2018; Senior Portfolio Manager since March 2015 and Chairman since January 2017, Sprott Asset Management USA Inc.
Michael W. Clark, Director
Year of Birth: 1959 | Number of Funds Overseen: 4 | Tenure: Director since 2015; Term expires 2022 | Other Directorships: Board of the Sprott Funds Trust
Principal Occupation(s) During Past Five Years: President, Chief Operating Officer, Chief Risk Officer, Head of Executive Committee, and member of Board of Directors of Chilton Investment Company since 2005.
Barbara Connolly Keady, Director
Year of Birth: 1962 | Number of Funds Overseen: 4 | Tenure: Director since 2015; Term expires 2023 | Other Directorships: Board of the Sprott Funds Trust
Principal Occupation(s) During Past Five Years: Director of New Business Development at Ceres Partners since 2010.
Peyton T. Muldoon, Director
Year of Birth: 1969 | Number of Funds Overseen: 4 | Tenure: Director since 2017; Term expires 2023 | Other Directorships: Board of the Sprott Funds Trust
Principal Occupation(s) During Past 5 Years: Licensed salesperson, Sotheby’s International Realty, a global real estate brokerage firm since 2011.
James R. Pierce, Jr., Director
Year of Birth: 1956 | Number of Funds Overseen: 4 | Tenure: Director since 2015; Term expires 2021 | Other Directorships: Board of the Sprott Funds Trust
Principal Occupation(s) During Past Five Years: Chairman of JLT Specialty Insurance Services, Inc. since September, 2014.
Thomas W. Ulrich, President, Secretary, Chief Compliance Officer
Year of Birth: 1963 | Tenure: Since 2015
Principal Occupation(s) During Past Five Years: Managing Director, Sprott Inc. group of companies (since January 2018); General Counsel and Chief Compliance Officer of Sprott Asset Management USA Inc. (since October, 2012); In-House Counsel and Chief Compliance Officer of Sprott Global Resource Investments Ltd. (since October, 2012).
Varinder Bhathal, Treasurer
Year of Birth: 1971 | Tenure: since 2017
Principal Occupation(s) During Past 5 Years: Chief Financial Officer of Sprott Asset Management LP since Dec 2018;
Managing Director, Corporate Finance and Investment Operations of Sprott Inc. since Oct 2017; Chief Financial Officer of Sprott Capital Partners since Oct 2016; Vice President, Finance of Sprott Inc. Dec 2015 to Oct 2017.
| 1 | Mr. George is an “interested person”, as defined in Section 2(a)(19) of the 1940 Act, of the Fund due to several relationships including his position as President of Sprott, Inc., the parent company of Sprott Asset Management USA Inc., the Fund’s sub-adviser. |
The Statement of Additional Information has additional information about the Fund’s Directors and is available without charge, upon request, by calling (203) 656-2340.
2020 Annual Report to Stockholders | 25
Notes to Performance and Other Important Information
The thoughts expressed in this report concerning recent market movement and future outlook are solely the opinion of Sprott at December 31, 2020 and, of course, historical market trends are not necessarily indicative of future market movements. Statements regarding the future prospects for particular securities held in the Fund’s portfolio and Sprott’s investment intentions with respect to those securities reflect Sprott’s opinions as of December 31, 2020 and are subject to change at any time without notice. There can be no assurance that securities mentioned in this report will be included in the Fund in the future. Investments in securities of micro-cap, small-cap and/or mid-cap companies may involve considerably more risk than investments in securities of larger-cap companies. All publicly released material information is always disclosed by the Fund on the website at www.sprottfocustrust.com.
Sector weightings are determined using the Global Industry Classification Standard (“GICS”). GICS was developed by, and is the exclusive property of, Standard & Poor’s Financial Services LLC (“S&P”) and MSCI Inc. (“MSCI”). GICS is the trademark of S&P and MSCI. “Global Industry Classification Standard (GICS)” and “GICS Direct” are service marks of S&P and MSCI.
All indexes referred to are unmanaged and capitalization weighted. Each index’s returns include net reinvested dividends and/or interest income. Russell Investment Group is the source and owner of the trademarks, service marks, and copyrights related to the Russell Indexes. Russell® is a trademark of Russell Investment Group. The Russell 3000 Index measures the performance of the largest 3,000 U.S. companies representing approximately 98% of the investable U.S. equity market. The Russell 3000 Index is constructed to provide a comprehensive, unbiased and stable barometer of the broad market and is completely reconstituted annually to ensure new and growing equities are reflected. The performance of an index does not represent exactly any particular investment, as you cannot invest directly in an index. Returns for the market indexes used in this report were based on information supplied to Sprott by Russell Investments.
The Price-Earnings, or P/E, Ratio is calculated by dividing a fund’s share price by its trailing 12-month earnings-per share (EPS). The Price-to- Book, or P/B, Ratio is calculated by dividing a fund’s share price by its book value per share. The Sharpe Ratio is calculated for a specified period by dividing a fund’s annualized excess returns by its annualized standard deviation. The higher the Sharpe Ratio, the better the fund’s historical risk-adjusted performance. Standard deviation is a statistical measure within which a fund’s total returns have varied over time. The greater the standard deviation, the greater a fund’s volatility.
Forward-Looking Statements
This material contains forward-looking statements within the meaning of the Securities Exchange Act of 1934, as amended (the “Exchange Act”), that involve risks and uncertainties, including, among others, statements as to:
| | • | | the Fund’s future operating results |
| | • | | the prospects of the Fund’s portfolio companies |
| | • | | the impact of investments that the Fund has made or may make |
| | • | | the dependence of the Fund’s future success on the general economy and its impact on the companies and industries in which the Fund invests, and |
| | • | | the ability of the Fund’s portfolio companies to achieve their objectives. |
This report uses words such as “anticipates,” “believes,” “expects,” “future,” “intends,” and similar expressions to identify forward-looking statements. Actual results may differ materially from those projected in the forward-looking statements for any reason.
The Fund has based the forward-looking statements included in this report on information available to us on the date of the report, and we assume no obligation to update any such forward-looking statements. Although the Fund undertakes no obligation to revise or update any forward-looking statements, whether as a result of new information, future events or otherwise, you are advised to consult any additional disclosures that we may make through future stockholder communications or reports.
Authorized Share Transactions
The Board authorized a share repurchase program, under which the Fund may purchase up to 5% of its outstanding common shares between November 20, 2020 and December 31, 2021. Any such repurchase would take place at then prevailing prices in the open market or in other transactions. Common stock repurchases would be effected at a price per share that is less than the share’s then current net asset value.
The Fund is also authorized to offer its common stockholders an opportunity to subscribe for additional shares of its common stock through rights offerings at a price per share that may be less than the share’s then current net asset value. The timing and terms of any such offerings are within the Board’s discretion.
Proxy Voting
A copy of the policies and procedures that the Fund uses to determine how to vote proxies relating to portfolio securities and information regarding how the Fund voted proxies relating to portfolio securities during the most recent 12-month period ended June 30 is available, without charge, on the Fund’s website at www.sprottfocustrust.com, by calling (203) 656-2430 (toll-free) and on the website of the Securities and Exchange Commission, at www.sec.gov.
26 | 2020 Annual Report to Stockholders
Notes to Performance and Other Important Information (continued)
Quarterly Portfolio Disclosure
The Fund files its complete schedule of investments with the SEC for the first and third quarters of each fiscal year as an exhibit to its reports on Form N-PORT. The Fund’s Form N-PORT filings are available on the SEC’s website at www.sec.gov. The Fund’s holdings are also on the Fund’s website (www.sprottfocustrust.com) approximately 15 to 20 days after each calendar quarter end and remain available until the next quarter’s holdings are posted.
2020 Annual Report to Stockholders | 27

www.sprott.com
Item 2. Code(s) of Ethics. As of the end of the period covered by this report, the Registrant had adopted a code of ethics, as defined in Item 2 of Form N-CSR, applicable to its principal executive officer, principal financial officer, principal accounting officer or controller, or persons performing similar functions. A copy of this code of ethics is filed as an exhibit to this Form N-CSR. No substantive amendments were approved or waivers were granted to this code of ethics during the period covered by this report.
Item 3. Audit Committee Financial Expert.
(a)(1) The Board of Directors of the Registrant has determined that it has an audit committee financial expert.
(a)(2) Michael W. Clark is designated by the Board of Directors as the Registrant’s Audit Committee Financial Expert. Mr. Clark is “independent” as defined under Item 3 of Form N-CSR.
Item 4. Principal Accountant Fees and Services.
(a) Audit Fees:
Year ended December 31, 2020 – $30,000
Year ended December 31, 2019 – $30,000
(b) Audit-Related Fees:
Year ended December 31, 2020 – $0
Year ended December 31, 2019 – $0
(c) Tax Fees:
Year ended December 31, 2020 – $7,200 – Preparation of tax returns
Year ended December 31, 2019 – $7,200 – Preparation of tax returns
(d) All Other Fees:
Year ended December 31, 2020 – $0
Year ended December 31, 2019 – $0
(e)(1) The Registrant has adopted policies and procedures requiring the pre-approval by the Audit Committee of audit and non-audit services provided to the Registrant by the Registrant’s independent registered public accounting firm, and the pre-approval of all audit and non-audit services provided to the Registrant’s investment adviser and any and any entity controlling, controlled by, or under common control with the investment adviser that provides ongoing services to the Registrant, to the extent that such services are directly related to the operations or financial reporting of the Registrant.
| (g) | Year ended December 31, 2020 – $7,200 |
Year ended December 31, 2019 – $7,200
| (h) | No such services were rendered during 2020 or 2019. |
Item 5. Audit Committee of Listed Registrants. The Registrant has a separately designated standing audit committee established in accordance with Section 3(a)(58)(A) of the Securities Exchange Act of 1934. Michael W. Clark, Barbara C. Keady, Peyton T. Muldoon and James R. Pierce, Jr. are members of the Registrant’s audit committee.
Item 6. Investments.
(a) See Item 1.
(b) Not applicable.
Item 7. Disclosure of Proxy Voting Policies and Procedures for Closed-End Management Investment Companies. The Registrant’s Board has delegated all proxy voting decisions to Sprott Asset Management LP, the investment adviser to the Registrant (the “Adviser”). The Adviser has adopted written proxy voting policies and procedures for itself, the Fund, and any other client accounts for which the Adviser is responsible for voting proxies. From time to time, a vote may present a conflict between the interests of the Registrant’s shareholders, on the one hand, and those of the Adviser, or any affiliated person of the Registrant or the Adviser, on the other. If the Adviser becomes aware of any material conflict of interest in voting proxies with respect to the Registrant, the Adviser shall notify the Board of Directors of the Registrant and request the Board’s recommendations for protecting the best interests of Registrant’s shareholders.
PROXY VOTING POLICY AND PROCEDURES
Proxy voting is an important right of shareholders and reasonable care and diligence must be undertaken to ensure that such rights are properly and timely exercised. When the Adviser has discretion to vote the proxies of its clients, it will vote those proxies in the best interest of its clients and in accordance with these policies and procedures.
In the absence of specific voting guidelines from the client, the Adviser will vote proxies in the best interests of each particular client, which may result in different voting results for proxies for the same issuer. The Adviser believes that voting proxies in accordance with the following guidelines is in the best interests of its clients.
Generally speaking, the Adviser will vote in favor of the following proxy proposals:
| | (i) | electing and fixing number of directors |
| | (iii) | ratifying director actions |
| | (iv) | approving private placements exceeding a 25% threshold |
| | (v) | changing a registered address |
| | (vi) | authorizing directors to fix remuneration of auditors |
| | (vii) | approving private placements to insiders exceeding a 10% threshold |
| | (viii) | approving special resolutions to change the authorized capital of the company to an unlimited number of common shares without par value. |
The Adviser will generally vote against any proposal relating to stock option plans that:
| | (i) | exceed 5% of the common shares issued and outstanding at the time of grant over a three year period (on a non-diluted basis); |
| | (ii) | provide that the maximum number of common shares issuable pursuant to such plan be a “rolling” maximum that exceed 5% of the outstanding common shares at the date of the grant of applicable options; or |
| | (iii) | reprices the stock option. |
In certain cases, proxy votes may not be cast when the Adviser determines that it is not in the best interests of the client to vote such proxies.
The Adviser retains the discretion to depart from these polices on any particular proxy vote depending upon the facts and circumstances.
Item 8. Portfolio Managers of Closed-End Management Investment Companies.
(a)(1) Portfolio Managers of Closed-End Management Investment Companies (information as of December 31, 2020)
| | | | | | |
Name | | Title | | Length of Service | | Principal Occupation(s) During Past 5 Years |
| W. Whitney George | | Senior Portfolio Manager
of Sprott Asset
Management USA Inc.;
Director of the Registrant | | Since July 2002 | | Chief Investment Officer of Sprott Asset Management, LP, a registered investment adviser, since April 2018; Senior Portfolio Manager since March 2015 and Chairman since January 2017, Sprott Asset Management USA Inc., a registered investment adviser and President of Sprott Inc. since January 2018. |
(a)(2) Other Accounts Managed by Portfolio Manager and Potential Conflicts of Interest (information as of December 31, 2020)
Other Accounts
| | | | | | | | | | | | | | | | |
Type of Account | | Number of
Accounts
Managed | | | Total
Assets
Managed | | | Number of
Accounts
Managed for
which
Advisory Fee is
Performance-
Based | | | Value of Managed
Accounts for which
Advisory Fee is
Performance
Based | |
Registered investment companies | | | 0 | | | $ | 0 | | | | 0 | | | $ | 0 | |
Private pooled investment vehicles | | | 0 | | | $ | 0 | | | | 0 | | | $ | 0 | |
Other accounts | | | 0 | | | $ | 0 | | | | 0 | | | | 0 | |
Conflicts of Interest
The Portfolio Manager has day-to-day management responsibility for more than one account. This may create actual, potential or apparent conflicts of interest, as the Portfolio Manager may not be able to devote the same amount of time and attention to each account, or may give preferential treatment of one account over others in terms of allocation of resources or investment opportunities. The Portfolio Manager is subject to the policies and procedures of Sprott Asset Management USA Inc., the sub-adviser to the Registrant (the “Sub-Adviser”), that are intended to address conflicts of interest relating to the management of multiple accounts, including accounts that have different fee arrangements, and the allocation of investment opportunities. The Sub-Adviser reviews investment decisions of its investment personnel, including the Portfolio Manager, for the purpose of ensuring that all accounts with substantially similar investment objectives are treated equitably. The performance of similarly managed accounts is also compared to determine whether there are any unexplained significant discrepancies. In addition, the Sub-Adviser’s procedures relating to the allocation of investment opportunities require that similar client accounts that are managed using the same investment strategy participate in investment opportunities generally based on available cash as a percentage of total assets under management in the account, subject to certain considerations and clients’ respective investment guidelines and restrictions. The Portfolio Manager’s compensation is generally not based on, or linked to, the specific performance of a particular client or the level of assets under management.
(a)(3) Description of Portfolio Manager Compensation Structure (information as of December 31, 2020)
The Portfolio Manager receives a fixed salary, plus a discretionary bonus that is determined based on a variety of factors, including the Portfolio Manager’s contribution to the overall growth of the Sub-Adviser and its affiliates, leadership and other contributions to the Sub-Adviser. The Portfolio Manager’s compensation is not specifically linked to the performance of the Registrant or any other particular client account, or the value of the assets held in the portfolio of the Registrant or any other particular client account.
(a)(4) Dollar Range of Equity Securities in Registrant Beneficially Owned by Portfolio Manager (information as of December 31, 2020)
The following table shows the dollar range of the Registrant’s shares owned beneficially and of record by the Portfolio Manager, including investments by his immediate family members sharing the same household and amounts invested through any retirement and deferred compensation plans.
Dollar Range of Registrant’s Shares Beneficially Owned
Over $1,000,000
(b) Not Applicable.
Item 9. Purchases of Equity Securities by Closed-End Management Investment Company and Affiliated Purchasers. Not applicable.
Item 10. Submission of Matters to a Vote of Security Holders. There have been no material changes to the procedures by which shareholders may recommend nominees to the Registrant’s Board implemented after the Registrant last provided disclosure in response to this Item.
Item 11. Controls and Procedures.
(a) Disclosure Controls and Procedures. The Principal Executive and Financial Officers concluded that the Registrant’s Disclosure Controls and Procedures are effective based on their evaluation of the Disclosure Controls and Procedures as of a date within 90 days of the filing date of this report.
(b) Internal Control over Financial Reporting. There was no change in the Registrant’s internal control over financial reporting that occurred during the second fiscal quarter of the period covered by this report that has materially affected, or is reasonably likely to materially affect, the Registrant’s internal control over financial reporting.
Item 12. Exhibits. Disclosure of Securities Lending Activities for Closed-End Management Investment Companies.
(a) If the registrant is a closed-end management investment company, provide the following dollar amounts of income and fees/compensation related to the securities lending activities of the registrant during its most recent fiscal year:
(1) Gross income from securities lending activities;
(2) All fees and/or compensation for each of the following securities lending activities and related services: any share of revenue generated by the securities lending program paid to the securities lending agent(s) (“revenue split”); fees paid for cash collateral management services (including fees deducted from a pooled cash collateral reinvestment vehicle) that are not included in the revenue split; administrative fees that are not included in the revenue split; fees for indemnification that are not included in the revenue split; rebates paid to borrowers; and any other fees relating to the securities lending program that are not included in the revenue split, including a description of those other fees;
(3) The aggregate fees/compensation disclosed pursuant to paragraph (2); and
(4) Net income from securities lending activities (i.e., the dollar amount in paragraph (1) minus the dollar amount in paragraph (3)).
Instruction to paragraph (a)
If a fee for a service is included in the revenue split, state that the fee is “included in the revenue split.”
(b) If the registrant is a closed-end management investment company, describe the services provided to the registrant by the securities lending agent in the registrant’s most recent fiscal year.
During Sprott Focus Trust (the “Fund”) most recent fiscal year ending December 31, 2020, State Street Bank and Trust Company (“State Street”) served as the Fund’s securities lending agent.
As a securities lending agent, State Street is responsible for the implementation and administration of a Fund’s securities lending program. Pursuant to its respective Securities Lending Authorization Agreement (“Securities Lending Agreement”) with the Fund, State Street, as a general matter, performs various services, including the following:
| | • | | lend available securities to institutions that are approved borrowers |
| | • | | determine whether a loan shall be made and negotiate and establish the terms and conditions of the loan with the borrower |
| | • | | ensure that all dividends and other distributions paid with respect to loaned securities are credited to the fund’s relevant account |
| | • | | receive and hold, on the fund’s behalf, or transfer to a fund account, upon instruction by the fund, collateral from borrowers to secure obligations of borrowers with respect to any loan of available securities |
| | • | | mark-to-market the market value of loaned securities relative to the market value of the collateral each business day |
| | • | | obtain additional collateral, as needed, in order to maintain the value of the collateral relative to the market value of the loaned securities at the levels required by the Securities Lending Agreement |
| | • | | at the termination of a loan, return the collateral to the borrower upon the return of the loaned securities |
| | • | | in accordance with the terms of the Securities Lending Agreement, invest cash collateral in permitted investments, including investments managed by the fund’s investment adviser |
| | • | | maintain records relating to the fund’s securities lending activity and provide to the fund a monthly statement describing, among other things, the loans made during the period, the income derived from the loans (or losses incurred) and the amounts of any fees or payments paid with respect to each loan |
State Street is compensated for the above-described services from its securities lending revenue split. The tables below show the Fund earned and the fees and compensation it paid to service providers in connections with its securities lending activities during its most recent fiscal year.
| | | | |
Securities Lending Activities Income and Fees for Fiscal Year 2020 | | | |
Gross income from securities lending activities
(including income from cash collateral reinvestment) | | $ | 71,176 | |
| | | | |
Fees and/or compensation for securities lending activities and related services | | | | |
Fees paid to securities lending agent from a revenue split | | $ | 11,220 | |
| | | | |
Fees paid for any cash collateral management service (including fees deducted from a pooled cash collateral reinvestment vehicle) that are not included in the revenue split | | $ | — | |
| | | | |
Administrative fees not included in revenue split | | | — | |
| | | | |
Indemnification fee not included in revenue split | | | — | |
| | | | |
Rebate (paid to borrower) | | $ | 15,068 | |
| | | | |
Other fees not included in revenue split | | | — | |
| | | | |
Aggregate fees/compensation for securities lending activities and related services | | $ | 26,288 | |
| | | | |
Net income from securities lending activities | | $ | 44,888 | |
Item 13. Exhibits. Attached hereto.
(a)(1) The Registrant’s code of ethics pursuant to Item 2 of Form N-CSR.
(a)(2) Separate certifications by the Registrant’s Principal Executive Officer and Principal Financial Officer as required by Rule 30a-2(a) under the Investment Company Act of 1940.
(a)(3) Not applicable
(b) Separate certifications by the Registrant’s Principal Executive Officer and Principal Financial Officer, pursuant to Section 906 of the Sarbanes-Oxley Act of 2002 and required by Rule 30a-2(b) under the Investment Company Act of 1940.
Pursuant to the requirements of the Securities Exchange Act of 1934 and the Investment Company Act of 1940, the registrant has duly caused this report to be signed on its behalf by the undersigned, thereunto duly authorized.
| | |
| SPROTT FOCUS TRUST, INC. |
| |
| By: | | /s/ Thomas W. Ulrich |
| | Thomas W. Ulrich President |
Date: March 8, 2021
Pursuant to the requirements of the Securities Exchange Act of 1934 and the Investment Company Act of 1940, this report has been signed below by the following persons on behalf of the registrant and in the capacities and on the dates indicated.
| | | | | | | | | | |
SPROTT FOCUS TRUST, INC. | | | | | | SPROTT FOCUS TRUST, INC. |
| | | | | |
By: | | /s/ Thomas W. Ulrich | | | | | | By: | | /s/ Varinder Bhathal |
| | Thomas W. Ulrich | | | | | | | | Varinder Bhathal |
| | (Principal Executive Officer) | | | | | | | | (Principal Financial Officer) |
| | | |
Date: March 8, 2021 | | | | | | Date: March 8, 2021 |