EXHIBIT 99.16
Alliance Capital
Fourth Quarter and Full Year 2001 Review
Bruce W. Calvert |
| John D. Carifa |
| Lewis A. Sanders |
Chairman and CEO |
| President and COO |
| Vice Chairman and CIO |
January 31, 2002
Introduction
The SEC adopted Regulation FD in October 2000. In light of Regulation FD, Management will be limited in responding to inquiries from investors or analysts in a non-public forum. You are encouraged to ask all questions of a material nature on this conference call.
Forward-Looking Statements
Certain statements provided by Alliance Capital Management L.P. (“Alliance Capital”) and Alliance Capital Management Holding L.P. (“Alliance Holding”) inthis report are “forward-looking statements” within the meaning of the Private SecuritiesLitigation Reform Act of 1995. Such forward-looking statements are subject to risks, uncertainties and otherfactors which could cause actual results to differ materially from future results expressed or implied by such forward-looking statements. The most significant of such factors include, but are not limited to, the following: the performance of financial markets, the investment performance of Alliance Capital’s sponsored investment products and separately managed accounts, general economic conditions, future acquisitions, competitive conditions, and government regulations, including changes in tax rates. Alliance Capital and Alliance Holding caution readers to carefully consider such factors. Further, such forward-looking statements speak only as of the date on which such statements are made; Alliance Capital and Alliance Holding undertake no obligation to update any forward-looking statements to reflect events or circumstances after the date of such statements.
Fourth Quarter Financial Highlights
|
| 4Q01 vs. 3Q01 | 4Q01 vs. 4Q00 |
|
|
|
|
• | AUM | $455 bn vs $421 bn, up 8%, benefiting from higher markets | $455 bn vs $454 bn, up 0.4%, with $42 bn in net new business offsetting market declines |
|
|
|
|
• | Average AUM | $443 bn vs $449 bn, down 1% | $443 bn vs $461 bn, down 4% due to lower market levels year-over-year |
|
|
|
|
• | Net new business | $2 bn in 4Q01 compared to $6 bn in 3Q01; positive in all three channels | $2 bn in 4Q01, down from $7 bn in 4Q00 |
|
|
|
|
• | Revenues (excl. | Increased 7%, primarily due to higher performance fees | Decreased 1%, due to lower average AUM |
|
|
|
|
• | Expenses | Increased 11%, attributable to higher performance fee related compensation and SCB deferred compensation | Increased 3%, primarily from higher net distribution expense and SCB deferred compensation |
|
|
|
|
• | NOE per Alliance Holding Unit | $0.68, in line with 3Q01 | Down 11% from $0.76 in 4Q00 |
|
|
|
|
• | Distributions per Alliance Holding Unit | $0.67, in line with 3Q01 | Down 14% from $0.78 in 4Q00 |
Alliance Capital Fourth Quarter Financial Highlights
|
|
|
| 4Q01 |
| 3Q01 |
| % chg |
| 4Q00 |
| % chg |
| |||
• |
| Revenues (excluding distribution revenues): |
|
|
|
|
|
|
|
|
|
|
| |||
|
| Base Fee & Other |
| $ | 583 |
| $ | 582 |
| – |
| $ | 591 |
| -2 |
|
|
| Performance Fee |
| 50 |
| 9 |
| +456 |
| 50 |
| – |
| |||
|
|
|
| 633 |
| 591 |
| +7 |
| 641 |
| -1 |
| |||
• |
| Expenses |
|
|
|
|
|
|
|
|
|
|
| |||
|
| Compensation |
| 261 |
| 219 |
| +19 |
| 253 |
| +3 |
| |||
|
| Distribution, Net (1) |
| 44 |
| 44 |
| – |
| 25 |
| +76 |
| |||
|
| Other |
| 134 |
| 134 |
| – |
| 148 |
| -9 |
| |||
|
|
|
| 439 |
| 397 |
| +11 |
| 426 |
| +3 |
| |||
|
|
|
|
|
|
|
|
|
|
|
|
|
| |||
• |
| Net Operating Earnings |
| $ | 194 |
| $ | 194 |
| – |
| $ | 215 |
| -11 |
|
|
|
|
|
|
|
|
|
|
|
|
|
|
| |||
• |
| Base Fee Earnings |
| $ | 169 |
| $ | 187 |
| -10 |
| $ | 194 |
| -13 |
|
• |
| Performance Fee Earnings |
| 25 |
| 7 |
| +257 |
| 21 |
| +19 |
| |||
• |
| Net Operating Earnings |
| $ | 194 |
| $ | 194 |
| – |
| $ | 215 |
| -10 |
|
(1) Distribution revenue less distribution plan payments and amortization of deferred sales commissions. In $ millions
Pre-tax Operating Margin
|
|
|
|
|
| % of |
|
|
| % of |
|
|
| % of |
| |||
|
|
|
| 4Q01 |
| Rev (1) |
| 3Q01 |
| Rev (1) |
| 4Q00 |
| Rev (1) |
| |||
• |
| Base Fee Earnings, Net |
| $ | 210 |
| 33.2 | % | $ | 231 |
| 39.2 | % | $ | 223 |
| 34.7 | % |
|
|
|
|
|
|
|
|
|
|
|
|
|
|
|
| |||
• |
| Distribution Expense, Net |
| (34 | ) | -5.5 |
| (35 | ) | -5.9 |
| (20 | ) | -3.0 |
| |||
|
|
|
|
|
|
|
|
|
|
|
|
|
|
|
| |||
• |
| Performance Fee Earnings, Net |
| 26 |
| 4.2 |
| 7 |
| 1.2 |
| 22 |
| 3.4 |
| |||
|
|
|
|
|
|
|
|
|
|
|
|
|
|
|
| |||
• |
| Pre-tax Operating Earnings |
| $ | 202 |
| 31.9 | % | $ | 203 |
| 34.5 | % | $ | 225 |
| 35.1 | % |
4Q01 vs. 3Q01 |
|
| 4Q01 vs. 4Q00 |
| ||||
• |
| Increased compensation (primarily from Bernstein amortization) |
| • |
| Lower base advisory fees | ||
|
|
|
| • |
| Net distribution expense 78% higher | ||
|
|
|
|
|
|
| ||
|
|
|
| • |
| Increased compensation (primarily from Bernstein amortization) offsets decline in promotion & servicing | ||
(1) Excludes distribution revenues.
Alliance Holding Fourth Quarter Financial Highlights
|
|
|
| 4Q01 |
| 3Q01 |
| % chg |
| 4Q00 |
| % chg |
| |||
|
|
|
|
|
|
|
|
|
|
|
|
|
| |||
• |
| Diluted Net Income |
| $ | 0.51 |
| $ | 0.51 |
| – |
| $ | 0.50 |
| +2 |
|
|
|
|
|
|
|
|
|
|
|
|
|
|
| |||
• |
| Amortization of Intangible Assets |
| 0.17 |
| 0.17 |
| – |
| 0.17 |
| – |
| |||
|
|
|
|
|
|
|
|
|
|
|
|
|
| |||
• |
| Non-recurring Items, Net |
| – |
| – |
| – |
| 0.09 |
| – |
| |||
|
|
|
|
|
|
|
|
|
|
|
|
|
| |||
• |
| Net Operating Earnings |
| $ | 0.68 |
| $ | 0.68 |
| – |
| $ | 0.76 |
| -11 |
|
|
|
|
|
|
|
|
|
|
|
|
|
|
| |||
|
|
|
|
|
|
|
|
|
|
|
|
|
| |||
• |
| Base Fee Earnings |
| $ | 0.59 |
| $ | 0.66 |
| -11 |
| $ | 0.69 |
| -14 |
|
|
|
|
|
|
|
|
|
|
|
|
|
|
| |||
• |
| Performance Fee Earnings |
| 0.09 |
| 0.02 |
| +350 |
| 0.07 |
| +29 |
| |||
|
|
|
|
|
|
|
|
|
|
|
|
|
| |||
• |
| Net Operating Earnings |
| $ | 0.68 |
| $ | 0.68 |
| – |
| $ | 0.76 |
| -11 |
|
|
|
|
|
|
|
|
|
|
|
|
|
|
| |||
|
|
|
|
|
|
|
|
|
|
|
|
|
| |||
• |
| Distribution |
| $ | 0.67 |
| $ | 0.67 |
| – |
| $ | 0.78 |
| -14 |
|
Per Unit amounts
Alliance Holding Full Year Financial Highlights
|
|
|
| 2001 |
| 2000 |
| % chg |
| ||
|
|
|
|
|
|
|
|
|
| ||
• |
| Diluted Net Income |
| $ | 2.10 |
| $ | 2.93 |
| -28 |
|
|
|
|
|
|
|
|
|
|
| ||
• |
| Amortization of Intangible Assets |
| 0.67 |
| 0.22 |
| +205 |
| ||
|
|
|
|
|
|
|
|
|
| ||
• |
| Net Operating Earnings |
| $ | 2.77 |
| $ | 3.15 |
| -12 |
|
|
|
|
|
|
|
|
|
|
| ||
|
|
|
|
|
|
|
|
|
| ||
• |
| Base Fee Earnings |
| $ | 2.60 |
| $ | 3.00 |
| -13 |
|
|
|
|
|
|
|
|
|
|
| ||
• |
| Performance Fee Earnings |
| 0.17 |
| 0.15 |
| +13 |
| ||
|
|
|
|
|
|
|
|
|
| ||
• |
| Net Operating Earnings |
| $ | 2.77 |
| $ | 3.15 |
| -12 |
|
Per Unit amounts
Second Best Year Ever Despite 2000-2001 Equity Market Decline
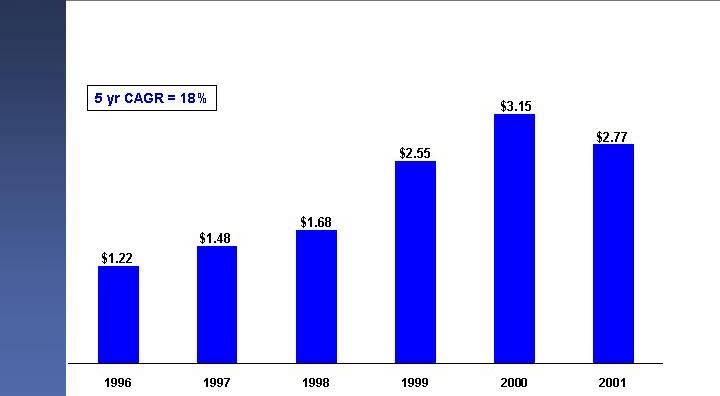
Distributions per Unit are adjusted for two-for-one Unit split in 1998.
2001 Summary
• Equity markets declined for a second consecutive year; growth stocks again led the decline
• Benefits of the Bernstein acquisition began to materialize
• Integration successfully completed
• A more balanced product line contributed to revenue and profit stability
• Began to realize revenue synergies
• Retail: AllianceBernstein Value mutual funds AUM reached $946 million
• Institutional Investment Management: Vanguard growth subadvisory mandate added $12.5 billion in AUM; public fund growth-value blend account added $1 billion
• Private Client: Balanced product capability contributed to a dramatic improvement in our competitive position
2001 Summary
• Investment results exceeded client benchmarks in the main
• Exceptional results in value oriented equity disciplines
• The Enron investment
• Positive net new business in three primary distribution channels every quarter
• Collegeboundfund: one of largest 529 programs in the country–net sales reached $1.5 billion
• Record institutional wins
• Private client inflows positive every month of year
• Modest decline in revenue yields consistent with AUM mix shift
• Successful restructuring of managed account business
• Sanford C. Bernstein & Co. LLC, our Institutional Research group, grew revenues and market share
• Important investments were made for the future
Challenging Market Environment
|
|
|
| Year |
| ||
|
|
|
| 2001 |
| 2000 |
|
• |
| S&P 500 |
| -12 | % | -9 | % |
|
|
|
|
|
|
|
|
• |
| Russell 1000 Growth |
| -20 | % | -22 | % |
|
|
|
|
|
|
|
|
• |
| Russell 1000 Value |
| -6 | % | 7 | % |
|
|
|
|
|
|
|
|
• |
| NASDAQ Composite |
| -21 | % | -39 | % |
|
|
|
|
|
|
|
|
• |
| Lehman Aggregate Bond |
| 8 | % | 12 | % |
Annualized total returns
Relative Performance (1) – Institutional Inv Mgmt Services
Institutional Equity Composites vs. Benchmarks
Value Oriented Services
|
| Strategic |
| Diversified |
| Relative |
| Small-Mid Cap |
| International |
| Emerging Market |
|
|
| Value(2) |
| Value(3) |
| Value(2) |
| Value(4) |
| Value(5)* |
| Value(6)* |
|
1yr |
| +15.0 |
| +14.0 |
| +3.7 |
| +12.6 |
| +7.5 |
| +0.3 |
|
|
|
|
|
|
|
|
|
|
|
|
|
|
|
3yr |
| +3.6 |
| +5.7 |
| +4.6 |
| – |
| +2.4 |
| +2.6 |
|
|
|
|
|
|
|
|
|
|
|
|
|
|
|
5yr |
| -0.2 |
| +1.1 |
| +3.1 |
| – |
| +2.4 |
| +0.3 |
|
|
|
|
|
|
|
|
|
|
|
|
|
|
|
10yr |
| +2.4 |
| +1.6 |
| – |
| – |
| – |
| – |
|
(1) Investment performance of composites are after investment management fees.
(2) vs. Russell 1000 Value (3) vs. S&P 500 (4) vs. Russell 2500 Value (5) vs. MSCI EAFE Value (6) vs. MSCI Emerging Markets Free
* Preliminary returns
Composite and benchmark data through 12/31/01.
See Performance Disclosure
Relative Performance (1) – Institutional Inv Mgmt Services
Institutional Equity Composites vs. Benchmarks
Growth Oriented Services
|
| Large Cap |
| Disciplined |
| Multi Cap |
| Small Cap |
| Intl Lg Cap |
| Emerging Market |
|
|
| Growth(2) |
| Growth(2) |
| Growth(3) |
| Growth(4) |
| Growth(5) |
| Growth(6) |
|
1yr |
| +2.9 |
| +0.2 |
| -2.3 |
| -1.7 |
| +5.5 |
| -5.2 |
|
|
|
|
|
|
|
|
|
|
|
|
|
|
|
3yr |
| +2.8 |
| +0.3 |
| +1.6 |
| +10.5 |
| +8.8 |
| +7.8 |
|
|
|
|
|
|
|
|
|
|
|
|
|
|
|
5yr |
| +4.9 |
| +1.8 |
| +1.2 |
| +7.0 |
| +5.2 |
| +3.8 |
|
|
|
|
|
|
|
|
|
|
|
|
|
|
|
10yr |
| +3.3 |
| +1.6 |
| +1.4 |
| +7.1 |
| +4.6 |
| +2.6 |
|
(1) Investment performance of composites are after investment management fees.
(2) vs. Russell 1000 Growth (3) vs. Russell 3000 Growth (4) vs. Russell 2000 Growth (5) vs. MSCI EAFE Growth (6) vs. MSCI Emerging Markets Free Composite and benchmark data through 12/31/01.
See Performance Disclosure
Relative Performance –Retail Services
Retail Mutual Funds vs. Lipper Averages
|
| Premier |
|
|
| Growth & |
| AB Disc |
| Global Growth |
| North Amer |
|
|
| Growth(1) |
| Technology(2) |
| Income(3) |
| Value(3) |
| Trends(4) |
| Govt Trust(5) |
|
1yr |
| -1.0 |
| +11.7 |
| -0.1 |
| +8.4 |
| +3.8 |
| -2.3 |
|
|
|
|
|
|
|
|
|
|
|
|
|
|
|
3yr |
| -3.9 |
| 0.0 |
| +1.9 |
| – |
| +8.9 |
| +7.4 |
|
|
|
|
|
|
|
|
|
|
|
|
|
|
|
5yr |
| +1.1 |
| +1.0 |
| +3.6 |
| – |
| +7.5 |
| +6.6 |
|
|
|
|
|
|
|
|
|
|
|
|
|
|
|
10yr |
| – |
| +0.5 |
| +0.5 |
| – |
| +7.2 |
| – |
|
(1) vs. Large Cap Growth average (2) vs. Science and Technology average (3) vs. Multi-Cap Value average (4) vs. Global Growth average
(5) vs. Global Income average
Mutual fund performance and Lipper data through 12/31/01.
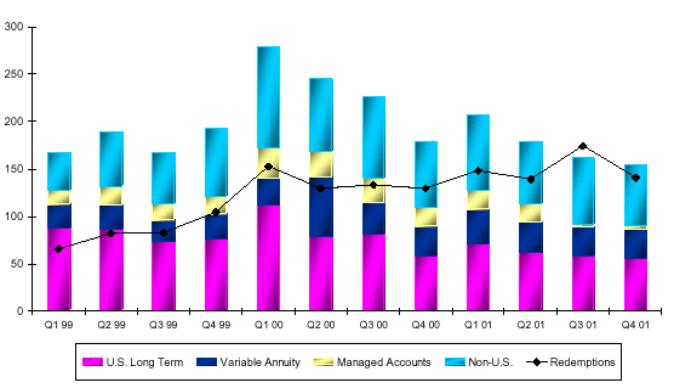
Net New Business Strengthened by Product Diversity
|
|
|
|
|
|
|
|
|
|
|
|
| |||||
|
|
|
|
|
|
|
|
|
|
|
| ||||||
|
|
|
|
|
|
|
|
|
|
|
| ||||||
|
|
|
|
|
|
|
|
|
|
|
| ||||||
|
| Growth |
| Value |
| Fixed |
|
|
|
|
| ||||||
|
| Equity |
| Equity |
| Income |
| Passive |
| Total |
| ||||||
• Dec 2000 AUM |
| $ | 197 |
| $ | 91 |
| $ | 130 |
| $ | 36 |
| $ | 454 |
| |
|
|
|
|
|
|
|
|
|
|
|
| ||||||
• Net New Business |
| 16 |
| 9 |
| 9 |
| – |
| 34 |
| ||||||
|
|
|
|
|
|
|
|
|
|
|
| ||||||
• Australia JV |
| 3 |
| – |
| 6 |
| – |
| 9 |
| ||||||
|
|
|
|
|
|
|
|
|
|
|
|
| |||||
• Discontinued JVs |
| – |
| – |
| (1 | ) | – |
| (1 | ) |
| |||||
|
|
|
|
|
|
|
|
|
|
|
|
| |||||
• Net Change |
| 19 |
| 9 |
| 14 |
| – |
| 42 |
|
| |||||
|
|
|
|
|
|
|
|
|
|
|
|
| |||||
• Market Appreciation |
| (41 | ) | 1 |
| 3 |
| (4 | ) | (41 | ) |
| |||||
|
|
|
|
|
|
|
|
|
|
|
|
| |||||
• Dec 2001 AUM |
| $ | 175 |
| $ | 101 |
| $ | 147 |
| $ | 32 |
| $ | 455 |
|
|
In $ billions
Positive Net New Business in All Distribution Channels
Every Quarter in 2001
|
|
|
|
|
|
|
|
|
|
|
|
| ||||
|
|
|
|
|
|
|
|
|
|
|
| |||||
|
|
|
|
|
|
|
|
|
|
|
| |||||
|
|
|
|
|
|
|
|
|
|
|
| |||||
|
|
|
|
|
| Institutional |
| Private |
|
|
| |||||
|
|
|
| Retail |
| Inv Mgmt |
| Client |
| Total |
| |||||
|
|
|
|
|
|
|
|
|
|
|
| |||||
• |
| Dec 2000 AUM |
| $ | 164 |
| $ | 253 |
| $ | 37 |
| $ | 454 |
| |
|
|
|
|
|
|
|
|
|
|
|
| |||||
• |
| Net New Business |
| 12 |
| 24 |
| 2 |
| 38 |
| |||||
|
|
|
|
|
|
|
|
|
|
|
| |||||
• |
| Cash Management |
| 2 |
| 2 |
| – |
| 4 |
|
| ||||
|
|
|
|
|
|
|
|
|
|
|
|
| ||||
• |
| Net Change |
| 14 |
| 26 |
| 2 |
| 42 |
|
| ||||
|
|
|
|
|
|
|
|
|
|
|
|
| ||||
• |
| Market Appreciation |
| (22 | ) | (20 | ) | 1 |
| (41 | ) |
| ||||
|
|
|
|
|
|
|
|
|
|
|
|
| ||||
• |
| Dec 2001 AUM |
| $ | 156 |
| $ | 259 |
| $ | 40 |
| $ | 455 |
|
|
In $ billions.
Retail Net Sales
|
|
|
| 2001 |
| 2000 |
| ||
|
|
|
|
|
|
|
| ||
• |
| U.S. |
| $ | 3,261 |
| $ | 9,056 |
|
|
|
|
|
|
|
|
| ||
• |
| Non-U.S. |
| 2,906 |
| 4,775 |
| ||
|
|
|
|
|
|
|
| ||
• |
| Variable Annuity |
| 2,671 |
| 5,080 |
| ||
|
|
|
|
|
|
|
| ||
• |
| Managed Accounts |
| (1,647 | ) | 4,981 |
| ||
|
|
|
|
|
|
|
| ||
• |
| Cash Management |
| 1,742 |
| 2,935 |
| ||
|
|
|
|
|
|
|
| ||
• |
| Total |
| $ | 8,933 |
| $ | 26,827 |
|
In $ millions.
Excludes unreinvested dividends, Australia joint venture, and net cash flow.
Balanced Mix of Institutional Separately Managed
Account Wins – 2001
|
| New |
| 336 New Accounts |
| |
Growth Equity Products |
| Accounts |
|
|
| |
Large Cap Growth |
| 72 |
| $33.1 Billion in AUM |
| |
Disciplined Growth |
| 24 |
|
|
| |
Emerging Markets Growth |
| 9 |
| 44 Investment Disciplines |
| |
Large Cap Core |
| 6 |
|
|
|
|
Japan Growth |
| 5 |
|
|
| New |
Global Large Cap Growth |
| 5 |
| Fixed Income Products |
| Accounts |
Small Cap Growth |
| 3 |
| Insurance |
| 8 |
Multi Cap Growth |
| 1 |
| Sector Rotation |
| 7 |
Mid Cap Growth |
| 1 |
| Mortgage |
| 6 |
Strategic Growth |
| 1 |
| Cash Management |
| 6 |
International Large Cap Growth |
| 1 |
| Canadian Fixed Income |
| 3 |
European Growth |
| 1 |
| High Yield |
| 3 |
Australian Growth |
| 1 |
| Corporate Bond |
| 2 |
|
| 130 |
| Low Duration |
| 1 |
Value Equity Products |
|
|
| Intermediate Duration |
| 1 |
Diversified Value |
| 43 |
| Global Sector Rotation |
| 1 |
Strategic Value |
| 13 |
| Global High Yield |
| 1 |
Global Value |
| 12 |
| International Fixed Income |
| 1 |
International Value |
| 9 |
| Specialist Active Bond |
| 1 |
Relative Value |
| 7 |
| Other |
| 11 |
Canadian Value |
| 4 |
|
|
| 52 |
UK Value |
| 3 |
| Other Products |
|
|
Small/Mid Cap Value |
| 1 |
| Commingled Vehicles |
| 40 |
Other |
| 6 |
| Passive |
| 9 |
|
| 98 |
| Balanced |
| 1 |
Blended Equity Products |
|
|
| Balanced Large Cap Core |
| 1 |
Strategic Growth/Value |
| 2 |
| Balanced Diversified Value |
| 1 |
Large Cap Growth/Value |
| 1 |
| Global Balanced |
| 1 |
|
| 3 |
|
|
| 53 |
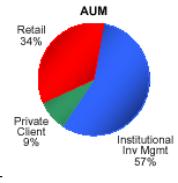
AUM by Channel and Investment Orientation
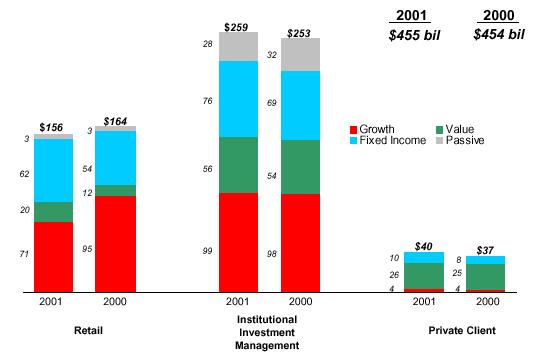
In $ billions
Annual Fee Base (1) by Channel and Investment Orientation
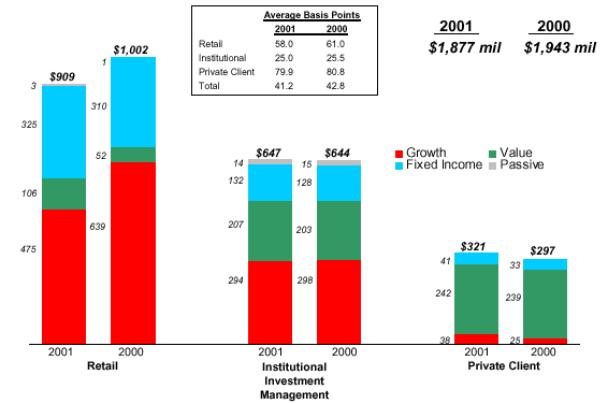
(1) Annual Fee Base is defined as period end AUM times contractual annual fee rates; assumes no change in AUM or fee rates for one year.
In $ millions
Investments for the Future
• Investment Management Platform
• Added UK, European and Japan value equity services
• Developed “blend” equity services
• Retail
• Increased resources to support leadership position in 529 college savings business
• Enhanced client relationship tools to increase marketing focus and reduce cost of sales
• Expanded international sales organization, with emphasis on Europe
• Institutional Investment Management
• Selectively added to European marketing staff
• Private Client
• Grew financial advisors by 15%
• Opened Minneapolis office; prepared to open Houston and Miami
• Launched new proprietary wealth forecasting system
• Institutional Research Services
• Expanded research and sales capabilities in U.S. and Europe; 14 new product launches
• Added new European trading capability
• Joint Ventures
• Established JVs in Australia and Taiwan
• Technology
• Continue to invest in platforms that support investment process and client service
Organic Growth
|
| 2001 |
| 2000 (1) |
| ||||||
|
| Net New |
| % Beginning |
| Net New |
| % Beginning |
| ||
|
| Business |
| AUM |
| Business |
| AUM |
| ||
• Retail |
|
|
|
|
|
|
|
|
| ||
Long-Term |
| $ | 5 |
| 4 | % | $ | 22 |
| 18 | % |
Cash Management |
| 2 |
| 6 | % | 3 |
| 11 | % | ||
|
| 7 |
| 4 | % | 25 |
| 17 | % | ||
|
|
|
|
|
|
|
|
|
| ||
• Institutional Investment Mgmt |
|
|
|
|
|
|
|
|
| ||
Long-Term |
| 22 |
| 9 | % | – |
| 0 | % | ||
Cash Management |
| 2 |
| 24 | % | 3 |
| 52 | % | ||
|
| 24 |
| 10 | % | 3 |
| 1 | % | ||
|
|
|
|
|
|
|
|
|
| ||
• Private Client |
| 3 |
| 7 | % | (5 | ) | -12 | % | ||
|
|
|
|
|
|
|
|
|
| ||
• Total |
| $ | 34 |
| 8 | % | $ | 24 |
| 5 | % |
In $ billions. Excludes joint ventures. Table may not add due to rounding.
(1) 2000 data includes the business of Sanford C. Bernstein from December 31, 1999.
Assumptions For Looking Ahead
• 2002 expected revenue growth of 5-7%
• AUM mix shift
• 7-9% growth from net new flows
• 6-7% blended capital markets growth
• Decline in performance fees
• Continued growth in institutional research services
• Expense growth likely to exceed base revenue growth
• Amortization of second and third tranches of deferred compensation plan related to SCB acquisition adds $33 million
• Increase in distribution expenses modeled at $36 million
• Growth in all other expenses approximately 8%
• Lead to:
• Difficult first quarter comparisons
• Comparisons turning positive in the second half of the year
• “Flattish” net operating earnings and distributions for 2002
Positioned For Growth
• Worldwide research and investment capabilities
• Unique with strengths in both growth and value investing
• Broad array of fixed income services
• Highly regarded marketing and client service teams
• Well-positioned in retail, institutional and private client channels
• Continued underlying business strength
• Strong financials
• Cogent strategy
Superior Long-Term Investor Returns
Total Annualized Return*

*As of 12/31/01. AC and S&P returns include reinvestment of cash distributions and dividends, respectively.
**Since IPO 4/88.
|

Performance Disclosure – Growth Composites
Net of Fee
Alliance Capital Management L.P. (“ACMLP”), is a registered investment advisor. ACMLP had US$455.4 billion in assets under management as of December 31, 2001. Performance figures in this report have been presented gross net of investment management fees. Net performance figures have been calculated by deducting the highest fee charged to an account in the composite from inception of the composite to December 2000. The annual fees used were: 0.90% for the Disciplined Growth Composite from 01/01/00 to 12/31/00 and 0.75% from inception to 12/31/99, 0.75% for the Relative Value Composite, 1.00% for the Emerging Markets Growth Composite, 0.90% for the International Large Cap Growth Composite from 10/01/00 to 12/31/00 and 0.75% from inception to 09/30/00, 0.90% for the Large Cap Growth Composite from 01/01/00 to 12/31/00 and 0.75% from inception to 12/31/99, 1.00% for the Multi Capitalization Growth Composite, and 1.00% for the Small Cap Growth Composite. From January 2001 forward, the Composites’ net of fee returns are based upon a weighted average of the actual fee rates charged to each account in the Composites. The average fees applied were: 0.33% for the Disciplined Growth Composite; 0.22% for the Relative Value Composite; 0.49% for the Emerging Markets Growth Composite; 0.30% for the International Large Cap Growth Composite; 0.33% for the Large Cap Growth Composite; 0.62% for the Multi Capitalization Growth Composite; and 0.87% for the Small Cap Growth Composite. Both fee structures exclude accounts with performance-based fee arrangements. Net-of-fee performance figures reflect the compounding effect of such fees.
No representation is made that the performance shown in this presentation is indicative of future performance. A portfolio could suffer losses as well as gains. Performance figures for each account are calculated monthly on a trade date basis using an internal rate of return calculation. Monthly market values include income accruals and reflect the daily weighting of cash flows. The composite results are asset-weighted on a monthly basis. Quarterly and annual composite performance figures are computed by linking monthly returns, resulting in a "time-weighted" rate of return. Performance results include the reinvestment of dividends and other earnings. Returns are calculated in US dollars.
As of December 31, 2001, the Composites include fee-paying discretionary accounts with assets over US$10 million, which are not subject to significant investment restrictions imposed by clients. As of December 31, 2001, the Emerging Markets Growth Composite had 4.50% of its assets invested in countries or regions outside of the benchmark, and the International Large Cap Growth Composite had 4.40% of its assets invested in countries or regions outside of the benchmark.
The number of accounts in each composite, the market value, and percentage of composite assets in relation to the total assets under management are included in the following table.
|
| Number of |
| Asset Value |
| % of Alliance |
| Minimum |
|
|
| Accounts |
| ($ in mil) |
| Total Assets |
| Asset ($ mil) |
|
Large Cap Growth Composite |
| 290 |
| 28,800 |
| 6 |
| 10 |
|
Disciplined Growth Composite |
| 111 |
| 9,059 |
| 2 |
| 10 |
|
Small Cap Growth Composite |
| 11 |
| 657 |
| <1 |
| 10 |
|
Multi Cap Growth Composite |
| 12 |
| 787 |
| <1 |
| 10 |
|
Relative Value Composite |
| 13 |
| 2,099 |
| 5 |
| 10 |
|
International Large Cap Growth Composite |
| 7 |
| 2,165 |
| 5 |
| 10 |
|
Emerging Markets Growth Composite |
| 3 |
| 725 |
| <1 |
| 10 |
|
Performance Disclosure – Growth Composites
Net of Fee
The Large Cap and Disciplined Growth Composites include the equity segment of balanced accounts. In these portfolios, the asset allocation mix is generally determined by client guidelines and cash flows are allocated in accordance with these guidelines. The remainder of the Composites do not include the equity segments of balanced accounts.
The withholding tax basis of the International Large Cap Growth and Emerging Markets Growth Composites are consistent with the benchmark, which is Luxembourg.
The dispersion of annual returns was calculated based on the asset-weighted standard deviation. Dispersion of performance for the Composites is as follows: Disciplined Growth: 1993: 1.10; 1994: 0.68; 1995: 1.05; 1996: 1.09; 1997: 1.64; 1998: 0.88; 1999: 1.36; 2000: 1.68; 2001: 1.75
Relative Value: 1994(Q4): 0.53; 1995: 2.72; 1996: 0.39; 1997: 0.23; 1998: 0.54; 1999: 0.76; 2000: 0.24; 2001: 0.50 Emerging Markets Growth:: 1993: N/M*; 1994: 2.56; 1995: 1.00; 1996: 0.57; 1997: 0.31; 1998: 0.04; 1999: N/M*; 2000: N/M*; 2001: N/M*
International Large Cap Growth: 1993: 2.22; 1994: 0.49; 1995: 1.18; 1996: 0.24; 1997: 0.90; 1998: 3.06; 1999: 5.77; 2000: 2.58; 2001: 0.69
Large Cap Growth: 1993: 1.61; 1994: 1.22; 1995: 1.86; 1996: 1.29; 1997: 4.97; 1998: 2.43; 1999: 3.23; 2000: 2.11; 2001: 3.56 Multi Capitalization Growth: 1993: 1.86; 1994: 0.46; 1995: 0.39; 1996: 1.18; 1997: 0.71; 1998: 0.34; 1999: 1.13; 2000: 0.25; 2001: 0.27
Small Cap Growth: 1994(Q2-Q4): 1.65; 1995: 0.19; 1996: 0.09; 1997: 0.14; 1998: 0.29; 1999: 0.55; 2000: 0.79; 2001: 0.28
Alliance Capital has prepared and presented this report in compliance with the Performance Presentation Standards of the Association for Investment Management and Research (AIMR-PPS®), the US and Canadian versions of the Global Investment Performance Standards (GIPS®). AIMR has not been involved in the preparation or review of this report. Alliance Capital received Level 1 and 2 AIMR Verification from KPMG LLP for 1992, 1993, 1994, 1995, 1996, 1997 and 1998. KPMG LLP is currently auditing 1999 and 2000. This verification is available upon request.
To receive a complete list and description of Alliance Capital’s composites contact Sarah Ringle at (212) 823-8681, and/or a presentation that adheres to the AIMR-PPS standards, contact Victoria Grancarich at (212) 969-6695.
*N/M represents not meaningful. N/M coding indicates that only one account, or no accounts, are in the Composite for the full year. Dispersion is only shown for accounts included in each quarter of each year presented.
Performance Disclosure – Value Composites
Net of Fee
Performance Statistics Are Not Financial Statements - There are various methods of compiling or reporting performance statistics. The standards of performance measurement used in compiling this data are in accordance with the methods set forth below. Past performance statistics are not indicative of future results.
Total Return - Performance results of accounts and comparisons are made on a total-return basis, which includes all dividends, interest and accrued interest, and realized and unrealized gains or losses. Securities are included in accounts on a trade-date basis. Performance results are after deductions of all transaction charges and fees.
Rate of Return - Investment results are computed on a “time-weighted” rate-of-return basis. Assuming dividends and interest are reinvested, the growth in dollars of an investment in a period can be computed using these rates of return. In computing the time-weighted rate of return, if an account’s net monthly cash flow exceeds 10% of its beginning market value, the cash flows are weighted on a daily basis. When an account’s net monthly cash flows are less than 10% of its beginning market value, the cash flows are weighted by the “end-of-the-month” assumption. Beginning 2001, all cash flows are daily-weighted using the modified Dietz method.
Preparation of Data - Investment results for Strategic Value accounts for the entire quarter were added together and the sum divided by the total number of accounts in each quarter through 1992; beginning in 1993, and since inception for all other cited composites, quarterly performance was for all accounts weighted by their market value. These quarterly performance figures were then linked to produce a continuous-performance index. The continuous-performance index from inception was used to create point-to-point comparisons. Closed accounts are included for each full quarter prior to their closing. From inception, returns for Diversified Value optimized against the Russell 1000 Value Index exclude certain accounts with special restrictions imposed by clients. Strategic Value returns include all accounts offered from 1974-1982 and, from 1983, all Strategic Value accounts with $5 million or more in assets. Beginning January 1, 2000, results exclude accounts with a client-directed margin balance of 20% or more of market value at any month end. From July 1993 quarterly results were those of GDP-weighted, half-hedged International Value accounts separately managed in US dollars. The minimum account size for Emerging Market Value accounts (including commingled accounts) included in performance is $5 million or more in assets.
Performance Disclosure – Value Composites
Net of Fee
Dispersion - The dispersion factor is a measure around the average account performance. The dispersion factor is calculated as the standard deviation of the equal-weighted returns from the asset-weighted mean. Specifically, it is the standard deviation around the performance for accounts managed during each period and indicates the range from average performance of approximately two-thirds of the accounts included in each period. Dispersion of performance for accounts under management are: Diversified Value (Russell 1000 Value) – 1999: 2Q-4Q: 1.8; 2000: 1.9; 2001: 1.0; Strategic Value - 1974: 29.1; 1975: 26.5; 1976: 17.6; 1977: 8.3; 1978: 11.5; 1979: 9.0; 1980: 8.7; 1981: 5.6; 1982: 5.5; 1983: 2.9; 1984: 1.6; 1985: 1.6; 1986: 1.1; 1987: 1.7; 1988: 1.7; 1989: 1.4; 1990: 1.2; 1991: 2.0; 1992: 1.4; 1993: 1.2; 1994: 1.2; 1995: 1.3; 1996: 1.3; 1997: 1.6; 1998: 2.5; 1999: 2.5; 2000: 2.6; 2001: 2.1. Dispersion of performance for Small & Mid-Cap Value composite is currently not available. International Value (GDP-weighted, half-hedged) - 1993:2H: 0.5; 1994: 0.9; 1995: 1.1; 1996: 1.0; 1997: 1.3; 1998: 1.6; 1999: 1.8; 2000: 1.6; 2001: 0.9; Emerging Markets Value - 1996: 0.0; 1997: 3.8; 1998: 2.7; 1999: 2.8; 2000: 2.0; 2001; 2.1
Financial Securities Environment - Various indices are used to indicate the type of investment environment existing during the time periods shown.
Composites used for reporting purposes represent the following:
|
|
|
|
|
| % of Total Firm |
|
Strategy |
| Number of Accounts |
| Assets ($mm) |
| Assets |
|
Strategic Value (accts. over $5 million) |
| 317 |
| 13,946 |
| 3% |
|
Diversified Value (opt to Russell 1000 Value) |
| 371 |
| 19,123 |
| 4 |
|
Small-Mid Cap Value |
| N/A |
| N/A |
| N/A |
|
International Value (half-hedged, GDP wtd) |
| 186 |
| 7,846 |
| 2 |
|
Emerging Markets Value |
| 30 |
| 697 |
| <1 |
|
APPENDIX
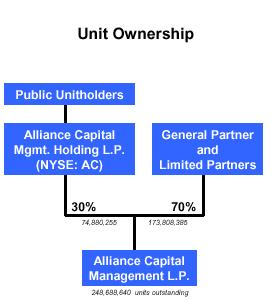
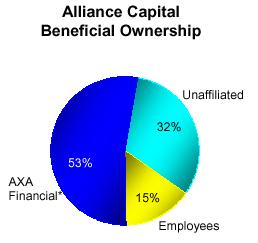
About Alliance Capital – Ownership Structure
|
|
|
| If all unexercised options are included, Alliance employee ownership is 20%. | |
|
|
|
|
| * AXA Financial ownership includes General Partnership interests. Employee ownership percentage includes restricted unit awards.
|
Changes in AUM by Client
Three Months Ended December 31, 2001
|
|
|
| Institutional |
|
|
|
|
| ||||
|
|
|
| Investment |
| Private |
|
|
| ||||
|
| Retail |
| Management |
| Client |
| Total |
| ||||
|
|
|
|
|
|
|
|
|
| ||||
Beginning of Period |
| $ | 146,372 |
| $ | 237,778 |
| $ | 37,252 |
| $ | 421,402 |
|
|
|
|
|
|
|
|
|
|
| ||||
Sales/New accounts |
| 9,842 |
| 6,104 |
| 1,336 |
| 17,282 |
| ||||
Redemptions/Terminations |
| (8,852 | ) | (5,159 | ) | (834 | ) | (14,845 | ) | ||||
Net cash management sales |
| (834 | ) | (1,685 | ) | (10 | ) | (2,529 | ) | ||||
Cash flow |
| 800 |
| 1,475 |
| (67 | ) | 2,208 |
| ||||
Unreinvested dividends |
| (289 | ) | 36 |
| (50 | ) | (303 | ) | ||||
Net new business |
| 667 |
| 771 |
| 375 |
| 1,813 |
| ||||
|
|
|
|
|
|
|
|
|
| ||||
Market appreciation |
| 9,557 |
| 20,093 |
| 2,537 |
| 32,187 |
| ||||
End of Period |
| $ | 156,596 |
| $ | 258,642 |
| $ | 40,164 |
| $ | 455,402 |
|
Assets reflect 100% of the assets managed by the Joint Venture companies.
Amounts in $ millions.
Changes in AUM by Client
Twelve Months Ended December 31, 2001
|
|
|
| Institutional |
|
|
|
|
| ||||
|
|
|
| Investment |
| Private |
|
|
| ||||
|
| Retail |
| Management |
| Client |
| Total |
| ||||
|
|
|
|
|
|
|
|
|
| ||||
Beginning of Period |
| $ | 164,248 |
| $ | 252,597 |
| $ | 36,834 |
| $ | 453,679 |
|
|
|
|
|
|
|
|
|
|
| ||||
Sales/New accounts |
| 42,991 |
| 33,076 |
| 5,139 |
| 81,206 |
| ||||
Redemptions/Terminations |
| (35,800 | ) | (12,458 | ) | (2,804 | ) | (51,062 | ) | ||||
Net cash management sales |
| 1,742 |
| 1,962 |
| 221 |
| 3,925 |
| ||||
Cash flow |
| 92 |
| 1,721 |
| 139 |
| 1,952 |
| ||||
Unreinvested dividends |
| (905 | ) | (11 | ) | (174 | ) | (1,090 | ) | ||||
Net new business |
| 8,120 |
| 24,290 |
| 2,521 |
| 34,931 |
| ||||
|
|
|
|
|
|
|
|
|
| ||||
Australia JV |
| 5,405 |
| 3,152 |
| - |
| 8,557 |
| ||||
Discontinued JVs |
| (917 | ) | (271 | ) | - |
| (1,188 | ) | ||||
Transfers |
| 749 |
| (749 | ) | - |
| - |
| ||||
|
|
|
|
|
|
|
|
|
| ||||
Market appreciation (depreciation) |
| (21,009 | ) | (20,377 | ) | 809 |
| (40,577 | ) | ||||
End of Period |
| $ | 156,596 |
| $ | 258,642 |
| $ | 40,164 |
| $ | 455,402 |
|
Assets reflect 100% of the assets managed by the Joint Venture companies.
Amounts in $ millions.
Changes in AUM by Investment Orientation
Three Months Ended December 31, 2001
|
| Growth |
| Value |
| Fixed |
|
|
|
|
| |||||
|
| Equity |
| Equity |
| Income |
| Passive |
| Total |
| |||||
|
|
|
|
|
|
|
|
|
|
|
| |||||
Beginning of Period |
| $ | 156,789 |
| $ | 88,390 |
| $ | 147,763 |
| $ | 28,460 |
| $ | 421,402 |
|
|
|
|
|
|
|
|
|
|
|
|
| |||||
Sales/New accounts |
| 6,006 |
| 3,937 |
| 7,087 |
| 252 |
| 17,282 |
| |||||
Redemptions/Terminations |
| (8,823 | ) | (1,304 | ) | (4,583 | ) | (135 | ) | (14,845 | ) | |||||
Net cash management sales |
| - |
| - |
| (2,529 | ) | - |
| (2,529 | ) | |||||
Cash flow |
| 1,503 |
| 2,001 |
| (1,592 | ) | 296 |
| 2,208 |
| |||||
Unreinvested dividends |
| (3 | ) | (69 | ) | (231 | ) | - |
| (303 | ) | |||||
Net new business |
| (1,317 | ) | 4,565 |
| (1,848 | ) | 413 |
| 1,813 |
| |||||
|
|
|
|
|
|
|
|
|
|
|
| |||||
Market appreciation |
| 19,277 |
| 8,455 |
| 1,372 |
| 3,083 |
| 32,187 |
| |||||
|
|
|
|
|
|
|
|
|
|
|
| |||||
End Of Period |
| $ | 174,749 |
| $ | 101,410 |
| $ | 147,287 |
| $ | 31,956 |
| $ | 455,402 |
|
Assets reflect 100% of the assets managed by the Joint Venture companies.
Amounts in $ millions.
Changes in AUM by Investment Orientation
Twelve Months Ended December 31, 2001
|
| Growth |
| Value |
| Fixed |
|
|
|
|
| |||||
|
| Equity |
| Equity |
| Income |
| Passive |
| Total |
| |||||
|
|
|
|
|
|
|
|
|
|
|
| |||||
Beginning of Period |
| $ | 197,366 |
| $ | 90,886 |
| $ | 130,058 |
| $ | 35,369 |
| $ | 453,679 |
|
|
|
|
|
|
|
|
|
|
|
|
| |||||
Sales/New accounts |
| 41,034 |
| 13,368 |
| 25,086 |
| 1,718 |
| 81,206 |
| |||||
Redemptions/Terminations |
| (26,212 | ) | (4,912 | ) | (18,856 | ) | (1,082 | ) | (51,062 | ) | |||||
Net cash management sales |
| - |
| - |
| 3,925 |
| - |
| 3,925 |
| |||||
Cash flow |
| 1,325 |
| 1,159 |
| (82 | ) | (450 | ) | 1,952 |
| |||||
Unreinvested dividends |
| (12 | ) | (75 | ) | (1,003 | ) | - |
| (1,090 | ) | |||||
Net new business |
| 16,135 |
| 9,540 |
| 9,070 |
| 186 |
| 34,931 |
| |||||
|
|
|
|
|
|
|
|
|
|
|
| |||||
Australia JV |
| 2,879 |
| - |
| 5,642 |
| 36 |
| 8,557 |
| |||||
Discontinued JVs |
| (359 | ) | - |
| (829 | ) | - |
| (1,188 | ) | |||||
|
|
|
|
|
|
|
|
|
|
|
| |||||
Market appreciation (depreciation) |
| (41,272 | ) | 984 |
| 3,346 |
| (3,635 | ) | (40,577 | ) | |||||
|
|
|
|
|
|
|
|
|
|
|
| |||||
End Of Period |
| $ | 174,749 |
| $ | 101,410 |
| $ | 147,287 |
| $ | 31,956 |
| $ | 455,402 |
|
Assets reflect 100% of the assets managed by the Joint Venture companies.
Amounts in $ millions.
Retail 4Q01 Highlights
• | AUM up 7% from 3Q; average AUM declined 3% from 3Q |
| ||
|
| |||
• | Revenues down 2% from 3Q | |||
|
| |||
| • | Shift to lower fee equity, fixed income and cash management | ||
|
|
|
| |
• | Total net sales $156 million, down from $1.6 billion in 3Q | |||
|
| |||
| • | Net U.S. long-term fund sales: $1.5 billion, compared to $1.1 billion in 3Q (excluding managed account products) | ||
|
|
|
| |
|
| — | CollegeBoundfund –net sales of $616 million, compared to net sales of $445 million in 3Q | |
|
|
|
| |
| • | Net non-U.S. long-term fund sales: $236 million, down 66% from 3Q | ||
|
|
|
| |
| • | Cash management net redemptions of $834 million | ||
|
|
| ||
| • | Managed account products – net redemptions of $702 million slowed from 3Q | ||
|
|
|
| |
|
| — | Reinstatement in Merrill Lynch system in Jan ‘02 | |
|
|
|
| |
|
| — | Continued hold status in other programs | |
|
|
|
| |
• | AllianceBernstein value funds (U.S. and non-U.S.) – $946 million in AUM and $340 million in 4Q net sales | |||

Changes in Retail AUM by Investment Orientation
Twelve Months Ended December 31, 2001
|
| Growth |
| Value |
| Fixed |
| Cash |
|
|
| |||||
|
| Equity |
| Equity |
| Income |
| Mgmt |
| Total |
| |||||
|
|
|
|
|
|
|
|
|
|
|
| |||||
Beginning Of Period |
| $ | 98,797 |
| $ | 11,786 |
| $ | 24,124 |
| $ | 29,541 |
| $ | 164,248 |
|
|
|
|
|
|
|
|
|
|
|
|
| |||||
Sales |
| 18,903 |
| 7,918 |
| 16,170 |
| - |
| 42,991 |
| |||||
Redemptions |
| (20,670 | ) | (2,448 | ) | (12,682 | ) | - |
| (35,800 | ) | |||||
Net cash management sales |
| - |
| - |
| - |
| 1,742 |
| 1,742 |
| |||||
Cash flow |
| (2,344 | ) | 1,874 |
| 562 |
| - |
| 92 |
| |||||
Unreinvested dividends |
| (13 | ) | (75 | ) | (817 | ) | - |
| (905 | ) | |||||
Net new business |
| (4,124 | ) | 7,269 |
| 3,233 |
| 1,742 |
| 8,120 |
| |||||
|
|
|
|
|
|
|
|
|
|
|
| |||||
Australia JV |
| 2,343 |
| - |
| 3,062 |
| - |
| 5,405 |
| |||||
Discontinued JVs |
| (116 | ) | - |
| (801 | ) | - |
| (917 | ) | |||||
Transfers |
| - |
| 749 |
| - |
| - |
| 749 |
| |||||
Market appreciation (depreciation) |
| (22,394 | ) | 110 |
| 1,271 |
| 4 |
| (21,009 | ) | |||||
|
|
|
|
|
|
|
|
|
|
|
| |||||
End Of Period |
| $ | 74,506 |
| $ | 19,914 |
| $ | 30,889 |
| $ | 31,287 |
| $ | 156,596 |
|
Assets reflect 100% of the assets managed by the Joint Venture companies.
Amounts in $ millions.
Changes in Retail AUM by Product
Twelve Months Ended December 31, 2001
|
| U.S. |
| Non-U.S. |
| Variable |
| Managed |
|
|
| |||||
|
| Funds |
| Funds |
| Annuity |
| Accounts |
| Total |
| |||||
|
|
|
|
|
|
|
|
|
|
|
| |||||
Beginning Of Period |
| $ | 88,982 |
| $ | 19,583 |
| $ | 41,169 |
| $ | 14,514 |
| $ | 164,248 |
|
|
|
|
|
|
|
|
|
|
|
|
| |||||
Sales |
| 15,183 |
| 17,008 |
| 8,029 |
| 2,771 |
| 42,991 |
| |||||
Redemptions |
| (11,926 | ) | (14,097 | ) | (5,359 | ) | (4,418 | ) | (35,800 | ) | |||||
Net cash management sales |
| 1,744 |
| (2 | ) | 0 |
| - |
| 1,742 |
| |||||
Cash flow |
| (18 | ) | (52 | ) | 162 |
| - |
| 92 |
| |||||
Unreinvested dividends |
| (726 | ) | (179 | ) | 0 |
| - |
| (905 | ) | |||||
Net new business |
| 4,257 |
| 2,678 |
| 2,832 |
| (1,647 | ) | 8,120 |
| |||||
|
|
|
|
|
|
|
|
|
|
|
| |||||
Australia JV |
| - |
| 5,405 |
| - |
| - |
| 5,405 |
| |||||
Discontinued JVs |
| - |
| (917 | ) | - |
| - |
| (917 | ) | |||||
Transfers |
| - |
| - |
| 749 |
| - |
| 749 |
| |||||
Market depreciation |
| (8,403 | ) | (3,517 | ) | (7,280 | ) | (1,809 | ) | (21,009 | ) | |||||
|
|
|
|
|
|
|
|
|
|
|
| |||||
End Of Period |
| $ | 84,836 |
| $ | 23,232 |
| $ | 37,470 |
| $ | 11,058 |
| $ | 156,596 |
|
Assets reflect 100% of the assets managed by the Joint Venture companies.
Amounts in $ millions.
Average Global Daily Gross Sales
Amounts in $ millions.
Market Share of U.S.-Based Mutual Fund Gross Sales In Key Advisor-Assisted Channels
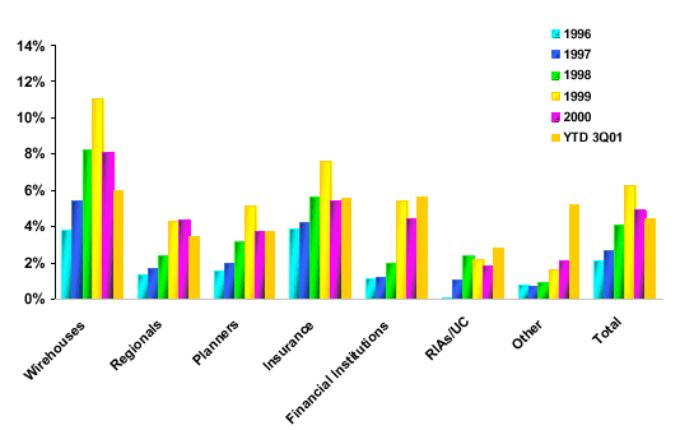
Nonproprietary gross sales domestic long-term funds.
Source: ICI
AllianceBernstein Institutional Investment Mgmt 4Q01 Highlights
• | AUM up 9% from 3Q; average AUM declined 1% from 3Q |
|
|
| |
• | Revenues up 7% from 3Q | |
|
| |
• | 106 new separate account wins totaled $6 billion in AUM; 2001 account wins of 336 totaled $33 billion | |
|
| |
• | Net new inflows were $771 million | |
|
| |
|
| |
|
| |
|
| |
|
| |
|
| |
|
| |
|
| |
|
| |
|
| |
|
|
Changes in Institutional Investment Management AUM
by Investment Orientation
Twelve Months Ended December 31, 2001
|
| Growth |
| Value |
| Fixed |
|
|
|
|
| |||||
|
| Equity |
| Equity |
| Income |
| Passive |
| Total |
| |||||
|
|
|
|
|
|
|
|
|
|
|
| |||||
Beginning Of Period |
| $ | 98,292 |
| $ | 53,691 |
| $ | 68,706 |
| $ | 31,908 |
| $ | 252,597 |
|
|
|
|
|
|
|
|
|
|
|
|
| |||||
Sales/New accounts |
| 21,899 |
| 3,626 |
| 6,583 |
| 968 |
| 33,076 |
| |||||
Redemptions/Terminations |
| (5,545 | ) | (1,521 | ) | (4,877 | ) | (515 | ) | (12,458 | ) | |||||
Cash Management Sales, Net |
| - |
| - |
| 1,962 |
| - |
| 1,962 |
| |||||
Cash flow |
| 2,184 |
| 551 |
| (604 | ) | (410 | ) | 1,721 |
| |||||
Unreinvested dividends |
| - |
| - |
| (11 | ) | - |
| (11 | ) | |||||
Net new business |
| 18,538 |
| 2,656 |
| 3,053 |
| 43 |
| 24,290 |
| |||||
|
|
|
|
|
|
|
|
|
|
|
| |||||
Australia JV |
| 566 |
| - |
| 2,580 |
| 6 |
| 3,152 |
| |||||
Discontinued JVs |
| (243 | ) | - |
| (28 | ) | - |
| (271 | ) | |||||
Transfers |
| - |
| (749 | ) | - |
| - |
| (749 | ) | |||||
Market appreciation (depreciation) |
| (17,928 | ) | 218 |
| 1,126 |
| (3,793 | ) | (20,377 | ) | |||||
|
|
|
|
|
|
|
|
|
|
|
| |||||
End Of Period |
| $ | 99,225 |
| $ | 55,816 |
| $ | 75,437 |
| $ | 28,164 |
| $ | 258,642 |
|
Assets reflect 100% of the assets managed by the Joint Venture companies.
Amounts in $ millions.
Private Client 4Q01 Highlights
Bernstein Investment Research & Management
• | AUM up 8% from 3Q; average AUM up 1% from 3Q |
| |
|
|
| |
• | Revenues up 33% from 3Q | ||
|
|
| |
• | Net new flows of $375 million | ||
|
|
| |
| • | Positive inflows every month this year | |
|
|
| |
• | Launched new proprietary wealth forecasting system | ||
Institutional Research Services 4Q01 Highlights
• | Revenues up 5% from 3Q |
| |
|
| ||
| • | Impact of five additional trading days offset 0.1% decline in market share and lower NYSE volume | |
|
|
| |
• | Fourteen product launches in 2001 | ||
|
|
| |
• | Added 2 seats on NYSE | ||
Retail AUM and Net Flows
|
|
|
| Quarters |
| ||||||||
|
| AUM |
| Net Flows |
| Net Flows |
| Net Flows |
| ||||
|
| 12/31/01 |
| 4Q 2001 |
| 3Q 2001 |
| 4Q 2000 |
| ||||
U.S. Based Mutual Funds |
| $ | 53,549 |
| $ | 1,017 |
| $ | 335 |
| $ | (316 | ) |
Non-U.S. Based Mutual Funds: |
|
|
|
|
|
|
|
|
| ||||
Luxembourg Funds |
| 8,842 |
| 860 |
| 181 |
| 523 |
| ||||
EPTA Funds |
| 2,717 |
| (110 | ) | (241 | ) | 426 |
| ||||
India |
| 665 |
| 8 |
| 18 |
| 7 |
| ||||
Japan ITM |
| 3,037 |
| (8 | ) | 80 |
| (107 | ) | ||||
Other Funds |
| 790 |
| (95 | ) | (9 | ) | 48 |
| ||||
Joint Venture Funds |
| 7,180 |
| (451 | ) | 590 |
| 91 |
| ||||
Total Non-U.S. |
| 23,231 |
| 204 |
| 619 |
| 988 |
| ||||
|
|
|
|
|
|
|
|
|
| ||||
Managed Accounts |
| 11,058 |
| (702 | ) | (2,107 | ) | 820 |
| ||||
Variable Annuity |
| 37,471 |
| 982 |
| (132 | ) | 744 |
| ||||
Total Long-Term |
| 125,309 |
| 1,501 |
| (1,285 | ) | 2,236 |
| ||||
|
|
|
|
|
|
|
|
|
| ||||
Cash Management |
| 31,287 |
| (834 | ) | 1,856 |
| 2,799 |
| ||||
|
|
|
|
|
|
|
|
|
| ||||
Total |
| $ | 156,596 |
| $ | 667 |
| $ | 571 |
| $ | 5,035 |
|
Assets reflect 100% of the assets managed by the Joint Venture companies.
Amounts in $ millions; except AUM in $ billions.
Institutional Investment Management AUM and Net Flows
|
|
|
| Quarters |
| ||||||||
|
| AUM |
| Net Flows |
| Net Flows |
| Net Flows |
| ||||
|
| 12/31/01 |
| 4Q 2001 |
| 3Q 2001 |
| 4Q 2000 |
| ||||
Mutual Funds |
|
|
|
|
|
|
|
|
| ||||
U.S. Based |
| $ | 853 |
| $ | 10 |
| $ | (56 | ) | $ | (77 | ) |
|
|
|
|
|
|
|
|
|
| ||||
Non-U.S. Based: |
|
|
|
|
|
|
|
|
| ||||
Luxembourg |
| - |
| - |
| - |
| - |
| ||||
Structured Products |
| 3,564 |
| (13 | ) | (288 | ) | (177 | ) | ||||
Other |
| 14 |
| - |
| - |
| (1 | ) | ||||
Total Non-U.S. |
| 3,578 |
| (13 | ) | (288 | ) | (178 | ) | ||||
|
|
|
|
|
|
|
|
|
| ||||
Separate Accounts |
| 243,923 |
| 2,459 |
| 3,211 |
| 2,095 |
| ||||
|
|
|
|
|
|
|
|
|
| ||||
Total Long-Term |
| 248,354 |
| 2,456 |
| 2,867 |
| 1,840 |
| ||||
|
|
|
|
|
|
|
|
|
| ||||
Cash Management |
| 10,288 |
| (1,685 | ) | 1,755 |
| (615 | ) | ||||
|
|
|
|
|
|
|
|
|
| ||||
Total |
| $ | 258,642 |
| $ | 771 |
| $ | 4,622 |
| $ | 1,225 |
|
Assets reflect 100% of the assets managed by the Joint Venture companies.
Amounts in $ millions; except AUM in $ billions.
Private Client AUM and Net Flows
|
|
|
| Quarters |
| ||||||||
|
| AUM |
| Net Flows |
| Net Flows |
| Net Flows |
| ||||
|
| 12/31/01 |
| 4Q 2001 |
| 3Q 2001 |
| 4Q 2000 |
| ||||
Mutual Funds |
| $ | 11,232 |
| $ | (65 | ) | $ | 86 |
| $ | (515 | ) |
Separate Accounts |
| 28,664 |
| 450 |
| 669 |
| (280 | ) | ||||
Total Long-Term |
| 39,896 |
| 385 |
| 755 |
| (795 | ) | ||||
|
|
|
|
|
|
|
|
|
| ||||
Cash Management |
| 268 |
| (10 | ) | 91 |
| - |
| ||||
|
|
|
|
|
|
|
|
|
| ||||
Total |
| $ | 40,164 |
| $ | 375 |
| $ | 846 |
| $ | (795 | ) |
Amounts in $ millions; except AUM in $ billions.
Alliance Capital (The Operating Partnership)
Consolidated Balance Sheet
|
| 12/31/01 |
| 12/31/00 |
| ||
Assets |
|
|
|
|
| ||
Cash and investments |
| $ | 501,845 |
| $ | 556,569 |
|
Cash and securities |
| 1,415,158 |
| 1,306,334 |
| ||
Receivables |
| 1,954,582 |
| 1,906,248 |
| ||
Intangible assets, net |
| 3,264,782 |
| 3,430,708 |
| ||
Deferred sales commissions, net |
| 648,244 |
| 715,692 |
| ||
Other |
| 390,782 |
| 355,211 |
| ||
Total Assets |
| $ | 8,175,393 |
| $ | 8,270,762 |
|
|
|
|
|
|
| ||
Liabilities and Partners' Capital |
|
|
|
|
| ||
Liabilites: |
|
|
|
|
| ||
Payables |
| $ | 3,029,983 |
| $ | 2,798,694 |
|
Accounts payable and accrued expenses |
| 194,538 |
| 238,640 |
| ||
Accrued compensation and benefits |
| 328,077 |
| 313,426 |
| ||
Debt |
| 627,609 |
| 782,232 |
| ||
Other |
| 7,026 |
| 4,093 |
| ||
Total Liabilities |
| 4,187,233 |
| 4,137,085 |
| ||
|
|
|
|
|
| ||
Partners' Capital |
| 3,988,160 |
| 4,133,677 |
| ||
Total Liabilities and Partners' Capital |
| $ | 8,175,393 |
| $ | 8,270,762 |
|
Amounts in $ thousands. Unaudited
Alliance Capital (The Operating Partnership)
Consolidated Cash Flow
|
| Twelve Months Ended |
| ||||
|
| 12/31/01 |
| 12/31/00 |
| ||
Cash Flows From Operating Activities: |
|
|
|
|
| ||
Net income |
| $ | 614,625 |
| $ | 668,749 |
|
Non-cash items: |
|
|
|
|
| ||
Amortization and depreciation |
| 446,119 |
| 301,618 |
| ||
Non-recurring item |
| - |
| 34,634 |
| ||
Other, net |
| 67,686 |
| 64,603 |
| ||
Changes in assets and liabilities |
| (131,596 | ) | (387,202 | ) | ||
Net cash provided from operating activities |
| 996,834 |
| 682,402 |
| ||
|
|
|
|
|
| ||
Cash Flows From Investing Activities: |
|
|
|
|
| ||
Sales (purchase) of investments, net |
| 56,762 |
| (203,711 | ) | ||
Additions to furniture, equipment and leaseholds, net |
| (87,000 | ) | (75,796 | ) | ||
Other |
| (5,422 | ) | (1,475,400 | ) | ||
Net cash (used in) investing actvities |
| (35,660 | ) | (1,754,907 | ) | ||
|
|
|
|
|
| ||
Cash Flows From Financing Activities: |
|
|
|
|
| ||
Increase (decrease) in debt, net |
| (173,111 | ) | 368,375 |
| ||
Distributions to partners |
| (785,530 | ) | (633,163 | ) | ||
Proceeds from issuance of Units to ELAS and AXF |
| - |
| 1,629,525 |
| ||
Other |
| 1,935 |
| (154,281 | ) | ||
Net cash provided from (used in) financing activities |
| (956,706 | ) | 1,210,456 |
| ||
|
|
|
|
|
| ||
Effect of exchange rate change on cash |
| (592 | ) | (1,885 | ) | ||
|
|
|
|
|
| ||
Net increase in cash |
| 3,876 |
| 136,066 |
| ||
Cash at the beginning of period |
| 216,251 |
| 80,185 |
| ||
Cash at the end of period |
| $ | 220,127 |
| $ | 216,251 | �� |
Amounts in $ thousands. Unaudited
Alliance Capital Investment Management Services
Alliance Capital provides diversified investment management and related services globally to a broad range of clients:
1. Retail Services consists of investment management products and services distributed to individual investors through financial intermediaries, such as brokers and financial planners by means of:
· mutual funds sponsored by Alliance Capital and affiliated joint venture companies,
· cash management products such as money market funds and deposit accounts,
· mutual fund sub-advisory relationships resulting from the efforts of the mutual fund marketing department, and
· "managed money” products;
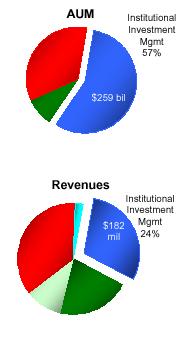
2. Institutional Investment Management Services consists of investment management services to unaffiliated parties such as corporate and public employee pension funds, endowment funds, domestic and foreign institutions and governments, and affiliates such as AXA and its insurance company subsidiaries by means of:
· separate accounts,
· mutual fund shares and classes sold principally to institutional investors and high net worth individuals,
· sub-advisory relationships resulting from the efforts of the institutional marketing department,
· hedge funds,
· structured products, and
· group trusts;
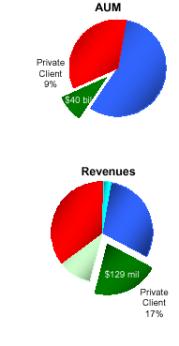
3. Private Client Services consists of investment management services provided to high net worth individuals, trusts and estates, charitable foundations, partnerships, private and family corporations and other entities by means of:
· separate accounts,
· hedge funds and
· certain other vehicles; and
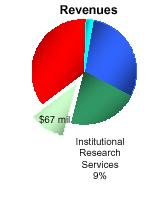
4. Institutional Research Services to institutional clients by means of:
· in-depth research,
· portfolio strategy,
· trading and
· brokerage-related services.