Exhibit 99.04
Link to searchable text of slide shown above
Link to searchable text of slide shown above
Link to searchable text of slide shown above
Link to searchable text of slide shown above
Link to searchable text of slide shown above
Link to searchable text of slide shown above
Link to searchable text of slide shown above

Link to searchable text of slide shown above

Link to searchable text of slide shown above
Link to searchable text of slide shown above
Link to searchable text of slide shown above
Link to searchable text of slide shown above
Link to searchable text of slide shown above
Link to searchable text of slide shown above

Link to searchable text of slide shown above
Link to searchable text of slide shown above
Link to searchable text of slide shown above
Link to searchable text of slide shown above
Link to searchable text of slide shown above

Link to searchable text of slide shown above
Link to searchable text of slide shown above
Link to searchable text of slide shown above
Link to searchable text of slide shown above
Link to searchable text of slide shown above
Link to searchable text of slide shown above
Link to searchable text of slide shown above
Link to searchable text of slide shown above
Link to searchable text of slide shown above
Link to searchable text of slide shown above

Link to searchable text of slide shown above

Link to searchable text of slide shown above
Link to searchable text of slide shown above
Link to searchable text of slide shown above
Link to searchable text of slide shown above

Link to searchable text of slide shown above

Link to searchable text of slide shown above
Link to searchable text of slide shown above
Link to searchable text of slide shown above

Link to searchable text of slide shown above
Link to searchable text of slide shown above
Link to searchable text of slide shown above
Link to searchable text of slide shown above
Link to searchable text of slide shown above
Link to searchable text of slide shown above
Link to searchable text of slide shown above
Link to searchable text of slide shown above
Link to searchable text of slide shown above

Link to searchable text of slide shown above
Link to searchable text of slide shown above
Link to searchable text of slide shown above
Link to searchable text of slide shown above
Link to searchable text of slide shown above
Link to searchable text of slide shown above

Link to searchable text of slide shown above
Link to searchable text of slide shown above

Link to searchable text of slide shown above
Link to searchable text of slide shown above

Link to searchable text of slide shown above
Searchable text section of graphics shown above
Exhibit 99.04
Alliance Capital and Alliance Holding
Fourth Quarter and Full Year 2002 Review
Bruce W. Calvert |
| John D. Carifa |
| Lewis A. Sanders |
Chairman and CEO |
| President and COO |
| Vice Chairman and CIO |
January 30, 2003
The SEC adopted Regulation FD in October 2000. In light of Regulation FD, Management will be limited in responding to inquiries from investors or analysts in a non-public forum. You are encouraged to ask all questions of a material nature on this conference call.
Forward-Looking Statements
Certain statements provided by Alliance Capital Management L.P. (“Alliance Capital”) and Alliance Capital Management Holding L.P. (“Alliance Holding”) in this report are “forward-looking statements” within the meaning of the Private Securities Litigation Reform Act of 1995. Such forward-looking statements are subject to risks, uncertainties and otherfactors which could cause actual results to differ materially from future results expressed or implied by such forward-looking statements. The most significant of such factors include, but are not limited to, the following: the performance of financial markets, the investment performance of Alliance Capital’s sponsored investment products and separately managed accounts, general economic conditions, future acquisitions, competitive conditions, and government regulations, including changes in tax rates. Alliance Capital and Alliance Holding caution readers to carefully consider such factors. Further, such forward-looking statements speak only as of the date on which such statements are made; Alliance Capital and Alliance Holding undertake no obligation to update any forward-looking statements to reflect events or circumstances after the date of such statements.
2
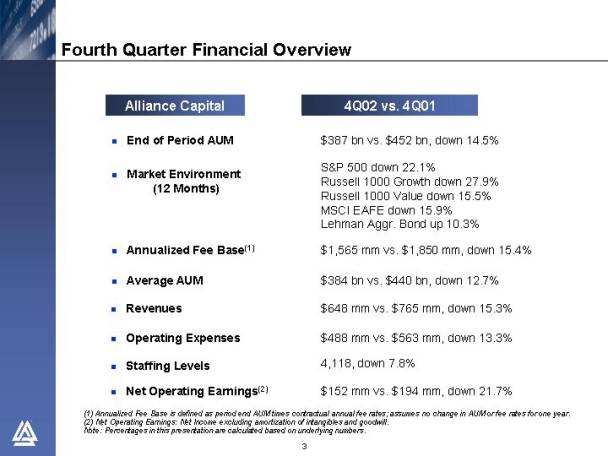
Fourth Quarter Financial Overview
| Alliance Capital |
| 4Q02 vs. 4Q01 |
|
|
|
|
• | End of Period AUM |
| $387 bn vs. $452 bn, down 14.5% |
|
|
|
|
• | Market Environment |
| S&P 500 down 22.1% |
| (12 Months) |
| Russell 1000 Growth down 27.9% |
|
|
| Russell 1000 Value down 15.5% |
|
|
| MSCI EAFE down 15.9% |
|
|
| Lehman Aggr. Bond up 10.3% |
|
|
|
|
• | Annualized Fee Base(1) |
| $1,565 mm vs. $1,850 mm, down 15.4% |
|
|
|
|
• | Average AUM |
| $384 bn vs. $440 bn, down 12.7% |
|
|
|
|
• | Revenues |
| $648 mm vs. $765 mm, down 15.3% |
|
|
|
|
• | Operating Expenses |
| $488 mm vs. $563 mm, down 13.3% |
|
|
|
|
• | Staffing Levels |
| 4,118, down 7.8% |
|
|
|
|
• | Net Operating Earnings(2) |
| $152 mm vs. $194 mm, down 21.7% |
(1) Annualized Fee Base is defined as period end AUM times contractual annual fee rates; assumes no change in AUM or fee rates for one year.
(2) Net Operating Earnings: Net Income excluding amortization of intangibles and goodwill.
Note: Percentages in this presentation are calculated based on underlying numbers.
3
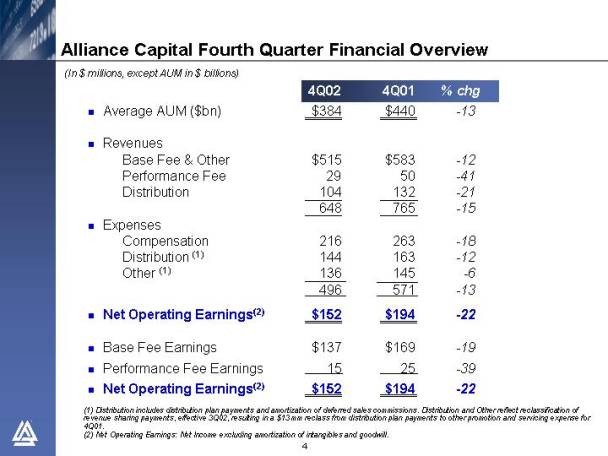
Alliance Capital Fourth Quarter Financial Overview
(In $ millions, except AUM in $ billions)
|
| 4Q02 |
| 4Q01 |
| % chg | |||
• Average AUM ($bn) |
| $ | 384 |
| $ | 440 |
| -13 | |
|
|
|
|
|
|
| |||
• Revenues |
|
|
|
|
|
| |||
Base Fee & Other |
| $ | 515 |
| $ | 583 |
| -12 | |
Performance Fee |
| 29 |
| 50 |
| -41 | |||
Distribution |
| 104 |
| 132 |
| -21 | |||
|
|
| 648 |
| 765 |
| -15 | ||
• Expenses |
|
|
|
|
|
| |||
Compensation |
| 216 |
| 263 |
| -18 | |||
Distribution (1) |
| 144 |
| 163 |
| -12 | |||
Other (1) |
| 136 |
| 145 |
| -6 | |||
|
| 496 |
| 571 |
| -13 | |||
• Net Operating Earnings(2) |
| $ | 152 |
| $ | 194 |
| -22 | |
|
|
|
|
|
|
| |||
• Base Fee Earnings |
| $ | 137 |
| $ | 169 |
| -19 | |
|
|
|
|
|
|
| |||
• Performance Fee Earnings |
| 15 |
| 25 |
| -39 | |||
|
|
|
|
|
|
| |||
• Net Operating Earnings(2) |
| $ | 152 |
| $ | 194 |
| -22 | |
(1) Distribution includes distribution plan payments and amortization of deferred sales commissions. Distribution and Other reflect reclassification of revenue sharing payments, effective 3Q02, resulting in a $13 mm reclass from distribution plan payments to other promotion and servicing expense for 4Q01.
(2) Net Operating Earnings: Net Income excluding amortization of intangibles and goodwill.
4
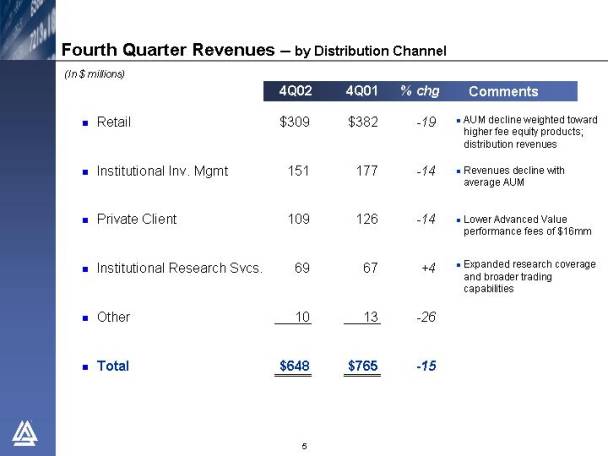
Fourth Quarter Revenues — by Distribution Channel
(In $ millions)
|
| 4Q02 |
| 4Q01 |
| % chg |
| Comments | ||
|
|
|
|
|
|
|
|
| ||
• Retail |
| $ | 309 |
| $ | 382 |
| -19 | • | AUM decline weighted toward higher fee equity products; distribution revenues |
|
|
|
|
|
|
|
|
| ||
• Institutional Inv. Mgmt |
| 151 |
| 177 |
| -14 | • | Revenues decline with average AUM | ||
|
|
|
|
|
|
|
|
| ||
• Private Client |
| 109 |
| 126 |
| -14 | • | Lower Advanced Value performance fees of $16 mm | ||
|
|
|
|
|
|
|
|
| ||
• Institutional Research Svcs. |
| 69 |
| 67 |
| +4 | • | Expanded research coverage and broader trading capabilities | ||
|
|
|
|
|
|
|
|
| ||
• Other |
| 10 |
| 13 |
| -26 |
|
| ||
|
|
|
|
|
|
|
|
| ||
• Total |
| $ | 648 |
| $ | 765 |
| -15 |
|
|
5
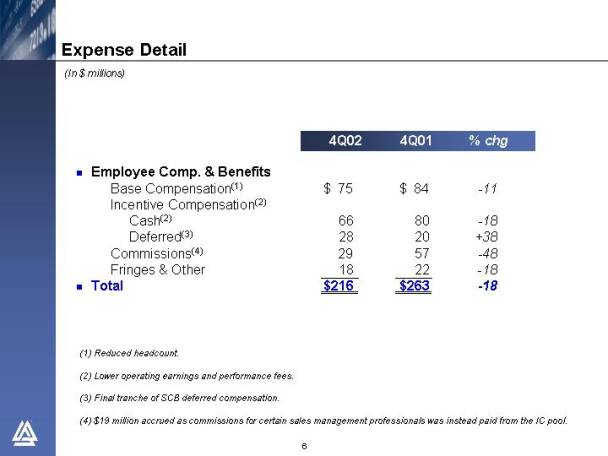
(In $ millions)
|
| 4Q02 |
| 4Q01 |
| % chg | ||
|
|
|
|
|
|
| ||
• Employee Comp. & Benefits |
|
|
|
|
|
| ||
Base Compensation(1) |
| $ | 75 |
| $ | 84 |
| -11 |
Incentive Compensation(2) |
|
|
|
|
|
| ||
Cash(2) |
| 66 |
| 80 |
| -18 | ||
Deferred(3) |
| 28 |
| 20 |
| +38 | ||
Commissions(4) |
| 29 |
| 57 |
| -48 | ||
Fringes & Other |
| 18 |
| 22 |
| -18 | ||
• Total |
| $ | 216 |
| $ | 263 |
| -18 |
(1) Reduced headcount.
(2) Lower operating earnings and performance fees.
(3) Final tranche of SCB deferred compensation.
(4) $19 million accrued as commissions for certain sales management professionals was instead paid from the IC pool.
6
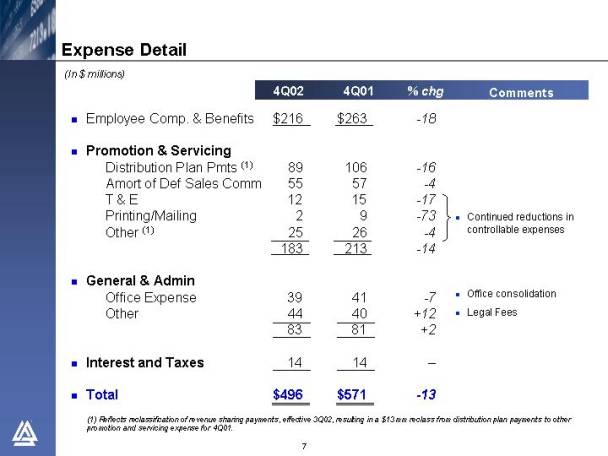
(In $ millions)
|
| 4Q02 |
| 4Q01 |
| % chg |
| Comments | |||
|
|
|
|
|
|
|
|
| |||
• Employee Comp. & Benefits |
| $ | 216 |
| $ | 263 |
| -18 |
|
| |
|
|
|
|
|
|
|
|
| |||
• Promotion & Servicing |
|
|
|
|
|
|
|
| |||
Distribution Plan Pmts (1) |
| 89 |
| 106 |
| -16 |
|
| |||
Amort of Def Sales Comm |
| 55 |
| 57 |
| -4 |
|
| |||
T & E |
| 12 |
| 15 |
| -17 |
| • | Continued reductions in controllable expenses | ||
Printing/Mailing |
| 2 |
| 9 |
| -73 | |||||
Other (1) |
| 25 |
| 26 |
| -4 |
| ||||
|
| 183 |
| 213 |
| -14 |
|
| |||
|
|
|
|
|
|
|
|
| |||
• General & Admin |
|
|
|
|
|
|
|
| |||
Office Expense |
| 39 |
| 41 |
| -7 | • | Office consolidation | |||
Other |
| 44 |
| 40 |
| +12 | • | Legal Fees | |||
|
| 83 |
| 81 |
| +2 |
|
| |||
|
|
|
|
|
|
|
|
| |||
• Interest and Taxes |
| 14 |
| 14 |
| — |
|
| |||
|
|
|
|
|
|
|
|
| |||
• Total |
| $ | 496 |
| $ | 571 |
| -13 |
|
| |
(1) Reflects reclassification of revenue sharing payments, effective 3Q02, resulting in a $13 mm reclass from distribution plan payments to other promotion and servicing expense for 4Q01.
7
(In $ millions)
|
| 4Q02 |
| 4Q01 |
| % chg | ||
|
|
|
|
|
|
| ||
• Distribution Revenues |
| $ | 104 |
| $ | 132 |
| -21 |
|
|
|
|
|
|
| ||
• Distribution Expenses |
|
|
|
|
|
| ||
Distribution Plan Payments (1) |
| 89 |
| 106 |
| -16 | ||
Amort of Def Sales Comm |
| 55 |
| 57 |
| -4 | ||
|
| 144 |
| 163 |
| -12 | ||
|
|
|
|
|
|
| ||
• Net Distribution Expense |
| $ | 40 |
| $ | 31 |
| +26 |
(1) Reflects reclassification of revenue sharing payments, effective 3Q02, resulting in a $13 mm reclass from distribution plan payments to other promotion and servicing expense for 4Q01.
8
Alliance Capital Pre-tax Operating Margin
(In $ millions)
|
| 4Q02 |
| % of |
| 4Q01 |
| % of |
| ||
|
|
|
|
|
|
|
|
|
| ||
• Base Fee Earnings, Net |
| $ | 175 |
| 32.1 | % | $ | 200 |
| 31.6 | % |
|
|
|
|
|
|
|
|
|
| ||
• Distribution Expense, Net (2) |
| (31 | ) | -5.8 |
| (25 | ) | -3.9 |
| ||
|
|
|
|
|
|
|
|
|
| ||
• Performance Fee Earnings, Net |
| 16 |
| 3.0 |
| 27 |
| 4.2 |
| ||
|
|
|
|
|
|
|
|
|
| ||
• Pre-tax Operating Earnings |
| $ | 160 |
| 29.3 | % | $ | 202 |
| 31.9 | % |
(1) Excludes distribution revenues.
(2) Net distribution expense and net performance fee earnings include allocations of incentive compensation.
9
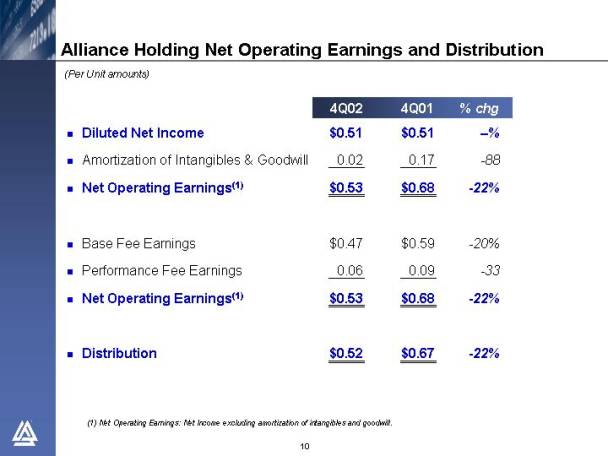
Alliance Holding Net Operating Earnings and Distribution
(Per Unit amounts)
|
| 4Q02 |
| 4Q01 |
| % chg |
| ||
|
|
|
|
|
|
|
| ||
• Diluted Net Income |
| $ | 0.51 |
| $ | 0.51 |
| — | % |
|
|
|
|
|
|
|
| ||
• Amortization of Intangibles & Goodwill |
| 0.02 |
| 0.17 |
| -88 |
| ||
|
|
|
|
|
|
|
| ||
• Net Operating Earnings(1) |
| $ | 0.53 |
| $ | 0.68 |
| -22 | % |
|
|
|
|
|
|
|
| ||
• Base Fee Earnings |
| $ | 0.47 |
| $ | 0.59 |
| -20 | % |
|
|
|
|
|
|
|
| ||
• Performance Fee Earnings |
| 0.06 |
| 0.09 |
| -33 |
| ||
|
|
|
|
|
|
|
| ||
• Net Operating Earnings(1) |
| $ | 0.53 |
| $ | 0.68 |
| -22 | % |
|
|
|
|
|
|
|
| ||
• Distribution |
| $ | 0.52 |
| $ | 0.67 |
| -22 | % |
(1) Net Operating Earnings: Net Income excluding amortization of intangibles and goodwill.
10
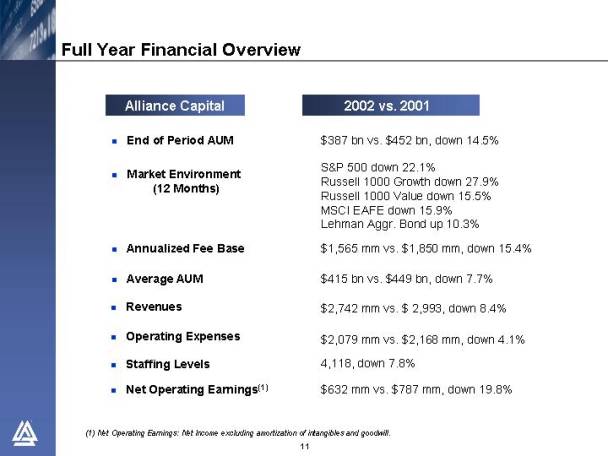
Alliance Capital |
| 2002 vs. 2001 |
|
|
|
• End of Period AUM |
| $387 bn vs. $452 bn, down 14.5% |
|
|
|
• Market Environment |
| S&P 500 down 22.1% |
(12 Months) |
| Russell 1000 Growth down 27.9% |
|
| Russell 1000 Value down 15.5% |
|
| MSCI EAFE down 15.9% |
|
| Lehman Aggr. Bond up 10.3% |
|
|
|
• Annualized Fee Base |
| $1,565 mm vs. $1,850 mm, down 15.4% |
|
|
|
• Average AUM |
| $415 bn vs. $449 bn, down 7.7% |
|
|
|
• Revenues |
| $2,742 mm vs. $2,993 mm, down 8.4% |
|
|
|
• Operating Expenses |
| $2,079 mm vs. $2,168 mm, down 4.1% |
|
|
|
• Staffing Levels |
| 4,118, down 7.8% |
|
|
|
• Net Operating Earnings(1) |
| $632 mm vs. $787 mm, down 19.8% |
(1) Net Operating Earnings: Net Income excluding amortization of intangibles and goodwill.
11
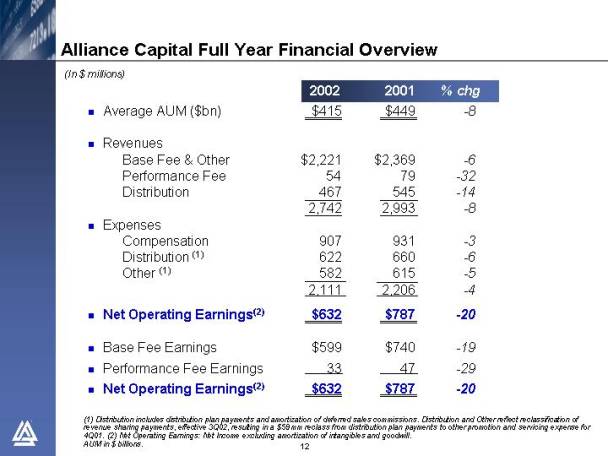
Alliance Capital Full Year Financial Overview
(In $ millions)
|
| 2002 |
| 2001 |
| % chg | ||
• Average AUM ($bn) |
| $ | 415 |
| $ | 449 |
| -8 |
|
|
|
|
|
|
| ||
• Revenues |
|
|
|
|
|
| ||
Base Fee & Other |
| $ | 2,221 |
| $ | 2,369 |
| -6 |
Performance Fee |
| 54 |
| 79 |
| -32 | ||
Distribution |
| 467 |
| 545 |
| -14 | ||
|
| 2,742 |
| 2,993 |
| -8 | ||
• Expenses |
|
|
|
|
|
| ||
Compensation |
| 907 |
| 931 |
| -3 | ||
Distribution (1) |
| 622 |
| 660 |
| -6 | ||
Other (1) |
| 582 |
| 615 |
| -5 | ||
|
| 2,111 |
| 2,206 |
| -4 | ||
• Net Operating Earnings(2) |
| $ | 632 |
| $ | 787 |
| -20 |
|
|
|
|
|
|
| ||
• Base Fee Earnings |
| $ | 599 |
| $ | 740 |
| -19 |
|
|
|
|
|
|
|
|
|
• Performance Fee Earnings |
| 33 |
| 47 |
| -29 | ||
|
|
|
|
|
|
| ||
• Net Operating Earnings(2) |
| $ | 632 |
| $ | 787 |
| -20 |
(1) Distribution includes distribution plan payments and amortization of deferred sales commissions. Distribution and Other reflect reclassification of revenue sharing payments, effective 3Q02, resulting in a $59 mm reclass from distribution plan payments to other promotion and servicing expense for 4Q01. (2) Net Operating Earnings: Net Income excluding amortization of intangibles and goodwill.
AUM in $ billions.
12
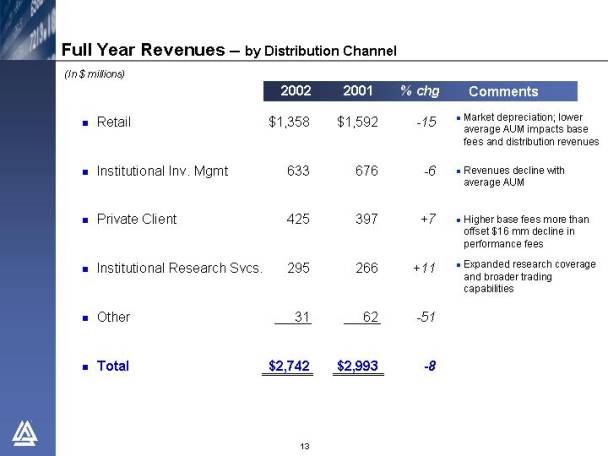
Full Year Revenues — by Distribution Channel
(In $ millions)
|
| 2002 |
| 2001 |
| % chg |
| Comments | ||
|
|
|
|
|
|
|
|
| ||
• Retail |
| $ | 1,358 |
| $ | 1,592 |
| -15 | • | Market depreciation; lower average AUM impacts base fees and distribution revenues |
|
|
|
|
|
|
|
|
| ||
• Institutional Inv. Mgmt |
| 633 |
| 676 |
| -6 | • | Revenues decline with average AUM | ||
|
|
|
|
|
|
|
|
| ||
• Private Client |
| 425 |
| 397 |
| +7 | • | Higher base fees more than offset $16 mm decline in performance fees | ||
|
|
|
|
|
|
|
|
| ||
• Institutional Research Svcs. |
| 295 |
| 266 |
| +11 | • | Expanded research coverage and broader trading capabilities | ||
|
|
|
|
|
|
|
|
| ||
• Other |
| 31 |
| 62 |
| -51 |
|
| ||
|
|
|
|
|
|
|
|
| ||
• Total |
| $ | 2,742 |
| $ | 2,993 |
| -8 |
|
|
13
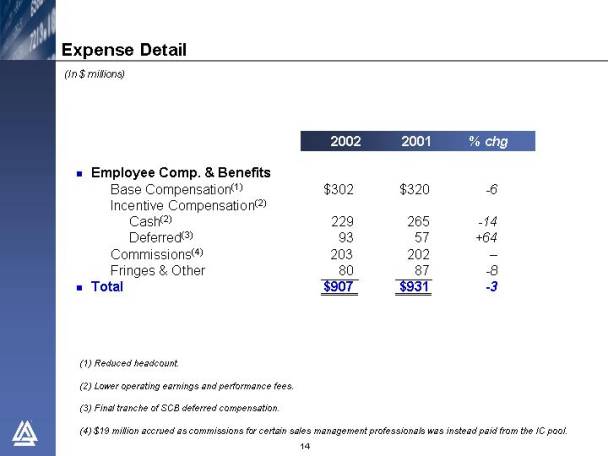
(In $ millions)
|
| 2002 |
| 2001 |
| % chg | ||
|
|
|
|
|
|
| ||
• Employee Comp. & Benefits |
|
|
|
|
|
| ||
Base Compensation(1) |
| $ | 302 |
| $ | 320 |
| -6 |
Incentive Compensation(2) |
|
|
|
|
|
| ||
Cash(2) |
| 229 |
| 265 |
| -14 | ||
Deferred(3) |
| 93 |
| 57 |
| +64 | ||
Commissions(4) |
| 203 |
| 202 |
| — | ||
Fringes & Other |
| 80 |
| 87 |
| -8 | ||
• Total |
| $ | 907 |
| $ | 931 |
| -3 |
(1) Reduced headcount.
(2) Lower operating earnings and performance fees.
(3) Final trancheof SCB deferred compensation.
(4) $19 million accrued as commissions for certain sales management professionals was instead paid from the IC pool.
14
(In $ millions)
|
| 2002 |
| 2001 |
| % chg |
| Comments | |||
|
|
|
|
|
|
|
|
| |||
• Employee Comp. & Benefits |
| 907 |
| 931 |
| -3 |
|
| |||
|
|
|
|
|
|
|
|
| |||
• Promotion & Servicing |
|
|
|
|
|
|
|
| |||
Distribution Plan Pmts (1) |
| 393 |
| 429 |
| -9 |
|
| |||
Amort of Def Sales Comm |
| 229 |
| 231 |
| -1 |
|
| |||
T & E |
| 53 |
| 66 |
| -19 |
| • | Continued reductions in controllable expenses | ||
Printing/Mailing |
| 30 |
| 43 |
| -31 | |||||
Other (1) |
| 110 |
| 124 |
| -11 |
| ||||
|
| 815 |
| 893 |
| -9 |
|
| |||
|
|
|
|
|
|
|
|
| |||
• General & Admin |
|
|
|
|
|
|
|
| |||
Office Expense |
| 165 |
| 157 |
| +5 | • | Office expansion and restacking | |||
Other |
| 164 |
| 155 |
| +6 | • | Legal fees | |||
|
| 329 |
| 312 |
| +6 |
|
| |||
|
|
|
|
|
|
|
|
| |||
• Interest and Taxes |
| 60 |
| 70 |
| -15 | • | Lower debt and earnings | |||
|
|
|
|
|
|
|
|
| |||
• Total |
| $ | 2,111 |
| $ | 2,206 |
| -4 |
|
| |
(1) Reflects reclassification of revenue sharing payments, effective 3Q02, resulting in a $59 mm reclass from distribution plan payments to other promotion and servicing expense for 4Q01.
15
(In $ millions)
|
| 2002 |
| 2001 |
| % chg | ||
|
|
|
|
|
|
| ||
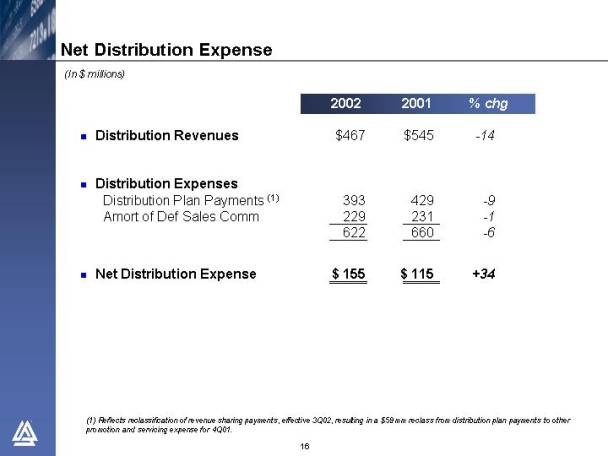
• Distribution Revenues |
| $ | 467 |
| $ | 545 |
| -14 |
|
|
|
|
|
|
| ||
• Distribution Expenses |
|
|
|
|
|
| ||
Distribution Plan Payments (1) |
| 393 |
| 429 |
| -9 | ||
Amort of Def Sales Comm |
| 229 |
| 231 |
| -1 | ||
|
| 622 |
| 660 |
| -6 | ||
|
|
|
|
|
|
| ||
• Net Distribution Expense |
| $ | 155 |
| $ | 115 |
| +34 |
(1) Reflects reclassification of revenue sharing payments, effective 3Q02, resulting in a $59 mm reclass from distribution plan payments to other promotion and servicing expense for 4Q01.
16
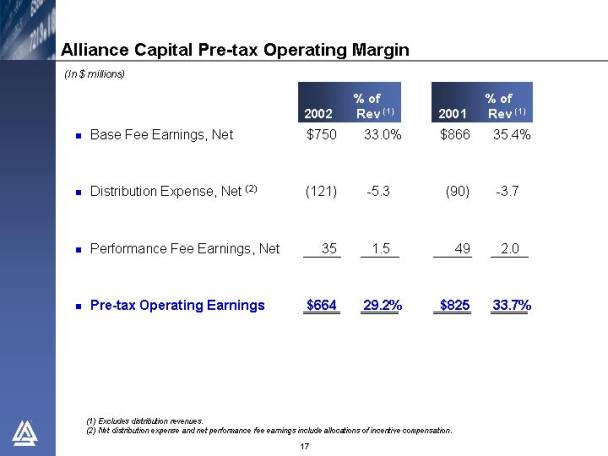
Alliance Capital Pre-tax Operating Margin
(In $ millions)
|
| 2002 |
| % of |
| 2001 |
| % of |
| ||
|
|
|
|
|
|
|
|
|
| ||
• Base Fee Earnings, Net |
| $ | 750 |
| 33.0 | % | $ | 866 |
| 35.4 | % |
|
|
|
|
|
|
|
|
|
| ||
• Distribution Expense, Net (2) |
| (121 | ) | -5.3 |
| (90 | ) | -3.7 |
| ||
|
|
|
|
|
|
|
|
|
| ||
• Performance Fee Earnings, Net |
| 35 |
| 1.5 |
| 49 |
| 2.0 |
| ||
|
|
|
|
|
|
|
|
|
| ||
• Pre-tax Operating Earnings |
| $ | 664 |
| 29.2 | % | $ | 825 |
| 33.7 | % |
(1) Excludes distribution revenues.
(2) Net distribution expense and net performance fee earnings include allocations of incentive compensation.
17
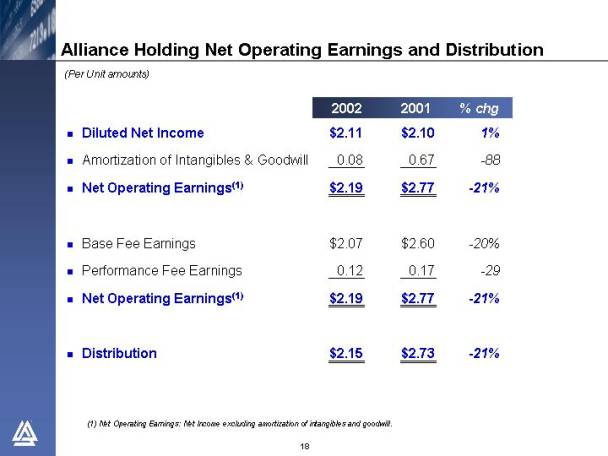
Alliance Holding Net Operating Earnings and Distribution
(Per Unit amounts)
|
| 2002 |
| 2001 |
| % chg |
| ||
|
|
|
|
|
|
|
| ||
• Diluted Net Income |
| $ | 2.11 |
| $ | 2.10 |
| 1 | % |
|
|
|
|
|
|
|
| ||
• Amortization of Intangibles & Goodwill |
| 0.08 |
| 0.67 |
| -88 |
| ||
|
|
|
|
|
|
|
| ||
• Net Operating Earnings(1) |
| $ | 2.19 |
| $ | 2.77 |
| -21 | % |
|
|
|
|
|
|
|
| ||
• Base Fee Earnings |
| $ | 2.07 |
| $ | 2.60 |
| -20 | % |
|
|
|
|
|
|
|
| ||
• Performance Fee Earnings |
| 0.12 |
| 0.17 |
| -29 |
| ||
|
|
|
|
|
|
|
| ||
• Net Operating Earnings(1) |
| $ | 2.19 |
| $ | 2.77 |
| -21 | % |
|
|
|
|
|
|
|
| ||
• Distribution |
| $ | 2.15 |
| $ | 2.73 |
| -21 | % |
(1) Net Operating Earnings: Net Income excluding amortization of intangibles and goodwill.
18
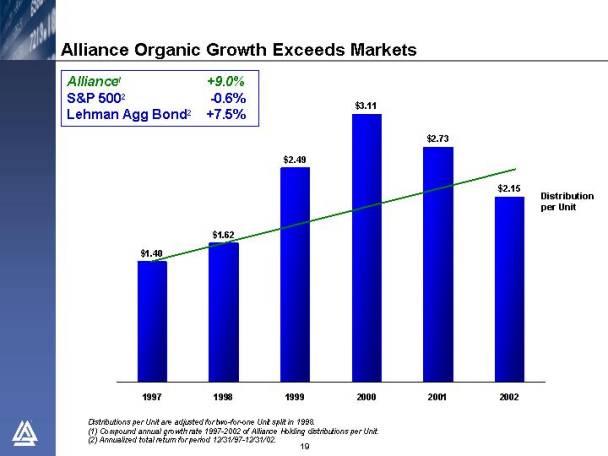
Alliance Organic Growth Exceeds Markets
[GRAPH]
Distributions per Unit are adjusted for two-for-one Unit split in 1998.
(1) Compound annual growth rate 1997-2002 of Alliance Holding distributions per Unit.
(2) Annualized total return for period 12/31/97-12/31/02.
19
Solid Long-Term Outperformance - Alliance Holding Units
Total Annualized Return*
[GRAPH]
*As of 12/31/02. Alliance Holding and S& P returns include reinvestment of cash distributions and dividends, respectively.
** Since IPO 4/88.
20
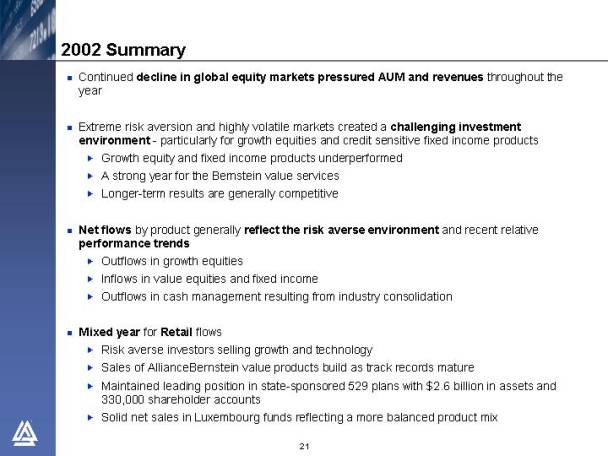
• Continued decline in global equity markets pressured AUM and revenues throughout the year
• Extreme risk aversion and highly volatile markets created a challenging investment environment - particularly for growth equities and credit sensitive fixed income products
• Growth equity and fixed income products underperformed
• A strong year for the Bernstein value services
• Longer-term results are generally competitive
• Net flows by product generally reflect the risk averse environment and recent relative performance trends
• Outflows in growth equities
• Inflows in value equities and fixed income
• Outflows in cash management resulting from industry consolidation
• Mixed year for Retail flows
• Risk averse investors selling growth and technology
• Sales of AllianceBernstein value products build as track records mature
• Maintained leading position in state-sponsored 529 plans with $2.6 billion in assets and 330,000 shareholder accounts
• Solid net sales in Luxembourg funds reflecting a more balanced product mix
21
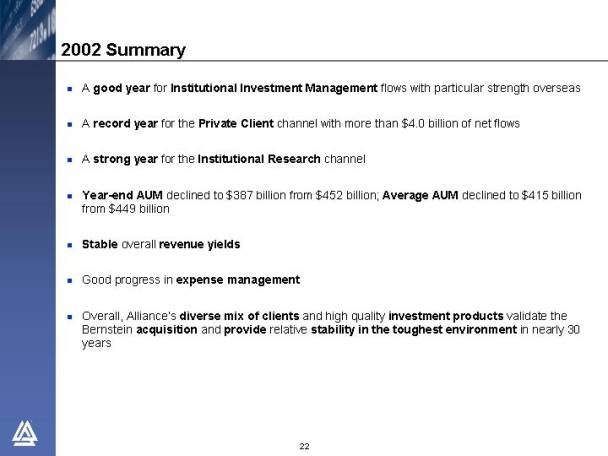
• A good year for Institutional Investment Management flows with particular strength overseas
• A record year for the Private Client channel with more than $4.0 billion of net flows
• A strong year for the Institutional Research channel
• Year-end AUM declined to $387 billion from $452 billion; Average AUM declined to $415 billion from $449 billion
• Stable overall revenue yields
• Good progress in expense management
• Overall, Alliance’s diverse mix of clients and high quality investment products validate the Bernstein acquisition and provide relative stability in the toughest environment in nearly 30 years
22
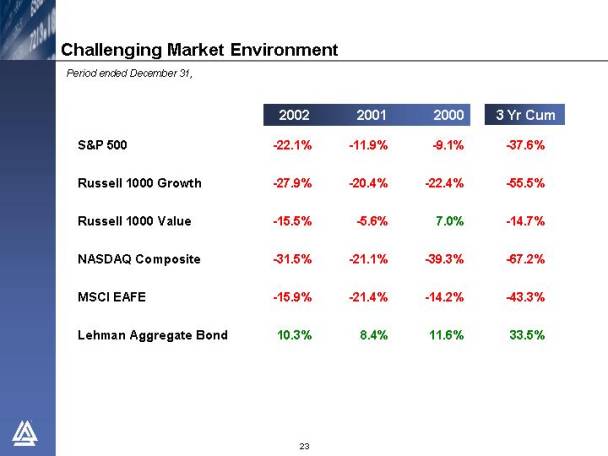
Challenging Market Environment
Period ended December 31,
|
| 2002 |
| 2001 |
| 2000 |
| 3 Yr Cum |
|
|
|
|
|
|
|
|
|
|
|
S&P 500 |
| -22.1 | % | -11.9 | % | -9.1 | % | -37.6 | % |
|
|
|
|
|
|
|
|
|
|
Russell 1000 Growth |
| -27.9 | % | -20.4 | % | -22.4 | % | -55.5 | % |
|
|
|
|
|
|
|
|
|
|
Russell 1000 Value |
| -15.5 | % | -5.6 | % | 7.0 | % | -14.7 | % |
|
|
|
|
|
|
|
|
|
|
NASDAQ Composite |
| -31.5 | % | -21.1 | % | -39.3 | % | -67.2 | % |
|
|
|
|
|
|
|
|
|
|
MSCI EAFE |
| -15.9 | % | -21.4 | % | -14.2 | % | -43.3 | % |
|
|
|
|
|
|
|
|
|
|
Lehman Aggregate Bond |
| 10.3 | % | 8.4 | % | 11.6 | % | 33.5 | % |
23
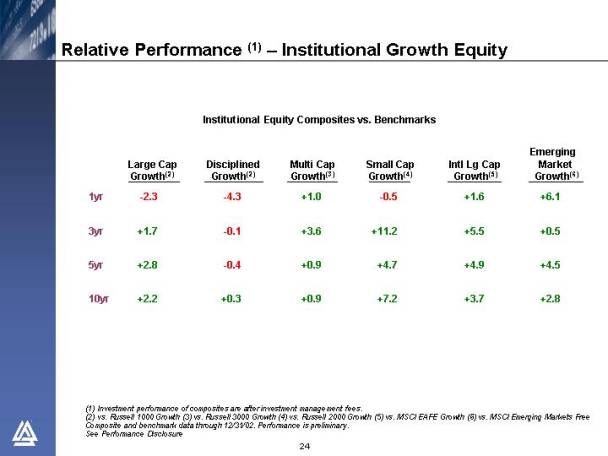
Relative Performance (1)—Institutional Growth Equity
Institutional Equity Composites vs. Benchmarks
|
| Large Cap |
| Disciplined Growth(2) |
| Multi Cap Growth(3) |
| Small Cap |
| Intl Lg Cap |
| Emerging |
|
|
|
|
|
|
|
|
|
|
|
|
|
|
|
1yr |
| -2.3 |
| -4.3 |
| +1.0 |
| -0.5 |
| +1.6 |
| +6.1 |
|
3yr |
| +1.7 |
| -0.1 |
| +3.6 |
| +11.2 |
| +5.5 |
| +0.5 |
|
5yr |
| +2.8 |
| -0.4 |
| +0.9 |
| +4.7 |
| +4.9 |
| +4.5 |
|
10yr |
| +2.2 |
| +0.3 |
| +0.9 |
| +7.2 |
| +3.7 |
| +2.8 |
|
|
|
|
|
|
|
|
|
|
|
|
|
|
|
(1) Investment performance of composites are after investment management fees.
(2) vs. Russell 1000 Growth (3) vs. Russell 3000 Growth (4) vs. Russell 2000 Growth (5) vs. MSCI EAFE Growth (6) vs. MSCI Emerging Markets Free Composite and benchmark data through 12/31/02. Performance is preliminary.
See Performance Disclosure
24
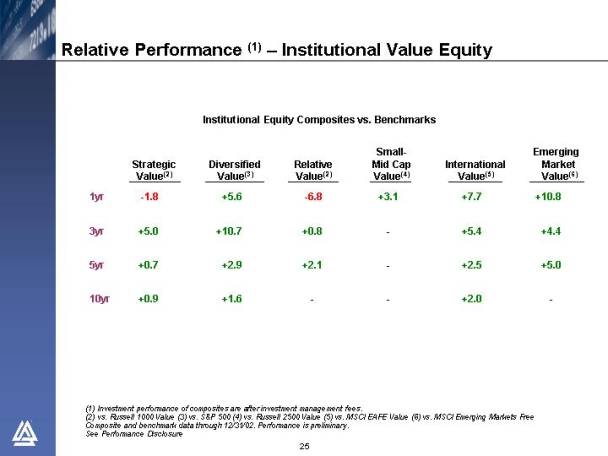
Relative Performance (1)—Institutional Value Equity
Institutional Equity Composites vs. Benchmarks
|
| Strategic |
| Diversified |
| Relative |
| Small- Mid CapValue(4) |
| International Value(5) |
| Emerging Market |
|
|
|
|
|
|
|
|
|
|
|
|
|
|
|
1yr |
| -1.8 |
| +5.6 |
| -6.8 |
| +3.1 |
| +7.7 |
| +10.8 |
|
3yr |
| +5.0 |
| +10.7 |
| +0.8 |
| — |
| +5.4 |
| +4.4 |
|
5yr |
| +0.7 |
| +2.9 |
| +2.1 |
| — |
| +2.5 |
| +5.0 |
|
10yr |
| +0.9 |
| +1.6 |
| — |
| — |
| +2.0 |
| — |
|
(1) Investment performance of composites are after investment management fees.
(2) vs. Russell 1000 Value (3) vs. S&P 500 (4) vs. Russell 2500 Value (5) vs. MSCI EAFE Value (6) vs. MSCI Emerging Markets Free Composite and benchmark data through 12/31/02. Performance is preliminary.
See Performance Disclosure
25
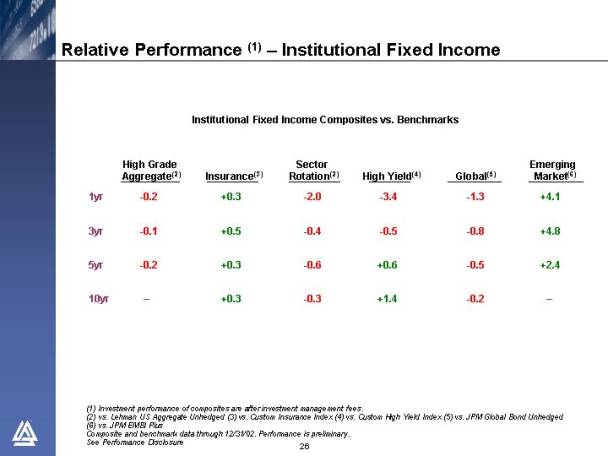
Relative Performance (1)—Institutional Fixed Income
Institutional Fixed Income Composites vs. Benchmarks
|
| High Grade |
| Sector |
| Emerging |
| High Yield(4) |
| Global(5) |
| Emerging |
|
|
|
|
|
|
|
|
|
|
|
|
|
|
|
1yr |
| -0.2 |
| +0.3 |
| -2.0 |
| -3.4 |
| -1.3 |
| +4.1 |
|
3yr |
| -0.1 |
| +0.5 |
| -0.4 |
| -0.5 |
| -0.8 |
| +4.8 |
|
5yr |
| -0.2 |
| +0.3 |
| -0.6 |
| +0.6 |
| -0.5 |
| +2.4 |
|
10yr |
| — |
| +0.3 |
| -0.3 |
| +1.4 |
| -0.2 |
| — |
|
|
|
|
|
|
|
|
|
|
|
|
|
|
|
(1) Investment performance of composites are after investment management fees.
(2) vs. Lehman US Aggregate Unhedged (3) vs. Custom Insurance Index (4) vs. Custom High Yield Index (5) vs. JPM Global Bond Unhedged (6) vs. JPM EMBI Plus Composite and benchmark data through 12/31/02. Performance is preliminary.
See Performance Disclosure
26
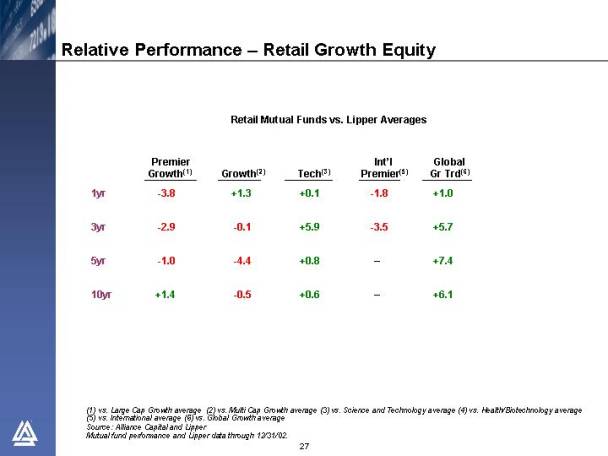
Relative Performance —Retail Growth Equity
Retail Mutual Funds vs. Lipper Averages
|
| Premier |
| Growth(2) |
| Tech(3) |
| Int’l |
| Global |
|
|
|
|
|
|
|
|
|
|
|
|
|
1yr |
| -3.8 |
| +1.3 |
| +0.1 |
| -1.8 |
| +1.0 |
|
3yr |
| -2.9 |
| -0.1 |
| +5.9 |
| -3.5 |
| +5.7 |
|
5yr |
| -1.0 |
| -4.4 |
| +0.8 |
| — |
| +7.4 |
|
10yr |
| +1.4 |
| -0.5 |
| +0.6 |
| — |
| +6.1 |
|
(1) vs. Large Cap Growth average (2) vs. Multi Cap Growth average (3) vs. Science and Technology average (4) vs. Health/Biotechnology average (5) vs. International average (6) vs. Global Growth average
Source: Alliance Capital and Lipper
Mutual fund performance and Lipper data through 12/31/02.
27
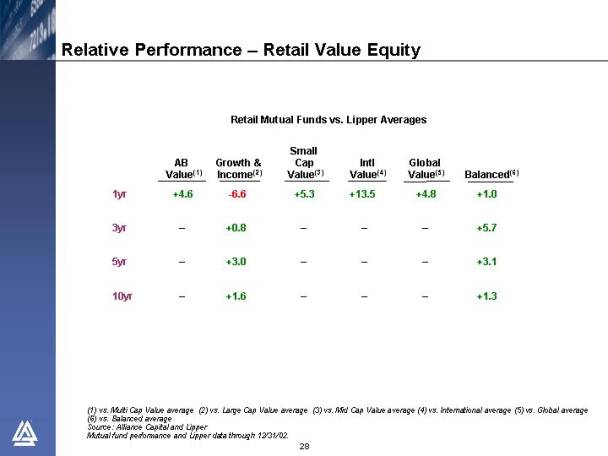
Relative Performance —Retail Value Equity
Retail Mutual Funds vs. Lipper Averages
|
| AB Value(1) |
| Growth & |
| Small Cap |
| Int’l |
| Global |
| Balanced(6) |
|
|
|
|
|
|
|
|
|
|
|
|
|
|
|
1yr |
| +4.6 |
| -6.6 |
| +5.3 |
| +13.5 |
| +4.8 |
| +1.0 |
|
3yr |
| — |
| +0.8 |
| — |
| — |
| — |
| +5.7 |
|
5yr |
| — |
| +3.0 |
| — |
| — |
| — |
| +3.1 |
|
10yr |
| — |
| +1.6 |
| — |
| — |
| — |
| +1.3 |
|
(1) vs. Multi Cap Value average (2) vs. Large Cap Value average (3) vs. Mid Cap Value average (4) vs. International average (5) vs. Global average (6) vs. Balanced average
Source: Alliance Capital andLipper
Mutual fund performance and Lipper data through 12/31/02.
28
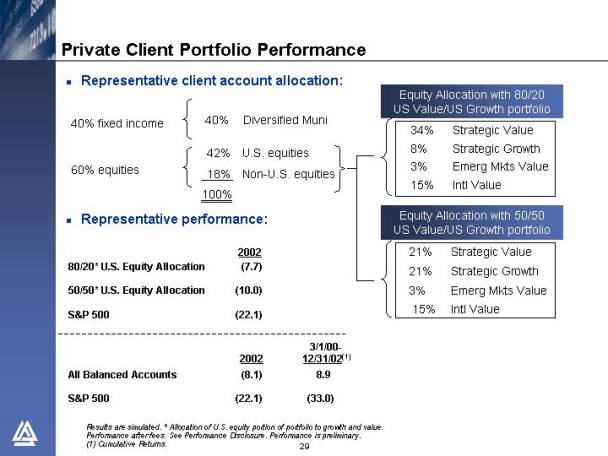
Private Client Portfolio Performance
- Representative client account allocation:
|
|
|
|
|
|
|
|
| Equity Allocation with 80/20 |
| ||||||
40% fixed income | { | 40% |
| Diversified Muni |
|
|
|
|
|
| ||||||
|
|
|
|
|
|
|
|
| 34% |
| Strategic Value | |||||
60% equities | { | 42% |
| U.S. equities | } |
|
| 8% |
| Strategic Growth | ||||||
18% |
| Non-U.S. equities |
|
| 3% |
| Emerg Mkts Value | |||||||||
|
| 100% |
|
|
|
|
| 15% |
| Intl Value | ||||||
|
|
|
|
|
|
|
|
|
|
|
|
| ||||
|
|
|
|
|
|
|
|
|
|
|
| Equity Allocation with 50/50 | ||||
|
|
|
|
|
|
|
|
|
| 21% |
| Strategic Value | ||||
|
|
|
|
|
|
|
| 21% |
| Strategic Growth | ||||||
|
|
|
|
|
|
|
| 3% |
| Emerg Mkts Value | ||||||
|
|
|
|
|
|
|
| 15% |
| Intl Value | ||||||
- Representative performance:
|
| 2002 |
|
80/20* U.S. Equity Allocation |
| (7.7 | ) |
50/50* U.S. Equity Allocation |
| (10.0 | ) |
S&P 500 |
| (22.1 | ) |
|
| 2002 |
| 3/1/00- |
|
All Balanced Accounts |
| (8.1 | ) | 8.9 |
|
S&P 500 |
| (22.1 | ) | (33.0 | ) |
Results are simulated. * Allocation of U.S. equity portion of portfolio to growth and value. Performance after fees. See Performance Disclosure. Performance is preliminary.
(1) Cumulative Returns.
29
Twelve Months Ended Dec. 31, 2002
(In $ billions)
|
|
| Growth |
| Value |
| Fixed |
| Passive |
| Total |
| |||||
|
|
|
|
|
|
|
|
|
|
|
|
| |||||
• | Dec. 2001 AUM* |
| $ | 173 |
| $ | 101 |
| $ | 146 |
| $ | 32 |
| $ | 452 |
|
|
|
|
|
|
|
|
|
|
|
|
|
| |||||
• | Net Long-Term Flows |
| (15 | ) | 9 |
| 11 |
| (3 | ) | 2 |
| |||||
|
|
|
|
|
|
|
|
|
|
|
|
| |||||
• | Cash Management, Net |
| — |
| — |
| (6 | ) | — |
| (6 | ) | |||||
|
|
|
|
|
|
|
|
|
|
|
|
| |||||
• | Net New Business/(Outflows) |
| (15 | ) | 9 |
| 5 |
| (3 | ) | (4 | ) | |||||
|
|
|
|
|
|
|
|
|
|
|
|
| |||||
• | Transfers |
| (5 | ) | 4 |
| 1 |
| — |
| — |
| |||||
|
|
|
|
|
|
|
|
|
|
|
|
| |||||
• | Apprec/(Deprec) |
| (44 | ) | (15 | ) | 4 |
| (6 | ) | (61 | ) | |||||
|
|
|
|
|
|
|
|
|
|
|
|
| |||||
• | Dec. 2002 AUM |
| $ | 109 |
| $ | 99 |
| $ | 156 |
| $ | 23 |
| $ | 387 |
|
|
|
|
|
|
|
|
|
|
|
|
|
| |||||
• | % Change |
| -37.2 | % | -2.7 | % | +7.1 | % | -26.8 | % | -14.5 | % | |||||
|
|
|
|
|
|
|
|
|
|
|
|
| |||||
• | % Total |
| 28.1 | % | 25.5 | % | 40.3 | % | 6.0 | % |
|
| |||||
|
|
|
|
|
|
|
|
|
|
|
|
| |||||
* AUM previously reported as of each date prior to March 31, 2002, have been restated to exclude assets managed by unconsolidated affiliates.
30
Twelve Months Ended Dec. 31, 2002
(In $ billions)
|
|
| Retail |
| Institutional |
| Private |
| Total |
| ||||
|
|
|
|
|
|
|
|
|
|
| ||||
• | Dec. 2001 AUM* |
| $ | 172 |
| $ | 241 |
| $ | 39 |
| $ | 452 |
|
|
|
|
|
|
|
|
|
|
|
| ||||
• | Net Long-Term Flows |
| (6 | ) | 4 |
| 4 |
| 2 |
| ||||
|
|
|
|
|
|
|
|
|
|
| ||||
• | Cash Management, Net |
| (6 | ) | — |
| — |
| (6 | ) | ||||
|
|
|
|
|
|
|
|
|
|
| ||||
• | Net New Business/(Outflows) |
| (12 | ) | 4 |
| 4 |
| (4 | ) | ||||
|
|
|
|
|
|
|
|
|
|
| ||||
• | Transfers |
| — |
| — |
| — |
| — |
| ||||
|
|
|
|
|
|
|
|
|
|
| ||||
• | Depreciation |
| (24 | ) | (34 | ) | (3 | ) | (61 | ) | ||||
|
|
|
|
|
|
|
|
|
|
| ||||
• | Dec. 2002 AUM |
| $ | 136 |
| $ | 211 |
| $ | 40 |
| $ | 387 |
|
|
|
|
|
|
|
|
|
|
|
| ||||
• | % Change |
| -20.8 | % | -12.6 | % | +1.3 | % | -14.5 | % | ||||
|
|
|
|
|
|
|
|
|
|
| ||||
• | % Total |
| 35.2 | % | 54 6 | % | 10.3 | % |
|
| ||||
|
|
|
|
|
|
|
|
|
|
| ||||
* AUM previously reported as of each date prior to March 31, 2002, have been restated to exclude assets managed by unconsolidated affiliates.
31
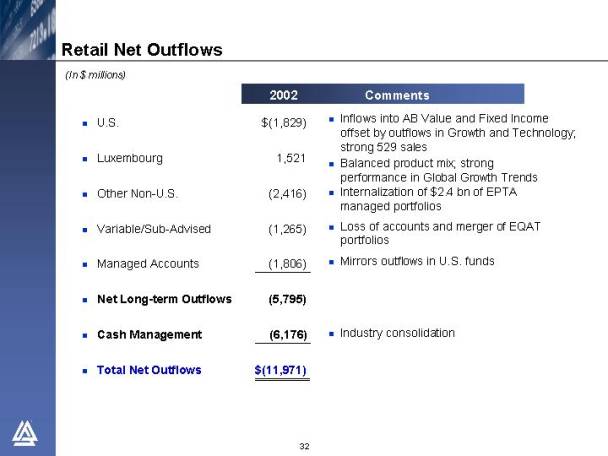
(In $ millions)
|
|
| 2002 |
|
|
| Comments | |
|
|
|
|
|
|
|
| |
• | U. S. |
| $ | (1,829 | ) | • |
| Inflows into AB Value and Fixed Income offset by outflows in Growth and Technology; strong 529 sales |
|
|
|
|
|
|
|
| |
• | Luxembourg |
| 1,521 |
| • |
| Balanced product mix; strong performance in Global Growth Trends | |
|
|
|
|
|
|
|
| |
• | Other Non-U. S. |
| (2, 416 | ) | • |
| Internalization of $2.4 bn of EPTA managed portfolios | |
|
|
|
|
|
|
|
| |
• | Variable/Sub-Advised |
| (1, 265 | ) | • |
| Loss of accounts and merger of EQAT portfolios | |
|
|
|
|
|
|
|
| |
• | Managed Accounts |
| (1,806 | ) | • |
| Mirrors outflows in U. S. funds | |
|
|
|
|
|
|
|
| |
• | Net Long-term Outflows |
| (5,795 | ) |
|
|
| |
|
|
|
|
|
|
|
| |
• | Cash Management |
| (6,176 | ) | • |
| Industry consolidation | |
|
|
|
|
|
|
|
| |
• | Total Net Outflows |
| $ | (11,971 | ) |
|
|
|
32
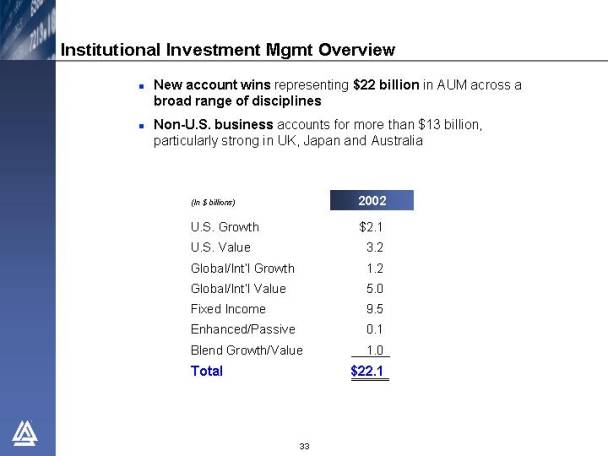
Institutional Investment Mgmt Overview
- New account wins representing $22 billion in AUM across a broad range of disciplines
- Non-U.S. business accounts for more than $13 billion, particularly strong in UK, Japan and Australia
(In $billions) |
| 2002 | |
|
|
| |
U. S. Growth |
| $ | 2.1 |
U. S. Value |
| 3.2 | |
Global/ Int’l Growth |
| 1.2 | |
Global/ Int’l Value |
| 5.0 | |
Fixed Income |
| 9.5 | |
Enhanced/ Passive |
| 0.1 | |
Blend Growth/ Value |
| 1.0 | |
Total |
| $ | 22.1 |
33
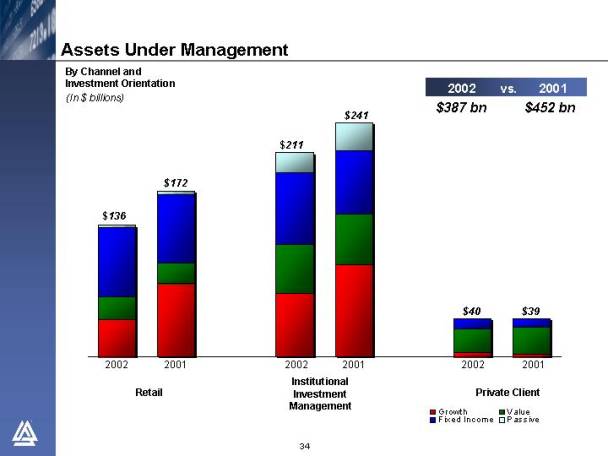
By Channel and
Investment Orientation
(In $ billions)
[GRAPH]
34
Annualized Fee Base (1)
By Channel and
Investment Orientation
(In $ millions)
[GRAPH]
(1) Annualized Fee Base is defined as period end AUM times contractual annual fee rates;
assumes no change in AUM or fee rates for one year.
35
[GRAPH]
36
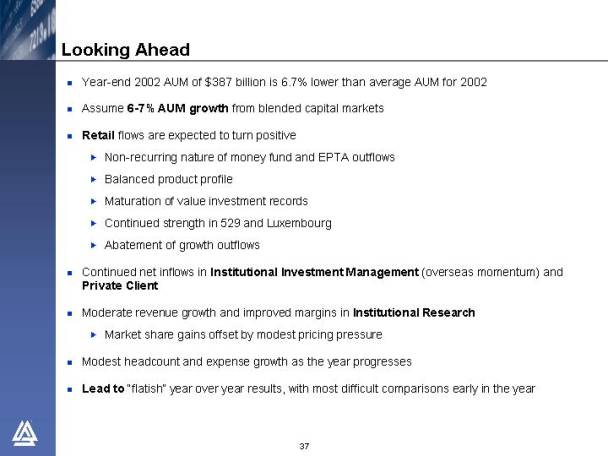
- Year-end 2002 AUM of $387 billion is 6.7% lower than average AUM for 2002
- Assume 6-7% AUM growth from blended capital markets
- Retail flows are expected to turn positive
Ø Non-recurring nature of money fund and EPTA outflows
Ø Balanced product profile
Ø Maturation of value investment records
Ø Continued strength in 529 and Luxembourg
Ø Abatement of growth outflows
- Continued net inflows in Institutional Investment Management (overseas momentum) and Private Client
- Moderate revenue growth and improved margins in Institutional Research
Ø Market share gains offset by modest pricing pressure
- Modest headcount and expense growth as the year progresses
- Lead to "flatish” year over year results, with most difficult comparisons early in the year
37
- Worldwide research and investment capabilities
- Unique with strengths in both growth and value equity investing
- Broad array of fixed income services
- Generally competitive long-term investment results
- Highly regarded marketing and client service teams
- Well-positioned in retail, institutional and private client channels
- Highly valued independent sell-side research and institutional trading
- Strong financials
- Cogent strategy
38
39
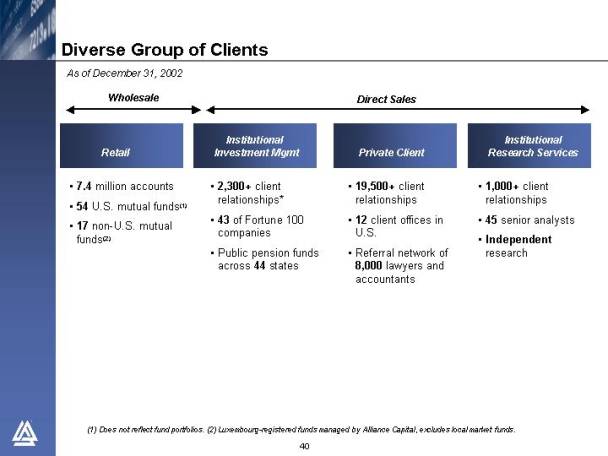
As of December 31, 2002
Wholesale |
| Direct Sales |
| ||||
Retail |
| Institutional |
| Private Client |
| Institutional |
|
|
|
|
|
|
|
|
|
• 7.4 million accounts |
| • 2,300+ client relationships* |
| • 19,500+ client relationships |
| • 1,000+ client relationships |
|
|
|
|
|
|
|
|
|
• 54 U. S. mutual funds(1) |
| • 43 of Fortune 100 companies |
| • 12 client offices in U. S. |
| • 45 senior analysts |
|
|
|
|
|
|
|
|
|
• 17 non-U. S. mutual funds(2) |
| • Public pension funds across 44 states |
| • Referral network of 8,000 lawyers and accountants |
| • Independent research |
|
|
|
|
|
|
|
|
|
(1) Does not reflect fund portfolios. (2) Luxembourg-registered funds managed by Alliance Capital, excludes local market funds.
40
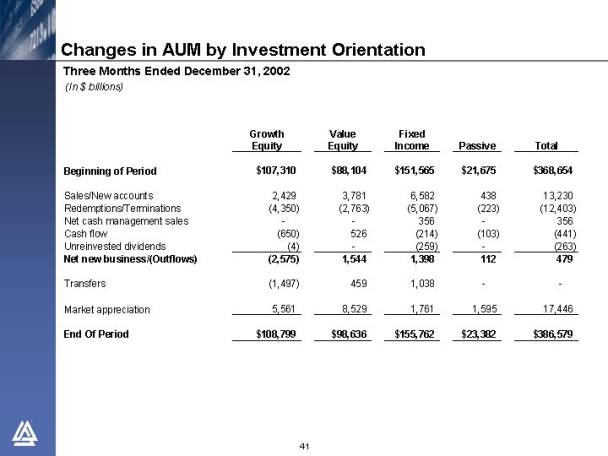
Changes in AUM by Investment Orientation
Three Months Ended December 31, 2002
(In $ billions)
|
| Growth |
| Value |
| Fixed |
| Passive |
| Total |
| |||||
|
|
|
|
|
|
|
|
|
|
|
| |||||
Beginning of Period |
| $ | 107,310 |
| $ | 88,104 |
| $ | 151,565 |
| $ | 21,675 |
| $ | 368,654 |
|
|
|
|
|
|
|
|
|
|
|
|
| |||||
Sales/New accounts |
| 2,429 |
| 3,781 |
| 6,582 |
| 438 |
| 13,230 |
| |||||
Redemptions/Terminations |
| (4,350 | ) | (2,763 | ) | (5,067 | ) | (223 | ) | (12,403 | ) | |||||
Net cash management sales |
| — |
| — |
| 356 |
| — |
| 356 |
| |||||
Cash flow |
| (650 | ) | 526 |
| (214 | ) | (103 | ) | (441 | ) | |||||
Unreinvested dividends |
| (4 | ) | — |
| (259 | ) | — |
| (263 | ) | |||||
Net new business/(Outflows) |
| (2,575 | ) | 1,544 |
| 1,398 |
| 112 |
| 479 |
| |||||
|
|
|
|
|
|
|
|
|
|
|
| |||||
Transfers |
| (1,497 | ) | 459 |
| 1,038 |
| — |
| — |
| |||||
|
|
|
|
|
|
|
|
|
|
|
| |||||
Market appreciation |
| 5,561 |
| 8,529 |
| 1,761 |
| 1,595 |
| 17,446 |
| |||||
|
|
|
|
|
|
|
|
|
|
|
| |||||
End Of Period |
| $ | 108,799 |
| $ | 98,636 |
| $ | 155,762 |
| $ | 23,382 |
| $ | 386,579 |
|
41
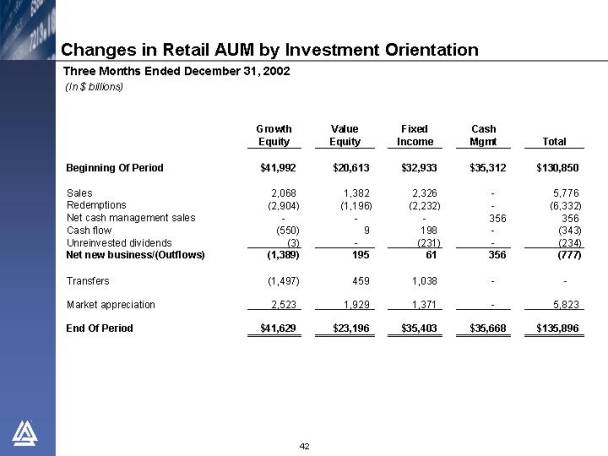
Changes in Retail AUM by Investment Orientation
Three Months Ended December 31, 2002
(In $ billions)
|
| Growth |
| Value |
| Fixed |
| Cash |
| Total |
| |||||
|
|
|
|
|
|
|
|
|
|
|
| |||||
Beginning Of Period |
| $ | 41,992 |
| $ | 20,613 |
| $ | 32,933 |
| $ | 35,312 |
| $ | 130,850 |
|
|
|
|
|
|
|
|
|
|
|
|
| |||||
Sales |
| 2,068 |
| 1,382 |
| 2,326 |
| — |
| 5,776 |
| |||||
Redemptions |
| (2,904 | ) | (1,196 | ) | (2,232 | ) | — |
| (6,332 | ) | |||||
Net cash management sales |
| — |
| — |
| — |
| 356 |
| 356 |
| |||||
Cash flow |
| (550 | ) | 9 |
| 198 |
| — |
| (343 | ) | |||||
Unreinvested dividends |
| (3 | ) | — |
| (231 | ) | — |
| (234 | ) | |||||
Net new business/(Outflows) |
| (1,389 | ) | 195 |
| 61 |
| 356 |
| (777 | ) | |||||
|
|
|
|
|
|
|
|
|
|
|
| |||||
Transfers |
| (1,497 | ) | 459 |
| 1,038 |
| — |
| — |
| |||||
|
|
|
|
|
|
|
|
|
|
|
| |||||
Market appreciation |
| 2,523 |
| 1,929 |
| 1,371 |
| — |
| 5,823 |
| |||||
|
|
|
|
|
|
|
|
|
|
|
| |||||
End Of Period |
| $ | 41,629 |
| $ | 23,196 |
| $ | 35,403 |
| $ | 35,668 |
| $ | 135,896 |
|
42
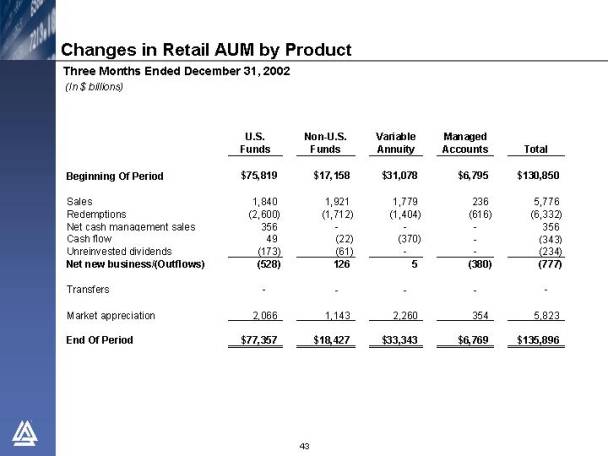
Changes in Retail AUM by Product
Three Months Ended December 31, 2002
(In $ billions)
|
| U. S. |
| Non-U. S. |
| Variable |
| Managed |
| Total |
| |||||
Beginning Of Period |
| $ | 75,819 |
| $ | 17,158 |
| $ | 31,078 |
| $ | 6,795 |
| $ | 130,850 |
|
|
|
|
|
|
|
|
|
|
|
|
| |||||
Sales |
| 1,840 |
| 1,921 |
| 1,779 |
| 236 |
| 5,776 |
| |||||
Redemptions |
| (2,600 | ) | (1,712 | ) | (1,404 | ) | (616 | ) | (6,332 | ) | |||||
Net cash management sales |
| 356 |
| — |
| — |
| — |
| 356 |
| |||||
Cash flow |
| 49 |
| (22 | ) | (370 | ) | — |
| (343 | ) | |||||
Unreinvested dividends |
| (173 | ) | (61 | ) | — |
| — |
| (234 | ) | |||||
Net new business/(Outflows) |
| (528 | ) | 126 |
| 5 |
| (380 | ) | (777 | ) | |||||
|
|
|
|
|
|
|
|
|
|
|
| |||||
Transfers |
| — |
| — |
| — |
| — |
| — |
| |||||
|
|
|
|
|
|
|
|
|
|
|
| |||||
Market appreciation |
| 2,066 |
| 1,143 |
| 2,260 |
| 354 |
| 5,823 |
| |||||
|
|
|
|
|
|
|
|
|
|
|
| |||||
End Of Period |
| $ | 77,357 |
| $ | 18,427 |
| $ | 33,343 |
| $ | 6,769 |
| $ | 135,896 |
|
43
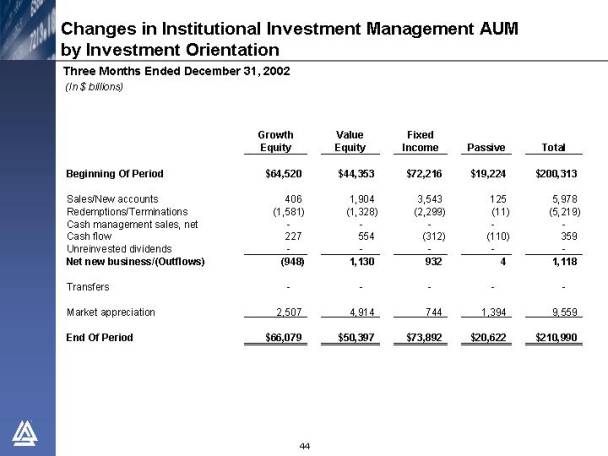
Changes in Institutional Investment Management AUM
by Investment Orientation
Three Months Ended December 31, 2002
(In $ billions)
|
| Growth |
| Value |
| Fixed |
| Passive |
| Total |
| |||||
Beginning Of Period |
| $ | 64,520 |
| $ | 44,353 |
| $ | 72,216 |
| $ | 19,224 |
| $ | 200,313 |
|
|
|
|
|
|
|
|
|
|
|
|
| |||||
Sales/New accounts |
| 406 |
| 1,904 |
| 3,543 |
| 125 |
| 5,978 |
| |||||
Redemptions/Terminations |
| (1,581 | ) | (1,328 | ) | (2,299 | ) | (11 | ) | (5,219 | ) | |||||
Cash management sales, net |
| — |
| — |
| — |
| — |
| — |
| |||||
Cash flow |
| 227 |
| 554 |
| (312 | ) | (110 | ) | 359 |
| |||||
Unreinvested dividends |
| — |
| — |
| — |
| — |
| — |
| |||||
Net new business/(Outflows) |
| (948 | ) | 1,130 |
| 932 |
| 4 |
| 1,118 |
| |||||
|
|
|
|
|
|
|
|
|
|
|
| |||||
Transfers |
| — |
| — |
| — |
| — |
|
|
| |||||
|
|
|
|
|
|
|
|
|
|
|
| |||||
Market appreciation |
| 2,507 |
| 4,914 |
| 744 |
| 1,394 |
| 9,559 |
| |||||
|
|
|
|
|
|
|
|
|
|
|
| |||||
End Of Period |
| $ | 66,079 |
| $ | 50,397 |
| $ | 73,892 |
| $ | 20,622 |
| $ | 210,990 |
|
44
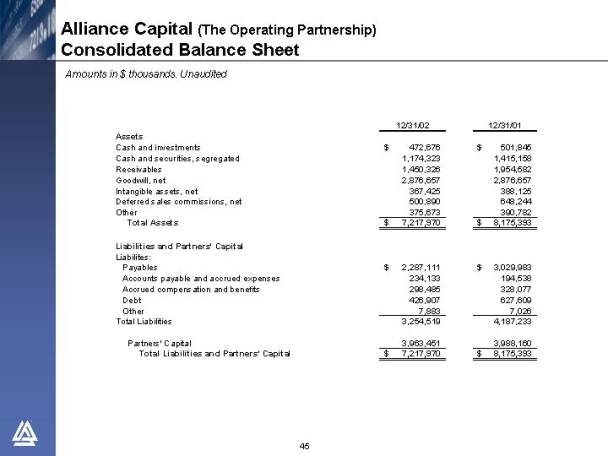
Alliance Capital (The Operating Partnership)
Consolidated Balance Sheet
Amounts in $ thousands. Unaudited
|
| 12/31/02 |
| 12/31/01 |
| |||
|
|
|
|
|
| |||
Assets |
|
|
|
|
| |||
Cash and investments |
| $ | 472,676 |
| $ | 501,845 |
| |
Cash and securities, segregated |
| 1,174,323 |
| 1,415,158 |
| |||
Receivables |
| 1,450,326 |
| 1,954,582 |
| |||
Goodwill, net |
| 2,876,657 |
| 2,876,657 |
| |||
Intangible assets, net |
| 367,425 |
| 388,125 |
| |||
Deferred sales commissions, net |
| 500,890 |
| 648,244 |
| |||
Other |
| 375,673 |
| 390,782 |
| |||
Total Assets |
| $ | 7,217,970 |
| $ | 8,175,393 |
| |
|
|
|
|
|
| |||
Liabilities and Partners’ Capital |
|
|
|
|
| |||
Liabilites: |
|
|
|
|
| |||
Payables |
| $ | 2,287,111 |
| $ | 3,029,983 |
| |
Accounts payable and accrued expenses |
| 234,133 |
| 194,538 |
| |||
Accrued compensation and benefits |
| 298,485 |
| 328,077 |
| |||
Debt |
| 426,907 |
| 627,609 |
| |||
Other |
| 7,883 |
| 7,026 |
| |||
Total Liabilities |
| 3,254,519 |
| 4,187,233 |
| |||
|
|
|
|
|
| |||
Partners’ Capital |
| 3,963,451 |
| 3,988,160 |
| |||
Total Liabilities and Partners’ Capital |
| $ | 7,217,970 |
| $ | 8,175,393 |
| |
45
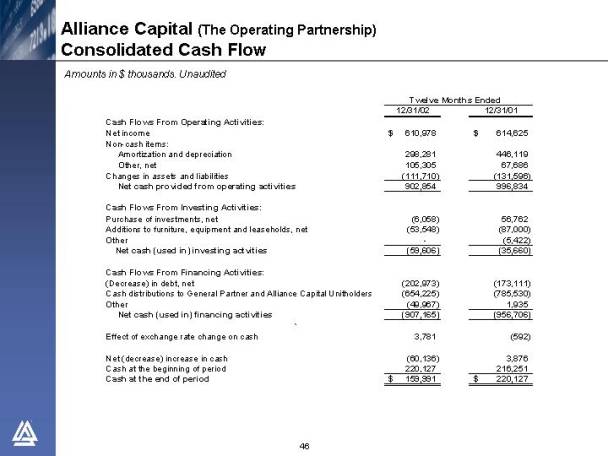
Alliance Capital (The Operating Partnership)
Consolidated Cash Flow
Amounts in $ thousands. Unaudited
|
| Twelve Months Ended |
| ||||
|
| 12/31/02 |
| 12/31/01 |
| ||
|
|
|
|
|
| ||
Cash Flows From Operating Activities: |
|
|
|
|
| ||
Net income |
| $ | 610,978 |
| $ | 614,625 |
|
Non-cash items: |
|
|
|
|
| ||
Amortization and depreciation |
| 298,281 |
| 446,119 |
| ||
Other, net |
| 105,305 |
| 67,686 |
| ||
Changes in assets and liabilities |
| (111,710 | ) | (131,596 | ) | ||
Net cash provided from operating activities |
| 902,854 |
| 996,834 |
| ||
|
|
|
|
|
| ||
Cash Flows From Investing Activities: |
|
|
|
|
| ||
Purchase of investments, net |
| (6,058 | ) | 56,762 |
| ||
Additions to furniture, equipment and leaseholds, net |
| (53,548 | ) | (87,000 | ) | ||
Other |
| — |
| (5,422 | ) | ||
Net cash (used in) investing actvities |
| (59,606 | ) | (35,660 | ) | ||
|
|
|
|
|
| ||
Cash Flows From Financing Activities: |
|
|
|
|
| ||
(Decrease) in debt, net |
| (202,973 | ) | (173,111 | ) | ||
Cash distributions to General Partner and Alliance Capital Unitholders |
| (654,225 | ) | (785,530 | ) | ||
Other |
| (49,967 | ) | 1,935 |
| ||
Net cash (used in) financing activities |
| (907,165 | ) | (956,706 | ) | ||
|
|
|
|
|
| ||
Effect of exchange rate change on cash |
| 3,781 |
| (592 | ) | ||
|
|
|
|
|
| ||
Net (decrease) increase in cash |
| (60,136 | ) | 3,876 |
| ||
Cash at the beginning of period |
| 220,127 |
| 216,251 |
| ||
Cash at the end of period |
| $ | 159,991 |
| $ | 220,127 |
|
46
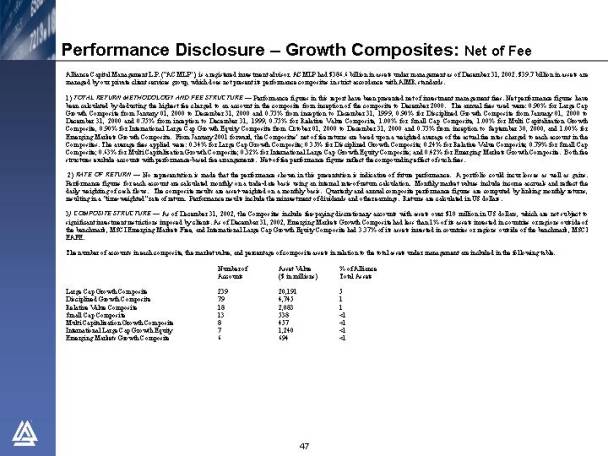
Performance Disclosure — Growth Composites: Net of Fee
Alliance Capital Management L.P. (“ACMLP”), is a registered investment advisor. ACMLP had $386. 6 billion in assets under management as of December 31, 2002. $39.7 billion in assets are managed by our private client services group, which does not present its performance composites in strict accordance with AIMR standards.
1) TOTAL RETURN METHODOLOGY AND FEE STRUCTURE — Performance figures in this report have been presented net of investment management fees. Net performance figures have been calculated by deducting the highest fee charged to an account in the composite from inception of the composite to December 2000. The annual fees used were: 0.90% for Large Cap Growth Composite from January 01, 2000 to December 31, 2000 and 0.75% from inception to December 31, 1999, 0.90% for Disciplined Growth Composite from January 01, 2000 to December 31, 2000 and 0.75% from inception to December 31, 1999, 0.75% for Relative Value Composite, 1.00% for Small Cap Composite, 1.00% for Multi Capitalization Growth Composite, 0.90% for International Large Cap Growth Equity Composite from October 01, 2000 to December 31, 2000 and 0.75% from inception to September 30, 2000, and 1.00% for Emerging Markets Growth Composite. From January 2001 forward, the Composites’ net of fee returns are based upon a weighted average of the actual fee rates charged to each account in the Composites. The average fees applied were: 0.34% for Large Cap Growth Composite; 0.35% for Disciplined Growth Composite; 0.24% for Relative Value Composite; 0.79% for Small Cap Composite; 0.63% for Multi Capitalization Growth Composite; 0.32% for International Large Cap Growth Equity Composite; and 0.42% for Emerging Markets Growth Composite. Both fee structures exclude accounts with performance-based fee arrangements. Net-of-fee performance figures reflect the compounding effect of such fees.
2) RATE OF RETURN — No representation is made that the performance shown in this presentation is indicative of future performance. A portfolio could incur losses as well as gains. Performance figures for each account are calculated monthly on a trade-date basis using an internal rate-of-return calculation. Monthly market values include income accruals and reflect the daily weighting of cash flows. The composite results are asset-weighted on a monthly basis. Quarterly and annual composite performance figures are computed by linking monthly returns, resulting in a “time-weighted” rate of return. Performance results include the reinvestment of dividends and other earnings. Returns are calculated in US dollars.
3) COMPOSITE STRUCTURE — As of December 31, 2002, the Composites include fee-paying discretionary accounts with assets over $10 million in US dollars, which are not subject to significant investment restrictions imposed by clients. As of December 31, 2002, Emerging Markets Growth Composite had less than 1% of its assets invested in countries or regions outside of the benchmark, MSCI Emerging Markets Free, and International Large Cap Growth Equity Composite had 3.37% of its assets invested in countries or regions outside of the benchmark, MSCI EAFE.
The number of accounts in each composite, the market value, and percentage of composite assets in relation to the total assets under management are included in the following table.
|
| Number of |
| Asset Value |
| % of Alliance |
|
Large Cap Growth Composite |
| 239 |
| 20,191 |
| 5 |
|
Disciplined Growth Composite |
| 79 |
| 4,745 |
| 1 |
|
Relative Value Composite |
| 18 |
| 2,083 |
| 1 |
|
Small Cap Composite |
| 13 |
| 538 |
| <1 |
|
Multi Capitalization Growth Composite |
| 8 |
| 457 |
| <1 |
|
International Large Cap Growth Equity |
| 7 |
| 1,240 |
| <1 |
|
Emerging Markets Growth Composite |
| 6 |
| 694 |
| <1 |
|
47
Performance Disclosure — Growth Composites: Net of Fee
The Large Cap and Disciplined Growth Composites include the equity segment of balanced accounts. In these portfolios, the asset allocation mix is generally determined by client guidelines and cash flows are allocated in accordance with these guidelines. The primary portfolio manager responsible for managing the Small Cap Strategy, who had been in place since June of 1994, left the firm in January of 1999. A new team responsible for managing the Small Cap Strategy was put in place during January of 1999. The Relative Value Composite has been restated to reflect a material change in the investment process during the fourth quarter of 1994. The nature of the restatement has resulted in a change in the inception of the composite from January 1, 1992 to January 1, 1995. No other changes occurred as a result of this restatement.
The withholding tax basis of the Global Composites is consistent with the benchmark, which is Luxembourg. The Creation dates of the composites are as follows: MultiCap Growth: December 2000. The Large Cap Growth, Disciplined Growth, International Large Cap Growth, Relative Growth and Small Cap Growth Composites were created prior to December 1992, the first year that these Composites were AIMR verified. The Emerging Growth Composite was created prior to December 1994, the first year that the Composite was AIMR verified.
4) DISPERSION — The dispersion of annual returns was calculated based on the asset-weighted standard deviation. Dispersion of performance for the Composites is as follows:
Large Cap Growth Composite: 1993: 1.61; 1994: 1.22; 1995: 1.86; 1996: 1.29; 1997: 4.96; 1998: 2.43; 1999: 3.23; 2000: 2.11; 2001: 3.56; 2002: 1.94;
Disciplined Growth Composite: 1993: 1.10; 1994: 0.68; 1995: 1.05; 1996: 1.09; 1997: 1.64; 1998: 0.88; 1999: 1.36; 2000: 1.68; 2001: 1.75; 2002: 0.80;
Relative Value Composite: 1994 Q4: 0.53; 1995: 2.72; 1996: 0.39; 1997: 0.23; 1998: 0.54; 1999: 0.76; 2000: 0.24; 2001: 0.50; 2002: 1.24;
Small Cap Composite: 1994 Q2-Q4: 1.65; 1995: 0.19; 1996: 0.09; 1997: 0.14; 1998: 0.29; 1999: 0.55; 2000: 0.79; 2001: 0.29; 2002: 0.27;
Multi Capitalization Growth Composite: 1993: 1.64; 1994: 0.41; 1995: 0.36; 1996: 0.94; 1997: 0.69; 1998: 0.26; 1999: 1.14; 2000: 0.28; 2001: 0.24; 2002: 0.45;
International Large Cap Growth Equity Co: 1993: 2.22; 1994: 0.49; 1995: 1.18; 1996: 0.24; 1997: 0.90; 1998: 3.06; 1999: 5.77; 2000: 2.58; 2001: 0.69; 2002: 0.88;
Emerging Markets Growth Composite: 1993:
N/M*; 1994: 2.56; 1995: 1.00; 1996: 0.57; 1997: 0.31; 1998: 0.04; 1999:
N/M*; 2000:
N/M*; 2001:
N/M*; 2002: 0.24.
5) ANNUAL RETURNS — Large Cap Growth: Gross: 1993: 10.70; 1994: (2.92); 1995: 40.00; 1996: 23.61; 1997: 37.63; 1998: 52.24; 1999: 32.96; 2000: (16.81); 2001: (17.25); 2002: (29.90). Net: 1993: 9.88; 1994: (3.64); 1995: 38.99; 1996: 22.71; 1997: 36.63; 1998: 51.14; 1999: 31.99; 2000: (17.57); 2001: (17.52); 2002: (30.14).
Disciplined Growth: Gross: 1993: 10.61; 1994: (1.86); 1995: 38.36; 1996: 23.41; 1997: 37.10; 1998: 43.74; 1999: 27.76; 2000: (17.14); 2001: (20.01); 2002: (31.92). Net: 1993: 9.80; 1994: (2.59); 1995: 37.36; 1996: 22.51; 1997: 36.11; 1998: 42.70; 1999: 26.83; 2000: (17.90); 2001: (20.27); 2002: (32.17).
Relative Value: Gross: 1995: 38.17; 1996: 26.40; 1997: 29.77; 1998: 22.86; 1999: 10.45; 2000: 15.90; 2001: (1.73); 2002: (22.09). Net: 1995: 37.17; 1996: 25.48; 1997: 28.83; 1998: 21.96; 1999: 9.63; 2000: 15.04; 2001: (1.92); 2002: (22.32).
Small Cap Growth: Gross: 1993: 15.21; 1994: (2.56); 1995: 55.52; 1996: 37.91; 1997: 23.11; 1998: (2.66); 1999: 30.08; 2000: 19.62; 2001: (10.14); 2002: (30.12). Net: 1993: 14.08; 1994: (3.52); 1995: 54.03; 1996: 36.58; 1997: 21.91; 1998: (3.63); 1999: 28.82; 2000: 18.45; 2001: (10.92); 2002: (30.73).
Multi Capitalization Growth: Gross: 1993: 20.32; 1994: (6.94); 1995: 32.46; 1996: 26.25; 1997: 32.54; 1998: 34.33; 1999: 25.56; 2000: (8.67); 2001: (21.43); 2002: (26.60). Net: 1993: 19.15; 1994: (7.87); 1995: 31.17; 1996: 25.02; 1997: 31.25; 1998: 33.03; 1999: 24.34; 2000: (9.59); 2001: (21.92); 2002: (27.08).
International Large Cap Growth: Gross: 1993: 28.49; 1994: 7.40; 1995: 12.42; 1996: 8.58; 1997: 5.56; 1998: 17.37; 1999: 43.57; 2000: (14.83); 2001: (18.81); 2002: (14.12). Net: 1991: 9.20; 1992: (3.60); 1993: 27.56; 1994: 6.61; 1995: 11.59; 1996: 7.77; 1997: 4.78; 1998: 16.51; 1999: 42.53; 2000: (15.51); 2001: (19.05); 2002: (14.41).
Emerging Market Growth: Gross: 1993: 64.90; 1994: (12.28); 1995: (3.06); 1996: 22.53; 1997: (8.42); 1998: (28.06); 1999: 118.32; 2000: (29.23); 2001: (7.14); 2002: 0.69. Net: 1993: 63.33; 1994: (13.16); 1995: (4.03); 1996: 21.34; 1997: (9.33); 1998: (28.80); 1999: 116.29; 2000: (29.96); 2001: (7.56); 2002: 0.21.
Alliance Capital has prepared and presented this report in compliance with the Performance Presentation Standards of the Association for Investment Management and Research (AIMR-PPS®), the US and Canadian versions of the Global Investment Performance Standards (GIPS®). AIMR has not been involved in the preparation or review of this report. Alliance Capital received Level 1 and 2 AIMR Verification from KPMG LLP for 1992, 1993, 1994, 1995, 1996, 1997, 1998, 1999 and 2000. KPMG LLP is currently auditing 2001. This verification is available upon request.
To receive a complete list and description of Alliance Capital’s composites and/or a presentation that adheres to the AIMR-PPS standards, please submit a request via email to Victoria Grancarich at GrancarichVJ@bernstein.com.
*N/M represents “not meaningful”. N/M coding indicates that only one account, or no accounts, are in the Composite for the full year. Dispersion is only shown for accounts included in each quarter of each year presented.
48
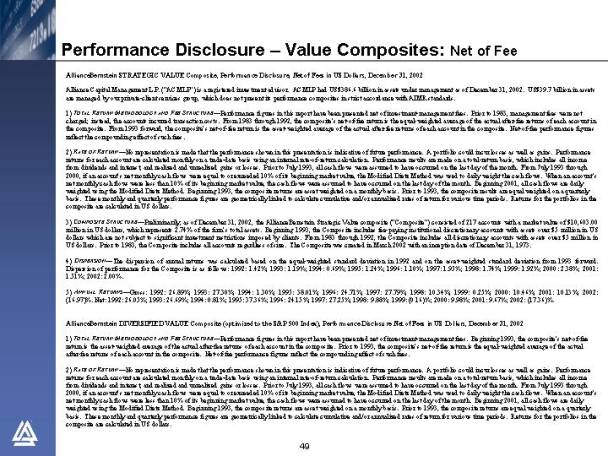
Performance Disclosure — Value Composites: Net of Fee
AllianceBernstein STRATEGIC VALUE Composite, Performance Disclosure, Net of Fees in US Dollars, December 31, 2002
Alliance Capital Management L.P. (“ACMLP”) is a registered investment advisor. ACMLP had US$386.6 billion in assets under management as of December 31, 2002. US$39.7 billion in assets are managed by our private-client services group, which does not present its performance composites in strict accordance with AIMR standards.
1) TOTAL RETURN METHODOLOGY AND FEE STRUCTURE — Performance figures in this report have been presented net of investment-management fees. Prior to 1983, management fees were not charged; instead, the accounts incurred transaction costs. From 1983 through 1992, the composite’s net-of-fee return is the equal-weighted average of the actual after-fee returns of each account in the composite. From 1993 forward, the composite’s net-of-fee return is the asset-weighted average of the actual after-fee returns of each account in the composite. Net-of-fee performance figures reflect the compounding effect of such fees.
2) RATE OF RETURN — No representation is made that the performance shown in this presentation is indicative of future performance. A portfolio could incur losses as well as gains. Performance returns for each account are calculated monthly on a trade-date basis using an internal rate-of-return calculation. Performance results are made on a total-return basis, which includes all income from dividends and interest, and realized and unrealized gains or losses. Prior to July 1993, all cash flows were assumed to have occurred on the last day of the month. From July 1993 through 2000, if an account’s net monthly cash flows were equal to or exceeded 10% of its beginning market value, the Modified Dietz Method was used to daily weight the cash flows. When an account’s net monthly cash flows were less than 10% of its beginning market value, the cash flows were assumed to have occurred on the last day of the month. Beginning 2001, all cash flows are daily weighted using the Modified Dietz Method. Beginning 1993, the composite returns are asset weighted on a monthly basis. Prior to 1993, the composite results are equal weighted on a quarterly basis. These monthly and quarterly performance figures are geometrically linked to calculate cumulative and/ or annualized rates of return for various time periods. Returns for the portfolios in the composite are calculated in US dollars.
3) COMPOSITE STRUCTURE — Preliminarily, as of December 31, 2002, the AllianceBernstein Strategic Value composite (“Composite”) consisted of 217 accounts with a market value of $10,603.00 million in US dollars, which represents 2.74% of the firm’s total assets. Beginning 1993, the Composite includes fee-paying institutional discretionary accounts with assets over $5 million in US dollars which are not subject to significant investment restrictions imposed by clients. From 1983 through 1992, the Composite includes all discretionary accounts with assets over $5 million in US dollars. Prior to 1983, the Composite includes all accounts regardless of size. The Composite was created in March 2002 with an inception date of December 31, 1973.
4) DISPERSION — The dispersion of annual returns was calculated based on the equal-weighted standard deviation in 1992 and on the asset-weighted standard deviation from 1993 forward. Dispersion of performance for the Composite is as follows: 1992: 1.42%; 1993: 1.19%; 1994: 0.69%; 1995: 1.24%; 1996: 1.10%; 1997: 1.95%; 1998: 1.74%; 1999: 1.92%; 2000: 2.38%; 2001: 1.51%; 2002: 2.00%.
5) ANNUAL RETURNS — Gross: 1992: 26.89%; 1993: 27.30%; 1994: 1.30%; 1995: 38.01%; 1996: 24.71%; 1997: 27.79%; 1998: 10.34%; 1999: 0.25%; 2000: 10.46%; 2001: 10.13%; 2002: (16.97)%. Net: 1992: 26.05%; 1993: 26.69%; 1994: 0.81%; 1995: 37.36%; 1996: 24.15%; 1997: 27.25%; 1998: 9.88%; 1999: (0.16)%; 2000: 9.98%; 2001: 9.67%; 2002: (17.36)%.
AllianceBernstein DIVERSIFIED VALUE Composite (optimized to the S&P 500 Index), Performance Disclosure Net of Fees in US Dollars, December 31, 2002
1) TOTAL RETURN METHODOLOGY AND FEE STRUCTURE — Performance figures in this report have been presented net of investment-management fees. Beginning 1993, the composite’s net-of-fee return is the asset-weighted average of the actual after-fee returns of each account in the composite. Prior to 1993, the composite’s net-of-fee return is the equal-weighted average of the actual after-fee returns of each account in the composite. Net-of-fee performance figures reflect the compounding effect of such fees.
2) RATE OF RETURN — No representation is made that the performance shown in this presentation is indicative of future performance. A portfolio could incur losses as well as gains. Performance returns for each account are calculated monthly on a trade-date basis using an internal rate-of-return calculation. Performance results are made on a total-return basis, which includes all income from dividends and interest, and realized and unrealized gains or losses. Prior to July 1993, all cash flows were assumed to have occurred on the last day of the month. From July 1993 through 2000, if an account’s net monthly cash flows were equal to or exceeded 10% of its beginning market value, the Modified Dietz Method was used to daily weight the cash flows. When an account’s net monthly cash flows were less than 10% of its beginning market value, the cash flows were assumed to have occurred on the last day of the month. Beginning 2001, all cash flows are daily weighted using the Modified Dietz Method. Beginning 1993, the composite returns are asset weighted on a monthly basis. Prior to 1993, the composite returns are equal weighted on a quarterly basis. These monthly and quarterly performance figures are geometrically linked to calculate cumulative and/or annualized rates of return for various time periods. Returns for the portfolios in the composite are calculated in US dollars.
49
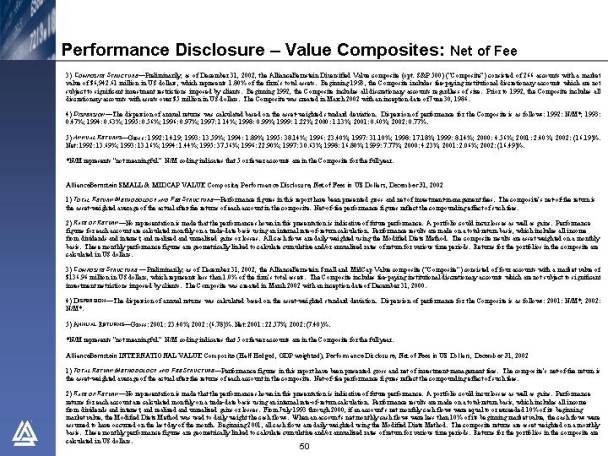
Performance Disclosure — Value Composites: Net of Fee
3) COMPOSITE STRUCTURE — Preliminarily, as of December 31, 2002, the AllianceBernstein Diversified Value composite (opt. S&P 500) (“Composite”) consisted of 266 accounts with a market value of $6,942.61 million in US dollars, which represents 1.80% of the firm’s total assets. Beginning 1993, the Composite includes fee-paying institutional discretionary accounts which are not subject to significant investment restrictions imposed by clients. Beginning 1992, the Composite includes all discretionary accounts regardless of size. Prior to 1992, the Composite includes all discretionary accounts with assets over $5 million in US dollars. The Composite was created in March 2002 with an inception date of June 30, 1986.
4) DISPERSION — The dispersion of annual returns was calculated based on the asset-weighted standard deviation. Dispersion of performance for the Composite is as follows: 1992: N/M*; 1993: 0.47%; 1994: 0.63%; 1995: 0.56%; 1996: 0.97%; 1997: 1.14%; 1998: 0.99%; 1999: 1.22%; 2000: 1.13%; 2001: 0.60%; 2002: 0.77%.
5) ANNUAL RETURNS —Gross: 1992: 14.19; 1993: 13.59%; 1994: 1.89%; 1995: 38.14%; 1996: 23.40%; 1997: 31.10%; 1998: 17.18%; 1999: 8.14%; 2000: 4.56%; 2001: 2.40%; 2002: (16.19)%.Net: 1992: 13.69%; 1993: 13.16%; 1994: 1.44%; 1995: 37.56%; 1996: 22.90%; 1997: 30.63%; 1998: 16.80%; 1999: 7.77%; 2000: 4.23%; 2001: 2.06%; 2002: (16.49)%.
*N/M represents “not meaningful.” N/M coding indicates that 5 or fewer accounts are in the Composite for the full year.
AllianceBernstein SMALL & MIDCAP VALUE Composite, Performance Disclosure, Net of Fees in US Dollars, December 31, 2002
1) TOTAL RETURN METHODOLOGY AND FEE STRUCTURE — Performance figures in this report have been presented gross and net of investment-management fees. The composite’s net-of-fee return is the asset-weighted average of the actual after-fee returns of each account in the composite. Net-of-fee performance figures reflect the compounding effect of such fees.
2) RATE OF RETURN — No representation is made that the performance shown in this presentation is indicative of future performance. A portfolio could incur losses as well as gains. Performance figures for each account are calculated monthly on a trade-date basis using an internal rate-of-return calculation. Performance results are made on a total-return basis, which includes all income from dividends and interest, and realized and unrealized gains or losses. All cash flows are daily weighted using the Modified Dietz Method. The composite results are asset weighted on a monthly basis. These monthly performance figures are geometrically linked to calculate cumulative and/or annualized rates of return for various time periods. Returns for the portfolios in the composite are calculated in US dollars.
3) COMPOSITE STRUCTURE — Preliminarily, as of December 31, 2002, the AllianceBernstein Small and MidCap Value composite (“Composite”) consisted of four accounts with a market value of $136. 96 million in US dollars, which represents less than 1.0% of the firm’s total assets. The Composite includes fee-paying institutional discretionary accounts which are not subject to significant investment restrictions imposed by clients. The Composite was created in March 2002 with an inception date of December 31, 2000.
4) DISPERSION — The dispersion of annual returns was calculated based on the asset-weighted standard deviation. Dispersion of performance for the Composite is as follows: 2001: N/M*; 2002: N/M*.
5) ANNUAL RETURNS — Gross: 2001: 23.40%; 2002: (6.78)%. Net: 2001: 22.57%; 2002: (7.40)%.
*N/M represents “not meaningful.” N/M coding indicates that 5 or fewer accounts are in the Composite for the full year.
AllianceBernstein INTERNATIONAL VALUE Composite (Half Hedged, GDP weighted), Performance Disclosure, Net of Fees in US Dollars, December 31, 2002
1) TOTAL RETURN METHODOLOGY AND FEE STRUCTURE — Performance figures in this report have been presented gross and net of investment-management fees. The composite’s net-of-fee return is the asset-weighted average of the actual after-fee returns of each account in the composite. Net-of-fee performance figures reflect the compounding effect of such fees.
2) RATE OF RETURN — No representation is made that the performance shown in this presentation is indicative of future performance. A portfolio could incur losses as well as gains. Performance returns for each account are calculated monthly on a trade-date basis using an internal rate-of-return calculation. Performance results are made on a total-return basis, which includes all income from dividends and interest, and realized and unrealized gains or losses. From July 1993 through 2000, if an account’s net monthly cash flows were equal to or exceeded 10% of its beginning market value, the Modified Dietz Method was used to daily weight the cash flows. When an account’s net monthly cash flows were less than 10% of its beginning market value, the cash flows were assumed to have occurred on the last day of the month. Beginning 2001, all cash flows are daily weighted using the Modified Dietz Method. The composite returns are asset weighted on a monthly basis. These monthly performance figures are geometrically linked to calculate cumulative and/or annualized rates of return for various time periods. Returns for the portfolios in the composite are calculated in US dollars.
50
Performance Disclosure — Value Composites: Net of Fee
3) COMPOSITE STRUCTURE — Preliminarily, as of December 31, 2002, the International Value composite (HH, GDP) (“Composite”) consisted of 25 accounts with a market value of $1,424.31 million in US dollars, which represents less than 1.0% of the firm’s total assets. From July 1992 through September 1993, the Composite consisted of a single-pooled discretionary account. Beginning July 1993, the pooled discretionary account is excluded and the Composite includes only fee-paying institutional discretionary accounts, which are not subject to significant investment restrictions imposed by clients. The withholding tax basis of the composite is consistent with the benchmark, which is Luxembourg. The Composite was created in March 2002 with an inception date of June 30, 1992. As of September 30, 2002, the Composite had 5.0% of its assets invested in countries or regions outside of the benchmark, the MSCI EAFE Index (half hedged, GDP weighted).
4) DISPERSION — The dispersion of annual returns was calculated based on the asset-weighted standard deviation. Dispersion of performance for the Composite is as follows: 6/30—12/31/92: N/M*; 1993: N/M*; 1994: 1.00%; 1995: 1.04%; 1996: 0.62%; 1997: 1.26%; 1998: 1.41%; 1999: 1.81%; 2000: 1.18%; 2001: 1.00%; 2002: 0.85%.
5) ANNUAL RETURNS — Gross: 6/30 — 12/31/92: (4.08)%; 1993: 37.45%; 1994: 5.65%; 1995: 9.48%; 1996: 18.69%; 1997: 10.54%; 1998: 14.49%; 1999: 22.01%; 2000: (1.79)%; 2001: (10.73)%; 2002: (7.61)%. Net: 6/30 — 12/31/92: (4.99)%; 1993: 36.00%; 1994: 5.11%; 1995: 8.84%; 1996: 18.14%; 1997: 9.84%; 1998: 13.81%; 1999: 21.32%; 2000: (2.42)%; 2001: (11.22)%; 2002: (8.21)%.
*N/M represents “not meaningful.” N/M coding indicates that 5 or fewer accounts are in the Composite for the full year.
AllianceBernstein EMERGING MARKETS VALUE Composite, Performance Disclosure, Net of Fees in US Dollars, December 31, 2002
1) TOTAL RETURN METHODOLOGY AND FEE STRUCTURE — Performance figures in this report have been presented gross and net of investment-management fees. Net performance figures have been calculated by deducting the highest fee payable by an account of this type; 1.25% annually. Net-of-fee performance figures reflect the compounding effect of such fees.
2) RATE OF RETURN — No representation is made that the performance shown in this presentation is indicative of future performance. A portfolio could incur losses as well as gains. Performance returns for each account are calculated monthly on a trade-date basis using an internal rate-of-return calculation. Performance results are made on a total-return basis, which includes all income from dividends and interest, and realized and unrealized gains or losses. Prior to 2001, if an account’s net monthly cash flows were equal to or exceeded 10% of its beginning market value, the Modified Dietz Method was used to daily weight the cash flows. When an account’s net monthly cash flows were less than 10% of its beginning market value, the cash flows were assumed to have occurred on the last day of the month. Beginning 2001, all cash flows are daily weighted using the Modified Dietz Method. The composite returns are asset weighted on a monthly basis. These monthly performance figures are geometrically linked to calculate cumulative and/or annualized rates of return for various time periods. The composite contains portfolios of clients denominated in foreign currencies. To calculate composite performance, each portfolio’s monthly returns are converted to US dollars using WM Reuters month-end exchange rates.
3) COMPOSITE STRUCTURE — Preliminarily, as of December 31, 2002, the Emerging Markets Value composite (“Composite”) consisted of six accounts with a market value of $1,296.33 million in US dollars, which represents less than 1.0% of the firm’s total assets. The Composite includes fee-paying institutional and pooled discretionary accounts which are not subject to significant investment restrictions imposed by clients. In 1996, the Composite consisted of a single-pooled discretionary account. The withholding tax basis of the composite is consistent with the benchmark, which is Luxembourg. The Composite was created in March 2002 with an inception date of December 31, 1995. As of September 30, 2002, the Composite had 0.6% of its assets invested in countries or regions outside of the benchmark, the MSCI Emerging Markets Free Index.
4) DISPERSION — The dispersion of annual returns was calculated based on the asset-weighted standard deviation. Dispersion of performance for the Composite is as follows: 1996: N/M*; 1997: N/M*; 1998: N/M*; 1999: N/M*; 2000: N/M*; 2001: N/M*; 2002: N/M*.
5) ANNUAL RETURNS — Gross: 1996: 9.06%; 1997: (21.56)%; 1998: (18.40)%; 1999: 73.28%; 2000: (26.83)%; 2001: (1.12)%; 2002: 6.17%. Net: 1996: 7.71%; 1997: (22.54)%; 1998: (19.42)%; 1999: 71.13%; 2000: (27.74)%; 2001: (2.35)%; 2002: 4.85%.
* N/M represents “not meaningful.” N/M coding indicates that 5 or fewer accounts are in the Composite for the full year.
51
Performance Disclosure — Fixed Income: Net of Fee
RATES OF RETURN — No representation is made that the performance shown in this presentation is indicative of future performance. A portfolio could incur losses as well as gains. Performance figures for each account are calculated monthly on a trade-date basis using an internal rate-of-return calculation. Monthly market values include income accruals and reflect the daily weighting of cash flows. The composite results are asset-weighted on a monthly basis. Quarterly and annual composite performance figures are computed by linking monthly returns, resulting in a “time-weighted” rate of return. Performance results include the reinvestment of dividends and other earnings. Returns are calculated in US dollars.
1. Emerging Markets Fixed Income Composite
TOTAL RETURN METHODOLOGY AND FEE STRUCTURE — Performance figures in this report have been presented net of investment-management fees. Net performance figures have been calculated by deducting the highest fee charged to an account in the composite from inception of the composite to December 2000, which was an annual fee of 0.65%. From January 2001 forward, the composite’s net of fee return is based upon a weighted average of the actual fee rates charged to each account in the composite. The fee applied to the composite represents a standard institutional fee of 0.70%. Both fee structures exclude accounts with performance based fee arrangements. Net of fee performance figures reflect the compounding effect of such fees.
COMPOSITE STRUCTURE — As of December 31, 2002, the Emerging Markets Fixed Composite (“Composite”) consists of one account with a market value of $64.87 million in US dollars, which represents less than less than 1% of the firm’s total assets as of December 31, 2002. The Composite includes fee-paying discretionary tax-exempt account with assets over $10 million in US dollars, which are not subject to significant investment restrictions imposed by clients. As of December 31, 2002, the composite had less than 1% of its assets invested in countries outside of the benchmark, JPM EMBI+. The Composite includes the fixed segment of a multiple-asset fund account. In these single-asset fund accounts, the asset allocation mix is generally determined by client guidelines and cash flows are allocated in accordance with these guidelines.
The creation date of this composite was prior to December 1994, the first year that this composite was AIMR verified.
Accounts in the Composite may maintain short positions, use futures, interest rate swaps and interest rate futures to hedge interest rate exposure, align risk with the index and reduce client risk and volatility. In certain situations, the use of these instruments may constitute leverage.
DISPERSION — The dispersion of annual returns was calculated based on the asset-weighted standard deviation. Dispersion of performance for the Composite is as follows: 1994 Q3-Q4: N/M*; 1995: N/M*; 1996: N/M*; 1997: N/M*; 1998: N/M*; 1999: N/M*; 2000: N/M*; 2001: N/M*; 2002: N/M*.
ANNUAL RETURNS — Gross: 1995: 37.68; 1996: 47.23; 1997: 19.65; 1998: (21.59); 1999: 36.82; 2000: 16.69; 2001: 9.30; 2002: 19.13. Net: 1995: 36.82; 1996: 46.31; 1997: 18.89; 1998: (22.11); 1999: 35.96; 2000: 15.94; 2001: 8.60; 2002: 18.34.
2. Global Fixed Income Composite
TOTAL RETURN METHODOLOGY AND FEE STRUCTURE — Performance figures in this report have been presented net of investment-management fees. Net performance figures have been calculated by deducting the highest fee charged to an account in the composite from inception of the composite to December 2000, which was an annual fee of 0.50%. From January 2001 forward, the composite’s net of fee return is based upon a weighted average of the actual fee rates charged to each account in the composite. The fee applied to the composite represents a standard institutional fee of 0.50%. Both fee structures exclude accounts with performance based fee arrangements. Net of fee performance figures reflect the compounding effect of such fees.
COMPOSITE STRUCTURE — As of December 31, 2002, the Global Fixed Income Composite (“Composite”) consists of one account with a market value of $13.03 million in US dollars, which represents less than less than 1% of the firm’s total assets as of December 31, 2002. The Composite includes fee-paying discretionary tax-exempt account with assets over $10 million in US dollars, which are not subject to significant investment restrictions imposed by clients. As of December 31, 2002, the composite had none of its assets invested in countries or regions outside of the benchmark, Salomon Brothers World Government Bond Index. The Composite includes the fixed segment of a multiple-asset fund account. In these single-asset fund accounts, the asset allocation mix is generally determined by client guidelines and cash flows are allocated in accordance with these guidelines.
52
Performance Disclosure — Fixed Income: Net of Fee
The creation date of this Composite was prior to December 1992, the first year that this composite was AIMR verified.
DISPERSION — The dispersion of annual returns was calculated based on the asset-weighted standard deviation. Dispersion of performance for the Composite is as follows: 1993: N/M*; 1994: N/M*; 1995: N/M*; 1996: N/M*; 1997: N/M*; 1998: N/M*; 1999: N/M*; 2000: N/M*; 2001: N/M*; 2002: N/M*.
ANNUAL RETURNS — Gross: 1993: 16.43; 1994: (0.97); 1995: 19.45; 1996: 5.96; 1997: 1.90; 1998: 16.70; 1999: (5.50); 2000: 1.60; 2001: (0.23); 2002: 18.68; Net: 1993: 15.86; 1994: (1.46); 1995: 18.86; 1996: 5.44; 1997: 1.40; 1998: 16.13; 1999: (5.97); 2000: 1.10; 2001: (0.73); 2002: 18.10.
4. High Grade AGG Composite
TOTAL RETURN METHODOLOGY AND FEE STRUCTURE — Performance figures in this report have been presented net of investment management fees. Net performance figures have been calculated by deducting the highest fee charged to an account in the composite from inception of the composite to December 2000, which was an annual fee of 0.40%. From January 2001 forward, the composite’s net of fee return is based upon a weighted average of the actual fee rates charged to each account in the composite. The fee applied was 0.29%. Both fee structures exclude accounts with performance based fee arrangements. Net of fee performance figures reflect the compounding effect of such fees.
COMPOSITE STRUCTURE — As of December 31, 2002, the High Grade AGG Composite ("Composite”) consists of five accounts with a market value of $431.67 million in US dollars, which represents less than 1% of the firm’s total assets as of December 31, 2002. The Composite includes fee-paying discretionary tax-exempt accounts with assets over $10 million in US dollars, which are not subject to significant investment restrictions imposed by clients. The creation date of this Composite was October 31, 2000. The Composite does not include the fixed income segment of balanced accounts.
DISPERSION — The dispersion of annual returns was calculated based on the asset-weighted standard deviation. Dispersion of performance for the Composite is as follows: 1997: 2QTR: 0.02, 1997: 3QTR: 0.02, 1997: 4QTR: 0.03, 1998: 0.10, 1999: 0.11, 2000: 0.03, 2001: 0.55; 2002: 0.24.
ANNUAL RETURNS — Gross: 1997: 2QTR: 3.72; 1997: 3QTR: 3.24; 1997: 4QTR: 2.80; 1998: 9.22; 1999: (1.22); 2000: 11.61; 2001: 9.12; 2002: 10.45.Net: 1997: 2QTR: 3.61; 1997: 3QTR: 3.14; 1997: 4QTR: 2.70; 1998: 8.79; 1999: (1.61); 2000: 11.17; 2001: 8.83; 2002: 10.16.
5. High Yield Composite
TOTAL RETURN METHODOLOGY AND FEE STRUCTURE — Performance figures in this report have been presented net of investment-management fees. Net performance figures have been calculated by deducting the highest fee charged to an account in the composite from inception of the composite to December 2000, which was an annual fee of 0.65%. From January 2001 forward, the composite’s net of fee return is based upon a weighted average of the actual fee rates charged to each account in the composite. The fee applied was 0.26%. Both fee structures exclude accounts with performance based fee arrangements. Net of fee performance figures reflect the compounding effect of such fees.
COMPOSITE STRUCTURE — As of December 31, 2002, the High Yield Composite (“Composite”) consists of eight accounts with a market value of $963.95 million in US dollars, which represents less than 1% of the firm’s total assets as of December 31, 2002. The Composite includes fee-paying discretionary tax-exempt accounts with assets over $10 million in US dollars, which are not subject to significant investment restrictions imposed by clients. The creation date of this Composite was prior to December 1993, the first year that this composite was AIMR verified.
Prior to October 2000, the benchmark for this Composite was the CSFB High Yield Bond Index, thereafter the Composite’s benchmark is a customized, asset-weighted blend of the benchmarks of each of the accounts in the Composite. A weighting is applied to the benchmarks by using the prior month-end market values of the portfolios within the Composite. Prior to the beginning of a new quarter, if an account is added or deleted, the custom benchmark will automatically be rebalanced to reflect the changes in market value and benchmarks.
53
Performance Disclosure — Fixed Income: Net of Fee
The Composite does not include the fixed income segment of balanced accounts.
DISPERSION — The dispersion of annual returns was calculated based on the asset-weighted standard deviation. Dispersion of performance for the Composite is as follows: 1993: N/M*; 1994: N/M*; 1995: 1.28; 1996: 1.10; 1997: 0.07; 1998: 0.96; 1999: N/M*; 2000: N/M*; 2001: 0.47; 2002: 0.68.
ANNUAL RETURNS —Gross: 1993: 21.05; 1994: (2.53); 1995: 16.89; 1996: 21.84; 1997: 19.03; 1998: (0.99); 1999: 10.85; 2000: (2.23); 2001: 4.97; 2002: (3.34). Net: 1993: 20.30; 1994: (3.17); 1995: 16.14; 1996: 21.06; 1997: 18.28; 1998: (1.63); 1999: 10.14; 2000: (2.86); 2001: 4.72; 2002: (3.59).
6. Insurance Composite
TOTAL RETURN METHODOLOGY AND FEE STRUCTURE — Performance figures in this report have been presented net of investment management fees. Net performance figures have been calculated by deducting the highest fee charged to an account in the composite from inception of the composite to December 2000, which was an annual fee of 0.18%. From January 2001 forward, the composite’s net of fee return is based upon a weighted average of the actual fee rates charged to each account in the composite. The fee applied was 0.18%. Both fee structures exclude accounts with performance based fee arrangements. Net of fee performance figures
reflect the compounding effect of such fees.
COMPOSITE STRUCTURE — As of December 31, 2002, the Insurance Composite (“Composite”) consists of nine accounts with a market value of $2,415.78 million in US dollars, which represents less than 1% of the firm’s total assets as of December 31, 2002. The Composite includes fee-paying discretionary taxable accounts with assets over $40 million in US dollars, which are not subject to significant investment restrictions imposed by clients. The Composite does not include the fixed income segment of balanced accounts.
The composite’s benchmark used in the presentation is a customized, asset-weighted blend of the benchmarks of each of the accounts in the Composite('custom benchmark’). A weighting is applied to the benchmarks by using the prior month-end market values of the portfolios within the Composite. Prior to the beginning of a new quarter, if an account is added or deleted, the custom benchmark will automatically be rebalanced to include the new account’s market value and benchmark. The terminated account’s market value and benchmark return will be excluded.
The creation date of this Composite was prior to December 1993, the first year that this Composite was AIMR verified.
DISPERSION — The dispersion of annual returns was calculated based on the asset-weighted standard deviation. Dispersion of performance for the Composite is as follows: 1993: N/M*; 1994: N/M*; 1995: N/M*; 1996: 0.53; 1997: 0.57; 1998: 0.50; 1999: 1.09; 2000: 0.50; 2001: 0.81; 2002: 1.04.
ANNUAL RETURNS — Gross: 1993: 11.16; 1994: (1.73); 1995: 18.91; 1996: 4.02; 1997: 9.37; 1998: 8.46; 1999: 0.40; 2000: 10.92; 2001: 9.69; 2002: 10.79. Net: 1993: 10.97; 1994: (1.91); 1995: 18.70; 1996: 3.83; 1997: 9.17; 1998: 8.27; 1999: 0.22; 2000: 10.73; 2001: 9.49; 2002: 10.59.
7. Sector Rotation (formerly Broad) Composite
TOTAL RETURN METHODOLOGY AND FEE STRUCTURE — Performance figures in this report have been presented net of investment-management fees. Net performance figures have been calculated by deducting the highest fee charged to an account in the composite from inception of the composite to December 2000, which was an annual fee of 0.40%. From January 2001 forward, the composite’s net of fee return is based upon a weighted average of the actual fee rates charged to each account in the composite. The fee applied was 0.23%. Both fee structures exclude accounts with performance based fee arrangements. Net of fee performance figures reflect the compounding effect of such fees.
COMPOSITE STRUCTURE — As of December 31, 2002, the Sector Rotation (formerly Broad) Composite (“Composite”) consists of 17 accounts with a market value of $1,957.06 million in US dollars, which represents less than 1% of the firm’s total assets as of December 31, 2002. The Composite includes fee-paying discretionary tax-exempt accounts with assets over $10 million in US dollars, which are not subject to significant investment restrictions imposed by clients. The Composite includes the fixed income segment of balanced accounts. In these portfolios, the asset allocation mix is generally determined by client guidelines and cash flows are allocated in accordance with these guidelines.
54
Performance Disclosure — Fixed Income: Net of Fee
The creation date of this Composite was prior to December 1992, the first year that this composite was AIMR verified.
DISPERSION — The dispersion of annual returns was calculated based on the asset-weighted standard deviation. Dispersion of performance for the Composite is as follows: 1993: 0.55; 1994: 0.43; 1995: 0.32; 1996: 0.81; 1997: 0.17; 1998: 0.70; 1999: 0.63; 2000: 0.25; 2001: 0.17; 2002: 0.17.
ANNUAL RETURNS — Gross: 1993: 12.66; 1994: (3.88); 1995: 18.81; 1996: 3.52; 1997: 9.56; 1998: 9.39; 1999: (2.02); 2000: 12.22; 2001: 9.20; 2002: 8.50. Net: 1993: 12.22; 1994: (4.26); 1995: 18.34; 1996: 3.11; 1997: 9.13; 1998: 8.95; 1999: (2.41); 2000: 11.77; 2001: 8.94; 2002: 8.26.
Alliance Capital has prepared and presented this report in compliance with the Performance Presentation Standards of the Association for Investment Management and Research (AIMR-PPS®), the US and Canadian versions of the Global Investment Performance Standards (GIPS®). AIMR has not been involved in the preparation or review of this report. Alliance Capital received Level 1 and 2 AIMR Verification from KPMG LLP for 1992, 1993, 1994, 1995, 1996, 1997, 1998, 1999 and 2000. KPMG LLP is currently auditing 2001. This verification is available upon request.
To receive a complete list and description of Alliance Capital’s composites and/ or a presentation that adheres to the AIMR-PPS standards, please submit a request via e-mail to Victoria Grancarich at GrancarichVJ@bernstein.com.
*N/M represents “not meaningful”. N/M coding indicates that only one account, or no accounts, are in the Composite for the full year. Dispersion is only shown for accounts included in each quarter of each year presented.
55
Performance Disclosure — Value Composites and Private
Client Simulation: Net of Fee
All Balanced Accounts Composite Methodology
Investment results on a quarterly basis for All Balanced Accounts for the entire quarter were added together and the sum divided by the total number of accounts in each quarter to produce a series of average quarterly performance figures. All Balanced Accounts include those with any combination of equity and fixed income (U.S. or non-U.S.), in any percentage mix. When an account’s net monthly cash flows were less than 10% of its beginning market value, the cash flows were assumed to have occurred on the last day of the month. Beginning in 2001, all cash flows are daily weighted using the modified Dietz method.
Private Client Portfolio Performance — Simulation
The private client portfolio representative performance does not represent actual account performance but is a simulation constructed using the following products in the asset allocation shown below. As such, performance returns are not compliant with AIMR presentation standards and are provided as supplemental information only. Simulated trading programs in general are also subject to the fact that they are designated with the benefit of hindsight. No representation is being made that any account will, or is likely to, achieve profits or losses similar to those shown.
For 50/50 U.S. Equity/Asset Allocation Blend:
21% Bernstein “Strategic Value” composite (after all costs); 21% Bernstein “Strategic Growth” composite (after all costs); 15% Bernstein “Tax-Managed International Value Fund” (after all costs); 3% Bernstein “Emerging Markets Value Fund” (after expenses but before 2% purchase & 2% redemption fees); 40% Bernstein “Intermediate Diversified Municipal Bond Fund” (after all costs)
For 80/20 U.S. Equity/Asset Allocation Blend:
34% Bernstein “Strategic Value” composite (after all costs); 8% Bernstein “Strategic Growth” composite (after all costs); 15% Bernstein “Tax-Managed International Value Fund” (after all costs); 3% Bernstein “Emerging Markets Value Fund” (after expenses but before 2% purchase & 2% redemption fees); 40% Bernstein “Intermediate Diversified Municipal Bond Fund” (after all costs)
The simulated returns were calculated on a monthly basis; each product’s actual monthly return was multiplied by its weight within the blend then summed together. These monthly returns were then geometrically linked to calculate year-to-date 6/30/02 returns. This methodology assumes the portfolio is rebalanced monthly to the allocation described above but does not account for the costs of rebalancing.
56
Performance Disclosure — Private Client: Net of Fee
Strategic Value (All) / Strategic Growth
1. Preparation of Data - Investment results for the Strategic Value (All) composite discretionary accounts are added together and the sum divided by the total number of accounts to produce a series of average quarterly performance figures. Strategic Value (All) composite returns include all accounts from 1974-1999 that are not subject to significant investment restrictions imposed by clients. Beginning January 1, 2000, results exclude accounts with a client-directed margin balance of 20% or more of market value at any month end. Prior to 2001, in computing the time-weighted rate of return, if an account’s net monthly cash flow was equal to or exceeded 10% of its beginning market value, the modified Dietz method was used to daily weight the cash flows. When an account’s net monthly cash flows were less than 10% of its beginning market value, the cash flows were assumed to have occurred on the last day of the month. Beginning 2001, all cash flows are daily weighted using the modified Dietz method.
The performance results of the Strategic Growth composite are calculated by linking the asset-weighted quarterly returns of the Alliance Large Cap Growth composite for the period 1979 through 2000 with those of Strategic Growth thereafter. The quarterly asset-weighted returns are geometrically linked to calculate cumulative and/ or annualized rates of return for various periods. Alliance Large Cap Growth differs from Strategic Growth, which is offered exclusively to clients of the Bernstein Investment Research and Management unit of Alliance Capital Management L.P., in that, among other things, Strategic Growth offers tax management and may contain fewer stocks.
Alliance Large Cap Growth Composite Methodology (1979-2000) - Monthly market values include income accruals and reflect the daily weighting of cash flows. The Alliance Large Cap Growth composite results are asset-weighted on a monthly basis. The quarterly composite performance figures are computed by linking the monthly returns, resulting in a time-weighted rate of return. The composite includes fee-paying discretionary tax-exempt accounts with assets over $10 million not subject to significant investment restrictions imposed by clients. The composite includes the equity segment of balanced accounts. In these equity portfolios, the asset-allocation mix is generally determined by client guidelines and cash flows are allocated in accordance with these guidelines. Fee structures exclude accounts with performance-based fee arrangements. Net-of-fee performance figures reflect the compounding effect of such fees.
Strategic Growth Composite Methodology (2001-present) - The Strategic Growth composite returns are calculated on a quarterly basis with each account’s return weighted by its prior quarter-end market value. All cash flows are daily weighted using the modified Deitz method. Results exclude accounts with a client-directed margin balance of 20% or more of market value at any month end.
2. Net-of-fee performance figures have been calculated as follows:
Strategic Value (All) composite:
a. Prior to 1983, management fees were not charged; instead, the accounts incurred transaction costs.
b. From 1983 forward, the composite’s net-of-fee return is the equal-weighted average of the actual after-fee returns of Strategic Value accounts in the composite.
Strategic Growth composite:
a. From 1979-1982, 0.75%, the highest annual fee charged to an Alliance Large Cap Growth account for that period (excluding accounts with performance-based fee arrangements) was deducted from the composite’s gross-of-fee returns.
b. From 1983 through 2000, the actual average quarterly fee charged by Bernstein for the Strategic Value (All) service was deducted from the Alliance Large Cap Growth composite gross-of-fee returns.
c. From January 2001 forward, the composite’s net-of-fee return is the asset-weighted average of the actual after-fee returns of Strategic Growth accounts in the composite.
3. Dispersion: Dispersion is calculated on the gross-of-fee returns. Dispersion, or standard deviation, measures the variability of account returns within a composite. In a normal distribution, approximately two-thirds of the account returns will fall within the range of one standard deviation above and below the equal-weighted mean return.
Dispersion of returns for Strategic Value (All) is as follows: 1974: 26.0; 1975: 20.3; 1976: 14.3; 1977: 8.3; 1978: 10.9; 1979: 8.5; 1980: 7.8; 1981: 5.5; 1982: 5.6; 1983: 3.7; 1984: 2.8; 1985: 2.4; 1986: 2.1; 1987: 3.3; 1988: 2.1; 1989: 1.7; 1990: 2.1; 1991: 2.4; 1992: 2.1; 1993: 1.6; 1994: 1.4; 1995: 1.6; 1996: 1.4; 1997: 1.9; 1998: 2.9; 1999: 3.1; 2000: 3.0; 2001: 2.2; 2002: N/A.
Dispersion of returns for accounts within the Alliance Large Cap Growth from 1979-2000 is as follows 1979: 4.7; 1980: 1.4; 1981: 2.4; 1982: 3.1; 1983: 2.4; 1984: 2.1; 1985: 2.6; 1986: 5.3; 1987: 3.9; 1988: 2.9; 1989: 5.4; 1990: 1.5; 1991: 3.3; 1992: 3.1; 1993: 1.6; 1994: 1.2; 1995: 1.9; 1996: 1.3; 1997: 5.0; 1998: 2.4; 1999: 3.2; 2000: 2.1. Dispersion of returns for Strategic Growth is as follows: 2001: 2.2; 2002: N/A.
Year 2002 data are preliminary, pending completion of internal audit.
Performance of Private Client International Value, Emerging Markets Value and Intermediate Muni are the returns of portfolios of the Sanford C. Bernstein Fund, Inc. Past performance is not necessarily indicative of future results. The investment return and principal value of an investment may fluctuate so that an investor’s shares, when redeemed, may be worth more or less than the original cost. Portfolio returns are expressed after all fees.
57
Alliance Capital Investment Management Services
Alliance Capital provides diversified investment management and related services globally to a broad range of clients:
1. Retail Services consists of investment management products and services distributed to individual investors through financial intermediaries, such as brokers and financial planners by means of:
· mutual funds sponsored by Alliance Capital and consolidated joint venture companies,
· cash management products such as money market funds and deposit accounts,
· mutual fund sub-advisory relationships resulting from the efforts of the mutual fund marketing department, and
· managed account products;
2. Institutional Investment Management Services consists of investment management services to unaffiliated parties such as corporate and public employee pension funds, endowment funds, domestic and foreign institutions and governments, and affiliates such as AXA and its insurance company subsidiaries by means of:
· separate accounts,
· mutual fund shares sold exclusively to institutional investors and high net worth individuals,
· sub-advisory relationships resulting from the efforts of the institutional marketing department,
· structured products, and
· group trusts;
3. Private Client Services consists of investment management services provided to high net worth individuals, trusts and estates, charitable foundations, partnerships, private and family corporations and other entities by means of:
· separate accounts,
· hedge funds and
· certain other vehicles; and
4. Institutional Research Services provided to institutional clients by means of:
· in-depth research,
· portfolio strategy,
· trading and
· brokerage-related services.
58