Exhibit 99.21

Link to searchable text of slide shown above
Link to searchable text of slide shown above
Link to searchable text of slide shown above
Link to searchable text of slide shown above
Link to searchable text of slide shown above
Link to searchable text of slide shown above

Link to searchable text of slide shown above
Link to searchable text of slide shown above

Link to searchable text of slide shown above

Link to searchable text of slide shown above
Link to searchable text of slide shown above
Link to searchable text of slide shown above

Link to searchable text of slide shown above
Link to searchable text of slide shown above
Link to searchable text of slide shown above

Link to searchable text of slide shown above
Link to searchable text of slide shown above

Link to searchable text of slide shown above
Link to searchable text of slide shown above

Link to searchable text of slide shown above
Link to searchable text of slide shown above
Link to searchable text of slide shown above

Link to searchable text of slide shown above

Link to searchable text of slide shown above
Link to searchable text of slide shown above
Link to searchable text of slide shown above

Link to searchable text of slide shown above

Link to searchable text of slide shown above
Link to searchable text of slide shown above
Link to searchable text of slide shown above

Link to searchable text of slide shown above
Link to searchable text of slide shown above

Link to searchable text of slide shown above

Link to searchable text of slide shown above
Link to searchable text of slide shown above
Link to searchable text of slide shown above
Link to searchable text of slide shown above

Link to searchable text of slide shown above

Link to searchable text of slide shown above
Link to searchable text of slide shown above
Searchable text section of graphics shown above
Exhibit 99.21
Third Quarter 2003 Review
|
|
|
|
|
Bruce W. Calvert |
| Lewis A. Sanders |
| John D. Carifa |
Chairman |
| Vice Chairman and CEO |
| President and COO |
|
|
|
|
|
|
|
|
|
|
October 30, 2003 | ||||
[LOGO]
The SEC adopted Regulation FD in October 2000. In light of Regulation FD, Management will be limited in responding to inquiries from investors or analysts in a non-public forum. You are encouraged to ask all questions of a material nature on this conference call.
Forward-Looking Statements
Certain statements provided by Alliance Capital Management L.P. (“Alliance Capital”) and Alliance Capital Management Holding L.P. (“Alliance Holding”) in this report are “forward-looking statements” within the meaning of the Private Securities Litigation Reform Act of 1995. Such forward-looking statements are subject to risks, uncertainties and other factors which could cause actual results to differ materially from future results expressed or implied by such forward-looking statements. The most significant of such factors include, but are not limited to, the following: the performance of financial markets, the investment performance of Alliance Capital’s sponsored investment products and separately managed accounts, general economic conditions, future acquisitions, competitive conditions, and government regulations, including changes in tax rates. Alliance Capital and Alliance Holding caution readers to carefully consider such factors. Further, such forward-looking statements speak only as of the date on which such statements are made; Alliance Capital and Alliance Holding undertake no obligation to update any forward-looking statements to reflect events or circumstances after the date of such statements.
[LOGO]
2
Alliance Capital |
| 3Q03 vs. 2Q03 |
| 3Q03 vs. 3Q02 | ||
|
|
|
|
|
|
|
• |
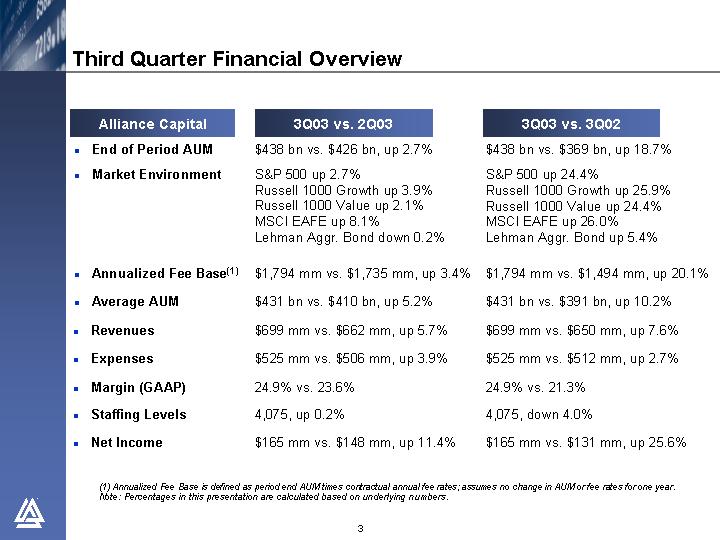
| End of Period AUM |
| $438 bn vs. $426 bn, up 2.7% |
| $438 bn vs. $369 bn, up 18.7% |
|
|
|
|
|
|
|
• |
| Market Environment |
| S&P 500 up 2.7% |
| S&P 500 up 24.4% |
|
|
|
|
|
|
|
• |
| Annualized Fee Base(1) |
| $1,794 mm vs. $1,735 mm, up 3.4% |
| $1,794 mm vs. $1,494 mm, up 20.1% |
|
|
|
|
|
|
|
• |
| Average AUM |
| $431 bn vs. $410 bn, up 5.2% |
| $431 bn vs. $391 bn, up 10.2% |
|
|
|
|
|
|
|
• |
| Revenues |
| $699 mm vs. $662 mm, up 5.7% |
| $699 mm vs. $650 mm, up 7.6% |
|
|
|
|
|
|
|
• |
| Expenses |
| $525 mm vs. $506 mm, up 3.9% |
| $525 mm vs. $512 mm, up 2.7% |
|
|
|
|
|
|
|
• |
| Margin (GAAP) |
| 24.9% vs. 23.6% |
| 24.9% vs. 21.3% |
|
|
|
|
|
|
|
• |
| Staffing Levels |
| 4,075, up 0.2% |
| 4,075, down 4.0% |
|
|
|
|
|
|
|
• |
| Net Income |
| $165 mm vs. $148 mm, up 11.4% |
| $165 mm vs. $131 mm, up 25.6% |
(1) Annualized Fee Base is defined as period end AUM times contractual annual fee rates; assumes no change in AUM or fee rates for one year.
Note: Percentages in this presentation are calculated based on underlying numbers.
[LOGO]
3
Third Quarter Financial Overview
(In $ millions, except AUM in $ billions)
|
|
| 3Q03 |
| 3Q02 |
| % chg |
| ||
|
|
|
|
|
|
|
|
| ||
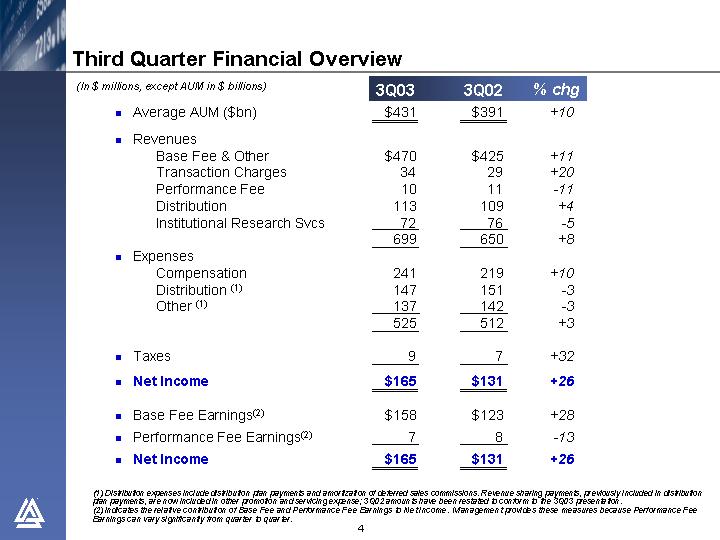
• Average AUM ($bn) |
| $ | 431 |
| $ | 391 |
| +10 |
| |
|
|
|
|
|
|
|
|
| ||
• Revenues |
|
|
|
|
|
|
| |||
Base Fee & Other |
| $ | 470 |
| $ | 425 |
| +11 |
| |
Transaction Charges |
| 34 |
| 29 |
| +20 |
| |||
Performance Fee |
| 10 |
| 11 |
| -11 |
| |||
Distribution |
| 113 |
| 109 |
| +4 |
| |||
Institutional Research Svcs |
| 72 |
| 76 |
| -5 |
| |||
|
| 699 |
| 650 |
| +8 |
| |||
• Expenses |
|
|
|
|
|
|
| |||
Compensation |
| 241 |
| 219 |
| +10 |
| |||
Distribution (1) |
| 147 |
| 151 |
| -3 |
| |||
Other (1) |
| 137 |
| 142 |
| -3 |
| |||
|
| 525 |
| 512 |
| +3 |
| |||
|
|
|
|
|
|
|
| |||
• Taxes |
| 9 |
| 7 |
| +32 |
| |||
• Net Income |
| $ | 165 |
| $ | 131 |
| +26 |
| |
|
|
|
|
|
|
|
| |||
• Base Fee Earnings(2) |
| $ | 158 |
| $ | 123 |
| +28 |
| |
• Performance Fee Earnings(2) |
| 7 |
| 8 |
| -13 |
| |||
• Net Income |
| $ | 165 |
| $ | 131 |
| +26 |
| |
(1) Distribution expenses include distribution plan payments and amortization of deferred sales commissions. Revenue sharing payments, previously included in distribution plan payments, are now included in other promotion and servicing expense; 3Q02 amounts have been restated to conform to the 3Q03 presentation.
(2) Indicates the relative contribution of Base Fee and Performanc e Fee Earnings to Net Income. Management provides these measures because Performance Fee Earnings can vary significantly from quarter to quarter.
[LOGO]
4
Third Quarter Revenues – by Distribution Channel
(In $millions)
|
| 3Q03 |
| 3Q02 |
| % chg |
| Comments | |||
|
|
|
|
|
|
|
|
|
| ||
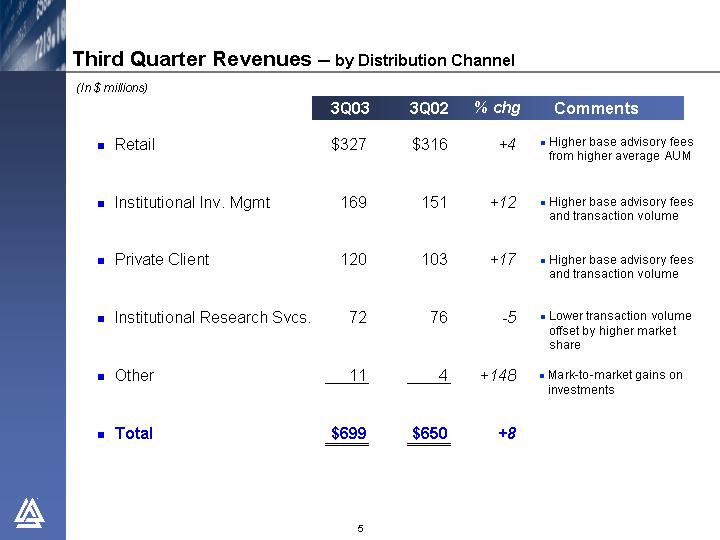
• Retail |
| $ | 327 |
| $ | 316 |
| +4 |
| • | Higher base advisory fees from higher average AUM |
|
|
|
|
|
|
|
|
|
| ||
• Institutional Inv. Mgmt |
| 169 |
| 151 |
| +12 |
| • | Higher base advisory fees and transaction volume | ||
|
|
|
|
|
|
|
|
|
| ||
• Private Client |
| 120 |
| 103 |
| +17 |
| • | Higher base advisory fees and transaction volume | ||
|
|
|
|
|
|
|
|
|
| ||
• Institutional Research Svcs. |
| 72 |
| 76 |
| -5 |
| • | Lower transaction volume offset by higher market share | ||
|
|
|
|
|
|
|
|
|
| ||
• Other |
| 11 |
| 4 |
| +148 |
| • | Mark-to-market gains on investments | ||
|
|
|
|
|
|
|
|
|
| ||
• Total |
| $ | 699 |
| $ | 650 |
| +8 |
|
|
|
[LOGO]
5
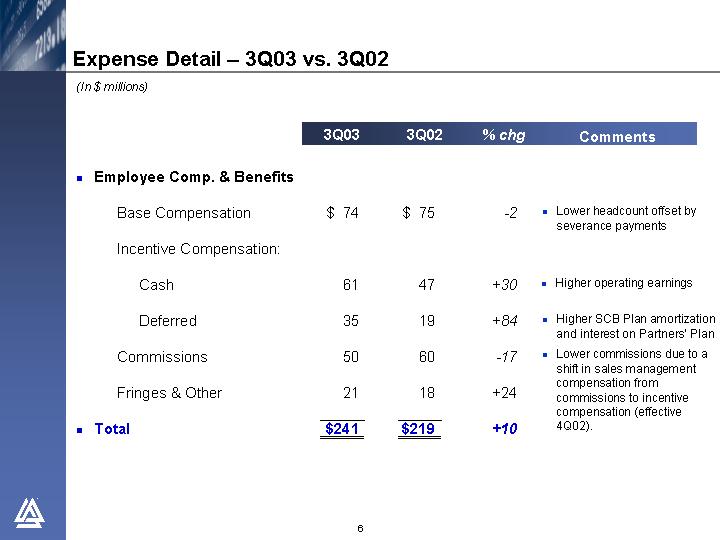
Expense Detail – 3Q03 vs. 3Q02
(In $ millions)
|
| 3Q03 |
| 3Q02 |
| % chg |
| Comments | |||
|
|
|
|
|
|
|
|
|
| ||
• Employee Comp. & Benefits |
|
|
|
|
|
|
|
|
| ||
|
|
|
|
|
|
|
|
|
| ||
Base Compensation |
| $ | 74 |
| $ | 75 |
| -2 |
| • | Lower headcount offset by severance payments |
|
|
|
|
|
|
|
|
|
| ||
Incentive Compensation: |
|
|
|
|
|
|
|
|
| ||
|
|
|
|
|
|
|
|
|
| ||
Cash |
| 61 |
| 47 |
| +30 |
| • | Higher operating earnings | ||
|
|
|
|
|
|
|
|
|
| ||
Deferred |
| 35 |
| 19 |
| +84 |
| • | Higher SCB Plan amortization and interest on Partners’ Plan | ||
|
|
|
|
|
|
|
|
|
| ||
Commissions |
| 50 |
| 60 |
| -17 |
| • | Lower commissions due to a shift in sales management compensation from commissions to incentive compensation (effective 4Q02). | ||
|
|
|
|
|
|
|
|
|
| ||
Fringes & Other |
| 21 |
| 18 |
| +24 |
|
|
| ||
|
|
|
|
|
|
|
|
|
| ||
• Total |
| $ | 241 |
| $ | 219 |
| +10 |
|
|
|
[LOGO]
6
Expense Detail – 3Q03 vs. 3Q02
(In $ millions)
|
| 3Q03 |
| 3Q02 |
| % chg |
| Comments | ||
|
|
|
|
|
|
|
|
| ||
• Employee Comp. & Benefits |
| $ | 241 |
| $ | 219 |
| +10 |
|
|
|
|
|
|
|
|
|
|
| ||
• Promotion & Servicing |
|
|
|
|
|
|
|
| ||
Distribution Plan Pmts (1) |
| 95 |
| 95 |
| — |
|
| ||
Amort of Def Sales Comm |
| 52 |
| 56 |
| -7 |
| • Lower sales | ||
T & E |
| 13 |
| 13 |
| — |
|
| ||
Printing/Mailing |
| 3 |
| 7 |
| -58 |
| • Continued cost-cutting initiatives | ||
Other (1) |
| 25 |
| 26 |
| -4 |
|
| ||
|
| 188 |
| 197 |
| -5 |
|
| ||
|
|
|
|
|
|
|
|
| ||
• General & Admin |
|
|
|
|
|
|
|
| ||
Office Expense |
| 40 |
| 43 |
| -6 |
| • Office consolidation | ||
Other |
| 45 |
| 41 |
| +10 |
| • Higher legal fees and insurance | ||
|
| 85 |
| 84 |
| +1 |
|
| ||
|
|
|
|
|
|
|
|
| ||
• Interest |
| 6 |
| 7 |
| -6 |
|
| ||
|
|
|
|
|
|
|
|
| ||
• Amort of Intangible Assets |
| 5 |
| 5 |
| — |
|
| ||
|
|
|
|
|
|
|
|
| ||
• Total |
| $ | 525 |
| $ | 512 |
| +3 |
|
|
(1) Includes reclassification of revenue sharing payments from distribution plan payments to other promotion and servicing expense.
[LOGO]
7
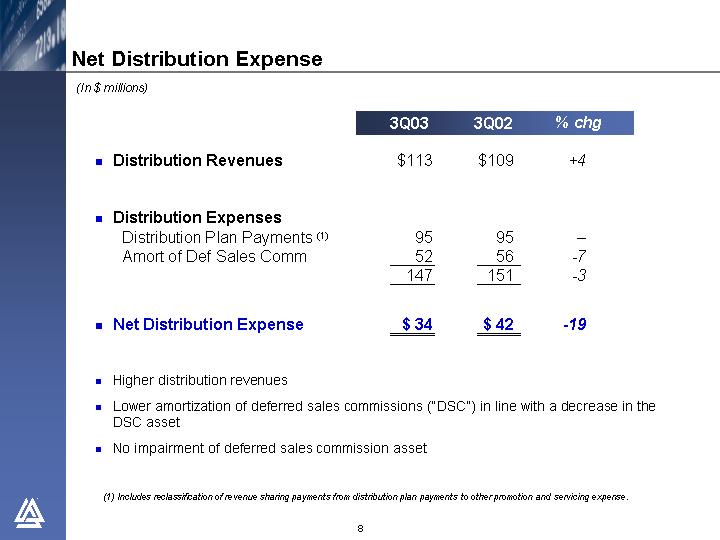
(In $ millions)
|
| 3Q03 |
| 3Q02 |
| % chg |
| ||
|
|
|
|
|
|
|
| ||
• Distribution Revenues |
| $ | 113 |
| $ | 109 |
| +4 |
|
|
|
|
|
|
|
|
| ||
• Distribution Expenses |
|
|
|
|
|
|
| ||
Distribution Plan Payments (1) |
| 95 |
| 95 |
| — |
| ||
Amort of Def Sales Comm |
| 52 |
| 56 |
| -7 |
| ||
|
| 147 |
| 151 |
| -3 |
| ||
|
|
|
|
|
|
|
| ||
• Net Distribution Expense |
| $ | 34 |
| $ | 42 |
| -19 |
|
• Higher distribution revenues
• Lower amortization of deferred sales commissions (“DSC”) in line with a decrease in the DSC asset
• No impairment of deferred sales commission asset
(1) Includes reclassification of revenue sharing payments from distribution plan payments to other promotion and servicing expense.
[LOGO]
8
(In $ millions)
|
| 3Q03 |
| % of |
| 3Q02 |
| % of |
| ||
• Base Fee Earnings |
| $ | 194 |
| 33.0 | % | $ | 163 |
| 30.1 | % |
|
|
|
|
|
|
|
|
|
| ||
• Net Distribution Expense (2) |
| (27 | ) | -4.6 |
| (33 | ) | 6.1 |
| ||
|
|
|
|
|
|
|
|
|
| ||
• Performance Fee Earnings (2) |
| 7 |
| 1.3 |
| 8 |
| 1.6 |
| ||
|
|
|
|
|
|
|
|
|
| ||
• Pre-tax Margin (Non-GAAP) (3) |
| $ | 174 |
| 29.7 | % | $ | 138 |
| 25.6 | % |
|
|
|
|
|
|
|
|
|
| ||
• Pre-tax Margin (GAAP) |
|
|
| 24.9 | % |
|
| 21.3 | % | ||
• Higher contribution from base fee earnings resulting from higher revenue and reduced impact of lower distribution expense
(1) Excludes distribution revenues.
(2) Net distribution expense and performance fee earnings include allocations of incentive compensation.
(3) Presented as a non-GAAP financial measure. Please see page 29 for a reconciliation to pre-tax margin (GAAP).
[LOGO]
9
|
| 3Q03 |
| 3Q02 |
| % chg |
| ||
(In $millions) |
|
|
|
|
|
|
| ||
• Equity in Earnings |
| $ | 50 |
| $ | 39 |
| +27 | % |
|
|
|
|
|
|
|
| ||
• Income Taxes |
| 5 |
| 5 |
| +6 |
| ||
|
|
|
|
|
|
|
| ||
• Net Income |
| $ | 45 |
| $ | 34 |
| +30 | % |
|
|
|
|
|
|
|
| ||
(Per Unit amounts) |
|
|
|
|
|
|
| ||
• Base Fee Earnings(1) |
| $ | 0.54 |
| $ | 0.42 |
| +29 | % |
|
|
|
|
|
|
|
| ||
• Performance Fee Earnings(1) |
| 0.03 |
| 0.03 |
| — |
| ||
|
|
|
|
|
|
|
| ||
• Diluted Net Income |
| $ | 0.57 |
| $ | 0.45 |
| +27 | % |
|
|
|
|
|
|
|
| ||
• Distribution |
| $ | 0.57 |
| $ | 0.46 |
| +24 | % |
(1) Indicates the relative contribution of Base Fee and Performance Fee Earnings to Net Income. Management provides these measures because Performance Fee Earnings can vary significantly from quarter to quarter.
[LOGO]
10
|
|
|
|
|
| Annualized |
| Cumulative |
|
|
| 3Q03 |
| 1 Yr |
| 3 Yr |
| 3 Yr |
|
|
|
|
|
|
|
|
|
|
|
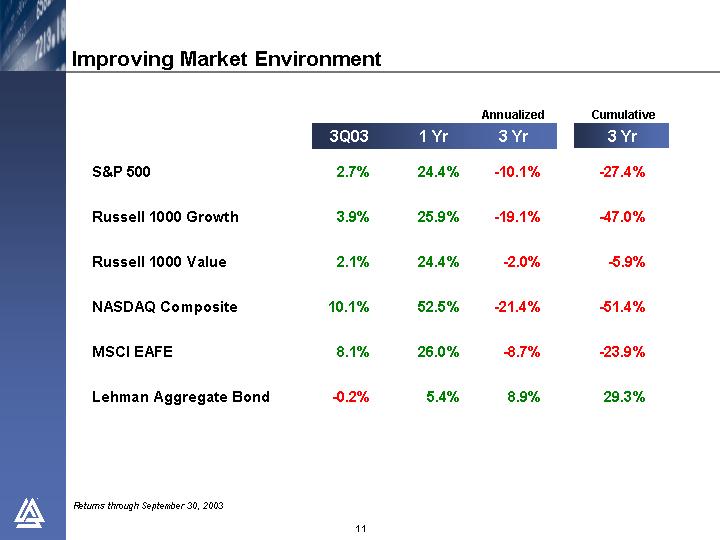
S&P 500 |
| 2.7 | % | 24.4 | % | -10.1 | % | -27.4 | % |
|
|
|
|
|
|
|
|
|
|
Russell 1000 Growth |
| 3.9 | % | 25.9 | % | -19.1 | % | -47.0 | % |
|
|
|
|
|
|
|
|
|
|
Russell 1000 Value |
| 2.1 | % | 24.4 | % | -2.0 | % | -5.9 | % |
|
|
|
|
|
|
|
|
|
|
NASDAQ Composite |
| 10.1 | % | 52.5 | % | -21.4 | % | -51.4 | % |
|
|
|
|
|
|
|
|
|
|
MSCI EAFE |
| 8.1 | % | 26.0 | % | -8.7 | % | -23.9 | % |
|
|
|
|
|
|
|
|
|
|
Lehman Aggregate Bond |
| -0.2 | % | 5.4 | % | 8.9 | % | 29.3 | % |
Returns through September 30, 2003
[LOGO]
11
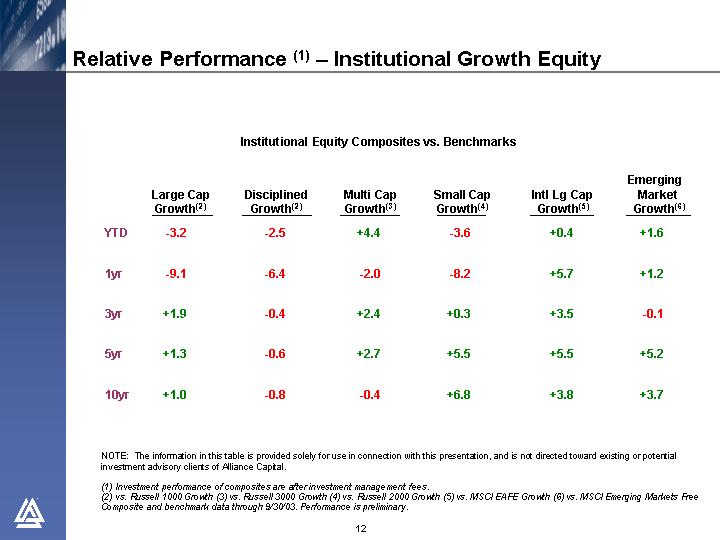
Institutional Equity Composites vs. Benchmarks
|
| Large Cap |
| Disciplined |
| Multi Cap |
| Small Cap |
| Intl Lg Cap |
| Emerging |
|
|
|
|
|
|
|
|
|
|
|
|
|
|
|
YTD |
| -3.2 |
| -2.5 |
| +4.4 |
| -3.6 |
| +0.4 |
| +1.6 |
|
|
|
|
|
|
|
|
|
|
|
|
|
|
|
1yr |
| -9.1 |
| -6.4 |
| -2.0 |
| -8.2 |
| +5.7 |
| +1.2 |
|
|
|
|
|
|
|
|
|
|
|
|
|
|
|
3yr |
| +1.9 |
| -0.4 |
| +2.4 |
| +0.3 |
| +3.5 |
| -0.1 |
|
|
|
|
|
|
|
|
|
|
|
|
|
|
|
5yr |
| +1.3 |
| -0.6 |
| +2.7 |
| +5.5 |
| +5.5 |
| +5.2 |
|
|
|
|
|
|
|
|
|
|
|
|
|
|
|
10yr |
| +1.0 |
| -0.8 |
| -0.4 |
| +6.8 |
| +3.8 |
| +3.7 |
|
NOTE: The information in this table is provided solely for use in connection with this presentation, and is not directed toward existing or potential investment advisory clients of Alliance Capital.
(1) Investment performance of composites are after investment management fees.
(2) vs. Russell 1000 Growth (3) vs. Russell 3000 Growth (4) vs. Russell 2000 Growth (5) vs. MSCI EAFE Growth (6) vs. MSCI Emerging Markets Free.
Composite and benchmark data through 9/30/03. Performance is preliminary
[LOGO]
12
Relative Performance (1) – Institutional Value Equity
Institutional Equity Composites vs. Benchmarks
|
| Strategic |
| Diversified |
| Relative |
| Small- |
| International |
| Emerging |
|
|
|
|
|
|
|
|
|
|
|
|
|
|
|
YTD |
| +2.8 |
| +1.1 |
| +5.0 |
| -3.5 |
| -0.3 |
| +8.0 |
|
|
|
|
|
|
|
|
|
|
|
|
|
|
|
1yr |
| +5.3 |
| +2.7 |
| +5.2 |
| +1.9 |
| +1.4 |
| +7.8 |
|
|
|
|
|
|
|
|
|
|
|
|
|
|
|
3yr |
| +8.8 |
| +6.6 |
| -0.5 |
| — |
| +5.4 |
| +7.5 |
|
|
|
|
|
|
|
|
|
|
|
|
|
|
|
5yr |
| +1.6 |
| — |
| +3.4 |
| — |
| +2.0 |
| +6.7 |
|
|
|
|
|
|
|
|
|
|
|
|
|
|
|
10yr |
| +1.1 |
| — |
| — |
| — |
| +2.2 |
| — |
|
NOTE: The information in this table is provided solely for use in connection with this presentation, and is not directed toward existing or potential investment advisory clients of Alliance Capital.
(1) Investment performance of composites are after investment management fees.
(2) vs. Russell 1000 Value (3) vs. Russell 2500 Value (4) vs. MSCI EAFE Value (5) vs. MSCI Emerging Markets Free
Composite and benchmark data through 9/30/03. Performance is preliminary.
[LOGO]
13
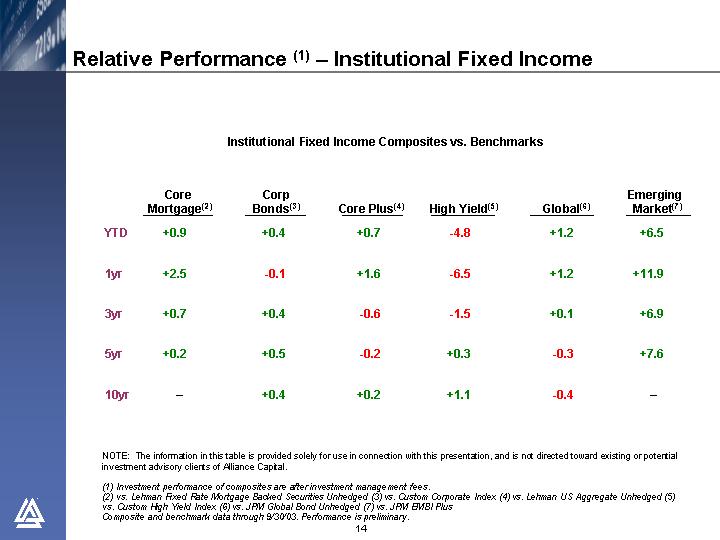
Relative Performance (1) – Institutional Fixed Income
Institutional Fixed Income Composites vs. Benchmarks
|
| Core |
| Corp |
| Core Plus(4) |
| High Yield(5) |
| Global(6) |
| Emerging |
|
|
|
|
|
|
|
|
|
|
|
|
|
|
|
YTD |
| +0.9 |
| +0.4 |
| +0.7 |
| -4.8 |
| +1.2 |
| +6.5 |
|
|
|
|
|
|
|
|
|
|
|
|
|
|
|
1yr |
| +2.5 |
| -0.1 |
| +1.6 |
| -6.5 |
| +1.2 |
| +11.9 |
|
|
|
|
|
|
|
|
|
|
|
|
|
|
|
3yr |
| +0.7 |
| +0.4 |
| -0.6 |
| -1.5 |
| +0.1 |
| +6.9 |
|
|
|
|
|
|
|
|
|
|
|
|
|
|
|
5yr |
| +0.2 |
| +0.5 |
| -0.2 |
| +0.3 |
| -0.3 |
| +7.6 |
|
|
|
|
|
|
|
|
|
|
|
|
|
|
|
10yr |
| — |
| +0.4 |
| +0.2 |
| +1.1 |
| -0.4 |
| — |
|
NOTE: The information in this table is provided solely for use in connection with this presentation, and is not directed toward existing or potential investment advisory clients of Alliance Capital.
(1) Investment performance of composites are after investment management fees.
(2) vs. Lehman Fixed Rate Mortgage Backed Securities Unhedged (3) vs. Custom Corporate Index (4) vs. Lehman US Aggregate Unhedged (5) vs. Custom High Yield Index (6) vs. JPM Global Bond Unhedged (7) vs. JPM EMBI Plus
Composite and benchmark data through 9/30/03. Performance is preliminary.
[LOGO]
14
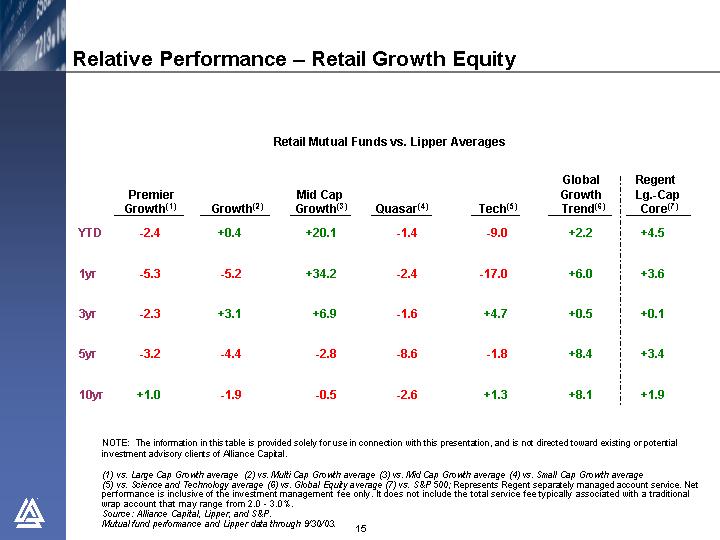
Relative Performance – Retail Growth Equity
Retail Mutual Funds vs. Lipper Averages
|
| Premier |
| Growth(2) |
| Mid Cap |
| Quasar(4) |
| Tech(5) |
| Global |
|
|
| Regent |
|
|
|
|
|
|
|
|
|
|
|
|
|
|
|
|
|
| |
YTD |
| -2.4 |
| +0.4 |
| +20.1 |
| -1.4 |
| -9.0 |
| +2.2 |
|
| +4.5 |
| |
|
|
|
|
|
|
|
|
|
|
|
|
|
|
|
|
| |
1yr |
| -5.3 |
| -5.2 |
| +34.2 |
| -2.4 |
| -17.0 |
| +6.0 |
|
| +3.6 |
| |
|
|
|
|
|
|
|
|
|
|
|
|
|
|
|
|
| |
3yr |
| -2.3 |
| +3.1 |
| +6.9 |
| -1.6 |
| +4.7 |
| +0.5 |
|
| +0.1 |
| |
|
|
|
|
|
|
|
|
|
|
|
|
|
|
|
|
| |
5yr |
| -3.2 |
| -4.4 |
| -2.8 |
| -8.6 |
| -1.8 |
| +8.4 |
|
| +3.4 |
| |
|
|
|
|
|
|
|
|
|
|
|
|
|
|
|
|
| |
10yr |
| +1.0 |
| -1.9 |
| -0.5 |
| -2.6 |
| +1.3 |
| +8.1 |
|
| +1.9 |
|
NOTE: The information in this table is provided solely for use in connection with this presentation, and is not directed toward existing or potential investment advisory clients of Alliance Capital.
(1) vs. Large Cap Growth average (2) vs. Multi Cap Growth average (3) vs. Mid Cap Growth average (4) vs. Small Cap Growth average (5) vs. Science and Technology average (6) vs. Global Equity average (7) vs. S&P 500; Represents Regent separately managed account service. Net performance is inclusive of the investment management fee only. It does not include the total service fee typically associated with a traditional wrap account that may range from 2.0 - 3.0%.
Source: Alliance Capital, Lipper, and S&P.
Mutual fund performance and Lipper data through 9/30/03.
[LOGO]
15
Relative Performance – Retail Value Equity
Retail Mutual Funds vs. Lipper Averages
|
| AB |
| Growth & |
| Small |
| Intl |
| Global |
| Balanced(6) |
YTD |
| +1.1 |
| +4.8 |
| -0.8 |
| +8.2 |
| +1.5 |
| +2.3 |
|
|
|
|
|
|
|
|
|
|
|
|
|
1yr |
| +2.8 |
| +5.5 |
| +2.2 |
| +16.4 |
| +8.0 |
| +3.6 |
|
|
|
|
|
|
|
|
|
|
|
|
|
2yr |
| +3.8 |
| -1.2 |
| +3.8 |
| +13.4 |
| +2.0 |
| +1.5 |
|
|
|
|
|
|
|
|
|
|
|
|
|
3yr |
| — |
| -0.8 |
| — |
| — |
| — |
| +4.3 |
|
|
|
|
|
|
|
|
|
|
|
|
|
5yr |
| — |
| +3.1 |
| — |
| — |
| — |
| +3.5 |
|
|
|
|
|
|
|
|
|
|
|
|
|
10yr |
| — |
| +2.1 |
| — |
| — |
| — |
| +1.4 |
NOTE: The information in this table is provided solely for use in connection with this presentation, and is not directed toward existing or potential investment advisory clients of Alliance Capital.
(1) vs. Large Cap Value average; if compared to Multi Cap Value average, YTD would be (1.5), 1 yr would be 0.7, and 2 yr would be 1.0 (2) vs. Large Cap Value average (3) vs. Mid Cap Value average (4) vs. International average (5) vs. Global average (6) vs. Balanced average
Source: Alliance Capital and Lipper
Mutual fund performance and Lipper data through 9/30/03.
[LOGO]
16
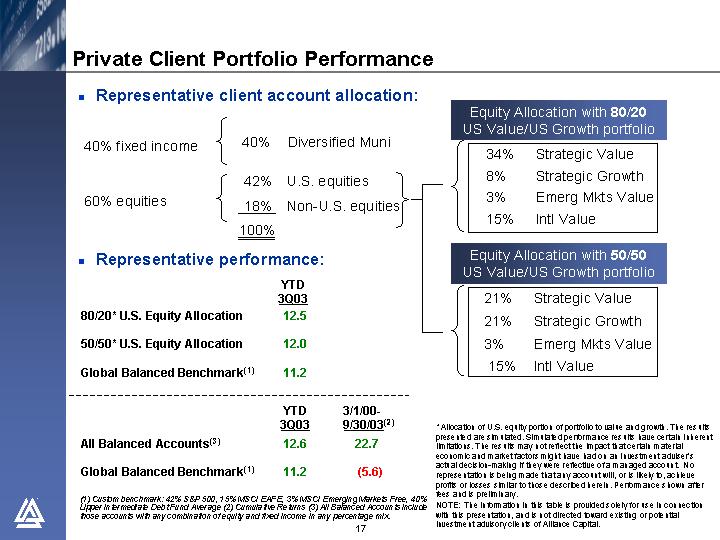
• Representative client account allocation:
|
|
|
|
|
|
|
|
|
| Equity Allocation with 80/20 US Value/US Growth portfolio |
| |
40% fixed income |
| 40 | % | Diversified Muni |
|
|
|
|
|
| ||
|
|
|
|
|
|
|
| 34% | Strategic Value |
| ||
|
|
|
|
|
|
|
| 8% | Strategic Growth |
| ||
|
|
| 42 | % | U.S. equities |
| 3% | Emerg Mkts Value |
| |||
60% equities |
| 18 | % | Non-U.S. equities | 15% | Intl Value |
| |||||
|
|
| 100 | % |
|
|
|
|
|
| ||
|
|
|
|
|
|
|
|
|
|
| ||
|
|
|
|
|
|
|
|
| Equity Allocation with 50/50 US Value/US Growth portfolio |
| ||
|
|
|
|
|
|
|
| 21% | Strategic Value |
| ||
|
|
|
|
|
|
| 21% | Strategic Growth |
| |||
|
|
|
|
|
|
|
| 3% | Emerg Mkts Value |
| ||
|
|
|
|
|
|
|
| 15% | Intl Value |
| ||
• Representative performance:
|
| YTD 3Q03 |
|
80/20* U.S. Equity Allocation |
| 12.5 |
|
|
|
|
|
50/50* U.S. Equity Allocation |
| 12.0 |
|
|
|
|
|
Global Balanced Benchmark(1) |
| 11.2 |
|
- - - - - - - - - - - - - - - - - - - - - - - - - - - - - - - - - - - - - - - - - - - - - - - - - - - - - - - - - - - - - - - - - - - - - | |||||
|
| YTD 3Q03 |
| 3/1/00- 9/30/03(2) |
|
All Balanced Accounts(3) |
| 12.6 |
| 22.7 |
|
|
|
|
|
|
|
Global Balanced Benchmark(1) |
| 11.2 |
| (5.6) |
|
(1) Custom benchmark: 42% S&P 500, 15% MSCI EAFE, 3% MSCI Emerging Markets Free, 40% Lipper Intermediate Debt Fund Average (2) Cumulative Returns (3) All Balanced Accounts include those accounts with any combination of equity and fixed income in any percentage mix.
* Allocation of U.S. equity portion of portfolio to value and growth. The results presented are simulated. Simulated performance results have certain inherent limitations. The results may not reflect the impact that certain material economic and market factors might have had on an investment adviser’s actual decision-making if they were reflective of a managed account. No representation is being made that any account will, or is likely to, achieve profits or losses similar to those described herein. Performance shown after fees and is preliminary.
NOTE: The information in this table is provided solely for use in connection with this presentation, and is not directed toward existing or potential investment advisory clients of Alliance Capital.
[LOGO]
17
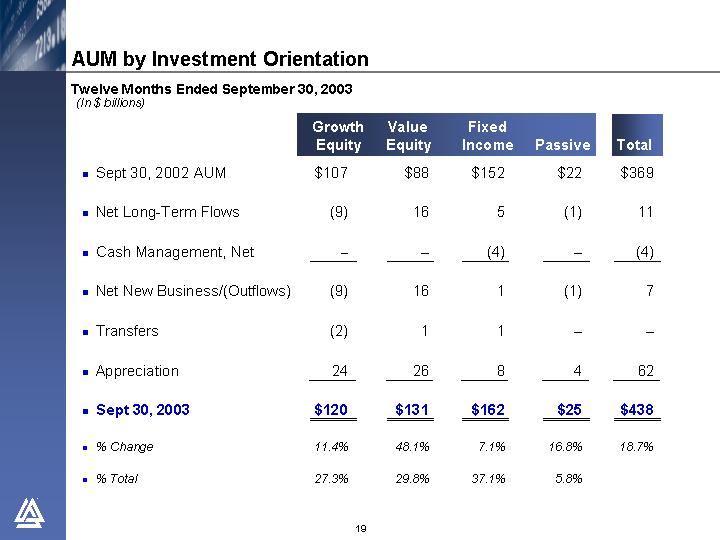
AUM by Investment Orientation
Three Months Ended September 30, 2003
(In $ billions)
|
| Growth |
| Value |
| Fixed |
| Passive |
| Total |
| |||||
• June 30, 2003 AUM |
| $ | 115 |
| $ | 119 |
| $ | 168 |
| $ | 24 |
| $ | 426 |
|
|
|
|
|
|
|
|
|
|
|
|
| |||||
• Net Long-Term Flows |
| (1 | ) | 7 |
| (5 | ) | 1 |
| 2 |
| |||||
|
|
|
|
|
|
|
|
|
|
|
| |||||
• Cash Management, Net |
| — |
| — |
| (2 | ) | — |
| (2 | ) | |||||
|
|
|
|
|
|
|
|
|
|
|
| |||||
• Net New Business/(Outflows) |
| (1 | ) | 7 |
| (7 | ) | 1 |
| — |
| |||||
|
|
|
|
|
|
|
|
|
|
|
| |||||
• Appreciation |
| 6 |
| 5 |
| 1 |
| — |
| 12 |
| |||||
|
|
|
|
|
|
|
|
|
|
|
| |||||
• Sept 30, 2003 |
| $ | 120 |
| $ | 131 |
| $ | 162 |
| $ | 25 |
| $ | 438 |
|
|
|
|
|
|
|
|
|
|
|
|
| |||||
• % Change |
| 4.0 | % | 9.7 | % | -3.6 | % | 6.0 | % | 2.7 | % | |||||
• % Total |
| 27.3 | % | 29.8 | % | 37.1 | % | 5.8 | % |
|
| |||||
[LOGO]
18
Twelve Months Ended September 30, 2003
(In $ billions)
|
| Growth |
| Value |
| Fixed |
| Passive |
| Total |
| |||||
• Sept 30, 2002 AUM |
| $ | 107 |
| $ | 88 |
| $ | 152 |
| $ | 22 |
| $ | 369 |
|
|
|
|
|
|
|
|
|
|
|
|
| |||||
• Net Long-Term Flows |
| (9 | ) | 16 |
| 5 |
| (1 | ) | 11 |
| |||||
|
|
|
|
|
|
|
|
|
|
|
| |||||
• Cash Management, Net |
| — |
| — |
| (4 | ) | — |
| (4 | ) | |||||
|
|
|
|
|
|
|
|
|
|
|
| |||||
• Net New Business/(Outflows) |
| (9 | ) | 16 |
| 1 |
| (1 | ) | 7 |
| |||||
|
|
|
|
|
|
|
|
|
|
|
| |||||
• Transfers |
| (2 | ) | 1 |
| 1 |
| — |
| — |
| |||||
|
|
|
|
|
|
|
|
|
|
|
| |||||
• Appreciation |
| 24 |
| 26 |
| 8 |
| 4 |
| 62 |
| |||||
|
|
|
|
|
|
|
|
|
|
|
| |||||
• Sept 30, 2003 |
| $ | 120 |
| $ | 131 |
| $ | 162 |
| $ | 25 |
| $ | 438 |
|
|
|
|
|
|
|
|
|
|
|
|
| |||||
• % Change |
| 11.4 | % | 48.1 | % | 7.1 | % | 16.8 | % | 18.7 | % | |||||
|
|
|
|
|
|
|
|
|
|
|
| |||||
• % Total |
| 27.3 | % | 29.8 | % | 37.1 | % | 5.8 | % |
|
| |||||
[LOGO]
19
Three Months Ended September 30, 2003
(In $ billions)
|
| Retail |
| Institutional |
| Private |
| Total |
| ||||
• June 30, 2003 AUM |
| $ | 147 |
| $ | 234 |
| $ | 45 |
| $ | 426 |
|
|
|
|
|
|
|
|
|
|
| ||||
• Net Long-Term Flows |
| (3 | ) | 4 |
| 1 |
| 2 |
| ||||
|
|
|
|
|
|
|
|
|
| ||||
• Cash Management, Net |
| (2 | ) | — |
| — |
| (2 | ) | ||||
|
|
|
|
|
|
|
|
|
| ||||
• Net New Business/(Outflows) |
| (5 | ) | 4 |
| 1 |
| — |
| ||||
|
|
|
|
|
|
|
|
|
| ||||
• Appreciation |
| 4 |
| 7 |
| 1 |
| 12 |
| ||||
|
|
|
|
|
|
|
|
|
| ||||
• Sept 30, 2003 AUM |
| $ | 146 |
| $ | 245 |
| $ | 47 |
| $ | 438 |
|
|
|
|
|
|
|
|
|
|
| ||||
• % Change |
| -1.0 | % | 4.6 | % | 5.0 | % | 2.7 | % | ||||
• % Total |
| 33.3 | % | 56.1 | % | 10.7 | % |
|
| ||||
[LOGO]
20
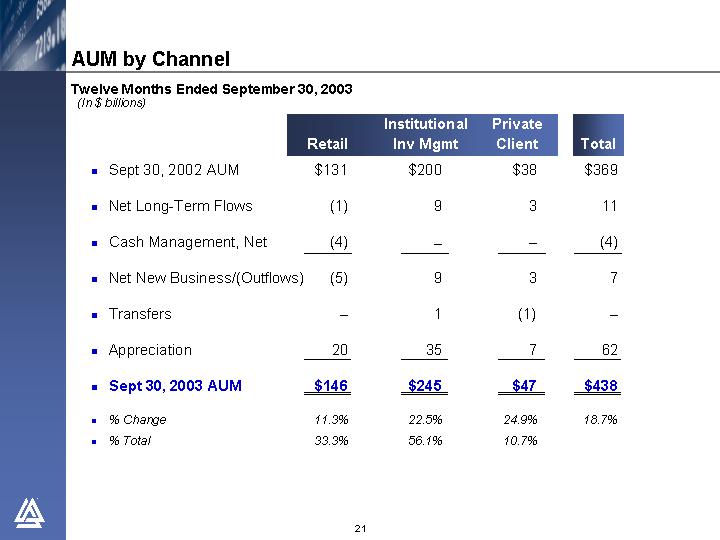
Twelve Months Ended September 30, 2003
(In $ billions)
|
| Retail |
| Institutional |
| Private |
| Total |
| ||||
• Sept 30, 2002 AUM |
| $ | 131 |
| $ | 200 |
| $ | 38 |
| $ | 369 |
|
|
|
|
|
|
|
|
|
|
| ||||
• Net Long-Term Flows |
| (1 | ) | 9 |
| 3 |
| 11 |
| ||||
|
|
|
|
|
|
|
|
|
| ||||
• Cash Management, Net |
| (4 | ) | — |
| — |
| (4 | ) | ||||
|
|
|
|
|
|
|
|
|
| ||||
• Net New Business/(Outflows) |
| (5 | ) | 9 |
| 3 |
| 7 |
| ||||
|
|
|
|
|
|
|
|
|
| ||||
• Transfers |
| — |
| 1 |
| (1 | ) | — |
| ||||
|
|
|
|
|
|
|
|
|
| ||||
• Appreciation |
| 20 |
| 35 |
| 7 |
| 62 |
| ||||
|
|
|
|
|
|
|
|
|
| ||||
• Sept 30, 2003 AUM |
| $ | 146 |
| $ | 245 |
| $ | 47 |
| $ | 438 |
|
|
|
|
|
|
|
|
|
|
| ||||
• % Change |
| 11.3 | % | 22.5 | % | 24.9 | % | 18.7 | % | ||||
• % Total |
| 33.3 | % | 56.1 | % | 10.7 | % |
|
| ||||
[LOGO]
21
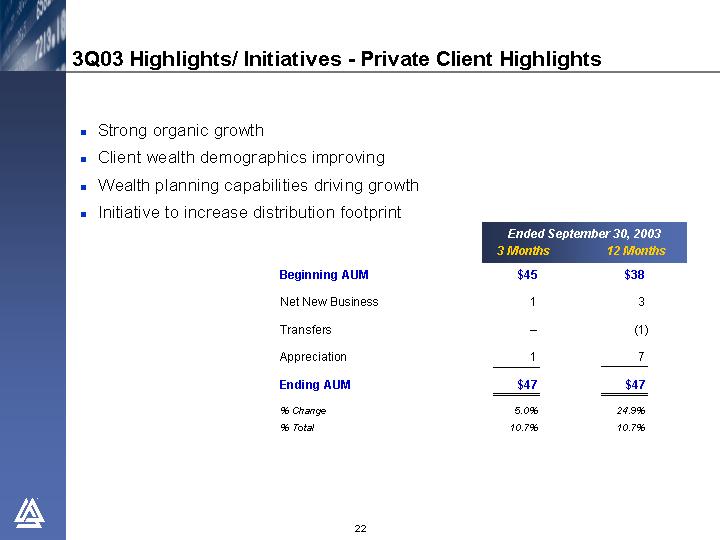
• Strong organic growth
• Client wealth demographics improving
• Wealth planning capabilities driving growth
• Initiative to increase distribution footprint
|
| Ended September 30, 2003 |
| ||||
|
| 3 Months |
| 12 Months |
| ||
Beginning AUM |
| $ | 45 |
| $ | 38 |
|
|
|
|
|
|
| ||
Net New Business |
| 1 |
| 3 |
| ||
|
|
|
|
|
| ||
Transfers |
| — |
| (1 | ) | ||
|
|
|
|
|
| ||
Appreciation |
| 1 |
| 7 |
| ||
|
|
|
|
|
| ||
Ending AUM |
| $ | 47 |
| $ | 47 |
|
|
|
|
|
|
| ||
% Change |
| 5.0 | % | 24.9 | % | ||
% Total |
| 10.7 | % | 10.7 | % | ||
[LOGO]
22
• Organic growth accelerating
• Global products gaining widespread acceptance
• Growth in non-U.S. markets especially strong
|
| Ended September 30, 2003 |
| ||||
|
| 3 Months |
| 12 Months |
| ||
Beginning AUM |
| $ | 234 |
| $ | 200 |
|
|
|
|
|
|
| ||
Net New Business |
| 4 |
| 9 |
| ||
|
|
|
|
|
| ||
Transfers |
| — |
| 1 |
| ||
|
|
|
|
|
| ||
Appreciation |
| 7 |
| 35 |
| ||
|
|
|
|
|
| ||
Ending AUM |
| $ | 245 |
| $ | 245 |
|
|
|
|
|
|
| ||
% Change |
| 4.6 | % | 22.5 | % | ||
% Total |
| 56.1 | % | 56.1 | % | ||
[LOGO]
23
• Net cash flow weak
• Initiatives to invigorate growth underway
• Launch of Wealth Strategies fund family
• Value based services gaining traction
• AB Regent managed account service revitalized
• Non-U.S. field force to be expanded
|
| Ended September 30, 2003 |
| ||||
|
| 3 Months |
| 12 Months |
| ||
Beginning AUM |
| $ | 147 |
| $ | 131 |
|
|
|
|
|
|
| ||
Net Long-Term Flows |
| (3 | ) | (1 | ) | ||
|
|
|
|
|
| ||
Net Cash Management |
| (2 | ) | (4 | ) | ||
|
|
|
|
|
| ||
Net Outflows |
| (5 | ) | (5 | ) | ||
|
|
|
|
|
| ||
Appreciation |
| 4 |
| 20 |
| ||
|
|
|
|
|
| ||
Ending AUM |
| $ | 146 |
| $ | 146 |
|
|
|
|
|
|
| ||
% Change |
| -1.0 | % | 11.3 | % | ||
% Total |
| 33.3 | % | 33.3 | % | ||
[LOGO]
24
3Q03 Highlights/ Initiatives - Institutional Research Svcs
• Bernstein research highly rated by All-American Institutional Investor Survey; ranked slots increased to 11 from 9
• Lower transaction volume but higher market share of NYSE volume and higher price realization
• Launched coverage of 2 new industries
• Continued strong momentum in London
[LOGO]
25
• Worldwide research and investment capabilities
• Unique with strengths in both growth and value equity investing
• Broad array of fixed income services
• Generally competitive long-term investment results
• Highly regarded marketing and client service teams
• Well-positioned in retail, institutional and private client channels
• Highly valued independent sell-side research and institutional trading
• Strong financials
• Cogent strategy
[LOGO]
26
27
As of September 30, 2003
Wholesale |
| Direct Sales | ||||
|
|
| ||||
Retail |
| Institutional |
| Private Client |
| Institutional |
|
|
|
|
|
|
|
[LOGO] |
| [LOGO] |
| [LOGO] |
| Sanford C. Bernstein |
|
|
|
|
|
|
|
• 7.2 million accounts |
| • 2,100+ client relationships |
| • 21,000+ client relationships |
| • 1,000 client relationships |
|
|
|
|
|
|
|
• 52 U.S. mutual funds(1) |
| • 43 of Fortune 100 companies |
| • 11 client offices in U.S. |
| • 38 senior analysts |
|
|
|
|
|
|
|
• 16 non-U.S. mutual funds(2) |
| • Public pension funds across 43 states |
| • Referral network of 9,100+ lawyers and accountants |
| • Independent research |
(1) Does not reflect fund portfolios. (2) Luxembourg-registered funds managed by Alliance Capital, excludes local market funds.
[LOGO]
28
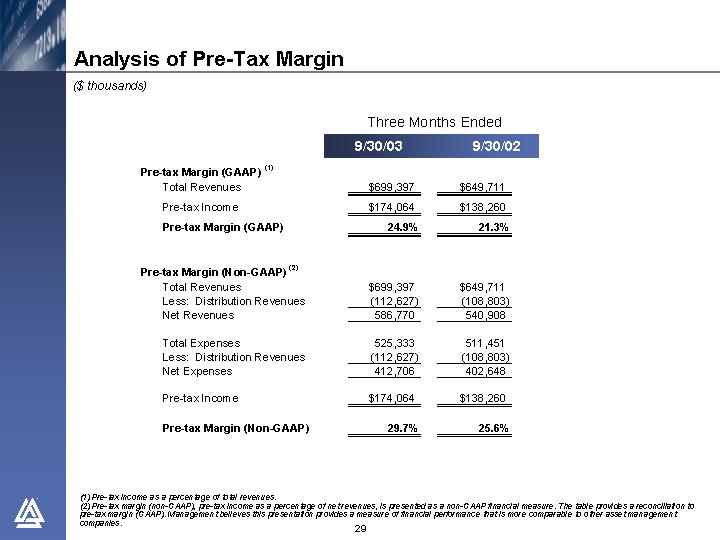
($ thousands)
|
| Three Months Ended |
| ||||
|
| 9/30/03 |
| 9/30/02 |
| ||
Pre-tax Margin (GAAP) (1) |
|
|
|
|
| ||
Total Revenues |
| $ | 699,397 |
| $ | 649,711 |
|
Pre-tax Income |
| $ | 174,064 |
| $ | 138,260 |
|
Pre-tax Margin (GAAP) |
| 24.9 | % | 21.3 | % | ||
|
|
|
|
|
| ||
Pre-tax Margin (Non-GAAP) (2) |
|
|
|
|
| ||
Total Revenues |
| $ | 699,397 |
| $ | 649,711 |
|
Less: Distribution Revenues |
| (112,627 | ) | (108,803 | ) | ||
Net Revenues |
| 586,770 |
| 540,908 |
| ||
|
|
|
|
|
| ||
Total Expenses |
| 525,333 |
| 511,451 |
| ||
Less: Distribution Revenues |
| (112,627 | ) | (108,803 | ) | ||
Net Expenses |
| 412,706 |
| 402,648 |
| ||
|
|
|
|
|
| ||
Pre-tax Income |
| $ | 174,064 |
| $ | 138,260 |
|
|
|
|
|
|
| ||
Pre-tax Margin (Non-GAAP) |
| 29.7 | % | 25.6 | % | ||
(1) Pre-tax income as a percentage of total revenues.
(2) Pre-tax margin (non-GAAP), pre-tax income as a percentage of net revenues, is presented as a non-GAAP financial measure. The table provides a reconciliation to pre-tax margin (GAAP). Management believes this presentation provides a measure of financial performance that is more comparable to other asset management companies.
[LOGO]
29
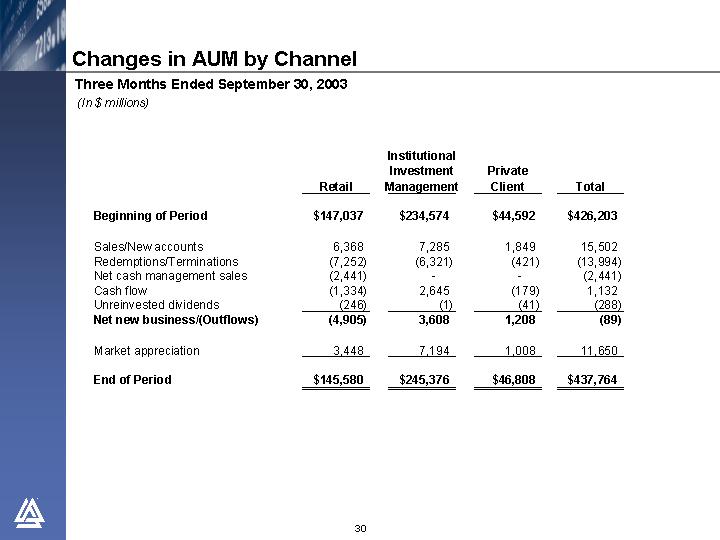
Three Months Ended September 30, 2003
(In $ millions)
|
| Retail |
| Institutional |
| Private |
| Total |
| ||||
|
|
|
|
|
|
|
|
|
| ||||
Beginning of Period |
| $ | 147,037 |
| $ | 234,574 |
| $ | 44,592 |
| $ | 426,203 |
|
|
|
|
|
|
|
|
|
|
| ||||
Sales/New accounts |
| 6,368 |
| 7,285 |
| 1,849 |
| 15,502 |
| ||||
Redemptions/Terminations |
| (7,252 | ) | (6,321 | ) | (421 | ) | (13,994 | ) | ||||
Net cash management sales |
| (2,441 | ) | — |
| — |
| (2,441 | ) | ||||
Cash flow |
| (1,334 | ) | 2,645 |
| (179 | ) | 1,132 |
| ||||
Unreinvested dividends |
| (246 | ) | (1 | ) | (41 | ) | (288 | ) | ||||
Net new business/(Outflows) |
| (4,905 | ) | 3,608 |
| 1,208 |
| (89 | ) | ||||
|
|
|
|
|
|
|
|
|
| ||||
Market appreciation |
| 3,448 |
| 7,194 |
| 1,008 |
| 11,650 |
| ||||
|
|
|
|
|
|
|
|
|
| ||||
End of Period |
| $ | 145,580 |
| $ | 245,376 |
| $ | 46,808 |
| $ | 437,764 |
|
[LOGO]
30
Three Months Ended September 30, 2003
(In $ millions)
|
| Growth |
| Value |
| Fixed |
| Passive |
| Total |
| |||||
|
|
|
|
|
|
|
|
|
|
|
| |||||
Beginning of Period |
| $ | 114,963 |
| $ | 118,969 |
| $ | 168,386 |
| $ | 23,885 |
| $ | 426,203 |
|
|
|
|
|
|
|
|
|
|
|
|
| |||||
Sales/New accounts |
| 3,371 |
| 7,685 |
| 3,868 |
| 578 |
| 15,502 |
| |||||
Redemptions/Terminations |
| (3,182 | ) | (2,330 | ) | (8,326 | ) | (156 | ) | (13,994 | ) | |||||
Net cash management sales |
| — |
| — |
| (2,441 | ) | — |
| (2,441 | ) | |||||
Cash flow |
| (809 | ) | 1,209 |
| 582 |
| 150 |
| 1,132 |
| |||||
Unreinvested dividends |
| — |
| (8 | ) | (280 | ) | — |
| (288 | ) | |||||
Net new business/(Outflows) |
| (620 | ) | 6,556 |
| (6,597 | ) | 572 |
| (89 | ) | |||||
|
|
|
|
|
|
|
|
|
|
|
| |||||
Market appreciation |
| 5,251 |
| 4,944 |
| 602 |
| 853 |
| 11,650 |
| |||||
|
|
|
|
|
|
|
|
|
|
|
| |||||
End Of Period |
| $ | 119,594 |
| $ | 130,469 |
| $ | 162,391 |
| $ | 25,310 |
| $ | 437,764 |
|
[LOGO]
31
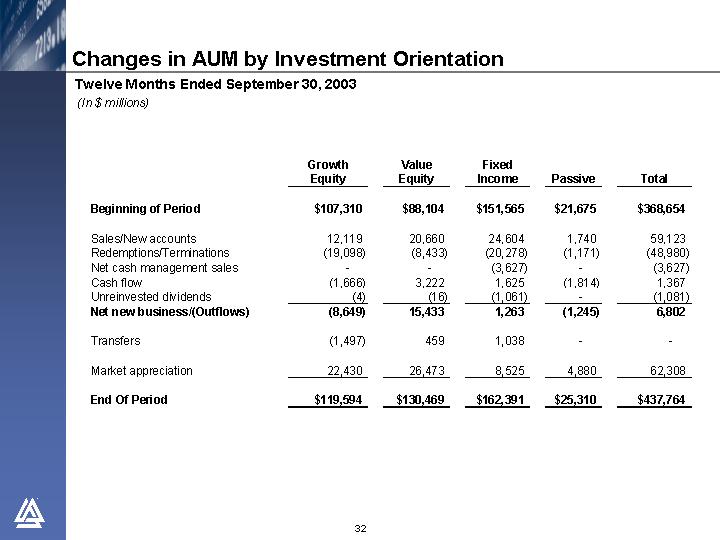
Changes in AUM by Investment Orientation
Twelve Months Ended September 30, 2003
(In $ millions)
|
| Growth |
| Value |
| Fixed |
| Passive |
| Total |
| |||||
|
|
|
|
|
|
|
|
|
|
|
| |||||
Beginning of Period |
| $ | 107,310 |
| $ | 88,104 |
| $ | 151,565 |
| $ | 21,675 |
| $ | 368,654 |
|
|
|
|
|
|
|
|
|
|
|
|
| |||||
Sales/New accounts |
| 12,119 |
| 20,660 |
| 24,604 |
| 1,740 |
| 59,123 |
| |||||
Redemptions/Terminations |
| (19,098 | ) | (8,433 | ) | (20,278 | ) | (1,171 | ) | (48,980 | ) | |||||
Net cash management sales |
| — |
| — |
| (3,627 | ) | — |
| (3,627 | ) | |||||
Cash flow |
| (1,666 | ) | 3,222 |
| 1,625 |
| (1,814 | ) | 1,367 |
| |||||
Unreinvested dividends |
| (4 | ) | (16 | ) | (1,061 | ) | — |
| (1,081 | ) | |||||
Net new business/(Outflows) |
| (8,649 | ) | 15,433 |
| 1,263 |
| (1,245 | ) | 6,802 |
| |||||
|
|
|
|
|
|
|
|
|
|
|
| |||||
Transfers |
| (1,497 | ) | 459 |
| 1,038 |
| — |
| — |
| |||||
|
|
|
|
|
|
|
|
|
|
|
| |||||
Market appreciation |
| 22,430 |
| 26,473 |
| 8,525 |
| 4,880 |
| 62,308 |
| |||||
|
|
|
|
|
|
|
|
|
|
|
| |||||
End Of Period |
| $ | 119,594 |
| $ | 130,469 |
| $ | 162,391 |
| $ | 25,310 |
| $ | 437,764 |
|
[LOGO]
32
Changes in Retail AUM by Investment Orientation
Twelve Months Ended September 30, 2003
(In $ millions)
|
| Growth |
| Value |
| Fixed |
| Cash |
| Total |
| |||||
|
|
|
|
|
|
|
|
|
|
|
| |||||
Beginning Of Period |
| $ | 41,992 |
| $ | 20,613 |
| $ | 32,933 |
| $ | 35,312 |
| $ | 130,850 |
|
|
|
|
|
|
|
|
|
|
|
|
| |||||
Sales |
| 8,648 |
| 6,157 |
| 12,061 |
| — |
| 26,866 |
| |||||
Redemptions |
| (11,413 | ) | (4,670 | ) | (10,210 | ) | — |
| (26,293 | ) | |||||
Net cash management sales |
| — |
| — |
| — |
| (3,627 | ) | (3,627 | ) | |||||
Cash flow |
| (1,245 | ) | 190 |
| (260 | ) | — |
| (1,315 | ) | |||||
Unreinvested dividends |
| (3 | ) | (16 | ) | (908 | ) | — |
| (927 | ) | |||||
Net new business/(Outflows) |
| (4,013 | ) | 1,661 |
| 683 |
| (3,627 | ) | (5,296 | ) | |||||
|
|
|
|
|
|
|
|
|
|
|
| |||||
Transfers |
| (1,497 | ) | 459 |
| 1,038 |
| — |
| — |
| |||||
|
|
|
|
|
|
|
|
|
|
|
| |||||
Market appreciation |
| 10,147 |
| 5,940 |
| 3,939 |
| — |
| 20,026 |
| |||||
|
|
|
|
|
|
|
|
|
|
|
| |||||
End Of Period |
| $ | 46,629 |
| $ | 28,673 |
| $ | 38,593 |
| $ | 31,685 |
| $ | 145,580 |
|
[LOGO]
33
Twelve Months Ended September 30, 2003
(In $ millions)
|
| U.S. |
| Non-U.S. |
| Variable |
| Managed |
| Total |
| |||||
|
|
|
|
|
|
|
|
|
|
|
| |||||
Beginning Of Period |
| $ | 75,819 |
| $ | 17,158 |
| $ | 31,078 |
| $ | 6,795 |
| $ | 130,850 |
|
|
|
|
|
|
|
|
|
|
|
|
| |||||
Sales |
| 7,629 |
| 10,264 |
| 7,749 |
| 1,224 |
| 26,866 |
| |||||
Redemptions |
| (10,486 | ) | (7,787 | ) | (5,903 | ) | (2,117 | ) | (26,293 | ) | |||||
Net cash management sales |
| (3,627 | ) | 0 |
| 0 |
| 0 |
| (3,627 | ) | |||||
Cash flow |
| 71 |
| 491 |
| (1,877 | ) | 0 |
| (1,315 | ) | |||||
Unreinvested dividends |
| (611 | ) | (316 | ) | 0 |
| 0 |
| (927 | ) | |||||
Net new business/(Outflows) |
| (7,024 | ) | 2,652 |
| (31 | ) | (893 | ) | (5,296 | ) | |||||
|
|
|
|
|
|
|
|
|
|
|
| |||||
Market appreciation |
| 7,645 |
| 3,738 |
| 7,590 |
| 1,053 |
| 20,026 |
| |||||
|
|
|
|
|
|
|
|
|
|
|
| |||||
End Of Period |
| $ | 76,440 |
| $ | 23,548 |
| $ | 38,637 |
| $ | 6,955 |
| $ | 145,580 |
|
[LOGO]
34
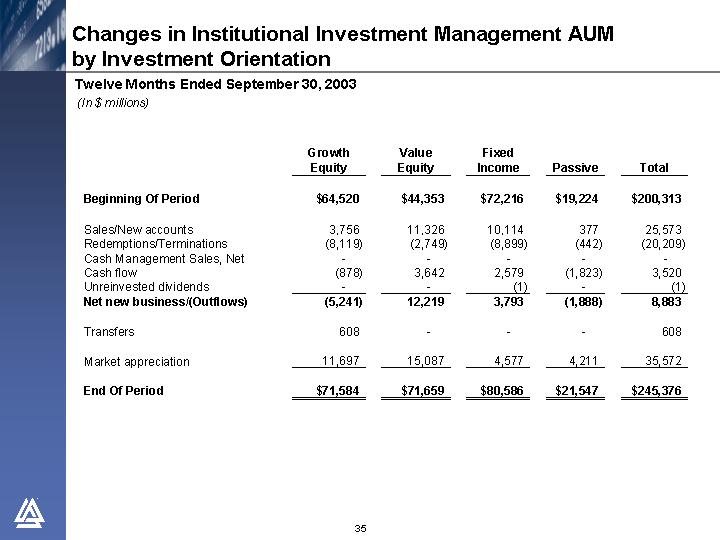
Changes in Institutional Investment Management AUM
by Investment Orientation
Twelve Months Ended September 30, 2003
(In $ millions)
|
| Growth |
| Value |
| Fixed |
| Passive |
| Total |
| |||||
|
|
|
|
|
|
|
|
|
|
|
| |||||
Beginning Of Period |
| $ | 64,520 |
| $ | 44,353 |
| $ | 72,216 |
| $ | 19,224 |
| $ | 200,313 |
|
|
|
|
|
|
|
|
|
|
|
|
| |||||
Sales/New accounts |
| 3,756 |
| 11,326 |
| 10,114 |
| 377 |
| 25,573 |
| |||||
Redemptions/Terminations |
| (8,119 | ) | (2,749 | ) | (8,899 | ) | (442 | ) | (20,209 | ) | |||||
Cash Management Sales, Net |
| — |
| — |
| — |
| — |
| — |
| |||||
Cash flow |
| (878 | ) | 3,642 |
| 2,579 |
| (1,823 | ) | 3,520 |
| |||||
Unreinvested dividends |
| — |
| — |
| (1 | ) | — |
| (1 | ) | |||||
Net new business/(Outflows) |
| (5,241 | ) | 12,219 |
| 3,793 |
| (1,888 | ) | 8,883 |
| |||||
|
|
|
|
|
|
|
|
|
|
|
| |||||
Transfers |
| 608 |
| — |
| — |
| — |
| 608 |
| |||||
|
|
|
|
|
|
|
|
|
|
|
| |||||
Market appreciation |
| 11,697 |
| 15,087 |
| 4,577 |
| 4,211 |
| 35,572 |
| |||||
|
|
|
|
|
|
|
|
|
|
|
| |||||
End Of Period |
| $ | 71,584 |
| $ | 71,659 |
| $ | 80,586 |
| $ | 21,547 |
| $ | 245,376 |
|
[LOGO]
35
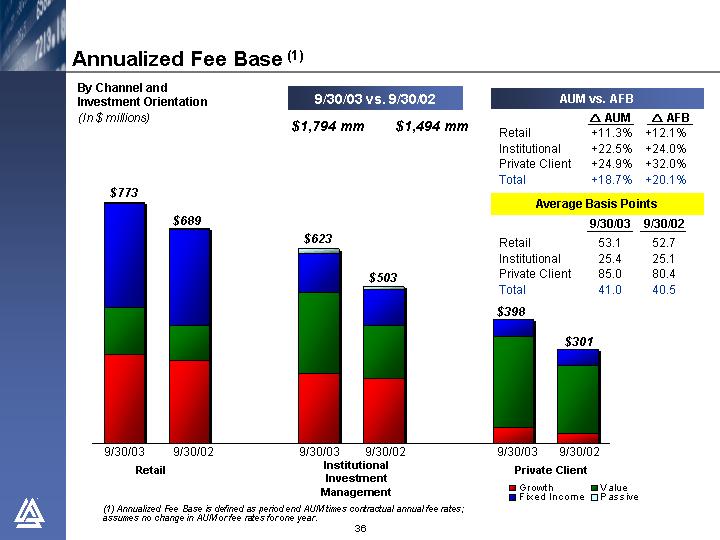
By Channel and |
| 9/30/03 vs. 9/30/02 |
| AUM vs. AFB |
| ||||||||
|
|
|
|
|
|
|
|
|
|
| |||
| $ | 1,794 mm |
| $ | 1,494 mm |
| Retail |
| +11.3 | % | +12.1 | % | |
|
|
|
|
|
| Institutional |
| +22.5 | % | +24.0 | % | ||
|
|
|
|
|
| Private Client |
| +24.9 | % | +32.0 | % | ||
|
|
|
|
|
| Total |
| +18.7 | % | +20.1 | % | ||
|
|
|
|
|
|
|
|
|
|
|
| ||
|
|
|
|
|
| Average Basis Points |
| ||||||
|
|
|
|
|
|
|
| 9/30/03 |
| 9/30/02 |
| ||
|
|
|
|
|
| Retail |
| 53.1 |
| 52.7 |
| ||
|
|
|
|
|
| Institutional |
| 25.4 |
| 25.1 |
| ||
|
|
|
|
|
| Private Client |
| 85.0 |
| 80.4 |
| ||
|
|
|
|
|
| Total |
| 41.0 |
| 40.5 |
| ||
[CHART]
(1) Annualized Fee Base is defined as period end AUM times contractual annual fee rates; assumes no change in AUM or fee rates for one year.
[LOGO]
36
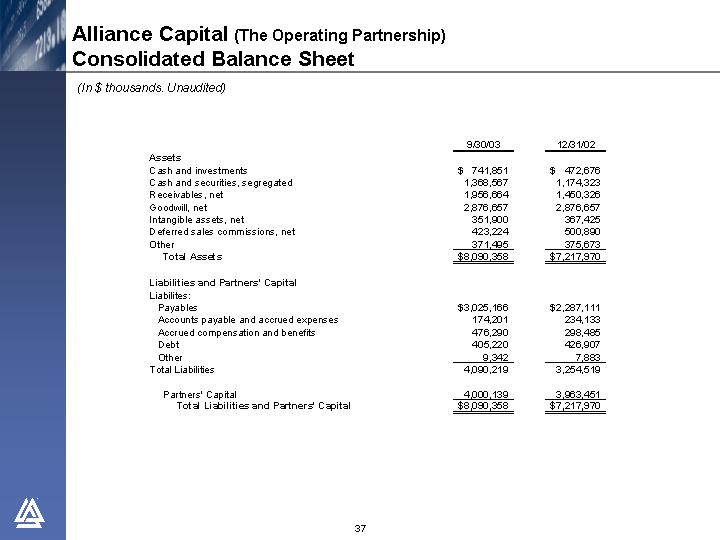
Alliance Capital (The Operating Partnership)
Consolidated Balance Sheet
(In $ thousands. Unaudited)
|
| 9/30/03 |
| 12/31/02 |
| ||
Assets |
|
|
|
|
| ||
Cash and investments |
| $ | 741,851 |
| $ | 472,676 |
|
Cash and securities, segregated |
| 1,368,567 |
| 1,174,323 |
| ||
Receivables, net |
| 1,956,664 |
| 1,450,326 |
| ||
Goodwill, net |
| 2,876,657 |
| 2,876,657 |
| ||
Intangible assets, net |
| 351,900 |
| 367,425 |
| ||
Deferred sales commissions, net |
| 423,224 |
| 500,890 |
| ||
Other |
| 371,495 |
| 375,673 |
| ||
Total Assets |
| $ | 8,090,358 |
| $ | 7,217,970 |
|
|
|
|
|
|
| ||
Liabilities and Partners’ Capital |
|
|
|
|
| ||
Liabilites: |
|
|
|
|
| ||
Payables |
| $ | 3,025,166 |
| $ | 2,287,111 |
|
Accounts payable and accrued expenses |
| 174,201 |
| 234,133 |
| ||
Accrued compensation and benefits |
| 476,290 |
| 298,485 |
| ||
Debt |
| 405,220 |
| 426,907 |
| ||
Other |
| 9,342 |
| 7,883 |
| ||
Total Liabilities |
| 4,090,219 |
| 3,254,519 |
| ||
|
|
|
|
|
| ||
Partners’ Capital |
| 4,000,139 |
| 3,963,451 |
| ||
Total Liabilities and Partners’ Capital |
| $ | 8,090,358 |
| $ | 7,217,970 |
|
[LOGO]
37
Alliance Capital (The Operating Partnership)
Consolidated Cash Flow
(In $ thousands. Unaudited)
|
| Nine Months Ended |
| ||||
|
| 9/30/03 |
| 9/30/02 |
| ||
|
|
|
|
|
| ||
Cash Flows From Operating Activities: |
|
|
|
|
| ||
Net income |
| $ | 422,044 |
| $ | 464,261 |
|
Non-cash items: |
|
|
|
|
| ||
Amortization and depreciation: |
|
|
|
|
| ||
Amortization of deferred sales commissions |
| 157,794 |
| 174,001 |
| ||
Amortization of deferred compensation |
| 95,961 |
| 69,127 |
| ||
Other depreciation and amortization |
| 54,253 |
| 54,000 |
| ||
Other, net |
| (6,182 | ) | 3,085 |
| ||
Changes in assets and liabilities |
| 5,074 |
| 51,109 |
| ||
Net cash provided from operating activities |
| 728,944 |
| 815,583 |
| ||
|
|
|
|
|
| ||
Cash Flows From Investing Activities: |
|
|
|
|
| ||
(Sale) Purchase of investments, net |
| (45,704 | ) | (77,360 | ) | ||
Additions to furniture, equipment and leaseholds, net |
| (20,571 | ) | (43,246 | ) | ||
Net cash (used in) investing actvities |
| (66,275 | ) | (120,606 | ) | ||
|
|
|
|
|
| ||
Cash Flows From Financing Activities: |
|
|
|
|
| ||
Increase (decrease) in debt, net |
| (22,078 | ) | (195,956 | ) | ||
Distributions to partners |
| (404,420 | ) | (520,469 | ) | ||
Other |
| (52,932 | ) | (54,916 | ) | ||
Net cash (used in) financing activities |
| (479,430 | ) | (771,341 | ) | ||
|
|
|
|
|
| ||
Effect of exchange rate change on cash |
| 5,924 |
| 4,275 |
| ||
|
|
|
|
|
| ||
Net increase (decrease) in cash |
| 189,163 |
| (72,089 | ) | ||
Cash at the beginning of period |
| 159,991 |
| 220,127 |
| ||
Cash at the end of period |
| $ | 349,154 |
| $ | 148,038 |
|
[LOGO]
38
Alliance Capital provides diversified investment management and related services globally to a broad range of clients:
1. Retail Services consists of investment management products and services distributed to individual investors through financial intermediaries, such as brokers and financial planners by means of:
• mutual funds sponsored by Alliance Capital and consolidated joint venture companies,
• cash management products such as money market funds and deposit accounts,
• mutual fund sub-advisory relationships resulting from the efforts of the mutual fund marketing department, and
• managed account products;
2. Institutional Investment Management Services consists of investment management services to unaffiliated parties such as corporate and public employee pension funds, endowment funds, domestic and foreign institutions and governments, and affiliates such as AXA and its insurance company subsidiaries by means of:
• separate accounts,
• mutual fund shares sold exclusively to institutional investors and high net worth individuals,
• sub-advisory relationships resulting from the efforts of the institutional marketing department,
• structured products, and
• group trusts;
3. Private Client Services consists of investment management services provided to high net worth individuals, trusts and estates, charitable foundations, partnerships, private and family corporations and other entities by means of:
• separate accounts,
• hedge funds and
• certain other vehicles; and
4. Institutional Research Services provided to institutional clients by means of:
• in-depth research,
• portfolio strategy,
• trading and
• brokerage-related services.
[LOGO]
39
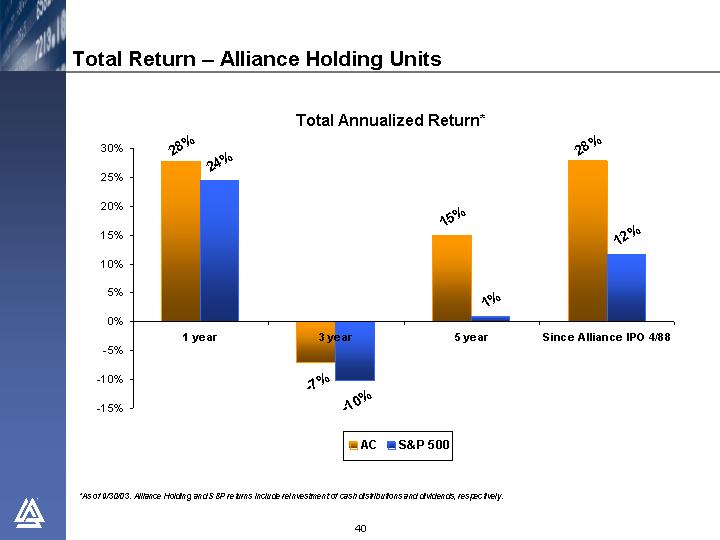
Total Return – Alliance Holding Units
TOTAL ANNUALIZED RETURN*
[CHART]
*As of 9/30/03. Alliance Holding and S&P returns include reinvestment of cash distributions and dividends, respectively.
[LOGO]
40