EXHIBIT 99.03

Link to searchable text of slide shown above
Link to searchable text of slide shown above

Link to searchable text of slide shown above

Link to searchable text of slide shown above
Link to searchable text of slide shown above
Link to searchable text of slide shown above

Link to searchable text of slide shown above

Link to searchable text of slide shown above
Link to searchable text of slide shown above
Link to searchable text of slide shown above
Link to searchable text of slide shown above

Link to searchable text of slide shown above
Link to searchable text of slide shown above

Link to searchable text of slide shown above
Link to searchable text of slide shown above
Link to searchable text of slide shown above
Link to searchable text of slide shown above

Link to searchable text of slide shown above

Link to searchable text of slide shown above
Link to searchable text of slide shown above
Link to searchable text of slide shown above
Link to searchable text of slide shown above

Link to searchable text of slide shown above

Link to searchable text of slide shown above
Link to searchable text of slide shown above
Link to searchable text of slide shown above

Link to searchable text of slide shown above
Link to searchable text of slide shown above
Link to searchable text of slide shown above

Link to searchable text of slide shown above
Link to searchable text of slide shown above
Link to searchable text of slide shown above
Link to searchable text of slide shown above
Searchable text section of graphics shown above
Alliance Capital and Alliance Holding
Fourth Quarter and Full Year 2003 Review
Lewis A. Sanders
Chief Executive Officer | | Gerald M. Lieberman
Chief Operating Officer |
January 29, 2004

Introduction
The SEC adopted Regulation FD in October 2000. In light of Regulation FD, Management will be limited in responding to inquiries from investors or analysts in a non-public forum. You are encouraged to ask all questions of a material nature on this conference call.
Forward-Looking Statements
Certain statements provided by Alliance Capital Management L.P. (“Alliance Capital”) and Alliance Capital Management Holding L.P. (“Alliance Holding”) in this report are “forward-looking statements” within the meaning of the Private Securities Litigation Reform Act of 1995. Such forward-looking statements are subject to risks, uncertainties and other factors which could cause actual results to differ materially from future results expressed or implied by such forward-looking statements. The most significant of such factors include, but are not limited to, the following: the performance of financial markets, the investment performance of Alliance Capital’s sponsored investment products and separately managed accounts, general economic conditions, future acquisitions, competitive conditions, and government regulations, including changes in tax rates. Alliance Capital and Alliance Holding caution readers to carefully consider such factors. Further, such forward-looking statements speak only as of the date on which such statements are made; Alliance Capital and Alliance Holding undertake no obligation to update any forward-looking statements to reflect events or circumstances after the date of such statements.

2
Improved Equity Market Environment
| | 4Q03 | | 2003 | | 2002 | | Annualized
3 Yr | | Cumulative
3 Yr | |
| | | | | | | | | | | |
S&P 500 | | 12.2 | % | 28.7 | % | -22.1 | % | -4.1 | % | -11.7 | % |
| | | | | | | | | | | |
Russell 1000 Growth | | 10.4 | % | 29.8 | % | -27.9 | % | -9.4 | % | -25.5 | % |
| | | | | | | | | | | |
Russell 1000 Value | | 14.2 | % | 30.0 | % | -15.5 | % | 1.2 | % | 3.7 | % |
| | | | | | | | | | | |
MSCI EAFE | | 17.1 | % | 38.6 | % | -15.9 | % | -2.9 | % | -8.5 | % |
| | | | | | | | | | | |
Lehman Aggregate Bond | | 0.3 | % | 4.1 | % | 10.3 | % | 7.6 | % | 24.5 | % |
Returns through December 31, 2003

3
Investment Performance
Institutional Value Equity
• Large Cap value services generally outperformed benchmarks in 2003; significantly outperformed the broader markets
• Particularly strong in Emerging Markets and Relative Value
• Very competitive over 3, 5, and 10 year periods
Institutional Growth Equity
• Large Cap growth services underperformed benchmarks, primarily due to a quality orientation to security selection
• Other growth services generally outperformed, in some cases by substantial margins
Institutional Fixed Income
• Outperformed benchmarks in 2003 for all major services, except High Yield
• Long-term results generally competitive

4
Investment Performance
Retail Value Equity
• Strong performance relative to Lipper averages over nearly all periods
• Three-year anniversary for AB value services in April 2004
Retail Growth Equity
• Large Cap Growth and Technology services underperformed the Lipper averages
• Short and long-term outperformance in Mid-Cap, Global Growth Research and other services mirrored comparable institutional results
• Regent Large Cap Core, our largest managed account service, had significant outperformance
Retail Fixed Income
• Single sector, style-pure funds - Corporate Bond and Emerging Market Debt - significantly outperformed Lipper averages; High Yield fund underperformed the Lipper average
• Multi-sector, style-blend funds - Americas Government Income and American Income produced strong relative returns
Private Client
• Balanced accounts lead global balanced benchmark for 1, 3, and 5 year periods

5
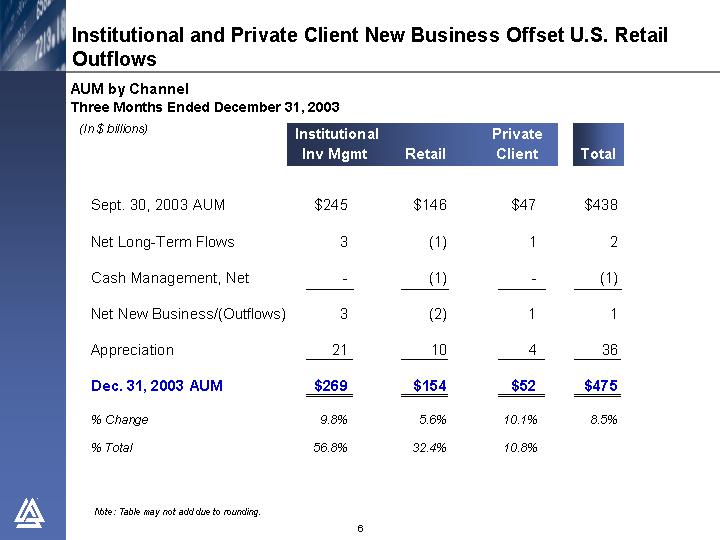
Institutional and Private Client New Business Offset U.S. Retail Outflows
AUM by Channel
Three Months Ended December 31, 2003
(In $ billions)
| | Institutional
Inv Mgmt | | Retail | | Private
Client | | Total | |
| | | | | | | | | |
Sept. 30, 2003 AUM | | $ | 245 | | $ | 146 | | $ | 47 | | $ | 438 | |
| | | | | | | | | |
Net Long-Term Flows | | 3 | | (1 | ) | 1 | | 2 | |
| | | | | | | | | |
Cash Management, Net | | — | | (1 | ) | — | | (1 | ) |
| | | | | | | | | |
Net New Business/(Outflows) | | 3 | | (2 | ) | 1 | | 1 | |
| | | | | | | | | |
Appreciation | | 21 | | 10 | | 4 | | 36 | |
| | | | | | | | | |
Dec. 31, 2003 AUM | | $ | 269 | | $ | 154 | | $ | 52 | | $ | 475 | |
| | | | | | | | | |
% Change | | 9.8 | % | 5.6 | % | 10.1 | % | 8.5 | % |
| | | | | | | | | |
% Total | | 56.8 | % | 32.4 | % | 10.8 | % | | |
Note: Table may not add due to rounding.

6
Market Appreciation and Value Equity Inflows Drive AUM Growth
AUM by Investment Orientation
Three Months Ended December 31, 2003
(In $ billions)
| | Value
Equity | | Growth
Equity | | Fixed
Income | | Passive | | Total | |
| | | | | | | | | | | |
Sept. 30, 2003 AUM | | $ | 131 | | $ | 120 | | $ | 162 | | $ | 25 | | $ | 438 | |
| | | | | | | | | | | |
Net Long-Term Flows | | 7 | | (4 | ) | — | | — | | 2 | |
| | | | | | | | | | | |
Cash Management, Net | | — | | — | | (1 | ) | — | | (1 | ) |
| | | | | | | | | | | |
Net New Business/(Outflows) | | 7 | | (4 | ) | (1 | ) | — | | 1 | |
| | | | | | | | | | | |
Appreciation | | 18 | | 12 | | 3 | | 3 | | 36 | |
| | | | | | | | | | | |
Dec. 31, 2003 AUM | | $ | 155 | | $ | 127 | | $ | 164 | | $ | 29 | | $ | 475 | |
| | | | | | | | | | | |
% Change | | 18.7 | % | 6.3 | % | 1.2 | % | 12.5 | % | 8.5 | % |
| | | | | | | | | | | |
% Total | | 32.6 | % | 26.8 | % | 34.6 | % | 6.0 | % | | |
Note: Table may not add due to rounding.

7
AUM up 23% - - $88 Billion
AUM by Channel
Twelve Months Ended December 31, 2003
(In $ billions)
| | Institutional
Inv Mgmt | | Retail | | Private
Client | | Total | |
| | | | | | | | | |
Dec. 31, 2002 AUM | | $ | 211 | | $ | 136 | | $ | 40 | | $ | 387 | |
| | | | | | | | | |
Net Long-Term Flows | | 10 | | (2 | ) | 4 | | 13 | |
| | | | | | | | | |
Cash Management, Net | | — | | (5 | ) | — | | (5 | ) |
| | | | | | | | | |
Net New Business/(Outflows) | | 10 | | (7 | ) | 4 | | 8 | |
| | | | | | | | | |
Transfers | | 1 | | — | | (1 | ) | — | |
| | | | | | | | | |
Appreciation | | 47 | | 25 | | 8 | | 80 | |
| | | | | | | | | |
Dec. 31, 2003 AUM | | $ | 269 | | $ | 154 | | $ | 52 | | $ | 475 | |
| | | | | | | | | |
% Change | | 27.7 | % | 13.2 | % | 29.8 | % | 22.8 | % |
% Total | | 56.8 | % | 32.4 | % | 10.8 | % | | |
Note: Table may not add due to rounding.

8
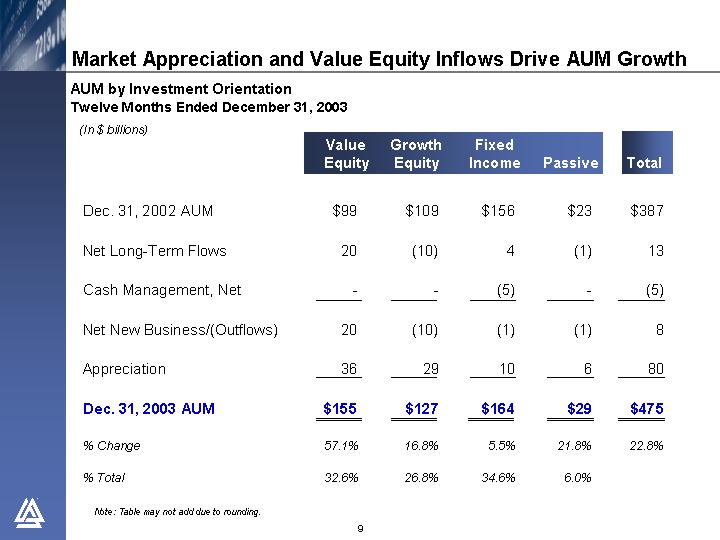
Market Appreciation and Value Equity Inflows Drive AUM Growth
AUM by Investment Orientation
Twelve Months Ended December 31, 2003
(In $ billions)
| | Value
Equity | | Growth
Equity | | Fixed
Income | | Passive | | Total | |
| | | | | | | | | | | |
Dec. 31, 2002 AUM | | $ | 99 | | $ | 109 | | $ | 156 | | $ | 23 | | $ | 387 | |
| | | | | | | | | | | |
Net Long-Term Flows | | 20 | | (10 | ) | 4 | | (1 | ) | 13 | |
| | | | | | | | | | | |
Cash Management, Net | | — | | — | | (5 | ) | — | | (5 | ) |
| | | | | | | | | | | |
Net New Business/(Outflows) | | 20 | | (10 | ) | (1 | ) | (1 | ) | 8 | |
| | | | | | | | | | | |
Appreciation | | 36 | | 29 | | 10 | | 6 | | 80 | |
| | | | | | | | | | | |
Dec. 31, 2003 AUM | | $ | 155 | | $ | 127 | | $ | 164 | | $ | 29 | | $ | 475 | |
| | | | | | | | | | | |
% Change | | 57.1 | % | 16.8 | % | 5.5 | % | 21.8 | % | 22.8 | % |
| | | | | | | | | | | |
% Total | | 32.6 | % | 26.8 | % | 34.6 | % | 6.0 | % | | |
Note: Table may not add due to rounding.

9
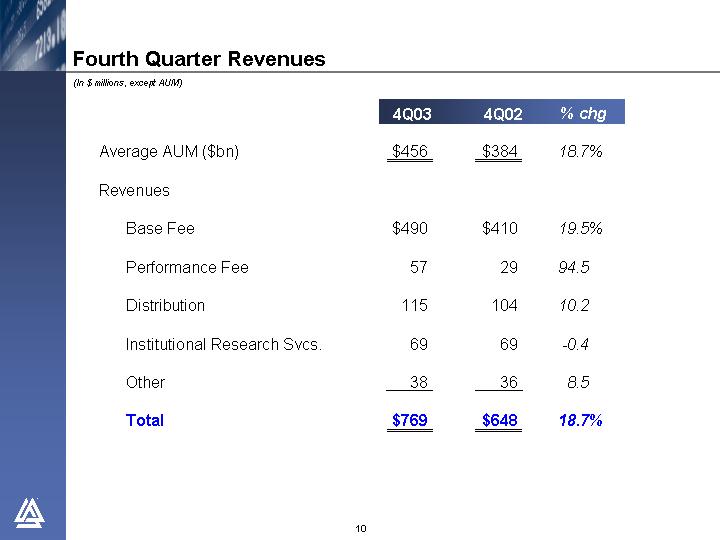
Fourth Quarter Revenues
(In $ millions, except AUM)
| | 4Q03 | | 4Q02 | | % chg | |
| | | | | | | |
Average AUM ($bn) | | $ | 456 | | $ | 384 | | 18.7 | % |
| | | | | | | |
Revenues | | | | | | | |
| | | | | | | |
Base Fee | | $ | 490 | | $ | 410 | | 19.5 | % |
| | | | | | | |
Performance Fee | | 57 | | 29 | | 94.5 | |
| | | | | | | |
Distribution | | 115 | | 104 | | 10.2 | |
| | | | | | | |
Institutional Research Svcs. | | 69 | | 69 | | -0.4 | |
| | | | | | | |
Other | | 38 | | 36 | | 8.5 | |
| | | | | | | |
Total | | $ | 769 | | $ | 648 | | 18.7 | % |

10
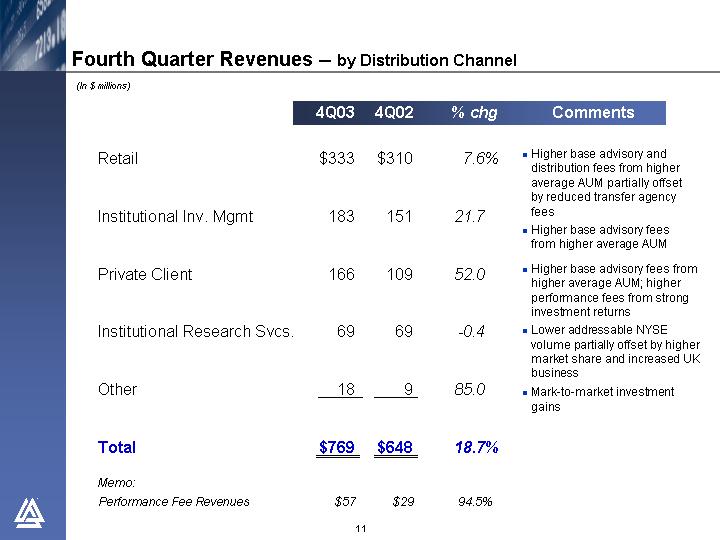
(In $ millions)
| | 4Q03 | | 4Q02 | | % chg | | Comments | |
| | | | | | | | | |
Retail | | $ | 333 | | $ | 310 | | 7.6 | % | • Higher base advisory and distribution fees from higher average AUM partially offset by reduced transfer agency fees | |
| | | | | | | | | |
Institutional Inv. Mgmt | | 183 | | 151 | | 21.7 | | • Higher base advisory fees from higher average AUM | |
| | | | | | | | | |
Private Client | | 166 | | 109 | | 52.0 | | • Higher base advisory fees from higher average AUM; higher performance fees from strong investment returns | |
| | | | | | | | | |
Institutional Research Svcs. | | 69 | | 69 | | -0.4 | | • Lower addressable NYSE volume partially offset by higher market share and increased UK business | |
| | | | | | | | | |
Other | | 18 | | 9 | | 85.0 | | • Mark-to-market investment gains | |
| | | | | | | | | |
Total | | $ | 769 | | $ | 648 | | 18.7 | % | | |
| | | | | | | | | |
Memo: | | | | | | | | | |
Performance Fee Revenues | | $ | 57 | | $ | 29 | | 94.5 | % | | |

11
(In $ millions)
| | 4Q03 | | 4Q02 | | % chg | | Comments | |
| | | | | | | | | |
Employee Comp & Benefits | | $ | 270 | | $ | 216 | | 24.7 | % | • See page 13 | |
| | | | | | | | | |
Promotion & Servicing | | 191 | | 184 | | 4.3 | | | |
| | | | | | | | | |
General & Administrative | | 95 | | 83 | | 14.6 | | • Higher legal fees and write-offs of capitalized software | |
| | | | | | | | | |
| | | | | | | | | |
Interest | | 6 | | 6 | | 0.6 | | | |
| | | | | | | | | |
Amortization of Intangibles | | 5 | | 5 | | — | | | |
| | | | | | | | | |
| | 567 | | 494 | | 14.8 | | | |
| | | | | | | | | |
Mutual Fund Matters & Legal Proceedings | | 140 | | — | | n/a | | • See page 14 | |
| | | 707 | | | 494 | | 43.2 | | | |
| | | | | | | | | |
Income Before Taxes | | 62 | | 154 | | -59.8 | | | |
| | | | | | | | | |
Income Taxes | | 8 | | 7 | | 10.3 | | | |
| | | | | | | | | |
Net Income | | $ | 54 | | $ | 147 | | -63.5 | % | | |

12
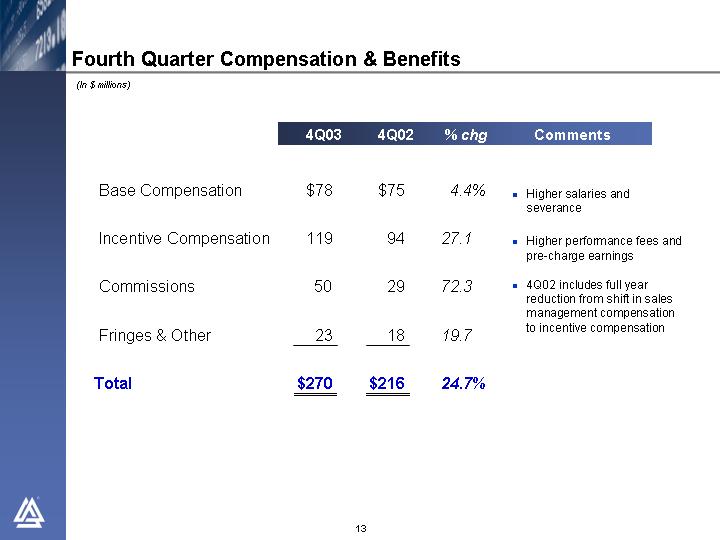
(In $ millions)
| | 4Q03 | | 4Q02 | | % chg | | Comments | |
| | | | | | | | | |
Base Compensation | | $ | 78 | | $ | 75 | | 4.4 | % | • Higher salaries and severance | |
| | | | | | | | | |
Incentive Compensation | | 119 | | 94 | | 27.1 | | • Higher performance fees and pre-charge earnings | |
| | | | | | | | | |
| | | | | | | | | |
Commissions | | 50 | | 29 | | 72.3 | | • 4Q02 includes full year reduction from shift in sales management compensation to incentive compensation | |
| | | | | | | | | |
Fringes & Other | | 23 | | 18 | | 19.7 | | | |
| | | | | | | | | |
Total | | $ | 270 | | $ | 216 | | 24.7 | % | | |

13
(In $ millions, except per Unit amounts)
| | 4Q03 | | 3Q03 | | 2003 | |
| | | | | | | |
Mutual Fund Matters & Legal Proceedings | | $ | 140 | | $ | 190 | | $ | 330 | |
Incentive Compensation | | — | | (41 | ) | (41 | ) |
| | 140 | | 149 | | 289 | |
| | | | | | | |
Taxes | | (2 | ) | (3 | ) | (5 | ) |
Reduction of Alliance Capital Net Income | | $ | 138 | | $ | 146 | | $ | 284 | |
| | | | | | | |
Reduction of Alliance Holding Net Income per Unit | | $ | 0.54 | | $ | 0.57 | | $ | 1.11 | |

14
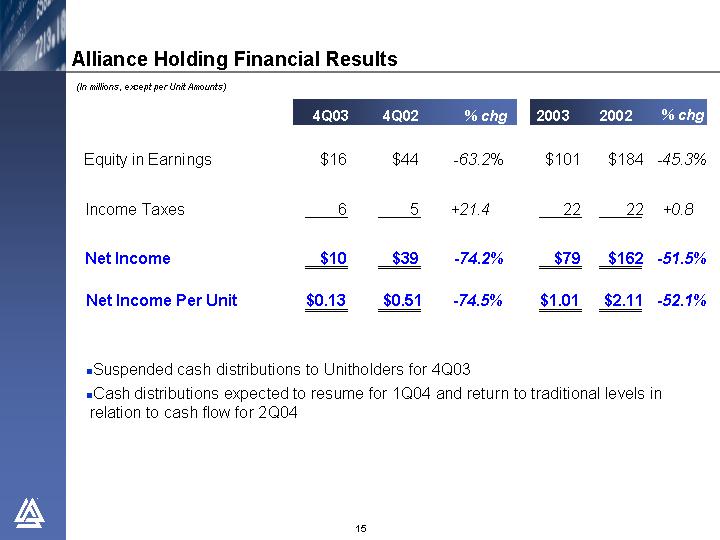
(In millions, except per Unit Amounts)
| | 4Q03 | | 4Q02 | | % chg | | 2003 | | 2002 | | % chg | |
| | | | | | | | | | | | | |
Equity in Earnings | | $ | 16 | | $ | 44 | | -63.2 | % | $ | 101 | | $ | 184 | | -45.3 | % |
| | | | | | | | | | | | | |
Income Taxes | | 6 | | 5 | | +21.4 | | 22 | | 22 | | +0.8 | |
| | | | | | | | | | | | | |
Net Income | | $ | 10 | | $ | 39 | | -74.2 | % | $ | 79 | | $ | 162 | | -51.5 | % |
| | | | | | | | | | | | | |
Net Income Per Unit | | $ | 0.13 | | $ | 0.51 | | -74.5 | % | $ | 1.01 | | $ | 2.11 | | -52.1 | % |
• Suspended cash distributions to Unitholders for 4Q03
• Cash distributions expected to resume for 1Q04 and return to traditional levels in relation to cash flow for 2Q04

15
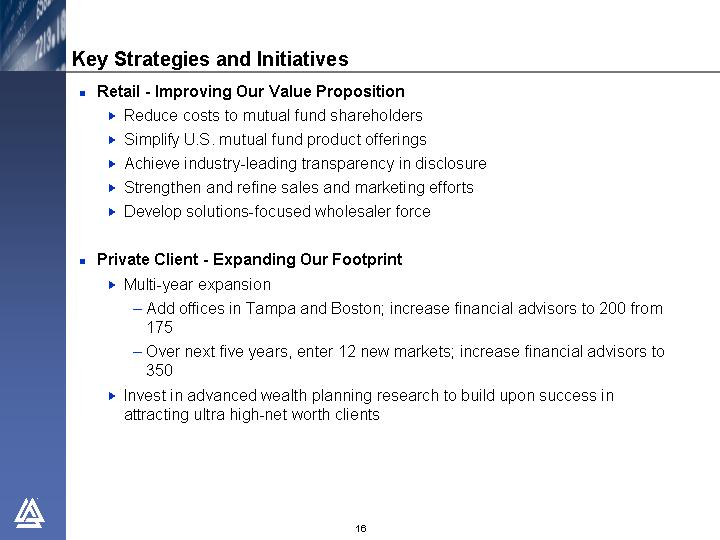
Key Strategies and Initiatives
• Retail - - Improving Our Value Proposition
• Reduce costs to mutual fund shareholders
• Simplify U.S. mutual fund product offerings
• Achieve industry-leading transparency in disclosure
• Strengthen and refine sales and marketing efforts
• Develop solutions-focused wholesaler force
• Private Client - Expanding Our Footprint
• Multi-year expansion
- Add offices in Tampa and Boston; increase financial advisors to 200 from 175
- Over next five years, enter 12 new markets; increase financial advisors to 350
• Invest in advanced wealth planning research to build upon success in attracting ultra high-net worth clients

16
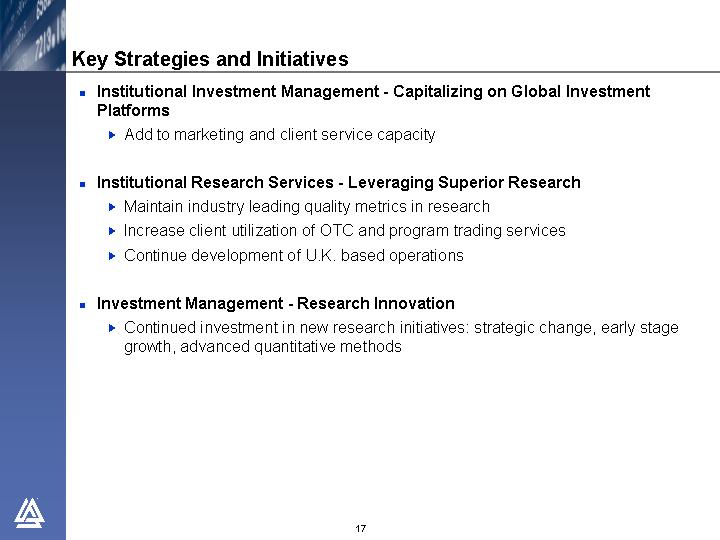
• Institutional Investment Management -Capitalizing on Global Investment Platforms
• Add to marketing and client service capacity
• Institutional Research Services - Leveraging Superior Research
• Maintain industry leading quality metrics in research
• Increase client utilization of OTC and program trading services
• Continue development of U.K. based operations
• Investment Management - Research Innovation
• Continued investment in new research initiatives: strategic change, early stage growth, advanced quantitative methods

17

Institutional Equity Composites vs. Benchmarks
| | Strategic
Value(2) | | Diversified
Value(2) | | Relative
Value(2) | | Small-
Mid Cap
Value(3) | | International
Value(4) | | Emerging
Market
Value(5) | |
| | | | | | | | | | | | | |
1yr | | +1.8 | | +0.3 | | +3.1 | | -2.8 | | -5.1 | | +22.7 | |
| | | | | | | | | | | | | |
3yr | | +4.9 | | +4.6 | | -0.7 | | +4.5 | | +4.7 | | +9.6 | |
| | | | | | | | | | | | | |
5yr | | +2.0 | | — | | +1.5 | | — | | +2.6 | | +7.2 | |
| | | | | | | | | | | | | |
10yr | | +0.3 | | — | | — | | — | | +1.9 | | — | |
NOTE: The information in this table is provided solely for use in connection with this presentation, and is not directed toward existing or potential investment advisory clients of Alliance Capital.
(1) Investment performance of composites are after investment management fees.
(2) vs. Russell 1000 Value
(3) vs. Russell 2500 Value
(4) vs. MSCI EAFE Value
(5) vs. MSCI Emerging Markets Free
Composite and benchmark data through 12/31/03. Performance is preliminary.

19
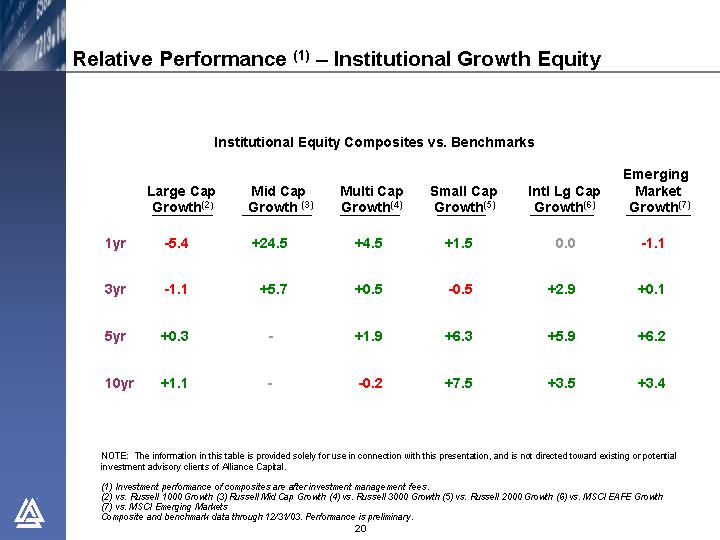
Institutional Equity Composites vs. Benchmarks
| | Large Cap
Growth(2) | | Mid Cap
Growth (3) | | Multi Cap
Growth(4) | | Small Cap
Growth(5) | | Intl Lg Cap
Growth(6) | | Emerging
Market
Growth(7) | |
| | | | | | | | | | | | | |
1yr | | -5.4 | | +24.5 | | +4.5 | | +1.5 | | 0.0 | | -1.1 | |
| | | | | | | | | | | | | |
3yr | | -1.1 | | +5.7 | | +0.5 | | -0.5 | | +2.9 | | +0.1 | |
| | | | | | | | | | | | | |
5yr | | +0.3 | | — | | +1.9 | | +6.3 | | +5.9 | | +6.2 | |
| | | | | | | | | | | | | |
10yr | | +1.1 | | — | | -0.2 | | +7.5 | | +3.5 | | +3.4 | |
NOTE: The information in this table is provided solely for use in connection with this presentation, and is not directed toward existing or potential investment advisory clients of Alliance Capital.
(1) Investment performance of composites are after investment management fees.
(2) vs. Russell 1000 Growth
(3) Russell Mid Cap Growth
(4) vs. Russell 3000 Growth
(5) vs. Russell 2000 Growth
(6) vs. MSCI EAFE Growth
(7) vs. MSCI Emerging Markets
Composite and benchmark data through 12/31/03. Performance is preliminary.

20
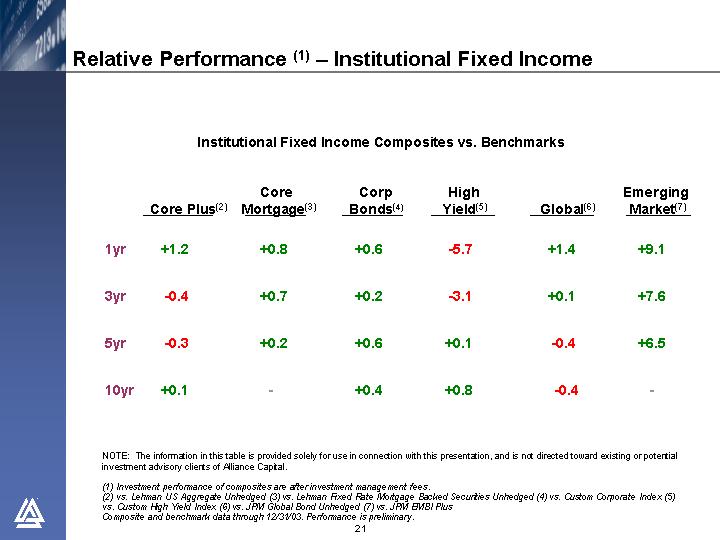
Institutional Fixed Income Composites vs. Benchmarks
| | Core Plus(2) | | Core
Mortgage(3) | | Corp
Bonds(4) | | High
Yield(5) | | Global(6) | | Emerging
Market(7) | |
| | | | | | | | | | | | | |
1yr | | +1.2 | | +0.8 | | +0.6 | | -5.7 | | +1.4 | | +9.1 | |
| | | | | | | | | | | | | |
3yr | | -0.4 | | +0.7 | | +0.2 | | -3.1 | | +0.1 | | +7.6 | |
| | | | | | | | | | | | | |
5yr | | -0.3 | | +0.2 | | +0.6 | | +0.1 | | -0.4 | | +6.5 | |
| | | | | | | | | | | | | |
10yr | | +0.1 | | — | | +0.4 | | +0.8 | | -0.4 | | — | |
NOTE: The information in this table is provided solely for use in connection with this presentation, and is not directed toward existing or potential investment advisory clients of Alliance Capital.
(1) Investment performance of composites are after investment management fees.
(2) vs. Lehman US Aggregate Unhedged
(3) vs. Lehman Fixed Rate Mortgage Backed Securities Unhedged
(4) vs. Custom Corporate Index
(5) vs. Custom High Yield Index
(6) vs. JPM Global Bond Unhedged
(7) vs. JPM EMBI Plus
Composite and benchmark data through 12/31/03. Performance is preliminary.

21
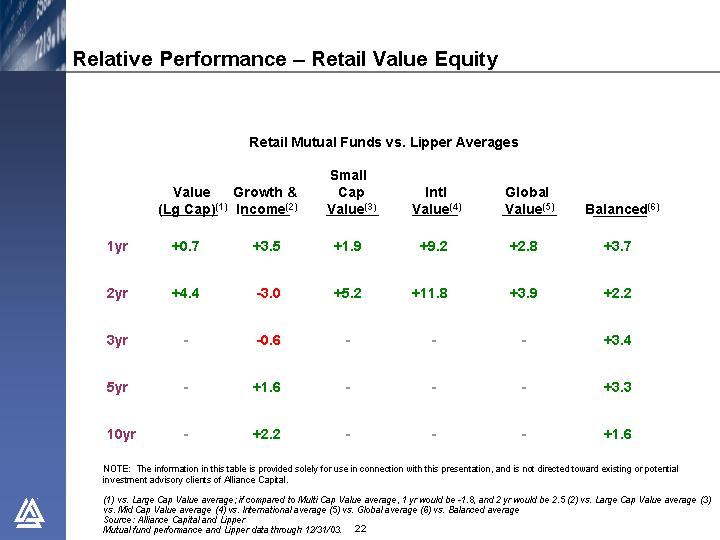
Relative Performance – Retail Value Equity
Retail Mutual Funds vs. Lipper Averages
| | Value
(Lg Cap)(1) | | Growth &
Income(2) | | Small
Cap
Value(3) | | Intl
Value(4) | | Global
Value(5) | | Balanced(6) | |
| | | | | | | | | | | | | |
1yr | | +0.7 | | +3.5 | | +1.9 | | +9.2 | | +2.8 | | +3.7 | |
| | | | | | | | | | | | | |
2yr | | +4.4 | | -3.0 | | +5.2 | | +11.8 | | +3.9 | | +2.2 | |
| | | | | | | | | | | | | |
3yr | | — | | -0.6 | | — | | — | | — | | +3.4 | |
| | | | | | | | | | | | | |
5yr | | — | | +1.6 | | — | | — | | — | | +3.3 | |
| | | | | | | | | | | | | |
10yr | | — | | +2.2 | | — | | — | | — | | +1.6 | |
NOTE: The information in this table is provided solely for use in connection with this presentation, and is not directed toward existing or potential investment advisory clients of Alliance Capital.
(1) vs. Large Cap Value average; if compared to Multi Cap Value average, 1 yr would be -1.8, and 2 yr would be 2.5
(2) vs. Large Cap Value average
(3) vs. Mid Cap Value average
(4) vs. International average
(5) vs. Global average
(6) vs. Balanced average
Source: Alliance Capital and Lipper
Mutual fund performance and Lipper data through 12/31/03.

22
Retail Mutual Funds vs. Lipper Averages
| | Premier
Growth
(Lg Cap)(1) | | Growth
(Multi Cap)(2) | | Mid Cap
Growth(3) | | Small Cap
Growth(4) | | Tech(5) | | Global
Growth
Research(6) | | Regent
Lg.-Cap
Core(7) | |
| | | | | | | | | | | | | | | |
1yr | | -4.3 | | -0.5 | | +30.2 | | + 3.7 | | -14.1 | | +1.6 | | +7.2 | |
| | | | | | | | | | | | | | | |
3yr | | -3.2 | | +0.3 | | +6.0 | | -1.0 | | +1.5 | | +2.3 | | +1.3 | |
| | | | | | | | | | | | | | | |
5yr | | -4.3 | | -4.5 | | -1.7 | | -6.8 | | -2.2 | | +6.6 | | +3.0 | |
| | | | | | | | | | | | | | | |
10yr | | +0.8 | | -2.2 | | — | | -2.2 | | -0.7 | | +8.0 | | +2.2 | |
NOTE: The information in this table is provided solely for use in connection with this presentation, and is not directed toward existing or potential investment advisory clients of Alliance Capital.
(1) vs. Large Cap Growth average
(2) vs. Multi Cap Growth average
(3) vs. Mid Cap Growth average
(4) vs. Small Cap Growth average. Formerly named Quasar
(5) vs. Science and Technology average
(6) vs. Global Equity average. Formerly named Global Growth Trends
(7) vs. S&P 500;
Represents Regent separately managed account service. Net performance is inclusive of the investment management fee only. It does not include the total service fee typically associated with a traditional wrap account that may range from 2.0 - 3.0%.
Source: Alliance Capital, Lipper, and S&P.
Mutual fund performance and Lipper data through 12/31/03.

23
Retail Fixed Income Funds vs. Lipper Averages
| | Bond Fund
Corporate
Bond(1) | | Americas Govt
Income(2) | | Emerging
Market Debt(3) | | High
Yield(4) | | Bernstein
Short
Duration Plus(5) | | ACMGI-
American
Income -OS(6) | |
| | | | | | | | | | | | | |
1yr | | +8.2 | | +1.7 | | +8.3 | | 0.0 | | +0.1 | | +7.3 | |
| | | | | | | | | | | | | |
3yr | | -0.4 | | -0.4 | | +2.9 | | -1.6 | | +0.5 | | -9.6 | |
| | | | | | | | | | | | | |
5yr | | +0.3 | | +4.5 | | +2.7 | | -2.9 | | +0.3 | | +3.2 | |
| | | | | | | | | | | | | |
10yr | | — | | +2.3 | | — | | — | | 0.1 | | +2.0 | |
NOTE: The information in this table is provided solely for use in connection with this presentation, and is not directed toward existing or potential investment advisory clients of Alliance Capital.
(1) vs. Lipper Corporate Debt Funds BBB-Rated
(2) vs. Lipper Global Income Funds
(3) vs. Lipper Emerging Markets Debt
(4) vs.Lipper High Yield Bonds
(5) vs. Lipper Short Investment Grade Debt Funds
(6) vs. Lipper Global Bond US Dollar
Source: Alliance Capital and Lipper
Composite and benchmark data through 12/31/03. Performance is preliminary.

24
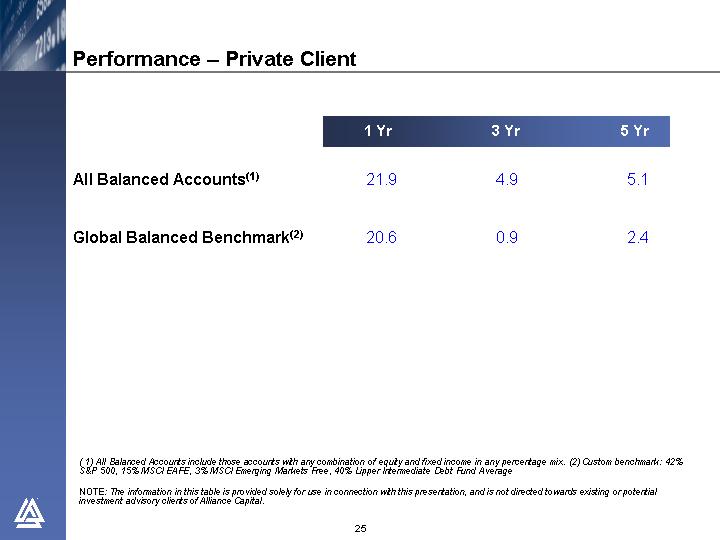
| | 1 yr | | 3 yr | | 5 yr | |
| | | | | | | |
All Balanced Accounts(1) | | 21.9 | | 4.9 | | 5.1 | |
| | | | | | | |
Global Balanced Benchmark(2) | | 20.6 | | 0.9 | | 2.4 | |
(1) All Balanced Accounts include those accounts with any combination of equity and fixed income in any percentage mix.
(2) Custom benchmark: 42% S&P 500, 15% MSCI EAFE, 3% MSCI Emerging Markets Free, 40% Lipper Intermediate Debt Fund Average
NOTE: The information in this table is provided solely for use in connection with this presentation, and is not directed towards existing or potential investment advisory clients of Alliance Capital.

25
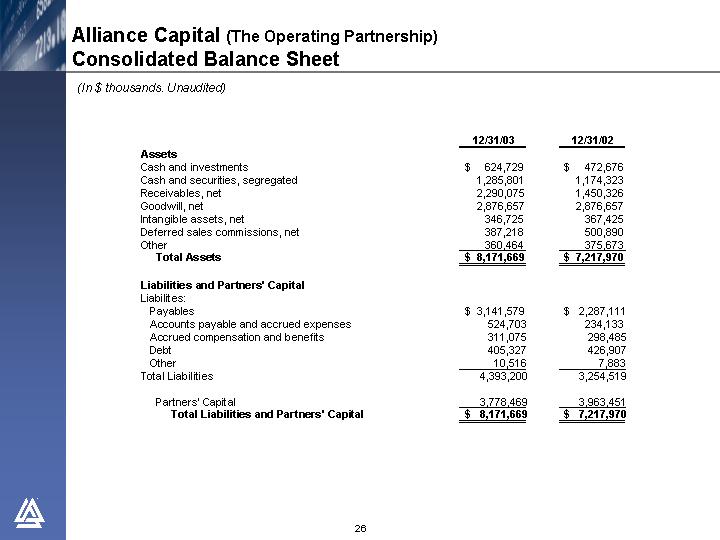
Alliance Capital (The Operating Partnership)
(In $ thousands. Unaudited)
| | 12/31/03 | | 12/31/02 | |
Assets | | | | | |
Cash and investments | | $ | 624,729 | | $ | 472,676 | |
Cash and securities, segregated | | 1,285,801 | | 1,174,323 | |
Receivables, net | | 2,290,075 | | 1,450,326 | |
Goodwill, net | | 2,876,657 | | 2,876,657 | |
Intangible assets, net | | 346,725 | | 367,425 | |
Deferred sales commissions, net | | 387,218 | | 500,890 | |
Other | | 360,464 | | 375,673 | |
Total Assets | | $ | 8,171,669 | | $ | 7,217,970 | |
| | | | | |
Liabilities and Partners’ Capital | | | | | |
Liabilites: | | | | | |
Payables | | $ | 3,141,579 | | $ | 2,287,111 | |
Accounts payable and accrued expenses | | 524,703 | | 234,133 | |
Accrued compensation and benefits | | 311,075 | | 298,485 | |
Debt | | 405,327 | | 426,907 | |
Other | | 10,516 | | 7,883 | |
Total Liabilities | | 4,393,200 | | 3,254,519 | |
| | | | | |
Partners’ Capital | | 3,778,469 | | 3,963,451 | |
Total Liabilities and Partners’ Capital | | $ | 8,171,669 | | $ | 7,217,970 | |

26
Alliance Capital (The Operating Partnership)
(In $ thousands. Unaudited)
| | Twelve Months Ended | |
| | 12/31/03 | | 12/31/02 | |
| | | | | |
Cash Flows From Operating Activities: | | | | | |
Net income | | $ | 329,808 | | $ | 610,978 | |
Non-cash items: | | | | | |
Amortization and depreciation: | | | | | |
Amortization of deferred sales commissions | | 208,565 | | 228,968 | |
Amortization of deferred compensation | | 116,357 | | 99,237 | |
Other depreciation and amortization | | 77,583 | | 71,584 | |
Other, net | | (13,104 | ) | 3,797 | |
Changes in assets and liabilities | | 49,923 | | (122,699 | ) |
Net cash provided from operating activities | | 769,132 | | 891,865 | |
| | | | | |
Cash Flows From Investing Activities: | | | | | |
(Sale) Purchase of investments, net | | (24,943 | ) | 50,195 | |
Additions to furniture, equipment and leaseholds, net | | (29,154 | ) | (53,548 | ) |
Net cash (used in) investing actvities | | (54,097 | ) | (3,353 | ) |
| | | | | |
Cash Flows From Financing Activities: | | | | | |
Increase (decrease) in debt, net | | (22,078 | ) | (202,973 | ) |
Distributions to partners | | (566,598 | ) | (654,225 | ) |
Other | | (43,784 | ) | (49,967 | ) |
Net cash (used in) financing activities | | (632,460 | ) | (907,165 | ) |
| | | | | |
Effect of exchange rate change on cash | | 14,196 | | 6,176 | |
| | | | | |
Net increase (decrease) in cash | | 96,771 | | (12,477 | ) |
Cash at the beginning of period | | 405,249 | | 417,726 | |
Cash at the end of period | | $ | 502,020 | | $ | 405,249 | |

27
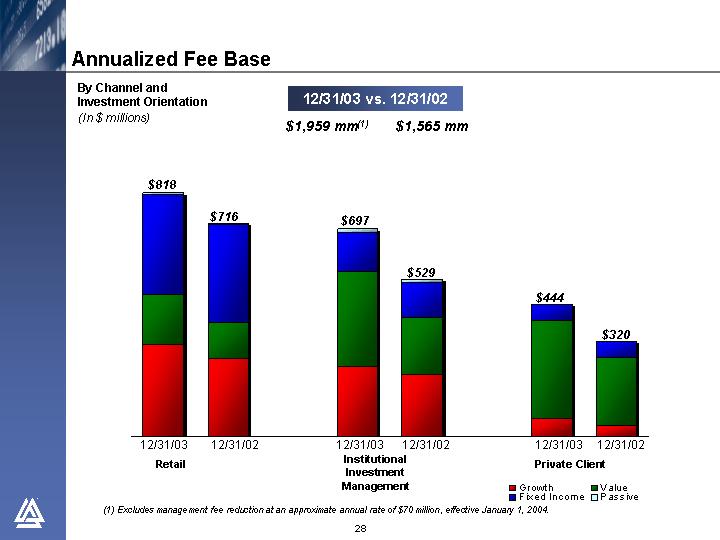
By Channel and
Investment Orientation
(In $ millions)
12/31/03 vs. 12/31/02 | |
$ | 1,959 mm(1) | | $ | 1,565 mm | |
| | | | | |
[CHART]
(1) Excludes management fee reduction at an approximate annual rate of $70 million, effective January 1, 2004.

28
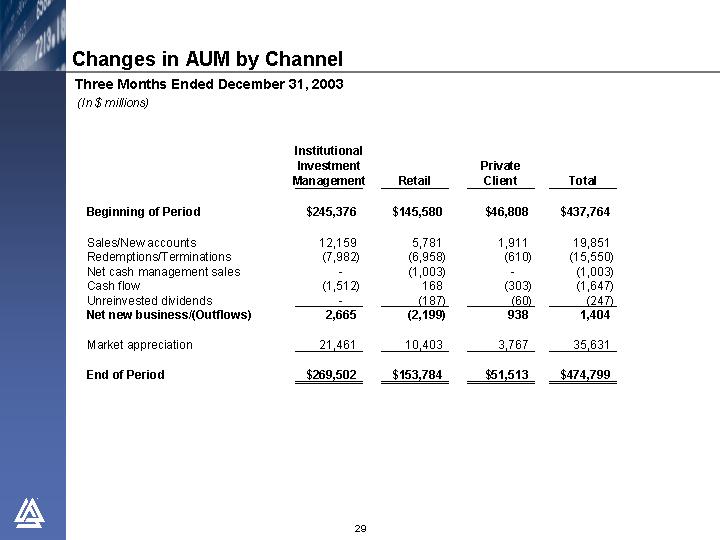
Three Months Ended December 31, 2003
(In $ millions)
| | Institutional
Investment
Management | | Retail | | Private
Client | | Total | |
| | | | | | | | | |
Beginning of Period | | $ | 245,376 | | $ | 145,580 | | $ | 46,808 | | $ | 437,764 | |
| | | | | | | | | |
Sales/New accounts | | 12,159 | | 5,781 | | 1,911 | | 19,851 | |
Redemptions/Terminations | | (7,982 | ) | (6,958 | ) | (610 | ) | (15,550 | ) |
Net cash management sales | | — | | (1,003 | ) | — | | (1,003 | ) |
Cash flow | | (1,512 | ) | 168 | | (303 | ) | (1,647 | ) |
Unreinvested dividends | | — | | (187 | ) | (60 | ) | (247 | ) |
Net new business/(Outflows) | | 2,665 | | (2,199 | ) | 938 | | 1,404 | |
| | | | | | | | | |
Market appreciation | | 21,461 | | 10,403 | | 3,767 | | 35,631 | |
| | | | | | | | | |
End of Period | | $ | 269,502 | | $ | 153,784 | | $ | 51,513 | | $ | 474,799 | |

29
Changes in AUM by Channel
Twelve Months Ended December 31, 2003
(In $ millions)
| | Institutional
Investment
Management | | Retail | | Private
Client | | Total | |
| | | | | | | | | |
Beginning of Period | | $ | 210,990 | | $ | 135,896 | | $ | 39,693 | | $ | 386,579 | |
| | | | | | | | | |
Sales/New accounts | | 31,754 | | 26,871 | | 7,119 | | 65,744 | |
Redemptions/Terminations | | (22,972 | ) | (26,919 | ) | (2,236 | ) | (52,127 | ) |
Net cash management sales | | — | | (4,986 | ) | — | | (4,986 | ) |
Cash flow | | 1,649 | | (804 | ) | (684 | ) | 161 | |
Unreinvested dividends | | (1 | ) | (880 | ) | (184 | ) | (1,065 | ) |
Net new business/(Outflows) | | 10,430 | | (6,718 | ) | 4,015 | | 7,727 | |
| | | | | | | | | |
Transfers | | 608 | | — | | (608 | ) | — | |
| | | | | | | | | |
Market appreciation | | 47,474 | | 24,606 | | 8,413 | | 80,493 | |
| | | | | | | | | |
End of Period | | $ | 269,502 | | $ | 153,784 | | $ | 51,513 | | $ | 474,799 | |

30
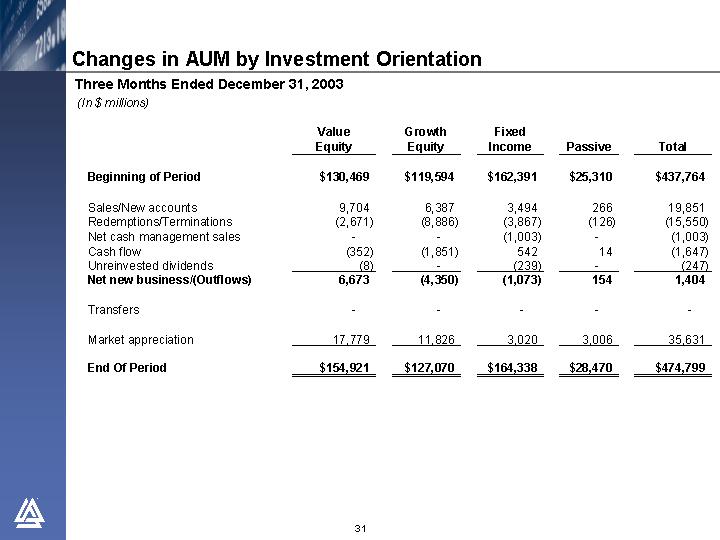
Three Months Ended December 31, 2003
(In $ millions)
| | Value
Equity | | Growth
Equity | | Fixed
Income | | Passive | | Total | |
| | | | | | | | | | | |
Beginning of Period | | $ | 130,469 | | $ | 119,594 | | $ | 162,391 | | $ | 25,310 | | $ | 437,764 | |
| | | | | | | | | | | |
Sales/New accounts | | 9,704 | | 6,387 | | 3,494 | | 266 | | 19,851 | |
Redemptions/Terminations | | (2,671 | ) | (8,886 | ) | (3,867 | ) | (126 | ) | (15,550 | ) |
Net cash management sales | | — | | — | | (1,003 | ) | — | | (1,003 | ) |
Cash flow | | (352 | ) | (1,851 | ) | 542 | | 14 | | (1,647 | ) |
Unreinvested dividends | | (8 | ) | — | | (239 | ) | — | | (247 | ) |
Net new business/(Outflows) | | 6,673 | | (4,350 | ) | (1,073 | ) | 154 | | 1,404 | |
| | | | | | | | | | | |
Transfers | | — | | — | | — | | — | | — | |
| | | | | | | | | | | |
Market appreciation | | 17,779 | | 11,826 | | 3,020 | | 3,006 | | 35,631 | |
| | | | | | | | | | | |
End Of Period | | $ | 154,921 | | $ | 127,070 | | $ | 164,338 | | $ | 28,470 | | $ | 474,799 | |

31
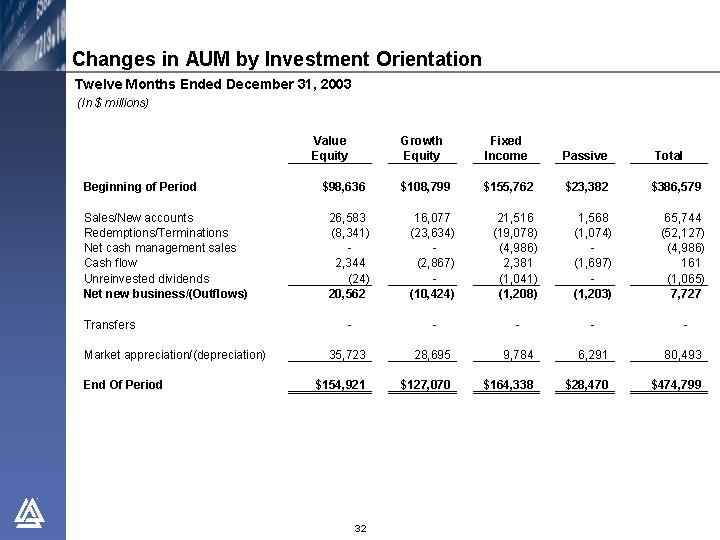
Changes in AUM by Investment Orientation
Twelve Months Ended December 31, 2003
(In $ millions)
| | Value
Equity | | Growth
Equity | | Fixed
Income | | Passive | | Total | |
| | | | | | | | | | | |
Beginning of Period | | $ | 98,636 | | $ | 108,799 | | $ | 155,762 | | $ | 23,382 | | $ | 386,579 | |
| | | | | | | | | | | |
Sales/New accounts | | 26,583 | | 16,077 | | 21,516 | | 1,568 | | 65,744 | |
Redemptions/Terminations | | (8,341 | ) | (23,634 | ) | (19,078 | ) | (1,074 | ) | (52,127 | ) |
Net cash management sales | | — | | — | | (4,986 | ) | — | | (4,986 | ) |
Cash flow | | 2,344 | | (2,867 | ) | 2,381 | | (1,697 | ) | 161 | |
Unreinvested dividends | | (24 | ) | — | | (1,041 | ) | — | | (1,065 | ) |
Net new business/(Outflows) | | 20,562 | | (10,424 | ) | (1,208 | ) | (1,203 | ) | 7,727 | |
| | | | | | | | | | | |
Transfers | | — | | — | | — | | — | | — | |
| | | | | | | | | | | |
Market appreciation/(depreciation) | | 35,723 | | 28,695 | | 9,784 | | 6,291 | | 80,493 | |
| | | | | | | | | | | |
End Of Period | | $ | 154,921 | | $ | 127,070 | | $ | 164,338 | | $ | 28,470 | | $ | 474,799 | |

32
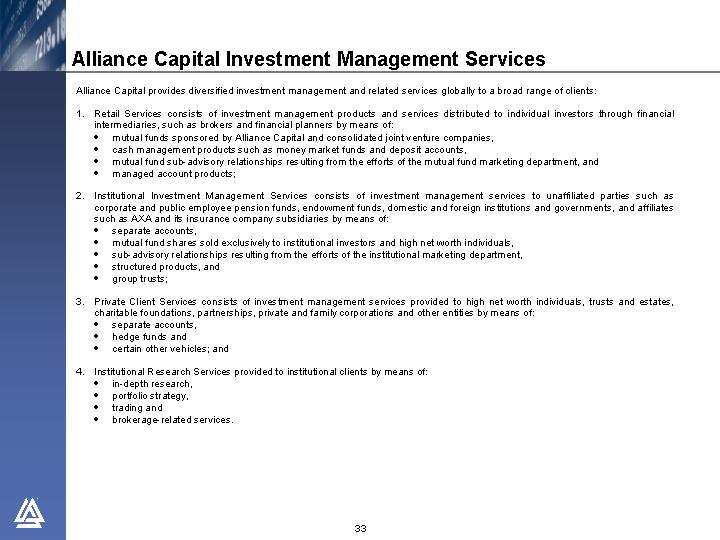
Alliance Capital provides diversified investment management and related services globally to a broad range of clients:
1. Retail Services consists of investment management products and services distributed to individual investors through financial intermediaries, such as brokers and financial planners by means of:
• mutual funds sponsored by Alliance Capital and consolidated joint venture companies,
• cash management products such as money market funds and deposit accounts,
• mutual fund sub-advisory relationships resulting from the efforts of the mutual fund marketing department, and ·
• managed account products;
2. Institutional Investment Management Services consists of investment management services to unaffiliated parties such as corporate and public employee pension funds, endowment funds, domestic and foreign institutions and governments, and affiliates such as AXA and its insurance company subsidiaries by means of:
• separate accounts,
• mutual fund shares sold exclusively to institutional investors and high net worth individuals,
• sub-advisory relationships resulting from the efforts of the institutional marketing department,
• structured products, and
• group trusts;
3. Private Client Services consists of investment management services provided to high net worth individuals, trusts and estates, charitable foundations, partnerships, private and family corporations and other entities by means of:
• separate accounts,
• hedge funds and
• certain other vehicles; and
4. Institutional Research Services provided to institutional clients by means of:
• in-depth research,
• portfolio strategy,
• trading and
• brokerage-related services.

33