Searchable text section of graphics shown above
[GRAPHIC] | |
| |
[LOGO] | www.alliancecapital.com |
| |
| January 27, 2005 |
FOURTH QUARTER 2004 REVIEW
Gerald M. Lieberman
President & Chief Operating Officer
There is no guarantee that any forecasts or opinions in this material will be realized. Information should not be construed as investment advice.
The SEC adopted Regulation FD in October 2000. In light of Regulation FD, Management will be limited in responding to inquiries from investors or analysts in a non-public forum such as this one.
Forward-Looking Statements
Certain statements provided by Alliance Capital and Alliance Holding in this presentation are “forward-looking statements” within the meaning of the Private Securities Litigation Reform Act of 1995. Such forward-looking statements are subject to risks, uncertainties and other factors, which could cause actual results to differ materially from future results expressed or implied by such forward-looking statements. The most significant of such factors include, but are not limited to, the following: the performance of financial markets, the investment performance of Alliance Capital’s sponsored investment products and separately managed accounts, general economic conditions, future acquisitions, competitive conditions, and government regulations, including changes in tax rates. The forward-looking statements in this presentation include statements regarding expected levels of general and administrative expenses. General and administrative expenses, including occupancy costs, legal fees (net of partially offsetting insurance recoveries), compliance with the Sarbanes-Oxley Act of 2002, and various other expenses, fluctuate from period to period due to changes in business needs and other factors.
Alliance Capital and Alliance Holding caution readers to carefully consider such forward-looking statements. Further, such forward-looking statements speak only as of the date on which such statements are made; Alliance Capital and Alliance Holding undertake no obligation to update any forward-looking statements to reflect events or circumstances after the date of such statements. For further information regarding these forward-looking statements and the factors that could cause actual results to differ, please refer to the Risk Factors section in Part I of Form 10-K for the year ended December 31, 2003. Any or all of the forward-looking statements that we make in Form 10-K, this presentation or any other public statements we issue may turn out to be wrong. It is important to remember that other factors besides those listed in the Risk Factors section of Form 10-K could also adversely affect our business, operating results or financial condition.
[LOGO]
1
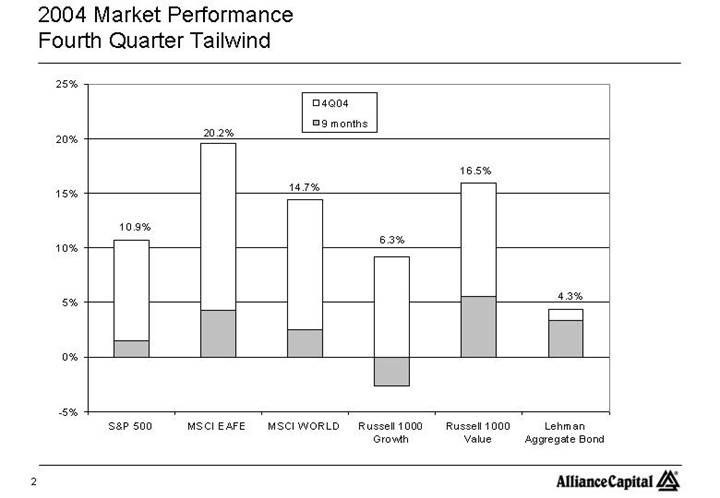
Fourth Quarter Tailwind
[CHART]
2
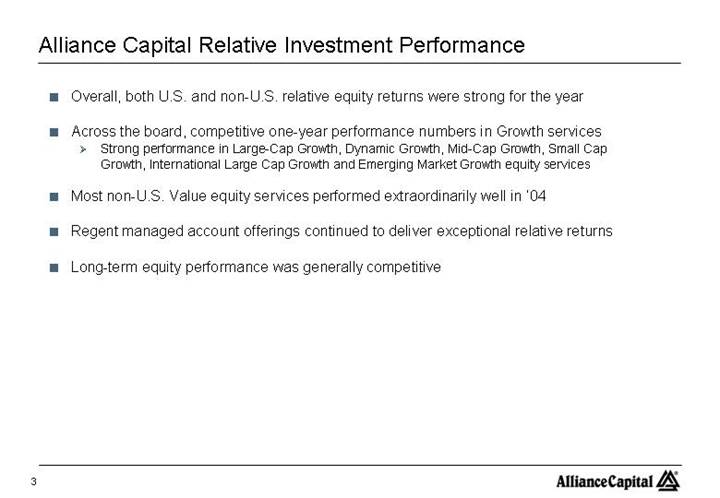
Alliance Capital Relative Investment Performance |
• Overall, both U.S. and non-U.S. relative equity returns were strong for the year
• Across the board, competitive one-year performance numbers in Growth services
• Strong performance in Large-Cap Growth, Dynamic Growth, Mid-Cap Growth, Small Cap Growth, International Large Cap Growth and Emerging Market Growth equity services
• Most non-U.S. Value equity services performed extraordinarily well in ‘04
• Regent managed account offerings continued to deliver exceptional relative returns
• Long-term equity performance was generally competitive
3
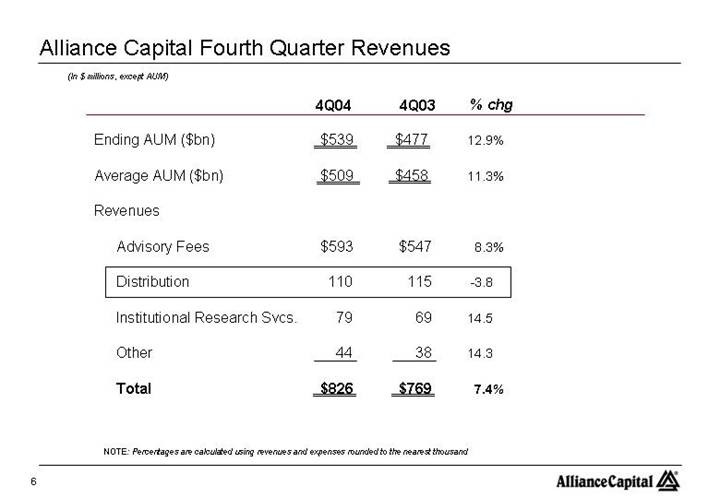
Alliance Capital Fourth Quarter Revenues |
(In $ millions, except AUM)
| | 4Q04 | | 4Q03 | | % chg | | | | Comments | |
| | | | | | | | | | | |
Ending AUM ($bn) | | $ | 539 | | $ | 477 | | 12.9 | % | | | | |
| | | | | | | | | | | |
Average AUM ($bn) | | $ | 509 | | $ | 458 | | 11.3 | % | | • | Market appreciation and | |
| | | | | | | | | | positive net asset flows | |
| | | | | | | | | | | |
Revenues | | | | | | | | | | | |
| | | | | | | | | | | |
Advisory Fees | | $ | 593 | | $ | 547 | | 8.3 | % | | | | |
| | | | | | | | | | | |
Distribution | | 110 | | 115 | | -3.8 | | | | | |
| | | | | | | | | | | |
Institutional Research Svcs. | | 79 | | 69 | | 14.5 | | | | | |
| | | | | | | | | | | |
Other | | 44 | | 38 | | 14.3 | | | | | |
| | | | | | | | | | | |
Total | | $ | 826 | | $ | 769 | | 7.4 | % | | | | |
NOTE: Percentages are calculated using revenues and expenses rounded to the nearest thousand
4
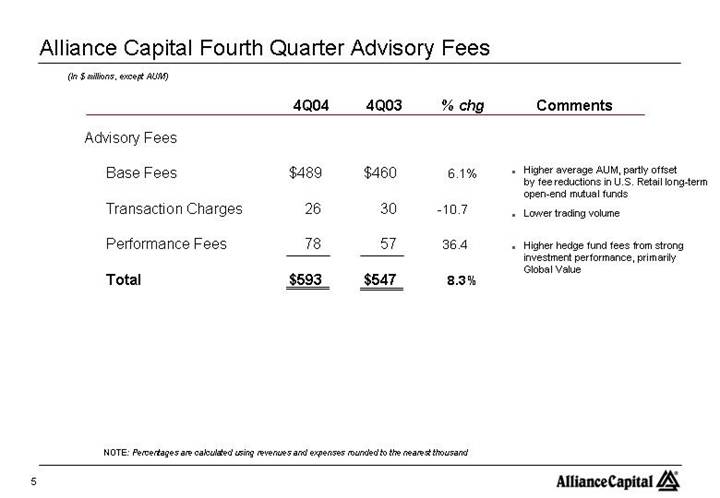
Alliance Capital Fourth Quarter Advisory Fees |
(In $ millions, except AUM)
| | 4Q04 | | 4Q03 | | % chg | | | | Comments | |
| | | | | | | | | | | |
Advisory Fees | | | | | | | | | | | |
| | | | | | | | | | | |
Base Fees | | $ | 489 | | $ | 460 | | 6.1 | % | | • | Higher average AUM, | |
| | | | | | | | | | partly offset by fee reductions in U.S. Retail long-term open-end mutual funds | |
| | | | | | | | | | | |
Transaction Charges | | 26 | | 30 | | -10.7 | | | • | Lower trading volume | |
| | | | | | | | | | | |
Performance Fees | | 78 | | 57 | | 36.4 | | | • | Higher hedge fund fees | |
| | | | | | | | | | from strong investment performance, primarily Global Value | |
Total | | $ | 593 | | $ | 547 | | 8.3 | % | | | | |
NOTE: Percentages are calculated using revenues and expenses rounded to the nearest thousand
5
Alliance Capital Fourth Quarter Revenues |
(In $ millions, except AUM)
| | 4Q04 | | 4Q03 | | % chg | |
| | | | | | | |
Ending AUM ($bn) | | $ | 539 | | $ | 477 | | 12.9 | % |
| | | | | | | |
Average AUM ($bn) | | $ | 509 | | $ | 458 | | 11.3 | % |
| | | | | | | |
Revenues | | | | | | | |
| | | | | | | |
Advisory Fees | | $ | 593 | | $ | 547 | | 8.3 | % |
| | | | | | | |
Distribution | | 110 | | 115 | | -3.8 | |
| | | | | | | |
Institutional Research Svcs. | | 79 | | 69 | | 14.5 | |
| | | | | | | |
Other | | 44 | | 38 | | 14.3 | |
| | | | | | | |
Total | | $ | 826 | | $ | 769 | | 7.4 | % |
NOTE: Percentages are calculated using revenues and expenses rounded to the nearest thousand
6
Alliance Capital Fourth Quarter Net Distribution Activity |
(In $ millions, except AUM)
| | 4Q04 | | 4Q03 | } | % chg | | | Comments | |
| | | | | | | | | |
Distribution Revenues | | $ | 110 | | $ | 115 | -3.8 | % | | | |
| | | | | | | | | |
| | | | | | | • | Distribution Revenues significantly offset by Distribution Plan Payments | |
Distribution Expenses | | | | | | | | | |
| | | | | | | | | |
Distribution Plan Payments | | 93 | | 95 | -1.1 | | | | |
| | | | | | | | | | |
Amort of Def Sales Comm | | 39 | | 51 | | -23.4 | | • | Decrease due to decline | |
| | | | | | | | | in B-share sales | |
| | 132 | | 146 | | -8.9 | | | | |
| | | | | | | | | | |
Net Distribution Expense | | $ | 22 | | $ | 31 | | -27.8 | % | | | |
NOTE: Percentages are calculated using revenues and expenses rounded to the nearest thousand
7
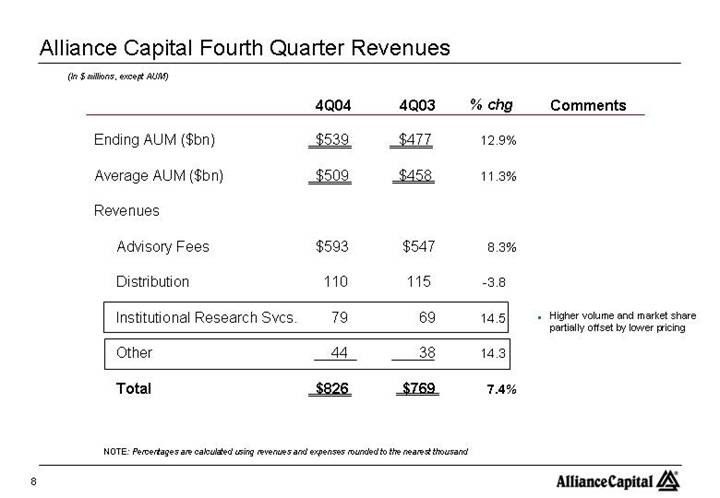
Alliance Capital Fourth Quarter Revenues |
(In $ millions, except AUM)
| | 4Q04 | | 4Q03 | | % chg | | | | Comments | |
| | | | | | | | | | | |
Ending AUM ($bn) | | $ | 539 | | $ | 477 | | 12.9 | % | | | | |
| | | | | | | | | | | |
Average AUM ($bn) | | $ | 509 | | $ | 458 | | 11.3 | % | | | | |
| | | | | | | | | | | |
Revenues | | | | | | | | | | | |
| | | | | | | | | | | |
Advisory Fees | | $ | 593 | | $ | 547 | | 8.3 | % | | | | |
| | | | | | | | | | | |
Distribution | | 110 | | 115 | | -3.8 | | | | | |
| | | | | | | | | | | |
Institutional Research Svcs. | | 79 | | 69 | | 14.5 | | | • | Higher volume and market | |
| | | | | | | | | | share partially offset by lower pricing | |
Other | | 44 | | 38 | | 14.3 | | | | | |
| | | | | | | | | | | |
Total | | $ | 826 | | $ | 769 | | 7.4 | % | | | | |
NOTE: Percentages are calculated using revenues and expenses rounded to the nearest thousand
8
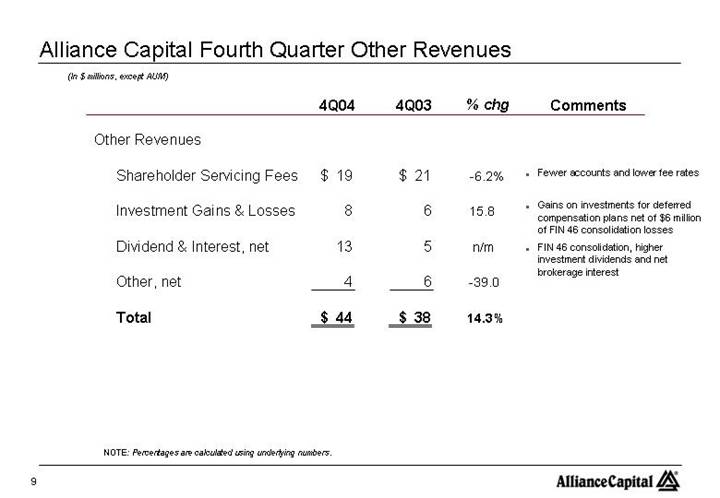
Alliance Capital Fourth Quarter Other Revenues |
(In $ millions, except AUM)
| | 4Q04 | | 4Q03 | | % chg | | | | Comments | |
| | | | | | | | | | | |
Other Revenues | | | | | | | | | | | |
| | | | | | | | | | | |
Shareholder Servicing Fees | | $ | 19 | | $ | 21 | | -6.2 | % | | • | Fewer accounts and lower | |
| | | | | | | | | | fee rates | |
| | | | | | | | | | | |
Investment Gains & Losses | | 8 | | 6 | | 15.8 | | | • | Gains on investments for | |
| | | | | | | | | | deferred compensation plans net of $6 million of FIN 46 consolidation losses | |
| | | | | | | | | | | |
Dividend & Interest, net | | 13 | | 5 | | n/m | | | • | FIN 46 consolidation, | |
| | | | | | | | | | higher investment dividends and net brokerage interest | |
Other, net | | 4 | | 6 | | -39.0 | | | | | |
| | | | | | | | | | | |
Total | | $ | 44 | | $ | 38 | | 14.3 | % | | | | |
NOTE: Percentages are calculated using underlying numbers.
9
Alliance Capital Fourth Quarter Expenses & Net Income |
(In $ millions)
| | 4Q04 | | 4Q03 | | % chg | |
| | | | | | | |
Employee Comp. & Benefits | | $ | 288 | | $ | 270 | | 6.6 | % |
| | | | | | | |
Promotion & Servicing | | 174 | | 191 | | -9.2 | |
| | | | | | | |
General & Administrative | | 109 | | 95 | | 15.5 | |
| | | | | | | |
Interest | | 5 | | 6 | | -19.8 | |
| | | | | | | |
Amortization of Intangibles | | 5 | | 5 | | — | |
| | 581 | | 567 | | 2.4 | |
| | | | | | | |
Charge for Mutual Fund Matters and Legal Proceedings | | — | | 140 | | -100.0 | |
| | | | | | | |
| | 581 | | 707 | | -17.9 | |
| | | | | | | |
Income Before Taxes | | 245 | | 62 | | n/m | |
| | | | | | | |
Income Taxes | | 12 | | 8 | | 41.7 | |
| | | | | | | |
Net Income | | $ | 233 | | $ | 54 | | n/m | |
| | | | | | | |
Pre-Tax Margin (1) | | 29.7 | % | 8.1 | % | | |
(1) Pre-tax income as a percentage of revenues. NOTE: Percentages are calculated using revenues and expenses rounded to the nearest thousand
10
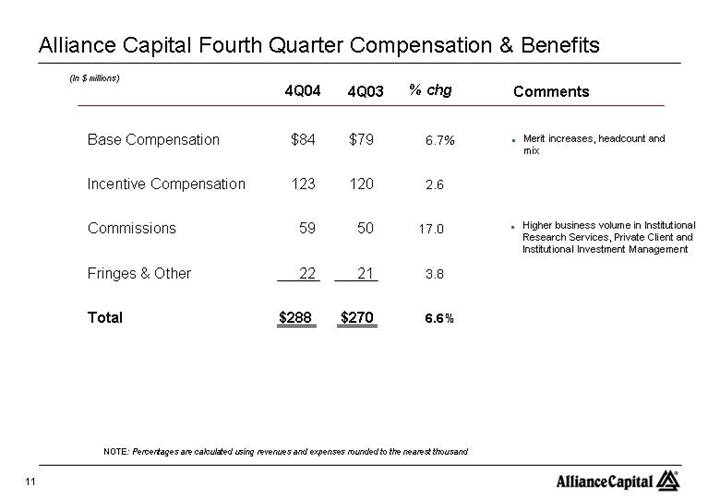
Alliance Capital Fourth Quarter Compensation & Benefits |
(In $ millions)
| | 4Q04 | | 4Q03 | | % chg | | Comments | |
| | | | | | | | | | |
Base Compensation | | $ | 84 | | $ | 79 | | 6.7 | % | • | Merit increases, headcount and mix | |
| | | | | | | | | | |
Incentive Compensation | | 123 | | 120 | | 2.6 | | | | |
| | | | | | | | | | |
Commissions | | 59 | | 50 | | 17.0 | | • | Higher business volume in Institutional Research Services, Private Client and Institutional Investment Management | |
| | | | | | | | | | |
Fringes & Other | | 22 | | 21 | | 3.8 | | | | |
| | | | | | | | | | |
Total | | $ | 288 | | $ | 270 | | 6.6 | % | | | |
NOTE: Percentages are calculated using revenues and expenses rounded to the nearest thousand
11
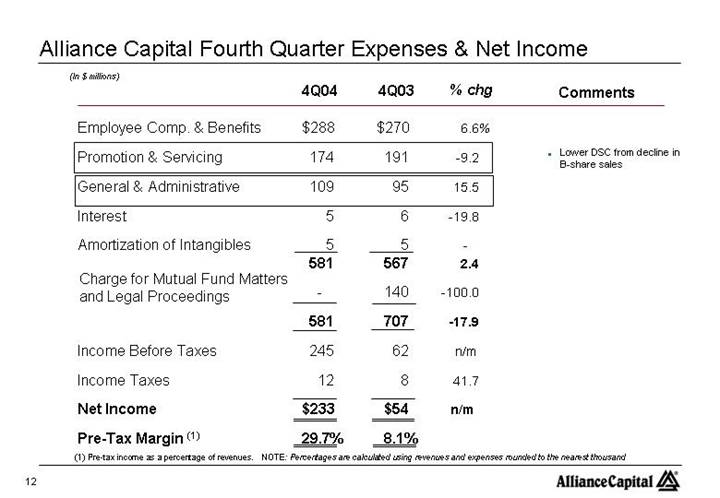
Alliance Capital Fourth Quarter Expenses & Net Income |
(In $ millions)
| | 4Q04 | | 4Q03 | | % chg | | | | |
| | | | | | | | | | |
Employee Comp. & Benefits | | $ | 288 | | $ | 270 | | 6.6 | % | | | |
Promotion & Servicing | | 174 | | 191 | | -9.2 | | • | Lower DSC from decline in | |
| | | | | | | | | B-share sales | |
General & Administrative | | 109 | | 95 | | 15.5 | | | | |
Interest | | 5 | | 6 | | -19.8 | | | | |
Amortization of Intangibles | | 5 | | 5 | | — | | | | |
| | 581 | | 567 | | 2.4 | | | | |
Charge for Mutual Fund Matters and Legal Proceedings | | — | | 140 | | -100.0 | | | | |
| | 581 | | 707 | | -17.9 | | | | |
Income Before Taxes | | 245 | | 62 | | n/m | | | | |
Income Taxes | | 12 | | 8 | | 41.7 | | | | |
Net Income | | $ | 233 | | $ | 54 | | n/m | | | | |
Pre-Tax Margin (1) | | 29.7 | % | 8.1 | % | | | | | |
(1) Pre-tax income as a percentage of revenues.
NOTE: Percentages are calculated using revenues and expenses rounded to the nearest thousand
12
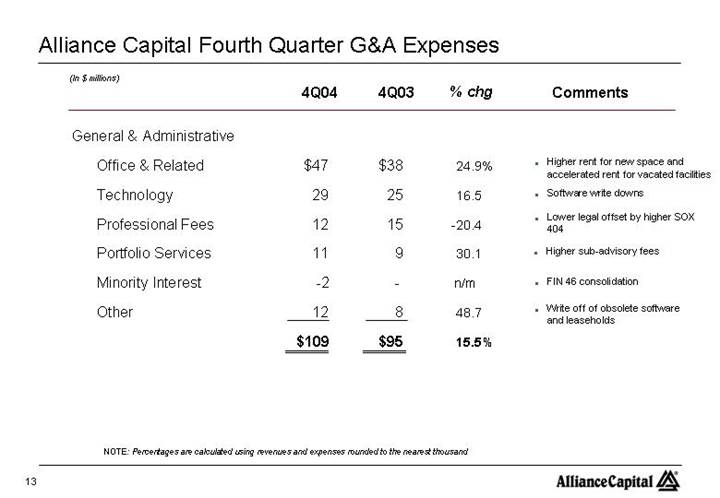
Alliance Capital Fourth Quarter G&A Expenses |
(In $ millions)
| | 4Q04 | | 4Q03 | | % chg | | Comments | |
| | | | | | | | | | |
General & Administrative | | | | | | | | | | |
Office & Related | | $ | 47 | | $ | 38 | | 24.9 | % | • | Higher rent for new space and | |
| | | | | | | | | accelerated rent for vacated facilities | |
Technology | | 29 | | 25 | | 16.5 | | • | Software write downs | |
Professional Fees | | 12 | | 15 | | -20.4 | | • | Lower legal offset by higher SOX 404 | |
Portfolio Services | | 11 | | 9 | | 30.1 | | • | Higher sub-advisory fees | |
Minority Interest | | -2 | | — | | n/m | | • | FIN 46 consolidation | |
Other | | 12 | | 8 | | 48.7 | | • | Write off of obsolete software and
leaseholds | |
| | | | | | | | | | |
| | | | | | | | | | | | |
| | $ | 109 | | $ | 95 | | 15.5 | % | | | |
NOTE: Percentages are calculated using revenues and expenses rounded to the nearest thousand
13
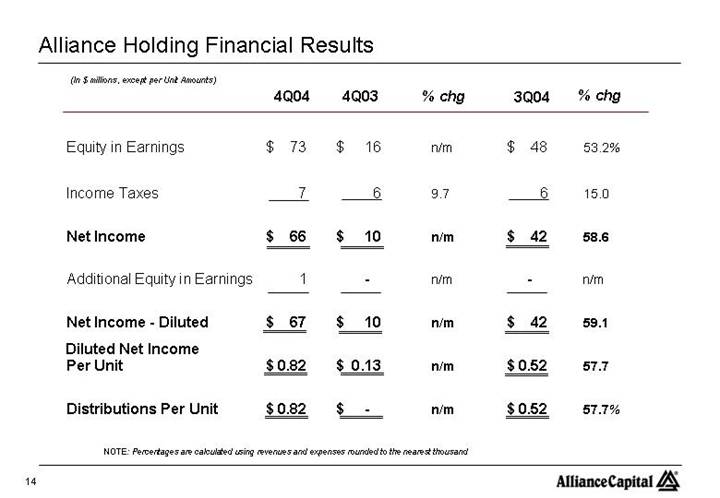
Alliance Holding Financial Results |
(In $ millions, except per Unit Amounts)
| | 4Q04 | | 4Q03 | | % chg | | 3Q04 | | % chg | |
| | | | | | | | | | | |
Equity in Earnings | | $ | 73 | | $ | 16 | | n/m | | $ | 48 | | 53.2 | % |
| | | | | | | | | | | |
Income Taxes | | 7 | | 6 | | 9.7 | | 6 | | 15.0 | |
| | | | | | | | | | | |
Net Income | | $ | 66 | | $ | 10 | | n/m | | $ | 42 | | 58.6 | |
| | | | | | | | | | | |
Additional Equity in Earnings | | 1 | | — | | n/m | | — | | n/m | |
| | | | | | | | | | | |
Net Income - Diluted | | $ | 67 | | $ | 10 | | n/m | | $ | 42 | | 59.1 | |
| | | | | | | | | | | |
Diluted Net Income Per Unit | | $ | 0.82 | | $ | 0.13 | | n/m | | $ | 0.52 | | 57.7 | |
| | | | | | | | | | | |
Distributions Per Unit | | $ | 0.82 | | $ | — | | n/m | | $ | 0.52 | | 57.7 | % |
NOTE: Percentages are calculated using revenues and expenses rounded to the nearest thousand
14
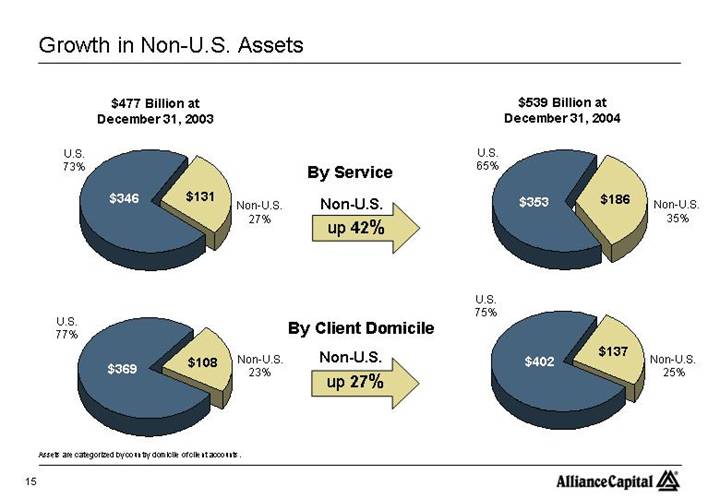
Growth in Non-U.S. Assets |
$477 Billion at | | $539 Billion at | |
December 31, 2003 | | December 31, 2004 | |
| | | |
| By Service | | |
[CHART] | Non-U.S. | [CHART] | |
| up 42% | | |
| | | |
| By Client Domicile | | |
[CHART] | Non-U.S. | [CHART] | |
| up 27% | | |
Assets are categorized by country domicile of client accounts.
15
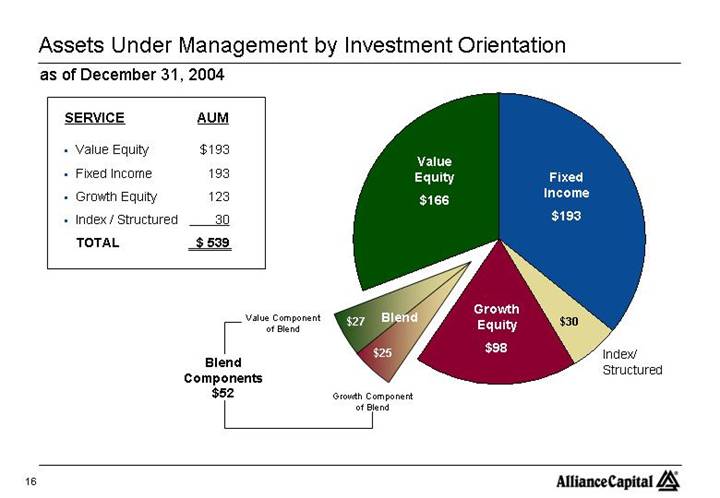
Assets Under Management by Investment Orientation |
as of December 31, 2004
SERVICE | | AUM | |
| | | |
• Value Equity | | $ | 193 | |
• Fixed Income | | 193 | |
• Growth Equity | | 123 | |
• Index / Structured | | 30 | |
| | | |
TOTAL | | $ | 539 | |
[CHART]
16
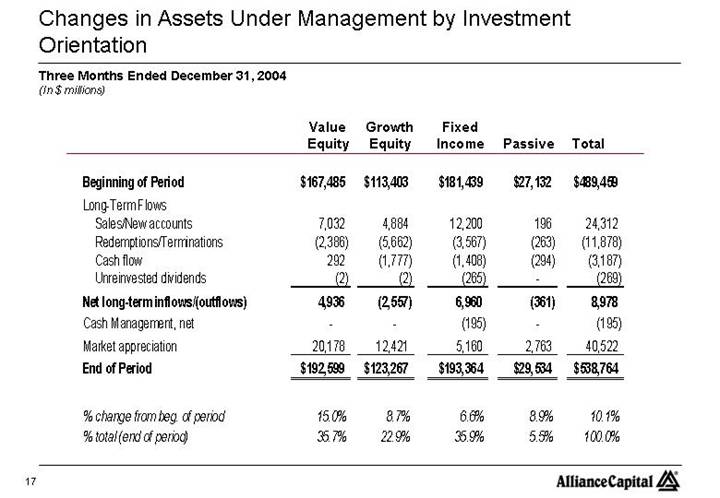
Changes in Assets Under Management by Investment Orientation |
Three Months Ended December 31, 2004
(In $ millions)
| | Value
Equity | | Growth
Equity | | Fixed
Income | | Passive | | Total | |
| | | | | | | | | | | |
Beginning of Period | | $ | 167,485 | | $ | 113,403 | | $ | 181,439 | | $ | 27,132 | | $ | 489,459 | |
Long-Term Flows | | | | | | | | | | | |
Sales/New accounts | | 7,032 | | 4,884 | | 12,200 | | 196 | | 24,312 | |
Redemptions/Terminations | | (2,386 | ) | (5,662 | ) | (3,567 | ) | (263 | ) | (11,878 | ) |
Cash flow | | 292 | | (1,777 | ) | (1,408 | ) | (294 | ) | (3,187 | ) |
Unreinvested dividends | | (2 | ) | (2 | ) | (265 | ) | — | | (269 | ) |
Net long-term inflows/(outflows) | | 4,936 | | (2,557 | ) | 6,960 | | (361 | ) | 8,978 | |
Cash Management, net | | — | | — | | (195 | ) | — | | (195 | ) |
Market appreciation | | 20,178 | | 12,421 | | 5,160 | | 2,763 | | 40,522 | |
End of Period | | $ | 192,599 | | $ | 123,267 | | $ | 193,364 | | $ | 29,534 | | $ | 538,764 | |
| | | | | | | | | | | |
% change from beg. of period | | 15.0 | % | 8.7 | % | 6.6 | % | 8.9 | % | 10.1 | % |
% total (end of period) | | 35.7 | % | 22.9 | % | 35.9 | % | 5.5 | % | 100.0 | % |
17
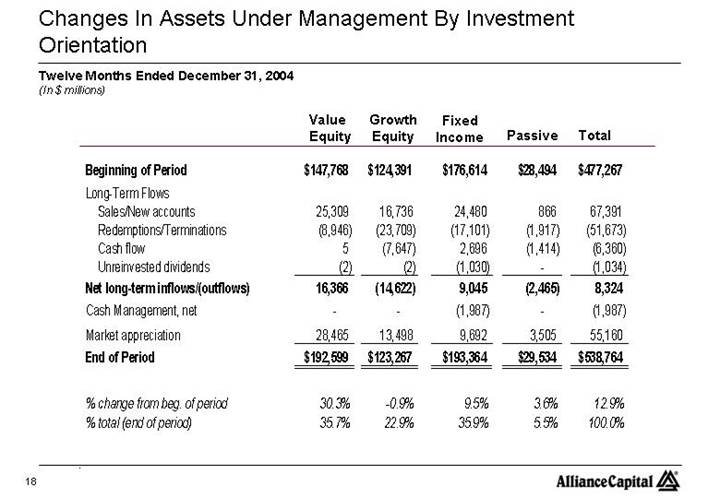
Changes In Assets Under Management By Investment Orientation |
Twelve Months Ended December 31, 2004
(In $ millions)
| | Value
Equity | | Growth
Equity | | Fixed
Income | | Passive | | Total | |
Beginning of Period | | $ | 147,768 | | $ | 124,391 | | $ | 176,614 | | $ | 28,494 | | $ | 477,267 | |
Long-Term Flows | | | | | | | | | | | |
Sales/New accounts | | 25,309 | | 16,736 | | 24,480 | | 866 | | 67,391 | |
Redemptions/Terminations | | (8,946 | ) | (23,709 | ) | (17,101 | ) | (1,917 | ) | (51,673 | ) |
Cash flow | | 5 | | (7,647 | ) | 2,696 | | (1,414 | ) | (6,360 | ) |
Unreinvested dividends | | (2 | ) | (2 | ) | (1,030 | ) | — | | (1,034 | ) |
Net long-term inflows/(outflows) | | 16,366 | | (14,622 | ) | 9,045 | | (2,465 | ) | 8,324 | |
Cash Management, net | | — | | — | | (1,987 | ) | — | | (1,987 | ) |
Market appreciation | | 28,465 | | 13,498 | | 9,692 | | 3,505 | | 55,160 | |
End of Period | | $ | 192,599 | | $ | 123,267 | | $ | 193,364 | | $ | 29,534 | | $ | 538,764 | |
| | | | | | | | | | | |
% change from beg. of period | | 30.3 | % | -0.9 | % | 9.5 | % | 3.6 | % | 12.9 | % |
% total (end of period) | | 35.7 | % | 22.9 | % | 35.9 | % | 5.5 | % | 100.0 | % |
18
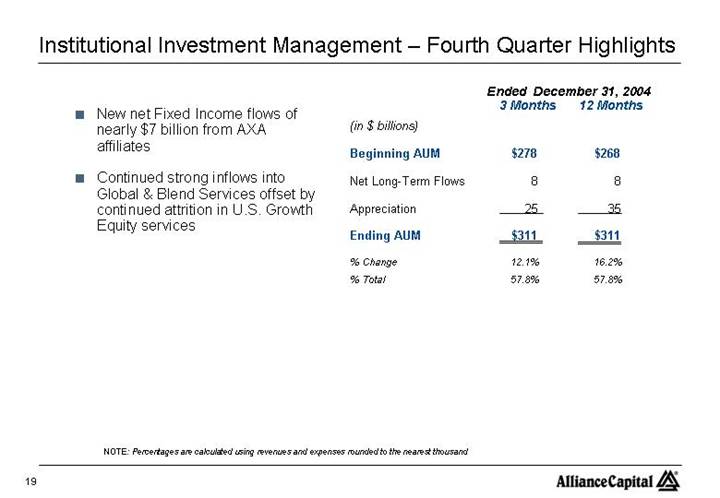
Institutional Investment Management – Fourth Quarter Highlights |
| | | | | Ended December 31, 2004 | |
| | | | (in $ billions) | | 3 Months | | 12 Months | |
| | | | | | | | | |
| • | New net Fixed Income flows of | | Beginning AUM | | $ | 278 | | $ | 268 | |
| | nearly $7 billion from AXA | | Net Long-Term Flows | | 8 | | 8 | |
| | affiliates | | | | | | | |
| | | | Appreciation | | 25 | | 35 | |
| • | Continued strong inflows into | | | | | | | |
| | Global & Blend Services offset by | | Ending AUM | | $ | 311 | | $ | 311 | |
| | continued attrition in U.S. Growth | | | | | | | |
| | Equity services | | % Change | | 12.1 | % | 16.2 | % |
| | | | % Total | | 57.8 | % | 57.8 | % |
NOTE: Percentages are calculated using revenues and expenses rounded to the nearest thousand
19
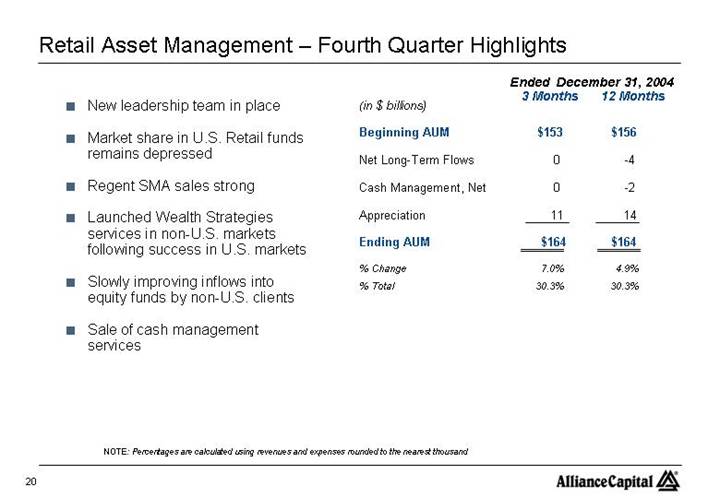
Retail Asset Management – Fourth Quarter Highlights |
| | | | | Ended December 31, 2004 | |
| | | | (in $ billions) | | 3 Months | | 12 Months | |
| | | | | | | | | |
| • | New leadership team in place | | Beginning AUM | | $ | 153 | | $ | 156 | |
| | | | | | | | | |
| • | Market share in U.S. Retail funds | | Net Long-Term Flows | | 0 | | -4 | |
| | remains depressed | | | | | | | |
| | | | Cash Management, Net | | 0 | | -2 | |
| • | Regent SMA sales strong | | | | | | | |
| | | | Appreciation | | 11 | | 14 | |
| • | Launched Wealth Strategies services in non-U.S. | | | | | | | |
| | markets following success in U.S. markets | | Ending AUM | | $ | 164 | | $ | 164 | |
| | | | | | | | | |
| | | | % Change | | 7.0 | % | 4.9 | % |
| • | Slowly improving inflows into equity funds | | % Total | | 30.3 | % | 30.3 | % |
| | by non-U.S. clients | | | | | | | |
| | | | | | | | | |
| • | Sale of cash management services | | | | | | | |
NOTE: Percentages are calculated using revenues and expenses rounded to the nearest thousand
20
Private Client Asset Management – Fourth Quarter Highlights |
| | | | | Ended December 31, 2004 | |
| | | (in $ billions) | | 3 Months | | 12 Months | |
• | Net flows slowed to $452 million
due to increased attrition | | Beginning AUM | | $ | 59 | | $ | 53 | |
| | | | | | | | |
• | Expansion continues | | Net Long-Term Flows | | 0 | | 5 | |
| | | | | | | | | |
| | • | Financial Advisors total 193 (+17%) | | Appreciation | | 5 | | 6 | |
| | | | | | | | | | |
| | | | | Ending AUM | | $ | 64 | | $ | 64 | |
| | • | 3 new offices opened in 2004: | | | | | | | |
| | | Boston, Tampa & | | % Change | | 8.3 | % | 19.3 | % |
| | | Philadelphia (4Q) | | % Total | | 11.9 | % | 11.9 | % |
NOTE: Percentages are calculated using revenues and expenses rounded to the nearest thousand
21
Institutional Research Services – Fourth Quarter Highlights |
• Double-digit revenue growth
• Increased market share and market volume more than offset lower pricing in U.S. and London
• A record year in revenues
• Sanford C. Bernstein remains a leader for quality research in major investor polls
22
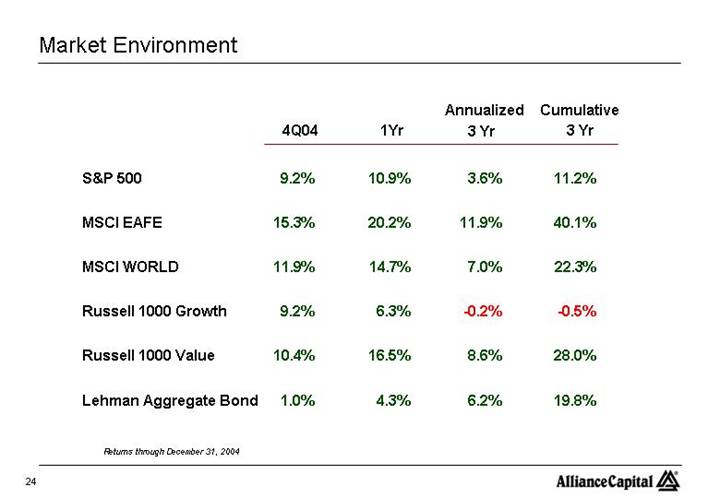
| | | | | | Annualized | | Cumulative | |
| | 4Q04 | | 1Yr | | 3 Yr | | 3 Yr | |
| | | | | | | | | |
S&P 500 | | 9.2 | % | 10.9 | % | 3.6 | % | 11.2 | % |
| | | | | | | | | |
MSCI EAFE | | 15.3 | % | 20.2 | % | 11.9 | % | 40.1 | % |
| | | | | | | | | |
MSCI WORLD | | 11.9 | % | 14.7 | % | 7.0 | % | 22.3 | % |
| | | | | | | | | |
Russell 1000 Growth | | 9.2 | % | 6.3 | % | -0.2 | % | -0.5 | % |
| | | | | | | | | |
Russell 1000 Value | | 10.4 | % | 16.5 | % | 8.6 | % | 28.0 | % |
| | | | | | | | | |
Lehman Aggregate Bond | | 1.0 | % | 4.3 | % | 6.2 | % | 19.8 | % |
Returns through December 31, 2004
24
Relative Performance – Institutional Value Equity (Before Fees) (1) |
Institutional Equity Composites vs. Benchmarks
| | U.S.
Strategic
Value(2) | | U.S.
Diversified
Value(2) | | Bernstein
International
Value(3) | | Global
Value(4) | | Emerging
Markets
Value(5) | |
| | | | | | | | | | | |
4Q04 | | -0.9 | | -0.7 | | -0.2 | | +0.4 | | +7.9 | |
| | | | | | | | | | | |
1yr | | -2.4 | | -1.4 | | +6.6 | | +5.2 | | +14.1 | |
| | | | | | | | | | | |
3yr | | -0.7 | | +1.3 | | +8.6 | | +6.7 | | +16.5 | |
| | | | | | | | | | | |
5yr | | + 3.6 | | +4.2 | | +9.2 | | +11.4 | | +9.7 | |
| | | | | | | | | | | |
10yr | | +0.2 | | — | | — | | — | | — | |
NOTE: The information in this table is provided solely for use in connection with this presentation, and is not directed toward existing or potential investment advisory clients of Alliance Capital.
(1) Investment performance of composites is presented before investment management fees. Please see page 28 for after fee results.
(2) vs. Russell 1000 Value (3) vs. MSCI EAFE (Cap, UH) and MSCI World (4) vs. MSCI World (Cap, UH) (5) vs. MSCI Emerging Markets. Composite and benchmark data through 12/31/04. Performance is preliminary.
25
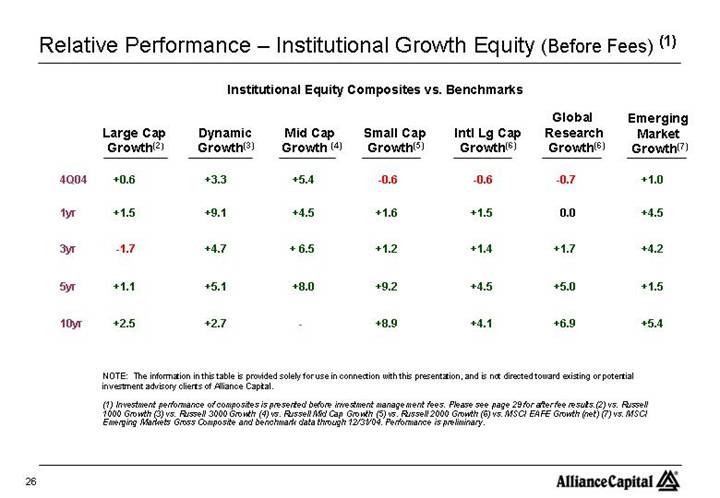
Relative Performance – Institutional Growth Equity (Before Fees) (1) |
Institutional Equity Composites vs. Benchmarks
| | Large Cap
Growth(2) | | Dynamic
Growth(3) | | Mid Cap
Growth(4) | | Small Cap
Growth(5) | | Intl Lg Cap
Growth(6) | | Global
Research
Growth(6) | | Emerging
Market
Growth(7) | |
| | | | | | | | | | | | | | | |
4Q04 | | +0.6 | | +3.3 | | +5.4 | | -0.6 | | -0.6 | | -0.7 | | +1.0 | |
| | | | | | | | | | | | | | | |
1yr | | +1.5 | | +9.1 | | +4.5 | | +1.6 | | +1.5 | | 0.0 | | +4.5 | |
| | | | | | | | | | | | | | | |
3yr | | -1.7 | | +4.7 | | + 6.5 | | +1.2 | | +1.4 | | +1.7 | | +4.2 | |
| | | | | | | | | | | | | | | |
5yr | | +1.1 | | +5.1 | | +8.0 | | +9.2 | | +4.5 | | +5.0 | | +1.5 | |
| | | | | | | | | | | | | | | |
10yr | | +2.5 | | +2.7 | | — | | +8.9 | | +4.1 | | +6.9 | | +5.4 | |
NOTE: The information in this table is provided solely for use in connection with this presentation, and is not directed toward existing or potential investment advisory clients of Alliance Capital.
(1) Investment performance of composites is presented before investment management fees. Please see page 29 for after fee results. (2) vs. Russell 1000 Growth (3) vs. Russell 3000 Growth (4) vs. Russell Mid Cap Growth (5) vs. Russell 2000 Growth (6) vs. MSCI EAFE Growth (net) (7) vs. MSCI Emerging Markets Gross. Composite and benchmark data through 12/31/04. Performance is preliminary.
26
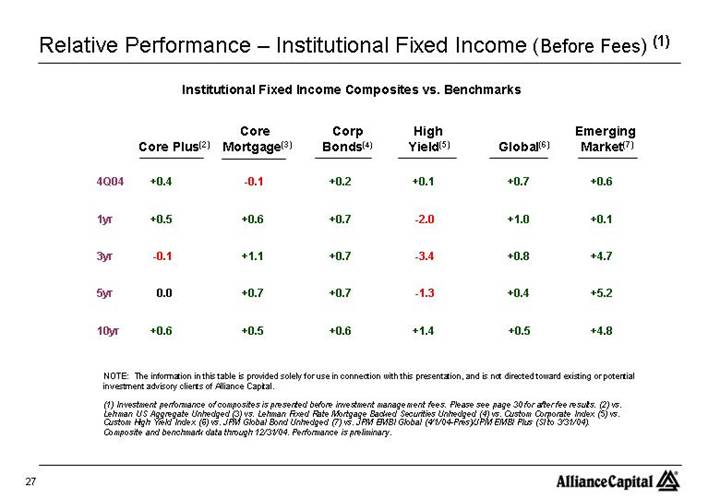
Relative Performance – Institutional Fixed Income (Before Fees) (1) |
Institutional Fixed Income Composites vs. Benchmarks
| | Core Plus(2) | | Core
Mortgage(3) | | Corp
Bonds(4) | | High
Yield(5) | | Global(6) | | Emerging
Market(7) | |
| | | | | | | | | | | | | |
4Q04 | | +0.4 | | -0.1 | | +0.2 | | +0.1 | | +0.7 | | +0.6 | |
| | | | | | | | | | | | | |
1yr | | +0.5 | | +0.6 | | +0.7 | | -2.0 | | +1.0 | | +0.1 | |
| | | | | | | | | | | | | |
3yr | | -0.1 | | +1.1 | | +0.7 | | -3.4 | | +0.8 | | +4.7 | |
| | | | | | | | | | | | | |
5yr | | 0.0 | | +0.7 | | +0.7 | | -1.3 | | +0.4 | | +5.2 | |
| | | | | | | | | | | | | |
10yr | | +0.6 | | +0.5 | | +0.6 | | +1.4 | | +0.5 | | +4.8 | |
NOTE: The information in this table is provided solely for use in connection with this presentation, and is not directed toward existing or potential investment advisory clients of Alliance Capital.
(1) Investment performance of composites is presented before investment management fees. Please see page 30 for after fee results. (2) vs. Lehman US Aggregate Unhedged (3) vs. Lehman Fixed Rate Mortgage Backed Securities Unhedged (4) vs. Custom Corporate Index (5) vs. Custom High Yield Index (6) vs. JPM Global Bond Unhedged (7) vs. JPM EMBI Global (4/1/04-Pres)/JPM EMBI Plus (SI to 3/31/04). Composite and benchmark data through 12/31/04. Performance is preliminary.
27
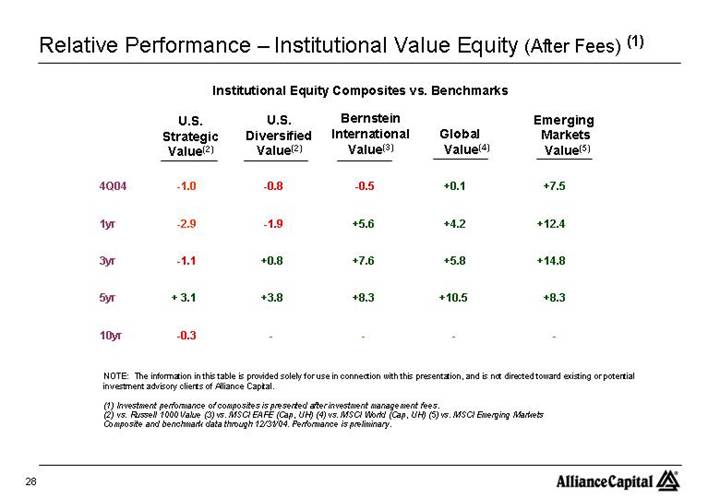
Relative Performance – Institutional Value Equity (After Fees) (1) |
Institutional Equity Composites vs. Benchmarks
| | U.S.
Strategic
Value(2) | | U.S.
Diversified
Value(2) | | Bernstein
International
Value(3) | | Global
Value(4) | | Emerging
Markets
Value(5) | |
| | | | | | | | | | | |
4Q04 | | -1.0 | | -0.8 | | -0.5 | | +0.1 | | +7.5 | |
| | | | | | | | | | | |
1yr | | -2.9 | | -1.9 | | +5.6 | | +4.2 | | +12.4 | |
| | | | | | | | | | | |
3yr | | -1.1 | | +0.8 | | +7.6 | | +5.8 | | +14.8 | |
| | | | | | | | | | | |
5yr | | + 3.1 | | +3.8 | | +8.3 | | +10.5 | | +8.3 | |
| | | | | | | | | | | |
10yr | | -0.3 | | — | | — | | — | | — | |
NOTE: The information in this table is provided solely for use in connection with this presentation, and is not directed toward existing or potential investment advisory clients of Alliance Capital.
(1) Investment performance of composites is presented after investment management fees.
(2) vs. Russell 1000 Value (3) vs. MSCI EAFE (Cap, UH) (4) vs. MSCI World (Cap, UH) (5) vs. MSCI Emerging Markets
Composite and benchmark data through 12/31/04. Performance is preliminary.
28
Relative Performance – Institutional Growth Equity (After Fees) (1) |
Institutional Equity Composites vs. Benchmarks
| | Large Cap
Growth(2) | | Dynamic
Growth(3) | | Mid Cap
Growth (4) | | Small Cap
Growth(5) | | Intl Lg Cap
Growth(6) | | Global
Research
Growth(6) | | Emerging
Market
Growth(7) | |
| | | | | | | | | | | | | | | |
4Q04 | | +0.5 | | +3.2 | | +5.3 | | -0.8 | | -0.7 | | -0.9 | | +0.9 | |
| | | | | | | | | | | | | | | |
1yr | | +1.2 | | +8.6 | | +4.2 | | +0.7 | | +1.1 | | -1.1 | | +4.1 | |
| | | | | | | | | | | | | | | |
3yr | | -2.0 | | +4.2 | | + 6.1 | | +0.3 | | +1.1 | | +0.5 | | +3.7 | |
| | | | | | | | | | | | | | | |
5yr | | +0.7 | | +4.5 | | +7.6 | | +8.3 | | +4.1 | | +3.6 | | +0.9 | |
| | | | | | | | | | | | | | | |
10yr | | +1.9 | | +1.7 | | — | | +7.8 | | +3.5 | | +5.0 | | +4.5 | |
NOTE: The information in this table is provided solely for use in connection with this presentation, and is not directed toward existing or potential investment advisory clients of Alliance Capital.
(1) Investment performance of composites is presented after investment management fees. (2) vs. Russell 1000 Growth (3) vs. Russell 3000 Growth (4) vs. Russell Mid Cap Growth (5) vs. Russell 2000 Growth (6) vs. MSCI EAFE Growth (net) (7) vs. MSCI Emerging Markets Gross. Composite and benchmark data through 12/31/04. Performance is preliminary.
29
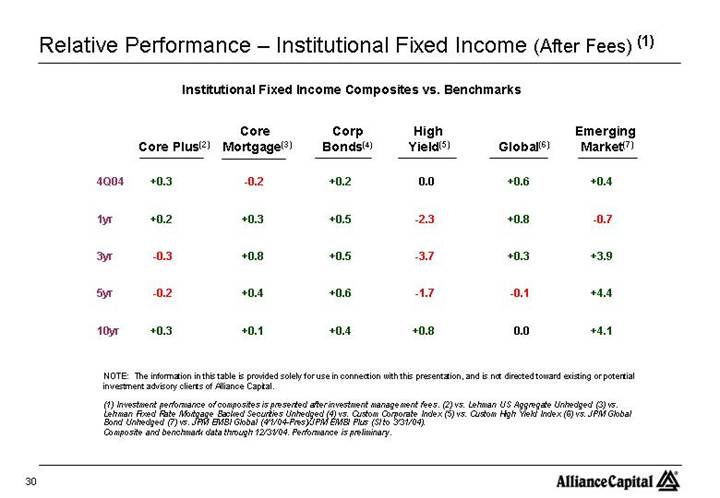
Relative Performance – Institutional Fixed Income (After Fees) (1) |
Institutional Fixed Income Composites vs. Benchmarks
| | Core Plus(2) | | Core
Mortgage(3) | | Corp
Bonds(4) | | High
Yield(5) | | Global(6) | | Emerging
Market(7) | |
| | | | | | | | | | | | | |
4Q04 | | +0.3 | | -0.2 | | +0.2 | | 0.0 | | +0.6 | | +0.4 | |
| | | | | | | | | | | | | |
1yr | | +0.2 | | +0.3 | | +0.5 | | -2.3 | | +0.8 | | -0.7 | |
| | | | | | | | | | | | | |
3yr | | -0.3 | | +0.8 | | +0.5 | | -3.7 | | +0.3 | | +3.9 | |
| | | | | | | | | | | | | |
5yr | | -0.2 | | +0.4 | | +0.6 | | -1.7 | | -0.1 | | +4.4 | |
| | | | | | | | | | | | | |
10yr | | +0.3 | | +0.1 | | +0.4 | | +0.8 | | 0.0 | | +4.1 | |
NOTE: The information in this table is provided solely for use in connection with this presentation, and is not directed toward existing or potential investment advisory clients of Alliance Capital.
(1) Investment performance of composites is presented after investment management fees. (2) vs. Lehman US Aggregate Unhedged(3) vs. Lehman Fixed Rate Mortgage Backed Securities Unhedged(4) vs. Custom Corporate Index (5) vs. Custom High Yield Index (6) vs. JPM Global Bond Unhedged(7) vs. JPM EMBI Global (4/1/04-Pres)/JPM EMBI Plus (SI to 3/31/04).
Composite and benchmark data through 12/31/04. Performance is preliminary.
30
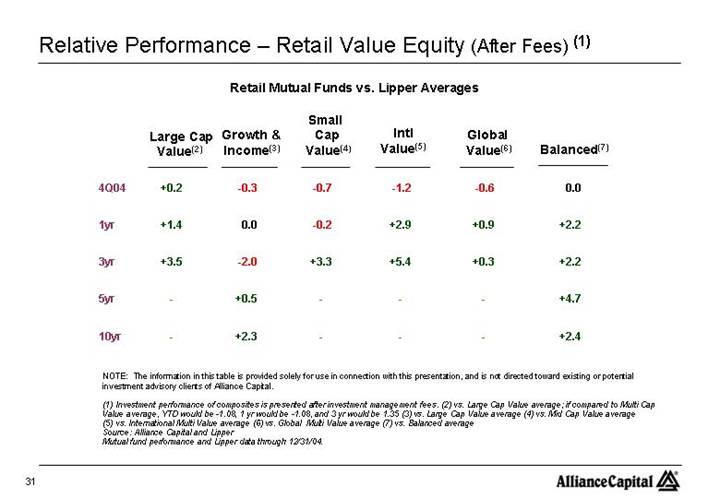
Relative Performance – Retail Value Equity (After Fees) (1) |
Retail Mutual Funds vs. Lipper Averages
| | Large Cap
Value(2) | | Growth &
Income(3) | | Small
Cap
Value(4) | | Intl
Value(5) | | Global
Value(6) | | Balanced(7) | |
| | | | | | | | | | | | | |
4Q04 | | +0.2 | | -0.3 | | -0.7 | | -1.2 | | -0.6 | | 0.0 | |
| | | | | | | | | | | | | |
1yr | | +1.4 | | 0.0 | | -0.2 | | +2.9 | | +0.9 | | +2.2 | |
| | | | | | | | | | | | | |
3yr | | +3.5 | | -2.0 | | +3.3 | | +5.4 | | +0.3 | | +2.2 | |
| | | | | | | | | | | | | |
5yr | | — | | +0.5 | | — | | — | | — | | +4.7 | |
| | | | | | | | | | | | | |
10yr | | — | | +2.3 | | — | | — | | — | | +2.4 | |
NOTE: The information in this table is provided solely for use in connection with this presentation, and is not directed toward existing or potential investment advisory clients of Alliance Capital.
(1) Investment performance of composites is presented after investment management fees. (2) vs. Large Cap Value average; if compared to Multi Cap Value average, YTD would be -1.08, 1 yr would be -1.08, and 3 yr would be 1.35 (3) vs. Large Cap Value average (4) vs. Mid Cap Value average (5) vs. International Multi Value average (6) vs. Global Multi Value average (7) vs. Balanced average
Source: Alliance Capital and Lipper
Mutual fund performance and Lipper data through 12/31/04.
31
Relative Performance – Retail Growth Equity (After Fees) (1) |
Retail Mutual Funds vs. Lipper Averages
| | Large Cap
Growth(2) | | Growth
Multi Cap(3) | | Mid Cap
Growth(4) | | Small Cap
Growth(5) | | Global
Growth
Research(6) | | Regent
Core
Equity(7) | |
| | | | | | | | | | | | | |
4Q04 | | +0.4 | | +0.5 | | +6.1 | | -0.2 | | -1.0 | | +0.8 | |
| | | | | | | | | | | | | |
1yr | | +1.0 | | +4.3 | | +6.4 | | +3.3 | | -0.5 | | +8.8 | |
| | | | | | | | | | | | | |
3yr | | -3.0 | | +1.6 | | +6.6 | | +0.9 | | — | | +5.0 | |
| | | | | | | | | | | | | |
5yr | | -3.1 | | +0.1 | | +1.7 | | +0.1 | | — | | +3.0 | |
| | | | | | | | | | | | | |
10yr | | +1.3 | | -2.1 | | +0.1 | | -0.9 | | — | | +3.0 | |
NOTE: The information in this table is provided solely for use in connection with this presentation, and is not directed toward existing or potential investment advisory clients of Alliance Capital.
(1) Investment performance of composites is presented after investment management fees (2) vs. Large Cap Growth average. Formerly named Premier Growth (3) vs. Multi Cap Growth average (4) vs. Mid Cap Growth average (5) vs. Small Cap Growth average. Formerly named Quasar (6) vs. Global Multi Growth Equity average. Formerly named Global Growth Trends (7) vs. S&P 500; represents Regent separately managed account service. Net performance is inclusive of the investment management fee only. It does not include the total service fee typically associated with a traditional wrap account that may range from 2.0 - 3.0%.
Source: Alliance Capital, Lipper, and S&P
Mutual fund performance and Lipper data through 12/31/04.
32
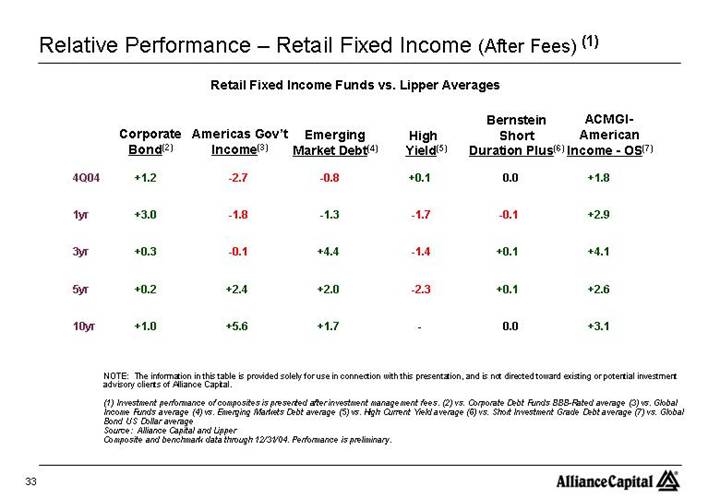
Relative Performance – Retail Fixed Income (After Fees) (1) |
Retail Fixed Income Funds vs. Lipper Averages
| | Corporate
Bond(2) | | Americas Gov’t
Income(3) | | Emerging
Market Debt(4) | | High
Yield(5) | | Bernstein
Short
Duration Plus(6) | | ACMGI-
American
Income - OS(7) | |
| | | | | | | | | | | | | |
4Q04 | | +1.2 | | -2.7 | | -0.8 | | +0.1 | | 0.0 | | +1.8 | |
| | | | | | | | | | | | | |
1yr | | +3.0 | | -1.8 | | -1.3 | | -1.7 | | -0.1 | | +2.9 | |
| | | | | | | | | | | | | |
3yr | | +0.3 | | -0.1 | | +4.4 | | -1.4 | | +0.1 | | +4.1 | |
| | | | | | | | | | | | | |
5yr | | +0.2 | | +2.4 | | +2.0 | | -2.3 | | +0.1 | | +2.6 | |
| | | | | | | | | | | | | |
10yr | | +1.0 | | +5.6 | | +1.7 | | — | | 0.0 | | +3.1 | |
NOTE: The information in this table is provided solely for use in connection with this presentation, and is not directed toward existing or potential investment advisory clients of Alliance Capital.
(1) Investment performance of composites is presented after investment management fees. (2) vs. Corporate Debt Funds BBB-Rated average (3) vs. Global Income Funds average (4) vs. Emerging Markets Debt average (5) vs. High Current Yield average (6) vs. Short Investment Grade Debt average (7) vs. Global Bond US Dollar average
Source: Alliance Capital and Lipper
Composite and benchmark data through 12/31/04. Performance is preliminary.
33
Absolute Performance – Private Client (After Fees) (1) |
| | 4Q04 | | 1 Yr | | 3 Yr | | 5 Yr | |
| | | | | | | | | |
All Balanced Accounts(2) | | +7.3 | | +9.9 | | +7.2 | | +6.1 | |
| | | | | | | | | |
Global Balanced Benchmark(3) | | +6.9 | | +9.3 | | +6.3 | | +1.6 | |
NOTE: The information in this table is provided solely for use in connection with this presentation, and is not directed towards existing or potential investment advisory clients of Alliance Capital.
(1) Investment performance of composites is presented after investment management fees. (2) All Balanced Accounts include those accounts with any combination of equity and fixed income in any percentage mix. (3) Custom benchmark: 42% S&P 500, 15% MSCI EAFE, 3% MSCI Emerging Markets, 40% Lipper Intermediate Municipal Debt Fund Average
34
Fourth Quarter Revenues – by Distribution Channel |
(In $ millions)
| | 4Q04 | | 4Q03 | | % chg | |
| | | | | | | |
Institutional Inv. Mgmt | | $ | 207 | | $ | 184 | | 12.7 | % |
| | | | | | | |
Retail | | 311 | | 332 | | -6.4 | |
| | | | | | | |
Private Client | | 204 | | 166 | | 22.8 | |
| | | | | | | |
Institutional Research Svcs. | | 79 | | 69 | | 14.5 | |
| | | | | | | |
Other | | 25 | | 18 | | 38.5 | |
| | | | | | | |
Total | | $ | 826 | | $ | 769 | | 7.4 | % |
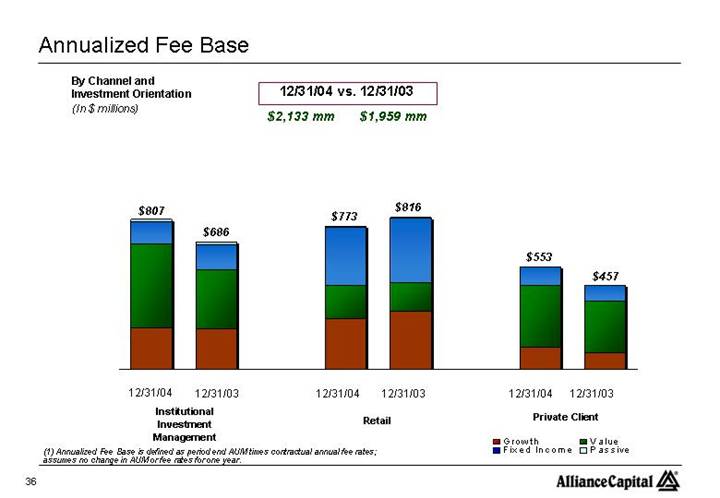
35
By Channel and | | |
Investment Orientation | 12/31/04 vs. 12/31/03 | |
(In $ millions) | | |
| $2,133 mm $1,959 mm | |
[CHART]
(1) Annualized Fee Base is defined as period end AUM times contractual annual fee rates; assumes no change in AUM or fee rates for one year.
36
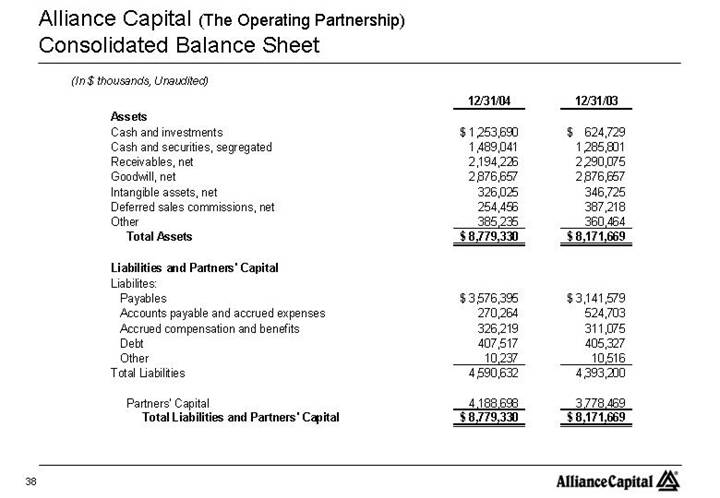
Alliance Capital (The Operating Partnership) |
Consolidated Balance Sheet
(In $ thousands, Unaudited)
| | 12/31/04 | | 12/31/03 | |
Assets | | | | | |
Cash and investments | | $ | 1,253,690 | | $ | 624,729 | |
Cash and securities, segregated | | 1,489,041 | | 1,285,801 | |
Receivables, net | | 2,194,226 | | 2,290,075 | |
Goodwill, net | | 2,876,657 | | 2,876,657 | |
Intangible assets, net | | 326,025 | | 346,725 | |
Deferred sales commissions, net | | 254,456 | | 387,218 | |
Other | | 385,235 | | 360,464 | |
Total Assets | | $ | 8,779,330 | | $ | 8,171,669 | |
| | | | | |
Liabilities and Partners’ Capital | | | | | |
Liabilites: | | | | | |
Payables | | $ | 3,576,395 | | $ | 3,141,579 | |
Accounts payable and accrued expenses | | 270,264 | | 524,703 | |
Accrued compensation and benefits | | 326,219 | | 311,075 | |
Debt | | 407,517 | | 405,327 | |
Other | | 10,237 | | 10,516 | |
Total Liabilities | | 4,590,632 | | 4,393,200 | |
| | | | | |
Partners’ Capital | | 4,188,698 | | 3,778,469 | |
Total Liabilities and Partners’ Capital | | $ | 8,779,330 | | $ | 8,171,669 | |
38
Alliance Capital (The Operating Partnership) |
Consolidated Cash Flow
(In $ thousands, Unaudited)
| | 12/31/04 | | 12/31/03 | |
Cash Flows From Operating Activities: | | | | | |
Net income | | $ | 710,150 | | $ | 329,808 | |
Non-cash items: | | | | | |
Amortization and depreciation: | | | | | |
Amortization of deferred sales commissions | | 177,355 | | 208,565 | |
Amortization of deferred compensation | | 101,561 | | 116,357 | |
Other depreciation and amortization | | 74,878 | | 77,583 | |
Other, net | | 7,860 | | (13,057 | ) |
Changes in assets and liabilities | | (103,640 | ) | 38,700 | |
Net cash provided by operating activities | | 968,164 | | 757,956 | |
| | | | | |
Cash Flows From Investing Activities: | | | | | |
Purchases of investments, net | | (27,407 | ) | (62,607 | ) |
Proceeds from sale of investments | | 38,046 | | 36,514 | |
Additions to furniture, equipment and leaseholds, net | | (57,313 | ) | (29,154 | ) |
Net cash used in investing actvities | | (46,674 | ) | (55,247 | ) |
| | | | | |
Cash Flows From Financing Activities: | | | | | |
Decrease in debt, net | | (92 | ) | (22,077 | ) |
Distributions to partners | | (382,982 | ) | (566,598 | ) |
Other | | 7,526 | | (43,785 | ) |
Net cash used in financing activities | | (375,548 | ) | (632,460 | ) |
| | | | | |
Effect of exchange rate change on cash | | 12,723 | | 14,851 | |
| | | | | |
Net increase in cash and cash equivalents | | 558,665 | | 85,100 | |
Cash and cash equivalents at the beginning of period | | 502,858 | | 417,758 | |
Cash and cash equivalents at the end of period | | $ | 1,061,523 | | $ | 502,858 | |
39
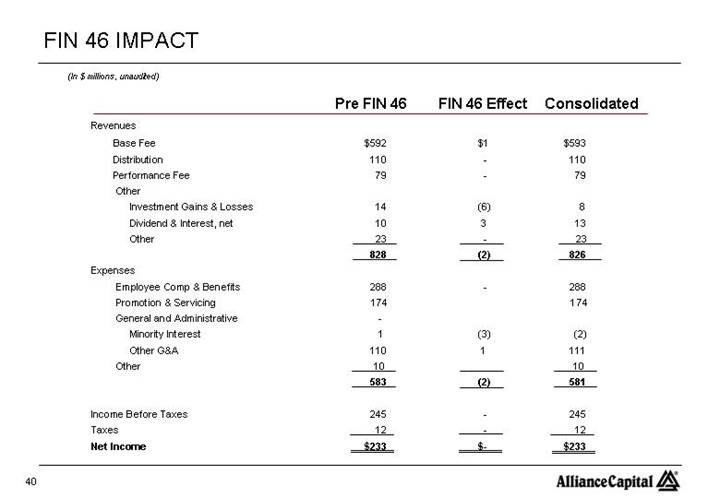
(In $ millions, unaudited)
| | Pre FIN 46 | | FIN 46 Effect | | Consolidated | |
Revenues | | | | | | | |
Base Fee | | $ | 592 | | $ | 1 | | $ | 593 | |
Distribution | | 110 | | — | | 110 | |
Performance Fee | | 79 | | — | | 79 | |
Other | | | | | | | |
Investment Gains & Losses | | 14 | | (6 | ) | 8 | |
Dividend & Interest, net | | 10 | | 3 | | 13 | |
Other | | 23 | | — | | 23 | |
| | 828 | | (2 | ) | 826 | |
Expenses | | | | | | | |
Employee Comp & Benefits | | 288 | | — | | 288 | |
Promotion & Servicing | | 174 | | | | 174 | |
General and Administrative | | — | | | | | |
Minority Interest | | 1 | | (3 | ) | (2 | ) |
Other G&A | | 110 | | 1 | | 111 | |
Other | | 10 | | | | 10 | |
| | 583 | | (2 | ) | 581 | |
| | | | | | | |
Income Before Taxes | | 245 | | — | | 245 | |
Taxes | | 12 | | — | | 12 | |
Net Income | | $ | 233 | | $ | — | | $ | 233 | |
40
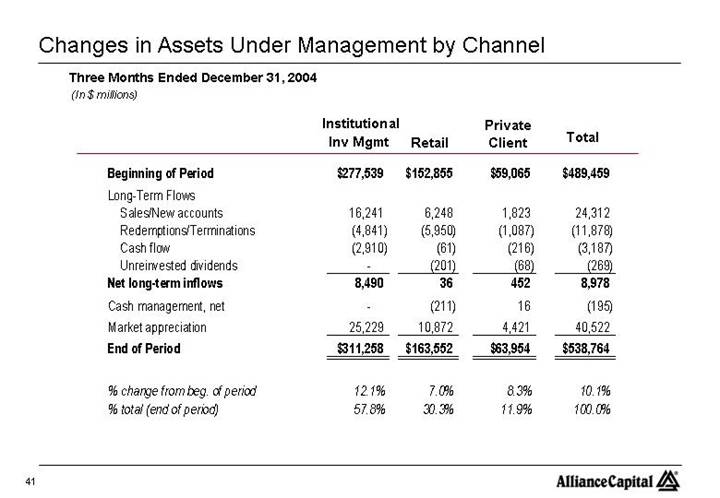
Changes in Assets Under Management by Channel |
Three Months Ended December 31, 2004
(In $ millions)
| | Institutional
Inv Mgmt | | Retail | | Private
Client | | Total | |
Beginning of Period | | $ | 277,539 | | $ | 152,855 | | $ | 59,065 | | $ | 489,459 | |
Long-Term Flows | | | | | | | | | |
Sales/New accounts | | 16,241 | | 6,248 | | 1,823 | | 24,312 | |
Redemptions/Terminations | | (4,841 | ) | (5,950 | ) | (1,087 | ) | (11,878 | ) |
Cash flow | | (2,910 | ) | (61 | ) | (216 | ) | (3,187 | ) |
Unreinvested dividends | | — | | (201 | ) | (68 | ) | (269 | ) |
Net long-term inflows | | 8,490 | | 36 | | 452 | | 8,978 | |
Cash management, net | | — | | (211 | ) | 16 | | (195 | ) |
Market appreciation | | 25,229 | | 10,872 | | 4,421 | | 40,522 | |
End of Period | | $ | 311,258 | | $ | 163,552 | | $ | 63,954 | | $ | 538,764 | |
| | | | | | | | | |
% change from beg. of period | | 12.1 | % | 7.0 | % | 8.3 | % | 10.1 | % |
% total (end of period) | | 57.8 | % | 30.3 | % | 11.9 | % | 100.0 | % |
41
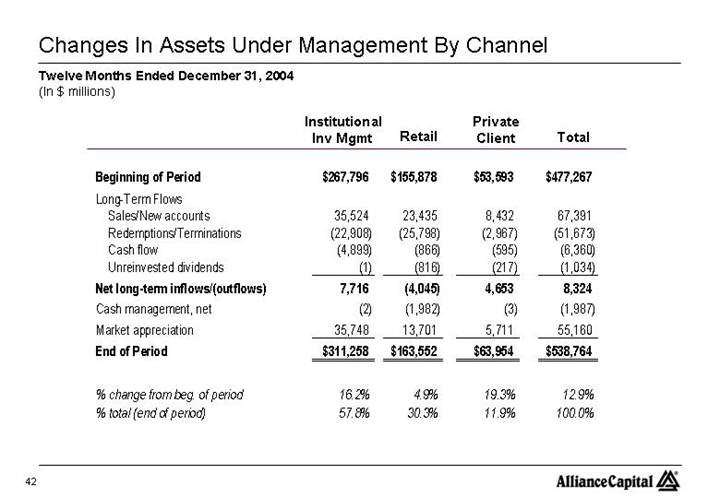
Changes In Assets Under Management By Channel |
Twelve Months Ended December 31, 2004
(In $ millions)
| | Institutional
Inv Mgmt | | Retail | | Private
Client | | Total | |
Beginning of Period | | $ | 267,796 | | $ | 155,878 | | $ | 53,593 | | $ | 477,267 | |
Long-Term Flows | | | | | | | | | |
Sales/New accounts | | 35,524 | | 23,435 | | 8,432 | | 67,391 | |
Redemptions/Terminations | | (22,908 | ) | (25,798 | ) | (2,967 | ) | (51,673 | ) |
Cash flow | | (4,899 | ) | (866 | ) | (595 | ) | (6,360 | ) |
Unreinvested dividends | | (1 | ) | (816 | ) | (217 | ) | (1,034 | ) |
Net long-term inflows/(outflows) | | 7,716 | | (4,045 | ) | 4,653 | | 8,324 | |
Cash management, net | | (2 | ) | (1,982 | ) | (3 | ) | (1,987 | ) |
Market appreciation | | 35,748 | | 13,701 | | 5,711 | | 55,160 | |
End of Period | | $ | 311,258 | | $ | 163,552 | | $ | 63,954 | | $ | 538,764 | |
| | | | | | | | | |
% change from beg. of period | | 16.2 | % | 4.9 | % | 19.3 | % | 12.9 | % |
% total (end of period) | | 57.8 | % | 30.3 | % | 11.9 | % | 100.0 | % |
42
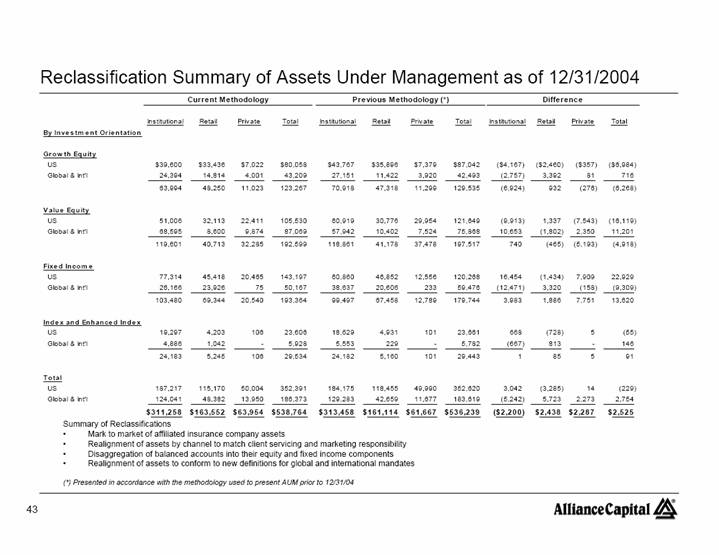
Reclassification Summary of Assets Under Management as of 12/31/2004 |
| | Current Methodology | | Previous Methodology (*) | | Difference | |
| | Institutional | | Retail | | Private | | Total | | Institutional | | Retail | | Private | | Total | | Institutional | | Retail | | Private | | Total | |
By Investment Orientation | | | | | | | | | | | | | | | | | | | | | | | | | |
| | | | | | | | | | | | | | | | | | | | | | | | | |
Growth Equity | | | | | | | | | | | | | | | | | | | | | | | | | |
US | | $ | 39,600 | | $ | 33,436 | | $ | 7,022 | | $ | 80,058 | | $ | 43,767 | | $ | 35,896 | | $ | 7,379 | | $ | 87,042 | | $ | (4,167 | ) | $ | (2,460 | ) | $ | (357 | ) | $ | (6,984 | ) |
Global & Int’l | | 24,394 | | 14,814 | | 4,001 | | 43,209 | | 27,151 | | 11,422 | | 3,920 | | 42,493 | | (2,757 | ) | 3,392 | | 81 | | 716 | |
| | 63,994 | | 48,250 | | 11,023 | | 123,267 | | 70,918 | | 47,318 | | 11,299 | | 129,535 | | (6,924 | ) | 932 | | (276 | ) | (6,268 | ) |
| | | | | | | | | | | | | | | | | | | | | | | | | |
Value Equity | | | | | | | | | | | | | | | | | | | | | | | | | |
US | | 51,006 | | 32,113 | | 22,411 | | 105,530 | | 60,919 | | 30,776 | | 29,954 | | 121,649 | | (9,913 | ) | 1,337 | | (7,543 | ) | (16,119 | ) |
Global & Int’l | | 68,595 | | 8,600 | | 9,874 | | 87,069 | | 57,942 | | 10,402 | | 7,524 | | 75,868 | | 10,653 | | (1,802 | ) | 2,350 | | 11,201 | |
| | 119,601 | | 40,713 | | 32,285 | | 192,599 | | 118,861 | | 41,178 | | 37,478 | | 197,517 | | 740 | | (465 | ) | (5,193 | ) | (4,918 | ) |
| | | | | | | | | | | | | | | | | | | | | | | | | |
Fixed Income | | | | | | | | | | | | | | | | | | | | | | | | | |
US | | 77,314 | | 45,418 | | 20,465 | | 143,197 | | 60,860 | | 46,852 | | 12,556 | | 120,268 | | 16,454 | | (1,434 | ) | 7,909 | | 22,929 | |
Global & Int’l | | 26,166 | | 23,926 | | 75 | | 50,167 | | 38,637 | | 20,606 | | 233 | | 59,476 | | (12,471 | ) | 3,320 | | (158 | ) | (9,309 | ) |
| | 103,480 | | 69,344 | | 20,540 | | 193,364 | | 99,497 | | 67,458 | | 12,789 | | 179,744 | | 3,983 | | 1,886 | | 7,751 | | 13,620 | |
| | | | | | | | | | | | | | | | | | | | | | | | | |
Index and Enhanced Index | | | | | | | | | | | | | | | | | | | | | | | | | |
US | | 19,297 | | 4,203 | | 106 | | 23,606 | | 18,629 | | 4,931 | | 101 | | 23,661 | | 668 | | (728 | ) | 5 | | (55 | ) |
Global & Int’l | | 4,886 | | 1,042 | | — | | 5,928 | | 5,553 | | 229 | | — | | 5,782 | | (667 | ) | 813 | | — | | 146 | |
| | 24,183 | | 5,245 | | 106 | | 29,534 | | 24,182 | | 5,160 | | 101 | | 29,443 | | 1 | | 85 | | 5 | | 91 | |
| | | | | | | | | | | | | | | | | | | | | | | | | |
Total | | | | | | | | | | | | | | | | | | | | | | | | | |
US | | 187,217 | | 115,170 | | 50,004 | | 352,391 | | 184,175 | | 118,455 | | 49,990 | | 352,620 | | 3,042 | | (3,285 | ) | 14 | | (229 | ) |
Global & Int’l | | 124,041 | | 48,382 | | 13,950 | | 186,373 | | 129,283 | | 42,659 | | 11,677 | | 183,619 | | (5,242 | ) | 5,723 | | 2,273 | | 2,754 | |
| | $ | 311,258 | | $ | 163,552 | | $ | 63,954 | | $ | 538,764 | | $ | 313,458 | | $ | 161,114 | | $ | 61,667 | | $ | 536,239 | | $ | (2,200 | ) | $ | 2,438 | | $ | 2,287 | | $ | 2,525 | |
Summary of Reclassifications
• Mark to market of affiliated insurance company assets
• Realignment of assets by channel to match client servicing and marketing responsibility
• Disaggregation of balanced accounts into their equity and fixed income components
• Realignment of assets to conform to new definitions for global and international mandates
(*) Presented in accordance with the methodology used to present AUM prior to 12/31/04
43
Alliance Capital Investment Management Services |
Alliance Capital provides diversified investment management and related services globally to a broad range of clients:
1. Retail Services consists of investment management products and services distributed to individual investors through financial intermediaries, such as brokers and financial planners by means of:
• mutual funds sponsored by Alliance Capital and consolidated joint venture companies,
• mutual fund sub-advisory relationships resulting from the efforts of the mutual fund marketing department, and
• managed account products;
2. Institutional Investment Management Services consists of investment management services to unaffiliated parties such as corporate and public employee pension funds, endowment funds, domestic and foreign institutions and governments, and affiliates such as AXA and its insurance company subsidiaries by means of:
• separate accounts,
• mutual fund shares sold exclusively to institutional investors and high net worth individuals,
• sub-advisory relationships resulting from the efforts of the institutional marketing department,
• structured products, and
• group trusts;
3. Private Client Services consists of investment management services provided to high net worth individuals, trusts and estates, charitable foundations, partnerships, private and family corporations and other entities by means of:
• separate accounts,
• hedge funds and
• certain other vehicles; and
4. Institutional Research Services provided to institutional clients by means of:
• in-depth research,
• portfolio strategy,
• trading and
• brokerage-related services.
44