Searchable text section of graphics shown above
[GRAPHIC]
[LOGO] | | www.alliancecapital.com |
| | |
| | April 28, 2005 |
First-Quarter 2005 Review
Lewis A. Sanders | Gerald M. Lieberman |
Chairman & Chief Executive Officer | President & Chief Operating Officer |
Any forecasts or opinions in this material may not be realized. Information should not be construed as investment advice.
Introduction
The SEC adopted Regulation FD in October 2000. In light of Regulation FD, Management will be limited in responding to inquiries from investors or analysts in a non-public forum such as this one.
Forward-Looking Statements
Certain statements in this presentation are “forward-looking statements” within the meaning of the Private Securities Litigation Reform Act of 1995. Such forward-looking statements are subject to risks, uncertainties, and other factors that could cause actual results to differ materially from future results expressed or implied by such forward-looking statements. The most significant of these factors include, but are not limited to, the following: the performance of financial markets, the investment performance we achieve for our clients, general economic conditions, future acquisitions, competitive conditions, and government regulations, including changes in tax rates. We caution readers to carefully consider such forward-looking statements in light of these factors. Further, such forward-looking statements speak only as of the date on which such statements are made; we undertake no obligation to update any forward-looking statements to reflect events or circumstances after the date of such statements. For further information regarding these forward-looking statements and the factors that could cause actual results to differ, see “Risk Factors” in Item I of Form 10-K for the year ended December 31, 2004. Any or all of the forward-looking statements that we make in Form 10-K, this presentation, or any other public statements we issue may turn out to be wrong. Please remember that factors other than those listed in “Risk Factors” could also adversely affect our business, operating results, or financial condition.
The forward-looking statements we make in this presentation include statements regarding expected levels of certain expenses. Legal fees associated with litigation (net of partially offsetting insurance recoveries), and the costs of compliance with the Sarbanes-Oxley Act of 2002, and various other expenses, fluctuate from period to period. Litigation is inherently unpredictable, and costs of regulatory compliance vary due to changes in regulation, guidance from regulators, and evolving industry-wide standards.
First-Quarter 2005 Review | | [LOGO] |
2
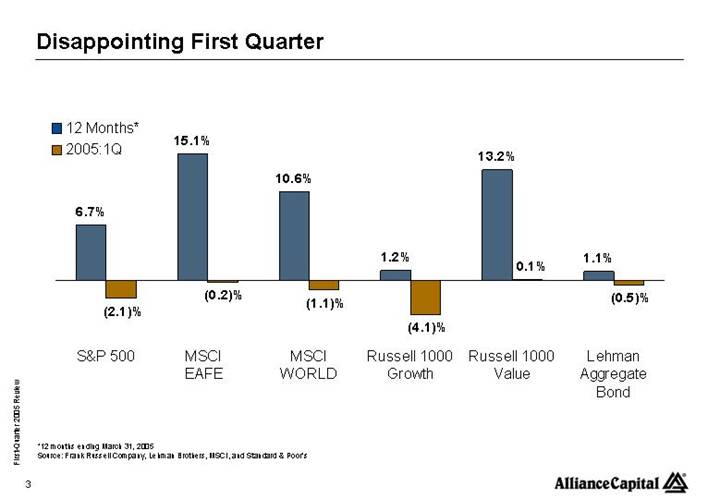
Disappointing First Quarter
[CHART]
*12 months ending March 31, 2005
Source: Frank Russell Company, Lehman Brothers, MSCI, and Standard & Poor’s
First-Quarter 2005 Review | | [LOGO] |
3
Alliance Capital Investment Performance
• Relative returns in the U.S. were lackluster and especially weak in growth-oriented services
• Absolute returns were negative in the U.S. in both equities and fixed income
• Non-U.S. relative returns were better; many services produced positive returns
• Strong relative performance in most non-U.S. value-based services
• Long-term returns remain competitive throughout the product array
First-Quarter 2005 Review | | [LOGO] |
4
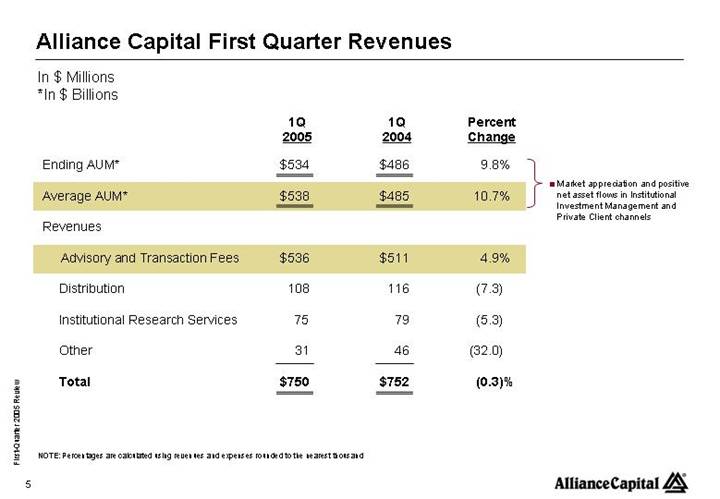
Alliance Capital First Quarter Revenues
In $ Millions
*In $ Billions
| | 1Q
2005 | | 1Q
2004 | | Percent
Change | | | |
| | | | | | | | | |
Ending AUM* | | $ | 534 | | $ | 486 | | 9.8 | % | 
| • |
Market appreciation and positive net asset flows in Institutional
Investment Management and Private Client channels |
| | | | | | | |
Average AUM* | | $ | 538 | | $ | 485 | | 10.7 | % |
| | | | | | | | | |
Revenues | | | | | | | | | |
| | | | | | | | | |
Advisory and Transaction Fees | | $ | 536 | | $ | 511 | | 4.9 | % | | |
| | | | | | | | | |
Distribution | | 108 | | 116 | | (7.3 | ) | | |
| | | | | | | | | |
Institutional Research Services | | 75 | | 79 | | (5.3 | ) | | |
| | | | | | | | | |
Other | | 31 | | 46 | | (32.0 | ) | | |
| | | | | | | | | |
Total | | $ | 750 | | $ | 752 | | (0.3 | )% | | |
NOTE: Percentages are calculated using revenues and expenses rounded to the nearest thousand
First-Quarter 2005 Review | | [LOGO] |
5
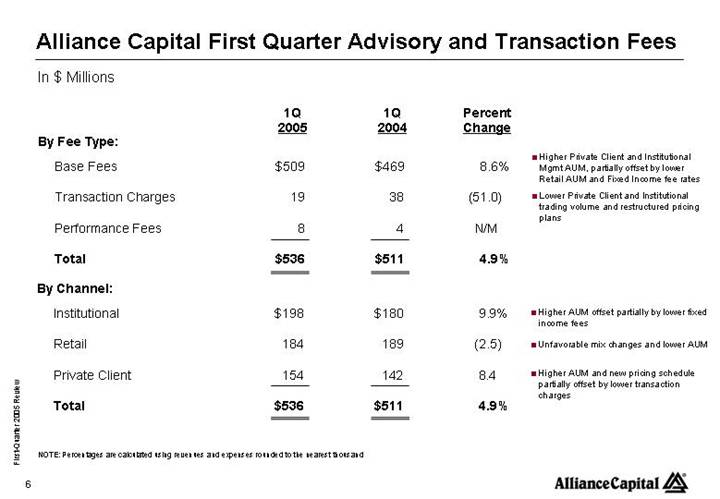
Alliance Capital First Quarter Advisory and Transaction Fees
In $ Millions
| | 1Q
2005 | | 1Q
2004 | | Percent
Change | | | |
By Fee Type: | | | | | | | | | |
Base Fees | | $ | 509 | | $ | 469 | | 8.6 | % | | • | Higher Private Client and Institutional Mgmt AUM, partially offset by lower Retail AUM |
| | | | | | | | | | and Fixed Income fee rates |
Transaction Charges | | 19 | | 38 | | (51.0 | ) | |
•
| Lower Private Client and Institutional trading |
| | | | | | | | | volume and restructured pricing plans |
Performance Fees | | 8 | | 4 | | N/M | | | | |
| | | | | | | | | | |
Total | | $ | 536 | | $ | 511 | | 4.9 | % | | | |
| | | | | | | | | | |
By Channel: | | | | | | | | | | |
Institutional | | $ | 198 | | $ | 180 | | 9.9 | % | | • |
Higher AUM offset partially by lower fixed
|
| | | | | | | | | | income fees |
Retail | | 184 | | 189 | | (2.5 | ) | | • | Unfavorable mix changes and lower AUM |
| | | | | | | | | | |
Private Client | | 154 | | 142 | | 8.4 | | | • | Higher AUM and new pricing schedule partially |
| | | | | | | | | | offset by lower transaction charges |
Total | | $ | 536 | | $ | 511 | | 4.9 | % | | | |
NOTE: Percentages are calculated using revenues and expenses rounded to the nearest thousand
First-Quarter 2005 Review | | [LOGO] |
6
Alliance Capital First Quarter Revenues
In $ Millions
*In $ Billions
| | 1Q
2005 | | 1Q
2004 | | Percent
Change | |
| | | | | | | |
Ending AUM* | | $ | 534 | | $ | 486 | | 9.8 | % |
| | | | | | | |
Average AUM* | | $ | 538 | | $ | 485 | | 10.7 | % |
| | | | | | | |
Revenues | | | | | | | |
| | | | | | | |
Advisory Fees | | $ | 536 | | $ | 511 | | 4.9 | % |
| | | | | | | |
Distribution | | 108 | | 116 | | (7.3 | ) |
| | | | | | | |
Institutional Research Svcs. | | 75 | | 79 | | (5.3 | ) |
| | | | | | | |
Other | | 31 | | 46 | | (32.0 | ) |
| | | | | | | |
Total | | $ | 750 | | $ | 752 | | (0.3 | )% |
NOTE: Percentages are calculated using revenues and expenses rounded to the nearest thousand
First-Quarter 2005 Review | | [LOGO] |
7
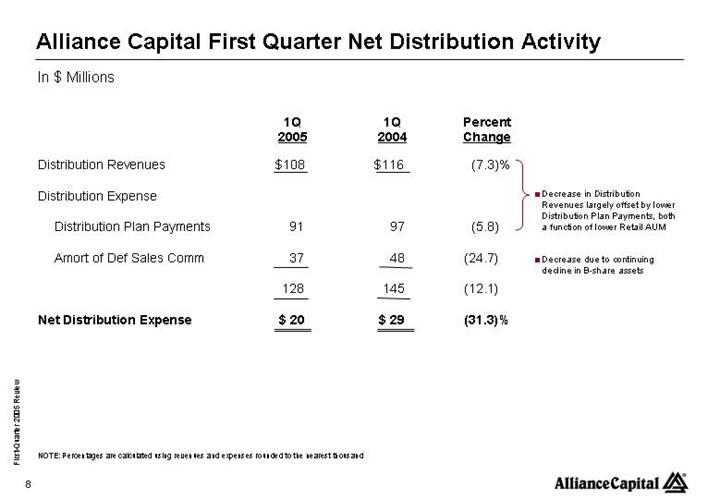
Alliance Capital First Quarter Net Distribution Activity
In $ Millions
| | 1Q
2005 | | 1Q
2004 | | Percent
Change | | | |
| | | | | | | | | |
Distribution Revenues | | $ | 108 | | $ | 116 | | (7.3 | )% | 
| • |
Decrease in Distribution Revenues largely offset by lower Distribution Plan Payments, both a function of lower Retail AUM
|
| | | | | | | |
Distribution Expense | | | | | | | |
| | | | | | | |
Distribution Plan Payments | | 91 | | 97 | | (5.8 | ) |
| | | | | | | | | | |
Amort of Def Sales Comm | | 37 | | 48 | | (24.7 | ) | | • | Decrease due to continuing decline in |
| | | | | | | | | | B-share assets |
| | 128 | | 145 | | (12.1 | ) | | |
| | | | | | | | | |
Net Distribution Expense | | $ | 20 | | $ | 29 | | (31.3 | )% | | |
NOTE: Percentages are calculated using revenues and expenses rounded to the nearest thousand
First-Quarter 2005 Review | | [LOGO] |
8
Alliance Capital First Quarter Revenues
In $ Millions
*In $ Billions
| | 1Q
2005 | | 1Q
2004 | | Percent
Change | | | |
| | | | | | | | | |
Ending AUM* | | $ | 534 | | $ | 486 | | 9.8 | % | | |
| | | | | | | | | |
Average AUM* | | $ | 538 | | $ | 485 | | 10.7 | % | | |
| | | | | | | | | |
Revenues | | | | | | | | | |
| | | | | | | | | |
Advisory Fees | | $ | 536 | | $ | 511 | | 4.9 | % | | |
| | | | | | | | | |
Distribution | | 108 | | 116 | | (7.3 | ) | | |
| | | | | | | | | |
Institutional Research Services | | 75 | | 79 | | (5.3 | ) | | • | Lower pricing and market share, partially |
| | | | | | | | | | offset by higher market volume |
Other | | 31 | | 46 | | (32.0 | ) | | |
| | | | | | | | | |
Total | | $ | 750 | | $ | 752 | | (0.3 | )% | | |
NOTE: Percentages are calculated using revenues and expenses rounded to the nearest thousand
First-Quarter 2005 Review | | [LOGO] |
9
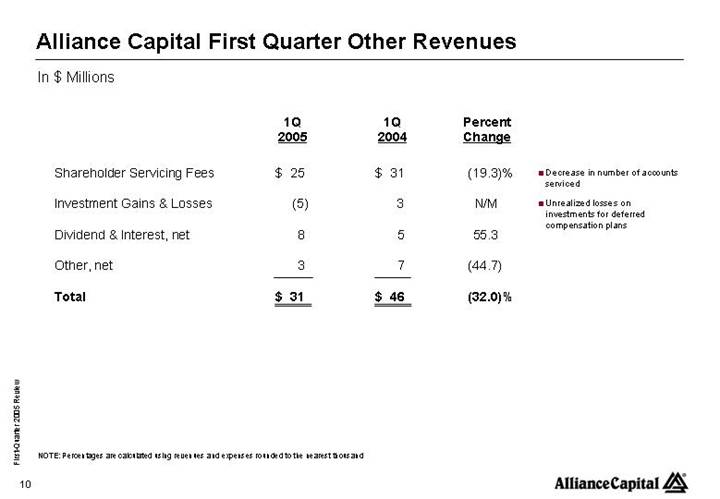
Alliance Capital First Quarter Other Revenues
In $ Millions
| | 1Q
2005 | | 1Q
2004 | | Percent
Change | | | |
| | | | | | | | | |
Shareholder Servicing Fees | | $ | 25 | | $ | 31 | | (19.3 | )% | | • | Decrease in number of accounts serviced |
| | | | | | | | | |
Investment Gains & Losses | | (5 | ) | 3 | | N/M | | | • | Unrealized losses on investments for deferred compensation |
| | | | | | | | | | plans |
Dividend & Interest, net | | 8 | | 5 | | 55.3 | | | |
| | | | | | | | | |
Other, net | | 3 | | 7 | | (44.7 | ) | | |
| | | | | | | | | |
Total | | $ | 31 | | $ | 46 | | (32.0 | )% | | |
NOTE: Percentages are calculated using revenues and expenses rounded to the nearest thousand
First-Quarter 2005 Review | | [LOGO] |
10
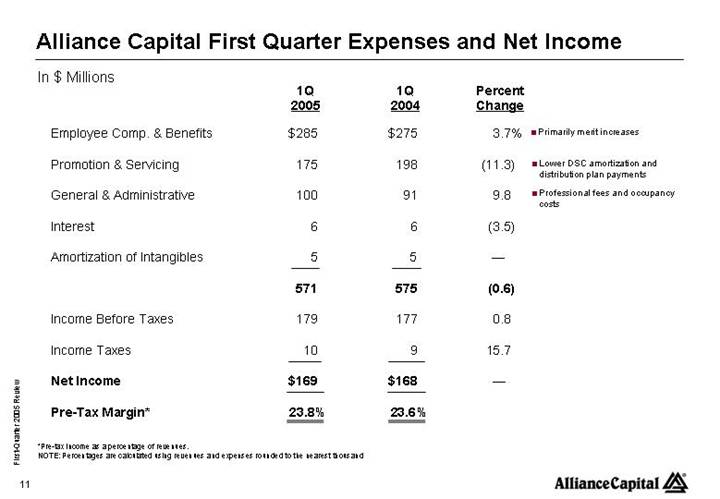
Alliance Capital First Quarter Expenses and Net Income
In $ Millions
| | 1Q
2005 | | 1Q
2004 | | Percent
Change | | | |
| | | | | | | | | |
Employee Comp. & Benefits | | $ | 285 | | $ | 275 | | 3.7 | % | | • | Primarily merit increases |
| | | | | | | | | |
Promotion & Servicing | | 175 | | 198 | | (11.3 | ) | | • | Lower DSC amortization and distribution plan |
| | | | | | | | | | payments |
General & Administrative | | 100 | | 91 | | 9.8 | | | • | Professional fees and occupancy costs |
| | | | | | | | | |
Interest | | 6 | | 6 | | (3.5 | ) | | |
| | | | | | | | | |
Amortization of Intangibles | | 5 | | 5 | | — | | | |
| | | | | | | | | |
| | 571 | | 575 | | (0.6 | ) | | |
| | | | | | | | | |
Income Before Taxes | | 179 | | 177 | | 0.8 | | | |
| | | | | | | | | |
Income Taxes | | 10 | | 9 | | 15.7 | | | |
| | | | | | | | | |
Net Income | | $ | 169 | | $ | 168 | | — | | | |
| | | | | | | | | |
Pre-Tax Margin* | | 23.8 | % | 23.6 | % | | | | |
*Pre-tax income as a percentage of revenues.
NOTE: Percentages are calculated using revenues and expenses rounded to the nearest thousand
First-Quarter 2005 Review | | [LOGO] |
11
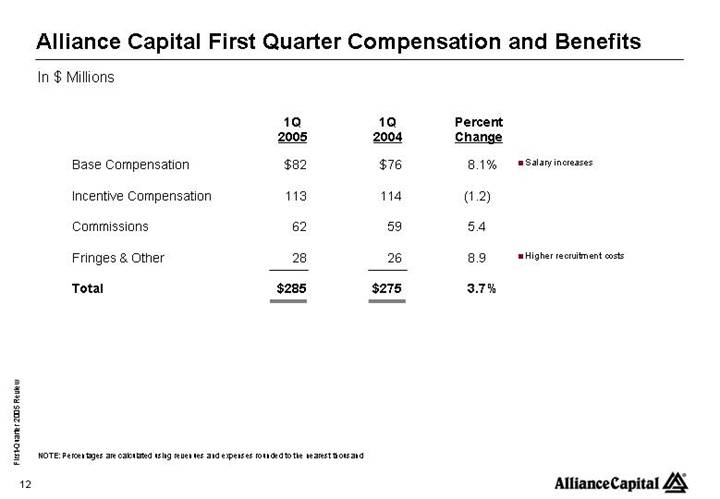
Alliance Capital First Quarter Compensation and Benefits
In $ Millions
| | 1Q
2005 | | 1Q
2004 | | Percent
Change | | | |
| | | | | | | | | |
Base Compensation | | $ | 82 | | $ | 76 | | 8.1 | % | | • Salary increases |
| | | | | | | | | |
Incentive Compensation | | 113 | | 114 | | (1.2 | ) | | |
| | | | | | | | | |
Commissions | | 62 | | 59 | | 5.4 | | | |
| | | | | | | | | |
Fringes & Other | | 28 | | 26 | | 8.9 | | | • Higher recruitment costs |
| | | | | | | | | |
Total | | $ | 285 | | $ | 275 | | 3.7 | % | | |
NOTE: Percentages are calculated using revenues and expenses rounded to the nearest thousand
First-Quarter 2005 Review | | [LOGO] |
12
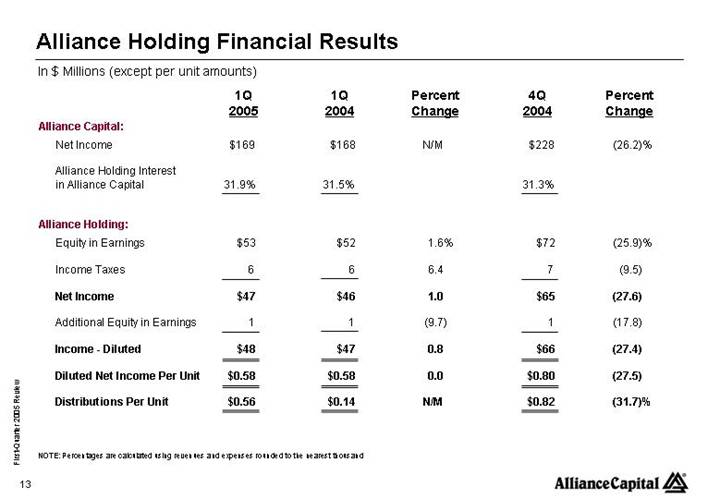
Alliance Holding Financial Results
In $ Millions (except per unit amounts)
| | 1Q
2005 | | 1Q
2004 | | Percent
Change | | 4Q
2004 | | Percent
Change | |
| | | | | | | | | | | |
Alliance Capital: | | | | | | | | | | | |
| | | | | | | | | | | |
Net Income | | $ | 169 | | $ | 168 | | N/M | | $ | 228 | | (26.2 | )% |
| | | | | | | | | | | |
Alliance Holding Interest in Alliance Capital | | 31.9 | % | 31.5 | % | | | 31.3 | % | | |
| | | | | | | | | | | |
Alliance Holding: | | | | | | | | | | | |
| | | | | | | | | | | |
Equity in Earnings | | $ | 53 | | $ | 52 | | 1.6 | % | $ | 72 | | (25.9 | )% |
| | | | | | | | | | | |
Income Taxes | | 6 | | 6 | | 6.4 | | 7 | | (9.5 | ) |
| | | | | | | | | | | |
Net Income | | $ | 47 | | $ | 46 | | 1.0 | | $ | 65 | | (27.6 | ) |
| | | | | | | | | | | |
Additional Equity in Earnings | | 1 | | 1 | | (9.7 | ) | 1 | | (17.8 | ) |
| | | | | | | | | | | |
Income - Diluted | | $ | 48 | | $ | 47 | | 0.8 | | $ | 66 | | (27.4 | ) |
| | | | | | | | | | | |
Diluted Net Income Per Unit | | $ | 0.58 | | $ | 0.58 | | 0.0 | | $ | 0.80 | | (27.5 | ) |
| | | | | | | | | | | |
Distributions Per Unit | | $ | 0.56 | | $ | 0.14 | | N/M | | $ | 0.82 | | (31.7 | )% |
NOTE: Percentages are calculated using revenues and expenses rounded to the nearest thousand
First-Quarter 2005 Review | | [LOGO] |
13
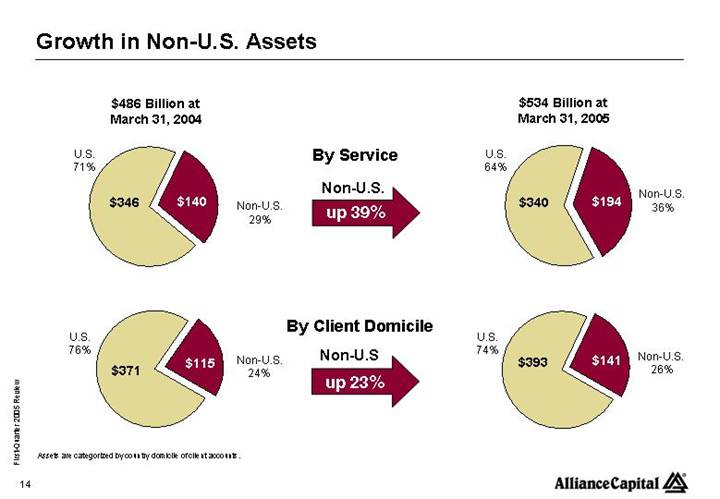
Growth in Non-U.S. Assets
$486 Billion at | | | | $534 Billion at |
March 31, 2004 | | | | March 31, 2005 |
| | By Service | | |
[CHART] | | | | [CHART] |
| | Non-U.S. | | |
| | up 39% | | |
| | | | |
| | By Client Domicile | | |
[CHART] | | | | [CHART] |
| | Non-U.S. | | |
| | up 23% | | |
Assets are categorized by country domicile of client accounts.
First-Quarter 2005 Review | | [LOGO] |
14
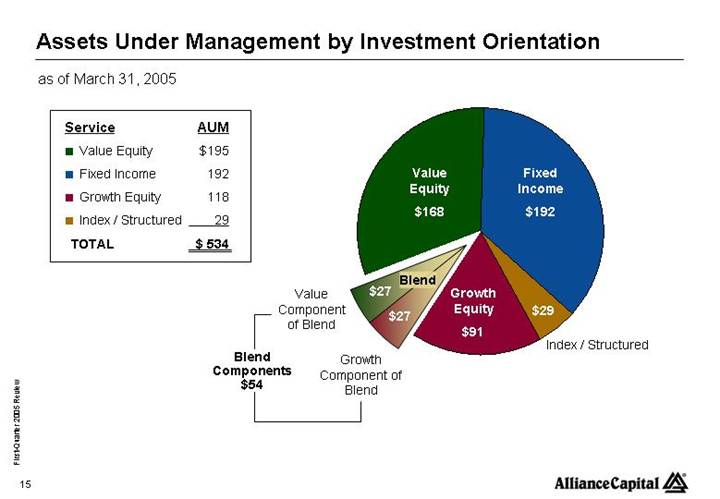
Assets Under Management by Investment Orientation
as of March 31, 2005
Service | | AUM | |
• Value Equity | | $ | 195 | |
• Fixed Income | | 192 | |
• Growth Equity | | 118 | |
• Index / Structured | | 29 | |
| | | |
TOTAL | | $ | 534 | |
[CHART]
First-Quarter 2005 Review | | [LOGO] |
15
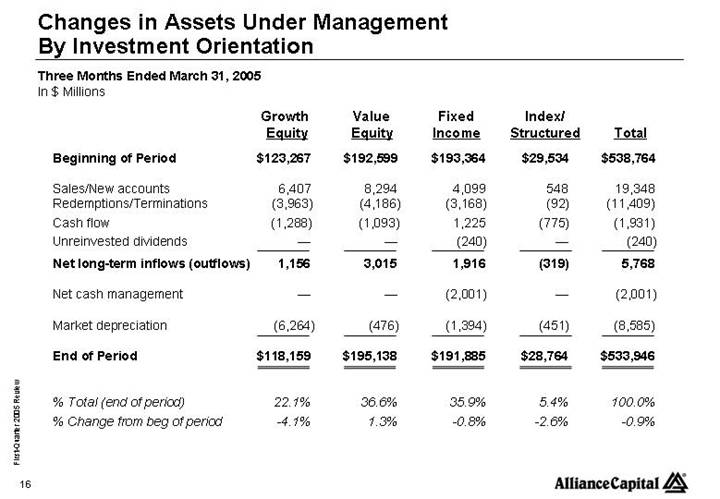
Changes in Assets Under Management
By Investment Orientation
Three Months Ended March 31, 2005
In $ Millions
| | Growth
Equity | | Value
Equity | | Fixed
Income | | Index/
Structured | | Total | |
| | | | | | | | | | | |
Beginning of Period | | $ | 123,267 | | $ | 192,599 | | $ | 193,364 | | $ | 29,534 | | $ | 538,764 | |
| | | | | | | | | | | |
Sales/New accounts | | 6,407 | | 8,294 | | 4,099 | | 548 | | 19,348 | |
Redemptions/Terminations | | (3,963 | ) | (4,186 | ) | (3,168 | ) | (92 | ) | (11,409 | ) |
Cash flow | | (1,288 | ) | (1,093 | ) | 1,225 | | (775 | ) | (1,931 | ) |
Unreinvested dividends | | — | | — | | (240 | ) | — | | (240 | ) |
Net long-term inflows (outflows) | | 1,156 | | 3,015 | | 1,916 | | (319 | ) | 5,768 | |
| | | | | | | | | | | |
Net cash management | | — | | — | | (2,001 | ) | — | | (2,001 | ) |
| | | | | | | | | | | |
Market depreciation | | (6,264 | ) | (476 | ) | (1,394 | ) | (451 | ) | (8,585 | ) |
| | | | | | | | | | | |
End of Period | | $ | 118,159 | | $ | 195,138 | | $ | 191,885 | | $ | 28,764 | | $ | 533,946 | |
| | | | | | | | | | | |
% Total (end of period) | | 22.1 | % | 36.6 | % | 35.9 | % | 5.4 | % | 100.0 | % |
% Change from beg of period | | -4.1 | % | 1.3 | % | -0.8 | % | -2.6 | % | -0.9 | % |
| | | | | | | | | | | | | | | | | | | | |
First-Quarter 2005 Review | | [LOGO] |
16
Changes In Assets Under Management
By Investment Orientation
Twelve Months Ended March 31, 2005
In $ Millions
| | Growth
Equity | | Value
Equity | | Fixed
Income | | Index/
Structured | | Total | |
| | | | | | | | | | | |
Beginning of Period | | $ | 122,303 | | $ | 155,187 | | $ | 180,871 | | $ | 27,995 | | $ | 486,356 | |
| | | | | | | | | | | |
Sales/New accounts | | 19,335 | | 28,175 | | 24,234 | | 1,231 | | 72,975 | |
Redemptions/Terminations | | (19,541 | ) | (10,450 | ) | (15,256 | ) | (1,910 | ) | (47,157 | ) |
Cash flow | | (7,740 | ) | (972 | ) | 4,432 | | (823 | ) | (5,103 | ) |
Unreinvested dividends | | (2 | ) | (2 | ) | (1,027 | ) | — | | (1,031 | ) |
Net long-term inflows (outflows) | | (7,948 | ) | 16,751 | | 12,383 | | (1,502 | ) | 19,684 | |
| | | | | | | | | | | |
Net cash management | | — | | — | | (5,737 | ) | — | | (5,737 | ) |
| | | | | | | | | | | |
Market appreciation | | 3,804 | | 23,200 | | 4,368 | | 2,271 | | 33,643 | |
| | | | | | | | | | | |
End of Period | | $ | 118,159 | | $ | 195,138 | | $ | 191,885 | | $ | 28,764 | | $ | 533,946 | |
| | | | | | | | | | | |
% Total (end of period) | | 22.1 | % | 36.6 | % | 35.9 | % | 5.4 | % | 100.0 | % |
% Change from beg of period | | -3.4 | % | 25.7 | % | 6.1 | % | 2.7 | % | 9.8 | % |
| | | | | | | | | | | | | | | | | | | | |
First-Quarter 2005 Review | | [LOGO] |
17
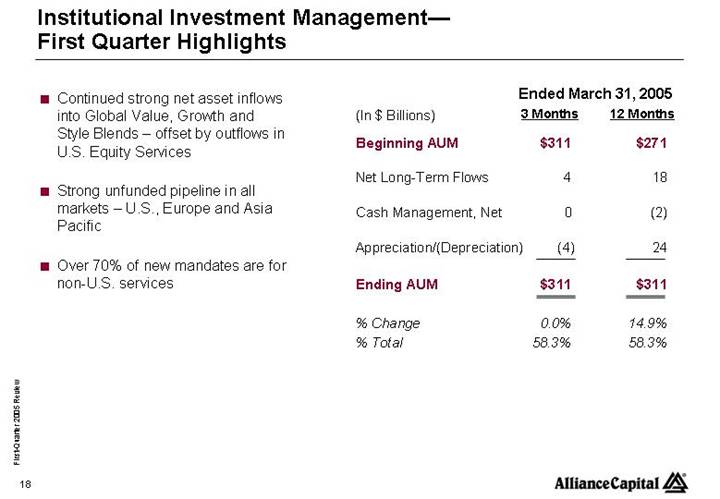
Institutional Investment Management—
First Quarter Highlights
• Continued strong net asset inflows into Global Value, Growth and Style Blends – offset by outflows in U.S. Equity Services
• Strong unfunded pipeline in all markets – U.S., Europe and Asia Pacific
• Over 70% of new mandates are for non-U.S. services
| | Ended March 31, 2005 | |
(In $ Billions) | | 3 Months | | 12 Months | |
| | | | | |
Beginning AUM | | $ | 311 | | $ | 271 | |
| | | | | |
Net Long-Term Flows | | 4 | | 18 | |
| | | | | |
Cash Management, Net | | 0 | | (2 | ) |
| | | | | |
Appreciation/(Depreciation) | | (4 | ) | 24 | |
| | | | | |
Ending AUM | | $ | 311 | | $ | 311 | |
| | | | | |
% Change | | 0.0 | % | 14.9 | % |
% Total | | 58.3 | % | 58.3 | % |
First-Quarter 2005 Review | | [LOGO] |
18
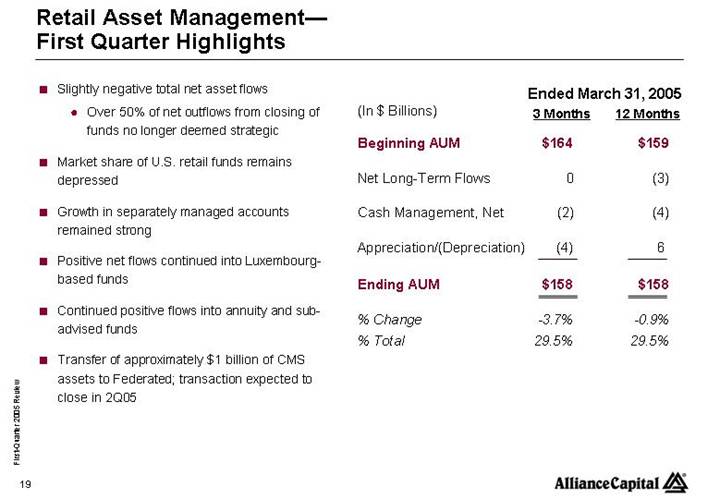
Retail Asset Management—
First Quarter Highlights
• Slightly negative total net asset flows
• Over 50% of net outflows from closing of funds no longer deemed strategic
• Market share of U.S. retail funds remains depressed
• Growth in separately managed accounts remained strong
• Positive net flows continued into Luxembourg-based funds
• Continued positive flows into annuity and sub-advised funds
• Transfer of approximately $1 billion of CMS assets to Federated; transaction expected to close in 2Q05
| | Ended March 31, 2005 | |
(In $ Billions) | | 3 Months | | 12 Months | |
| | | | | |
Beginning AUM | | $ | 164 | | $ | 159 | |
| | | | | |
Net Long-Term Flows | | 0 | | (3 | ) |
| | | | | |
Cash Management, Net | | (2 | ) | (4 | ) |
| | | | | |
Appreciation/(Depreciation) | | (4 | ) | 6 | |
| | | | | |
Ending AUM | | $ | 158 | | $ | 158 | |
| | | | | |
% Change | | -3.7 | % | -0.9 | % |
% Total | | 29.5 | % | 29.5 | % |
First-Quarter 2005 Review | | [LOGO] |
19
Private Client Asset Management—
First Quarter Highlights
• Strong net inflows for quarter and twelve months
• Financial advisor productivity (2 years +) continues to improve
• Footprint expansion on plan
• Financial Advisors increased 14% to 220
• 3 new offices to open in 2005
• Atlanta, Denver and San Diego
| | Ended March 31, 2005 | |
(In $ Billions) | | 3 Months | | 12 Months | |
| | | | | |
Beginning AUM | | $ | 64 | | $ | 56 | |
| | | | | |
Net Long-Term Flows | | 2 | | 5 | |
| | | | | |
Cash Management, Net | | 0 | | 0 | |
| | | | | |
Appreciation/(Depreciation) | | (1 | ) | 4 | |
| | | | | |
Ending AUM | | $ | 65 | | $ | 65 | |
| | | | | |
% Change | | 1.8 | % | 15.4 | % |
% Total | | 12.2 | % | 12.2 | % |
First-Quarter 2005 Review | | [LOGO] |
20
Institutional Research Services—
First Quarter Highlights
• Lower U.S. revenues
• Decrease in pricing and market share, partially offset by higher market volume
• Expanded European research team
• Added 7 new analysts
• 2 new U.S. research launches
First-Quarter 2005 Review | | [LOGO] |
21
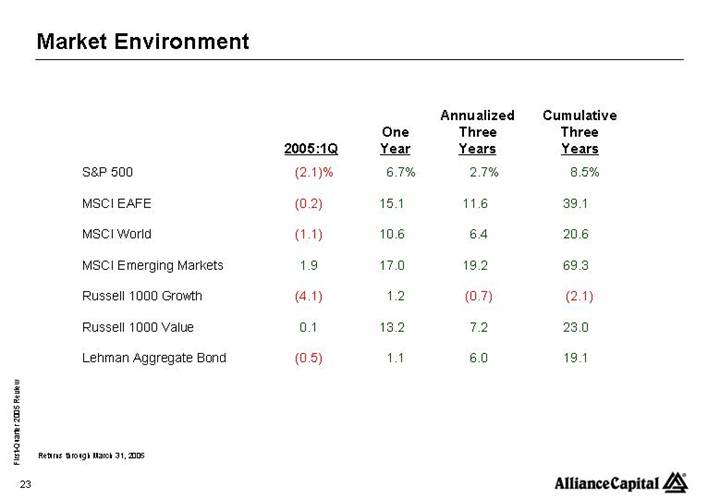
| | | | | | Annualized | | Cumulative | |
| | | | One | | Three | | Three | |
| | 2005:1Q | | Year | | Years | | Years | |
S&P 500 | | (2.1 | )% | 6.7 | % | 2.7 | % | 8.5 | % |
| | | | | | | | | |
MSCI EAFE | | (0.2 | ) | 15.1 | | 11.6 | | 39.1 | |
| | | | | | | | | |
MSCI World | | (1.1 | ) | 10.6 | | 6.4 | | 20.6 | |
| | | | | | | | | |
MSCI Emerging Markets | | 1.9 | | 17.0 | | 19.2 | | 69.3 | |
| | | | | | | | | |
Russell 1000 Growth | | (4.1 | ) | 1.2 | | (0.7 | ) | (2.1 | ) |
| | | | | | | | | |
Russell 1000 Value | | 0.1 | | 13.2 | | 7.2 | | 23.0 | |
| | | | | | | | | |
Lehman Aggregate Bond | | (0.5 | ) | 1.1 | | 6.0 | | 19.1 | |
Returns through March 31, 2005
First-Quarter 2005 Review | | [LOGO] |
23
Relative Performance: Institutional Value Equity (After Fees)(1)
Institutional Equity Composites vs. Benchmarks
| | U.S. | | U.S. | | Bernstein | | | | Emerging | |
| | Strategic | | Diversified | | International | | Global | | Markets | |
| | Value(2) | | Value(2) | | Value(3) | | Value(4) | | Value(5) | |
2005:1Q | | (0.8 | )% | (0.6 | )% | +1.6 | % | +1.5 | % | (0.5 | )% |
| | | | | | | | | | | |
One Year | | (3.9 | ) | (3.3 | ) | +6.3 | | +4.7 | | +17.7 | |
| | | | | | | | | | | |
Three Years | | (1.2 | ) | +0.2 | | +6.8 | | +5.1 | | +13.3 | |
| | | | | | | | | | | |
Five Years | | +4.5 | | +4.4 | | +9.2 | | +12.3 | | +10.1 | |
| | | | | | | | | | | |
10 Years | | (0.6 | ) | — | | — | | — | | — | |
NOTE: The information in this table is provided solely for use in connection with this presentation, and is not directed toward existing or potential investment advisory clients of Alliance Capital.
(1) Investment performance of composites is presented after investment management fees. (2) vs. Russell 1000 Value (3) vs. MSCI EAFE (Cap, UH) (4) vs. MSCI World (Cap, UH) (5) vs. MSCI Emerging Markets Composite and benchmark data through 3/31/05. Performance is preliminary.
First-Quarter 2005 Review | | [LOGO] |
24
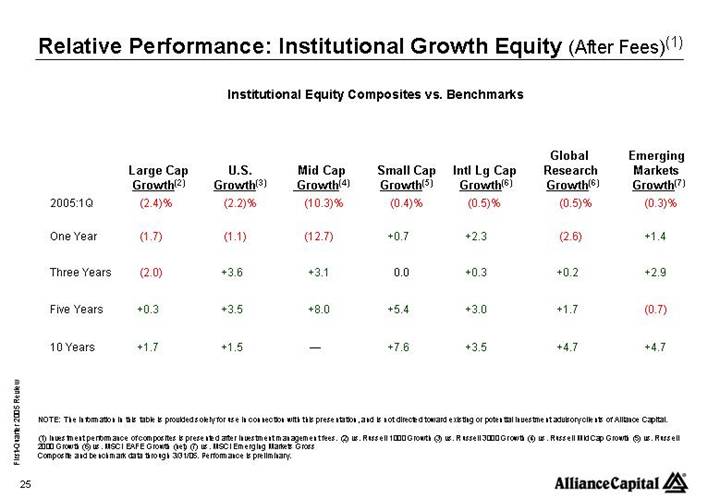
Relative Performance: Institutional Growth Equity (After Fees)(1)
Institutional Equity Composites vs. Benchmarks
| | | | | | | | | | | | Global | | Emerging | |
| | Large Cap | | U.S. | | Mid Cap | | Small Cap | | Intl Lg Cap | | Research | | Markets | |
| | Growth(2) | | Growth(3) | | Growth(4) | | Growth(5) | | Growth(6) | | Growth(6) | | Growth(7) | |
2005:1Q | | (2.4 | )% | (2.2 | )% | (10.3 | )% | (0.4 | )% | (0.5 | )% | (0.5 | )% | (0.3 | )% |
| | | | | | | | | | | | | | | |
One Year | | (1.7 | ) | (1.1 | ) | (12.7 | ) | +0.7 | | +2.3 | | (2.6 | ) | +1.4 | |
| | | | | | | | | | | | | | | |
Three Years | | (2.0 | ) | +3.6 | | +3.1 | | 0.0 | | +0.3 | | +0.2 | | +2.9 | |
| | | | | | | | | | | | | | | |
Five Years | | +0.3 | | +3.5 | | +8.0 | | +5.4 | | +3.0 | | +1.7 | | (0.7 | ) |
| | | | | | | | | | | | | | | |
10 Years | | +1.7 | | +1.5 | | — | | +7.6 | | +3.5 | | +4.7 | | +4.7 | |
NOTE: The information in this table is provided solely for use in connection with this presentation, and is not directed toward existing or potential investment advisory clients of Alliance Capital.
(1) Investment performance of composites is presented after investment management fees. (2) vs. Russell 1000 Growth (3) vs. Russell 3000 Growth (4) vs. Russell Mid Cap Growth (5) vs. Russell 2000 Growth (6) vs. MSCI EAFE Growth (net) (7) vs. MSCI Emerging Markets Gross
Composite and benchmark data through 3/31/05. Performance is preliminary.
First-Quarter 2005 Review | | [LOGO] |
25
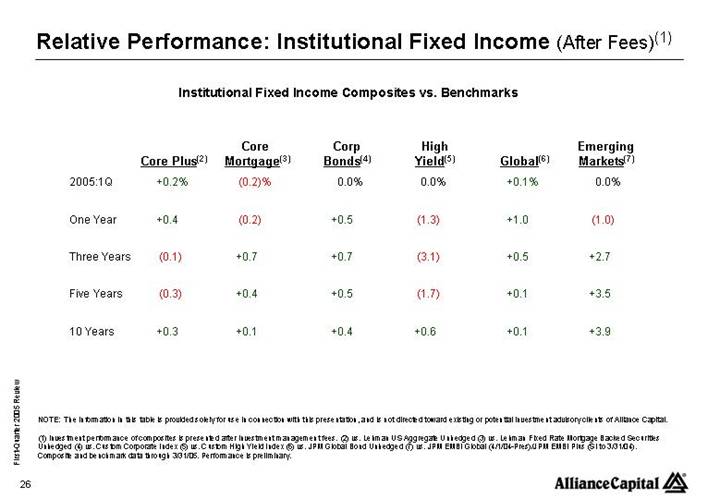
Relative Performance: Institutional Fixed Income (After Fees)(1)
Institutional Fixed Income Composites vs. Benchmarks
| | | | Core | | Corp | | High | | | | Emerging | |
| | Core Plus(2) | | Mortgage(3) | | Bonds(4) | | Yield(5) | | Global(6) | | Markets(7) | |
2005:1Q | | +0.2 | % | (0.2 | )% | 0.0 | % | 0.0 | % | +0.1 | % | 0.0 | % |
| | | | | | | | | | | | | |
One Year | | +0.4 | | (0.2 | ) | +0.5 | | (1.3 | ) | +1.0 | | (1.0 | ) |
| | | | | | | | | | | | | |
Three Years | | (0.1 | ) | +0.7 | | +0.7 | | (3.1 | ) | +0.5 | | +2.7 | |
| | | | | | | | | | | | | |
Five Years | | (0.3 | ) | +0.4 | | +0.5 | | (1.7 | ) | +0.1 | | +3.5 | |
| | | | | | | | | | | | | |
10 Years | | +0.3 | | +0.1 | | +0.4 | | +0.6 | | +0.1 | | +3.9 | |
NOTE: The information in this table is provided solely for use in connection with this presentation, and is not directed toward existing or potential investment advisory clients of Alliance Capital.
(1) Investment performance of composites is presented after investment management fees. (2) vs. Lehman US Aggregate Unhedged (3) vs. Lehman Fixed Rate Mortgage Backed Securities Unhedged (4) vs. Custom Corporate Index (5) vs. Custom High Yield Index (6) vs. JPM Global Bond Unhedged (7) vs. JPM EMBI Global (4/1/04-Pres)/JPM EMBI Plus (SI to 3/31/04).
Composite and benchmark data through 3/31/05. Performance is preliminary.
First-Quarter 2005 Review | | [LOGO] |
26
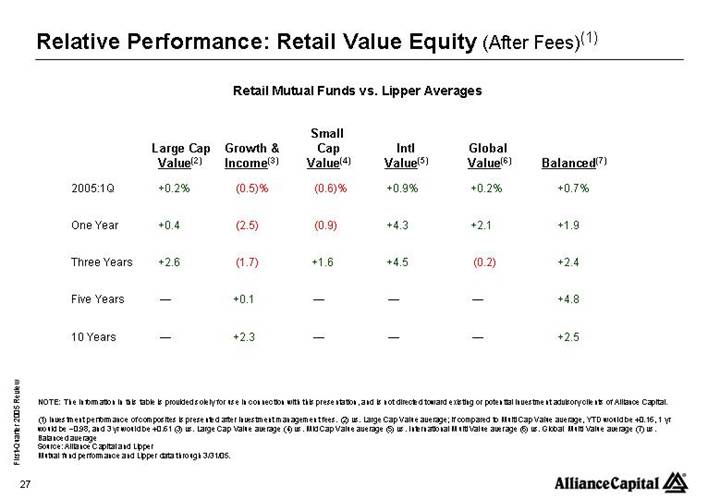
Relative Performance: Retail Value Equity (After Fees)(1)
Retail Mutual Funds vs. Lipper Averages
| | | | | | Small | | | | | | | |
| | Large Cap | | Growth & | | Cap | | Intl | | Global | | | |
| | Value(2) | | Income(3) | | Value(4) | | Value(5) | | Value(6) | | Balanced(7) | |
2005:1Q | | +0.2 | % | (0.5 | )% | (0.6 | )% | +0.9 | % | +0.2 | % | +0.7 | % |
| | | | | | | | | | | | | |
One Year | | +0.4 | | (2.5 | ) | (0.9 | ) | +4.3 | | +2.1 | | +1.9 | |
| | | | | | | | | | | | | |
Three Years | | +2.6 | | (1.7 | ) | +1.6 | | +4.5 | | (0.2 | ) | +2.4 | |
| | | | | | | | | | | | | |
Five Years | | — | | +0.1 | | — | | — | | — | | +4.8 | |
| | | | | | | | | | | | | |
10 Years | | — | | +2.3 | | — | | — | | — | | +2.5 | |
NOTE: The information in this table is provided solely for use in connection with this presentation, and is not directed toward existing or potential investment advisory clients of Alliance Capital.
(1) Investment performance of composites is presented after investment management fees. (2) vs. Large Cap Value average; if compared to Multi Cap Value average, YTD would be +0.16, 1 yr would be –0.98, and 3 yr would be +0.61 (3) vs. Large Cap Value average (4) vs. Mid Cap Value average (5) vs. International Multi Value average (6) vs. Global Multi Value average (7) vs. Balanced average
Source: Alliance Capital and Lipper
Mutual fund performance and Lipper data through 3/31/05.
First-Quarter 2005 Review | | [LOGO] |
27
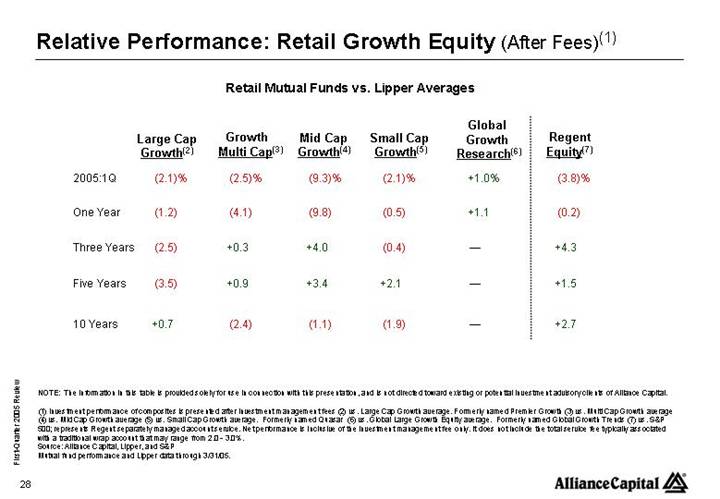
Relative Performance: Retail Growth Equity (After Fees)(1)
Retail Mutual Funds vs. Lipper Averages
| | | | | | | | | | Global | | | |
| | Large Cap | | Growth | | Mid Cap | | Small Cap | | Growth | | Regent | |
| | Growth(2) | | Multi Cap(3) | | Growth(4) | | Growth(5) | | Research(6) | | Equity(7) | |
2005:1Q | | (2.1 | )% | (2.5 | )% | (9.3 | )% | (2.1 | )% | +1.0 | % | (3.8 | )% |
| | | | | | | | | | | | | |
One Year | | (1.2 | ) | (4.1 | ) | (9.8 | ) | (0.5 | ) | +1.1 | | (0.2 | ) |
| | | | | | | | | | | | | |
Three Years | | (2.5 | ) | +0.3 | | +4.0 | | (0.4 | ) | — | | +4.3 | |
| | | | | | | | | | | | | |
Five Years | | (3.5 | ) | +0.9 | | +3.4 | | +2.1 | | — | | +1.5 | |
| | | | | | | | | | | | | |
10 Years | | +0.7 | | (2.4 | ) | (1.1 | ) | (1.9 | ) | — | | +2.7 | |
NOTE: The information in this table is provided solely for use in connection with this presentation, and is not directed toward existing or potential investment advisory clients of Alliance Capital.
(1) Investment performance of composites is presented after investment management fees (2) vs. Large Cap Growth average. Formerly named Premier Growth (3) vs. Multi Cap Growth average (4) vs. Mid Cap Growth average (5) vs. Small Cap Growth average. Formerly named Quasar (6) vs. Global Large Growth Equity average. Formerly named Global Growth Trends (7) vs. S&P 500; represents Regent separately managed account service. Net performance is inclusive of the investment management fee only. It does not include the total service fee typically associated with a traditional wrap account that may range from 2.0 - 3.0%.
Source: Alliance Capital, Lipper, and S&P
Mutual fund performance and Lipper data through 3/31/05.
First-Quarter 2005 Review | | [LOGO] |
28
Relative Performance: Retail Fixed Income (After Fees)(1)
Retail Fixed Income Funds vs. Lipper Averages
| | | | Americas | | Emerging | | | | Bernstein | | ACMGI- | |
| | Corporate | | Gov’t | | Market | | High | | Short | | American | |
| | Bond(2) | | Income(3) | | Debt(4) | | Yield(5) | | Duration Plus(6) | | Income–OS(7) | |
2005:1Q | | +0.6 | % | +0.2 | % | (0.3 | )% | +0.2 | % | (0.1 | )% | (0.7 | )% |
| | | | | | | | | | | | | |
One Year | | +3.5 | | (3.8 | ) | (2.2 | ) | (1.0 | ) | (0.5 | ) | +1.6 | |
| | | | | | | | | | | | | |
Three Years | | +1.3 | | (1.0 | ) | +3.4 | | (1.2 | ) | 0.0 | | +3.3 | |
| | | | | | | | | | | | | |
Five Years | | +0.1 | | +0.6 | | +1.3 | | (2.3 | ) | +0.1 | | +1.9 | |
| | | | | | | | | | | | | |
10 Years | | +1.7 | | +6.4 | | +2.0 | | — | | 0.0 | | +3.7 | |
NOTE: The information in this table is provided solely for use in connection with this presentation, and is not directed toward existing or potential investment advisory clients of Alliance Capital.
(1) Investment performance of composites is presented after investment management fees. (2) vs. Corporate Debt Funds BBB-Rated average (3) vs. Global Income Funds average (4) vs. Emerging Markets Debt average (5) vs. High Current Yield average (6) vs. Short Investment Grade Debt average (7) vs. Global Bond US Dollar average
Source: Alliance Capital and Lipper
Composite and benchmark data through 3/31/05. Performance is preliminary.
First-Quarter 2005 Review | | [LOGO] |
29
Absolute Performance: Private Client (After Fees)(1)
| | | | Annualized | |
| | 1Q05 | | 1 Year | | 3 Year | | 5 Year | |
All Balanced Accounts(2) | | (2.0 | )% | +5.3 | % | +5.9 | % | +6.1 | % |
| | | | | | | | | |
Global Balanced Benchmark(3) | | (1.2 | ) | +5.8 | | +5.6 | | +1.0 | |
NOTE: The information in this table is provided solely for use in connection with this presentation, and is not directed towards existing or potential investment advisory clients of Alliance Capital.
(1) Investment performance of composites is presented after investment management fees. (2) All Balanced Accounts include those accounts with any combination of equity and fixed income in any percentage mix. (3) Custom benchmark: 42% S&P 500, 15% MSCI EAFE, 3% MSCI Emerging Markets, 40% Lipper Intermediate Municipal Debt Fund Average
First-Quarter 2005 Review | | [LOGO] |
30
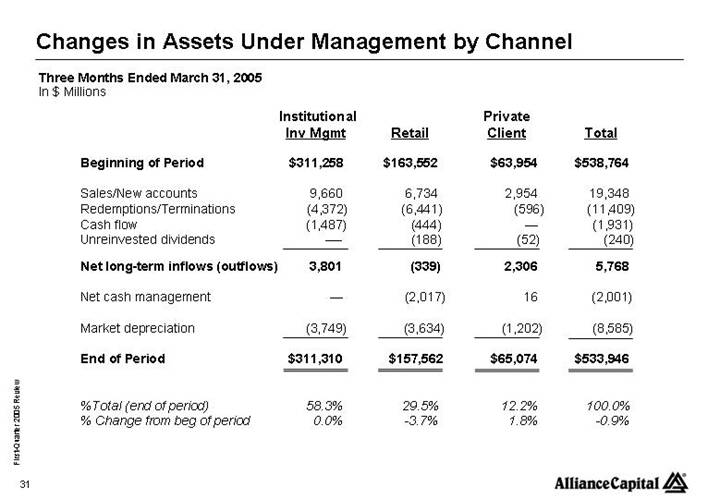
Changes in Assets Under Management by Channel
Three Months Ended March 31, 2005
In $ Millions
| | Institutional | | | | Private | | | |
| | Inv Mgmt | | Retail | | Client | | Total | |
Beginning of Period | | $ | 311,258 | | $ | 163,552 | | $ | 63,954 | | $ | 538,764 | |
| | | | | | | | | |
Sales/New accounts | | 9,660 | | 6,734 | | 2,954 | | 19,348 | |
Redemptions/Terminations | | (4,372 | ) | (6,441 | ) | (596 | ) | (11,409 | ) |
Cash flow | | (1,487 | ) | (444 | ) | — | | (1,931 | ) |
Unreinvested dividends | | — | | (188 | ) | (52 | ) | (240 | ) |
Net long-term inflows (outflows) | | 3,801 | | (339 | ) | 2,306 | | 5,768 | |
| | | | | | | | | |
Net cash management | | — | | (2,017 | ) | 16 | | (2,001 | ) |
| | | | | | | | | |
Market depreciation | | (3,749 | ) | (3,634 | ) | (1,202 | ) | (8,585 | ) |
| | | | | | | | | |
End of Period | | $ | 311,310 | | $ | 157,562 | | $ | 65,074 | | $ | 533,946 | |
| | | | | | | | | |
%Total (end of period) | | 58.3 | % | 29.5 | % | 12.2 | % | 100.0 | % |
% Change from beg of period | | 0.0 | % | -3.7 | % | 1.8 | % | -0.9 | % |
First-Quarter 2005 Review | | [LOGO] |
31
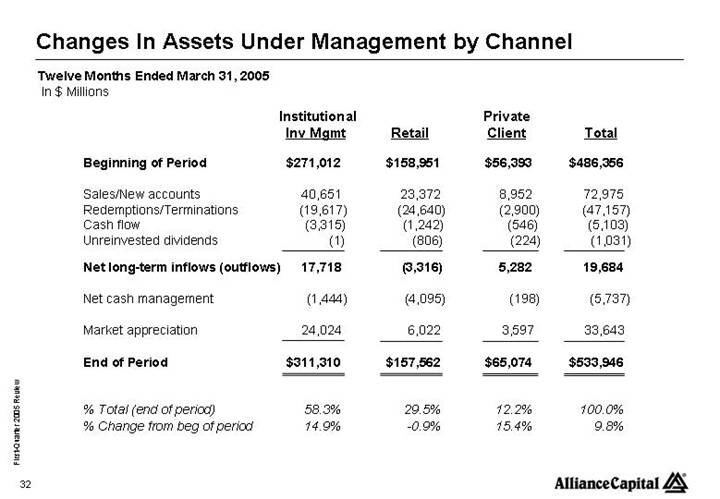
Changes in Assets Under Management by Channel
Twelve Months Ended March 31, 2005
In $ Millions
| | Institutional | | | | Private | | | |
| | Inv Mgmt | | Retail | | Client | | Total | |
Beginning of Period | | $ | 271,012 | | $ | 158,951 | | $ | 56,393 | | $ | 486,356 | |
| | | | | | | | | |
Sales/New accounts | | 40,651 | | 23,372 | | 8,952 | | 72,975 | |
Redemptions/Terminations | | (19,617 | ) | (24,640 | ) | (2,900 | ) | (47,157 | ) |
Cash flow | | (3,315 | ) | (1,242 | ) | (546 | ) | (5,103 | ) |
Unreinvested dividends | | (1 | ) | (806 | ) | (224 | ) | (1,031 | ) |
Net long-term inflows (outflows) | | 17,718 | | (3,316 | ) | 5,282 | | 19,684 | |
| | | | | | | | | |
Net cash management | | (1,444 | ) | (4,095 | ) | (198 | ) | (5,737 | ) |
| | | | | | | | | |
Market appreciation | | 24,024 | | 6,022 | | 3,597 | | 33,643 | |
| | | | | | | | | |
End of Period | | $ | 311,310 | | $ | 157,562 | | $ | 65,074 | | $ | 533,946 | |
| | | | | | | | | |
% Total (end of period) | | 58.3 | % | 29.5 | % | 12.2 | % | 100.0 | % |
% Change from beg of period | | 14.9 | % | -0.9 | % | 15.4 | % | 9.8 | % |
First-Quarter 2005 Review | | [LOGO] |
32
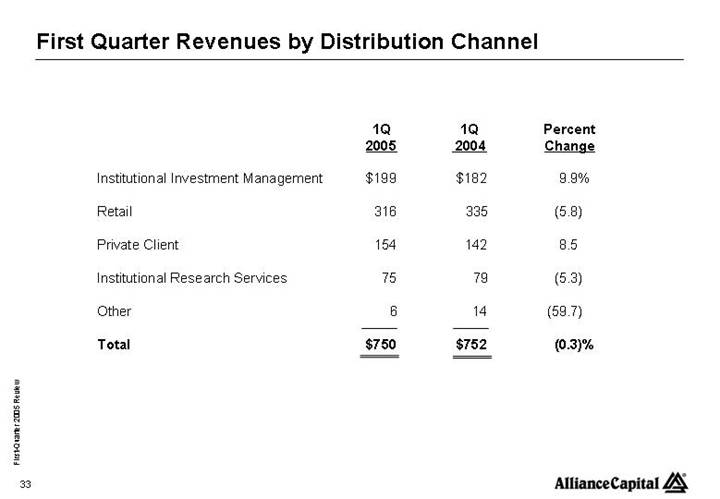
First Quarter Revenues by Distribution Channel
| | 1Q | | 1Q | | Percent | |
| | 2005 | | 2004 | | Change | |
| | | | | | | |
Institutional Investment Management | | $ | 199 | | $ | 182 | | 9.9 | % |
| | | | | | | |
Retail | | 316 | | 335 | | (5.8 | ) |
| | | | | | | |
Private Client | | 154 | | 142 | | 8.5 | |
| | | | | | | |
Institutional Research Services | | 75 | | 79 | | (5.3 | ) |
| | | | | | | |
Other | | 6 | | 14 | | (59.7 | ) |
| | | | | | | |
Total | | $ | 750 | | $ | 752 | | (0.3 | )% |
First-Quarter 2005 Review | | [LOGO] |
33
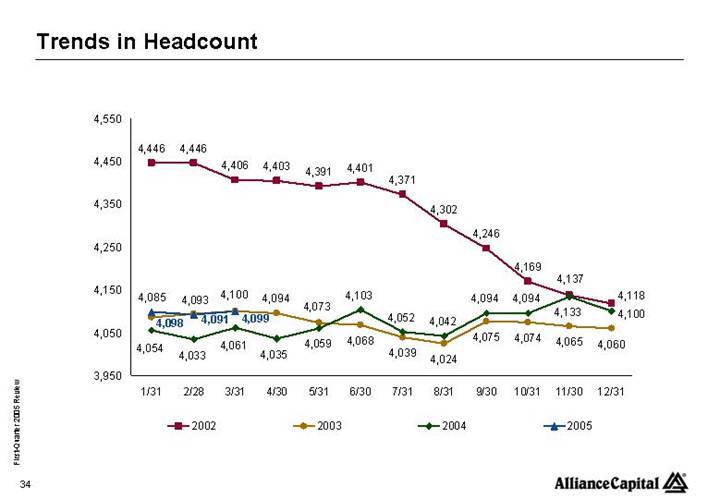
Trends in Headcount
First-Quarter 2005 Review | | [LOGO] |
34
Alliance Capital
Consolidated Balance Sheet
(In $ thousands)
| | March 31, 2005 | | December 31, 2004 | |
| | (Unaudited) | | | |
Assets | | | | | |
Cash and investments | | $ | 1,242,297 | | $ | 1,253,690 | |
Cash and securities, segregated | | 1,690,316 | | 1,489,041 | |
Receivables, net | | 2,359,545 | | 2,194,226 | |
Goodwill, net | | 2,876,657 | | 2,876,657 | |
Intangible assets, net | | 320,850 | | 326,025 | |
Deferred sales commissions, net | | 233,580 | | 254,456 | |
Other | | 373,631 | | 385,235 | |
Total Assets | | $ | 9,096,876 | | $ | 8,779,330 | |
| | | | | |
Liabilities and Partners’ Capital | | | | | |
Liabilities: | | | | | |
Payables | | $ | 3,883,051 | | $ | 3,576,395 | |
Accounts payable and accrued expenses | | 273,508 | | 275,264 | |
Accrued compensation and benefits | | 375,369 | | 326,219 | |
Debt | | 407,466 | | 407,517 | |
Other | | 11,033 | | 10,237 | |
Total Liabilities | | 4,950,427 | | 4,595,632 | |
| | | | | |
Partners’ Capital | | 4,146,449 | | 4,183,698 | |
Total Liabilities and Partners’ Capital | | $ | 9,096,876 | | $ | 8,779,330 | |
First-Quarter 2005 Review | | [LOGO] |
35
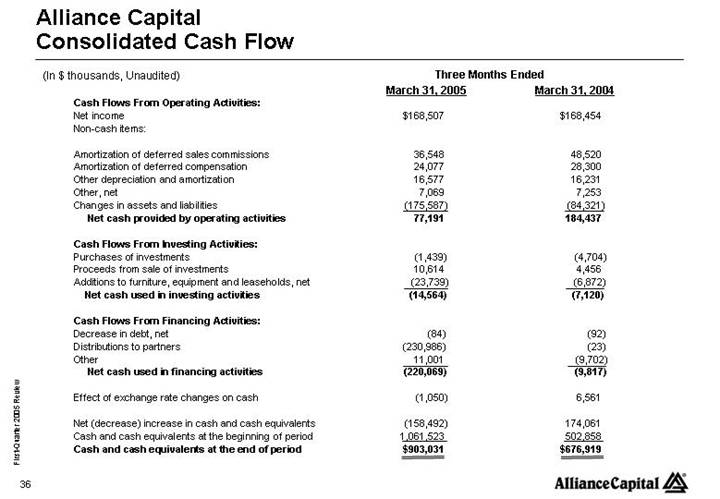
Alliance Capital
Consolidated Cash Flow
(In $ thousands, Unaudited)
| | Three Months Ended | |
| | March 31, 2005 | | March 31, 2004 | |
Cash Flows From Operating Activities: | | | | | |
Net income | | $ | 168,507 | | $ | 168,454 | |
Non-cash items: | | | | | |
| | | | | |
Amortization of deferred sales commissions | | 36,548 | | 48,520 | |
Amortization of deferred compensation | | 24,077 | | 28,300 | |
Other depreciation and amortization | | 16,577 | | 16,231 | |
Other, net | | 7,069 | | 7,253 | |
Changes in assets and liabilities | | (175,587 | ) | (84,321 | ) |
Net cash provided by operating activities | | 77,191 | | 184,437 | |
| | | | | |
Cash Flows From Investing Activities: | | | | | |
Purchases of investments | | (1,439 | ) | (4,704 | ) |
Proceeds from sale of investments | | 10,614 | | 4,456 | |
Additions to furniture, equipment and leaseholds, net | | (23,739 | ) | (6,872 | ) |
Net cash used in investing activities | | (14,564 | ) | (7,120 | ) |
| | | | | |
Cash Flows From Financing Activities: | | | | | |
Decrease in debt, net | | (84 | ) | (92 | ) |
Distributions to partners | | (230,986 | ) | (23 | ) |
Other | | 11,001 | | (9,702 | ) |
Net cash used in financing activities | | (220,069 | ) | (9,817 | ) |
| | | | | |
Effect of exchange rate changes on cash | | (1,050 | ) | 6,561 | |
| | | | | |
Net (decrease) increase in cash and cash equivalents | | (158,492 | ) | 174,061 | |
Cash and cash equivalents at the beginning of period | | 1,061,523 | | 502,858 | |
Cash and cash equivalents at the end of period | | $ | 903,031 | | $ | 676,919 | |
First-Quarter 2005 Review | | [LOGO] |
36
Alliance Capital Investment Management Services
Alliance Capital provides diversified investment management and related services globally to a broad range of clients:
1. Institutional Investment Management Services consists of investment management services to unaffiliated parties such as corporate and public employee pension funds, endowment funds, domestic and foreign institutions and governments, and affiliates such as AXA and its insurance company subsidiaries by means of:
• separate accounts,
• mutual fund shares sold exclusively to institutional investors and high net worth individuals,
• sub-advisory relationships resulting from the efforts of the institutional marketing department,
• structured products, and
• group trusts;
2. Retail Services consists of investment management products and services distributed to individual investors through financial intermediaries, such as brokers and financial planners by means of:
• mutual funds sponsored by Alliance Capital and consolidated joint venture companies,
• mutual fund sub-advisory relationships resulting from the efforts of the mutual fund marketing department, and
• managed account products;
First-Quarter 2005 Review | | [LOGO] |
37
Alliance Capital Investment Management Services (continued)
3. Private Client Services consists of investment management services provided to high net worth individuals, trusts and estates, charitable foundations, partnerships, private and family corporations and other entities by means of:
• separate accounts,
• hedge funds, and
• certain other vehicles; and
4. Institutional Research Services provided to institutional clients by means of:
• in-depth research,
• portfolio strategy,
• trading, and
• brokerage-related services.
First-Quarter 2005 Review | | [LOGO] |
38