


Searchable text section of graphics shown above
[GRAPHIC]
[LOGO] |
| www.alliancecapital.com |
|
|
|
|
| July 26, 2005 |
Second-Quarter 2005 Review
Lewis A. Sanders | Gerald M. Lieberman |
Chairman & Chief Executive Officer | President & Chief Operating Officer |
Any forecasts or opinions in this material may not be realized. Information should not be construed as investment advice.
Introduction
The SEC adopted Regulation FD in October 2000. In light of Regulation FD, Management will be limited in responding to inquiries from investors or analysts in a non-public forum.
Forward-Looking Statements
Certain statements in this presentation are “forward-looking statements” within the meaning of the Private Securities Litigation Reform Act of 1995. Such forward-looking statements are subject to risks, uncertainties, and other factors that could cause actual results to differ materially from future results expressed or implied by such forward-looking statements. The most significant of these factors include, but are not limited to, the following: the performance of financial markets, the investment performance we achieve for our clients, general economic conditions, future acquisitions, competitive conditions, and government regulations, including changes in tax rates. We caution readers to carefully consider such forward-looking statements in light of these factors. Further, such forward-looking statements speak only as of the date on which such statements are made; we undertake no obligation to update any forward-looking statements to reflect events or circumstances after the date of such statements. For further information regarding these forward-looking statements and the factors that could cause actual results to differ, see “Risk Factors” in Item I of Form 10-K for the year ended December 31, 2004. Any or all of the forward-looking statements that we make in Form 10-K, this presentation, or any other public statements we issue may turn out to be wrong. Please remember that factors other than those listed in “Risk Factors” could also adversely affect our business, operating results, or financial condition.
The forward-looking statements we make in this presentation include statements regarding the expected persisting effect of factors which caused a substantial decline in transaction revenue, estimated earnings guidance and related assumptions provided for the remainder of 2005, and an expectation that the firm’s margins will rise if client performance objectives are achieved. The persistence of factors affecting transaction revenues, including future increases in the use of electronic trading platforms and reductions in transaction pricing, will depend on competitive factors affecting the market for securities execution services. The earnings guidance is based on a number of assumptions, including the following: increased net inflows of client assets under management due to the expected funding of institutional mandates, anticipated faster growth in the private client channel, neutral net flows in the retail channel and annualized capital market returns of 8% and 5%, respectively, for equity and fixed income assets. Before they are funded, institutional mandates do not represent legally binding commitments to fund and, accordingly, the possibility exists that not all mandates will be funded; growth in the private client channel may be impaired by changes in competitive and securities market conditions and relative performance; net flows in retail are subject to domestic and international market conditions and relative performance, each or both of which may have a negative effect on net retail flows; and capital market performance is inherently unpredictable. In view of the above, and particularly given the volatility of capital markets and the difficulty of predicting client asset inflows and outflows, these earnings estimates should not be relied on as predictions of actual performance, but only as estimates based on assumptions, which may or may not be correct. There can be no assurance that we will be able to meet our performance objectives or that, even if we do, it will result in an increase in our margins.
Second-Quarter 2005 Review |
| [LOGO] |
2
Market Performance - U.S.
[CHART]
*12 months ending June 30, 2005
Source: Frank Russell Company, Lehman Brothers, MSCI, and Standard & Poor’s
Second-Quarter 2005 Review |
| [LOGO] |
3
Market Performance - Non-U.S.
[CHART]
*12 months ending June 30, 2005
Source: Frank Russell Company, Lehman Brothers, MSCI, and Standard & Poor’s
Second-Quarter 2005 Review |
| [LOGO] |
4
Alliance Capital Investment Performance
• Overall, investment returns for clients were strong
• Investment results in Value equities remained competitive, especially in international and global services
• U.S. Growth Equity outperformed U.S. Value Equity for the first time in 4 quarters
• Importantly, Growth services returns for Retail and Institutional clients improved significantly and were above benchmarks
• U.S. Large Cap Growth service strongly outperformed its benchmark in 2Q
• Global Growth services generated premiums in the quarter
• Mid-Cap Growth outperformed its benchmark
• Fixed Income returns were satisfactory
Second-Quarter 2005 Review |
| [LOGO] |
5
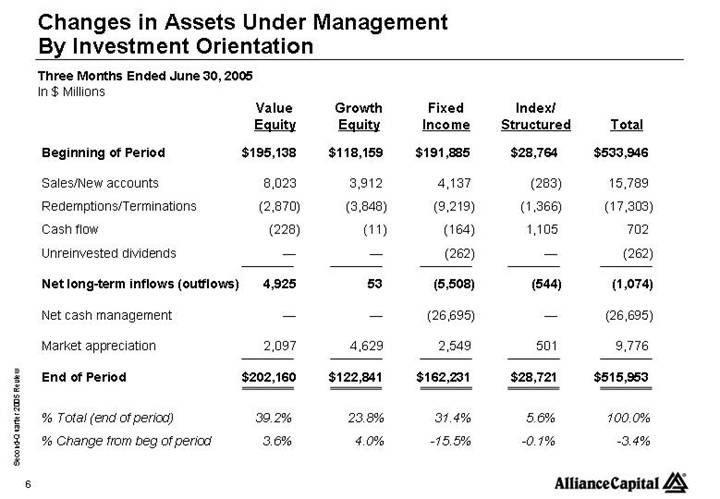
Changes in Assets Under Management
By Investment Orientation
Three Months Ended June 30, 2005
In $ Millions
|
| Value |
| Growth |
| Fixed |
| Index/ |
| Total |
| |||||
|
|
|
|
|
|
|
|
|
|
|
| |||||
Beginning of Period |
| $ | 195,138 |
| $ | 118,159 |
| $ | 191,885 |
| $ | 28,764 |
| $ | 533,946 |
|
|
|
|
|
|
|
|
|
|
|
|
| |||||
Sales/New accounts |
| 8,023 |
| 3,912 |
| 4,137 |
| (283 | ) | 15,789 |
| |||||
Redemptions/Terminations |
| (2,870 | ) | (3,848 | ) | (9,219 | ) | (1,366 | ) | (17,303 | ) | |||||
Cash flow |
| (228 | ) | (11 | ) | (164 | ) | 1,105 |
| 702 |
| |||||
Unreinvested dividends |
| — |
| — |
| (262 | ) | — |
| (262 | ) | |||||
|
|
|
|
|
|
|
|
|
|
|
| |||||
Net long-term inflows (outflows) |
| 4,925 |
| 53 |
| (5,508 | ) | (544 | ) | (1,074 | ) | |||||
|
|
|
|
|
|
|
|
|
|
|
| |||||
Net cash management |
| — |
| — |
| (26,695 | ) | — |
| (26,695 | ) | |||||
|
|
|
|
|
|
|
|
|
|
|
| |||||
Market appreciation |
| 2,097 |
| 4,629 |
| 2,549 |
| 501 |
| 9,776 |
| |||||
|
|
|
|
|
|
|
|
|
|
|
| |||||
End of Period |
| $ | 202,160 |
| $ | 122,841 |
| $ | 162,231 |
| $ | 28,721 |
| $ | 515,953 |
|
|
|
|
|
|
|
|
|
|
|
|
| |||||
% Total (end of period) |
| 39.2 | % | 23.8 | % | 31.4 | % | 5.6 | % | 100.0 | % | |||||
% Change from beg of period |
| 3.6 | % | 4.0 | % | -15.5 | % | -0.1 | % | -3.4 | % | |||||
Second-Quarter 2005 Review |
| [LOGO] |
6
Changes In Assets Under Management
By Investment Orientation
Twelve Months Ended June 30, 2005
In $ Millions
|
| Value |
| Growth |
| Fixed |
| Index/ |
| Total |
| |||||
|
|
|
|
|
|
|
|
|
|
|
| |||||
Beginning of Period |
| $ | 160,728 |
| $ | 120,201 |
| $ | 172,910 |
| $ | 28,359 |
| $ | 482,198 |
|
|
|
|
|
|
|
|
|
|
|
|
| |||||
Sales/New accounts |
| 29,519 |
| 18,716 |
| 24,118 |
| 610 |
| 72,963 |
| |||||
Redemptions/Terminations |
| (11,440 | ) | (18,616 | ) | (19,604 | ) | (2,934 | ) | (52,594 | ) | |||||
Cash flow |
| (1,163 | ) | (4,473 | ) | 3,543 |
| 137 |
| (1,956 | ) | |||||
Unreinvested dividends |
| (2 | ) | (2 | ) | (1,024 | ) | — |
| (1,028 | ) | |||||
|
|
|
|
|
|
|
|
|
|
|
| |||||
Net long-term inflows (outflows) |
| 16,914 |
| (4,375 | ) | 7,033 |
| (2,187 | ) | 17,385 |
| |||||
|
|
|
|
|
|
|
|
|
|
|
| |||||
Net cash management |
| — |
| — |
| (29,505 | ) | — |
| (29,505 | ) | |||||
|
|
|
|
|
|
|
|
|
|
|
| |||||
Market appreciation |
| 24,518 |
| 7,015 |
| 11,793 |
| 2,549 |
| 45,875 |
| |||||
|
|
|
|
|
|
|
|
|
|
|
| |||||
End of Period |
| $ | 202,160 |
| $ | 122,841 |
| $ | 162,231 |
| $ | 28,721 |
| $ | 515,953 |
|
|
|
|
|
|
|
|
|
|
|
|
| |||||
% Total (end of period) |
| 39.2 | % | 23.8 | % | 31.4 | % | 5.6 | % | 100.0 | % | |||||
|
|
|
|
|
|
|
|
|
|
|
| |||||
% Change from beg of period |
| 25.8 | % | 2.2 | % | -6.2 | % | 1.3 | % | 7.0 | % | |||||
Second-Quarter 2005 Review |
| [LOGO] |
7
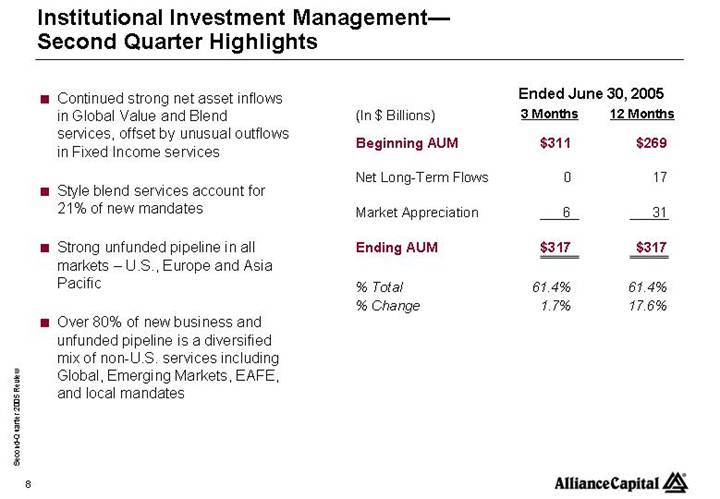
Institutional Investment Management—
Second Quarter Highlights
|
|
| Ended June 30, 2005 |
| ||||
| (In $ Billions) |
| 3 Months |
| 12 Months |
| ||
• Continued strong net asset inflows in Global Value and Blend services, |
|
|
|
|
|
| ||
offset by unusual outflows in Fixed Income services | Beginning AUM |
| $ | 311 |
| $ | 269 |
|
|
|
|
|
|
|
| ||
• Style blend services account for 21% of new mandates | Net Long-Term Flows |
| 0 |
| 17 |
| ||
|
|
|
|
|
|
| ||
• Strong unfunded pipeline in all markets – U.S., Europe and Asia Pacific | Market Appreciation |
| 6 |
| 31 |
| ||
|
|
|
|
|
|
| ||
• Over 80% of new business and unfunded pipeline is a diversified mix | Ending AUM |
| $ | 317 |
| $ | 317 |
|
of non-U.S. services including Global, Emerging Markets, EAFE, and |
|
|
|
|
|
| ||
local mandates | % Total |
| 61.4 | % | 61.4 | % | ||
| % Change |
| 1.7 | % | 17.6 | % | ||
Second-Quarter 2005 Review |
| [LOGO] |
8
Retail Asset Management—
Second Quarter Highlights
• Sale of non-core Cash Management Services “CMS” to Federated Investors, Inc. completed in June |
|
| Ended June 30, 2005 |
| ||||
| (In $ Billions) |
| 3 Months |
| 12 Months |
| ||
• Positive net long-term flows into Value Equities were more than offset |
|
|
|
|
|
| ||
by outflows from affiliated Fixed Income accounts | Beginning AUM |
| $ | 157 |
| $ | 156 |
|
|
|
|
|
|
|
| ||
• Majority of outflows were short-duration Fixed Income assets, | Net Long-Term Flows |
| (2 | ) | (5 | ) | ||
unrelated to Federated transaction |
|
|
|
|
|
| ||
| Net Cash Management |
| (26 | ) | (29 | ) | ||
• Separately managed account business remained strong, mainly the |
|
|
|
|
|
| ||
result of a broader product offering | Market Appreciation |
| 3 |
| 10 |
| ||
|
|
|
|
|
|
| ||
• Continued positive net flows into Luxembourg-based funds | Ending AUM |
| $ | 132 |
| $ | 132 |
|
|
|
|
|
|
|
| ||
• Strong sales of Global Wealth Strategies in Latin America and Europe | % Total |
| 25.6 | % | 25.6 | % | ||
| % Change |
| -16.2 | % | -15.1 | % | ||
Second-Quarter 2005 Review |
| [LOGO] |
9
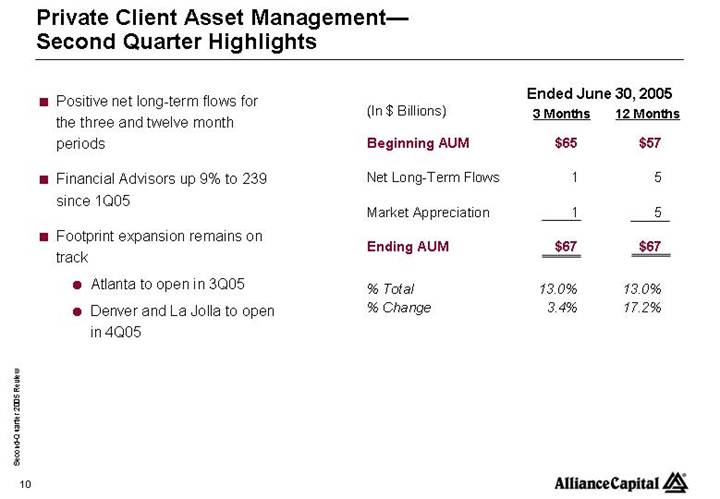
Private Client Asset Management—
Second Quarter Highlights
|
|
| Ended June 30, 2005 |
| ||||
| (In $ Billions) |
| 3 Months |
| 12 Months |
| ||
|
|
|
|
|
|
| ||
• Positive net long-term flows for the three and twelve month periods | Beginning AUM |
| $ | 65 |
| $ | 57 |
|
|
|
|
|
|
|
| ||
• Financial Advisors up 9% to 239 since 1Q05 | Net Long-Term Flows |
| 1 |
| 5 |
| ||
|
|
|
|
|
|
| ||
• Footprint expansion remains on track | Market Appreciation |
| 1 |
| 5 |
| ||
|
|
|
|
|
|
| ||
• Atlanta to open in 3Q05 | Ending AUM |
| $ | 67 |
| $ | 67 |
|
|
|
|
|
|
|
| ||
• Denver and La Jolla to open in 4Q05 | % Total |
| 13.0 | % | 13.0 | % | ||
| % Change |
| 3.4 | % | 17.2 | % | ||
Second-Quarter 2005 Review |
| [LOGO] |
10
Institutional Research Services—
Second Quarter Highlights
• Higher U.S. revenues driven by higher market share and volume
• Market share gains result of success with portfolio and algorithmic trading products
• Increased volume completely offset by continued industry-wide pricing declines
• Growth of non-U.S. revenues driven by expanded product offerings in Europe and growth of London-based research team
• Two new product launches
• Bernstein tied for first in the third annual Bloomberg News survey of top U.S. stock pickers in 50 industries
Second-Quarter 2005 Review |
| [LOGO] |
11
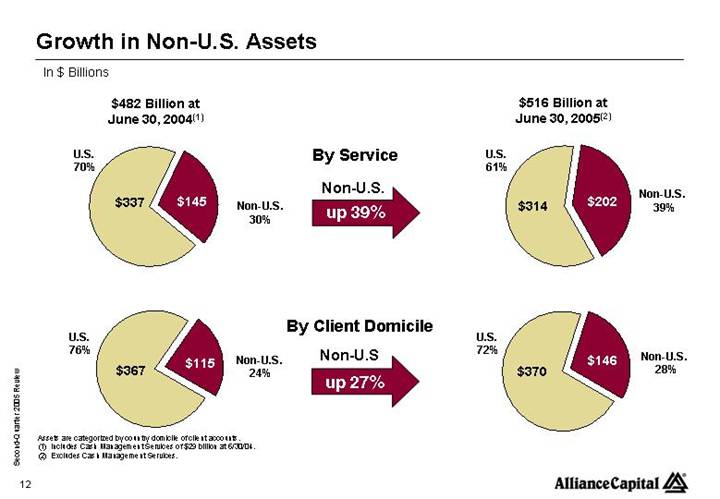
Growth in Non-U.S. Assets
In $ Billions
$482 Billion at |
|
|
| $516 Billion at |
|
| By Service |
|
|
|
|
|
|
|
[CHART] |
| Non-U.S. |
| [CHART] |
| up 39% |
| ||
|
|
|
|
|
|
| By Client Domicile |
|
|
|
|
|
|
|
[CHART] |
| Non-U.S. |
| [CHART] |
| up 27% |
|
Assets are categorized by country domicile of client accounts.
(1) Includes Cash Management Services of $29 billion at 6/30/04.
(2) Excludes Cash Management Services.
Second-Quarter 2005 Review |
| [LOGO] |
12
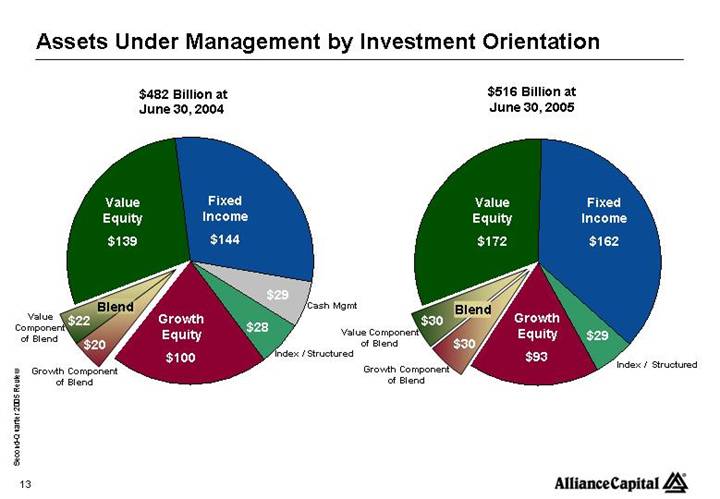
Assets Under Management by Investment Orientation
$482 Billion at |
| $516 Billion at |
|
|
|
[CHART] |
| [CHART] |
Second-Quarter 2005 Review |
| [LOGO] |
13
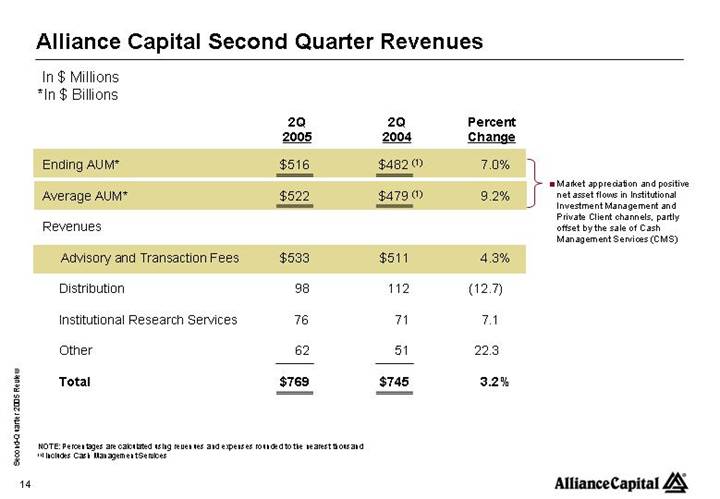
Alliance Capital Second Quarter Revenues
In $ Millions
*In $ Billions
|
| 2Q |
| 2Q |
| Percent |
|
|
| |||
|
|
|
|
|
|
|
|
|
| |||
Ending AUM* |
| $ | 516 |
| $ | 482 | (1) | 7.0 | % |
| • |
|
|
|
|
|
|
|
|
| |||||
Average AUM* |
| $ | 522 |
| $ | 479 | (1) | 9.2 | % | |||
|
|
|
|
|
|
|
|
|
| |||
Revenues |
|
|
|
|
|
|
|
|
| |||
|
|
|
|
|
|
|
|
|
| |||
Advisory and Transaction Fees |
| $ | 533 |
| $ | 511 |
| 4.3 | % |
|
| |
|
|
|
|
|
|
|
|
|
| |||
Distribution |
| 98 |
| 112 |
| (12.7 | ) |
|
| |||
|
|
|
|
|
|
|
|
|
| |||
Institutional Research Services |
| 76 |
| 71 |
| 7.1 |
|
|
| |||
|
|
|
|
|
|
|
|
|
| |||
Other |
| 62 |
| 51 |
| 22.3 |
|
|
| |||
|
|
|
|
|
|
|
|
|
| |||
Total |
| $ | 769 |
| $ | 745 |
| 3.2 | % |
|
| |
NOTE: Percentages are calculated using revenues and expenses rounded to the nearest thousand
(1) Includes Cash Management Services
Second-Quarter 2005 Review |
| [LOGO] |
14
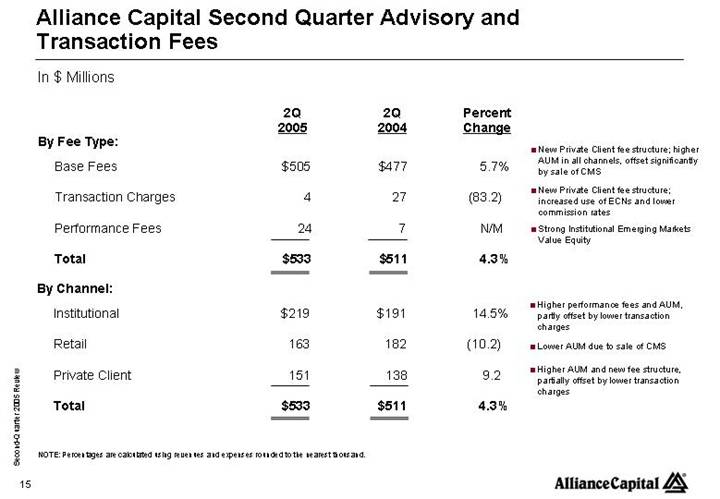
Alliance Capital Second Quarter Advisory and
Transaction Fees
In $ Millions
NOTE: Percentages are calculated using revenues and expenses rounded to the nearest thousand.
Second-Quarter 2005 Review |
| [LOGO] |
15
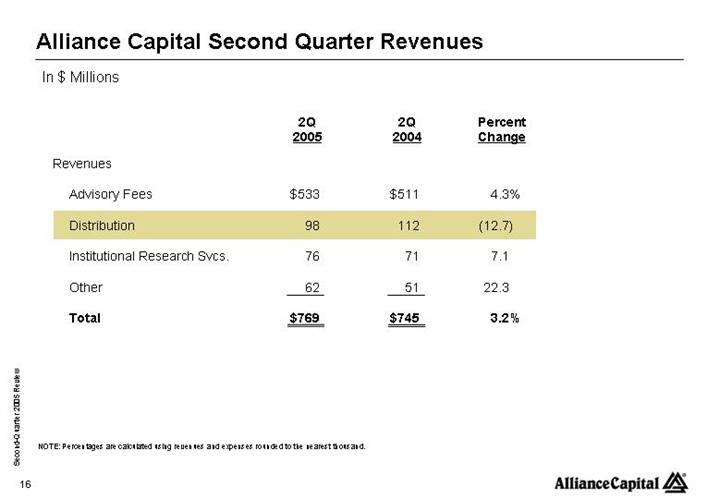
Alliance Capital Second Quarter Revenues
In $ Millions
|
| 2Q |
| 2Q |
| Percent |
| ||
|
|
|
|
|
|
|
| ||
Revenues |
|
|
|
|
|
|
| ||
|
|
|
|
|
|
|
| ||
Advisory Fees |
| $ | 533 |
| $ | 511 |
| 4.3 | % |
|
|
|
|
|
|
|
| ||
Distribution |
| 98 |
| 112 |
| (12.7 | ) | ||
|
|
|
|
|
|
|
| ||
Institutional Research Svcs. |
| 76 |
| 71 |
| 7.1 |
| ||
|
|
|
|
|
|
|
| ||
Other |
| 62 |
| 51 |
| 22.3 |
| ||
|
|
|
|
|
|
|
| ||
Total |
| $ | 769 |
| $ | 745 |
| 3.2 | % |
NOTE: Percentages are calculated using revenues and expenses rounded to the nearest thousand.
Second-Quarter 2005 Review |
| [LOGO] |
16
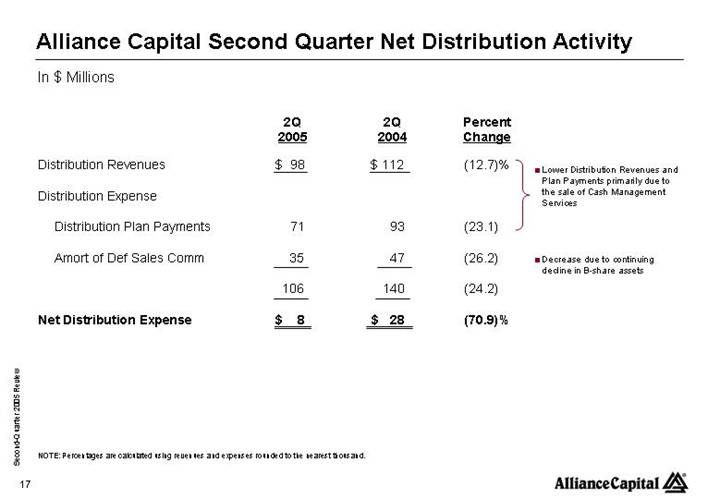
Alliance Capital Second Quarter Net Distribution Activity
In $ Millions
|
| 2Q |
| 2Q |
| Percent |
|
|
| ||
|
|
|
|
|
|
|
|
|
| ||
Distribution Revenues |
| $ | 98 |
| $ | 112 |
| (12.7 | )% |
|
• Lower Distribution Revenues and Plan Payments primarily due to the sale of Cash Management Services |
|
|
|
|
|
|
|
| ||||
Distribution Expense |
|
|
|
|
|
|
| ||||
|
|
|
|
|
|
|
| ||||
Distribution Plan Payments |
| 71 |
| 93 |
| (23.1 | ) | ||||
|
|
|
|
|
|
|
|
|
| ||
Amort of Def Sales Comm |
| 35 |
| 47 |
| (26.2 | ) |
|
• Decrease due to continuing decline in B-share assets | ||
|
|
|
|
|
|
|
|
| |||
|
| 106 |
| 140 |
| (24.2 | ) |
|
| ||
|
|
|
|
|
|
|
|
|
| ||
Net Distribution Expense |
| $ | 8 |
| $ | 28 |
| (70.9 | )% |
|
|
NOTE: Percentages are calculated using revenues and expenses rounded to the nearest thousand.
Second-Quarter 2005 Review |
| [LOGO] |
17
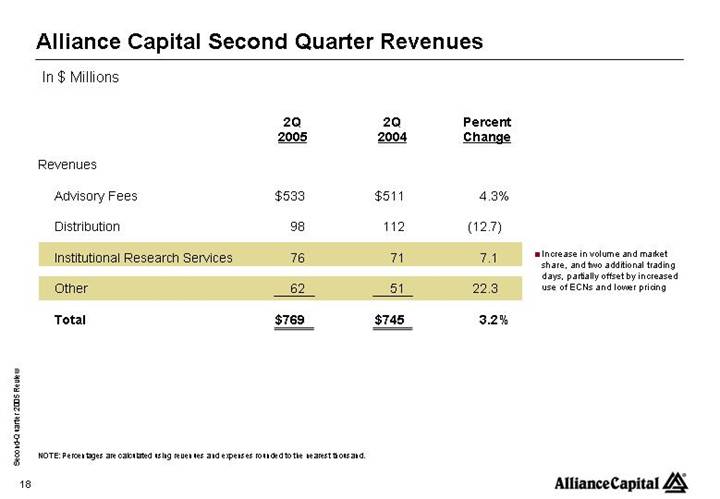
Alliance Capital Second Quarter Revenues
In $ Millions
|
| 2Q |
| 2Q |
| Percent |
|
|
| ||
|
|
|
|
|
|
|
|
|
| ||
Revenues |
|
|
|
|
|
|
|
|
| ||
|
|
|
|
|
|
|
| ||||
Advisory Fees |
| $ | 533 |
| $ | 511 |
| 4.3 | % | ||
|
|
|
|
|
|
|
| ||||
Distribution |
| 98 |
| 112 |
| (12.7 | ) | ||||
|
|
|
|
|
|
|
|
|
| ||
Institutional Research Services |
| 76 |
| 71 |
| 7.1 |
|
| • Increase in volume and market share, and two additional trading days, partially offset by increased use of ECNs and lower pricing | ||
|
|
|
|
|
|
|
|
| |||
Other |
| 62 |
| 51 |
| 22.3 |
|
| |||
|
|
|
|
|
|
|
|
|
| ||
Total |
| $ | 769 |
| $ | 745 |
| 3.2 | % |
|
|
NOTE: Percentages are calculated using revenues and expenses rounded to the nearest thousand.
Second-Quarter 2005 Review |
| [LOGO] |
18
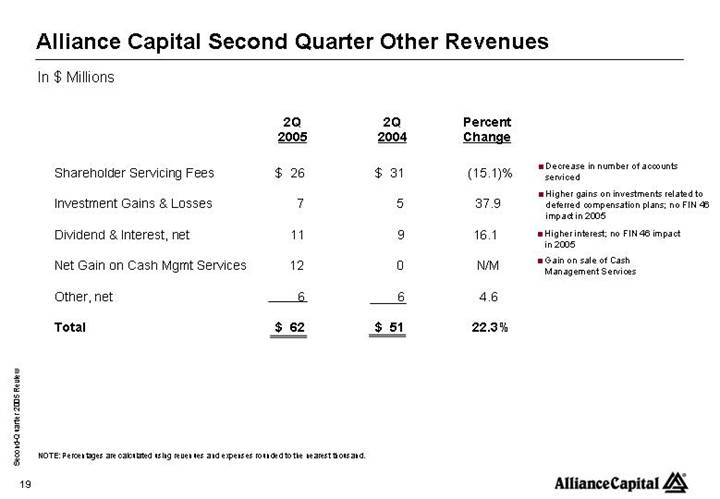
Alliance Capital Second Quarter Other Revenues
In $ Millions
|
| 2Q |
| 2Q |
| Percent |
|
|
| ||
|
|
|
|
|
|
|
|
|
| ||
Shareholder Servicing Fees |
| $ | 26 |
| $ | 31 |
| (15.1 | )% |
| • Decrease in number of accounts serviced • Higher gains on investments related to deferred compensation plans; no FIN 46 impact in 2005 • �� Higher interest; no FIN 46 impact in 2005
• Gain on sale of Cash Management Services |
|
|
|
|
|
|
|
| ||||
Investment Gains & Losses |
| 7 |
| 5 |
| 37.9 |
| ||||
|
|
|
|
|
|
|
| ||||
Dividend & Interest, net |
| 11 |
| 9 |
| 16.1 |
| ||||
|
|
|
|
|
|
|
|
| |||
Net Gain on Cash Mgmt Services |
| 12 |
| 0 |
| N/M |
|
| |||
|
|
|
|
|
|
|
|
| |||
Other, net |
| 6 |
| 6 |
| 4.6 |
|
| |||
|
|
|
|
|
|
|
|
|
| ||
Total |
| $ | 62 |
| $ | 51 |
| 22.3 | % |
|
|
NOTE: Percentages are calculated using revenues and expenses rounded to the nearest thousand.
Second-Quarter 2005 Review |
| [LOGO] |
19
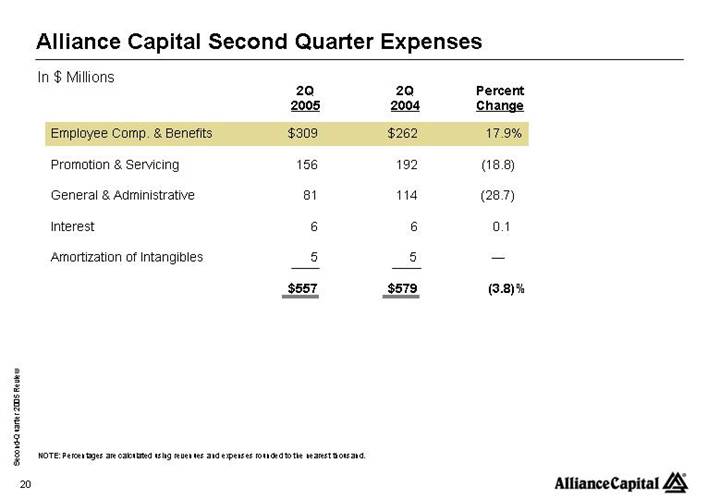
Alliance Capital Second Quarter Expenses
In $ Millions
|
| 2Q |
| 2Q |
| Percent |
| ||
|
|
|
|
|
|
|
| ||
Employee Comp. & Benefits |
| $ | 309 |
| $ | 262 |
| 17.9 | % |
|
|
|
|
|
|
|
| ||
Promotion & Servicing |
| 156 |
| 192 |
| (18.8 | ) | ||
|
|
|
|
|
|
|
| ||
General & Administrative |
| 81 |
| 114 |
| (28.7 | ) | ||
|
|
|
|
|
|
|
| ||
Interest |
| 6 |
| 6 |
| 0.1 |
| ||
|
|
|
|
|
|
|
| ||
Amortization of Intangibles |
| 5 |
| 5 |
| — |
| ||
|
|
|
|
|
|
|
| ||
|
| $ | 557 |
| $ | 579 |
| (3.8 | )% |
NOTE: Percentages are calculated using revenues and expenses rounded to the nearest thousand.
Second-Quarter 2005 Review |
| [LOGO] |
20
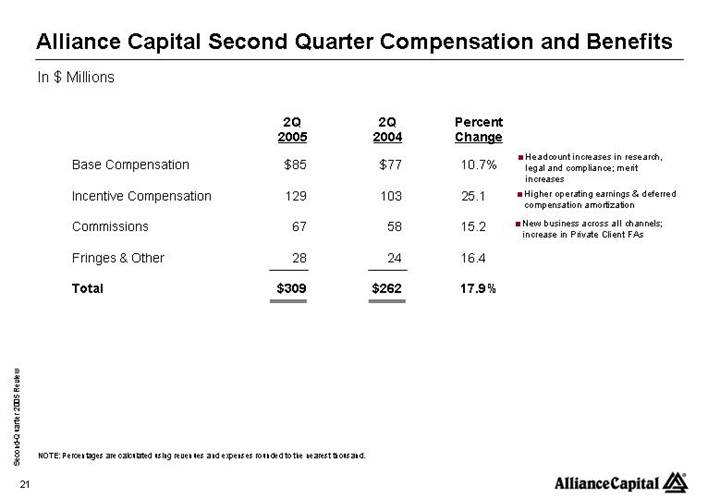
Alliance Capital Second Quarter Compensation and Benefits
In $ Millions
|
| 2Q |
| 2Q |
| Percent |
|
|
| ||
|
|
|
|
|
|
|
|
|
| ||
Base Compensation |
| $ | 85 |
| $ | 77 |
| 10.7 | % |
| • Headcount increases in research, legal and compliance; merit increases • Higher operating earnings & deferred compensation amortization • New business across all channels; increase in Private Client FAs |
|
|
|
|
|
|
|
| ||||
Incentive Compensation |
| 129 |
| 103 |
| 25.1 |
| ||||
|
|
|
|
|
|
|
| ||||
Commissions |
| 67 |
| 58 |
| 15.2 |
| ||||
|
|
|
|
|
|
|
|
| |||
Fringes & Other |
| 28 |
| 24 |
| 16.4 |
|
| |||
|
|
|
|
|
|
|
|
| |||
Total |
| $ | 309 |
| $ | 262 |
| 17.9 | % |
| |
NOTE: Percentages are calculated using revenues and expenses rounded to the nearest thousand.
Second-Quarter 2005 Review |
| [LOGO] |
21
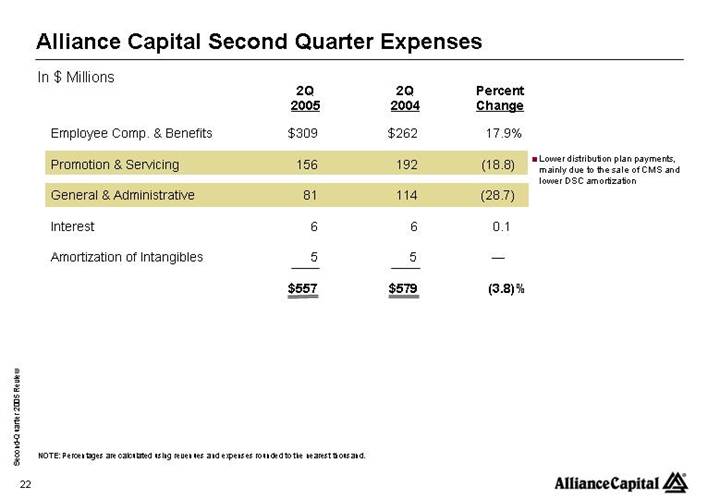
Alliance Capital Second Quarter Expenses
In $ Millions
|
| 2Q |
| 2Q |
| Percent |
|
|
| ||
|
|
|
|
|
|
|
|
|
| ||
Employee Comp. & Benefits |
| $ | 309 |
| $ | 262 |
| 17.9 | % |
|
|
|
|
|
|
|
|
|
|
|
| ||
Promotion & Servicing |
| 156 |
| 192 |
| (18.8 | ) |
| • Lower distribution plan payments, mainly due to the sale of CMS and lower DSC amortization | ||
|
|
|
|
|
|
|
| ||||
General & Administrative |
| 81 |
| 114 |
| (28.7 | ) | ||||
|
|
|
|
|
|
|
| ||||
Interest |
| 6 |
| 6 |
| 0.1 |
| ||||
|
|
|
|
|
|
|
|
| |||
Amortization of Intangibles |
| 5 |
| 5 |
| — |
|
| |||
|
|
|
|
|
|
|
|
| |||
|
| $ | 557 |
| $ | 579 |
| (3.8 | )% |
| |
NOTE: Percentages are calculated using revenues and expenses rounded to the nearest thousand.
Second-Quarter 2005 Review |
| [LOGO] |
22
Alliance Capital Second Quarter G&A Expenses
In $ Millions
|
| 2Q |
| 2Q |
| Percent |
|
|
| ||
|
|
|
|
|
|
|
|
|
| ||
Office & Related |
| $ | 44 |
| $ | 44 |
| 1.0 | % |
|
|
|
|
|
|
|
|
|
|
|
| ||
Technology |
| 21 |
| 22 |
| (5.1 | ) |
|
| ||
|
|
|
|
|
|
|
|
|
| ||
Professional Fees |
| (5 | ) | 5 |
| N/M |
|
| • Lower legal expenses, including substantial insurance reimbursement of prior period expenses
• Elimination of FIN 46 consolidation in 2005
• Write-off of obsolete software in ‘04 | ||
|
|
|
|
|
|
|
|
| |||
Portfolio Services |
| 10 |
| 10 |
| (3.6 | ) |
| |||
|
|
|
|
|
|
|
|
| |||
Minority Interest |
| 1 |
| 10 |
| (87.5 | ) |
| |||
|
|
|
|
|
|
|
| ||||
Other |
| 10 |
| 23 |
| (54.7 | ) | ||||
|
|
|
|
|
|
|
| ||||
|
| $ | 81 |
| $ | 114 |
| (28.7 | )% | ||
NOTE: Percentages are calculated using revenues and expenses rounded to the nearest thousand.
Second-Quarter 2005 Review |
| [LOGO] |
23
Alliance Capital Second Quarter Net Income
In $ Millions
|
| 2Q |
| 2Q |
| Percent |
| ||
|
|
|
|
|
|
|
| ||
Revenues |
| $ | 769 |
| $ | 745 |
| 3.2 | % |
|
|
|
|
|
|
|
| ||
Expenses |
| 557 |
| 579 |
| (3.8 | ) | ||
|
|
|
|
|
|
|
| ||
Income Before Taxes |
| 212 |
| 166 |
| 27.6 |
| ||
|
|
|
|
|
|
|
| ||
Income Taxes |
| 14 |
| 10 |
| 36.1 |
| ||
|
|
|
|
|
|
|
| ||
Net Income |
| $ | 198 |
| $ | 156 |
| 27.1 | % |
|
|
|
|
|
|
|
| ||
Pre-Tax Margin* |
| 27.6 | % | 22.3 | % |
|
| ||
*Pre-tax income as a percentage of revenues.
NOTE: Percentages are calculated using revenues and expenses rounded to the nearest thousand.
Second-Quarter 2005 Review |
| [LOGO] |
24
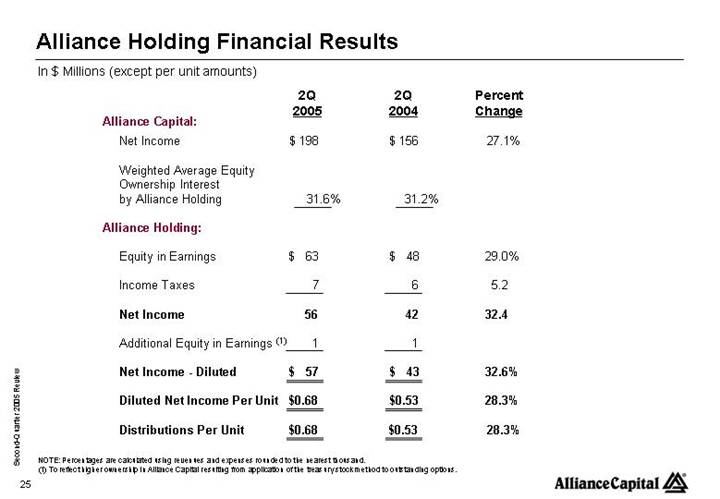
Alliance Holding Financial Results
In $ Millions (except per unit amounts)
|
| 2Q |
| 2Q |
| Percent |
| ||
|
|
|
|
|
|
|
| ||
Alliance Capital: |
|
|
|
|
|
|
| ||
|
|
|
|
|
|
|
| ||
Net Income |
| $ | 198 |
| $ | 156 |
| 27.1 | % |
|
|
|
|
|
|
|
| ||
Weighted Average Equity Ownership Interest by Alliance Holding |
| 31.6 | % | 31.2 | % |
|
| ||
|
|
|
|
|
|
|
| ||
Alliance Holding: |
|
|
|
|
|
|
| ||
|
|
|
|
|
|
|
| ||
Equity in Earnings |
| $ | 63 |
| $ | 48 |
| 29.0 | % |
|
|
|
|
|
|
|
| ||
Income Taxes |
| 7 |
| 6 |
| 5.2 |
| ||
|
|
|
|
|
|
|
| ||
Net Income |
| 56 |
| 42 |
| 32.4 |
| ||
|
|
|
|
|
|
|
| ||
Additional Equity in Earnings (1) |
| 1 |
| 1 |
|
|
| ||
|
|
|
|
|
|
|
| ||
Net Income - Diluted |
| $ | 57 |
| $ | 43 |
| 32.6 | % |
|
|
|
|
|
|
|
| ||
Diluted Net Income Per Unit |
| $ | 0.68 |
| $ | 0.53 |
| 28.3 | % |
|
|
|
|
|
|
|
| ||
Distributions Per Unit |
| $ | 0.68 |
| $ | 0.53 |
| 28.3 | % |
NOTE: Percentages are calculated using revenues and expenses rounded to the nearest thousand.
(1) To reflect higher ownership in Alliance Capital resulting from application of the treasury stock method to outstanding options.
Second-Quarter 2005 Review |
| [LOGO] |
25
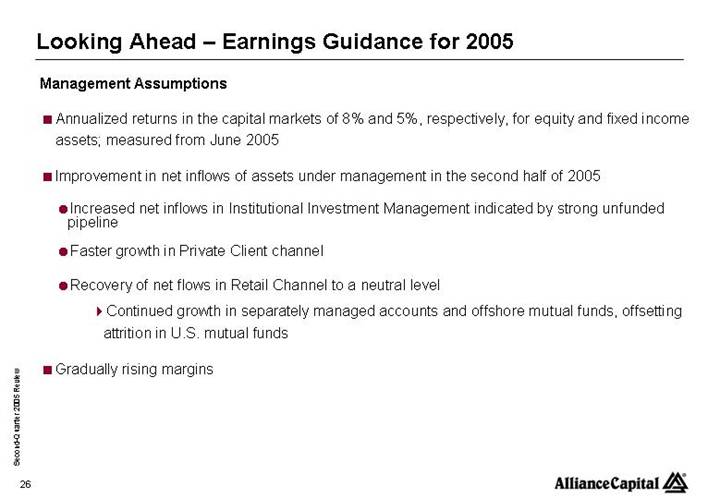
Looking Ahead – Earnings Guidance for 2005
Management Assumptions
• Annualized returns in the capital markets of 8% and 5%, respectively, for equity and fixed income assets; measured from June 2005
• Improvement in net inflows of assets under management in the second half of 2005
• Increased net inflows in Institutional Investment Management indicated by strong unfunded pipeline
• Faster growth in Private Client channel
• Recovery of net flows in Retail Channel to a neutral level
• Continued growth in separately managed accounts and offshore mutual funds, offsetting attrition in U.S. mutual funds
• Gradually rising margins
Second-Quarter 2005 Review |
| [LOGO] |
26
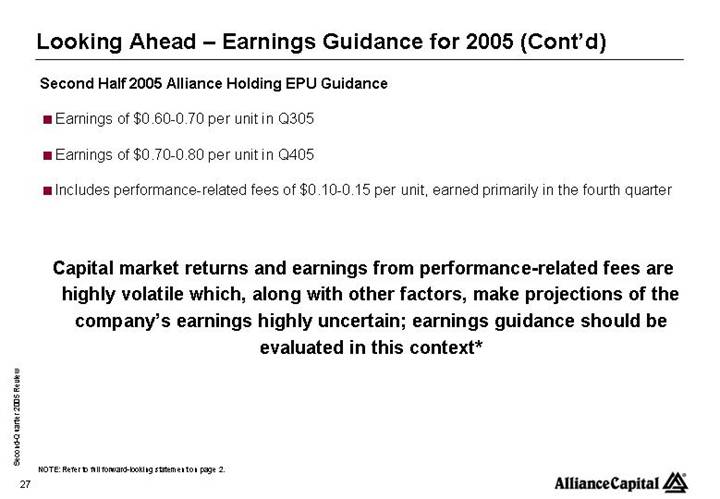
Looking Ahead – Earnings Guidance for 2005 (Cont’d)
Second Half 2005 Alliance Holding EPU Guidance
• Earnings of $0.60-0.70 per unit in Q305
• Earnings of $0.70-0.80 per unit in Q405
• Includes performance-related fees of $0.10-0.15 per unit, earned primarily in the fourth quarter
Capital market returns and earnings from performance-related fees are highly volatile which, along with other factors, make projections of the company’s earnings highly uncertain; earnings guidance should be evaluated in this context*
NOTE: Refer to full forward-looking statement on page 2.
Second-Quarter 2005 Review |
| [LOGO] |
27
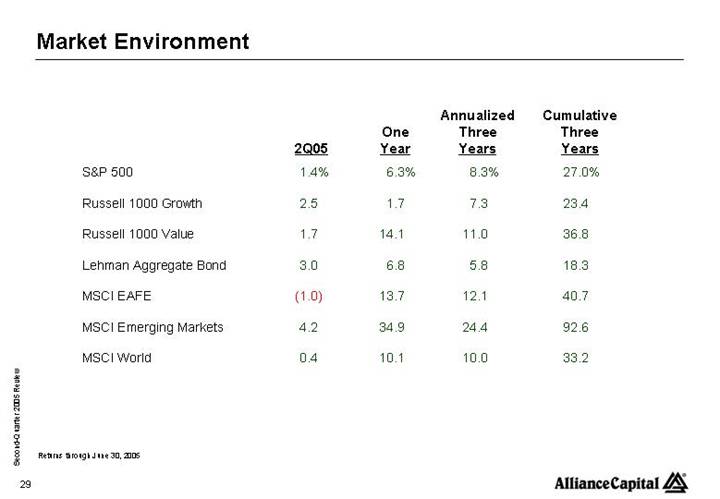
Market Environment
|
| 2Q05 |
| One |
| Annualized |
| Cumulative |
|
|
|
|
|
|
|
|
|
|
|
S&P 500 |
| 1.4 | % | 6.3 | % | 8.3 | % | 27.0 | % |
|
|
|
|
|
|
|
|
|
|
Russell 1000 Growth |
| 2.5 |
| 1.7 |
| 7.3 |
| 23.4 |
|
|
|
|
|
|
|
|
|
|
|
Russell 1000 Value |
| 1.7 |
| 14.1 |
| 11.0 |
| 36.8 |
|
|
|
|
|
|
|
|
|
|
|
Lehman Aggregate Bond |
| 3.0 |
| 6.8 |
| 5.8 |
| 18.3 |
|
|
|
|
|
|
|
|
|
|
|
MSCI EAFE |
| (1.0 | ) | 13.7 |
| 12.1 |
| 40.7 |
|
|
|
|
|
|
|
|
|
|
|
MSCI Emerging Markets |
| 4.2 |
| 34.9 |
| 24.4 |
| 92.6 |
|
|
|
|
|
|
|
|
|
|
|
MSCI World |
| 0.4 |
| 10.1 |
| 10.0 |
| 33.2 |
|
Returns through June 30, 2005
Second-Quarter 2005 Review |
| [LOGO] |
29
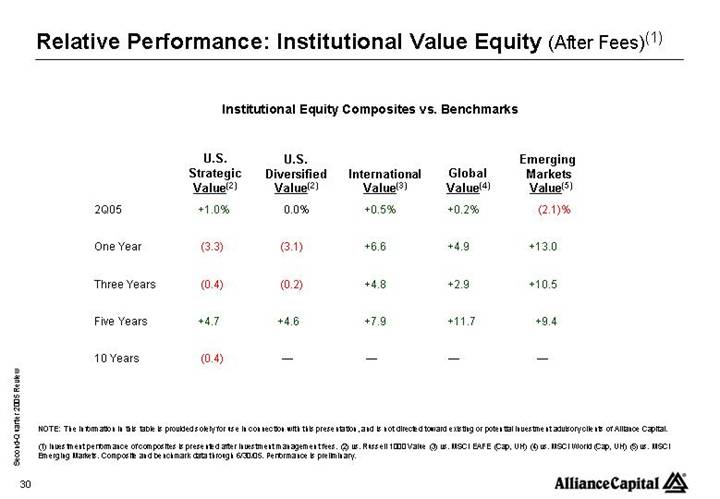
Relative Performance: Institutional Value Equity (After Fees)(1)
Institutional Equity Composites vs. Benchmarks
|
| U.S. |
| U.S. |
| International |
| Global |
| Emerging |
|
|
|
|
|
|
|
|
|
|
|
|
|
2Q05 |
| +1.0 | % | 0.0 | % | +0.5 | % | +0.2 | % | (2.1 | )% |
|
|
|
|
|
|
|
|
|
|
|
|
One Year |
| (3.3 | ) | (3.1 | ) | +6.6 |
| +4.9 |
| +13.0 |
|
|
|
|
|
|
|
|
|
|
|
|
|
Three Years |
| (0.4 | ) | (0.2 | ) | +4.8 |
| +2.9 |
| +10.5 |
|
|
|
|
|
|
|
|
|
|
|
|
|
Five Years |
| +4.7 |
| +4.6 |
| +7.9 |
| +11.7 |
| +9.4 |
|
|
|
|
|
|
|
|
|
|
|
|
|
10 Years |
| (0.4 | ) | — |
| — |
| — |
| — |
|
NOTE: The information in this table is provided solely for use in connection with this presentation, and is not directed toward existing or potential investment advisory clients of Alliance Capital.
(1) Investment performance of composites is presented after investment management fees. (2) vs. Russell 1000 Value (3) vs. MSCI EAFE (Cap, UH) (4) vs. MSCI World (Cap, UH) (5) vs. MSCI Emerging Markets. Composite and benchmark data through 6/30/05. Performance is preliminary.
Second-Quarter 2005 Review |
| [LOGO] |
30
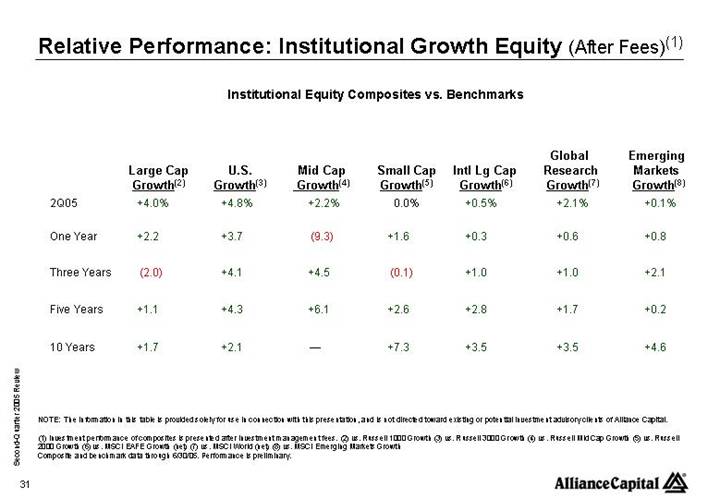
Relative Performance: Institutional Growth Equity (After Fees)(1)
Institutional Equity Composites vs. Benchmarks
|
| Large Cap |
| U.S. |
| Mid Cap |
| Small Cap |
| Intl Lg Cap |
| Global |
| Emerging |
|
|
|
|
|
|
|
|
|
|
|
|
|
|
|
|
|
2Q05 |
| +4.0 | % | +4.8 | % | +2.2 | % | 0.0 | % | +0.5 | % | +2.1 | % | +0.1 | % |
|
|
|
|
|
|
|
|
|
|
|
|
|
|
|
|
One Year |
| +2.2 |
| +3.7 |
| (9.3 | ) | +1.6 |
| +0.3 |
| +0.6 |
| +0.8 |
|
|
|
|
|
|
|
|
|
|
|
|
|
|
|
|
|
Three Years |
| (2.0 | ) | +4.1 |
| +4.5 |
| (0.1 | ) | +1.0 |
| +1.0 |
| +2.1 |
|
|
|
|
|
|
|
|
|
|
|
|
|
|
|
|
|
Five Years |
| +1.1 |
| +4.3 |
| +6.1 |
| +2.6 |
| +2.8 |
| +1.7 |
| +0.2 |
|
|
|
|
|
|
|
|
|
|
|
|
|
|
|
|
|
10 Years |
| +1.7 |
| +2.1 |
| — |
| +7.3 |
| +3.5 |
| +3.5 |
| +4.6 |
|
NOTE: The information in this table is provided solely for use in connection with this presentation, and is not directed toward existing or potential investment advisory clients of Alliance Capital.
(1) Investment performance of composites is presented after investment management fees. (2) vs. Russell 1000 Growth (3) vs. Russell 3000 Growth (4) vs. Russell Mid Cap Growth (5) vs. Russell 2000 Growth (6) vs. MSCI EAFE Growth (net) (7) vs. MSCI World (net) (8) vs. MSCI Emerging Markets Growth Composite and benchmark data through 6/30/05. Performance is preliminary.
Second-Quarter 2005 Review |
| [LOGO] |
31
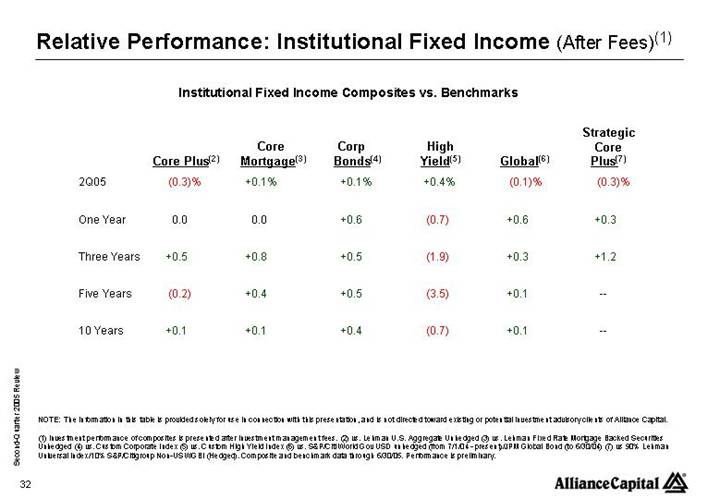
Relative Performance: Institutional Fixed Income (After Fees)(1)
Institutional Fixed Income Composites vs. Benchmarks
|
| Core Plus(2) |
| Core |
| Corp |
| High |
| Global(6) |
| Strategic |
|
|
|
|
|
|
|
|
|
|
|
|
|
|
|
2Q05 |
| (0.3 | )% | +0.1 | % | +0.1 | % | +0.4 | % | (0.1 | )% | (0.3 | )% |
|
|
|
|
|
|
|
|
|
|
|
|
|
|
One Year |
| 0.0 |
| 0.0 |
| +0.6 |
| (0.7 | ) | +0.6 |
| +0.3 |
|
|
|
|
|
|
|
|
|
|
|
|
|
|
|
Three Years |
| +0.5 |
| +0.8 |
| +0.5 |
| (1.9 | ) | +0.3 |
| +1.2 |
|
|
|
|
|
|
|
|
|
|
|
|
|
|
|
Five Years |
| (0.2 | ) | +0.4 |
| +0.5 |
| (3.5 | ) | +0.1 |
| — |
|
|
|
|
|
|
|
|
|
|
|
|
|
|
|
10 Years |
| +0.1 |
| +0.1 |
| +0.4 |
| (0.7 | ) | +0.1 |
| — |
|
NOTE: The information in this table is provided solely for use in connection with this presentation, and is not directed toward existing or potential investment advisory clients of Alliance Capital.
(1) Investment performance of composites is presented after investment management fees. (2) vs. Lehman U.S. Aggregate Unhedged (3) vs. Lehman Fixed Rate Mortgage Backed Securities Unhedged (4) vs. Custom Corporate Index (5) vs. Custom High Yield Index (6) vs. S&P/Citi World Gov USD unhedged (from 7/1/04 - - present)/JPM Global Bond (to 6/30/04)(7) vs 90% Lehman Universal Index/10% S&P/Citigroup Non-US WGBI (Hedged). Composite and benchmark data through 6/30/05. Performance is preliminary.
Second-Quarter 2005 Review |
| [LOGO] |
32
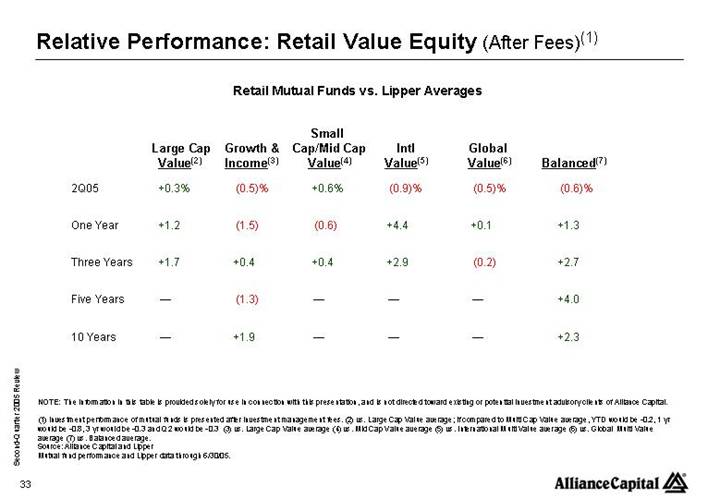
Relative Performance: Retail Value Equity (After Fees)(1)
Retail Mutual Funds vs. Lipper Averages
|
| Large Cap |
| Growth & |
| Small |
| Intl |
| Global |
| Balanced(7) |
|
|
|
|
|
|
|
|
|
|
|
|
|
|
|
2Q05 |
| +0.3 | % | (0.5 | )% | +0.6 | % | (0.9 | )% | (0.5 | )% | (0.6 | )% |
|
|
|
|
|
|
|
|
|
|
|
|
|
|
One Year |
| +1.2 |
| (1.5 | ) | (0.6 | ) | +4.4 |
| +0.1 |
| +1.3 |
|
|
|
|
|
|
|
|
|
|
|
|
|
|
|
Three Years |
| +1.7 |
| +0.4 |
| +0.4 |
| +2.9 |
| (0.2 | ) | +2.7 |
|
|
|
|
|
|
|
|
|
|
|
|
|
|
|
Five Years |
| — |
| (1.3 | ) | — |
| — |
| — |
| +4.0 |
|
|
|
|
|
|
|
|
|
|
|
|
|
|
|
10 Years |
| — |
| +1.9 |
| — |
| — |
| — |
| +2.3 |
|
NOTE: The information in this table is provided solely for use in connection with this presentation, and is not directed toward existing or potential investment advisory clients of Alliance Capital.
(1) Investment performance of mutual funds is presented after investment management fees. (2) vs. Large Cap Value average; if compared to Multi Cap Value average, YTD would be -0.2, 1 yr would be -0.8, 3 yr would be -0.3 and Q2 would be -0.3 (3) vs. Large Cap Value average (4) vs. Mid Cap Value average (5) vs. International Multi Value average (6) vs. Global Multi Value average (7) vs. Balanced average.
Source: Alliance Capital and Lipper
Mutual fund performance and Lipper data through 6/30/05.
Second-Quarter 2005 Review |
| [LOGO] |
33
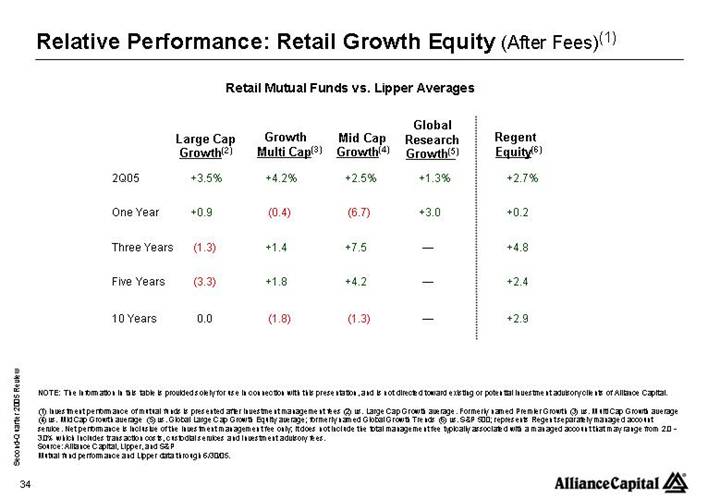
Relative Performance: Retail Growth Equity (After Fees)(1)
Retail Mutual Funds vs. Lipper Averages
|
| Large Cap |
| Growth |
| Mid Cap |
| Global |
| Regent |
|
|
|
|
|
|
|
|
|
|
|
|
|
2Q05 |
| +3.5 | % | +4.2 | % | +2.5 | % | +1.3 | % | +2.7 | % |
|
|
|
|
|
|
|
|
|
|
|
|
One Year |
| +0.9 |
| (0.4 | ) | (6.7 | ) | +3.0 |
| +0.2 |
|
|
|
|
|
|
|
|
|
|
|
|
|
Three Years |
| (1.3 | ) | +1.4 |
| +7.5 |
| — |
| +4.8 |
|
|
|
|
|
|
|
|
|
|
|
|
|
Five Years |
| (3.3 | ) | +1.8 |
| +4.2 |
| — |
| +2.4 |
|
|
|
|
|
|
|
|
|
|
|
|
|
10 Years |
| 0.0 |
| (1.8 | ) | (1.3 | ) | — |
| +2.9 |
|
NOTE: The information in this table is provided solely for use in connection with this presentation, and is not directed toward existing or potential investment advisory clients of Alliance Capital.
(1) Investment performance of mutual funds is presented after investment management fees (2) vs. Large Cap Growth average. Formerly named Premier Growth (3) vs. Multi Cap Growth average (4) vs. Mid Cap Growth average (5) vs. Global Large Cap Growth Equity average; formerly named Global Growth Trends (6) vs. S&P 500; represents Regent separately managed account service. Net performance is inclusive of the investment management fee only; it does not include the total management fee typically associated with a managed account that may range from 2.0 -3.0% which includes transaction costs, custodial services and investment advisory fees.
Source: Alliance Capital, Lipper, and S&P
Mutual fund performance and Lipper data through 6/30/05.
Second-Quarter 2005 Review |
| [LOGO] |
34
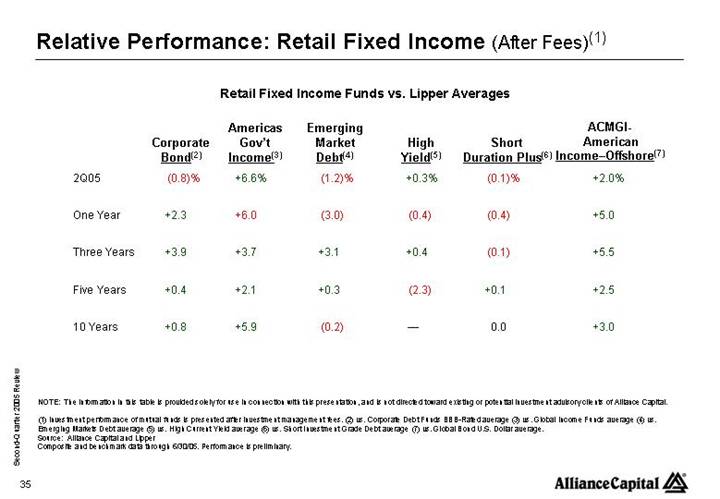
Relative Performance: Retail Fixed Income (After Fees)(1)
Retail Fixed Income Funds vs. Lipper Averages
|
| Corporate |
| Americas |
| Emerging |
| High |
| Short |
| ACMGI- |
|
|
|
|
|
|
|
|
|
|
|
|
|
|
|
2Q05 |
| (0.8 | )% | +6.6 | % | (1.2 | )% | +0.3 | % | (0.1 | )% | +2.0 | % |
|
|
|
|
|
|
|
|
|
|
|
|
|
|
One Year |
| +2.3 |
| +6.0 |
| (3.0 | ) | (0.4 | ) | (0.4 | ) | +5.0 |
|
|
|
|
|
|
|
|
|
|
|
|
|
|
|
Three Years |
| +3.9 |
| +3.7 |
| +3.1 |
| +0.4 |
| (0.1 | ) | +5.5 |
|
|
|
|
|
|
|
|
|
|
|
|
|
|
|
Five Years |
| +0.4 |
| +2.1 |
| +0.3 |
| (2.3 | ) | +0.1 |
| +2.5 |
|
|
|
|
|
|
|
|
|
|
|
|
|
|
|
10 Years |
| +0.8 |
| +5.9 |
| (0.2 | ) | — |
| 0.0 |
| +3.0 |
|
NOTE: The information in this table is provided solely for use in connection with this presentation, and is not directed toward existing or potential investment advisory clients of Alliance Capital.
(1) Investment performance of mutual funds is presented after investment management fees. (2) vs. Corporate Debt Funds BBB-Rated average (3) vs. Global Income Funds average (4) vs. Emerging Markets Debt average (5) vs. High Current Yield average (6) vs. Short Investment Grade Debt average (7) vs. Global Bond U.S. Dollar average.
Source: Alliance Capital and Lipper
Composite and benchmark data through 6/30/05. Performance is preliminary.
Second-Quarter 2005 Review |
| [LOGO] |
35
Absolute Performance:Private Client (After Fees)(1)
|
|
|
| Annualized |
| ||||
|
| 2Q05 |
| 1 Year |
| 3 Year |
| 5 Year |
|
|
|
|
|
|
|
|
|
|
|
All Balanced Accounts(2) |
| +1.9 | % | +7.9 | % | +8.0 | % | +6.7 | % |
|
|
|
|
|
|
|
|
|
|
Global Balanced Benchmark(3) |
| +1.5 |
| +7.8 |
| +7.9 |
| +1.6 |
|
NOTE: The information in this table is provided solely for use in connection with this presentation, and is not directed towards existing or potential investment advisory clients of Alliance Capital.
(1) Investment performance of composites is presented after investment management fees. (2) All Balanced Accounts include those accounts with any combination of equity and fixed income in any percentage mix. (3) Custom benchmark: 42% S&P 500, 15% MSCI EAFE, 3% MSCI Emerging Markets, 40% Lipper Intermediate Municipal Debt Fund Average.
Second-Quarter 2005 Review |
| [LOGO] |
36
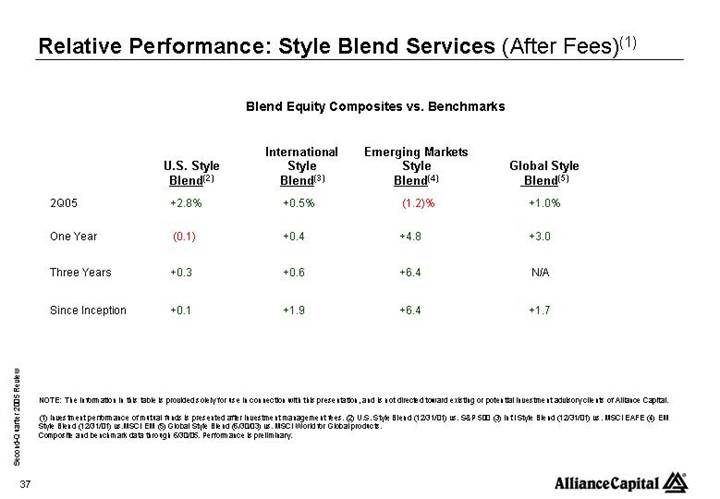
Relative Performance: Style Blend Services (After Fees)(1)
Blend Equity Composites vs. Benchmarks
|
| U.S. Style |
| International |
| Emerging Markets |
| Global Style |
|
|
|
|
|
|
|
|
|
|
|
2Q05 |
| +2.8 | % | +0.5 | % | (1.2 | )% | +1.0 | % |
|
|
|
|
|
|
|
|
|
|
One Year |
| (0.1 | ) | +0.4 |
| +4.8 |
| +3.0 |
|
|
|
|
|
|
|
|
|
|
|
Three Years |
| +0.3 |
| +0.6 |
| +6.4 |
| N/A |
|
|
|
|
|
|
|
|
|
|
|
Since Inception |
| +0.1 |
| +1.9 |
| +6.4 |
| +1.7 |
|
NOTE: The information in this table is provided solely for use in connection with this presentation, and is not directed toward existing or potential investment advisory clients of Alliance Capital.
(1) Investment performance of mutual funds is presented after investment management fees. (2) U.S. Style Blend (12/31/01) vs. S&P 500 (3) Int’l Style Blend (12/31/01) vs. MSCI EAFE (4) EM Style Blend (12/31/01) vs.MSCI EM (5) Global Style Blend (6/30/03) vs. MSCI World for Global products.
Composite and benchmark data through 6/30/05. Performance is preliminary.
Second-Quarter 2005 Review |
| [LOGO] |
37
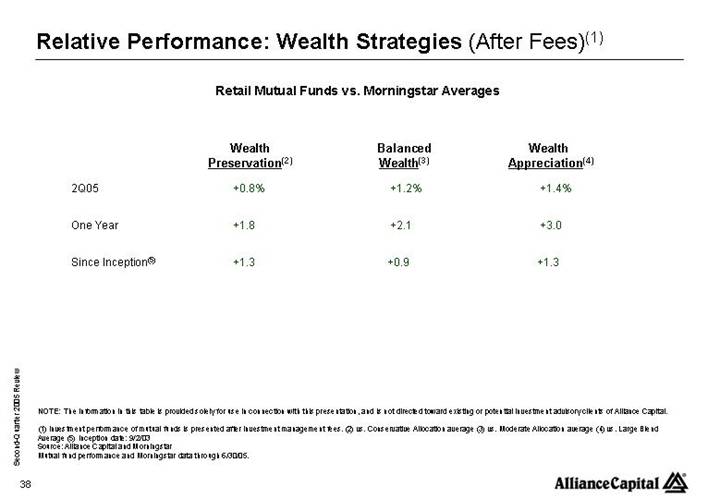
Relative Performance: Wealth Strategies (After Fees)(1)
Retail Mutual Funds vs. Morningstar Averages
|
| Wealth |
| Balanced |
| Wealth |
|
|
|
|
|
|
|
|
|
2Q05 |
| +0.8 | % | +1.2 | % | +1.4 | % |
|
|
|
|
|
|
|
|
One Year |
| +1.8 |
| +2.1 |
| +3.0 |
|
|
|
|
|
|
|
|
|
Since Inception(5) |
| +1.3 |
| +0.9 |
| +1.3 |
|
NOTE: The information in this table is provided solely for use in connection with this presentation, and is not directed toward existing or potential investment advisory clients of Alliance Capital.
(1) Investment performance of mutual funds is presented after investment management fees. (2) vs. Conservative Allocation average (3) vs. Moderate Allocation average (4) vs. Large Blend Average (5) Inception date: 9/2/03 Source: Alliance Capital and Morningstar Mutual fund performance and Morningstar data through 6/30/05.
Second-Quarter 2005 Review |
| [LOGO] |
38
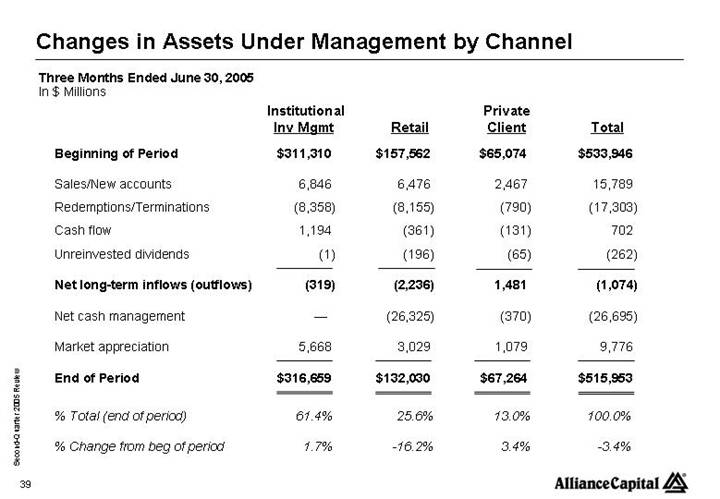
Changes in Assets Under Management by Channel
Three Months Ended June 30, 2005
In $ Millions
|
| Institutional |
| Retail |
| Private |
| Total |
| ||||
|
|
|
|
|
|
|
|
|
| ||||
Beginning of Period |
| $ | 311,310 |
| $ | 157,562 |
| $ | 65,074 |
| $ | 533,946 |
|
|
|
|
|
|
|
|
|
|
| ||||
Sales/New accounts |
| 6,846 |
| 6,476 |
| 2,467 |
| 15,789 |
| ||||
Redemptions/Terminations |
| (8,358 | ) | (8,155 | ) | (790 | ) | (17,303 | ) | ||||
Cash flow |
| 1,194 |
| (361 | ) | (131 | ) | 702 |
| ||||
Unreinvested dividends |
| (1 | ) | (196 | ) | (65 | ) | (262 | ) | ||||
|
|
|
|
|
|
|
|
|
| ||||
Net long-term inflows (outflows) |
| (319 | ) | (2,236 | ) | 1,481 |
| (1,074 | ) | ||||
|
|
|
|
|
|
|
|
|
| ||||
Net cash management |
| — |
| (26,325 | ) | (370 | ) | (26,695 | ) | ||||
|
|
|
|
|
|
|
|
|
| ||||
Market appreciation |
| 5,668 |
| 3,029 |
| 1,079 |
| 9,776 |
| ||||
|
|
|
|
|
|
|
|
|
| ||||
End of Period |
| $ | 316,659 |
| $ | 132,030 |
| $ | 67,264 |
| $ | 515,953 |
|
|
|
|
|
|
|
|
|
|
| ||||
% Total (end of period) |
| 61.4 | % | 25.6 | % | 13.0 | % | 100.0 | % | ||||
|
|
|
|
|
|
|
|
|
| ||||
% Change from beg of period |
| 1.7 | % | -16.2 | % | 3.4 | % | -3.4 | % | ||||
Second-Quarter 2005 Review |
| [LOGO] |
39
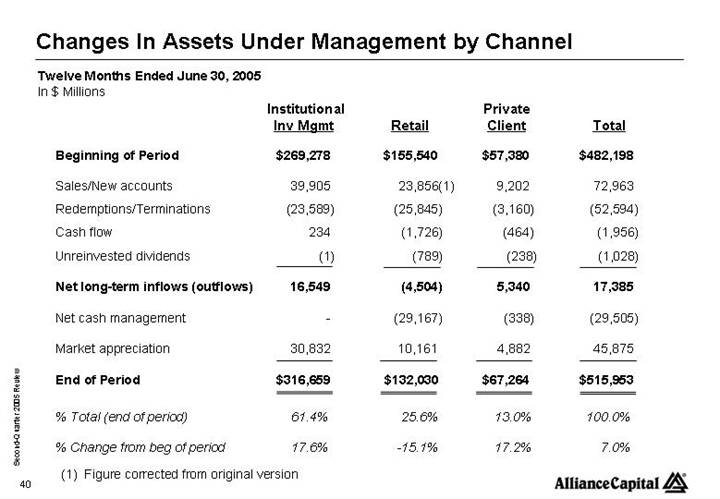
Changes In Assets Under Management by Channel
Twelve Months Ended June 30, 2005
In $ Millions
|
| Institutional |
| Retail |
| Private |
| Total |
| ||||
|
|
|
|
|
|
|
|
|
| ||||
Beginning of Period |
| $ | 269,278 |
| $ | 155,540 |
| $ | 57,380 |
| $ | 482,198 |
|
|
|
|
|
|
|
|
|
|
| ||||
Sales/New accounts |
| 39,905 |
| 23,856 | (1) | 9,202 |
| 72,963 |
| ||||
Redemptions/Terminations |
| (23,589 | ) | (25,845 | ) | (3,160 | ) | (52,594 | ) | ||||
Cash flow |
| 234 |
| (1,726 | ) | (464 | ) | (1,956 | ) | ||||
Unreinvested dividends |
| (1 | ) | (789 | ) | (238 | ) | (1,028 | ) | ||||
|
|
|
|
|
|
|
|
|
| ||||
Net long-term inflows (outflows) |
| 16,549 |
| (4,504 | ) | 5,340 |
| 17,385 |
| ||||
|
|
|
|
|
|
|
|
|
| ||||
Net cash management |
| — |
| (29,167 | ) | (338 | ) | (29,505 | ) | ||||
|
|
|
|
|
|
|
|
|
| ||||
Market appreciation |
| 30,832 |
| 10,161 |
| 4,882 |
| 45,875 |
| ||||
|
|
|
|
|
|
|
|
|
| ||||
End of Period |
| $ | 316,659 |
| $ | 132,030 |
| $ | 67,264 |
| $ | 515,953 |
|
|
|
|
|
|
|
|
|
|
| ||||
% Total (end of period) |
| 61.4 | % | 25.6 | % | 13.0 | % | 100.0 | % | ||||
|
|
|
|
|
|
|
|
|
| ||||
% Change from beg of period |
| 17.6 | % | -15.1 | % | 17.2 | % | 7.0 | % | ||||
(1) Figure corrected from original version
Second-Quarter 2005 Review |
| [LOGO] |
40
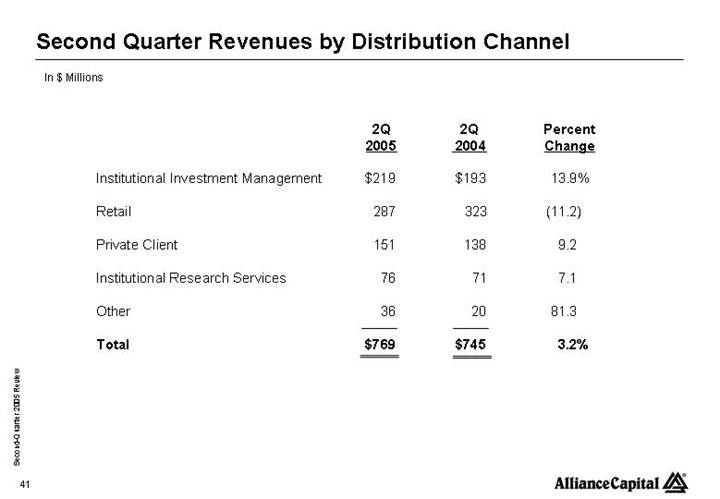
Second Quarter Revenuesby Distribution Channel
In $ Millions
|
| 2Q |
| 2Q |
| Percent |
| ||
|
|
|
|
|
|
|
| ||
Institutional Investment Management |
| $ | 219 |
| $ | 193 |
| 13.9 | % |
|
|
|
|
|
|
|
| ||
Retail |
| 287 |
| 323 |
| (11.2 | ) | ||
|
|
|
|
|
|
|
| ||
Private Client |
| 151 |
| 138 |
| 9.2 |
| ||
|
|
|
|
|
|
|
| ||
Institutional Research Services |
| 76 |
| 71 |
| 7.1 |
| ||
|
|
|
|
|
|
|
| ||
Other |
| 36 |
| 20 |
| 81.3 |
| ||
|
|
|
|
|
|
|
| ||
Total |
| $ | 769 |
| $ | 745 |
| 3.2 | % |
Second-Quarter 2005 Review |
| [LOGO] |
41
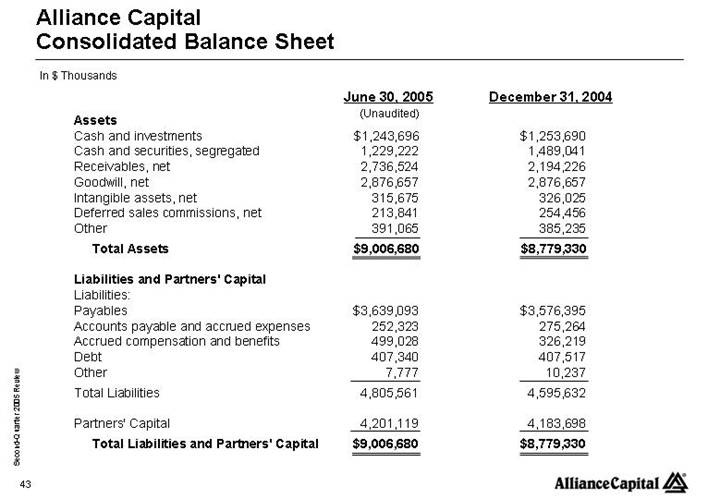
Alliance Capital
Consolidated Balance Sheet
In $ Thousands
|
| June 30, 2005 |
| December 31, 2004 |
| ||
|
| (Unaudited) |
|
|
| ||
Assets |
|
|
|
|
| ||
Cash and investments |
| $ | 1,243,696 |
| $ | 1,253,690 |
|
Cash and securities, segregated |
| 1,229,222 |
| 1,489,041 |
| ||
Receivables, net |
| 2,736,524 |
| 2,194,226 |
| ||
Goodwill, net |
| 2,876,657 |
| 2,876,657 |
| ||
Intangible assets, net |
| 315,675 |
| 326,025 |
| ||
Deferred sales commissions, net |
| 213,841 |
| 254,456 |
| ||
Other |
| 391,065 |
| 385,235 |
| ||
Total Assets |
| $ | 9,006,680 |
| $ | 8,779,330 |
|
|
|
|
|
|
| ||
Liabilities and Partners’ Capital |
|
|
|
|
| ||
Liabilities: |
|
|
|
|
| ||
Payables |
| $ | 3,639,093 |
| $ | 3,576,395 |
|
Accounts payable and accrued expenses |
| 252,323 |
| 275,264 |
| ||
Accrued compensation and benefits |
| 499,028 |
| 326,219 |
| ||
Debt |
| 407,340 |
| 407,517 |
| ||
Other |
| 7,777 |
| 10,237 |
| ||
Total Liabilities |
| 4,805,561 |
| 4,595,632 |
| ||
|
|
|
|
|
| ||
Partners’ Capital |
| 4,201,119 |
| 4,183,698 |
| ||
Total Liabilities and Partners’ Capital |
| $ | 9,006,680 |
| $ | 8,779,330 |
|
Second-Quarter 2005 Review |
| [LOGO] |
43
Alliance Capital
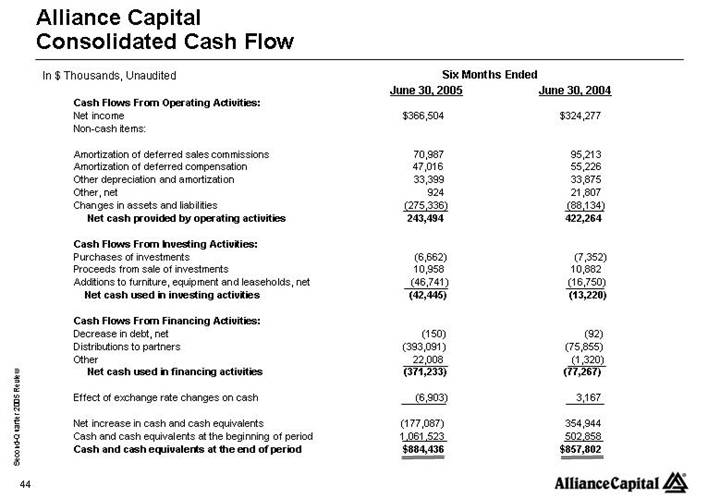
Consolidated Cash Flow
In $ Thousands, Unaudited
|
| Six Months Ended |
| ||||
|
| June 30, 2005 |
| June 30, 2004 |
| ||
Cash Flows From Operating Activities: |
|
|
|
|
| ||
Net income |
| $ | 366,504 |
| $ | 324,277 |
|
Non-cash items: |
|
|
|
|
| ||
|
|
|
|
|
| ||
Amortization of deferred sales commissions |
| 70,987 |
| 95,213 |
| ||
Amortization of deferred compensation |
| 47,016 |
| 55,226 |
| ||
Other depreciation and amortization |
| 33,399 |
| 33,875 |
| ||
Other, net |
| 924 |
| 21,807 |
| ||
Changes in assets and liabilities |
| (275,336 | ) | (88,134 | ) | ||
Net cash provided by operating activities |
| 243,494 |
| 422,264 |
| ||
|
|
|
|
|
| ||
Cash Flows From Investing Activities: |
|
|
|
|
| ||
Purchases of investments |
| (6,662 | ) | (7,352 | ) | ||
Proceeds from sale of investments |
| 10,958 |
| 10,882 |
| ||
Additions to furniture, equipment and leaseholds, net |
| (46,741 | ) | (16,750 | ) | ||
Net cash used in investing activities |
| (42,445 | ) | (13,220 | ) | ||
|
|
|
|
|
| ||
Cash Flows From Financing Activities: |
|
|
|
|
| ||
Decrease in debt, net |
| (150 | ) | (92 | ) | ||
Distributions to partners |
| (393,091 | ) | (75,855 | ) | ||
Other |
| 22,008 |
| (1,320 | ) | ||
Net cash used in financing activities |
| (371,233 | ) | (77,267 | ) | ||
|
|
|
|
|
| ||
Effect of exchange rate changes on cash |
| (6,903 | ) | 3,167 |
| ||
|
|
|
|
|
| ||
Net increase in cash and cash equivalents |
| (177,087 | ) | 354,944 |
| ||
Cash and cash equivalents at the beginning of period |
| 1,061,523 |
| 502,858 |
| ||
Cash and cash equivalents at the end of period |
| $ | 884,436 |
| $ | 857,802 |
|
Second-Quarter 2005 Review |
| [LOGO] |
44
Alliance Capital Investment Management Services
Alliance Capital provides diversified investment management and related services globally to a broad range of clients including:
1. Institutional Investment Management Services consists of investment management services to unaffiliated parties such as corporate and public employee pension funds, endowment funds, domestic and foreign institutions and governments, and affiliates such as AXA and its insurance company subsidiaries by means of:
• separately managed accounts,
• mutual fund shares sold exclusively to institutional investors and high-net-worth individuals,
• sub-advisory relationships resulting from the efforts of the institutional marketing department,
• structured products, and
• group trusts;
2. Retail Services consists of investment management products and services distributed to individual investors through financial intermediaries, such as brokers and financial planners by means of:
• mutual funds sponsored by Alliance Capital and consolidated joint venture companies,
• mutual fund sub-advisory relationships resulting from the efforts of the mutual fund marketing department, and
• separately managed account programs;
Second-Quarter 2005 Review |
| [LOGO] |
45
Alliance Capital Investment Management Services (continued)
3. Private Client Services consists of investment management services provided to high-net-worth individuals, trusts and estates, charitable foundations, partnerships, private and family corporations and other entities by means of:
• separately managed accounts,
• hedge funds,
• mutual funds, and
• certain other investment vehicles; and
4. Institutional Research Services provided to institutional investors by means of:
• in-depth research,
• portfolio strategy,
• trading, and
• brokerage-related services.
Second-Quarter 2005 Review |
| [LOGO] |
46