Searchable text section of graphics shown above
[LOGO]
ALLIANCEBERNSTEIN
Research Innovation:
Knowing More...Using Knowledge Better
Prudential CEO Conference Call Series
May 22, 2006
Lewis A. Sanders
Chairman and Chief Executive Officer
AllianceBernstein® and the AB AllianceBernstein logo are trademarks and service marks owned by AllianceBernstein L.P.
AllianceBernstein L.P.
Unusual Breadth by Client Group and Investment Services
$618 Billion
at Mar 31, 2006
By Client Group | By Service |
| |
[CHART] | [CHART] |
AllianceBernstein
AllianceBernstein Research Resources Span the Globe...
[GRAPHIC]
As of December 31, 2005
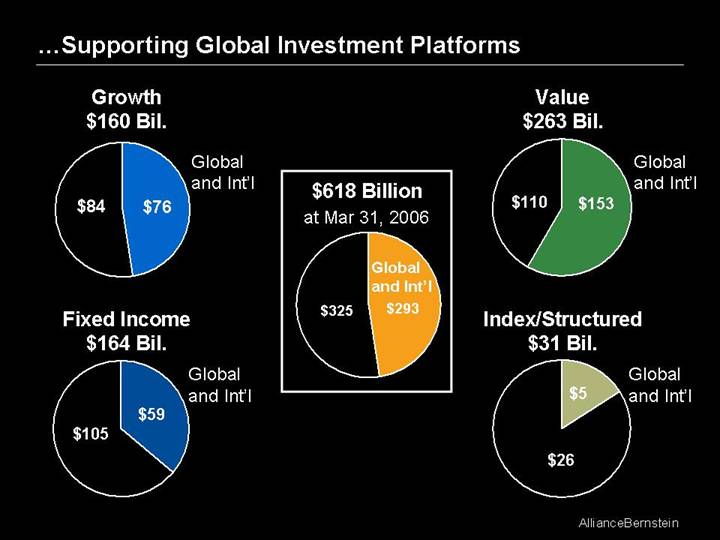
…Supporting Global Investment Platforms
Growth
$160 Bil. | $618 Billion
at Mar 31, 2006
[CHART] | Value
$263 Bil. |
| |
[CHART] | [CHART] |
| |
Fixed Income
$164 Bil. | Index/Structured
$31 Bil. |
| |
[CHART] | [CHART] |
Rapid Growth in Global / International Mandates and
Non-U.S. Client Base
| By Service | | By Client Domicile | |
| | | | |
$618 Billion | [CHART] | +51% | [CHART] | +40% |
at Mar 31, 2006 |
| | | | |
$534 Billion | [CHART] | | [CHART] | |
at Mar 31, 2005 | |
Assets categorized by country domicle of client accounts
Contribution to Growth of Assets Under Management
12 Months ending March 31, 2006*
Growth of AUM
by Service | Contribution to Growth
by Source |
| |
[CHART] | [CHART] |
Past performance does not guarantee future results.
*Excludes dispositions
Investment Performance: Delivering Results for Clients
Net-of-Fee Annualized Performance Premiums
| | | Inception
Date | | Inception–
Mar 2006 | |
Bernstein Value Equities | | | | | |
 
| U.S. Strategic Value | | Dec 31, 73 | | +2.6 | % |
| U.S. Diversified Value | | Jun 30, 86 | | +1.1 | |

| Global Value | | Sep 30, 95 | | +3.2 | |
| Emerging Markets Value | | Dec 31, 95 | | +3.8 | |

| European Value | | Jun 30, 97 | | +2.8 | |

| Canadian Value | | Dec 31, 97 | | +5.0 | |
| Global Diversified Value | | Mar 31, 98 | | +2.7 | |

| International Value (EAFE) | | Sep 30, 99 | | +6.2 | |

| U.K. Value | | Jun 30, 00 | | +4.4 | |
| International Diversified Value | | Sep 30, 00 | | +5.8 | |

| U.S. Small/Mid Cap Value | | Dec 31, 00 | | +5.7 | |
| International Strategic Value | | Mar 31, 01 | | +8.8 | |
| Global Strategic Value | | Apr 30, 01 | | +9.2 | |

| Japan Strategic Value | | Mar 31, 02 | | +9.1 | |

| Australian Value | | Jun 30, 03 | | +4.9 | |
| | | | | | |
AllianceBernstein Style Blend | | | | | |
| Emerging Markets Style Blend | | Dec 31, 01 | | +5.6 | % |

| International Style Blend | | Dec 31, 01 | | +2.3 | |
| U.S. Style Blend | | Dec 31, 01 | | +0.8 | |
| Global Style Blend | | Jun 30, 03 | | +3.8 | |
| | | | | | |
Alliance Growth Equities | | | | | |
| U.S. Growth | | Dec 31, 70 | | +4.2 | % |
| U.S. Small Cap Growth | | Dec 31, 78 | | +3.3 | |
| U.S. Large Cap Growth | | Dec 31, 77 | | +1.8 | |
| U.S. Disciplined Growth | | Dec 31, 87 | | +3.0 | |
| International Large Cap Growth | | Dec 31, 90 | | +8.9 | |
| Emerging Markets Growth | | Sep 30, 91 | | +2.1 | |
| Japan Growth | | Sep 30, 91 | | +3.7 | |
| Global Research Growth | | Dec 31, 91 | | +6.9 | |
| European Concentrated Growth | | Jun 30, 98 | | -2.1 | |
| U.S. Mid Cap Growth | | Mar 31, 99 | | +5.6 | |

| Australian Growth | | Jun 30, 00 | | -1.4 | |
| | | | | | |
AllianceBernstein Fixed Income | | | | | |

| Global Fixed Income | | Jun 30, 86 | | +0.3 | % |
| U.S. High Yield | | Dec 31, 86 | | -0.7 | |
| U.S. Investment-Grade Corporates | | Dec 31, 91 | | +0.4 | |
| U.S. Short Duration | | Mar 31, 92 | | +0.2 | |
| Emerging-Market Debt | | Jun 30, 94 | | +3.1 | |
| U.S. Core Mortgage | | Dec 31, 94 | | +0.1 | |
| U.S. Low Duration | | Dec 31, 95 | | +0.1 | |
| Europe Core Plus | | Mar 31, 99 | | -1.4 | |
| Japan Credit | | Sep 30, 00 | | +0.0 | |
| Global-Plus Fixed Income | | Jun 30, 01 | | +0.5 | |
| U.S. Strategic Core Plus | | Jun 30, 01 | | +0.6 | |

| Canadian Core Plus Advanced | | Sep 30, 02 | | +4.0 | |
The information in this table is provided solely for use in connection with this presentation and is not directed towards existing or potential investment advisory clients of AllianceBernstein. Past performance is no guarantee of future results. The returns presented above are net of fees.
Source: Bloomberg, Citigroup, FTSE, JPMorgan Chase, Lehman Brothers, Merrill Lynch, MSCI, Nomura, Russell Investment Group, Scotia Capital, S&P, TOPIX, and AllianceBernstein.
Commitment to Fundamental Research
Industry Analysts
Total 209
[CHART]
As of March 31, 2006
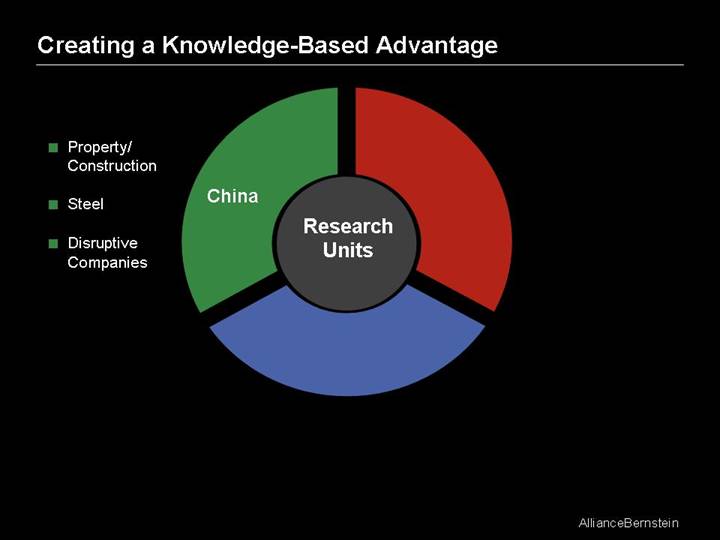
Creating a Knowledge-Based Advantage
Research Units
China
• Property/Construction
• Steel
• Disruptive Companies
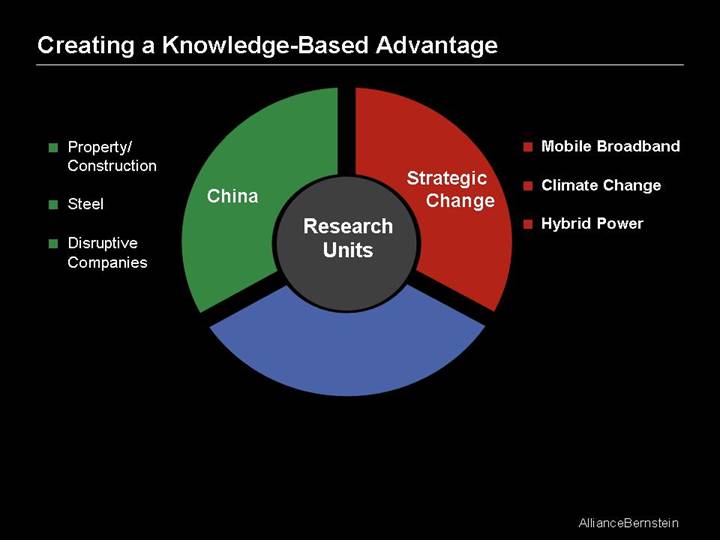
Research Units
China
• Property/Construction
• Steel
• Disruptive Companies
Strategic Change
• Mobile Broadband
• Climate Change
• Hybrid Power
Research Units
China
• Property/Construction
• Steel
• Disruptive Companies
Strategic Change
• Mobile Broadband
• Climate Change
• Hybrid Power
Early-Stage Growth
• Pharmacogenomics
• Mobile Media
• High-Energy Batteries
• Alternative Energy
• Open Source Software
Quantitative Methods: Using Knowledge Better
Alpha Generation | Portfolio Optimization |
|
Asset/Liability Modeling |
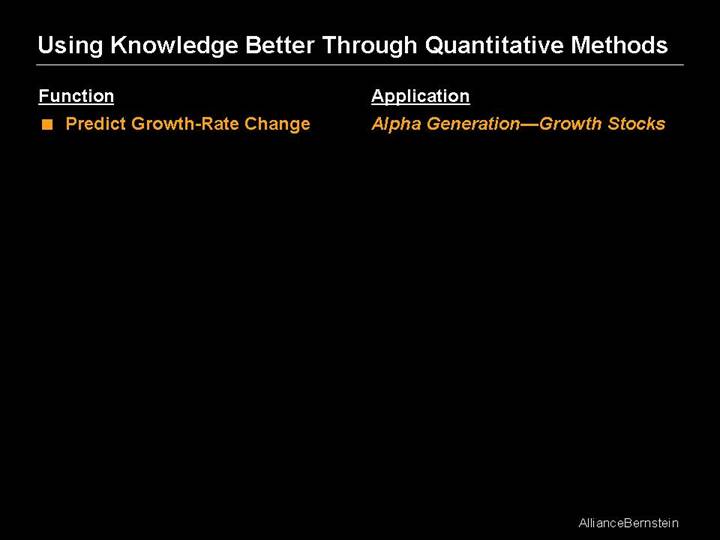
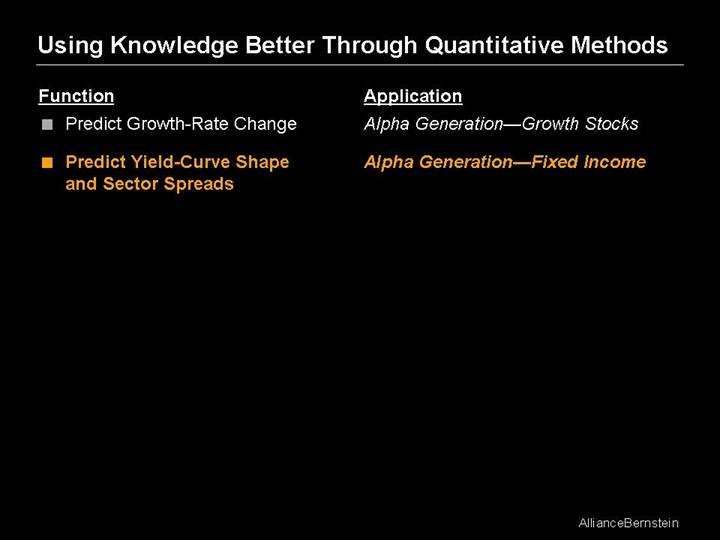
Using Knowledge Better Through Quantitative Methods
Function | Application |
| |
• Predict Growth-Rate Change | Alpha Generation—Growth Stocks |
Using Knowledge Better Through Quantitative Methods
Function | Application |
| |
• Predict Growth-Rate Change | Alpha Generation—Growth Stocks |
| |
• Predict Yield-Curve Shape and Sector Spreads | Alpha Generation—Fixed Income |
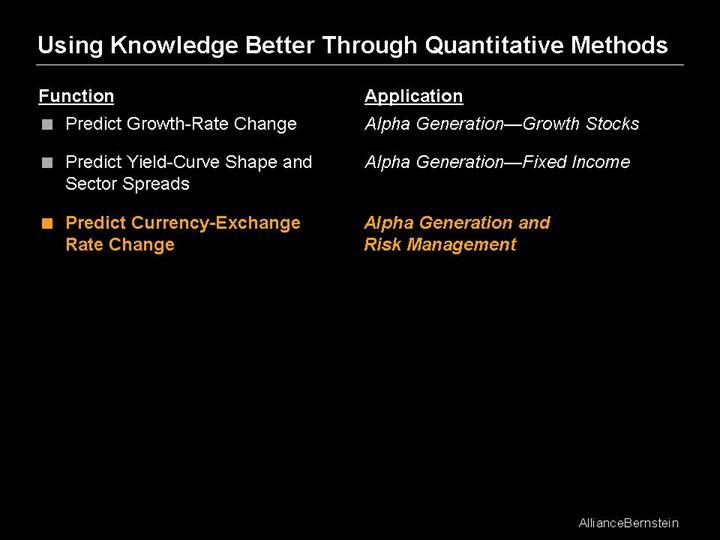
Using Knowledge Better Through Quantitative Methods
Function | Application |
| |
• Predict Growth-Rate Change | Alpha Generation—Growth Stocks |
| |
• Predict Yield-Curve Shape and Sector Spreads | Alpha Generation—Fixed Income |
| |
• Predict Currency-Exchange Rate Change | Alpha Generation and Risk Management |
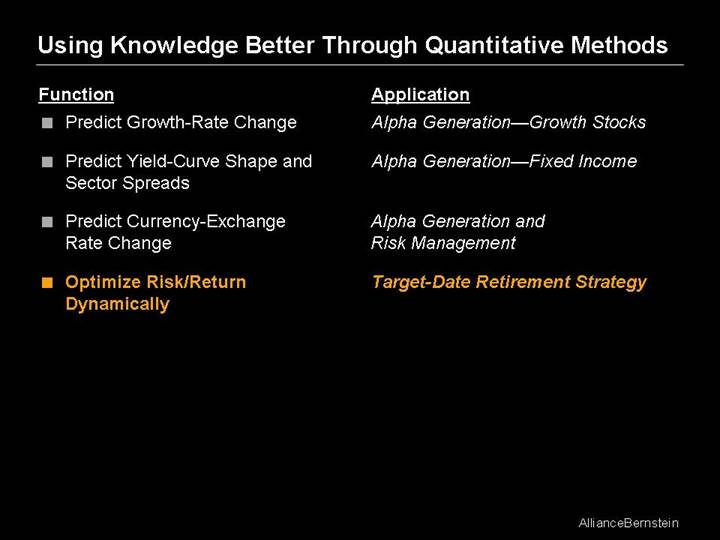
| |
• Optimize Risk/Return Dynamically | Target-Date Retirement Strategy |
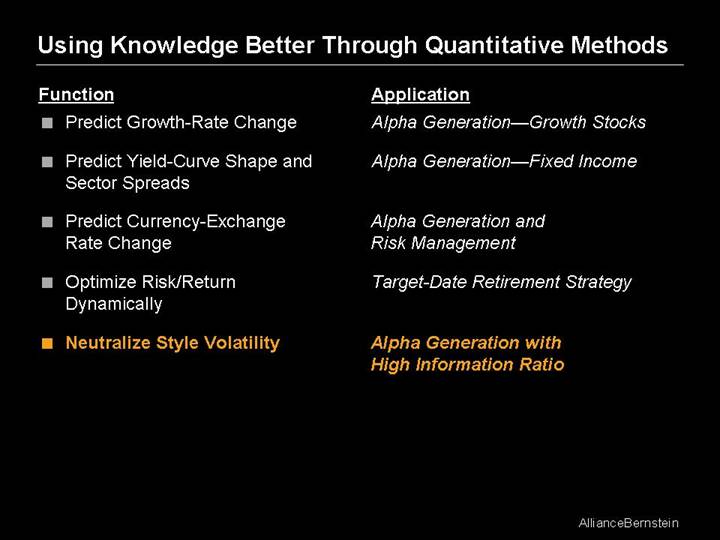
| |
• Neutralize Style Volatility | Alpha Generation with High Information Ratio |
Style-Blend Services of Increasing Significance
$618 Billion
at Mar 31, 2006
[CHART]
*Excludes $4 billion of Blend Fixed Income AUM
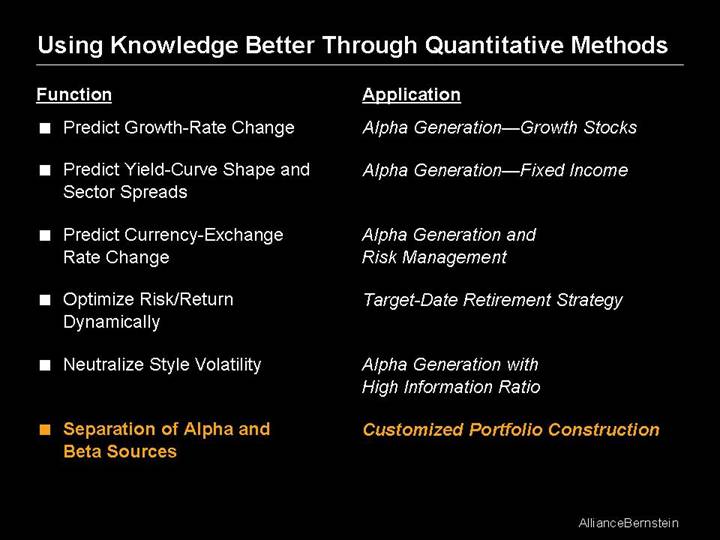
Using Knowledge Better Through Quantitative Methods
Function | Application |
| |
• Predict Growth-Rate Change | Alpha Generation—Growth Stocks |
| |
• Predict Yield-Curve Shape and Sector Spreads | Alpha Generation—Fixed Income |
| |
• Predict Currency-Exchange Rate Change | Alpha Generation and Risk Management |
| |
• Optimize Risk/Return Dynamically | Target-Date Retirement Strategy |
| |
• Neutralize Style Volatility | Alpha Generation with High Information Ratio |
| |
• Separation of Alpha and Beta Sources | Customized Portfolio Construction |
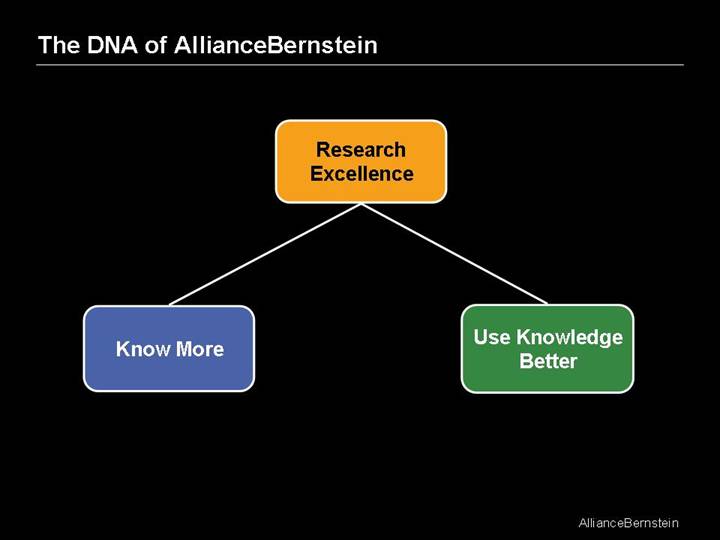
The DNA of AllianceBernstein
Research Excellence |
|
|
Know More | Use Knowledge Better |