
Second Quarter 2006 Review
Gerald M. Lieberman
President & Chief Operating Officer
Lewis A. Sanders
Chairman & Chief Executive Officer
Any forecasts in this material may not be realized. Information or opinions should not be construed as investment advice.
July 26, 2006

Forward-Looking Statements
Certain statements in this presentation are “forward-looking statements” within the meaning of the Private Securities Litigation Reform Act of 1995. Such forward-looking statements are subject to risks, uncertainties, and other factors that could cause actual results to differ materially from future results expressed or implied by such forward-looking statements. The most significant of these factors include, but are not limited to, the following: the performance of financial markets, the investment performance we achieve for our clients, general economic conditions, future acquisitions, competitive conditions and government regulations, including changes in tax rates. We caution readers to carefully consider such forward-looking statements in light of these factors. Further, such forward-looking statements speak only as of the date on which such statements are made; we have no obligation to update any forward-looking statements to reflect events or circumstances after the date of such statements. For further information regarding these forward-looking statements and the factors that could cause actual results to differ, see “Risk Factors” in Item 1A of Form 10-K for the year ended December 31, 2005. Any or all of the forward-looking statements that we make in Form 10-K, this presentation, or any other public statements we issue may turn out to be wrong. Please remember that factors other than those listed in “Risk Factors” could also adversely affect our business, operating results, or financial condition.
The forward-looking statements referred to in the preceding paragraph include statements regarding noteworthy investment opportunity, especially in growth stocks, resulting from second quarter market turbulence, and slower growth in asset inflows in our institutional and retail distribution channels resulting from a decline from the record high levels reached earlier this year in unfunded institutional mandates and difficult capital market conditions, respectively. The actual performance of the capital markets and other factors beyond our control will affect our investment success and asset inflows.
In light of Regulation FD, management will be limited in responding to inquiries from investors or analysts in a non-public forum.
Introduction

AllianceBernstein – Second Quarter Highlights
<
Equity markets weak in almost all geographies
<
Relative performance disappointing
<
Net AUM flows at record highs
<
Financial performance very strong
=
AllianceBernstein (Operating)
Ø
Net Revenues up 23.4%
Ø
Net Income up 31.9%
=
AllianceBernstein Holding
Ø
Net Income per Unit up 30.9% to $0.89
Ø
Distribution of $0.89 per Unit
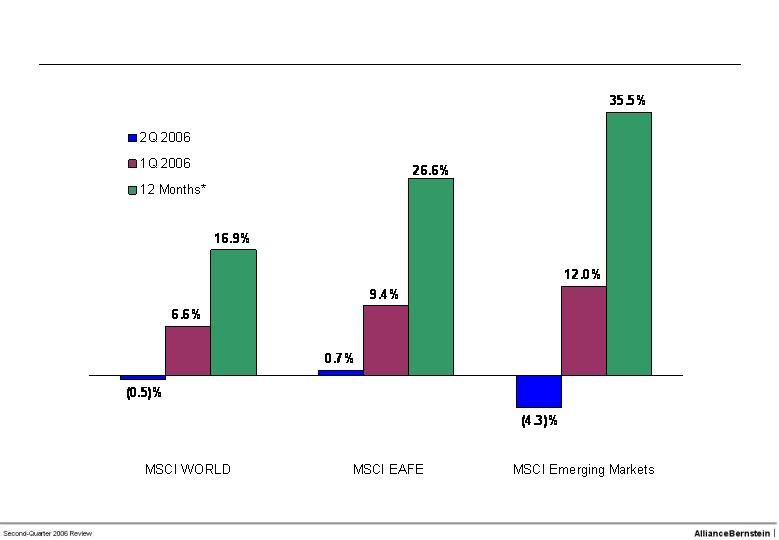
*12 months ending June 30, 2006.
Source: MSCI (Morgan Stanley Capital International).
Market Performance - Non-U.S.
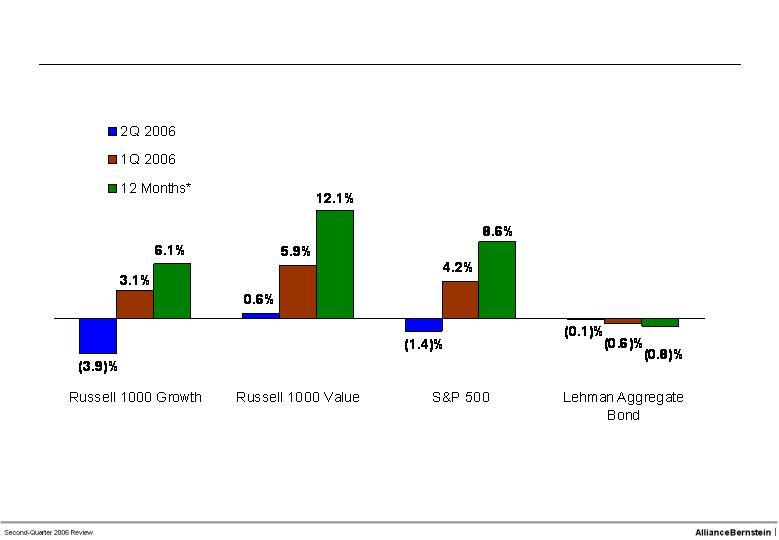
*12 months ending June 30, 2006.
Source: Frank Russell Company, Standard & Poor’s, and Lehman Brothers.
Market Performance - U.S.

<
Relative investment performance disappointing in quarter
=
Weak relative returns in Growth and Emerging Markets
=
No “out-performance” in Value Equities or Fixed income
<
Competitive or better longer-term performance vs. benchmarks
=
Global and International Value Equities
=
Blend Equities
<
Market turbulence generating growth stock investment opportunities
Relative Performance Summary
Three Months Ended June 30, 2006
In $ Millions
(1)
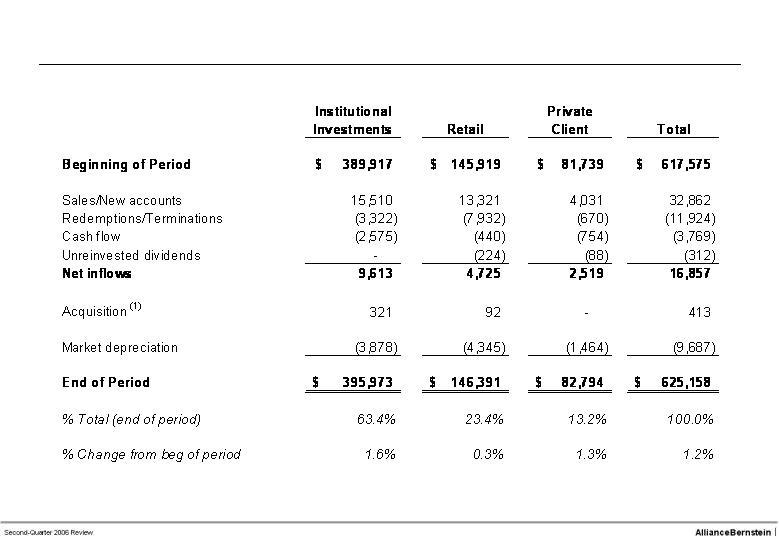
Hong Kong joint venture interest.
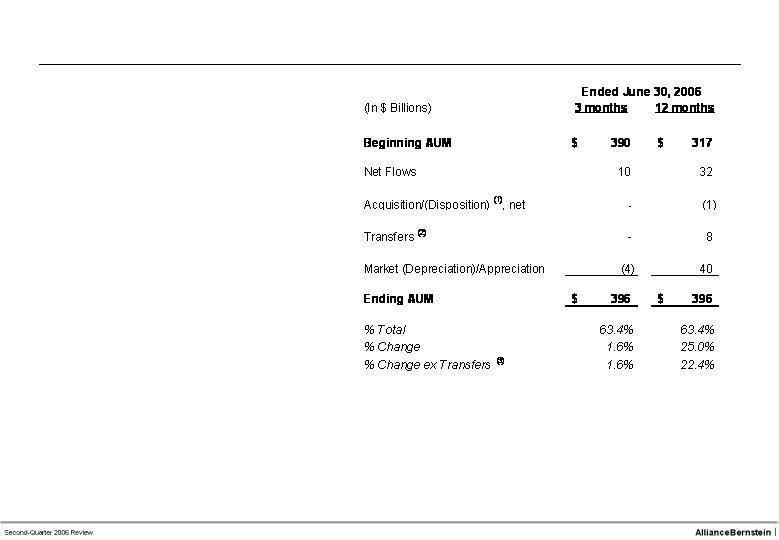
Changes in Assets Under Management
By Channel

Twelve Months Ended June 30, 2006
In $ Millions
(1)
Acquisition of Hong Kong joint venture interest; disposition of South African joint venture interest and Indian mutual funds.
(2)
Transfers of certain client accounts were made among distribution channels resulting from changes in how these
accounts are serviced by the firm. AUM at June 30, 2006 reflect these transfers.
(3) Percentages are calculated by adjusting ending AUM by transfer amounts.
Changes In Assets Under Management
By Channel
Three Months Ended June 30, 2006
In $ Millions
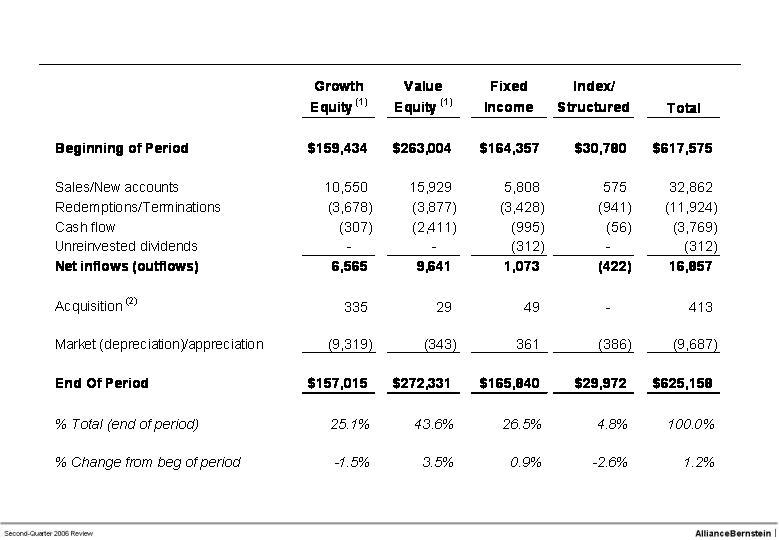
(1) Includes Blend style services combining growth and value equity components.
(2) Hong Kong joint venture interest.
Changes in Assets Under Management
By Investment Service
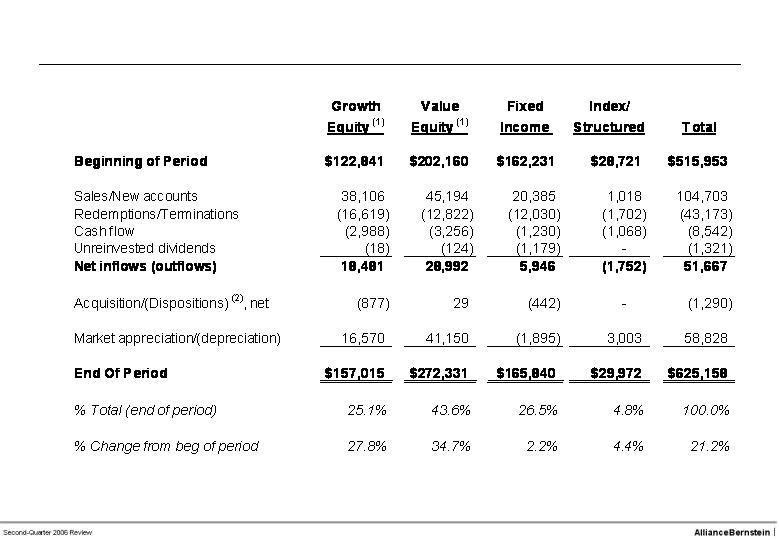
Twelve Months Ended June 30, 2006
In $ Millions
(1) Includes Blend style services combining growth and value equity components.
(2) Acquisition of Hong Kong joint venture interest; disposition of South African joint venture interest and Indian mutual funds.
Changes In Assets Under Management
By Investment Service
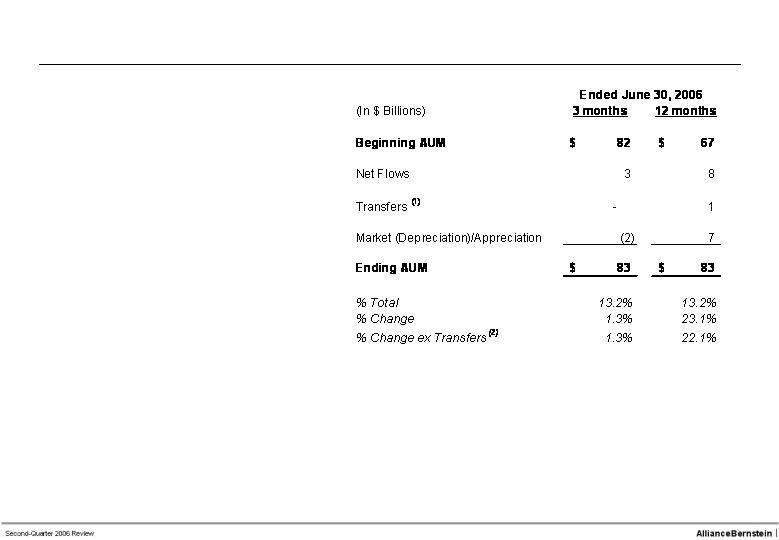
(1) Acquisition of Hong Kong joint venture interest; disposition of South African joint venture interest.
(2) Transfers of certain client accounts were made among distribution channels resulting from changes in how these
accounts are serviced by the firm. AUM at June 30, 2006 reflect these transfers.
(3) Percentage is calculated by adjusting ending AUM by transfer amounts.
Institutional Investments—
Second Quarter Highlights
<
Continuing strong net inflows into Core/Blend and Global and International services
<
Core/Blend Equity services accounted for approximately 1/3 of all new assets
<
Approximately 80% of new fundings attributable to Global and International services
<
Pipeline of unfunded mandates, while still substantial, declined from record high first quarter level
<
Established dedicated team to focus on Defined Contribution market opportunity
<
Positive net flows for fourth consecutive quarter with all market segments contributing to growth
<
Wealth Strategies services reached nearly $6.5 billion in assets (2)
=
Wealth Strategies - $4.3 billion
=
Global Wealth Strategies - $2.2 billion
<
CollegeBound Fund ranked #1 savings plan based on performance (3)
=
$6.8 billion in assets(2)
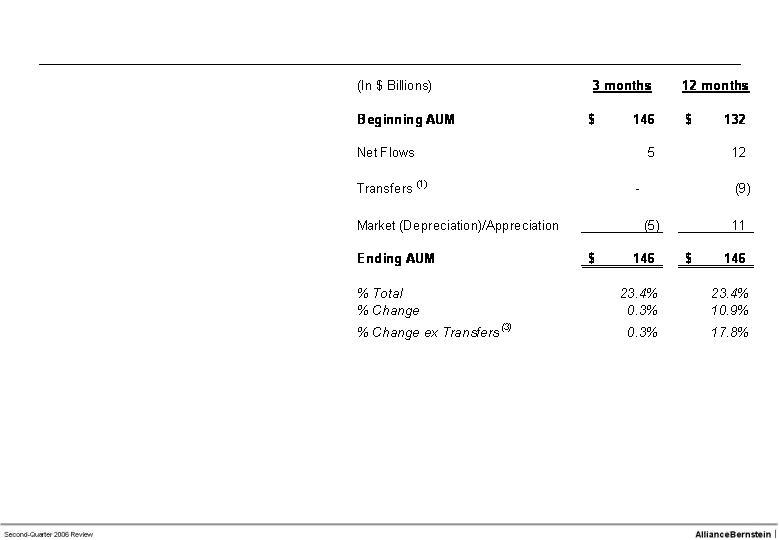
(1) Transfers of certain client accounts were made among distribution channels resulting from changes in how these
accounts are serviced by the firm. AUM at June 30, 2006 reflect these transfers.
(2) Mainly Retail; includes some Private Client and Institutional Investments assets.
(3) By savingforcollege.com.
Retail—
Second Quarter Highlights
(1) Transfers of certain client accounts were made among distribution channels resulting from changes in how these
accounts are serviced by the firm. AUM at June 30, 2006 reflect these transfers.
(2) Percentage is calculated by adjusting ending AUM by transfer amount.
Private Client—
Second Quarter Highlights
<
Continued strong net inflows
<
Financial Advisors up 50 (22%) from 2Q05 to 280
<
UK office opened in July

<
Record revenues of $103 million in quarter
<
Double-digit organic revenue growth in both the U.S. and U.K. offices
<
Higher market share and volume, partially offset by industry-wide pricing declines
<
Received high marks for research quality in two leading European research surveys, reinforcing strong market position
<
Algorithmic trading platforms continued to contribute to gain in market share
<
Research coverage launches included European Medical Devices/Supplies, European Luxury Goods and European Retail
Institutional Research Services—
Second Quarter Highlights
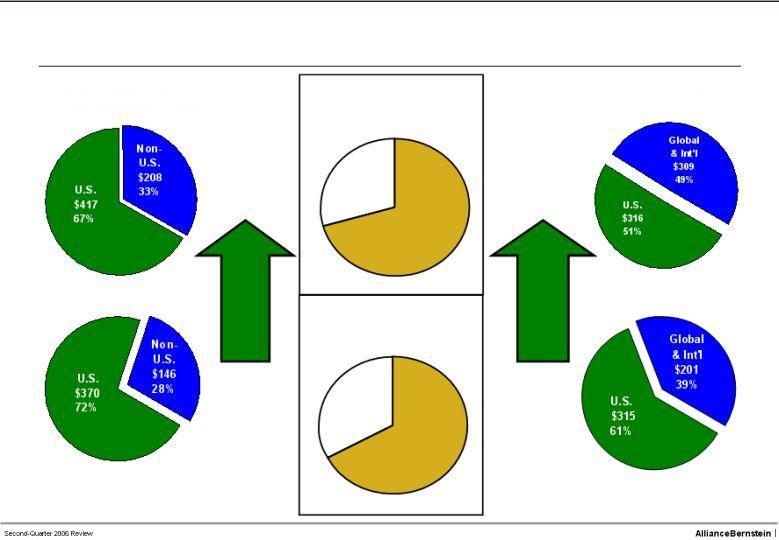
By Client Domicile
By Service
In $ Billions
Non-U.S.
UP 42%
Global &
Int’l
UP 54%
$459
73%
$166
27%
$354
69%
$162
31%
$625 Billion
at June 30, 2006
Equity
$516 Billion
at June 30, 2005
Equity
F/I
F/I
Growth in Global Assets

(1)
Includes $4 million reclassified from advisory fees.
(2)
Includes Investment Gains (Losses) and Other Revenues.
NOTE: Percentages are calculated using revenues and expenses rounded to the nearest thousand.
In $ Millions
Percent
2Q 2006
2Q 2005
Change
Revenues:
Advisory Fees
690
$
529
$
30.5%
Distribution
104
98
6.9%
Institutional Research Services
103
80
(1)
27.5%
Dividend and Interest Income
62
30
100.6%
Other
(2)
20
39
-47.3%
Total Revenues
979
776
26.1%
Less: Interest Expense
(46)
(20)
128.2%
Net Revenues
933
$
756
$
23.4%
AllianceBernstein Second Quarter Revenues

NOTE: Percentages are calculated using revenues and expenses rounded to the nearest thousand.
Percent
2Q 2006
2Q 2005
Change
Ending AUM (In $ Billions)
625
$
516
$
21.2%
Average AUM (In $ Billions)
625
$
522
$
19.7%
By Fee Type (In $ Millions):
Base Fees
653
$
505
$
29.5%
<
Higher AUM and
favorable mix
Performance Fees
37
24
52.2%
n
Anniversary dates for
long-only Institutional
Total
690
$
529
$
30.5%
Investments
By Channel (In $ Millions):
Institutional
308
$
217
$
42.2%
<
Higher average AUM, favorable
mix and performance fees
Retail
193
163
18.5%
<
Higher average AUM, partly offset
by CMS disposition
Private Client
189
149
26.8%
<
Higher AUM
Total
690
$
529
$
30.5%
AllianceBernstein Second Quarter Advisory Fees

(1)
Includes $4 million reclassified from advisory fees.
(2)
Includes Investment Gains (Losses) and Other Revenues.
NOTE: Percentages are calculated using revenues and expenses rounded to the nearest thousand.
In $ Millions
Percent
2Q 2006
2Q 2005
Change
Revenues:
Advisory Fees
690
$
529
$
30.5%
Distribution
104
98
6.9%
Institutional Research Services
103
80
(1)
27.5%
n
Higher NYSE volume and
market share; lower pricing
Dividend and Interest Income
62
30
100.6%
n
Higher rates and balances
Other
(2)
20
39
-47.3%
<
MTM losses on deferred
compensation investments
Total Revenues
979
776
26.1%
Less: Interest Expense
(46)
(20)
128.2%
<
Higher rates and balances
Net Revenues
933
$
756
$
23.4%
AllianceBernstein Second Quarter Revenues

NOTE: Percentages are calculated using revenues and expenses rounded to the nearest thousand.
In $ Millions
Percent
2Q 2006
2Q 2005
Change
Employee Comp & Benefits
374
$
309
$
21.1%
Promotion & Servicing
156
156
0.6%
General & Administrative
128
81
57.1%
Interest
7
6
8.7%
Amortization of Intangibles
5
5
_
Total
670
$
557
$
20.3%
AllianceBernstein Second Quarter Expenses

NOTE: Percentages are calculated using revenues and expenses rounded to the nearest thousand.
In $ Millions
Percent
2Q 2006
2Q 2005
Change
Base Compensation
94
$
85
$
10.0%
n
470 higher headcount
Incentive Compensation
147
129
14.5%
n
Higher earnings; lower amortization
Commissions
94
67
40.4%
n
New business across all channels
Fringes & Other
39
28
38.9%
n
Higher payroll taxes
Total
374
$
309
$
21.1%
AllianceBernstein Second Quarter Compensation & Benefits

NOTE: Percentages are calculated using revenues and expenses rounded to the nearest thousand.
In $ Millions
Percent
2Q 2006
2Q 2005
Change
Employee Comp & Benefits
374
$
309
$
21.1%
Promotion & Servicing
156
156
0.6%
$18 MM '05 legal recovery;
higher '06 occupancy,
data processing and
market data services
General & Administrative
128
81
57.1%
n
Interest
7
6
8.7%
Amortization of Intangibles
5
5
_
Total
670
$
557
$
20.3%
AllianceBernstein Second Quarter Expenses

*Pre-tax income as a percentage of net revenues
NOTE: Percentages are calculated using revenues and expenses rounded to the nearest thousand.
In $ Millions
Percent
2Q 2006
2Q 2005
Change
Net Revenues
933
$
756
$
23.4%
Expenses
670
557
20.3%
Operating Income
263
199
32.1%
Non-operating income
10
13
-21.0%
Income before Taxes
273
212
29.0%
Income Taxes
12
14
-11.8%
<
Lower estimated
full year rate
Net Income
261
$
198
$
31.9%
Pre-Tax Margin *
29.3%
28.0%
AllianceBernstein Second Quarter Net Income

NOTE: Percentages are calculated using revenues and expenses rounded to the nearest thousand.
In $ Millions (except per unit amounts)
Percent
2Q 2006
2Q 2005
Change
AllianceBernstein:
Net Income
261
$
198
$
31.9%
Weighted Average Equity
Ownership Interest
32.4%
31.6%
AllianceBernstein Holding:
Equity in Earnings
85
$
63
$
34.9%
Income Taxes
9
7
30.3%
Net Income
76
$
56
$
35.4%
Diluted Net Income Per Unit
0.89
$
0.68
$
30.9%
Distributions Per Unit
0.89
$
0.68
$
30.9%
AllianceBernstein Holding Financial Results

Appendix

Annualized
Cumulative
2Q 06
One Year
Three Years
Three Years
MSCI Emerging Markets
(4.3)
35.5
34.3
142.4
MSCI EAFE
0.7
26.6
23.9
90.4
MSCI World
(0.5)
16.9
16.9
59.6
Russell 1000 Growth
(3.9)
6.1
8.3
27.2
Russell 1000 Value
0.6
12.1
15.7
54.9
S&P 500
(1.4)
8.6
11.2
37.6
Lehman Aggregate Bond
(0.1)
(0.8)
2.0
6.3
Returns in % through June 30, 2006.
Market Environment
Net-of-Fee Annualized Relative Performance Premiums
The information in this table is provided solely for use in connection with this presentation and is not directed towards existing or potential investment advisory clients of AllianceBernstein. Past performance is no guarantee of future results. The returns presented above are net of fees.
Source: Bloomberg, Citigroup, FTSE, JPMorgan Chase, Lehman Brothers, Merrill Lynch, MSCI, Nomura, Russell Investment Group, Scotia Capital, S&P, TOPIX, and AllianceBernstein.
Investment Performance: Delivering Results for Clients

Institutional Equity Composites vs. Benchmarks
Global
Emerging
Large Cap
U.S.
Mid Cap
Small Cap
Intl Lg Cap
Research
Markets
Growth
(2)
Growth
(3)
Growth
(4)
Growth
(5)
Growth
(6)
Growth
(7)
Growth
(8)
2Q 06
(3.7)
(6.1)
(7.6)
(2.0)
(2.8)
(3.0)
(1.0)
One Year
2.7
(5.1)
1.5
1.2
(2.5)
3.0
(2.1)
Three Years
1.0
2.4
1.1
1.4
(0.7)
1.3
3.0
Five Years
(0.3)
1.6
2.1
0.3
1.1
1.3
4.1
10 Years
2.4
2.3
N/A
4.7
2.8
3.8
N/A
NOTE: The information in this table is provided solely for use in connection with this presentation, and is not directed toward existing or potential investment advisory clients of AllianceBernstein.
(1) Investment performance of composites is presented after investment management fees. (2) vs. Russell 1000 Growth (3) vs. Russell 3000 Growth (4) vs. Russell Mid Cap Growth (5) vs. Russell 2000 Growth (6) vs. MSCI EAFE Growth (net) (7) vs. MSCI World (net) (8) vs. MSCI Emerging Markets Growth
Composite and benchmark data through 6/30/06. Performance is preliminary.
Relative Performance: Institutional Growth Equity (After Fees) (1)

Institutional Equity Composites vs. Benchmarks
U.S.
U.S.
Emerging
Strategic
Diversified
International
Global
Markets
Value
(2)
Value
(2)
Value
(3)
Value
(4)
Value
(5)
2Q 06
(0.4)
(0.2)
(0.7)
1.3
(2.1)
One Year
(0.8)
(0.8)
6.4
6.9
(3.1)
Three Years
(1.0)
(1.0)
4.1
3.8
6.1
Five Years
0.7
1.2
6.2
6.2
6.4
10 Years
(0.3)
N/A
N/A
3.5
3.2
NOTE: The information in this table is provided solely for use in connection with this presentation, and is not directed toward existing or potential investment advisory clients of AllianceBernstein.
(1) Investment performance of composites is presented after investment management fees. (2) vs. Russell 1000 Value (3) vs. MSCI EAFE (Cap, UH) (4) vs. MSCI World (Cap, UH) (5) vs. MSCI Emerging Markets. Composite and benchmark data through 6/30/06. Performance is preliminary.
Relative Performance: Institutional Value Equity (After Fees)(1)

Blend Equity Composites vs. Benchmarks
International
Emerging Markets
U.S. Style
Global Style
Style
Style
Blend
(2)
Blend
(5)
Blend
(3)
Blend
(4)
2Q 06
(2.2)
(1.1)
(2.1)
(2.0)
One Year
0.6
5.3
0.7
(3.0)
Three Years
0.3
3.0
(1.0)
3.2
Since Inception
0.2
3.0
1.7
4.7
NOTE: The information in this table is provided solely for use in connection with this presentation, and is not directed toward existing or potential investment advisory clients of AllianceBernstein.
(1) Investment performance of mutual funds is presented after investment management fees. (2) U.S. Style Blend (12/31/01) vs. S&P 500 (3) Int’l Style Blend (12/31/01) vs. MSCI EAFE (4) EM Style Blend (12/31/01) vs. MSCI EM (5) Global Style Blend (6/30/03) vs. MSCI World for Global products.
Composite and benchmark data through 6/30/06. Performance is preliminary.
Relative Performance: Style Blend Services (After Fees)(1)

Institutional Fixed Income Composites vs. Benchmarks
Core
Core
Corp
Plus
(2)
Mortgage
(3)
Bonds
(4)
Global
(5)
Plus
(6)
2Q 06
(0.1)
(0.1)
0.0
0.1
0.1
One Year
0.6
(0.1)
0.1
0.2
0.9
Three Years
0.4
0.2
0.1
0.4
0.9
Five Years
(0.1)
0.5
0.3
0.2
0.6
10 Years
(0.0)
0.1
0.3
0.1
N/A
NOTE: The information in this table is provided solely for use in connection with this presentation, and is not directed toward existing or potential investment advisory clients of AllianceBernstein.
(1) Investment performance of composites is presented after investment management fees. (2) vs. Lehman U.S. Aggregate Unhedged (3) vs. Lehman Fixed Rate Mortgage Backed Securities Unhedged (4) vs. Custom Corporate Index (5) vs. S&P/Citi World Gov USD unhedged (from 7/1/04 - present)/JPM Global Bond (to 6/30/04) (6) vs 90% Lehman Universal Index/10% S&P/Citigroup Non-US WGBI (Hedged). Composite and benchmark data through 6/30/06. Performance is preliminary.
Strategic Core
Relative Performance: Institutional Fixed Income (After Fees) (1)

2Q 06
1 Year
3 Year
5 Year
Fully Diversified Simulation
(2)
(2.1)
10.3
11.4
6.7
S&P 500
(1.4)
8.6
11.2
2.5
NOTE: The information in this table is provided solely for use in connection with this presentation, and is not directed towards existing or potential investment advisory clients of AllianceBernstein.
(1) Investment performance of composites is presented after investment management fees. (2) The Bernstein Fully Divserified Portfolio is a simulation composed of specific proporations of each of the products that follow, which joined the simulation as of the following dates:
Strategic Value: 1/1/83; Strategic Growth: 1/1/83 (ACM Large Cap Growth used as a proxy for Strategic Growth through 1/1/01; Strategic Growth used thereafter); Intermediate Municpal Bond Composite: 1/1/83; Bernstein Tax-Managed International Fund: 7/1/92; Emerging Markets Fund: 1/1/96; Alliance/Bernstein Institutional REIT Fund: 7/1/01. It is rebalanced quarterly. Simulated performance results have certain inherent limitations. The results may not reflect the impact that certain material economic and market factors might have had on actual decision making if they were reflective of a managed account. No representation is being made that any account will, or is likely to, achieve profits or losses similar to those described herein.
Source: AllianceBernstein and S&P
Mutual fund, Composite and S&P performance through 6/30/06. Performance is preliminary.
Annualized
Absolute Performance: Private Client (After Fees)(1)

Retail Mutual Funds vs. Lipper Averages
Global
Large Cap
Mid Cap
Research
Growth
(2)
Growth
(3)
Growth
(4)
Growth
(5)
Equity
(6)
2Q 06
(3.1)
(5.6)
(6.7)
(1.2)
(4.6)
One Year
0.4
(10.2)
1.0
2.0
1.6
Three Years
0.5
(1.6)
2.8
2.3
4.3
Five Years
(2.3)
(0.6)
2.4
N/A
2.5
10 Years
(0.2)
(1.8)
(0.6)
N/A
3.0
NOTE: The information in this table is provided solely for use in connection with this presentation, and is not directed toward existing or potential investment advisory clients of AllianceBernstein.
(1) Investment performance of mutual funds is presented after investment management fees (2) vs. Large Cap Growth average. Formerly named Premier Growth (3) vs. Multi Cap Growth average (4) vs. Mid Cap Growth average (5) vs. Global Large Cap Growth Equity average; formerly named Global Growth Trends (6) vs. S&P 500; represents Regent separately managed account service. Net performance is inclusive of the investment management fee only; it does not include the total management fee typically associated with a managed account that may range from 2.0 - 3.0% which includes transaction costs, custodial services and investment advisory fees.
Source: AllianceBernstein, Lipper, and S&P
Mutual fund performance and Lipper data through 6/30/06.
Strategic
Research
Relative Performance: Retail Growth Equity (After Fees)(1)

Retail Mutual Funds vs. Lipper Averages
Growth &
Small/Mid Cap
Intl
Global
Value
(2)
Income
(3)
Value
(4)
Value
(5)
Value
(6)
2Q 06
0.1
(2.2)
1.2
0.5
0.4
One Year
0.1
(4.3)
0.7
7.4
1.8
Three Years
0.9
(2.1)
1.4
2.6
(0.4)
Five Years
2.7
(2.4)
3.5
5.7
1.0
10 Years
N/A
1.3
N/A
N/A
N/A
NOTE: The information in this table is provided solely for use in connection with this presentation, and is not directed toward existing or potential investment advisory clients of AllianceBernstein.
(1) Investment performance of mutual funds is presented after investment management fees. (2) vs. Large Cap Value average; if compared to Multi Cap Value average, 2nd QTR would be 0.8, 1 yr would be 0.1, 3 yr would be (0.8) and 5 yr would be 0.8. (3) vs. Large Cap Value average (4) vs. Mid Cap Value average (5) vs. International Multi Value average (6) vs. Global Multi Value average
Source: AllianceBernstein and Lipper
Mutual fund performance and Lipper data through 6/30/06.
Relative Performance: Retail Value Equity (After Fees)(1)

Retail Fixed Income Funds vs. Peer Group Averages
Global
Emerging
American
Short
Corporate
Gov’t
Market
Income
Duration
Intermediate
Bond
(2)
Income
(3)
Debt
(4)
Portfolio
(7)
Plus
(5)
Duration
(6)
2Q 06
(0.5)
(3.1)
0.4
(4.9)
(0.0)
(0.1)
One Year
(0.9)
1.2
(0.7)
(0.9)
(0.1)
0.4
Three Years
1.4
1.3
(0.5)
(1.2)
0.0
0.2
Five Years
(0.3)
0.1
0.8
(3.3)
0.3
(0.5)
10 Years
0.2
4.7
0.4
0.7
0.2
(0.8)
NOTE: The information in this table is provided solely for use in connection with this presentation, and is not directed toward existing or potential investment advisory clients of AllianceBernstein.
(1) Investment performance of mutual funds is presented after investment management fees. (2) vs. Corporate Debt Funds BBB-Rated average (3) vs. Global Income Funds average (4) vs. Emerging Markets Debt average (5) vs. Short Investment Grade Debt average (6) vs. Intermediate Investment Grade Average (7) vs. Micropal Fixed Income USD Peers
Source: AllianceBernstein and Lipper
Composite and benchmark data through 6/30/06. Performance is preliminary.
Relative Performance: Retail Fixed Income (After Fees)(1)

Wealth
Balanced
Wealth
Preservation
(2)
Wealth
(3)
Appreciation
(4)
2Q 06
(0.1)
(0.5)
(0.6)
One Year
2.0
3.5
7.4
Since Inception
(5)
0.9
1.3
2.5
NOTE: The information in this table is provided solely for use in connection with this presentation, and is not directed toward existing or potential investment advisory clients of AllianceBernstein.
(1) Investment performance of mutual funds is presented after investment management fees. (2) vs. Conservative Allocation average (3) vs. Moderate Allocation average (4) vs. Large Blend Average (5) Inception date: 9/2/03
Source: AllianceBernstein and Morningstar
Mutual fund performance and Morningstar data through 6/30/06.
Retail Mutual Funds vs. Morningstar Averages
Relative Performance: Wealth Strategies (After Fees)(1)

In $ Millions
Percent
2Q 2006
2Q 2005
Change
Advisory Fees
Prior period presentation
690
$
533
$
29.4%
Reclassification to IRS
-
(4)
N/M
As reported
690
$
529
$
30.5%
Institutional Research Services
Prior period presentation
103
$
76
$
34.5%
Reclassification from
Advisory Fees
-
4
N/M
As reported
103
$
80
$
27.5%
AllianceBernstein Transaction Fees

In $ Thousands, Unaudited
6/30/06
12/31/05
Assets
Cash and investments
1,405,237
$
999,213
$
Cash and securities, segregated
1,861,528
1,720,809
Receivables, net
3,162,391
2,936,245
Goodwill, net
2,893,339
2,876,657
Intangible assets, net
294,975
305,325
Deferred sales commissions, net
197,685
196,637
Other (incl. furniture & equipment)
478,992
455,594
Total Assets
10,294,147
$
9,490,480
$
Liabilities and Partners' Capital
Liabilites:
Payables
4,664,319
$
4,127,377
$
Accounts payable and accrued expenses
270,638
286,449
Accrued compensation and benefits
557,244
357,321
Debt
414,918
407,291
Minority Interest
11,203
9,368
Total Liabilities
5,918,322
5,187,806
Partners' Capital
4,375,825
4,302,674
Total Liabilities and Partners' Capital
10,294,147
$
9,490,480
$
AllianceBernstein
Consolidated Balance Sheet

In $ Thousands, Unaudited
Six Months Ended
6/30/06
6/30/05
Cash Flows From Operating Activities:
Net income
488,675
$
366,504
$
Non-cash items:
Amortization and depreciation:
Amortization of deferred sales commissions
49,970
70,987
Amortization of deferred compensation
38,435
47,016
Depreciation and other amortization
35,659
33,399
Other, net
(1,083)
924
Changes in assets and liabilities
138,279
(275,336)
Net cash provided by operating activities
749,935
243,494
Cash Flows From Investing Activities:
Purchases of investments, net
(41,966)
(6,662)
Proceeds from sale of investments
931
10,958
Additions to furniture, equipment and leaseholds, net
(49,623)
(46,741)
Purchase of business, net of cash acquired
(16,086)
-
Net cash used in investing actvities
(106,744)
(42,445)
Cash Flows From Financing Activities:
Issuance (repayment) of debt, net
5,430
(150)
Distributions to partners
(517,167)
(393,091)
Other
28,771
22,008
Net cash used in financing activities
(482,966)
(371,233)
Effect of exchange rate change on cash and cash equivalents
2,939
(6,903)
Net increase/(decrease) in cash and cash equivalents
163,164
(177,087)
Cash and cash equivalents at the beginning of period
654,168
1,061,523
Cash and cash equivalents at the end of period
817,332
$
884,436
$
AllianceBernstein
Consolidated Cash Flow

AllianceBernstein® and the AB AllianceBernstein Logo are trademarks and service marks owned by AllianceBernstein L.P.
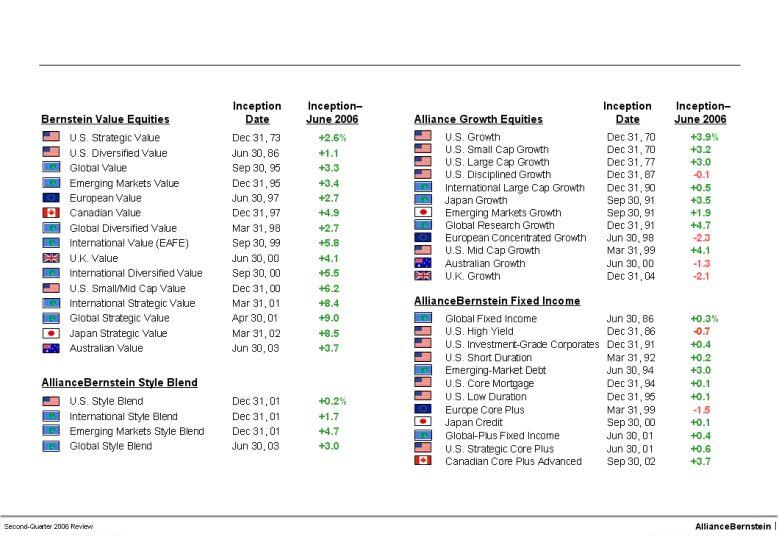
Bernstein Value Equities Inception Date Inception-June 2006 U.S. Strategic Value Dec 31, 73 +2.6% U.S. Diversified Value Jun 30, 86 +1.1 Global Value Sep 30, 95 +3.3 Emerging Markets Value Dec 31, 95 +3.4 European Value Jun 30, 97 +2.7 Canadian Value Dec 31, 97 +4.9 Global Diversified Value Mar 31, 98 +2.7 International Value (EAFE) Sep 30, 99 +5.8 U.K. Value Jun 30, 00 +4.1 International Diversified Value Sep 30, 00 +5.5 U.S. Small/Mid Cap Value Dec 31, 00 +6.2 International Strategic Value Mar 31, 01 +8.4 Global Strategic Value Apr 30, 01 +9.0 Japan Strategic Value Mar 31, 02 +8.5 Australian Value Jun 30, 03 +3.7 AllianceBernstein Style Blend U.S. Style Blend Dec 31, 01 +0.2% International Style Blend Dec 31, 01 +1.7 Emerging Markets Style Blend Dec 31, 01 +4.7 Global Style Blend Jun 30, 03 +3.0 Alliance Growth Equities Inception Date Inception-June 2006 U.S. Growth Dec 31, 70 +3.9% U.S. Small Cap Growth Dec 31, 70 +3.2 U.S. Large Cap Growth Dec 31, 77 +3.0 U.S. Disciplined Growth Dec 31, 87 -0.1 International Large Cap Growth Dec 31, 90 +0.5 Japan Growth Sep 30, 91 +3.5 Emerging Markets Growth Sep 30, 91 +1.9 Global Research Growth Dec 31, 91 +4.7 European Concentrated Growth Jun 30, 98 -2.3 U.S. Mid Cap Growth Mar 31, 99 +4.1 Australian Growth Jun 30, 00 -1.3 U.K. Growth Dec 31, 04 -2.1 AllianceBernstein Fixed Income Global Fixed Income Jun 30, 86 +0.3% U.S. High Yield Dec 31, 86 -0.7 U.S. Investment-Grade Corporates Dec 31, 91 +0.4 U.S. Short Duration Mar 31, 92 +0.2 Emerging-Market Debt Jun 30, 94 +3.0 U.S. Core Mortgage Dec 31, 94 +0.1 U.S. Low Duration Dec 31, 95 +0.1 Europe Core Plus Mar 31, 99 -1.5 Japan Credit Sep 30, 00 +0.1 Global-Plus Fixed Income Jun 30, 01 +0.4 U.S. Strategic Core Plus Jun 30, 01 +0.6 Canadian Core Plus Advanced Sep 30, 02 +3.7