Exhibit 99.1

Good Times Restaurants Inc. (Nasdaq Capital Market: GTIM) Investor Presentation September 2014

Safe Harbor The presentation includes forward-looking statements within the meaning of Section 27A of the Securities Act and Section 21E of the Exchange Act, and such statements are subject to the safe harbors created thereby. A forward-looking statement is neither a prediction nor a guarantee of future events. We try, whenever possible, to identify these forward-looking statements by using words such as “anticipate,” “assume,” “believe,” “estimate,” “expect,” “intend,” “plan,” “project,” “may,” “will,” “would,” “could,” and similar expressions. Forward-looking statements may relate to, among other things: business objectives and strategic plans; operating strategies; our ability to open and operate additional restaurants profitably and the timing of such openings; restaurant and franchise acquisitions; anticipated price increases; expected future revenues and earnings, comparable and non-comparable restaurant sales, results of operations, and future restaurant growth (both company-owned and franchised); estimated costs of opening and operating new restaurants, including general and administrative, marketing, franchise development and restaurant operating costs; anticipated selling, general and administrative expenses and restaurant operating costs, including commodity prices, labor and energy costs; future capital expenditures; our expectation that we will have adequate cash from operations and credit facility borrowings to meet all future debt service, capital expenditure and working capital requirements in the current fiscal year; the sufficiency of the supply of commodities and labor pool to carry on our business; success of advertising and marketing activities; the absence of any material adverse impact arising out of any current litigations in which we are involved; the impact of changes in federal, state, or local government statutes, rules, and regulations; the impact of the adoption of new accounting standards and our financial and accounting systems and analysis programs; and the other matters described in “Risk Factors,” “Management’s Discussion and Analysis of Financial condition and Results of Operations,” and “Business” in the company’s prospectus. All statements of Bad Daddy’s financial information are based on management’s review of unaudited financial statements, operating data & point of sale reports from existing Bad Daddy’s restaurants. Although we believe that the expectations reflected in our forward-looking statements are based on reasonable assumptions, such expectations may prove to be materially incorrect due to known and unknown risks and uncertainties. Given these risks and uncertainties, we urge you to read the company’s prospectus completely with the understanding that actual future results may be materially different from what we plan or expect. Good Times Restaurants Inc. *

Our Brands * Good Times Restaurants Inc. Quick service restaurants providing a menu of high quality all natural hamburgers, 100% all natural chicken tenderloins, fresh frozen custard, fresh cut fries, fresh lemonades and other unique offerings. Only QSR with steroid-free, hormone-free, vegetarian fed, humanely raised beef and chicken. Operates and franchises 36 restaurants located primarily in the front-range communities of Colorado. Full service, upscale restaurant concept featuring a chef driven menu of gourmet signature burgers, chopped salads, appetizers and sandwiches with a full bar and a focus on a selection of craft microbrew beers in a high energy atmosphere. Founded by an award-winning chef and the entrepreneur founder of numerous successful concepts. Operates and franchises 10 restaurants in North Carolina (7), South Carolina (1) and Colorado (2).
Key Recent Developments * Good Times Restaurants Inc. In 2013, Good Times acquired development rights for Bad Daddy’s Burger Bar restaurants as well as the ownership of 48% of the franchisor entity, Bad Daddy’s Franchise Development LLC (“BDFD”). BD of Colorado LLC will develop, own and operate Bad Daddy’s locations in Colorado, Arizona and Kansas. - 1st CO location opened February 2014; 2nd opened July 2014. Bad Daddy’s International LLC (owned by the founders of the concept) will continue to develop, own and operate Bad Daddy’s locations in North Carolina and Virginia. - Good Times has certain rights of first refusal to purchase BDI’s restaurants and BDI’s interest in BDFD. Franchise agreements will be executed between BDFD and multi-unit franchisees for Bad Daddy’s. BDFD’s franchise sales efforts are being led by former VP of Franchise Sales at Buffalo Wild Wings, Inc. where he took the brand from 50 to more than 500 restaurants. Good Times manages BDFD under a management agreement.
Key Recent Developments * Good Times Restaurants Inc. On August 21, 2013, Good Times completed a public offering of 2,200,000 shares of common stock, together with warrants to purchase 2,200,000 shares of our common stock (“A Warrants”) and additional warrants to purchase 1,100,000 shares of our common stock (“B Warrants”) . $4.7 million of net proceeds from offering (8/21/13) $5.6 million of net proceeds from warrants (as of 9/15/14) Good Times used a portion of offering proceeds to fund its remaining required equity contribution to BDFD and intends to use the balance of the proceeds for the remodeling and reimaging of existing Good Times restaurants, the development of new Bad Daddy’s restaurants through BD of CO, working capital reserves and future capital investment.

GTIM Growth Platform * Good Times Restaurants Inc. Good Times Drive Thru Inc. 25 Company Owned Good Times Stores 11 Franchised Good Times Stores Bad Daddy’s Franchise Development LLC BD of Colorado Bad Daddy’s Franchise Target Markets Company Owned Bad Daddy’s Stores Colorado (2) Arizona Kansas Mid-Atl/SE S. Carolina (1) Virginia Maryland Georgia Kentucky DC Chicago Tennessee Florida West Oklahoma Utah Nevada Missouri Nebraska Texas New Good Times Growth in Colorado Bad Daddy’s International 6 Owned 1 Licensed 100% 100% 48% 52% Good Times Restaurants Inc.

Good Times Burgers & Frozen Custard Overview Restaurants are a combination of free-standing structures containing approximately 880 to 1,000 square feet for the double drive thru format and a 2,400 square foot, 70 seat dining room format Ranked #1 in Colorado for quality, freshness & friendliness (based on Sandelman Quicktrack) Differentiation leading to acceleration in growth Only QSR with steroid-free, hormone-free, vegetarian fed, humanely raised beef and chicken Fresh, All Natural, Regional Ingredients Frozen Custard made fresh every few hours Fresh Squeezed Lemonades Fresh Cut Fries Hatch Valley New Mexico Green Chile Breakfast Burritos $6+ Average Check – upper end of national QSR competitors New breakfast daypart generating 8-9% incremental sales rolled out in December 2012 Good Times Restaurants Inc. *

Good Times Burgers & Frozen Custard Overview Positive EBITDA and 16 consecutive quarters of same store sales growth. 17 consecutive months of double digit growth from April 2013 – August 2014. 11 consecutive months of two-year same store increases over 20%. Additional new restaurant growth in its existing market. Compelling new store cash on cash ROI model $1.1-1.3 mm sales target with 30-40% cash on cash return using sale leasebacks. Sales increases from reimaging investment in existing stores. Sophisticated operating, management & Administrative systems & processes; SOX compliant. Existing infrastructure can be significantly leveraged with new concept. Good Times Restaurants Inc. *
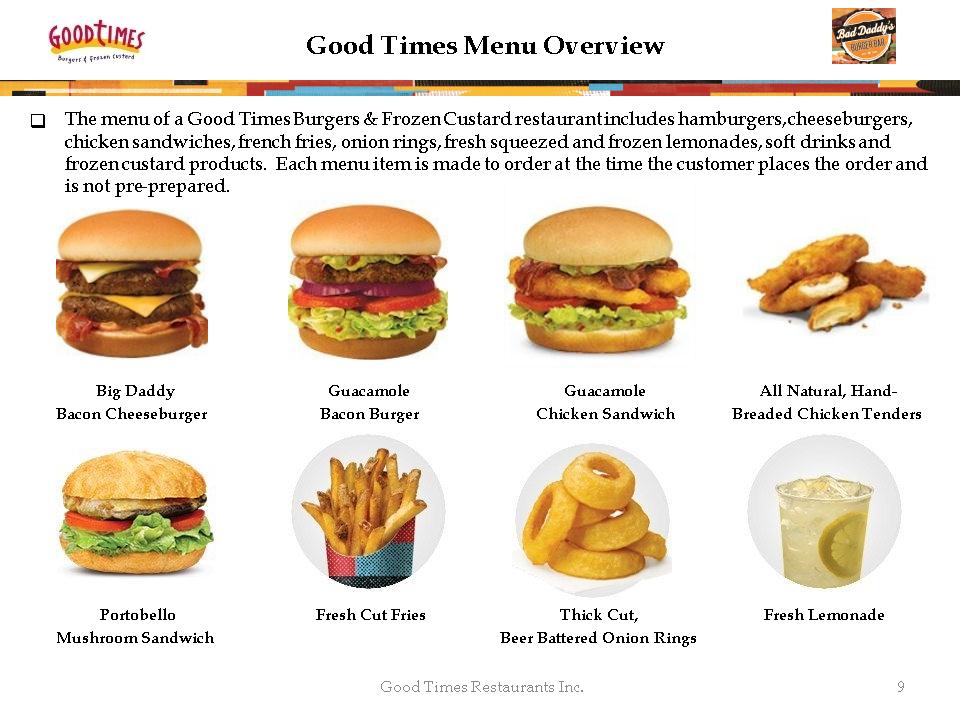
Good Times Menu Overview Good Times Restaurants Inc. * The menu of a Good Times Burgers & Frozen Custard restaurant includes hamburgers, cheeseburgers, chicken sandwiches, french fries, onion rings, fresh squeezed and frozen lemonades, soft drinks and frozen custard products. Each menu item is made to order at the time the customer places the order and is not pre-prepared. * Big Daddy Guacamole Guacamole All Natural, Hand- Bacon Cheeseburger Bacon Burger Chicken Sandwich Breaded Chicken Tenders Portobello Fresh Cut Fries Thick Cut, Fresh Lemonade Mushroom Sandwich Beer Battered Onion Rings
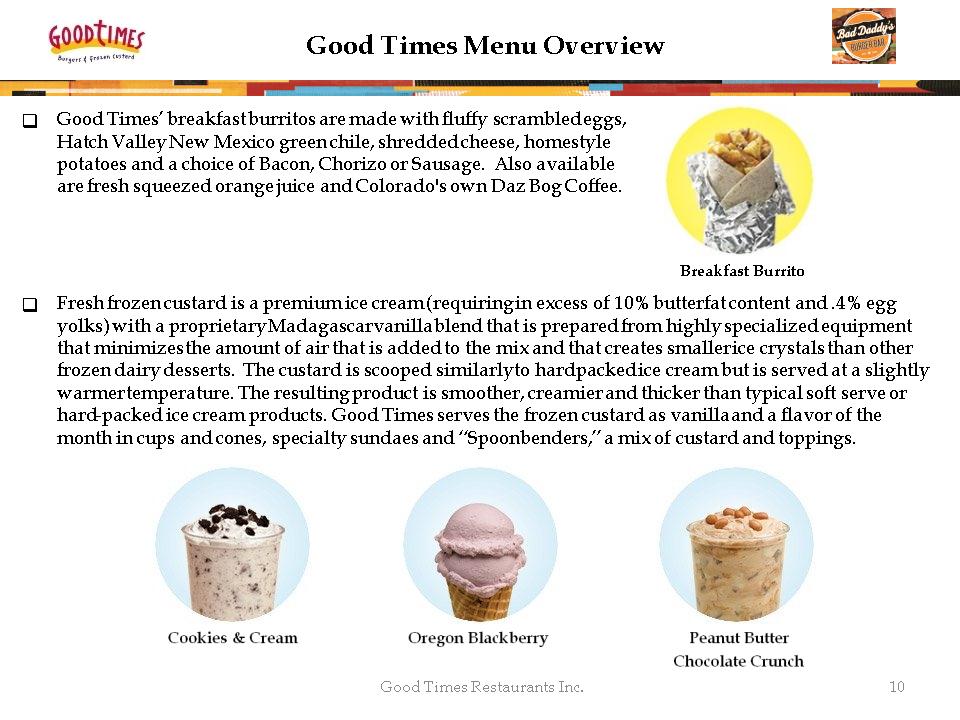
Good Times Menu Overview Good Times Restaurants Inc. * Fresh frozen custard is a premium ice cream (requiring in excess of 10% butterfat content and .4% egg yolks) with a proprietary Madagascar vanilla blend that is prepared from highly specialized equipment that minimizes the amount of air that is added to the mix and that creates smaller ice crystals than other frozen dairy desserts. The custard is scooped similarly to hardpacked ice cream but is served at a slightly warmer temperature. The resulting product is smoother, creamier and thicker than typical soft serve or hard-packed ice cream products. Good Times serves the frozen custard as vanilla and a flavor of the month in cups and cones, specialty sundaes and “Spoonbenders,” a mix of custard and toppings. * Good Times’ breakfast burritos are made with fluffy scrambled eggs, Hatch Valley New Mexico green chile, shredded cheese, homestyle potatoes and a choice of Bacon, Chorizo or Sausage. Also available are fresh squeezed orange juice and Colorado's own Daz Bog Coffee. Breakfast Burrito
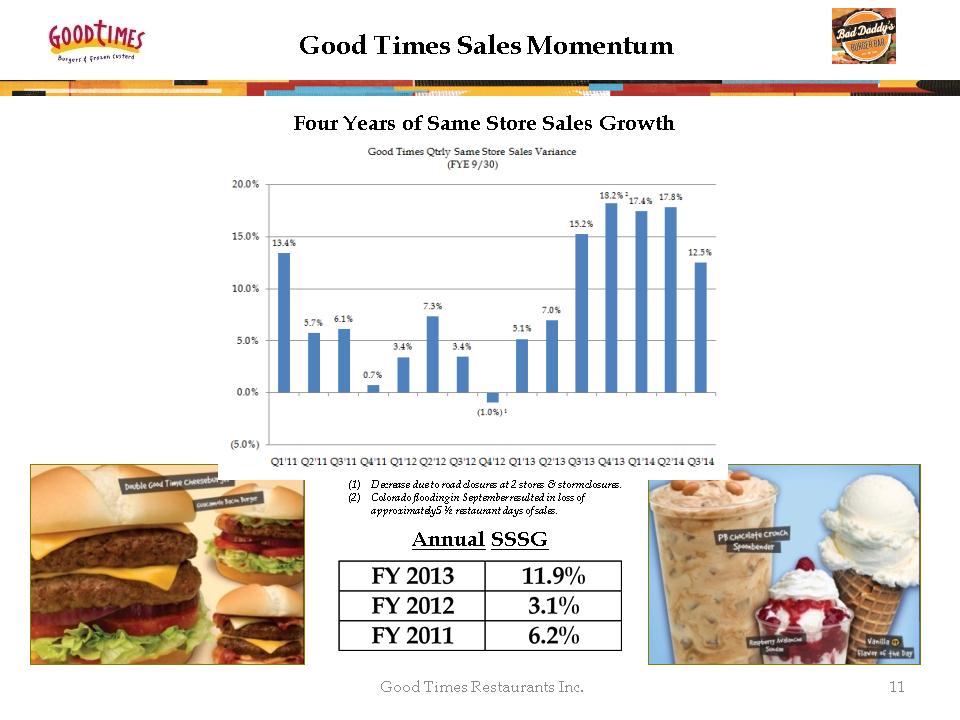
Good Times Sales Momentum Good Times Restaurants Inc. * Four Years of Same Store Sales Growth Decrease due to road closures at 2 stores & storm closures. (2) Colorado flooding in September resulted in loss of approximately 5 ½ restaurant days of sales. Annual SSSG FY 2013 11.9% FY 2012 3.1% FY 2011 6.2%

Average Store Sales & Cash Flow Increasing Good Times Restaurants Inc. * Average Store Sales (34% increase from FY 2010) Average Store Cash Flow (3x increase from FY 2010) Menu Initiatives Remodels Eliminated underperforming stores Breakfast Intro New marketing

Good Times Financial Snapshot Good Times Restaurants Inc. * FYE 9/30 FYE 9/30 FYE 9/30 TTM 6/30/14 2011 2012 2013 2014 (Audited) (Audited) (Audited) (Unaudited) Total Net Revenues 1 20,603,000 $ 19,706,000 $ 22,892,000 $ 26,258,000 $ Restaurant Sales 20,183,000 19,274,000 22,523,000 25,881,000 Restaurant Level Cash Flow 2,3 1,665,000 8.2% 2,014,000 10.4% 2,754,000 12.2% 3,909,000 15.1% Restaurant Level Operating Income 2 839,000 4.2% 1,257,000 6.5% 1,995,000 8.9% 3,212,000 12.4% Net Income (Loss) (1,013,000) (777,000) (687,000) (704,000) Adjusted EBITDA 3,4 (80,000) 192,000 496,000 1,012,000 Summary Annual Income Statement Q3 Q3 FY 2013 FY 2014 (Audited) (Unaudited) Total Net Revenues 1 6,487,000 $ 7,572,000 $ Restaurant Sales 6,394,000 7,464,000 Restaurant Level Cash Flow 2,3 1,026,000 16.0% 1,312,000 17.6% Restaurant Level Operating Income 2 846,000 13.2% 1,124,000 15.1% Net Income (Loss) 141,000 162,000 Adjusted EBITDA 3,4 393,000 498,000 Summary Quarterly Income Statement Cash and Cash Equivalents 8,188,000 $ Total Assets 14,109,000 Total Liabilities 2,705,000 Total Stockholders' Equity 11,404,000 Balance Sheet Data as of 6/30/14 1 Includes franchise revenues. 2 Percentages are as percent of Restaurant Sales. 3 Restaurant Level Cash Flow (= restaurant sales less all operating expenses, excluding any G&A or depreciation) and EBITDA (earnings before interest, taxes, depreciation and amortization) are non-GAAP measures. 4 Adjusted to reflect straight-line rent, stock option expense (non-cash), pre-opening costs, non-recurring professional fees, affiliate loss (BDFD start-up costs), and loss/gain from discontinued operations, interest rate swap and asset sales.

Bad Daddy’s Burger Bar Overview Full service, upscale restaurant concept featuring a chef driven menu of gourmet signature burgers, chopped salads, appetizers and sandwiches with a full bar and a focus on a selection of craft microbrew beers in a high energy, family friendly atmosphere. Operates in the emerging small box dining segment, the fastest growing portion of fast and full service casual dining, reflecting years of evolution and innovation. Ten (10) restaurants currently open in North Carolina (7), South Carolina (1) and Colorado (2) USA Today top 25 burgers in US, Zagat rated – local concept with national press. Ambience is a high energy, pop culture oriented atmosphere. The service is personal, informal and ultra-friendly to support the brand’s irreverent personality. * Good Times Restaurants Inc.

Bad Daddy’s Burger Bar Overview TTM (3/31/14) sales for the 4 Bad Daddy’s open more than one year was $2.5 million. Total bar sales are only 15% of total sales – an opportunity. Craft beer sector grew over 9% in 2013 as consumers are increasingly expressing interest in exploring the variety of flavor profiles that are compatible with different foods. $16 Per Person average, similar to Burger Lounge, the Counter, Bobby’s Burger Palace but below Zinburger, Five Napkin Burger and other high check concepts. (As reported by Nation’s Restaurant News) A higher average check than fast casual concepts such as Five Guys and Smashburger, but below polished casual or sport themed big box concepts such as BJ’s, Buffalo Wild Wings or Cheesecake Factory. (Based on Company developed reports) * All statements of Bad Daddy’s financial information are based on management’s review of unaudited financial statements, operating data & point of sale reports from existing Bad Daddy’s restaurants. Good Times Restaurants Inc.
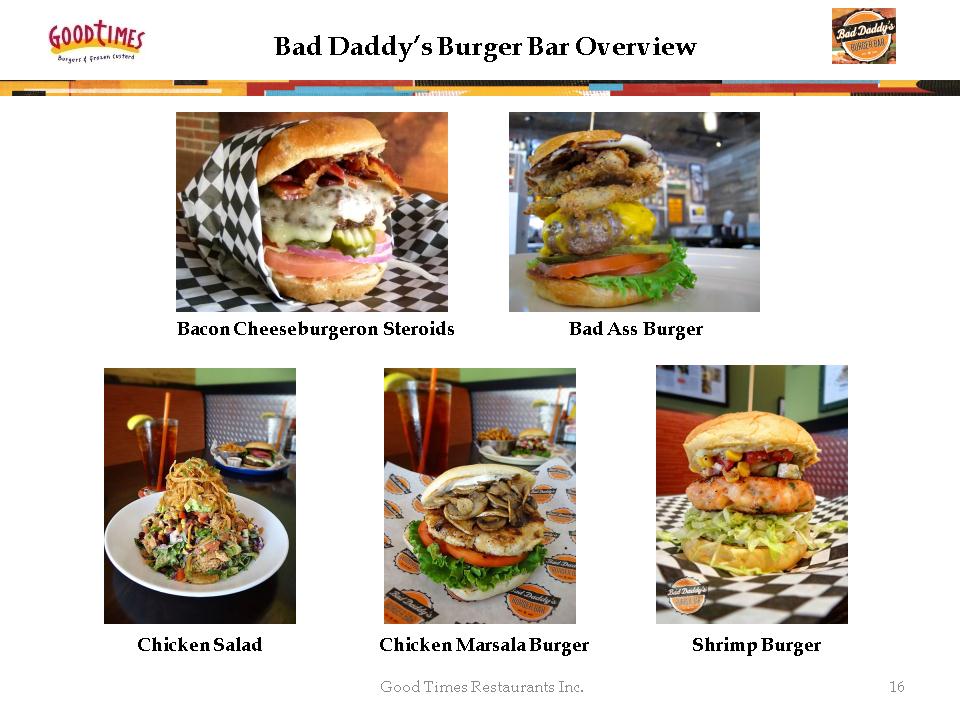
Bad Daddy’s Burger Bar Overview * Good Times Restaurants Inc. Bacon Cheeseburger on Steroids Chicken Salad Chicken Marsala Burger Shrimp Burger Bad Ass Burger
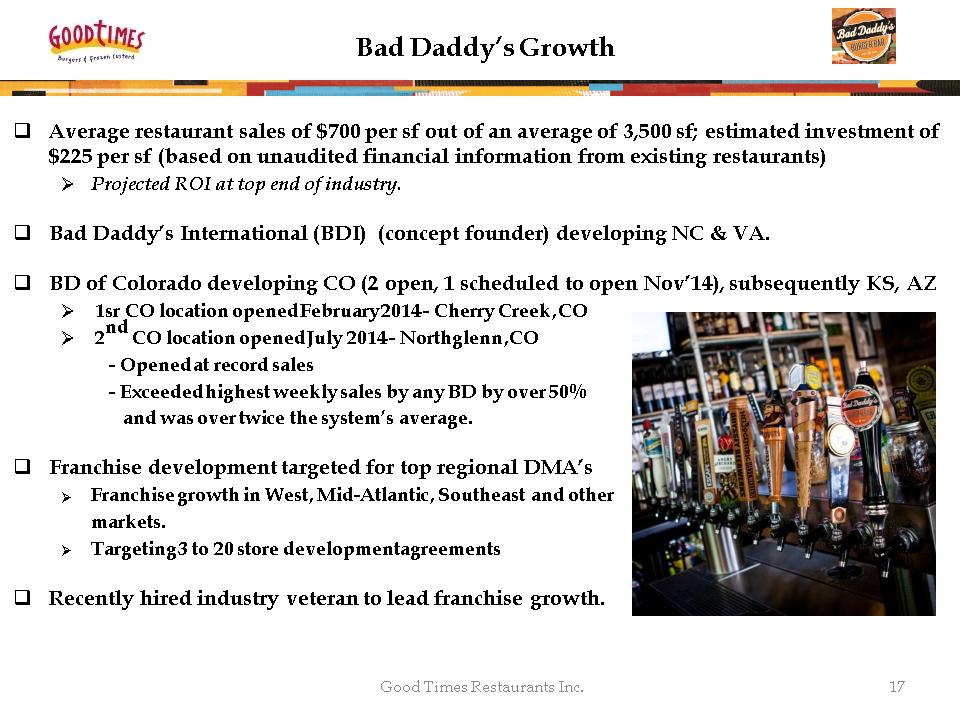
* Good Times Restaurants Inc. Bad Daddy’s Growth Average restaurant sales of $700 per sf out of an average of 3,500 sf; estimated investment of $225 per sf (based on unaudited financial information from existing restaurants) Projected ROI at top end of industry. Bad Daddy’s International (BDI) (concept founder) developing NC & VA. BD of Colorado developing CO (2 open, 1 scheduled to open Nov’14), subsequently KS, AZ 1sr CO location opened February 2014 – Cherry Creek, CO 2nd CO location opened July 2014 – Northglenn, CO Opened at record sales Exceeded highest weekly sales by any BD by over 50% and was over twice the system’s average. Franchise development targeted for top regional DMA’s Franchise growth in West, Mid-Atlantic, Southeast and other markets. Targeting 3 to 20 store development agreements Recently hired industry veteran to lead franchise growth.
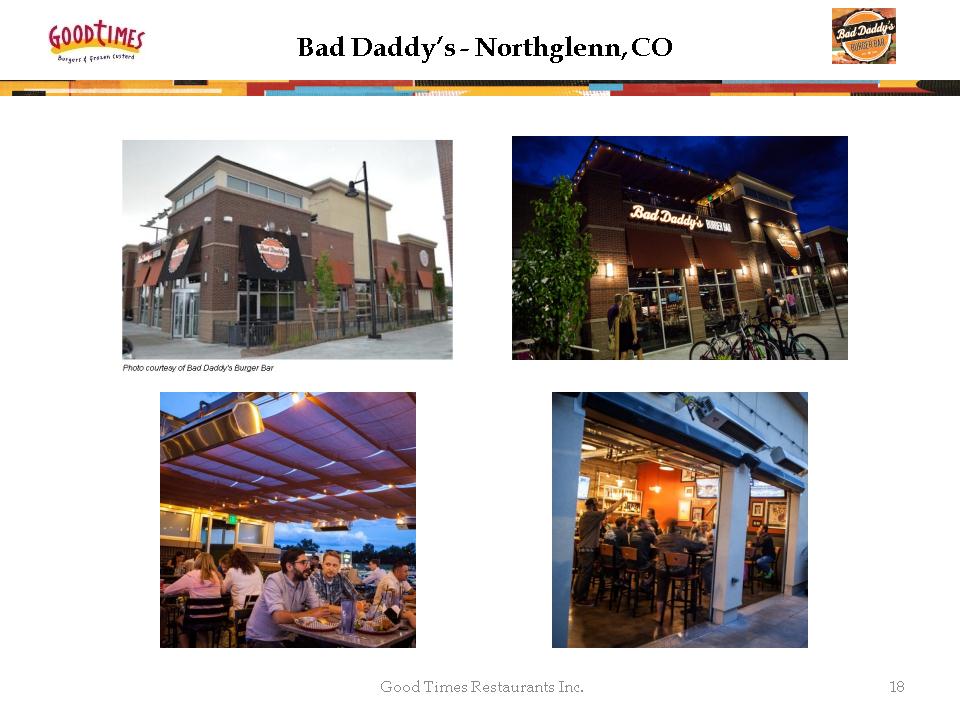
* Good Times Restaurants Inc. Bad Daddy’s – Northglenn, CO
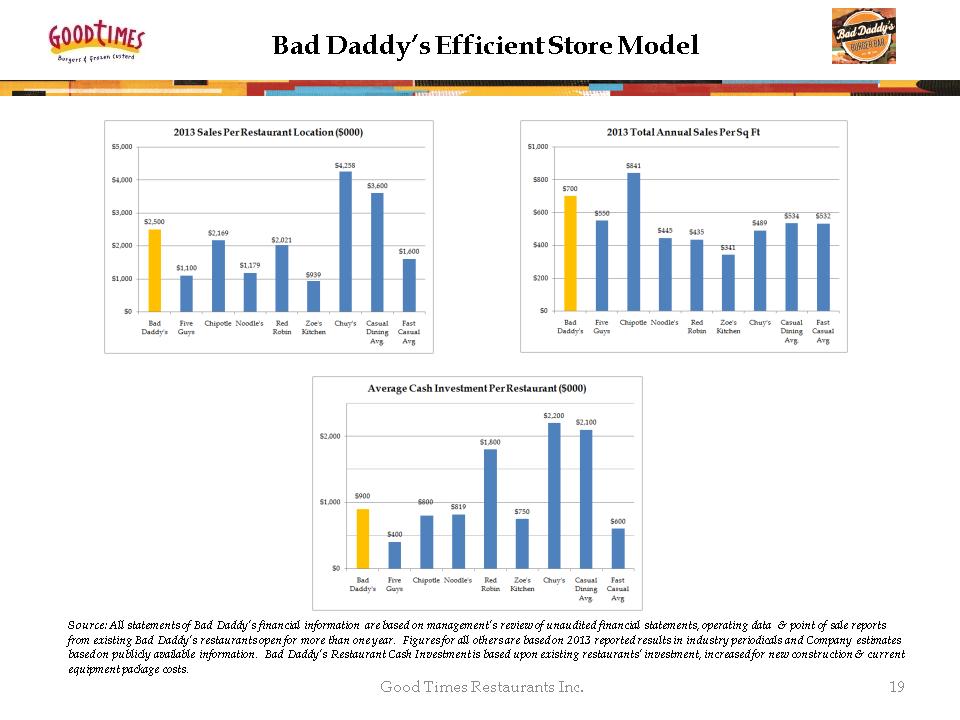
Bad Daddy’s Efficient Store Model * Source: All statements of Bad Daddy’s financial information are based on management’s review of unaudited financial statements, operating data & point of sale reports from existing Bad Daddy’s restaurants open for more than one year. Figures for all others are based on 2013 reported results in industry periodicals and Company estimates based on publicly available information. Bad Daddy’s Restaurant Cash Investment is based upon existing restaurants’ investment, increased for new construction & current equipment package costs. Good Times Restaurants Inc.

Top Tier Unit Economics Comps * Good Times Restaurants Inc. Source:. Figures are based on 2012 reported results in industry periodicals and Company estimates based on publicly available information.
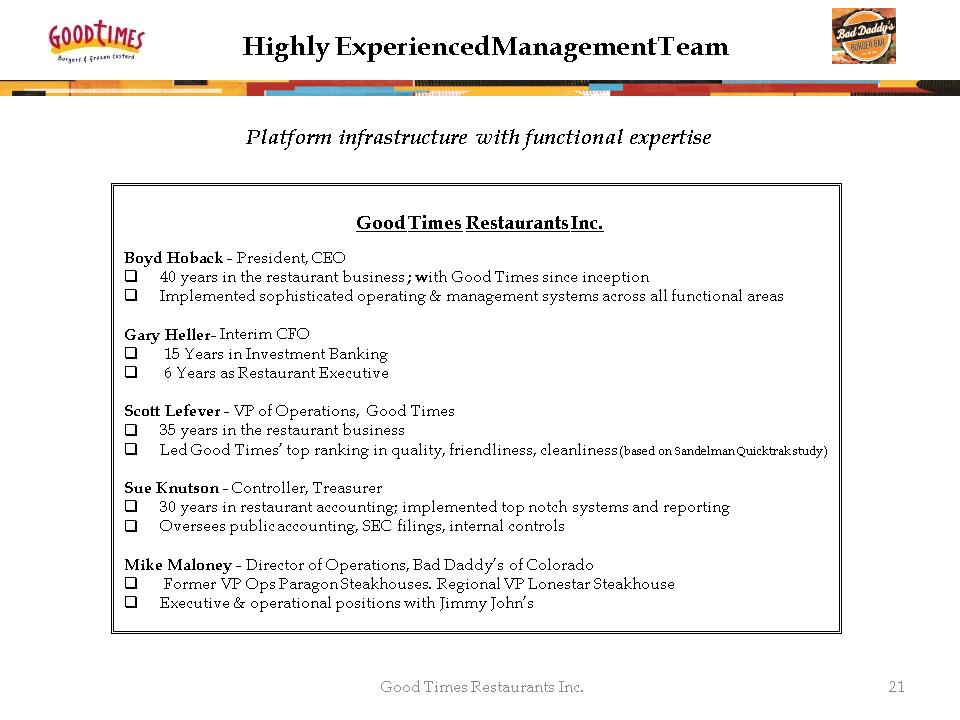
Highly Experienced Management Team Good Times Restaurants Inc. Boyd Hoback – President, CEO 40 years in the restaurant business ; with Good Times since inception Implemented sophisticated operating & management systems across all functional areas Gary Heller– Interim CFO 15 Years in Investment Banking 6 Years as Restaurant Executive Scott Lefever – VP of Operations, Good Times 35 years in the restaurant business Led Good Times’ top ranking in quality, friendliness, cleanliness (based on Sandelman Quicktrak study) Sue Knutson – Controller, Treasurer 30 years in restaurant accounting; implemented top notch systems and reporting Oversees public accounting, SEC filings, internal controls Mike Maloney – Director of Operations, Bad Daddy’s of Colorado Former VP Ops Paragon Steakhouses. Regional VP Lonestar Steakhouse Executive & operational positions with Jimmy John’s Good Times Restaurants Inc. * Platform infrastructure with functional expertise
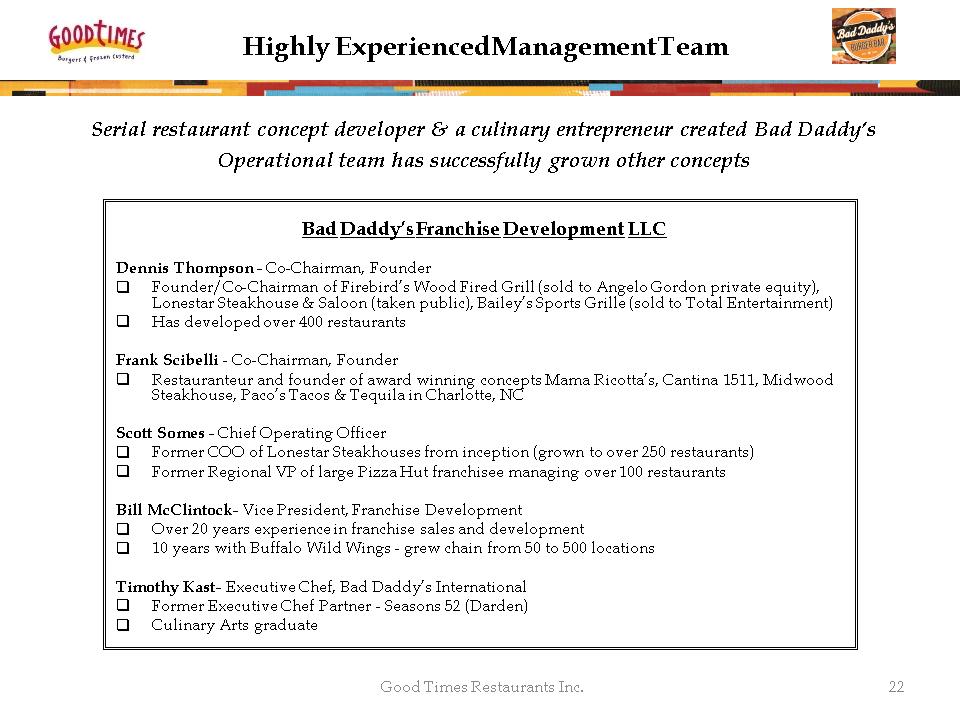
Highly Experienced Management Team Bad Daddy’s Franchise Development LLC Dennis Thompson – Co-Chairman, Founder Founder/Co-Chairman of Firebird’s Wood Fired Grill (sold to Angelo Gordon private equity), Lonestar Steakhouse & Saloon (taken public), Bailey’s Sports Grille (sold to Total Entertainment) Has developed over 400 restaurants Frank Scibelli – Co-Chairman, Founder Restauranteur and founder of award winning concepts Mama Ricotta’s, Cantina 1511, Midwood Steakhouse, Paco’s Tacos & Tequila in Charlotte, NC Scott Somes – Chief Operating Officer Former COO of Lonestar Steakhouses from inception (grown to over 250 restaurants) Former Regional VP of large Pizza Hut franchisee managing over 100 restaurants Bill McClintock– Vice President, Franchise Development Over 20 years experience in franchise sales and development 10 years with Buffalo Wild Wings – grew chain from 50 to 500 locations Timothy Kast– Executive Chef, Bad Daddy’s International Former Executive Chef Partner – Seasons 52 (Darden) Culinary Arts graduate Good Times Restaurants Inc. * Serial restaurant concept developer & a culinary entrepreneur created Bad Daddy’s Operational team has successfully grown other concepts

Why Invest in GTIM Unique brands in both Quick Serve and Upscale Casual Dining Stable, Debt-Free Company with Positive and Growing EBITDA Four Years of Positive Same Store Sales Growth, including 17 consecutive months of double digit growth and 11 consecutive months of two-year same store increases over 20%. Non-leveraged, pure store-level ROI driven growth Well-Established Platform with Strong Systems and Management Highly Experienced Management Team Continuing to grow Good Times’ profitability with comp sales growth, remodels & new stores in Colorado Good Times Restaurants Inc. *
Why Invest in GTIM Plans to expand Bad Daddy’s nationally through franchising Award-Winning, Highly Differentiated Concept in High Growth Segment Industry leading unit economics Led by highly experienced industry veterans Plans to develop company-owned Bad Daddy’s in Colorado, Kansas & Arizona Leveraging Good Times’ existing overhead structure Public Multiple Expansion for Growth and Franchised Concepts Franchisor companies yield higher valuation multiples (based on Company’s comparison of public restaurant companies) Good Times Restaurants Inc. *

GTIM Capitalization Good Times Restaurants Inc. * Market Cap (9/17/14): $38.3 million # Shares Outstanding: 7,485,366 Price (9/17/14): $5.11 52-Week High $5.49 52-Week Low $2.06 Common Stock Outstanding 7,485,366 Common Stock Underlying Warrants 2,100,750 1,2 9,586,116 1 Includes 1.95 mm shares underlying "A" Warrants exercisable on or before August 16, 2018 at an exercise price of $2.75 per share, and 154,000 shares underlying Warrants exercisable on or before August 15, 2016 at an exercise price of $3.125 per share. 2 "A" Warrants are callable at $4.125 beginning August 2014. GTIM Capitalization