Index
PART I
(Dollars in thousands)
Forward-Looking Statements
Certain matters contained in this report, including the information contained under the heading “Fiscal 2014 Outlook,” constitute forward-looking statements that are based on certain assumptions and involve certain risks and uncertainties. These include the following, without limitation: assumptions, risks and uncertainties associated with the Company’s future performance, the Company’s development and introduction of new technologies in general; the ability to protect and utilize the Company’s intellectual property; continued customer acceptance of the InLight technology; the adaptability of optically stimulated luminescence (“OSL”) technology to new platforms and formats; military and other government funding for the purchase of certain of the Company’s equipment and services; the impact on sales and pricing of certain customer group purchasing arrangements; changes in spending or reimbursement for medical products or services; the costs associated with the Company’s research and business development efforts; the usefulness of older technologies and related licenses and intellectual property; the effectiveness of and costs associated with the Company’s IT platform enhancements; the anticipated results of operations of the Company and its subsidiaries or ventures; valuation of the Company’s long-lived assets or business units relative to future cash flows; changes in pricing of services and products; changes in postal and delivery practices; the Company’s business plans; anticipated revenue and cost growth; the ability to integrate the operations of acquired businesses and to realize the expected benefits of acquisitions; the risks associated with conducting business internationally; costs incurred for potential acquisitions or similar transactions; other anticipated financial events; the effects of changing economic and competitive conditions, including instability in capital markets which could impact availability of short and long-term financing; the timing and extent of changes in interest rates; the level of borrowings; foreign exchange rates; government regulations; accreditation requirements; changes in the trading market that affect the costs of obligations under the Company’s benefit plans; and pending accounting pronouncements. These assumptions may not materialize to the extent assumed, and risks and uncertainties may cause actual results to be different from what is anticipated today. These risks and uncertainties also may result in changes to the Company’s business plans and prospects, and could create the need from time to time to write down the value of assets or otherwise cause the Company to incur unanticipated expenses. Additional information may be obtained by reviewing the information set forth in Item 1A “Risk Factors” and Item 7A “Quantitative and Qualitative Disclosures about Market Risk” and information contained in the Company's reports filed, from time to time, with the SEC. The Company does not undertake, and expressly disclaims, any duty to update any forward-looking statement whether as a result of new information, future events or changes in the Company’s expectations, except as required by law.
Item 1. Business
General Description
Landauer, Inc. is a Delaware corporation organized on December 22, 1987. As used herein, the “Company”, “we”, “our”, “us” or “Landauer” refers to Landauer, Inc. and its subsidiaries. The Company’s shares are listed on the New York Stock Exchange under the symbol LDR.
Landauer is a leading global provider of technical and analytical services to determine occupational and environmental radiation exposure, the leading domestic provider of outsourced medical physics services, and a provider of radiology related medical products. Since November 2011, the Company has operated in three primary business segments, Radiation Measurement, Medical Physics and Medical Products. Radiation Measurement has been the core business for over 50 years. The Company has provided complete radiation dosimetry services to hospitals, medical and dental offices, universities, national laboratories, nuclear facilities and other industries in which radiation poses a potential threat to employees. Landauer’s services include the manufacture of various types of radiation detection monitors, the distribution and collection of the monitors to and from customers, and the analysis and reporting of exposure findings. These services are provided to approximately 1.8 million individuals globally. In addition to providing analytical services, the Company may lease or sell dosimetry detectors and reading equipment to large customers that want to manage their own dosimetry programs, or into smaller international markets in which it is not economical to establish a direct service.
The majority of the Radiation Measurement revenues are realized from radiation measurement services and other services incidental to radiation dose measurement. The Company enters into agreements with customers to provide them with radiation measurement services, generally for a twelve-month period. Such agreements generally have a high renewal rate, resulting in customer relationships that are generally stable and recurring. As part of its services, the Company provides to its customers radiation detection badges, which are produced and owned by the Company. The badges are worn for a period selected by the customers (“wear period”), which is usually one, two, or three months in duration. At the end of the wear period, the badges are returned to the Company for analysis. The Company analyzes the badges that have been worn and provides its customers with a report indicating their radiation exposures. The Company recycles certain badge components for reuse, while also producing replacement badges on a continual basis.
The Company offers its service for measuring the dosages of x-ray, gamma radiation and other penetrating ionizing radiations to which the wearer has been exposed, primarily through badges, which contain OSL material, which are worn by customer personnel. This technology is marketed under the trade names Luxel+® and InLight®.
A key component of the Company’s dosimetry system is OSL crystal material. Radiation Measurement operates a crystal manufacturing facility in Stillwater, Oklahoma that it acquired in August 1998. The Company’s base OSL material is manufactured utilizing a proprietary process to create aluminum oxide crystals in a unique structure that is able to retain charged electrons following the crystal’s exposure to radiation.
Radiation Measurement’s InLight dosimetry system provides in-house and commercial laboratories with the ability to provide in-house radiation measurement services using OSL technology. InLight services may involve a customer acquiring or leasing dosimetry devices as well as analytical reading equipment from the Company. The system is based on the Company’s proprietary technology and instruments, and dosimetry devices developed in Japan. The InLight system allows customers the flexibility to tailor their precise dosimetry needs.
Radiation Measurement’s RadWatch-RadLight system provides the military and first responder user with a portable, field-ready option for tactical radiation monitoring using OSL technology. RadWatch-RadLight is offered through a partnership agreement with Yamasato, Fujiwara, Higa & Associates, Inc. (“YFH”) doing business as Aquila. RadWatch-RadLight solution fulfills a recognized gap for acquiring a legal dose of record for radiation emergency response teams.
Other radiation measurement-related services (“ancillary services”) augment the basic radiation measurement services that the Company offers, providing administrative and informational tools to customers for the management of their radiation safety programs.
In November 2009 Landauer completed the acquisition of Gammadata Mätteknik AB (“GDM”), a Swedish provider of radon measurement services. GDM is based near Stockholm, Sweden and provides measurement services throughout the Scandinavian region and Europe. In October 2009, Landauer acquired a dosimetry service in Sweden, now called Landauer Persondosimetri AB (“PDM”). As of November 2011, GDM and PDM are now known as Landauer Nordic AB. In December 2010, the Company established an unconsolidated joint venture in Turkey, which provides radiation measurement services. In August 2012 the Company invested $11.8 million for a 49% minority interest in YFH, doing business as Aquila, a small business supplier to the International Atomic Energy Agency as well as the U.S. Military. The Company provides dosimetry parts to Aquila for their military contract.
Medical physics services are provided through the Company’s Landauer Medical Physics (“LMP”) division. In November 2009, Landauer completed its first LMP acquisition by acquiring Global Physics Solutions, Inc. (“GPS”). With primary offices in Illinois and upstate New York, LMP has operations throughout the United States (“U.S”). The Company uses LMP as a platform to expand into the medical physics services market, serving domestic hospitals, radiation therapy centers and imaging centers. LMP is the leading nationwide service provider of clinical physics support, equipment commissioning and accreditation support and imaging equipment testing. Clinical physics support is provided by medical physicists, who individually focus on either imaging or therapeutic medical physics. Imaging physicists are concerned primarily with the radiation delivered by imaging equipment, image quality and compliance with safe practices in nuclear pharmacies. Therapeutic physicists are concerned with the safe delivery of radiation in cancer treatment. Therapeutic physicists contribute to the development of therapeutic
techniques, collaborate with radiation oncologists to design treatment plans, and monitor equipment and procedures to ensure that cancer patients receive the prescribed dose of radiation to the correct location. Both specialties are aligned with critical treatment trends in the continued increased utilization of radiation for the diagnosis and treatment of disease. The ability to target treatments and reduce the impact of surgical procedures is often aided by imaging and therapeutic techniques. In June 2010, Landauer, through its Medical Physics segment, completed the acquisition of the assets of Upstate Medical Physics (“UMP”), a provider of imaging physics services in upstate New York. In addition, four smaller regional practices were also acquired in fiscal 2011 and 2012 to augment the LMP operations. The Company reports the operating results of LMP in the Medical Physics reporting segment.
In November 2011, Landauer completed the acquisition of IZI Medical Products, LLC (“IZI”), which is headquartered in Maryland. The Company completed the acquisition of IZI as a platform to expand into the radiation oncology, radiology, and image guided surgery end markets as its Medical Products segment. IZI is a leading domestic provider of high quality medical consumable accessories used in radiology, radiation therapy, and image guided surgery procedures. IZI’s customer base includes buyers at several stages along the supply chain including distributors, manufacturers of image guided navigation equipment, and product end users such as community hospitals, radiation oncology clinics, mammography clinics, and imaging centers. IZI’s medical accessories range from consumables used with MRI, CT, and mammography technologies to highly engineered passive reflective markers used during image guided surgery procedures. In alignment with treatment trends which increasingly utilize radiation for the diagnosis and treatment of disease, as well as growing demand for minimally invasive procedures, IZI products provide the ability to increase procedural accuracy while decreasing procedural time.
Landauer believes that its business is largely dependent upon the Company’s technical competence, the quality, reliability and price of its services and products, and its prompt and responsive service.
A summary of selected financial data for Landauer for the last five fiscal years is set forth in Item 6 of Part II of this Annual Report on Form 10-K. Financial information about geographic areas and segments is provided in the Notes to Consolidated Financial Statements in Item 8 of Part II of this Annual Report on Form 10-K.
Marketing and Sales
Landauer’s radiation measurement services and products are marketed in the U.S. and Canada primarily by full-time Company personnel located in five sales regions with support from telesales representatives. The Company’s non-U.S. and Canada radiation measurement services and products are marketed through its wholly owned subsidiaries operating in the United Kingdom, France and Sweden as well as its ventures in Japan and Turkey and its consolidated subsidiaries in Brazil, Australia, Mexico and China. Other firms and individuals market the Company’s radiation measurement products and services on a distributorship or commission basis, generally to small customers or in geographic regions in which the Company does not have a direct presence.
Worldwide, the Company’s Radiation Measurement segment serves approximately 73,000 customers representing approximately 1.8 million individuals annually. The customer base is diverse and fragmented with no single customer representing greater than 2% of revenue. Typically, a customer will contract on a subscription basis for one year of service in advance, representing monthly, bimonthly, quarterly, semi-annual or annual badges, readings and reports. Customer relationships in the radiation measurement market are generally stable and recurring. Details of the Company’s revenue recognition and deferred contract revenue policy are set forth in the “Critical Accounting Policies” section of Item 7 of this Annual Report on Form 10-K.
The Company’s U.S. and Canada radiation measurement services are largely based on the Luxel+ dosimeter system in which all analyses are performed at the Company’s laboratories in Glenwood, Illinois. Luxel+ employs the Company’s proprietary OSL technology. The Company’s InLight dosimetry system enables certain customers to make their own measurements using OSL technology.
For most radiation dosimetry laboratories operating around the world, the laboratory must maintain accreditation with a regulatory body to provide the user with a formal record of dose – a process that is expensive and time consuming. By combining the implementation of an InLight system in the laboratory and “dose of record” determination by Landauer or a Landauer affiliated and accredited facility, the user can provide its workers with the periodic radiation safety management infrastructure without the need to maintain its own accreditation. Additionally,
dosimetry management software options provide the ability to measure the incremental radiation dose of workers at regular intervals over long periods of time.
InLight also forms the basis for Landauer’s operations in Europe, Asia, and Latin America and other future operations that might occur where local requirements preclude using a U.S. or other foreign-based laboratory.
Medical physics outsourced services are marketed to hospitals and free-standing cancer centers or free-standing imaging centers across the United States. LMP medical physicists partner with other healthcare professionals to deliver services to address evolving technology, safety and regulatory needs, with the objective of improving patient outcomes through safe and effective use of radiation in medicine. The services are marketed to radiation oncology and imaging customers by a team of business development professionals supported by LMP’s senior leadership and physicists.
In November 2011, the Company acquired 100% of IZI, which became the Company’s Medical Products segment. IZI products are marketed to buyers at several stages along the supply chain including distributors, manufacturers of image guided navigation equipment, and product end users such as community hospitals, radiation oncology clinics, mammography clinics, and imaging centers. IZI's products are marketed in the U.S. and Canada primarily by full-time Company telesales representatives located in IZI’s Maryland facility. Outside of the U.S. and Canada, the Company primarily utilizes the companies that manufacture image-guided navigation equipment to market and distribute the navigation products. IZI uses distributors to sell its radiology and radiation therapy products.
Seasonality
The services provided by the Company to its radiation measurement customers are on-going and are of a subscription nature. As such, revenues are recognized in the periods in which such services are rendered, irrespective of whether invoiced in advance or in arrears. Given the subscription nature of Radiation Measurement services, quarterly revenues are fairly consistent.
There is no identifiable seasonality to the Company’s Medical Physics or Medical Products segments as their services and products are utilized in radiographic, radiation therapy and surgical procedures that are performed throughout the year.
International Activities
Information regarding the Company’s activities by geographic region is contained under the footnote “Geographic Information” in Item 8 of this Annual Report on Form 10-K.
Patents
The Company holds exclusive worldwide licenses to patent rights for certain technologies that measure and image radiation exposure to crystalline materials when stimulated with light. These licenses were acquired by the Company from Battelle Memorial Institute (“Battelle”) and Oklahoma State University (“OSU”) as part of collaborative efforts to develop and commercialize a new generation of radiation dosimetry technology. The underlying patents for these licenses expire in years 2014 through 2023. The Battelle patents address specific OSL materials and basic aspects of use. The OSU patents are specific to the stimulation process, imaging and data interpretation. As of September 30, 2013, the Company is using OSL technology to provide dosimetry services to the majority of its domestic and international customers. Landauer from time to time evaluates the continued need and benefits to licensing certain patent rights and may discontinue such licenses in instances where Landauer does not believe that such licenses remain necessary.
Additionally, the Company holds certain patents, generated from the Company’s research and development activities, that relate to various dosimeter designs, radiation measurement materials and methods, optical data storage techniques using aluminum oxide and marking technologies used in radiology, radiation therapy and image-guided procedures. These patents expire between 2017 and 2033.
Rights to inventions of employees working for the Company are assigned to the Company.
Raw Materials
The Company has multiple sources for most of its raw materials and supplies, and believes that the number of sources and availability of these items are adequate. Landauer internally produces certain of its requirements, such as OSL detector materials and plastic badge holders. All crystal materials used in the Company’s OSL technology are produced at the Company’s crystal manufacturing facility in Stillwater, Oklahoma. The InLight dosimetry system and its components are manufactured by a Japanese company under an exclusive agreement. The Company sources the Radwatch-RadLight analytical instrument sold for military and emergency radiological response applications from YFH on a sole source basis. IZI sources a key component of its medical products from a sole supplier. If the Company were to lose availability of its Stillwater facility or materials from the Japanese company or IZI’s sole supplier due to a fire, natural disaster or other disruptions, such loss could have a material adverse effect on the Company and its operations.
Competition
In the U.S., the Company competes against a number of dosimetry service providers. One of these providers is a division of Mirion Technologies, a significant competitor with substantial resources. Other competitors in the U.S. that provide dosimetry services tend to be smaller companies, some of which operate on a regional basis. Most government agencies in the U.S., such as the Department of Energy and Department of Defense, have their own in-house radiation measurement services, as do many large private nuclear power plants. Outside of the U.S., radiation measurement activities are conducted by a combination of private entities and government agencies.
The Company competes on the basis of advanced technologies, competent execution of these technologies, the quality, reliability and price of its services, and its prompt and responsive performance. The Company’s InLight dosimetry system competes with other dosimetry systems based on the technical advantages of OSL methods combined with an integrated systems approach featuring comprehensive software, automation and value.
Medical physics outsourced services represents a large fragmented market where LMP has many small competitors. In addition, many facilities directly employ full-time physicists as an alternative for obtaining services from an outsourced provider. LMP competes with other outsourced medical physicists by having responsive regional practices that are backed by the safety, stability and standards of a global company. LMP offers a complementary alternative for clients who require support for their full-time staff in meeting patient care needs.
The Medical Products segment generally competes against a limited number of smaller companies. Two of its primary competitors are a division of Roper Industries, Inc., and Medtronics, each of which is a significant competitor with substantial resources.
Research and Development
The Company’s technological expertise has been an important factor in its growth. The Company regularly pursues product improvements to maintain its technical position. The development of OSL dosimetry, announced in 1994, was funded by the Company in its collaborative effort with Battelle and OSU. The Company commercialized this technology beginning in 1998 and has converted most of its customers to the technology. Current research efforts seek to expand the use of OSL, particularly as it applies to radiation measurements in therapeutic and imaging radiology and nuclear medicine as well as to environmental radiation dosimetry. In addition, the Company is evaluating new badge and InLight reader configurations that have military application and is designing a badge that will support global standardization.
The Company also participates regularly in several technical professional societies, both domestic and international, that are active in the fields of health physics and radiation detection and measurement.
IZI has a robust product development process, which focuses on identifying products that will increase the accuracy of procedures and reduce procedural time. Current research efforts are concentrated to radiology products, which reduce radiation exposure to physicians and patients, as well as products that increase the accuracy of imaging by using reference markers.
Over the last three years the company has spent $4.1 million, $4.0 million, and $2.4 million in research and development activities for the fiscal years 2013, 2012 and 2011, respectively.
Regulatory Matters
Domestic Regulations
The Company manufactures and markets products that are medical devices subject to regulation by the U.S. Food and Drug Administration (“FDA”), as well as other regulatory bodies. FDA regulations govern the following activities that the Company performs and will continue to perform: product design and development; document and purchasing controls; production and process controls; acceptance controls; product testing; product manufacturing; product safety; product labeling; product storage; recordkeeping; complaint handling; pre-market clearance; advertising and promotion; and product sales and distribution.
FDA pre-market clearance and approval requirements. Unless an exemption applies, each medical device the Company wishes to commercially distribute in the U.S. will require either prior 510(k) clearance or pre-market approval from the FDA. The FDA classifies medical devices into one of three classes. Devices deemed to pose lower risks are placed in either class I or II, which requires the manufacturer to submit to the FDA a pre-market notification to commercially distribute the device. This process is generally known as 510(k) clearance. Some low- risk devices are exempted from this requirement. Devices deemed by the FDA to pose the greatest risks, such as life-sustaining, life-supporting or implantable devices, or devices deemed not substantially equivalent to a previously cleared 510(k) device, are placed in class III and require pre-market approval. All of the Company’s current products are either class I or class II devices.
Pervasive and continuing regulation. After a device is placed on the market, numerous regulatory requirements apply. These include, but are not limited to:
· | Quality System Regulation, or QSR, which require manufacturers, including third-party manufacturers, to follow stringent design, testing, documentation and other quality assurance procedures during product design and throughout the manufacturing process; |
· | Labeling regulations and FDA prohibitions against the promotion of products for uncleared, unapproved or off-label uses and against making false and misleading claims; and |
· | Medical device reporting regulations, which require that manufacturers report to the FDA if their device may have caused or contributed to a death or serious injury or malfunctioned in a way that would likely cause or contribute to a death or serious injury if the malfunction were to recur. |
The FDA has broad post-market and regulatory enforcement powers. The Company is subject to unannounced inspections by the FDA to determine its compliance with the QSR and other regulations. The Company’s subcontractors also may be subject to FDA inspection.
For additional information regarding FDA regulations that impact the Company, please see the following risk factors set forth in Item 1A “Risk Factors” of this annual report:
· | “The Company’s medical device business is subject to many laws and government regulations governing the manufacture and sale of medical devices, including the FDA’s 510(k) clearance process.” |
· | “The FDA may change its policies, adopt additional regulations, or revise existing regulations, in particular relating to the 510(k) clearance process.” |
· | “The Company’s medical device business is subject to unannounced inspections by the FDA to determine our compliance with FDA requirements.” |
Environmental Regulations
The Company believes that it complies with federal, state and local provisions that have been enacted or adopted regulating the discharge of materials into the environment or otherwise protecting the environment. This compliance has not had, nor is it expected to have, a material effect on the capital expenditures, financial condition, liquidity, results of operations, or competitive position of the Company.
Other Governmental Regulations
Many of the Company’s technology-based services must comply with various national and international standards that are used by regulatory and accreditation bodies for approving such services and products. These accreditation bodies include, for example, the National Voluntary Laboratory Accreditation Program in the U.S. and governmental agencies, generally, in international markets. Changes in these standards and accreditation requirements can result in the Company having to incur costs to adapt its offerings and procedures. Such adaptations may introduce quality assurance issues during transition that need to be addressed to ensure timely and accurate analyses and data reporting. Additionally, changes affecting radiation protection practices, including new understandings of the hazards of radiation exposure and amended regulations, may impact how the Company’s services are used by its customers and may, in some circumstances, cause the Company to alter its products and delivery of its services. Finally, other healthcare regulatory and reimbursement factors may impact the Company. For additional information regarding healthcare and reimbursement laws and policies that may impact the Company, please see the following risk factors set forth in Item 1A “Risk Factors” of this annual report:
· | “The current U.S. and state health reform legislative initiatives could adversely affect our operations and business condition.” |
· | “The applicable healthcare fraud and abuse laws and regulations, along with the increased enforcement environment, may lead to an enforcement action targeting the Company, which could adversely affect our business.” |
Employees and Labor Relations
As of September 30, 2013, the Company employed approximately 650 full-time employees worldwide, of which 132 employees and 34 employees were in the Company’s Medical Physics and Medical Products segments, respectively. The Company believes that it generally maintains good relations with employees at all locations.
Available Information
The Company annual reports on Form 10-K, quarterly reports on Form 10-Q, current reports on Form 8-K and amendments to those reports filed or furnished pursuant to Section 13(a) or 15(d) of the Securities Exchange Act of 1934 may be accessed free of charge through Landauer’s website as soon as reasonably practicable after Landauer has electronically filed such material with, or furnished it to, the Securities and Exchange Commission. The address of Landauer’s website is http://www.landauer.com. A copy of any of these reports is available free of charge upon the written request from any shareholder. Requests should be submitted to the following address: Landauer, Inc., Attention: Corporate Secretary, 2 Science Road, Glenwood, Illinois 60425.
Pursuant to Section 303A.12(a), Landauer, Inc. has complied with the New York Stock Exchange requirement to provide an annual CEO certification no later than 30 days following the Company’s annual meeting.
Item 1A. Risk Factors
In addition to factors discussed elsewhere in this Annual Report on Form 10-K, set forth below are certain risks and uncertainties that could adversely affect the Company’s results of operations or financial condition and cause actual results or events to differ materially from those expressed in any forward-looking statements made by or on behalf of the Company.
We rely on a single facility for the primary manufacturing and processing of our dosimetry services and products, and a single facility for the manufacturing and processing of our medical devices.
The Company conducts its primary dosimetry manufacturing and laboratory processing operations and performs significant functions for some of its international operations from a single facility in Glenwood, Illinois. The Company’s IZI subsidiary conducts its medical device manufacturing and operations from a single facility in Baltimore, Maryland. If the Company were to lose availability of either of these primary facilities due to fire, natural disaster or other disruptions, the Company’s operations could be significantly impaired. Despite the Company’s business continuity preparedness efforts, there can be no assurance that such plan could ensure the Company’s ability to rapidly respond to such disaster. Although the Company maintains business interruption insurance, there can be no assurance that the proceeds of such insurance would be sufficient to offset any loss the Company might incur or that the Company would be able to retain its customer base if operations were so disrupted.
Increased IT security threats and more sophisticated and targeted computer crime could pose a risk to our systems, networks, products, solutions and services.
Increased global IT security threats and more sophisticated and targeted computer crime pose a risk to the security of our systems and networks and the confidentiality, availability and integrity of our data. While we attempt to mitigate these risks by employing a number of measures, including employee training; comprehensive monitoring of our networks and systems; and maintenance of backup and protective systems, our systems, networks, products, solutions and services remain potentially vulnerable to advanced persistent threats. Depending on their nature and scope, such threats could potentially lead to the compromising of confidential information; improper use of our systems and networks; manipulation and destruction of data; defective products; production downtimes; and operational disruptions, which in turn could adversely affect our reputation, competitiveness, and operating results.
We rely on a single source for the manufacturing of crystal material, a key component in our OSL technology, a single vendor for the manufacturing of InLight products and a single vendor for a key component of our medical devices.
Crystal material is a key component in Landauer’s OSL technology. The Company operates a single crystal manufacturing facility in Stillwater, Oklahoma that currently supplies all OSL crystal radiation measurement material used by the Company. Although multiple sources for raw crystal material exist, there can be no assurance that the Company could secure another source to produce finished crystal materials to Landauer’s specification in the event of a disruption at the Stillwater facility. The InLight dosimetry system and its components are manufactured by Panasonic Communications Company (“Panasonic”) under an exclusive agreement. IZI sources a key component of its medical accessories from a sole supplier. If the Company were to lose availability of its Stillwater facility or materials from Panasonic or IZI’s sole supplier due to a fire, natural disaster or other disruptions, such loss could have a material adverse effect on the Company and its operations.
If we are not successful in the development or introduction of new technologies, our financial condition and results of operations could be materially and adversely affected.
The Company’s radiation measurement business is a mature business and the number of workers being monitored for radiation exposure has not grown in recent years. Additionally, economic pressures can adversely affect the value of occupational measurement perceived by customers or increase pricing pressures. The Company believes that the development and introduction of new technologies and products will be essential to help counter these pressures. The Company regularly pursues product improvements to maintain its technical position. The development and introduction of new technologies, the adaptability of OSL to new platforms and new formats, the usefulness of older technologies and the introduction of new technologies by the competition present various risks to the Company’s business. The failure or lack of market acceptance of a new technology or the inability to respond to market requirements for new technology could adversely affect the Company’s operations or reputation with customers. The cancellation of technology projects or the cessation of use of an existing technology could result in write-downs and charges to the Company’s earnings.
As a medical device accessory provider, introducing new products is critical to growing the Company’s business. If the Company does not manage its new product development projects on time or experiences unforeseen
problems, the launch of those products would be put at risk which could have a negative effect on IZI’s revenue opportunity and the Company’s results of operations. The failure or lack of market acceptance of a new product or the inability to respond to market requirements for new technology could adversely affect the Company’s operations and reputation with customers.
We may fail to adequately protect our customer data.
We may fail to adequately protect our customer data. In the normal course of operations, we collect and maintain confidential data from our customers. Our failure to adequately preserve the security of this data, whether due to technological failures or errors in or deviations from our data maintenance policies and procedures, could result in data loss or corruption. If we fail to adequately maintain and protect our customer data, we could be exposed to potential litigation from our customers and could face risk for loss or breach of customer data under state privacy laws. Additionally, our reputation could be harmed, and we could lose existing and have difficulty attracting new customers, all of which could adversely affect our operating results.
If we are unable to successfully execute business development activities and diversification such as the acquisition and integration of strategic businesses, our on-going business and results of operations may be adversely affected.
A principal growth strategy of the Company is to explore opportunities to selectively enhance its business through development activities, such as strategic acquisitions, investments and alliances. In furtherance of this objective, in November 2009, the Company acquired GPS and Landauer Nordic AB. In November 2011, the Compnay acquired IZI. In August 2012 the Company acquired a 49% minority interest in YFH, doing business as Aquila, a small business supplier to the International Atomic Energy Agency as well as the U.S. Military. The Company may not be able to identify appropriate acquisition candidates or successfully negotiate, finance or integrate acquisitions. Covenants in the Company’s revolving credit facility may also limit the amount and types of indebtedness that it may incur to finance acquisitions. If the Company is unable to make further acquisitions, it may be unable to realize its growth strategy. Additionally, if the Company is unable to successfully manage acquisition risks, future earnings may be adversely affected. Acquisitions and other business development activities involve various significant challenges and risks, including the following:
· | Difficulty in acquiring desired businesses or assets on economically acceptable terms; |
· | Difficulty in integrating new employees, business systems and technology; |
· | Difficulty in consolidating facilities and infrastructure; |
· | Potential need to operate and manage new lines of business; |
· | Potential loss of key personnel; |
· | Diversion of management’s attention from on-going operations; |
· | Realization of satisfactory returns on investments; and |
· | Disputes with strategic partners, due to conflicting priorities or conflicts of interest. |
Development activities could result in the incurrence of debt, contingent liabilities, interest and amortization expenses or periodic impairment charges related to goodwill and other intangible assets as well as significant charges related to integration costs. If the Company is unable to successfully integrate and manage businesses that it acquires within expected terms and in a timely manner, its business and results of operations could be adversely affected.
Unforeseen problems with the stabilization and maintenance of our equipment and information systems could interfere with our operations.
In the normal course of its business, the Company must record and process significant amounts of data quickly and accurately and relies on various computer and telecommunications equipment and information technology systems. Any failure of such equipment or systems could adversely affect the Company’s operations.
The Company has recently implemented a new enterprise resource planning solution to manage certain business operations of its’ Order to Cash, Procure to Pay, and Radiation Measurement - Reporting and Analysis business processes. The Company will continue to incur additional costs associated with stabilization and ongoing development of the new solution. As new applications and functionality are added in order to increase the efficiency of the Company workforce and business processes, unforeseen problems could arise. Such problems could adversely impact the Company’s operations, including the ability to perform the following in a timely manner: customer quotes, customer orders, product shipment, customer services and support, order billing and tracking, contractual obligations fulfillment and other related operations.
Certain of our operations are conducted through joint ventures in which we rely significantly on our joint venture partners.
A substantial portion of the Company’s operations are conducted through joint ventures with third parties. In Australia, Brazil, China, and Mexico, the Company has a controlling interest in the related joint ventures. The Company has a 50% interest in Nagase-Landauer, Ltd. located in Japan and Epsilon-Landauer located in Turkey as well as a 49% interest in YFH. In all of these joint ventures and others, the Company relies significantly on the services and skills of its joint venture partners to manage and conduct the local operations and ensure compliance with local laws and regulations. If the joint venture partners were unable to perform these functions adequately, the Company’s operations in such regions could be adversely affected.
There can be no assurances that our operations will generate cash flows in an amount sufficient to enable us to pay our indebtedness.
The Company’s ability to make scheduled payments on its existing or future debt obligations and fund operations will depend on its future financial and operating performance. While the Company believes it will continue to have sufficient cash flows to operate its businesses, there can be no assurances that its operations will generate sufficient cash flows to enable it to pay its remaining indebtedness or to fund its other liquidity needs. If the Company cannot make scheduled payments on its debt, the Company will be in default and, as a result, among other things, all outstanding principal and interest under its revolving credit facility will automatically be due and payable which could force the Company to liquidate certain assets or substantially restructure or alter its business operations or debt obligations. Moreover, if the Company is unable to obtain additional capital or if its current sources of financing are reduced or unavailable, the Company may be required to eliminate or reduce the scope of its plans for expansion and growth and this could affect its overall operations.
If we experience decreasing prices for our goods and services and we are unable to reduce our expenses, our results of operations could suffer.
The Company may experience decreasing prices for the goods and services it offers due to customer consolidation, increased influence of hospital group purchasing organizations, and pricing pressure experienced by its customers from managed care organizations, the Medicare and Medicaid programs and other third-party payers. Decreasing prices may also be due to increased market power of its customers as the medical industry consolidates and increased competition among dosimetry and physics services providers. If the prices for its goods and services decrease and it is unable to reduce its expenses, the Company’s results of operations could be adversely affected.
The Company may also experience decreasing prices for the products offered by its medical device business due to potential changes in the reimbursement levels of hospitals and other customers. The customers and the other entities with which the Company has a business relationship are affected by changes in statutes, regulations and limitations in governmental spending for Medicare, Medicaid and other programs. Recent government actions and future legislative and administrative changes could limit government spending for the Medicare and Medicaid programs, limit payments to hospitals and other providers, increase emphasis on competition, consolidation, or integrated delivery systems, impose price controls, initiate new and expanded value-based reimbursement programs and/or create other programs that potentially could have an adverse effect on the Company’s customers and the other entities with which it has a business relationship. If the Company’s pricing experiences significant downward pressure, its business will be less profitable and its results of operations could be adversely affected.
We may be subject to future impairment losses due to potential declines in the fair value of our assets.
As a result of acquisitions and capital expenditures, the Company has goodwill, intangible assets and fixed assets on our balance sheets. The Company tests goodwill, intangible assets and fixed assets for impairment on a periodic basis as required and whenever events or changes in circumstances indicate that the carrying value may not be recoverable. The events or changes that could require the Company to test our goodwill, intangible assets and fixed assets for impairment include a reduction in the Company’s stock price and market capitalization, changes in estimated future cash flows, changes in rates of growth in the Company’s industry or in any of the Company’s reporting units.
The potential for goodwill impairment is increased during a period of economic uncertainty. To the extent the Company acquires a company at a negotiated price based on anticipated future performance, subsequent market conditions may result in the acquired business performing at a lower level than was anticipated at the time of the acquisition. Any of these charges would reduce our operating results and could cause the price of our common stock to decline. A slowing recovery in the U.S., a prolonged recovery or second recession in Europe, and slowing growth in the global economy may result in declining performance that would require the Company to examine goodwill for potential additional impairment.
The Company will continue to evaluate the carrying value of the remaining goodwill, intangible assets and fixed assets, and if they determine in the future that there is a potential further impairment, the Company may be required to record additional losses, which could materially and adversely affect operating results.
Restrictions in our revolving credit facility could adversely affect our business, financial condition, and results of operations.
The Company has a committed $175.0 million, secured revolving credit facility syndicated with a group of commercial banks that expires on August 2, 2018.
The facility also contains certain financial covenants, but no net worth covenant. The maximum leverage ratio covenant is a range of 3.50 to 1.00 for the period of September 30, 2013 through June 30, 2015, and to a maximum 3.25 to 1.00 for the periods September 30, 2015 and thereafter. The minimum fixed charge coverage ratio covenant is a range of 1.10 to 1.00 for the period of September 30, 2013 through June 30, 2015, and to a minimum 1.15 to 1.00 for the periods September 30, 2015 and thereafter. Interest rate equal to LIBOR plus a margin of between 1.25% and 2.50% and for the base rate a margin of between 0.25% and 1.50%.
If the Company has significant borrowings under the facility and it violates a covenant or an event of default occurs and the lenders accelerate the maturity of any outstanding borrowings and terminate their commitment to make future loans, it could have a material adverse effect on the Company’s business, results of operations and financial condition. There can be no assurance that the Company will be able to comply with its financial or other covenants or that any covenant violations will be waived. In addition, if the Company fails to comply with its financial or other covenants, it may need additional financing in order to service or extinguish its indebtedness. In the future, the Company may not be able to obtain financing or refinancing on terms acceptable to it, if at all.
Our radiation-measurement and technology-based services business is subject to extensive domestic and foreign government regulations, which could increase our costs, cause us to incur liabilities and adversely affect our results of operations.
Regulation, present and future, is a constant factor affecting the Company’s business. The radiation measurement industry is subject to federal, state and international governmental regulation. Unknown matters, new laws and regulations, or stricter interpretations of existing laws or regulations may materially affect the Company’s business or operations in the future and/or could increase the cost of compliance. The equipment commissioning business of LMP, which the Company first acquired in November 2009, and the employment of physicists and other healthcare professionals also are subject to federal, state and international governmental regulation and licensing requirements.
Many of the Company’s technology-based services must comply with various domestic and international standards that are used by regulatory and accreditation bodies for approving such services and products. The failure of the Company to obtain accreditation for its services and products may adversely affect the Company’s business, require the Company to alter its products or procedures or adversely affect the market perception of the effectiveness of its services and products. Changes in these standards and accreditation requirements may also result in the Company having to incur substantial costs to adapt its offerings and procedures to maintain accreditations and approvals. Such adaptations may introduce quality assurance issues during transition that need to be addressed to ensure timely and accurate analyses and data reporting. Additionally, changes affecting radiation protection practices, including new understandings of the hazards of radiation exposure and amended regulations, may impact how the Company’s services are used by its customers and may, in some circumstances, cause the Company to alter its products and delivery of its services.
The Company’s medical device business is subject to many laws and government regulations governing the manufacture and sale of medical devices, including the FDA’s 510(k) clearance process.
IZI’s products are medical devices that are subject to extensive regulation in the U.S. by the federal government, including by the FDA. The FDA regulates virtually all aspects of a medical device’s design, development, testing, manufacturing, labeling, storage, record keeping, adverse event reporting, sale, promotion, distribution and shipping. The Company must report to the FDA when evidence suggests that one of its devices may have caused or contributed to death or serious injury or has malfunctioned and the device or a similar device would be likely to cause or contribute to death or serious injury if the malfunction were to recur. If such adverse event occurred, the Company could incur substantial expense and harm to its reputation and the Company’s business and results of operations could be adversely affected.
Before a new medical device can be marketed in the U.S., it must first receive either premarket approval or 510(k) clearance from the FDA, unless an exemption exists. The same rule applies when a manufacturer plans to market a medical device for a new use. The process can be costly and time-consuming. The FDA is expected to respond to a section 510(k) notification in 90 days, but often takes much longer. The premarket approval process usually takes six months to three years, but may take longer. The Company cannot assure that any new medical devices or new use for an existing medical device that IZI develops will be cleared or approved in a timely or cost-effective manner, if cleared or approved at all. Even if such devices are cleared or approved, the products may not be cleared or approved for all indications. Because medical devices may only be marketed for cleared or approved indications, this could significantly limit the market for that product and may adversely affect the Company’s results of operations.
Currently, all IZI medical devices have been cleared through the 510(k) clearance process or are exempt from this requirement. Any modification to a 510(k) device that could significantly affect its safety or efficacy, or that would constitute a significant change in its intended use, will require a new clearance process. Any modification to an exempt device could potentially subject the exempt device to the 510(k) clearance requirements. The FDA requires device manufacturers to make their own determination regarding whether a modification requires a new clearance; however, the FDA can review and invalidate a manufacturer’s decision not to file for a new clearance. The Company cannot guarantee that the FDA will agree with its decisions not to seek clearances for particular device modifications or that it will be successful in obtaining 510(k) clearances for modifications. Any such additional clearance processes with the FDA could delay the Company’s ability to market a modified product and may adversely affect the Company’s results of operations.
The FDA may change its policies, adopt additional regulations, or revise existing regulations, in particular relating to the 510(k) clearance process.
The FDA also may change its policies, adopt additional regulations, or revise existing regulations, each of which could prevent or delay premarket approval or 510(k) clearance of a device, or could impact the Company’s ability to market its currently cleared devices. The Company anticipates significant changes in the near future that will affect the way the 510(k) clearance program will operate. On August 3, 2010, the FDA released for public comment two internal working group reports with numerous recommendations to improve the 510(k) process and utilize science in regulatory decision making to encourage innovation yet maintain predictability of the clearance
process. In July, 2011, the Institute of Medicine, which was asked by the FDA to evaluate and make recommendations on the 510(k) program, released its report entitled “Medical Devices and the Public’s Health, The FDA 510(k) Clearance Process.” The report contained numerous and broad recommendations that, if followed, will have a significant impact on the medical device industry. Also in July, 2011, the FDA issued a draft guidance titled “510(k) Device Modifications: Deciding When to Submit a 510(k) for a Change to an Existing Device.” This draft guidance document was withdrawn on July 17, 2012 in accordance with Section 510(n)(2)(B) of the Federal Food, Drug, and Cosmetic Act as amended by Food and Drug Administration Safety and Innovation Act. An existing 1997 guidance on the same topic therefore remains in effect, but any future reforms could require the Company to file new 510(k)s and could increase the total number of 510(k)s to be filed. The Company cannot predict what effect these reforms will have on its ability to obtain 510(k) clearances in a timely manner. The Company also cannot predict the nature of other regulatory reforms and their resulting effects on its business.
The Company’s medical device business is subject to unannounced inspections by the FDA to determine our compliance with FDA requirements.
FDA inspections can result in inspectional observations on FDA’s Form-483, warning letters or other forms of more significant enforcement action. More specifically, if FDA concludes that the Company is not in compliance with applicable laws or regulations, or that any of IZI’s medical devices are ineffective or pose an unreasonable health risk, the FDA could:
· | require the Company to notify health professionals and others that its devices present unreasonable risk of substantial harm to public health; |
· | order the Company to recall, repair, replace or refund the cost of any medical device that it manufactured or distributed; |
· | detain, seize or ban adulterated or misbranded medical devices; |
· | refuse to provide the Company with documents necessary to export its products; |
· | refuse requests for 510(k) clearance or premarket approval of new products or new intended uses; |
· | withdraw 510(k) clearances or premarket approvals that are already granted; |
· | impose operating restrictions, including requiring a partial or total shutdown of production; |
· | enjoin or restrain conduct resulting in violations of applicable law pertaining to medical devices; and/or |
· | assess criminal or civil penalties against the Company’s officers, employees or the Company. |
If the FDA concludes that the Company failed to comply with any regulatory requirement during an inspection, it could have a material adverse effect on its business and financial condition. The Company could incur substantial expense and harm to its reputation and its ability to introduce new or enhanced products in a timely manner could be adversely affected.
The current United States and state health reform legislative initiatives could adversely affect our operations and business condition.
In both the U.S. and some foreign jurisdictions, there have been a number of legislative and regulatory proposals to change the health care system in ways that might affect the Company’s business. In March 2010, President Obama signed into law the Patient Protection and Affordable Care Act, as amended by the Health Care and Education Reconciliation Act, or collectively, the Health Care Reform Law, a sweeping law intended to broaden access to health insurance, reduce or constrain the growth of healthcare spending, enhance remedies against fraud and abuse, add new transparency requirements for healthcare and health insurance industries, impose new taxes and fees on the health industry and impose additional health policy reforms. This legislation includes reforms and reductions that could affect Medicare reimbursements and health insurance coverage for certain services and treatments. Effective January 1, 2013, The Health Reform Law also imposed a 2.3% excise tax on the sale of certain medical devices by manufacturers or importers in the U.S. The Health Reform Law continues to be implemented, including with the new American Health Benefit Insurance Exchanges and their qualified health plans, which are scheduled to begin coverage on January 1, 2014. Some states also have pending health reform legislative initiatives. Further, the Joint Select Committee on Deficit Reduction, which was created by the Budget Control Act of 2011, concluded its work in November 2011, and issued a statement that it was not able to make a bipartisan agreement, thus triggering the sequestration process. The sequestration process combined with past and
potential future government shutdowns have resulted and may result in spending reductions and have and could result in reduced Medicare, Medicaid and other Federal health care reimbursements for the Company’s services and products. Changes in reimbursements and coverages, including risk-sharing arrangements and quality-based reimbursement initiatives, could adversely affect hospitals and other medical services and products providers, which could result in reduced demand for certain services and products offered by the Company, including services offered by its Medical Physics business and products manufactured by its Medical Products business. The Company will not know the full effects of the Health Care Reform Law until applicable federal and state agencies issue regulations or guidance under the new law. The Company cannot predict whether or when future healthcare reform initiatives at the Federal or state level or other initiatives affecting its business will be proposed, enacted or implemented or what impact those initiatives may have on its business, financial condition or results of operations. The Company’s customers and the other entities with which it has a business relationship could react to these initiatives and the uncertainty surrounding these proposals by curtailing or deferring investments, including those for the Company’s services and products.
The applicable healthcare fraud and abuse laws and regulations, along with the increased enforcement environment, may lead to an enforcement action targeting the Company, which could adversely affect our business.
The medical device business recently acquired by the Company is subject to healthcare fraud and abuse laws and regulations including, but not limited to, the Federal Anti-Kickback Statute, state anti-kickback statutes, the Federal False Claims Act, and state false claims acts. Additionally, to the extent the Company maintains financial relationships with physicians and other healthcare providers, the Company may be subject to Federal and state physician payment sunshine laws and regulations, which require the Company to track and disclose these financial relationships. These and other laws regulate interactions amongst health care entities and with sources of referrals of business, among other things. The Federal Anti-Kickback Statute is a criminal statute that imposes substantial penalties on persons or entities that offer, solicit, pay or receive payments in return for referrals, recommendations, purchases or orders of items or services that are reimbursable by Federal healthcare programs. The False Claims Act imposes liability on any person or entity that submits or causes to be submitted a claim to the Federal government that he or she knows (or should know) is false. The Health Reform Law further provides that a claim submitted for items or services, the provision of which resulted from a violation of the Anti-Kickback Statute, is “false” under the False Claims Act and certain other false claims statutes.
The Company may be subject to liability under these laws based on the activities of its recently acquired medical device company for its conduct prior to acquisition and may also be subject to liability for any future conduct that is deemed by the government or the courts to violate these laws. Additionally, over the past ten years, partially as the result of the passage of the Health Insurance Portability and Accountability Act of 1996 and of the Health Reform Law, the government has pursued an increasing number of enforcement actions. This increased enforcement environment may increase scrutiny of the Company, directly or indirectly, and could increase the likelihood of an enforcement action targeting the Company. The Company’s Medical Products segment has entered into complex distribution and collaboration agreements, as well as purchase agreements with a number of its customers, including parties that bill Federal healthcare programs for the Company’s products, which may be subject to government scrutiny. Finally, to the extent that any of the agreements are breached or terminated, the Company’s medical device business may experience a decrease in sales, and accordingly, revenue. In addition, to the extent that its customers, many of whom are providers, may be affected by this increased enforcement environment, the Company’s business could correspondingly be affected. It is possible that a review of the Company’s business practices or those of its customers by courts or government authorities could result in a determination with an adverse effect on its business. The Company cannot predict the effect of possible future enforcement actions on the Company.
Changes in, or interpretations of, tax rules and regulations may adversely affect our effective tax rates.
The Company is subject to income and other taxes in the U.S. and several foreign jurisdictions. Significant judgment is required in evaluating our provision for income taxes. During the ordinary course of business, there are many transactions for which the ultimate tax determination is uncertain. For example, there could be changes in the valuation of our deferred tax assets and liabilities; or changes in the relevant tax, accounting, and other laws, regulations, principles and interpretations. The Company is subject to audits in various jurisdictions, and such
jurisdictions may assess additional tax against us. Although the Company believes our tax estimates are reasonable, the final determination of tax audits and any related litigation could be materially different from our historical income tax provisions and accruals. The results of an audit or litigation, or the effects of a change in tax policy in the U.S. or international jurisdictions where we do business, could have a material effect on our operating results in the period or periods for which that determination is made.
As a portion of our business is conducted outside of the United States, adverse international developments could negatively impact our business and results of operations.
The Company conducts business in numerous international markets such as Australia, Brazil, Canada, China, France, Japan, Mexico, Sweden, Turkey and the United Kingdom. Foreign operations are subject to a number of special risks, including, among others, currency exchange rate fluctuations; disruption in relations; political and economic unrest; trade barriers; exchange controls; expropriation; and changes in laws and policies, including those governing foreign owned operations.
Fluctuations in currency exchange rates could adversely affect our results.
The Company is exposed to market risk, including changes in foreign currency exchange rates. The financial statements of the Company’s non-U.S. subsidiaries are remeasured into U.S. dollars using the U.S. dollar as the reporting currency. To date, the market risk associated with foreign currency exchange rates has not been material in relation to the Company’s financial position, results of operations or cash flows. These risks could increase, however, as the Company expands in international markets.
Several of our current and potential competitors have significantly greater resources and increased competition could impair sales of our products.
The Company competes on the basis of advanced technologies, competent execution of these technologies, the quality, reliability and price of its services and its prompt and responsive performance. In much of the world, radiation measurement activities are conducted by a combination of private entities and governmental agencies. The Company’s primary radiation measurement and medical physics competitor in the U.S., Global Dosimetry Solutions, a division of Mirion Technologies, is large, has substantial resources, and has been particularly active in recent years in soliciting business from the Company’s customers. IZI generally competes against a limited number of smaller companies. Two of its primary competitors are a division of Roper Industries, Inc., and Medtronics, each of which is a significant competitor with substantial resources.
Our failure to attract, motivate and retain qualified and key personnel to support our business may have a material adverse effect on our business plans, prospects, results of operations and financial condition.
The Company’s success depends, in large part, upon the talent and efforts of key individuals including highly skilled scientists, physicists and engineers, as well as experienced senior management, sales, marketing and finance personnel. Competition for these individuals is intense and there can be no assurance that the Company will be successful in attracting, motivating, or retaining key personnel. The loss of the services of one or more of these senior executives or key employees, or the inability to continue to attract these personnel may have a material effect on its business plans, prospects, results of operations and financial condition. The Company’s continued ability to compete effectively depends on its ability to attract new skilled employees and to retain and motivate its existing employees.
The Medical Physics business involves the delivery of professional services and is highly labor-intensive. Its success depends largely on its general ability to attract, develop, motivate and retain highly skilled licensed medical physicists (“physicists”). Further, the Company must successfully maintain the right mix of physicists with relevant experience and skill sets as the Company continues to grow, as it expands into new service offerings, and as the market evolves. The loss of a significant number of its physicists, the inability to attract, hire, develop, train and retain additional skilled personnel, or not maintaining the right mix of professionals could have a serious negative effect on the Company, including its ability to manage, staff and successfully complete its existing engagements and
obtain new engagements. Qualified physicists are in great demand, and the Company faces significant competition for both senior and junior physicists with the requisite credentials and experience. The Company’s principal competition for talent comes from other outsourced medical physicist firms, hospitals and free-standing radiation therapy centers. Many of these competitors may be able to offer significantly greater compensation and benefits or more attractive lifestyle choices, career paths or geographic locations than those of the Company. Therefore, the Company may not be successful in attracting and retaining the skilled physicists it requires to conduct and expand its operations successfully. Increasing competition for these revenue-generating medical physicists may also significantly increase the Company’s labor costs, which could negatively affect its margins and results of operations.
We could be subject to professional liability lawsuits, some of which we may not be fully insured against or reserved for, which could adversely affect our financial condition and results of operations.
In recent years, physicians, hospitals and other participants in the healthcare industry have become subject to an increasing number of lawsuits alleging medical malpractice and related legal theories such as negligent hiring, supervision and credentialing, and vicarious liability for acts of their employees or independent contractors. In addition, the level and effect of radiation being administered by certain radiation equipment is also attracting increased scrutiny and giving rise to patient safety claims. Many of these lawsuits involve large claims and substantial defense costs. As the Company increases its presence in the healthcare industry, through the Medical Physics business, it could be exposed to litigation or subject to fines, penalties or suspension of services relating to the compliance with regulatory requirements.
Item 1B. Unresolved Staff Comments
None.
Item 2. Properties
The Company owns three adjacent buildings totaling approximately 59,000 square feet in Glenwood, Illinois, about 30 miles south of Chicago, leases a 24,000 square foot warehouse and leases 6,100 square feet of office space in Chicago. The properties house the Company’s administrative offices, information technology resources, and laboratory, assembly and reading operations. The properties and equipment of the Company are in good condition and, in the opinion of management, are suitable and adequate for the Company’s operations. For its Radiation Measurement operations, the Company leases a crystal growth facility in Stillwater, Oklahoma and maintains laboratories in Australia, Brazil, China, France, Mexico, Sweden, and Turkey, as well as a sales office in England. The Company’s joint venture in Japan, Nagase-Landauer, owns a manufacturing facility which began operating in April 2010. The Company leases offices in New York, North Carolina and Missouri for its Medical Physics operations, and leases manufacturing and office space in Maryland for its Medical Products operations.
Item 3. Legal Proceedings
The Company is a party, from time to time, to various legal proceedings, lawsuits and other claims arising in the ordinary course of its business. The Company does not believe that any such litigation pending as of September 30, 2013, if adversely determined, would have a material effect on its business, financial position, results of operations, or cash flows.
Item 4. Mine Safety Disclosures
Not Applicable
PART II
(Dollars in thousands, except per share data)
Item 5. Market for Registrant’s Common Equity, Related Stockholder Matters and Issuer
Purchases of Equity Securities
The Company’s common stock is traded on the New York Stock Exchange under the trading symbol LDR. The following table indicates the reported high and low market prices of the Company’s common stock and dividends paid per share for each quarterly period during the last two fiscal years:
| | | | | | | | | | |
| | | | | | | | | | |
Year | Quarter | | | High | | | Low | | | Dividends
Paid Per Share |
2013 | | | | | | | | | | |
| First | | $ | 63.85 | | $ | 54.48 | | $ | 0.55 |
| Second | | $ | 66.04 | | $ | 55.70 | | $ | 0.55 |
| Third | | $ | 57.35 | | $ | 48.21 | | $ | 0.55 |
| Fourth | | $ | 51.73 | | $ | 45.89 | | $ | 0.55 |
2012 | | | | | | | | | | |
| First | | $ | 53.40 | | $ | 45.69 | | $ | 0.55 |
| Second | | $ | 60.95 | | $ | 50.87 | | $ | 0.55 |
| Third | | $ | 57.74 | | $ | 47.56 | | $ | 0.55 |
| Fourth | | $ | 61.93 | | $ | 54.79 | | $ | 0.55 |
The Company expects to continue paying regular quarterly cash dividends, although there is no assurance as to future dividends because they depend on future earnings, capital requirements and financial condition. In December 2013, the Board of Directors declared a fiscal 2014 first quarter cash dividend of $0.55 per common share.
As of November 28, 2013, there were 273 shareholders of record.
Issuer Purchases of Equity Securities
| | | | | | | | |
| | | | | | | | |
Period | Total Number of Shares Purchased(a) | | | Average Price Paid Per Share | | Total Number of Shares Purchased as Part of Publicly Announced Plans or Programs | | Maximum Number of Shares that May Yet be Purchased Under the Plans or Programs |
October 1 – October 31, 2012 | - | | $ | - | | - | | - |
November 1 – November 30, 2012 | 1,100 | | | 59 | | - | | - |
December 1 – December 31, 2012 | 9,715 | | | 58 | | - | | - |
Total for quarter ended December 31, 2012 | 10,815 | | $ | 58 | | - | | - |
January 1 – January 31, 2013 | - | | | - | | - | | - |
February 1 – February 29, 2013 | 88 | | | 59 | | - | | - |
March 1 – March 31, 2013 | - | | | - | | - | | - |
Total for quarter ended March 31, 2013 | 88 | | $ | 59 | | - | | - |
April 1 – April 30, 2013 | - | | | - | | - | | - |
May 1 – May 31, 2013 | - | | | - | | - | | - |
June 1 – June 30, 2013 | - | | | - | | - | | - |
Total for quarter ended June 30, 2013 | - | | $ | - | | - | | - |
July 1 – July 31, 2013 | 249 | | | 48 | | - | | - |
August 1 – August 31, 2013 | 410 | | | 47 | | - | | - |
September 1 – September 30, 2013 | 4,987 | | | 51 | | - | | - |
Total for quarter ended September 30, 2013 | 5,646 | | $ | 51 | | - | | - |
(a) | This column includes the deemed surrender of existing shares of the Company’s common stock to the Company by stock-based compensation plan participants to satisfy the exercise price or tax liability of employee stock awards at the time of exercise or vesting. These surrendered shares are not part of any publicly announced share repurchase program. |
The Company funds its share repurchases with cash on hand and cash generated from operations.
Performance Graph
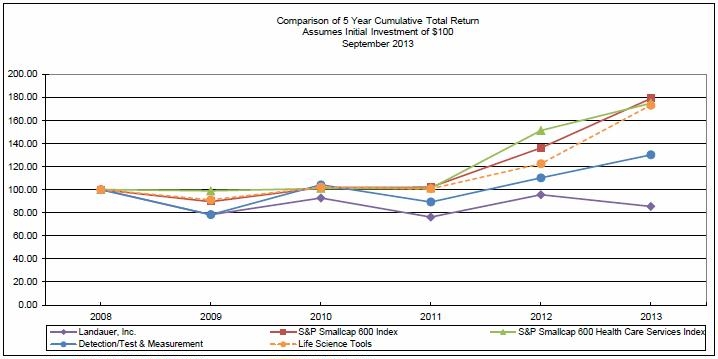
The following graph reflects a comparison of the cumulative total return (change in stock price plus reinvested dividends) assuming $100 invested in: (a) Landauer’s common stock, (b) a group of detection/test and measurement companies composed of ticker symbols LDR, ES, OSIS, VAR, ASEI, (c) the S&P 600 industry index represented by a group of health care services companies, (d) a group of life science tool companies composed of ticker symbols LDR, QGEN, SIAL, BRKR, PKI, TMO, A, WAT, LIFE, FEIC and MTD and (e) the S&P 600 industry index represented by a group of health care services companies during the period from September 30, 2008 through September 30, 2013. The comparisons in the following table are historical and are not intended to forecast or be indicative of possible future performance of Landauer’s common stock.
| | | | | | | | | | | | |
| | | | | | | | | | | | |
| Value of Investment at September 30, |
(Dollars) | 2008 | 2009 | 2010 | 2011 | 2012 | 2013 |
Landauer, Inc. | $ | 100 | $ | 78 | $ | 93 | $ | 76 | $ | 96 | $ | 85 |
Detection/Test and Measurement | | 100 | | 78 | | 104 | | 89 | | 110 | | 130 |
S&P Smallcap 600 Index | | 100 | | 90 | | 102 | | 102 | | 136 | | 179 |
Life Science Tools | | 100 | | 91 | | 102 | | 101 | | 122 | | 173 |
S&P Health Care Services | | 100 | | 99 | | 101 | | 101 | | 151 | | 175 |
Item 6. Selected Financial Data
Five Year Selected Financial Data
Landauer, Inc. and Subsidiaries
For the Years Ended September 30,
| | | | | | | | | | | | | | | |
| | | | | | | | | | | | | | | |
(Dollars in Thousands, Except per Share) | | 2013 | 2012 | 2011 | 2010 | 2009 |
Operating results | | | | | | | | | | | | | | | |
Net revenues | | $ | 150,200 | | $ | 152,400 | | $ | 120,458 | | $ | 114,367 | | $ | 93,827 |
Operating income(1) | | | 4,120 | | | 28,170 | | | 34,883 | | | 34,637 | | | 32,518 |
Net income attributable to Landauer, Inc. | | | 4,836 | | | 19,270 | | | 24,538 | | | 23,674 | | | 23,366 |
Basic net income per share | | $ | 0.50 | | $ | 2.04 | | $ | 2.60 | | $ | 2.53 | | $ | 2.51 |
Diluted net income per share | | $ | 0.49 | | $ | 2.03 | | $ | 2.58 | | $ | 2.52 | | $ | 2.49 |
Weighted average diluted shares outstanding | | | 9,482 | | | 9,437 | | | 9,477 | | | 9,349 | | | 9,366 |
Cash dividends per share | | $ | 2.20 | | $ | 2.20 | | $ | 2.20 | | $ | 2.15 | | $ | 2.10 |
Total assets | | $ | 276,833 | | $ | 302,125 | | $ | 168,656 | | $ | 150,696 | | $ | 125,205 |
Short-term debt | | $ | - | | $ | - | | $ | 19,805 | | $ | 12,504 | | $ | - |
Long-term debt | | $ | 142,785 | | $ | 141,347 | | $ | - | | $ | - | | $ | - |
(1)In fiscal 2013 results are impacted by goodwill impairment of $22,700.
Non-GAAP Financial Measures
The tables below include financial measures of Earnings Before Interest, Taxes, Depreciation and Amortization (“EBITDA”), Adjusted EBITDA, Adjusted Net Income and Adjusted Net Income per Diluted Share. These are non-generally accepted accounting principles (“GAAP”) measures. Management believes that such measures supplement evaluations using operating income, net income and diluted earnings per share and other GAAP measures, and are a useful indicator for investors. These indicators can help readers gain a meaningful understanding of the Company’s core operating results and future prospects without the effect of non-recurring and non-cash items and the Company’s ability to generate cash flows from operations that are available for taxes, capital expenditures and debt repayment. Investors should recognize that these non-GAAP measures might not be comparable to similarly titled measures of other companies. These measures should be considered in addition to, and not as a substitute for or superior to, any measure of performance, cash flows or liquidity prepared in accordance with accounting principles generally accepted in the U.S.
The Company uses these non-GAAP financial measures for internal budgeting and other managerial purposes, such as when publicly providing the Company’s business outlook and as a measurement for potential acquisitions. A limitation associated with Adjusted EBITDA is that it does not reflect the periodic costs of certain capitalized tangible and intangible assets used in generating revenues in the Company’s business. Management evaluates the costs of such tangible and intangible assets through other financial measures such as capital expenditures. Management compensates for these limitations by also relying on the comparable GAAP financial measure of operating income, which includes depreciation and amortization.
These non-GAAP measures may be considered in addition to results prepared in accordance with GAAP, but they should not be considered a substitute for, or superior to, GAAP results. The Company intends to continue to provide these non-GAAP financial measures as part of its future earnings discussions and, therefore, the inclusion of these non-GAAP financial measures will provide consistency in the Company’s financial reporting.
| | | | | | | | | | | | | | | |
| | | | | | | | | | | | | | | |
| | For the Years Ended September 30, |
(Dollars in Thousands, Except per Share) | | 2013 | | 2012 | | 2011 | | 2010 | | 2009 |
Adjusted EBITDA | | | | | | | | | | | | | | | |
Net income attributable to Landauer, Inc. | | $ | 4,836 | | $ | 19,270 | | $ | 24,538 | | $ | 23,674 | | $ | 23,366 |
Add back: | | | | | | | | | | | | | | | |
Net financing costs | | | 3,744 | | | 2,969 | | | 270 | | | - | | | - |
Depreciation and amortization | | | 14,924 | | | 11,631 | | | 7,991 | | | 6,681 | | | 5,845 |
Provision for income taxes | | | (1,216) | | | 8,040 | | | 11,527 | | | 11,893 | | | 11,071 |
Earnings before interest, taxes, depreciation and amortization (EBITDA) | | | 22,288 | | | 41,910 | | | 44,326 | | | 42,248 | | | 40,282 |
Adjustments: | | | | | | | | | | | | | | | |
Non-cash stock-based compensation | | | 2,634 | | | 2,434 | | | 1,481 | | | 1,287 | | | 2,152 |
IT platform enhancements | | | 206 | | | 2,155 | | | 1,185 | | | 963 | | | 837 |
Acquisition, reorganization and nonrecurring costs | | | 1,392 | | | 4,299 | | | 1,489 | | | 2,028 | | | 416 |
Non-cash goodwill impairment charge | | | 22,700 | | | - | | | | | | | | | |
Abandonment charges | | | - | | | 3,443 | | | - | | | - | | | - |
Pension curtailment and transition | | | - | | | - | | | - | | | - | | | 2,236 |
Sub-total adjustments | | | 26,932 | | | 12,331 | | | 4,155 | | | 4,278 | | | 5,641 |
Adjusted EBITDA | | $ | 49,220 | | $ | 54,241 | | $ | 48,481 | | $ | 46,526 | | $ | 45,923 |
| | | | | | | | | | | | | | | |
Adjusted Net Income | | | | | | | | | | | | | | | |
Net income attributable to Landauer, Inc. | | $ | 4,836 | | $ | 19,270 | | $ | 24,538 | | $ | 23,674 | | $ | 23,366 |
Sub-total adjustments | | | 26,932 | | | 12,331 | | | 4,155 | | | 4,278 | | | 5,641 |
Income benefit (taxes) on adjustments | | | 7,299 | | | (3,527) | | | (1,305) | | | (1,412) | | | (1,799) |
Adjustments, net | | | 34,231 | | | 8,804 | | | 2,850 | | | 2,866 | | | 3,842 |
Adjusted net income | | $ | 39,067 | | $ | 28,074 | | $ | 27,388 | | $ | 26,540 | | $ | 27,208 |
Adjusted Net Income per Diluted Share | | $ | 4.12 | | $ | 2.97 | | $ | 2.89 | | $ | 2.84 | | $ | 2.90 |
Item 7. Management’s Discussion and Analysis of Financial Condition and Results of Operations
The following discussion and analysis of our consolidated financial condition and results of operations should be read in conjunction with Item 6. “Selected Financial Data” and our annual audited consolidated financial statements and related notes thereto. The following discussion includes forward-looking statements that involve certain risks and uncertainties. For additional information regarding forward-looking statements and risk factors, see “Forward-Looking Statements” and Item 1A. “Risk Factors.”
In the accompanying analysis of financial information, we sometimes use information derived from consolidated financial information but not presented in our financial statements prepared in accordance with US GAAP. Some of this data is considered “non-GAAP financial measures.” For such measures, we have provided supplemental explanations and reconciliations in Item 6. “Selected Financial Data” under the heading “Non-GAAP Financial Measures.”
Overview
The Company operates in three reportable segments: Radiation Measurement, Medical Physics and Medical Products.
The Company’s Radiation Measurement segment is a mature business and growth in numbers of customers is modest. In recent years, the Company’s strategy has been to expand into new international markets, primarily by partnering with existing dosimetry service providers with a prominent local presence. In addition, the Company has been developing new platforms and formats for its OSL technology, such as InLight®, Radwatch® and Radlight® to gain access to markets where the Company previously did not have a significant presence, such as smaller in-house and commercial laboratories, nuclear power facilities, tactical military and first responder measurement and hospitals to support measurement of patient exposure to radiation. Revenue growth in recent years has occurred as a result of entry into new markets through joint ventures and acquisitions, modest unit growth, sale of InLight equipment and badges, Radwatch-Radlight, and new ancillary opportunities to obtain regular price increases from its customers. The continued economic downturn and uncertain impact of healthcare reform has resulted in increased pricing pressure with the Company's healthcare customer base, which is expected to continue into the future.
Through its LMP operations, the Company provides therapeutic and imaging physics services to the medical community. LMP is the leading nationwide provider of medical physics services to hospitals, free standing imaging centers and radiation therapy centers. Medical physics services is a large fragmented market. Market growth is expected to be driven by the utilization of radiation in the provision of healthcare; trends towards outsourcing of services in healthcare settings; and a tightening domestic supply of qualified medical physicists. The Company reports these operating results in the Medical Physics reporting segment.
In November 2011, the Company completed the acquisition of IZI and formed the Medical Products segment. IZI is a leading global provider of high quality medical consumable accessories used in radiology, radiation therapy, and image guided surgery procedures. IZI’s customer base includes buyers at several stages along the supply chain including distributors, manufacturers of image guided navigation equipment, and product end users such as community hospitals, radiation oncology clinics, mammography clinics, and imaging centers. IZI’s medical accessories range from consumables used with MRI, CT, and mammography technologies to highly engineered passive reflective markers used during image guided surgery procedures. In alignment with treatment trends which increasingly utilize radiation for the diagnosis and treatment of disease, as well as growing demand for minimally invasive procedures, IZI products provide the ability to increase procedural accuracy while decreasing procedural time.
Critical Accounting Policies
The preparation of financial statements in conformity with accounting principles generally accepted in the United States of America requires that management make assumptions and estimates that affect the results of operations and the amounts of assets and liabilities reported in the financial statements as well as related disclosures. Critical accounting policies are those that are most important to the portrayal of a company’s financial condition and results, and that require management’s most difficult, subjective or complex judgments, often as a result of the need to make estimates about the effect of matters that are inherently uncertain. Below are the critical accounting policies which have been applied in the preparation of the Company’s financial statements and accompanying notes.
Revenue Recognition and Deferred Contract Revenue
The source of Radiation Measurement segment revenues for the Company is radiation measuring and measurement services including other services incidental to measuring and monitoring. The measuring and monitoring services provided by the Company to its customers are of a subscription nature and are continuous. The Company views its business in the Radiation Measurement segment as services provided to customers over a period of time and the wear period is the period over which those services are provided. Badge production, wearing of badges, badge analysis, and report preparation are integral to the benefit that the Company provides to its customers. These services are provided to customers on an agreed-upon recurring basis (monthly, bi-monthly, quarterly, semi-annually or annually) that the customer chooses for the wear period. Revenue is recognized on a straight-line basis, adjusted for changes in pricing and volume, over the wear period as the service is continuous and no other discernible pattern of recognition is evident. Revenues are recognized over the periods in which the customers wear the badges irrespective of whether invoiced in advance or in arrears. To a lesser degree the company does provide equipment and sells badges to smaller distributors and joint ventures. These product sales are recognized at time of shipment.
The Company, through its Medical Physics segment, offers full scope medical physics services to hospitals and radiation therapy centers. Services offered include, but are not limited to, clinical physics support in radiation oncology, commissioning services, special projects support and imaging physics services. Delivery of the medical physics services can be of a contracted, recurring nature or as a discrete project with a defined service outcome. Recurring services often are provided on the customer's premises by a full-time employee or fraction of a full-time employee. These services are recognized as revenue on a straight-line basis over the life of the contract. Fee for service projects’ revenue is recognized when the service is delivered.
Contracted services are billed on an agreed-upon recurring basis, either in advance or arrears of the service being delivered. Customers may be billed monthly, quarterly, or at some other regular interval over the contracted period. The amounts recorded as deferred revenue represent invoiced amounts in advance of delivery of the service. Management believes that the amount of deferred contract revenue fairly represents remaining business activity with customers invoiced in advance. Fee for service revenue is typically associated with much shorter contract periods, or with discrete individual projects. Invoicing is usually done after completion of the project and customer acceptance thereof.
The Medical Products segment offers a broad product portfolio ranging from consumables used with MRI, CT, and Mammography technologies to highly engineered consumable passive reflective markers used during Image Guided Surgery procedures. The Company recognizes revenue upon product shipment, provided that a purchase order has been received or a contract has been executed, there are no uncertainties regarding customer acceptance, the sales price is fixed and determinable and collection is deemed probable.
The amounts recorded as deferred contract revenue in the consolidated balance sheets represent invoiced amounts in advance of delivery of the service, and are net of services rendered through the respective consolidated balance sheet date. Such advance billings amounted to $13.2 million and $14.9 million, respectively, as of September 30, 2013 and 2012.
Property, Plant & Equipment and Other Assets
Maintenance and repairs are charged to expense and renewals and betterments are capitalized. Plant and equipment and other assets, primarily dosimetry badges, are recorded at cost and are depreciated or amortized on a straight-line basis over the estimated useful lives, which are primarily 30 years for buildings, three to eight years for equipment, five to ten years for internal software and thirty months to eight years for other assets. The Company assesses the carrying value and the remaining useful lives of its property, plant, equipment, and other assets when events or circumstances indicate the carrying value may not be recoverable or the estimated useful life may no longer be appropriate. Factors that could trigger this review include competitive conditions, government regulations and technological changes.
The Company capitalizes costs of software which is acquired, internally developed, or modified solely to meet the Company’s internal needs. In accordance with Financial Accounting Standards Boards (“FASB”) authoritative guidance, internal and external costs incurred to develop internal-use computer software during the application development stage are capitalized. Costs incurred during the preliminary project stage as well as training costs and
maintenance costs during the post implementation-operation stage are expensed. Capitalized costs of software amounted to $2.4 million and $10.3 million for fiscal 2013 and 2012, respectively.
Goodwill and Other Intangible Assets
The Company’s intangible assets include purchased customer lists, licenses, patents, trademarks, tradenames and goodwill. Purchased customer lists are recorded at cost and are amortized on a straight-line basis over estimated useful lives, which range from 10 to 15 years. Patents and licenses are also recorded at cost and are amortized on a straight-line basis over their useful lives, which range from 10 to 20 years. Tradenames have both definite lives up to 10 years and indefinite lives. The Company acquired goodwill primarily from its acquisitions of Landauer-Europe, SAPRA-Landauer, LMP and IZI as well as other smaller investments. Goodwill has an indefinite life.
FASB authoritative guidance requires that goodwill and certain intangible assets with indefinite lives be reviewed annually for impairment. The Company has three segments (reporting units), Radiation Measurement, Medical Physics and Medical Products. The Company performs an impairment test for each of its segments with goodwill annually. An impairment test is also performed for goodwill and other intangible assets that are not being amortized whenever events or changes in circumstances indicate that the carrying amount of the asset may not be recoverable. Triggering events include, but are not limited to, a current-period operating or cash flow loss; a product, technology, or service introduced by a competitor; or a loss of key personnel. When such events or changes in circumstances occur, the Company performs a financial analysis of future undiscounted cash flows projections by asset or asset group.
Pursuant to our policy, the Company performed the annual goodwill impairment test as of September 30, 2012 and determined that no impairment of goodwill existed as of that date. During the third quarter of fiscal 2013, it became apparent that recent changes implemented to the Medical Products segment had not yet achieved anticipated upward sales trends to the extent forecasted. Early budget reviews also indicated future sales growth may be less than expected. The Company updated the forecasted results of operations for the Medical Products operating segment based on the third quarter fiscal 2013 financial results and the best estimates of future operations. The updated forecast reflected a slower growth in revenues for the Medical Products segment due to anticipated continued pricing pressures from certain competitors greater than the anticipated growth from existing and new product sales. As a result, the Company concluded a triggering event occurred, and in connection with the preparation of the financial statements for the quarter ended June 30, 2013, the Company performed an impairment analysis with respect to the carrying value of goodwill in the Medical Products segment.
In accordance with FASB ASC Topic 350, the Company aggregates their business components into segments and test for goodwill impairment. Goodwill impairment is determined using a two-step process. The first step of the goodwill impairment test is to identify potential impairment by comparing the fair value of a segment with its net book value (or carrying amount), including goodwill. If the fair value of a segment exceeds its carrying amount, goodwill of the segment is considered not to be impaired and the second step of the impairment test is unnecessary. If the carrying amount of the segment exceeds its fair value, the second step of the goodwill impairment test is performed to measure the amount of the impairment loss, if any. The second step of the goodwill impairment test compares the implied fair value of the segment’s goodwill with the carrying amount of that goodwill. If the carrying amount of the segment’s goodwill exceeds the implied fair value of that goodwill, an impairment loss is recognized in an amount equal to that excess. The implied fair value of goodwill is determined in the same manner as the amount of goodwill recognized in a business combination. That is, the fair value of the segment is allocated to all of the assets and liabilities of that unit (including any unrecognized intangible assets) as if the segment had been acquired in a business combination, and the fair value of the segment was the purchase price paid to acquire the segment.
Based on the result of the first step of the goodwill impairment analysis, the Company determined that the fair value of the Medical Products segment was less than its carrying value as of June 30, 2013 and, as such, the Company applied the second step of the goodwill impairment test to this segment. Based on the result of this second step of the goodwill impairment analysis, the Company recorded a $22.7 million non-cash pretax charge to reduce the carrying value of goodwill in the Medical Products segment. As a result of the charge recognized during the third quarter of fiscal 2013, the carrying amount of the goodwill in the Medical Products segment was reduced to $41.4 million at June 30, 2013. Determining the fair value of a segment requires the Company’s management to make significant judgments, estimates and assumptions. These estimates and assumptions could have a significant
impact on whether or not an impairment charge is recognized and also the magnitude of any such charge. In estimating the fair value of the Medical Products segment, the Company considered the income approach and the market approach. The income approach recognizes that the value of an asset is premised upon the expected receipt of future economic benefits. This approach involves projecting the cash flows the asset is expected to generate. Fair value indications are developed in the income approach by discounting expected future cash flows available to the investor at a rate which reflects the risk inherent in the investment. The market approach is primarily comprised of comparable companies. This approach compares the subject segment to selected reasonably similar companies whose securities are actively traded in the public markets. Comparing revenue growth and EBITDA margins allows the Company to project an indicated range of fair values. In determining the fair value of the Medical Products segment, the Company has relied on a combination of the income approach and the market approach. For companies providing services similar to those provided by the Company, the income and market approaches will generally provide the most reliable indications of value because the value of such companies is more dependent on their ability to generate earnings than on the value of the individual assets.
In the income approach, the Company utilized a discounted cash flow analysis, which involved estimating the expected after-tax cash flows that will be generated by the Medical Products segment and then discounting these cash flows to present value reflecting the relevant risks associated with the segment and the time value of money. This approach requires the use of significant estimates and assumptions, including long-term projections of future cash flows, market conditions, discount rates reflecting the risk inherent in future cash flows, revenue growth, perpetual growth rates and profitability, among others. In estimating future cash flows for the Medical Products segment, the Company relied on an internally generated 10 year forecasts built around previous estimates and modified for recent weaknesses and business assumptions. The Company’s forecast is based on the Company’s historical experience, current backlog, expected market demand, and other industry information. The Company’s discounted cash flow analysis assumed an 11% weighted average cost of capital discount rate considering the segment as an independent standalone entity not part of the Company’s enterprise. In the market approach, we selected reasonably similar companies whose securities are actively traded in the public markets. Comparing revenue growth and EBITDA margins allows the Company to project an indicated range of fair values. These multiples were then applied to the operating data for the Medical Products segment and adjusted for factors to arrive at an indication of value.
While the Company believes that the estimates and assumptions underlying the valuation methodology are reasonable, different estimates and assumptions could result in different outcomes. The table below presents the decrease in the fair value of the Medical Products segment from the fourth quarter fiscal 2013 model given a one percent increase in the discount rate or a one percent decrease in the long term assumed annual revenue growth rate.
| | | |
| | | |
(Dollars in Thousands) | | | Decrease in Fair Value of the Medical Products Segment |
Discount rate - increase by 1% | | $ | 8,000 |
Long-term growth rate - decrease by 1% | | $ | 4,000 |
As described above, a goodwill impairment analysis requires significant judgments, estimates and assumptions. The results of this impairment analysis are as of a point in time. There is no assurance that the actual future earnings or cash flows of the Company’s segments will not decline significantly from our projections. Any significant decline in our operations could result in additional goodwill impairment charges. After taking into account the $22.7 million impairment charge, the carrying values of goodwill for each of our segments as of September 30, 2013 are as follows:
| | | | | | | | | | | |
| | | | | | | | | | | |
(Dollars in Thousands) | Radiation
Measurement | | Medical
Physics | | Medical
Products | | Total |
Goodwill at September 30, 2012 | $ | 20,037 | | $ | 22,611 | | $ | 64,069 | | $ | 106,717 |
Effects of foreign currency | | 419 | | | 0 | | | 0 | | | 419 |
Accumulated goodwill impairment | | 0 | | | 0 | | | (22,700) | | | (22,700) |
Goodwill at September 30, 2013 | $ | 20,456 | | $ | 22,611 | | $ | 41,369 | | $ | 84,436 |
Intangible assets represent purchased assets that lack physical substance but can be distinguished from goodwill. The Company’s intangible assets, net of accumulated amortization, totaled $37.6 million at September 30, 2013 and consist of customer lists, trademarks and trade names, licenses and patents as well as other intangibles. The Company uses valuation techniques in estimating the initial fair value of acquired intangible assets. These valuations are primarily based on the present value of the estimated net cash flows expected to be derived from the intangible assets, discounted for assumptions such as future customer attrition. The Company evaluates intangible assets for impairment annually or whenever events or changes in circumstances indicate that the carrying amount of the assets may not be recoverable. Therefore, changes such as higher or earlier-than-expected customer attrition or obsolescence of technology may result in higher future amortization charges or an impairment charge for intangible assets. As part of the goodwill impairment analysis discussed above, the Company also reviewed the Medical Products segment intangible assets and did not identify any impairment. Information regarding the value of goodwill and other intangible assets is presented under the footnote “Goodwill and Other Intangible Assets” in Item 8 of this Annual Report on Form 10‑K.
Income Taxes
The Company estimates the income tax provision for income taxes that are currently payable, and records deferred tax assets and liabilities for the temporary differences in tax consequences between the financial statements and tax returns. Temporary differences result from, among other events, revenues, expenses, gains, or losses that are included in taxable income of an earlier or later year than the year in which they are recognized in financial income. These deferred tax assets and liabilities are measured using enacted tax rates expected to apply to taxable income in the years in which those temporary differences are expected to be recovered or settled. To the extent that deferred tax assets will not likely be recovered from future taxable income, a valuation allowance is established against such deferred tax assets. The Company maintains cash indefinitely reinvested in foreign jurisdictions.
Management exercises significant judgment in the valuation of its current and deferred tax assets and liabilities. The Company recognizes the financial statement effects of its tax positions in its current and deferred tax assets and liabilities when it is more likely than not that the position will be sustained upon examination by a taxing authority. Management considers, among other factors, the Company’s current and past performance, the market environment in which the Company operates, and tax planning strategies. Further, the Company provides for income tax issues not yet resolved with federal, state, local, and foreign tax authorities. The Company assesses and updates its tax positions when significant changes in circumstances occur, which may cause a change in judgment about the likelihood of realizing the deferred items. Variations in the actual outcome of these future tax consequences could materially impact the Company’s financial position, results of operations or cash flows. Any change to the Company’s policy on cash indefinitely reinvested in foreign jurisdictions would not likely result in any significant incremental U.S. Federal and state income tax liability. Further information regarding the Company’s income taxes is contained under the footnote “Income Taxes” in Item 8 of this Annual Report on Form 10-K.
Defined Benefit Pension and Other Postretirement Benefit Plans
The pension expenses and benefit obligations recorded for the Company’s defined benefit plans are dependent on actuarial assumptions. The defined benefit pension and other postretirement benefit plans were frozen as of March 2009. These assumptions include discount rates, expected return on plan assets, interest costs, expected compensation increases, benefits earned, mortality rates, and other factors. Management reviews the plan assumptions on an annual basis to ensure that the most current, relevant information is considered. If actual results vary considerably from those that are expected or if future changes are made to these assumptions, the amounts recognized for these plans could change significantly.
The weighted-average assumed discount rates used to determine plan expenses were 3.77% for both pension and other benefits in fiscal 2013 and 4.60% for both pension and other benefits in fiscal 2012. For fiscal 2013 expense, the long-term rate of return of plan assets was 6.50%, unchanged from fiscal 2012. In establishing the rate, management considered the historical rates of return and the current and planned asset classes of the plan investment portfolio. The weighted-average discount rate used to determine benefit obligations at September 30, 2013 was 4.72% compared to the September 30, 2012 rate of 3.77%, adjusted to reflect the single rate that, when applied to the projected benefit disbursements from the plan, would result in the same discounted value as the array of rates that make up the Citigroup Pension Discount Curve as of September 30.
The Company recognizes on its balance sheet the amount by which the projected benefit obligations of its defined benefit plans exceed the fair value of plan assets. Subsequent changes in the funded status of the plans as a result of future transactions and events, amortization of previously unrecognized costs, and changes to actuarial assumptions are recognized as an asset or a liability and amortized as components of net periodic pension cost or accumulated other comprehensive income. An increase or decrease in the assumptions or economic events outside of management’s control could have a material effect on the Company’s results of operations or financial condition. Information regarding these plans is contained under the footnote “Employee Benefit Plans” in Item 8 of this Annual Report on Form 10-K.
Stock-Based Compensation
The Company measures and recognizes compensation cost at fair value for all stock-based awards, net of the estimated impact of forfeited awards. The Company has not granted stock options subsequent to fiscal 2005. The fair values of options were estimated using a Black-Scholes option pricing model. In addition to stock options, key employees and/or non-employee directors are eligible to receive performance shares and restricted stock. Upon the adoption of the Company’s Incentive Compensation Plan in February 2008, the fair value of performance shares and restricted stock granted under the new plan is based on the Company’s closing stock price on the grant date. The terms of performance share awards allow the recipients of such awards to earn a variable number of shares based on the achievement of the performance goals specified in the awards. Stock-based compensation expense associated with performance share awards is recognized based on management’s best estimates of the achievement of the performance goals specified in such awards and the resulting number of shares that are expected to be earned. The Company evaluates on a quarterly basis the progress towards achieving the performance criteria. The cumulative effect on current and prior periods of a change in the estimated number of performance share awards expected to be earned is recognized as compensation cost or as a reduction of cost in the period of the revised estimate. Compensation expense for restricted stock is recognized ratably over the vesting period.
Forfeitures of awards are estimated at the time of grant and stock-based compensation cost is recognized only for those awards expected to vest. The Company uses historical experience to estimate projected forfeitures. The Company recognizes the cumulative effect on current and prior periods of a change in the forfeiture rate, or actual forfeitures, as compensation cost or as a reduction of cost in the period of the revision. If revisions are made to management’s assumptions and estimates or if actual results vary considerably from those that are expected, stock-based compensation expense could change significantly, impacting the Company’s results of operations or financial condition. Further information regarding the Company’s stock-based awards is presented under the footnote “Stock-Based Compensation” in Item 8 of this Annual Report on Form 10‑K.
Results of Operations
Comparison of the Fiscal Years Ended September 30, 2013 and September 30, 2012
Revenues for fiscal 2013 were $150.2 million, a decrease of $2.2 million, or 1.4%, compared with revenues of $152.4 million for fiscal 2012. The Medical Products segment decreased by $4.0 million due to the decline in the Spherz selling price and shipments and the Radiation Measurement segment increased $1.9 million on higher international sales, primarily of equipment, offset by declines in domestic badge revenues.
Cost of sales for fiscal 2013 was $71.0 million, an increase of $5.6 million, or 8.6%, compared with cost of sales of $65.4 million for fiscal 2012. The cost of sales increase was due to the IT expenses related to the Company’s IT platform enhancement that went live a little over a year ago. Increased support costs of $3.2 million, increased IT systems depreciation of $1.3 million as well as international cost increases of $1.8 million on higher equipment shipments.
Selling, general and administrative expenses for fiscal 2013 were $51.0 million, a decrease of $0.1 million, compared with selling, general and administrative expenses of $51.1 million for fiscal 2012. Increases in customer service support of $1.0 million as well as increased IT systems depreciation of $1.0 million were offset by prior years IT system enhancement costs of $2.0 million. Service cost reductions in Medical Physics of $1.3 million offset increases in Medical Products of $0.7 million and Radiation Measurement of $0.3 million.
During the third quarter of fiscal 2013, it became apparent that anticipated revenue trends in our Medical Products segment were not being achieved to the extent forecasted. Early budget reviews also indicated future sales growth may be less than expected. The Company updated the forecasted results of operations for our Medical Products operating segment based on the most recent financial results and our best estimates of future operations. The updated forecast reflects a slower growth in revenues for the Medical Products segment due to anticipated continued pricing pressures from certain competitors greater than the anticipated growth from existing and new product sales. As a result of these lowered actual and forecasted results, the Company performed a goodwill impairment test, which indicated the value of the Medical Products goodwill was less than its book value. The Company recorded a $22.7 million pretax charge for the impairment of goodwill to reduce the carrying value of goodwill in the Company’s Medical Products segment. The impairment charge was non-cash in nature and does not affect the Company’s liquidity or debt covenant compliance.
Acquisition, reorganization and nonrecurring costs were $1.4 million and consisted of $0.6 million in corporate reorganization expenses, $0.4 million reserves for escheatment liability and $0.4 million of costs related to acquisitions.
Operating income for fiscal 2013 was $4.1 million, a decrease of $24.1 million, or 85.5%, compared with operating income of $28.2 million for fiscal 2012. The decrease in operating income was due primarily to the $22.7 million goodwill impairment charge to reduce the carrying value of goodwill in our Medical Products segment. The remaining variance of $1.0 million to prior year relates to Medical Products revenue decrease of $4.0 million offset by $1.9 million of increased Radiation Measurement revenue. Increased cost of sales due to the IT platform enhancement of $4.5 million and increased international costs of $1.8 million offset by cost savings of $0.8 million and selling, general and administrative expenses higher by $0.9 million.
Equity in income of joint ventures for fiscal 2013 was $3.9 million, an increase of $0.7 million, or 21.9%, compared with equity in income of joint ventures of $3.2 million for fiscal 2012. Interest expense for fiscal 2013 was $4.2 million, an increase of $0.9 million, or 27.2%, compared with interest expense of $3.3 million for fiscal 2012.
The effective tax rate was (27.2%), or ($1.2) million benefit, and 28.6%, or $8.0 million expense, for fiscal 2013 and 2012, respectively. The fiscal 2013 effective tax rate decreased due primarily to an increased realization of certain U.S. tax credits and mix of earnings by jurisdiction.
Net income for fiscal 2013 was $4.8 million, a decrease of $14.5 million, or 75.1%, compared with net income of $19.3 million for fiscal 2012. The decrease in net income was due primarily to a goodwill impairment charge of $22.7 million, decreased Medical Products revenue of $4.0 million offset by $1.9 million of increased Radiation Measurement revenue. Increased cost of sales was due primarily to the IT platform enhancement of $4.5 million and increased international costs of $1.8 million and higher selling, general and administrative expense of $0.9 million offset by cost savings of $0.8 million. Income taxes offset the decreases by $9.2 million.
EBITDA for fiscal 2013 was $22.3 million, a 46.8% decrease compared with $41.9 million in the prior year. The decrease was due primarily to a non-cash charge for goodwill impairment. Adjusted EBITDA for fiscal 2013 was $49.2 million, a 9.2% decrease compared with $54.2 million in the prior year. A reconciliation of net income to EBITDA, Adjusted EBITDA, Adjusted Net Income and Non-GAAP diluted earnings per share is included herein under Part II, Section 6.
Radiation Measurement Segment
Radiation Measurement revenues for fiscal 2013 were $109.8 million, an increase of $1.9 million, or 1.8%, compared with revenues of $107.9 million for fiscal 2012. Revenues increased $3.0 million primarily on higher international equipment sales of $3.0 million due to tenders in China and EMEA while domestic Inlight equipment decreases were offset by increases in Radwatch products. In addition, the segment had decreased domestic service badge revenue of $1.0 million and foreign exchange losses of $0.1 million.
Radiation Measurement operating income for fiscal 2013 was $22.4 million, an increase of $0.9 million, or 4.2%, compared with operating income of $21.5 million for fiscal 2012. The revenue increase of $1.9 million was partially offset by IT platform enhancement increases of $3.2 million, IT systems depreciation of $2.3 million and increased international equipment costs of $1.8 million on higher sales and increased customer service support of $1.0 million offset by prior year non-recurring acquisition costs of $3.2 million and asset abandonments of $2.5 million and prior year IT Platform expenses of $2.0 million and decreased material costs of $0.3 million.
Corporate expenses for shared functions are recognized in Radiation Measurement segment where they have been reported historically. Acquisition, reorganization and nonrecurring costs are not allocated to the segment. As the Company’s business model evolves in increased complexity, management may determine it will be necessary to change this reporting practice to reflect any appropriate allocations.
Medical Physics Segment
Medical Physics revenues were $30.9 million for both fiscal 2013 and 2012.
Medical Physics operating income for fiscal 2013 was $3.5 million, an increase of $2.2 million, or 169.2%, compared with operating income of $1.3 million for fiscal 2012. The increase in operating income was primarily due to operating efficiencies in the core Medical Physics business as well as segment administration cost reductions.
Medical Products Segment
Medical Products revenues for fiscal 2013 were $9.5 million, a decrease of $4.0 million, or 29.6%, compared with revenues of $13.5 million for fiscal 2012. The Medical Products segment decreased by $4.0 million due to the decline in the Spherz selling price and shipments. While the Company continues to experience pricing pressure on its Spherz product line, the Company currently anticipates that the planned expansion of certain other product lines in its Medical Products segment may mitigate the impact of the Spherz pricing pressure on the results of operations of its Medical Products segment.
Medical Products operating loss for fiscal 2013 was $21.8 million, a decrease of $27.1 million, or 511.3%, compared with operating income of $5.3 million for fiscal 2012. The decrease was primarily attributable to the third quarter goodwill impairment charge of $22.7 million and the revenue decrease of $4.0 million due to the decline in Spherz selling price and shipments and additional tradename amortization of $0.4 million.
Comparison of the Fiscal Years Ended September 30, 2012 and September 30, 2011
Revenues for fiscal 2012 were $152.4 million, an increase of $31.9 million, or 26.5%, compared with revenues of $120.5 million for fiscal 2011. The Medical Physics segment and the Radiation Measurement segment
contributed an increase of $10.3 million and $8.1 million, respectively. The contribution of the new Medical Products segment increased revenues by $13.5 million. Consolidated revenue for the fiscal year ended September 30, 2012 was negatively affected $2.0 million by currency fluctuation, as compared with the prior year, principally due to weakness in the Euro against the U.S. dollar.
Cost of sales for fiscal 2012 was $65.4 million, an increase of $17.9 million, or 37.6%, compared with cost of sales of $47.5 million for fiscal 2011. The increase in cost of sales was primarily driven by $8.3 million associated with acquired companies purchased subsequent to the prior year, $3.5 million in cost of sales associated with sales from the Company’s ongoing military and first responder initiatives, $1.5 million in cost of sales associated with international revenue increases, $0.7 million increase in depreciation related to the Company’s IT platform enhancements and the impact of the mix of lower margin equipment sales within Radiation Measurement. Gross margins were 57.1% for fiscal 2012, compared with 60.6% for fiscal 2011. The decrease in the gross margin rate was primarily due to a shift in the mix of cost of sales resulting from the overall growth of the Medical Physics segment, which has lower margins compared to the Radiation Measurement and Medical Products segments, along with lower margin equipment sales, including Radwatch System sales to the military and First Responder markets, in the Radiation Measurement segment.
Selling, general and administrative expenses for fiscal 2012 were $51.1 million, an increase of $14.5 million, or 39.7%, compared with selling, general and administrative expenses of $36.6 million for fiscal 2011. The selling, general and administrative expenses increase was due to $6.3 million associated with acquired companies purchased subsequent to the prior year, $2.4 million due to performance against incentive compensation plans associated with improved operating performance in fiscal 2012 versus targets, $1.7 million in expenses related to the Company’s IT platform enhancements, $1.5 million for investment in research and development in support of military and first responder initiatives, $1.4 million investment in customer facing organizations and $0.8 million for expenses supporting international growth.
For fiscal 2012, total operating expenses were $58.8 million compared to $38.1 million for fiscal 2011. Before $4.3 million of non-recurring acquisition expenses, $3.4 million for asset abandonments, $2.2 million of IT platform enhancement related expenses and $2.4 million of non-cash stock based compensation expenses, were $46.5 million, or 30.5% of total revenues for fiscal 2012. This compares with the $33.9 million, or 28.2% of total revenues, reported for fiscal 2011, before $1.5 million of non-recurring acquisition expenses, $1.2 million of IT platform enhancement related expenses, and $1.5 million of non-cash stock based compensation expenses.
Operating income for fiscal 2012 was $28.2 million, a decrease of $6.7 million, or 19.2%, compared with operating income of $34.9 million for fiscal 2011. The decrease in operating income was primarily driven by a $6.2 million increase in non-recurring acquisition and reorganization costs and asset abandonment charges incurred in fiscal 2012. An additional decline of $8.4 million in Radiation Measurement operating income, due primarily to the higher operating expenses, was partially offset by an increase in operating income of $1.8 million in the Medical Physics segment and the addition of the Medical Products segment which contributed $5.3 million in operating income. Operating income, adjusted for non-recurring acquisition and reorganization expenses, asset abandonment charges, IT platform enhancement related expenses, and non-cash stock based compensation expenses, for fiscal 2012 was $40.5 million, a 3.7% increase compared with operating income, adjusted for these items on a relative basis, of $39.0 million for fiscal 2011.
Equity in income of joint ventures for fiscal 2012 was $3.2 million, an increase of $1.0 million, or 45.2%, from the prior year. Other expense, including interest expense, for fiscal 2012 was $3.2 million, an increase of $2.9 million from the prior year, due to interest expense associated with borrowings to acquire IZI in the first fiscal quarter of 2012.
The effective tax rate was 28.6% and 31.4% for fiscal 2012 and 2011, respectively. The fiscal 2012 effective tax rate decreased due primarily to an increased realization of the Foreign Tax Credit and an increased research and development credit by a foreign affiliate.
Net income for fiscal 2012 was $19.3 million, a decrease of $5.2 million, or 21.5%, compared with $24.5 million for fiscal 2011. Excluding the costs associated with the acquisitions and reorganization costs, asset abandonment charges, IT platform enhancement and non-cash stock based compensation, adjusted net income was
$28.1 million, as compared to $27.4 million in the prior year. The resulting adjusted diluted earnings per share for the fiscal year ended September 30, 2012 were $2.97 per share, excluding $0.94 per diluted share of acquisition and reorganization costs, asset abandonment charges, IT platform enhancement, and non-cash stock based compensation expenses. This compares with $2.89 per share, excluding $0.31 per diluted share of acquisition, IT platform enhancement, and non-cash stock based compensation expenses, for the fiscal year ended September 30, 2011.
EBITDA for fiscal 2012 was $41.9 million, a 5.5% decrease compared with $44.3 million in the prior year. The decrease was due primarily to the increase in non-recurring acquisition and reorganization costs, asset abandonment charges, IT platform enhancement and non-cash stock based compensation expenses. Adjusted EBITDA for fiscal 2012 was $54.2 million, an 11.9% increase compared with $48.5 million in the prior year. A reconciliation of net income to EBITDA, Adjusted EBITDA, Adjusted Net Income and Non-GAAP diluted earnings per share is included herein under Part II, Section 6.
The following is a discussion of the Company’s segment operating results.
Radiation Measurement Segment
Radiation Measurement revenues for fiscal 2012 were $107.9 million, an increase of 8.1%, or $8.1 million, from fiscal 2011 of $99.9 million. Of the increase, $6.7 million was related to the impact of higher equipment sales from the Company’s ongoing initiatives with the military market. International Radiation Measurement revenues increased $1.3 million, or 4.5%, from the prior year, driven primarily by organic growth in most regions, including both equipment sales and service revenues, partially offset by $2.0 million of foreign exchange losses.
Radiation Measurement operating income for fiscal 2012 decreased to $21.5 million, a 39.1% decrease from $35.4 million in the prior year, impacted by the increase and mix in lower margin equipment sales both domestically and internationally, including Radwatch System sales to the military, and higher selling, general and administrative expenses. Selling, general and administrative costs for fiscal 2012 increased 42.6%, or $13.9 million, to $46.6 million. The increase was due primarily to a $5.5 million increase in non-recurring acquisition and reorganization costs, asset abandonment charges, IT platform enhancement and non-cash stock based compensation related expenses, a $2.4 million increase in compensation costs, consistent with operating performance expectations and timing of short-term and long-term incentive plans, a $1.5 million increase in research and development activities in connection with the military and first responder initiatives, $0.8 million of increased spending to support international revenue growth, a $1.4 million investment in customer facing organizations, a $0.3 million increase in employee benefit plans and medical expenses, $0.6 million of increased professional fees, and a $1.7 million increase due to the Company’s IT platform enhancement. Radiation Measurement operating income for fiscal 2012 was negatively affected $0.6 million, as compared with the prior year, by currency fluctuation, principally due to weakness in the Euro and the Real against the U.S. dollar.
Radiation Measurement operating income, adjusted for the impact of acquisition related transaction expenses, asset abandonment charges, IT platform enhancement expenses, and non-cash stock based compensation expenses, for fiscal 2012 decreased 16.2%, or $6.4 million, to $33.1 million compared with adjusted operating income of $39.5 million for fiscal 2011.
Corporate expenses for shared functions are recognized in the Radiation Measurement segment where they have been reported historically. Acquisition and reorganization costs are not allocated to the segments. As the Company’s business model evolves in increased complexity, management may determine it necessary to change this reporting practice to reflect any appropriate allocations.
Medical Physics Segment
Medical Physics revenues for fiscal 2012 of $30.9 million increased 50.3%, or $10.3 million, from fiscal 2011 of $20.6 million on $2.2 million of organic growth and $8.1 million due to the impact of acquired companies. The Medical Physics segment operating income of $1.3 million, or 4.3% of revenues, increased $1.8 million as compared to a loss of $0.5 million, or 2.4% of revenues, for fiscal 2011. The improvement in operating income was primarily due to operating efficiencies in the core Medical Physics business and higher episodic equipment commissioning sales leveraging a relatively fixed cost structure, as well as higher volume sales inclusive of acquired companies.
Medical Products Segment
With the acquisition of IZI on November 14, 2011, the Company now operates in a third reportable segment, Medical Products. Revenues for the period from the date of acquisition through September 30, 2012 were $13.5 million. Medical Products operating income was $5.3 million or 39.1% of revenues for the same period. Given the acquisition of IZI was completed during the first quarter of fiscal 2012, there is no direct comparison to the prior fiscal year.
Fiscal 2014 Outlook
The Company’s business plan for fiscal 2014 currently anticipates aggregate revenues for the year to be in the range of $140 to $160 million and reflects the uncertainty of government funding during fiscal 2014 for the military equipment sales opportunities the company has developed.
The business plan also anticipates an effective tax rate for the full fiscal year to be within a range of 28 percent to 32 percent.
Based upon the above assumptions, the Company anticipates reported net income for fiscal 2014 in the range of $16 to $18 million and Adjusted EBITDA expected for fiscal 2014 in the range of $46 to $49 million.
Liquidity and Capital Resources
Cash and cash equivalents decreased $6.4 million to $11.2 million during fiscal 2013. The Company’s primary sources of liquidity are cash flows from operations and funds available under its syndicated credit facility. At the end of fiscal 2013, the Company has $32.0 million available under the loan agreement and in compliance with all covenants.
Cash provided by operating activities for fiscal 2013 was $23.0 million, a 38.7% decrease compared to $37.5 million for fiscal 2012. The decrease in operating cash flow was primarily driven by a decrease in accounts payable, an increase in prepaid taxes and an increase in other assets.
Cash used by investing activities for fiscal 2013 was $8.5 million compared to a use of $126.1 million in fiscal 2012. The primary reason for the increase in fiscal 2012 was the Company’s acquisitions of joint ventures and businesses, primarily IZI, as described under the footnote “Business Combinations” herein. Investing activities included the Company’s acquisitions of property, plant and equipment of $6.4 million and $15.2 million during fiscal 2013 and 2012, respectively.
Financing activities for fiscal 2013 were comprised primarily of long-term borrowings on the credit agreement, repayments of long-term borrowings and payments of cash dividends to shareholders. During fiscal 2013, the Company funded cash dividends of $20.9 million, or $0.55 per share; Fiscal year 2012, the Company funded cash dividends of $20.8 million, or $0.55 per share. If the Company would repatriate cash from its’ indefinitely reinvested foreign jurisdictions it does not anticipate any significant incremental U.S. Federal and state income tax liability.
On August 2, 2013, the Company entered into an amended and restated revolving credit agreement (the “Credit Agreement”) with its group of lenders that provided, among other things, the extension of the expiration date from November 14, 2016 to August 2, 2018 and the accordion feature increased from $25.0 million to $50.0 million.
In addition, the covenants for minimum net worth have been deleted from the Credit Agreement. The leverage ratio covenants have changed to a maximum 3.50 to 1.00 for the period of September 30, 2013 through June 30, 2015, and to a maximum 3.25 to 1.00 for the periods September 30, 2015 and thereafter. The fixed charge ratio covenants have changed to a minimum 1.10 to 1.00 for the period of September 30, 2013 through June 30, 2015, and to a minimum 1.15 to 1.00 for the periods September 30, 2015 and thereafter. The amended terms provide for an interest rate equal to LIBOR plus a margin of between 1.25% and 2.50% and for the base rate a margin of between 0.25% and 1.50% as compared to a Libor margin of between 1.25% and 2.75%, and a base rate margin of between 0.25% and 1.75% in the current credit agreement.
Contractual Obligations
As of September 30, 2013, the expected resources required for scheduled payment of contractual obligations were as follows:
| | | | | | | | | | | | | | | |
| | | | | | | | | | | | | | | |
| | Schedules payments by fiscal year |
(Dollars in Thousands) | | Total | | 2014 | | 2015-16 | | 2017-18 | | Thereafter |
Long-term debt (1) | | $ | 164,385 | | $ | 4,320 | | $ | 8,640 | | $ | 151,425 | | $ | - |
Capital leases | | | 97 | | | 68 | | | 8 | | | 8 | | | 13 |
Operating leases | | | 6,421 | | | 1,092 | | | 1,824 | | | 1,623 | | | 1,882 |
Purchase obligations (2) | | | 15,033 | | | 15,033 | | | - | | | - | | | - |
Dividends (3) | | | 5,419 | | | 5,419 | | | - | | | - | | | - |
Pension and postretirement benefits (4) | | | 3,822 | | | 388 | | | 749 | | | 750 | | | 1,935 |
Total obligations | | $ | 195,177 | | $ | 26,320 | | $ | 11,221 | | $ | 153,806 | | $ | 3,830 |
(1)Includes estimated interest expense calculated using the variable interest rate at September 30, 2013 of 3.03% for current outstanding borrowing facility amount with no planned repayment.
(2)Includes accounts payable and other agreements to purchase goods or services including open purchase orders; also includes remaining contractual obligations associated with the Company’s IT platform enhancement.
(3)Cash dividends in the amount of $0.55 per share were declared on August 23, 2013.
(4)Includes estimated future benefit payments for supplemental key executive retirement plans and a terminated retirement plan that provides certain retirement benefits payable to non-employee directors. The amounts are actuarially determined, which includes the use of assumptions, and may vary significantly from expectations.
The Company is not able to reasonably estimate the ultimate timing of the payments or the amount by which its uncertain tax positions of $0.6 million will be settled. Therefore, the liability is excluded from the preceding table. Further information regarding the Company’s income taxes is contained under the footnote “Income Taxes” in Item 8 of this Annual Report on Form 10-K.
Off-Balance Sheet Arrangements
At September 30, 2013, the Company had no off-balance sheet financing or other arrangements with unconsolidated entities or financial partnerships (such as entities often referred to as structured finance or special purpose entities) established for purposes of facilitating off-balance sheet financing or other debt arrangements or for other contractually narrow or limited purposes.
Recent Accounting Pronouncements
See Note 1 to the Consolidated Financial Statements in Item 8 of this Form 10-K.
Inflation
The Company strives to reflect the inflationary impact of materials, labor and other operating costs and expenses in its prices. The market for the services and products that the Company offers, however, is highly competitive, and in some cases has limited the ability of the Company to offset inflationary cost increases.
Item 7A. Quantitative and Qualitative Disclosures about Market Risk
The Company is exposed to market risk, including changes in foreign currency exchange rates. The financial statements of the Company’s international subsidiaries are remeasured into U.S. dollars using the U.S. dollar as the reporting currency. To date, the market risk associated with foreign currency exchange rates has not been material in relation to the Company’s financial position, results of operations, or cash flows. These risks could increase, however, as the Company expands in international markets and markets becomes more volatile. The Company estimates that a 10% and 20% adverse change in the underlying foreign currency exchange rates would have decreased reported net income in fiscal 2013 by approximately $0.8 million and $1.4 million, respectively. Historically, the Company believes that adverse changes in foreign exchange rates have not materially impacted its financial condition.
Item 8. Financial Statements and Supplementary Data
Consolidated Balance Sheets
Landauer, Inc. and Subsidiaries
As of September 30,
| | | | | | |
| | | | | | |
(Dollars in Thousands) | | 2013 | | 2012 |
ASSETS | | | | | | |
Current assets: | | | | | | |
Cash and cash equivalents | | $ | 11,184 | | $ | 17,633 |
Receivables, net of allowances of $600 in 2013 and $1,088 in 2012 | | | 38,419 | | | 35,165 |
Inventories | | | 9,539 | | | 8,638 |
Prepaid income taxes (Note 9) | | | 3,132 | | | 2,148 |
Prepaid expenses and other current assets | | | 4,019 | | | 3,975 |
Current assets | | | 66,293 | | | 67,559 |
Property, plant and equipment, at cost: | | | | | | |
Land and improvements | | | 591 | | | 591 |
Buildings and improvements | | | 4,341 | | | 4,327 |
Internal software | | | 52,304 | | | 50,108 |
Equipment | | | 50,210 | | | 46,349 |
Total property, plant and equipment cost | | | 107,446 | | | 101,375 |
Accumulated depreciation and amortization | | | (55,514) | | | (46,983) |
Net property, plant and equipment | | | 51,932 | | | 54,392 |
Equity in joint ventures (Note 7) | | | 23,942 | | | 24,108 |
Goodwill (Note 8) | | | 84,436 | | | 106,717 |
Intangible assets, net of accumulated amortization of $13,605 in 2013 and $9,696 in 2012 (Note 8) | | | 37,161 | | | 37,402 |
Dosimetry devices, net of accumulated depreciation of $9,472 in 2013 and $8,879 in 2012 | | | 5,798 | | | 6,189 |
Other assets (Note 3) | | | 7,271 | | | 5,758 |
ASSETS | | $ | 276,833 | | $ | 302,125 |
| | | | | | |
LIABILITIES AND STOCKHOLDERS’ EQUITY | | | | | | |
Current liabilities: | | | | | | |
Accounts payable | | $ | 6,310 | | $ | 9,656 |
Dividends payable | | | 5,419 | | | 5,345 |
Deferred contract revenue | | | 13,181 | | | 14,947 |
Accrued compensation and related costs | | | 8,207 | | | 8,260 |
Other accrued expenses | | | 7,531 | | | 7,096 |
Current liabilities | | | 40,648 | | | 45,304 |
Non-current liabilities: | | | | | | |
Long-term debt (Note 10) | | | 142,785 | | | 141,347 |
Pension and postretirement obligations (Note 12) | | | 13,047 | | | 17,586 |
Deferred income taxes (Note 9) | | | 9,817 | | | 15,733 |
Other non-current liabilities | | | 915 | | | 1,053 |
Non-current liabilities | | | 166,564 | | | 175,719 |
| | | | | | |
Commitments and Contingencies (Note 13) | | | | | | |
| | | | | | |
STOCKHOLDERS’ EQUITY | | | | | | |
Preferred stock, $.10 par value per share, authorized 1,000,000 shares; none issued | | | - | | | - |
Common stock, $.10 par value per share, authorized 20,000,000 shares; 9,575,926 and 9,493,368 issued and outstanding, respectively, in 2013 and 2012 (Note 11) | | | 958 | | | 949 |
Additional paid in capital | | | 39,465 | | | 35,898 |
Accumulated other comprehensive loss | | | (4,456) | | | (5,272) |
Retained earnings | | | 32,012 | | | 48,142 |
Landauer, Inc. stockholders’ equity | | | 67,979 | | | 79,717 |
Noncontrolling interest | | | 1,642 | | | 1,385 |
Stockholders’ equity | | | 69,621 | | | 81,102 |
LIABILITIES AND STOCKHOLDERS’ EQUITY | | $ | 276,833 | | $ | 302,125 |
The accompanying notes are an integral part of these financial statements.
Consolidated Statements of Income
Landauer, Inc. and Subsidiaries
For the Years Ended September 30,
| | | | | | | | | |
| | | | | | | | | |
(Dollars in Thousands, Except per Share) | | 2013 | | 2012 | | 2011 |
Service revenues | | $ | 126,840 | | $ | 124,979 | | $ | 114,364 |
Product revenues | | | 23,360 | | | 27,421 | | | 6,094 |
Net revenues | | | 150,200 | | | 152,400 | | | 120,458 |
Costs and expenses: | | | | | | | | | |
Service costs | | | 59,859 | | | 53,489 | | | 43,241 |
Product costs | | | 11,161 | | | 11,903 | | | 4,269 |
Total cost of sales | | | 71,020 | | | 65,392 | | | 47,510 |
Selling, general, and administrative | | | 50,968 | | | 51,096 | | | 36,576 |
Goodwill impairment charge | | | 22,700 | | | - | | | - |
Acquisition, reorganization and nonrecurring costs | | | 1,392 | | | 4,299 | | | 1,489 |
Abandonment charges | | | - | | | 3,443 | | | - |
Operating income | | | 4,120 | | | 28,170 | | | 34,883 |
Equity in income of joint ventures | | | 3,881 | | | 3,181 | | | 2,191 |
Interest expense, net | | | (4,184) | | | (3,308) | | | (270) |
Other income (expense), net | | | 663 | | | 97 | | | (69) |
Income before taxes | | | 4,480 | | | 28,140 | | | 36,735 |
Income tax (benefit) expense | | | (1,216) | | | 8,040 | | | 11,527 |
Net income | | | 5,696 | | | 20,100 | | | 25,208 |
Less: Net income attributed to noncontrolling interest | | | 860 | | | 830 | | | 670 |
Net income attributed to Landauer, Inc. | | $ | 4,836 | | $ | 19,270 | | $ | 24,538 |
Net income per share attributed to Landauer, Inc. shareholders: | | | | | | | | | |
Basic | | $ | 0.50 | | $ | 2.04 | | $ | 2.60 |
Weighted average basic shares outstanding | | | 9,434 | | | 9,389 | | | 9,395 |
Diluted | | $ | 0.49 | | $ | 2.03 | | $ | 2.58 |
Weighted average diluted shares outstanding | | | 9,482 | | | 9,437 | | | 9,477 |
The accompanying notes are an integral part of these financial statements.
Consolidated Statements of Comprehensive Income
Landauer, Inc. and Subsidiaries
For the Years Ended September 30,
| | | | | | | | | |
| | | | | | | | | |
| | 2013 |
(Dollars in Thousands) | | Landauer, Inc. | | Noncontrolling
Interest | | Total |
Net income attributed to Landauer, Inc. | | $ | 4,836 | | $ | 860 | | $ | 5,696 |
Other comprehensive income: | | | | | | | | | |
Defined benefit pension and postretirement plans activity, net of taxes of ($1,911) | | | 2,894 | | | - | | | 2,894 |
Foreign currency translation adjustment | | | (2,078) | | | (177) | | | (2,255) |
Comprehensive income | | $ | 5,652 | | $ | 683 | | $ | 6,335 |
| | | | | | | | | |
| | 2012 |
(Dollars in Thousands) | | Landauer, Inc. | | Noncontrolling
Interest | | Total |
Net income attributed to Landauer, Inc. | | $ | 19,270 | | $ | 830 | | $ | 20,100 |
Other comprehensive income: | | | | | | | | | |
Defined benefit pension and postretirement plans activity, net of taxes of $813 | | | (1,757) | | | - | | | (1,757) |
Foreign currency translation adjustment | | | (386) | | | (197) | | | (583) |
Comprehensive income | | $ | 17,127 | | $ | 633 | | $ | 17,760 |
| | | | | | | | | |
| | 2011 |
(Dollars in Thousands) | | Landauer, Inc. | | Noncontrolling
Interest | | Total |
Net income attributed to Landauer, Inc. | | $ | 24,538 | | $ | 670 | | $ | 25,208 |
Other comprehensive income: | | | | | | | | | |
Defined benefit pension and postretirement plans activity, net of taxes of $1,496 | | | (2,632) | | | - | | | (2,632) |
Foreign currency translation adjustment | | | 286 | | | (167) | | | 119 |
Comprehensive income | | $ | 22,192 | | $ | 503 | | $ | 22,695 |
The accompanying notes are an integral part of these financial statements.
Consolidated Statements of Stockholders’ Equity
Landauer, Inc. and Subsidiaries
| | | | | | | | | | | | | | | | | | | |
| | | | | | | | | | | | | | | | | | | |
| | | | Landauer, Inc. Stockholders’ Equity | | | | | | |
(Dollars in Thousands) | Common Stock Shares | | | Common
Stock | | | Additional Paid In Capital | | | Accumulated Other Comprehensive
Income | | | Retained
Earnings | | | Non-controlling
Interest | | | Total |
Balance September 30, 2010 | 9,452,765 | | $ | 945 | | $ | 32,688 | | $ | (783) | | $ | 45,940 | | $ | 913 | | $ | 79,703 |
Stock-based compensation arrangements | 10,042 | | | 1 | | | 1,103 | | | - | | | - | | | - | | | 1,104 |
Dividends | - | | | - | | | - | | | - | | | (20,754) | | | (340) | | | (21,094) |
Net income | - | | | - | | | - | | | - | | | 24,538 | | | 670 | | | 25,208 |
Foreign currency translation adjustment | - | | | - | | | - | | | 286 | | | - | | | (167) | | | 119 |
Defined benefit pension and postretirement plans activity, net of tax | - | | | - | | | - | | | (2,632) | | | - | | | 0 | | | (2,632) |
Balance September 30, 2011 | 9,462,807 | | $ | 946 | | $ | 33,791 | | $ | (3,129) | | $ | 49,724 | | $ | 1,076 | | $ | 82,408 |
Stock-based compensation arrangements | 30,561 | | | 3 | | | 2,107 | | | - | | | - | | | - | | | 2,110 |
Dividends | - | | | - | | | - | | | - | | | (20,852) | | | (324) | | | (21,176) |
Net income | - | | | - | | | - | | | - | | | 19,270 | | | 830 | | | 20,100 |
Foreign currency translation adjustment | - | | | - | | | - | | | (386) | | | - | | | (197) | | | (583) |
Defined benefit pension and postretirement plans activity, net of tax | - | | | - | | | - | | | (1,757) | | | - | | | - | | | (1,757) |
Balance September 30, 2012 | 9,493,368 | | $ | 949 | | $ | 35,898 | | $ | (5,272) | | $ | 48,142 | | $ | 1,385 | | $ | 81,102 |
Stock-based compensation arrangements | 82,558 | | | 9 | | | 3,567 | | | - | | | - | | | - | | | 3,576 |
Dividends | - | | | - | | | - | | | - | | | (20,966) | | | (426) | | | (21,392) |
Net income | - | | | - | | | - | | | - | | | 4,836 | | | 860 | | | 5,696 |
Foreign currency translation adjustment | - | | | - | | | - | | | (2,078) | | | - | | | (177) | | | (2,255) |
Defined benefit pension and postretirement plans activity, net of tax | - | | | - | | | - | | | 2,894 | | | - | | | - | | | 2,894 |
Balance September 30, 2013 | 9,575,926 | | $ | 958 | | $ | 39,465 | | $ | (4,456) | | $ | 32,012 | | $ | 1,642 | | $ | 69,621 |
The accompanying notes are an integral part of these financial statements.
Consolidated Statements of Cash Flows
Landauer, Inc. and Subsidiaries
For the Years Ended September 30,
| | | | | | | | | |
| | | | | | | | | |
(Dollars in Thousands) | | 2013 | | 2012 | | 2011 |
Cash flows provided from operating activities: | | | | | | | | | |
Net income | | $ | 5,696 | | $ | 20,100 | | $ | 25,208 |
Adjustments to reconcile net income to net cash provided by operating activities: | | | | | | | | | |
Depreciation and amortization | | | 14,924 | | | 11,631 | | | 7,991 |
Goodwill impairment charge | | | 22,700 | | | - | | | - |
(Gain) loss on sale, disposal and abandonment of assets | | | (32) | | | 3,455 | | | 89 |
Equity in income of joint ventures | | | (3,881) | | | (3,181) | | | (2,191) |
Dividends from joint ventures | | | 1,891 | | | 1,393 | | | 911 |
Stock-based compensation and related net tax benefits | | | 2,541 | | | 2,413 | | | 1,435 |
Current and long-term deferred taxes, net | | | (5,858) | | | 2,833 | | | 1,687 |
Changes in operating assets and liabilities: | | | | | | | | | |
Increase in accounts receivable, net | | | (3,113) | | | (7,636) | | | (1,855) |
(Increase) decrease in prepaid taxes | | | (985) | | | 2,774 | | | 514 |
Increase in other operating assets, net | | | (4,036) | | | (1,925) | | | (3,984) |
(Decrease) increase in accounts payable and other accrued liabilities | | | (3,389) | | | 3,982 | | | (323) |
(Decrease) increase in other operating liabilities, net | | | (3,501) | | | 1,678 | | | 1,755 |
Net cash provided by operating activities | | | 22,957 | | | 37,517 | | | 31,237 |
| | | | | | | | | |
Cash flows used by investing activities: | | | | | | | | | |
Acquisition of property, plant & equipment | | | (6,352) | | | (15,196) | | | (12,923) |
Acquisition of joint ventures and businesses, net of cash acquired | | | - | | | (110,057) | | | (2,847) |
Other investing activities, net | | | (2,151) | | | (880) | | | (1,579) |
Net cash used by investing activities | | | (8,503) | | | (126,133) | | | (17,349) |
| | | | | | | | | |
Cash flows (used) provided by financing activities: | | | | | | | | | |
Net borrowings on revolving credit facility | | | (19) | | | (19,803) | | | 7,313 |
Long–term borrowings - loan | | | 27,691 | | | 144,797 | | | - |
Long–term borrowings - repayment | | | (27,187) | | | (5,300) | | | - |
Dividends paid to stockholders | | | (20,897) | | | (20,808) | | | (20,593) |
Other financing activities, net | | | (261) | | | (210) | | | (155) |
Net cash (used) provided by financing activities | | | (20,673) | | | 98,676 | | | (13,435) |
| | | | | | | | | |
Effects of foreign currency translation | | | (230) | | | (341) | | | (198) |
| | | | | | | | | |
Net (decrease) increase in cash and cash equivalents | | | (6,449) | | | 9,719 | | | 255 |
Opening balance – cash and cash equivalents | | | 17,633 | | | 7,914 | | | 7,659 |
Ending balance – cash and cash equivalents | | $ | 11,184 | | $ | 17,633 | | $ | 7,914 |
| | | | | | | | | |
Supplemental disclosure of cash flow information: | | | | | | | | | |
Cash paid for interest, net of amounts capitalized | | $ | 4,441 | | $ | 3,582 | | $ | 436 |
Cash paid for income taxes | | $ | 7,374 | | $ | 2,050 | | $ | 8,011 |
The accompanying notes are an integral part of these financial statements.
Notes to Consolidated Financial Statements
Landauer, Inc. and Subsidiaries
(Dollars in thousands)
1. Summary of Significant Accounting Policies
Basis of Consolidation
The consolidated financial statements include the accounts of the Company, its subsidiaries and variable interest entities in which the Company has controlling financial interest. All inter-company balances and transactions are eliminated in consolidation. Entities in which the Company does not have a controlling financial interest but is considered to have significant influence are accounted for on the equity method.
Cash Equivalents
Cash equivalents include investments with an original maturity of three months or less. Primarily all investments are short-term money market instruments. Instruments that have been included in cash equivalents with original maturities of greater than three months are demand instruments with banking institutions that are backed by government supported financial institutions. These instruments also are not subject to penalty for early withdrawal.
Inventories
Inventories, principally the components associated with dosimetry devices, are valued at lower of cost or market utilizing a first-in, first-out method.
Revenues and Deferred Contract Revenue
The source of Radiation Measurement segment revenues for the Company is radiation measuring and monitoring services including other services incidental to measuring and monitoring. The measuring and monitoring services provided by the Company to its customers are of a subscription nature and are continuous. The Company views its business in the Radiation Measurement segment as services provided to customers over a period of time and the wear period is the period over which those services are provided. Badge production, wearing of badges, badge analysis, and report preparation are integral to the benefit that the Company provides to its customers. These services are provided to customers on an agreed-upon recurring basis (monthly, bi-monthly, quarterly, semi-annually or annually) that the customer chooses for the wear period. Revenue is recognized on a straight-line basis, adjusted for changes in pricing and volume, over the wear period as the service is continuous and no other discernible pattern of recognition is evident. Revenues are recognized over the periods in which the customers wear the badges irrespective of whether invoiced in advance or in arrears.
Many customers pay for these services in advance. The amounts recorded as deferred contract revenue in the consolidated balance sheets represent customer deposits invoiced in advance during the preceding twelve months for services to be rendered over the succeeding twelve months, and are net of services rendered through the respective consolidated balance sheet date. Management believes that the amount of deferred contract revenue shown at the respective consolidated balance sheet date fairly represents the level of business activity it expects to conduct with customers invoiced under this arrangement.
Other services incidental to measuring and monitoring augment the basic radiation measurement services that the Company offers, providing administrative and informational tools to customers for the management of their radiation detection programs. Other service revenues are recognized upon delivery of the reports to customers or as other such services are provided.
The Company sells radiation measurement products to its customers, principally InLight products, for their use in conducting radiation measurements or managing radiation detection programs. Revenues from product sales are recognized when shipped.
The Company, through its Medical Physics segment, offers full scope medical physics services to hospitals and radiation therapy centers. Services offered include, but are not limited to, clinical physics support in radiation oncology, commissioning services, special projects support and imaging physics services. Delivery of the medical physics services can be of a contracted, recurring nature or as a discrete project with a defined service outcome. Recurring services often are provided on the customer's premises by a full-time employee or fraction of a full-time employee. These services are recognized as revenue on a straight-line basis over the life of the contract. Fee for service projects’ revenue is recognized when the service is delivered.
Contracted services are billed on an agreed-upon recurring basis, either in advance or arrears of the service being delivered. Customers may be billed monthly, quarterly, or at some other regular interval over the contracted period. The amounts recorded as deferred revenue represent invoiced amounts in advance of delivery of the service. Management believes that the amount of deferred contract revenue fairly represents remaining business activity with customers invoiced in advance.
Fee for service revenue is typically associated with much shorter contract periods, or with discrete individual projects. Invoicing is usually done after completion of the project and customer acceptance thereof.
Additional medical physics services under the full scope offering of the medical physics practice groups comprising the Medical Physics segment include radiation center design and consulting, accreditation work and quality assurance reviews.
The Company, through its Medical Products segment, offers high quality medical consumable accessories used in radiology, radiation therapy, and image guided surgery procedures. IZI’s customer base includes buyers at several stages along the supply chain including distributors, manufacturers of image guided navigation equipment, and product end users such as hospitals, radiation oncology clinics, mammography clinics, and imaging centers. Revenues from medical product sales are recognized when shipped.
Research and Development
The cost of research and development programs is charged to selling, general and administrative expense as incurred and amounted to approximately $4,121, $3,957 and $2,361 in fiscal 2013, 2012 and 2011, respectively. Research and development costs include salaries and allocated employee benefits, third-party research contracts, depreciation and supplies.
Depreciation, Amortization and Maintenance
Property, plant and equipment are recorded at cost. Plant, equipment and custom software are depreciated on a straight-line basis over their estimated useful lives, which are primarily 30 years for buildings, three to eight years for equipment and five to ten years for internal software. Dosimetry devices, principally badges, and software are amortized on a straight-line basis over their estimated lives, which are thirty months to eight years. Maintenance and repairs are charged to expense, and renewals and betterments are capitalized.
Advertising
The Company expenses the costs of advertising as incurred. Advertising expense, primarily related to product shows and exhibits, amounted to $1,339, $920 and $877 in fiscal 2013, 2012 and 2011, respectively.
Income Taxes
The Company files income tax returns in the jurisdictions in which it operates. The Company estimates the income tax provision for income taxes that are currently payable, and records deferred tax assets and liabilities for the temporary differences in tax consequences between the financial statements and tax returns. The Company would record a valuation allowance in situations where the realization of deferred tax assets is not more likely than not. The Company recognizes the financial statement effects of its tax positions in its current and deferred tax assets and liabilities when it is more likely than not that the position will be sustained upon examination by a taxing authority. Further information regarding the Company’s income taxes is contained under the footnote “Income Taxes” of this Annual Report on Form 10-K.
Fair value of financial instruments
The Company’s financial instruments consist primarily of cash and cash equivalents, accounts receivable, accounts payable, and debt. The carrying value of the Company’s financial instruments approximates their fair value.
Use of Estimates
The preparation of financial statements in conformity with generally accepted accounting principles requires management to make estimates and assumptions that affect the reported amounts of assets and liabilities and disclosure of contingent assets and liabilities at the date of the financial statements and the reported amounts of revenues and expenses during the reporting period. Actual results could differ from those estimates.
Reclassifications and Adjustments
Certain reclassifications have been made in the financial statements for comparative purposes. These reclassifications have no effect on the results of operations or financial position.
In addition, the 2012 statement of cash flows was corrected for a classification error related to the payment of debt financing fees. The correction increases net cash provided by operating activities and decreases net cash (used) provided by financing activities by $1.8 million. The Company believes this classification change is immaterial to the previously issued financial statements.
Further, the current year financial statements include the correction of certain out of period adjustments relating to prior periods. The net effect of the corrections were primarily related to the equity in income of joint ventures that increased net income in the current year by approximately $400,000. The Company does not believe these corrections were material to any current or prior interim or annual periods that were affected.
Accumulated Other Comprehensive Loss
The components of accumulated other comprehensive loss included in the accompanying consolidated balance sheets consist of defined benefit pension and postretirement plan adjustments for net gains, losses and prior service costs, net defined benefit plan curtailment loss and cumulative foreign currency translation adjustments. The following table sets forth the balances in accumulated other comprehensive loss for the years ended September 30:
| | | | | | | | | |
| | | | | | | | | |
(Dollars in Thousands) | | 2013 | | 2012 | | 2011 |
Foreign currency translation adjustments | | $ | (178) | | $ | 1,900 | | $ | 2,286 |
Defined benefit pension and postretirement plans activity, net of tax | | | (4,278) | | | (7,172) | | | (5,415) |
Total accumulated other comprehensive loss | | $ | (4,456) | | $ | (5,272) | | $ | (3,129) |
Stock-Based Compensation
The Company measures and recognizes compensation cost at fair value for all share-based payments, including stock options. Stock-based compensation expense, primarily for grants of restricted stock, totaled approximately $2,634, $2,434 and $1,481 for fiscal 2013, 2012 and 2011, respectively. The total income tax benefit recognized in the consolidated statements of income related to expense for stock-based compensation was approximately $981, $901 and $537 during fiscal 2013, 2012 and 2011, respectively.
The Company has not granted stock options subsequent to fiscal 2005. Awards of stock options in prior fiscal years were granted with an exercise price equal to the market value of the stock on the date of grant. The fair value of stock options was estimated using the Black-Scholes option-pricing model. Expected volatility and the expected life of stock options were based on historical experience. The risk free interest rate was derived from the implied yield available on U.S. Treasury zero-coupon issues with a remaining term, as of the date of grant, equal to the expected term of the option. The dividend yield was based on annual dividends and the fair market value of the Company’s stock on the date of grant. Compensation expense was recognized ratably over the vesting period of the stock option.
Subsequent to fiscal 2005, key employees and/or non-employee directors have been granted restricted share awards that consist of performance shares and time vested restricted stock. Performance shares represent a right to receive shares of common stock upon satisfaction of performance goals or other specified metrics. Restricted stock represents a right to receive shares of common stock upon the passage of a specified period of time. Upon the adoption of the Company’s Incentive Compensation Plan in February 2008, the fair value of performance shares and restricted stock granted under the new plan is based on the Company’s closing stock price on the date of grant. Compensation expense for performance shares is recorded ratably over the vesting period, assuming that achievement of performance goals is deemed probable. Compensation expense for restricted stock is recognized ratably over the vesting period. The per share weighted average fair value of restricted shares, including restricted stock and performance shares, granted during fiscal 2013, 2012 and 2011 was $58.19, $51.89 and $62.17, respectively.
Employee Benefit Plans
The Company sponsors postretirement benefit plans to provide pension, supplemental retirement funds, and medical expense reimbursement to eligible retired employees, as well as a directors' retirement plan that provides for certain retirement benefits payable to non-employee directors. Further information on these benefit plans is contained under the footnote “Employee Benefit Plans” of this Annual Report on Form 10-K.
Recent Accounting Pronouncements
In July 2012, FASB issued new guidance on the impairment testing for indefinite-lived intangible assets other than goodwill. This guidance now permits entities to initially perform a qualitative assessment on indefinite-lived intangible assets impairment to assess whether it is more likely than not that the fair value of an indefinite-lived intangible asset is less than its carrying amount. If, as a result of the qualitative assessment, it is determined that it is more likely than not that the fair value of an indefinite-lived intangible asset is less than its carrying amount, the quantitative impairment test is required. The Company has adopted the guidance for its annual impairment tests performed in fiscal 2013.
In February 2013, the FASB issued new guidance on the presentation of comprehensive income. This guidance requires reclassification adjustments from other comprehensive income to be presented either in the financial statements or in the notes to the financial statements. The standard would not change the current requirements for reporting net income or other comprehensive income in financial statements. However, the guidance would require an entity to provide enhanced disclosures to present separately by component reclassifications out of accumulated other comprehensive income. This guidance is effective for the Company in the first quarter of fiscal 2014. The Company does not expect the adoption of this guidance to have a material impact on its consolidated financial statements.
In March 2013, the FASB issued an accounting update that clarifies the applicable guidance for the release of the cumulative translation adjustment when an entity ceases to have a controlling financial interest in a subsidiary or a group of assets that is a business within a foreign entity. The guidance outlines the events when cumulative translation adjustments should be released into net income and is intended by FASB to eliminate some disparity in current accounting practice. This guidance is effective for the Company in the first quarter of fiscal 2014. The Company does not expect the adoption of this guidance to have a material impact on its consolidated financial statements.
In July 2013, the FASB issued new guidance to reduce the diversity in presentation of an unrecognized tax benefit when a net operating loss carryforward, a similar tax loss or a tax credit carryforward exists. This requires an unrecognized tax benefit to be presented in the financial statements as a reduction to a deferred tax asset for a net operating loss carryforward, a similar tax loss, or a tax credit carryforward, with certain exceptions listed in the guidance. This guidance is effective for the Company in the first quarter of fiscal 2015. The Company does not expect the adoption of this guidance to have a material impact on its consolidated financial statements.
2. Business Combinations
Acquisition of IZI
On November 14, 2011, the Company acquired all of the outstanding equity interests of IZI, a leading provider of high quality medical consumable accessories used in radiology, radiation therapy, and image guided surgery
procedures, for $93,000 plus working capital and the assumption of liabilities. The Company completed the acquisition of IZI as a platform to expand into the radiation oncology, radiology, and image guided surgery end markets. The operating results of IZI are reported in the Medical Products reporting segment.
A portion of the purchase price, in the amount of $26,941, was applied to repay the outstanding indebtedness of IZI and certain unpaid expenses incurred by IZI and other disclosed parties in connection with the transaction. The Company funded the acquisition through borrowings under the new credit agreement with a syndicate of lenders led by BMO Harris and PNC Bank.
The following table summarized the $94,283 of consideration transferred to acquire IZI and the assets acquired and liabilities assumed based on their fair values as of the date of the acquisition.
| | | |
| | | |
(Dollars in Thousands) | | | |
Current assets | | $ | 4,587 |
Property, plant and equipment | | | 763 |
Intangible assets | | | 27,000 |
Goodwill | | | 64,069 |
Non-current deferred taxes, net | | | 212 |
Other non-current assets | | | 24 |
Current liabilities | | | (2,196) |
Other long-term liabilities | | | (176) |
Total assets acquired and liabilities assumed | | $ | 94,283 |
The excess of the consideration transferred over the fair value of the net tangible and intangible assets acquired resulted in goodwill of $64,069, which is attributable primarily to the earnings power of the future products and services expected to be produced by IZI, new customer expansion opportunities in adjacent markets that are expected to result from the business combination with the Company, and the potential to acquire or merge with other businesses. The goodwill has been assigned to the Medical Products reporting segment. For income tax purposes, the Company is amortizing goodwill of $64,641 over 15 years The Company acquired $23,000 of customer relationships and trademarks and tradenames in the amount of $2,000 which were corrected and are now being amortized over 10 years and patents in the amount of $2,000 which are being amortized over 7 years. For income tax purposes, the values of the trademarks and tradenames, patents and customer relationships are being amortized over 15 years.
3. Fair Value Measurements
Fair value is defined as the price that would be received to sell an asset or paid to transfer a liability in an orderly transaction between market participants at the measurement date in a principal or most advantageous market. Fair value is a market-based measurement that is determined based on inputs, which refer broadly to assumptions that market participant’s use in pricing assets or liabilities. A fair value hierarchy with three tiers has been established to prioritize the inputs to valuation techniques used to measure fair value. The hierarchy requires entities to maximize the use of observable inputs and minimize the use of unobservable inputs. Level 1 inputs include quoted prices in active markets for identical assets and liabilities. Level 2 inputs consist of observable inputs other than quoted prices in active markets or indirectly observable through corroboration with observable market data. Level 3 inputs are not observable in the market and include management’s own judgments about the assumptions market participants would use in pricing the asset or liability based on the best information available in the circumstances.
As of September 30, 2013, the Company’s financial assets measured and recorded at fair value on a recurring basis were comprised of investments in trading securities, which are reported in other long-term assets. The investments are held in a Rabbi trust for benefits under the Company’s deferred compensation plan. Under the plan, participants designate investment options to serve as the basis for measurement of the notional value of their
accounts. The investments include a money market fund and mutual funds that are publicly traded. The fair values of the shares or underlying securities of these funds are based on quoted market prices and, therefore, are categorized as Level 1 in the fair value hierarchy.
Financial assets measured at fair value on a recurring basis are summarized below:
| | | | | | | | | |
| | | | | | | | | |
| | Fair Value Measurements at September 30, 2013 Using: |
(Dollars in Thousands) | | | Quoted Prices in
Active Markets for
Identical Assets
(Level 1) | | | Significant Other
Observable Inputs
(Level 2) | | | Significant
Unobservable Inputs
(Level 3) |
Asset Category | | | | | | | | | |
Cash equivalents | | $ | 55 | | $ | - | | $ | - |
Mutual funds | | | 2,922 | | | - | | | - |
Total financial assets at fair value | | $ | 2,977 | | $ | - | | $ | - |
| | | | | | | | | |
| | | | | | | | | |
| | Fair Value Measurements at September 30, 2012 Using: |
(Dollars in Thousands) | | | Quoted Prices in
Active Markets for
Identical Assets
(Level 1) | | | Significant Other
Observable Inputs
(Level 2) | | | Significant
Unobservable Inputs
(Level 3) |
Asset Category | | | | | | | | | |
Cash equivalents | | $ | 42 | | $ | - | | $ | - |
Mutual funds | | | 2,368 | | | - | | | - |
Total financial assets at fair value | | $ | 2,410 | | $ | - | | $ | - |
As of September 30, 2013, the carrying amount of the Company’s long-term debt approximated fair value as the stated interest rates were variable in relation to prevailing market rates.
4. Acquisition, Reorganization and Non-recurring Costs
Acquisition and reorganization costs during fiscal 2013, 2012 and 2011 were $1,392, $4,299 and $1,489, respectively. Such expenses were primarily for professional fees with accounting, financial, legal and tax advisors to support the due diligence, transaction structure and accounting for acquisitions, as well as costs in the pursuit of acquisitions that may not be consummated. In fiscal 2012, such expenses primarily supported the acquisition of IZI. In fiscal 2011, such expenses were related to the establishment of a radiation measurement unconsolidated joint venture in Turkey and the acquisition of three medical physics practices. Acquisition costs were expensed as incurred.
In addition, the fiscal 2013 and 2012 charges included in reorganization costs for severance to support changes in selected management roles throughout the organization, including LMP and IZI, were $647 and $760, respectively. In fiscal 2013 the Company made severance payments of $537. Remaining payments of $136 are expected to be paid in fiscal 2014.
During fiscal 2013 the Company recorded a $394 reserve for escheatment liability. Adjustments may be made in the future as information becomes available.
5. Abandonment Charges
In the fourth quarter of fiscal 2012, the Company abandoned tangible and intangible assets in the amount of $3,443. Based on post-implementation events and assessments, the Company abandoned specific assets under its IT platform enhancements that supported the previous systems prior to cutover to the enhanced system in July 2012. The completion of the strategic assessment identified assets to be abandoned in the amount of $2,693. As of September 30, 2012, the Company accelerated its rebranding strategy of the LMP tradename and ceased its use of the GPS tradename completely, resulting in abandonment costs for the remaining book value of $750. There were no abandonment charges in fiscal 2013.
6. Income per Common Share
Basic net income per share was computed by dividing net income available to common stockholders for the period by the weighted average number of shares of common stock outstanding during the period. Diluted net income per share was computed by dividing net income available to common stockholders for the period by the weighted average number of shares of common stock that would have been outstanding assuming dilution from stock-based compensation awards during the period.
Unvested stock-based compensation awards that contain non-forfeitable rights to dividends are treated as participating securities and included in the computation of earnings per share pursuant to the two-class method. The Company’s time vested restricted stock is a participating security. The following table sets forth the computation of net income per share for the years ended September 30:
| | | | | | | | | |
| | | | | | | | | |
(Dollars in Thousands, Except per Share) | | 2013 | | 2012 | | 2011 |
Basic Net Income per Share: | | | | | | | | | |
Net income attributed to Landauer, Inc. | | $ | 4,836 | | $ | 19,270 | | $ | 24,538 |
Less: Income allocated to unvested restricted stock | | | 165 | | | 137 | | | 129 |
Net income available to common stockholders | | $ | 4,671 | | $ | 19,133 | | $ | 24,409 |
Basic weighted averages shares outstanding | | | 9,434 | | | 9,389 | | | 9,395 |
Net income per share – Basic | | $ | 0.50 | | $ | 2.04 | | $ | 2.60 |
| | | | | | | | | |
Diluted Net Income per Share: | | | | | | | | | |
Net income attributed to Landauer, Inc. | | $ | 4,836 | | $ | 19,270 | | $ | 24,538 |
Less: Income allocated to unvested restricted stock | | | 165 | | | 137 | | | 129 |
Net income available to common stockholders | | $ | 4,671 | | $ | 19,133 | | $ | 24,409 |
Basic weighted averages shares outstanding | | | 9,434 | | | 9,389 | | | 9,395 |
Effect of dilutive securities | | | 48 | | | 48 | | | 82 |
Diluted weighted averages shares outstanding | | | 9,482 | | | 9,437 | | | 9,477 |
Net income per share - Diluted | | $ | 0.49 | | $ | 2.03 | | $ | 2.58 |
7. Equity in Joint Ventures
Investments accounted for on the equity basis have the related equity in earnings of these joint ventures included in its own caption in the accompanying Statements of Income. At September 30, 2013, the Company had a 50% equity interest in Nagase-Landauer, Ltd., a radiation measurement company in Japan; a 50% equity interest in Epsilon Landauer Dozimetri, a radiation measurement company in Turkey; and a 49% equity interest in Yamasato, Fujiwara, Higa & Associates, Inc., a domestic small business supplier to the International Atomic Energy Agency as well as the U.S. military.
The combined summary financial information as of and for the years ended September 30, 2013, 2012 and 2011 is presented for all equity method investments owned during the respective periods.
| | | | | | | | | |
| | | | | | | | | |
(Dollars in Thousands) | | 2013 | | 2012 | | 2011 |
Revenues | | $ | 60,523 | | $ | 34,937 | | $ | 26,663 |
Gross profit | | | 24,289 | | | 19,796 | | | 15,125 |
Net income | | | 7,810 | | | 6,374 | | | 4,382 |
| | | | | | |
| | | | | | |
(Dollars in Thousands) | | 2013 | | 2012 |
Current assets | | $ | 27,580 | | $ | 27,738 |
Other assets | | | 41,292 | | | 44,404 |
Current liabilities | | | 13,514 | | | 19,580 |
Other liabilities | | | 2,354 | | | 3,727 |
8. Goodwill and Other Intangible Assets
Changes in the carrying amount of goodwill, by reportable segment, for the years ended September 30, 2013 and 2012 were as follows:
| | | | | | | | | | | | |
| | | | | | | | | | | | |
(Dollars in Thousands) | | Radiation
Measurement | | Medical
Physics | | Medical
Products | | Total |
Goodwill at September 30, 2011 | | $ | 20,225 | | $ | 19,737 | | $ | - | | $ | 39,962 |
Increase related to acquisitions | | | - | | | 2,874 | | | 64,069 | | | 66,943 |
Effects of foreign currency | | | (188) | | | - | | | - | | | (188) |
Goodwill at September 30, 2012 | | $ | 20,037 | | $ | 22,611 | | $ | 64,069 | | $ | 106,717 |
Effects of foreign currency | | | 419 | | | - | | | - | | | 419 |
Accumulated goodwill impairment charges | | | - | | | - | | | (22,700) | | | (22,700) |
Goodwill at September 30, 2013 | | $ | 20,456 | | $ | 22,611 | | $ | 41,369 | | $ | 84,436 |
During the third quarter of fiscal 2013, in connection with our quarterly forecasting cycle, we updated the forecasted results of operations for our operating segments based on the most recent financial results and our best estimate of future operations. The updated forecast reflected a decline in revenues for the Medical Products segment primarily due to the inability to generate new sales to replace decreasing revenues. As a result, in connection with the preparation of our financial statements for the quarter ended June 30, 2013, the Company performed an impairment analysis with respect to the carrying value of goodwill in our Medical Products segment.
In accordance with FASB ASC 350, the Company aggregated our business components into reporting units to test for goodwill impairment. For our purposes, our reporting units and operating segments are the same as our reporting segments, so the Company tests goodwill at the reporting segment level. Goodwill impairment is determined using two-step process. The first step of the goodwill impairment test is to identify potential impairment by comparing the fair value of a segment with its net book value (or carrying amount), including goodwill. If the
fair value of a segment exceeds its carrying amount, goodwill of the segment is considered not to be impaired and the second step of the impairment test is unnecessary. If the carrying amount of the segment exceeds its fair value, the second step of the goodwill impairment test is performed to measure the amount of the impairment loss, if any. The second step of the goodwill impairment test compares the implied fair value of the segment’s goodwill with the carrying amount of that goodwill. If the carrying amount of the segment’s goodwill exceeds the implied fair value of that goodwill, an impairment loss is recognized in an amount equal to that excess. The implied fair value of goodwill is determined in the same manner as the amount of goodwill recognized in a business combination. That is, the fair value of the segment is allocated to all of the assets and liabilities of that segment (including any unrecognized intangible assets) as if the segment had been acquired in a business combination and the fair value of the segment was the purchase price paid to acquire the segment.
Based on the result of the first step of the goodwill impairment analysis, the Company determined that the fair value of our Medical Products segment was less than its carrying value as of June 30, 2013 and, as such, the Company applied the second step of the goodwill impairment test to this segment. Based on the result of the second step of the goodwill impairment analysis, the Company recorded a $22,700 non-cash pretax charge to reduce the carrying value of goodwill in our Medical Products segment. The impairment charge is non-cash in nature and does not affect the Company’s liquidity. As a result of the impairment charge in our Medical Products segment recognized during the third quarter of fiscal 2013 and the effects of foreign currency in our Radiation Measurement segment, the carrying amount of our goodwill was reduced to $84,436 as of September 30, 2013 from $106,717 as of September 30, 2012.
Intangible assets for the years ended September 30 were as follows:
| | | | | | | | | | | | |
| | | | | | | | | | | | |
| | 2013 | | 2012 |
(Dollars in Thousands) | | Gross Carrying
Amount | | Accumulated
Amortization | | Gross Carrying
Amount | | Accumulated
Amortization |
Customer lists | | $ | 43,954 | | $ | 11,639 | | $ | 40,880 | | $ | 8,501 |
Trademarks and tradenames | | | 2,154 | | | 400 | | | 2,123 | | | - |
Licenses and patents | | | 4,080 | | | 1,009 | | | 3,518 | | | 638 |
Other intangibles | | | 577 | | | 557 | | | 577 | | | 557 |
Intangible assets | | $ | 50,765 | | $ | 13,605 | | $ | 47,098 | | $ | 9,696 |
The Company assumed $2,485 in customer lists and no tradenames during fiscal 2013 relating to business combinations and $29,914 during fiscal 2012. Amortization of intangible assets was $4,095, $3,270 and $1,033 for the years ended September 30, 2013, 2012 and 2011, respectively. Annual aggregate amortization expense related to intangible assets is estimated to be approximately $3,250 for the next five fiscal years.
9. Income Taxes
The components of pretax income for the years ended September 30 were as follows:
| | | | | | | | | |
| | | | | | | | | |
(Dollars in Thousands) | | 2013 | | 2012 | | 2011 |
Pretax income: | | | | | | | | | |
U.S. | | $ | (3,112) | | $ | 21,323 | | $ | 30,160 |
Foreign | | | 7,592 | | | 6,817 | | | 6,575 |
Total pretax income | | $ | 4,480 | | $ | 28,140 | | $ | 36,735 |
The components of the provision for income taxes for the years ended September 30 were as follows:
| | | | | | | | | |
| | | | | | | | | |
(Dollars in Thousands) | | 2013 | | 2012 | | 2011 |
Current: | | | | | | | | | |
U.S. Federal | | $ | 3,594 | | $ | 1,857 | | $ | 5,512 |
State and local | | | 477 | | | 194 | | | 511 |
Foreign | | | 2,335 | | | 2,149 | | | 2,370 |
Current tax provision | | $ | 6,406 | | $ | 4,200 | | $ | 8,393 |
Deferred: | | | | | | | | | |
U.S. Federal | | $ | (7,011) | | $ | 3,927 | | $ | 2,360 |
State and local | | | (378) | | | 388 | | | 107 |
Foreign | | | (233) | | | (475) | | | 667 |
Deferred tax provision | | $ | (7,622) | | $ | 3,840 | | $ | 3,134 |
Income tax provision | | $ | (1,216) | | $ | 8,040 | | $ | 11,527 |
The effective tax rates for the fiscal years ended September 30, 2013, 2012 and 2011 were (27.2%), 28.6% and 31.4%, respectively. The fiscal 2013 effective tax rate decreased due primarily to an increased realization of certain U.S. tax credits and mix of earnings by jurisdiction. The following is a reconciliation of the U.S. federal statutory rate of 35% to the effective income tax rate:
| | | | | | | | | |
| | | | | | | | | |
| | 2013 | | 2012 | | 2011 |
U.S. Federal statutory rate | | | 35.0% | | | 35.0% | | | 35.0% |
State and local taxes net of Federal tax benefit | | | -3.5% | | | 1.3% | | | 0.9% |
Lower rates on Foreign operations | | | -11.1% | | | -3.9% | | | -1.4% |
Non-taxed equity earnings | | | -30.3% | | | -4.0% | | | -2.1% |
Foreign tax credit impact, net | | | -5.5% | | | -1.5% | | | -0.5% |
R&D credit | | | -6.5% | | | -0.5% | | | -1.0% |
Domestic production activity deduction | | | -6.0% | | | -0.5% | | | -0.8% |
Partnership income | | | 10.2% | | | 1.6% | | | 1.2% |
Provision to return adjustments | | | -14.0% | | | -0.2% | | | 0.3% |
Meals and entertainment | | | 1.8% | | | 0.3% | | | 0.2% |
Change in deferred rate | | | 2.0% | | | 0.7% | | | -0.4% |
Unremitted/non-indefinitely reinvested earnings | | | 2.1% | | | 0.0% | | | -0.1% |
Other | | | -1.4% | | | 0.3% | | | 0.1% |
Effective income tax rate | | | -27.2% | | | 28.6% | | | 31.4% |
The tax effects of temporary differences that gave rise to deferred income tax assets and liabilities consisted of the following at September 30:
| | | | | | |
| | | | | | |
(Dollars in Thousands) | | 2013 | | 2012 |
Deferred tax assets: | | | | | | |
Pension accrual | | $ | 1,391 | | $ | 2,998 |
Compensation expense | | | 3,360 | | | 2,794 |
Transaction costs | | | 1,133 | | | 1,187 |
Medical insurance claims | | | 402 | | | 475 |
Retirement plans | | | 1,896 | | | 2,251 |
Accruals not currently deductible | | | 156 | | | 416 |
NOLs and attributes | | | 189 | | | 81 |
Other | | | 647 | | | 636 |
| | $ | 9,174 | | $ | 10,838 |
Deferred tax liabilities: | | | | | | |
Depreciation | | $ | 1,745 | | $ | 1,904 |
Software development | | | 14,401 | | | 14,812 |
Intangible asset amortization | | | 232 | | | 7,267 |
Other | | | 202 | | | 79 |
| | $ | 16,580 | | $ | 24,062 |
Net deferred tax liability | | $ | (7,406) | | $ | (13,224) |
The Company believes that the realization of deferred tax assets is more likely than not based upon the expectation the Company will generate the necessary taxable income in the future periods. Therefore, no valuation allowances have been provided.
The Company has provided for U.S. deferred income taxes and foreign withholding tax in the amount of $68 on undistributed earnings not considered permanently reinvested in its non-U.S. subsidiaries. The Company has not provided for U.S. deferred income taxes or foreign withholding tax on the remainder of undistributed earnings from its non-U.S. subsidiaries because such earnings are considered to be permanently reinvested as it is the Company’s intention to reinvest accumulated cash balances, future cash flows and profits to make capital improvements, and grow and expand its foreign operations. In accordance with this plan, cash held by certain foreign subsidiaries will not be available for U.S. Company operations, and under current laws, will not be subject to U.S. taxation. As of September 30, 2013, 2012 and 2011, permanently reinvested cumulative undistributed earnings attributable to certain foreign operations were approximately $13,085, $14,262 and $13,047, respectively. The change in the permanently reinvested cumulative undistributed earnings from fiscal 2012 to fiscal 2013 is due primarily to repatriation of funds from Mexico and translation. The Company has sufficient cash and cash equivalents available for use in the U.S. to fund current operations without drawing on the permanently reinvested funds held by its foreign operations. If in the future the Company decides to repatriate these permanently reinvested foreign earnings, it does not anticipate any significant incremental U.S. Federal and State income tax.
As of September 30, 2013, the Company's U.S. income tax returns for fiscal 2010 and subsequent years remained subject to examination by the Internal Revenue Service ("IRS"). The Company is not currently under audit by the IRS. State income tax returns generally have statute of limitations for periods between three and four years from the date of filing. The Company is currently undergoing a state income tax audit. The Company does not expect the audit to have a material impact on its consolidated financial statements. The Company is not currently under audit in any foreign jurisdictions. The Company’s foreign operations have statute of limitations on the examination of tax returns for periods between two and six years.
The Company operates in numerous taxing jurisdictions and is subject to regular examinations by various U.S. federal, state, local and foreign jurisdictions for various tax periods. The Company’s income tax positions are based on research and interpretations of the income tax laws and rulings in each of the jurisdictions in which it does business. Due to the subjectivity of interpretations of the income tax laws and rulings in each jurisdiction, the differences and interplay in tax laws between those jurisdictions, as well as the inherent uncertainty in estimating the final resolution of complex tax audit matters, the Company’s estimates of income tax liabilities may differ from actual payments or assessments.
Accounting for uncertainty in income taxes requires a more-likely-than-not threshold for financial statement recognition and measurement of tax positions taken or expected to be taken in a tax return. The Company records a liability for the difference between the benefit recognized and measured for financial statement purposes and the tax position taken or expected to be taken on its tax return. To the extent that the Company’s assessment of such tax positions changes, the change in estimate is recorded in the period in which the determination is made.
A reconciliation of gross unrecognized tax benefits, exclusive of interest and penalties, is as follows:
| | | | | | | | | |
| | | | | | | | | |
(Dollars in Thousands) | | 2013 | | 2012 | | 2011 |
Balance at beginning of year | | $ | 583 | | $ | 770 | | $ | 714 |
Tax positions related to current year: | | | | | | | | | |
Gross increases | | | 52 | | | 23 | | | 150 |
Tax positions related to prior periods: | | | | | | | | | |
Gross increases | | | 99 | | | 127 | | | 167 |
Gross decreases | | | - | | | (182) | | | (50) |
Decreases related to settlements | | | - | | | - | | | - |
Decreases related to lapse of statute of limitations | | | (186) | | | (155) | | | (211) |
Balance at end of year | | $ | 548 | | $ | 583 | | $ | 770 |
The total amount of unrecognized tax benefits, net of federal benefit that, if recognized, would affect the effective tax rate was $507, $547 and $666, as of September 30, 2013, 2012 and 2011, respectively.
The Company recognizes accrued interest and penalties related to unrecognized tax benefits in the provision for income taxes. As of September 30, 2013 and 2012, the gross amount of interest and penalties recorded was $77 and $82, respectively. The Company does not expect that any change in the amount of unrecognized tax benefits in the next twelve months, with respect to items identified, will have a significant impact on the consolidated results of operations or the financial position of the Company. The amount of unrecognized tax benefits and the related interest and penalties expected to reverse within the next fiscal year is estimated to be approximately $285.
10. Credit Facility
On August 2, 2013, the Company entered into an amended and restated revolving credit agreement (the “Credit Agreement”) with its group of lenders that provided, among other things, the extension of the expiration date from November 14, 2016 to August 2, 2018 and the accordion feature increased from $25,000 to $50,000.
In addition, the covenants for minimum net worth have been deleted from the Credit Agreement. The leverage ratio covenants have changed to a maximum 3.50 to 1.00 for the period of September 30, 2013 through June 30, 2015, and to a maximum 3.25 to 1.00 for the periods September 30, 2015 and thereafter. The fixed charge ratio covenants have changed to a minimum 1.10 to 1.00 for the period of September 30, 2013 through June 30, 2015, and to a minimum 1.15 to 1.00 for the periods September 30, 2015 and thereafter. The amended terms provide for an interest rate equal to LIBOR plus a margin of between 1.25% and 2.50% and for the base rate a margin of between 0.25% and 1.50% as compared to a Libor margin of between 1.25% and 2.75%, and a base rate margin of between 0.25% and 1.75% in the current credit agreement.
Borrowings under the credit agreement are classified as long-term debt. The Company repaid $27,187 and $5,300 of the borrowings under the credit facility as of September 30, 2013 and 2012, respectively. The balance outstanding under the Company’s credit agreement was $142,785 and $141,347 as of September 30, 2013 and 2012, respectively. Interest expense on the borrowings was $4,320 and $3,627 for the fiscal years ended September 30, 2013 and 2012, respectively. The weighted average interest rate for the base and LIBOR rate was 2.9% and 3.03% for fiscal 2013 and 2012, respectively. The applicable interest rate for the base and LIBOR rate separately was 4.75% and 2.682% per annum at September 30, 2013 and 4.75% and 2.735% per annum at September 30, 2012.
11. Capital Stock
The Company has two classes of capital stock, preferred and common, with a par value of $0.10 per share for each class. Of 20,000,000 common shares which are authorized, there were 9,575,926 and 9,493,368 shares of common stock issued and outstanding as of September 30, 2013 and 2012, respectively. Of 1,000,000 preferred shares which are authorized, there were no shares of preferred stock issued. Cash dividends of $2.20 per common share were declared in fiscal 2013. As of September 30, 2013, there were accrued and unpaid dividends of $5,419. The Company has reserved 500,000 shares of common stock under the Landauer, Inc. Incentive Compensation Plan approved by shareholders on February 7, 2008.
12.Employee Benefit Plans
Defined Contribution Plans
The Company maintains a 401(k) savings plan covering substantially all radiation measurement U.S. full-time employees. Qualified contributions made by employees to the plan are partially matched by the Company. Employees of the Company’s LMP and IZI subsidiaries participate in a 401(k) savings plan which provides for an employer matching contribution. The Company also maintains a supplemental defined contribution plan for certain executives, which allows participating executives to make voluntary deferrals and provides for employer contributions at the discretion of the Company.
Amounts expensed for Company contributions under these plans during the fiscal years ended September 30, 2013, 2012 and 2011 were $1,699, $1,319 and $791, respectively.
Defined Benefit Plans
Historically the Company provided, to substantially all full-time employees in the U.S., a qualified noncontributory defined benefit pension plan to provide a basic replacement income benefit upon retirement. For key executives, the basic benefit was supplemented with a supplemental executive retirement plan to address U.S. tax law limitations placed on the benefits under the qualified pension plan. The supplemental plan is not separately funded and costs of the plan are expensed annually. The qualified noncontributory defined benefit pension plan and the supplemental executive retirement plan were frozen in fiscal 2009 and future benefit accruals under such plans ceased. The Company formerly maintained a directors' retirement plan that provides certain retirement benefits for non-employee directors. The directors' plan was terminated in January 1997 and benefits accrued under the retirement plan are frozen.
The Company also maintains an unfunded retiree medical expense reimbursement plan. Under the terms of the plan, which covers retirees with ten or more years of service, the Company reimburses retirees to age 70, or to age 65 in accordance with plan changes effective October 1, 2005, for (i) a portion of the cost of coverage under the then-current medical and dental insurance plans if the retiree is under age 65, or (ii) all or a portion of the cost of Medicare and supplemental coverage if the retiree is over age 64. The assumptions for health-care cost ultimate trend rates were 6% for those younger than 65, and 5% for those 65 and older.
The Company recognizes the over- or underfunded status of its defined benefit pension and postretirement plans on its balance sheet and recognizes changes in the funded status, as the changes occur, through comprehensive income. The Company uses its fiscal year end, September 30, as the measurement date for its plans. The following tables set forth the status of the combined defined benefit pension plans and the postretirement medical plan, as pension benefits and other benefits, respectively, at September 30.
| | | | | | | | | | | | |
| | | | | | | | | | | | |
| | Pension Benefits | | Other Benefits |
(Dollars in Thousands) | | 2013 | | 2012 | | 2013 | | 2012 |
Change in benefit obligation: | | | | | | | | | | | | |
Benefit obligation at beginning of year | | $ | 36,436 | | $ | 31,714 | | $ | 1,286 | | $ | 1,196 |
Service cost | | | - | | | - | | | 63 | | | 61 |
Interest cost | | | 1,361 | | | 1,442 | | | 41 | | | 53 |
Actuarial (gain) loss | | | (4,297) | | | 4,293 | | | (222) | | | 55 |
Benefits paid | | | (1,126) | | | (1,013) | | | (88) | | | (79) |
Benefit obligation at end of year | | | 32,374 | | | 36,436 | | | 1,080 | | | 1,286 |
Change in plan assets: | | | | | | | | | | | | |
Fair value of plan assets at beginning of year | | | 22,675 | | | 20,540 | | | - | | | - |
Actual return on plan assets | | | 1,315 | | | 2,775 | | | - | | | - |
Employer contributions | | | 757 | | | 373 | | | 88 | | | 79 |
Benefits paid | | | (1,126) | | | (1,013) | | | (88) | | | (79) |
Fair value of plan assets at end of year | | | 23,621 | | | 22,675 | | | - | | | - |
Funded status at end of year | | $ | (8,753) | | $ | (13,761) | | $ | (1,080) | | $ | (1,286) |
| | | | | | | | | | | | |
| | | | | | | | | | | | |
| | Pension Benefits | | Other Benefits |
(Dollars in Thousands) | | 2013 | | 2012 | | 2013 | | 2012 |
Amounts recognized in consolidated balance sheets: | | | | | | | | | | | | |
Current liabilities – accrued pension and postretirement costs | | $ | (380) | | $ | (382) | | $ | (64) | | $ | (63) |
Noncurrent liabilities – pension and postretirement obligations | | | (8,373) | | | (13,379) | | | (1,016) | | | (1,223) |
Net amount recognized | | $ | (8,753) | | $ | (13,761) | | $ | (1,080) | | $ | (1,286) |
| | | | | | | | | | | | |
Amounts recognized in accumulated other comprehensive income (loss): | | | | | | | | | | | | |
Net loss (gain) | | $ | 6,466 | | $ | 11,050 | | $ | (192) | | $ | 29 |
Net amount recognized in accumulated other comprehensive income (loss) | | $ | 6,466 | | $ | 11,050 | | $ | (192) | | $ | 29 |
As of September 30, 2013 and 2012, the accumulated benefit obligation for all defined benefit pension plans was $32,374 and $36,436, respectively. Information for pension plans with an accumulated benefit obligation in excess of plan assets as of September 30 is set forth in the following table:
| | | | | | |
| | | | | | |
(Dollars in Thousands) | | 2013 | | 2012 |
Projected benefit obligation | | $ | 32,374 | | $ | 36,436 |
Accumulated benefit obligation | | | 32,374 | | | 36,436 |
Fair value of plan assets | | | 23,621 | | | 22,675 |
The components of net periodic benefit cost were as follows:
| | | | | | | | | |
| | | | | | | | | |
| | Pension Benefits |
(Dollars in Thousands) | | 2013 | | 2012 | | 2011 |
Interest cost | | $ | 1,361 | | $ | 1,442 | | $ | 1,454 |
Expected return on plan assets | | | (1,460) | | | (1,312) | | | (1,380) |
Recognized net actuarial loss | | | 433 | | | 314 | | | 104 |
Net periodic benefit cost | | $ | 334 | | $ | 444 | | $ | 178 |
| | | | | | | | | |
| | Other Benefits |
(Dollars in Thousands) | | 2013 | | 2012 | | 2011 |
Service cost | | $ | 63 | | $ | 61 | | $ | 54 |
Interest cost | | | 41 | | | 53 | | | 55 |
Amortization of prior service credit | | | - | | | - | | | (111) |
Recognized net actuarial loss | | | (1) | | | - | | | - |
Net periodic benefit cost (credit) | | $ | 103 | | $ | 114 | | $ | (2) |
Other changes in plan assets and benefit obligations recognized in other comprehensive income, pre-tax, were as follows:
| | | | | | | | | |
| | | | | | | | | |
| | Pension Benefits |
(Dollars in Thousands) | | 2013 | | 2012 | | 2011 |
Net (gain) loss | | $ | (4,151) | | $ | 2,829 | | $ | 4,091 |
Amortization of net loss | | | (433) | | | (314) | | | (104) |
Total recognized in other comprehensive (loss) income | | | (4,584) | | | 2,515 | | | 3,987 |
Total recognized in net periodic benefit cost and other comprehensive (loss) income | | $ | (4,250) | | $ | 2,959 | | $ | 4,165 |
| | | | | | | | | |
| | Other Benefits |
(Dollars in Thousands) | | 2013 | | 2012 | | 2011 |
Net (gain) loss | | $ | (222) | | $ | 55 | | $ | 30 |
Amortization of net loss | | | 1 | | | - | | | - |
Amortization of prior service cost | | | - | | | - | | | 111 |
Total recognized in other comprehensive (loss) income | | | (221) | | | 55 | | | 141 |
Total recognized in net periodic benefit cost and other comprehensive (loss) income | | $ | (118) | | $ | 169 | | $ | 139 |
The estimated pre-tax amount in accumulated other comprehensive income expected to be recognized in net periodic benefit cost over the next fiscal year for pension benefits is a net loss of $189. The estimated pre-tax amount in accumulated other comprehensive income expected to be recognized in net periodic benefit cost over the next fiscal year for other benefits is a gain of $14.
Assumptions
The weighted-average assumptions used to determine benefit obligations at September 30 were as follows:
| | | | | | | | | | | |
| | | | | | | | | | | |
| Pension Benefits | | Other Benefits |
| | 2013 | | | 2012 | | | 2013 | | | 2012 |
Discount rate | | 4.72% | | | 3.77% | | | 4.72% | | | 3.77% |
Rate of compensation increase | | na | | | na | | | na | | | na |
The weighted-average assumptions used to determine net periodic benefit cost for years ended September 30 were as follows:
| | | | | | | | | | | | |
| | | | | | | | | | | | |
| Pension Benefits | | Other Benefits |
| | 2013 | | 2012 | | 2011 | | 2013 | | 2012 | | 2011 |
Discount rate | | 3.77% | | 4.60% | | 5.08% | | 3.77% | | 4.60% | | 5.08% |
Expected long-term return on plan assets | | 6.50% | | 6.50% | | 6.50% | | na | | na | | na |
Rate of compensation increase | | na | | na | | na | | na | | na | | na |
The expected long-term rate of return of plan assets is based on historical and projected rates of return for current and planned asset classes in the plan’s investment portfolio. Based on the target asset allocation for each asset class, the overall expected rate of return for the portfolio was developed and adjusted for historical and expected experience of the active portfolio management results compared to the benchmark returns and for the effect of expenses paid from plan assets. The Company reviews this long-term assumption on an annual basis.
Assumed health care cost trend rates at September 30 were as follows:
| | | | | |
| | | | | |
| | 2013 | | | 2012 |
Health care cost trend rate assumed for next year | | 11% | | | 12% |
Rate to which the cost trend rate is assumed to decline (the ultimate trend rate) | | 6% | | | 6% |
Year that the rate reaches the ultimate trend rate | | 2018 | | | 2018 |
Assumed health care cost trend rates have a significant effect on the amounts reported for the health care plans. A one-percentage-point change in assumed health care cost trend rates would have the following effects as of September 30, 2013.
| | | | | |
| | | | | |
(Dollars in Thousands) | | 1-Percentage-
Point Increase | | | 1-Percentage-
Point Decrease |
Effect on aggregate of service and interest cost | $ | 9 | | $ | 8 |
Effect on postretirement benefit obligation | $ | 78 | | $ | 71 |
Contributions
The Company, under IRS minimum funding standards, has no required contributions to make to its defined benefit pension plan during fiscal 2014.
Estimated Future Benefit Payments
The following benefit payments, which reflect expected future service as appropriate, are expected to be paid:
| | | | | |
| | | | | |
(Dollars in Thousands) | | Pension
Benefits | | | Other
Benefits |
2014 | $ | 1,212 | | $ | 65 |
2015 | | 1,254 | | | 88 |
2016 | | 1,264 | | | 121 |
2017 | | 1,355 | | | 137 |
2018 | | 1,553 | | | 136 |
Years 2019-2023 | | 9,720 | | | 616 |
Plan Assets
The Company’s pension plan weighted-average asset allocations by asset category at September 30 were as follows:
| | | | | |
| | | | | |
| Plan Assets at September 30, |
Asset Category: | | 2013 | | | 2012 |
Fixed income | | 42% | | | 57% |
Equity securities | | 55% | | | 41% |
Cash equivalents | | 3% | | | 2% |
Total | | 100% | | | 100% |
Plan assets for the qualified defined benefit pension plan include marketable equity securities, corporate and government debt securities, and cash and short-term investments. The plan assets are not directly invested in the Company’s common stock. The supplemental executive retirement plans and the directors’ retirement plan are not separately funded.
The plan’s investment strategy supports the objectives of the plan. These objectives are to maximize returns in order to meet long-term cash requirements within reasonable and prudent levels of risk. To achieve these objectives, the Company has established a strategic asset allocation policy which is to maintain approximately one half of plan assets in high quality fixed income securities such as investment grade bonds and short term government securities, with the other half containing large capitalization equity securities. The plan’s objective is to periodically rebalance its assets to approximate weighted-average target asset allocations. Investments are diversified across classes and within each class to minimize the risk of large losses.
Refer to footnote 3, “Fair Value Measurements” for further information regarding fair value inputs and hierarchy. Plan assets measured at fair value on a recurring basis are summarized below:
| | | | | | | | |
| | | | | | | | |
| Fair Value Measurements at September 30, 2013 Using: |
(Dollars in Thousands) | | Quoted Prices in Active Markets for
Identical Assets
(Level 1) | | | Significant
Other
Observable Inputs
(Level 2) | | | Significant
Unobservable
Inputs
(Level 3) |
Asset Category: | | | | | | | | |
Money market accounts | $ | - | | $ | - | | $ | 205 |
Debt securities: | | | | | | | | |
Corporate bonds | | - | | | 1,667 | | | - |
Government bonds | | - | | | 120 | | | - |
Registered investment companies | | 8,231 | | | - | | | - |
Equity securities: | | | | | | | | |
Domestic | | 4,819 | | | - | | | - |
International | | 8,579 | | | - | | | - |
Total assets at fair value | $ | 21,629 | | $ | 1,787 | | $ | 205 |
| | | | | | | | |
| | | | | | | | |
| Fair Value Measurements at September 30, 2012 Using: |
(Dollars in Thousands) | | Quoted Prices in Active Markets for
Identical Assets
(Level 1) | | | Significant
Other
Observable Inputs
(Level 2) | | | Significant
Unobservable
Inputs
(Level 3) |
Asset Category: | | | | | | | | |
Money market accounts | $ | 61 | | $ | - | | $ | - |
Debt securities: | | | | | | | | |
Corporate bonds | | - | | | 4,950 | | | - |
Government bonds | | - | | | 264 | | | - |
Registered investment companies | | 7,797 | | | - | | | - |
Equity securities: | | | | | | | | |
Domestic | | 6,598 | | | - | | | - |
International | | 3,005 | | | - | | | - |
Total assets at fair value | $ | 17,461 | | $ | 5,214 | | $ | - |
13. Commitments and Contingencies
The Company is a party to a variety of legal proceedings that arise in the ordinary course of its business. While the results of these legal proceedings cannot be predicted with certainty, the Company regularly reviews legal
matters and records provisions for claims that it can estimate and are considered probable of loss. As of September 30, 2013, management believes that the final outcome of these proceedings will not have a material adverse effect on the Company’s results of operations or financial position.
14. Stock-Based Compensation
The Company maintains stock-based compensation awards for key employees and/or non-employee directors under the Landauer, Inc. Incentive Compensation Plan (the “IC Plan”) which was approved by shareholders in February 2008. For future grants, the IC Plan replaced the previous three plans. The Company reserved 500,000 shares of its common stock for grant under the IC Plan, and shares reserved for award and unused under the previous three plans were cancelled. The Plan provide for grants of options to purchase the Company’s common stock, restricted stock, restricted stock units, performance shares and units, and stock appreciation rights. Shares issued upon settlement of stock-based compensation awards are issued from the Company’s authorized, unissued stock.
Restricted Share Awards
Restricted share awards consist of performance shares and time vested restricted stock. Expense related to performance shares and restricted stock is recognized ratably over the vesting period. Restricted stock issued to eligible employees and directors under the Plans vests, to date, over a period from 1 year to 5 years, and performance shares contingently vest over various periods, depending on the nature of the performance goal. Restricted share transactions during fiscal 2013 were as follows:
| | | | | |
| | | | | |
| | Number of Restricted Share Awards
(in Thousands) | | | Weighted-Average Fair Value |
Outstanding at October 1, 2012 | | 114 | | $ | 55.50 |
Granted | | 75 | | | 58.19 |
Vested | | (33) | | | 60.18 |
Forfeited | | (31) | | | 55.07 |
Outstanding at September 30, 2013 | | 125 | | $ | 55.99 |
As of September 30, 2013, unrecognized compensation expense related to restricted share awards totaled $3,792 and is expected to be recognized over a weighted average period of 1.44 years. The total fair value of shares vested during fiscal 2013, 2012 and 2011 was $1,999, $1,593 and $1,623, respectively.
Stock Options
Expense related to stock options issued to eligible employees and directors under the Plans is recognized ratably over the vesting period. Stock options generally vest over a period of 0 to 4 years and have 10-year contractual terms. A summary of stock option activity during fiscal 2013 is presented below:
| | | | | | | | | | | |
| | | | | | | | | | | |
| | Number of Options
(in Thousands) | | | Weighted-Average Exercise
Price | | | Weighted-Average Remaining Contractual Term (Years) | | | Aggregate Intrinsic Value
(in Thousands) |
Outstanding at October 1, 2012 | | 87 | | $ | 45.29 | | | | | | |
Exercised | | (15) | | | 43.98 | | | | | | |
Outstanding at September 30, 2013 | | 72 | | $ | 47.71 | | | 1.7 | | $ | 257 |
Exercisable at September 30, 2013 | | 72 | | $ | 47.71 | | | 1.7 | | $ | 257 |
As of September 30, 2013, all outstanding stock options were vested and compensation expense related to stock options was recognized. The Company has not granted stock options subsequent to fiscal 2005. The intrinsic value of options exercised totaled $216, $34 and $73 during fiscal 2013, 2012 and 2011, respectively. The total income tax benefit recognized in the consolidated statements of income related to the exercise of stock options was $99, $13 and $27 during fiscal 2013, 2012 and 2011, respectively.
15. Geographic Information
The Company provides its services primarily to customers in the U.S., as well as to customers in other geographic markets. The Company does not have any significant long-lived assets in foreign countries. The following table shows the geographical distribution of external customer revenues that were attributed to a particular region based on whether the customer had a direct contract with the Company’s subsidiary located in that region for the fiscal years ended September 30:
| | | | | | | | | |
| | | | | | | | | |
(Dollars in Thousands) | | 2013 | | 2012 | | 2011 |
Domestic | | $ | 116,469 | | $ | 121,519 | | $ | 90,897 |
Europe | | | 21,559 | | | 20,245 | | | 20,472 |
Other countries | | | 12,172 | | | 10,636 | | | 9,089 |
Consolidated revenues | | $ | 150,200 | | $ | 152,400 | | $ | 120,458 |
16. Segment Information
The Company operates in three reportable segments, Radiation Measurement, Medical Physics and Medical Products. The factors for determining the reportable segments reflect specific markets and the products and services offered combined with the nature of the individual business traits, as well as key financial information reviewed by management. The Radiation Measurement segment comprises the metrological activities of the business.
The Radiation Measurement segment provides analytical services to determine occupational and environmental radiation exposure. These services are provided internationally primarily to hospitals, medical and dental offices, universities, national laboratories, and nuclear facilities. Radiation Measurement activities include the manufacture of various types of radiation detection monitors, the distribution and collection of the monitors to and from customers, and the analysis and reporting of exposure findings. In addition to providing analytical services, the Radiation Measurement segment leases or sells dosimetry detectors and reading equipment.
The Medical Physics segment provides therapeutic and imaging physics services to domestic hospitals and radiation therapy centers. Service offerings include clinical physics support, equipment commissioning, accreditation support and imaging equipment testing. These professional services are provided to customers on-site by skilled physicists. Medical physics services are provided through the Company’s LMP subsidiary.
The Medical Products segment provides medical consumable accessories used in radiology, radiation therapy, and image guided surgery procedures. Medical products range from consumables used with MRI, CT, and mammography technologies to highly engineered passive reflective markers used during image guided surgery procedures. Medical Products sales are provided through the Company’s IZI subsidiary.
The Company primarily evaluates performance of the individual segments based upon, among other metrics, segment operating income or loss. Segment operating income or loss is segment revenues less segment cost of sales and segment selling, general and administrative expenses. Corporate expenses for shared functions, including corporate management, corporate finance and human resources, are recognized in the Radiation Measurement segment where they have been reported historically. In addition, acquisition and reorganization costs are not allocated to the segments. Information about net other income, including interest income and expense, and income taxes is not provided at the segment level. As the Company’s business model evolves in increased complexity, management may determine it necessary to change this reporting practice to reflect any appropriate allocations.
The following tables summarize financial information for each reportable segment for the years ended September 30:
| | | | | | | | | | | | |
| | | | | | | | | | | | |
| | 2013 |
(Dollars in Thousands) | | Radiation
Measurement | | Medical
Physics | | Medical
Products | | Consolidated |
Revenues | | $ | 109,836 | | $ | 30,859 | | $ | 9,505 | | $ | 150,200 |
Operating income(1) | | | 22,441 | | | 3,507 | | | (21,828) | | | 4,120 |
Depreciation and amortization | | | 11,180 | | | 1,185 | | | 2,559 | | | 14,924 |
| | | | | | | | | | | | |
| | 2012 |
(Dollars in Thousands) | | Radiation
Measurement | | Medical
Physics | | Medical
Products | | Consolidated |
Revenues | | $ | 107,922 | | $ | 30,937 | | $ | 13,541 | | $ | 152,400 |
Operating income | | | 21,539 | | | 1,334 | | | 5,297 | | | 28,170 |
Depreciation and amortization | | | 8,377 | | | 1,419 | | | 1,835 | | | 11,631 |
| | | | | | | | | | | | |
| | 2011 |
(Dollars in Thousands) | | Radiation
Measurement | | Medical
Physics | | Medical
Products | | Consolidated |
Revenues | | $ | 99,868 | | $ | 20,590 | | $ | - | | $ | 120,458 |
Operating income (loss) | | | 35,373 | | | (490) | | | - | | | 34,883 |
Depreciation and amortization | | | 7,032 | | | 959 | | | - | | | 7,991 |
(1)Fiscal 2013 includes $22,700 impairment charge.
| | | | | | |
| | | | | | |
(Dollars in Thousands) | | 2013 | | 2012 |
Segment assets: | | | | | | |
Radiation Measurement | | $ | 170,648 | | $ | 171,831 |
Medical Physics | | | 35,218 | | | 36,304 |
Medical Products | | | 70,967 | | | 93,990 |
Total assets | | $ | 276,833 | | $ | 302,125 |
17. Quarterly Financial Data (unaudited)
| | | | | | | | | | | | | | | | | |
| | | | | | | | | | | | | | | | | |
(Dollars in Thousands, Except per Share) | | | | First Quarter | | Second Quarter | | Third Quarter | | Fourth Quarter | | Total Year |
Net revenues | | 2013 | | $ | 36,681 | | $ | 37,082 | | $ | 36,580 | | $ | 39,857 | | $ | 150,200 |
| | 2012 | | $ | 36,669 | | $ | 39,094 | | $ | 39,205 | | $ | 37,432 | | $ | 152,400 |
Gross profit | | 2013 | | $ | 20,118 | | $ | 20,032 | | $ | 18,616 | | $ | 20,414 | | $ | 79,180 |
| | 2012 | | $ | 21,763 | | $ | 23,065 | | $ | 21,848 | | $ | 20,332 | | $ | 87,008 |
Operating income (loss)(1) | | 2013 | | $ | 6,727 | | $ | 7,154 | | $ | (16,776) | | $ | 7,015 | | $ | 4,120 |
| | 2012 | | $ | 7,553 | | $ | 10,149 | | $ | 9,249 | | $ | 1,219 | | $ | 28,170 |
Net income (loss) attributed to Landauer, Inc. | | 2013 | | $ | 4,877 | | $ | 5,153 | | $ | (13,753) | | $ | 8,559 | | $ | 4,836 |
| | 2012 | | $ | 4,925 | | $ | 7,110 | | $ | 6,566 | | $ | 669 | | $ | 19,270 |
Basic net income (loss) per share | | 2013 | | $ | 0.52 | | $ | 0.54 | | $ | (1.46) | | $ | 0.90 | | $ | 0.50 |
| | 2012 | | $ | 0.52 | | $ | 0.76 | | $ | 0.70 | | $ | 0.07 | | $ | 2.04 |
Diluted net income (loss) per share | | 2013 | | $ | 0.52 | | $ | 0.54 | | $ | (1.46) | | $ | 0.90 | | $ | 0.49 |
| | 2012 | | $ | 0.52 | | $ | 0.75 | | $ | 0.69 | | $ | 0.07 | | $ | 2.03 |
Weighted average basic shares outstanding | | 2013 | | | 9,336 | | | 9,417 | | | 9,439 | | | 9,462 | | | 9,434 |
| | 2012 | | | 9,348 | | | 9,361 | | | 9,371 | | | 9,397 | | | 9,389 |
Weighted average diluted shares outstanding | | 2013 | | | 9,385 | | | 9,462 | | | 9,439 | | | 9,506 | | | 9,482 |
| | 2012 | | | 9,385 | | | 9,402 | | | 9,412 | | | 9,456 | | | 9,437 |
(1) Third quarter of fiscal 2013 includes a $22,700 impairment charge. The fourth quarter of fiscal 2013 includes correction of certain errors relating to prior periods. The corrections decreased operating income by approximately $350 and increased equity in income of joint ventures by approximately $300. The Company does not believe these corrections were material to any current or prior interim or annual periods that were affected.
Report of Independent Registered Public Accounting Firm
To Stockholders and Board of Directors of Landauer, Inc.:
In our opinion, the accompanying consolidated balance sheets and the related consolidated statements of income, comprehensive income, stockholders' equity, and cash flows present fairly, in all material respects, the financial position of Landauer, Inc. and its subsidiaries at September 30, 2013 and September 30, 2012, and the results of their operations and their cash flows for each of the three years in the period ended September 30, 2013 in conformity with accounting principles generally accepted in the United States of America. In addition, the financial statement schedule listed in the index appearing under Item 15 presents fairly, in all material respects, the information set forth therein when read in conjunction with the related consolidated financial statements. Also in our opinion, the Company maintained, in all material respects, effective internal control over financial reporting as of September 30, 2013, based on criteria established in Internal Control - Integrated Framework (1992) issued by the Committee of Sponsoring Organizations of the Treadway Commission (COSO). The Company's management is responsible for these financial statements and financial statement schedule, for maintaining effective internal control over financial reporting and for its assessment of the effectiveness of internal control over financial reporting, included in Management's Report on Internal Control over Financial Reporting, appearing under Item 9A. Our responsibility is to express opinions on these financial statements, on the financial statement schedule and on the Company's internal control over financial reporting based on our integrated audits. We conducted our audits in accordance with the standards of the Public Company Accounting Oversight Board (United States). Those standards require that we plan and perform the audits to obtain reasonable assurance about whether the financial statements are free of material misstatement and whether effective internal control over financial reporting was maintained in all material respects. Our audits of the financial statements included examining, on a test basis, evidence supporting the amounts and disclosures in the financial statements, assessing the accounting principles used and significant estimates made by management, and evaluating the overall financial statement presentation. Our audit of internal control over financial reporting included obtaining an understanding of internal control over financial reporting, assessing the risk that a material weakness exists, and testing and evaluating the design and operating effectiveness of internal control based on the assessed risk. Our audits also included performing such other procedures as we considered necessary in the circumstances. We believe that our audits provide a reasonable basis for our opinions.
A company’s internal control over financial reporting is a process designed to provide reasonable assurance regarding the reliability of financial reporting and the preparation of financial statements for external purposes in accordance with generally accepted accounting principles. A company’s internal control over financial reporting includes those policies and procedures that (i) pertain to the maintenance of records that, in reasonable detail, accurately and fairly reflect the transactions and dispositions of the assets of the company; (ii) provide reasonable assurance that transactions are recorded as necessary to permit preparation of financial statements in accordance with generally accepted accounting principles, and that receipts and expenditures of the company are being made only in accordance with authorizations of management and directors of the company; and (iii) provide reasonable assurance regarding prevention or timely detection of unauthorized acquisition, use, or disposition of the company’s assets that could have a material effect on the financial statements.
Because of its inherent limitations, internal control over financial reporting may not prevent or detect misstatements. Also, projections of any evaluation of effectiveness to future periods are subject to the risk that controls may become inadequate because of changes in conditions, or that the degree of compliance with the policies or procedures may deteriorate.
/s/ PricewaterhouseCoopers LLP
PricewaterhouseCoopers LLP
Chicago, IL
December 16, 2013
Item 9. Changes in and Disagreements with Accountants on Accounting and Financial Disclosure
None.
Item 9A. Controls and Procedures
Disclosure Controls and Procedures
As of the end of the period covered by this report, an evaluation was performed under the supervision and with the participation of the Company’s management, including the Chief Executive Officer (“CEO”) and the Chief Financial Officer (“CFO”) (the Company’s principal executive officer and principal financial officer, respectively), of the effectiveness of the design and operation of the Company’s disclosure controls and procedures as defined in Rule 13a-15(e) and 15d-15(e) under the Securities and Exchange Act of 1934, as amended (the “Exchange Act”). Based upon that evaluation, the Company’s CEO and CFO concluded that the Company’s disclosure controls and procedures as of September 30, 2013 were effective.
Management’s Report on Internal Control over Financial Reporting
Management of the Company is responsible for establishing and maintaining adequate internal control over financial reporting, as defined in Exchange Act Rules 13a-15(f) and 15d-15(f). The Company’s internal control over financial reporting is a process designed to provide reasonable assurance regarding the reliability of financial reporting and the preparation of financial statements for external purposes in accordance with GAAP. Because of its inherent limitations, internal control over financial reporting may not prevent or detect misstatements. Also, projections of any evaluation of effectiveness to future periods are subject to the risk that controls may become inadequate because of changes in conditions, or that the degree of compliance with the policies or procedures may deteriorate.
Our management evaluated the effectiveness of our internal control over financial reporting based on the framework in Internal Controls-Integrated Framework issued by the Committee of Sponsoring Organizations of the Treadway Commission. Based on this evaluation, our management concluded that the Company's internal control over financial reporting was effective as of September 30, 2013. The effectiveness of the Company's internal control over financial reporting as of September 30, 2013 has been audited by PricewaterhouseCoopers LLP, an independent registered public accounting firm, as stated in their attestation report which appears under Item 8 of this Annual Report on Form 10-K.
Changes in Internal Control over Financial Reporting
The Company extended its Section 404 compliance program under the Sarbanes-Oxley Act of 2002 and the applicable rules and regulations under such Act to include acquisitions as of September 30, 2013. There have been no other changes in the Company’s internal control over financial reporting that occurred during the quarterly period ended September 30, 2013 that have materially affected, or are reasonably likely to materially affect, the Company’s internal control over financial reporting.
Item 9B. Other Information
None.
PART III
Item 10. Directors, Executive Officers and Corporate Governance
Information pursuant to this Item relating to the directors of the Company, contained under the headings “Election of Directors”, “Beneficial Ownership of Common Stock”, “Process for Nominating Directors” and “Executive Officers” in the Proxy Statement, is incorporated herein by reference.
Disclosure pursuant to this Item regarding Section 16(a) reporting compliance, contained under the heading “Section 16(a) Beneficial Ownership Reporting Compliance” in the Proxy Statement, is incorporated herein by reference. Information pursuant to this Item relating to the Company’s Audit Committee and the Company’s code of ethics, contained under the heading “Board of Directors and Committees” in the Proxy Statement, is incorporated herein by reference.
Item 11. Executive Compensation
Except for the information relating to Item 13 hereof, the information contained under the headings “Executive Compensation” and “Compensation Committee Report” in the Proxy Statement, is incorporated herein by reference.
Item 12. Security Ownership of Certain Beneficial Owners and Management and
Related Stockholder Matters
The information contained under the headings “Beneficial Ownership of Common Stock” and “Equity Compensation Plan Information” in the Proxy Statement is incorporated herein by reference.
Item 13. Certain Relationships and Related Transactions, and Director Independence
Except for the information relating to Item 11 hereof, the information contained under the headings “Election of Directors” and “Independence of Directors” in the Proxy Statement is incorporated herein by reference.
Item 14. Principal Accounting Fees and Services
The information contained under the heading “Fees Billed by Independent Public Accountants” in the Proxy Statement is incorporated herein by reference.
PART IV
Item 15. Exhibits and Financial Statement Schedules
| |
(a) | The following documents are filed as part of this report: |
| |
(1) | Financial Statements – The financial statements of Landauer listed under Item 8 herein. |
(2) | Financial Statement Schedules – Schedule II - Valuation and Qualifying Accounts |
(3) | Exhibits – The following exhibits: |
| |
| |
(3)(a) | Certificate of Incorporation of the Registrant, as amended through February 4, 1993, is incorporated by reference to Exhibit (3)(a) to the Annual Report on Form 10-K for the fiscal year ended September 30, 1993. |
(3)(b) | By-laws of the Registrant, as amended and restated effective February 5, 2009, are incorporated by reference to Exhibit 3.1 to the Current Report on Form 8-K dated February 5, 2009. |
(4)(a) | Specimen common stock certificate of the Registrant is incorporated by reference to Exhibit (4)(a) to the Annual Report on Form 10-K for the fiscal year ended September 30, 1997. |
(10)(a) | The Landauer, Inc. Executive Special Severance Plan as amended and restated on November 12, 2009 is incorporated by reference to Exhibit (10)(k) to the Annual Report on Form 10-K for the fiscal year ended September 30, 2009. |
(10)(b) | Amendments to the Landauer, Inc. Executive Special Severance Plan dated December 18, 2012 are incorporated by reference to Exhibit 10.2 to the Current Report on Form 8-K dated December 18, 2012. |
(10)(c) | Employment agreement dated September 28, 2005 between the Registrant and William E. Saxelby is incorporated by reference to Exhibit (10)(q) to the Annual Report on Form 10-K for the fiscal year ended September 30, 2005. |
(10)(d) | Amendment dated as of May 1, 2009 to the Employment Agreement between the Registrant and William E. Saxelby is incorporated by reference to Exhibit 10.1 to the Current Report on Form 8-K dated May 1, 2009. |
(10)(e) | Amendment dated as of December 18, 2012 to the Employment Agreement between the Registrant and William E. Saxelby is incorporated by reference to Exhibit 10.1 to the Current Report on Form 8-K dated December 18, 2012. |
(10)(f) | Employment agreement dated February 29, 1996 between the Registrant and R. Craig Yoder is incorporated by reference to the Annual Report on Form 10-K for the fiscal year ended September 30, 1998. |
(10)(g) | Amendment to Employment Agreement dated May 2, 2006 between the Registrant and R. Craig Yoder is incorporated by reference to Exhibit 10.1 to the Quarterly Report on Form 10-Q for the quarter ended June 30, 2006. |
(10)(h) | The Landauer, Inc. Incentive Compensation Plan is incorporated by reference to Exhibit A to the Proxy Statement for the Annual Meeting of Shareholders dated January 7, 2013. |
(10)(i) | Form of Restricted Stock Award under the Landauer, Inc. Incentive Compensation Plan is incorporated by reference to Exhibit 10.1 to the Current Report on Form 8-K dated February 7, 2008. |
(10)(j) | Form of Performance Stock Award under the Landauer, Inc. Incentive Compensation Plan is incorporated by reference to Exhibit 10.2 to the Current Report on Form 8-K dated February 7, 2008. |
(10)(k) | Amended and Restated Credit Agreement, dated as of August 2, 2013, among Landauer, Inc., Global Physics Solutions, Inc. and IZI Medical Products, LLC, as borrowers. BMO Harris Bank N.A., as administrative agent, the lenders party thereto and PNC Bank, National Association as syndication agent is incorporated by reference to Exhibit 10.1 to the Quarterly Report on Form 10-Q for the fiscal quarter ended June 30, 2013. |
(21) | Subsidiaries of the Registrant. |
(23) | Consent of PricewaterhouseCoopers LLP |
(31.1) | Certification of William E. Saxelby, President and Chief Executive Officer, as adopted pursuant to Section 302 of the Sarbanes-Oxley Act of 2002 filed herewith. |
(31.2) | Certification of Michael K. Burke, Chief Financial Officer, as adopted pursuant to Section 302 of the Sarbanes-Oxley Act of 2002 filed herewith. |
(32.1) | Certification of William E. Saxelby, President and Chief Executive Officer, pursuant to 18 U.S.C. Section 1350, as adopted pursuant to Section 906 of the Sarbanes-Oxley Act of 2002 furnished herewith. |
(32.2) | Certification of Michael K. Burke, Chief Financial Officer, pursuant to 18 U.S.C. Section 1350, as adopted pursuant to Section 906 of the Sarbanes-Oxley Act of 2002 furnished herewith. |
(101) | The following financial information from our Annual Report on Form 10-K for the year ended September 30, 2013, filed with the Securities and Exchange commission on December 11, 2013, is formatted in Extensible Business Reporting Language (“XBRL”): (i) Consolidated Balance Sheets, (ii) Consolidated Statements of Income, (iii) Consolidated Statements of Comprehensive Income, (iv) Consolidated Statements of Stockholders’ Equity, (v) Consolidated Statements of Cash Flows, and (vi) Notes to Consolidated Financial Statements. |
| |
| Exhibits 10(a) through 10(j) listed above are management contracts and compensatory plans or arrangement. |
Signatures
Pursuant to the requirements of Section 13 or 15(d) of the Securities Exchange Act of 1934, the registrant has duly caused this report to be signed on its behalf by the undersigned, thereunto duly authorized.
1 | | | |
| | LANDAUER, INC. | |
| | | |
| | /s/ William E. Saxelby | December 16, 2013 |
| | William E. Saxelby | |
| | Chief Executive Officer | |
Pursuant to the requirements of the Securities Exchange Act of 1934, this report has been signed below by the following persons on behalf of the registrant and in the capacities and on the dates indicated.
| | |
Signature | Title | Date |
| | |
/s/ William E. Saxelby | President, Chief Executive Officer and Director | December 16, 2013 |
William E. Saxelby | (Principal Executive Officer) | |
| | |
/s/ Michael K. Burke | Chief Financial Officer | December 16, 2013 |
Michael K. Burke | (Principal Financial Officer) | |
| | |
/s/ Ronald R. Zilkowski | Vice President, Corporate Controller | December 16, 2013 |
Ronald R. Zilkowski | (Principal Accounting Officer) | |
| | |
/s/ Robert J. Cronin | Director | December 16, 2013 |
Robert J. Cronin | | |
| | |
/s/ William G. Dempsey | Director | December 16, 2013 |
William G. Dempsey | | |
| | |
/s/ Michael T. Leatherman | Director | December 16, 2013 |
Michael T. Leatherman | | |
/s/ David E. Meador | Director | December 16, 2013 |
David E. Meador | | |
| | |
/s/ Stephen C. Mitchell | Director | December 16, 2013 |
Stephen C. Mitchell | | |
| | |
/s/ Thomas M. White | Director | December 16, 2013 |
Thomas M. White | | |
Landauer, Inc. and Subsidiaries
Schedule II – Valuation and Qualifying Accounts
For the Years Ended September 30,
| | | | | | | | | |
| | | | | | | | | |
Allowance for Doubtful Accounts | | | | | | | | | |
(Dollars in Thousands) | | 2013 | | 2012 | | 2011 |
Balance at beginning of period | | $ | 1,088 | | $ | 794 | | $ | 852 |
Additions: | | | | | | | | | |
Charged to costs and expenses | | | (173) | | | 445 | | | 192 |
Charged to other accounts(1) | | | 20 | | | 81 | | | 53 |
Deductions(2) | | | (335) | | | (232) | | | (303) |
Balance at end of period | | $ | 600 | | $ | 1,088 | | $ | 794 |
(1)Collection of accounts previously written off
(2)Uncollectible accounts written off