`
UNITED STATES
SECURITIES AND EXCHANGE COMMISSION
Washington, DC 20549
FORM 10-K
(Mark One)
ANNUAL REPORT PURSUANT TO SECTION 13 OR 15(D) OF THE
SECURITIES EXCHANGE ACT OF 1934
For the fiscal year ended September 30, 2007 or
TRANSITION REPORT PURSUANT TO SECTION 13 OR 15(D) OF THE
SECURITIES EXCHANGE ACT OF 1934
For the transition period from _______________________ to ______________________.
Commission File Number 1-9789
TECH/OPS SEVCON, INC.
(Exact name of registrant as specified in its charter)
| Delaware | 04-2985631 |
| (State or other jurisdiction of incorporation or organization) | (I.R.S. Employer Identification No.) |
155 Northboro Road, Southborough, Massachusetts 01772
(Address of Principal Executive Offices) (Zip Code)
Registrant's Area Code and Telephone Number (508) 281 5510
Securities registered pursuant to Section 12(b) of the Act:
| (Title of Each Class) | (Name of Exchange on Which Registered) |
| COMMON STOCK, PAR VALUE $.10 PER SHARE | AMERICAN STOCK EXCHANGE |
Securities registered pursuant to Section 12(g) of the Act: None
Indicate by check mark if the registrant is a well-known seasoned issuer, as defined in Rule 405 of the Securities Act. Yes o No x
Indicate by check mark if the registrant is not required to file reports pursuant to Section 13 or Section 15(d) of the Act. Yes o No x
Indicate by check mark whether the registrant (1) has filed all reports required to be filed by Section 13 or 15(d) of the Securities Exchange Act of 1934 during the preceding 12 months (or for such shorter period that the registrant was required to file such reports), and (2) has been subject to such filing requirements for the past 90 days. Yes x No o
Indicate by check mark if disclosure of delinquent filers pursuant to Item 405 of Regulation S-K is not contained herein, and will not be contained, to the best of Registrant’s knowledge, in definitive proxy or information statements incorporated by reference in Part III of this Form 10-K or any amendment to this Form 10-K. x
Indicate by check mark whether the registrant is a large accelerated filer, an accelerated filer or a non-accelerated filer. See definition of “accelerated filer and large accelerated filer” in Rule 12b-2 of the Exchange Act. (Check one):
Large accelerated filer o Accelerated Filer o Non accelerated filer x
Indicate by check mark whether the registrant is a shell company (as defined in Rule 12b-2 of the Securities Exchange Act of 1934).
Yes o No x
As of March 31, 2007, 3,233,051 common shares were outstanding, and the aggregate market value of the common shares (based upon the closing price on the American Stock Exchange) held by non-affiliates was $16,460,000. As of December 14, 2007, 3,257,702 common shares were outstanding.
Documents incorporated by reference: Portions of the Proxy Statement for Annual Meeting of Stockholders to be held January 22, 2008 are incorporated by reference into Part III of this report.
INDEX
| ITEM | PAGE |
| |
| |
| 3 |
| 3 |
| 3 |
| 3 |
| 3 |
| 3 |
| 3 |
| 4 |
| 4 |
| 4 |
| 5 |
| 5 |
| 5 |
| 5 |
| |
| 5 |
| 6 |
| 7 |
| 13 |
| |
| 14 |
| 15 |
| 15 |
| 16 |
| 17 |
| 18 |
| 29 |
| 30 |
| 30 |
| 30 |
| |
| 30 |
| 31 |
| 31 |
| 31 |
| 31 |
| |
| |
| 32 |
| 32 |
| 33 |
| |
| 36 |
Schedules other than the one referred to above have been omitted as inapplicable or not required, or the information is included elsewhere in financial statements or the notes thereto.
Unless explicitly stated otherwise, each reference to “year” in this Annual Report is to the fiscal year ending on the respective September 30.
Tech/Ops Sevcon, Inc. (“Tech/Ops Sevcon” or the “Company”) is a Delaware corporation organized on December 22, 1987 to carry on the electronic controls business previously performed by Tech/Ops, Inc. (Tech/Ops). Through wholly-owned subsidiaries located in the United States, England, France, South Korea and Japan, the Company designs, manufactures, sells, and services, under the Sevcon name, solid-state products which control motor speed and acceleration for battery powered electric vehicles in a number of applications, primarily electric fork lift trucks, aerial lifts and underground coal-mining equipment. Through another subsidiary located in the United Kingdom, Tech/Ops Sevcon manufactures special metallized film capacitors for electronics applications. These capacitors are used as components in the power electronics, signaling and audio equipment markets. Approximately 94% of the Company’s revenues in 2007 were derived from the controls business, with the remainder derived from the capacitor business. The largest customer accounted for 14% of sales in fiscal 2007 compared to 17% in fiscal 2006 and 16% in fiscal 2005.
In fiscal 2007 sales were $39,213,000, an increase of $4,583,000, or 13%, compared to the previous year. Foreign currency fluctuations accounted for an increase of $2,162,000, or 6%, in reported sales. Excluding the foreign currency impact, sales volume grew by 7% compared to fiscal 2006. Operating income in fiscal 2007 was $2,063,000, compared to $1,844,000 in the previous year, an increase of 12%. Net income was $1,303,000, or $ .41 per diluted share, compared to $1,114,000, or $.35 per diluted share, last year. See Management’s Discussion and Analysis of Financial Condition and Results of Operations for a more detailed analysis of fiscal 2007 performance.
Sales are made primarily through a small full-time marketing staff. Sales in the United States were $14,832,000, $14,643,000 and $12,893,000, in fiscal years 2007, 2006 and 2005, respectively, which accounted for approximately 38%, 42% and 41%, respectively, of total sales. Approximately 63% of sales are made to 10 manufacturers of electric vehicles in the United States, Europe and the Far East. Approximately 90% of the Company’s sales are direct to end customers, with 10% made to the Company’s international dealer network. See Note 8 to the Consolidated Financial Statements (Segment Information) in this Annual Report for an analysis of sales by segment, geographic location and major customers, and the risk factor on page 4 regarding sales and operations outside the United States which are incorporated by reference herein.
Although the Company has international patent protection for some of its product ranges, the Company believes that its business is not significantly dependent on patent protection. The Company is primarily dependent upon technical competence, the quality of its products, and its prompt and responsive service performance.
Tech/Ops Sevcon's backlog at September 30, 2007 was $5,566,000, compared to $4,923,000 at September 2006 and $4,957,000 at September 2005.
Tech/Ops Sevcon's products require a wide variety of components and materials. The Company has many sources for most of such components and materials and produces certain of these items internally. However, the Company relies on certain suppliers and subcontractors for all of its requirements for certain components, sub-assemblies, and finished products. The Company is taking steps to reduce its reliance on any single subcontractor and as a consequence to diversify its risk.
The Company has global competitors which are divisions of larger public companies, including Danaher’s Motion division, Sauer Danfoss, Hitachi and the motors division of General Electric. It also competes on a worldwide basis with Curtis Instruments Inc., Zapi SpA. and Iskra, private companies based in U.S., Italy and Slovenia, respectively that have international operations. In addition, some large fork lift truck manufacturers make their own controls and system products. The Company differentiates itself by providing highly reliable, technically innovative products which the Company is prepared to customize for a specific customer or application. The Company believes that it is one of the largest independent suppliers of controls for battery operated vehicles.
Tech/Ops Sevcon's technological expertise is an important factor in its business. The Company regularly pursues product improvements to maintain its technical position. Research and development expenditures amounted to $3,790,000 in 2007, compared to $3,582,000 in 2006 and $3,499,000 in 2005. The increase in research and development spending of $208,000, or 6%, in fiscal 2007 was due to the effect of adverse exchange rate changes.
The Company complies, to the best of its knowledge, with federal, state and local provisions which have been enacted or adopted regulating the discharge of materials into the environment or otherwise protecting the environment. This compliance has not had, nor is it expected to have, a material effect on the capital expenditures, earnings, or competitive position of Tech/Ops Sevcon.
As of September 30, 2007, the Company employed 157 full-time employees, of whom 15 were in the United States, 128 were in the United Kingdom (of which 32 were employed by the capacitor business), 11 were in France, and 3 were in the Far East. Tech/Ops Sevcon believes its relations with its employees are good.
In addition to the market risk factors relating to foreign currency and interest rate risk set out in Item 7A on page 13, the Company believes that the following represent the most significant risk factors for the Company:
Capital goods markets are cyclical
The Company’s customers are mainly manufacturers of capital goods such as fork lift trucks, aerial lifts and railway signaling equipment. These markets are cyclical and are currently showing modest growth, but demand in these markets could decrease or customers could decide to purchase alternative products. In this event the Company’s sales could decrease below its current break-even point and there is no certainty that the Company would be able to decrease overhead expenses to enable it to operate profitably.
The Company relies on a small number of key customers for a substantial portion of its revenues
Ten customers accounted for 63% of the Company’s revenues in fiscal 2007 and the largest customer accounted for 14% of revenues. Although we have had business relationships with these customers for many years, there are no long-term contractual supply agreements in place. Accordingly our performance could be adversely affected by the loss of one or more of these key customers.
The Company has substantial sales and operations outside the United States that could be adversely affected by changes in international markets
A significant portion of our operations is located, and a significant portion of our business comes from, outside the United States. Accordingly, our performance could be adversely affected by economic downturns in Europe or the Far East as well as in the United States. A consequence of significant international business is that a large percentage of our revenues and expenses are denominated in foreign currencies that fluctuate in value versus the U.S. dollar. Although we enter into hedging arrangements, significant fluctuations in foreign exchange rates can and do have a material impact on our financial results, which are reported in U.S. dollars. Other risks associated with international business include: changing regulatory practices and tariffs; staffing and managing international operations, including complying with local employment laws; longer collection cycles in certain areas; and changes in tax and other laws.
Single source materials and sub-contractors may not meet the Company’s needs
The Company relies on certain suppliers and sub-contractors for all of its requirements for certain components, sub-assemblies and finished products. In the event that such suppliers and sub-contractors are unable or unwilling to continue supplying the Company, or to meet the Company’s cost and quality targets or needs for timely delivery, there is no certainty that the Company would be able to establish alternative sources of supply in time to meet customer demand.
Damage to the Company’s or sub-contractor’s buildings would hurt results
In the controller business the majority of product is produced in a single plant in England and uses sub-assemblies sourced from a sub-contractor with two plants in Poland. The capacitor business is located in a single plant in Wales. In the event that any of these plants was to be damaged or destroyed, there is no certainty that the Company would be able to establish alternative facilities in time to meet customer demand. The Company does carry property damage and business interruption insurance but this may not cover certain lost business due to the long-term nature of the relationships with many customers.
Product liability claims may have a material adverse effect
The Company’s products are technically complex and are installed and used by third parties. Defects in their design, installation, use or manufacturing may result in product liability claims against the Company. Such claims may result in significant damage awards, and the cost of any such litigation could be material.
None.
The US subsidiary of the Company leases approximately 13,500 square feet in Southborough, Mass., under a lease expiring in 2013. The United Kingdom (UK) electronic controls business of Tech/Ops Sevcon is carried on in two adjacent buildings owned by it located in Gateshead, England, containing 40,000 and 20,000 square feet of space respectively. The land on which these buildings stand are held on ground leases expiring in 2068 and 2121 respectively. The UK subsidiary sub-lets approximately 11,000 square feet of unused space in one of its buildings for a five-year term expiring in 2011. The French subsidiary leases 5,000 square feet of space near Paris, France under a lease expiring in December 2009. The capacitor subsidiary of the Company owns a 9,000 square foot building, built in 1981, in Wrexham, Wales. The South Korean subsidiary of the Company leases approximately 600 square feet of office space in Bucheon City, near Seoul, under a lease due to expire in 2008. The Japanese subsidiary leases approximately 600 square feet of office space in Tokyo, Japan under a lease due to expire in 2009. The properties and equipment of the Company are in good condition and, in the opinion of the management, are suitable and adequate for the Company's operations.
The Company is involved in various legal proceedings arising in the ordinary course of business, but believes that these matters will be resolved without a material effect on its financial position.
None.
The Common Stock of the Company is traded on the American Stock Exchange under the symbol TO. A summary of the market prices of, and dividends paid on, the Company’s Common Stock is shown below. At December 14, 2007, there were approximately 266 shareholders of record.
| | | Quarter 1 | | | Quarter 2 | | | Quarter 3 | | | Quarter 4 | | | Year | |
| 2007 Quarters | | | | | | | | | | | | | | | | |
| Cash dividends per share | | $ | .03 | | $ | .03 | | $ | .03 | | $ | .03 | | $ | .12 | |
Common stock price per share - High - Low | | $ | 7.85 6.61 | | $ | 7.94 6.40 | | $ | 11.25 6.88 | | $ | 11.93 7.80 | | $ | 11.93 6.40 | |
| 2006 Quarters | | | | | | | | | | | | | | | | |
| Cash dividends per share | | $ | .03 | | $ | .03 | | $ | .03 | | $ | .03 | | $ | .12 | |
Common stock price per share - High - Low | | $ | 6.10 4.95 | | $ | 6.55 5.36 | | $ | 7.36 5.95 | | $ | 7.09 6.20 | | $ | 7.36 4.95 | |
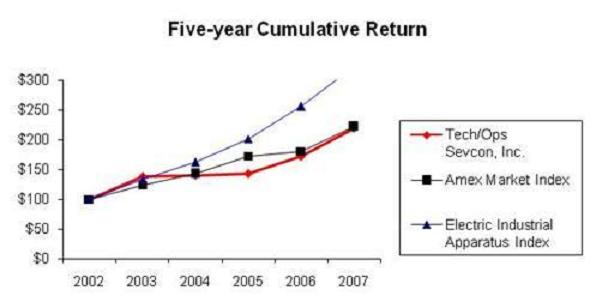
PERFORMANCE GRAPH
The following graph compares the cumulative total return (change in stock price plus reinvested dividends) assuming $100 invested in the Common Stock of the Company, in the American Stock Exchange (“AMEX”) Market Value Index, and in the Hemscott Electric Industrial Apparatus Index during the period from September 30, 2002 through September 30, 2007. This performance graph is furnished and shall not be deemed “filed” with the SEC nor subject to Section 18 of the Securities Exchange Act of 1934, nor shall it be deemed incorporated by reference in any of our filings under the Securities Act of 1933.
Value of Investment at September 30,
| | 2002 | 2003 | 2004 | 2005 | 2006 | 2007 |
| Tech/Ops Sevcon, Inc. | 100 | 138 | 140 | 143 | 172 | 219 |
| AMEX Market Value Index | 100 | 124 | 143 | 173 | 180 | 222 |
| Hemscott Electric Industrial Apparatus Index | 100 | 133 | 162 | 201 | 255 | 321 |
A summary of selected financial data for the last five years is set out below:
As of September 30 (in thousands except per share data)
| | | | 2007 | | | 2006 | | | 2005 | | | 2004 | | | 2003 | |
| Net sales | | $ | 39,213 | | $ | 34,630 | | $ | 31,675 | | $ | 29,150 | | $ | 23,113 | |
| Operating income | | | 2,063 | | | 1,844 | | | 999 | | | 972 | | | 151 | |
| Net income | | | 1,303 | | | 1,114 | | | 641 | | | 611 | | | 83 | |
| Basic income per share | | $ | .41 | | $ | .35 | | $ | .21 | | $ | .20 | | $ | .03 | |
| Cash dividends per share | | $ | .12 | | $ | .12 | | $ | .12 | | $ | .12 | | $ | .12 | |
| Average shares outstanding | | | 3,167 | | | 3,139 | | | 3,125 | | | 3,125 | | | 3,125 | |
| Pension and other long-term liabilities | | | 2,305 | | | 2,942 | | | - | | | - | | | - | |
| Stockholders’ equity | | | 12,434 | | | 10,037 | | | 10,589 | | | 10,464 | | | 9,648 | |
| Total assets | | $ | 21,926 | | $ | 18,652 | | $ | 16,446 | | $ | 16,608 | | $ | 13,784 | |
ITEM 7 MANAGEMENT'S DISCUSSION AND ANALYSIS OF FINANCIAL CONDITION AND RESULTS OF OPERATIONS
FORWARD LOOKING STATEMENTS
Statements in this discussion and analysis about the Company’s anticipated financial results and growth, as well as those about the development of its products and markets, are forward-looking statements that involve risks and uncertainties that could cause actual results to differ materially from those projected. These include the risks discussed in Item 1A to this Annual Report, entitled ‘Risk Factors’.
NEW ACCOUNTING PRONOUNCEMENTS
The Company adopted the following new accounting pronouncement in fiscal 2007. See Note (1) P. to Consolidated Financial Statements for a more detailed description of new accounting pronouncements.
In September 2006, the Securities and Exchange Commission issued Staff Accounting Bulletin (“SAB”) No. 108, “Considering the Effects of Prior Year Misstatements when Quantifying Current Year Misstatements”. SAB No. 108 requires analysis of misstatements using both an income statement (rollover) approach and a balance sheet (iron curtain) approach in assessing materiality and provides for a one-time cumulative effect transition adjustment. SAB No. 108 was effective for our fiscal year 2007 annual financial statements. This did not have a material impact on the Company’s financial statements.
CRITICAL ACCOUNTING ESTIMATES
The Company's significant accounting policies are summarized in Note 1 of its Consolidated Financial Statements in this Annual Report. While all these significant accounting policies impact its financial condition and results of operations, certain of these policies require management to use a significant degree of judgment and/or make estimates, consistently with generally accepted accounting principles, that affect the reported amounts of assets and liabilities and disclosures of contingent assets and liabilities as of the date of the financial statements and the reported amounts of income and expenses during the reporting periods. Since these are judgments and estimates, they are sensitive to changes in business and economic realities, and events may cause actual operating results to differ materially from the amounts derived from management’s estimates and judgments.
The Company believes the following represent the most critical accounting judgments and estimates affecting its reported financial condition and results of operations:
Bad Debts
The Company estimates an allowance for doubtful accounts based on known factors related to the credit risk of each customer and management’s judgment about the customer’s business. Ten customers account for approximately 63% of the Company’s sales. At September 30, 2007, the allowance for bad debts amounted to $180,000, which represented 2% of receivables.
Because of the Company’s long term relationships with the majority of its customers, in most cases, the principal bad debt risk to the Company arises from the insolvency of a customer rather than its unwillingness to pay. In addition, in certain cases the Company maintains credit insurance covering up to 90% of the amount outstanding from specific customers. The Company also carries out some of its foreign trade, particularly in the Far East, using letters of credit.
The Company reviews all accounts receivable balances on a regular basis, concentrating on any balances that are more than 30 days overdue, or where there is an identified credit risk with a specific customer. A decision is taken on a customer-by-customer basis as to whether a bad debt reserve is considered necessary based on the specific facts and circumstances of each account. In general, the Company would reserve 100% of the receivable, net of any recoverable value added taxes or insurance coverages, for a customer that becomes insolvent or files for bankruptcy, and lesser amounts for less imminent defaults. To a lesser degree, the Company maintains a small bad debt reserve to cover the remaining balances based on historical default percentages.
If the financial condition of any of the Company's customers is worse than estimated or were to deteriorate, resulting in an impairment of its ability to make payments, the Company’s results may be adversely affected and additional allowances may be required. With the exception of a significant loss of $562,000 in fiscal 2001 relating to one US customer, credit losses have not been significant in the past ten years.
Inventories
Inventories are valued at the lower of cost or market. Inventory costs include materials, direct labor and manufacturing overhead, and are relieved from inventory on a first-in, first-out basis. The Company carries out a significant amount of customization of standard products and also designs and manufactures special products to meet the unique requirements of its customers. This results in a significant proportion of the Company’s inventory being customer specific. The Company’s reported financial condition includes a provision for estimated slow-moving and obsolete inventory that is based on a comparison of inventory levels with forecast future demand. Such demand is estimated based on many factors, including management judgments, relating to each customer’s business and to economic conditions. The Company reviews in detail all significant inventory items with holdings in excess of estimated normal requirements. It also considers the likely impact of changing technology. It makes an estimate of the provision for slow moving and obsolete stock on an item-by-item basis based on a combination of likely usage based on forecast customer demand, potential sale or scrap value and possible alternative use. This provision represents the difference between original cost and market value at the end of the financial period. In cases where there is no estimated future use for the inventory item and there is no estimated scrap or resale value, a 100% provision is recorded. Where the Company estimates that only part of the total holding of an inventory item will not be used, or there is an estimated scrap, resale or alternate use value, then a proportionate provision is recorded. Once an item has been written down, it is not subsequently revalued upwards. The provision for slow moving and obsolete inventories at September 30, 2007 was $860,000, or 14% of the original cost of gross inventory. At September 30, 2006, the provision was $923,000, or 16% of gross inventory. If actual future demand or market conditions are less favorable than those projected by management, or if product designs change more quickly than forecast, additional inventory write-downs may be required, which may have a material adverse impact on reported results.
Warranty Costs
The Company provides for the estimated cost of product warranties at the time revenue is recognized. While the Company engages in product quality programs and processes, the Company's warranty obligation is affected by product failure rates and repair or replacement costs incurred in correcting a product failure. Accordingly, the provision for warranty costs is based upon anticipated in-warranty failure rates and estimated costs of repair or replacement. Anticipating product failure rates involves making difficult judgments about the likelihood of defects in materials, design and manufacturing errors, and other factors that are based in part on historical failure rates and trends, but also on management’s expertise in engineering and manufacturing. Estimated repair and replacement costs are affected by varying component and labor costs. Should actual product failure rates and repair or replacement costs differ from estimates, revisions to the estimated warranty liability may be required and the Company’s results may be materially adversely affected. In the event that the Company discovers a product defect that impacts the safety of its products, then a product recall may be necessary, which could involve the Company in substantial unanticipated expense significantly in excess of the reserve. There were no significant safety related product recalls during the past three fiscal years.
Goodwill Impairment
The Company carries out an annual assessment to determine if the goodwill relating to the controls business amounting to $1,435,000 has been impaired, in accordance with the requirements of Financial Accounting Standards Board Statement No.142 “Goodwill and Other Intangible Assets” (SFAS No. 142). In fiscal 2004 the Company retained an investment banking firm specializing in valuations to assist the Company in performing this impairment assessment. The assessment was based on three separate methods of valuing the controls business based on expected free cash flows, the market price of the Company’s stock and an analysis of precedent transactions. These valuation methods require estimates of future revenues, profits, capital expenditures and working capital requirements which are based on evaluation of historical trends, current budgets, operating plans and industry data. Based on all of these valuation methods, management concluded that the goodwill had not been impaired. Management updated the analysis in 2007, 2006 and 2005 using similar methodologies and again concluded that the goodwill had not been impaired. If, in future periods, the Company’s results of operations, cash flows or the market price of the Company’s stock were to decrease significantly, then it may be necessary to record an impairment charge relating to goodwill of up to $1,435,000.
Pension Plan Assumptions
The Company makes a number of assumptions relating to its pension plans in order to measure the financial position of the plans and the net periodic benefit cost. The most significant assumptions relate to the discount rate, the expected long term return on plan assets and the rate of future compensation increase. If these assumptions prove to be incorrect then the Company may need to record additional expense or liabilities relating to the pension plans, which could have a material effect on the Company’s financial position and results of operations. The company adopted Financial Accounting Standards Board Statement No.158 “Employers’ Accounting for Defined Benefit Pension and Other Postretirement Plans - An Amendment of FASB Statements No. 87, 88, 106, and 132(R)” (SFAS No. 158) in September 2006. At September 30, 2007 there was a pension liability in the Company’s balance sheet of $2,244,000. The Company’s pension plans are significant relative to the size of the Company. At September 30, 2007, pension plan assets were $22,280,000, plan liabilities were $24,524,000, and the total assets of the Company were $21,926,000. Under SFAS No. 158 changes in the funded status of the pension plans (plan assets less plan liabilities) are recorded in the Company’s balance sheet and could have a material effect on the Company’s financial position. At September 30, 2007, a change in the assumed discount rate of one-tenth of one percent (0.1%) would have resulted in a change in the liability for pension benefits of approximately $550,000.
· A) Results of Operations
2007 compared to 2006
The following table compares results, for both the controls and capacitor segments, for fiscal 2007 with the prior year, showing separately the percentage variances due to currency and volume / other.
| | | | | | | | (in thousands of dollars except percentages) |
| | | | | | | | | | % change due to: | |
| | | | 2007 | | | 2006 | | | Total | | | Currency | | | Volume / other | |
| Sales | | | | | | | | | | | | | | | | |
Controls - to external customers | | $ | 37,009 | | $ | 32,808 | | | 13% | | | 6% | | | 7% | |
Capacitors- to external customers | | | 2,204 | | | 1,822 | | | 21% | | | 11% | | | 10% | |
Capacitors - inter-segment | | | 52 | | | 64 | | | -19% | | | 7% | | | -26% | |
Capacitors - total | | | 2,256 | | | 1,886 | | | 20% | | | 11% | | | 9% | |
Total sales to external customers | | | 39,213 | | | 34,630 | | | 13% | | | 6% | | | 7% | |
| Gross Profit | | | | | | | | | | | | | | | | |
Controls | | | 13,479 | | | 12,268 | | | 10% | | | 2% | | | 8% | |
Capacitors | | | 869 | | | 838 | | | 4% | | | 9% | | | -5% | |
| Total | | | 14,348 | | | 13,106 | | | 9% | | | 2% | | | 7% | |
| Selling research and administrative expenses | | | | | | | | | | | | | | | | |
Controls | | | 10,810 | | | 10,094 | | | 7% | | | 7% | | | 0% | |
Capacitors | | | 1,158 | | | 770 | | | 50% | | | 12% | | | 38% | |
Unallocated corporate expense | | | 317 | | | 398 | | | -20% | | | 0% | | | -20% | |
| Total | | | 12,285 | | | 11,262 | | | 9% | | | 7% | | | 2% | |
| Operating income | | | | | | | | | | | | | | | | |
Controls | | | 2,669 | | | 2,174 | | | 23% | | | -24% | | | 47% | |
Capacitors | | | (289 | ) | | 68 | | | -525% | | | -27% | | | -498% | |
Unallocated corporate expense | | | (317 | ) | | (398 | ) | | -20% | | | 0% | | | -20% | |
Total | | | 2,063 | | | 1,844 | | | 12% | | | -29% | | | 41% | |
| Other income and expense | | | (75 | ) | | (110 | ) | | -32% | | | -11% | | | -21% | |
| Income before income taxes | | | 1,988 | | | 1,734 | | | 15% | | | -30% | | | 45% | |
| Income taxes | | | (685 | ) | | (620 | ) | | 10% | | | -30% | | | 40% | |
| Net Income | | $ | 1,303 | | $ | 1,114 | | | 17% | | | -31% | | | 48% | |
In fiscal 2007 sales revenues increased by $4,583,000, or 13%, to $39,213,000. In fiscal 2007 approximately 62% of the Company’s sales were made outside the United States. As the majority of foreign sales were denominated in currencies other than the US Dollar, principally the Euro and the British Pound, they were subject to fluctuation when translated into US Dollars. In Fiscal 2007 the average dollar exchange rate weakened compared to the British Pound by 10% and by 8% compared to the Euro. As a result, foreign currency sales translated into more dollars, increasing reported sales by 6%. Sales volume, net of foreign currency fluctuations, was 7% higher than the previous year, with the increase spread across most of our businesses.
In the controls business segment revenues were 13% higher than in fiscal 2006, reflecting a 6% increase due to foreign currency fluctuations and a further 7% increase in volumes shipped. In the United States controller business, sales were $14,832,000 compared to $14,643,000 in 2006, an increase of 1%. Slightly lower demand in the United States in the fork lift truck and aerial lift markets were offset by higher volumes shipped to the mining and other electric vehicle markets. In the controller businesses foreign sales improved by 22% compared to last year reflecting an 11% increase in volumes shipped and an additional 11% increase due to foreign currency fluctuations. Volumes shipped in Europe and the Far East increased largely due to higher demand in the European and Japanese aerial lift markets.
In the capacitor business segment, revenues increased by $382,000, or 21%. Capacitor volumes increased by 10% compared to last year augmented by foreign currency fluctuations increasing reported sales by a further 11%. This volume increase was mainly due to increased demand in industrial and audio markets.
Cost of sales was $24,865,000 compared to $21,524,000 in fiscal 2006, an increase of $3,341,000, or 15.5%. Approximately 72% of this cost of sales was denominated in British Pounds. Largely as a result of the weaker US Dollar compared with the British Pound, foreign currency fluctuations increased cost of sales by $1,888,000, or 9%. The remaining 6.5% increase, of the 15.5% total increase in cost of sales, was mainly due to the 7% increase in volumes shipped.
Gross profit was $14,348,000, or 36.6% of sales, compared to $13,106,000, or 37.8% of sales, in fiscal 2006. Foreign currency fluctuations had a favorable impact on gross profit of $274,000 but, due to the currency impact on sales, this decreased the gross profit percentage by 1.4%. Excluding the foreign currency impact, there was a year-to-year increase in the gross profit percentage of 0.2% of sales. In the controls segment, gross profit of $13,479,000 was 10% ahead of last year; this compared to an increase in volumes of 8%. In the capacitor segment gross profit was $869,000, an increase of $31,000, or 4%, compared to fiscal 2006. Capacitor business gross profit was 38.5% of sales in fiscal 2007 compared to 44.4% of sales in fiscal 2006. The decline in the capacitor business gross profit percentage was mainly due to a decrease in sales to high margin customers, offset by sales growth at lower than average margins. The table below analyses the year-to-year change in sales, cost of sales and gross profit.
| | | | | | (in thousands of dollars except percentages) |
| | | Sales | | | Cost of sales | | | Gross Profit | | | Gross Profit | % |
| Actual Fiscal 2006 | | $ | 34,630 | | $ | 21,524 | | $ | 13,106 | | | 37.8% | |
| Change in fiscal 2007 due to: | | | | | | | | | | | | | |
Foreign Currency fluctuations | | | 2,162 | | | 1,888 | | | 274 | | | (1.4%) | |
Increased volume, assuming 2006 gross profit percentage | | | 2,421 | | | 1,506 | | | 915 | | | - | |
Other cost of sales changes, net | | | - | | | (53 | ) | | 53 | | | 0.2% | |
| Actual Fiscal 2007 | | $ | 39,213 | | $ | 24,865 | | $ | 14,348 | | | 36.6% | |
Selling, research and administrative expenses (operating expenses) were $12,285,000, an increase of $1,023,000, or 9%, compared to fiscal 2006. Adverse foreign currency fluctuations increased reported operating expenses by $818,000, or 7%. Excluding the unfavorable currency impact and the $497,000 cost of management changes, underlying operating expenses decreased by $292,000, or 3%. In fiscal 2007, expenditure on new product engineering reduced by $67,000, before the impact of currency fluctuations. In fiscal 2007 sales and marketing expenses decreased by $243,000 before the impact of currency fluctuations. Included in administrative expense in 2007 in the capacitor business segment was a one-time charge of $297,000 for management changes. In addition, as a result of the Company’s succession planning, there was additional expense for the recruitment and employment of the Principal Accounting Officer. An analysis of the year-to-year change in selling, research and administrative expenses is set out below:
| Selling, research and administrative expenses | (in thousands of dollars) | |
Reported expense in fiscal 2007 | | $ | 12,285 | |
| Reported expense in fiscal 2006 | | | 11,262 | |
| Increase in expense | | | 1,023 | |
| Increase (decrease) due to: | | | | |
Effect of exchange rate changes | | | 818 | |
Lower engineering expense, net of currency effect | | | (67 | ) |
Decrease in sales and marketing expense, net of currency effect | | | (243 | ) |
One-time cost of management changes in the capacitor business | | | 297 | |
Cost of recruitment and employment of Principal Accounting Officer | | | 200 | |
Other operating expense changes, net | | | 18 | |
| Total increase in selling research and administrative expenses in fiscal 2007 | | $ | 1,023 | |
Operating income was $2,063,000 compared to $1,844,000 in fiscal 2006, an increase of $219,000, or 12%, despite foreign currency fluctuations which reduced operating income by $544,000 in fiscal 2007. Excluding the currency effect, operating income increased by 41% compared to fiscal 2006, mainly due to increased volumes. In the controller business, and excluding the currency impact, operating income was 47% ahead of the prior year. The capacitor business made an operating loss of $289,000 in fiscal 2007 compared to an operating profit of $68,000 in fiscal 2006; this was mainly due to the one-time charge of $297,000 for management changes in the year.
Other expense was $75,000 in fiscal 2007 compared to $110,000 in the previous year. Interest expense was lower by $19,000 at $45,000 and interest income in 2007 was $4,000 higher at $10,000. The foreign currency exchange loss in 2007 was $40,000 compared to $52,000 in 2006.
Income before income taxes was $1,988,000 compared to $1,734,000 in 2006, an increase of $254,000, or 15%. Foreign currency fluctuations decreased pre tax income by $532,000 in fiscal 2007. Pre-tax income, before the effect of currency fluctuations, was 45% ahead of the prior year. Income taxes were 34.5% of pre-tax income compared to 35.8% in fiscal 2006. The lower tax rate was mainly due to a change in the deferred tax valuation allowance relating to foreign tax credits.
Net income was $1,303,000, an increase of $189,000, or 17%, compared to $1,114,000 last year. Basic income per share was $.41 per share in 2007 compared to $.35 in fiscal 2006, an increase of 17%. Diluted income per share was $.41 per share in fiscal 2007, an increase of $.06 per share compared to last year.
2006 compared to 2005
The following table compares results, for both the controls and capacitor segments, for fiscal 2006 with fiscal 2005, showing separately the percentage variances due to currency and volume / other.
| | | | | | | | | (in thousands of dollars except percentages) |
| | | | | | | | | % change due to: |
| | | | 2006 | | | 2005 | | | Total | | | Currency | | | Volume / other | |
| Sales | | | | | | | | | | | | | | | | |
Controls - to external customers | | $ | 32,808 | | $ | 30,009 | | | 9% | | | -2% | | | 11% | |
Capacitors- to external customers | | | 1,822 | | | 1,666 | | | 9% | | | -3% | | | 12% | |
Capacitors - inter-segment | | | 64 | | | 199 | | | -68% | | | -2% | | | -66% | |
Capacitors - total | | | 1,886 | | | 1,865 | | | 1% | | | -3% | | | 4% | |
Total sales to external customers | | | 34,630 | | | 31,675 | | | 9% | | | -2% | | | 11% | |
| Gross Profit | | | | | | | | | | | | | | | | |
Controls | | | 12,268 | | | 11,259 | | | 9% | | | 0% | | | 9% | |
Capacitors | | | 838 | | | 777 | | | 8% | | | -2% | | | 10% | |
| Total | | | 13,106 | | | 12,036 | | | 9% | | | 0% | | | 9% | |
| Selling research and administrative expenses | | | | | | | | | | | | | | | | |
Controls | | | 10,094 | | | 9,916 | | | 2% | | | -2% | | | 4% | |
Capacitors | | | 770 | | | 745 | | | 3% | | | -2% | | | 5% | |
Unallocated corporate expense | | | 398 | | | 376 | | | 6% | | | 0% | | | 6% | |
| Total | | | 11,262 | | | 11,037 | | | 2% | | | -2% | | | 4% | |
| Operating income | | | | | | | | | | | | | | | | |
Controls | | | 2,174 | | | 1,343 | | | 62% | | | 11% | | | 51% | |
Capacitors | | | 68 | | | 32 | | | 113% | | | -3% | | | 116% | |
Unallocated corporate expense | | | (398 | ) | | (376 | ) | | 6% | | | 0% | | | 6% | |
Total | | | 1,844 | | | 999 | | | 85% | | | 15% | | | 70% | |
| Other income and expense | | | (110 | ) | | (48 | ) | | 129% | | | 117% | | | 12% | |
| Income before income taxes | | | 1,734 | | | 951 | | | 82% | | | 10% | | | 72% | |
| Income taxes | | | (620 | ) | | (310 | ) | | 100% | | | 12% | | | 88% | |
| Net Income | | $ | 1,114 | | $ | 641 | | | 74% | | | 9% | | | 65% | |
In fiscal 2006 sales revenues increased by $2,525,000, or 9%, to $34,630,000. In fiscal 2006 approximately 58% of the Company’s sales were made outside the United States. As the majority of foreign sales were denominated in currencies other than the US Dollar, principally the Euro and the British Pound, they were subject to fluctuation when translated into US Dollars. In Fiscal 2006 the average dollar exchange rate strengthened compared to the British Pound by 2% and by 3% compared to the Euro. As a result, foreign currency sales translated into fewer dollars. Foreign currency fluctuations accounted for a 2% decrease in reported sales, even though volumes were 11% higher than in fiscal 2005.
In the controls business segment revenues were 9% higher in fiscal 2006 than in fiscal 2005, reflecting a 2% decrease due to foreign currency fluctuations and an 11% increase in volumes shipped. In the United States controller business, sales were $14,643,000 compared to $12,893,000 in 2005, an increase of 14%. Non-U.S. sales volumes in the controller businesses improved by 9% compared to fiscal 2005. In the aerial lift market volumes in fiscal 2006 were 20% ahead of fiscal 2005 and volumes also increased in the other electric vehicle, mining and airport ground support markets. Volumes in the fork lift truck market declined by 8% in fiscal 2006 compared to fiscal 2005.
In the capacitor business segment, revenues increased by $156,000, or 9%. Capacitor volumes increased by 12% compared to fiscal 2005, but were partially offset by adverse foreign currency fluctuations. This volume increase was mainly due to stronger conditions in the railway signaling market for capacitors.
Cost of sales in fiscal 2006 was $21,524,000 compared to $19,639,000 in fiscal 2005, an increase of $1,885,000, or 10%. Approximately 75% of this cost of sales was denominated in British Pounds. As a result foreign currency fluctuations decreased cost of sales by $450,000, or 2%. The remaining 12% increase in cost of sales was mainly due to higher volumes. Sales mix was marginally adverse, with volume gains concentrated in the lower than average margin aerial lift market.
Gross profit in fiscal 2006 was $13,106,000, or 37.8% of sales, compared to $12,036,000, or 38.0% of sales, in fiscal 2005. Foreign currency fluctuations adversely impacted the gross profit percentage by $50,000, or 0.1%, with adverse sales mix the main cause of the remaining 0.1% decrease in the gross profit percentage. In the controls segment, gross profit in fiscal 2006 of $12,268,000 was 9% ahead of fiscal 2005; this compared to an increase in volumes of 11%. In the capacitor segment gross profit in fiscal 2006 was $838,000, an increase of $61,000, or 8% compared to fiscal 2005. Capacitor business gross profit in fiscal 2006 was 44.4% of sales compared to 41.7% of sales in fiscal 2005. The increase in capacitor business gross profit was mainly due to increased volumes.
Selling, research and administrative expenses (operating expenses) in fiscal 2006 were $11,262,000, an increase of $225,000, or 2%, compared to fiscal 2005. Foreign currency fluctuations reduced reported operating expenses by $200,000, or 2%. Excluding the currency impact, operating expenses increased by $455,000, or 4%. In fiscal 2006, expenditure on new product engineering increased by $156,000, before the impact of currency fluctuations. Spending on sales and marketing resources in fiscal 2006, mainly to support the introduction of new products, increased by $264,000, before the impact of currency fluctuations. In fiscal 2006 the Company set up a subsidiary in Tokyo, Japan to improve service to customers in the Japanese market. Included in administrative expense was a charge of $175,000 in 2006 compared to $87,000 in fiscal 2005, relating to equity compensation expense. This included restricted stock granted to employees and directors and expensing options under SFAS No. 123R in 2006, which were previously accounted for under APB No. 25, under which no expense was recorded. An analysis of the year-to-year change in selling, research and administrative expenses is set out below:
| Selling, research and administrative expenses | (in thousands of dollars) | |
Reported expense in fiscal 2006 | | $ | 11,262 | |
| Reported expense in fiscal 2005 | | | 11,037 | |
| Increase in expense | | | 225 | |
| Increase (decrease) due to: | | | | |
Effect of exchange rate changes | | | (200 | ) |
Additional engineering expense, net of currency effect | | | 156 | |
Additional sales and marketing expense, net of currency effect | | | 264 | |
Increased cost of equity compensation in 2006 | | | 88 | |
Net other operating expense decreases | | | (108 | ) |
| Total increase in selling research and administrative expenses in fiscal 2006 | | $ | 225 | |
Operating income in fiscal 2006 was $1,844,000 compared to $999,000 in fiscal 2005, an increase of $845,000, or 85%. Foreign currency fluctuations increased operating income by $150,000 in fiscal 2006. Excluding the currency effect, operating income increased by 70% compared to fiscal 2005, mainly due to increased volumes. In the controller business, and excluding the currency impact, operating income in fiscal 2006 was 51% ahead of fiscal 2005. Capacitor business operating income increased by 113% to $68,000 compared to $32,000 in fiscal 2005, mainly due to higher volumes.
Other expense was $110,000 in fiscal 2006 compared to $48,000 in fiscal 2005. Interest expense increased by $8,000 to $64,000 and interest income in 2006 was $2,000 higher than fiscal 2005 at $6,000. There was a foreign currency loss of $52,000 in 2006 compared to a foreign currency gain of $4,000 in 2005.
Income before income taxes in 2006 was $1,734,000 compared to $951,000 in 2005, an increase of $783,000, or 82%. Foreign currency fluctuations increased pre-tax income by $94,000 in fiscal 2006. Pre-tax income, before the effect of currency fluctuations, was 72% ahead of fiscal 2005. Income taxes in fiscal 2006 were 35.8% of pre-tax income compared to 32.6% in fiscal 2005. The higher tax rate was mainly due to a change in the deferred tax valuation allowance relating to foreign tax credits. Net income in fiscal 2006 was $1,114,000, an increase of $473,000, or 74%, compared to $641,000 in fiscal 2005. Basic income per share was $.35 per share in 2006 compared to $.21 in fiscal 2005, an increase of 67%. Diluted income per share was $.35 per share in fiscal 2006, an increase of $.15 per share compared to fiscal 2005.
· B) Liquidity and Capital Resources
The Company’s cash flow from operating activities for fiscal 2007 was $849,000 compared to $950,000 in the prior fiscal year. Acquisitions of property, plant and equipment amounted to $909,000 compared to $706,000 in fiscal 2006. Quarterly dividend payments were at the rate of $.03 per share throughout both fiscal 2007 and 2006. In fiscal 2007 dividend payments amounted to $386,000 compared to $384,000 in 2006 Exchange rate changes increased cash by $164,000 in fiscal 2007 compared to an increase of $292,000 last year. In fiscal 2007, cash balances decreased by $276,000, compared to an increase of $160,000 in 2006. The main changes in operating assets and liabilities in fiscal 2007 were an increase in accounts receivable of $2,058,000 and lower accounts payable of $815,000. Inventories increased by $372,000, accrued expenses increased by $259,000 and prepaid expenses and other current assets were $45,000 higher than last year.
The Company has no long-term debt and has overdraft facilities in the United Kingdom (UK) amounting to $2,241,000 and in France of $142,000. These facilities were unused at September 30, 2007 and September 30, 2006. The UK overdraft facilities are secured by all of the Company’s assets in the UK and are due for renewal in September 2008 but, in line with normal practice in Europe, can be withdrawn on demand by the bank. The French overdraft facilities are unsecured and are due for renewal in September 2008 but, in line with normal practice in Europe, can be withdrawn on demand by the bank.
At September 30, 2007 the Company’s cash balances were $1,014,000 and there was no short-term or long-term debt. The Company has, since January 1990, maintained a program of regular cash dividends. The dividends amounted to $.03 per quarter in fiscal 2007. In the opinion of management, the Company’s requirements for working capital to meet future business growth can be met by a combination of existing cash resources, future earnings and existing borrowing facilities in Europe. The Company’s capital expenditures are not expected, on average over a two to three year period, to significantly exceed the depreciation charge, which over the last three fiscal years averaged $686,000. There were no significant capital expenditure commitments at September 30, 2007. Tech/Ops Sevcon's resources, in the opinion of management, are adequate for projected operations and capital spending programs, as well as continuation of cash dividends.
· C) Off balance sheet arrangements
The Company does not have any off balance sheet financing or arrangements.
· D) Contractual Obligations
Set out below are the Company’s contractual obligations at September 30, 2007:
| | | | | | | | | | | | | (in thousands of dollars) | |
| | | Total | | | Less than 1 year | | | 1 - 3 years | | | 3 - 5 years | | | More than 5 years | |
| Long-term debt obligations | | $ | - | | $ | - | | $ | - | | $ | - | | $ | - | |
| Capital lease obligations | | | - | | | - | | | - | | | - | | | - | |
| Operating lease obligations | | | 2,547 | | | 236 | | | 436 | | | 381 | | | 1,494 | |
| Purchase Obligations | | | 4,293 | | | 4,293 | | | - | | | - | | | - | |
| Other long term liabilities | | | 61 | | | - | | | - | | | 61 | | | - | |
| Total | | $ | 6,901 | | $ | 4,529 | | $ | 436 | | $ | 442 | | $ | 1,494 | |
The Company’s operations are sensitive to a number of market factors, any one of which could materially adversely affect its results of operations in any given year. Other risks dealing with contingencies are described in Notes (1) J. and (6) to the Company’s Consolidated Financial Statements included under Item 8 and other risks are described under the caption Risk Factors in Item 1A above.
Foreign currency risk
The Company sells to customers throughout the industrialized world. In fiscal 2007 approximately 38% of the Company’s sales were made in US Dollars, 27% were made in British Pounds and 35% were made in Euros. The majority of the Company’s products are manufactured in the United Kingdom or by a sub-contractor based in Poland and approximately 72% of the Company’s cost of sales in fiscal 2007 was incurred in British Pounds. This resulted in the Company’s sales and margins being exposed to fluctuations due to the change in the exchange rates of the US Dollar, the British Pound and the Euro.
In addition, the translation of the sales and income of foreign subsidiaries into US Dollars is subject to fluctuations in foreign currency exchange rates.
Where appropriate, the Company undertakes hedging activities to manage the foreign exchange exposures related to forecast purchases and sales in foreign currency and the associated foreign currency denominated receivables and payables. The Company does not engage in speculative foreign exchange transactions. Details of this hedging activity and the underlying exposures are contained in Note (1) J. to the Company’s consolidated financial statements included under Item 8, which is incorporated herein by reference.
Because the difference between the spot and hedged foreign exchange rates at September 30, 2007 was less than 2%, and amounted to $43,000, the risk of default by counterparties is not material to the Company.
Interest Rate Risk
The Company does not currently have any interest bearing debt. The Company does invest surplus funds in instruments with maturities of less than 12 months at both fixed and floating interest rates. The Company incurs short-term borrowings from time-to-time on its overdraft facilities in Europe at variable interest rates. Due to the short-term nature of the Company’s investments at September 30, 2007 the risk arising from changes in interest rates was not material.
Tech/Ops Sevcon, Inc. and Subsidiaries
September 30, 2007 and 2006
(in thousands of dollars)
| ASSETS | | | 2007 | | | 2006 | |
| Current assets: | | | | | | | |
Cash and cash equivalents | | $ | 1,014 | | $ | 1,290 | |
Receivables, net of allowances for doubtful accounts of $180 in 2007 and $141 in 2006 | | | 8,714 | | | 6,187 | |
Inventories | | | 5,422 | | | 4,717 | |
Prepaid expenses and other current assets | | | 916 | | | 847 | |
| Total current assets | | | 16,066 | | | 13,041 | |
| Property, plant and equipment, at cost: | | | | | | | |
Land and improvements | | | 29 | | | 26 | |
Buildings and improvements | | | 2,462 | | | 2,256 | |
Equipment | | | 9,774 | | | 8,215 | |
| | | | 12,265 | | | 10,497 | |
Less: accumulated depreciation and amortization | | | 8,497 | | | 7,202 | |
| Net property, plant and equipment | | | 3,768 | | | 3,295 | |
| Long-term deferred tax asset | | | 657 | | | 881 | |
| Goodwill | | | 1,435 | | | 1,435 | |
| Total assets | | $ | 21,926 | | $ | 18,652 | |
LIABILITIES AND STOCKHOLDERS’ EQUITY | | | | | | | |
| Current liabilities: | | | | | | | |
Accounts payable | | $ | 3,398 | | $ | 2,397 | |
Dividend payable | | | 97 | | | 96 | |
Accrued expenses | | | 3,162 | | | 2,701 | |
Accrued taxes on income | | | 530 | | | 479 | |
| Total current liabilities | | | 7,187 | | | 5,673 | |
| Liability for pension benefits | | | 2,244 | | | 2,886 | |
| Other long term liabilities | | | 61 | | | 56 | |
| Total liabilities | | | 9,492 | | | 8,615 | |
| Commitments and contingencies (note 5) | | | | | | | |
Stockholders’ equity | | | | | | | |
Preferred stock, par value $.10 per share - authorized - 1,000,000 shares; outstanding - none | | | - | | | - | |
Common stock, par value $.10 per share - authorized - 8,000,000 shares; outstanding | | | | | | | |
3,238,702 shares in 2007 and 3,211,051 shares in 2006 | | | 324 | | | 321 | |
Premium paid in on common stock | | | 4,623 | | | 4,309 | |
Retained earnings | | | 7,961 | | | 7,123 | |
Accumulated other comprehensive loss | | | (474 | ) | | (1,716 | ) |
| Total stockholders’ equity | | | 12,434 | | | 10,037 | |
| Total liabilities and stockholders’ equity | | $ | 21,926 | | $ | 18,652 | |
The accompanying notes are an integral part of these consolidated financial statements.
Tech/Ops Sevcon, Inc. and Subsidiaries
For the Years ended September 30, 2007, 2006 and 2005
(in thousands of dollars except per share data)
| | | | 2007 | | | 2006 | | | 2005 | |
| Net sales | | $ | 39,213 | | $ | 34,630 | | $ | 31,675 | |
| Cost of sales | | | 24,865 | | | 21,524 | | | 19,639 | |
| Gross profit | | | 14,348 | | | 13,106 | | | 12,036 | |
| Selling, research and administrative expenses | | | 12,285 | | | 11,262 | | | 11,037 | |
| Operating income | | | 2,063 | | | 1,844 | | | 999 | |
| Interest expense | | | (45 | ) | | (64 | ) | | (56 | ) |
| Interest income | | | 10 | | | 6 | | | 4 | |
| Foreign currency gain (loss) | | | (40 | ) | | (52 | ) | | 4 | |
| Income before income taxes | | | 1,988 | | | 1,734 | | | 951 | |
| Income taxes | | | (685 | ) | | (620 | ) | | (310 | ) |
| Net income | | $ | 1,303 | | $ | 1,114 | | $ | 641 | |
| Basic income per share | | $ | .41 | | $ | .35 | | $ | .21 | |
| Diluted income per share | | $ | .41 | | $ | .35 | | $ | .20 | |
Tech/Ops Sevcon, Inc. and Subsidiaries
For the Years ended September 30, 2007, 2006 and 2005
(in thousands of dollars)
| | | | 2007 | | | 2006 | | | 2005 | |
| Net income | | $ | 1,303 | | $ | 1,114 | | $ | 641 | |
| Foreign currency translation adjustment | | | 732 | | | 459 | | | (208 | ) |
| Changes in fair market value of cash flow hedges | | | 3 | | | - | | | (15 | ) |
| Pension liability adjustment, net of tax | | | 507 | | | - | | | - | |
| Comprehensive income | | $ | 2,545 | | $ | 1,573 | | $ | 418 | |
The accompanying notes are an integral part of these consolidated financial statements.
Tech/Ops Sevcon, Inc. and Subsidiaries
For the Years ended September 30, 2007, 2006 and 2005
(in thousands of dollars except per share data)
| | | Common stock | | | Premium paid in on common stock | | | Retained earnings | | | Unearned compensation on restricted stock | | | Cumulative other comprehensive income (loss | ) | | Total stockholders’ equity | |
| Balance September 30, 2004 | | $ | 313 | | $ | 4,047 | | $ | 6,133 | | $ | - | | $ | (29 | ) | $ | 10,464 | |
| Net income | | | - | | | - | | | 641 | | | - | | | - | | | 641 | |
| Dividends ($.12 per share) | | | - | | | - | | | (380 | ) | | - | | | - | | | (380 | ) |
| Currency translation adjustment | | | - | | | - | | | - | | | - | | | (208 | ) | | (208 | ) |
Change in fair market value of cash flow hedge | | | - | | | - | | | - | | | - | | | (15 | ) | | (15 | ) |
| Issuance of restricted stock | | | 4 | | | 263 | | | - | | | (267 | ) | | - | | | - | |
| Restricted stock expense | | | - | | | - | | | - | | | 87 | | | - | | | 87 | |
| Balance September 30, 2005 | | | 317 | | | 4,310 | | | 6,394 | | | (180 | ) | | (252 | ) | | 10,589 | |
| Net income | | | - | | | - | | | 1,114 | | | - | | | - | | | 1,114 | |
| Dividends ($.12 per share) | | | - | | | - | | | (385 | ) | | - | | | - | | | (385 | ) |
| Currency translation adjustment | | | - | | | - | | | - | | | - | | | 459 | | | 459 | |
Reclassification of unearned compensation on adoption of SFAS No. 123R | | | - | | | (180 | ) | | - | | | 180 | | | - | | | - | |
| Issuance of restricted stock | | | 4 | | | (4 | ) | | - | | | - | | | - | | | - | |
| Exercise of stock options | | | - | | | 8 | | | - | | | - | | | - | | | 8 | |
| Equity compensation expense | | | - | | | 175 | | | - | | | | | | - | | | 175 | |
Pension liability adjustment to initially apply SFAS No. 158, net of tax benefit of $849 | | | - | | | - | | | - | | | - | | | (1,923 | ) | | (1,923 | ) |
| Balance September 30, 2006 | | | 321 | | | 4,309 | | | 7,123 | | | - | | | (1,716 | ) | | 10,037 | |
| Net income | | | - | | | - | | | 1,303 | | | - | | | - | | | 1,303 | |
| Dividends ($.12 per share) | | | - | | | - | | | (387 | ) | | - | | | - | | | (387 | ) |
| Currency translation adjustment | | | - | | | - | | | - | | | - | | | 732 | | | 732 | |
Change in fair market value of cash flow hedge | | | - | | | - | | | - | | | - | | | 3 | | | 3 | |
| Issuance of restricted stock | | | 2 | | | (2 | ) | | - | | | - | | | - | | | - | |
| Exercise of stock options | | | 2 | | | 94 | | | - | | | - | | | - | | | 96 | |
Purchase and retirement of common stock in connection with stock option exercise | | | (1 | ) | | (11 | ) | | (78 | ) | | - | | | - | | | (90 | ) |
| Tax benefit on exercise of stock options | | | - | | | 40 | | | - | | | - | | | - | | | 40 | |
| Equity compensation expense | | | | | | 193 | | | | | | | | | | | | 193 | |
Pension liability adjustment, net of tax charge of $239 | | | - | | | - | | | - | | | - | | | 507 | | | 507 | |
| Balance September 30, 2007 | | $ | 324 | | $ | 4,623 | | $ | 7,961 | | $ | - | | $ | (474 | ) | $ | 12,434 | |
The accompanying notes are an integral part of these consolidated financial statements.
Tech/Ops Sevcon, Inc. and Subsidiaries
For the Years ended September 30, 2007, 2006 and 2005
(in thousands of dollars)
| | | | 2007 | | | 2006 | | | 2005 | |
| Cash flow from operating activities: | | | | | | | | | | |
| Net income | | $ | 1,303 | | $ | 1,114 | | $ | 641 | |
| Adjustments to reconcile net income to net cash from operating activities: | | | | | | | | | | |
Depreciation and amortization | | | 739 | | | 657 | | | 661 | |
Stock-based compensation | | | 193 | | | 175 | | | 87 | |
Pension contributions in excess of pension expenses | | | (45 | ) | | - | | | - | |
Deferred tax provision (benefit) | | | 61 | | | 64 | | | (6 | ) |
Increase (decrease) in cash resulting from changes in operating assets and liabilities: | | | | | | | | | | |
Receivables | | | (2,058 | ) | | 6 | | | (84 | ) |
Inventories | | | (372 | ) | | (980 | ) | | 306 | |
Prepaid expenses and other current assets | | | (45 | ) | | 10 | | | (21 | ) |
Accounts payable | | | 815 | | | (202 | ) | | (401 | ) |
Accrued expenses | | | 259 | | | 16 | | | 144 | |
Accrued taxes on income | | | (1 | ) | | 34 | | | (2 | ) |
Proceeds of rental deposit | | | - | | | 56 | | | - | |
| Net cash generated from operating activities | | | 849 | | | 950 | | | 1,324 | |
| Cash flow used by investing activities: | | | | | | | | | | |
Acquisition of property, plant and equipment | | | (909 | ) | | (706 | ) | | (571 | ) |
| Net cash used by investing activities | | | (909 | ) | | (706 | ) | | (571 | ) |
| Cash flow used by financing activities: | | | | | | | | | | |
Dividends paid | | | (386 | ) | | (384 | ) | | (379 | ) |
Exercise of stock options | | | 6 | | | 8 | | | - | |
Net cash used by financing activities | | | (380 | ) | | (376 | ) | | (379 | ) |
| Effect of exchange rate changes on cash | | | 164 | | | 292 | | | (149 | ) |
| Net (decrease) increase in cash | | | (276 | ) | | 160 | | | 225 | |
| Beginning balance - cash and cash equivalents | | | 1,290 | | | 1,130 | | | 905 | |
| Ending balance - cash and cash equivalents | | $ | 1,014 | | $ | 1,290 | | $ | 1,130 | |
| Supplemental disclosure of cash flow information: | | | | | | | | | | |
Cash paid for income taxes | | $ | 677 | | $ | 650 | | $ | 354 | |
Cash paid for interest | | $ | 45 | | $ | 64 | | $ | 56 | |
| Supplemental disclosure of non-cash financing activity: | | | | | | | | | | |
Dividend declared | | $ | 97 | | $ | 96 | | $ | 95 | |
The accompanying notes are an integral part of these consolidated financial statements.
NOTES TO CONSOLIDATED FINANCIAL STATEMENTS
Tech/Ops Sevcon, Inc. and Subsidiaries
(1) SUMMARY OF SIGNIFICANT ACCOUNTING POLICIES
A. Basis of presentation
The accompanying consolidated financial statements include the accounts of Tech/Ops Sevcon, Inc. (Tech/Ops Sevcon), Sevcon, Inc., Sevcon Limited and subsidiaries, Sevcon SA and Sevcon Asia Limited. All material intercompany transactions have been eliminated. Certain prior year amounts have been reclassified to conform to the current year presentation.
B. Revenue recognition
The Company recognizes revenue upon shipment of its products. The Company’s only post shipment obligation relates to warranty in the normal course of business for which ongoing reserves, which management believes to be adequate, are maintained. The movement in warranty reserves was as follows:
(in thousands of dollars)
| | | | 2007 | | | 2006 | |
| Warranty reserves at beginning of year | | $ | 364 | | $ | 364 | |
| Decrease in beginning balance for warranty obligations settled during the year | | | (308 | ) | | (329 | ) |
| Other changes to pre-existing warranties | | | 16 | | | 4 | |
| Net increase in warranty reserves for products sold during the year | | | 386 | | | 325 | |
| Warranty reserves at end of year | | $ | 458 | | $ | 364 | |
C. Research and development
The cost of research and development programs is charged against income as incurred and amounted to approximately $3,790,000 in 2007, $3,582,000 in 2006 and $3,499,000 in 2005. This expense is included in selling, research and administrative expense in the income statement. Research and development expense was 9.7% of sales in 2007 compared to 10.0% in 2006 and 11.0% in 2005.
D. Depreciation and maintenance
Plant and equipment are depreciated on a straight-line basis over their estimated useful lives, which are primarily fifty years for buildings, seven years for equipment and four years for computer equipment and software. Maintenance and repairs are charged to expense and renewals and betterments are capitalized.
E. Stock based compensation plans
SFAS No. 123 “Accounting for Stock-Based Compensation”, as amended by SFAS No. 148 “Accounting for Stock-Based Compensation - Transition and Disclosure” and replaced by SFAS No.123R “Share-Based Payment”, defined a fair value based method of accounting for employee stock options or similar equity instruments and encouraged all entities to adopt that method of accounting. However, it also allowed an entity to continue to measure compensation costs using the method of accounting prescribed by APB No. 25 “Accounting for Stock Issued to Employees”, until SFAS No. 123R became effective in fiscal 2006. Prior to fiscal 2006, the Company accounted for its stock-based compensation plans under APB No. 25, under which no compensation cost was recognized. The Company has not restated prior periods to reflect this change in accounting. Had compensation cost for these plans been determined consistent with SFAS No. 123, the Company’s net income and earnings per share would have equaled the following pro forma amounts for 2005:
| (in thousands of dollars except per share data) | |
| | | | 2005 | |
| Net income - As reported | | $ | 641 | |
| Pro-forma effect of expensing stock options (net of tax) | | $ | (52 | ) |
| Net income - Pro forma | | $ | 589 | |
| Basic net income per share - As reported | | $ | .21 | |
| Basic net income per share - Pro forma | | $ | .19 | |
| Diluted net income per share - As reported | | $ | .20 | |
| Diluted net income per share - Pro forma | | $ | .19 | |
The adoption of SFAS No. 123R reduced net income in fiscal 2007 by $33,000 and in fiscal 2006 by $46,000 ($.01 per basic and diluted share in each year). The adoption of this statement had no effect on the statement of cash flows for fiscal 2007 and fiscal 2006.
The fair value of each option grant is estimated on the date of grant using the Black-Scholes option pricing model. There were no option grants in fiscal 2007, 2006 or 2005 and therefore no assumptions were made as to risk-free interest rate, expected dividend yield, expected life or expected volatility. When options are exercised the Company normally issues new shares.
F. Income taxes
Tech/Ops Sevcon files tax returns in the respective countries in which it operates. The financial statements reflect the current and deferred tax consequences of all events recognized in the financial statements or tax returns. See Note 4.
G. Inventories
Inventories are valued at the lower of cost or market. Inventory costs include materials, direct labor and manufacturing overhead, and are relieved from inventory on a first-in, first-out basis. The Company’s reported financial condition includes a provision for estimated slow-moving and obsolete inventory that is based on a comparison of inventory levels with forecast future demand. Such demand is estimated based on many factors, including management judgments, relating to each customer’s business and to economic conditions. The Company reviews in detail all significant inventory items with holdings in excess of estimated normal requirements. It also considers the likely impact of changing technology. It makes an estimate of the provision for slow moving and obsolete stock on an item-by-item basis based on a combination of likely usage based on forecast customer demand, potential sale or scrap value and possible alternative use. This provision represents the difference between original cost and market value at the end of the financial period. In cases where there is no estimated future use for the inventory item and there is no estimated scrap or resale value, a 100% provision is recorded. Where the Company estimates that only part of the total holding of an inventory item will not be used, or there is an estimated scrap, resale or alternate use value, then a proportionate provision is recorded. Once an item has been written down, it is not subsequently revalued upwards. The provision for slow moving and obsolete inventories at September 30, 2007 was $860,000, or 14% of the original cost of gross inventory. At September 30, 2006 the provision was $923,000, or 16% of gross inventory. Inventories were comprised of:
(in thousands of dollars)
| | | | 2007 | | | 2006 | |
| Raw materials | | $ | 2,517 | | $ | 2,195 | |
| Work-in-process | | | 134 | | | 119 | |
| Finished goods | | | 2,771 | | | 2,403 | |
| | | $ | 5,422 | | $ | 4,717 | |
H. Accounts receivable
In the normal course of business, the Company provides credit to customers, performs credit evaluations of these customers, monitors payment performance, and maintains reserves for potential credit losses in the allowance for doubtful accounts which, when realized, have historically been within the range of the Company’s reserves.
I. Translation of foreign currencies
Tech/Ops Sevcon translates the assets and liabilities of its foreign subsidiaries at the current rate of exchange, and income statement accounts at the average exchange rates in effect during the period. Gains or losses from foreign currency translation are credited or charged to cumulative translation adjustment included in the statement of comprehensive income and as a component of cumulative other comprehensive income in stockholders' equity in the balance sheet. Foreign currency transaction gains and losses are shown in the statement of income.
J. Derivative instruments and hedging
The Company accounts for derivative instruments and hedging under SFAS No. 133, “Accounting for Derivative Instruments and Hedging Activities”, which requires that all derivatives, including foreign currency exchange contracts, be recognized on the balance sheet at fair value. Derivatives that are not hedges must be recorded at fair value through earnings. If a derivative is a hedge, depending on the nature of the hedge, changes in the fair value of the derivative are either offset against the change in fair value of assets, liabilities or firm commitments through earnings or recognized in other comprehensive income until the hedged item is recognized in earnings. The ineffective portion of a derivative’s change in fair value is immediately recognized in earnings.
The Company sells to customers throughout the industrialized world. The majority of the Company’s products are manufactured in the United Kingdom or by a sub-contractor based in Poland. Approximately 38% of the Company’s sales are made in US Dollars, 27% are made in British Pounds and 35% are made in Euros. Approximately 72 % of the Company’s cost of sales is incurred in British Pounds. This results in the Company’s sales and margins being exposed to fluctuations due to the change in the exchange rates of US Dollar, the British Pound and the Euro.
Forward foreign exchange contracts are used primarily by the Company to hedge the operational (“cash-flow” hedges) exposures resulting from changes in foreign currency exchange rates described above. These foreign exchange contracts are entered into to hedge anticipated intercompany product purchases and third party sales and the associated accounts payable and receivable made in the normal course of business. Accordingly, these forward foreign exchange contracts are not speculative in nature. As part of its overall strategy to manage the level of exposure to the risk of foreign currency exchange rate fluctuations, the Company hedges a portion of its foreign currency exposures anticipated over the ensuing 9-month period. At September 30, 2007, the Company had effectively hedged approximately 25% of its estimated foreign currency exposures that principally relate to anticipated cash flows to be remitted to the UK over the next year, using foreign exchange contracts that have maturities of twelve months or less. The Company does not hold or transact in financial instruments for purposes other than risk management.
Under hedge accounting, the Company records its foreign currency exchange contracts at fair value in its consolidated balance sheet as other current assets and a portion of the related gains or losses on these hedge contracts related to anticipated transactions are deferred as a component of other comprehensive income. These deferred gains and losses will be recognized in income in the period in which the underlying anticipated transaction occurs.
Unrealized gains and losses resulting from the impact of currency exchange rate movements on forward foreign exchange contracts designated to offset certain functional currency denominated assets are recognized as other income or expense in the period in which the exchange rates change and offset the foreign currency losses and gains on the underlying exposures being hedged.
The Company discontinues hedge accounting prospectively when (1) it is determined that the derivative is no longer effective in offsetting changes in fair value or cash flows of a hedged item (including forecasted transactions); (2) the derivative is sold or terminated; (3) the derivative is de-designated as a hedge instrument, because it is unlikely that a forecasted transaction will occur or a balance sheet exposure ceases to exist; or (4) management determines that designation of the derivative as a hedge instrument is no longer appropriate.
The following table provides information about the Company’s foreign currency derivative financial instruments outstanding as of September 30, 2007 and 2006. The information is provided in US Dollar amounts, as presented in the Company’s consolidated financial statements. The table presents the notional amount (at contract exchange rates) and the weighted average contractual foreign currency exchange rates. All contracts mature within twelve months.
Foreign currency spot/forward contracts:
(in thousands of dollars, except average contract rates)
| | | 2007 | | 2006 |
| | Notional Amount | Average Contract Rate | Notional Amount | Average Contract Rate |
Sell Euros for British Pounds Sell US Dollars for British Pounds | $ 2,942 $ 2,700 | €1.45 = £1 $1.99 = £1 | $ - $250 | - $1.73 = £1 |
| Total | $ 5,642 | | $250 | |
| Estimated fair value * | $ 43 | | $ 19 | |
| Amount recorded as other comprehensive income | $ 3 | | $ - | |
*The estimated fair value is based on the estimated amount at which the contracts could be settled based on forward exchange rates.
K. Cash equivalents and short-term investments
The Company considers all highly liquid investments with a maturity of 90 days or less to be cash equivalents. Highly liquid investments with maturities greater than 90 days and less than one year are classified as short-term investments.
Such investments are generally money market funds, bank certificates of deposit, US Treasury bills and short-term bank deposits in Europe.
L. Earnings per share
Basic and diluted net income per common share for the three years ended September 30, 2007 are calculated as follows:
(in thousands except per share data)
| | | | 2007 | | | 2006 | | | 2005 | |
| Net income | | $ | 1,303 | | $ | 1,114 | | $ | 641 | |
| Weighted average shares outstanding | | | 3,167 | | | 3,139 | | | 3,125 | |
| Basic income per share | | $ | .41 | | $ | .35 | | $ | .21 | |
| Common stock equivalents | | | 47 | | | 27 | | | 27 | |
| Average common and common equivalent shares outstanding | | | 3,214 | | | 3,166 | | | 3,152 | |
| Diluted income per share | | $ | .41 | | $ | .35 | | $ | .20 | |
For the years ended 2007, 2006 and 2005 respectively, approximately 80,000, 100,000 and 105,000 shares attributable to the exercise of outstanding options were excluded from the calculation of diluted earnings per share because the effect was antidilutive.
M. Use of estimates in the preparation of financial statements
The presentation of financial statements in conformity with generally accepted accounting principles requires management to make estimates and assumptions that affect the reported amounts of assets and liabilities and disclosures of contingent assets and liabilities as of the date of the financial statements and the reported amounts of income and expenses during the reporting periods. The most significant estimates and assumptions made by management include bad debt, inventory and warranty reserves, goodwill impairment assessment, pension plan assumptions and income tax assumptions. Operating results in the future could vary from the amounts derived from management's estimates and assumptions.
N. Fair value of financial instruments
The Company's financial instruments consist mainly of cash and cash equivalents, short-term investments, accounts receivable and accounts payable. The carrying amount of these financial instruments as of September 30, 2007, approximates fair value due to the short-term nature of these instruments.
O. Goodwill
The amount by which the cost of purchased businesses included in the accompanying financial statements exceeded the fair value of net assets at the date of acquisition has been recorded as "goodwill". The Company assesses the carrying value of this asset whenever events or changes in circumstances indicate that this value has diminished. The Company considers the future profitability of the business in assessing the value of this asset.
In accordance with SFAS No. 142 “Goodwill and Other Intangible Assets” the Company performs an annual assessment of goodwill impairment and has determined that goodwill has not been impaired.
P. New Accounting Pronouncements
In June 2006 the Financial Accounting Standards Board (FASB) issued Interpretation No. 48 “Accounting for Uncertainty in Income Taxes” (“FIN 48”) which is effective for fiscal years beginning after December 15, 2006. FIN 48 prescribes detailed guidance for the financial statement recognition, measurement and disclosure of uncertain tax positions recognized in an enterprise’s financial statements in accordance with Statement of Financial Accounting Standard (SFAS) No. 109. Tax positions must meet a more-likely-than-not recognition threshold at the effective date to be recognized upon the adoption of FIN 48, and in subsequent periods. The Company is currently evaluating the impact, if any, of adopting FIN 48 on its consolidated results of operations and financial position but does not anticipate that its adoption will have a material impact on either the consolidated results from operations or its financial position.
In September 2006, the Securities and Exchange Commission issued Staff Accounting Bulletin (“SAB”) No. 108, “Considering the Effects of Prior Year Misstatements when Quantifying Current Year Misstatements”. SAB No. 108 requires analysis of misstatements using both an income statement (rollover) approach and a balance sheet (iron curtain) approach in assessing materiality and provides for a one-time cumulative effect transition adjustment. SAB No. 108 was effective for our fiscal year 2007 annual financial statements. This did not have a material impact on the Company’s financial statements.
In September 2006, the FASB issued SFAS No. 157, “Fair Value Measurements”, which defines fair value, establishes a framework for measuring fair value in generally accepted accounting principles, and expands disclosures about fair value measurements. SFAS No. 157 does not require any new fair value measurements, but provides guidance on how to measure fair value by providing a fair value hierarchy used to classify the source of the information. This statement is effective for the Company beginning October 1, 2008. The Company does not expect that the adoption of SFAS No. 157 will have a material impact on its financial statements.
In September 2006, the FASB issued SFAS No. 158, "Employers’ Accounting for Defined Benefit Pension and Other Postretirement Plans - an amendment of FASB Statements No. 87, 88, 106, and 132(R)." SFAS No. 158 requires an employer to recognize a plan’s over funded or under funded status in its balance sheets and recognize the changes in a plan’s funded status in comprehensive income in the year which the changes occur. The Company adopted SFAS No. 158 effective on September 30, 2006. In addition, SFAS No. 158 requires an employer to measure plan assets and obligations that determine its funded status as of the end of its fiscal year. See Note 7 to these Consolidated Financial Statements for details of the impact of this on the Company’s financial statements.
In February 2007, the FASB issued SFAS No. 159, “The Fair Value Option for Financial Assets and Financial Liabilities” (SFAS 159), which permits entities to choose to measure many financial instruments and certain other items at fair value that are not currently required to be measured at fair value. SFAS No. 159 will be effective for the Company on October 1, 2008. The Company is currently evaluating the impact, if any, of adopting SFAS No. 159 on its financial position and results of operations.
(2) CAPITAL STOCK
Tech/Ops Sevcon, Inc. has two classes of capital stock, preferred and common. There are authorized 1,000,000 shares of preferred stock, $.10 par value and 8,000,000 shares of common stock, $.10 par value.
The company issued 37,000 shares of restricted common stock to employees and directors in fiscal 2006 and a further 14,000 shares of restricted common stock in fiscal 2007.
(3) STOCK-BASED COMPENSATION PLANS
Under the Company’s 1996 Equity Incentive Plan there were 78,000 shares reserved and available for grant at September 30, 2007. No options were granted in fiscal 2007, 2006 or 2005. In fiscal 2007 options for 22,000 shares were exercised by 4 employees. In fiscal 2006 one employee exercised an option for 2000 shares.
Recipients of grants or options must execute a standard form of non-competition agreement. The plan provides for the grant of Restricted Stock, Restricted Stock Units, Options, and Stock Appreciation Rights (SARs). Stock Appreciation Rights may be awarded either separately, or in relation to options granted, and for the grant of bonus shares. Options granted are exercisable at a price not less than fair market value on the date of grant.
Option transactions under the plans for the three years ended September 30, 2006 were as follows:
| | | Shares under option | | | Weighted average exercise price | | | Weighted average remaining contractual life (years | ) | | Aggregate Intrinsic value | |
| Outstanding at September 30, 2004 | | | 188,000 | | $ | 9.42 | | | | | | | |
| Cancelled in 2005 | | | (6,000 | ) | $ | 14.48 | | | | | | | |
| Outstanding at September 30, 2005 | | | 182,000 | | $ | 9.26 | | | | | | | |
| Exercised in 2006 | | | (2,000 | ) | $ | 4.37 | | | | | | | |
| Cancelled in 2006 | | | (8,000 | ) | $ | 8.46 | | | | | | | |
| Outstanding at September 30, 2006 | | | 172,000 | | $ | 9.35 | | | | | | | |
| Exercised in 2007 | | | (22,000 | ) | $ | 4.37 | | | | | | | |
| Cancelled in 2007 | | | (21,000 | ) | $ | 13.84 | | | | | | | |
| Outstanding at September 30, 2007 | | | 129,000 | | $ | 9.47 | | | 2 years | | $ | 204,000 | |
| Exercisable at September 30, 2007 | | | 93,250 | | $ | 10.38 | | | 3 years | | $ | 111,000 | |
The aggregate intrinsic value included in the table above represents the difference between the exercise price of the options and the market price of the Company’s common stock for the options that had exercise prices that were lower than the $8.70 market price of the Company’s common stock at September 30, 2007. Options for 22,000 shares were exercised by 4 employees in fiscal 2007. The total intrinsic value of options exercised in 2007 was $137,000 and the proceeds received on the exercise of these options were $96,000. In connection with the exercise of options in fiscal 2007 the company repurchased 8,349 shares at market for a total cost of $89,000. In fiscal 2006 options for 2,000 shares were exercised with a total intrinsic value of options exercised in fiscal 2006 was $3,000 and the proceeds received on the exercise of these options were $8,000. At September 30, 2007 there was $59,000 of total unrecognized compensation expense related to options granted under all equity compensation plans. The Company expects to recognize that cost over a weighted average period of 3 years.
Details of options outstanding at September 30, 2007 were as follows:
| Price range | | | Shares under option | | | Weighted average remaining contractual life | |
| $ 4.37 - $ 6.56 | | | 49,000 | | | 6 years | |
| $ 6.57 - $ 9.85 | | | 10,000 | | | 4 years | |
| $ 9.86 - $14.79 | | | 50,000 | | | 1 years | |
| $ 14.80 - $22.20 | | | 20,000 | | | 0.3 years | |
| | | | 129,000 | | | 2 years | |
In April 2007, the Company granted 2,000 shares of restricted stock to a new employee that vested in December 2007. The estimated fair value of the stock on the date of grant was $17,000 based on the fair market value of the stock on date of issue. This amount was credited to common stock and premium paid in on common stock and the $17,000 was netted off premium paid in on common stock in stockholders’ equity. This unearned compensation is being charged to income on a straight line basis over the eight month period during which the forfeiture conditions lapse. The charge to income for this employee restricted stock grants in 2007 was $11,000, and the remaining $6,000 will be charged to income in fiscal 2008.
In January 2007, the Company granted 12,000 shares of restricted stock to six non-employee directors which will vest on the day before the 2008 annual meeting providing that the grantee remains a director of the Company, or as determined by the Compensation Committee. The estimated fair value of the stock on the date of grant was $92,000 based on the fair market value of the stock on date of issue. This amount was credited to common stock and premium paid in on common stock and the $92,000 was netted off premium paid in on common stock in stockholders’ equity. This unearned compensation is being charged to income on a straight line basis over the twelve month period during which the forfeiture conditions lapse. The charge to income for these director restricted stock grants in fiscal 2007 was $61,000 and the remaining $31,000 will be charged to income in fiscal 2008.
In fiscal 2006 the Company granted 25,000 shares of restricted stock to five employees which will vest in five equal annual installments and 12,000 shares of restricted stock to six non-employee directors which vested on the day before the 2007 annual meeting.
During the restriction period, generally five years for employees (except for a grant to a new employee in fiscal 2007 which had an eight month restriction period) and one year for non-employee directors, ownership of unvested shares cannot be transferred. Restricted stock has the same cash dividend and voting rights as other common stock and is considered to be currently issued and outstanding. For the purposes of calculating average issued shares for earnings per share these shares are only considered to be outstanding when the forfeiture conditions lapse and the shares vest.
Restricted stock transactions under the plans for the three years ended September 30, 2007 were as follows:
(in thousands of shares)
| | | | 2007 | | | 2006 | | | 2005 | |
| Beginning Balance - Non-vested | | | 65 | | | 47 | | | - | |
| Granted to employees - 5 year vesting | | | - | | | 25 | | | 35 | |
| Granted to employees - 8 month vesting | | | 2 | | | | | | | |
| Granted to non-employee directors - 1 year vesting | | | 12 | | | 12 | | | 12 | |
| Vested | | | (24 | ) | | (19 | ) | | - | |
| Forfeited | | | - | | | - | | | - | |
| Ending Balance - Non-vested | | | 55 | | | 65 | | | 47 | |
| Weighted-average fair value for shares granted during the year | | $ | 7.77 | | $ | 5.58 | | $ | 6.18 | |
| Weighted-average fair value for shares vested during the year | | $ | 5.72 | | $ | 6.64 | | $ | - | |
| Weighted-average fair value for ending balance - non-vested | | $ | 6.22 | | $ | 5.70 | | $ | 6.18 | |
As of September 30, 2007, there was $198,000 of total restricted stock compensation expense related to non-vested awards not yet recognized, which is expected to be recognized over a weighted average period of 2.3 years.
The stock-based compensation expense in the last three fiscal years was as follows:
(in thousands of dollars)
| | | | 2007 | | | 2006 | | | 2005 | |
Stock option expense under SFAS No. 123R | | $ | 33 | | $ | 46 | | $ | - | |
Restricted stock grants: | | | | | | | | | | |
Employees | | $ | 84 | | $ | 55 | | $ | 30 | |
Non-employee directors | | $ | 76 | | $ | 74 | | $ | 57 | |
Total stock based compensation expense | | $ | 193 | | $ | 175 | | $ | 87 | |
(4) INCOME TAXES
The domestic and foreign components of income before income taxes are as follows:
(in thousands of dollars)
| | | | 2007 | | | 2006 | | | 2005 | |
| Domestic | | $ | (53 | ) | $ | (87 | ) | $ | 1 | |
| Foreign | | | 2,041 | | | 1,821 | | | 950 | |
| | | $ | 1,988 | | $ | 1,734 | | $ | 951 | |
The components of the provision / (benefit) for income taxes for the years ended September 30, 2007, 2006 and 2005 are as follows:
(in thousands of dollars)
| | | | | | | 2007 | | | | |
| | | Current | | | Deferred | | | Total | |
| Federal | | $ | 60 | | $ | (45 | ) | $ | 15 | |
| State | | | 1 | | | (16 | ) | | (15 | ) |
| Foreign | | | 660 | | | 25 | | | 685 | |
| | | $ | 721 | | $ | (36 | ) | $ | 685 | |
| | | | | | | 2006 | | | | |
| | | Current | | | Deferred | | | Total | |
| Federal | | $ | 77 | | $ | (45 | ) | $ | 32 | |
| State | | | 21 | | | (1 | ) | | 20 | |
| Foreign | | | 504 | | | 65 | | | 569 | |
| | | $ | 601 | | $ | 19 | | $ | 620 | |
| | | | | | | 2005 | | | | |
| | | | Current | | | Deferred | | | Total | |
| Federal | | $ | 24 | | $ | (32 | ) | $ | (8 | ) |
| State | | | 7 | | | 8 | | | 15 | |
| Foreign | | | 338 | | | (35 | ) | | 303 | |
| | | $ | 369 | | $ | (59 | ) | $ | 310 | |
The provision for income taxes in each period differs from that which would be computed by applying the statutory US Federal income tax rate to the income before income taxes. The following is a summary of the major items affecting the provision:
(in thousands of dollars)
| | | | 2007 | | | 2006 | | | 2005 | |
| Statutory Federal income tax rate | | | 34% | | | 34% | | | 34% | |
| Computed tax provision at statutory rate | | $ | 676 | | $ | 590 | | $ | 323 | |
| Increases (decreases) resulting from: | | | | | | | | | | |
Foreign tax rate differentials | | | (64 | ) | | (53 | ) | | (20 | ) |
State taxes net of federal tax benefit | | | 7 | | | 13 | | | (7 | ) |
Change in deferred tax valuation allowance | | | (18 | ) | | 58 | | | 7 | |
Other | | | 84 | | | 12 | | | 7 | |
| Income tax provision in the Statement of Income | | $ | 685 | | $ | 620 | | $ | 310 | |
Deferred tax assets and liabilities are recognized for the future tax consequences attributable to differences between the financial statement carrying amounts of existing assets and liabilities and their respective tax bases. Deferred tax assets and liabilities are measured using enacted tax rates expected to apply to taxable income in the years in which those temporary differences are expected to be recovered or settled. The effect on deferred tax assets and liabilities of a change in tax rates is recognized in income in the period that includes the enactment date. A valuation allowance is provided for deferred tax assets if it is more likely than not that these items will either expire before the Company is able to realize the benefit, or that future deductibility is uncertain. The significant items comprising the domestic and foreign deferred tax accounts at September 30, 2007 and 2006 are as follows:
(in thousands of dollars)
| | | | | | 2007 | | | |
| | | | Domestic current | | | Domestic long-term | | | Foreign current | | | Foreign long-term | |
| Assets: | | | | | | | | | | | | | |
Pension accruals (prepaid) | | $ | 78 | | $ | 160 | | $ | - | | $ | 514 | |
Inventory basis differences | | | 61 | | | - | | | 62 | | | - | |
Warranty reserves | | | 48 | | | - | | | - | | | - | |
Foreign tax credit carry forwards | | | 224 | | | - | | | - | | | - | |
Accrued compensation expense | | | 209 | | | - | | | 62 | | | - | |
Other (net) | | | 12 | | | - | | | - | | | - | |
| | | | 632 | | | 160 | | | 124 | | | 514 | |
| Liabilities: | | | | | | | | | | | | | |
Property basis differences | | | - | | | - | | | - | | | (17 | ) |
| Net asset (liability) | | | 632 | | | 160 | | | 124 | | | 497 | |
| Valuation allowance | | | (171 | ) | | - | | | - | | | - | |
| Net deferred tax asset (liability) | | $ | 461 | | $ | 160 | | $ | 124 | | $ | 497 | |
| | | | | | 2006 | | | |
| | | | Domestic current | | | Domestic long-term | | | Foreign current | | | Foreign long-term | |
| Assets: | | | | | | | | | | | | | |
Pension accruals (prepaid) | | $ | 83 | | $ | 233 | | $ | 28 | | $ | 687 | |
Inventory basis differences | | | 58 | | | - | | | 58 | | | - | |
Warranty reserves | | | 45 | | | - | | | - | | | - | |
Foreign tax credit carry forwards | | | 189 | | | - | | | - | | | - | |
Accrued compensation expense | | | 196 | | | - | | | - | | | - | |
Other (net) | | | 34 | | | - | | | 2 | | | - | |
| | | | 605 | | | 233 | | | 88 | | | 687 | |
| Liabilities: | | | | | | | | | | | | | |
Property basis differences | | | - | | | (22 | ) | | - | | | (17 | ) |
| Net asset (liability) | | | 605 | | | 211 | | | 88 | | | | |
| Valuation allowance | | | (189 | ) | | - | | | - | | | - | |
| Net deferred tax asset (liability) | | $ | 416 | | $ | 211 | | $ | 88 | | $ | 670 | |
(5) ACCRUED EXPENSES
The analysis of accrued expenses at September 30, 2007 and 2006, showing separately any items in excess of 5% of total current liabilities, was as follows:
(in thousands of dollars)
| | | | 2007 | | | 2006 | |
| Accrued compensation and related costs | | $ | 1,118 | | $ | 1,047 | |
| Warranty reserves | | | 458 | | | 364 | |
| Other accrued expenses | | | 1,586 | | | 1,290 | |
| | | $ | 3,162 | | $ | 2,701 | |
(6) COMMITMENTS AND CONTINGENCIES
Tech/Ops Sevcon is involved in various legal proceedings in the ordinary course of business but believes that it is remote that the outcome will be material to operations.
The Company maintains a directors' retirement plan which provides for certain retirement benefits to non-employee directors. Effective January 1997 the plan was frozen and no further benefits are being accrued. While the cost of the plan has been fully charged to expense, the plan is not separately funded. The estimated maximum liability which has been recorded based on the cost of buying deferred annuities at September 30, 2007 was $200,000.
Minimum rental commitments under all non-cancelable leases are as follows for the years ended September 30: 2008 - $236,000; 2009 - $218,000; 2010 - $218,000; 2011 - $218,000; 2012 - $163,000 and $1,494,000 thereafter. Net rentals of certain land, buildings and equipment charged to expense were $236,000 in 2007, $224,000 in 2006, and $214,000 in 2005.
The UK subsidiaries of the Company have given to a bank a security interest in all of their assets as security for overdraft facilities of $2,241,000. There were no amounts outstanding on the overdraft facilities at September 30, 2007 or 2006.
(7) EMPLOYEE BENEFIT PLANS
Tech/Ops Sevcon has defined benefit plans covering the majority of its US and UK employees. There is also a small defined contribution plan covering senior managers in the capacitor business. The Company uses a September 30 measurement date for its pension plans.
In September 2006, the FASB issued SFAS No. 158, "Employers’ Accounting for Defined Benefit Pension and Other Postretirement Plans - an amendment of FASB Statements No. 87, 88, 106, and 132(R)." SFAS No. 158 requires an employer to recognize a plan’s over funded or under funded status in its balance sheets and recognize the changes in a plan’s funded status in comprehensive income in the year which the changes occur. Implementation of these provisions of SFAS No. 158 is required for fiscal years ending after December 15, 2006 and early adoption is encouraged. The Company adopted SFAS No. 158 effective on September 30, 2006. In addition, SFAS No. 158 requires an employer to measure plan assets and obligations that determine its funded status as of the end of its fiscal year. As stated above the Company already measures plan assets and liabilities as of September 30, therefore this provision will not impact the Company. The following table sets forth the estimated funded status of these defined benefit plans and the amounts recognized by Tech/Ops Sevcon:
(in thousands of dollars)
| | | | 2007 | | | 2006 | |
| Change in benefit obligation: | | | | | | | |
| Benefit obligation at beginning of year | | $ | 20,476 | | $ | 15,910 | |
| Service cost | | | 592 | | | 393 | |
| Interest cost | | | 1,159 | | | 972 | |
| Plan participants contributions | | | 289 | | | 269 | |
| Actuarial (gain) loss | | | 510 | | | 2,209 | |
| Benefits paid | | | (234 | ) | | (58 | ) |
| Foreign currency exchange rate changes | | | 1,732 | | | 781 | |
| Benefit obligation at end of year | | | 24,524 | | | 20,476 | |
| Change in plan assets: | | | | | | | |
| Fair value of plan assets at beginning of year | | | 17,590 | | | 14,210 | |
| Return on plan assets | | | 2,333 | | | 1,575 | |
| Employer contributions | | | 758 | | | 871 | |
| Plan participants contributions | | | 289 | | | 269 | |
| Benefits paid | | | (234 | ) | | (58 | ) |
| Foreign currency exchange rate changes | | | 1,544 | | | 723 | |
| Fair value of plan assets at end of year | | | 22,280 | | | 17,590 | |
| Funded status | | | (2,244 | ) | | (2,886 | ) |
| Unrecognized transition obligation (asset) | | | n/a | | | n/a | |
| Unrecognized prior service cost | | | n/a | | | n/a | |
| Unrecognized net actuarial (gain) loss | | | n/a | | | n/a | |
| Accrued benefit cost | | | n/a | | | n/a | |
| Liability for pension benefits recorded in the balance sheet | | $ | (2,244 | ) | $ | (2,886 | ) |
The changes in the balance sheet at September 30, 2006 arising from the adoption of SFAS No. 158 are set out below:
(in thousands of dollars)
| | | | Before implementation of SFAS No. 158 | | | Change due to SFAS No. 158 | | | After implementation of SFAS No. 158 | |
| ASSETS | | | | | | | | | | |
Prepaid expense and other current assets | | $ | 1,290 | | $ | (443 | ) | $ | 847 | |
Total current assets | | | 13,484 | | | (443 | ) | | 13,041 | |
Long-term deferred tax asset | | | - | | | 881 | | | 881 | |
Total assets | | | 18,214 | | | 438 | | | 18,652 | |
| LIABILITIES AND STOCKHOLDERS’ EQUITY | | | | | | | | | | |
Accrued expenses | | | 3,102 | | | (401 | ) | | 2,701 | |
Total Current liabilities | | | 6,074 | | | (401 | ) | | 5,673 | |
Deferred taxes on income | | | 124 | | | (124 | ) | | - | |
Liability for pension benefits | | | - | | | 2,886 | | | 2,886 | |
Cumulative other comprehensive income | | | 207 | | | (1,923 | ) | | (1,716 | ) |
Total Stockholders’ equity | | | 11,960 | | | (1,923 | ) | | 10,037 | |
Total liabilities and stockholders’ equity | | | 18,214 | | | 438 | | | 18,652 | |
The improvement in the funded status of the pension plans during fiscal 2007 was mainly due to an increase from 5.2% to 5.7% in the discount rate for the UK plan and better than estimated investment returns, partially offset by changes in mortality assumptions.
The Tech/Ops Sevcon net pension cost included the following components as defined by SFAS #132.
(in thousands of dollars)
| | | | 2007 | | | 2006 | | | 2005 | |
| Components of net periodic benefit cost: | | | | | | | | | | |
Service cost | | $ | 592 | | $ | 382 | | $ | 434 | |
Interest cost | | | 1,159 | | | 942 | | | 901 | |
Expected return on plan assets | | | (1,148 | ) | | (886 | ) | | (845 | ) |
Amortization of transition obligation | | | (1 | ) | | (2 | ) | | (2 | ) |
Amortization of prior service cost | | | 59 | | | 54 | | | 55 | |
Recognized net actuarial gain (loss) | | | 14 | | | - | | | - | |
Net periodic benefit cost | | $ | 675 | | $ | 490 | | $ | 543 | |
Net cost of defined contribution plans | | $ | 147 | | $ | 35 | | $ | 29 | |
The increase in the net cost of defined contribution plans mainly relates to a payment into the plan in connection with the termination of one employee.
The weighted average assumptions used to determine plan obligations and net periodic benefit cost for the years ended September 30, 2007 and 2006 were as set out below:
| | | | 2007 | | | 2006 | |
| Plan obligations: | | | | | | | |
Discount rate | | | 5.76% | | | 5.27% | |
Rate of compensation increase | | | 4.25% | | | 3.98% | |
| Net periodic benefit cost: | | | | | | | |
Discount rate | | | 5.76% | | | 5.27% | |
Expected long term return on plan assets | | | 6.50% | | | 6.04% | |
Rate of compensation increase | | | 4.25% | | | 3.98% | |
The changes in these assumptions reflect actuarial advice and changing market conditions and experience.
The weighted average asset allocations by asset category are set out below for both the UK and US plans:
(percentage of total assets)
| | | | | | | 2007 | | | | | | | | | 2006 | | | | |
| | | | US Plan | | | UK Plan | | | Total | | | US Plan | | | UK Plan | | | Total | |
| Equity securities | | | 40% | | | 53% | | | 52% | | | 39% | | | 43% | | | 42% | |
| Debt securities | | | 54% | | | 26% | | | 28% | | | 56% | | | 36% | | | 38% | |
| Real estate | | | - | | | 17% | | | 16% | | | - | | | 17% | | | 16% | |
| Other | | | 6% | | | 4% | | | 4% | | | 5% | | | 4% | | | 4% | |
| Total | | | 100% | | | 100% | | | 100% | | | 100% | | | 100% | | | 100% | |
For the US plan the target asset allocations are 40% - 45% equity securities and 55% - 60% debt securities. The UK plan is invested in an insurance company with-profits unit fund which holds various investments as decided by the insurance company’s fund manager, who is responsible for the asset allocation within the fund. The asset allocations of the insurance company with-profits units are included in the table above.
The overall expected long-term rate of return on plan assets has been based on the expected returns on equities, bonds and real estate based broadly on the current asset allocation, with a small reduction in the expected rate to reflect the conservative nature of the distributions from the insurance company with profits unit fund.
The following benefit payments, which reflect future service, as appropriate, are expected to be paid:
(in thousands of dollars)
| 2007 | $111 |
| 2008 | 154 |
| 2009 | 198 |
| 2010 | 303 |
| 2011 | 437 |
| 2012 - 2016 | 4,039 |
In fiscal 2008 it is estimated that the Company will make contributions to the plans of $799,000, and that there will be employee contributions to the UK plan of $305,000.
(8) SEGMENT INFORMATION
The Company has two reportable segments: electronic controls and capacitors. The electronic controls segment produces control systems for battery powered vehicles. The capacitor segment produces electronic components for sale to electronic equipment manufacturers. Each segment has its own management team, manufacturing facilities and sales force.
The accounting policies of the segments are the same as those described in Note 1. Intersegment sales are accounted for at current market prices. The Company evaluates the performance of each segment principally based on operating income. The Company does not allocate income taxes, interest income and expense or foreign currency translation gains and losses to segments. Information concerning operations of these businesses is as follows:
(in thousands of dollars)
| | | | | | | | | | 2007 | | | | |
| | | | Controls | | | Capacitors | | | Corporate | | | Total | |
| Sales to external customers | | $ | 37,009 | | $ | 2,204 | | $ | - | | $ | 39,213 | |
| Inter-segment revenues | | | - | | | 52 | | | - | | | 52 | |
| Operating income | | | 2,669 | | | (289 | ) | | (317 | ) | | 2,063 | |
| Depreciation and amortization | | | 686 | | | 56 | | | - | | | | |
| Identifiable assets | | | 20,338 | | | 1,090 | | | 498 | | | 21,296 | |
| Capital expenditures | | | 823 | | | 87 | | | - | | | 910 | |
| | | | | | | | | | 2006 | | | | |
| | | | Controls | | | Capacitors | | | Corporate | | | Total | |
| Sales to external customers | | $ | 32,808 | | $ | 1,822 | | $ | - | | $ | 34,630 | |
| Inter-segment revenues | | | - | | | 64 | | | - | | | 64 | |
| Operating income | | | 2,174 | | | 68 | | | (398 | ) | | 1,844 | |
| Depreciation and amortization | | | 586 | | | 71 | | | - | | | 657 | |
| Identifiable assets | | | 17,121 | | | 1,097 | | | 434 | | | 18,652 | |
| Capital expenditures | | | 664 | | | 42 | | | - | | | 706 | |
| | | | | | | | | | 2005 | | | | |
| | | | Controls | | | Capacitors | | | Corporate | | | Total | |
| Sales to external customers | | $ | 30,009 | | $ | 1,666 | | $ | - | | $ | 31,675 | |
| Inter-segment revenues | | | - | | | 199 | | | - | | | 199 | |
| Operating income | | | 1,343 | | | 32 | | | (376 | ) | | 999 | |
| Depreciation and amortization | | | 611 | | | 50 | | | - | | | 661 | |
| Identifiable assets | | | 14,948 | | | 951 | | | 547 | | | 16,446 | |
| Capital expenditures | | | 536 | | | 35 | | | - | | | 571 | |
The Company has businesses located in the United States, the United Kingdom, France, Korea and Japan. The analysis of revenues set out below is by the location of the business selling the products rather than by destination of the products.
(in thousands of dollars)
| | | | 2007 | | | 2006 | | | 2005 | |
| Sales:- | | | | | | | | | | |
| US sales | | $ | 14,832 | | $ | 14,643 | | $ | 12,893 | |
| Foreign sales: | | | | | | | | | | |
United Kingdom | | | 12,338 | | | 10,702 | | | 9,477 | |
France | | | 12,043 | | | 9,285 | | | 9,305 | |
| Total Foreign | | | 24,381 | | | 19,987 | | | 18,782 | |
| Total sales | | $ | 39,213 | | $ | 34,630 | | $ | 31,675 | |
| Long-lived assets: | | | | | | | | | | |
| USA | | $ | 1,516 | | $ | 1,732 | | $ | 1,543 | |
| Foreign: | | | | | | | | | | |
United Kingdom | | | 3,530 | | | 3,768 | | | 2,866 | |
France | | | 142 | | | 90 | | | 51 | |
Korea and Japan | | | 8 | | | 21 | | | 11 | |
| Total Foreign | | | 3,680 | | | 3,879 | | | 2,928 | |
| Total | | $ | 5,196 | | $ | 5,611 | | $ | 4,471 | |
The business located in the United States services customers in North and South America. The business located in France services customers in France, Spain, Portugal, Belgium, Germany, Netherlands and North Africa. The businesses located in Korea and Japan support customers in Asia, however, sales to these customers are made from the United Kingdom. The businesses located in the United Kingdom service customers in the rest of the world, principally Europe and the Far East.
In fiscal 2007 Tech/Ops Sevcon's largest customer accounted for 14% of sales and for 17% of receivables. In 2006 the largest customer accounted for 17% of sales and 16% of receivables. In 2005 the largest customer accounted for 16% of sales and 20% of receivables.
The Board of Directors and Shareholders of Tech/Ops Sevcon, Inc.:
We have audited the accompanying consolidated balance sheets of Tech/Ops Sevcon, Inc. and subsidiaries as of September 30, 2007 and 2006 and the related consolidated statements of income, comprehensive income, stockholders’ equity and cash flows for each of the three years in the period ended September 30, 2007. These consolidated financial statements are the responsibility of the Company’s management. Our responsibility is to express an opinion on these consolidated financial statements based on our audits.
We conducted our audits in accordance with the standards of the Public Company Accounting Oversight Board (United States). Those standards require that we plan and perform the audit to obtain reasonable assurance about whether the financial statements are free of material misstatement. The Company is not required to have, nor were we engaged to perform, an audit of its internal control over financial reporting. Our audit included consideration of internal control over financial reporting as a basis for designing audit procedures that are appropriate in the circumstances, but not for the purpose of expressing an opinion on the effectiveness of the Company’s internal control over financial reporting. Accordingly, we express no such opinion. An audit includes examining, on a test basis, evidence supporting the amounts and disclosures in the financial statements. An audit also includes assessing the accounting principles used and significant estimates made by management, as well as evaluating the overall financial statement presentation. We believe that our audits provide a reasonable basis for our opinion.
In our opinion, the consolidated financial statements referred to above present fairly, in all material respects, the financial position of Tech/Ops Sevcon, Inc. and subsidiaries as of September 30, 2007 and 2006 and the results of their operations and their cash flows for each of the three years in the period ended September 30, 2007 in conformity with accounting principles generally accepted in the United States of America.
We have also audited Schedule II for each of the three years in the period ended September 30, 2007. In our opinion, this schedule, when considered in relation to the basic consolidated financial statements taken as a whole, presents fairly, in all material respects, the information therein.
/s/ Vitale, Caturano & Company, Ltd.
Boston, Massachusetts
December 6, 2007
SELECTED QUARTERLY FINANCIAL DATA (UNAUDITED)
Selected quarterly financial data for fiscal years 2007 and 2006 is set out below:
(in thousands except per share data)
| | | | First Quarter | | | Second Quarter | | | Third Quarter | | | Fourth Quarter | | | Total Year | |
| 2007 Quarters | | | | | | | | | | | | | | | | |
| Net sales | | $ | 8,226 | | $ | 10,374 | | $ | 10,341 | | $ | 10,272 | | $ | 39,213 | |
| Gross profit | | | 2,998 | | | 4,014 | | | 3,791 | | | 3,545 | | | 14,348 | |
| Operating income | | | 204 | | | 898 | | | 782 | | | 179 | | | 2,063 | |
| Net income | | | 88 | | | 568 | | | 483 | | | 164 | | | 1,303 | |
| Basic income per share | | $ | .03 | | $ | .18 | | $ | .15 | | $ | .05 | | $ | .41 | |
| Diluted income per share | | $ | .03 | | $ | .18 | | $ | .15 | | $ | .05 | | $ | .41 | |
| 2006 Quarters | | | | | | | | | | | | | | | | |
| Net sales | | $ | 7,821 | | $ | 8,562 | | $ | 9,313 | | $ | 8,934 | | $ | 34,630 | |
| Gross profit | | | 3,047 | | | 3,317 | | | 3,552 | | | 3,190 | | | 13,106 | |
| Operating income | | | 244 | | | 562 | | | 584 | | | 454 | | | 1,844 | |
| Net income | | | 160 | | | 342 | | | 369 | | | 243 | | | 1,114 | |
| Basic income per share | | $ | .05 | | $ | .11 | | $ | .12 | | $ | .08 | | $ | .35 | |
| Diluted income per share | | $ | .05 | | $ | .11 | | $ | .12 | | $ | .08 | | $ | .35 | |
None.
(a) Evaluation of disclosure controls and procedures. The Company’s principal executive officer and principal financial officer, after evaluating the effectiveness of the Company’s “disclosure controls and procedures” (as defined in Securities Exchange Act of 1934 Rule 13a-15(e)) have concluded that, as of September 30, 2007, the disclosure controls and procedures were effective.
(b) Changes in internal control over financial reporting. The Company’s principal executive officer and principal financial officer have identified no change in the Company’s “internal control over financial reporting” (as defined in Securities Exchange Act of 1934 Rule 13a-15(f)) that occurred during the fourth quarter of fiscal 2007 that has materially affected, or is reasonably likely to materially affect, the Company’s internal control over financial reporting.
None.
The requisite information regarding the Company’s directors, executive officers and audit committee members is incorporated by reference from the discussion responsive thereto under the captions “Election of Directors” and “Section 16(a) Beneficial Ownership Reporting Compliance” in the Company’s Proxy Statement for the 2008 Annual Meeting of Stockholders.
We have adopted a Code of Ethics for Senior Officers that applies to our chief executive officer, chief financial officer, principal accounting officer and controllers. We have also adopted a Code of Conduct and Ethics that applies to all of our employees, including, but not limited to, our chief executive officer, chief financial officer, principal accounting officer, and controllers. A copy of either Code is available without charge upon request from the Chief Financial Officer at Tech/Ops Sevcon, Inc., 155 Northboro Road, Southborough, MA 01772. If we make any substantive amendments to the Code of Ethics for Senior Officers or grant any waiver from a provision of such Code, or if we make any substantive amendment to a provision of the Code of Conduct that applies to our chief executive officer, chief financial officer, principal accounting officer or controller, or if we grant any waiver from a provision of such Code for any such persons we will disclose the nature of such amendment or waiver in a report on Form 8-K.
EXECUTIVE OFFICERS OF THE REGISTRANT
| Name of Officer | Age | Position |
| Matthew Boyle | 45 | President & Chief Executive Officer |
| Paul A. McPartlin | 62 | Vice President & Chief Financial Officer |
| Paul N. Farquhar | 45 | Vice President, Treasurer & Principal Accounting Officer |
There are no family relationships between any director or executive officer and any other director or executive officer of the Company.
All officers serve until the next annual meeting and until their successors are elected and qualified. Mr. Boyle has been President and Chief Executive Officer since 1997 and was Vice President and Chief Operating Officer of the Company from 1996 to 1997. Mr. McPartlin has been Vice President and Chief Financial Officer of the Company since 1990 and was Treasurer until April 2007. On April 24, 2007 we appointed Mr. Paul N. Farquhar as Vice President, Treasurer and Principal Accounting Officer. Mr. Farquhar is a British Chartered Accountant and from January 2005 to March 2007 was European Financial Controller for AAF International, a global company providing products for air filtration. From 1997 to January 2005 he was European Finance Director of Haskel International Inc., a world leading manufacturer of hydraulic and pneumatic driven high pressure products, systems and accessories.
ITEM 11 EXECUTIVE COMPENSATION
This information is incorporated by reference from the information under the captions “Election of Directors - Director Compensation,” and “Executive Compensation” in the Company’s Proxy Statement for the 2008 Annual Meeting of Stockholders.
The requisite information concerning security ownership is incorporated by reference from the information responsive thereto under the captions “Beneficial Ownership of Common Stock” and “Election of Directors” in the Company’s Proxy Statement for the 2008 Annual Meeting of Stockholders.
The following table sets out the status of shares authorized for issuance under equity compensation plans at September 30, 2007.
| Plan Category | Number of securities to be issued upon exercise of outstanding options warrants and rights | Weighted-average exercise price of outstanding options, warrants and rights | Number of securities remaining available for future issuance under equity compensation plans(excluding securities reflected in column (a)) at beginning of year | Number of securities remaining available for future issuance under equity compensation plans(excluding securities reflected in column (a)) at end of year |
| | (a) | (b) | (c) | (d) |
Equity compensation plans approved by security holders: 1996 Equity Incentive Plan 1998 Director Stock Option Plan | 104,000 25,000 | $ 8.57 $13.23 | 71,000 - | 78,000 - |
Sub Total | 129,000 | $ 9.35 | 71,000 | 78,000 |
| Equity compensation plans not approved by security holders | - | - | - | - |
| Total | 172,000 | $ 9.35 | 71,000 | 78,000 |
This information is incorporated by reference from the information responsive thereto under the captions “Transactions with Related Parties” and “Election of Directors - Director Independence” in the Company’s Proxy Statement for the 2008 Annual Meeting of Stockholders.
This information is incorporated by reference from the discussion responsive thereto under the caption “Auditors” in the Company’s Proxy Statement relating to the 2008 Annual Meeting of Stockholders.
| (a) | Financial statements and schedule |
| | The financial statements and financial statement schedule listed under Item 8 in the index following the cover page are filed as part of this Annual Report on Form 10-K. |
| (b) | Exhibits |
| | The exhibits filed as part of this Annual Report on Form 10-K are listed on the Exhibit Index below. |
| *(3)(a) | Certificate of Incorporation of the registrant (incorporated by reference to Exhibit (3)(a) to Quarterly Report on Form 10-Q for the quarter ended July 3, 2004). |
| *(3)(b) | By-laws of the registrant (incorporated by reference to Exhibit (3) (b) to Quarterly Report on Form 10-Q for the quarter ended June 30, 2000). |
| *(4)(a) | Specimen common stock of registrant (incorporated by reference to Exhibit (4) (a) to Annual Report for the fiscal year ended September 30, 1994). |
| *(10)(a) | Tech/Ops Sevcon, Inc. 1996 Equity Incentive Plan (incorporated by reference to the Registrant's 2004 Proxy Statement filed on December 29, 2003). |
| *(10)(b) | Form of Option for 1996 Equity Incentive Plan (incorporated by reference to Exhibit (10) (b) to Annual Report for the fiscal year ended September 30, 2002). |
| *(10)(c) | Form of Restricted Stock Agreement for employees for 1996 Equity Incentive Plan (incorporated by reference to Exhibit (10) (c) to Annual Report for the fiscal year ended September 30, 2004). |
| *(10)(d) | Form of Restricted Stock Agreement for non-employee directors for 1996 Equity Incentive Plan (incorporated by reference to Exhibit (10) (d) to Annual Report for the fiscal year ended September 30, 2004). |
| *(10)(e) | Form of Indemnification Agreement dated January 4, 1988 between the registrant and each of its directors (incorporated by reference to Exhibit (10) (e) to Annual Report for the fiscal year ended September 30, 1994). |
| *(10)(f) | Directors’ Retirement Plan (incorporated by reference to Exhibit (10) (b) to Annual Report for the fiscal year ended September 30, 1990). |
| *(10)(g) | Board resolution terminating Directors’ Retirement Plan (incorporated by reference to Exhibit (10) (e) to Annual Report for the fiscal year ended September 30, 1997). |
| *(10)(h) | Tech/Ops Sevcon, Inc. 1998 Director Stock Option Plan (incorporated by reference to Exhibit 10 to Quarterly Report on Form 10-Q for the quarter ended March 31, 1998). |
| (10)(i) | Summary of Director and Executive Officer Non-Plan Compensation (filed herewith). |
| *(21) | Subsidiaries of the registrant (incorporated by reference to exhibit (21) to Annual Report for the fiscal year ended September 30, 2001). |
| (23) | Consent of Vitale Caturano & Company, Ltd. (filed herewith). |
| (31.1) | Certification of Principal Executive Officer pursuant to section 302 of the Sarbanes-Oxley Act of 2002. (Filed herewith) |
| (31.2) | Certification of Principal Financial Officer pursuant to section 302 of the Sarbanes-Oxley Act of 2002. (Filed herewith) |
| (32.1) | Certification of Principal Executive Officer and Principal Financial Officer pursuant to section 906 of the Sarbanes-Oxley Act of 2002. (Furnished herewith) |
*Indicates exhibit previously filed and incorporated by reference. Exhibits filed with periodic reports were filed under File No. 1-9789.
Executive Compensation Plans and Arrangements:
Exhibits (10) (a) - (i) are management contracts or compensatory plans or arrangements in which the executive officers or directors of the registrant participate.
A copy of these exhibits may be obtained on the SEC’s EDGAR database (at www.sec.gov) or will be furnished without charge to any stockholder upon written request to Tech/Ops Sevcon, Inc., attention Paul N. Farquhar, Treasurer, 155 Northboro Road, Southborough MA 01772, Telephone: (581) 281 5510.
Pursuant to the requirements of Section 13 or 15(d) of the Securities Exchange Act of 1934, the registrant has duly caused this report to be signed on its behalf by the undersigned, thereunto duly authorized.
| | TECH/OPS SEVCON, INC. | |
| | | |
| | By /s/ Matthew Boyle | December 14, 2007 |
| | Matthew Boyle | |
| | President and Chief Executive Officer | |
Pursuant to the requirements of the Securities Exchange Act of 1934, this report has been signed below by the following persons on behalf of the registrant and in the capacities and on the dates indicated:
SIGNATURE | TITLE | DATE |
/s/ Matthew Boyle | President, Chief Executive | December 14, 2007 |
Matthew Boyle | Officer and Director | |
| | (Principal Executive Officer) | |
| | | |
/s/ Paul A. McPartlin | Vice President and Chief | December 14, 2007 |
Paul A. McPartlin | Financial Officer | |
| | (Principal Financial Officer) | |
| | | |
/s/ Paul N. Farquhar | Vice President, Treasurer | December 14, 2007 |
Paul N. Farquhar | and Principal Accounting Officer | |
| | (Principal Accounting Officer) | |
| | | |
/s/ Maarten D. Hemsley | Director | December 14, 2007 |
Maarten D. Hemsley | | |
| | | |
/s/ Paul B. Rosenberg | Director | December 14, 2007 |
Paul B. Rosenberg | | |
| | | |
/s/ Marvin G. Schorr | Director | December 14, 2007 |
Marvin G. Schorr | | |
| | | |
/s/ Bernard F. Start | Director | December 14, 2007 |
Bernard F. Start | | |
| | | |
/s/ David R. A. Steadman | Director | December 14, 2007 |
David R. A. Steadman | | |
| | | |
/s/ Paul O. Stump | Director | December 14, 2007 |
Paul O. Stump | | |
| | | |
TECH/OPS SEVCON, INC. AND SUBSIDIARIES
Reserves for the three years ended September 30, 2007(in thousands of dollars)
| Allowance for doubtful accounts | | | 2007 | | | 2006 | | | 2005 | |
| Balance at beginning of year | | | 141 | | | 144 | | | 192 | |
| Additions charged to costs and expenses | | | 38 | | | 14 | | | 73 | |
| Deductions from reserves: | | | | | | | | | | |
Accounts collected | | | (11 | ) | | (10 | ) | | (8 | ) |
Write off of uncollectible accounts | | | (1 | ) | | (13 | ) | | (111 | ) |
| Foreign currency translation adjustment | | | 13 | | | 6 | | | (2 | ) |
| Balance at end of year | | | 180 | | | 141 | | | 144 | |