Andrew Seaberg
215-988-3328
andrew.seaberg@dbr.com
December 21, 2017
VIA EDGAR
Ms. Deborah O’Neal-Johnson
Securities and Exchange Commission
100 F Street, N.E.
Washington, D.C. 20549
| Re: | Trust for Credit Unions (“Registrant”) |
Post-Effective Amendment No. 54
(File Nos.33-18781 and811-5407)
Dear Ms. O’Neal-Johnson:
The following responds to the comments we received from you on December 14, 2017, regarding the above-referenced Post-Effective Amendment to Registrant’s Registration Statement on FormN-1A (the Post-Effective Amendment). The Post-Effective Amendment was filed pursuant to paragraph (a)(1) of Rule 485 under the Securities Act of 1933, as amended, to reflect the change in the investment adviser for the Registrant’s series (the “Portfolios,” each, a “Portfolio”). Per your request, we have also attached the final version of the “Portfolio Fees and Expenses” table and the “Performance” table and chart for each Portfolio. Our responses (in bold) follow your comments.
Comments Related to Summary Sections of Prospectuses
1. Comment: With regard to the securities held by the Ultra-Short Duration Government Portfolio, please confirm that the Portfolio will maintain sufficient liquidity to meet the liquidity requirements of the Investment Company Act of 1940, as amended.
Response: The Registrant confirms.
2. Comment: In the Summary Section for the Ultra-Short Duration Government Portfolio and Short Duration Portfolio, please provide a description of how duration operates with respect to changes in interest rates.
Response: The Registrant will add an example of the relationship between interest rates and duration to each Portfolio’s Summary Section.
Ms. Deborah O’Neal-Johnson
Page 2
December 21, 2017
Comments Related to Statements of Additional Information (“SAI”)
3. Comment: Investment Restriction (1) in the Registrant’s SAI for the Ultra-Short Duration Government Portfolio and Short Duration Portfolio (the “Bond Portfolio SAI”) concludes with the following statement: “during normal market conditions the Short Duration Portfolio intends to invest at least 25% of the value of its total assets in mortgage-related securities.” Please advise as to how TCU implements this policy and whether it interprets privately issued mortgage securities as an industry. Also, has the Short Duration Portfolio ever held 25% or more of its assets in privately issued mortgage securities or does it plan to do so in the future?
Response: For industry concentration purposes, Registrant considers privately issued mortgage-related securities to be a type of “mortgage-related security”. As stated in the fundamental investment restriction, “during normal market conditions the Short Duration Portfolio intends to invest at least 25% of the value of its total assets in mortgage-related securities.” Because the Portfolio is normally concentrated in mortgage-related securities, as disclosed in its Prospectus and SAI, Registrant does not routinely monitor the percentage of the Portfolio’s assets that is invested in agency and privately issued mortgage securities. Registrant notes that at August 31, 2016 and August 31, 2017, the Portfolio’s assets were not invested in privately issued mortgage-backed securities.
4. Comment: Investment Restriction (1) in the Bond Portfolio SAI states that the Ultra-Short Duration Government Portfolio provides that “there is no limitation with respect to or arising out of (b) in the case of the Ultra-Short Duration Government Portfolio, investments in obligations issued or guaranteed by the U.S. Government or its agencies or instrumentalities, repurchase agreements by such Portfolio of securities collateralized by such obligations or by cash, certificates of deposit, bankers’ acceptances and bank repurchase agreements . . .”. Please explain the Fund’s reservation of the ability to invest more than 25% of the value of its total assets in certificates of deposit, bankers’ acceptances and bank repurchase agreements in light of the SEC staff position that freedom to concentrate with respect to such investment vehicles may only be reserved by money market funds and describe any steps the Ultra-Short Duration Government Portfolio will take with respect to concentration in these instruments.
Response: With respect to the Ultra-Short Duration Government Portfolio’s policy regarding concentration of investments, the Portfolio has adopted a policy to invest, under normal circumstances, at least 80% of its net assets (measured at the time of purchase) in Securities guaranteed as to principal and interest by the U.S. government or by its agencies, instrumentalities or sponsored enterprises (“U.S. Government Securities”) and related custodial receipts, including mortgage-related securities representing an interest in or collateralized by other mortgage-related securities and/or in repurchase agreements collateralized by U.S. Government Securities. The Registrant will add the below note following the last sentence of Investment Restriction (1) in the Bond Portfolio SAIs:
Ms. Deborah O’Neal-Johnson
Page 3
December 21, 2017
Note: The current position of the staff of the SEC is that only the Government Money Market Portfolio may reserve freedom of action to concentrate in bank obligations and that the exclusion with respect to bank instruments referred to above may only be applied to instruments of domestic banks. For this purpose, the staff also takes the position that foreign branches of domestic banks may, if certain conditions are met, be treated as domestic banks. The Fund intends to consider only obligations of domestic banks (as construed to include foreign branches of domestic banks to the extent they satisfy the above-referenced conditions) to be within this exclusion until such time, if ever, that the SEC staff modifies its position.
We thank you for your assistance. If you should have any questions regarding the Registrant’s responses to your comments, please do not hesitate to contact the undersigned at215-988-2887, or in my absence, Michael Malloy at215-988-2978.
| Sincerely, |
/s/ Andrew Seaberg |
| Andrew Seaberg |
Enclosures
| cc: | Mr. Jay Johnson |
Dan Dawson, Esq.
Michael P. Malloy, Esq.
TRUST FOR CREDIT UNIONS
4400 Computer Drive
Westborough, MA 01581
December 21, 2017
VIA EDGAR TRANSMISSION
Securities and Exchange Commission
100 F Street, NE
Washington, D.C. 20549
| Re: | Trust for Credit Unions (“Registrant”)/Post-Effective Amendment No. 54 to the Registration Statement on FormN-1A |
(1933 Act Registration No. 33-18781) (1940 Act Registration No. 811-05407)
Ladies and Gentlemen:
Attached is a letter responding to the staff’s comments on Post-Effective Amendment No. 54 to Registrant’s Registration Statement on FormN-1A (the “Post-Effective Amendment”). Additionally, attached as Exhibit A is the fee table, expense example and performance for each class of each Portfolio that will be included in Post-Effective Amendment No. 55 to Registrant’s Registration Statement on Form N-1A.
Registrant acknowledges that it is responsible for the adequacy and accuracy of the disclosure in the Post-Effective Amendment. Registrant further acknowledges that staff comments or changes to disclosure in response to staff comments on the Post-Effective Amendment may not foreclose the Securities and Exchange Commission (the “Commission”) from taking any action with respect to the Post-Effective Amendment. Registrant further acknowledges that it may not assert staff comments as a defense in any proceeding initiated by the Commission or any party under the federal securities laws of the United States of America.
| Very truly yours, | ||
| Trust for Credit Unions | ||
| By: | /s/ Andrew Seaberg | |
| Andrew Seaberg | ||
EXHIBIT A
MONEY MARKET PORTFOLIO (TCU SHARES) – SUMMARY SECTION
Portfolio Fees and Expenses
This table describes the fees and expenses that you may pay if you buy and hold TCU Shares of the Portfolio.*
Shareholder Fees | ||||||||
(fees paid directly from your investment): | ||||||||
Maximum Sales Charge (Load) Imposed on Purchases | None | |||||||
Maximum Deferred Sales Charge (Load) | None | |||||||
Maximum Sales Charge (Load) Imposed on Reinvested Dividends | None | |||||||
Redemption Fees | None | |||||||
Exchange Fees | None | |||||||
Maximum Account Fee | None | |||||||
Annual Portfolio Operating Expenses | ||||||||
(expenses that you pay each year as a percentage of the value of your investment): | ||||||||
Management Fees(1) | 0.08 | % | ||||||
Other Expenses | 0.48 | % | ||||||
Administration Fees | 0.10 | % | ||||||
Other Operating Expenses | 0.38 | % | ||||||
|
|
|
| |||||
Total Annual Portfolio Operating Expenses | 0.56 | %(1) | ||||||
Fee Waiver and/or Expense Reimbursement | (0.48 | %)(2) | ||||||
Total Annual Portfolio Operating Expenses After Fee Waiver and/or Expense Reimbursement | 0.08 | %(2) | ||||||
|
|
| * | Prior to October 1, 2012, the Money Market Portfolio offered only one class of shares, which have been redesignated as TCU Shares. |
| (1) | Expenses have been restated to reflect current fees. |
| (2) | The Administrator has agreed to reduce or limit the “Total Annual Portfolio Operating Expenses” of TCU Shares of the Portfolio (excluding interest, taxes, brokerage and extraordinary expenses) such that the “Total Annual Portfolio Operating Expenses After Fee Waiver and/or Expense Reimbursement” for TCU Shares of the Portfolio is not more than 0.20% of the average daily net assets attributable to TCU Shares of the Portfolio. This expense reduction/limitation will remain in effect through at least December 31, 2018 and, prior to such date, the Administrator may not terminate the arrangement without the approval of the Trust for Credit Unions’ Board of Trustees. |
Example
This Example is intended to help you compare the cost of investing in the Portfolio with the cost of investing in other mutual funds. The Example assumes that you invest $10,000 in TCU Shares of the Portfolio for the time periods indicated and then redeem all of your TCU Shares at the end of those periods. The Example also assumes that your investment has a 5% return each year and that the operating expenses for TCU Shares of the Portfolio remain the same (except that the Example incorporates the expense reduction/limitation arrangement for only the first year). Although your actual costs may be higher or lower, based on these assumptions your costs would be:
| 1 Year | 3 Years | 5 Years | 10 Years | |||||||||||
| $ | 8 | $ | 131 | $ | 265 | $ | 655 | |||||||
|
|
|
|
|
|
|
| |||||||
A-1
Performance
The Portfolio suspended operations as of the close of business on May 30, 2014. From inception through the suspension of its operations, the Portfolio operated as a money market fund pursuant to Rule2a-7 under the 1940 Act. Effective upon the resumption of its operations, the Portfolio intends to qualify as a “government money market fund” that invests at least 99.5% of its assets in cash, U.S. Government Securities, and/or repurchase agreements that are collateralized fully by cash or such securities.
The bar chart and table below provide an indication of the risks of investing in the Portfolio by showing: (a) changes in the performance of TCU Shares of the Portfolio from year to year for ten calendar years prior to the suspension of its operations; and (b) the Portfolio’s average annual total returns of TCU Shares of the Portfolio for the1-year,5-year,10-year and since inception periods ended December 31, 2013.* The Portfolio’s past performance is not necessarily an indication of how it will perform in the future. You may obtain the Portfolio’s current yield by calling1-800-342-5828 or1-800-237-5678.
| * | Prior to October 1, 2012, the Portfolio offered only one class of shares, which have been redesignated as TCU Shares. |
TOTAL RETURN | CALENDAR YEAR | |||
The total return for the period ended March 31, 2014 was 0.00%. | ||||
Best Quarter Q4 ’06 1.32% | ||||
Worst Quarter Q4 ’11 0.00% | ||||
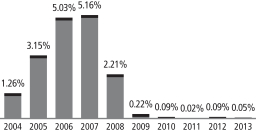
AVERAGE ANNUAL TOTAL RETURN
For the period ended December 31, 2013 | 1 Year | 5 Years | 10 Years | Life of Portfolio | ||||||||||||
Money Market Portfolio (Inception 5/17/88) | 0.05 | % | 0.09 | % | 1.71 | % | 3.78 | % | ||||||||
A-2
MONEY MARKET PORTFOLIO (INVESTOR SHARES) – SUMMARY SECTION
Portfolio Fees and Expenses
This table describes the fees and expenses that you may pay if you buy and hold Investor Shares of the Portfolio.
Shareholder Fees | ||||||||
(fees paid directly from your investment): | ||||||||
Maximum Sales Charge (Load) Imposed on Purchases | None | |||||||
Maximum Deferred Sales Charge (Load) | None | |||||||
Maximum Sales Charge (Load) Imposed on Reinvested Dividends | None | |||||||
Redemption Fees | None | |||||||
Exchange Fees | None | |||||||
Maximum Account Fee | None | |||||||
Annual Portfolio Operating Expenses | ||||||||
(expenses that you pay each year as a percentage of the value of your investment): | ||||||||
Management Fees(1) | 0.08 | % | ||||||
Distribution and Service(12b-1) Fees | 0.00 | % | ||||||
Other Expenses | 0.48 | % | ||||||
Administration Fees | 0.10 | % | ||||||
Other Operating Expenses | 0.38 | % | ||||||
|
|
|
| |||||
Total Annual Portfolio Operating Expenses | 0.56 | %(1) | ||||||
Fee Waiver and/or Expense Reimbursement | (0.48 | %)(2) | ||||||
Total Annual Portfolio Operating Expenses After Fee Waiver and/or Expense Reimbursement | 0.08 | %(1) | ||||||
|
|
| (1) | Expenses have been restated to reflect current fees. |
| (2) | The Administrator has agreed to reduce or limit the “Total Annual Portfolio Operating Expenses” of Investor Shares of the Portfolio (excluding distribution and service(12b-1) fees, interest, taxes, brokerage and extraordinary expenses) such that the “Total Annual Portfolio Operating Expenses After Fee Waiver and/or Expense Reimbursement” for Investor Shares of the Portfolio is not more than 0.20% of the average daily net assets attributable to Investor Shares of the Portfolio. This expense reduction/limitation will remain in effect through at least December 31, 2018 and, prior to such date, the Administrator may not terminate the arrangement without the approval of the Trust for Credit Unions’ Board of Trustees. |
Example
This Example is intended to help you compare the cost of investing in the Portfolio with the cost of investing in other mutual funds. The Example assumes that you invest $10,000 in Investor Shares of the Portfolio for the time periods indicated and then redeem all of your Investor Shares at the end of those periods. The Example also assumes that your investment has a 5% return each year and that the operating expenses for Investor Shares of the Portfolio remain the same (except that the Example incorporates the expense reduction/limitation arrangement for only the first year). Although your actual costs may be higher or lower, based on these assumptions your costs would be:
| 1 Year | 3 Years | 5 Years | 10 Years | |||||||||||
| $ | 8 | $ | 131 | $ | 265 | $ | 655 | |||||||
|
|
|
|
|
|
|
| |||||||
Performance
The Portfolio suspended operations as of the close of business on May 30, 2014. From inception through the suspension of its operations, the Portfolio operated as a money market fund pursuant to Rule2a-7 under the 1940 Act. Effective upon the resumption of its operations, the Portfolio intends to qualify as a “government money market fund” that invests at least 99.5% of its assets in cash, U.S. Government Securities, and/or repurchase agreements that are collateralized fully by cash or such securities.
A-3
The bar chart and table below provide an indication of the risks of investing in the Portfolio by showing: (a) changes in the Portfolio’s performance from year to year for ten calendar years prior to the suspension of its operations; and (b) the Portfolio’s average annual total returns for the1-year,5-year,10-year and since inception periods ended December 31, 2013. The Portfolio’s past performance is not necessarily an indication of how it will perform in the future. You may obtain the Portfolio’s current yield by calling1-800-342-5828 or1-800-237-5678.
As of the date of this Prospectus, Investor Shares of the Portfolio have not commenced operations. The returns below represent the returns for TCU Shares of the Portfolio which are offered in a separate prospectus. TCU Shares and Investor Shares of the Portfolio should have returns that are substantially the same because they represent investments in the same portfolio securities and differ only to the extent that they have different expenses.
TOTAL RETURN | CALENDAR YEAR | |||
The total return for the period ended March 31, 2014 was 0.00%. | ||||
Best Quarter Q4 ’06 1.32% | ||||
Worst Quarter Q4 ’11 0.00% | ||||
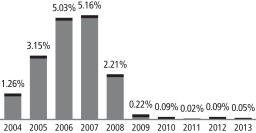
AVERAGE ANNUAL TOTAL RETURN
For the period ended December 31, 2013 | 1 Year | 5 Years | 10 Years | Life of Portfolio | ||||||||||||
Money Market Portfolio (Inception 5/17/88) | 0.05 | % | 0.09 | % | 1.71 | % | 3.78 | % | ||||||||
A-4
ULTRA-SHORT DURATION GOVERNMENT PORTFOLIO (TCU SHARES) – SUMMARY SECTION
Portfolio Fees and Expenses
This table describes the fees and expenses that you may pay if you buy and hold TCU Shares of the Portfolio.
Shareholder Fees | ||||||||
(fees paid directly from your investment): | ||||||||
Maximum Sales Charge (Load) Imposed on Purchases | None | |||||||
Maximum Deferred Sales Charge (Load) | None | |||||||
Maximum Sales Charge (Load) Imposed on Reinvested Dividends | None | |||||||
Redemption Fees | None | |||||||
Exchange Fees | None | |||||||
Maximum Account Fee | None | |||||||
Annual Portfolio Operating Expenses | ||||||||
(expenses that you pay each year as a percentage of the value of your investment): | ||||||||
Management Fees(1) | 0.10 | % | ||||||
Other Expenses | 0.27 | % | ||||||
Administration Fees | 0.05 | % | ||||||
Other Operating Expenses | 0.22 | % | ||||||
|
|
|
| |||||
Total Annual Portfolio Operating Expenses | 0.37 | %(1) | ||||||
|
|
| (1) | Expenses have been restated to reflect current fees. |
Example
This Example is intended to help you compare the cost of investing in the Portfolio with the cost of investing in other mutual funds. The Example assumes that you invest $10,000 in TCU Shares of the Portfolio for the time periods indicated and then redeem all of your shares at the end of those periods. The Example also assumes that your investment has a 5% return each year and that the operating expenses for TCU Shares of the Portfolio remain the same. Although your actual costs may be higher or lower, based on these assumptions your costs would be:
| 1 Year | 3 Years | 5 Years | 10 Years | |||||||||||
| $ | 37 | $ | 118 | $ | 207 | $ | 467 | |||||||
|
|
|
|
|
|
|
| |||||||
Performance
The bar chart and table below provide an indication of the risks of investing in the Portfolio by showing: (a) changes in the performance of TCU Shares of the Portfolio from year to year for the last ten calendar years; and (b) the average annual total returns of TCU Shares of the Portfolio for the1-year,5-year,10-year and since inception periods and how such returns compare to those of broad-based securities market indices.* The Portfolio’s past performance is not necessarily an indication of how it will perform in the future. Updated performance information is available and may be obtained on the Fund’s website at www.trustcu.com and/or by calling1-800-342-5828 or1-800-237-5678.
| * | Prior to October 1, 2012, the Portfolio offered only one class of shares, which have been redesignated as TCU Shares. Effective April 17, 2017, the Portfolio engaged a new investment adviser. Returns for periods prior to April 17, 2017, reflect the management of the Portfolio by the previous investment adviser. |
TOTAL RETURN | CALENDAR YEAR | |||
The total return for the9-month period ended September 30, 2017 was 0.50%. | ||||
Best Quarter : Q4 ‘08 1.75% | ||||
Worst Quarter: Q2 ‘13 (0.21)% | ||||
A-5
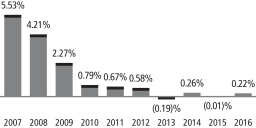
AVERAGE ANNUAL TOTAL RETURN
For the period ended December 31, 2016 | 1 Year | 5 Years | 10 Years | Life of Portfolio | ||||||||||||
Ultra-Short Duration Government Portfolio (Inception 7/10/91) | 0.22 | % | 0.18 | % | 1.42 | % | 2.81 | % | ||||||||
BofA Merrill LynchSix-Month U.S. Treasury Bill Index (reflects no deduction for fees or expenses) | 0.67 | % | 0.27 | % | 1.16 | % | 3.05 | %(1) | ||||||||
BofA Merrill LynchOne-Year U.S. Treasury Note Index (reflects no deduction for fees or expenses) | 0.75 | % | 0.32 | % | 1.43 | % | 3.33 | %(1) | ||||||||
Barclays Capital Mutual Fund Short(1-2 Yr) Government Index (reflects no deduction for fees or expenses) | 0.83 | % | 0.46 | % | 1.86 | % | 3.57 | %(2) | ||||||||
| (1) | Since August 1, 1991. |
| (2) | Since November 1, 1992. |
A-6
ULTRA-SHORT DURATION GOVERNMENT PORTFOLIO (INVESTOR SHARES) – SUMMARY SECTION
Portfolio Fees and Expenses
This table describes the fees and expenses that you may pay if you buy and hold Investor Shares of the Portfolio.
Shareholder Fees | ||||||||
(fees paid directly from your investment): | ||||||||
Maximum Sales Charge (Load) Imposed on Purchases | None | |||||||
Maximum Deferred Sales Charge (Load) | None | |||||||
Maximum Sales Charge (Load) Imposed on Reinvested Dividends | None | |||||||
Redemption Fees | None | |||||||
Exchange Fees | None | |||||||
Maximum Account Fee | None | |||||||
Annual Portfolio Operating Expenses | ||||||||
(expenses that you pay each year as a percentage of the value of your investment): | ||||||||
Management Fees(1) | 0.10 | % | ||||||
Distribution and Service(12b-1) Fees | 0.03 | % | ||||||
Other Expenses | 0.27 | % | ||||||
Administration Fees | 0.05 | % | ||||||
Other Operating Expenses | 0.22 | % | ||||||
|
|
|
| |||||
Total Annual Portfolio Operating Expenses | 0.40 | %(1) | ||||||
|
|
| (1) | Expenses have been restated to reflect current fees. |
Example
This Example is intended to help you compare the cost of investing in the Portfolio with the cost of investing in other mutual funds. The Example assumes that you invest $10,000 in Investor Shares of the Portfolio for the time periods indicated and then redeem all of your shares at the end of those periods. The Example also assumes that your investment has a 5% return each year and that the operating expenses for Investor Shares of the Portfolio remain the same. Although your actual costs may be higher or lower, based on these assumptions your costs would be:
| 1 Year | 3 Years | 5 Years | 10 Years | |||||||||||
| $ | 40 | $ | 127 | $ | 223 | $ | 504 | |||||||
|
|
|
|
|
|
|
| |||||||
Performance
The bar chart and table below provide an indication of the risks of investing in the Portfolio by showing: (a) changes in the Portfolio’s performance from year to year for the last ten calendar years; and (b) the Portfolio’s average annual total returns for the1-year,5-year,10-year and since inception periods and how such returns compare to those of broad-based securities market indices. The Portfolio’s past performance is not necessarily an indication of how it will perform in the future. Updated performance information is available and may be obtained on the Fund’s website at www.trustcu.com and/or by calling1-800-342-5828 or1-800-237-5678.
Investor Shares of the Portfolio commenced operations on November 30, 2012. The returns shown below since November 30, 2012, represent the returns for Investor Shares of the Portfolio. The returns shown below for periods prior to November 30, 2012 represent the returns for TCU Shares of the Portfolio, which are offered in a separate prospectus. TCU Shares and Investor Shares of the Portfolio should have returns that are substantially the same because they represent investments in the same portfolio securities and differ only to the extent that they have different expenses. Effective April 17, 2017, the Portfolio engaged a new investment adviser. Returns for periods prior to April 17, 2017, reflect the management of the Portfolio by the previous investment adviser.
A-7
TOTAL RETURN | CALENDAR YEAR | |||
The total return for the9-month period ended September 30, 2017 was 0.47%. | ||||
Best Quarter : Q4 ‘08 1.75% | ||||
Worst Quarter: Q2 ‘13 (0.21)% | ||||
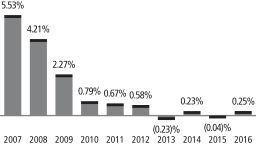
AVERAGE ANNUAL TOTAL RETURN
For the period ended December 31, 2016 | 1 Year | 5 Years | 10 Years | Life of Portfolio | ||||||||||||
Ultra-Short Duration Government Portfolio (Inception 7/10/91 – TCU Shares) | 0.25 | % | 0.18 | % | 1.42 | % | 2.81 | % | ||||||||
BofA Merrill LynchSix-Month U.S. Treasury Bill Index (reflects no deduction for fees or expenses) | 0.67 | % | 0.27 | % | 1.16 | % | 3.05 | %(1) | ||||||||
BofA Merrill LynchOne-Year U.S. Treasury Note Index (reflects no deduction for fees or expenses) | 0.75 | % | 0.32 | % | 1.43 | % | 3.33 | %(1) | ||||||||
Barclays Capital Mutual Fund Short(1-2 Yr) Government Index (reflects no deduction for fees or expenses) | 0.83 | % | 0.46 | % | 1.86 | % | 3.57 | %(2) | ||||||||
| (1) | Since August 1, 1991. |
| (2) | Since November 1, 1992. |
A-8
SHORT DURATION PORTFOLIO (TCU SHARES) – SUMMARY SECTION
Portfolio Fees and Expenses
This table describes the fees and expenses that you may pay if you buy and hold TCU Shares of the Portfolio.
Shareholder Fees | ||||||||
(fees paid directly from your investment): | ||||||||
Maximum Sales Charge (Load) Imposed on Purchases | None | |||||||
Maximum Deferred Sales Charge (Load) | None | |||||||
Maximum Sales Charge (Load) Imposed on Reinvested Dividends | None | |||||||
Redemption Fees | None | |||||||
Exchange Fees | None | |||||||
Maximum Account Fee | None | |||||||
Annual Portfolio Operating Expenses | ||||||||
(expenses that you pay each year as a percentage of the value of your investment): | ||||||||
Management Fees(1) | 0.10 | % | ||||||
Other Expenses | 0.26 | % | ||||||
Administration Fees | 0.05 | % | ||||||
Other Operating Expenses | 0.21 | % | ||||||
|
|
|
| |||||
Total Annual Portfolio Operating Expenses | 0.36 | %(1) | ||||||
|
|
| (1) | Expenses have been restated to reflect current fees. |
Example
This Example is intended to help you compare the cost of investing in the Portfolio with the cost of investing in other mutual funds. The Example assumes that you invest $10,000 in TCU Shares of the Portfolio for the time periods indicated and then redeem all of your shares at the end of those periods. The Example also assumes that your investment has a 5% return each year and that the operating expenses for TCU Shares of the Portfolio remain the same. Although your actual costs may be higher or lower, based on these assumptions your costs would be:
| 1 Year | 3 Years | 5 Years | 10 Years | |||||||||||
| $ | 37 | $ | 116 | $ | 202 | $ | 456 | |||||||
|
|
|
|
|
|
|
| |||||||
Performance
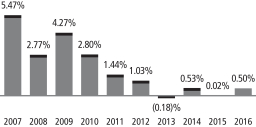
The bar chart and table below provide an indication of the risks of investing in the Portfolio by showing: (a) changes in the performance of TCU Shares of the Portfolio from year to year for the last ten calendar years; and (b) the average annual total returns of TCU Shares of the Portfolio for the1-year,5-year,10-year and since inception periods and how such returns compare to those of broad-based securities market indices.* The Portfolio’s past performance is not necessarily an indication of how it will perform in the future. Updated performance information is available and may be obtained on the Fund’s website at www.trustcu.com and/or by calling1-800-342-5828 or1-800-237-5678.
*Prior to October 1, 2012, the portfolio offered only one class of shares, which have been redesignated as TCU Shares. Effective April 17, 2017, the Portfolio engaged a new investment adviser. Returns for periods prior to April 17, 2017, reflect the management of the Portfolio by the previous investment adviser.
TOTAL RETURN | CALENDAR YEAR | |||
The total return for the9-month period ended September 30, 2017 was 0.91%. | ||||
Best Quarter: Q3 ‘09 1.89% | ||||
Worst Quarter: Q4 ‘16 (0.61)% | ||||
A-9
AVERAGE ANNUAL TOTAL RETURN
For the period ended December 31, 2016 | 1 Year | 5 Years | 10 Years | Life of Portfolio(1) | ||||||||||||
Short Duration Portfolio (Inception 10/9/92) | 0.50 | % | 0.39 | % | 1.85 | % | 3.43 | % | ||||||||
BofA Merrill LynchTwo-Year U.S. Treasury Note Index (reflects no deduction for fees or expenses) | 0.66 | % | 0.48 | % | 2.18 | % | 3.67 | %(2) | ||||||||
Barclays Capital Mutual Fund Short(1-3 Yr) Government Index (reflects no deduction for fees or expenses) | 0.87 | % | 0.59 | % | 2.18 | % | 3.80 | %(2) | ||||||||
| (1) | During the fiscal year ended August 31, 2004, one of the principal investment strategies of the Portfolio was revised to provide that the Portfolio intends to invest a substantial portion (formerly 80%) of its net assets in mortgage-related securities. |
| (2) | Since November 1, 1992. |
A-10
SHORT DURATION PORTFOLIO (INVESTOR SHARES) – SUMMARY SECTION
Portfolio Fees and Expenses
This table describes the fees and expenses that you may pay if you buy and hold Investor Shares of the Portfolio.
Shareholder Fees | ||||||||
(fees paid directly from your investment): | ||||||||
Maximum Sales Charge (Load) Imposed on Purchases | None | |||||||
Maximum Deferred Sales Charge (Load) | None | |||||||
Maximum Sales Charge (Load) Imposed on Reinvested Dividends | None | |||||||
Redemption Fees | None | |||||||
Exchange Fees | None | |||||||
Maximum Account Fee | None | |||||||
Annual Portfolio Operating Expenses | ||||||||
(expenses that you pay each year as a percentage of the value of your investment): | ||||||||
Management Fees(1) | 0.10 | % | ||||||
Distribution and Service(12b-1) Fees | 0.03 | % | ||||||
Other Expenses | 0.26 | % | ||||||
Administration Fees | 0.05 | % | ||||||
Other Operating Expenses | 0.21 | % | ||||||
|
|
|
| |||||
Total Annual Portfolio Operating Expenses | 0.39 | %(1) | ||||||
|
|
| (1) | Expenses have been restated to reflect current fees. |
Example
This Example is intended to help you compare the cost of investing in the Portfolio with the cost of investing in other mutual funds. The Example assumes that you invest $10,000 in Investor Shares of the Portfolio for the time periods indicated and then redeem all of your shares at the end of those periods. The Example also assumes that your investment has a 5% return each year and that the operating expenses for Investor Shares of the Portfolio remain the same. Although your actual costs may be higher or lower, based on these assumptions your costs would be:
| 1 Year | 3 Years | 5 Years | 10 Years | |||||||||||
| $ | 40 | $ | 125 | $ | 219 | $ | 493 | |||||||
|
|
|
|
|
|
|
| |||||||
Performance
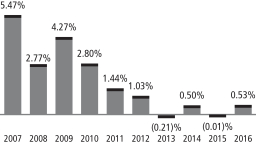
The bar chart and table below provide an indication of the risks of investing in the Portfolio by showing: (a) changes in the Portfolio’s performance from year to year for the last ten calendar years; and (b) the Portfolio’s average annual total returns for the1-year,5-year,10-year and since inception periods and how such returns compare to those of broad-based securities market indices. The Portfolio’s past performance is not necessarily an indication of how it will perform in the future. Updated performance information is available and may be obtained on the Fund’s website at www.trustcu.com and/or by calling1-800-342-5828 or1-800-237-5678.
A-11
Investor Shares of the Portfolio commenced operations on November 30, 2012. The returns shown below since November 30, 2012, represent the returns for Investor Shares of the Portfolio. The returns shown below for periods prior to November 30, 2012 represent the returns for TCU Shares of the Portfolio, which are offered in a separate prospectus. TCU Shares and Investor Shares of the Portfolio should have returns that are substantially the same because they represent investments in the same portfolio securities and differ only to the extent that they have different expenses. Effective April 17, 2017, the Portfolio engaged a new investment adviser. Returns for periods prior to April 17, 2017, reflect the management of the Portfolio by the previous investment adviser.
TOTAL RETURN | CALENDAR YEAR | |||
The total return for the9-month period ended September 30, 2017 was 0.89%. | ||||
Best Quarter: Q1 ‘16 0.75% | ||||
Worst Quarter: Q4 ‘16 (0.62)% | ||||
AVERAGE ANNUAL TOTAL RETURN
For the period ended December 31, 2016 | 1 Year | 5 Years | 10 Years | Life of Portfolio* | ||||||||||||
Short Duration Portfolio (Inception 10/9/92 – TCU Shares) | 0.53 | % | 0.39 | % | 1.85 | % | 3.43 | % | ||||||||
BofA Merrill LynchTwo-Year U.S. Treasury Note Index (reflects no deduction for fees or expenses) | 0.66 | % | 0.48 | %�� | 2.18 | % | 3.67 | %(1) | ||||||||
Barclays Capital Mutual Fund Short(1-3 Yr) Government Index (reflects no deduction for fees or expenses) | 0.87 | % | 0.59 | % | 2.18 | % | 3.80 | %(1) | ||||||||
| * | During the fiscal year ended August 31, 2004, one of the principal investment strategies of the Portfolio was revised to provide that the Portfolio intends to invest a substantial portion (formerly 80%) of its net assets in mortgage-related securities. |
| (1) | Since November 1, 1992. |
A-12