Exhibit 13
Orrstown Financial Services, Inc.
2006 Annual Financial Report
CONTENTS
| | |
| | | Page |
| REPORT OF INDEPENDENT REGISTERED PUBLIC ACCOUNTING FIRM | | 1 |
| |
| MANAGEMENT’S REPORT ON INTERNAL CONTROL | | 3 |
| |
| CONSOLIDATED FINANCIAL STATEMENTS | | |
| |
Balance sheets | | 4 |
Statements of income | | 5 |
Statements of changes in shareholders’ equity | | 6 |
Statements of cash flows | | 7 |
Notes to consolidated financial statements | | 8 - 27 |
| |
| MANAGEMENT’S DISCUSSION AND ANALYSIS OF CONSOLIDATED FINANCIAL CONDITION AND RESULTS OF OPERATIONS | | 28 - 38 |
| |
| PERFORMANCE GRAPH | | 39 |
| |
| SUMMARY OF QUARTERLY FINANCIAL DATA | | 40 |
| |
| SELECTED FIVE-YEAR FINANCIAL DATA | | 41 |
| |
| MARKET, DIVIDEND AND INVESTOR INFORMATION | | 42 |
Exhibit 13

REPORT OF INDEPENDENT REGISTERED PUBLIC ACCOUNTING FIRM
To the Board of Directors and Shareholders of
Orrstown Financial Services, Inc.
We have audited the accompanying consolidated balance sheets of Orrstown Financial Services, Inc. and its wholly-owned subsidiaries as of December 31, 2006 and 2005, and the related statements of income, changes in shareholders’ equity, and cash flows for each of the years in the three-year period ended December 31, 2006. We also have audited management’s assessment, included in the accompanying Management’s Report on Internal Control, that Orrstown Financial Services, Inc. and its wholly-owned subsidiaries maintained effective internal control over financial reporting as of December 31, 2006, based on criteria established inInternal Control - Integrated Framework issued by the Committee of Sponsoring Organizations of the Treadway Commission (COSO). Orrstown Financial Services, Inc. and its wholly-owned subsidiaries’ management is responsible for these financial statements, for maintaining effective internal control over financial reporting, and for its assessment of the effectiveness of internal control over financial reporting. Our responsibility is to express an opinion on these financial statements, an opinion on management’s assessment, and an opinion on the effectiveness of the Corporation’s internal control over financial reporting based on our audits.
We conducted our audits in accordance with the standards of the Public Company Accounting Oversight Board (United States). Those standards require that we plan and perform the audits to obtain reasonable assurance about whether the financial statements are free of material misstatement and whether effective internal control over financial reporting was maintained in all material respects. Our audit of financial statements included examining, on a test basis, evidence supporting the amounts and disclosures in the financial statements, assessing the accounting principles used and significant estimates made by management, and evaluating the overall financial statement presentation. Our audit of internal control over financial reporting included obtaining an understanding of internal control over financial reporting, evaluating management’s assessment, testing and evaluating the design and operating effectiveness of internal control, and performing such other procedures as we considered necessary in the circumstances. We believe that our audits provide a reasonable basis for our opinions.
A company’s internal control over financial reporting is a process designed to provide reasonable assurance regarding the reliability of financial reporting and the preparation of financial statements for external purposes in accordance with generally accepted accounting principles. A company’s internal control over financial reporting includes those policies and procedures that (1) pertain to the maintenance of records that, in reasonable detail, accurately and fairly reflect the transactions and dispositions of the assets of the company; (2) provide reasonable assurance that transactions are recorded as necessary to permit preparation of financial statements in accordance with generally accepted accounting principles, and that receipts and expenditures of the company are being made only in accordance with authorizations of management and directors of the company; and (3) provide reasonable assurance regarding prevention or timely detection of unauthorized acquisition, use, or disposition of the company’s assets that could have a material effect on the financial statements.
Because of its inherent limitations, internal control over financial reporting may not prevent or detect misstatements. Also, projections of any evaluation of effectiveness to future periods are subject to the risk that controls may become inadequate because of changes in conditions, or that the degree of compliance with the policies or procedures may deteriorate.
- 1 -
In our opinion, the financial statements referred to above present fairly, in all material respects, the financial position of Orrstown Financial Services, Inc. and its wholly-owned subsidiaries as of December 31, 2006 and 2005, and the results of their operations and their cash flows for each of the years in the three-year period ended December 31, 2006 in conformity with accounting principles generally accepted in the United States of America. Also, in our opinion, management’s assessment that Orrstown Financial Services, Inc. and its wholly-owned subsidiaries maintained effective internal control over financial reporting as of December 31, 2006 is fairly stated, in all material respects, based on criteria established inInternal Control – Integrated Framework issued by COSO. Furthermore, in our opinion, Orrstown Financial Services, Inc. and its wholly-owned subsidiaries maintained, in all material respects, effective internal control over financial reporting as of December 31, 2006, based on criteria established inInternal Control – Integrated Frameworkissued by COSO.
As discussed in Note 1 to the Consolidated Financial Statements, the Corporation changed its policy for accounting for stock-based compensation in 2006.
|
|
| /S/SMITH ELLIOTT KEARNS & COMPANY, LLC |
| SMITH ELLIOTT KEARNS & COMPANY, LLC |
Chambersburg, Pennsylvania
March 12, 2007
- 2 -
MANAGEMENT’S REPORT ON INTERNAL CONTROL
To our shareholders,
Orrstown Financial Services, Inc.
Shippensburg, Pennsylvania
The management of Orrstown Financial Services, Inc. and its wholly-owned subsidiaries has the responsibility for establishing and maintaining an adequate internal control structure and procedures for financial reporting. Management maintains a comprehensive system of internal control to provide reasonable assurance of the proper authorization of transactions, the safeguarding of assets and the reliability of the financial records. The system of internal control provides for appropriate division of responsibility and is documented by written policies and procedures that are communicated to employees. Orrstown Financial Services, Inc. and its wholly-owned subsidiaries maintains an internal auditing program, under the supervision of the Audit Committee of the Board of Directors, which independently assesses the effectiveness of the system of internal control and recommends possible improvements.
Under the supervision and with the participation of the Corporation’s management, including its Chief Executive Officer and Chief Financial Officer, the Corporation has evaluated the effectiveness of its internal control over financial reporting as of December 31, 2006, using theInternal Control – Integrated Framework issued by the Committee of Sponsoring Organizations of the Treadway Commission. Based upon this evaluation, the Chief Executive Officer and the Chief Financial Officer have concluded that the Corporation’s disclosure controls and procedures are adequate and effective to ensure that material information relating to the Corporation and its consolidated subsidiaries is made known to them by others within those entities. The Chief Executive Officer and the Chief Financial Officer believe that at December 31, 2006, Orrstown Financial Services, Inc. and its wholly-owned subsidiaries maintained an effective system of internal control over financial reporting.
The accounting firm Smith Elliott Kearns & Company, LLC has issued an attestation report on management’s assessment of the Corporation’s internal control over financial reporting. The accounting firm’s attestation report is included in this financial report.
| | | | |
/s/ Kenneth R. Shoemaker | | | | /s/ Bradley S. Everly |
| Kenneth R. Shoemaker | | | | Bradley S. Everly |
| President and Chief Executive Officer | | | | Senior Vice President and Chief Financial Officer |
| | |
| March 12, 2007 | | | | |
- 3 -
CONSOLIDATED BALANCE SHEETS
ORRSTOWN FINANCIAL SERVICES, INC. AND ITS WHOLLY-OWNED SUBSIDIARIES
| | | | | | | | |
| | | At December 31, | |
(Dollars in thousands) | | 2006 | | | 2005 | |
Assets | | | | | | | | |
Cash and due from banks | | $ | 20,730 | | | $ | 11,901 | |
Federal funds sold | | | 18,404 | | | | 23,430 | |
| | | | | | | | |
Cash and cash equivalents | | | 39,134 | | | | 35,331 | |
| | | | | | | | |
| | |
Interest bearing deposits with banks | | | 895 | | | | 3,445 | |
Securities available for sale | | | 87,543 | | | | 69,008 | |
Federal Home Loan Bank, Federal Reserve and Atlantic Central Bankers Bank stock, at cost which approximates market value | | | 3,850 | | | | 2,669 | |
| | |
Loans | | | | | | | | |
Commercial, financial and agricultural | | | 59,593 | | | | 50,104 | |
Real estate—Mortgages | | | 503,362 | | | | 373,410 | |
Real estate—Construction and land development | | | 46,947 | | | | 30,532 | |
Consumer | | | 8,925 | | | | 6,340 | |
| | | | | | | | |
| | | 618,827 | | | | 460,386 | |
Less: Allowance for loan losses | | | (5,520 | ) | | | (4,428 | ) |
| | | | | | | | |
Net Loans | | | 613,307 | | | | 455,958 | |
| | | | | | | | |
| | |
Premises and equipment, net | | | 19,852 | | | | 13,636 | |
Cash surrender value of life insurance | | | 15,573 | | | | 7,787 | |
Goodwill and intangible assets | | | 21,567 | | | | 1,935 | |
Accrued interest receivable | | | 3,279 | | | | 2,169 | |
Other assets | | | 4,031 | | | | 9,522 | |
| | | | | | | | |
Total assets | | $ | 809,031 | | | $ | 601,460 | |
| | | | | | | | |
| | |
Liabilities and Shareholders’ Equity | | | | | | | | |
Deposits: | | | | | | | | |
Non-interest bearing | | $ | 85,420 | | | $ | 68,697 | |
Interest bearing | | | 553,299 | | | | 394,125 | |
| | | | | | | | |
Total deposits | | | 638,719 | | | | 462,822 | |
| | | | | | | | |
| | |
Short-term borrowings | | | 41,703 | | | | 36,138 | |
Long-term debt | | | 32,440 | | | | 40,306 | |
Accrued interest and other liabilities | | | 6,781 | | | | 4,884 | |
| | | | | | | | |
Total liabilities | | | 719,643 | | | | 544,150 | |
| | | | | | | | |
| | |
Common stock, no par value—$ .05205 stated value per share 50,000,000 shares authorized with 6,145,049 shares issued at December 31, 2006; 5,439,227 shares issued at December 31, 2005 | | | 320 | | | | 283 | |
Additional paid—in capital | | | 72,023 | | | | 46,876 | |
Retained earnings | | | 16,934 | | | | 9,964 | |
Accumulated other comprehensive income | | | 507 | | | | 187 | |
Treasury stock—common, at cost 10,717 shares in 2006; 23 shares in 2005 | | | (396 | ) | | | 0 | |
| | | | | | | | |
Total shareholders’ equity | | | 89,388 | | | | 57,310 | |
| | | | | | | | |
Total liabilities and shareholders’ equity | | $ | 809,031 | | | $ | 601,460 | |
| | | | | | | | |
The Notes to Consolidated Financial Statements are an integral part of these statements.
- 4 -
CONSOLIDATED STATEMENTS OF INCOME
ORRSTOWN FINANCIAL SERVICES, INC. AND ITS WHOLLY-OWNED SUBSIDIARIES
| | | | | | | | | | |
| | | Years Ended December 31, |
(Dollars in thousands) | | 2006 | | 2005 | | | 2004 |
Interest and dividend income | | | | | | | | | | |
Interest and fees on loans | | $ | 40,086 | | $ | 28,527 | | | $ | 22,231 |
Interest and dividends on investment securities | | | | | | | | | | |
U.S. Government and agency | | | 2,198 | | | 2,006 | | | | 2,083 |
Tax exempt | | | 1,266 | | | 1,139 | | | | 1,206 |
Other investment income | | | 1,238 | | | 743 | | | | 372 |
| | | | | | | | | | |
Total interest and dividend income | | | 44,788 | | | 32,415 | | | | 25,892 |
| | | | | | | | | | |
| | | |
Interest expense | | | | | | | | | | |
Interest on deposits | | | 14,189 | | | 7,291 | | | | 5,201 |
Interest on short-term borrowings | | | 1,833 | | | 796 | | | | 304 |
Interest on long-term debt | | | 1,349 | | | 1,450 | | | | 1,481 |
| | | | | | | | | | |
Total interest expense | | | 17,371 | | | 9,537 | | | | 6,986 |
| | | | | | | | | | |
| | | |
Net interest income | | | 27,417 | | | 22,878 | | | | 18,906 |
Provision for loan losses | | | 390 | | | 144 | | | | 210 |
| | | | | | | | | | |
Net interest income after provision for loan losses | | | 27,027 | | | 22,734 | | | | 18,696 |
| | | | | | | | | | |
| | | |
Other income | | | | | | | | | | |
Service charges on deposit accounts | | | 4,671 | | | 3,815 | | | | 3,066 |
Other service charges, commissions and fees | | | 1,921 | | | 1,760 | | | | 1,016 |
Trust department income | | | 2,325 | | | 2,174 | | | | 1,863 |
Brokerage income | | | 1,382 | | | 990 | | | | 608 |
Investment securities gains (losses) | | | 41 | | | (60 | ) | | | 88 |
Other income | | | 743 | | | 380 | | | | 328 |
| | | | | | | | | | |
Total other income | | | 11,083 | | | 9,059 | | | | 6,969 |
| | | | | | | | | | |
| | | |
Other expenses | | | | | | | | | | |
Salaries | | | 9,116 | | | 6,028 | | | | 5,117 |
Employee benefits | | | 3,899 | | | 3,229 | | | | 2,792 |
Occupancy and equipment | | | 3,357 | | | 2,673 | | | | 2,398 |
Other operating expenses | | | 5,256 | | | 5,467 | | | | 4,411 |
| | | | | | | | | | |
Total other expenses | | | 21,628 | | | 17,397 | | | | 14,718 |
| | | | | | | | | | |
Income before income tax | | | 16,482 | | | 14,396 | | | | 10,947 |
Income tax expense | | | 4,850 | | | 4,409 | | | | 3,177 |
| | | | | | | | | | |
Net income | | $ | 11,632 | | $ | 9,987 | | | $ | 7,770 |
| | | | | | | | | | |
| | | |
Earnings per share: | | | | | | | | | | |
Basic earnings per share | | $ | 1.97 | | $ | 1.85 | | | $ | 1.45 |
Diluted earnings per share | | $ | 1.89 | | $ | 1.77 | | | $ | 1.40 |
Dividends per share | | $ | 0.78 | | $ | 0.58 | | | $ | 0.48 |
The Notes to Consolidated Financial Statements are an integral part of these statements.
- 5 -
CONSOLIDATED STATEMENTS OF CHANGES IN SHAREHOLDERS’ EQUITY
ORRSTOWN FINANCIAL SERVICES, INC. AND ITS WHOLLY-OWNED SUBSIDIARIES
| | | | | | | | | | | | | | | | | | | | | | | |
| | | Years Ended December 31, 2006, 2005 and 2004 | |
(Dollars in thousands) | | Common
Stock | | Additional Paid-In
Capital | | | Retained
Earnings | | | Accumulated Other Comprehensive
Income | | | Treasury
Stock | | | Total Shareholders’
Equity | |
Balance, December 31, 2003 | | $ | 264 | | $ | 32,928 | | | $ | 8,509 | | | $ | 1,134 | | | $ | 0 | | | $ | 42,835 | |
| | | | | | |
Comprehensive income | | | | | | | | | | | | | | | | | | | | | | | |
Net income | | | 0 | | | 0 | | | | 7,770 | | | | 0 | | | | 0 | | | | 7,770 | |
Change in unrealized loss on investment securities available for sale, net of tax of $159 | | | 0 | | | 0 | | | | 0 | | | | (308 | ) | | | 0 | | | | (308 | ) |
| | | | | | | | | | | | | | | | | | | | | | | |
Total comprehensive income | | | | | | | | | | | | | | | | | | | | | | 7,462 | |
| | | | | | | | | | | | | | | | | | | | | | | |
Cash dividends ($.48 per share) | | | 0 | | | 0 | | | | (2,556 | ) | | | 0 | | | | 0 | | | | (2,556 | ) |
Stock-based compensation plans: | | | | | | | | | | | | | | | | | | | | | | | |
Issuance of stock | | | 2 | | | 591 | | | | 0 | | | | 0 | | | | 0 | | | | 593 | |
Issuance of stock through dividend reinvestment plan | | | 1 | | | 915 | | | | 0 | | | | 0 | | | | 0 | | | | 916 | |
| | | | | | | | | | | | | | | | | | | | | | | |
Balance, December 31, 2004 | | | 267 | | | 34,434 | | | | 13,723 | | | | 826 | | | | 0 | | | | 49,250 | |
| | | | | | |
Comprehensive income | | | | | | | | | | | | | | | | | | | | | | | |
Net income | | | 0 | | | 0 | | | | 9,987 | | | | 0 | | | | 0 | | | | 9,987 | |
Change in unrealized loss on investment securities available for sale, net of tax of $329 | | | 0 | | | 0 | | | | 0 | | | | (639 | ) | | | 0 | | | | (639 | ) |
| | | | | | | | | | | | | | | | | | | | | | | |
Total comprehensive income | | | | | | | | | | | | | | | | | | | | | | 9,348 | |
| | | | | | | | | | | | | | | | | | | | | | | |
Cash dividends ($.58 per share) | | | 0 | | | 0 | | | | (3,157 | ) | | | 0 | | | | 0 | | | | (3,157 | ) |
Stock dividends issued | | | 13 | | | 10,557 | | | | (10,570 | ) | | | 0 | | | | 0 | | | | 0 | |
Cash paid in lieu of fractional stock dividends | | | 0 | | | 0 | | | | (19 | ) | | | 0 | | | | 0 | | | | (19 | ) |
Stock-based compensation plans: | | | | | | | | | | | | | | | | | | | | | | | |
Issuance of stock | | | 1 | | | 490 | | | | 0 | | | | 0 | | | | 0 | | | | 491 | |
Issuance of stock through dividend reinvestment plan | | | 2 | | | 1,395 | | | | 0 | | | | 0 | | | | 0 | | | | 1,397 | |
| | | | | | | | | | | | | | | | | | | | | | | |
Balance, December 31, 2005 | | | 283 | | | 46,876 | | | | 9,964 | | | | 187 | | | | 0 | | | | 57,310 | |
| | | | | | |
Comprehensive income | | | | | | | | | | | | | | | | | | | | | | | |
Net income | | | 0 | | | 0 | | | | 11,632 | | | | 0 | | | | 0 | | | | 11,632 | |
Change in unrealized gain on investment securities available for sale, net of tax of $177 | | | 0 | | | 0 | | | | 0 | | | | 320 | | | | 0 | | | | 320 | |
| | | | | | | | | | | | | | | | | | | | | | | |
Total comprehensive income | | | | | | | | | | | | | | | | | | | | | | 11,952 | |
| | | | | | | | | | | | | | | | | | | | | | | |
Cash dividends ($.78 per share) | | | 0 | | | 0 | | | | (4,662 | ) | | | 0 | | | | 0 | | | | (4,662 | ) |
Acquisition of First National—common stock issued | | | 36 | | | 24,805 | | | | 0 | | | | 0 | | | | 0 | | | | 24,841 | |
Stock-based compensation plans: | | | | | | | | | | | | | | | | | | | | | | | |
Compensation expense | | | 0 | | | 224 | | | | 0 | | | | 0 | | | | 0 | | | | 224 | |
Issuance of stock | | | 1 | | | 147 | | | | 0 | | | | 0 | | | | 0 | | | | 148 | |
Purchase of treasury stock (14,749 shares) | | | 0 | | | 0 | | | | 0 | | | | 0 | | | | (543 | ) | | | (543 | ) |
Issuance of treasury stock (4,055 shares) | | | 0 | | | (29 | ) | | | 0 | | | | 0 | | | | 147 | | | | 118 | |
| | | | | | | | | | | | | | | | | | | | | | | |
Balance, December 31, 2006 | | $ | 320 | | $ | 72,023 | | | $ | 16,934 | | | $ | 507 | | | ($ | 396 | ) | | $ | 89,388 | |
| | | | | | | | | | | | | | | | | | | | | | | |
The Notes to Consolidated Financial Statements are an integral part of these statements.
- 6 -
CONSOLIDATED STATEMENTS OF CASH FLOWS
ORRSTOWN FINANCIAL SERVICES, INC. AND ITS WHOLLY-OWNED SUBSIDIARIES
| | | | | | | | | | | | |
| | | Years Ended December 31, | |
(Dollars in thousands) | | 2006 | | | 2005 | | | 2004 | |
Cash flows from operating activities | | | | | | | | | | | | |
Net income | | $ | 11,632 | | | $ | 9,987 | | | $ | 7,770 | |
Adjustments to reconcile net income to net cash provided by operating activities: | | | | | | | | | | | | |
Depreciation and amortization | | | 1,730 | | | | 1,424 | | | | 1,197 | |
Provision for loan losses | | | 390 | | | | 144 | | | | 210 | |
Stock based compensation | | | 224 | | | | 0 | | | | 0 | |
(Gain) loss on disposal of other real estate owned | | | 62 | | | | (20 | ) | | | 45 | |
(Gain) on disposal of bank premises and equipment | | | 0 | | | | 0 | | | | (6 | ) |
Deferred income taxes | | | (493 | ) | | | (191 | ) | | | 28 | |
Investment securities (gains) losses | | | (41 | ) | | | 60 | | | | (88 | ) |
Increase in cash surrender value of life insurance | | | (564 | ) | | | (271 | ) | | | (282 | ) |
(Increase) in accrued interest receivable | | | (566 | ) | | | (394 | ) | | | (128 | ) |
Increase in accrued interest payable | | | 287 | | | | 119 | | | | 34 | |
Other, net | | | 635 | | | | (980 | ) | | | 589 | |
| | | | | | | | | | | | |
Net cash provided by operating activities | | | 13,296 | | | | 9,878 | | | | 9,369 | |
| | | | | | | | | | | | |
| | | |
Cash flows from investing activities | | | | | | | | | | | | |
Net (increase) decrease in interest bearing deposits with banks | | | 2,725 | | | | (2,321 | ) | | | (123 | ) |
Sales of available for sale securities | | | 577 | | | | 4,149 | | | | 6,407 | |
Maturities of available for sale securities | | | 15,352 | | | | 14,437 | | | | 17,518 | |
Purchases of available for sale securities | | | (5,036 | ) | | | (8,928 | ) | | | (15,101 | ) |
Net (purchases) sales of FHLB & FRB Stock | | | (785 | ) | | | 303 | | | | (60 | ) |
Net (increase) in loans | | | (86,347 | ) | | | (73,047 | ) | | | (44,328 | ) |
Purchases of bank premises and equipment | | | (5,165 | ) | | | (1,604 | ) | | | (3,182 | ) |
Purchases of intangible assets | | | 0 | | | | (600 | ) | | | (1,155 | ) |
Proceeds from disposal of other real estate owned | | | 1,882 | | | | 162 | | | | 228 | |
Proceeds from disposal of bank premises and equipment | | | 0 | | | | 0 | | | | 61 | |
Purchase price of shares exchanged for cash | | | (8,882 | ) | | | 0 | | | | 0 | |
Cash acquired in acquisition | | | 13,031 | | | | 0 | | | | 0 | |
Deposit on purchase of bank owned life insurance | | | 0 | | | | (4,500 | ) | | | 0 | |
| | | | | | | | | | | | |
Net cash (used) by investing activities | | | (72,648 | ) | | | (71,949 | ) | | | (39,735 | ) |
| | | | | | | | | | | | |
| | | |
Cash flows from financing activities | | | | | | | | | | | | |
Net increase in deposits | | | 70,395 | | | | 57,459 | | | | 46,720 | |
Net increase (decrease) in short term purchased funds | | | 5,565 | | | | 16,645 | | | | (9,947 | ) |
Proceeds from debt | | | 11,028 | | | | 6,757 | | | | 0 | |
Payments on debt | | | (18,894 | ) | | | (2,020 | ) | | | (1,624 | ) |
Dividends paid | | | (4,662 | ) | | | (3,157 | ) | | | (2,556 | ) |
Proceeds from issuance of common stock | | | 148 | | | | 1,888 | | | | 1,510 | |
Purchase of treasury stock | | | (543 | ) | | | 0 | | | | 0 | |
Net proceeds from issuance of treasury stock | | | 118 | | | | 0 | | | | 0 | |
Cash paid in lieu of fractional shares | | | 0 | | | | (19 | ) | | | 0 | |
| | | | | | | | | | | | |
Net cash provided by financing activities | | | 63,155 | | | | 77,553 | | | | 34,103 | |
| | | | | | | | | | | | |
Net increase in cash and cash equivalents | | | 3,803 | | | | 15,482 | | | | 3,737 | |
Cash and cash equivalents at beginning of period | | | 35,331 | | | | 19,849 | | | | 16,112 | |
| | | | | | | | | | | | |
Cash and cash equivalents at end of period | | $ | 39,134 | | | $ | 35,331 | | | $ | 19,849 | |
| | | | | | | | | | | | |
- 7 -
CONSOLIDATED STATEMENTS OF CASH FLOWS (Continued)
ORRSTOWN FINANCIAL SERVICES, INC. AND ITS WHOLLY-OWNED SUBSIDIARIES
| | | | | | | | | | | |
| | | Years Ended December 31, | |
(Dollars in thousands) | | 2006 | | 2005 | | | 2004 | |
Supplemental disclosure of cash flow information: | | | | | | | | | | | |
Cash paid during the period for: | | | | | | | | | | | |
Interest | | $ | 17,084 | | $ | 9,418 | | | $ | 6,952 | |
Income Taxes | | | 5,390 | | | 4,550 | | | | 3,205 | |
Supplemental schedule of noncash investing and financing activities: | | | | | | | | | | | |
Common stock issued for acquisition of bank | | | 24,841 | | | 0 | | | | 0 | |
Other real estate acquired in settlement of loans | | | 584 | | | 1,895 | | | | 61 | |
Unrealized gain (loss) on investments securities available for sale (net of tax effects) | | | 320 | | | (639 | ) | | | (308 | ) |
| | | | | | | | | | | |
The Notes to Consolidated Financial Statements are an integral part of these statements.
NOTES TO CONSOLIDATED FINANCIAL STATEMENTS
NOTE 1. SUMMARY OF SIGNIFICANT ACCOUNTING POLICIES
Nature of operations
Orrstown Financial Services, Inc. (the Corporation) is a financial holding company whose primary activity consists of supervising its wholly-owned subsidiaries, Orrstown Bank and The First National Bank of Newport (First National). The Corporation operates through its office in Shippensburg, Pennsylvania. Orrstown Bank and First National provide services through their network of offices in Franklin, Cumberland and Perry Counties of Pennsylvania and in Washington County, Maryland. The banks engage in lending services for commercial loans, residential loans, commercial mortgages and various forms of consumer lending. Deposit services include checking, savings, time and money market deposits. Orrstown Bank also provides investment and brokerage services through its Orrstown Financial Advisors division. Orrstown Bank has sixteen branches located in Shippensburg (2), Carlisle (4), Spring Run, Orrstown, Chambersburg (3), Mechanicsburg (2), Camp Hill and Greencastle, Pennsylvania and Hagerstown, Maryland. First National has four branches located in Newport (2), Duncannon, and New Bloomfield, Pennsylvania. The Corporation and its subsidiaries are subject to the regulation of certain federal and state agencies and undergo periodic examinations by such regulatory authorities.
Principles of consolidation
The consolidated financial statements include the accounts of the Corporation and its wholly-owned subsidiaries, Orrstown Bank and The First National Bank of Newport. All significant intercompany transactions and accounts have been eliminated. Pennbanks Insurance Company Cell P1 was a previously wholly-owned subsidiary of the Corporation. As of January 1, 2006, the Corporation has divested the Pennbanks Insurance Company Cell P1 insurance book of business. The liabilities associated with the insurance business were assumed by American General under a contractual arrangement.
Use of estimates
The preparation of financial statements in conformity with generally accepted accounting principles requires management to make estimates and assumptions that affect the reported amounts of assets and liabilities and disclosure of contingent assets and liabilities at the date of the financial statements and the reported amounts of revenues and expenses during the reporting period. Actual results could differ from those estimates.
Material estimates that are particularly susceptible to significant change relate to the determination of the allowance for losses on loans and the valuation of real estate acquired in connection with foreclosures or in satisfaction of loans. In connection with the determination of the allowance for losses on loans and foreclosed real estate, management obtains independent appraisals for significant properties.
While management uses available information to recognize losses on loans and foreclosed real estate; future additions to the allowances may be necessary based on changes in local economic conditions. In addition, regulatory agencies, as an integral part of their examination process, periodically review the Corporation’s allowance for losses on loans and foreclosed real estate. Such agencies may require the Corporation to recognize additions to the allowance based on their judgments concerning information available to them at the time of their examination. Because of these factors, management’s estimate of credit losses inherent in the loan portfolio and the related allowance may change in the near term.
- 8 -
Investment securities
Under generally accepting accounting principles, the Corporation may segregate their investment portfolio into three specific categories: “securities held to maturity”, “trading securities” and “securities available for sale”. Securities held to maturity are to be accounted for at their amortized cost; securities classified as trading securities are to be accounted for at their current market value with unrealized gains and losses on such securities included in current period earnings; and securities classified as available for sale are to be accounted for at their current market value with unrealized gains and losses on such securities to be excluded from earnings and reported as a net amount in other comprehensive income.
Management determines the appropriate classification of securities at the time of purchase. If management has the intent and the Corporation has the ability at the time of purchase to hold securities until maturity, they are classified as securities held to maturity and carried at amortized historical cost. Securities to be held for indefinite periods of time and not intended to be held to maturity are classified as available for sale and carried at fair value. Securities held for indefinite periods of time include securities that management intends to use as part of its asset and liability management strategy and that may be sold in response to changes in interest rates, resultant prepayment risk and other factors related to interest rate and resultant prepayment risk changes.
The Corporation has classified all of its investment securities as “available for sale”.
Realized gains and losses on dispositions are based on the net proceeds and the adjusted book value of the securities sold, using the specific identification method. Unrealized gains and losses on investment securities available for sale are based on the difference between book value and fair value of each security. These gains and losses are credited or charged to other comprehensive income, whereas realized gains and losses flow through the Corporation’s results of operations.
Cash flows
For purposes of the Statements of Cash Flows, the Corporation has defined cash and cash equivalents as those amounts included in the balance sheet captions “Cash and due from banks” and “Federal funds sold”. The Corporation has elected to present the net increase or decrease in deposits with banks, loans, and deposits in the Statements of Cash Flows.
Premises and equipment
Buildings, improvements, equipment, furniture and fixtures are carried at cost less accumulated depreciation. Depreciation has been provided generally on the straight-line method and is computed over the estimated useful lives of the various assets as follows: buildings and improvements, 10 to 40 years, equipment, furniture and fixtures 3 to 15 years, and computer software is amortized over 3-5 years. Repairs and maintenance are charged to operations as incurred, while major additions and improvements are capitalized. Gain or loss on retirement or disposal of individual assets is recorded as income or expense in the period of retirement or disposal.
Goodwill and other intangible assets
The cost of acquired companies in excess of the fair value of their net assets at the date of acquisition is recorded as goodwill. Identifiable intangible assets relate to acquisitions of deposits from other banks and the purchase of investment management businesses. Goodwill is evaluated annually for impairment and other intangible assets are amortized over the identifiable life of the asset or 15 years.
Loans and allowance for loan losses
Loans are stated at the amount of unpaid principal, reduced by an allowance for loan losses. Interest on loans is calculated by using the simple interest method on daily balances of the principal amount outstanding. The allowance for loan losses is established through a provision for loan losses charged to expense. Loans are charged against the allowance when management believes that the collectibility of the principal is unlikely. Subsequent recoveries, if any, are credited to the allowance. The allowance is an amount that management believes will be adequate to absorb possible losses on existing loans that may become uncollectible. Evaluations of the allowance and collectibility of loans are made on a quarterly basis by management and are guided by the Corporation’s policies. The evaluations take into consideration such factors as prior loan loss experience, changes in the nature and volume of the loan portfolio, overall portfolio quality, review of specific problem loans, and current economic conditions that may affect the borrowers’ ability to pay. This evaluation is inherently subjective as it requires estimates that are susceptible to significant revision as additional information becomes available. An unallocated component is maintained in the allowance to cover uncertainties inherent in management’s underlying assumptions used to estimate probable losses.
Nonaccrual / Impaired loans
The accrual of interest income on loans ceases when principal or interest is past due 90 days or more and collateral is inadequate to cover principal and interest or immediately if, in the opinion of management, full collection is unlikely. Interest accrued but not collected as of the date of placement on nonaccrual status is reversed and charged against current income unless fully collateralized. Subsequent payments received are either applied to the outstanding principal balance or recorded as interest income, depending upon management’s assessment of the ultimate collectibility of principal.
- 9 -
A loan is considered impaired when, based on current information and events, it is probable that the Corporation will be unable to collect the scheduled payments of principal or interest when due according to the contractual terms of the loan agreement. Impairment is measured on a loan-by-loan basis by comparing the contractual principal and interest payments to the present value of expected future cash flows discounted at the loan’s effective interest rate, the loan’s obtainable market price, or the fair value of the collateral if the loan is collateral dependent. Consumer loans, comprised of smaller balance homogeneous loans, are collectively evaluated for impairment. Interest income generally is not recognized on specific impaired loans unless the likelihood of further loss is remote. Interest income on impaired loans is recognized only to the extent of interest payments received.
Loans serviced
The banks administer secondary market mortgage programs available through the Federal Home Loan Bank of Pittsburgh and the Federal National Mortgage Association and offer residential mortgage products and services to customers. The banks originate single-family residential mortgage loans for immediate sale in the secondary market, and retain the servicing of those loans. At December 31, 2006 and 2005 the balance of loans serviced for others was $71,242,000 and $49,288,000 respectively.
Foreclosed real estate
Real estate properties acquired through, or in lieu of, loan foreclosure are to be sold and are initially recorded at the lower of carrying value or fair value less estimated costs to sell the underlying collateral. Capitalized costs include accrued interest and any costs that significantly improve the value of the properties. After foreclosure, valuations are periodically performed by management and the real estate is carried at the lower of carrying amount or fair value less estimated cost to sell.
Earnings per share of common stock
Earnings per share is calculated as net income divided by the weighted average number of shares outstanding, after giving retroactive recognition to a two-for-one stock split effective February 2004, and a 5% stock dividend paid June 2005. For diluted net income per share, net income is divided by the weighted average of shares outstanding plus the incremental number of shares added as a result of converting common stock equivalents. The Corporation’s common stock equivalents consist of outstanding stock options.
A reconciliation of the weighted average shares outstanding used to calculate basic net income per share and diluted net income per share follows. There is no adjustment to net income to arrive at diluted net income per share.
| | | | | | | | | |
(in thousands, except per share data) | | 2006 | | 2005 | | 2004 |
Net income | | $ | 11,632 | | $ | 9,987 | | $ | 7,770 |
| | | | | | | | | |
| | | |
Weighted average number of shares outstanding (basic) | | | 5,906 | | | 5,407 | | | 5,362 |
Effect of dilutive stock options | | | 261 | | | 229 | | | 197 |
| | | | | | | | | |
Weighted average number of shares outstanding (diluted) | | | 6,167 | | | 5,636 | | | 5,559 |
| | | | | | | | | |
| | | |
Per share information: | | | | | | | | | |
Basic earnings per share | | $ | 1.97 | | $ | 1.85 | | $ | 1.45 |
Diluted earnings per share | | $ | 1.89 | | $ | 1.77 | | $ | 1.40 |
Stock-Based Compensation
The Corporation maintains two stock-based compensation plans. These plans provide for the granting of stock options to the Corporation’s employees and directors. The Corporation has historically accounted for the plans using the intrinsic-value method under the recognition and measurement principles of APB Opinion No. 25 and related Interpretations. In December 2004, the FASB issued a final FAS Statement No 123R, “Share-Based Payment”, which requires financial statement recognition of compensation cost for stock options and other stock-based awards. As of January 1, 2006, the Corporation has adopted the modified prospective method. This requires the recognition of compensation expense for the unvested portion of existing awards and new grants, but does not require a restatement of prior periods. All options that were awarded prior to January 1, 2006 were fully vested when granted and did not require any amounts to be expensed. Options have an exercise price equal to the fair market value as established by the average of the daily high bid and daily low offer quotations for the shares reported in the OTC Bulletin Board service during the ten trading days immediately preceding the date of grant. The fair value of each option grant was estimated on the date of grant using the Black-Scholes option-pricing model.
- 10 -
As a result of adopting Statement 123R, the Corporation’s income before taxes and net income for the year ended December 31, 2006, are $224,000 and $146,000 lower, respectively, than if it had continued to account for share-based compensation under Opinion 25. Basic and diluted earnings per share for the year ended December 31, 2006 are $.02 and $.02 lower, respectively, than if the company had continued to account for share-based compensation under Opinion 25. The following table illustrated the effect on net income and earnings per share if the Corporation had applied the fair value recognition provisions of FASB Statement No. 123, “Accounting for Stock-Based Compensation”, to stock-based employee and/or director compensation during 2005 and 2004.
| | | | | | |
| | | Years Ended December 31, |
(in thousands, except per share data) | | 2005 | | 2004 |
Net income | | | | | | |
As reported | | $ | 9,987 | | $ | 7,770 |
Pro forma | | | 9,710 | | | 7,385 |
| | |
Basic earnings per share | | | | | | |
As reported | | $ | 1.85 | | $ | 1.45 |
Pro forma | | $ | 1.80 | | $ | 1.38 |
| | |
Diluted earnings per share | | | | | | |
As reported | | $ | 1.77 | | $ | 1.40 |
Pro forma | | $ | 1.72 | | $ | 1.33 |
Federal income taxes
For financial reporting purposes, the provision for loan losses charged to operating expense is based on management’s judgment, whereas for federal income tax purposes, the amount allowable under present tax law is deducted. Deferred compensation is charged to operating expense in the period the liability is incurred for financial reporting purposes, whereas for federal income tax purposes, these expenses are deducted when paid. Amortization of goodwill is not deducted unless the asset is considered impaired for financial reporting purposes and, if deductible, is deducted on a straight line basis over a fifteen year life for federal income tax purposes. As a result of these, unrealized gains and losses on securities available for sale, and timing differences in depreciation expense and insurance company reserves, deferred income taxes are provided for in the financial statements. See Note 12 for further details.
Fair values of financial instruments
The Corporation meets the requirements for disclosure of fair value information about financial instruments, whether or not recognized in the balance sheet. In cases where quoted market prices are not available, fair values are based on estimates using present value or other valuation techniques. Those techniques are significantly affected by the assumptions used, including the discount rate and estimates of future cash flows. In that regard, the derived fair value estimates cannot be substantiated by comparison to independent markets and, in many cases, could not be realized in immediate settlement of the instruments. Certain financial instruments and all non-financial instruments are excluded from disclosure requirements. Accordingly, the aggregate fair value amounts presented do not represent the underlying value of the Corporation.
The following methods and assumptions were used by the Corporation in estimating fair values of financial instruments as disclosed herein:
Cash, Due from Banks, Short-Term Investments, and Federal Funds Sold. The carrying amounts of cash, due from banks, short-term investments, and federal funds sold approximate their fair value.
Securities Available for Sale. Fair values for investment securities are based on quoted market prices.
Loans Receivable. For variable-rate loans that reprice frequently and have no significant change in credit risk, fair values are based on carrying values. Fair values for fixed rate loans are estimated using discounted cash flow analyses, using interest rates currently being offered for loans with similar terms to borrowers of similar credit quality. Fair values for impaired loans are estimated using discounted cash flow analyses or underlying collateral values, where applicable.
Deposit Liabilities. The fair values disclosed for demand deposits are, by definition, equal to the amount payable on demand at the reporting date (that is, their carrying amounts). The carrying amounts of variable-rate, fixed-term money market accounts and certificates of deposit approximate their fair values at the reporting date. Fair values for fixed-rate certificates of deposits and IRA’s are estimated using a discounted cash flow calculation that applies interest rates currently being offered to a schedule of aggregated expected maturities on time deposits.
- 11 -
Short-Term Borrowings.The carrying amounts of federal funds purchased, borrowings under repurchase agreements, and other short-term borrowings maturing within 90 days approximate their fair values. Fair values of other short-term borrowings are estimated using discounted cash flow analyses based on the Corporation’s current incremental borrowing rates for similar types of borrowing arrangements.
Long-Term Borrowings. The fair value of the Corporation’s long-term debt is estimated using a discounted cash flow analysis based on the Corporation’s current incremental borrowing rate for similar types of borrowing arrangements.
Accrued Interest. The carrying amounts of accrued interest approximate their fair values.
Off-Balance-Sheet Instruments. The Corporation generally does not charge commitment fees. Fees for standby letters of credit and other off-balance-sheet instruments are not significant.
Comprehensive income
Under generally accepted accounting principles, comprehensive income is defined as the change in equity from transactions and other events from non-owner sources. It includes all changes in equity except those resulting from investments by shareholders and distributions to shareholders. Comprehensive income includes net income and certain elements of “other comprehensive income” such as foreign currency transactions; accounting for futures contracts; employers accounting for pensions; and accounting for certain investments in debt and equity securities.
The Corporation has elected to report its comprehensive income in the statement of changes in shareholders’ equity. The only element of “other comprehensive income” that the Corporation has is the unrealized gain or loss on available for sale securities.
The components of the change in net unrealized gains (losses) on securities were as follows:
| | | | | | | | | | | | |
(Dollars in thousands) | | 2006 | | | 2005 | | | 2004 | |
Gross unrealized holding gains (losses) arising during the year | | $ | 538 | | | $ | (1,028 | ) | | $ | (379 | ) |
Reclassification adjustment for (gains) losses realized in net income | | | (41 | ) | | | 60 | | | | (88 | ) |
| | | | | | | | | | | | |
Net unrealized holding gains (losses) before taxes | | | 497 | | | | (968 | ) | | | (467 | ) |
Tax effect | | | (177 | ) | | | 329 | | | | 159 | |
| | | | | | | | | | | | |
Net change | | $ | 320 | | | $ | (639 | ) | | $ | (308 | ) |
| | | | | | | | | | | | |
NOTE 2. ACQUISITION
On May 1, 2006, Orrstown Financial Services, Inc. completed the acquisition of The First National Bank of Newport, a national banking institution with $120 million of assets. First National has four banking offices in Perry County, Pennsylvania and operates as a wholly-owned subsidiary of Orrstown Financial Services, Inc. under the name “The First National Bank of Newport”.
Under the terms of the agreement, each share of First National common stock outstanding at the time of the transaction was exchanged for 1.75 shares of Orrstown Financial Services, Inc. common stock and $22.20 in cash. The purchase price for shares exchanged for common stock was $35.49 with 400,000 shares of First National common stock outstanding. In accordance with SFAS No. 141, “Business Combinations”, the Corporation recorded this transaction using the purchase accounting method. As a result of the acquisition, the results of operations of the Corporation include First National from and after May 1, 2006.
The following table summarizes the preliminary purchase price allocation based on estimated fair values of the assets acquired and liabilities assumed at the date of acquisition.
| | | |
(Dollars in thousands) |
Assets | | | |
Cash and cash equivalents | | | 13,031 |
Investment securities | | | 29,398 |
Net Loans | | | 71,976 |
Core deposit intangible | | | 1,665 |
Other assets | | | 5,828 |
| | | |
Total identifiable assets | | $ | 121,898 |
| | | |
- 12 -
NOTE 2. ACQUISITION (Continued)
| | | |
(Dollars in thousands) | | |
Liabilities | | | |
Total deposits | | | 105,502 |
Short term borrowings | | | 0 |
Long term borrowings | | | 0 |
Other liabilities | | | 547 |
| | | |
Total liabilities | | $ | 106,049 |
| | | |
Merger related expenses of $286,000 were paid in the second quarter of 2006 and recorded as goodwill and associated deferred taxes. All goodwill resulting from the merger was recorded on the balance sheet of First National. The $18,160,000 of goodwill resulting from the acquisition is calculated below.
| | | | | | | |
(Dollars in thousands, except per share data) | | | | | |
Orrstown Financial Services, Inc common stock issued | | | 699,949 | | | | |
Average purchase price per Orrstown common shares | | $ | 35.49 | | | | |
| | | | | | | |
| | | | | | $ | 24,841 |
Cash price paid at $22.20 per share plus 51 fractional shares | | | | | | | 8,882 |
Merger costs | | | | | | | 286 |
| | | | | | | |
Total purchase price | | | | | | | 34,009 |
| | |
Net assets acquired: | | | | | | | |
First National’s shareholders’ equity | | | 13,648 | | | | |
| | |
Adjustments to reflect assets acquired at fair value: | | | | | | | |
Investments | | | 0 | | | | |
Loans | | | 329 | | | | |
Bank premises | | | 1,189 | | | | |
Core deposit intangible | | | 1,665 | | | | |
Deferred tax assets | | | (1,165 | ) | | | |
Adjustments to reflect liabilities acquired at fair value: | | | | | | | |
Time deposits | | | 183 | | | | |
| | | | | | | |
| | | | | | | 15,849 |
| | | | | | | |
Goodwill resulting from merger | | | | | | $ | 18,160 |
| | | | | | | |
As a result of the amortization or accretion of premiums, discounts and intangible assets, net income before taxes was reduced by $29,000. The table below sets forth the periods and methods of amortization or accretion and the estimated remaining lives by intangible class.
| | | | | | | | | | |
| | | | | | Amortization | | |
(Dollars in thousands) | | Gross Amount | | | Period | | Method | | Remaining
Life |
Commercial loans | | $ | (378 | ) | | 4 years | | Declining balance – annual | | 3.3 years |
Consumer loans | | | 13 | | | 4 years | | Declining balance – annual | | 3.3 years |
Mortgage loans | | | 694 | | | 9 years | | Declining balance – annual | | 8.3 years |
Bank premises | | | 1,189 | | | 30 years | | Straight line | | 29.3 years |
Core deposit intangible | | | 1,665 | | | 10 years | | Straight line | | 9.3 years |
Time deposits | | | 183 | | | 6 years | | Declining balance – monthly | | 5.3 years |
| | | | | | | | | | |
Weighted average amortization period | | | | | | 14.9 years | | | | |
| | | | | | | | | | |
- 13 -
NOTE 2. ACQUISITION (Continued)
The following pro forma combined results of operations for the years ended December 31, 2006 and December 31, 2005, and gives effect to the merger as if the merger had been completed on January 1, 2006 and January 1, 2005, respectively. The pro forma information shows the combination of First National’s historical results into Orrstown Financial Services, Inc. results of operations under the purchase method of accounting. While certain adjustments have been made for the estimated impact of purchase accounting adjustments, the pro forma results of operations is presented for illustrative purposes only and does not indicate the financial results of the Corporation had the companies actually been combined at the beginning of the period presented.
| | | | |
(Dollars in thousands, except per share data) | | Pro forma |
| | | Years Ended December 31, |
| | | 2006 | | 2005 |
Net interest income | | 28,973 | | 27,310 |
Other income | | 11,268 | | 9,829 |
Net income | | 11,949 | | 11,461 |
| | |
Earnings per share | | 1.95 | | 1.88 |
NOTE 3. INVESTMENTS
At December 31, 2006 and 2005 the investment securities portfolio was comprised of securities classified as “available for sale”, resulting in investment securities being carried at fair value.
The amortized cost and fair values of investment securities available for sale at December 31 were:
| | | | | | | | | | | | |
| | | Amortized
Cost | | Gross
Unrealized
Gains | | Gross
Unrealized
Losses | | Fair
Value |
(Dollars in thousands) | | 2006 |
U. S. Treasury securities and obligations of U. S. Government corporations and agencies | | $ | 25,344 | | $ | 7 | | $ | 241 | | $ | 25,110 |
Obligations of states and political subdivisions | | | 28,096 | | | 846 | | | 92 | | | 28,850 |
Mortgage-backed securities | | | 29,963 | | | 40 | | | 664 | | | 29,339 |
Corporate bonds | | | 1,302 | | | 0 | | | 10 | | | 1,292 |
Equity securities | | | 2,448 | | | 537 | | | 33 | | | 2,952 |
| | | | | | | | | | | | |
Totals | | $ | 87,153 | | $ | 1,430 | | $ | 1,040 | | $ | 87,543 |
| | | | | | | | | | | | |
| |
| | | 2005 |
U. S. Treasury securities and obligations of U. S. Government corporations and agencies | | $ | 16,492 | | $ | 0 | | $ | 282 | | $ | 16,210 |
Obligations of states and political subdivisions | | | 20,531 | | | 949 | | | 33 | | | 21,447 |
Mortgage-backed securities | | | 29,529 | | | 59 | | | 728 | | | 28,860 |
Equity securities | | | 2,172 | | | 365 | | | 46 | | | 2,491 |
| | | | | | | | | | | | |
Totals | | $ | 68,724 | | $ | 1,373 | | $ | 1,089 | | $ | 69,008 |
| | | | | | | | | | | | |
- 14 -
NOTE 3. INVESTMENTS (Continued)
The following table shows gross unrealized losses and fair value, aggregated by investment category and length of time that individual securities have been in a continuous unrealized loss position, at December 31:
| | | | | | | | | | | | | | | | | | |
| | | Less Than 12 Months | | 12 Months or More | | Total |
| | | Fair Value | | Unrealized
Losses | | Fair Value | | Unrealized
Losses | | Fair Value | | Unrealized
Losses |
(Dollars in thousands) | | 2006 |
U. S. Treasury securities and obligations of U. S. Government corporations and agencies | | $ | 7,419 | | $ | 87 | | $ | 13,179 | | $ | 154 | | $ | 20,598 | | $ | 241 |
Obligations of states and political subdivisions | | | 3,663 | | | 69 | | | 1,683 | | | 23 | | | 5,346 | | | 92 |
Mortgage-backed securities | | | 6,028 | | | 148 | | | 20,288 | | | 516 | | | 26,316 | | | 664 |
Corporate bonds | | | 893 | | | 10 | | | 0 | | | 0 | | | 893 | | | 10 |
| | | | | | | | | | | | | | | | | | |
Total debt securities | | | 18,003 | | | 314 | | | 35,150 | | | 693 | | | 53,153 | | | 1,007 |
| | | | | | | | | | | | | | | | | | |
Equity securities | | | 201 | | | 20 | | | 71 | | | 13 | | | 272 | | | 33 |
| | | | | | | | | | | | | | | | | | |
Total temporarily impaired securities | | $ | 18,204 | | $ | 334 | | $ | 35,221 | | $ | 706 | | $ | 53,425 | | $ | 1,040 |
| | | | | | | | | | | | | | | | | | |
| |
| | | 2005 |
U. S. Treasury securities and obligations of U. S. Government corporations and agencies | | $ | 4,053 | | $ | 67 | | $ | 12,157 | | $ | 215 | | $ | 16,210 | | $ | 282 |
Obligations of states and political subdivisions | | | 492 | | | 8 | | | 1,205 | | | 25 | | | 1,697 | | | 33 |
Mortgage-backed securities | | | 1,940 | | | 43 | | | 23,930 | | | 685 | | | 25,870 | | | 728 |
| | | | | | | | | | | | | | | | | | |
Total debt securities | | | 6,485 | | | 118 | | | 37,292 | | | 925 | | | 43,777 | | | 1,043 |
| | | | | | | | | | | | | | | | | | |
Equity securities | | | 438 | | | 26 | | | 76 | | | 20 | | | 514 | | | 46 |
| | | | | | | | | | | | | | | | | | |
Total temporarily impaired securities | | $ | 6,923 | | $ | 144 | | $ | 37,368 | | $ | 945 | | $ | 44,291 | | $ | 1,089 |
| | | | | | | | | | | | | | | | | | |
The previous table represents one hundred twenty-one investment securities at December 31, 2006 and fifty-two investment securities at December 31, 2005 where the current fair value is less than the related amortized cost. Management believes the impairments to be temporary in all cases for both years disclosed. Consideration is given to the extent to which the fair value has been less than cost, the financial condition and near-term prospects of the issuer, and the intent and ability of the Corporation to retain its investment in the issuer for a period of time sufficient to allow for any anticipated recovery in fair value.
At December 31, 2006, the Corporation held 8 issues of high quality US treasuries and US government agency obligations and 2 municipal securities with fair values less than the related amortized cost for twelve months or more. In addition, 14 issues of US government agency mortgage backed securities were held with fair values less than the related amortized cost for twelve months or more. All 24 of these issues had been purchased during lower rate periods and carry lower than current rates. They do not reflect any deterioration of the credit worthiness of the issuing entities. As management has the ability to hold these securities for the foreseeable future in all cases, no decline is deemed to be other than temporary. Three marketable equity securities have unrealized losses for twelve months or more. All three companies are profitable and paying dividends. Since these companies are considered viable and carry the possibility of price appreciation in the future, impairments are considered temporary.
At December 31, 2005, US treasuries, state and municipal and mortgage-backed securities combined, had twenty-three issues with fair values less than the related amortized cost for twelve months or more; and four marketable equity securities had fair values less than the related amortized cost for twelve months or more.
The amortized cost and fair values of investment securities available for sale at December 31, 2006, by contractual maturity are shown below. Contractual maturities will differ from expected maturities because borrowers may have the right to call or prepay obligations with or without call or prepayment penalties.
| | | | | | |
(Dollars in thousands) | | Amortized Cost | | Fair Value |
Due in one year or less | | $ | 13,170 | | $ | 13,062 |
Due after one year through five years | | | 15,472 | | | 15,330 |
Due after five years through ten years | | | 10,724 | | | 10,820 |
Due after ten years | | | 15,376 | | | 16,040 |
Mortgage-backed securities | | | 29,963 | | | 29,339 |
Equity securities | | | 2,448 | | | 2,952 |
| | | | | | |
| | $ | 87,153 | | $ | 87,543 |
| | | | | | |
- 15 -
NOTE 3. INVESTMENTS (Continued)
Proceeds from sales of securities available for sale for the years ended December 31, 2006, 2005, and 2004, were $577,000, $4,149,000 and $6,407,000, respectively. Gross gains and losses on 2006 sales were $57,000 and $16,000 respectively. Gross gains and losses on 2005 sales were $49,000 and $109,000, respectively. Gross gains and losses on 2004 sales were $164,000 and $76,000, respectively.
The Corporation owned $2,580,000 of Federal Home Loan Bank stock, $64,000 of Atlantic Central Bankers Bank stock and $1,206,000 of Federal Reserve Bank stock at December 31, 2006. At December 31, 2005, the Corporation owned $2,426,000 of Federal Home Loan Bank stock, $54,000 of Atlantic Central Bankers Bank stock and $189,000 of Federal Reserve Bank stock. Market value approximates cost since none of the stocks are actively traded.
Securities with a market value of $66,574,000 and $60,916,000 at December 31, 2006 and 2005, respectively, were pledged to secure public funds and for other purposes as required or permitted by law.
NOTE 4. CONCENTRATION OF CREDIT RISK
The Corporation grants agribusiness, commercial, residential and consumer loans to customers in its market area. Although the Corporation maintains a diversified loan portfolio, a significant portion of its customers’ ability to honor their contracts is dependent upon economic sectors for construction contractors, non-residential building operators, sales finance, sub-dividers and developers. Management evaluates each customer’s creditworthiness on a case-by-case basis. The amount of collateral obtained, if collateral is deemed necessary by the Corporation upon the extension of credit, is based on management’s credit evaluation of the customer. Collateral held varies but generally includes real estate and equipment.
NOTE 5. ALLOWANCE FOR LOAN LOSSES
An allowance amount has been established for the acquired credit risk of the loan portfolio less any amounts attributable to loans with credit quality issues acquired in the May 1, 2006 acquisition of The First National Bank of Newport. Activity in the allowance for loan losses is summarized as follows:
| | | | | | | | | |
(Dollars in thousands) | | 2006 | | 2005 | | 2004 |
Balance at beginning of period | | $ | 4,428 | | $ | 4,318 | | $ | 4,161 |
Recoveries | | | 79 | | | 48 | | | 32 |
Provision for loan losses charged to income | | | 390 | | | 144 | | | 210 |
| | | | | | | | | |
Total | | | 4,897 | | | 4,510 | | | 4,403 |
Losses | | | 97 | | | 82 | | | 85 |
Additions established for acquired credit risk | | | 720 | | | 0 | | | 0 |
| | | | | | | | | |
Balance at end of period | | $ | 5,520 | | $ | 4,428 | | $ | 4,318 |
| | | | | | | | | |
NOTE 6. LOANS TO RELATED PARTIES
The Corporation has granted loans to the officers and directors of the Corporation and its subsidiary and to their associates. Related party loans are made on substantially the same terms, including interest rates and collateral, as those prevailing at the time for comparable transactions with unrelated persons and do not involve more than normal risk of collectibility. The aggregate dollar amount of these loans was $2,508,000 at December 31, 2006, and $1,227,000 at December 31, 2005. During 2006, $1,250,000 of loans to officers and directors were acquired with the purchase of First National, $1,050,000 of new loans were granted and repayments totaled $1,019,000. Outstanding loans to employees totaled $4,825,000 and $3,074,000 at December 31, 2006 and 2005, respectively.
- 16 -
NOTE 7. DELINQUENT AND NONACCRUAL LOANS
Loans 90 days or more past due (still accruing interest) were as follows at December 31:
| | | | | | | | | |
(Dollars in thousands) | | 2006 | | 2005 | | 2004 |
Commercial, financial and agricultural | | $ | 0 | | $ | 16 | | $ | 0 |
Real estate | | | 1,067 | | | 390 | | | 2,541 |
Consumer | | | 17 | | | 5 | | | 9 |
| | | | | | | | | |
Total | | $ | 1,084 | | $ | 411 | | $ | 2,550 |
| | | | | | | | | |
The following table shows the principal balances of nonaccrual loans as of December 31:
| | | | | | | | | | |
(Dollars in thousands) | | 2006 | | | 2005 | | 2004 |
Nonaccrual loans | | $ | 120 | | | $ | 52 | | $ | 314 |
| | | | | | | | | | |
Interest income that would have been accrued at original contract rates | | | 23 | | | | 30 | | | 31 |
Amount recognized as interest income | | | 27 | | | | 10 | | | 13 |
| | | | | | | | | | |
Foregone (recovered) revenue | | $ | (4 | ) | | $ | 20 | | $ | 18 |
| | | | | | | | | | |
The Corporation had no impairment of loans as of December 31, 2006, 2005, and 2004.
During 2006, the Corporation foreclosed on four loans secured by real estate property. Nine properties were sold during 2006 at a gain of $62,000. This amount is included in other income on the statements of income. Net gains (losses) from sales of foreclosed property for the years ended December 31, 2005 and 2004 were $20,000 and ($45,000), respectively. At December 31, 2006, the Corporation held one property obtained through foreclosure. The carrying value for this property totaled $318,000, which is included in other assets on the balance sheet at December 31, 2006. At December 31, 2005, the Corporation held six properties obtained through foreclosure. The carrying value for these properties totaled $1,754,000, which is included in other assets on the balance sheet at December 31, 2005.
NOTE 8. FINANCIAL INSTRUMENTS WITH OFF-BALANCE-SHEET RISK
The Corporation is a party to financial instruments with off-balance-sheet risk in the normal course of business to meet the financial needs of its customers and to reduce its own exposure to fluctuations in interest rates. These financial instruments include commitments to extend credit and standby letters of credit. Those instruments involve, to varying degrees, elements of credit and interest rate risk in excess of the amount recognized in the balance sheets. The contract amounts of those instruments reflect the extent of involvement the Corporation has in particular classes of financial instruments.
The Corporation’s exposure to credit loss in the event of nonperformance by the other party to the financial instrument for commitments to extend credit and standby letters of credit and financial guarantees written is represented by the contractual amount of those instruments. The Corporation uses the same credit policies in making commitments and conditional obligations as it does for on-balance-sheet instruments.
| | | | | | |
| | | Contract or Notional Amount |
(Dollars in thousands) | | 2006 | | 2005 |
Financial instruments whose contract amounts represent credit risk at December 31: | | | | | | |
Commitments to extend credit | | $ | 128,197 | | $ | 125,490 |
Standby letters of credit and financial guarantees written | | | 21,517 | | | 16,401 |
| | | | | | |
Commitments to extend credit are agreements to lend to a customer as long as there is no violation of any condition established in the contract. Commitments generally have fixed expiration dates or other termination clauses and may require payment of a fee. Since many of the commitments are expected to expire without being drawn upon, the total commitment amounts do not necessarily represent future cash requirements. The Corporation evaluates each customer’s credit-worthiness on a case-by-case basis. The amount of collateral obtained, if deemed necessary by the Corporation upon extension of credit, is based on management’s credit evaluation of the customer. Collateral held varies but may include accounts receivable, inventory, equipment, residential real estate, and income-producing commercial properties.
Standby letters of credit and financial guarantees written are conditional commitments issued by the Corporation to guarantee the performance of a customer to a third party. Those guarantees are primarily issued to support public and private borrowing arrangements. The credit risk involved in issuing letters of credit is essentially the same as that involved in extending loans to customers. The Corporation holds collateral supporting those commitments when deemed necessary by management.
- 17 -
NOTE 9. PREMISES AND EQUIPMENT
A summary of bank premises and equipment is as follows:
| | | | | | |
(Dollars in thousands) | | 2006 | | 2005 |
Land | | $ | 3,545 | | $ | 2,043 |
Buildings and improvements | | | 14,584 | | | 9,677 |
Leasehold improvements | | | 321 | | | 279 |
Furniture and equipment | | | 12,344 | | | 9,376 |
Construction in progress | | | 574 | | | 630 |
| | | | | | |
Total | | | 31,368 | | | 22,005 |
Less accumulated depreciation and amortization | | | 11,516 | | | 8,369 |
| | | | | | |
Bank premises and equipment, net | | $ | 19,852 | | $ | 13,636 |
| | | | | | |
Depreciation expense amounted to $1,408,000, $1,190,000, and $1,073,000 for the years ended December 31, 2006, 2005 and 2004, respectively.
NOTE 10. RETIREMENT PLANS
The Corporation maintains 401(k) profit-sharing plans for those employees who meet the eligibility requirements set forth in the plans. Employer contributions to the plans are based on performance and are at the discretion of the subsidiary bank Boards of Directors. The plans contain limited match or safe harbor provisions. Substantially all of the Corporation’s employees are covered by the plan and the contributions charged to operations were $1,228,000, $977,000 and $899,000 for the years ended December 31, 2006, 2005, and 2004, respectively.
The Corporation has a deferred compensation arrangement with certain present and former board directors whereby a director or his beneficiaries will receive a monthly retirement benefit at age 65. The arrangement is funded by an amount of life insurance on the participating director calculated to meet the Corporation’s obligations under the compensation agreement. The cash value of the life insurance policies is an unrestricted asset of the Corporation. The estimated present value of future benefits to be paid, which is included in other liabilities, amounted to $119,000 and $120,000 at December 31, 2006 and 2005, respectively. Total annual expense for this deferred compensation plan was approximately $12,000 for each of the years ended December 31, 2006, 2005 and 2004.
The Corporation also has supplemental discretionary deferred compensation plans for directors and executive officers. The plans are funded annually with director fees and salary reductions which are either placed in a trust account invested by the Corporation’s Orrstown Financial Advisors division or recognized as a liability. The trust account balance was $809,000 and $683,000 at December 31, 2006 and 2005, respectively, and is included in other assets on the balance sheets, offset by other liabilities in the same amount. The liability account for the plan at First National stood at $113,000 on December 31, 2006. Total amount contributed to the plans was $103,000, $86,000 and $77,000, for the years ended December 31, 2006, 2005, and 2004, respectively.
The Corporation has also adopted three supplemental retirement and salary continuation plans for directors and executive officers. These plans are funded with single premium life insurance on the plan participants. The cash value of the life insurance policies is an unrestricted asset of the Corporation. The estimated present value of future benefits to be paid totaled $1,849,000 and $1,368,000 at December 31, 2006 and 2005, respectively, which is included in other liabilities. Total annual expense for these plans amounted to $481,000, $233,000 and $217,000, for the years ended December 31, 2006, 2005, and 2004, respectively.
- 18 -
NOTE 11. STOCK COMPENSATION PLANS
During 2000, the Corporation implemented two stock option plans, one for employees and one for nonemployee directors. Under the Corporation’s stock option plans, the Corporation may grant options to its directors, officers, and employees for up to 532,507 shares of common stock. Both incentive stock options and nonqualified stock options may be granted under the plans. The exercise price of each option equals the market price of the Corporation’s stock on the date of grant and an option’s maximum term is ten years. All options are fully vested upon issuance.
A summary of the status of the Corporation’s stock option plans at December 31, 2006, 2005 and 2004 is presented below:
| | | | | | | | | | | | | | | | | | |
| | | Shares | | | Weighted Average Exercise
Price | | Shares | | | Weighted Average Exercise
Price | | Shares | | | Weighted Average Exercise
Price |
| | | 2006 | | 2005 | | 2004 |
Outstanding at beginning of year | | 244,108 | | | $ | 28.37 | | 211,841 | | | $ | 24.64 | | 190,603 | | | $ | 19.98 |
Granted | | 34,712 | | | | 37.32 | | 48,616 | | | | 42.01 | | 48,202 | | | | 38.88 |
Exercised | | (4,208 | ) | | | 23.67 | | (16,349 | ) | | | 20.62 | | (26,964 | ) | | | 17.22 |
Forfeited | | 0 | | | | 0.00 | | 0 | | | | 0.00 | | 0 | | | | 0.00 |
| | | | | | | | | | | | | | | | | | |
Options exercisable at year end | | 274,612 | | | $ | 29.57 | | 244,108 | | | $ | 28.37 | | 211,841 | | | $ | 24.64 |
| | | | | | | | | | | | | | | | | | |
Information pertaining to options outstanding at December 31, 2006 is as follows:
| | | | | | | | | | | | |
Options Outstanding | | Options Exercisable |
Range of Exercise Prices | | Number Outstanding | | Weighted Average Remaining Contractual Life (Years) | | Weighted Average Exercise Price | | Number Exercisable | | Weighted Average Exercise Price |
$16.20 - $17.11 | | 18,658 | | 3.44 | | $ | 16.42 | | 18,658 | | $ | 16.42 |
$17.12 - $17.32 | | 37,568 | | 4.46 | | | 17.29 | | 37,568 | | | 17.29 |
$17.33 - $19.99 | | 43,884 | | 5.47 | | | 19.67 | | 43,884 | | | 19.67 |
$20.00 - $25.99 | | 43,497 | | 6.47 | | | 25.50 | | 43,497 | | | 25.50 |
$30.00 - $37.99 | | 34,712 | | 9.47 | | | 37.32 | | 34,712 | | | 37.32 |
$38.00 - $42.15 | | 96,293 | | 7.99 | | | 40.46 | | 96,293 | | | 40.46 |
| | | | | | | | | | | | |
$16.20 - $42.15 | | 274,612 | | 6.74 | | $ | 29.57 | | 274,612 | | $ | 29.57 |
| | | | | | | | | | | | |
The aggregate intrinsic value of outstanding stock options at December 31, 2006 is $1,917,000 and the total intrinsic value of stock options exercised during 2006 was $49,000.
The fair value of each option granted is estimated on the date of grant using the Black-Scholes option-pricing model with the following weighted-average assumptions:
| | | | | | | | | | | | | | |
| | | Grant-Date Fair Value | | Dividend Yield | | | Expected Volatility | | | Risk Free Interest Rate | | | Expected Life (Yrs) |
Nonemployee director stock option plan | | | | | | | | | | | | | | |
2006 | | $ | 6.96 | | 2.23 | % | | 15.74 | % | | 4.83 | % | | 7 |
2005 | | | 9.28 | | 1.28 | | | 19.47 | | | 4.29 | | | 7 |
2004 | | | 14.05 | | 1.11 | | | 32.80 | | | 3.38 | | | 7 |
Employee stock option plan | | | | | | | | | | | | | | |
2006 | | $ | 6.39 | | 2.11 | % | | 14.83 | % | | 5.18 | % | | 5 |
2005 | | | 8.59 | | 1.33 | | | 19.41 | | | 3.74 | | | 5 |
2004 | | | 12.00 | | 1.18 | | | 32.18 | | | 3.85 | | | 5 |
During 2000, the Corporation implemented an employee stock purchase plan under which 173,643 shares of common stock have been reserved for issuance to employees. The number of shares which may be issued to each participant is determined annually, based on individual earnings, and their cost is equal to 85% of the fair market value as established by the average of the average of the daily high bid and daily low offer quotations for the shares reported in the OTC Bulletin Board service, during the ten trading days immediately preceding the date of purchase. If no bid or offer quotation for the shares is reported through the OTC Bulletin Board service during the ten business day period, the fair market value is the price of the last trade reported through the OTC Bulletin Board service prior to the purchase date. A total of 139,086 shares of common stock remained reserved at December 31, 2006 for future grants under the plan. Employees purchased 5,695, 4,911 and 4,111 shares at a weighted average price of $29.19, $31.26 and $31.18 per share in 2006, 2005 and 2004, respectively. During 1998, the Corporation implemented a Dividend Reinvestment Plan under which 995,557 shares of common stock have been reserved for issuance to shareholders enrolled in the plan. The Board of directors temporarily suspended the dividend Reinvestment Plan effective the first quarter of 2006.
- 19 -
NOTE 11. STOCK COMPENSATION PLANS (Continued)
Shares of common stock registered and available for issuance through approved plans at December 31, 2006 are as follows:
| | |
| | | Number of Shares |
Stock option plans | | 207,493 |
Employee stock purchase plan | | 139,086 |
Dividend reinvestment plan | | 729,647 |
| | |
Total registered shares | | 1,076,226 |
| | |
NOTE 12. INCOME TAXES
The components of federal income tax expense are summarized as follows:
| | | | | | | | | | | |
(Dollars in thousands) | | 2006 | | | 2005 | | | 2004 |
Current year provision | | $ | 5,343 | | | $ | 4,600 | | | $ | 3,149 |
Deferred income taxes (benefits) | | | (493 | ) | | | (191 | ) | | | 28 |
| | | | | | | | | | | |
Net federal income tax expense | | $ | 4,850 | | | $ | 4,409 | | | $ | 3,177 |
| | | | | | | | | | | |
Federal income taxes were computed after reducing pretax accounting income for non-taxable income in the amount of $2,553,000, $1,613,000 and $1,713,000 for 2006, 2005 and 2004, respectively.
A reconciliation of the effective applicable income tax rate to the federal statutory rate is as follows:
| | | | | | | | | |
| | | 2006 | | | 2005 | | | 2004 | |
Federal income tax rate | | 35.0 | % | | 34.0 | % | | 34.0 | % |
Reduction resulting from nontaxable income | | 5.6 | % | | 3.4 | % | | 5.0 | % |
| | | | | | | | | |
Effective income tax rate | | 29.4 | % | | 30.6 | % | | 29.0 | % |
| | | | | | | | | |
Deferred tax liabilities have been provided for taxable temporary differences related to accumulated depreciation, unrealized gains on available for sale securities and deductible amortization expense of goodwill, intangibles and purchase accounting adjustments. Deferred tax assets have been provided for deductible temporary differences related to the allowance for loan losses, asset impairment, deferred compensation, stock options, capitalized merger expenses and retirement plans. The Corporation has not recorded a valuation allowance for deferred tax assets as it is more likely than not that they will be ultimately realized.
The net deferred tax assets (liabilities) included in the accompanying consolidated balance sheets includes the following significant components:
| | | | | | | | |
(Dollars in thousands) | | 2006 | | | 2005 | |
Deferred tax assets | | | | | | | | |
Allowance for loan losses | | $ | 1,794 | | | $ | 1,431 | |
Deferred fees | | | 7 | | | | 26 | |
Asset impairment | | | 14 | | | | 13 | |
Deferred compensation | | | 359 | | | | 273 | |
Stock options expense | | | 78 | | | | 0 | |
Capitalized merger expenses | | | 14 | | | | 0 | |
Retirement plans and salary continuation | | | 638 | | | | 466 | |
| | | | | | | | |
Total deferred tax assets | | | 2,904 | | | | 2,209 | |
| | | | | | | | |
Deferred tax liabilities | | | | | | | | |
Net unrealized (gains) on securities available for sale | | | (273 | ) | | | (96 | ) |
Depreciation | | | (972 | ) | | | (943 | ) |
Intangibles | | | (58 | ) | | | (30 | ) |
Purchase accounting adjustments | | | (981 | ) | | | 0 | |
Insurance company reserves | | | 0 | | | | (37 | ) |
| | | | | | | | |
Total deferred tax liabilities | | | (2,284 | ) | | | (1,106 | ) |
| | | | | | | | |
Net deferred tax asset | | $ | 620 | | | $ | 1,103 | |
| | | | | | | | |
- 20 -
NOTE 13. DEPOSITS
NOW account products with balances totaling $118,981,000 and $116,576,000 are included in interest bearing deposits at December 31, 2006 and 2005, respectively. Also included in interest bearing deposits at December 31, 2006 and 2005 are money market account products with balances totaling $59,393,000 and $31,610,000, respectively. At December 31, 2006 and 2005 time deposits of $100,000 and over aggregated $115,668,000 and $57,352,000, respectively. Interest expense on time deposits of $100,000 and over was $4,318,000, $1,618,000 and $788,000 for the years ended December 31, 2006, 2005 and 2004, respectively. At December 31, 2006, the scheduled maturities of certificates of deposit are as follows:
| | | |
(Dollars in thousands) | | |
2007 | | $ | 228,692 |
2008 | | | 25,073 |
2009 | | | 20,357 |
2010 | | | 6,998 |
2011 | | | 3,113 |
thereafter | | | 2,331 |
| | | |
| | $ | 286,564 |
| | | |
The Corporation accepts deposits of the officers and directors of the Corporation and its subsidiary on the same terms, including interest rates, as those prevailing at the time for comparable transactions with unrelated persons. The aggregate dollar amount of deposits of officers and directors totaled $1,276,000 and $658,000 at December 31, 2006 and 2005, respectively.
Total overdrafts of deposit accounts of $170,000 and $137,000 at December 31, 2006 and 2005, respectively, were reclassified as loans for financial reporting purposes.
NOTE 14. LIABILITIES FOR BORROWED MONEY
Federal funds purchased and securities sold under agreements to repurchase generally mature within one day from the transaction date. The Corporation requires US treasury, agency and state and municipal issues to be held as underlying securities for repurchase agreements. If no issues of securities are available at the time, a FHLB letter of credit may be purchased to secure the agreement. Information concerning securities sold under agreements to repurchase is summarized as follows:
| | | | | | | | |
(Dollars in thousands) | | 2006 | | | 2005 | |
Average balance during the year | | $ | 39,281 | | | $ | 26,350 | |
Average interest rate during the year | | | 4.62 | % | | | 3.02 | % |
Maximum month-end balance during the year | | $ | 59,320 | | | $ | 38,555 | |
Securities underlying the agreements at year-end: | | | | | | | | |
Carrying value | | | 38,791 | | | | 42,841 | |
Estimated fair value | | | 38,809 | | | | 42,567 | |
| | | | | | | | |
- 21 -
NOTE 14. LIABILITIES FOR BORROWED MONEY (Continued)
At December 31, the Corporation had notes outstanding with the Federal Home Loan Bank of Pittsburgh as follows:
| | | | | | | | | | | | | |
| (Dollars in thousands) | | | | | | | | | |
| Amount | | | | | | | | | |
| 2006 | | 2005 | | Maturity
Date | | Interest
Rate | | Potentially Convertible to Adjustable Rate | | | Frequency & Basis for Adjustable Rate |
| $ | 0 | | $ | 5,000 | | 05/06 | | 2.08 | | | | | Fixed Rate |
| | 592 | | | 997 | | 05/08 | | 2.43 | | | | | Fixed Rate (Amortizing) |
| | 7,500 | | | 7,500 | | 09/08 | | 5.06 | | 09/15/03 | (1) | | Quarterly based on 3 months |
| | | | | | | | | | | | | LIBOR plus .15% |
| | 0 | | | 5,000 | | 10/08 | | 4.66 | | 10/07/03 | (1) | | Quarterly based on 3 months |
| | | | | | | | | | | | | LIBOR plus .15% |
| | 5,000 | | | 0 | | 11/08 | | 4.93 | | | | | Fixed Rate |
| | 2,500 | | | 0 | | 11/09 | | 5.05 | | | | | Fixed Rate |
| | 3,500 | | | 0 | | 12/09 | | 4.76 | | | | | Fixed Rate |
| | 1,026 | | | 1,308 | | 05/10 | | 2.85 | | | | | Fixed Rate (Amortizing) |
| | 0 | | | 5,000 | | 02/11 | | 4.50 | | 02/07/02 | (1) | | Quarterly based on 3 months |
| | | | | | | | | | | | | LIBOR plus .19% |
| | 0 | | | 3,000 | | 03/11 | | 3.94 | | 03/25/02 | (1) | | Quarterly based on 3 months |
| | | | | | | | | | | | | LIBOR plus .13% |
| | 5,000 | | | 5,000 | | 02/12 | | 4.70 | | 02/17/04 | (2) | | |
| | 350 | | | 350 | | 04/20 | | 7.40 | | | | | Fixed Rate |
| | 6,521 | | | 6,728 | | 12/25 | | 4.74 | | | | | Fixed Rate (Amortizing) |
| | | | | | | | | | | | | | |
| | $ 31,989 | | $ | 39,883 | | | | | | | | | |
| | | | | | | | | | | | | | |
| (1) | The rate can adjust to an adjustable rate based on market rates. |
| (2) | The 3 month LIBOR is evaluated quarterly and the loan converts to an adjustable rate if the 3 month LIBOR is greater than 8%. The rate would then adjust quarterly based on 3 month LIBOR plus .20%. |
Interest rates are fixed, but, as indicated above, some of the notes can convert to adjustable rates. Except for amortizing loans, interest only is paid on a monthly basis. The notes contain prepayment penalty charges, but management has no intention to pay off early.
Three of the above borrowings are term notes that require monthly principal reductions of the note balance. The aggregate amount of future principal payments required on these three notes at December 31, 2006 is as follows:
| | | |
(Dollars in thousands) | | |
2007 | | $ | 922 |
2008 | | | 702 |
2009 | | | 545 |
2010 | | | 381 |
2011 | | | 262 |
Thereafter | | | 5,327 |
| | | |
| | $ | 8,139 |
| | | |
The Banks are members of the Federal Home Loan Bank of Pittsburgh (FHLB) and, as such, can take advantage of the FHLB program of overnight and term advances. Under terms of a blanket collateral agreement, advances, lines and letters of credit from the FHLB are collateralized by first mortgage loans and securities. Collateral for all outstanding advances, lines and letters of credit consisted of certain securities and the banks’ 1-4 family mortgage loans totaling $364,550,000 and $214,283,000 at December 31, 2006 and 2005, respectively. At December 31, 2006, Orrstown Bank could borrow approximately $192,000,000 and First National could borrow approximately $55,708,000 based on qualifying collateral. Orrstown Bank has a $15 million line of credit with FHLB at December 31, 2006 and 2005 and First National has a $10 million line of credit at December 31, 2006. The interest rate on these lines are variable and can changes daily based on current market conditions. There were no borrowings under these lines of credit at December 31, 2006 and 2005.
Orrstown Bank also has available a line of credit with Atlantic Central Bankers Bank of $8.5 million at December 31, 2006 and 2005 and First National has available $3,000,000 at December 31, 2006. The ACBB lines of credit are unsecured and the rates are based on the daily Federal Funds rate. There were no borrowings under these lines of credit at December 31, 2006 and 2005.
- 22 -
NOTE 14. LIABILITIES FOR BORROWED MONEY (Continued)
Orrstown Bank has a $5 million available line of credit with a correspondent bank at December 31, 2006 and 2005, the line of credit is unsecured and the rate is based on the daily Federal Funds rate. There were no borrowings under this line of credit at December 31, 2006 and 2005.
The Corporation has a $10 million unsecured line of credit with a correspondent bank with a rate based on 1.60 basis points over the 30 day Libor rate that can change monthly. At December 31, 2006, $750,000 was borrowed against this line.
Also included in other borrowed funds are borrowings against certain life insurance policies that are used to fund deferred compensation benefits for certain directors. Interest rates are fixed at 8%. Collateral is the cash surrender value of the policies as disclosed in Note 10. The total balance of these loans was $451,000 and $423,000 at December 31, 2006 and 2005, respectively.
Total interest expense on borrowed funds charged to operations was $3,182,000, $2,246,000 and $1,785,000 for the years ended December 31, 2006, 2005, and 2004, respectively.
NOTE 15. ORRSTOWN FINANCIAL SERVICES, INC. (PARENT COMPANY ONLY) FINANCIAL INFORMATION
The following are the condensed balance sheets, income statements and statements of cash flows for the parent company:
| | | | | | | |
| BALANCE SHEETS | | At December 31, |
(Dollars in thousands) | | 2006 | | | 2005 |
Assets | | | | | | | |
Cash | | $ | 55 | | | $ | 3,404 |
Securities available for sale | | | 2,952 | | | | 2,452 |
Investment in wholly-owned subsidiaries | | | 87,134 | | | | 51,498 |
Other assets | | | 294 | | | | 151 |
| | | | | | | |
Total assets | | $ | 90,435 | | | $ | 57,505 |
| | | | | | | |
Liabilities | | | | | | | |
Accrued expenses | | $ | 121 | | | $ | 85 |
Deferred taxes | | | 176 | | | | 110 |
Short -term borrowings | | | 750 | | | | 0 |
| | | | | | | |
Total liabilities | | | 1,047 | | | | 195 |
| | | | | | | |
Shareholders’ Equity | | | | | | | |
Common stock, no par value—$ .05205 stated value per share 50,000,000 shares authorized with 6,145,049 shares issued at December 31, 2006; 5,439,227 shares issued at December 31, 2005 | | | 320 | | | | 283 |
Additional paid-in capital | | | 72,023 | | | | 46,876 |
Retained earnings | | | 16,934 | | | | 9,964 |
Accumulated other comprehensive income | | | 507 | | | | 187 |
Treasury stock—common, at cost 10,717 shares in 2006; 23 shares in 2005 | | | (396 | ) | | | 0 |
| | | | | | | |
Total shareholders’ equity | | | 89,388 | | | | 57,310 |
| | | | | | | |
Total liabilities and shareholders’ equity | | $ | 90,435 | | | $ | 57,505 |
| | | | | | | |
- 23 -
NOTE 15. ORRSTOWN FINANCIAL SERVICES, INC. (PARENT COMPANY ONLY) FINANCIAL INFORMATION (Continued)
| | | | | | | | | | | | |
| INCOME STATEMENTS | | Years Ended December 31, | |
(Dollars in thousands) | | 2006 | | | 2005 | | | 2004 | |
Income | | | | | | | | | | | | |
Dividends from wholly-owned subsidiaries | | $ | 10,290 | | | $ | 3,150 | | | $ | 2,475 | |
Other interest and dividend income | | | 99 | | | | 148 | | | | 145 | |
Other income | | | 86 | | | | 1 | | | | 44 | |
Gain on sale of investment securities | | | 34 | | | | 1 | | | | 51 | |
| | | | | | | | | | | | |
Total income | | | 10,509 | | | | 3,300 | | | | 2,715 | |
| | | | | | | | | | | | |
Expenses | | | | | | | | | | | | |
Interest on borrowings | | | 44 | | | | 24 | | | | 52 | |
Stock option expense | | | 224 | | | | 0 | | | | 0 | |
Other expenses | | | 380 | | | | 449 | | | | 238 | |
| | | | | | | | | | | | |
Total expenses | | | 648 | | | | 473 | | | | 290 | |
| | | | | | | | | | | | |
Income before income taxes and equity in undistributed income of subsidiaries | | | 9,861 | | | | 2,827 | | | | 2,425 | |
Income tax expense (benefit) | | | (164 | ) | | | (122 | ) | | | (12 | ) |
| | | | | | | | | | | | |
Income before equity in undistributed income of subsidiaries | | | 10,025 | | | | 2,949 | | | | 2,437 | |
| | | | | | | | | | | | |
Equity in undistributed income of subsidiaries | | | | | | | | | | | | |
Net income of subsidiaries | | | 11,897 | | | | 10,188 | | | | 7,808 | |
Less: dividends | | | (10,290 | ) | | | (3,150 | ) | | | (2,475 | ) |
| | | | | | | | | | | | |
Equity in undistributed income of subsidiaries | | | 1,607 | | | | 7,038 | | | | 5,333 | |
| | | | | | | | | | | | |
Net income | | $ | 11,632 | | | $ | 9,987 | | | $ | 7,770 | |
| | | | | | | | | | | | |
| | | | | | | | | | | | |
| STATEMENTS OF CASH FLOWS | | Years Ended December 31, | |
(Dollars in thousands) | | 2006 | | | 2005 | | | 2004 | |
Cash flows from operating activities: | | | | | | | | | | | | |
Net income | | $ | 11,632 | | | $ | 9,987 | | | $ | 7,770 | |
Adjustments to reconcile net income to cash provided by operating activities: | | | | | | | | | | | | |
Investment securities (gains) | | | (34 | ) | | | (1 | ) | | | (51 | ) |
Stock based compensation | | | 224 | | | | 0 | | | | 0 | |
Equity in undistributed income of subsidiary | | | (1,607 | ) | | | (7,038 | ) | | | (5,333 | ) |
Increase (decrease) in other liabilities | | | 36 | | | | (596 | ) | | | 88 | |
(Increase) in other assets | | | (143 | ) | | | (102 | ) | | | (17 | ) |
| | | | | | | | | | | | |
Net cash provided by operating activities | | | 10,108 | | | | 2,250 | | | | 2,457 | |
| | | | | | | | | | | | |
Cash flows from investing activities: | | | | | | | | | | | | |
Purchase of available for sale securities | | | (507 | ) | | | (669 | ) | | | (522 | ) |
Sales of available for sale securities | | | 221 | | | | 144 | | | | 393 | |
Maturities of available for sale securities | | | 0 | | | | 1,000 | | | | 0 | |
Proceeds from divesting of subsidiaries | | | 78 | | | | 0 | | | | 0 | |
Capitalized merger expenses | | | (178 | ) | | | 0 | | | | 0 | |
Purchase price of shares exchanged for cash | | | (8,882 | ) | | | 0 | | | | 0 | |
| | | | | | | | | | | | |
Net cash provided (used) by investing activities | | | (9,268 | ) | | | 475 | | | | (129 | ) |
| | | | | | | | | | | | |
- 24 -
NOTE 15. ORRSTOWN FINANCIAL SERVICES, INC. (PARENT COMPANY ONLY) FINANCIAL INFORMATION (Continued)
| | | | | | | | | | | | |
| STATEMENTS OF CASH FLOWS (Continued) | | Years Ended December 31, | |
(Dollars in thousands) | | 2006 | | | 2005 | | | 2004 | |
Cash flows from financing activities: | | | | | | | | | | | | |
Net proceeds (payments) on debt | | | 750 | | | | (700 | ) | | | 0 | |
Dividends paid | | | (4,662 | ) | | | (3,157 | ) | | | (2,556 | ) |
Proceeds from issuance of common stock | | | 148 | | | | 1,888 | | | | 1,510 | |
Purchase of treasury stock | | | (543 | ) | | | 0 | | | | 0 | |
Net proceeds from issuance of treasury stock | | | 118 | | | | 0 | | | | 0 | |
Cash paid in lieu of fractional shares | | | 0 | | | | (19 | ) | | | 0 | |
| | | | | | | | | | | | |
Net cash (used) by financing activities | | | (4,189 | ) | | | (1,988 | ) | | | (1,046 | ) |
| | | | | | | | | | | | |
Net increase in cash | | | (3,349 | ) | | | 737 | | | | 1,282 | |
Cash, beginning balance | | | 3,404 | | | | 2,667 | | | | 1,385 | |
| | | | | | | | | | | | |
Cash, ending balance | | $ | 55 | | | $ | 3,404 | | | $ | 2,667 | |
| | | | | | | | | | | | |
NOTE 16. REGULATORY MATTERS
Dividends paid by Orrstown Financial Services, Inc. are generally provided from the subsidiary banks’ dividends to the parent company. Under provisions of the Pennsylvania Banking Code, cash dividends may be paid from accumulated net earnings (retained earnings) as long as minimum capital requirements are met. The minimum capital requirements stipulate that the bank’s surplus or additional paid-in capital be equal to the amount of capital stock. Both banks carry capital well in excess of capital requirements. Orrstown Bank has a balance of $46,194,000 in its retained earnings at December 31, 2006 which is fully available for the payout of cash dividends. First National carried a balance in retained earnings of $560,000 at December 31, 2006 which is also fully available for the payout of cash dividends. In order for the Corporation to maintain its “Financial Holding Company” status, all banking subsidiaries must maintain a well capitalized status. Orrstown Financial Services’ balance of retained earnings at December 31, 2006 is $16,934,000 and would be available for the payout of cash dividends, although payment of dividends to such extent would not be prudent or likely. The Federal Reserve Board, which regulates bank holding companies, establishes guidelines which indicate that cash dividends should be covered by current period earnings.
The Corporation is also subject to various regulatory capital requirements administered by federal banking agencies. Failure to meet minimum capital requirements can initiate certain mandatory and possible additional discretionary actions by regulators that, if undertaken, could have a direct material effect on the Corporation’s financial statements. Under capital adequacy guidelines, the Corporation is required to maintain minimum capital ratios. The leverage ratio compares capital to total adjusted balance sheet assets, while the risk-based ratios compare capital to risk-weighted assets and off-balance-sheet activity in order to make capital levels more sensitive to risk profiles of individual banks.
A comparison of Orrstown Financial Services’ capital ratios to regulatory minimums at December 31 is as follows:
| | | | | | | | | | | | |
| | | Orrstown Financial Services | | | Regulatory Requirements | |
| | | 2006 | | | 2005 | | | Minimum | | | Well
Capitalized | |
Leverage ratio | | 8.60 | % | | 9.53 | % | | 4 | % | | 5 | % |
Risk-based capital ratios: | | | | | | | | | | | | |
Tier I (core capital) | | 11.03 | % | | 11.79 | % | | 4 | % | | 6 | % |
Combined Tier I and Tier II (core capital plus allowance for loan losses) | | 11.98 | % | | 12.78 | % | | 8 | % | | 10 | % |
As of December 31, 2006, the most recent notification from the Federal Reserve Board categorized the Corporation as well capitalized under the regulatory framework for prompt corrective action. Management believes that no conditions or events have occurred since notification that would alter their well capitalized classification.
- 25 -
NOTE 17. LEASES
The Corporation leases land and building space associated with certain branch offices, remote automated teller machines, and certain data processing equipment under agreements which expire at various times from 2007 through 2024. Total rent expense charged to operations in connection with these leases was $350,000, $270,000 and $244,000 for the years ended December 31, 2006, 2005, and 2004, respectively.
The total minimum rental commitments under operating leases with maturities in excess of one year at December 31, 2006 are as follows:
| | | |
(Dollars in thousands) | | Due in the Year Ending December 31, |
2007 | | $ | 279 |
2008 | | | 253 |
2009 | | | 189 |
2010 | | | 190 |
2011 | | | 175 |
Thereafter | | | 959 |
| | | |
| | $ | 2,045 |
| | | |
NOTE 18. COMPENSATING BALANCE ARRANGEMENTS
The Corporation maintains deposit balances at several correspondent banks which provide check collection and item processing services to the Corporation. The balances with these correspondent banks, at times, exceed federally insured limits; management considers this to be a normal business risk.
For Orrstown Bank, the required deposit balance at the Federal Reserve was $65,000 at both December 31, 2006 and 2005. The required deposit balance at Atlantic Central Bankers Bank was $540,000 at both December 31, 2006 and 2005. For First National, the required deposit balance at the Federal Reserve was $40,000 at December 31, 2006. The required deposit balance at Atlantic Central Bankers Bank was $470,000 at December 31, 2006.
NOTE 19. FAIR VALUE OF FINANCIAL INSTRUMENTS
The estimated fair values of the Corporation’s financial instruments were as follows at December 31:
| | | | | | | | | | | | | | |
| | | 2006 | | 2005 |
(Dollars in thousands) | | Carrying Amount | | | Fair Value | | Carrying
Amount | | | Fair Value |
Financial Assets | | | | | | | | | | | | | | |
Cash, due from banks, and short-term investments | | $ | 21,625 | | | $ | 21,625 | | $ | 15,346 | | | $ | 15,346 |
Federal funds sold | | | 18,404 | | | | 18,404 | | | 23,430 | | | | 23,430 |
Securities available for sale | | | 87,543 | | �� | | 87,543 | | | 69,008 | | | | 69,008 |
Restricted bank stocks | | | 3,850 | | | | 3,850 | | | 2,669 | | | | 2,669 |
| | | | |
Loans | | | 618,827 | | | | | | | 460,386 | | | | |
Allowance for loan losses | | | (5,520 | ) | | | | | | (4,428 | ) | | | |
| | | | | | | | | | | | | | |
Net loans | | | 613,307 | | | | 579,234 | | | 455,958 | | | | 434,317 |
| | | | |
Accrued interest receivable | | | 3,279 | | | | 3,279 | | | 2,169 | | | | 2,169 |
| | | | | | | | | | | | | | |
Total financial assets | | $ | 748,008 | | | $ | 713,935 | | $ | 568,580 | | | $ | 546,939 |
| | | | | | | | | | | | | | |
Financial Liabilities | | | | | | | | | | | | | | |
Deposits | | $ | 638,719 | | | $ | 638,951 | | $ | 462,822 | | | $ | 462,051 |
Short-term borrowed funds | | | 41,703 | | | | 41,703 | | | 36,138 | | | | 36,138 |
Long-term borrowed funds | | | 32,440 | | | | 31,645 | | | 40,306 | | | | 39,316 |
Accrued interest payable | | | 1,111 | | | | 1,111 | | | 550 | | | | 550 |
| | | | | | | | | | | | | | |
Total financial liabilities | | $ | 713,973 | | | $ | 713,410 | | $ | 539,816 | | | $ | 538,055 |
| | | | | | | | | | | | | | |
- 26 -
NOTE 20. GOODWILL AND INTANGIBLE ASSETS
On May 1, 2006, Orrstown Financial Services, Inc. completed the acquisition of The First National Bank of Newport. The following intangible assets were recorded as part of this transaction:
| | | | | |
(Dollars in thousands) | | Gross Amount | | Amortization Period |
Goodwill | | $ | 18,160 | | Subject to impairment evaluation |
| | | | | |
Intangible assets: | | | | | |
Core deposit intangible | | | 1,665 | | 10 years |
Total intangible assets | | $ | 1,665 | | |
| | | | | |
The identifiable intangible assets that are related to acquisitions of customer lists and other intangibles are amortized on a straight-line basis over fifteen years, and the core deposit intangibles are amortized on a straight-line basis over ten years. The following table shows the amount of goodwill and intangible assets on the balance sheet at December 31:
| | | | | | | | | |
| | | Gross Amount | | Accumulated
Amortization | | Net Amount |
(Dollars in thousands) | | 2006 |
Goodwill | | $ | 19,358 | | $ | 0 | | $ | 19,358 |
| | | | | | | | | |
Intangible assets: | | | | | | | | | |
Deposit premiums | | | 2,348 | | | 609 | | | 1,739 |
Customer list | | | 551 | | | 81 | | | 470 |
Other | | | 62 | | | 62 | | | 0 |
| | | | | | | | | |
Total intangible assets | | $ | 2,961 | | $ | 752 | | $ | 2,209 |
| | | | | | | | | |
| |
(Dollars in thousands) | | 2005 |
Goodwill | | $ | 1,198 | | $ | 0 | | $ | 1,198 |
| | | | | | | | | |
Intangible assets: | | | | | | | | | |
Deposit premiums | | | 683 | | | 453 | | | 230 |
Customer list | | | 551 | | | 44 | | | 507 |
Other | | | 62 | | | 61 | | | 1 |
| | | | | | | | | |
Total intangible assets | | $ | 1,296 | | $ | 558 | | $ | 738 |
| | | | | | | | | |
Amortization expense was $194,000, $98,000, and $82,000 for the years ended December 31, 2006, 2005 and 2004, respectively. The estimated aggregate amortization expense for the next five years is as follows:
| | | |
(Dollars in thousands) | | |
2007 | | $ | 249 |
2008 | | | 249 |
2009 | | | 249 |
2010 | | | 235 |
2011 | | | 208 |
| | | |
| | $ | 1,190 |
| | | |
NOTE 21. COMMITMENTS
During 2006, the Corporation entered into purchase commitments of $2,194,000 related to a proposed land site and expanding and remodeling existing offices. At December 31, 2006, $437,000 of these commitments had been paid.
NOTE 22. STOCK REPURCHASE PLAN
On April 27, 2006, Orrstown Financial Services, Inc. announced a Stock Repurchase Plan approving the purchase of up to 150,000 shares as conditions allow. The plan may be suspended at any time without prior notice and has no prescribed time limit in which to fill the authorized repurchase amount. As of December 31, 2006, 14,749 shares have been purchased under the program. Orrstown did not sell any unregistered securities.
- 27 -
| Item 7. | Management’s Discussion and Analysis of Consolidated Financial Condition and Results of Operations |
The following is a discussion of our consolidated financial condition and results of operations for each of the three years ended December 31, 2006, 2005 and 2004. Some statements and information contained in this “Management’s Discussion and Analysis of Financial Condition and Results of Operations” are not historical facts but are forward-looking statements. For a discussion of these forward-looking statements and important factors that could cause results to differ materially from the forward-looking statements contained in this Annual Report, see “Important Factors Relating to Forward Looking Statements”. The following discussion and analysis should be read in conjunction with our Consolidated Financial Statements and Notes to Consolidated Financial Statements presented in this report. Certain prior period amounts presented in this discussion and analysis have been reclassified to conform to current period classifications.
Overview
Orrstown Financial Services, Inc. (the Corporation) is a financial holding company with two wholly-owned bank subsidiaries, Orrstown Bank and The First National Bank of Newport (First National). The Corporation divested itself of the Pennbanks Insurance Company Cell P1 credit life and disability reinsurance business in early 2006.
On May 1, 2006, the Corporation acquired The First National Bank of Newport. First National is located in Perry County, a small but growing county, which is contiguous to our markets in Cumberland and Franklin Counties. First National is chartered as a national bank and operated as a wholly owned subsidiary of Orrstown Financial Services, Inc.; results of their operations were included for the last eight months of 2006. During January 2007, both bank boards executed documents allowing combination of the two banks into one company. The consolidation of the companies is expected to take place during the second quarter of 2007. Once the entities have been combined, The First National Bank of Newport and its four branch locations will become part of Orrstown Bank. This transaction will provide cost savings generated through the centralization of operations plus the elimination of separate financial reporting and fewer regulatory examinations. For our customers, this means that they will have the ability to bank at any of our 20 branch locations as well as having the same products and services offered throughout all of our locations.
With the addition of the four offices acquired via the First National transaction plus a new office that opened on March 30, 2006 in Hagerstown, Maryland, and the purchase of a former Omega branch in Mechanicsburg on October 10, 2006, we expanded our market area tremendously this year while still providing a wide array of services and products to our customers. Deposit services include a variety of checking, savings, time and money market deposits along with related debit card and merchant services. The Branch Executive Officers, Customer Service Officers and tellers are ready to serve all our customers with the best personal and professional service in our market areas. Lending services include commercial loans, residential loans, commercial mortgages and various forms of consumer lending. The Orrstown Financial Advisors division has continued to increase the assets under management throughout 2006 with approximately $693 million of assets under management at December 31, 2006, including $404 million held in the trust department and $289 million held in brokerage accounts. The Orrstown Financial Advisors division offers a diverse line of financial services to our customers, including, but not limited to, brokerage, mutual funds, trusts, estate planning, investments and insurance products.
The Corporation has had another year of strong operating performance and the results of our financial performance again exceeded peer group averages by a significant margin and continue to rank our company among the top performing banking companies. The Corporation is committed to providing both shareholder value and unparalleled customer service.
For the year ended December 31, 2006, the Corporation recorded net income of $11,632,000, an increase of 16.5% over 2005 earnings of $9,987,000, which was a 28.5% increase over net income of $7,770,000 realized in 2004. First National contributed $1,150,000 of net income during the last eight months of 2006. Basic earnings per share have increased over the last three years from $1.45 in 2004 to $1.85 in 2005 and $1.97 in 2006. The per share amounts have been restated to reflect the 2-for-1 stock split effective February 10, 2004 and the 5% stock dividend paid to shareholders on June 29, 2005.
The Corporation’s earnings performance continues to be well above peer group averages as measured by various ratio analyses. Two widely recognized performance indicators are the return on average assets (ROA) and the return on average equity (ROE). The return on average assets was 1.61% in 2006, 1.81% in 2005, and 1.57% in 2004. The average publicly traded banking company generates an ROA of approximately 1.00% while 0.88% is average for the Mid-Atlantic Region per SNL Financial, a provider of financial information for the banking industry. The return on average equity for the Corporation was 16.78% in 2004, 18.69% in 2005, and 15.10% in 2006. SNL Financial indicates that approximately 11.00% is the median for our industry while Mid-Atlantic banks return less than 10.00% on average. In order to compare past years’ performance ratios more effectively with the addition of First National and the associated goodwill and intangibles, we have included the return on average tangible assets (ROTA) and return on average tangible equity (ROTE) ratios which exclude intangibles from equity and assets. The return on average tangible assets was 1.64% in 2006, 1.81% in 2005, and 1.57% in 2004. The return on average tangible equity was 18.78% in 2006, 19.28% in 2005 and 17.09% in 2004.
- 28 -
Economic Climate
The Federal Reserve steadily raised rates during 2004 and 2005 with eight 25 basis point hikes throughout 2005. Dr. Ben S. Bernanke was sworn in as the Chairman of the Federal Reserve in February 2006 and initially continued the policies of former Chairman Greenspan with consistent 25 basis point interest rate increases. Under Chairman Bernanke, the Federal Reserve halted such increases in mid 2006. During the first half of 2006, the federal funds rate increased four times in 25 basis point increments. The prime lending rate stood at 7.25% at December 31, 2005 and at 8.25% at December 31, 2006. Overall, the economy was solid in 2006 as the U.S. Stock Market posted strong gains, inflation stayed under control, and the unemployment rate remained below 5% throughout the year. However, the economy did have to overcome some obstacles, namely the inevitable correction in the housing market and another spike in oil prices, which peaked at around $78 per barrel in July 2006.
In 2007, the typical forecast for the U.S. economy calls for continued growth but at a slower pace. Thus far, Chairman Bernanke has seemed to have a calming influence on U.S. markets and interest rate changes during 2007 are expected to be minimal. Economists will keep an eye on the housing and oil problems as they may have an impact on the overall performance of the economy in 2007.
The Corporation, along with the majority of the banking industry, sustained compressed margins in 2006 due to changes in the yield curve. The curve, which had flattened out in 2005, remained flat early in 2006 and progressively developed a pronounced inversion by the second half of the year. The yield curve remains inverted at present. A normal yield curve has lower short term rates that graduate to higher rates as the terms extend. The flat yield curve is characterized by shorter term rates roughly equivalent to longer term rates. With the yield curve inverted, the shorter term rates are generally higher than the longer term rates. The flat and inverted yield curves create pressure to increase the short term deposit rates we pay to customers, while also creating pressure to keep rates low on long term loans made to borrowers. Although this has helped to generate loans and has increased deposits in higher paying savings products and certificates of deposit, it has contributed to a reduction in our margin from prior years. To offset some of this compression, management has closely watched our discretionarily priced deposit products and has made changes throughout the year to insure that we stay profitable as well as to continue our strong lending practices. The Corporation is positioned adequately to avoid material earnings damage if rates do not rise, while increases in spread would be anticipated in a rising rate environment. Should the yield curve return to a normal position it would afford the Corporation opportunities to increase spread via the use of prudent, balanced short term mismatches given our continued strong loan demand.
Net Interest Income
Net interest income is the amount by which interest income on earning assets exceeds interest paid on interest bearing liabilities. The amount of net interest income is affected by changes in interest rates, account balances or volumes and the mix of earning assets and interest bearing liabilities. Net interest income is still the primary source of commercial bank profits despite a continued focus on noninterest income sources. Throughout this discussion, the yield on earning assets is stated on a fully taxable-equivalent basis (FTE) and balances represent average daily balance unless otherwise stated.
For the year ended December 31, 2006, non FTE net interest income totaled $27,417,000, an increase of $4,539,000, or 19.8%, over 2005, the 2005 net interest total was $22,878,000, or 21.0%, over 2004 results. First National contributed $3,021,000 to non FTE net interest income during their eight months of inclusion. On a FTE basis, net interest income increased by 20.9% in 2006 and 20.0% in 2005. Marginal tax rates used in the taxable equivalent equation were 34% for 2004 and 2005 and 35% for 2006. The Corporation’s net interest spread was 3.91% in 2004, 4.16% in 2005, and 3.85% in 2006. The net interest margin, which factors in noninterest bearing funds sources, has moved from 4.21% to 4.55% to 4.32%, respectively. Average earning assets as a percent of average assets have declined, primarily due to the intangible assets that arose with the acquisition, resulting in ratios of 91.3% for 2006, 93.8% for 2005, and 94.0% for 2004.
In 2006, there were four 25 basis point increases in the prime lending rate during the first half of the year, while in 2005 there were eight 25 basis point jumps in the prime lending rate spaced throughout the year. In 2005, rate factors were more significant than volume factors in generating the increase in interest income. Contrastingly, in 2006, despite market rate increases, volume factors were much more significant due to the acquisition of First National and robust organic growth. Interest earning assets grew 27.2%, or $141,184,000 with First National adding $75,924,000 during 2006 on an average daily basis, and interest income increased $12,751,000 or 38.5%, during the same period. The loan portfolio grew by $131,863,000 during 2006 with most of the growth channeled into commercial loans. Commercial loan balances wee up $91,852,000, or 33.6%, over 2005 levels. The acquisition of First National helped to increase the consumer and mortgage loan portfolios.
Interest bearing liabilities grew 31.0%, or $132,357,000, during 2006, with First National contributing $64,436,000. Much of the funding growth was in time deposit balances which increased by $103,684,000, or 73.9%, over 2005. The
- 29 -
addition of First National accounted for $33,702,000 of this growth. Interest bearing transaction accounts decreased by $3,853,000 while savings deposits increased by $24,491,000. A rising rate environment generally creates a shift to time deposits as consumers desire to lock in available rates. The movement of dollars to time deposit products has helped to compress our spread during 2006 but our net interest margin remains above peer levels within the industry. Our deposit mix, which has significant balances in discretionarily priced transaction accounts, enables us some flexibility in pricing. Long term borrowings decreased by $5,902,000 in 2006 as we were able to replace such funding with deposits. Short term borrowings, in the form of customer repurchase agreement accounts, grew by $13,937,000 during 2006. The inverted yield curve has helped increase the popularity of the short term borrowings as they are tied to the 91 day Treasury bill rate. Free funds increased by $8,827,000 during 2006.
The movement of deposit dollars to higher yielding categories, the competitive environment for loans and the inclusion of First National’s portfolios, all served to reduce our margins during 2006 as net interest spread tightened by 31 basis points to 3.85% from the 4.16% realized in 2005 while the net interest margin moved from 4.55% in 2005 to 4.32% in 2006.
The Corporation’s margins produced during 2006 remained comfortably ahead of industry averages of approximately 4.0% overall and 3.75% with in the Mid-Atlantic region per SNL Financial. The movement of our balance sheet to a more balanced position versus earlier years, position us to be able to react to movements of rates in either direction.
ANALYSIS OF NET INTEREST INCOME
Average Balances and Interest Rates, Taxable Equivalent Basis
| | | | | | | | | | | | | | | | | | | | | | | | | | | | | | |
| | | 2006 | | | 2005 | | | 2004 | |
(Dollars in thousands) | | Average
Balance | | | Tax
Equivalent
Interest | | Tax
Equivalent
Rate | | | Average
Balance | | | Tax
Equivalent
Interest | | Tax
Equivalent
Rate | | | Average
Balance | | | Tax
Equivalent
Interest | | Tax
Equivalent
Rate | |
Assets | | | | | | | | | | | | | | | | | | | | | | | | | | | | | | |
Interest Earning Assets: | | | | | | | | | | | | | | | | | | | | | | | | | | | | | | |
Federal funds sold & interest bearing bank balances | | $ | 18,964 | | | $ | 956 | | 5.04 | % | | $ | 16,030 | | | $ | 539 | | 3.36 | % | | $ | 12,764 | | | $ | 178 | | 1.39 | % |
| | | | | | | | | | | | | | | | | | | | | | | | | | | | | | |
Taxable investment securities | | | 60,432 | | | | 2,480 | | 4.10 | | | | 58,631 | | | | 2,210 | | 3.77 | | | | 60,888 | | | | 2,277 | | 3.74 | |
Tax-exempt investment securities | | | 26,395 | | | | 1,948 | | 7.38 | | | | 21,809 | | | | 1,726 | | 7.91 | | | | 23,033 | | | | 1,828 | | 7.94 | |
| | | | | | | | | | | | | | | | | | | | | | | | | | | | | | |
Total investment securities | | | 86,827 | | | | 4,428 | | 5.10 | | | | 80,440 | | | | 3,936 | | 4.89 | | | | 83,921 | | | | 4,105 | | 4.89 | |
| | | | | | | | | | | | | | | | | | | | | | | | | | | | | | |
Taxable loans | | | 538,637 | | | | 39,380 | | 7.31 | | | | 417,485 | | | | 28,339 | | 6.79 | | | | 364,678 | | | | 22,021 | | 6.04 | |
Tax-exempt loans | | | 14,954 | | | | 1,086 | | 7.26 | | | | 4,243 | | | | 285 | | 6.72 | | | | 4,731 | | | | 318 | | 6.72 | |
| | | | | | | | | | | | | | | | | | | | | | | | | | | | | | |
Total Loans | | | 553,591 | | | | 40,466 | | 7.31 | | | | 421,728 | | | | 28,624 | | 6.79 | | | | 369,409 | | | | 22,339 | | 6.05 | |
| | | | | | | | | | | | | | | | | | | | | | | | | | | | | | |
Total interest-earning assets | | | 659,382 | | | | 45,850 | | 6.95 | | | | 518,198 | | | | 33,099 | | 6.39 | | | | 466,094 | | | | 26,622 | | 5.71 | |
Non-Interest Earning Assets: | | | | | | | | | | | | | | | | | | | | | | | | | | | | | | |
Cash and due from banks | | | 15,206 | | | | | | | | | | 11,791 | | | | | | | | | | 10,687 | | | | | | | |
Bank premises and equipment | | | 16,802 | | | | | | | | | | 13,322 | | | | | | | | | | 11,852 | | | | | | | |
Other assets | | | 36,141 | | | | | | | | | | 13,636 | | | | | | | | | | 11,602 | | | | | | | |
Less allowance for loan losses | | | (4,960 | ) | | | | | | | | | (4,355 | ) | | | | | | | | | (4,316 | ) | | | | | | |
| | | | | | | | | | | | | | | | | | | | | | | | | | | | | | |
Total | | $ | 722,571 | | | | | | | | | $ | 552,592 | | | | | | | | | $ | 495,919 | | | | | | | |
| | | | | | | | | | | | | | | | | | | | | | | | | | | | | | |
- 30 -
ANALYSIS OF NET INTEREST INCOME (Continued)
| | | | | | | | | | | | | | | | | | | | | | | | | | | |
| | | 2006 | | | 2005 | | | 2004 | |
(Dollars in thousands) | | Average
Balance | | Tax Equivalent
Interest | | Tax Equivalent
Rate | | | Average
Balance | | Tax Equivalent
Interest | | Tax Equivalent
Rate | | | Average
Balance | | Tax Equivalent
Interest | | Tax Equivalent
Rate | |
| | | | | | | | | |
Liabilities and Shareholders’ Equity | | | | | | | | | | | | | | | | | | | | | | | | | | | |
Interest Bearing Liabilities: | | | | | | | | | | | | | | | | | | | | | | | | | | | |
Interest bearing demand deposits | | $ | 159,035 | | $ | 1,887 | | 1.19 | % | | $ | 162,888 | | $ | 1,649 | | 1.01 | % | | $ | 183,649 | | $ | 1,942 | | 1.06 | % |
Savings deposits | | | 87,665 | | | 2,015 | | 2.30 | | | | 63,174 | | | 1,180 | | 1.87 | | | | 29,752 | | | 135 | | 0.45 | |
Time deposits | | | 243,929 | | | 10,287 | | 4.22 | | | | 140,245 | | | 4,462 | | 3.18 | | | | 114,181 | | | 3,124 | | 2.74 | |
Short term borrowings | | | 40,293 | | | 1,877 | | 4.66 | | | | 26,356 | | | 796 | | 3.02 | | | | 24,296 | | | 304 | | 1.25 | |
Long term borrowings | | | 28,651 | | | 1,305 | | 4.55 | | | | 34,553 | | | 1,450 | | 4.20 | | | | 35,885 | | | 1,481 | | 4.13 | |
| | | | | | | | | | | | | | | | | | | | | | | | | | | |
Total interest bearing liabilities | | | 559,573 | | | 17,371 | | 3.10 | | | | 427,216 | | | 9,537 | | 2.23 | | | | 387,763 | | | 6,986 | | 1.80 | |
Non-Interest Bearing Liabilities: | | | | | | | | | | | | | | | | | | | | | | | | | | | |
Demand deposits | | | 79,733 | | | | | | | | | 66,829 | | | | | | | | | 57,762 | | | | | | |
Other | | | 6,237 | | | | | | | | | 5,124 | | | | | | | | | 4,085 | | | | | | |
| | | | | | | | | | | | | | | | | | | | | | | | | | | |
Total Liabilities | | | 645,543 | | | | | | | | | 499,169 | | | | | | | | | 449,610 | | | | | | |
Shareholders’ Equity | | | 77,028 | | | | | | | | | 53,423 | | | | | | | | | 46,309 | | | | | | |
| | | | | | | | | | | | | | | | | | | | | | | | | | | |
Total | | $ | 722,571 | | | | | 2.63 | | | $ | 552,592 | | | | | 1.84 | | | $ | 495,919 | | | | | 1.50 | |
| | | | | | | | | | | | | | | | | | | | | | | | | | | |
Net interest income / net interest spread | | | | | $ | 28,479 | | 3.85 | % | | | | | $ | 23,562 | | 4.16 | % | | | | | $ | 19,636 | | 3.91 | % |
| | | | | | | | | | | | | | | | | | | | | | | | | | | |
Net interest margin | | | | | | | | 4.32 | % | | | | | | | | 4.55 | % | | | | | | | | 4.21 | % |
| | | | | | | | | | | | | | | | | | | | | | | | | | | |
Tax-Equivalent Net Interest Income
| | | | | | | | | |
| | | December 31, |
(Dollars in thousands) | | 2006 | | 2005 | | 2004 |
GAAP Financial Measurements: | | | | | | | | | |
Interest income—securities and other investment income | | $ | 4,702 | | $ | 3,888 | | $ | 3,661 |
Interest income—loans | | | 40,086 | | | 28,527 | | | 22,231 |
Interest expense—deposits | | | 14,189 | | | 7,291 | | | 5,201 |
Interest expense—borrowings | | | 3,182 | | | 2,246 | | | 1,785 |
| | | | | | | | | |
Net interest income | | | 27,417 | | | 22,878 | | | 18,906 |
| | | |
Non-GAAP Financial Measurements: | | | | | | | | | |
Add: tax benefit on tax-exempt investment securities | | $ | 682 | | $ | 587 | | $ | 622 |
Add: tax benefit on tax-exempt loans | | | 380 | | | 97 | | | 108 |
| | | | | | | | | |
Total tax benefit on tax-exempt interest income | | | 1,062 | | | 684 | | | 730 |
| | | | | | | | | |
Tax-equivalent net interest income | | $ | 28,479 | | $ | 23,562 | | $ | 19,636 |
| | | | | | | | | |
- 31 -
Noninterest Income and Expenses
Other income and other expenses showed significant increases during 2006 with the inclusion of First National for the last eight months of the year being an obvious factor.
Other income, excluding securities gains, increased $1,923,000, or 21.1%, in 2006. The majority of the increase was due to service charges on deposit accounts which increased $856,000. Included in service charges on deposits was a $590,000 increase in bounce protection fees due to the continued popularity of that program. Consumer spending habits continue to change and that change contributed to a $138,000 increase in debit card fees; while an increased focus on our merchant accounts helped to grow revenue by $122,000. ATM fees rose by $173,000 reflecting increased consumer utilization and the addition of First National’s machines. Although our secondary mortgage market program is still growing, it is not growing at the extremely fast rate that occurred in 2005. As opportunities were fewer in 2006 than 2005, revenues on secondary market mortgages declined by $170,000. Orrstown Financial Advisors contributed to other income as trust department income increased by $151,000 and brokerage income increased by $392,000 over 2005 due, in part, to the acquisition of an investment management firm purchased in August 2005 that was fully phased in during 2006. The 108% increase in cash value buildup on life insurance arose via the acquisition of additional policies plus the inclusion of First National’s policies during 2006. Our investment in bank owned life insurance remains well within regulatory guidelines. The Corporation had net securities gains in 2006 of $41,000 and net securities losses in 2005 of $60,000.
Total operating expenses increased $4,231,000, or 24.3%, over 2005. The acquisition of First National added $2,296,000 to operating expenses in 2006 and the organic growth of the Corporation generally contributed the rest of the increase. Throughout the year, the Corporation expanded its employee base which increased the salary expense by $2,313,000, or 38.4%. Employee benefits increased 49.4% or $1,290,000 over 2005, with health care costs leading the way.
Occupancy and equipment costs rose 25.6%, or $684,000, versus 2005. Approximately half of that, or $354,000, was due to the inclusion of First National’s building and equipment expenses. Increases in depreciation expense amounted to $218,000 overall due to the acquisition of the four offices in Perry County, the addition of the Hagerstown, Maryland office in March 2006, the purchase of a branch in Mechanicsburg in October 2006 from another bank, and the movement of the Greencastle office to a new facility in June 2006. Maintenance agreements and equipment repairs are becoming a larger expense for the Corporation as we continue to grow. Occupancy and equipment will continue to see increases in 2007 as we expand our presence in the Hagerstown market with a planned branch and remodel and expand some of our current offices, including our original office in Orrstown, Pennsylvania.
Data processing fees were up 24.7% during the year. The merchant program continues to grow and the change in processors during early 2006 helped contain processing costs increases. Merchant processing fees grew by $60,000 over 2005 levels. Trust core processing fees increased $24,000 and other processing fees increased by $89,000, including payroll processing and residual data processing fees of $59,000 for First National’s core processing before conversion.
The addition of intangibles from the acquisition of First National contributed to the increased amortization expense of $112,000. Other operating expenses declined over 2005 by $750,000 however, primarily due to the deferral of loan origination costs accompanied by our robust loan growth. An additional $1,352,000 of loan origination costs were deferred in 2006 versus 2005.
Despite the overall growth in noninterest expenses and the acquisition of First National, the Corporation was able to maintain an enviable efficiency ratio for 2006 of 54.0%. Efficiency ratios of 52.9% and 55.2% had been generated during 2005 and 2004, respectively. SNL Financial reports average efficiency ratios of approximately 64.5% for the industry and for banks in our peer size. The table that follows provides additional information regarding noninterest income and noninterest expense changes over the past three years:
ANALYSES OF NONINTEREST INCOME AND EXPENSES
| | | | | | | | | | | | | | | | |
| | | Year Ended December 31, | | % Change | |
(Dollars in thousands) | | 2006 | | 2005 | | | 2004 | | 2006-2005 | | | 2005-2004 | |
Other Income | | | | | | | | | | | | | | | | |
Service charges on deposit accounts | | $ | 4,671 | | $ | 3,815 | | | $ | 3,066 | | 22.4 | % | | 24.4 | % |
Loan service charges and fees | | | 1,363 | | | 1,436 | | | | 688 | | -5.1 | % | | 108.7 | % |
ATM fees | | | 405 | | | 232 | | | | 227 | | 74.6 | % | | 2.2 | % |
Other service charges, commissions and fees | | | 153 | | | 92 | | | | 101 | | 66.3 | % | | -8.9 | % |
Trust department income | | | 2,325 | | | 2,174 | | | | 1,863 | | 6.9 | % | | 16.7 | % |
Brokerage income | | | 1,382 | | | 990 | | | | 608 | | 39.6 | % | | 62.8 | % |
Cash surrender value increases | | | 564 | | | 271 | | | | 282 | | 108.1 | % | | -3.9 | % |
Other operating income | | | 179 | | | 109 | | | | 46 | | 64.2 | % | | 137.0 | % |
| | | | | | | | | | | | | | | | |
Subtotal before securities transactions | | | 11,042 | | | 9,119 | | | | 6,881 | | 21.1 | % | | 32.5 | % |
Securities gains (losses) | | | 41 | | | (60 | ) | | | 88 | | -168.3 | % | | -168.2 | % |
| | | | | | | | | | | | | | | | |
Total other income | | $ | 11,083 | | $ | 9,059 | | | $ | 6,969 | | 22.3 | % | | 30.0 | % |
| | | | | | | | | | | | | | | | |
- 32 -
ANALYSES OF NONINTEREST INCOME AND EXPENSES (Continued)
| | | | | | | | | | | | | | | | | | |
| | | Year Ended December 31, | | | % Change | |
(Dollars in thousands) | | 2006 | | | 2005 | | | 2004 | | | 2006-2005 | | | 2005-2004 | |
Other Expenses | | | | | | | | | | | | | | | | | | |
Salaries | | | 8,341 | | | | 6,028 | | | | 5,117 | | | 38.4 | % | | 17.8 | % |
Incentive compensation | | | 775 | | | | 620 | | | | 531 | | | 25.0 | % | | 16.8 | % |
Employee benefits | | | 3,899 | | | | 2,609 | | | | 2,261 | | | 49.4 | % | | 15.4 | % |
Occupancy and equipment | | | 3,357 | | | | 2,673 | | | | 2,398 | | | 25.6 | % | | 11.5 | % |
Data processing | | | 873 | | | | 700 | | | | 582 | | | 24.7 | % | | 20.3 | % |
ATM expense | | | 206 | | | | 142 | | | | 142 | | | 45.1 | % | | 0.0 | % |
Telephone | | | 350 | | | | 277 | | | | 259 | | | 26.4 | % | | 6.9 | % |
Printing and supplies | | | 487 | | | | 335 | | | | 239 | | | 45.4 | % | | 40.2 | % |
Postage | | | 274 | | | | 217 | | | | 187 | | | 26.3 | % | | 16.0 | % |
Directors fees | | | 405 | | | | 362 | | | | 326 | | | 11.9 | % | | 11.0 | % |
Advertising | | | 406 | | | | 362 | | | | 291 | | | 12.2 | % | | 24.4 | % |
Pennsylvania shares tax | | | 445 | | | | 364 | | | | 306 | | | 22.3 | % | | 19.0 | % |
Contributions | | | 299 | | | | 447 | | | | 163 | | | -33.1 | % | | 174.2 | % |
Other operating expenses | | | 1,511 | | | | 2,261 | | | | 1,916 | | | -33.2 | % | | 18.0 | % |
| | | | | | | | | | | | | | | | | | |
Total operating expenses | | $ | 21,628 | | | $ | 17,397 | | | $ | 14,718 | | | 24.3 | % | | 18.2 | % |
| | | | | | | | | | | | | | | | | | |
noninterest income as a % of noninterest expense | | | 51.2 | % | | | 52.1 | % | | | 47.4 | % | | | | | | |
Federal Income Taxes
The Corporation’s effective federal income tax rate for the year ended December 31, 2006 was 29.4% as compared to 30.6% in 2005 and 29.0% in 2004. Increased low income housing credits that arose from investment in community projects helped to minimally lower the effective rate in 2006. Corporate income tax rates for 2007 are forecast to be similar but slightly above 2006 levels due to maturing tax free debt securities and marginally higher rates. The Corporation was pushed into the 35% tax bracket during 2006, an increase from the 34% bracket used in prior years. During 2007, taxable income for the Corporation will be at the 35% rate on average but marginally at the 38% rate.
Asset Quality
The quality of the Corporation’s asset structure continues to be strong. A substantial amount of time is devoted by management to overseeing the investment of funds in loans and securities and the formulation of policies directed toward the profitability and minimization of risk associated with such investments.
Credit Risk Analysis
The Banks follow generally conservative lending practices and they continue to carry high quality loan portfolios with no unusual or undue concentrations of credit. No loans are extended to non domestic borrowers or governments, consistent with past practice and policy. Net charge-offs historically have been quite low, when compared to industry standards, and represented .00% of average outstanding loans during 2006 and .01% of average 2005 loans. Charge-offs for the industry averaged approximately .07% of loans during 2006 and 2005, down from .11% of loans in 2004, per SNL Financial. Nonperforming loans, as represented by nonaccrual and renegotiated loans, were .02% and .01% of outstanding loans at December 31, 2006 and 2005, respectively. Loans 90 days or more past due and still accruing represented .18% and .09% of outstanding loans at December 31, 2006 and 2005, respectively.
Allowance for Loan Losses
Historically, the Corporation has had an enviable record regarding its control of loan losses, but lending is a banking service that inherently contains elements of risk. The Banks’ policies, related to the allowance for loan losses, are considered to be critical accounting policies because the allowance for loan losses represents a particularly sensitive accounting estimate. The amount of the allowance is based on management’s evaluation of the collectibility of the loan portfolio, including the nature of the loan portfolio and loan growth, credit concentrations, trends in historical loss experience, specific impaired loans, and national and local economic conditions. The allowance for loan losses is established through a provision for loan losses charged to expense. Loans are charged against the allowance for loan losses when management believes that the collectibility of the principal is unlikely. The allowance is an amount that
- 33 -
management believes will be adequate to absorb possible losses on existing loans that may become uncollectible, based on evaluations of the collectibility of loans and prior loan loss experience. The evaluations take into consideration such factors as changes in the nature and volume of the loan portfolio, charge-offs and recoveries in total, overall portfolio quality, review of specific problem loans, recent examinations, and current economic conditions that may affect the borrowers’ ability to pay.
Through this review and evaluation process, an amount deemed adequate to meet current growth and future loss expectations is charged to operations. An allowance amount has been established for the acquired credit risk of the loan portfolio less any amounts attributable to loans with credit quality issues acquired in the May 1, 2006 acquisition of The First National Bank of Newport. The provision for loan losses amounted to $390,000, $144,000, and $210,000 for 2006, 2005 and 2004, respectively. These provisions compared to net charge-offs of $18,000, $34,000 and $53,000 for 2006, 2005 and 2004, respectively. The unallocated portion of the reserve was approximately 20.3% at December 31, 2006. The reserve at December 31, 2006 represented 0.89% of loans outstanding, a ratio that has decreased in each of the past four years in recognition of the quality of the loan portfolio. Net charge-offs for 2006 represented .00% of average loans outstanding.
The unallocated portion of the reserve ensures that any additional unforeseen losses that are not otherwise identifiable will be able to be absorbed. It is intended to provide for imprecise estimates in assessing projected losses, uncertainties in economic conditions and allocating pool reserves. Management deems the total of the allocated and unallocated portions of the allowance for loan losses to be adequate to absorb any losses at this time.
SUMMARY OF LOAN LOSS EXPERIENCE
| | | | | | | | | | | | | | | | | | | | |
| | | Year Ended December 31, | |
(Dollars in thousands) | | 2006 | | | 2005 | | | 2004 | | | 2003 | | | 2002 | |
Amount of loans outstanding at end of period | | $ | 618,827 | | | $ | 460,386 | | | $ | 389,268 | | | $ | 345,054 | | | $ | 281,391 | |
| | | | | | | | | | | | | | | | | | | | |
Daily average loans outstanding | | $ | 553,591 | | | $ | 421,728 | | | $ | 369,409 | | | $ | 313,833 | | | $ | 264,296 | |
| | | | | | | | | | | | | | | | | | | | |
Balance of allowance for possible loan losses at beginning of period | | $ | 4,428 | | | $ | 4,318 | | | $ | 4,161 | | | $ | 3,734 | | | $ | 3,104 | |
Loans charged off | | | | | | | | | | | | | | | | | | | | |
Commercial, financial and agricultural | | | 12 | | | | 0 | | | | 21 | | | | 4 | | | | 0 | |
Real estate | | | 0 | | | | 30 | | | | 9 | | | | 13 | | | | 48 | |
Consumer | | | 85 | | | | 52 | | | | 55 | | | | 64 | | | | 53 | |
| | | | | | | | | | | | | | | | | | | | |
Total loans charged off | | | 97 | | | | 82 | | | | 85 | | | | 81 | | | | 101 | |
| | | | | | | | | | | | | | | | | | | | |
Recoveries of loans previously charged off | | | | | | | | | | | | | | | | | | | | |
Commercial, financial and agricultural | | | 50 | | | | 0 | | | | 0 | | | | 0 | | | | 0 | |
Real estate | | | 7 | | | | 22 | | | | 3 | | | | 3 | | | | 3 | |
Consumer | | | 22 | | | | 26 | | | | 29 | | | | 14 | | | | 8 | |
| | | | | | | | | | | | | | | | | | | | |
Total recoveries | | | 79 | | | | 48 | | | | 32 | | | | 17 | | | | 11 | |
| | | | | | | | | | | | | | | | | | | | |
Net loans charged off (recovered) | | | 18 | | | | 34 | | | | 53 | | | | 64 | | | | 90 | |
Additions to allowance charged to expense | | | 390 | | | | 144 | | | | 210 | | | | 491 | | | | 720 | |
Additions established for acquired credit risk | | | 720 | | | | 0 | | | | 0 | | | | 0 | | | | 0 | |
| | | | | | | | | | | | | | | | | | | | |
Balance at end of period | | $ | 5,520 | | | $ | 4,428 | | | $ | 4,318 | | | $ | 4,161 | | | $ | 3,734 | |
| | | | | | | | | | | | | | | | | | | | |
Ratio of net charge-offs to average loans outstanding | | | 0.00 | % | | | 0.01 | % | | | 0.01 | % | | | 0.02 | % | | | 0.03 | % |
| | | | | | | | | | | | | | | | | | | | |
Ratio of reserve to gross loans outstanding at December 31 | | | 0.89 | % | | | 0.96 | % | | | 1.11 | % | | | 1.21 | % | | | 1.33 | % |
| | | | | | | | | | | | | | | | | | | | |
Risk Elements
Nonperforming assets are comprised of nonaccrual and restructured loans and other real estate owned (OREO) not including bank premises. OREO represents property acquired through foreclosure or settlements of loans and is carried at the lower of the principal amount of the loan outstanding at the time acquired or the estimated fair value of the property. The excess, if any, of the principal balance at the time acquired over the carrying amount is charged against the reserve for loan losses. Nonaccrual loans are loans for which interest income is not accrued due to concerns about the collectibility of interest and/or principal. Restructured loans are loans whose terms have been renegotiated to provide a reduction or deferral of interest or principal because of deterioration in the financial position of the borrower. Other credit risk elements include loans past due for 90 days or more. The Corporation’s loan loss history has been much better than
- 34 -
peer standards and analysis of the current credit risk position is favorable. The allowance for loan losses is ample given the current composition of the loan portfolio and adequately covers the credit risk management sees under present economic conditions. Management is prepared to make any reserve adjustments that may become necessary as economic conditions change.
NONPERFORMING ASSETS
| | | | | | | | | | | | | | | | | | | | |
| | | December 31, | |
(Dollars in thousands) | | 2006 | | | 2005 | | | 2004 | | | 2003 | | | 2002 | |
Loans on nonaccrual (cash) basis | | $ | 120 | | | $ | 52 | | | $ | 314 | | | $ | 130 | | | $ | 85 | |
Loans whose terms have been renegotiated to provide a reduction or deferral of interest or principal because of a deterioration in the financial position of the borrower | | | 0 | | | | 0 | | | | 0 | | | | 1,410 | | | | 1,428 | |
OREO | | | 318 | | | | 1,754 | | | | 0 | | | | 211 | | | | 211 | |
| | | | | | | | | | | | | | | | | | | | |
Total nonperforming loans and OREO | | $ | 438 | | | $ | 1,806 | | | $ | 314 | | | $ | 1,751 | | | $ | 1,724 | |
| | | | | | | | | | | | | | | | | | | | |
Ratio of nonperforming assets to total loans and OREO | | | 0.07 | % | | | 0.39 | % | | | 0.08 | % | | | 0.51 | % | | | 0.61 | % |
| | | | | | | | | | | | | | | | | | | | |
Ratio of nonperforming assets to total assets | | | 0.05 | % | | | 0.30 | % | | | 0.06 | % | | | 0.37 | % | | | 0.42 | % |
| | | | | | | | | | | | | | | | | | | | |
OTHER CREDIT RISK ELEMENTS: | | | | | | | | | | | | | | | | | | | | |
Loans past due 90 or more days and still accruing | | $ | 1,084 | | | $ | 411 | | | $ | 2,550 | | | $ | 2,743 | | | $ | 1,446 | |
| | | | | | | | | | | | | | | | | | | | |
Ratio of other credit risk elements to total loans and OREO | | | 0.18 | % | | | 0.09 | % | | | 0.66 | % | | | 0.79 | % | | | 0.51 | % |
| | | | | | | | | | | | | | | | | | | | |
Ratio of other credit risk elements to total assets | | | 0.13 | % | | | 0.07 | % | | | 0.50 | % | | | 0.58 | % | | | 0.35 | % |
| | | | | | | | | | | | | | | | | | | | |
Total nonperforming and other risk assets | | $ | 1,522 | | | $ | 2,217 | | | $ | 2,864 | | | $ | 4,494 | | | $ | 3,170 | |
| | | | | | | | | | | | | | | | | | | | |
Ratio of total risk assets to total loans and OREO | | | 0.25 | % | | | 0.48 | % | | | 0.74 | % | | | 1.30 | % | | | 1.13 | % |
| | | | | | | | | | | | | | | | | | | | |
Ratio of total risk assets to total assets | | | 0.19 | % | | | 0.37 | % | | | 0.56 | % | | | 0.95 | % | | | 0.77 | % |
| | | | | | | | | | | | | | | | | | | | |
Liquidity, Rate Sensitivity and Interest Rate Risk Analysis
The primary function of asset/liability management is to assure adequate liquidity and sensitivity to changing interest rates. Liquidity management involves the ability to meet the cash flow requirements of customers who may be either depositors wanting to withdraw funds or borrowers needing assurance that sufficient funds will be available to meet their credit needs. Interest rate sensitivity management requires the maintenance of an appropriate balance between interest sensitive assets and liabilities. Interest bearing assets and liabilities that are maturing or repricing should be adequately balanced to avoid fluctuating net interest margins and to enhance consistent growth of net interest income through periods of changing interest rates.
The Corporation has consistently followed a strategy of pricing assets and liabilities according to prevailing market rates while largely matching maturities, within the guidelines of sound marketing and competitive practices. The goal is to maintain a predominantly matched position with very few planned mismatches. Rate spreads will be sacrificed at times in order to enable the overall rate sensitivity position to stay within the guidelines called for by asset/liability management policy. Rate sensitivity is measured by monthly gap analyses, quarterly rate shocks, and periodic simulation. Investment and pricing decisions are made using both liquidity and sensitivity analyses as tools. The schedule that follows reflects the degree to which the Corporation can adjust its various portfolios to meet interest rate changes. Additionally, the Banks are Federal Home Loan Bank (FHLB) members, and standard credit arrangements available to FHLB members provide increased liquidity.
- 35 -
RATE SENSITIVITY ANALYSIS AT DECEMBER 31, 2006
| | | | | | | | | | | | | | | | | | | |
| | | Interest Sensitivity Period |
(Dollars in thousands) | | Within 3
Months | | | After 3 Within 6
Months | | | After 6 Within 12
Months | | | After 1 Year | | | Total |
Rate Sensitive Assets (RSA) | | | | | | | | | | | | | | | | | | | |
Loans | | $ | 215,824 | | | $ | 12,641 | | | $ | 23,521 | | | $ | 366,842 | | | $ | 618,828 |
Investment securities | | | 7,702 | | | | 6,777 | | | | 12,948 | | | | 63,965 | | | | 91,392 |
Other earning assets | | | 19,299 | | | | 0 | | | | 0 | | | | 0 | | | | 19,299 |
| | | | | | | | | | | | | | | | | | | |
Total RSA | | $ | 242,825 | | | $ | 19,418 | | | $ | 36,469 | | | $ | 430,807 | | | $ | 729,519 |
| | | | | | | | | | | | | | | | | | | |
Rate Sensitive Liabilities (RSL) | | | | | | | | | | | | | | | | | | | |
Interest bearing deposits | | $ | 178,127 | | | $ | 54,707 | | | $ | 66,151 | | | $ | 254,314 | | | $ | 553,299 |
Short term borrowed funds | | | 41,703 | | | | 0 | | | | 0 | | | | 0 | | | | 41,703 |
Long term borrowed funds | | | 0 | | | | 0 | | | | 0 | | | | 32,440 | | | | 32,440 |
| | | | | | | | | | | | | | | | | | | |
Total RSL | | $ | 219,830 | | | $ | 54,707 | | | $ | 66,151 | | | $ | 286,754 | | | $ | 627,442 |
| | | | | | | | | | | | | | | | | | | |
Rate Sensitive GAP | | | | | | | | | | | | | | | | | | | |
Period | | $ | 22,995 | | | $ | (35,289 | ) | | $ | (29,682 | ) | | $ | 144,053 | | | $ | 102,077 |
Cumulative | | $ | 22,995 | | | $ | (12,294 | ) | | $ | (41,976 | ) | | $ | 102,077 | | | | |
GAP as a Percent of Total Assets | | | | | | | | | | | | | | | | | | | |
Period | | | 2.84 | % | | | -4.36 | % | | | -3.67 | % | | | 17.81 | % | | | |
Cumulative | | | 2.84 | % | | | -1.52 | % | | | -5.19 | % | | | 12.62 | % | | | |
RSA/RSL cumulative | | | 1.10 | % | | | 0.96 | % | | | 0.88 | % | | | 1.16 | % | | | |
The asset biased, or positive, gap position indicates that earnings are naturally enhanced, or more easily maintained, in a rising rate environment. The cumulative RSA/RSL at December 31, 2006 is 1.10% at three months, 0.96% at six months and 0.88% at twelve months, so the Corporation enjoys a closely balanced position that does not place it at undue risk under any interest rate scenario. Many of the interest bearing deposits that are variable rate are subject to discretionary pricing so management retains flexibility with those funds. This indicates that the balance sheet is well positioned to react to rate changes in either direction during 2007.
Capital Adequacy and Regulatory Matters
The Corporation maintains a strong capital base which provides adequate resources to absorb both normal and unusual risks inherent to the banking business. Internal capital generation has been supported primarily by net income retained after the declaration of dividends but also through the exercise of options and employee stock purchases. Total shareholders’ equity rose $32,078,000 during 2006, an increase of 56.0% since December 31, 2005. This followed growth of 16.4% and 15.0% during 2005 and 2004, respectively. Growth in 2006 was significantly enhanced by the First National acquisition.
At May 1, 2006 Orrstown Financial Services, Inc. issued 699,949 shares to complete the acquisition of First National, resulting in an additional $24,841,000 in shareholders’ equity. The purchase price assigned to shares issued was based on the average closing prices of Orrstown Financial Services, Inc.’s common stock 2-days before and 2 days after the announcement date between the Corporation and First National.
Unrealized gain on securities increased $320,000 between December 31, 2005 and December 31, 2006 and treasury stock purchases of $543,000 were completed during 2006. The Board of Directors temporarily suspended the Corporation’s Dividend Reinvestment Plan effective with the first quarter dividend of 2006. All other growth experienced during 2006 has been supported by capital growth in the form of retained earnings. Equity represented 11.05% of assets at December 31, 2006 which is up from 9.53% at December 31, 2005. The equity to asset ratio was enhanced with the addition of the well capitalized First National along with the included purchase accounting adjustments. The increasing earnings stream during this period has allowed the Corporation to steadily increase cash dividends paid to shareholders. In 2006, cash dividends rose $1,505,000 or 47.7% over 2005 levels while net income rose 16.5% during the same period. This followed a 23.5% increase in dividend payout for 2005 versus 2004. Dividends per share have moved from $0.476 to $0.583 to $0.78 for 2004 through 2006, respectively.
- 36 -
CAPITAL AND DIVIDEND RATIOS
| | | | | | | | | | | | |
(Dollars in thousands) | | 2006 | | | 2005 | | | 2004 | |
At December 31: | | | | | | | | | | | | |
Shareholders’ equity | | $ | 89,388 | | | $ | 57,310 | | | $ | 49,250 | |
Equity / assets | | | 11.05 | % | | | 9.53 | % | | | 9.57 | % |
For the Year: | | | | | | | | | | | | |
Average equity / average assets | | | 10.66 | % | | | 9.67 | % | | | 9.34 | % |
Dividend payout | | | 40.07 | % | | | 31.62 | % | | | 32.89 | % |
Return on average equity | | | 15.10 | % | | | 18.69 | % | | | 16.78 | % |
Return on average tangible equity | | | 18.78 | % | | | 19.28 | % | | | 17.09 | % |
Dividends paid | | $ | 4,662 | | | $ | 3,157 | | | $ | 2,556 | |
| | | | | | | | | | | | | | | |
| | | Orrstown Financial Services | | | Regulatory Requirements | |
| | | 2006 | | | 2005 | | | 2004 | | | Minimum | | | Well
Capitalized | |
Regulatory Capital Measures: | | | | | | | | | | | | | | | |
Leverage ratio | | 8.6 | % | | 9.5 | % | | 9.3 | % | | 4.0 | % | | 5.0 | % |
Tier I capital ratio | | 11.0 | % | | 11.8 | % | | 12.2 | % | | 4.0 | % | | 6.0 | % |
Total (Tier I and Tier II) capital ratio | | 12.0 | % | | 12.8 | % | | 13.4 | % | | 8.0 | % | | 10.0 | % |
The maintenance of a strong capital base, well above regulatory risk based minimums and industry averages, has been an integral part of the Corporation’s operating philosophy. Management foresees no problem in maintaining capital ratios comfortably in excess of regulatory requirements.
The Corporation and its banking subsidiaries are subject to periodic examinations by the Federal Reserve Bank, the Pennsylvania Department of Banking and the OCC. During 2006, an examination was conducted at Orrstown Bank that included, but was not limited to, competency of management, earnings performance, capital adequacy, asset quality, liquidity provisions, sensitivity to market risk and asset/liability management. No comments were received from regulatory agencies which, if implemented, would have a material effect on Orrstown Financial Services, Inc.’s liquidity, capital resources, or operations.
Future Impact of Recently Issued Accounting Standards
On March 17, 2006, the Financial Accounting Standards Board (FASB) issued Statement of Financial Accounting Standards (SFAS) No. 156, “Accounting for Servicing of Financial Assets.” The new Standard, which is an amendment to SFAS No. 140, addresses the recognition and measurement of separately recognized servicing assets and liabilities and provides an approach to simplify efforts to obtain hedge-like (offset) accounting. It also permits an entity with a separately recognized servicing asset or liability to choose either the Amortization Method or Fair Value Method for subsequent measurement. This standard is effective for all separately recognized servicing asset and liabilities acquired or issued after the beginning of an entity’s fiscal year that begins after September 15, 2006, with early adoption permitted. The Corporation does not expect the implementation of SFAS 156 to have a material impact on its financial statements.
In July 2006, the FASB issued Interpretation No. 48, “Accounting for Uncertainty in Income Taxes: An Interpretation of FASB Statement No. 109” (FIN 48). FIN 48 clarifies the accounting for uncertainty in income taxes recognized in an entity’s financial statements in accordance with SFAS 109. The Interpretation prescribes a recognition threshold and measurement principles for the financial statement recognition and measurement of tax positions taken or expected to be taken on a tax return. FIN 48 is effective for fiscal years beginning after December 15, 2006. The Corporation does not expect the implementation of FIN 48 to have a material impact on its financial statements.
In September 2006, the FASB issued Statement of Financial Accounting Standards No. 157, “Fair Value Measurements” (SFAS 157). SFAS 157 defines fair value, establishes a framework for measuring fair value in generally accepted accounting principles, and expands disclosures about fair value measurements. SFAS 157 does not require any new fair value measurements but may change current practice for some entities. This Statement is effective for financial statements issued for fiscal years beginning after November 15, 2007 and interim periods within those years. The Corporation does not expect the implementation of SFAS 157 to have a material impact on its financial statements.
In September 2006, the Securities and Exchange Commission issued Staff Accounting Bulletin (SAB) 108, “Considering the Effects of Prior Year Misstatements when Quantifying Misstatements in Current Year Financial Statements.” SAB 108 provides guidance on how prior year misstatements should be taken into consideration when quantifying misstatements in current year financial statements for purposes of determining whether the current year’s financial statements are materially misstated. SAB 108 is effective for fiscal years ending on or after November 15, 2006. The adoption of SAB 108 is not expected to have a material impact on the Corporation’s financial statements.
- 37 -
In February 2007, the FASB issued SFAS No. 159, “The Fair Value Option for Financial Assets and Financial Liabilities.” The fair value option established by this SFAS permits all entities to choose to measure eligible items at fair value at specified election dates. A business entity shall report unrealized gains and losses on items for which the fair value option has been elected in earnings at each subsequent reporting date. This SFAS is effective for fiscal years beginning after November 15, 2007. Early adoption is permitted as of the fiscal year that begins before November 15, 2007, provided the entity also elects to apply the provisions of SFAS No. 157, “Fair Value Measurement.” The Corporation is currently evaluating the potential impact, if any, of the adoption of SFAS No. 159 on their consolidated financial position, results of operations and cash flows.
Important Factors Relating to Forward Looking Statements
This Report contains statements that are considered “forward-looking statements” as defined in the Private Securities Litigation Reform Act of 1995. In addition, the Corporation may make other written and oral communications from time to time that contain such statements. Forward-looking statements, including statements as to industry trends, future expectations and other matters that do not relate strictly to historical facts, are based on certain assumptions by management, and are often identified by words or phrases such as “anticipated”, “believe”, “expect”, “intend”, “seek”, “plan”, “objective”, “trend”, and “goal”. Forward-looking statements are subject to various assumptions, risks, and uncertainties, which change over time, and speak only as of the date they are made.
The Corporation undertakes no obligation to update any forward-looking statements. Actual results could differ materially from those anticipated in forward-looking statements and future results could differ materially from historical performance. In addition to factors mentioned elsewhere in this Report or previously disclosed in our SEC reports (accessible on the SEC’s website at www.sec.gov or on our website at www.orrstown.com), the following factors, among others, could cause actual results to differ materially from forward-looking statements and future results could differ materially from historical performance:
| | • | | general political and economic conditions may be less favorable than expected; |
| | • | | developments concerning credit quality in various corporate lending industry sectors as well as consumer and other types of credit, may result in an increase in the level of our provision for credit losses, nonperforming assets, net charge-offs and reserve for credit losses; |
| | • | | customer borrowing, repayment, investment, and deposit practices generally may be less favorable than anticipated; and interest rate and currency fluctuations, equity and bond market fluctuations, and inflation may be greater than expected; |
| | • | | the mix of interest rates and maturities of our interest earning assets and interest bearing liabilities (primarily loans and deposits) may be less favorable than expected; |
| | • | | competitive product and pricing pressures among financial institutions within our markets may increase; |
| | • | | legislative or regulatory developments, including changes in laws or regulations concerning taxes, banking, securities, capital requirements and risk-based capital guidelines, reserve methodologies, deposit insurance and other aspects of the financial services industry, may adversely affect the businesses in which we are engaged or our financial results; |
| | • | | legal and regulatory proceedings and related matters with respect to the financial services industry, including those directly involving the Corporation and its subsidiaries, could adversely affect the Corporation or the financial services industry generally; |
| | • | | pending and proposed changes in accounting rules, policies, practices, and procedures could adversely affect our financial results; |
| | • | | instruments and strategies used to manage exposure to various types of market and credit risk could be less effective than anticipated, and we may not be able to effectively mitigate our risk exposures in particular market environments or against particular types of risk; |
| | • | | terrorist activities or other hostilities, including the situation surrounding Iraq, may adversely affect the general economy, financial and capital markets, specific industries, and the Corporation; and |
| | • | | technological changes may be more difficult or expensive than anticipated. |
- 38 -
PERFORMANCE GRAPH
The following graph shows a five-year comparison of the cumulative total return on the Corporation’s common stock as compared to other indexes: the SNL index of banks with assets between $500 million and $1 billion, the S&P 500 Index, and the NASDAQ Composite index. Shareholder returns on the Corporation’s common stock are based upon trades reported by the National Association of Securities Dealers’ Inc.’s OTC Bulletin Board service. The Corporation is not aware of all prices at which shares traded during such periods. The shareholder returns shown in the graph are not necessarily indicative of future performance. The performance illustrated assumes that $100 was invested in the Corporations common stock and each index on December 31, 2001 and that all dividends were reinvested.
Orrstown Financial Services, Inc.
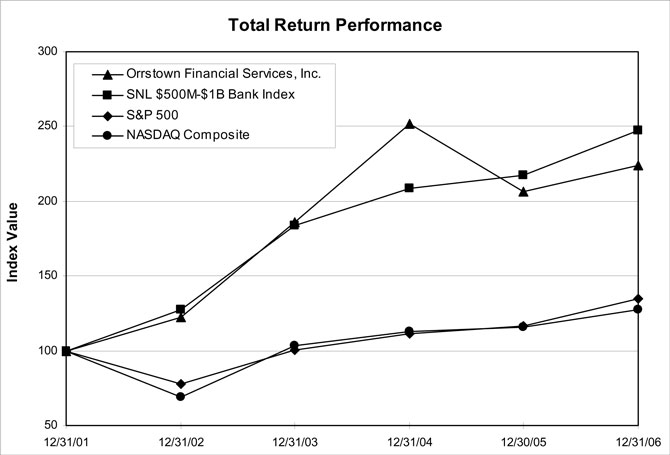
| | | | | | | | | | | | |
| | | Period Ending |
Index | | 12/31/01 | | 12/31/02 | | 12/31/03 | | 12/31/04 | | 12/30/05 | | 12/31/06 |
Orrstown Financial Services, Inc. | | 100.00 | | 122.49 | | 185.99 | | 252.05 | | 206.65 | | 223.67 |
SNL $500M-$1B Bank Index | | 100.00 | | 127.67 | | 184.09 | | 208.62 | | 217.57 | | 247.44 |
S&P 500 | | 100.00 | | 77.90 | | 100.24 | | 111.14 | | 116.59 | | 135.00 |
NASDAQ Composite | | 100.00 | | 68.76 | | 103.67 | | 113.16 | | 115.57 | | 127.58 |
- 39 -
SUMMARY OF QUARTERLY FINANCIAL DATA
The unaudited quarterly results of operations for the years ended December 31, are as follows:
| | | | | | | | | | | | | | | | | | | | | | | | | | | | | | | | |
| | | 2006 | | | 2005 | |
| | | Quarter Ended | | | Quarter Ended | |
(Dollars in thousands) | | March | | | June | | | September | | | December | | | March | | | June | | | September | | | December | |
Interest income | | $ | 9,080 | | | $ | 10,845 | | | $ | 12,274 | | | $ | 12,589 | | | $ | 7,219 | | | $ | 7,805 | | | $ | 8,425 | | | $ | 8,966 | |
Interest expense | | | 3,206 | | | | 3,980 | | | | 4,915 | | | | 5,270 | | | | 1,961 | | | | 2,209 | | | | 2,563 | | | | 2,804 | |
| | | | | | | | | | | | | | | | | | | | | | | | | | | | | | | | |
Net interest income | | | 5,874 | | | | 6,865 | | | | 7,359 | | | | 7,319 | | | | 5,258 | | | | 5,596 | | | | 5,862 | | | | 6,162 | |
Provision for loan losses | | | 36 | | | | 36 | | | | 36 | | | | 282 | | | | 24 | | | | 24 | | | | 24 | | | | 72 | |
| | | | | | | | | | | | | | | | | | | | | | | | | | | | | | | | |
Net interest income after provision for loan losses | | | 5,838 | | | | 6,829 | | | | 7,323 | | | | 7,037 | | | | 5,234 | | | | 5,572 | | | | 5,838 | | | | 6,090 | |
Securities gains (losses) | | | 2 | | | | 10 | | | | 27 | | | | 2 | | | | (2 | ) | | | 0 | | | | 13 | | | | (71 | ) |
Other income | | | 2,285 | | | | 2,944 | | | | 2,789 | | | | 3,024 | | | | 1,903 | | | | 2,307 | | | | 2,727 | | | | 2,182 | |
Other expense | | | 4,548 | | | | 5,350 | | | | 5,865 | | | | 5,865 | | | | 4,027 | | | | 4,144 | | | | 4,627 | | | | 4,599 | |
| | | | | | | | | | | | | | | | | | | | | | | | | | | | | | | | |
Income before income taxes | | | 3,577 | | | | 4,433 | | | | 4,274 | | | | 4,198 | | | | 3,108 | | | | 3,735 | | | | 3,951 | | | | 3,602 | |
Applicable income taxes | | | 1,079 | | | | 1,287 | | | | 1,270 | | | | 1,214 | | | | 937 | | | | 1,175 | | | | 1,189 | | | | 1,108 | |
| | | | | | | | | | | | | | | | | | | | | | | | | | | | | | | | |
Net income | | $ | 2,498 | | | $ | 3,146 | | | $ | 3,004 | | | $ | 2,984 | | | $ | 2,171 | | | $ | 2,560 | | | $ | 2,762 | | | $ | 2,494 | |
| | | | | | | | | | | | | | | | | | | | | | | | | | | | | | | | |
Per Common Share Data | | | | | | | | | | | | | | | | | | | | | | | | | | | | | | | | |
Net income | | $ | 0.46 | | | $ | 0.53 | | | $ | 0.49 | | | $ | 0.49 | | | $ | 0.40 | | | $ | 0.48 | | | $ | 0.51 | | | $ | 0.46 | |
Diluted net income | | $ | 0.44 | | | $ | 0.51 | | | $ | 0.47 | | | $ | 0.47 | | | $ | 0.39 | | | $ | 0.45 | | | $ | 0.49 | | | $ | 0.44 | |
Dividends | | | 0.18 | | | | 0.20 | | | | 0.20 | | | | 0.20 | | | | 0.133 | | | | 0.140 | | | | 0.150 | | | | 0.160 | |
| | | | | | | | |
Performance Statistics | | | | | | | | | | | | | | | | | | | | | | | | | | | | | | | | |
Return on average assets | | | 1.69 | % | | | 1.79 | % | | | 1.52 | % | | | 1.48 | % | | | 1.70 | % | | | 1.90 | % | | | 1.92 | % | | | 1.71 | % |
Return on average tangible assets | | | 1.70 | % | | | 1.83 | % | | | 1.56 | % | | | 1.52 | % | | | 1.70 | % | | | 1.90 | % | | | 1.92 | % | | | 1.72 | % |
Return on average equity | | | 17.55 | % | | | 16.54 | % | | | 13.92 | % | | | 13.44 | % | | | 17.43 | % | | | 19.73 | % | | | 20.04 | % | | | 17.55 | % |
Return on average tangible equity | | | 18.16 | % | | | 20.55 | % | | | 18.64 | % | | | 17.81 | % | | | 17.94 | % | | | 20.27 | % | | | 20.71 | % | | | 18.17 | % |
Average equity / avg. assets | | | 9.64 | % | | | 10.81 | % | | | 10.92 | % | | | 11.03 | % | | | 9.74 | % | | | 9.61 | % | | | 9.57 | % | | | 9.76 | % |
All per share amounts have been adjusted to give retroactive recognition to a 5% stock dividend paid June 29, 2005.
- 40 -
SELECTED FIVE -YEAR FINANCIAL DATA
ORRSTOWN FINANCIAL SERVICES, INC. AND ITS WHOLLY-OWNED SUBSIDIARIES
| | | | | | | | | | | | | | | | | | | | |
| | | Year Ended December 31, | |
(Dollars in thousands) | | 2006 | | | 2005 | | | 2004 | | | 2003 | | | 2002 | |
Summary of Operations | | | | | | | | | | | | | | | | | | | | |
Interest income | | $ | 44,788 | | | $ | 32,415 | | | $ | 25,892 | | | $ | 23,484 | | | $ | 23,173 | |
Interest expense | | | 17,371 | | | | 9,537 | | | | 6,986 | | | | 6,757 | | | | 7,985 | |
| | | | | | | | | | | | | | | | | | | | |
Net interest income | | | 27,417 | | | | 22,878 | | | | 18,906 | | | | 16,727 | | | | 15,188 | |
Provision for loan losses | | | 390 | | | | 144 | | | | 210 | | | | 491 | | | | 720 | |
| | | | | | | | | | | | | | | | | | | | |
Net interest income after provision for loan losses | | | 27,027 | | | | 22,734 | | | | 18,696 | | | | 16,236 | | | | 14,468 | |
Securities gains (losses) | | | 41 | | | | (60 | ) | | | 88 | | | | 199 | | | | 21 | |
Other operating income | | | 11,042 | | | | 9,119 | | | | 6,881 | | | | 6,233 | | | | 5,339 | |
Other operating expenses | | | 21,628 | | | | 17,397 | | | | 14,718 | | | | 13,010 | | | | 11,688 | |
| | | | | | | | | | | | | | | | | | | | |
Income before income taxes | | | 16,482 | | | | 14,396 | | | | 10,947 | | | | 9,658 | | | | 8,140 | |
Applicable income tax | | | 4,850 | | | | 4,409 | | | | 3,177 | | | | 2,678 | | | | 2,225 | |
| | | | | | | | | | | | | | | | | | | | |
Net income | | $ | 11,632 | | | $ | 9,987 | | | $ | 7,770 | | | $ | 6,980 | | | $ | 5,915 | |
| | | | | | | | | | | | | | | | | | | | |
Per Common Share Data* | | | | | | | | | | | | | | | | | | | | |
Income before taxes | | $ | 2.79 | | | $ | 2.66 | | | $ | 2.04 | | | $ | 1.82 | | | $ | 1.54 | |
Applicable income taxes | | | 0.82 | | | | 0.82 | | | | 0.59 | | | | 0.50 | | | | 0.42 | |
Net income | | | 1.97 | | | | 1.85 | | | | 1.45 | | | | 1.32 | | | | 1.12 | |
Diluted net income | | | 1.89 | | | | 1.77 | | | | 1.40 | | | | 1.27 | | | | 1.10 | |
Cash dividend paid | | | 0.780 | | | | 0.583 | | | | 0.476 | | | | 0.401 | | | | 0.327 | |
Book value at December 31 | | | 14.57 | | | | 10.54 | | | | 9.15 | | | | 8.04 | | | | 7.18 | |
Average shares outstanding—basic | | | 5,906,646 | | | | 5,407,550 | | | | 5,362,017 | | | | 5,307,089 | | | | 5,271,303 | |
Average shares outstanding—diluted | | | 6,167,422 | | | | 5,636,191 | | | | 5,558,851 | | | | 5,476,292 | | | | 5,390,015 | |
| | | | | |
Stock Price Statistics* | | | | | | | | | | | | | | | | | | | | |
Close | | $ | 36.55 | | | $ | 34.50 | | | $ | 42.86 | | | $ | 31.90 | | | $ | 21.32 | |
High | | | 39.00 | | | | 47.62 | | | | 47.62 | | | | 32.38 | | | | 22.68 | |
Low | | | 31.80 | | | | 34.45 | | | | 30.95 | | | | 21.32 | | | | 17.48 | |
Price earnings ratio at close | | | 18.6 | | | | 18.7 | | | | 29.6 | | | | 24.3 | | | | 19.0 | |
Price to book at close | | | 2.5 | | | | 3.3 | | | | 4.7 | | | | 4.0 | | | | 3.0 | |
| | | | | |
Year-End Balance Sheet Data | | | | | | | | | | | | | | | | | | | | |
Total assets | | $ | 809,031 | | | $ | 601,460 | | | $ | 514,651 | | | $ | 472,393 | | | $ | 410,298 | |
Total loans | | | 618,827 | | | | 460,386 | | | | 389,268 | | | | 345,054 | | | | 281,391 | |
Total investment securities | | | 91,393 | | | | 71,677 | | | | 82,801 | | | | 91,986 | | | | 92,374 | |
Deposits—noninterest bearing | | | 85,420 | | | | 68,697 | | | | 66,784 | | | | 52,276 | | | | 42,704 | |
Deposits—interest bearing | | | 553,299 | | | | 394,125 | | | | 338,579 | | | | 306,367 | | | | 276,464 | |
Total deposits | | | 638,719 | | | | 462,822 | | | | 405,363 | | | | 358,643 | | | | 319,168 | |
Liabilities for borrowed money | | | 74,143 | | | | 76,444 | | | | 55,062 | | | | 66,633 | | | | 49,347 | |
Total shareholders’ equity | | | 89,388 | | | | 57,310 | | | | 49,250 | | | | 42,835 | | | | 37,962 | |
Trust assets under management—market value | | | 404,000 | | | | 368,000 | | | | 349,000 | | | | 294,000 | | | | 231,000 | |
| | | | | |
Performance Statistics | | | | | | | | | | | | | | | | | | | | |
Average equity / average assets | | | 10.66 | % | | | 9.67 | % | | | 9.34 | % | | | 9.13 | % | | | 8.92 | % |
Return on average equity | | | 15.10 | % | | | 18.69 | % | | | 16.78 | % | | | 17.24 | % | | | 17.19 | % |
Return on average tangible equity | | | 18.78 | % | | | 19.28 | % | | | 17.09 | % | | | 17.39 | % | | | 17.40 | % |
Return on average assets | | | 1.61 | % | | | 1.81 | % | | | 1.57 | % | | | 1.57 | % | | | 1.53 | % |
Return on average tangible assets | | | 1.64 | % | | | 1.81 | % | | | 1.57 | % | | | 1.57 | % | | | 1.53 | % |
| * | Per share amounts have been restated to reflect: a 5% stock dividend paid June 29, 2005, a 2-for-1 stock split paid February 10, 2004 and a 5% stock dividend paid May 30, 2003. |
- 41 -
MARKET, DIVIDEND & INVESTOR INFORMATION
Market and Dividend Information
The common stock of Orrstown Financial Services, Inc. is traded in the over-the-counter market under the symbol ORRF. At the close of business December 31, 2006, there were approximately 3,022 shareholders of record, with a total of 6,134,332 shares outstanding. The table below sets forth the range of high and low quarterly sales prices and dividends declared per common share.
| | | | | | | | | | | | | | | | | | |
| | | 2006 | | 2005 |
| | | Market Price | | Market Price |
| | | High | | Low | | Quarterly Dividend | | High | | Low | | Quarterly
Dividend |
First quarter | | $ | 35.70 | | $ | 31.80 | | $ | 0.18 | | $ | 47.62 | | $ | 39.05 | | $ | 0.133 |
Second quarter | | $ | 39.00 | | $ | 32.00 | | $ | 0.20 | | $ | 43.75 | | $ | 37.14 | | $ | 0.140 |
Third quarter | | $ | 38.25 | | $ | 36.50 | | $ | 0.20 | | $ | 42.20 | | $ | 37.55 | | $ | 0.150 |
Fourth quarter | | $ | 39.00 | | $ | 36.55 | | $ | 0.20 | | $ | 37.95 | | $ | 34.45 | | $ | 0.160 |
| | | | | | | | | | | | | | | | | | |
| | | | | | | | $ | 0.78 | | | | | | | | $ | 0.583 |
Investor Information
Annual Meeting
The annual meeting of Orrstown Financial Services, Inc. stockholders is scheduled for May 10, 2007 at 10:00 a.m. at Shippensburg University Conference Center, 500 Newburg Road, Shippensburg, PA 17257. All stockholders are cordially invited to attend.
Annual and Quarterly Reports
Copies of the annual and quarterly reports may be obtained at any office of Orrstown Bank, by writing to Registrar and Transfer Company or by contacting Charlene Feuchtenberger, Orrstown Bank, P.O. Box 250, Shippensburg, PA 17257.
Form 10-K
A copy of the corporation’s Form 10-K, as filed with the Securities and Exchange Commission, may be obtained by writing to Orrstown Bank, P.O. Box 250, Shippensburg, PA 17257.
Transfer Agent
The transfer agent for Orrstown Financial Services, Inc. is Registrar and Transfer Company, 10 Commerce Drive, Cranford, New Jersey 07016-3572. E-mail: info@rtco.com. Internet address: www.rtco.com. Phone (800) 368-5948.
Market Makers
| | |
Ferris, Baker Watts, Inc. | | Ryan, Beck & Co., Inc. |
1405 McFarland Road | | 18 Columbia Turnpike |
Pittsburgh, PA 15216 | | Florham Park, NJ 07932 |
412.306.1730 | | 800.342.2325 |
| |
Boenning & Scattergood, Inc. | | Janney Montgomery Scott, LLC |
Four Tower Bridge | | 1801 Market Street |
200 Barr Harbor Drive, Suite 300 | | 10th Floor |
West Conshohocken, PA 19428 | | Philadelphia, PA 19103 |
800.883.1212 | | 800.526.6397 |
- 42 -