Investor Presentation May 2013 Orrstown Financial Services, Inc. Exhibit 99 |
2 This presentation may contain forward-looking statements as defined in the Private Securities Litigation Reform Act of 1995. Forward- looking statements are statements that include projections, predictions, expectations, or beliefs about events or results or otherwise are not statements of historical facts, including statements related to improving credit, improving core fundamental operations, improving operational efficiency, cost savings, growing core earnings through expense reduction and revenue growth, investments in revenue generating lines of business, preserving capital, serving shareholder returns, expanding core funding, converting non-performing assets to earning assets, being well positioned for selective loan growth, our target efficiency ratio in the next 36 months, our initiatives meeting return on capital minimums, and strong reserve coverage. Actual results and trends could differ materially from those set forth in such statements and there can be no assurances we will: improve credit, improve core fundamental operations, improve operational efficiency, achieve cost savings, grow core earnings, grow our revenues, reduce expenses, expand our business, preserve capital, provide the return that our shareholders may expect, expand core funding, convert non-performing assets to earning assets, grow our loan portfolio, achieve our target efficiency ratio in the next 36 months, or that our initiatives will meet return on capital minimums or that our reserves will be adequate. Factors that could cause actual results to differ from those expressed or implied by the forward-looking statements include, but are not limited to, the following: ineffectiveness of the Company's business strategy due to changes in current or future market conditions; the effects of competition, including industry consolidation and development of competing financial products and services; changes in laws and regulations, including the Dodd-Frank Wall Street Reform and Consumer Protection Act; interest rate movements; changes in credit quality; inability to raise capital under favorable conditions, volatilities in the securities markets, deteriorating economic conditions, and other risks and uncertainties, including those detailed in Orrstown Financial Services, Inc.'s Form 10-K for the fiscal year ended December 31, 2012 and 2011 and Form 10-Qs for the quarters ended March 31, 2012, June 30, 2012, September 30, 2012 and March 31, 2013, and other filings made with the Securities and Exchange Commission. The statements are valid only as of the date hereof and Orrstown Financial Services, Inc. disclaims any obligation to update this information. Forward Looking Information |
3 Orrstown Financial Services, Inc. $1.2 billion in assets Headquartered in Shippensburg, PA 21 locations in Pennsylvania and Maryland • 9 branches in Cumberland • 7 branches in Franklin • 4 branches in Perry • 1 branch in Washington Customer-focused business model with nearly 100 years of success In addition to community banking services, provides trust & investment services to individuals, businesses, non- profits and municipalities (over $1 billion of trust assets as of March 31, 2013) Trades on the NASDAQ under the symbol “ORRF” |
4 Seasoned Leadership Team Thomas R. Quinn, Jr. has served as President, Chief Executive Officer and Director of Orrstown Financial Services, Inc. and of Orrstown Bank since May 2009. Mr. Quinn joined the Bank in March 2009 as President-elect and served in that capacity until he was appointed President and Chief Executive Officer. He served as President and Chief Executive Officer of Fifth Third Bancorp’s South Florida Affiliate from 2005 to July 2008, and in a variety of executive positions with Citigroup and its affiliates from 1992 to 2005. Mr. Quinn is a graduate of Edinboro University of Pennsylvania. Thomas R. Quinn Jr. President & CEO David P. Boyle has served as Executive Vice President and Chief Financial Officer of Orrstown Financial Services, Inc. and Orrstown Bank since August 2012. Mr. Boyle graduated from Westminster College with a degree in Business Administration and Accounting. Mr. Boyle worked as an Accountant for four years at a Big Four accounting firm following graduation before entering the banking field in 1990 as Vice President, Controller at Wayne Bancorp, Inc., in Wooster, Ohio. As his career progressed at Wayne Bancorp, Inc., Mr. Boyle was named Chief Financial Officer in 1995; President, Chief Operating Officer in 1999; and Chairman, President and Chief Executive Officer in 2001. His most recent position was Executive Vice President, Chief Performance Officer at PNC. David P. Boyle Executive VP & CFO Jeffrey M. Seibert began as a Management Trainee and progressed through roles of increasing responsibility prior to joining Peoples State Bank ("Peoples") in 1994. He worked for Peoples, and its successor, Community Banks of Harrisburg as Senior Lender, Chief Credit Officer, and Managing Director of Banking Services. Mr. Seibert served as Chief Operating Officer of Susquehanna Bank, PA, Managing Director of Commercial Banking, and finally President of the Pennsylvania Division. Jeffrey M. Seibert EVP & COO Years Experience Previous Experience 23 Years 22 Years David D. Keim Executive VP & Chief Risk Officer David D. Keim oversees the Enterprise Risk Management function of the Bank and is responsible for the leadership, innovation, governance, and management necessary to identify, evaluate, mitigate, and monitor the Bank's operational and strategic risk. A graduate of Drexel University and the Stonier Graduate School of Banking, Mr. Keim spent the majority of his career in south central Pennsylvania at Susquehanna Bank in roles of increasing responsibility focused on risk management. Robert G. Coradi Senior VP & Chief Credit Officer 32 Years 41+ Years 25 Years Robert G. Coradi is based out of the Bank's North Pointe Operations Center in Chambersburg, PA and oversees the credit administration functions of the organization. With 25 years of banking experience and having held various positions such as Senior Credit Officer, Chief Operating Officer and President & Chief Executive Officer, Mr. Coradi brings extensive experience and knowledge to his position at Orrstown Bank. Mr. Coradi attended Penn State University where he earned his Bachelor's degree in Finance with a Minor in Economics and he attained his MBA from Mt. St. Mary's College with a Finance Concentration. |
5 Market Area Currently operating 21 full-service locations along the Route 81 corridor from Washington County, Maryland through Franklin, Cumberland and Perry Counties, Pennsylvania The combined population of the current market area is approximately 580,000 as of June 30, 2012 The current combined market has over $9.7 billion in total deposits as of June 30, 2012 Orrstown has over a billion in deposits as of June 30, 2012 or approximately 11.7% of the total market share 3 contiguous counties to the East represent growth markets of approximately $15 billion in deposits Harrisburg is approximately 70 miles from Baltimore, 90 miles from Philadelphia and 95 miles from Washington D.C. |
6 Timeline of Events Significant Staffing Hires: 8/14/12 - Jeffrey Seibert, COO 8/29/12 - David Boyle, CFO 9/25/12 – David Keim, CRO 11/5/12 - Robert Coradi , CCO Note: Non-Performing assets defined as nonaccrual loans, restructured loans, loans past due 90 days or more and still accruing, and real estate owned. |
7 Future Strategic Initiatives Completing Credit Turnaround • Asset quality remediation, including loan workouts, additional structural enhancements, and multiples sales of non performing assets to third parties have driven an 83% reduction in non performing assets from December 31, 2011 • Asset quality metrics are now more comparable to “pre-crisis” levels Improving Fundamental Operations • Grow earnings through expense reduction and revenue expansion • “Operation Bottom Line” announced in December 2012 will drive improved operational efficiency through targeted cost savings initiatives and investments in revenue generating lines of business • Returned to profitability in the fourth quarter of 2012 and remained profitable in the first quarter of 2013 Franchise Expansion Management Team Accountable for Results Preserve and Continue to Grow Capital Position Financial Discipline Serving Shareholder Returns |
8 Summary Financial Highlights 1. Return on average tangible equity is a non-GAAP-based financial measure calculated using non-GAAP-based amounts, including management’s definition of tangible assets and tangible equity. The most directly comparable GAAP-based measure is return on average equity. 2. The efficiency ratio expresses noninterest expense as a percentage of tax equivalent net interest income and noninterest income, excluding securities gains, goodwill impairment, and other non-recurring items. 3. The ratio of tangible common equity, or TCE, to tangible assets, or TA, is a non-GAAP-based financial measure. In order to calculate tangible common equity and tangible assets, the Company’s management subtracts intangible assets from both common equity and assets. The most directly comparable GAAP-based measure is the ratio of stockholders’ equity to assets. 4. NPAs defined as nonaccrual loans, restructured loans, loans past due 90 days or more and still accruing, and real estate owned. 5. NPLs include nonaccrual loans, restructured loans, loans past due 90 days or more and still accruing. Second consecutive quarter of profitability (51% increase from previous quarter) (Dollars in 000s, except per share data) 2013Q1 Balance Sheet: 2008 2009 2010 2011 2012 Total Assets $1,051,783 $1,196,432 $1,511,722 $1,444,097 $1,232,668 $1,197,038 Total Gross Loans 820,468 881,074 966,986 967,993 711,601 681,928 Total Deposits 757,368 915,170 1,188,377 1,216,902 1,085,039 1,044,297 Total Equity 103,347 110,886 160,484 128,197 87,694 88,849 Results of Operations: Net Income (Loss) $13,103 $13,373 $16,581 ($31,964) ($38,454) $1,560 Diluted EPS $2.03 $2.07 $2.17 ($3.98) ($4.77) $0.19 Return on Average Assets 1.38% 1.19% 1.21% (2.11%) (2.84%) 0.52% Return on Average Equity 13.20% 12.48% 11.22% (20.33%) (35.22%) 7.12% Return on Average Tangible Equity (1) 17.02% 15.73% 13.19% (9.17%) (35.40%) 7.34% Net Interest Margin 3.93% 3.66% 3.73% 3.66% 3.12% 3.07% Efficiency Ratio (2) 56.7% 58.9% 54.9% 55.2% 72.2% 84.3% Noninterest Expense/ Average Assets 2.97% 2.81% 2.67% 3.98% 3.21% 3.69% Capital Adequacy: Tang. Common Equity / Tang. Assets (3) 7.97% 7.65% 9.38% 8.81% 7.05% 7.36% Total Risk-based Capital Ratio 10.9% 11.4% 14.8% 13.0% 12.2% 12.8% Asset Quality: NPAs / Assets (4) 0.68% 0.96% 1.22% 7.88% 1.86% 1.61% Loan Loss Reserves/ NPLs (5) 109.6% 106.2% 92.5% 39.2% 110.1% 126.7% Loan Loss Reserves/ Gross Loans 0.87% 1.26% 1.66% 4.53% 3.29% 3.25% Year Ended December 31, |
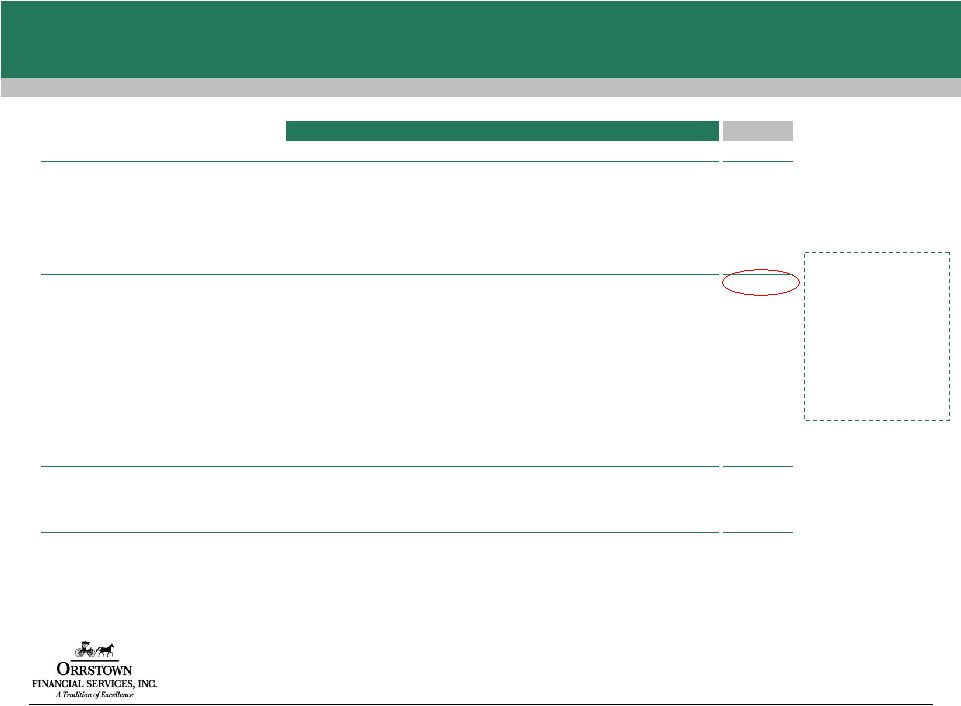
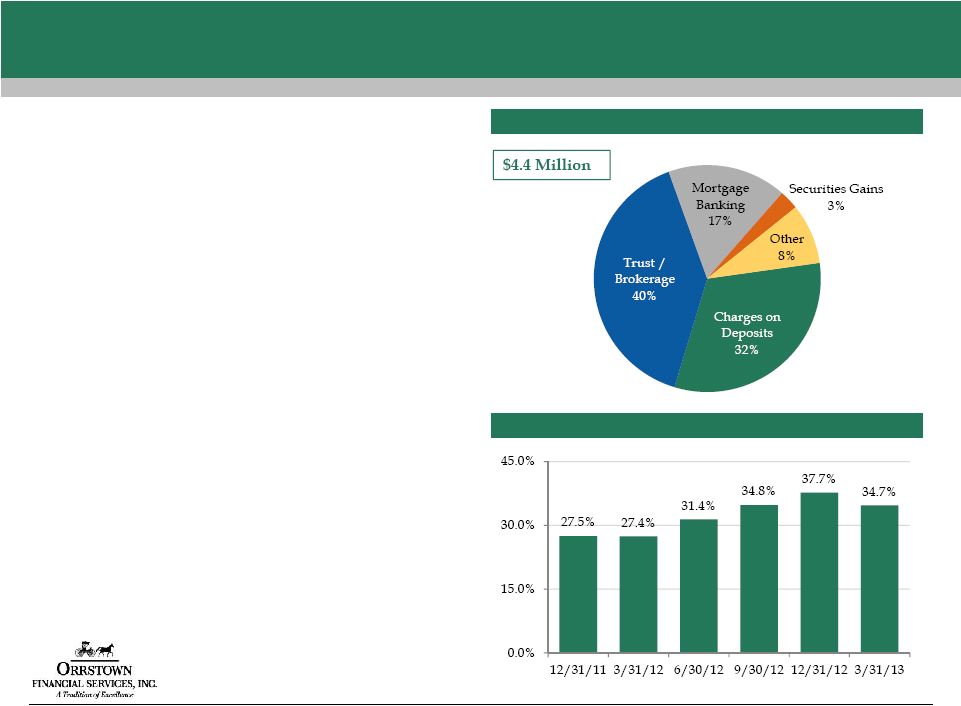
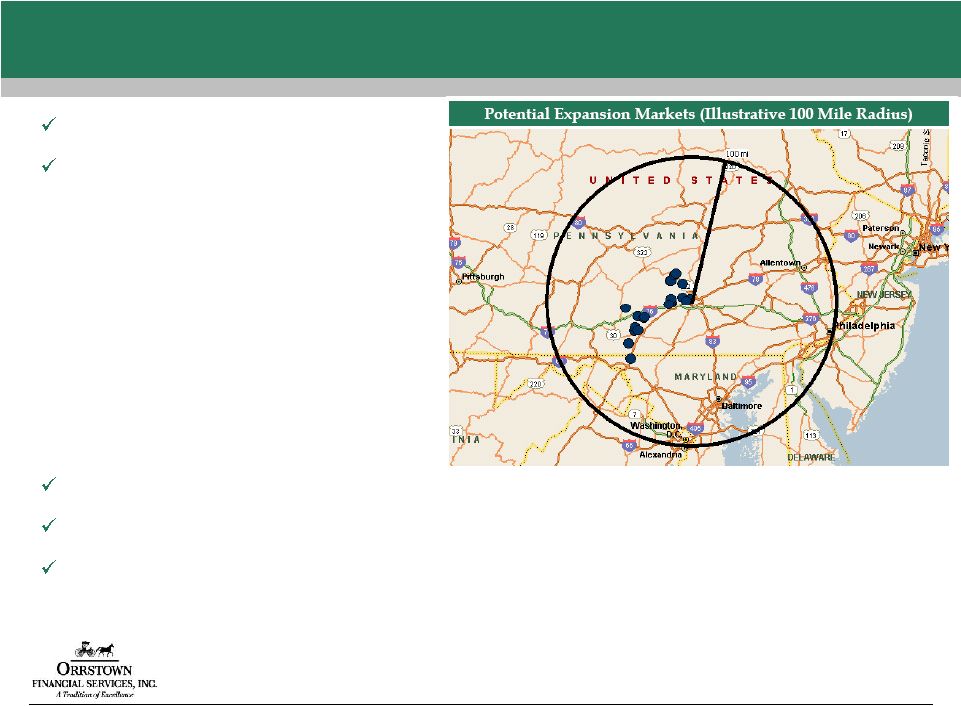
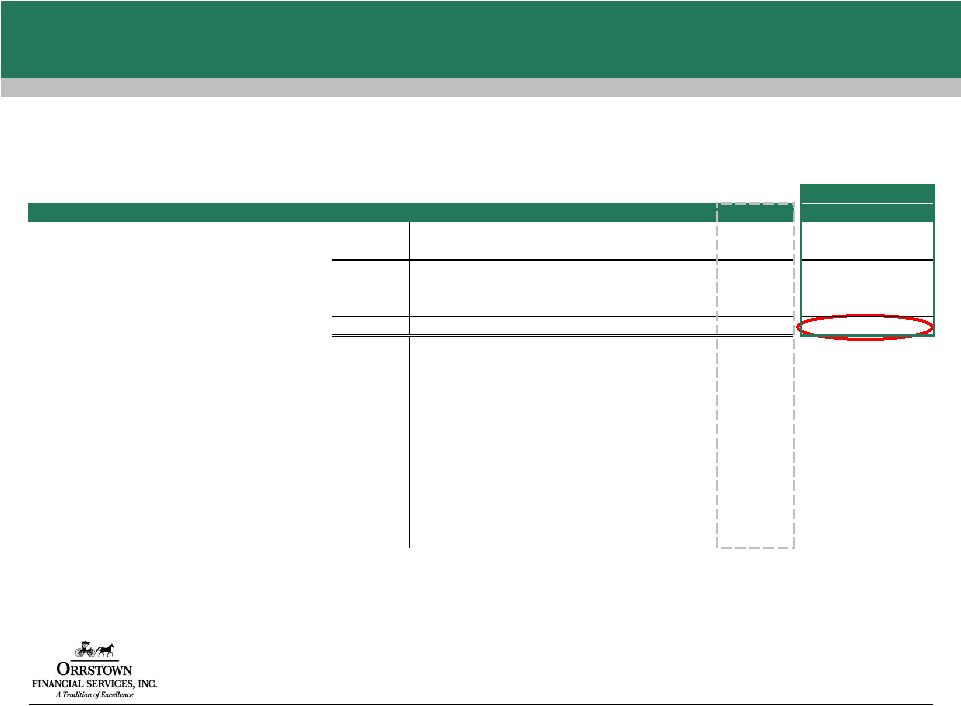
9 Fundamental Operations Net Interest Margin • Use current market opportunities to expand core funding • Convert NPAs to earning assets • Require pricing discipline amid competitors leading with price Loan Growth • Expansion on key lines of business (C&I, medical and professional) • Well positioned near substantial markets allowing for selective loan growth Increasing Fee Income • Target leveraging both deposit and loan customers • Both wealth management lines and transaction fees Efficiency Ratio • Branch optimization and expansion – disciplined return on invested capital approach • Utilize experiences of new management team members • Continual upgrading of employee talent level – driving revenue will lower efficiency ratio • “Operation Bottom Line”: 58% - 62% target efficiency ratio in the next 36 months Earnings Summary 1. Real Estate Owned Expenses include OREO expenses, gains and losses. 2. “Adjusted Earnings” is a non-GAAP-based financial measure calculated using non-GAAP-based amounts, including management’s definition of “non-core” items. 3. The efficiency ratio expresses noninterest expense as a percentage of tax equivalent net interest income and noninterest income, excluding securities gains, goodwill impairment, and other non-recurring items (excludes other litigation expenses for 3/31/13 and 12/31/12). For the Quarter Ended, (Dollars in 000s) 12/31/11 3/31/12 6/30/12 9/30/12 12/31/12 3/31/13 Net Interest Income (FTE) $12,265 $11,494 $10,129 $9,574 $8,954 $8,562 Noninterest Income 7,379 6,191 7,027 4,880 5,164 4,432 Noninterest Expense 30,486 10,883 10,733 11,133 10,600 10,949 Pre-Tax/ Pre-Provision Income (FTE) ($10,842) $6,802 $6,423 $3,321 $3,518 $2,045 Non-core Items: (Less) Realized Gain on Securities $3,025 $2,231 $2,595 ($2) - $122 + Goodwill Impair. & Intang. Amt. 19,500 52 52 52 52 52 + Collection and Problem Loan 477 719 579 593 407 182 + Other Litigation Charges - - - - 80 371 + Real Estate Owned Expenses (1) 368 376 100 230 128 43 "Adjusted" Earnings (2) $6,478 $5,718 $4,559 $4,198 $4,185 $2,571 "Adjusted" PTPP Return on Assets 1.76% 1.59% 1.28% 1.29% 1.34% 0.86% Efficiency Ratio (3) 63.9% 67.7% 72.7% 75.1% 73.2% 81.4% Net Interest Margin 3.45% 3.37% 2.96% 3.10% 3.00% 3.07% |
10 Diverse and Growing Revenue Stream 2013Q1 Noninterest Income Composition • Non-interest income continues to be a stable and significant source of revenue • Mortgage banking favorably influenced by continued low interest rate environment and greater stability in the real estate market • Orrstown Financial Advisors continues to generate solid trust and brokerage revenue • Overall, favorable market conditions, combined with new business opportunities has led to an enhanced revenue stream Noninterest Income / Total Revenue (%) (1) 1. Note: noninterest income excludes gain on securities, total revenue includes net interest income and noninterest income (excluding gain on securities) |
11 Deposit Franchise Deposit Composition (3/31/13) • Significant deposit franchise - with over 83% “core “ • Limited use of wholesale and brokered deposits • Effectively managing the cost of deposits which declined to 0.46% for the quarter ended March 31, 2013 Cost of Total Deposits (%) |
12 Capital Position • Regulatory Capital levels are solidly above “well capitalized” • Simple capital structure – no trust preferred, TARP or holding company debt • Common dividend was suspended in 2011 to preserve capital • Deferred tax valuation allowance of $20.3 million taken in 2012 combined with recent profitability implies future potential upside to capital ratios 3/31/13 Capital Ratios (%) |
13 Diversified Loan Portfolio Loans Held for Investment Composition (3/31/13) Non-Performing Loans by Type (3/31/13) (1) 1. NPLs include nonaccrual loans, restructured loans and still accruing, loans past due 90 days or more and still accruing. |
14 Aggressive Sale of Problem Assets • Fourth quarter 2012 loan sale of 172 distressed commercial loans with a book balance of $45.6 million significantly reduced non-performing asset levels • OREO exits have balanced capital considerations as well as substantial “soft costs” in holding NPA Inflows Continue to Slow Future CRE and A&D will be Limited and Targeted Strong Reserve Coverage • The allowance for loan losses totaled $21.9 million at March 31, 2013, or approximately 3.3% of gross loans and 127% of NPLs Completing Credit Turnaround Significant Reduction in NPAs • Asset quality issues were addressed quickly and aggressively in 2012 • “Risk Assets” totaled $19.2 million at March 31, 2013, a 83% reduction from $113.8 million at December 31, 2011 • Risk Assets to assets of 1.61% as of March 31, 2013 is now in-line with peers and more comparable to pre-crisis levels • Renegotiated loans (or “TDRs”) substantially “cured” in 2012 Note: Non-Performing assets defined as nonaccrual loans, restructured loans and still accruing, loans past due 90 days or more and still accruing, and real estate owned. |
15 Shareholder Focus – ROI /Accretion New Markets Loan Production Offices and Full Service Branches Branch Franchise Acquisitions Whole Company Mergers Each initiative will meet return on capital minimums Transitioning to Offense - Expansion Opportunities • Targeting attractive adjacent markets • Expansion market customer base allows for targeted line of business growth |
16 Investment Highlights Established South Central Pennsylvania bank Deep and experienced Management team with strong operational ability Aggressively dealt with asset quality issues, with ratios that are now in-line with peers as a result of 2012 strategies Strategic plans in place to drive core earnings growth, with a return to profitability in the fourth quarter of 2012 and sustained profitability in the first quarter of 2013 Well-positioned for future growth throughout the region Compelling absolute and relative valuation |
Appendix |
18 Non-Performing Asset Summary 1. Non-Performing Assets = Nonaccrual + OREO. 2. “Risk Assets” = Nonaccrual + Restructured and still accruing + 90 day past due and still accruing + OREO. % Change Q1'13 vs. (dollars in thousands) 12/31/11 3/31/12 6/30/12 9/30/12 12/31/12 3/31/13 Q1'12 Q4'12 Non-Accrual Loans 83,697 $ 82,058 $ 56,917 $ 57,780 $ 17,943 $ 14,220 $ (83%) (21%) OREO 2,165 2,413 2,337 2,575 1,876 1,925 (20%) 3% Non-Performing Assets 85,862 $ 84,471 $ 59,254 $ 60,355 $ 19,819 $ 16,145 $ (81%) (19%) Restructured Loans Still Accruing 27,917 3,844 2,831 3,113 3,092 3,078 (20%) (0%) 90+ Days Delinquent Still Accruing - 2 1,275 923 - - (100%) NA Total "Risk Assets" 113,779 $ 88,317 $ 63,360 $ 64,391 $ 22,911 $ 19,223 $ (78%) (16%) Loans 30-89 Past Due 6,723 $ 6,501 $ 6,219 $ 5,435 $ 3,578 $ 6,069 $ Asset Quality Ratios: Non-Accrual Loans / Loans 8.67% 9.13% 6.79% 7.19% 2.55% 2.11% NPAs/Assets (1) 5.95% 5.84% 4.46% 4.75% 1.61% 1.35% NPAs /Loans + OREO 8.87% 9.37% 7.05% 7.49% 2.81% 2.39% "Risk Assets" /Loans + OREO 11.76% 9.80% 7.54% 7.99% 3.25% 2.84% "Risk Assets"/Assets (2) 7.88% 6.10% 4.77% 5.07% 1.86% 1.61% Allowance for Loan Losses/ Loans 4.53% 3.13% 4.32% 4.57% 3.29% 3.25% Allowance for Loan Losses/ Non-Accrual Loans 52.2% 34.3% 63.7% 63.5% 129.1% 154.1% Allowance for Loan Losses/ Non-Accrual + Restructured 39.2% 32.8% 60.6% 60.3% 110.1% 126.7% |
19 Asset Quality Trends NPAs (Incl. TDRs) & 90+PD / Assets (1) Allowance for Loan Losses / Loans Allowance for Loan Losses / NPLs (2) NCOs / Avg. Loans Source SNL Financial, Peers consist of 19 exchange traded institutions headquartered in the Mid-Atlantic with assets between $1.0 and $2.0 billion. 1. Non-Performing Assets = Nonaccrual + Restructured and still accruing + 90 day past due and still accruing + OREO. 2. Non-Performing Loans = Nonaccrual + Restructured and still accruing + 90 day past due and still accruing. |