
Investor Presentation December 2013

Safe Harbor Statement NOTE: This presentation contains certain statements that are not historical facts and that constitute “forward-looking statements” within the meaning of the Private Securities Litigation Reform Act of 1995. Statements in this presentation addressing expectations, assumptions, beliefs, projections, future plans, strategies, and events, developments that we expect or anticipate will occur in the future, and future operating results or financial condition are forward-looking statements. Forward-looking statements in this presentation may include, but are not limited to statements about projected future investment strategies, investment opportunities, financial performance, dividends, leverage ratios, capital raising activities, share issuances and repurchases, the use or impact of NOL carryforwards, and interest rates. The words “will,” “believe,” “expect,” “forecast,” “anticipate,” “intend,” “estimate,” “assume,” “project,” “plan,” “continue,” and similar expressions also identify forward-looking statements. These forward-looking statements reflect our current beliefs, assumptions and expectations based on information currently available to us, and are applicable only as of the date of this presentation. Forward-looking statements are inherently subject to risks, uncertainties, and other factors, some of which cannot be predicted or quantified and any of which could cause the Company’s actual results and timing of certain events to differ materially from those projected in or contemplated by these forward-looking statements. Not all of these risks, uncertainties and other factors are known to us. New risks and uncertainties arise over time, and it is not possible to predict those risks or uncertainties or how they may affect us. The projections, assumptions, expectations or beliefs upon which the forward-looking statements are based can also change as a result of these risks and uncertainties or other factors. If such a risk, uncertainty, or other factor materializes in future periods, our business, financial condition, liquidity and results of operations may differ materially from those expressed or implied in our forward-looking statements. While it is not possible to identify all factors, some of the factors that may cause actual results to differ from historical results or from any results expressed or implied by our forward-looking statements, or that may cause our projections, assumptions, expectations or beliefs to change, include the following: the risks and uncertainties referenced in our Annual Report on Form 10-K for the year ended December 31, 2012 and subsequent filings with the Securities and Exchange Commission, particularly those set forth under the caption “Risk Factors. 2

Market Snapshot Common Stock Preferred Stock NYSE Stock Ticker: DX DXPrA DXPrB Shares Outstanding: (as of 9/30/13) 54,426,049 2,300,000 2,250,000 Q3 Dividends per share: $0.27 $0.53125 $0.4765625 Dividend Yield: (annualized) 12.87% 9.26% 9.12% Share Price: $8.39 $22.95 $20.90 Market Capitalization: $456.63M $52.79M $47.03M Price to Book: (based on 9/30/13 Book Value) .98x - - (as of 11/29/13 unless otherwise noted) 3
4 Guiding Principles Our Mission Our Core Values •Generate dividends for shareholders •Manage leverage conservatively • Remain owner-operators • Maintain a culture of integrity and employ the highest ethical standards • Provide a strong risk management culture • Focus on long-term shareholder value while preserving capital Manage a successful public mortgage REIT with a focus on capital preservation and providing risk-adjusted returns reflective of a diversified, leveraged fixed income portfolio.
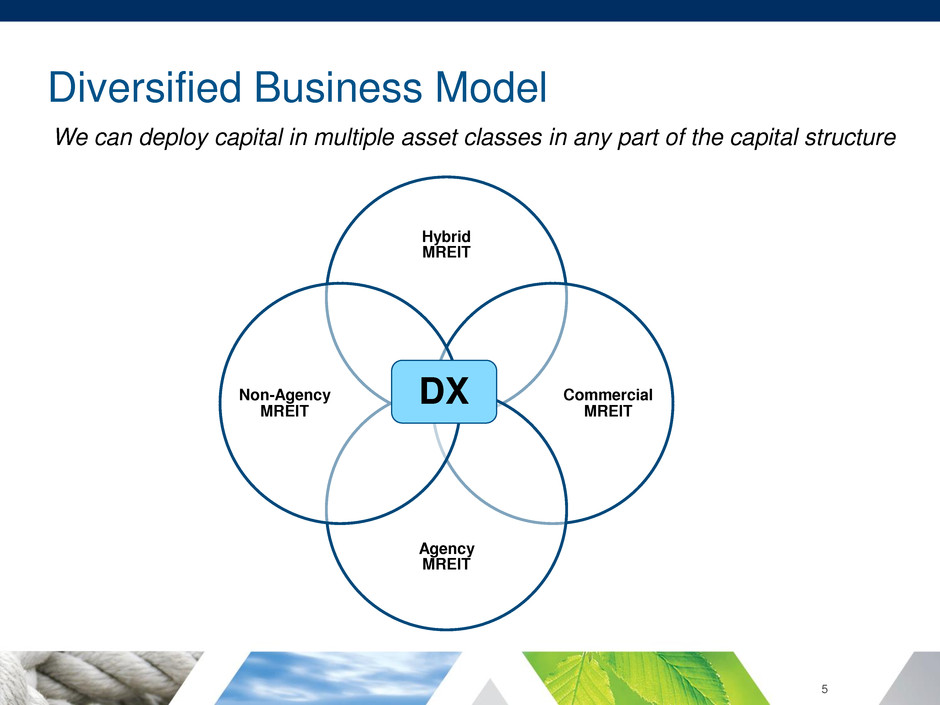
Diversified Business Model Hybrid MREIT Commercial MREIT Agency MREIT Non-Agency MREIT DX We can deploy capital in multiple asset classes in any part of the capital structure 5
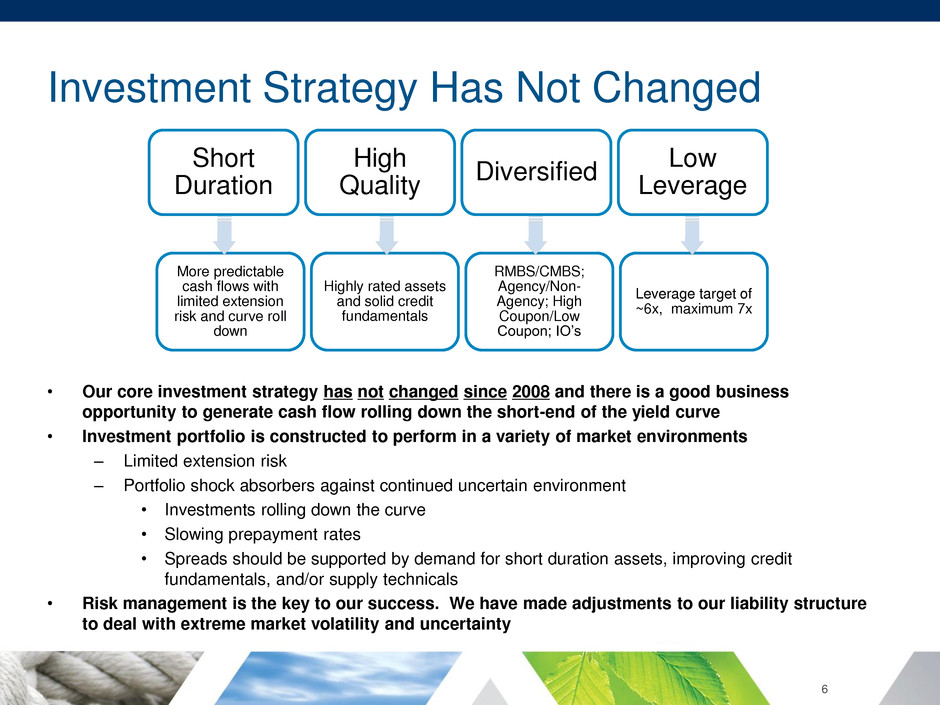
Investment Strategy Has Not Changed • Our core investment strategy has not changed since 2008 and there is a good business opportunity to generate cash flow rolling down the short-end of the yield curve • Investment portfolio is constructed to perform in a variety of market environments – Limited extension risk – Portfolio shock absorbers against continued uncertain environment • Investments rolling down the curve • Slowing prepayment rates • Spreads should be supported by demand for short duration assets, improving credit fundamentals, and/or supply technicals • Risk management is the key to our success. We have made adjustments to our liability structure to deal with extreme market volatility and uncertainty 6 Short Duration High Quality Diversified Low Leverage More predictable cash flows with limited extension risk and curve roll down Highly rated assets and solid credit fundamentals RMBS/CMBS; Agency/Non- Agency; High Coupon/Low Coupon; IO’s Leverage target of ~6x, maximum 7x

Disciplined Top-Down Investment Philosophy Macroeconomic Analysis Sector Analysis Security Selection and Funding Performance and Risk Management 7
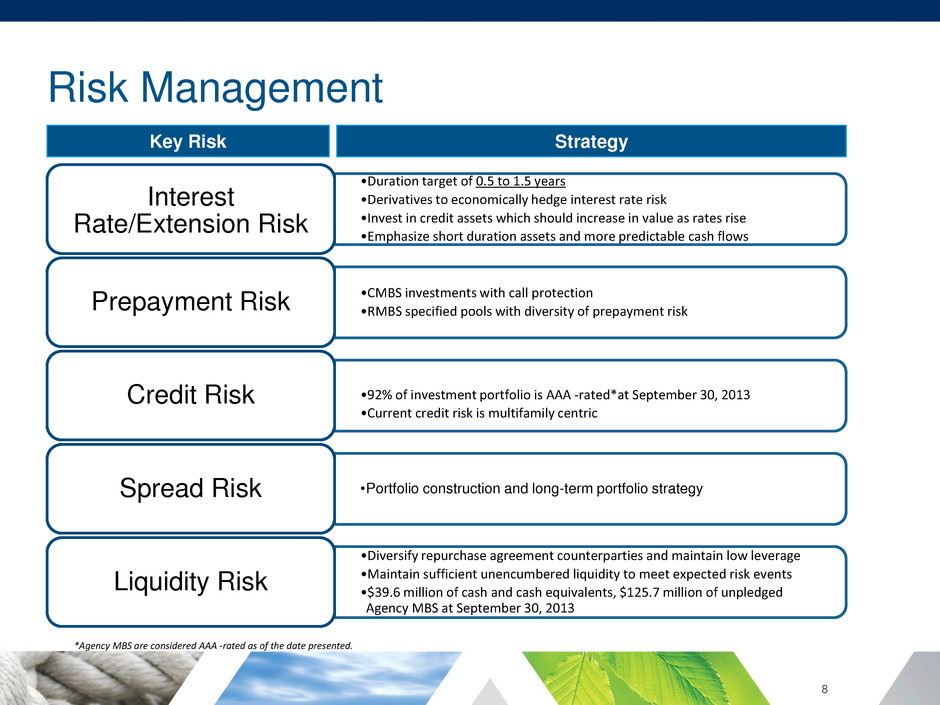
Risk Management •Duration target of 0.5 to 1.5 years •Derivatives to economically hedge interest rate risk •Invest in credit assets which should increase in value as rates rise •Emphasize short duration assets and more predictable cash flows Interest Rate/Extension Risk •CMBS investments with call protection •RMBS specified pools with diversity of prepayment risk Prepayment Risk •92% of investment portfolio is AAA -rated*at September 30, 2013 •Current credit risk is multifamily centric Credit Risk •Portfolio construction and long-term portfolio strategy Spread Risk •Diversify repurchase agreement counterparties and maintain low leverage •Maintain sufficient unencumbered liquidity to meet expected risk events •$39.6 million of cash and cash equivalents, $125.7 million of unpledged Agency MBS at September 30, 2013 Liquidity Risk Key Risk Strategy *Agency MBS are considered AAA -rated as of the date presented. 8

Portfolio Construction • Our fundamental portfolio construction has not changed • Portfolio is designed to generate cash flow off the short-end of the yield curve and increase in value from rolling down the curve • During 3Q, we significantly reduced sensitivity to parallel yield curve shifts up and down • We changed our overall portfolio positioning to reflect a more volatile environment; added swap and Eurodollar future hedges between the 5-10 year part of the yield curve • As the quarter progressed and into 4Q, we repositioned hedges to benefit from Fed Policy with respect to short rates • We have remained cautious in reinvesting pay downs • During 3Q 2013 we modestly delevered and extended repo maturities as part of our overall risk management philosophy 9
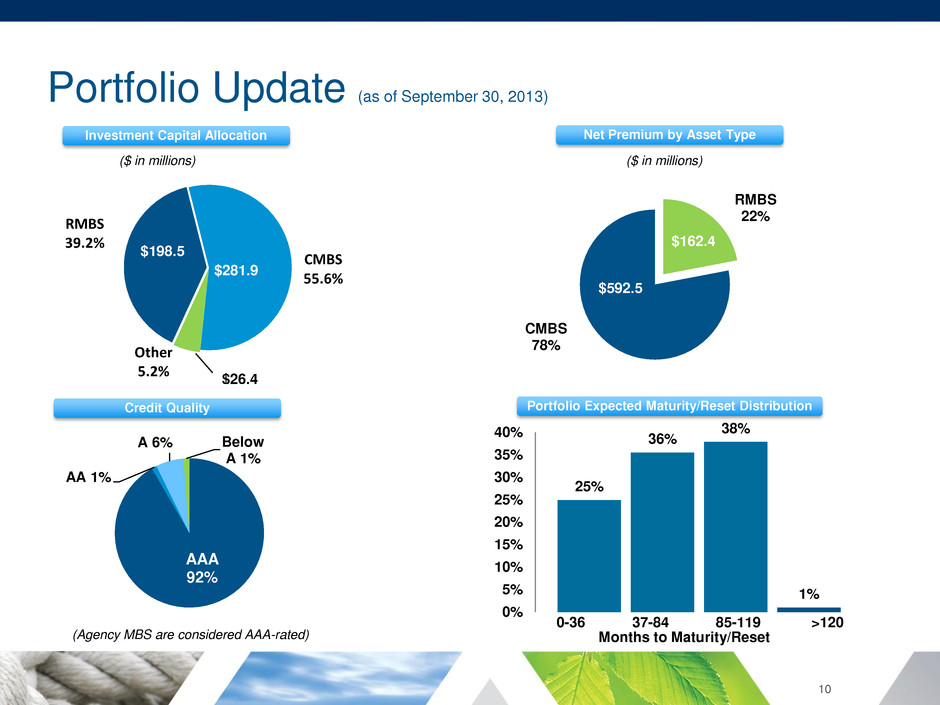
Portfolio Update (as of September 30, 2013) 10 RMBS 22% CMBS 78% $162.4 Other 5.2% RMBS 39.2% CMBS 55.6% $281.9 $198.5 $26,4 ($ in millions) Credit Quality 25% 36% 38% 1% 0% 5% 10% 15% 20% 25% 30% 35% 40% Months to Maturity/Reset Investment Capital Allocation Net Premium by Asset Type Portfolio Expected Maturity/Reset Distribution AAA 92% AA 1% A 6% Below A 1% $592.5 0-36 37-84 85-119 >120 (Agency MBS are considered AAA-rated) ($ in millions)

CMBS Portfolio (as of September 30, 2013) AAA, 76% AA, 4% A, 17% Below A, 3% Other 21% Multifamily 79% $99.6 $0.0 $0.0 $400.7 prior to 2000 2000-2005 2006-2008 2009 or newer Agency CMBS, $322.2 Agency CMBS IO, $475.6 Non- Agency CMBS, $374.7 Non- Agency CMBS IO, $125.5 Credit Quality Collateral Non-Agency Vintage Asset Type By year of origination $ in millions $ in millions Agency CMBS are considered AAA-rated as of the date presented. Includes CMBS IO securities. 11
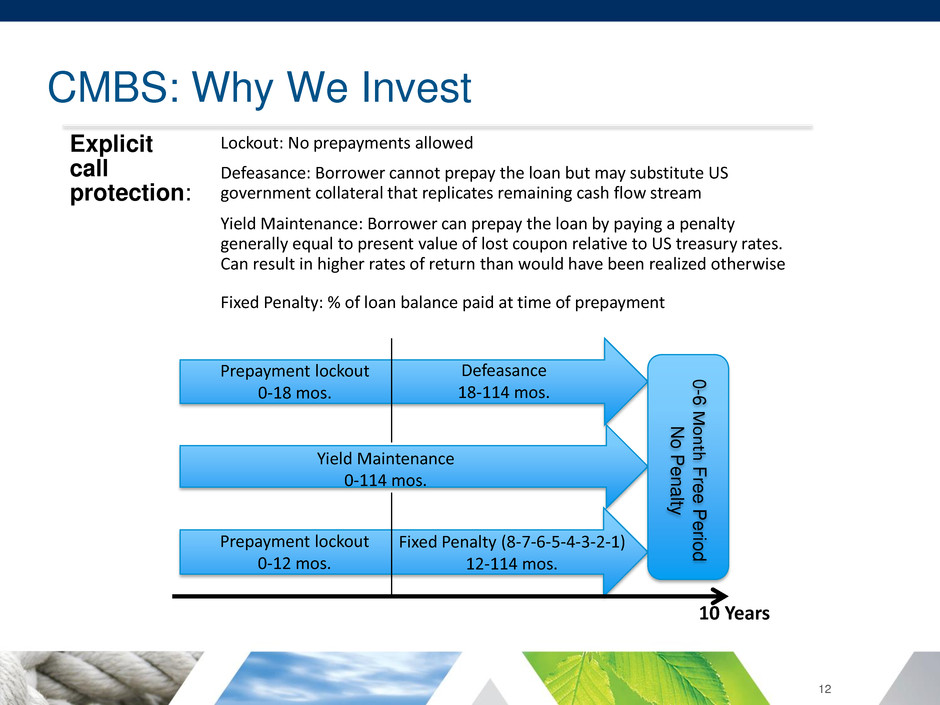
CMBS: Why We Invest Explicit call protection: Lockout: No prepayments allowed Defeasance: Borrower cannot prepay the loan but may substitute US government collateral that replicates remaining cash flow stream Yield Maintenance: Borrower can prepay the loan by paying a penalty generally equal to present value of lost coupon relative to US treasury rates. Can result in higher rates of return than would have been realized otherwise Fixed Penalty: % of loan balance paid at time of prepayment Prepayment lockout 0-18 mos. Prepayment lockout 0-12 mos. Defeasance 18-114 mos. Yield Maintenance 0-114 mos. Fixed Penalty (8-7-6-5-4-3-2-1) 12-114 mos. 0 -6 M o n th Free Per iod No Pe nal ty 10 Years 12
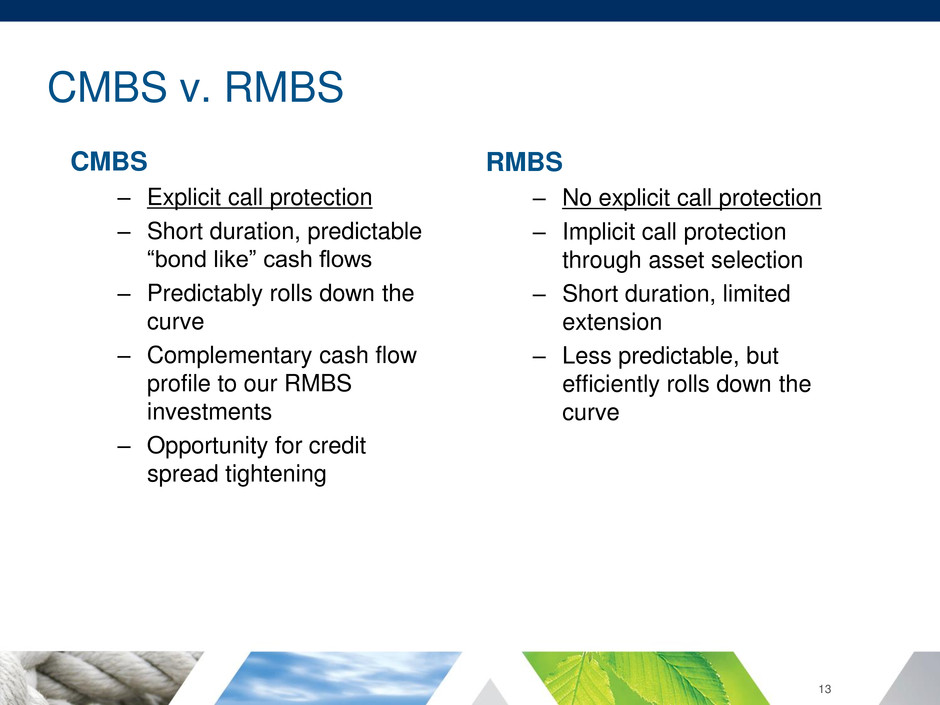
CMBS v. RMBS CMBS – Explicit call protection – Short duration, predictable “bond like” cash flows – Predictably rolls down the curve – Complementary cash flow profile to our RMBS investments – Opportunity for credit spread tightening RMBS – No explicit call protection – Implicit call protection through asset selection – Short duration, limited extension – Less predictable, but efficiently rolls down the curve 13
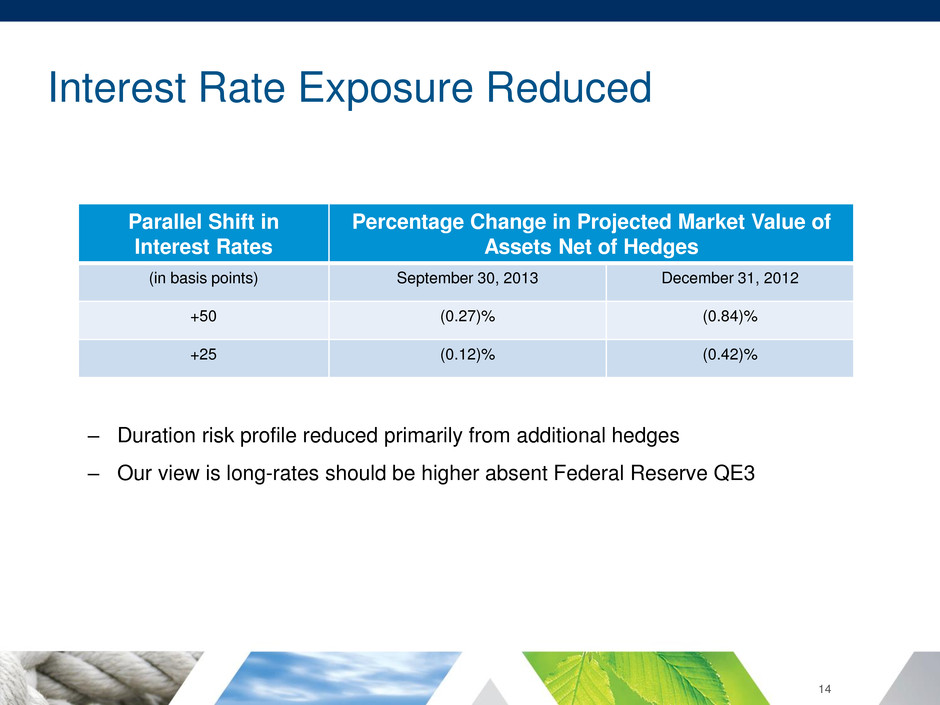
Interest Rate Exposure Reduced 14 Parallel Shift in Interest Rates Percentage Change in Projected Market Value of Assets Net of Hedges (in basis points) September 30, 2013 December 31, 2012 +50 (0.27)% (0.84)% +25 (0.12)% (0.42)% – Duration risk profile reduced primarily from additional hedges – Our view is long-rates should be higher absent Federal Reserve QE3

Prepayment Speeds vs. Refinancing Index 0 5 10 15 20 25 30 Q2 2011 Q3 2011 Q4 2011 Q1 2012 Q2 2012 Q3 2012 Q4 2012 Q1 2013 Q2 2013 Q3 2013 Hybrid ARMs/ARMs Total Agency Total Portfolio Dynex Portfolio CPRs MBA Refinancing Index Source: Bloomberg 15
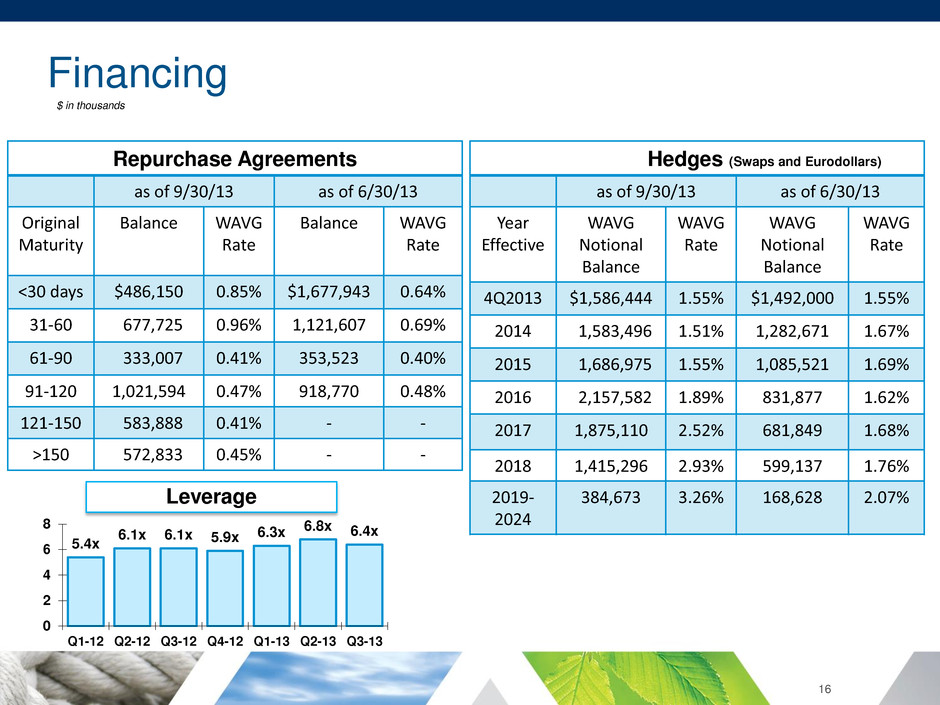
Financing Hedges (Swaps and Eurodollars) as of 9/30/13 as of 6/30/13 Year Effective WAVG Notional Balance WAVG Rate WAVG Notional Balance WAVG Rate 4Q2013 $1,586,444 1.55% $1,492,000 1.55% 2014 1,583,496 1.51% 1,282,671 1.67% 2015 1,686,975 1.55% 1,085,521 1.69% 2016 2,157,582 1.89% 831,877 1.62% 2017 1,875,110 2.52% 681,849 1.68% 2018 1,415,296 2.93% 599,137 1.76% 2019- 2024 384,673 3.26% 168,628 2.07% $ in thousands 16 Repurchase Agreements as of 9/30/13 as of 6/30/13 Original Maturity Balance WAVG Rate Balance WAVG Rate <30 days $486,150 0.85% $1,677,943 0.64% 31-60 677,725 0.96% 1,121,607 0.69% 61-90 333,007 0.41% 353,523 0.40% 91-120 1,021,594 0.47% 918,770 0.48% 121-150 583,888 0.41% - - >150 572,833 0.45% - - 5.4x 6.1x 6.1x 5.9x 6.3x 6.8x 6.4x 0 2 4 6 8 Q1-12 Q2-12 Q3-12 Q4-12 Q1-13 Q2-13 Q3-13 Leverage

Economic Fundamentals are Uncertain • Sustainability and trajectory of US economic growth is uncertain • Federal reserve policy makers are projecting accelerating growth into 2014-2015, but economic growth today is only moderate • Moderate economic activity implies a 3.0%-3.25% rate on the ten- year Treasury absent quantitative easing – Equates to a 2’s-10’s spread of 2.70%-2.95% • Higher rates have the potential to impede economic activity as current growth is dependent upon low interest rates • Government deleveraging and austerity in the U.S. and Europe could hamper growth • Inflation levels are declining and could become a surprise factor 17
Market Technicals/Psychology are more Important 18 • Market Technicals – Technicals have been distorted by Federal Reserve participation in the capital markets • Long term interest rates and spread volatility were artificially low • Taper talk increased both spread and interest rate volatility. This was further exacerbated by debt ceiling / budget negotiation cliffhanger – The Federal Reserve did not taper in September 2013, but technical factors relevant today are: • Dealer balance sheets and their commitment to make markets have been negatively impacted by regulation • Originator pipelines are reduced given declining refinance activity • As we have always expected, the Hybrid ARM market is gaining in attractiveness as more investors are seeking short-duration assets • Market Psychology – Psychology will continue to be influenced by perceptions of economic data and Federal Reserve monetary policy – We believe that YTD market behavior has been driven by psychological factors as opposed to technicals and fundamentals – Fed’s stance on QE3 tapering will continue to drive market movements

Government Policy is Key 19 • Monetary Policy – Federal Reserve expected to maintain dovish policy holding short rates low for “extended period” – Steady short term interest rates should create an environment in which we can deploy capital profitably – QE3 artificially influences long rates lower – QE3 exit strategy uncertain • Regulatory Policy – Uncertain, restrictive and changing rapidly • Fiscal Policy – Creating economic headwinds and unlikely to be resolved in the near future Government policy will drive investment returns and future investment opportunities
Market Environment is Uncertain • The combined factors of an uncertain economic environment, distorted monetary policy and unclear fiscal and regulatory policies has and is continuing to foster a volatile market environment – On the one hand, short-rates provide opportunity to earn net interest income – On the other hand, hedging costs are increasing due to the volatility and book value has declined • The Federal Reserve has indicated it is data dependent while markets have become monetary policy dependent • Global uncertainty adds more volatility to the mix • However, market expectations of higher interest rates is becoming supportive of our short-duration Hybrid ARM investment portfolio and credit fundamentals supporting our CMBS assets continue to be strong • Market volatility has been high, and will continue to be high, due to: – uncertain economic activity – data dependency of Federal Reserve monetary policy – Federal Reserve desire to be transparent 20
Outlook and Opportunities • The macro environment of lower short term rates and a steeper yield curve provides an attractive carry environment • However, market volatility is generating additional costs related to increased hedging/risk management activities • Longer term, we see opportunities for credit investments in both residential and commercial assets and in markets currently dominated by the Fed/GSE’s • ROE opportunities continue to be attractive, but are lower than the extraordinary opportunities of several years ago • We are focused on taking advantage of opportunities presented, but we remain cautious and have a risk management first approach 21
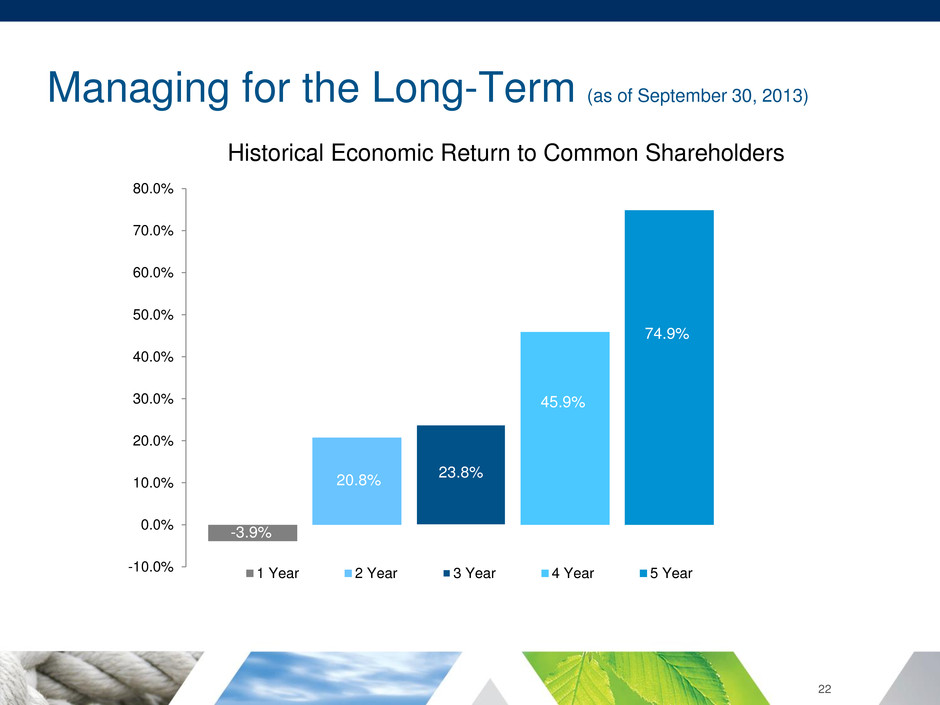
Managing for the Long-Term (as of September 30, 2013) Historical Economic Return to Common Shareholders 22 -3.9% 20.8% 23.8% 45.9% 74.9% -10.0% 0.0% 10.0% 20.0% 30.0% 40.0% 50.0% 60.0% 70.0% 80.0% 1 Year 2 Year 3 Year 4 Year 5 Year

APPENDIX 23
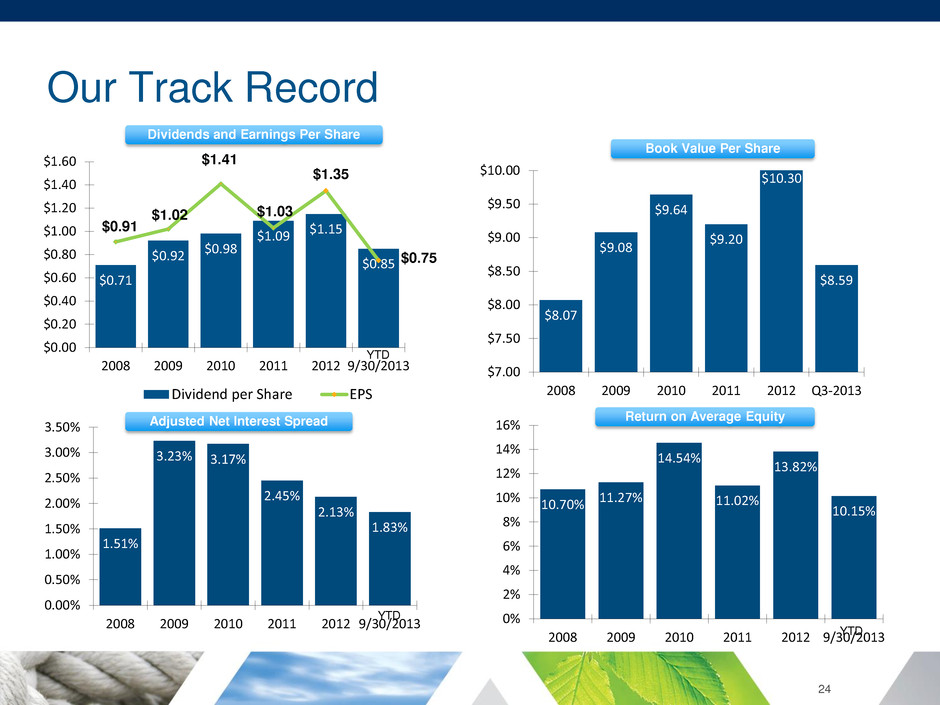
Our Track Record $0.71 $0.92 $0.98 $1.09 $1.15 $0.85 $0.91 $1.02 $1.41 $1.03 $1.35 $0.75 $0.00 $0.20 $0.40 $0.60 $0.80 $1.00 $1.20 $1.40 $1.60 2008 2009 2010 2011 2012 9/30/2013 Dividend per Share EPS $8.07 $9.08 $9.64 $9.20 $8.59 $7.00 $7.50 $8.00 $8.50 $9.00 $9.50 $10.00 2008 2009 2010 2011 2012 Q3-2013 $10.30 1.51% 3.23% 3.17% 2.45% 2.13% 1.83% 0.00% 0.50% 1.00% 1.50% 2.00% 2.50% 3.00% 3.50% 2008 2009 2010 2011 2012 9/30/2013 YTD 10.70% 11.27% 14.54% 11.02% 13.82% 10.15% 0% 2% 4% 6% 8% 10% 12% 14% 16% 2008 2009 2010 2011 2012 9/30/2013YTD Dividends and Earnings Per Share Adjusted Net Interest Spread Book Value Per Share Return on Average Equity 24 YTD
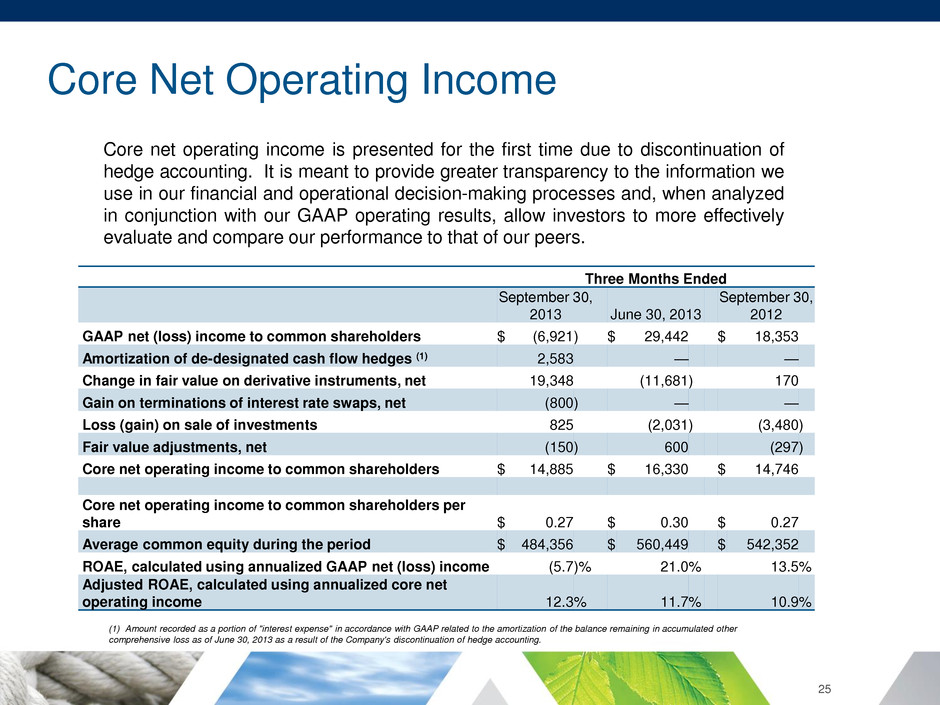
Core Net Operating Income 25 (1) Amount recorded as a portion of "interest expense" in accordance with GAAP related to the amortization of the balance remaining in accumulated other comprehensive loss as of June 30, 2013 as a result of the Company's discontinuation of hedge accounting. Core net operating income is presented for the first time due to discontinuation of hedge accounting. It is meant to provide greater transparency to the information we use in our financial and operational decision-making processes and, when analyzed in conjunction with our GAAP operating results, allow investors to more effectively evaluate and compare our performance to that of our peers. Three Months Ended September 30, 2013 June 30, 2013 September 30, 2012 GAAP net (loss) income to common shareholders $ (6,921 ) $ 29,442 $ 18,353 Amortization of de-designated cash flow hedges (1) 2,583 — — Change in fair value on derivative instruments, net 19,348 (11,681 ) 170 Gain on terminations of interest rate swaps, net (800 ) — — Loss (gain) on sale of investments 825 (2,031 ) (3,480 ) Fair value adjustments, net (150 ) 600 (297 ) Core net operating income to common shareholders $ 14,885 $ 16,330 $ 14,746 Core net operating income to common shareholders per share $ 0.27 $ 0.30 $ 0.27 Average common equity during the period $ 484,356 $ 560,449 $ 542,352 ROAE, calculated using annualized GAAP net (loss) income (5.7 )% 21.0 % 13.5 % Adjusted ROAE, calculated using annualized core net operating income 12.3 % 11.7 % 10.9 %
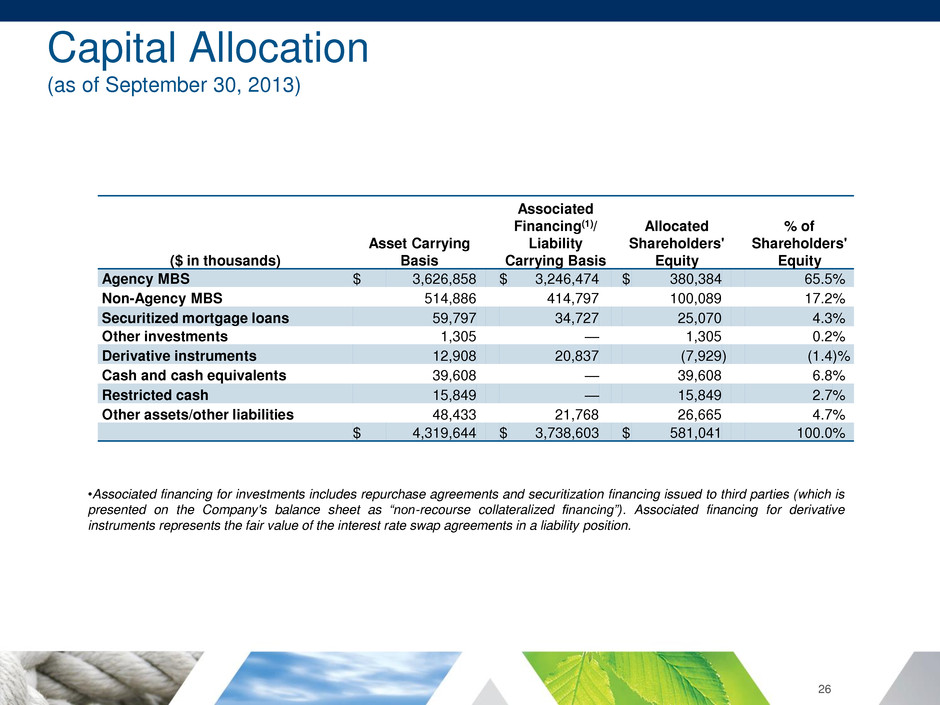
Capital Allocation (as of September 30, 2013) 26 •Associated financing for investments includes repurchase agreements and securitization financing issued to third parties (which is presented on the Company's balance sheet as “non-recourse collateralized financing”). Associated financing for derivative instruments represents the fair value of the interest rate swap agreements in a liability position. ($ in thousands) Asset Carrying Basis Associated Financing(1)/ Liability Carrying Basis Allocated Shareholders' Equity % of Shareholders' Equity Agency MBS $ 3,626,858 $ 3,246,474 $ 380,384 65.5 % Non-Agency MBS 514,886 414,797 100,089 17.2 % Securitized mortgage loans 59,797 34,727 25,070 4.3 % Other investments 1,305 — 1,305 0.2 % Derivative instruments 12,908 20,837 (7,929 ) (1.4 )% Cash and cash equivalents 39,608 — 39,608 6.8 % Restricted cash 15,849 — 15,849 2.7 % Other assets/other liabilities 48,433 21,768 26,665 4.7 % $ 4,319,644 $ 3,738,603 $ 581,041 100.0 %
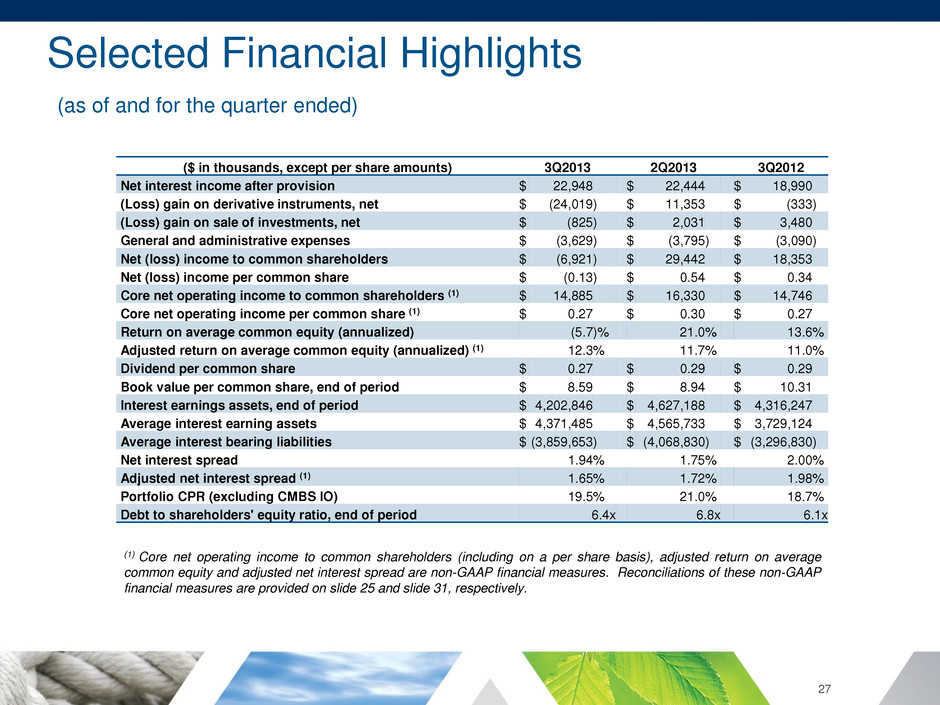
Selected Financial Highlights (as of and for the quarter ended) 27 (1) Core net operating income to common shareholders (including on a per share basis), adjusted return on average common equity and adjusted net interest spread are non-GAAP financial measures. Reconciliations of these non-GAAP financial measures are provided on slide 25 and slide 31, respectively. ($ in thousands, except per share amounts) 3Q2013 2Q2013 3Q2012 Net interest income after provision $ 22,948 $ 22,444 $ 18,990 (Loss) gain on derivative instruments, net $ (24,019 ) $ 11,353 $ (333 ) (Loss) gain on sale of investments, net $ (825 ) $ 2,031 $ 3,480 General and administrative expenses $ (3,629 ) $ (3,795 ) $ (3,090 ) Net (loss) income to common shareholders $ (6,921 ) $ 29,442 $ 18,353 Net (loss) income per common share $ (0.13 ) $ 0.54 $ 0.34 Core net operating income to common shareholders (1) $ 14,885 $ 16,330 $ 14,746 Core net operating income per common share (1) $ 0.27 $ 0.30 $ 0.27 Return on average common equity (annualized) (5.7 )% 21.0 % 13.6 % Adjusted return on average common equity (annualized) (1) 12.3 % 11.7 % 11.0 % Dividend per common share $ 0.27 $ 0.29 $ 0.29 Book value per common share, end of period $ 8.59 $ 8.94 $ 10.31 Interest earnings assets, end of period $ 4,202,846 $ 4,627,188 $ 4,316,247 Average interest earning assets $ 4,371,485 $ 4,565,733 $ 3,729,124 Average interest bearing liabilities $ (3,859,653 ) $ (4,068,830 ) $ (3,296,830 ) Net interest spread 1.94 % 1.75 % 2.00 % Adjusted net interest spread (1) 1.65 % 1.72 % 1.98 % Portfolio CPR (excluding CMBS IO) 19.5 % 21.0 % 18.7 % Debt to shareholders' equity ratio, end of period 6.4x 6.8x 6.1x

Credit Spread Changes Assets September 30, 2013 June 30, 2013 Change 2 year vs. 10 year UST spread 230 218 12 Hybrid ARM 5/1 (2.0% coupon) spread to UST 40 45 -5 Hybrid ARM 10/1 (2.5% coupon) spread to UST 80 75 5 Agency CMBS spread to interest rate swaps 72 92 -20 ‘A’-rated CMBS spread to interest rate swaps 255 287 -32 Agency CMBS IO spread to UST 200 200 0 IG Index spread to UST 166 165 1 HY Index spread to UST 531 537 -6 CMBX.NA.A.6 (2012 ‘A’-rated) 270 254 -16 Note: Amounts represent basis point spread to benchmark as noted. Source: JP Morgan 28
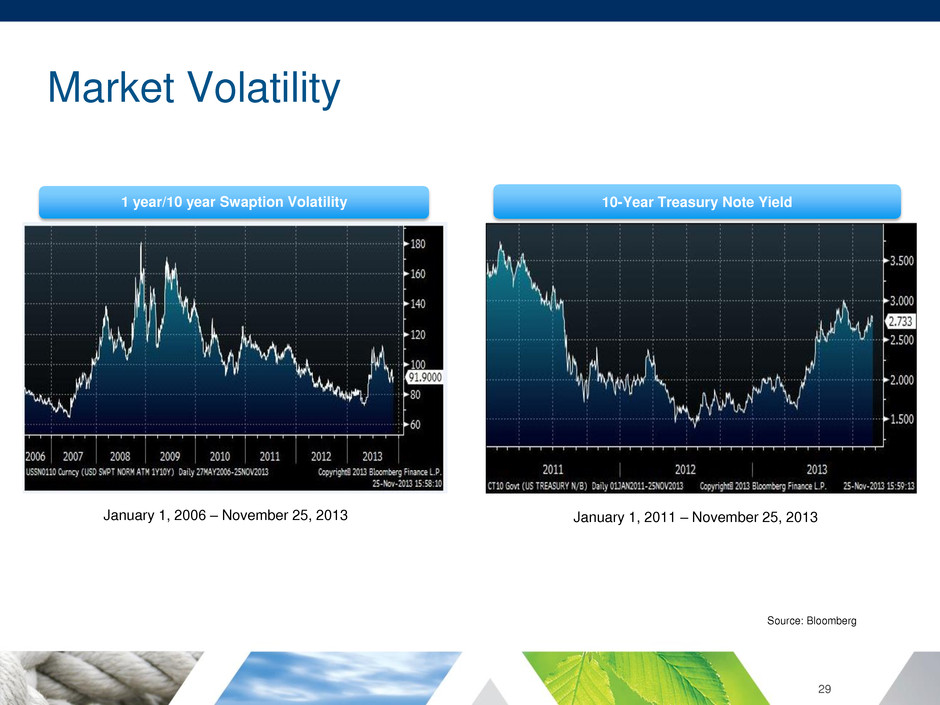
Market Volatility Source: Bloomberg 1 year/10 year Swaption Volatility January 1, 2006 – November 25, 2013 29 10-Year Treasury Note Yield January 1, 2011 – November 25, 2013
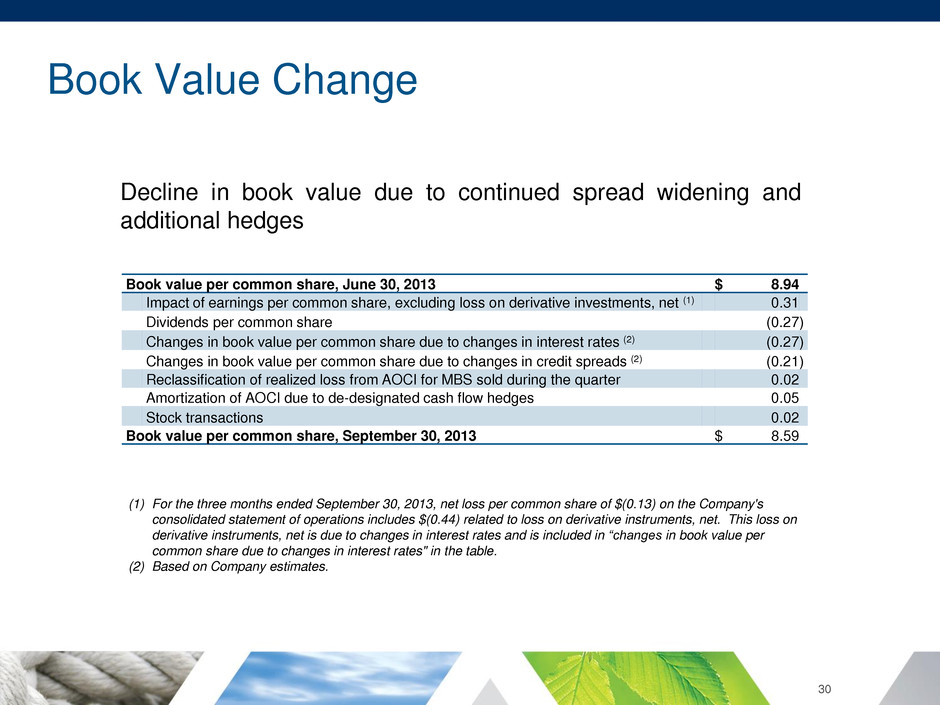
Book Value Change 30 Decline in book value due to continued spread widening and additional hedges Book value per common share, June 30, 2013 $ 8.94 Impact of earnings per common share, excluding loss on derivative investments, net (1) 0.31 Dividends per common share (0.27 ) Changes in book value per common share due to changes in interest rates (2) (0.27 ) Changes in book value per common share due to changes in credit spreads (2) (0.21 ) Reclassification of realized loss from AOCI for MBS sold during the quarter 0.02 Amortization of AOCI due to de-designated cash flow hedges 0.05 Stock transactions 0.02 Book value per common share, September 30, 2013 $ 8.59 (1) For the three months ended September 30, 2013, net loss per common share of $(0.13) on the Company's consolidated statement of operations includes $(0.44) related to loss on derivative instruments, net. This loss on derivative instruments, net is due to changes in interest rates and is included in “changes in book value per common share due to changes in interest rates" in the table. (2) Based on Company estimates.
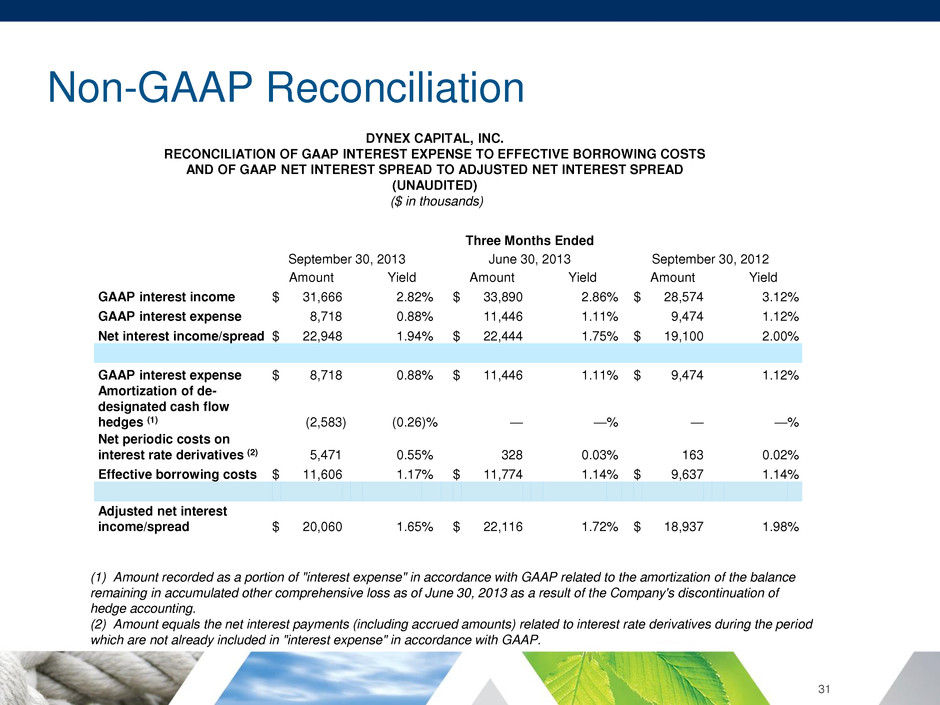
Non-GAAP Reconciliation 31 DYNEX CAPITAL, INC. RECONCILIATION OF GAAP INTEREST EXPENSE TO EFFECTIVE BORROWING COSTS AND OF GAAP NET INTEREST SPREAD TO ADJUSTED NET INTEREST SPREAD (UNAUDITED) ($ in thousands) Three Months Ended September 30, 2013 June 30, 2013 September 30, 2012 Amount Yield Amount Yield Amount Yield GAAP interest income $ 31,666 2.82 % $ 33,890 2.86 % $ 28,574 3.12 % GAAP interest expense 8,718 0.88 % 11,446 1.11 % 9,474 1.12 % Net interest income/spread $ 22,948 1.94 % $ 22,444 1.75 % $ 19,100 2.00 % GAAP interest expense $ 8,718 0.88 % $ 11,446 1.11 % $ 9,474 1.12 % Amortization of de- designated cash flow hedges (1) (2,583 ) (0.26 )% — — % — — % Net periodic costs on interest rate derivatives (2) 5,471 0.55 % 328 0.03 % 163 0.02 % Effective borrowing costs $ 11,606 1.17 % $ 11,774 1.14 % $ 9,637 1.14 % Adjusted net interest income/spread $ 20,060 1.65 % $ 22,116 1.72 % $ 18,937 1.98 % (1) Amount recorded as a portion of "interest expense" in accordance with GAAP related to the amortization of the balance remaining in accumulated other comprehensive loss as of June 30, 2013 as a result of the Company's discontinuation of hedge accounting. (2) Amount equals the net interest payments (including accrued amounts) related to interest rate derivatives during the period which are not already included in "interest expense" in accordance with GAAP.
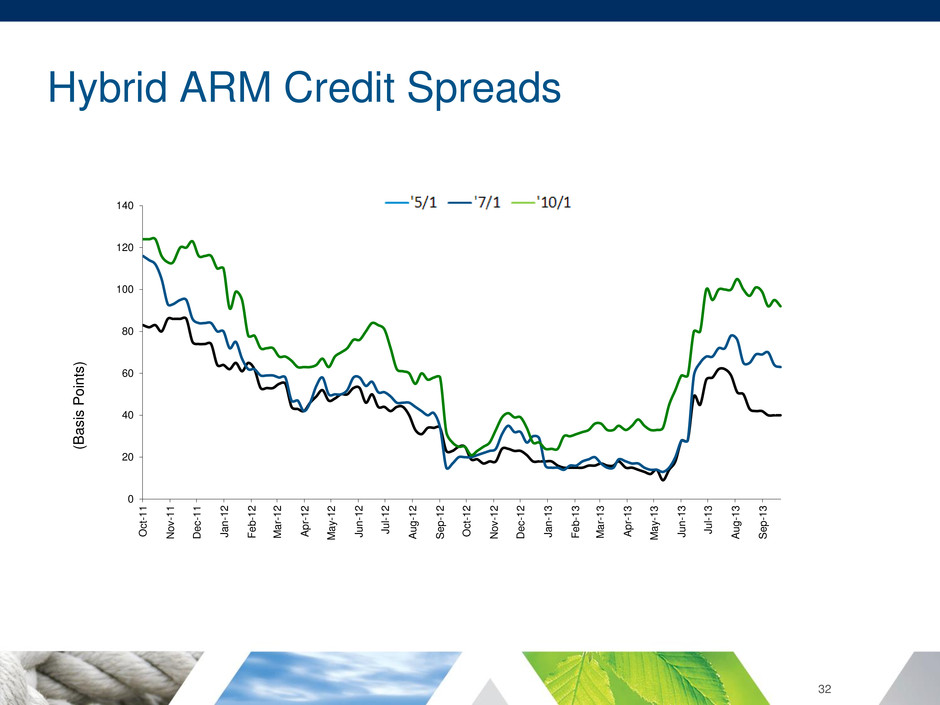
Hybrid ARM Credit Spreads (B as is P o ints ) 0 20 40 60 80 100 120 140 O c t- 1 1 N o v -1 1 D e c -1 1 J a n -1 2 Fe b -1 2 Ma r- 1 2 A p r- 1 2 Ma y -1 2 J u n -1 2 J u l- 1 2 A u g -1 2 S e p -1 2 O c t- 1 2 N o v -1 2 D e c -1 2 J a n -1 3 Fe b -1 3 Ma r- 1 3 A p r- 1 3 Ma y -1 3 J u n -1 3 J u l- 1 3 A u g -1 3 S e p -1 3 32

CMBS Credit Spreads Source: Company Data 33 0 200 400 600 800 1000 1200 1400 Ba si s P o in ts CMBS Spreads vs Swaps AAA CMBS DUS Freddie Credit

Investment Premium Allocation -$100 $0 $100 $200 $300 $400 $500 $600 $700 $800 $900 2009 2010 2011 2012 1Q2013 2Q2013 3Q2013 M il li on s Premium (Discount), net - CMBS and loans Premium, net - RMBS and loans (as of end of period) 34
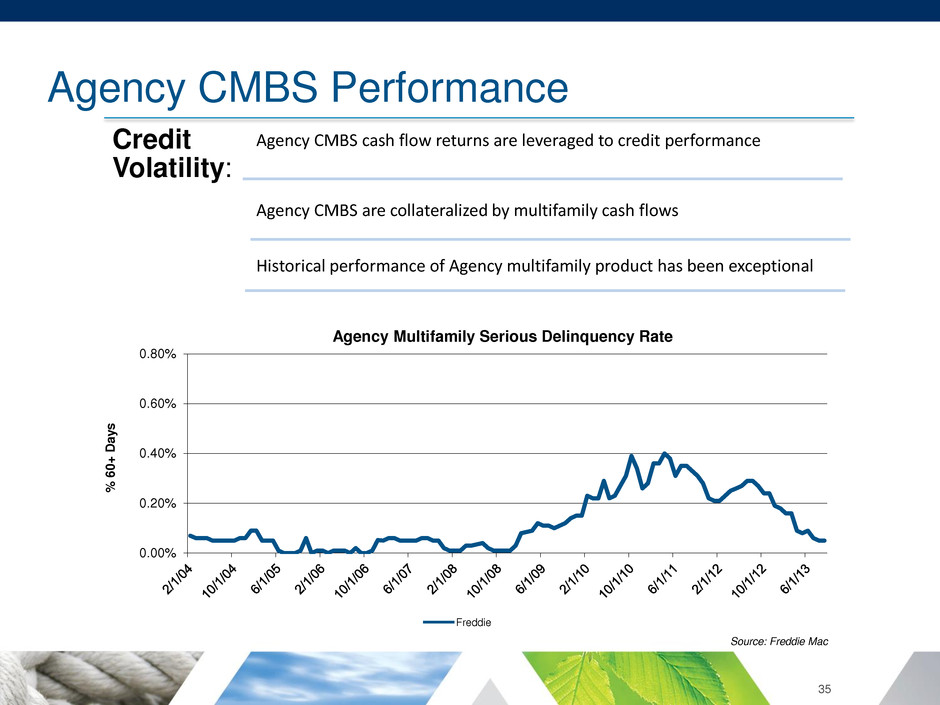
Agency CMBS Performance Source: Freddie Mac Credit Volatility: Agency CMBS cash flow returns are leveraged to credit performance Agency CMBS are collateralized by multifamily cash flows Historical performance of Agency multifamily product has been exceptional Freddie 35 0.00% 0.20% 0.40% 0.60% 0.80% % 60 + D a y s Agency Multifamily Serious Delinquency Rate
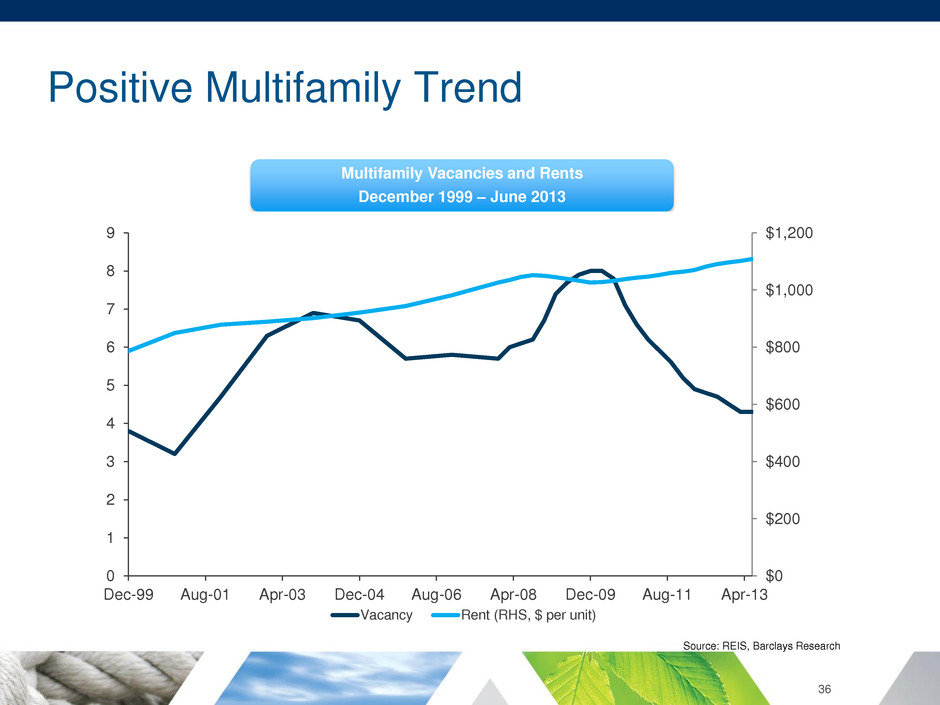
Positive Multifamily Trend Multifamily Vacancies and Rents December 1999 – June 2013 Source: REIS, Barclays Research $0 $200 $400 $600 $800 $1,000 $1,200 0 1 2 3 4 5 6 7 8 9 Dec-99 Aug-01 Apr-03 Dec-04 Aug-06 Apr-08 Dec-09 Aug-11 Apr-13 Vacancy Rent (RHS, $ per unit) 36
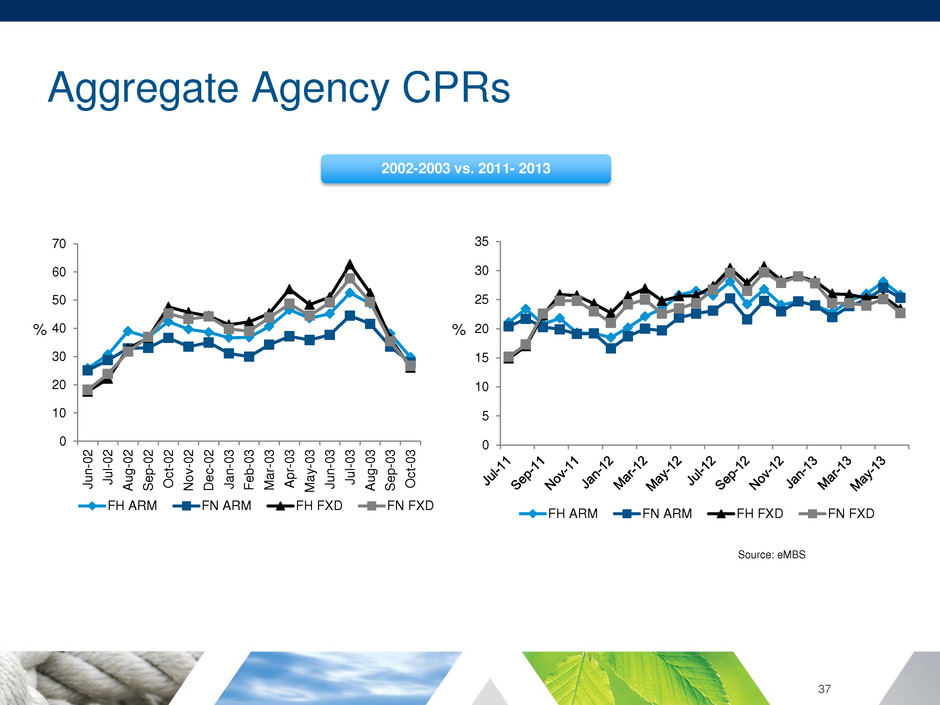
Aggregate Agency CPRs 0 10 20 30 40 50 60 70 Ju n - 02 Ju l-0 2 Au g- 02 Se p- 02 O ct -0 2 N ov - 02 D ec - 02 Ja n- 03 Fe b- 03 M ar - 03 Apr -0 3 M ay - 03 Ju n - 03 Ju l-0 3 Au g- 03 Se p- 03 O ct -0 3 FH ARM FN ARM FH FXD FN FXD 2002-2003 vs. 2011- 2013 Source: eMBS % % 0 5 10 15 20 25 30 35 FH ARM FN ARM FH FXD FN FXD 37
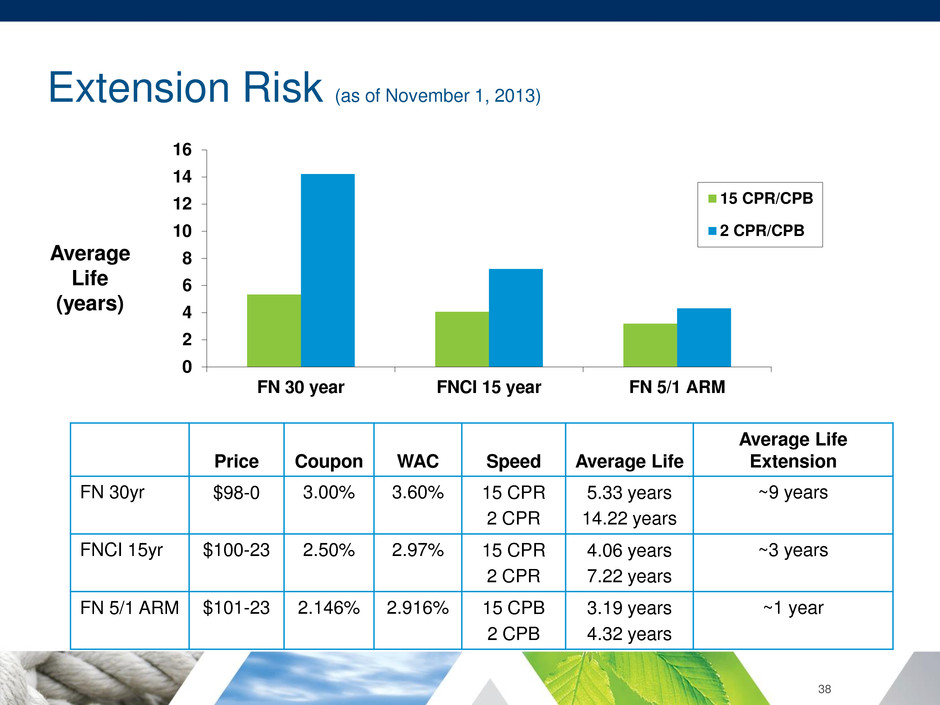
Extension Risk (as of November 1, 2013) 0 2 4 6 8 10 12 14 16 FN 30 year FNCI 15 year FN 5/1 ARM 15 CPR/CPB 2 CPR/CPB Average Life (years) Price Coupon WAC Speed Average Life Average Life Extension FN 30yr $98-0 3.00% 3.60% 15 CPR 2 CPR 5.33 years 14.22 years ~9 years FNCI 15yr $100-23 2.50% 2.97% 15 CPR 2 CPR 4.06 years 7.22 years ~3 years FN 5/1 ARM $101-23 2.146% 2.916% 15 CPB 2 CPB 3.19 years 4.32 years ~1 year 38
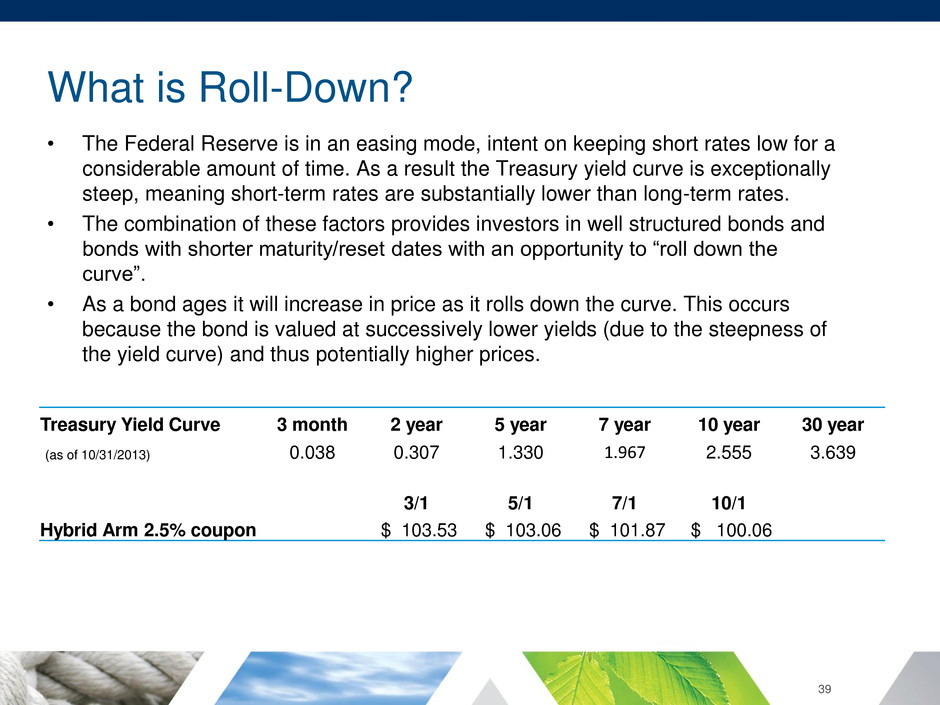
What is Roll-Down? • The Federal Reserve is in an easing mode, intent on keeping short rates low for a considerable amount of time. As a result the Treasury yield curve is exceptionally steep, meaning short-term rates are substantially lower than long-term rates. • The combination of these factors provides investors in well structured bonds and bonds with shorter maturity/reset dates with an opportunity to “roll down the curve”. • As a bond ages it will increase in price as it rolls down the curve. This occurs because the bond is valued at successively lower yields (due to the steepness of the yield curve) and thus potentially higher prices. Treasury Yield Curve 3 month 2 year 5 year 7 year 10 year 30 year (as of 10/31/2013) 0.038 0.307 1.330 1.967 2.555 3.639 3/1 5/1 7/1 10/1 Hybrid Arm 2.5% coupon $ 103.53 $ 103.06 $ 101.87 $ 100.06 39
Spread Risk • An asset’s “spread” is the market premium above a benchmark rate that reflects the relative riskiness of the asset versus the benchmark. • Spread risk is the uncertainty in pricing resulting from the expansion and contraction of the risk premium over the benchmark. • Spreads (and therefore prices) are impacted by the following factors: – Fundamentals: Probability of default, cash flow uncertainty – Technicals: Supply and demand for various assets – Psychology: Reflects the risk appetite of the market and the perceived riskiness of specific assets • Most mortgage REIT business models are inherently exposed to spread risk. At Dynex, we focus on all three aspects of spread risk. However, changes in pricing due to technicals and psychology are very difficult to predict. We manage spread risk over the long-term through portfolio construction. 40


