
Well positioned to deliver value JMP Securities 2019 Financial Services Conference November 14, 2019
Safe Harbor Statement NOTE: This presentation contains certain statements that are not historical facts and that constitute “forward-looking statements” within the meaning of the Private Securities Litigation Reform Act of 1995. Statements in this presentation addressing expectations, assumptions, beliefs, projections, estimates, future plans, strategies, and events, developments that we expect or anticipate will occur in the future, and future operating results or financial condition are forward-looking statements. Forward-looking statements in this presentation may include, but are not limited to, statements regarding our financial performance in future periods, future interest rates, our views on expected characteristics of future investment environments, prepayment rates and investment risks, our future investment strategies, our future leverage levels and financing strategies, the use of specific financing and hedging instruments and the future impacts of these strategies, future actions by the Federal Reserve and other central banks, and the expected performance of our investments. The words “will,” “believe,” “expect,” “forecast,” “anticipate,” “intend,” “estimate,” “assume,” “project,” “plan,” “continue,” and similar expressions also identify forward-looking statements. These forward-looking statements reflect our current beliefs, assumptions and expectations based on information currently available to us, and are applicable only as of the date of this presentation. Forward-looking statements are inherently subject to risks, uncertainties, and other factors, some of which cannot be predicted or quantified and any of which could cause the Company’s actual results and timing of certain events to differ materially from those projected in or contemplated by these forward-looking statements. Not all of these risks, uncertainties and other factors are known to us. New risks and uncertainties arise over time, and it is not possible to predict those risks or uncertainties or how they may affect us. The projections, assumptions, expectations or beliefs upon which the forward-looking statements are based can also change as a result of these risks and uncertainties or other factors. If such a risk, uncertainty, or other factor materializes in future periods, our business, financial condition, liquidity and results of operations may differ materially from those expressed or implied in our forward-looking statements. While it is not possible to identify all factors, some of the factors that may cause actual results to differ from historical results or from any results expressed or implied by our forward-looking statements, or that may cause our projections, assumptions, expectations or beliefs to change, include the risks and uncertainties referenced in our Annual Report on Form 10-K for the year ended December 31, 2018 and subsequent filings with the Securities and Exchange Commission, particularly those set forth under the caption “Risk Factors”. 2

Contents Market Snapshot 4 Recent Developments 5 Performance 6 Macro Economic Thesis 7 Investment Strategy 8 Hedging & Risk Management 11 Funding Strategy 13 Return Environment 14 Key Takeaways 15 Summary 16 Appendix 17 - Macro charts 18 - Portfolio and Financial tables 22 - MREIT Reference Materials 27 3

Market Snapshot Common Stock Preferred Stocks NYSE Ticker DX DXPrA DXPrB Shares Outstanding (in millions) (at 9/30/19) 22.9 2.3 4.5 3Q19 Dividends per share $0.48 $0.53125 $0.4765625 Annualized Dividend Yield 11.79% 8.20% 7.60% Book Value (at 9/30/19) $18.07 — — Share Price (11/11/19 close) $16.29 $25.90 $25.09 Market Capitalization (in millions) $373.79 $59.57 $112.60 Price to Book 90.1% — — 4
Recent Developments (through November 12, 2019) We continue to believe it is highly probable that the yield range on the 10-year Treasury will remain between 1.5%-2.5% with a greater likelihood toward the lower end of the range in the near term. • Relative to our third quarter results, we expect net interest spread and adjusted net interest spread expansion to persist in 4Q as repo financing costs decline and we benefit from the hedge adjustments the Company made in 2Q and 3Q, providing further support for core EPS. • While the Federal Reserve has acted to relieve the pressure on repo markets, financing rates remain elevated principally from technical and regulatory factors. To attempt to insulate ourselves from year-end risk, we have rolled over 90% of our Agency CMBS and RMBS repo agreement financing past year-end and anticipate having substantially all of the maturities rolled past year end by the end of November. • Post quarter-end we made portfolio adjustments to further reduce exposure to rising rates. Based on our daily pricing process, as of close of business on November 12, 2019, we estimate that BV has declined in a range of 1%–2% since quarter end. • Our portfolio prepayment experience in October and November was in-line with our expectations. The market significantly over-predicted prepayment speeds in higher coupons which were materially below expectations for November. • The diversification of our portfolio (50% CMBS and 50% RMBS) has significantly contributed to keeping prepayment risk well contained and cushioning book value. If interest rates continue to rise, we expect spreads to tighten, mitigating book value impact from higher rates. • Available market returns remain in the low to mid-teens, relatively unchanged since quarter end. We expect our marginal capital allocation to be opportunistic and weighted 50% to CMBS and 50% to Agency RMBS. 5

Third Quarter 2019 Performance • Comprehensive income of $0.63 per common share and GAAP net loss of ($1.65) per common share • Core net operating income(1) of $0.48 per common share versus $0.43 per share in the second quarter of 2019 • Book value per common share increased 2.2%, to $18.07 at September 30, 2019 compared to $17.68 at June 30, 2019 • Total economic return(2) for the third quarter was $0.87, or 4.9%. For the year total economic return(2) is $1.56, or 8.6% • Net interest spread and adjusted net interest spread (1) increased to 0.82% and 1.14%, respectively, for the third quarter of 2019 compared to 0.76% and 1.03%, respectively, for the second quarter of 2019 • Leverage(3) including TBA net long positions decreased to 9.1x shareholders’ equity at September 30, 2019 compared to 9.4x at June 30, 2019 (1) Reconciliations for non-GAAP measures are presented on slide 26. (2) For 3Q19 equals sum of common stock dividend of $0.48 per share plus the increase in book value of $0.39 per common share divided by beginning book value per common share of $17.68. For YTD 2019, equals sum of dividends paid year-to-date of $1.56 per common share plus no change in book value per common share divided by beginning book value per common share of $18.07 (3) Equals sum of (i) total liabilities and (ii) amortized cost basis of net long TBAs (if settled) divided by total shareholders' equity. 6
Macro Economic Thesis • The global economy is fragile and downside risks are increasing; this remains the core of our long- term macro economic and investment thesis. • The combination of global debt, demographics, technology, human conflict and climate change continue to impose a drag on global growth and inflation. • Global economies and the global financial system cannot stand on their own without the central banks continuing to play a major role. The stress experienced in the overnight funding markets in the third quarter highlights this fact. • While fiscal policy remains an important potential factor for stimulating growth and inflation, when debt financed, the increased supply of bonds is a governor for how low interest rates can fall in the absence of a crisis, and also puts liquidity pressure on markets. • Interest rates should remain in their narrower range with large pools globally of negative yielding debt, and a global economy still needing the continued support of central banks. • Given the combination of these factors, we believe it is highly probable that the yield range on the 10-year Treasury will remain between 1.5% - 2.5%, with a greater likelihood toward the lower end of the range in the near term. 7

Investment Portfolio September 30, 2019 June 30, 2019 Agency Agency CMBS: 33% CMBS: 40% Agency RMBS (1): Agency 50% RMBS (1): 59% CMBS IO: 8% CMBS IO: 10% • Diversification of the portfolio between commercial and residential securities creates an asset profile that reduces overall hedging costs in the long-term. • The combination of CMBS and RMBS greatly reduces duration variability and therefore cash flow variability and hedging costs, relative to a portfolio of 100% Agency RMBS. 1) Includes TBA dollar roll positions at their implied market value as if settled which are accounted for as “derivative assets (liabilities)” on our consolidated balance sheet. 8

Portfolio Characteristics (as of September 30, 2019) ($ in millions) Par Value 3- WAVG Unamortized month Total Par Estimated % of Coupon Amortized Premium 3-month WAVG (1) Security Pools TBA Value Fair Value Portfolio (2) cost (%) Balance CPR yield Agency RMBS 2.5% coupon $— $245,000 $245,000 $243,718 4.7% 2.50% (3) (3) (3) (3) 3.0% coupon 316,877 150,000 466,877 476,152 9.2% 3.00% 101.0% $3,213 8.2% 2.84% 3.5% coupon 556,845 — 556,845 579,577 11.2% 3.50% 102.1% 11,608 6.2% 3.22% 4.0% coupon 1,457,065 (500,000) 957,065 1,015,591 19.6% 4.00% 102.4% 34,656 15.4% 3.39% 4.5% coupon 279,354 — 279,354 298,126 5.8% 4.50% 104.2% 11,696 24.8% 2.92% Total Agency RMBS 2,610,141 (105,000) 2,505,141 2,613,164 50.5% 102.3% 61,173 13.6% 3.22% Agency CMBS 1,922,930 — 1,922,930 2,075,203 40.0% 3.30% 100.8% 15,957 (5) 3.22% CMBS Interest- only (4) — (4) 489,543 9.5% 0.65% n/a 474,548 (5) 3.90% Other non- Agency MBS 2,043 — 2,043 1,808 —% 5.92% 57.1% (876) - 34.65% Totals $4,535,114 ($105,000) $4,430,114 $5,179,718 100% $550,802 3.29% (1) Estimated fair value of TBA long and short positions total a net $(123.2) million in fair value. (2) The weighted average coupon (“WAC”) is the gross interest rate of the security weighted by the outstanding principal balance (or by notional amount for CMBS IO). (3) Amortized cost %, unamortized premium balance, WALA, 3-month CPR and 1-month WAVG yield exclude TBA securities. (4) CMBS IO do not have underlying par values. The total notional value underlying CMBS IO is $22.8 billion. (5) Structurally, we are compensated for CMBS prepayments, but there are exceptions under certain circumstances. 9

Prepayment Protection on Unamortized Premium Investment Premium by Asset Type (as of September 30, 2019) ($ in millions) Prepayment protected CMBS and CMBS IO: Prepayment advantaged RMBS: unamortized premium $490.5 unamortized premium $61 100% of CMBS IO: investment $474.5 premium exposure in Investment premium CMBS has 4.0%: $34.7 protection in Agency structural RMBS, while non- prepayment 3.5%: structural, is $9.5 protection achieved through 4.5%: $11.7 careful selection of 3.0%: $1.4 pool characteristics(1) (1) Includes Agency RMBS collateralized by low loan balance, high LTV or geographically favorable loans Agency CMBS: $16.0 10
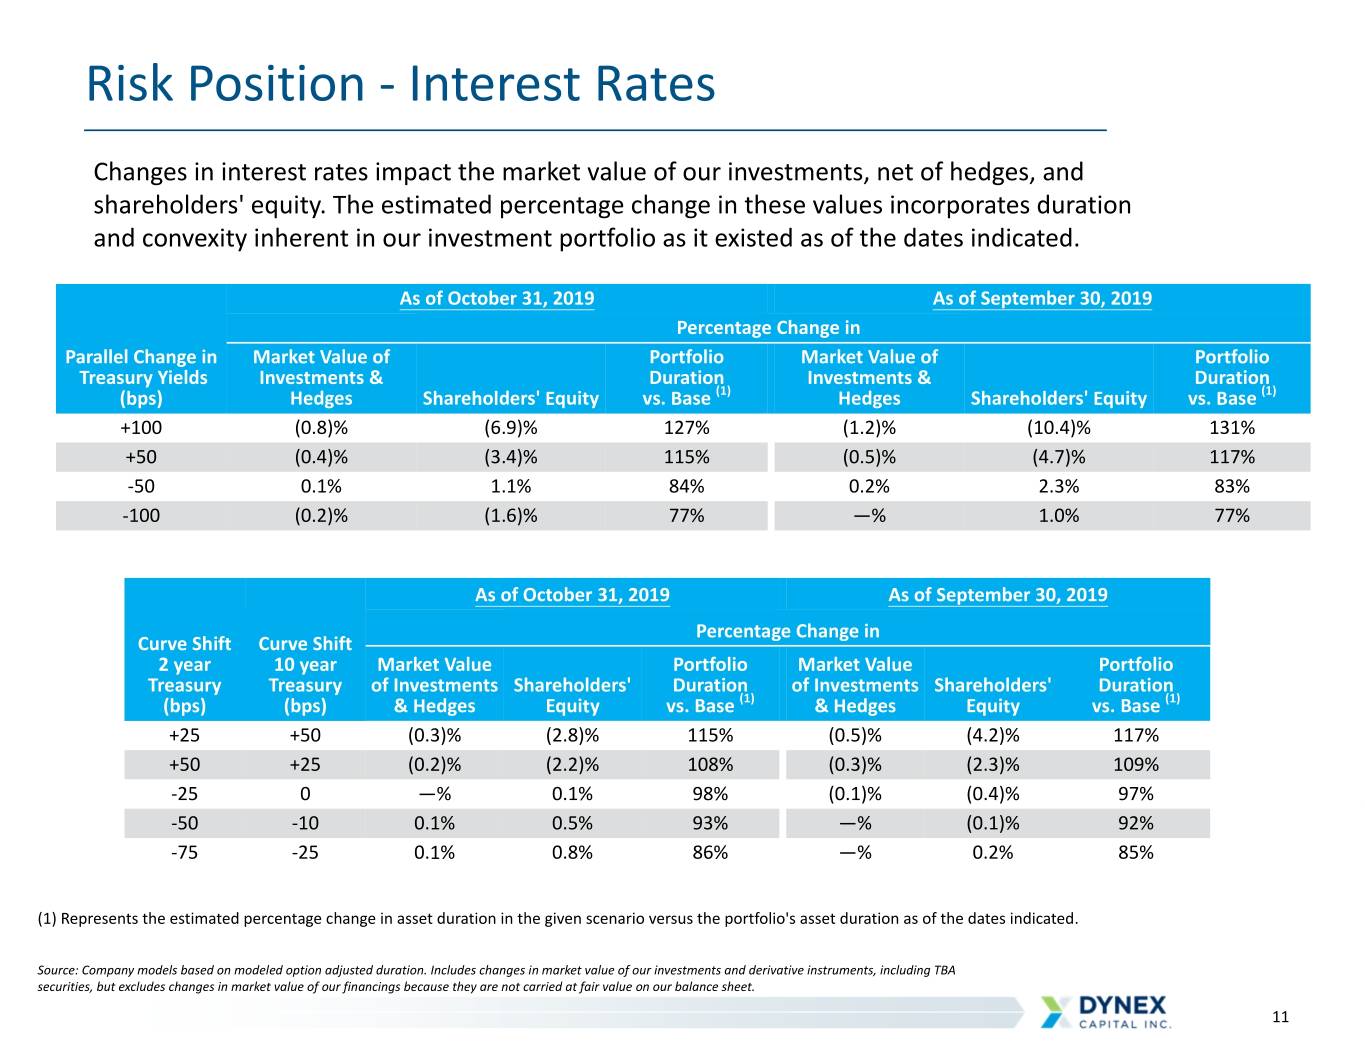
Risk Position - Interest Rates Changes in interest rates impact the market value of our investments, net of hedges, and shareholders' equity. The estimated percentage change in these values incorporates duration and convexity inherent in our investment portfolio as it existed as of the dates indicated. As of October 31, 2019 As of September 30, 2019 Percentage Change in Parallel Change in Market Value of Portfolio Market Value of Portfolio Treasury Yields Investments & Duration Investments & Duration (bps) Hedges Shareholders' Equity vs. Base (1) Hedges Shareholders' Equity vs. Base (1) +100 (0.8)% (6.9)% 127% (1.2)% (10.4)% 131% +50 (0.4)% (3.4)% 115% (0.5)% (4.7)% 117% -50 0.1% 1.1% 84% 0.2% 2.3% 83% -100 (0.2)% (1.6)% 77% —% 1.0% 77% As of October 31, 2019 As of September 30, 2019 Percentage Change in Curve Shift Curve Shift 2 year 10 year Market Value Portfolio Market Value Portfolio Treasury Treasury of Investments Shareholders' Duration of Investments Shareholders' Duration (bps) (bps) & Hedges Equity vs. Base (1) & Hedges Equity vs. Base (1) +25 +50 (0.3)% (2.8)% 115% (0.5)% (4.2)% 117% +50 +25 (0.2)% (2.2)% 108% (0.3)% (2.3)% 109% -25 0 —% 0.1% 98% (0.1)% (0.4)% 97% -50 -10 0.1% 0.5% 93% —% (0.1)% 92% -75 -25 0.1% 0.8% 86% —% 0.2% 85% (1) Represents the estimated percentage change in asset duration in the given scenario versus the portfolio's asset duration as of the dates indicated. Source: Company models based on modeled option adjusted duration. Includes changes in market value of our investments and derivative instruments, including TBA securities, but excludes changes in market value of our financings because they are not carried at fair value on our balance sheet. 11

Hedge Position (as of September 30, 2019) Hedging Portfolio Summary Interest Rate Swap Maturities Notional WAVG Notional WAVG WAVG Life ($ in millions) Amount Rate Duration (1) Years to Maturity- Amount (in Pay-Fixed Remaining Swaps millions) Rate (in years) Interest rate swaps $ 3,880 1.65% -3.27 Interest rate swaptions 750 2.07% -0.14 < 3 years $ 2,360 1.58% 1.6 Futures (2) 6,000 1.35% -0.29 >3 and < 6 years 550 1.35% 4.9 $ 10,630 1.51% >6 and < 10 years 850 1.85% 9.6 (1) Represents a modeled estimate of interest rate sensitivity measured in years. >10 years 120 2.84% 27.9 (2) Represents the combined notional of eight 3-month contracts at $750 million each with maturities ranging between 2020 and 2022. Total $ 3,880 1.65% 4.7 Interest Rate Swaps $4.0 4.0% ) s n $3.9 o i l l i b $3.0 $3.3 3.0% n i ( l 1.97% a 1.75% 1.80% n $2.0 1.65% 1.63% 1.63% 1.69% 2.0% o i t o $2.7 N G $1.0 $1.9 1.0% V $1.5 A $1.3 $1.0 W $0.0 0.0% 9 0 1 2 3 4 * 1 2 2 2 2 2 5 0 0 0 0 0 0 2 2 2 2 2 2 2 0 2 Interest Rate Swap Notional Weighted Average Fixed-Pay Rate * Additional interest rate swaps outstanding from 2026-2047 had an average balance of $256.3 million at a weighted average pay-fixed rate of 2.12% as of September 30, 2019. 12
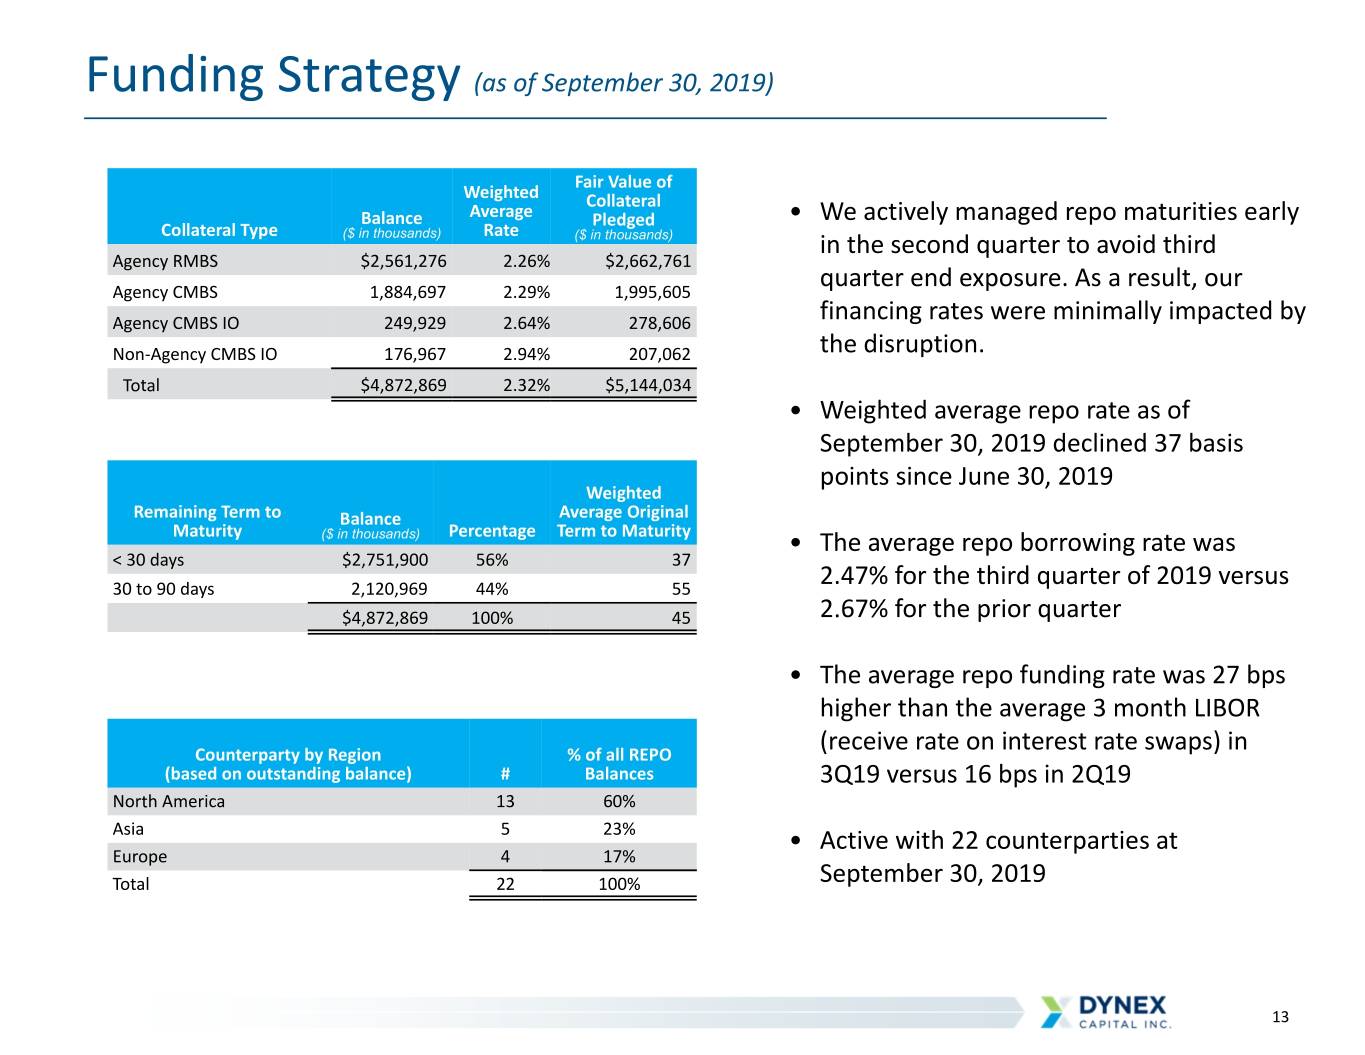
Funding Strategy (as of September 30, 2019) Fair Value of Weighted Collateral Balance Average Pledged • We actively managed repo maturities early Collateral Type Rate ($ in thousands) ($ in thousands) in the second quarter to avoid third Agency RMBS $2,561,276 2.26% $2,662,761 quarter end exposure. As a result, our Agency CMBS 1,884,697 2.29% 1,995,605 Agency CMBS IO 249,929 2.64% 278,606 financing rates were minimally impacted by Non-Agency CMBS IO 176,967 2.94% 207,062 the disruption. Total $4,872,869 2.32% $5,144,034 • Weighted average repo rate as of September 30, 2019 declined 37 basis points since June 30, 2019 Weighted Remaining Term to Balance Average Original Maturity ($ in thousands) Percentage Term to Maturity • The average repo borrowing rate was < 30 days $2,751,900 56% 37 30 to 90 days 2,120,969 44% 55 2.47% for the third quarter of 2019 versus $4,872,869 100% 45 2.67% for the prior quarter • The average repo funding rate was 27 bps higher than the average 3 month LIBOR Counterparty by Region % of all REPO (receive rate on interest rate swaps) in (based on outstanding balance) # Balances 3Q19 versus 16 bps in 2Q19 North America 13 60% Asia 5 23% • Active with 22 counterparties at Europe 4 17% Total 22 100% September 30, 2019 13

Return Environment (as of October 22, 2019) Assets & Available Returns (1) Agency RMBS and CMBS offer attractive returns Higher Agency MBS Government RMBS(2), CMBS, CMBS-IO • The most compelling levered risk-adjusted returns Issued AAA Range 10-15% are still in the highest credit quality and the most Rated liquid assets. • Agency CMBS are an attractive long term Non-Agency MBS AAA CMBS-IO, RMBS, RMBS-IO, investment due to the prepayment protection, Rated CMBS stable cash flow and roll down. Range 7-13% • Agency RMBS offer attractive returns as the AA – BBB Non-Agency MBS Federal Reserve reduces its investment in this Rated Range 5-11% sector - we expect to be opportunistic in this sector. Non-Agency MBS Below Range 6-13% Investment • Investing in more liquid MBS allows us the Grade/ flexibility to rapidly pivot to other opportunities Non-Rated Loans/MSRs Lower Range 5-10% when they arise. (1) Range of levered returns based on Company assumptions and calculations (2) Includes specified pools and TBAs 14

Key Takeaways: Well Positioned to Deliver Value • Long-term we continue to have a macro economic view that the global economy is fragile, that we are in a low return environment and that our financing costs will be reduced substantially in the future. • We fully expect our net interest margin to expand as the Federal Reserve continues to reduce short term interest rates and addresses repo market mechanics. • We are actively managing book value with tactical decisions on both sides of the balance sheet in accordance with our macro economic thesis. • Other long-term trends favor our business model. • Private capital's role in the US housing finance system should expand as the Federal Reserve and GSEs reduce their footprint. • Anticipated lower regulatory costs over the long-term. • Global demographics support a growing demand for cash yield as the world's population ages. • Favorable U.S. demographic trends driving household formation/housing demand. • Investors should seek and favor experienced management teams and Dynex brings significant experience and expertise in managing securitized real estate assets through multiple economic cycles. 15

Summary: U.S. Real Estate Assets Provide Attractive Returns • In our view, generating cash income from U.S. real estate related assets and the US housing finance system is one of the most attractive investment alternatives. • Alternatives for earning an attractive cash yield globally have declined materially over the past 10 years, increasing the relative attractiveness of mREITs. • Investors should focus on the long-term total returns of mortgage REITs and the power of dividends over time. Total Return (%) January 1, 2008 - October 23, 2019 Source: SNL 16

Supplemental Information

"Global Risks Are Intensifying" World Economic Forum Global Risk Report 2019 According to the 2019 World Economic Forum’s Global Risks Report... "The world is facing a growing number of complex and interconnected challenges-from slowing global growth and persistent economic inequality to climate change, geopolitical tensions and the accelerating pace of the Fourth Industrial Revolution." 18
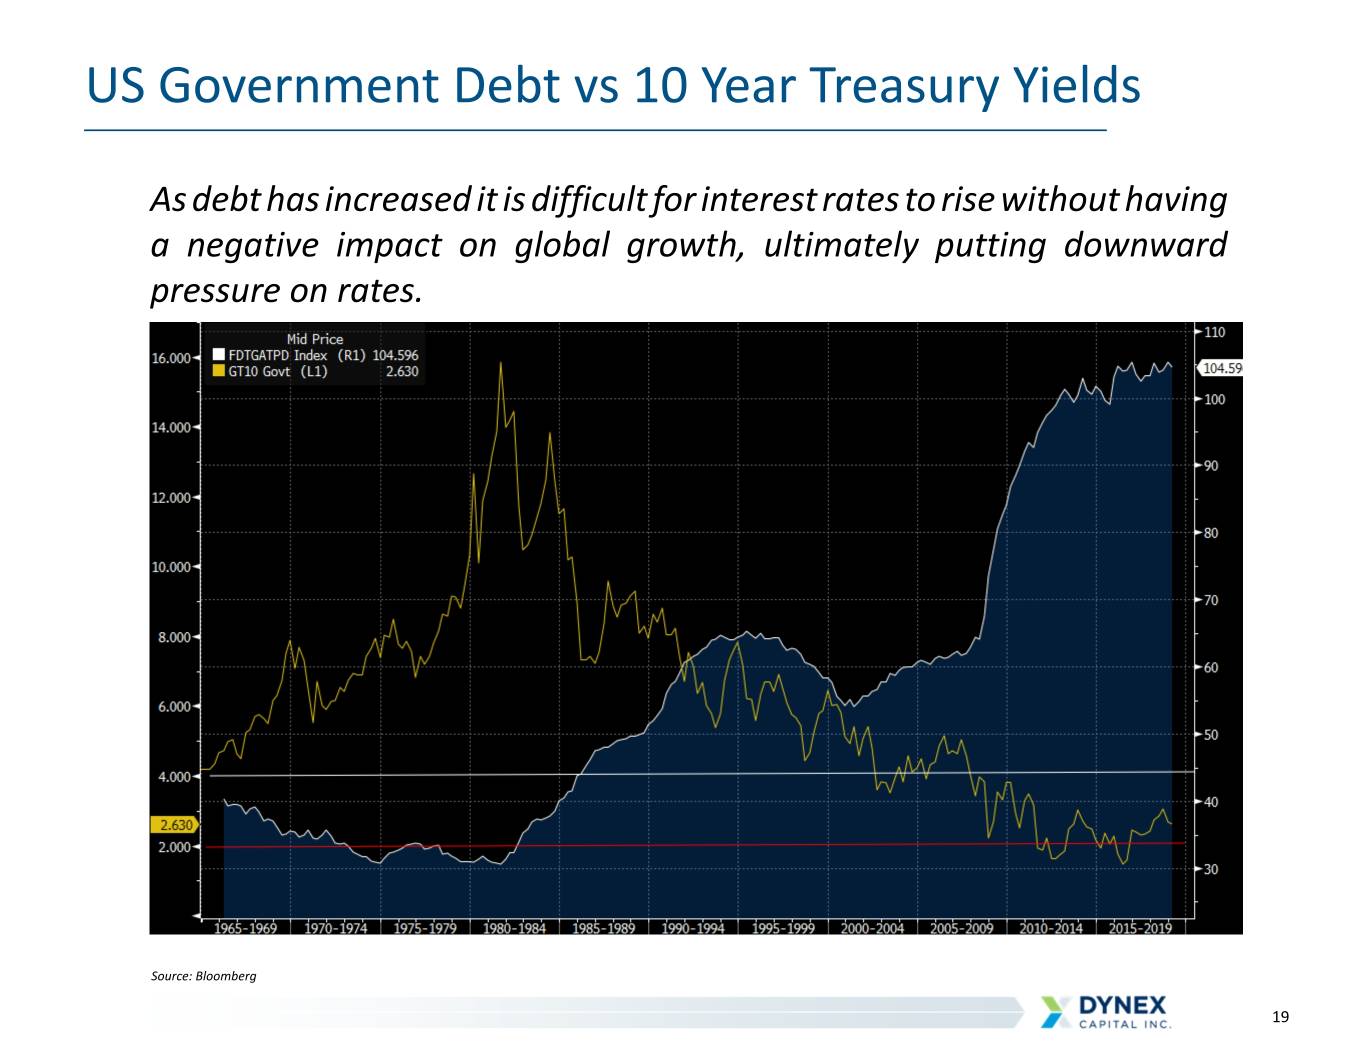
US Government Debt vs 10 Year Treasury Yields As debt has increased it is difficult for interest rates to rise without having a negative impact on global growth, ultimately putting downward pressure on rates. US 10yr Yields % US Govt Debt to GDP % (left axis) (right axis) US 10yr Yields % US Govt Debt to GDP % (left axis) (right axis) Source: Bloomberg 19

Japan Government Debt % to GDP vs 10 Year Yields As debt has risen, Japanese 10 yr yields have remained below 2% for 20 years Source: Bloomberg 20
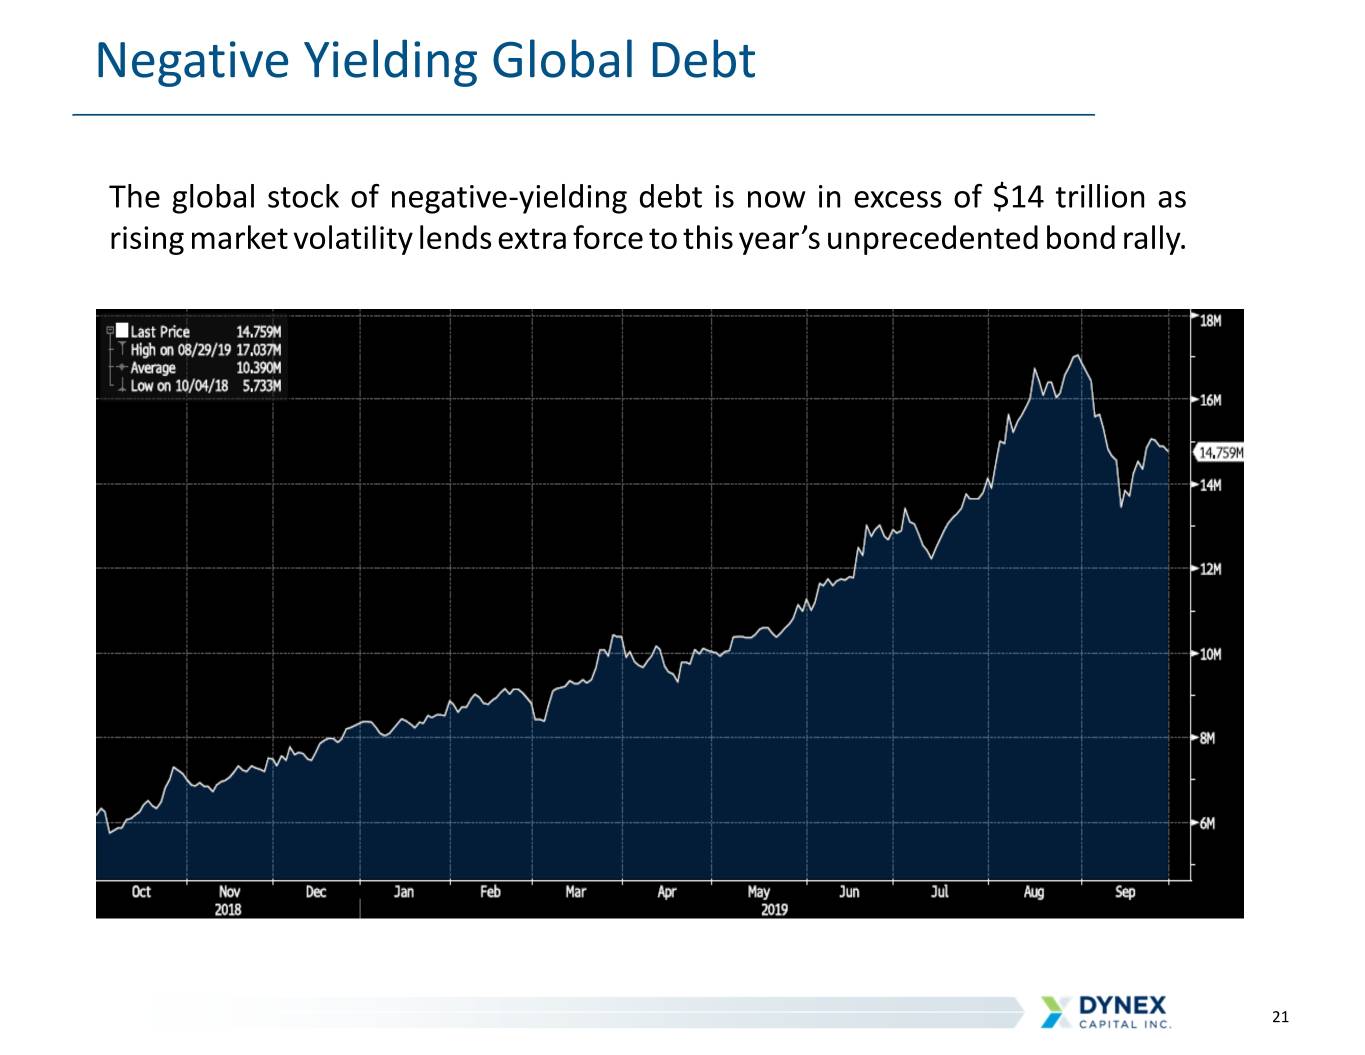
Negative Yielding Global Debt The global stock of negative-yielding debt is now in excess of $14 trillion as rising market volatility lends extra force to this year’s unprecedented bond rally. 21

Investment Strategy Diversified investment approach that performs in a variety of market environments • Dynamic and disciplined capital allocation model enables capturing long-term value • Invest in a high quality, liquid asset portfolio of primarily Agency investments • Diversification is a key benefit ◦ Balance between commercial and residential sectors provides diversified cash flow and prepayment profile ◦ Agency CMBS protect the portfolio from extension risk. High quality CMBS IO add yield and are intended to limit credit exposure and prepayment volatility vs. lower rated tranches ◦ Agency fixed rate RMBS allow opportunistic balance sheet growth in high quality liquid assets • Flexible portfolio duration position to reflect changing market conditions 22
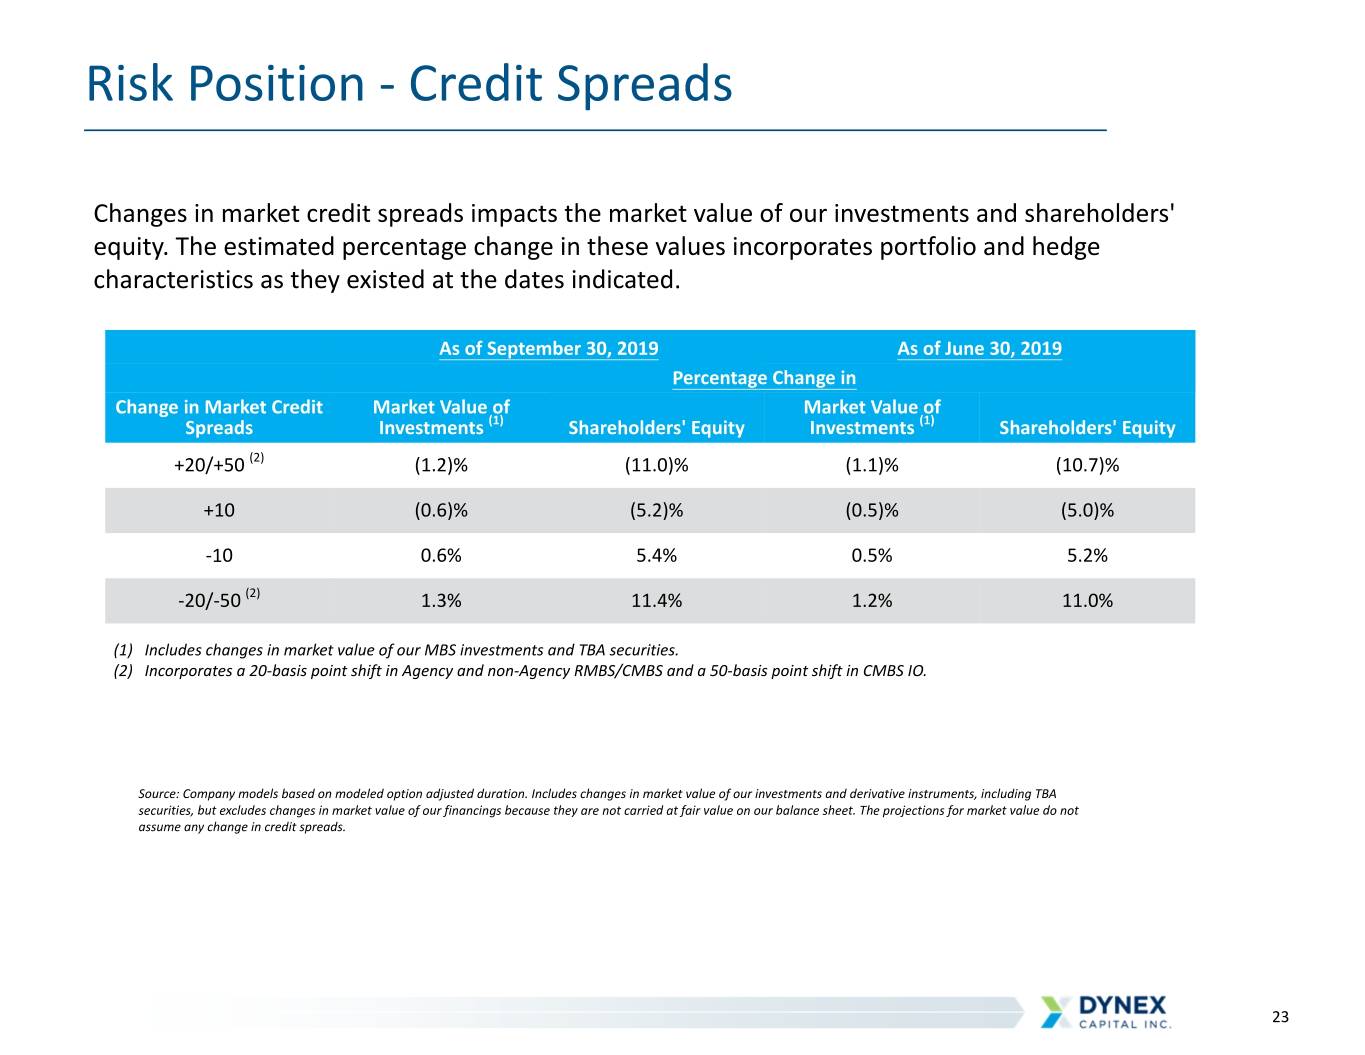
Risk Position - Credit Spreads Changes in market credit spreads impacts the market value of our investments and shareholders' equity. The estimated percentage change in these values incorporates portfolio and hedge characteristics as they existed at the dates indicated. As of September 30, 2019 As of June 30, 2019 Percentage Change in Change in Market Credit Market Value of Market Value of Spreads Investments (1) Shareholders' Equity Investments (1) Shareholders' Equity +20/+50 (2) (1.2)% (11.0)% (1.1)% (10.7)% +10 (0.6)% (5.2)% (0.5)% (5.0)% -10 0.6% 5.4% 0.5% 5.2% -20/-50 (2) 1.3% 11.4% 1.2% 11.0% (1) Includes changes in market value of our MBS investments and TBA securities. (2) Incorporates a 20-basis point shift in Agency and non-Agency RMBS/CMBS and a 50-basis point shift in CMBS IO. Source: Company models based on modeled option adjusted duration. Includes changes in market value of our investments and derivative instruments, including TBA securities, but excludes changes in market value of our financings because they are not carried at fair value on our balance sheet. The projections for market value do not assume any change in credit spreads. 23

Financial Performance - Comparative Quarters 3Q19 2Q19 Income Per Common Income Per Common ($ in thousands, except per share amounts) (Expense) Share (Expense) Share Interest income $44,502 $1.84 $43,748 $1.78 Interest expense 31,256 1.29 30,813 1.25 GAAP net interest income 13,246 0.55 12,935 0.53 TBA drop income (1) 1,404 0.06 1,282 0.05 Net periodic interest benefit of interest rate swaps (1) 3,966 0.16 3,553 0.14 Adjusted net interest income (2) 18,616 0.77 17,770 0.72 Other operating income (expense), net 25 — 256 0.01 General and administrative expenses (3,758) (0.15) (4,265) (0.17) Preferred stock dividends (3,341) (0.14) (3,206) (0.13) Core net operating income to common shareholders (2) 11,542 0.48 10,555 0.43 Change in fair value of derivatives (1) (56,079) (2.32) (122,370) (4.99) Realized gain (loss) on sale of investments, net 4,605 0.19 (10,360) (0.42) Fair value adjustments, net (13) — (16) — GAAP net loss to common shareholders (39,945) (1.65) (122,191) (4.98) Unrealized gain on MBS 55,195 2.28 111,127 4.53 Comprehensive income (loss) to common shareholders $15,250 $0.63 ($11,064) ($0.45) WAVG common shares outstanding 24,174 24,541 (1) TBA drop income, net periodic interest benefit, and change in fair value of derivatives are components of "gain (loss) on derivative instruments, net" reported in the comprehensive income statement. (2) See reconciliations for non-GAAP measures on slide 26. 24

Book Value Rollforward Per Common ($ in thousands, except per share amounts) Share Common shareholders' equity, June 30, 2019 (1) $435,785 $17.68 GAAP net loss to common shareholders: Core net operating income to common (2) 11,542 Realized gain on sale of MBS, net 4,605 Change in fair value of derivatives (56,079) Other (13) Unrealized net gain on MBS 55,195 Dividends declared (11,577) Stock transactions (3) (24,719) Common shareholders' equity, September 30, 2019 (1) $414,739 $18.07 (1) Common shareholders' equity represents total shareholders' equity less the liquidation value of preferred stock outstanding as of the date indicated. (2) Reconciliations for non-GAAP measures are presented on slide 26. (3) Includes cash paid for common stock repurchases, net of proceeds received from common stock issuances, stock issuance cost, restricted stock amortization, and impact on common equity from preferred shares issued below liquidation value of $25.00 per share. 25

Reconciliation of GAAP Measures to Non-GAAP Measures ($ in thousands except per share data) Quarter Ended 09/30/2019 06/30/2019 3/31/2019 12/31/2018 9/30/18 GAAP net (loss) income to common shareholders ($39,945) ($122,191) ($55,273) ($81,485) $22,630 Adjustments: Change in fair value of derivatives instruments, net (1) 56,079 122,370 67,557 86,993 (13,460) Loss on sale of investments, net (4,605) 10,360 — 5,428 1,726 Accretion of de-designated cash flow hedges (2) — — (165) (75) (66) Fair value adjustments, net 13 16 13 16 (12) Core net operating income to common shareholders $11,542 $10,555 $12,132 $10,877 $10,818 Core net operating income per common share $0.48 $0.43 $0.53 $0.54 $0.56 Quarter Ended 09/30/2019 06/30/2019 3/31/2019 12/31/2018 9/30/18 GAAP net interest income $13,246 $12,935 $13,681 $12,961 $12,174 Add: TBA drop income 1,404 1,282 1,963 3,072 4,262 Add: net periodic interest benefit (3) 3,966 3,553 3,897 1,940 1,777 Less: de-designated hedge accretion (2) — — (165) (75) (66) Non-GAAP adjusted net interest income $18,616 $17,770 $19,376 $17,898 $18,147 GAAP interest expense $31,256 $30,813 $26,276 $19,053 $14,751 Add: net periodic interest benefit (3) (3,966) (3,553) (3,897) (1,940) (1,777) Less: de-designated hedge accretion (2) — — 165 75 66 Non-GAAP adjusted interest expense $27,290 $27,260 $22,544 $17,188 $13,040 (1) Amount represents net realized and unrealized gains and losses on derivatives and excludes net periodic interest costs related to these instruments. (2) Amount recorded as a portion of "interest expense" in accordance with GAAP related to the accretion of the balance remaining in accumulated other comprehensive income as a result of the Company's discontinuation of cash flow hedge accounting effective June 30, 2013. (3) Amount represents net periodic interest benefit (cost) of effective interest rate swaps outstanding during the period and exclude termination costs and changes in fair value of derivative instruments. 26

Mortgage REIT Business Model ASSETS CAPITAL Agency MBS Higher Repo/Dollar Rolls Government Issued AAA RMBS, CMBS, CMBS-IO Short Rated Committed Repo Term Non-Agency MBS Warehouse Lines AAA CMBS-IO, RMBS, RMBS-IO, Rated CMBS Unsecured Notes Medium AA – BBB Non-Agency MBS Term Convertible Notes Rated Permanent Non-Agency MBS Preferred Stock Below ~7-9 % Yield Investment Permanent Grade/ Non- Common Stock Lower Rated Loans/MSRs ~9-14 % Yield 27

MREIT Glossary of Terms Commercial Mortgage-Backed Securities (CMBS) are a type of mortgage-backed security that is secured by the mortgage on a commercial property. CMBS can be Agency issued and issued by a private enterprise (non-Agency). Credit Risk is the risk of loss of principal or interest stemming from a borrower’s failure to repay a loan. Curve Twist Terms: Bull Flattener: Is a rate environment in which long-term interest rates are declining faster than short- term interest rates. Bear Flattener: Is a yield-rate environment in which short-term interest rates are rising faster rate than long-term interest rates. Bear Steepener: Is a rate environment in which long-term interest rates are rising faster than short-term interest rates. Bull Steepener: Is a rate environment in which short-term interest rates are declining faster than long-term interest rates. Duration is a measure of the sensitivity of the price of a fixed-income investment to a change in interest rates. Duration is expressed as a number of years. Duration Drift is a measure of the change in duration for a change in interest rates Interest Only Securities (IOs) are securities backed by a portion of the excess interest of a securitization and sold individually from the principal component. Interest Rate Risk is the risk that an investment’s value will change due to a change in the absolute level of interest rates, the shape of the yield curve or in any other interest rate relationship. Interest rate risk can also manifest itself through the purchase of fixed rate instruments funded with floating rate, or very short maturity, instruments. Leverage is the use of borrowed money to finance assets including TBA dollar rolls. Prepayment Risk is the risk associated with the early unscheduled return of principal. 28

MREIT Glossary of Terms Repurchase Agreements are a short-term borrowing that uses loans or securities as collateral. The lender advances only a portion of the value of the asset (the advance rate). The inverse of the advance rate is the equity contribution of the borrower (the haircut). Residential Mortgage-Backed Securities (RMBS) are a type of mortgage-backed debt obligation whose cash flows come from residential debt, such as mortgages, home-equity loans and subprime mortgages. Each security is typically backed by a pool of mortgage loans created by US government agencies, banks, or other financial institutions. RMBS can be Agency issued or issued by a private enterprise (non-Agency). Specified Mortgage Backed Securities Pools are pools created with loans that have similar characteristics, or “stories.” Spread Risk is the potential price volatility resulting from the expansion and contraction of the security’s risk premium over a benchmark (or risk-free) interest rate. TBA Dollar Roll is a financing mechanism for long positions in TBAs whereby an investor enters into an offsetting short position and simultaneously enters into an identical TBA with a later settlement date. To Be Announced (TBA) Securities are forward contracts involving the purchase or sale of non-specified Agency RMBS or CMBS. 29


