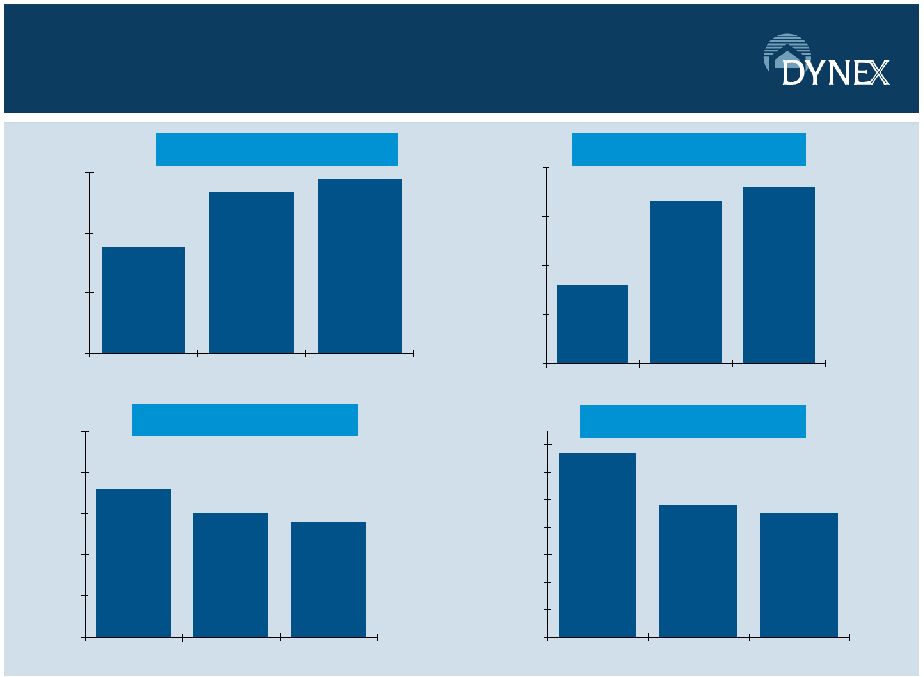
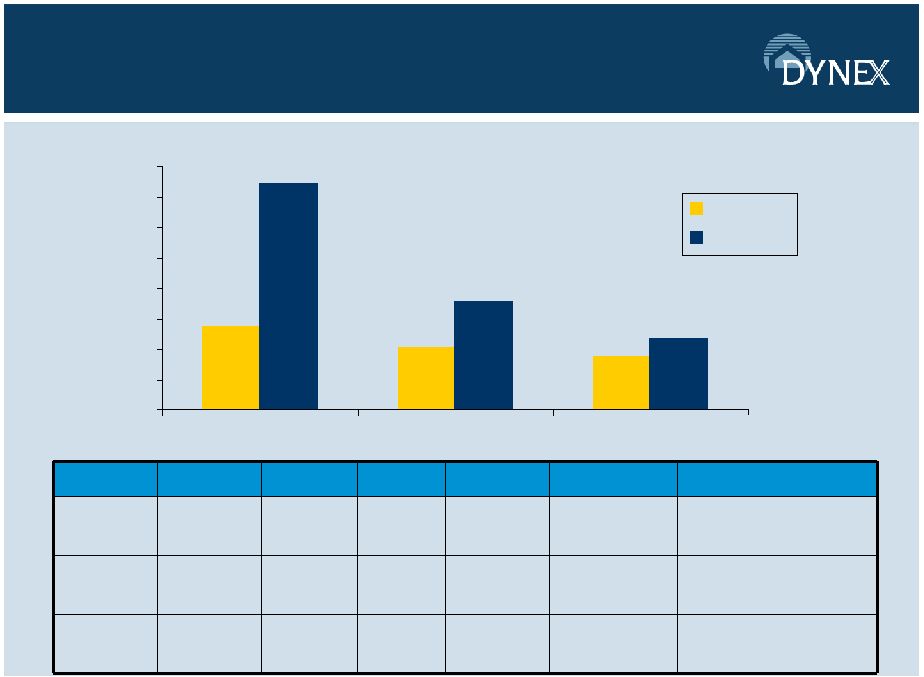
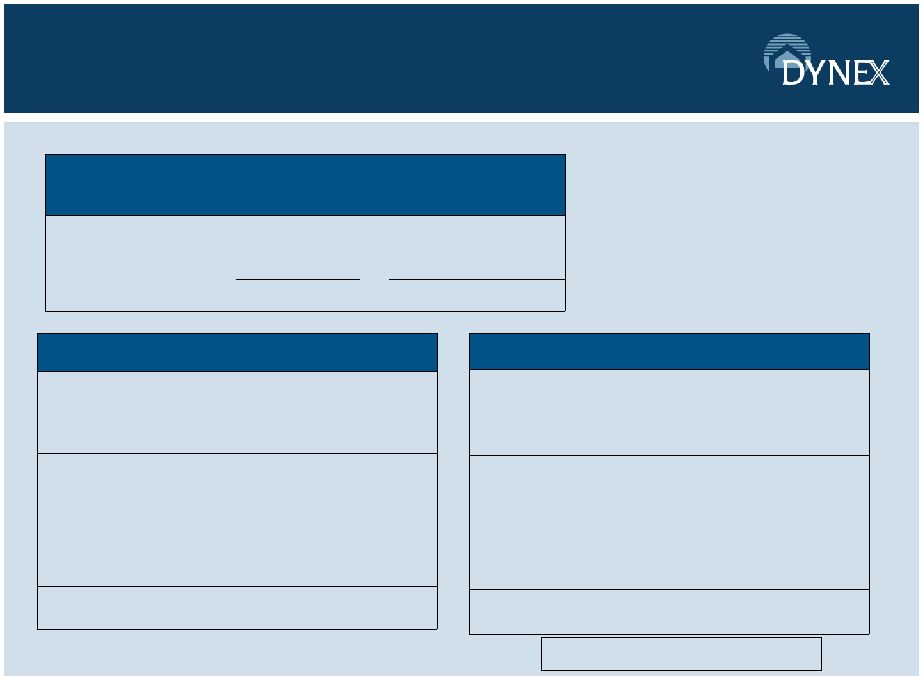
23 23 Selected Financial Highlights (as of and for the quarter ended) * Diluted EPS Ex-Items was $0.32. EPS Ex-Items, or Dynex’s earnings per share excluding certain items, excludes from GAAP earnings per share the impact of litigation settlement and related defense costs of $8.2 million (or $0.20 per diluted common share), a loss of $2.0 million (or $0.05 per diluted common share) on redemption of non-recourse collateralized financings, and $1.3 million (or $0.03 per diluted common share) in net accelerated premium amortization due to an increase in forecasted prepayment speeds during the third quarter Financial Highlights: ($000 except per share amounts) Sept 30, 2011 Jun 30, 2011 Mar 31, 2011 Dec 31, 2010 Sept 30, 2010 Total Investments 2,595,574 $ 2,591,097 $ 2,279,610 $ 1,614,126 $ $ 1,064,546 Total Assets 2,633,686 2,656,703 2,359,816 1,649,584 1,091,835 Total Liabilities 2,264,152 2,269,843 1,976,323 1,357,227 866,361 Total Equity 369,534 386,860 383,493 292,357 225,474 Interest Income 21,143 21,065 17,465 11,734 Interest Expense 6,583 6,032 4,734 3,385 3,333 Net Interest Income 14,560 15,033 12,731 10,896 8,401 General and Administrative Expenses 2,335 2,255 2,118 2,911 1,971 Net income 1,532 $ 13,594 $ 10,280 $ 9,646 $ 7,022 Diluted EPS $ 0.04* 0.34 $ 0.31 $ 0.40 $ 0.33 $ Dividends declared per common share 0.27 0.27 0.27 0.27 0.25 Book Value per share 9.15 9.59 9.51 9.64 9.80 14,281 $ of 2011. See the Company’s press release issued November 1, 2011 for further discussion. |

