UNITED STATES
SECURITIES AND EXCHANGE COMMISSION
Washington, D.C. 20549
FORM N-CSR
CERTIFIED SHAREHOLDER REPORT OF REGISTERED
MANAGEMENT INVESTMENT COMPANIES
Investment Company Act file number: 811-05430
SSGA FUNDS
(Exact name of registrant as specified in charter)
One Iron Street
Boston, Massachusetts 02210
(Address of principal executive offices)(Zip code)
| | |
| (Name and Address of Agent for Service) | | Copy to: |
| |
Joshua A. Weinberg, Esq. Managing Director and Managing Counsel c/o SSGA Funds Management, Inc. One Iron Street Boston, Massachusetts 02210 | | Timothy W. Diggins, Esq. Ropes & Gray LLP 800 Boylston Street Boston, Massachusetts 02110-2624 |
Registrant’s telephone number, including area code: (617) 664-7037
Date of fiscal year end: August 31
Date of reporting period: February 28, 2018
Item 1. Shareholder Report.
Semi-Annual Report
February 28, 2018
SSGA Funds
SSGA Dynamic Small Cap Fund
State Street Disciplined Emerging Markets Equity Fund
SSGA International Stock Selection Fund
SSGA High Yield Bond Fund
The information contained in this report is intended for the general information of shareholders of the Trust. This report is not authorized for distribution to prospective investors unless preceded or accompanied by a current Trust prospectus which contains important information concerning the Trust. You may obtain a current prospectus and SAI from the Distributor by calling 1-800-997-7327 or visiting www.ssgafunds.com. Please read the prospectus carefully before you invest.

SSGA Funds
Semi-Annual Report
February 28, 2018 (Unaudited)
Table of Contents
“SSGA” is a registered trademark of State Street Corporation and is licensed for use by the SSGA Funds.
The information contained in this report is intended for the general information of shareholders of the Trust. This report is not authorized for distribution to prospective investors unless preceded or accompanied by a current Trust prospectus which contains important information concerning the Trust. You may obtain a current prospectus and SAI from the Distributor by calling 1-800-997-7327 or visiting www.ssgafunds.com. Please read the prospectus carefully before you invest.
Performance quoted represents past performance and past performance does not guarantee future results. Current performance may be higher or lower than the performance quoted. For the most recent month end performance information, visit www.ssgafunds.com. Investment in the Funds poses investment risks, including the possible loss of principal. The investment return and principal value of an investment will fluctuate so that shares, when redeemed, may be worth more or less than their original cost.
SSGA Dynamic Small Cap Fund
Portfolio Statistics (Unaudited)
Top Five Holdings — as of February 28, 2018
| | | | |
| Description | | % of
Net Assets | |
Curtiss-Wright Corp. | | | 0.9 | |
Encompass Health Corp. | | | 0.8 | |
Entegris, Inc. | | | 0.8 | |
Aaron’s, Inc. | | | 0.8 | |
Trinseo SA | | | 0.8 | |
| | | | |
Total | | | 4.1 | |
| | | | |
(The five largest holdings are subject to change, and there are no guarantees the Fund will continue to remain invested in any particular company.)
Industry Breakdown — as of February 28, 2018*
| | | | |
| Industry | | % of
Net
Assets | |
Banks | | | 9.1 | % |
Real Estate Investment Trusts (REITs) | | | 7.6 | |
Health Care Providers & Services | | | 5.5 | |
Specialty Retail | | | 5.4 | |
Electronic Equipment, Instruments & Components | | | 5.1 | |
Machinery | | | 4.9 | |
IT Services | | | 4.4 | |
Biotechnology | | | 4.0 | |
Commercial Services & Supplies | | | 4.0 | |
Insurance | | | 4.0 | |
Semiconductors & Semiconductor Equipment | | | 4.0 | |
Health Care Equipment & Supplies | | | 3.6 | |
Professional Services | | | 3.6 | |
Hotels, Restaurants & Leisure | | | 3.5 | |
Household Durables | | | 3.1 | |
Auto Components | | | 2.9 | |
Trading Companies & Distributors | | | 2.8 | |
Aerospace & Defense | | | 2.7 | |
Thrifts & Mortgage Finance | | | 2.1 | |
Metals & Mining | | | 1.7 | |
Chemicals | | | 1.5 | |
Food Products | | | 1.3 | |
| | | | |
| Industry | | % of
Net
Assets | |
Software | | | 1.3 | % |
Pharmaceuticals | | | 1.2 | |
Capital Markets | | | 0.8 | |
Consumer Finance | | | 0.8 | |
Leisure Equipment & Products | | | 0.8 | |
Oil, Gas & Consumable Fuels | | | 0.8 | |
Construction & Engineering | | | 0.7 | |
Multiline Retail | | | 0.7 | |
Road & Rail | | | 0.7 | |
Textiles, Apparel & Luxury Goods | | | 0.7 | |
Health Care Technology | | | 0.6 | |
Internet & Catalog Retail | | | 0.6 | |
Life Sciences Tools & Services | | | 0.6 | |
Internet Software & Services | | | 0.4 | |
Building Products | | | 0.3 | |
Energy Equipment & Services | | | 0.3 | |
Diversified Consumer Services | | | 0.2 | |
Food & Staples Retailing | | | 0.2 | |
Paper & Forest Products | | | 0.2 | |
Short-Term Investments | | | 2.5 | |
Liabilities in Excess of Other Assets | | | (1.2 | ) |
| | | | |
Total | | | 100.0 | % |
| | | | |
| * | | The Fund’s industry breakdown is expressed as a percentage of net assets and may change over time. |
See accompanying notes to financial statements.
SSGA Dynamic Small Cap Fund
Schedule of Investments — February 28, 2018 (Unaudited)
| | | | | | | | |
| Security Description | | Shares | | | Value | |
| |
| Common Stocks - 98.8% | |
Consumer Discretionary - 17.0% | |
Aaron’s, Inc. | | | 4,473 | | | $ | 206,697 | |
Abercrombie & Fitch Co. Class A | | | 5,100 | | | | 105,213 | |
American Eagle Outfitters, Inc. | | | 6,297 | | | | 121,343 | |
Asbury Automotive Group, Inc. (a) | | | 2,404 | | | | 158,303 | |
Big Lots, Inc. (b) | | | 3,215 | | | | 180,683 | |
Bloomin’ Brands, Inc. | | | 8,358 | | | | 192,986 | |
Brinker International, Inc. (b) | | | 752 | | | | 25,891 | |
Burlington Stores, Inc. (a) | | | 1,270 | | | | 155,753 | |
Caleres, Inc. | | | 1,026 | | | | 28,738 | |
Capella Education Co. | | | 734 | | | | 57,032 | |
Children’s Place, Inc. (b) | | | 1,275 | | | | 181,433 | |
Citi Trends, Inc. | | | 1,207 | | | | 26,747 | |
Cooper-Standard Holdings, Inc. (a) | | | 1,607 | | | | 195,797 | |
Dana, Inc. | | | 6,330 | | | | 168,188 | |
DineEquity, Inc. (b) | | | 2,028 | | | | 154,088 | |
DSW, Inc. Class A (b) | | | 8,632 | | | | 169,274 | |
Group 1 Automotive, Inc. | | | 2,052 | | | | 141,260 | |
Haverty Furniture Cos., Inc. | | | 317 | | | | 6,451 | |
Helen of Troy, Ltd. (a) | | | 2,043 | | | | 183,972 | |
ILG, Inc. | | | 726 | | | | 22,041 | |
Johnson Outdoors, Inc. Class A | | | 2,450 | | | | 151,018 | |
La-Z-Boy, Inc. | | | 5,763 | | | | 176,924 | |
Malibu Boats, Inc. Class A (a) | | | 1,025 | | | | 32,851 | |
Marriott Vacations Worldwide Corp. | | | 1,149 | | | | 161,435 | |
MCBC Holdings, Inc. (a) | | | 1,156 | | | | 28,334 | |
MDC Holdings, Inc. | | | 3,645 | | | | 100,894 | |
RCI Hospitality Holdings, Inc. | | | 5,463 | | | | 147,556 | |
Rent-A-Center, Inc. (b) | | | 13,570 | | | | 102,046 | |
Ruth’s Hospitality Group, Inc. | | | 7,127 | | | | 174,968 | |
Speedway Motorsports, Inc. | | | 2,313 | | | | 45,404 | |
Stoneridge, Inc. (a) | | | 7,303 | | | | 158,913 | |
Superior Industries International, Inc. | | | 1,409 | | | | 20,360 | |
Taylor Morrison Home Corp. Class A (a) | | | 7,428 | | | | 166,684 | |
Tenneco, Inc. | | | 2,818 | | | | 148,086 | |
TopBuild Corp. (a) | | | 1,027 | | | | 71,520 | |
Tower International, Inc. | | | 2,762 | | | | 72,088 | |
Vitamin Shoppe, Inc. (a)(b) | | | 3,240 | | | | 12,150 | |
Wolverine World Wide, Inc. | | | 6,251 | | | | 183,029 | |
| | | | | | | | |
| | | | | | | 4,436,150 | |
| | | | | | | | |
|
Consumer Staples - 1.5% | |
Fresh Del Monte Produce, Inc. | | | 3,798 | | | | 177,291 | |
Ingles Markets, Inc. Class A | | | 628 | | | | 20,221 | |
Sanderson Farms, Inc. (b) | | | 1,339 | | | | 164,898 | |
SpartanNash Co. | | | 1,890 | | | | 31,695 | |
| | | | | | | | |
| | | | | | | 394,105 | |
| | | | | | | | |
|
Energy - 1.5% | |
Arch Coal, Inc. Class A | | | 1,914 | | | | 183,189 | |
Exterran Corp. (a) | | | 3,245 | | | | 83,948 | |
| | | | | | | | |
| Security Description | | Shares | | | Value | |
NACCO Industries, Inc. Class A | | | 2,656 | | | $ | 109,427 | |
Penn Virginia Corp. (a) | | | 208 | | | | 7,759 | |
Renewable Energy Group, Inc. (a)(b) | | | 759 | | | | 8,425 | |
| | | | | | | | |
| | | | | | | 392,748 | |
| | | | | | | | |
|
Financials - 21.1% | |
AG Mortgage Investment Trust, Inc. REIT | | | 8,153 | | | | 133,383 | |
Anworth Mortgage Asset Corp. REIT | | | 15,017 | | | | 68,477 | |
Ares Commercial Real Estate Corp. REIT | | | 12,894 | | | | 158,854 | |
Argo Group International Holdings, Ltd. | | | 2,830 | | | | 164,847 | |
Boston Private Financial Holdings, Inc. | | | 9,806 | | | | 143,168 | |
Cathay General Bancorp | | | 4,825 | | | | 198,114 | |
Central Pacific Financial Corp. | | | 4,700 | | | | 130,989 | |
CNO Financial Group, Inc. | | | 8,979 | | | | 202,387 | |
Diamond Hill Investment Group, Inc. | | | 214 | | | | 43,876 | |
Dynex Capital, Inc. REIT | | | 8,843 | | | | 53,235 | |
Employers Holdings, Inc. | | | 4,273 | | | | 167,288 | |
Essent Group, Ltd. (a) | | | 4,075 | | | | 183,742 | |
Federal Agricultural Mortgage Corp. Class C | | | 313 | | | | 23,807 | |
First American Financial Corp. | | | 2,724 | | | | 158,074 | |
First Financial Corp. | | | 3,011 | | | | 129,172 | |
First Interstate BancSystem, Inc. Class A | | | 4,186 | | | | 165,347 | |
First Merchants Corp. | | | 3,252 | | | | 134,405 | |
Flushing Financial Corp. | | | 6,119 | | | | 163,377 | |
Green Dot Corp. Class A (a) | | | 3,130 | | | | 203,857 | |
Heritage Financial Corp. | | | 5,499 | | | | 163,595 | |
Independent Bank Corp. | | | 7,075 | | | | 161,664 | |
Infinity Property & Casualty Corp. | | | 1,457 | | | | 171,853 | |
International Bancshares Corp. | | | 4,566 | | | | 176,476 | |
Invesco Mortgage Capital, Inc. REIT (b) | | | 9,910 | | | | 152,317 | |
Investors Bancorp, Inc. | | | 11,149 | | | | 150,511 | |
MTGE Investment Corp. REIT | | | 9,446 | | | | 160,582 | |
New Residential Investment Corp. REIT | | | 8,672 | | | | 139,879 | |
OM Asset Management PLC | | | 10,958 | | | | 167,986 | |
PennyMac Financial Services, Inc. Class A (a) | | | 1,174 | | | | 27,354 | |
PennyMac Mortgage Investment Trust REIT (b) | | | 9,880 | | | | 164,700 | |
Peoples Bancorp, Inc. | | | 4,737 | | | | 163,379 | |
Primerica, Inc. | | | 1,380 | | | | 134,550 | |
Prosperity Bancshares, Inc. | | | 1,231 | | | | 92,325 | |
Provident Financial Holdings, Inc. | | | 432 | | | | 7,871 | |
Provident Financial Services, Inc. | | | 2,860 | | | | 71,157 | |
Redwood Trust, Inc. REIT | | | 7,004 | | | | 102,609 | |
Republic Bancorp, Inc. Class A | | | 2,059 | | | | 76,698 | |
Selective Insurance Group, Inc. | | | 826 | | | | 46,958 | |
See accompanying notes to financial statements.
SSGA Dynamic Small Cap Fund
Schedule of Investments, continued — February 28, 2018 (Unaudited)
| | | | | | | | |
| Security Description | | Shares | | | Value | |
| |
Umpqua Holdings Corp. | | | 9,539 | | | $ | 203,276 | |
United Community Banks, Inc. | | | 4,299 | | | | 132,882 | |
United Community Financial Corp. | | | 4,482 | | | | 41,414 | |
Washington Federal, Inc. | | | 5,371 | | | | 186,374 | |
| | | | | | | | |
| | | | | | | 5,522,809 | |
| | | | | | | | |
|
Health Care - 15.5% | |
Aileron Therapeutics, Inc. (a) | | | 3,397 | | | | 27,889 | |
AMAG Pharmaceuticals, Inc. (a) | | | 2,511 | | | | 52,857 | |
AMN Healthcare Services, Inc. (a) | | | 3,500 | | | | 194,775 | |
AnaptysBio, Inc. (a) | | | 228 | | | | 27,989 | |
Anavex Life Sciences Corp. (a) | | | 1,545 | | | | 3,646 | |
Athenex, Inc. (a) | | | 2,357 | | | | 37,335 | |
Atrion Corp. | | | 261 | | | | 153,703 | |
Avexis, Inc. (a) | | | 351 | | | | 43,429 | |
Bluebird Bio, Inc. (a)(b) | | | 426 | | | | 85,626 | |
Cambrex Corp. (a) | | | 386 | | | | 20,053 | |
Catalent, Inc. (a) | | | 3,138 | | | | 131,012 | |
Chemed Corp. (b) | | | 788 | | | | 204,588 | |
Chimerix, Inc. (a) | | | 2,285 | | | | 11,105 | |
Clovis Oncology, Inc. (a)(b) | | | 60 | | | | 3,484 | |
Corcept Therapeutics, Inc. (a) | | | 1,083 | | | | 16,451 | |
CorVel Corp. (a) | | | 2,893 | | | | 141,612 | |
Cotiviti Holdings, Inc. (a) | | | 500 | | | | 16,755 | |
CTI BioPharma Corp. (a) | | | 192 | | | | 772 | |
Cytokinetics, Inc. (a)(b) | | | 4,324 | | | | 33,511 | |
CytomX Therapeutics, Inc. (a) | | | 290 | | | | 8,616 | |
Emergent BioSolutions, Inc. (a) | | | 1,359 | | | | 67,542 | |
Enanta Pharmaceuticals, Inc. (a) | | | 452 | | | | 35,536 | |
Encompass Health Corp. | | | 4,037 | | | | 215,011 | |
Exact Sciences Corp. (a)(b) | | | 1,328 | | | | 59,242 | |
Exelixis, Inc. (a) | | | 424 | | | | 10,939 | |
FibroGen, Inc. (a) | | | 854 | | | | 47,055 | |
Foundation Medicine, Inc. (a) | | | 181 | | | | 14,978 | |
G1 Therapeutics, Inc. (a) | | | 1,728 | | | | 39,036 | |
Galectin Therapeutics, Inc. (a)(b) | | | 250 | | | | 1,028 | |
Halyard Health, Inc. (a) | | | 684 | | | | 33,776 | |
HMS Holdings Corp. (a) | | | 8,354 | | | | 133,998 | |
Horizon Pharma PLC (a) | | | 2,001 | | | | 29,175 | |
ImmunoGen, Inc. (a)(b) | | | 1,592 | | | | 17,687 | |
Innoviva, Inc. (a) | | | 5,936 | | | | 92,067 | |
Integer Holdings Corp. (a) | | | 3,997 | | | | 204,047 | |
Iovance Biotherapeutics, Inc. (a) | | | 743 | | | | 12,891 | |
Lexicon Pharmaceuticals, Inc. (a)(b) | | | 466 | | | | 4,022 | |
Ligand Pharmaceuticals, Inc. (a)(b) | | | 250 | | | | 37,973 | |
Magellan Health, Inc. (a) | | | 2,018 | | | | 203,616 | |
Masimo Corp. (a) | | | 2,314 | | | | 202,544 | |
Medpace Holdings, Inc. (a)(b) | | | 202 | | | | 6,474 | |
Mersana Therapeutics, Inc. (a)(b) | | | 2,465 | | | | 42,669 | |
MiMedx Group, Inc. (a)(b) | | | 1,246 | | | | 8,834 | |
Myriad Genetics, Inc. (a) | | | 2,102 | | | | 68,147 | |
National HealthCare Corp. | | | 2,636 | | | | 154,654 | |
Orthofix International NV (a) | | | 3,246 | | | | 181,809 | |
PDL BioPharma, Inc. (a) | | | 14,341 | | | | 34,418 | |
| | | | | | | | |
| Security Description | | Shares | | | Value | |
Phibro Animal Health Corp. Class A | | | 689 | | | $ | 26,492 | |
PRA Health Sciences, Inc. (a) | | | 1,186 | | | | 99,624 | |
Providence Service Corp. (a) | | | 2,585 | | | | 164,303 | |
Sage Therapeutics, Inc. (a)(b) | | | 513 | | | | 82,778 | |
Sangamo Therapeutics, Inc. (a) | | | 1,041 | | | | 24,932 | |
Sarepta Therapeutics, Inc. (a)(b) | | | 748 | | | | 46,952 | |
Spectrum Pharmaceuticals, Inc. (a) | | | 1,110 | | | | 23,876 | |
Supernus Pharmaceuticals, Inc. (a) | | | 604 | | | | 23,496 | |
Syneos Health, Inc. (a) | | | 710 | | | | 29,749 | |
Utah Medical Products, Inc. | | | 1,772 | | | | 157,176 | |
VBI Vaccines, Inc. (a) | | | 9,611 | | | | 35,272 | |
WellCare Health Plans, Inc. (a) | | | 775 | | | | 150,280 | |
| | | | | | | | |
| | | | | | | 4,039,306 | |
| | | | | | | | |
|
Industrials - 19.7% | |
AAR Corp. | | | 4,167 | | | | 177,431 | |
ACCO Brands Corp. | | | 10,110 | | | | 127,891 | |
Alamo Group, Inc. | | | 745 | | | | 82,807 | |
Applied Industrial Technologies, Inc. | | | 2,776 | | | | 195,430 | |
Barnes Group, Inc. | | | 3,196 | | | | 192,751 | |
Brady Corp. Class A | | | 4,265 | | | | 159,511 | |
Briggs & Stratton Corp. | | | 6,920 | | | | 155,562 | |
Comfort Systems USA, Inc. | | | 4,261 | | | | 174,914 | |
CRA International, Inc. | | | 3,640 | | | | 181,964 | |
Curtiss-Wright Corp. | | | 1,706 | | | | 230,276 | |
Ennis, Inc. | | | 3,262 | | | | 63,609 | |
EnPro Industries, Inc. | | | 2,327 | | | | 168,614 | |
Forrester Research, Inc. | | | 151 | | | | 6,116 | |
H&E Equipment Services, Inc. | | | 4,760 | | | | 179,404 | |
Huron Consulting Group, Inc. (a) | | | 3,734 | | | | 130,690 | |
Insperity, Inc. | | | 2,542 | | | | 165,993 | |
Kforce, Inc. | | | 4,638 | | | | 128,473 | |
Kimball International, Inc. Class B | | | 8,667 | | | | 142,399 | |
Korn/Ferry International | | | 4,215 | | | | 176,651 | |
McGrath RentCorp | | | 3,707 | | | | 187,648 | |
Meritor, Inc. (a) | | | 7,297 | | | | 178,776 | |
Miller Industries, Inc. | | | 865 | | | | 21,063 | |
Moog, Inc. Class A (a) | | | 2,132 | | | | 178,726 | |
Navigant Consulting, Inc. (a) | | | 3,722 | | | | 73,993 | |
On Assignment, Inc. (a) | | | 928 | | | | 71,168 | |
Rush Enterprises, Inc. Class A (a) | | | 3,545 | | | | 150,698 | |
Rush Enterprises, Inc. Class B (a) | | | 1,928 | | | | 76,754 | |
Simpson Manufacturing Co., Inc. | | | 1,642 | | | | 90,835 | |
SP Plus Corp. (a) | | | 4,270 | | | | 153,720 | |
Steelcase, Inc. Class A | | | 1,956 | | | | 26,699 | |
Tetra Tech, Inc. | | | 3,832 | | | | 187,576 | |
Triton International, Ltd. | | | 4,723 | | | | 134,700 | |
Vectrus, Inc. (a) | | | 4,056 | | | | 110,688 | |
Wabash National Corp. (b) | | | 7,500 | | | | 163,875 | |
Watts Water Technologies, Inc. Class A | | | 2,387 | | | | 180,218 | |
Werner Enterprises, Inc. | | | 4,700 | | | | 175,075 | |
Woodward, Inc. | | | 2,038 | | | | 144,352 | |
| | | | | | | | |
| | | | | | | 5,147,050 | |
| | | | | | | | |
See accompanying notes to financial statements.
SSGA Dynamic Small Cap Fund
Schedule of Investments, continued — February 28, 2018 (Unaudited)
| | | | | | | | |
| Security Description | | Shares | | | Value | |
| |
Information Technology - 15.8% | |
Advanced Energy Industries, Inc. (a) | | | 2,861 | | | $ | 189,742 | |
American Software, Inc. Class A | | | 4,262 | | | | 53,019 | |
Aspen Technology, Inc. (a) | | | 1,186 | | | | 91,654 | |
Benchmark Electronics, Inc. (a) | | | 5,810 | | | | 174,300 | |
Cirrus Logic, Inc. (a) | | | 3,925 | | | | 173,917 | |
CSG Systems International, Inc. | | | 3,749 | | | | 175,003 | |
Diodes, Inc. (a) | | | 5,143 | | | | 154,804 | |
Entegris, Inc. | | | 6,427 | | | | 213,376 | |
ePlus, Inc. (a) | | | 1,868 | | | | 142,995 | |
Hackett Group, Inc. | | | 7,555 | | | | 136,217 | |
Insight Enterprises, Inc. (a) | | | 4,850 | | | | 169,411 | |
Itron, Inc. (a) | | | 2,535 | | | | 177,450 | |
j2 Global, Inc. | | | 1,432 | | | | 105,997 | |
ManTech International Corp. Class A | | | 2,475 | | | | 139,516 | |
MAXIMUS, Inc. | | | 2,989 | | | | 200,203 | |
Methode Electronics, Inc. | | | 4,462 | | | | 176,026 | |
Nanometrics, Inc. (a) | | | 4,992 | | | | 131,739 | |
Novanta, Inc. (a) | | | 659 | | | | 36,805 | |
OSI Systems, Inc. (a) | | | 1,862 | | | | 117,567 | |
Perficient, Inc. (a) | | | 8,650 | | | | 168,416 | |
Progress Software Corp. | | | 3,850 | | | | 180,449 | |
Rudolph Technologies, Inc. (a) | | | 6,693 | | | | 177,699 | |
Sanmina Corp. (a) | | | 4,385 | | | | 120,807 | |
ScanSource, Inc. (a) | | | 1,122 | | | | 36,746 | |
Sykes Enterprises, Inc. (a) | | | 5,689 | | | | 165,322 | |
Travelport Worldwide, Ltd. | | | 11,708 | | | | 166,839 | |
Unisys Corp. (a)(b) | | | 14,159 | | | | 158,581 | |
Vishay Intertechnology, Inc. (b) | | | 9,691 | | | | 178,314 | |
Zix Corp. (a) | | | 1,084 | | | | 4,390 | |
| | | | | | | | |
| | | | | | | 4,117,304 | |
| | | | | | | | |
|
Materials - 3.4% | |
Hawkins, Inc. | | | 94 | | | | 3,149 | |
Innophos Holdings, Inc. | | | 3,671 | | | | 152,567 | |
Kaiser Aluminum Corp. | | | 1,711 | | | | 171,733 | |
Materion Corp. | | | 2,538 | | | | 127,915 | |
PH Glatfelter Co. | | | 197 | | | | 4,021 | |
PolyOne Corp. | | | 867 | | | | 35,816 | |
Schweitzer-Mauduit International, Inc. | | | 952 | | | | 37,328 | |
Trinseo SA | | | 2,578 | | | | 205,209 | |
Worthington Industries, Inc. | | | 3,428 | | | | 151,654 | |
| | | | | | | | |
| | | | | | | 889,392 | |
| | | | | | | | |
| | | | | | | | |
| Security Description | | Shares | | | Value | |
Real Estate - 3.3% | |
Chesapeake Lodging Trust REIT | | | 6,222 | | | $ | 160,901 | |
DiamondRock Hospitality Co. REIT | | | 15,638 | | | | 160,759 | |
National Health Investors, Inc. REIT | | | 732 | | | | 47,485 | |
Ryman Hospitality Properties, Inc. REIT | | | 2,848 | | | | 196,398 | |
Summit Hotel Properties, Inc. REIT | | | 3,314 | | | | 43,645 | |
Tier REIT, Inc. REIT | | | 3,942 | | | | 73,242 | |
Xenia Hotels & Resorts, Inc. REIT | | | 9,132 | | | | 179,627 | |
| | | | | | | | |
| | | | | | | 862,057 | |
| | | | | | | | |
| |
Total Common Stocks
(cost $24,314,300) | | | | 25,800,921 | |
| | | | | | | | |
|
| Short-Term Investments - 2.4% | |
State Street Institutional U.S. Government Money Market Fund, Class G Shares
1.34% (c)(d) | | | 347,664 | | | | 347,664 | |
State Street Navigator Securities Lending Government Money Market Portfolio (c)(e) | | | 295,173 | | | | 295,173 | |
| | | | | | | | |
| |
Total Short-Term Investments
(cost $642,837) | | | | 642,837 | |
| | | | | | | | |
| |
Total Investments - 101.2%
(cost $24,957,137) | | | | 26,443,758 | |
| |
| Liabilities in Excess of Other Assets - (1.2)% | | | | (324,699 | ) |
| | | | | | | | |
| | |
| Net Assets - 100.0% | | | | | | $ | 26,119,059 | |
| | | | | | | | |
| (a) | Non-income producing security. |
| (b) | All or a portion of the shares of the security are on loan at February 28, 2018. |
| (c) | The Fund invested in certain money market funds managed by SSGA Funds Management, Inc. Amounts related to these transactions during the period ended February 28, 2018 are shown in the Affiliate Table below. |
| (d) | The rate shown is the annualized seven-day yield at February 28, 2018. |
| (e) | Investment of cash collateral for securities loaned. |
| REIT | Real Estate Investment Trust |
See accompanying notes to financial statements.
SSGA Dynamic Small Cap Fund
Schedule of Investments, continued — February 28, 2018 (Unaudited)
The following table summarizes the value of the Fund’s investments according to the fair value hierarchy as of February 28, 2018.
| | | | | | | | | | | | | | | | |
| Description | | Level 1 —
Quoted Prices | | | Level 2 —
Other Significant
Observable
Inputs | | | Level 3 —
Significant
Unobservable
Inputs | | | Total | |
Assets: | | | | | | | | | | | | | | | | |
| | | | |
Investments: | | | | | | | | | | | | | | | | |
Common Stocks | | | | | | | | | | | | | | | | |
Consumer Discretionary | | $ | 4,436,150 | | | $ | — | | | $ | — | | | $ | 4,436,150 | |
Consumer Staples | | | 394,105 | | | | — | | | | — | | | | 394,105 | |
Energy | | | 392,748 | | | | — | | | | — | | | | 392,748 | |
Financials | | | 5,522,809 | | | | — | | | | — | | | | 5,522,809 | |
Health Care | | | 4,039,306 | | | | — | | | | — | | | | 4,039,306 | |
Industrials | | | 5,147,050 | | | | — | | | | — | | | | 5,147,050 | |
Information Technology | | | 4,117,304 | | | | — | | | | — | | | | 4,117,304 | |
Materials | | | 889,392 | | | | — | | | | — | | | | 889,392 | |
Real Estate | | | 862,057 | | | | — | | | | — | | | | 862,057 | |
Short-Term Investments | | | 642,837 | | | | — | | | | — | | | | 642,837 | |
| | | | | | | | | | | | | | | | |
Total Investments | | $ | 26,443,758 | | | $ | — | | | $ | — | | | $ | 26,443,758 | |
| | | | | | | | | | | | | | | | |
Affiliate Table
| | | | | | | | | | | | | | | | | | | | | | | | | | | | | | | | | | | | |
| | | Number
of Shares
Held at
8/31/17 | | | Value At
8/31/17 | | | Cost of
Purchases | | | Proceeds
from
Shares
Sold | | | Realized
Gain
(Loss) | | | Change in
Unrealized
Appreciation/
Depreciation | | | Number
of Shares
Held at
2/28/18 | | | Value at
2/28/18 | | | Dividend
Income | |
State Street Institutional U.S. Government Money Market Fund - Class G Shares | | | 104,563 | | | $ | 104,563 | | | $ | 11,256,145 | | | $ | 11,013,044 | | | $ | — | | | $ | — | | | | 347,664 | | | $ | 347,664 | | | $ | 2,122 | |
State Street Navigator Securities Lending Government Money Market Portfolio | | | 554,024 | | | | 554,024 | | | | 135,421 | | | | 394,272 | | | | — | | | | — | | | | 295,173 | | | | 295,173 | | | | 3,695 | |
| | | | | | | | | | | | | | | | | | | | | | | | | | | | | | | | | | | | |
Total | | | | | | $ | 658,587 | | | $ | 11,391,566 | | | $ | 11,407,316 | | | $ | — | | | $ | — | | | | | | | $ | 642,837 | | | $ | 5,817 | |
| | | | | | | | | | | | | | | | | | | | | | | | | | | | | | | | | | | | |
See accompanying notes to financial statements.
State Street Disciplined Emerging Markets Equity Fund
Portfolio Statistics (Unaudited)
Top Five Holdings — as of February 28, 2018
| | | | |
| Description | | % of
Net
Assets | |
Taiwan Semiconductor Manufacturing Co., Ltd. | | | 2.9 | |
Chunghwa Telecom Co., Ltd. | | | 2.7 | |
Public Bank Bhd | | | 2.6 | |
O2 Czech Republic A/S | | | 2.5 | |
Bank Tabungan Negara Persero Tbk PT | | | 2.4 | |
| | | | |
Total | | | 13.1 | |
| | | | |
(The five largest holdings are subject to change, and there are no guarantees the Fund will continue to remain invested in any particular company.)
Industry Breakdown — as of February 28, 2018*
| | | | |
| Industry | | % of
Net
Assets | |
Banks | | | 16.7 | % |
Diversified Telecommunication Services | | | 12.5 | |
Oil, Gas & Consumable Fuels | | | 11.1 | |
Semiconductors & Semiconductor Equipment | | | 5.2 | |
Automobiles | | | 4.0 | |
Chemicals | | | 3.9 | |
Transportation Infrastructure | | | 3.6 | |
Technology Hardware, Storage & Peripherals | | | 3.3 | |
Wireless Telecommunication Services | | | 3.3 | |
Household Durables | | | 3.1 | |
Real Estate Management & Development | | | 2.3 | |
Diversified Financial Services | | | 1.8 | |
Construction Materials | | | 1.7 | |
Electronic Equipment, Instruments & Components | | | 1.6 | |
Tobacco | | | 1.6 | |
IT Services | | | 1.5 | |
Construction & Engineering | | | 1.4 | |
Airlines | | | 1.3 | |
Pharmaceuticals | | | 1.3 | |
Food & Staples Retailing | | | 1.2 | |
Food Products | | | 1.1 | |
Gas Utilities | | | 1.1 | |
Internet Software & Services | | | 1.1 | |
Marine | | | 1.1 | |
Textiles, Apparel & Luxury Goods | | | 1.1 | |
| | | | |
| Industry | | % of
Net
Assets | |
Real Estate Investment Trusts (REITs) | | | 0.8 | % |
Electric Utilities | | | 0.7 | |
Paper & Forest Products | | | 0.7 | |
Independent Power Producers & Energy Traders | | | 0.6 | |
Metals & Mining | | | 0.6 | |
Water Utilities | | | 0.6 | |
Auto Components | | | 0.5 | |
Commercial Services & Supplies | | | 0.5 | |
Life Sciences Tools & Services | | | 0.5 | |
Specialty Retail | | | 0.5 | |
Health Care Providers & Services | | | 0.4 | |
Household Products | | | 0.3 | |
Software | | | 0.3 | |
Thrifts & Mortgage Finance | | | 0.3 | |
Air Freight & Logistics | | | 0.2 | |
Beverages | | | 0.2 | |
Capital Markets | | | 0.2 | |
Consumer Finance | | | 0.2 | |
Insurance | | | 0.2 | |
Media | | | 0.2 | |
Short-Term Investments | | | 3.5 | |
Other Assets in Excess of Liabilities | | | 0.1 | |
| | | | |
Total | | | 100.0 | % |
| | | | |
| * | | The Fund’s industry breakdown is expressed as a percentage of net assets and may change over time. |
See accompanying notes to financial statements.
| | |
| 6 | | Disciplined Emerging Markets Equity Fund |
State Street Disciplined Emerging Markets Equity Fund
Schedule of Investments — February 28, 2018 (Unaudited)
| | | | | | | | |
| Security Description | | Shares | | | Value | |
| |
| Common Stocks - 96.4% | |
Brazil - 2.3% | |
Atacadao Distribuicao Comercio e Industria Ltda (a) | | | 54,800 | | | $ | 250,633 | |
Braskem SA Class A, Preference Shares | | | 23,100 | | | | 330,396 | |
Fibria Celulose SA | | | 27,500 | | | | 522,321 | |
Itau Unibanco Holding SA Preference Shares | | | 28,100 | | | | 436,009 | |
Itausa - Investimentos Itau SA | | | 82 | | | | 337 | |
Itausa - Investimentos Itau SA Preference Shares | | | 71,638 | | | | 289,473 | |
| | | | | | | | |
| | | | | | | 1,829,169 | |
| | | | | | | | |
|
Chile - 0.7% | |
Engie Energia Chile SA | | | 247,451 | | | | 555,970 | |
| | | | | | | | |
|
China - 19.3% | |
Agricultural Bank of China, Ltd. Class H | | | 1,313,000 | | | | 721,428 | |
Air China, Ltd. Class H | | | 174,000 | | | | 262,650 | |
China Communications Services Corp., Ltd. Class H | | | 2,214,000 | | | | 1,308,826 | |
China Huarong Asset Management Co., Ltd. Class H (b) | | | 414,000 | | | | 186,832 | |
China Mobile, Ltd. | | | 166,200 | | | | 1,547,825 | |
China Railway Construction Corp., Ltd. Class H | | | 1,065,500 | | | | 1,140,264 | |
China Shenhua Energy Co., Ltd. Class H | | | 421,500 | | | | 1,192,972 | |
Chongqing Rural Commercial Bank Co., Ltd. Class H | | | 241,000 | | | | 194,083 | |
CNOOC, Ltd. | | | 590,000 | | | | 842,015 | |
Great Wall Motor Co., Ltd. Class H (c) | | | 217,500 | | | | 254,435 | |
Guangdong Provincial Expressway Development Co., Ltd. Class B | | | 1,549,900 | | | | 1,316,883 | |
Guangzhou Automobile Group Co., Ltd. Class H | | | 752,000 | | | | 1,653,610 | |
Industrial & Commercial Bank of China, Ltd. Class H | | | 790,000 | | | | 673,506 | |
Jiangsu Expressway Co., Ltd. Class H | | | 406,000 | | | | 628,736 | |
Tencent Holdings, Ltd. | | | 15,900 | | | | 869,865 | |
Wuxi Little Swan Co., Ltd. Class B | | | 281,250 | | | | 1,774,666 | |
Zhejiang Expressway Co., Ltd. Class H | | | 840,000 | | | | 913,257 | |
| | | | | | | | |
| | | | | | | 15,481,853 | |
| | | | | | | | |
|
Czech Republic - 3.1% | |
O2 Czech Republic A/S | | | 153,035 | | | | 1,994,915 | |
Pegas Nonwovens SA | | | 6,656 | | | | 294,012 | |
Philip Morris CR A/S | | | 207 | | | | 168,165 | |
| | | | | | | | |
| | | | | | | 2,457,092 | |
| | | | | | | | |
| | | | | | | | |
| Security Description | | Shares | | | Value | |
Greece - 1.1% | |
Aegean Airlines SA | | | 37,912 | | | $ | 424,137 | |
Motor Oil Hellas Corinth Refineries SA | | | 19,225 | | | | 451,264 | |
| | | | | | | | |
| | | | | | | 875,401 | |
| | | | | | | | |
|
Hungary - 1.8% | |
Magyar Telekom Telecommunications PLC | | | 244,605 | | | | 431,550 | |
Richter Gedeon Nyrt | | | 46,424 | | | | 1,021,619 | |
| | | | | | | | |
| | | | | | | 1,453,169 | |
| | | | | | | | |
|
India - 8.7% | |
Akzo Nobel India, Ltd. | | | 9,099 | | | | 249,596 | |
Bajaj Auto, Ltd. | | | 17,056 | | | | 786,511 | |
Bharat Petroleum Corp., Ltd. | | | 235,912 | | | | 1,551,300 | |
Divi’s Laboratories, Ltd. | | | 25,443 | | | | 398,083 | |
Finolex Industries, Ltd. | | | 15,537 | | | | 155,760 | |
Indiabulls Housing Finance, Ltd. | | | 12,776 | | | | 243,524 | |
Indraprastha Gas, Ltd. | | | 188,725 | | | | 878,509 | |
Infosys, Ltd. | | | 66,303 | | | | 1,184,016 | |
Jagran Prakashan, Ltd. | | | 63,300 | | | | 160,372 | |
Reliance Industries, Ltd. | | | 67,700 | | | | 985,980 | |
Vardhman Textiles, Ltd. | | | 17,448 | | | | 361,019 | |
| | | | | | | | |
| | | | | | | 6,954,670 | |
| | | | | | | | |
|
Indonesia - 5.8% | |
Bank Central Asia Tbk PT | | | 168,000 | | | | 282,737 | |
Bank Rakyat Indonesia Persero Tbk PT | | | 2,040,100 | | | | 560,903 | |
Bank Tabungan Negara Persero Tbk PT | | | 7,224,500 | | | | 1,952,903 | |
Telekomunikasi Indonesia Persero Tbk PT | | | 6,484,300 | | | | 1,877,734 | |
| | | | | | | | |
| | | | | | | 4,674,277 | |
| | | | | | | | |
|
Malaysia - 5.3% | |
Malayan Banking Bhd | | | 220,035 | | | | 586,713 | |
MISC Bhd | | | 523,400 | | | | 913,313 | |
Padini Holdings Bhd | | | 291,500 | | | | 369,119 | |
PPB Group Bhd | | | 60,600 | | | | 273,837 | |
Public Bank Bhd | | | 359,000 | | | | 2,103,874 | |
| | | | | | | | |
| | | | | | | 4,246,856 | |
| | | | | | | | |
|
Mexico - 1.7% | |
America Movil SAB de CV Class L ADR | | | 9,900 | | | | 181,764 | |
Bolsa Mexicana de Valores SAB de CV | | | 98,800 | | | | 183,127 | |
Grupo Financiero Banorte SAB de CV Series O | | | 99,500 | | | | 597,296 | |
Wal-Mart de Mexico SAB de CV | | | 176,100 | | | | 411,042 | |
| | | | | | | | |
| | | | | | | 1,373,229 | |
| | | | | | | | |
See accompanying notes to financial statements.
| | | | |
| Disciplined Emerging Markets Equity Fund | | | 7 | |
State Street Disciplined Emerging Markets Equity Fund
Schedule of Investments, continued — February 28, 2018 (Unaudited)
| | | | | | | | |
| Security Description | | Shares | | | Value | |
| |
Pakistan - 2.9% | |
Hub Power Co. Ltd | | | 376,300 | | | $ | 332,606 | |
Indus Motor Co., Ltd. | | | 14,220 | | | | 221,207 | |
Kot Addu Power Co., Ltd. | | | 305,500 | | | | 165,207 | |
MCB Bank, Ltd. | | | 405,500 | | | | 801,096 | |
National Bank of Pakistan | | | 285,500 | | | | 120,920 | |
Nishat Mills, Ltd. | | | 172,400 | | | | 248,825 | |
Oil & Gas Development Co., Ltd. | | | 320,300 | | | | 470,299 | |
| | | | | | | | |
| | | | | | | 2,360,160 | |
| | | | | | | | |
|
Philippines - 3.3% | |
Cebu Air, Inc. | | | 207,650 | | | | 399,909 | |
Globe Telecom, Inc. | | | 15,900 | | | | 525,726 | |
Manila Water Co., Inc. | | | 987,800 | | | | 493,141 | |
Metro Pacific Investments Corp. | | | 11,577,900 | | | | 1,251,605 | |
| | | | | | | | |
| | | | | | | 2,670,381 | |
| | | | | | | | |
|
Poland - 2.7% | |
Asseco Poland SA | | | 19,835 | | | | 271,886 | |
Netia SA | | | 87,832 | | | | 137,417 | |
Neuca SA | | | 4,491 | | | | 341,132 | |
Polski Koncern Naftowy ORLEN SA | | | 40,219 | | | | 1,124,512 | |
Polskie Gornictwo Naftowe i Gazownictwo SA | | | 186,109 | | | | 327,937 | |
| | | | | | | | |
| | | | | | | 2,202,884 | |
| | | | | | | | |
|
Qatar - 2.5% | |
Barwa Real Estate Co. | | | 22,068 | | | | 204,255 | |
Masraf Al Rayan QSC | | | 18,680 | | | | 192,905 | |
Ooredoo QPSC | | | 53,745 | | | | 1,279,901 | |
Qatar Islamic Bank SAQ | | | 11,709 | | | | 308,756 | |
| | | | | | | | |
| | | | | | | 1,985,817 | |
| | | | | | | | |
|
Russia - 0.7% | |
LUKOIL PJSC ADR | | | 1,610 | | | | 106,684 | |
Mobile TeleSystems PJSC ADR | | | 16,400 | | | | 196,144 | |
X5 Retail Group NV GDR (a) | | | 8,004 | | | | 284,610 | |
| | | | | | | | |
| | | | | | | 587,438 | |
| | | | | | | | |
|
South Africa - 2.0% | |
AngloGold Ashanti, Ltd. | | | 32,424 | | | | 294,206 | |
Gold Fields, Ltd. ADR | | | 39,100 | | | | 153,272 | |
Growthpoint Properties, Ltd. REIT (c) | | | 262,732 | | | | 657,178 | |
Sasol, Ltd. ADR | | | 6,700 | | | | 230,949 | |
Standard Bank Group, Ltd. | | | 16,727 | | | | 306,746 | |
| | | | | | | | |
| | | | | | | 1,642,351 | |
| | | | | | | | |
|
South Korea - 8.0% | |
Coway Co., Ltd. | | | 1,926 | | | | 154,023 | |
Hanwha Life Insurance Co., Ltd. | | | 24,755 | | | | 153,390 | |
Hyundai Glovis Co., Ltd. | | | 1,261 | | | | 166,335 | |
| | | | | | | | |
| Security Description | | Shares | | | Value | |
Hyundai Mobis Co., Ltd. | | | 1,771 | | | $ | 372,876 | |
KT Corp. | | | 31,131 | | | | 801,195 | |
KT&G Corp. | | | 11,927 | | | | 1,099,192 | |
LG Household & Health Care, Ltd. | | | 256 | | | | 258,784 | |
Samsung Card Co., Ltd. | | | 5,345 | | | | 179,490 | |
Samsung Electronics Co., Ltd. | | | 581 | | | | 1,262,553 | |
Samsung Electronics Co., Ltd. Preference Shares | | | 607 | | | | 1,115,054 | |
Woori Bank | | | 53,567 | | | | 817,522 | |
| | | | | | | | |
| | | | | | | 6,380,414 | |
| | | | | | | | |
|
Switzerland - 0.2% | |
Coca-Cola HBC AG (a) | | | 5,292 | | | | 173,007 | |
| | | | | | | | |
|
Taiwan - 18.0% | |
Advanced Semiconductor Engineering, Inc. | | | 131,000 | | | | 176,275 | |
Asustek Computer, Inc. | | | 29,000 | | | | 273,947 | |
AU Optronics Corp. | | | 613,000 | | | | 269,906 | |
Chipbond Technology Corp. | | | 74,000 | | | | 169,918 | |
Chunghwa Telecom Co., Ltd. | | | 584,000 | | | | 2,186,299 | |
E.Sun Financial Holding Co., Ltd. | | | 851,333 | | | | 560,764 | |
First Financial Holding Co., Ltd. | | | 1,352,960 | | | | 919,155 | |
Formosa Chemicals & Fibre Corp. | | | 365,000 | | | | 1,337,332 | |
Formosa Plastics Corp. | | | 301,000 | | | | 1,054,268 | |
Greatek Electronics, Inc. | | | 212,000 | | | | 406,693 | |
Hon Hai Precision Industry Co., Ltd. | | | 349,651 | | | | 1,030,287 | |
Powertech Technology, Inc. | | | 225,000 | | | | 692,168 | |
Sampo Corp. | | | 799,000 | | | | 359,862 | |
Siliconware Precision Industries Co., Ltd. | | | 255,000 | | | | 443,628 | |
Taiwan Cement Corp. | | | 741,000 | | | | 931,779 | |
Taiwan Mobile Co., Ltd. | | | 47,000 | | | | 172,179 | |
Taiwan Semiconductor Manufacturing Co., Ltd. | | | 275,782 | | | | 2,289,982 | |
Taiwan Shin Kong Security Co., Ltd. | | | 288,000 | | | | 377,078 | |
Ttet Union Corp. | | | 65,000 | | | | 204,148 | |
Uni-President Enterprises Corp. | | | 158,960 | | | | 372,172 | |
Zeng Hsing Industrial Co., Ltd. | | | 55,000 | | | | 237,055 | |
| | | | | | | | |
| | | | | | | 14,464,895 | |
| | | | | | | | |
|
Thailand - 2.6% | |
Siam Cement PCL | | | 26,800 | | | | 418,548 | |
Thai Oil PCL (d) | | | 506,700 | | | | 1,662,635 | |
| | | | | | | | |
| | | | | | | 2,081,183 | |
| | | | | | | | |
|
Turkey - 0.4% | |
Tofas Turk Otomobil Fabrikasi A/S | | | 39,360 | | | | 313,037 | |
| | | | | | | | |
|
United Arab Emirates - 3.3% | |
Abu Dhabi Commercial Bank PJSC | | | 505,243 | | | | 1,004,186 | |
Aldar Properties PJSC | | | 1,444,172 | | | | 849,305 | |
See accompanying notes to financial statements.
| | |
| 8 | | Disciplined Emerging Markets Equity Fund |
State Street Disciplined Emerging Markets Equity Fund
Schedule of Investments, continued — February 28, 2018 (Unaudited)
| | | | | | | | |
| Security Description | | Shares | | | Value | |
| |
DAMAC Properties Dubai Co. PJSC | | | 950,846 | | | $ | 776,644 | |
| | | | | | | | |
| | | | | | | 2,630,135 | |
| | | | | | | | |
| | |
Total Common Stocks
(cost $57,788,246) | | | | | | | 77,393,388 | |
| | | | | | | | |
|
| Rights - 0.0% (e) | |
Brazil - 0.0% (e) | |
Itausa - Investimentos Itau SA, Preference Shares
(expiring 3/29/18) (a) | | | 1,683 | | | | 2,799 | |
| | | | | | | | |
|
| Short-Term Investments - 3.5% | |
State Street Institutional U.S. Government Money Market Fund, Class G Shares
1.34% (f)(g) | | | 2,246,153 | | | | 2,246,153 | |
State Street Navigator Securities Lending Government Money Market Portfolio (f)(h) | | | 565,607 | | | | 565,607 | |
| | | | | | | | |
| |
Total Short-Term Investments
(cost $2,811,760) | | | | 2,811,760 | |
| | | | | | | | |
| |
Total Investments - 99.9%
(cost $60,600,006) | | | | 80,207,947 | |
| |
Other Assets in Excess of
Liabilities - 0.1% | | | | 66,315 | |
| | | | | | | | |
| | |
| Net Assets - 100.0% | | | | | | $ | 80,274,262 | |
| | | | | | | | |
| (a) | Non-income producing security. |
| (b) | Security purchased pursuant to Rule 144A of the Securities Act of 1933, as amended. This security, which represents 0.2% of net assets as of February 28, 2018, is considered liquid and may be resold in transactions exempt from registration, normally to qualified institutional buyers. |
| (c) | All or a portion of the shares of the security are on loan at February 28, 2018. |
| (d) | Fair valued as determined in good faith by the Trust’s Oversight Committee in accordance with policy and procedures approved by the Board of Trustees. Security value is determined based on Level 3 inputs. As of February 28, 2018, total aggregate fair value of the security is $1,662,635, representing 2.1% of the Fund’s net assets. |
| (e) | Amount is less than 0.05% of net assets. |
| (f) | The Fund invested in certain money market funds managed by SSGA Funds Management, Inc. Amounts related to these transactions during the period ended February 28, 2018 are shown in the Affiliate Table below. |
| (g) | The rate shown is the annualized seven-day yield at February 28, 2018. |
| (h) | Investment of cash collateral for securities loaned. |
| REIT | Real Estate Investment Trust |
At February 28, 2018, open futures contracts purchased were as follows:
| | | | | | | | | | | | | | | | | | | | |
| Futures Contracts | | Expiration
Date | | | Number of
Contracts | | | Notional
Amount | | | Value | | | Unrealized
Depreciation | |
| | | | | | | | | | | | | | | | | | | | |
Mini MSCI Emerging Markets Index (long) | | | 03/16/2018 | | | | 36 | | | | 2,196,470 | | | $ | 2,129,318 | | | $ | (67,152 | ) |
During the period ended February 28, 2018, average notional value related to futures contracts was $1,866,258 or 2% of net assets.
The following table summarizes the value of the Fund’s investments according to the fair value hierarchy as of February 28, 2018.
| | | | | | | | | | | | | | | | |
| Description | | Level 1 —
Quoted Prices | | | Level 2 —
Other Significant
Observable
Inputs | | | Level 3 —
Significant
Unobservable
Inputs | | | Total | |
Assets: | | | | | | | | | | | | | | | | |
| | | | |
Investments: | | | | | | | | | | | | | | | | |
Common Stocks | | | | | | | | | | | | | | | | |
Brazil | | $ | 1,829,169 | | | $ | — | | | $ | — | | | $ | 1,829,169 | |
Chile | | | 555,970 | | | | — | | | | — | | | | 555,970 | |
China | | | 15,481,853 | | | | — | | | | — | | | | 15,481,853 | |
Czech Republic | | | 2,457,092 | | | | — | | | | — | | | | 2,457,092 | |
Greece | | | 875,401 | | | | — | | | | — | | | | 875,401 | |
Hungary | | | 1,453,169 | | | | — | | | | — | | | | 1,453,169 | |
India | | | 6,954,670 | | | | — | | | | — | | | | 6,954,670 | |
Indonesia | | | 4,674,277 | | | | — | | | | — | | | | 4,674,277 | |
See accompanying notes to financial statements.
| | | | |
| Disciplined Emerging Markets Equity Fund | | | 9 | |
State Street Disciplined Emerging Markets Equity Fund
Schedule of Investments, continued — February 28, 2018 (Unaudited)
| | | | | | | | | | | | | | | | |
| Description | | Level 1 —
Quoted Prices | | | Level 2 —
Other Significant
Observable
Inputs | | | Level 3 —
Significant
Unobservable
Inputs | | | Total | |
Malaysia | | $ | 4,246,856 | | | $ | — | | | $ | — | | | $ | 4,246,856 | |
Mexico | | | 1,373,229 | | | | — | | | | — | | | | 1,373,229 | |
Pakistan | | | 2,360,160 | | | | — | | | | — | | | | 2,360,160 | |
Philippines | | | 2,670,381 | | | | — | | | | — | | | | 2,670,381 | |
Poland | | | 2,202,884 | | | | — | | | | — | | | | 2,202,884 | |
Qatar | | | 1,985,817 | | | | — | | | | — | | | | 1,985,817 | |
Russia | | | 587,438 | | | | — | | | | — | | | | 587,438 | |
South Africa | | | 1,642,351 | | | | — | | | | — | | | | 1,642,351 | |
South Korea | | | 6,380,414 | | | | — | | | | — | | | | 6,380,414 | |
Switzerland | | | 173,007 | | | | — | | | | — | | | | 173,007 | |
Taiwan | | | 14,464,895 | | | | — | | | | — | | | | 14,464,895 | |
Thailand | | | 418,548 | | | | 1,662,635 | | | | — | | | | 2,081,183 | |
Turkey | | | 313,037 | | | | — | | | | — | | | | 313,037 | |
United Arab Emirates | | | 2,630,135 | | | | — | | | | — | | | | 2,630,135 | |
Rights | | | | | | | | | | | | | | | | |
Brazil | | | 2,801 | | | | — | | | | — | | | | 2,801 | |
Short-Term Investments | | | 2,811,760 | | | | — | | | | — | | | | 2,811,760 | |
| | | | | | | | | | | | | | | | |
Total Investments | | $ | 78,545,314 | | | $ | 1,662,635 | | | $ | — | | | $ | 80,207,949 | |
| | | | | | | | | | | | | | | | |
| | | | |
Liabilities: | | | | | | | | | | | | | | | | |
| | | | |
Other Financial Instruments: | | | | | | | | | | | | | | | | |
Futures Contracts (a) | | | (67,152 | ) | | | — | | | | — | | | | (67,152 | ) |
| | | | | | | | | | | | | | | | |
| | | | |
Total Other Financial Instruments | | $ | (67,152 | ) | | $ | — | | | $ | — | | | $ | (67,152 | ) |
| | | | | | | | | | | | | | | | |
| (a) | | Futures Contracts are valued at unrealized appreciation (depreciation). |
Affiliate Table
| | | | | | | | | | | | | | | | | | | | | | | | | | | | | | | | | | | | |
| | | Number
of Shares
Held at
8/31/17 | | | Value At
8/31/17 | | | Cost of
Purchases | | | Proceeds
from
Shares
Sold | | | Realized
Gain
(Loss) | | | Change in
Unrealized
Appreciation/
Depreciation | | | Number
of Shares
Held at
2/28/18 | | | Value at
2/28/18 | | | Dividend
Income | |
State Street Institutional U.S. Government Money Market Fund - Class G Shares | | | 1,460,460 | | | $ | 1,460,460 | | | $ | 13,710,891 | | | $ | 12,925,198 | | | $ | — | | | $ | — | | | | 2,246,153 | | | $ | 2,246,153 | | | $ | 5,322 | |
State Street Navigator Securities Lending Government Money Market Portfolio | | | — | | | | — | | | | 714,792 | | | | 149,185 | | | | — | | | | — | | | | 565,607 | | | | 565,607 | | | | 34 | |
| | | | | | | | | | | | | | | | | | | | | | | | | | | | | | | | | | | | |
Total | | | | | | $ | 1,460,460 | | | $ | 14,425,683 | | | $ | 13,074,383 | | | $ | — | | | $ | — | | | | | | | $ | 2,811,760 | | | $ | 5,356 | |
| | | | | | | | | | | | | | | | | | | | | | | | | | | | | | | | | | | | |
See accompanying notes to financial statements.
| | |
| 10 | | Disciplined Emerging Markets Equity Fund |
SSGA International Stock Selection Fund
Portfolio Statistics (Unaudited)
Top Five Holdings — as of February 28, 2018
| | | | |
| Description | | % of
Net
Assets | |
Novartis AG | | | 2.7 | |
Toyota Motor Corp. | | | 2.5 | |
Lloyds Banking Group PLC | | | 1.8 | |
ING Groep NV | | | 1.7 | |
ITOCHU Corp. | | | 1.7 | |
| | | | |
Total | | | 10.4 | |
| | | | |
(The five largest holdings are subject to change, and there are no guarantees the Fund will continue to remain invested in any particular company.)
Industry Breakdown — as of February 28, 2018*
| | | | |
| Industry | | % of
Net
Assets | |
Banks | | | 11.1 | % |
Insurance | | | 7.9 | |
Pharmaceuticals | | | 7.6 | |
Automobiles | | | 5.6 | |
Food Products | | | 5.1 | |
Chemicals | | | 4.9 | |
Trading Companies & Distributors | | | 4.5 | |
Construction & Engineering | | | 3.9 | |
Airlines | | | 3.4 | |
Household Durables | | | 3.4 | |
Oil, Gas & Consumable Fuels | | | 2.9 | |
Real Estate Investment Trusts (REITs) | | | 2.9 | |
Capital Markets | | | 2.6 | |
Technology Hardware, Storage & Peripherals | | | 2.6 | |
Diversified Telecommunication Services | | | 2.5 | |
Metals & Mining | | | 2.3 | |
Paper & Forest Products | | | 2.2 | |
Beverages | | | 2.1 | |
Auto Components | | | 2.0 | |
Electronic Equipment, Instruments & Components | | | 1.7 | |
Tobacco | | | 1.7 | |
Electric Utilities | | | 1.5 | |
Gas Utilities | | | 1.5 | |
| | | | |
| Industry | | % of
Net
Assets | |
Hotels, Restaurants & Leisure | | | 1.5 | % |
Multi-Utilities | | | 1.3 | |
Air Freight & Logistics | | | 1.2 | |
Building Products | | | 1.2 | |
Food & Staples Retailing | | | 0.9 | |
Real Estate Management & Development | | | 0.9 | |
Machinery | | | 0.7 | |
Electrical Equipment | | | 0.6 | |
IT Services | | | 0.6 | |
Construction Materials | | | 0.5 | |
Energy Equipment & Services | | | 0.4 | |
Semiconductors & Semiconductor Equipment | | | 0.4 | |
Specialty Retail | | | 0.4 | |
Consumer Finance | | | 0.3 | |
Health Care Providers & Services | | | 0.3 | |
Health Care Equipment & Supplies | | | 0.2 | |
Industrial Conglomerates | | | 0.2 | |
Transportation Infrastructure | | | 0.2 | |
Marine | | | 0.1 | |
Personal Products | | | 0.1 | |
Short-Term Investments | | | 1.2 | |
Other Assets in Excess of Liabilities | | | 0.9 | |
| | | | |
Total | | | 100.0 | % |
| | | | |
| * | | The Fund’s industry breakdown is expressed as a percentage of net assets and may change over time. |
See accompanying notes to financial statements.
| | | | |
| International Stock Selection Fund | | | 11 | |
SSGA International Stock Selection Fund
Schedule of Investments — February 28, 2018 (Unaudited)
| | | | | | | | |
| Security Description | | Shares | | | Value | |
| |
| Common Stocks - 97.9% | |
Australia - 5.9% | |
Asaleo Care, Ltd. | | | 283,250 | | | $ | 297,001 | |
BHP Billiton, Ltd. | | | 25,046 | | | | 588,136 | |
BlueScope Steel, Ltd. | | | 120,772 | | | | 1,503,190 | |
Caltex Australia, Ltd. | | | 109,106 | | | | 2,957,555 | |
CSR, Ltd. | | | 389,194 | | | | 1,548,538 | |
Insurance Australia Group, Ltd. | | | 99,400 | | | | 628,108 | |
Macquarie Group, Ltd. | | | 7,905 | | | | 629,822 | |
Qantas Airways, Ltd. | | | 479,962 | | | | 2,184,754 | |
Regis Resources, Ltd. | | | 214,205 | | | | 708,279 | |
South32, Ltd. | | | 857,587 | | | | 2,165,523 | |
Stockland REIT | | | 1,036,425 | | | | 3,239,540 | |
Vicinity Centres REIT | | | 361,409 | | | | 693,117 | |
| | | | | | | | |
| | | | | | | 17,143,563 | |
| | | | | | | | |
|
Belgium - 0.3% | |
bpost SA | | | 21,107 | | | | 716,234 | |
| | | | | | | | |
|
Denmark - 2.8% | |
Danske Bank A/S | | | 116,804 | | | | 4,687,985 | |
Dfds A/S | | | 6,401 | | | | 352,519 | |
H Lundbeck A/S | | | 17,571 | | | | 920,120 | |
Novo Nordisk A/S Class B | | | 14,592 | | | | 754,858 | |
Royal Unibrew A/S | | | 10,454 | | | | 641,485 | |
Sydbank A/S | | | 16,968 | | | | 662,346 | |
| | | | | | | | |
| | | | | | | 8,019,313 | |
| | | | | | | | |
|
Finland - 2.2% | |
Orion Oyj Class B | | | 31,596 | | | | 1,029,073 | |
Stora Enso Oyj Class R | | | 256,031 | | | | 4,521,594 | |
UPM-Kymmene Oyj | | | 24,317 | | | | 831,978 | |
| | | | | | | | |
| | | | | | | 6,382,645 | |
| | | | | | | | |
|
France - 7.8% | |
AXA SA | | | 78,536 | | | | 2,459,673 | |
Cie de Saint-Gobain | | | 60,328 | | | | 3,414,492 | |
Cie Generale des Etablissements Michelin SCA | | | 30,084 | | | | 4,624,052 | |
CNP Assurances | | | 88,529 | | | | 2,145,370 | |
Sanofi | | | 60,763 | | | | 4,797,230 | |
Sopra Steria Group | | | 1,223 | | | | 237,515 | |
TOTAL SA | | | 30,289 | | | | 1,722,800 | |
Veolia Environnement SA | | | 126,831 | | | | 3,080,483 | |
| | | | | | | | |
| | | | | | | 22,481,615 | |
| | | | | | | | |
|
Germany - 6.7% | |
BASF SE | | | 23,602 | | | | 2,465,690 | |
Bayer AG | | | 40,126 | | | | 4,682,547 | |
Covestro AG (a) | | | 28,367 | | | | 3,200,090 | |
Deutsche Lufthansa AG | | | 131,033 | | | | 4,375,201 | |
Deutsche Post AG | | | 59,507 | | | | 2,714,782 | |
METRO AG | | | 70,095 | | | | 1,367,081 | |
| | | | | | | | |
| Security Description | | Shares | | | Value | |
Volkswagen AG Preference Shares | | | 2,943 | | | $ | 572,527 | |
| | | | | | | | |
| | | | | | | 19,377,918 | |
| | | | | | | | |
|
Hong Kong - 6.1% | |
BOC Hong Kong Holdings, Ltd. | | | 706,500 | | | | 3,550,505 | |
CK Asset Holdings, Ltd. | | | 177,000 | | | | 1,520,834 | |
CLP Holdings, Ltd. | | | 120,000 | | | | 1,213,727 | |
HKT Trust & HKT, Ltd. | | | 248,000 | | | | 316,896 | |
Hysan Development Co., Ltd. | | | 103,000 | | | | 595,260 | |
Jardine Matheson Holdings, Ltd. | | | 8,900 | | | | 579,835 | |
Kerry Properties, Ltd. | | | 130,000 | | | | 587,633 | |
Link REIT | | | 522,000 | | | | 4,437,517 | |
WH Group, Ltd. (a) | | | 3,942,500 | | | | 4,855,601 | |
| | | | | | | | |
| | | | | | | 17,657,808 | |
| | | | | | | | |
|
Italy - 2.1% | |
Hera SpA | | | 193,679 | | | | 658,764 | |
Recordati SpA | | | 24,171 | | | | 864,094 | |
Saras SpA | | | 123,633 | | | | 259,148 | |
Snam SpA | | | 966,853 | | | | 4,328,173 | |
| | | | | | | | |
| | | | | | | 6,110,179 | |
| | | | | | | | |
|
Japan - 25.3% | |
Alfresa Holdings Corp. | | | 34,100 | | | | 762,231 | |
Canon, Inc. | | | 77,500 | | | | 2,953,431 | |
Denso Corp. | | | 10,100 | | | | 589,515 | |
FUJIFILM Holdings Corp. | | | 86,700 | | | | 3,612,980 | |
Heiwado Co., Ltd. | | | 26,300 | | | | 607,936 | |
Hitachi, Ltd. | | | 630,000 | | | | 4,764,124 | |
Honda Motor Co., Ltd. | | | 130,300 | | | | 4,711,944 | |
ITOCHU Corp. | | | 253,800 | | | | 4,878,681 | |
Japan Airlines Co., Ltd. | | | 83,800 | | | | 3,193,798 | |
JXTG Holdings, Inc. | | | 51,600 | | | | 309,514 | |
K’s Holdings Corp. | | | 23,300 | | | | 647,705 | |
Kajima Corp. | | | 346,000 | | | | 3,294,241 | |
Kirin Holdings Co., Ltd. | | | 41,800 | | | | 1,078,718 | |
Marubeni Corp. | | | 332,100 | | | | 2,530,360 | |
Mitsubishi Chemical Holdings Corp. | | | 94,000 | | | | 948,355 | |
Mitsui & Co., Ltd. | | | 222,400 | | | | 4,030,760 | |
Mitsui Chemicals, Inc. | | | 144,100 | | | | 4,372,613 | |
Nippon Telegraph & Telephone Corp. | | | 96,200 | | | | 4,468,163 | |
Nisshin Oillio Group, Ltd. | | | 20,800 | | | | 565,531 | |
Obayashi Corp. | | | 198,200 | | | | 2,236,641 | |
Prima Meat Packers, Ltd. | | | 102,000 | | | | 612,979 | |
Sumitomo Chemical Co., Ltd. | | | 534,000 | | | | 3,292,469 | |
Sumitomo Electric Industries, Ltd. | | | 36,300 | | | | 572,603 | |
Suzuki Motor Corp. | | | 65,900 | | | | 3,759,321 | |
Taisei Corp. | | | 87,300 | | | | 4,424,607 | |
Toyota Motor Corp. | | | 107,400 | | | | 7,236,946 | |
See accompanying notes to financial statements.
| | |
| 12 | | International Stock Selection Fund |
SSGA International Stock Selection Fund
Schedule of Investments, continued — February 28, 2018 (Unaudited)
| | | | | | | | |
| Security Description | | Shares | | | Value | |
| |
Toyota Tsusho Corp. | | | 37,400 | | | $ | 1,384,743 | |
Ulvac, Inc. | | | 17,000 | | | | 1,036,612 | |
| | | | | | | | |
| | | | | | | 72,877,521 | |
| | | | | | | | |
|
Netherlands - 4.3% | |
ABN AMRO Group NV (a) | | | 81,326 | | | | 2,530,347 | |
Heineken Holding NV | | | 5,786 | | | | 575,541 | |
ING Groep NV | | | 281,866 | | | | 4,946,179 | |
NN Group NV | | | 98,470 | | | | 4,389,882 | |
| | | | | | | | |
| | | | | | | 12,441,949 | |
| | | | | | | | |
|
Norway - 3.3% | |
Austevoll Seafood ASA | | | 77,308 | | | | 693,035 | |
DNB ASA | | | 230,789 | | | | 4,527,002 | |
Marine Harvest ASA (b) | | | 35,746 | | | | 688,561 | |
Orkla ASA | | | 114,958 | | | | 1,260,424 | |
Salmar ASA | | | 19,070 | | | | 677,971 | |
Telenor ASA | | | 71,069 | | | | 1,594,892 | |
| | | | | | | | |
| | | | | | | 9,441,885 | |
| | | | | | | | |
|
Singapore - 0.2% | |
Oversea-Chinese Banking Corp., Ltd. | | | 60,500 | | | | 592,032 | |
| | | | | | | | |
|
South Africa - 0.3% | |
Mondi PLC | | | 33,403 | | | | 868,925 | |
| | | | | | | | |
|
Spain - 3.6% | |
ACS Actividades de Construccion y Servicios SA | | | 45,015 | | | | 1,543,061 | |
Amadeus IT Group SA | | | 21,258 | | | | 1,560,674 | |
Banco Santander SA | | | 165,861 | | | | 1,136,905 | |
Endesa SA | | | 32,027 | | | | 672,329 | |
Iberdrola SA | | | 338,321 | | | | 2,489,812 | |
Repsol SA | | | 171,831 | | | | 3,052,998 | |
| | | | | | | | |
| | | | | | | 10,455,779 | |
| | | | | | | | |
|
Sweden - 4.0% | |
Electrolux AB Series B | | | 20,234 | | | | 664,282 | |
Skandinaviska Enskilda Banken AB Class A | | | 347,100 | | | | 4,073,720 | |
Swedish Match AB | | | 112,717 | | | | 4,787,906 | |
Volvo AB Class B | | | 110,439 | | | | 2,076,465 | |
| | | | | | | | |
| | | | | | | 11,602,373 | |
| | | | | | | | |
|
Switzerland - 8.8% | |
ABB, Ltd. | | | 71,083 | | | | 1,720,119 | |
Baloise Holding AG | | | 6,873 | | | | 1,081,268 | |
Cembra Money Bank AG (c) | | | 7,277 | | | | 684,741 | |
Flughafen Zuerich AG | | | 2,689 | | | | 638,426 | |
GAM Holding AG (c) | | | 33,913 | | | | 609,323 | |
Logitech International SA | | | 20,900 | | | | 820,283 | |
Nestle SA | | | 22,533 | | | | 1,790,269 | |
| | | | | | | | |
| Security Description | | Shares | | | Value | |
Novartis AG | | | 94,448 | | | $ | 7,879,019 | |
Roche Holding AG | | | 5,448 | | | | 1,258,379 | |
Swiss Life Holding AG (c) | | | 10,339 | | | | 3,733,651 | |
Swisscom AG | | | 1,128 | | | | 609,075 | |
Zurich Insurance Group AG | | | 13,783 | | | | 4,531,785 | |
| | | | | | | | |
| | | | | | | 25,356,338 | |
| | | | | | | | |
|
United Kingdom - 14.2% | |
3i Group PLC | | | 345,820 | | | | 4,448,288 | |
Barratt Developments PLC | | | 206,588 | | | | 1,526,764 | |
Bellway PLC | | | 39,099 | | | | 1,666,670 | |
Berkeley Group Holdings PLC | | | 22,939 | | | | 1,213,974 | |
Booker Group PLC (b) | | | 195,460 | | | | 611,103 | |
Carnival PLC | | | 66,086 | | | | 4,349,531 | |
Centamin PLC | | | 704,373 | | | | 1,441,194 | |
Diageo PLC | | | 109,070 | | | | 3,700,804 | |
Direct Line Insurance Group PLC | | | 772,794 | | | | 4,064,246 | |
Kingfisher PLC | | | 130,811 | | | | 643,824 | |
Lloyds Banking Group PLC | | | 5,511,784 | | | | 5,207,707 | |
Man Group PLC | | | 749,398 | | | | 1,760,936 | |
Persimmon PLC | | | 123,487 | | | | 4,414,476 | |
Redrow PLC | | | 68,729 | | | | 554,741 | |
Smith & Nephew PLC | | | 35,596 | | | | 621,465 | |
Subsea 7 SA | | | 84,205 | | | | 1,250,387 | |
Tate & Lyle PLC | | | 464,054 | | | | 3,563,972 | |
| | | | | | | | |
| | | | | | | 41,040,082 | |
| | | | | | | | |
| |
Total Common Stocks
(cost $258,435,106) | | | | 282,566,159 | |
| | | | | | | | |
|
| Short-Term Investments - 1.2% | |
State Street Institutional U.S. Government Money Market Fund, Class G Shares 1.34% (d)(e) | | | 2,345,548 | | | | 2,345,548 | |
State Street Navigator Securities Lending Government Money Market Portfolio (d)(f) | | | 1,238,413 | | | | 1,238,413 | |
| | | | | | | | |
| |
Total Short-Term Investments
(cost $3,583,961) | | | | 3,583,961 | |
| | | | | | | | |
| |
Total Investments - 99.1%
(cost $262,019,067) | | | | 286,150,120 | |
| |
Other Assets in Excess of
Liabilities - 0.9% | | | | 2,622,126 | |
| | | | | | | | |
| |
| Net Assets - 100.0% | | | $ | 288,772,246 | |
| | | | | | | | |
| (a) | Securities purchased pursuant to Rule 144A of the Securities Act of 1933, as amended. These securities, which represent 3.7% of net assets as of February 28, 2018, are considered liquid and may be resold in transactions exempt from registration, normally to qualified institutional buyers. |
| (b) | All or a portion of the shares of the security are on loan at February 28, 2018. |
See accompanying notes to financial statements.
| | | | |
| International Stock Selection Fund | | | 13 | |
SSGA International Stock Selection Fund
Schedule of Investments, continued — February 28, 2018 (Unaudited)
| (c) | Non-income producing security. |
| (d) | The Fund invested in certain money market funds managed by SSGA Funds Management, Inc. Amounts related to these transactions during the period ended February 28, 2018 are shown in the Affiliate Table below. |
| (e) | The rate shown is the annualized seven-day yield at February 28, 2018. |
| (f) | Investment of cash collateral for securities loaned. |
| REIT | Real Estate Investment Trust |
At February 28, 2018, open futures contracts purchased were as follows:
| | | | | | | | | | | | | | | | | | | | |
| Futures Contracts | | Expiration
Date | | | Number of
Contracts | | | Notional
Amount | | | Value | | | Unrealized
Appreciation | |
| | | | | | | | | | | | | | | | | | | | |
Mini MSCI EAFE Index (long) | | | 03/16/2018 | | | | 28 | | | | 2,822,045 | | | $ | 2,851,039 | | | $ | 28,994 | |
During the period ended February 28, 2018, average notional value related to futures contracts was $2,889,602 or 1% of net assets.
The following table summarizes the value of the Fund’s investments according to the fair value hierarchy as of February 28, 2018.
| | | | | | | | | | | | | | | | |
| Description | | Level 1 —
Quoted Prices | | | Level 2 —
Other Significant
Observable
Inputs | | | Level 3 —
Significant
Unobservable
Inputs | | | Total | |
Assets: | | | | | | | | | | | | | | | | |
| | | | |
Investments: | | | | | | | | | | | | | | | | |
Common Stocks | | | | | | | | | | | | | | | | |
Australia | | $ | 17,143,563 | | | $ | — | | | $ | — | | | $ | 17,143,563 | |
Belgium | | | 716,234 | | | | — | | | | — | | | | 716,234 | |
Denmark | | | 8,019,313 | | | | — | | | | — | | | | 8,019,313 | |
Finland | | | 6,382,645 | | | | — | | | | — | | | | 6,382,645 | |
France | | | 22,481,615 | | | | — | | | | — | | | | 22,481,615 | |
Germany | | | 19,377,918 | | | | — | | | | — | | | | 19,377,918 | |
Hong Kong | | | 17,657,808 | | | | — | | | | — | | | | 17,657,808 | |
Italy | | | 6,110,179 | | | | — | | | | — | | | | 6,110,179 | |
Japan | | | 72,877,521 | | | | — | | | | — | | | | 72,877,521 | |
Netherlands | | | 12,441,949 | | | | — | | | | — | | | | 12,441,949 | |
Norway | | | 9,441,885 | | | | — | | | | — | | | | 9,441,885 | |
Singapore | | | 592,032 | | | | — | | | | — | | | | 592,032 | |
South Africa | | | 868,925 | | | | — | | | | — | | | | 868,925 | |
Spain | | | 10,455,779 | | | | — | | | | — | | | | 10,455,779 | |
Sweden | | | 11,602,373 | | | | — | | | | — | | | | 11,602,373 | |
Switzerland | | | 25,356,338 | | | | — | | | | — | | | | 25,356,338 | |
United Kingdom | | | 41,040,082 | | | | — | | | | — | | | | 41,040,082 | |
Short-Term Investments | | | 3,583,961 | | | | — | | | | — | | | | 3,583,961 | |
| | | | | | | | | | | | | | | | |
Total Investments | | $ | 286,150,120 | | | $ | — | | | $ | — | | | $ | 286,150,120 | |
| | | | | | | | | | | | | | | | |
| | | | |
Other Financial Instruments: | | | | | | | | | | | | | | | | |
Futures Contracts (a) | | | 28,994 | | | | — | | | | — | | | | 28,994 | |
| | | | | | | | | | | | | | | | |
| | | | |
Total Investments and Other Financial Instruments | | $ | 286,179,114 | | | $ | | | | $ | — | | | $ | 286,179,114 | |
| | | | | | | | | | | | | | | | |
| (a) | | Futures Contracts are valued at unrealized appreciation (depreciation). |
See accompanying notes to financial statements.
| | |
| 14 | | International Stock Selection Fund |
SSGA International Stock Selection Fund
Schedule of Investments, continued — February 28, 2018 (Unaudited)
Affiliate Table
| | | | | | | | | | | | | | | | | | | | | | | | | | | | | | | | | | | | |
| | | Number
of Shares
Held at
8/31/17 | | | Value At
8/31/17 | | | Cost of
Purchases | | | Proceeds
from
Shares
Sold | | | Realized
Gain
(Loss) | | | Change in
Unrealized
Appreciation/
Depreciation | | | Number
of Shares
Held at
2/28/18 | | | Value at
2/28/18 | | | Dividend
Income | |
State Street Institutional U.S. Government Money Market Fund - Class G Shares | | | 100 | | | $ | 100 | | | $ | 16,100,330 | | | $ | 13,754,882 | | | $ | — | | | $ | — | | | | 2,345,548 | | | $ | 2,345,548 | | | $ | 8,726 | |
State Street Navigator Securities Lending Government Money Market Portfolio | | | — | | | | — | | | | 4,678,272 | | | | 3,439,859 | | | | — | | | | — | | | | 1,238,413 | | | | 1,238,413 | | | | 13,417 | |
| | | | | | | | | | | | | | | | | | | | | | | | | | | | | | | | | | | | |
Total | | | | | | $ | 100 | | | $ | 20,778,602 | | | $ | 17,194,741 | | | $ | — | | | $ | — | | | | | | | $ | 3,583,961 | | | $ | 22,143 | |
| | | | | | | | | | | | | | | | | | | | | | | | | | | | | | | | | | | | |
See accompanying notes to financial statements.
| | | | |
| International Stock Selection Fund | | | 15 | |
SSGA High Yield Bond Fund
Portfolio Statistics (Unaudited)
Top Five Holdings — as of February 28, 2018
| | | | |
| Description | | % of
Net
Assets | |
HCA Healthcare, Inc. 6.25% 02/15/2021 | | | 1.2 | |
CSC Holdings LLC 10.13% 01/15/2023 | | | 1.0 | |
Valeant Pharmaceuticals International, Inc. 6.13% 04/15/2025 | | | 0.9 | |
Valeant Pharmaceuticals International, Inc. 7.00% 03/15/2024 | | | 0.8 | |
CCO Holdings LLC/CCO Holdings Capital Corp. 5.88% 04/01/2024 | | | 0.8 | |
| | | | |
Total | | | 4.7 | |
| | | | |
(The five largest holdings are subject to change, and there are no guarantees the Fund will continue to remain invested in any particular company.)
Industry Breakdown — as of February 28, 2018*
| | | | |
| Industry | | % of
Net
Assets | |
Oil & Gas | | | 10.4 | % |
Telecommunications | | | 8.6 | |
Health Care Services | | | 8.1 | |
Media | | | 6.0 | |
Retail | | | 4.8 | |
Diversified Financial Services | | | 4.5 | |
Commercial Services | | | 4.2 | |
Mining | | | 3.5 | |
Pipelines | | | 3.3 | |
Packaging & Containers | | | 3.1 | |
Chemicals | | | 2.8 | |
Electric | | | 2.4 | |
Food | | | 2.4 | |
Entertainment | | | 2.3 | |
IT Services | | | 2.3 | |
Banks | | | 2.1 | |
Pharmaceuticals | | | 2.1 | |
Home Builders | | | 2.0 | |
Iron/Steel | | | 1.9 | |
Construction Materials | | | 1.7 | |
Distribution & Wholesale | | | 1.5 | |
Auto Parts & Equipment | | | 1.3 | |
Lodging | | | 1.3 | |
Software | | | 1.3 | |
| | | | |
| Industry | | % of
Net
Assets | |
Coal | | | 0.9 | % |
Environmental Control | | | 0.8 | |
Oil & Gas Services | | | 0.7 | |
Aerospace & Defense | | | 0.6 | |
Internet | | | 0.6 | |
Household Products & Wares | | | 0.5 | |
Miscellaneous Manufacturer | | | 0.5 | |
Semiconductors | | | 0.5 | |
Beverages | | | 0.3 | |
Electrical Components & Equipment | | | 0.3 | |
Electronics | | | 0.3 | |
Housewares | | | 0.3 | |
Real Estate Investment Trusts | | | 0.3 | |
Advertising | | | 0.2 | |
Food Service | | | 0.2 | |
Home Furnishings | | | 0.2 | |
Metal Fabricate & Hardware | | | 0.2 | |
Toys/Games/Hobbies | | | 0.2 | |
Energy-Alternate Sources | | | 0.1 | |
Health Care Products | | | 0.1 | |
Short-Term Investment | | | 6.4 | |
Other Assets in Excess of Liabilities | | | 1.9 | |
| | | | |
Total | | | 100.0 | % |
| | | | |
| * | | The Fund’s industry breakdown is expressed as a percentage of net assets and may change over time. |
See accompanying notes to financial statements.
SSGA High Yield Bond Fund
Schedule of Investments — February 28, 2018 (Unaudited)
| | | | | | | | |
| Security Description | | Principal
Amount | | | Value | |
| |
| Corporate Bonds & Notes - 91.7% | |
Australia - 0.3% | |
FMG Resources August 2006 Pty, Ltd.
5.13%, 5/15/2024 (a) | | $ | 160,000 | | | $ | 159,344 | |
| | | | | | | | |
|
Bermuda - 0.7% | |
Aircastle, Ltd.
5.00%, 4/1/2023 | | | 120,000 | | | | 123,732 | |
Weatherford International, Ltd.
8.25%, 6/15/2023 | | | 325,000 | | | | 313,828 | |
| | | | | | | | |
| | | | | | | 437,560 | |
| | | | | | | | |
|
Brazil - 0.3% | |
JBS USA LUX SA/JBS USA Finance, Inc.
6.75%, 2/15/2028 (a) | | | 160,000 | | | | 158,432 | |
| | | | | | | | |
|
Canada - 2.5% | |
1011778 BC ULC/New Red Finance, Inc.:
4.25%, 5/15/2024 (a) | | | 350,000 | | | | 334,687 | |
5.00%, 10/15/2025 (a) | | | 93,000 | | | | 90,443 | |
Bombardier, Inc.:
7.50%, 12/1/2024 (a) | | | 128,000 | | | | 132,877 | |
7.50%, 3/15/2025 (a) | | | 200,000 | | | | 204,500 | |
Hudbay Minerals, Inc.
7.63%, 1/15/2025 (a) | | | 95,000 | | | | 103,313 | |
MEG Energy Corp.:
6.38%, 1/30/2023 (a) | | | 50,000 | | | | 43,000 | |
6.50%, 1/15/2025 (a) | | | 125,000 | | | | 122,812 | |
Teck Resources, Ltd.:
3.75%, 2/1/2023 | | | 300,000 | | | | 292,312 | |
6.13%, 10/1/2035 | | | 100,000 | | | | 109,250 | |
6.25%, 7/15/2041 | | | 125,000 | | | | 137,500 | |
| | | | | | | | |
| | | | | | | 1,570,694 | |
| | | | | | | | |
|
Cayman Islands - 1.1% | |
Transocean, Inc.:
6.80%, 3/15/2038 | | | 100,000 | | | | 80,500 | |
9.00%, 7/15/2023 (a) | | | 310,000 | | | | 332,475 | |
UPCB Finance IV, Ltd.
5.38%, 1/15/2025 (a) | | | 250,000 | | | | 247,825 | |
| | | | | | | | |
| | | | | | | 660,800 | |
| | | | | | | | |
|
France - 0.5% | |
SFR Group SA
6.00%, 5/15/2022 (a) | | | 300,000 | | | | 291,090 | |
| | | | | | | | |
|
Germany - 0.5% | |
Deutsche Bank AG:
5 Year USD Swap + 2.25%, 4.30%, 5/24/2028 (b) | | | 200,000 | | | | 194,500 | |
4.50%, 4/1/2025 | | | 150,000 | | | | 146,865 | |
| | | | | | | | |
| | | | | | | 341,365 | |
| | | | | | | | |
| | | | | | | | |
| Security Description | | Principal
Amount | | | Value | |
Ireland - 1.2% | |
Ardagh Packaging Finance PLC/Ardagh Holdings USA, Inc.
6.00%, 2/15/2025 (a) | | $ | 300,000 | | | $ | 307,125 | |
C&W Senior Financing Designated Activity Co.
6.88%, 9/15/2027 (a) | | | 200,000 | | | | 206,000 | |
Endo Dac/Endo Finance LLC/Endo Finco, Inc.
6.00%, 7/15/2023 (a) | | | 300,000 | | | | 225,000 | |
| | | | | | | | |
| | | | | | | 738,125 | |
| | | | | | | | |
|
Luxembourg - 2.3% | |
Altice Finco SA
8.13%, 1/15/2024 (a) | | | 250,000 | | | | 255,437 | |
Altice Luxembourg SA
7.75%, 5/15/2022 (a) | | | 425,000 | | | | 396,865 | |
ArcelorMittal:
6.50%, 2/25/2022 | | | 250,000 | | | | 271,850 | |
7.25%, 10/15/2039 | | | 175,000 | | | | 216,300 | |
INEOS Group Holdings SA
5.63%, 8/1/2024 (a) | | | 272,000 | | | | 276,434 | |
| | | | | | | | |
| | | | | | | 1,416,886 | |
| | | | | | | | |
|
Netherlands - 1.2% | |
Constellium NV
5.88%, 2/15/2026 (a) | | | 250,000 | | | | 252,500 | |
Lincoln Finance, Ltd.
7.38%, 4/15/2021 (a) | | | 200,000 | | | | 208,000 | |
NXP B.V./NXP Funding LLC
4.63%, 6/1/2023 (a) | | | 123,000 | | | | 126,613 | |
Ziggo Bond Finance B.V.
5.88%, 1/15/2025 (a) | | | 200,000 | | | | 192,500 | |
| | | | | | | | |
| | | | | | | 779,613 | |
| | | | | | | | |
|
Sweden - 0.2% | |
Perstorp Holding AB
11.00%, 9/30/2021 (a) | | | 100,000 | | | | 107,875 | |
| | | | | | | | |
|
United Kingdom - 2.4% | |
Alpha 3 B.V./Alpha US Bidco, Inc.
6.25%, 2/1/2025 (a) | | | 345,000 | | | | 346,725 | |
Inmarsat Finance PLC
4.88%, 5/15/2022 (a) | | | 275,000 | | | | 272,332 | |
International Game Technology PLC
6.25%, 2/15/2022 (a) | | | 100,000 | | | | 105,630 | |
Noble Holding International, Ltd.
7.88%, 2/1/2026 (a) | | | 100,000 | | | | 100,090 | |
Royal Bank of Scotland Group PLC:
6.13%, 12/15/2022 | | | 75,000 | | | | 79,676 | |
See accompanying notes to financial statements.
SSGA High Yield Bond Fund
Schedule of Investments, continued — February 28, 2018 (Unaudited)
| | | | | | | | |
| Security Description | | Principal
Amount | | | Value | |
| |
3 Month USD LIBOR + 2.50%, 7.65%, 9/30/2031 (b)(c) | | $ | 200,000 | | | $ | 259,300 | |
Virgin Media Finance PLC
6.38%, 4/15/2023 (a) | | | 350,000 | | | | 359,625 | |
| | | | | | | | |
| | | | | | | 1,523,378 | |
| | | | | | | | |
|
United States - 78.5% | |
Acadia Healthcare Co., Inc.
6.50%, 3/1/2024 | | | 250,000 | | | | 259,700 | |
ADT Corp.
3.50%, 7/15/2022 | | | 325,000 | | | | 311,594 | |
Advanced Disposal Services, Inc.
5.63%, 11/15/2024 (a) | | | 210,000 | | | | 213,675 | |
AES Corp.:
4.88%, 5/15/2023 | | | 225,000 | | | | 227,542 | |
5.13%, 9/1/2027 | | | 91,000 | | | | 92,024 | |
6.00%, 5/15/2026 | | | 80,000 | | | | 84,104 | |
Albertsons Cos. LLC/Safeway, Inc./New Albertson’s, Inc./Albertson’s LLC
6.63%, 6/15/2024 | | | 150,000 | | | | 138,195 | |
Allison Transmission, Inc.:
4.75%, 10/1/2027 (a) | | | 83,000 | | | | 81,133 | |
5.00%, 10/1/2024 (a) | | | 140,000 | | | | 141,932 | |
Ally Financial, Inc.:
4.13%, 2/13/2022 | | | 200,000 | | | | 200,750 | |
5.75%, 11/20/2025 | | | 250,000 | | | | 261,250 | |
8.00%, 11/1/2031 | | | 275,000 | | | | 340,312 | |
Altice US Finance I Corp.
5.50%, 5/15/2026 (a) | | | 100,000 | | | | 99,000 | |
AMC Entertainment Holdings, Inc.
5.75%, 6/15/2025 | | | 375,000 | | | | 364,687 | |
AMC Networks, Inc.
4.75%, 8/1/2025 | | | 40,000 | | | | 38,800 | |
American Axle & Manufacturing, Inc.
6.25%, 4/1/2025 | | | 260,000 | | | | 268,294 | |
American Greetings Corp.
7.88%, 2/15/2025 (a) | | | 200,000 | | | | 204,500 | |
AMN Healthcare, Inc.
5.13%, 10/1/2024 (a) | | | 210,000 | | | | 212,100 | |
Antero Resources Corp.
5.63%, 6/1/2023 | | | 345,000 | | | | 353,625 | |
Aramark Services, Inc.
5.00%, 2/1/2028 (a) | | | 120,000 | | | | 119,556 | |
Arconic, Inc.:
5.13%, 10/1/2024 | | | 175,000 | | | | 181,352 | |
5.95%, 2/1/2037 | | | 100,000 | | | | 106,750 | |
6.15%, 8/15/2020 | | | 100,000 | | | | 105,813 | |
Artesyn Embedded Technologies, Inc.
9.75%, 10/15/2020 (a) | | | 175,000 | | | | 168,656 | |
| | | | | | | | |
| Security Description | | Principal
Amount | | | Value | |
Asbury Automotive Group, Inc.
6.00%, 12/15/2024 | | $ | 250,000 | | | $ | 259,375 | |
Ascent Resources Utica Holdings LLC/ARU Finance Corp.
10.00%, 4/1/2022 (a) | | | 150,000 | | | | 160,125 | |
Ashtead Capital, Inc.
5.63%, 10/1/2024 (a) | | | 225,000 | | | | 234,844 | |
ASP AMC Merger Sub, Inc.
8.00%, 5/15/2025 (a) | | | 175,000 | | | | 165,375 | |
Avantor, Inc.
6.00%, 10/1/2024 (a) | | | 336,000 | | | | 336,420 | |
Beacon Escrow Corp.
4.88%, 11/1/2025 (a) | | | 66,000 | | | | 64,185 | |
Beacon Roofing Supply, Inc.
6.38%, 10/1/2023 | | | 220,000 | | | | 232,375 | |
Beazer Homes USA, Inc.:
5.88%, 10/15/2027 | | | 100,000 | | | | 95,000 | |
6.75%, 3/15/2025 | | | 100,000 | | | | 100,875 | |
Berry Global, Inc.:
5.13%, 7/15/2023 | | | 150,000 | | | | 153,375 | |
4.50%, 2/15/2026 (a) | | | 100,000 | | | | 97,250 | |
Block Communications, Inc.
6.88%, 2/15/2025 (a) | | | 125,000 | | | | 129,531 | |
Booz Allen Hamilton, Inc.
5.13%, 5/1/2025 (a) | | | 140,000 | | | | 139,300 | |
Boyd Gaming Corp.
6.38%, 4/1/2026 | | | 275,000 | | | | 289,094 | |
Builders FirstSource, Inc.
5.63%, 9/1/2024 (a) | | | 265,000 | | | | 269,306 | |
BWAY Holding Co.
7.25%, 4/15/2025 (a) | | | 260,000 | | | | 267,150 | |
California Resources Corp.
8.00%, 12/15/2022 (a) | | | 200,000 | | | | 158,500 | |
Carrizo Oil & Gas, Inc.
6.25%, 4/15/2023 | | | 242,000 | | | | 242,605 | |
CBS Radio, Inc.
7.25%, 11/1/2024 (a) | | | 100,000 | | | | 103,563 | |
CCO Holdings LLC/CCO Holdings Capital Corp.:
5.00%, 2/1/2028 (a) | | | 143,000 | | | | 135,178 | |
5.75%, 2/15/2026 (a) | | | 155,000 | | | | 156,937 | |
5.88%, 4/1/2024 (a) | | | 500,000 | | | | 516,250 | |
CD&R Waterworks Merger Sub LLC
6.13%, 8/15/2025 (a) | | | 45,000 | | | | 44,719 | |
Centene Corp.
4.75%, 1/15/2025 | | | 250,000 | | | | 248,750 | |
Central Garden & Pet Co.
6.13%, 11/15/2023 | | | 75,000 | | | | 78,188 | |
CenturyLink, Inc. Series Y,
7.50%, 4/1/2024 | | | 300,000 | | | | 302,250 | |
Cequel Communications Holdings I LLC/Cequel Capital Corp.
6.38%, 9/15/2020 (a) | | | 150,000 | | | | 151,695 | |
See accompanying notes to financial statements.
SSGA High Yield Bond Fund
Schedule of Investments, continued — February 28, 2018 (Unaudited)
| | | | | | | | |
| Security Description | | Principal
Amount | | | Value | |
| |
CF Industries, Inc.
4.95%, 6/1/2043 | | $ | 150,000 | | | $ | 136,500 | |
Change Healthcare Holdings LLC/Change Healthcare Finance, Inc.
5.75%, 3/1/2025 (a) | | | 340,000 | | | | 340,000 | |
Cheniere Energy Partners L.P.
5.25%, 10/1/2025 (a) | | | 187,000 | | | | 188,870 | |
Chesapeake Energy Corp.:
8.00%, 1/15/2025 (a) | | | 96,000 | | | | 94,800 | |
8.00%, 6/15/2027 (a) | | | 205,000 | | | | 195,898 | |
CHS/Community Health Systems, Inc.
6.25%, 3/31/2023 | | | 330,000 | | | | 300,300 | |
CIT Group, Inc.:
3.88%, 2/19/2019 | | | 330,000 | | | | 331,254 | |
5.00%, 8/15/2022 | | | 125,000 | | | | 128,913 | |
3 Month USD LIBOR + 3.97%, 5.80%, 6/15/2022 (b)(c) | | | 135,000 | | | | 136,688 | |
Cleveland-Cliffs, Inc.
5.75%, 3/1/2025 (a) | | | 200,000 | | | | 194,120 | |
CONSOL Energy, Inc.
5.88%, 4/15/2022 | | | 295,000 | | | | 296,858 | |
Continental Resources, Inc.
5.00%, 9/15/2022 | | | 325,000 | | | | 329,875 | |
Cott Holdings, Inc.
5.50%, 4/1/2025 (a) | | | 170,000 | | | | 169,337 | |
Covanta Holding Corp.
5.88%, 7/1/2025 | | | 275,000 | | | | 273,625 | |
CRC Escrow Issuer LLC/CRC Finco, Inc.
5.25%, 10/15/2025 (a) | | | 194,000 | | | | 188,665 | |
Crestwood Midstream Partners L.P./Crestwood Midstream Finance Corp.
6.25%, 4/1/2023 | | | 75,000 | | | | 77,438 | |
Crown Americas LLC/Crown Americas Capital Corp.
4.75%, 2/1/2026 (a) | | | 50,000 | | | | 49,250 | |
CSC Holdings LLC
10.13%, 1/15/2023 (a) | | | 550,000 | | | | 613,250 | |
DaVita, Inc.
5.00%, 5/1/2025 | | | 353,000 | | | | 345,516 | |
DCP Midstream Operating L.P.
3.88%, 3/15/2023 | | | 350,000 | | | | 342,125 | |
Dell International LLC/EMC Corp.
5.88%, 6/15/2021 (a) | | | 275,000 | | | | 281,875 | |
Denbury Resources, Inc.
9.00%, 5/15/2021 (a) | | | 155,000 | | | | 159,456 | |
Diamondback Energy, Inc.
4.75%, 11/1/2024 | | | 140,000 | | | | 138,684 | |
| | | | | | | | |
| Security Description | | Principal
Amount | | | Value | |
Diebold Nixdorf, Inc.
8.50%, 4/15/2024 | | $ | 333,000 | | | $ | 350,482 | |
DISH DBS Corp.:
5.88%, 11/15/2024 | | | 285,000 | | | | 267,187 | |
7.75%, 7/1/2026 | | | 280,000 | | | | 276,164 | |
Dynegy, Inc.:
7.38%, 11/1/2022 | | | 150,000 | | | | 157,687 | |
7.63%, 11/1/2024 | | | 110,000 | | | | 118,525 | |
8.00%, 1/15/2025 (a) | | | 100,000 | | | | 108,250 | |
8.13%, 1/30/2026 (a) | | | 75,000 | | | | 82,219 | |
Eldorado Resorts, Inc.
7.00%, 8/1/2023 | | | 181,000 | | | | 192,086 | |
EMC Corp.
3.38%, 6/1/2023 | | | 125,000 | | | | 115,000 | |
Energy Transfer Equity L.P.: | | | | | | | | |
4.25%, 3/15/2023 | | | 135,000 | | | | 132,260 | |
7.50%, 10/15/2020 | | | 150,000 | | | | 162,570 | |
Ensco PLC
7.75%, 2/1/2026 | | | 170,000 | | | | 160,650 | |
Entegris, Inc.
4.63%, 2/10/2026 (a) | | | 200,000 | | | | 197,250 | |
Envision Healthcare Corp.
6.25%, 12/1/2024 (a) | | | 340,000 | | | | 356,150 | |
EP Energy LLC/Everest Acquisition Finance, Inc.
8.00%, 11/29/2024 (a) | | | 175,000 | | | | 180,687 | |
Equinix, Inc.
5.38%, 1/1/2022 | | | 125,000 | | | | 129,538 | |
EW Scripps Co.
5.13%, 5/15/2025 (a) | | | 70,000 | | | | 67,550 | |
First Data Corp.
7.00%, 12/1/2023 (a) | | | 230,000 | | | | 241,799 | |
Flex Acquisition Co., Inc.
6.88%, 1/15/2025 (a) | | | 150,000 | | | | 150,375 | |
Freeport-McMoRan, Inc.:
2.38%, 3/15/2018 | | | 125,000 | | | | 124,925 | |
3.55%, 3/1/2022 | | | 200,000 | | | | 194,880 | |
5.45%, 3/15/2043 | | | 200,000 | | | | 193,000 | |
Frontier Communications Corp.
10.50%, 9/15/2022 | | | 575,000 | | | | 489,267 | |
GameStop Corp.
6.75%, 3/15/2021 (a) | | | 350,000 | | | | 358,330 | |
Genesis Energy L.P./Genesis Energy Finance Corp.:
6.25%, 5/15/2026 | | | 150,000 | | | | 144,570 | |
6.50%, 10/1/2025 | | | 250,000 | | | | 249,375 | |
Goodyear Tire & Rubber Co.
5.13%, 11/15/2023 | | | 150,000 | | | | 153,330 | |
Great Lakes Dredge & Dock Corp.
8.00%, 5/15/2022 | | | 225,000 | | | | 234,000 | |
H&E Equipment Services, Inc.
5.63%, 9/1/2025 (a) | | | 154,000 | | | | 157,280 | |
See accompanying notes to financial statements.
SSGA High Yield Bond Fund
Schedule of Investments, continued — February 28, 2018 (Unaudited)
| | | | | | | | |
| Security Description | | Principal
Amount | | | Value | |
| |
Halcon Resources Corp.
6.75%, 2/15/2025 | | $ | 120,000 | | | $ | 120,600 | |
Harland Clarke Holdings Corp.
8.38%, 8/15/2022 (a) | | | 190,000 | | | | 196,422 | |
HCA Healthcare, Inc.
6.25%, 2/15/2021 | | | 700,000 | | | | 738,500 | |
HCA, Inc.:
4.75%, 5/1/2023 | | | 500,000 | | | | 510,000 | |
5.88%, 5/1/2023 | | | 200,000 | | | | 210,060 | |
HD Supply, Inc.
5.75%, 4/15/2024 (a) | | | 150,000 | | | | 157,500 | |
Hertz Corp.
7.63%, 6/1/2022 (a) | | | 205,000 | | | | 210,391 | |
Hilcorp Energy I L.P./Hilcorp Finance Co.
5.75%, 10/1/2025 (a) | | | 170,000 | | | | 172,550 | |
Icahn Enterprises L.P./Icahn Enterprises Finance Corp.:
5.88%, 2/1/2022 | | | 150,000 | | | | 150,563 | |
6.00%, 8/1/2020 | | | 275,000 | | | | 280,142 | |
6.25%, 2/1/2022 | | | 240,000 | | | | 243,600 | |
IHS Markit, Ltd.
4.00%, 3/1/2026 (a) | | | 21,000 | | | | 20,305 | |
Indigo Natural Resources LLC
6.88%, 2/15/2026 (a) | | | 155,000 | | | | 151,544 | |
Ingevity Corp.
4.50%, 2/1/2026 (a) | | | 140,000 | | | | 136,850 | |
IPALCO Enterprises, Inc.
3.70%, 9/1/2024 | | | 75,000 | | | | 73,307 | |
j2 Cloud Services LLC/j2 Global Co-Obligor, Inc.
6.00%, 7/15/2025 (a) | | | 130,000 | | | | 134,550 | |
Jacobs Entertainment, Inc.
7.88%, 2/1/2024 (a) | | | 175,000 | | | | 186,812 | |
Jeld-Wen, Inc.:
4.63%, 12/15/2025 (a) | | | 107,000 | | | | 104,593 | |
4.88%, 12/15/2027 (a) | | | 100,000 | | | | 97,000 | |
Jonah Energy LLC/Jonah Energy Finance Corp.
7.25%, 10/15/2025 (a) | | | 154,000 | | | | 146,300 | |
Joseph T Ryerson & Son, Inc.
11.00%, 5/15/2022 (a) | | | 119,000 | | | | 132,495 | |
KAR Auction Services, Inc.
5.13%, 6/1/2025 (a) | | | 255,000 | | | | 256,275 | |
KFC Holding Co./Pizza Hut Holdings LLC/Taco Bell of America LLC
5.00%, 6/1/2024 (a) | | | 200,000 | | | | 202,000 | |
Kronos Acquisition Holdings, Inc.
9.00%, 8/15/2023 (a) | | | 145,000 | | | | 140,868 | |
L Brands, Inc.
6.88%, 11/1/2035 | | | 270,000 | | | | 268,819 | |
| | | | | | | | |
| Security Description | | Principal
Amount | | | Value | |
Lamb Weston Holdings, Inc.
4.63%, 11/1/2024 (a) | | $ | 160,000 | | | $ | 161,200 | |
Lee Enterprises, Inc.
9.50%, 3/15/2022 (a) | | | 140,000 | | | | 145,863 | |
Lennar Corp.:
4.75%, 5/30/2025 | | | 150,000 | | | | 150,000 | |
4.75%, 11/29/2027 (a) | | | 229,000 | | | | 221,855 | |
Level 3 Financing, Inc.
5.38%, 1/15/2024 | | | 400,000 | | | | 398,000 | |
Lions Gate Entertainment Corp.
5.88%, 11/1/2024 (a) | | | 230,000 | | | | 240,781 | |
Lithia Motors, Inc.
5.25%, 8/1/2025 (a) | | | 188,000 | | | | 190,820 | |
M/I Homes, Inc.
5.63%, 8/1/2025 | | | 160,000 | | | | 160,000 | |
Mallinckrodt International Finance SA/Mallinckrodt CB LLC
5.63%, 10/15/2023 (a) | | | 100,000 | | | | 83,880 | |
Masonite International Corp.
5.63%, 3/15/2023 (a) | | | 16,000 | | | | 16,440 | |
Mattel, Inc.
6.75%, 12/31/2025 (a) | | | 150,000 | | | | 152,625 | |
Meccanica Holdings USA, Inc.
6.25%, 1/15/2040 (a) | | | 50,000 | | | | 55,906 | |
MEDNAX, Inc.
5.25%, 12/1/2023 (a) | | | 365,000 | | | | 373,687 | |
MGM Growth Properties Operating Partnership L.P./MGP Finance Co-Issuer, Inc.
5.63%, 5/1/2024 | | | 59,000 | | | | 61,036 | |
MGM Resorts International:
6.63%, 12/15/2021 | | | 200,000 | | | | 216,120 | |
7.75%, 3/15/2022 | | | 125,000 | | | | 139,844 | |
Molina Healthcare, Inc.
4.88%, 6/15/2025 (a) | | | 355,000 | | | | 341,466 | |
MPH Acquisition Holdings LLC
7.13%, 6/1/2024 (a) | | | 268,000 | | | | 281,400 | |
MSCI, Inc.
5.25%, 11/15/2024 (a) | | | 150,000 | | | | 153,270 | |
Multi-Color Corp.
4.88%, 11/1/2025 (a) | | | 172,000 | | | | 165,120 | |
Murphy Oil Corp.
5.75%, 8/15/2025 | | | 341,000 | | | | 339,738 | |
Nabors Industries, Inc.:
5.50%, 1/15/2023 | | | 150,000 | | | | 148,875 | |
5.75%, 2/1/2025 (a) | | | 170,000 | | | | 162,248 | |
Navient Corp. Series MTN,
8.00%, 3/25/2020 | | | 300,000 | | | | 321,390 | |
NCR Corp.
5.88%, 12/15/2021 | | | 200,000 | | | | 204,000 | |
Netflix, Inc.
5.50%, 2/15/2022 | | | 125,000 | | | | 129,688 | |
See accompanying notes to financial statements.
SSGA High Yield Bond Fund
Schedule of Investments, continued — February 28, 2018 (Unaudited)
| | | | | | | | |
| Security Description | | Principal
Amount | | | Value | |
| |
Newfield Exploration Co.
5.75%, 1/30/2022 | | $ | 225,000 | | | $ | 236,531 | |
Nexstar Broadcasting, Inc.
6.13%, 2/15/2022 (a) | | | 175,000 | | | | 180,250 | |
NextEra Energy Operating Partners L.P.
4.25%, 9/15/2024 (a) | | | 73,000 | | | | 71,814 | |
NGPL PipeCo LLC
4.88%, 8/15/2027 (a) | | | 135,000 | | | | 136,013 | |
Nielsen Co. Luxembourg SARL
5.00%, 2/1/2025 (a) | | | 150,000 | | | | 149,670 | |
Novelis Corp.
6.25%, 8/15/2024 (a) | | | 135,000 | | | | 138,881 | |
NRG Energy, Inc.:
5.75%, 1/15/2028 (a) | | | 128,000 | | | | 126,221 | |
6.25%, 7/15/2022 | | | 200,000 | | | | 207,000 | |
6.25%, 5/1/2024 | | | 115,000 | | | | 118,881 | |
NuStar Logistics L.P.
5.63%, 4/28/2027 | | | 90,000 | | | | 89,550 | |
Olin Corp.
5.00%, 2/1/2030 | | | 125,000 | | | | 120,625 | |
OneMain Financial Holdings LLC
7.25%, 12/15/2021 (a) | | | 225,000 | | | | 232,312 | |
Outfront Media Capital LLC/Outfront Media Capital Corp.
5.63%, 2/15/2024 | | | 100,000 | | | | 101,125 | |
Owens-Brockway Glass Container, Inc.
5.88%, 8/15/2023 (a) | | | 100,000 | | | | 103,750 | |
Parsley Energy LLC/Parsley Finance Corp.: | | | | | | | | |
5.38%, 1/15/2025 (a) | | | 150,000 | | | | 148,688 | |
5.63%, 10/15/2027 (a) | | | 50,000 | | | | 49,565 | |
Party City Holdings, Inc.
6.13%, 8/15/2023 (a) | | | 150,000 | | | | 153,750 | |
PDC Energy, Inc.
6.13%, 9/15/2024 | | | 225,000 | | | | 230,355 | |
Peabody Energy Corp.
6.38%, 3/31/2025 (a) | | | 225,000 | | | | 234,703 | |
Penske Automotive Group, Inc.
5.38%, 12/1/2024 | | | 360,000 | | | | 361,368 | |
PetSmart, Inc.
5.88%, 6/1/2025 (a) | | | 285,000 | | | | 221,245 | |
PF Chang’s China Bistro, Inc.
10.25%, 6/30/2020 (a) | | | 200,000 | | | | 176,000 | |
Pilgrim’s Pride Corp.:
5.75%, 3/15/2025 (a) | | | 42,000 | | | | 41,790 | |
5.88%, 9/30/2027 (a) | | | 67,000 | | | | 65,144 | |
Plantronics, Inc.
5.50%, 5/31/2023 (a) | | | 203,000 | | | | 204,396 | |
Platform Specialty Products Corp.
6.50%, 2/1/2022 (a) | | | 220,000 | | | | 225,786 | |
| | | | | | | | |
| Security Description | | Principal
Amount | | | Value | |
Polaris Intermediate Corp. PIK,
8.50%, 12/1/2022 (a) | | $ | 153,000 | | | $ | 156,060 | |
Post Holdings, Inc.:
5.50%, 3/1/2025 (a) | | | 380,000 | | | | 382,394 | |
5.63%, 1/15/2028 (a) | | | 125,000 | | | | 121,563 | |
PQ Corp.:
5.75%, 12/15/2025 (a) | | | 60,000 | | | | 60,900 | |
6.75%, 11/15/2022 (a) | | | 140,000 | | | | 147,714 | |
Prestige Brands, Inc.
6.38%, 3/1/2024 (a) | | | 100,000 | | | | 102,500 | |
Provident Funding Associates L.P./PFG Finance Corp.
6.38%, 6/15/2025 (a) | | | 150,000 | | | | 153,844 | |
Qualitytech LP/QTS Finance Corp.
4.75%, 11/15/2025 (a) | | | 200,000 | | | | 194,375 | |
Quicken Loans, Inc.
5.25%, 1/15/2028 (a) | | | 170,000 | | | | 164,050 | |
Radiate Holdco LLC/Radiate Finance, Inc.
6.88%, 2/15/2023 (a) | | | 100,000 | | | | 99,750 | |
Range Resources Corp.:
4.88%, 5/15/2025 | | | 235,000 | | | | 225,012 | |
5.00%, 8/15/2022 | | | 75,000 | | | | 74,025 | |
Reynolds Group Issuer, Inc./Reynolds Group Issuer LLC/Reynolds Group Issuer Lu:
5.75%, 10/15/2020 | | | 96,911 | | | | 98,064 | |
6.88%, 2/15/2021 | | | 83,169 | | | | 84,313 | |
7.00%, 7/15/2024 (a) | | | 100,000 | | | | 105,250 | |
RR Donnelley & Sons Co.
7.88%, 3/15/2021 | | | 350,000 | | | | 368,375 | |
Scientific Games International, Inc.: | | | | | | | | |
5.00%, 10/15/2025 (a) | | | 195,000 | | | | 192,816 | |
7.00%, 1/1/2022 (a) | | | 100,000 | | | | 105,250 | |
Sealed Air Corp.
4.88%, 12/1/2022 (a) | | | 300,000 | | | | 307,875 | |
ServiceMaster Co. LLC
5.13%, 11/15/2024 (a) | | | 200,000 | | | | 197,260 | |
Signode Industrial Group Lux SA/Signode Industrial Group US, Inc.
6.38%, 5/1/2022 (a) | | | 100,000 | | | | 103,375 | |
Simmons Foods, Inc.
5.75%, 11/1/2024 (a) | | | 188,000 | | | | 178,600 | |
Sirius XM Radio, Inc.
6.00%, 7/15/2024 (a) | | | 425,000 | | | | 444,656 | |
SM Energy Co.
6.75%, 9/15/2026 | | | 205,000 | | | | 205,897 | |
Southwestern Energy Co.
6.70%, 1/23/2025 | | | 275,000 | | | | 270,270 | |
See accompanying notes to financial statements.
SSGA High Yield Bond Fund
Schedule of Investments, continued — February 28, 2018 (Unaudited)
| | | | | | | | |
| Security Description | | Principal
Amount | | | Value | |
| |
Sprint Communications, Inc.
7.00%, 3/1/2020 (a) | | $ | 200,000 | | | $ | 211,000 | |
Sprint Corp.:
7.25%, 9/15/2021 | | | 275,000 | | | | 286,687 | |
7.63%, 3/1/2026 | | | 135,000 | | | | 134,325 | |
7.88%, 9/15/2023 | | | 450,000 | | | | 463,500 | |
SRC Energy, Inc.
6.25%, 12/1/2025 (a) | | | 210,000 | | | | 211,323 | |
Standard Industries, Inc.:
4.75%, 1/15/2028 (a) | | | 284,000 | | | | 273,009 | |
6.00%, 10/15/2025 (a) | | | 50,000 | | | | 52,625 | |
StandardAero Aviation Holdings, Inc.
10.00%, 7/15/2023 (a) | | | 150,000 | | | | 162,750 | |
Staples, Inc.
8.50%, 9/15/2025 (a) | | | 205,000 | | | | 196,800 | |
Steel Dynamics, Inc.
5.13%, 10/1/2021 | | | 160,000 | | | | 163,200 | |
Sunoco L.P./Sunoco Finance Corp.:
4.88%, 1/15/2023 (a) | | | 88,000 | | | | 87,226 | |
5.88%, 3/15/2028 (a) | | | 138,000 | | | | 137,828 | |
T-Mobile USA, Inc.:
4.50%, 2/1/2026 | | | 85,000 | | | | 83,198 | |
5.13%, 4/15/2025 | | | 350,000 | | | | 353,937 | |
Targa Resources Partners L.P./Targa Resources Partners Finance Corp.
5.00%, 1/15/2028 (a) | | | 200,000 | | | | 194,260 | |
Tempur Sealy International, Inc.
5.63%, 10/15/2023 | | | 150,000 | | | | 151,695 | |
Tenet Healthcare Corp.:
4.38%, 10/1/2021 | | | 200,000 | | | | 199,000 | |
6.75%, 6/15/2023 | | | 250,000 | | | | 249,825 | |
6.88%, 11/15/2031 | | | 150,000 | | | | 135,000 | |
Tenneco, Inc.:
5.00%, 7/15/2026 | | | 50,000 | | | | 49,125 | |
5.38%, 12/15/2024 | | | 150,000 | | | | 154,688 | |
TerraForm Power Operating LLC
5.00%, 1/31/2028 (a) | | | 66,000 | | | | 63,875 | |
Toll Brothers Finance Corp.
4.88%, 11/15/2025 | | | 225,000 | | | | 223,875 | |
TransDigm, Inc.
6.00%, 7/15/2022 | | | 125,000 | | | | 127,969 | |
Transocean, Inc.
7.50%, 1/15/2026 (a) | | | 92,000 | | | | 92,580 | |
Tribune Media Co.
5.88%, 7/15/2022 | | | 200,000 | | | | 204,500 | |
TTM Technologies, Inc.
5.63%, 10/1/2025 (a) | | | 160,000 | | | | 159,600 | |
Ultra Resources, Inc.
6.88%, 4/15/2022 (a) | | | 140,000 | | | | 128,100 | |
| | | | | | | | |
| Security Description | | Principal
Amount | | | Value | |
United Rentals North America, Inc.:
4.88%, 1/15/2028 | | $ | 173,000 | | | $ | 168,467 | |
5.50%, 7/15/2025 | | | 175,000 | | | | 180,040 | |
United States Steel Corp.
6.88%, 8/15/2025 | | | 186,000 | | | | 195,077 | |
US Concrete, Inc.
6.38%, 6/1/2024 | | | 250,000 | | | | 263,750 | |
US Foods, Inc.
5.88%, 6/15/2024 (a) | | | 191,000 | | | | 198,640 | |
Valeant Pharmaceuticals International, Inc.:
6.13%, 4/15/2025 (a) | | | 625,000 | | | | 550,000 | |
7.00%, 3/15/2024 (a) | | | 500,000 | | | | 526,900 | |
Valvoline, Inc.
4.38%, 8/15/2025 | | | 175,000 | | | | 171,062 | |
VeriSign, Inc.
4.75%, 7/15/2027 | | | 225,000 | | | | 219,667 | |
VFH Parent LLC/Orchestra Co-Issuer, Inc.
6.75%, 6/15/2022 (a) | | | 130,000 | | | | 136,253 | |
WellCare Health Plans, Inc.
5.25%, 4/1/2025 | | | 250,000 | | | | 253,025 | |
Western Digital Corp.:
4.75%, 2/15/2026 | | | 250,000 | | | | 251,074 | |
7.38%, 4/1/2023 (a) | | | 200,000 | | | | 217,000 | |
Whiting Petroleum Corp.
5.75%, 3/15/2021 | | | 200,000 | | | | 204,500 | |
William Lyon Homes, Inc.
5.88%, 1/31/2025 | | | 175,000 | | | | 174,562 | |
Williams Cos., Inc.
4.55%, 6/24/2024 | | | 400,000 | | | | 402,000 | |
WPX Energy, Inc.
5.25%, 9/15/2024 | | | 133,000 | | | | 132,840 | |
Yum! Brands, Inc.
5.35%, 11/1/2043 | | | 175,000 | | | | 158,812 | |
| | | | | | | | |
| | | | | | | 48,848,310 | |
| | | | | | | | |
| |
Total Corporate Bonds & Notes
(cost $56,422,531) | | | | 57,033,472 | |
| | | | | | | | |
|
| Short-Term Investment - 6.4% | |
State Street Institutional U.S. Government Money Market Fund, Class G Shares
1.34% (d)(e)
(cost $3,998,584) | | | 3,998,584 | | | | 3,998,584 | |
| | | | | | | | |
| |
Total Investments - 98.1%
(cost $60,421,115) | | | | 61,032,056 | |
| |
Other Assets in Excess of
Liabilities - 1.9% | | | | 1,200,131 | |
| | | | | | | | |
| |
| Net Assets - 100.0% | | | $ | 62,232,187 | |
| | | | | | | | |
See accompanying notes to financial statements.
SSGA High Yield Bond Fund
Schedule of Investments, continued — February 28, 2018 (Unaudited)
| (a) | Securities purchased pursuant to Rule 144A of the Securities Act of 1933, as amended. These securities, which represent 47.2% of net assets as of February 28, 2018, are considered liquid and may be resold in transactions exempt from registration, normally to qualified institutional buyers. |
| (b) | Adjustable or floating rate security. Rate shown reflects rate in effect at period end. |
| (c) | Perpetual floating rate security. Date shown reflects the next reset date. |
| (d) | The Fund invested in certain money market funds managed by SSGA Funds Management, Inc. Amounts related to these transactions during the period ended February 28, 2018 are shown in the Affiliate Table below. |
| (e) | The rate shown is the annualized seven-day yield at February 28, 2018. |
| | | | | | | | | | | | | | | | | | | | | | | | | | | | |
| Centrally-Cleared Credit Default Swap Contracts | |
| Credit Indicies | |
Reference Entity | | Notional
Amount* | | | Fund
(Pays)/
Receives
Fixed
Rate/
Payment
Frequency | | | Termination
Date | | | Value
$ | | | Upfront
Premiums
Received/
(Paid)
$ | | | Unrealized
Appreciation/
(Depreciation)
$ | |
| | | | | | | | | | | | | | | | | | | | | | | | | | | | |
| | | | | | | | | | | | | | | | | | | | | | | | | | | | |
Protection Sold: | |
Markit CDX North American High Yield Index, Series 29 | | | USD | | | | 2,500,000 | | |
| 5.00%/
Quarterly |
| | | 12/20/2022 | | | $ | 173,143 | | | $ | (189,113 | ) | | $ | (15,970 | ) |
| * | The maximum potential amount the Fund may pay should a negative event take place as defined under the terms of the agreement. |
During the period ended February 28, 2018, average notional value related to swap contracts was $2,166,666 or 3% of net assets.
The following table summarizes the value of the Fund’s investments according to the fair value hierarchy as of February 28, 2018.
| | | | | | | | | | | | | | | | |
| Description | | Level 1 —
Quoted Prices | | | Level 2 —
Other Significant
Observable
Inputs | | | Level 3 —
Significant
Unobservable
Inputs | | | Total | |
Assets: | | | | | | | | | | | | | | | | |
| | | | |
Investments: | | | | | | | | | | | | | | | | |
Corporate Bonds & Notes | | | | | | | | | | | | | | | | |
Australia | | $ | — | | | $ | 159,344 | | | $ | — | | | $ | 159,344 | |
Bermuda | | | — | | | | 437,560 | | | | — | | | | 437,560 | |
Brazil | | | — | | | | 158,432 | | | | — | | | | 158,432 | |
Canada | | | — | | | | 1,570,694 | | | | — | | | | 1,570,694 | |
Cayman Islands | | | — | | | | 660,800 | | | | — | | | | 660,800 | |
France | | | — | | | | 291,090 | | | | — | | | | 291,090 | |
Germany | | | — | | | | 341,365 | | | | — | | | | 341,365 | |
Ireland | | | — | | | | 738,125 | | | | — | | | | 738,125 | |
Luxembourg | | | — | | | | 1,416,886 | | | | — | | | | 1,416,886 | |
Netherlands | | | — | | | | 779,613 | | | | — | | | | 779,613 | |
Sweden | | | — | | | | 107,875 | | | | — | | | | 107,875 | |
United Kingdom | | | — | | | | 1,523,378 | | | | — | | | | 1,523,378 | |
United States | | | — | | | | 48,848,310 | | | | — | | | | 48,848,310 | |
Short-Term Investment | | | 3,998,584 | | | | — | | | | — | | | | 3,998,584 | |
| | | | | | | | | | | | | | | | |
Total Investments | | $ | 3,998,584 | | | $ | 57,033,472 | | | $ | — | | | $ | 61,032,056 | |
| | | | | | | | | | | | | | | | |
| | | | |
Liabilities: | | | | | | | | | | | | | | | | |
| | | | |
Other Financial Instruments: | | | | | | | | | | | | | | | | |
Credit Default Swap Contracts (a) | | | — | | | | (15,970 | ) | | | — | | | | (15,970 | ) |
| | | | | | | | | | | | | | | | |
| | | | |
Total Other Financial Instruments | | $ | — | | | $ | (15,970 | ) | | $ | — | | | $ | (15,970 | ) |
| | | | | | | | | | | | | | | | |
| (a) | | Credit Default Swap Contracts are valued at unrealized appreciation (depreciation). |
See accompanying notes to financial statements.
SSGA High Yield Bond Fund
Schedule of Investments, continued — February 28, 2018 (Unaudited)
Affiliate Table
| | | | | | | | | | | | | | | | | | | | | | | | | | | | | | | | | | | | |
| | | Number of Shares Held at 8/31/17 | | | Value At 8/31/17 | | | Cost of Purchases | | | Proceeds from Shares Sold | | | Realized
Gain
(Loss) | | | Change in
Unrealized
Appreciation/ Depreciation | | | Number of Shares
Held at 2/28/18 | | | Value at 2/28/18 | | | Dividend
Income | |
State Street Institutional U.S. Government Money Market Fund - Class G Shares | | | 3,253,226 | | | $ | 3,253,226 | | | $ | 17,716,473 | | | $ | 16,971,115 | | | $ | — | | | $ | — | | | | 3,998,584 | | | $ | 3,998,584 | | | $ | 22,721 | |
| | | | | | | | | | | | | | | | | | | | | | | | | | | | | | | | | | | | |
Total | | | | | | $ | 3,253,226 | | | $ | 17,716,473 | | | $ | 16,971,115 | | | $ | — | | | $ | — | | | | | | | $ | 3,998,584 | | | $ | 22,721 | |
| | | | | | | | | | | | | | | | | | | | | | | | | | | | | | | | | | | | |
See accompanying notes to financial statements.
SSGA Funds
Statements of Assets and Liabilities — February 28, 2018 (Unaudited)
| | | | | | | | | | | | | | | | |
| | | SSGA
Dynamic
Small Cap
Fund | | | State Street
Disciplined
Emerging
Markets
Equity Fund | | | SSGA
International
Stock Selection
Fund | | | SSGA High Yield
Bond Fund | |
| | | | | | | | | | | | | | | | |
Assets | | | | | |
Investments in unaffiliated issuers, at value* | | $ | 25,800,921 | | | $ | 77,396,189 | | | $ | 282,566,159 | | | $ | 57,033,472 | |
Investments in affiliated issuers, at value | | | 642,837 | | | | 2,811,760 | | | | 3,583,961 | | | | 3,998,584 | |
Total Investments | | | 26,443,758 | | | | 80,207,949 | | | | 286,150,120 | | | | 61,032,056 | |
Foreign currency, at value | | | — | | | | 177,649 | | | | 3,708,286 | | | | — | |
Cash at broker | | | — | | | | 93,600 | | | | 120,945 | | | | 116,234 | |
Cash | | | 6 | | | | — | | | | 4 | | | | — | |
Receivable from broker — variation margin on open futures contracts | | | — | | | | 19,186 | | | | 29,055 | | | | — | |
Receivable for investments sold | | | — | | | | — | | | | — | | | | 514,112 | |
Receivable for fund shares sold | | | 1,145 | | | | 3,267 | | | | 70,052 | | | | 3,276 | |
Dividends receivable — unaffiliated issuers | | | 11,909 | | | | 335,321 | | | | 153,499 | | | | — | |
Interest receivable — unaffiliated issuers | | | — | | | | — | | | | — | | | | 923,443 | |
Dividends receivable — affiliated issuers | | | 228 | | | | 955 | | | | 1,114 | | | | 2,054 | |
Securities lending income receivable — affiliated issuers | | | 323 | | | | 30 | | | | 1,288 | | | | — | |
Securities lending income receivable — unaffiliated issuers | | | 194 | | | | 118 | | | | 557 | | | | — | |
Receivable from Adviser | | | 33,907 | | | | 32,146 | | | | 69,419 | | | | 17,712 | |
Receivable for foreign taxes recoverable | | | — | | | | 317,923 | | | | 193,937 | | | | — | |
Other Receivable — Contribution from Adviser (Note 4) | | | — | | | | 126,543 | | | | — | | | | — | |
Prepaid expenses and other assets | | | 727 | | | | 298 | | | | 1,005 | | | | 231 | |
| | | | | | | | | | | | | | | | |
Total assets | | | 26,492,197 | | | | 81,314,985 | | | | 290,499,281 | | | | 62,609,118 | |
| | | | | | | | | | | | | | | | |
| |
Liabilities | | | | | |
Due to custodian | | | — | | | | 64,000 | | | | — | | | | 281,114 | |
Payable upon return of securities loaned | | | 295,173 | | | | 565,607 | | | | 1,238,413 | | | | — | |
Due to Broker — Variation margin on open swap contracts | | | — | | | | — | | | | — | | | | 140 | |
Payable for fund shares repurchased | | | 4,563 | | | | 59,050 | | | | 168,276 | | | | 4,932 | |
Deferred foreign taxes payable | | | — | | | | 217,366 | | | | — | | | | — | |
Advisory fee payable | | | 15,300 | | | | 47,221 | | | | 168,082 | | | | 14,584 | |
Custodian fees payable | | | 5,756 | | | | 685 | | | | 26,740 | | | | 9,319 | |
Administration fees payable | | | 1,060 | | | | 4,847 | | | | 11,524 | | | | 2,734 | |
Shareholder servicing fee payable | | | 1,659 | | | | 1,153 | | | | 3,340 | | | | 432 | |
Distribution fees payable | | | 4,400 | | | | 13,766 | | | | 37,351 | | | | 6,956 | |
Trustees’ fees and expenses payable | | | 849 | | | | 60 | | | | — | | | | 328 | |
Transfer agent fees payable | | | 18,362 | | | | 28,664 | | | | 29,530 | | | | 20,009 | |
Sub-transfer agent fee payable | | | 3,039 | | | | 2,461 | | | | 1,197 | | | | 451 | |
Registration and filing fees payable | | | — | | | | — | | | | 7,181 | | | | 7,868 | |
Professional fees payable | | | 18,995 | | | | 17,786 | | | | 20,537 | | | | 26,732 | |
Printing and postage fees payable | | | 3,835 | | | | 17,128 | | | | — | | | | 981 | |
Accrued expenses and other liabilities | | | 147 | | | | 929 | | | | 14,864 | | | | 351 | |
| | | | | | | | | | | | | | | | |
Total liabilities | | | 373,138 | | | | 1,040,723 | | | | 1,727,035 | | | | 376,931 | |
| | | | | | | | | | | | | | | | |
| | | | | | | | | | | | | | | | |
Net Assets | | $ | 26,119,059 | | | $ | 80,274,262 | | | $ | 288,772,246 | | | $ | 62,232,187 | |
| | | | | | | | | | | | | | | | |
| |
Net Assets Consist of: | | | | | |
Paid-in Capital | | $ | 28,218,909 | | | $ | 51,471,341 | | | $ | 686,885,027 | | | $ | 66,565,551 | |
Undistributed (distribution in excess of) net investment income (loss) | | | 130,070 | | | | 430,004 | | | | (3,070,238 | ) | | | (72,822 | ) |
Accumulated net realized gain (loss) on investments, foreign currency transactions, swap contracts and futures contracts | | | (3,716,541 | ) | | | 9,063,384 | | | | (419,162,700 | ) | | | (4,855,513 | ) |
Net unrealized appreciation (depreciation) on: | | | | | | | | | | | | | | | | |
Investments — unaffiliated issuers** | | | 1,486,621 | | | | 19,390,576 | | | | 24,131,053 | | | | 610,941 | |
Foreign currency transactions | | | — | | | | (13,891 | ) | | | (39,890 | ) | | | — | |
Futures contracts | | | — | | | | (67,152 | ) | | | 28,994 | | | | — | |
Swap contracts | | | — | | | | — | | | | — | | | | (15,970 | ) |
| | | | | | | | | | | | | | | | |
Net Assets | | $ | 26,119,059 | | | $ | 80,274,262 | | | $ | 288,772,246 | | | $ | 62,232,187 | |
| | | | | | | | | | | | | | | | |
See accompanying notes to financial statements.
| | | | |
| Statements of Assets and Liabilities | | | 25 | |
SSGA Funds
Statements of Assets and Liabilities — February 28, 2018 (Unaudited)
| | | | | | | | | | | | | | | | |
| | | SSGA
Dynamic
Small Cap
Fund | | | State Street
Disciplined
Emerging
Markets
Equity Fund | | | SSGA
International
Stock Selection
Fund | | | SSGA High Yield
Bond Fund | |
| | | | | | | | | | | | | | | | |
Net Asset Values: | | | | | | | | | | | | | | | | |
Class N | | | | | |
Net assets | | $ | 24,766,032 | | | $ | 77,921,346 | | | $ | 205,106,588 | | | $ | 39,086,322 | |
Shares outstanding | | | 514,996 | | | | 9,244,166 | | | | 17,658,226 | | | | 5,226,381 | |
Net asset value, offering and redemption price per share | | $ | 48.09 | | | $ | 8.43 | | | $ | 11.62 | | | $ | 7.48 | |
Class A | | | | | |
Net assets | | $ | 237,699 | | | $ | 55,037 | | | $ | 6,955,564 | | | $ | 84,621 | |
Shares outstanding | | | 4,970 | | | | 6,577 | | | | 602,665 | | | | 11,299 | |
Net asset value, offering and redemption price per share | | $ | 47.83 | | | $ | 8.37 | | | $ | 11.54 | | | $ | 7.49 | |
Maximum sales charge | | | 5.25 | % | | | 5.25 | % | | | 5.25 | % | | | 3.75 | % |
Maximum offering price per share | | $ | 50.48 | | | $ | 8.83 | | | $ | 12.18 | | | $ | 7.78 | |
Class I | | | | | |
Net assets | | $ | 1,102,440 | | | $ | 1,290,054 | | | $ | 2,163,676 | | | $ | 940,092 | |
Shares outstanding | | | 22,927 | | | | 153,042 | | | | 186,477 | | | | 125,656 | |
Net asset value, offering and redemption price per share | | $ | 48.08 | | | $ | 8.43 | | | $ | 11.60 | | | $ | 7.48 | |
Class K | | | | | |
Net assets | | $ | 12,888 | | | $ | 1,007,825 | | | $ | 74,546,418 | | | $ | 22,121,152 | |
Shares outstanding | | | 267.534 | | | | 119,209 | | | | 6,426,031 | | | | 2,957,896 | |
Net asset value, offering and redemption price per share | | $ | 48.17 | | | $ | 8.45 | | | $ | 11.60 | | | $ | 7.48 | |
Cost of Investments: | | | | | |
Investments in unaffiliated issuers | | $ | 24,314,300 | | | $ | 57,788,246 | | | $ | 258,435,106 | | | $ | 56,422,531 | |
Investments in affiliated issuers | | | 642,837 | | | | 2,811,760 | | | | 3,583,961 | | | | 3,998,584 | |
Total cost of investments | | $ | 24,957,137 | | | $ | 60,600,006 | | | $ | 262,019,067 | | | $ | 60,421,115 | |
Foreign currency, at cost | | $ | — | | | $ | 178,160 | | | $ | 3,761,273 | | | $ | — | |
| | | | |
* Includes investments in securities on loan, at value | | $ | 1,963,505 | | | $ | 755,721 | | | $ | 1,176,494 | | | $ | — | |
** Includes deferred foreign taxes | | $ | — | | | $ | 217,366 | | | $ | — | | | $ | — | |
See accompanying notes to financial statements.
| | |
| 26 | | Statements of Assets and Liabilities |
SSGA Funds
Statements of Operations — For the Six Months Ended February 28, 2018 (Unaudited)
| | | | | | | | | | | | | | | | |
| | | SSGA
Dynamic
Small Cap
Fund | | | State Street
Disciplined
Emerging
Markets
Equity Fund | | | SSGA
International
Stock Selection
Fund | | |
SSGA
High Yield
Bond
Fund | |
| | | | | | | | | | | | | | | | |
Investment Income | | | | | | | | | | | | | | | | |
Interest income — unaffiliated issuers | | $ | 31 | | | $ | 17,325 | | | $ | 23 | | | $ | 1,904,795 | |
Dividend income — unaffiliated issuers | | | 285,106 | | | | 1,027,653 | | | | 2,229,411 | | | | — | |
Dividend income — affiliated issuers | | | 2,122 | | | | 5,322 | | | | 8,726 | | | | 22,721 | |
Unaffiliated securities lending income | | | 1,157 | | | | 210 | | | | — | | | | — | |
Affiliated securities lending income | | | 3,695 | | | | 34 | | | | 13,417 | | | | — | |
Dividend income — non cash transactions | | | — | | | | — | | | | 226,398 | | | | — | |
Foreign taxes withheld | | | — | | | | (80,176 | ) | | | (200,951 | ) | | | — | |
| | | | | | | | | | | | | | | | |
Total investment income (loss) | | | 292,111 | | | | 970,368 | | | | 2,277,024 | | | | 1,927,516 | |
| | | | | | | | | | | | | | | | |
| |
Expenses | | | | | |
Advisory fees | | | 111,534 | | | | 326,822 | | | | 1,123,253 | | | | 100,517 | |
Administration fees | | | 7,436 | | | | 21,788 | | | | 74,884 | | | | 16,753 | |
Shareholder servicing fees | | | | | | | | | | | | | | | | |
Class N | | | 3,110 | | | | 10,041 | | | | 24,501 | | | | 4,300 | |
Distribution fees | | | | | | | | | | | | | | | | |
Class N | | | 31,806 | | | | 94,132 | | | | 239,684 | | | | 48,380 | |
Class A | | | 342 | | | | 68 | | | | 8,595 | | | | 101 | |
Custodian fees | | | 23,119 | | | | 73,776 | | | | 87,064 | | | | 32,980 | |
Trustees’ fees and expenses | | | 11,383 | | | | 11,972 | | | | 16,881 | | | | 11,770 | |
Transfer agent fees | | | 50,756 | | | | 65,897 | | | | 70,106 | | | | 46,531 | |
Sub-transfer agent fee | | | | | | | | | | | | | | | | |
Class A | | | — | | | | — | | | | 10,551 | | | | — | |
Class I | | | — | | | | — | | | | — | | | | 138 | |
Registration and filing fees | | | 37,623 | | | | 29,923 | | | | 28,257 | | | | 27,723 | |
Professional fees | | | 15,974 | | | | 22,351 | | | | 39,057 | | | | 26,644 | |
Printing and postage fees | | | 4,256 | | | | 12,800 | | | | 30,310 | | | | 7,676 | |
Insurance expense | | | 136 | | | | 443 | | | | 1,493 | | | | 346 | |
Miscellaneous expenses | | | 2,900 | | | | 7,257 | | | | 5,724 | | | | 3,521 | |
| | | | | | | | | | | | | | | | |
Total expenses | | | 300,375 | | | | 677,270 | | | | 1,760,360 | | | | 327,380 | |
| | | | | | | | | | | | | | | | |
Expenses waived/reimbursed by the Adviser | | | (138,712 | ) | | | (137,266 | ) | | | (351,598 | ) | | | (106,933 | ) |
| | | | | | | | | | | | | | | | |
Net expenses | | | 161,663 | | | | 540,004 | | | | 1,408,762 | | | | 220,447 | |
| | | | | | | | | | | | | | | | |
Net investment income (loss) | | | 130,448 | | | | 430,364 | | | | 868,262 | | | | 1,707,069 | |
| | | | | | | | | | | | | | | | |
| |
Realized and Unrealized Gain (Loss) | | | | | |
Net realized gain (loss) on: | | | | | | | | | | | | | | | | |
Investments — unaffiliated issuers | | | 2,774,295 | | | | 9,239,103 | | | | 13,888,575 | | | | 311,095 | |
Foreign currency transactions | | | — | | | | (24,590 | ) | | | 120,400 | | | | — | |
Futures contracts | | | 10,686 | | | | 288,746 | | | | 176,257 | | | | — | |
Swap contracts | | | — | | | | — | | | | — | | | | 53,591 | |
| | | | | | | | | | | | | | | | |
Net realized gain (loss) | | | 2,784,981 | | | | 9,503,259 | | | | 14,185,232 | | | | 364,686 | |
| | | | | | | | | | | | | | | | |
Net change in unrealized appreciation/depreciation on: | | | | | | | | | | | | | | | | |
Investments — unaffiliated issuers | | | (1,087,700 | ) | | | (6,512,527 | ) | | | (8,740,367 | ) | | | (1,702,086 | ) |
Foreign currency transactions | | | — | | | | (8,348 | ) | | | (61,015 | ) | | | — | |
Futures contracts | | | — | | | | (119,616 | ) | | | 28,994 | | | | — | |
Swap contracts | | | — | | | | — | | | | — | | | | (16,868 | ) |
| | | | | | | | | | | | | | | | |
Net change in unrealized appreciation/depreciation | | | (1,087,700 | ) | | | (6,640,491 | ) | | | (8,772,388 | ) | | | (1,718,954 | ) |
| | | | | | | | | | | | | | | | |
| | | | |
Net realized and unrealized gain (loss) | | | 1,697,281 | | | | 2,862,768 | | | | 5,412,844 | | | | (1,354,268 | ) |
| | | | | | | | | | | | | | | | |
Net Increase (Decrease) in Net Assets from Operations | | $ | 1,827,729 | | | $ | 3,293,132 | | | $ | 6,281,106 | | | $ | 352,801 | |
| | | | | | | | | | | | | | | | |
| | | | |
* Includes foreign capital gain taxes | | $ | — | | | $ | (2,986 | ) | | $ | — | | | $ | — | |
| | | | | | | | | | | | | | | | |
** Includes foreign deferred taxes | | $ | — | | | $ | (217,367 | ) | | $ | — | | | $ | — | |
| | | | | | | | | | | | | | | | |
See accompanying notes to financial statements.
| | | | |
| Statements of Operations | | | 27 | |
SSGA Funds
Statements of Changes in Net Assets
| | | | | | | | |
| | | SSGA Dynamic Small Cap Fund | |
| | | Six Months Ended
2/28/18
(Unaudited) | | | Year Ended
8/31/17 | |
| | | | | | | | |
Increase (Decrease) in Net Assets from Operations: | | | | | | | | |
Net investment income (loss) | | $ | 130,448 | | | $ | 157,273 | |
Net realized gain (loss) | | | 2,784,981 | | | | 5,063,248 | |
Net change in unrealized appreciation/depreciation | | | (1,087,700 | ) | | | (1,620,328 | ) |
| | | | | | | | |
Net increase (decrease) in net assets resulting from operations | | | 1,827,729 | | | | 3,600,193 | |
| | | | | | | | |
| | |
Distributions to Shareholders from: | | | | | | | | |
Net investment income | | | | | | | | |
Class N | | | (146,950 | ) | | | (62,612 | ) |
Class A | | | (1,237 | ) | | | (328 | ) |
Class I | | | (6,910 | ) | | | (4,267 | ) |
Class K | | | (86 | ) | | | (49 | ) |
| | | | | | | | |
Total distributions from net investment income | | | (155,183 | ) | | | (67,256 | ) |
| | | | | | | | |
| | |
From Beneficial Interest Transactions: | | | | | | | | |
Class N | | | | | | | | |
Shares sold | | | 7,766,629 | | | | 3,691,398 | |
Reinvestment of distributions | | | 140,596 | | | | 60,202 | |
Shares redeemed | | | (10,193,921 | ) | | | (10,934,276 | ) |
| | | | | | | | |
Net increase (decrease) from capital share transactions | | | (2,286,696 | ) | | | (7,182,676 | ) |
| | | | | | | | |
Class A | | | | | | | | |
Shares sold | | | 19,863 | | | | 196,681 | |
Reinvestment of distributions | | | 1,121 | | | | 289 | |
Shares redeemed | | | (161,823 | ) | | | (32,743 | ) |
| | | | | | | | |
Net increase (decrease) from capital share transactions | | | (140,839 | ) | | | 164,227 | |
| | | | | | | | |
Class I | | | | | | | | |
Shares sold | | | 33,447 | | | | 372,158 | |
Reinvestment of distributions | | | 6,741 | | | | 4,200 | |
Shares redeemed | | | (326,661 | ) | | | (966,914 | ) |
| | | | | | | | |
Net increase (decrease) from capital share transactions | | | (286,473 | ) | | | (590,556 | ) |
| | | | | | | | |
Net increase (decrease) in net assets from beneficial interest transactions | | | (2,714,008 | ) | | | (7,609,005 | ) |
| | | | | | | | |
Net increase (decrease) in net assets during the period | | | (1,041,462 | ) | | | (4,076,068 | ) |
| | | | | | | | |
Net assets at beginning of period | | | 27,160,521 | | | | 31,236,589 | |
| | | | | | | | |
| | |
Net Assets at End of Period | | $ | 26,119,059 | | | $ | 27,160,521 | |
| | | | | | | | |
Undistributed (distribution in excess of) net investment income (loss) | | $ | 130,070 | | | $ | 154,805 | |
| | | | | | | | |
| | |
Shares of Beneficial Interest: | | | | | | | | |
Class N | | | | | | | | |
Shares sold | | | 159,199 | | | | 84,017 | |
Reinvestment of distributions | | | 2,882 | | | | 1,331 | |
Shares redeemed | | | (210,023 | ) | | | (245,423 | ) |
| | | | | | | | |
Net increase (decrease) from share transactions | | | (47,942 | ) | | | (160,075 | ) |
| | | | | | | | |
Class A | | | | | | | | |
Shares sold | | | 418 | | | | 4,401 | |
Reinvestment of distributions | | | 23 | | | | 6 | |
Shares redeemed | | | (3,337 | ) | | | (737 | ) |
| | | | | | | | |
Net increase (decrease) from share transactions | | | (2,896 | ) | | | 3,670 | |
| | | | | | | | |
Class I | | | | | | | | |
Shares sold | | | 674 | | | | 8,480 | |
Reinvestment of distributions | | | 138 | | | | 93 | |
Shares redeemed | | | (6,886 | ) | | | (21,585 | ) |
| | | | | | | | |
Net increase (decrease) from share transactions | | | (6,074 | ) | | | (13,012 | ) |
| | | | | | | | |
See accompanying notes to financial statements.
| | |
| 28 | | Statements of Changes in Net Assets |
| | | | | | | | |
| | | State Street Disciplined Emerging
Markets Equity Fund | |
| | | Six Months Ended
2/28/18
(Unaudited) | | | Year Ended
8/31/17 | |
| | | | | | | | |
Increase (Decrease) in Net Assets from Operations: | | | | | | | | |
Net investment income (loss) | | $ | 430,364 | | | $ | 1,517,554 | |
Net realized gain (loss) | | | 9,503,259 | | | | 7,940,752 | |
Net change in unrealized appreciation/depreciation | | | (6,640,491 | ) | | | 2,953,179 | |
| | | | | | | | |
Net increase (decrease) in net assets resulting from operations | | | 3,293,132 | | | | 12,411,485 | |
| | | | | | | | |
| | |
Distributions to Shareholders from: | | | | | | | | |
Net investment income | | | | | | | | |
Class N | | | (1,270,354 | ) | | | (1,310,113 | ) |
Class A | | | (831 | ) | | | (1,805 | ) |
Class I | | | (22,991 | ) | | | (19,953 | ) |
Class K | | | (37,749 | ) | | | (38,797 | ) |
| | | | | | | | |
Total distributions from net investment income | | | (1,331,925 | ) | | | (1,370,668 | ) |
| | | | | | | | |
Net realized gain on investments | | | | | | | | |
Class N | | | (2,927,420 | ) | | | — | |
Class A | | | (1,932 | ) | | | — | |
Class I | | | (48,784 | ) | | | — | |
Class K | | | (78,161 | ) | | | — | |
| | | | | | | | |
Total distributions from net realized gain on investments | | | (3,056,297 | ) | | | — | |
| | | | | | | | |
Total distributions to shareholders | | | (4,388,222 | ) | | | (1,370,668 | ) |
| | | | | | | | |
| | |
From Beneficial Interest Transactions: | | | | | | | | |
Class N | | | | | | | | |
Shares sold | | | 1,768,513 | | | | 10,092,048 | |
Reinvestment of distributions | | | 4,097,594 | | | | 1,279,162 | |
Shares redeemed | | | (13,626,964 | ) | | | (42,562,575 | ) |
| | | | | | | | |
Net increase (decrease) from capital share transactions | | | (7,760,857 | ) | | | (31,191,365 | ) |
| | | | | | | | |
Class A | | | | | | | | |
Shares sold | | | — | | | | 64,200 | |
Reinvestment of distributions | | | 2,527 | | | | 661 | |
Shares redeemed | | | — | | | | (63,371 | ) |
| | | | | | | | |
Net increase (decrease) from capital share transactions | | | 2,527 | | | | 1,490 | |
| | | | | | | | |
Class I | | | | | | | | |
Shares sold | | | 23,899 | | | | 342,647 | |
Reinvestment of distributions | | | 66,522 | | | | 18,673 | |
Shares redeemed | | | (279,568 | ) | | | (557,483 | ) |
| | | | | | | | |
Net increase (decrease) from capital share transactions | | | (189,147 | ) | | | (196,163 | ) |
| | | | | | | | |
Class K | | | | | | | | |
Shares sold | | | 11,540 | | | | 165,828 | |
Reinvestment of distributions | | | 115,666 | | | | 38,728 | |
Shares redeemed | | | (1,398,726 | ) | | | (975,576 | ) |
| | | | | | | | |
Net increase (decrease) from capital share transactions | | | (1,271,520 | ) | | | (771,020 | ) |
| | | | | | | | |
Net increase (decrease) in net assets from beneficial interest transactions | | | (9,218,997 | ) | | | (32,157,058 | ) |
| | | | | | | | |
Contribution from Adviser (Note 4) | | | 126,543 | | | | — | |
| | | | | | | | |
Net increase (decrease) in net assets during the period | | | (10,187,544 | ) | | | (21,116,241 | ) |
| | | | | | | | |
Net assets at beginning of period | | | 90,461,806 | | | | 111,578,047 | |
| | | | | | | | |
| | |
Net Assets at End of Period | | $ | 80,274,262 | | | $ | 90,461,806 | |
| | | | | | | | |
Undistributed (distribution in excess of) net investment income (loss) | | $ | 430,004 | | | $ | 1,331,565 | |
| | | | | | | | |
See accompanying notes to financial statements.
| | | | |
| Statements of Changes in Net Assets | | | 29 | |
SSGA Funds
Statements of Changes in Net Assets
| | | | | | | | |
| | | State Street Disciplined Emerging
Markets Equity Fund | |
| | | Six Months Ended
2/28/18
(Unaudited) | | | Year Ended
8/31/17 | |
| | | | | | | | |
Shares of Beneficial Interest: | | | | | | | | |
Class N | | | | | | | | |
Shares sold | | | 205,041 | | | | 1,344,751 | |
Reinvestment of distributions | | | 496,678 | | | | 184,850 | |
Shares redeemed | | | (1,577,227 | ) | | | (5,683,268 | ) |
| | | | | | | | |
Net increase (decrease) from share transactions | | | (875,508 | ) | | | (4,153,667 | ) |
| | | | | | | | |
Class A | | | | | | | | |
Shares sold | | | — | | | | 9,211 | |
Reinvestment of distributions | | | 308 | | | | 96 | |
Shares redeemed | | | — | | | | (9,211 | ) |
| | | | | | | | |
Net increase (decrease) from share transactions | | | 308 | | | | 96 | |
| | | | | | | | |
Class I | | | | | | | | |
Shares sold | | | 2,790 | | | | 43,727 | |
Reinvestment of distributions | | | 8,073 | | | | 2,698 | |
Shares redeemed | | | (32,492 | ) | | | (74,444 | ) |
| | | | | | | | |
Net increase (decrease) from share transactions | | | (21,629 | ) | | | (28,019 | ) |
| | | | | | | | |
Class K | | | | | | | | |
Shares sold | | | 1,337 | | | | 22,927 | |
Reinvestment of distributions | | | 13,986 | | | | 5,580 | |
Shares redeemed | | | (156,989 | ) | | | (125,275 | ) |
| | | | | | | | |
Net increase (decrease) from share transactions | | | (141,666 | ) | | | (96,768 | ) |
| | | | | | | | |
See accompanying notes to financial statements.
| | |
| 30 | | Statements of Changes in Net Assets |
| | | | | | | | |
| | | SSGA International Stock
Selection Fund | |
| | | Six Months Ended
2/28/18
(Unaudited) | | | Year Ended
8/31/17 | |
| | | | | | | | |
Increase (Decrease) in Net Assets from Operations: | | | | | | | | |
Net investment income (loss) | | $ | 868,262 | | | $ | 6,267,445 | |
Net realized gain (loss) | | | 14,185,232 | | | | 15,892,844 | |
Net change in unrealized appreciation/depreciation | | | (8,772,388 | ) | | | 33,125,233 | |
| | | | | | | | |
Net increase (decrease) in net assets resulting from operations | | | 6,281,106 | | | | 55,285,522 | |
| | | | | | | | |
| | |
Distributions to Shareholders from: | | | | | | | | |
Net investment income | | | | | | | | |
Class N | | | (7,557,291 | ) | | | (5,910,486 | ) |
Class A | | | (244,468 | ) | | | (5,787 | ) |
Class I | | | (22,848 | ) | | | (10,386 | ) |
Class K | | | (3,038,416 | ) | | | (2,050,895 | ) |
| | | | | | | | |
Total distributions from net investment income | | | (10,863,023 | ) | | | (7,977,554 | ) |
| | | | | | | | |
| | |
From Beneficial Interest Transactions: | | | | | | | | |
Class N | | | | | | | | |
Shares sold | | | 7,235,502 | | | | 15,545,166 | |
Reinvestment of distributions | | | 7,507,103 | | | | 5,870,427 | |
Shares redeemed | | | (20,060,305 | ) | | | (70,372,858 | ) |
| | | | | | | | |
Net increase (decrease) from capital share transactions | | | (5,317,700 | ) | | | (48,957,265 | ) |
| | | | | | | | |
Class A | | | | | | | | |
Shares sold | | | 444,833 | | | | 6,055,570 | |
Reinvestment of distributions | | | 244,098 | | | | 5,245 | |
Shares redeemed | | | (286,179 | ) | | | (732,706 | ) |
| | | | | | | | |
Net increase (decrease) from capital share transactions | | | 402,752 | | | | 5,328,109 | |
| | | | | | | | |
Class I | | | | | | | | |
Shares sold | | | 1,634,863 | | | | 240,944 | |
Reinvestment of distributions | | | 20,632 | | | | 10,112 | |
Shares redeemed | | | (53,584 | ) | | | (170,216 | ) |
| | | | | | | | |
Net increase (decrease) from capital share transactions | | | 1,601,911 | | | | 80,840 | |
| | | | | | | | |
Class K | | | | | | | | |
Shares sold | | | 2,730,700 | | | | 12,123,284 | |
Reinvestment of distributions | | | 3,038,018 | | | | 2,050,634 | |
Shares redeemed | | | (10,171,669 | ) | | | (21,989,222 | ) |
| | | | | | | | |
Net increase (decrease) from capital share transactions | | | (4,402,951 | ) | | | (7,815,304 | ) |
| | | | | | | | |
Net increase (decrease) in net assets from beneficial interest transactions | | | (7,715,988 | ) | | | (51,363,620 | ) |
| | | | | | | | |
Net increase (decrease) in net assets during the period | | | (12,297,905 | ) | | | (4,055,652 | ) |
| | | | | | | | |
Net assets at beginning of period | | | 301,070,151 | | | | 305,125,803 | |
| | | | | | | | |
| | |
Net Assets at End of Period | | $ | 288,772,246 | | | $ | 301,070,151 | |
| | | | | | | | |
Undistributed (distribution in excess of) net investment income (loss) | | $ | (3,070,238 | ) | | $ | 6,924,523 | |
| | | | | | | | |
See accompanying notes to financial statements.
| | | | |
| Statements of Changes in Net Assets | | | 31 | |
SSGA Funds
Statements of Changes in Net Assets
| | | | | | | | |
| | | SSGA International Stock
Selection Fund | |
| | | Six Months Ended
2/28/18
(Unaudited) | | | Year Ended
8/31/17 | |
| | | | | | | | |
Shares of Beneficial Interest: | | | | | | | | |
Class N | | | | | | | | |
Shares sold | | | 601,893 | | | | 1,440,835 | |
Reinvestment of distributions | | | 648,842 | | | | 591,181 | |
Shares redeemed | | | (1,678,264 | ) | | | (6,554,556 | ) |
| | | | | | | | |
Net increase (decrease) from share transactions | | | (427,529 | ) | | | (4,522,540 | ) |
| | | | | | | | |
Class A | | | | | | | | |
Shares sold | | | 37,122 | | | | 606,814 | |
Reinvestment of distributions | | | 21,208 | | | | 530 | |
Shares redeemed | | | (23,773 | ) | | | (67,483 | ) |
| | | | | | | | |
Net increase (decrease) from share transactions | | | 34,557 | | | | 539,861 | |
| | | | | | | | |
Class I | | | | | | | | |
Shares sold | | | 138,838 | | | | 22,512 | |
Reinvestment of distributions | | | 1,786 | | | | 1,019 | |
Shares redeemed | | | (4,404 | ) | | | (16,042 | ) |
| | | | | | | | |
Net increase (decrease) from share transactions | | | 136,220 | | | | 7,489 | |
| | | | | | | | |
Class K | | | | | | | | |
Shares sold | | | 229,159 | | | | 1,147,518 | |
Reinvestment of distributions | | | 263,032 | | | | 206,717 | |
Shares redeemed | | | (848,818 | ) | | | (2,066,644 | ) |
| | | | | | | | |
Net increase (decrease) from share transactions | | | (356,627 | ) | | | (712,409 | ) |
| | | | | | | | |
See accompanying notes to financial statements.
| | |
| 32 | | Statements of Changes in Net Assets |
| | | | | | | | |
| | | SSGA High Yield Bond Fund | |
| | | Six Months Ended
2/28/18
(Unaudited) | | | Year Ended
8/31/17 | |
| | | | | | | | |
| | |
Increase (Decrease) in Net Assets from Operations: | | | | | | | | |
Net investment income (loss) | | $ | 1,707,069 | | | $ | 3,867,210 | |
Net realized gain (loss) | | | 364,686 | | | | 1,639,210 | |
Net change in unrealized appreciation/depreciation | | | (1,718,954 | ) | | | (207,307 | ) |
| | | | | | | | |
Net increase (decrease) in net assets resulting from operations | | | 352,801 | | | | 5,299,113 | |
| | | | | | | | |
| | |
Distributions to Shareholders from: | | | | | | | | |
Net investment income | | | | | | | | |
Class N | | | (1,159,881 | ) | | | (2,595,593 | ) |
Class A | | | (2,154 | ) | | | (2,812 | ) |
Class I | | | (28,655 | ) | | | (33,889 | ) |
Class K | | | (646,558 | ) | | | (1,435,884 | ) |
| | | | | | | | |
Total distributions from net investment income | | | (1,837,248 | ) | | | (4,068,178 | ) |
| | | | | | | | |
| | |
From Beneficial Interest Transactions: | | | | | | | | |
Class N | | | | | | | | |
Shares sold | | | 6,932,654 | | | | 20,205,165 | |
Reinvestment of distributions | | | 1,147,928 | | | | 2,563,387 | |
Shares redeemed | | | (12,806,361 | ) | | | (32,483,425 | ) |
| | | | | | | | |
Net increase (decrease) from capital share transactions | | | (4,725,779 | ) | | | (9,714,873 | ) |
| | | | | | | | |
Class A | | | | | | | | |
Shares sold | | | 7,155 | | | | 225,626 | |
Reinvestment of distributions | | | 1,860 | | | | 2,246 | |
Shares redeemed | | | (13,998 | ) | | | (149,981 | ) |
| | | | | | | | |
Net increase (decrease) from capital share transactions | | | (4,983 | ) | | | 77,891 | |
| | | | | | | | |
Class I | | | | | | | | |
Shares sold | | | 198,500 | | | | 648,359 | |
Reinvestment of distributions | | | 26,962 | | | | 30,353 | |
Shares redeemed | | | (210,917 | ) | | | (82,904 | ) |
| | | | | | | | |
Net increase (decrease) from capital share transactions | | | 14,545 | | | | 595,808 | |
| | | | | | | | |
Class K | | | | | | | | |
Shares sold | | | 819,488 | | | | 3,734,529 | |
Reinvestment of distributions | | | 546,696 | | | | 1,219,809 | |
Shares redeemed | | | (2,912,462 | ) | | | (9,255,398 | ) |
| | | | | | | | |
Net increase (decrease) from capital share transactions | | | (1,546,278 | ) | | | (4,301,060 | ) |
| | | | | | | | |
Net increase (decrease) in net assets from beneficial interest transactions | | | (6,262,495 | ) | | | (13,342,234 | ) |
| | | | | | | | |
Net increase (decrease) in net assets during the period | | | (7,746,942 | ) | | | (12,111,299 | ) |
| | | | | | | | |
Net assets at beginning of period | | | 69,979,129 | | | | 82,090,428 | |
| | | | | | | | |
| | |
Net Assets at End of Period | | $ | 62,232,187 | | | $ | 69,979,129 | |
| | | | | | | | |
Undistributed (distribution in excess of) net investment income (loss) | | $ | (72,822 | ) | | $ | 57,357 | |
| | | | | | | | |
See accompanying notes to financial statements.
| | | | |
| Statements of Changes in Net Assets | | | 33 | |
SSGA Funds
Statements of Changes in Net Assets
| | | | | | | | |
| | | SSGA High Yield Bond Fund | |
| | | Six Months Ended
2/28/18
(Unaudited) | | | Year Ended
8/31/17 | |
| | | | | | | | |
Shares of Beneficial Interest: | | | | | | | | |
Class N | | | | | | | | |
Shares sold | | | 915,532 | | | | 2,678,198 | |
Reinvestment of distributions | | | 151,113 | | | | 340,179 | |
Shares redeemed | | | (1,696,176 | ) | | | (4,321,880 | ) |
| | | | | | | | |
Net increase (decrease) from share transactions | | | (629,531 | ) | | | (1,303,503 | ) |
| | | | | | | | |
Class A | | | | | | | | |
Shares sold | | | 940 | | | | 30,063 | |
Reinvestment of distributions | | | 245 | | | | 296 | |
Shares redeemed | | | (1,830 | ) | | | (19,873 | ) |
| | | | | | | | |
Net increase (decrease) from share transactions | | | (645 | ) | | | 10,486 | |
| | | | | | | | |
Class I | | | | | | | | |
Shares sold | | | 25,949 | | | | 85,301 | |
Reinvestment of distributions | | | 3,549 | | | | 4,004 | |
Shares redeemed | | | (27,819 | ) | | | (10,949 | ) |
| | | | | | | | |
Net increase (decrease) from share transactions | | | 1,679 | | | | 78,356 | |
| | | | | | | | |
Class K | | | | | | | | |
Shares sold | | | 107,879 | | | | 495,477 | |
Reinvestment of distributions | | | 71,991 | | | | 161,918 | |
Shares redeemed | | | (384,388 | ) | | | (1,228,268 | ) |
| | | | | | | | |
Net increase (decrease) from share transactions | | | (204,518 | ) | | | (570,873 | ) |
| | | | | | | | |
See accompanying notes to financial statements.
| | |
| 34 | | Statements of Changes in Net Assets |
SSGA Funds
Financial Highlights
Selected data for a share outstanding throughout each period
| | | | | | | | | | | | | | | | | | | | | | | | |
| | | SSGA Dynamic Small Cap Fund | |
| | | Class N | |
| | | Six Months
Ended
2/28/18
(Unaudited) | | | Year Ended
8/31/17 | | | Year Ended
8/31/16 | | | Year Ended
8/31/15 | | | Year Ended
8/31/14(a) | | | Year Ended
8/31/13(a) | |
Net asset value, beginning of period | | $ | 45.27 | | | $ | 40.60 | | | $ | 37.26 | | | $ | 37.33 | | | $ | 31.76 | | | $ | 24.28 | |
| | | | | | | | | | | | | | | | | | | | | | | | |
Income (loss) from investment operations: | | | | | | | | | | | | | | | | | | | | | | | | |
Net investment income (loss)(b)(c) | | | 0.21 | | | | 0.22 | | | | 0.22 | | | | 0.27 | | | | 0.17 | | | | 0.17 | |
Net realized and unrealized gain (loss) | | | 2.85 | | | | 4.54 | | | | 3.38 | | | | (0.14 | ) | | | 5.67 | | | | 7.56 | |
| | | | | | | | | | | | | | | | | | | | | | | | |
Total from investment operations | | | 3.06 | | | | 4.76 | | | | 3.60 | | | | 0.13 | | | | 5.84 | | | | 7.73 | |
| | | | | | | | | | | | | | | | | | | | | | | | |
Voluntary contribution from Adviser | | | — | | | | — | | | | — | | | | — | | | | — | | | | 0.01 | |
| | | | | | | | | | | | | | | | | | | | | | | | |
Distributions to shareholders from: | | | | | | | | | | | | | | | | | | | | | | | | |
Net investment income | | | (0.24 | ) | | | (0.09 | ) | | | (0.26 | ) | | | (0.20 | ) | | | (0.27 | ) | | | (0.26 | ) |
| | | | | | | | | | | | | | | | | | | | | | | | |
Net asset value, end of period | | $ | 48.09 | | | $ | 45.27 | | | $ | 40.60 | | | $ | 37.26 | | | $ | 37.33 | | | $ | 31.76 | |
| | | | | | | | | | | | | | | | | | | | | | | | |
Total return(e) | | | 6.76 | % | | | 11.74 | % | | | 9.72 | % | | | 0.33 | % | | | 18.42 | % | | | 32.20 | %(d) |
Ratios and Supplemental Data: | | | | | | | | | | | | | | | | | | | | | | | | |
Net assets, end of period (in 000s) | | $ | 24,766 | | | $ | 25,482 | | | $ | 29,353 | | | $ | 22,508 | | | $ | 24,136 | | | $ | 23,509 | |
Ratios to average net assets: | | | | | | | | | | | | | | | | | | | | | | | | |
Total expenses(c) | | | 2.03 | %(f) | | | 1.98 | % | | | 2.18 | % | | | 2.08 | % | | | 1.82 | % | | | 2.28 | % |
Net expenses(c) | | | 1.10 | %(f) | | | 1.10 | % | | | 1.02 | % | | | 1.10 | % | | | 1.20 | % | | | 1.25 | % |
Net investment income (loss)(c) | | | 0.87 | %(f) | | | 0.50 | % | | | 0.58 | % | | | 0.72 | % | | | 0.46 | % | | | 0.61 | % |
Portfolio turnover rate | | | 59 | %(g) | | | 94 | % | | | 115 | % | | | 73 | % | | | 189 | % | | | 147 | % |
| (a) | | Beginning with the year ended August 31, 2015, the Funds were audited by Ernst & Young LLP. The previous years/periods were audited by another independent registered public accounting firm. |
| (b) | | Average daily shares outstanding were used for this calculation. |
| (c) | | May reflect amounts waived and/or reimbursed by the investment adviser and for certain funds, custody credit arrangements. |
| (d) | | If the Adviser had not made a one-time voluntary contribution during the period ended August 31, 2013, the total return would have been 31.70%. |
| (e) | | Total return is calculated assuming a purchase of shares at net asset value on the first day and a sale at net asset value on the last day of each period reported. Distributions are assumed, for the purpose of this calculation, to be reinvested at net asset value per share on the respective payment dates of the Fund. Total return for periods of less than one year are not annualized. Results represent past performance and are not indicative of future results. |
See accompanying notes to financial statements.
SSGA Funds
Financial Highlights
Selected data for a share outstanding throughout each period
| | | | | | | | | | | | | | | | | | | | |
| | | SSGA Dynamic Small Cap Fund | |
| | | Class A | |
| | | Six Months
Ended
2/28/18
(Unaudited) | | | Year Ended
8/31/17 | | | Year Ended
8/31/16 | | | Year Ended
8/31/15 | | | For the
Period
7/7/14* -
8/31/14(a) | |
Net asset value, beginning of period | | $ | 45.02 | | | $ | 40.42 | | | $ | 37.21 | | | $ | 37.32 | | | $ | 37.38 | |
| | | | | | | | | | | | | | | | | | | | |
Income (loss) from investment operations: | |
Net investment income (loss)(b)(c) | | | 0.23 | | | | 0.18 | | | | 0.17 | | | | 0.19 | | | | (0.01 | ) |
Net realized and unrealized gain (loss) | | | 2.83 | | | | 4.50 | | | | 3.33 | | | | (0.13 | ) | | | (0.05 | ) |
| | | | | | | | | | | | | | | | | | | | |
Total from investment operations | | | 3.06 | | | | 4.68 | | | | 3.50 | | | | 0.06 | | | | (0.06 | ) |
| | | | | | | | | | | | | | | | | | | | |
Distributions to shareholders from: | |
Net investment income | | | (0.25 | ) | | | (0.08 | ) | | | (0.29 | ) | | | (0.17 | ) | | | — | |
| | | | | | | | | | | | | | | | | | | | |
Net asset value, end of period | | $ | 47.83 | | | $ | 45.02 | | | $ | 40.42 | | | $ | 37.21 | | | $ | 37.32 | |
| | | | | | | | | | | | | | | | | | | | |
Total return(d) | | | 6.78 | % | | | 11.58 | % | | | 9.48 | % | | | 0.15 | % | | | (0.16 | )% |
Ratios and Supplemental Data: | |
Net assets, end of period (in 000s) | | $ | 238 | | | $ | 354 | | | $ | 170 | | | $ | 10 | | | $ | 10 | |
Ratios to average net assets: | |
Total expenses(c) | | | 2.05 | %(e) | | | 2.09 | % | | | 2.39 | % | | | 2.28 | % | | | 3.04 | %(e) |
Net expenses(c) | | | 1.10 | %(e) | | | 1.20 | % | | | 1.22 | % | | | 1.30 | % | | | 1.20 | %(e) |
Net investment income (loss)(c) | | | 0.96 | %(e) | | | 0.40 | % | | | 0.46 | % | | | 0.49 | % | | | (0.17 | )%(e) |
Portfolio turnover rate | | | 59 | %(f) | | | 94 | % | | | 115 | % | | | 73 | % | | | 189 | %(f) |
| * | | Commencement of operations. |
| (a) | | Beginning with the year ended August 31, 2015, the Funds were audited by Ernst & Young LLP. The previous years/periods were audited by another independent registered public accounting firm. |
| (b) | | Average daily shares outstanding were used for this calculation. |
| (c) | | May reflect amounts waived and/or reimbursed by the investment adviser and for certain funds, custody credit arrangements. |
| (d) | | Total return is calculated assuming a purchase of shares at net asset value on the first day and a sale at net asset value on the last day of each period reported. Distributions are assumed, for the purpose of this calculation, to be reinvested at net asset value per share on the respective payment dates of the Fund. Total return for periods of less than one year are not annualized. Results represent past performance and are not indicative of future results. |
See accompanying notes to financial statements.
SSGA Funds
Financial Highlights
Selected data for a share outstanding throughout each period
| | | | | | | | | | | | | | | | | | | | |
| | | SSGA Dynamic Small Cap Fund | |
| | | Class I | |
| | | Six Months
Ended
2/28/18
(Unaudited) | | | Year Ended
8/31/17 | | | Year Ended
8/31/16 | | | Year Ended
8/31/15 | | | For the
Period
7/7/14* -
8/31/14(a) | |
Net asset value, beginning of period | | $ | 45.25 | | | $ | 40.54 | | | $ | 37.25 | | | $ | 37.33 | | | $ | 37.38 | |
| | | | | | | | | | | | | | | | | | | | |
Income (loss) from investment operations | |
Net investment income (loss)(b)(c) | | | 0.27 | | | | 0.27 | | | | 0.24 | | | | 0.25 | | | | 0.00 | (d) |
Net realized and unrealized gain (loss) | | | 2.85 | | | | 4.54 | | | | 3.36 | | | | (0.10 | ) | | | (0.05 | ) |
| | | | | | | | | | | | | | | | | | | | |
Total from investment operations | | | 3.12 | | | | 4.81 | | | | 3.60 | | | | 0.15 | | | | (0.05 | ) |
| | | | | | | | | | | | | | | | | | | | |
Distributions to shareholders from: | |
Net investment income | | | (0.29 | ) | | | (0.10 | ) | | | (0.31 | ) | | | (0.23 | ) | | | (0.00 | )(d) |
| | | | | | | | | | | | | | | | | | | | |
Net asset value, end of period | | $ | 48.08 | | | $ | 45.25 | | | $ | 40.54 | | | $ | 37.25 | | | $ | 37.33 | |
| | | | | | | | | | | | | | | | | | | | |
Total return(e) | | | 6.88 | % | | | 11.88 | % | | | 9.75 | % | | | 0.40 | % | | | (0.13 | )% |
Ratios and Supplemental Data: | |
Net assets, end of period (in 000s) | | $ | 1,102 | | | $ | 1,312 | | | $ | 1,703 | | | $ | 1,282 | | | $ | 10 | |
Ratios to average net assets: | |
Total expenses(c) | | | 1.80 | %(f) | | | 1.85 | % | | | 2.14 | % | | | 2.03 | % | | | 2.79 | %(f) |
Net expenses(c) | | | 0.85 | %(f) | | | 0.97 | % | | | 0.98 | % | | | 1.05 | % | | | 0.95 | %(f) |
Net investment income (loss)(c) | | | 1.13 | %(f) | | | 0.61 | % | | | 0.65 | % | | | 0.65 | % | | | 0.08 | %(f) |
Portfolio turnover rate | | | 59 | %(g) | | | 94 | % | | | 115 | % | | | 73 | % | | | 189 | %(g) |
| * | | Commencement of operations. |
| (a) | | Beginning with the year ended August 31, 2015, the Funds were audited by Ernst & Young LLP. The previous years/periods were audited by another independent registered public accounting firm. |
| (b) | | Average daily shares outstanding were used for this calculation. |
| (c) | | May reflect amounts waived and/or reimbursed by the investment adviser and for certain funds, custody credit arrangements. |
| (d) | | Amount is less than $0.005 per share. |
| (e) | | Total return is calculated assuming a purchase of shares at net asset value on the first day and a sale at net asset value on the last day of each period reported. Distributions are assumed, for the purpose of this calculation, to be reinvested at net asset value per share on the respective payment dates of the Fund. Total return for periods of less than one year are not annualized. Results represent past performance and are not indicative of future results. |
See accompanying notes to financial statements.
SSGA Funds
Financial Highlights
Selected data for a share outstanding throughout each period
| | | | | | | | | | | | | | | | | | | | |
| | | SSGA Dynamic Small Cap Fund | |
| | | Class K | |
| | | Six Months
Ended
2/28/18
(Unaudited) | | | Year Ended
8/31/17 | | | Year Ended
8/31/16 | | | Year Ended
8/31/15 | | | For the
Period
7/7/14* -
8/31/14(a) | |
Net asset value, beginning of period | | $ | 45.36 | | | $ | 40.67 | | | $ | 37.33 | | | $ | 37.34 | | | $ | 37.38 | |
| | | | | | | | | | | | | | | | | | | | |
Income (loss) from investment operations | |
Net investment income (loss)(b)(c) | | | 0.27 | | | | 0.34 | | | | 0.32 | | | | 0.36 | | | | 0.01 | |
Net realized and unrealized gain (loss) | | | 2.86 | | | | 4.53 | | | | 3.37 | | | | (0.13 | ) | | | (0.05 | ) |
| | | | | | | | | | | | | | | | | | | | |
Total from investment operations | | | 3.13 | | | | 4.87 | | | | 3.69 | | | | 0.23 | | | | (0.04 | ) |
| | | | | | | | | | | | | | | | | | | | |
Distributions to shareholders from: | |
Net investment income | | | (0.32 | ) | | | (0.18 | ) | | | (0.35 | ) | | | (0.24 | ) | | | — | |
| | | | | | | | | | | | | | | | | | | | |
Net asset value, end of period | | $ | 48.17 | | | $ | 45.36 | | | $ | 40.67 | | | $ | 37.33 | | | $ | 37.34 | |
| | | | | | | | | | | | | | | | | | | | |
Total return(d) | | | 6.90 | % | | | 11.98 | % | | | 9.97 | % | | | 0.61 | % | | | (0.11 | )% |
Ratios and Supplemental Data: | |
Net assets, end of period (in 000s) | | $ | 13 | | | $ | 12 | | | $ | 11 | | | $ | 10 | | | $ | 10 | |
Ratios to average net assets: | |
Total expenses(c) | | | 1.80 | %(e) | | | 1.73 | % | | | 1.94 | % | | | 1.83 | % | | | 2.62 | %(e) |
Net expenses(c) | | | 0.84 | %(e) | | | 0.85 | % | | | 0.78 | % | | | 0.85 | % | | | 0.76 | %(e) |
Net investment income (loss)(c) | | | 1.13 | %(e) | | | 0.77 | % | | | 0.85 | % | | | 0.94 | % | | | 0.26 | %(e) |
Portfolio turnover rate | | | 59 | %(f) | | | 94 | % | | | 115 | % | | | 73 | % | | | 189 | %(f) |
| * | | Commencement of operations. |
| (a) | | Beginning with the year ended August 31, 2015, the Funds were audited by Ernst & Young LLP. The previous years/periods were audited by another independent registered public accounting firm. |
| (b) | | Average daily shares outstanding were used for this calculation. |
| (c) | | May reflect amounts waived and/or reimbursed by the investment adviser and for certain funds, custody credit arrangements. |
| (d) | | Total return is calculated assuming a purchase of shares at net asset value on the first day and a sale at net asset value on the last day of each period reported. Distributions are assumed, for the purpose of this calculation, to be reinvested at net asset value per share on the respective payment dates of the Fund. Total return for periods of less than one year are not annualized. Results represent past performance and are not indicative of future results. |
See accompanying notes to financial statements.
SSGA Funds
Financial Highlights
Selected data for a share outstanding throughout each period
| | | | | | | | | | | | | | | | | | | | | | | | |
| | | State Street Disciplined Emerging Markets Equity Fund | |
| | | Class N | |
| | | Six Months
Ended
2/28/18
(Unaudited) | | | Year Ended
8/31/17 | | | Year Ended
8/31/16 | | | Year Ended
8/31/15 | | | Year Ended
8/31/14(a) | | | Year Ended
8/31/13(a) | |
Net asset value, beginning of period | | $ | 8.56 | | | $ | 7.52 | | | $ | 9.30 | | | $ | 19.22 | | | $ | 18.47 | | | $ | 18.71 | |
| | | | | | | | | | | | | | | | | | | | | | | | |
Income (loss) from investment operations: | |
Net investment income (loss)(b)(c) | | | 0.04 | | | | 0.12 | | | | 0.13 | | | | 0.20 | | | | 0.26 | | | | 0.37 | |
Net realized and unrealized gain (loss)(d) | | | 0.26 | | | | 1.03 | | | | 0.08 | | | | (3.89 | ) | | | 2.53 | | | | (0.28 | ) |
| | | | | | | | | | | | | | | | | | | | | | | | |
Total from investment operations | | | 0.30 | | | | 1.15 | | | | 0.21 | | | | (3.69 | ) | | | 2.79 | | | | 0.09 | |
| | | | | | | | | | | | | | | | | | | | | | | | |
Contribution from Adviser | | | 0.01 | | | | — | | | | — | | | | — | | | | 0.01 | | | | — | |
| | | | | | | | | | | | | | | | | | | | | | | | |
Distributions to shareholders from: | |
Net investment income | | | (0.13 | ) | | | (0.11 | ) | | | — | | | | (0.39 | ) | | | (0.44 | ) | | | (0.33 | ) |
Net realized gains | | | (0.31 | ) | | | — | | | | (1.99 | ) | | | (5.84 | ) | | | (1.61 | ) | | | — | |
| | | | | | | | | | | | | | | | | | | | | | | | |
Total distributions | | | (0.44 | ) | | | (0.11 | ) | | | (1.99 | ) | | | (6.23 | ) | | | (2.05 | ) | | | (0.33 | ) |
| | | | | | | | | | | | | | | | | | | | | | | | |
Net asset value, end of period | | $ | 8.43 | | | $ | 8.56 | | | $ | 7.52 | | | $ | 9.30 | | | $ | 19.22 | | | $ | 18.47 | |
| | | | | | | | | | | | | | | | | | | | | | | | |
Total return(e) | | | 3.76 | %(h) | | | 15.58 | % | | | 3.83 | % | | | (22.67 | )% | | | 15.68 | %(f) | | | 0.45 | %(g) |
Ratios and Supplemental Data: | |
Net assets, end of period (in 000s) | | $ | 77,921 | | | $ | 86,670 | | | $ | 107,308 | | | $ | 171,885 | | | $ | 495,509 | | | $ | 938,195 | |
Ratios to average net assets: | |
Total expenses(c) | | | 1.56 | %(i) | | | 1.65 | % | | | 1.48 | % | | | 1.40 | % | | | 1.24 | % | | | 1.26 | % |
Net expenses(c) | | | 1.25 | %(i) | | | 1.25 | % | | | 1.21 | % | | | 1.25 | % | | | 1.20 | % | | | 1.25 | % |
Net investment income (loss)(c) | | | 0.98 | %(i) | | | 1.60 | % | | | 1.71 | % | | | 1.54 | % | | | 1.44 | % | | | 1.86 | % |
Portfolio turnover rate | | | 23 | %(j) | | | 38 | % | | | 101 | % | | | 78 | % | | | 89 | % | | | 56 | % |
| (a) | | Beginning with the year ended August 31, 2015, the Funds were audited by Ernst & Young LLP. The previous years/periods were audited by another independent registered public accounting firm. |
| (b) | | Average daily shares outstanding were used for this calculation. |
| (c) | | May reflect amounts waived and/or reimbursed by the investment adviser and for certain funds, custody credit arrangements. |
| (d) | | Amounts shown in this caption for a share outstanding may not accord with the change in aggregate gains and losses in securities for the fiscal period because of the timing of sales and repurchases of Fund shares in relation to fluctuating market values for the Fund. |
| (e) | | Total return is calculated assuming a purchase of shares at net asset value on the first day and a sale at net asset value on the last day of each period reported. Distributions are assumed, for the purpose of this calculation, to be reinvested at net asset value per share on the respective payment dates of the Fund. Total return for periods of less than one year are not annualized. Results represent past performance and are not indicative of future results. |
| (f) | | If the Adviser had not made a contribution during the period ended August 31, 2014, the total return would have been 15.62%. |
| (g) | | If the Adviser had not made a contribution during the period ended August 31, 2013, the total return would have been 0.41%. |
| (h) | | If the Adviser had not made a contribution during the period ended February 28, 2018, the total return would have been 3.63% |
See accompanying notes to financial statements.
SSGA Funds
Financial Highlights
Selected data for a share outstanding throughout each period
| | | | | | | | | | | | | | | | | | | | |
| | | State Street Disciplined Emerging Markets Equity Fund | |
| | | Class A | |
| | | Six Months
Ended
2/28/18
(Unaudited) | | | Year Ended
8/31/17 | | | Year Ended
8/31/16 | | | Year Ended
8/31/15 | | | For the
Period
7/7/14* -
8/31/14(a) | |
Net asset value, beginning of period | | $ | 8.50 | | | $ | 7.48 | | | $ | 9.29 | | | $ | 19.22 | | | $ | 18.68 | |
| | | | | | | | | | | | | | | | | | | | |
Income (loss) from investment operations: | |
Net investment income (loss)(b)(c) | | | 0.04 | | | | 0.11 | | | | 0.14 | | | | 0.26 | | | | 0.07 | |
Net realized and unrealized gain (loss)(d) | | | 0.26 | | | | 1.03 | | | | 0.04 | | | | (3.97 | ) | | | 0.46 | (e) |
| | | | | | | | | | | | | | | | | | | | |
Total from investment operations | | | 0.30 | | | | 1.14 | | | | 0.18 | | | | (3.71 | ) | | | 0.53 | (e) |
| | | | | | | | | | | | | | | | | | | | |
Contribution from Advisor | | | 0.01 | | | | — | | | | — | | | | — | | | | 0.01 | |
| | | | | | | | | | | | | | | | | | | | |
Distributions to shareholders from: | |
Net investment income | | | (0.13 | ) | | | (0.12 | ) | | | — | | | | (0.38 | ) | | | — | |
Net realized gains | | | (0.31 | ) | | | — | | | | (1.99 | ) | | | (5.84 | ) | | | — | |
| | | | | | | | | | | | | | | | | | | | |
Total distributions | | | (0.44 | ) | | | (0.12 | ) | | | (1.99 | ) | | | (6.22 | ) | | | — | |
| | | | | | | | | | | | | | | | | | | | |
Net asset value, end of period | | $ | 8.37 | | | $ | 8.50 | | | $ | 7.48 | | | $ | 9.29 | | | $ | 19.22 | |
| | | | | | | | | | | | | | | | | | | | |
Total return(f) | | | 3.77 | %(h) | | | 15.57 | % | | | 3.35 | % | | | (22.73 | )% | | | 2.89 | %(g) |
Ratios and Supplemental Data: | |
Net assets, end of period (in 000s) | | $ | 55 | | | $ | 53 | | | $ | 46 | | | $ | 19 | | | $ | 10 | |
Ratios to average net assets: | |
Total expenses(c) | | | 1.57 | %(i) | | | 1.77 | % | | | 1.69 | % | | | 1.59 | % | | | 1.77 | %(i) |
Net expenses(c) | | | 1.25 | %(i) | | | 1.37 | % | | | 1.41 | % | | | 1.45 | % | | | 1.36 | %(i) |
Net investment income (loss)(c) | | | 0.99 | %(i) | | | 1.42 | % | | | 1.88 | % | | | 2.19 | % | | | 2.27 | %(i) |
Portfolio turnover rate | | | 23 | %(j) | | | 38 | % | | | 101 | % | | | 78 | % | | | 89 | %(j) |
| * | | Commencement of operations. |
| (a) | | Beginning with the year ended August 31, 2015, the Funds were audited by Ernst & Young LLP. The previous years/periods were audited by another independent registered public accounting firm. |
| (b) | | Average daily shares outstanding were used for this calculation. |
| (c) | | May reflect amounts waived and/or reimbursed by the investment adviser and for certain funds, custody credit arrangements. |
| (d) | | Amounts shown in this caption for a share outstanding may not accord with the change in aggregate gains and losses in securities for the fiscal period because of the timing of sales and repurchases of Fund shares in relation to fluctuating market values for the Fund. |
| (e) | | Amount previously presented has been restated by $0.01. |
| (f) | | Total return is calculated assuming a purchase of shares at net asset value on the first day and a sale at net asset value on the last day of each period reported. Distributions are assumed, for the purpose of this calculation, to be reinvested at net asset value per share on the respective payment dates of the Fund. Total return for periods of less than one year are not annualized. Results represent past performance and are not indicative of future results. |
| (g) | | If the Adviser had not made a contribution during the period ended August 31, 2014, the total return would have been 2.84%. |
| (h) | | If the Adviser had not made a contribution during the period ended February 28, 2018, the total return would have been 3.65% |
See accompanying notes to financial statements.
SSGA Funds
Financial Highlights
Selected data for a share outstanding throughout each period
| | | | | | | | | | | | | | | | | | | | |
| | | State Street Disciplined Emerging Markets Equity Fund | |
| | | Class I | |
| | | Six Months
Ended
2/28/18
(Unaudited) | | | Year Ended
8/31/17 | | | Year Ended
8/31/16 | | | Year Ended
8/31/15 | | | For the
Period
7/7/14* -
8/31/14(a) | |
Net asset value, beginning of period | | $ | 8.57 | | | $ | 7.52 | | | $ | 9.30 | | | $ | 19.23 | | | $ | 18.68 | |
| | | | | | | | | | | | | | | | | | | | |
Income (loss) from investment operations | |
Net investment income (loss)(b)(c) | | | 0.05 | | | | 0.14 | | | | 0.14 | | | | 0.20 | | | | 0.07 | |
Net realized and unrealized gain (loss)(d) | | | 0.26 | | | | 1.02 | | | | 0.07 | | | | (3.88 | ) | | | 0.47 | (e) |
| | | | | | | | | | | | | | | | | | | | |
Total from investment operations | | | 0.31 | | | | 1.16 | | | | 0.21 | | | | (3.68 | ) | | | 0.54 | (e) |
| | | | | | | | | | | | | | | | | | | | |
Contribution from Advisor | | | 0.01 | | | | — | | | | — | | | | — | | | | 0.01 | |
| | | | | | | | | | | | | | | | | | | | |
Distributions to shareholders from: | |
Net investment income | | | (0.15 | ) | | | (0.11 | ) | | | — | | | | (0.41 | ) | | | — | |
Net realized gains | | | (0.31 | ) | | | — | | | | (1.99 | ) | | | (5.84 | ) | | | — | |
| | | | | | | | | | | | | | | | | | | | |
Total distributions | | | (0.46 | ) | | | (0.11 | ) | | | (1.99 | ) | | | (6.25 | ) | | | — | |
| | | | | | | | | | | | | | | | | | | | |
Net asset value, end of period | | $ | 8.43 | | | $ | 8.57 | | | $ | 7.52 | | | $ | 9.30 | | | $ | 19.23 | |
| | | | | | | | | | | | | | | | | | | | |
Total return(f) | | | 3.78 | %(h) | | | 15.96 | % | | | 3.70 | % | | | (22.56 | )% | | | 2.94 | %(g) |
Ratios and Supplemental Data: | |
Net assets, end of period (in 000s) | | $ | 1,290 | | | $ | 1,496 | | | $ | 1,523 | | | $ | 1,447 | | | $ | 10 | |
Ratios to average net assets: | |
Total expenses(c) | | | 1.31 | %(i) | | | 1.51 | % | | | 1.46 | % | | | 1.34 | % | | | 1.52 | %(i) |
Net expenses(c) | | | 1.00 | %(i) | | | 1.11 | % | | | 1.18 | % | | | 1.20 | % | | | 1.12 | %(i) |
Net investment income (loss)(c) | | | 1.23 | %(i) | | | 1.81 | % | | | 1.80 | % | | | 1.83 | % | | | 2.52 | %(i) |
Portfolio turnover rate | | | 23 | %(j) | | | 38 | % | | | 101 | % | | | 78 | % | | | 89 | %(j) |
| * | | Commencement of operations. |
| (a) | | Beginning with the year ended August 31, 2015, the Funds were audited by Ernst & Young LLP. The previous years/periods were audited by another independent registered public accounting firm. |
| (b) | | Average daily shares outstanding were used for this calculation. |
| (c) | | May reflect amounts waived and/or reimbursed by the investment adviser and for certain funds, custody credit arrangements. |
| (d) | | Amounts shown in this caption for a share outstanding may not accord with the change in aggregate gains and losses in securities for the fiscal period because of the timing of sales and repurchases of Fund shares in relation to fluctuating market values for the Fund. |
| (e) | | Amount previously presented has been restated by $0.01. |
| (f) | | Total return is calculated assuming a purchase of shares at net asset value on the first day and a sale at net asset value on the last day of each period reported. Distributions are assumed, for the purpose of this calculation, to be reinvested at net asset value per share on the respective payment dates of the Fund. Total return for periods of less than one year are not annualized. Results represent past performance and are not indicative of future results. |
| (g) | | If the Adviser had not made a contribution during the period ended August 31, 2014, the total return would have been 2.89%. |
| (h) | | If the Adviser had not made a contribution during the period ended February 28, 2018, the total return would have been 3.65% |
See accompanying notes to financial statements.
SSGA Funds
Financial Highlights
Selected data for a share outstanding throughout each period
| | | | | | | | | | | | | | | | | | | | |
| | | State Street Disciplined Emerging Markets Equity Fund | |
| | | Class K | |
| | | Six Months
Ended
2/28/18
(Unaudited) | | | Year Ended
8/31/17 | | | Year Ended
8/31/16 | | | Year Ended
8/31/15 | | | For the
Period
7/7/14* -
8/31/14(a) | |
Net asset value, beginning of period | | $ | 8.60 | | | $ | 7.55 | | | $ | 9.31 | | | $ | 19.23 | | | $ | 18.68 | |
| | | | | | | | | | | | | | | | | | | | |
Income (loss) from investment operations | | | | | | | | | | | | | | | | | | | | |
Net investment income (loss)(b)(c) | | | 0.05 | | | | 0.15 | | | | 0.20 | | | | 0.23 | | | | 0.08 | |
Net realized and unrealized gain (loss)(d) | | | 0.25 | | | | 1.03 | | | | 0.03 | | | | (3.89 | ) | | | 0.46 | (e) |
| | | | | | | | | | | | | | | | | | | | |
Total from investment operations | | | 0.30 | | | | 1.18 | | | | 0.23 | | | | (3.66 | ) | | | 0.54 | (e) |
| | | | | | | | | | | | | | | | | | | | |
Contribution from Advisor | | | 0.01 | | | | — | | | | — | | | | — | | | | 0.01 | |
| | | | | | | | | | | | | | | | | | | | |
Distributions to shareholders from: | | | | | | | | | | | | | | | | | | | | |
Net investment income | | | (0.15 | ) | | | (0.13 | ) | | | — | | | | (0.42 | ) | | | — | |
Net realized gains | | | (0.31 | ) | | | — | | | | (1.99 | ) | | | (5.84 | ) | | | — | |
| | | | | | | | | | | | | | | | | | | | |
Total distributions | | | (0.46 | ) | | | (0.13 | ) | | | (1.99 | ) | | | (6.26 | ) | | | — | |
| | | | | | | | | | | | | | | | | | | | |
Net asset value, end of period | | $ | 8.45 | | | $ | 8.60 | | | $ | 7.55 | | | $ | 9.31 | | | $ | 19.23 | |
| | | | | | | | | | | | | | | | | | | | |
Total return(f) | | | 3.56 | %(h) | | | 16.02 | % | | | 4.07 | % | | | (22.49 | )% | | | 2.94 | %(g) |
Ratios and Supplemental Data: | | | | | | | | | | | | | | | | | | | | |
Net assets, end of period (in 000s) | | $ | 1,008 | | | $ | 2,243 | | | $ | 2,701 | | | $ | 5 | | | $ | 10 | |
Ratios to average net assets: | | | | | | | | | | | | | | | | | | | | |
Total expenses(c) | | | 1.29 | %(i) | | | 1.40 | % | | | 1.20 | % | | | 1.15 | % | | | 1.42 | %(i) |
Net expenses(c) | | | 1.00 | %(i) | | | 1.00 | % | | | 0.92 | % | | | 1.01 | % | | | 0.97 | %(i) |
Net investment income (loss)(c) | | | 1.14 | %(i) | | | 1.93 | % | | | 2.86 | % | | | 1.78 | % | | | 2.65 | %(i) |
Portfolio turnover rate | | | 23 | %(j) | | | 38 | % | | | 101 | % | | | 78 | % | | | 89 | %(j) |
| * | | Commencement of operations. |
| (a) | | Beginning with the year ended August 31, 2015, the Funds were audited by Ernst & Young LLP. The previous years/periods were audited by another independent registered public accounting firm. |
| (b) | | Average daily shares outstanding were used for this calculation. |
| (c) | | May reflect amounts waived and/or reimbursed by the investment adviser and for certain funds, custody credit arrangements. |
| (d) | | Amounts shown in this caption for a share outstanding may not accord with the change in aggregate gains and losses in securities for the fiscal period because of the timing of sales and repurchases of Fund shares in relation to fluctuating market values for the Fund. |
| (e) | | Amount previously presented has been restated by $0.01. |
| (f) | | Total return is calculated assuming a purchase of shares at net asset value on the first day and a sale at net asset value on the last day of each period reported. Distributions are assumed, for the purpose of this calculation, to be reinvested at net asset value per share on the respective payment dates of the Fund. Total return for periods of less than one year are not annualized. Results represent past performance and are not indicative of future results. |
| (g) | | If the Adviser had not made a contribution during the period ended August 31, 2014, the total return would have been 2.89%. |
| (h) | | If the Adviser had not made a contribution during the period ended February 28, 2018, the total return would have been 3.44% |
See accompanying notes to financial statements.
SSGA Funds
Financial Highlights
Selected data for a share outstanding throughout each period
| | | | | | | | | | | | | | | | | | | | | | | | |
| | | SSGA International Stock Selection Fund | |
| | | Class N | |
| | | Six Months
Ended
2/28/18
(Unaudited) | | | Year Ended
8/31/17 | | | Year Ended
8/31/16 | | | Year Ended
8/31/15 | | | Year Ended
8/31/14(a) | | | Year Ended
8/31/13(a) | |
Net asset value, beginning of period | | $ | 11.81 | | | $ | 10.11 | | | $ | 10.65 | | | $ | 11.24 | | | $ | 9.90 | | | $ | 8.61 | |
| | | | | | | | | | | | | | | | | | | | | | | | |
Income (loss) from investment operations: | | | | | | | | | | | | | | | | | | | | | | | | |
Net investment income (loss)(b)(c) | | | 0.03 | | | | 0.21 | | | | 0.24 | | | | 0.25 | | | | 0.27 | | | | 0.23 | |
Net realized and unrealized gain (loss) | | | 0.21 | | | | 1.76 | | | | (0.52 | ) | | | (0.74 | ) | | | 1.53 | | | | 1.40 | |
| | | | | | | | | | | | | | | | | | | | | | | | |
Total from investment operations | | | 0.24 | | | | 1.97 | | | | (0.28 | ) | | | (0.49 | ) | | | 1.80 | | | | 1.63 | |
| | | | | | | | | | | | | | | | | | | | | | | | |
Distributions to shareholders from: | | | | | | | | | | | | | | | | | | | | | | | | |
Net investment income | | | (0.43 | ) | | | (0.27 | ) | | | (0.26 | ) | | | (0.10 | ) | | | (0.46 | ) | | | (0.34 | ) |
| | | | | | | | | | | | | | | | | | | | | | | | |
Net asset value, end of period | | $ | 11.62 | | | $ | 11.81 | | | $ | 10.11 | | | $ | 10.65 | | | $ | 11.24 | | | $ | 9.90 | |
| | | | | | | | | | | | | | | | | | | | | | | | |
Total return(d) | | | 2.04 | % | | | 20.04 | % | | | (2.61 | )% | | | (4.31 | )% | | | 18.31 | % | | | 19.45 | %(e) |
Ratios and Supplemental Data: | | | | | | | | | | | | | | | | | | | | | | | | |
Net assets, end of period (in 000s) | | $ | 205,107 | | | $ | 213,660 | | | $ | 228,594 | | | $ | 325,556 | | | $ | 385,784 | | | $ | 368,091 | |
Ratios to average net assets: | | | | | | | | | | | | | | | | | | | | | | | | |
Total expenses(c) | | | 1.23 | %(f) | | | 1.24 | % | | | 1.26 | % | | | 1.20 | % | | | 1.19 | % | | | 1.19 | % |
Net expenses(c) | | | 1.00 | %(f) | | | 1.00 | % | | | 0.99 | % | | | 1.00 | % | | | 1.02 | % | | | 1.00 | % |
Net investment income (loss)(c) | | | 0.52 | %(f) | | | 1.98 | % | | | 2.41 | % | | | 2.26 | % | | | 2.46 | % | | | 2.41 | % |
Portfolio turnover rate | | | 39 | %(g) | | | 94 | % | | | 105 | % | | | 60 | % | | | 74 | % | | | 54 | % |
| (a) | | Beginning with the year ended August 31, 2015, the Funds were audited by Ernst & Young LLP. The previous years/periods were audited by another independent registered public accounting firm. |
| (b) | | Average daily shares outstanding were used for this calculation. |
| (c) | | May reflect amounts waived and/or reimbursed by the investment adviser and for certain funds, custody credit arrangements. |
| (d) | | Total return is calculated assuming a purchase of shares at net asset value on the first day and a sale at net asset value on the last day of each period reported. Distributions are assumed, for the purpose of this calculation, to be reinvested at net asset value per share on the respective payment dates of the Fund. Total return for periods of less than one year are not annualized. Results represent past performance and are not indicative of future results. |
| (e) | | If the Adviser had not made a contribution during the period ended August 31, 2013, the total return would have remained 19.45%. |
See accompanying notes to financial statements.
SSGA Funds
Financial Highlights
Selected data for a share outstanding throughout each period
| | | | | | | | | | | | | | | | | | | | |
| | | SSGA International Stock Selection Fund | |
| | | Class A | |
| | | Six Months
Ended
2/28/18
(Unaudited) | | | Year Ended
8/31/17 | | | Year Ended
8/31/16 | | | Year Ended
8/31/15 | | | For the
Period
7/7/14* -
8/31/14(a) | |
Net asset value, beginning of period | | $ | 11.76 | | | $ | 10.05 | | | $ | 10.64 | | | $ | 11.23 | | | $ | 11.54 | |
| | | | | | | | | | | | | | | | | | | | |
Income (loss) from investment operations: | | | | | | | | | | | | | | | | | | | | |
Net investment income (loss)(b)(c) | | | 0.01 | | | | 0.27 | | | | 0.27 | | | | 0.24 | | | | 0.03 | |
Net realized and unrealized gain (loss) | | | 0.20 | | | | 1.69 | | | | (0.58 | ) | | | (0.73 | ) | | | (0.34 | ) |
| | | | | | | | | | | | | | | | | | | | |
Total from investment operations | | | 0.21 | | | | 1.96 | | | | (0.31 | ) | | | (0.49 | ) | | | (0.31 | ) |
| | | | | | | | | | | | | | | | | | | | |
Distributions to shareholders from: | | | | | | | | | | | | | | | | | | | | |
Net investment income | | | (0.43 | ) | | | (0.25 | ) | | | (0.28 | ) | | | (0.10 | ) | | | — | |
| | | | | | | | | | | | | | | | | | | | |
Net asset value, end of period | | $ | 11.54 | | | $ | 11.76 | | | $ | 10.05 | | | $ | 10.64 | | | $ | 11.23 | |
| | | | | | | | | | | | | | | | | | | | |
Total return(d) | | | 1.85 | % | | | 19.95 | % | | | (2.89 | )% | | | (4.39 | )% | | | (2.69 | )% |
Ratios and Supplemental Data: | | | | | | | | | | | | | | | | | | | | |
Net assets, end of period (in 000s) | | $ | 6,956 | | | $ | 6,679 | | | $ | 284 | | | $ | 16 | | | $ | 10 | |
Ratios to average net assets: | | | | | | | | | | | | | | | | | | | | |
Total expenses(c) | | | 1.54 | %(e) | | | 1.31 | % | | | 1.46 | % | | | 1.40 | % | | | 1.50 | %(e) |
Net expenses(c) | | | 1.31 | %(e) | | | 1.07 | % | | | 1.19 | % | | | 1.20 | % | | | 1.17 | %(e) |
Net investment income (loss)(c) | | | 0.20 | %(e) | | | 2.51 | % | | | 2.73 | % | | | 2.16 | % | | | 1.65 | %(e) |
Portfolio turnover rate | | | 39 | %(f) | | | 94 | % | | | 105 | % | | | 60 | % | | | 74 | %(f) |
| * | | Commencement of operations. |
| (a) | | Beginning with the year ended August 31, 2015, the Funds were audited by Ernst & Young LLP. The previous years/periods were audited by another independent registered public accounting firm. |
| (b) | | Average daily shares outstanding were used for this calculation. |
| (c) | | May reflect amounts waived and/or reimbursed by the investment adviser and for certain funds, custody credit arrangements. |
| (d) | | Total return is calculated assuming a purchase of shares at net asset value on the first day and a sale at net asset value on the last day of each period reported. Distributions are assumed, for the purpose of this calculation, to be reinvested at net asset value per share on the respective payment dates of the Fund. Total return for periods of less than one year are not annualized. Results represent past performance and are not indicative of future results. |
See accompanying notes to financial statements.
SSGA Funds
Financial Highlights
Selected data for a share outstanding throughout each period
| | | | | | | | | | | | | | | | | | | | |
| | | SSGA International Stock Selection Fund | |
| | | Class I | |
| | | Six Months
Ended
2/28/18
(Unaudited) | | | Year Ended
8/31/17 | | | Year Ended
8/31/16 | | | Year Ended
8/31/15 | | | For the
Period
7/7/14* -
8/31/14(a) | |
Net asset value, beginning of period | | $ | 11.81 | | | $ | 10.10 | | | $ | 10.65 | | | $ | 11.24 | | | $ | 11.54 | |
| | | | | | | | | | | | | | | | | | | | |
Income (loss) from investment operations | | | | | | | | | | | | | | | | | | | | |
Net investment income (loss)(b)(c) | | | 0.04 | | | | 0.25 | | | | 0.25 | | | | 0.29 | | | | 0.03 | |
Net realized and unrealized gain (loss) | | | 0.21 | | | | 1.74 | | | | (0.53 | ) | | | (0.76 | ) | | | (0.33 | ) |
| | | | | | | | | | | | | | | | | | | | |
Total from investment operations | | | 0.25 | | | | 1.99 | | | | (0.28 | ) | | | (0.47 | ) | | | (0.30 | ) |
| | | | | | | | | | | | | | | | | | | | |
Distributions to shareholders from: | | | | | | | | | | | | | | | | | | | | |
Net investment income | | | (0.46 | ) | | | (0.28 | ) | | | (0.27 | ) | | | (0.12 | ) | | | — | |
| | | | | | | | | | | | | | | | | | | | |
Net asset value, end of period | | $ | 11.60 | | | $ | 11.81 | | | $ | 10.10 | | | $ | 10.65 | | | $ | 11.24 | |
| | | | | | | | | | | | | | | | | | | | |
Total return(d) | | | 2.09 | % | | | 20.23 | % | | | (2.60 | )% | | | (4.21 | )% | | | (2.60 | )% |
Ratios and Supplemental Data: | | | | | | | | | | | | | | | | | | | | |
Net assets, end of period (in 000s) | | $ | 2,164 | | | $ | 594 | | | $ | 432 | | | $ | 499 | | | $ | 10 | |
Ratios to average net assets: | | | | | | | | | | | | | | | | | | | | |
Total expenses(c) | | | 1.02 | %(e) | | | 1.09 | % | | | 1.21 | % | | | 1.16 | % | | | 1.24 | %(e) |
Net expenses(c) | | | 0.75 | %(e) | | | 0.85 | % | | | 0.94 | % | | | 0.95 | % | | | 0.92 | %(e) |
Net investment income (loss)(c) | | | 0.73 | %(e) | | | 2.33 | % | | | 2.45 | % | | | 2.61 | % | | | 1.90 | %(e) |
Portfolio turnover rate | | | 39 | %(f) | | | 94 | % | | | 105 | % | | | 60 | % | | | 74 | %(f) |
| * | | Commencement of operations. |
| (a) | | Beginning with the year ended August 31, 2015, the Funds were audited by Ernst & Young LLP. The previous years/periods were audited by another independent registered public accounting firm. |
| (b) | | Average daily shares outstanding were used for this calculation. |
| (c) | | May reflect amounts waived and/or reimbursed by the investment adviser and for certain funds, custody credit arrangements. |
| (d) | | Total return is calculated assuming a purchase of shares at net asset value on the first day and a sale at net asset value on the last day of each period reported. Distributions are assumed, for the purpose of this calculation, to be reinvested at net asset value per share on the respective payment dates of the Fund. Total return for periods of less than one year are not annualized. Results represent past performance and are not indicative of future results. |
See accompanying notes to financial statements.
SSGA Funds
Financial Highlights
Selected data for a share outstanding throughout each period
| | | | | | | | | | | | | | | | | | | | |
| | | SSGA International Stock Selection Fund | |
| | | Class K | |
| | | Six Months
Ended
2/28/18
(Unaudited) | | | Year Ended
8/31/17 | | | Year Ended
8/31/16 | | | Year Ended
8/31/15 | | | For the
Period
7/7/14* -
8/31/14(a) | |
Net asset value, beginning of period | | $ | 11.82 | | | $ | 10.12 | | | $ | 10.67 | | | $ | 11.24 | | | $ | 11.54 | |
| | | | | | | | | | | | | | | | | | | | |
Income (loss) from investment operations | | | | | | | | | | | | | | | | | | | | |
Net investment income (loss)(b)(c) | | | 0.05 | | | | 0.25 | | | | 0.28 | | | | 0.28 | | | | 0.04 | |
Net realized and unrealized gain (loss) | | | 0.19 | | | | 1.75 | | | | (0.54 | ) | | | (0.73 | ) | | | (0.34 | ) |
| | | | | | | | | | | | | | | | | | | | |
Total from investment operations | | | 0.24 | | | | 2.00 | | | | (0.26 | ) | | | (0.45 | ) | | | (0.30 | ) |
| | | | | | | | | | | | | | | | | | | | |
Distributions to shareholders from: | | | | | | | | | | | | | | | | | | | | |
Net investment income | | | (0.46 | ) | | | (0.30 | ) | | | (0.29 | ) | | | (0.12 | ) | | | — | |
| | | | | | | | | | | | | | | | | | | | |
Net asset value, end of period | | $ | 11.60 | | | $ | 11.82 | | | $ | 10.12 | | | $ | 10.67 | | | $ | 11.24 | |
| | | | | | | | | | | | | | | | | | | | |
Total return(d) | | | 2.13 | % | | | 20.25 | % | | | (2.44 | )% | | | (4.01 | )% | | | (2.60 | )% |
Ratios and Supplemental Data: | | | | | | | | | | | | | | | | | | | | |
Net assets, end of period (in 000s) | | $ | 74,546 | | | $ | 80,137 | | | $ | 75,816 | | | $ | 9 | | | $ | 10 | |
Ratios to average net assets: | | | | | | | | | | | | | | | | | | | | |
Total expenses(c) | | | 0.99 | %(e) | | | 0.99 | % | | | 0.99 | % | | | 0.96 | % | | | 1.11 | %(e) |
Net expenses(c) | | | 0.75 | %(e) | | | 0.75 | % | | | 0.73 | % | | | 0.75 | % | | | 0.73 | %(e) |
Net investment income (loss)(c) | | | 0.77 | %(e) | | | 2.37 | % | | | 2.79 | % | | | 2.54 | % | | | 2.09 | %(e) |
Portfolio turnover rate | | | 39 | %(f) | | | 94 | % | | | 105 | % | | | 60 | % | | | 74 | %(f) |
| * | | Commencement of operations. |
| (a) | | Beginning with the year ended August 31, 2015, the Funds were audited by Ernst & Young LLP. The previous years/periods were audited by another independent registered public accounting firm. |
| (b) | | Average daily shares outstanding were used for this calculation. |
| (c) | | May reflect amounts waived and/or reimbursed by the investment adviser and for certain funds, custody credit arrangements. |
| (d) | | Total return is calculated assuming a purchase of shares at net asset value on the first day and a sale at net asset value on the last day of each period reported. Distributions are assumed, for the purpose of this calculation, to be reinvested at net asset value per share on the respective payment dates of the Fund. Total return for periods of less than one year are not annualized. Results represent past performance and are not indicative of future results. |
See accompanying notes to financial statements.
SSGA Funds
Financial Highlights
Selected data for a share outstanding throughout each period
| | | | | | | | | | | | | | | | | | | | | | | | |
| | | SSGA High Yield Bond Fund | |
| | | Class N | |
| | | Six Months
Ended
2/28/18
(Unaudited) | | | Year Ended
8/31/17 | | | Year Ended
8/31/16 | | | Year Ended
8/31/15 | | | Year Ended
8/31/14(a) | | | Year Ended
8/31/13(a) | |
Net asset value, beginning of period | | $ | 7.64 | | | $ | 7.50 | | | $ | 7.55 | | | $ | 8.36 | | | $ | 8.40 | | | $ | 8.36 | |
| | | | | | | | | | | | | | | | | | | | | | | | |
Income (loss) from investment operations: | | | | | | | | | | | | | | | | | | | | | | | | |
Net investment income (loss)(b)(c) | | | 0.19 | | | | 0.39 | | | | 0.40 | | | | 0.42 | | | | 0.47 | | | | 0.49 | |
Net realized and unrealized gain (loss) | | | (0.15 | ) | | | 0.16 | | | | (0.03 | ) | | | (0.62 | ) | | | 0.36 | | | | 0.08 | |
| | | | | | | | | | | | | | | | | | | | | | | | |
Total from investment operations | | | 0.04 | | | | 0.55 | | | | 0.37 | | | | (0.20 | ) | | | 0.83 | | | | 0.57 | |
| | | | | | | | | | | | | | | | | | | | | | | | |
Distributions to shareholders from: | | | | | | | | | | | | | | | | | | | | | | | | |
Net investment income | | | (0.20 | ) | | | (0.41 | ) | | | (0.42 | ) | | | (0.46 | ) | | | (0.47 | ) | | | (0.51 | ) |
Net realized gains | | | — | | | | — | | | | — | | | | (0.15 | ) | | | (0.40 | ) | | | (0.02 | ) |
| | | | | | | | | | | | | | | | | | | | | | | | |
Total distributions | | | (0.20 | ) | | | (0.41 | ) | | | (0.42 | ) | | | (0.61 | ) | | | (0.87 | ) | | | (0.53 | ) |
| | | | | | | | | | | | | | | | | | | | | | | | |
Net asset value, end of period | | $ | 7.48 | | | $ | 7.64 | | | $ | 7.50 | | | $ | 7.55 | | | $ | 8.36 | | | $ | 8.40 | |
| | | | | | | | | | | | | | | | | | | | | | | | |
Total return(d) | | | 0.54 | % | | | 7.47 | % | | | 5.21 | % | | | (2.38 | )% | | | 10.49 | % | | | 6.85 | % |
Ratios and Supplemental Data: | | | | | | | | | | | | | | | | | | | | | | | | |
Net assets, end of period (in 000s) | | $ | 39,086 | | | $ | 44,765 | | | $ | 53,726 | | | $ | 75,632 | | | $ | 89,027 | | | $ | 89,257 | |
Ratios to average net assets: | | | | | | | | | | | | | | | | | | | | | | | | |
Total expenses(c) | | | 1.06 | %(e) | | | 1.03 | % | | | 1.02 | % | | | 0.92 | % | | | 0.78 | % | | | 0.79 | % |
Net expenses(c) | | | 0.74 | %(e) | | | 0.74 | % | | | 0.68 | % | | | 0.75 | % | | | 0.73 | % | | | 0.75 | % |
Net investment income (loss)(c) | | | 5.01 | %(e) | | | 5.14 | % | | | 5.48 | % | | | 5.38 | % | | | 5.61 | % | | | 5.70 | % |
Portfolio turnover rate | | | 25 | %(f) | | | 56 | % | | | 77 | % | | | 100 | % | | | 79 | % | | | 112 | % |
| (a) | | Beginning with the year ended August 31, 2015, the Funds were audited by Ernst & Young LLP. The previous years/periods were audited by another independent registered public accounting firm. |
| (b) | | Average daily shares outstanding were used for this calculation. |
| (c) | | May reflect amounts waived and/or reimbursed by the investment adviser and for certain funds, custody credit arrangements. |
| (d) | | Total return is calculated assuming a purchase of shares at net asset value on the first day and a sale at net asset value on the last day of each period reported. Distributions are assumed, for the purpose of this calculation, to be reinvested at net asset value per share on the respective payment dates of the Fund. Total return for periods of less than one year are not annualized. Results represent past performance and are not indicative of future results. |
See accompanying notes to financial statements.
SSGA Funds
Financial Highlights
Selected data for a share outstanding throughout each period
| | | | | | | | | | | | | | | | | | | | |
| | | SSGA High Yield Bond Fund | |
| | | Class A | |
| | | Six Months
Ended
2/28/18
(Unaudited) | | | Year Ended
8/31/17 | | | Year Ended
8/31/16 | | | Year Ended
8/31/15 | | | For the
Period
7/7/14* -
8/31/14(a) | |
Net asset value, beginning of period | | $ | 7.65 | | | $ | 7.50 | | | $ | 7.55 | | | $ | 8.36 | | | $ | 8.41 | |
| | | | | | | | | | | | | | | | | | | | |
Income (loss) from investment operations: | | | | | | | | | | | | | | | | | | | | |
Net investment income (loss)(b)(c) | | | 0.19 | | | | 0.39 | | | | 0.38 | | | | 0.41 | | | | 0.07 | |
Net realized and unrealized gain (loss) | | | (0.15 | ) | | | 0.15 | | | | (0.03 | ) | | | (0.63 | ) | | | (0.07 | ) |
| | | | | | | | | | | | | | | | | | | | |
Total from investment operations | | | 0.04 | | | | 0.54 | | | | 0.35 | | | | (0.22 | ) | | | — | |
| | | | | | | | | | | | | | | | | | | | |
Distributions to shareholders from: | | | | | | | | | | | | | | | | | | | | |
Net investment income | | | (0.20 | ) | | | (0.39 | ) | | | (0.40 | ) | | | (0.44 | ) | | | (0.05 | ) |
Net realized gains | | | — | | | | — | | | | — | | | | (0.15 | ) | | | — | |
| | | | | | | | | | | | | | | | | | | | |
Total distributions | | | (0.20 | ) | | | (0.39 | ) | | | (0.40 | ) | | | (0.59 | ) | | | (0.05 | ) |
| | | | | | | | | | | | | | | | | | | | |
Net asset value, end of period | | $ | 7.49 | | | $ | 7.65 | | | $ | 7.50 | | | $ | 7.55 | | | $ | 8.36 | |
| | | | | | | | | | | | | | | | | | | | |
Total return(d) | | | 0.53 | % | | | 7.36 | % | | | 5.02 | % | | | (2.57 | )% | | | (0.05 | )% |
Ratios and Supplemental Data: | | | | | | | | | | | | | | | | | | | | |
Net assets, end of period (in 000s) | | $ | 85 | | | $ | 91 | | | $ | 11 | | | $ | 9 | | | $ | 10 | |
Ratios to average net assets: | | | | | | | | | | | | | | | | | | | | |
Total expenses(c) | | | 1.07 | %(e) | | | 1.08 | % | | | 1.25 | % | | | 1.11 | % | | | 1.19 | %(e) |
Net expenses(c) | | | 0.75 | %(e) | | | 0.80 | % | | | 0.91 | % | | | 0.94 | % | | | 0.93 | %(e) |
Net investment income (loss)(c) | | | 5.01 | %(e) | | | 5.15 | % | | | 5.22 | % | | | 5.21 | % | | | 5.18 | %(e) |
Portfolio turnover rate | | | 25 | %(f) | | | 56 | % | | | 77 | % | | | 100 | % | | | 79 | %(f) |
| * | | Commencement of operations. |
| (a) | | Beginning with the year ended August 31, 2015, the Funds were audited by Ernst & Young LLP. The previous years/periods were audited by another independent registered public accounting firm. |
| (b) | | Average daily shares outstanding were used for this calculation. |
| (c) | | May reflect amounts waived and/or reimbursed by the investment adviser and for certain funds, custody credit arrangements. |
| (d) | | Total return is calculated assuming a purchase of shares at net asset value on the first day and a sale at net asset value on the last day of each period reported. Distributions are assumed, for the purpose of this calculation, to be reinvested at net asset value per share on the respective payment dates of the Fund. Total return for periods of less than one year are not annualized. Results represent past performance and are not indicative of future results. |
See accompanying notes to financial statements.
SSGA Funds
Financial Highlights
Selected data for a share outstanding throughout each period
| | | | | | | | | | | | | | | | | | | | |
| | | SSGA High Yield Bond Fund | |
| | | Class I | |
| | | Six Months
Ended
2/28/18
(Unaudited) | | | Year Ended
8/31/17 | | | Year Ended
8/31/16 | | | Year Ended
8/31/15 | | | For the
Period
7/7/14* -
8/31/14(a) | |
Net asset value, beginning of period | | $ | 7.65 | | | $ | 7.51 | | | $ | 7.56 | | | $ | 8.36 | | | $ | 8.41 | |
| | | | | | | | | | | | | | | | | | | | |
Income (loss) from investment operations | | | | | | | | | | | | | | | | | | | | |
Net investment income (loss)(b)(c) | | | 0.20 | | | | 0.40 | | | | 0.40 | | | | 0.42 | | | | 0.07 | |
Net realized and unrealized gain (loss) | | | (0.16 | ) | | | 0.15 | | | | (0.03 | ) | | | (0.61 | ) | | | (0.07 | ) |
| | | | | | | | | | | | | | | | | | | | |
Total from investment operations | | | 0.04 | | | | 0.55 | | | | 0.37 | | | | (0.19 | ) | | | — | |
| | | | | | | | | | | | | | | | | | | | |
Distributions to shareholders from: | | | | | | | | | | | | | | | | | | | | |
Net investment income | | | (0.21 | ) | | | (0.41 | ) | | | (0.42 | ) | | | (0.46 | ) | | | (0.05 | ) |
Net realized gains | | | — | | | | — | | | | — | | | | (0.15 | ) | | | — | |
| | | | | | | | | | | | | | | | | | | | |
Total distributions | | | (0.21 | ) | | | (0.41 | ) | | | (0.42 | ) | | | (0.61 | ) | | | (0.05 | ) |
| | | | | | | | | | | | | | | | | | | | |
Net asset value, end of period | | $ | 7.48 | | | $ | 7.65 | | | $ | 7.51 | | | $ | 7.56 | | | $ | 8.36 | |
| | | | | | | | | | | | | | | | | | | | |
Total return(d) | | | 0.53 | % | | | 7.60 | % | | | 5.26 | % | | | (2.22 | )% | | | (0.03 | )% |
Ratios and Supplemental Data: | | | | | | | | | | | | | | | | | | | | |
Net assets, end of period (in 000s) | | $ | 940 | | | $ | 948 | | | $ | 342 | | | $ | 467 | | | $ | 10 | |
Ratios to average net assets: | | | | | | | | | | | | | | | | | | | | |
Total expenses(c) | | | 0.85 | %(e) | | | 0.86 | % | | | 1.01 | % | | | 0.87 | % | | | 0.94 | %(e) |
Net expenses(c) | | | 0.53 | %(e) | | | 0.57 | % | | | 0.67 | % | | | 0.70 | % | | | 0.68 | %(e) |
Net investment income (loss)(c) | | | 5.22 | %(e) | | | 5.36 | % | | | 5.48 | % | | | 5.42 | % | | | 5.43 | %(e) |
Portfolio turnover rate | | | 25 | %(f) | | | 56 | % | | | 77 | % | | | 100 | % | | | 79 | %(f) |
| * | | Commencement of operations. |
| (a) | | Beginning with the year ended August 31, 2015, the Funds were audited by Ernst & Young LLP. The previous years/periods were audited by another independent registered public accounting firm. |
| (b) | | Average daily shares outstanding were used for this calculation. |
| (c) | | May reflect amounts waived and/or reimbursed by the investment adviser and for certain funds, custody credit arrangements. |
| (d) | | Total return is calculated assuming a purchase of shares at net asset value on the first day and a sale at net asset value on the last day of each period reported. Distributions are assumed, for the purpose of this calculation, to be reinvested at net asset value per share on the respective payment dates of the Fund. Total return for periods of less than one year are not annualized. Results represent past performance and are not indicative of future results. |
See accompanying notes to financial statements.
SSGA Funds
Financial Highlights
Selected data for a share outstanding throughout each period
| | | | | | | | | | | | | | | | | | | | |
| | | SSGA High Yield Bond Fund | |
| | | Class K | |
| | | Six Months
Ended
2/28/18
(Unaudited) | | | Year Ended
8/31/17 | | | Year Ended
8/31/16 | | | Year Ended
8/31/15 | | | For the
Period
7/7/14* -
8/31/14(a) | |
Net asset value, beginning of period | | $ | 7.64 | | | $ | 7.50 | | | $ | 7.56 | | | $ | 8.36 | | | $ | 8.41 | |
| | | | | | | | | | | | | | | | | | | | |
Income (loss) from investment operations | |
Net investment income (loss)(b)(c) | | | 0.20 | | | | 0.41 | | | | 0.39 | | | | 0.45 | | | | 0.07 | |
Net realized and unrealized gain (loss) | | | (0.15 | ) | | | 0.15 | | | | (0.02 | ) | | | (0.62 | ) | | | (0.07 | ) |
| | | | | | | | | | | | | | | | | | | | |
Total from investment operations | | | 0.05 | | | | 0.56 | | | | 0.37 | | | | (0.17 | ) | | | — | |
| | | | | | | | | | | | | | | | | | | | |
Distributions to shareholders from: | |
Net investment income | | | (0.21 | ) | | | (0.42 | ) | | | (0.43 | ) | | | (0.48 | ) | | | (0.05 | ) |
Net realized gains | | | — | | | | — | | | | — | | | | (0.15 | ) | | | — | |
| | | | | | | | | | | | | | | | | | | | |
Total distributions | | | (0.21 | ) | | | (0.42 | ) | | | (0.43 | ) | | | (0.63 | ) | | | (0.05 | ) |
| | | | | | | | | | | | | | | | | | | | |
Net asset value, end of period | | $ | 7.48 | | | $ | 7.64 | | | $ | 7.50 | | | $ | 7.56 | | | $ | 8.36 | |
| | | | | | | | | | | | | | | | | | | | |
Total return(d) | | | 0.66 | % | | | 7.73 | % | | | 5.32 | % | | | (2.16 | )% | | | (0.02 | )% |
Ratios and Supplemental Data: | |
Net assets, end of period (in 000s) | | $ | 22,121 | | | $ | 24,175 | | | $ | 28,011 | | | $ | 9 | | | $ | 10 | |
Ratios to average net assets: | |
Total expenses(c) | | | 0.82 | %(e) | | | 0.79 | % | | | 0.77 | % | | | 0.67 | % | | | 0.81 | %(e) |
Net expenses(c) | | | 0.50 | %(e) | | | 0.50 | % | | | 0.42 | % | | | 0.50 | % | | | 0.50 | %(e) |
Net investment income (loss)(c) | | | 5.25 | %(e) | | | 5.39 | % | | | 5.41 | % | | | 5.66 | % | | | 5.63 | %(e) |
Portfolio turnover rate | | | 25 | %(f) | | | 56 | % | | | 77 | % | | | 100 | % | | | 79 | %(f) |
| * | | Commencement of operations. |
| (a) | | Beginning with the year ended August 31, 2015, the Funds were audited by Ernst & Young LLP. The previous years/periods were audited by another independent registered public accounting firm. |
| (b) | | Average daily shares outstanding were used for this calculation. |
| (c) | | May reflect amounts waived and/or reimbursed by the investment adviser and for certain funds, custody credit arrangements. |
| (d) | | Total return is calculated assuming a purchase of shares at net asset value on the first day and a sale at net asset value on the last day of each period reported. Distributions are assumed, for the purpose of this calculation, to be reinvested at net asset value per share on the respective payment dates of the Fund. Total return for periods of less than one year are not annualized. Results represent past performance and are not indicative of future results. |
See accompanying notes to financial statements.
SSGA Funds
Notes to Financial Statements — February 28, 2018 (Unaudited)
The SSGA Funds (the “Trust”), a Massachusetts business trust registered under the Investment Company Act of 1940, as amended (“1940 Act”), is an open-end management investment company.
As of February 28, 2018, the Trust consists of five (5) series (and corresponding classes, each of which have the same rights and privileges, including voting rights), each of which represents a separate series of beneficial interest in the Trust. The Declaration of Trust permits the Board of Trustees of the Trust (the “Board”) to authorize the issuance of an unlimited number of shares of beneficial interest at $0.001 par value. The financial statements herein relate to the following series (each a “Fund”, and collectively, the “Funds”):
| | | | | | |
| Fund | | Classes | | Commencement of
Operations: | | Diversification
Classification |
SSGA Dynamic Small Cap Fund | | Class N Class A Class I Class K | | July 1, 1992 July 7, 2014 July 7, 2014 July 7, 2014 | | Diversified |
State Street Disciplined Emerging Markets Equity Fund | | Class N Class A Class I Class K | | March 1, 1994 July 7, 2014 July 7, 2014 July 7, 2014 | | Diversified |
SSGA International Stock Selection Fund | | Class N Class A Class I Class K | | March 7, 1995 July 7, 2014 July 7, 2014 July 7, 2014 | | Diversified |
SSGA High Yield Bond Fund | | Class N Class A Class I Class K | | May 4, 1998 July 7, 2014 July 7, 2014 July 7, 2014 | | Diversified |
On November 20, 2017, the SSGA Enhanced Small Cap Fund was liquidated and closed.
On August 26, 2016, the Funds’ Class C Shares were converted to Class A Shares.
Class A shares are available to the general public for investment through transaction-based financial intermediaries. Class A shares impose a sales charge (as a percentage of offering price) and may be subject to a 1.00% contingent deferred sales charge (“CDSC”) if no initial sales charge was paid at the time of purchase of an investment of $1,000,000 or more and the shares are redeemed within 18 months of purchase. Class N, Class I and Class K shares are sold without a sales charge and only to certain eligible investors.
Under the Trust’s organizational documents, its officers and trustees are indemnified against certain liabilities arising out of the performance of their duties to the Trust. Additionally, in the normal course of business, the Trust enters into contracts with service providers that contain general indemnification clauses. The Trust’s maximum exposure under these arrangements is unknown as this would involve future claims that may be made against the Trust that have not yet occurred.
| 2. | | Summary of Significant Accounting Policies |
The following is a summary of significant accounting policies followed by the Trust in the preparation of its financial statements:
The preparation of financial statements in accordance with U.S. generally accepted accounting principles (“U.S. GAAP”) requires management to make estimates and assumptions that affect the reported amounts and disclosures in the financial statements. Actual results could differ from those estimates. Each Fund is an investment company under U.S. GAAP and follows the accounting and reporting guidance applicable to investment companies.
| | | | |
| Notes to Financial Statements | | | 51 | |
SSGA Funds
Notes to Financial Statements, continued — February 28, 2018 (Unaudited)
Security Valuation
Each Fund’s investments are valued at fair value each day that the New York Stock Exchange (“NYSE”) is open and, for financial reporting purposes, as of the report date should the reporting period end on a day that the NYSE is not open. Fair value is generally defined as the price a fund would receive to sell an asset or pay to transfer a liability in an orderly transaction between market participants at the measurement date. By its nature, a fair value price is a good faith estimate of the valuation in a current sale and may not reflect an actual market price. The investments of each Fund are valued pursuant to the policy and procedures developed by the Oversight Committee (the “Committee”) and approved by the Board. The Committee provides oversight of the valuation of investments for the Funds. The Board has responsibility for determining the fair value of investments.
Valuation techniques used to value each Fund’s investments by major category are as follows:
| | • | | Equity investments traded on a recognized securities exchange for which market quotations are readily available are valued at the last sale price or official closing price, as applicable, on the primary market or exchange on which they trade. Equity investments traded on a recognized exchange for which there were no sales on that day are valued at the last published sale price or at fair value. |
| | • | | Rights and warrants are valued at the last reported sale price obtained from independent pricing services or brokers on the valuation date. If no price is obtained from pricing services or brokers, valuation will be based upon the intrinsic value, pursuant to the valuation policy and procedures approved by the Board. |
| | • | | Investments in registered investment companies (including money market funds) or other unitized pooled investment vehicles that are not traded on an exchange are valued at that day’s published net asset value (NAV) per share or unit. |
| | • | | Debt obligations (including short-term investments) are valued using quotations from independent pricing services or brokers or are generally valued at the last reported evaluated prices. |
| | • | | Exchange-traded futures contracts are valued at the closing settlement price on the primary market on which they are traded most extensively. Exchange-traded futures contracts traded on a recognized exchange for which there were no sales on that day are valued at the last reported sale price obtained from independent pricing services or brokers or at fair value. |
| | • | | Swap agreements are valued daily based upon prices supplied by Board approved pricing vendors or through brokers. Depending on the product and terms of the transaction, the value of agreements is determined using a series of techniques including valuation models that incorporate a number of market data factors, such as discounted cash flows, yields, curves, trades and values of the underlying reference instruments. In the event SSGA Funds Management, Inc. (the “Adviser” or “SSGA FM”) is unable to obtain an independent, third–party valuation, the agreements will be fair valued. |
In the event prices or quotations are not readily available or that the application of these valuation methods results in a price for an investment that is deemed to be not representative of the fair value of such investment, fair value will be determined in good faith by the Committee, in accordance with the valuation policy and procedures approved by the Board.
Various inputs are used in determining the value of the Funds’ investments.
The Funds value their assets and liabilities at fair value using a fair value hierarchy consisting of three broad levels that prioritize the inputs to valuation techniques giving the highest priority to readily available unadjusted quoted prices in active markets for identical assets or liabilities (Level 1 measurements) and the lowest priority to unobservable inputs (Level 3 measurements) when market prices are not readily available or reliable. The categorization of a value determined for an investment within the hierarchy is based upon the pricing transparency of the investment and is not necessarily an indication of the risk associated with investing in it.
The three levels of the fair value hierarchy are as follows:
| | • | | Level 1 — Unadjusted quoted prices in active markets for an identical asset or liability; |
| | • | | Level 2 — Inputs other than quoted prices included within Level 1 that are observable for the asset or liability either directly or indirectly, including quoted prices for similar assets or liabilities in active markets, quoted prices for identical |
| | |
| 52 | | Notes to Financial Statements |
SSGA Funds
Notes to Financial Statements, continued — February 28, 2018 (Unaudited)
| | or similar assets or liabilities in markets that are not considered to be active, inputs other than quoted prices that are observable for the asset or liability (such as exchange rates, financing terms, interest rates, yield curves, volatilities, prepayment speeds, loss severities, credit risks and default rates) or other market-corroborated inputs; and |
| | • | | Level 3 — Unobservable inputs for the asset or liability, including the Committee’s assumptions used in determining the fair value of investments. |
The value of each Fund’s investments according to the fair value hierarchy as of February 28, 2018, is disclosed in each respective Fund’s Schedule of Investments.
Changes in valuation techniques may result in transfers in or out of an assigned level within the fair value hierarchy. Transfers between different levels of the fair value hierarchy are recognized at the end of the reporting period.
The Funds had no transfers between levels for the period ended February 28, 2018.
Investment Transactions and Income Recognition
Investment transactions are accounted for on trade date for financial reporting purposes. Realized gains and losses from the sale or disposition of investments and foreign exchange transactions, if any, are determined using the identified cost method. Dividend income and capital gain distributions, if any, are recognized on the ex-dividend date, net of any foreign taxes withheld at the source, if any. Interest income is recorded daily on an accrual basis. All premiums and discounts are amortized/accreted for financial reporting purposes. Non-cash dividends received in the form of stock are recorded as dividend income at fair value.
Certain Funds invest in real estate investment trusts (“REITs”). REITs determine the tax character of their distributions annually and may characterize a portion of their distributions as a return of capital or capital gain. The Funds’ policy is to record all REIT distributions initially as dividend income and re-designate the prior calendar year’s to return of capital or capital gains distributions at year end based on information provided by the REIT and/or Adviser estimates of such re-designations for which actual information has not yet been reported.
Expenses
Certain expenses, which are directly identifiable to a specific Fund, are applied to that Fund within the Trust. Other expenses which cannot be attributed to a specific Fund are allocated in such a manner as deemed equitable, taking into consideration the nature and type of expense and the relative net assets of the Funds within the Trust. Class specific expenses are borne by each class.
Foreign Currency Translation
The accounting records of the Funds are maintained in U.S. dollars. Foreign currencies as well as investment securities and other assets and liabilities denominated in a foreign currency are translated to U.S. dollars using exchange rates at period end. Purchases and sales of securities, income receipts and expense payments denominated in foreign currencies are translated into U.S. dollars at the prevailing exchange rate on the respective dates of the transactions.
The effects of exchange rate fluctuations on investments are included with the net realized and unrealized gain (loss) on investment securities. Other foreign currency transactions resulting in realized and unrealized gain (loss) are disclosed separately.
Foreign Taxes
The Funds may be subject to foreign taxes (a portion of which may be reclaimable) on income, stock dividends, realized and unrealized capital gains on investments or certain foreign currency transactions. Foreign taxes are recorded in accordance with SSGA FM’s understanding of the applicable foreign tax regulations and rates that exist in the foreign jurisdictions in which the Funds invest. These foreign taxes, if any, are paid by the Funds and are reflected in the Statements of Operations, if applicable. Foreign taxes payable or deferred as of February 28, 2018, if any, are disclosed in the Funds’ Statements of Assets and Liabilities.
| | | | |
| Notes to Financial Statements | | | 53 | |
SSGA Funds
Notes to Financial Statements, continued — February 28, 2018 (Unaudited)
Distributions
Distributions from net investment income, if any, are declared and paid annually for all Funds except for SSGA High Yield Bond Fund. The SSGA High Yield Bond Fund declares and distributes distributions to shareholders monthly. Net realized capital gains, if any, are distributed annually, unless additional distributions are required for compliance with applicable tax regulations. The amount and character of income and capital gains to be distributed are determined in accordance with applicable tax regulations which may differ from net investment income and realized gains recognized for U.S. GAAP purposes.
| 3. | | Derivative Financial Instruments |
Futures Contracts
Certain Funds may enter into futures contracts to meet the Funds’ objectives. A futures contract is a standardized, exchange-traded agreement to buy or sell a financial instrument at a set price on a future date. Upon entering into a futures contract, the Fund is required to deposit with the broker, cash or securities in an amount equal to the minimum initial margin requirements of the clearing house. Subsequent payments are made or received by the Funds equal to the daily change in the contract value and are recorded as variation margin receivable or payable with a corresponding offset to unrealized gains or losses. The Funds recognize a realized gain or loss when the contract is closed.
Losses may arise if the value of a futures contract decreases due to unfavorable changes in the market rates or values of the underlying instrument during the term of the contract or if the counterparty does not perform under the contract. The use of futures contracts also involves the risk that the movements in the price of the futures contracts do not correlate with the movement of the assets underlying such contracts.
For the period ended February 28, 2017, the following Funds entered into futures contracts for the strategies listed below:
| | |
| Fund | | Strategies |
SSGA Dynamic Small Cap Fund | | Exposing cash reserves to markets |
State Street Disciplined Emerging Markets Equity Fund | | Exposing cash reserves to markets |
SSGA International Stock Selection Fund | | Exposing cash reserves to markets |
Swaps
The SSGA High Yield Bond Fund may enter into swap agreements, in which the Fund and counterparty agree either to make periodic net payments on a specified notional amount or a net payment upon termination. Swap agreements are privately negotiated in the OTC market and may be entered into as a bilateral contract (“BL OTC”) or centrally cleared (“centrally cleared swaps”). Swaps are marked-to-market daily and changes in value are recorded as unrealized appreciation (depreciation).
A BL OTC swap is a transaction between a fund and dealer counterparty where cash flows are exchanged between the two parties for the life of the swap. For BL OTC swaps, any upfront premiums paid are recorded as assets and any upfront fees received are recorded as liabilities and are shown as credit default swap contracts premiums paid and credit default swap contracts premiums received, respectively, in the Statements of Assets and Liabilities and amortized to realized gain/loss ratably over the term of the BL OTC swap. Payments received or made by the Fund for BL OTC swaps are recorded in the Statements of Operations as realized gains or losses, respectively. When a BL OTC swap is terminated, the Fund will record a realized gain or loss equal to the difference between the proceeds from (or cost of) the closing transaction and the Fund’s basis in the contract, if any. Generally, the basis of the contracts is the premium received or paid.
A centrally cleared OTC swap is a transaction executed between a fund and a dealer counterparty, then cleared by a futures commission merchant (FCM) through a clearinghouse. Once cleared, the clearinghouse serves as a central counterparty (“CCP”), with whom a fund exchanges cash flows for the life of the transaction, similar to transactions in futures contracts.
The Fund is required to interface with the CCP through a broker. Upon entering into a centrally cleared swap, the Fund is required to deposit initial margin with the broker in the form of cash or securities in an amount that varies depending on the
| | |
| 54 | | Notes to Financial Statements |
SSGA Funds
Notes to Financial Statements, continued — February 28, 2018 (Unaudited)
size and risk profile of the particular swap. Securities deposited as initial margin if any, are designated on the Schedule of Investments and cash deposited is segregated and recorded on the Statement of Assets and Liabilities as due from broker. The daily change in valuation of centrally cleared swaps is recorded as a receivable or payable for variation margin in the Statement of Assets and Liabilities. Payments received from (paid to) the counterparty, including at termination, are recorded as realized gain (loss) in the Statement of Operations. For both bi-lateral and centrally cleared OTC swaps, payments are exchanged at specified intervals, accrued daily commencing with the effective date of the contract and recorded as realized gain or (loss). Some swaps may be terminated prior to the effective date and realize a gain or loss upon termination.
Credit Default Swaps
The SSGA High Yield Bond Fund may enter into a credit default swap for hedging purposes or to seek to increase total return of the Fund as well as managing the liquidity profile of the Fund. Credit default swap contracts may be entered into OTC or may be executed through a clearinghouse (“cleared credit default swap”). The Fund enters into these transactions primarily to preserve a return or spread on a particular investment or portion of its portfolio or to protect against any increase in the price of securities it anticipates purchasing at a later date. These transactions are intended to be used as a hedge and not as a speculative investment. Accordingly, the Fund does not follow hedge accounting, even for derivatives employed as economic hedges.
Credit default swaps are typically governed by the standard terms and conditions of an International Swaps and Derivatives Association (“ISDA”) Master Agreements or similar agreements (“Master Agreements”). A credit default swap involves a protection buyer and a protection seller. The Fund may be either a protection buyer or seller. Credit default swaps enable the Fund to buy or sell protection against specified credit events on a single-name issuer or a traded credit index. Under the terms of a credit default swap the buyer of protection (buyer) receives credit protection in exchange for making periodic payments to the seller of protection (seller) based on a fixed percentage applied to a notional principal amount. In return for these payments, the seller will be required to make a payment upon the occurrence of one or more specified credit events. The Fund enters into credit default swaps as a seller to gain credit exposure to an issuer and/or as a buyer to obtain a measure of protection against defaults of an issuer. Periodic payments are made over the life of the contract by the buyer provided that no credit event occurs. For credit default swaps on most corporate and sovereign issuers, credit events include bankruptcy, failure to pay or repudiation/moratorium. For credit default swaps on corporate or sovereign issuers, the obligation that may be put to the seller is not limited to the specific reference obligation described in the Schedule of Investments. For credit default swaps on asset-backed securities, a credit event may be triggered by events such as failure to pay principal, maturity extension, rating downgrade or write-down. For credit default swaps on asset-backed securities, the reference obligation described represents the security that may be put to the seller. For credit default swaps on a traded credit index, a specified credit event may affect all or individual underlying securities included in the index.
As a seller, if an underlying credit event occurs, the Fund will pay a net settlement amount of cash equal to the notional amount of the swap less the recovery value of the reference obligation or underlying securities comprising an index. Only in the event of the industry’s inability to value the underlying asset will the Fund be required to take delivery of the reference obligation or underlying securities comprising an index and pay an amount equal to the notional amount of the swap.
As a buyer, if an underlying credit event occurs, the Fund will receive a net settlement amount of cash equal to the notional amount of the swap less the recovery value of the reference obligation or underlying securities comprising an index. Only in the event of the industry’s inability to value the underlying asset will the Fund be required to deliver the reference obligation or underlying securities comprising an index in exchange for payment of an amount equal to the notional amount of the swap.
Typically, the value of each credit default swap and credit rating disclosed for each reference obligation in the Schedule of Investments, where the Fund is the seller, can be used as measures of the current payment/performance risk of the swap. As the value of the swap changes as a positive or negative percentage of the total notional amount, the payment/performance risk may decrease or increase, respectively. In addition to these measures, the investment adviser monitors a variety of factors including cash flow assumptions, market activity and market sentiment as part of its ongoing process of assessing payment/performance risk.
Credit default swap agreements are considered to have credit-risk-related contingent features since they trigger payment by the protection seller to the protection buyer upon the occurrence of a defined credit event.
| | | | |
| Notes to Financial Statements | | | 55 | |
SSGA Funds
Notes to Financial Statements, continued — February 28, 2018 (Unaudited)
The aggregate fair value of credit default swap agreements in a net asset position as of February 28, 2018 is disclosed in the footnotes to the Schedule of Investments. The maximum amount of future, undiscounted payments that the Fund, as protection seller, could be required to make is equal to the swap agreement’s notional amount. The protection seller’s payment obligation would be offset to the extent of the value of the agreement’s deliverable obligation. If a defined credit event had occurred as of February 28, 2018, the swap agreement’s credit-risk-related contingent features would have been triggered and, for those swap agreements in a net asset position for which the Fund is the protection seller, the Fund in order to settle these swap agreements would have been required to either (1) pay the swap agreement’s notional value of $2,500,000 less the value of the agreements’ related deliverable obligations as decided through an ISDA auction or (2) pay the notional value of the swap agreements in return for physical receipt of the deliverable obligations.
The Fund’s maximum risk of loss from counterparty risk, either as the protection seller or as the protection buyer, is the fair value of the agreement.
The aggregate value of the collateral of the credit default swap held as of February 28, 2018 was $115,168.
Risks Associated with Derivatives
Derivative financial instruments involve, to varying degrees, elements of credit, market and/or interest rate risk in excess of the amounts reported in the Statement of Assets and Liabilities. Such risks involve the possibility that there will be no liquid market for these agreements, that the counterparty to the agreements may default on its obligation to perform or disagree as to the meaning of the contractual terms in the agreements, and that there may be unfavorable changes in interest rates and/or market values associated with these transactions.
Derivative transactions can create investment leverage and may be highly volatile. Use of derivatives other than for hedging purposes may be considered speculative. When the Fund invests in a derivative instrument, the future exposure is potentially unlimited. The value of a derivative instrument will depend on the ability and the willingness of the Fund’s derivative counterparty to perform its obligations under the transaction. A liquid secondary market may not always exist for the Fund’s derivative positions at any time and may impact the Fund’s ability to establish fair market value of a derivative transaction and close out derivative positions. Although the use of derivatives is intended to complement the Fund’s performance, it may instead reduce returns and increase volatility. The measurement of the risks associated with derivative instruments is meaningful only when all related and offsetting transactions are considered. The Fund must set aside liquid assets or engage in other appropriate measures to cover its obligations under these derivative instruments.
Certain derivatives, including some swap contracts, as applicable, are entered into over the counter (“OTC”) under the terms and conditions of an ISDA Master Agreement, which are separately negotiated with each counterparty. An ISDA Master Agreement is a bilateral agreement between the Fund and a counterparty that governs certain OTC derivatives and typically contains, among other things, collateral posting terms and netting provisions in the event of a default and/or termination event. Under an ISDA Master Agreement, the Fund may, under certain circumstances, offset with the counterparty certain derivative financial instruments’ payables and/or receivables with collateral held and/or posted and create one single net payment. The provisions of the ISDA Master Agreement typically permit a single net payment in the event of default including the bankruptcy or insolvency of the counterparty. Bankruptcy or insolvency laws of a particular jurisdiction may restrict or prohibit the right of offset in bankruptcy, insolvency or other events. In addition, certain ISDA Master Agreements allow counterparties to terminate derivative contracts prior to maturity in the event a Fund’s net assets decline by a stated percentage or the Fund fails to meet the terms of its ISDA Master Agreements. The result would cause the Fund to accelerate payment of any net liability owed to the counterparty.
For derivatives traded under an ISDA Master Agreement, the collateral requirements are typically calculated by netting the mark-to-market amount for each transaction under such agreement and comparing that amount to the value of any collateral currently pledged by the Fund and the counterparty. Cash collateral that has been pledged to cover obligations of the Fund and cash collateral received from the counterparty, if any, is reported separately on the Statements of Assets and Liabilities as cash pledged as collateral and cash received as collateral, respectively. Non-cash collateral pledged or received by the Fund, if any, is noted in the Schedule of Investments. Notional principal amounts are one component used to calculate the amount of exposure to the underlying instrument, but is not the amount delivered under the contract. Accordingly, credit risk is limited to any amounts receivable from the counterparty. To reduce credit risk from potential counterparty default, the Fund enters into
| | |
| 56 | | Notes to Financial Statements |
SSGA Funds
Notes to Financial Statements, continued — February 28, 2018 (Unaudited)
swap contracts with counterparties whose creditworthiness have been recommended by SSGA FM. The Fund bears the market risk arising from any change in index or security values or interest rates.
The following tables summarize the value of the Funds’ derivative instruments as of February 28, 2018 and the related location in the accompanying Statements of Assets and Liabilities and Statements of Operations, presented by primary underlying risk exposure:
| | | | | | | | | | | | | | | | | | | | | | | | |
| Asset Derivatives | | | | | | | | | | | | | | | | | | |
| | | Interest
Rate
Contracts
Risk | | | Foreign
Exchange
Contracts
Risk | | | Credit
Contracts
Risk | | | Equity
Contracts
Risk | | | Commodity
Contracts
Risk | | | Total | |
| | | | | | | | | | | | | | | | | | | | | | | | |
SSGA International Stock Selection Fund | | | | | | | | | | | | | | | | | | | | | | | | |
Futures Contracts(a) | | $ | — | | �� | $ | — | | | $ | — | | | $ | 28,994 | | | $ | — | | | $ | 28,994 | |
| | (a) | Unrealized appreciation on open futures contracts. The Statements of Assets and Liabilities only reflect the current day’s net variation margin. |
| | | | | | | | | | | | | | | | | | | | | | | | |
| Liability Derivatives | | | | | | | | | | | | | | | | | | |
| | | Interest
Rate
Contracts
Risk | | | Foreign
Exchange
Contracts
Risk | | | Credit
Contracts
Risk | | | Equity
Contracts
Risk | | | Commodity
Contracts
Risk | | | Total | |
| | | | | | | | | | | | | | | | | | | | | | | | |
State Street Disciplined Emerging Markets Equity Fund | | | | | | | | | | | | | | | | | | | | | | | | |
Futures Contracts(a) | | $ | — | | | $ | — | | | $ | — | | | $ | (67,152 | ) | | $ | — | | | $ | (67,152 | ) |
SSGA High Yield Bond Fund | |
Swap Contracts(b) | | | — | | | | — | | | | (15,970 | ) | | | — | | | | — | | | | (15,970 | ) |
| | (a) | Unrealized depreciation on open futures contracts. The Statements of Assets and Liabilities only reflect the current day’s net variation margin. |
| | (b) | Unrealized depreciation on swap contracts. The Statements of Assets and Liabilities only reflect the current day’s net variation margin. |
| | | | | | | | | | | | | | | | | | | | | | | | |
| Net Realized Gain (Loss) | | | | | | | | | | | | | | | | | | |
| | | Interest
Rate
Contracts
Risk | | | Foreign
Exchange
Contracts
Risk | | | Credit
Contracts
Risk | | | Equity
Contracts
Risk | | | Commodity
Contracts
Risk | | | Total | |
| | | | | | | | | | | | | | | | | | | | | | | | |
SSGA Dynamic Small Cap Fund | | | | | | | | | | | | | | | | | | | | | | | | |
Futures Contracts | | $ | — | | | $ | — | | | $ | — | | | $ | 10,686 | | | $ | — | | | $ | 10,686 | |
State Street Disciplined Emerging Markets Equity Fund | | | | | | | | | | | | | | | | | | | | | | | | |
Futures Contracts | | | — | | | | — | | | | — | | | | 288,746 | | | | — | | | | 288,746 | |
SSGA International Stock Selection Fund | | | | | | | | | | | | | | | | | | | | | | | | |
Futures Contracts | | | — | | | | — | | | | — | | | | 176,257 | | | | — | | | | 176,257 | |
SSGA High Yield Bond Fund | | | | | | | | | | | | | | | | | | | | | | | | |
Swap Contracts | | | — | | | | — | | | | 53,591 | | | | — | | | | — | | | | 53,591 | |
| | | | | | | | | | | | | | | | | | | | | | | | |
Net Change in Unrealized
Appreciation (Depreciation) | | | | | | | | | | | | | | | | | | |
| | | Interest
Rate
Contracts
Risk | | | Foreign
Exchange
Contracts
Risk | | | Credit
Contracts
Risk | | | Equity
Contracts
Risk | | | Commodity
Contracts
Risk | | | Total | |
| | | | | | | | | | | | | | | | | | | | | | | | |
State Street Disciplined Emerging Markets Equity Fund | | | | | | | | | | | | | | | | | | | | | | | | |
Futures Contracts | | $ | — | | | $ | — | | | $ | — | | | $ | (119,616 | ) | | $ | — | | | $ | (119,616 | ) |
| | | | |
| Notes to Financial Statements | | | 57 | |
SSGA Funds
Notes to Financial Statements, continued — February 28, 2018 (Unaudited)
| | | | | | | | | | | | | | | | | | | | | | | | |
Net Change in Unrealized
Appreciation (Depreciation) | | | | | | | | | | | | | | | | | | |
| | | Interest
Rate
Contracts
Risk | | | Foreign
Exchange
Contracts
Risk | | | Credit
Contracts
Risk | | | Equity
Contracts
Risk | | | Commodity
Contracts
Risk | | | Total | |
SSGA International Stock Selection Fund | | | | | | | | | | | | | | | | | | | | | | | | |
Futures Contracts | | $ | — | | | $ | — | | | $ | — | | | $ | 28,994 | | | $ | — | | | $ | 28,994 | |
SSGA High Yield Bond Fund | | | | | | | | | | | | | | | | | | | | | | | | |
Swap Contracts | | | — | | | | — | | | | (16,868 | ) | | | — | | | | — | | | | (16,868 | ) |
| 4. | | Fees and Transactions with Affiliates |
Advisory Fee
SSGA FM manages the Funds pursuant to an Investment Advisory Agreement between the Trust and the Adviser. The Adviser is a wholly-owned subsidiary of State Street Global Advisors, Inc., which itself is a wholly owned subsidiary of State Street Corporation. The Adviser and other advisory affiliates of State Street Corporation make up State Street Global Advisors, the investment management arm of State Street Corporation and its affiliated companies. The Adviser directs the investments of the Funds in accordance with their investment objectives, policies, and limitations. For its services, each Fund pays the Adviser an annual management fee, calculated daily and paid monthly, at the following annual rates of their average daily net assets:
| | | | |
| Funds | | % | |
SSGA Dynamic Small Cap Fund | | | 0.75 | |
State Street Disciplined Emerging Markets Equity Fund | | | 0.75 | |
SSGA International Stock Selection Fund | | | 0.75 | |
SSGA High Yield Bond Fund | | | 0.30 | |
The Adviser is contractually obligated until December 31, 2018, to waive its management fee and/or to reimburse each Fund for expenses to the extent that total expenses (exclusive of non-recurring account fees, extraordinary expenses, acquired fund fees, distribution, shareholder servicing, and sub-transfer agency fees) exceed the following percent of average daily net assets on an annual basis as follows:
| | | | |
| Funds | | Expense Limitations | |
SSGA Dynamic Small Cap Fund | | | 0.85 | % |
State Street Disciplined Emerging Markets Equity Fund | | | 1.00 | % |
SSGA International Stock Selection Fund | | | 0.75 | % |
SSGA High Yield Bond Fund | | | 0.50 | % |
This waiver and/or reimbursement may not be terminated with respect to a Fund prior to December 31, 2018 except with the approval of the Board. This waiver and/or reimbursement supersedes any prior voluntary waiver or reimbursement arrangements for the Funds specifically named above and may, at the Adviser’s option, continue after the dates designated above.
The total amounts of waivers for the period ended February 28, 2018, are detailed in the following table.
| | | | |
| | | Amount Waived
or Reimbursed | |
| | | | |
SSGA Dynamic Small Cap Fund | | $ | 137,225 | |
State Street Disciplined Emerging Markets Equity Fund | | | 132,908 | |
SSGA International Stock Selection Fund | | | 336,622 | |
SSGA High Yield Bond Fund | | | 103,582 | |
Administrator, Sub-Administrator and Custodian Fees
SSGA FM serves as administrator and State Street Bank and Trust Company (“State Street”), an affiliate of the Adviser, serves as custodian and sub-administrator. For its administrative services, each Fund pays SSGA FM a fee at an annual rate of 0.05%
| | |
| 58 | | Notes to Financial Statements |
SSGA Funds
Notes to Financial Statements, continued — February 28, 2018 (Unaudited)
of its average daily net assets. SSGA FM has contractually agreed to waive 0.01% of its administration fee. The waiver may not be terminated or modified except with the approval of the Board. For the period ended February 28, 2018, the total administration fees waived pursuant to the waiver agreement were as follows:
| | | | |
| | | Amount Waived | |
| | | | |
SSGA Dynamic Small Cap Fund | | $ | 1,487 | |
State Street Disciplined Emerging Markets Equity Fund | | | 4,358 | |
SSGA International Stock Selection Fund | | | 14,976 | |
SSGA High Yield Bond Fund | | | 3,351 | |
For its services as custodian, each Fund pays State Street an annual fee. SSGA FM pays State Street for its services as sub-administrator.
Distribution and Shareholder Servicing Fees
State Street Global Advisors Funds Distributors, LLC (“SSGA FD” or the “Distributor”) an affiliate of the Adviser, serves as the distributor of the Trust.
The Funds, with the exception of the State Street Disciplined Emerging Markets Equity Fund Class N shares, adopted a distribution plan pursuant to Rule 12b-1 under the 1940 Act, under which a Fund may compensate the Distributor (or others) for services in connection with the distribution of the Fund’s Class A and Class N shares and for services provided to shareholders in those classes (the “Plan”).
The Plan calls for payments at an annual rate (based on average daily net assets) of 0.25% of a Fund’s net assets attributable to its Class A shares and 0.25% of a Fund’s net assets attributable to its Class N shares. In addition to payments under the Plan, the Funds may reimburse the Distributor or its affiliates for payments it makes to financial intermediaries that provide certain administrative, recordkeeping, and account maintenance services. The amount of the reimbursement and the manner in which it is calculated are reviewed by the Trustees periodically.
With respect to the Class N shares of the State Street Disciplined Emerging Markets Equity Fund, the Trust has adopted a distribution plan pursuant to Rule 12b-1 (the “Historical Class N Plan”) under the 1940 Act. Under the Historical Class N Plan, the Trust is authorized to make payments to the Distributor, or any shareholder servicing agent, for services in connection with the distribution of Class N shares of the State Street Disciplined Emerging Markets Equity Fund and the servicing of investor accounts. Payments to the Distributor for the sale and distribution of these Class N shares are not permitted to exceed 0.25% of the State Street Disciplined Emerging Markets Equity Fund’s average annual net assets.
Other Transactions with Affiliates — Securities Lending
State Street, an affiliate of the Funds, acts as the securities lending agent for the Funds, pursuant to an amended and restated securities lending authorization agreement dated January 6, 2017.
Proceeds collected by State Street on investment of cash collateral or any fee income are allocated as follows (after deduction of such other amounts payable to State Street under the terms of the securities lending agreement): 85% payable to the Fund, and 15% payable to State Street.
In addition, cash collateral from lending activities is invested in the State Street Navigator Securities Lending Government Money Market Portfolio, an affiliated money market fund, for which SSGA FM serves as investment adviser. See Note 8 for additional information regarding securities lending.
Other Transactions with Affiliates
The Funds may invest in affiliated entities, including securities issued by State Street Corporation, affiliated funds, or entities deemed to be affiliates as a result of the Funds owning more than five percent of the entity’s voting securities or outstanding shares. Amounts relating to these transactions during the period ended February 28, 2018, are disclosed in the Funds’ respective Schedules of Investments.
On February 26, 2018, the Adviser agreed to make a contribution of $126,543 to the State Street Disciplined Emerging Markets Equity Fund in connection with a portfolio matter.
| | | | |
| Notes to Financial Statements | | | 59 | |
SSGA Funds
Notes to Financial Statements, continued — February 28, 2018 (Unaudited)
Due to Custodian
In certain circumstances, the Funds may have cash overdrafts with the custodian. The Due to custodian amount, if any, reflects cash overdrawn with State Street as custodian who is an affiliate of the Funds. As of February 28, 2018, State Street Disciplined Emerging Markets Equity Fund and SSGA High Yield Bond Fund had cash overdrafts related to the trading of securities.
The fees and expenses of the Trust’s trustees who are not “interested persons” of the Trust, as defined in the 1940 Act (“Independent Trustees”), are paid directly by the Funds. The Independent Trustees are reimbursed for travel and other out-of-pocket expenses in connection with meeting attendance and industry seminars.
| 6. | | Investment Transactions |
Purchases and sales of investments (excluding in-kind transactions, short term investments and derivative contracts) for the period ended February 28, 2018, were as follows:
| | | | | | | | |
| | | Other Securities | |
| | | Purchases | | | Sales | |
| | | | | | | | |
SSGA Dynamic Small Cap Fund | | $ | 17,576,466 | | | $ | 20,520,673 | |
State Street Disciplined Emerging Markets Equity Fund | | | 19,235,657 | | | | 33,234,961 | |
SSGA International Stock Selection Fund | | | 114,668,123 | | | | 137,324,902 | |
SSGA High Yield Bond Fund | | | 15,332,306 | | | | 21,833,139 | |
| 7. | | Income Tax Information |
The Funds have qualified and intend to continue to qualify as regulated investment companies under Subchapter M of the Internal Revenue Code of 1986, as amended. Each Fund will not be subject to federal income taxes to the extent they distribute their taxable income, including any net realized capital gains, for each fiscal year. Therefore, no provision for federal income tax is required.
The Funds file federal and various state and local tax returns as required. No income tax returns are currently under examination. Generally, the federal returns are subject to examination by the Internal Revenue Service for a period of three years from date of filing, while the state returns may remain open for an additional year depending upon jurisdiction. As of August 31, 2017, SSGA FM has analyzed each Fund’s tax positions taken on tax returns for all open years and does not believe there are any uncertain tax positions that would require recognition of a tax liability.
Distributions to shareholders are recorded on ex-dividend date. Income dividends and gain distributions are determined in accordance with income tax rules and regulations, which may differ from generally accepted accounting principles.
As of February 28, 2018, gross unrealized appreciation and gross unrealized depreciation of investments based on cost for federal income tax purposes were as follows:
| | | | | | | | | | | | | | | | |
| | | Tax Cost | | | Gross
Unrealized
Appreciation | | | Gross
Unrealized
Depreciation | | | Net Unrealized
Appreciation
(Depreciation) | |
| | | | | | | | | | | | | | | | |
SSGA Dynamic Small Cap Fund | | $ | 24,981,324 | | | $ | 2,542,111 | | | $ | 1,079,677 | | | $ | 1,462,434 | |
State Street Disciplined Emerging Markets Equity Fund | | | 60,650,739 | | | | 21,276,039 | | | | 1,785,981 | | | | 19,490,058 | |
SSGA International Stock Selection Fund | | | 264,781,225 | | | | 30,197,324 | | | | 8,799,435 | | | | 21,397,889 | |
SSGA High Yield Bond Fund | | | 60,460,899 | | | | 1,360,645 | | | | 773,518 | | | | 587,127 | |
Each Fund may lend securities to qualified broker-dealers or institutional investors. The loans are secured at all times by cash, cash equivalents or U.S. government securities in an amount at least equal to the market value of the securities loaned, plus accrued interest and dividends, determined on a daily basis and adjusted accordingly. The value of the collateral with respect
| | |
| 60 | | Notes to Financial Statements |
SSGA Funds
Notes to Financial Statements, continued — February 28, 2018 (Unaudited)
to a loaned security may be temporarily more or less than the value of a security due to market fluctuations of securities values. With respect to each loan, if on any U.S. business day the aggregate market value of securities collateral plus cash collateral is less than the aggregate market value of the securities which are subject to the loan, the borrower will be notified to provide additional collateral on the next business day.
The Funds will regain record ownership of loaned securities to exercise certain beneficial rights; however, the Funds may bear the risk of delay in recovery of, or even loss of rights in the securities loaned should the borrower fail financially. In addition, a Fund will bear the risk of loss of any cash collateral that it may invest. Each Fund receives compensation for lending its securities from interest or dividends earned on the cash, cash equivalents or U.S. government securities held as collateral, net of fee rebates paid to the borrower and net of fees paid to State Street as the lending agent. Additionally, a Fund will receive a fee from the borrower for non-cash collateral equal to a percentage of the market value of the loaned securities.
The market value of securities on loan as of February 28, 2018, and the value of the invested cash collateral are disclosed in the Funds’ Statements of Assets and Liabilities. Non-cash collateral is not disclosed in the Funds’ Statements of Assets and Liabilities as it is held by the lending agent on behalf of the Funds, and the Funds do not have the ability to re-hypothecate those securities. Securities lending income, as disclosed in the Funds’ Statements of Operations, represents the income earned from the non-cash collateral and the investment of cash collateral, net of fee rebates paid to the borrower and net of fees paid to State Street as lending agent.
The following is a summary of each Fund’s securities lending agreements and related cash and non-cash collateral received as of February 28, 2018:
| | | | | | | | | | | | | | | | |
| Fund | | Market Value
of Securities
on Loan | | | Cash
Collateral
Received | | | Non Cash
Collateral
Received | | | Total
Collateral
Received | |
| | | | | | | | | | | | | | | | |
SSGA Dynamic Small Cap Fund | | $ | 1,963,505 | | | $ | 295,173 | | | $ | 1,733,483 | | | $ | 2,028,656 | |
State Street Disciplined Emerging Markets Equity Fund | | | 755,721 | | | | 565,607 | | | | 254,475 | | | | 820,082 | |
SSGA International Stock Selection Fund | | | 1,176,494 | | | | 1,238,413 | | | | — | | | | 1,238,413 | |
| | * | The non-cash collateral includes U.S. Treasuries and U.S. Government Agency securities. |
The following tables reflect a breakdown of transactions accounted for as secured borrowings, the gross obligation by the type of collateral pledged or securities loaned, and the remaining contractual maturity of those transactions as of February 28, 2018:
| | | | | | | | | | | | | | | | | | | | | | | | | | |
| | | | | | | | Remaining Contractual Maturity of the Agreements
As of February 28, 2018 | |
| Fund | | Securities
Lending
Transactions | | Overnight and
Continuous | | | <30 days | | | Between
30 & 90
days | | | >90 days | | | Total Borrowings | | | Gross Amount of Recognized Liabilities for Securities Lending
Transactions | |
| | | | | | | | | | | | | | | | | | | | | | | | | | |
SSGA Dynamic Small Cap Fund | | Common Stocks | | $ | 295,173 | | | $ | — | | | $ | — | | | $ | — | | | $ | 295,173 | | | $ | 295,173 | |
State Street Disciplined Emerging Markets Equity Fund | | Common Stocks | | | 565,607 | | | | — | | | | — | | | | — | | | | 565,607 | | | | 565,607 | |
SSGA International Stock Selection Fund | | Common Stocks | | | 1,238,413 | | | | — | | | | — | | | | — | | | | 1,238,413 | | | | 1,238,413 | |
The Funds and other affiliated funds (each a “Participant” and, collectively, the “Participants”) participate in a $500 million revolving credit facility provided by a syndication of banks under which the Participants may borrow to fund shareholder redemptions. This agreement expires in October 2018 unless extended or renewed.
The Participants are charged an annual commitment fee which is calculated based on the unused portion of the shared credit line. Commitment fees are allocated among each of the Participants based on relative net assets. Commitment fees are ordinary
| | | | |
| Notes to Financial Statements | | | 61 | |
SSGA Funds
Notes to Financial Statements, continued — February 28, 2018 (Unaudited)
fund operating expenses. A Participant incurs and pays the interest expense related to its borrowing. Interest is calculated at a rate per annum equal to the sum of 1% plus the greater of the New York Fed Bank Rate and 1-month LIBOR rate.
Prior to October 12, 2017, the Funds and other affiliated funds participated in a $360 million revolving credit facility.
The Funds had no outstanding loans as of February 28, 2018.
Interest Expense
The Funds may incur interest expense on cash overdrafts at the custodian or from the use of the line of credit. Interest expense incurred, if any, for the period ended February 28, 2018, is reflected on the Statements of Operations.
Concentration Risk
As a result of the Funds’ ability to invest a large percentage of its assets in obligations of issuers within the same country, state, region, currency or economic sector, an adverse economic, business or political development may affect the value of the Funds’ investments more than if the Funds were more broadly diversified.
Foreign and Emerging Markets Risk
Investing in foreign markets involves risks and considerations not typically associated with investing in the U.S. Foreign securities may be subject to risk of loss because of government regulation, economic, political and social instability in the countries in which the Funds’ invest. Foreign markets may be less liquid than investments in the U.S. and may be subject to the risks of currency fluctuations. To the extent that a Fund invests in securities of issuers located in emerging markets, these risks may be even more pronounced.
Market and Credit Risk
In the normal course of business, the Funds trade financial instruments and enter into financial transactions where risk of potential loss exists due to changes in the general economic conditions and fluctuations of the market (market risk). Additionally, a Fund may also be exposed to credit risk in the event that an issuer or guarantor fails to perform or that an institution or entity with which the Fund has unsettled or open transactions defaults.
| 11. | | Recent Accounting Pronouncement |
In March 2017, the Financial Accounting Standards Board (FASB) issued Accounting Standards Update (ASU) No. 2017-08, Receivables — Nonrefundable Fees and Other Costs (Subtopic 310-20): Premium Amortization on Purchased Callable Debt Securities. The amendments in the ASU shorten the amortization period for certain callable debt securities, held at a premium, to be amortized to the earliest call date. The ASU does not require an accounting change for securities held at a discount; which continues to be amortized to maturity. The ASU is effective for fiscal years and interim periods within those fiscal years beginning after December 15, 2018. Management is currently evaluating the impact, if any, of applying this provision.
Management has evaluated the impact of all subsequent events on the Funds through the date on which the financial statements were available to be issued and has determined that there were no subsequent events requiring adjustment or disclosure in the financial statements other than below.
On February 14, 2018, the Board voted to close and liquidate the SSGA High Yield Bond Fund.
| | |
| 62 | | Notes to Financial Statements |
SSGA Funds
Other Information — February 28, 2018 (Unaudited)
Expense Example
As a shareholder of a Fund, you incur two types of costs (1) transaction costs, including sales charges (loads), if applicable, on purchase payments, reinvested dividends, or other distributions and (2) ongoing costs, including advisory fees and other Fund expenses. This example is intended to help you understand your ongoing costs (in dollars) of investing in the Fund and to compare these costs with the ongoing costs of investing in other mutual funds. It is based on an investment of $1,000 made at the beginning of the period shown and held for the entire period from September 1, 2017 to February 28, 2018.
The table below illustrates your Fund’s cost in two ways:
Based on actual fund return — This section helps you to estimate the actual expenses that you paid over the period. The “Ending Account Value” shown is derived from each Fund’s actual return, and the third column shows the dollar amount that would have been paid by an investor who started with $1,000 in the Fund. You may use the information here, together with the amount you invested, to estimate the expenses that you paid over the period. To do so, simply divide your account value by $1,000 (for example, an $8,600 account value divided by $1,000 = 8.6), then multiply the result by the number given for the Fund under the heading “Expenses Paid During Period”.
Based on hypothetical 5% return — This section is intended to help you compare your Fund’s costs with those of other mutual funds. It assumes that the Fund had a yearly return of 5% before expenses, but that the expense ratio is unchanged. In this case, because the return used is not the Fund’s actual return, the results do not apply to your investment. The example is useful in making comparisons because the U.S. Securities and Exchange Commission (the “SEC”) requires all mutual funds to calculate expenses based on a 5% return. You can assess your Fund’s costs by comparing this hypothetical example with the hypothetical examples that appear in shareholder reports of other funds.
Please note that the expenses shown in the table are meant to highlight your ongoing costs only and do not reflect any transaction costs, such as sales load charges (loads). Therefore, the hypothetical 5% return section of the table is useful in comparing ongoing costs only, and will not help you determine the relative total costs of owning different funds. In addition, if these transaction costs were included, your costs would have been higher.
| | | | | | | | | | | | | | | | | | | | |
| | | | Actual | | |
| Hypothetical (assuming a 5%
return before expenses) |
|
| | |
| Annualized
Expense Ratio |
| |
| Ending Account
Value |
| |
| Expenses Paid
During Period(a) |
| |
| Ending Account
Value |
| |
| Expenses Paid
During Period(a) |
|
SSGA Dynamic Small Cap Fund | | | | | | | | | | | | | |
Class N | | | 1.10 | % | | $ | 1,067.60 | | | $ | 5.64 | | | $ | 1,019.30 | | | $ | 5.51 | |
Class A | | | 1.10 | | | | 1,067.80 | | | | 5.64 | | | | 1,019.30 | | | | 5.51 | |
Class I | | | 0.85 | | | | 1,068.80 | | | | 4.36 | | | | 1,020.60 | | | | 4.26 | |
Class K | | | 0.84 | | | | 1,069.00 | | | | 4.31 | | | | 1,020.60 | | | | 4.21 | |
State Street Disciplined Emerging Markets Equity Fund | | | | | | | | | | | | | |
Class N | | | 1.25 | | | | 1,037.60 | | | | 6.32 | | | | 1,018.60 | | | | 6.26 | |
Class A | | | 1.25 | | | | 1,037.70 | | | | 6.32 | | | | 1,018.60 | | | | 6.26 | |
Class I | | | 1.00 | | | | 1,037.80 | | | | 5.05 | | | | 1,019.80 | | | | 5.01 | |
Class K | | | 1.00 | | | | 1,035.60 | | | | 5.05 | | | | 1,019.80 | | | | 5.01 | |
SSGA International Stock Selection Fund | | | | | | | | | | | | | |
Class N | | | 1.00 | | | | 1,020.40 | | | | 5.01 | | | | 1,019.80 | | | | 5.01 | |
Class A | | | 1.31 | | | | 1,018.50 | | | | 6.56 | | | | 1,018.30 | | | | 6.56 | |
Class I | | | 0.75 | | | | 1,020.90 | | | | 3.76 | | | | 1,021.10 | | | | 3.76 | |
Class K | | | 0.75 | | | | 1,021.30 | | | | 3.76 | | | | 1,021.10 | | | | 3.76 | |
SSGA High Yield Bond Fund | | | | | | | | | | | | | |
Class N | | | 0.74 | | | | 1,005.40 | | | | 3.68 | | | | 1,021.10 | | | | 3.71 | |
Class A | | | 0.75 | | | | 1,005.30 | | | | 3.73 | | | | 1,021.10 | | | | 3.76 | |
Class I | | | 0.53 | | | | 1,005.30 | | | | 2.64 | | | | 1,022.20 | | | | 2.66 | |
Class K | | | 0.50 | | | | 1,006.60 | | | | 2.49 | | | | 1,022.30 | | | | 2.51 | |
| (a) | Expenses are equal to the Fund’s annualized net expense ratio multiplied by the average account value of the period, multiplied by 181, then divided by 365. |
SSGA Funds
Other Information, continued — February 28, 2018 (Unaudited)
Proxy Voting Policies and Procedures and Record
The Funds have adopted the proxy voting policies of the Adviser. A description of the policies and procedures that the Funds have adopted to determine how to vote proxies relating to portfolio securities are contained in the Fund’s Statement of Additional Information, which is available (i) without charge, upon request, by calling 1-800-997-7327, (ii) on the Funds’ website at www.ssgafunds.com, (iii) on the SEC’s website at www.sec.gov, or (iv) at the SEC’s public reference room. Information on the operation of the public reference room may be obtained by calling 1-800-SEC-0330. Information regarding how the Fund voted proxies, if any, during the most recent 12-month period ended June 30 is available by August 31 of each year without charge (1) by calling 1-800-997-7327 (toll free), or (2) on the website of the SEC at www.sec.gov.
| Quarterly | | Portfolio Schedule |
The Funds will file their complete schedules of investments with the SEC for the first and third quarters of each fiscal year on Form N-Q. For the second and fourth quarters, the complete schedule of investments are available in the Fund’s semi-annual and annual financial statements. The Funds’ Form N-Q is available (i) without charge, upon request, by calling 1-800-997-7327, (ii) on the Funds’ website at www.ssgafunds.com, (iii) on the SEC’s website at www.sec.gov, or (iv) at the SEC’s public reference room. Information on the operation of the public reference room may be obtained by calling 1-800-SEC-0330.
SSGA Funds
One Iron Street
Boston, MA 02210
(800) 997-7327
Trustees
Michael F. Holland
Michael A. Jessee
William L. Marshall
Patrick J. Riley
James E. Ross
Richard D. Shirk
Rina K. Spence
Bruce D. Taber
Douglas T. Williams
Investment Adviser and Administrator
SSGA Funds Management, Inc.
One Iron Street
Boston, MA 02210
Custodian and Office of Shareholder Inquiries
State Street Bank and Trust Company
1776 Heritage Drive
North Quincy, Massachusetts 02171
Transfer and Dividend Paying Agent
DST Asset Manager Solutions Inc.
2000 Crown Colony Drive
Quincy, Massachusetts 02169
Distributor
State Street Global Advisors Funds Distributors, LLC
One Iron Street
Boston, MA 02210
Sub-Administrator
State Street Bank and Trust Company
State Street Financial Center
One Lincoln Street
Boston, Massachusetts 02111
Legal Counsel
Ropes & Gray LLP
800 Boylston Street
Boston, Massachusetts 02199
Independent Registered Public Accounting Firm
Ernst & Young LLP
200 Clarendon Street
Boston, Massachusetts 02116
Distributor: State Street Global Advisors Funds Distributors, LLC, member FINRA, SIPC, an indirect wholly owned subsidiary of State Street Corporation. References to State Street may include State Street Corporation and its affiliates. The SSGA Funds pay State Street Bank and Trust Company for its services as custodian and shareholder servicing agent and pay SSGA Funds Management, Inc. for investment advisory and administrator services.
The information contained in this report is intended for the general information of shareholders of the Trust. This report is not authorized for distribution to prospective investors unless preceded or accompanied by a current Trust prospectus which contains important information concerning the Trust. You may obtain a current prospectus and SAI from the Distributor by calling 1-800-997-7327 or visiting www.ssgafunds.com. Please read the prospectus carefully before you invest.
Semi-Annual Report
February 28, 2018
SSGA Funds
SSGA S&P 500 Index Fund
The information contained in this report is intended for the general information of shareholders of the Trust. This report is not authorized for distribution to prospective investors unless preceded or accompanied by a current Trust prospectus which contains important information concerning the Trust. You may obtain a current prospectus and SAI from the Distributor by calling 1-800-997-7327 or visiting www.ssgafunds.com. Please read the prospectus carefully before you invest.

SSGA Funds
SSGA S&P 500 Index Fund
Semi-Annual Report
February 28, 2018 (Unaudited)
Table of Contents
“SSGA” is a registered trademark of State Street Corporation and is licensed for use by the SSGA Funds.
The information contained in this report is intended for the general information of shareholders of the Trust. This report is not authorized for distribution to prospective investors unless preceded or accompanied by a current Trust prospectus which contains important information concerning the Trust. You may obtain a current prospectus and SAI from the Distributor by calling 1-800-997-7327 or visiting www.ssgafunds.com. Please read the prospectus carefully before you invest.
Performance quoted represents past performance and past performance does not guarantee future results. Current performance may be higher or lower than the performance quoted. For the most recent month end performance information, visit www.ssgafunds.com. Investment in the Funds poses investment risks, including the possible loss of principal. The investment return and principal value of an investment will fluctuate so that shares, when redeemed, may be worth more or less than their original cost.
SSGA S&P 500 Index Fund
Portfolio Statistics — (Unaudited)
| | | | |
Portfolio Composition as of February 28, 2018* | | % of Master Portfolio Net Assets | |
| | | | |
Common Stock | | | | |
Consumer Discretionary | | | 12.5 | % |
Consumer Staples | | | 7.4 | |
Energy | | | 5.4 | |
Financials | | | 14.7 | |
Health Care | | | 13.5 | |
Industrials | | | 10.1 | |
Information Technology | | | 24.6 | |
Materials | | | 2.9 | |
Real Estate | | | 2.6 | |
Telecommunication Services | | | 1.8 | |
Utilities | | | 2.6 | |
Short-Term Investments | | | 1.4 | |
| | | | |
Total Investments | | | 99.5 | |
Other Assets in Excess of Liabilities | | | 0.5 | |
| | | | |
| | | 100.0 | |
| | | | |
Futures Contracts | | | 0.1 | |
| * | The Fund’s portfolio composition is expressed as a percentage of net assets and may change over time. |
See accompanying notes to financial statements and statements of the affiliated portfolio.
| | | | |
| SSGA S&P 500 Index Fund | | | 1 | |
SSGA S&P 500 Index Fund
Statement of Assets and Liabilities — February 28, 2018 (Unaudited)
| | | | |
| | | | |
Assets | | | | |
Investment in corresponding affiliated Portfolio, at value | | $ | 1,590,587,822 | |
Receivable for fund shares sold | | | 1,167,500 | |
Receivable from Adviser | | | 113,398 | |
Prepaid expenses and other assets | | | 7,394 | |
| | | | |
Total assets | | | 1,591,876,114 | |
| | | | |
| |
Liabilities | | | | |
Due to custodian | | | 2,200 | |
Payable for fund shares repurchased | | | 5,737,681 | |
Custodian fees payable | | | 13,671 | |
Administration fees payable | | | 54,048 | |
Shareholder servicing fee payable | | | 29,592 | |
Distribution fees payable | | | 45,621 | |
Accrued Trustees’ fees and expenses | | | 47 | |
Transfer agent fees payable | | | 37,528 | |
Professional fees payable | | | 15,378 | |
Printing and postage fees payable | | | 7,996 | |
| | | | |
Total liabilities | | | 5,943,762 | |
| | | | |
| | | | |
Net Assets | | $ | 1,585,932,352 | |
| | | | |
| |
Net Assets Consist of: | | | | |
Paid-in Capital | | $ | 631,304,787 | |
Undistributed (distribution in excess of) net investment income (loss) | | | 13,930,678 | |
Accumulated net realized gain (loss) on investments and futures contracts allocated from affiliated Portfolio | | | 27,982,977 | |
Net unrealized appreciation (depreciation) allocated from affiliated Portfolio on: | | | | |
Investments | | | 911,301,464 | |
Futures contracts | | | 1,412,446 | |
| | | | |
Net Assets | | $ | 1,585,932,352 | |
| | | | |
| |
Net Asset Value Per Share | | | | |
Net asset value per share | | $ | 38.41 | |
| | | | |
Shares outstanding (unlimited amount authorized, $0.001 par value) | | | 41,292,499 | |
| | | | |
| |
Cost of Investments: | | | | |
Investments in corresponding affiliated Portfolio | | $ | 679,286,358 | |
See accompanying notes to financial statements and statements of the affiliated portfolio.
| | |
| 2 | | Statement of Assets and Liabilities |
SSGA S&P 500 Index Fund
Statement of Operations — For the Six Months Ended February 28, 2018 (Unaudited)
| | | | |
| | | | |
| | | | |
Income and Expenses Allocated from Portfolio | | | | |
Interest income allocated from affiliated Portfolio | | $ | 141,731 | |
Dividend income allocated from affiliated Portfolio | | | 15,097,303 | |
Affiliated securities lending income allocated from affiliated Portfolio | | | 25,488 | |
Foreign taxes withheld allocated from affiliated Portfolio | | | (59,628 | ) |
Expenses allocated from affiliated Portfolio | | | (364,768 | ) |
| | | | |
Total investment income (loss) allocated from portfolio | | | 14,840,126 | |
| | | | |
| |
Expenses | | | | |
Administration fees | | | 405,190 | |
Shareholder servicing fees | | | 194,491 | |
Distribution fees | | | 299,841 | |
Custodian fees | | | 52,513 | |
Trustees’ fees and expenses | | | 8,787 | |
Transfer agent fees | | | 101,385 | |
Registration and filing fees | | | 19,210 | |
Professional fees | | | 135,623 | |
Printing fees | | | 38,801 | |
Insurance expense | | | 7,707 | |
Miscellaneous expenses | | | 6,623 | |
| | | | |
Total expenses | | | 1,270,171 | |
| | | | |
Expenses waived/reimbursed by the Adviser | | | (362,642 | ) |
| | | | |
Net expenses | | | 907,529 | |
| | | | |
Net investment income (loss) | | | 13,932,597 | |
| | | | |
| |
Realized and Unrealized Gain (Loss) | | | | |
Net realized gain (loss) allocated from affiliated Portfolio on: | | | | |
Investments | | | 86,690,822 | |
Futures contracts | | | 2,351,864 | |
| | | | |
| |
Net realized gain (loss) allocated from affiliated Portfolio | | | 89,042,686 | |
| | | | |
Net change in unrealized appreciation/depreciation allocated from affiliated Portfolio on: | | | | |
Investments | | | 64,165,147 | |
Futures contracts | | | 183,480 | |
| | | | |
| |
Net change in unrealized appreciation/depreciation allocated from affiliated Portfolio | | | 64,348,627 | |
| | | | |
| |
Net Realized and Unrealized Gain (Loss) | | | 153,391,313 | |
| | | | |
Net Increase (Decrease) in Net Assets from Operations | | $ | 167,323,910 | |
| | | | |
See accompanying notes to financial statements and statements of the affiliated portfolio.
| | | | |
| Statement of Operations | | | 3 | |
SSGA S&P 500 Index Fund
Statements of Changes in Net Assets
| | | | | | | | |
| | | Six Months Ended
2/28/18
(Unaudited) | | | Year Ended
8/31/17 | |
Increase (Decrease) in Net Assets from Operations: | | | | | | | | |
Net investment income (loss) | | $ | 13,932,597 | | | $ | 29,294,387 | |
Net realized gain (loss) | | | 89,042,686 | | | | 88,523,543 | |
Net change in unrealized appreciation/depreciation | | | 64,348,627 | | | | 109,465,074 | |
| | | | | | | | |
Net increase (decrease) in net assets resulting from operations | | | 167,323,910 | | | | 227,283,004 | |
| | | | | | | | |
| | |
Distributions to Shareholders From: | | | | | | | | |
Net investment income | | | (8,855,762 | ) | | | (28,594,164 | ) |
Net realized gains | | | (51,589,619 | ) | | | (102,985,326 | ) |
| | | | | | | | |
Total distributions to shareholders | | | (60,445,381 | ) | | | (131,579,490 | ) |
| | | | | | | | |
| | |
From Beneficial Interest Transactions: | | | | | | | | |
Proceeds from sale of shares sold | | | 157,943,226 | | | | 272,460,669 | |
Reinvestment of distributions | | | 59,433,508 | | | | 129,216,041 | |
Cost of shares redeemed | | | (310,196,211 | ) | | | (444,454,856 | ) |
| | | | | | | | |
Net increase (decrease) in net assets from beneficial interest transactions | | | (92,819,477 | ) | | | (42,778,146 | ) |
| | | | | | | | |
Net increase (decrease) in net assets during the period | | | 14,059,052 | | | | 52,925,368 | |
| | | | | | | | |
Net assets at beginning of period | | | 1,571,873,300 | | | | 1,518,947,932 | |
| | | | | | | | |
| | |
Net Assets at End of Period | | $ | 1,585,932,352 | | | $ | 1,571,873,300 | |
| | | | | | | | |
Undistributed (distribution in excess of) net investment income (loss) | | $ | 13,930,678 | | | $ | 8,853,843 | |
| | | | | | | | |
| | |
Shares of Beneficial Interest: | | | | | | | | |
Shares sold | | | 4,146,656 | | | | 7,971,017 | |
Reinvestment of distributions | | | 1,584,690 | | | | 3,889,147 | |
Shares redeemed | | | (8,118,975 | ) | | | (13,048,670 | ) |
| | | | | | | | |
Net increase (decrease) | | | (2,387,629 | ) | | | (1,188,506 | ) |
| | | | | | | | |
See accompanying notes to financial statements and statements of the affiliated portfolio.
| | |
| 4 | | Statements of Changes in Net Assets |
SSGA S&P 500 Index Fund
Financial Highlights
Selected data for a share outstanding throughout each period(a)
| | | | | | | | | | | | | | | | | | | | | | | | |
| | | Six Months
Ended
2/28/18
(Unaudited) | | | Year Ended
8/31/17 | | | Year Ended
8/31/16 | | | Year Ended
8/31/15 | | | Year Ended
8/31/14(b) | | | Year Ended
8/31/13(b) | |
Net asset value, beginning of period | | $ | 35.99 | | | $ | 33.85 | | | $ | 31.40 | | | $ | 32.23 | | | $ | 26.57 | | | $ | 23.18 | |
| | | | | | | | | | | | | | | | | | | | | | | | |
Income (loss) from investment operations: | | | | | | | | | | | | | | | | |
Net investment income (loss)(c) | | | 0.32 | (d)(e) | | | 0.66 | (d)(e) | | | 0.66 | (d) | | | 0.61 | (e) | | | 0.56 | | | | 0.52 | |
Net realized and unrealized gain (loss) | | | 3.50 | | | | 4.47 | | | | 3.10 | | | | (0.46 | ) | | | 5.96 | | | | 3.67 | |
| | | | | | | | | | | | | | | | | | | | | | | | |
Total from investment operations | | | 3.82 | | | | 5.13 | | | | 3.76 | | | | 0.15 | | | | 6.52 | | | | 4.19 | |
| | | | | | | | | | | | | | | | | | | | | | | | |
Distributions to shareholders from: | | | | | | | | | | | | | | | | |
Net investment income | | | (0.20 | ) | | | (0.64 | ) | | | (0.65 | ) | | | (0.60 | ) | | | (0.54 | ) | | | (0.50 | ) |
Net realized gains | | | (1.20 | ) | | | (2.35 | ) | | | (0.66 | ) | | | (0.38 | ) | | | (0.32 | ) | | | (0.30 | ) |
| | | | | | | | | | | | | | | | | | | | | | | | |
Total distributions | | | (1.40 | ) | | | (2.99 | ) | | | (1.31 | ) | | | (0.98 | ) | | | (0.86 | ) | | | (0.80 | ) |
| | | | | | | | | | | | | | | | | | | | | | | | |
Net asset value, end of period | | $ | 38.41 | | | $ | 35.99 | | | $ | 33.85 | | | $ | 31.40 | | | $ | 32.23 | | | $ | 26.57 | |
| | | | | | | | | | | | | | | | | | | | | | | | |
Total return(f) | | | 10.72 | % | | | 16.06 | % | | | 12.38 | % | | | 0.36 | % | | | 24.98 | % | | | 18.54 | % |
Ratios and Supplemental Data: | | | | | | | | | | | | | | | | |
Net assets, end of period (in 000s) | | $ | 1,585,932 | | | $ | 1,571,873 | | | $ | 1,518,948 | | | $ | 1,532,049 | | | $ | 1,508,573 | | | $ | 1,221,928 | |
Ratios to average net assets: | | | | | | | | | | | | | | | | |
Total expenses | | | 0.20 | %(g) | | | 0.20 | % | | | 0.20 | % | | | 0.16 | % | | | 0.15 | % | | | 0.17 | % |
Net expenses | | | 0.16 | %(d)(e)(g) | | | 0.16 | %(d)(e) | | | 0.15 | %(d)(e) | | | 0.16 | %(e) | | | 0.15 | % | | | 0.17 | % |
Net investment income (loss) | | | 1.72 | %(d)(e)(g) | | | 1.91 | %(d)(e) | | | 2.03 | %(d)(e) | | | 1.88 | %(e) | | | 1.88 | % | | | 2.08 | % |
Portfolio turnover rate(h) | | | 1 | %(i) | | | 3 | % | | | 6 | % | | | 2 | % | | | 2 | % | | | 2 | % |
| (a) | | The per share amounts and percentages include the Fund’s proportionate share of income and expenses of the Portfolio. |
| (b) | | Beginning with the year ended August 31, 2015, the Funds were audited by Ernst & Young LLP. The previous years/periods were audited by another independent registered public accounting firm. |
| (c) | | Average daily shares outstanding were used for this calculation. |
| (d) | | Reflects amounts waived and/or reimbursed by the investment adviser. |
| (e) | | Reflects amounts waived by the administrator. |
| (f) | | Total return is calculated assuming a purchase of shares at net asset value on the first day and a sale at net asset value on the last day of each period reported. Distributions are assumed, for the purpose of this calculation, to be reinvested at net asset value per share on the respective payment dates of the Fund. Total return for periods of less than one year are not annualized. Results represent past performance and are not indicative of future results. |
| (h) | | Portfolio turnover rate is from the Portfolio. |
See accompanying notes to financial statements and statements of the affiliated portfolio.
SSGA Funds
SSGA S&P 500 Index Fund
Notes to Financial Statements — February 28, 2018 (Unaudited)
The SSGA Funds (the “Trust”), a Massachusetts business trust registered under the Investment Company Act of 1940, as amended (“1940 Act”), is an open-end management investment company.
As of February 28, 2018, the Trust consists of five (5) series (and corresponding classes, each of which have the same rights and privileges, including voting rights), each of which represents a separate series of beneficial interest in the Trust. The Declaration of Trust permits the Board of Trustees of the Trust (the “Board”) to authorize the issuance of an unlimited number of shares of beneficial interest at $0.001 par value. The financial statements herein relate only to the following series (the “Fund”):
| | | | | | |
| Fund | | Classes | | Commencement of Operations: | | Diversification Classification |
SSGA S&P 500 Index Fund | | Class N | | December 30, 1992 | | Diversified |
The Fund is part of a master-feeder structure and invests substantially all of its assets in State Street Equity 500 Index Portfolio (the “Portfolio”), a separate series of the State Street Master Funds. The value of the Fund’s investment in the Portfolio reflects the Fund’s proportionate interest in net assets of the Portfolio (99.99% at February 28, 2018). The performance of the Fund is directly affected by the performance of the Portfolio. The financial statements of the Portfolio, including its Schedule of Investments, are attached to this report and should be read in conjunction with the Fund’s financial statements.
Under the Trust’s organizational documents, its officers and trustees are indemnified against certain liabilities arising out of the performance of their duties to the Trust. Additionally, in the normal course of business, the Trust enters into contracts with service providers that contain general indemnification clauses. The Trust’s maximum exposure under these arrangements is unknown as this would involve future claims that may be made against the Trust that have not yet occurred.
| 2. | | Summary of Significant Accounting Policies |
The following is a summary of significant accounting policies followed by the Trust in the preparation of its financial statements:
The preparation of financial statements in accordance with U.S. generally accepted accounting principles (“U.S. GAAP”) requires management to make estimates and assumptions that affect the reported amounts and disclosures in the financial statements. Actual results could differ from those estimates. The Fund is an investment company under U.S. GAAP and follows the accounting and reporting guidance applicable to investment companies.
Security Valuation
The Fund records its investments in its Portfolio at fair value (net asset value) each business day. The valuation policy of the Portfolio is discussed in Note 2 of the Portfolio’s Notes to Financial Statements, which are attached to this report.
The Portfolio’s investments are valued at fair value each day that the New York Stock Exchange (“NYSE”) is open and, for financial reporting purposes, as of the report date should the reporting period end on a day the NYSE is not open. Fair value is generally defined as the price a fund would receive to sell an asset or pay to transfer a liability in an orderly transaction between market participants at the measurement date. By its nature, a fair value price is a good faith estimate of the valuation in a current sale and may not reflect an actual market price. The investments of the Portfolio are valued pursuant to the policy and procedures developed by the Oversight Committee (the “Committee”) and approved by the Board. The Committee provides oversight of the valuation of investments for the Portfolio. The Board has responsibility for determining the fair value of investments. The summary of the inputs used for the Portfolio, as of February 28, 2018, in valuing the Portfolio’s securities carried at fair value are discussed in Note 2 of the Portfolio’s Notes to Financial Statements, which are attached to this report.
| | |
| 6 | | Notes to Financial Statements |
SSGA Funds
SSGA S&P 500 Index Fund
Notes to Financial Statements, continued — February 28, 2018 (Unaudited)
Investment Transactions and Income Recognition
Investment transactions are accounted for on the trade date for financial reporting purposes. Realized gains and losses from security transactions consist of the Fund’s pro-rata share of its Portfolio’s realized gains and losses. Net investment income consists of the Fund’s pro-rata share of the net investment income of its Portfolio less expenses of the Fund.
Expenses
Certain expenses, which are directly identifiable to a specific Fund, are applied to that Fund within the Trust. Other expenses which cannot be attributed to a specific Fund are allocated in such a manner as deemed equitable, taking into consideration the nature and type of expense and relative net assets of the Fund within the Trust.
The Fund is allocated a pro-rata share of the expense of its Portfolio.
Distributions
Distributions from net investment income, if any, are declared and paid quarterly. Net realized capital gains, if any, are distributed annually, unless additional distributions are required for compliance with applicable tax regulations. The amount and character of income and capital gains to be distributed are determined in accordance with applicable tax regulations which may differ from net investment income and realized gains recognized for U.S. GAAP purposes.
| 3. | | Fees and Transactions with Affiliates |
Advisory Fee
The Fund pays no advisory fee directly to SSGA Funds Management, Inc. (the “Adviser” or “SSGA FM”), for so long as assets of the Fund are invested in the Portfolio. The Portfolio has entered into an Investment Advisory Agreement with SSGA FM. The Adviser is a wholly-owned subsidiary of State Street Global Advisors, Inc., which itself is a wholly-owned subsidiary of State Street Corporation. As compensation for the Adviser’s services to the Portfolio as investment adviser and State Street’s services to the Portfolio as sub-administrator, custodian and transfer agent (and for assuming ordinary operating expenses of the Portfolio, including ordinary legal and audit expenses), the Portfolio is obligated to pay a fee for the services in the amount of 0.045% of average daily net assets on an annual basis, accrued daily and paid monthly.
The Adviser is contractually obligated until December 31, 2018 to waive its management fee and/or to reimburse the Fund for expenses to the extent that total expenses exceed 0.157% of average daily net assets on an annual basis. This waiver and/or reimbursement may not be terminated prior to December 31, 2018 except with the approval of the Fund’s Board. During the period ended February 28, 2018, SSGA FM agreed to waive fees of $281,604.
Administrator, Sub-Administrator, and Custodian Fees
SSGA FM serves as administrator and State Street, an affiliate of the Adviser, serves as custodian and sub-administrator to the Fund. For its administrative services, the Fund pays SSGA FM a fee at an annual rate of 0.05% of its average daily net assets. The fees are accrued daily and paid monthly. SSGA FM has contractually agreed to waive 0.01% of its administration fee. The waiver may not be terminated or modified except with the approval of the Board. For the period ended February 28, 2018, SSGA FM waived fees in the amount of $81,038.
For its services as custodian, the Fund pays State Street an annual fee. SSGA FM pays State Street for its services as sub-administrator.
Distribution and Shareholder Servicing Fees
State Street Global Advisors Funds Distributors, LLC (“SSGA FD” or the “Distributor”), an affiliate of the Adviser, serves as the distributor of the Trust.
| | | | |
| Notes to Financial Statements | | | 7 | |
SSGA Funds
SSGA S&P 500 Index Fund
Notes to Financial Statements, continued — February 28, 2018 (Unaudited)
The Fund has adopted a distribution plan pursuant to Rule 12b-1 under the 1940 Act, under which the Fund may compensate the Distributor (or others) for services in connection with the distribution of the Fund’s Class N shares and for services provided to shareholders in that class (the “Plan”).
The Plan calls for payments at an annual rate (based on average daily net assets) of 0.25% of the Fund’s net assets attributable to its Class N shares. In addition to payments under the Plan, the Fund may reimburse the Distributor or its affiliates for payments it makes to financial intermediaries that provide certain administrative, recordkeeping, and account maintenance services. The amount of the reimbursement and the manner in which it is calculated are reviewed by the Trustees periodically.
Additionally, the Board approved a limit of 0.062% of average daily net assets on the amount of Rule 12b-1 fees paid to the Distributor.
Due to Custodian
In certain circumstances, the Fund may have cash overdraft with the custodian. The Due to Custodian amount, if any, reflects cash overdrawn with State Street as custodian who is an affiliate of the Fund. As of February 28, 2018, the Fund has a cash overdraft related to investment expense payments.
The fees and expenses of the Trust’s trustees, who are not “interested persons” of the Trust, as defined in the 1940 Act (“Independent Trustees”), are paid directly by the Fund. The Independent Trustees are reimbursed for travel and other out-of-pocket expenses in connection with meeting attendance and industry seminars.
| 5. | | Income Tax Information |
The Fund has qualified and intends to continue to qualify as a regulated investment company under Subchapter M of the Internal Revenue Code of 1986, as amended. The Fund will not be subject to federal income taxes to the extent it distributes its taxable income, including any net realized capital gains, for each fiscal year. Therefore, no provision for federal income tax is required.
The Fund files federal and various state and local tax returns as required. No income tax returns are currently under examination. Generally, the federal returns are subject to examination by the Internal Revenue Service for a period of three years from date of filing, while the state returns may remain open for an additional year depending upon jurisdiction. As of August 31, 2017, SSGA FM has analyzed the Fund’s tax positions taken on tax returns for all open years and does not believe there are any uncertain tax positions that would require recognition of a tax liability.
Distributions to shareholders are recorded on ex-dividend date. Income dividends and gain distributions are determined in accordance with income tax rules and regulations, which may differ from generally accepted accounting principles.
As of February 28, 2018, gross unrealized appreciation and gross unrealized depreciation of investments and other financial instruments based on cost for federal income tax purposes were as follows:
| | | | | | | | | | | | | | | | |
| | | Tax Cost | | | Gross
Unrealized
Appreciation | | | Gross
Unrealized
Depreciation | | | Net Unrealized
Appreciation
(Depreciation) | |
| | | | | | | | | | | | | | | | |
SSGA S&P 500 Index Fund | | $ | 803,279,328 | | | $ | 788,720,940 | | | $ | — | | | $ | 788,720,940 | |
Market and Credit Risk
In the normal course of business, the Fund trades financial instruments and enters into financial transactions where risk of potential loss exists due to changes in the general economic conditions and fluctuations of the market (market risk). Additionally, the Fund may also be exposed to credit risk in the event that an issuer or guarantor fails to perform or that an institution or entity with which the Fund has unsettled or open transactions defaults.
| | |
| 8 | | Notes to Financial Statements |
SSGA Funds
SSGA S&P 500 Index Fund
Notes to Financial Statements, continued — February 28, 2018 (Unaudited)
Management has evaluated the impact of all subsequent events on the Fund through the date on which the financial statements were available to be issued and has determined that there were no subsequent events requiring adjustment or disclosure in the financial statements.
| | | | |
| Notes to Financial Statements | | | 9 | |
SSGA S&P 500 Index Fund
Other Information — February 28, 2018 (Unaudited)
Expense Example
As a shareholder of a Fund, you incur two types of costs: (1) transaction costs, including sales charges (loads), if applicable, on purchase payments, reinvested dividends, or other distributions and (2) ongoing costs, including advisory fees and to the extent applicable, distribution (12b-1) and/or service fees; and other Fund expenses. This example is intended to help you understand your ongoing costs (in dollars) of investing in the Fund and to compare these costs with the ongoing costs of investing in other mutual funds. It is based on an investment of $1,000 made at the beginning of the period shown and held for the entire period from September 1, 2017 to February 28, 2018.
The table below illustrates your Fund’s cost in two ways:
| • | | Based on actual fund return — This section helps you to estimate the actual expenses that you paid over the period. The “Ending Account Value” shown is derived from the Fund’s actual return, and the third column shows the dollar amount that would have been paid by an investor who started with $1,000 in the Fund. You may use the information here, together with the amount you invested, to estimate the expenses that you paid over the period. To do so, simply divide your account value by $1,000 (for example, an $8,600 account value divided by $1,000 = 8.6), then multiply the result by the number given for the Fund under the heading “Expenses Paid During Period”. |
| • | | Based on hypothetical 5% return — This section is intended to help you compare your Fund’s costs with those of other mutual funds. It assumes that the Fund had a yearly return of 5% before expenses, but that the expense ratio is unchanged. In this case, because the return used is not the Fund’s actual return, the results do not apply to your investment. The example is useful in making comparisons because the Securities and Exchange Commission (“SEC”) requires all mutual funds to calculate expenses based on a 5% return. You can assess your Fund’s costs by comparing this hypothetical example with the hypothetical examples that appear in shareholder reports of other funds. |
Please note that the expenses shown in the table are meant to highlight your ongoing costs only and do not reflect any transaction costs, such as sales load charges (loads). Therefore, the hypothetical 5% return section of the table is useful in comparing ongoing costs only, and will not help you determine the relative total costs of owning different funds. In addition, if these transaction costs were included, your costs would have been higher.
| | | | | | | | | | | | | | | | | | | | |
| | | | Actual | | | Hypothetical (assuming a 5% return
before expenses) | |
| | | Annualized
Expense Ratio | | | Ending Account
Value | | | Expenses Paid
During Period(a) | | | Ending Account
Value | | | Expenses Paid
During Period(a) | |
SSGA S&P 500 Index Fund(b) | | | 0.16 | % | | $ | 1,107.20 | | | $ | 0.84 | | | $ | 1,024.00 | | | $ | 0.80 | |
| (a) | | Expenses are equal to the Fund’s annualized net expense ratio multiplied by the average account value of the period, multiplied by 181, then divided by 365. |
| (b) | | Because the Fund invests all of its assets in its Master Portfolio, the expense example reflects the net expenses of both the Fund and the Master Portfolio in which it invests. |
SSGA S&P 500 Index Fund
Other Information — February 28, 2018 (Unaudited), continued
Proxy Voting Policies and Procedures and Record
A description of the policies and procedures that the Fund has adopted to determine how to vote proxies relating to portfolio securities are contained in the Fund’s Statement of Additional Information, which is available (i) without charge, upon request, by calling 1-800-997-7327, (ii) on the Fund’s website at www.ssgafunds.com, (iii) on the SEC’s website at www.sec.gov, or (iv) at the SEC’s public reference room. Information on the operation of the public reference room may be obtained by calling 1-800-SEC-0330. Information regarding how the Fund voted proxies, if any, during the most recent 12-month period ended June 30 is available by August 31 of each year without charge (1) by calling 1-800-997-7327 (toll free), or (2) on the SEC’s website at www.sec.gov.
Quarterly Portfolio Schedule
The Fund will file its complete schedule of investments with the SEC for the first and third quarters of each fiscal year on Form N-Q. The Fund’s Form N-Q is available (i) without charge, upon request, by calling 1-800-997-7327, (ii) on the Fund’s website at www.ssgafunds.com, (iii) on the SEC’s website at www.sec.gov, or (iv) at the SEC’s public reference room. Information on the operation of the public reference room may be obtained by calling 1-800-SEC-0330.
SSGA S&P 500 Index Fund
One Iron Street
Boston, MA 02210
(800) 997-7327
Trustees
Michael F. Holland
Michael A. Jessee
William L. Marshall
Patrick J. Riley
James E. Ross
Richard D. Shirk
Rina K. Spence
Bruce D. Taber
Douglas T. Williams
Investment Adviser and Administrator
SSGA Funds Management, Inc.
One Iron Street
Boston, MA 02210
Custodian and Office of Shareholder Inquiries
State Street Bank and Trust Company
1776 Heritage Drive
North Quincy, Massachusetts 02171
Transfer and Dividend Paying Agent
DST Asset Manager Solutions Inc.
2000 Crown Colony Drive
Quincy, Massachusetts 02169
Distributor
State Street Global Advisors Funds Distributors, LLC
One Iron Street
Boston, MA 02210
Sub-Administrator
State Street Bank and Trust Company
State Street Financial Center
One Lincoln Street
Boston, Massachusetts 02111
Legal Counsel
Ropes & Gray LLP
800 Boylston Street
Boston, Massachusetts 02199
Independent Registered Public Accounting Firm
Ernst & Young LLP
200 Clarendon Street
Boston, Massachusetts 02116
Distributor: State Street Global Advisors Funds Distributors, LLC member FINRA, SIPC, an indirect wholly owned subsidiary of State Street Corporation. References to State Street may include State Street Corporation and its affiliates. The SSGA Funds pay State Street Bank and Trust Company for its services as custodian and shareholder servicing agent and pay SSGA Funds Management, Inc. for investment advisory and administrator services.
The information contained in this report is intended for the general information of shareholders of the Trust. This report is not authorized for distribution to prospective investors unless preceded or accompanied by a current Trust prospectus which contains important information concerning the Trust. You may obtain a current prospectus and SAI from the Distributor by calling 1-800-997-7327 or visiting www.ssgafunds.com. Please read the prospectus carefully before you invest.
February 28, 2018
State Street Master Funds
State Street Equity 500 Index Portfolio
The information contained in this report is intended for the general information of shareholders of the Portfolio and shareholders of any fund invested in the Portfolio. Interests in the Portfolio are offered solely to eligible investors in private placement transactions that do not involve any “public offering” within the meaning of Section 4(a)(2) of the 1933 Act. This report is not authorized for distribution (i) to prospective investors in any fund invested in the Portfolio unless preceded or accompanied by a current offering document for such fund or (ii) to prospective eligible investors in the Portfolio unless preceded or accompanied by a current offering document of the Portfolio. Eligible investors in the Portfolio may obtain a current Portfolio offering document by calling 1-877-521-4083. Please read the offering document carefully before investing in the Portfolio.
State Street Master Funds
State Street Equity 500 Index Portfolio
February 28, 2018 (Unaudited)
Table of Contents
The information contained in this report is intended for the general information of shareholders of the Portfolio and shareholders of any fund invested in the Portfolio. Interests in the Portfolio are offered solely to eligible investors in private placement transactions that do not involve any “public offering” within the meaning of Section 4(a)(2) of the 1933 Act. This report is not authorized for distribution (i) to prospective investors in any fund invested in the Portfolio unless preceded or accompanied by a current offering document for such fund or (ii) to prospective eligible investors in the Portfolio unless preceded or accompanied by a current offering document of the Portfolio. Eligible investors in the Portfolio may obtain a current Portfolio offering document by calling 1-877-521-4083. Please read the offering document carefully before investing in the Portfolio.
State Street Master Funds
State Street Equity 500 Index Portfolio
Portfolio Statistics (Unaudited)
| | | | |
Portfolio Composition as of February 28, 2018 | | % of Net Assets | |
| | | | |
Common Stocks | | | 98.1 | % |
Short-Term Investments | | | 1.4 | |
Other Assets in Excess of Liabilities | | | 0.5 | |
| | | | |
Total | | | 100.0 | % |
| | | | |
(The composition is expressed as a percentage of net assets as of the date indicated. The composition will vary over time.)
| | | | |
Top Five Sectors as of February 28, 2018 | | % of Net Assets | |
| | | | |
Information Technology | | | 24.6 | % |
Financials | | | 14.7 | |
Health Care | | | 13.5 | |
Consumer Discretionary | | | 12.5 | |
Industrials | | | 10.1 | |
| | | | |
Total | | | 75.4 | % |
| | | | |
(The top five sectors are expressed as a percentage of net assets and may change over time.)
See accompanying notes to financial statements.
| | | | |
| State Street Equity 500 Index Portfolio | | | 1 | |
State Street Equity 500 Index Portfolio
Schedule of Investments — February 28, 2018 (Unaudited)
| | | | | | | | |
| Security Description | | Shares | | | Value | |
| | | | | | | | |
| Common Stocks - 98.1% | | | | | | | | |
Consumer Discretionary - 12.5% | |
Advance Auto Parts, Inc. | | | 5,500 | | | $ | 628,375 | |
Amazon.com, Inc. (a) | | | 26,902 | | | | 40,687,930 | |
Aptiv PLC | | | 17,781 | | | | 1,623,939 | |
AutoZone, Inc. (a) | | | 1,888 | | | | 1,254,991 | |
Best Buy Co., Inc. | | | 18,413 | | | | 1,333,838 | |
Booking Holdings, Inc. (a) | | | 3,308 | | | | 6,728,604 | |
BorgWarner, Inc. | | | 13,223 | | | | 648,985 | |
CarMax, Inc. (a)(b) | | | 13,197 | | | | 817,158 | |
Carnival Corp. | | | 27,049 | | | | 1,809,849 | |
CBS Corp. Class B | | | 23,118 | | | | 1,224,560 | |
Charter Communications, Inc. Class A (a) | | | 12,900 | | | | 4,410,897 | |
Chipotle Mexican Grill, Inc. (a)(b) | | | 1,614 | | | | 513,914 | |
Comcast Corp. Class A | | | 312,130 | | | | 11,302,227 | |
D.R. Horton, Inc. | | | 22,479 | | | | 941,870 | |
Darden Restaurants, Inc. | | | 8,117 | | | | 748,306 | |
Discovery Communications, Inc. Class A (a)(b) | | | 12,597 | | | | 306,359 | |
Discovery Communications, Inc. Class C (a)(b) | | | 13,397 | | | | 307,863 | |
DISH Network Corp. Class A (a) | | | 17,000 | | | | 708,730 | |
Dollar General Corp. | | | 17,287 | | | | 1,635,177 | |
Dollar Tree, Inc. (a) | | | 15,782 | | | | 1,619,865 | |
Expedia, Inc. | | | 7,923 | | | | 833,262 | |
Foot Locker, Inc. | | | 10,100 | | | | 463,691 | |
Ford Motor Co. | | | 265,760 | | | | 2,819,714 | |
Gap, Inc. | | | 15,364 | | | | 485,195 | |
Garmin, Ltd. | | | 6,260 | | | | 370,842 | |
General Motors Co. | | | 87,877 | | | | 3,457,960 | |
Genuine Parts Co. | | | 9,220 | | | | 846,765 | |
Goodyear Tire & Rubber Co. | | | 14,413 | | | | 417,112 | |
H&R Block, Inc. | | | 16,351 | | | | 414,171 | |
Hanesbrands, Inc. (b) | | | 23,400 | | | | 453,960 | |
Harley-Davidson, Inc. (b) | | | 12,385 | | | | 562,031 | |
Hasbro, Inc. | | | 7,628 | | | | 729,008 | |
Hilton Worldwide Holdings, Inc. | | | 13,700 | | | | 1,106,823 | |
Home Depot, Inc. | | | 78,210 | | | | 14,255,337 | |
Interpublic Group of Cos., Inc. | | | 23,128 | | | | 541,195 | |
Kohl’s Corp. | | | 12,388 | | | | 818,723 | |
L Brands, Inc. (b) | | | 17,746 | | | | 875,410 | |
Leggett & Platt, Inc. | | | 9,844 | | | | 427,820 | |
Lennar Corp. Class A | | | 15,425 | | | | 872,747 | |
LKQ Corp. (a) | | | 20,800 | | | | 821,184 | |
Lowe’s Cos., Inc. | | | 56,012 | | | | 5,018,115 | |
Macy’s, Inc. (b) | | | 17,561 | | | | 516,469 | |
Marriott International, Inc. Class A | | | 20,952 | | | | 2,958,632 | |
Mattel, Inc. (b) | | | 27,743 | | | | 441,114 | |
McDonald’s Corp. | | | 53,415 | | | | 8,425,682 | |
MGM Resorts International | | | 35,300 | | | | 1,208,319 | |
Michael Kors Holdings, Ltd. (a) | | | 11,686 | | | | 735,400 | |
Mohawk Industries, Inc. (a) | | | 4,569 | | | | 1,096,012 | |
Netflix, Inc. (a) | | | 29,296 | | | | 8,536,269 | |
| | | | | | | | |
| Security Description | | Shares | | | Value | |
Newell Brands, Inc. | | | 34,450 | | | $ | 885,021 | |
News Corp. Class A | | | 28,814 | | | | 464,770 | |
News Corp. Class B | | | 7,500 | | | | 123,000 | |
NIKE, Inc. Class B | | | 88,302 | | | | 5,918,883 | |
Nordstrom, Inc. (b) | | | 7,756 | | | | 397,960 | |
Norwegian Cruise Line Holdings, Ltd. (a) | | | 12,900 | | | | 734,010 | |
O’Reilly Automotive, Inc. (a) | | | 5,620 | | | | 1,372,348 | |
Omnicom Group, Inc. (b) | | | 14,950 | | | | 1,139,639 | |
PulteGroup, Inc. | | | 19,543 | | | | 548,572 | |
PVH Corp. | | | 4,751 | | | | 685,474 | |
Ralph Lauren Corp. | | | 4,136 | | | | 437,754 | |
Ross Stores, Inc. | | | 25,044 | | | | 1,955,686 | |
Royal Caribbean Cruises, Ltd. | | | 11,300 | | | | 1,430,580 | |
Scripps Networks Interactive, Inc. Class A | | | 6,863 | | | | 616,709 | |
Signet Jewelers, Ltd. | | | 5,100 | | | | 256,428 | |
Starbucks Corp. | | | 95,592 | | | | 5,458,303 | |
Tapestry, Inc. | | | 19,000 | | | | 967,290 | |
Target Corp. | | | 36,444 | | | | 2,748,242 | |
Tiffany & Co. | | | 6,581 | | | | 664,944 | |
Time Warner, Inc. | | | 52,180 | | | | 4,850,653 | |
TJX Cos., Inc. | | | 43,775 | | | | 3,619,317 | |
Tractor Supply Co. | | | 9,774 | | | | 634,626 | |
TripAdvisor, Inc. (a)(b) | | | 9,015 | | | | 361,321 | |
Twenty-First Century Fox, Inc. Class A | | | 71,809 | | | | 2,644,007 | |
Twenty-First Century Fox, Inc. Class B | | | 28,600 | | | | 1,041,612 | |
Ulta Salon Cosmetics & Fragrance, Inc. (a) | | | 3,600 | | | | 732,060 | |
Under Armour, Inc. Class A (a)(b) | | | 14,376 | | | | 238,354 | |
Under Armour, Inc. Class C (a)(b) | | | 14,478 | | | | 217,894 | |
VF Corp. | | | 21,928 | | | | 1,635,171 | |
Viacom, Inc. Class B | | | 24,341 | | | | 811,529 | |
Walt Disney Co. | | | 102,293 | | | | 10,552,546 | |
Whirlpool Corp. | | | 4,559 | | | | 740,518 | |
Wyndham Worldwide Corp. | | | 6,246 | | | | 723,162 | |
Wynn Resorts, Ltd. | | | 5,859 | | | | 981,383 | |
Yum! Brands, Inc. | | | 21,690 | | | | 1,765,132 | |
| | | | | | | | |
| | | | | | | 198,117,297 | |
| | | | | | | | |
| | |
Consumer Staples - 7.4% | | | | | | | | |
Altria Group, Inc. | | | 127,870 | | | | 8,049,416 | |
Archer-Daniels-Midland Co. | | | 39,892 | | | | 1,656,316 | |
British American Tobacco PLC ADR | | | 1 | | | | 59 | |
Brown-Forman Corp. Class B | | | 12,022 | | | | 839,015 | |
Campbell Soup Co. (b) | | | 14,083 | | | | 606,273 | |
Church & Dwight Co., Inc. | | | 17,800 | | | | 875,582 | |
Clorox Co. | | | 8,179 | | | | 1,055,745 | |
Coca-Cola Co. | | | 260,422 | | | | 11,255,439 | |
Colgate-Palmolive Co. | | | 58,279 | | | | 4,019,503 | |
Conagra Brands, Inc. | | | 26,151 | | | | 944,836 | |
See accompanying notes to schedule of investments.
| | |
| 2 | | State Street Equity 500 Index Portfolio |
State Street Equity 500 Index Portfolio
Schedule of Investments, continued — February 28, 2018 (Unaudited)
| | | | | | | | |
| Security Description | | Shares | | | Value | |
| | | | | | | | |
Constellation Brands, Inc. Class A | | | 11,376 | | | $ | 2,451,300 | |
Costco Wholesale Corp. | | | 29,334 | | | | 5,599,861 | |
Coty, Inc. Class A (b) | | | 28,940 | | | | 559,121 | |
CVS Health Corp. | | | 67,027 | | | | 4,539,739 | |
Dr. Pepper Snapple Group, Inc. | | | 11,903 | | | | 1,383,724 | |
Estee Lauder Cos., Inc. Class A | | | 14,963 | | | | 2,071,478 | |
General Mills, Inc. | | | 37,022 | | | | 1,871,462 | |
Hershey Co. | | | 10,415 | | | | 1,023,378 | |
Hormel Foods Corp. (b) | | | 15,998 | | | | 519,295 | |
J.M. Smucker Co. | | | 7,355 | | | | 928,936 | |
Kellogg Co. (b) | | | 17,307 | | | | 1,145,723 | |
Kimberly-Clark Corp. | | | 23,273 | | | | 2,581,441 | |
Kraft Heinz Co. | | | 41,051 | | | | 2,752,469 | |
Kroger Co. | | | 57,410 | | | | 1,556,959 | |
McCormick & Co., Inc. | | | 8,061 | | | | 860,754 | |
Molson Coors Brewing Co. Class B | | | 13,609 | | | | 1,037,686 | |
Mondelez International, Inc. Class A | | | 99,294 | | | | 4,359,007 | |
Monster Beverage Corp. (a) | | | 27,287 | | | | 1,729,177 | |
PepsiCo, Inc. | | | 96,338 | | | | 10,571,169 | |
Philip Morris International, Inc. | | | 105,187 | | | | 10,892,114 | |
Procter & Gamble Co. | | | 170,613 | | | | 13,396,533 | |
Sysco Corp. | | | 32,435 | | | | 1,934,748 | |
Tyson Foods, Inc. Class A | | | 19,191 | | | | 1,427,427 | |
Walgreens Boots Alliance, Inc. | | | 59,113 | | | | 4,072,294 | |
Walmart, Inc. | | | 98,199 | | | | 8,838,892 | |
| | | | | | | | |
| | | | | | | 117,406,871 | |
| | | | | | | | |
| | |
Energy - 5.4% | | | | | | | | |
Anadarko Petroleum Corp. | | | 36,444 | | | | 2,078,766 | |
Andeavor | | | 10,249 | | | | 918,515 | |
Apache Corp. | | | 24,970 | | | | 852,726 | |
Baker Hughes a GE Co. | | | 30,594 | | | | 807,682 | |
Cabot Oil & Gas Corp. | | | 33,722 | | | | 814,724 | |
Chesapeake Energy Corp. (a)(b) | | | 45,894 | | | | 129,421 | |
Chevron Corp. | | | 127,234 | | | | 14,240,029 | |
Cimarex Energy Co. | | | 6,942 | | | | 667,057 | |
Concho Resources, Inc. (a) | | | 9,900 | | | | 1,492,920 | |
ConocoPhillips | | | 79,403 | | | | 4,312,377 | |
Devon Energy Corp. | | | 34,550 | | | | 1,059,648 | |
EOG Resources, Inc. | | | 39,563 | | | | 4,012,479 | |
EQT Corp. | | | 17,743 | | | | 892,650 | |
Exxon Mobil Corp. | | | 285,472 | | | | 21,621,649 | |
Halliburton Co. | | | 58,767 | | | | 2,727,964 | |
Helmerich & Payne, Inc. | | | 7,974 | | | | 514,722 | |
Hess Corp. | | | 16,544 | | | | 751,428 | |
Kinder Morgan, Inc. | | | 130,576 | | | | 2,115,331 | |
Marathon Oil Corp. | | | 55,089 | | | | 799,892 | |
Marathon Petroleum Corp. | | | 33,202 | | | | 2,126,920 | |
National Oilwell Varco, Inc. | | | 26,341 | | | | 924,306 | |
Newfield Exploration Co. (a) | | | 15,685 | | | | 365,931 | |
Noble Energy, Inc. | | | 32,895 | | | | 981,258 | |
Occidental Petroleum Corp. | | | 52,235 | | | | 3,426,616 | |
ONEOK, Inc. | | | 27,904 | | | | 1,571,832 | |
| | | | | | | | |
| Security Description | | Shares | | | Value | |
Phillips 66 | | | 27,392 | | | $ | 2,475,415 | |
Pioneer Natural Resources Co. | | | 11,524 | | | | 1,961,731 | |
Range Resources Corp. (b) | | | 14,541 | | | | 193,250 | |
Schlumberger, Ltd. | | | 93,593 | | | | 6,143,445 | |
TechnipFMC PLC | | | 29,109 | | | | 838,921 | |
Valero Energy Corp. | | | 29,986 | | | | 2,711,334 | |
Williams Cos., Inc. | | | 57,910 | | | | 1,607,582 | |
| | | | | | | | |
| | | | | | | 86,138,521 | |
| | | | | | | | |
| | |
Financials - 14.7% | | | | | | | | |
Affiliated Managers Group, Inc. | | | 3,376 | | | | 639,279 | |
Aflac, Inc. | | | 25,937 | | | | 2,305,280 | |
Allstate Corp. | | | 24,367 | | | | 2,248,099 | |
American Express Co. | | | 47,852 | | | | 4,666,048 | |
American International Group, Inc. | | | 60,132 | | | | 3,447,969 | |
Ameriprise Financial, Inc. | | | 9,463 | | | | 1,480,392 | |
Aon PLC | | | 16,982 | | | | 2,382,914 | |
Arthur J Gallagher & Co. | | | 12,000 | | | | 829,320 | |
Assurant, Inc. | | | 3,946 | | | | 337,265 | |
Bank of America Corp. | | | 653,466 | | | | 20,976,259 | |
Bank of New York Mellon Corp. | | | 67,591 | | | | 3,854,715 | |
BB&T Corp. | | | 53,139 | | | | 2,888,105 | |
Berkshire Hathaway, Inc. Class B (a) | | | 129,719 | | | | 26,877,777 | |
BlackRock, Inc. | | | 8,218 | | | | 4,515,216 | |
Brighthouse Financial, Inc. (a) | | | 7,075 | | | | 383,960 | |
Capital One Financial Corp. | | | 32,368 | | | | 3,169,798 | |
Cboe Global Markets, Inc. | | | 8,200 | | | | 918,482 | |
Charles Schwab Corp. | | | 79,189 | | | | 4,198,601 | |
Chubb, Ltd. | | | 30,841 | | | | 4,376,955 | |
Cincinnati Financial Corp. | | | 9,205 | | | | 686,601 | |
Citigroup, Inc. | | | 177,093 | | | | 13,368,750 | |
Citizens Financial Group, Inc. | | | 34,200 | | | | 1,487,358 | |
CME Group, Inc. | | | 23,192 | | | | 3,853,583 | |
Comerica, Inc. | | | 11,017 | | | | 1,071,073 | |
Discover Financial Services | | | 23,777 | | | | 1,874,341 | |
E*TRADE Financial Corp. (a) | | | 16,989 | | | | 887,335 | |
Everest Re Group, Ltd. | | | 2,700 | | | | 648,648 | |
Fifth Third Bancorp | | | 46,254 | | | | 1,528,695 | |
Franklin Resources, Inc. | | | 22,151 | | | | 856,579 | |
Goldman Sachs Group, Inc. | | | 23,688 | | | | 6,228,286 | |
Hartford Financial Services Group, Inc. | | | 24,930 | | | | 1,317,550 | |
Huntington Bancshares, Inc. | | | 75,965 | | | | 1,192,650 | |
Intercontinental Exchange, Inc. | | | 39,625 | | | | 2,895,795 | |
Invesco, Ltd. | | | 28,289 | | | | 920,524 | |
JPMorgan Chase & Co. | | | 233,972 | | | | 27,023,766 | |
KeyCorp | | | 71,879 | | | | 1,518,803 | |
Leucadia National Corp. | | | 23,809 | | | | 571,178 | |
Lincoln National Corp. | | | 14,310 | | | | 1,089,993 | |
Loews Corp. | | | 20,312 | | | | 1,001,991 | |
M&T Bank Corp. | | | 9,834 | | | | 1,866,886 | |
Marsh & McLennan Cos., Inc. | | | 35,034 | | | | 2,908,523 | |
MetLife, Inc. | | | 72,626 | | | | 3,354,595 | |
Moody’s Corp. | | | 11,034 | | | | 1,841,354 | |
See accompanying notes to schedule of investments.
| | | | |
| State Street Equity 500 Index Portfolio | | | 3 | |
State Street Equity 500 Index Portfolio
Schedule of Investments, continued — February 28, 2018 (Unaudited)
| | | | | | | | |
| Security Description | | Shares | | | Value | |
| | | | | | | | |
Morgan Stanley | | | 93,255 | | | $ | 5,224,145 | |
Nasdaq, Inc. | | | 6,925 | | | | 559,194 | |
Navient Corp. | | | 16,541 | | | | 214,371 | |
Northern Trust Corp. | | | 14,710 | | | | 1,557,348 | |
People’s United Financial, Inc. | | | 22,434 | | | | 429,387 | |
PNC Financial Services Group, Inc. | | | 31,642 | | | | 4,988,678 | |
Principal Financial Group, Inc. | | | 18,426 | | | | 1,148,493 | |
Progressive Corp. | | | 37,852 | | | | 2,179,518 | |
Prudential Financial, Inc. | | | 29,037 | | | | 3,087,214 | |
Raymond James Financial, Inc. | | | 9,600 | | | | 890,016 | |
Regions Financial Corp. | | | 76,243 | | | | 1,479,877 | |
S&P Global, Inc. | | | 17,498 | | | | 3,356,116 | |
State Street Corp. (c) | | | 25,847 | | | | 2,743,659 | |
SunTrust Banks, Inc. | | | 32,182 | | | | 2,247,591 | |
Synchrony Financial | | | 49,771 | | | | 1,811,167 | |
T Rowe Price Group, Inc. | | | 16,720 | | | | 1,870,968 | |
Torchmark Corp. | | | 6,384 | | | | 545,002 | |
Travelers Cos., Inc. | | | 18,098 | | | | 2,515,622 | |
Unum Group | | | 14,124 | | | | 719,759 | |
US Bancorp | | | 106,330 | | | | 5,780,099 | |
Wells Fargo & Co. | | | 298,346 | | | | 17,426,390 | |
Willis Towers Watson PLC | | | 9,479 | | | | 1,496,734 | |
XL Group, Ltd. | | | 15,420 | | | | 652,420 | |
Zions Bancorp | | | 12,058 | | | | 662,828 | |
| | | | | | | | |
| | | | | | | 234,077,887 | |
| | | | | | | | |
| | |
Health Care - 13.5% | | | | | | | | |
Abbott Laboratories | | | 117,649 | | | | 7,097,764 | |
AbbVie, Inc. | | | 107,963 | | | | 12,505,354 | |
Aetna, Inc. | | | 21,515 | | | | 3,809,446 | |
Agilent Technologies, Inc. | | | 22,475 | | | | 1,541,560 | |
Alexion Pharmaceuticals, Inc. (a) | | | 14,427 | | | | 1,694,451 | |
Align Technology, Inc. (a) | | | 5,000 | | | | 1,312,600 | |
Allergan PLC | | | 22,926 | | | | 3,535,648 | |
AmerisourceBergen Corp. | | | 10,552 | | | | 1,004,128 | |
Amgen, Inc. | | | 49,191 | | | | 9,039,830 | |
Anthem, Inc. | | | 16,919 | | | | 3,982,394 | |
Baxter International, Inc. | | | 33,770 | | | | 2,289,268 | |
Becton Dickinson and Co. | | | 17,677 | | | | 3,924,648 | |
Biogen, Inc. (a) | | | 14,047 | | | | 4,059,443 | |
Boston Scientific Corp. (a) | | | 93,577 | | | | 2,550,909 | |
Bristol-Myers Squibb Co. | | | 110,612 | | | | 7,322,514 | |
Cardinal Health, Inc. | | | 20,924 | | | | 1,448,150 | |
Celgene Corp. (a) | | | 52,865 | | | | 4,605,599 | |
Centene Corp. (a) | | | 11,700 | | | | 1,186,614 | |
Cerner Corp. (a) | | | 22,263 | | | | 1,428,394 | |
Cigna Corp. | | | 16,911 | | | | 3,312,696 | |
Cooper Cos., Inc. | | | 3,300 | | | | 760,716 | |
Danaher Corp. | | | 41,678 | | | | 4,075,275 | |
DaVita, Inc. (a) | | | 11,472 | | | | 826,213 | |
DENTSPLY SIRONA, Inc. | | | 14,366 | | | | 805,358 | |
Edwards Lifesciences Corp. (a) | | | 14,190 | | | | 1,896,777 | |
Eli Lilly & Co. | | | 64,557 | | | | 4,972,180 | |
Envision Healthcare Corp. (a)(b) | | | 9,118 | | | | 351,043 | |
| | | | | | | | |
| Security Description | | Shares | | | Value | |
Express Scripts Holding Co. (a) | | | 38,447 | | | $ | 2,900,826 | |
Gilead Sciences, Inc. | | | 88,346 | | | | 6,955,481 | |
HCA Healthcare, Inc. | | | 18,600 | | | | 1,846,050 | |
Henry Schein, Inc. (a) | | | 11,000 | | | | 728,090 | |
Hologic, Inc. (a) | | | 17,600 | | | | 683,408 | |
Humana, Inc. | | | 9,517 | | | | 2,586,911 | |
IDEXX Laboratories, Inc. (a) | | | 6,100 | | | | 1,142,103 | |
Illumina, Inc. (a) | | | 9,900 | | | | 2,257,398 | |
Incyte Corp. (a) | | | 11,900 | | | | 1,013,404 | |
Intuitive Surgical, Inc. (a) | | | 7,456 | | | | 3,179,611 | |
IQVIA Holdings, Inc. (a) | | | 10,000 | | | | 983,300 | |
Johnson & Johnson | | | 181,041 | | | | 23,513,605 | |
Laboratory Corp. of America Holdings (a) | | | 6,447 | | | | 1,113,397 | |
McKesson Corp. | | | 14,631 | | | | 2,183,384 | |
Medtronic PLC | | | 91,604 | | | | 7,318,244 | |
Merck & Co., Inc. | | | 185,198 | | | | 10,041,436 | |
Mettler-Toledo International, Inc. (a) | | | 1,800 | | | | 1,109,196 | |
Mylan NV (a) | | | 34,707 | | | | 1,399,386 | |
Patterson Cos., Inc. (b) | | | 6,459 | | | | 203,975 | |
PerkinElmer, Inc. | | | 7,032 | | | | 536,823 | |
Perrigo Co. PLC | | | 9,814 | | | | 799,448 | |
Pfizer, Inc. | | | 399,348 | | | | 14,500,326 | |
Quest Diagnostics, Inc. | | | 8,458 | | | | 871,597 | |
Regeneron Pharmaceuticals, Inc. (a) | | | 5,158 | | | | 1,652,830 | |
ResMed, Inc. | | | 10,400 | | | | 990,808 | |
Stryker Corp. | | | 22,195 | | | | 3,599,141 | |
Thermo Fisher Scientific, Inc. | | | 26,612 | | | | 5,550,731 | |
UnitedHealth Group, Inc. | | | 64,922 | | | | 14,682,760 | |
Universal Health Services, Inc. Class B | | | 5,300 | | | | 605,260 | |
Varian Medical Systems, Inc. (a) | | | 6,031 | | | | 719,740 | |
Vertex Pharmaceuticals, Inc. (a) | | | 17,148 | | | | 2,847,082 | |
Waters Corp. (a) | | | 5,415 | | | | 1,108,126 | |
Zimmer Biomet Holdings, Inc. | | | 13,427 | | | | 1,560,889 | |
Zoetis, Inc. | | | 31,928 | | | | 2,581,698 | |
| | | | | | | | |
| | | | | | | 215,105,436 | |
| | | | | | | | |
| | |
Industrials - 10.1% | | | | | | | | |
3M Co. | | | 40,043 | | | | 9,430,527 | |
Acuity Brands, Inc. | | | 3,000 | | | | 427,740 | |
Alaska Air Group, Inc. | | | 9,000 | | | | 580,500 | |
Allegion PLC | | | 5,437 | | | | 457,306 | |
American Airlines Group, Inc. | | | 28,100 | | | | 1,524,425 | |
AMETEK, Inc. | | | 15,701 | | | | 1,189,194 | |
AO Smith Corp. | | | 10,800 | | | | 693,252 | |
Arconic, Inc. | | | 28,263 | | | | 689,335 | |
Boeing Co. | | | 37,924 | | | | 13,736,452 | |
C.H. Robinson Worldwide, Inc. (b) | | | 9,582 | | | | 894,576 | |
Caterpillar, Inc. | | | 40,055 | | | | 6,193,705 | |
Cintas Corp. | | | 5,722 | | | | 976,517 | |
CSX Corp. | | | 61,559 | | | | 3,306,949 | |
See accompanying notes to schedule of investments.
| | |
| 4 | | State Street Equity 500 Index Portfolio |
State Street Equity 500 Index Portfolio
Schedule of Investments, continued — February 28, 2018 (Unaudited)
| | | | | | | | |
| Security Description | | Shares | | | Value | |
| | | | | | | | |
Cummins, Inc. | | | 10,744 | | | $ | 1,806,818 | |
Deere & Co. | | | 22,054 | | | | 3,547,827 | |
Delta Air Lines, Inc. | | | 44,766 | | | | 2,412,887 | |
Dover Corp. | | | 10,545 | | | | 1,055,555 | |
Eaton Corp. PLC | | | 29,999 | | | | 2,420,919 | |
Emerson Electric Co. | | | 43,369 | | | | 3,081,801 | |
Equifax, Inc. | | | 8,395 | | | | 948,635 | |
Expeditors International of Washington, Inc. | | | 11,844 | | | | 769,386 | |
Fastenal Co. (b) | | | 20,242 | | | | 1,107,642 | |
FedEx Corp. | | | 16,350 | | | | 4,028,803 | |
Flowserve Corp. | | | 9,555 | | | | 404,654 | |
Fluor Corp. | | | 10,956 | | | | 623,396 | |
Fortive Corp. | | | 19,739 | | | | 1,515,955 | |
Fortune Brands Home & Security, Inc. | | | 10,100 | | | | 612,666 | |
General Dynamics Corp. | | | 18,889 | | | | 4,201,858 | |
General Electric Co. | | | 581,149 | | | | 8,200,012 | |
Harris Corp. | | | 8,598 | | | | 1,342,578 | |
Honeywell International, Inc. | | | 51,603 | | | | 7,797,729 | |
Huntington Ingalls Industries, Inc. | | | 3,200 | | | | 838,432 | |
IHS Markit, Ltd. (a) | | | 23,400 | | | | 1,100,970 | |
Illinois Tool Works, Inc. | | | 20,871 | | | | 3,369,414 | |
Ingersoll-Rand PLC | | | 16,716 | | | | 1,484,381 | |
Jacobs Engineering Group, Inc. | | | 7,057 | | | | 430,900 | |
JB Hunt Transport Services, Inc. | | | 5,500 | | | | 652,135 | |
Johnson Controls International PLC | | | 63,093 | | | | 2,326,239 | |
Kansas City Southern | | | 7,004 | | | | 721,692 | |
L3 Technologies, Inc. | | | 5,365 | | | | 1,113,506 | |
Lockheed Martin Corp. | | | 16,790 | | | | 5,917,468 | |
Masco Corp. | | | 21,639 | | | | 889,796 | |
Nielsen Holdings PLC | | | 23,375 | | | | 762,726 | |
Norfolk Southern Corp. | | | 19,568 | | | | 2,721,517 | |
Northrop Grumman Corp. | | | 11,986 | | | | 4,195,579 | |
PACCAR, Inc. | | | 23,635 | | | | 1,692,030 | |
Parker-Hannifin Corp. | | | 9,214 | | | | 1,644,423 | |
Pentair PLC | | | 11,791 | | | | 809,924 | |
Quanta Services, Inc. (a) | | | 11,593 | | | | 399,263 | |
Raytheon Co. | | | 19,136 | | | | 4,162,271 | |
Republic Services, Inc. | | | 15,814 | | | | 1,062,385 | |
Robert Half International, Inc. | | | 9,374 | | | | 534,974 | |
Rockwell Automation, Inc. | | | 8,379 | | | | 1,514,923 | |
Rockwell Collins, Inc. | | | 10,800 | | | | 1,487,376 | |
Roper Technologies, Inc. | | | 6,835 | | | | 1,880,240 | |
Snap-on, Inc. | | | 3,572 | | | | 568,734 | |
Southwest Airlines Co. | | | 37,227 | | | | 2,153,210 | |
Stanley Black & Decker, Inc. | | | 10,650 | | | | 1,695,374 | |
Stericycle, Inc. (a) | | | 6,604 | | | | 413,873 | |
Textron, Inc. | | | 17,106 | | | | 1,023,794 | |
TransDigm Group, Inc. (b) | | | 3,400 | | | | 980,254 | |
Union Pacific Corp. | | | 53,138 | | | | 6,921,224 | |
United Continental Holdings, Inc. (a) | | | 17,400 | | | | 1,179,546 | |
United Parcel Service, Inc. Class B | | | 46,155 | | | | 4,819,044 | |
United Rentals, Inc. (a) | | | 6,100 | | | | 1,068,049 | |
United Technologies Corp. | | | 50,127 | | | | 6,754,112 | |
| | | | | | | | |
| Security Description | | Shares | | | Value | |
Verisk Analytics, Inc. (a) | | | 10,300 | | | $ | 1,052,557 | |
W.W. Grainger, Inc. | | | 3,212 | | | | 840,099 | |
Waste Management, Inc. | | | 26,404 | | | | 2,279,193 | |
Xylem, Inc. | | | 11,434 | | | | 852,748 | |
| | | | | | | | |
| | | | | | | 160,293,974 | |
| | | | | | | | |
|
Information Technology - 24.6% | |
Accenture PLC Class A | | | 41,282 | | | | 6,646,815 | |
Activision Blizzard, Inc. | | | 52,000 | | | | 3,802,760 | |
Adobe Systems, Inc. (a) | | | 33,313 | | | | 6,966,748 | |
Advanced Micro Devices, Inc. (a)(b) | | | 57,800 | | | | 699,958 | |
Akamai Technologies, Inc. (a) | | | 12,634 | | | | 852,290 | |
Alliance Data Systems Corp. | | | 3,504 | | | | 844,324 | |
Alphabet, Inc. Class A (a) | | | 20,123 | | | | 22,214,182 | |
Alphabet, Inc. Class C (a) | | | 20,345 | | | | 22,475,732 | |
Amphenol Corp. Class A | | | 20,580 | | | | 1,880,806 | |
Analog Devices, Inc. | | | 23,970 | | | | 2,160,895 | |
ANSYS, Inc. (a) | | | 5,600 | | | | 895,664 | |
Apple, Inc. | | | 345,364 | | | | 61,516,236 | |
Applied Materials, Inc. | | | 73,353 | | | | 4,224,399 | |
Autodesk, Inc. (a) | | | 14,270 | | | | 1,676,297 | |
Automatic Data Processing, Inc. | | | 30,565 | | | | 3,524,756 | |
Broadcom, Ltd. | | | 27,435 | | | | 6,761,630 | |
CA, Inc. | | | 19,459 | | | | 683,011 | |
Cadence Design Systems, Inc. (a) | | | 20,400 | | | | 790,908 | |
Cars.com, Inc. (a) | | | 1 | | | | 27 | |
Cisco Systems, Inc. | | | 331,229 | | | | 14,832,435 | |
Citrix Systems, Inc. (a) | | | 9,478 | | | | 871,976 | |
Cognizant Technology Solutions Corp. Class A | | | 39,827 | | | | 3,266,611 | |
Corning, Inc. | | | 56,850 | | | | 1,653,198 | |
CSRA, Inc. | | | 9,732 | | | | 394,438 | |
DXC Technology Co. | | | 19,291 | | | | 1,978,099 | |
eBay, Inc. (a) | | | 65,658 | | | | 2,814,102 | |
Electronic Arts, Inc. (a) | | | 20,121 | | | | 2,488,968 | |
F5 Networks, Inc. (a) | | | 3,759 | | | | 558,287 | |
Facebook, Inc. Class A (a) | | | 160,807 | | | | 28,675,104 | |
Fidelity National Information Services, Inc. | | | 22,386 | | | | 2,175,471 | |
Fiserv, Inc. (a) | | | 13,842 | | | | 1,984,804 | |
FLIR Systems, Inc. | | | 8,239 | | | | 404,535 | |
Gartner, Inc. (a) | | | 6,700 | | | | 759,847 | |
Global Payments, Inc. | | | 11,275 | | | | 1,278,472 | |
Hewlett Packard Enterprise Co. | | | 104,163 | | | | 1,936,390 | |
HP, Inc. | | | 112,063 | | | | 2,621,154 | |
Intel Corp. | | | 313,620 | | | | 15,458,330 | |
International Business Machines Corp. | | | 57,747 | | | | 8,998,715 | |
Intuit, Inc. | | | 16,126 | | | | 2,690,784 | |
Juniper Networks, Inc. | | | 27,844 | | | | 714,477 | |
KLA-Tencor Corp. | | | 9,873 | | | | 1,118,710 | |
Lam Research Corp. | | | 10,681 | | | | 2,049,257 | |
Mastercard, Inc. Class A | | | 62,749 | | | | 11,028,764 | |
See accompanying notes to schedule of investments.
| | | | |
| State Street Equity 500 Index Portfolio | | | 5 | |
State Street Equity 500 Index Portfolio
Schedule of Investments, continued — February 28, 2018 (Unaudited)
| | | | | | | | |
| Security Description | | Shares | | | Value | |
| | | | | | | | |
Microchip Technology, Inc. (b) | | | 16,206 | | | $ | 1,441,200 | |
Micron Technology, Inc. (a) | | | 76,928 | | | | 3,754,856 | |
Microsoft Corp. | | | 518,777 | | | | 48,645,719 | |
Motorola Solutions, Inc. | | | 10,428 | | | | 1,106,932 | |
NetApp, Inc. | | | 16,843 | | | | 1,019,844 | |
NVIDIA Corp. | | | 41,112 | | | | 9,949,104 | |
Oracle Corp. | | | 204,470 | | | | 10,360,495 | |
Paychex, Inc. | | | 21,131 | | | | 1,376,262 | |
PayPal Holdings, Inc. (a) | | | 75,858 | | | | 6,023,884 | |
Qorvo, Inc. (a) | | | 7,600 | | | | 613,396 | |
QUALCOMM, Inc. | | | 99,585 | | | | 6,473,025 | |
Red Hat, Inc. (a) | | | 12,530 | | | | 1,846,922 | |
salesforce.com, Inc. (a) | | | 45,505 | | | | 5,289,956 | |
Seagate Technology PLC | | | 18,476 | | | | 986,618 | |
Skyworks Solutions, Inc. | | | 11,800 | | | | 1,289,150 | |
Symantec Corp. | | | 39,403 | | | | 1,035,905 | |
Synopsys, Inc. (a) | | | 9,400 | | | | 795,898 | |
TE Connectivity, Ltd. | | | 22,949 | | | | 2,365,812 | |
Texas Instruments, Inc. | | | 66,606 | | | | 7,216,760 | |
Total System Services, Inc. | | | 10,899 | | | | 958,567 | |
VeriSign, Inc. (a)(b) | | | 5,320 | | | | 617,226 | |
Visa, Inc. Class A | | | 121,540 | | | | 14,942,128 | |
Western Digital Corp. | | | 19,506 | | | | 1,697,802 | |
Western Union Co. | | | 27,940 | | | | 553,771 | |
Xerox Corp. | | | 15,823 | | | | 479,753 | |
Xilinx, Inc. | | | 16,042 | | | | 1,142,992 | |
| | | | | | | | |
| | | | | | | 391,354,343 | |
| | | | | | | | |
| | |
Materials - 2.9% | | | | | | | | |
Air Products & Chemicals, Inc. | | | 14,907 | | | | 2,396,896 | |
Albemarle Corp. (b) | | | 7,100 | | | | 713,053 | |
Avery Dennison Corp. | | | 6,518 | | | | 770,102 | |
Ball Corp. | | | 25,716 | | | | 1,027,354 | |
CF Industries Holdings, Inc. | | | 16,730 | | | | 689,945 | |
DowDuPont, Inc. | | | 158,432 | | | | 11,137,770 | |
Eastman Chemical Co. | | | 8,972 | | | | 906,890 | |
Ecolab, Inc. | | | 17,165 | | | | 2,239,174 | |
FMC Corp. | | | 8,622 | | | | 676,655 | |
Freeport-McMoRan, Inc. (a) | | | 90,364 | | | | 1,680,770 | |
International Flavors & Fragrances, Inc. | | | 5,880 | | | | 830,550 | |
International Paper Co. | | | 27,508 | | | | 1,639,202 | |
LyondellBasell Industries NV Class A | | | 22,052 | | | | 2,386,467 | |
Martin Marietta Materials, Inc. | | | 4,055 | | | | 826,936 | |
Monsanto Co. | | | 29,994 | | | | 3,700,360 | |
Mosaic Co. | | | 20,816 | | | | 547,877 | |
Newmont Mining Corp. | | | 36,973 | | | | 1,412,369 | |
Nucor Corp. | | | 21,906 | | | | 1,432,652 | |
Packaging Corp. of America | | | 6,900 | | | | 822,480 | |
PPG Industries, Inc. | | | 17,288 | | | | 1,943,863 | |
Praxair, Inc. | | | 19,600 | | | | 2,935,100 | |
Sealed Air Corp. | | | 11,269 | | | | 477,468 | |
Sherwin-Williams Co. | | | 5,587 | | | | 2,243,627 | |
| | | | | | | | |
| Security Description | | Shares | | | Value | |
Vulcan Materials Co. | | | 8,390 | | | $ | 987,755 | |
WestRock Co. | | | 16,448 | | | | 1,081,620 | |
| | | | | | | | |
| | | | | | | 45,506,935 | |
| | | | | | | | |
| | |
Real Estate - 2.6% | | | | | | | | |
Alexandria Real Estate Equities, Inc. REIT | | | 6,700 | | | | 812,777 | |
American Tower Corp. REIT | | | 29,282 | | | | 4,079,861 | |
Apartment Investment & Management Co. Class A REIT | | | 11,865 | | | | 458,701 | |
AvalonBay Communities, Inc. REIT | | | 9,729 | | | | 1,517,919 | |
Boston Properties, Inc. REIT | | | 9,821 | | | | 1,167,422 | |
CBRE Group, Inc. Class A (a) | | | 21,708 | | | | 1,014,849 | |
Crown Castle International Corp. REIT | | | 26,642 | | | | 2,932,218 | |
Digital Realty Trust, Inc. REIT | | | 13,300 | | | | 1,338,512 | |
Duke Realty Corp. REIT | | | 26,000 | | | | 644,020 | |
Equinix, Inc. REIT | | | 5,338 | | | | 2,093,030 | |
Equity Residential REIT | | | 24,138 | | | | 1,357,280 | |
Essex Property Trust, Inc. REIT | | | 4,455 | | | | 997,163 | |
Extra Space Storage, Inc. REIT | | | 9,500 | | | | 807,975 | |
Federal Realty Investment Trust REIT | | | 5,400 | | | | 615,276 | |
GGP, Inc. REIT | | | 42,942 | | | | 909,082 | |
HCP, Inc. REIT | | | 32,677 | | | | 707,130 | |
Host Hotels & Resorts, Inc. REIT | | | 54,259 | | | | 1,007,047 | |
Iron Mountain, Inc. REIT | | | 18,074 | | | | 568,608 | |
Kimco Realty Corp. REIT | | | 32,916 | | | | 492,423 | |
Macerich Co. REIT | | | 8,645 | | | | 509,536 | |
Mid-America Apartment Communities, Inc. REIT | | | 6,900 | | | | 592,158 | |
Prologis, Inc. REIT | | | 36,247 | | | | 2,199,468 | |
Public Storage REIT | | | 10,152 | | | | 1,973,955 | |
Realty Income Corp. REIT | | | 19,800 | | | | 973,764 | |
Regency Centers Corp. REIT | | | 10,899 | | | | 633,341 | |
SBA Communications Corp. REIT (a) | | | 7,700 | | | | 1,210,979 | |
Simon Property Group, Inc. REIT | | | 21,435 | | | | 3,290,487 | |
SL Green Realty Corp. REIT | | | 6,100 | | | | 591,212 | |
UDR, Inc. REIT | | | 20,100 | | | | 675,762 | |
Ventas, Inc. REIT | | | 23,803 | | | | 1,150,161 | |
Vornado Realty Trust REIT | | | 10,446 | | | | 694,346 | |
Welltower, Inc. REIT | | | 23,881 | | | | 1,253,752 | |
Weyerhaeuser Co. REIT | | | 49,998 | | | | 1,751,430 | |
| | | | | | | | |
| | | | | | | 41,021,644 | |
| | | | | | | | |
|
Telecommunication Services - 1.8% | |
AT&T, Inc. | | | 411,418 | | | | 14,934,474 | |
CenturyLink, Inc. | | | 67,987 | | | | 1,201,330 | |
Verizon Communications, Inc. | | | 273,151 | | | | 13,040,229 | |
| | | | | | | | |
| | | | | | | 29,176,033 | |
| | | | | | | | |
| | |
Utilities - 2.6% | | | | | | | | |
AES Corp. | | | 49,859 | | | | 541,967 | |
Alliant Energy Corp. | | | 14,700 | | | | 568,155 | |
See accompanying notes to schedule of investments.
| | |
| 6 | | State Street Equity 500 Index Portfolio |
State Street Equity 500 Index Portfolio
Schedule of Investments, continued — February 28, 2018 (Unaudited)
| | | | | | | | |
| Security Description | | Shares | | | Value | |
| | | | | | | | |
Ameren Corp. | | | 16,456 | | | $ | 893,561 | |
American Electric Power Co., Inc. | | | 33,143 | | | | 2,173,518 | |
American Water Works Co., Inc. | | | 12,300 | | | | 976,128 | |
CenterPoint Energy, Inc. | | | 26,535 | | | | 717,772 | |
CMS Energy Corp. | | | 18,801 | | | | 798,102 | |
Consolidated Edison, Inc. | | | 21,500 | | | | 1,610,135 | |
Dominion Energy, Inc. | | | 44,368 | | | | 3,286,338 | |
DTE Energy Co. | | | 11,439 | | | | 1,152,822 | |
Duke Energy Corp. | | | 46,791 | | | | 3,525,234 | |
Edison International | | | 21,305 | | | | 1,290,870 | |
Entergy Corp. | | | 12,200 | | | | 925,004 | |
Eversource Energy | | | 22,043 | | | | 1,256,451 | |
Exelon Corp. | | | 64,459 | | | | 2,387,561 | |
FirstEnergy Corp. | | | 32,229 | | | | 1,041,964 | |
NextEra Energy, Inc. | | | 31,457 | | | | 4,786,183 | |
NiSource, Inc. | | | 23,078 | | | | 533,794 | |
NRG Energy, Inc. | | | 22,498 | | | | 581,798 | |
PG&E Corp. | | | 33,712 | | | | 1,385,226 | |
Pinnacle West Capital Corp. | | | 6,556 | | | | 504,550 | |
PPL Corp. | | | 44,756 | | | | 1,282,259 | |
Public Service Enterprise Group, Inc. | | | 33,936 | | | | 1,643,520 | |
SCANA Corp. | | | 11,501 | | | | 456,245 | |
Sempra Energy | | | 17,624 | | | | 1,920,664 | |
Southern Co. | | | 69,084 | | | | 2,974,757 | |
WEC Energy Group, Inc. | | | 20,287 | | | | 1,215,597 | |
Xcel Energy, Inc. | | | 33,700 | | | | 1,458,536 | |
| | | | | | | | |
| | | | | | | 41,888,711 | |
| | | | | | | | |
| | |
Total Common Stocks
(Cost $451,924,843) | | | | | | | 1,560,087,652 | |
| | | | | | | | |
| | | | | | | | |
| Security Description | | Shares | | | Value | |
| Short-Term Investments - 1.4% | |
Money Market Funds - 1.4% | |
State Street Institutional U.S. Government Money Market Fund, Class G Shares 1.34% (d)(e) | | | 20,230,967 | | | $ | 20,230,967 | |
State Street Navigator Securities Lending Government Money Market Portfolio (d)(f) | | | 1,671,844 | | | | 1,671,844 | |
| | | | | | | | |
| | | | | | | 21,902,811 | |
| | | | | | | | |
| |
Total Short-Term Investments
(Cost $21,902,811) | | | | 21,902,811 | |
| | | | | | | | |
| |
Total Investments - 99.5%
(Cost $473,827,654) | | | | 1,581,990,463 | |
| |
| Other Assets in Excess of Liabilities - 0.5% | | | | 8,598,719 | |
| | | | | | | | |
| | |
| Net Assets - 100.0% | | | | | | $ | 1,590,589,182 | |
| | | | | | | | |
| (a) | Non-income producing security. |
| (b) | All or a portion of the shares of the security are on loan at February 28, 2018. |
| (c) | The Portfolio invested in an affiliated entity, State Street Corp. Amounts related to these transactions during the period ended February 28, 2018 are shown in the Affiliate Table below. |
| (d) | The Portfolio invested in certain money market funds managed by SSGA Funds Management, Inc. Amounts related to these transactions during the period ended February 28, 2018 are shown in the Affiliate Table below. |
| (e) | The rate shown is the annualized seven-day yield at February 28, 2018. |
| (f) | Investment of cash collateral for securities loaned. |
| ADR | American Depositary Receipt |
| REIT | Real Estate Investment Trust |
At February 28, 2018, open futures contracts purchased were as follows:
| | | | | | | | | | | | | | | | | | | | |
| Futures Contracts | | Expiration
Date | | | Number of
Contracts | | | Notional
Amount | | | Value | | | Unrealized
Appreciation | |
E-Mini S&P 500 Index (long) | | | 03/16/2018 | | | | 233 | | | | 30,937,595 | | | $ | 31,622,760 | | | $ | 685,165 | |
During the period ended February 28, 2018, average notional value related to futures contracts was $31,415,643 or 2% of net assets.
See accompanying notes to schedule of investments.
| | | | |
| State Street Equity 500 Index Portfolio | | | 7 | |
State Street Equity 500 Index Portfolio
Schedule of Investments, continued — February 28, 2018 (Unaudited)
The following table summarizes the value of the Portfolio’s investments according to the fair value hierarchy as of February 28, 2018.
| | | | | | | | | | | | | | | | |
| Description | | Level 1 — Quoted Prices | | | Level 2 — Other Significant Observable
Inputs | | | Level 3 — Significant Unobservable
Inputs | | | Total | |
Assets: | | | | | | | | | | | | | | | | |
| | | | |
Investments: | | | | | | | | | | | | | | | | |
Common Stocks | | | | | | | | | | | | | | | | |
Consumer Discretionary | | $ | 198,117,297 | | | $ | — | | | $ | — | | | $ | 198,117,297 | |
Consumer Staples | | | 117,406,871 | | | | — | | | | — | | | | 117,406,871 | |
Energy | | | 86,138,521 | | | | — | | | | — | | | | 86,138,521 | |
Financials | | | 234,077,887 | | | | — | | | | — | | | | 234,077,887 | |
Health Care | | | 215,105,436 | | | | — | | | | — | | | | 215,105,436 | |
Industrials | | | 160,293,974 | | | | — | | | | — | | | | 160,293,974 | |
Information Technology | | | 391,354,343 | | | | — | | | | — | | | | 391,354,343 | |
Materials | | | 45,506,935 | | | | — | | | | — | | | | 45,506,935 | |
Real Estate | | | 41,021,644 | | | | — | | | | — | | | | 41,021,644 | |
Telecommunication Services | | | 29,176,033 | | | | — | | | | — | | | | 29,176,033 | |
Utilities | | | 41,888,711 | | | | — | | | | — | | | | 41,888,711 | |
Short-Term Investments | | | | | | | | | | | | | | | | |
Money Market Funds | | | 21,902,811 | | | | — | | | | — | | | | 21,902,811 | |
| | | | | | | | | | | | | | | | |
Total Investments | | $ | 1,581,990,463 | | | $ | — | | | $ | — | | | $ | 1,581,990,463 | |
| | | | | | | | | | | | | | | | |
| | | | |
Other Financial Instruments: | | | | | | | | | | | | | | | | |
Futures Contracts(a) | | | 685,165 | | | | — | | | | — | | | | 685,165 | |
| | | | | | | | | | | | | | | | |
| | | | |
Total Investments and Other Financial Instruments | | $ | 1,582,675,628 | | | $ | — | | | $ | — | | | $ | 1,582,675,628 | |
| | | | | | | | | | | | | | | | |
| (a) | | Futures Contracts are valued at unrealized appreciation (depreciation). |
Affiliate Table
| | | | | | | | | | | | | | | | | | | | | | | | | | | | | | | | | | | | |
| | | Number
of Shares Held at
12/31/17 | | | Value at 12/31/17 | | | Cost of Purchases | | | Proceeds from Shares Sold | | | Realized Gain
(Loss) | | | Change in
Unrealized Appreciation/ Depreciation | | | Number
of Shares
Held at 2/28/18 | | | Value at 2/28/18 | | | Dividend Income | |
State Street Corp. | | | 25,847 | | | $ | 2,522,926 | | | $ | — | | | $ | — | | | $ | — | | | $ | 220,733 | | | | 25,847 | | | $ | 2,743,659 | | | $ | — | |
State Street Institutional U.S. Government Money Market Fund, Class G Shares | | | 27,556,254 | | | | 27,556,254 | | | | 65,952,335 | | | | 73,277,622 | | | | — | | | | — | | | | 20,230,967 | | | | 20,230,967 | | | | 52,214 | |
State Street Navigator Securities Lending Government Money Market Portfolio | | | 818,690 | | | | 818,690 | | | | 3,602,710 | | | | 2,749,556 | | | | — | | | | — | | | | 1,671,844 | | | | 1,671,844 | | | | 10,148 | |
| | | | | | | | | | | | | | | | | | | | | | | | | | | | | | | | | | | | |
Total | | | | | | $ | 30,897,870 | | | $ | 69,555,045 | | | $ | 76,027,178 | | | $ | — | | | $ | 220,733 | | | | | | | $ | 24,646,470 | | | $ | 62,362 | |
| | | | | | | | | | | | | | | | | | | | | | | | | | | | | | | | | | | | |
See accompanying notes to schedule of investments.
| | |
| 8 | | State Street Equity 500 Index Portfolio |
State Street Master Funds
State Street Equity 500 Index Portfolio
Notes to Schedule of Investments — February 28, 2018 (Unaudited)
Security Valuation
The Portfolio’s investments are valued at fair value each day that the New York Stock Exchange (“NYSE”) is open and, for financial reporting purposes, as of the report date should the reporting period end on a day that the NYSE is not open. Fair value is generally defined as the price a fund would receive to sell an asset or pay to transfer a liability in an orderly transaction between market participants at the measurement date. By its nature, a fair value price is a good faith estimate of the valuation in a current sale and may not reflect an actual market price. The investments of the Portfolio are valued pursuant to the policy and procedures developed by the Oversight Committee (the “Committee”) and approved by the Board of Trustees of the Trust (the “Board”). The Committee provides oversight of the valuation of investments for the Portfolio. The Board has responsibility for determining the fair value of investments.
Valuation techniques used to value the Portfolio’s investments by major category are as follows:
| | • | | Equity investments traded on a recognized securities exchange for which market quotations are readily available are valued at the last sale price or official closing price, as applicable, on the primary market or exchange on which they trade. Equity investments traded on a recognized exchange for which there were no sales on that day are valued at the last published sale price or at fair value. |
| | • | | Investments in registered investment companies (including money market funds) or other unitized pooled investment vehicles that are not traded on an exchange are valued at that day’s published net asset value (“NAV”) per share or unit. |
| | • | | Exchange-traded futures contracts are valued at the closing settlement price on the primary market on which they are traded most extensively. Exchange-traded futures contracts traded on a recognized exchange for which there were no sales on that day are valued at the last reported sale price obtained from independent pricing services or brokers or at fair value. |
In the event prices or quotations are not readily available or that the application of these valuation methods results in a price for an investment that is deemed to be not representative of the fair value of such investment, fair value will be determined in good faith by the Committee, in accordance with the valuation policy and procedures approved by the Board.
Various inputs are used in determining the value of the Portfolio’s investments.
The Portfolio values its assets and liabilities at fair value using a fair value hierarchy consisting of three broad levels that prioritize the inputs to valuation techniques giving the highest priority to readily available unadjusted quoted prices in active markets for identical assets or liabilities (Level 1 measurements) and the lowest priority to unobservable inputs (Level 3 measurements) when market prices are not readily available or reliable. The categorization of a value determined for an investment within the hierarchy is based upon the pricing transparency of the investment and is not necessarily an indication of the risk associated with investing in it.
The three levels of the fair value hierarchy are as follows:
| | • | | Level 1 — Unadjusted quoted prices in active markets for an identical asset or liability; |
| | • | | Level 2 — Inputs other than quoted prices included within Level 1 that are observable for the asset or liability either directly or indirectly, including quoted prices for similar assets or liabilities in active markets, quoted prices for identical or similar assets or liabilities in markets that are not considered to be active, inputs other than quoted prices that are observable for the asset or liability (such as exchange rates, financing terms, interest rates, yield curves, volatilities, prepayment speeds, loss severities, credit risks and default rates) or other market-corroborated inputs; and |
| | • | | Level 3 — Unobservable inputs for the asset or liability, including the Committee’s assumptions used in determining the fair value of investments. |
Changes in valuation techniques may result in transfers in or out of an assigned level within the fair value hierarchy. Transfers between different levels of the fair value hierarchy are recognized at the end of the reporting period.
The Portfolio had no transfers between levels for the period ended February 28, 2018.
| | | | |
| State Street Equity 500 Index Portfolio | | | 9 | |
State Street Master Funds
State Street Equity 500 Index Portfolio
Notes to Schedule of Investments, continued — February 28, 2018 (Unaudited)
Futures Contracts
The Portfolio may enter into futures contracts to meet its objectives. A futures contract is a standardized, exchange-traded agreement to buy or sell a financial instrument at a set price on a future date. Upon entering into a futures contract, the Portfolio is required to deposit with the broker, cash or securities in an amount equal to the minimum initial margin requirements of the clearing house. Subsequent payments are made or received by the Portfolio equal to the daily change in the contract value and are recorded as variation margin receivable or payable with a corresponding offset to unrealized gains or losses. The Portfolio recognizes a realized gain or loss when the contract is closed.
Losses may arise if the value of a futures contract decreases due to unfavorable changes in the market rates or values of the underlying instrument during the term of the contract or if the counterparty does not perform under the contract. The use of futures contracts also involves the risk that the movements in the price of the futures contracts do not correlate with the movement of the assets underlying such contracts.
For the period ended February 28, 2018, the Portfolio entered into futures contracts for cash equitization, to reduce tracking error and to facilitate daily liquidity.
The following table summarizes the value of the Portfolio’s derivative instruments as of February 28, 2018 and the related location in the accompanying Statement of Assets and Liabilities, presented by primary underlying risk exposure:
Asset Derivatives
| | | | | | | | | | | | | | | | | | | | | | | | |
| | | Interest Rate Contracts Risk | | | Foreign Exchange Contracts Risk | | | Credit Contracts Risk | | | Equity Contracts Risk | | | Commodity Contracts Risk | | | Total | |
| | | | | | | | | | | | | | | | | | | | | | | | |
State Street Equity 500 Index Portfolio | |
Futures Contracts(a) | | $ | — | | | | — | | | $ | — | | | $ | 685,165 | | | $ | — | | | $ | 685,165 | |
| | (a) | Unrealized appreciation on open futures contracts. The Statement of Assets and Liabilities only reflect the current day’s net variation margin. |
Other Transactions with Affiliates—Securities Lending
State Street, an affiliate of the Portfolio, acts as the securities lending agent for the Portfolio, pursuant to an amended and restated securities lending authorization agreement dated January 6, 2017.
Proceeds collected by State Street on investment of cash collateral or any fee income are allocated as follows (after deduction of such other amounts payable to State Street under the terms of the securities lending agreement): 85% payable to the Fund, and 15% payable to State Street.
In addition, cash collateral from lending activities is invested in the State Street Navigator Securities Lending Government Money Market Portfolio, an affiliated money market fund, for which SSGA FM serves as investment adviser.
Other Transactions with Affiliates
The Portfolio may invest in affiliated entities, including securities issued by State Street Corporation, affiliated funds, or entities deemed to be affiliates as a result of the Portfolio owning more than five percent of the entity’s voting securities or outstanding shares. Amounts relating to these transactions during the period ended February 28, 2018 are disclosed in the Schedule of Investments.
Securities Lending
The Portfolio may lend securities to qualified broker-dealers or institutional investors. The loans are secured at all times by cash, cash equivalents or U.S. government securities in an amount at least equal to the market value of the securities loaned, plus accrued interest and dividends, determined on a daily basis and adjusted accordingly. The value of the collateral with respect to a loaned security may be temporarily more or less than the value of a security due to market fluctuations of
| | |
| 10 | | State Street Equity 500 Index Portfolio |
State Street Master Funds
State Street Equity 500 Index Portfolio
Notes to Schedule of Investments, continued — February 28, 2018 (Unaudited)
securities values. With respect to each loan, if on any U.S. business day the aggregate market value of securities collateral plus cash collateral is less than the aggregate market value of the securities which are subject to the loan, the borrower will be notified to provide additional collateral on the next business day.
The Portfolio will regain record ownership of loaned securities to exercise certain beneficial rights; however, the Portfolio may bear the risk of delay in recovery of, or even loss of rights in the securities loaned should the borrower fail financially. In addition, a Portfolio will bear the risk of loss of any cash collateral that it may invest. The Portfolio receives compensation for lending its securities from interest or dividends earned on the cash, cash equivalents or U.S. government securities held as collateral, net of fee rebates paid to the borrower and net of fees paid to State Street as the lending agent. Additionally, a Portfolio will receive a fee from the borrower for non-cash collateral equal to a percentage of the market value of the loaned securities.
The market value of securities on loan as of February 28, 2018, and the value of the invested cash collateral are disclosed in the Portfolio’s Statement of Assets and Liabilities. Non-cash collateral is not disclosed in the Portfolio’s Statement of Assets and Liabilities as it is held by the lending agent on behalf of the Portfolio, and the Portfolio does not have the ability to re-hypothecate those securities.
The following is a summary of the Portfolio’s securities lending agreements and related cash and non-cash collateral received as of February 28, 2018:
| | | | | | | | | | | | | | | | |
| Fund | | Market Value of Securities on Loan | | | Cash Collateral Received | | | Non Cash Collateral Received* | | | Total Collateral Received | |
| | | | | | | | | | | | | | | | |
State Street Equity 500 Index Portfolio | | $ | 15,171,136 | | | $ | 1,671,844 | | | $ | 14,043,274 | | | $ | 15,715,118 | |
| | * | The non-cash collateral includes U.S. Treasuries and U.S. Government Agency securities. |
The following table reflects a breakdown of transactions accounted for as secured borrowings, the gross obligation by the type of collateral pledged or securities loaned, and the remaining contractual maturity of those transactions as of February 28, 2018:
| | | | | | | | | | | | | | | | | | | | | | | | | | | | |
| | | | | | Remaining Contractual Maturity of the Agreements
As of February 28, 2018 | |
| | | Securities
Lending
Transactions | | | Overnight
and
Continuous | | | <30 Days | | | Between
30 & 90
Days | | | >90 Days | | | Total
Borrowings | | | Gross Amount
of Recognized
Liabilities for
Securities Lending
Transactions | |
State Street Equity 500 Index Portfolio | | | Common Stocks | | | $ | 1,671,844 | | | $ | — | | | $ | — | | | $ | — | | | $ | 1,671,844 | | | $ | 1,671,844 | |
| | | | |
| State Street Equity 500 Index Portfolio | | | 11 | |
State Street Master Funds
State Street Equity 500 Index Portfolio
Statement of Assets and Liabilities — February 28, 2018 (Unaudited)
| | | | |
| | | | |
| | | | |
Assets | | | | |
Investments in unaffiliated issuers, at value* | | $ | 1,557,343,993 | |
Investments in affiliated issuers, at value | | | 24,646,470 | |
| | | | |
Total Investments | | | 1,581,990,463 | |
Cash at broker | | | 1,351,400 | |
Receivable for investments sold | | | 6,411,687 | |
Dividends receivable — unaffiliated issuers | | | 2,975,433 | |
Dividends receivable — affiliated issuers | | | 24,382 | |
Securities lending income receivable — affiliated issuers | | | 1,041 | |
Securities lending income receivable — unaffiliated issuers | | | 1,329 | |
Receivable from Adviser | | | 3,701 | |
| | | | |
Total assets | | | 1,592,759,436 | |
| | | | |
| |
Liabilities | | | | |
Payable upon return of securities loaned | | | 1,671,844 | |
Payable to broker — variation margin on open futures contracts | | | 385,616 | |
Advisory fee payable | | | 112,794 | |
| | | | |
Total liabilities | | | 2,170,254 | |
| | | | |
| | | | |
Net Assets | | $ | 1,590,589,182 | |
| | | | |
| |
* Includes investments in securities on loan, at value | | $ | 15,171,136 | |
| | |
| 12 | | Statement of Assets and Liabilities |
Annual Report
December 31, 2017
State Street Master Funds
State Street Equity 500 Index Portfolio
The information contained in this report is intended for the general information of shareholders of the Portfolio and shareholders of any fund invested in the Portfolio. Interests in the Portfolio are offered solely to eligible investors in private placement transactions that do not involve any “public offering” within the meaning of Section 4(a)(2) of the 1933 Act. This report is not authorized for distribution (i) to prospective investors in any fund invested in the Portfolio unless preceded or accompanied by a current offering document for such fund or (ii) to prospective eligible investors in the Portfolio unless preceded or accompanied by a current offering document of the Portfolio. Eligible investors in the Portfolio may obtain a current Portfolio offering document by calling 1-800-997-7327. Please read the offering document carefully before investing in the Portfolio.

TABLE OF CONTENTS
The information contained in this report is intended for the general information of shareholders of the Portfolio and shareholders of any fund invested in the Portfolio. Interests in the Portfolio are offered solely to eligible investors in private placement transactions that do not involve any “public offering” within the meaning of Section 4(a)(2) of the 1933 Act. This report is not authorized for distribution (i) to prospective investors in any fund invested in the Portfolio unless preceded or accompanied by a current offering document for such fund or (ii) to prospective eligible investors in the Portfolio unless preceded or accompanied by a current offering document of the Portfolio. Eligible investors in the Portfolio may obtain a current Portfolio offering document by calling 1-800-997-7327. Please read the offering document carefully before investing in the Portfolio.
STATE STREET EQUITY 500 INDEX PORTFOLIO
MANAGEMENT’S DISCUSSIONOF FUND PERFORMANCE (UNAUDITED)
The State Street Equity 500 Index Portfolio (the “Portfolio”) seeks to replicate as closely as possible, before expenses, the performance of the Standard & Poor’s 500 Index (the “S&P 500” or the “Index”). The Portfolio’s benchmark is the S&P 500 Index (the “Index”). In seeking to achieve this objective, the Portfolio utilizes an index-based management strategy designed to track the performance of the Index. The Portfolio also employs futures to maintain market exposure and otherwise assist in attempting to replicate the performance of the Index.
For the 12-month period ended December 31, 2017 (the “Reporting Period”), the total return for the Portfolio was 22.42%, and the Index was 21.83%. The Portfolio and Index returns reflect the reinvestment of dividends and other income. The Portfolio���s performance reflects the expenses of managing the Porfolio, including brokerage and advisory expenses. The Index is unmanaged and Index returns do not reflect fees and expenses of any kind, which would have a negative impact on returns. Expenses, managing cash inflows to and outflows from the Portfolio, and small security misweights contributed to the difference between the Portfolio’s performance and that of the Index.
After opening 2017 with a respectable gain of approximately 1.9% in January, the S&P 500 Total Return Index better than doubled that performance in February, rising just shy of 4% for the month. After starting the month on March 1st with a 1.4% approximate gain, the Index meandered lower during much of the rest of March to finish the month near unchanged. The positive surge in U.S. stocks to open the month coincided with a very positive response to U.S. President Trump’s address to Congress on February 28th. Political and policy concerns weighed on markets toward the end of the month as the failed attempt to advance a health care bill caused some market participants to question the likelihood of other policy priorities.
The year-to-date performance through the end of June hit approximately 9.3%, reaching new all-time highs and better than two decade lows in both realized and implied volatility during that time. The second quarter of 2017 finished up just over 3%, which was half that of the first quarter. This indicated a more tentative, but still positive, U.S. growth and inflation.
The third quarter of 2017 commenced with a continuation of many of the themes that prevailed in the first half of the year, including an accelerating selloff for the U.S. dollar. The financial markets had seemingly given a pass to the Trump administration, even in its early tenure when it had been unable to move forward on an anticipated growth agenda. August, in contrast, provided a reminder that markets do take the U.S. president seriously. Trump declared on August 8th that North Korea would be met with “fire and fury” if it continues to threaten the U.S. Volatility picked up in response to his comments, and once again when the President was less than critical in his comments pertaining to violent neo-Nazi protestors in Charlottesville, Virginia. The Index ended up gaining approximately only 0.3% for the month of August. As September progressed, the market picked back up and the Index gained over 2% for the month, posting a gain of approximately 4.5% for the quarter.
The last quarter of the Reporting Period gained strength in early October with a notable increase in U.S. interest rates. November hit its 51st all-time closing high for the Index on November 3rd. December kept pace and the fourth quarter had three months of solid returns for the Index; it finished up approximately 6.6% for the three month period and an impressive 21.8%, approximately, for the year. Information Technology was the greatest contributing sector to this performance at weight of approximately 22.7% and a return of approximately 38.8% for the year. The next greatest was Health Care with an approximate weight of 14.1% and an approximate return of 22.1%. The only two sectors with negative returns were Telecommunication Services and Energy. Both are relatively low weights in the index, so did not have much impact on the overall performance.
The Portfolio used S&P 500 futures contracts in order to equitize the small amount of cash in the portfolio during the Reporting Period. The Portfolio’s use of futures contracts did not have a material impact on Portfolio performance.
On an individual security level, the top positive contributors to the Portfolio’s performance during the Reporting Period were Apple Inc., Microsoft Corporation and Amazon.com Inc. The top negative contributors to the Portfolio’s performance during the Reporting Period were General Electric Company, Schlumberger Ltd. and Exxon Mobil Corporation.
The views expressed above reflect those of the Portfolio’s portfolio manager only through the Reporting Period, and do not necessarily represent the views of the Adviser as a whole. Any such views are subject to change at any time based upon market or other conditions and the Adviser disclaims any responsibility to update such views. These views may not be relied on as investment advice and, because investment decisions for a fund are based on numerous factors, may not be relied on as an indication of trading intent on behalf of any fund.
See accompanying notes to financial statements.
1
STATE STREET EQUITY 500 INDEX PORTFOLIO
PERFORMANCE SUMMARY (UNAUDITED)
Comparison of Change in Value of a $10,000 Investment (Based on Net Asset Value)
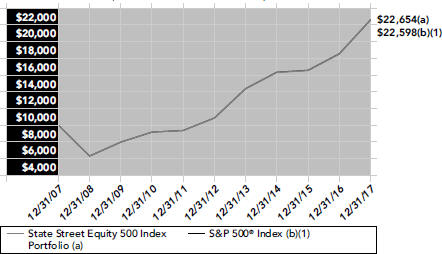
Line graph is based on cumulative total return.
Performance as of December 31, 2017
| | | | | | | | | | | | | | | | |
| | | | | | | | | | | | | | |
| | | | | Total Return
One Year Ended
December 31, 2017 | | | Average Annual
Total Return
Five Years Ended
December 31, 2017 | | | Average Annual
Total Return
Ten Years Ended
December 31, 2017 | | | |
| | | State Street Equity 500 Index Portfolio | | | 22.42% | | | | 15.86% | | | | 8.52% | | | |
| | | S&P 500® Index (1) | | | 21.83% | | | | 15.79% | | | | 8.50% | | | |
| | | | | | | | | | | | | | |
| | (1) | The S&P 500® Index is composed of five hundred (500) selected stocks, all of which are listed on national stock exchanges and spans over 25 separate industry groups. |
Total returns and performance graph information represent past performance and are not indicative of future results, which may be lower or higher than performance data quoted. Investment return and principal value of an investment will fluctuate so that an investor’s share, when redeemed, may be worth more or less than its original cost. The graph and table above do not reflect the deduction of taxes that a shareholder would pay on fund distributions, sales, or the redemption of fund shares.
See accompanying notes to financial statements.
2
STATE STREET EQUITY 500 INDEX PORTFOLIO
PORTFOLIO STATISTICS (UNAUDITED)
Portfolio Composition as of December 31, 2017
| | | | | | | | |
| | | | | % of Net
Assets | | | |
| | Common Stocks | | | 95.7 | % | | |
| | Short-Term Investments | | | 1.7 | | | |
| | | Other Assets in Excess of Liabilities | | | 2.6 | | | |
| | | TOTAL | | | 100.0 | % | | |
(The composition is expressed as a percentage of net assets as of the date indicated. The composition will vary over time.)
Top Five Sectors as of December 31, 2017
| | | | | | | | |
| | | Description | | % of Net
Assets | | | |
| | Information Technology | | | 22.8 | % | | |
| | Financials | | | 14.1 | | | |
| | Health Care | | | 13.2 | | | |
| | Consumer Discretionary | | | 11.7 | | | |
| | | Industrials | | | 9.8 | | | |
| | | TOTAL | | | 71.6 | % | | |
(The top five sectors are expressed as a percentage of net assets and may change over time.)
See accompanying notes to financial statements.
3
STATE STREET MASTER FUNDS
STATE STREET EQUITY 500 INDEX PORTFOLIO
SCHEDULE OF INVESTMENTS
December 31, 2017
| | | | | | | | |
Security Description | | Shares | | | Value | |
COMMON STOCKS — 95.7% | | | | | | | | |
CONSUMER DISCRETIONARY — 11.7% | | | | | | | | |
Advance Auto Parts, Inc. | | | 5,500 | | | $ | 548,295 | |
Amazon.com, Inc. (a) | | | 28,102 | | | | 32,864,446 | |
Aptiv PLC | | | 17,781 | | | | 1,508,362 | |
AutoZone, Inc. (a) | | | 1,888 | | | | 1,343,067 | |
Best Buy Co., Inc. | | | 18,413 | | | | 1,260,738 | |
BorgWarner, Inc. | | | 13,223 | | | | 675,563 | |
CarMax, Inc. (a) | | | 13,197 | | | | 846,324 | |
Carnival Corp. | | | 29,749 | | | | 1,974,441 | |
CBS Corp. Class B | | | 26,218 | | | | 1,546,862 | |
Charter Communications, Inc. Class A (a) | | | 13,400 | | | | 4,501,864 | |
Chipotle Mexican Grill, Inc. (a) (b) | | | 1,614 | | | | 466,494 | |
Comcast Corp. Class A | | | 326,730 | | | | 13,085,536 | |
D.R. Horton, Inc. | | | 22,479 | | | | 1,148,003 | |
Darden Restaurants, Inc. | | | 8,117 | | | | 779,394 | |
Discovery Communications, Inc. Class A (a) (b) | | | 12,597 | | | | 281,921 | |
Discovery Communications, Inc. Class C (a) (b) | | | 13,397 | | | | 283,614 | |
DISH Network Corp. Class A (a) | | | 17,000 | | | | 811,750 | |
Dollar General Corp. | | | 19,287 | | | | 1,793,884 | |
Dollar Tree, Inc. (a) | | | 17,482 | | | | 1,875,993 | |
Expedia, Inc. (b) | | | 9,323 | | | | 1,116,616 | |
Foot Locker, Inc. | | | 10,100 | | | | 473,488 | |
Ford Motor Co. | | | 281,260 | | | | 3,512,937 | |
Gap, Inc. | | | 15,364 | | | | 523,298 | |
Garmin, Ltd. | | | 9,160 | | | | 545,661 | |
General Motors Co. | | | 92,377 | | | | 3,786,533 | |
Genuine Parts Co. | | | 10,920 | | | | 1,037,509 | |
Goodyear Tire & Rubber Co. | | | 19,613 | | | | 633,696 | |
H&R Block, Inc. | | | 16,351 | | | | 428,723 | |
Hanesbrands, Inc. (b) | | | 23,400 | | | | 489,294 | |
Harley-Davidson, Inc. (b) | | | 12,385 | | | | 630,149 | |
Hasbro, Inc. | | | 7,628 | | | | 693,309 | |
Hilton Worldwide Holdings, Inc. | | | 13,700 | | | | 1,094,082 | |
Home Depot, Inc. | | | 81,910 | | | | 15,524,402 | |
Interpublic Group of Cos., Inc. | | | 31,928 | | | | 643,668 | |
Kohl’s Corp. (b) | | | 12,388 | | | | 671,801 | |
L Brands, Inc. (b) | | | 17,746 | | | | 1,068,664 | |
Leggett & Platt, Inc. | | | 9,844 | | | | 469,854 | |
Lennar Corp. Class A | | | 15,425 | | | | 975,477 | |
LKQ Corp. (a) | | | 20,800 | | | | 845,936 | |
Lowe’s Cos., Inc. | | | 57,812 | | | | 5,373,047 | |
Macy’s, Inc. (b) | | | 24,361 | | | | 613,654 | |
Marriott International, Inc. Class A | | | 20,952 | | | | 2,843,815 | |
Mattel, Inc. (b) | | | 27,743 | | | | 426,687 | |
McDonald’s Corp. | | | 55,715 | | | | 9,589,666 | |
MGM Resorts International | | | 35,300 | | | | 1,178,667 | |
Michael Kors Holdings, Ltd. (a) | | | 11,686 | | | | 735,634 | |
Mohawk Industries, Inc. (a) | | | 4,569 | | | | 1,260,587 | |
Netflix, Inc. (a) | | | 30,096 | | | | 5,777,228 | |
Newell Brands, Inc. | | | 34,450 | | | | 1,064,505 | |
News Corp. Class A | | | 28,814 | | | | 467,075 | |
News Corp. Class B | | | 7,500 | | | | 124,500 | |
NIKE, Inc. Class B | | | 94,102 | | | | 5,886,080 | |
Nordstrom, Inc. (b) | | | 7,756 | | | | 367,479 | |
Norwegian Cruise Line Holdings, Ltd. (a) | | | 12,900 | | | | 686,925 | |
Omnicom Group, Inc. | | | 17,450 | | | | 1,270,884 | |
O’Reilly Automotive, Inc. (a) | | | 5,620 | | | | 1,351,835 | |
Priceline Group, Inc. (a) | | | 3,408 | | | | 5,922,218 | |
PulteGroup, Inc. | | | 19,543 | | | | 649,805 | |
PVH Corp. | | | 6,051 | | | | 830,258 | |
Ralph Lauren Corp. | | | 4,136 | | | | 428,862 | |
Ross Stores, Inc. | | | 27,244 | | | | 2,186,331 | |
Royal Caribbean Cruises, Ltd. | | | 12,800 | | | | 1,526,784 | |
Scripps Networks Interactive, Inc. Class A | | | 6,863 | | | | 585,963 | |
Signet Jewelers, Ltd. (b) | | | 5,100 | | | | 288,405 | |
Starbucks Corp. | | | 98,892 | | | | 5,679,368 | |
Tapestry, Inc. | | | 19,000 | | | | 840,370 | |
Target Corp. | | | 38,944 | | | | 2,541,096 | |
Tiffany & Co. | | | 6,581 | | | | 684,095 | |
Time Warner, Inc. | | | 53,980 | | | | 4,937,551 | |
TJX Cos., Inc. | | | 43,775 | | | | 3,347,036 | |
Tractor Supply Co. | | | 9,774 | | | | 730,607 | |
TripAdvisor, Inc. (a) (b) | | | 9,015 | | | | 310,657 | |
Twenty-First Century Fox, Inc. Class A | | | 77,109 | | | | 2,662,574 | |
Twenty-First Century Fox, Inc. Class B | | | 28,600 | | | | 975,832 | |
Ulta Salon Cosmetics & Fragrance, Inc. (a) | | | 4,400 | | | | 984,104 | |
Under Armour, Inc. Class A (a) (b) | | | 14,376 | | | | 207,446 | |
Under Armour, Inc. Class C (a) (b) | | | 14,478 | | | | 192,847 | |
VF Corp. (b) | | | 24,428 | | | | 1,807,672 | |
Viacom, Inc. Class B | | | 24,341 | | | | 749,946 | |
Walt Disney Co. | | | 105,693 | | | | 11,363,054 | |
Whirlpool Corp. | | | 4,559 | | | | 768,830 | |
Wyndham Worldwide Corp. | | | 7,746 | | | | 897,529 | |
Wynn Resorts, Ltd. | | | 5,859 | | | | 987,769 | |
Yum! Brands, Inc. | | | 23,890 | | | | 1,949,663 | |
| | | | | | | | |
| | | | | | | 196,816,588 | |
| | | | | | | | |
CONSUMER STAPLES — 7.8% | | | | | | | | |
Altria Group, Inc. | | | 133,370 | | | | 9,523,952 | |
Archer-Daniels-Midland Co. | | | 39,892 | | | | 1,598,871 | |
British American Tobacco PLC ADR | | | 1 | | | | 67 | |
Brown-Forman Corp. Class B | | | 12,022 | | | | 825,551 | |
Campbell Soup Co. (b) | | | 14,083 | | | | 677,533 | |
Church & Dwight Co., Inc. | | | 17,800 | | | | 893,026 | |
Clorox Co. | | | 9,479 | | | | 1,409,906 | |
Coca-Cola Co. | | | 268,522 | | | | 12,319,789 | |
Colgate-Palmolive Co. | | | 60,779 | | | | 4,585,776 | |
Conagra Brands, Inc. | | | 30,951 | | | | 1,165,924 | |
Constellation Brands, Inc. Class A | | | 12,276 | | | | 2,805,925 | |
Costco Wholesale Corp. | | | 30,334 | | | | 5,645,764 | |
Coty, Inc. Class A | | | 37,840 | | | | 752,638 | |
CVS Health Corp. | | | 72,227 | | | | 5,236,458 | |
Dr. Pepper Snapple Group, Inc. | | | 11,903 | | | | 1,155,305 | |
See accompanying notes to financial statements.
4
STATE STREET MASTER FUNDS
STATE STREET EQUITY 500 INDEX PORTFOLIO
SCHEDULE OF INVESTMENTS (continued)
December 31, 2017
| | | | | | | | |
Security Description | | Shares | | | Value | |
Estee Lauder Cos., Inc. Class A | | | 16,363 | | | $ | 2,082,028 | |
General Mills, Inc. | | | 40,222 | | | | 2,384,762 | |
Hershey Co. | | | 10,415 | | | | 1,182,207 | |
Hormel Foods Corp. (b) | | | 21,098 | | | | 767,756 | |
J.M. Smucker Co. | | | 7,355 | | | | 913,785 | |
Kellogg Co. (b) | | | 17,307 | | | | 1,176,530 | |
Kimberly-Clark Corp. | | | 24,773 | | | | 2,989,110 | |
Kraft Heinz Co. | | | 41,051 | | | | 3,192,126 | |
Kroger Co. | | | 63,510 | | | | 1,743,350 | |
McCormick & Co., Inc. | | | 8,061 | | | | 821,497 | |
Molson Coors Brewing Co. Class B | | | 13,609 | | | | 1,116,891 | |
Mondelez International, Inc. Class A | | | 103,494 | | | | 4,429,543 | |
Monster Beverage Corp. (a) | | | 30,087 | | | | 1,904,206 | |
PepsiCo, Inc. | | | 99,538 | | | | 11,936,597 | |
Philip Morris International, Inc. | | | 108,687 | | | | 11,482,782 | |
Procter & Gamble Co. | | | 178,713 | | | | 16,420,150 | |
Sysco Corp. | | | 32,435 | | | | 1,969,778 | |
Tyson Foods, Inc. Class A | | | 21,491 | | | | 1,742,275 | |
Wal-Mart Stores, Inc. | | | 102,399 | | | | 10,111,901 | |
Walgreens Boots Alliance, Inc. | | | 61,813 | | | | 4,488,860 | |
| | | | | | | | |
| | | | | | | 131,452,619 | |
| | | | | | | | |
ENERGY — 5.8% | | | | | | | | |
Anadarko Petroleum Corp. | | | 39,544 | | | | 2,121,140 | |
Andeavor | | | 10,249 | | | | 1,171,871 | |
Apache Corp. (b) | | | 24,970 | | | | 1,054,233 | |
Baker Hughes a GE Co. | | | 30,594 | | | | 967,994 | |
Cabot Oil & Gas Corp. | | | 33,722 | | | | 964,449 | |
Chesapeake Energy Corp. (a) (b) | | | 45,894 | | | | 181,740 | |
Chevron Corp. | | | 133,234 | | | | 16,679,565 | |
Cimarex Energy Co. | | | 6,942 | | | | 846,994 | |
Concho Resources, Inc. (a) (b) | | | 11,100 | | | | 1,667,442 | |
ConocoPhillips | | | 82,803 | | | | 4,545,057 | |
Devon Energy Corp. | | | 38,850 | | | | 1,608,390 | |
EOG Resources, Inc. | | | 41,463 | | | | 4,474,272 | |
EQT Corp. | | | 17,743 | | | | 1,009,932 | |
Exxon Mobil Corp. | | | 297,672 | | | | 24,897,286 | |
Halliburton Co. | | | 62,267 | | | | 3,042,988 | |
Helmerich & Payne, Inc. (b) | | | 7,974 | | | | 515,439 | |
Hess Corp. (b) | | | 20,244 | | | | 960,983 | |
Kinder Morgan, Inc. | | | 140,676 | | | | 2,542,015 | |
Marathon Oil Corp. | | | 65,189 | | | | 1,103,650 | |
Marathon Petroleum Corp. | | | 33,202 | | | | 2,190,668 | |
National Oilwell Varco, Inc. (b) | | | 26,341 | | | | 948,803 | |
Newfield Exploration Co. (a) | | | 15,685 | | | | 494,548 | |
Noble Energy, Inc. | | | 32,895 | | | | 958,560 | |
Occidental Petroleum Corp. | | | 54,635 | | | | 4,024,414 | |
ONEOK, Inc. | | | 27,904 | | | | 1,491,469 | |
Phillips 66 | | | 31,192 | | | | 3,155,071 | |
Pioneer Natural Resources Co. | | | 11,524 | | | | 1,991,923 | |
Range Resources Corp. (b) | | | 14,541 | | | | 248,070 | |
Schlumberger, Ltd. | | | 98,893 | | | | 6,664,399 | |
TechnipFMC PLC | | | 29,109 | | | | 911,403 | |
Valero Energy Corp. | | | 29,986 | | | | 2,756,013 | |
Williams Cos., Inc. | | | 57,910 | | | | 1,765,676 | |
| | | | | | | | |
| | | | | | | 97,956,457 | |
| | | | | | | | |
FINANCIALS — 14.1% | | | | | | | | |
Affiliated Managers Group, Inc. | | | 4,276 | | | | 877,649 | |
Aflac, Inc. | | | 28,237 | | | | 2,478,644 | |
Allstate Corp. | | | 26,167 | | | | 2,739,947 | |
American Express Co. | | | 49,952 | | | | 4,960,733 | |
American International Group, Inc. | | | 63,532 | | | | 3,785,236 | |
Ameriprise Financial, Inc. | | | 10,563 | | | | 1,790,112 | |
Aon PLC | | | 16,982 | | | | 2,275,588 | |
Arthur J Gallagher & Co. | | | 12,000 | | | | 759,360 | |
Assurant, Inc. | | | 3,946 | | | | 397,915 | |
Bank of America Corp. | | | 681,066 | | | | 20,105,068 | |
Bank of New York Mellon Corp. | | | 70,691 | | | | 3,807,417 | |
BB&T Corp. | | | 56,839 | | | | 2,826,035 | |
Berkshire Hathaway, Inc. Class B (a) | | | 135,219 | | | | 26,803,110 | |
BlackRock, Inc. | | | 8,518 | | | | 4,375,782 | |
Brighthouse Financial, Inc. (a) | | | 7,075 | | | | 414,878 | |
Capital One Financial Corp. | | | 34,068 | | | | 3,392,491 | |
Cboe Global Markets, Inc. | | | 8,200 | | | | 1,021,638 | |
Charles Schwab Corp. | | | 82,589 | | | | 4,242,597 | |
Chubb, Ltd. | | | 32,141 | | | | 4,696,764 | |
Cincinnati Financial Corp. | | | 11,705 | | | | 877,524 | |
Citigroup, Inc. | | | 185,293 | | | | 13,787,652 | |
Citizens Financial Group, Inc. | | | 34,200 | | | | 1,435,716 | |
CME Group, Inc. | | | 24,392 | | | | 3,562,452 | |
Comerica, Inc. | | | 13,017 | | | | 1,130,006 | |
Discover Financial Services | | | 26,277 | | | | 2,021,227 | |
E*TRADE Financial Corp. (a) | | | 20,489 | | | | 1,015,640 | |
Everest Re Group, Ltd. | | | 2,700 | | | | 597,402 | |
Fifth Third Bancorp | | | 51,854 | | | | 1,573,250 | |
Franklin Resources, Inc. | | | 22,151 | | | | 959,803 | |
Goldman Sachs Group, Inc. | | | 24,388 | | | | 6,213,087 | |
Hartford Financial Services Group, Inc. | | | 24,930 | | | | 1,403,060 | |
Huntington Bancshares, Inc. | | | 75,965 | | | | 1,106,050 | |
Intercontinental Exchange, Inc. | | | 42,225 | | | | 2,979,396 | |
Invesco, Ltd. | | | 28,289 | | | | 1,033,680 | |
JPMorgan Chase & Co. | | | 243,872 | | | | 26,079,672 | |
KeyCorp. | | | 71,879 | | | | 1,449,799 | |
Leucadia National Corp. | | | 23,809 | | | | 630,700 | |
Lincoln National Corp. | | | 16,710 | | | | 1,284,498 | |
Loews Corp. | | | 20,312 | | | | 1,016,209 | |
M&T Bank Corp. | | | 10,834 | | | | 1,852,506 | |
Marsh & McLennan Cos., Inc. | | | 35,034 | | | | 2,851,417 | |
MetLife, Inc. | | | 72,626 | | | | 3,671,971 | |
Moody’s Corp. | | | 12,234 | | | | 1,805,861 | |
Morgan Stanley | | | 96,555 | | | | 5,066,241 | |
Nasdaq, Inc. | | | 9,225 | | | | 708,757 | |
Navient Corp. | | | 16,541 | | | | 220,326 | |
Northern Trust Corp. | | | 14,710 | | | | 1,469,382 | |
People’s United Financial, Inc. | | | 22,434 | | | | 419,516 | |
PNC Financial Services Group, Inc. | | | 32,942 | | | | 4,753,201 | |
Principal Financial Group, Inc. | | | 18,426 | | | | 1,300,139 | |
Progressive Corp. | | | 40,852 | | | | 2,300,785 | |
See accompanying notes to financial statements.
5
STATE STREET MASTER FUNDS
STATE STREET EQUITY 500 INDEX PORTFOLIO
SCHEDULE OF INVESTMENTS (continued)
December 31, 2017
| | | | | | | | |
Security Description | | Shares | | | Value | |
Prudential Financial, Inc. | | | 30,737 | | | $ | 3,534,140 | |
Raymond James Financial, Inc. | | | 9,600 | | | | 857,280 | |
Regions Financial Corp. | | | 86,943 | | | | 1,502,375 | |
S&P Global, Inc. | | | 17,498 | | | | 2,964,161 | |
State Street Corp. (c) | | | 25,847 | | | | 2,522,926 | |
SunTrust Banks, Inc. | | | 34,882 | | | | 2,253,028 | |
Synchrony Financial | | | 49,771 | | | | 1,921,658 | |
T Rowe Price Group, Inc. | | | 16,720 | | | | 1,754,430 | |
Torchmark Corp. | | | 8,384 | | | | 760,513 | |
Travelers Cos., Inc. | | | 19,298 | | | | 2,617,581 | |
Unum Group | | | 17,324 | | | | 950,914 | |
US Bancorp | | | 109,630 | | | | 5,873,975 | |
Wells Fargo & Co. | | | 311,046 | | | | 18,871,161 | |
Willis Towers Watson PLC | | | 9,479 | | | | 1,428,390 | |
XL Group, Ltd. | | | 20,520 | | | | 721,483 | |
Zions Bancorp | | | 15,258 | | | | 775,564 | |
| | | | | | | | |
| | | | | | | 237,637,468 | |
| | | | | | | | |
HEALTH CARE — 13.2% | | | | | | | | |
Abbott Laboratories | | | 121,249 | | | | 6,919,680 | |
AbbVie, Inc. | | | 111,563 | | | | 10,789,258 | |
Aetna, Inc. | | | 22,515 | | | | 4,061,481 | |
Agilent Technologies, Inc. | | | 22,475 | | | | 1,505,151 | |
Alexion Pharmaceuticals, Inc. (a) | | | 15,927 | | | | 1,904,710 | |
Align Technology, Inc. (a) | | | 5,000 | | | | 1,110,950 | |
Allergan PLC | | | 22,926 | | | | 3,750,235 | |
AmerisourceBergen Corp. | | | 10,552 | | | | 968,885 | |
Amgen, Inc. | | | 50,691 | | | | 8,815,165 | |
Anthem, Inc. | | | 17,719 | | | | 3,986,952 | |
Baxter International, Inc. | | | 36,370 | | | | 2,350,957 | |
Becton Dickinson and Co. | | | 18,477 | | | | 3,955,199 | |
Biogen, Inc. (a) | | | 15,147 | | | | 4,825,380 | |
Boston Scientific Corp. (a) | | | 93,577 | | | | 2,319,774 | |
Bristol-Myers Squibb Co. | | | 114,012 | | | | 6,986,655 | |
Cardinal Health, Inc. | | | 20,924 | | | | 1,282,013 | |
Celgene Corp. (a) | | | 54,765 | | | | 5,715,275 | |
Centene Corp. (a) | | | 11,700 | | | | 1,180,296 | |
Cerner Corp. (a) | | | 22,263 | | | | 1,500,304 | |
Cigna Corp. | | | 17,811 | | | | 3,617,236 | |
Cooper Cos., Inc. | | | 3,300 | | | | 719,004 | |
Danaher Corp. | | | 43,678 | | | | 4,054,192 | |
DaVita, Inc. (a) | | | 11,472 | | | | 828,852 | |
DENTSPLY SIRONA, Inc. | | | 17,366 | | | | 1,143,204 | |
Edwards Lifesciences Corp. (a) | | | 15,790 | | | | 1,779,691 | |
Eli Lilly & Co. | | | 69,157 | | | | 5,841,000 | |
Envision Healthcare Corp. (a) | | | 9,118 | | | | 315,118 | |
Express Scripts Holding Co. (a) | | | 40,747 | | | | 3,041,356 | |
Gilead Sciences, Inc. | | | 90,946 | | | | 6,515,371 | |
HCA Healthcare, Inc. (a) | | | 20,400 | | | | 1,791,936 | |
Henry Schein, Inc. (a) | | | 11,000 | | | | 768,680 | |
Hologic, Inc. (a) | | | 17,600 | | | | 752,400 | |
Humana, Inc. | | | 10,217 | | | | 2,534,531 | |
IDEXX Laboratories, Inc. (a) | | | 6,100 | | | | 953,918 | |
Illumina, Inc. (a) | | | 9,900 | | | | 2,163,051 | |
Incyte Corp. (a) | | | 11,900 | | | | 1,127,049 | |
Intuitive Surgical, Inc. (a) | | | 7,956 | | | | 2,903,463 | |
IQVIA Holdings, Inc. (a) | | | 10,000 | | | | 979,000 | |
Johnson & Johnson | | | 188,841 | | | | 26,384,864 | |
Laboratory Corp. of America Holdings (a) | | | 7,447 | | | | 1,187,871 | |
McKesson Corp. | | | 14,631 | | | | 2,281,704 | |
Medtronic PLC | | | 94,404 | | | | 7,623,123 | |
Merck & Co., Inc. | | | 191,398 | | | | 10,769,965 | |
Mettler-Toledo International, Inc. (a) | | | 1,800 | | | | 1,115,136 | |
Mylan NV (a) | | | 39,107 | | | | 1,654,617 | |
Patterson Cos., Inc. (b) | | | 6,459 | | | | 233,364 | |
PerkinElmer, Inc. | | | 7,032 | | | | 514,180 | |
Perrigo Co. PLC (b) | | | 9,814 | | | | 855,388 | |
Pfizer, Inc. | | | 417,948 | | | | 15,138,077 | |
Quest Diagnostics, Inc. | | | 10,158 | | | | 1,000,461 | |
Regeneron Pharmaceuticals, Inc. (a) | | | 5,658 | | | | 2,127,182 | |
ResMed, Inc. (b) | | | 10,400 | | | | 880,776 | |
Stryker Corp. | | | 22,195 | | | | 3,436,674 | |
Thermo Fisher Scientific, Inc. | | | 28,612 | | | | 5,432,847 | |
UnitedHealth Group, Inc. | | | 67,922 | | | | 14,974,084 | |
Universal Health Services, Inc. Class B | | | 6,800 | | | | 770,780 | |
Varian Medical Systems, Inc. (a) | | | 6,031 | | | | 670,346 | |
Vertex Pharmaceuticals, Inc. (a) | | | 18,348 | | | | 2,749,631 | |
Waters Corp. (a) | | | 5,415 | | | | 1,046,124 | |
Zimmer Biomet Holdings, Inc. | | | 14,827 | | | | 1,789,174 | |
Zoetis, Inc. | | | 34,228 | | | | 2,465,785 | |
| | | | | | | | |
| | | | | | | 220,859,525 | |
| | | | | | | | |
INDUSTRIALS — 9.8% | | | | | | | | |
3M Co. | | | 41,743 | | | | 9,825,050 | |
Acuity Brands, Inc. | | | 3,000 | | | | 528,000 | |
Alaska Air Group, Inc. | | | 9,000 | | | | 661,590 | |
Allegion PLC | | | 7,537 | | | | 599,644 | |
American Airlines Group, Inc. | | | 31,600 | | | | 1,644,148 | |
AMETEK, Inc. | | | 15,701 | | | | 1,137,851 | |
AO Smith Corp. | | | 10,800 | | | | 661,824 | |
Arconic, Inc. | | | 28,263 | | | | 770,167 | |
Boeing Co. | | | 39,224 | | | | 11,567,550 | |
C.H. Robinson Worldwide, Inc. (b) | | | 9,582 | | | | 853,660 | |
Caterpillar, Inc. | | | 42,455 | | | | 6,690,059 | |
Cintas Corp. | | | 5,722 | | | | 891,659 | |
CSX Corp. | | | 61,559 | | | | 3,386,361 | |
Cummins, Inc. | | | 10,744 | | | | 1,897,820 | |
Deere & Co. | | | 22,054 | | | | 3,451,672 | |
Delta Air Lines, Inc. | | | 44,766 | | | | 2,506,896 | |
Dover Corp. | | | 10,545 | | | | 1,064,940 | |
Eaton Corp. PLC | | | 29,999 | | | | 2,370,221 | |
Emerson Electric Co. | | | 45,969 | | | | 3,203,580 | |
Equifax, Inc. | | | 8,395 | | | | 989,938 | |
Expeditors International of Washington, Inc. | | | 11,844 | | | | 766,188 | |
Fastenal Co. | | | 20,242 | | | | 1,107,035 | |
FedEx Corp. | | | 17,050 | | | | 4,254,657 | |
Flowserve Corp. | | | 9,555 | | | | 402,552 | |
Fluor Corp. | | | 10,956 | | | | 565,877 | |
Fortive Corp. | | | 22,139 | | | | 1,601,757 | |
Fortune Brands Home & Security, Inc. | | | 10,100 | | | | 691,244 | |
See accompanying notes to financial statements.
6
STATE STREET MASTER FUNDS
STATE STREET EQUITY 500 INDEX PORTFOLIO
SCHEDULE OF INVESTMENTS (continued)
December 31, 2017
| | | | | | | | |
Security Description | | Shares | | | Value | |
General Dynamics Corp. | | | 19,789 | | | $ | 4,026,072 | |
General Electric Co. | | | 606,649 | | | | 10,586,025 | |
Harris Corp. | | | 8,598 | | | | 1,217,907 | |
Honeywell International, Inc. | | | 53,203 | | | | 8,159,212 | |
IHS Markit, Ltd. (a) | | | 23,400 | | | | 1,056,510 | |
Illinois Tool Works, Inc. | | | 21,971 | | | | 3,665,861 | |
Ingersoll-Rand PLC | | | 16,716 | | | | 1,490,900 | |
Jacobs Engineering Group, Inc. | | | 9,657 | | | | 636,976 | |
JB Hunt Transport Services, Inc. | | | 5,500 | | | | 632,390 | |
Johnson Controls International PLC | | | 63,093 | | | | 2,404,474 | |
Kansas City Southern | | | 7,004 | | | | 736,961 | |
L3 Technologies, Inc. | | | 5,365 | | | | 1,061,465 | |
Lockheed Martin Corp. | | | 17,890 | | | | 5,743,584 | |
Masco Corp. | | | 21,639 | | | | 950,818 | |
Nielsen Holdings PLC | | | 23,375 | | | | 850,850 | |
Norfolk Southern Corp. | | | 20,768 | | | | 3,009,283 | |
Northrop Grumman Corp. | | | 12,586 | | | | 3,862,769 | |
PACCAR, Inc. | | | 26,035 | | | | 1,850,568 | |
Parker-Hannifin Corp. | | | 9,214 | | | | 1,838,930 | |
Pentair PLC | | | 11,791 | | | | 832,680 | |
Quanta Services, Inc. (a) | | | 11,593 | | | | 453,402 | |
Raytheon Co. | | | 19,936 | | | | 3,744,978 | |
Republic Services, Inc. | | | 15,814 | | | | 1,069,185 | |
Robert Half International, Inc. | | | 9,374 | | | | 520,632 | |
Rockwell Automation, Inc. | | | 9,379 | | | | 1,841,567 | |
Rockwell Collins, Inc. | | | 12,100 | | | | 1,641,002 | |
Roper Technologies, Inc. | | | 7,535 | | | | 1,951,565 | |
Snap-on, Inc. (b) | | | 4,572 | | | | 796,900 | |
Southwest Airlines Co. | | | 37,227 | | | | 2,436,507 | |
Stanley Black & Decker, Inc. | | | 10,650 | | | | 1,807,198 | |
Stericycle, Inc. (a) | | | 6,604 | | | | 449,006 | |
Textron, Inc. | | | 17,106 | | | | 968,029 | |
TransDigm Group, Inc. (b) | | | 3,400 | | | | 933,708 | |
Union Pacific Corp. | | | 54,938 | | | | 7,367,186 | |
United Continental Holdings, Inc. (a) | | | 17,400 | | | | 1,172,760 | |
United Parcel Service, Inc. Class B | | | 47,755 | | | | 5,690,008 | |
United Rentals, Inc. (a) | | | 6,100 | | | | 1,048,651 | |
United Technologies Corp. | | | 53,127 | | | | 6,777,411 | |
Verisk Analytics, Inc. (a) | | | 10,300 | | | | 988,800 | |
W.W. Grainger, Inc. (b) | | | 4,012 | | | | 947,835 | |
Waste Management, Inc. | | | 28,604 | | | | 2,468,525 | |
Xylem, Inc. | | | 11,434 | | | | 779,799 | |
| | | | | | | | |
| | | | | | | 164,560,829 | |
| | | | | | | | |
INFORMATION TECHNOLOGY — 22.8% | |
Accenture PLC Class A | | | 43,982 | | | | 6,733,204 | |
Activision Blizzard, Inc. | | | 52,000 | | | | 3,292,640 | |
Adobe Systems, Inc. (a) | | | 34,313 | | | | 6,013,010 | |
Advanced Micro Devices, Inc. (a) (b) | | | 57,800 | | | | 594,184 | |
Akamai Technologies, Inc. (a) | | | 12,634 | | | | 821,715 | |
Alliance Data Systems Corp. | | | 3,504 | | | | 888,194 | |
Alphabet, Inc. Class A (a) | | | 20,923 | | | | 22,040,288 | |
Alphabet, Inc. Class C (a) | | | 21,245 | | | | 22,230,768 | |
Amphenol Corp. Class A | | | 20,580 | | | | 1,806,924 | |
Analog Devices, Inc. | | | 25,870 | | | | 2,303,206 | |
ANSYS, Inc. (a) | | | 5,600 | | | | 826,504 | |
Apple, Inc. | | | 361,464 | | | | 61,170,553 | |
Applied Materials, Inc. | | | 77,053 | | | | 3,938,949 | |
Autodesk, Inc. (a) | | | 15,970 | | | | 1,674,135 | |
Automatic Data Processing, Inc. | | | 30,565 | | | | 3,581,912 | |
Broadcom, Ltd. | | | 28,335 | | | | 7,279,261 | |
CA, Inc. | | | 24,759 | | | | 823,980 | |
Cadence Design Systems, Inc. (a) | | | 20,400 | | | | 853,128 | |
Cars.com, Inc. (a) | | | 1 | | | | 29 | |
Cisco Systems, Inc | | | 346,329 | | | | 13,264,401 | |
Citrix Systems, Inc. (a) | | | 9,478 | | | | 834,064 | |
Cognizant Technology Solutions Corp. Class A | | | 42,227 | | | | 2,998,962 | |
Corning, Inc. | | | 62,850 | | | | 2,010,572 | |
CSRA, Inc. | | | 9,732 | | | | 291,181 | |
DXC Technology Co. | | | 19,291 | | | | 1,830,716 | |
eBay, Inc. (a) | | | 70,358 | | | | 2,655,311 | |
Electronic Arts, Inc. (a) | | | 21,521 | | | | 2,260,996 | |
F5 Networks, Inc. (a) | | | 5,059 | | | | 663,842 | |
Facebook, Inc. Class A (a) | | | 167,607 | | | | 29,575,931 | |
Fidelity National Information Services, Inc. | | | 24,386 | | | | 2,294,479 | |
Fiserv, Inc. (a) | | | 15,142 | | | | 1,985,570 | |
FLIR Systems, Inc. | | | 8,239 | | | | 384,102 | |
Gartner, Inc. (a) | | | 6,700 | | | | 825,105 | |
Global Payments, Inc. | | | 11,275 | | | | 1,130,206 | |
Hewlett Packard Enterprise Co. | | | 115,263 | | | | 1,655,177 | |
HP, Inc. | | | 120,363 | | | | 2,528,827 | |
Intel Corp. | | | 328,120 | | | | 15,146,019 | |
International Business Machines Corp. | | | 60,147 | | | | 9,227,753 | |
Intuit, Inc. | | | 17,326 | | | | 2,733,696 | |
Juniper Networks, Inc. | | | 27,844 | | | | 793,554 | |
KLA-Tencor Corp. | | | 11,473 | | | | 1,205,468 | |
Lam Research Corp. (b) | | | 11,581 | | | | 2,131,715 | |
Mastercard, Inc. Class A | | | 64,949 | | | | 9,830,681 | |
Microchip Technology, Inc. (b) | | | 16,206 | | | | 1,424,183 | |
Micron Technology, Inc. (a) | | | 81,128 | | | | 3,335,983 | |
Microsoft Corp. | | | 542,877 | | | | 46,437,699 | |
Motorola Solutions, Inc. | | | 12,428 | | | | 1,122,746 | |
NetApp, Inc. | | | 19,943 | | | | 1,103,247 | |
NVIDIA Corp. | | | 42,312 | | | | 8,187,372 | |
Oracle Corp. | | | 213,070 | | | | 10,073,950 | |
Paychex, Inc. | | | 23,831 | | | | 1,622,414 | |
PayPal Holdings, Inc. (a) | | | 80,758 | | | | 5,945,404 | |
Qorvo, Inc. (a) | | | 9,800 | | | | 652,680 | |
QUALCOMM, Inc. | | | 102,685 | | | | 6,573,894 | |
Red Hat, Inc. (a) | | | 12,530 | | | | 1,504,853 | |
salesforce.com, Inc. (a) | | | 49,005 | | | | 5,009,781 | |
Seagate Technology PLC (b) | | | 18,476 | | | | 773,036 | |
Skyworks Solutions, Inc. | | | 13,600 | | | | 1,291,320 | |
Symantec Corp. | | | 45,903 | | | | 1,288,038 | |
Synopsys, Inc. (a) | | | 11,300 | | | | 963,212 | |
TE Connectivity, Ltd. | | | 24,649 | | | | 2,342,641 | |
Texas Instruments, Inc. | | | 68,706 | | | | 7,175,655 | |
Total System Services, Inc. | | | 10,899 | | | | 862,002 | |
VeriSign, Inc. (a) (b) | | | 5,320 | | | | 608,821 | |
See accompanying notes to financial statements.
7
STATE STREET MASTER FUNDS
STATE STREET EQUITY 500 INDEX PORTFOLIO
SCHEDULE OF INVESTMENTS (continued)
December 31, 2017
| | | | | | | | |
Security Description | | Shares | | | Value | |
Visa, Inc. Class A | | | 127,140 | | | $ | 14,496,503 | |
Western Digital Corp. | | | 21,706 | | | | 1,726,278 | |
Western Union Co. | | | 37,340 | | | | 709,833 | |
Xerox Corp. | | | 15,823 | | | | 461,240 | |
Xilinx, Inc. (b) | | | 18,542 | | | | 1,250,102 | |
| | | | | | | | |
| | | | | | | 382,073,799 | |
| | | | | | | | |
MATERIALS — 2.9% | | | | | | | | |
Air Products & Chemicals, Inc. | | | 14,907 | | | | 2,445,941 | |
Albemarle Corp. (b) | | | 8,400 | | | | 1,074,276 | |
Avery Dennison Corp. | | | 6,518 | | | | 748,657 | |
Ball Corp. | | | 25,716 | | | | 973,351 | |
CF Industries Holdings, Inc. | | | 16,730 | | | | 711,694 | |
DowDuPont, Inc. | | | 163,832 | | | | 11,668,115 | |
Eastman Chemical Co. | | | 10,672 | | | | 988,654 | |
Ecolab, Inc. | | | 18,665 | | | | 2,504,470 | |
FMC Corp. | | | 10,522 | | | | 996,013 | |
Freeport-McMoRan, Inc. (a) | | | 99,564 | | | | 1,887,733 | |
International Flavors & Fragrances, Inc. | | | 5,880 | | | | 897,347 | |
International Paper Co. | | | 30,508 | | | | 1,767,634 | |
LyondellBasell Industries NV Class A | | | 22,052 | | | | 2,432,777 | |
Martin Marietta Materials, Inc. | | | 4,855 | | | | 1,073,149 | |
Monsanto Co. | | | 31,494 | | | | 3,677,869 | |
Mosaic Co. | | | 27,716 | | | | 711,193 | |
Newmont Mining Corp. | | | 36,973 | | | | 1,387,227 | |
Nucor Corp. | | | 21,906 | | | | 1,392,783 | |
Packaging Corp. of America | | | 6,900 | | | | 831,795 | |
PPG Industries, Inc. | | | 17,288 | | | | 2,019,584 | |
Praxair, Inc. | | | 20,800 | | | | 3,217,344 | |
Sealed Air Corp. | | | 11,269 | | | | 555,562 | |
Sherwin-Williams Co. | | | 5,587 | | | | 2,290,893 | |
Vulcan Materials Co. | | | 9,790 | | | | 1,256,742 | |
WestRock Co. | | | 19,148 | | | | 1,210,345 | |
| | | | | | | | |
| | | | | | | 48,721,148 | |
| | | | | | | | |
REAL ESTATE — 2.8% | | | | | | | | |
Alexandria Real Estate Equities, Inc. REIT | | | 6,700 | | | | 874,953 | |
American Tower Corp. REIT | | | 30,582 | | | | 4,363,134 | |
Apartment Investment & Management Co. Class A, REIT | | | 11,865 | | | | 518,619 | |
AvalonBay Communities, Inc. REIT | | | 9,729 | | | | 1,735,751 | |
Boston Properties, Inc. REIT | | | 11,421 | | | | 1,485,073 | |
CBRE Group, Inc. Class A (a) | | | 21,708 | | | | 940,174 | |
Crown Castle International Corp. REIT | | | 28,242 | | | | 3,135,145 | |
Digital Realty Trust, Inc. REIT | | | 14,900 | | | | 1,697,110 | |
Duke Realty Corp. REIT | | | 26,000 | | | | 707,460 | |
Equinix, Inc. REIT | | | 5,338 | | | | 2,419,288 | |
Equity Residential REIT | | | 27,038 | | | | 1,724,213 | |
Essex Property Trust, Inc. REIT | | | 4,455 | | | | 1,075,303 | |
Extra Space Storage, Inc. REIT | | | 9,500 | | | | 830,775 | |
Federal Realty Investment Trust REIT | | | 5,400 | | | | 717,174 | |
GGP, Inc. REIT | | | 42,942 | | | | 1,004,413 | |
HCP, Inc. REIT | | | 32,677 | | | | 852,216 | |
Host Hotels & Resorts, Inc. REIT | | | 54,259 | | | | 1,077,041 | |
Iron Mountain, Inc. REIT | | | 18,074 | | | | 681,932 | |
Kimco Realty Corp. REIT | | | 32,916 | | | | 597,425 | |
Macerich Co. REIT | | | 8,645 | | | | 567,804 | |
Mid-America Apartment Communities, Inc. REIT | | | 8,800 | | | | 884,928 | |
Prologis, Inc. REIT | | | 36,247 | | | | 2,338,294 | |
Public Storage REIT | | | 10,152 | | | | 2,121,768 | |
Realty Income Corp. REIT | | | 19,800 | | | | 1,128,996 | |
Regency Centers Corp. REIT | | | 10,899 | | | | 753,993 | |
SBA Communications Corp. REIT (a) | | | 8,800 | | | | 1,437,568 | |
Simon Property Group, Inc. REIT | | | 21,435 | | | | 3,681,247 | |
SL Green Realty Corp. REIT | | | 6,100 | | | | 615,673 | |
UDR, Inc. REIT | | | 20,100 | | | | 774,252 | |
Ventas, Inc. REIT | | | 23,803 | | | | 1,428,418 | |
Vornado Realty Trust REIT | | | 13,046 | | | | 1,019,936 | |
Welltower, Inc. REIT | | | 26,881 | | | | 1,714,201 | |
Weyerhaeuser Co. REIT | | | 55,198 | | | | 1,946,282 | |
| | | | | | | | |
| | | | | | | 46,850,559 | |
| | | | | | | | |
TELECOMMUNICATION SERVICES — 2.0% | |
AT&T, Inc. | | | 430,718 | | | | 16,746,316 | |
CenturyLink, Inc. (b) | | | 67,987 | | | | 1,134,023 | |
Verizon Communications, Inc. | | | 286,051 | | | | 15,140,679 | |
| | | | | | | | |
| | | | | | | 33,021,018 | |
| | | | | | | | |
UTILITIES — 2.8% | | | | | | | | |
AES Corp. | | | 49,859 | | | | 539,973 | |
Alliant Energy Corp. | | | 14,700 | | | | 626,367 | |
Ameren Corp. | | | 16,456 | | | | 970,739 | |
American Electric Power Co., Inc. | | | 35,743 | | | | 2,629,613 | |
American Water Works Co., Inc. | | | 12,300 | | | | 1,125,327 | |
CenterPoint Energy, Inc. | | | 33,235 | | | | 942,545 | |
CMS Energy Corp. | | | 18,801 | | | | 889,287 | |
Consolidated Edison, Inc. | | | 21,500 | | | | 1,826,425 | |
Dominion Energy, Inc. | | | 44,368 | | | | 3,596,470 | |
DTE Energy Co. | | | 13,239 | | | | 1,449,141 | |
Duke Energy Corp. | | | 49,591 | | | | 4,171,099 | |
Edison International | | | 24,205 | | | | 1,530,724 | |
Entergy Corp. | | | 12,200 | | | | 992,958 | |
Eversource Energy | | | 22,043 | | | | 1,392,677 | |
Exelon Corp. | | | 69,359 | | | | 2,733,438 | |
FirstEnergy Corp. | | | 32,229 | | | | 986,852 | |
NextEra Energy, Inc. | | | 32,657 | | | | 5,100,697 | |
NiSource, Inc. | | | 23,078 | | | | 592,412 | |
NRG Energy, Inc. | | | 22,498 | | | | 640,743 | |
PG&E Corp. | | | 37,712 | | | | 1,690,629 | |
Pinnacle West Capital Corp. | | | 8,756 | | | | 745,836 | |
PPL Corp. | | | 50,456 | | | | 1,561,613 | |
Public Service Enterprise Group, Inc. | | | 37,536 | | | | 1,933,104 | |
SCANA Corp. | | | 11,501 | | | | 457,510 | |
Sempra Energy | | | 17,624 | | | | 1,884,358 | |
See accompanying notes to financial statements.
8
STATE STREET MASTER FUNDS
STATE STREET EQUITY 500 INDEX PORTFOLIO
SCHEDULE OF INVESTMENTS (continued)
December 31, 2017
| | | | | | | | | | | | |
Security Description | | | | | Shares | | | Value | |
Southern Co. | | | | | | | 69,084 | | | $ | 3,322,250 | |
WEC Energy Group, Inc. | | | | | | | 23,287 | | | | 1,546,955 | |
Xcel Energy, Inc. | | | | | | | 37,600 | | | | 1,808,936 | |
| | | | | | | | | | | | |
| | | | | | | | | | | 47,688,678 | |
| | | | | | | | | | | | |
TOTAL COMMON STOCKS
(Cost $479,714,178) | | | | 1,607,638,688 | |
| | | | | | | | | | | | |
SHORT-TERM INVESTMENTS — 1.7% | |
State Street Institutional U.S. Government Money Market Fund, Class G Shares 1.25% (d) (e) | | | | | | | 27,556,254 | | | | 27,556,254 | |
State Street Navigator Securities Lending Government Money Market Portfolio (d) (f) | | | | | | | 818,690 | | | | 818,690 | |
| | | | | | | | | | | | |
TOTAL SHORT-TERM INVESTMENTS
(Cost $28,374,944) | | | | | | | | | | | 28,374,944 | |
| | | | | | | | | | | | |
TOTAL INVESTMENTS — 97.4%
(Cost $508,089,122) | | | | | | | | | | | 1,636,013,632 | |
| | | | | | | | | | | | |
OTHER ASSETS IN EXCESS OF LIABILITIES — 2.6% | | | | | | | | | | | 43,236,032 | |
| | | | | | | | | | | | |
NET ASSETS — 100.0% | | | | | | | | | | $ | 1,679,249,664 | |
| | | | | | | | | | | | |
| (a) | Non-income producing security. |
| (b) | All or a portion of the shares of the security are on loan at December 31, 2017. |
| (c) | The Fund invested in an affiliated entity, State Street Corp. Amounts related to these transactions during the period ended December 31, 2017 are shown in the Affiliate Table below. |
| (d) | The Fund invested in certain money market funds managed by SSGA Funds Management, Inc. Amounts related to these transactions during the period ended December 31, 2017 are shown in the Affiliate Table below. |
| (e) | The rate shown is the annualized seven-day yield at December 31, 2017. |
| (f) | Investment of cash collateral for securities loaned. |
ADR = American Depositary Receipt
REIT = Real Estate Investment Trust
At December 31, 2017, open futures contracts purchased were as follows:
| | | | | | | | | | | | | | | | | | | | |
Futures Contracts | | Expiration
Date | | | Number of
Contracts | | | Notional
Amount | | | Value | | | Unrealized
Appreciation/
(Depreciation) | |
E-Mini S&P 500 Index (long) | | | 03/16/2018 | | | | 222 | | | $ | 29,214,220 | | | $ | 29,703,600 | | | $ | 489,380 | |
| | | | | | | | | | | | | | | | | | | | |
| | | | | | | | | | | | | | | | | | $ | 489,380 | |
| | | | | | | | | | | | | | | | | | | | |
During the period ended December 31, 2017, average notional value related to futures contracts was $28,935,876 or 2% of net assets.
The following table summarizes the value of the Portfolio’s investments according to the fair value hierarchy as of December 31, 2017.
| | | | | | | | | | | | | | | | |
Description | | Level 1 —
Quoted
Prices | | | Level 2 —
Other Significant
Observable
Inputs | | | Level 3 —
Significant
Unobservable
Inputs | | | Total | |
ASSETS | | | | | | | | | | | | | | | | |
INVESTMENTS: | | | | | | | | | | | | | | | | |
Common Stocks | | | | | | | | | | | | | | | | |
Consumer Discretionary | | $ | 196,816,588 | | | $ | — | | | $ | — | | | $ | 196,816,588 | |
Consumer Staples | | | 131,452,619 | | | | — | | | | — | | | | 131,452,619 | |
Energy | | | 97,956,457 | | | | — | | | | — | | | | 97,956,457 | |
Financials | | | 237,637,468 | | | | — | | | | — | | | | 237,637,468 | |
Health Care | | | 220,859,525 | | | | — | | | | — | | | | 220,859,525 | |
Industrials | | | 164,560,829 | | | | — | | | | — | | | | 164,560,829 | |
See accompanying notes to financial statements.
9
STATE STREET MASTER FUNDS
STATE STREET EQUITY 500 INDEX PORTFOLIO
SCHEDULE OF INVESTMENTS (continued)
December 31, 2017
| | | | | | | | | | | | | | | | |
Description | | Level 1 —
Quoted
Prices | | | Level 2 —
Other Significant
Observable
Inputs | | | Level 3 —
Significant
Unobservable
Inputs | | | Total | |
Information Technology | | | 382,073,799 | | | $ | — | | | $ | — | | | | 382,073,799 | |
Materials | | | 48,721,148 | | | | — | | | | — | | | | 48,721,148 | |
Real Estate | | | 46,850,559 | | | | — | | | | — | | | | 46,850,559 | |
Telecommunication Services | | | 33,021,018 | | | | — | | | | — | | | | 33,021,018 | |
Utilities | | | 47,688,678 | | | | — | | | | — | | | | 47,688,678 | |
Short-Term Investments | | | 28,374,944 | | | | — | | | | — | | | | 28,374,944 | |
| | | | | | | | | | | | | | | | |
TOTAL INVESTMENTS | | $ | 1,636,013,632 | | | $ | — | | | $ | — | | | $ | 1,636,013,632 | |
| | | | | | | | | | | | | | | | |
OTHER FINANCIAL INSTRUMENTS: | | | | | | | | | | | | | | | | |
Futures Contracts (a) | | | 489,380 | | | | — | | | | — | | | | 489,380 | |
| | | | | | | | | | | | | | | | |
TOTAL INVESTMENTS AND OTHER FINANCIAL INSTRUMENTS | | $ | 1,636,503,012 | | | $ | — | | | $ | — | | | $ | 1,636,503,012 | |
| | | | | | | | | | | | | | | | |
| (a) | Futures Contracts are valued at unrealized appreciation (depreciation). |
Affiliate Table
| | | | | | | | | | | | | | | | | | | | | | | | | | | | | | | | | | | | | | | | |
| | | Number
of Shares
Held at
12/31/16 | | | Value at
12/31/16 | | | Cost of
Purchases | | | Proceeds
from
Shares
Sold | | | Realized
Gain
(Loss) | | | Change in
Unrealized
Appreciation/
Depreciation | | | Number
of Shares
Held at
12/31/17 | | | Value at
12/31/17 | | | Dividend
Income | | | Capital Gains
Distributions | |
State Street Corp. | | | 27,747 | | | $ | 2,156,497 | | | $ | — | | | $ | 151,031 | | | $ | 43,261 | | | $ | 474,199 | | | | 25,847 | | | $ | 2,522,926 | | | $ | 42,077 | | | $ | — | |
State Street Institutional U.S. Government Money Market Fund, Class G Shares | | | — | | | | — | | | | 94,983,704 | | | | 67,427,450 | | | | — | | | | — | | | | 27,556,254 | | | | 27,556,254 | | | | 150,202 | | | | — | |
State Street Institutional U.S. Government Money Market Fund, Premier Class | | | 18,425,570 | | | | 18,425,570 | | | | 78,281,942 | | | | 96,707,512 | | | | — | | | | — | | | | — | | | | — | | | | 42,426 | | | | — | |
State Street Navigator Securities Lending Government Money Market Portfolio | | | — | | | | — | | | | 24,459,246 | | | | 23,640,556 | | | | — | | | | — | | | | 818,690 | | | | 818,690 | | | | 14,170 | | | | — | |
| | | | | | | | | | | | | | | | | | | | | | | | | | | | | | | | | | | | | | | | |
Total | | | | | | $ | 20,582,067 | | | $ | 197,724,892 | | | $ | 187,926,549 | | | $ | 43,261 | | | $ | 474,199 | | | | | | | $ | 30,897,870 | | | $ | 248,875 | | | $ | — | |
| | | | | | | | | | | | | | | | | | | | | | | | | | | | | | | | | | | | | | | | |
See accompanying notes to financial statements.
10
STATE STREET MASTER FUNDS
STATE STREET EQUITY 500 INDEX PORTFOLIO
STATEMENT OF ASSETS AND LIABILITIES
December 31, 2017
| | | | |
ASSETS | | | | |
Investments in unaffiliated issuers, at value* | | $ | 1,605,115,762 | |
Investments in affiliated issuers, at value | | | 30,897,870 | |
| | | | |
Total Investments | | | 1,636,013,632 | |
Cash at broker | | | 999,000 | |
Cash | | | 1,165 | |
Receivable for investments sold | | | 42,190,886 | |
Dividends receivable — unaffiliated issuers | | | 1,646,970 | |
Dividends receivable — affiliated issuers | | | 34,928 | |
Securities lending income receivable — unaffiliated issuers | | | 2,691 | |
Securities lending income receivable — affiliated issuers | | | 975 | |
Receivable from Adviser | | | 3,701 | |
| | | | |
TOTAL ASSETS | | | 1,680,893,948 | |
| | | | |
LIABILITIES | | | | |
Payable upon return of securities loaned | | | 818,690 | |
Payable for investments purchased | | | 600,007 | |
Payable to broker – variation margin on open futures contracts | | | 107,671 | |
Advisory fee payable | | | 117,916 | |
| | | | |
TOTAL LIABILITIES | | | 1,644,284 | |
| | | | |
NET ASSETS | | $ | 1,679,249,664 | |
| | | | |
COST OF INVESTMENTS: | | | | |
Investments in unaffiliated issuers | | $ | 478,977,048 | |
Investments in affiliated issuers | | | 29,112,074 | |
| | | | |
Total cost of investments | | $ | 508,089,122 | |
| | | | |
* Includes investments in securities on loan, at value | | $ | 21,975,355 | |
| | | | |
See accompanying notes to financial statements.
11
STATE STREET MASTER FUNDS
STATE STREET EQUITY 500 INDEX PORTFOLIO
STATEMENT OF OPERATIONS
For the Year Ended December 31, 2017
| | | | |
INVESTMENT INCOME | | | | |
Interest income — unaffiliated issuers | | $ | 19,599 | |
Dividend income — unaffiliated issuers | | | 31,762,872 | |
Dividend income — affiliated issuers | | | 234,705 | |
Unaffiliated securities lending income | | | 21,023 | |
Affiliated securities lending income | | | 14,170 | |
Foreign taxes withheld | | | (127,340 | ) |
| | | | |
TOTAL INVESTMENT INCOME (LOSS) | | | 31,925,029 | |
| | | | |
EXPENSES | | | | |
Advisory fee | | | 708,813 | |
Miscellaneous expenses | | | 76 | |
| | | | |
TOTAL EXPENSES | | | 708,889 | |
| | | | |
NET INVESTMENT INCOME (LOSS) | | | 31,216,140 | |
| | | | |
REALIZED AND UNREALIZED GAIN (LOSS) | | | | |
Net realized gain (loss) on: | | | | |
Investments — unaffiliated issuers | | | 92,151,713 | |
Investments — affiliated issuers | | | 43,261 | |
Futures contracts | | | 4,495,428 | |
| | | | |
Net realized gain (loss) | | | 96,690,402 | |
| | | | |
Net change in unrealized appreciation/depreciation on: | | | | |
Investments — unaffiliated issuers | | | 181,855,451 | |
Investments — affiliated issuers | | | 474,199 | |
Futures contracts | | | 682,055 | |
| | | | |
Net change in unrealized appreciation/depreciation | | | 183,011,705 | |
| | | | |
NET REALIZED AND UNREALIZED GAIN (LOSS) | | | 279,702,107 | |
| | | | |
NET INCREASE (DECREASE) IN NET ASSETS FROM OPERATIONS | | $ | 310,918,247 | |
| | | | |
See accompanying notes to financial statements.
12
STATE STREET MASTER FUNDS
STATE STREET EQUITY 500 INDEX PORTFOLIO
STATEMENTS OF CHANGES IN NET ASSETS
| | | | | | | | |
| | | Year Ended
12/31/17 | | | Year Ended
12/31/16 | |
INCREASE (DECREASE) IN NET ASSETS FROM OPERATIONS: | | | | | | | | |
Net investment income (loss) | | $ | 31,216,140 | | | $ | 33,251,620 | |
Net realized gain (loss) | | | 96,690,402 | | | | 105,963,108 | |
Net change in unrealized appreciation/depreciation | | | 183,011,705 | | | | 34,051,685 | |
| | | | | | | | |
Net increase (decrease) in net assets resulting from operations | | | 310,918,247 | | | | 173,266,413 | |
| | | | | | | | |
FROM BENEFICIAL INTEREST TRANSACTIONS | | | | | | | | |
Contributions | | | 44,261,255 | | | | 116,324,014 | |
Withdrawals | | | (194,742,512 | ) | | | (372,376,185 | ) |
| | | | | | | | |
Net increase (decrease) in net assets from capital transactions | | | (150,481,257 | ) | | | (256,052,171 | ) |
| | | | | | | | |
Net increase (decrease) in net assets during the period | | | 160,436,990 | | | | (82,785,758 | ) |
| | | | | | | | |
Net assets at beginning of period | | | 1,518,812,674 | | | | 1,601,598,432 | |
| | | | | | | | |
NET ASSETS AT END OF PERIOD | | $ | 1,679,249,664 | | | $ | 1,518,812,674 | |
| | | | | | | | |
See accompanying notes to financial statements.
13
STATE STREET MASTER FUNDS
STATE STREET EQUITY 500 INDEX PORTFOLIO
FINANCIAL HIGHLIGHTS
The following table includes selected supplemental data and ratios to average net assets:
| | | | | | | | | | | | | | | | | | | | |
| | | Year Ended
12/31/17 | | | Year Ended
12/31/16 | | | Year Ended
12/31/15 | | | Year Ended
12/31/14 | | | Year Ended
12/31/13 | |
Total return (a) | | | 22.42 | %(b) | | | 11.90 | % | | | 1.41 | % | | | 13.62 | % | | | 32.30 | % |
Ratios and Supplemental Data: | | | | | | | | | | | | | | | | | | | | |
Net assets, end of period (in 000s) | | $ | 1,679,250 | | | $ | 1,518,813 | | | $ | 1,601,598 | | | $ | 2,869,323 | | | $ | 2,739,594 | |
Ratios to average net assets: | | | | | | | | | | | | | | | | | | | | |
Total expenses | | | 0.05 | % | | | 0.05 | % | | | 0.05 | % | | | 0.050 | % | | | 0.05 | % |
Net expenses | | | 0.05 | % | | | 0.04 | % | | | 0.05 | % | | | 0.05 | % | | | 0.05 | % |
Net investment income (loss) | | | 1.98 | % | | | 2.18 | % | | | 2.00 | % | | | 1.98 | % | | | 2.05 | % |
Portfolio turnover rate | | | 2 | % | | | 5 | % | | | 7 | %(c) | | | 2 | %(c) | | | 4 | %(c) |
| (a) | Results represent past performance and are not indicative of future results. Total return for periods of less than one year are not annualized. |
| (b) | Reflects a non-recurring litigation payment received by the Portfolio from State Street Corp., an affiliate, which amounted to less than $0.01 per share outstanding as of March 8, 2017. This payment resulted in an increase to total return of less than 0.005% for the period ended December 31, 2017. |
| (c) | Portfolio turnover rate excludes in-kind security transactions. |
See accompanying notes to financial statements.
14
STATE STREET MASTER FUNDS
STATE STREET EQUITY 500 INDEX PORTFOLIO
NOTES TO FINANCIAL STATEMENTS
December 31, 2017
State Street Master Funds (the “Trust”), a Massachusetts business trust registered under the Investment Company Act of 1940, as amended (“1940 Act”), is an open-end management investment company.
As of December 31, 2017, the Trust consists of six (6) series (and corresponding classes, each of which have the same rights and privileges, including voting rights), each of which represents a separate series of beneficial interest in the Trust. The State Street Equity 500 Index Portfolio (the “Portfolio”) is authorized to issue unlimited number of non transferable beneficial interest. The financial statements herein relate only to:
| | | | |
| Fund | | Commencement of
Operations | | Diversification
Classification |
State Street Equity 500 Index Portfolio | | March 1, 2000 | | Diversified |
Under the Trust’s organizational documents, its officers and trustees are indemnified against certain liabilities arising out of the performance of their duties to the Trust. Additionally, in the normal course of business, the Trust enters into contracts with service providers that contain general indemnification clauses. The Trust’s maximum exposure under these arrangements is unknown as this would involve future claims that may be made against the Trust that have not yet occurred.
| 2. | Summary of Significant Accounting Policies |
The following is a summary of significant accounting policies followed by the Trust in the preparation of its financial statements:
The preparation of financial statements in accordance with U.S. generally accepted accounting principles (“U.S. GAAP”) requires management to make estimates and assumptions that affect the reported amounts and disclosures in the financial statements. Actual results could differ from those estimates. The Portfolio is an investment company under U.S. GAAP and follows the accounting and reporting guidance applicable to investment companies.
Security Valuation
The Portfolio’s investments are valued at fair value each day that the New York Stock Exchange (“NYSE”) is open and, for financial reporting purposes, as of the report date should the reporting period end on a day that the NYSE is not open. Fair value is generally defined as the price a fund would receive to sell an asset or pay to transfer a liability in an orderly transaction between market participants at the measurement date. By its nature, a fair value price is a good faith estimate of the valuation in a current sale and may not reflect an actual market price. The investments of the Portfolio are valued pursuant to the policy and procedures developed by the Oversight Committee (the “Committee”) and approved by the Board of Trustees of the Trust (the “Board”). The Committee provides oversight of the valuation of investments for the Portfolio. The Board has responsibility for determining the fair value of investments.
Valuation techniques used to value the Portfolio’s investments by major category are as follows:
| • | | Equity investments traded on a recognized securities exchange for which market quotations are readily available are valued at the last sale price or official closing price, as applicable, on the primary market or exchange on which they trade. Equity investments traded on a recognized exchange for which there were no sales on that day are valued at the last published sale price or at fair value. |
| • | | Investments in registered investment companies (including money market funds) or other unitized pooled investment vehicles that are not traded on an exchange are valued at that day’s published net asset value (“NAV”) per share or unit. |
| • | | Government and municipal fixed income securities are generally valued using quotations from independent pricing services or brokers. Certain government inflation-indexed securities may require a calculated fair valuation as the cumulative inflation is contained within the price provided by the pricing service or broker. For these securities, the inflation component of the price is “cleaned” from the pricing service or broker price utilizing the published inflation factors in order to ensure proper accrual of income. |
15
STATE STREET MASTER FUNDS
STATE STREET EQUITY 500 INDEX PORTFOLIO
NOTES TO FINANCIAL STATEMENTS (continued)
December 31, 2017
| • | | Exchange-traded futures contracts are valued at the closing settlement price on the primary market on which they are traded most extensively. Exchange-traded futures contracts traded on a recognized exchange for which there were no sales on that day are valued at the last reported sale price obtained from independent pricing services or brokers or at fair value. |
In the event prices or quotations are not readily available or that the application of these valuation methods results in a price for an investment that is deemed to be not representative of the fair value of such investment, fair value will be determined in good faith by the Committee, in accordance with the valuation policy and procedures approved by the Board.
Various inputs are used in determining the value of the Portfolio’s investments.
The Portfolio values its assets and liabilities at fair value using a fair value hierarchy consisting of three broad levels that prioritize the inputs to valuation techniques giving the highest priority to readily available unadjusted quoted prices in active markets for identical assets or liabilities (Level 1 measurements) and the lowest priority to unobservable inputs (Level 3 measurements) when market prices are not readily available or reliable. The categorization of a value determined for an investment within the hierarchy is based upon the pricing transparency of the investment and is not necessarily an indication of the risk associated with investing in it.
The three levels of the fair value hierarchy are as follows:
| • | | Level 1 — Unadjusted quoted prices in active markets for an identical asset or liability; |
| • | | Level 2 — Inputs other than quoted prices included within Level 1 that are observable for the asset or liability either directly or indirectly, including quoted prices for similar assets or liabilities in active markets, quoted prices for identical or similar assets or liabilities in markets that are not considered to be active, inputs other than quoted prices that are observable for the asset or liability (such as exchange rates, financing terms, interest rates, yield curves, volatilities, prepayment speeds, loss severities, credit risks and default rates) or other market-corroborated inputs; and |
| • | | Level 3 — Unobservable inputs for the asset or liability, including the Committee’s assumptions used in determining the fair value of investments. |
The value of the Portfolio’s investments according to the fair value hierarchy as of December 31, 2017, is disclosed in the Portfolio’s Schedule of Investments.
Changes in valuation techniques may result in transfers in or out of an assigned level within the fair value hierarchy. Transfers between different levels of the fair value hierarchy are recognized at the end of the reporting period.
The Portfolio had no transfers between levels for the period ended December 31, 2017.
Investment Transactions and Income Recognition
Investment transactions are accounted for on trade date for financial reporting purposes. Realized gains and losses from the sale or disposition of investments are determined using the identified cost method. Dividend income and capital gain distributions, if any, are recognized on the ex-dividend date, net of any foreign taxes withheld at source, if any. Interest income is recorded daily on an accrual basis. Non-cash dividends received in the form of stock are recorded as dividend income at fair value.
Distributions received by the Portfolio may include a return of capital that is estimated by management. Such amounts are recorded as a reduction of the cost of investments or reclassified to capital gains.
All of the net investment income and realized and unrealized gains and losses from the security transactions of the Portfolio are allocated pro rata among the partners in the Portfolio on a daily basis based on each partner’s daily ownership percentage.
Expenses
Certain expenses, which are directly identifiable to a specific Portfolio, are applied to that Portfolio within the Trust. Other expenses which cannot be attributed to a specific Portfolio are allocated in such a manner as deemed equitable, taking into consideration the nature and type of expense and the relative net assets of the Portfolio within the Trust.
16
STATE STREET MASTER FUNDS
STATE STREET EQUITY 500 INDEX PORTFOLIO
NOTES TO FINANCIAL STATEMENTS (continued)
December 31, 2017
Foreign Taxes
The Portfolio may be subject to foreign taxes (a portion of which may be reclaimable) on income, stock dividends, realized and unrealized capital gains on investments or certain foreign currency transactions. Foreign taxes are recorded in accordance with SSGA Funds Management, Inc.’s (the “Adviser” or “SSGA FM”) understanding of the applicable foreign tax regulations and rates that exist in the foreign jurisdictions in which the Portfolio invests. These foreign taxes, if any, are paid by the Portfolio and are reflected in the Statement of Operations, if applicable. Foreign taxes payable or deferred as of December 31, 2017, if any, are disclosed in the Portfolio’s Statement of Assets and Liabilities.
| 3. | Derivative Financial Instruments |
Futures Contracts
The Portfolio may enter into futures contracts to meet its objectives. A futures contract is a standardized, exchange-traded agreement to buy or sell a financial instrument at a set price on a future date. Upon entering into a futures contract, the Portfolio is required to deposit with the broker, cash or securities in an amount equal to the minimum initial margin requirements of the clearing house. Subsequent payments are made or received by the Portfolio equal to the daily change in the contract value and are recorded as variation margin receivable or payable with a corresponding offset to unrealized gains or losses. The Portfolio recognizes a realized gain or loss when the contract is closed.
Losses may arise if the value of a futures contract decreases due to unfavorable changes in the market rates or values of the underlying instrument during the term of the contract or if the counterparty does not perform under the contract. The use of futures contracts also involves the risk that the movements in the price of the futures contracts do not correlate with the movement of the assets underlying such contracts.
For the period ended December 31, 2017, the Portfolio entered into futures contracts for cash equitization, to reduce tracking error and to facilitate daily liquidity.
The following tables summarize the value of the Portfolio’s derivative instruments as of December 31, 2017, and the related location in the accompanying Statement of Assets and Liabilities and Statement of Operations, presented by primary underlying risk exposure:
| | | | | | | | | | | | | | | | | | | | | | |
| | | Asset Derivatives |
| | | Interest
Rate
Contracts
Risk | | | Foreign
Exchange
Contracts
Risk | | | Credit
Contracts
Risk | | | Equity
Contracts
Risk | | | Commodity
Contracts
Risk | | | Total |
State Street Equity 500 Index Portfolio | | | | | | | | | | | | | | | | | | | | | | |
Futures Contracts (a) | | $ | — | | | $ | — | | | $ | — | | | $ | 489,380 | | | $ | — | | | $ 489,380 |
|
(a) Unrealized appreciation on open futures contracts. The Statement of Assets and Liabilities only reflect the current day’s net variation margin. |
| | | Net Realized Gain (Loss) |
| | | Interest
Rate
Contracts
Risk | | | Foreign
Exchange
Contracts
Risk | | | Credit
Contracts
Risk | | | Equity
Contracts
Risk | | | Commodity
Contracts
Risk | | | Total |
State Street Equity 500 Index Portfolio | | | | | | | | | | | | | | | | | | | | | | |
Futures Contracts | | $ | — | | | $ | — | | | $ | — | | | $ | 4,495,428 | | | $ | — | | | $4,495,428 |
17
STATE STREET MASTER FUNDS
STATE STREET EQUITY 500 INDEX PORTFOLIO
NOTES TO FINANCIAL STATEMENTS (continued)
December 31, 2017
| | | | | | | | | | | | | | | | | | | | | | | | |
| | | Net Change in Unrealized Appreciation (Depreciation) | |
| | | Interest
Rate
Contracts
Risk | | | Foreign
Exchange
Contracts
Risk | | | Credit
Contracts
Risk | | | Equity
Contracts
Risk | | | Commodity
Contracts
Risk | | | Total | |
State Street Equity 500 Index Portfolio | | | | | | | | | | | | | | | | | | | | | | | | |
Futures Contracts | | $ | — | | | $ | — | | | $ | — | | | $ | 682,055 | | | $ | — | | | $ | 682,055 | |
| 4. | Fees and Transactions with Affiliates |
Advisory Fees
The Portfolio has entered into an Investment Advisory Agreement with SSGA FM, a subsidiary of State Street Corporation and an affiliate of State Street Bank and Trust Company (“State Street”), under which SSGA FM directs the investments of the Portfolio in accordance with its investment objective, policies, and limitations.
Administrator, Custodian, Sub-Administrator and Transfer Agent Fees
SSGA FM serves as administrator and State Street, an affiliate of the Adviser, serves as custodian, sub-administrator and transfer agent to the Portfolio. In compensation for SSGA FM’s services as investment adviser and administrator and for State Street’s services as custodian, sub-administrator and transfer agent (and for assuming ordinary operating expenses of the Portfolio, including ordinary legal, audit and trustees expense), State Street receives a unitary fee, calculated daily, at the annual rate of 0.045% of the Portfolio’s average daily net assets.
Other Transactions with Affiliates — Securities Lending
State Street, an affiliate of the Portfolio, acts as the securities lending agent for the Portfolio, pursuant to an amended and restated securities lending authorization agreement dated January 6, 2017.
Proceeds collected by State Street on investment of cash collateral or any fee income are allocated as follows (after deduction of such other amounts payable to State Street under the terms of the securities lending agreement): 85% payable to the Portfolio, and 15% payable to State Street.
In addition, cash collateral from lending activities is invested in the State Street Navigator Securities Lending Government Money Market Portfolio, an affiliated money market fund, for which SSGA FM serves as investment adviser. See Note 8 for additional information regarding securities lending.
Other Transactions with Affiliates
The Portfolio may invest in affiliated entities, including securities issued by State Street Corporation, affiliated funds, or entities deemed to be affiliates as a result of the Portfolio owning more than five percent of the entity’s voting securities or outstanding shares. Amounts relating to these transactions during the period ended December 31, 2017, are disclosed in the Schedule of Investments.
On March 8, 2017, the Portfolio received a non-recurring litigation payment of $6,722, from State Street Corporation, an affiliate of the Adviser, which is recorded as a realized gain in the Statement of Operations.
The fees and expenses of the Trust’s trustees, who are not “interested persons” of the Trust, as defined in the 1940 Act (“Independent Trustees”), are paid directly by the Portfolio. The Independent Trustees are reimbursed for travel and other out-of-pocket expenses in connection with meeting attendance and industry seminars.
18
STATE STREET MASTER FUNDS
STATE STREET EQUITY 500 INDEX PORTFOLIO
NOTES TO FINANCIAL STATEMENTS (continued)
December 31, 2017
| 6. | Investment Transactions |
Purchases and sales of investments (excluding in-kind transactions, short term investments and derivative contracts) for the period ended December 31, 2017, were as follows:
| | | | | | | | |
| | | Purchases | | | Sales | |
State Street Equity 500 Index Portfolio | | $ | 35,529,815 | | | $ | 192,019,343 | |
The Portfolio is not required to pay federal income taxes on its net investment income and net capital gains because it is treated as a partnership for federal income tax purposes. All interest, gains and losses of the Portfolio are deemed to have been “passed through” to the Portfolio’s partners in proportion to their holdings in the Portfolio, regardless of whether such items have been distributed by the Portfolio. Each partner is responsible for its tax liability based on its distributive share; therefore, no provision has been made for federal income taxes.
The Portfolio files federal and various state and local tax returns as required. No income tax returns are currently under examination. Generally, the federal returns are subject to examination by the Internal Revenue Service for a period of three years from date of filing, while the state returns may remain open for an additional year depending upon jurisdiction. SSGA FM has analyzed the Portfolio’s tax positions taken on tax returns for all open years and does not believe there are any uncertain tax positions that would require recognition of a tax liability.
As of December 31, 2017, gross unrealized appreciation and gross unrealized depreciation of investments and other financial instruments based on cost for federal income tax purposes were as follows:
| | | | | | | | | | | | | | | | |
| | | Tax
Cost | | | Gross
Unrealized
Appreciation | | | Gross
Unrealized
Depreciation | | | Net Unrealized
Appreciation
(Depreciation) | |
State Street Equity 500 Index Portfolio | | $ | 568,146,969 | | | $ | 1,141,277,507 | | | $ | 72,921,464 | | | $ | 1,068,356,043 | |
The Portfolio may lend securities to qualified broker-dealers or institutional investors. The loans are secured at all times by cash, cash equivalents or U.S. government securities in an amount at least equal to the market value of the securities loaned, plus accrued interest and dividends, determined on a daily basis and adjusted accordingly. The value of the collateral with respect to a loaned security may be temporarily more or less than the value of a security due to market fluctuations of securities values. With respect to each loan, if on any U.S. business day the aggregate market value of securities collateral plus cash collateral is less than the aggregate market value of the securities which are subject to the loan, the borrower will be notified to provide additional collateral on the next business day.
The Portfolio will regain record ownership of loaned securities to exercise certain beneficial rights; however, the Portfolio may bear the risk of delay in recovery of, or even loss of rights in the securities loaned should the borrower fail financially. In addition, the Portfolio will bear the risk of loss of any cash collateral that it may invest. The Portfolio receives compensation for lending its securities from interest or dividends earned on the cash, cash equivalents or U.S. government securities held as collateral, net of fee rebates paid to the borrower and net of fees paid to State Street as the lending agent. Additionally, the Portfolio will receive a fee from the borrower for non-cash collateral equal to a percentage of the market value of the loaned securities.
The market value of securities on loan as of December 31, 2017, and the value of the invested cash collateral are disclosed in the Portfolio’s Statement of Assets and Liabilities. Non-cash collateral is not disclosed in the Portfolio’s Statement of Assets and Liabilities as it is held by the lending agent on behalf of the Portfolio, and the Portfolio does not have the ability to re-hypothecate those securities. Securities lending income, as disclosed in the Portfolio’s Statement of Operations, represents the income earned from the non-cash collateral and the investment of cash collateral, net of fee rebates paid to the borrower and net of fees paid to State Street as lending agent.
19
STATE STREET MASTER FUNDS
STATE STREET EQUITY 500 INDEX PORTFOLIO
NOTES TO FINANCIAL STATEMENTS (continued)
December 31, 2017
The following is a summary of the Portfolio’s securities lending agreements and related cash and non-cash collateral received as of December 31, 2017:
| | | | | | | | | | | | | | | | |
Fund | | Market Value of
Securities on Loan | | | Cash
Collateral
Received | | | Non Cash
Collateral
Received* | | | Total
Collateral
Received | |
State Street Equity 500 Index Portfolio | | $ | 21,975,355 | | | $ | 818,690 | | | $ | 21,872,186 | | | $ | 22,690,876 | |
| * | The non-cash collateral includes U.S. Treasuries and U.S. Government Agency securities. |
The following table reflects a breakdown of transactions accounted for as secured borrowings, the gross obligation by the type of collateral pledged or securities loaned, and the remaining contractual maturity of those transactions as of December 31, 2017:
| | | | | | | | | | | | | | | | | | | | | | | | | | |
| | | | | Remaining Contractual Maturity of the Agreements
As of December 31, 2017 | |
Fund | | Securities Lending
Transactions | | Overnight and
Continuous | | | <30 Days | | | Between
30 & 90
Days | | | >90 Days | | | Total
Borrowings | | | Gross Amount
of Recognized
Liabilities for
Securities
Lending
Transactions | |
State Street Equity 500 Index Portfolio | | Common Stocks | | $ | 818,690 | | | $ | — | | | $ | — | | | $ | — | | | $ | 818,690 | | | $ | 818,690 | |
The Portfolio and other affiliated funds (each a “Participant” and, collectively, the “Participants”) participate in a $500 million revolving credit facility provided by a syndication of banks under which the Participants may borrow to fund shareholder redemptions. This agreement expires in October 2018 unless extended or renewed.
The Participants are charged an annual commitment fee which is calculated based on the unused portion of the shared credit line. Commitment fees are allocated among each of the Participants based on relative net assets. Commitment fees are ordinary fund operating expenses. A Participant incurs and pays the interest expense related to its borrowing. Interest is calculated at a rate per annum equal to the sum of 1% plus the greater of the New York Fed Bank Rate and 1-month LIBOR rate.
Prior to October 12, 2017, the Portfolio and other affiliated funds participated in a $360 million revolving credit facility.
The Portfolio had no outstanding loans as of December 31, 2017.
Concentration Risk
As a result of the Portfolio’s ability to invest a large percentage of its assets in obligations of issuers within the same country, state, region, currency or economic sector, an adverse economic, business or political development may affect the value of the Portfolio’s investments more than if the Portfolio were more broadly diversified.
Market and Credit Risk
In the normal course of business, the Portfolio trades financial instruments and enters into transactions where risk of potential loss exists due to changes in the general economic conditions and fluctuations of the market (market risk). Additionally, the Portfolio may also be exposed to credit risk in the event that an issuer or guarantor fails to perform or that an institution or entity with which the Portfolio has unsettled or open transactions defaults.
20
STATE STREET MASTER FUNDS
STATE STREET EQUITY 500 INDEX PORTFOLIO
NOTES TO FINANCIAL STATEMENTS (continued)
December 31, 2017
11. Subsequent Events
Management has evaluated the impact of all subsequent events on the Portfolio through the date on which the financial statements were available to be issued and has determined that there were no subsequent events requiring adjustment or disclosure in the financial statements.
21
STATE STREET MASTER FUNDS
STATE STREET EQUITY 500 INDEX PORTFOLIO
REPORT OF INDEPENDENT REGISTERED PUBLIC ACCOUNTING FIRM
To the Owners of Beneficial Interest and Board of Trustees of
State Street Equity 500 Index Portfolio:
Opinion on the Financial Statements
We have audited the accompanying statement of assets and liabilities of State Street Equity 500 Index Portfolio (the “Portfolio”) (one of the portfolios constituting State Street Master Funds (the “Trust”)), including the schedule of investments, as of December 31, 2017, and the related statement of operations for the year then ended, the statement of changes in net assets for each of the two years in the period then ended, the financial highlights for each of the five years in the period then ended and the related notes (collectively referred to as the “financial statements”). In our opinion, the financial statements present fairly, in all material respects, the financial position of State Street Equity 500 Index Portfolio (one of the portfolios constituting State Street Master Funds) at December 31, 2017, the results of its operations for the year then ended, the changes in its net assets for each of the two years in the period then ended and its financial highlights for each of the five years in the period then ended, in conformity with U.S. generally accepted accounting principles.
Basis for Opinion
These financial statements are the responsibility of the Trust’s management. Our responsibility is to express an opinion on the Portfolio’s financial statements based on our audits. We are a public accounting firm registered with the Public Company Accounting Oversight Board (United States) (“PCAOB”) and are required to be independent with respect to the Fund in accordance with the U.S. federal securities laws and the applicable rules and regulations of the Securities and Exchange Commission and the PCAOB.
We conducted our audits in accordance with the standards of the PCAOB. Those standards require that we plan and perform the audit to obtain reasonable assurance about whether the financial statements are free of material misstatement, whether due to error or fraud. The Trust is not required to have, nor were we engaged to perform, an audit of the Trust’s internal control over financial reporting. As part of our audits, we are required to obtain an understanding of internal control over financial reporting, but not for the purpose of expressing an opinion on the effectiveness of the Trust’s internal control over financials reporting. Accordingly, we express no such opinion.
Our audits included performing procedures to assess the risks of material misstatement of the financial statements, whether due to error or fraud, and performing procedures that respond to those risks. Such procedures included examining, on a test basis, evidence regarding the amounts and disclosures in the financial statements. Our procedures included confirmation of securities owned as of December 31, 2017, by correspondence with the custodian, brokers and others or by other appropriate auditing procedures where replies from brokers and others were not received. Our audits also included evaluating the accounting principles used and significant estimates made by management, as well as evaluating the overall presentation of the financial statements. We believe that our audits provides a reasonable basis for our opinion.

We have served as the auditor of one or more State Street Global Advisors investment companies since 2000.
Boston, Massachusetts
February 28, 2018
22
STATE STREET MASTER FUNDS
STATE STREET EQUITY 500 INDEX PORTFOLIO
OTHER INFORMATION
December 31, 2017 (Unaudited)
Expense Example
As a shareholder of the Portfolio, you incur two types of costs: (1) transaction costs, including sales charges (loads), if applicable, on purchase payments, reinvested dividends, or other distributions and (2) ongoing costs, including advisory fees and to the extent applicable, distribution (12b-1) and/or service fees; and other Portfolio expenses. This example is intended to help you understand your ongoing costs (in dollars) of investing in the Portfolio and to compare these costs with the ongoing costs of investing in other mutual funds. It is based on an investment of $1,000 made at the beginning of the period shown and held for the entire period from July 1, 2017 to December 31, 2017.
The table below illustrates your Portfolio’s cost in two ways:
Based on actual fund return — This section helps you to estimate the actual expenses that you paid over the period. The “Ending Account Value” shown is derived from the Portfolio’s actual return, and the third column shows the dollar amount that would have been paid by an investor who started with $1,000 in the Portfolio. You may use the information here, together with the amount you invested, to estimate the expenses that you paid over the period. To do so, simply divide your account value by $1,000 (for example, an $8,600 account value divided by $1,000 = 8.6), then multiply the result by the number given for the Portfolio under the heading “Expenses Paid During Period”.
Based on hypothetical 5% return — This section is intended to help you compare your Portfolio’s costs with those of other mutual funds. It assumes that the Portfolio had a yearly return of 5% before expenses, but that the expense ratio is unchanged. In this case, because the return used is not the Portfolio’s actual return, the results do not apply to your investment. The example is useful in making comparisons because the U.S. Securities and Exchange Commission (the “SEC”) requires all mutual funds to calculate expenses based on a 5% return. You can assess your Portfolio’s costs by comparing this hypothetical example with the hypothetical examples that appear in shareholder reports of other funds.
Please note that the expenses shown in the table are meant to highlight your ongoing costs only and do not reflect any transaction costs, such as sales load charges (loads). Therefore, the hypothetical 5% return section of the table is useful in comparing ongoing costs only, and will not help you determine the relative total costs of owning different funds. In addition, if these transaction costs were included, your costs would have been higher.
| | | | | | | | | | | | | | | | | | | | |
| | | | | | Actual | | | Hypothetical (assuming a 5%
return before expenses) | |
| | | Annualized
Expense Ratio | | | Ending Account
Value | | | Expenses Paid
During Period(a) | | | Ending Account
Value | | | Expenses Paid
During Period(a) | |
State Street Equity 500 Index Portfolio | | | 0.05 | % | | $ | 1,119.70 | | | $ | 0.27 | | | $ | 1,025.00 | | | $ | 0.26 | |
| (a) | Hypothetical expenses are equal to the Portfolio’s annualized net expense ratio multiplied by the average account value of the year multiplied by 184, then divided by 365. |
23
STATE STREET MASTER FUNDS
STATE STREET EQUITY 500 INDEX PORTFOLIO
OTHER INFORMATION (continued)
December 31, 2017 (Unaudited)
Proxy Voting Policies and Procedures and Records
The Portfolio has adopted the proxy voting policies of the Adviser. A description of the policies and procedures that the Portfolio have adopted to determine how to vote proxies relating to portfolio securities are contained in the Portfolio’s Statement of Additional Information, which is available (i) without charge, upon request, by calling the Portfolio at 1-800-997-7327, (ii) on the SEC’s website at www.sec.gov, or (iii) at the SEC’s public reference room. Information on the operation of the public reference room may be obtained by calling 1-800-SEC-0330. Information regarding how the Portfolio voted proxies, if any, during the most recent 12-month period ended June 30 is available by August 31 of each year without charge (1) by calling 1-800-997-7327 (toll free), or (2) on the website of the SEC at www.sec.gov.
Quarterly Portfolio Schedule
The Portfolio will file its complete schedule of investments with the SEC for the first and third quarters of each fiscal year on Form N-Q. The Portfolio’s Form N-Q is available (i) without charge, upon request, by calling the Portfolio at 1-800-997-7327, (ii) on the SEC’s website at www.sec.gov, or (iii) at the SEC’s public reference room. Information on the operation of the public reference room may be obtained by calling 1-800-SEC-0330.
24
STATE STREET MASTER FUNDS
STATE STREET EQUITY 500 INDEX PORTFOLIO
OTHER INFORMATION (continued)
December 31, 2017 (Unaudited)
TRUSTEES AND OFFICERS
| | | | | | | | | | |
Name, Address and Year of Birth | | Position(s)
Held with
Trust | | Term of
Office and
Length of
Time Served | | Principal Occupation During the Past Five Years
and Relevant Experience | | Number of
Funds in Fund
Complex
Overseen
by Trustee† | | Other
Directorships
Held by Trustee
During the Past Five Years |
Trustees | | | | | | | | | | |
Independent Trustees | | | | | | | | | | |
Michael F. Holland c/o SSGA Funds Management, Inc. State Street Financial Center One Lincoln Street Boston, MA 02111-2900 YOB: 1944 | | Trustee and Co-Chairman of the Board | | Term: Indefinite Elected: 7/99 | | Chairman, Holland & Company L.L.C. (investment adviser) (1995-present). | | 67 | | Director, the Holland Series Fund, Inc.; Director, The China Fund, Inc.; Director, The Taiwan Fund, Inc. (2007-2017); Director, Reaves Utility Income Fund, Inc.; and Director, Blackstone/GSO Loans (and Real Estate) Funds. |
Patrick J. Riley c/o SSGA Funds Management, Inc. State Street Financial Center One Lincoln Street Boston, MA 02111-2900 YOB: 1948 | | Trustee and Co-Chairman of the Board | | Term: Indefinite Elected: 1/14 | | 2002 to May 2010, Associate Justice of the Superior Court, Commonwealth of Massachusetts; 1985 to 2002, Partner, Riley, Burke & Donahue, L.L.P. (law firm); 1998 to Present, Independent Director, State Street Global Advisers Ireland, Ltd. (investment company); 1998 to Present, Independent Director, SSGA Liquidity plc (formerly, SSGA Cash Management Fund plc); January 2009 to Present, Independent Director, SSGA Fixed Income plc; and January 2009 to Present, Independent Director, SSGA Qualified Funds PLC. | | 73 | | Board Director and Chairman, SPDR Europe 1PLC Board (2011-Present); Board Director and Chairman, SPDR Europe II, PLC (2013- Present). |
William L. Marshall c/o SSGA Funds Management, Inc. State Street Financial Center One Lincoln Street Boston, MA 02111-2900 YOB: 1942 | | Trustee and Co-Chairman of the Audit Committee | | Term: Indefinite Elected: 1/14 | | July 2016 to Present, Chief Executive Officer and Chief Compliance Officer, The Marshall Financial Group, Inc.; 2015 to present, Board member, The Doylestown Health Foundation Board; April 2011 to June 2016, Chairman (until April 2011, Chief Executive Officer and President), Wm. L. Marshall Associates, Inc., Wm. L. Marshall Companies, Inc. and the Marshall Financial Group, Inc. (a registered investment adviser and provider of financial and related consulting services); Certified Financial Planner; Member, Financial Planners Association. | | 73 | | None. |
Richard D. Shirk c/o SSGA Funds Management, Inc. State Street Financial Center One Lincoln Street Boston, MA 02111-2900 YOB: 1945 | | Trustee and Co-Chairman of the Qualified Legal and Compliance Committee | | Term: Indefinite Elected: 1/14 | | March 2001 to April 2002, Chairman (1996 to March 2001, President and Chief Executive Officer), Cerulean Companies, Inc. (holding company) (Retired); 1992 to March 2001, President and Chief Executive Officer, Blue Cross Blue Shield of Georgia (health insurer, managed healthcare). | | 73 | | 1998 to December 2008, Chairman, Board Member and December 2008 to Present, Investment Committee Member, Healthcare Georgia Foundation (private foundation); September 2002 to 2012, Lead Director and Board Member, Amerigroup Corp. (managed health care); 1999 to 2013, Board Member and (since 2001) Investment Committee Member, Woodruff Arts Center; and 2003 to 2009, Trustee, Gettysburg College; Board member, Aerocare Holdings, Regenesis Biomedical Inc. |
Rina K. Spence c/o SSGA Funds Management, Inc. State Street Financial Center One Lincoln Street Boston, MA 02111-2900 YOB: 1948 | | Trustee and Co-Chair of the Qualified Legal and Compliance Committee and Co-Chair of the Governance Committee | | Term: Indefinite Elected: 7/99 | | President of SpenceCare International LLC (international healthcare consulting) (1999-present); Chief Executive Officer, IEmily.com (health internet company) (2000-2001); Chief Executive Officer of Consensus Pharmaceutical, Inc. (1998-1999); Founder, President and Chief Executive Officer of Spence Center for Women’s Health (1994-1998); President and CEO, Emerson Hospital (1984-1994); Honorary Consul for Monaco in Boston (2015-present). | | 73 | | Trustee, Eastern Enterprise (utilities) (1988-2000); Director, Berkshire Life Insurance Company of America (1993-2009). |
25
STATE STREET MASTER FUNDS
STATE STREET EQUITY 500 INDEX PORTFOLIO
OTHER INFORMATION (continued)
December 31, 2017 (Unaudited)
| | | | | | | | | | |
Name, Address and Year of Birth | | Position(s)
Held with
Trust | | Term of Office and Length of
Time Served | | Principal Occupation During the Past Five Years
and Relevant Experience | | Number of
Funds
in Fund
Complex
Overseen
by Trustee† | | Other
Directorships
Held by Trustee
During the Past Five Years |
Bruce D. Taber c/o SSGA Funds Management, Inc. State Street Financial Center One Lincoln Street Boston, MA 02111-2900 YOB: 1943 | | Trustee and Co-Chairman of the Valuation Committee and Co-Chair of the Governance Committee | | Term: Indefinite Elected: 1/14 | | Retired; 1999 to 2016, Partner, Zenergy LLC (a technology company providing Computer Modeling and System Analysis to the General Electric Power Generation Division); Until December 2008, Independent Director, SSGA Cash Management Fund plc; Until December 2008, Independent Director, State Street Global Advisers Ireland, Ltd. (investment companies); and Until August 1994, President, Alonzo B. Reed, Inc., (a Boston architect-engineering firm). | | 67 | | None. |
Douglas T. Williams c/o SSGA Funds Management, Inc. State Street Financial Center One Lincoln Street Boston, MA 02111-2900 YOB: 1940 | | Trustee and Co-Chairman of the Audit Committee | | Term: Indefinite Elected: 7/99 | | Retired Executive Vice President and member of Executive Committee, Chase Manhattan Bank (1987-1999); President, Boston Stock Exchange Depository Trust Company, 1981-1982; Treasurer, Nantucket Educational Trust, (2002-2007); Executive Vice President and Global Head of Technology and Operations, JP Morgan Chase (1994 to1998). | | 73 | | None. |
Michael A. Jessee c/o SSGA Funds Management, Inc. State Street Financial Center One Lincoln Street Boston, MA 02111-2900 YOB: 1946 | | Trustee and Co-Chairman of the Valuation Committee | | Term: Indefinite Appointed: 7/16 | | Retired; formerly, President and Chief Executive Officer of the Federal Home Loan Bank of Boston (1989-2009); Trustee, Randolph-Macon College (2004-2016). | | 73 | | None. |
Interested Trustees(1) | | | | | | | | | | |
James E. Ross SSGA Funds Management, Inc. One Lincoln Street Boston, MA 02111-2900 YOB: 1965 | | Trustee | | Term: Indefinite Appointed: 2/07 | | Chairman and Director, SSGA Funds Management, Inc. (2005-present); Executive Vice President, State Street Global Advisors (2012-present); Chief Executive Officer and Director, State Street Global Advisors Funds Distributors, LLC (May 2017-present); Director, State Street Global Markets, LLC (2013-April 2017); President, SSGA Funds Management, Inc. (2005-2012), Principal, State Street Global Advisors (2000-2005). | | 234 | | SSGA SPDR ETFs Europe I plc (Director) (November 2016-present); SSGA SPDR ETFs Europe II plc (Director) (November 2016-present). |
| † | For the purpose of determining the number of portfolios overseen by the Trustees, “Fund Complex” comprises registered investment companies for which SSGA Funds Management, Inc. serves as investment adviser. |
| (1) | Mr. Ross is an Interested Trustee because of his employment by SSGA FM, an affiliate of the Trust. |
The following lists the principal officers for the Trust, as well as their mailing addresses and ages, positions with the Trust and length of time served, and present and principal occupations:
| | | | | | |
Name, Address and Year of Birth | | Position(s)
Held with
Trust | | Term of
Office and
Length of Time Served | | Principal Occupation(s) During the Past 5 Years |
Officers | | | | | | |
ELLEN M. NEEDHAM SSGA Funds Management, Inc. State Street Financial Center One Lincoln Street Boston, MA 02111-2900 YOB: 1967 | | President | | Term: Indefinite Elected: 10/12 | | President and Director, SSGA Funds Management, Inc. (2001-present)*; Senior Managing Director, State Street Global Advisors (1992-present); Director, State Street Global Advisors Funds Distributors, LLC (May 2017-present).* |
26
STATE STREET MASTER FUNDS
STATE STREET EQUITY 500 INDEX PORTFOLIO
OTHER INFORMATION (continued)
December 31, 2017 (Unaudited)
| | | | | | |
Name, Address and Year of Birth | | Position(s)
Held with
Trust | | Term of
Office and
Length of
Time Served | | Principal Occupation(s) During the Past 5 Years |
BRUCE S. ROSENBERG SSGA Funds Management, Inc. State Street Financial Center One Lincoln Street Boston, MA 02111-2900 YOB: 1961 | | Treasurer | | Term: Indefinite Elected: 2/16 | | Managing Director, State Street Global Advisors and SSGA Funds Management, Inc. (July 2015-present); Director, Credit Suisse (April 2008-July 2015). |
ANN M. CARPENTER SSGA Funds Management, Inc. State Street Financial Center One Lincoln Street Boston, MA 02111-2900 YOB: 1966 | | Vice President and Deputy Treasurer | | Term: Indefinite Elected: 10/12 Term: Indefinite Elected: 2/16 | | Chief Operating Officer, SSGA Funds Management, Inc. (2005-Present)*; Managing Director, State Street Global Advisors (2005-present).* |
CHAD C. HALLETT SSGA Funds Management, Inc. State Street Financial Center One Lincoln Street Boston, MA 02111-2900 YOB: 1969 | | Deputy Treasurer | | Term: Indefinite Elected: 2/16 | | Vice President, State Street Global Advisors and SSGA Funds Management, Inc. (November 2014-present); Vice President, State Street Bank and Trust Company (2001-November 2014).* |
DARLENE ANDERSON-VASQUEZ SSGA Funds Management, Inc. State Street Financial Center One Lincoln Street Boston, MA 02111-2900 YOB: 1968 | | Deputy Treasurer | | Term: Indefinite Elected: 11/16 | | Managing Director, State Street Global Advisors and SSGA Funds Management, Inc. (May 2016-present); Senior Vice President, John Hancock Investments (September 2007-May 2016). |
ARTHUR A. JENSEN SSGA Funds Management, Inc. 1600 Summer Street Stamford, CT 06905 YOB: 1966 | | Deputy Treasurer | | Term: Indefinite Elected: 11/16 | | Vice President at State Street Global Advisors (July 2016-present); Deputy Treasurer of Elfun Funds (July 2016-present); Treasurer of State Street Institutional Funds, State Street Variable Insurance Series Funds, Inc. and GE Retirement Savings Plan Funds (June 2011-present); Treasurer of Elfun Funds (June 2011-July 2016); Mutual Funds Controller of GE Asset Management Incorporated (April 2011-July 2016). |
SUJATA UPRETI SSGA Funds Management, Inc. State Street Financial Center One Lincoln Street Boston, MA 02111-2900 YOB: 1974 | | Assistant Treasurer | | Term: Indefinite Elected: 2/16 | | Vice President, State Street Global Advisors and SSGA Funds Management, Inc. (May 2015-present); Assistant Director, Cambridge Associates, LLC (July 2014-January 2015); Vice President, Bank of New York Mellon (July 2012-August 2013); Manager, PricewaterhouseCoopers, LLP (September 2003-July 2012). |
DANIEL FOLEY SSGA Funds Management, Inc. State Street Financial Center One Lincoln Street Boston, MA 02111-2900 YOB: 1972 | | Assistant Treasurer | | Term: Indefinite Elected: 2/16 | | Vice President, State Street Global Advisors and SSGA Funds Management, Inc. (April 2007-present).* |
DANIEL G. PLOURDE SSGA Funds Management, Inc. State Street Financial Center One Lincoln Street Boston, MA 02111-2900 YOB: 1980 | | Assistant Treasurer | | Term: Indefinite Elected: 5/17 | | Assistant Vice President, SSGA Funds Management, Inc. (May 2015-present); Officer, State Street Bank and Trust Company (March 2009-May 2015). |
BRIAN HARRIS SSGA Funds Management, Inc. State Street Financial Center One Lincoln Street Boston, MA 02111-2900 YOB: 1973 | | Chief Compliance Officer, Anti-Money Laundering Officer and Code of Ethics Compliance Officer | | Term: Indefinite Elected: 11/13 Term: Indefinite Elected: 9/16 | | Managing Director, State Street Global Advisors and SSGA Funds Management, Inc. (2013-Present); Senior Vice President and Global Head of Investment Compliance, BofA Global Capital Management (September 2010-May 2013). |
27
STATE STREET MASTER FUNDS
STATE STREET EQUITY 500 INDEX PORTFOLIO
OTHER INFORMATION (continued)
December 31, 2017 (Unaudited)
| | | | | | |
Name, Address and Year of Birth | | Position(s)
Held with
Trust | | Term of
Office and
Length of
Time Served | | Principal Occupation(s) During the Past 5 Years |
JOSHUA A. WEINBERG SSGA Funds Management, Inc. State Street Financial Center One Lincoln Street Boston, MA 02111-2900 YOB: 1978 | | Chief Legal Officer | | Term: Indefinite Elected: 2/15 | | Managing Director and Managing Counsel, State Street Global Advisors (2011-present)*; Clerk, SSGA Funds Management, Inc. (2013-present); Associate, Financial Services Group, Dechert LLP (2005-2011). |
JESSE D. HALLEE State Street Bank and Trust Company 100 Summer Street, 7th Floor Boston, MA 02111-2900 YOB: 1976 | | Secretary | | Term: Indefinite Elected: 9/16 | | Vice President and Managing Counsel, State Street Bank and Trust Company (2013-present); Vice President and Counsel, Brown Brothers Harriman & Co. (2007-2013). |
KHIMMARA GREER State Street Bank and Trust Company 100 Summer Street, 7th Floor Boston, MA 02111-2900 YOB: 1983 | | Assistant Secretary | | Term: Indefinite Elected: 5/16 | | Vice President and Counsel, State Street Bank and Trust Company (2015- present); Regulatory Advisor, JPMorgan (2014-2015); Claims Case Manager, Liberty Mutual Insurance (2012-2014); Contract Attorney, Various Law Firms (2011-2012). |
| * | Served in various capacities and/or with various affiliated entities during noted time period. |
Statement of Additional Information (SAI) includes additional information about the Portfolio’s directors and is available, without charge, upon request and by calling 1-800-997-7327.
28
Trustees
Michael F. Holland
Michael A. Jessee
William L. Marshall
Patrick J. Riley
James E. Ross
Richard D. Shirk
Rina K. Spence
Bruce D. Taber
Douglas T. Williams
Investment Adviser and Administrator
SSGA Funds Management, Inc.
State Street Financial Center
One Lincoln Street
Boston, MA 02111
Custodian, Sub-Administrator and Transfer Agent
State Street Bank and Trust Company
State Street Financial Center
One Lincoln Street
Boston, MA 02111
Independent Registered Public Accounting Firm
Ernst & Young LLP
200 Clarendon Street
Boston, MA 02116
Legal Counsel
Ropes & Gray LLP
800 Boylston Street
Boston, MA 02199
This report is for shareholder information. This is not a prospectus intended for use in the purchase or sale of shares of beneficial interest.
State Street Equity 500 Index Portfolio
State Street Bank and Trust Company
P.O. Box 5049
Boston, MA 02206
The information contained in this report is intended for the general information of shareholders of the Portfolio and shareholders of any fund invested in the Portfolio. Interests in the Portfolio are offered solely to eligible investors in private placement transactions that do not involve any “public offering” within the meaning of Section 4(a)(2) of the 1933 Act. This report is not authorized for distribution (i) to prospective investors in any fund invested in the Portfolio unless preceded or accompanied by a current offering document for such fund or (ii) to prospective eligible investors in the Portfolio unless preceded or accompanied by a current offering document of the Portfolio. Eligible investors in the Portfolio may obtain a current Portfolio offering document by calling 1-800-997-7327. Please read the offering document carefully before investing in the Portfolio.
SSGASPSAR01
Item 2. Code of Ethics.
Not applicable to this filing.
Item 3. Audit Committee Financial Expert.
Not applicable to this filing.
Item 4. Principal Accountant Fees and Services.
Not applicable to this filing.
Item 5. Audit Committee of Listed Registrants.
Not applicable to the Registrant.
Item 6. Schedule of Investments.
| (a) | Schedules of Investments are included as part of the reports to shareholders filed under Item 1 of this Form N-CSR. |
| (b) | Not applicable to the Registrant. |
Item 7. Disclosure of Proxy Voting Policies and Procedures for Closed-End Management Investment Companies.
Not applicable to the Registrant.
Item 8. Portfolio Managers of Closed-End Management Investment Companies.
Not applicable to the Registrant.
Item 9. Purchases of Equity Securities by Closed-End Management Investment Company and Affiliated Purchasers.
Not applicable to the Registrant.
Item 10. Submission of Matters to a Vote of Security Holders.
There were no material changes to the procedures by which shareholders may recommend nominees to the Registrant’s Board of Trustees.
Item 11. Controls and Procedures.
(a) The Trust’s principal executive officer and principal financial officer have concluded that the Trust’s disclosure controls and procedures (as defined in Rule 30a-3(c) under the Investment
Company Act of 1940, as amended (the “1940 Act”)) are effective to provide reasonable assurance that information required to be disclosed by the Registrant on Form N-CSR is recorded, processed, summarized and reported as of a date within 90 days of the filing date of this report, based on their evaluation of these controls and procedures required by Rule 30a-3(b) under the 1940 Act and Rules 13a-15(b) or 15d-15(b) under the Securities Exchange Act of 1934, as amended.
(b) There were no changes in the Trust’s internal control over financial reporting (as defined in Rule 30a-3(d) under the 1940 Act) that occurred during the Trust’s last fiscal quarter of the period covered by this Form N-CSR filing that have materially affected, or are reasonably likely to materially affect, the Trust’s internal control over financial reporting.
Item 12. Disclosure of Securities Lending Activities for Closed-End Management Investment Companies.
Item 13. Exhibits.
(a)(1) Not applicable; this Form N-CSR is a Semi-Annual Report.
(a)(2) Certifications of principal executive officer and principal financial and accounting officer of the Trust as required by Rule 30a-2(a) under the 1940 Act are attached hereto.
(a)(3) Not applicable to the Registrant.
(b) Certifications of principal executive officer and principal financial and accounting officer of the Trust as required by Rule 30a-2(b) under the 1940 Act and Section 906 of the Sarbanes-Oxley Act of 2002 are attached hereto.
SIGNATURES
Pursuant to the requirements of the Securities Exchange Act of 1934 and the Investment Company Act of 1940, as amended, the Registrant has duly caused this report to be signed on its behalf by the undersigned, thereunto duly authorized.
| | | | |
| Registrant: | | SSGA FUNDS |
| |
| By: | | /s/ Ellen M. Needham |
| | Ellen M. Needham |
| | President |
| |
| Date: | | April 23, 2018 |
Pursuant to the requirements of the Securities Exchange Act of 1934 and the Investment Company Act of 1940, as amended, this report has been signed below by the following persons on behalf of the Registrant and in the capacities and on the dates indicated.
| | | | |
| By: | | /s/ Ellen M. Needham |
| | Ellen M. Needham |
| | President (Principal Executive Officer) |
| |
| Date: | | April 23, 2018 |
| |
| By: | | /s/ Bruce S. Rosenberg |
| | Bruce S. Rosenberg |
| | Treasurer (Principal Financial and Accounting Officer) |
| |
| Date: | | April 23, 2018 |