UNITED STATES
SECURITIES AND EXCHANGE COMMISSION
Washington, D.C. 20549
FORM N-CSR
CERTIFIED SHAREHOLDER REPORT OF REGISTERED
MANAGEMENT INVESTMENT COMPANIES
Investment Company Act file number: 811-05430
SSGA FUNDS
(Exact name of registrant as specified in charter)
One Iron Street, Boston, Massachusetts 02210
(Address of principal executive offices)(Zip code)
| | |
| (Name and Address of Agent for Service) | | Copy to: |
Sean O’Malley, Esq. Senior Vice President and General Counsel c/o SSGA Funds Management, Inc. One Iron Street Boston, Massachusetts 02210 | | Timothy W. Diggins, Esq. Ropes & Gray LLP Prudential Tower 800 Boylston Street Boston, Massachusetts 02199-3600 |
Registrant’s telephone number, including area code: (617) 664-1465
Date of fiscal year end: August 31
Date of reporting period: August 31, 2022
Item 1. Reports to Stockholders.
(a) The Reports to Shareholders are attached herewith.
Annual Report
August 31, 2022
SSGA Funds
| State Street S&P 500 Index Fund |
The information contained in this report is intended for the general information of shareholders of the Trust. This report is not authorized for distribution to prospective investors unless preceded or accompanied by a current Trust prospectus which contains important information concerning the Trust. You may obtain a current prospectus and SAI from the Distributor by calling 1-800-997-7327 or visiting www.ssga.com. Please read the prospectus carefully before you invest.
TABLE OF CONTENTS
The information contained in this report is intended for the general information of shareholders of the Trust. This report is not authorized for distribution to prospective investors unless preceded or accompanied by a current Trust prospectus which contains important information concerning the Trust. You may obtain a current prospectus and SAI from the Distributor by calling 1-866-787-2257 or visiting www.ssga.com. Please read the prospectus carefully before you invest.
[This Page Intentionally Left Blank]
State Street S&P 500 Index Fund
Management's Discussion of Fund Performance (Unaudited)
The State Street S&P 500 Index Fund (the “Fund”) seeks to replicate as closely as possible, before expenses, the performance of the Standard & Poor’s® 500 Index (the “Index”).
For the 12-month period ended August 31, 2022 (the “Reporting Period”), the total return for the Fund was –11.36%, and the Index was –11.23%. The Fund and Index returns reflect the reinvestment of dividends and other income. The Fund’s performance reflects the expenses of managing the Fund, including brokerage and advisory expenses. The Index is unmanaged and Index returns do not reflect fees and expenses of any kind, which would have a negative impact on returns. Expenses, managing cash inflows to and outflows from the Fund, and small security misweights contributed to the difference between the Fund’s performance and that of the Index.
The Fund’s performance was up nearly 6% in the first quarter of the Reporting Period as the economy continued its momentum with its further ���reopening” post COVID-19 amid increasing vaccination rates. However, supply chain issues continued and loomed as a possible headwind going forward. Inflation was bubbling up a bit but the Federal Reserve believed it to be transitory at the time as a result of the continued bounce back from the COVID-19 shutdown. The fourth quarter of 2021 was particularly strong for the equity markets as evidenced by the +11.03% return of the Index. Earnings growth saw its fourth consecutive quarter of 20%+ increases. The U.S. Congress was finally able to pass a bipartisan infrastructure spending bill as the Fed was just beginning to abandon the notion of inflation being transitory, paving the way for accelerated tapering and future rate hikes.
The Index dropped over 16% year-to-date in 2022, as it flirted with bear market territory. Commodity prices accelerated and supply side issues increased following the Russian invasion of Ukraine. Western countries ratcheted up sanctions against Russia in response to the invasion. Earnings saw their lowest level of growth in nearly two years. On the monetary front, many Central Banks raised their hawkish tone amid the stubbornness of inflation as it reached a 40 year high in the U.S. As a result, there were over 50 rate hikes initiated across the globe. To make matters worse, fears of a recession permeated markets with U.S. housing and consumer spending numbers coming in especially weak.
Throughout the Reporting Period, eight of the eleven sectors posted negative returns. The top performing sectors (the only sectors with positive returns) were Energy, Utilities and Consumer Staples. The bottom performing sectors were Communication Services, Consumer Discretionary and Information Technology.
The Fund used futures in order to expose cash and dividends to the market during the Reporting Period. The Fund’s use of futures detracted from the Fund’s performance relative to the Index.
On an individual security level, the top positive contributors to the Fund’s performance during the Reporting Period were: Exxon Mobil Corp., Chevron Corp., and UnitedHealth Group Inc. The top negative contributors to the Fund’s performance during the Reporting Period were: Meta Platforms Inc., Amazon.com Inc., Salesforce.com and Microsoft Corp.
The views expressed above reflect those of the Fund’s portfolio manager only through the Reporting Period, and do not necessarily represent the views of the Adviser as a whole. Any such views are subject to change at any time based upon market or other conditions and the Adviser disclaims any responsibility to update such views. These views may not be relied on as investment advice and, because investment decisions for a fund are based on numerous factors, may not be relied on as an indication of trading intent on behalf of any fund.
See accompanying notes to financial statements.
1
State Street S&P 500 Index Fund
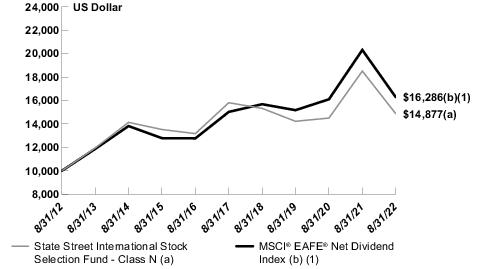
Performance Summary (Unaudited)
Comparison of Change in Value of a $10,000 Investment
(Based on Net Asset Value)
Past performance is not a guarantee of future results.
Index returns do not reflect any fees or expenses and it is not possible to invest directly into an index.
Line graph is based on cumulative total return.
Average Annual Total Returns as of August 31, 2022
| | Total Return
One Year Ended
August 31, 2022 | Average Annual
Total Return
Five Years Ended
August 31, 2022 | Average Annual
Total Return
Ten Years Ended
August 31, 2022 |
| State Street S&P 500 Index Fund | (11.36%) | 11.71% | 12.93% |
| S&P 500® Index (1) | (11.23%) | 11.82% | 13.08% |
| (1) | The State Street S&P 500 Index Fund seeks to replicate the total return of the S&P 500® Index. |
Performance quoted represents past performance, which is no guarantee of future results. Investment return and principal value will fluctuate, so you may have a gain or loss when shares are sold. Current performance may be higher or lower than that quoted. Visit www.ssga.com for most recent month-end performance. The returns do not reflect the deduction of taxes that a shareholder would pay on Fund distributions or on the redemption of Fund shares. The gross expense ratio for the State Street S&P 500 Index Fund as stated in the Fees and Expenses table of the most recent prospectus is 0.18%.
“Standard & Poor’s®”, “S&P®”, “S&P 500®”, “Standard & Poor’s 500” and “500” are trademarks of Standard & Poor’s Corporation and have been licensed for use by the SSGA Funds. The Product is not sponsored, endorsed, sold or promoted by Standard & Poor’s, and Standard & Poor’s makes no representation regarding the advisability of investing in the Product.
Performance data reflects an expense limitation currently in effect, without which returns would have been lower.
See accompanying notes to financial statements.
2
State Street S&P 500 Index Fund
Portfolio Statistics (Unaudited)
Top Five Holdings as of August 31, 2022
| | | |
| | Description | % of Net Assets | |
| | Apple, Inc. | 7.3% | |
| | Microsoft Corp. | 5.9 | |
| | Amazon.com, Inc. | 3.3 | |
| | Tesla, Inc. | 2.1 | |
| | Alphabet, Inc. Class A | 2.0 | |
| | TOTAL | 20.6% | |
(The five largest holdings are subject to change, and there are no guarantees the Fund will continue to remain invested in any particular company.)
Industry Breakdown as of August 31, 2022
| | | |
| | | % of Net Assets | |
| | Software | 8.8% | |
| | Technology Hardware, Storage & Peripherals | 7.5 | |
| | Semiconductors & Semiconductor Equipment | 5.1 | |
| | Interactive Media & Services | 5.0 | |
| | IT Services | 4.4 | |
| | Oil, Gas & Consumable Fuels | 4.3 | |
| | Pharmaceuticals | 4.2 | |
| | Banks | 3.7 | |
| | Health Care Providers & Services | 3.5 | |
| | Internet & Direct Marketing Retail | 3.4 | |
| | Capital Markets | 3.0 | |
| | Equity Real Estate Investment Trusts (REITs) | 2.8 | |
| | Health Care Equipment & Supplies | 2.6 | |
| | Automobiles | 2.4 | |
| | Insurance | 2.1 | |
| | Specialty Retail | 2.1 | |
| | Biotechnology | 2.0 | |
| | Electric Utilities | 2.0 | |
| | Hotels, Restaurants & Leisure | 1.9 | |
| | Life Sciences Tools & Services | 1.9 | |
| | Beverages | 1.8 | |
| | Chemicals | 1.8 | |
| | Aerospace & Defense | 1.7 | |
| | Machinery | 1.6 | |
| | Food & Staples Retailing | 1.6 | |
| | Diversified Financial Services | 1.5 | |
| | Household Products | 1.4 | |
| | Entertainment | 1.4 | |
| | Food Products | 1.1 | |
| | Multi-Utilities | 1.0 | |
| | Diversified Telecommunication Services | 0.9 | |
| | Road & Rail | 0.9 | |
| | Industrial Conglomerates | 0.8 | |
| | Media | 0.8 | |
| | Communications Equipment | 0.8 | |
| | Tobacco | 0.7 | |
| | Air Freight & Logistics | 0.7 | |
| | Electronic Equipment, Instruments & Components | 0.7 | |
| | Consumer Finance | 0.5 | |
| | Electrical Equipment | 0.5 | |
| | Textiles, Apparel & Luxury Goods | 0.5 | |
| | Commercial Services & Supplies | 0.5 | |
| | Multiline Retail | 0.5 | |
| | Building Products | 0.4 | |
| | Metals & Mining | 0.3 | |
| | Household Durables | 0.3 | |
| | Energy Equipment & Services | 0.3 | |
| | Professional Services | 0.3 | |
| | Containers & Packaging | 0.3 | |
| | Wireless Telecommunication Services | 0.3 | |
| | Trading Companies & Distributors | 0.2 | |
| | Airlines | 0.2 | |
| | Personal Products | 0.2 | |
| | Distributors | 0.2 | |
| | Construction Materials | 0.1 | |
| | Auto Components | 0.1 | |
| | Water Utilities | 0.1 | |
| | Real Estate Management & Development | 0.1 | |
| | Construction & Engineering | 0.1 | |
| | Independent Power & Renewable Electricity Producers | 0.1 | |
| | Gas Utilities | 0.0* | |
| | Leisure Equipment & Products | 0.0* | |
See accompanying notes to financial statements.
3
State Street S&P 500 Index Fund
Portfolio Statistics (Unaudited) (continued)
| | | |
| | | % of Net Assets | |
| | Short-Term Investments | 0.2% | |
| | Liabilities in Excess of Other Assets | (0.2) | |
| | TOTAL | 100.0% | |
| * | Amount shown represents less than 0.05% of net assets. | |
(The Fund’s industry breakdown is expressed as a percentage of net assets and may change over time.)
See accompanying notes to financial statements.
4
STATE STREET S&P 500 INDEX FUND
SCHEDULE OF INVESTMENTS
August 31, 2022
| Security Description | | | Shares | | Value |
| COMMON STOCKS — 100.0% | | | | | |
| COMMUNICATION SERVICES — 8.4% | | | |
Activision Blizzard, Inc.
| | | 31,700 | | $ 2,488,133 |
Alphabet, Inc. Class A (a)
| | | 246,460 | | 26,671,901 |
Alphabet, Inc. Class C (a)
| | | 226,900 | | 24,766,135 |
AT&T, Inc.
| | | 295,400 | | 5,181,316 |
Charter Communications, Inc. Class A (a)
| | | 4,800 | | 1,980,624 |
Comcast Corp. Class A
| | | 184,930 | | 6,692,617 |
DISH Network Corp. Class A (a)(b)
| | | 11,017 | | 191,145 |
Electronic Arts, Inc.
| | | 11,421 | | 1,448,982 |
Fox Corp. Class A
| | | 12,603 | | 430,771 |
Fox Corp. Class B
| | | 5,600 | | 177,072 |
Interpublic Group of Cos., Inc.
| | | 15,428 | | 426,430 |
Live Nation Entertainment, Inc. (a)
| | | 5,300 | | 478,908 |
Lumen Technologies, Inc. (b)
| | | 35,987 | | 358,430 |
Match Group, Inc. (a)
| | | 11,500 | | 650,095 |
Meta Platforms, Inc. Class A (a)
| | | 94,007 | | 15,316,560 |
Netflix, Inc. (a)
| | | 18,296 | | 4,090,254 |
News Corp. Class A
| | | 14,614 | | 247,269 |
News Corp. Class B
| | | 3,800 | | 65,512 |
Omnicom Group, Inc.
| | | 8,450 | | 565,305 |
Paramount Global Class B (b)
| | | 25,531 | | 597,170 |
Take-Two Interactive Software, Inc. (a)
| | | 6,500 | | 796,640 |
T-Mobile US, Inc. (a)
| | | 23,850 | | 3,433,446 |
Twitter, Inc. (a)
| | | 30,000 | | 1,162,500 |
Verizon Communications, Inc.
| | | 171,751 | | 7,180,909 |
Walt Disney Co. (a)
| | | 74,538 | | 8,354,219 |
Warner Bros Discovery, Inc. (a)
| | | 91,819 | | 1,215,684 |
| | | | | | 114,968,027 |
| CONSUMER DISCRETIONARY — 11.4% | | | |
Advance Auto Parts, Inc.
| | | 2,500 | | 421,600 |
Amazon.com, Inc. (a)
| | | 360,040 | | 45,642,271 |
Aptiv PLC (a)
| | | 11,281 | | 1,053,984 |
AutoZone, Inc. (a)
| | | 788 | | 1,669,937 |
Bath & Body Works, Inc.
| | | 8,646 | | 322,755 |
Best Buy Co., Inc.
| | | 8,913 | | 630,060 |
Booking Holdings, Inc. (a)
| | | 1,608 | | 3,016,302 |
BorgWarner, Inc.
| | | 10,723 | | 404,257 |
Caesars Entertainment, Inc. (a)
| | | 8,800 | | 379,456 |
CarMax, Inc. (a)
| | | 6,697 | | 592,283 |
Carnival Corp. (a)(b)
| | | 31,149 | | 294,670 |
Chipotle Mexican Grill, Inc. (a)
| | | 1,114 | | 1,778,835 |
D.R. Horton, Inc.
| | | 13,479 | | 959,031 |
Darden Restaurants, Inc.
| | | 5,317 | | 657,766 |
Dollar General Corp.
| | | 9,587 | | 2,276,146 |
Dollar Tree, Inc. (a)
| | | 8,982 | | 1,218,678 |
Domino's Pizza, Inc.
| | | 1,500 | | 557,790 |
eBay, Inc.
| | | 23,058 | | 1,017,550 |
Etsy, Inc. (a)
| | | 5,200 | | 549,172 |
Expedia Group, Inc. (a)
| | | 5,975 | | 613,334 |
Ford Motor Co.
| | | 161,360 | | 2,459,126 |
| Security Description | | | Shares | | Value |
Garmin, Ltd.
| | | 6,560 | | $ 580,494 |
General Motors Co.
| | | 60,177 | | 2,299,363 |
Genuine Parts Co.
| | | 6,120 | | 954,781 |
Hasbro, Inc.
| | | 5,628 | | 443,599 |
Hilton Worldwide Holdings, Inc.
| | | 11,600 | | 1,477,376 |
Home Depot, Inc.
| | | 42,310 | | 12,203,050 |
Las Vegas Sands Corp. (a)
| | | 14,800 | | 556,924 |
Lennar Corp. Class A
| | | 10,225 | | 791,926 |
LKQ Corp.
| | | 9,900 | | 526,878 |
Lowe's Cos., Inc.
| | | 26,912 | | 5,224,696 |
Marriott International, Inc. Class A
| | | 11,352 | | 1,745,256 |
McDonald's Corp.
| | | 30,215 | | 7,622,640 |
MGM Resorts International
| | | 15,500 | | 505,920 |
Mohawk Industries, Inc. (a)
| | | 2,169 | | 239,371 |
Newell Brands, Inc.
| | | 17,050 | | 304,343 |
NIKE, Inc. Class B
| | | 51,802 | | 5,514,323 |
Norwegian Cruise Line Holdings, Ltd. (a)
| | | 16,300 | | 213,204 |
NVR, Inc. (a)
| | | 140 | | 579,608 |
O'Reilly Automotive, Inc. (a)
| | | 2,620 | | 1,826,454 |
Penn Entertainment, Inc. (a)
| | | 6,700 | | 209,241 |
Pool Corp.
| | | 1,600 | | 542,704 |
PulteGroup, Inc.
| | | 10,343 | | 420,546 |
PVH Corp.
| | | 2,951 | | 165,994 |
Ralph Lauren Corp.
| | | 2,236 | | 204,214 |
Ross Stores, Inc.
| | | 14,444 | | 1,246,084 |
Royal Caribbean Cruises, Ltd. (a)
| | | 8,900 | | 363,565 |
Starbucks Corp.
| | | 47,692 | | 4,009,466 |
Tapestry, Inc.
| | | 11,000 | | 382,030 |
Target Corp.
| | | 18,744 | | 3,005,413 |
Tesla, Inc. (a)
| | | 103,500 | | 28,525,635 |
TJX Cos., Inc.
| | | 48,450 | | 3,020,858 |
Tractor Supply Co.
| | | 4,574 | | 846,876 |
Ulta Beauty, Inc. (a)
| | | 2,100 | | 881,727 |
Under Armour, Inc. Class A (a)
| | | 8,476 | | 71,368 |
Under Armour, Inc. Class C (a)
| | | 9,278 | | 70,420 |
VF Corp.
| | | 13,328 | | 552,446 |
Whirlpool Corp.
| | | 2,359 | | 369,419 |
Wynn Resorts, Ltd. (a)(b)
| | | 4,559 | | 276,230 |
Yum! Brands, Inc.
| | | 11,890 | | 1,322,644 |
| | | | | | 156,612,089 |
| CONSUMER STAPLES — 6.8% | | | |
Altria Group, Inc.
| | | 75,670 | | 3,414,230 |
Archer-Daniels-Midland Co.
| | | 23,092 | | 2,029,556 |
Brown-Forman Corp. Class B
| | | 7,127 | | 518,133 |
Campbell Soup Co.
| | | 8,783 | | 442,488 |
Church & Dwight Co., Inc.
| | | 10,100 | | 845,471 |
Clorox Co.
| | | 4,979 | | 718,669 |
Coca-Cola Co.
| | | 160,822 | | 9,924,326 |
Colgate-Palmolive Co.
| | | 34,879 | | 2,727,887 |
Conagra Brands, Inc.
| | | 20,751 | | 713,419 |
Constellation Brands, Inc. Class A
| | | 6,676 | | 1,642,630 |
Costco Wholesale Corp.
| | | 18,134 | | 9,467,761 |
See accompanying notes to financial statements.
5
STATE STREET S&P 500 INDEX FUND
SCHEDULE OF INVESTMENTS (continued)
August 31, 2022
| Security Description | | | Shares | | Value |
Estee Lauder Cos., Inc. Class A
| | | 9,563 | | $ 2,432,636 |
General Mills, Inc.
| | | 25,122 | | 1,929,370 |
Hershey Co.
| | | 6,015 | | 1,351,390 |
Hormel Foods Corp.
| | | 11,598 | | 583,147 |
J.M. Smucker Co.
| | | 4,255 | | 595,657 |
Kellogg Co.
| | | 10,307 | | 749,731 |
Keurig Dr. Pepper, Inc.
| | | 30,400 | | 1,158,848 |
Kimberly-Clark Corp.
| | | 13,973 | | 1,781,837 |
Kraft Heinz Co.
| | | 30,051 | | 1,123,907 |
Kroger Co.
| | | 28,010 | | 1,342,799 |
Lamb Weston Holdings, Inc.
| | | 5,700 | | 453,321 |
McCormick & Co., Inc.
| | | 10,022 | | 842,550 |
Molson Coors Beverage Co. Class B
| | | 7,409 | | 382,823 |
Mondelez International, Inc. Class A
| | | 56,394 | | 3,488,533 |
Monster Beverage Corp. (a)
| | | 15,487 | | 1,375,710 |
PepsiCo, Inc.
| | | 56,638 | | 9,757,028 |
Philip Morris International, Inc.
| | | 63,287 | | 6,043,276 |
Procter & Gamble Co.
| | | 98,413 | | 13,575,089 |
Sysco Corp.
| | | 21,235 | | 1,745,942 |
Tyson Foods, Inc. Class A
| | | 11,691 | | 881,268 |
Walgreens Boots Alliance, Inc.
| | | 29,713 | | 1,041,738 |
Walmart, Inc.
| | | 57,899 | | 7,674,512 |
| | | | | | 92,755,682 |
| ENERGY — 4.6% | | | |
APA Corp.
| | | 14,370 | | 562,011 |
Baker Hughes Co.
| | | 36,294 | | 916,786 |
Chevron Corp.
| | | 80,998 | | 12,802,544 |
ConocoPhillips
| | | 53,027 | | 5,803,805 |
Coterra Energy, Inc.
| | | 33,622 | | 1,039,256 |
Devon Energy Corp.
| | | 24,380 | | 1,721,716 |
Diamondback Energy, Inc.
| | | 7,000 | | 932,960 |
EOG Resources, Inc.
| | | 23,963 | | 2,906,712 |
Exxon Mobil Corp.
| | | 172,772 | | 16,515,276 |
Halliburton Co.
| | | 35,967 | | 1,083,686 |
Hess Corp.
| | | 11,144 | | 1,345,972 |
Kinder Morgan, Inc.
| | | 79,576 | | 1,457,832 |
Marathon Oil Corp.
| | | 30,689 | | 785,332 |
Marathon Petroleum Corp.
| | | 22,284 | | 2,245,113 |
Occidental Petroleum Corp.
| | | 35,937 | | 2,551,527 |
ONEOK, Inc.
| | | 18,304 | | 1,120,754 |
Phillips 66
| | | 18,892 | | 1,690,078 |
Pioneer Natural Resources Co.
| | | 9,324 | | 2,361,023 |
Schlumberger NV
| | | 57,893 | | 2,208,618 |
Valero Energy Corp.
| | | 16,686 | | 1,954,264 |
Williams Cos., Inc.
| | | 49,610 | | 1,688,228 |
| | | | | | 63,693,493 |
| FINANCIALS — 10.9% | | | |
Aflac, Inc.
| | | 23,974 | | 1,424,535 |
Allstate Corp.
| | | 11,767 | | 1,417,923 |
American Express Co.
| | | 24,752 | | 3,762,304 |
American International Group, Inc.
| | | 31,532 | | 1,631,781 |
| Security Description | | | Shares | | Value |
Ameriprise Financial, Inc.
| | | 4,663 | | $ 1,249,731 |
Aon PLC Class A
| | | 8,647 | | 2,414,761 |
Arthur J Gallagher & Co.
| | | 8,600 | | 1,561,502 |
Assurant, Inc.
| | | 2,246 | | 355,968 |
Bank of America Corp.
| | | 291,466 | | 9,796,172 |
Bank of New York Mellon Corp.
| | | 31,291 | | 1,299,515 |
Berkshire Hathaway, Inc. Class B (a)
| | | 74,519 | | 20,924,935 |
BlackRock, Inc.
| | | 5,918 | | 3,943,696 |
Brown & Brown, Inc.
| | | 10,200 | | 643,008 |
Capital One Financial Corp.
| | | 16,668 | | 1,763,808 |
Cboe Global Markets, Inc.
| | | 4,700 | | 554,459 |
Charles Schwab Corp.
| | | 62,189 | | 4,412,309 |
Chubb, Ltd.
| | | 17,141 | | 3,240,506 |
Cincinnati Financial Corp.
| | | 6,005 | | 582,245 |
Citigroup, Inc.
| | | 78,793 | | 3,845,886 |
Citizens Financial Group, Inc.
| | | 20,200 | | 740,936 |
CME Group, Inc.
| | | 14,892 | | 2,913,024 |
Comerica, Inc.
| | | 5,417 | | 434,985 |
Discover Financial Services
| | | 11,977 | | 1,203,569 |
Everest Re Group, Ltd.
| | | 1,600 | | 430,480 |
FactSet Research Systems, Inc.
| | | 1,600 | | 693,344 |
Fifth Third Bancorp
| | | 28,254 | | 964,874 |
First Republic Bank
| | | 7,300 | | 1,108,359 |
Franklin Resources, Inc.
| | | 10,551 | | 275,065 |
Globe Life, Inc.
| | | 3,684 | | 358,048 |
Goldman Sachs Group, Inc.
| | | 14,188 | | 4,719,922 |
Hartford Financial Services Group, Inc.
| | | 13,730 | | 882,976 |
Huntington Bancshares, Inc.
| | | 60,065 | | 804,871 |
Intercontinental Exchange, Inc.
| | | 22,625 | | 2,281,731 |
Invesco, Ltd.
| | | 12,889 | | 212,282 |
JPMorgan Chase & Co.
| | | 120,372 | | 13,689,908 |
KeyCorp.
| | | 38,779 | | 686,000 |
Lincoln National Corp.
| | | 7,410 | | 341,305 |
Loews Corp.
| | | 8,312 | | 459,737 |
M&T Bank Corp.
| | | 7,344 | | 1,334,992 |
MarketAxess Holdings, Inc.
| | | 1,500 | | 372,885 |
Marsh & McLennan Cos., Inc.
| | | 20,834 | | 3,361,983 |
MetLife, Inc.
| | | 28,226 | | 1,815,779 |
Moody's Corp.
| | | 6,634 | | 1,887,506 |
Morgan Stanley
| | | 57,861 | | 4,930,914 |
MSCI, Inc.
| | | 3,400 | | 1,527,416 |
Nasdaq, Inc.
| | | 15,075 | | 897,415 |
Northern Trust Corp.
| | | 8,210 | | 780,689 |
PNC Financial Services Group, Inc.
| | | 16,642 | | 2,629,436 |
Principal Financial Group, Inc.
| | | 10,126 | | 757,020 |
Progressive Corp.
| | | 24,152 | | 2,962,243 |
Prudential Financial, Inc.
| | | 15,537 | | 1,487,668 |
Raymond James Financial, Inc.
| | | 7,500 | | 782,775 |
Regions Financial Corp.
| | | 39,343 | | 852,563 |
S&P Global, Inc.
| | | 14,109 | | 4,968,908 |
Signature Bank
| | | 2,600 | | 453,336 |
State Street Corp. (c)
| | | 15,047 | | 1,028,462 |
See accompanying notes to financial statements.
6
STATE STREET S&P 500 INDEX FUND
SCHEDULE OF INVESTMENTS (continued)
August 31, 2022
| Security Description | | | Shares | | Value |
SVB Financial Group (a)
| | | 2,400 | | $ 975,648 |
Synchrony Financial
| | | 22,071 | | 722,825 |
T Rowe Price Group, Inc.
| | | 9,120 | | 1,094,400 |
Travelers Cos., Inc.
| | | 9,698 | | 1,567,585 |
Truist Financial Corp.
| | | 54,798 | | 2,566,738 |
US Bancorp
| | | 55,730 | | 2,541,845 |
Wells Fargo & Co.
| | | 154,646 | | 6,759,577 |
Willis Towers Watson PLC
| | | 4,328 | | 895,160 |
WR Berkley Corp.
| | | 9,150 | | 592,920 |
Zions Bancorp NA
| | | 5,758 | | 316,863 |
| | | | | | 148,892,011 |
| HEALTH CARE — 14.1% | | | |
Abbott Laboratories
| | | 73,049 | | 7,498,480 |
AbbVie, Inc.
| | | 72,552 | | 9,755,342 |
ABIOMED, Inc. (a)
| | | 1,800 | | 466,704 |
Agilent Technologies, Inc.
| | | 12,275 | | 1,574,269 |
Align Technology, Inc. (a)
| | | 3,000 | | 731,100 |
AmerisourceBergen Corp.
| | | 6,052 | | 886,981 |
Amgen, Inc.
| | | 21,991 | | 5,284,437 |
Baxter International, Inc.
| | | 20,770 | | 1,193,444 |
Becton Dickinson & Co.
| | | 11,777 | | 2,972,750 |
Biogen, Inc. (a)
| | | 6,147 | | 1,201,001 |
Bio-Rad Laboratories, Inc. Class A (a)
| | | 900 | | 436,536 |
Bio-Techne Corp.
| | | 1,700 | | 564,077 |
Boston Scientific Corp. (a)
| | | 58,877 | | 2,373,332 |
Bristol-Myers Squibb Co.
| | | 86,977 | | 5,863,119 |
Cardinal Health, Inc.
| | | 11,124 | | 786,689 |
Catalent, Inc. (a)
| | | 7,200 | | 633,600 |
Centene Corp. (a)
| | | 24,278 | | 2,178,708 |
Charles River Laboratories International, Inc. (a)
| | | 2,200 | | 451,550 |
Cigna Corp.
| | | 12,884 | | 3,651,970 |
Cooper Cos., Inc.
| | | 2,000 | | 574,880 |
CVS Health Corp.
| | | 53,533 | | 5,254,264 |
Danaher Corp.
| | | 26,278 | | 7,092,695 |
DaVita, Inc. (a)
| | | 2,072 | | 176,721 |
DENTSPLY SIRONA, Inc.
| | | 8,566 | | 280,708 |
DexCom, Inc. (a)
| | | 16,000 | | 1,315,360 |
Edwards Lifesciences Corp. (a)
| | | 26,070 | | 2,348,907 |
Elevance Health, Inc.
| | | 10,019 | | 4,860,317 |
Eli Lilly & Co.
| | | 32,562 | | 9,808,651 |
Gilead Sciences, Inc.
| | | 52,146 | | 3,309,707 |
HCA Healthcare, Inc.
| | | 9,100 | | 1,800,617 |
Henry Schein, Inc. (a)
| | | 5,200 | | 381,732 |
Hologic, Inc. (a)
| | | 10,300 | | 695,868 |
Humana, Inc.
| | | 5,317 | | 2,561,624 |
IDEXX Laboratories, Inc. (a)
| | | 3,500 | | 1,216,670 |
Illumina, Inc. (a)
| | | 6,500 | | 1,310,660 |
Incyte Corp. (a)
| | | 8,200 | | 577,526 |
Intuitive Surgical, Inc. (a)
| | | 14,768 | | 3,038,368 |
IQVIA Holdings, Inc. (a)
| | | 8,000 | | 1,701,280 |
Johnson & Johnson
| | | 108,241 | | 17,463,603 |
Laboratory Corp. of America Holdings
| | | 3,647 | | 821,560 |
McKesson Corp.
| | | 5,929 | | 2,175,943 |
| Security Description | | | Shares | | Value |
Medtronic PLC
| | | 55,504 | | $ 4,879,912 |
Merck & Co., Inc.
| | | 103,398 | | 8,826,053 |
Mettler-Toledo International, Inc. (a)
| | | 900 | | 1,091,214 |
Moderna, Inc. (a)
| | | 14,200 | | 1,878,234 |
Molina Healthcare, Inc. (a)
| | | 2,400 | | 809,688 |
Organon & Co.
| | | 11,149 | | 318,081 |
PerkinElmer, Inc.
| | | 5,332 | | 720,140 |
Pfizer, Inc.
| | | 230,248 | | 10,414,117 |
Quest Diagnostics, Inc.
| | | 5,058 | | 633,818 |
Regeneron Pharmaceuticals, Inc. (a)
| | | 4,358 | | 2,532,259 |
ResMed, Inc.
| | | 5,900 | | 1,297,528 |
STERIS PLC
| | | 4,100 | | 825,658 |
Stryker Corp.
| | | 13,795 | | 2,830,734 |
Teleflex, Inc.
| | | 2,000 | | 452,520 |
Thermo Fisher Scientific, Inc.
| | | 16,112 | | 8,786,196 |
UnitedHealth Group, Inc.
| | | 38,522 | | 20,005,630 |
Universal Health Services, Inc. Class B
| | | 3,200 | | 313,088 |
Vertex Pharmaceuticals, Inc. (a)
| | | 10,548 | | 2,972,004 |
Viatris, Inc.
| | | 49,672 | | 474,368 |
Waters Corp. (a)
| | | 2,415 | | 721,119 |
West Pharmaceutical Services, Inc.
| | | 3,100 | | 919,739 |
Zimmer Biomet Holdings, Inc.
| | | 8,327 | | 885,327 |
Zoetis, Inc.
| | | 19,528 | | 3,056,718 |
| | | | | | 192,915,895 |
| INDUSTRIALS — 7.9% | | | |
3M Co. (b)
| | | 23,743 | | 2,952,442 |
A.O. Smith Corp.
| | | 5,200 | | 293,540 |
Alaska Air Group, Inc. (a)
| | | 5,200 | | 226,512 |
Allegion PLC
| | | 3,737 | | 355,389 |
American Airlines Group, Inc. (a)
| | | 28,800 | | 374,112 |
AMETEK, Inc.
| | | 9,301 | | 1,117,608 |
Boeing Co. (a)
| | | 22,124 | | 3,545,371 |
C.H. Robinson Worldwide, Inc.
| | | 5,382 | | 614,355 |
Carrier Global Corp.
| | | 36,079 | | 1,411,410 |
Caterpillar, Inc.
| | | 22,055 | | 4,073,779 |
Cintas Corp.
| | | 3,622 | | 1,473,575 |
Copart, Inc. (a)
| | | 8,800 | | 1,052,920 |
CSX Corp.
| | | 87,677 | | 2,774,977 |
Cummins, Inc.
| | | 5,844 | | 1,258,622 |
Deere & Co.
| | | 11,454 | | 4,183,574 |
Delta Air Lines, Inc. (a)
| | | 25,766 | | 800,550 |
Dover Corp.
| | | 5,845 | | 730,391 |
Eaton Corp. PLC
| | | 16,599 | | 2,268,087 |
Emerson Electric Co.
| | | 24,369 | | 1,991,922 |
Equifax, Inc.
| | | 5,095 | | 961,681 |
Expeditors International of Washington, Inc.
| | | 6,844 | | 704,179 |
Fastenal Co.
| | | 24,284 | | 1,222,214 |
FedEx Corp.
| | | 9,650 | | 2,034,317 |
Fortive Corp.
| | | 14,781 | | 936,081 |
See accompanying notes to financial statements.
7
STATE STREET S&P 500 INDEX FUND
SCHEDULE OF INVESTMENTS (continued)
August 31, 2022
| Security Description | | | Shares | | Value |
Fortune Brands Home & Security, Inc.
| | | 5,400 | | $ 331,722 |
Generac Holdings, Inc. (a)
| | | 2,600 | | 573,066 |
General Dynamics Corp.
| | | 9,489 | | 2,172,317 |
General Electric Co.
| | | 45,193 | | 3,318,974 |
Honeywell International, Inc.
| | | 27,703 | | 5,245,563 |
Howmet Aerospace, Inc.
| | | 14,463 | | 512,424 |
Huntington Ingalls Industries, Inc.
| | | 1,800 | | 414,468 |
IDEX Corp.
| | | 3,100 | | 623,751 |
Illinois Tool Works, Inc.
| | | 11,671 | | 2,273,861 |
Ingersoll Rand, Inc.
| | | 16,791 | | 795,390 |
Jacobs Solutions, Inc.
| | | 5,457 | | 679,833 |
JB Hunt Transport Services, Inc.
| | | 3,400 | | 591,668 |
Johnson Controls International PLC
| | | 28,093 | | 1,520,955 |
L3Harris Technologies, Inc.
| | | 8,012 | | 1,828,258 |
Leidos Holdings, Inc.
| | | 5,500 | | 522,775 |
Lockheed Martin Corp.
| | | 9,590 | | 4,028,855 |
Masco Corp.
| | | 9,439 | | 480,162 |
Nielsen Holdings PLC
| | | 14,775 | | 411,336 |
Nordson Corp.
| | | 2,200 | | 499,774 |
Norfolk Southern Corp.
| | | 9,668 | | 2,350,581 |
Northrop Grumman Corp.
| | | 5,986 | | 2,861,248 |
Old Dominion Freight Line, Inc.
| | | 3,900 | | 1,058,499 |
Otis Worldwide Corp.
| | | 17,289 | | 1,248,612 |
PACCAR, Inc.
| | | 13,935 | | 1,219,452 |
Parker-Hannifin Corp.
| | | 5,314 | | 1,408,210 |
Pentair PLC
| | | 7,291 | | 324,450 |
Quanta Services, Inc.
| | | 6,093 | | 860,941 |
Raytheon Technologies Corp.
| | | 60,652 | | 5,443,517 |
Republic Services, Inc.
| | | 8,614 | | 1,229,390 |
Robert Half International, Inc.
| | | 4,374 | | 336,667 |
Rockwell Automation, Inc.
| | | 4,879 | | 1,156,030 |
Rollins, Inc.
| | | 9,325 | | 314,812 |
Snap-on, Inc.
| | | 2,272 | | 494,978 |
Southwest Airlines Co. (a)
| | | 23,527 | | 863,441 |
Stanley Black & Decker, Inc.
| | | 6,750 | | 594,675 |
Textron, Inc.
| | | 9,106 | | 568,032 |
Trane Technologies PLC
| | | 9,316 | | 1,435,316 |
TransDigm Group, Inc.
| | | 2,200 | | 1,320,858 |
Union Pacific Corp.
| | | 26,038 | | 5,845,791 |
United Airlines Holdings, Inc. (a)
| | | 13,400 | | 469,134 |
United Parcel Service, Inc. Class B
| | | 30,155 | | 5,865,449 |
United Rentals, Inc. (a)
| | | 3,000 | | 876,120 |
Verisk Analytics, Inc.
| | | 6,700 | | 1,253,972 |
W.W. Grainger, Inc.
| | | 1,812 | | 1,005,551 |
Waste Management, Inc.
| | | 15,904 | | 2,688,253 |
Westinghouse Air Brake Technologies Corp.
| | | 7,982 | | 699,622 |
Xylem, Inc.
| | | 7,234 | | 659,017 |
| | | | | | 108,635,378 |
| Security Description | | | Shares | | Value |
| INFORMATION TECHNOLOGY — 27.4% | | | |
Accenture PLC Class A
| | | 26,082 | | $ 7,523,614 |
Adobe, Inc. (a)
| | | 19,313 | | 7,212,247 |
Advanced Micro Devices, Inc. (a)
| | | 66,223 | | 5,620,346 |
Akamai Technologies, Inc. (a)
| | | 6,734 | | 607,945 |
Amphenol Corp. Class A
| | | 24,660 | | 1,813,250 |
Analog Devices, Inc.
| | | 21,407 | | 3,243,803 |
ANSYS, Inc. (a)
| | | 3,600 | | 893,880 |
Apple, Inc.
| | | 632,318 | | 99,413,036 |
Applied Materials, Inc.
| | | 36,053 | | 3,391,506 |
Arista Networks, Inc. (a)
| | | 9,300 | | 1,114,884 |
Autodesk, Inc. (a)
| | | 9,170 | | 1,849,956 |
Automatic Data Processing, Inc.
| | | 17,365 | | 4,244,180 |
Broadcom, Inc.
| | | 16,835 | | 8,402,517 |
Broadridge Financial Solutions, Inc.
| | | 4,700 | | 804,499 |
Cadence Design Systems, Inc. (a)
| | | 11,300 | | 1,963,601 |
CDW Corp.
| | | 5,700 | | 972,990 |
Ceridian HCM Holding, Inc. (a)
| | | 5,900 | | 351,876 |
Cisco Systems, Inc.
| | | 169,729 | | 7,590,281 |
Citrix Systems, Inc.
| | | 4,678 | | 480,758 |
Cognizant Technology Solutions Corp. Class A
| | | 21,927 | | 1,385,129 |
Corning, Inc.
| | | 31,250 | | 1,072,500 |
DXC Technology Co. (a)
| | | 8,991 | | 222,797 |
Enphase Energy, Inc. (a)
| | | 5,500 | | 1,575,420 |
EPAM Systems, Inc. (a)
| | | 2,400 | | 1,023,600 |
F5, Inc. (a)
| | | 2,659 | | 417,623 |
Fidelity National Information Services, Inc.
| | | 25,186 | | 2,301,245 |
Fiserv, Inc. (a)
| | | 23,484 | | 2,376,346 |
FleetCor Technologies, Inc. (a)
| | | 3,200 | | 680,096 |
Fortinet, Inc. (a)
| | | 26,500 | | 1,290,285 |
Gartner, Inc. (a)
| | | 3,400 | | 970,088 |
Global Payments, Inc.
| | | 11,918 | | 1,480,573 |
Hewlett Packard Enterprise Co.
| | | 55,063 | | 748,857 |
HP, Inc.
| | | 44,863 | | 1,288,017 |
Intel Corp.
| | | 168,020 | | 5,363,198 |
International Business Machines Corp.
| | | 36,947 | | 4,745,842 |
Intuit, Inc.
| | | 11,526 | | 4,976,696 |
Jack Henry & Associates, Inc.
| | | 3,100 | | 595,820 |
Juniper Networks, Inc.
| | | 14,244 | | 404,814 |
Keysight Technologies, Inc. (a)
| | | 7,700 | | 1,261,953 |
KLA Corp.
| | | 6,273 | | 2,158,727 |
Lam Research Corp.
| | | 5,781 | | 2,531,558 |
Mastercard, Inc. Class A
| | | 35,449 | | 11,498,592 |
Microchip Technology, Inc.
| | | 23,212 | | 1,514,583 |
Micron Technology, Inc.
| | | 46,028 | | 2,601,963 |
Microsoft Corp.
| | | 307,534 | | 80,410,915 |
Monolithic Power Systems, Inc.
| | | 1,700 | | 770,406 |
Motorola Solutions, Inc.
| | | 7,028 | | 1,710,685 |
NetApp, Inc.
| | | 8,943 | | 645,059 |
NortonLifeLock, Inc.
| | | 22,603 | | 510,602 |
See accompanying notes to financial statements.
8
STATE STREET S&P 500 INDEX FUND
SCHEDULE OF INVESTMENTS (continued)
August 31, 2022
| Security Description | | | Shares | | Value |
NVIDIA Corp.
| | | 102,848 | | $ 15,523,877 |
NXP Semiconductors NV
| | | 11,000 | | 1,810,380 |
ON Semiconductor Corp. (a)
| | | 17,900 | | 1,230,983 |
Oracle Corp.
| | | 65,270 | | 4,839,770 |
Paychex, Inc.
| | | 13,231 | | 1,631,912 |
Paycom Software, Inc. (a)
| | | 2,000 | | 702,400 |
PayPal Holdings, Inc. (a)
| | | 47,358 | | 4,425,131 |
PTC, Inc. (a)
| | | 4,400 | | 505,516 |
Qorvo, Inc. (a)
| | | 4,500 | | 404,010 |
QUALCOMM, Inc.
| | | 46,085 | | 6,095,663 |
Roper Technologies, Inc.
| | | 4,335 | | 1,745,184 |
Salesforce, Inc. (a)
| | | 41,005 | | 6,401,701 |
Seagate Technology Holdings PLC
| | | 8,276 | | 554,161 |
ServiceNow, Inc. (a)
| | | 8,200 | | 3,563,884 |
Skyworks Solutions, Inc.
| | | 6,800 | | 670,140 |
SolarEdge Technologies, Inc. (a)
| | | 2,200 | | 607,134 |
Synopsys, Inc. (a)
| | | 6,400 | | 2,214,528 |
TE Connectivity, Ltd.
| | | 13,449 | | 1,697,398 |
Teledyne Technologies, Inc. (a)
| | | 1,926 | | 709,461 |
Teradyne, Inc. (b)
| | | 6,700 | | 567,088 |
Texas Instruments, Inc.
| | | 38,106 | | 6,295,492 |
Trimble, Inc. (a)
| | | 10,400 | | 657,800 |
Tyler Technologies, Inc. (a)
| | | 1,700 | | 631,567 |
VeriSign, Inc. (a)
| | | 4,020 | | 732,524 |
Visa, Inc. Class A
| | | 67,440 | | 13,401,002 |
Western Digital Corp. (a)
| | | 13,106 | | 553,860 |
Zebra Technologies Corp. Class A (a)
| | | 2,200 | | 663,608 |
| | | | | | 374,865,332 |
| MATERIALS — 2.6% | | | |
Air Products & Chemicals, Inc.
| | | 9,107 | | 2,299,062 |
Albemarle Corp.
| | | 4,900 | | 1,313,004 |
Amcor PLC
| | | 61,430 | | 737,774 |
Avery Dennison Corp.
| | | 3,618 | | 664,337 |
Ball Corp.
| | | 13,216 | | 737,585 |
Celanese Corp.
| | | 4,500 | | 498,870 |
CF Industries Holdings, Inc.
| | | 8,630 | | 892,860 |
Corteva, Inc.
| | | 29,277 | | 1,798,486 |
Dow, Inc.
| | | 30,410 | | 1,550,910 |
DuPont de Nemours, Inc.
| | | 21,174 | | 1,178,122 |
Eastman Chemical Co.
| | | 5,572 | | 507,052 |
Ecolab, Inc.
| | | 10,489 | | 1,718,413 |
FMC Corp.
| | | 5,222 | | 564,394 |
Freeport-McMoRan, Inc.
| | | 60,564 | | 1,792,695 |
International Flavors & Fragrances, Inc.
| | | 10,744 | | 1,186,997 |
International Paper Co.
| | | 15,108 | | 628,795 |
Linde PLC (a)
| | | 20,729 | | 5,863,405 |
LyondellBasell Industries NV Class A
| | | 11,122 | | 923,126 |
Martin Marietta Materials, Inc.
| | | 2,655 | | 923,170 |
Mosaic Co.
| | | 15,516 | | 835,847 |
Newmont Corp.
| | | 32,673 | | 1,351,355 |
Nucor Corp.
| | | 10,706 | | 1,423,256 |
| Security Description | | | Shares | | Value |
Packaging Corp. of America
| | | 3,700 | | $ 506,604 |
PPG Industries, Inc.
| | | 9,788 | | 1,242,880 |
Sealed Air Corp.
| | | 6,569 | | 353,478 |
Sherwin-Williams Co.
| | | 9,861 | | 2,288,738 |
Vulcan Materials Co.
| | | 5,290 | | 880,732 |
Westrock Co.
| | | 11,048 | | 448,438 |
| | | | | | 35,110,385 |
| REAL ESTATE — 2.8% | | | |
Alexandria Real Estate Equities, Inc. REIT
| | | 6,200 | | 951,080 |
American Tower Corp. REIT
| | | 18,782 | | 4,771,567 |
AvalonBay Communities, Inc. REIT
| | | 5,829 | | 1,171,104 |
Boston Properties, Inc. REIT
| | | 6,121 | | 486,191 |
Camden Property Trust REIT
| | | 4,200 | | 539,742 |
CBRE Group, Inc. Class A (a)
| | | 13,808 | | 1,090,280 |
Crown Castle, Inc. REIT
| | | 17,842 | | 3,047,949 |
Digital Realty Trust, Inc. REIT
| | | 11,700 | | 1,446,471 |
Duke Realty Corp. REIT
| | | 15,700 | | 923,945 |
Equinix, Inc. REIT
| | | 3,738 | | 2,457,249 |
Equity Residential REIT
| | | 14,238 | | 1,041,937 |
Essex Property Trust, Inc. REIT
| | | 2,655 | | 703,734 |
Extra Space Storage, Inc. REIT
| | | 5,500 | | 1,093,015 |
Federal Realty Investment Trust REIT
| | | 2,800 | | 283,556 |
Healthpeak Properties, Inc. REIT
| | | 22,877 | | 600,521 |
Host Hotels & Resorts, Inc. REIT
| | | 28,759 | | 511,048 |
Iron Mountain, Inc. REIT
| | | 11,274 | | 593,125 |
Kimco Realty Corp. REIT
| | | 26,816 | | 565,281 |
Mid-America Apartment Communities, Inc. REIT
| | | 4,700 | | 778,649 |
Prologis, Inc. REIT
| | | 30,045 | | 3,740,903 |
Public Storage REIT
| | | 6,352 | | 2,101,432 |
Realty Income Corp. REIT
| | | 23,700 | | 1,618,236 |
Regency Centers Corp. REIT
| | | 5,799 | | 352,811 |
SBA Communications Corp. REIT
| | | 4,500 | | 1,463,625 |
Simon Property Group, Inc. REIT
| | | 13,435 | | 1,370,101 |
UDR, Inc. REIT
| | | 12,200 | | 547,414 |
Ventas, Inc. REIT
| | | 16,603 | | 794,620 |
VICI Properties, Inc. REIT
| | | 39,700 | | 1,309,703 |
Vornado Realty Trust REIT
| | | 6,046 | | 158,526 |
Welltower, Inc. REIT
| | | 18,181 | | 1,393,574 |
Weyerhaeuser Co. REIT
| | | 31,198 | | 1,065,724 |
| | | | | | 38,973,113 |
| UTILITIES — 3.1% | | | |
AES Corp.
| | | 29,159 | | 742,097 |
Alliant Energy Corp.
| | | 9,800 | | 598,192 |
Ameren Corp.
| | | 10,856 | | 1,005,483 |
American Electric Power Co., Inc.
| | | 20,243 | | 2,028,349 |
See accompanying notes to financial statements.
9
STATE STREET S&P 500 INDEX FUND
SCHEDULE OF INVESTMENTS (continued)
August 31, 2022
| Security Description | | | Shares | | Value |
American Water Works Co., Inc.
| | | 7,600 | | $ 1,128,220 |
Atmos Energy Corp.
| | | 5,200 | | 589,576 |
CenterPoint Energy, Inc.
| | | 26,635 | | 839,802 |
CMS Energy Corp.
| | | 11,301 | | 763,269 |
Consolidated Edison, Inc.
| | | 14,800 | | 1,446,552 |
Constellation Energy Corp.
| | | 13,353 | | 1,089,471 |
Dominion Energy, Inc.
| | | 33,224 | | 2,717,723 |
DTE Energy Co.
| | | 8,039 | | 1,047,803 |
Duke Energy Corp.
| | | 31,791 | | 3,398,776 |
Edison International
| | | 15,305 | | 1,037,220 |
Entergy Corp. (b)
| | | 8,400 | | 968,520 |
Evergy, Inc.
| | | 9,399 | | 644,113 |
Eversource Energy
| | | 14,143 | | 1,268,486 |
Exelon Corp.
| | | 40,059 | | 1,758,991 |
FirstEnergy Corp.
| | | 22,429 | | 887,067 |
NextEra Energy, Inc.
| | | 80,928 | | 6,883,736 |
NiSource, Inc.
| | | 15,578 | | 459,707 |
NRG Energy, Inc.
| | | 9,498 | | 392,077 |
Pinnacle West Capital Corp.
| | | 4,756 | | 358,365 |
PPL Corp.
| | | 30,356 | | 882,752 |
Public Service Enterprise Group, Inc.
| | | 20,836 | | 1,341,005 |
Sempra Energy
| | | 13,024 | | 2,148,569 |
Southern Co.
| | | 42,984 | | 3,312,777 |
WEC Energy Group, Inc.
| | | 12,887 | | 1,329,165 |
Xcel Energy, Inc.
| | | 22,200 | | 1,648,350 |
| | | | | | 42,716,213 |
TOTAL COMMON STOCKS
(Cost $312,734,986)
| | | | | 1,370,137,618 |
| Security Description | | | Shares | | Value |
| SHORT-TERM INVESTMENTS — 0.2% | |
State Street Institutional U.S. Government Money Market Fund, Class G Shares 2.29% (d) (e)
| | | 100 | | $ 100 |
State Street Navigator Securities Lending Portfolio II (c) (f)
| | | 2,791,762 | | 2,791,762 |
TOTAL SHORT-TERM INVESTMENTS
(Cost $2,791,862)
| | 2,791,862 | |
TOTAL INVESTMENTS — 100.2%
(Cost $315,526,848)
| | 1,372,929,480 | |
LIABILITIES IN EXCESS OF OTHER ASSETS — (0.2)%
| | | | | (2,160,848) |
NET ASSETS — 100.0%
| | | | | $ 1,370,768,632 |
| (a) | Non-income producing security. |
| (b) | All or a portion of the shares of the security are on loan at August 31, 2022. |
| (c) | The Fund invested in an affiliated entity. Amounts related to these transactions during the period ended August 31, 2022 are shown in the Affiliate Table below. |
| (d) | The Fund invested in certain money market funds managed by SSGA Funds Management, Inc. Amounts related to these transactions during the period ended August 31, 2022 are shown in the Affiliate Table below. |
| (e) | The rate shown is the annualized seven-day yield at August 31, 2022. |
| (f) | Investment of cash collateral for securities loaned. |
| REIT | Real Estate Investment Trust |
At August 31, 2022, open futures contracts were as follows:
| Description | | Number of
Contracts | | Expiration
Date | | Notional
Amount | | Value | | Unrealized
Appreciation
(Depreciation) |
| E-Mini S&P 500 Index (long) | | 22 | | 09/16/2022 | | $4,116,016 | | $4,352,150 | | $236,134 |
During the period ended August 31, 2022, average notional value related to futures contracts was $16,368,554.
See accompanying notes to financial statements.
10
STATE STREET S&P 500 INDEX FUND
SCHEDULE OF INVESTMENTS (continued)
August 31, 2022
The following table summarizes the value of the Fund's investments according to the fair value hierarchy as of August 31, 2022.
| Description | | Level 1 –
Quoted Prices | | Level 2 –
Other Significant
Observable Inputs | | Level 3 –
Significant
Unobservable Inputs | | Total |
| ASSETS: | | | | | | | | |
| INVESTMENTS: | | | | | | | | |
Common Stocks
| | $1,370,137,618 | | $— | | $— | | $1,370,137,618 |
Short-Term Investments
| | 2,791,862 | | — | | — | | 2,791,862 |
TOTAL INVESTMENTS
| | $1,372,929,480 | | $— | | $— | | $1,372,929,480 |
| OTHER FINANCIAL INSTRUMENTS: | | | | | | | | |
Futures Contracts(a)
| | $ 236,134 | | $— | | $— | | $ 236,134 |
TOTAL OTHER FINANCIAL INSTRUMENTS:
| | $ 236,134 | | $— | | $— | | $ 236,134 |
TOTAL INVESTMENTS AND OTHER FINANCIAL INSTRUMENTS
| | $1,373,165,614 | | $— | | $— | | $1,373,165,614 |
| (a) | Futures Contracts are valued at unrealized appreciation (depreciation). |
Affiliate Table
| | Number of
Shares Held
at
8/31/21 | | Value at
8/31/21 | | Cost of
Purchases | | Proceeds
from
Shares Sold | | Realized
Gain (Loss) | | Change in
Unrealized
Appreciation/
Depreciation | | Number of
Shares Held
at
8/31/22 | | Value at
8/31/22 | | Dividend
Income |
State Street Corp.
| 15,847 | | $ 1,472,345 | | $ — | | $ 67,854 | | $45,753 | | $(421,782) | | 15,047 | | $1,028,462 | | $34,307 |
State Street Institutional U.S. Government Money Market Fund, Class G Shares
| 19,985,484 | | 19,985,484 | | 160,114,879 | | 180,100,263 | | — | | — | | 100 | | 100 | | 24,016 |
State Street Navigator Securities Lending Portfolio II
| 1,230,063 | | 1,230,063 | | 16,479,203 | | 14,917,504 | | — | | — | | 2,791,762 | | 2,791,762 | | 2,369 |
Total
| | | $22,687,892 | | $176,594,082 | | $195,085,621 | | $45,753 | | $(421,782) | | | | $3,820,324 | | $60,692 |
See accompanying notes to financial statements.
11
State Street S&P 500 Index Fund
Statement of Assets and Liabilities
August 31, 2022
| ASSETS | |
Investments in unaffiliated issuers, at value*
| $1,369,109,156 |
Investments in affiliated issuers, at value
| 3,820,324 |
Total Investments
| 1,372,929,480 |
Receivable from broker — accumulated variation margin on futures contracts
| 172,791 |
Receivable for fund shares sold
| 105,438 |
Dividends receivable — unaffiliated issuers
| 2,247,111 |
Dividends receivable — affiliated issuers
| 4,016 |
Securities lending income receivable — unaffiliated issuers
| 94 |
Securities lending income receivable — affiliated issuers
| 542 |
Receivable from Adviser
| 43 |
Prepaid expenses and other assets
| 13,287 |
TOTAL ASSETS
| 1,375,472,802 |
| LIABILITIES | |
Net Cash at Broker
| 28,548 |
Due to custodian
| 264,493 |
Payable upon return of securities loaned
| 2,791,762 |
Payable for fund shares repurchased
| 1,248,101 |
Advisory fee payable
| 64,977 |
Custodian fees payable
| 14,397 |
Administration fees payable
| 41,690 |
Shareholder servicing fee payable
| 29,575 |
Distribution fees payable
| 45,595 |
Trustees’ fees and expenses payable
| 1,146 |
Transfer agent fees payable
| 63,240 |
Registration and filing fees payable
| 477 |
Professional fees payable
| 61,652 |
Printing and postage fees payable
| 44,384 |
Accrued expenses and other liabilities
| 4,133 |
TOTAL LIABILITIES
| 4,704,170 |
NET ASSETS
| $1,370,768,632 |
| NET ASSETS CONSIST OF: | |
Paid-in Capital
| $ 263,220,202 |
Total distributable earnings (loss)
| 1,107,548,430 |
NET ASSETS
| $1,370,768,632 |
| NET ASSET VALUE PER SHARE | |
Net asset value per share
| $ 226.34 |
Shares outstanding (unlimited amount authorized, $0.01 par value)
| 6,056,266 |
| COST OF INVESTMENTS: | |
Investments in unaffiliated issuers
| $ 312,341,467 |
Investments in affiliated issuers
| 3,185,381 |
Total cost of investments
| $ 315,526,848 |
* Includes investments in securities on loan, at value
| $ 4,618,187 |
See accompanying notes to financial statements.
12
State Street S&P 500 Index Fund
Statement of Operations
For the Year Ended August 31, 2022
| INVESTMENT INCOME | |
Interest income — unaffiliated issuers
| $ 1,749 |
Dividend income — unaffiliated issuers
| 22,785,644 |
Dividend income — affiliated issuers
| 58,323 |
Unaffiliated securities lending income
| 751 |
Affiliated securities lending income
| 2,369 |
Foreign taxes withheld
| (4,721) |
TOTAL INVESTMENT INCOME (LOSS)
| 22,844,115 |
| EXPENSES | |
Advisory fee
| 466,243 |
Administration fees
| 777,072 |
Shareholder servicing fees
| 372,995 |
Distribution fees
| 575,033 |
Custodian fees
| 79,309 |
Trustees’ fees and expenses
| 33,066 |
Transfer agent fees
| 184,746 |
Registration and filing fees
| 46,910 |
Professional fees and expenses
| 60,297 |
Printing and postage fees
| 84,635 |
Insurance expense
| 15,065 |
Miscellaneous expenses
| 15,447 |
TOTAL EXPENSES
| 2,710,818 |
Expenses waived/reimbursed by the Adviser
| (271,063) |
NET EXPENSES
| 2,439,755 |
NET INVESTMENT INCOME (LOSS)
| $ 20,404,360 |
| REALIZED AND UNREALIZED GAIN (LOSS) | |
| Net realized gain (loss) on: | |
Investments — unaffiliated issuers
| 98,397,546 |
Investments — affiliated issuers
| 45,753 |
Futures contracts
| (820,543) |
Net realized gain (loss)
| 97,622,756 |
| Net change in unrealized appreciation/depreciation on: | |
Investments — unaffiliated issuers
| (295,793,320) |
Investments — affiliated issuers
| (421,782) |
Futures contracts
| (1,217,656) |
Net change in unrealized appreciation/depreciation
| (297,432,758) |
NET REALIZED AND UNREALIZED GAIN (LOSS)
| (199,810,002) |
NET INCREASE (DECREASE) IN NET ASSETS FROM OPERATIONS
| $(179,405,642) |
See accompanying notes to financial statements.
13
State Street S&P 500 Index Fund
Statements of Changes in Net Assets
| | Year Ended
8/31/22 | | Year Ended
8/31/21 |
| INCREASE (DECREASE) IN NET ASSETS FROM OPERATIONS: | | | |
Net investment income (loss)
| $ 20,404,360 | | $ 20,651,490 |
Net realized gain (loss)
| 97,622,756 | | 261,796,619 |
Net change in unrealized appreciation/depreciation
| (297,432,758) | | 136,365,655 |
Net increase (decrease) in net assets resulting from operations
| (179,405,642) | | 418,813,764 |
Distributions to shareholders
| (181,920,500) | | (210,170,347) |
| FROM BENEFICIAL INTEREST TRANSACTIONS: | | | |
Proceeds from shares sold
| 150,445,702 | | 212,581,202 |
Reinvestment of distributions
| 177,563,946 | | 204,655,169 |
Cost of shares redeemed
| (305,023,751) | | (526,227,206) |
Net increase (decrease) in net assets from beneficial interest transactions
| 22,985,897 | | (108,990,835) |
Net increase (decrease) in net assets during the period
| (338,340,245) | | 99,652,582 |
Net assets at beginning of period
| 1,709,108,877 | | 1,609,456,295 |
NET ASSETS AT END OF PERIOD
| $1,370,768,632 | | $1,709,108,877 |
| SHARES OF BENEFICIAL INTEREST: | | | |
Shares sold
| 580,960 | | 825,394 |
Reinvestment of distributions
| 684,802 | | 871,746 |
Shares redeemed
| (1,167,653) | | (2,085,747) |
Net increase (decrease)
| 98,109 | | (388,607) |
See accompanying notes to financial statements.
14
State Street S&P 500 Index Fund
Financial Highlights
Selected data for a share outstanding throughout each period
| | Year
Ended
8/31/22 | | Year
Ended
8/31/21 | | Year
Ended
8/31/20(a) | | Year
Ended
8/31/19(a)(b) | | Year
Ended
8/31/18(a)(b) |
Net asset value, beginning of period
| $ 286.85 | | $ 253.59 | | $ 222.06 | | $ 244.74 | | $ 215.94 |
| Income (loss) from investment operations: | | | | | | | | | |
Net investment income (loss) (c)
| 3.36 | | 3.43 | | 4.55 | | 4.38(d)(e) | | 3.96(d)(e) |
Net realized and unrealized gain (loss)
| (32.17) | | 66.60 | | 42.08 | | (2.52) | | 36.72 |
Total from investment operations
| (28.81) | | 70.03 | | 46.63 | | 1.86 | | 40.68 |
| Distributions to shareholders from: | | | | | | | | | |
Net investment income
| (4.54) | | (2.88) | | (4.20) | | (4.26) | | (4.68) |
Net realized gains
| (27.16) | | (33.89) | | (10.90) | | (20.28) | | (7.20) |
Total distributions
| (31.70) | | (36.77) | | (15.10) | | (24.54) | | (11.88) |
Net asset value, end of period
| $ 226.34 | | $ 286.85 | | $ 253.59 | | $ 222.06 | | $ 244.74 |
Total return (f)
| (11.36)% | | 31.01% | | 22.14% | | 2.71% | | 19.41% |
| Ratios and Supplemental Data: | | | | | | | | | |
Net assets, end of period (in 000s)
| $1,370,769 | | $1,709,109 | | $1,609,456 | | $1,527,785 | | $1,606,947 |
| Ratios to average net assets: | | | | | | | | | |
Total expenses
| 0.17% | | 0.18% | | 0.19% | | 0.20% | | 0.20% |
Net expenses
| 0.16%(d)(e) | | 0.16%(d)(e) | | 0.16%(d)(e) | | 0.16%(d)(e) | | 0.16%(d)(e) |
Net investment income (loss)
| 1.31%(d)(e) | | 1.33%(d)(e) | | 2.02%(d)(e) | | 2.00%(d)(e) | | 1.74%(d)(e) |
Portfolio turnover rate
| 2% | | 4% | | 5% | | 3%(g) | | 2%(g) |
| (a) | After the close of trading on April 17, 2020, State Street S&P 500 Index Fund underwent a 1-for-6 reverse share split. The historical per share activity presented here has been retroactively adjusted to reflect this split. |
| (b) | The per share amounts and percentages include the Fund’s proportionate share of income and expenses of the affiliated Portfolio prior to the discontinuance of the master feeder structure. |
| (c) | Per share numbers have been calculated using average shares outstanding, which more appropriately presents the per share data for the year. |
| (d) | Reflects amounts waived by the administrator. |
| (e) | Reflects amounts waived and/or reimbursed by the investment adviser. |
| (f) | Total return is calculated assuming a purchase of shares at net asset value on the first day and a sale at net asset value on the last day of each period reported. Distributions are assumed, for the purpose of this calculation, to be reinvested at net asset value per share on the respective payment dates of the Fund. Results represent past performance and are not indicative of future results. |
| (g) | Portfolio turnover is from the Fund's Portfolio prior to discontinuance of master-feeder structure. |
See accompanying notes to financial statements.
15
SSGA Funds
STATE STREET S&P 500 INDEX FUND
Notes to Financial Statements — August 31, 2022
1. Organization
The SSGA Funds (the “Trust”), a Massachusetts business trust registered under the Investment Company Act of 1940, as amended (“1940 Act”), is an open-end management investment company.
As of August 31, 2022, the Trust consists of two (2) series (and corresponding classes, each of which have the same rights and privileges, including voting rights), each of which represents a separate series of beneficial interest in the Trust. The Declaration of Trust permits the Board of Trustees of the Trust (the “Board" and each member thereof, a "Trustee" ) to authorize the issuance of an unlimited number of shares of beneficial interest at $0.001 par value. The financial statements herein relate to the following series (the “Fund”):
| Fund | Classes | Commencement of Operations | Diversification Classification |
| State Street S&P 500 Index Fund | Class N | December 30, 1992 | Diversified |
Under the Trust’s organizational documents, its officers and Trustees are indemnified against certain liabilities arising out of the performance of their duties to the Trust. Additionally, in the normal course of business, the Trust enters into contracts with service providers that contain general indemnification clauses. The Trust’s maximum exposure under these arrangements is unknown as this would involve future claims that may be made against the Trust that have not yet occurred.
2. Summary of Significant Accounting Policies
The following is a summary of significant accounting policies followed by the Trust in the preparation of its financial statements:
The preparation of financial statements in accordance with U.S. generally accepted accounting principles (“U.S. GAAP”) requires management to make estimates and assumptions that affect the reported amounts and disclosures in the financial statements. Actual results could differ from those estimates. The Fund is an investment company under U.S. GAAP and follows the accounting and reporting guidance applicable to investment companies.
Security Valuation
The Fund's investments are valued at fair value each day that the New York Stock Exchange (“NYSE”) is open and, for financial reporting purposes, as of the report date should the reporting period end on a day that the NYSE is not open. Fair value is generally defined as the price the Fund would receive to sell an asset or pay to transfer a liability in an orderly transaction between market participants at the measurement date. By its nature, a fair value price is a good faith estimate of the valuation in a current sale and may not reflect an actual market price. The investments of the Fund are valued pursuant to the policy and procedures developed by the Oversight Committee (the “Committee”) and approved by the Board. The Committee provides oversight of the valuation of investments for the Fund. The Board has responsibility for overseeing the determination of the fair value of investments.
Valuation techniques used to value the Fund's investments by major category are as follows:
• Equity investments traded on a recognized securities exchange for which market quotations are readily available are valued at the last sale price or official closing price, as applicable, on the primary market or exchange on which they trade. Equity investments traded on a recognized exchange for which there were no sales on that day are valued at the last published sale price or at fair value.
• Investments in registered investment companies (including money market funds) or other unitized pooled investment vehicles that are not traded on an exchange are valued at that day’s published net asset value (“NAV”) per share or unit.
• Exchange-traded futures contracts are valued at the closing settlement price on the primary market on which they are traded most extensively. Exchange-traded futures contracts traded on a recognized exchange for which there were no sales on that day are valued at the last reported sale price obtained from independent pricing services or brokers or at fair value.
SSGA Funds
STATE STREET S&P 500 INDEX FUND (continued)
Notes to Financial Statements — August 31, 2022
In the event prices or quotations are not readily available or that the application of these valuation methods results in a price for an investment that is deemed to be not representative of the fair value of such investment, fair value will be determined in good faith by the Committee, in accordance with the valuation policy and procedures approved by the Board.
Various inputs are used in determining the value of the Fund's investments.
The Fund values its assets and liabilities at fair value using a fair value hierarchy consisting of three broad levels that prioritize the inputs to valuation techniques giving the highest priority to readily available unadjusted quoted prices in active markets for identical assets or liabilities (Level 1 measurements) and the lowest priority to unobservable inputs (Level 3 measurements) when market prices are not readily available or reliable. The categorization of a value determined for an investment within the hierarchy is based upon the pricing transparency of the investment and is not necessarily an indication of the risk associated with investing in it.
The three levels of the fair value hierarchy are as follows:
• Level 1 – Unadjusted quoted prices in active markets for an identical asset or liability;
• Level 2 – Inputs other than quoted prices included within Level 1 that are observable for the asset or liability either directly or indirectly, including quoted prices for similar assets or liabilities in active markets, quoted prices for identical or similar assets or liabilities in markets that are not considered to be active, inputs other than quoted prices that are observable for the asset or liability (such as exchange rates, financing terms, interest rates, yield curves, volatilities, prepayment speeds, loss severities, credit risks and default rates) or other market-corroborated inputs; and
• Level 3 – Unobservable inputs for the asset or liability, including the Committee’s assumptions used in determining the fair value of investments.
The value of the Fund’s investments according to the fair value hierarchy as of August 31, 2022 is disclosed in the Fund’s Schedule of Investments.
Investment Transactions and Income Recognition
Investment transactions are accounted for on the trade date for financial reporting purposes. Realized gains and losses from the sale and disposition of investments are determined using the identified cost method. Dividend income and capital gain distributions, if any, are recognized on the ex-dividend date, or when the information becomes available, net of any foreign taxes withheld at source, if any. Non-cash dividends received in the form of stock, if any, are recorded as dividend income at fair value.
The Fund invests in real estate investment trusts (“REITs”). REITs determine the tax character of their distributions annually and may characterize a portion of their distributions as a return of capital or capital gain. The Fund’s policy is to record all REIT distributions initially as dividend income and re-designate a portion of the capital or capital gains distributions at year end based on information provided by the REIT and/or SSGA Funds Management, Inc.’s (the “Adviser” or “SSGA FM”) estimates of such re-designations for which actual information has not yet been reported.
Expenses
Certain expenses, which are directly identifiable to a specific Fund, are applied to that Fund within the Trust. Other expenses which cannot be attributed to a specific Fund are allocated in such a manner as deemed equitable, taking into consideration the nature and type of expense and relative net assets of the Fund within the Trust.
Distributions
Distributions from net investment income, if any, are declared and paid quarterly. Net realized capital gains, if any, are distributed annually, unless additional distributions are required for compliance with applicable tax regulations. The amount and character of income and capital gains to be distributed are determined in accordance with applicable tax regulations which may differ from net investment income and realized gains recognized for U.S. GAAP purposes.
SSGA Funds
STATE STREET S&P 500 INDEX FUND (continued)
Notes to Financial Statements — August 31, 2022
3. Derivative Financial Instruments
Futures Contracts
The Fund may enter into futures contracts to meet its objectives. A futures contract is a standardized, exchange-traded agreement to buy or sell a financial instrument at a set price on a future date. Upon entering into a futures contract, the Fund is required to deposit with the broker, cash or securities in an amount equal to the minimum initial margin requirements of the clearing house. Securities deposited, if any, are designated on the Schedules of Investments and cash deposited, if any, is included in Net cash at broker on the Statements of Assets and Liabilities. Subsequent payments are made or received by the Fund equal to the daily change in the contract value, accumulated, exchange rates, and or other transactional fees. The accumulation of those payments are recorded as variation margin receivable or payable with a corresponding offset to unrealized gains or losses. The Fund recognizes a realized gain or loss when the contract is closed.
Losses may arise if the value of a futures contract decreases due to unfavorable changes in the market rates or values of the underlying instrument during the term of the contract or if the counterparty does not perform under the contract. The use of futures contracts also involves the risk that the movements in the price of the futures contracts do not correlate with the movement of the assets underlying such contracts.
For the year ended August 31, 2022, the Fund entered into futures contracts for cash equitization, to reduce tracking error and to facilitate daily liquidity.
The following tables summarize the value of the Fund's derivative instruments as of August 31, 2022, and the related location in the accompanying Statement of Assets and Liabilities and Statement of Operations, presented by primary underlying risk exposure:
| | Asset Derivatives |
| | Interest
Rate
Risk | | Foreign
Exchange
Risk | | Credit
Risk | | Equity
Risk | | Commodity
Risk | | Total |
| State Street S&P 500 Index Fund | | | | | | | | | | | |
Futures Contracts
| $— | | $— | | $— | | $172,791 | | $— | | $172,791 |
| | Net Realized Gain (Loss) |
| | Interest
Rate
Risk | | Foreign
Exchange
Risk | | Credit
Risk | | Equity
Risk | | Commodity
Risk | | Total |
| State Street S&P 500 Index Fund | | | | | | | | | | | |
Futures Contracts
| $— | | $— | | $— | | $(820,543) | | $— | | $(820,543) |
| | Net Change in Unrealized Appreciation (Depreciation) |
| | Interest
Rate
Risk | | Foreign
Exchange
Risk | | Credit
Risk | | Equity
Risk | | Commodity
Risk | | Total |
| State Street S&P 500 Index Fund | | | | | | | | | | | |
Futures Contracts
| $— | | $— | | $— | | (1,217,656) | | $— | | (1,217,656) |
4. Fees and Transactions with Affiliates
Advisory Fee
The Trust, on behalf of the Fund, has entered into an Investment Advisory Agreement with SSGA FM. The Adviser is a wholly-owned subsidiary of State Street Global Advisors, Inc., which itself is a wholly-owned subsidiary of State Street Corporation. For its advisory services, the Fund pays the Adviser a management fee at an annual rate of 0.03% of its average daily net assets. The fees are accrued daily and paid monthly.
The Adviser is contractually obligated until December 31, 2022 to waive up to the full amount of the advisory fee payable by the Fund and/or reimburse the Fund to the extent that total annual Fund operating expenses exceed 0.157% of average daily net assets on an annual basis. This waiver and/or reimbursement may not be terminated
SSGA Funds
STATE STREET S&P 500 INDEX FUND (continued)
Notes to Financial Statements — August 31, 2022
prior to December 31, 2022 except with the approval of the Board. During the year ended August 31, 2022, SSGA FM agreed to reimburse fees of $115,648.
Administrator, Sub-Administrator and Custodian Fees
SSGA FM serves as administrator and State Street Bank and Trust Company ("State Street"), an affiliate of the Adviser, serves as custodian and sub-administrator. For its administrative services, the Fund pays SSGA FM a fee at an annual rate of 0.05% of its average daily net assets. The fees are accrued daily and paid monthly. SSGA FM has contractually agreed to waive 0.01% of its administration fee. The waiver may not be terminated or modified except with the approval of the Board and shall continue until at least December 31, 2022. For the year ended August 31, 2022, SSGA FM waived fees in the amount of $155,415.The Adviser and the Fund each bear a portion of the fee paid to State Street for providing sub-administration and custodian services with respect to the Fund.
Distribution and Shareholder Servicing Fees
State Street Global Advisors Funds Distributors, LLC (“SSGA FD” or the “Distributor”), an affiliate of the Adviser, serves as the distributor of the Trust.
The Fund has adopted a distribution plan pursuant to Rule 12b-1 under the 1940 Act, under which the Fund may compensate the Distributor (or others) for services in connection with the distribution of the Fund’s Class N shares and for services provided to shareholders in that class (the “Plan”).
The Plan calls for payments at an annual rate (based on average daily net assets) of 0.25% of the Fund’s net assets attributable to its Class N shares. In addition to payments under the Plan, the Fund may reimburse the Distributor or its affiliates for payments it makes to financial intermediaries that provide certain administrative, recordkeeping and account maintenance services. The amount of the reimbursement and the manner in which it is calculated are reviewed by the Trustees periodically.
Additionally, the Board approved a limit of 0.062% of average daily net assets on the amount of Rule 12b-1 fees paid to the Distributor.
Other Transactions with Affiliates - Securities Lending
State Street, an affiliate of the Fund, acts as the securities lending agent for the Fund, pursuant to an amended and restated securities lending authorization agreement dated January 6, 2017, as amended.
Effective January 1, 2022, net proceeds collected by State Street on investment of cash collateral or any fee income less rebates payable to borrowers, are paid as follows: If the calendar year to date net proceeds is below a specified threshold across participating affiliated funds, the Fund retains Eighty Five percent (85%) of the net proceeds and Fifteen percent (15%) of such net proceeds is payable to State Street. Starting the business day following the date that calendar year to date net proceeds exceeds a specified threshold, the Fund retains Ninety percent (90%) of the net proceeds and Ten percent (10%) of such net proceeds is payable to State Street. Prior to January 1, 2022, net proceeds were 85% payable to the Fund and 15% payable to State Street.
In addition, cash collateral from lending activities is invested in the State Street Navigator Securities Lending Portfolio II, an affiliated fund, for which SSGA FM serves as investment adviser. See Note 8 for additional information regarding securities lending.
Other Transactions with Affiliates
The Fund may invest in affiliated entities, including securities issued by State Street Corporation, affiliated funds, or entities deemed to be affiliates as a result of the Fund owning more than five percent of the entity’s voting securities or outstanding shares. Amounts relating to these transactions during the year ended August 31, 2022 are disclosed in the Schedule of Investments.
5. Trustees’ Fees
The fees and expenses of the Trustees, who are not "interested persons" of the Trust, as defined in the 1940 Act ("Independent Trustees"), are paid directly by the Fund. The Independent Trustees are reimbursed for travel and other out-of-pocket expenses in connection with meeting attendance and industry seminars.
SSGA Funds
STATE STREET S&P 500 INDEX FUND (continued)
Notes to Financial Statements — August 31, 2022
6. Investment Transactions
Purchases and sales of investments (excluding in-kind transactions, derivative contracts and short term investments) for the year ended August 31, 2022 were as follows:
| | Purchases | | Sales |
State Street S&P 500 Index Fund
| $28,204,784 | | $142,319,013 |
7. Income Tax Information
The Fund has qualified and intends to continue to qualify as a regulated investment company under Subchapter M of the Internal Revenue Code of 1986, as amended. The Fund will not be subject to federal income taxes to the extent it distributes its taxable income, including any net realized capital gains, for each fiscal year. Therefore, no provision for federal income tax is required.
The Fund files federal and various state and local tax returns as required. No income tax returns are currently under examination. Generally, the federal returns are subject to examination by the Internal Revenue Service (the "IRS") for a period of three years from date of filing, while the state returns may remain open for an additional year depending upon jurisdiction. SSGA FM has analyzed the Fund’s tax positions taken on tax returns for all open years and does not believe there are any uncertain tax positions that would require recognition of a tax liability.
Distributions to shareholders are recorded on ex-dividend date. Income dividends and gain distributions are determined in accordance with income tax rules and regulations, which may differ from generally accepted accounting principles.
Certain capital accounts in the financial statements have been adjusted for permanent book-tax differences. These adjustments have no impact on net asset values or results of operations. Temporary book-tax differences will reverse in the future. These book-tax differences are primarily due to nontaxable dividend adjustments to income, wash sale loss deferrals, and futures contracts. In addition, the Fund has claimed a portion of the payments made to redeeming shareholder as a distribution for income tax purposes.
The tax character of distributions paid during the year ended August 31, 2022, was as follows:
| | Ordinary
Income | | Long-Term
Capital Gains | | Total |
State Street S&P 500 Index Fund
| $32,277,987 | | $149,642,513 | | $181,920,500 |
The tax character of distributions paid during the year ended August 31, 2021, was as follows:
| | Ordinary
Income | | Long-Term
Capital Gains | | Total |
State Street S&P 500 Index Fund
| $ 23,910,683 | | $ 186,259,664 | | $ 210,170,347 |
At August 31, 2022, the components of distributable earnings on a tax basis were as follows:
| | Undistributed
Ordinary Income | | Capital Loss
Carryforwards | | Undistributed
Long-Term
Capital Gains | | Net Unrealized
Gains (Losses) | | Qualified
Late-Year
Losses | | Total |
State Street S&P 500 Index Fund
| $3,487,278 | | $— | | $77,615,858 | | $1,027,468,623 | | $(1,023,329) | | $1,107,548,430 |
As of August 31, 2022, gross unrealized appreciation and gross unrealized depreciation of investments and other financial instruments based on cost for federal income tax purposes were as follows:
| | Tax
Cost | | Gross
Unrealized
Appreciation | | Gross
Unrealized
Depreciation | | Net Unrealized
Appreciation
(Depreciation) |
State Street S&P 500 Index Fund
| $345,696,991 | | $1,044,084,302 | | $16,615,679 | | $1,027,468,623 |
SSGA Funds
STATE STREET S&P 500 INDEX FUND (continued)
Notes to Financial Statements — August 31, 2022
8. Securities Lending
The Fund may lend securities to qualified broker-dealers or institutional investors. The loans are secured at all times by cash, cash equivalents or U.S. government securities in an amount at least equal to the market value of the securities loaned, plus accrued interest and dividends, determined on a daily basis and adjusted accordingly. The value of the collateral with respect to a loaned security may be temporarily more or less than the value of a security due to market fluctuations of securities values. With respect to each loan, if on any U.S. business day the aggregate market value of securities collateral plus cash collateral is less than the aggregate market value of the securities which are subject to the loan, the borrower will be notified to provide additional collateral on the next business day.
The Fund will regain record ownership of loaned securities to exercise certain beneficial rights; however, the Fund may bear the risk of delay in recovery of, or even loss of rights in the securities loaned should the borrower fail financially. In addition, the Fund will bear the risk of loss of any cash collateral that it may invest. The Fund receives compensation for lending its securities from interest or dividends earned on the cash, cash equivalents or U.S. government securities held as collateral, net of fee rebates paid to the borrower and net of fees paid to State Street as the lending agent. Additionally, the Fund will receive a fee from the borrower for non-cash collateral equal to a percentage of the market value of the loaned securities.
The market value of securities on loan as of August 31, 2022, and the value of the invested cash collateral are disclosed in the Fund's Statements of Assets and Liabilities. Non-cash collateral is not disclosed in the Fund's Statements of Assets and Liabilities as it is held by the lending agent on behalf of the Fund, and the Fund does not have the ability to re-hypothecate those securities. Securities lending income, as disclosed in the Fund's Statements of Operations, represents the income earned from the non-cash collateral and the investment of cash collateral, net of fee rebates paid to the borrower and net of fees paid to State Street as lending agent.
The following is a summary of the Fund's securities lending agreements and related cash and non-cash collateral received as of August 31, 2022:
| Fund | | Market Value of
Securities on Loan | | Cash
Collateral
Received | | Non-Cash
Collateral
Received* | | Total
Collateral
Received |
State Street S&P 500 Index Fund
| | $ 4,618,187 | | $ 2,791,762 | | $ 1,987,388 | | $ 4,779,150 |
| * | The non-cash collateral includes U.S. Treasuries and U.S. Government Agency securities. |
The following table reflects a breakdown of transactions accounted for as secured borrowings, the gross obligation by the type of collateral pledged or securities loaned, and the remaining contractual maturity of those transactions as of August 31, 2022:
| | | | | Remaining Contractual Maturity of the Agreements
as of August 31, 2022 |
| Fund | | Securities
Lending
Transactions | | Overnight
and
Continuous | | <30 Days | | Between
30 & 90
Days | | >90 Days | | Total
Borrowings | | Gross Amount
of Recognized
Liabilities for
Securities Lending Transactions |
State Street S&P 500 Index Fund
| | Common Stocks | | $2,791,762 | | $— | | $— | | $— | | $2,791,762 | | $2,791,762 |
9. Line of Credit
The Fund and other affiliated funds (each, a “Participant” and collectively, the “Participants”) have access to $200 million of a $1.275 billion ($1.1 billion prior to October 6, 2022) revolving credit facility, provided by a syndication of banks under which the Participants may borrow to fund shareholder redemptions. This agreement expires in October 2023 unless extended or renewed.
The Participants are charged an annual commitment fee which is calculated based on the unused portion of the shared credit line. Commitment fees are allocated among each of the Participants based on relative net assets. Commitment fees are ordinary fund operating expenses. A Participant incurs and pays the interest expense related to its borrowing. Interest is calculated at a rate per annum equal to the sum of 1.00% plus the greater of the New York Fed Bank Rate and the one-month SOFR Rate. Prior to October 7, 2021, the Fund had access to $200 million of a $500 million revolving credit facility and interest was calculated at a rate per annum equal to the sum of 1.25% plus the New York Fed Bank Rate.
SSGA Funds
STATE STREET S&P 500 INDEX FUND (continued)
Notes to Financial Statements — August 31, 2022
The Fund had no outstanding loans as of August 31, 2022.
10. Risks
Market Risk
The Fund’s investments are subject to changes in general economic conditions, general market fluctuations and the risks inherent in investment in securities markets. Investment markets can be volatile and prices of investments can change substantially due to various factors including, but not limited to, economic growth or recession, changes in interest rates, changes in the actual or perceived creditworthiness of issuers, and general market liquidity. The Fund is subject to the risk that geopolitical events will disrupt securities markets and adversely affect global economies and markets. Local, regional or global events such as war, acts of terrorism, the spread of infectious illness or other public health issues, or other events could have a significant impact on the Fund and its investments.
An outbreak of a respiratory disease caused by a novel coronavirus first detected in China in December 2019 has spread globally. In an organized attempt to contain and mitigate the effects of the spread of the coronavirus known as COVID-19, governments and businesses world-wide have taken aggressive measures, including closing borders, restricting international and domestic travel, and the imposition of prolonged quarantines of large populations. COVID-19 has resulted in the disruption of and delays in the delivery of healthcare services and processes, the cancellation of organized events and educational institutions, the disruption of production and supply chains, a decline in consumer demand for certain goods and services, and general concern and uncertainty, all of which have contributed to increased volatility in global markets. The effects of COVID-19 will likely affect certain sectors and industries more dramatically than others, which may adversely affect the value of the Fund’s investments in those sectors or industries. COVID-19, and other epidemics and pandemics that may arise in the future, could adversely affect the economies of many nations, the global economy, individual companies and capital markets in ways that cannot be foreseen at the present time. In addition, the impact of infectious diseases in developing or emerging market countries may be greater due to limited health care resources. Political, economic and social stresses caused by COVID-19 also may exacerbate other pre-existing political, social and economic risks in certain countries. The duration of COVID-19 and its effects cannot be determined at this time, but the effects could be present for an extended period of time.
Credit Risk
The Fund may be exposed to credit risk in the event that an issuer or guarantor fails to perform or that an institution or entity with which the Fund has unsettled or open transactions defaults.
11. Subsequent Events
Management has evaluated the impact of all subsequent events on the Fund through the date the financial statements were available to be issued and has determined that there were no subsequent events requiring adjustment or disclosure in the financial statements.
REPORT OF INDEPENDENT REGISTERED PUBLIC
ACCOUNTING FIRM
To the Shareholders and the Board of Trustees of State Street S&P 500 Index Fund
Opinion on the Financial Statements
We have audited the accompanying statement of assets and liabilities of State Street S&P 500 Index Fund (the “Fund”) (one of the funds constituting SSGA Funds (the “Trust”)), including the schedule of investments, as of August 31, 2022, and the related statement of operations for the year then ended, the statements of changes in net assets for each of the two years in the period then ended, the financial highlights for each of the five years in the period then ended and the related notes (collectively referred to as the “financial statements”). In our opinion, the financial statements present fairly, in all material respects, the financial position of the Fund (one of the funds constituting SSGA Funds) at August 31, 2022, the results of its operations for the year then ended, the changes in its net assets for each of the two years in the period then ended and its financial highlights for each of the five years in the period then ended, in conformity with U.S. generally accepted accounting principles.
Basis for Opinion
These financial statements are the responsibility of the Trust’s management. Our responsibility is to express an opinion on the Fund’s financial statements based on our audits. We are a public accounting firm registered with the Public Company Accounting Oversight Board (United States) (“PCAOB”) and are required to be independent with respect to the Trust in accordance with the U.S. federal securities laws and the applicable rules and regulations of the Securities and Exchange Commission and the PCAOB.
We conducted our audits in accordance with the standards of the PCAOB. Those standards require that we plan and perform the audit to obtain reasonable assurance about whether the financial statements are free of material misstatement, whether due to error or fraud. The Trust is not required to have, nor were we engaged to perform, an audit of the Trust’s internal control over financial reporting. As part of our audits, we are required to obtain an understanding of internal control over financial reporting but not for the purpose of expressing an opinion on the effectiveness of the Trust’s internal control over financial reporting. Accordingly, we express no such opinion.
Our audits included performing procedures to assess the risks of material misstatement of the financial statements, whether due to error or fraud, and performing procedures that respond to those risks. Such procedures included examining, on a test basis, evidence regarding the amounts and disclosures in the financial statements. Our procedures included confirmation of securities owned as of August 31, 2022, by correspondence with the custodian, brokers and others; when replies were not received from brokers and others, we performed other auditing procedures. Our audits also included evaluating the accounting principles used and significant estimates made by management, as well as evaluating the overall presentation of the financial statements. We believe that our audits provide a reasonable basis for our opinion.
We have served as the auditor of one or more State Street Global Advisors investment companies since 2000.
Boston, Massachusetts
October 25, 2022
SSGA FUNDS
State Street S&P 500 Index Fund
Other Information — August 31, 2022 (Unaudited)
Expense Example
As a shareholder of the Fund, you incur two types of costs: (1) transaction costs, including sales charges (loads), if applicable, on purchase payments, reinvested dividends, or other distributions and (2) ongoing costs, including advisory fees and to the extent applicable, distribution (12b-1) and/or service fees; and other Fund expenses. This example is intended to help you understand your ongoing costs (in dollars) of investing in the Fund and to compare these costs with the ongoing costs of investing in other mutual funds. It is based on an investment of $1,000 made at the beginning of the period shown and held for the entire period from March 1, 2022 to August 31, 2022.
The table below illustrates your Fund’s cost in two ways:
Based on actual fund return ——This section helps you to estimate the actual expenses that you paid over the period. The “Ending Account Value” shown is derived from the Fund's actual return, and the third column shows the dollar amount that would have been paid by an investor who started with $1,000 in the Fund. You may use the information here, together with the amount you invested, to estimate the expenses that you paid over the period. To do so, simply divide your account value by $1,000 (for example, an $8,600 account value divided by $1,000 = 8.6), then multiply the result by the number given for the Fund under the heading “Expenses Paid During Period”.
Based on hypothetical 5% return ——This section is intended to help you compare your Fund’s costs with those of other mutual funds. It assumes that the Fund had a yearly return of 5% before expenses, but that the expense ratio is unchanged. In this case, because the return used is not the Fund’s actual return, the results do not apply to your investment. The example is useful in making comparisons because the U.S. Securities and Exchange Commission (the “SEC”) requires all mutual funds to calculate expenses based on a 5% return. You can assess your Fund’s costs by comparing this hypothetical example with the hypothetical examples that appear in shareholder reports of other funds.
Please note that the expenses shown in the table are meant to highlight your ongoing costs only and do not reflect any transaction costs, such as sales load charges (loads). Therefore, the hypothetical 5% return section of the table is useful in comparing ongoing costs only, and will not help you determine the relative total costs of owning different funds. In addition, if these transaction costs were included, your costs would have been higher.
| | | | Actual | | Hypothetical (assuming a 5%
return before expenses) |
| | Annualized
Expense Ratio | | Ending Account
Value | | Expenses Paid
During Period(a) | | Ending Account
Value | | Expenses Paid
During Period(a) |
State Street S&P 500 Index Fund
| 0.16% | | $910.90 | | $0.77 | | $1,024.40 | | $0.82 |
| (a) | Expenses are equal to the Fund's annualized net expense ratio multiplied by the average account value of the period, multiplied by 184, then divided by 365. |
SSGA FUNDS
State Street S&P 500 Index Fund (continued)
Other Information — August 31, 2022 (Unaudited)
Tax Information
For federal income tax purposes, the following information is furnished with respect to the distributions of the Trust for its fiscal year ended August 31, 2022.
Dividends Received Deduction
The Fund reports the maximum amount allowable of its net taxable income as eligible for the corporate dividends received deduction.
Qualified Business Income Deduction
The Fund reports the maximum amount allowable of qualified REIT dividends eligible for the qualified business income deduction under Section 199A.
Qualified Dividend Income
A portion of dividends distributed by the Fund during the fiscal year ended August 31, 2022, is considered qualified dividend income and is eligible for reduced tax rates. The Fund reports the maximum amount allowable of its net taxable income as qualified dividend income as provided in the Jobs and Growth Tax Relief Reconciliation Act of 2003.
Qualified Interest Income
The Fund reports the maximum amount allowable of its net taxable income and short-term capital gain as qualified interest income.
Capital Gain Dividend
Long term capital gains dividends were paid from the following Fund during the year ended August 31, 2022:
| | Amount |
State Street S&P 500 Index Fund
| $155,365,534 |
SSGA FUNDS
State Street S&P 500 Index Fund (continued)
Other Information — August 31, 2022 (Unaudited)
Proxy Voting Policies and Procedures and Record
The Fund has adopted the proxy voting policies of the Adviser. A description of the Fund's proxy voting policies and procedures that are used by the Fund's Adviser to vote proxies relating to the Fund's portfolio of securities are available (i) without charge, upon request, by calling 1-800-997-7327 (toll free) and (ii) on the SEC’s website at www.sec.gov. Information regarding how the Fund voted for the prior 12-months period ended June 30 is available by August 31 of each year by calling the same number on the SEC’s website, at www.sec.gov, and on the Fund's website at www.ssga.com.
Quarterly Portfolio Schedule
Following the Fund’s first and third fiscal quarter-ends, a complete Schedule of Investments are filed with the SEC as an exhibit on Form N-PORT, which can be found on the Fund's website at www.ssga.com and the SEC’s website at www.sec.gov. The Fund's Schedules of Investments are available upon request, without charge, by calling 1-800-997-7327 (toll free).
SSGA FUNDS
State Street S&P 500 Index Fund (continued)
Other Information — August 31, 2022 (Unaudited)
TRUSTEE CONSIDERATIONS IN APPROVING CONTINUATION OF INVESTMENT ADVISORY AGREEMENT 1
Overview of the Contract Review Process
Under the Investment Company Act of 1940, as amended (the “1940 Act”), an investment advisory agreement between a mutual fund and its investment adviser may continue in effect from year to year only if its continuance is approved at least annually by the fund’s board of trustees or its shareholders, and by a vote of a majority of those trustees who are not “interested persons” of the fund (the “Independent Trustees”) cast in person at a meeting called for the purpose of considering such approval.
Consistent with these requirements, the Board of Trustees (the “Board”) of the SSGA Funds (the “Trust”), met in person on April 6, 2022 and May 11-12, 2022, including in executive sessions attended by the Independent Trustees, to consider a proposal to approve, with respect to State Street S&P 500 Index Fund (the “Fund”), the continuation of the investment advisory agreement (the “Advisory Agreement”) with SSGA Funds Management, Inc. (“SSGA FM” or the “Adviser”). Prior to voting on the proposal, the Independent Trustees, as well as the Trustee who is an “interested person” of the Adviser, reviewed information furnished by the Adviser and others reasonably necessary to permit the Board to evaluate the proposal fully. The Independent Trustees were separately represented by counsel who are independent of the Adviser (“Independent Counsel”) in connection with their consideration of approval of the Advisory Agreement. Following the April 6, 2022 meeting, the Independent Trustees submitted questions and requests for additional information to management, and considered management’s responses thereto prior to and at the May 11-12, 2022 meeting. The Independent Trustees considered, among other things, the following:
Information about Performance, Expenses and Fees
A report prepared by an independent third-party provider of investment company data, which includes for the Fund:
| o | Comparisons of the Fund’s performance over the past one-, three-, five- and ten-year periods ended December 31, 2021, to the performance of an appropriate benchmark constructed by Broadridge Financial Solutions, Inc. (“Broadridge”) for the Fund (the “Lipper Index”) and a universe of other mutual funds with similar investment objectives and policies (the “Performance Group” and/or the “Performance Universe”); |
| o | Comparisons of the Fund’s expense ratio (with detail of component expenses) to the expense ratios of a group of comparable mutual funds selected by the independent third-party data provider (the “Expense Group” and/or “Expense Universe”); |
| o | A chart showing the Fund’s historical average net assets relative to its total expenses, management fees, and non-management expenses over the past five calendar years; and |
| o | Comparisons of the Fund’s contractual management fee to the contractual management fees of comparable mutual funds at different asset levels. |
| • | Comparative information concerning fees charged by the Adviser for managing institutional accounts using investment strategies and techniques similar to those used in managing the Fund, as applicable; and |
| • | Profitability analyses for (a) the Adviser with respect to the Fund and (b) affiliates of the Adviser that provide services to the Fund (“Affiliated Service Providers”). |
______________________________________________
1 Over the course of many years overseeing the Fund and other investment companies, the Independent Trustees have identified numerous relevant issues, factors and concerns ("issues, factors and concerns") that they consider each year in connection with the proposed continuation of the advisory agreement, the administration agreement, the distribution plans, the distribution agreement and various related-party service agreements (the "annual review process"). The statement of issues, factors and concerns and the related conclusions of the Independent Trustees may not change substantially from year to year. However, the information requested by, and provided to, the Independent Trustees with respect to the issues, factors and concerns and on which their conclusions are based is updated annually and, in some cases, may differ substantially from the previous year. The Independent Trustees schedule annually a separate in-person meeting that is dedicated to the annual review process (the "special meeting"). At the special meeting and throughout the annual review process, the Independent Trustees take a fresh look at each of the issues, factors and concerns in light of the latest available information and each year present one or more sets of comments and questions to management with respect to specific issues, factors and concerns. Management responds to such comments and questions to the satisfaction of the Independent Trustees before the annual review process is completed and prior to the Independent Trustees voting on proposals to approve continuation of the agreements and plans.
SSGA FUNDS
State Street S&P 500 Index Fund (continued)
Other Information — August 31, 2022 (Unaudited)
Information about Portfolio Management
| • | Descriptions of the investment management services provided by the Adviser, including its investment strategies and processes; |
| • | Information concerning the allocation of brokerage; and |
| • | Information regarding the procedures and processes used to value the assets of the Fund. |
Information about the Adviser
| • | Reports detailing the financial results and condition of the Adviser and its affiliates; |
| • | Descriptions of the qualifications, education and experience of the individual investment and other professionals responsible for managing the portfolio of the Fund and for Fund operations; |
| • | Information relating to compliance with and the administration of the Code of Ethics adopted by the Adviser; |
| • | Information about the Adviser’s proxy voting policies and procedures and information regarding the Adviser’s practices for overseeing proxy vendors; |
| • | Information concerning the resources devoted by the Adviser to overseeing compliance by the Fund and its service providers, including information concerning compliance with investment policies and restrictions and other operating policies of the Fund; |
| • | A description of the adequacy and sophistication of the Adviser’s technology and systems with respect to investment and administrative matters and a description of any material improvements or changes in technology or systems in the past year; |
| • | A description of the business continuity and disaster recovery plans of the Adviser; and |
| • | Information regarding the Adviser’s risk management processes |
Other Relevant Information
| • | Information concerning the nature, extent, quality and cost of services provided to the Fund by SSGA FM in its capacity as the Fund’s administrator (the “Administrator”); |
| • | Information concerning the nature, extent, quality and cost of various non-investment management services provided to the Fund by affiliates of the Adviser, including the custodian, sub-administrator, fund accountant and securities lending agent of the Fund, as applicable, and the role of the Adviser in managing the Fund’s relationship with these service providers; |
| • | Copies of the Advisory Agreement and agreements with other service providers of the Fund; |
| • | Responses to a request for information reviewed prior to the April 6, 2022 and May 11-12, 2022 meetings by Independent Counsel, requesting specific information from each of: |
| o | SSGA FM, in its capacity as the Fund’s Adviser and Administrator, with respect to its operations relating to the Fund and its approximate profit margins from such operations for the calendar year ended December 31, 2021; and the relevant operations of other Affiliated Service Providers to the Fund, together with their approximate profit margins from such relevant operations for the calendar year ended December 31, 2021; |
| o | State Street Bank and Trust Company (“State Street”), the sub-administrator, custodian and securities lending agent for the Fund, with respect to its operations relating to the Fund; and |
| o | State Street Global Advisors Funds Distributors, LLC, the principal underwriter and distributor of the shares of the Fund (the “Distributor”), with respect to its operations relating to the Fund, together with the Fund’s related distribution plans and arrangements under Rule 12b-1 of the 1940 Act; |
| • | Information from SSGA FM, State Street and the Distributor with respect to the Trust providing any material changes to the previous information supplied in response to the letter from Independent Counsel prior to the executive session of the Board on May 11-12, 2022; and |
| • | Materials provided by Broadridge, circulated to the Independent Trustees and to Independent Counsel. |
SSGA FUNDS
State Street S&P 500 Index Fund (continued)
Other Information — August 31, 2022 (Unaudited)
In addition to the information identified above, the Board considered information provided from time to time by the Adviser, and other service providers of the Fund throughout the year at meetings of the Board and its committees. At such meetings, the Trustees received, among other things, presentations by the portfolio managers and other investment professionals of the Adviser relating to the performance of the Fund and the investment strategies used in pursuing the Fund’s investment objective.
The Independent Trustees were assisted throughout the contract review process by their Independent Counsel. The Independent Trustees relied upon the advice of such counsel and their own business judgment in determining the material factors to be considered in evaluating the Advisory Agreement, and the weight to be given to each such factor. The conclusions reached with respect to the Advisory Agreement were based on a comprehensive evaluation of all the information provided and not any single factor. Moreover, each Trustee may have placed varying emphasis on particular factors in reaching conclusions with respect to the Fund.
Results of the Process
Based on a consideration of the foregoing and such other information as deemed relevant, including the factors and conclusions described below, at the meeting held on May 11-12, 2022, the Board, including a majority of the Independent Trustees, voted to approve the continuation of the Advisory Agreement effective June 1, 2022, for an additional year with respect to the Fund.
Nature, Extent and Quality of Services
In considering whether to approve the Advisory Agreement, the Board evaluated the nature, extent and quality of services provided to the Fund by the Adviser.
The Board considered the Adviser’s management capabilities and investment process with respect to the types of investments held by the Fund, including the education, experience and number of investment professionals and other personnel who provide portfolio management, investment research, and similar services to the Fund. The Board evaluated, where relevant, the abilities and experience of such investment personnel in analyzing particular markets, industries and specific issuers of securities in these markets and industries. The Board also considered the substantial expertise of the Adviser in developing and applying proprietary quantitative models for managing various funds that invest primarily in equity securities. The Board considered the extensive experience and resources committed by the Adviser to risk management, including with respect to investment risk, liquidity risk, operational risk, counterparty risk and model risk. Further, the Board considered material enhancements made to the risk management processes and systems over the past year. The Trustees also considered the significant risks assumed by the Adviser in connection with the services provided to the Fund, including reputational and entrepreneurial risks. The Board also took into account the compensation paid to recruit and retain investment personnel, and the time and attention devoted to the Fund by senior management, as well as the Adviser’s succession planning process.
The Board had previously reviewed the compliance programs of SSGA FM and various affiliated service providers. Among other things, the Board considered compliance and reporting matters relating to personal trading by investment personnel, selective disclosure of portfolio holdings, late trading, frequent trading, portfolio valuation, business continuity, the allocation of investment opportunities and the voting of proxies. The Board also considered the role of the Adviser in overseeing the Fund’s securities lending activities. The Board also considered the performance of certain portions of the business continuity plan which have been invoked in response to the COVID-19 pandemic
On the basis of the foregoing and other relevant information, the Board concluded that the Adviser can be expected to continue to provide high quality investment management and related services for the Fund.
Fund Performance
The Board compared the Fund’s investment performance to the performance of an appropriate benchmark and universe of comparable mutual funds for various time periods ended December 31, 2021. For purposes of these comparisons the Independent Trustees relied extensively on the Performance Group, Performance Universe and Lipper Index and the analyses of the related data provided by Broadridge. Among other information, the Board considered the following performance information in its evaluation of the Fund:
State Street S&P 500 Index Fund. The Board considered that the Fund’s performance was above the medians of its Performance Group and Performance Universe for the 1-, 3-, 5- and 10-year periods. The Board also considered that the Fund’s performance was above its Lipper Index for the 1-, 3-, 5- and 10-year periods.
On the basis of the foregoing and other relevant information, the Board concluded that the performance of the Fund is satisfactory.
SSGA FUNDS
State Street S&P 500 Index Fund (continued)
Other Information — August 31, 2022 (Unaudited)
Management Fees and Expenses
The Board reviewed the contractual investment advisory fee rates payable by the Fund and actual fees paid by the Fund, net of waivers. As part of its review, the Board considered the Fund’s management fee and total expense ratio, including the portion attributable to administrative services provided by SSGA FM (both before and after giving effect to any expense caps), as compared to its Expense Group and Expense Universe, as constructed by Broadridge, and the related Broadridge analysis for the Fund. The Board also considered the comparability of the fees charged and the services provided to the Fund by the Adviser to the fees charged and services provided to other clients of the Adviser, including institutional accounts. In addition, the Board considered the willingness of the Adviser to provide undertakings from time to time to waive fees or pay expenses of the Fund to limit the total expenses borne by shareholders of the Fund. Among other information, the Board considered the following expense information in its evaluation of the Fund:
State Street S&P 500 Index Fund. The Board considered that the Fund’s actual management fee was below the medians of its Expense Group and Expense Universe. The Board also considered that the Fund’s total expenses were below the medians of its Expense Group and Expense Universe.
On the basis of the foregoing and other relevant information, and in light of the nature, extent and quality of the services provided by the Adviser, the Board concluded that the fees and the expense ratio of the Fund compare favorably to the fees and expenses of the Expense Group and Expense Universe and are reasonable in relation to the services provided.
Profitability
The Board reviewed the level of profits realized by the Adviser and its affiliates in providing investment advisory and other services to the Fund and to all funds within the fund complex.The Board considered other direct and indirect benefits received by SSGA FM and Affiliated Service Providers in connection with their relationships with the Fund, together with the profitability of each of the Affiliated Service Providers with respect to their services to the Fund and/or fund complex. The Board also considered the various risks borne by SSGA FM and State Street in connection with their various roles in servicing the Trust, including reputational and entrepreneurial risks.
The Board concluded that the profitability of the Adviser with respect to the Fund, and the profitability range of each of the Affiliated Service Providers with respect to its services to the Fund, were reasonable in relation to the services provided.
Economies of Scale
In reviewing management fees and profitability, the Board also considered the extent to which the Adviser and its affiliates, on the one hand, and the Fund and the fund complex, on the other hand, can expect to realize benefits from economies of scale as the assets of the Fund and fund complex increase. The Board acknowledged the difficulty in accurately measuring the benefits resulting from the economies of scale with respect to the management of the Fund. The Board concluded that, in light of the current size of the Fund and the fund complex, the level of profitability of the Adviser and its affiliates with respect to the Fund and the fund complex over various time periods, and the comparative management fee and expense ratio of the Fund during these periods, it does not appear that the Adviser or its affiliates has realized benefits from economies of scale in managing the assets of the Fund to such an extent that previously agreed advisory fees should be reduced or that breakpoints in such fees should be implemented for the Fund at this time.
Conclusions
In reaching its decision to approve the Advisory Agreement, the Board did not identify any single factor as being controlling, but based its recommendation on each of the factors it considered. Each Trustee may have contributed different weight to the various factors. Based upon the materials reviewed, the representations made and the considerations described above, and as part of its deliberations, the Board, including the Independent Trustees, concluded that the Adviser possesses the capability and resources to perform the duties required of it under the Advisory Agreement.
Further, based upon its review of the Advisory Agreement, the materials provided, and the considerations described above, the Board, including the Independent Trustees, concluded that (1) the terms of the Advisory Agreement are reasonable, fair, and in the best interests of the Fund and its shareholders, and (2) the rates payable under the Advisory Agreement are fair and reasonable in light of the usual and customary charges made for services of the same nature and quality.
SSGA FUNDS
State Street S&P 500 Index Fund (continued)
Other Information — August 31, 2022 (Unaudited)
TRUSTEES AND OFFICERS INFORMATION
Name, Address
and Year of Birth | | Position(s) Held with Trust | | Term of
Office and
Length of
Time Served | | Principal Occupation During the Past Five Years and Relevant Experience | | Number of Funds in Fund Complex Overseen by Trustee† | | Other
Directorships
Held by Trustee
During the
Past Five Years |
| Trustees | | | | | | | | | | |
| Independent Trustees | | | | | | | | | | |
Michael F. Holland
c/o SSGA Funds
Management, Inc.
One Iron Street
Boston, MA 02210
YOB: 1944 | | Trustee and
Co-
Chairperson
of the Board | | Term: Indefinite
Elected: 1/14 | | Chairman, Holland & Company L.L.C. (investment adviser) (1995 - present). | | 59 | | Director, the Holland Series Fund, Inc.; Director, The China Fund, Inc. (1992-2017); Director, The Taiwan Fund, Inc. (2007-2017); Director, Reaves Utility Income Fund, Inc.; and Director, Blackstone/GSO Loans (and Real Estate) Funds. |
Patrick J. Riley
c/o SSGA Funds
Management, Inc.
One Iron Street
Boston, MA 02210
YOB: 1948 | | Trustee and
Co-
Chairperson
of the Board | | Term: Indefinite
Elected: 1988 | | 2002 to May 2010, Associate Justice of the Superior Court, Commonwealth of Massachusetts; 1985 to 2002, Partner, Riley, Burke & Donahue, L.L.P. (law firm); 1998 to Present, Independent Director, State Street Global Advisers Europe, Limited (investment company); 1998 to Present, Independent Director, SSGA Liquidity plc (formerly, SSGA Cash Management Fund plc); January 2009 to present, Independent Director, SSGA Fixed Income plc; and January 2009 - 2019, Independent Director, SSGA Qualified Funds PLC. | | 59 | | Board Director and Chairman, SPDR Europe 1PLC Board (2011 - present); Board Director and Chairman, SPDR Europe II, PLC (2013 - present). |
John R. Costantino
c/o SSGA Funds
Management, Inc.
One Iron Street
Boston, MA 02210
YOB: 1946 | | Trustee and
Chairperson
of the
Qualified Legal
Compliance
Committee | | Term: Indefinite
Elected: 12/18 | | Senior Advisor to NGN Capital LLC (January 2020 - present); Managing General Partner, NGN Capital LLC (2006 - December 2019). | | 59 | | Director of Kleinfeld Bridal Corp. (January 2016 - present); Trustee of Neuroscience Research Institute (1986 - 2017); Trustee of Fordham University (1989 - 1995 and 2001 - 2007) and Trustee Emeritus (2007 - present);Trustee and Independent Chairperson of GE Funds (1993 - February 2011); Director, Muscular Dystrophy Association (since 2019);
Trustee of Gregorian University Foundation (1992 - 2007); Chairman of the Board of Directors, Vivaldi Biosciences Inc. (May 2017 - present); Chairman of the Supervisory Board, Vivaldi Biosciences AG. (May 2017 - present); Trustee, Gallim Dance (December 2021 - present). |
Donna M. Rapaccioli
c/o SSGA Funds
Management, Inc.
One Iron Street
Boston, MA 02210
YOB: 1962 | | Trustee and
Chairperson of the Audit Committee | | Term: Indefinite
Elected: 12/18 | | Dean of the Gabelli School of Business (2007 - June 2022) and Accounting Professor (1987 - present) at Fordham University. | | 59 | | Director- Graduate Management Admissions Council (2015 - present); Trustee of Emmanuel College (2010 - 2019). |
Richard D. Shirk
c/o SSGA Funds
Management, Inc.
One Iron Street
Boston, MA 02210
YOB: 1945 | | Trustee and
Chairperson
of the
Nominating Committee and
Chairperson of the
Governance Committee | | Term: Indefinite
Elected: 1988 | | March 2001 to April 2002, Chairman (1996 to March 2001, President and Chief Executive Officer), Cerulean Companies, Inc. (holding company) (Retired); 1992 to March 2001, President and Chief Executive Officer, Blue Cross Blue Shield of Georgia (health insurer, managed healthcare). | | 59 | | 1998 to December 2008, Chairman, Board Member and December 2008 to Present, Investment Committee Member, Healthcare Georgia Foundation (private foundation); September 2002 to 2012, Lead Director and Board Member, Amerigroup Corp. (managed health care); 1999 to 2013, Board Member and (2001 to 2017) Investment Committee Member, Woodruff Arts Center; 2003 to 2009, Trustee, Gettysburg College; Board member, Aerocare Holdings (2003 - January 2021), Regenesis Biomedical Inc. (April 2012 - present). |
SSGA FUNDS
State Street S&P 500 Index Fund (continued)
Other Information — August 31, 2022 (Unaudited)
Name, Address
and Year of Birth | | Position(s) Held with Trust | | Term of
Office and
Length of
Time Served | | Principal Occupation During the Past Five Years and Relevant Experience | | Number of Funds in Fund Complex Overseen by Trustee† | | Other
Directorships
Held by Trustee
During the
Past Five Years |
Michael A. Jessee
c/o SSGA Funds
Management, Inc.
One Iron Street
Boston, MA 02210
YOB: 1946 | | Trustee and Co-
Chairperson
of the Valuation Committee | | Term: Indefinite
Appointed: 7/16
Elected: 12/18 | | Retired; formerly, President and Chief Executive Officer of the Federal Home Loan Bank of Boston (1989 - 2009); Trustee, Randolph-Macon College (2004 - 2016). | | 59 | | None. |
Margaret McLaughlin
c/o SSGA Funds
Management, Inc.
One Iron Street
Boston, MA 02210
YOB: 1967 | | Trustee | | Term: Indefinite
Appointed: 9/22 | | Consultant (since 2020) Bates Group (consultants); Consultant (2019 - 2020) Madison Dearborn Partners (private equity); General Counsel/CCO (2011 - 2019) Kramer Van Kirk Credit Strategies L.P./Mariana Systems LLC (Investment Adviser/SaaS Technology). | | 59 | | Director, Manning & Napier Fund Inc. (2021 – present). |
George Pereira
c/o SSGA Funds
Management, Inc.
One Iron Street
Boston, MA 02210
YOB: 1964 | | Trustee | | Term: Indefinite
Appointed: 9/22 | | Chief Operating Officer (January 2011 - September 2020) and Chief Financial Officer (November 2004 – September 2020), Charles Schwab Investment Management. | | 59 | | Director, Pacific Premier Bancorp, Pacific Premier Bank (2021 - present); Director, Charles Schwab Asset Management (Ireland) Ltd., & Charles Schwab Worldwide Funds plc. (2005 - 2020); Director, Rotaplast International, Inc. (non-profit providing free medical services to children worldwide) (2012 - 2018). |
| Interested Trustee(1) | | | | | | | | | | |
Ellen M. Needham(2)
SSGA Funds Management, Inc.
One Iron Street
Boston, MA 02210
YOB: 1967 | | Trustee and President | | Term: Indefinite
Elected: 12/18 | | Chairman, SSGA Funds Management, Inc. (March 2020 - present); President and Director, SSGA Funds Management, Inc. (2001 - present)*; Senior Managing Director, State Street Global Advisors (1992 - present)*; Manager, State Street Global Advisors Funds Distributors, LLC (May 2017 - present). | | 59 | | Board Director, SSGA SPDR ETFs Europe 1 plc (May 2020 - present); Board Director, SSGA SPDR ETFs Europe II plc (May 2020 - present). |
| † For the purpose of determining the number of portfolios overseen by the Trustees, “Fund Complex” comprises registered investment companies for which SSGA FM serves as investment adviser. |
| (1) The individual listed below is a Trustee who is an “interested person,” as defined in the 1940 Act, of the Trust (“Interested Trustee”). |
| (2) Ms. Needham is an Interested Trustee because of her employment by SSGA FM, an affiliate of the Trust. |
| * Served in various capacities and/or with various affiliated entities during noted time period. |
SSGA FUNDS
State Street S&P 500 Index Fund (continued)
Other Information — August 31, 2022 (Unaudited)
| The following lists the principal officers for the Trust, as well as their mailing addresses and ages, positions with the Trust and length of time served, and present and principal occupations: |
Name, Address
and Year of Birth | | Position(s) Held with Trust | | Term of
Office and
Length of
Time Served | | Principal Occupation(s) During the Past 5 Years |
| Officers | | | | | | |
ELLEN M. NEEDHAM
SSGA Funds Management, Inc.
One Iron Street
Boston, MA 02210
YOB: 1967 | | President,
Trustee | | Term: Indefinite
Elected: 10/12 | | Chairman, SSGA Funds Management, Inc. (March 2020 - present); President and Director, SSGA Funds Management, Inc. (2001 - present)*; Senior Managing Director, State Street Global Advisors (1992 - present)*; Manager, State Street Global Advisors Funds Distributors, LLC (May 2017 - present). |
BRUCE S. ROSENBERG
SSGA Funds Management, Inc.
One Iron Street
Boston, MA 02210
YOB: 1961 | | Treasurer | | Term: Indefinite
Elected: 2/16 | | Managing Director, State Street Global Advisors and SSGA Funds Management, Inc. (July 2015 - present); Director, Credit Suisse (April 2008 - July 2015). |
ANN M. CARPENTER
SSGA Funds Management, Inc.
One Iron Street
Boston, MA 02210
YOB: 1966 | | Vice
President
and Deputy
Treasurer | | Term: Indefinite
Elected: 10/12
Term: Indefinite
Elected: 2/16 | | Chief Operating Officer, SSGA Funds Management, Inc. (April 2005 - present)*; Managing Director, State Street Global Advisors (April 2005 - present).* |
CHAD C. HALLETT
SSGA Funds Management, Inc.
One Iron Street
Boston, MA 02210
YOB: 1969 | | Deputy Treasurer | | Term: Indefinite
Elected: 2/16 | | Vice President, State Street Global Advisors and SSGA Funds Management, Inc. (November 2014 - present); Vice President, State Street Bank and Trust Company (2001 - November 2014).* |
DARLENE ANDERSON-VASQUEZ
SSGA Funds Management, Inc.
One Iron Street
Boston, MA 02210
YOB: 1968 | | Deputy Treasurer | | Term: Indefinite
Elected: 11/16 | | Managing Director, State Street Global Advisors and SSGA Funds Management, Inc. (May 2016 - present); Senior Vice President, John Hancock Investments (September 2007 - May 2016). |
ARTHUR A. JENSEN
SSGA Funds Management, Inc.
1600 Summer Street
Stamford, CT 06905
YOB: 1966 | | Deputy Treasurer | | Term: Indefinite
Elected: 9/17 | | Vice President, State Street Global Advisors and SSGA Funds Management, Inc. (July 2016 - present); Mutual Fund Controller, GE Asset Management Incorporated (April 2011 - July 2016). |
DAVID LANCASTER
SSGA Funds Management, Inc.
One Iron Street
Boston, MA 02210
YOB: 1971 | | Assistant
Treasurer | | Term: Indefinite
Elected: 11/20 | | Vice President, State Street Global Advisors and SSGA Funds Management, Inc. (July 2017 - present); Assistant Vice President, State Street Bank and Trust Company (November 2011 - July 2017).* |
RYAN HILL
SSGA Funds Management, Inc.
One Iron Street
Boston, MA 02210
YOB: 1982 | | Assistant Treasurer | | Term: Indefinite
Elected: 5/22 | | Vice President, State Street Global Advisors and SSGA Funds Management, Inc. (May 2017 – present); Assistant Vice President, State Street Bank and Trust Company (May 2014 – May 2017). |
JOHN BETTENCOURT
SSGA Funds Management, Inc.
One Iron Street,
Boston, MA 02210
YOB:1976 | | Assistant Treasurer | | Term: Indefinite
Elected: 5/22 | | Vice President, State Street Global Advisors and SSGA Funds Management, Inc. (March 2020 – present); Assistant Vice President, State Street Global Advisors (June 2007 – March 2020). |
BRIAN HARRIS
SSGA Funds Management, Inc.
One Iron Street
Boston, MA 02210
YOB: 1973 | | Chief Compliance Officer, Anti-Money Laundering Officer and Code of Ethics Compliance Officer | | Term: Indifinite
Elected: 11/13
Term: Indefinite
Elected: 9/16 | | Managing Director, State Street Global Advisors and SSGA Funds Management, Inc. (June 2013 - present).* |
SEAN O'MALLEY
SSGA Funds Management, Inc.
One Iron Street
Boston, MA 02210
YOB: 1969 | | Chief Legal Officer | | Term: Indefinite
Elected: 8/19 | | Senior Vice President and General Counsel, State Street Global Advisors (May 2022 - present); Senior Vice President and Deputy General Counsel, State Street Global Advisors (November 2013 - May 2022). |
SSGA FUNDS
State Street S&P 500 Index Fund (continued)
Other Information — August 31, 2022 (Unaudited)
Name, Address
and Year of Birth | | Position(s) Held with Trust | | Term of
Office and
Length of
Time Served | | Principal Occupation(s) During the Past 5 Years |
DAVID BARR
SSGA Funds Management, Inc.
One Iron Street
Boston, MA 02210
YOB:1974 | | Secretary | | Term: Indefinite
Elected: 9/20 | | Vice President and Senior Counsel, State Street Global Advisors (October 2019 - present); Vice President and Counsel, Eaton Vance Corp. (October 2010 - October 2019). |
DAVID URMAN
SSGA Funds Management, Inc.
One Iron Street
Boston,MA 02210
YOB:1985 | | Assistant Secretary | | Term: Indefinite
Elected: 8/19 | | Vice President and Senior Counsel, State Street Global Advisors (April 2019 - present); Vice President and Counsel, State Street Global Advisors (August 2015 - April 2019); Associate, Ropes & Gray LLP (November 2012 - August 2015). |
| * Served in various capacities and/or with various affiliated entities during noted time period. |
| The Statement of Additional Information (SAI) includes additional information about the Trust's trustees and officers and is available, without charge, upon request and by calling 1-877-521-4083. |
| |
[This Page Intentionally Left Blank]
State Street S&P 500 Index Fund
One Iron Street
Boston, Massachusetts 02210
(800) 997-7327
Trustees
John R. Costantino
Michael F. Holland
Michael A. Jessee
Ellen M. Needham
Donna M. Rapaccioli
Patrick J. Riley
Richard D. Shirk
Margaret McLaughlin
George Pereira
Investment Adviser and Administrator
SSGA Funds Management, Inc.
One Iron Street
Boston, MA 02210
Custodian and Office of Shareholder Inquiries
State Street Bank Financial Center
One Lincoln Street
Boston, Massachusetts 02111
Transfer and Dividend Paying Agent
DST Asset Manager Solutions Inc.
State Street Global Advisors
P.O. Box 219737
Kansas City, MO 64121-9737
Distributor
State Street Global Advisors Funds Distributors, LLC
One Iron Street
Boston, Massachusetts 02210
Sub-Administrator
State Street Bank and Trust Company
State Street Financial Center
One Lincoln Street
Boston, Massachusetts 02111
Legal Counsel
Ropes & Gray LLP
800 Boylston Street
Boston, MA 02199
Independent Registered Public Accounting Firm
Ernst & Young LLP
200 Clarendon Street
Boston, MA 02116
Distributor: State Street Global Advisors Funds Distributors, LLC, member FINRA, SIPC, an indirect wholly owned subsidiary of State Street Corporation. References to State Street may include State Street Corporation and its affiliates. The SSGA Funds pay State Street Bank and Trust Company for its services as custodian and shareholder servicing agent and pay SSGA Funds Management, Inc. for investment advisory and administrator services.
The information contained in this report is intended for the general information of shareholders of the Trust. This report is not authorized for distribution to prospective investors unless preceded or accompanied by a current Trust prospectus which contains important information concerning the Trust. You may obtain a current prospectus and SAI from the Distributor by calling 1-800-997-7327 or visiting www.ssga.com. Please read the prospectus carefully before you invest.
SSGASPFDAR
Annual Report
August 31, 2022
SSGA Funds
| State Street International Stock Selection Fund |
The information contained in this report is intended for the general information of shareholders of the Trust. This report is not authorized for distribution to prospective investors unless preceded or accompanied by a current Trust prospectus which contains important information concerning the Trust. You may obtain a current prospectus and SAI from the Distributor by calling 1-800-997-7327 or visiting www.ssga.com. Please read the prospectus carefully before you invest.
TABLE OF CONTENTS
The information contained in this report is intended for the general information of shareholders of the Trust. This report is not authorized for distribution to prospective investors unless preceded or accompanied by a current Trust prospectus which contains important information concerning the Trust. You may obtain a current prospectus and SAI from the Distributor by calling 1-800-997-7327 or visiting www.ssga.com. Please read the prospectus carefully before you invest.
State Street International Stock Selection Fund
MANAGEMENT DISCUSSION OF FUND PERFORMANCE (UNAUDITED)
State Street International Stock Selection Fund (the “Fund”) seeks to provide long-term capital growth by investing primarily in securities of foreign issuers. The Fund’s benchmark is the MSCI EAFE Net Dividend Index (the “Index”).
For the 12-month period ended August 31, 2022 (the “Reporting Period”), the total return for the Fund’s Class K was –19.42%, and the Index was –19.80%. The Fund and Index returns reflect the reinvestment of dividends and other income. The Fund’s performance reflects the expenses of managing the Fund, including brokerage and advisory expenses. The Index is unmanaged and Index returns do not reflect fees and expenses of any kind, which would have a negative impact on returns.
Value, sentiment and quality based factors were primary drivers of Fund performance during the Reporting Period relative to the Index. All three themes yielded positive spreads as companies with lower valuation, good market sentiment and higher quality outperformed their more expensive, bad market sentiment and lower quality peers.
Stock selection in each of the Industrials and Information Technology sectors was the largest positive contribution to Fund performance, while stock selection in the Consumer Staples and Materials sectors was the largest negative contribution to excess return relative to the Index.
The Fund used futures in order to equitize cash during the Reporting Period. The Fund’s use of MSCI EAFE futures did not materially impact Fund performance relative to the Index as it is held only to equitize cash, and the futures contract tracks the Index.
On an individual security level, the top positive contributors to the Fund’s performance on an absolute basis during the Reporting Period were Marubeni Corporation, Glencore PLC and Equinor ASA. The top negative contributors to the Fund’s performance on an absolute basis during the Reporting Period were Anglo America PLC, Total Energies and Deutsche Post AG.
The views expressed above reflect those of the Fund’s portfolio manager only through the Reporting Period, and do not necessarily represent the views of the Adviser as a whole. Any such views are subject to change at any time based upon market or other conditions and the Adviser disclaims any responsibility to update such views. These views may not be relied on as investment advice and, because investment decisions for a fund are based on numerous factors, may not be relied on as an indication of trading intent on behalf of any fund.
See accompanying notes to financial statements.
1
State Street International Stock Selection Fund
Performance Summary (Unaudited)
Comparison of Change in Value of a $10,000 Investment
(Based on Net Asset Value)
Past performance is not a guarantee of future results.
The growth of $10,000 is cumulative. The performance of other shares classes will vary based on the sales charges and
the fee structure of those classes.
Index returns do not reflect any fees or expenses and it is not possible to invest directly into an index.
Line graph is based on cumulative total return.
Average Annual Total Returns as of August 31, 2022
| | Total Return
One Year Ended
August 31, 2022 | Adjusted for
the Maximum
Sales Charge
(Max 5.25% Load) | Average Annual
Total Return
Five Years Ended
August 31, 2022 | Adjusted for
the Maximum
Sales Charge
(Max 5.25% Load) | Average Annual
Total Return
Ten Years Ended
August 31, 2022 | Adjusted for
the Maximum
Sales Charge
(Max 5.25% Load) |
| State Street International Stock Selection Fund Class A | (19.76%) | (24.00%) | (1.45%) | (2.50%) | 3.83% | 3.27% |
| State Street International Stock Selection Fund Class I | (19.47%) | N/A | (1.03%) | N/A | 4.17% | N/A |
| State Street International Stock Selection Fund Class K | (19.42%) | N/A | (0.96%) | N/A | 4.25% | N/A |
| State Street International Stock Selection Fund Class N | (19.61%) | N/A | (1.21%) | N/A | 4.05% | N/A |
| MSCI ® EAFE® Net Dividend Index (reflects no deduction for fees, expenses or taxes) (1) | (19.80%) | N/A | 1.63% | N/A | 5.00% | N/A |
| (1) | The MSCI® EAFE® Net Dividend Index (Europe, Australasia, Far East) is a free float-adjusted market capitalization index that is designed to measure the equity market performance of developed markets, excluding the U.S. and Canada. The MSCI® EAFE® Net Dividend Index consists of the following 21 developed market country indices: Australia, Austria, Belgium, Denmark, Finland, France, Germany, Hong Kong, Ireland, Israel, Italy, Japan, the Netherlands, New Zealand, Norway, Portugal, Singapore, Spain, Sweden, Switzerland, and the United Kingdom. |
See accompanying notes to financial statements.
2
State Street International Stock Selection Fund
Performance Summary (Unaudited) (continued)
The maximum sales charge for Class A shares is 5.25%. A contingent deferred sales charge ("CDSC") of 1.00% may be assessed on redemptions of Class A shares made within 18 months after purchase where no initial sales charge was paid at the time of purchase as part of an investment of $1,000,000 or more. Class I, Class K, and Class N are not subject to a sales charge.
Adjusted Performance shown for the periods prior to the inception of Class A shares on July 7, 2014 reflects the historical performance of the Fund’s Class N shares adjusted to reflect the higher expenses of Class A shares, including applicable 12b-1 fees and the maximum sales load of Class A. Unadjusted Performance shown for the periods prior to the inception of Class A shares on July 7, 2014 reflects the historical performance of the Fund’s Class N shares adjusted to reflect the higher expenses of Class A shares, including applicable 12b-1 fees. Unadjusted returns do not reflect sales charges and would have been lower if they had. Performance shown for the periods prior to the inception of Class I and K shares on July 7, 2014, reflects the historical performance of the Fund’s Class N shares. Had the Fund’s Class I and K fees been reflected, the returns shown for those periods would have been higher.
Performance quoted represents past performance, which is no guarantee of future results. Investment return and principal value will fluctuate, so you may have a gain or loss when shares are sold. Current performance may be higher or lower than that quoted. Visit www.ssga.com for most recent month-end performance. The returns do not reflect the deduction of taxes that a shareholder would pay on Fund distributions or on the redemption of Fund shares. Performance includes reinvestment of all distributions. The gross expense ratio for the State Street International Stock Selection Fund as stated in the Fees and Expenses table of the most recent prospectus is 1.46%, 1.21%, 1.01%, and 1.26% for Class A, I, K, and N, respectively, and may differ from the expense ratios disclosed in the Financial Highlights tables in this report.
Performance data reflects an expense limitation currently in effect, without which returns would have been lower.
See accompanying notes to financial statements.
3
State Street International Stock Selection Fund
Portfolio Statistics (Unaudited)
Top Five Holdings as of August 31, 2022
| | | |
| | Description | % of Net Assets | |
| | Roche Holding AG | 2.3% | |
| | Novartis AG | 2.0 | |
| | BP PLC | 1.6 | |
| | British American Tobacco PLC | 1.5 | |
| | Shell PLC | 1.4 | |
| | TOTAL | 8.8% | |
(The five largest holdings are subject to change, and there are no guarantees the Fund will continue to remain invested in any particular company.)
See accompanying notes to financial statements.
4
STATE STREET INTERNATIONAL STOCK SELECTION FUND
SCHEDULE OF INVESTMENTS
August 31, 2022
| Security Description | | | Shares | | Value |
| COMMON STOCKS — 90.8% | | | | |
| AUSTRALIA — 10.4% | |
Ampol, Ltd.
| | | 15,714 | | $ 369,348 |
Aurizon Holdings, Ltd.
| | | 403,587 | | 1,020,725 |
Austal, Ltd.
| | | 104,750 | | 183,216 |
BHP Group, Ltd.
| | | 72,837 | | 1,986,994 |
Brambles, Ltd.
| | | 29,670 | | 249,709 |
Coles Group, Ltd.
| | | 128,377 | | 1,536,566 |
Genworth Mortgage Insurance Australia, Ltd.
| | | 23,408 | | 45,037 |
Glencore PLC (a)
| | | 360,440 | | 1,970,727 |
GPT Group REIT
| | | 380,178 | | 1,083,319 |
GrainCorp, Ltd. Class A
| | | 55,459 | | 313,674 |
Growthpoint Properties Australia, Ltd. REIT
| | | 171,430 | | 410,065 |
Incitec Pivot, Ltd.
| | | 297,122 | | 785,191 |
JB Hi-Fi, Ltd. (b)
| | | 6,556 | | 180,813 |
NRW Holdings, Ltd.
| | | 281,136 | | 467,361 |
Orora, Ltd.
| | | 32,835 | | 73,957 |
Rio Tinto PLC
| | | 12,631 | | 697,361 |
Scentre Group REIT
| | | 822,113 | | 1,633,781 |
Seven West Media, Ltd. (a)(b)
| | | 449,266 | | 158,071 |
SmartGroup Corp., Ltd.
| | | 81,249 | | 328,137 |
Sonic Healthcare, Ltd.
| | | 64,603 | | 1,493,943 |
Stockland REIT
| | | 53,139 | | 130,715 |
Vicinity Centres REIT
| | | 1,154,905 | | 1,512,012 |
Woodside Energy Group, Ltd.
| | | 2,140 | | 49,709 |
| | | | | | 16,680,431 |
| AUSTRIA — 0.1% | |
Strabag SE
| | | 3,520 | | 135,306 |
| BELGIUM — 0.4% | |
Bekaert SA
| | | 19,019 | | 583,368 |
| CHINA — 0.0% (c) | |
Kerry Logistics Network, Ltd.
| | | 23,500 | | 51,666 |
| DENMARK — 2.4% | |
AP Moller - Maersk A/S Class A
| | | 36 | | 84,100 |
AP Moller - Maersk A/S Class B
| | | 551 | | 1,321,933 |
D/S Norden A/S
| | | 8,635 | | 402,600 |
Matas A/S
| | | 20,419 | | 209,402 |
Novo Nordisk A/S Class B
| | | 8,398 | | 897,862 |
Solar A/S Class B
| | | 2,952 | | 238,666 |
Sydbank A/S
| | | 24,948 | | 720,894 |
| | | | | | 3,875,457 |
| FINLAND — 2.7% | |
Citycon Oyj (a)(b)
| | | 73,124 | | 518,180 |
Kesko Oyj Class B
| | | 17,139 | | 360,564 |
Nokia Oyj
| | | 327,375 | | 1,649,762 |
Nordea Bank Abp
| | | 191,471 | | 1,775,290 |
| | | | | | 4,303,796 |
| FRANCE — 8.4% | |
Arkema SA
| | | 13,594 | | 1,147,628 |
BNP Paribas SA
| | | 790 | | 36,711 |
Capgemini SE
| | | 8,784 | | 1,517,682 |
| Security Description | | | Shares | | Value |
Carmila SA REIT (a)
| | | 27,053 | | $ 430,851 |
Cie de Saint-Gobain
| | | 32,099 | | 1,292,875 |
Cie des Alpes (a)
| | | 7,574 | | 119,819 |
Coface SA
| | | 60,316 | | 603,128 |
Derichebourg SA
| | | 36,040 | | 202,743 |
Eiffage SA
| | | 17,023 | | 1,497,257 |
Ipsen SA
| | | 12,975 | | 1,243,487 |
LVMH Moet Hennessy Louis Vuitton SE
| | | 823 | | 531,055 |
Publicis Groupe SA (a)
| | | 26,919 | | 1,314,328 |
Rexel SA (a)
| | | 42,290 | | 686,872 |
Sanofi
| | | 25,754 | | 2,105,384 |
Societe Generale SA
| | | 31,725 | | 699,391 |
| | | | | | 13,429,211 |
| GEORGIA — 0.4% | |
TBC Bank Group PLC
| | | 31,140 | | 641,751 |
| GERMANY — 5.8% | |
Bayer AG
| | | 34,543 | | 1,826,910 |
Bayerische Motoren Werke AG
| | | 19,672 | | 1,449,406 |
Bilfinger SE
| | | 18,771 | | 557,336 |
Elmos Semiconductor SE
| | | 7,653 | | 324,657 |
GFT Technologies SE
| | | 8,677 | | 288,448 |
Mercedes-Benz Group AG
| | | 8,302 | | 465,457 |
Merck KGaA
| | | 8,244 | | 1,416,154 |
RWE AG
| | | 32,693 | | 1,248,134 |
Telefonica Deutschland Holding AG
| | | 342,138 | | 888,171 |
Volkswagen AG
| | | 279 | | 51,607 |
Wacker Chemie AG
| | | 5,096 | | 724,742 |
| | | | | | 9,241,022 |
| HONG KONG — 0.6% | |
Hutchison Port Holdings Trust Stapled Security
| | | 1,760,400 | | 377,741 |
Kerry Properties, Ltd.
| | | 30,000 | | 69,166 |
Luk Fook Holdings International, Ltd.
| | | 14,000 | | 35,788 |
Sun Hung Kai & Co., Ltd.
| | | 156,000 | | 71,898 |
Texhong Textile Group, Ltd.
| | | 174,500 | | 163,951 |
WH Group, Ltd. (d)
| | | 433,000 | | 295,013 |
| | | | | | 1,013,557 |
| INDONESIA — 1.0% | |
Bumitama Agri, Ltd.
| | | 565,000 | | 252,416 |
First Pacific Co., Ltd.
| | | 1,970,000 | | 759,698 |
Golden Agri-Resources, Ltd.
| | | 3,099,100 | | 621,273 |
| | | | | | 1,633,387 |
| ISRAEL — 1.3% | |
Bank Leumi Le-Israel BM
| | | 152,877 | | 1,616,096 |
Delek Automotive Systems, Ltd.
| | | 17,547 | | 270,588 |
ICL Group, Ltd.
| | | 15,643 | | 149,370 |
ZIM Integrated Shipping Services, Ltd. (b)
| | | 1,400 | | 50,526 |
| | | | | | 2,086,580 |
See accompanying notes to financial statements.
5
STATE STREET INTERNATIONAL STOCK SELECTION FUND
SCHEDULE OF INVESTMENTS (continued)
August 31, 2022
| Security Description | | | Shares | | Value |
| ITALY — 0.5% | |
Eni SpA
| | | 20,644 | | $ 243,866 |
Sanlorenzo SpA/Ameglia
| | | 6,313 | | 198,339 |
Unipol Gruppo SpA
| | | 70,281 | | 294,308 |
| | | | | | 736,513 |
| JAPAN — 22.4% | |
Astellas Pharma, Inc.
| | | 28,700 | | 406,902 |
Brother Industries, Ltd.
| | | 51,600 | | 987,495 |
Canon, Inc.
| | | 70,300 | | 1,683,636 |
Citizen Watch Co., Ltd.
| | | 9,800 | | 41,872 |
Dai Nippon Printing Co., Ltd.
| | | 38,200 | | 804,065 |
Dai-ichi Life Holdings, Inc.
| | | 63,100 | | 1,090,242 |
Dentsu Group, Inc.
| | | 23,300 | | 750,377 |
Dexerials Corp. (b)
| | | 17,400 | | 483,782 |
Electric Power Development Co., Ltd.
| | | 2,900 | | 44,672 |
Fujikura, Ltd.
| | | 52,900 | | 375,658 |
Idec Corp.
| | | 5,900 | | 123,262 |
Idemitsu Kosan Co., Ltd. (b)
| | | 41,500 | | 1,094,241 |
ITOCHU Corp.
| | | 21,000 | | 577,935 |
Japan Post Holdings Co., Ltd.
| | | 241,500 | | 1,666,056 |
Japan Post Insurance Co., Ltd.
| | | 81,100 | | 1,242,258 |
Japan Tobacco, Inc.
| | | 68,100 | | 1,153,847 |
Kawasaki Kisen Kaisha, Ltd. (b)
| | | 500 | | 31,634 |
KDDI Corp.
| | | 53,200 | | 1,627,980 |
Marubeni Corp.
| | | 159,800 | | 1,665,481 |
Mazda Motor Corp.
| | | 172,500 | | 1,527,678 |
Mitsui & Co., Ltd.
| | | 80,500 | | 1,889,264 |
Mitsui OSK Lines, Ltd. (b)
| | | 31,500 | | 820,688 |
NGK Insulators, Ltd.
| | | 63,700 | | 909,475 |
NGK Spark Plug Co., Ltd.
| | | 36,400 | | 746,842 |
Nippon Telegraph & Telephone Corp.
| | | 61,300 | | 1,661,492 |
Nippon Yusen KK (b)
| | | 17,600 | | 1,342,425 |
Ono Pharmaceutical Co., Ltd.
| | | 35,500 | | 847,391 |
ORIX Corp.
| | | 98,200 | | 1,614,150 |
Osaka Soda Co., Ltd. (b)
| | | 4,900 | | 132,995 |
Renesas Electronics Corp. (a)
| | | 104,800 | | 992,304 |
SCREEN Holdings Co., Ltd.
| | | 8,800 | | 584,522 |
Seiko Epson Corp.
| | | 45,900 | | 721,264 |
Sekisui House, Ltd.
| | | 37,400 | | 635,973 |
Sompo Holdings, Inc.
| | | 8,300 | | 355,873 |
Sumitomo Forestry Co., Ltd.
| | | 3,000 | | 50,722 |
Takeda Pharmaceutical Co., Ltd.
| | | 54,800 | | 1,514,675 |
Tokyo Gas Co., Ltd.
| | | 32,100 | | 602,235 |
Tomy Co., Ltd.
| | | 6,700 | | 63,515 |
Topcon Corp.
| | | 15,800 | | 213,130 |
TOPPAN, INC.
| | | 66,400 | | 1,042,788 |
Toyo Seikan Group Holdings, Ltd.
| | | 3,700 | | 43,785 |
Toyota Motor Corp.
| | | 102,200 | | 1,529,429 |
| | | | | | 35,694,010 |
| LUXEMBOURG — 0.8% | |
ArcelorMittal SA
| | | 55,378 | | 1,314,348 |
| Security Description | | | Shares | | Value |
| NETHERLANDS — 3.5% | |
ASML Holding NV
| | | 1,622 | | $ 791,723 |
ASR Nederland NV
| | | 18,295 | | 746,696 |
Brunel International NV
| | | 27,125 | | 253,970 |
Eurocommercial Properties NV REIT
| | | 10,739 | | 224,753 |
Koninklijke Ahold Delhaize NV
| | | 2,392 | | 65,796 |
Koninklijke KPN NV
| | | 56,976 | | 181,303 |
NN Group NV
| | | 13,020 | | 535,096 |
OCI NV
| | | 4,067 | | 152,687 |
Shell PLC
| | | 84,709 | | 2,242,081 |
TKH Group NV
| | | 11,166 | | 389,555 |
| | | | | | 5,583,660 |
| NIGERIA — 0.1% | |
Airtel Africa PLC
| | | 106,493 | | 163,489 |
| NORWAY — 2.3% | |
Austevoll Seafood ASA
| | | 19,764 | | 211,855 |
Elkem ASA (a)(d)
| | | 203,881 | | 811,354 |
Equinor ASA
| | | 50,409 | | 1,956,405 |
Golden Ocean Group, Ltd.
| | | 4,113 | | 38,765 |
Grieg Seafood ASA
| | | 47,763 | | 577,889 |
Stolt-Nielsen, Ltd.
| | | 3,370 | | 72,015 |
| | | | | | 3,668,283 |
| PORTUGAL — 0.4% | |
Sonae SGPS SA
| | | 629,771 | | 633,008 |
| SINGAPORE — 0.6% | |
STMicroelectronics NV
| | | 28,742 | | 1,001,663 |
| SPAIN — 1.1% | |
Aedas Homes SA (d)
| | | 4,355 | | 76,590 |
Banco Bilbao Vizcaya Argentaria SA
| | | 183,423 | | 823,054 |
Telefonica SA (b)
| | | 189,793 | | 783,279 |
| | | | | | 1,682,923 |
| SWEDEN — 2.9% | |
Bilia AB Class A
| | | 32,499 | | 404,319 |
Boliden AB (a)
| | | 5,476 | | 175,353 |
Clas Ohlson AB Class B
| | | 29,226 | | 263,626 |
Coor Service Management Holding AB (d)
| | | 87,447 | | 677,096 |
Evolution AB (d)
| | | 1,829 | | 146,326 |
Inwido AB
| | | 57,461 | | 561,933 |
Loomis AB
| | | 28,257 | | 763,321 |
New Wave Group AB Class B
| | | 43,559 | | 700,624 |
SSAB AB Class A
| | | 150,382 | | 723,300 |
Swedish Orphan Biovitrum AB (a)
| | | 5,890 | | 130,062 |
Telia Co. AB
| | | 29,855 | | 105,082 |
| | | | | | 4,651,042 |
| SWITZERLAND — 7.7% | |
Cie Financiere Richemont SA Class A
| | | 2,264 | | 253,180 |
Holcim AG (a)
| | | 19,003 | | 842,318 |
Mobilezone Holding AG
| | | 42,080 | | 696,638 |
See accompanying notes to financial statements.
6
STATE STREET INTERNATIONAL STOCK SELECTION FUND
SCHEDULE OF INVESTMENTS (continued)
August 31, 2022
| Security Description | | | Shares | | Value |
Novartis AG
| | | 40,410 | | $ 3,268,685 |
Roche Holding AG Bearer Shares (b)
| | | 217 | | 82,885 |
Roche Holding AG
| | | 11,571 | | 3,728,655 |
Swiss Life Holding AG
| | | 2,611 | | 1,364,709 |
UBS Group AG
| | | 126,235 | | 2,000,410 |
| | | | | | 12,237,480 |
| UNITED KINGDOM — 11.7% | |
3i Group PLC
| | | 85,776 | | 1,207,408 |
AstraZeneca PLC
| | | 5,796 | | 716,921 |
Balfour Beatty PLC (b)
| | | 104,580 | | 382,938 |
BP PLC
| | | 497,175 | | 2,540,527 |
British American Tobacco PLC
| | | 60,076 | | 2,406,209 |
Burberry Group PLC
| | | 70,642 | | 1,428,995 |
CK Hutchison Holdings, Ltd.
| | | 125,000 | | 807,207 |
Coca-Cola Europacific Partners PLC
| | | 14,700 | | 722,799 |
Diageo PLC
| | | 2,894 | | 125,734 |
Inchcape PLC (b)
| | | 74,260 | | 652,089 |
Legal & General Group PLC
| | | 505,535 | | 1,480,747 |
Man Group PLC
| | | 224,111 | | 633,308 |
Morgan Sindall Group PLC
| | | 26,530 | | 529,664 |
NatWest Group PLC
| | | 507,965 | | 1,449,562 |
OSB Group PLC
| | | 110,303 | | 703,260 |
Redde Northgate PLC
| | | 83,463 | | 332,085 |
Redrow PLC (b)
| | | 24,775 | | 145,540 |
SSE PLC
| | | 44,602 | | 854,696 |
Tesco PLC
| | | 529,283 | | 1,528,712 |
| | | | | | 18,648,401 |
| UNITED STATES — 3.3% | |
GSK PLC
| | | 96,025 | | 1,534,961 |
Nestle SA
| | | 17,333 | | 2,028,358 |
Stellantis NV
| | | 126,300 | | 1,682,383 |
| | | | | | 5,245,702 |
TOTAL COMMON STOCKS
(Cost $159,135,708)
| | | | | 144,936,054 |
| Security Description | | | Shares | | Value |
| SHORT-TERM INVESTMENTS — 0.7% | | | |
State Street Institutional U.S. Government Money Market Fund, Class G Shares 2.29% (e)(f)
| | 100 | | $ 100 |
State Street Navigator Securities Lending Portfolio II (g)(h)
| | 1,198,958 | | 1,198,958 |
TOTAL SHORT-TERM INVESTMENTS
(Cost $1,199,058)
| | 1,199,058 | |
TOTAL INVESTMENTS — 91.5%
(Cost $160,334,766)
| | 146,135,112 | |
OTHER ASSETS IN EXCESS OF
LIABILITIES — 8.5%
| | 13,494,457 | |
NET ASSETS — 100.0%
| | $ 159,629,569 | |
| (a) | Non-income producing security. |
| (b) | All or a portion of the shares of the security are on loan at August 31, 2022. |
| (c) | Amount is less than 0.05% of net assets. |
| (d) | Securities purchased pursuant to Rule 144A of the Securities Act of 1933, as amended. These securities, which represent 1.3% of net assets as of August 31, 2022, are considered liquid and may be resold in transactions exempt from registration, normally to qualified institutional buyers. |
| (e) | The Fund invested in certain money market funds managed by SSGA Funds Management, Inc. Amounts related to these transactions during the period ended August 31, 2022 are shown in the Affiliate Table below. |
| (f) | The rate shown is the annualized seven-day yield at August 31, 2022. |
| (g) | The Fund invested in an affiliated entity. Amounts related to these investments during the year ended August 31, 2022 are shown in the Affiliate Table below. |
| (h) | Investment of cash collateral for securities loaned. |
| REIT | Real Estate Investment Trust |
At August 31, 2022, open futures contracts were as follows:
| Description | | Number of
Contracts | | Expiration
Date | | Notional
Amount | | Value | | Unrealized
Appreciation
(Depreciation) |
| MSCI EAFE Index (long) | | 17 | | 09/16/2022 | | $1,573,945 | | $1,553,035 | | $(20,910) |
During the year ended August 31, 2022, average notional value related to futures contracts was $1,920,427.
See accompanying notes to financial statements.
7
STATE STREET INTERNATIONAL STOCK SELECTION FUND
SCHEDULE OF INVESTMENTS (continued)
August 31, 2022
The following table summarizes the value of the Fund's investments according to the fair value hierarchy as of August 31, 2022.
| Description | | Level 1 –
Quoted Prices | | Level 2 –
Other Significant
Observable Inputs | | Level 3 –
Significant
Unobservable Inputs | | Total |
| ASSETS: | | | | | | | | |
| INVESTMENTS: | | | | | | | | |
Common Stocks
| | $2,341,995 | | $142,594,059 | | $— | | $144,936,054 |
Short-Term Investments
| | 1,199,058 | | — | | — | | 1,199,058 |
TOTAL INVESTMENTS
| | $3,541,053 | | $142,594,059 | | $— | | $ 146,135,112 |
| LIABILITIES: | | | | | | | | |
| OTHER FINANCIAL INSTRUMENTS: | | | | | | | | |
Futures Contracts(a)
| | (20,910) | | — | | — | | (20,910) |
TOTAL OTHER FINANCIAL INSTRUMENTS:
| | $ (20,910) | | $ — | | $— | | $ (20,910) |
| (a) | Futures Contracts are valued at unrealized appreciation (depreciation). |
Industry Breakdown as of August 31, 2022
| | |
| | | % of Net Assets |
| | Pharmaceuticals | 12.3% |
| | Insurance | 5.9 |
| | Oil, Gas & Consumable Fuels | 5.3 |
| | Banks | 4.9 |
| | Metals & Mining | 4.7 |
| | Automobiles | 4.2 |
| | Equity Real Estate Investment Trusts (REITs) | 3.4 |
| | Trading Companies & Distributors | 3.2 |
| | Food Products | 3.0 |
| | Food & Staples Retailing | 2.8 |
| | Commercial Services & Supplies | 2.7 |
| | Marine | 2.6 |
| | Chemicals | 2.4 |
| | Capital Markets | 2.4 |
| | Semiconductors & Semiconductor Equipment | 2.3 |
| | Diversified Telecommunication Services | 2.3 |
| | Tobacco | 2.2 |
| | Technology Hardware, Storage & Peripherals | 2.1 |
| | Textiles, Apparel & Luxury Goods | 1.9 |
| | Construction & Engineering | 1.9 |
| | Media | 1.4 |
| | Specialty Retail | 1.3 |
| | Building Products | 1.2 |
| | IT Services | 1.1 |
| | Wireless Telecommunication Services | 1.1 |
| | Communications Equipment | 1.0 |
| | Diversified Financial Services | 1.0 |
| | Health Care Providers & Services | 0.9 |
| | Road & Rail | 0.8 |
| | Independent Power and Renewable Electricity Producers | 0.8 |
| | Machinery | 0.6 |
| | Electrical Equipment | 0.6 |
| | Electric Utilities | 0.5 |
| | Beverages | 0.5 |
| | Construction Materials | 0.5 |
| | Household Durables | 0.5 |
| | Industrial Conglomerates | 0.5 |
| | Thrifts & Mortgage Finance | 0.5 |
| | Auto Components | 0.5 |
| | Electronic Equipment, Instruments & Components | 0.5 |
| | Real Estate Management & Development | 0.4 |
| | Distributors | 0.4 |
| | Gas Utilities | 0.4 |
| | Professional Services | 0.4 |
| | Transportation Infrastructure | 0.2 |
See accompanying notes to financial statements.
8
STATE STREET INTERNATIONAL STOCK SELECTION FUND
SCHEDULE OF INVESTMENTS (continued)
August 31, 2022
| | |
| | | % of Net Assets |
| | Hotels, Restaurants & Leisure | 0.2% |
| | Leisure Equipment & Products | 0.2 |
| | Aerospace & Defense | 0.1 |
| | Biotechnology | 0.1 |
| | Containers & Packaging | 0.1 |
| | Consumer Finance | 0.0* |
| | Air Freight & Logistics | 0.0* |
| | Short-Term Investments | 0.7 |
| | Other Assets in Excess of Liabilities | 8.5 |
| | TOTAL | 100.0% |
| * | Amount shown represents less than 0.05% of net assets. |
(The Fund’s industry breakdown is expressed as a percentage of net assets and may change over time.)
Affiliate Table
| | Number of
Shares Held
at
8/31/21 | | Value at
8/31/21 | | Cost of
Purchases | | Proceeds
from
Shares Sold | | Realized
Gain (Loss) | | Change in
Unrealized
Appreciation/
Depreciation | | Number of
Shares Held
at
8/31/22 | | Value at
8/31/22 | | Dividend
Income |
State Street Institutional U.S. Government Money Market Fund, Class G Shares
| 738,939 | | $ 738,940 | | $54,270,694 | | $55,009,534 | | $— | | $— | | 100 | | $ 100 | | $ 9,655 |
State Street Navigator Securities Lending Portfolio II
| 1,372,214 | | 1,372,214 | | 38,904,969 | | 39,078,225 | | — | | — | | 1,198,958 | | 1,198,958 | | 35,350 |
Total
| | | $ 2,111,154 | | $93,175,663 | | $94,087,759 | | $— | | $— | | | | $1,199,058 | | $45,005 |
See accompanying notes to financial statements.
9
STATE STREET INTERNATIONAL STOCK SELECTION FUND
Statement of Assets and Liabilities
August 31, 2022
| ASSETS | |
Investments in unaffiliated issuers, at value*
| $144,936,054 |
Investments in affiliated issuers, at value
| 1,199,058 |
Total Investments
| 146,135,112 |
Foreign currency, at value
| 1,085,817 |
Net cash at broker
| 89,665 |
Receivable for fund shares sold
| 12,686,763 |
Dividends receivable — unaffiliated issuers
| 566,675 |
Dividends receivable — affiliated issuers
| 1,752 |
Securities lending income receivable — unaffiliated issuers
| 1,302 |
Securities lending income receivable — affiliated issuers
| 3,289 |
Receivable from Adviser
| 36,504 |
Net receivable for foreign taxes recoverable
| 577,926 |
Prepaid expenses and other assets
| 1,481 |
TOTAL ASSETS
| 161,186,286 |
| LIABILITIES | |
Due to custodian
| 17,697 |
Payable upon return of securities loaned
| 1,198,958 |
Payable for fund shares repurchased
| 88,154 |
Payable to broker – variation margin on open futures contracts
| 20,910 |
Deferred foreign taxes payable
| 350 |
Advisory fee payable
| 90,375 |
Custodian fees payable
| 18,468 |
Administration fees payable
| 5,547 |
Shareholder servicing fee payable
| 1,424 |
Distribution fees payable
| 18,086 |
Trustees’ fees and expenses payable
| 537 |
Transfer agent fees payable
| 33,407 |
Sub-transfer agent fee payable
| 238 |
Registration and filing fees payable
| 873 |
Professional fees payable
| 39,819 |
Printing and postage fees payable
| 21,357 |
Accrued expenses and other liabilities
| 517 |
TOTAL LIABILITIES
| 1,556,717 |
NET ASSETS
| $159,629,569 |
| NET ASSETS CONSIST OF: | |
Paid-in Capital
| $187,049,499 |
Total distributable earnings (loss)**
| (27,419,930) |
NET ASSETS
| $159,629,569 |
| Class A | |
Net Assets
| $ 3,725,028 |
Shares Outstanding
| 408,887 |
Net asset value, offering and redemption price per share
| $ 9.11 |
Maximum sales charge
| 5.25% |
Maximum offering price per share
| $ 9.61 |
| Class I | |
Net Assets
| $ 2,604,347 |
Shares Outstanding
| 283,898 |
Net asset value, offering and redemption price per share
| $ 9.17 |
| Class K | |
Net Assets
| $ 66,730,823 |
Shares Outstanding
| 7,274,458 |
Net asset value, offering and redemption price per share
| $ 9.17 |
| Class N | |
Net Assets
| $ 86,569,371 |
Shares Outstanding
| 9,425,155 |
Net asset value, offering and redemption price per share
| $ 9.18 |
See accompanying notes to financial statements.
10
STATE STREET INTERNATIONAL STOCK SELECTION FUND
Statement of Assets and Liabilities (continued)
August 31, 2022
| COST OF INVESTMENTS: | |
Investments in unaffiliated issuers
| $159,135,708 |
Investments in affiliated issuers
| 1,199,058 |
Total cost of investments
| $160,334,766 |
Foreign currency, at cost
| $ 1,090,554 |
* Includes investments in securities on loan, at value
| $ 3,939,956 |
See accompanying notes to financial statements.
11
STATE STREET INTERNATIONAL STOCK SELECTION FUND
Statement of Operations
For the Year Ended August 31, 2022
| INVESTMENT INCOME | |
Dividend income — unaffiliated issuers
| $ 8,079,071 |
Dividend income — affiliated issuers
| 9,655 |
Unaffiliated securities lending income
| 49,882 |
Affiliated securities lending income
| 35,350 |
Foreign taxes withheld
| (753,282) |
TOTAL INVESTMENT INCOME (LOSS)
| 7,420,676 |
| EXPENSES | |
Advisory fee
| 1,340,152 |
Administration fees
| 89,344 |
| Shareholder servicing fees | |
Class N
| 23,974 |
| Distribution fees | |
Class A
| 10,583 |
Class N
| 234,531 |
Custodian fees
| 102,455 |
Trustees’ fees and expenses
| 22,844 |
Transfer agent fees
| 81,954 |
Class A
| 8,535 |
Class I
| 1,802 |
Registration and filing fees
| 71,225 |
Professional fees and expenses
| 38,081 |
Printing and postage fees
| 18,021 |
Insurance expense
| 1,836 |
Taxes and fees
| 2,183 |
Miscellaneous expenses
| 4,779 |
TOTAL EXPENSES
| 2,052,299 |
Expenses waived/reimbursed by the Adviser
| (430,560) |
NET EXPENSES
| 1,621,739 |
NET INVESTMENT INCOME (LOSS)
| $ 5,798,937 |
| REALIZED AND UNREALIZED GAIN (LOSS) | |
| Net realized gain (loss) on: | |
Investments — unaffiliated issuers
| (4,252,445) |
Foreign currency transactions
| 18,657 |
Futures contracts
| (557,329) |
Net realized gain (loss)
| (4,791,117) |
| Net change in unrealized appreciation/depreciation on: | |
Investments — unaffiliated issuers*
| (37,722,456) |
Foreign currency translations
| (126,551) |
Futures contracts
| (20,947) |
Net change in unrealized appreciation/depreciation
| (37,869,954) |
NET REALIZED AND UNREALIZED GAIN (LOSS)
| (42,661,071) |
NET INCREASE (DECREASE) IN NET ASSETS FROM OPERATIONS
| $(36,862,134) |
See accompanying notes to financial statements.
12
STATE STREET INTERNATIONAL STOCK SELECTION FUND
Statements of Changes in Net Assets
| | Year Ended
8/31/22 | | Year Ended
8/31/21 |
| INCREASE (DECREASE) IN NET ASSETS FROM OPERATIONS: | | | |
Net investment income (loss)
| $ 5,798,937 | | $ 5,186,023 |
Net realized gain (loss)
| (4,791,117) | | 22,343,154 |
Net change in unrealized appreciation/depreciation
| (37,869,954) | | 18,500,083 |
Net increase (decrease) in net assets resulting from operations
| (36,862,134) | | 46,029,260 |
| DISTRIBUTIONS TO SHAREHOLDERS: | | | |
Class A
| (187,690) | | (79,462) |
Class I
| (140,625) | | (55,371) |
Class K
| (3,772,129) | | (1,427,961) |
Class N
| (4,922,997) | | (2,064,307) |
Total distributions to shareholders
| (9,023,441) | | (3,627,101) |
| FROM BENEFICIAL INTEREST TRANSACTIONS: | | | |
| Class A | | | |
Proceeds from shares sold
| 352,002 | | 298,858 |
Reinvestment of distributions
| 187,689 | | 79,462 |
Cost of shares redeemed
| (361,993) | | (885,198) |
Net increase (decrease) from capital share transactions
| 177,698 | | (506,878) |
| Class I | | | |
Proceeds from shares sold
| 419,672 | | 522,871 |
Reinvestment of distributions
| 135,836 | | 54,572 |
Cost of shares redeemed
| (607,779) | | (380,406) |
Net increase (decrease) from capital share transactions
| (52,271) | | 197,037 |
| Class K | | | |
Proceeds from shares sold
| 40,971,886 | | 8,621,813 |
Reinvestment of distributions
| 3,772,129 | | 1,427,961 |
Cost of shares redeemed
| (37,489,034) | | (9,080,362) |
Net increase (decrease) from capital share transactions
| 7,254,981 | | 969,412 |
| Class N | | | |
Proceeds from shares sold
| 4,197,758 | | 4,614,275 |
Reinvestment of distributions
| 4,877,616 | | 2,043,169 |
Cost of shares redeemed
| (13,224,128) | | (18,281,351) |
Net increase (decrease) from capital share transactions
| (4,148,754) | | (11,623,907) |
Net increase (decrease) in net assets from beneficial interest transactions
| 3,231,654 | | (10,964,336) |
Net increase (decrease) in net assets during the period
| (42,653,921) | | 31,437,823 |
Net assets at beginning of period
| 202,283,490 | | 170,845,667 |
NET ASSETS AT END OF PERIOD
| $159,629,569 | | $202,283,490 |
| SHARES OF BENEFICIAL INTEREST: | | | |
| Class A | | | |
Shares sold
| 33,934 | | 29,750 |
Reinvestment of distributions
| 16,773 | | 7,604 |
Shares redeemed
| (33,927) | | (83,135) |
Net increase (decrease) from capital share transactions
| 16,780 | | (45,781) |
| Class I | | | |
Shares sold
| 40,278 | | 47,323 |
Reinvestment of distributions
| 12,085 | | 5,202 |
Shares redeemed
| (55,046) | | (34,818) |
Net increase (decrease) from capital share transactions
| (2,683) | | 17,707 |
| Class K | | | |
Shares sold
| 4,032,448 | | 808,210 |
Reinvestment of distributions
| 335,897 | | 136,126 |
Shares redeemed
| (3,526,185) | | (836,399) |
Net increase (decrease) from capital share transactions
| 842,160 | | 107,937 |
| Class N | | | |
Shares sold
| 392,672 | | 432,798 |
Reinvestment of distributions
| 433,181 | | 194,218 |
Shares redeemed
| (1,236,698) | | (1,705,572) |
Net increase (decrease) from capital share transactions
| (410,845) | | (1,078,556) |
See accompanying notes to financial statements.
13
STATE STREET INTERNATIONAL STOCK SELECTION FUND
FINANCIAL HIGHLIGHTS
Selected data for a share outstanding throughout each period
| | Class A |
| | Year Ended
8/31/22 | | Year Ended
8/31/21 | | Year Ended
8/31/20 | | Year Ended
8/31/19 | | Year Ended
8/31/18 |
Net asset value, beginning of period
| $ 11.84 | | $ 9.46 | | $ 9.59 | | $10.96 | | $ 11.76 |
| Income (loss) from investment operations: | | | | | | | | | |
Net investment income (loss) (a)(b)
| 0.32 | | 0.25 | | 0.19 | | 0.22 | | 0.26 |
Net realized and unrealized gain (loss)
| (2.57) | | 2.31 | | (0.00)(c) | | (1.07) | | (0.63) |
Total from investment operations
| (2.25) | | 2.56 | | 0.19 | | (0.85) | | (0.37) |
| Distributions to shareholders from: | | | | | | | | | |
Net investment income
| (0.48) | | (0.18) | | (0.32) | | (0.52) | | (0.43) |
Net asset value, end of period
| $ 9.11 | | $ 11.84 | | $ 9.46 | | $ 9.59 | | $10.96 |
Total return (d)
| (19.76)% | | 27.33% | | 1.75% | | (7.46)% | | (3.35)% |
| Ratios and Supplemental Data: | | | | | | | | | |
Net assets, end of period (in 000s)
| $ 3,725 | | $4,642 | | $4,141 | | $4,148 | | $6,933 |
| Ratios to Average Net Assets: | | | | | | | | | |
Total expenses (b)
| 1.44% | | 1.55% | | 1.48% | | 1.49% | | 1.49% |
Net expenses (b)
| 1.20% | | 1.29% | | 1.20% | | 1.22% | | 1.25% |
Net investment income (loss) (b)
| 3.05% | | 2.30% | | 2.03% | | 2.19% | | 2.28% |
Portfolio turnover rate
| 120% | | 111% | | 104% | | 125% | | 72% |
| (a) | Average daily shares outstanding were used for this calculation. |
| (b) | May reflect amounts waived and/or reimbursed by the investment adviser and for certain funds, custody credit arrangements. |
| (c) | Amount is less than $0.005 per share. |
| (d) | Total return is calculated assuming a purchase of shares at net asset value on the first day and a sale at net asset value on the last day of each period reported. Distributions are assumed, for the purpose of this calculation, to be reinvested at net asset value per share on the respective payment dates of the Fund. Results represent past performance and are not indicative of future results. |
See accompanying notes to financial statements.
14
STATE STREET INTERNATIONAL STOCK SELECTION FUND
FINANCIAL HIGHLIGHTS (continued)
Selected data for a share outstanding throughout each period
| |
Class I |
| | Year Ended
8/31/22 | | Year Ended
8/31/21 | | Year Ended
8/31/20 | | Year Ended
8/31/19 | | Year Ended
8/31/18 |
Net asset value, beginning of period
| $ 11.93 | | $ 9.51 | | $ 9.65 | | $ 11.05 | | $ 11.81 |
| Income (loss) from investment operations: | | | | | | | | | |
Net investment income (loss) (a)(b)
| 0.37 | | 0.31 | | 0.22 | | 0.34 | | 0.44 |
Net realized and unrealized gain (loss)
| (2.59) | | 2.32 | | 0.00(c) | | (1.17) | | (0.74) |
Total from investment operations
| (2.22) | | 2.63 | | 0.22 | | (0.83) | | (0.30) |
| Distributions to shareholders from: | | | | | | | | | |
Net investment income
| (0.54) | | (0.21) | | (0.36) | | (0.57) | | (0.46) |
Net asset value, end of period
| $ 9.17 | | $ 11.93 | | $ 9.51 | | $ 9.65 | | $ 11.05 |
Total return (d)
| (19.47)% | | 27.94% | | 2.02% | | (7.03)% | | (2.84)% |
| Ratios and Supplemental Data: | | | | | | | | | |
Net assets, end of period (in 000s)
| $ 2,604 | | $3,419 | | $2,557 | | $4,610 | | $2,551 |
| Ratios to Average Net Assets: | | | | | | | | | |
Total expenses (b)
| 1.04% | | 1.11% | | 1.15% | | 1.12% | | 1.00% |
Net expenses (b)
| 0.81% | | 0.85% | | 0.87% | | 0.84% | | 0.76% |
Net investment income (loss) (b)
| 3.46% | | 2.88% | | 2.33% | | 3.38% | | 3.84% |
Portfolio turnover rate
| 120% | | 111% | | 104% | | 125% | | 72% |
| (a) | Average daily shares outstanding were used for this calculation. |
| (b) | May reflect amounts waived and/or reimbursed by the investment adviser and for certain funds, custody credit arrangements. |
| (c) | Amount is less than $0.005 per share. |
| (d) | Total return is calculated assuming a purchase of shares at net asset value on the first day and a sale at net asset value on the last day of each period reported. Distributions are assumed, for the purpose of this calculation, to be reinvested at net asset value per share on the respective payment dates of the Fund. Results represent past performance and are not indicative of future results. |
See accompanying notes to financial statements.
15
STATE STREET INTERNATIONAL STOCK SELECTION FUND
FINANCIAL HIGHLIGHTS (continued)
Selected data for a share outstanding throughout each period
| |
Class K |
| | Year Ended
8/31/22 | | Year Ended
8/31/21 | | Year Ended
8/31/20 | | Year Ended
8/31/19 | | Year Ended
8/31/18 |
Net asset value, beginning of period
| $ 11.93 | | $ 9.52 | | $ 9.65 | | $ 11.04 | | $ 11.82 |
| Income (loss) from investment operations: | | | | | | | | | |
Net investment income (loss) (a)(b)
| 0.35 | | 0.32 | | 0.24 | | 0.31 | | 0.32 |
Net realized and unrealized gain (loss)
| (2.57) | | 2.31 | | (0.00)(c) | | (1.12) | | (0.64) |
Total from investment operations
| (2.22) | | 2.63 | | 0.24 | | (0.81) | | (0.32) |
| Distributions to shareholders from: | | | | | | | | | |
Net investment income
| (0.54) | | (0.22) | | (0.37) | | (0.58) | | (0.46) |
Net asset value, end of period
| $ 9.17 | | $ 11.93 | | $ 9.52 | | $ 9.65 | | $ 11.04 |
Total return (d)
| (19.42)% | | 27.97% | | 2.21% | | (6.98)% | | (2.80)% |
| Ratios and Supplemental Data: | | | | | | | | | |
Net assets, end of period (in 000s)
| $66,731 | | $76,748 | | $60,185 | | $53,350 | | $67,632 |
| Ratios to Average Net Assets: | | | | | | | | | |
Total expenses (b)
| 0.98% | | 1.01% | | 1.03% | | 1.03% | | 0.99% |
Net expenses (b)
| 0.75% | | 0.75% | | 0.75% | | 0.75% | | 0.75% |
Net investment income (loss) (b)
| 3.25% | | 2.93% | | 2.52% | | 3.07% | | 2.72% |
Portfolio turnover rate
| 120% | | 111% | | 104% | | 125% | | 72% |
| (a) | Average daily shares outstanding were used for this calculation. |
| (b) | May reflect amounts waived and/or reimbursed by the investment adviser and for certain funds, custody credit arrangements. |
| (c) | Amount is less than $0.005 per share. |
| (d) | Total return is calculated assuming a purchase of shares at net asset value on the first day and a sale at net asset value on the last day of each period reported. Distributions are assumed, for the purpose of this calculation, to be reinvested at net asset value per share on the respective payment dates of the Fund. Results represent past performance and are not indicative of future results. |
See accompanying notes to financial statements.
16
STATE STREET INTERNATIONAL STOCK SELECTION FUND
FINANCIAL HIGHLIGHTS (continued)
Selected data for a share outstanding throughout each period
| |
Class N |
| | Year Ended
8/31/22 | | Year Ended
8/31/21 | | Year Ended
8/31/20 | | Year Ended
8/31/19 | | Year Ended
8/31/18 |
Net asset value, beginning of period
| $ 11.94 | | $ 9.53 | | $ 9.66 | | $ 11.04 | | $ 11.81 |
| Income (loss) from investment operations: | | | | | | | | | |
Net investment income (loss) (a)(b)
| 0.35 | | 0.29 | | 0.21 | | 0.29 | | 0.29 |
Net realized and unrealized gain (loss)
| (2.60) | | 2.32 | | 0.01 | | (1.12) | | (0.63) |
Total from investment operations
| (2.25) | | 2.61 | | 0.22 | | (0.83) | | (0.34) |
| Distributions to shareholders from: | | | | | | | | | |
Net investment income
| (0.51) | | (0.20) | | (0.35) | | (0.55) | | (0.43) |
Net asset value, end of period
| $ 9.18 | | $ 11.94 | | $ 9.53 | | $ 9.66 | | $ 11.04 |
Total return (c)
| (19.61)% | | 27.63% | | 1.94% | | (7.19)% | | (3.06)% |
| Ratios and Supplemental Data: | | | | | | | | | |
Net assets, end of period (in 000s)
| $86,569 | | $117,474 | | $103,963 | | $130,895 | | $180,398 |
| Ratios to Average Net Assets: | | | | | | | | | |
Total expenses (b)
| 1.23% | | 1.26% | | 1.28% | | 1.28% | | 1.23% |
Net expenses (b)
| 1.00% | | 1.00% | | 1.00% | | 1.00% | | 1.00% |
Net investment income (loss) (b)
| 3.25% | | 2.64% | | 2.20% | | 2.85% | | 2.49% |
Portfolio turnover rate
| 120% | | 111% | | 104% | | 125% | | 72% |
| (a) | Average daily shares outstanding were used for this calculation. |
| (b) | May reflect amounts waived and/or reimbursed by the investment adviser and for certain funds, custody credit arrangements. |
| (c) | Total return is calculated assuming a purchase of shares at net asset value on the first day and a sale at net asset value on the last day of each period reported. Distributions are assumed, for the purpose of this calculation, to be reinvested at net asset value per share on the respective payment dates of the Fund. Results represent past performance and are not indicative of future results. |
See accompanying notes to financial statements.
17
SSGA FUNDS
STATE STREET INTERNATIONAL STOCK SELECTION FUND
Notes to Financial Statements — August 31, 2022
1. Organization
The SSGA Funds (the “Trust”), a Massachusetts business trust registered under the Investment Company Act of 1940, as amended (“1940 Act”), is an open-end management investment company.
As of August 31, 2022, the Trust consists of two (2) series (and corresponding classes, each of which have the same rights and privileges, including voting rights), each of which represents a separate series of beneficial interest in the Trust. The Declaration of Trust permits the Board of Trustees of the Trust (the “Board" and each member thereof, a "Trustee") to authorize the issuance of an unlimited number of shares of beneficial interest at $0.001 par value. The financial statements herein relate to the following series (the “Fund”):
| Fund | Classes | Commencement of
Operations | Diversification
Classification |
| State Street International Stock Selection Fund | Class A
Class I
Class K
Class N | July 7, 2014
July 7, 2014
July 7, 2014
March 7, 1995 | Diversified |
Class A shares are available to the general public for investment through transaction-based financial intermediaries. Class A shares impose a sales charge (as a percentage of offering price) and may be subject to a 1.00% contingent deferred sales charge (“CDSC”) if no initial sales charge was paid at the time of purchase of an investment of $1,000,000 or more and the shares are redeemed within 18 months of purchase. Class I, Class K and Class N shares are sold without a sales charge and only to certain eligible investors.
Under the Trust’s organizational documents, its officers and Trustees are indemnified against certain liabilities arising out of the performance of their duties to the Trust. Additionally, in the normal course of business, the Trust enters into contracts with service providers that contain general indemnification clauses. The Trust’s maximum exposure under these arrangements is unknown as this would involve future claims that may be made against the Trust that have not yet occurred.
2. Summary of Significant Accounting Policies
The following is a summary of significant accounting policies followed by the Trust in the preparation of its financial statements:
The preparation of financial statements in accordance with U.S. generally accepted accounting principles (“U.S. GAAP”) requires management to make estimates and assumptions that affect the reported amounts and disclosures in the financial statements. Actual results could differ from those estimates. The Fund is an investment company under U.S. GAAP and follows the accounting and reporting guidance applicable to investment companies.
Security Valuation
The Fund's investments are valued at fair value each day that the New York Stock Exchange (“NYSE”) is open and, for financial reporting purposes, as of the report date should the reporting period end on a day that the NYSE is not open. Fair value is generally defined as the price the Fund would receive to sell an asset or pay to transfer a liability in an orderly transaction between market participants at the measurement date. By its nature, a fair value price is a good faith estimate of the valuation in a current sale and may not reflect an actual market price. The investments of the Fund are valued pursuant to the policy and procedures developed by the Oversight Committee (the “Committee”) and approved by the Board. The Committee provides oversight of the valuation of investments for the Fund. The Board has responsibility for overseeing the determination of the fair value of investments.
Valuation techniques used to value the Fund's investments by major category are as follows:
• Equity investments traded on a recognized securities exchange for which market quotations are readily available are valued at the last sale price or official closing price, as applicable, on the primary market or exchange on which they trade. Equity investments traded on a recognized exchange for which there were no sales on that day are valued at the last published sale price or at fair value.
• Investments in registered investment companies (including money market funds) or other unitized pooled investment vehicles that are not traded on an exchange are valued at that day’s published net asset value (“NAV”) per share or unit.
SSGA FUNDS
STATE STREET INTERNATIONAL STOCK SELECTION FUND (continued)
Notes to Financial Statements — August 31, 2022
• Exchange-traded futures contracts are valued at the closing settlement price on the primary market on which they are traded most extensively. Exchange-traded futures contracts traded on a recognized exchange for which there were no sales on that day are valued at the last reported sale price obtained from independent pricing services or brokers or at fair value.
In the event prices or quotations are not readily available or that the application of these valuation methods results in a price for an investment that is deemed to be not representative of the fair value of such investment, fair value will be determined in good faith by the Committee, in accordance with the valuation policy and procedures approved by the Board.
A “significant event” is an event that the Board believes, with a reasonably high degree of certainty, has caused the closing market prices of the Fund’s portfolio securities to no longer reflect their value at the time of the Fund’s net asset value calculation. Fair value may be determined using an independent fair value service under valuation procedures approved by the Board. The independent fair value service takes into account multiple factors including, but not limited to, movements in the U.S. securities markets, certain depositary receipts, futures contracts and foreign currency exchange rates that have occurred subsequent to the close of foreign securities exchanges. The use of the independent fair value service or alternative fair valuation methods would result in the investments being classified within Level 2 of the fair value hierarchy. At August 31, 2022, the independent fair value service was used for certain foreign securities in the State Street International Stock Selection Fund. These securities were classified within Level 2 of the fair value hierarchy.
Various inputs are used in determining the value of the Fund's investments.
The Fund values its assets and liabilities at fair value using a fair value hierarchy consisting of three broad levels that prioritize the inputs to valuation techniques giving the highest priority to readily available unadjusted quoted prices in active markets for identical assets or liabilities (Level 1 measurements) and the lowest priority to unobservable inputs (Level 3 measurements) when market prices are not readily available or reliable. The categorization of a value determined for an investment within the hierarchy is based upon the pricing transparency of the investment and is not necessarily an indication of the risk associated with investing in it.
The three levels of the fair value hierarchy are as follows:
• Level 1 �� Unadjusted quoted prices in active markets for an identical asset or liability;
• Level 2 – Inputs other than quoted prices included within Level 1 that are observable for the asset or liability either directly or indirectly, including quoted prices for similar assets or liabilities in active markets, quoted prices for identical or similar assets or liabilities in markets that are not considered to be active, inputs other than quoted prices that are observable for the asset or liability (such as exchange rates, financing terms, interest rates, yield curves, volatilities, prepayment speeds, loss severities, credit risks and default rates) or other market-corroborated inputs; and
• Level 3 – Unobservable inputs for the asset or liability, including the Committee’s assumptions used in determining the fair value of investments.
The value of the Fund’s investments according to the fair value hierarchy as of August 31, 2022 is disclosed in the Fund’s Schedule of Investments.
Investment Transactions and Income Recognition
Investment transactions are accounted for on trade date for financial reporting purposes. Realized gains and losses from the sale or disposition of investments and foreign exchange transactions, if any, are determined using the identified cost method. Dividend income and capital gain distributions, if any, are recognized on the ex-dividend date, or when the information becomes available, net of any foreign taxes withheld at source, if any. Non-cash dividends received in the form of stock, are recorded as dividend income at fair value. Distributions received by the Fund may include a return of capital that is estimated by management. Such amounts are recorded as a reduction of the cost of investments or reclassified to capital gains.
The Fund invests in Real Estate Investment Trusts (“REITs”). REITs determine the tax character of their distributions annually and may characterize a portion of their distributions as a return of capital or capital gain. The Fund's policy is to record all REIT distributions initially as dividend income and re-designate a portion of the capital or capital gains distributions at year end based on information provided by the REIT and/or SSGA Funds Management, Inc.’s (the “Adviser” or “SSGA FM”) estimates of such re-designations for which actual information
SSGA FUNDS
STATE STREET INTERNATIONAL STOCK SELECTION FUND (continued)
Notes to Financial Statements — August 31, 2022
has not yet been reported.
Expenses
Certain expenses, which are directly identifiable to a specific Fund, are applied to that Fund within the Trust. Other expenses which cannot be attributed to a specific Fund are allocated in such a manner as deemed equitable, taking into consideration the nature and type of expense and the relative net assets of the Funds within the Trust. Class specific expenses are borne by each class.
Foreign Currency Translation
The accounting records of the Fund are maintained in U.S. dollars. Foreign currencies as well as investment securities and other assets and liabilities denominated in a foreign currency are translated to U.S. dollars using exchange rates at period end. Purchases and sales of securities, income receipts and expense payments denominated in foreign currencies are translated into U.S. dollars at the prevailing exchange rate on the respective dates of the transactions.
The effects of exchange rate fluctuations on investments are included with the net realized and unrealized gain (loss) on investment securities. Other foreign currency transactions resulting in realized and unrealized gain (loss) are disclosed separately.
Foreign Taxes
The Fund may be subject to foreign taxes (a portion of which may be reclaimable) on income, stock dividends, realized and unrealized capital gains on investments or certain foreign currency transactions. Foreign taxes are recorded in accordance with SSGA FM's understanding of the applicable foreign tax regulations and rates that exist in the foreign jurisdictions in which the Fund invests. These foreign taxes, if any, are paid by the Fund and are reflected in the Statement of Operations, if applicable. Foreign taxes payable or deferred as of August 31, 2022, if any, are disclosed in the Fund's Statement of Assets and Liabilities.
As a result of several court cases, in certain countries across the European Union ("EU"), the Fund filed for additional tax reclaims for previously withheld taxes on dividends earned in those countries. These additional filings are subject to various administrative proceedings by the local jurisdictions’ tax authorities within the EU, as well as a number of related judicial proceedings. Income recognized for such EU reclaims is reflected in the Statement of Operations. When uncertainty exists as to the ultimate resolution of these proceedings, the likelihood of receipt of these EU reclaims, and the potential timing of payment, no amounts are reflected in the financial statements.
For U.S. income tax purposes, EU reclaims received by the Fund, if any, during a fiscal year reduce the amounts of foreign taxes that the Fund passes through to its shareholders for their use as foreign tax credits on their individual income tax returns. In the event that EU reclaims received by the Fund during the fiscal year exceed foreign withholding taxes paid, and the Fund previously passed through those refunded EU taxes to its shareholders for their use as foreign tax credits on prior year individual income tax returns the Fund will enter into a closing agreement with the Internal Revenue Service (the "IRS") in order to pay the associated tax liability on behalf of the Fund's shareholders, payable by the Fund to the IRS as a compliance fee.
Distributions
Distributions from net investment income, if any, are declared and paid annually. Net realized capital gains, if any, are distributed annually, unless additional distributions are required for compliance with applicable tax regulations. The amount and character of income and capital gains to be distributed are determined in accordance with applicable tax regulations which may differ from net investment income and realized gains recognized for U.S. GAAP purposes.
3. Derivative Financial Instruments
Futures Contracts
The Fund may enter into futures contracts to meet the Fund's objectives. A futures contract is a standardized, exchange-traded agreement to buy or sell a financial instrument at a set price on a future date. Upon entering into a futures contract, the Fund is required to deposit with the broker, cash or securities in an amount equal to the minimum initial margin requirements of the clearing house. Securities deposited, if any, are designated on the Schedule of Investments and cash deposited, if any, is included in Net cash at Broker on the Statement of Assets
SSGA FUNDS
STATE STREET INTERNATIONAL STOCK SELECTION FUND (continued)
Notes to Financial Statements — August 31, 2022
and Liabilities. Subsequent payments are made or received by the Fund equal to the daily change in the contract value, accumulated, exchange rates, and or other transactional fees. The accumulation of those payments are recorded as variation margin receivable or payable with a corresponding offset to unrealized gains or losses. The Fund recognizes a realized gain or loss when the contract is closed.
Losses may arise if the value of a futures contract decreases due to unfavorable changes in the market rates or values of the underlying instrument during the term of the contract or if the counterparty does not perform under the contract. The use of futures contracts also involves the risk that the movements in the price of the futures contracts do not correlate with the movement of the assets underlying such contracts.
For the year ended August 31, 2022, the Fund entered into futures contracts in order to equitize cash.
The following tables summarize the value of the Fund's derivative instruments as of August 31, 2022, and the related location in the accompanying Statement of Operations, presented by primary underlying risk exposure:
| | Liability Derivatives |
| | Interest
Rate
Risk | | Foreign
Exchange
Risk | | Credit
Risk | | Equity
Risk | | Commodity
Risk | | Total |
| State Street International Stock Selection Fund | | | | | | | | | | | |
Futures Contracts
| $— | | $— | | $— | | $20,910 | | $— | | $20,910 |
| | Net Realized Gain (Loss) |
| | Interest
Rate
Risk | | Foreign
Exchange
Risk | | Credit
Risk | | Equity
Risk | | Commodity
Risk | | Total |
| State Street International Stock Selection Fund | | | | | | | | | | | |
Futures Contracts
| $— | | $— | | $— | | $(557,329) | | $— | | $(557,329) |
| | Net Change in Unrealized Appreciation (Depreciation) |
| | Interest
Rate
Risk | | Foreign
Exchange
Risk | | Credit
Risk | | Equity
Risk | | Commodity
Risk | | Total |
| State Street International Stock Selection Fund | | | | | | | | | | | |
Futures Contracts
| $— | | $— | | $— | | $(20,947) | | $— | | $(20,947) |
4. Fees and Transactions with Affiliates
Advisory Fees
SSGA FM manages the Fund pursuant to an Investment Advisory Agreement between the Trust and the Adviser. The Adviser is a wholly-owned subsidiary of State Street Global Advisors, Inc., which itself is a wholly owned subsidiary of State Street Corporation. The Adviser and other advisory affiliates of State Street Corporation make up State Street Global Advisors, the investment management arm of State Street Corporation and its affiliated companies. The Adviser directs the investments of the Fund in accordance with its investment objectives, policies and limitations. For its services, the Fund pays the Adviser an annual management fee, calculated daily and paid monthly, at the following annual rates of their average daily net assets:
| | Annual Rate |
State Street International Stock Selection Fund
| 0.75% |
The Adviser is contractually obligated until December 31, 2022 to waive up to the full amount of its management fee and/or to reimburse the Fund for expenses to the extent that total annual Fund operating expenses (exclusive of non-recurring account fees, extraordinary expenses, acquired fund fees and expenses, and distribution, shareholder servicing and sub-transfer agency fees) exceed the following percent of average daily net assets on
SSGA FUNDS
STATE STREET INTERNATIONAL STOCK SELECTION FUND (continued)
Notes to Financial Statements — August 31, 2022
an annual basis as follows:
| | Expense Limitations |
State Street International Stock Selection Fund
| 0.75% |
This waiver and/or reimbursement may not be terminated with respect to the Fund prior to December 31, 2022 except with the approval of the Board.
The total amount of waivers for the year ended August 31, 2022 is detailed in the following table:
| Fund | Amount Waived or Reimbursed |
State Street International Stock Selection Fund
| $412,691 |
Administrator, Sub-Administrator and Custodian Fees
SSGA FM serves as administrator and State Street Bank and Trust Company (“State Street”), an affiliate of the Adviser, serves as custodian and sub-administrator. For its administrative services, the Fund pays SSGA FM a fee at an annual rate of 0.05% of its average daily net assets. The fees are accrued daily and paid monthly. SSGA FM has contractually agreed to waive 0.01% of its administration fee. The waiver may not be terminated or modified except with the approval of the Board and shall continue until at least December 31, 2022. For the year ended August 31, 2022, the total administration fees waived pursuant to the waiver agreement were as follows:
| | Amount Waived |
State Street International Stock Selection Fund
| $17,869 |
The Adviser and the Fund each bear a portion of the fee paid to State Street for providing sub-administration and custodian services with respect to the Fund.
Distribution and Shareholder Servicing Fees
State Street Global Advisors Funds Distributors, LLC (“SSGA FD” or the “Distributor”) an affiliate of the Adviser, serves as the distributor of the Trust.
The Fund adopted a distribution plan pursuant to Rule 12b-1 under the 1940 Act, under which the Fund may compensate the Distributor (or others) for services in connection with the distribution of the Fund’s Class A and Class N shares and for services provided to shareholders in those classes (the “Plan”).
The Plan calls for payments at an annual rate (based on average daily net assets) of 0.25% of the Fund’s net assets attributable to its Class A shares and 0.25% of the Fund’s net assets attributable to its Class N shares. In addition to payments under the Plan, the Fund may reimburse the Distributor or its affiliates for payments it makes to financial intermediaries that provide certain administrative, recordkeeping and account maintenance services. The amount of the reimbursement and the manner in which it is calculated are reviewed by the Trustees periodically.
Other Transactions with Affiliates - Securities Lending
State Street, an affiliate of the Fund, acts as the securities lending agent for the Fund, pursuant to an amended and restated securities lending authorization agreement dated January 6, 2017, as amended.
Effective January 1, 2022, net proceeds collected by State Street on investment of cash collateral or any fee income less rebates payable to borrowers are paid as follows: If the calendar year to date net proceeds are below a specified threshold across participating affiliated funds, the Fund retains eighty five percent (85%) of the net proceeds and fifteen percent (15%) of such net proceeds is payable to State Street. Starting the business day following the date that calendar year to date net proceeds exceeds a specified threshold, the Fund retains ninety percent (90%) of the net proceeds and ten percent (10%) of such net proceeds is payable to State Street. Prior to January 1, 2022, net proceeds were 85% payable to the Fund and 15% payable to State Street.
SSGA FUNDS
STATE STREET INTERNATIONAL STOCK SELECTION FUND (continued)
Notes to Financial Statements — August 31, 2022
In addition, cash collateral from lending activities is invested in the State Street Navigator Securities Lending Portfolio II, an affiliated fund, for which SSGA FM serves as investment adviser. See Note 8 for additional information regarding securities lending.
Other Transactions with Affiliates
The Fund may invest in affiliated entities, including securities issued by State Street Corporation, affiliated funds, or entities deemed to be affiliates as a result of the Fund owning more than five percent of the entity’s voting securities or outstanding shares. Amounts relating to these transactions during the year ended August 31, 2022 are disclosed in the Fund's Schedule of Investments.
Due to Custodian
In certain circumstances, the Fund may have cash overdrafts with the Custodian due to expense payments, capital transactions, trading of securities, investment operations or derivative transactions. The Due to Custodian amount, if any, reflects cash overdrawn with State Street, as custodian, who is an affiliate of the Fund.
5. Trustees’ Fees
The fees and expenses of the Trustees, who are not “interested persons” of the Trust, as defined in the 1940 Act (“Independent Trustees”), are paid directly by the Fund. The Independent Trustees are reimbursed for travel and other out-of-pocket expenses in connection with meeting attendance and industry seminars.
6. Investment Transactions
Purchases and sales of investments (excluding in-kind transactions, derivative contracts and short term investments) for the year ended August 31, 2022 were as follows:
| | Purchases | | Sales |
State Street International Stock Selection Fund
| $209,266,499 | | $221,156,512 |
7. Income Tax Information
The Fund has qualified and intends to continue to qualify as a regulated investment company under Subchapter M of the Internal Revenue Code of 1986, as amended. The Fund will not be subject to federal income taxes to the extent it distributes its taxable income, including any net realized capital gains, for each fiscal year. Therefore, no provision for federal income tax is required.
The Fund files federal and various state and local tax returns as required. No income tax returns are currently under examination. Generally, the federal returns are subject to examination by the IRS for a period of three years from date of filing, while the state returns may remain open for an additional year depending upon jurisdiction. SSGA FM has analyzed the Fund’s tax positions taken on tax returns for all open years and does not believe there are any uncertain tax positions that would require recognition of a tax liability.
Distributions to shareholders are recorded on ex-dividend date. Income dividends and gain distributions are determined in accordance with income tax rules and regulations, which may differ from generally accepted accounting principles.
Certain capital accounts in the financial statements have been adjusted for permanent book-tax differences. These adjustments have no impact on net asset values or results of operations. Temporary book-tax differences will reverse in the future. These book-tax differences are primarily due to foreign currencies, passive foreign investment companies, wash sale loss deferrals, and futures contracts. In addition, certain funds claimed a portion of the payments made to redeeming shareholders as a distribution for income tax purposes.
The tax character of distributions paid during the year ended August 31, 2022, was as follows:
| | Ordinary
Income | | Long-Term
Capital Gains | | Total |
State Street International Stock Selection Fund
| $9,023,441 | | $— | | $9,023,441 |
SSGA FUNDS
STATE STREET INTERNATIONAL STOCK SELECTION FUND (continued)
Notes to Financial Statements — August 31, 2022
The tax character of distributions paid during the year ended August 31, 2021, was as follows:
| | Ordinary
Income | | Long-Term
Capital Gains | | Total |
State Street International Stock Selection Fund
| $ 3,627,101 | | $ — | | $ 3,627,101 |
At August 31, 2022, the components of distributable earnings on a tax basis were as follows:
| | Undistributed
Ordinary Income | | Capital Loss
Carryforwards | | Undistributed
Long-Term
Capital Gains | | Net Unrealized
Gains (Losses) | | Total |
State Street International Stock Selection Fund
| $2,788,501 | | $(15,527,882) | | $— | | $(14,680,549) | | $(27,419,930) |
As of August 31, 2022, the Fund had capital loss carryforwards available to offset future realized capital gains as follows:
| | Non-Expiring
Short Term | | Non-Expiring
Long Term |
State Street International Stock Selection Fund
| $15,527,882 | | $— |
As of August 31, 2022, gross unrealized appreciation and gross unrealized depreciation of investments and other financial instruments based on cost for federal income tax purposes were as follows:
| | Tax
Cost | | Gross
Unrealized
Appreciation | | Gross
Unrealized
Depreciation | | Net Unrealized
Appreciation
(Depreciation) |
State Street International Stock Selection Fund
| $160,706,105 | | $3,908,368 | | $18,500,271 | | $(14,591,903) |
8. Securities Lending
The Fund may lend securities to qualified broker-dealers or institutional investors. The loans are secured at all times by cash, cash equivalents or U.S. government securities in an amount at least equal to the market value of the securities loaned, plus accrued interest and dividends, determined on a daily basis and adjusted accordingly. The value of the collateral with respect to a loaned security may be temporarily more or less than the value of a security due to market fluctuations of securities values. With respect to each loan, if on any U.S. business day the aggregate market value of securities collateral plus cash collateral is less than the aggregate market value of the securities which are subject to the loan, the borrower will be notified to provide additional collateral on the next business day.
The Fund will regain record ownership of loaned securities to exercise certain beneficial rights; however, the Fund may bear the risk of delay in recovery of, or even loss of rights in the securities loaned should the borrower fail financially. In addition, the Fund will bear the risk of loss of any cash collateral that it may invest. The Fund receives compensation for lending its securities from interest or dividends earned on the cash, cash equivalents or U.S. government securities held as collateral, net of fee rebates paid to the borrower and net of fees paid to State Street as the lending agent. Additionally, the Fund will receive a fee from the borrower for non-cash collateral equal to a percentage of the market value of the loaned securities.
The market value of securities on loan as of August 31, 2022, and the value of the invested cash collateral are disclosed in the Fund's Statement of Assets and Liabilities. Non-cash collateral is not disclosed in the Fund's Statement of Assets and Liabilities as it is held by the lending agent on behalf of the Fund, and the Fund does not have the ability to re-hypothecate those securities. Securities lending income, as disclosed in the Fund's Statement of Operations, represents the income earned from the non-cash collateral and the investment of cash collateral, net of fee rebates paid to the borrower and net of fees paid to State Street as lending agent.
The following is a summary of the Fund's securities lending agreements and related cash and non-cash collateral received as of August 31, 2022:
| Fund | | Market Value of
Securities on Loan | | Cash
Collateral
Received | | Non-Cash
Collateral
Received* | | Total
Collateral
Received |
State Street International Stock Selection Fund
| | $ 3,939,956 | | $ 1,198,958 | | $ 2,977,941 | | $ 4,176,899 |
SSGA FUNDS
STATE STREET INTERNATIONAL STOCK SELECTION FUND (continued)
Notes to Financial Statements — August 31, 2022
| * | The non-cash collateral includes U.S. Treasuries and U.S. Government Agency securities. |
| | | | | Remaining Contractual Maturity of the Agreements
as of August 31, 2022 |
| Fund | | Securities
Lending
Transactions | | Overnight
and
Continuous | | <30 Days | | Between
30 & 90
Days | | >90 Days | | Total
Borrowings | | Gross Amount
of Recognized
Liabilities for
Securities Lending Transactions |
State Street International Stock Selection Fund
| | Common Stocks | | $1,198,958 | | $— | | $— | | $— | | $1,198,958 | | $1,198,958 |
9. Line of Credit
The Fund and other affiliated funds (each, a “Participant” and collectively, the “Participants”) have access to $200 million of a $1.275 billion ($1.1 billion prior to October 6, 2022) revolving credit facility, provided by a syndication of banks under which the Participants may borrow to fund shareholder redemptions. This agreement expires in October 2023 unless extended or renewed.
The Participants are charged an annual commitment fee which is calculated based on the unused portion of the shared credit line. Commitment fees are allocated among each of the Participants based on relative net assets. Commitment fees are ordinary fund operating expenses. A Participant incurs and pays the interest expense related to its borrowing. Interest is calculated at a rate per annum equal to the sum of 1.00% plus the greater of the New York Fed Bank Rate and the one-month SOFR Rate. Prior to October 7, 2021, the Fund had access to $200 million of a $500 million revolving credit facility and interest was calculated at a rate per annum equal to the sum of 1.25% plus the New York Fed Bank Rate.
The Fund had no outstanding loans as of August 31, 2022.
10. Risks
Concentration Risk
As a result of the Fund's ability to invest a large percentage of its assets in obligations of issuers within the same country, state, region, currency or economic sector, an adverse economic, business or political development may affect the value of the Fund's investments more than if the Fund was more broadly diversified.
Foreign and Emerging Markets Risk
Investing in foreign markets involves risks and considerations not typically associated with investing in the U.S. Foreign securities may be subject to risk of loss because of government regulation, economic, political and social instability in the countries in which the Fund invests. Foreign markets may be less liquid than investments in the U.S. and may be subject to the risks of currency fluctuations. To the extent that the Fund invests in securities of issuers located in emerging markets, these risks may be even more pronounced.
Russian Sanctions Risk
Sanctions threatened or imposed by a number of jurisdictions, including the United States, the European Union and the United Kingdom, and other intergovernmental actions that have been or may be undertaken in the future, against Russia, Russian entities or Russian individuals, may result in the devaluation of Russian currency, a downgrade in the country’s credit rating, an immediate freeze of Russian assets, a decline in the value and liquidity of Russian securities, property or interests, and/or other adverse consequences to the Russian economy or the Fund. The scope and scale of sanctions in place at a particular time may be expanded or otherwise modified in a way that have negative effects on the Fund. Sanctions, or the threat of new or modified sanctions, could impair the ability of the Fund to buy, sell, hold, receive, deliver or otherwise transact in certain affected securities or other investment instruments. Sanctions could also result in Russia taking counter measures or other actions in response, which may further impair the value and liquidity of Russian securities. These sanctions, and the resulting disruption of the Russian economy, may cause volatility in other regional and global markets and may negatively impact the performance of various sectors and industries, as well as companies in other countries, which could have a negative effect on the performance of the Fund, even if the Fund does not have direct exposure to securities of Russian issuers. As a collective result of the imposition of sanctions, Russian government countermeasures and the impact that they have had on the trading markets for Russian securities, certain Funds have used, and may in the future use, fair valuation procedures approved by the Fund’s Board to value certain
SSGA FUNDS
STATE STREET INTERNATIONAL STOCK SELECTION FUND (continued)
Notes to Financial Statements — August 31, 2022
Russian securities, which could result in such securities being deemed to have a zero value.
Credit Risk
The Fund may be exposed to credit risk in the event that an issuer or guarantor fails to perform or that an institution or entity with which the Fund has unsettled or open transactions defaults.
Market Risk
The Fund’s investments are subject to changes in general economic conditions, general market fluctuations and the risks inherent in investment in securities markets. Investment markets can be volatile and prices of investments can change substantially due to various factors including, but not limited to, economic growth or recession, changes in interest rates, changes in the actual or perceived creditworthiness of issuers, and general market liquidity. The Fund is subject to the risk that geopolitical events will disrupt securities markets and adversely affect global economies and markets. Local, regional or global events such as war, acts of terrorism, the spread of infectious illness or other public health issues, or other events could have a significant impact on the Fund and its investments.
An outbreak of a respiratory disease caused by a novel coronavirus first detected in China in December 2019 has spread globally. In an organized attempt to contain and mitigate the effects of the spread of the coronavirus known as COVID-19, governments and businesses world-wide have taken aggressive measures, including closing borders, restricting international and domestic travel, and the imposition of prolonged quarantines of large populations. COVID-19 has resulted in the disruption of and delays in the delivery of healthcare services and processes, the cancellation of organized events and educational institutions, the disruption of production and supply chains, a decline in consumer demand for certain goods and services, and general concern and uncertainty, all of which have contributed to increased volatility in global markets. The effects of COVID-19 will likely affect certain sectors and industries more dramatically than others, which may adversely affect the value of the Fund’s investments in those sectors or industries. COVID-19, and other epidemics and pandemics that may arise in the future, could adversely affect the economies of many nations, the global economy, individual companies and capital markets in ways that cannot be foreseen at the present time. In addition, the impact of infectious diseases in developing or emerging market countries may be greater due to limited health care resources. Political, economic and social stresses caused by COVID-19 also may exacerbate other pre-existing political, social and economic risks in certain countries. The duration of COVID-19 and its effects cannot be determined at this time, but the effects could be present for an extended period of time.
11. Subsequent Events
Management has evaluated the impact of all subsequent events on the Fund through the date the financial statements were issued and has determined that there were no subsequent events requiring adjustment or disclosure in the financial statements.
SSGA FUNDS
REPORT OF INDEPENDENT REGISTERED PUBLIC
ACCOUNTING FIRM
To the Shareholders and the Board of Trustees of State Street International Stock Selection Fund
Opinion on the Financial Statements
We have audited the accompanying statement of assets and liabilities of State Street International Stock Selection Fund (the “Fund”) (one of the funds constituting SSGA Funds (the “Trust”)), including the schedule of investments, as of August 31, 2022, and the related statement of operations for the year then ended, the statements of changes in net assets for each of the two years in the period then ended, the financial highlights for each of the five years in the period then ended and the related notes (collectively referred to as the “financial statements”). In our opinion, the financial statements present fairly, in all material respects, the financial position of the Fund (one of the funds constituting SSGA Funds) at August 31, 2022, the results of its operations for the year then ended, the changes in its net assets for each of the two years in the period then ended and its financial highlights for each of the five years in the period then ended, in conformity with U.S. generally accepted accounting principles.
Basis for Opinion
These financial statements are the responsibility of the Trust’s management. Our responsibility is to express an opinion on the Fund’s financial statements based on our audits. We are a public accounting firm registered with the Public Company Accounting Oversight Board (United States) (“PCAOB”) and are required to be independent with respect to the Trust in accordance with the U.S. federal securities laws and the applicable rules and regulations of the Securities and Exchange Commission and the PCAOB.
We conducted our audits in accordance with the standards of the PCAOB. Those standards require that we plan and perform the audit to obtain reasonable assurance about whether the financial statements are free of material misstatement, whether due to error or fraud. The Trust is not required to have, nor were we engaged to perform, an audit of the Trust’s internal control over financial reporting. As part of our audits, we are required to obtain an understanding of internal control over financial reporting but not for the purpose of expressing an opinion on the effectiveness of the Trust’s internal control over financial reporting. Accordingly, we express no such opinion.
Our audits included performing procedures to assess the risks of material misstatement of the financial statements, whether due to error or fraud, and performing procedures that respond to those risks. Such procedures included examining, on a test basis, evidence regarding the amounts and disclosures in the financial statements. Our procedures included confirmation of securities owned as of August 31, 2022, by correspondence with the custodian, brokers and others; when replies were not received from brokers and others, we performed other auditing procedures. Our audits also included evaluating the accounting principles used and significant estimates made by management, as well as evaluating the overall presentation of the financial statements. We believe that our audits provide a reasonable basis for our opinion.
We have served as the auditor of one or more State Street Global Advisors investment companies since 2000.
Boston, Massachusetts
October 25, 2022
SSGA FUNDS
State Street International Stock Selection Fund
Other Information — August 31, 2022 (Unaudited)
Expense Example
As a shareholder of the Fund, you incur two types of costs: (1) transaction costs, including sales charges (loads), if applicable, on purchase payments, reinvested dividends, or other distributions and (2) ongoing costs, including advisory fees and to the extent applicable, distribution (12b-1) and/or service fees; and other Fund expenses. This example is intended to help you understand your ongoing costs (in dollars) of investing in the Fund and to compare these costs with the ongoing costs of investing in other mutual funds. It is based on an investment of $1,000 made at the beginning of the period shown and held for the entire period from March 1, 2022 to August 31, 2022.
The table below illustrates your Fund’s cost in two ways:
Based on actual fund return ——This section helps you to estimate the actual expenses that you paid over the period. The “Ending Account Value” shown is derived from the Fund's actual return, and the third column shows the dollar amount that would have been paid by an investor who started with $1,000 in the Fund. You may use the information here, together with the amount you invested, to estimate the expenses that you paid over the period. To do so, simply divide your account value by $1,000 (for example, an $8,600 account value divided by $1,000 = 8.6), then multiply the result by the number given for the Fund under the heading “Expenses Paid During Period”.
Based on hypothetical 5% return ——This section is intended to help you compare your Fund’s costs with those of other mutual funds. It assumes that the Fund had a yearly return of 5% before expenses, but that the expense ratio is unchanged. In this case, because the return used is not the Fund’s actual return, the results do not apply to your investment. The example is useful in making comparisons because the U.S. Securities and Exchange Commission (the “SEC”) requires all mutual funds to calculate expenses based on a 5% return. You can assess your Fund’s costs by comparing this hypothetical example with the hypothetical examples that appear in shareholder reports of other funds.
Please note that the expenses shown in the table are meant to highlight your ongoing costs only and do not reflect any transaction costs, such as sales load charges (loads). Therefore, the hypothetical 5% return section of the table is useful in comparing ongoing costs only, and will not help you determine the relative total costs of owning different funds. In addition, if these transaction costs were included, your costs would have been higher.
| | | | Actual | | Hypothetical (assuming a 5%
return before expenses) |
| | Annualized
Expense Ratio | | Ending Account
Value | | Expenses Paid
During Period(a) | | Ending Account
Value | | Expenses Paid
During Period(a) |
State Street International Stock Selection Fund
| | | | | | | | | |
Class A
| 1.20% | | $861.10 | | $5.63 | | $1,019.20 | | $ 6.11 |
Class I
| 0.80 | | 862.70 | | 3.76 | | 1,021.20 | | 4.08 |
Class K
| 0.75 | | 862.70 | | 3.52 | | 1,021.40 | | 3.82 |
Class N
| 1.00 | | 861.20 | | 4.69 | | 1,020.20 | | 5.09 |
| (a) | Expenses are equal to the Fund's annualized net expense ratio multiplied by the average account value of the period, multiplied by 184, then divided by 365. |
SSGA FUNDS
State Street International Stock Selection Fund (continued)
Other Information — August 31, 2022 (Unaudited)
Tax Information
For federal income tax purposes, the following information is furnished with respect to the distributions of the Trust for its fiscal year ended August 31, 2022.
Qualified Business Income Deduction
The Fund reports the maximum amount allowable of qualified REIT dividends eligible for the qualified business income deduction under Section 199A.
Qualified Dividend Income
A portion of dividends distributed by the Fund during the fiscal year ended August 31, 2022 is considered qualified dividend income and is eligible for reduced tax rates. The Fund reports the maximum amount allowable of its net taxable income as qualified dividend income as provided in the Jobs and Growth Tax Relief Reconciliation Act of 2003.
Foreign Tax Credit
The Fund has made an election under Internal Revenue Code Section 853 to pass through foreign taxes paid by the Fund to its shareholders. For the year ended August 31, 2022, the total amount of foreign taxes that will be passed through are:
| | Amount |
State Street International Stock Selection Fund
| $400,245 |
The amount of foreign source income earned on the Fund during the year ended August 31, 2022 was as follows:
| | Amount |
State Street International Stock Selection Fund
| $6,672,732 |
SSGA FUNDS
State Street International Stock Selection Fund (continued)
Other Information — August 31, 2022 (Unaudited)
Proxy Voting Policies and Procedures and Record
The Fund has adopted the proxy voting policies of the Adviser. A description of the Fund's proxy voting policies and procedures that are used by the Fund's Adviser to vote proxies relating to the Fund's portfolio of securities are available (i) without charge, upon request, by calling 1-800-997-7327 (toll free) and (ii) on the SEC’s website at www.sec.gov. Information regarding how the Fund voted for the prior 12-months period ended June 30 is available by August 31 of each year by calling the same number on the SEC’s website, at www.sec.gov, and on the Fund's website at www.ssga.com.
Quarterly Portfolio Schedule
Following the Fund’s first and third fiscal quarter-ends, complete Schedules of Investments filed with the SEC as an exhibit on Form N-PORT, which can be found on the Fund's website at www.ssga.com and the SEC’s website at www.sec.gov. The Fund's Schedules of Investments are available upon request, without charge, by calling 1-800-997-7327 (toll free).
SSGA FUNDS
State Street International Stock Selection Fund (continued)
Other Information — August 31, 2022 (Unaudited)
TRUSTEE CONSIDERATIONS IN APPROVING CONTINUATION OF INVESTMENT ADVISORY AGREEMENT1
Overview of the Contract Review Process
Under the Investment Company Act of 1940, as amended (the “1940 Act”), an investment advisory agreement between a mutual fund and its investment adviser may continue in effect from year to year only if its continuance is approved at least annually by the fund’s board of trustees or its shareholders, and by a vote of a majority of those trustees who are not “interested persons” of the fund (the “Independent Trustees”) cast in person at a meeting called for the purpose of considering such approval.
Consistent with these requirements, the Board of Trustees (the “Board”) of the SSGA Funds (the “Trust”), met in person on April 6, 2022 and May 11-12, 2022, including in executive sessions attended by the Independent Trustees, to consider a proposal to approve, with respect to State Street International Stock Selection Fund (the “Fund”), the continuation of the investment advisory agreement (the “Advisory Agreement”) with SSGA Funds Management, Inc. (“SSGA FM” or the “Adviser”). Prior to voting on the proposal, the Independent Trustees, as well as the Trustee who is an “interested person” of the Adviser, reviewed information furnished by the Adviser and others reasonably necessary to permit the Board to evaluate the proposal fully. The Independent Trustees were separately represented by counsel who are independent of the Adviser (“Independent Counsel”) in connection with their consideration of approval of the Advisory Agreement. Following the April 6, 2022 meeting, the Independent Trustees submitted questions and requests for additional information to management, and considered management’s responses thereto prior to and at the May 11-12, 2022 meeting. The Independent Trustees considered, among other things, the following:
______________________________________________
1 Over the course of many years overseeing the Fund and other investment companies, the Independent Trustees have identified numerous relevant issues, factors and concerns ("issues, factors and concerns") that they consider each year in connection with the proposed continuation of the advisory agreement, the administration agreement, the distribution plans, the distribution agreement and various related-party service agreements (the "annual review process"). The statement of issues, factors and concerns and the related conclusions of the Independent Trustees may not change substantially from year to year. However, the information requested by, and provided to, the Independent Trustees with respect to the issues, factors and concerns and on which their conclusions are based is updated annually and, in some cases, may differ substantially from the previous year. The Independent Trustees schedule annually a separate in-person meeting that is dedicated to the annual review process (the "special meeting"). At the special meeting and throughout the annual review process, the Independent Trustees take a fresh look at each of the issues, factors and concerns in light of the latest available information and each year present one or more sets of comments and questions to management with respect to specific issues, factors and concerns. Management responds to such comments and questions to the satisfaction of the Independent Trustees before the annual review process is completed and prior to the Independent Trustees voting on proposals to approve continuation of the agreements and plans.
SSGA FUNDS
State Street International Stock Selection Fund (continued)
Other Information — August 31, 2022 (Unaudited)
Information about Performance, Expenses and Fees
| • | A report prepared by an independent third-party provider of investment company data, which includes for the Fund: |
| o | Comparisons of the Fund’s performance over the past one-, three-, five- and ten-year periods ended December 31, 2021, to the performance of an appropriate benchmark constructed by Broadridge Financial Solutions, Inc. (“Broadridge”) for the Fund (the “Lipper Index”) and a universe of other mutual funds with similar investment objectives and policies (the “Performance Group” and/or the “Performance Universe”); |
| o | Comparisons of the Fund’s expense ratio (with detail of component expenses) to the expense ratios of a group of comparable mutual funds selected by the independent third-party data provider (the “Expense Group” and/or “Expense Universe”); |
| o | A chart showing the Fund’s historical average net assets relative to its total expenses, management fees, and non-management expenses over the past five calendar years; and |
| o | Comparisons of the Fund’s contractual management fee to the contractual management fees of comparable mutual funds at different asset levels. |
| • | Comparative information concerning fees charged by the Adviser for managing institutional accounts using investment strategies and techniques similar to those used in managing the Fund, as applicable; and |
| • | Profitability analyses for (a) the Adviser with respect to the Fund and (b) affiliates of the Adviser that provide services to the Fund (“Affiliated Service Providers”). |
Information about Portfolio Management
| • | Descriptions of the investment management services provided by the Adviser, including its investment strategies and processes; |
| • | Information concerning the allocation of brokerage; and |
| • | Information regarding the procedures and processes used to value the assets of the Fund. |
Information about the Adviser
| • | Reports detailing the financial results and condition of the Adviser and its affiliates; |
| • | Descriptions of the qualifications, education and experience of the individual investment and other professionals responsible for managing the portfolio of the Fund and for Fund operations; |
| • | Information relating to compliance with and the administration of the Code of Ethics adopted by the Adviser; |
| • | Information about the Adviser’s proxy voting policies and procedures and information regarding the Adviser’s practices for overseeing proxy vendors; |
| • | Information concerning the resources devoted by the Adviser to overseeing compliance by the Fund and its service providers, including information concerning compliance with investment policies and restrictions and other operating policies of the Fund; |
| • | A description of the adequacy and sophistication of the Adviser’s technology and systems with respect to investment and administrative matters and a description of any material improvements or changes in technology or systems in the past year; |
| • | A description of the business continuity and disaster recovery plans of the Adviser; and |
| • | Information regarding the Adviser’s risk management processes. |
Other Relevant Information
| • | Information concerning the nature, extent, quality and cost of services provided to the Fund by SSGA FM in its capacity as the Fund’s administrator (the “Administrator”); |
SSGA FUNDS
State Street International Stock Selection Fund (continued)
Other Information — August 31, 2022 (Unaudited)
| • | Information concerning the nature, extent, quality and cost of various non-investment management services provided to the Fund by affiliates of the Adviser, including the custodian, sub-administrator, fund accountant and securities lending agent of the Fund, as applicable, and the role of the Adviser in managing the Fund’s relationship with these service providers; |
| • | Copies of the Advisory Agreement and agreements with other service providers of the Fund; |
| • | Responses to a request for information reviewed prior to the April 6, 2022 and May 11-12, 2022 meetings by Independent Counsel, requesting specific information from each of: |
| o | SSGA FM, in its capacity as the Fund’s Adviser and Administrator, with respect to its operations relating to the Fund and its approximate profit margins from such operations for the calendar year ended December 31, 2021; and the relevant operations of other Affiliated Service Providers to the Fund, together with their approximate profit margins from such relevant operations for the calendar year ended December 31, 2021; |
| o | State Street Bank and Trust Company (“State Street”), the sub-administrator, custodian and securities lending agent for the Fund, with respect to its operations relating to the Fund; and |
| o | State Street Global Advisors Funds Distributors, LLC, the principal underwriter and distributor of the shares of the Fund (the “Distributor”), with respect to its operations relating to the Fund, together with the Fund’s related distribution plans and arrangements under Rule 12b-1 of the 1940 Act; |
| • | Information from SSGA FM, State Street and the Distributor with respect to the Trust providing any material changes to the previous information supplied in response to the letter from Independent Counsel prior to the executive session of the Board on May 11-12, 2022; and |
| • | Materials provided by Broadridge, circulated to the Independent Trustees and to Independent Counsel. |
In addition to the information identified above, the Board considered information provided from time to time by the Adviser, and other service providers of the Fund throughout the year at meetings of the Board and its committees. At such meetings, the Trustees received, among other things, presentations by the portfolio managers and other investment professionals of the Adviser relating to the performance of the Fund and the investment strategies used in pursuing the Fund’s investment objective.
The Independent Trustees were assisted throughout the contract review process by their Independent Counsel. The Independent Trustees relied upon the advice of such counsel and their own business judgment in determining the material factors to be considered in evaluating the Advisory Agreement, and the weight to be given to each such factor. The conclusions reached with respect to the Advisory Agreement were based on a comprehensive evaluation of all the information provided and not any single factor. Moreover, each Trustee may have placed varying emphasis on particular factors in reaching conclusions with respect to the Fund.
Results of the Process
Based on a consideration of the foregoing and such other information as deemed relevant, including the factors and conclusions described below, at the meeting held on May 11-12, 2022, the Board, including a majority of the Independent Trustees, voted to approve the continuation of the Advisory Agreement effective June 1, 2022, for an additional year with respect to the Fund.
Nature, Extent and Quality of Services
In considering whether to approve the Advisory Agreement, the Board evaluated the nature, extent and quality of services provided to the Fund by the Adviser.
The Board considered the Adviser’s management capabilities and investment process with respect to the types of investments held by the Fund, including the education, experience and number of investment professionals and other personnel who provide portfolio management, investment research, and similar services to the Fund. The Board evaluated, where relevant, the abilities and experience of such investment personnel in analyzing particular markets, industries and specific issuers of securities in these markets and industries. The Board also considered the substantial expertise of the Adviser in developing and applying proprietary quantitative models for managing various funds that invest primarily in equity securities. The Board considered the extensive experience and resources committed by the Adviser to risk management, including with respect to investment risk, liquidity risk, operational risk, counterparty risk and model risk. Further, the Board considered material enhancements made to the risk management processes and systems over the past year. The Trustees also considered the significant risks assumed by the Adviser in connection with the services provided to the Fund, including reputational and
SSGA FUNDS
State Street International Stock Selection Fund (continued)
Other Information — August 31, 2022 (Unaudited)
entrepreneurial risks. The Board also took into account the compensation paid to recruit and retain investment personnel, and the time and attention devoted to the Fund by senior management, as well as the Adviser’s succession planning process.
The Board had previously reviewed the compliance programs of SSGA FM and various Affiliated Service Providers. Among other things, the Board considered compliance and reporting matters relating to personal trading by investment personnel, selective disclosure of portfolio holdings, late trading, frequent trading, portfolio valuation, business continuity, the allocation of investment opportunities and the voting of proxies. The Board also considered the role of the Adviser in overseeing the Fund’s securities lending activities. The Board also considered the performance of certain portions of the business continuity plan which have been invoked in response to the COVID-19 pandemic.
On the basis of the foregoing and other relevant information, the Board concluded that the Adviser can be expected to continue to provide high quality investment management and related services for the Fund.
Fund Performance
The Board compared the Fund’s investment performance to the performance of an appropriate benchmark and universe of comparable mutual funds for various time periods ended December 31, 2021. For purposes of these comparisons the Independent Trustees relied extensively on the Performance Group, Performance Universe and Lipper Index and the analyses of the related data provided by Broadridge. Among other information, the Board considered the following performance information in its evaluation of the Fund:
State Street International Stock Selection Fund. The Board considered that the Fund’s performance was below the median of its Performance Group for the 1-, 3- and 5-year periods and was above the median of its Performance Group for the 10-year period. The Board also considered that the Fund’s performance was above the median of its Performance Universe for the 1-, 3- and 10-year periods and was below the median of its Performance Universe for the 5-year period. The Board also considered that the Fund’s performance was below its Lipper Index for the 1-, 3- and 5-year periods and was above its Lipper Index for the 10-year period.
On the basis of the foregoing and other relevant information, the Board concluded that the performance of the Fund is satisfactory.
Management Fees and Expenses
The Board reviewed the contractual investment advisory fee rates payable by the Fund and actual fees paid by the Fund, net of waivers. As part of its review, the Board considered the Fund’s management fee and total expense ratio, including the portion attributable to administrative services provided by SSGA FM (both before and after giving effect to any expense caps), as compared to its Expense Group and Expense Universe, as constructed by Broadridge, and the related Broadridge analysis for the Fund. The Board also considered the comparability of the fees charged and the services provided to the Fund by the Adviser to the fees charged and services provided to other clients of the Adviser, including institutional accounts. In addition, the Board considered the willingness of the Adviser to provide undertakings from time to time to waive fees or pay expenses of the Fund to limit the total expenses borne by shareholders of the Fund. Among other information, the Board considered the following expense information in its evaluation of the Fund:
State Street International Stock Selection Fund. The Board considered that the Fund’s actual management fee was below the medians of its Expense Group and Expense Universe. The Board also considered that the Fund’s total expenses were below the medians of its Expense Group and Expense Universe.
On the basis of the foregoing and other relevant information, and in light of the nature, extent and quality of the services provided by the Adviser, the Board concluded that the fees and the expense ratio of the Fund compare favorably to the fees and expenses of the Expense Group and Expense Universe and are reasonable in relation to the services provided.
Profitability
The Board reviewed the level of profits realized by the Adviser and its affiliates in providing investment advisory and other services to the Fund and to all funds within the fund complex. The Board considered other direct and indirect benefits received by SSGA FM and Affiliated Service Providers in connection with their relationships with the Fund, together with the profitability of each of the Affiliated Service Providers with respect to their services to the Fund and/or fund complex. The Board also considered the various risks borne by SSGA FM and State Street in connection with their various roles in servicing the Trust, including reputational and entrepreneurial risks.
SSGA FUNDS
State Street International Stock Selection Fund (continued)
Other Information — August 31, 2022 (Unaudited)
The Board concluded that the profitability of the Adviser with respect to the Fund, and the profitability range of each of the Affiliated Service Providers with respect to its services to the Fund, were reasonable in relation to the services provided.
Economies of Scale
In reviewing management fees and profitability, the Board also considered the extent to which the Adviser and its affiliates, on the one hand, and the Fund and the fund complex, on the other hand, can expect to realize benefits from economies of scale as the assets of the Fund and fund complex increase. The Board acknowledged the difficulty in accurately measuring the benefits resulting from the economies of scale with respect to the management of the Fund. The Board concluded that, in light of the current size of the Fund and the fund complex, the level of profitability of the Adviser and its affiliates with respect to the Fund and the fund complex over various time periods, and the comparative management fee and expense ratio of the Fund during these periods, it does not appear that the Adviser or its affiliates has realized benefits from economies of scale in managing the assets of the Fund to such an extent that previously agreed advisory fees should be reduced or that breakpoints in such fees should be implemented for the Fund at this time.
Conclusions
In reaching its decision to approve the Advisory Agreement, the Board did not identify any single factor as being controlling, but based its recommendation on each of the factors it considered. Each Trustee may have contributed different weight to the various factors. Based upon the materials reviewed, the representations made and the considerations described above, and as part of its deliberations, the Board, including the Independent Trustees, concluded that the Adviser possesses the capability and resources to perform the duties required of it under the Advisory Agreement.
Further, based upon its review of the Advisory Agreement, the materials provided, and the considerations described above, the Board, including the Independent Trustees, concluded that (1) the terms of the Advisory Agreement are reasonable, fair, and in the best interests of the Fund and its shareholders, and (2) the rates payable under the Advisory Agreement are fair and reasonable in light of the usual and customary charges made for services of the same nature and quality.
SSGA FUNDS
State Street International Stock Selection Fund (continued)
Other Information — August 31, 2022 (Unaudited)
TRUSTEES AND OFFICERS INFORMATION
Name, Address
and Year of Birth | | Position(s) Held with Trust | | Term of
Office and
Length of
Time Served | | Principal Occupation During the Past Five Years and Relevant Experience | | Number of Funds in Fund Complex Overseen by Trustee† | | Other
Directorships
Held by Trustee
During the
Past Five Years |
| Trustees | | | | | | | | | | |
| Independent Trustees | | | | | | | | | | |
Michael F. Holland
c/o SSGA Funds
Management, Inc.
One Iron Street
Boston, MA 02210
YOB: 1944 | | Trustee and
Co-
Chairperson
of the Board | | Term: Indefinite
Elected: 1/14 | | Chairman, Holland & Company L.L.C. (investment adviser) (1995 - present). | | 59 | | Director, the Holland Series Fund, Inc.; Director, The China Fund, Inc. (1992-2017); Director, The Taiwan Fund, Inc. (2007-2017); Director, Reaves Utility Income Fund, Inc.; and Director, Blackstone/GSO Loans (and Real Estate) Funds. |
Patrick J. Riley
c/o SSGA Funds
Management, Inc.
One Iron Street
Boston, MA 02210
YOB: 1948 | | Trustee and
Co-
Chairperson
of the Board | | Term: Indefinite
Elected: 1988 | | 2002 to May 2010, Associate Justice of the Superior Court, Commonwealth of Massachusetts; 1985 to 2002, Partner, Riley, Burke & Donahue, L.L.P. (law firm); 1998 to Present, Independent Director, State Street Global Advisers Europe, Limited (investment company); 1998 to Present, Independent Director, SSGA Liquidity plc (formerly, SSGA Cash Management Fund plc); January 2009 to present, Independent Director, SSGA Fixed Income plc; and January 2009 - 2019, Independent Director, SSGA Qualified Funds PLC. | | 59 | | Board Director and Chairman, SPDR Europe 1PLC Board (2011 - present); Board Director and Chairman, SPDR Europe II, PLC (2013 - present). |
John R. Costantino
c/o SSGA Funds
Management, Inc.
One Iron Street
Boston, MA 02210
YOB: 1946 | | Trustee and
Chairperson
of the
Qualified Legal
Compliance
Committee | | Term: Indefinite
Elected: 12/18 | | Senior Advisor to NGN Capital LLC (January 2020 - present); Managing General Partner, NGN Capital LLC (2006 - December 2019). | | 59 | | Director of Kleinfeld Bridal Corp. (January 2016 - present); Trustee of Neuroscience Research Institute (1986 - 2017); Trustee of Fordham University (1989 - 1995 and 2001 - 2007) and Trustee Emeritus (2007 - present);Trustee and Independent Chairperson of GE Funds (1993 - February 2011); Director, Muscular Dystrophy Association (since 2019);
Trustee of Gregorian University Foundation (1992 - 2007); Chairman of the Board of Directors, Vivaldi Biosciences Inc. (May 2017 - present); Chairman of the Supervisory Board, Vivaldi Biosciences AG. (May 2017 - present); Trustee, Gallim Dance (December 2021 - present). |
Donna M. Rapaccioli
c/o SSGA Funds
Management, Inc.
One Iron Street
Boston, MA 02210
YOB: 1962 | | Trustee and
Chairperson of the Audit Committee | | Term: Indefinite
Elected: 12/18 | | Dean of the Gabelli School of Business (2007 - June 2022) and Accounting Professor (1987 - present) at Fordham University. | | 59 | | Director- Graduate Management Admissions Council (2015 - present); Trustee of Emmanuel College (2010 - 2019). |
Richard D. Shirk
c/o SSGA Funds
Management, Inc.
One Iron Street
Boston, MA 02210
YOB: 1945 | | Trustee and
Chairperson
of the
Nominating Committee and
Chairperson of the
Governance Committee | | Term: Indefinite
Elected: 1988 | | March 2001 to April 2002, Chairman (1996 to March 2001, President and Chief Executive Officer), Cerulean Companies, Inc. (holding company) (Retired); 1992 to March 2001, President and Chief Executive Officer, Blue Cross Blue Shield of Georgia (health insurer, managed healthcare). | | 59 | | 1998 to December 2008, Chairman, Board Member and December 2008 to Present, Investment Committee Member, Healthcare Georgia Foundation (private foundation); September 2002 to 2012, Lead Director and Board Member, Amerigroup Corp. (managed health care); 1999 to 2013, Board Member and (2001 to 2017) Investment Committee Member, Woodruff Arts Center; 2003 to 2009, Trustee, Gettysburg College; Board member, Aerocare Holdings (2003 - January 2021), Regenesis Biomedical Inc. (April 2012 - present). |
SSGA FUNDS
State Street International Stock Selection Fund (continued)
Other Information — August 31, 2022 (Unaudited)
Name, Address
and Year of Birth | | Position(s) Held with Trust | | Term of
Office and
Length of
Time Served | | Principal Occupation During the Past Five Years and Relevant Experience | | Number of Funds in Fund Complex Overseen by Trustee† | | Other
Directorships
Held by Trustee
During the
Past Five Years |
Michael A. Jessee
c/o SSGA Funds
Management, Inc.
One Iron Street
Boston, MA 02210
YOB: 1946 | | Trustee and Co-
Chairperson
of the Valuation Committee | | Term: Indefinite
Appointed: 7/16
Elected: 12/18 | | Retired; formerly, President and Chief Executive Officer of the Federal Home Loan Bank of Boston (1989 - 2009); Trustee, Randolph-Macon College (2004 - 2016). | | 59 | | None. |
Margaret McLaughlin
c/o SSGA Funds
Management, Inc.
One Iron Street
Boston, MA 02210
YOB: 1967 | | Trustee | | Term: Indefinite
Appointed: 9/22 | | Consultant (since 2020) Bates Group (consultants); Consultant (2019 - 2020) Madison Dearborn Partners (private equity); General Counsel/CCO (2011 - 2019) Kramer Van Kirk Credit Strategies L.P./Mariana Systems LLC (Investment Adviser/SaaS Technology). | | 59 | | Director, Manning & Napier Fund Inc. (2021 – present). |
George Pereira
c/o SSGA Funds
Management, Inc.
One Iron Street
Boston, MA 02210
YOB: 1964 | | Trustee | | Term: Indefinite
Appointed: 9/22 | | Chief Operating Officer (January 2011 - September 2020) and Chief Financial Officer (November 2004 – September 2020), Charles Schwab Investment Management. | | 59 | | Director, Pacific Premier Bancorp, Pacific Premier Bank (2021 - present); Director, Charles Schwab Asset Management (Ireland) Ltd., & Charles Schwab Worldwide Funds plc. (2005 - 2020); Director, Rotaplast International, Inc. (non-profit providing free medical services to children worldwide) (2012 - 2018). |
| Interested Trustee(1) | | | | | | | | | | |
Ellen M. Needham(2)
SSGA Funds Management, Inc.
One Iron Street
Boston, MA 02210
YOB: 1967 | | Trustee and President | | Term: Indefinite
Elected: 12/18 | | Chairman, SSGA Funds Management, Inc. (March 2020 - present); President and Director, SSGA Funds Management, Inc. (2001 - present)*; Senior Managing Director, State Street Global Advisors (1992 - present)*; Manager, State Street Global Advisors Funds Distributors, LLC (May 2017 - present). | | 59 | | Board Director, SSGA SPDR ETFs Europe 1 plc (May 2020 - present); Board Director, SSGA SPDR ETFs Europe II plc (May 2020 - present). |
| † For the purpose of determining the number of portfolios overseen by the Trustees, “Fund Complex” comprises registered investment companies for which SSGA FM serves as investment adviser. |
| (1) The individual listed below is a Trustee who is an “interested person,” as defined in the 1940 Act, of the Trust (“Interested Trustee”). |
| (2) Ms. Needham is an Interested Trustee because of her employment by SSGA FM, an affiliate of the Trust. |
| * Served in various capacities and/or with various affiliated entities during noted time period. |
SSGA FUNDS
State Street International Stock Selection Fund (continued)
Other Information — August 31, 2022 (Unaudited)
| The following lists the principal officers for the Trust, as well as their mailing addresses and ages, positions with the Trust and length of time served, and present and principal occupations: |
Name, Address
and Year of Birth | | Position(s) Held with Trust | | Term of
Office and
Length of
Time Served | | Principal Occupation(s) During the Past 5 Years |
| Officers | | | | | | |
ELLEN M. NEEDHAM
SSGA Funds Management, Inc.
One Iron Street
Boston, MA 02210
YOB: 1967 | | President,
Trustee | | Term: Indefinite
Elected: 10/12 | | Chairman, SSGA Funds Management, Inc. (March 2020 - present); President and Director, SSGA Funds Management, Inc. (2001 - present)*; Senior Managing Director, State Street Global Advisors (1992 - present)*; Manager, State Street Global Advisors Funds Distributors, LLC (May 2017 - present). |
BRUCE S. ROSENBERG
SSGA Funds Management, Inc.
One Iron Street
Boston, MA 02210
YOB: 1961 | | Treasurer | | Term: Indefinite
Elected: 2/16 | | Managing Director, State Street Global Advisors and SSGA Funds Management, Inc. (July 2015 - present); Director, Credit Suisse (April 2008 - July 2015). |
ANN M. CARPENTER
SSGA Funds Management, Inc.
One Iron Street
Boston, MA 02210
YOB: 1966 | | Vice
President
and Deputy
Treasurer | | Term: Indefinite
Elected: 10/12
Term: Indefinite
Elected: 2/16 | | Chief Operating Officer, SSGA Funds Management, Inc. (April 2005 - present)*; Managing Director, State Street Global Advisors (April 2005 - present).* |
CHAD C. HALLETT
SSGA Funds Management, Inc.
One Iron Street
Boston, MA 02210
YOB: 1969 | | Deputy Treasurer | | Term: Indefinite
Elected: 2/16 | | Vice President, State Street Global Advisors and SSGA Funds Management, Inc. (November 2014 - present); Vice President, State Street Bank and Trust Company (2001 - November 2014).* |
DARLENE ANDERSON-VASQUEZ
SSGA Funds Management, Inc.
One Iron Street
Boston, MA 02210
YOB: 1968 | | Deputy Treasurer | | Term: Indefinite
Elected: 11/16 | | Managing Director, State Street Global Advisors and SSGA Funds Management, Inc. (May 2016 - present); Senior Vice President, John Hancock Investments (September 2007 - May 2016). |
ARTHUR A. JENSEN
SSGA Funds Management, Inc.
1600 Summer Street
Stamford, CT 06905
YOB: 1966 | | Deputy Treasurer | | Term: Indefinite
Elected: 9/17 | | Vice President, State Street Global Advisors and SSGA Funds Management, Inc. (July 2016 - present); Mutual Fund Controller, GE Asset Management Incorporated (April 2011 - July 2016). |
DAVID LANCASTER
SSGA Funds Management, Inc.
One Iron Street
Boston, MA 02210
YOB: 1971 | | Assistant
Treasurer | | Term: Indefinite
Elected: 11/20 | | Vice President, State Street Global Advisors and SSGA Funds Management, Inc. (July 2017 - present); Assistant Vice President, State Street Bank and Trust Company (November 2011 - July 2017).* |
RYAN HILL
SSGA Funds Management, Inc.
One Iron Street
Boston, MA 02210
YOB: 1982 | | Assistant Treasurer | | Term: Indefinite
Elected: 5/22 | | Vice President, State Street Global Advisors and SSGA Funds Management, Inc. (May 2017 – present); Assistant Vice President, State Street Bank and Trust Company (May 2014 – May 2017). |
JOHN BETTENCOURT
SSGA Funds Management, Inc.
One Iron Street,
Boston, MA 02210
YOB:1976 | | Assistant Treasurer | | Term: Indefinite
Elected: 5/22 | | Vice President, State Street Global Advisors and SSGA Funds Management, Inc. (March 2020 – present); Assistant Vice President, State Street Global Advisors (June 2007 – March 2020). |
BRIAN HARRIS
SSGA Funds Management, Inc.
One Iron Street
Boston, MA 02210
YOB: 1973 | | Chief Compliance Officer, Anti-Money Laundering Officer and Code of Ethics Compliance Officer | | Term: Indifinite
Elected: 11/13
Term: Indefinite
Elected: 9/16 | | Managing Director, State Street Global Advisors and SSGA Funds Management, Inc. (June 2013 - present).* |
SEAN O'MALLEY
SSGA Funds Management, Inc.
One Iron Street
Boston, MA 02210
YOB: 1969 | | Chief Legal Officer | | Term: Indefinite
Elected: 8/19 | | Senior Vice President and General Counsel, State Street Global Advisors (May 2022 - present); Senior Vice President and Deputy General Counsel, State Street Global Advisors (November 2013 - May 2022). |
SSGA FUNDS
State Street International Stock Selection Fund (continued)
Other Information — August 31, 2022 (Unaudited)
Name, Address
and Year of Birth | | Position(s) Held with Trust | | Term of
Office and
Length of
Time Served | | Principal Occupation(s) During the Past 5 Years |
DAVID BARR
SSGA Funds Management, Inc.
One Iron Street
Boston, MA 02210
YOB:1974 | | Secretary | | Term: Indefinite
Elected: 9/20 | | Vice President and Senior Counsel, State Street Global Advisors (October 2019 - present); Vice President and Counsel, Eaton Vance Corp. (October 2010 - October 2019). |
DAVID URMAN
SSGA Funds Management, Inc.
One Iron Street
Boston,MA 02210
YOB:1985 | | Assistant Secretary | | Term: Indefinite
Elected: 8/19 | | Vice President and Senior Counsel, State Street Global Advisors (April 2019 - present); Vice President and Counsel, State Street Global Advisors (August 2015 - April 2019); Associate, Ropes & Gray LLP (November 2012 - August 2015). |
| * Served in various capacities and/or with various affiliated entities during noted time period. |
| The Statement of Additional Information (SAI) includes additional information about the Trust's trustees and officers and is available, without charge, upon request and by calling 1-877-521-4083. |
| |
State Street International Stock Selection Fund
One Iron Street
Boston, Massachusetts 02210
(800) 997-7327
Trustees
John R. Costantino
Michael F. Holland
Michael A. Jessee
Ellen M. Needham
Donna M. Rapaccioli
Patrick J. Riley
Richard D. Shirk
Margaret McLaughlin
George Pereira
Investment Adviser and Administrator
SSGA Funds Management, Inc.
One Iron Street
Boston, MA 02210
Custodian and Office of Shareholder Inquiries
State Street Bank and Trust Company
One Lincoln Street
Boston, MA 02111
Transfer and Dividend Paying Agent
DST Asset Manager Solutions Inc.
State Street Global Advisors
P.O. Box 219737
Kansas City, MO 64121-9737
Distributor
State Street Global Advisors Funds Distributors, LLC
One Iron Street
Boston, Massachusetts 02210
Sub-Administrator
State Street Bank and Trust Company
State Street Financial Center
One Lincoln Street
Boston, Massachusetts 02111
Legal Counsel
Ropes & Gray LLP
800 Boylston Street
Boston, MA 02199
Independent Registered Public Accounting Firm
Ernst & Young LLP
200 Clarendon Street
Boston, MA 02116
Distributor: State Street Global Advisors Funds Distributors, LLC, member FINRA, SIPC, an indirect wholly owned subsidiary of State Street Corporation. References to State Street may include State Street Corporation and its affiliates. The SSGA Funds pay State Street Bank and Trust Company for its services as custodian and shareholder servicing agent and pay SSGA Funds Management, Inc. for investment advisory and administrator services.
The information contained in this report is intended for the general information of shareholders of the Trust. This report is not authorized for distribution to prospective investors unless preceded or accompanied by a current Trust prospectus which contains important information concerning the Trust. You may obtain a current prospectus and SAI from the Distributor by calling 1-800-997-7327 or visiting www.ssga.com. Please read the prospectus carefully before you invest.
SSGAISSAR
(b) Not applicable to the Registrant.
Item 2. Code of Ethics.
As of the end of the period covered by this report, SSGA Funds (the “Trust,” “Fund Entity” or “Registrant”) has adopted a code of ethics, as defined in Item 2(b) of Form N-CSR, that applies to the Registrant’s principal executive officer, principal financial officer, principal accounting officer or controller, or persons performing similar functions, regardless of whether these individuals are employed by the Registrant or a third party (the “Code”). That Code comprises written standards that are reasonably designed to deter wrongdoing and to promote: (1) honest and ethical conduct, including the ethical handling of actual or apparent conflicts of interest between personal and professional relationships; (2) full, fair, accurate, timely and understandable disclosure in reports and documents that the Registrant files with, or submits to, the U.S. Securities Exchange Commission (the “SEC”) and in other public communications made by the Registrant; (3) compliance with applicable laws and governmental rules and regulations; (4) the prompt internal reporting to an appropriate person or persons identified in the Code of violations of the Code; and (5) accountability for adherence to the Code. For the period covered by the report, the Code was combined with other mutual funds advised by SSGA Funds Management, Inc. (“SSGA FM” or the “Adviser”). The Registrant has not made any amendments to the Code that relates to any element of the code of ethics definition set forth in Item 2(b) of Form N-CSR during the covered period. The Registrant has not granted any waivers from any provisions of the Code during the covered period. A copy of the Code is filed as Exhibit 13(a)(1) to this Form N-CSR.
Item 3. Audit Committee Financial Expert.
The Trust’s Board of Trustees (the “Board”) has determined that the Trust has the following “audit committee financial experts” as defined in Item 3(b) of Form N-CSR serving on its audit committee (the “Audit Committee”): Messrs. Michael F. Holland, Richard D. Shirk and John R. Costantino and Ms. Donna M. Rapaccioli. Each of the “audit committee financial experts” is “independent” as that term is defined in Item 3(a)(2) of Form N-CSR.
An “audit committee financial expert” is not an “expert” for any purpose, including for purposes of Section 11 of the Securities Act of 1933, as amended, as a result of being designated as an “audit committee financial expert.” Further, the designation of a person as an “audit committee financial expert” does not mean that the person has any greater duties, obligations, or liability than those imposed on the person without the “audit committee financial expert” designation. Similarly, the designation of a person as an “audit committee financial expert” does not affect the duties, obligations, or liability of any other member of the Audit Committee or the Board.
Item 4. Principal Accountant Fees and Services.
For the fiscal years ended August 31, 2022 and August 31, 2021, the aggregate audit fees billed for professional services rendered by Ernst & Young LLP (“E&Y”), the Trust’s principal accountant, for the audit of the Trust’s annual financial statements or services normally provided by E&Y in connection with the Trust’s statutory and regulatory filings and engagements were $62,605 and $84,270, respectively.
For the fiscal years ended August 31, 2022 and August 31, 2021, there were no fees for assurance and related services by E&Y reasonably related to the performance of the audit of the Trust’s financial statements that were not reported under paragraph (a) of this Item.
For the fiscal years ended August 31, 2022 and August 31, 2021, the aggregate tax fees billed for professional services rendered by E&Y for the review of year-end distribution requirements and a tax compliance matter were $35,987 and $18,981, respectively.
For the fiscal years ended August 31, 2022 and August 31, 2021, there were no fees billed for professional services rendered by E&Y for products and services provided by E&Y to the Trust, other than the services reported in paragraphs (a) through (c).
For the fiscal years ended August 31, 2022 and August 31, 2021, the aggregate fees for professional services rendered by E&Y for products and services provided by E&Y to the Adviser and any entity controlling, controlled by, or under common control with the Adviser that provides ongoing services to the Trust that (i) relate directly to the operations and financial reporting of the Trust and (ii) were pre-approved by the Audit Committee were approximately $9,327,125 and $7,321,519, respectively.
| | (e)(1) | Audit Committee Pre-Approval Policies and Procedures |
The Trust’s Audit Committee Charter states the following with respect to pre-approval procedures:
The Audit Committee shall have the following duties and powers:
| | • | | To pre-approve engagements by a Fund Entity’s independent auditor for non-audit services to be rendered to the Fund’s investment adviser (not including any subadviser whose role is primarily portfolio management and is subcontracted with or overseen by another investment adviser), and any entity controlling, controlled by, or under common control with the investment adviser that provides ongoing services to the Fund, if the engagement relates directly to the operations and financial reporting of the Fund; |
| | • | | To establish, if deemed necessary or appropriate as an alternative to Audit Committee pre-approval of services to be provided by the independent auditor as required by paragraph (b) above, policies and procedures to permit such services to be pre-approved by other means, such as by action of a designated member or members of the Audit Committee, subject to the requirement that the decision of any member to whom authority is delegated to pre-approve an activity shall be presented to the full Audit Committee at its next scheduled meeting; |
Alternate Pre-Approval Procedure:
| | • | | The Chairperson, or a Co-Chairperson, of the Audit Committee is authorized to pre-approve any engagement involving the Fund Entity’s independent auditors to the same extent as the Audit Committee. Any pre-approval decision by the Chairperson, or a Co-Chairperson, under the foregoing authority shall be presented to the Audit Committee at its next scheduled meeting. |
| | (e)(2) | Percentages of Services |
None of the services described in paragraphs (b) through (d) of this Item were performed in reliance on paragraph (c)(7)(i)(C) of Rule 2-01 of Regulation S-X during the period of time for which such rule was effective.
| | (f) | Not applicable to the Registrant. |
| | (g) | Total Fees Paid By Adviser and Certain Affiliates |
The aggregate non-audit fees billed for by E&Y for services rendered to the Trust and the Adviser and any entity controlling, controlled by, or under common control with the Adviser that provided ongoing services to the Trust were as follows:
| | | | | | | | |
| | | FY 2022
(in millions) | | | FY 2021
(in millions) | |
Non audit services billed to: | | | | | | | | |
Registrant: | | | See Item 4 | (c) | | | See Item 4 | (c) |
Investment Adviser: | | | — | | | | — | |
Other entities in the Investment Company Complex (1)(2): | | | | | | | | |
Audit Related Fees | | $ | 18.1 | | | $ | 18.4 | |
Tax Fees | | $ | 5.4 | | | $ | 4.4 | |
All Other Fees | | $ | 14.5 | | | $ | 14.5 | |
| (1) | Information is for the calendar years 2022 and 2021, respectively. |
| (2) | Services under the caption Audit-Related Fees consisted principally of reports on the processing of transactions by servicing organizations, audits of employee benefit plan, non-statutory audits and due diligence procedures. Services under the caption Tax Fees consisted principally of expatriate, compliance and corporate tax advisory services. Services under the caption All Other Fees primarily related to statutory and financial statement audits and the requirement to opine on the design and operating effectiveness of internal control over financial reporting. |
| | (h) | E&Y notified the Trust’s Audit Committee of all non-audit services that were rendered by E&Y to the Adviser and any entity controlling, controlled by, or under common control with the Adviser that provides services to the Trust, which services were not required to be pre-approved pursuant to paragraph (c)(7)(ii) of Rule 2-01 of Regulation S-X, allowing the Trust’s Audit Committee to consider whether such services were compatible with maintaining E&Y’s independence. |
| | (i) | Not applicable to the Registrant. |
| | (j) | Not applicable to the Registrant. |
Item 5. Audit Committee of Listed Registrants.
Not applicable to the Registrant.
Item 6. Investments.
| (a) | Schedules of Investments are included as part of the reports to shareholders filed under Item 1 of this Form N-CSR. |
| (b) | Not applicable to the Registrant. |
Item 7. Disclosure of Proxy Voting Policies and Procedures for Closed-End Management Investment Companies.
Not applicable to the Registrant.
Item 8. Portfolio Managers of Closed-End Management Investment Companies.
Not applicable to the Registrant.
Item 9. Purchases of Equity Securities by Closed-End Management Investment Company and Affiliated Purchasers.
Not applicable to the Registrant.
Item 10. Submission of Matters to a Vote of Security Holders.
There were no material changes to the procedures by which shareholders may recommend nominees to the Board.
Item 11. Controls and Procedures.
| (a) | The Trust’s principal executive officer and principal financial officer have concluded that the Trust’s disclosure controls and procedures (as defined in Rule 30a-3(c) under the Investment Company Act of 1940, as amended (the “1940 Act”)) are effective to provide reasonable assurance that information required to be disclosed by the Registrant on Form N-CSR is recorded, processed, summarized and reported as of a date within 90 days of the filing date of this report, based on their evaluation of these controls and procedures required by Rule 30a-3(b) under the 1940 Act and Rules 13a-15(b) or 15d-15(b) under the Securities Exchange Act of 1934, as amended. |
| (b) | There were no changes in the Registrant’s internal control over financial reporting (as defined in Rule 30a-3(d) under the 1940 Act) that occurred during the period covered by this report that have materially affected, or are reasonably likely to materially affect, the Registrant’s internal control over financial reporting. |
Item 12. Disclosure of Securities Lending Activities for Closed-End Management Investment Companies.
(a) Not applicable to the Registrant.
(b) Not applicable to the Registrant.
Item 13. Exhibits.
SIGNATURES
Pursuant to the requirements of the Securities Exchange Act of 1934, as amended, and the Investment Company Act of 1940, as amended, the Registrant has duly caused this report to be signed on its behalf by the undersigned, thereunto duly authorized.
| | |
| Registrant: | | SSGA FUNDS |
| |
| By: | | /s/ Ellen M. Needham |
| | Ellen M. Needham |
| | President |
| |
| Date: | | November 3, 2022 |
Pursuant to the requirements of the Securities Exchange Act of 1934, as amended, and the Investment Company Act of 1940, as amended, this report has been signed below by the following persons on behalf of the Registrant and in the capacities and on the dates indicated.
| | |
| By: | | /s/ Ellen M. Needham |
| | Ellen M. Needham |
| | President (Principal Executive Officer) |
| |
| Date: | | November 3, 2022 |
| |
| By: | | /s/ Bruce S. Rosenberg |
| | Bruce S. Rosenberg |
| | Treasurer (Principal Financial and Accounting Officer) |
| |
| Date: | | November 3, 2022 |